False00010235142023FY00010235142022-07-012023-06-300001023514dei:BusinessContactMember2022-07-012023-06-300001023514exch:XNYS2022-07-012023-06-300001023514sic:Z8880exch:XNYS2022-07-012023-06-3000010235142023-06-30xbrli:sharesiso4217:ZAR00010235142021-07-012022-06-3000010235142020-07-012021-06-30iso4217:ZARxbrli:shares00010235142022-06-300001023514ifrs-full:IssuedCapitalMember2020-06-300001023514ifrs-full:RetainedEarningsMember2020-06-300001023514ifrs-full:OtherReservesMember2020-06-300001023514ifrs-full:NoncontrollingInterestsMember2020-06-3000010235142020-06-300001023514ifrs-full:IssuedCapitalMember2020-07-012021-06-300001023514ifrs-full:OtherReservesMember2020-07-012021-06-300001023514ifrs-full:NoncontrollingInterestsMember2020-07-012021-06-300001023514ifrs-full:RetainedEarningsMember2020-07-012021-06-300001023514ifrs-full:IssuedCapitalMember2021-06-300001023514ifrs-full:RetainedEarningsMember2021-06-300001023514ifrs-full:OtherReservesMember2021-06-300001023514ifrs-full:NoncontrollingInterestsMember2021-06-3000010235142021-06-300001023514ifrs-full:IssuedCapitalMember2021-07-012022-06-300001023514ifrs-full:OtherReservesMember2021-07-012022-06-300001023514ifrs-full:RetainedEarningsMember2021-07-012022-06-300001023514ifrs-full:NoncontrollingInterestsMember2021-07-012022-06-300001023514ifrs-full:IssuedCapitalMember2022-06-300001023514ifrs-full:RetainedEarningsMember2022-06-300001023514ifrs-full:OtherReservesMember2022-06-300001023514ifrs-full:NoncontrollingInterestsMember2022-06-300001023514ifrs-full:IssuedCapitalMember2022-07-012023-06-300001023514ifrs-full:OtherReservesMember2022-07-012023-06-300001023514ifrs-full:RetainedEarningsMember2022-07-012023-06-300001023514ifrs-full:NoncontrollingInterestsMember2022-07-012023-06-300001023514ifrs-full:IssuedCapitalMember2023-06-300001023514ifrs-full:RetainedEarningsMember2023-06-300001023514ifrs-full:OtherReservesMember2023-06-300001023514ifrs-full:NoncontrollingInterestsMember2023-06-300001023514hmy:GoldMember2022-07-012023-06-300001023514hmy:GoldMember2021-07-012022-06-300001023514hmy:GoldMember2020-07-012021-06-300001023514hmy:SilverMember2022-07-012023-06-300001023514hmy:SilverMember2021-07-012022-06-300001023514hmy:SilverMember2020-07-012021-06-300001023514hmy:UraniumMember2022-07-012023-06-300001023514hmy:UraniumMember2021-07-012022-06-300001023514hmy:UraniumMember2020-07-012021-06-300001023514hmy:CommoditiesMember2022-07-012023-06-300001023514hmy:CommoditiesMember2021-07-012022-06-300001023514hmy:CommoditiesMember2020-07-012021-06-300001023514hmy:TollTreatmentsMember2022-07-012023-06-300001023514hmy:TollTreatmentsMember2021-07-012022-06-300001023514hmy:TollTreatmentsMember2020-07-012021-06-30iso4217:USDhmy:Ounceiso4217:ZARutr:kgiso4217:USDutr:lbiso4217:ZARiso4217:USDxbrli:pure0001023514hmy:BambananiMember2021-07-012022-06-30utr:kg0001023514hmy:HiddenValleyMember2022-07-012023-06-300001023514hmy:BambananiMember2021-07-012022-06-300001023514hmy:HiddenValleyMember2021-07-012022-06-300001023514hmy:MineWasteSolutionsMember2021-07-012022-06-300001023514hmy:MponengMember2021-07-012022-06-300001023514hmy:BambananiMember2022-01-012022-06-300001023514hmy:VaalRiverClosureMember2021-07-012022-06-300001023514hmy:TshepongNorthMember2022-07-012023-06-300001023514hmy:TshepongNorthMember2021-07-012022-06-300001023514hmy:TshepongNorthMember2020-07-012021-06-300001023514hmy:TshepongSouthMember2022-07-012023-06-300001023514hmy:TshepongSouthMember2021-07-012022-06-300001023514hmy:TshepongSouthMember2020-07-012021-06-300001023514hmy:MoabKhotsongMember2022-07-012023-06-300001023514hmy:MoabKhotsongMember2021-07-012022-06-300001023514hmy:MoabKhotsongMember2020-07-012021-06-300001023514hmy:KusasalethuMember2022-07-012023-06-300001023514hmy:KusasalethuMember2021-07-012022-06-300001023514hmy:KusasalethuMember2020-07-012021-06-300001023514hmy:BambananiMember2022-07-012023-06-300001023514hmy:BambananiMember2020-07-012021-06-300001023514hmy:Target3Member2022-07-012023-06-300001023514hmy:Target3Member2021-07-012022-06-300001023514hmy:Target3Member2020-07-012021-06-300001023514hmy:TshepongSouthMember2022-06-300001023514hmy:TshepongSouthMember2021-06-300001023514hmy:TshepongSouthMemberhmy:LifeofminePlanMember2022-06-300001023514hmy:ResourceBaseMemberhmy:TshepongSouthMember2022-06-300001023514hmy:TshepongNorthMember2022-06-300001023514hmy:TshepongNorthMember2021-06-300001023514hmy:TshepongOLOMMember2022-06-300001023514hmy:TshepongOLOMMember2021-06-300001023514hmy:TshepongNorthMemberhmy:LifeofminePlanMember2022-06-300001023514hmy:ResourceBaseMemberhmy:TshepongNorthMember2022-06-300001023514hmy:MoabKhotsongMember2022-06-300001023514hmy:MoabKhotsongMember2021-06-300001023514hmy:MoabKhotsongMemberhmy:LifeofminePlanMember2022-06-300001023514hmy:ResourceBaseMemberhmy:MoabKhotsongMember2022-06-300001023514hmy:KusasalethuMemberhmy:LifeofminePlanMember2022-06-300001023514hmy:ResourceBaseMemberhmy:KusasalethuMember2022-06-300001023514hmy:KusasalethuMember2022-06-300001023514hmy:BambananiMember2021-12-310001023514hmy:BambananiMember2022-06-300001023514ifrs-full:NotLaterThanOneYearMember2021-12-31iso4217:USDutr:oz0001023514hmy:BambananiMemberhmy:LifeofminePlanMember2022-06-300001023514hmy:ResourceBaseMemberhmy:BambananiMember2022-06-300001023514hmy:TshepongSouthMemberhmy:LifeofminePlanMember2021-06-300001023514hmy:ResourceBaseMemberhmy:TshepongSouthMember2021-06-300001023514hmy:TshepongNorthMemberhmy:LifeofminePlanMember2021-06-300001023514hmy:ResourceBaseMemberhmy:TshepongNorthMember2021-06-300001023514hmy:BambananiMemberhmy:LifeofminePlanMember2021-06-300001023514hmy:ResourceBaseMemberhmy:BambananiMember2021-06-300001023514hmy:BambananiMember2021-06-300001023514hmy:Target3Member2021-06-300001023514hmy:Target3Memberhmy:LifeofminePlanMember2021-06-300001023514hmy:ResourceBaseMemberhmy:Target3Member2021-06-300001023514hmy:EvaCopperMemberhmy:US400MillionFacilitySustainabilityLinkedMember2022-07-012023-06-30iso4217:USD0001023514hmy:EquityLinkedDepositsMember2022-07-012023-06-300001023514hmy:OtherProvisions1Member2022-07-012023-06-300001023514hmy:OtherProvisions1Member2021-07-012022-06-300001023514hmy:OtherProvisions1Member2020-07-012021-06-300001023514ifrs-full:ProvisionForDecommissioningRestorationAndRehabilitationCostsMember2022-07-012023-06-300001023514ifrs-full:ProvisionForDecommissioningRestorationAndRehabilitationCostsMember2021-07-012022-06-300001023514ifrs-full:ProvisionForDecommissioningRestorationAndRehabilitationCostsMember2020-07-012021-06-300001023514hmy:MiningProductsMemberifrs-full:CountryOfDomicileMember2022-07-012023-06-300001023514hmy:MiningProductsMemberifrs-full:CountryOfDomicileMember2021-07-012022-06-300001023514hmy:MiningProductsMemberifrs-full:CountryOfDomicileMember2020-07-012021-06-300001023514hmy:NonMiningProductsMemberifrs-full:CountryOfDomicileMember2022-07-012023-06-300001023514hmy:NonMiningProductsMemberifrs-full:CountryOfDomicileMember2021-07-012022-06-300001023514hmy:NonMiningProductsMemberifrs-full:CountryOfDomicileMember2020-07-012021-06-300001023514ifrs-full:CountryOfDomicileMember2022-07-012023-06-300001023514ifrs-full:CountryOfDomicileMember2021-07-012022-06-300001023514ifrs-full:CountryOfDomicileMember2020-07-012021-06-300001023514hmy:AustralianEntitiesAndPNGOperationMember2021-07-012022-06-300001023514hmy:AustralianEntitiesAndPNGOperationMember2022-07-012023-06-300001023514hmy:AustralianEntitiesAndPNGOperationMember2020-07-012021-06-300001023514hmy:MponengMemberifrs-full:CountryOfDomicileMember2022-07-012023-06-300001023514hmy:MponengMemberifrs-full:CountryOfDomicileMember2021-07-012022-06-300001023514hmy:MoabKhotsongMemberifrs-full:CountryOfDomicileMember2022-07-012023-06-300001023514hmy:MoabKhotsongMemberifrs-full:CountryOfDomicileMember2021-07-012022-06-300001023514hmy:MponengMemberhmy:UnredeemedCapitalExpendituresRelatedToTemporaryDifferencesDeferredTaxMember2023-06-300001023514srt:ParentCompanyMember2022-07-012023-06-300001023514srt:ParentCompanyMember2021-07-012022-06-300001023514srt:ParentCompanyMember2020-07-012021-06-300001023514hmy:FreegoldMember2022-07-012023-06-300001023514hmy:FreegoldMember2021-07-012022-06-300001023514hmy:FreegoldMember2020-07-012021-06-300001023514hmy:RandfonteinEstatesLimitedMember2022-07-012023-06-300001023514hmy:RandfonteinEstatesLimitedMember2021-07-012022-06-300001023514hmy:RandfonteinEstatesLimitedMember2020-07-012021-06-300001023514hmy:KalgoldMember2022-07-012023-06-300001023514hmy:KalgoldMember2021-07-012022-06-300001023514hmy:KalgoldMember2020-07-012021-06-300001023514hmy:MoabKhotsongMember2022-07-012023-06-300001023514hmy:MoabKhotsongMember2021-07-012022-06-300001023514hmy:MoabKhotsongMember2020-07-012021-06-300001023514hmy:MponengMember2022-07-012023-06-300001023514hmy:MponengMember2021-07-012022-06-300001023514hmy:MponengMember2020-07-012021-06-300001023514hmy:TemporaryDifferencesExcludingHedgeAccountedDerivativesMember2022-07-012023-06-300001023514hmy:TemporaryDifferencesExcludingHedgeAccountedDerivativesMember2021-07-012022-06-300001023514hmy:TemporaryDifferencesExcludingHedgeAccountedDerivativesMember2020-07-012021-06-300001023514ifrs-full:PropertyPlantAndEquipmentMember2022-07-012023-06-300001023514ifrs-full:PropertyPlantAndEquipmentMember2021-07-012022-06-300001023514ifrs-full:PropertyPlantAndEquipmentMember2020-07-012021-06-300001023514hmy:UnredeemedCapitalExpendituresRelatedToTemporaryDifferencesDeferredTaxMember2022-07-012023-06-300001023514hmy:UnredeemedCapitalExpendituresRelatedToTemporaryDifferencesDeferredTaxMember2021-07-012022-06-300001023514hmy:UnredeemedCapitalExpendituresRelatedToTemporaryDifferencesDeferredTaxMember2020-07-012021-06-300001023514hmy:AvgoldLimitedMember2021-07-012022-06-300001023514hmy:AvgoldLimitedMember2022-07-012023-06-300001023514hmy:AvgoldLimitedMember2020-07-012021-06-300001023514hmy:DeferredTaxAssetsGrossMember2023-06-300001023514hmy:DeferredTaxAssetsGrossMember2022-06-300001023514hmy:DeferredTaxAssetToBeRecoveredAfterMoreThan12MonthsGrossMember2023-06-300001023514hmy:DeferredTaxAssetToBeRecoveredAfterMoreThan12MonthsGrossMember2022-06-300001023514hmy:DeferredTaxAssetToBeRecoveredWithin12MonthsGrossMember2023-06-300001023514hmy:DeferredTaxAssetToBeRecoveredWithin12MonthsGrossMember2022-06-300001023514hmy:DeferredTaxLiabilitiesGrossMember2023-06-300001023514hmy:DeferredTaxLiabilitiesGrossMember2022-06-300001023514hmy:DeferredTaxLiabilityToBeRecoveredAfterMoreThan12MonthsGrossMember2023-06-300001023514hmy:DeferredTaxLiabilityToBeRecoveredAfterMoreThan12MonthsGrossMember2022-06-300001023514hmy:DeferredTaxLiabilityToBeRecoveredWithin12MonthsGrossMember2023-06-300001023514hmy:DeferredTaxLiabilityToBeRecoveredWithin12MonthsGrossMember2022-06-300001023514hmy:AmortisationAndDepreciationOfDeferredTaxMember2023-06-300001023514hmy:AmortisationAndDepreciationOfDeferredTaxMember2022-06-300001023514hmy:DerivativeFinancialInstrumentsTemporaryDifferencesMember2023-06-300001023514hmy:DerivativeFinancialInstrumentsTemporaryDifferencesMember2022-06-300001023514ifrs-full:OtherTemporaryDifferencesMember2023-06-300001023514ifrs-full:OtherTemporaryDifferencesMember2022-06-300001023514hmy:UnredeemedCapitalExpendituresRelatedToTemporaryDifferencesDeferredTaxMember2023-06-300001023514hmy:UnredeemedCapitalExpendituresRelatedToTemporaryDifferencesDeferredTaxMember2022-06-300001023514hmy:ExpenseProvisionsRelatedToTemporaryDifferencesDeferredTaxMember2023-06-300001023514hmy:ExpenseProvisionsRelatedToTemporaryDifferencesDeferredTaxMember2022-06-300001023514hmy:ContingentConsiderationLiabilityMember2023-06-300001023514hmy:ContingentConsiderationLiabilityMember2022-06-300001023514hmy:StreamingContractLiabilityMember2023-06-300001023514hmy:StreamingContractLiabilityMember2022-06-300001023514hmy:OtherDeferredTaxAssetsMember2023-06-300001023514hmy:OtherDeferredTaxAssetsMember2022-06-300001023514ifrs-full:UnusedTaxLossesMember2023-06-300001023514ifrs-full:UnusedTaxLossesMember2022-06-300001023514hmy:DeferredTaxAssetNotRecognisedRelatedTemporaryDifferencesMember2023-06-300001023514hmy:DeferredTaxAssetNotRecognisedRelatedTemporaryDifferencesMember2022-06-300001023514hmy:HiddenValleyMemberhmy:UnredeemedCapitalExpendituresRelatedToTemporaryDifferencesDeferredTaxMember2023-06-300001023514hmy:HiddenValleyMemberhmy:UnredeemedCapitalExpendituresRelatedToTemporaryDifferencesDeferredTaxMember2022-06-300001023514hmy:HiddenValleyMemberifrs-full:UnusedTaxLossesMember2023-06-300001023514hmy:HiddenValleyMemberifrs-full:UnusedTaxLossesMember2022-06-300001023514ifrs-full:ParentMember2023-06-300001023514ifrs-full:ParentMember2022-06-300001023514hmy:CGTLossesRelatedToTemporaryDifferencesMember2023-06-300001023514hmy:CGTLossesRelatedToTemporaryDifferencesMember2022-06-300001023514hmy:AvgoldLimitedMemberhmy:UnredeemedCapitalExpendituresRelatedToTemporaryDifferencesDeferredTaxMember2023-06-300001023514hmy:AvgoldLimitedMemberhmy:UnredeemedCapitalExpendituresRelatedToTemporaryDifferencesDeferredTaxMember2022-06-300001023514hmy:UnredeemedCapitalExpendituresRelatedToTemporaryDifferencesDeferredTaxMemberhmy:RandfonteinEstatesLimitedMember2023-06-300001023514hmy:UnredeemedCapitalExpendituresRelatedToTemporaryDifferencesDeferredTaxMemberhmy:RandfonteinEstatesLimitedMember2022-06-300001023514hmy:MponengMemberhmy:UnredeemedCapitalExpendituresRelatedToTemporaryDifferencesDeferredTaxMember2022-06-300001023514hmy:UnredeemedCapitalExpendituresRelatedToTemporaryDifferencesDeferredTaxMemberhmy:MineWasteSolutionsMember2023-06-300001023514hmy:UnredeemedCapitalExpendituresRelatedToTemporaryDifferencesDeferredTaxMemberhmy:MineWasteSolutionsMember2022-06-300001023514ifrs-full:UnusedTaxLossesMemberhmy:RandfonteinEstatesLimitedMember2023-06-300001023514ifrs-full:UnusedTaxLossesMemberhmy:RandfonteinEstatesLimitedMember2022-06-300001023514ifrs-full:UnusedTaxLossesMemberhmy:AvgoldLimitedMember2023-06-300001023514ifrs-full:UnusedTaxLossesMemberhmy:AvgoldLimitedMember2022-06-300001023514hmy:SisonkeEmployeeShareOwnershipPlanMember2021-07-012022-06-300001023514hmy:SisonkeEmployeeShareOwnershipPlanMember2020-07-012021-06-3000010235142022-02-252022-02-2500010235142022-04-112022-04-1100010235142021-04-192021-04-1900010235142022-08-292022-08-2900010235142022-10-172022-10-1700010235142021-10-182021-10-1800010235142023-10-162023-10-1600010235142023-08-292023-08-2900010235142023-08-152023-08-1500010235142022-08-112022-08-1100010235142021-08-102021-08-100001023514hmy:EvaCopperMember2022-07-012023-06-300001023514hmy:EvaCopperMember2022-12-160001023514ifrs-full:TopOfRangeMemberhmy:EvaCopperMember2022-10-060001023514hmy:EvaCopperMemberhmy:NominalDiscountRateMember2022-12-160001023514hmy:EvaCopperMemberifrs-full:BottomOfRangeMember2022-12-160001023514ifrs-full:TopOfRangeMemberhmy:EvaCopperMember2022-12-16hmy:ZAR_per_AUD0001023514hmy:EvaCopperMemberhmy:ProvisionalFairValueMember2022-12-160001023514hmy:EvaCopperMemberhmy:MeasurementPeriodAdjustmentMember2022-12-160001023514hmy:EvaCopperMemberhmy:FinalFairValueMember2022-12-160001023514hmy:MponengOperationsAndRelatedAssetsMember2020-09-300001023514hmy:MponengOperationsAndRelatedAssetsMember2020-10-010001023514hmy:MponengOperationsAndRelatedAssetsMember2020-10-012020-10-010001023514hmy:MponengOperationsAndRelatedAssetsMember2020-07-012021-06-300001023514ifrs-full:MiningAssetsMember2023-06-300001023514ifrs-full:MiningAssetsMember2022-06-300001023514ifrs-full:ConstructionInProgressMember2023-06-300001023514ifrs-full:ConstructionInProgressMember2022-06-300001023514hmy:UndevelopedPropertiesMember2023-06-300001023514hmy:UndevelopedPropertiesMember2022-06-300001023514hmy:OtherNonMiningAssetsMember2023-06-300001023514hmy:OtherNonMiningAssetsMember2022-06-300001023514ifrs-full:NotLaterThanOneYearMember2023-06-300001023514ifrs-full:NotLaterThanOneYearMember2022-06-300001023514ifrs-full:NotLaterThanOneYearMember2021-06-300001023514ifrs-full:LaterThanOneYearAndNotLaterThanTwoYearsMember2023-06-300001023514ifrs-full:LaterThanOneYearAndNotLaterThanTwoYearsMember2022-06-300001023514ifrs-full:LaterThanOneYearAndNotLaterThanTwoYearsMember2021-06-300001023514ifrs-full:LaterThanTwoYearsAndNotLaterThanThreeYearsMember2023-06-300001023514ifrs-full:LaterThanTwoYearsAndNotLaterThanThreeYearsMember2022-06-300001023514ifrs-full:LaterThanTwoYearsAndNotLaterThanThreeYearsMember2021-06-300001023514ifrs-full:LaterThanThreeYearsMember2023-06-300001023514ifrs-full:LaterThanThreeYearsMember2022-06-300001023514ifrs-full:LaterThanThreeYearsMember2021-06-30iso4217:PGKiso4217:USD0001023514hmy:UndergroundResourcesMemberhmy:SouthAfricanOperationsMember2022-06-300001023514hmy:UndergroundResourcesMemberhmy:SouthAfricanOperationsMember2021-06-300001023514hmy:SurfaceResourcesMemberhmy:SouthAfricanOperationsMember2022-06-300001023514hmy:SurfaceResourcesMemberhmy:SouthAfricanOperationsMember2021-06-300001023514hmy:HiddenValleyMemberhmy:SurfaceResourcesMember2022-06-300001023514hmy:HiddenValleyMemberhmy:SurfaceResourcesMember2021-06-300001023514ifrs-full:BottomOfRangeMemberhmy:SouthAfricanOperationsMember2023-06-300001023514ifrs-full:TopOfRangeMemberhmy:SouthAfricanOperationsMember2023-06-300001023514ifrs-full:BottomOfRangeMemberhmy:SouthAfricanOperationsMember2022-06-300001023514ifrs-full:TopOfRangeMemberhmy:SouthAfricanOperationsMember2022-06-300001023514ifrs-full:BottomOfRangeMemberhmy:SouthAfricanOperationsMember2021-06-300001023514ifrs-full:TopOfRangeMemberhmy:SouthAfricanOperationsMember2021-06-300001023514hmy:DoornkopMember2022-06-300001023514hmy:MponengMember2022-06-300001023514hmy:Target1Member2023-06-300001023514hmy:Target1Member2022-06-300001023514hmy:JoelMember2022-06-300001023514hmy:KusasalethuMember2023-06-300001023514hmy:MineWasteSolutionsMember2022-06-300001023514hmy:KalgoldMember2023-06-300001023514hmy:KalgoldMember2022-06-300001023514hmy:OtherSurfaceOperationsMember2022-06-300001023514hmy:HiddenValleyMember2022-06-300001023514hmy:CentralPlantReclamationMember2022-06-30hmy:basis_point0001023514ifrs-full:MiningAssetsMemberifrs-full:GrossCarryingAmountMember2022-06-300001023514ifrs-full:MiningAssetsMemberifrs-full:GrossCarryingAmountMember2021-06-300001023514ifrs-full:MiningAssetsMemberifrs-full:GrossCarryingAmountMember2022-07-012023-06-300001023514ifrs-full:MiningAssetsMemberifrs-full:GrossCarryingAmountMember2021-07-012022-06-300001023514ifrs-full:MiningAssetsMemberifrs-full:GrossCarryingAmountMember2023-06-300001023514ifrs-full:MiningAssetsMemberifrs-full:AccumulatedDepreciationAmortisationAndImpairmentMember2022-06-300001023514ifrs-full:MiningAssetsMemberifrs-full:AccumulatedDepreciationAmortisationAndImpairmentMember2021-06-300001023514ifrs-full:MiningAssetsMemberifrs-full:AccumulatedDepreciationAmortisationAndImpairmentMember2022-07-012023-06-300001023514ifrs-full:MiningAssetsMemberifrs-full:AccumulatedDepreciationAmortisationAndImpairmentMember2021-07-012022-06-300001023514ifrs-full:MiningAssetsMemberifrs-full:AccumulatedDepreciationAmortisationAndImpairmentMember2023-06-300001023514ifrs-full:MiningAssetsMemberhmy:HiddenValleyMemberifrs-full:GrossCarryingAmountMember2022-07-012023-06-300001023514ifrs-full:MiningAssetsMemberhmy:HiddenValleyMemberifrs-full:GrossCarryingAmountMember2021-07-012022-06-300001023514ifrs-full:MiningAssetsMemberhmy:HiddenValleyMember2022-07-012023-06-300001023514ifrs-full:MiningAssetsMemberhmy:HiddenValleyMember2021-07-012022-06-300001023514ifrs-full:MiningAssetsMemberhmy:KalgoldMember2023-06-300001023514ifrs-full:MiningAssetsMemberhmy:KalgoldMember2022-06-300001023514ifrs-full:MiningAssetsMemberhmy:HiddenValleyMember2023-06-300001023514ifrs-full:MiningAssetsMemberhmy:HiddenValleyMember2022-06-300001023514ifrs-full:MiningAssetsMemberhmy:KalgoldMember2022-07-012023-06-300001023514ifrs-full:MiningAssetsMemberhmy:KalgoldMember2021-07-012022-06-300001023514ifrs-full:GrossCarryingAmountMemberifrs-full:ConstructionInProgressMember2022-06-300001023514ifrs-full:GrossCarryingAmountMemberifrs-full:ConstructionInProgressMember2021-06-300001023514ifrs-full:GrossCarryingAmountMemberifrs-full:ConstructionInProgressMember2022-07-012023-06-300001023514ifrs-full:GrossCarryingAmountMemberifrs-full:ConstructionInProgressMember2021-07-012022-06-300001023514ifrs-full:GrossCarryingAmountMemberifrs-full:ConstructionInProgressMember2023-06-300001023514ifrs-full:ConstructionInProgressMemberifrs-full:AccumulatedDepreciationAmortisationAndImpairmentMember2022-06-300001023514ifrs-full:ConstructionInProgressMemberifrs-full:AccumulatedDepreciationAmortisationAndImpairmentMember2021-06-300001023514ifrs-full:ConstructionInProgressMemberifrs-full:AccumulatedDepreciationAmortisationAndImpairmentMember2022-07-012023-06-300001023514ifrs-full:ConstructionInProgressMemberifrs-full:AccumulatedDepreciationAmortisationAndImpairmentMember2021-07-012022-06-300001023514ifrs-full:ConstructionInProgressMemberifrs-full:AccumulatedDepreciationAmortisationAndImpairmentMember2023-06-300001023514ifrs-full:GrossCarryingAmountMemberhmy:MoabKhotsongGreatNoligwaMemberifrs-full:ConstructionInProgressMember2022-07-012023-06-300001023514ifrs-full:GrossCarryingAmountMemberhmy:MoabKhotsongGreatNoligwaMemberifrs-full:ConstructionInProgressMember2021-07-012022-06-300001023514hmy:MoabKhotsongZaaiplaatsMemberifrs-full:GrossCarryingAmountMemberifrs-full:ConstructionInProgressMember2022-07-012023-06-300001023514hmy:MoabKhotsongZaaiplaatsMemberifrs-full:GrossCarryingAmountMemberifrs-full:ConstructionInProgressMember2021-07-012022-06-300001023514hmy:DoornkopMemberifrs-full:GrossCarryingAmountMemberifrs-full:ConstructionInProgressMember2022-07-012023-06-300001023514hmy:DoornkopMemberifrs-full:GrossCarryingAmountMemberifrs-full:ConstructionInProgressMember2021-07-012022-06-300001023514hmy:MineWasteSolutionsKareerandTSFExpansionProjectMemberifrs-full:GrossCarryingAmountMemberifrs-full:ConstructionInProgressMember2022-07-012023-06-300001023514hmy:MineWasteSolutionsKareerandTSFExpansionProjectMemberifrs-full:GrossCarryingAmountMemberifrs-full:ConstructionInProgressMember2021-07-012022-06-300001023514ifrs-full:GrossCarryingAmountMemberifrs-full:ConstructionInProgressMemberhmy:TshepongNorthMember2021-07-012022-06-300001023514hmy:WafiGolpuJointOperationMember2022-07-012023-06-300001023514hmy:WafiGolpuJointOperationMember2021-07-012022-06-300001023514hmy:UndevelopedPropertiesMemberifrs-full:GrossCarryingAmountMember2022-06-300001023514hmy:UndevelopedPropertiesMemberifrs-full:GrossCarryingAmountMember2021-06-300001023514hmy:EvaCopperMemberhmy:UndevelopedPropertiesMemberifrs-full:GrossCarryingAmountMember2022-07-012023-06-300001023514hmy:EvaCopperMemberhmy:UndevelopedPropertiesMemberifrs-full:GrossCarryingAmountMember2021-07-012022-06-300001023514hmy:UndevelopedPropertiesMemberifrs-full:GrossCarryingAmountMember2022-07-012023-06-300001023514hmy:UndevelopedPropertiesMemberifrs-full:GrossCarryingAmountMember2021-07-012022-06-300001023514hmy:UndevelopedPropertiesMemberifrs-full:GrossCarryingAmountMember2023-06-300001023514hmy:UndevelopedPropertiesMemberifrs-full:AccumulatedDepreciationAmortisationAndImpairmentMember2022-06-300001023514hmy:UndevelopedPropertiesMemberifrs-full:AccumulatedDepreciationAmortisationAndImpairmentMember2021-06-300001023514hmy:UndevelopedPropertiesMemberifrs-full:AccumulatedDepreciationAmortisationAndImpairmentMember2022-07-012023-06-300001023514hmy:UndevelopedPropertiesMemberifrs-full:AccumulatedDepreciationAmortisationAndImpairmentMember2021-07-012022-06-300001023514hmy:UndevelopedPropertiesMemberifrs-full:AccumulatedDepreciationAmortisationAndImpairmentMember2023-06-300001023514ifrs-full:VehiclesMember2022-07-012023-06-300001023514ifrs-full:ComputerEquipmentMember2022-07-012023-06-300001023514hmy:FurnitureAndEquipmentMember2022-07-012023-06-300001023514hmy:OtherNonMiningAssetsMemberifrs-full:GrossCarryingAmountMember2022-06-300001023514hmy:OtherNonMiningAssetsMemberifrs-full:GrossCarryingAmountMember2021-06-300001023514hmy:OtherNonMiningAssetsMemberifrs-full:GrossCarryingAmountMember2022-07-012023-06-300001023514hmy:OtherNonMiningAssetsMemberifrs-full:GrossCarryingAmountMember2021-07-012022-06-300001023514hmy:OtherNonMiningAssetsMemberifrs-full:GrossCarryingAmountMember2023-06-300001023514hmy:OtherNonMiningAssetsMemberifrs-full:AccumulatedDepreciationAmortisationAndImpairmentMember2022-06-300001023514hmy:OtherNonMiningAssetsMemberifrs-full:AccumulatedDepreciationAmortisationAndImpairmentMember2021-06-300001023514hmy:OtherNonMiningAssetsMemberifrs-full:AccumulatedDepreciationAmortisationAndImpairmentMember2022-07-012023-06-300001023514hmy:OtherNonMiningAssetsMemberifrs-full:AccumulatedDepreciationAmortisationAndImpairmentMember2021-07-012022-06-300001023514hmy:OtherNonMiningAssetsMemberifrs-full:AccumulatedDepreciationAmortisationAndImpairmentMember2023-06-300001023514ifrs-full:ComputerSoftwareMember2022-07-012023-06-300001023514ifrs-full:GrossCarryingAmountMemberifrs-full:GoodwillMember2023-06-300001023514ifrs-full:GrossCarryingAmountMemberifrs-full:GoodwillMember2022-06-300001023514ifrs-full:GoodwillMemberifrs-full:AccumulatedDepreciationAmortisationAndImpairmentMember2022-06-300001023514ifrs-full:GoodwillMemberifrs-full:AccumulatedDepreciationAmortisationAndImpairmentMember2021-06-300001023514ifrs-full:GoodwillMemberifrs-full:AccumulatedDepreciationAmortisationAndImpairmentMember2022-07-012023-06-300001023514ifrs-full:GoodwillMemberifrs-full:AccumulatedDepreciationAmortisationAndImpairmentMember2021-07-012022-06-300001023514ifrs-full:GoodwillMemberifrs-full:AccumulatedDepreciationAmortisationAndImpairmentMember2023-06-300001023514ifrs-full:GoodwillMember2023-06-300001023514ifrs-full:GoodwillMember2022-06-300001023514hmy:EnvironmentalGuaranteesAndRehabilitationMember2023-06-300001023514hmy:EnvironmentalGuaranteesAndRehabilitationMember2022-06-300001023514hmy:SilicosisSettlementMember2023-06-300001023514hmy:SilicosisSettlementMember2022-06-300001023514hmy:PNGOperationsMember2023-06-300001023514hmy:PNGOperationsMember2022-06-300001023514hmy:OtherRestrictedCashMember2023-06-300001023514hmy:OtherRestrictedCashMember2022-06-300001023514hmy:RestrictedInvestmentsHeldByEnvironmentalTrustFundsMember2023-06-300001023514hmy:RestrictedInvestmentsHeldByEnvironmentalTrustFundsMember2022-06-300001023514hmy:RestrictedInvestmentsHeldBySocialTrustFundsMember2023-06-300001023514hmy:RestrictedInvestmentsHeldBySocialTrustFundsMember2022-06-300001023514hmy:RestrictedInvestmentsHeldByEnvironmentalTrustFundsFixedDepositsMember2023-06-300001023514hmy:RestrictedInvestmentsHeldByEnvironmentalTrustFundsFixedDepositsMember2022-06-300001023514hmy:RestrictedInvestmentsHeldByEnvironmentalTrustFundsCashAndCashEquivalentsMember2023-06-300001023514hmy:RestrictedInvestmentsHeldByEnvironmentalTrustFundsCashAndCashEquivalentsMember2022-06-300001023514hmy:RestrictedInvestmentsHeldByEnvironmentalTrustFundsEquitylinkedDepositsMember2023-06-300001023514hmy:RestrictedInvestmentsHeldByEnvironmentalTrustFundsEquitylinkedDepositsMember2022-06-300001023514hmy:RestrictedInvestmentsGovernmentBondsMember2023-06-300001023514hmy:RestrictedInvestmentsGovernmentBondsMember2022-06-300001023514ifrs-full:EquityInvestmentsMember2023-06-300001023514ifrs-full:EquityInvestmentsMember2022-06-300001023514hmy:RestrictedInvestmentsCollectiveInvestmentSchemeUnitTrustMember2023-06-300001023514hmy:RestrictedInvestmentsCollectiveInvestmentSchemeUnitTrustMember2022-06-300001023514hmy:RestrictedInvestmentsHeldByEnvironmentalTrustFundsMember2021-06-300001023514hmy:RestrictedInvestmentsHeldByEnvironmentalTrustFundsMember2022-07-012023-06-300001023514hmy:RestrictedInvestmentsHeldByEnvironmentalTrustFundsMember2021-07-012022-06-300001023514hmy:ARMBBEETrustMember2023-06-300001023514hmy:ARMBBEETrustMember2022-06-300001023514hmy:DebtInstrumentMember2023-06-300001023514hmy:DebtInstrumentMember2022-06-300001023514hmy:RandMutualAssuranceMember2023-06-300001023514hmy:RandMutualAssuranceMember2022-06-300001023514hmy:OtherInvestmentsMember2023-06-300001023514hmy:OtherInvestmentsMember2022-06-300001023514hmy:PamodziMember2023-06-300001023514hmy:PamodziMember2022-06-300001023514hmy:ARMBBEETrustMember2020-07-012021-06-300001023514hmy:ARMMember2022-07-012023-06-300001023514hmy:ARMBBEETrustMember2022-07-012023-06-300001023514hmy:ARMBBEETrustMember2021-07-012022-06-300001023514hmy:RandGoldHedgingContractsMember2023-06-300001023514hmy:USGoldHedgingContractsMember2023-06-300001023514hmy:USsilvercontractsMember2023-06-300001023514hmy:ForeignExchangeContractsMember2023-06-300001023514hmy:RandGoldHedgingContractsMember2022-07-012023-06-300001023514hmy:USGoldHedgingContractsMember2022-07-012023-06-300001023514hmy:USsilvercontractsMember2022-07-012023-06-300001023514hmy:ForeignExchangeContractsMember2022-07-012023-06-300001023514hmy:RandGoldHedgingContractsMember2022-06-300001023514hmy:USGoldHedgingContractsMember2022-06-300001023514hmy:USsilvercontractsMember2022-06-300001023514hmy:ForeignExchangeContractsMember2022-06-300001023514hmy:RandGoldHedgingContractsMember2021-07-012022-06-300001023514hmy:USGoldHedgingContractsMember2021-07-012022-06-300001023514hmy:USsilvercontractsMember2021-07-012022-06-300001023514hmy:ForeignExchangeContractsMember2021-07-012022-06-300001023514hmy:RandGoldHedgingContractsMember2020-07-012021-06-300001023514hmy:USGoldHedgingContractsMember2020-07-012021-06-300001023514hmy:USsilvercontractsMember2020-07-012021-06-300001023514hmy:ForeignExchangeContractsMember2020-07-012021-06-300001023514hmy:RandGoldDerivativeContractsMember2020-07-012021-06-300001023514ifrs-full:NotLaterThanThreeMonthsMemberhmy:ZeroCostCollarsMemberMember2023-06-300001023514hmy:ZeroCostCollarsMemberMemberifrs-full:LaterThanThreeMonthsAndNotLaterThanSixMonthsMember2023-06-300001023514hmy:ZeroCostCollarsMemberMemberhmy:LaterThanSixMonthsAndNotLaterThanNineMonthsMember2023-06-300001023514hmy:ZeroCostCollarsMemberMemberhmy:LaterThanNineMonthsAndNotLaterThanOneYearMember2023-06-300001023514hmy:ZeroCostCollarsMemberMemberhmy:LaterThanOneYearNotLaterThanOneYearThreeMonthsMember2023-06-300001023514hmy:LaterThanOneYearThreeMonthsNotLaterThanOneYearSixMonthsMemberhmy:ZeroCostCollarsMemberMember2023-06-300001023514hmy:ZeroCostCollarsMemberMemberhmy:LaterThanOneYearSixMonthsNotLaterThanOneYearNineMonthsMember2023-06-300001023514hmy:ZeroCostCollarsMemberMemberhmy:LaterthanOneYearNineMonthsNotLaterthanTwoYearsMember2023-06-300001023514hmy:ZeroCostCollarsMemberMember2023-06-300001023514ifrs-full:NotLaterThanThreeMonthsMemberhmy:ZeroCostCollarsMemberMemberifrs-full:BottomOfRangeMember2023-06-300001023514hmy:ZeroCostCollarsMemberMemberifrs-full:BottomOfRangeMemberifrs-full:LaterThanThreeMonthsAndNotLaterThanSixMonthsMember2023-06-300001023514hmy:ZeroCostCollarsMemberMemberifrs-full:BottomOfRangeMemberhmy:LaterThanSixMonthsAndNotLaterThanNineMonthsMember2023-06-300001023514hmy:ZeroCostCollarsMemberMemberhmy:LaterThanNineMonthsAndNotLaterThanOneYearMemberifrs-full:BottomOfRangeMember2023-06-300001023514hmy:ZeroCostCollarsMemberMemberhmy:LaterThanOneYearNotLaterThanOneYearThreeMonthsMemberifrs-full:BottomOfRangeMember2023-06-300001023514hmy:LaterThanOneYearThreeMonthsNotLaterThanOneYearSixMonthsMemberhmy:ZeroCostCollarsMemberMemberifrs-full:BottomOfRangeMember2023-06-300001023514hmy:ZeroCostCollarsMemberMemberifrs-full:BottomOfRangeMemberhmy:LaterThanOneYearSixMonthsNotLaterThanOneYearNineMonthsMember2023-06-300001023514hmy:ZeroCostCollarsMemberMemberifrs-full:BottomOfRangeMemberhmy:LaterthanOneYearNineMonthsNotLaterthanTwoYearsMember2023-06-300001023514hmy:ZeroCostCollarsMemberMemberifrs-full:BottomOfRangeMember2023-06-300001023514ifrs-full:NotLaterThanThreeMonthsMemberhmy:ZeroCostCollarsMemberMemberifrs-full:TopOfRangeMember2023-06-300001023514hmy:ZeroCostCollarsMemberMemberifrs-full:TopOfRangeMemberifrs-full:LaterThanThreeMonthsAndNotLaterThanSixMonthsMember2023-06-300001023514hmy:ZeroCostCollarsMemberMemberifrs-full:TopOfRangeMemberhmy:LaterThanSixMonthsAndNotLaterThanNineMonthsMember2023-06-300001023514hmy:ZeroCostCollarsMemberMemberhmy:LaterThanNineMonthsAndNotLaterThanOneYearMemberifrs-full:TopOfRangeMember2023-06-300001023514hmy:ZeroCostCollarsMemberMemberifrs-full:TopOfRangeMemberhmy:LaterThanOneYearNotLaterThanOneYearThreeMonthsMember2023-06-300001023514hmy:LaterThanOneYearThreeMonthsNotLaterThanOneYearSixMonthsMemberhmy:ZeroCostCollarsMemberMemberifrs-full:TopOfRangeMember2023-06-300001023514hmy:ZeroCostCollarsMemberMemberifrs-full:TopOfRangeMemberhmy:LaterThanOneYearSixMonthsNotLaterThanOneYearNineMonthsMember2023-06-300001023514hmy:ZeroCostCollarsMemberMemberifrs-full:TopOfRangeMemberhmy:LaterthanOneYearNineMonthsNotLaterthanTwoYearsMember2023-06-300001023514hmy:ZeroCostCollarsMemberMemberifrs-full:TopOfRangeMember2023-06-300001023514ifrs-full:NotLaterThanThreeMonthsMemberhmy:ForwardExchangeContractsMember2023-06-300001023514hmy:ForwardExchangeContractsMemberifrs-full:LaterThanThreeMonthsAndNotLaterThanSixMonthsMember2023-06-300001023514hmy:ForwardExchangeContractsMemberhmy:LaterThanSixMonthsAndNotLaterThanNineMonthsMember2023-06-300001023514hmy:ForwardExchangeContractsMemberhmy:LaterThanNineMonthsAndNotLaterThanOneYearMember2023-06-300001023514hmy:ForwardExchangeContractsMemberhmy:LaterThanOneYearNotLaterThanOneYearThreeMonthsMember2023-06-300001023514hmy:LaterThanOneYearThreeMonthsNotLaterThanOneYearSixMonthsMemberhmy:ForwardExchangeContractsMember2023-06-300001023514hmy:ForwardExchangeContractsMemberhmy:LaterThanOneYearSixMonthsNotLaterThanOneYearNineMonthsMember2023-06-300001023514hmy:ForwardExchangeContractsMemberhmy:LaterthanOneYearNineMonthsNotLaterthanTwoYearsMember2023-06-300001023514hmy:ForwardExchangeContractsMember2023-06-300001023514ifrs-full:NotLaterThanThreeMonthsMemberifrs-full:CashFlowHedgesMemberhmy:RandGoldHedgingContractsMember2023-06-30utr:oz0001023514ifrs-full:CashFlowHedgesMemberhmy:RandGoldHedgingContractsMemberifrs-full:LaterThanThreeMonthsAndNotLaterThanSixMonthsMember2023-06-300001023514ifrs-full:CashFlowHedgesMemberhmy:LaterThanSixMonthsAndNotLaterThanNineMonthsMemberhmy:RandGoldHedgingContractsMember2023-06-300001023514ifrs-full:CashFlowHedgesMemberhmy:LaterThanNineMonthsAndNotLaterThanOneYearMemberhmy:RandGoldHedgingContractsMember2023-06-300001023514ifrs-full:CashFlowHedgesMemberhmy:LaterThanOneYearNotLaterThanOneYearThreeMonthsMemberhmy:RandGoldHedgingContractsMember2023-06-300001023514hmy:LaterThanOneYearThreeMonthsNotLaterThanOneYearSixMonthsMemberifrs-full:CashFlowHedgesMemberhmy:RandGoldHedgingContractsMember2023-06-300001023514ifrs-full:CashFlowHedgesMemberhmy:LaterThanOneYearSixMonthsNotLaterThanOneYearNineMonthsMemberhmy:RandGoldHedgingContractsMember2023-06-300001023514ifrs-full:CashFlowHedgesMemberhmy:RandGoldHedgingContractsMemberhmy:LaterthanOneYearNineMonthsNotLaterthanTwoYearsMember2023-06-300001023514ifrs-full:CashFlowHedgesMemberhmy:RandGoldHedgingContractsMember2023-06-300001023514ifrs-full:NotLaterThanThreeMonthsMemberhmy:RandGoldHedgingContractsMember2023-06-300001023514hmy:RandGoldHedgingContractsMemberifrs-full:LaterThanThreeMonthsAndNotLaterThanSixMonthsMember2023-06-300001023514hmy:RandGoldHedgingContractsMemberhmy:LaterThanSixMonthsAndNotLaterThanNineMonthsMember2023-06-300001023514hmy:LaterThanNineMonthsAndNotLaterThanOneYearMemberhmy:RandGoldHedgingContractsMember2023-06-300001023514hmy:RandGoldHedgingContractsMemberhmy:LaterThanOneYearNotLaterThanOneYearThreeMonthsMember2023-06-300001023514hmy:LaterThanOneYearThreeMonthsNotLaterThanOneYearSixMonthsMemberhmy:RandGoldHedgingContractsMember2023-06-300001023514hmy:RandGoldHedgingContractsMemberhmy:LaterThanOneYearSixMonthsNotLaterThanOneYearNineMonthsMember2023-06-300001023514hmy:RandGoldHedgingContractsMemberhmy:LaterthanOneYearNineMonthsNotLaterthanTwoYearsMember2023-06-300001023514hmy:RandGoldHedgingContractsMember2023-06-300001023514ifrs-full:NotLaterThanThreeMonthsMemberhmy:USGoldHedgingContractsMemberifrs-full:CashFlowHedgesMember2023-06-300001023514hmy:USGoldHedgingContractsMemberifrs-full:CashFlowHedgesMemberifrs-full:LaterThanThreeMonthsAndNotLaterThanSixMonthsMember2023-06-300001023514hmy:USGoldHedgingContractsMemberifrs-full:CashFlowHedgesMemberhmy:LaterThanSixMonthsAndNotLaterThanNineMonthsMember2023-06-300001023514hmy:USGoldHedgingContractsMemberifrs-full:CashFlowHedgesMemberhmy:LaterThanNineMonthsAndNotLaterThanOneYearMember2023-06-300001023514hmy:USGoldHedgingContractsMemberifrs-full:CashFlowHedgesMemberhmy:LaterThanOneYearNotLaterThanOneYearThreeMonthsMember2023-06-300001023514hmy:LaterThanOneYearThreeMonthsNotLaterThanOneYearSixMonthsMemberhmy:USGoldHedgingContractsMemberifrs-full:CashFlowHedgesMember2023-06-300001023514hmy:USGoldHedgingContractsMemberifrs-full:CashFlowHedgesMemberhmy:LaterThanOneYearSixMonthsNotLaterThanOneYearNineMonthsMember2023-06-300001023514hmy:USGoldHedgingContractsMemberifrs-full:CashFlowHedgesMemberhmy:LaterthanOneYearNineMonthsNotLaterthanTwoYearsMember2023-06-300001023514hmy:USGoldHedgingContractsMemberifrs-full:CashFlowHedgesMember2023-06-300001023514ifrs-full:NotLaterThanThreeMonthsMemberhmy:USGoldHedgingContractsMember2023-06-300001023514hmy:USGoldHedgingContractsMemberifrs-full:LaterThanThreeMonthsAndNotLaterThanSixMonthsMember2023-06-300001023514hmy:USGoldHedgingContractsMemberhmy:LaterThanSixMonthsAndNotLaterThanNineMonthsMember2023-06-300001023514hmy:LaterThanNineMonthsAndNotLaterThanOneYearMemberhmy:USGoldHedgingContractsMember2023-06-300001023514hmy:LaterThanOneYearNotLaterThanOneYearThreeMonthsMemberhmy:USGoldHedgingContractsMember2023-06-300001023514hmy:LaterThanOneYearThreeMonthsNotLaterThanOneYearSixMonthsMemberhmy:USGoldHedgingContractsMember2023-06-300001023514hmy:USGoldHedgingContractsMemberhmy:LaterThanOneYearSixMonthsNotLaterThanOneYearNineMonthsMember2023-06-300001023514hmy:USGoldHedgingContractsMemberhmy:LaterthanOneYearNineMonthsNotLaterthanTwoYearsMember2023-06-300001023514hmy:USGoldHedgingContractsMember2023-06-300001023514ifrs-full:NotLaterThanThreeMonthsMemberhmy:TotalGoldMember2023-06-300001023514hmy:TotalGoldMemberifrs-full:LaterThanThreeMonthsAndNotLaterThanSixMonthsMember2023-06-300001023514hmy:TotalGoldMemberhmy:LaterThanSixMonthsAndNotLaterThanNineMonthsMember2023-06-300001023514hmy:LaterThanNineMonthsAndNotLaterThanOneYearMemberhmy:TotalGoldMember2023-06-300001023514hmy:LaterThanOneYearNotLaterThanOneYearThreeMonthsMemberhmy:TotalGoldMember2023-06-300001023514hmy:LaterThanOneYearThreeMonthsNotLaterThanOneYearSixMonthsMemberhmy:TotalGoldMember2023-06-300001023514hmy:TotalGoldMemberhmy:LaterThanOneYearSixMonthsNotLaterThanOneYearNineMonthsMember2023-06-300001023514hmy:TotalGoldMemberhmy:LaterthanOneYearNineMonthsNotLaterthanTwoYearsMember2023-06-300001023514hmy:TotalGoldMember2023-06-300001023514ifrs-full:NotLaterThanThreeMonthsMemberhmy:USsilvercontractsMember2023-06-300001023514hmy:USsilvercontractsMemberifrs-full:LaterThanThreeMonthsAndNotLaterThanSixMonthsMember2023-06-300001023514hmy:USsilvercontractsMemberhmy:LaterThanSixMonthsAndNotLaterThanNineMonthsMember2023-06-300001023514hmy:LaterThanNineMonthsAndNotLaterThanOneYearMemberhmy:USsilvercontractsMember2023-06-300001023514hmy:USsilvercontractsMemberhmy:LaterThanOneYearNotLaterThanOneYearThreeMonthsMember2023-06-300001023514hmy:LaterThanOneYearThreeMonthsNotLaterThanOneYearSixMonthsMemberhmy:USsilvercontractsMember2023-06-300001023514hmy:USsilvercontractsMemberhmy:LaterThanOneYearSixMonthsNotLaterThanOneYearNineMonthsMember2023-06-300001023514hmy:USsilvercontractsMemberhmy:LaterthanOneYearNineMonthsNotLaterthanTwoYearsMember2023-06-300001023514ifrs-full:NotLaterThanThreeMonthsMemberhmy:USsilvercontractsMemberifrs-full:BottomOfRangeMember2023-06-300001023514hmy:USsilvercontractsMemberifrs-full:BottomOfRangeMemberifrs-full:LaterThanThreeMonthsAndNotLaterThanSixMonthsMember2023-06-300001023514hmy:USsilvercontractsMemberifrs-full:BottomOfRangeMemberhmy:LaterThanSixMonthsAndNotLaterThanNineMonthsMember2023-06-300001023514hmy:LaterThanNineMonthsAndNotLaterThanOneYearMemberhmy:USsilvercontractsMemberifrs-full:BottomOfRangeMember2023-06-300001023514hmy:USsilvercontractsMemberhmy:LaterThanOneYearNotLaterThanOneYearThreeMonthsMemberifrs-full:BottomOfRangeMember2023-06-300001023514hmy:LaterThanOneYearThreeMonthsNotLaterThanOneYearSixMonthsMemberhmy:USsilvercontractsMemberifrs-full:BottomOfRangeMember2023-06-300001023514hmy:USsilvercontractsMemberifrs-full:BottomOfRangeMemberhmy:LaterThanOneYearSixMonthsNotLaterThanOneYearNineMonthsMember2023-06-300001023514hmy:USsilvercontractsMemberifrs-full:BottomOfRangeMemberhmy:LaterthanOneYearNineMonthsNotLaterthanTwoYearsMember2023-06-300001023514hmy:USsilvercontractsMemberifrs-full:BottomOfRangeMember2023-06-300001023514ifrs-full:NotLaterThanThreeMonthsMemberifrs-full:TopOfRangeMemberhmy:USsilvercontractsMember2023-06-300001023514ifrs-full:TopOfRangeMemberhmy:USsilvercontractsMemberifrs-full:LaterThanThreeMonthsAndNotLaterThanSixMonthsMember2023-06-300001023514ifrs-full:TopOfRangeMemberhmy:USsilvercontractsMemberhmy:LaterThanSixMonthsAndNotLaterThanNineMonthsMember2023-06-300001023514hmy:LaterThanNineMonthsAndNotLaterThanOneYearMemberifrs-full:TopOfRangeMemberhmy:USsilvercontractsMember2023-06-300001023514ifrs-full:TopOfRangeMemberhmy:USsilvercontractsMemberhmy:LaterThanOneYearNotLaterThanOneYearThreeMonthsMember2023-06-300001023514hmy:LaterThanOneYearThreeMonthsNotLaterThanOneYearSixMonthsMemberifrs-full:TopOfRangeMemberhmy:USsilvercontractsMember2023-06-300001023514ifrs-full:TopOfRangeMemberhmy:USsilvercontractsMemberhmy:LaterThanOneYearSixMonthsNotLaterThanOneYearNineMonthsMember2023-06-300001023514ifrs-full:TopOfRangeMemberhmy:USsilvercontractsMemberhmy:LaterthanOneYearNineMonthsNotLaterthanTwoYearsMember2023-06-300001023514ifrs-full:TopOfRangeMemberhmy:USsilvercontractsMember2023-06-300001023514ifrs-full:GrossCarryingAmountMemberhmy:TradereceivablesmetalsMember2023-06-300001023514ifrs-full:GrossCarryingAmountMemberhmy:TradereceivablesmetalsMember2022-06-300001023514hmy:OtherTradeReceivablesMemberifrs-full:GrossCarryingAmountMember2023-06-300001023514hmy:OtherTradeReceivablesMemberifrs-full:GrossCarryingAmountMember2022-06-300001023514ifrs-full:TradeReceivablesMember2023-06-300001023514ifrs-full:TradeReceivablesMember2022-06-300001023514ifrs-full:TradeReceivablesMember2021-06-300001023514ifrs-full:TradeReceivablesMember2022-07-012023-06-300001023514ifrs-full:TradeReceivablesMember2021-07-012022-06-300001023514ifrs-full:FinancialAssetsIndividuallyAssessedForCreditLossesMemberifrs-full:TradeReceivablesMemberifrs-full:GrossCarryingAmountMemberhmy:NeitherPastDueNorImpairedMember2023-06-300001023514ifrs-full:FinancialAssetsIndividuallyAssessedForCreditLossesMemberifrs-full:TradeReceivablesMemberhmy:NeitherPastDueNorImpairedMemberifrs-full:AccumulatedImpairmentMember2023-06-300001023514ifrs-full:CurrentMemberifrs-full:TradeReceivablesMemberifrs-full:GrossCarryingAmountMember2023-06-300001023514ifrs-full:CurrentMemberifrs-full:TradeReceivablesMemberifrs-full:AccumulatedImpairmentMember2023-06-300001023514ifrs-full:TradeReceivablesMemberifrs-full:GrossCarryingAmountMemberifrs-full:LaterThanOneMonthAndNotLaterThanTwoMonthsMember2023-06-300001023514ifrs-full:TradeReceivablesMemberifrs-full:LaterThanOneMonthAndNotLaterThanTwoMonthsMemberifrs-full:AccumulatedImpairmentMember2023-06-300001023514ifrs-full:LaterThanTwoMonthsAndNotLaterThanThreeMonthsMemberifrs-full:TradeReceivablesMemberifrs-full:GrossCarryingAmountMember2023-06-300001023514ifrs-full:LaterThanTwoMonthsAndNotLaterThanThreeMonthsMemberifrs-full:TradeReceivablesMemberifrs-full:AccumulatedImpairmentMember2023-06-300001023514ifrs-full:LaterThanThreeMonthsMemberifrs-full:TradeReceivablesMemberifrs-full:GrossCarryingAmountMember2023-06-300001023514ifrs-full:LaterThanThreeMonthsMemberifrs-full:TradeReceivablesMemberifrs-full:AccumulatedImpairmentMember2023-06-300001023514ifrs-full:TradeReceivablesMemberifrs-full:LaterThanOneYearMemberifrs-full:GrossCarryingAmountMember2023-06-300001023514ifrs-full:TradeReceivablesMemberifrs-full:LaterThanOneYearMemberifrs-full:AccumulatedImpairmentMember2023-06-300001023514ifrs-full:TradeReceivablesMemberifrs-full:GrossCarryingAmountMember2023-06-300001023514ifrs-full:TradeReceivablesMemberifrs-full:AccumulatedImpairmentMember2023-06-300001023514ifrs-full:FinancialAssetsIndividuallyAssessedForCreditLossesMemberifrs-full:TradeReceivablesMemberhmy:NotPastDueButImpairedMemberifrs-full:GrossCarryingAmountMember2022-06-300001023514ifrs-full:FinancialAssetsIndividuallyAssessedForCreditLossesMemberifrs-full:TradeReceivablesMemberhmy:NotPastDueButImpairedMemberifrs-full:AccumulatedImpairmentMember2022-06-300001023514ifrs-full:CurrentMemberifrs-full:TradeReceivablesMemberifrs-full:GrossCarryingAmountMember2022-06-300001023514ifrs-full:CurrentMemberifrs-full:TradeReceivablesMemberifrs-full:AccumulatedImpairmentMember2022-06-300001023514ifrs-full:TradeReceivablesMemberifrs-full:GrossCarryingAmountMemberifrs-full:LaterThanOneMonthAndNotLaterThanTwoMonthsMember2022-06-300001023514ifrs-full:TradeReceivablesMemberifrs-full:LaterThanOneMonthAndNotLaterThanTwoMonthsMemberifrs-full:AccumulatedImpairmentMember2022-06-300001023514ifrs-full:LaterThanTwoMonthsAndNotLaterThanThreeMonthsMemberifrs-full:TradeReceivablesMemberifrs-full:GrossCarryingAmountMember2022-06-300001023514ifrs-full:LaterThanTwoMonthsAndNotLaterThanThreeMonthsMemberifrs-full:TradeReceivablesMemberifrs-full:AccumulatedImpairmentMember2022-06-300001023514ifrs-full:LaterThanThreeMonthsMemberifrs-full:TradeReceivablesMemberifrs-full:GrossCarryingAmountMember2022-06-300001023514ifrs-full:LaterThanThreeMonthsMemberifrs-full:TradeReceivablesMemberifrs-full:AccumulatedImpairmentMember2022-06-300001023514ifrs-full:TradeReceivablesMemberifrs-full:LaterThanOneYearMemberifrs-full:GrossCarryingAmountMember2022-06-300001023514ifrs-full:TradeReceivablesMemberifrs-full:LaterThanOneYearMemberifrs-full:AccumulatedImpairmentMember2022-06-300001023514ifrs-full:TradeReceivablesMemberifrs-full:GrossCarryingAmountMember2022-06-300001023514ifrs-full:TradeReceivablesMemberifrs-full:AccumulatedImpairmentMember2022-06-300001023514hmy:PamodziMember2008-02-272008-02-270001023514hmy:PamodziMember2008-02-270001023514hmy:RandRefineryMember2022-07-012023-06-300001023514hmy:RandRefineryMember2021-07-012022-06-300001023514hmy:NewcrestMiningLimitedMemberhmy:WafiGolpuJointOperationMember2022-07-012023-06-300001023514hmy:PGStateMember2022-07-012023-06-300001023514hmy:WafiGolpuJointOperationMember2023-06-300001023514hmy:WafiGolpuJointOperationMember2022-06-300001023514ifrs-full:OrdinarySharesMember2023-06-300001023514ifrs-full:OrdinarySharesMember2022-06-300001023514ifrs-full:PreferenceSharesMember2023-06-300001023514ifrs-full:PreferenceSharesMember2022-06-300001023514ifrs-full:SubsidiariesMemberifrs-full:OrdinarySharesMemberhmy:LydenburgExplorationLimitedMember2023-06-300001023514ifrs-full:SubsidiariesMemberifrs-full:OrdinarySharesMemberhmy:LydenburgExplorationLimitedMember2022-06-300001023514hmy:ShareTrustControlledByTheEntityMemberifrs-full:OrdinarySharesMemberhmy:KalgoldShareTrustMember2023-06-300001023514hmy:ShareTrustControlledByTheEntityMemberifrs-full:OrdinarySharesMemberhmy:KalgoldShareTrustMember2022-06-300001023514ifrs-full:PreferenceSharesMemberhmy:ShareTrustControlledByTheEntityMemberhmy:HarmonyGoldCommunityTrustMember2023-06-300001023514ifrs-full:PreferenceSharesMemberhmy:ShareTrustControlledByTheEntityMemberhmy:HarmonyGoldCommunityTrustMember2022-06-300001023514hmy:AbelleLimitedMember2004-03-152004-03-150001023514hmy:AbelleLimitedMember2004-03-150001023514hmy:AfricanVanguardResourcesProprietaryLimitedMemberhmy:DoornkopSouthReefMember2010-03-192010-03-190001023514ifrs-full:ProvisionForDecommissioningRestorationAndRehabilitationCostsMembercountry:ZAifrs-full:NotLaterThanOneYearMember2022-07-012023-06-300001023514ifrs-full:ProvisionForDecommissioningRestorationAndRehabilitationCostsMembercountry:ZAifrs-full:NotLaterThanOneYearMember2021-07-012022-06-300001023514ifrs-full:ProvisionForDecommissioningRestorationAndRehabilitationCostsMembercountry:ZAifrs-full:NotLaterThanOneYearMember2020-07-012021-06-300001023514ifrs-full:ProvisionForDecommissioningRestorationAndRehabilitationCostsMembercountry:ZAifrs-full:LaterThanOneYearAndNotLaterThanTwoYearsMember2022-07-012023-06-300001023514ifrs-full:ProvisionForDecommissioningRestorationAndRehabilitationCostsMembercountry:ZAifrs-full:LaterThanOneYearAndNotLaterThanTwoYearsMember2021-07-012022-06-300001023514ifrs-full:ProvisionForDecommissioningRestorationAndRehabilitationCostsMembercountry:ZAifrs-full:LaterThanOneYearAndNotLaterThanTwoYearsMember2020-07-012021-06-300001023514ifrs-full:ProvisionForDecommissioningRestorationAndRehabilitationCostsMembercountry:ZAifrs-full:LaterThanTwoYearsAndNotLaterThanThreeYearsMember2022-07-012023-06-300001023514ifrs-full:ProvisionForDecommissioningRestorationAndRehabilitationCostsMembercountry:ZAhmy:LaterThanTwoYearsMember2021-07-012022-06-300001023514ifrs-full:ProvisionForDecommissioningRestorationAndRehabilitationCostsMembercountry:ZAhmy:LaterThanTwoYearsMember2020-07-012021-06-300001023514ifrs-full:LaterThanThreeYearsMemberifrs-full:ProvisionForDecommissioningRestorationAndRehabilitationCostsMembercountry:ZA2022-07-012023-06-300001023514ifrs-full:LaterThanOneYearAndNotLaterThanFiveYearsMemberifrs-full:ProvisionForDecommissioningRestorationAndRehabilitationCostsMembercountry:ZA2022-07-012023-06-300001023514ifrs-full:LaterThanOneYearAndNotLaterThanFiveYearsMemberifrs-full:ProvisionForDecommissioningRestorationAndRehabilitationCostsMembercountry:ZA2021-07-012022-06-300001023514ifrs-full:LaterThanOneYearAndNotLaterThanFiveYearsMemberifrs-full:ProvisionForDecommissioningRestorationAndRehabilitationCostsMembercountry:ZA2020-07-012021-06-300001023514ifrs-full:ProvisionForDecommissioningRestorationAndRehabilitationCostsMembercountry:ZAifrs-full:LaterThanFiveYearsAndNotLaterThanTenYearsMember2022-07-012023-06-300001023514ifrs-full:ProvisionForDecommissioningRestorationAndRehabilitationCostsMembercountry:ZAifrs-full:LaterThanFiveYearsAndNotLaterThanTenYearsMember2021-07-012022-06-300001023514ifrs-full:ProvisionForDecommissioningRestorationAndRehabilitationCostsMembercountry:ZAifrs-full:LaterThanFiveYearsAndNotLaterThanTenYearsMember2020-07-012021-06-300001023514ifrs-full:ProvisionForDecommissioningRestorationAndRehabilitationCostsMembercountry:ZAifrs-full:LaterThanTenYearsMember2022-07-012023-06-300001023514ifrs-full:ProvisionForDecommissioningRestorationAndRehabilitationCostsMembercountry:ZAifrs-full:LaterThanTenYearsMember2021-07-012022-06-300001023514ifrs-full:ProvisionForDecommissioningRestorationAndRehabilitationCostsMembercountry:ZAifrs-full:LaterThanTenYearsMember2020-07-012021-06-300001023514ifrs-full:ProvisionForDecommissioningRestorationAndRehabilitationCostsMemberhmy:PGMember2022-07-012023-06-300001023514ifrs-full:ProvisionForDecommissioningRestorationAndRehabilitationCostsMemberhmy:PGMember2021-07-012022-06-300001023514ifrs-full:ProvisionForDecommissioningRestorationAndRehabilitationCostsMemberhmy:PGMember2020-07-012021-06-300001023514ifrs-full:ProvisionForDecommissioningRestorationAndRehabilitationCostsMember2022-06-300001023514ifrs-full:ProvisionForDecommissioningRestorationAndRehabilitationCostsMember2021-06-300001023514ifrs-full:ProvisionForDecommissioningRestorationAndRehabilitationCostsMember2023-06-300001023514ifrs-full:ProvisionForDecommissioningRestorationAndRehabilitationCostsMemberhmy:PGMember2023-06-300001023514ifrs-full:ProvisionForDecommissioningRestorationAndRehabilitationCostsMemberhmy:PGMember2022-06-300001023514ifrs-full:LegalProceedingsProvisionMember2022-07-012023-06-300001023514ifrs-full:LegalProceedingsProvisionMember2021-07-012022-06-300001023514ifrs-full:LegalProceedingsProvisionMember2020-07-012021-06-300001023514ifrs-full:LegalProceedingsProvisionMember2023-06-300001023514hmy:AssumptionOfBenefitTakeUpRateMember2023-06-300001023514hmy:AssumptionOfBenefitTakeUpRateMember2022-06-300001023514hmy:AssumptionOfDiseasePrevalenceRateMember2023-06-300001023514hmy:AssumptionOfDiseasePrevalenceRateMember2022-06-300001023514hmy:AssumptionOfDiseaseProgressionRateMember2023-06-300001023514hmy:AssumptionOfDiseaseProgressionRateMember2022-06-300001023514hmy:AssumptionOfBenefitTakeUpRateMember2023-06-300001023514hmy:AssumptionOfBenefitTakeUpRateMember2022-06-300001023514hmy:ActuarialAssumptionOfLabourNumberMember2023-06-300001023514hmy:ActuarialAssumptionOfLabourNumberMember2022-06-300001023514hmy:ActuarialAssumptionOfDiseaseRiskMember2022-06-300001023514hmy:ActuarialAssumptionOfDiseaseRiskMember2023-06-300001023514hmy:AssumptionOfDiseaseProgressionRateMember2023-06-300001023514hmy:AssumptionOfDiseaseProgressionRateMember2022-06-300001023514hmy:CurrentEmployeesMember2023-06-300001023514hmy:CurrentEmployeesMember2022-06-300001023514hmy:RetiredEmployeesMember2023-06-300001023514hmy:RetiredEmployeesMember2022-06-300001023514ifrs-full:PresentValueOfDefinedBenefitObligationMember2022-07-012023-06-300001023514ifrs-full:PresentValueOfDefinedBenefitObligationMember2021-07-012022-06-300001023514ifrs-full:PresentValueOfDefinedBenefitObligationMember2023-06-300001023514ifrs-full:PresentValueOfDefinedBenefitObligationMember2022-06-300001023514ifrs-full:PlanAssetsMember2023-06-300001023514ifrs-full:PlanAssetsMember2022-06-300001023514ifrs-full:LaterThanOneYearAndNotLaterThanFiveYearsMember2023-06-300001023514ifrs-full:LaterThanOneYearAndNotLaterThanFiveYearsMember2022-06-300001023514ifrs-full:LaterThanFiveYearsMember2023-06-300001023514ifrs-full:LaterThanFiveYearsMember2022-06-300001023514ifrs-full:LeaseLiabilitiesMember2022-07-012023-06-300001023514ifrs-full:LeaseLiabilitiesMember2021-07-012022-06-300001023514hmy:ShorttermleasepaymentsMember2022-07-012023-06-300001023514hmy:ShorttermleasepaymentsMember2021-07-012022-06-300001023514hmy:LeasepaymentsoflowvalueassetsleasedMember2022-07-012023-06-300001023514hmy:LeasepaymentsoflowvalueassetsleasedMember2021-07-012022-06-300001023514hmy:VariableleasepaymentsMember2022-07-012023-06-300001023514hmy:VariableleasepaymentsMember2021-07-012022-06-300001023514hmy:TotalleasesMember2022-07-012023-06-300001023514hmy:TotalleasesMember2021-07-012022-06-300001023514hmy:MponengOperationsAndRelatedAssetsMember2023-06-300001023514hmy:MponengOperationsAndRelatedAssetsMember2022-06-300001023514hmy:MponengOperationsAndRelatedAssetsMember2021-06-300001023514hmy:EvaCopperMember2023-06-300001023514hmy:FrancoNevadaMember2020-10-010001023514ifrs-full:ParentMember2020-10-010001023514hmy:FrancoNevadaMember2022-07-012023-06-300001023514ifrs-full:TopOfRangeMemberhmy:FrancoNevadaMember2008-12-172008-12-170001023514hmy:FrancoNevadaMember2022-06-300001023514hmy:FrancoNevadaMember2021-06-300001023514hmy:FrancoNevadaMember2021-07-012022-06-300001023514hmy:FrancoNevadaMember2023-06-300001023514hmy:FrancoNevadaMember2020-10-012020-12-160001023514hmy:FrancoNevadaMember2020-12-172021-12-160001023514hmy:FrancoNevadaMember2021-12-172022-12-160001023514hmy:FrancoNevadaMember2022-12-172023-06-300001023514hmy:R25BillionFacilitySustainabilityLinkedMember2022-05-300001023514hmy:R25BillionFacilitySustainabilityLinkedMember2022-05-012022-05-300001023514hmy:R25BillionFacilitySustainabilityLinkedMemberhmy:JohannesburgInterbankAgreedRateJIBARMember2022-05-300001023514hmy:US400MillionFacilitySustainabilityLinkedMember2022-05-300001023514hmy:US400MillionFacilitySustainabilityLinkedMember2022-05-012022-05-300001023514hmy:US400MillionFacilitySustainabilityLinkedMemberhmy:TermLoanMember2022-05-300001023514hmy:SecuredOvernightFinancingRateSOFRMemberhmy:US400MillionFacilitySustainabilityLinkedMemberhmy:TermLoanMember2022-05-300001023514hmy:RCFMemberhmy:US400MillionFacilitySustainabilityLinkedMember2022-05-300001023514hmy:SecuredOvernightFinancingRateSOFRMemberhmy:RCFMemberhmy:US400MillionFacilitySustainabilityLinkedMember2022-05-300001023514hmy:R15BillionFacilityGreenTermLoanMember2022-05-300001023514hmy:R15BillionFacilityGreenTermLoanMember2022-05-012022-05-300001023514hmy:R15BillionFacilityGreenTermLoanMemberhmy:JohannesburgInterbankAgreedRateJIBARMember2022-05-300001023514hmy:R2BillionFacilitySecuredLoanMaturedMember2018-11-300001023514hmy:R2BillionFacilitySecuredLoanMaturedMember2018-11-012018-11-300001023514hmy:R2BillionFacilitySecuredLoanMaturedMemberhmy:TermLoanMember2018-11-300001023514hmy:R2BillionFacilitySecuredLoanMaturedMemberhmy:JohannesburgInterbankAgreedRateJIBARMemberhmy:TermLoanMember2018-11-300001023514hmy:RCFMemberhmy:R2BillionFacilitySecuredLoanMaturedMember2018-11-300001023514hmy:RCFMemberhmy:R2BillionFacilitySecuredLoanMaturedMemberhmy:JohannesburgInterbankAgreedRateJIBARMember2018-11-300001023514hmy:US400MillionFacilitySecuredLoanMaturedMember2019-09-300001023514hmy:US400MillionFacilitySecuredLoanMaturedMember2019-09-012019-09-300001023514hmy:RCFMemberhmy:US400MillionFacilitySecuredLoanMaturedMember2019-09-300001023514hmy:RCFMemberhmy:US400MillionFacilitySecuredLoanMaturedMemberhmy:LondonInterbankOfferedRateLIBOR1Member2019-09-300001023514hmy:US400MillionFacilitySecuredLoanMaturedMemberhmy:TermLoanMember2019-09-300001023514hmy:US400MillionFacilitySecuredLoanMaturedMemberhmy:LondonInterbankOfferedRateLIBOR1Memberhmy:TermLoanMember2019-09-300001023514hmy:US24millionWestpacSecuredLoanMember2018-07-310001023514hmy:US24millionWestpacSecuredLoanMember2018-07-012018-07-310001023514hmy:US24millionWestpacSecuredLoanMemberhmy:LondonInterbankOfferedRateLIBOR1Member2018-07-310001023514hmy:RandRCFUSRCFUSTermLoanMember2022-07-012023-06-30utr:t0001023514hmy:RandRCFUSRCFUSTermLoanMember2023-07-012024-06-300001023514hmy:RandRCFUSRCFUSTermLoanMember2024-07-012025-06-30hmy:megaliterhmy:Ratio0001023514hmy:R2BillionFacilitySecuredLoanMaturedMember2023-06-300001023514hmy:R2BillionFacilitySecuredLoanMaturedMember2022-06-300001023514hmy:R2BillionFacilitySecuredLoanMaturedMember2021-06-300001023514hmy:R2BillionFacilitySecuredLoanMaturedMember2022-07-012023-06-300001023514hmy:R2BillionFacilitySecuredLoanMaturedMember2021-07-012022-06-300001023514hmy:US24millionWestpacSecuredLoanMember2023-06-300001023514hmy:US24millionWestpacSecuredLoanMember2022-06-300001023514hmy:US24millionWestpacSecuredLoanMember2021-06-300001023514hmy:US24millionWestpacSecuredLoanMember2022-07-012023-06-300001023514hmy:US24millionWestpacSecuredLoanMember2021-07-012022-06-300001023514hmy:R25BillionFacilitySustainabilityLinkedMember2023-06-300001023514hmy:R25BillionFacilitySustainabilityLinkedMember2022-06-300001023514hmy:R25BillionFacilitySustainabilityLinkedMember2021-06-300001023514hmy:R25BillionFacilitySustainabilityLinkedMember2022-07-012023-06-300001023514hmy:R25BillionFacilitySustainabilityLinkedMember2021-07-012022-06-300001023514hmy:R15BillionFacilityGreenTermLoanMember2023-06-300001023514hmy:R15BillionFacilityGreenTermLoanMember2022-06-300001023514hmy:R15BillionFacilityGreenTermLoanMember2021-06-300001023514hmy:R15BillionFacilityGreenTermLoanMember2022-07-012023-06-300001023514hmy:R15BillionFacilityGreenTermLoanMember2021-07-012022-06-300001023514hmy:US400MillionFacilitySustainabilityLinkedMember2023-06-300001023514hmy:US400MillionFacilitySustainabilityLinkedMember2022-06-300001023514hmy:US400MillionFacilitySustainabilityLinkedMember2021-06-300001023514hmy:US400MillionFacilitySustainabilityLinkedMember2022-07-012023-06-300001023514hmy:US400MillionFacilitySustainabilityLinkedMember2021-07-012022-06-300001023514hmy:US400MillionFacilitySecuredLoanMaturedMember2023-06-300001023514hmy:US400MillionFacilitySecuredLoanMaturedMember2022-06-300001023514hmy:US400MillionFacilitySecuredLoanMaturedMember2021-06-300001023514hmy:US400MillionFacilitySecuredLoanMaturedMember2022-07-012023-06-300001023514hmy:US400MillionFacilitySecuredLoanMaturedMember2021-07-012022-06-300001023514ifrs-full:LaterThanOneYearMember2023-06-300001023514ifrs-full:LaterThanOneYearMember2022-06-300001023514hmy:R2BillionFacilitySecuredLoanMaturedMemberhmy:EffectiveInterestRateMember2023-06-300001023514hmy:R2BillionFacilitySecuredLoanMaturedMemberhmy:EffectiveInterestRateMember2022-06-300001023514hmy:EffectiveInterestRateMemberhmy:US24millionWestpacSecuredLoanMember2023-06-300001023514hmy:EffectiveInterestRateMemberhmy:US24millionWestpacSecuredLoanMember2022-06-300001023514hmy:US400MillionFacilitySecuredLoanMaturedMemberhmy:EffectiveInterestRateMember2023-06-300001023514hmy:US400MillionFacilitySecuredLoanMaturedMemberhmy:EffectiveInterestRateMember2022-06-300001023514hmy:R25BillionFacilitySustainabilityLinkedMemberhmy:EffectiveInterestRateMember2023-06-300001023514hmy:R25BillionFacilitySustainabilityLinkedMemberhmy:EffectiveInterestRateMember2022-06-300001023514hmy:EffectiveInterestRateMemberhmy:US400MillionFacilitySustainabilityLinkedMember2023-06-300001023514hmy:EffectiveInterestRateMemberhmy:US400MillionFacilitySustainabilityLinkedMember2022-06-300001023514hmy:TollTreatmentsMember2023-06-300001023514hmy:RestrictedInvestmentsHeldByEnvironmentalTrustFundsMember2020-07-012021-06-300001023514ifrs-full:LaterThanOneYearMember2021-06-300001023514ifrs-full:CountryOfDomicileMember2023-06-30hmy:numberOfEmployees0001023514ifrs-full:CountryOfDomicileMember2022-06-300001023514ifrs-full:ForeignCountriesMember2023-06-300001023514ifrs-full:ForeignCountriesMember2022-06-300001023514hmy:EvaCopperMember2023-06-300001023514hmy:EvaCopperMember2022-06-300001023514ifrs-full:BottomOfRangeMemberhmy:ManagementdeferredshareplanMember2019-09-182019-09-180001023514ifrs-full:TopOfRangeMemberhmy:ManagementdeferredshareplanMember2019-09-182019-09-180001023514hmy:ManagementdeferredshareplanMember2020-09-182020-09-180001023514ifrs-full:BottomOfRangeMemberhmy:ManagementdeferredshareplanMember2021-09-202021-09-200001023514ifrs-full:TopOfRangeMemberhmy:ManagementdeferredshareplanMember2021-09-202021-09-200001023514ifrs-full:BottomOfRangeMemberhmy:ManagementdeferredshareplanMember2022-09-192022-09-190001023514ifrs-full:TopOfRangeMemberhmy:ManagementdeferredshareplanMember2022-09-192022-09-190001023514hmy:September192022Memberifrs-full:BottomOfRangeMemberhmy:ManagementdeferredshareplanMember2022-09-192022-09-190001023514ifrs-full:TopOfRangeMemberhmy:September192022Memberhmy:ManagementdeferredshareplanMember2022-09-192022-09-190001023514hmy:September192022Memberifrs-full:BottomOfRangeMemberhmy:ManagementdeferredshareplanMember2022-09-190001023514ifrs-full:TopOfRangeMemberhmy:September192022Memberhmy:ManagementdeferredshareplanMember2022-09-190001023514hmy:OverthreeyearsMemberhmy:September192022Memberhmy:ManagementdeferredshareplanMember2022-09-192022-09-190001023514hmy:OverfiveyearsMemberhmy:September192022Memberhmy:ManagementdeferredshareplanMember2022-09-192022-09-190001023514hmy:SisonkeEmployeeShareOwnershipPlanMember2022-07-012023-06-300001023514hmy:ManagementdeferredshareplanMember2022-07-012023-06-300001023514hmy:ManagementdeferredshareplanMember2021-07-012022-06-300001023514ifrs-full:OrdinarySharesMemberhmy:ManagementdeferredshareplanMember2023-06-300001023514hmy:SisonkeEmployeeShareOwnershipPlanMemberhmy:ParticipationUnitsMember2019-01-152019-01-150001023514hmy:SisonkeEmployeeShareOwnershipPlanMemberhmy:ParticipationUnitsMember2022-06-300001023514hmy:SisonkeEmployeeShareOwnershipPlanMemberhmy:ParticipationUnitsMember2021-06-300001023514hmy:SisonkeEmployeeShareOwnershipPlanMemberhmy:ParticipationUnitsMember2022-07-012023-06-300001023514hmy:SisonkeEmployeeShareOwnershipPlanMemberhmy:ParticipationUnitsMember2021-07-012022-06-300001023514hmy:SisonkeEmployeeShareOwnershipPlanMemberhmy:ParticipationUnitsMember2023-06-300001023514hmy:SharebasedPaymentArrangementTrancheFive1Memberhmy:DSMemberhmy:ExecutiveDirectorsAndPrescribedOfficersMemberhmy:ManagementdeferredshareplanMember2022-07-012023-06-300001023514hmy:DSMemberhmy:SharebasedPaymentArrangementTrancheThree1Memberhmy:ExecutiveDirectorsAndPrescribedOfficersMemberhmy:ManagementdeferredshareplanMember2022-07-012023-06-300001023514hmy:ShareBasedPaymentArrangementTrancheTwo1Memberhmy:DSMemberhmy:ExecutiveDirectorsAndPrescribedOfficersMemberhmy:ManagementdeferredshareplanMember2022-07-012023-06-300001023514hmy:DSMemberhmy:ShareBasedPaymentArrangementTrancheOne1Memberhmy:ExecutiveDirectorsAndPrescribedOfficersMemberhmy:ManagementdeferredshareplanMember2022-07-012023-06-300001023514hmy:DSMemberhmy:ExecutiveDirectorsAndPrescribedOfficersMemberhmy:SharebasedPaymentArrangementTrancheFour1Memberhmy:ManagementdeferredshareplanMember2022-07-012023-06-300001023514hmy:OverthreeyearsMemberhmy:September182019Memberhmy:DSMemberhmy:ManagementdeferredshareplanMember2022-07-012023-06-300001023514hmy:OverthreeyearsMemberhmy:September182019Memberhmy:DSMemberhmy:ManagementdeferredshareplanMember2021-07-012022-06-300001023514hmy:OverthreeyearsMemberhmy:September182019Memberhmy:DSMemberhmy:ManagementdeferredshareplanMember2023-06-30hmy:year0001023514hmy:OverthreeyearsMemberhmy:September182019Memberhmy:DSMemberhmy:ManagementdeferredshareplanMember2022-06-300001023514hmy:OverfiveyearsMemberhmy:September182019Memberhmy:DSMemberhmy:ManagementdeferredshareplanMember2022-07-012023-06-300001023514hmy:OverfiveyearsMemberhmy:September182019Memberhmy:DSMemberhmy:ManagementdeferredshareplanMember2021-07-012022-06-300001023514hmy:OverfiveyearsMemberhmy:September182019Memberhmy:DSMemberhmy:ManagementdeferredshareplanMember2023-06-300001023514hmy:OverfiveyearsMemberhmy:September182019Memberhmy:DSMemberhmy:ManagementdeferredshareplanMember2022-06-300001023514hmy:OverthreeyearsMemberhmy:DSMemberhmy:September182020Memberhmy:ManagementdeferredshareplanMember2022-07-012023-06-300001023514hmy:OverthreeyearsMemberhmy:DSMemberhmy:September182020Memberhmy:ManagementdeferredshareplanMember2021-07-012022-06-300001023514hmy:OverthreeyearsMemberhmy:DSMemberhmy:September182020Memberhmy:ManagementdeferredshareplanMember2023-06-300001023514hmy:OverthreeyearsMemberhmy:DSMemberhmy:September182020Memberhmy:ManagementdeferredshareplanMember2022-06-300001023514hmy:OverfiveyearsMemberhmy:DSMemberhmy:September182020Memberhmy:ManagementdeferredshareplanMember2022-07-012023-06-300001023514hmy:OverfiveyearsMemberhmy:DSMemberhmy:September182020Memberhmy:ManagementdeferredshareplanMember2021-07-012022-06-300001023514hmy:OverfiveyearsMemberhmy:DSMemberhmy:September182020Memberhmy:ManagementdeferredshareplanMember2023-06-300001023514hmy:OverfiveyearsMemberhmy:DSMemberhmy:September182020Memberhmy:ManagementdeferredshareplanMember2022-06-300001023514hmy:OverthreeyearsMemberhmy:DSMemberhmy:September182021Memberhmy:ManagementdeferredshareplanMember2022-07-012023-06-300001023514hmy:OverthreeyearsMemberhmy:DSMemberhmy:September182021Memberhmy:ManagementdeferredshareplanMember2021-07-012022-06-300001023514hmy:OverthreeyearsMemberhmy:DSMemberhmy:September182021Memberhmy:ManagementdeferredshareplanMember2023-06-300001023514hmy:OverthreeyearsMemberhmy:DSMemberhmy:September182021Memberhmy:ManagementdeferredshareplanMember2022-06-300001023514hmy:OverfiveyearsMemberhmy:DSMemberhmy:September182021Memberhmy:ManagementdeferredshareplanMember2022-07-012023-06-300001023514hmy:OverfiveyearsMemberhmy:DSMemberhmy:September182021Memberhmy:ManagementdeferredshareplanMember2021-07-012022-06-300001023514hmy:OverfiveyearsMemberhmy:DSMemberhmy:September182021Memberhmy:ManagementdeferredshareplanMember2023-06-300001023514hmy:OverfiveyearsMemberhmy:DSMemberhmy:September182021Memberhmy:ManagementdeferredshareplanMember2022-06-300001023514hmy:DSMemberhmy:ManagementdeferredshareplanMember2022-06-300001023514hmy:DSMemberhmy:ManagementdeferredshareplanMember2021-06-300001023514hmy:DSMemberhmy:ManagementdeferredshareplanMember2022-07-012023-06-300001023514hmy:DSMemberhmy:ManagementdeferredshareplanMember2021-07-012022-06-300001023514hmy:DSMemberhmy:ManagementdeferredshareplanMember2023-06-300001023514hmy:OverthreeyearsMemberhmy:September182022Memberhmy:DSMemberhmy:ManagementdeferredshareplanMember2023-06-300001023514hmy:OverfiveyearsMemberhmy:September182022Memberhmy:DSMemberhmy:ManagementdeferredshareplanMember2023-06-300001023514hmy:ExecutiveDirectorMember2022-07-012023-06-300001023514hmy:NonExecutiveDirectorMember2022-07-012023-06-300001023514hmy:ExecutiveDirectorMember2021-07-012022-06-300001023514hmy:NonExecutiveDirectorMember2021-07-012022-06-300001023514hmy:Director1Memberhmy:PeterSteenkampDirectorMember2023-06-300001023514hmy:Director1Memberhmy:PeterSteenkampDirectorMember2022-06-300001023514hmy:BoipeloLekuboDirectorMemberhmy:Director1Member2023-06-300001023514hmy:BoipeloLekuboDirectorMemberhmy:Director1Member2022-06-300001023514hmy:HarryMashegoDirectorMemberhmy:Director1Member2023-06-300001023514hmy:HarryMashegoDirectorMemberhmy:Director1Member2022-06-300001023514hmy:BeyersNelPrescribedOfficerMemberhmy:Officer1Member2023-06-300001023514hmy:BeyersNelPrescribedOfficerMemberhmy:Officer1Member2022-06-300001023514hmy:MarianVanDerWaltPrescribedOfficerMemberhmy:Officer1Member2023-06-300001023514hmy:MarianVanDerWaltPrescribedOfficerMemberhmy:Officer1Member2022-06-300001023514hmy:Officer1Memberhmy:MelanieNaidooVermaakPrescribedOfficerMember2023-06-300001023514hmy:Officer1Memberhmy:MelanieNaidooVermaakPrescribedOfficerMember2022-06-300001023514hmy:Officer1Memberhmy:JohannesVanHeerdenPrescribedOfficerMember2023-06-300001023514hmy:Officer1Memberhmy:JohannesVanHeerdenPrescribedOfficerMember2022-06-300001023514hmy:DeputyChairmanMember2021-07-012022-06-300001023514ifrs-full:JointControlOrSignificantInfluenceMember2022-07-012023-06-300001023514ifrs-full:JointControlOrSignificantInfluenceMember2021-07-012022-06-300001023514hmy:Director1Member2022-07-012023-06-300001023514hmy:Director1Member2021-07-012022-06-300001023514ifrs-full:AssociatesMember2022-07-012023-06-300001023514ifrs-full:AssociatesMember2021-07-012022-06-300001023514hmy:SolarProjectsMember2023-06-300001023514hmy:ContingentLiabilityForGuaranteesAndSuretyshipsMember2023-06-300001023514hmy:ContingentLiabilityForGuaranteesAndSuretyshipsMember2022-06-300001023514hmy:ContingentLiabilityForEnvironmentalGuaranteesMember2023-06-300001023514hmy:ContingentLiabilityForEnvironmentalGuaranteesMember2022-06-300001023514ifrs-full:ContingentLiabilityForGuaranteesMember2023-06-300001023514ifrs-full:ContingentLiabilityForGuaranteesMember2022-06-300001023514hmy:RioTintoLimitedMember2008-12-012008-12-010001023514hmy:RioTintoLimitedMember2008-12-0100010235142008-12-010001023514hmy:WafiGolpuJointOperationMember2008-12-010001023514hmy:ContingentLiabilityForDecommissioningRestorationAndRehabilitationCostsPriorToEffectiveDateOfSaleMember2023-06-300001023514hmy:RandUraniumMemberhmy:ContingentLiabilityForDecommissioningRestorationAndRehabilitationCostsPriorToEffectiveDateOfSaleMember2023-06-300001023514hmy:ContingentLiabilityForRatesPayableMerafongMemberifrs-full:BottomOfRangeMember2023-06-300001023514ifrs-full:TopOfRangeMemberhmy:ContingentLiabilityForRatesPayableMerafongMember2023-06-300001023514hmy:ContingentLiabilityPayableForRatesHarmonyMember2023-06-300001023514hmy:RestrictedCashAndInvestmentsMemberifrs-full:FinancialAssetsAtAmortisedCostCategoryMember2023-06-300001023514hmy:RestrictedCashAndInvestmentsMemberifrs-full:InvestmentsInEquityInstrumentsMeasuredAtFairValueThroughOtherComprehensiveIncomeMember2023-06-300001023514hmy:RestrictedCashAndInvestmentsMemberifrs-full:FinancialAssetsAtFairValueThroughProfitOrLossCategoryMember2023-06-300001023514ifrs-full:FinancialAssetsAtAmortisedCostCategoryMemberhmy:OtherNoncurrentAssetsMember2023-06-300001023514ifrs-full:InvestmentsInEquityInstrumentsMeasuredAtFairValueThroughOtherComprehensiveIncomeMemberhmy:OtherNoncurrentAssetsMember2023-06-300001023514ifrs-full:FinancialAssetsAtFairValueThroughProfitOrLossCategoryMemberhmy:OtherNoncurrentAssetsMember2023-06-300001023514ifrs-full:CashFlowHedgesMemberhmy:DesignatedAsHedgingInstrument1Memberifrs-full:FinancialAssetsAtFairValueThroughProfitOrLossCategoryMemberhmy:NoncurrentDerivativeAssetsMember2023-06-300001023514hmy:Nondesignated1Memberifrs-full:FinancialAssetsAtFairValueThroughProfitOrLossCategoryMemberhmy:NoncurrentDerivativeAssetsMember2023-06-300001023514ifrs-full:CashFlowHedgesMemberhmy:DesignatedAsHedgingInstrument1Memberifrs-full:FinancialAssetsAtFairValueThroughProfitOrLossCategoryMemberhmy:NoncurrentDerivativeAssetsMemberhmy:RandGoldHedgingContractsMember2023-06-300001023514hmy:USGoldHedgingContractsMemberifrs-full:CashFlowHedgesMemberhmy:DesignatedAsHedgingInstrument1Memberifrs-full:FinancialAssetsAtFairValueThroughProfitOrLossCategoryMemberhmy:NoncurrentDerivativeAssetsMember2023-06-300001023514hmy:Nondesignated1Memberifrs-full:FinancialAssetsAtFairValueThroughProfitOrLossCategoryMemberhmy:ForeignExchangeContractsMemberhmy:NoncurrentDerivativeAssetsMember2023-06-300001023514hmy:Nondesignated1Memberhmy:USsilvercontractsMemberifrs-full:FinancialAssetsAtFairValueThroughProfitOrLossCategoryMemberhmy:NoncurrentDerivativeAssetsMember2023-06-300001023514ifrs-full:CashFlowHedgesMemberhmy:DesignatedAsHedgingInstrument1Memberhmy:CurrentDerivativeAssetsMemberifrs-full:FinancialAssetsAtFairValueThroughProfitOrLossCategoryMember2023-06-300001023514hmy:Nondesignated1Memberhmy:CurrentDerivativeAssetsMemberifrs-full:FinancialAssetsAtFairValueThroughProfitOrLossCategoryMember2023-06-300001023514ifrs-full:CashFlowHedgesMemberhmy:DesignatedAsHedgingInstrument1Memberhmy:CurrentDerivativeAssetsMemberifrs-full:FinancialAssetsAtFairValueThroughProfitOrLossCategoryMemberhmy:RandGoldHedgingContractsMember2023-06-300001023514hmy:USGoldHedgingContractsMemberifrs-full:CashFlowHedgesMemberhmy:DesignatedAsHedgingInstrument1Memberhmy:CurrentDerivativeAssetsMemberifrs-full:FinancialAssetsAtFairValueThroughProfitOrLossCategoryMember2023-06-300001023514hmy:Nondesignated1Memberhmy:CurrentDerivativeAssetsMemberifrs-full:FinancialAssetsAtFairValueThroughProfitOrLossCategoryMemberhmy:ForeignExchangeContractsMember2023-06-300001023514hmy:Nondesignated1Memberhmy:USsilvercontractsMemberhmy:CurrentDerivativeAssetsMemberifrs-full:FinancialAssetsAtFairValueThroughProfitOrLossCategoryMember2023-06-300001023514ifrs-full:TradeReceivablesMemberifrs-full:FinancialAssetsAtAmortisedCostCategoryMember2023-06-300001023514hmy:CashandCashEquivalents1Memberifrs-full:FinancialAssetsAtAmortisedCostCategoryMember2023-06-300001023514ifrs-full:CashFlowHedgesMemberhmy:NoncurrentDerivativeLiabilitiesMemberifrs-full:FinancialLiabilitiesAtFairValueThroughProfitOrLossCategoryMemberhmy:DesignatedAsHedgingInstrument1Member2023-06-300001023514hmy:Nondesignated1Memberhmy:NoncurrentDerivativeLiabilitiesMemberifrs-full:FinancialLiabilitiesAtFairValueThroughProfitOrLossCategoryMember2023-06-300001023514ifrs-full:CashFlowHedgesMemberhmy:NoncurrentDerivativeLiabilitiesMemberifrs-full:FinancialLiabilitiesAtFairValueThroughProfitOrLossCategoryMemberhmy:DesignatedAsHedgingInstrument1Memberhmy:RandGoldHedgingContractsMember2023-06-300001023514hmy:Nondesignated1Memberhmy:NoncurrentDerivativeLiabilitiesMemberifrs-full:FinancialLiabilitiesAtFairValueThroughProfitOrLossCategoryMemberhmy:ForeignExchangeContractsMember2023-06-300001023514hmy:CurrentDerivativeLiabilitiesMemberifrs-full:CashFlowHedgesMemberifrs-full:FinancialLiabilitiesAtFairValueThroughProfitOrLossCategoryMemberhmy:DesignatedAsHedgingInstrument1Member2023-06-300001023514hmy:CurrentDerivativeLiabilitiesMemberhmy:Nondesignated1Memberifrs-full:FinancialLiabilitiesAtFairValueThroughProfitOrLossCategoryMember2023-06-300001023514hmy:CurrentDerivativeLiabilitiesMemberifrs-full:CashFlowHedgesMemberifrs-full:FinancialLiabilitiesAtFairValueThroughProfitOrLossCategoryMemberhmy:DesignatedAsHedgingInstrument1Memberhmy:RandGoldHedgingContractsMember2023-06-300001023514hmy:CurrentDerivativeLiabilitiesMemberhmy:USGoldHedgingContractsMemberifrs-full:CashFlowHedgesMemberifrs-full:FinancialLiabilitiesAtFairValueThroughProfitOrLossCategoryMemberhmy:DesignatedAsHedgingInstrument1Member2023-06-300001023514hmy:CurrentDerivativeLiabilitiesMemberhmy:Nondesignated1Memberifrs-full:FinancialLiabilitiesAtFairValueThroughProfitOrLossCategoryMemberhmy:ForeignExchangeContractsMember2023-06-300001023514ifrs-full:FinancialLiabilitiesAtAmortisedCostCategoryMemberhmy:Borrowings1Member2023-06-300001023514ifrs-full:FinancialLiabilitiesAtFairValueThroughProfitOrLossCategoryMemberhmy:ContingentConsiderationLiabilityMember2023-06-300001023514hmy:OtherNoncurrentPayablesMemberifrs-full:FinancialLiabilitiesAtAmortisedCostCategoryMember2023-06-300001023514hmy:TradeAndOtherPayablesMemberifrs-full:FinancialLiabilitiesAtAmortisedCostCategoryMember2023-06-300001023514hmy:RestrictedCashAndInvestmentsMemberifrs-full:FinancialAssetsAtAmortisedCostCategoryMember2022-06-300001023514hmy:RestrictedCashAndInvestmentsMemberifrs-full:InvestmentsInEquityInstrumentsMeasuredAtFairValueThroughOtherComprehensiveIncomeMember2022-06-300001023514hmy:RestrictedCashAndInvestmentsMemberifrs-full:FinancialAssetsAtFairValueThroughProfitOrLossCategoryMember2022-06-300001023514ifrs-full:FinancialAssetsAtAmortisedCostCategoryMemberhmy:OtherNoncurrentAssetsMember2022-06-300001023514ifrs-full:InvestmentsInEquityInstrumentsMeasuredAtFairValueThroughOtherComprehensiveIncomeMemberhmy:OtherNoncurrentAssetsMember2022-06-300001023514ifrs-full:FinancialAssetsAtFairValueThroughProfitOrLossCategoryMemberhmy:OtherNoncurrentAssetsMember2022-06-300001023514ifrs-full:CashFlowHedgesMemberhmy:DesignatedAsHedgingInstrument1Memberifrs-full:FinancialAssetsAtFairValueThroughProfitOrLossCategoryMemberhmy:NoncurrentDerivativeAssetsMember2022-06-300001023514hmy:Nondesignated1Memberifrs-full:FinancialAssetsAtFairValueThroughProfitOrLossCategoryMemberhmy:NoncurrentDerivativeAssetsMember2022-06-300001023514ifrs-full:CashFlowHedgesMemberhmy:DesignatedAsHedgingInstrument1Memberifrs-full:FinancialAssetsAtFairValueThroughProfitOrLossCategoryMemberhmy:NoncurrentDerivativeAssetsMemberhmy:RandGoldHedgingContractsMember2022-06-300001023514hmy:USGoldHedgingContractsMemberifrs-full:CashFlowHedgesMemberhmy:DesignatedAsHedgingInstrument1Memberifrs-full:FinancialAssetsAtFairValueThroughProfitOrLossCategoryMemberhmy:NoncurrentDerivativeAssetsMember2022-06-300001023514hmy:Nondesignated1Memberhmy:USsilvercontractsMemberifrs-full:FinancialAssetsAtFairValueThroughProfitOrLossCategoryMemberhmy:NoncurrentDerivativeAssetsMember2022-06-300001023514ifrs-full:CashFlowHedgesMemberhmy:DesignatedAsHedgingInstrument1Memberhmy:CurrentDerivativeAssetsMemberifrs-full:FinancialAssetsAtFairValueThroughProfitOrLossCategoryMember2022-06-300001023514hmy:Nondesignated1Memberhmy:CurrentDerivativeAssetsMemberifrs-full:FinancialAssetsAtFairValueThroughProfitOrLossCategoryMember2022-06-300001023514ifrs-full:CashFlowHedgesMemberhmy:DesignatedAsHedgingInstrument1Memberhmy:CurrentDerivativeAssetsMemberifrs-full:FinancialAssetsAtFairValueThroughProfitOrLossCategoryMemberhmy:RandGoldHedgingContractsMember2022-06-300001023514hmy:USGoldHedgingContractsMemberifrs-full:CashFlowHedgesMemberhmy:DesignatedAsHedgingInstrument1Memberhmy:CurrentDerivativeAssetsMemberifrs-full:FinancialAssetsAtFairValueThroughProfitOrLossCategoryMember2022-06-300001023514hmy:Nondesignated1Memberhmy:CurrentDerivativeAssetsMemberifrs-full:FinancialAssetsAtFairValueThroughProfitOrLossCategoryMemberhmy:ForeignExchangeContractsMember2022-06-300001023514hmy:Nondesignated1Memberhmy:USsilvercontractsMemberhmy:CurrentDerivativeAssetsMemberifrs-full:FinancialAssetsAtFairValueThroughProfitOrLossCategoryMember2022-06-300001023514ifrs-full:TradeReceivablesMemberifrs-full:FinancialAssetsAtAmortisedCostCategoryMember2022-06-300001023514hmy:CashandCashEquivalents1Memberifrs-full:FinancialAssetsAtAmortisedCostCategoryMember2022-06-300001023514ifrs-full:CashFlowHedgesMemberhmy:NoncurrentDerivativeLiabilitiesMemberifrs-full:FinancialLiabilitiesAtFairValueThroughProfitOrLossCategoryMemberhmy:DesignatedAsHedgingInstrument1Member2022-06-300001023514ifrs-full:CashFlowHedgesMemberhmy:NoncurrentDerivativeLiabilitiesMemberifrs-full:FinancialLiabilitiesAtFairValueThroughProfitOrLossCategoryMemberhmy:DesignatedAsHedgingInstrument1Memberhmy:RandGoldHedgingContractsMember2022-06-300001023514hmy:CurrentDerivativeLiabilitiesMemberifrs-full:CashFlowHedgesMemberifrs-full:FinancialLiabilitiesAtFairValueThroughProfitOrLossCategoryMemberhmy:DesignatedAsHedgingInstrument1Member2022-06-300001023514hmy:CurrentDerivativeLiabilitiesMemberifrs-full:CashFlowHedgesMemberifrs-full:FinancialLiabilitiesAtFairValueThroughProfitOrLossCategoryMemberhmy:DesignatedAsHedgingInstrument1Memberhmy:RandGoldHedgingContractsMember2022-06-300001023514ifrs-full:FinancialLiabilitiesAtAmortisedCostCategoryMemberhmy:Borrowings1Member2022-06-300001023514ifrs-full:FinancialLiabilitiesAtFairValueThroughProfitOrLossCategoryMemberhmy:ContingentConsiderationLiabilityMember2022-06-300001023514hmy:OtherNoncurrentPayablesMemberifrs-full:FinancialLiabilitiesAtAmortisedCostCategoryMember2022-06-300001023514hmy:TradeAndOtherPayablesMemberifrs-full:FinancialLiabilitiesAtAmortisedCostCategoryMember2022-06-300001023514hmy:RandAgainstUSDMemberifrs-full:CurrencyRiskMemberhmy:Borrowings1Member2022-07-012023-06-300001023514hmy:RandAgainstUSDMemberifrs-full:CurrencyRiskMemberhmy:Borrowings1Member2021-07-012022-06-300001023514hmy:ContingentConsiderationLiabilityEvaMemberifrs-full:CurrencyRiskMemberhmy:USDagainstAUDMember2022-07-012023-06-300001023514ifrs-full:CurrencyRiskMemberhmy:FinancialAssetMemberhmy:USDagainstAUDMember2021-07-012022-06-300001023514hmy:RandAgainstUSDMemberifrs-full:CurrencyRiskMemberhmy:Borrowings1Member2023-06-300001023514hmy:RandAgainstUSDMemberifrs-full:CurrencyRiskMemberhmy:Borrowings1Member2022-06-300001023514hmy:RandAgainstUSDMemberifrs-full:CurrencyRiskMemberhmy:ContingentConsiderationLiabilityMember2023-06-300001023514hmy:RandAgainstUSDMemberifrs-full:CurrencyRiskMemberhmy:ContingentConsiderationLiabilityMember2022-06-300001023514hmy:RandAgainstUSDMemberifrs-full:CurrencyRiskMemberhmy:ContingentConsiderationLiabilityMember2022-07-012023-06-300001023514hmy:RandAgainstUSDMemberifrs-full:CurrencyRiskMemberhmy:ContingentConsiderationLiabilityMember2021-07-012022-06-300001023514hmy:ContingentConsiderationLiabilityEvaMemberifrs-full:CurrencyRiskMemberhmy:USDagainstAUDMember2023-06-300001023514hmy:ContingentConsiderationLiabilityEvaMemberifrs-full:CurrencyRiskMemberhmy:USDagainstAUDMember2022-07-012023-06-300001023514hmy:ContingentConsiderationLiabilityEvaMemberifrs-full:CurrencyRiskMemberhmy:USDagainstAUDMember2021-07-012022-06-300001023514hmy:RandAgainstUSDMemberifrs-full:CurrencyRiskMemberhmy:DerivativeFinancialInstrumentsMember2023-06-300001023514hmy:RandAgainstUSDMemberifrs-full:CurrencyRiskMemberhmy:DerivativeFinancialInstrumentsMember2022-06-300001023514hmy:RandAgainstUSDMemberifrs-full:CurrencyRiskMemberhmy:DerivativeFinancialInstrumentsMember2022-07-012023-06-300001023514hmy:RandAgainstUSDMemberifrs-full:CurrencyRiskMemberhmy:DerivativeFinancialInstrumentsMember2021-07-012022-06-300001023514ifrs-full:CurrencyRiskMemberhmy:FinancialAssetMemberhmy:USDagainstAUDMember2023-06-300001023514ifrs-full:CurrencyRiskMemberhmy:FinancialAssetMemberhmy:USDagainstAUDMember2022-06-300001023514ifrs-full:CurrencyRiskMemberhmy:FinancialAssetMemberhmy:USDagainstAUDMember2022-07-012023-06-30hmy:USD_per_AUD0001023514ifrs-full:CashFlowHedgesMemberhmy:RandGoldHedgingContractsMemberifrs-full:CommodityPriceRiskMember2022-07-012023-06-300001023514ifrs-full:CashFlowHedgesMemberhmy:RandGoldHedgingContractsMemberifrs-full:CommodityPriceRiskMember2021-07-012022-06-300001023514hmy:USGoldHedgingContractsMemberifrs-full:CashFlowHedgesMemberifrs-full:CommodityPriceRiskMember2022-07-012023-06-300001023514hmy:USGoldHedgingContractsMemberifrs-full:CashFlowHedgesMemberifrs-full:CommodityPriceRiskMember2021-07-012022-06-300001023514ifrs-full:OtherPriceRiskMember2022-07-012023-06-300001023514ifrs-full:OtherPriceRiskMember2021-07-012022-06-300001023514ifrs-full:InterestRateRiskMemberhmy:USDenominatedBorrowingsMember2022-07-012023-06-30hmy:Basis_points0001023514ifrs-full:InterestRateRiskMemberhmy:USDenominatedBorrowingsMember2021-07-012022-06-300001023514ifrs-full:InterestRateRiskMemberhmy:FinancialAssetMember2022-07-012023-06-300001023514ifrs-full:InterestRateRiskMemberhmy:FinancialAssetMember2021-07-012022-06-300001023514hmy:RestrictedInvestmentsCollectiveInvestmentSchemeCombinedUnitTrustMember2023-06-300001023514hmy:RestrictedInvestmentsCollectiveInvestmentSchemeCombinedUnitTrustMember2022-06-300001023514hmy:CreditRatingAAPlusMemberhmy:CashandCashEquivalents1Member2023-06-300001023514hmy:CreditRatingAAPlusMemberhmy:CashandCashEquivalents1Member2022-06-300001023514hmy:CreditRatingAPlusMemberhmy:CashandCashEquivalents1Member2023-06-300001023514hmy:CreditRatingAPlusMemberhmy:CashandCashEquivalents1Member2022-06-300001023514hmy:CashandCashEquivalents1Member2023-06-300001023514hmy:CashandCashEquivalents1Member2022-06-300001023514hmy:RestrictedCashAndInvestmentsMemberhmy:CreditRatingAAAMember2023-06-300001023514hmy:RestrictedCashAndInvestmentsMemberhmy:CreditRatingAAAMember2022-06-300001023514hmy:RestrictedCashAndInvestmentsMemberhmy:CreditRatingAAPlusMember2023-06-300001023514hmy:RestrictedCashAndInvestmentsMemberhmy:CreditRatingAAPlusMember2022-06-300001023514hmy:RestrictedCashAndInvestmentsMember2023-06-300001023514hmy:RestrictedCashAndInvestmentsMember2022-06-300001023514hmy:CreditRatingAAPlusMemberifrs-full:DerivativesMember2023-06-300001023514hmy:CreditRatingAAPlusMemberifrs-full:DerivativesMember2022-06-300001023514ifrs-full:DerivativesMemberhmy:CreditRatingAAMember2023-06-300001023514ifrs-full:DerivativesMemberhmy:CreditRatingAAMember2022-06-300001023514ifrs-full:DerivativesMemberhmy:CreditRatingAAMinusMember2023-06-300001023514ifrs-full:DerivativesMemberhmy:CreditRatingAAMinusMember2022-06-300001023514hmy:CreditRatingAPlusMemberifrs-full:DerivativesMember2023-06-300001023514hmy:CreditRatingAPlusMemberifrs-full:DerivativesMember2022-06-300001023514ifrs-full:DerivativesMember2023-06-300001023514ifrs-full:DerivativesMember2022-06-300001023514ifrs-full:LaterThanOneYearAndNotLaterThanFiveYearsMemberifrs-full:LiquidityRiskMember2023-06-300001023514ifrs-full:LaterThanOneYearAndNotLaterThanFiveYearsMemberifrs-full:LiquidityRiskMember2022-06-300001023514hmy:LaterThanSixYearsAndNotLaterThanTenYearsMemberifrs-full:LiquidityRiskMember2023-06-300001023514ifrs-full:LaterThanTenYearsAndNotLaterThanFifteenYearsMemberifrs-full:LiquidityRiskMember2023-06-300001023514ifrs-full:LiquidityRiskMemberifrs-full:LaterThanOneYearMember2023-06-300001023514ifrs-full:LiquidityRiskMemberifrs-full:LaterThanOneYearMember2022-06-300001023514ifrs-full:LiquidityRiskMemberifrs-full:NotLaterThanOneYearMember2023-06-300001023514ifrs-full:LiquidityRiskMemberifrs-full:NotLaterThanOneYearMember2022-06-300001023514ifrs-full:LiquidityRiskMemberhmy:NotLaterThanSixMonthsMember2023-06-300001023514ifrs-full:LiquidityRiskMemberhmy:NotLaterThanSixMonthsMember2022-06-300001023514ifrs-full:LaterThanSixMonthsAndNotLaterThanOneYearMemberifrs-full:LiquidityRiskMember2023-06-300001023514ifrs-full:LaterThanSixMonthsAndNotLaterThanOneYearMemberifrs-full:LiquidityRiskMember2022-06-300001023514ifrs-full:LiquidityRiskMemberifrs-full:LaterThanOneYearAndNotLaterThanTwoYearsMember2023-06-300001023514ifrs-full:LiquidityRiskMemberifrs-full:LaterThanOneYearAndNotLaterThanTwoYearsMember2022-06-300001023514ifrs-full:LaterThanTwoYearsAndNotLaterThanThreeYearsMemberifrs-full:LiquidityRiskMember2023-06-300001023514ifrs-full:LaterThanTwoYearsAndNotLaterThanThreeYearsMemberifrs-full:LiquidityRiskMember2022-06-300001023514ifrs-full:LiquidityRiskMemberhmy:ContingentConsiderationSettledWithin3To4YearsMember2023-06-300001023514hmy:BorrowingsFinalRepaymentOfCapitalMay2026Memberifrs-full:LiquidityRiskMember2023-06-300001023514hmy:BorrowingsFinalRepaymentOfCapitalMay2025Memberifrs-full:LiquidityRiskMember2022-06-300001023514ifrs-full:Level3OfFairValueHierarchyMemberifrs-full:FinancialAssetsAtFairValueThroughOtherComprehensiveIncomeCategoryMemberhmy:OtherNoncurrentAssetsMember2023-06-300001023514ifrs-full:Level3OfFairValueHierarchyMemberifrs-full:FinancialAssetsAtFairValueThroughOtherComprehensiveIncomeCategoryMemberhmy:OtherNoncurrentAssetsMember2022-06-300001023514ifrs-full:Level1OfFairValueHierarchyMemberhmy:RestrictedCashAndInvestmentsMemberifrs-full:FinancialAssetsAtFairValueThroughOtherComprehensiveIncomeCategoryMember2023-06-300001023514ifrs-full:Level1OfFairValueHierarchyMemberhmy:RestrictedCashAndInvestmentsMemberifrs-full:FinancialAssetsAtFairValueThroughOtherComprehensiveIncomeCategoryMember2022-06-300001023514ifrs-full:FinancialAssetsAtFairValueThroughProfitOrLossCategoryMemberhmy:RestrictedCashAndInvestmentsMemberifrs-full:Level2OfFairValueHierarchyMember2023-06-300001023514ifrs-full:FinancialAssetsAtFairValueThroughProfitOrLossCategoryMemberhmy:RestrictedCashAndInvestmentsMemberifrs-full:Level2OfFairValueHierarchyMember2022-06-300001023514ifrs-full:DerivativesMemberifrs-full:FinancialAssetsAtFairValueThroughProfitOrLossCategoryMemberifrs-full:Level2OfFairValueHierarchyMember2023-06-300001023514ifrs-full:DerivativesMemberifrs-full:FinancialAssetsAtFairValueThroughProfitOrLossCategoryMemberifrs-full:Level2OfFairValueHierarchyMember2022-06-300001023514ifrs-full:FinancialLiabilitiesAtFairValueThroughProfitOrLossCategoryMemberifrs-full:DerivativesMemberifrs-full:Level2OfFairValueHierarchyMember2023-06-300001023514ifrs-full:FinancialLiabilitiesAtFairValueThroughProfitOrLossCategoryMemberifrs-full:DerivativesMemberifrs-full:Level2OfFairValueHierarchyMember2022-06-300001023514ifrs-full:Level3OfFairValueHierarchyMemberifrs-full:FinancialAssetsAtFairValueThroughProfitOrLossCategoryMemberhmy:OtherNoncurrentAssetsMember2023-06-300001023514ifrs-full:Level3OfFairValueHierarchyMemberifrs-full:FinancialAssetsAtFairValueThroughProfitOrLossCategoryMemberhmy:OtherNoncurrentAssetsMember2022-06-300001023514ifrs-full:FinancialLiabilitiesAtFairValueThroughProfitOrLossCategoryMemberhmy:ContingentConsiderationLiabilityMemberifrs-full:Level3OfFairValueHierarchyMember2023-06-300001023514ifrs-full:FinancialLiabilitiesAtFairValueThroughProfitOrLossCategoryMemberhmy:ContingentConsiderationLiabilityMemberifrs-full:Level3OfFairValueHierarchyMember2022-06-300001023514hmy:ARMBBEETrustMemberifrs-full:Level3OfFairValueHierarchyMemberifrs-full:FinancialAssetsAtFairValueThroughProfitOrLossCategoryMemberhmy:OtherNoncurrentAssetsMember2023-06-300001023514hmy:ARMBBEETrustMemberifrs-full:Level3OfFairValueHierarchyMemberifrs-full:FinancialAssetsAtFairValueThroughProfitOrLossCategoryMemberhmy:OtherNoncurrentAssetsMember2022-06-300001023514hmy:ARMBBEETrustMemberifrs-full:Level3OfFairValueHierarchyMemberifrs-full:FairValueModelMemberhmy:OtherNoncurrentAssetsMember2022-07-012023-06-300001023514hmy:ARMBBEETrustMemberifrs-full:Level3OfFairValueHierarchyMemberifrs-full:FairValueModelMemberhmy:OtherNoncurrentAssetsMember2021-07-012022-06-300001023514hmy:ContingentConsiderationLiabilityMemberhmy:MponengMember2023-06-300001023514hmy:ContingentConsiderationLiabilityMemberhmy:MponengMember2022-06-300001023514ifrs-full:FinancialLiabilitiesAtFairValueThroughProfitOrLossCategoryMemberhmy:ContingentConsiderationLiabilityMemberifrs-full:Level3OfFairValueHierarchyMemberhmy:MponengOperationsAndRelatedAssetsMember2023-06-300001023514ifrs-full:FinancialLiabilitiesAtFairValueThroughProfitOrLossCategoryMemberhmy:ContingentConsiderationLiabilityMemberifrs-full:Level3OfFairValueHierarchyMemberhmy:MponengOperationsAndRelatedAssetsMember2022-06-300001023514hmy:AngloGoldAshantiMemberhmy:ContingentConsiderationLiabilityMemberifrs-full:FairValueModelMember2022-07-012023-06-300001023514hmy:AngloGoldAshantiMemberhmy:ContingentConsiderationLiabilityMemberifrs-full:FairValueModelMember2021-07-012022-06-300001023514hmy:EvaCopperMemberhmy:ContingentConsiderationLiabilityMember2023-06-300001023514hmy:US400MillionFacilitySustainabilityLinkedMember2023-07-032023-07-030001023514hmy:RCFMemberhmy:US400MillionFacilitySustainabilityLinkedMember2023-07-032023-07-030001023514hmy:RepaymentOfInterestPortionMemberhmy:US400MillionFacilitySustainabilityLinkedMember2023-07-032023-07-030001023514hmy:US400MillionFacilitySustainabilityLinkedMember2023-09-062023-09-060001023514hmy:RCFMemberhmy:US400MillionFacilitySustainabilityLinkedMember2023-09-062023-09-060001023514hmy:RepaymentOfInterestPortionMemberhmy:US400MillionFacilitySustainabilityLinkedMember2023-09-062023-09-060001023514hmy:US400MillionFacilitySustainabilityLinkedMember2023-09-082023-09-080001023514hmy:RCFMemberhmy:US400MillionFacilitySustainabilityLinkedMember2023-09-082023-09-080001023514hmy:RepaymentOfInterestPortionMemberhmy:US400MillionFacilitySustainabilityLinkedMember2023-09-082023-09-08hmy:product0001023514hmy:MoabKhotsongMemberifrs-full:OperatingSegmentsMemberifrs-full:CountryOfDomicileMember2022-07-012023-06-300001023514hmy:MoabKhotsongMemberifrs-full:OperatingSegmentsMemberifrs-full:CountryOfDomicileMember2021-07-012022-06-300001023514hmy:MoabKhotsongMemberifrs-full:OperatingSegmentsMemberifrs-full:CountryOfDomicileMember2020-07-012021-06-300001023514hmy:MoabKhotsongMemberifrs-full:OperatingSegmentsMemberifrs-full:CountryOfDomicileMember2023-06-300001023514hmy:MoabKhotsongMemberifrs-full:OperatingSegmentsMemberifrs-full:CountryOfDomicileMember2022-06-300001023514hmy:MoabKhotsongMemberifrs-full:OperatingSegmentsMemberifrs-full:CountryOfDomicileMember2021-06-300001023514ifrs-full:OperatingSegmentsMemberifrs-full:CountryOfDomicileMemberhmy:MponengMember2022-07-012023-06-300001023514ifrs-full:OperatingSegmentsMemberifrs-full:CountryOfDomicileMemberhmy:MponengMember2021-07-012022-06-300001023514ifrs-full:OperatingSegmentsMemberifrs-full:CountryOfDomicileMemberhmy:MponengMember2020-07-012021-06-300001023514ifrs-full:OperatingSegmentsMemberifrs-full:CountryOfDomicileMemberhmy:MponengMember2023-06-300001023514ifrs-full:OperatingSegmentsMemberifrs-full:CountryOfDomicileMemberhmy:MponengMember2022-06-300001023514ifrs-full:OperatingSegmentsMemberifrs-full:CountryOfDomicileMemberhmy:MponengMember2021-06-300001023514ifrs-full:OperatingSegmentsMemberhmy:TshepongNorthMemberifrs-full:CountryOfDomicileMember2022-07-012023-06-300001023514ifrs-full:OperatingSegmentsMemberhmy:TshepongNorthMemberifrs-full:CountryOfDomicileMember2021-07-012022-06-300001023514ifrs-full:OperatingSegmentsMemberhmy:TshepongNorthMemberifrs-full:CountryOfDomicileMember2020-07-012021-06-300001023514ifrs-full:OperatingSegmentsMemberhmy:TshepongNorthMemberifrs-full:CountryOfDomicileMember2023-06-300001023514ifrs-full:OperatingSegmentsMemberhmy:TshepongNorthMemberifrs-full:CountryOfDomicileMember2022-06-300001023514ifrs-full:OperatingSegmentsMemberhmy:TshepongNorthMemberifrs-full:CountryOfDomicileMember2021-06-300001023514ifrs-full:OperatingSegmentsMemberhmy:TshepongSouthMemberifrs-full:CountryOfDomicileMember2022-07-012023-06-300001023514ifrs-full:OperatingSegmentsMemberhmy:TshepongSouthMemberifrs-full:CountryOfDomicileMember2021-07-012022-06-300001023514ifrs-full:OperatingSegmentsMemberhmy:TshepongSouthMemberifrs-full:CountryOfDomicileMember2020-07-012021-06-300001023514ifrs-full:OperatingSegmentsMemberhmy:TshepongSouthMemberifrs-full:CountryOfDomicileMember2023-06-300001023514ifrs-full:OperatingSegmentsMemberhmy:TshepongSouthMemberifrs-full:CountryOfDomicileMember2022-06-300001023514ifrs-full:OperatingSegmentsMemberhmy:TshepongSouthMemberifrs-full:CountryOfDomicileMember2021-06-300001023514ifrs-full:OperatingSegmentsMemberifrs-full:CountryOfDomicileMemberhmy:DoornkopMember2022-07-012023-06-300001023514ifrs-full:OperatingSegmentsMemberifrs-full:CountryOfDomicileMemberhmy:DoornkopMember2021-07-012022-06-300001023514ifrs-full:OperatingSegmentsMemberifrs-full:CountryOfDomicileMemberhmy:DoornkopMember2020-07-012021-06-300001023514ifrs-full:OperatingSegmentsMemberifrs-full:CountryOfDomicileMemberhmy:DoornkopMember2023-06-300001023514ifrs-full:OperatingSegmentsMemberifrs-full:CountryOfDomicileMemberhmy:DoornkopMember2022-06-300001023514ifrs-full:OperatingSegmentsMemberifrs-full:CountryOfDomicileMemberhmy:DoornkopMember2021-06-300001023514hmy:JoelMemberifrs-full:OperatingSegmentsMemberifrs-full:CountryOfDomicileMember2022-07-012023-06-300001023514hmy:JoelMemberifrs-full:OperatingSegmentsMemberifrs-full:CountryOfDomicileMember2021-07-012022-06-300001023514hmy:JoelMemberifrs-full:OperatingSegmentsMemberifrs-full:CountryOfDomicileMember2020-07-012021-06-300001023514hmy:JoelMemberifrs-full:OperatingSegmentsMemberifrs-full:CountryOfDomicileMember2023-06-300001023514hmy:JoelMemberifrs-full:OperatingSegmentsMemberifrs-full:CountryOfDomicileMember2022-06-300001023514hmy:JoelMemberifrs-full:OperatingSegmentsMemberifrs-full:CountryOfDomicileMember2021-06-300001023514ifrs-full:OperatingSegmentsMemberifrs-full:CountryOfDomicileMemberhmy:Target1Member2022-07-012023-06-300001023514ifrs-full:OperatingSegmentsMemberifrs-full:CountryOfDomicileMemberhmy:Target1Member2021-07-012022-06-300001023514ifrs-full:OperatingSegmentsMemberifrs-full:CountryOfDomicileMemberhmy:Target1Member2020-07-012021-06-300001023514ifrs-full:OperatingSegmentsMemberifrs-full:CountryOfDomicileMemberhmy:Target1Member2023-06-300001023514ifrs-full:OperatingSegmentsMemberifrs-full:CountryOfDomicileMemberhmy:Target1Member2022-06-300001023514ifrs-full:OperatingSegmentsMemberifrs-full:CountryOfDomicileMemberhmy:Target1Member2021-06-300001023514hmy:KusasalethuMemberifrs-full:OperatingSegmentsMemberifrs-full:CountryOfDomicileMember2022-07-012023-06-300001023514hmy:KusasalethuMemberifrs-full:OperatingSegmentsMemberifrs-full:CountryOfDomicileMember2021-07-012022-06-300001023514hmy:KusasalethuMemberifrs-full:OperatingSegmentsMemberifrs-full:CountryOfDomicileMember2020-07-012021-06-300001023514hmy:KusasalethuMemberifrs-full:OperatingSegmentsMemberifrs-full:CountryOfDomicileMember2023-06-300001023514hmy:KusasalethuMemberifrs-full:OperatingSegmentsMemberifrs-full:CountryOfDomicileMember2022-06-300001023514hmy:KusasalethuMemberifrs-full:OperatingSegmentsMemberifrs-full:CountryOfDomicileMember2021-06-300001023514hmy:MasimongMemberifrs-full:OperatingSegmentsMemberifrs-full:CountryOfDomicileMember2022-07-012023-06-300001023514hmy:MasimongMemberifrs-full:OperatingSegmentsMemberifrs-full:CountryOfDomicileMember2021-07-012022-06-300001023514hmy:MasimongMemberifrs-full:OperatingSegmentsMemberifrs-full:CountryOfDomicileMember2020-07-012021-06-300001023514hmy:MasimongMemberifrs-full:OperatingSegmentsMemberifrs-full:CountryOfDomicileMember2023-06-300001023514hmy:MasimongMemberifrs-full:OperatingSegmentsMemberifrs-full:CountryOfDomicileMember2022-06-300001023514hmy:MasimongMemberifrs-full:OperatingSegmentsMemberifrs-full:CountryOfDomicileMember2021-06-300001023514hmy:BambananiMemberifrs-full:OperatingSegmentsMemberifrs-full:CountryOfDomicileMember2022-07-012023-06-300001023514hmy:BambananiMemberifrs-full:OperatingSegmentsMemberifrs-full:CountryOfDomicileMember2021-07-012022-06-300001023514hmy:BambananiMemberifrs-full:OperatingSegmentsMemberifrs-full:CountryOfDomicileMember2020-07-012021-06-300001023514hmy:BambananiMemberifrs-full:OperatingSegmentsMemberifrs-full:CountryOfDomicileMember2023-06-300001023514hmy:BambananiMemberifrs-full:OperatingSegmentsMemberifrs-full:CountryOfDomicileMember2022-06-300001023514hmy:BambananiMemberifrs-full:OperatingSegmentsMemberifrs-full:CountryOfDomicileMember2021-06-300001023514hmy:MineWasteSolutionsMemberifrs-full:OperatingSegmentsMemberifrs-full:CountryOfDomicileMember2022-07-012023-06-300001023514hmy:MineWasteSolutionsMemberifrs-full:OperatingSegmentsMemberifrs-full:CountryOfDomicileMember2021-07-012022-06-300001023514hmy:MineWasteSolutionsMemberifrs-full:OperatingSegmentsMemberifrs-full:CountryOfDomicileMember2020-07-012021-06-300001023514hmy:MineWasteSolutionsMemberifrs-full:OperatingSegmentsMemberifrs-full:CountryOfDomicileMember2023-06-300001023514hmy:MineWasteSolutionsMemberifrs-full:OperatingSegmentsMemberifrs-full:CountryOfDomicileMember2022-06-300001023514hmy:MineWasteSolutionsMemberifrs-full:OperatingSegmentsMemberifrs-full:CountryOfDomicileMember2021-06-300001023514ifrs-full:OperatingSegmentsMemberifrs-full:AllOtherSegmentsMemberifrs-full:CountryOfDomicileMember2022-07-012023-06-300001023514ifrs-full:OperatingSegmentsMemberifrs-full:AllOtherSegmentsMemberifrs-full:CountryOfDomicileMember2021-07-012022-06-300001023514ifrs-full:OperatingSegmentsMemberifrs-full:AllOtherSegmentsMemberifrs-full:CountryOfDomicileMember2020-07-012021-06-300001023514ifrs-full:OperatingSegmentsMemberifrs-full:AllOtherSegmentsMemberifrs-full:CountryOfDomicileMember2023-06-300001023514ifrs-full:OperatingSegmentsMemberifrs-full:AllOtherSegmentsMemberifrs-full:CountryOfDomicileMember2022-06-300001023514ifrs-full:OperatingSegmentsMemberifrs-full:AllOtherSegmentsMemberifrs-full:CountryOfDomicileMember2021-06-300001023514ifrs-full:OperatingSegmentsMemberifrs-full:CountryOfDomicileMember2022-07-012023-06-300001023514ifrs-full:OperatingSegmentsMemberifrs-full:CountryOfDomicileMember2021-07-012022-06-300001023514ifrs-full:OperatingSegmentsMemberifrs-full:CountryOfDomicileMember2020-07-012021-06-300001023514ifrs-full:OperatingSegmentsMemberifrs-full:CountryOfDomicileMember2023-06-300001023514ifrs-full:OperatingSegmentsMemberifrs-full:CountryOfDomicileMember2022-06-300001023514ifrs-full:OperatingSegmentsMemberifrs-full:CountryOfDomicileMember2021-06-300001023514ifrs-full:OperatingSegmentsMemberifrs-full:ForeignCountriesMemberhmy:HiddenValleyMember2022-07-012023-06-300001023514ifrs-full:OperatingSegmentsMemberifrs-full:ForeignCountriesMemberhmy:HiddenValleyMember2021-07-012022-06-300001023514ifrs-full:OperatingSegmentsMemberifrs-full:ForeignCountriesMemberhmy:HiddenValleyMember2020-07-012021-06-300001023514ifrs-full:OperatingSegmentsMemberifrs-full:ForeignCountriesMemberhmy:HiddenValleyMember2023-06-300001023514ifrs-full:OperatingSegmentsMemberifrs-full:ForeignCountriesMemberhmy:HiddenValleyMember2022-06-300001023514ifrs-full:OperatingSegmentsMemberifrs-full:ForeignCountriesMemberhmy:HiddenValleyMember2021-06-300001023514ifrs-full:OperatingSegmentsMemberifrs-full:ForeignCountriesMember2022-07-012023-06-300001023514ifrs-full:OperatingSegmentsMemberifrs-full:ForeignCountriesMember2021-07-012022-06-300001023514ifrs-full:OperatingSegmentsMemberifrs-full:ForeignCountriesMember2020-07-012021-06-300001023514ifrs-full:OperatingSegmentsMemberifrs-full:ForeignCountriesMember2023-06-300001023514ifrs-full:OperatingSegmentsMemberifrs-full:ForeignCountriesMember2022-06-300001023514ifrs-full:OperatingSegmentsMemberifrs-full:ForeignCountriesMember2021-06-300001023514ifrs-full:OperatingSegmentsMember2022-07-012023-06-300001023514ifrs-full:OperatingSegmentsMember2021-07-012022-06-300001023514ifrs-full:OperatingSegmentsMember2020-07-012021-06-300001023514ifrs-full:OperatingSegmentsMember2023-06-300001023514ifrs-full:OperatingSegmentsMember2022-06-300001023514ifrs-full:OperatingSegmentsMember2021-06-300001023514ifrs-full:MaterialReconcilingItemsMember2022-07-012023-06-300001023514ifrs-full:MaterialReconcilingItemsMember2021-07-012022-06-300001023514ifrs-full:MaterialReconcilingItemsMember2020-07-012021-06-300001023514ifrs-full:UnallocatedAmountsMember2023-06-300001023514ifrs-full:UnallocatedAmountsMember2022-06-300001023514ifrs-full:UnallocatedAmountsMember2021-06-300001023514hmy:EvaCopperMemberhmy:WafiGolpuJointOperationMemberifrs-full:ForeignCountriesMember2022-07-012023-06-300001023514hmy:WafiGolpuJointOperationMemberifrs-full:ForeignCountriesMember2021-07-012022-06-300001023514hmy:WafiGolpuJointOperationMemberifrs-full:ForeignCountriesMember2020-07-012021-06-300001023514hmy:SilverAndUraniumSalesMemberifrs-full:MaterialReconcilingItemsMember2022-07-012023-06-300001023514hmy:SilverAndUraniumSalesMemberifrs-full:MaterialReconcilingItemsMember2021-07-012022-06-300001023514hmy:SilverAndUraniumSalesMemberifrs-full:MaterialReconcilingItemsMember2020-07-012021-06-300001023514ifrs-full:MaterialReconcilingItemsMemberhmy:TollTreatmentsMember2022-07-012023-06-300001023514ifrs-full:MaterialReconcilingItemsMemberhmy:TollTreatmentsMember2021-07-012022-06-300001023514ifrs-full:MaterialReconcilingItemsMemberhmy:TollTreatmentsMember2020-07-012021-06-300001023514ifrs-full:UnallocatedAmountsMemberhmy:TollTreatmentsMember2022-07-012023-06-300001023514ifrs-full:UnallocatedAmountsMemberhmy:TollTreatmentsMember2021-07-012022-06-300001023514ifrs-full:UnallocatedAmountsMemberhmy:TollTreatmentsMember2020-07-012021-06-300001023514ifrs-full:UnallocatedAmountsMember2022-07-012023-06-300001023514ifrs-full:UnallocatedAmountsMember2021-07-012022-06-300001023514ifrs-full:UnallocatedAmountsMember2020-07-012021-06-300001023514ifrs-full:UnallocatedAmountsMemberifrs-full:MiningAssetsMember2023-06-300001023514ifrs-full:UnallocatedAmountsMemberifrs-full:MiningAssetsMember2022-06-300001023514ifrs-full:UnallocatedAmountsMemberifrs-full:MiningAssetsMember2021-06-300001023514ifrs-full:UnallocatedAmountsMemberhmy:UndevelopedPropertiesMember2023-06-300001023514ifrs-full:UnallocatedAmountsMemberhmy:UndevelopedPropertiesMember2022-06-300001023514ifrs-full:UnallocatedAmountsMemberhmy:UndevelopedPropertiesMember2021-06-300001023514ifrs-full:UnallocatedAmountsMemberhmy:OtherNonMiningAssetsMember2023-06-300001023514ifrs-full:UnallocatedAmountsMemberhmy:OtherNonMiningAssetsMember2022-06-300001023514ifrs-full:UnallocatedAmountsMemberhmy:OtherNonMiningAssetsMember2021-06-300001023514ifrs-full:UnallocatedAmountsMemberifrs-full:ConstructionInProgressMember2023-06-300001023514ifrs-full:UnallocatedAmountsMemberifrs-full:ConstructionInProgressMember2022-06-300001023514ifrs-full:UnallocatedAmountsMemberifrs-full:ConstructionInProgressMember2021-06-30
As filed with the Securities and Exchange Commission on October 31, 2023
UNITED STATES SECURITIES AND EXCHANGE COMMISSION
WASHINGTON, D.C. 20549
_______________________________
FORM 20-F
|
|
|
|
|
|
☐ |
REGISTRATION STATEMENT PURSUANT TO SECTION 12(b) OR (g) OF THE SECURITIES EXCHANGE ACT OF 1934 |
OR
|
|
|
|
|
|
☑ |
ANNUAL REPORT PURSUANT TO SECTION 13 OR 15(d) OF THE SECURITIES EXCHANGE ACT OF 1934 |
For the fiscal year ended June 30, 2023
OR
|
|
|
|
|
|
☐ |
TRANSITION REPORT PURSUANT TO SECTION 13 OR 15(d) OF THE SECURITIES EXCHANGE ACT OF 1934 |
OR
|
|
|
|
|
|
☐ |
SHELL COMPANY REPORT PURSUANT TO SECTION 13 OR 15(d) OF THE SECURITIES EXCHANGE ACT OF 1934 |
Date of event requiring this shell company report
For the transition period from___ to___
Commission file number: 001-31545
HARMONY GOLD MINING COMPANY LIMITED
(Exact name of registrant as specified in its charter)
Republic of South Africa
(Jurisdiction of incorporation or organization)
RANDFONTEIN OFFICE PARK, CNR WARD AVENUE AND MAIN REEF ROAD,
RANDFONTEIN, South Africa, 1759
(Address of principal executive offices)
Shela Mohatla, Group Company Secretary
Tel: +27 11 411 2359, shela.mohatla@harmony.co.za, fax: +27 11 696 9734,
Randfontein Office Park, CNR Ward Avenue and Main Reef Road, Randfontein, South Africa, 1759
(Name, Telephone, E-mail and/or Facsimile number and Address of Company Contact Person)
Securities registered or to be registered pursuant to Section 12(b) of the Act:
|
|
|
|
|
|
|
|
|
| Title of each class |
Trading Symbol(s) |
Name of Each Exchange on Which Registered |
Ordinary shares, with no par value per share* |
n/a* |
New York Stock Exchange* |
American Depositary Shares (as evidenced by American Depositary Receipts), each representing one ordinary share |
HMY |
New York Stock Exchange |
* Not for trading, but only in connection with the registration of American Depositary Shares, pursuant to the requirements of the Securities and Exchange Commission.
Securities registered or to be registered pursuant to Section 12(g) of the Act:
None
Securities for which there is a reporting obligation pursuant to Section 15(d) of the Act:
None
The number of outstanding shares of each of the issuer’s classes of capital or common stock as of the close of the last full fiscal year covered by this Annual Report was 618,071,972 ordinary shares, with no par value per share
Indicate by check mark if the registrant is a well-known seasoned issuer, as defined in Rule 405 of the Securities Act. Yes ☑ No ☐
If this report is an annual or transition report, indicate by check mark if the registrant is not required to file reports pursuant to Section 13 or 15(d) of the Securities Exchange Act of 1934. Yes ☐ No ☑
Note – Checking the box above will not relieve any registrant required to file reports pursuant to Section 13 or 15(d) of the Securities Exchange Act of 1934 from their obligations under those Sections.
Indicate by check mark whether the registrant (1) has filed all reports required to be filed by Section 13 or 15(d) of the Securities Exchange Act of 1934 during the preceding 12 months (or for such shorter period that the registrant was required to file such reports), and (2) has been subject to such filing requirements for the past 90 days. Yes ☑ No ☐
Indicate by check mark whether the registrant has submitted electronically and posted on its corporate Web site, if any, every Interactive Data File required to be submitted and posted pursuant to Rule 405 of Regulation S-T during the preceding 12 months (or for such shorter period that the registrant was required to submit and post such files). Yes ☑ No ☐
Indicate by check mark whether the registrant is a large accelerated filer, an accelerated filer, a non-accelerated filer, or an emerging growth company. See definition of “large accelerated filer," "accelerated filer,” and "emerging growth company" in Rule 12b-2 of the Exchange Act.
|
|
|
|
|
|
|
|
|
|
|
|
Large Accelerated Filer ☑ |
Accelerated filer ☐ |
Non-accelerated filer ☐ |
Emerging growth company ☐ |
If an emerging growth company that prepares its financial statements in accordance with U.S. GAAP, indicate by check mark if the registrant has elected not to use the extended transition period for complying with any new or revised financial accounting standards† provided pursuant to Section 13(a) of the Exchange Act. ☐
† The term “new or revised financial accounting standard” refers to any update issued by the Financial Accounting Standards Board to its Accounting Standards Codification after April 5, 2012.
Indicate by check mark whether the registrant has filed a report on and attestation to its management’s assessment of the effectiveness of its internal control over financial reporting under Section 404(b) of the Sarbanes-Oxley Act (15 U.S.C. 7262(b)) by the registered public accounting firm that prepared or issued its audit report. ☑
If securities are registered pursuant to Section 12(b) of the Act, indicate by check mark whether the financial statements of the registrant included in the filing reflect the correction of an error to previously issued financial statements. ☐
Indicate by check mark whether any of those error corrections are restatements that required a recovery analysis of incentive- based compensation received by any of the registrant’s executive officers during the relevant recovery period pursuant to §240.10D-1(b). ☐
Indicate by check mark which basis of accounting the registrant has used to prepare the financial statements included in this filing:
|
|
|
|
|
|
|
|
|
| US GAAP ☐ |
International Financial Reporting Standards as issued by the International Accounting Standards Board ☑ |
Other ☐ |
If “Other” has been checked in response to the previous question, indicate by check mark which financial statement item the registrant has elected to follow: Item 17 ☐ Item 18 ☐
If this is an annual report, indicate by check mark whether the registrant is a shell company (as defined in Rule 12b-2 of the Exchange Act). Yes ☐ No ☑
(APPLICABLE ONLY TO ISSUERS INVOLVED IN BANKRUPTCY PROCEEDINGS DURING THE PAST FIVE YEARS)
Indicate by check mark whether the registrant has filed all documents and reports required to be filed by Sections 12, 13 or 15(d) of the Securities Exchange Act of 1934 subsequent to the distribution of securities under a plan confirmed by a court. Yes ☐ No ☐
TABLE OF CONTENTS
This document comprises the annual report on Form 20-F for the year ended June 30, 2023 (“Harmony 2023 Form 20-F”) of Harmony Gold Mining Company Limited (“Harmony” or the “Company”). Certain of the information in the Harmony's 2023 suite of reports, including from its Integrated annual report 2023, Environmental, Social and Governance ("ESG") report 2023 as well as the Climate-related financial disclosures report 2023, included in Exhibit 15.1 (“Integrated Annual Report for the 20-F 2023”) is incorporated by reference into the Harmony 2023 Form 20-F, as specified elsewhere in this report, in accordance with Rule 12b-23(a) of the Securities Exchange Act of 1934, as amended (the “Exchange Act”). With the exception of the items so specified, the Integrated Annual Report for the 20-F 2023 is not deemed to be filed as part of the Harmony 2023 Form 20-F.
Only (i) the information included in the Harmony 2023 Form 20-F, (ii) the information in the Integrated Annual Report for the 20-F 2023 that is expressly incorporated by reference in the Harmony 2023 Form 20-F and (iii) the exhibits to the Harmony 2023 Form 20-F that are required to be filed pursuant to the Form 20-F (the “Exhibits”), shall be deemed to be filed with the Securities and Exchange Commission (“SEC”) for any purpose. Any information in the Integrated Annual Report for the 20-F 2023 which is not referenced in the Harmony 2023 Form 20-F or filed as an Exhibit, shall not be deemed to be so incorporated by reference.
Financial and other material information regarding Harmony is routinely posted on and accessible at the Harmony website, www.harmony.co.za. No material referred to in this annual report as being available on our website is incorporated by reference into, or forms any part of, this annual report. References herein to our website shall not be deemed to cause such incorporation.
USE OF TERMS AND CONVENTIONS IN THIS ANNUAL REPORT
Harmony Gold Mining Company Limited is a corporation organized under the laws of the Republic of South Africa. As used in this Harmony 2023 Form 20-F, unless the context otherwise requires, the terms “Harmony” and “Company” refer to Harmony Gold Mining Company Limited; the term “South Africa” refers to the Republic of South Africa; the terms “we”, “us” and “our” refer to Harmony and, as applicable, its direct and indirect subsidiaries as a “Group”.
In this annual report, references to “R”, “Rand” and “c”, “cents” are to the South African Rand, the lawful currency of South Africa, “A$” and “Australian dollars” refers to Australian dollars, “K” or “Kina” refers to Papua New Guinean Kina and references to “$”, “US$” and “US dollars” are to United States dollars.
This annual report contains information concerning our gold reserves. While this annual report has been prepared in accordance with United States Securities and Exchange Commission Regulation S-K 1300, it is based on assumptions which may prove to be incorrect. See Item 3: “Key Information - Risk Factors - Risks Related to Our Operations and Business - Estimations of our reserves are based on a number of assumptions, including mining and recovery factors, future cash costs of production, exchange rates, and relevant commodity prices; As a result, metals produced in future may differ from current estimates.”
This annual report contains descriptions of gold mining and the gold mining industry, including descriptions of geological formations and mining processes. We have explained some of these terms in the Glossary of Mining Terms included in this annual report. This glossary may assist you in understanding these terms.
All references to websites in this annual report are intended to be inactive textual reference for information only and information contained in or accessible through any such website does not form a part of this annual report.
PRESENTATION OF FINANCIAL INFORMATION
Harmony is a South African company and the majority of the Group operations are located in South Africa. Accordingly, our books of account are maintained in South African Rand and our annual financial statements are prepared in accordance with International Financial Reporting Standards (“IFRS”) as issued by the International Accounting Standards Board (“IASB”). This annual report includes our consolidated financial statements prepared in accordance with IFRS presented in the functional currency of the Company, being South African Rand. All financial information, except as otherwise noted, is stated in accordance with IFRS.
In this annual report, we also present “cash costs”, “cash costs per ounce”, “cash costs per kilogram”, “all-in sustaining costs”, “all-in sustaining costs per ounce”, and “all-in sustaining costs per kilogram”, which are non-GAAP measures. An investor should not consider these items in isolation or as alternatives to production costs, cost of sales or any other measure of financial performance presented in accordance with IFRS. The calculation of cash costs, cash costs per ounce/kilogram, all-in sustaining costs and all-in sustaining costs per ounce/kilogram, may vary significantly among gold mining companies and, by themselves, do not necessarily provide a basis for comparison with other gold mining companies. Nevertheless, Harmony believes that cash costs, cash costs per ounce/kilogram, all-in sustaining costs and all-in sustaining costs per ounce/kilogram are useful indicators to investors and management as they provide an indication of profitability, efficiency and cash flows, the trend in costs as the mining operations mature over time on a consistent basis and an internal benchmark of performance to allow for comparison against other mines, both within the Group and at other gold mining companies. For further information, see Item 5: “Operating and Financial Review and Prospects - Key factors affecting our results – Costs" and :- Reconciliation of Non-GAAP Measures”.
We have included the US dollar equivalent amounts of certain information and transactions in Rand, Kina and A$. Unless otherwise stated, we have translated assets and liabilities at the spot rate for the day, while the US$ equivalents of cash costs and all-in sustaining costs have been translated at the average rate for the year (R17.76 per US$1.00 for fiscal 2023 and R15.21 per US$1.00 for fiscal 2022). By including these US dollar equivalents in this annual report, we are not representing that the Rand, Kina and A$ amounts actually represent the US dollar amounts, as the case may be, or that these amounts could be converted at the rates indicated.
CAUTIONARY STATEMENT ABOUT FORWARD-LOOKING STATEMENTS
This annual report contains forward-looking statements within the meaning of the safe harbor provided by Section 21E of the Exchange Act and Section 27A of the Securities Act of 1933, as amended (the “Securities Act”), with respect to our financial condition, results of operations, business strategies, operating efficiencies, competitive positions, growth opportunities for existing services, plans and objectives of management, markets for stock and other matters.
These forward-looking statements, including, among others, those relating to our future business prospects, revenues, and the potential benefit of acquisitions (including statements regarding growth and cost savings) wherever they may occur in this annual report and the exhibits to this annual report, and including any climate change-related statements, targets and metrics, are necessarily estimates reflecting the best judgment of our senior management and involve a number of risks and uncertainties that could cause actual results to differ materially from those suggested by the forward-looking statements. As a consequence, these forward-looking statements should be considered in light of various important factors, including those set forth in this annual report. All statements other than statements of historical facts included in this report may be forward-looking statements. Forward-looking statements also often use words such as “will”, “forecast”, “potential”, “estimate”, “expect” and words of similar meaning. By their nature, forward-looking statements involve risk and uncertainty because they relate to future events and circumstances and should be considered in light of various important factors, including those set forth in this disclaimer. Readers are cautioned not to place undue reliance on such statements. Important factors that could cause actual results to differ materially from estimates or projections contained in the forward-looking statements include, without limitation:
•overall economic and business conditions in South Africa, Papua New Guinea, Australia and elsewhere;
•the impact from, and measures taken to address, the coronavirus disease ("Covid-19") pandemic and other contagious diseases, such as HIV and tuberculosis;
•high and rising inflation, supply chain issues, volatile commodity costs and other inflationary pressures exacerbated by the Russian invasion of Ukraine and subsequent sanctions;
•estimates of future earnings, and the sensitivity of earnings to gold and other metals prices;
•estimates of future gold and other metals production and sales;
•estimates of future cash costs;
•estimates of future cash flows, and the sensitivity of cash flows to gold and other metals prices;
•estimates of provision for silicosis settlement;
•increasing regulation of environmental and sustainability matters such as greenhouse gas (“GHG”) emission and climate change, and the impact of climate change on our operations;
•estimates of future tax liabilities under the Carbon Tax Act (as defined below);
•statements regarding future debt repayments;
•estimates of future capital expenditures;
•the success of our business strategy, exploration and development activities and other initiatives;
•future financial position, plans, strategies, objectives, capital expenditures, projected costs and anticipated cost savings and financing plans;
•estimates of reserves statements regarding future exploration results and the replacement of reserves;
•the ability to achieve anticipated efficiencies and other cost savings in connection with past and future acquisitions, as well as at existing operations;
•fluctuations in the market price of gold and other metals;
•the occurrence of hazards associated with underground and surface gold mining;
•the occurrence of labor disruptions related to industrial action or health and safety incidents;
•power cost increases as well as power stoppages, fluctuations and usage constraints;
•supply chain shortages and increases in the prices of production imports and the availability, terms and deployment of capital;
•our ability to hire and retain senior management, sufficiently technically-skilled employees, as well as our ability to achieve sufficient representation of historically disadvantaged persons in management positions or sufficient gender diversity in management positions or at Board level;
•our ability to comply with requirements that we operate in a sustainable manner and provide benefits to affected communities;
•potential liabilities related to occupational health diseases;
•changes in government regulation and the political environment, particularly tax and royalties, mining rights, health, safety, environmental regulation and business ownership including any interpretation thereof;
•court decisions affecting the mining industry, including, without limitation, regarding the interpretation of mining rights;
•our ability to protect our information technology and communication systems and the personal data we retain;
•risks related to the failure of internal controls;
•our ability to meet our environmental, social and corporate governance targets
•the outcome of pending or future litigation or regulatory proceedings;
•fluctuations in exchange rates and currency devaluations and other macroeconomic monetary policies;
•the adequacy of the Group’s insurance coverage;
•any further downgrade of South Africa's credit rating; and
•socio-economic or political instability in South Africa, Papua New Guinea and other countries in which we operate.
The foregoing factors and others described under “Risk Factors” should not be construed as exhaustive.
We undertake no obligation to update publicly or release any revisions to these forward-looking statements to reflect events or circumstances after the date of this annual report or to reflect the occurrence of unanticipated events, except as required by law. All subsequent written or oral forward-looking statements attributable to Harmony or any person acting on its behalf are qualified by the cautionary statements herein.
PART I
ITEM 1. IDENTITY OF DIRECTORS, SENIOR MANAGEMENT AND ADVISERS
Not applicable.
ITEM 2. OFFER STATISTICS AND EXPECTED TIMETABLE
Not applicable.
ITEM 3. KEY INFORMATION
A. [Reserved]
B. CAPITALIZATION AND INDEBTEDNESS
Not applicable.
C. REASONS FOR THE OFFER AND USE OF PROCEEDS
Not applicable.
D. RISK FACTORS
In addition to the other information included in this annual report and the exhibits, you should also carefully consider the following factors related to our ordinary shares and American Depositary Shares ("ADSs"). There may be additional risks that we do not currently know of or that we currently deem immaterial based on information currently available to us. Although we have a formal risk policy framework in place, the maintenance and development of which is undertaken on an ongoing basis so as to help management address systematic categories of risk associated with our business operations, any of these risks could have a material adverse effect on our business, financial condition or results of operations, leading to a decline in the trading price of our ordinary shares or our ADSs. The risks described below may, in retrospect, turn out to be incomplete and therefore may not be the only risks to which we are exposed. Additional risks and uncertainties not presently known to us or that we now believe are immaterial (and have therefore not been included), could also adversely affect our business, results of operations or financial condition. The order of presentation of the risk factors below does not indicate the likelihood of their occurrence or the magnitude or the significance of the individual risks.
Summary of Risk Factors
Risks Related to Our Industry
1.We are exposed to the impact of any significant decreases in the commodity prices on our production
2.The impact from, and measures taken to address the Covid-19 pandemic, as well as other infectious diseases, such as HIV/AIDS and tuberculosis, pose risks to us in terms of productivity and costs and may adversely affect our people, and may impact our business continuity, operating results, cash flows and financial condition
3.The nature of our mining operations presents safety risks
4.Mining companies face strong competition and industry consolidation
5.Laws governing health and safety affect our business and could impose significant costs and burdens
6.Since our labor force has substantial trade union participation, we face the risk of disruption from labor disputes and non-procedural industrial action resulting in loss of production and increased labor costs impacting negatively on production and financial results
7.Laws governing mineral rights affect our business and could impose significant costs and obligations; mineral rights in the countries in which we operate could be altered, suspended or canceled for a variety of reasons, including breaches in our obligations in respect of such mining rights
8.Our financial flexibility could be constrained by the Exchange Control Regulations of the countries in which we operate
Risks Related to Our Operations and Business
1.Risks associated with pumping water inflows from closed mines adjacent to our operations, including related closure liabilities, could adversely affect our operational results
2.Infrastructure constraints and aging infrastructure could adversely affect our operations
3.Disruptions to the supply of electricity and increases in the cost of power may adversely affect our results of operations and financial condition
4.Illegal mining and other criminal activity at our operations, including theft of gold and gold-bearing material, could pose a threat to the safety of employees, result in damage to property and could expose us to losses, business disruption and liability
5.Actual and potential shortages of production inputs and supply chain disruptions may affect our operational results
6.Fluctuations in insurance cost and availability could adversely affect our operating results and our insurance coverage may prove inadequate to satisfy future claims
7.We compete with mining and other companies for key human resources with critical skills and our inability to retain key personnel could have an adverse effect on our business
8.The use of contractors at certain of our operations may expose us to delays or suspensions in mining activities and increases in mining costs
9.We are dependent on a number of highly-integrated communication and IT systems, any disruption to which could have an adverse effect on our results of operations and financial condition
10.Estimations of our reserves are based on a number of assumptions, including mining and recovery factors, future cash costs of production, exchange rates, and the relevant commodity prices; as a result, metals produced in future may differ from current estimates
11.Our operations have limited proved and probable reserves; exploration for additional resources and reserves is speculative in nature, may be unsuccessful and involves many risks
12.We are subject to the risk of litigation, the causes and costs of which are not always known
13.The risk of unforeseen difficulties, delays or cost in implementing our business strategy and projects may lead to us not delivering the anticipated benefits of our strategy and projects; in addition, actual cash costs, capital expenditure, production and economic returns may differ significantly from those anticipated by feasibility studies for new development projects
Risks Related to ESG
1.Increasing scrutiny and changing expectations from our stakeholders, including communities, governments and non-governmental organization ("NGOs") as well as investors, lenders and other market participants, with respect to our ESG performance and policies may impose additional costs or expose us to additional risks
2.We are subject to extensive environmental regulations in the countries in which we operate
3.The socio-economic framework in the regions in which we operate may have an adverse effect on our operations and profits
4.Given the nature of mining and the type of mines we operate, we face a material risk of liability, delays and increased cash costs of production from environmental and industrial accidents and pollution compliance breaches
5.Mining companies are increasingly expected to provide benefits to affected communities; failure to comply with, and beyond, our legal obligations could result in legal suits, additional operational costs, investor divestment and impact our “social license to operate”, which could adversely impact our business, operating results and financial condition; we are finding increasing expectations on our business to provide social investment beyond our legal obligations especially as communities demand services and basic infrastructure from companies such as Harmony (where local government has failed the communities)
6.We may not be able to meet our ESG targets
7.Compliance with emerging climate change regulations could result in significant costs for us
8.Climate change may present physical risks to our operations and carbon tax projections may have serious financial implications to our business profitability and sustainability
9.The cost of occupational health care services and the potential liabilities related to occupational health diseases may increase in future and may be substantial
10.Our operations are subject to water use and other licenses, which could impose significant costs
11.Compliance with tailings management requirements and standards, and potential liabilities in the event of a failure to timely comply or an incident involving a tailings storage facility, could adversely impact our financial condition, results of operations and reputation
12.We may have exposure to rehabilitate potential groundwater and land pollution, which may include salination, and radiation contamination that may exist where we have operated or continue to operate; implementation of the financial provision regulations may require us to include provision in our financial statements for rehabilitation
13.Compliance with new and changing corporate governance and public disclosure requirements adds uncertainty to our compliance policies and increases our costs of compliance
Risks Related to Our Corporate and Financing Structure and Strategy
1.Our inability to maintain effective disclosure controls and procedures, and an effective system of internal control over financial reporting may have an adverse effect on investors’ confidence in the reliability of our financial statements and other disclosures
2.We may experience problems in identifying, financing and managing new acquisitions or other business combination transactions and integrating them with our existing operations; we may not have full management control over future joint venture partners
3.Certain factors may affect our ability to support the carrying value of our property, plant and equipment, and other assets on our balance sheet, resulting in impairments
4.Our ability to service our debt will depend on our future financial performance and other factors
5.We are subject to the imposition of various regulatory costs, such as mining taxes and royalties, changes to which may have a material adverse effect on our operations and profits; our operations and financial condition could also be adversely affected by policies and legislation related to greater state intervention in the mining and potentially the expropriation of mining assets without compensation
6.Sales of large quantities of our ordinary shares and ADSs, or the perception that these sales may occur, could adversely affect the prevailing market price of such securities
7.As we have a significant number of shares that may be issued in terms of the employee share schemes, our ordinary shares are subject to dilution
8.The continued status of South Africa’s credit rating as non-investment grade, as well as the recent grey-listing of South Africa by the Financial Action Task Force ("FATF"), may have an adverse effect on our ability to secure financing on favorable terms, or at all
9.We may not pay dividends or make similar payments to our shareholders in the future
Strategic and Market Risks
1.The profitability of our operations, and cash flows generated by those operations, are affected by changes in the price of gold and other metals; a fall in the gold price below our cash cost of production and capital expenditure required to maintain production for any sustained period may lead to losses and require us to curtail or suspend certain operations
2.Fluctuations in input production prices linked to commodities may adversely affect our operational results and financial condition
3.Foreign exchange fluctuations could have a material adverse effect on our operational results and financial condition
4.Fluctuations in the exchange rate of currencies may reduce the market value of our securities, as well as the market value of any dividends or distributions paid by us
5.Rising inflation, including as a result of Russia’s invasion of Ukraine, may have a material adverse effect on our business, operating results and financial condition
6.Investors may face liquidity risk in trading our ordinary shares on the JSE Limited
7.Shareholders outside South Africa may not be able to participate in future issues of securities (including ordinary shares)
8.Global, social, political and economic conditions could adversely affect the profitability of our operations
Other Regulatory and Legal Risks
1.Breaches in our information technology ("IT") security processes and violations of data protection laws may adversely impact our business activities and lead to public and private censure, regulatory penalties, fines and/or sanctions and may damage our reputation
2.Failure to comply with laws, regulations, codes and standards, policies and procedures or contractual obligations may lead to fines and penalties, loss of licenses or permits, may negatively affect our financial results, and adversely affect our reputation
3.Investors in the United States may have difficulty bringing actions, and enforcing judgments, against us, our directors and our executive officers based on the civil liabilities provisions of the federal securities laws or other laws of the United States or any state thereof
4.US securities laws do not require us to disclose as much information to investors as a US company is required to disclose, and investors may receive less information about us than they might otherwise receive from a comparable US company
Risks Related to Our Industry
We are exposed to the impact of any significant decreases in the commodity prices on our production
As a rule, we sell our gold and silver at the prevailing market price. In order to manage commodity price risk we maintain a commodity hedging program. Contracts entered into under this program manage variability of cash flows for up to 20% of the Group’s total production over a two-year period for gold and up to 50% for silver. Our remaining unhedged future production is not protected against decreases. If the gold or silver price should decrease significantly, our revenues may be materially adversely affected, which could materially adversely affect our operating results and financial condition.
The impact from, and measures taken to address the Covid-19 pandemic, as well as other infectious diseases, such as HIV/AIDS and tuberculosis, pose risks to us in terms of productivity and costs and may adversely affect our people, and may impact our business continuity, operating results, cash flows and financial condition
The advent of Covid-19 posed an adverse effect to production and sustainability with a greater threat of life to employees. Covid-19 remains a threat due to emergence of new variants which may be more infectious and/or more lethal. Our operations have been and may continue to be impacted by the Covid-19 pandemic. The continued spread of Covid-19 could continue to result in serious illness (including incapacity) or death of our employees and contractors.
These effects have been exacerbated by employees and contractors working in close proximity to each other in underground and surface mines and living in close quarters. In addition, certain underlying health conditions including conditions which compromise the immune system, such as HIV/AIDS and diabetes have worsened the outcomes among the individuals infected with Covid-19.
The World Health Organization (WHO) has downgraded Covid-19 from a global emergency to a country monitoring level. Harmony will continue to monitor local and global events in relation to the pandemic.
Although Covid-19 vaccines have been rolled out globally, including in the regions where we operate, uncertainties remain with respect to the emergence of new Covid-19 viral mutations and the efficacy of the Covid-19 vaccines currently available to address these new mutations. We note the emergence of the new sub-variant in the East, Central Europe and in the United States with a slight increase in infections and hospitalization. We therefore continue to monitor Covid-19 and remain diligent, as the threat remains.
Our operational costs have increased due to Covid-19 and we believe we will be required to continue to allocate financial resources on preventative measures such as vaccine rollouts, promotion and education. Any new measures may result in additional costs incurred or interference with management's and/or employees’ productivity.
Presently, most Covid-19 regulations have been repealed within the regions where we operate, including the wearing of masks, mass gatherings and travel restrictions in a move not uncommon globally signaling the lower risk identified around the virus.
Our property and business interruption insurance and liability may not cover or be sufficient to fully cover any of our losses resulting from public health emergencies and other events that could disrupt our operations, such as Covid-19. See “– Risks related to Our Operations and Business - Fluctuations in insurance cost and availability could adversely affect our operating results and our insurance coverage may prove inadequate to satisfy future claims”.
The full extent to which Covid-19 and other contagious diseases will impact our operational and financial performance, whether directly or indirectly, will depend on future developments, which are highly uncertain and cannot be predicted. Any disruption to production or increased operational costs as a result of Covid-19 or other contagious diseases could have a material adverse effect on our business, operating results and financial condition.
The nature of our mining operations presents safety risks
Mining, and particularly the conduct of activities underground, is an inherently risky activity, presenting potential health, safety, industrial, environmental and other risks for our operations, employees and communities within which we operate. These and other risks identified elsewhere in this annual report also could lead to the suspension and potential closure of operations for indeterminate periods. Safety risks, even in situations where no injuries occur, can have a material adverse effect on our results of operations and financial condition. See Item 4: “Information on the Company - Business Overview - Regulation - Health and Safety - South Africa” and “Integrated Annual Report for the 20-F 2023 – Social – Safety” and "– Health" on pages 170 to 179 and 180 to 187.
Mining companies face strong competition and industry consolidation
The mining industry is competitive in all of its phases. We compete with other mining companies and individuals for specialized equipment, components and supplies necessary for exploration and development, for mining claims and leases on exploration properties and for the acquisition of mining assets. These competitors may have greater financial resources, operational experience and technical capabilities than us. Competition may increase our cost of acquiring suitable claims, properties and assets, which could have a material adverse effect on our financial condition.
Further, industry consolidation may lead to increased competition due to lesser availability of mining and exploration assets. Similar consolidations in the form of acquisitions, business combinations, joint ventures, partnerships or other strategic relationships may continue in the future. The companies or alliances resulting from these transactions or any further consolidation involving our competitors may benefit from greater economies of scale as well as significantly larger and more diversified asset bases than us. In addition, following such transactions certain of our competitors may decide to sell specific mining assets increasing the availability of such assets in the market, which could adversely impact any sale process that we may undertake at the same time, including such sales processes taking longer to complete or not completing at all or not realizing the full value of the assets being disposed of.
Such developments could have a material adverse effect on our business, operating results and financial condition.
Laws governing health and safety affect our business and could impose significant costs and burdens
South Africa
In South Africa, the Mine Health and Safety Act, 29 of 1996 (“MHSA”), requires that employers implement various measures to ensure the safety and health of persons working at a mine as far as reasonably practicable. This obligation is extended to any contractor employees that may be working at a mine. These obligations include the identification and assessment of risk, implementation of codes of practice and standards setting out safe work procedures, proper and appropriate training, supervision, medical surveillance and the provision of safe equipment, machinery and personal protective equipment. Further, pursuant to the MHSA we must ensure compliance with various licenses, permissions or consents that have been issued to it pursuant to the various provisions of applicable legislation.
An employer may be subjected to significant penalties and/or administrative fines for non-compliance under the MHSA and other applicable legislation. Depending on the particular circumstances, litigation (criminal and/or civil) may, depending on the circumstances, be instituted against the employer in respect of an accident or incident which has resulted in the injury, death or occupational disease contracted by an employee (or contractor employee). In some of the jurisdictions in which we operate, the regulatory authority also issues closure notices for the operation or parts thereof, following the threat of potential occurrence of an injury or death. In the past, certain of our operations have also been temporarily suspended for safety reasons. Such closure notices or suspensions, if of sufficient magnitude, could have a material adverse effect on our business, operating results or financial condition. See Item 4: “Information on the Company - Business Overview - Regulation - Health and Safety - South Africa”.
In June 2022, the Minister of Mineral Resources and Energy ("Minister") released a draft Mine Health and Safety Amendment Bill 2022 (the "MHSA Amendment Bill") for public comment. The MHSA Amendment Bill would amend certain provisions of the MHSA. The Bill contains a number of provisions which, if enacted in their present form, could have a material adverse effect on our business, operating results and financial condition. The MHSA Amendment Bill provides for (among others things) an increase in the monetary value of the fines that may be imposed in respect of instances of non-compliance, more direct involvement of executives (particularly CEOs), stricter liability in instances of non-compliance, and changes to the obligations relating to training and the formulation of training programs.
Any further changes to the health and safety laws which increase the burden of compliance on the employer and impose higher penalties for non-compliance may result in us incurring further significant costs, which could have a material adverse effect on our business, operating results and financial condition. In addition, our reputation could be damaged by any significant governmental investigation or enforcement of health and safety laws, regulations, codes or standards, which could also have a material adverse effect on our business, operating results and financial condition.
Australia
In the State of Queensland, where our Eva Copper Project is situated, the safety of employees, contractors and third parties concerning mining operations is regulated by the Mining and Quarrying Safety and Health Act 1999 (Qld) (the "MQSH Act") and the Mining and Quarrying Safety and Health Regulation 2017 (the "MQSH Regulations"). Risk is effectively managed when all persons individually and as part of their respective workgroups and organizations take action to keep risk at an acceptable level, being the conduct of operations so that the level of risk from the operations is within acceptable limits and as low as reasonably achievable, taking into account the likelihood of injury and the severity of the injury.
Safety and health obligations are administered by site safety and health representatives elected by the workers at the mine site, site safety and health committees, District workers’ representatives and appointed inspectors, inspection officers and authorized officers with powers inter alia of site access, inspection and seizure.
Significant penalties may be imposed if safety and health obligations under the MQSH Act are not appropriately discharged. Any such penalties, if material, could have a material adverse effect on our business, operating results and financial condition. See Item 4: “Information on the Company – Business Overview – Regulation – Health and Safety – Australia”.
Papua New Guinea
In the Independent State of Papua New Guinea (“PNG”), the safety of employees, contractors and third parties at our mining operations is regulated by the PNG Mining (Safety) Act 1977 (the "PNG Mining (Safety) Act") and the Regulations issued thereunder. Pursuant to section 6(1)(e)(i) of the PNG Mining (Safety) Act, an inspector has the power to order the cessation of operations on any part of a mine for such unlimited time as he or she considers may be necessary to satisfy the safety provisions of the PNG Mining (Safety) Act. Such order for cessation can often result in lower or a total stoppage of production resulting in significant financial losses during and following the cessation.
Significant penalties may be imposed if safety and health obligations under the PNG Mining (Safety) Act are not appropriately discharged. Any such penalties, if material, could have a material adverse effect on our business, operating results and financial condition.
The mining regime in PNG, including the PNG Mining (Safety) Act and Regulations, is currently the subject of comprehensive ongoing review, which may result in changes which will affect our operations and projects in PNG. In 2021, the PNG Ministry of Mining’s Department of Mineral Policy and Geohazards Management (“DMPGM”) released a draft Mine and Works (Safety and Health) Bill 2021 (the "MWSH Bill") for consultation with industry groups. The Bill seeks to modernize the PNG mining safety regime, but contains provisions (including a very broad definition of ownership which includes the directors of the tenement holder and its parent companies) which are problematic for Harmony and other industry groups.
We continue to engage with the government of PNG (the “PNG Government”) and relevant regulators on these matters, indirectly through the offices of the PNG Chamber of Mines and Petroleum and directly with the PNG Mineral Resources Authority (“PNG MRA”), the DMPGM and the PNG Chief Inspector of Mines.
If enacted in its present form, the MWSH Bill will introduce provisions which could have a material adverse effect on our operations and projects in PNG, and our operating results or financial condition. See Item 4: “Information on the Company – Business Overview - Regulation - Health and Safety – Papua New Guinea”.
Since our labor force has substantial trade union participation, we face the risk of disruption from labor disputes and non-procedural industrial action resulting in loss of production and increased labor costs impacting negatively on production and financial results
South Africa
In South Africa, our labor force has substantial trade union participation. Despite a history of constructive engagement with labor unions, there are periods when various stakeholders are unable to agree on the dispute resolution processes. Disruptive activities on the part of labor, which normally differ in intensity, then become unavoidable. Due to the high level of union membership, which is about 95% among our employees, we are at risk of production stoppages for indefinite periods due to strikes and other disputes, especially wildcat strikes. Inter-union rivalry may increase the risk of labor relations instability. In addition, in South Africa, a variety of legacy issues such as housing, migrant labor, education, poor service delivery and youth unemployment can lead to communities and unions working together to create instability in and around mining operations.
On September 16, 2021, Harmony announced the acceptance of another three-year wage agreement by the unions, effective from July 1, 2021. The negotiations were concluded in a peaceful manner. However, we are not able to predict whether we will experience significant labor disputes in the future, nor what the financial impact of any such disputes may be. Any labor unrest and disruptions caused by such labor disputes could have a material adverse effect on our results of operations and financial condition. See Item 4: “Information on the Company – Business Overview – Regulation – Labor Relations”, “Integrated Annual Report for the 20-F 2023 – Social – Caring for our employees” on pages 188 to 196. South African employment law sets out minimum terms and conditions of employment for employees although these may be improved by agreements between us and the trade unions, prescribed minimum terms and conditions form the benchmark for all employment contracts. See “Integrated Annual Report for the 20-F 2023 – About Harmony – Our material matters” on page 46 to 51.
We are required to submit a report under South African employment law detailing the progress made towards achieving employment equity in the workplace. If this report is not submitted, we could incur substantial penalties.
Developments in South African employment law may increase our cash costs of production or alter our relationship with our employees and trade unions, which may have an adverse effect on our business, operating results and financial condition.
Australia
In Queensland, there are a number of well-established mining unions, particularly in the coal and energy sectors. At present, our Australian workforce is not unionized. However, if the Eva Copper Project moves into the development and operational phases, there is a risk that the level of unionization may rise significantly. This process of unionization may also be further prompted by the possible passage of a proposed Industrial Relations and Other Legislation Amendment Bill 2022 (Qld).
Increased unionization may give rise to increased costs or labor disruptions, which could have a material adverse effect on our results of operations and financial condition.
Papua New Guinea
In PNG, the workforce in our mining operations is not significantly unionized, and attempts to unionize have had little employee support. However, during the Covid-19 pandemic our PNG operations experienced limited non-procedural industrial action arising from adjustments to work rosters and incentive programs to align with mine health and Covid-19 quarantine measures.
Our PNG operations are also subject to disruption as a result of actions taken by landowners and occupants of the land within the area of impact of such operations, including the blockading of access routes to the operations. These disruptions generally arise as a result of grievances with regard to the non-distribution by the PNG Government to local communities of mine-derived royalties and other benefits, or in relation to the participation of local businesses in the provision of goods and services to the operations.
In the event that we experience industrial relations related interruptions at any of our operations or in other industries that impact our operations, or increased employment-related costs due to union or employee activity, these may have a material adverse effect on our business, production levels, operating costs, production targets, operating results, financial condition, reputation and future prospects. In addition, mining conditions can deteriorate during extended periods without production, such as during and after strikes; lower levels of mining activity can have a longer term impact on production levels and operating costs, which may affect our mines’ operating life, which could have a material adverse effect on our business, operating results and financial condition.
Laws governing mineral rights affect our business and could impose significant costs and obligations; mineral rights in the countries in which we operate could be altered, suspended or canceled for a variety of reasons, including breaches in our obligations in respect of such mining rights
Our operations in South Africa, Australia and PNG are subject to legislation regulating mineral rights. Certain of the Company’s properties may be subject to the rights or the asserted rights of various community stakeholders, including indigenous peoples. The presence of those stakeholders may therefore have an impact on our ability to develop or operate our mining interests.
South Africa
In South Africa, we are governed by the Mineral and Petroleum Resources Development Act, 28 of 2002 (“MPRDA”). See Item 4: “Information on the Company - Business Overview - Regulation - Mineral Rights - South Africa - MPRDA” for a description of the principal objectives set out in the MPRDA.
The MPRDA was promulgated as effective legislation on May 1, 2004 and transferred ownership of mineral resources to the South African people, with the South African government acting as custodian in order to, among other things, promote equitable access to the nation’s mineral resources by South Africans, expand opportunities to Historically Disadvantaged South Africans (“HDSAs”) who wish to participate in the South African mining industry and advance socio-economic development. We currently continue to comply with the requirements of the MPRDA. Any failure to comply with the conditions of our mining rights, whether intentional or unintentional, could have a material adverse effect on our operations and financial condition and could result in the cancellation or suspension of our mining rights.
The Department of Mineral Resources and Energy (“DMRE”) has indicated that certain amendments to the MPRDA would be made. To this end, the DMRE has already convened a MPRDA Review Summit which was held on July 13, 2023 where a number of stakeholders were invited and participated in preparatory discussions aimed at establishing what aspects of the current MPRDA legislation need to be amended. The DMRE has indicated that it intends circulating a Discussion Paper on proposed amendments by October 30, 2023 which will be followed by further consultation and discussion with all “industry partners” by November 30, 2023, with a view to commence with the drafting of the proposed MPRDA amendments by December 2023. More clarity on the impact of any suggested changes to the MPRDA would be obtained once the suggested MPRDA amendments have been circulated for public comment (probably in the first quarter of 2024).
There is a large degree of uncertainty regarding the changes that will be brought about should the Mineral and Petroleum Resources Development Amendment Bill, 2013 (the “MPRDA Bill”), which was introduced in 2013, be revived and made law. Among other things, the MPRDA Bill provides that applicants will no longer be able to rely on the “first come, first served” principle when submitting an application for a right, it seeks to require the consent of the Minister for the transfer of any interest in an unlisted company or any controlling interest in a listed company where such companies hold a prospecting right or mining right and to give the Minister broad discretionary powers to prescribe the levels of minerals required to be offered to domestic beneficiators for beneficiation. We cannot yet determine the full impact that the MPRDA Bill may have on our business and there can be no assurance that such changes will not have a material adverse effect on our operations and financial condition.
Regulations under the MPRDA
On March 27, 2020 the Minister published for implementation amendments to the regulations promulgated pursuant to the MPRDA in 2004 (the “MPRDA Regulations” and as amended the “Amended Regulations”). The Amended Regulations include the following notable changes:
•Mining right applicants must “meaningfully consult” with landowners, lawful occupiers and interested and affected parties in accordance with the procedures contemplated under the Environmental Impact Assessment Regulations, 2014 (the “EIA Regulations”). The office of the Regional Manager is permitted to participate as an observer in these processes.
•Mining right holders must, pursuant to their social and labor plans (“SLPs”), contribute to the socio-economic development in the areas in which they operate and labor sending areas (i.e. a local municipality which a majority of mine workers consider to be their primary residence). This requirement may impose obligations on mining right holder to effect measures in communities that are located far away from the mine and / or could give rise to some social issues.
•Although most of the provisions regulating environmental matters have been deleted from the Amended Regulations, those sections dealing with mine closure have been retained but have been amended to state that mine closure must be regulated pursuant to the National Environmental Management Act, 107 of 1998 (“NEMA”), the EIA Regulations and the Financial Provision Regulations, 2015 (as they may be amended). As discussed in Item 4: “Information on the Company – Business Overview – Regulation - Laws and Regulations Pertaining to Environmental Protection – South Africa” it is anticipated that the Financial Provision Regulations, 2015 will be replaced by revised regulations following further engagement with the mining industry.
•The appeal process in the MPRDA Regulations has been replaced with a more comprehensive procedure that includes specific time periods within which appellants, respondents and the competent authority must submit appeals, responses or consider appeals (as the case may be). Although there is no guarantee that the parties will comply with these time periods, the time periods are intended to hold the parties accountable and to ensure that appeals are resolved in a timely manner.
The Mining Charter
On September 27, 2018, the Minister published the Broad-Based Socio-Economic Empowerment Charter for the Mining and Minerals Industry, 2018 (“Mining Charter III”), on which date it also became effective, as amended by the notice published in the Government Gazette on December 19, 2018 and read with the Implementation Guidelines for the Broad Based Socio-Economic Empowerment Charter for the Mining and Minerals Industry, 2018 (“Implementation Guidelines”) published on the same date. It replaces, in their entirety, the original Mining Charter negotiated in 2002 and gazetted in 2004 (the "Original Charter") and the amended Charter gazetted in September 2010 (the “Amended Charter”).
Mining Charter III imposes new obligations and increased participation by HDSAs in relation to a mining company’s ownership, procurement of goods and services, enterprise and supplier development, human resource development and employment equity requirements. The first annual reporting for compliance with Mining Charter III was due on or before March 31, 2020, although on April 11, 2020, the Minister gazetted directions under the regulations of the Disaster Management Act as part of the measures to address, prevent and combat the spread of Covid-19, which extended the date for submission of the first annual report to June 1, 2020. Harmony submitted its first report under Mining Charter III within the specified deadline and has subsequently submitted its compliance report for the year ended December 31, 2021, as per the annual reporting requirement.
While the ownership requirement for HDSAs in relation to existing mining rights has not increased (provided that we met the 26% requirement under the Amended Charter), we may be required to comply with new HDSA ownership requirements in relation to any renewals, consolidations and transfers of our existing rights and any applications for new mining rights. The increased HDSA requirements in relation to employment equity, procurement of goods and services and enterprise and supplier development may result in additional costs being incurred by us, which could have a material adverse effect on our results of operations and financial condition.
While Mining Charter III was effective from September 27, 2018, many of its provisions are vague and untested despite the publication of the Implementation Guidelines. See Item 4: “Information on the Company - Business Overview - Regulation - Mineral Rights - South Africa - The Mining Charter”.
On March 26, 2019, the Minerals Council South Africa (previously the Chamber of Mines) (“MCSA”) filed an application for the judicial review and setting aside of certain clauses of Mining Charter III. The MCSA had engaged in ongoing attempts to reach a compromise with the Minister on certain provisions that are problematic for the industry, and which would be detrimental to its sustainability.
The application aligns with the MCSA’s previously stated view that most aspects of Mining Charter III represent a reasonable and workable framework. However, the MCSA’s application contends that Mining Charter III does not fully recognize the continuing consequences of previous empowerment transactions, particularly in relation to mining right renewals and transfers of such rights. In August 2020, the current Minister, Gwede Mantashe, withdrew his notice of appeal to the Supreme Court of Appeal in respect of the declaratory order issued in April 2018 by the High Court of South Africa (Gauteng Division). The declaratory order held that black economic empowerment (“BEE”) ownership transactions should continue to be recognized for regulatory certainty purposes and for the duration of the mining right – even where the BEE partner has sold or transferred part of or all its equity. The MCSA’s judicial review application was heard before a full bench of judges in May 2021. Judgment was handed down on September 21, 2021 (the "2021 Judgement") setting aside certain of the problematic provisions, while providing that the remainder of Mining Charter III should continue in force. In November 2021, the DMRE informed the National Assembly's Portfolio Committee on Mineral Resources and Energy that it did not intend to appeal the outcome of the 2021 Judgement, but instead will consider steps to achieve the empowerment objectives through legislative amendments to the MPRDA.
We cannot guarantee that we will meet all the targets set out by Mining Charter III. Should we breach any obligations in complying with the MPRDA or Mining Charter III, our existing mining rights in South Africa could be suspended or canceled by the Minister in accordance with the provisions of the MPRDA. It may also influence our ability to obtain any new mining rights. Any such suspension or cancellation could have a material adverse effect on our results of operations and financial condition.
Australia
In Australia, mining is regulated by the laws of the State in which the deposit is situated. Presently, our only mining activity in Australia is the Eva Copper Project, located in the State of Queensland. Mining in Queensland is regulated by the Mineral Resources Act 1989 (Qld) (the "Queensland MRA"), the Mineral and Energy Resources (Common Provisions) Act 2014, the MQSH Act, and the regulations, practice manual, operational policies and guidelines thereunder. See Item 4: “Information on the Company - Business Overview - Regulation - Mineral Rights - Australia”.
Generally, all mineral resources in Queensland are owned by the State of Queensland. These resources are managed by the Queensland Department of Resources. Under the Queensland MRA, the Department of Resources requires all large mining projects to apply for a resource authority, including mining leases, exploration permits and mineral development licenses. An exploration permit ("EP") allows the holder to carry out exploration activities to determine what minerals exist and their quality and quantity in or under land or in the waters or sea above such land, in accordance with agreed work programs and subject to compliance with prescribed security and financial obligations.
If the holder of an EP wishes to develop a mine to exploit discovered resources, application must be made for a mining lease. This entitles the holder to machine-mine specified minerals and carry out activities associated with mining, including infrastructure to support mining operations. The Queensland MRA, and mining tenements issued thereunder, contain provisions and conditions, the breach of which may result in the imposition of a fine, imprisonment or the cancellation of the tenement.
Should we breach any obligations in complying with the Queensland MRA or any other laws and regulations relating to our exploration and mining activities in Queensland, we could be subject to fines or other sanction our existing mining rights or our EP in Queensland could be suspended or cancelled, or we could be subject to fines or other sanction. Any such suspension, cancellation or sanction could have a material adverse effect on our results of operations and financial condition.
Papua New Guinea
In PNG, mining is primarily regulated by the PNG Mining Act 1992 (the “PNG Mining Act”) and the PNG Mining (Safety) Act and their respective Regulations. All minerals are owned by the Independent State of Papua New Guinea, which grants rights to explore for or mine such minerals under a concessionary tenement system. Types of tenement include: exploration license; mining lease; Special Mining Lease; alluvial mining lease; lease for mining purposes; and mining easement. See Item 4: "Information on the Company – Business Overview – Regulation - Mineral Rights - Papua New Guinea".
Since 2009, the mining regime in PNG has been the subject of a comprehensive ongoing review involving various PNG Government agencies. In addition to the review of applicable legislation, PNG mineral policy and mining-specific sector policies are also being reviewed and drafted, including a biodiversity offsets policy, a national oceans policy, a sustainable development policy, an involuntary relocation policy, a national content policy, and a mine closure policy and mining project rehabilitation and closure guideline.
Over that period, various draft revisions of the PNG Mining Act have been circulated for comment, most recently in 2018 and 2020. The most recent draft revisions include an increase in the royalty rate and changes to the terms of the PNG Government's option to acquire an interest in a mineral discovery, the percentage extent of such option, the consideration payable for it, and the contributions to be made by the PNG Government pursuant to it. Other proposed revisions include the introduction of a development levy and a waste fee, the introduction of an obligation to maintain production at minimum prescribed levels, a prohibition on non-local “fly-in, fly-out” employment practices, and the introduction of downstream processing obligations (including a national gold refinery and bullion bank). If enacted in their proposed form and applied to our operations and projects in PNG, the revisions will potentially affect those operations and projects and could have a material adverse effect on our business, operating results and financial condition.
In May 2019, Hon James Marape M.P. was appointed Prime Minister of PNG following a vote of no confidence in the previous Government. In September 2022, he was re-appointed as Prime Minister for a second term following a national general election. Since his appointment, the PNG Government has advocated a policy of "Take Back PNG", including a review and restructuring of resource laws so as to increase the PNG Government's share of the proceeds from mining, enhance landholder and provincial government equity participation in mining projects, and promote direct involvement in mining and exploration by a State-owned entity ("SOE").
On June 26, 2020 the Mining (Amendment) Act 2020 (the “PNG Mining (Amendment) Act”) was enacted, which requires the real-time provision of production and mineral sales data to the PNG MRA. The PNG Mining (Amendment) Act also amended the PNG Mining Act to provide that the PNG Government has the power to reserve land that is subject to an expired, cancelled, surrendered or relinquished tenement. Wholly or majority PNG-owned entities, including an SOE, then have a statutory priority in applying for a new tenement over the reserved land.
On July 16, 2020 a proposed Organic Law on Ownership and Development of Hydrocarbons and Minerals and the Commercialization of State Businesses (the “PNG Organic Law”) was tabled for reading in Parliament. The PNG Organic Law (if adopted) will materially alter the legislative and regulatory regime governing mining in PNG, including the transfer of ownership of minerals from the PNG Government to an SOE (which will not be subject to the PNG Mining Act or the regulation of the PNG MRA), and the transformation of the methodology of its participation in mining operations from a concessionary to a production sharing regime. The PNG Organic Law is silent on the form and content of the production sharing regime to be entered into, which arrangements it envisages will be negotiated by the SOE on a case-by-case basis.
It is presently uncertain if the PNG Organic Law will be adopted, or (if adopted) whether or how the PNG Organic Law will be applied to our current operations and projects in PNG. We continue to engage with the PNG Government and relevant regulators on these matters, indirectly through the offices of the PNG Chamber of Mines and Petroleum and directly with the PNG MRA and the DMPGM.
In August 2023, the PNG Department of Commerce and Industry presented a draft "Papua New Guinea National Content Policy for Resource Sectors 2023-2027", which policy is designed to encourage greater national participation and partnership in major resource investments in PNG. It has five key focus areas, namely domestic procurement of goods and services and supplier development; localization of employment opportunities; skilled workforce development; greater equity participation by PNG; and sustainable development of project impacted communities. It is presently uncertain the extent to which, and how, the proposed policy will be applied to our current operations and projects in PNG.
Due to this uncertainty, we are unable to express a view on the likely impact of the potential changes to the PNG mining regime, save to state that, if the presently proposed changes are adopted and applied to our operations and projects in PNG, they could have a material adverse effect on our business, operating results and financial condition.
PNG mining legislation and mining tenements contain provisions and conditions, the breach of which may result in the imposition of a fine, imprisonment or the cancellation of the tenement. Should we breach any obligations in complying with the PNG Mining Act or any other laws and regulations relating to our exploration and mining activities in PNG, our existing mining rights in PNG could be suspended or cancelled, or we could be subject to fines or other sanction. Any such suspension, cancellation or sanction could have a material adverse effect on our results of operations and financial condition.
Our financial flexibility could be constrained by the Exchange Control Regulations of the countries in which we operate
South Africa’s Exchange Control Regulations restrict the export of capital from South Africa. Transactions between South African residents (including companies) and non-residents (excluding residents of the Republic of Namibia and the Kingdoms of Lesotho and Eswatini, known collectively as the Common Monetary Area (“CMA”)) are subject to exchange controls enforced by South African Reserve Bank ("SARB"). While South African exchange controls have been relaxed in recent years, South African companies remain subject to restrictions on their ability to deploy capital outside of the CMA. As a result, our ability to raise and deploy capital outside the CMA is restricted. These restrictions could hinder our financial and strategic flexibility, particularly our ability to raise funds outside South Africa and could therefore have a material adverse effect on our business, operating results and financial condition.
Our operation in PNG (including the export of gold and the operation of approved offshore foreign currency accounts) are subject to the foreign exchange control and other directives of the Bank of Papua New Guinea. The withdrawal of existing approvals or the imposition of restrictions could potentially hinder our financial and strategic flexibility, and could have a material adverse effect on our business, operating results and financial condition.
Australia does not restrict the flow of currency into or out of the country. The Australian dollar is freely convertible. International supply and demand determine exchange rates. Official policy is not to defend any particular exchange rate level. Australian Reserve Bank intervention is minimal and occurs only to curb extreme foreign exchange market volatility. Only authorized foreign exchange dealers make foreign exchange transactions. As a result, our financial and strategic flexibility relating to foreign currency flows to and from Australia are not considered to be materially impacted and therefore it does not have a material adverse effect on our business, operating results and financial condition.
Risks Related to Our Operations and Business
Risks associated with pumping water inflows from closed mines adjacent to our operations, including related closure liabilities, could adversely affect our operational results
Certain of our mining operations in South Africa are adjacent to the mining operations of other companies. A mine closure can affect continued operations at an adjacent mine if appropriate preventative steps are not taken. In particular, this could include the ingress of underground water when pumping operations at the closed mine are suspended. This can result in damage to property, operational disruptions and additional pumping costs, which could adversely affect any one of our adjacent mining operations and, in turn could adversely affect our business, operating results and financial condition.
In connection with our acquisition in 2018 of the Moab Khotsong and Great Noligwa mines from AngloGold Ashanti Limited ("AngloGold"), together with other assets and related infrastructure (the “Moab Acquisition”), we acquired a two-thirds interest in the Margaret Water Company NPC ("Margaret Water") for all pumping and water-related infrastructure at its Margaret shaft. The shaft operates for the purpose of de-watering the Klerksdorp, Orkney, Stilfontein, Hartbeesfontein (“KOSH”) basin groundwater. This is to allow Moab Khotsong operations and the mine operated by Kopanang Gold Mining Company Proprietary Limited (the mining company holding the remaining one–third interest in Margaret Water Company and the only other mining company continuing operating in the area) to remain dry and to prevent flooding of operational areas. Therefore, it remains imperative for the shaft to continue pumping water.
Flooding and potential decant in the future resulting from a failure in pumping and water-related infrastructure could pose an unpredicted “force majeure” type event, which could result in financial liability for us, and could have an adverse impact on our results of operations and financial condition. Although studies indicate that we do not currently have a decant risk at our Doornkop and Kusasalethu operations, due to the interconnectivity, any long-term water management solution would require a regional strategy co-created with neighboring and inter-connected mines. Although we have installed water treatment plants at both sites for current treatment needs, which could serve as water plants for final decant should the situation arise, there can be no assurance that such plants will be sufficient to address such risks. There is also a flooding risk at operations assumed as part of our acquisition with effect on October 1, 2020 of the remainder of AngloGold’s South African business (the “Mponeng Acquisition”). This relates to the Mponeng mine, requiring the continuous pumping arrangement with Covalent Water Company (Pty) Limited (a wholly-owned subsidiary) to stay in place.
Obligations in respect of the pumping and treatment of extraneous water must also be addressed in connection with our final closure plans for each of our operations. We are responsible for these liabilities until a closure certificate is issued pursuant to the MPRDA and possibly thereafter under the NEMA. The occurrence of any of the risks discussed above could have an adverse effect on our operating results and financial condition. This liability is discussed in more details in Item 4: “Information on the Company – Business Overview – Regulation – Law and Regulations Pertaining to Environmental Protections in South Africa – NEMA”. See also “– We are subject to extensive environmental regulations in the countries in which we operate” below.
Infrastructure constraints and aging infrastructure could adversely affect our operations
Mining, processing, development and exploration activities depend on adequate infrastructure. Reliable rail, ports, roads, bridges, power sources, power transmission facilities and water supply are critical to the Company’s business operations and affect capital and operating costs. The infrastructure and services are often provided by third parties whose operational activities are outside the control of the Company.
Interference to the maintenance or provision of infrastructure, including by extreme weather conditions, scarcity of equipment, sabotage or social unrest, could impede our ability to deliver products on time and adversely affect our business results of operations and financial condition.
Once a shaft or a processing plant has reached the end of its intended lifespan, higher than normal maintenance and care is required. Maintaining this infrastructure requires skilled human resources, capital allocation, management and planned maintenance. Although we have implemented a comprehensive maintenance strategy, incidents resulting in production delays, increased costs or industrial accidents may occur. Such incidents may have an adverse effect on our operating results and financial condition.
Disruptions to the supply of electricity and increases in the cost of power may adversely affect our results of operations and financial condition
South Africa
In South Africa, each of our mining operations depends on electrical power generated largely from fossil fuels by the South African state utility, Eskom Holdings SOC Limited (“Eskom”), which holds a monopoly in the South African market. Electricity supply in South Africa has been constrained over the past decade and there have been multiple power disruptions as a result of continued poor generation performance and reliability. Eskom reintroduced national rotational power cuts ("load shedding") in December 2018. Load shedding continued at increasing rates from 2019 to date, increasing from 21 days in calendar year 2019 to 272 days up until the end of September 2023. Under load shedding, our South African operations are required to reduce power demand which can result in production losses. Load curtailment is the program for industrial customers who can manage their load, while load shedding is implemented for other customers. In fiscal 2022 and 2023, the electricity supply in South Africa continued to see substantial pressure, with Eskom instituting load curtailment ranging from Stage 1 to Stage 4 on multiple occasions.
During Stage 1 to Stage 4 we were required to reduce load by 10% to 20% respectively and thereafter we are forced to reduce all but essential loads, which allows for only critical processes to continue such as pumping and running the winders to remove people from underground.
Eskom’s aging infrastructure, its need to replace or upgrade its power generation fleet and its deferral of routine maintenance due to financial constraints, may adversely affect electricity supply in South Africa. A lack of plant availability was a major contributor to increased load curtailment in fiscal 2022 and fiscal 2023. In addition, Eskom’s ability to undertake necessary infrastructure and fleet upgrades, on commercially acceptable terms or otherwise, may be limited by the amount of debt it has outstanding and it is anticipated that more financing and reduction in debt will be required for financial sustainability. Any blackouts or other disruptions to power supply could have a material adverse effect on our business, operating results and financial condition.
Eskom’s inability to fully meet the country’s demand has led and may continue to lead to rolling blackouts, unscheduled power cuts and surveillance programs to ensure non-essential lighting and electricity appliances are powered off. There can be no assurance that Eskom’s efforts to protect the national electrical grid will prevent a complete national blackout.
Although management has been able to comply with the load shedding and curtailment requirements experienced in our 2023 fiscal year [and the first quarter of fiscal 2024 without incurring material production losses], there can be no guarantee that we will be able to comply with such curtailment requirements without incurring material production losses in the future.
In addition to supply constraints, severe weather events, labor unrest in South Africa has before, and may in future, disrupt the supply of coal to power stations operated by Eskom, or the operation of the power stations directly, and result in curtailed supply. For example, in February 2021, Cyclone Eloise caused extensive rainfall which, in turn, led to constraints in the quality and supply of coal, national power constraints and load curtailment.
In February 2019, the President of South Africa announced the vertical unbundling of Eskom. While full-state ownership will be maintained, the unbundling is expected to result in the separation of the Eskom’s generation, transmission and distribution functions into separate entities. The unbundling is currently underway for the legal separation of the transmission function and the generation and distribution functions are still to be unbundled. The transmission unbundling was planned to be completed by December 2021 and the distribution and generation functions by December 2022 but these dates have subsequently been pushed back. In July 2023, the National Energy Regulator of South Africa ("NERSA") approved the operating license for the National Transmission Company South Africa SOC Limited. The exact timing and impact of the vertical unbundling is not known but it may result in tariff increases, price instability and/or poor reliability in the supply of electricity. Poor reliability of the supply of electricity, instability in prices and a possible tariff increase above inflation are expected to continue through the unbundling process. Should we experience further power tariff increases, our business operating results and financial condition may be adversely impacted.
Eskom tariffs are determined through a consultative multi-year price determination application (“MYPD”) process, with occasional tariff increase adjustments under the Regulatory Clearing Account (“RCA”) mechanism. In the most recent MYPD process, NERSA, granted Eskom tariff increases of 8.1% (later adding an additional 0.7%) for the period 2020 to 2021 and 15.1% for the period 2021 to 2022 (after the initial approval of 5.2%). In February 2022, NERSA granted Eskom a 9.6% tariff increase for the period 2022 to 2023, which includes an RCA amount of R14 billion. The RCA figure may change however. For instance, NERSA appealed in August 2020 an earlier court ruling requiring R23 billion in revenue to be added to the 2021/2022 increase, and leave to appeal was granted in October 2020. In addition, NERSA also announced the approval of R3.9 billion from the RCA in costs incurred by Eskom over and above the previously regulated costs, applicable from April 2021. The recovery period from the consumer is yet to be determined. Moreover, Eskom has indicated that it is still assessing NERSA’s tariff increase of 9.6% for the period 2022 to 2023. On the basis of external economic advice, we are planning for 10% increases in both 2022/2023 and 2023/2024, but there can be no assurance that this will be adequate to meet our obligations under the tariffs as finally approved.
Increasing global demand for energy, concerns about nuclear power and the limited growth of new supply are also impacting the price and supply of energy. Various factors have resulted in increased demand or constrained supply and escalating oil and energy prices. These included, among others, the transition of emerging markets to higher energy consumption, actual and proposed pricing or taxation of carbon emissions, unrest and potential conflict in the Middle East as well as the recent armed conflict between Russia and Ukraine. In particular, the recent hostilities between Russia and Ukraine triggered the imposition of retaliatory measures, and could result in further measures in the future, by the United States, the EU, the United Kingdom, the North Atlantic Treaty Organization (“NATO”) and other jurisdictions against Russia. These and any additional measures, including sanctions or export controls, as well as any countermeasures taken by Russia or other jurisdictions, have led to, and may lead to additional, increases in oil and energy prices, given Russia’s role as a major global exporter of crude oil and natural gas.
Papua New Guinea
In PNG, power generation and distribution is supplied by the state utility, PNG Power Limited. This utility is severely financially constrained, with aging and poorly maintained infrastructure subject to disruptions in electrical power supply. Currently, our Hidden Valley mine and projects receive approximately 70% of their daily demand from PNG Power Limited, with the balance generated by the Hidden Valley mine's own diesel power station. Although the mine has the capacity to self-generate by means of diesel-generated power when required, the cost of this power will fluctuate with changes in the oil price. Furthermore, our ability to rely on our own generation is dependent on transport logistics and our ability to deliver sufficient volumes of fuel to the diesel power station.
Disruptions in electrical power and other energy supply or substantial increases in electricity tariffs or the cost of oil or natural gas could have a material adverse effect on our business, operating results and financial condition.
See Item 5: “Operating and Financial Review and Prospects – Operating Results – Key factors affecting our results - Electricity in South Africa.” and “Integrated Annual Report for the 20-F 2023 – Environment – Climate change, energy and emissions management” on pages 125 to 131.
Illegal mining and other criminal activity at our operations, including theft of gold and gold-bearing material, could pose a threat to the safety of employees, result in damage to property and could expose us to losses, business disruption and liability
The activities of illegal and artisanal miners, which include theft, has increased over the years and had become more violent and threatens both the safety of employees and sustainability of the mining industry. Artisanal and illegal miners are active on, or adjacent to, several of our properties, but are mostly active on surface the last year. Artisanal and illegal miners at times may lead to interference with our operations and results in conflict that presents a security threat to property and human life. The environmental, social, safety and health impacts of artisanal mining are frequently attributed to formal mining activity, and it is often assumed that artisanal-mined gold is channeled through large-scale mining operators, even though artisanal and large-scale miners have distinct supply chains. These misconceptions impact negatively on the reputation of the industry.
The activities of the illegal miners, which include theft, can cause damage to our properties, including by way of pollution, copper cable theft, underground fires, critical infrastructure damage, operational disruption, project delays or personal injury or death, for which we could potentially be held responsible. Illegal and artisanal mining could contribute to the depletion of mineral deposits, potentially making the future mining of such deposits uneconomic. Most illegal miners are found at abandoned shafts or old work places.
Illegal and artisanal mining (which may be by employees or third parties) is associated with a number of negative impacts, including environmental degradation and human rights abuse, such as forced labor, human trafficking, child labor, corruption, money laundering and other violent crimes in the communities and at the mines. Effective local government administration is often lacking in the locations where illegal and artisanal miners operate, due to rapid population growth and the lack of functioning structures, which can create a complex, unstable social environment. The disbandment of specialized South African Police Service ("SAPS") units has also left a huge gap in the apprehension of high-ranking criminals in the illicit gold trade.
The presence of illegal miners could lead to project delays and disputes regarding the development or operation of commercial gold deposits. In addition, illegal mining could lead to an increase in the level of organization and funding of criminal activity around some of our operations. Criminal activities such as trespassing, illegal and artisanal mining, and related sabotage, theft and vandalism could lead to damage to, and disruptions at, our operations.
Rising gold and copper prices may result in an increase in gold and copper thefts; moreover, incidences of illegal mining may escalate as a result of social and economic conditions. The occurrence of any of these events could have a material adverse effect on our financial condition on results of our operations.
Actual and potential shortages of production inputs and supply chain disruptions may affect our operational results
Our operational results may be affected by the availability and pricing of consumables such as fuel, chemical reagents, explosives, tires, steel and other essential production inputs. Issues with regards to availability of consumables may result from shortages, long lead times to deliver and supply chain disruptions, which could result in production delays and production shortfalls. We expect cost increases to continue in fiscal 2024 across our operations, including as a result of factors such as the price of oil, inflationary increases and labor costs. See “— Rising inflation, including as a result of Russia’s invasion of Ukraine, have had a material adverse effect on our business, operating results and financial condition”.
Our mining operations have experienced significant impacts from the widespread shortages of steel and chemical reagents throughout South Africa. These shortages can be attributed to the ongoing consequences of the power outages and unplanned breakdowns that resulted in issue of force majeures in fiscal 2023, as these affect optimal plant production output. Concurrently, the steel and chemical industry has witnessed a surge in protests related to wage concerns. This trend has affected major local steelmakers and retailers, making it challenging for them to meet the increased demand for steel. The national shortage of steel, primarily due to intermittent plant breakdowns and protest-related disruptions, is having adverse effects on numerous engineering companies within our extensive supply chain network, regardless of their size. Consequently, the availability of mining inputs, specifically steel and chemical reagents, is being adversely affected. Our suppliers of essential reagents such as sodium cyanide, hydrochloric acid, and caustic soda are similarly facing challenges in meeting our requirements due to ongoing plant breakdowns and disruptions associated with the power disruptions.
The pricing of consumables could continue to be significantly impacted by these challenges, particularly if shortages become more prevalent. Factors such as global supply and demand dynamics, governmental regulations including import parities on steel and chemical-related products, and industrial actions, may contribute to price fluctuations. A sustained interruption in the supply of these consumables would necessitate swift identification of alternative suppliers, potentially resulting in higher costs. Moreover, such interruptions could adversely affect our ability to pursue our development projects. Any significant increase in the prices of these consumables would escalate operating costs and have adverse effects on profitability. Consequently, this could impact our financial condition and results of operations.
Fluctuations in insurance cost and availability could adversely affect our operating results and our insurance coverage may prove inadequate to satisfy future claims
We have global insurance policies covering general liability, directors’ and officers’ liability, cyber-security, and accidental loss or material damage to our property, including resultant business interruption. The costs of maintaining adequate insurance coverage, continue to increase and may continue to do so in the future, thereby adversely affecting our operating results.
We have comprehensive third-party liability coverage, including for unforeseen sudden and accidental environmental liabilities, however we may also be subject to liability for pollution or other hazards against which we have not insured or cannot insure, including those for past mining activities. We also maintain property and liability insurance consistent with industry practice, but as with all insurance policies this insurance contains exclusions and limitations on coverage.
In addition, there can be no assurance that insurance will be available and at economically acceptable premiums. As a result, our insurance coverage may not cover claims against it relating to certain environmental or industrial accidents, pollution or public health emergencies, data protection and cybersecurity breaches and other events that could disrupt our operations, such as Covid-19, which could have a material adverse effect on our financial condition.
We compete with mining and other companies for key human resources with critical skills and our inability to retain key personnel could have an adverse effect on our business
The risk of losing senior management or being unable to hire and retain sufficient technically skilled employees or sufficient representation by HDSAs in management positions, or sufficient gender diversity in management positions or at Board level, may materially impact on our ability to achieve our objectives.
We compete with mining and other companies globally to attract and retain key human resources at all levels with the appropriate technical skills and operating and managerial experience necessary to continue operating our business. The need to recruit, develop and retain skilled employees is particularly critical with HDSAs and women in mining in South Africa, and the global shortage of key mining specialists, including geologists, mining engineers, mechanical and electrical engineers, metallurgists and skilled artisans has been exacerbated by increased mining activity across the globe. There can be no assurance that we will attract and retain skilled and experienced employees. Should we lose any of our key personnel, our business may be harmed and our operational results and financial condition could be adversely affected. See Item 4: “Information on the Company – Business Overview – Regulation – Labor Relations” and “Integrated Annual Report for the 20-F 2023 – Social – Caring for our employees” on pages 188 to 196.
Although it is presently uncertain the extent to which, and how, the PNG Department of Commerce and Industry’s draft Papua New Guinea National Content Policy for Resource Sectors 2023-2027 will be applied to our current operations and projects in PNG, if the localization of the workforce policy provisions are introduced, we believe that they would severely restrict the utilization of offshore-based “fly-in, fly out” expatriate employees, and potentially also result in a tightening of legislation around the granting of work permits and visas to foreign skilled employees. This would, in turn, adversely affect our ability in PNG to engage and retain appropriately skilled human resources, and could necessitate the application of additional resources to the construction or provision of housing for residential employees, and the recruiting and training of local landowners and landowner businesses, all of which may have an adverse effect on our business, operating results and financial condition.
The use of contractors at certain of our operations may expose us to delays or suspensions in mining activities and increases in mining costs
We use contractors at certain of our operations to mine and deliver ore to processing plants as well as for other purposes. At mines employing mining contractors, contracting costs represent a significant proportion of the total operating costs of these operations and we do not own all of the mining equipment.
Our operations could be disrupted, resulting in additional costs and liabilities, if the mining contractors at affected mines have financial difficulties, if a dispute arises in renegotiating a contract, or if there is a delay in replacing an existing contractor and its operating equipment to meet business needs at expected cost levels. Increases in contract mining rates, in the absence of associated productivity increases, will also have an adverse impact on our results of operations and financial condition.
Contractors can adversely affect our reputation, results of operations and financial condition by: our reduced control over those aspects of operations which are the responsibility of contractors; their failure to comply with applicable legal, human rights and regulatory requirements; their inability to manage their workforce to provide high quality services and a high level of productivity. This may result in us incurring liability to third parties due to the actions of contractors, which could have a material adverse effect on our business, operating results and financial condition.
Although it is presently uncertain the extent to which, and how, the PNG Department of Commerce and Industry’s draft “Papua New Guinea National Content Policy for Resource Sectors 2023-2027" will be applied to our current operations and projects in PNG, if these provisions are introduced, we believe they will prescribe increased levels of participation by locally-owned businesses in the provision of goods and services, which could adversely affect our ability in PNG to manage the costs of goods and services to our operations, which would, in turn, have an adverse effect on our business, operating results and financial condition.
We are dependent on a number of highly-integrated communication and IT systems, any disruption to which could have an adverse effect on our results of operations and financial condition
We utilize and rely on various internal and external IT systems to support our business activities. Damage or interruption of our IT systems, whether due to accidents, human error, natural events or malicious acts, may lead to disruptions to our business operations and/or essential data being irretrievably lost, exposed or damaged, thereby adversely affecting our business, operating results and financial condition.
Estimations of our reserves are based on a number of assumptions, including mining and recovery factors, future cash costs of production, exchange rates, and the relevant commodity prices; as a result, metals produced in future may differ from current estimates
The mineral reserve estimates in this annual report are estimates of the mill-delivered quantity and grade of metals in our deposits and stockpiles. They represent the amount of metals that we believe can be mined, processed and sold at prices sufficient to recover our estimated future cash costs of production, remaining investment and anticipated additional capital expenditures. Our mineral reserves are estimated based on a number of factors, which have been stated in accordance with the South African Code for the Reporting of Exploration Results, Mineral Resources and Mineral Reserves, 2016 edition (“SAMREC, 2016”). For the purposes of this report on Form 20-F, our Mineral Resources and Mineral Reserves have been classified in accordance with Item 1302(d)(1)(iii)(A) of Regulation S-K. Calculations of our mineral reserves are based on estimates of:
•future cash costs;
•future commodity prices;
•future currency exchange rates; and
•metallurgical and mining recovery rates.
These factors, which significantly impact mineral reserve estimates, are beyond our control. As a result, reserve estimates in this annual report should not be interpreted as assurances of the economic life of our gold and other precious metal deposits or the future profitability of operations.
Since these mineral reserves are estimates based on assumptions related to factors detailed above, should there be changes to any of these assumptions, we may in future need to revise these estimates. In particular, if our cash operating and production costs increase or the gold price decreases, recovering a portion of our mineral reserves may become uneconomical. This will lead, in turn, to a reduction in estimated reserves. Any reduction in our mineral reserves estimate could materially adversely affect our business, operating results and financial condition.
Our operations have limited proved and probable reserves; exploration for additional resources and reserves is speculative in nature, may be unsuccessful and involves many risks
Our operations have limited proved and probable reserves, and exploration and discovery of new resources and reserves are necessary to maintain current gold production levels at these operations. Exploration for gold and other precious metals is speculative in nature, may be unsuccessful and involves risks including those related to:
•locating orebodies;
•geological nature of the orebodies;
•identifying the metallurgical properties of orebodies;
•estimating the economic feasibility of mining orebodies;
•developing appropriate metallurgical processes;
•obtaining necessary governmental permits; and
•constructing mining and processing facilities at any site chosen for mining.
Our exploration efforts might not result in the discovery of mineralization, and any mineralization discovered might not result in an increase in resources or proved and probable reserves. To access additional resources and reserves, we will need to complete development projects successfully, including extensions to existing mines and, possibly, establishing new mines. Development projects would also be required to access any new mineralization discovered by exploration activities around the world. We typically use feasibility studies to determine whether to undertake significant development projects. These studies often require substantial expenditure. Feasibility studies include estimates of expected or anticipated economic returns, which are based on assumptions about:
•future gold and other metal prices;
•anticipated tonnage, grades and metallurgical characteristics of ore to be mined and processed;
•anticipated recovery rates of gold and other metals from the ore; and
•anticipated total costs of the project, including capital expenditure and cash costs.
All projects are subject to project study risk. There is no certainty or guarantee that a feasibility study, if undertaken, will be successfully concluded or that the project that is the subject of the study will satisfy our economic, technical, risk and other criteria in order to progress that project to development.
A failure in our ability to discover new resources and reserves, enhance existing resources and reserves or develop new operations in sufficient quantities to maintain or grow the current level of our resources and reserves could negatively affect our business, operating results and financial condition.
We are subject to the risk of litigation, the causes and costs of which are not always known
We are subject to litigation, arbitration and other legal proceedings arising in the normal course of business, and we may be involved in disputes that may result in litigation. Potential future litigation may arise from a variety of causes, including among other things, business activities, environmental, health and safety matters, share price volatility, unlawful community protest actions and failure to comply with disclosure obligations. The results of litigation, arbitration and other legal proceedings cannot be predicted with certainty, but could include costly damage awards or settlements, fines, and the loss of licenses, concessions, or rights, among other things.
In the event of a dispute, we may be subject to the exclusive jurisdiction of foreign courts or may not be successful in subjecting foreign persons to the jurisdiction of courts in South Africa. An adverse or arbitrary decision of a foreign court could have a material adverse impact on our financial performance, cash flow and results of operations.
We are subject to numerous claims, including class actions or similar group claims relating to silicosis and other occupational health diseases, and could be subject to similar claims in the future. A settlement in the silicosis class action claims has been reached and a provision for silicosis has been made. A provision of R549 million has been recognized at June 30, 2023, for our potential cost to settle the silicosis and TB class actions that have been instituted against us in South Africa. Significant judgment was applied in estimating the costs that will be incurred to settle the silicosis class action claims and related expenditure and the final costs may differ from current cost estimates. Management believes the assumptions are appropriate, however changes in the assumptions may materially affect the provision and final costs of settlement. There can be no assurance that the ultimate resolution of this matter will not result in losses in excess of the recorded provision and the ultimate settlement may have a material adverse effect on our financial position. For further information, see Item 8: “Financial Information – Consolidated Statements and Other Financial Information – Legal Proceedings” and “Integrated Annual Report for the 20-F 2023 – Social – Health” on pages 180 to 187 for further information. See note 27 “Other Provisions – Provision for silicosis settlement” to our consolidated financial statements set forth beginning on page F-1.
It is possible that additional class actions and/or individual claims relating to silicosis and/or other occupational health diseases will be filed against us in the future. We will defend all and any subsequent claims as filed on their merits. Should we be unsuccessful in defending any such claims, or in otherwise favorably resolving perceived deficiencies in the national occupational disease compensation framework that were identified in the earlier decision by the Constitutional Court, such matters would have an adverse effect on our financial position, which could be material.
In PNG, it is proposed to utilize deep sea tailings placement (“DSTP”) as the tailings management method for the Wafi-Golpu Project, which method is authorized under the environment permit issued for the project. The grant of the permit is currently the subject of two judicial reviews, the first applied for in March 2021 by the previous Governor of the Morobe Province in PNG, who was opposed to DSTP, and the second in December 2022 by coastal villagers represented by the Centre for Environmental Law and Community Rights Inc. ("CELCOR"). The present Governor, who was appointed in September 2022, is not opposed to DSTP and has stated publicly that he intends to withdraw his proceedings, but has not yet done so. Notwithstanding the change of position of the Governor or the outcome of the judicial review instituted by CELCOR, it is possible that a class action or individual claim relating to DSTP may be filed against us in the future, which could have a material adverse impact on the Wafi-Golpu Project.
Should we be unable to resolve disputes favorably or to enforce our rights, this may have a material adverse impact on our financial performance, cash flow and results of operations.
The risk of unforeseen difficulties, delays or costs in implementing our business strategy and projects may lead to us not delivering the anticipated benefits of our strategy and projects; in addition, actual cash costs, capital expenditure, production and economic returns may differ significantly from those anticipated by feasibility studies for new development projects
The successful implementation of our business strategy and projects depends upon many factors, including those outside our control. For example, the successful management of costs will depend on prevailing market prices for input costs. The ability to grow our business will depend on the successful implementation of our existing and proposed projects and continued exploration success, as well as on the availability of attractive acquisition opportunities, all of which are subject to the relevant mining and company specific risks as outlined in these risk factors.
It can take a number of years from the initial feasibility study until development of a project is completed and, during that time, the economic feasibility of production may change. In addition, there are a number of inherent uncertainties in developing and constructing an extension to an existing mine or a new mine, including:
•availability and timing of necessary environmental and governmental permits;
•timing and cost of constructing mining and processing facilities, which can be considerable;
•availability and cost of skilled labor, power, water, fuel, mining equipment and other materials;
•accessibility of transportation and other infrastructure, particularly in remote locations;
•availability and cost of smelting and refining arrangements;
•availability of funds to finance construction and development activities; and
•spot and expected future commodity prices of metals including gold, silver, copper, uranium and molybdenum.
All of these factors, and others, could result in our actual cash costs, capital expenditures, production and economic returns differing materially from those anticipated by feasibility studies.
We currently maintain a range of focused exploration programs, concentrating mainly on a number of prospective known gold and copper mineralized areas in PNG, the Kraaipan Greenstone belt and the Witwatersrand area in South Africa.
In order to maintain or expand our operations and reserve base, we have sought, and may continue to seek to enter into joint ventures or to make acquisitions of primarily gold and copper producing companies or assets. For example, with effect on October 1, 2020, acquired the remainder of AngloGold’s South African business, including the Mponeng mine and MWS, in the Mponeng Acquisition. In October 2022, Harmony entered into an agreement with Copper Mountain Mining Corporation ("Copper Mountain"), to acquire its wholly-owned Eva Copper Project and its 2,295km2 exploration land package in Queensland, Australia. The acquisition was completed in December 2022. See “– Risks Related to Our Corporate and Financing Structure and Strategy – We may experience problems in identifying, financing and managing new acquisitions or other business combination transactions and integrating them with our existing operations.
We may not have full management control over future joint venture partners”. However, there is no assurance that any future development projects will extend the life of our existing mining operations or result in any new commercial mining operations. Unforeseen difficulties, delays or costs may adversely affect the successful implementation of our business strategy and projects, and such strategy and projects may not result in the anticipated benefits, which could have a material adverse effect on our results of operations, financial condition and prospects.
Risks Related to ESG
Increasing scrutiny and changing expectations from our stakeholders, including communities, governments and NGOs as well as investors, lenders and other market participants, with respect to our ESG performance and policies may impose additional costs or expose us to additional risks
Companies across all industries are facing increasing scrutiny related to ESG issues, including their internal ESG policies and governance practices. Investor advocacy groups, certain institutional investors, investment funds, lenders and other market participants are increasingly focused on ESG-related matters and in recent years have placed increasing importance on the environmental and social costs and impact of their investments. The increased focus and activism related to ESG and similar matters may hinder access to capital, as investors and lenders may decide to reallocate capital or to not commit capital as a result of their assessment of a company’s ESG practices. In addition, host communities, as well as certain governmental and non-government actors, are increasingly focused on a company’s ability to operate in a sustainable manner and to mitigate related risks, as well as the public commitments and quantitative metrics used to demonstrate performance and track progress.
For us, this includes, in particular, the safe operation of our mines, mitigating our impact to local environments and affected communities, reducing GHG emissions in line with our voluntary commitments, working to high ethical standards, maintaining a healthy work culture, protecting and promoting human rights, operating to acceptable levels of compliance and focusing on supplier credibility. If our performance fails to meet internal or adopted external ESG standards, or we otherwise fail to satisfy stakeholder expectations with respect to our commitments and performance, regardless of whether there is a legal requirement to do so, such failure could result in reputational damage to and litigation against us and our business, losing our license to operate, financial condition, and/or share price could be materially and adversely affected.
In addition to compliance with local laws and regulations, our operations are also increasingly subject to stakeholder expectations concerning the application of stringent internationally-recognized environmental, health and safety and social standards and benchmarks. The application of such standards could impose significant costs on us. Certain financial institutions from whom we borrow money may also require compliance with any of these standards, the subsequent deviation from which could prevent or adversely affect our financial condition, existing financing arrangements and ability to secure future financing.
We may be required to implement even more stringent ESG practices or standards to meet the expectations of existing and future stakeholders and, if we fail to achieve these objectives or to adhere to internal or adopted external standards, or are perceived to be insufficiently committed to addressing ESG concerns across all of our operations and activities, our reputation and brand image could be damaged. Further, we could lose the trust of our stakeholders (including governments, NGOs, investors, customers and employees) or be subject to litigation brought by those stakeholders and our business, financial condition and results of operations could be adversely impacted.
We are subject to extensive environmental regulations in the countries in which we operate
As a gold mining company, we are subject to extensive environmental regulation. These regulations relate to, among other things, the protection of the environment, pollution prevention, water management, adequate waste disposal practices, promoting biodiversity conservation measures, occupational health and safety, including mine safety, toxic substances and the closure of mining operations. We expect the trend of rising production costs due to compliance with environmental laws and regulations in South Africa, Australia and PNG to continue.
In particular, we face heightened pressures from stakeholders, who are increasingly focused on climate change, to prioritize energy efficiency in our operations, reduce our carbon footprint and improve water and other resource consumption, as well as to be transparent about how climate-related risks and opportunities are managed throughout the supply chain to foster and promote business resiliency, accountability and stakeholder value.
South Africa
In South Africa, the MPRDA and NEMA, along with various other environmental statutes, regulations and standards regulate the impact of our prospecting and mining operations on the environment. These statutes, regulations and standards are regularly updated, amended and supplemented, imposing additional obligations on mining companies to, among other things, minimize emissions, reduce, re-use and recycle waste and improve the quality of effluent and wastewater discharged from the operations. See Item 4: “Information on the Company – Business Overview – Regulation – Laws and Regulations Pertaining to Environmental Protection - South Africa – NEMA”.
Under the MPRDA, a mining title holder remains responsible for any environmental liability, pollution, ecological degradation, the pumping and treatment of extraneous water and the sustainable closure of mining operations until such time as the Minister issues a closure certificate. Notwithstanding this, the NEMA states that a mining right holder will remain responsible for these obligations even after a closure certificate is issued. In a recent High Court judgement (Ezulwini Mining Company (Pty) Ltd v Minister of Mineral Resources and Others), the court found that upon a proper interpretation of the relevant provisions of the MPRDA and NEMA, mining companies are obliged to continue to pump and treat extraneous water from their underground mining areas until authorized to cease pumping following the issuance of a closure certificate by the Minister.
In South Africa, until such time as a closure certificate is issued, a mining right holder is required to assess annually the environmental liabilities associated with the mining operation (including the pumping and treatment of extraneous water) and put up financial provision for the rehabilitation, closure and ongoing post decommissioning management of negative environmental impacts.
This financial provision may be released when the Minister issues a closure certificate. However, he or she may determine to retain a portion of the financial provision in perpetuity for any latent environmental liabilities.
The manner in which the amount of the financial provision is calculated may in future be regulated under the Financial Provision Regulations, 2015 (as they may be amended), which were published by the Minister of Environmental Affairs in November 2015. Prior to this, the amount of financial provision has been calculated pursuant to the Guideline Document for the Evaluation of the Quantum of Closure-related Financial Provision Provided by a Mine (the “DMRE Guidelines”) of the DMRE. The DMRE Guidelines were criticized for undervaluing the costs of environmental rehabilitation thus exposing the DMRE to potential liability in the event that the mining right holder was unable to fulfill its environmental obligations. The proposed Financial Provision Regulations, 2015 place an emphasis on post-closure water pumping and treatment and the need for upfront provision to be set aside for the management of these types of impacts.
The Financial Provision Regulations, 2015 sought to rectify the inadequacies of the DMRE Guidelines by, among other things, including preliminary and general costs in the financial provision calculations, imposing VAT (at 15%) on the total amount, prohibiting the withdrawal of trust funds for concurrent rehabilitation (even in circumstances where the financial provision exceeds the evaluated environmental liability) and ceding a portion of the funds to the Minister as security for possible latent and residual post-closure environmental impacts.
Compliance with these obligations would result in a significant increase in the required financial provision and, consequently, has been strongly opposed by the mining industry. In response to this opposition, the Department of Forestry, Fisheries and the Environment (“DFFE”), the competent authority for drafting the Financial Provision Regulations, 2015, undertook to engage further with mining industry and other stakeholders to amend or develop new financial provision regulations. Draft amendments to the Financial Provision Regulations, 2015 were published by the Minister of the DFFE ("Environment Minister") in May 2019, August 2021 and again in July 2022. We have submitted comments on these latest draft amendments in an effort to address some of the remaining issues. In light of this the ongoing consultation, the date by which mining companies are required to align their financial provision with the Financial Provision Regulations, 2015 was extended to September 19, 2023. On May 19, 2023, the Environment Minister published a further notice of her intention to extend further the period for mining companies to comply with the Financial Provision Regulations, 2015 to February 19, 2024. It is likely that the financial provision calculation will be more stringent than the calculations under the DMRE Guidelines and we may have to adjust our financial provision.
In addition, we may also face increased environmental costs should other mines in the vicinity fail to meet their obligations related to the pumping or treatment of water.
The adoption of these, or additional or more comprehensive and stringent requirements, particularly for the management of hazardous waste, pollution of ground and groundwater systems and duty to rehabilitate closed mines, may result in additional costs and liabilities, which could have a material adverse effect on our business, operating results and financial condition.
We continue to engage with the DFFE and the DMRE regarding matters relating to financial provision including the Financial Provision Regulations, 2015, as well as the adjustment of financial provision in respect of the mining operations. There are concerns about the ambiguity of the provisions and how they can be operationalized within the prescribed transitional time frames, which may result in misinterpretation, mis-application and potential disputes with the DFFE, any of which could have a material adverse effect on our business, operating results and financial condition. See note 26 “Provision for environmental rehabilitation” to our consolidated financial statements set forth beginning on page F-1.
Other key environmental legislation includes the South African National Water Act, 36 of 1998 (“NWA”), the National Environmental Management: Air Quality Act, 39 of 2004 (the "Air Quality Act"), the National Environmental Management: Waste Act, 59 of 2008 (the "Waste Act"), the National Nuclear Regulator Act, 47 of 1999, the National Environmental Management: Biodiversity Act, 10 of 2004, the National Heritage Resources Act, 25 of 1999, the Carbon Tax Act, 15 of 2019 (the “Carbon Tax Act”), and the MPRDA. The National Environmental Management Laws Amendment Act, 2 of 2022 (“NEMLAA”) was assented to on June 21, 2022. The majority of the provisions in NEMLAA came into effect on June 30, 2023, as determined by the Environment Minister. The NEMLAA contains numerous amendments to NEMA, many of which are intended to resolve several issues linked to the roll-out of the "One Environmental System" including the jurisdiction, responsibility and enforcement powers of the DFFE, DMRE and local authorities. The NEMLAA has been described as the most significant piece of environmental legislation since the implementation of the One Environmental System, bringing with it a major shift in South Africa’s environmental legislative landscape. One of the material amendments arising from the NEMLAA is that the Environmental Minister may prescribe that financial provision is set aside for activities which historically have not been required to put up financial rehabilitation including the reclamation of historic residue stockpiles and deposits.
In terms of the NEMLAA amendments, the financial provision retained by the Environment Minister must be transferred to an account administered by the Environment Minister or, where the financial provision is an insurance policy, the Environment Minister must access the funds. Harmony will have no right to regulate the way these funds are spent to rectify any latent and residual environmental impacts. Notwithstanding this, Harmony will remain liable for any such liabilities. If the latent and residual environmental liabilities do not materialize, there is no mechanism in terms of which the funds will be returned to the holder. See Item 4: “Information on the Company – Business Overview – Regulation – Laws and Regulations Pertaining to Environmental Protection - South Africa”.
Compliance with existing or new environmental legislation, which increases the burden of compliance or the penalties for non-compliance may cause us to incur further significant costs and could have a material adverse effect on our business, operating results and financial condition.
Australia
In the State of Queensland, mining operations are subject to the Environmental Protection 1994 Act (Qld) (the "Queensland EPA") and Environmental Protection Regulations 2019. The Queensland EPA and Regulations prescribe the preparation and assessment of environmental impact studies for purposes of the issuance of Environmental Authorities, which are assessed by the Queensland Department of Environment and Science. See Item 4: “Information on the Company – Business Overview – Regulation – Laws and Regulations Pertaining to Environmental Protection – Australia”.
Eva Copper Mining Pty Limited is the holder of an Environmental Authorization for the Eva Copper Project, issued under the Queensland EPA. The Environmental Authorization will be amended from time to time to align with project updates and optimizations.
In addition, various other environmental legislation applies, including the Commonwealth Environment Protection and Biodiversity Conservation Act 1999 (“EPBC Act”) and the National Greenhouse and Energy Reporting Act 2007(“NGER Act”).
The EPBC Act is administered by the Commonwealth Department of Climate Change, Energy, the Environment and Water (the "DCCEEW") and provides a legal framework to protect and manage unique plants, animals, habitats and places in Australia. Projects that could have a significant impact on Commonwealth protected matters must be referred to the Commonwealth Minister for Environment, who will determine whether the proposed action requires assessment and approval under the EPBC Act. The decision to refer a project under the EPBC Act is a self-assessment process. The Eva Project does not hold any approvals under the EPBC Act.
In 2021, a desktop assessment was completed which determined that the Eva Copper Project is unlikely to have a significant impact on Commonwealth matters of national environmental significance ("MNES") and therefore referral under the EPBC Act was not required. Referrals under the EPBC Act may be necessary to support future amendments and will be assessed and determined on a case-by-case basis.
The NGER Act establishes the NGER Scheme, which is a national framework for reporting greenhouse gas emissions, greenhouse gas projects and energy consumption and production by corporations in Australia. The NGER Act makes registration and reporting mandatory for corporations whose energy production, energy use or greenhouse gas emissions meet specified thresholds.
In addition to reporting obligations, the NGER Act introduces a mechanism (the “Safeguard Mechanism”) that provides a framework for Australia's largest emitters to measure, report and manage their emissions. It does this by requiring large facilities, whose net emissions exceed the Safeguard Mechanism threshold, to keep their emissions at or below emissions baselines. The Safeguard Mechanism applies to facilities with scope 1 covered emissions of more than 100,000 tonnes of carbon dioxide equivalent ("CO2-e") per year. Reforms to the Safeguard Mechanisms came into effect on July 1, 2023 which apply a decline rate to facilities’ baselines so that they are reduced predictably and gradually over time on a trajectory consistent with achieving Australia’s emission reduction targets of 43% below 2005 levels by 2030 and net zero by 2045.
As part of the feasibility study currently in progress, the Eva Copper Project is quantifying its predicted emissions under the NGER Act to determine the potential applicability of monitoring and reporting obligations and the Safeguard Mechanism.
Compliance with existing or new environmental legislation, which increases the burden of compliance or the penalties for non-compliance may cause us to incur further significant costs and could have a material adverse effect on our business, operating results and financial condition.
Papua New Guinea
Our PNG operations are subject to the PNG Environment Act 2000 (“PNG Environment Act”) and various related regulations and guidelines. The PNG Environment Act regulates discharges to air, land and water, and sets out the requirements for proponents to obtain an environment permit for the construction and operation of prescribed activities having the potential to cause environmental harm.
An Environmental impact Statement ("EIS") is required when projects are likely to have a significant adverse impact on the environment and other social or cultural heritage aspects. The PNG Government will use the EIS as the means to assess a project's impacts, in accordance with statutory processes, and decide whether the Environment Minister should grant approval in principle for the project under the PNG Environment Act. Thereafter, the Managing Director of the Conservation and Environment Protection Authority ("CEPA") may grant a Level 3 environment permit for the project.
In 2010, the PNG Government engaged the Scottish Association for Marine Science ("SAMS") to conduct an independent assessment of DSTP systems in PNG in 2010 with consideration to international best practice, and to prepare Draft General Guidelines for DSTP in PNG (SAMS 2010). These guidelines are referenced in the PNG Government’s Terms of Reference for an EIS for DSTP projects.
Compliance with existing or new environmental legislation, which increases the burden of compliance or the penalties for non-compliance may cause us to incur further significant costs and could have a material adverse effect on our business, operating results and financial condition.
A process of mining regime review is underway within PNG and a number of environmental matters are under consideration. These include a Mine Closure Policy and Mining Project Rehabilitation and Closure Guidelines (which include requirements for the provision of financial assurance for mine closure and rehabilitation costs), a Biodiversity Offsets Policy (which anticipates biodiversity offset payments to support biodiversity initiatives), and a National Oceans Policy. See Item 4: “Information on the Company – Business Overview – Regulation – Laws and Regulations pertaining to Environmental Protection – Papua New Guinea”.
Failure by Harmony to comply with the conditions of our mining rights and mineral rights legislation in any of the jurisdictions in which we operate may cause us to lose the right to mine, fail to acquire new rights to mine and may have a material adverse effect on our business, operating results and financial condition.
See "Integrated Annual Report for the 20-F 2023 – Environment – Environmental management and stewardship” on pages 113 to 119 for further discussion on the applicable legislation and our policies on environmental matters.
The socio-economic framework in the regions in which we operate may have an adverse effect on our operations and profits
We have operations in South Africa, Australia and PNG. As a result, changes to or instability in the social, economic or political environment in any of these countries or in countries proximate to them could affect an investment in us. Without limitation, political risks may include the following: political instability and terrorism; nationalization; change in legislative, regulatory or fiscal frameworks; renegotiation or nullification of existing contracts, leases, permits or other agreements; restrictions on repatriation of earnings or capital; changes in laws and policy; and socio-economic risks including civil unrest and criminality. The impact of future long-term health related issues may heighten social tensions and demands, as individuals look to the mining industry for job creation opportunities and other resources and benefits.
South Africa
In March 2019, the President of South Africa, Cyril Ramaphosa, announced in parliament that South Africa would move forward with the nationalization of the SARB. Since the announcement, there have been various contradictory statements made by government officials regarding the government’s plans to nationalize the SARB, which have created uncertainty around this issue, notwithstanding that the SARB’s independence is constitutionally guaranteed. Although statements of the African National Congress (“ANC”), the current ruling party, suggest that nationalizing the SARB is still part of their policy, it appears that the nationalization process has been put on hold and a final resolution of the matter is still pending.
Papua New Guinea
In PNG, the government of Prime Minister James Marape has advocated a policy of "Take Back PNG", intended to increase the PNG Government’s share of the proceeds from mining, enhance landholder and provincial government equity participation in mining projects and promote direct involvement in mining and exploration by State-owned enterprises. In addition to a comprehensive ongoing review of PNG’s mining regime, this policy has witnessed the passage of the Mining (Amendment) Act 2020 which empowers the PNG Government to reserve land that is subject to an expired, cancelled, surrendered or relinquished tenement, and the tabling of the PNG Organic Law, which envisages the transfer of ownership of minerals from the PNG Government to a SOE not subject to the PNG Mining Act.
It is difficult to predict the future political, social and economic environment in these countries, or any other country in which we operate save to state that any social, economic or political changes or instability may adversely affect the general business environment and our business, results of operations and financial condition, including the movement of funds into or out of South Africa and PNG.
Given the nature of mining and the type of mines we operate, we face a material risk of liability, delays and increased cash costs of production from environmental and industrial accidents and pollution compliance breaches
The business of gold mining involves significant risks and hazards, including environmental hazards and industrial accidents. In particular, hazards associated with underground mining include:
• rock bursts;
• seismic events;
• underground fires;
• cave-ins or fall-of-ground;
• discharges of gases and toxic chemicals;
• release of radioactive hazards;
• flooding or droughts;
• mining of pillars (integrity of shaft support structures may be compromised and cause increased seismicity);
• processing plant fire and explosion;
• critical equipment failures;
• inability to access methane filled shafts for rehabilitation;
• accidents and loss-of-life incidents; and
• other conditions resulting from drilling, blasting and the removal and processing of material from a deep-level mine.
Hazards associated with opencast mining (also known as open-pit mining) include:
• flooding of the open-pit;
• collapse of open-pit walls or slope failures;
• processing plant fire and explosion;
• accidents associated with operating large open-pit and rock transportation equipment;
• accidents associated with preparing and igniting of large-scale open-pit blasting operations; and
• major equipment failures.
Hazards associated with construction and operation of waste rock dumps and tailings storage facilities include:
• accidents associated with operating a waste dump and rock transportation;
• production disruptions caused by natural phenomena, such as floods and droughts and weather conditions, potentially exacerbated by climate change;
• dam, wall or slope failures; and
• contamination of ground or surface water.
We are at risk from any or all of these environmental and industrial hazards. In addition, the nature of our mining operations presents safety risks. Our operations are subject to health and safety regulations, which could impose additional costs and compliance requirements. We may face claims and liability for breaches, or alleged breaches, of such regulations and other applicable laws. Any legislative changes relating to financial provisions could add to the costs. The occurrence of any of these events could disrupt production, increase cash costs and, individually or in the aggregate, have a material adverse effect on our business, results of operations and our financial condition.
Mining companies are increasingly expected to provide benefits to affected communities; failure to comply with, and beyond, our legal obligations could result in legal suits, additional operational costs, investor divestment and impact our “social license to operate”, which could adversely impact our business, operating results and financial condition: we are finding increasing expectations on our business to provide social investment beyond our legal obligations especially as communities demand services and basic infrastructure from companies such as Harmony (where local government has failed the communities)
As a result of public concern about the perceived ill effects of economic globalization, businesses in general and large international companies such as our company, in particular, face increasing public scrutiny of their activities.
Like other mining companies, we are under pressure to demonstrate that while we seek a satisfactory return on investment for shareholders, other stakeholders including employees, contractors, regulators, communities surrounding the operations and the countries in which we operate, also benefit from our commercial activities. Such pressures tend to be particularly focused on companies whose activities are perceived to have a high impact on the social and physical environment. The potential consequences of these pressures include reputational damage, legal suits, social spending obligations and investor withdrawal. There is also increasing action by members of the general financial and investment communities, such as asset managers, sovereign wealth funds, public pension funds, universities and other groups, to promote improvements in ESG performance by us and others.
Existing and proposed mining operations are often located at or near existing towns and villages and other infrastructure, or natural water courses. The impacts of dust generation, waste storage, water quality or shortages may be immediate and directly adverse to those communities; poor environmental management practices, in particular, adverse changes in the supply or quality of water can result in community protest, regulatory sanctions or ultimately in the withdrawal of community and government support. While mining operations are intended to be designed to mitigate the impact on such communities and the environment, there can be no assurance that they will do so, and the occurrence of any of these events could disrupt production, increase cash costs and, individually or in the aggregate, have a material adverse effect on our business, results of operations and our financial condition.
Australia
Mining in Australia is subject to the Native Title Act 1993 (Cth) (the “Native Title Act”). Any "future act" on land or waters that will affect native title rights and cultural heritage interests is subject to native title processes intended to protect such rights and interests through a right to negotiate enabling affected parties to reach agreement on the terms of consent concerning the proposed future acts, including monetary compensation, employment and training, contracting opportunities and cultural heritage. These arrangements are captured in Indigenous Land Use Agreements, which are then registered with the National Native Title Tribunal.
Papua New Guinea
In PNG, we are required under the PNG Mining Act and PNG Environment Act to pay landowners compensation for any loss or damage sustained by them arising from our exploration or mining activities. In certain prescribed instances, the quantum of these payments is regulated, or otherwise is the subject of negotiation (and determination by a mine warden in the event of disagreement).
In addition, it is practice under the PNG mining regime for mining tenement holders to enter into a negotiated Memorandum of Agreement (“MOA”) (also referred to as a community development agreement) with the PNG Government, the affected provincial and local level governments, the affected landowner(s) and other stakeholder organizations regarding the sharing of benefits (e.g. royalties payable to the PNG Government) derived from the mining operations and other social performance objectives.
Under the Hidden Valley Mine MOA, which was executed in 2005, an agreed share of the royalties paid by us to the PNG Government in respect of our mining operations is allocated among Morobe Provincial and local level governments and landowner groups. Also, the Hidden Valley MOA contains agreed national content, localization and social performance plans, which address various aspects of procurement, business development, employment and training and other community support.
It will similarly be necessary to enter into a Wafi-Golpu MOA in the course of the permitting of the Wafi-Golpu Project.
Cultural heritage sites are protected under the PNG Conservation Areas Act 1978, which regulates the conservation of sites having particular historic, scientific and social importance in coordination with the provisions of environmental permits issued under the PNG Environment Act, and archaeological permits issued by the PNG National Museum and Art Gallery.
Delays in projects attributable to a lack of community support or community-related disruptions or delays can translate directly into a decrease in the value of a project or into an inability to bring the project to, or maintain, production. The cost of implementing these and other measures to support sustainable development could increase capital expenditure and operating costs and therefore adversely impact our reputation, business, operational results and financial condition. See "Integrated Annual Report for the 20-F 2023 – About Harmony – Our material matters" on pages 46 to 51 and "– Stakeholder engagement” on pages 52 to 57.
We may not be able to meet our ESG targets
We have announced a range of net zero and other ESG-related targets for the next five years, including environmental management, land rehabilitation, climate change, energy and emissions management, water use optimization, tailings and waste management, air quality, biodiversity and conservation, employee health and safety, wellness and healthcare, community empowerment, corporate social investment and corporate governance. We cannot guarantee that we will meet all these targets. For instance, the climate crisis cannot be addressed by Harmony, or any organization, on its own. Our progress is dependent not only on our own actions but on (i) the governments of the countries in which we operate, (ii) clear, early regulatory policy to help drive the change needed to meet our targets and (iii) actions of those in our value chain and wider society. Failure to meet these targets could have a material adverse effect on our business, operating results and financial condition, as well as pose reputational and litigation risks. See "Integrated Annual Report for the 20-F 2023 – Environment" set forth on pages 113 to 164.
Compliance with emerging climate change regulations could result in significant costs for us
Increased global awareness that GHGs contribute to climate change has resulted in legislative mechanisms obliging companies to report GHG emissions and implement measures to reduce GHG emissions and imposing penalties or taxes on GHG emissions. The manner in which these legislative mechanisms and sustainability measures will affect the Company are set out in more detail below.
Reporting GHG Emissions
In South Africa, the National Greenhouse Gas Emission Reporting Regulations require that we register our operations that involve fuel combustion activities associated with mining and quarrying in excess of 10MW as well as certain other activities associated with the mineral industry. We must report our GHG emissions and activity data in respect of these operations in accordance with the Technical Guidelines for Monitoring, Reporting and Verification of Greenhouse Gas Emissions by Industry (“Technical Guidelines”) for each of the relevant GHGs and the Intergovernmental Panel on Climate Change (“IPCC”), emission sources by March 31st of each year. The Technical Guidelines are a companion to the South African National GHG Regulations and describe the reporting methodology as specified in the Air Quality Act.
Reduction in GHGs
GHGs are emitted directly by our operations, as well as indirectly as a result of consuming electricity generated by external utilities. Emissions from electricity consumption are indirectly attributable to our operations.
A number of international measures seeking to mitigate or limit GHG emissions have been ratified by South Africa, Australia and PNG, including the Paris Agreement, a treaty negotiated at the Conference of the Parties of the UN Framework Convention on Climate Change in Paris in December 2015 (the “Paris Agreement”), pursuant to which member countries set out the manner and period in which they plan to reduce emissions. This commitment or “nationally-determined contribution” is informed by each member country’s circumstances.
Pursuant to South Africa’s nationally-determined contribution, GHG emissions will peak between 2020 and 2025, plateau from 2025 to 2035 and thereafter decline from 2036 onwards.
The Australian government has committed to reaching net zero emissions by 2050 and, in 2022, announced additional emissions reduction targets of 43% on 2005 levels by 2030.
PNG’s GHG emissions have historically been negligible. However, according to PNG’s nationally-determined contribution, economic development in PNG will see an increased reliance on fuel. The PNG Government therefore plans to reduce fossil fuel emissions in the electricity generation sector and transition to 100% renewable energy by 2030, provided that funding is available.
The Carbon Tax Act was enacted to assist South Africa in meeting its objectives under its nationally-determined contribution. The Carbon Tax Act came into effect on June 1, 2019 notwithstanding that the regulations required for implementation had not then been promulgated. Pursuant to the Carbon Tax Act, a party is liable to pay a carbon tax if it conducts an activity in South Africa resulting in GHG emissions above the threshold set out in Schedule 2 to the Carbon Tax Act. The tax is charged at a rate of R144 per tonne of GHG emissions generated by burning fossil fuels, unintentionally emitting GHGs during the extraction, processing, delivery and burning of fossil fuels for energy production, including from industrial plant and pipelines, and conducting manufacturing processes that chemically and physically transform materials.
The tonnage of GHGs in respect of these activities is determined by multiplying GHG emission factors contained in the Schedules to the Carbon Tax Act by the mass of fossil fuels or raw materials used or produced, as the case may be. Until December 31, 2025 the tax rate will be increased annually by the consumer price index (“CPI”) plus 2%. Thereafter, the rate will increase annually by the CPI.
In order to reduce the significant tax that results by multiplying the total tonnage of GHG by R144, the Carbon Tax Act makes provision for various “allowances” which could result in a decrease of the carbon tax payable by up to 95%. These allowances include:
• allowance for fossil fuel combustion;
• allowance for industrial process emissions;
• allowance in respect of fugitive emissions;
• a trade exposure allowance;
• a performance allowance;
• a carbon budget allowance; and
• an offset allowance.
These allowances reduce the effective carbon tax rate to between R6 and R48 per tonne of GHG. Pursuant to section 19 of the Carbon Tax Act, the South African Minister of Finance ("Minister of Finance") must make regulations regarding: the sub-sector GHG emissions intensity benchmark required in order to calculate the performance allowance; the manner in which the trade exposure allowance must be determined; and carbon offsets. To date, only the carbon offset regulations under the Carbon Tax Act have been promulgated, which set out the eligibility criteria for carbon offset projects, a procedure for taxpayers claiming the carbon offset allowance, and administration of the offset system. The South African National Treasury published amendments to the carbon offset regulations in March 2021, which among other things stated that the carbon offset regulations were amended to clarify that carbon credits from approved “clean development mechanism” projects issued under national registries will be eligible for carbon offsets. The intensity benchmark regulations and trade exposure regulations are still only in draft form. In respect of carbon budgets, the South African government has undertaken to consult with industry to ensure an “optimal combination” of mitigation actions that strike a balance between South Africa’s socio-economic imperatives, especially creating and preserving jobs, as well as the need to manage climate change impacts and contribute to global efforts to stabilize GHG concentrations.
On February 18, 2022, the DFFE introduced the Climate Change Bill, 9 of 2022 (the “2022 Climate Change Bill”), for public consultation. The 2022 Climate Change Bill would impose carbon budgets on entities in certain high-emitting industries, such as mining. It also requires companies, including Harmony, to submit pollution prevention plans covering the period from January 1, 2021 to December 31, 2025. The carbon budgets are intended to operate as statutory limits for CO2e emissions in excess of which may entail a fine, or other punitive measures. It is expected that the Carbon Tax Act will be aligned with the 2022 Climate Change Bill, such that it will set out the amount that companies will be required to pay for CO2e emissions exceeding the applicable carbon budget. Further, if the 2022 Climate Change Bill is enacted, it is expected that the South African government will phase out the current carbon budget allowance of 5% provided for under the Carbon Tax Act.
The first carbon tax payment for the period from June 1, 2019 to December 31, 2019 was originally due on July 31, 2020, but was extended to October 31, 2020 due to the Covid-19 pandemic. Carbon tax reporting and payment for 2020 was due on July 29, 2021, with details and requirements related to reporting available on the South African Revenue Service’s website.
Our tax liability due to the carbon tax has been provisionally estimated post 2030. However, at this time it is not possible to determine the ultimate impact of the Carbon Tax Act on the Company. Nevertheless, we have set our internal carbon price (for the South African operations) to match that of the carbon tax. We may also be liable for potential pass-through costs from our suppliers in the short term from increased fuel prices. Simultaneously with the introduction of the carbon tax under the Carbon Tax Act, a carbon fuel levy was introduced under the Customs and Excise Act 91 of 1964 ("Customs and Excise Tax"), as part of the current South African fuel levy regime. The carbon tax on liquid fuels will be imposed at the fuel source. It is estimated that the increased fuel price would be R0.13/liter. This will have an impact on our operational expenses.
The carbon tax poses a relatively low cost to us until December 31, 2025 after which it is anticipated that the “allowances” discussed above will be reduced and the tax will be increased. It is also anticipated that carbon taxes will be imposed on electricity usage generated from fossil fuels. The impact of the carbon tax on us arising from electricity usage after December 31, 2025 is estimated to range from R100m to R600m by 2030
The new escalations incremental rate % increases, effective on a calendar year basis, are as follows and based on unmitigated projections:
•R159 in 2023 (up 10% from R144 in 2022)
•R190 in 2024 (20%)
•R236 in 2025 (24%)
•R308 in 2026 (30%)
•R347 in 2027 (13%)
•R385 in 2028 (10%)
•R424 in 2029 (10%)
•R462 in 2030 (9%).
Although these rates as well as the longer term assumptions have been built into our business plans, with a 300% absolute increase in the price of carbon over the next seven years, it is set to put significant pressure on our business.
The largest portion of GHG emissions is predominantly electricity-related, with electricity expenditure amounting to approximately 15% of our cash costs in South Africa. While cost management is clearly a strategic issue for us, of even greater importance is that energy supply be constant and reliable, given the implications of a loss of energy on both production and health and safety. Additional taxes on energy will affect us significantly, as will regulation that may include, among other things, emission measurement and reduction, audit processes and human resource costs.
There is some sentiment expressed by South African National Treasury that the taxes may be increased but this is not supported by regulation at present.
Assessments of the potential impact of future climate change regulation are still uncertain, given the wide scope of potential regulatory change in South Africa. Such regulatory initiatives and related costs could have a material adverse effect on the business, operating results and financial condition.
Climate Change legislation and policy
South Africa
As mentioned above, the DFFE published the 2022 Climate Change Bill for public consultation in response to the international commitments made under the Paris Agreement. It aims to address climate change in the long-term by aiming for a climate resilient and low carbon economy in South Africa. Comments on the 2022 Climate Change Bill were due on May 27, 2022. It is unclear when a new draft will be made available.
Australia
Australia has recently passed the Climate Change Act 2022 (Cth) which enacted the 2030 and 2050 targets in legislation. The Australian government has also progressed reforms in a number of sectors to align with its climate targets, including amendments to the Safeguard Mechanism, the primary tool to limit emissions from large emitting facilities. See “– We are subject to extensive environmental regulations in the countries in which we operate – Australia”. Such regulatory initiatives and related costs, while they are not expected to have significant impact in the near term, could have a material adverse effect on the business, operating results and financial condition in the future.
PNG
In PNG, the PNG Climate Change (Management) Act 2015 provides the regulatory framework with respect to climate change in PNG, and establishes PNG’s Climate Change and Development Authority as the coordinating entity for climate change related policies and actions across PNG and the designated National Authority under the UN Framework Convention on Climate Change. Implementation actions under this policy to date have been very limited, however in January 2021 the PNG Climate Change Fees and Charges came into effect which include taxes on carbon in fuel products and a Green Fee (a departure tax for non-residents leaving PNG), and in August 2022 a draft Climate Change (Management) (Carbon Markets) Regulation was circulated for discussion. Future implications of the climate change policy on our operations in PNG are still being established and while they are not expected to have significant impact in the near term, they may potentially have a material adverse effect on our business, operating results and financial condition in the future.
See "Integrated Annual Report for the 20-F 2023 – Environment – Environmental management and stewardship", and "– Climate change, energy and emissions management” on pages 113 to 119 and 125 to 131 for disclosure regarding our GHG emissions.
Climate change may present physical risks to our operations and carbon tax projections may have serious financial implications to our business profitability and sustainability
Our operations could be exposed to a number of physical risks posed by climate change, such as changes in rainfall, rising sea levels, reduced water availability, higher temperatures and more frequent extreme weather events. Events or conditions such as fires, flooding or inadequate water supplies could disrupt our mining and transport operations, mineral processing and rehabilitation efforts, create resource or energy shortages, damage property or equipment and increase health and safety risks. Such events or conditions could have other adverse effects on our workforce and on the communities around our mines, such as an increased risk of food insecurity, water scarcity and prevalence of disease. Each of these potential physical impacts of climate change could disrupt our operations and have a material adverse effect on our business, operating results and financial condition.
The cost of occupational health care services and the potential liabilities related to occupational health diseases may increase in future and may be substantial
Our operations are subject to health and safety regulations which could impose significant cost burdens.
South Africa
In South Africa, the MHSA imposes various duties on mines and grants the authorities broad powers to, among others, close mines which are unsafe or hazardous to the health of persons and order corrective action on health and safety matters.
There is a risk that the cost of providing health services, complying with applicable regulations, including the Compensation for Occupational Injuries and Diseases Act, 130 of 1993 ("COIDA"), and the Occupational Diseases in Mines and Works Act, 78 of 1973 ("ODMWA"), and implementing various programs could increase in future, depending on changes to underlying legislation, legal claims and the profile of our employees. This increased cost, should it transpire, could be substantial, but is currently indeterminate.
The Occupational Lung Disease Working Group (“Working Group”), was formed in fiscal 2014 to address issues relating to compensation and medical care for occupational lung disease in the South African gold mining industry. The Working Group, made up of African Rainbow Minerals Limited, Anglo American SA, AngloGold, Gold Fields Limited, Harmony and Sibanye Gold Limited, has had extensive engagements with a wide range of stakeholders since its formation, including government, organized labor, other mining companies and the legal representatives of claimants who have filed legal actions against the companies.
We have been subject to numerous claims, including class actions or similar group claims relating to silicosis and other occupational lung diseases, and could be subject to similar claims in the future. For instance, in May 2016, the High Court of South Africa (Gauteng Division) certified a class action by current and former mine workers against gold mining companies in South Africa, including us.
The matter was subsequently settled in May 2018. The terms of the settlement are available on our website. Accordingly, the Tshiamiso Trust was created for purposes of administering the settlement funds. On January 31, 2020, the Working Group commenced the payment of their quarterly administration and benefit contributions to the Tshiamiso Trust to enable the trustees to settle benefits of eligible claimants. See Item 8: “Financial Information – Consolidated Statements and Other Financial Information – Legal Proceedings” and "Integrated Annual Report for the 20-F 2023 – Health” on pages 180 to 187 for further information. See note 27 “Other Provisions – Provision for silicosis settlement” to our consolidated financial statements set forth beginning on page F-1.
At June 30, 2023 the provision in our statement of financial position was R820 million. We believe that this remains a reasonable estimate of our share of the estimated cost in relation to the Working Group of the settlement of the class action claims and related costs. The final settlement costs and related expenditure may, however, be higher than the recorded provision depending on various factors, such as, among other things, differences in the number and profile of eligible claimants actually compensated compared to current estimates and fluctuations in foreign exchange rates.
Australia
Operations in the State of Queensland, where our Eva Copper Project is situated, are subject to similar duties and powers, including under the following laws and regulations: the MQSH Act and the MQSH Regulations.
We are not aware of any occupational health claims, including class actions or similar group claims, presently being made in relation to any of our operations in Queensland, but as a mining operator there is a risk we could be subject to such claims in the future. There is also a risk that the cost of providing health services, complying with applicable regulations, and implementing various programs could increase in future, depending on changes to underlying legislation, legal claims and the profile of our employees. This increased cost, should it transpire, could be substantial, but is currently indeterminate
Papua New Guinea
Operations in PNG are subject to similar duties and powers, including under the following laws and regulations: the PNG Mining (Safety) Act, the PNG Mining Safety Regulation 1935 (updated in 2006), the PNG Mining Act, the Industrial Safety, Health and Welfare Act 1961 (PNG), the Industrial Safety, Health and Welfare Regulations 1965 (PNG) and the PNG Environment Act. In June 2021, the PNG Ministry of Mining released the draft Mine & Works (Safety & Health) Bill 2021 which, if enacted in its present form, will repeal and replace the PNG Mining (Safety) Act.
We are not aware of any occupational health claims, including class actions or similar group claims, presently being made in relation to any of our operations in PNG, but as a mining operator there is a risk we could be subject to such claims in the future. There is also a risk that the cost of providing health services, complying with applicable regulations, and implementing various programs could increase in future, depending on changes to underlying legislation, legal claims and the profile of our employees. This increased cost, should it transpire, could be substantial, but is currently indeterminate.
If we or any of our subsidiaries in South Africa, Australia or PNG were to face a significant number of additional such claims and the claims were suitably established against it, the payments of compensation to the claimants could have a material adverse effect on our results of operations and financial condition. In addition, we may incur significant additional costs, including costs relating to the payment of fees, levies or other contributions in respect of compensatory or other funds established (if any), and expenditures arising out of our efforts to resolve any such claims or other potential actions, any of which could have a material adverse effect on our results of operations and financial condition.
Our operations are subject to water use and other licenses, which could impose significant costs
South Africa
Under the NWA a person may only undertake a “water use” subject to a water use license (and the conditions contained therein) issued under the NWA, a general authorization issued by the Minister of Water and Sanitation or in terms of a prior existing water use, such as a water permit issued under the NWA’s predecessor, Water Act, 54 of 1954 (“Water Act”). Persons undertaking water use under a general authorization or prior existing water use are required to register this use with the Department of Water and Sanitation (“DWS”) and are required to comply with the conditions contained in the published general authorization or any conditions contained in any prior existing water use (to the extent there are any).
Our South African operations are predominantly regulated under water permits issued pursuant to the Water Act, with some having been converted to water use licenses under the NWA. Notwithstanding this, the South African operations have elected to convert all prior existing water uses into water use licenses under the NWA to ensure these operations are carried out in accordance with current best practice and water quality standards. Submissions were made as early as 2003 and we have been working closely with the regional directors in the review process.
Some operations have received draft licenses for review and comment before finalization by the regional directors at the DWS. Kusasalethu and Kalgold received their final water use licenses. These licenses, however, contain conditions that are impossible to meet and, as a result, we have applied to amend the relevant conditions.
In future, when new water licenses are issued, we may need to implement alternate water management measures that may require significant cost implication for our business. We intend to work collaboratively with the regional departments and catchment management agencies (which are aimed at decentralizing water management and facilitating inclusive stewardship of water resources) to reach a sustainable outcome for both us and the water resource/environment.
Failing to comply with the conditions of a water use license may result in the competent authority issuing a compliance notice or directive to us instructing it to take measures to correct the non-compliance and, in some instances, to cease operations pending the resolution of the non-compliance.
In addition, failing to comply with a water use license is an offense that may result in prosecution. If we are successfully prosecuted, the court may impose fines, damages, director and employee liability and imprisonment.
Any of these could have a material effect on our business, operating results and financial condition.
In addition to the licensing requirements mentioned above, the NWA imposes a duty of care on us to take reasonable measures to prevent pollution or contamination of water resources. The nature and extent of the reasonable measures will depend on the circumstances of each case. If we fail to implement the measures required of it, a directive may be issued by the competent authority instructing us to implement certain measures within a prescribed period. Failing to comply with a directive is an offense and may result in prosecution and the penalties contemplated above. In addition, the competent authority could implement the necessary measures using its own methods and resources, and thereafter recoup the costs from us.
Any such environmental levy could have a material effect on our business, operating results and financial condition. In addition, the occurrence of Acid Mine Drainage ("AMD") at any of our mines could affect our ability to comply with our water use license requirements.
Obligations in respect of the pumping and treatment of extraneous water must also be addressed in connection with our final closure plans for each of our operations and we are responsible for these liabilities until a closure certificate is issued pursuant to the MPRDA and possibly thereafter under the NEMA. This liability is discussed in more details in Item 4: “Information on the Company – Business Overview – Regulation – Law and Regulations Pertaining to Environmental Protections in South Africa – NEMA”. Refer to "– Risks associated with pumping water inflows from closed mines adjacent to our operations, including related closure liabilities, could adversely affect our operational results".
Australia
Under the conditions of the mining leases for the Eva Copper Project, Eva Copper Mine Pty Limited is permitted to construct groundwater bores within the area subject to the mining leases.
To authorize the uptake of groundwater from a bore/borefield, a water license is required only if the bore is in an area where groundwater is managed (i.e. within an identified groundwater unit of a relevant water plan). This is not presently the case for the Eva Copper Project. If at any future stage the Project considers groundwater supply from any listed Great Artesian Basin groundwater management units, a water license will be required and we would be required to comply with the terms of such license.
Should we breach any obligations in complying with the provisions of any permit or license or any laws and regulations under which they were issued, our permit or license could be suspended or cancelled, or we could be subject to fines or other sanction. Any such suspension, cancellation or sanction could have a material adverse effect on our results of operations and financial condition.
Papua New Guinea
In PNG, the issuance of separate "waste discharge" and "water extraction" (water use) permits has now been abolished and, following the conclusion of the assessment process for a project, a single environment permit is issued by the Managing Director of CEPA under the provisions of the PNG Environment Act. The environment permit includes provisions for both water extraction and waste discharge. An annual administration fee is payable for this permit.
Should we breach any obligations in complying with the provisions of our environment permit or the PNG Environment Act, our permit could be suspended or cancelled, or we could be subject to fines or other sanction. Any such suspension, cancellation or sanction could have a material adverse effect on our results of operations and financial condition.
See "Integrated Annual Report for the 20-F 2023 – Environment – Water use” on pages 132 to 137.
Compliance with tailings management requirements and standards, and potential liabilities in the event of a failure to timely comply or an incident involving a tailings storage facility, could adversely impact our financial condition, results of operations and reputation
Mining companies face inherent risks in their management of uneconomical milled ore residue and water, known as tailings, which includes the operation of tailings storage facilities and other tailings disposal systems, like DSTP. Tailings storage facilities are engineered structures built for the containment of tailings, and DSTP facilities are engineered pipeline and mixing infrastructure for the placement of tailings in the sea.
We presently operate only tailings storage facilities, but DSTP is the approved tailings management system for the proposed Wafi-Golpu Project. The proposed use of DSTP facilities at the Wafi-Golpu Project may expose us to reputational risk.
The use of tailings storage facilities exposes us to certain risks, including the failure of a tailings dam due to events such as high rainfall, overtopping of the dam, piping or seepage failures. The potential occurrence of a dam failure at one of our tailings storage facilities could lead to the loss of human life and extensive property and environmental damage.
We maintain measures to manage the safety of our tailings storage facilities, including compliance with the International Council on Mining and Metals’ Tailings Governance Position Statement, our Code of Practice and undertakes routine reviews by independent consulting companies.
Although we have a tailings storage facility management system, the effectiveness of its designs, construction quality or regular monitoring cannot be guaranteed throughout its operations and it cannot be guaranteed that these measures will prevent the failure of one or more of its tailings dams or that such potential failure will be detected in advance. In addition, although we generally require our partners to maintain such systems, we cannot guarantee that our partners maintain similar safety precautions or monitoring systems on their tailings storage facilities.
There is no assurance that any safety measures implemented will prevent the failure of any tailings storage facility.
The failure of a tailings storage facility will lead to multiple legal proceedings and investigations, which could include securities class actions, criminal proceedings and public civil actions (against us or individuals) for significant amounts of damages. Furthermore, the elimination of the “conventional” practice of storing wet tailings (e.g. alternatively filtering, “dry” stacking and compacting the tailings) could require the research and development of new technologies, which could lead to additional large expenditures. As a result of the dam failure in Brazil in 2015 and 2019, and Canada in 2014 (neither of which are associated with us) or as a result of future dam failures, additional environmental and health and safety laws and regulations may be forthcoming globally, including in jurisdictions where we operate, which may ban the storage of wet tailings completely. In addition, changes in laws and regulations may impose more stringent conditions in connection with the construction of tailings dams, particularly with respect to upstream tailings dams which could also be made illegal. Further, we may see changes in the licensing process of projects and operations, the imposition of significant financial assurance requirements, and increased criminal and civil liability for companies, officers and contractors.
Furthermore, the unexpected failure of a dam at a tailings storage facility could lead to the need for a large expenditure on contingencies and on recovering the regions and people affected, extensive and permanent environmental damage and the payment of penalties, fines or other money damages. The occurrence of any of such risks could have a material adverse effect on our business, operating results and financial condition. See "Integrated Annual Report for the 20-F 2023 – Environment – Tailings and waste management” on pages 138 to 144.
We may have exposure to rehabilitate potential groundwater and land pollution, which may include salination, and radiation contamination that may exist where we have operated or continue to operate; implementation of the financial provision regulations may require us to include provision in our financial statements for rehabilitation
Due to the interconnected nature of mining operations at Doornkop, Kusasalethu, Mponeng, Mine Waste Solutions ("MWS") and Moab Khotsong, any proposed solution for potential flooding and decant risk posed by deep groundwater needs to comprise a regional solution supported by all mines located in the goldfields and the government in the event of legacy issues. As a result, the DMRE and affected mining companies are involved in developing a regional mine closure strategy. In view of the status of the Financial Provision Regulations, 2015, no reliable estimate can be made for any possible obligations or liabilities, which could be material and have an adverse impact on our financial condition.
See “—Risks Related to Our Industry - We are subject to extensive environmental regulations in the countries in which we operate”.
We are implementing the following steps to ensure that funds are available to top up our financial provision, if necessary:
• facilitating concurrent rehabilitation;
• re-purposing infrastructure and mining affected land; and
• accelerating mine closure rehabilitation where operations have reached the end of its geological life.
Currently, no provision for any potential liability has been made in our financial statements under the Financial Provision Regulations, 2015. If provision needs to be made, and is substantial, this could have a material adverse effect on our business, operating results and financial condition.
Compliance with new and changing corporate governance and public disclosure requirements adds uncertainty to our compliance policies and increases our costs of compliance
Laws, regulations and standards relating to accounting, corporate governance and public disclosure, “conflict minerals” and “responsible” gold, SEC regulations and other listing regulations applicable to us are subject to change and can create uncertainty for companies like us. New or changed laws, regulations, codes and standards could lack specificity or be subject to varying interpretations. Their application in practice may evolve over time as new guidance is provided by regulatory and governing bodies. This could result in continuing uncertainty on compliance matters and higher costs of compliance as a result of ongoing revisions to such governance standards.
We are committed to maintaining high standards of corporate governance and public disclosure, and our efforts to comply with evolving laws, regulations, codes and standards in this regard have resulted in, and are likely to continue to result in, increased general and administrative expenses, which could have a material adverse effect on our business, operating results and financial condition.
Risks Related to Our Corporate and Financing Structure and Strategy
Our inability to maintain effective disclosure controls and procedures, and an effective system of internal control over financial reporting may have an adverse effect on investors’ confidence in the reliability of our financial statements and other disclosures
Internal control over financial reporting is a process designed to provide reasonable assurance regarding the reliability of financial reporting and the preparation of the Company’s financial statements for external purposes in accordance with IFRS as issued by the IASB. Disclosure controls and procedures are designed to ensure that information required to be disclosed by a company in reports that it files or submits under the Exchange Act, is recorded, processed, summarized and reported within the time periods specified in the rules and forms of the SEC. We have invested in resources to manage the documentation and assessment of our system of disclosure controls and our internal control over financial reporting. However, a control system, no matter how well designed and operated, can provide only reasonable, not absolute, assurance with respect to the reliability of financial reporting, financial statement preparation and other disclosures. If we were unable to maintain effective disclosure controls and procedures as well as an effective system of internal control over financial reporting, investors may lose confidence in the reliability of our financial statements, and this may have an adverse impact on investors’ abilities to make decisions about their investment in us.
See Item 15: “Controls and Procedures”.
We may experience problems in identifying, financing and managing new acquisitions or other business combination transactions and integrating them with our existing operations; we may not have full management control over future joint venture partners
In order to maintain or expand our operations and reserve base, we have sought, and may continue to seek to enter into joint ventures or other business combination transactions or to make acquisitions of selected precious metal producing companies or assets. For example, with effect on October 1, 2020, acquired the remainder of AngloGold’s South African business, including the Mponeng mine and MWS, in the Mponeng Acquisition. In December 2022, Harmony acquired its Eva Copper Project in Queensland, Australia.
Acquiring new mining operations or entering into other business combination transactions involves a number of risks including:
•our ability to identify appropriate assets for acquisition and/or to negotiate an acquisition or combination on favorable terms;
•obtaining the financing necessary to complete future acquisitions;
•difficulties in assimilating the operations of the acquired business;
•the changing regulatory environment as it relates to the Mining Charter (as defined below) and the general policy uncertainty in South Africa;
•difficulties in maintaining our financial and strategic focus while integrating the acquired business;
•problems in implementing uniform quality, standards, controls, procedures and policies;
•management capacity, and skills to supplement that capacity, to integrate new assets and operations;
•increasing pressures on existing management to oversee an expanding company; and
•to the extent we acquire mining operations or enter into another business combination transaction outside South Africa, Australia or PNG, encountering difficulties relating to operating in countries in which we have not previously operated.
Any such acquisition or joint venture may change the scale of our business and operations and may expose us to new geographic, geological, political, social, operating, financial, legal, regulatory and contractual risks. Our ability to make successful acquisitions and any difficulties or time delays in achieving successful integration of any of such acquisitions could have a material adverse effect on our business, operating results and financial condition.
In addition, to the extent that we participate in the development of a project through a joint venture or other multi-party commercial structure, there could be disagreements, legal or otherwise or divergent interests or goals among the parties, which could jeopardize the success of the project, particularly if we do not have full management control over the joint venture. There can be no assurance that any joint venture will achieve the results intended and, as such, any joint venture could have a material adverse effect on our revenues, cash and other operating costs. See Item 5. “Operating and Financial Review and Prospects - Liquidity and Capital Resources - Cash flows from investing activities”.
Certain factors may affect our ability to support the carrying value of our property, plant and equipment, and other assets on our balance sheet, resulting in impairments
We review and test the carrying value of our assets when events or changes in circumstances suggest that this amount may not be recoverable and impairments may be recorded as a result of testing performed.
Our market capitalization on any reporting date is calculated on the basis of the price of our shares and ADSs on that date. Our shares and ADSs may trade in a wide range through the fiscal year depending on the changes in the market, including trader sentiment on various factors including gold price. Therefore, there may be times where our market capitalization is greater than the value of our net assets, or “book value”, and other times when our market capitalization is less than our book value. Where our market capitalization is less than our net asset or book value, this could indicate a potential impairment and we may be required to record an impairment charge in the relevant period.
At least on an annual basis for goodwill, and when there are indications that impairment of property, plant and equipment and other non-financial assets may have occurred, estimates of expected future cash flows for each group of assets are prepared in order to determine the recoverable amounts of each group of assets. These estimates are prepared at the lowest level at which identifiable cash flows are considered as being independent of the cash flows of other mining assets and liabilities. Expected future cash flows are inherently uncertain, and could materially change over time. Such cash flows are significantly affected by reserve and production estimates, together with economic factors such as spot and forward gold prices, discount rates, currency exchange rates, estimates of costs to produce reserves and future capital expenditures.
As at June 30, 2023, we had substantial amounts of property, plant and equipment and other assets on our consolidated balance sheet. There were no impairment charges relating to property, plant and equipment, and other assets recorded in fiscal 2023. If management is required to recognize impairment charges in the future, this could have a material adverse effect on our results of operations and financial condition.
Our ability to service our debt will depend on our future financial performance and other factors
Our ability to service our debt and maintain compliance with financial covenants depends on our financial performance, which in turn will be affected by our operating performance as well as by financial and other factors, and in particular the gold price, certain of which are beyond our control. Various financial and other factors may result in an increase in our indebtedness, which could adversely affect us in several respects, including:
•limiting our ability to access the capital markets;
•hindering our flexibility to plan for or react to changing market, industry or economic conditions;
•limiting the amount of cash flow available for future operations, acquisitions, dividends, or other uses, making us more vulnerable to economic or industry downturns, including interest rate increases;
•increasing the risk that we will need to sell assets, possibly on unfavorable terms, to meet payment obligations; or
•increasing the risk that we may not meet the financial covenants contained in our debt agreements or timely make all required debt payments.
The occurrence of any of these events could adversely affect our results of operations and our financial condition. See “ – The impact from, and measures taken to address the Covid-19 pandemic, as well as other infectious diseases, such as HIV/AIDS and tuberculosis, pose risks to us in terms of productivity and costs and may adversely affect our people, and may impact our business continuity, operating results, cash flows and financial condition.”
Our ability to service our debt also depends on the amount of our indebtedness. During fiscal 2023 we acquired the Eva Copper Project in Australia for a cash consideration of US$180 million. This was funded from undrawn debt facilities which increased our net debt level. Higher gold prices in the latter half of the year improved our cash flow and as a result we repaid a portion of the debt before the end of fiscal 2023.
In May 2022 we entered into a US$400 million sustainability-linked syndicated term and revolving credit facility, a R2.5 billion sustainability-linked revolving credit facility, as well as a R1.5 billion Green term loan. The first two facilities have a three-year term and include two extension options of one year each and the last facility has a six and one-half year term. The extension option on the US$400 million sustainability-linked loan was exercised during the year, extending the maturity date to May 2026. At June 30, 2023, US$200 million was drawn against the US$ facility but there was no amounts drawn against either of the Rand facilities. See Item 5: “Operating and Financial Review and Prospects - Liquidity and Capital Resources - Cash flows from financing activities” and “- Outstanding Credit Facilities and Other Borrowings”.
In the near term, we expect to manage our liquidity needs from cash generated by our operations, cash on hand, committed and unutilized facilities, as well as additional funding opportunities. However, if our cost of debt were to increase or if we were to encounter difficulties in obtaining financing in the future, our sources of funding may not match our financing needs, which could have a material adverse effect on our business, operating results and financial condition.
We are subject to the imposition of various regulatory costs, such as mining taxes and royalties, changes to which may have a material adverse effect on our operations and profits; our operations and financial condition could also be adversely affected by policies and legislation related to greater state intervention in the mining and potentially the expropriation of mining assets without compensation
With increasing resource nationalism in recent years, governments, communities, non-government organizations and trade unions in several jurisdictions have sought and, in some cases, have imposed greater participatory imposts on the mining industry. In South Africa, draft legislation has been proposed that would envisages greater state intervention in the mining industry, including the revision of existing royalties, the imposition of new taxes, an increase in the South African government’s holdings in mining companies and potentially the expropriation of mining assets without compensation. Such imposts, whether in the form of taxes, royalties and levies, interference in project management, mandatory social investment requirements, local content requirements or creeping expropriation, are an increasing feature of the global mining industry and could materially adversely affect our business, operating results and financial condition. See Item 4 "Business Overview - Land expropriation", "- Assessed losses", "- Base erosion and profit shifting" and "- Renewable energy".
Australia
Harmony Gold Australia Pty Ltd ("HGA") is the head company of the South-east Asia Group, and the holding company for the Harmony assets held in Australia and PNG. HGA acquired 100% of the shares in Copper Mountain in December 2022 which included acquisition of the Eva Copper Project in Queensland, Australia.
Australia operates a system of self-assessment with regard to taxation and the Australian Taxation Office ("ATO") accepts the information given in relevant filings and disclosure as complete and accurate. The ATO will review information provided if they have reason to think information provided is not complete or accurate or if a transaction is considered high risk.
We believe that the key risks in relation to the Australian operations are:
•Transfer pricing risk in relation to interest free loans advanced from HGA to its PNG subsidiaries and related parties: The appropriateness of the interest free nature of the loans is currently subject to an ATO review. Harmony has provided its response and analysis to the ATO pending feedback; and
•Ability to use tax losses inherited by Copper Mountain against taxable income of the Eva Copper Project once it reaches production: ATO is likely to review and assess whether the relevant business continuity tests are satisfied to allow these losses to be utilized and deducted against project income in the future.
Papua New Guinea
In PNG, taxes take a variety of forms.
Taxes on Group companies are governed by the PNG Income Tax Act 1959 ("PNG Income Tax Act") and the Goods and Services Tax Act 2003, while under the PNG Mining Act and the Mineral Resources Authority Act 2018, holders of mining leases must pay royalties to the PNG Government based on production (currently 2% of the net proceeds of sale of minerals).
In addition to the PNG Government’s entitlement to taxes and royalties, all tenement holders pay area-based rents and mining lease holders pay a mineral production levy (currently 0.5% of assessable income derived by a producer of minerals) to the PNG MRA. In addition, CEPA imposes "user pays" levies.
PNG exploration licenses each contain a condition that the PNG Government may, at any time prior to the commencement of mining, purchase an equitable interest of up to 30% in any mineral discovery arising from the license at a price pro rata to the accumulated exploration expenditure. The PNG Government has indicated that it intends to exercise the PNG Government's option in full in respect of the Wafi-Golpu Project.
Since 2009, the mining regime in PNG has been the subject of a comprehensive ongoing review involving various PNG Government agencies. Over that period, various draft revisions of the PNG Mining Act have been submitted to the PNG Chamber of Mines and Petroleum for its comments, most recently in 2018 and 2020. Proposed revisions include significant increases in the rate of royalties payable to the PNG Government, and changes to the terms governing the PNG Government's option to purchase an interest in a mineral discovery. If enacted and applied to our operations and projects in PNG, these revisions could have a material adverse effect on our business, operating results and financial condition. We continue to engage with the PNG Government and relevant regulators on these matters, indirectly through the offices of the PNG Chamber of Mines and Petroleum, and directly with the PNG MRA, the CEPA and the DMPGM.
A new Income Tax Act (to simplify and modernize the PNG income law) is in the process of being drafted and is expected to be passed in the 2024 budget, with an expected commencement date of January 1, 2025. If enacted, there will be a transition period of 13 months given to taxpayers to enable them to familiarize themselves with the new Income Tax Act and its requirements. The draft regulations are expected to ready in the first half of 2024 and will be circulated for consultation. The income tax act will include the introduction of a capital gains tax, which is expected to tax capital gains at a rate of 15%.
To date, the key outstanding issue is the transitional rules for treatment of existing Mining Capital and Exploration Expenditure, which rules are still to be written. We understand that these rules will be drafted and included in the final draft of the legislation that is currently in progress.
The effect of the proposals, measures and developments described above, as well as the imposition of additional restrictions, obligations, operational costs, taxes or royalty payments, could have a material adverse effect on Harmony’s business, operating results and financial condition.
Sales of large quantities of our ordinary shares and ADSs, or the perception that these sales may occur, could adversely affect the prevailing market price of such securities
The market price of our ordinary shares or ADSs could fall if large quantities of ordinary shares or ADSs are sold in the public market, or there is a perception in the marketplace that such sales could occur. Subject to applicable securities laws, holders of our ordinary shares or ADSs may decide to sell them at any time. The market price of our ordinary shares or ADSs could also fall as a result of any future offerings it makes of ordinary shares, ADSs or securities exchangeable or exercisable for our ordinary shares or ADSs, or the perception in the marketplace that these sales might occur. We may make such offerings of additional ADS rights, letters of allocation or similar securities from time to time in the future.
As we have a significant number of shares that may be issued in terms of the employee share schemes, our ordinary shares are subject to dilution
We have a Deferred Share Plan as part of our new Total Incentive Plan that came into effect in 2020. Our shareholders have authorized up to 25,000,000 shares of the issued share capital to be used for this plan.
As a result, shareholders’ equity interests in us are subject to dilution to the extent of the potential future exercises of the options through the share plan.
A new ESOP is being considered in collaboration with all stakeholders to further create and enhance shared value for all beneficiaries and will be implemented in 2024, subject to shareholder approval.
The continued status of South Africa’s credit rating as non-investment grade, as well as the recent grey-listing of South Africa by the Financial Action Task Force ("FATF"), may have an adverse effect on our ability to secure financing on favorable terms, or at all
Over the past several years, the slowing economy, rising sovereign debt, escalating labor disputes and the structural challenges facing the mining industry and other sectors have resulted in the downgrading of South Africa’s sovereign credit ratings.
Currently, South Africa’s sovereign credit is rated as non-investment grade: Fitch has assigned South Africa a sovereign credit rating of BB-, Moody’s has assigned South Africa a sovereign credit rating of Ba2 and S&P has assigned South Africa a sovereign credit rating of BB-. Most recently, on July 17, 2023, Fitch affirmed South Africa’s sovereign credit rating as BB- and maintained the outlook as stable; on April 1, 2022, Moody’s affirmed South Africa’s sovereign credit rating as Ba2 and upgraded the outlook to stable and on March 8, 2023, S&P affirmed South Africa’s sovereign credit rating as BB- and downgraded the outlook to stable.
In February 2023 the FATF, an inter-governmental body, published their 'Mutual Evaluation Report' that highlighted several shortcomings of the criminal justice system insofar it relates to the prosecution and conviction of commercial crimes as well as acts of money laundering. South Africa was classified as a country under increased monitoring (also referred to as "grey-listing").
The continued status of South Africa’s credit rating as non-investment grade and any downgrading by any of these agencies, as well as the grey-listing by the FATF may adversely affect the South African mining industry and our business, operating results and financial condition by making it more difficult to obtain external financing or could result in any such financing being available only at greater cost or on more restrictive terms than might otherwise be available.
We may not pay dividends or make similar payments to our shareholders in the future
Our dividend policy is to pay cash dividends only if funds are available for that purpose; specifically our policy is set at 20% of net free cash subject to future major capital expenditure and meeting solvency and liquidity requirements as well as current banking covenants. Whether funds are available depends on a variety of factors, including the amount of cash available, our capital expenditures and other current or future anticipated cash requirements existing at the time. Under South African law, we are only entitled to pay a dividend or similar payment to shareholders if we meet the solvency and liquidity tests set out in the Companies Act, 71 of 2008 (as amended) including its Regulations (the “Companies Act”), and our current Memorandum of Incorporation. Cash dividends or other similar payments may not be paid in the future. It should be noted that there is currently a 20% withholding tax on dividends declared by South African resident companies to non-resident shareholders or non-resident ADS holders.
In addition, our foreign shareholders face investment risk from currency exchange rate fluctuations affecting the market value of any dividends or distributions paid by us.
Strategic and Market Risks
The profitability of our operations, and cash flows generated by those operations, are affected by changes in the price of gold and other metals; a fall in the gold price below our cash cost of production and capital expenditure required to maintain production for any sustained period may lead to losses and require us to curtail or suspend certain operations
Substantially all of our revenues come from the sale of gold. Historically, the market price for gold has fluctuated widely and has been affected by numerous factors, over which we have no control, including:
•demand for gold for industrial uses, jewelry and investment;
•international or regional social, political and economic events and trends;
•strength or weakness of the US dollar (the currency in which gold prices generally are quoted) and of other currencies;
•monetary policies announced or implemented by central banks, including the US Federal Reserve;
•financial market expectations on the rate of inflation;
•changes in the supply of gold from production, divestment, scrap and hedging;
•interest rates;
•speculative activities;
•gold hedging or de-hedging by gold producers;
•actual or expected purchases and sales of gold bullion held by central banks or other large gold bullion holders or dealers; and
•production and cost levels for gold in major gold-producing nations, such as South Africa, China, the United States and Australia.
In addition, current demand and supply affects the price of gold, but not necessarily in the same manner as current demand and supply affect the prices of other commodities. Historically, gold has retained its value in relative terms against basic goods in times of inflation and monetary crisis. As a result, central banks, financial institutions and individuals hold large amounts of gold as a store of value and production in any given year constitutes a very small portion of the total potential supply of gold. However, as gold has historically been used as a hedge against unstable or lower economic performance, improved economic performance may have a negative impact on the price for gold. Since the potential supply of gold is large relative to mine production in any given year, normal variations in current production will not necessarily have a significant effect on the supply of gold or its price. Uncertainty in global economic conditions has impacted the price of gold significantly in the past and continued to do so in fiscal 2023. These include rising inflation countered by increased interest rates, subdued economic growth and possible recessions in major economies. In addition, the past three years have been affected by Covid-19 and certain geopolitical events, such as Russia’s invasion of Ukraine, which have resulted, and may continue to result, in increased volatility.
The volatility of gold prices is illustrated in the table, which shows the annual high, low and average of the afternoon London bullion market fixing price of gold in US dollars for each of the past ten years:
Annual gold price: 2013 - 2023
|
|
|
|
|
|
|
|
|
|
|
|
|
Price per ounce (US$) |
| Calendar year |
High |
Low |
Average |
| 2013 |
1,694 |
|
1,192 |
|
1,411 |
|
| 2014 |
1,385 |
|
1,142 |
|
1,266 |
|
| 2015 |
1,296 |
|
1,049 |
|
1,160 |
|
| 2016 |
1,366 |
|
1,077 |
|
1,251 |
|
| 2017 |
1,346 |
|
1,151 |
|
1,253 |
|
| 2018 |
1,355 |
|
1,178 |
|
1,268 |
|
| 2019 |
1,546 |
|
1,270 |
|
1,393 |
|
| 2020 |
2,067 |
|
1,474 |
|
1,770 |
|
| 2021 |
1,943 |
|
1,684 |
|
1,799 |
|
| 2022 |
2,039 |
|
1,629 |
|
1,800 |
|
| 2023 (up to and including October 25, 2023) |
2,048 |
|
1,811 |
|
1,928 |
|
There was a notable increase in the price of gold following the outbreak of Covid-19 and again after Russia’s invasion of Ukraine. See “- The impact from, and measures taken to address, the Covid-19 pandemic may adversely affect our people, and may impact our business continuity, operating results, cash flows and financial condition”. On October 25, 2023, the afternoon fixing price of gold on the London bullion market was US$1,983.
While the price volatility is difficult to predict, if gold prices should fall below our cash cost of production and capital expenditure required to sustain production and remain at these levels for any sustained period, we may record losses and be forced to curtail or suspend some or all of our operations, which could materially adversely affect our business, operating results and financial condition.
In addition, we would also have to assess the economic impact of low gold prices on our ability to recover any losses that may be incurred during that period and on our ability to maintain adequate reserves. The use of lower gold prices in reserve calculations and LOM plans could also result in material impairments of our investment in gold mining properties or a reduction in our reserve estimates and corresponding restatements of our reserves and increased amortization, reclamation and closure charges.
Fluctuations in input production prices linked to commodities may adversely affect our operational results and financial condition
Fuel, energy, and consumables, including diesel, heavy fuel oil, chemical reagents, explosives, tires, steel, and mining equipment, constitute a significant portion of the operating costs and capital expenditure for a mining company. In fiscal 2023, the price of oil has experienced a consistent downward trend, primarily due to weak export data from China and increased fuel stocks in the United States. These factors have put pressure on the market's demand growth, compounded by constrained production outputs from major oil producers.
The price of oil started at US$108.92 per barrel of Brent Crude in July 2022 and reached a low price of US$74.89 per barrel in June 2023, although from July 2023 the price of Brent crude oil increased. The price of steel fluctuated between a low of US$869 and a high of US$1,074 per tonne in fiscal 2023. It is important to note that our control over the costs of these consumables is limited, as many of them are directly or indirectly influenced by the price of oil and steel. Consequently, fluctuations in the oil and steel markets can significantly impact the pricing of these essential materials.
Fluctuations in oil and steel prices have a substantial impact on both operating costs and capital expenditure estimates. In the absence of other economic fluctuations, such price variations have the potential to cause significant changes in the overall expenditure estimates for new mining projects. In certain cases, these changes could render specific projects non-viable, which would have a material adverse effect on our business, operating results, and financial condition.
Foreign exchange fluctuations could have a material adverse effect on our operational results and financial condition
Gold is priced throughout the world in US dollars and, as a result, our revenue is realized in US dollars, but most of our operating costs are incurred in Rand and other non-US currencies, including the Australian dollar and Kina. From time to time, we may implement currency hedges intended to reduce exposure to changes in the foreign currency risk, which we started doing in fiscal 2016 and will continue as long as it remains part of our risk management policy. This hedging strategy is currently implemented up to 25% of our estimated exposure, and our unhedged foreign exchange exposure will continue to be subject to market fluctuations. Any significant and sustained appreciation of the Rand and other non-US currencies against the dollar will materially reduce our Rand revenues and overall net income, which could materially adversely affect our operating results and financial condition. See Item 11L – “Quantitative and Qualitative Disclosure about Market Risk”.
Fluctuations in the exchange rate of currencies may reduce the market value of our securities, as well as the market value of any dividends or distributions paid by us
We have historically declared all dividends in South African Rand. As a result, exchange rate movements may have affected the Australian dollar, the Kina and the US dollar value of these dividends, as well as of any other distributions paid by the Depositary to holders of ADSs.
Furthermore, our Memorandum of Incorporation allows for dividends and distributions to be declared in any currency at the discretion of the board of directors or the Company’s shareholders at a general meeting. If, and to the extent that, we opt to declare dividends and distributions in US dollars, exchange rate movements will not affect the US dollar value of any dividends or distributions. Nevertheless, the value of any dividend or distribution in Australian dollars, Kina, British pounds or South African Rand will continue to be affected. If, and to the extent that, dividends and distributions are declared in South African Rand in the future, exchange rate movements will continue to affect the Australian dollar, Kina, British pound and US dollar value of these dividends and distributions. This may reduce the value of the Company’s securities to investors. Additionally, the market value of our securities as expressed in Australian dollars, Kina, British pounds, US dollars and South African Rand will continue to fluctuate in part as a result of foreign exchange fluctuations.
Rising inflation, including as a result of Russia’s invasion of Ukraine, may have a material adverse effect on our business, operating results and financial condition
While inflation in South Africa has fluctuated in a narrow band in recent years, remaining within or just outside the inflation range of 3% - 6% set by the SARB, it began to increase significantly in the latter half of fiscal 2022. At the end of fiscal 2021, 2022 and 2023, inflation was 4.9%, 7.4% and 5.4%, respectively, in South Africa. Prolonged periods of inflation may impact our profitability by negatively impacting our fixed costs and expenses, including raw material, transportation and labor costs. If these increased costs are not offset by an increase in gold prices, they could have a material adverse effect on Harmony’s business, operating results and financial condition.
Geopolitical risks and conflicts around the world could further disrupt supply chains and create additional inflationary pressures. Specifically, Russia’s invasion of Ukraine has led to sanctions, travel bans, and asset or financial freezes being levied by the governments of the United States, the EU, the United Kingdom and other jurisdictions against Russian entities and individuals, with additional sanctions being proposed. These sanctions and other measures have had a significant impact on commodity prices, including increased oil, gas, steel and gold prices. The oil price is a driver of a number of input costs, including diesel and transport costs, while gas prices have an impact on power costs, and other commodity prices drive direct mining and processing costs. These inflationary pressures could also cause interest rates and the cost of borrowing to increase and could have a material adverse effect on the financial markets and economic conditions throughout the world. The extent and duration of the invasion, sanctions and resulting market disruptions are impossible to predict. Any inflationary impacts or disruptions caused by the invasion or resulting sanctions may have a material adverse effect on Harmony’s business, operating results and financial condition, and may magnify the impact of other risks described in this annual report.
At the end of fiscal 2021, 2022 and 2023, inflation was 5.0%, 6.6% and 5.7% (forecast) respectively, in PNG and 3.8%, 6.1% and 6.0% respectively, in Australia.
Our results of operations, profits and financial condition could be adversely affected to the extent that cost inflation is not offset by devaluation in operating currencies or an increase in the price of gold.
Investors may face liquidity risk in trading our ordinary shares on the JSE Limited
The primary listing of our ordinary shares is on the JSE Limited. Historically, the trading volumes and liquidity of shares listed on the JSE have been low relative to other major markets. The ability of a holder to sell a substantial number of our ordinary shares on the JSE in a timely manner, especially in a large block trade, may be restricted by this limited liquidity. See Item 9: “The Offer and Listing - Markets - The Securities Exchange in South Africa.”
Shareholders outside South Africa may not be able to participate in future issues of securities (including ordinary shares)
Securities laws of certain jurisdictions may restrict our ability to allow participation by certain shareholders in future issues of securities (including ordinary shares) carried out by us or an affiliate. In particular, holders of our securities who are located in the United States (including those who hold ordinary shares or ADSs) may not be able to participate in securities offerings by or on behalf of us unless a registration statement under the Securities Act is effective with respect to such securities or an exemption from the registration requirements of the Securities Act is available. Securities laws of certain other jurisdictions may also restrict our ability to allow the participation of all holders in such jurisdictions in future issues of securities. Holders who have a registered address or are resident in, or who are citizens of, countries other than South Africa should consult their professional advisors as to whether they require any governmental or other consents or approvals or need to observe any other formalities to enable them to participate in any offering of our securities.
Global, social, political and economic conditions could adversely affect the profitability of our operations
Our operations and performance depend on global economic conditions. Global economic conditions remain fragile with significant uncertainty regarding recovery prospects, level of recovery and long-term economic growth effects, and have been further adversely impacted by the Covid-19 pandemic. A global economic downturn may have follow-on effects on our business. These could include:
•key suppliers or contractors becoming insolvent, resulting in a break-down in the supply chain;
•a reduction in the availability of credit which may make it more difficult for us to obtain financing for our operations and capital expenditures or make that financing more costly;
•exposure to the liquidity and insolvency risks of our lenders and customers; or
•the availability of credit being reduced, which may make it more difficult for us to obtain financing for our operations and capital expenditure or make financing more expensive.
Coupled with the volatility of commodity prices as well as the rising trend of input costs, such factors could result in initiatives relating to strategic alignment, portfolio review, restructuring and cost-cutting, temporary or permanent shutdowns and divestments.
Further, sudden changes in a life-of-mine ("LOM") plan or the accelerated closure of a mine may result in the recognition of impairments and give rise to the recognition of liabilities that are not anticipated.
As a result of the geopolitical tensions and armed conflict between Russia and Ukraine due to the recent recognition by Russia of the independence of the self-proclaimed People’s Republics of Donetsk and Luhansk, in the Donbas region of Ukraine, followed by Russia’s military invasion of Ukraine, the governments of the United States, the EU, the United Kingdom and other jurisdictions announced the imposition of various sanctions against Russia. Despite the fact that we have limited commercial interests in Russia, Ukraine and the current areas of conflict, these and any additional sanctions or export controls, as well as any responses by Russia or other jurisdictions, have led to a sharp increase in oil and energy prices, which are important input costs for our business. Furthermore, the invasion of Ukraine and the retaliatory measures that have been taken, and could be taken in the future, by the United States, the EU, the United Kingdom and other jurisdictions have created global security concerns that could result in a regional or global conflict and otherwise have a lasting impact on regional and global economies, any or all of which could adversely affect our business.
In addition to the potentially adverse impact on the profitability of our operations, any uncertainty on global economic conditions may also increase volatility or negatively impact the market value of our securities. Any of these events could materially adversely affect our business, operating results and financial condition.
Other Regulatory and Legal Risks
Breaches in our IT security processes and violations of data protection laws may adversely impact our business activities and lead to public and private censure, regulatory penalties, fines and/or sanctions and may damage our reputation
We maintain global IT systems to support our business activities. Our IT systems may experience service outages that may adversely impact our business activities. This includes potential cybercrime and disruptive technologies. Our vulnerability to such cyber-attacks could also be increased due to a proportion of our employees working remotely. The sophistication and magnitude of cybersecurity incidents are growing and include malicious software, attempts to gain unauthorized access to data and other electronic security and protected information breaches that could lead to production downtimes, operational delays, the compromising of confidential or otherwise protected information, destruction or corruption of data, other manipulation or improper use of Harmony’s IT systems or financial losses from remedial actions.
A sharp increase in ransomware-related threats has also been recorded throughout the mining industry, with several high-profile organizations experiencing disruptions. The information security management system, or ISMS, protecting our IT systems may not prevent future malicious action, including denial-of-service attacks or fraud by individuals, groups or organizations resulting in the corruption of IT systems, theft of commercially sensitive data, including commercial price outlooks, mergers and acquisitions and divestment transactions, misappropriation of funds and disruptions to our business operations, the occurrence of any of which could have a material adverse effect on our business and results of operations.
South Africa’s comprehensive privacy law, the Protection of Personal Information Act, 4 of 2013 (the “POPIA”), became effective on July 1, 2020. All processing of personal information was required to comply with the POPIA’s provisions by July 1, 2021. Failure to comply with POPIA may lead to penalties and fines between R1 million – R10 million and/or imprisonment. We may also have insufficient insurance coverage for any data protection breaches, including concerning POPIA. See “– Risks Related to Our Operations and Business - Fluctuations in insurance cost and availability could adversely affect our operating results, and our insurance coverage may prove inadequate to satisfy future claims”.
In Australia, our data practices must comply with the Privacy Act 1988 (Cth) ("Australian Privacy Act") and state-based surveillance laws. The Australian Privacy Act regulates the way an individual’s personal information is handled. Under the Australian Privacy Act, there is a mandatory scheme requiring entities to report data breaches to the Office of the Australian Information Commissioner (“OAIC”) and affected individuals if the breach is likely to result in serious harm to an individual whose personal information is involved. Following a series of high profile data breaches in 2022 involving both government agencies and public companies, the Australian Parliament passed the Privacy Legislation Amendment (Enforcement and Other Measures) Act 2022, which introduced significantly increased penalties for serious and/or repeated privacy breaches and increased the OAIC’s ability to resolve breaches.
On May 25, 2018, the General Data Protection Regulation (“GDPR”) came into force. The GDPR is an EU-wide framework for protecting personal data being processed in or outside the EU based on certain application criteria. The GDPR enhances existing legal requirements through several new rules, including more substantial rights for data subjects’ cross-border transfer of information and mandatory data breach notification requirements, and increases penalties for non-compliance. Failure to comply with the GDPR may lead to a fine of up to four percent of a company’s worldwide turnover or up to €20 million.
The interpretation and application of consumer and data protection laws in South Africa, the United States, Australia, Papua New Guinea and elsewhere are ambiguous and evolving. It is possible that these laws may be interpreted and applied in a manner that is inconsistent with our data practices. Complying with these various laws is complex and could cause Harmony to incur substantial costs or require us to change our business practices in a manner adverse to our business.
Failure to comply with laws, regulations, codes and standards, policies and procedures or contractual obligations may lead to fines and penalties, loss of licenses or permits, may negatively affect our financial results, and adversely affect our reputation
We operate in multiple jurisdictions, including those with less developed political and regulatory environments, and within numerous and complex frameworks. Our governance and compliance processes may not prevent potential breaches of law, accounting principles or other governance practices.
Our Code of Conduct and Behavioral Code, among other policies and procedures, standards and guidance, and training thereon may not prevent instances of unethical or unlawful behavior, including bribery or corruption, nor do they guarantee compliance with legal and regulatory requirements, and breaches may not be detected by management.
To the extent that we suffer from any actual or alleged breach or breaches of relevant laws, including South African anti-bribery and corruption legislation or the US Foreign Corrupt Practices Act of 1977 under any circumstances, they may lead to investigations and examinations, fines, penalties, imprisonment of officers, litigation, and loss of operating licenses or permits, suspensions of operations, negative effects on our reported financial results and may damage our reputation. Such sanctions could have a material adverse impact on our business, operating results and financial condition.
Investors in the United States may have difficulty bringing actions, and enforcing judgments, against us, our directors and our executive officers based on the civil liabilities provisions of the federal securities laws or other laws of the United States or any state thereof
We are incorporated in South Africa. Each of our directors and executive officers (and our independent registered public accounting firm) resides outside the United States. Substantially all of the assets of these persons and substantially all our assets are located outside the United States. As a result, it may not be possible for investors to enforce a judgment against these persons or ourselves obtained in a court of the United States predicated upon the civil liability provisions of the federal securities or other laws of the United States or any state thereof. A foreign judgment is not directly enforceable in South Africa, but constitutes a cause of action which may be enforced by South African courts provided that:
•the court that pronounced the judgment had jurisdiction to entertain the case according to the principles recognized by South African law with reference to the jurisdiction of foreign courts;
•the judgment is final and conclusive;
•the judgment has not lapsed;
•the recognition and enforcement of the judgment by South African courts would not be contrary to public policy, including observance of the rules of natural justice which require that the documents initiating the United States proceeding were properly served on the defendant and that the defendant was given the right to be heard and represented by counsel in a free and fair trial before an impartial tribunal;
•the judgment does not involve the enforcement of a penal or revenue law; and
•the enforcement of the judgment is not otherwise precluded by the provisions of the Protection of Business Act 99 of 1978, as amended, of the Republic of South Africa.
US securities laws do not require us to disclose as much information to investors as a US company is required to disclose, and investors may receive less information about us than they might otherwise receive from a comparable US company
We are subject to the periodic reporting requirements of the SEC and the NYSE that apply to “foreign private issuers”. The periodic disclosure required of foreign private issuers under applicable rules is more limited than the periodic disclosure required of US issuers. Investors may receive less timely financial reports than they otherwise might receive from a comparable US company or from certain of our peers in the industry. This may have an adverse impact on investors’ abilities to make decisions about their investment in us.
ITEM 4. INFORMATION ON THE COMPANY
A. HISTORY AND DEVELOPMENT OF THE COMPANY
Harmony Gold Mining Company Limited is a public limited company incorporated in South Africa, with its registered office at Randfontein Office Park, Corner Main Reef Road and Ward Avenue, Randfontein, 1759, telephone number +27 11 411 2000. Harmony was incorporated and registered as a public limited company in South Africa under registration number 1950/038232/06 on August 25, 1950. Harmony Gold Mining Company Limited is the ultimate holding company of the Group.
IThe information set forth under the headings:
•“– Who we are ” on page 7 to 9;
•“– Our business model” on pages 13 to 16;
•“– Delivering profitable ounces – Operational performance” on pages 67 to 108; and
•“– Delivering profitable ounces – Exploration and projects” on pages 109 to 112
of the Integrated Annual Report for the 20-F 2023 is incorporated herein by reference. Also see note 21 “Investments in Associates” and note 22 “Investment in Joint Operations” of our consolidated financial statements, set forth beginning on page F-1.
For information concerning our principal capital expenditures currently in progress, including the distribution of these investments geographically and the method of financing, refer to Item 4: "Information on the Company – Business Overview –Capital Expenditures” and Item 5: “Operating and Financial Review and Prospects – Liquidity and Capital Resources”.
In fiscal 2023, we did not receive any public takeover offers by third parties or make any public takeover offers in respect of other companies’ shares.
The SEC maintains an internet site that contains reports, proxy and information statements, and other information regarding issuers that file electronically with the SEC (www.sec.gov). As a foreign private issuer, we are exempt from the rules under the Exchange Act that prescribe the furnishing and content of proxy statements to shareholders.
Our corporate website is www.harmony.co.za.
Recent Developments
Developments since June 30, 2023
•On July 3, 2023 a payment of US$24 million (R450 million), comprising US$20 million of capital and US$4 million of interest, was made on the US$300 million revolving credit facility under the US$400 Million Syndicated Facility.
•On August 29, 2023, a final dividend of 75 SA cents was declared, paid on October 16, 2023.
•On September 6, 2023 a payment of US$32 million (R600 million), comprising US$30 million of capital and US$2 million of interest, was made on the US$300 million revolving credit facility under the US$400 Million Syndicated Facility.
•On September 8, 2023 a payment of US$54 million (R994 million), comprising US$50 million of capital and US$4 million of interest, was made on the US$300 million revolving credit facility under the US$400 Million Syndicated Facility.
B. BUSINESS OVERVIEW
The information set forth under the headings:
•“– Who we are” on page 7 to 9;
•"– Our operations" on page 10 to 12;
•"– Our business model" on page 13 to 16;
•“– Our external operating environment” on pages 25 to 31;
•"– Our risks and opportunity profile" on pages 32 to 45;
•"– Our material matters" on page 46 to 51;
•"– Stakeholder engagement" on pages 52 to 57;
•“– Delivering profitable ounces – Operational performance” on pages 67 to 108
•“– Delivering profitable ounces – Exploration and projects” on pages 109 to 112;
•“– Environment" on pages 113 to 164; and
•“– Social” on pages 165 to 213
of the Integrated Annual Report for the 20-F 2023 is incorporated herein by reference.
Capital Expenditures
Capital expenditures for all operations and capitalized exploration incurred for fiscal 2023 amounted to R7,598 million, compared with R6,192 million in fiscal 2022. During fiscal 2023, capital expenditures at Hidden Valley accounted for 23% of the total, with Moab Khotsong for 15%, Mine Waste Solutions for 12%, Doornkop and Mponeng each at 9%. During fiscal 2022, capital expenditures at Tshepong North and Tshepong South accounted for 24% of the total, with Hidden Valley accounting for 20%, Moab Khotsong for 14% and Mponeng for 10%.
The focus of our capital expenditures in recent years has been underground development and plant improvement and upgrades. During fiscal 2023, the capital expenditure was funded from Harmony's cash generated by operations. See Item 5: “Operating and Financial Review and Prospects - Liquidity and Capital Resources”.
We have budgeted approximately R9,530 million, excluding capital allocated for renewables, for operational capital expenditures in fiscal 2024. We currently expect that our planned operational capital expenditures will be financed from cash generated by operations and new borrowings as needed. Details regarding the capital expenditure for each operation is included in the table below.
|
|
|
|
|
|
|
Capital expenditure budgeted for fiscal 2024 |
|
(R’million) |
| South Africa |
|
Moab Khotsong1 |
1,285 |
|
| Mponeng |
932 |
|
| Tshepong North |
494 |
|
| Tshepong South |
540 |
|
| Doornkop |
754 |
|
| Joel |
236 |
|
| Target 1 |
575 |
|
| Kusasalethu |
266 |
|
| Masimong |
87 |
|
| Mine Waste Solutions |
1,548 |
|
| Other - surface |
381 |
|
| International |
|
Hidden Valley2 |
2,432 |
|
| Total operational capital expenditure |
9,530 |
|
| Total capital expenditure |
9,530 |
|
1 Includes capital expenditure for Zaaiplaats.
2 Includes capitalized stripping costs.
Regulation
Mineral Rights – South Africa
MPRDA
The MPRDA was promulgated as effective legislation on May 1, 2004 and is the primary legislation regulating the mining industry in South Africa. Pursuant to the MPRDA, the South African government is the custodian of South Africa’s mineral and petroleum resources and has a duty to administer these resources for the benefit of all South Africans. As a consequence, an owner of the surface rights has no claim to the minerals found in, on or under the surface of his or her land. The MPRDA extinguished private ownership of minerals. The DMRE is the government body which, through its regional offices, implements and administers the MPRDA.
Any person (including the owner of the surface rights) who wishes to exploit mineral resources in South Africa is required to first apply for and obtain the appropriate right under the MPRDA. The Minister is authorized to grant or refuse applications for rights under the MPRDA. Provided that an applicant meets all the requirements relating to the right for which the applicant has applied, the Minister is obliged to grant the right. Once the right is granted in terms of the MPRDA and registered in terms of the Mining Titles Registration Act, 16 of 1967, the holder holds a limited real right in respect of the mineral and the land to which such right relates.
In accordance with the MPRDA, the holder of a mining right must comply with the terms of the right, the provisions of the MPRDA, the environmental authorization (issued under the NEMA), the mining work program and the SLP approved as part of the right. The SLP relates to the obligations placed on the mining right holder to, among other things, train employees of the mine in accordance with prescribed training methodologies, achieve employment equity and human resource development in the mining company, improve housing and living conditions of employees and set up local economic development projects.
Compliance with each of the provisions of the MPRDA, environmental authorization, mining work program and SLP is monitored by submission of monthly, bi-annual and annual returns and reports by the holder of the right to the DMRE in accordance with the provisions of the MPRDA and the right. A prospecting or mining right can be suspended or canceled if the holder conducts mining operations in breach of the MPRDA, a term or condition of the right or an environmental management plan, or if the holder of the right submits false, incorrect or misleading information to the DMRE. The MPRDA sets out a process which must be followed before the Minister is entitled to suspend or cancel the prospecting or mining right.
We have been working on our program of licensing since 2004, which involved the compilation of a mineral assets register and the identification of all of our economic, mineral and mining rights. We actively carry out mining and exploration activities in all of our material mineral rights areas in South Africa. In the period following the MPRDA taking effect, we applied for and were granted conversion of all of our "old order" mining rights into "new order" mining rights in terms of the MPRDA.
Our strategy has been to secure all strategic mining rights on a region-by-region basis, which we have achieved as we have secured all “old order" mining rights and validated existing mining authorizations. All mining operations have valid mining rights in terms of the MPRDA and we now have to continue complying with the required monthly, annual and bi-annual reporting obligation to the DMRE.
On June 21, 2013, the Minister introduced the MPRDA Bill into Parliament. The DMRE briefed the National Assembly's Portfolio Committee on Mineral Resources in July 2013. The MPRDA Bill was passed by both the National Assembly and the NCOP on March 27, 2014.
In January 2015, the former President, Jacob Zuma, referred the MPRDA Bill back to Parliament for reconsideration and on November 1, 2016, the Portfolio Committee on Mineral Resources tabled non-substantial revisions to the MPRDA Bill in the National Assembly and a slightly revised version of the MPRDA Bill was passed by the National Assembly and referred to the NCOP. On March 3, 2017, the National Assembly passed certain minor amendments to the MPRDA Bill. The National Assembly referred the MPRDA Bill to the NCOP where the Select Committee received comments on the draft legislation. The chairperson of the Select Committee had targeted January or February of 2018 to pass the legislation. On February 16, 2018, the current President of South Africa, Cyril Ramaphosa, announced that the MPRDA Bill was at an advanced stage in Parliament. However, in August 2018, the Minister announced that, given certain concerns with the MPRDA Bill, his recommendation would be to withdraw it entirely. The South African Cabinet subsequently supported the Minister's proposal to withdraw the MPRDA Bill. While the MPRDA Bill was not formally withdrawn by Parliament, it lapsed on March 28, 2019. Although Parliament has the ability to revive a lapsed Bill, it seems unlikely that it will revive the MPRDA Bill given both the Minister's and Cabinet's support for its withdrawal.
Among other things, the MPRDA Bill, if promulgated, would achieve the following:
•Concentration of rights
The MPRDA Bill seeks to introduce a system whereby the Minister invites applications for prospecting rights, exploration rights, mining rights, technical co-operation permit, production rights and mining permits in respect of any area of land. Applicants for rights will no longer be able to rely on the "first come, first served" principle when submitting an application.
•Ownership of tailings created before May 1, 2004
The MPRDA provides that historic tailings are not regulated in terms of the MPRDA; however, the MPRDA Bill purports to amend the MPRDA so as to render historic tailings subject to regulation under the MPRDA, resulting in the South African government gaining custodianship of historic tailings.
•Transfers of interests in companies
The MPRDA Bill seeks to require the consent of the Minister for the transfer of any interest in an unlisted company or any controlling interest in a listed company where such companies hold a prospecting right or mining right.
•Mineral beneficiation
A key change is that the MPRDA Bill seeks to make it mandatory for the Minister to “initiate or promote the beneficiation of minerals and petroleum resources in the Republic of South Africa”. The MPRDA Bill affords the broad discretion over beneficiation, without providing any criteria under which such discretion should be exercised.
•Issue of a closure certificate
The MPRDA Bill envisages that a rights holder will remain liable for any latent or residual environmental and associated damage caused by prospecting and mining operations, even after (and notwithstanding) the issue of a closure certificate by the Minister. This means that a rights holder will no longer be indemnified from liability after the issue of a closure certificate.
There is a large degree of uncertainty regarding the changes that will be brought about in the unlikely event that the MPRDA Bill is revived and made law.
The Mining Charter
The South African government has identified the South African mining industry as a sector in which significant participation by HDSAs is required. One of the objects of the MPRDA is to substantially and meaningfully encourage HDSAs to enter the mineral and petroleum industries and to benefit from the exploitation of the nation’s mineral and petroleum resources. In terms of section 100 of the MPRDA, the Minister was empowered to develop a broad-based socio-economic charter in order to set the framework for targets and time periods for giving effect to these objectives.
Among other things, the Original Charter stated that mining companies agreed to achieve 26% HDSA ownership of South African mining industry assets within 10 years (i.e. by the end of 2014). Ownership could comprise active involvement, through HDSA-controlled companies (where HDSAs own at least 50% plus one share of the company and have management control), strategic joint ventures or partnerships (where HDSAs own at least 25% plus one vote of the joint venture or partnership interest and there is joint management and control), collective investment vehicles, the majority ownership of which is HDSA based, or passive involvement, particularly through broad-based vehicles such as employee stock option plans.
The Original Charter was subsequently amended by the Amended Charter which included targets and timelines for HDSA participation in procurement and enterprise development, beneficiation, employment equity, human resources development, mine community development, housing and living conditions, sustainable development and growth of the mining industry and reporting (monitoring and evaluation). It required mining companies to achieve the following, among other things, by no later than December 31, 2014:
•have a minimum effective HDSA ownership of 26%;
•procure a minimum of 40% of capital goods, 70% of services and 50% of consumer goods from HDSA suppliers (i.e. suppliers in which a minimum of 25% + one vote of their share capital must be owned by HDSAs) by 2014 (exclusive of non-discretionary procurement expenditure);
•ensure that multinational suppliers of capital goods contribute a minimum of 0.5% of their annual income generated from South African mining companies into a social development fund from 2010 towards the socio-economic development of South African communities;
•achieve a minimum of 40% HDSA demographic representation at executive management (board) level, senior management (executive committee) level, core and critical skills, middle management level and junior management level;
•invest up to 5% of annual payroll in essential skills development activities; and
•implement measures to improve the standards of housing and living conditions for mineworkers by converting or upgrading mineworkers’ hostels into family units, attaining an occupancy rate of one person per room and facilitating home ownership options for all mineworkers in consultation with organized labor.
In addition, mining companies were required to monitor and evaluate their compliance with the Amended Charter and submit annual compliance reports to the DMRE. The "scorecard" attached to the Amended Charter made provision for a phased-in approach for compliance with the above targets over the five year period ending on December 31, 2014. For measurement purposes, the scorecard allocated various weightings to the different elements of the Amended Charter. Failure to comply with the provisions of the Amended Charter would, according to its provisions, ostensibly amount to a breach of the MPRDA and could have resulted in the cancellation or suspension of a mining company’s mining rights.
In March 2015, the DMRE prepared an interim report of consolidated results of the self-assessment by reporting companies of compliance with the Amended Charter, reporting relatively broad compliance with the non-ownership requirements of the Amended Charter. However, the DMRE did not report the results of compliance with the HDSA ownership guidelines of the Amended Charter and noted that there was no consensus on certain principles applicable to the interpretation of the ownership element.
On March 31, 2015, the MCSA and the DMRE jointly agreed to approach the High Court of South Africa (Gauteng Division) to seek a declaratory order that would provide a ruling on the relevant legislation and the status of the Original Charter and the Amended Charter, including clarity on the status of previous empowerment (i.e., HDSA ownership) transactions concluded by mining companies and a determination on whether the ownership element of the Original Charter and the Amended Charter should be a continuous compliance requirement for the duration of the mining right as argued by the DMRE, or a once-off requirement as argued by the MSCA, on the “once empowered always empowered” principle. The MCSA and the DMRE filed papers in court (the "Main Application") and the matter was placed on the roll to be heard on March 15, 2016. On February 16, 2017, the High Court of South Africa (Gauteng Division) postponed the hearing of the application indefinitely to allow the MCSA and the South African government to engage in further discussion on this matter.
The Minister published the Broad-Based Black Socio-Economic Empowerment Charter for the South African Mining and Minerals Industry, 2017 ("2017 Mining Charter") which came into effect on June 15, 2017. The MCSA launched an urgent application in the High Court of South Africa (Gauteng Division) to interdict the implementation of the 2017 Mining Charter (the "Interdict Application") pending a judicial review application on the basis that it was unilaterally developed and imposed on the industry and that the process that was followed by the DMRE in developing the 2017 Mining Charter had been seriously flawed (the "2017 Review Application"). However, the Minister and the MCSA reached an agreement on September 13, 2017 under which the Interdict Application did not proceed as the Minister undertook to suspend the 2017 Mining Charter pending the outcome of the 2017 Review Application by the MCSA. The 2017 Review Application was subsequently indefinitely postponed by agreement between the DMRE and the MCSA on the basis that the MCSA had entered into a new round of discussions with the President of South Africa, Cyril Ramaphosa, and the Minister. On February 19, 2018, the High Court of South Africa (Gauteng Division) ordered that the DMRE and the MCSA also involve communities affected by mining activities in these new discussions relating to the 2017 Mining Charter.
When the 2017 Mining Charter was published, the MCSA re-enrolled the Main Application for hearing and the High Court of South Africa (Gauteng Division) hearing was held in December 2017.
On April 4, 2018, the High Court of South Africa (Gauteng Division) delivered its judgment (the "2018 Judgment"). The effect of the 2018 Judgement is that mining companies are not required to re-empower themselves after their HDSA shareholders have sold out and that the DMRE cannot rely on the provisions of the MPRDA to enforce compliance with the Amended Charter, unless the provisions which the DMRE seeks to enforce were made a term or condition of the mining right. The High Court of South Africa (Gauteng Division) also held that the Minister's promulgation of the Amended Charter did not occur in terms of or in compliance with the duty imposed under section 100(2) of the MPRDA and, as such, the terms of the Amended Charter can have legal consequences or significance only insofar as they are, by any means, reflected in the terms of conditions subject to which the Minister grants a mining right. It also brings the validity and enforceability of any subsequent mining charter into question unless it is legislatively authorized. On April 19, 2018, the DMRE filed a notice of intention to appeal the judgment of the High Court of South Africa (Gauteng Division), but later withdrew its appeal in August 2020.
On September 27, 2018, the Minister published the Mining Charter III on which date it also became effective, as amended by the notice published in the Government Gazette on December 19, 2018 and read with the Implementation Guidelines. It replaces, in their entirety, the Original Charter and the Amended Charter. Mining Charter III imposes new obligations and increased participation by HDSAs in relation to a mining company's ownership, procurement of goods and services, enterprise and supplier development, human resource development and employment equity requirements. The first annual reporting for compliance with Mining Charter III was on or before March 31, 2020, although on April 11, 2020, the Minister gazetted Directions under the regulations of the Disaster Management Act as part of the measures to address, prevent and combat the spread of Covid-19, which extended the date for submission of the first annual report to June 1, 2020. Harmony submitted its first report under Mining Charter III within the specified deadline, and has timeously submitted subsequent reports.
Some of the material changes introduced by Mining Charter III include:
•in relation to existing mining rights, the continuing consequences of historical BEE transactions will be recognized and existing right holders will not be required to increase their HDSA shareholding for the duration of their mining right in circumstances where they either achieved and maintained 26% HDSA ownership or where they achieved the 26% HDSA ownership but their HDSA shareholder has since exited;
•in relation to the renewal and transfer of existing mining rights, historical BEE credentials will not be recognized and mining companies will be required to comply with the ownership requirements in relation to new mining rights (see below);
•in relation to new mining rights (granted after September 27, 2018) mining companies must have a minimum of 30% BEE shareholding distributed as follows: a minimum of 5% non-transferable carried interest to qualifying employees; a minimum of 5% non-transferable carried interest to host communities, or a minimum 5% equity equivalent benefit; and a minimum of 20% to a BEE entrepreneur, 5% of which must preferably be for women; "carried interest" is defined as "shares issued to qualifying employees and host communities at no cost to them and free of any encumbrances. The cost for the carried interest shall be recovered by a right holder from the development of the asset";
•applications for mining rights lodged and accepted prior to September 27, 2018, will be processed in terms of the Amended Charter (i.e. with a 26% HDSA ownership requirement) but with a further obligation to increase their HDSA shareholding to 30% within five years of the granting of the right;
•BEE shareholding may be concluded at holding company level, mining right level, on units of production, shares or assets and where it is concluded at any level other than mining right level, the flow-through principle will apply;
•the permitted beneficiation off-set of up to 11% against the HDSA ownership requirement contained in the Original Charter and Amended Charter has been reduced to 5% unless it was "claimed" prior to September 27, 2018;
•a minimum of 70% of total mining goods procurement spend (including non-discretionary expenditure) must be on South African manufactured goods, allocated amongst HDSA owned and controlled companies, women and youth owned and controlled companies and BEE compliant companies;
•a minimum of 80% of the total spend on services (including non-discretionary expenditure) must be sourced from South African companies, allocated among HDSA owned and controlled companies, women and youth owned and controlled companies and BEE compliant companies;
•mining companies must achieve a minimum representation of HDSAs in the following management positions: 50% on the Board of directors (20% of which must be women), 50% in executive (20% of which must be women), 60% in senior management (25% of which must be women); 60% in middle level (25% of which must be women); 70% in junior level (30% of which must be women) and 60% in core and critical skills. In addition; HDSAs with disabilities must constitute 1.5% of all employees;
•the Minister may, by notice in the Government Gazette, review Mining Charter III;
•the ownership and mine community development elements are ring-fenced and require 100% compliance at all times; and
•a mining rights holder that has not complied with the ownership element and falls between levels 6 and 8 of the Mining Charter scorecard shall be in breach of the MPRDA and its mining right may be suspended or canceled in accordance with the provisions of the MPRDA.
While Mining Charter III is now effective, there are transitional arrangements in relation to compliance with the procurement and the employment equity element targets.
On March 26, 2019, the MCSA instituted judicial review proceedings in High Court of South Africa (Gauteng Division) for an order reviewing and setting aside certain provisions of Mining Charter III. The provisions challenged by the MCSA relate to those which, among other things:
•provide that mining rights holders must at all times comply with the ownership requirements imposed under Mining Charter III;
•stipulate that the continuing consequences of historic empowerment transactions will not be recognized if existing mining rights are renewed or transferred to third parties;
•impose the procurement thresholds for goods and services; and
•indicate that the Minister may invoke the sanctions prescribed under the MPRDA, if a mineral right holder fails to comply with the threshold requirements imposed under the Charter.
The application aligns with the MCSA’s previously stated view that most aspects of the Mining Charter III represent a reasonable and workable framework. However, the MCSA’s application contended that Mining Charter III does not fully recognize the continuing consequences of previous empowerment transactions, particularly in relation to mining right renewals and transfers of such rights. According to the MCSA, this constitutes a breach of the declaratory order on the matter issued by the High Court of South Africa (Gauteng Division) in April 2018. On June 30, 2020, the High Court of South Africa (Gauteng Division) ordered that various mine-affected communities and trade unions be joined as parties to the MCSA's application. The MCSA's application was heard before a full bench of judges in May 2021. The 2021 Judgement was handed down on September 21, 2021, setting aside certain of the problematic provisions, while providing that the remainder of Mining Charter III should continue in force. In November 2021, the DMRE informed National Assembly's Portfolio Committee on Mineral Resources and Energy that it does not intend to appeal the outcome of the 2021 Judgment, but instead will consider steps to achieve the empowerment objectives through legislative amendments to the MPRDA.
The 2021 Judgement was discussed at the parliamentary mineral resources and energy committee meeting on March 18, 2022. The meeting involved various stakeholders such as labor unions and the MCSA to present their views on the 2021 Judgement. To date, there have been no developments with regards to the above-mentioned views of the stakeholders.
For details of our compliance in the regard, see “Integrated Annual Report for the 20-F 2023 – Governance – Mining Charter III” on pages 251 to 252.
Regulations under the MPRDA
On March 27, 2020 the Minister published for implementation amendments to the MPRDA Regulations (the “Amended Regulations”). The Amended Regulations include the following notable changes:
•Mining rights applicants must "meaningfully consult" with landowners, lawful occupiers and interested and affected parties in accordance with the procedures contemplated under the EIA Regulations. The office of the Regional Manager is permitted to participate as an observer in these processes.
•Mining rights holders must pursuant to their SLPs contribute to the socio-economic development in the areas in which they operate and "labor sending" areas (i.e. a local municipality which a majority of mine workers consider to be their primary residence). This requirement may impose obligations on mining rights holder to effect measures in communities that are located far away from the mine and / or could give rise to some social issues.
•Although most of the provisions regulating environmental matters have been deleted from the Amended Regulations, those sections dealing with mine closure have been retained but have been amended to state that mine closure must be regulated in terms of the NEMA, the EIA Regulations and the Financial Provision Regulations, 2015 (as they may be amended). As discussed below, it is anticipated that the Financial Provision Regulations, 2015 will be replaced by revised regulations following further engagement with the mining industry.
•The appeal process in the MPRDA Regulations has been replaced with a more comprehensive procedure that includes specific time periods within which appellants, respondents and the competent authority must submit appeals, responses or consider appeals (as the case may be). Although there is no guarantee that the parties will comply with these time periods, the time periods are intended to hold the parties accountable and to ensure that appeals are resolved in a timely manner.
The Royalty Act
The Mineral and Petroleum Royalty Act, 28 of 2008, and the Mineral and Petroleum Royalty Administration Act, 29 of 2008, were assented to on November 21, 2008 with the commencement date set as May 1, 2009. However, the date on which royalties became payable was deferred to March 1, 2010. Royalties are payable by the holders of mining rights to the government according to formula based on a defined earnings before interest and tax. This rate is then applied to a defined gross sales leviable amount to calculate the royalty amount due, with a minimum of 0.5% and a maximum of 5% for gold. For 2023, the average royalty rate for our South African operations was 1.27% of the gross sales leviable amount.
The BBBEE Act and the BBBEE Amendment Act
The BBBEE Act, 53 of 2003 (the "BBBEE Act"), which came into effect on April 21, 2004, established a national policy on broad-based black economic empowerment with the objective to (i) remedy historical racial imbalances in the South Africa economy and (ii) achieve economic transformation, by increasing the number of black people who participate in the mainstream South African economy. The BBBEE Act provides for various measures to promote BEE participation, including empowering the Minister of Trade and Industry to issue Codes of Good Practice (the "BBBEE Codes"), with which organs of state and public entities and parties interacting with them or obtaining rights and licenses from them would be required to comply. The BBBEE Codes were first published in 2007, and were revised in 2013 (although the revisions only came into effect in 2015). The BBBEE Codes sought to provide a standard framework, in the form of a "generic scorecard", for the measurement of BBBEE across all sectors and industries operating within the South African economy and sought to regularize such sectors and industries by providing clear and comprehensive criteria for the measurement of BBBEE.
On October 24, 2014, the BBBEE Amendment Act, 46 of 2013 (the “BBBEE Amendment Act”), came into effect. The BBBEE Amendment Act inserted a new provision in the BBBEE Act, whereby the BBBEE Act would trump the provisions of any other law in South Africa which conflicts with the provisions of the BBBEE Act, provided such conflicting law was in force immediately prior to the effective date of the BBBEE Amendment Act. The BBBEE Amendment Act also stipulates that this provision would only be effective one year after the BBBEE Amendment Act is brought into effect, on October 24, 2015. On October 27, 2015, the Minister of Trade and Industry published a government gazette notice declaring an exemption in favor of the DMRE from applying the requirements contained in section 10(1) of the BBBEE Act for a period of 12 months.
There has been some debate as to whether or to what extent the mining industry was subject to the BBBEE Act and the policies and codes provided for thereunder. The BBBEE Codes apply in the absence of sector specific codes which have been agreed to by interested and affected parties active within a specific sector. By way of background, various sectors within the South African economy may negotiate and agree Codes of Good Practice which would govern transformation in that specific sector. In addition, certain codes fall outside of the regulatory framework established by the BBBEE Act and BBBEE Codes promulgated by the Minister of Trade and Industry thereunder. One such sector is the mining industry, where the Original Charter, the Amended Charter and Mining Charter III (which we refer to generally in this section as the Mining Charter), govern the implementation of BBBEE, among other things, within the mining industry.
For purposes of the BBBEE Act, the Mining Charter is not a "sector code". It is not clear at this stage how the Mining Charter and BBBEE Codes relate to each other. The government may designate the Mining Charter as a sector code, in which case it will be under the auspices of the BBBEE Act. On the other hand, the Mining Charter may remain a stand-alone document under the auspices of the MPRDA and may be subject to the trumping provision, discussed above, to the extent that there is a conflict between the two. This uncertainty may be resolved through either government clarification or judicial attention. The exemption by the Minister of Trade and Industry can be read as confirmation that the Department of Trade and Industry regards the BBBEE Codes as “applicable” to the Mining Industry after the exemption was lifted on October 27, 2016.
On February 17, 2016, the Minister of Trade and Industry published a gazette notice which repealed and confirmed the validity of a number of sector codes. The omission of the Mining Charter from the notice can be interpreted as confirmation that the Mining Charter is not contemplated as a sector code. This supports the interpretation BBBEE Act did not intend to trump the Mining Charter. While it remains to be seen how this will be interpreted, it appears that the BBBEE Act and the BEE Codes will not overrule the Mining Charter in the future and, in any event, our view is that the DMRE is likely to continue implementing the Mining Charter and it is unlikely that the DMRE will begin applying the BBBEE Act and BBBEE Codes in administering the MPRDA, since in order to do so will potentially require an amendment of the MPRDA.
Housing and Living Standards
On December 11, 2019 the Minister published the Housing and Living Conditions Standard for the Minerals Industry (the "Housing and Living Conditions Standard"). The purpose of the Housing and Living Conditions Standard is to ensure that mine employees are provided with adequate housing, healthcare services, balanced nutrition and water. The Housing and Living Conditions Standard repeals the previous iteration of the Housing and Living Conditions Standard from 2009 and applies to existing and new mining right holders. The underlying purpose of the Housing and Living Conditions Standard is to develop decent single and family housing units for mine employees and their families.
Mining right holders are required to develop, in consultation with organized labor, relevant municipalities and the DWS, a housing and living conditions plan taking into account various principles in giving effect to the above objectives including, engaging with all relevant stakeholders, ensuring equity in the implementation and administration of the housing of employees, providing employees with a range of housing options (such as subsidized rental, private ownership, living out allowances and government subsidized ownership) and ensuring that all housing facilities are developed or redeveloped with access to electricity, water and ablutions in accordance with the requisite norms and standards.
Resettlement Guidelines
The Minister published the draft Mine Community Resettlement Guidelines, 2019 (Draft Resettlement Guidelines) for public comment in December 2019. The Minister published the final Mine Community Resettlement Guidelines, 2022 ("Resettlement Guidelines") for implementation on March 30, 2022, on which date they also became effective. The Resettlement Guidelines apply to applicants and holders of mining rights, prospecting rights and mining permits pursuant to the MPRDA, which result in the displacement of parties. Resettlement is guided by several fundamental principles including meaningful consultation, gender equality, the avoidance of resettlement, where possible, rules concerning meetings and the protection of existing rights.
Applicants and holders of mining rights will need to make provision for a Resettlement Plan, Resettlement Action Plan and a Resettlement Agreement. The Resettlement Plan sets out the nature of the project, its expected impacts, the manner in which consultation will be implemented and the various cost implications for the resettlement. The Resettlement Action Plan sets out the specific steps that the holder will need to meet to implement the Resettlement Plan and the Resettlement Agreement records the commitments made by the holder. There are no specific requirements in the Resettlement Guidelines regarding the content of these agreements. However, all stakeholders should be engaged and commit to their respective obligations.
No mining activities may commence until such time as the Resettlement Agreement has been concluded. This includes agreement on the compensation that should be paid to affected parties. Any disputes between the parties regarding the Resettlement Agreement or associated plans, should be resolved between the parties. To the extent that the parties are unable to reach an amicable solution, only then should the Regional Manager-led process in section 54 of the MPRDA be invoked.
Geoscience Regulations
The Minister published the draft regulations to the Geoscience Act, 100 of 1993 (the "Geoscience Act") for public comment on March 4, 2021. On March 30, 2022, the Minister published the final version of the Geoscience Act Regulations, 2022 (the "Geoscience Regulations"), on which date they also became effective.
The Geoscience Regulations obligate the lodgment of geoscience data and information in respect of reconnaissance and prospecting with the Council for Geoscience ("CG"). The Geoscience Regulations require that the owners of onshore and offshore geoscience data and geoscience information must submit this information to the CG.
The Geoscience Regulations state that the lodgment of geoscience data and information should include several categories of information such as geology, geochemistry, borehole profile logs and physical borehole core, and geophysical data. The requirement to submit physical borehole material has been qualified to only be necessary upon a specific request by the CG as well the fact that physical core materials drilled for research purposes may only be discarded after obtaining consent from the CG. All physical materials recovered from boreholes drilled for infrastructure and development purposes can only be discarded after consultation with the CG.
In terms of the Geoscience Regulations, entities which hold historical information relating to onshore and offshore geoscience data and information are obliged to notify the CG that such data and information is in their possession within 18 months of the Geoscience Regulations coming into effect (i.e. by September 30, 2022). Following such notification, the CG, at its expense, must arrange to collect the data and/or information. Lastly, the Geoscience Regulations classify all geoscience data and information not related to prospecting and reconnaissance, preceding the coming into operation of these Geoscience Regulations, as historical data, and the same provisions and time described above will apply.
The Geoscience Regulations provide for the disclosure and accessibility of geoscience data, geoscience information, and prescribed services through digital and non-digital media as well as data requests that may be made directly to the CG. The Geoscience Regulations contain confidentiality provisions relating to geoscience data and information, which are consistent with the confidentiality provisions found in the MPRDA. However, the confidentiality provisions are subject to the provision that geoscience data or information relating to a prospecting permit or reconnaissance may not be disclosed until the permit has lapsed or been abandoned in line with section 30(5) of the MPRDA. Additionally, the Geoscience Regulations state that geoscience data and information not relating to reconnaissance or prospecting are considered confidential and will only be disclosed in limited circumstances.
Mineral Rights – Australia
In Australia, mining is regulated by the laws of the State in which the deposit is situated and the mining activity occurs. Our only current mining activity in Australia is the Eva Copper Project, located in the State of Queensland.
Mining in Queensland is regulated by the Queensland MRA, the Mineral and Energy Resources (Common Provisions) Act 2014, the Mining Quarrying Safety and Health Act 1999 (Qld), and the regulations, practice manual, operational policies and guidelines thereunder.
Generally, all mineral resources in Queensland are owned by the State of Queensland. These resources are managed by the Queensland Department of Resources. Under the Queensland MRA, the Department of Resources requires all large mining projects to apply for a resource authority, including mining leases, EPs and mineral development licenses. An EP allows the holder to carry out exploration activities to determine what minerals exist and their quality and quantity in or under land or in the waters or sea above such land, in accordance with agreed work programs and subject to compliance with prescribed security and financial obligations.
If the holder of an EP wishes to develop a mine to exploit discovered resources, application must be made for a mining lease. This entitles the holder to machine-mine specified minerals and carry out activities associated with mining, including infrastructure to support mining operations. The Queensland MRA and mining tenements issued thereunder contain provisions and conditions, the breach of which may result in the imposition of a fine, imprisonment or the cancellation of the tenement.
Mining in Queensland is also subject to the Native Title Act 1993 (Cth). Any "future act" on land or waters that will affect native title rights and interests is subject to native title processes intended to protect such rights and interests through a right to negotiate enabling affected parties to reach agreement on the terms of consent concerning the proposed future acts, including monetary compensation, employment and training, contracting opportunities and cultural heritage. These arrangements are captured in Indigenous Land Use Agreements, which are then registered with the National Native Title Tribunal.
Mineral Rights – Papua New Guinea
Mineral Rights in PNG are regulated by the PNG Mining Act. The PNG Mining Act stipulates that all minerals are the property of the PNG Government and, subject to the PNG Mining Act, all land is available for exploration and mining. The issuance and administration of mining tenements under the PNG Mining Act is effected through the offices of the PNG MRA established under the PNG Mineral Resources Authority Act 2018, and mining operations are administered by the Chief Inspector of Mines under the PNG Mining (Safety) Act. Mineral policy is administered by the Department of Mineral Policy and Geohazards Management, all three branches falling within the PNG Department of Mining. The permitting process can be very time consuming, and (subject to the applicable legislation) there is no assurance that a mining tenement will be granted or extended.
Mining tenements include:
•exploration licenses, issued for a term not exceeding two years, renewable on application for further two year terms subject to compliance with expenditure and other conditions. Each license contains a condition conferring on the PNG Government the right to make a single purchase up to 30% equitable interest in any mineral discovery under the license at a price pro rata to the accumulated exploration expenditure;
•mining leases, issued for a term not exceeding 20 years, renewable on application for up to ten years at the discretion of the PNG Minister for Mining after considering PNG Mining Advisory Board recommendations;
•Special Mining Leases, issued for a term not exceeding 40 years, renewable on application for up to twenty years at the discretion of the PNG Minister for Mining after considering PNG Mining Advisory Board recommendations and subject to the provisions of any mining development contract which may have been entered into between the PNG Government and the tenement holder;
•mining easements; and
•leases for mining purposes.
These tenements generally confer exclusive rights on the holder to exercise their rights thereunder. However, in PNG, citizens have the right to carry out non-mechanized mining of alluvial minerals on land owned by them, provided that an alluvial mining lease is obtained and provided there is not already a mining lease or Special Mining Lease over the subject land.
PNG exploration licenses contain a condition that the PNG Government may, at any time prior to the commencement of mining, acquire a participating interest of up to 30% in any mineral discovery at historical exploration cost. This condition confers on PNG or its nominee the option to take up a direct equity of participating interest in new mining projects. The PNG Government has indicated that it intends to exercise the PNG Government's option in full in respect of the Wafi-Golpu Project.
In addition, PNG mining legislation and mining tenements contain provisions and conditions, the breach of which may result in the imposition of a fine, imprisonment or the cancellation of the tenement.
Almost all land in PNG is owned by a person or group of persons under customary ownership, and is not generally overlaid by landowner title. The customary owners of the land have in some instances been formally identified through the work of the Land Titles Commission. However, there is often considerable difficulty in identifying landowners of a particular area of land because land ownership may arise from both contract and inheritance, and because of the absence of a formal written registration system.
Prior to commencing exploration, compensation for loss or damage must be agreed with the landowners. Prior to commencing mining, written agreements must be entered into with landowners dealing with compensation and, in company with the PNG Government as a party, a memorandum of agreement dealing with such other matters as the sharing of royalties and other mining benefits among and between landowner groups and Provincial and local government entities.
Along with standard corporate and other taxes and levies, mining companies must pay royalties to the PNG Government and a levy to the PNG MRA, based on production.
Health and Safety - South Africa
For many years, the safety of persons working in South African mines and quarries was controlled by the Mines and Works Act, 27 of 1956 and then by the Minerals Act, 50 of 1991, which was replaced by the MHSA. The objectives of the MHSA are:
•to protect the health and safety of persons at mines;
•to require employers and employees to identify hazards and eliminate, control and minimize the risks relating to health and safety at mines;
•to give effect to the public international law obligations of South Africa that concern health and safety at mines;
•to provide for employee participation in matters of health and safety through health and safety representatives and the health and safety committees at mines;
•to provide for effective monitoring of health and safety conditions at mines;
•to provide for enforcement of health and safety measures at mines;
•to provide for investigations and inquiries to improve health and safety at mines;
•to promote a culture of health and safety in the mining industry;
•to promote training in health and safety in the mining industry; and
•to promote co-operation and consultation on health and safety between the South African Government, employers, employees and their representatives.
One of the most important objectives of the MHSA is to protect the health and safety of all persons directly affected by the activities at mines and not merely the health and safety of employees. An employer is obliged, in terms of the MHSA and the regulations binding in terms thereof, to protect, as far as reasonably practicable, the health and safety of non-employees (such as visitors to a mine and the public who live in close proximity to the mine) and employees (which includes employees of independent contractors) performing work at a mine.
The word “employer” in section 102 of the MHSA is defined as the owner of the mine. In turn, an “owner” of a mine is defined to include: (i) the holder of the prospecting permit or mining authorization issued under the MPRDA; (ii) if a prospecting permit or mining authorization does not exist, the person for whom the activities in connection with the winning of a mineral are undertaken, but excluding an independent contractor; or (iii) the last person who worked the mine or that person’s successor in title.
The aforesaid subsection was amended by section 30(f) of the Mine Health and Safety Amendment Act, 74 of 2008 by substituting the term “Mineral and Petroleum Resources Development Act” for the term “Minerals Act.” Under the new system, mining authorizations do not exist. However, taking into account section 12 of the Interpretation Act 33 of 1957, the word “authorisation” must be substituted by the words “mining right or mining permit.” Accordingly, the holder of the “mining right or mining permit” is regarded as the employer for the purposes of the MHSA and the regulations binding thereunder. The employer therefore remains responsible to ensure that applicable provisions of the MHSA and the regulations binding in terms thereof, are complied with to ensure the health and safety of persons, as far as reasonably practicable and to prevent damage to property.
The MHSA prescribes, among other things, general and specific duties for employers and other persons, determines penalties for non-compliance with the MHSA and regulations thereunder, makes allowance for administrative fines to be issued for non-compliance with the MHSA and regulations thereunder, and provides for employee participation by requiring the appointment of health and safety representatives and the establishment of health and safety committees. The MHSA also entrenches the right of employees to refuse to work in dangerous conditions. The MHSA further places an obligation on employees to protect their own health and safety, as well as the health and safety of other persons.
See “Integrated Annual Report for the 20-F 2023 – Social – Caring for our employees” on pages 188 to 196 and "Integrated Annual Report for the 20-F 2023 – Social – Health and wellness” on pages 180 to 187.
The Mine Health and Safety Inspectorate ("MHSI") of the DMRE is responsible for the enforcement of the MHSA and the regulations binding in terms thereof. The DMRE also plays an important role in the promotion of health and safety at mines. The MHSI comprises of a Chief Inspector of Mines, Deputy General, Principal Inspectors of Mines for each region and various Senior Inspectors and Inspectors of Mines for each region. Should employers or employees fail to comply with their obligations under the MHSA, the MHSI may take a number of enforcement measures which may include the following:
•the issuing of statutory instructions (for example notices in terms of section 54 or section 55 of the MHSA) if an Inspector of Mines has reason to believe that any occurrence, practice or condition at a mine endangers the health and safety of any person at a mine, or alternatively if an Inspector of Mines has reason to believe that a provision of the MHSA has not been complied with. A notice in terms of section 54 of the MHSA, may halt all mining operations undertaken at a mine or part thereof. If a mine receives notices in terms of section 54 of the MHSA regularly, the production stoppages and the additional costs incurred as a result thereof will not only affect the production results of a mine but also the reputation and business of a mine. If, however, a notice in terms of section 54 of the MHSA has been issued unlawfully, the mine may appeal the said notice to the Chief Inspector of Mines. It must be noted that the aforesaid appeal does not suspend the operation of the notice issued in terms of section 54 of the MHSA. To suspend the operation of the notice in the above instance, a mine must lodge an urgent application to the Labour Court (being the court with jurisdiction) requesting the suspension of the operation of the notice issued in terms of section 54 of the MHSA, pending the outcome of the appeal to the Chief Inspector of Mines;
•the Chief Inspector of Mines may suspend or cancel certificates of competency issued in terms of the MHSA if the holder of that certificate is guilty of gross negligence or misconduct or has not complied with the MHSA or the regulations binding thereunder;
•a Principal Inspector of Mines may recommend prosecution to the National Director of Public Prosecutions if satisfied that there is sufficient admissible evidence that an offense has been committed. Any person convicted of an offence in terms of the MHSA may be issued with a fine or sentenced to imprisonment as may be prescribed; and
•a Principal Inspector of Mines may, after considering the recommendation of an Inspector of Mines and the written representations of the employer, impose an administrative fine for the failure to comply with, amongst others, the provisions of the MHSA and the regulations binding thereunder. In terms of Table 2 of Schedule 8 to the MHSA, the maximum administrative fine which may be imposed on an employer is one million Rand per transgression. The MHSA does not make provision for any internal appeal against an administrative fine which has been issued unlawfully. However, if a mine receives an administrative fine which has been issued unlawfully, the mine may lodge an application in the Labour Court (being the court with jurisdiction) to review the decision to impose an administrative fine.
Over and above the aforesaid, investigation and/or inquiry proceedings in terms of the MHSA are instituted by the MHSI following an accident or occurrence at a mine, which results in the death of any person.
In South Africa COIDA and ODMWA established two statutory systems for the payment of compensation for occupationally related injuries and certain occupationally related diseases. COIDA applies to the compensation of all occupational injuries (including payment of compensation in the event of the death of the injured employee), whether or not it occurs in or outside the mining industry. ODMWA applies to diseases which are defined as “compensatable diseases”, being primarily occupationally related lung diseases like silicosis.
COIDA indemnifies the employer against claims by the employee or his/her dependents for damages incurred as a result of occupational injuries and diseases. However, the Constitutional Court held in Mankayi v AngloGold Ashanti Limited 2011 (3) SA 237 (CC) that although COIDA applies to occupational diseases in general, COIDA does not apply in instances where the disease in question is a compensatable disease in terms of ODMWA and which was contracted as a result of the performance of “risk work” at a “controlled mine”. The Court further held that if an employee contracts a compensatable disease as defined in ODMWA, the employee would still be entitled to claim common law damages from the employer.
Health and Safety – Australia
In Queensland, where our Eva Copper Project is situated, the safety of employees, contractors and third parties concerning mining operations is regulated by the Mining and Quarrying Safety and Health Act 1999 (Qld) and the Mining and Quarrying Safety and Health Regulation 2017. Risk is effectively managed when all persons individually and as part of their respective workgroups and organizations take action to keep risk at an acceptable level, being the conduct of operations so that the level of risk from the operations is within acceptable limits and as low as reasonably achievable, taking into account the likelihood of injury and the severity of the injury.
The legislation places obligations on the operator of a mine, the site senior executive and others to ensure that, among other things, the risk to persons from operations is at an acceptable level and that safety and health management systems are developed and implemented. The legislation contemplates that operators and site senior executives will be assisted by site safety and health representatives elected by the workers at the mine site, site safety and health committees, District workers’ representatives and appointed inspectors, inspection officers and authorized officers with powers inter alia of site access, inspection and seizure.
Significant penalties may be imposed if safety and health obligations under the Act are not appropriately discharged.
Health and Safety – Papua New Guinea
PNG has a significant mining industry, and a developing system of occupational health and safety. The PNG Mining (Safety) Act is the principal legislation, which addresses a range of issues such as working hours, minimum safety and reporting requirements. Other legislation and regulations also apply.
The PNG Mining (Safety) Act and the Regulations issued thereunder are currently under review as part of the overall review of mining legislation in PNG. In June 2021, the DMPGM released the draft Mine & Works (Safety & Health) Bill 2021 and in June 2022, the PNG Minister for Mines released a draft Mine Health and Safety Amendment Bill 2022 for public comment. The Bill deals (among other matters) with the increase in monetary value of the fines which may be imposed in in respect of instances of non-compliance, the more direct involvement of executives (particularly CEOs), the imposition of stricter liability in respect of obligations under the Act, and changes to obligations relating to training and formulation of training programs. If enacted in its present form, the Bill will repeal and replace the PNG Mining (Safety) Act. The DMPGM proposed further one-on-one consultation with mining operations in 2023 but appears to have suspended the consultation process.
See above under "– Regulation – Mineral Rights – Papua New Guinea".
Harmony's operations and projects in PNG will potentially be affected by changes to PNG health and safety laws. Harmony continues to engage with the PNG Government through the offices of the Chamber of Mines and Petroleum of PNG, and directly with the PNG Minister for Mining and the Managing Director of the PNG MRA.
See “Integrated Annual Report for the 20-F 2023 – Social – Caring for our employees” on pages 188 to 196 and "Integrated Annual Report for the 20-F 2023 – Social – Health and wellness” on pages 180 to 187.
Laws and Regulations Pertaining to Environmental Protection - South Africa
In South Africa, environmental matters are regulated by national, provincial and municipal laws based on the competencies afforded to each of these spheres of government under South Africa's Constitution and relevant legislation. As a result, there are many statutes and by-laws that are applicable to construction, operation, decommissioning and closure of mining operations. The key legislation includes the NEMA, the NWA, the Air Quality Act, the National Environmental Management: Waste Act, 59 of 2008 (the "Waste Act"), the National Nuclear Regulator Act, 47 of 1999, the National Environmental Management: Biodiversity Act, 10 of 2004, the National Heritage Resources Act, 25 of 1999, the Carbon Tax Act and the MPRDA.
This legislation commonly requires businesses whose operations may have an impact on the environment to obtain permits, authorizations and other approvals for those operations. The rationale behind this is to ensure that companies with activities that are reasonably expected to have environmental impacts, can initially assess the extent of the environmental impacts from such activities, as well as to put reasonable and practicable mitigation measures in place to manage these impacts. In addition, businesses and authorities must monitor compliance to ensure that the requirements under the relevant permits, authorization and other approvals are achieved. In addition, the legislation may require compliance with standards or levels for which authorization is not required and impose a duty of care on businesses to ensure that reasonable measures are implemented to prevent pollution or environmental degradation from occurring, continuing or recurring.
NEMA
Section 24 of South Africa's Constitution is the cornerstone of South African environmental law. It affords every person the right to an environment that promotes their health and well-being and places an obligation on the state to create legislation and other instruments to give effect to this right taking into consideration the principles of sustainable development.
In accordance with this obligation, the Minister of Environmental Affairs and Tourism (as he was then) introduced the NEMA. The NEMA is “framework legislation”; that is, it provides the core principles and structures in terms of which all environmental legislation and decisions are interpreted, administered and applied. These principles include (but are not limited to) the principles of inter-generational equity, the polluter pays principle, the cradle to grave principle and the principle of sustainable development (the “Section 2 Principles”).
Listed Activities and competent authorities
The NEMA introduces environmental management tools aimed at ensuring that the Section 2 Principles are incorporated into all decisions that may have an effect on the environment. Chief among these tools is the environmental authorization process. Under section 24(1) of the NEMA, the Environment Minister may identify activities that may not commence without an environmental authorization (the “Listed Activities”).
The Environment Minister published the EIA Regulations and three lists of Listed Activities (the "Listing Notices"). The EIA Regulations contemplate two application processes for an environmental authorization: a "basic assessment" process and a "scoping and environmental impact assessment" process. The basic assessment is an abridged assessment process that considers the impacts of the proposed activity on the environment, while the scoping and environmental impact assessment is a much more detailed assessment that is reserved for those activities that are expected to have a greater impact on the environment. The activities listed in Listing Notices 1 and 3 trigger a basic assessment process, while the activities contained in Listing Notice 2 require the applicant to complete a scoping and environmental impact assessment. The period from the date of application until the granting or refusal of an environmental authorization should take no more than 300 days, excluding any appeal process that suspends the environmental authorization for the duration of the appeal. Due to departmental limitations and other hindering factors, the 300 day time period is not always adhered to.
The EIA Regulations and Listing Notices were published with effect from December 8, 2014, along with various amendments to the NEMA and the MPRDA pursuant to an agreement (referred to as the "One Environmental System”) concluded between the Environment Minister, the Minister of Mineral Resources and Energy and the Minister of Water and Sanitation as such ministries were then called. In terms of the One Environmental System, the DFFE is responsible for the creation of all legislation and regulation relating to the environment. The DMRE, however, is the competent authority responsible for implementing and enforcing this legislation as far as it directly relates to prospecting and mining activities, including the granting of environmental authorizations for these activities.
Prior to the One Environmental System, the powers and responsibilities of the DFFE and DMRE overlapped. Any person applying for a prospecting right, mining permit or mining right was required under the MPRDA to conduct an environmental impact assessment and obtain approval (referred to as an Environmental Management Programme or "EMPr") from the DMRE. To the extent that the proposed prospecting or mining activities also triggered any Listed Activities and prior versions of the EIA Regulations, an environmental authorization was required from the provincial environmental authorities. In practice, applicants for an EMPr and environmental authorization would conduct one environmental impact assessment and submit the final report to both the DMRE and provincial authority for their respective approvals. This dual system resulted in conflicting conditions with which the applicants were required to comply.
With effect from December 8, 2014, the DMRE became the competent authority in relation to all environmental matters directly related to prospecting, extraction and primary processing of mineral resources, including those ancillary Listed Activities associated with prospecting and mining operations previously governed by the provincial environmental authorities. Today, any person that seeks to obtain a prospecting right, mining permit or mining right must apply for an environmental authorization from the DMRE. This environmental authorization must be granted before a prospecting right, mining permit or mining right may be granted.
The NEMLAA was assented to on June 21, 2022. The majority of the provisions in NEMLAA came into effect on June 30, 2023, as determined by the Environment Minister. The NEMLAA will amend the Minister's jurisdiction to only include “mining activities” which refers "an activity which requires a permission, right, permit or consent under the MPRDA". This amendment may create uncertainty as to whether the Minister is the competent authority for ancillary activities for which a permission, right, permit or consent under the MPRDA is (in itself) not required.
The commencement of a Listed Activity without an environmental authorization is an offense but could possibly be corrected by submitting an application in terms of section 24G of the NEMA, which is an application for retrospective authorization. There is no guarantee that the competent authority will grant an environmental authorization in terms of this process.
They may instruct the applicant to rehabilitate the environment or take any other measures to rectify the unlawful conduct. Even if the authority agrees to grant an environmental authorization, it may only do so after the applicant has paid an administrative fine. The granting of an environmental authorization under section 24G does not absolve the applicant of potential criminal liability for commencing with an activity without the requisite authorization.
The NEMLAA introduced important changes to the section 24G process, extending the scope such that “successors in title” and “persons in control” of land on which a listed activity has commenced unlawfully are now permitted to submit rectification applications under section 24G. Prior to this amendment, only the person who commenced with the activity without the requisite approval was eligible to apply for rectification. Furthermore, the competent authority must now direct a person making a rectification application to cease undertaking the unlawful activity pending a decision on such application. The maximum quantum of the fine payable in terms of section 24G has also been increased from R5 million to R10 million. The NEMLAA also inserted a similar section into the Air Quality Act.
Financial provision
The NEMA requires applicants for environmental authorizations in respect of prospecting and mining to assess the environmental liabilities arising from their mining operations and to put up financial provision (in the form of cash, guarantees or certain insurance policies) to the satisfaction of the Minister. The amount of financial provision is assessed annually and, to the extent necessary, the financial provision is adjusted to the satisfaction of the Minister. If, at any point, the holder of environmental authorization fails to fulfill its obligations under the authorization or in terms of environmental laws, the Minister may call upon the financial provision to implement any necessary measures.
Prior to September 2, 2014, financial provision was regulated under section 41 of the MPRDA read with regulation 53 and 54 of the MPRDA Regulations. These sections and regulations required that a mining right applicant make financial provision for the rehabilitation of negative environmental impacts arising from their mining activities. The initial amount and subsequent increases thereof were determined in accordance with the DMRE Guidelines. Pursuant to the DMRE Guidelines and the MPRDA Regulations, the selected financial provision must cater for the actual costs associated with the premature closing, decommissioning and final closure and post closure management of residual and latent environmental impacts.
With effect from September 2, 2014, section 41 of the MPRDA was deleted and replaced with section 24P of the NEMA. Like section 41 of the MPRDA, section 24P of the NEMA states that the prospecting / mining right holder must annually assess their environmental liability in the prescribed manner and adjust the financial provision to the satisfaction of the Minister. The only material difference between section 41 of the MPRDA and section 24P of NEMA is that, in terms of the latter, the prospecting or mining right holder is required to maintain financial provision notwithstanding the issuing of a closure certificate by the Minister, while the former stated that the holder would be absolved of environmental liability once a closure certificate is used.
From September 2, 2014 until November 20, 2015, the amount of financial provision was calculated in accordance with the DMRE Guidelines as the Environment Minister had not published regulations in support of section 24P. The DMRE Guidelines were criticized for undervaluing the costs of environmental rehabilitation thus exposing the DMRE to potential liability if the mining right holder was unable to fulfill its environmental obligations.
On November 20, 2015, the Environment Minister published the Financial Provision Regulations, 2015. The Financial Provision Regulations, 2015 sought to rectify the inadequacies of the DMRE Guidelines by, among other things, including preliminary and general costs in the financial provision calculations, imposing VAT (at 15%) on the total amount, prohibiting the withdrawal of trust funds for concurrent rehabilitation (even in circumstances where the financial provision exceeds the evaluated environmental liability) and ceding a portion of the funds to the Minister as security for possible latent and residual post-closure environmental impacts.
Compliance with these obligations would have resulted in a significant increase in the required financial provision, and were consequently strongly opposed by the mining industry. In response to this opposition, the DFFE undertook to engage further with mining industry and other stakeholders to amend or develop new financial provision regulations. Draft amendments to the Financial Provision Regulations, 2015 were published by the Environment Minister in May 2019 and again on August 27, 2021. An amended draft incorporating certain comments submitted by Harmony was published on July 11, 2022. Harmony has submitted additional comments on these latest draft amendments to address some of the remaining issues. Considering the on-going consultation, the date by which mining companies are required to align their financial provision with the Financial Provision Regulations, 2015 has been extended to September 19, 2023, and which has been further extended until February, 2024.
Notwithstanding these on-going discussions, as stated above, the NEMLAA came into effect on June 30, 2023. The NEMLAA replaced section 24P of NEMA with two new sections: a new section 24P (financial provision for the remediation of environmental damage) which applies to mining and non-mining activities and section 24PA (financial provision for mining) which only relates to mining activities. In terms of the new section 24P, the Environment Minister can require that activities, other than mining are required to put up financial provision. Although the Environment Minister has not yet published such a list, it is anticipated that it would include the processing/reclamation of residue stockpiles and residue deposits created prior to May 1, 2004 which currently fall outside the scope of the definition of mining under the MPRDA and thus do not require financial provision.
The NEMLAA also restrict mining right holders’ ability to drawn down against their financial provision where there are more than 10 years before the final decommissioning and closure of the mine. This restriction does not take into consideration the actual environmental liability that may exist at the mine and sterilizes any surplus funds that a mining right holder may have in a rehabilitation trust. That is, these funds could only be used to offset any future increases in the holder’s environmental liability.
The financial provision must also be subjected to independent audits by the DMRE and the “review decision” must be published by Harmony.
Upon the suspension, cancellation, termination or lapsing of a prospecting or mining right, Harmony will have to comply with various regulatory requirements including applying for a closure certificate and will remain liable for compliance with the provisions of various relevant regulations, including any latent significant environmental impacts that manifest post-closure, notwithstanding the issuance of a closure certificate by the DMRE.
Until a closure certificate is granted, Harmony is required to obtain and maintain financial provision for rehabilitation. Upon the issuing of a closure certificate, the Minister may retain a portion of the financial provision for future latent and residual environmental liabilities. In terms of the NEMLAA amendments, the financial provision retained by the Minister must be transferred to an account administered by the Environment Minister or, where the financial provision is an insurance policy, the Environment Minister must access the funds. Harmony will have no right to regulate the way these funds are spent to rectify any latent and residual environmental impacts. Notwithstanding this, Harmony will remain liable for any such liabilities. If the latent and residual environmental liabilities do not materialize, there is no mechanism in terms of which the funds will be returned to the holder. See Item 5: "Operating and Financial Review and Prospects - Operating Results – Key factors affecting our results –Electricity in South Africa – Climate Change, Environmental Factors and Carbon tax" for a discussion regarding carbon tax.
Duty of care
NEMA imposes a statutory obligation on every person who has caused, is causing or is likely to cause significant contamination to take reasonable measures in relation thereto, failing which the director-general of the DFFE, the head of a province of the relevant environmental department, the director-general of the DMRE, or, since the NEMLAA, a municipal manager (collectively the "competent authority”) may issue a directive instructing a person to implement measures specified in the directive.
If the person fails to comply with the directive, the competent authority may apply to court for an order compelling various persons (including persons in control of the activities at the time the pollution / environmental degradation occurred, owners of property and persons who failed to prevent pollution / environmental degradation from occurring) to contribute towards the costs of effecting the reasonable measures. Amendments to the rights of the competent authority to delegate responsible activities under the NEMLAA have also been extended.
Enforcement
The NEMLAA extends the powers and responsibilities of environmental mineral and petroleum inspectors such that they have the same powers currently only afforded to environmental inspectors to conduct investigations, search and seizure operations.
The costs of preventing, controlling or remedying pollution, environmental degradation and consequent adverse health effects must be paid for by those responsible for harming the environment. This duty applies retrospectively and therefore includes contamination caused prior to 1998, when the NEMA came into effect.
Liabilities
A failure to comply with this duty to obtain or comply with an environmental authorization and other offenses may, upon successful prosecution, result in significant fines of up to R10 million and/or 10 years imprisonment being imposed. In addition, it may result in damages claims, obligations to rehabilitate the environment, paying the costs of the prosecution and even director and employee liability. Any person may use the relevant provisions in the NEMA to initiate the prosecution of an entity, its directors and/or employees in their personal capacity.
Waste management
Pursuant to section 19 of the Waste Act, the Minister is authorized to publish a list of waste management activities that are likely to have a detrimental effect on the environment. No one may commence or undertake a waste management activity except in accordance with the norms and standards created in terms of section 19(3) of the Waste Act or in terms of the provisions of a waste management license. The list of waste management activities that have, or are likely to have, a detrimental effect on the environment set out the various activities for which a waste management license is required. A basic assessment is required in respect of those activities listed in Category A, while a scoping and environmental impact assessment is required in respect of Category B listed activities. In respect of those activities listed in Category C, a waste management license is not required but the person seeking to undertake those activities must comply with published norms and standards.
Regulatory uncertainty exists regarding the management and re-processing of residue stockpiles and residue deposits created prior to May 1, 2004, being the date on which so-called “new order” and “old order” mining rights were created by the MPRDA. These residue deposits and residue stockpiles fall outside the scope of the MPRDA (and therefore outside the jurisdiction of the DMRE) and, as such, it is not possible to obtain a mining right or a mining permit over such residue stockpiles or deposits. Amendments were included in 2014 that sought to incorporate the reclamation of residue stockpiles and residue deposits within the scope of the Waste Act and within the jurisdiction of the DMRE. The amendments, however, are unclear and render it uncertain whether the DMRE or the DFFE is the competent authority in respect of these residue stockpiles and deposits. This may lead to possible legal challenges in circumstances where waste management licenses are obtained from the incorrect authority. The NEMLAA includes certain changes related to residue stockpiles and residue deposits. The definitions of each are inserted into NEMA, and both have the meaning assigned to them in section 1 of the MPRDA. The effect of the amendments is that residue stockpiles and residue deposits are now managed in terms of NEMA and are excluded from the scope of the Waste Act. This does not apply to residue stockpiles and residue deposits created prior to May 1, 2004 which fall outside of the definitions under the MPRDA. As a result, these residue stockpiles and deposits may fall within the scope of the broader definition of hazardous substances contemplated in the NEMLAA. These amendments under the NEMLAA are not yet in force.
Other waste management facilities constructed and/or operated by our operations may also be subject to licensing requirements, including hazardous waste disposal sites and central salvage yards.
In addition to licensing, mines must also comply with the management measures prescribed for residue stockpiles and deposits in the Regulations for Residue Stockpiles and Residue Deposits from a Prospecting, Mining, Exploration or Production Operation in GNR 632 of July 24, 2015. These regulations do not retrospectively apply to the management of existing stockpiles and deposits, provided they are in an approved EMPr. These regulations have notable cost implications for new residue stockpiles and deposits established after this date as they impose certain liner/barrier requirements for them.
The Waste Act also regulates contaminated land, whether or not the contamination occurred before the commencement of the Waste Act or at a different time from the actual activity that caused the contamination. Consequently, historic, as well as present or future arising, contaminated land which is identified as an investigation area by the environmental authorities, or which is notified as being contaminated by the landowner must be assessed and reported on. The direction of taking monitoring and management measures, or of undertaking site remediation, may follow depending on the level of risk associated with the contamination.
Failure to comply with the provisions of the Waste Act may result in penalties similar to those discussed under the NEMA above.
Water use and pollution
The NWA regulates the management and water quality of water resources, including watercourses, surface water, estuaries and aquifers to ensure the sustainability of all water resources in the interests of all water users.
The NWA defines a water use as:
•taking water from a water resource;
•storing water;
•impeding or diverting the flow of water in a watercourse;
•engaging in stream flow activities contemplated in the NWA;
•engaging in a controlled activity identified in terms of s37(1) of the NWA or declared in terms of s38(1);
•discharging waste or water containing waste into a water resource through a pipe, canal, sewer, sea outfall or other conduit;
•disposing of waste in a manner which may detrimentally impact on a water resource;
•disposing in any manner of water which contains waste from, or which has been heated in, any industrial or power generation process;
•altering the bed, banks, course or characteristics of a watercourse;
•removing, discharging or disposing of water found underground if it is necessary for the efficient continuation of an activity or for the safety of people; and
•using water for recreational purposes.
From a permitting perspective, water resources are regulated through the issuing of water use licenses, publishing of general authorizations and / or permitting persons to continue undertaking water uses that they were undertaking when the NWA came into effect in October 1998.
Most mining operations require a water use license in order to conduct their operations, particularly for activities relating to water abstraction, storage, effluent discharge, diversions, and facilities which have the potential to pollute groundwater resources. Water use licenses are difficult to obtain and usually involve a lengthy and delayed application process. Mines are also required to comply with the regulations which were specifically published for the use of water for mining and related activities in GN 704 of June 4, 1999. These regulations provide for limitations on the location of mining infrastructure and requirements for the separation of dirty and clean water systems and the design of certain water management infrastructure.
In addition to the permitting requirements, the NWA includes a duty of care similar to that discussed in the section above in respect of NEMA. Failure to comply with the NWA will result in penalties similar to those set out above in respect of NEMA.
Emissions
In South Africa, the National Greenhouse Gas Emission Reporting Regulations require that we register our operations that involve fuel combustion activities associated with mining and quarrying in excess of 10MW as well as certain other activities associated with the mineral industry. We must report our GHG emissions and activity data in respect of these operations in accordance with the Technical Guidelines for each of the relevant GHGs and the IPCC emission sources by March 31st of each year. The Technical Guidelines are a companion to the South African National GHG Regulations and describe the reporting methodology as specified in the Air Quality Act.
See Item 3: “Key Information - Risk Factors - Risks Related to ESG - Compliance with emerging climate change regulations and other sustainability measures could result in significant costs for us” for a discussion regarding the laws governing GHG emissions.
Carbon Tax Act
The South African government introduced a carbon tax under the Carbon Tax Act with effect from June 1, 2019. The Carbon Tax Act (together with the Customs and Excise Act, which contains provisions related to the administrative arrangements for the collection of carbon tax revenues by the South African Revenue Service) aims to reduce greenhouse gas emissions. For more information regarding the Carbon Tax Act, see Item 3: “Key Information - Risk Factors - Risks Related to ESG - Compliance with emerging climate change regulations and other sustainability measures could result in significant costs for us” and Item 5: "Operating and Financial Review and Prospects - Operating Results – Key factors affecting our results – Electricity in South Africa" and " – Climate Change, Environmental Factors and Carbon tax" for a discussion regarding carbon tax.
Laws and Regulations Pertaining to Environmental Protection – Australia
In Queensland, mining operations are subject to the Environmental Protection Act (Qld) 1994 and Environmental Protection Regulations 2019. The Act has as its object the protection of Queensland’s environment while allowing for development that improves the total quality of life, both now and in the future, in a way that maintains the ecological processes on which life depends (ecologically sustainable development). It includes the preparation and assessment of environmental impact studies under the Act, and the process of grant and administration of Environmental Authorities.
Eva Copper Mining Pty Limited is the holder of an issued Environmental Authority for the Eva Copper Project, which will be amended from time to time to align with project updates and optimizations. Harmony has developed a compliance and obligations database to assist in ensuring that environmental conditions, commitments, and obligations for the Eva Project are tracked and implemented.
In addition, various other environmental legislation applies, including the EPBC Act and the NGER Act.
The EPBC Act is administered by the Commonwealth Department of Climate Change, Energy, the Environment and Water and provides a legal framework to protect and manage unique plants, animals, habitats and places in Australia. Projects that could have a significant impact on Commonwealth protected matters, must be referred to the Commonwealth Minister for Environment who will determine whether the proposed action requires assessment and approval under the EPBC Act. The decision to refer a project under the EPBC Act is a self-assessment process. The Eva Project does not hold any approvals under the EPBC Act.
In 2021, a desktop assessment was completed which determined that the Eva Copper Project is unlikely to have a significant impact on Commonwealth matters of national environmental significance and therefore referral under the EPBC Act was not required. Referrals under the EPBC Act may be necessary to support future amendments and will be assessed and determined on a case-by-case basis.
The NGER Act establishes the legislative framework for the NGER Scheme which is a national framework for reporting greenhouse gas emissions, greenhouse gas projects and energy consumption and production by corporations in Australia. The NGER Act makes registration and reporting mandatory for corporations whose energy production, energy use or greenhouse gas emissions meet specified thresholds.
In addition to reporting obligations, the NGER Act introduces the Safeguard Mechanism which provides a framework for Australia's largest emitters to measure, report and manage their emissions. It does this by requiring large facilities, whose net emissions exceed the Safeguard threshold, to keep their emissions at or below emissions baselines. The Safeguard Mechanism applies to facilities with scope 1 covered emissions of more than 100,000 tonnes of carbon dioxide equivalent (CO2-e) per year. Reforms to the Safeguard Mechanisms came into effect on 1 July 2023 which apply a decline rate to facilities’ baselines so that they are reduced predictably and gradually over time on a trajectory consistent with achieving Australia’s emission reduction targets of 43% below 2005 levels by 2030 and net zero by 2050.
As part of the feasibility study currently in progress, the Eva Copper Project is quantifying its predicted emissions under the NGER Act to determine the potential applicability of monitoring and reporting obligations and the Safeguard Mechanism.
Laws and Regulations Pertaining to Environmental Protection – Papua New Guinea
The PNG Environment Act and various related regulations and guidelines regulate the impact of industry and other activities on the environment and sets out the environmental permitting requirements for developments, including mining projects. An environmental impact statement is required for activities that are likely to have a significant adverse impact on the environment and other social or cultural heritage aspects. This statement must be lodged with the PNG Conservation and Environment Protection Authority for assessment, which includes a public review and referral phase. For large projects, the review process may also involve an independent peer review.
The PNG Government will use the environmental impact statement as the means to assess a project's impacts, in accordance with statutory processes, and decide whether the Environment Minister should grant approval in principle for the project under the PNG Environment Act. Thereafter, the Managing Director Conservation and Environment Protection Authority may grant an environment permit for the activity.
Potential Changes to PNG Environment Laws
A process of mining regime review is underway within PNG and a number of environmental matters are under consideration. These include a Mine Closure Policy and Mining Project Rehabilitation and Closure Guidelines (which include requirements for the provision of financial assurance for mine closure and rehabilitation costs), a Biodiversity Offset Policy (which anticipates biodiversity offset payments to support biodiversity incentives) and a National Oceans Policy.
Harmony's operations and projects in PNG will potentially be affected by changes to PNG environmental laws, and Harmony continues to engage with the PNG Government on these matters through the offices of the PNG Chamber of Mines and Petroleum, and directly with CEPA and (in the case of mine closure) the PNG MRA.
Labor Relations
South Africa
Employee relations in South Africa are guided by the Labour Relations Act, 66 of 1995, as well as by the Employee Relations Framework Policy and mine-based recognition agreements. In South Africa, Harmony recognizes four labor unions (save for the Moab Khotsong and Target where the National Union of Metalworkers of South Africa ("NUMSA") is also recognized). As at fiscal year-end, these unions and their corresponding representation were as follows, namely the National Union of Mineworkers (at 53%); the Association of Mineworkers and Construction Union (at 28%); the United Association of South Africa (at 5%) NUMSA (6%) and Solidarity (at 2%). About 95% of our South African workforce is unionized, with the balance not belonging to a union. See “Integrated Annual Report for the 20-F 2023 – Social – Caring for our employees” on pages 188 to 196.
Australia
Employee relations in Australia are regulated by a combination of federal and state statutes that stipulate minimum standards and provide for collective bargaining and action. All employment contracts are based on the Australian Fair Work Act, 28 of 2009 and the National Employment Standards.
In Queensland, there are a number of well-established mining unions, particularly in the coal and energy sectors. At present, our Australian workforce is not unionized. However, if the Eva Copper Project moves into the development and operational phases, the level of unionization is expected to rise significantly. This process of unionization may also be further prompted by the possible passage of a proposed Industrial Relations and other Legislation Amendment Bill 2022 (Qld).
Papua New Guinea
Employee relations in PNG are regulated by the PNG Employment Act of 1978 and the PNG Employment of Non-Citizens Act 1978. Individual contracts are entered into, and the workforce is not unionized.
In PNG, wages are guided by independent market research that compares mining, oil and gas companies in the region. Industrial relations at Hidden Valley have been established through regular dialogue between management and employees via the Employee Relations Committee.
In addition, Hidden Valley mine employment is guided by the Employment and Training Plan appended to the Memorandum of Agreement (“MOA”) dated August 2005 between Morobe Consolidated Goldfields Limited, the PNG Government, provincial and local governments and the Landowner Association. The MOA requires that, as far as is reasonably possible, preference in training and employment is given to local and landowner candidates before individuals from other provinces or countries. Compliance with this agreement is a critical issue in maintaining Hidden Valley mine’s license to operate.
In PNG, the PNG Government is considering revisions of its local content policy. In August 2023, the Department of Commerce and Industry presented a draft “Papua New Guinea National Content Policy for Resource Sectors 2023-2027", which policy is designed to encourage greater national participation and partnership in major resource investments in PNG. It has five key focus areas, namely domestic procurement of goods and services and supplier development; localization of employment opportunities; skilled workforce development; greater equity participation by PNG; and sustainable development of project impacted communities. It is presently uncertain the extent to which, and how, the proposed policy will be applied to our current operations and projects in PNG.
Intellectual Property
Harmony is not dependent on intellectual property (including patents or licenses), industrial, commercial or financial contracts (including contracts with customers or suppliers) or new manufacturing processes for the conduct of its business as a whole.
Seasonality
Subject to other factors and unforeseen circumstances, in the third quarter production is generally lower than production during the rest of the year as a result of the ramp-up of operations after annual holiday production declines.
Raw Materials
Harmony uses chemicals, including cyanide, hydrochloric acid and caustic soda, as key reagents in the production of gold. These chemicals are available from a limited number of suppliers and with the exception of cyanide do not represent a material portion of the Company’s costs. Given the challenges associated with suppliers, aging production plants and reliability thereof, Harmony is currently experiencing continued interrupted supply of the foregoing stated reagents as well as other critical consumables utilized in the production of gold across our global operations. The latter has negatively impacted Harmony’s purchasing power and security of supply. As a result of sourcing from third-party raw materials suppliers importing consumables internationally, the security of supply is at a higher premium. Additionally, our stocking strategies account for potential lead time variation and supply constraints, thus minimizing the risk of changes in the marketplace. While commodity pricing is subject to volatility over time, we believe our contractual terms which include rise and fall clauses are dynamic enough to mitigate the market movement volatility.
However the war in Ukraine has caused significant disruption to financial and commodity markets. During fiscal 2023, prices for several hard and soft commodities had reached their highest levels in a decade or more, or in some cases had set records. Brent crude oil touched levels not seen since 2012 and copper advanced to its highest level ever. The higher cost for basic commodities used in our host countries and communities, and as key production inputs, could impact the costs of our raw materials. The impact on global supply chains from the conflict will become clearer over time. Item 3: "Key Information - Risk Factors – Strategic and Market Risks - Rising inflation, including as a result of Russia’s invasion of Ukraine, may have a material adverse effect on our business, operating results and financial condition”.
Land Expropriation
South Africa
In December 2017, during its national conference, the ANC resolved that as a matter of policy, the ANC should pursue the expropriation of land without compensation, provided that such expropriation is carried out without destabilizing the agricultural sector, endangering food security or undermining economic growth and job creation. In February 2018, the National Assembly assigned the Constitutional Review Committee (“CRC”), to review section 25 of South Africa’s Constitution and other relevant clauses to make it possible for the state to expropriate land in the public interest without compensation. On December 4, 2018, South Africa’s Parliament adopted the CRC’s report dated November 15, 2018 in which it recommended that section 25 of South Africa’s Constitution be amended to make explicit that expropriation of land without compensation is a legitimate option for land reform. On March 13, 2019, the CRC announced that the work to amend section 25 of South Africa’s Constitution would not be finished before the South African general elections in May 2019 and that consequently the matter would be taken up by Parliament after the elections. In the event that the CRC recommends a Constitutional amendment in favor of expropriation, various procedural milestones would need to occur, including a bill amending section 25 of the Constitution approved by a majority of the National Assembly as well as six of the nine provinces of the National Council of Provinces (“NCOP”) and signed by the President, among others. The legislative process to give effect to the proposed Constitutional amendment, has not yet been finalized. The National Assembly re-established the Ad-Hoc Committee tasked with initiating and introducing the legislation required to amend Section 25 of the Constitution in 2020. The Ad-Hoc Committee engaged in a public participation process which consisted of public hearings that took place from December 2019 to the end of February 2020. These public hearings were held in the nine provinces. The Ad-Hoc committee released the report on its findings on the public participation process on April 16, 2021. In a media statement on April 16, 2021, the Ad-Hoc committee advised that it had adopted the report and in a subsequent media statement on September 8, 2021, it advised that both the report and the Bill would be sent to the National Assembly for consideration.
The Draft Constitution Eighteenth Amendment Bill was published for comment at the end of 2019. The aim of the Draft Constitution Eighteenth Amendment Bill is to amend the Constitution of the Republic of South Africa, 1996 so as to provide that where land and any improvements thereon are expropriated for the purpose of land reform, the amount of compensation payable may be nil. The Draft Constitution Eighteenth Amendment Bill failed to receive the required two-thirds approval of the National Assembly in December 2021 and the proposed Amendment Bill is no longer being pursued.
In 2019, prior to the introduction of the Draft Constitution Eighteenth Amendment Bill, a draft expropriation bill (the “Draft Expropriation Bill”) was published for public comment by the South African Minister for Public Works (the “Minister for Public Works”), which would allow the state to expropriate land without compensation where doing so would be for a public purpose or in the public interest. In determining to expropriate land without compensation, this legislation would also require the consideration of “all relevant circumstances”, which include, among other things, whether the land is held purely for speculative purposes, is owned by the state or is abandoned. Following significant comments raised by the public on the Draft Expropriation Bill, in October 2020, a new draft expropriation bill (the “New Draft Expropriation Bill”) was introduced by the Minister for Public Works of South Africa. The New Draft Expropriation Bill was approved by the National Assembly on September 28, 2022. It has been referred to the NCOP for consideration, and the public was invited to comment and make written submissions on the New Draft Expropriation Bill by June 23, 2023. Once the New Draft Expropriation Bill has been considered by the NCOP in light of such comments and/or submissions, it will be referred to the President for ratification.
While the South African government has stated that it does not intend to nationalize mining assets or mining companies, certain political parties have stated publicly and in the media that the government should embark on a program of nationalization. For instance, the ANC has adopted two recommended approaches to interacting with the mining industry. While the ANC has rejected the possibility of mine nationalization for now, the first approach contemplates, among other things, greater state intervention in the mining industry, including the revision of existing royalties, the imposition of new taxes and an increase in the South African government’s holdings in mining companies. The second approach contemplates the South African government taking a more active role in the mining sector, including through the introduction of a state mining company to be involved in new projects either through partnerships or individually.
The proposed amendment to section 25 of South Africa’s Constitution or any legislation resulting in the expropriation of land or greater government intervention could disrupt our operations, which could have a material adverse effect on our business, operating results and financial condition.
The former President, Jacob Zuma, appointed the Davis Tax Committee to look into and review the current South African tax regime, including the mining tax regime. The committee’s first interim report on mining, which was released for public comment on August 13, 2015, proposed no changes to the royalty regime but recommended the discontinuation of the upfront capital expenditure write-off regime in favor of an accelerated capital expenditure depreciation regime. In addition, the report recommended retaining the so called “gold formula” for existing gold mines only, as new gold mines would be unlikely to be established in circumstances where profits are marginal or where gold mines would conduct mining of the type intended to be encouraged by the formula. The committee also recommended the phasing out of additional capital allowances available to gold mines in order to bring the gold mining corporate income tax regime in line with the tax system applicable to all taxpayers. In December 2016, following a period of public comment, the committee issued its second and final report to the Minister of Finance, which largely reaffirmed the committee’s initial recommendations. The final reports were published in November 2017. The South African National Treasury will continue to consider the committee’s final recommendations. It is not clear at this stage which, if any, of the recommendations will be adopted as legislation. Such legislation could, however, have a material adverse effect on our business, results of operations and financial condition.
On July 31, 2020, the South African National Treasury published for public comment the 2020 Draft Taxation Laws Amendments Bill which proposed, amongst others, amendments to disallow contract miners from benefiting from the accelerated capital expenditure allowance and the elimination of the Minister of Finance’s discretion to uplift the ring-fencing of capital expenditure per mine. Various stakeholders raised issues with the draft bill during the public consultation period. The Taxation Law Amendment Act, 23 of 2020 came into force on January 20, 2021. The amendments proposed in the Bill relating to contract miners and the Minister's discretion to uplift the ring-fencing of capital expenditure per mine were not included in the final Act.
On December 11, 2020, the Minister published the Housing and Living Conditions Standard, which requires us to revise our current housing and living condition plans in terms of its SLPs, which could result in increased costs. See Item 4: "Information on the Company – Business Overview – Regulation – Mining rights – South Africa – Housing and Living Standards".
Assessed Losses
In line with the 2020 Budget announcement, government broadened the corporate income tax base in terms of the Taxation Laws Amendment Act, No 20 of 2021, by restricting the offset of the balance of assessed losses carried forward to 80 per cent of taxable income, which came into effect for years of assessment ending on or after March 31, 2023.
To the extent that the balance of assessed loss exceeds 80 per cent of current-year taxable income, companies will be able to set off the higher of R1 million or 80 per cent of taxable income when calculating their tax liability. Stated differently, the assessed loss balance can be set off against 80 per cent of taxable income and the remainder remains deductible in future years. The remaining assessed loss that is not utilized in any given year may be carried forward indefinitely as previously. This limitation does not apply to assessed capital losses, which in most cases remain fully available for set-off against capital gains of the taxpayer.
In the case of mining companies, the legislation has been clarified to state that the deduction of the mining capital expenditure is calculated after the set-off of the assessed loss. The balance of unredeemed capital expenditure will be carried forward to the following year of assessment.
If the current year’s taxable income calculation results in an assessed loss before taking into account an assessed loss carried forward from the previous year of assessment, the loss limitation rule does not apply. In such a case the full amount of the current year’s assessed loss is added to the previous year’s assessed loss and the entire aggregate balance of assessed loss is carried forward to the following year of assessment.
Base Erosion and Profit Shifting
The South African Government is fully committed to implement the Inclusive Framework of the OECD relating to Base Erosion and Profit Shifting (“BEPS”) that were developed by the OECD/G20 countries even though it is not a member country on the basis that South Africa is an early adopter of the relevant measures. Consistent with this approach, it has not only implemented and strengthened the rules relating to the ability to deduct interest, but it has also widened the scope of the transfer pricing rules to include associated enterprises. In addition it also strengthened the laws relating to hybrid equity and hybrid interest and the returns from these instruments.
South Africa is also a signatory to the Multilateral Convention to Implement Tax Treaty related Measures to Prevent Base Erosion and Profit Shifting. In this context the so-called The Multilateral Instrument (“MLI”) was incorporated into South African tax law with effect from January 1, 2023. Among other things South Africa adopted the Principal Purpose Test to deal with treaty abuse.
In addition, South Africa also signed the so-called Pillar 1 and Pillar 2 proposals that are aimed to reduce opportunities for tax planning and tax avoidance for multinational entities by limiting tax competition and the place where taxes are in fact paid.
Effectively Pillar 1 aims to allocate business profits based on actual business activities in a specific country, whereas Pillar 2 aims to establish a minimum global tax rate of 15%. No specific legislation has been prepared yet, but it is expected that it will be introduced when the final proposals have been adopted.
Renewable Energy
South Africa is not only committed to reduce the carbon footprint consistent with the OECD Guidelines, but it has also introduced additional measures to increase the Carbon Tax over the next few years. In addition and to cater for constant loadshedding, it introduced measures to incentivize taxpayers to invest in renewable energy projects by allowing an allowance of up to 125% if the project is brought into use before March 1, 2025.
C. ORGANIZATIONAL STRUCTURE
Harmony is a holding company with its significant ownership interests organized as set forth in Exhibit 8.1 "Significant Subsidiaries of Harmony Gold Mining Company Limited”.
The information set forth under the heading:
•“– Who we are ” on page 7 to 9
of the Integrated Annual Report for the 20-F 2023 is incorporated herein by reference. Also see note 2.1 “Consolidation” of our consolidated financial statements, set forth beginning on page F-1.
D. PROPERTY, PLANT AND EQUIPMENT
The information set forth under the headings:
•“– Our Operations” on pages 10 to 12;
•“– Delivering profitable ounces – Operational performance” on pages 67 to 108; and
•“– Environment – Environmental management and stewardship” on pages 113 to 119.
of the Integrated Annual Report for the 20-F 2023 is incorporated herein by reference. Also see note 15 “Property, Plant and Equipment” and note 34 “Cash Generated by Operations” of our consolidated financial statements, set forth beginning on page F-1.
Also see Item 4: “Information on the Company - Business Overview - Regulation - Laws and Regulations Pertaining to Environmental Protection - South Africa”, “- Laws and Regulations Pertaining to Environmental Protection - Papua New Guinea" and “- Capital Expenditures” and Item 5: “Operating and Financial Review and Prospects - Liquidity and Capital Resources".
MINERAL RESOURCE AND MINERAL RESERVE SUMMARY DISCLOSURE
On October 31, 2018, the SEC adopted Subpart 1300 (17 CFR 229.1300) of Regulation S-K (“Regulation S-K 1300”) along with the amendments to related rules and guidance in order to modernize the property disclosure requirements for mining registrants under the Securities Act and the Securities Exchange Act. Registrants engaged in mining operations must comply with Regulation S-K 1300 for the first fiscal year beginning on or after January 1, 2022. Accordingly, Harmony is providing disclosure in compliance with Regulation S-K 1300 for its fiscal year ending June 30, 2023, and will continue to do so going forward. As part of its rule-making to modernize its disclosure requirements, the SEC rescinded Industry Guide 7, which accordingly is not applicable to Harmony’s current and future disclosures.
Mineral Resources and Mineral Reserves are estimates that contain inherent risk and depend upon geologic interpretation and statistical inferences drawn from drilling and sampling analysis, which may prove to be unreliable. For additional information on the risks and uncertainties associated with Harmony’s mining properties, see Item 3: "Key Information – Risk Factors".
Harmony’s South African operations include nine deep-level mines, an open pit mining operation and several surface retreatment facilities. Combined, these account for gold Mineral Resources (exclusive of Mineral Reserves) of 67.4 million ounces and gold Mineral Reserves of 20.2 million ounces at June 30, 2023.
Harmony has three underground mining operations in the West Rand: Doornkop, Kusasalethu and Mponeng. As at June 30, 2023, their combined Mineral Resources (exclusive of Mineral Reserves) were 29.7 million ounces and the combined Mineral Reserves were 4.1 million ounces. Harmony has one underground mining operation in the Klerksdorp goldfield: Moab Khotsong. As at June 30, 2023, the estimated Mineral Resources (exclusive of Mineral Reserves) were 4.6 million ounces and the estimated Mineral Reserves were 3.7 million ounces. Harmony has five underground mining operations in the Free State: Joel, Masimong, Tshepong South, Tshepong North, and Target 1. Target 3 is also situated in the Free State, but is currently held under care and maintenance. As at June 30, 2023, their combined estimated Mineral Resources (exclusive of Mineral Reserves) were 28.8 million ounces and the combined estimated Mineral Reserves were 2.7 million ounces.
Harmony has one open pit mine and several surface retreatment facilities in South Africa. These include: Kalgold, various surface sources in the Free State (including several tailings retreatment operations and waste rock dumps ("WRDs"), located largely in the vicinity of Welkom), marginal ore rock dumps and tailings (Mispah and Kop Paydam) associated with Moab Khotsong that are available for retreatment, Mine Waste Solutions, Vaal River and West Wits. As at June 30, 2023, their combined estimated Mineral Resources (exclusive of Mineral Reserves) were 4.2 million ounces and the combined estimated Mineral Reserves were 9.7 million ounces.
In PNG, Harmony has one wholly-owned open-pit, gold and silver mine: Hidden Valley, and a 50% interest in the Wafi-Golpu Project. As at June 30, 2023, our combined estimated gold and gold equivalent Mineral Resources (exclusive of Mineral Reserves) in PNG were 20.2 million ounces and the combined estimated Mineral Reserves were 19.2 million ounces.
In Australia, Harmony acquired the Eva Copper Project. As at June 30, 2023, our combined estimated gold and gold equivalent Mineral Resources (exclusive of Mineral Reserves) in Australia were 8.1 million ounces. The combined estimated Mineral Reserves may be declared once the feasibility study is concluded at the end of calendar 2024.
Locations of Properties
The following graphic sets out the geographical distribution of Harmony’s mining properties.
Maps showing the location of individual properties as well as infrastructure and licenses are shown in “—Individual Property Disclosure” below. All operations are 100 percent owned unless otherwise indicated.
The following table sets out the aggregate production of Harmony’s mining operations for the years ended June 30, 2023, 2022 and 2021.
|
|
|
|
|
|
|
|
|
|
|
|
|
Fiscal year ended June 30, |
|
2023 |
2022 |
2021 |
| Gold produced (kg) |
45,651 |
46,236 |
47,755 |
| Gold produced (000oz) |
1,468 |
1,487 |
1,535 |
Overview of Mining Properties and Operations
The following information is detailed for each material property in “—Individual Property Disclosure” below:
•the location of the properties;
•the type and amount of ownership interests;
•the identity of the operator or operators;
•titles, mineral rights, leases or options and acreage involved;
•the stages of the properties (exploration, development or production);
•key permit conditions;
•mine types and mineralization styles; and
•processing plants and other available facilities.
Methodology
Mineral Resources
A Mineral Resource is a concentration or occurrence of solid material of economic interest in or on the Earth’s crust in such form, grade or quality and quantity that there are reasonable prospects for eventual economic extraction. The location, quantity, grade, continuity and other geological characteristics of a Mineral Resource are known, estimated or interpreted from specific geological evidence and knowledge, including sampling.
An Inferred Mineral Resource is that part of a Mineral Resource for which quantity and grade or quality are estimated based on limited geological evidence and sampling. Geological evidence is sufficient to imply but not verify geological and grade or quality continuity. An Inferred Resource has a lower level of confidence than that applying to an Indicated Mineral Resource and must not be converted to a Mineral Reserve. It is reasonably expected that the majority of an Inferred Mineral Resource could be upgraded to an Indicated Mineral Resource with continued exploration.
An Indicated Mineral Resource is that part of a Mineral Resource for which quantity, grade or quality, densities, shape and physical characteristics are estimated with sufficient confidence to allow the application of modifying factors in sufficient detail to support mine planning and evaluation of the economic viability of the deposit. Geological evidence is derived from adequately detailed and reliable exploration, sampling and testing and is sufficient to assume geological and grade or quality continuity between points of observation.
A Measured Mineral Resource is that part of a Mineral Resource for which quantity, grade or quality, densities, shape, and physical characteristics are estimated with confidence sufficient to allow the application of modifying factors to support detailed mine planning and final evaluation of the economic viability of the deposit. Geological evidence is derived from detailed and reliable exploration, sampling and testing and is sufficient to confirm geological and grade or quality continuity between points of observation. A Measured Mineral Resource has a higher level of confidence than that applying to either an Indicated or an Inferred Mineral Resource. It may be converted to either a Proven Mineral Reserve or a Probable Mineral Reserve.
Mineral Resource estimation
To meet SAMREC, 2016’s requirements that this solid material reported as a Mineral Resource should have “reasonable and realistic prospects for eventual economic extraction”, Harmony has determined an appropriate cut-off grade which has been applied to the quantified mineralized body according to a process incorporating a long-term view on future economic modifying factors. In applying this process, Harmony uses a gold price of R920,000/kg to derive a cut-off grade to determine the Mineral Resources at each of its South African underground operations.
The estimation of Mineral Resources is based on geoscientific knowledge and borehole and sampling data (obtained by means of chip sampling on the reef horizon in a shaft-specific grid), with input from the company’s Ore Reserve managers, geologists and geostatistical staff. All sampling done is subject to quality assurance and quality control, as prescribed by SAMREC, 2016, to ensure data quality and accuracy. Each mine’s Mineral Resource is categorized – based on similarities in geology, facies, grade and structure, the orebody is divided into geozones. It is then blocked-out and ascribed an estimated value. A computerized geostatistical estimation process is used at all our mines.
To define that portion of a Measured and Indicated Mineral Resource that can be converted to a Proven and Probable Mineral Reserve, Harmony applies the concept of a cut-off grade. At our underground South African mines, this is done by defining the optimal cut-off as the lowest grade at which an orebody can be mined such that the total profits, under a specified set of mining parameters, are maximized. The cut-off grade is determined using the company’s Optimiser software, which requires the following as inputs:
•the database of Measured and Indicated Resource blocks (per shaft section);
•an assumed gold price which, for our Mineral Reserves, was taken as R825,000/kg;
•planned production rates;
•the mine recovery factor which is equivalent to the mine call factor multiplied by the plant recovery factor; and
•planned cash operating costs (Rand per tonne).
Rand per tonne cash operating costs are historically based but take cognizance of distinct changes in the cost environment such as restructuring, right-sizing, and other cost-reduction initiatives and, for below-infrastructure ounces, an estimate of capital expenditure.
In PNG, the block cave reserve at Golpu uses block cave optimization software to define the optimal mine plan and sequencing. The open-pit reserve at Hidden Valley is determined using the Whittle optimization program to guide the most efficient mine design given the commodity prices and cost inputs assumed.
Mineral Reserves represent that portion of the Measured and Indicated Mineral Resources above the cut-off grade in the LOM plan and are estimated after consideration of the factors affecting extraction, including mining, metallurgical, economic, marketing, legal, environmental, social and governmental factors. At our underground mines, the reported Mineral Reserves are accessible from existing infrastructure and/or infrastructure that is in the process of being developed.
A range of disciplines, including geology, survey, planning, mining engineering, rock engineering, metallurgy, financial management, human resources management and environmental management, are involved at each mine in the LOM planning process and the conversion of Mineral Resources into Mineral Reserves.
The modifying factors related to the ore flow that are used to convert Mineral Resources to Mineral Reserves through the LOM planning process are stated for each shaft. For these factors, historical information is used, except if there is a valid reason to do otherwise. As a result of the depth at which mining occurs and the resulting rock engineering requirements at our South African underground mines, some shafts include stope support pillars into the design of their mining layouts which accounts for discounts of 7% to 10%. A further 15% discount is applied as a LOM factor to provide for unpay and off-reef mining. In general, LOM plan extraction factors do not exceed 85% and are reflected in Mineral Reserves.
While there are some differences between the definition of SAMREC, 2016 and that of Regulation S-K 1300, only the Mineral Reserves at each of Harmony’s operations and advanced projects as at June 30, 2023 that qualify as Mineral Reserves for purposes of Regulation S-K 1300 are presented in the tables below.
Mineral Reserves
Modifying factors are considerations used to convert Mineral Resources to Mineral Reserves. These include, but are not restricted to, mining, processing, metallurgical, infrastructure, economic, marketing, legal, environmental, social and governmental factors. A Mineral Reserve is the economically mineable part of a Measured and/or Indicated Mineral Resource. It includes diluting materials and allowances for losses, which may occur when the material is mined or extracted and is defined by studies at prefeasibility or feasibility level as appropriate that include application of modifying factors. Such studies demonstrate that, at the time of reporting, extraction could reasonably be justified. The reference point at which Mineral Reserves are defined, usually the point where the ore is delivered to the processing plant, must be stated. It is important that in all situations where the reference point is different, such as for a saleable product, a clarifying statement is included to ensure that the reader is fully informed as to what is being reported.
A Probable Mineral Reserve is the economically mineable part of an Indicated, and in some circumstances, a Measured Mineral Resource. The confidence in the modifying factors applying to a Probable Mineral Reserve is lower than that applying to a Proven Mineral Reserve.
A Proven Mineral Reserve is the economically mineable part of a Measured Mineral Resource. A Proven Mineral Reserve implies a high degree of confidence in the modifying factors. A Scoping Study is an order of magnitude technical and economic study of the potential viability of Mineral Resources that includes appropriate assessments of realistically assumed modifying factors together with any other relevant operational factors that are necessary to demonstrate at the time of reporting that progress to a prefeasibility study can be reasonably justified.
A prefeasibility study is a comprehensive study of a range of options for the technical and economic viability of a mineral project that has advanced to a stage where a preferred mining method, in the case of underground mining, or the pit configuration, in the case of an open-pit, is established and an effective method of mineral processing is determined. It includes a financial analysis based on reasonable assumptions on the modifying factors and the evaluation of any other relevant factors which are sufficient for a competent person, acting reasonably, to determine if all or part of the Mineral Resource may be converted to a Mineral Reserve at the time of reporting. A prefeasibility study is at a lower confidence level than a feasibility study.
A feasibility study is a comprehensive technical and economic study of the selected development option for a mineral project that includes appropriately detailed assessments of applicable modifying factors together with any other relevant operational factors and detailed financial analysis that are necessary to demonstrate at the time of reporting that extraction is reasonably justified (economically mineable). The results of the study may reasonably serve as the basis for a final decision by a proponent or financial institution to proceed with, or finance, the development of the project. The confidence level of the study will be higher than that of a prefeasibility study.
For the reporting of Mineral Reserves the following parameters were applied:
•a gold price of US$1,582 per ounce;
•an exchange rate of R16.22 per US dollar;
•the above parameters resulting in a gold price of R825,000/kg for the South African assets;
•the Hidden Valley operation and Wafi-Golpu Project used prices of US$1,582/oz gold (“Au”), US$22.35/oz silver (“Ag”), US$ and US$3.70/lb copper (“Cu”) at an exchange rate of A$1.43 per US$;
•gold equivalent ounces are calculated assuming a US$1,582/oz Au, US$ 3.70/lb Cu and US$22.35/oz Ag with 100% recovery for all metals; and
•“gold equivalent” is computed as the value of Harmony's gold, silver and copper from all Mineral Resources/ Mineral Reserves classifications divided by the price of gold. All calculations are done using metal prices as stipulated.
Gold equivalent ounces
In instances where individual deposits may contain multiple valuable commodities with a reasonable expectation of being recovered (for example gold and copper in a single deposit) Harmony computes a gold equivalent to more easily assess the value of the deposit against gold-only mines. Harmony does this by calculating the value of each of the commodity, then dividing the product by the price of gold. For example, the gold equivalent of a gold and copper deposit would be calculated as follows: ((gold ounces x gold price per ounce) + (copper pounds x copper price per pound)) / gold price per ounce. All calculations are done using metal prices as stipulated above. Harmony assumes a 100% metallurgical recovery in its calculations unless otherwise stated.
Mineral Resources (exclusive of Mineral Reserves)
As at June 30, 2023, Harmony had aggregate attributable Measured and Indicated Resources (exclusive of Mineral Reserves) of approximately 44.2 million ounces of gold, 13.0 million ounces of gold equivalents, 30.3 thousand ounces of silver, 5.5 million pounds of copper, 71.5 million pounds of molybdenum and 44.4 million pounds of uranium.
|
|
|
|
|
|
|
|
|
|
|
|
|
|
|
|
|
|
|
|
|
|
|
|
|
|
|
|
|
|
|
|
|
|
|
|
|
|
|
| Operations |
Measured Resources |
Indicated Resources |
Measured and Indicated Resources |
Inferred Resources |
| Gold |
Tonnes
(Mt) |
Grade
(g/t) |
Gold
(000kg) |
Tonnes
(Mt) |
Grade
(g/t) |
Gold
(000kg) |
Tonnes
(Mt) |
Grade
(g/t) |
Gold
(000kg) |
Tonnes
(Mt) |
Grade
(g/t) |
Gold
(000kg) |
| South Africa underground |
|
|
|
|
|
|
|
|
|
|
|
|
| Tshepong North |
11.920 |
|
12.42 |
|
147.989 |
|
3.162 |
|
10.28 |
|
32.493 |
|
15.082 |
|
11.97 |
|
180.481 |
|
9.744 |
|
10.20 |
|
99.356 |
|
| Tshepong South |
5.661 |
|
13.02 |
|
73.695 |
|
6.680 |
|
11.67 |
|
77.950 |
|
12.341 |
|
12.29 |
|
151.645 |
|
25.090 |
|
10.67 |
|
267.678 |
|
| Joel |
1.392 |
|
9.83 |
|
13.690 |
|
2.940 |
|
7.07 |
|
20.802 |
|
4.332 |
|
7.96 |
|
34.491 |
|
0.762 |
|
7.87 |
|
6.001 |
|
| Masimong |
2.017 |
|
9.77 |
|
19.712 |
|
0.095 |
|
6.83 |
|
0.650 |
|
2.112 |
|
9.64 |
|
20.362 |
|
0.015 |
|
9.62 |
|
0.141 |
|
| Target 1 |
4.745 |
|
8.60 |
|
40.795 |
|
3.820 |
|
7.09 |
|
27.098 |
|
8.564 |
|
7.93 |
|
67.893 |
|
4.046 |
|
5.68 |
|
22.990 |
|
| Target 3 |
0.601 |
|
9.19 |
|
5.530 |
|
2.950 |
|
10.17 |
|
30.015 |
|
3.551 |
|
10.01 |
|
35.545 |
|
1.221 |
|
8.66 |
|
10.571 |
|
| Doornkop |
17.334 |
|
3.44 |
|
59.656 |
|
10.345 |
|
2.86 |
|
29.598 |
|
27.679 |
|
3.22 |
|
89.254 |
|
13.262 |
|
4.53 |
|
60.050 |
|
| Kusasalethu |
0.189 |
|
37.32 |
|
7.045 |
|
6.457 |
|
10.11 |
|
65.278 |
|
6.646 |
|
10.88 |
|
72.323 |
|
2.454 |
|
8.85 |
|
21.722 |
|
| Moab Khotsong |
2.881 |
|
18.34 |
|
52.822 |
|
3.122 |
|
13.57 |
|
42.361 |
|
6.002 |
|
15.86 |
|
95.183 |
|
2.549 |
|
19.09 |
|
48.663 |
|
| Mponeng |
2.843 |
|
17.99 |
|
51.126 |
|
18.632 |
|
13.92 |
|
259.408 |
|
21.474 |
|
14.46 |
|
310.534 |
|
31.520 |
|
11.70 |
|
368.729 |
|
| Total South Africa underground |
49.582 |
|
9.52 |
|
472.059 |
|
58.203 |
|
10.06 |
|
585.652 |
|
107.785 |
|
9.81 |
|
1,057.711 |
|
90.663 |
|
9.99 |
|
905.901 |
|
| Kalgold |
3.474 |
|
1.05 |
|
3.634 |
|
31.832 |
|
1.20 |
|
38.187 |
|
35.306 |
|
1.18 |
|
41.821 |
|
25.448 |
|
0.34 |
|
8.648 |
|
| Tailings |
|
|
|
|
|
|
|
|
|
|
|
|
| Other Free State tailings |
82.788 |
|
0.27 |
|
22.487 |
|
— |
|
— |
|
— |
|
82.788 |
|
0.27 |
|
22.487 |
|
15.459 |
|
0.19 |
|
2.937 |
|
| Phoenix |
19.530 |
|
0.27 |
|
5.188 |
|
— |
|
— |
|
— |
|
19.530 |
|
0.27 |
|
5.188 |
|
— |
|
— |
|
— |
|
| Central |
— |
|
— |
|
— |
|
— |
|
— |
|
— |
|
— |
|
— |
|
— |
|
— |
|
— |
|
— |
|
| Mine Waste Solutions |
54.061 |
|
0.20 |
|
10.902 |
|
52.912 |
|
0.24 |
|
12.840 |
|
106.973 |
|
0.22 |
|
23.741 |
|
77.701 |
|
0.13 |
|
9.984 |
|
| West Wits tailings |
— |
|
— |
|
— |
|
25.427 |
|
0.32 |
|
8.259 |
|
25.427 |
|
0.32 |
|
8.259 |
|
— |
|
— |
|
— |
|
| Total SA Tailings |
156.379 |
|
0.25 |
|
38.578 |
|
78.339 |
|
0.27 |
|
21.099 |
|
234.718 |
|
0.25 |
|
59.677 |
|
93.160 |
|
0.14 |
|
12.921 |
|
| Waste rock dumps |
|
|
|
|
|
|
|
|
|
|
|
|
| Free State WRD |
— |
|
— |
|
— |
|
0.802 |
|
0.34 |
|
0.274 |
|
0.802 |
|
0.34 |
|
0.274 |
|
17.095 |
|
0.43 |
|
7.354 |
|
| Mine Waste Solutions |
— |
|
— |
|
— |
|
2.060 |
|
0.30 |
|
0.619 |
|
2.060 |
|
0.30 |
|
0.619 |
|
2.502 |
|
0.24 |
|
0.611 |
|
| West Wits WRD |
— |
|
— |
|
— |
|
0.272 |
|
0.37 |
|
0.100 |
|
0.272 |
|
0.37 |
|
0.100 |
|
— |
|
— |
|
— |
|
Total SA Waste rock dumps |
— |
|
— |
|
— |
|
3.134 |
|
0.32 |
|
0.992 |
|
3.134 |
|
0.32 |
|
0.992 |
|
19.597 |
|
0.41 |
|
7.964 |
|
| Total South Africa Surface (including Kalgold) |
159.853 |
|
0.26 |
|
42.212 |
|
113.305 |
|
0.53 |
|
60.277 |
|
273.158 |
|
0.38 |
|
102.489 |
|
138.205 |
|
0.21 |
|
29.534 |
|
| Total South Africa |
209.435 |
|
|
514.271 |
|
171.508 |
|
|
645.930 |
|
380.943 |
|
|
1,160.200 |
|
228.869 |
|
|
935.435 |
|
| Papua New Guinea¹ |
|
|
|
|
|
|
|
|
|
|
|
|
| Hidden Valley |
0.374 |
|
0.21 |
|
0.080 |
|
28.548 |
|
1.27 |
|
36.394 |
|
28.922 |
|
1.26 |
|
36.474 |
|
0.913 |
|
1.10 |
|
1.042 |
|
| Hamata |
— |
|
— |
|
— |
|
1.910 |
|
1.80 |
|
3.436 |
|
1.910 |
|
1.80 |
|
3.436 |
|
0.208 |
|
1.44 |
|
0.291 |
|
| Wafi |
— |
|
— |
|
— |
|
54.000 |
|
1.66 |
|
89.000 |
|
54.000 |
|
1.66 |
|
89.000 |
|
20.000 |
|
1.37 |
|
26.000 |
|
| Golpu |
— |
|
— |
|
— |
|
145.000 |
|
0.54 |
|
78.000 |
|
145.000 |
|
0.54 |
|
78.000 |
|
70.000 |
|
0.62 |
|
44.000 |
|
| Nambonga |
— |
|
— |
|
— |
|
— |
|
— |
|
— |
|
— |
|
— |
|
— |
|
24.000 |
|
0.69 |
|
16.000 |
|
| Kerimenge |
— |
|
— |
|
— |
|
— |
|
— |
|
— |
|
— |
|
— |
|
— |
|
16.397 |
|
1.07 |
|
17.582 |
|
| Total Papua New Guinea |
0.374 |
|
0.21 |
|
0.080 |
|
229.458 |
|
0.90 |
|
206.830 |
|
229.832 |
|
0.90 |
|
206.910 |
|
131.518 |
|
0.80 |
|
104.915 |
|
| Australia |
|
|
|
|
|
|
|
|
|
|
|
|
| Little Eva |
— |
|
— |
|
— |
|
136.114 |
|
0.07 |
|
9.393 |
|
136.114 |
|
0.07 |
|
9.393 |
|
31.095 |
|
0.06 |
|
1.986 |
|
| Bedford |
— |
|
— |
|
— |
|
2.658 |
|
0.19 |
|
0.498 |
|
2.658 |
|
0.19 |
|
0.498 |
|
1.527 |
|
0.14 |
|
0.219 |
|
| Lady Clayre |
— |
|
— |
|
— |
|
5.097 |
|
0.15 |
|
0.761 |
|
5.097 |
|
0.15 |
|
0.761 |
|
1.141 |
|
0.08 |
|
0.097 |
|
| Ivy Anne |
— |
|
— |
|
— |
|
5.202 |
|
0.07 |
|
0.382 |
|
5.202 |
|
0.07 |
|
0.382 |
|
1.163 |
|
0.07 |
|
0.078 |
|
| Total Australia |
— |
|
— |
|
— |
|
149.071 |
|
0.07 |
|
11.034 |
|
149.071 |
|
0.07 |
|
11.034 |
|
34.927 |
|
0.07 |
|
2.380 |
|
| Grand total |
209.809 |
|
|
514.350 |
|
550.037 |
|
|
863.794 |
|
759.846 |
|
|
1,378.144 |
|
395.313 |
|
|
1,042.730 |
|
|
|
|
|
|
|
|
|
|
|
|
|
|
|
|
|
|
|
|
|
|
|
|
|
|
|
|
|
|
|
|
|
|
|
|
|
|
|
|
| Other metals |
Papua New Guinea1 |
Measured Resources |
Indicated Resources |
Measured and Indicated Resources |
Inferred Resources |
| Silver |
Tonnes(Mt) |
Grade
(g/t) |
silver (000kg) |
Tonnes(Mt) |
Grade
(g/t) |
silver (000kg) |
Tonnes(Mt) |
Grade
(g/t) |
silver (000kg) |
Tonnes(Mt) |
Grade
(g/t) |
silver (000kg) |
| Hidden Valley |
0.374 |
|
2.97 |
|
1.111 |
|
28.548 |
|
17.45 |
|
498.045 |
|
28.922 |
|
17.26 |
|
499.156 |
|
0.913 |
|
23.33 |
|
21.298 |
|
| Golpu |
— |
|
— |
|
— |
|
145.000 |
|
3.05 |
|
442.000 |
|
145.000 |
|
3.05 |
|
442.000 |
|
70.000 |
|
1.06 |
|
74.000 |
|
| Total |
0.374 |
|
2.97 |
|
1.111 |
|
173.548 |
|
5.42 |
|
940.045 |
|
173.922 |
|
5.41 |
|
941.156 |
|
70.913 |
|
1.34 |
|
95.298 |
|
|
|
|
|
|
|
|
|
|
|
|
|
|
| Copper |
Tonnes(Mt) |
% |
Cu (000t) |
Tonnes(Mt) |
% |
Cu (000t) |
Tonnes(Mt) |
% |
Cu (000t) |
Tonnes(Mt) |
% |
Cu (000t) |
| Golpu |
— |
|
— |
|
— |
|
145.000 |
|
0.93 |
|
1,350.000 |
|
145.000 |
|
0.93 |
|
1,350.000 |
|
70.000 |
|
0.86 |
|
600.000 |
|
| Nambonga |
— |
|
— |
|
— |
|
— |
|
— |
|
— |
|
— |
|
— |
|
— |
|
24.000 |
|
0.20 |
|
46.949 |
|
| Total |
— |
|
— |
|
— |
|
145.000 |
|
0.93 |
|
1,350.000 |
|
145.000 |
|
0.93 |
|
1,350.000 |
|
94.000 |
|
0.69 |
|
646.949 |
|
|
|
|
|
|
|
|
|
|
|
|
|
|
| Molybdenum |
Tons
(Mt)
|
ppm |
Mo
(000t)
|
Tons
(Mt)
|
ppm |
Mo
(000t)
|
Tons
(Mt)
|
ppm |
Mo
(000t)
|
Tons
(Mt)
|
ppm |
Mo
(000t)
|
| Golpu |
— |
|
— |
|
— |
|
345.000 |
|
94.00 |
|
32.430 |
|
345.000 |
|
94.00 |
|
32.430 |
|
70.000 |
|
72.00 |
|
5.040 |
|
| Total |
— |
|
— |
|
— |
|
345.000 |
|
94.00 |
|
32.430 |
|
345.000 |
|
94.00 |
|
32.430 |
|
70.000 |
|
72.00 |
|
5.040 |
|
|
|
|
|
|
|
|
|
|
|
|
|
|
| Equivalents |
|
|
|
|
|
|
|
|
|
|
|
|
| Silver |
Tonnes(Mt) |
|
silver (000kg) |
Tonnes(Mt) |
|
silver (000kg) |
Tonnes(Mt) |
|
silver (000kg) |
Tonnes(Mt) |
|
silver (000kg) |
| Hidden Valley |
0.374 |
|
|
0.024 |
|
28.548 |
|
|
7.029 |
|
28.922 |
|
|
7.053 |
|
0.913 |
|
|
0.316 |
|
|
|
|
|
|
|
|
|
|
|
|
|
|
| Copper |
Tons
(Mt)
|
|
Au eq
(000kg)
|
Tons
(Mt)
|
|
Au eq
(000kg) |
Tons
(Mt)
|
|
Au eq
(000oz)
|
Tons
(Mt)
|
|
Au eq
(000oz)
|
| Golpu |
— |
|
|
— |
|
145.000 |
|
|
208.444 |
|
145.000 |
|
|
208.444 |
|
70.000 |
|
|
96.203 |
|
| Nambonga |
— |
|
|
— |
|
— |
|
|
— |
|
— |
|
|
— |
|
24.000 |
|
|
7.527 |
|
| Total |
— |
|
|
— |
|
145.000 |
|
|
208.444 |
|
145.000 |
|
|
208.444 |
|
94.000 |
|
|
103.730 |
|
| Total Silver and Copper as gold equivalents |
0.374 |
|
|
0.024 |
|
173.548 |
|
|
215.473 |
|
173.922 |
|
|
215.497 |
|
94.913 |
|
|
104.046 |
|
| Total PNG including gold equivalents |
0.374 |
|
|
0.104 |
|
229.458 |
|
|
422.304 |
|
229.832 |
|
|
422.407 |
|
131.518 |
|
|
208.961 |
|
|
|
|
|
|
|
|
|
|
|
|
|
|
| Australia |
|
|
|
|
|
|
|
|
|
|
|
|
| Copper |
Tonnes(Mt) |
% |
Cu (000t) |
Tonnes(Mt) |
% |
Cu (000t) |
Tonnes(Mt) |
% |
Cu (000t) |
Tonnes(Mt) |
% |
Cu (000t) |
| Little Eva |
— |
|
— |
|
— |
|
136.114 |
0.39 |
529.774 |
136.114 |
0.39 |
529.774 |
31.095 |
0.36 |
111.507 |
| Turkey Creek |
— |
|
— |
|
— |
|
25.417 |
0.45 |
114.821 |
25.417 |
0.45 |
114.821 |
2.473 |
0.40 |
9.810 |
| Blackard |
— |
|
— |
|
— |
|
82.538 |
0.45 |
374.485 |
82.538 |
0.45 |
374.485 |
33.591 |
0.43 |
145.667 |
| Scanlan |
— |
|
— |
|
— |
|
18.228 |
0.38 |
102.021 |
18.228 |
0.38 |
102.021 |
8.465 |
0.37 |
35.993 |
| Bedford |
— |
|
— |
|
— |
|
2.658 |
0.60 |
16.010 |
2.658 |
0.60 |
16.010 |
1.527 |
0.46 |
7.051 |
| Lady Clayre |
— |
|
— |
|
— |
|
5.097 |
0.38 |
19.245 |
5.097 |
0.38 |
19.245 |
1.141 |
0.37 |
4.178 |
| Ivy Anne |
— |
|
— |
|
— |
|
5.202 |
0.34 |
17.823 |
5.202 |
0.34 |
17.823 |
1.163 |
0.33 |
3.876 |
| Total Copper |
— |
— |
— |
275.254 |
0.43 |
1174.178 |
275.254 |
0.43 |
1174.178 |
79.455 |
0.40 |
318.081 |
|
|
|
|
|
|
|
|
|
|
|
|
|
| Gold Equivalents |
|
|
|
|
|
|
|
|
|
|
|
|
| Copper: as gold equivalents |
Tonnes
(Mt)
|
|
Au eq
(000kg)
|
Tonnes
(Mt)
|
|
Au eq
(000kg) |
Tonnes
(Mt)
|
|
Au eq
(000kg)
|
Tonnes
(Mt)
|
|
Au eq
(000kg
|
| Little Eva |
— |
|
|
— |
|
136.114 |
|
84.944 |
136.114 |
|
84.944 |
31.095 |
|
17.889 |
| Turkey Creek |
— |
|
|
— |
|
25.417 |
|
18.409 |
25.417 |
|
18.409 |
2.473 |
|
1.573 |
| Blackard |
— |
|
|
— |
|
82.538 |
|
60.041 |
82.538 |
|
60.041 |
33.591 |
|
23.355 |
| Scanlan |
— |
|
|
— |
|
18.228 |
|
16.357 |
18.228 |
|
16.357 |
8.465 |
|
5.771 |
| Bedford |
— |
|
|
— |
|
2.658 |
|
2.581 |
2.658 |
|
2.581 |
1.527 |
|
1.118 |
| Lady Clayre |
— |
|
|
— |
|
5.097 |
|
3.096 |
5.097 |
|
3.096 |
1.141 |
|
0.681 |
| Ivy Anne |
— |
|
|
— |
|
5.202 |
|
2.852 |
5.202 |
|
2.852 |
1.163 |
|
0.606 |
| Total Copper as gold equivalents |
— |
|
— |
275.254 |
|
188.281 |
275.254 |
|
188.281 |
79.455 |
|
50.993 |
| Total AUSTRALIA (including gold equivalents) |
— |
|
— |
275.254 |
|
199.315 |
275.254 |
|
199.315 |
79.455 |
|
53.373 |
|
|
|
|
|
|
|
|
|
|
|
|
|
|
Tonnes(Mt) |
|
Gold equivalents (000 kg) |
Tonnes(Mt) |
|
Gold equivalents (000 kg) |
Tonnes(Mt) |
|
Gold equivalents (000 kg) |
Tonnes(Mt) |
|
Gold equivalents (000 kg) |
Total Harmony
including equivalents |
209.809 |
|
|
514.374 |
|
676.220 |
|
|
1,267.549 |
|
886.029 |
|
|
1,781.923 |
|
439.842 |
|
|
1,197.769 |
|
|
|
|
|
|
|
|
|
|
|
|
|
|
| Uranium |
|
|
|
|
|
|
|
|
|
|
|
|
| South Africa |
Tonnes(Mt) |
kg/t |
U3O8 (Mkg) |
Tonnes(Mt) |
kg/t |
U3O8 (Mkg) |
Tonnes(Mt) |
kg/t |
U3O8 (Mkg) |
Tonnes(Mt) |
kg/t |
U3O8 (Mkg) |
| Free State surface |
— |
|
— |
|
— |
|
82.788 |
|
0.093 |
|
7.699 |
|
82.788 |
|
0.093 |
|
7.699 |
|
— |
|
— |
|
— |
|
| Moab underground |
— |
|
— |
|
— |
|
6.002 |
|
0.684 |
|
4.106 |
|
6.002 |
|
0.684 |
|
4.106 |
|
2.549 |
|
0.732 |
|
1.866 |
|
| Mine Waste Solutions |
54.061 |
|
0.061 |
|
3.272 |
|
52.912 |
|
0.096 |
|
5.076 |
|
106.973 |
|
0.078 |
|
8.349 |
|
77.701 |
|
0.039 |
|
3.031 |
|
| Total Uranium |
54.061 |
|
0.061 |
|
3.272 |
|
141.702 |
|
0.119 |
|
16.882 |
|
195.763 |
|
0.103 |
|
20.154 |
|
80.250 |
|
0.061 |
|
4.898 |
|
¹ Total attributable Gold equivalent ounces are calculated assuming a US$1,582/oz Au, US$3.70/lb Cu and US$22.35/oz Ag with 100% recovery for all metals.
Note: rounding of numbers may result in slight computational discrepancies.
Mineral Reserves
As at June 30, 2023, Harmony had aggregate attributable Proven and Probable Mineral Reserves of approximately 26.7 million ounces of gold, 12.6 million ounces of gold equivalents, 16.9 thousand ounces of silver, 5.4 million pounds of copper and 9.4 million pounds of uranium.
|
|
|
|
|
|
|
|
|
|
|
|
|
|
|
|
|
|
|
|
|
|
|
|
|
|
|
|
|
|
| Operations |
Proven Reserves |
Probable Reserves |
Total Mineral Reserves |
| Gold |
Tonnes
(Mt)
|
Grade
(g/t)
|
Gold²
(000kg)
|
Tonnes
(Mt)
|
Grade
(g/t)
|
Gold²
(000kg)
|
Tonnes
(Mt)
|
Grade
(g/t)
|
Gold²
(000kg)
|
| South Africa underground |
|
|
|
|
|
|
|
|
|
Tshepong North |
2.997 |
|
4.79 |
|
14.341 |
|
0.766 |
|
5.73 |
|
4.390 |
|
3.763 |
|
4.98 |
|
18.731 |
|
Tshepong South |
2.882 |
|
7.79 |
|
22.466 |
|
0.563 |
|
7.06 |
|
3.972 |
|
3.445 |
|
7.67 |
|
26.438 |
|
| Masimong |
0.861 |
|
4.77 |
|
4.108 |
|
0.131 |
|
4.27 |
|
0.559 |
|
0.992 |
|
4.71 |
|
4.667 |
|
| Joel |
2.933 |
|
4.87 |
|
14.284 |
|
0.545 |
|
4.33 |
|
2.358 |
|
3.478 |
|
4.79 |
|
16.642 |
|
| Target 1 |
2.567 |
|
4.38 |
|
11.233 |
|
1.242 |
|
4.46 |
|
5.539 |
|
3.810 |
|
4.40 |
|
16.772 |
|
| Doornkop South Reef |
5.203 |
|
4.35 |
|
22.651 |
|
8.212 |
|
4.44 |
|
36.467 |
|
13.414 |
|
4.41 |
|
59.118 |
|
| Kusasalethu |
1.679 |
|
7.44 |
|
12.498 |
|
0.061 |
|
5.04 |
|
0.309 |
|
1.741 |
|
7.36 |
|
12.806 |
|
Moab Khotsong including Zaaiplaats |
3.897 |
|
7.80 |
|
30.396 |
|
9.447 |
|
8.90 |
|
84.106 |
|
13.345 |
|
8.58 |
|
114.502 |
|
| Mponeng |
2.678 |
|
9.68 |
|
25.929 |
|
3.316 |
|
8.87 |
|
29.410 |
|
5.994 |
|
9.23 |
|
55.340 |
|
| Total South Africa underground |
25.698 |
|
6.14 |
|
157.907 |
|
24.283 |
|
6.88 |
|
167.109 |
|
49.980 |
|
6.50 |
|
325.016 |
|
| South Africa Surface |
|
|
|
|
|
|
|
|
|
| Kalgold |
5.384 |
|
0.93 |
|
4.991 |
|
8.529 |
|
0.85 |
|
7.217 |
|
13.913 |
|
0.88 |
|
12.208 |
|
| Tailings |
|
|
|
|
|
|
|
|
|
| Other Free State tailings |
86.527 |
|
0.27 |
|
23.410 |
|
585.517 |
|
0.22 |
|
130.775 |
|
672.044 |
|
0.23 |
|
154.186 |
|
| Phoenix |
30.371 |
|
0.28 |
|
8.652 |
|
— |
|
— |
|
— |
|
30.371 |
|
0.28 |
|
8.652 |
|
| Central |
— |
|
— |
|
— |
|
45.087 |
|
0.27 |
|
11.964 |
|
45.087 |
|
0.27 |
|
11.964 |
|
|
|
|
|
|
|
|
|
|
|
|
|
|
|
|
|
|
|
|
|
| Mine Waste Solutions |
14.215 |
|
0.27 |
|
3.823 |
|
381.126 |
|
0.28 |
|
105.832 |
|
395.341 |
|
0.28 |
|
109.655 |
|
| West Wits tailings |
— |
|
— |
|
— |
|
17.357 |
|
0.32 |
|
5.485 |
|
17.357 |
|
0.32 |
|
5.485 |
|
Total Tailings |
131.114 |
|
0.27 |
|
35.886 |
|
1,029.088 |
|
0.25 |
|
254.056 |
|
1,160.201 |
|
0.25 |
|
289.942 |
|
Total South Africa Surface
(including Kalgold) |
136.498 |
|
0.30 |
|
40.877 |
|
1,037.616 |
|
0.25 |
|
261.273 |
|
1,174.114 |
|
0.26 |
|
302.149 |
|
| Total South Africa |
162.195 |
|
|
198.783 |
|
1,061.899 |
|
|
428.382 |
|
1,224.094 |
|
|
627.165 |
|
| Papua New Guinea |
|
|
|
|
|
|
|
|
|
| Hidden Valley |
1.627 |
|
0.97 |
|
1.586 |
|
17.600 |
|
1.78 |
|
31.352 |
|
19.227 |
|
1.71 |
|
32.939 |
|
| Hamata |
— |
|
— |
|
— |
|
0.158 |
|
1.77 |
|
0.280 |
|
0.158 |
|
1.77 |
|
0.280 |
|
| Golpu ¹ |
— |
|
— |
|
— |
|
200.000 |
|
0.86 |
|
171.000 |
|
200.000 |
|
0.86 |
|
171.000 |
|
| Total Papua New Guinea |
1.627 |
|
0.97 |
|
1.586 |
|
217.758 |
|
0.93 |
|
202.632 |
|
219.385 |
|
0.93 |
|
204.219 |
|
| Australia |
|
|
|
|
|
|
|
|
|
| Little Eva |
— |
|
— |
|
— |
|
— |
|
— |
|
— |
|
— |
|
— |
|
— |
|
| Bedford |
— |
|
— |
|
— |
|
— |
|
— |
|
— |
|
— |
|
— |
|
— |
|
| Lady Clayre |
— |
|
— |
|
— |
|
— |
|
— |
|
— |
|
— |
|
— |
|
— |
|
| Ivey Anne |
— |
|
— |
|
— |
|
— |
|
— |
|
— |
|
— |
|
— |
|
— |
|
| Total Australia |
— |
|
— |
|
— |
|
— |
|
— |
|
— |
|
— |
|
— |
|
— |
|
Total Harmony |
163.822 |
|
|
200.369 |
|
1,279.657 |
|
|
631.014 |
|
1,443.479 |
|
|
831.383 |
|
|
|
|
|
|
|
|
|
|
|
| Other metals |
|
|
|
|
|
|
|
|
|
Papua New Guinea1 |
Proven Reserves |
Probable Reserves |
Total Mineral Reserves |
| Silver |
Tonnes
(Mt)
|
Grade
(g/t)
|
Ag2
(000kg)
|
Tonnes
(Mt)
|
Grade
(g/t)
|
Ag2
(000kg)
|
Tonnes
(Mt)
|
Grade
(g/t)
|
Ag2
(000kg)
|
| Hidden Valley |
1.627 |
|
21.20 |
|
34.494 |
|
17.600 |
|
27.82 |
|
489.694 |
|
19.227 |
|
27.26 |
|
524.188 |
|
|
|
|
|
|
|
|
|
|
|
| Copper |
Tonnes
(Mt)
|
Grade
(%)
|
Cu²
(000t)
|
Tonnes
(Mt)
|
Grade
(%)
|
Cu²
(000t)
|
Tonnes
(Mt)
|
Grade
(%)
|
Cu²
(000t)
|
| Golpu |
— |
|
— |
|
— |
|
200.000 |
|
1.20 |
2,450.000 |
|
200.0 |
|
1.20 |
2,450.000 |
|
|
|
|
|
|
|
|
|
|
|
|
|
|
|
|
|
|
|
|
|
|
|
|
|
|
|
|
|
|
|
| Operations |
Proven Reserves |
Probable Reserves |
Total Mineral Reserves |
| Gold equivalents |
Tonnes
(Mt)
|
|
Au2
(000kg)
|
Tonnes
(Mt)
|
|
Au2
(000kg)
|
Tonnes
(Mt)
|
|
Au2
(000kg)
|
| Silver |
|
|
|
|
|
|
|
|
|
| Hidden Valley |
1.627 |
|
|
0.487 |
|
17.600 |
|
|
6.918 |
|
19.227 |
|
|
7.406 |
|
| Copper |
|
|
|
|
|
|
|
|
|
| Golpu¹ |
— |
|
|
— |
|
200.000 |
|
|
384.793 |
|
200.000 |
|
|
384.793 |
|
| Total silver and copper as gold equivalents |
1.627 |
|
|
0.487 |
|
217.600 |
|
|
391.711 |
|
219.227 |
|
|
392.199 |
|
| Total PNG including gold equivalents |
1.627 |
|
|
2.074 |
|
217.758 |
|
|
594.344 |
|
219.385 |
|
|
596.417 |
|
|
|
|
|
|
|
|
|
|
|
|
|
|
|
|
|
|
|
|
|
|
|
|
|
|
|
|
|
|
|
|
|
|
|
|
|
|
|
|
|
|
|
|
|
|
|
|
|
|
|
|
|
|
|
|
|
|
|
|
|
|
|
|
|
|
|
|
|
|
|
|
|
|
|
|
|
|
|
|
|
|
|
|
|
|
|
|
|
|
|
|
|
|
|
|
|
|
|
|
|
|
|
|
|
|
|
|
|
|
|
|
|
|
|
|
|
|
|
|
|
|
|
|
|
|
|
|
|
|
|
|
|
|
|
|
|
|
|
|
|
|
|
|
|
|
|
|
|
|
|
|
|
|
|
|
|
|
|
|
|
|
|
|
|
|
|
|
|
|
|
|
|
|
|
|
|
|
|
|
|
|
|
|
|
|
|
|
|
|
|
|
|
|
|
|
|
|
|
|
|
|
|
|
|
|
|
|
|
|
|
|
Total Harmony
including equivalents
|
163.822 |
|
|
200.857 |
|
1,279.657 |
|
|
1,022.725 |
|
1,443.479 |
|
|
1,223.582 |
|
| South Africa |
|
|
|
|
|
|
|
|
|
| Uranium |
Tonnes
(Mt)
|
Grade
(kg/t)
|
U3O8²
(Mkg)
|
Tonnes
(Mt)
|
Grade
(kg/t)
|
U3O8²
(Mkg)
|
Tonnes
(Mt)
|
Grade
(kg/t)
|
U3O8²
(Mkg)
|
| Moab Khotsong underground |
— |
|
— |
|
— |
|
13.345 |
|
0.32 |
|
4.260 |
|
13.345 |
|
0.32 |
|
4.260 |
|
¹ Total attributable Gold equivalent ounces are calculated assuming a US$1,582/oz Au, US$3.70/lb Cu and US$22.35/oz Ag with 100% recovery for all metals.
² Metal figures are fully inclusive of all mining dilutions and gold losses, and are reported as mill-delivered tonnes and head grades. Metallurgical recovery factors have not been applied to the reserve figures.
Note: rounding of numbers may result in slight computational discrepancies.
As at June 30, 2023, Harmony’s attributable gold and gold equivalent Mineral Reserves were 39.3 million ounces of gold, a decrease from 39.8 million ounces at June 30, 2022. The year on year Mineral Reserve reconciliation is shown below.
|
|
|
|
|
|
|
|
|
| Description |
(000kg) |
Moz |
June 30, 2022 Gold and gold equivalents |
1,238 |
39.8 |
| Changes during fiscal 2023 |
| Mined |
-53 |
-1.7 |
| Other losses (geology, planning) |
-19 |
-0.6 |
| Reserve additions from Operations and Hidden Valley |
30 |
1.0 |
| Gold equivalents |
27 |
0.9 |
| June 30, 2023 Gold and gold equivalents |
1,224 |
39.3 |
Note: rounding of numbers may result in slight computational discrepancies.
MINERAL RESOURCE AND MINERAL RESERVE INDIVIDUAL PROPERTY DISCLOSURE
For more information about Harmony’s mines, including a summary of the Company’s mining rights and licenses refer to Item 4: "Information on the Company - Business Overview – Regulation”. For detailed information about Harmony’s mines, including the mining rights and licenses refer to the Technical Report Summary ("TRS") on each individual property, filed as an Exhibit to this annual report on Form 20-F.
Doornkop
Property Description
Doornkop is an underground gold mine located in the West Wits mining district southwest of Johannesburg, in the Gauteng Province. At longitude 27°47'26.55"E and latitude 26°13'03.2"S, the mine forms part of Harmony's West Rand (“West Wits”) operations. Doornkop is wholly-owned and operated by Harmony.
The following graphic illustrates the location of the Doornkop mine, along with certain infrastructure.
The Doornkop shaft complex is located south of Krugersdorp, 30km west of Johannesburg, in Gauteng Province, South Africa. The property lies between Sibanye Stillwater Limited’s Cooke 1 shaft and Durban Roodepoort Deep Limited. Doornkop form part of Harmony’s West Rand operations and extends to a maximum depth of approximately 2,000m below surface. Current mining operations extract the South Reef, with the Mineral Reserves being comprised entirely of this reef. Mineral Resources are comprised of the South Reef and the Kimberley Reef, and a limited (<0.5%) amount of the Main Reef.
There is no material litigation (including violations or fines) against Harmony that threatens its mineral rights, tenure, or operations.
Operational Infrastructure
Infrastructure in the region is well established, supporting the numerous operational gold mines in the area. The regional infrastructure includes national and provincial paved road networks, power transmission and distribution networks, water supply networks and communication infrastructure. Doornkop’s surface and underground infrastructure, including its power and water supplies, is sufficient for the current and planned production level requirements.
Doornkop’s main and vent shaft systems are currently exploiting the South Reef to approximately 2,000m below surface. The narrow South Reef is exploited by means of conventional stoping. The ore mined at Doornkop is processed at the mine’s carbon-in-pulp (“CIP”) plant, which is located adjacent to the shaft. Operations are powered by electricity from Eskom.
Doornkop is an established operation, and the currently available infrastructure is sufficient to support the mine plan. Doornkop is accessible via the national and provincial roads. The general layout of Doornkop infrastructure is displayed in the graphic below.
Geology
Doornkop is situated on the northwestern margin of the Witwatersrand Basin of South Africa, one of the most prominent gold provinces in the world. While there are several gold-bearing conglomerate reefs present within the mining right area, only the Kimberley Reef and South Reef are considered to have prospects for economic extraction at this stage.
In the West Rand Goldfield, the Kimberley Reefs include a number of different gold-bearing conglomerate horizons. At Doornkop, it is the Kimberley K9 Reef horizon which comprises the Mineral Resources along with the South Reef. The Kimberley K9 Reef rests on an unconformity and is a multi-pulse conglomerate which is divided into four cycles, each consisting of an upper conglomerate and a lower quartzite.
The South Reef comprises a basal conglomerate unit and a cycle of trough cross-bedded sediments. The South Reef is dominated by silicate phases such as quartz, carbon (seam and specks), as well as sulphide phases such as pyrite, pyrrhotite and chalcopyrite. While the upper cycles may carry some gold values, up to 95% of the gold present is located in the lower cycle.
Both the Kimberley Reef and the South Reef have been subjected to faulting and are intruded by a series of dykes and sills of various ages that cut across the reefs. The gold mineralization is interpreted to have succeeded a period of deep burial, fracturing, and alteration. The gold and other elements are believed to have precipitated through the reaction of hydrothermal fluids at high temperatures along the reef horizons.
History
Although exploration in the Doornkop area dates back to the early 1930s, and multiple phases of exploration and mining activities have taken place in the intervening years, the sinking of the Main and Ventilation Shafts at Doornkop only commenced in 1983. At the time, Doornkop was owned by Johannesburg Consolidated Industries Limited (“JCI”).
It was initially planned to mine both the Kimberley and the South Reefs. However, a decision was then taken by JCI to target the shallower Kimberley Reef only, mining it by mechanized methods. In addition, the deepening of the Main Shaft required to access to the South Reef was deferred. During 1989, the planned production rates from the Kimberley Reefs were achieved, but the anticipated grades were not recovered. Adverse geological structures were encountered, and the decrease in grades were attributed to difficulties associated with the mechanized mining methods resulting in dilution.
A review of the operation was undertaken in 1991, and the mining approach was changed to a more selective mining cut, targeting higher grade areas of Kimberley Reef only. In 1999, the deepening project was stopped, as a result of the low prevailing gold prices. The sub-vertical shaft sinking had been completed with the shaft bottom at 1,953m below surface. The deepening of the Main Shaft stopped at 1,340m below surface.
Harmony acquired Doornkop when it took over control of Randfontein Estates Limited ("REL"), in early 2000. Harmony continued mining the Kimberley Reef using mechanized mining methods, but revisited the work done toward extracting the South Reef. The mining method for the Kimberley Reef was subsequently changed to the conventional stoping approach, in order to extract a reduced tonnage at an improved grade.
Mineral Tenure
Refer to Item 4: “Information on the Company – Business Overview – Regulation – Mineral Rights – South Africa” above for a summary of the regulatory environment in South Africa.
The current mining right is held by REL, a wholly owned subsidiary of Harmony. The right encompasses an area of 2,941.02ha and was successfully converted, executed and registered as a new order mining right at the Mineral and Petroleum Resources Titles Office ("MPRTO"). As such, it is secured under Mining Authorisation number ML 13/97. The DMRE reference GP30/5/1/2/2/09MR was issued for a period of 30 years expiring on October 6, 2038, and Harmony has the exclusive right to renew the right.
A summary of the status of environmental permits and licenses issued as at June 30, 2023, related to Doornkop operation is presented in the table below.
|
|
|
|
|
|
|
|
|
|
|
|
|
|
|
| Permit / Licence |
Reference No. |
Issued By |
Date Granted |
Validity |
| Environmental Management Programme Report (“EMPr”) |
GP30/5/1/2/2/(09) EM |
DMRE |
June 7, 2010 |
LOM |
| Certificate of Registration (Nuclear) |
01/0025/06 |
National Nuclear Regulator |
May 31, 2003 |
LOM |
| Water Use Permit |
33/2/323/24 |
DWS |
December 1, 1977 |
LOM |
| Integrated WUL (Draft) |
16/2/7/C221/C024 |
DWS |
January 1, 2010 |
LOM |
| ISO 14001 Certification |
631282 |
BSI |
Novemeber 1, 2021 |
November 1, 2024 |
| Cyanide Management Certification |
N/A |
ICMC |
April 1, 2021 |
April 1, 2024 |
| Precious Metal Refining Licence |
1889/000251/66 |
SA Diamond & Precious Metals Regulator |
June 1, 2011 |
June 1, 2024 |
| Environmental Authorisation for Water Treatment Plant |
GP30/5/1/2/2/(09) EM |
DMRE |
August 1, 2016 |
LOM |
| License to impound water in a dam with Safety risk |
12/2/C221/69 |
DWS |
July 17, 2009 |
LOM |
Notes: BSI - British Standard Institute, ICMC - International Cyanide Management Code.
Mining Method
Doornkop is a deep level underground gold mine currently operating at depths ranging between 1,870m and 1,950m below surface.
The mining method used at Doornkop is conventional breast mining, in a sequential grid, also known as sequential grid mining (“SGM”).
Doornkop does not use backfill for the support of stopes. The SGM method makes use of dip pillars and reduced mining spans with pre-developed tunnels, aimed at controlling geotechnical stress.
The mining sequence at Doornkop is typically a V-shaped configuration, colloquially referred to as the “inverted Christmas tree”. An underhand face configuration is adopted when mining towards the west and an overhand face configuration when mining towards the east.
Primary development is done off-reef (in waste rock), while secondary development is done on-reef (in the mineralized zone).
Mineral Processing
Doornkop's gold processing facility has been in operation since the mid-1980s. The technology used to process the gold-bearing ore is well established and is suitable for the style of mineralization.
The milled ore from Doornkop follows a standard cyanide leach, CIP and electrowinning process in order to extract the gold bullion.
The plant is currently operating below its designed throughput capacity and in the past has operated at the throughput required to deliver the forecasted ounces of gold in the LOM.
Qualified Persons
The Qualified Person (“QP") preparing the TRS was employed on a full-time basis by Harmony. The QP's qualifications, areas of responsibility and personal inspection of the property are summarized in the graphic below.
|
|
|
|
|
|
|
|
|
|
|
|
|
|
|
| Qualified Person |
Professional Organization |
Qualification |
TRS Section Responsibility |
Personal Insp. |
Mr. H. Chirambadare |
SACNASP |
BSc. (Geol, Math), BSc. (Hons) Geol, GDE, MENG, MBA |
All |
Full time |
Exploration
Exploration at Doornkop has been focused on improving confidence in the geological model, as well as adding and upgrading additional Mineral Resources to the mine as existing Mineral Resources are depleted through mining. Over the years, geological data has been obtained through surface drilling, a seismic survey, underground drilling, underground channel (chip) sampling and geological mapping.
Surface exploration drilling has taken place over several different campaigns since exploration was initially undertaken in the 1930s. Surface drilling provides widely spaced initial grade and channel width information, upon which mine development decisions are based.
Underground exploration drilling is a continuous process which would have been in place since the operation commenced. The underground drilling provides geological information, which is used for the Mineral Resource estimates, as well as for mine planning purposes
Diamond core drilling was used for all underground drill holes. Diamond core drilling has been undertaken using hydraulic and pneumatic drill rigs.
Drilling and logging practices are based on the Harmony company standards, which have been in place since Harmony took over Doornkop
The QP is of the opinion that the quality and quantity of the exploration methods and information gathered is sufficient to support the estimation of Mineral Resources and Mineral Reserves.
Mineral Resource Estimate
The Mineral Resource estimate for Doornkop is considered to have reasonable prospects for economic extraction. The cut-off value for the Mineral Resources has been determined as 650cmg/t, based on the economic assumptions presented in the table below at the effective date of June 30, 2023.
|
|
|
|
|
|
|
|
|
| Description |
Unit |
Value |
| Gold price |
US$/oz |
1,764 |
| FX rate |
R:US$ |
16.22 |
| Gold price |
R/kg |
920,000 |
| Plant recovery factor |
% |
96.65 |
| Unit cost |
R/t |
3,108 |
This cut-off value represents typical costs for the mining method and preliminary mining and metallurgical recovery assumptions.
The Mineral Resources were originally prepared, classified and reported according to the SAMREC, 2016. For the purposes of this report on Form 20-F, the Mineral Resources have been classified in accordance with Item 1302(d)(1)(iii)(A) of Regulation S-K. These Mineral Resources account for mining depletion recorded from July 2022 to June 2023. The Mineral Resource estimate, as at June 30, 2023, exclusive of the reported Mineral Reserves, is summarized in the table below.
|
|
|
|
|
|
|
|
|
|
|
|
|
|
|
|
|
|
|
|
|
|
|
|
|
Fiscal Year Ended June 30, |
% Change |
|
2023 |
2022 |
| Mineral Resource Category |
Tonnes (Mt) |
Gold Grade (g/t) |
Gold Content (kg) |
Tonnes (Mt) |
Gold Grade (g/t) |
Gold Content (kg) |
| Measured |
17.334 |
3.44 |
59,656 |
18.202 |
3.54 |
64,492 |
(7.5)% |
| Indicated |
10.345 |
2.86 |
29,598 |
10.528 |
2.97 |
31,245 |
(5.3)% |
| Total / Ave. Measured + Indicated |
27.679 |
3.22 |
89,254 |
28.730 |
3.33 |
95,738 |
(6.8)% |
| Inferred |
13.262 |
4.53 |
60,050 |
13.414 |
4.38 |
58,707 |
2.3% |
Notes
1.Mineral Resources are reported with an effective date of June 30, 2023 were originally prepared, classified and reported according to SAMREC, 2016. For the purposes of this TRS, the Mineral Resources have been classified in accordance with Item 1302(d)(1)(iii)(A) of Regulation S-K. The QP responsible for the estimate is Mr. H. Chirambadare, who is Ore Reserve Manager at Doornkop, and a Harmony employee.
2.The Mineral Resource tonnes are reported as in-situ with reasonable prospects for economic extraction.
3.No modifying factors or dilution sources have been included to in-situ Reserve which was subtracted from the SAMREC Resource in order to obtain the S-K 1300 Resource.
4.The Mineral Resources are reported using a cut-off value of 650 cmg/t determined at a 90% profit guidance, and a gold price of US$1,764/oz.
5.Tonnes are reported rounded to three decimal places. Gold values are rounded to zero decimal places.
6.Mineral Resources are exclusive of Mineral Reserves. Mineral Resources are not Mineral Reserves and do not necessarily demonstrate economic viability.
7.Rounding as required by reporting guidelines may result in apparent summation differences.
8.The Mineral Resource estimate is for Harmony’s 100% interest.
The reduction in Mineral resources is mainly as result if the increase in the resources cut-off grade from 638 cmg/t to 650 cmg/t.
Mineral Reserve Estimate
The Mineral Reserves were originally prepared, classified and reported according to SAMREC, 2016. For the purposes of this report on Form 20-F, the Mineral Reserves have been classified in accordance with Item 1302(d)(1)(iii)(A) of Regulation S-K. Mineral Reserves are derived from the Mineral Resources, a detailed business plan and the operational mine planning processes. Mine planning utilizes and takes into consideration historical technical parameters achieved. In addition, Mineral Resource conversion to Mineral Reserves considers certain modifying factors, dilution, ore losses, minimum mining widths, planned mine call and plant recovery factors.
The Mineral Reserve estimate, as at June 30, 2022 and 2023, is summarized in the table below.
|
|
|
|
|
|
|
|
|
|
|
|
|
|
|
|
|
|
|
|
|
|
|
|
| |
Fiscal Year Ended June 30, |
|
| |
2023 |
2022 |
|
| Mineral Reserve Category |
Tonnes (Mt) |
Gold Grade (g/t) |
Gold Content (kg) |
Tonnes (Mt) |
Gold Grade (g/t) |
Gold Content (kg) |
% Change |
Proven |
5.203 |
4.35 |
22,651 |
5.876 |
4.46 |
26,179 |
(13.5) |
% |
| Probable |
8.212 |
4.44 |
36,467 |
7.924 |
4.29 |
33,988 |
7.3 |
% |
Total / Ave. Proven + Probable |
13.414 |
4.41 |
59,118 |
13.799 |
4.36 |
60,167 |
(1.7) |
% |
Notes:
1.The Mineral Reserves were originally prepared, classified and reported according to SAMREC, 2016. For the purposes of this TRS, the Mineral Reserves have been classified in accordance with Item 1302(d)(1)(iii)(A) of Regulation S-K. The QP responsible for the estimate is Mr. H. Chirambadare, who is the Doornkop Ore Reserve Manager, and a Harmony employee.
2.Tonnes, grade, and gold content (oz) are declared as net delivered to the mills.
3.Figures are fully inclusive of all mining dilutions, gold losses and are reported as mill delivered tonnes and head grades. Metallurgical recovery factors have not been applied to the reserve figures.
4.Gold content is recovered gold content after taking into consideration the modifying factors.
5.Mineral Reserves are reported using a cut-off grade of 739cmg/t determined using a gold price of US$1.582/oz.
The increase in Mineral Reserves is due to long inclined borehole ("LIB") exploration drilling and on reef development which increased ore body confidence classification. LIB exploration drilling confirmed a flatter dipping reef which resulted in additional resources above infrastructure that were converted to reserves.
The table below presents a summary of the modifying factors used to convert the Mineral Resource to the Mineral Reserve for Doornkop. The modifying Factors are consistent with the modelling, planning and computing estimates used in determining the Mineral Reserves, which are also consistent with historical performance.
|
|
|
|
|
|
|
|
|
| Modifying Factor |
Unit |
Value |
| Relative Density |
t/mᶟ |
2.77 |
| Stoping width |
cm |
124.00 |
| Gully (dilution) |
% |
5.05 |
| Off Reef |
% |
2.62 |
| Waste to Reef |
% |
0.33 |
| Flushing tons |
% |
0.00 |
| Discrepancy |
% |
16.37 |
| Mine Call Factor |
% |
81.00 |
| Plant Recovery Factor |
% |
96.65 |
| Mine Recovery Factor |
% |
78.29 |
| Plant Call Factor |
% |
100.00 |
| Mineral Reserve cut-off |
cmg/t |
739.00 |
For additional information, see the TRS on each individual property, filed as an Exhibit of this annual report on Form 20-F.
Free State Surface Operations
Property Description
The Free State Surface Operations are located near the towns of Welkom and Virginia, Free State Province, South Africa. The operations reclaim and re-treat local surface tailings storage facilities (“TSFs”) and WRDs.
The Free State Surface Operations comprise Mineral Resources located in 26 TSFs and 9 WRDs; three of the TSFs are actively being mined and processed through two processing plants. The Free State Surface Operations comprise the following:
•Phoenix Project: this project is currently reclaiming two TSFs which are processed through the Saaiplaas Plant;
•Central Plant Reclamation. this operation is currently reclaiming one TSF which is processed through the Central Plant;
•Free Sate Tailings: this project is at pre-feasibility study ("PFS") level and will include the treatment of 21 TSFs. These TSFs will be processed through any of the plants; and
•WRDs located across Harmony's Free State mining operations.
The Free-State Surface Operations and their associated mineral rights are wholly owned by Harmony, except for the Phoenix Project. The Phoenix Project is 100% owned by Harmony’s BBBEE subsidiary, Tswelopele Beneficiation Operation (Pty) Limited, of which Harmony is a 76% shareholder (5% is held by the Harmony Community Trust).
The location of the TSFs situated between Welkom and Virginia is presented in figure below.
The location of the WRDs is presented in the figure below.
Phoenix Project is a tailings retreatment operation located approximately 6km north of the town of Virginia; it currently re-treats material from the Dam A (PB Dam A) and Dam 21 TSFs using the Saaiplaas Plant. The Saaiplaas Plant is located at latitude 28°03’37.68”S and longitude 26°53’14.59”E.
The Phoenix Project is nearing the end of its current ore sources and the next source that will be introduced is the FSS6 TSF.
The Central Plant Reclamation currently re-treats material from the FSS5 TSF using the Central Plant. The FSS5 TSF is located close to the southern edge of the town of Welkom, while the Central Plant is located approximately 7km southeast of the Saaiplaas Plant at a latitude of 28°02’8.36”S and a longitude of 26°52’8.99”E.
The Free State Tailings is currently at PFS stage. Although the results of the study completed in 2009 indicate a positive net present value, the project has not yet been commissioned. The project currently comprises the 21 TSFs.
There is no material litigation (including violations or fines) against Harmony that threatens its mineral rights, tenure, or operations.
Operational Infrastructure
The surrounding areas of Welkom and Virginia are well developed in terms of access and mining-related infrastructure supporting the numerous operational gold mines in the area. The regional infrastructure includes national and provincial paved road networks, power transmission and distribution networks, water supply networks and communication infrastructure.
Operations are powered by electricity from Eskom.
The Free State Surface Operations have adequate access to the infrastructure required to meet the planned LOM production schedules. In addition, all provisions and plans required for the Free State Tailings have been made. The surface infrastructure located in the vicinity of Welkom and Virginia is displayed in the graphic below.
Geology
Material contained in the TSFs and WRDs originates from deep level gold mines, operated by Harmony and other mining companies. The mining operations predominantly extract narrow, tabular gold-bearing conglomerate reefs, namely the Basal, B, Elsburg ("EA"), Dreyerskruil and Beatrix Reefs.
These reefs occur within the Archean Witwatersrand Basin which hosts the Witwatersrand Supergroup succession. The Basal Reef is located at the base of the Harmony Formation, within the Johannesburg Subgroup of the Central Rand Group (“CRG”). The B Reef is part of the Spec Bona Member at the base of the Aandenk Formation, within the Turffontein Subgroup of the CRG. The Beatrix Reef is part of the Earls Court Member of the Aandenk Formation, within the Turffontein Subgroup of the CRG. The EA and Dreyerskruil Reefs occur within the Eldorado Formation of the Turffontein Subgroup, capping the CRG in the Free State Goldfield.
The TSF material is the waste product of crushing, milling and gold extraction by carbon-in-leach (“CIL”) or CIP methods. As man-made deposits the TSFs are not the result of natural sedimentary processes. The grade of the TSFs is a function by the grade of the original reef sources, and the efficiency of the processing method at the time of treatment.
The WRDs comprise unconsolidated, untreated, low-grade gold-bearing rock extracted from underground workings during the mining process. These WRDs are also man-made and are not formed as a result of natural sedimentary processes. They exhibit no structure or continuity. The grade of the WRDs is a function of the grade of the original reef sources.
The most significant mineral in the TSFs and WRDs is quartz, which makes up more than 60% of the bulk mineral composition. The gold predominantly occurs in association with pyrite. Other minerals identified include silver, copper, iron oxide, nickel, bismuth, uranium, lead and zinc from the Basal, B, EA, Dreyerskruil and Beatrix conglomerates.
History
The Saaiplaas plant originally processed ore from Saaiplaas 1, 2 and 3 shafts. Saaiplaas 1 closed around 1980, Saaiplaas 2 around 1996, and Saaiplaas 3 around 2000. The Saaiplaas plant once also processed ore from the Erfdeel (now Masimong) shafts. With the decline of mining in the area, the plant was relegated to processing unmilled surface source material (waste) at a rate of 110,000tpm until July 2007. As all material currently processed by the plant is recovered by hydro-mining from old, desiccated slimes dams in the area, crushing or milling is not required. The ore-receiving silos were demolished in July 2007 when milling ceased.
Plant commissioning began for the Central Plant Reclamation in June 2017 with ramp-up to a capacity of 300,000t a month. Central Plant, which had previously processed WRDs, was converted into a tailings retreatment operation during 2016 and started treating TSF material only in fiscal 2017.
Mineral Tenure
Refer to Item 4: “Information on the Company – Business Overview – Regulation – Mineral Rights – South Africa” above for a summary of the regulatory environment in South Africa.
The mineral tenure of the Free State Surface Operations, under which the activity of reclaiming TSFs and WRDs are permitted, falls within the mining rights held by Harmony. The different mining right areas and associated TSFs and WRDs that form part of the Free State Surface Operations is detailed in the table below.
|
|
|
|
|
|
|
|
|
|
|
|
|
|
|
|
|
|
| TSF Name |
Licence Type |
Reference No. |
Effective Date |
Expiry Date |
Mineral |
Brand A (PB Dam A) |
MR |
82 |
December 11, 2007 |
December 10, 2029 |
Au |
| No. 21 (H3) |
MR |
82 |
December 11, 2007 |
December 10, 2029 |
Au |
| FSS3 |
MR |
227 |
December 11, 2007 |
December 10, 2029 |
Au |
| FSS5 |
MR |
227 |
December 11, 2007 |
December 10, 2029 |
Au |
| FSS6 |
MR |
227 |
December 11, 2007 |
December 10, 2029 |
Au |
| FSN6 |
MR |
227 |
December 11, 2007 |
December 10, 2029 |
Au |
| No. 32 |
MR |
82 |
December 11, 2007 |
December 10, 2029 |
Au |
FSS1 |
MR |
227 |
February 4, 2010 |
December 10, 2029 |
Au, Ag, Cu, Fe, Ni, Bi, U, Pb, Zn |
| FSS2 East and West |
MR |
83/227 |
December 11, 2007 |
December 10, 2029 |
Au |
| FSS4 |
MR |
83 |
December 11, 2007 |
December 10, 2029 |
Au |
| FSS7 |
MR |
83 |
December 11, 2007 |
December 10, 2029 |
Au |
| FSS8 East |
MR |
82 |
December 11, 2007 |
December 10, 2029 |
Au |
| FSS8 West |
| Brand D (PB Dam D) |
MR |
Welkom no MR |
December 11, 2007 |
December 10, 2029 |
Au |
| Saaiplaas 1 |
MR |
82 |
December 11, 2007 |
December 10, 2029 |
Au |
| Saaiplaas 3 and 2 |
MR |
82 |
December 11, 2007 |
December 10, 2029 |
Au |
| Saaiplaas 5b |
MR |
82 |
December 11, 2007 |
December 10, 2029 |
Au |
| Saaiplaas 6 |
MR |
82 |
December 11, 2007 |
December 10, 2029 |
Au |
| No. 23 (Central Plant) |
MR |
82 |
December 11, 2007 |
December 10, 2029 |
Au |
| No. 30a |
MR |
82 |
December 11, 2007 |
December 10, 2029 |
Au |
| No. 33b |
MR |
82 |
December 11, 2007 |
December 10, 2029 |
Au |
| No. 34a |
MR |
82 |
December 11, 2007 |
December 10, 2029 |
Au |
| Target Slimes Dam |
MR |
225 |
December 12, 2013 |
December 11, 2026 |
Au, Ag, Cu, Fe, Ni, Bi, U, Pb, Zn |
| Pres Steyn 9 (Freddies 9) |
MR |
226 |
February 4, 2010 |
February 3, 2040 |
Au, Ag, Cu, Fe, Ni, Bi, U, Pb, Zn |
A summary of the status of environmental permits and licenses issued as at June 30, 2023 related to Free State Surface operations is presented in the table below.
|
|
|
|
|
|
|
|
|
|
|
|
|
|
|
|
|
|
| Operation |
Permit / Licence |
Reference No. |
Issued By |
Date Granted |
Validity |
| Phoenix Project |
Atmospheric Air Emission Licence- Exemption |
LDM/AEL/YMK/017 |
Lejweleputswa District Municipality |
November 5, 2018 |
n/a |
| Water Permit |
1214N |
DWS |
n/a |
LOM |
| Central Plant Reclamation |
Atmospheric Air Emission Licence |
LDM/AEL/YMK/012 |
Lejweleputswa District Municipality |
November 5, 2018 |
November 6, 2023 |
| Water Permit |
1214N |
DWS |
n/a |
LOM |
| General |
Environmental Management Programme |
FS30/5/1/2/3/2/1(82) EM |
DMRE |
March 12, 2010 |
Valid |
Mining Method
The mining methods used at Free State Surface Operations is hydro-mining for the TSFs, and reclamation of WRDs using tracked dozers and front-end loaders (“FELs”).
The tailings material is reclaimed by blasting the TSF face with high pressure water, resulting in the slurry gravitating towards the pumping stations. Several hydraulic monitoring guns deliver high pressure water to the face of the TSF. The hydro-mining method allows for flexibility as the monitoring guns can be positioned to selectively reclaim the required areas in the TSF. The bench heights are constrained by the force delivered by the monitoring gun nozzle, taking safety measures into account.
For safety reasons, the top down method of hydro-mining is implemented. The gun is positioned at the top of the face, where it will cut downwards at a safe angle (a maximum angle of 45°). The horizontal distance between the cutting face and the bottom of the bench varies between 10m and 15m, depending on the bench angle. The track for the monitoring gun is located 2m from the cutting face, allowing for a safe angle of repose, taking geotechnical parameters into account.
The pump stations are located at the lowest point of the TSF, which ensures that the slurry material gravitates towards the pump stations, where it is then pumped to the processing plant.
With respect to WRD, dozers are positioned on top of the WRD. The dozers are used to create safe loading faces and blend the rock. The material is then loaded from the face onto trucks using FELs and transported to the relevant gold plants for processing. When loading is done at the bottom of the WRD, precaution must be taken to ensure that the face is not undercut.
This precaution measure is put in place to prevent rock falls from the dump. A slope with a maximum inclination angle of 15° is created towards the loading point, where the WRD material is pushed down. The slope angle is monitored and maintained on a continuous basis.
As a safety measure, two red indicating poles are located at the top of the dump in the area where the dozer is working. The dozer must not go beyond the indicating poles, and dozing does not take place vertically above a loading point where an FEL loading. A 30m advance is required between the dozer and the point vertically above an active loading point. As an additional safety consideration, operations at the WRDs take place during hours of daylight.
The WRD material is loaded onto rail hoppers using the FELs and transported to the relevant processing plant.
Mineral Processing
Two plants, namely the Central Plant and the Saaiplaas Plant, are currently dedicated to the processing of tailings material. Reclaimed tailings are pumped as slurry via pipelines and WRD material is transported on trucks, to the respective plants for processing.
The Saaiplaas Plant forms part of the Phoenix Project and is currently treating reclaimed tailings at a rate of 503ktpm from Brand A (PB Dam A) and Dam 21 TSFs.
Reclaimed tailings from FSS5 TSF are processed through the Central Plant at a rate of 320ktpm. The rate of treatment will remain unchanged for the duration of the LOM even when new TSFs form part of the feed to the plant.
The PFS proposes the processing of additional TSFs at both the following plants:
•Harmony One Plant: production will be ramped up in 300ktpm increments as the plant modules become available and the plant is repurposed in 2026, 2032 and 2041; and
•Target plant: this plant will be repurposed to 300ktpm tailings retreatment in 2028.
Qualified Persons
The QPs preparing the TRS were employed on a full-time basis by Harmony. The QPs’ qualifications, areas of responsibility and personal inspection of the property are summarized in the graphic below.
|
|
|
|
|
|
|
|
|
|
|
|
|
|
|
| Qualified Person |
Professional Organization |
Qualification |
TRS Section Responsibility |
Personal Insp. |
Mr. BJ. Selebogo |
SAGC |
MSCC, HND (MRM), Mine Survey CoC |
All Sections |
Full time |
Mr. D. Fourie |
SAIMM |
MSc. Eng, GDE |
6, 7, 9, 11, 12 |
Full time |
Mr. T. Leonard |
n/a |
BSc. (Elec Eng), GCC |
5, 6, 7, 8, 11, 12, 19 |
Full time |
Mr. TJ. Chuene |
MMMA |
NDip Extraction Metallurgy |
5, 10, 12, 13, 14, 15 |
Full time |
Mr. E. Kleinhans |
MMMA |
B-Tech Metallurgy |
5, 10, 12, 13, 14, 15 |
Full time |
Ms. M. Mbongo |
n/a |
B-Tech Cost & Man Acc |
18, 19 |
Full time |
Mr. O. Moiloa |
n/a |
B-Tech Analytical Chemistry |
8 |
Full time |
Mr. H. Mashaba |
n/a |
BSc. (Hon) Env Man |
17 |
Full time |
Exploration
Various auger drilling and sampling campaigns have been undertaken and are on record from 2007 to 2020. Recent drilling of nine TSFs (including Saaiplaas Complex, FSS1, FSS4, FSN6, FSS6, FSS7) began in January 2017 and was completed February 2020.
WRDs cannot be explored using drilling as they are comprised of unconsolidated rock. Instead, they are sampled around the periphery using pitting.
A total of 248 drill holes were drilled into nine TSFs (including Saaiplaas Complex, FSS1, FSS4, FSN6, FSS6, FSS7) between January 2017 and February 2020. The purpose of the drilling was the determination of grade estimate.
The drilling and sampling methodology in use for Harmony’s Free State TSFs has been developed specifically for the challenges posed by these deposits and is aligned with industry best practice. An internal protocol is in place, and the drilling components are applied by contractors who are experienced in this specific methodology.
The drill hole samples are deemed to be representative as they provide both vertical and horizontal coverage of each TSF. Drill holes are positioned at regular intervals across the TSFs.
The data spacing, density and distribution is sufficient to support the estimation of Mineral Resources for the various TSFs.
WRDs are not explored using exploration methods due to their unconsolidated nature.
The QPs are of the opinion that the quality and quantity of the exploration methods and information gathered is sufficient to support the estimation of Mineral Resources and Mineral Reserves.
Mineral Resource Estimate
The Mineral Resources were originally prepared, classified and reported according to SAMREC, 2016. For the purposes of this report on Form 20-F, the Mineral Resources have been classified in accordance with Item 1302(d)(1)(iii)(A) of Regulation S-K. These Mineral Resources account for mining depletion recorded from July 2022 to June 2023.
The Mineral Resource estimate for TSF, as at June 30, 2023 exclusive of the reported Mineral Reserves, is summarized in the table below:
|
|
|
|
|
|
|
|
|
|
|
|
|
|
|
|
|
|
|
|
|
|
|
|
|
|
|
| |
|
Fiscal Year Ended June 30, |
|
| |
|
2023 |
2022 |
|
| Mineral Resource Category |
Operation / Project |
Tonnes (Mt) |
Gold Grade
(g/t)
|
Gold Content (kg) |
Tonnes (Mt) |
Gold Grade
(g/t ) |
Gold Content (kg) |
% Change |
| Measured |
Phoenix Project |
19.530 |
0.27 |
5,188 |
21.852 |
0.27 |
5,855 |
(11) |
% |
|
|
|
|
|
|
|
|
| Free State Tailings |
82.788 |
0.27 |
22,487 |
82.788 |
0.27 |
22,487 |
— |
% |
| Sub Total / Ave. Measured |
102.318 |
0.27 |
27,676 |
104.640 |
0.27 |
28,342 |
(2) |
% |
| Indicated |
Phoenix Project |
— |
— |
— |
— |
— |
— |
— |
% |
|
|
|
|
|
|
|
|
| Free State Tailings |
— |
— |
— |
— |
— |
— |
— |
% |
| Sub Total / Ave. Indicated |
— |
— |
— |
— |
— |
— |
— |
% |
Total / Ave. Measured |
|
102.318 |
0.27 |
27,676 |
104.640 |
0.27 |
28,342 |
(2) |
% |
|
Free State Tailings |
15.459 |
0.19 |
2,937 |
15.459 |
0.19 |
2,937 |
— |
% |
| Total / Ave. Inferred |
15.459 |
0.19 |
2,937 |
15.459 |
0.19 |
2,937 |
— |
% |
Notes:
1.The Mineral Resources were originally prepared, classified and reported according to SAMREC, 2016. For the purposes of this TRS, the Mineral Reserves have been classified in accordance with Item 1302(d)(1)(iii)(A) of Regulation S-K. The QP responsible for the estimate is Mr. BJ. Selebogo, who is Ore Reserve Manager, and a Harmony employee.
2.The Mineral Resource tonnes are reported as in situ with reasonable prospects for economic extraction.
3.No cut-off grade has been applied for the estimation of Mineral Resources. Mineral Resource tonnes are reported based on a gold price of US$1,764/oz.
4.Tonnes are reported as million tonnes rounded to three decimal places. Gold values are rounded to zero decimal places.
5.Uranium content is not reported for any of the projects.
6.Metal content does not include allowances for processing losses.
7.Mineral Resources are exclusive of Mineral Reserves. Mineral Resources are not Mineral Reserves and do not necessarily demonstrate economic viability.
8.Rounding as required by reporting guidelines may result in apparent summation differences.
9.The Mineral Resource estimate is for Harmony’s 100% interest.
The change is as a result of estimation model and survey updates.
The Mineral Resource estimate for WRD, Mineral Resources as at June 30, 2023 (exclusive of the reported Mineral Reserves), is summarized in the table below:
|
|
|
|
|
|
|
|
|
|
|
|
|
|
|
|
|
|
|
|
|
|
|
|
|
|
|
|
|
Fiscal Year Ended June 30, |
|
|
|
2023 |
2022 |
|
Mineral Resource Category |
Operation / Project |
Tonnes (Mt) |
Gold Grade (g/t) |
Gold Content (kg) |
Tonnes (Mt) |
Gold Grade (g/t) |
Gold Content (kg) |
% Change |
|
|
|
|
|
|
|
|
|
Indicated |
n/a |
0.802 |
0.34 |
274 |
1.055 |
|
0.39 |
|
413 |
|
(33.7) |
% |
|
|
|
|
|
|
|
|
Inferred |
n/a |
17.095 |
0.43 |
7354 |
16.950 |
|
0.43 |
|
7,292 |
|
0.9 |
% |
Notes:
1.The Mineral Resources were originally prepared, classified and reported according to SAMREC, 2016. For the purposes of this TRS, the Mineral Reserves have been classified in accordance with Item 1302(d)(1)(iii)(A) of Regulation S-K. The QP responsible for the estimate is Mr. BJ. Selebogo, who is Ore Reserve Manager, and a Harmony employee.
2.The Mineral Resource tonnes are reported as in situ with reasonable prospects for economic extraction.
3.No cut-off grade has been applied for the estimation of Mineral Resources. Mineral Resource tonnes are reported based on a gold price of US$1,764/oz.
4.Tonnes are reported as million tonnes rounded to three decimal places. Gold values are rounded to zero decimal places.
5.Uranium content is not reported for any of the projects.
6.Metal content does not include allowances for processing losses.
7.Mineral Resources are exclusive of Mineral Reserves. Mineral Resources are not Mineral Reserves and do not necessarily demonstrate economic viability.
8.Rounding as required by reporting guidelines may result in apparent summation differences.
9.The Mineral Resource estimate is for Harmony’s 100% interest.
The change is due to the depletion replaced with new WRDs.
Mineral Reserve Estimate
The Mineral Reserves were originally prepared, classified and reported according to SAMREC, 2016.
For the purposes of this report on Form 20-F, the Mineral Reserves have been classified in accordance with Item 1302(d)(1)(iii)(A) of Regulation S-K. Mineral Reserves are derived from the Mineral Resources, a detailed business plan and the operational planning processes. The planning team utilizes and takes into consideration historical technical parameters achieved. In addition, Mineral Resource conversion to Mineral Reserves considers certain modifying factors , plant call factor, and plant recovery factors.
The Mineral Reserve estimate for Free State Surface Operations, as at June 30, 2022 and 2023, is summarized in the table below.
There are no Mineral Reserves estimated for the WRDs.
|
|
|
|
|
|
|
|
|
|
|
|
|
|
|
|
|
|
|
|
|
|
|
|
|
|
|
| |
|
Fiscal Year Ended June 30, |
|
| |
|
2023 |
2022 |
|
| Mineral Reserve Category |
Operation / Project |
Tonnes (Mt) |
Gold Grade (g/t) |
Gold Content (kg) |
Tonnes (Mt) |
Gold Grade (g/t) |
Gold Content (kg) |
% Change |
| Proven |
Phoenix Project |
30.371 |
|
0.28 |
|
8,652 |
|
36.519 |
0.29 |
10423 |
(17) |
% |
|
|
|
|
|
|
|
|
| Free State Tailings |
86.527 |
|
0.27 |
|
23,410 |
|
86.527 |
|
0.27 |
|
23,410 |
|
— |
% |
| Sub Total / Ave Proven |
116.898 |
|
0.27 |
|
32,063 |
|
123.046 |
0.27 |
|
33,834 |
|
(5) |
% |
Probable |
Central Plant Reclamation |
45.087 |
|
0.27 |
|
11,964 |
|
47.910 |
|
0.27 |
|
12844 |
(7) |
% |
|
|
|
|
|
|
|
|
| Free State Tailings |
585.517 |
|
0.22 |
|
130,775 |
|
578.727 |
0.22 |
|
129266 |
1 |
% |
| Sub Total / Ave Probable |
630.605 |
|
0.23 |
|
142,739 |
|
626.637 |
0.23 |
|
142110 |
— |
% |
Total / Ave Proven + Probable |
747.503 |
|
0.23 |
|
174,802 |
|
749.683 |
0.23 |
175943 |
(1) |
% |
Notes:
1.The Mineral Reserves were originally prepared, classified and reported according to SAMREC, 2016. For the purposes of this TRS, the Mineral Reserves have been classified in accordance with Item 1302(d)(1)(iii)(A) of Regulation S-K. The QP responsible for the estimate is Mr. BJ. Selebogo, who is the Ore Reserve Manager, and a Harmony employee.
2.Tonnes, grade, and gold content (oz) are declared as net delivered to the mills.
3.Gold content is recovered gold after taking into consideration the modifying factors.
4.Mineral Reserves are reported using a cut-off grade of 0.157g/t and a gold price of US$1,582/oz.
5.Recovered gold (kg) is based on a conversion factor of 32.1507oz/kg.
The decrease in Mineral Reserves is mainly due to depletions.
The table below presents a summary of the modifying factors used to convert the Mineral Resource to the Mineral Reserve for the Free State Surface Operations. The modifying factors are consistent with the modelling, planning and computing estimates used in determining the Mineral Reserves, which are also consistent with historical performance.
|
|
|
|
|
|
|
|
|
|
|
|
Operation / Project |
Source |
Cut-off Grade (g/t Au) |
Plant Recovery (%) |
| Phoenix Project |
No. 21 (H3) |
0.18 |
45.00 |
| Brand A (PB Dam A) |
0.18 |
45.00 |
| FSS6 |
0.18 |
45.00 |
| Central Plant Reclamation |
FSS5 |
0.18 |
48.00 |
| FSS3 |
0.17 |
50.00 |
| Free State Tailings |
Free State South 1 (FSS1) |
0.16 |
51.71 |
| Free State South 2 East & West (FSS2 E&W) |
0.16 |
51.71 |
| Free State South 4 (FSS4) |
0.16 |
51.71 |
| Free State South 7 (FSS7) |
0.17 |
48.67 |
| Free State South 8 (FSS8-E) |
0.16 |
51.71 |
| Free State South 8 (FSS8-W) |
0.16 |
51.71 |
| Free State North 6 (FSN6) |
0.19 |
43.32 |
| ARM (1+2+3+4)(Welkom Slimes Dam) |
0.16 |
45.00 |
| Brand D |
0.16 |
52.57 |
| Saaiplaas 1 |
0.16 |
52.57 |
| Saaiplaas 3 & 2 |
0.16 |
52.57 |
| Saaiplaas 5b |
0.16 |
52.57 |
| Saaiplaas 6 |
0.16 |
52.57 |
| No. 23 (Central Plant) |
0.16 |
52.57 |
| No. 30a |
0.17 |
52.57 |
| No. 33b |
0.16 |
48.97 |
| No. 34a |
0.17 |
52.57 |
| No. 32 |
0.16 |
49.89 |
| No 33A |
0.16 |
52.51 |
| Target Slimes Dam |
— |
52.00 |
| Pres Steyn 9 (Freddies 9) |
— |
52.00 |
For additional information, see the TRS on each individual property, filed as an Exhibit of this annual report on Form 20-F.
Joel
Property Description
Joel is located on the southern edge of the Witwatersrand Basin in the Free State Gold Field and lies 270km south southwest of Johannesburg at a longitude of 26°48'40"E and latitude 28°16'17"S. Joel is the most southern of the gold mines mined within the Harmony stable and is situated approximately 40km south of Welkom, 30km southeast of Virginia and 20km north of Theunissen. The mine has a common boundary with Beatrix Mine to the west of the mine property, but there are no underground connections between the two mines.
The following graphic illustrates the location of Joel, along with certain infrastructure.
Joel is an intermediate-depth underground gold mine that consists of two shaft complexes interconnected via a triple decline system, spanning four levels and mining at depths of 1,379m below mine datum (“BMD”). Joel currently has a LOM expectancy of seven years, which includes mining up to 137 level in a block of ground swapped with the neighboring Beatrix Mine.
There is no material litigation (including violations or fines) against Harmony that threatens its mineral rights, tenure, or operations.
Operational Infrastructure
The surrounding areas of Welkom and Virginia are well developed in terms of access and mining-related infrastructure supporting the numerous operational gold mines in the area. The regional infrastructure includes national and provincial paved road networks, power transmission and distribution networks, water supply networks and communication infrastructure.
Joel has two operational shaft complexes namely North Shaft and South Shaft, which service and support the mining operation as defined in the LOM plan. The Joel gold plant located near North Shaft was decommissioned in 2019. Joel ore is currently transported by truck to the Harmony One Plant, a distance of 40km away by road, where it is processed.
Operations are powered by electricity from Eskom.
Joel’s surface and underground infrastructure, including its power and water supplies, are sufficient for the LOM plan production requirements.
Geology
Joel is situated in the Free State Goldfield, on the southwestern margin of the Witwatersrand Basin of South Africa, one of the most prominent gold provinces in the world. The major gold bearing conglomerate reefs are mostly confined to the CRG of the Witwatersrand Supergroup.
The Free State Goldfield is structurally divided into two sections, cut by the north-south striking De Bron Fault, which has a downward vertical displacement to the west of about 1,500m in the region of Bambanani, as well as a dextral shift of 4km. This known lateral shift allows a reconstruction of the reefs to the west and east of the De Bron Fault. Several other major faults lie parallel to the De Bron Fault. Joel lies to the west of the De Bron Fault. Dips of the reef are mostly towards the east, averaging 30° but become steeper approaching the De Bron Fault. Between the east and west blocks lies the uplifted horst block of WRG sediments with no reef preserved.
The reef currently exploited at Joel is the Beatrix Reef, which covers approximately 90% of the mine. The other economic reefs are the VS5 Reef and the footwall reef (“Aandenk”) which cover the remaining 10% of Joel.
Mineralization is associated with the presence of medium to coarse, clast-supported oligomictic pebble horizons. The significant minerals in the deposit are pyrite (60%), quartz (35%) and garnets (5%) within medium to coarse, clast-supported oligomictic pebble horizons. Detrital carbon is also common.
History
Active prospecting in the area began on the farms Leeuwbult 580 and Leeuwfontein 256 in 1981. Construction of the twin-shaft system began in September 1985 and was completed by December 1987. Joel South was designed to be a fully trackless mining operation.
Previously known as HJ Joel Mine, its name was changed to Joel in 1998 when the then AngloGold was established. The mine’s name changed again to Taung in 1999 and finally reverted to Joel in January 2002 when the Freegold Joint Venture between Harmony and African Rainbow Minerals Limited Gold Division ("ARMGold") assumed responsibility for the operation.
Mineral Tenure
Refer to Item 4: “Information on the Company – Business Overview – Regulation – Mineral Rights – South Africa” above for a summary of the regulatory environment in South Africa.
The current mining rights (30/5/1/2/2/13 MR ) that encompasses an area of 2,166.92ha was successfully converted, executed and registered as a new order mining right at the MPRTO on August 6, 2010. The right was granted on December 3, 2007 for a period of 11 years, ending on December 2, 2018. The right further renewed in terms of section 24 (1) of the Mineral and Petroleum Resources Development Act on February 15, 2019 for a further 11 years, ending on February 14, 2030.
The following mining rights make up the full mining lease area of approximately 2,166.92ha:
•30/5/1/2/2/13 MR valid from February 15, 2019, to February 14, 2030.
A summary of the status of all environmental permits and licenses issued at the effective date related to Joel is presented in the table below.
Mining Method
|
|
|
|
|
|
|
|
|
|
|
|
|
|
|
| Permit / Licence |
Reference No. |
Issued By |
Date Granted |
Validity |
| Mining Right |
FS 30/5/1/2/2/13 MR |
DMRE |
Feb 15, 2019 |
11 years |
| EMPr |
FS 30/5/1/2/2/13 MR |
DMRE |
Mar 31, 2010 |
LOM |
| Water Permit |
1459B (B33/2/340/116) |
DWS |
May 27, 1991 |
LOM |
| Water Permit |
1460B (B33/2/340/116) |
DWS |
Mar 15, 1991 |
LOM |
| Waste Disposal Permit |
1339N(B33/2/340/116/P35) |
DWS |
Sept 16, 1992 |
LOM |
| Water Permit |
3M (B33/2/340/116) |
DWS |
May 27, 1991 |
LOM |
| Sewage Treatment Permit |
QC404.00.XR01 |
DWS |
Aug 20, 1986 |
LOM |
| Water Permit |
1339N (B33/2/340/116) |
DWS |
Mar 15, 1991 |
LOM |
|
|
|
|
|
|
|
|
|
|
|
|
|
|
|
|
|
|
|
|
|
|
|
|
|
Joel is an intermediate-depth underground gold mine that consists of two shaft complexes interconnected via a triple decline system, spanning four levels and mining at depths of up to 1,350m BMD. Joel currently has a LOM expectancy of seven years, which includes mining up to 137 level in a block of ground swapped with the neighboring Beatrix Mine.
Joel was originally designed to adopt trackless mechanized mining when production commenced at South Shaft, but in 1994 a decision was made to change to conventional mining mainly due to the high operating costs of trackless mining. Joel consists of two interconnected shaft complexes, the South Shaft complex which is the main operational shaft and the North Shaft which is available for hoisting ore.
Joel’s upper mining levels are in a mature phase of operation. The decline project development, from 129 to 137 levels, which started in 2011, is complete. This included mining up to 137 level and the Beatrix Mine block swap. The decline project to access the orebody from 137 level included two declines that were developed at 12° from 129 level – a chairlift decline and a conveyor belt decline. The belt, main tips and chairlifts have been completed. Primary footwall development is currently underway on 137 level and production from the 137 level E3 raise, 137 E4 raise and 137 E6 Raise is ongoing.
Joel has adopted conventional breast mining on a scattered grid (or scattered mining) which is tailored to the variable grades intersected as well as the associated rock-related hazards anticipated at this depth. Stoping panel stability in an intermediate stress environment may require additional stabilizing pillars be left to support the immediate hanging wall. These take the form of inter-panel crush pillars between neighboring mining panels.
The primary economic reef mined is the narrow tabular Beatrix Reef, accessed via conventional grid development. Mining consists of horizontal footwall development to access the reef horizon with inclined development on the reef plane to establish mining faces. Ore is cleared from the stopes through ore passes into the underlying cross-cuts.
Mineral Processing
The Joel gold plant designed and commissioned during the construction of the mine was decommissioned in fiscal 2009 and all ore mined at Joel is now processed at the Harmony One Plant.
Harmony One Plant is Harmony’s largest gold processing plant and processes underground ore from multiple shafts, as well as surface ore from nearby mine waste facilities. The plant was commissioned in 1986 and comprises three independent modules, each consisting of four feed silos, two run-of-mine ("ROM") mills, two conventional thickeners, cyanide leach, CIP absorption, elution, zinc precipitation and smelting. The plant CIP process reflects the technology which was current at the time of construction.
The Harmony One Plant has a steady state design capacity of 390ktpm with its conventional CIP flowsheet. The Harmony One plant is in good working condition and the equipment is also in good order with audits done on regular bases to check the operating performance of the plant.
Qualified Persons
The QPs preparing the TRS were employed on a full-time basis by Harmony. The QPs’ qualifications, areas of responsibility and personal inspection of the property are summarized in the graphic below.
|
|
|
|
|
|
|
|
|
|
|
|
|
|
|
| Qualified Person |
Professional Organization |
Qualification |
TRS Section Responsibility |
Personal Insp. |
| Ms. FO. Muthelo |
SACNASP |
BSc Hons (Geol) |
All Sections |
Full time |
| Ms. T. Stocks |
N/A |
B.Tech. (Cost & Man Acc) |
16, 18, 19 |
Full time |
| Mr. M. Kilian |
AMMSA |
B. Tech (Min Eng) |
16 |
Full time |
| Mr. K. Tose |
AMMSA |
BSc (Min Eng) |
13 |
Full time |
| Mr. F. Mufara |
MVSSA |
BSc (Comp Sci) |
3, 17 |
Full time |
| Ms. A. Sonandi |
AMRE |
Engineer Manager |
15 |
Full time |
|
|
|
|
|
|
|
|
|
|
|
|
|
|
|
|
|
|
|
|
|
|
|
|
|
|
|
|
|
|
Exploration
Geological data has been obtained through initial surface drilling, followed by underground drilling, mapping and channel (chip) sampling.
Since the inception of Joel in 1986, 48 exploration drill holes have been drilled from surface. Forty of the holes were drilled by the previous owners of the mine and eight holes, totaling 10,800m, have been drilled during Harmony’s tenure.
Surface exploration drilling by Harmony began in 2010, with the eight planned holes and their associated deflections. The purpose was to determine the facies and value in 137 level for the extension of the shaft to 137 level because at that time little information was known about 137 level.
In 2019, five holes were drilled with the purpose to also explore for the VS5 boundary in the eastern side of the shaft in 129 level and to determine the facies and value towards 145 level for the extension of the shaft to 145 level.
Underground exploration drilling has been ongoing throughout the operational life of Joel as the mine deepens. Underground exploration drilling is undertaken to supplement the surface drilling on a closer grid spacing. Underground drilling is undertaken ahead of the face to determine the location of the reef, the grade and the presence of structure.
The underground infill drilling system is in place to improve data density in specific areas and are drilled from the underground development access drives. The drill hole spacing is typically every 25m along strike and 40m down dip, with higher density in the western limb of the asymmetric syncline to the north-west of the mine. The underground drill holes are short drill holes rarely exceeding 200m in length.
The QPs are of the opinion that the quality and quantity of the exploration methods and information gathered is sufficient to support the estimation of Mineral Resources and Mineral Reserves.
Mineral Resource Estimate
The Mineral Resource estimate at Joel is considered to have reasonable prospect for economic extraction by underground mining methods. This is demonstrated by the results of the cash flow for the mine. The cut-off grade for the Mineral Resource is determined at 558cmg/t gold based on the economic assumptions presented in the table below at the effective date of June 30, 2023.
|
|
|
|
|
|
|
|
|
| Description |
Unit |
Value |
| Gold Price |
US$/oz |
1764 |
| Exchange Rate |
Rand:US$ |
16.22 |
| Gold Price |
Rand/kg |
920 000 |
| Plant Recovery Factor |
% |
94.38 |
| Unit Cost |
Rand/t |
3594 |
Note: Unit cost includes cash-operating cost, royalty and on-going development capital.
This cut-off value represents typical costs for the mining method and preliminary mining and metallurgical recovery assumptions.
The Mineral Resources were originally prepared, classified and reported according to SAMREC, 2016. For the purposes of this report on Form 20-F, the Mineral Resources have been classified in accordance with Item 1302(d)(1)(iii)(A) of Regulation S-K. These Mineral Resources account for mining depletion recorded from July 2022 to June 2023. The Mineral Resource estimate, as at June 30, 2023, exclusive of the reported Mineral Reserves is summarized in the table below.
|
|
|
|
|
|
|
|
|
|
|
|
|
|
|
|
|
|
|
|
|
|
|
|
|
Fiscal Year Ended June 30, |
% Change |
|
2023 |
2022 |
| Mineral Resource Category |
Tonnes (Mt) |
Gold Grade (g/t) |
Gold Content (kg) |
Tonnes (Mt) |
Gold Grade (g/t) |
Gold Content (kg) |
| Measured |
1.392 |
9.83 |
13,690 |
1.650 |
9.17 |
15,138 |
(9.6)% |
| Indicated |
2.940 |
7.07 |
20,802 |
2.794 |
6.92 |
19,336 |
7.6% |
| Total / Ave. Measured + Indicated |
4.332 |
7.96 |
34,491 |
4.444 |
7.76 |
34,474 |
—% |
| Inferred |
0.762 |
7.87 |
6,001 |
7.043 |
5.11 |
35,954 |
(83.3)% |
Notes:
1.Mineral Resources are reported with an effective date of June 30, 2023 were originally prepared, classified and reported according to SAMREC, 2016. For the purposes of this TRS, the Mineral Resources have been classified in accordance with Item 1302(d)(1)(iii)(A) of Regulation S-K. The Qualified Person responsible for the estimate is Ms. FO. Muthelo, who is Ore Reserve Manager at Joel, and a Harmony employee.
2.The Mineral Resource tonnes are reported as in-situ with reasonable prospects for economic extraction.
3.No modifying factors or dilution sources have been included to in-situ Reserve which was subtracted from the SAMREC Resource in order to obtain the S-K 1300 Resource.
4.4. The Mineral Resources are reported using a cut-off value of 558cmg/t determined at a 90% profit guidance, and a gold price of US$1,764/oz.
5.Tonnes are reported as rounded to three decimal places. Gold values are rounded to zero decimal places.
6.Mineral Resources are exclusive of Mineral Reserves. Mineral Resources are not Mineral Reserves and do not necessarily demonstrate economic viability.
7.Rounding as required by reporting guidelines may result in apparent summation differences.
8.The Mineral Resource estimate is for Harmony’s 100% interest.
Exploration drilling during fiscal 2023 confirmed the position of the VS5 boundary. The VS5 block is now being reported as minor reefs that do not form part of the Mineral Resources.
Mineral Reserve Estimate
The Mineral Reserves were originally prepared, classified and reported according to SAMREC, 2016. For the purposes of this report on Form 20-F, the Mineral Reserves have been classified in accordance with Item 1302(d)(1)(iii)(A) of Regulation S-K. Mineral Reserves are derived from the Mineral Resources, a detailed business plan and the operational mine planning processes. Mine planning utilizes and takes into consideration historical technical parameters achieved. In addition, Mineral Resource conversion to Mineral Reserves considers certain modifying factors, dilution, ore losses, minimum mining widths, planned mine call and plant recovery factors.
The Mineral Reserve estimate, as at June 30, 2022, and 2023, is summarized in the table below.
|
|
|
|
|
|
|
|
|
|
|
|
|
|
|
|
|
|
|
|
|
|
|
|
| |
Fiscal Year Ended June 30, |
|
| |
2023 |
2022 |
|
| Mineral Reserve Category |
Tonnes (Mt) |
Gold Grade (g/t) |
Gold Content (kg) |
Tonnes (Mt) |
Gold Grade (g/t) |
Gold Content (kg) |
% Change |
Proven |
2.933 |
4.87 |
14,284 |
2.781 |
5.01 |
13,941 |
2.5 |
% |
| Probable |
0.545 |
4.33 |
2,358 |
0.954 |
4.85 |
4,631 |
(49.1) |
% |
Total / Ave. Proven + Probable |
3.478 |
4.79 |
16,642 |
3.735 |
4.97 |
18,572 |
(10.4) |
% |
Notes:
1.The Mineral Reserves were originally prepared, classified and reported according to SAMREC, 2016. For the purposes of this TRS, the Mineral Reserves have been classified in accordance with Item 1302(d)(1)(iii)(A) of Regulation S-K. The Qualified Person responsible for the estimate is Ms. FO. Muthelo, who is the Joel Ore Reserve Manager, and a Harmony employee.
2.Tonnes, grade, and gold content (oz) are declared as net delivered to the mills.
3.Figures are fully inclusive of all mining dilutions, gold losses and are reported as mill delivered tonnes and head grades. Metallurgical recovery factors have not been applied to the reserve figures.
4.Gold content is recovered gold content after taking into consideration the modifying factors.
5.Mineral Reserves are reported using a cut-off grade of 915cmg/t determined using a gold price of US$1,582/oz gold.
The decrease in Mineral Reserves is mainly due to depletion and a decrease in grade to the far East of the mine as we approach the erosion channel associated with the VS5 boundary.
The table below presents a summary of the modifying factors used to convert the Mineral Resource to the Mineral Reserve for Joel. The modifying factors are consistent with the modelling, planning and computing estimates used in determining the Mineral Reserves, which are also consistent with historical performance.
|
|
|
|
|
|
|
|
|
| Modifying Factor |
Unit |
Value |
| Relative Density |
t/m3 |
2.75 |
| Average Stoping Width |
cm |
170 |
| Gully |
% |
4.52 |
| Off reef |
% |
1.09 |
| Waste to Reef |
% |
7.30 |
| Flushing Tons |
% |
0.00 |
| Discrepancy |
% |
0.22 |
| Mine Call Factor (MCF) |
% |
84 |
| Plant Recovery Factor (PRF) |
% |
94.38 |
| Mine Recovery Factor |
% |
79.28 |
| Plant Call Factor |
% |
100 |
| Mineral Reserve Cut Off |
cmg/t |
915 |
For additional information, see the TRS on each individual property, filed as an Exhibit of this annual report on Form 20-F.
Kalgold
Property Description
Kalgold is located at latitude 26°10.0’S and longitude 25°14.5’E, 55km southwest of Mahikeng, between Mahikeng and Stella, along the Mahikeng-Vryburg road (N18) in North West Province, South Africa. The Kalgold Mine is serviced by well-maintained sealed roads with good access to all nearby towns and cities. The mine is surrounded by farmland and the closest community is at Kraaipan, approximately 15km to the south of the mine. The Kalgold Mine has been in operation since 1995 and is the only significant mining operation in the region. Kalgold is wholly-owned and operated by Harmony.
The following graphic illustrates the location of the Kalgold mine, along with certain infrastructure.
Kalgold is a open-pit mining operation, extracting ore from a series of satellite orebodies.
There is no material litigation (including violations or fines) against the Company which threatens its mineral rights, tenure, or operations.
Operational Infrastructure
Infrastructure in the region is well established. The regional infrastructure includes national and provincial paved road networks, power transmission and distribution networks, water supply networks and communication infrastructure. Schools, clinics and hospitals are readily available in the surrounding areas. Operations are powered by electricity from Eskom.
Ore and waste material are transported separately, with ore being trucked from the pit to the plant ROM pad, and waste rock going to the mine's waste dumps. Marginal and low-grade ore is transported by truck and stockpiled for future processing. Kalgold has its own processing plant situated adjacent to the mine.
Kalgold is accessible via the provincial roads. The detailed surface infrastructural layout includes established haul roads for the transport of ore and waste, the waste dumps, and stockpiles for the associated pits.
The general layout of Kalgold infrastructure is displayed in the graphic below.
Geology
The Kalgold lode deposit is located within the geological terrane known as the Archaean Kraaipan Greenstone Belt ("KGB"). The KGB forms part of the Kaapvaal Craton of South Africa and comprises a linear belt of weakly metamorphosed mafic volcanic rocks with interbedded metasedimentary rocks and Banded Iron Formation (“BIF”). The belt extends in a roughly north/south direction over 250km from South Africa into southern Botswana.
The belt is intruded by several granitoid suites which range from tonalitic and trondhjemitic gneisses through to granodiorite-monzonite suites. There is a general paucity of outcrop owing to the variably developed weathering profile and to the Tertiary-to-Recent cover, including transported Kalahari sands. Due to the younger cover rocks and lack of surface exposure, the mineralization potential of the belt was poorly understood for many years.
The Kalgold lode deposit is accessed through five discrete mining areas, namely the D Zone, A Zone and A Zone south extension (Henry), Watertank, and Windmill pits. Watertank pit can be split into Watertank Main and North. Watertank North refers to the northern extension of the pit. The geology of the D Zone Pit is used as a benchmark for the other pits. The geology consists of mafic schist, which forms the immediate footwall, a BIF horizon as the main mineralized zone and a succession of clastic sediments consisting of shale, greywacke, and volcanic conglomerates as the hanging wall. Mining is currently taking place at the A Zone, Watertank, Henry and Windmill pits.
Mineralization at Kalgold is essentially strata bound to the BIF packages, resulting from intense silica, carbonate, sulphide, potassium alteration and metasomatic replacement of the BIF lenses. The mineralization is manifested primarily as quartz veined and sulphidized BIF, with sulphides dominated by pyrrhotite and pyrite. Gold predominantly occurs as small grains of native gold, in association with pyrrhotite and trace chalcopyrite and sphalerite.
History
Kalgold was previously known as Shamrock, formed in 1982 as a wholly owned exploration and development subsidiary of Shell.
Exploration of the Kraaipan Greenstone belt by Shell began in the 1980s. In 1994, West Rand Consolidated Mines (“WRCM”) acquired Shamrock. The company changed its name to Kalahari Goldridge Mining Company Limited ("Kalahari") in May 1996 and was listed on the Johannesburg Stock Exchange on October 14, 1996, via an issue of 18.4% of the shares of the company, as a dividend in specie, to shareholders of WRCM.
Harmony acquired Kalgold in July 1999.
Mineral Tenure
Refer to Item 4: “Information on the Company – Business Overview – Regulation – Mineral Rights – South Africa” above for a summary of the regulatory environment in South Africa.
The Kalgold mining right, which encompassed 615ha, was successfully converted, executed, and registered as a new order mining right on February 24, 2015, as MR12/2015 under Mining Right Protocol 574/2008. A Section 102, in terms of the MPRDA, to include portions of the farms Goldridge 632 IO and Ferndale 544 IO was executed on November 9, 2010, under Mining Right Protocol 774/2010.
The mining right now encompasses 988.23ha. The mining right was issued for a period of 30 years, expiring on August 27, 2038, and Kalgold has the exclusive right to renew the right for a further 30 years. The Kalgold mineral rights are held by Harmony. Under the MPRDA, Harmony is entitled to apply to renew the mining right on its expiry. At the effective date, Harmony was still preparing to re-submit the section 102 application refused by DMRE in 2021. These Prospecting Rights will be an extension to the current mining right.
Harmony is the holder of the following mining rights:
•NW30/5/1/2/2/77MR valid from August 28, 2008 to August 27, 2038; and
•NW30/5/1/1/2/863 and 1469PR. The section 102 application in terms of the MPRDA for the Prospecting Right to be incorporated as Kalgold mining right was not approved. A new Prospecting Right application will be lodged. The area is currently reserved, and the DMRE may not accept any other applications for the area.
A summary of the status of environmental permits and licenses issued as at June 30, 2023, related to Kalgold operation is presented in the table below.
|
|
|
|
|
|
|
|
|
|
|
|
|
|
|
| Permit / Licence |
Reference No. |
Issued By |
Date Granted |
Validity |
| Environmental Management Programme (Amendment) |
NW30/5/1/2/2/77MR |
DMR |
March 8, 2022 |
LOM |
| Environmental Authorisation |
(NW) 30/5/1/2/3/2/1/77 EM |
DMR |
October 4, 2022 |
LOM |
| Water Use Licence |
07/D41B/ABCGIJ/4754 |
DWS |
February 22, 2021 |
LOM |
| Certificate of Registration Inflammable Liquids and Substances |
FS/FLM 01/06/02/2023 |
Ngaka Modiri Molema District Municipality |
June 1, 2023 |
12 Months |
| Protected Trees Permit |
01-12-2020/24NW |
DFFE |
December 2, 2020 |
December 2, 2025 |
| Atmospheric Emission Licence |
NWPG/KALGOLDAEL 4.17/OCT2019 |
DEDUCT |
October 14, 2019 |
September 1, 2024 |
|
|
|
|
|
|
|
|
|
|
|
|
|
|
|
|
|
|
|
|
|
|
|
|
|
Mining Method
Kalgold is an open-pit mining operation located in the geological terrane of the Archaean KGB. Gold mineralization is hosted by steeply dipping BIF interbedded with schist, shale, and greywacke. The nature of the orebody requires the selective mining of the ore blocks, defined by the east and west mineralized limbs, to separate the ROM destined ore, above the Mineral Reserve cut-off of 0.6g/t. Based on the gold grade, properties of the host rock, and shallow depth of mineralization, open pit mining is appropriate for Kalgold. The gold deposit is mined most cost effectively, using a modular approach with multiple small to medium open pits defined by mineralized zones.
Mineral Processing
Kalgold's gold processing facility has been in operation since 1996. The technology used to process the gold-bearing ore is well established and has proven to be suitable for the style of mineralization. Kalgold processes the ore using a well-established cyanide and CIL process for their recovery of gold. The average planned milling tonnages per month is 128.540ktpm at the planned feed grade of 1.06g/t. The plant is operating at its designed throughput capacity and has shown its ability to produce the forecasted ounces of gold at said capacity.
Qualified Persons
The QPs preparing the TRS were employed by Harmony. The QPs’ qualifications, areas of responsibility and personal inspection of the property are summarized in the graphic below.
|
|
|
|
|
|
|
|
|
|
|
|
|
|
|
| Qualified Person |
Prof. Assoc. |
Qualifications |
TRS Section Responsibility |
Personal Insp. |
Mr. T. Hewitt |
GSSA Fellow (963219) , SACNASP (400069/01) |
BSc Hons (Geology), GDE (Mining) |
1, 6, 7, 8, 9, 22 |
Full time |
Mrs. B. van der Linden |
n/a |
B Com. (Hons) (Bank/Fin Mng.) |
1, 18, 19, 22 |
Full time |
Mr. D. Fourie |
SAIMM (706555) |
MSc. Eng, GDE |
1, 11, 22 |
Full time |
Mr. E. Malaola |
SAGC(PMS0196), IMSSA |
NHD Mine Surveying, Mine Surveyors CoC |
1, 9, 11.3 - 11.6, 12, 22 |
Full time |
Mr. FP. Coetzee |
ECSA Pr. Eng. (20100158), MMC |
B Eng. Mining, MBA |
1, 13.3, 13.4, 22 |
Full time |
Mr. J. Boshoff |
SACNASP, SAIMM, GSSA |
BSc. (Hons), MSc, MBA |
1, 9, 11.3 - 11.6, 12, 22 |
Full time |
Mr. K. Le Bron |
FSANIRE |
M.Sc. Eng., GDE, AREC (COM), MAP, PGCE, Blasting Cert. |
1, 13.2, 22 |
Full time |
Ms. N. Mogale |
n/a |
BSc Hons, Environmental Science with Geography and Environmental Management |
1, 4, 17, 22 |
Full time |
Mr. N. Wessels |
AMRE |
B. Eng (Mech), GCC |
1, 15, 22 |
Full time |
Ms. KN. Monaisa |
AMMSA |
B-Tech (Mining Engineering), MDP, MMC |
1, 13.3, 13.4, 23 |
Full time |
Mr. R. Montshonyane |
n/a |
BTech: Engineering Metallurgy, BT10014 |
1, 10, 14, 22 |
Full time |
Mr. R. Reid |
Australian Institute of Geoscientists (FAIG: 3507) |
BSc. Hons (Earth Science), Grad. DipSc. (GIS) |
1, 6, 11, 22 |
Full time |
Mr. RF. Gaelejwe |
SACNASP (400207/14) |
BSc. Hons (Geol), PgDip, EMBA |
All |
Full time |
Mr. T. van Dyk |
SACNASP, GSSA |
BSc. Hons (Geology) |
1, 9, 11.3 - 11.6, 12, 22 |
Full time |
Mr. W. De Wit |
n/a |
N.D.T. Mine Surveying, Mine Surveyors Certificate of Competency No 1605 |
1, 3, 5, 16.3 |
Full time |
Exploration
In the period 2017 to 2019, definition and exploration drilling were undertaken over the Kalgold line of lode deposit. This exploration was aimed at validating and expanding the Mineral Resource estimate at that time. The drilling yielded significant extensions to the Mineral Resource area, expanding on the understanding of the deposit. The drilling results were analyzed and incorporated into the geological model to upgrade the Mineral Resource estimates, and in-fill the areas between the A Zone and Watertank mining pits, known as the Bridge Zone.
Further exploration drilling took place during 2022. The results from this exploration drilling extended the mineralized area beyond the current resource limits. The exploration drilling and the subsequent definition of the Mineral Resources are ongoing, and the intention is that the Mineral Resource estimate will be continuously updated as the data becomes available and incorporated into the model.
Exploratory worked planned to the south of the D zone was not completed as planned due to the pending prospecting right application. This drilling was intended to support the plant Feasibility Study, aimed at increasing the current milling and processing capacity.
The QPs are of the opinion that the drilling and survey processes, the geological and geotechnical logging and the sampling and assaying data is appropriate for the Kalgold modelled deposit and mineralization style.
Mineral Resource Estimate
The Mineral Resources at Kalgold are considered to have reasonable prospects of economic extraction by open pit mining methods. Kalgold is an on-going operation with a well-defined set of operating parameters and costs. These parameters are used to generate a series of open pit Mineral Resource shells based on various gold prices, to constrain the Mineral Resource block model for reporting purposes. At this stage the Windmill Zone model has no constraining Mineral Resource shell and is reported to an RL (reduced level). Based on the parameters presented in the table below, the cut-off grade reporting to the Kalgold Mineral Resources at the effective date of June 30, 2023, is 0.54g/t gold.
|
|
|
|
|
|
|
|
|
| Description |
Unit |
Value |
| Gold price |
R/kg |
920,000 |
| Planned recovery factor |
% |
86 |
| Mining costs |
R/t |
Modelled based on Andru mining rates |
| Processing costs |
R/t |
263.00 |
| Plant throughput |
ktpm |
130 |
| Planned dilution (Weighted planned per pit) |
% |
9.3 |
This cut-off value represents typical costs for the mining method and preliminary mining and metallurgical recovery assumptions.
The Mineral Resources were originally prepared, classified and reported according to SAMREC, 2016. For the purposes of this report on Form 20-F, the Mineral Resources have been classified in accordance with Item 1302(d)(1)(iii)(A) of Regulation S-K. These Mineral Resources account for mining depletion recorded from July 2022 to June 2023.
The Mineral Resource estimate, as at June 30, 2023, exclusive of the reported Mineral Reserves, is summarized in the table below.
|
|
|
|
|
|
|
|
|
|
|
|
|
|
|
|
|
|
|
|
|
|
|
|
|
Fiscal Year Ended June 30, |
% Change |
|
2023 |
2022 |
| Mineral Resource Category |
Tonnes (Mt) |
Gold Grade (g/t) |
Gold Content (kg) |
Tonnes (Mt) |
Gold Grade (g/t) |
Gold Content (kg) |
| Measured |
3.474 |
1.05 |
3,634 |
0.576 |
1.65 |
953 |
281.3% |
| Indicated |
31.832 |
1.20 |
38,187 |
33.099 |
1.09 |
35,970 |
6.2% |
| Total / Ave. Measured + Indicated |
35.306 |
1.18 |
41,821 |
33.675 |
1.10 |
36,923 |
13.3% |
| Inferred |
25.448 |
0.34 |
8,648 |
25.440 |
0.34 |
8,557 |
1.1% |
Notes:
1.Mineral Resources are reported with an effective date of June 30, 2023 were originally prepared, classified and reported according to SAMREC, 2016. For the purposes of this TRS, the Mineral Resources have been classified in accordance with Item 1302(d)(1)(iii)(A) of Regulation S-K. The Qualified Person responsible for the estimate is Mr. RF. Gaelejwe, who is Ore Reserve Manager at Kalgold, and a Harmony employee.
2.The Mineral Resource tonnes are reported as in-situ with reasonable prospects for economic extraction.
3.No modifying factors or dilution sources have been included to in-situ Reserve which was subtracted from the SAMREC Resource in order to obtain the S-K 1300 Resource.
4.The Mineral Resources are reported using a cut-off value of 0.54g/t and a gold price of US$1,764/oz; for an assumed plant throughput of 130ktpa. These parameters have been used to constrain the Mineral Resource shell.
5.Tonnes are reported as rounded to three decimal places. Gold values are rounded to zero decimal places.
6.Mineral Resources are exclusive of Mineral Reserves. Mineral Resources are not Mineral Reserves and do not necessarily demonstrate economic viability.
7.Rounding as required by reporting guidelines may result in apparent summation differences.
8.The inferred portion of the Mineral Resource includes the historical Surface tailings of 6 263Kg (0,201Moz)
9.The Mineral Resource estimate is for Harmony’s 100% interest.
The declared exclusive Mineral Resource estimate increased by 11% from 1.462Moz as at June 30, 2022 to 1.623Moz as at June 30, 2023. The increase is attributed to the change in operational Life of Mine strategy offsetting the impact of reporting pit shells depth constrained by increased mining costs.
Mineral Reserve Estimate
The Mineral Reserves were originally prepared, classified and reported according to SAMREC, 2016. For the purposes of this report on Form 20-F, the Mineral Reserves have been classified in accordance with Item 1302(d)(1)(iii)(A) of Regulation S-K. Mineral Reserves are derived from the Mineral Resources, a detailed business plan and the operational mine planning processes. Mine planning utilizes and takes into consideration historical technical parameters achieved. In addition, Mineral Resource conversion to Mineral Reserves considers certain modifying factors, dilution, ore losses, minimum mining widths, planned mine call and plant recovery factors.
The Mineral Reserve estimate, as at June 30, 2023, is summarized in the table below.
|
|
|
|
|
|
|
|
|
|
|
|
|
|
|
|
|
|
|
|
|
|
|
|
| |
Fiscal Year Ended June 30, |
|
| |
2023 |
2022 |
|
| Mineral Reserve Category |
Tonnes (Mt) |
Gold Grade (g/t) |
Gold Content (kg) |
Tonnes (Mt) |
Gold Grade (g/t) |
Gold Content (kg) |
% Change |
Proven |
5.384 |
0.93 |
4,991 |
5.616 |
0.94 |
5,303 |
(5.9) |
% |
| Probable |
8.529 |
0.85 |
7,217 |
15.789 |
1.16 |
18,262 |
(60.5) |
% |
Total / Ave. Proven + Probable |
13.913 |
0.88 |
12,208 |
21.405 |
1.10 |
23,565 |
(48.2) |
% |
Notes:
1.The Mineral Reserves were originally prepared, classified and reported according to SAMREC, 2016. For the purposes of this TRS, the Mineral Reserves have been classified in accordance with Item 1302(d)(1)(iii)(A) of Regulation S-K. The Qualified Person responsible for the estimate is Mr. RF. Gaelejwe, who is the Kalgold Ore Reserve Manager, and a Harmony employee.
2.Tonnes, grade, and gold content are declared as net delivered to the mills.
3.Figures are fully inclusive of all mining dilutions, gold losses and are reported as mill delivered tonnes and head grades. Metallurgical recovery factors have not been applied to the reserve figures.
4.Gold content is recovered gold content after taking into consideration the modifying factors.
5.Mineral Reserves are reported using a cut-off grade of 0.60g/t determined using a gold price of US$1,582/oz gold.
The declared Mineral Reserve estimate decreased by 42% from 0.758Moz as at June 30, 2022 to 0.392Moz as at June 30, 2023. This difference is attributed to the exclusion of Watertank Main mining from LOM due to initial 130Ktpm and 170Ktpm LOM option plans being cashflow negative. This resulted in independent optimized access/ramping designs for A Zone and Watertank North, which excluded further waste and ore mining when compared to the previous integrated access/ramping system used for mining A Zone, Watertank Main and Watertank North.
The table below presents a summary of the modifying factors used to convert the Mineral Resource to the Mineral Reserve for Kalgold. The modifying factors are consistent with the modelling, planning and computing estimates used in determining the Mineral Reserves, which are also consistent with historical performance.
|
|
|
|
|
|
|
|
|
| Modifying Factor |
Unit |
Value |
| Mineral Reserve cut-off - Pit Mineral Reserves |
g/t |
0.60 |
| MCF - Pit Mineral Reserves |
% |
100 |
| Dilution - Pit Mineral Reserves |
% |
9.3 (Weighted planned per pit) |
| Plant Recovery Factor - Pit Mineral Reserves |
% |
86 |
| Plant Recovery Factor - Stockpile Mineral Reserves |
% |
70 |
For additional information, see the TRS on each individual property, filed as an Exhibit of this annual report on Form 20-F.
Kusasalethu
Property Description
Kusasalethu is a deep level gold mine, operating at depths ranging between 2,800m and 3,300m BMD, extracting the Ventersdorp Contact Reef ("VCR") and located in the West Wits mining district, Gauteng Province. At longitude 27°21'32.91"E and latitude 26°27'16.23"S, the mine is approximately 70km southwest of Johannesburg and 15km south southwest of Carletonville and forms part of Harmony's West Wits operations. Kusasalethu is wholly-owned and operated by Harmony.
The following graphic illustrates the location of the Kusasalethu mine, along with certain infrastructure.
All relevant underground mining and surface right permits, and any other permit related to the work conducted on the property have been obtained and are valid. There are no known legal proceedings (including violations or fines) against Harmony, which threaten its mineral rights, tenure, or operations.
Operational Infrastructure
Infrastructure in the region is well established supporting the numerous operational gold mines in the area. The regional infrastructure includes national and provincial paved road networks, power transmission and distribution networks, water supply networks and communication infrastructure.
Kusasalethu comprises a twin-shaft system with two surface vertical shafts and two vertical sub-shafts. Ore is hoisted to surface and is delivered to the plant by road. Although Kusasalethu has its own processing plant situated adjacent to the mine, this plant does not treat the mine’s ore and only supplies backfill material for underground support purposes. The ore mined from Kusasalethu is processed at the Mponeng Plant, located adjacent to the Mponeng shaft approximately 17km away. Operations are powered by electricity from Eskom.
Kusasalethu is accessible via the national and provincial roads. The general layout of Kusasalethu infrastructure in relation to the neighboring Harmony mines is displayed in the graphic below.
Geology
Kusasalethu is located on the north-western margin of the Archean Witwatersrand Basin, one of the prominent gold provinces in the world. There are seven gold-bearing conglomerates within the mining right area, of which only the VCR is economically viable.
The VCR is a tabular, inclined, gold-bearing quartz pebble conglomerate of intermediate to high grade. It forms the base of the Ventersdorp Supergroup, which caps the CRG of the Witwatersrand Supergroup via an angular unconformity. This reef is characterized by its palaeomorphology, where a thick reef is preserved in the form of terraces separated stratigraphically by a thin inter-terrace slope reef.
The Kusasalethu mining right area is also intruded by dolerite sills and syenite dykes of different ages (Manzi et al., 2015). Many of these dykes strike north to north–northeast with thicknesses that vary from 1m to 90m.
History
Kusasalethu was previously known as Elandsrand Gold Mine when it was owned by AngloGold. The shaft system (i.e., the vertical twin shaft) together with the gold plant were commissioned in 1978.
In 2001, Harmony took control and ownership of Elandsrand Gold Mine and Deelkraal Gold Mine from AngloGold. The name Elandsrand was changed to Kusasalethu in 2010.
Kusasalethu is part of the West Wits mining district that includes the former Western Deep Levels shafts which include the Mponeng, TauTona and Savuka mines, all now also 100% owned by Harmony.
Mineral Tenure
Refer to Item 4: “Information on the Company – Business Overview – Regulation – Mineral Rights – South Africa” above for a summary of the regulatory environment in South Africa.
A single mining right covers Kusasalethu which was successfully converted, executed and registered as a new order mining right at the MPRTO. The principal mining right (GP30/5/1/2/2/(07) MR) covers an area of 7,000ha for the mining of gold. This mining right was granted on December 18, 2007, and, unless cancelled or suspended, will continue in force for 30 years ending December 17, 2037.
A section 102 application was submitted in 2018 to combine the contiguous farms Buffelsdoorn 143IQ and Deelkraal 142IQ, which increased the extent of the original mining right from 5,100ha to the current 7,000ha.
The following mining rights make up the full mining lease area of approximately 7,000ha:
•GP30/5/1/2/2(07) MR valid from December 18, 2007 to December 17, 2037.
A summary of the status of environmental permits and licenses issued as at June 30, 2022, related to Kusasalethu operation is presented in the table below.
|
|
|
|
|
|
|
|
|
|
|
|
|
|
|
| Permit / Licence |
Reference No. |
Issued By |
Date Granted |
Validity |
| EMPr |
GP30/5/1/2/3/2/1(07) EM |
DMRE |
December 18, 2007 |
LOM |
| Mining Right |
GP30/5/1/2/2 (07)MR |
DMRE |
December 18, 2007 |
December 17, 2037 |
| Water Use License |
08/C23J/AJFG/1019 |
DWS |
December 18, 2007 |
December 17, 2037 |
|
|
|
|
|
|
|
|
|
|
|
|
|
|
|
|
|
|
|
|
|
|
|
|
|
|
|
|
|
|
Mining Method
Kusasalethu is a deep level underground gold mine, currently operating at depths ranging between 2,900m and 3,300m BMD. Access to the orebody is gained through a twin shaft system from surface to 73 level. The twin sub shaft system extends from 73 level to 115 level.
The VCR horizon is extracted at Kusasalethu, and mining is conducted over five levels (98 level to 113 level) using SGM techniques.
Due to the current mining depths at Kusasalethu, the SGM method with backfill and pre-conditioning is used. The SGM method is preferred due to the variability of the VCR orebody with respect to value, and the seismic risk associated with deep level mining. The mining sequence used for breast mining is a V-shaped configuration, colloquially referred to as the “inverted Christmas tree”. An underhand face configuration is adopted when mining towards the west, and an overhand face configuration when mining towards the east. The SGM method makes use of dip pillars and reduced mining spans with pre-developed tunnels, aimed at further control of stresses experienced during rock movement.
Primary development is done off-reef (in waste rock), while secondary development is done on-reef (in the mineralized zone).
Mineral Processing
The ore from Kusasalethu is processed at Mponeng’s gold processing facility which has been in operation since 1986. The technology used to process the gold-bearing ore is well established and suitable for the style of mineralization (i.e., VCR ore).
The ore milled at the Mponeng Plant follows a standard cyanide leach, CIP, and electrowinning process in order to extract the gold bullion. The plant is designed to process 95tph of ore. The plant capacity is well-matched to accommodate the total ore feed from Kusasalethu and Mponeng, and the gold produced is in line with the forecast ounces.
Qualified Persons
The QPs preparing the TRS were employed on a full-time basis by Harmony. The QPs’ qualifications, areas of responsibility and personal inspection of the property are summarized in the graphic below.
|
|
|
|
|
|
|
|
|
|
|
|
|
|
|
| Qualified Person |
Professional Organization |
Qualification |
TRS Section Responsibility |
Personal Insp. |
| Mr. JD. Ackermann |
SAIMM |
BSc (Geol) |
1, 2, 3, 4, 5, 7, 11, 12, 13, 15, 16, 17, 18, 19, 20, 21, 22, 23, 24, 25 |
Full time |
| Mr. M. Hopwood |
CIMA |
BCom (Hons) Management Accounting; ACMA/CGMA |
16, 18, 19 |
Full time |
| Ms. L. Makhuva |
None |
BSc (Hons) Environmental Management |
17 |
Full time |
| Mr. JJ. Le Roux |
None |
BSc (Hons)(Geology |
6,7,8 |
Full time |
| Mr. J. Williamson |
None |
Certificate in Mineral Resource Management |
13 |
Full time |
|
|
|
|
|
|
|
|
|
|
|
|
|
|
|
|
|
|
|
|
|
|
|
|
|
|
|
|
|
|
Exploration
Exploration at Kusasalethu has mainly focused on improving confidence in the geological model, as well as adding and upgrading additional Mineral Resources to the mine to replace depletion. Geological data has been obtained through underground channel (chip) sampling, underground mapping and underground drilling. The close spaced underground data gathering was preceded by a surface geophysical seismic survey, as well as surface diamond core drilling. Exploration from underground platforms continues to improve geological confidence for the VCR.
Exploration work on the Kusasalethu mining right area commenced in the early 1940s as part of the Western Deep Levels evaluation program. The work was initially limited to surface platforms, where an extensive surface exploration program was conducted across the Western Deep Levels leases by Anglo American Corporation Limited (“AAC”).
As the underground areas were accessed, platforms were generated for underground drilling.
Underground exploration drilling has been on-going throughout the operational life of Kusasalethu. Most of the underground drill holes used in the estimation of the current Mineral Resources were drilled by AAC and AngloGold before Harmony acquired the mine.
The drilling of exploration holes is limited by the availability of sufficient drilling platforms or development ends. This however has a marginal effect on estimation, due to the limited amount of development being done on the mine.
During fiscal 2023 the mine drilled 12 underground exploration holes, totaling 2,085m at a capital cost of R4.3m.
The underground infill drilling system is in place to improve data density in specific areas and are drilled from the underground development access drives. Drilling and logging practices are based on the Harmony company standards, which have been in place since Harmony took over Kusasalethu in 2001.
The QPs are of the opinion that the quality and quantity of the exploration methods and information gathered is sufficient to support the estimation of Mineral Resources and Mineral Reserves.
Mineral Resource Estimate
The Mineral Resource estimate for Kusasalethu is considered to have reasonable prospects for economic extraction. This is demonstrated by the results of the cash flow for the mine. The cut-off value for the Mineral Resources is determined at 1,085cmg/t gold based on the economic assumptions presented in the table below at the effective date June 30, 2023.
|
|
|
|
|
|
|
|
|
| Description |
Unit |
Value |
| Gold Price |
US$/oz |
1,764 |
| Exchange Rate |
Rand:US$ |
16.22 |
| Gold Price |
Rand/kg |
920,000 |
| Plant Recovery Factor |
% |
95.5 |
| Unit Cost |
Rand/t |
5,159 |
This cut-off value represents typical costs for the mining method and preliminary mining and metallurgical recovery assumptions.
The Mineral Resources were originally prepared, classified and reported according to the SAMREC, 2016. For the purposes of this report on Form 20-F, the Mineral Resources have been classified in accordance with Item 1302(d)(1)(iii)(A) of Regulation S-K. These Mineral Resources account for mining depletion recorded from July 2022 to June 2023. The Mineral Resource estimate, as at June 30, 2023, exclusive of the reported Mineral Reserves is summarized in the table below. The total Mineral Resource (excluding reserves) gold content estimate for 2023, decreased by 15%, from 110,166kg gold as at June 2022 to 94,044kg gold as at June 2023. The major difference in the reconciled Mineral Resources between June 2022 and June 2023 is attributed to a 4% increase in Mineral Resource cut off. This was directly driven by a 11% unit cost increase (from R4,655/t to R5,159/t) and only a 8% increase in the gold price used (R920/g versus R850/g). Further to this there was a decline in mineral inventory grade by 1% (964cmg/t to 971cmg/t).
|
|
|
|
|
|
|
|
|
|
|
|
|
|
|
|
|
|
|
|
|
|
|
|
|
Fiscal Year Ended June 30, |
% Change |
|
2023 |
2022 |
| Mineral Resource Category |
Tonnes (Mt) |
Gold Grade (g/t) |
Gold Content (kg) |
Tonnes (Mt) |
Gold Grade (g/t) |
Gold Content (kg) |
| Measured |
0.189 |
37.32 |
7,045 |
0.990 |
13.03 |
12,906 |
(45.4)% |
| Indicated |
6.457 |
10.11 |
65,278 |
8.545 |
9.28 |
79,333 |
(17.7)% |
| Total / Ave. Measured + Indicated |
6.646 |
10.88 |
72,323 |
9.535 |
9.67 |
92,239 |
(21.6)% |
| Inferred |
2.454 |
8.85 |
21,722 |
2.025 |
8.85 |
17,927 |
21.2% |
Notes:
1.Mineral Resources are reported with an effective date of June, 30 2023 were originally prepared, classified and reported according to SAMREC, 2016. For the purposes of this TRS, the Mineral Resources have been classified in accordance with Item 1302(d)(1)(iii)(A) of Regulation S-K. The Qualified Person responsible for the estimate is Mr. J. Ackerman, who is Ore Reserve Manager at Kusasalethu, and a Harmony employee.
2.The Mineral Resource tonnes are reported as in-situ with reasonable prospects for economic extraction.
3.No modifying factors or dilution sources have been included to in-situ Mineral Reserve which was subtracted from the SAMREC Resource in order to obtain the S-K 1300 Resource.
4.The Mineral Resources are reported using a cut-off value of 1,085cmg/t determined at a 90% profit guidance, and a gold price of US$1,764/oz.
5.Tonnes are reported rounded to three decimal places. Gold values are rounded to zero decimal places.
6.Mineral Resources are exclusive of Mineral Reserves. Mineral Resources are not Mineral Reserves and do not necessarily demonstrate economic viability.
7.Rounding as required by reporting guidelines may result in apparent summation differences.
8.The Mineral Resource estimate is for Harmony’s 100% interest.
Mineral Reserve Estimate
The Mineral Reserves were originally prepared, classified and reported according to SAMREC, 2016. For the purposes of this report on Form 20-F, the Mineral Reserves have been classified in accordance with Item 1302(d)(1)(iii)(A) of Regulation S-K.
Mineral Reserves are derived from the Mineral Resources, a detailed business plan and the operational mine planning processes. Mine planning utilizes and takes into consideration historical technical parameters achieved. In addition, Mineral Resource conversion to Mineral Reserves considers certain modifying factors, dilution, ore losses, minimum mining widths, planned mine call and plant recovery factors.
The Mineral Reserve estimate, as at June 30, 2022, and 2023, is summarized in the table below.
|
|
|
|
|
|
|
|
|
|
|
|
|
|
|
|
|
|
|
|
|
|
|
|
| |
Fiscal Year Ended June 30, |
|
| |
2023 |
2022 |
|
| Mineral Reserve Category |
Tonnes (Mt) |
Gold Grade (g/t) |
Gold Content (kg) |
Tonnes (Mt) |
Gold Grade (g/t) |
Gold Content (kg) |
% Change |
Proven |
1.679 |
7.44 |
12,498 |
1.313 |
6.97 |
9,153 |
36.5 |
% |
| Probable |
0.061 |
5.04 |
309 |
0.031 |
6.84 |
210 |
47.1 |
% |
Total / Ave. Proven + Probable |
1.741 |
7.36 |
12,806 |
1.343 |
6.97 |
9,363 |
36.8 |
% |
Notes:
1.The Mineral Reserves were originally prepared, classified and reported according to SAMREC, 2016. For the purposes of this TRS, the Mineral Reserves have been classified in accordance with Item 1302(d)(1)(iii)(A) of Regulation S-K. The QP responsible for the estimate is Mr. J. Ackerman, who is the Kusasalethu Ore Reserve Manager, and who is a Harmony employee.
2.Tonnes, grade, and gold content (oz) are declared as net delivered to the mills.
3.Figures are fully inclusive of all mining dilutions, gold losses and are reported as mill delivered tonnes and head grades. Metallurgical recovery factors have not been applied to the Mineral Reserve figures.
4.Gold content is recovered gold content after taking into consideration the modifying factors.
5.Mineral Reserves are reported using a cut-off grade of 1,100cmg/t determined using a gold price of US$1,582/oz gold.
The declared Mineral Reserve estimate increased from 9,363kg gold as at June 30, 2022 to 12,806kg gold as at June 30, 2023. The changes in the Kusasalethu Mineral Reserve estimate between June 30, 2022 and June 30, 2023 are attributed to an increase in the profitable mining plan by one year and nine months. Due to the incorporation of ground firmed up by drilling and redesigning some isolated blocks of ground.
The table below presents a summary of the modifying factors used to convert the Mineral Resource to the Mineral Reserve for Kusasalethu. The modifying factors are consistent with the modelling, planning and computing estimates used in determining the Mineral Reserves, which are also consistent with historical performance.
|
|
|
|
|
|
|
|
|
| Modifying Factor |
Unit |
Value |
| RD |
t/m³ |
2.78 |
| Stoping Width |
cm |
132.2 |
| Gully |
% |
5.16 |
| Off Reef |
% |
2.42 |
| Waste to Reef |
% |
0.31 |
| Flushing |
% |
0.18 |
| Discrepancy |
% |
11.23 |
| Mine Call Factor |
% |
85.92 |
| Plant Recovery Factor |
% |
95.50 |
| Mine Recovery Factor |
% |
82.05 |
| Plant Call Factor |
% |
100.00 |
| Mineral Reserves Cut Off |
cmg/t |
1,100 |
For additional information, see the TRS on each individual property, filed as an Exhibit of this annual report on Form 20-F.
Moab Khotsong
Property Description
Moab Khotsong comprises two operating underground deep level gold mines, namely the Moab Khotsong Mine and the Great Noligwa Mine. Moab Khotsong is sub-divided by major faults into three distinct geographical mining areas. These mining areas are referred to as Top Mine, accessed through Great Noligwa and Moab Khotsong shafts, Middle Mine, accessed through Moab Khotsong shaft, and Zaaiplaats, a Board approved project to be accessed through a decline system from Moab Khotsong.
At longitude 26°48'03.3"E and latitude 26°59'12.7"S, Moab Khotsong is approximately 180km from Johannesburg. The mine is located approximately 10km east of Orkney and directly south of the Vaal River, which forms the border between the North West and Free State provinces. Moab Khotsong is wholly-owned and operated by Harmony.
The following graphic illustrates the location of Moab Khotsong and the associated mines, along with certain infrastructure.
Moab Khotsong comprises the underground and surface assets associated with two mines, namely Moab Khotsong Mine and Great Noligwa Mine, which Harmony acquired from AngloGold in 2018. Both are deep level gold mines, operating at depths of between 2km and 3km. They are situated directly south of the Vaal River approximately 10km east of the town of Orkney, in the Free State Province of South Africa. The primary reef mined is the Vaal Reef ("VR"), with additional production being sourced from the C Reef.
Moab Khotsong is sub-divided by major faults into three distinct geographical mining areas. These are referred to as Top Mine, accessed through Great Noligwa shaft, Middle Mine, accessed through Moab Khotsong shaft, and Zaaiplaats, accessed through a decline system off the base of the Moab Khotsong shaft.
There is no material litigation (including violations or fines) against Harmony that threatens its mineral rights, tenure, or operations.
Operational Infrastructure
Infrastructure in the region is well established supporting the numerous operational gold mines in the area. The regional infrastructure includes national and provincial paved road networks, power transmission and distribution networks, water supply networks and communication infrastructure.
The operations are powered by electricity from Eskom, and they have the necessary water and power infrastructure to support their remaining lives, including Zaaiplaats.
Moab Khotsong Mine has a single vertical shaft. Great Noligwa Mine has a twin vertical shaft and a dedicated ore processing plant.
The infrastructural layout includes hoisting facilities; logistical support for ore handling, sampling, and transporting; the processing plant; waste rock facilities; tailings and leaching infrastructure; roads; water and power supply; ventilation and refrigeration systems; stores and workshop support; electrical supply; offices; housing and security.
The location of the surface infrastructure is displayed in the graphic below.
Geology
Moab Khotsong is situated within the Klerksdorp Goldfield on the western margin of the Witwatersrand Basin of South Africa, one of the most prominent gold provinces in the world. The major gold bearing conglomerate reefs are mostly confined to the CRG of the Witwatersrand Supergroup.
The CRG is up to 2,100m thick in the Vaal River area and the general orientation of the Witwatersrand Supergroup succession in this goldfield is interpreted as southwest-trending and southeast dipping. A series of northeast-trending faults including the Buffelsdoorn, the Kromdraai, the Buffels East and the Jersey Faults, is a key feature of the Klerksdorp Goldfield and the key structural features at Moab Khotsong are related to this series of faults.
Moab Khotsong exploits gold mineralization occurring in the VR. This reef is stratigraphically located near the top of the Johannesburg Sub-group, within the CRG. The VR ranges in depth at Moab Khotsong from 1,500m BMD to 3,400m BMD. Gold mineralization also occurs in the stratigraphically higher C-Reef, which lies approximately 225m above the VR. However, the C-Reef typically contributes less than 5% to the mining production.
History
Great Noligwa Mine was developed by AAC and was originally known as Vaal River No. 8 Shaft. Work on Great Noligwa was initiated in 1968, and the mine produced its first gold in 1972. Great Noligwa reached its production peak of around 1,000koz per annum in the late 1990s and at present, mining activity at Great Noligwa Mine is concentrated on the extraction of pillars.
The Moab Khotsong Mine was developed by AngloGold and is the youngest of South Africa’s deep-level gold mines. It came into production in 2003 and has been continuously economically exploited since then. The Great Noligwa Mine was merged with Moab Khotsong Mine in 2014, and since the merger of the two mines, annual production has been in the order of 250koz of gold.
Harmony assumed ownership of Moab Khotsong in March 2018, and has since added the Zaaiplaats area to the Mineral Resources and Mineral Reserves. The inclusion of Zaaiplaats in the LOM plan has extended the life of Moab Khotsong for 22 years up to 2044 and the overall production is expected to be in the order of 200koz of gold per annum.
Mineral Tenure
Refer to Note 4: “Information on the Company – Business Overview – Regulation – Mineral Rights – South Africa” above for a summary of the regulatory environment in South Africa.
Harmony holds two mining rights, which have been successfully converted, executed and registered as new order mining rights at the MPRTO. These rights cover a total combined area of 10,991.13ha for the mining of gold, silver, nickel and uranium. Both mining rights are valid and remain effective unless cancelled or suspended. Under the MPRDA, Harmony is entitled to apply to review the mining right on its expiry.
Harmony’s Moab Khotsong mineral tenure comprises two mining rights covering approximately 10,991ha, namely:
•NW30/5/1/2/2/15 MR valid from September 12, 2007 to September 11, 2037; and
•NW30/5/1/1/2/16 MR valid from August 20, 2008 to August 19, 2038.
A summary of the status of environmental permits and licenses issued as at June 30, 2023 related to Moab Khotsong operation is presented in the table below.
|
|
|
|
|
|
|
|
|
|
|
|
|
|
|
|
|
|
| Permit Holder |
Permit / Licence |
Reference No. |
Issued By |
Date Granted |
Validity |
| Harmony |
EMPr |
NW30/5/1/2/2/15&16MR |
DMRE |
October 21, 2022 |
LOM |
| Harmony |
Atmospheric Emission Licence |
AEL/FS/MKO- HGM/14/10/2019F |
DFFE |
January 29, 2021 |
January 30, 2026 |
| Harmony |
Waste Management Licence |
NWP/WM/DK2/ 2018/04/01/02 |
DARD |
March 13, 2019 |
LOM |
| Harmony |
Water Use Licence |
08/C24B/AGJ/9799 |
DWS |
November 12, 2020 |
November 12, 2040 |
Mining Method
The tabular nature of the orebody, along with its depth and structural complexity, dictates the mining method employed at Moab Khotsong. The primary mining method used at Moab Khotsong is conventional breast mining, on a scattered grid. This method, as opposed to the SGM, is necessitated by the complex geology at Moab Khotsong, which prevents the implementation of a strict mining sequence. Moab Khotsong makes extensive use of backfill for the support of stopes. The economic reef horizons of Top and Middle Mine are exploited between depths of 1,698m and 3,054m below surface.
Zaaiplaats is located between the elevations of 3,054m and 3,526m below surface. Zaaiplaats will be accessed by declines from the northeastern end of the Zaaiplaats property to take advantage of the existing access development in place.
The Scattered Mining makes use of pillars with a pre-developed grid of tunnels, aimed at providing geological information ahead of the mining face, in order to control geotechnical stress. The Geotechnical Engineering department provides detailed numerical modelling and guidance regarding the best mining practices to be applied to minimize the risk associated with seismicity.
Primary development is done off-reef (in waste rock), while secondary development is done on-reef (in the mineralized zone).
Mineral Processing
The gold processing facility at Great Noligwa has been in operation since the 1960s and is hence a well-established operation. The technology used to process the gold-bearing ore is well established, being used across the majority of South African gold operations and suitable for the style of mineralization. The milled ore follows a reverse gold leach method using an acid uranium leach, gold cyanide leach, CIP and electrowinning process in order to extract the gold bullion. The current plant capacity is 260ktpm, or daily treatment rate of approximately 9,420tpd at 92% availability.
The plant is operating below its designed throughput capacity and has the potential to process the additional ore planned from Zaaiplaats.
Qualified Persons
The QPs preparing the TRS were employed on a full-time basis by Harmony. The QPs’ qualifications, areas of responsibility and personal inspection of the property are summarized in the graphic below.
|
|
|
|
|
|
|
|
|
|
|
|
|
|
|
| Qualified Person |
Professional Organization |
Qualification |
TRS Section Responsibility |
Personal Insp. |
| Ms LB. Freese |
SACNASP, GSSA |
B.Sc. Hons (Geol), GDE (MRM) |
All sections |
Full time employed on the property |
| Mr VH. Esterhuizen |
SACNASP |
BSc Hons (Geol) |
Mineral Resource |
Full time employed on the property |
|
|
|
|
|
|
|
|
|
|
|
|
|
|
|
|
|
|
|
|
|
|
|
|
|
|
|
|
|
|
|
|
|
|
|
|
|
|
|
|
Exploration
Exploration at Moab Khotsong has focused on improving confidence in the geological model, as well as adding and upgrading additional Mineral Resources to the mine. Geological data has been obtained from an initial geophysical seismic survey and later through surface drilling, underground channel (chip) sampling, underground mapping and underground drilling.
The surface drill holes used in the estimation of the current Mineral Resources were drilled by AAC and AngloGold before Harmony acquired Moab Khotsong.
Underground exploration drilling has been on-going throughout the operational life of Moab Khotsong as the mine deepens. Underground drilling intersections are sampled where possible and, if acceptable and representative, are used in the estimation process. For estimation purposes 129 Surface and LIB intersections were used.
The QPs are of the opinion that the quality and quantity of the exploration methods and information gathered is sufficient to support the estimation of Mineral Resources and Mineral Reserves.
Mineral Resource Estimate
The Mineral Resource estimate for Moab Khotsong is considered to have reasonable prospects for economic extraction. The cut-off value for the Mineral Resources has been determined as 1,000cmg/t, based on the economic assumptions presented in the table below at the effective date of June 30, 2023.
|
|
|
|
|
|
|
|
|
| Description |
Unit |
Value |
| Gold Price |
US$/oz |
1764 |
| Exchange Rate |
Rand:US$ |
16.22 |
| Gold Price |
Rand/kg |
920,000 |
| Plant Recovery Factor |
% |
96.42 |
| Unit Cost |
Rand/t |
5,285 |
This cut-off value represents typical costs for the mining method and preliminary mining and metallurgical recovery assumptions.
The Mineral Resources were originally prepared, classified and reported according to the SAMREC, 2016. For the purposes of this report on Form 20-F, the Mineral Resources have been classified in accordance with Item 1302(d)(1)(iii)(A) of Regulation S-K. These Mineral Resources account for mining depletion recorded from July 2022 to June 2023. The Mineral Resource estimate, as at June 30, 2023, exclusive of the reported Mineral Reserves is summarized in the table below.
|
|
|
|
|
|
|
|
|
|
|
|
|
|
|
|
|
|
|
|
|
|
|
|
|
Fiscal Year Ended June 30, |
% Change |
|
2023 |
2022 |
| Mineral Resource Category |
Tonnes (Mt) |
Gold Grade (g/t) |
Gold Content (kg) |
Tonnes (Mt) |
Gold Grade (g/t) |
Gold Content (kg) |
| Measured |
2.881 |
18.34 |
52,822 |
2.331 |
17.64 |
41,110 |
28.5% |
| Indicated |
3.122 |
13.57 |
42,361 |
3.476 |
16.96 |
58,962 |
(28.2)% |
| Total / Ave. Measured + Indicated |
6.002 |
15.86 |
95,183 |
5.807 |
17.23 |
100,072 |
(4.9)% |
| Inferred |
2.549 |
19.09 |
48,663 |
2.555 |
19.09 |
48,762 |
(0.2)% |
Notes:
1.The Mineral Resources were originally prepared, classified and reported according to SAMREC, 2016. For the purposes of this TRS, the Mineral Resources have been classified in accordance with Item 1302(d)(1)(iii)(A) of Regulation S-K. The QP responsible for the estimate is Ms LB.. Freese, who is the Ore Reserve Manager, and who is a Harmony employee.
2.The Mineral Resource tonnes are reported as in-situ with reasonable prospects for economic extraction.
3.Tonne measurements are reported in metric units. Gold grades are reported in grams per metric tonne.
4.The Mineral Resources are reported using a cut-off value of 1,000cmg/t determined at a 90% profit guidance, and a gold price of US$1,764/oz.
5.Tonnes are reported as million metric tonnes rounded to two decimal places. Gold values are rounded to zero decimal places.
6.Mineral Resources are exclusive of Mineral Reserves. Mineral Resources are not Mineral Reserves and do not necessarily demonstrate economic viability.
7.Rounding as required by reporting guidelines may result in apparent summation differences between metric tonnes, gold value and metal content.
8.The Mineral Resource estimate is for Harmony’s 100% interest.
The Mineral Resource estimate decreased due to a 3% decrease in the grade estimation in the Zaaiplaats project area based on new sampling information from above infrastructure on reef development.
Mineral Reserve Estimate
The Mineral Reserves were originally prepared, classified and reported according to SAMREC, 2016. For the purposes of this report on Form 20-F, the Mineral Reserves have been classified in accordance with Item 1302(d)(1)(iii)(A) of Regulation S-K.
Mineral Reserves are derived from the Mineral Resources, a detailed business plan and the operational mine planning processes. Mine planning utilizes and takes into consideration historical technical parameters achieved. In addition, Mineral Resource conversion to Mineral Reserves considers certain modifying factors, dilution, ore losses, minimum mining widths, planned mine call and plant recovery factors.
The Mineral Reserve estimate, as at June 30, 2022, and 2023, is summarized in the table below.
|
|
|
|
|
|
|
|
|
|
|
|
|
|
|
|
|
|
|
|
|
|
|
|
| |
Fiscal Year Ended June 30, |
|
| |
2023 |
2022 |
|
| Mineral Reserve Category |
Tonnes (Mt) |
Gold Grade (g/t) |
Gold Content (kg) |
Tonnes (Mt) |
Gold Grade (g/t) |
Gold Content (kg) |
% Change |
Proven |
3.897 |
7.80 |
30,396 |
2.690 |
7.48 |
20,117 |
51.1 |
% |
| Probable |
9.447 |
8.90 |
84,106 |
11.984 |
8.78 |
105,250 |
(20.1) |
% |
Total / Ave. Proven + Probable |
13.345 |
8.58 |
114,502 |
14.675 |
8.54 |
125,367 |
(8.7) |
% |
Notes:
1.The Mineral Reserves were originally prepared, classified and reported according to SAMREC, 2016. For the purposes of this TRS, the Mineral Reserves have been classified in accordance with Item 1302(d)(1)(iii)(A) of Regulation S-K. The QP responsible for the estimate is Ms LB. Freese, who is the Ore Reserve Manager, and who is a Harmony employee.
2.Tonnes, grade, and gold content (oz) are declared as net delivered to the mills.
3. Gold content (kg) is recovered gold content after taking into consideration the Modifying Factors.
4.Recovered gold (kg) is based on a conversion factor of 32.1507oz/kg.
5.Mineral Reserves are reported using a cut-off grade of 1,500cmg/t determined using a gold price of US$1,582/oz gold.
The decrease in Mineral Reserves is mainly due to depletion.
The table below presents a summary of the modifying factors used to convert the Mineral Resource to the Mineral Reserve for Moab Khotsong. The modifying factors are consistent with the modelling, planning and computing estimates used in determining the Mineral Reserves, which are also consistent with historical performance.
|
|
|
|
|
|
|
|
|
|
|
|
|
|
|
| Modifying Factor |
Unit |
Moab Khotsong |
Zaaiplaats |
Great Noligwa Shaft Pillars |
| Relative Density |
t/m³ |
2.78t/m³ |
2.78t/m³ |
2.78t/m³ |
| Stoping width |
cm |
174.0 |
154.0cm |
179.0cm |
| Gully |
% |
10.42 |
% |
10.10 |
% |
11.48 |
% |
| Off Reef |
% |
15.48 |
% |
12.00 |
% |
15.72 |
% |
| Waste to Reef |
% |
11.43 |
% |
— |
% |
25.63 |
% |
| Flushing tons |
% |
1.33 |
% |
3.15 |
% |
— |
% |
| Discrepancy |
% |
24.43 |
% |
18.70 |
% |
24.43 |
% |
| Mine Call Factor |
% |
66.96 |
% |
78.00 |
% |
66.96 |
% |
| Plant Recover Factor |
% |
96.42 |
% |
96.50 |
% |
96.42 |
% |
| Mine Recover Factor |
% |
64.56 |
% |
75.27 |
% |
64.56 |
% |
| Plant Call Factor |
% |
100.00 |
% |
100.00 |
% |
100.00 |
% |
| Mineral Reserve cut-off |
cmg/t |
1,500 |
1,800 |
1,200 |
For additional information, see the TRS on each individual property, filed as an Exhibit of this annual report on Form 20-F.
Mponeng
Property Description
Mponeng is an underground gold producing mine located in the West Wits mining district south-west of Johannesburg, on the border between Gauteng and the North West Province. At longitude 27°25'53.62"E and latitude 26°26'12.27"S, the mine is approximately 65km from Johannesburg and 15km from Carletonville and forms part of Harmony's West Wits operations. Mponeng is wholly-owned and operated by Harmony.
The following graphic illustrates the location of the Mponeng mine, along with certain infrastructure.
Mponeng is the deepest mine in the world with development currently at 3,841m BMD. The primary reef mined is the VCR, and some limited mining from the Carbon Leader Reef ("CLR"), with future expansion planned on both the VCR and the CLR horizon. The original vertical twin shaft sinking from the surface commenced in 1981 and was commissioned along with the gold plant complex in 1986.
There is no material litigation (including violations or fines) against Harmony that threatens its mineral rights, tenure, or operations.
Operational Infrastructure
Infrastructure in the region is well established supporting the numerous operational gold mines in the area. The regional infrastructure includes national and provincial paved road networks, power transmission and distribution networks, water supply networks and communication infrastructure.
Mponeng comprises a twin-shaft system with two surface vertical shafts and two sub-vertical shafts. Ore and waste material are hoisted separately with ore being delivered to the plant by means of a conveyor belt and the waste rock going to the low-grade stockpile. Mponeng has its own processing plant situated adjacent to the mine. Operations are powered by electricity from Eskom.
Mponeng is accessible via the national and provincial roads. The general layout of Mponeng infrastructure in relation to the neighboring Harmony mines, TauTona and Savuka is displayed in the graphic below.
Geology
Mponeng is situated on the northwestern margin of the Witwatersrand Basin of South Africa, one of the prominent gold provinces in the world. There are seven gold-bearing conglomerates within the lease area, of which only the VCR and CLR are economically viable.
The VCR is a gold bearing quartz pebble conglomerate of intermediate to high grade. It forms the base of the Ventersdorp Supergroup, which caps the Witwatersrand Supergroup through an angular unconformity. A characteristic of this horizon is the pronounced palaeomorphology, where a thick reef is preserved in the form of terraces separated stratigraphically by a thin inter-terrace slope reef.
The CLR, historically mined at the adjacent Harmony wholly-owned TauTona and Savuka Mines, is reported as part of the Mponeng Mineral Resource. It is a c.20cm thick tabular, auriferous quartz pebble conglomerate. It lies 800-900m stratigraphically deeper than the VCR, near the base of the Johannesburg Subgroup of the CRG of the Witwatersrand Supergroup.
Both the VCR and the CLR have been subjected to faulting and are intruded by a series of igneous dykes and sills of various ages that cut across the reefs. The gold mineralization at Mponeng succeeded a period of deep burial, fracturing, and alteration. The gold and other elements are believed to have precipitated through the reaction of hydrothermal fluids at high temperatures along the reef horizons.
History
Mponeng was formerly known as Western Deep Levels South Shaft, or No.1 Shaft when AAC first owned the operation. The No. 1 South Shaft system (i.e., the vertical twin shaft) together with the gold plant were commissioned in 1986. The shaft system allowed access to the deeper VCR in the southern part of the lease area.
The name changed in 1999 to Mponeng and was 100% owned and operated until recently by AngloGold. As at October 1, 2020, Harmony took full control and ownership of Mponeng as part of the acquisition of AngloGold's South African business pursuant to the Mponeng Acquisition.
Mponeng is part of the West Wits mining district that includes the Savuka Mine (previously known as Western Deep Levels No.2 Shaft) and the TauTona Mine (previously known as Western Deep Levels No. 3 Shaft) (both now also 100% owned by Harmony). These two mines predominantly exploited the CLR within the lease area, which is now mostly mined out resulting in them being placed on care and maintenance in 2017. The Mineral Resources and Mineral Reserves for TauTona were transferred to Mponeng during the same year.
Mineral Tenure
Refer to Item 4: “Information on the Company – Business Overview – Regulation – Mineral Rights – South Africa” above for a summary of the regulatory environment in South Africa.
The following mining rights make up the full mining lease area of approximately 6,673ha:
•GP30/5/1/2/2(01) MR valid from February 14, 2006, to February 13, 2036; and
•GP30/5/1/2/2(248) MR (for Sand) valid from October 16, 2012, to October 15, 2023.
As part of the acquisition of AngloGold’s South African business, all mining rights related to Mponeng were transferred and are now held by Harmony. There are two mining rights that form the Mponeng area which were successfully converted, executed and registered at the MPRTO . The principal mining right (GP30/5/1/2/2(01) MR) covers an area of 6,477ha for the mining of gold, silver, nickel and uranium. This mining right, granted on February 14, 2006, unless cancelled or suspended will continue in force for 36 years ending February 13, 2036. The other mining right, GP30/5/1/2/2(248) MR, is planned to be incorporated into the principal mining right (GP30/5/1/2/2(01) MR.
The mining rights 01MR and 248MR were ceded from AngloGold to Golden Core, a wholly owned subsidiary of Harmony, on October 1, 2020 and were successfully registered in the Mining Titles Office on the June 14, 2021 as part of AngloGold’s sale of their last remaining South African assets to Harmony, including its West Wits Operations as part of the Mponeng Acquisition.
A section 102 Application in terms of the MPRDA was submitted previously by AngloGold in March 2017 to consolidate its West Wits mining rights into a single mining right (GP30/5/1/2/2(01) MR) ("AngloGold Application"). The AngloGold Application was approved by the DMRE in August 2020, but was, however, not implemented due to a change in circumstances as a result of the Mponeng Acquisition and will consequently be withdrawn by AngloGold. On February 15, 2022, Golden Core submitted an application in terms of section 102 of the MPRDA, substantively similar to the AngloGold Application, to consolidate the mining rights and mining right areas into a single mining right (GP30/5/1/2/2(01) MR) ("Golden Core Application"). The Golden Core Application is currently pending at the DMRE.
A summary of the status of environmental permits and licenses issued as at June 30, 2023 related to Mponeng’s operation is presented in the table below.
|
|
|
|
|
|
|
|
|
|
|
|
|
|
|
| Permit / Licence |
Reference No. |
Issued By |
Date Granted |
Validity |
| Environmental Management Programme (Amendment) |
(GP) 30/5/1/2/3/2/1 (01) |
DMRE |
April 12, 2012 |
LOM |
| Waste Management Licence |
GAUT 002/09-10/W0011 |
GDARD |
June 22, 2015 |
Expired July 2019. New application submitted. |
| Hazardous Waste Generator Certificate |
GPG-01-513 |
GDARD |
July 14, 2015 |
In perpetuity |
| Water Use Licence |
08/C23E/AEFGCEI/12157 |
DWS |
Licenced issued under Harmony Gold issued Septembr 2022 |
20 years |
|
|
|
|
|
| Certificate of Registration Inflammable Liquids and Substances |
RP438/ptn5 |
West Rand District Municipality |
November 30, 2021 |
Annually |
|
|
|
|
|
|
|
|
|
|
|
|
|
|
|
|
|
|
|
|
|
|
|
|
|
|
|
|
|
|
|
|
|
|
|
Mining Method
Mponeng is a deep level underground gold mine currently operating at depths ranging between 3,160m and 3,740m BMD, and currently the deepest mine in the world with development at 3,841m BMD. Potential future mining operations at Mponeng are expected to deepen the shaft bottom to 4,227m BMD. The reef portion currently being mined at Mponeng is accessible between 3,000 – 3,600m BMD.
There are two mining methods in practice at Mponeng. Historically, longwall mining was practiced at Mponeng until the breast mining method was used, aimed at reducing the occurrence of large seismic events. However, this has evolved to the SGM method with backfill support. The SGM method makes use of dip pillars and reduced mining spans with pre-developed tunnels, aimed at further control of stresses experienced in rock movement. While Mponeng’s business plan is based primarily on the SGM method, there are sections of the mine that are still operating using the breast mining method. The mining sequence is a V-shaped configuration, colloquially referred to as the “inverted Christmas tree”. An underhand face configuration is adopted when mining towards the west and an overhand face configuration when mining towards the east.
Mineral Processing
Mponeng's gold processing facility has been in operation since 1986. The technology used to process the gold-bearing ore is well established and is suitable for the style of mineralization (VCR and CLR ore). The current capacity of the plant is designed to process 95tph ore. The plant is operating below its designed throughput capacity and has shown its ability to produce the forecasted ounces of gold at said capacity.
Qualified Persons
The QPs preparing the TRS were employed on a full-time basis by Harmony. The QPs’ qualifications, areas of responsibility and personal inspection of the property are summarized in the graphic below.
|
|
|
|
|
|
|
|
|
|
|
|
|
|
|
| Qualified Person |
Professional Organization |
Qualification |
TRS Section Responsibility |
Personal Insp. |
| Mr. W. Oliver |
SAGC (No. MS 0136) |
GDE (Mining Engineering) Government Certificate of Competency in Mine Survey |
Relevant information in the Executive Summary (Section 1), Section 2-5, 7.6-7.7, 11.2-13, 15-25. |
Full time |
| Mr. G. Flitton |
SACNASP (No. 4000/19/15) |
BSc Hons (Geology)
GDE (Mineral Economics) |
Relevant information in the Executive Summary (Section 1). |
Full time |
| Mr. W. Beukes |
SAGC (No. MS 0118) |
NHD Mineral Resource Management |
Relevant information in the Executive Summary (Section 1), |
Full time |
|
|
|
|
|
|
|
|
|
|
|
|
|
|
|
|
|
|
|
|
|
|
|
|
|
|
|
|
|
|
|
|
|
|
|
|
|
|
|
|
Exploration
Exploration at Mponeng has mainly focused on improving confidence in the geological model, as well as adding and upgrading additional Mineral Resources to the mine. Geological data has been obtained through structured underground channel (chip) sampling, mapping and drilling. This underground detailed, closer spaced data gathering exercise has been preceded by surface exploration of the lease area using a historical geophysical seismic survey, as well as surface diamond core drilling.
Exploration from underground platforms is currently continuing for the VCR in the east and west of the current mining levels, between 3,500m and 3,700m below surface, to improve geological confidence.
Exploration of the VCR target areas west and east of the 126-level mining front continues for the 2023/2024 period. These will form part of the approved exploration campaign. These targets will generate the needed information in two areas, on the Booysens/Kimberley transition towards the east, ahead of the planned deepening extension areas and the area west of the Kimberley estimation domains.
Both areas are currently showing high levels of variability that will benefit from the additional information that will be generated for the completion of these exploration drill holes. VCR variability limits the forward confidence in the Mineral Resource estimation. More data collected can assist the QP define the zones of high variability.
Mponeng Mine infill exploration drilling of the VCR from 2022 to 2023 completed 2713m of drilling and increased confidence of the estimated ounces on the eastern area of the Booysens Shale footwall zone. For the 2023 to 2024 period an additional 5445m is planned to improve confidence of the Indicated Mineral Resource portions and continue to focus on the below 126 level project area.
The QPs are of the opinion that the quality and quantity of the exploration methods and information gathered is sufficient to support the estimation of Mineral Resources and Mineral Reserves.
Mineral Resource Estimate
The Mineral Resource estimate is reported in situ within the Mponeng lease area (which includes TauTona and Savuka), as determined through the analysis of the reasonable prospect for economic extraction by underground mining method. The cut-off value for the Mineral Resources is determined at 761cmg/t gold based on the economic assumptions presented in the table below at the effective date of June 30, 2023.
|
|
|
|
|
|
|
|
|
| Description |
Unit |
Value |
| Gold price |
US$/oz |
1,764 |
| FX rate |
Rand:US$ |
16.22 |
| Gold price |
Rand/kg |
920,000 |
| Plant recovery factor |
% |
98.0 |
| Unit cost |
Rand/t |
5,547 |
Note: Unit cost includes cash operating cost, royalty and ongoing development capital.
This cut-off value represents typical costs for the mining method and preliminary mining and metallurgical recovery assumptions.
The Mineral Resources were originally prepared, classified and reported according to the SAMREC, 2016. For the purposes of this report on Form 20-F, the Mineral Resources have been classified in accordance with Item 1302(d)(1)(iii)(A) of Regulation S-K. These Mineral Resources account for mining depletion recorded from July 2022 to June 2023.
The Mineral Resource estimate, as at June 30, 2023, exclusive of the reported Mineral Reserves is summarized in the table below.
|
|
|
|
|
|
|
|
|
|
|
|
|
|
|
|
|
|
|
|
|
|
|
|
|
Fiscal Year Ended June 30, |
% Change |
|
2023 |
2022 |
| Mineral Resource Category |
Tonnes (Mt) |
Gold Grade (g/t) |
Gold Content (kg) |
Tonnes (Mt) |
Gold Grade (g/t) |
Gold Content (kg) |
| Measured |
2.843 |
17.99 |
51,126 |
2.509 |
16.09 |
40,380 |
26.6% |
| Indicated |
18.632 |
13.92 |
259,408 |
18.335 |
13.96 |
255,945 |
1.4% |
| Total / Ave. Measured + Indicated |
21.474 |
14.46 |
310,534 |
20.844 |
14.22 |
296,324 |
4.8% |
| Inferred |
31.520 |
11.70 |
368,729 |
29.120 |
13.35 |
388,682 |
(5.1)% |
Notes:
1.Mineral Resources are reported with an effective date of June 30, 2023 were originally prepared, classified and reported according to SAMREC, 2016. For the purposes of this TRS, the Mineral Resources have been classified in accordance with Item 1302(d)(1)(iii)(A) of Regulation S-K. The QP responsible for the estimate is Mr. WH. Olivier, who is Ore Reserve Manager at Mponeng, and a Harmony employee.
2.The Mineral Resource tonnes are reported as in-situ with reasonable prospects for economic extraction.
3.No modifying factors or dilution sources have been included to in-situ Reserve which was subtracted from the SAMREC Resource in order to obtain the S-K 1300 Resource.
4.The Mineral Resources are reported using a cut-off value of 761cmg/t determined at a 90% profit guidance, and a gold price of US$1,764/oz.
5.Tonnes are reported as rounded to three decimal places. Gold values are rounded to zero decimal places.
6.Mineral Resources are exclusive of Mineral Reserves. Mineral Resources are not Mineral Reserves and do not necessarily demonstrate economic viability.
7.Rounding as required by reporting guidelines may result in apparent summation differences.
8.The Mineral Resource estimate is for Harmony’s 100% interest.
The Mineral Resources increase is due to higher estimated gold content from the incorporation of higher grades received from underground sampling.
Mineral Reserve Estimate
The Mineral Reserves were originally prepared, classified and reported according to SAMREC, 2016. For the purposes of this report on Form 20-F, the Mineral Reserves have been classified in accordance with Item 1302(d)(1)(iii)(A) of Regulation S-K. Mineral Reserves are derived from the Mineral Resources, a detailed business plan and the operational mine planning processes. Mine planning utilizes and takes into consideration historical technical parameters achieved. In addition, Mineral Resource conversion to Mineral Reserves considers certain modifying factors, dilution, ore losses, minimum mining widths, planned mine call and plant recovery factors.
The Mineral Reserve estimate, as at June 30, 2022, and 2023, is summarized in the table below.
|
|
|
|
|
|
|
|
|
|
|
|
|
|
|
|
|
|
|
|
|
|
|
|
| |
Fiscal Year Ended June 30, |
|
| |
2023 |
2022 |
|
| Mineral Reserve Category |
Tonnes (Mt) |
Gold Grade (g/t) |
Gold Content (kg) |
Tonnes (Mt) |
Gold Grade (g/t) |
Gold Content (kg) |
% Change |
Proven |
2,678 |
9.68 |
25,929 |
2.298 |
8.09 |
18,580 |
39.6 |
% |
Probable |
3,316 |
8.87 |
29,410 |
4.290 |
9.12 |
39,122 |
(24.8) |
% |
Total/ Ave. Proven + Probable |
5,994 |
9.23 |
55,339 |
6.587 |
8.76 |
57,701 |
(4.1) |
% |
Notes:
1.The Mineral Reserves were originally prepared, classified and reported according to SAMREC, 2016. For the purposes of this TRS, the Mineral Reserves have been classified in accordance with Item 1302(d)(1)(iii)(A) of Regulation S-K. The QP responsible for the estimate is Mr. WH. Olivier, who is the Mponeng Ore Reserve Manager, and a Harmony employee.
2.Tonnes, grade, and gold content are declared as net delivered to the mills.
3.Figures are fully inclusive of all mining dilutions, gold losses and are reported as mill delivered tonnes and head grades. Metallurgical recovery factors have not been applied to the reserve figures.
4.Gold content is recovered gold content after taking into consideration the modifying factors.
5.Mineral Reserves are reported using a cut-off grade of 971cmg/t determined using a gold price of US$1,582/oz gold.
The decrease in the Mineral Reserves is due principally to depletion, offset to some extent by a one-year extension to LOM.
The table below presents a summary of the modifying factors used to convert the Mineral Resource to the Mineral Reserve for Mponeng. The modifying factors are consistent with the modelling, planning and computing estimates used in determining the Mineral Reserves, which are also consistent with historical performance.
|
|
|
|
|
|
|
|
|
| Modifying Factor |
Unit |
Value |
| Relative Density |
t/m³ |
2.71 |
| Stoping width |
cm |
147.4 |
| Gully |
% |
6.69 |
| Off Reef |
% |
7.32 |
| Waste to Reef |
% |
2.56 |
| Flushing tons |
% |
8.77 |
| Discrepancy |
% |
22.28 |
| Mine Call Factor |
% |
80.75 |
| Plant Recover Factor |
% |
98.00 |
| Mine Recover Factor |
% |
79.25 |
| Plant Call Factor |
% |
100.00 |
| Mineral Reserve cut-off |
cmg/t |
971 |
For additional information, see the TRS on each individual property, filed as an Exhibit of this annual report on Form 20-F.
Target
Property Description
Target is an advanced, single-shaft, deep-level gold mine which has been operational for approximately 30 years. While most of the gold mineralization extracted comes from mechanized mining (massive mining techniques), conventional stoping is still employed for extraction of gold and also to de-stress areas ahead of mechanized mining. The mine is located in the Free State Province of South Africa, approximately 270km southwest of Johannesburg and 30km north of the town of Welkom. Target is wholly-owned and operated by Harmony.
The following graphic illustrates the location of the Target mine, along with certain infrastructure.
All relevant underground mining and surface right permits, and any other permit related to the work conducted on the property have been obtained and are valid. There are no known legal proceedings (including violations or fines) against Harmony, which threaten its mineral rights, tenure, or operations.
Operational Infrastructure
The surrounding areas of Welkom and Virginia are well developed in terms of access and mining-related infrastructure supporting the numerous operational gold mines in the area. The regional infrastructure includes national and provincial paved road networks, power transmission and distribution networks, water supply networks and communication infrastructure. Target’s surface and underground infrastructure, including its power and water supplies, are sufficient for the LOM plan production requirements.
Target includes a single underground mine constructed as an extension to the Loraine Gold Mine (“Loraine”) and uses a single shaft as access. The ore and development rock are hoisted together, with ore milled and processed at the Target Plant adjacent to the mine. Operations are powered by electricity from Eskom.
The Target mining area is well developed in terms of access and mining-related infrastructure. Access to the Target shafts (1, 2, 3 and 5) is via a well-maintained paved road. Adequately maintained roads is used to access other areas of the mine such as the explosives magazines, sewage works, slimes dam and the evaporation ponds. The area also has access to rail links and an airfield within proximity.
The surface infrastructure associated with Target is presented in the graphic below.
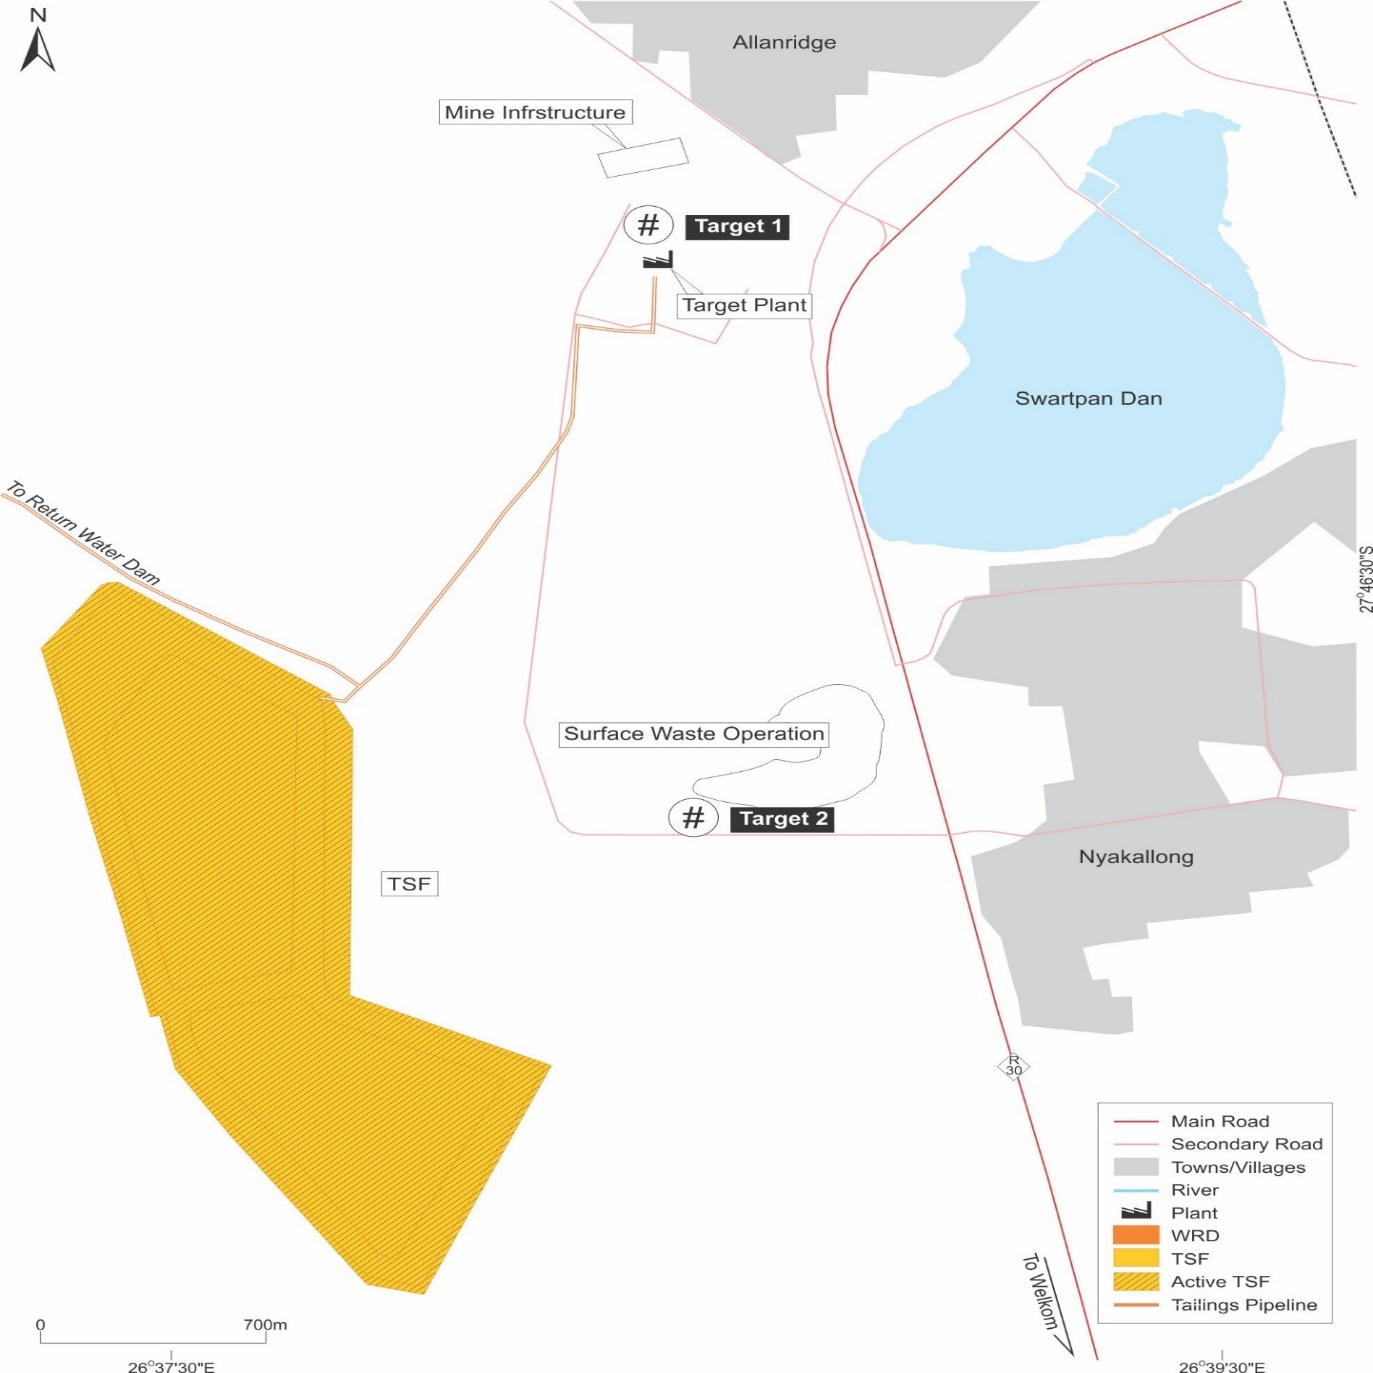
Geology
Target is situated on the north-western margin of the Witwatersrand Basin of South Africa, one of the prominent gold provinces in the world. The major gold bearing conglomerate reefs are mostly confined to the CRG of the Witwatersrand Supergroup.
Folding forms the major structural feature within the lease is and is manifested as an asymmetric syncline whose axis trends N15°W, with a general plunge of 10° to 12° north, although this is variable due to local structural features. The dip of the western limb of the syncline is often more than 55° eastwards. Numerous minor faults are also present.
These faults, with a displacement generally of less than 15m and traceable over a strike distance of less than 150m are too numerous to classify, however, it can be said that the eastern limb of the trough is less faulted than the western limb.
Gold mineralization currently exploited is hosted within a succession of EA and Dreyerskuil ("DK") quartz pebble conglomerate reefs hosted by the van den Heeversrust and Dreyerskuil (Uitkyk) Members of the Eldorado (Elsburg) Formation, respectively.
Additional mineralization occurs in the Big Pebble Reef of the underlying the Kimberley (formerly Aandenk) Formation. All these units are within the Turffontein Subgroup of the CRG. Mineralization is associated with the presence of medium to coarse, clast-supported oligomictic pebble horizons. The presence of allogenic (buckshot) pyrite and detrital carbon is also common.
History
Anglovaal Limited ("Anglovaal") previously held the mineral rights for the Target property. Target Exploration Company Limited ("Target Exploration Company"), a company formed by Anglovaal specifically for the purpose of exploration, later acquired this area. Options to the mineral rights north of Target were acquired by Sun Mining and Prospecting Company (Pty) Limited (“Sun”). The formation of Avgold Limited in 1996 was intended to further the gold mining and exploration interests of Anglovaal. Harmony acquired Target in 2002 by acquiring 100% of Avgold Limited's shares.
Mineral Tenure
Refer to Item 4: “Information on the Company – Business Overview – Regulation – Mineral Rights – South Africa” above for a summary of the regulatory environment in South Africa.
The current mining rights encompasses an area of 7,952.78ha. Harmony holds several mining rights for Target, which were successfully converted and executed as new order mining rights. Certain of these rights are still to be registered at the MPRTO.
The summary of mineral tenure and the approved mining rights include the following:
•FS30/5/1/2/2/14MR, which is valid from November 30, 2007, to December 29, 2025, and covers 4,237.00ha; and
•FS30/5/1/2/2/225MR, which is valid from December 12, 2013, to December 11, 2026, and 3,715.78ha.
A summary of the status of environmental permits and licenses issued as at June 30, 2022, related to Target is presented in the table below.
|
|
|
|
|
|
|
|
|
|
|
|
|
|
|
| Permit / Licence |
Reference No. |
Issued By |
Date Granted |
Validity |
| EMPr |
FS 30/5/1/2/3/2/1(14) EM |
DMRE |
April 16, 2010 |
LOM |
| Atmospheric Emission Licence |
LDM/AEL/YMK/013 |
Lejweleputswa District Municipality |
November 5, 2018 |
November 5, 2023 |
| Water Permit |
789N |
DWS |
November 4, 2008 |
Valid pending issue of new license |
| Water Permit |
1046B |
DWS |
November 4, 2008 |
Valid pending issue of new license |
Mining Method
The Target Mine deposit is made up of stacked mineralized multiple reef bands interbedded with quartzites and quartzwackes. The EA reefs are composited into thick mineralized packages to enable the application of massive open stoping mining method, while the Dreyerskuil Reefs are separated into thinner discrete horizons that enable narrow reef conventional mining method.
Target Mine is essentially a trackless mining operation with a combination of highly mechanized massive open stope mining, scattered mining and labor-intensive narrow reef stoping, the latter being more typical of South African gold mines’ conventional stoping.
The primary ore extraction method adopted at Target is massive mining of the thick mining horizons (EA1, EA3, EA7 and EA8) through a combination of scattered open stoping supplemented with the use of a 6%-cement backfill, and sub-level open stoping which does not make use of backfilling.
The balance of the ore is mined using a narrow reef mining ("NRM") method on the thinner Dreyerskuil Reefs, which does not make use of backfilling either.
Massive open stoping accounts for ±73% of the ore production with ±17% coming from conventional narrow reef stoping. The ±10% balance of production comes from trackless on-reef development sections.
Mineral Processing
The Target Plant was designed and commissioned in November 2001. The plant was designed to treat a total tonnage of 105ktpm with a potential to expand to 160ktpm for future demand. Currently the plant treats ore from Target and Target 2 waste dump.
Qualified Persons
The QPs preparing the TRS were employed on a full-time basis by Harmony. The QPs’ qualifications, areas of responsibility and personal inspection of the property are summarized in the graphic below.
|
|
|
|
|
|
|
|
|
|
|
|
|
|
|
| Qualified Person |
Professional Organization |
Qualification |
TRS Section Responsibility |
Personal Insp. |
Mr. S. Motlatla |
SACNASP (No. 400451/14) |
BSc. (Hons) Geol, GDE (Mining), Project Management Cert NQF Level 5 |
All the sections |
Full Time |
Mr. D. Fourie |
SAIMM (No. 706555) |
MSc. Min Eng, GDE (Mining) |
11 |
Regular |
Mr. M. Ncube |
SACNASP (No. 123075) |
BSc. (Hons) Geol |
8, 9, 11 |
Full Time |
Mr. L. Lochner |
SANIRE |
Rock Mechanics Cert |
13.1 - 13.2, 13.10 |
Full Time |
Mr. M. Gxekwa |
AMIHRP |
Dip HR Man, PgDip. (Labour law) |
13.9 |
Full Time |
Mr. J. van Heerden |
AMRE |
GCC Electrical |
13.7-13.8 |
Full Time |
Mr. C. Radebe |
MMMA |
B.Tech Metallurgy |
14 |
Full Time |
Mr. A. Relebona |
n/a |
BA (Hons) Env Sci |
17 |
Regular |
Mr. D. Graham |
n/a |
B.Com (Bus & Man Accounting) |
18, 19 |
Full Time |
Mr. E. Naude |
n/a |
MRM Certificate |
13 |
Full Time |
Mr. J. van Deventer |
SACNASP |
BSc. (Hons) Geol |
6, 7 |
Full Time |
Exploration
Geological data has been obtained through initial surface drilling, followed by underground drilling, mapping and channel (chip) sampling.
Initial surface drilling carried out during the 1980s, under the auspices of Sun, was designed to delineate the northward continuation of the synclinal axis, around which most of Loraine’s gold deposits are located. Following the incorporation of Target Exploration Company in 1990, a total of 17 drillholes and three long deflections from existing drillholes were drilled in three arrays parallel to the western margin, namely the Western, Central and Eastern arrays.
The Central Array targeted the EA Reefs, while the Western and Eastern arrays focused on definition of the proximal (steep west limb) and distal Kimberley and Basal Reefs, respectively.
The positive surface drilling results led to the construction of an underground drilling platform. Underground exploration drilling has been on-going throughout the operational life of Target as the mine deepens. Most of the underground drillholes are used in the geological modelling and estimation of the current Mineral Resources.
Underground diamond core drilling is conducted using hydraulic driven drill rigs, which typically drill BX core. Drill holes are typically short, rarely exceeding 300m in length.
Fans of drill holes are drilled from diamond drilling bays, which are developed at 50m intervals along the decline return airway (“RAW”) decline. The drilling fans consist of up to ten individual drill holes at inclinations ranging from -15° East to +30° West of vertical, or as dictated by local geological structures. Maximum drillhole lengths of 350m are required for complete Dreyerskuil intersections in the synclinal axis. Drill holes are stopped once the Ventersdorp lava has been intersected, or, in the case of flatter drill holes, once the trough axis has been identified and the drill hole is drilling parallel to the bedding.
The QPs are of the opinion that the quality and quantity of the exploration methods and information gathered is sufficient to support the estimation of Mineral Resources and Mineral Reserves.
Mineral Resource Estimate
The Mineral Resource estimate is reported in situ within the Target lease area, as determined through the analysis of the reasonable prospect for economic extraction by underground mining methods. The cut-off grade for the Mineral Resource is determined at 3.05g/t gold based on the economic assumptions presented in the table below at the effective date June 30, 2022.
|
|
|
|
|
|
|
|
|
| Description |
Unit |
Value |
| Gold Price |
US$/oz |
1,764 |
| Exchange Rate |
Rand:US$ |
16.22 |
| Gold Price |
Rand/kg |
920,000 |
| Plant Recovery Factor |
% |
94.78 |
| Unit Cost |
Rand/t |
2,607 |
Note: Unit cost includes cash-operating cost, royalty and on-going development capital.
This cut-off value represents typical costs for the mining method and preliminary mining and metallurgical recovery assumptions.
The Mineral Resources were originally prepared, classified and reported according to the SAMREC, 2016. For the purposes of this report on Form 20-F, the Mineral Resources have been classified in accordance with Item 1302(d)(1)(iii)(A) of Regulation S-K. These Mineral Resources account for mining depletion recorded from July 2022 to June 2023.
The Mineral Resource estimate, as at June 30, 2023, exclusive of the reported Mineral Reserves is summarized in the table below.
|
|
|
|
|
|
|
|
|
|
|
|
|
|
|
|
|
|
|
|
|
|
|
|
|
Fiscal Year Ended June 30, |
% Change |
|
2023 |
2022 |
| Mineral Resource Category |
Tonnes (Mt) |
Gold Grade (g/t) |
Gold Content (kg) |
Tonnes (Mt) |
Gold Grade (g/t) |
Gold Content (kg) |
| Measured |
4.745 |
8.60 |
40,795 |
4.374 |
8.89 |
38,860 |
5.0% |
| Indicated |
3.820 |
7.09 |
27,098 |
3.193 |
7.76 |
24,780 |
9.4% |
| Total / Ave. Measured + Indicated |
8.564 |
7.93 |
67,893 |
7.567 |
8.41 |
63,640 |
6.7% |
| Inferred |
4.046 |
5.68 |
22,990 |
4.028 |
5.96 |
24,007 |
(4.2)% |
Notes:
1.Mineral Resources are reported with an effective date of June 30, 2023 were originally prepared, classified and reported according to SAMREC, 2016. For the purposes of this TRS, the Mineral Resources have been classified in accordance with Item 1302(d)(1)(iii)(A) of Regulation S-K. The Qualified Person responsible for the estimate is Mr. D. Fourie, who is Head of Department Geostatistician, and a Harmony employee.
2.The Mineral Resource tonnes are reported as in-situ with reasonable prospects for economic extraction.
3.No modifying factors or dilution sources have been included to in-situ Reserve which was subtracted from the SAMREC Resource in order to obtain the S-K 1300 Resource.
4.The Mineral Resources are reported using a cut-off grade of 3.05g/t determined at a 90% profit guidance, and a gold price of US$1,764/oz.
5.Tonnes are reported as rounded to three decimal places. Gold values are rounded to zero decimal places.
6.Mineral Resources are exclusive of Mineral Reserves. Mineral Resources are not Mineral Reserves and do not necessarily demonstrate economic viability.
7.Rounding as required by reporting guidelines may result in apparent summation differences.
8.The Mineral Resource estimate is for Harmony’s 100% interest.
Increase in the mineral resource was due to the updating of estimation variogram models for fiscal 2024.
Mineral Reserve Estimate
The Mineral Reserves were originally prepared, classified and reported according to SAMREC, 2016. For the purposes of this report on Form 20-F, the Mineral Reserves have been classified in accordance with Item 1302(d)(1)(iii)(A) of Regulation S-K. Mineral Reserves are derived from the Mineral Resources, a detailed business plan and the operational mine planning processes. Mine planning utilizes and takes into consideration historical technical parameters achieved. In addition, Mineral Resource conversion to Mineral Reserves considers certain modifying factors, dilution, ore losses, minimum mining widths, planned mine call and plant recovery factors.
The Mineral Reserve estimate, as at June 30, 2022 and 2023, is summarized in the table below.
|
|
|
|
|
|
|
|
|
|
|
|
|
|
|
|
|
|
|
|
|
|
|
|
| |
Fiscal Year Ended June 30, |
|
| |
2023 |
2022 |
|
| Mineral Reserve Category |
Tonnes (Mt) |
Gold Grade (g/t) |
Gold Content (kg) |
Tonnes (Mt) |
Gold Grade (g/t) |
Gold Content (kg) |
% Change |
Proven |
2.567 |
4.38 |
11,233 |
2.722 |
4.32 |
11,744 |
(4.4) |
% |
| Probable |
1.242 |
4.46 |
5,539 |
1.726 |
4.11 |
7,096 |
(21.9) |
% |
Total / Ave. Proven + Probable |
3.810 |
4.40 |
16,772 |
4.447 |
4.24 |
18,840 |
(11.0) |
% |
Notes:
1.The Mineral Reserves were originally prepared, classified and reported according to SAMREC, 2016. For the purposes of this TRS, the Mineral Reserves have been classified in accordance with Item 1302(d)(1)(iii)(A) of Regulation S-K. The Qualified Person responsible for the estimate is Mr. S. Motlatla, who is the Target Ore Reserve Manager, and a Harmony employee.
2.Tonnes, grade, and gold content are declared as net delivered to the mills.
3.Figures are fully inclusive of all mining dilutions, gold losses and are reported as mill delivered tonnes and head grades. Metallurgical recovery factors have not been applied to the reserve figures.
4.Gold content is recovered gold content after taking into consideration the modifying factors.
5.The NRM Mineral Reserves are reported using a cut-off value of 941cmg/t determined using a gold price of US$1,582/oz. The massive open stoping Mineral Reserves are reported using a cut-off grade of 3.40g/t determined using a gold price of US$1,582/oz.
The decrease in Mineral Reserves is mainly due to omission of massive pillars which were previously earmarked for mining following geotechnical review of the ground conditions.
The table below presents a summary of the modifying factors used to convert the Mineral Resource to the Mineral Reserve for Target. The modifying factors are consistent with the modelling, planning and computing estimates used in determining the Mineral Reserves, which are also consistent with historical performance.
|
|
|
|
|
|
|
|
|
| Modifying Factor |
Unit |
Value |
| Relative Density |
t/m3 |
2.71 |
| Average Stoping Width |
cm |
180 |
| Mine Call Factor |
% |
95 |
| Plant Recovery Factor |
% |
95 |
| Mineral Reserve Paylimit - NRM |
cmg/t |
941 |
| Mineral Reserve Cut-off - Massive Open Stoping |
g/t |
3.40 |
| Mineral Reserve Cut-off - Development |
g/t |
3.40 |
| Dilution - Massive Open Stoping |
% |
6 |
For additional information, see the TRS on each individual property, filed as an Exhibit of this annual report on Form 20-F.
Tshepong North
Property Description
The Tshepong North comprise the underground and surface assets, situated between the towns of Welkom and Odendaalsrus in the Free State Province of South Africa. The mine is a moderate to deep-level gold mines, operating at depths of between 1.6km and 2.4km BMD.
The mine is located in the Free State Province of South Africa, approximately 250km southwest of Johannesburg and 15km to the north of the town of Welkom, situated at a latitude of 27°51’56.45”S and longitude of 26°42’45.15”E.
The following graphic illustrates the location of the Tshepong North, along with certain infrastructure.
The primary reef mined is the Basal Reef although the B reef mining has increased in the past 4 years from 8% to 32%.
All relevant underground mining and surface right permits, and any other permit related to the work conducted on the property have been obtained and are valid. There are no known legal proceedings (including violations or fines) against Harmony, which threaten its mineral rights, tenure, or operations.
Operational Infrastructure
The surrounding areas of Welkom and Odendaalsrus are well developed in terms of access and mining-related infrastructure, which supports the numerous operational gold mines in the area. The regional infrastructure includes national and provincial paved road networks, power transmission and distribution networks, water supply networks and communication infrastructure.
Tshepong North has a single shaft system with ore and waste being hoisted to surface through the main vertical shaft as well as a twin decline system from 66 level to 75 level with ore and waste being hoisted separate on a conveyor belt.
Tshepong North ore is transported, by rail, from the shaft to the Harmony One Plant in Welkom for processing.
Operations are powered by electricity from Eskom.
The surface infrastructure associated with Tshepong North is displayed in the graphic below.
Geology
Tshepong North is situated in the Free State Goldfield, on the southwestern margin of the Witwatersrand Basin of South Africa, one of the most prominent gold provinces in the world. The major gold bearing conglomerate reefs are mostly confined to the CRG of the Witwatersrand Supergroup.
The general orientation of the Witwatersrand Supergroup succession in this goldfield is interpreted as north-trending, within a syncline that is plunging to the north. The syncline has been divided by faults into the Odendaalsrus, Central Horst and Virginia sections. The Tshepong North mining right area is also affected by the Ophir and Dagbreek faults.
Tshepong North exploited primarily the Basal Reef, which occurs within the Harmony Formation of the Johannesburg Subgroup of the CRG.
Mineralization also occurs within the stratigraphically higher A and B reefs of the Kimberley (formerly Aandenk) Formation, within the Turffontein subgroup of the CRG. However, only the B Reef can be economically extracted.
Mineralization is associated with the presence of medium to coarse, clast-supported oligomictic pebble horizons. The presence of allogenic pyrite and detrital carbon is also common.
History
The Feasibility Study for the initial development of Tshepong North was concluded in 1984. Work to establish the site started in September 1984 and, by 1986, shaft sinking was underway. Sinking and equipping of the shaft were completed in 1991, with the mine being commissioned in November 1991.
The Tshepong South and Tshepong North were merged into the Tshepong Operations in 2017 and split into separate entities in 2023.
Mineral Tenure
Refer to Item 4: “Information on the Company – Business Overview – Regulation – Mineral Rights – South Africa” above for a summary of the regulatory environment in South Africa.
The current mining right for the Tshepong North encompasses an area of 10,798.74ha. Harmony holds several mining rights in the Free State goldfields which have been successfully converted and executed as new order mining rights, some of which are still to be registered at the MPRTO.
Tshepong North is wholly owned by Harmony, including the associated mineral rights. Harmony commenced acquiring the assets through the acquisition of AngloGold's Free State operations in 2001.
Mining at Tshepong North is carried out under the following mining right, covering both Tshepong North and Tshepong South:
•FS30/5/1/284MR, which is valid from December 11, 2007, to December 10, 2029, and covers an area of 10,798.74ha.
A summary of the status of environmental permits and licenses issued as at June 30, 2023, related to both Tshepong North and Tshepong South is presented in the table below.
|
|
|
|
|
|
|
|
|
|
|
|
|
|
|
Permit / Licence |
Reference No. |
Issued By |
Date Granted |
Validity |
| Environmental Management Programme |
FS 30/5/1/2/3/2/1(84)EM |
DMRE |
April 16, 2010 |
LOM |
| Environmental Management Updated |
FS 30/5/1/2/2/84MR |
DWAFEC |
Pending Approval Submitted in 2019 |
LOM |
| Water Permit 936B. Harmony. Free State Geduld Mines. Discharge of untreated effluents |
B33/2/340/31 |
DWAFEC |
April 2, 1981 |
LOM |
| Water Permit 870B. Harmony. Discharge of untreated effluents. |
B33/2/340/25 |
DWAFEC |
May 27, 1991 |
LOM |
| Water Permit 1214N. Free State Consolidated Gold Mine. Tshepong, Freddie’s and Phakisa shafts. |
B33/2/340/12 |
DWAFEC |
Not indicated. |
LOM |
|
|
|
|
|
|
|
|
|
|
|
|
|
|
|
|
|
|
|
|
|
|
|
|
|
|
|
|
|
|
Notes: DWAFEC - Department of Water Affairs, Forestry and Environmental Conservation.
Mining Method
Tshepong North mine may be classified as moderate to deep level underground gold mines currently operating at depths of up to 2,427m below surface.
SGM is the preferred mining method used at the Tshepong North. This method makes use of dip pillars and reduced mining spans with pre-developed tunnels, aimed at further control of stresses experienced in rock movement. The SGM sequence is a V-shaped configuration, colloquially referred to as the “inverted Christmas tree”.
The SGM mining methods are suitable for underground, narrow reef mining. A common feature of the SGM method is the layout of the primary and secondary development. Primary development is done off-reef (in waste rock), while secondary development is done on-reef (in the mineralized zone).
The SGM is employed for a deeper mining approach and offers various advantages, the critical one being increased safety. A noticeable characteristic of the SGM method is that mining from the raises is advanced in only one direction at a time, which is directed towards the stabilizing or regional pillars. This SGM mining sequence eliminates the creation of remnant pillars reducing the risk of seismicity.
While Tshepong North business plan is based primarily on the SGM methodology and sequencing, there are sections of the mine that are operating using the breast, undercut and open stoping mining methods.
Minor amounts of the B Reef that do not exceed 38% of the on-reef mined per annum, are extracted as an open stoping mining operation. Reason for mining at open stoping is as a result of the erratic nature of the channel width and the support design specific to B reef mining.
Mineral Processing
All ore mined at Tshepong North is processed at Harmony One Plant located west of Welkom. Harmony One Plant is Harmony’s largest gold processing plant and processes underground ore from multiple shafts, as well as surface ore from nearby mine waste facilities. The plant was commissioned in 1986 and comprises three independent modules, each consisting of four feed silos, two ROM mills, two conventional thickeners, cyanide leach, CIP adsorption, elution, zinc precipitation and smelting. The plant CIP process reflects the technology which was current at the time of construction.
The Harmony One Plant has a steady state design capacity of 390ktpm with its conventional CIP flowsheet. The Harmony One plant is in good working condition and the equipment is also in good order with audits done on regular bases to check the operating performance of the plant.
Qualified Persons
The QP preparing the TRS was employed on a full-time basis by Harmony. The QP's qualifications, areas of responsibility and personal inspection of the property are summarized in the graphic below.
|
|
|
|
|
|
|
|
|
|
|
|
|
|
|
| Qualified Person |
Professional Organization |
Qualification |
TRS Section Responsibility |
Personal Insp. |
| Mr. A. Louw |
SACNASP |
BSc. Hons. (Geohydro) |
All Sections (Tshepong) |
Full Time |
|
|
|
|
|
|
|
|
|
|
|
|
|
|
|
|
|
|
|
|
|
|
|
|
|
|
|
|
|
|
|
|
|
|
|
|
|
|
|
|
|
|
|
|
|
|
|
|
|
|
Exploration
Geological data has been obtained through initial surface drilling, followed by underground drilling, mapping and channel (chip) sampling.
Exploration from underground platforms is currently continuing for the Tshepong sub-75 development, to improve geological confidence.
Tshepong North is continuously undergoing B reef exploration drilling to identify any potential continuation of the current pay shoots connecting these mines. Footwall development began at Tshepong North during FY22 and will be used as a drilling platform to confirm and delineate the anticipated B Reef channel.
Underground exploration drilling has been ongoing throughout the operational life of Tshepong North as the mine deepens. Underground diamond core drilling is conducted using hydraulic driven and pneumatic drill rigs.
Fans of drill holes are drilled from diamond drilling bays, which are developed at 50m intervals along footwall developments ends (X/Cs) and 100m intervals along haulages and RAWs. The drilling fans consist of up to ten individual drill holes at inclinations ranging from -15° to +30° of vertical, or as dictated by local geological structures.
The underground infill drilling system is in place to improve data density in specific areas and are drilled from the underground development access drives.
Logging procedures are conducted as per the Harmony company standards, which are used on all surface and underground mines and are best practice and have been in place consistently since 2001.
The QP is of the opinion that the quality and quantity of the exploration methods and information gathered is sufficient to support the estimation of Mineral Resources and Mineral Reserves.
Mineral Resource Estimate
The Mineral Resource estimate for the Tshepong North is considered to have reasonable prospects for economic extraction. This is demonstrated by the results of the cash flow for the mines. The cut-off value for the Mineral Resources is determined at 700cmg/t for the gold based on the economic assumptions presented in the table below at the effective date June 30, 2023.
|
|
|
|
|
|
|
|
|
Tshepong North |
|
|
| Description |
Unit |
Value |
| Gold price |
US$/oz |
1,764 |
| FX rate |
Rand:US$ |
16.22 |
| Gold price |
Rand/kg |
920,000 |
| Plant recovery factor |
% |
95 |
| Unit cost |
Rand/t |
4,075 |
Note: Unit cost includes cash operating cost, royalty and ongoing development capital
This cut-off values represents typical costs for the mining method and preliminary mining and metallurgical recovery assumptions.
The Mineral Resources were originally prepared, classified and reported according to the SAMREC, 2016. For the purposes of this report on Form 20-F, the Mineral Resources have been classified in accordance with Item 1302(d)(1)(iii)(A) of Regulation S-K. These Mineral Resources account for mining depletion recorded from July 2022 to June 2023.
The Mineral Resource estimate for Tshepong North, as at June 30, 2023, exclusive of the reported Mineral Reserves, is summarized in the table below.
|
|
|
|
|
|
|
|
|
|
|
|
|
|
|
|
|
|
|
|
|
|
|
|
|
Fiscal Year Ended June 30, |
% Change |
|
2023 |
2022 |
| Mineral Resource Category |
Tonnes (Mt) |
Gold Grade (g/t) |
Gold Content (kg) |
Tonnes (Mt) |
Gold Grade (g/t) |
Gold Content (kg) |
| Measured |
11.920 |
12.42 |
147,989 |
12.484 |
12.13 |
151,437 |
(2.3)% |
| Indicated |
3.162 |
10.28 |
32,493 |
3.977 |
10.20 |
40,575 |
(19.9)% |
| Total / Ave. Measured + Indicated |
15.082 |
11.97 |
180,481 |
16.462 |
11.66 |
192,012 |
(6.0)% |
| Inferred |
9.744 |
10.20 |
99,356 |
9.434 |
10.18 |
96,037 |
3.5% |
Notes:
1.Mineral Resources are reported with an effective date of June 30, 2023 were originally prepared, classified and reported according to SAMREC, 2016. For the purposes of this TRS, the Mineral Resources have been classified in accordance with Item 1302(d)(1)(iii)(A) of Regulation S-K. The QP responsible for the estimate is Mr. A. Louw, who is Ore Reserve Manager at Tshepong, and a Harmony employee.
2.The Mineral Resource tonnes are reported as in-situ with reasonable prospects for economic extraction.
3.No modifying factors or dilution sources have been included to in-situ Reserve which was subtracted from the SAMREC Resource in order to obtain the S-K 1300 Resource.
4.The Mineral Resources are reported using a cut-off value of 700cmg/t determined at a 90% profit guidance, and a gold price of US$1,582/oz.
5.Tonnes are reported as rounded to three decimal places. Gold values are rounded to zero decimal places.
6.Mineral Resources are exclusive of Mineral Reserves. Mineral Resources are not Mineral Reserves and do not necessarily demonstrate economic viability.
7.Rounding as required by reporting guidelines may result in apparent summation differences.
8.The Mineral Resource estimate is for Harmony’s 100% interest.
The decrease in the Mineral Resource is mainly due to increase in the the resource cut-off grade from 648cmgt to 700cmgt.
Mineral Reserve Estimate
The Mineral Reserves were originally prepared, classified and reported according to SAMREC, 2016. For the purposes of this report on Form 20-F, the Mineral Reserves have been classified in accordance with Item 1302(d)(1)(iii)(A) of Regulation S-K.
Mineral Reserves are derived from the Mineral Resources, a detailed business plan and the operational mine planning processes. Mine planning utilizes and takes into consideration historical technical parameters achieved. In addition, Mineral Resource conversion to Mineral Reserves considers certain modifying factors, dilution, ore losses, minimum mining widths, planned mine call and plant recovery factors.
The Mineral Reserve estimate for Tshepong North, as at June 30, 2022, and 2023, is summarized in the table below.
|
|
|
|
|
|
|
|
|
|
|
|
|
|
|
|
|
|
|
|
|
|
|
|
| |
Fiscal Year Ended June 30, |
|
| |
2023 |
2022 |
|
| Mineral Reserve Category |
Tonnes (Mt) |
Gold Grade (g/t) |
Gold Content (kg) |
Tonnes (Mt) |
Gold Grade (g/t) |
Gold Content (kg) |
% Change |
Proven |
2.997 |
4.79 |
14,341 |
4.157 |
5.15 |
21,419 |
(33.0) |
% |
| Probable |
0.766 |
5.73 |
4,390 |
0.336 |
7.63 |
2,565 |
71.2 |
% |
Total / Ave. Proven + Probable |
3.763 |
4.98 |
18,731 |
4.493 |
5.34 |
23,985 |
(21.9) |
% |
Notes:
1.The Mineral Reserves were originally prepared, classified and reported according to SAMREC, 2016. For the purposes of this TRS, the Mineral Reserves have been classified in accordance with Item 1302(d)(1)(iii)(A) of Regulation S-K. The QP responsible for the estimate is Mr. A. Louw, who is Ore Reserve Manager at Tshepong, and a Harmony employee.
2.Tonnes, grade, and gold content are declared as net delivered to the mills.
3.Figures are fully inclusive of all mining dilutions, gold losses and are reported as mill delivered tonnes and head grades. Metallurgical recovery factors have not been applied to the reserve figures.
4.Gold content has not taken metallurgical recovery factors into account.
5.Mineral Reserves are reported using a cut-off grade of 800cmg/t determined using a gold price of US$1,582/oz gold.
The decrease in Mineral Reserves is due to the increase in the reserve cut-off grade from 690cmgt to 800cmgt.
The table below presents a summary of the modifying factors used to convert the Mineral Resource to the Mineral Reserve for Tshepong North. The modifying factors are consistent with the modelling, planning and computing estimates used in determining the Mineral Reserves, which are also consistent with historical performance.
|
|
|
|
|
|
|
|
|
| Modifying Factor |
Unit |
Value |
| Relative Density |
t/m3 |
2.72 |
| Stoping Width |
cm |
118 |
| Gully |
% |
8.90 |
| Off Reef |
% |
4.81 |
| Waste to Reef |
% |
0.80 |
| Flushing tons |
% |
2.28 |
| Discrepancy |
% |
5.06 |
| Mine Call Factor |
% |
72.00 |
| Plant Recover Factor |
% |
94.96 |
| Mine Recover Factor |
% |
68.37 |
| Plant Call Factor |
% |
100 |
| Mineral Reserve cut-off |
cmg/t |
800 |
Notes: Development waste to reef, including the decline development.
For additional information, see the TRS on each individual property, filed as an Exhibit of this annual report on Form 20-F.
Tshepong South
Property Description
The Tshepong South mine comprises one operating underground gold mine namely “Tshepong South”. Tshepong South is a mature, moderate to deep-level underground operation using conventional underground mining methods to depths of 2,427m BMD. The mine utilizes the Tshepong North and Nyala shafts. Tshepong South’s success is greatly dependent on the services rendered via Nyala where four main compressors are commissioned and Tshepong South’s ore is being hoisted.
The mines are located in the Free State Province of South Africa, approximately 250km southwest of Johannesburg and 15km to the north of the town of Welkom.Tshepong South is situated adjacent to the south of Tshepong North, and is located at a latitude of 27°54’1.27”S and longitude of 26°43’30.05”E.
The following graphic illustrates the location of Tshepong South, along with certain infrastructure.
The primary reef mined is the Basal Reef, with additional gold mineralization being found in the B Reef and A Reef. The B Reef, which lies between 150m and 170m stratigraphically above the Basal Reef, contributes just less than 20% to the mining production at Tshepong South.
All relevant underground mining and surface right permits, and any other permit related to the work conducted on the property have been obtained and are valid. There are no known legal proceedings (including violations or fines) against Harmony, which threaten its mineral rights, tenure, or operations.
Operational Infrastructure
The surrounding areas of Welkom and Odendaalsrus are well developed in terms of access and mining-related infrastructure, which supports the numerous operational gold mines in the area. The regional infrastructure includes national and provincial paved road networks, power transmission and distribution networks, water supply networks and communication infrastructure.
Tshepong South operates a single vertical shaft for man and materials. Rock is transported from the underground working via a RailVeyorTM system to the Nyala Shaft for hoisting.
The Tshepong South ore is transported, by rail, from Nyala shaft to the Harmony One Plant in Welkom for processing.
Tshepong South is powered by electricity from Eskom.
The surface infrastructure associated with Tshepong South is displayed in the graphic below.
Geology
Tshepong South is situated in the Free State Goldfield, on the southwestern margin of the Witwatersrand Basin of South Africa, one of the most prominent gold provinces in the world. The major gold bearing conglomerate reefs are mostly confined to the CRG of the Witwatersrand Supergroup.
The general orientation of the Witwatersrand Supergroup succession in this goldfield is interpreted as north-trending, within a syncline that is plunging to the north. The syncline has been divided by faults into the Odendaalsrus, Central Horst and Virginia sections. The Tshepong South mining right area is also affected by the Tribute fault (~270m) and Arrarat Fault (~180m) to the far south-east of the shaft.
Tshepong South exploited primarily the Basal Reef, which occurs within the Harmony Formation of the Johannesburg Subgroup of the CRG.
Mineralization also occurs within the stratigraphically higher A and B reefs of the Kimberley (formerly Aandenk) Formation, within the Turffontein subgroup of the CRG. However, only the B Reef can be economically extracted.
Mineralization is associated with the presence of medium to coarse, clast-supported oligomictic pebble horizons. The presence of allogenic pyrite and detrital carbon is also common.
History
Tshepong South was formerly known as FSG 4, Freddies 4 and Phakisa. Tshepong South development commenced in October 1993 and shaft sinking was started in February 1994. In 1995, shaft sinking was halted on 59 Level due to the prevailing low gold price. Operations at Tshepong South recommenced in September 1996 and sinking was completed to 75 Level, before being halted again in 1999.
Harmony acquired Tshepong South as part of the acquisition from AngloGold Ashanti’s Free State operations (previously known as Freegold), which completed in September 2003. Sinking and equipping was completed to a depth of 2,427m in 2006.
Tshepong South and Tshepong North were merged into the Tshepong Operations by Harmony in 2017 and split into separate entities in 2023.
Mineral Tenure
Refer to Item 4: “Information on the Company – Business Overview – Regulation – Mineral Rights – South Africa” above for a summary of the regulatory environment in South Africa.
The current mining right for Tshepong South and Tshepong North encompasses an area of 10,798.74ha. Harmony holds several mining rights in the Free State goldfields which have been successfully converted and executed as new order mining rights, some of which are still to be registered at the MPRTO.
Tshepong South is wholly owned by Harmony, including the associated mineral rights. Harmony commenced acquiring the assets through the acquisition of AngloGold's Free State operations in 2001, together with ARMGold. ARMGold was subsequently incorporated into Harmony in 2003, giving Harmony 100% ownership and control of the Tshepong South.
Mining at Tshepong South is carried out under the following mining right, covering both Tshepong and Tshepong South:
•FS30/5/1/284MR, which is valid from 11 December 2007 to 10 December 2029 and covers an area of 10,798.74ha.
A summary of the status of environmental permits and licenses issued as at June 30, 2023, related to both Tshepong South and Tshepong North is presented in the table below.
|
|
|
|
|
|
|
|
|
|
|
|
|
|
|
| Permit / Licence |
Reference No. |
Issued By |
Date Granted |
Validity |
| Environmental Management Programme |
FS 30/5/1/2/3/2/1(84)EM |
DMRE |
April 16, 2010 |
LOM |
| Environmental Management Updated |
FS 30/5/1/2/2/84MR |
DWAFEC |
Pending Approval Submitted in 2020 |
LOM |
| Water Permit 936B. Harmony. Free State Geduld Mines. Discharge of untreated effluents |
B33/2/340/31 |
DWAFEC |
April 2, 1981 |
LOM |
| Water Permit 870B. Harmony. Discharge of untreated effluents. |
B33/2/340/25 |
DWAFEC |
May 27, 1991 |
LOM |
| Water Permit 1214N. Free State Consolidated Gold Mine. Tshepong, Freddie’s and Phakisa shafts. |
B33/2/340/12 |
DWAFEC |
Not indicated. |
LOM |
|
|
|
|
|
|
|
|
|
|
|
|
|
|
|
|
|
|
|
|
|
|
|
|
|
|
|
|
|
|
Mining Method
Tshepong South may be classified as moderate to deep level underground gold mine currently operating at depths of up to 2,427m below surface.
The orebody at Tshepong South Mine is broken up into blocks by geological structures with large throws. Due to the orebody being broken up into these small blocks, a Scattered mining method is used at Tshepong South Mine. Scattered mining is when mining is done between the major geological structures. The mine design criteria is based on the sequential grid mining method where the crosscuts are spaced at fixed distance of 160m however additional development can be required in some instances and/or crosscut spacing reduced/increased depending on the prevailing geological structures. Primary Waste Development is done ahead of the stoping front in the virgin stress environment.
Primary development is done off-reef (in waste rock), while secondary development is done on-reef (in the mineralized zone). In primary development, horizontal haulages are developed from the vertical shaft, extending to the extremities of the mining level. Inter-level spacing is the perpendicular distance between two consecutive level stations underground. Further development is done at set intervals along the haulages towards the mineralized zones in the form of crosscuts.
For secondary development, an inclined excavation that connects two levels is established, referred to a raise or winze, depending on the upwards or downwards direction of the development.
A key feature of Scattered mining is that the mine design includes pillars in the stoping areas that are designed to cave in a planned and controlled manner. These pillars are referred to as crush pillars and the dimensions of the pillars are determined by the geotechnical properties of the host rock. The use of crush pillars minimizes the risk of unpredicted collapse of stoping areas. These collapses can compromise the safety of mining operations and may lead to permanent closure of stoping panels or sterilization of ore.
Mineral Processing
All ore mined at Tshepong South is processed at Harmony One Plant located west of Welkom. Harmony One Plant is Harmony’s largest gold processing plant and processes underground ore from multiple shafts, as well as surface ore from nearby mine waste facilities. The plant was commissioned in 1986 and comprises three independent modules, each consisting of four feed silos, two ROM mills, two conventional thickeners, cyanide leach, CIP adsorption, elution, zinc precipitation and smelting. The plant CIP process reflects the technology which was current at the time of construction. Overall the plant has been operating with no significant challenges and target metallurgical recoveries have been achieved.
The Harmony One Plant has a steady state design capacity of 390ktpm with its conventional CIP flowsheet. The Harmony One plant is in good working condition and the equipment is also in good order with audits done on regular bases to check the operating performance of the plant.
Qualified Persons
The QP preparing the TRS is employed on a full-time basis by Harmony. The QP's qualifications, areas of responsibility and personal inspection of the property are summarized in the graphic below.
|
|
|
|
|
|
|
|
|
|
|
|
|
|
|
| Qualified Person |
Professional Organization |
Qualification |
TRS Section Responsibility |
Personal Insp. |
| Ms. B. Phetlhu |
SACNASP |
BTech. (Geol), M (Eng) |
All Sections (Phakisa) |
Full Time |
|
|
|
|
|
|
|
|
|
|
|
|
|
|
|
|
|
|
|
|
|
|
|
|
|
|
|
|
|
|
|
|
|
|
|
|
|
|
|
|
|
|
|
|
|
|
|
|
|
|
Exploration
Geological data has been obtained through initial surface drilling, followed by underground drilling, mapping and channel (chip) sampling. The underground infill drilling system is in place to improve data density in specific areas and are drilled from the underground development access drives.
Tshepong South is undergoing extensive B Reef exploration drilling to better delineate the continuation of the identified pay shoot running from Tshepong North into Tshepong South thus connecting these mines. The drilling will also improve the geological confidence of the B Reef. Footwall development began at the Tshepong South during fiscal 2022 and is continuously being utilized as a drilling platform to confirm and delineate the anticipated target B Reef channel.
Underground exploration drilling has been ongoing throughout the operational life of Tshepong South. Underground diamond core drilling is conducted using hydraulic driven and pneumatic drill rigs.
Fans of drill holes are drilled from diamond drilling bays, which are developed at 50m intervals along footwall development ends (X/Cs) and 100m intervals along haulages and RAWs. The drilling fans consist of up to ten individual drill holes at inclinations ranging from +5° to +90° of vertical, or as dictated by local geological structures.
The underground infill drilling system is in place to improve data density in specific areas and are drilled from the underground development access drives.
Logging procedures are conducted as per the Harmony company standards, which are used on all surface and underground mines and are best practice and have been in place consistently since 2001.
The QP is of the opinion that the quality and quantity of the exploration methods and information gathered is sufficient to support the estimation of Mineral Resources and Mineral Reserves.
Mineral Resource Estimate
The Mineral Resource estimate for the Tshepong South is considered to have reasonable prospects for economic extraction. This is demonstrated by the results of the cash flow for the mine. The cut-off value for the Mineral Resources is determined at 780cmg/t for the gold, based on the economic assumptions presented in the table below at the effective date June 30, 2023.
|
|
|
|
|
|
|
|
|
| Tshepong South |
|
|
| Description |
Unit |
Value |
| Gold price |
US$/oz |
1,764 |
| FX rate |
Rand:US$ |
16.22 |
| Gold price |
Rand/kg |
920,000 |
| Plant recovery factor |
% |
95,2 |
| Unit cost |
Rand/t |
4,411 |
Note: Unit cost includes cash operating cost, royalty and ongoing development capital.
This cut-off values represents typical costs for the mining method and preliminary mining and metallurgical recovery assumptions.
The Mineral Resources were originally prepared, classified and reported according to the SAMREC, 2016. For the purposes of this report on Form 20-F, the Mineral Resources have been classified in accordance with Item 1302(d)(1)(iii)(A) of Regulation S-K. These Mineral Resources account for mining depletion recorded from July 2022 to June 2023.
The Mineral Resource estimate for Tshepong South, as at June 30, 2023, exclusive of the reported Mineral Reserves is summarized in the table below. There is a decrease in ounces due to the increase in geological discounts applied especially towards the Tribute fault area (East South), as new geological information became available.
|
|
|
|
|
|
|
|
|
|
|
|
|
|
|
|
|
|
|
|
|
|
|
|
|
Fiscal Year Ended June 30, |
% Change |
|
2023 |
2022 |
| Mineral Resource Category |
Tonnes (Mt) |
Gold Grade (g/t) |
Gold Content (kg) |
Tonnes (Mt) |
Gold Grade (g/t) |
Gold Content (kg) |
| Measured |
5.661 |
13.02 |
73,695 |
4.741 |
13.25 |
62,797 |
17.4% |
| Indicated |
6.680 |
11.67 |
77,950 |
7.264 |
11.27 |
81,831 |
(4.7)% |
| Total / Ave. Measured + Indicated |
12.341 |
12.29 |
151,645 |
12.005 |
12.05 |
144,627 |
4.9% |
| Inferred |
25.090 |
10.67 |
267,678 |
27.491 |
10.77 |
295,943 |
(9.6)% |
Notes:
1.Mineral Resources are reported with an effective date of June 30, 2023 were originally prepared, classified and reported according to SAMREC, 2016. For the purposes of this TRS, the Mineral Resources have been classified in accordance with Item 1302(d)(1)(iii)(A) of Regulation S-K. The QP responsible for the estimate is Ms. B. Phetlhu, who is Ore Reserve Manager at Tshepong South, and a Harmony employee.
2.The Mineral Resource tonnes are reported as in-situ with reasonable prospects for economic extraction.
3.No modifying factors or dilution sources have been included to in-situ Reserve which was subtracted from the SAMREC Resource in order to obtain the S-K 1300 Resource.
4.The Mineral Resources are reported using a cut-off value of 780cmg/t determined at a 90% profit guidance, and a gold price of US$1,764/oz.
5.Tonnes are reported as rounded to three decimal places. Gold values are rounded to zero decimal places.
6.Mineral Resources are exclusive of Mineral Reserves. Mineral Resources are not Mineral Reserves and do not necessarily demonstrate economic viability.
7.Rounding as required by reporting guidelines may result in apparent summation differences.
8.The Mineral Resource estimate is for Harmony’s 100% interest.
Mineral Reserve Estimate
The Mineral Reserves were originally prepared, classified and reported according to SAMREC, 2016. For the purposes of this report on Form 20-F, the Mineral Reserves have been classified in accordance with Item 1302(d)(1)(iii)(A) of Regulation S-K.
Mineral Reserves are derived from the Mineral Resources, a detailed business plan and the operational mine planning processes. Mine planning utilizes and takes into consideration historical technical parameters achieved. In addition, Mineral Resource conversion to Mineral Reserves considers certain modifying factors, dilution, ore losses, minimum mining widths, planned mine call and plant recovery factors.
The Mineral Reserve estimate for Tshepong South, as at June 30, 2022, and 2023, is summarized in the table below. There is an increase in ounces as a result of an increase in Basal Reef grade as from the 34 line to the South of the mine as well as the increase in the B-Reef footprint to the north of the shaft. These additions mitigated but could not completely make up for the total decrease in Mineral Reserves due to depletion.
|
|
|
|
|
|
|
|
|
|
|
|
|
|
|
|
|
|
|
|
|
|
|
|
| |
Fiscal Year Ended June 30, |
|
| |
2023 |
2022 |
|
| Mineral Reserve Category |
Tonnes (Mt) |
Gold Grade (g/t) |
Gold Content (kg) |
Tonnes (Mt) |
Gold Grade (g/t) |
Gold Content (kg) |
% Change |
Proven |
2.882 |
7.79 |
22,466 |
3.759 |
6.98 |
26,243 |
(14.4) |
% |
| Probable |
0.563 |
7.06 |
3,972 |
0.176 |
6.49 |
1,143 |
247.5 |
% |
Total / Proven + Probable |
3.445 |
7.67 |
26,438 |
3.935 |
6.96 |
27,386 |
(3.5) |
% |
Notes:
1.The Mineral Reserves were originally prepared, classified and reported according to SAMREC, 2016. For the purposes of this TRS, the Mineral Reserves have been classified in accordance with Item 1302(d)(1)(iii)(A) of Regulation S-K. The QP responsible for the estimate is Ms. B. Phetlhu, who is Ore Reserve Manager at Tshepong South, and a Harmony employee.
2.Tonnes, grade, and gold content are declared as net delivered to the mills.
3.Figures are fully inclusive of all mining dilutions, gold losses and are reported as mill delivered tonnes and head grades. Metallurgical recovery factors have not been applied to the reserve figures.
4.Gold content has not taken metallurgical recovery factors into account.
5.Mineral Reserves are reported using a cut-off grade of 791cmg/t determined using a gold price of US$1,582/oz gold.
The table below presents a summary of the modifying factors used to convert the Mineral Resource to the Mineral Reserve for Tshepong South. The modifying factors are consistent with the modelling, planning and computing estimates used in determining the Mineral Reserves, which are also consistent with historical performance.
|
|
|
|
|
|
|
|
|
| Modifying Factor |
Unit |
Value |
| Relative Density |
t/m3 |
2.72 |
|
| Stoping Width |
cm |
130 |
|
| Gully |
% |
6.9 |
|
| Off Reef |
% |
4.7 |
|
| Waste to Reef |
% |
0.23 |
|
| Flushing tons |
% |
— |
|
| Discrepancy |
% |
11.1 |
|
| Mine Call Factor |
% |
83.0 |
|
| Plant Recover Factor |
% |
95 |
|
| Mine Recover Factor |
% |
79 |
|
| Plant Call Factor |
% |
100 |
|
| Mineral Reserve cut-off |
cmg/t |
791 |
|
For additional information, see the TRS on each individual property, filed as an Exhibit of this annual report on Form 20-F.
Mine Waste Solutions
Property Description
Mine Waste Solutions is comprised of two distinct, geographically separated, operations namely the MWS Operation located on the Free State - North West provincial boundary, and the West Wits Operation situated in the West Rand Region of the Gauteng Province. Each operation will be discussed separately due to their geographical locations.
Mine Waste Solutions and its associated mineral rights are wholly owned by Harmony. Harmony acquired the assets as part of the transaction to take full ownership and control of AngloGold's remaining South African business, as of October 1, 2020.
The location of the MWS operation and the West Wits operation is presented in figure below.
The following graphic illustrates the location of the MWS Operation, along with certain infrastructure.
The following graphic illustrates the location of the West Wits Operation, along with certain infrastructure is The MWS Operation is located in the Vaal River area, and straddles the Free State, North West provincial border of South Africa, close to the town of Klerksdorp.
The MWS Gold Plant (26° 50’8.66”E; 26° 47’41.83”S) is situated close to the town of Stilfontein, while the TSFs and WRD for this operation are scattered over an area that stretches approximately 13.5km north to south and 14.0km east to west.
The West Wits Operation is situated in the West Rand Region of the Gauteng Province. The West Wits Operation is situated approximately 75km west of Johannesburg. The site is approximately 7km south of Carletonville. West Wits Operation occupies an area of 4,176ha in extent and is close to the boundary between Gauteng and North West Province.
The West Wits Operation reprocesses tailings from the Old North TSF dumps and waste rock from the Savuka WRD at the Savuka Plant (26° 25’20.31”E and 27° 24’11.30”S).
There is no material litigation (including violations or fines) against Harmony that threatens its mineral rights, tenure, or operations.
Operational Infrastructure
Infrastructure in the region is well established supporting the numerous operational gold mines in the area. The regional infrastructure includes national and provincial paved road networks, power transmission and distribution networks, water supply networks and communication infrastructure. Operations are powered by electricity from Eskom.
The MWS Operation is accessible from Johannesburg via the N12 national road and R502 regional road in Klerksdorp, North West. A large network of either tarred roads or well-maintained gravel roads exist between the tailing dams, WRDs and the MWS Plant that are scattered in the area. The West Wits Operations near Carletonville are accessible via the N12 national road and R500 regional road from Johannesburg.
The surface infrastructure associated with the MWS operation and the West Wits operation is presented in the graphic under "– Property Description" above.
Geology
Material contained in the TSFs and WRDs predominantly originates from deep level gold mines, operated by Harmony and others, mostly located in Klerksdorp and Carletonville. The West Wits mining operations predominantly extract tabular gold-bearing conglomeratic reefs, namely the CLR and VCR. The MWS Operation, however, mainly exploits TSFs and WRD derived from the VR.
The Witwatersrand reefs occur within the Archean Witwatersrand Basin which hosts the Witwatersrand Supergroup succession. The VCR horizon is located at the top of the Turffontein Subgroup of the CRG, capping the Witwatersrand Supergroup. The VR horizon is situated within the Krugersdorp Formation, in the Johannesburg Subgroup of the CRG. The CLR is situated near the base of the Johannesburg Subgroup.
The TSF material comprises previously treated residues of gold-bearing conglomeratic reefs processed by CIL. They are man-made “deposits” and are not the result of natural sedimentary processes. The grade of the TSFs is determined by the grade of the ore source at the time that they were processed, and the processing efficiency.
The WRDs are unconsolidated and are comprised of untreated, low grade, gold-bearing material from underground workings. The WRDs are also man-made deposits, with very little structure or continuity, and one in which the grade does not behave as a natural mineral deposit.
The most significant mineral in the TSFs and WRDs is quartz, which makes up more than 60% of the bulk mineral composition. The gold predominantly occurs in pyrite. Other minerals identified include uranium, iron oxide, titanium oxide and calcite from the VR, VCR and CLR conglomerates.
History
The MWS Operation commenced production in 1952 and was the original gold processing plant for the Stilfontein Gold Mine. Following the rise in the uranium price in the 1970s, the operation investigated uranium recovery from the Stilfontein Gold Mine’s gold tailings dams and commissioned the uranium plant in mid-1979. The plant operated until 1989, processing 29.4Mt of tailings and recovering 4.56t of U3O8. In 2003, the plant was converted into a gold tailings treatment operation and no further uranium was produced at that stage.
In 2007, First Uranium (Pty) Ltd (South Africa) ("First Uranium") acquired the MWS Operation with the purpose of treating the tailings dams for both gold and uranium. The second and third processing plants were commissioned between 2007 and 2012.
On July 20, 2012, the MWS Operation were acquired by AngloGold from First Uranium. The MWS uranium plant and flotation plants were commissioned in 2014, and were further reconfigured into a more efficient operation during 2016, as part of an optimization drive. In 2017, the uranium and flotation plants were discontinued resulting in MWS Operation again producing only gold.
On October 1, 2020, Harmony acquired all of AngloGold’s surface operations, including the MWS Operation.
The Savuka Plant was commissioned in 1961 and originally designed to treat ore from Savuka Mine and TauTona Mine. In 2015, upon the change in strategy to process the reef from the aforementioned shafts at Mponeng Plant, the plant was converted into a tailings and WRD treatment facility. The Savuka Plant treats tailings material from Savuka and Mponeng TSFs, and waste rock from the WRDs from the same operations. On October 1, 2020, Harmony acquired all of AngloGold’s South African business, including the surface assets which constitute the West Wits Operation.
Mineral Tenure
Refer to Item 4: “Information on the Company – Business Overview – Regulation – Mineral Rights – South Africa” above for a summary of the regulatory environment in South Africa.
The MWS Operation’s license to operate is covered by the Environmental Authorization under the National Environmental Management Act No. 107 of 1998. In terms of the current legislation, the MPRDA, a mining right is not required to reclaim TSFs.
Following the acquisition of MWS Operation, all relevant permits and licenses were acquired by Harmony and there is financial provision for rehabilitation liabilities for the MWS Operations, as well as the historic surface rights permits for MWS Operation. All of these permits are still valid. MWS no longer operates under any mining right. All relevant environmental and water-use permits are in place that cover the environmental, archaeological, and hydrological components of Mine Waste Solutions. All permits are audited regularly for compliance. The latest of EA is applicable to the Kareerand TSF expansion activities, issued to MWS in 2022. MWS is currently busy with an environmental authorization process to increase it piping capacity from Kareerand TSF to enable more return water to be pumped back to the MWS Plant and reclamation activities.
Mining Method
The mining methodologies adopted at Mine Waste Solutions entail the hydro-mining of the TSFs and reclamation of WRDs using FELs.
The TSF material is reclaimed using several hydraulic monitoring guns which deliver high-pressure water to the face. High pressure water is transferred to the monitoring guns observing the maximum design capacity of the equipment, limited to 40 bars. Typically, a 25m mining face length is achieved with a water pressure in the range of 27b to 30b.
The tailings material can be selectively mined based on the positioning of the monitoring guns. The TSF face is broken by the water pressure, resulting in the slurry gravitating towards the collection sumps that deliver the slurry to the pumping stations, which is then pumped via overland pipelines to the respective plant streams. The TSFs are fed into one of the three respective plant streams, which comprise the MWS Operation. The tailings material size is appropriate for high-pressure water to re-pulp the consolidated slimes to a slurry at a minimum relative density of around 1.45. No milling is required, as the material has previously been milled through the CIL plant treatment process.
Waste rock arises from underground development and is conveyed to large dumps where it is stockpiled. The grade values are inconsistently distributed amongst these rock deposits. Waste rock from off-reef development can also become contaminated during transport to surface by mineralized rock from unpay and marginal areas.
Tracked bulldozers are used on the top of WRDs during daylight hours, demarcated by surveyed markers, in accordance with safety standards. Vertical dozing operations are prohibited. During dozing operations, the geotechnical considerations and the materials’ natural angle of repose is adhered to, so as to maintain the WRD slope stability during loading operations.
Bulldozers are also used at the bottom of the WRDs to create a safe loading distance between the base of the WRD and the loading face. Loading measures take careful consideration of the existing dump design and ensures that extraction of the material is done safely. Front end loaders are used to load the dozed material into rail hoppers or trucks, which is transported to milling and mineral processing.
Mineral Processing
There are two plants, namely the MWS Gold Plant and the Savuka Gold Plant, which are dedicated to the processing of tailings material. Reclaimed tailings are pumped as slurry via pipelines to MWS and Savuka Gold Plants and WRD material is transported on trucks to the Mponeng Plant for processing.
The MWS Gold Plant is currently capable of processing 78,000tpd. This excludes Stream 4 which is planned for commissioning in 2024, at an expected capacity of 8,000tpd.
The Savuka Plant is a single process flow with a current processing capacity of 10,600tpd.
Qualified Persons
The QPs preparing the TRS were employed on a full-time basis by Harmony. The QPs’ qualifications, areas of responsibility and personal inspection of the property are summarized in the graphic below.
|
|
|
|
|
|
|
|
|
|
|
|
|
|
|
| Qualified Person |
Professional Organization |
Qualification |
TRS Section Responsibility |
Personal Insp. |
| Mr. BJ. Selebogo |
SAGC |
MSCC, HND (MRM), CoC Mine Survey |
11, 12, 13, 17, 20, 21, 22, 23 |
Full time |
| Ms. MS. Maipushi |
SACNASP |
BSc. (Hons) Geol |
6, 7, 8, 9, 10, 11 |
Full time |
| Mr. MR. Masakona |
ECSA, MMMA, SAIMM |
BSc. Eng (Chemical) |
13, 14, 15 |
Full time |
| Mr. GM. Semoeng |
N/A |
BTech Met, Post Grad B Admin |
10, 14, 15 |
Full time |
| Mr. C. Badashe |
MMMA |
Tailings Management |
13, 15 |
Full time |
| Mr. SS. Selamolela |
MMMA |
NHD – Extraction Metallurgy |
13, 14, 15 |
Full time |
| Mr. D. de Witt |
SAICA |
Hons BCom/MBA |
18, 19 |
Full time |
| Ms. C. Labuschagne |
N/A |
B. Comm, MDP |
18, 19 |
Full time |
| Ms. K. Sehularo |
N/A |
BA Geography and Environmental Management |
17 |
Full time |
| Ms. N. Strydom |
N/A |
LLB H:Dip Corporate Law |
3, 17 |
Full time |
| Mr. H. Mashaba |
N/A |
BSc. (Hons) Env Man |
17 |
Full time |
|
|
|
|
|
|
|
|
|
|
|
|
|
|
|
|
|
|
|
|
|
|
|
|
|
|
|
|
|
|
Exploration
Prior to 2011, grade estimations for the TSFs were based on residue grades obtained from the process plants, as well as various sampling projects in selected areas. Most of these TSFs have since been re-sampled by means of an extensive auger drilling exercise which commenced in 2011. The remaining TSFs will be re-sampled once they go out of service and become dormant.
A total of 1,497 drill holes have been drilled in these TSFs between 2011 and present.
WRDs cannot be explored using drilling because they are comprised of unconsolidated rock. No drilling is undertaken on the MWS and West Wits WRDs.
The drilling and sampling methodology in use for Harmony’s TSFs has been developed specifically for the challenges posed by these deposits and is aligned with industry best practice. This protocol has been in place since 2011, and the drilling components are applied by contractors who are experienced in this specific methodology.
The drill hole samples are deemed to be representative as they provide both vertical and horizontal coverage of each TSF. Drill holes are positioned at regular intervals across the TSF.
The data spacing, density and distribution is sufficient to support the estimation of Mineral Resources for the various TSFs.
WRDs are not explored using exploration methods due to their unconsolidated nature.
The QPs are of the opinion that the quality and quantity of the exploration methods and information gathered is sufficient to support the estimation of Mineral Resources and Mineral Reserves.
Mineral Resource Estimate
The Mineral Resources were originally prepared, classified and reported according to the SAMREC, 2016. For the purposes of this report on Form 20-F, the Mineral Resources have been classified in accordance with Item 1302(d)(1)(iii)(A) of Regulation S-K. These Mineral Resources account for mining depletion recorded from July 2022 to June 2023.
The Mineral Resource estimate for the MWS Operation, as at June 30, 2023, exclusive of the reported Mineral Reserves, is summarized in the table below:
|
|
|
|
|
|
|
|
|
|
|
|
|
|
|
|
|
|
|
|
|
|
|
|
|
|
|
|
|
|
|
|
|
|
|
|
|
|
|
|
|
Fiscal Year Ended June 30, |
|
| |
|
2023 |
2022 |
|
| |
|
|
Grade |
Metal Content |
|
Grade |
Metal Content |
|
| Mineral Resource Category |
Source |
Tonnes
(Mt) |
Gold
(g/t) |
U3O8
(kg/t)
|
Gold
(kg) |
U3O8
(t)
|
Tonnes
(Mt) |
Gold
(g/t) |
U3O8
(kg/t)
|
Gold
(kg) |
U3O8
(t)
|
%
Change |
| Measured |
TSF |
54.061 |
|
0.20 |
|
0.061 |
|
10,902 |
|
3,272 |
|
54.123 |
|
0.20 |
|
0.067 |
|
11,012 |
|
3,635 |
|
(1) |
% |
| WRD |
— |
|
— |
|
— |
|
— |
|
— |
|
— |
|
— |
|
— |
|
— |
|
— |
|
— |
% |
| Sub Total / Ave. Measured |
54.061 |
|
0.20 |
|
0.061 |
|
10,902 |
|
3,272 |
|
54.123 |
|
0.20 |
|
0.067 |
|
11,012 |
|
3,635 |
|
(1) |
% |
| Indicated |
TSF |
52.912 |
|
0.24 |
|
0.096 |
|
12,840 |
|
5,076 |
|
113.045 |
|
0.19 |
|
0.075 |
|
21,415 |
|
8,489 |
|
(40) |
% |
| WRD |
2.060 |
|
0.30 |
|
— |
|
619 |
|
— |
|
2.461 |
|
0.30 |
|
— |
|
741 |
|
— |
|
(16) |
% |
| Sub Total / Ave. Indicated |
54.972 |
|
0.25 |
|
0.096 |
|
13,458 |
|
5,076 |
|
115.506 |
|
0.19 |
|
0.075 |
|
22,156 |
|
8,489 |
|
(39) |
% |
| Total / Ave. Measured + Indicated |
109.033 |
|
0.22 |
|
0.078 |
|
24,360 |
|
8,348 |
|
169.629 |
|
0.20 |
|
0.073 |
|
33,168 |
|
12,124 |
|
(27) |
% |
| Inferred |
TSF |
77.701 |
|
0.13 |
|
0.039 |
|
9,984 |
|
3,031 |
|
— |
|
— |
|
— |
|
— |
|
— |
|
— |
% |
| WRD |
2.502 |
|
0.24 |
|
— |
|
611 |
|
— |
|
2.520 |
|
0.28 |
|
— |
|
700 |
|
— |
|
(13) |
% |
| Total / Ave Inferred |
80.203 |
|
0.13 |
|
0.038 |
|
10,594 |
|
3,031 |
|
2.520 |
|
0.28 |
|
— |
|
700 |
|
— |
|
1413 |
% |
Notes:
1.The Mineral Resources were originally prepared, classified and reported according to SAMREC, 2016. For the purposes of this TRS, the Mineral Reserves have been classified in accordance with Item 1302(d)(1)(iii)(A) of Regulation S-K. The QP responsible for the estimate is Mr. BJ. Selebogo, who is Ore Reserve Manager, and a Harmony employee.
2.The Mineral Resource tonnes are reported as in-situ with reasonable prospects for economic extraction.
3.No cut-off grade has been applied for the estimation of Mineral Resources. Mineral Resource tonnes are reported based on a gold price of US$1,764/oz.
4.Tonnes are reported as million tonnes rounded to three decimal places. Gold values are rounded to zero decimal places.
5.Uranium content is reported as part of the MWS Mineral Resource estimate only.
6.Metal content does not include allowances for processing losses.
7.Mineral Resources are exclusive of Mineral Reserves. Mineral Resources are not Mineral Reserves and do not necessarily demonstrate economic viability.
8.Rounding as required by reporting guidelines may result in apparent summation differences .
9.The Mineral Resource estimate is for Harmony’s 100% interest.
Change as a result of estimation model and survey updates.
The Mineral Resource estimate for the West Wits Operation, as at June 30, 2022, and 2023, is summarized in the table below:
|
|
|
|
|
|
|
|
|
|
|
|
|
|
|
|
|
|
|
|
|
|
|
|
|
|
|
|
|
|
|
|
|
|
|
|
|
|
|
| |
|
Fiscal Year Ended June 30, |
|
| |
|
2023 |
2022 |
|
| |
|
|
Grade |
Metal Content |
|
Grade |
Metal Content |
|
| Mineral Resource Category |
Source |
Tonnes
(Mt) |
Gold
(g/t) |
U3O8
(kg/t)
|
Gold
(kg) |
U3O8
(t)
|
Tonnes
(Mt) |
Gold
(g/t) |
U3O8
(kg/t)
|
Gold
(kg) |
U3O8
(t)
|
%
Change |
| Measured |
TSF |
— |
|
— |
|
— |
|
— |
|
— |
|
— |
|
— |
|
— |
|
— |
|
— |
|
— |
% |
| WRD |
— |
|
— |
|
— |
|
— |
|
— |
|
— |
|
— |
|
— |
|
— |
|
— |
|
— |
% |
Sub Total / Ave. Measured |
— |
|
— |
|
— |
|
— |
|
— |
|
— |
|
— |
|
— |
|
— |
|
— |
|
— |
% |
| Indicated |
TSF |
25.4 |
|
0.32 |
|
— |
|
8,259 |
|
— |
|
22.9 |
|
0.36 |
|
— |
|
8,260 |
|
— |
|
— |
% |
| WRD |
0.3 |
|
0.37 |
|
— |
|
100 |
|
— |
|
1.1 |
|
0.47 |
|
— |
|
513 |
|
— |
|
(81) |
% |
| Sub Total Indicated |
25.7 |
|
0.33 |
|
— |
|
8,359 |
|
— |
|
24.0 |
|
0.37 |
|
— |
|
8,773 |
|
— |
|
(5) |
% |
|
Total / Ave.
Measured + Indicated
|
25.7 |
|
0.33 |
|
— |
|
8,359 |
|
— |
|
24.0 |
|
0.37 |
|
— |
|
8,773 |
|
— |
|
(5) |
% |
| Inferred |
TSF |
— |
|
— |
|
— |
|
— |
|
— |
|
— |
|
— |
|
— |
|
— |
|
— |
|
— |
% |
| WRD |
— |
|
— |
|
— |
|
— |
|
— |
|
— |
|
— |
|
— |
|
— |
|
— |
|
— |
% |
Total / Ave. Inferred |
— |
|
— |
|
— |
|
— |
|
— |
|
— |
|
— |
|
— |
|
— |
|
— |
|
— |
% |
Inclusion of additional dam compartment (L22) previously excluded.
Mineral Reserve Estimate
The Mineral Reserves were originally prepared, classified and reported according to SAMREC, 2016. For the purposes of this report on Form 20-F, the Mineral Reserves have been classified in accordance with Item 1302(d)(1)(iii)(A) of Regulation S-K.
Mineral Reserves are derived from the Mineral Resources, a detailed business plan and the operational planning processes. The planning team utilizes and takes into consideration historical technical parameters achieved. In addition, Mineral Resource conversion to Mineral Reserves considers certain modifying factors, plant call factor, and plant recovery factors.
The Mineral Reserve estimate for the MWS Operation, as at June 30, 2022, and 2023, is summarized in the table below:
|
|
|
|
|
|
|
|
|
|
|
|
|
|
|
|
|
|
|
|
|
|
|
|
|
|
|
| |
|
Fiscal Year Ended June 30, |
|
| |
|
2023 |
2022 |
|
| Mineral Reserve Category |
Source |
Tonnes (Mt) |
Gold Grade (g/t) |
Gold Content (kg) |
Tonnes (Mt) |
Gold Grade (g/t) |
Gold Content (kg) |
% Change |
| Proven |
TSF |
14.2 |
0.27 |
3,823 |
21.1 |
0.26 |
5,553 |
(31.2) |
% |
|
|
|
|
|
|
|
|
|
|
|
|
|
|
|
|
| Probable |
TSF |
381.1 |
0.28 |
105,832 |
419.2 |
0.27 |
113,173 |
(6.5) |
% |
|
|
|
|
|
|
|
|
|
|
|
|
|
|
|
|
Total / Ave. Proven + Probable |
395.3 |
0.28 |
109,655 |
440.3 |
0.27 |
118,726 |
(7.6) |
% |
Notes:
1. The Mineral Reserves were originally prepared, classified and reported according to SAMREC, 2016. For the purposes of this TRS, the Mineral Reserves have been classified in accordance with Item 1302(d)(1)(iii)(A) of Regulation S-K. The QP responsible for the estimate is Mr. BJ. Selebogo, who is the Ore Reserve Manager, and a Harmony employee.
2. Tonnes, grade, and content are declared as net delivered to the mills.
3. Gold content is recovered gold after taking into consideration the modifying factors.
4. Mineral Reserves are reported using a cut-off grade of 0.235g/t and a gold price of US$1,582/oz.
5. Recovered gold (kg) is based on a conversion factor of 32.1507oz/kg.
Decrease due to estimation model update, change in the confidence classification resulting in the reduction of reserves in LOM.
The Mineral Reserve estimate for the West Wits Operation, as at June 30, 2022, and 2023, is summarized in the table below:
|
|
|
|
|
|
|
|
|
|
|
|
|
|
|
|
|
|
|
|
|
|
|
|
|
|
|
| |
|
Fiscal Year Ended June 30, |
|
| |
|
2023 |
2022 |
|
| Mineral Reserve Category |
Source |
Milled Tonnes (Mt) |
Grade
(g/t Au) |
Content Au (kg) |
Tonnes (Mt) |
Gold Grade (g/t) |
Gold Content (kg) |
% Change |
|
|
|
|
|
|
|
|
|
|
|
|
|
|
|
|
|
|
|
|
|
|
|
|
|
| Probable |
TSF |
17.4 |
0.32 |
5,485 |
19.3 |
0.33 |
6,288 |
(12.8) |
% |
Notes:
1. The Mineral Reserves were originally prepared, classified and reported according to SAMREC, 2016. For the purposes of this TRS, the Mineral Reserves have been classified in accordance with Item 1302(d)(1)(iii)(A) of Regulation S-K. The QP responsible for the estimate is Mr. BJ. Selebogo, who is the Ore Reserve Manager, and a Harmony employee.
2. Tonnes, grade, and gold content are declared as net delivered to the mills.
3. Gold content is recovered gold after taking into consideration the modifying factors.
4. Mineral Reserves are reported using a cut-off grade of 0.27g/t and a gold price of US$1,582/oz
5. Recovered gold (kg) is based on a conversion factor of 32.1507oz/kg.
Change due to the increase in the LoM processing volumes.
The tables below presents a summary of the modifying factors used to convert the Mineral Resource to the Mineral Reserve for the MWS Operation. The modifying factors are consistent with the modelling, planning and computing estimates used in determining the Mineral Reserves, which are also consistent with historical performance.
|
|
|
|
|
|
|
|
|
| Modifying Factor |
Unit |
Value |
| Gold Accounted For (“GAF”) - Grade Cut-off |
g/t |
0.24 |
| Recovery Factor |
% |
46.00 |
| Plant Call Factor |
% |
100.00 |
| Dilution |
% |
N/A |
| Conversion factor |
oz/kg |
32.1507 |
The tables below presents a summary of the modifying factors used to convert the Mineral Resource to the Mineral Reserve for the West Wits Operation. The modifying factors are consistent with the modelling, planning and computing estimates used in determining the Mineral Reserves, which are also consistent with historical performance.
|
|
|
|
|
|
|
|
|
| Modifying Factor |
Unit |
Value |
| GAF - Grade Cut-off |
g/t |
0.27 |
| Recovery Factor |
% |
42.0 |
| Mine Call Factor |
% |
100.0 |
| Dilution |
% |
n/a |
For additional information, see the TRS on each individual property, filed as an Exhibit of this annual report on Form 20-F.
Hidden Valley
Property Description
The Hidden Valley mine is located in the Morobe Province of Papua New Guinea and is 100% owned and operated by Morobe Consolidated Goldfields Limited, a wholly-owned subsidiary of Harmony. Hidden Valley mine consists of the Hidden Valley Kaveroi open pit ("HVK") and Hamata open pit located approximately 6km apart and an ore processing facility in steep, heavily forested, mountainous terrain. The deposit is located at latitude 7°22”S and longitude 146°39E, approximately 20km southwest of Wau within Mining Lease ML151.
The following graphic illustrates the location of the Hidden Valley mine.
The mineral tenure is presented in the table below.
|
|
|
|
|
|
|
|
|
|
|
|
|
|
|
|
|
|
Licence Holder |
Licence Type |
Reference No. |
Effective Date |
Expiry Date |
Area (ha) |
| Morobe Consolidated Goldfields |
Mining |
ML151 |
March 4, 2005 |
March 3, 2030 |
4,098.29 |
Operational Infrastructure
Wau is the closest town, with an estimated population of 5,800 (2011 census). This town was the center of the gold rush in the 1920s and 1930s in the Morobe Goldfield. An airstrip is operational in the town. The nearest large town is Bulolo, with a population estimated at 20,000 in 2010. In the 1930s, this town was the center of gold dredging on the Bulolo River. The town has an airport, schools, clinics and hospitals. Forestry is currently the dominant industry in the area.
Lae is an urban area, a major transport hub, and a commercial, administrative, industrial, residential, and educational center for both the Morobe Province and PNG, with a population in 2011 (the most recent year for which PNG census data are available) of approximately 149,000.
The existing infrastructure located at the mine site is sufficient to support the current mine plan.
The surface infrastructure plan for the mine area is presented in the graphic below.
Geology
The Hidden Valley Kaveroi deposit is a vein-stockwork gold-silver deposit located in the southeast corner of the Wau Graben and is hosted by the Morobe Granodiorite. The Kaindi Metamorphics occur as a cap to the Hidden Valley Kaveroi Mineralization. It comprises grey-black and green-brown, variably carbonaceous, schistose, quartz-rich psammites and pelites that have undergone regional greenschist metamorphism and localized, higher grade contact metamorphism on intrusive contacts with Morobe Granodiorite. The granodiorite comprises two parts; an upper homogenous granodiorite of uniform texture cut by thin aplite dykes and feldspar porphyry dykes. Below the Hidden Valley Kaveroi fault is a lower, more heterogeneous unit comprising granodiorite, diorite, adamellite, tonalite and feldspar porphyry. The lower unit tends to contain gypsum veining, not regularly seen in the upper unit.
Numerous porphyry dykes of the Eddie Creek Suite intrude both the Kaindi Metamorphics and the Morobe Granodiorite. Porphyry composition varies from hornblende-biotite to feldspar-quartz phenocryst varieties. These bodies are not general mineralized but do commonly show some alteration.
Surficial weathering, mainly by downward percolation of oxygenated meteoric water, is variable over the gold-silver deposit due to lithological, alteration and structural discontinuities. The granodiorite is usually more deeply weathered than the metasediment of the two main rock units. At the Hidden Valley Kaveroi deposit, four distinct oxidation zones are recognized; an oxide zone, partial oxidation zone, a zone of fracture oxidation, and a fresh (primary) zone. However, the effects of supergene gold enrichment or depletion (if present) are minimal for the Hidden Valley Kaveroi deposit.
History
Gold was discovered in Hidden Valley Creek by W.H. Chapman in 1927 (Lowensteub, 1982), and worked until 1929. In 1945, stream alluvial gold samples were taken close to the Hidden Valley Kaveroi discovery outcrop, but the deposit remained hidden. In 1984, CRA Exploration (Pty) Ltd ("CRAE") discovered the Hidden Valley Kaveroi deposit when it carried out a regional stream sediment sampling program in the headwaters of the Upper Watut River, -80mesh sediment samples returned values of 54ppm gold. Mapping up the creeks revealed a landslide on the northern bank of Hidden Valley Creek had exposed altered and mineralized granodiorite with initial chip sampling returning 55m at 3.8ppm gold. Drilling commenced in 1985, with the third and fourth holes intersecting wide zones of mimineralizationCRA completed a Pre-Feasibility Study in 1989, and concluded the deposit was too marginal at that time to develop. In 1992, Placer Pacific Limited entered into a joint venture with CRAE but withdrew from the joint venture in 1993. In that time Placer drilled 13 holes and tested some adjacent targets. The project went through a hiatus until 1995, when CRA reviewed the project. In 1997, CRA (now known as Rio Tinto Limited) sold its interest in the Hidden Valley Kaveroi deposit to a wholly-owned subsidiary of Australian Gold Fields NL ("AGF"), which was subsequently placed into administration. Aurora Gold Limited ("Aurora") acquired the deposit from the administrators of AGF in September 1998. Aurora completed a pre-feasibility study on the project in 2002. Abelle Limited ("Abelle") obtained 100% ownership of the deposit in February 2003, following the merger of Abelle with Aurora.
Harmony effectively acquired 100% of Abelle on May 1, 2003. A Memorandum of Agreement between landowners and the PNG Government was signed on August 5, 2005, resulting in the mining lease for the Hidden Valley project being granted. Harmony commenced and completed a feasibility project on the deposit and commenced construction in 2008.
In August 2008, Harmony and Newcrest Mining Limited ("Newcrest") commenced a joint venture relationship in the Morobe Province of PNG, and the Hidden Valley Joint Venture was established as an unincorporated 50:50 joint venture between Morobe Consolidated Goldfields Limited (Harmony) and Newcrest PNG1 Limited (Newcrest).
The Hidden Valley mine (comprising HVK and Hamata open pits) has been in operation since 2009, and was officially opened in September 2010.
In October 2016, Harmony acquired Newcrest’s joint venture interest, and Morobe Consolidated Goldfields Limited took 100% ownership of the Hidden Valley mine.
Mineral Tenure
Hidden Valley operates within Mining Lease, ML151, and also within Mining Easement ME 82 and Lease for Mining Purposes LMP80. All tenements are registered in the name of Morobe Consolidated Goldfields Limited and are valid until 2030.
In accordance with the PNG Environment Act, an EIS was submitted to the Department of Environment and Conservation (now CEPA) in February 2004. The EIS was approved in January 2005, and Waste Discharge and Water Extraction permits issued. In October 2017, these permits were amalgamated as Environment Permit EP-L3(578).
In December 2020, Morobe Consolidated Goldfields Limited submitted an application to CEPA for a minor amendment to Environment Permit EP-L3(578), in support of the Stage 8 expansion, in accordance with the Environment (Prescribed Activities) Regulation 2002. An amendment to Environment Permit EP-L3(578) was issued by CEPA in March 2022.
The mine presently operates in accordance with the 41 conditions prescribed by Environment Permit EP-L3(578), which will expire on March 29, 2030. The existing environmental and tenure permits and licenses are summarized below.
In accordance with Environment Permit EP-L3(578), condition 4, Morobe Consolidated Goldfields Limited reviews and updates its Hidden Valley Environmental Management Plan (“EMP”) every three years. The most recent iteration of the EMP (2021-2024) was submitted to CEPA for approval in March 2022.
A summary of the status of environmental permits and tenements issued as at June 30, 2023, is presented in the table below.
|
|
|
|
|
|
| Permit / Licence |
Status |
| Mining Lease |
ML151 current. Amended May 25, 2021. Expiry March 3, 2030. |
| Lease for Mining Purpose |
LMP80 current. Amended May 25, 2021. Expiry March 3, 2030. |
| Mining Easement |
ME82 current. Amended May 25, 2021. Expiry March 3, 2030. |
| Environment Permit EP-L3 (578) |
Awarded October 2017. Amended March 2021. Expires March 2030. |
| EIS |
Approved January 2005. |
|
|
|
|
|
|
|
|
Mining Method
Hidden Valley is an open pit gold-silver operation, operating conventional truck/excavator open pits and an ore-processing plant. Two separate open pits are currently in operation; the HVK pit and the Hamata pit. The HVK pit is the larger pit supplying the majority of the ore and is located some 6km from the processing plant. Hamata ore is predominately exhausted and is used for Tailings dam wall construction material. Hamata will be used for Tailing Storage Facility #2 once complete.
Mining operations employ conventional open pit mining techniques with back-hoe excavators and rigid dump trucks as the primary load and haul equipment. Front-end loaders are used for crusher feed and stockpile reclaim. A number of articulated smaller dump trucks are used for construction, and mining in Hamata. Mining bench configuration consists of 18m inter-berm heights, mined as 2 x 9m benches or 3 x 3m flitches (typically in ore).
Waste is disposed in engineered valley fill waste dumps, with toes keyed in and buttressed using competent non-acid producing rock. The construction of the Neikwiye valley toe buttress and underdrain network was completed in the 2018 fiscal year and waste rock will be disposed in this dump envelope through the remainder of the mine life. Similarly under drain construction and toe buttress will be completed in the Kaveroi Valley with selective placement to continue in this area for the LOM.
The Hidden Valley processing plant was designed to treat nominally 4.2Mtpa of gold/silver bearing ore although operational issues have prevented the plant reaching its design nameplate capacity. The processing plant treats gold/silver ore from the Hidden Valley, Kaveroi and Hamata deposits. Crushed ore is conveyed from the Hidden Valley pit via a 4.5km long overland pipe conveyor. Ore from the Hamata pit is trucked to the Hamata crushing station, located next to the Hidden Valley processing plant.
Tailings are stored in a TSF located to the southwest of the process plant. Dam-wall construction of the TSF is ongoing and largely constitutes placement of suitable oxide and fresh competent material sourced from mining in the Hamata pit. The processing inventory in this Mineral Reserve estimate is constrained by remaining TSF capacity. TFS1 has a remaining capacity of ~11.3Mt with TSF2 adding an additional 8.0Mt3 of capacity. The overall remaining TSF capacity is currently estimated at 19.3Mt.
Mineral Processing
The Hidden Valley CIL processing plant, located adjacent to the Hamata open pit, was commissioned in 2009. The Hidden Valley processing plant is designed to treat nominally 4.2Mtpa of gold bearing ore from three separate open pits. Three distinct ore types are to be treated through two alternate treatment routes:
•whole ore processing: used to process the blend containing ore from the Hamata deposit, and oxide, transitional and primary ore from the Hidden Valley and Kaveroi deposits; and
•primary ore processing: used when processing only the primary ore from the Hidden Valley and Kaveroi deposits.
The Hamata ore is typically a gold:silver ratio of 1:1 with varying sulphur grades from 0.5% to 5.0%. Transition and primary ores have a significantly higher silver content with a gold:silver ratio of 1:15. Transition sulphur averages 0.96% while primary ore has a sulphur grade of 1.81%.
Qualified Persons
The QPs preparing the TRS were employed on a full-time basis by Harmony. The QPs’ qualifications, areas of responsibility and personal inspection of the property are summarized in the graphic below.
|
|
|
|
|
|
|
|
|
|
|
|
|
|
|
| Qualified Person |
Prof. Assoc. |
Qualifications |
TRS Section Responsibility |
Personal Insp. |
| Mr. R. Reid |
FAIG, MAusIMM |
BSc.(Hons), Grad.Dip (Sc) |
3, 4, 5, 6, 7, 8, 9, 11 |
Regular.
Last February 2023 |
| Mr. G. Job |
FAusIMM |
BSc. MSc (Min Econ) |
1, 2, 3, 15, 21, 22, 23 |
Regular.
Last Febraury 2023 |
| Mr. D. Ross |
MAusIMM (CP), RPEQ |
BEng (Mining) |
12, 13 |
Regular.
Last June 2023 |
| Mr. M. Swart |
FAusIMM(CP), RPEQ |
BMetEng, MBA |
10, 14 |
Regular.
Last August 2023 |
| Ms. S. Watson |
MAusIMM |
MSc, BSc.(Hons) |
17 |
Regular.
Last February 2023 |
| Mr. D. Hall |
MAHRI & MAICD |
Bachelor Commerce (HR & Industrial Psychology) |
17 |
Regular.
Last April 2023 |
| Mr. M. Koehler |
CAANZ |
BBus Acc, Grad Dip (CA) |
16, 18, 19 |
Regular
Last August 2021 |
|
|
|
|
|
|
|
|
|
|
|
|
|
|
|
|
|
|
|
|
|
|
|
|
|
|
|
|
|
|
|
|
|
|
|
Exploration
The Hidden Valley Kaveroi deposit has had a long history of exploration dating back to the 1980s. The amount of exploration carried out over the Hidden Valley area is significant, and the volume of the results is too large to enable detailed reporting herein.
A large mapping dataset exists from detailed work completed over the years. The geological model used in the Mineral Resource estimate has been based upon combined drill hole data and surface mapping that has been completed over time. Structural mapping in and around the site and within the open pits has been conducted on a number of occasions. Observations gathered during open pit mapping have been combined with more regional mapping work completed over time by site geologists and consultants to construct a robust geological model that will support the grade estimate.
Available regional government geophysical datasets include a 1000m spaced fixed-wing airborne magnetic survey, a 400m spaced helicopter airborne magnetic survey and a 2000m spaced fixed-wing gravity survey. Available company geophysical datasets include a 50m spaced helicopter airborne magnetic survey, some prospect-specific ground magnetic survey stations, and induced polarization surveys.
Regional stream sediment and "Ridge and Spur" soil sampling was completed by CRAE between 1983 and 1989. Additional soils and trenches were completed prior to and post the commencement of drilling. Drilling data and mining have superseded the information in the trenching programs.
Available geochemical sampling on ML151 includes a total of 24,844 surface samples. These are a mix of historical company data and Harmony collected sampling. Surface geochemical sampling techniques include soil (8,741), rock chip (12,468), wacker (2,033), auger (920) and stream sediment (245), plus some other less common techniques. Available assay suites for both historical company data and Harmony collected sampling vary widely, with assay suites generally extended to more elements in more modern times.
CRAE discovered Hidden Valley using stream sediment sampling campaign up the headwaters of the Upper Watut River in 1984. Sediment samples (-80mesh) returned values of 54ppm Au. No further information is available on the stream sediment sampling campaign. These data are not, however, used in geological modelling and Mineral Resource estimation.
Surface drilling completed to date included diamond core and reverse circulation (“RC”) drilling. Drilling was undertaken continuously between 2009 to 2012, with some minor additional drilling done since. Some targeted deeper RC holes and diamond holes have been drilled into the deposit during 2014 to 2022, with various degrees of success to close up the drill spacing. A total of 34,086 holes measuring 1,099,053m of drilling were used in the generation of the 2022 geology and domain mode. This includes both blast and RC operational grade control drilling. A total of 1,586 drill holes, comprising 275,491m of drilling was used in the Mineral Resource estimate. It should be noted that these numbers exclude grade control drilling. This drilling was not included in the Mineral Resource estimate due to sample support issues which would result from such closely spaced drilling.
The QPs are of the opinion that the quality and quantity of the exploration methods and information gathered is sufficient to support the estimation of Mineral Resources and Mineral Reserves.
Mineral Resource Estimate
The Mineral Resource estimate is reported in situ within the Hidden Valley lease area, as determined through the analysis of the reasonable prospect for economic extraction by opencut mining method. The cut-off value for the Mineral Resources is determined at 0.60g/t gold based on the economic assumptions presented set forth in the table below at the effective date of June 30, 2023.
|
|
|
|
|
|
|
|
|
| Description |
Unit |
Value |
| Gold price |
US$/oz |
1,546 |
| Silver price |
US$/oz |
22.35 |
A$ FX rate |
US$:A$ |
0.73 |
K FX rate |
K:US$ |
3.5 |
Plant recovery factor – (ave of multi variate curve) |
% |
88.0 |
| Unit cost |
K/t |
10.21 |
Note: Unit cost includes cash operating cost, royalty and ongoing development capital.
This cut-off value represents typical costs for the mining method and preliminary mining and metallurgical recovery assumptions.
The Mineral Resources were originally prepared, classified and reported according to SAMREC, 2016. For the purposes of this report on Form 20-F, the Mineral Resources have been classified in accordance with Item 1302(d)(1)(iii)(A) of Regulation S-K. These Mineral Resources account for mining depletion recorded from July 2022 to June 2023. The apparent decrease in Resource tonnes is a product of the increased Reserve. The additional Reserves have been subtracted from the Resource numbers, which have also seen some depletion related to mining over the past year.
This cut-off value represents typical costs for the mining method and preliminary mining and metallurgical recovery assumptions.
The Mineral Resources were originally prepared, classified and reported according to SAMREC, 2016. For the purposes of this report on Form 20-F, the Mineral Resources have been classified in accordance with Item 1302(d)(1)(iii)(A) of Regulation S-K. These Mineral Resources account for mining depletion recorded from July 2022 to June 2023.
The Mineral Resource estimate, as at June 30, 2023, exclusive of the reported Mineral Reserves, is summarized in the table below.
|
|
|
|
|
|
|
|
|
|
|
|
|
|
|
|
|
|
|
|
|
|
|
|
|
|
|
|
|
|
|
|
|
|
|
|
|
|
|
|
|
Fiscal Year Ended June 30, |
|
| |
|
2023 |
2022 |
|
| |
|
|
Grade |
Metal Content |
|
Grade |
Metal Content |
|
| Mineral Resource Category |
Source |
Tonnes
(Mt) |
Gold
(g/t) |
Silver
(g/t)
|
Gold
(kg) |
Silver
(g/t)
|
Tonnes
(Mt) |
Gold
(g/t) |
Silver
(g/t)
|
Gold
(kg) |
Silver
(g/t)
|
%
Change |
| Measured |
HVK |
— |
|
— |
|
— |
|
— |
|
— |
|
— |
|
— |
|
— |
|
— |
|
— |
|
— |
% |
| Hamata |
— |
|
— |
|
— |
|
— |
|
— |
|
— |
|
— |
|
— |
|
— |
|
— |
|
— |
% |
| Sub Total / Ave. Measured |
— |
|
— |
|
— |
|
— |
|
— |
|
— |
|
— |
|
— |
|
— |
|
— |
|
— |
% |
| Indicated |
HVK |
28.500 |
|
1.26 |
|
17.400 |
|
36,000 |
|
498,000 |
|
32.986 |
|
1.34 |
|
21.970 |
|
44,064 |
|
724,693 |
|
(18) |
% |
| Hamata |
1.900 |
|
1.57 |
|
— |
|
3,000 |
|
— |
|
1.607 |
|
1.97 |
|
— |
|
47,228 |
|
724,693 |
|
(94) |
% |
| Sub Total / Ave. Indicated |
30.500 |
|
1.28 |
|
16.400 |
|
39,000 |
|
498,000 |
|
34,592.000 |
|
1.37 |
|
21.970 |
|
47,228 |
|
724,693 |
|
(17) |
% |
| Total / Ave. Measured + Indicated |
30.500 |
|
1.28 |
|
16.400 |
|
39,000 |
|
498,000 |
|
34,592.000 |
|
1.37 |
|
21.970 |
|
47,228 |
|
724,693 |
|
(17) |
% |
| Inferred |
HVK |
0.900 |
|
1.10 |
|
23.300 |
|
1,000 |
|
21,000 |
|
1.234 |
|
1.21 |
|
23.120 |
|
1,489 |
|
28,521 |
|
(33) |
% |
| Hamata |
0.200 |
|
1.44 |
|
— |
|
300 |
|
— |
|
0.190 |
|
1.50 |
|
— |
|
284 |
|
— |
|
6 |
% |
| Total / Ave Inferred |
1.100 |
|
1.16 |
|
18.700 |
|
1,300 |
|
21,000 |
|
1.423 |
|
1.25 |
|
23.120 |
|
1,773 |
|
28,521 |
|
(27) |
% |
Notes:
1.Mineral Resources are reported with an effective date of June 30, 2023 using the SAMREC Code, 2016. For the purposes of this TRS, the Mineral Resources have been classified in accordance with Item 1302(d)(1)(iii)(A) of Regulation S-K. The QP responsible for the estimate is Mr. R. Reid, Group Resource Geologist, and employee of Harmony PNG.
2.Mineral Resources are adjusted for mining depletion to end April 2023, with assumed production for May and June, 2023.
3.Measured Resources include surface stockpiles only.
4.Mineral Resources are reported on a 100% basis. Harmony holds a 100% interest.
5.Mineral Resources are reported exclusive of Mineral Reserves. Mineral Resources that are not Mineral Reserves do not have demonstrated economic viability.
6.Mineral Resources at HVK are reported assuming a bulk open pit mining metallurgical recovery for silver and gold by sulphide flotation. Mineral Resources are reported above a gold grade cut-off of 0.60g/t on the results of a profit algorithm; this equates to a marginal ore cut-off grade. The profit algorithm takes account of metal price, grade, ore processing route, recoveries and costs. Metal price assumptions are US$1,546/oz gold, US$22.35/oz silver and a 0.73 US$/A$ exchange rate. Adjustments to these figures will potentially impact upon the economic cut-off grade.
7.Tonnages are metric tonnes. Gold and silver ounces are estimates of metal contained in tonnages and do not include allowances for processing losses.
8.Rounding as required by reporting guidelines may result in apparent differences between tonnes, grade and contained metal content. Rounding is to three significant figures.
Mineral Reserve Estimate
The Mineral Reserves were originally prepared, classified and reported according to SAMREC, 2016. For the purposes of this report on Form 20-F, the Mineral Reserves have been classified in accordance with Item 1302(d)(1)(iii)(A) of Regulation S-K.
Mineral Reserves are derived from the Mineral Resources, a detailed business plan and the operational mine planning processes. Mine planning utilizes and takes into consideration historical technical parameters achieved. In addition, Mineral Resource conversion to Mineral Reserves considers certain modifying factors, dilution, ore losses, minimum mining widths, planned mine call factors.
The Mineral Reserve estimate, as at June 30, 2023, is summarized in the table below.
|
|
|
|
|
|
|
|
|
|
|
|
|
|
|
|
|
|
|
|
|
|
|
|
|
|
|
|
|
|
|
|
|
|
|
|
|
|
|
| |
|
Fiscal Year Ended June 30, |
|
| |
|
2023 |
2022 |
|
| |
|
|
Grade |
Metal
Content
|
|
Grade |
Metal
Content
|
|
Mineral Reserve Category |
Open Pit |
Tonnes
(Mt) |
Gold
(g/t) |
Silver
(g/t) |
Gold
(Kg)
|
Silver
(Kg)
|
Tonnes
(Mt) |
Gold
(g/t) |
Silver
(g/t) |
Gold
(Kg)
|
Silver
(Kg)
|
%
Change |
Proven |
HVK |
1.6 |
|
0.98 |
|
21.20 |
|
1,600.00 |
|
34,500 |
|
— |
|
0.86 |
|
18.32 |
|
2,000.00 |
|
47,000 |
|
(27) |
% |
| Hamata |
— |
|
— |
|
— |
|
— |
|
— |
|
— |
|
— |
|
— |
|
— |
|
— |
|
— |
% |
Sub Total / Ave. Proven |
1.6 |
|
0.98 |
|
21.20 |
|
1,600.00 |
|
34,500 |
|
— |
|
0.80 |
|
18.32 |
|
2,000.00 |
|
47,000 |
|
(27) |
% |
Probable |
HVK |
17.6 |
|
1.78 |
|
27.82 |
|
31,400.00 |
|
489,700 |
|
— |
|
1.78 |
|
22.45 |
|
29,000.00 |
|
366,000 |
|
34 |
% |
| Hamata |
0.2 |
|
1.90 |
|
— |
|
300.00 |
|
— |
|
— |
|
1.48 |
|
— |
|
400.00 |
|
— |
|
— |
% |
Sub Total Probable |
17.8 |
|
1.79 |
|
27.58 |
|
31,700.00 |
|
489,700 |
|
— |
|
1.77 |
|
22.45 |
|
29,400.00 |
|
366,000 |
|
34 |
% |
|
Total / Ave.
Proven + Probable
|
19.4 |
|
1.72 |
|
27.04 |
|
33,300.00 |
|
524,200 |
|
— |
|
1.64 |
|
21.97 |
|
31,400.00 |
|
413,000 |
|
27 |
% |
Notes:
1.Mineral Reserves are reported with an effective date of June 30, 2023, using the SAMREC Code, 2016. For the purposes of this TRS, the Mineral Reserves have been classified in accordance with Item 1302(d)(1)(iii)(A) of Regulation S-K. The QP responsible for the estimate is Mr. D. Ross, Group Mine Planning Engineer, and employee with Harmony PNG.
2.Mineral Resources are reported on a 100% basis. Harmony holds a 100% interest.
3.Mineral Reserves are reported using the following assumptions: open pit mining method, gold price of US$1,546/oz, silver price of US$22.35/oz at US$/A$ 0.73 exchange rate.
4.Not all “ore” as defined at the economic cut off reports to the Mineral Reserve due to the constrained tailing storage facility with some marginal grade ore material remaining on stockpile. The Proven Mineral Reserve is limited to stockpiles. Probable Mineral Reserve is derived from the Indicated Mineral Resource.
5.Gold and silver ounces are estimates of metal contained in tonnages and do not include allowances for processing losses.
6.Rounding as required by reporting guidelines may result in apparent differences between tonnes, grade and contained metal content. Rounding is to three significant figures.
The marginal increase in total Proven and Probable Mineral Reserve from 2022 to 2023 was primarily due to a pit redesign which included additional ore tonnes, offsetting depletion. The additional ore tonnes added to the pit design have been converted to Mineral Reserves in line with the additional realized TSF capacity.
|
|
|
|
|
|
|
|
|
| Modifying Factor |
Unit |
Value |
| Gold Price |
US$/oz |
1,582 |
| Silver Price |
US$/oz |
22.35 |
| Exchange Rate |
A$ : US$ |
: |
0.70 |
K : US$ |
: |
3.51 |
| Tonnage Recovery |
% |
100 |
| Gold Grade Recovery |
HVK >2300mRL |
% |
93 |
HVK < 2300mRL |
% |
90 |
Hamata |
% |
|
For additional information, see the TRS on each individual property, filed as an Exhibit of this annual report on Form 20-F.
Wafi-Golpu
Property Description
The Wafi-Golpu Project is situated within the Morobe Province of PNG, approximately 65km southwest of Lae, the nearest commercial center. The Wafi-Golpu Project comprises the Golpu copper–gold porphyry deposit (“Golpu deposit”), the Wafi epithermal gold deposit ("Wafi deposit") and the Nambonga copper-gold porphyry deposit ("Nambonga deposit"). Mineral Resources and Mineral Reserves were estimated for the Golpu deposit. Additional Mineral Resources were estimated for the Wafi deposit and the Nambonga deposit however, these deposits are not currently included in the mine plan. No production has yet occurred at this property. The Wafi-Golpu Project is situated at a latitude of 6°51’46.63”S and longitude of 146°27’08.20”E.
The following graphic illustrates the location of the Wafi-Golpu Project.
The tenements are held by the Wafi Golpu Joint Venture ("WGJV") which is a 50%:50% unincorporated joint venture between Wafi Mining Limited ("Wafi Mining") and Newcrest PNG2 Limited ("Newcrest PNG2"), subsidiaries respectively of Harmony and Newcrest and together referred to as the "WGJV participants". The WGJV participants hold two exploration licenses ("ELs") covering a total area of 12,984 ha. The deposits are located within EL440, with a range of major surface facilities to be located on EL1105.
The WGJV participants also hold an environment permit for the project issued under the PNG Environment Act. The permit authorizes the utiliization of DSTP as the tailings management method for the Wafi-Golpu Project.
Both tenements were in good standing as at June 30, 2023. There is no material litigation (including violations or fines) that threatens its mineral rights, tenure, or operations. However, the grant of the permit is currently the subject of two judicial reviews, the first applied for in March 2021 by the previous Governor of the Morobe Province in PNG, who was opposed to DSTP, and the second in December 2022 by coastal villagers represented by the CELCOR. The present Governor, who was appointed in September 2022, is not opposed to DSTP and has stated publicly that he intends to withdraw his proceedings, but has not yet done so. Notwithstanding the change of position of the Governor or the outcome of the judicial review instituted by CELCOR, it is possible that a class action or individual claim relating to DSTP may be filed against us in the future, which could have a material adverse impact on the Wafi-Golpu Project. See Item 3: “Risk Factors - We are subject to the risk of litigation, the causes and costs of which are not always known”.
Operational Infrastructure
The closest major community is Lae. Lae is an urban area, a major transport hub, and a commercial, administrative, industrial, residential, and educational center for both the Morobe Province and PNG, with a population in 2011 (the most recent year for which PNG census data are available) of approximately 149,000.
The Wafi-Golpu Project is located in a mountainous area of PNG. A combination of roads and access tracks exist between Lae and the project site. However, the track components are suitable for four-wheel drive vehicles and purpose-built trucks only. During major rainfall events this access route may become closed to vehicular traffic.
Current access to the planned mine site is via a partly-sealed road from Lae to Timini, and a gravel road from Timini (Demakwa) to Wafi, with the trip taking about three to four hours depending on the weather. As part of project development, a new road (including bridges) (the "northern access road"), will be constructed, running from the Highlands highway to the mine site, and linking up with the current exploration access road. A private mine access road will be constructed from the intersection of the northern access road and the current exploration access road.
Commercial airlines operate flights between the national capital, Port Moresby, and Nadzab airport, which is approximately a one-hour drive by road from Lae. The Nadzab airstrip is sealed. Helicopter access to the mine site area is available, with a suitable area at the proposed mine site cleared for landing.
The Golpu project is a greenfield site that currently does not have any infrastructure to support the planned mining and processing operations. There is no effective local infrastructure with respect to power, water, and roads that are trafficable by vehicles other than all-wheel drive vehicles. Water supply for drilling was sourced from rivers, and power at the exploration camp (Wafi Camp) is locally generated. The surface infrastructure plan for the mine area is displayed in the graphic below, along with the start of the infrastructure corridor.
Geology
Wafi–Golpu is a complex, multiphase mineralized system comprising the:
•Golpu porphyry copper–gold deposit;
•Wafi epithermal gold deposit; and
•Nambonga porphyry gold–copper deposit.
The Golpu Intrusive Complex consists of multiple, hornblende-bearing diorite porphyries intruded into the host sedimentary lithologies. The porphyries are separated based on their spatial position and, where not texturally destroyed, into coarse hornblende-rich variants, feldspathic-rich units and porphyries containing quartz-eye inclusions. Intrusions range from small dykes to small stocks/bosses and apotheoses. Single intrusions pinch and swell vertically over tens of meters and form dykes, pipes and stocks.
The Wafi Diatreme complex is a roughly rectangular shaped feature, 800m by 400m at surface with steep, inward-dipping sides. The diatreme comprises intrusive and sedimentary breccias, volcaniclastic rocks and tuffs, and was intruded by several phases of unmineralized dacitic porphyries.
The Nambonga diorite porphyry stock is typically medium-grained, containing plagioclase and hornblende phenocrysts set in a feldspathic matrix. The diorite is cut by a late barren diorite phase at depth. The diorite has intruded lithologies of the Owen Stanley Metamorphic Complex, consisting of metasandstone and minor metaconglomerate.
History
Historical exploration dates back to 1977 and has included regional exploration sampling, geophysical surveys, geochemical sampling, reverse circulation and diamond core drilling.
CRAE identified mineralized float in a regional geochemical sampling program and discovered the outcropping mineralization of the Wafi A Zone near Mount Golpu in 1979. The Mt Wanion Exploration License (EL440) was granted in 1980. The discovery of the Golpu copper–gold porphyry deposit occurred in 1990.
Aurora acquired project ownership in 2001 and updated Wafi resource estimate on A Zone, B Zone and Link Zone in 2002. Completed check resource estimate at Wafi in 2002. Aurora merged with Abelle in 2003. An updated Wafi Mineral Resource estimate was completed in 2003.
Harmony acquired Abelle in 2004 and completed the Wafi–Golpu Concept Study. Resource estimates for selected deposits were updated in 2005, 2006 and 2007. The Golpu Standalone Pre-Feasibility Study, was completed 2007. The Wafi–Golpu Integrated Pre-Feasibility Study was completed 2007. The Nambonga porphyry was discovered in 2007.
In 2008, Harmony and Newcrest commenced a joint venture relationship in the Morobe Province of PNG, and the WGJV was established as an unincorporated 50:50 joint venture between Wafi Mining and Newcrest PNG2.
The Golpu Development Project Desktop Study was completed 2009. This was followed by the Wafi Concept Study (2010), the Wafi–Golpu Pre-Feasibility Study (2012), and the Wafi Golpu Pre-Feasibility Optimization Study (2014). Regional geological mapping and geological synthesis was completed in 2015, which led to a re-evaluation of the development approach and the Golpu Stage 2 Pre-Feasibility Study, completed in 2015. Golpu Feasibility Study was then completed 2016.
On August 25, 2016 the WGJV submitted a Special Mining Lease ("SML") application to the PNG MRA for an SML area including the Golpu, Wafi and Nambonga deposits. The SML application included a Proposal for Development, which incorporated the 2016 Feasibility Study report and supporting application documents such as a National Content Plan. Further data collection and technical assessment undertaken in 2016–2017. The Feasibility Study Update was completed in December 2017 and submitted to the PNG MRA in March 2018. Permitting negotiations for the grant of the SML application are ongoing.
An EIS was submitted to CEPA on June 25, 2018, and an environment permit for the Wafi-Golpu Project was issued on December 18, 2020.
Mineral Tenure
Refer to Item 4: “Information on the Company – Business Overview – Regulation – Mineral Rights – Papua New Guinea” above for a summary of the regulatory environment in PNG.
The WGJV holds two ELs covering a total area of 12,894ha, each of which is registered in the names of Wafi Mining and Newcrest PNG2. The deposits are all located within EL440, with a range of major surface facilities to be located on EL1105. The summary of mineral tenure is presented in the table below.
|
|
|
|
|
|
|
|
|
|
|
|
|
|
|
|
|
|
License Holder |
License Type |
Reference No. |
Effective Date |
Expiry Date |
Area (ha) |
|
Wafi Mining and Newcrest PNG2
Wafi Mining and Newcrest PNG2
|
Exploration |
EL440 |
March 11, 2020 |
March 10, 20221 |
9,501 |
Exploration |
EL1105 |
January 16, 2021 |
February 25, 2023 |
3,393 |
Notes: 1. Renewal submitted on December 6, 2021.
Both tenements are in good standing and are currently under renewal. The WGJV participants lodged an application to extend the terms of EL440 for a further two years on December 6, 2021, in accordance with the requirements of the PNG Mining Act.
Each EL is subject to the condition that, “Subject to any agreement made under Section 17 of the Act, the State reserves the right to elect at any time, prior to the commencement of mining, to make a single purchase of up to 30% equitable interest in any mineral discovery arising from this license, at a price pro-rata to the accumulated exploration expenditure and then to contribute to further exploration and development in relation to the lease on a prorate basis unless otherwise agreed”. If the PNG State chooses to take-up its full 30% interest, the interest of each of Wafi Mining and Newcrest PNG 2 will become of a 35%.
The leases or permits required to develop and operate the Wafi-Golpu Project as at June 30, 2023 are presented in the table and summarized below:
•SML 10. For Block cave mines, Watut declines portal terrace, process plant terrace, Watut process plant, Nambonga decline portal terrace, waste rock storage facilities ("WRSFs"), Miapilli clay borrow pit, water treatment facilities, sedimentation dams, raw water dam, explosives magazine facilities, waste management facility, concrete batch plants, electrical substations, workshops and administration buildings, accommodation facility;
•LMP 100. For Finchif construction accommodation facility and power generation facilities;
•LMP 104. For Port facilities area (including concentrate filtration plant);
•LMP 105. For outfall area;
•ME 91. For Infrastructure corridor pipelines from the northern boundary of the SML application to Lae for pipelines and power transmission lines from the power generation facilities to the northern boundary of the SML;
•ME 92. For Mine access road;
•ME 93. For northern access road;
•ME 94. For wastewater discharge pipeline (for mine dewatering) to the Watut River and co-located raw water make-up pipeline;
•ME 96. For terrestrial tailings pipeline – Lae to Wagang; and
•ME 97. For component of outfall system, specifically the seawater intake and deep sea tailings placement outfall pipelines.
•ML 183. Northern Access Road Quarry
•ML 184. Madzim Gravel Pit
•ML 185. Lense Sibal Beamena Hard Rock Quarry
•ML 186. South Papas Gravel Pit
•ME 115. Madzim Gravel Pit Access Track
|
|
|
|
|
|
| Permit / Licence |
Status |
| EIR |
Submitted May 2017, approved June 2017. |
| EIS |
Submitted 2018. Approved November 2020. |
| Level 3 Environment Permit EP-L3 (767) |
Approved December 2020. Valid for 50 years. |
| Environmental Management Plan |
Submitted. Approved in EP-L3 (767) |
Mining Method
The proposed mining method is block caving on three levels, namely BC40, BC42 and BC44. The BC44 and BC42, underground services, and infrastructure areas are designed to a feasibility level of confidence. The BC40 cave footprint and thus extraction level layout are designed at a pre-feasibility confidence level. The infrastructure for BC40 is identical to that of BC44 and BC42 and is at a feasibility level of confidence. There will be no additional surface infrastructure for BC40.
Block caving was selected for the following reasons:
•orebody geometry and geotechnical conditions;
•high productivity, low operating cost mining method; and
•higher-value material located at depth can be accessed earlier in the mine plan.
The proposed mine plan uses technology conventional to block cave operations, including mine design and equipment. The mine is planned to operate 24 hours per day, every day of the year, apart from scheduled and unscheduled shutdowns.
Access to the mine workings will be via the Watut and Nambonga declines, with each generating waste rock that will either be used in construction activities, processed or deposited within the WRSFs. Block cave mining will not result in the production of waste rock because all material extracted from the block cave will be fed to the Watut process plant. Block cave mining will cause a subsidence zone of fractured rock to develop that will propagate to surface.
During caving operations, ore from the block cave drawpoints will be delivered by vehicles to an underground crusher. The crushed ore will then be conveyed to the surface. The ore conveyor emerging at the Watut declines portal terrace will continue overland for approximately 600m to deliver crushed ore to a coarse ore stockpile adjacent to the Watut process plant for processing.
Mineral Processing
The proposed Watut process plant will be a compact copper concentrator that is progressively built (in line with the profile of the mine ramp-up) to be capable of processing approximately 17Mtpa of crushed ore at peak capacity to produce a high-grade copper concentrate. The plant is designed to cater for the ore composition changes over the LOM, and blending is not expected to be required.
A two-stage ramp-up philosophy will be used. The plant will run intermittently (campaign treatment) and in 50% turndown mode for the first three years. During the mine ramp-up period, the total volume of the coarse ore stockpile and start-up stockpile will be used to maintain plant utilization as high as practicable, minimizing the number of plant stops.
Models for the two process flowsheet variations were derived from the validated base case flowsheets, using standard metal balance techniques per unit operation.
Qualified Persons
The QPs preparing the TRS were employed on a full-time basis by Harmony. The QPs’ qualifications, areas of responsibility and personal inspection of the property are summarized in the table below:
|
|
|
|
|
|
|
|
|
|
|
|
|
|
|
| Qualified Person |
Prof. Assoc. |
Qualifications |
TRS Section Responsibility |
Personal Insp. |
| Mr. R. Reid |
FAIG, MAusIMM |
BSc(Hons), Grad.Dip(Sc) |
3, 4, 5, 6, 7, 8, 9, 11 |
Regular
Last Aug 2019 |
| Mr. G. Job |
MAusIMM |
BSc. MSc (Min Econ) |
1, 2, 3, 15, 21, 22, 23 |
Regular, last 2020 |
| Caveman Consulting |
N/A |
N/A |
12, 13 |
2016 |
| Mr. M. Swart |
FAusIMM, RPEQ, MIEPNG |
BE (Met Eng), MBA |
10, 14 |
None1 |
| Ms. S. Watson |
MAusIMM |
MSc, BSc. (Hons) |
17 |
Regular |
| Mr. M. Koehler |
CAANZ |
BBus Acc, Grad Dip (CA) |
16, 18, 19 |
None1 |
|
|
|
|
|
|
|
|
|
|
|
|
|
|
|
|
|
|
|
|
|
|
|
|
|
Notes: 1. Not deemed necessary as no plant nor infrastructure has yet been constructed on site.
Exploration
The Wafi-Golpu Project has had a long history of exploration dating back to the 1980s. The amount of exploration carried out over the Wafi-Golpu Project area is significant and the volume of the results are too large to enable detailed reporting herein. The exploration results that have been used in the estimation of the Mineral Resources are identified.
A number of mapping programs were conducted over the Wafi-Golpu Project area including 1:10,000 fact mapping of available outcrop. Mapping data and subsequent interpretations were used together with drill hole data to model the deposit geology and structure. A structural model for the Wafi–Golpu area was compiled in 2011.
Geophysical surveys were conducted as part of the early-stage exploration activities. The following surveys were conducted:
• CRAE,1985: Dipole-dipole IP/resistivity survey;
• CRAE/Elders, 1990: Moving loop time domain electromagnetic (“EM”) geophysical survey; and
• CRAE, 1991–1997: Aeromagnetic, ground magnetic, SP, IP, and CSAMT geophysical surveys
WGJV staff re-examined some of the geophysical data in 2018, as follows:
•the 1985 survey, conducted using 100m and 200m dipole spacing, was compiled and inverted in three-dimensions (“3D”). Generally high chargeability values were noted, and clearly defined the lithocap as a strong resistor above a relatively conductive zone of clay alteration; and
•the 1990 EM survey data were inverted in 3D and show a clear conductor that coincides with the top of the Golpu deposit. This conductor is probably due to sulphide veining which, unlike magnetite, has not been affected by late advanced argillic alteration.
CRAE completed ridge and spur sampling programs from 1980–1982. CRAE also conducted an initial trenching program comprising 102 trenches, varying in length from 1–1,840m, for a total 34,129m of trenching. Information from these programs was superseded by drill data.
Drilling completed to date included diamond core drilling and RC. A total of 791 drill holes (including wedges) were completed in the project area since 1983, comprising 285,757m of core drilling and 17,180m of RC drilling. No drilling has been conducted since the end of 2018.
The QPs are of the opinion that the quality and quantity of the exploration methods and information gathered is sufficient to support the estimation of Mineral Resources and Mineral Reserves.
Mineral Resource Estimate
The Mineral Resource estimate assumes a bulk mining underground extraction method such as block caving and metallurgical recovery for copper and gold by sulphide flotation.
The Mineral Resource estimate is reported based on mass mining by block cave with no internal selectivity. The 40m x 40m x 40m parent block size was an appropriate cell size for the planned bulk mining method. The shell did not represent a conceptual block cave footprint and associated draw column height of draw. However, it did represent the economic material potentially recoverable from a major block cave. The primary model was passed through a net smelter return ("NSR") calculation sheet and a breakeven value shell was generated at margin 0 to remove isolated projections and incorporate a small volume of internal waste.
The metallurgical recovery model was based on copper flotation with copper and gold recovered to concentrate. Extensive testwork was completed to establish algorithms developed from variability modelling. Metallurgical domains were based on both the host rock type and alteration style. Each metallurgical domain was assigned a recovery algorithm, typically subdivided based on Cu:S and Au:S ratios.
The NSR estimation was required only to establish the Mineral Resource reporting breakeven value shell. Mining and milling costs were based on a block caving mining method and milling through a copper concentrator. The breakeven value shell spatially constraining the grade model includes internal waste, and excluded isolated above-cut-off blocks, which reflected the potential bulk mining scenario. There was no revenue assumed from silver or molybdenum in the NSR estimate; however, these elements were estimated as part of the Mineral Resource estimation process as there may be potential for these metals to be recovered with minor circuit modifications or concentrate contract negotiations, and therefore included in future Mineral Resource estimates.
|
|
|
|
|
|
|
|
|
| Description |
Unit |
Value |
| Gold price |
US$/oz |
1,200 |
| Copper price |
US$/oz |
3.00 |
A$ FX rate |
US$:A$ |
0.75 |
K FX rate |
K:US$ |
3.10 |
| Plant recovery factor - calculated |
% |
Varies |
|
|
|
|
|
|
Note:
1 Unit cost includes cash operating cost, royalty and ongoing development capital.
The cut-off value is a NSR value that contains typical costs for the mining method and preliminary mining and metallurgical recovery assumptions.
The Mineral Resources were originally prepared, classified and reported according to SAMREC, 2016. For the purposes of this report on Form 20-F, the Mineral Resources have been classified in accordance with Item 1302(d)(1)(iii)(A) of Regulation S-K. There has been no mining at Wafi-Golpu.
The Mineral Resource estimate for Golpu, as at June 30, 2023, exclusive of the reported Mineral Reserves is summarized in the table below.
|
|
|
|
|
|
|
|
|
|
|
|
|
|
|
|
|
|
|
|
|
|
|
|
|
|
|
|
|
|
|
|
|
|
|
|
|
|
|
|
|
|
|
|
|
|
|
|
|
Fiscal Year Ended June 30, |
|
| |
2023 |
2022 |
|
| |
|
Grade |
Metal Content |
|
Grade |
Metal Content |
|
| Mineral Resource Category |
Tonnes
(Mt) |
Gold
(g/t) |
Copper
(%) |
Silver
(g/t)
|
Gold
(kg) |
Copper (Mt) |
Silver
(Kg)
|
Tonnes
(Mt) |
Gold
(g/t) |
Copper
(%) |
Silver
(g/t)
|
Gold
(kg) |
Copper
(Mt)
|
Silver
(Kg)
|
%
Change |
Measured |
'- |
'- |
'- |
'- |
'- |
'- |
'- |
'- |
'- |
'- |
'- |
'- |
'- |
'- |
'- |
| Indicated |
145.0 |
|
0.54 |
|
0.90 |
1.26 |
|
78,000.00 |
|
1.35 |
182,826 |
|
145.0 |
|
0.54 |
|
0.90 |
|
1.26 |
|
78,000 |
|
1.350 |
|
182,826 |
|
— |
% |
| Total / Ave. Measured + Indicated |
145.0 |
|
0.54 |
|
0.90 |
1.26 |
|
78,000.00 |
|
1.35 |
182,826 |
|
145.0 |
|
0.54 |
|
0.90 |
|
1.26 |
|
78,000 |
|
1.350 |
|
182,826 |
|
— |
% |
| Inferred |
70.0 |
|
0.62 |
|
0.86 |
1.10 |
|
44,000.00 |
|
0.60 |
74,455 |
|
70.0 |
|
0.62 |
|
0.86 |
|
1.10 |
|
44,000 |
|
0.600 |
|
74,455 |
|
— |
% |
Notes:
1.Mineral Resources are reported with an effective date of June 30, 2023 using the SAMREC Code, 2016. For the purposes of this TRS, the Mineral Resources have been classified in accordance with Item 1302(d)(1)(iii)(A) of Regulation S-K. The QP responsible for the estimate is Mr. R. Reid, FAIG, MAusIMM, whose job title is Group Resource Geologist with Harmony Gold (PNG Services) Pty Limited.
2.Mineral Resources are reported on a 50% basis as Harmony holds a 50% interest in the WGJV.
3.Mineral Resources are reported exclusive of Mineral Reserves. Mineral Resources that are not Mineral Reserves do not have demonstrated economic viability.
4.Mineral Resources at Golpu are reported assuming a bulk mining underground extraction method and metallurgical recovery for copper and gold by sulphide flotation. Mineral Resources are reported above a NSR cut-off, which assumes a gold price of US$1,300/oz Au, a copper price of US$3.40/lb Cu, mining cost of US$8.37/t mined, processing cost of US$9.75/t processed, general and administrative (G&A) costs of US$4.17/t processed, copper concentrate treatment charge of US$100/dmt of concentrate, transport cost of US$33.50/wet tonne of concentrate, and copper refining charges of US$0.10/lb of recovered copper. Silver and molybdenum were not valued in the NSR cut-off; however, these elements were reported within the Mineral Resource as they were expected to be recovered with minor circuit modifications or concentrate contract negotiations. Over the life-of-mine, it is anticipated that copper recoveries will average 94% and gold recoveries will average 68%.
5.Metal contents reported do not include allowances for processing losses.
6.Rounding as required by reporting guidelines may result in apparent differences between tonnes, grade and contained metal content. Rounding is to three significant figures.
Mineral Resource estimate for Wafi, as at June 30, 2023, exclusive of the reported Mineral Reserves is summarized in the table below:
|
|
|
|
|
|
|
|
|
|
|
|
|
|
|
|
|
|
|
|
|
|
|
|
|
|
Grade |
Metal Content |
| Mineral Resource Category |
Tonnes (Mt) |
Gold (g/t) |
Copper (%) |
Silver (g/t) |
Gold (kg) |
Copper (Mt) |
Silver (kg) |
|
|
|
|
|
|
|
|
|
|
|
|
|
|
|
|
| Total / Ave. Measured + Indicated |
54.000 |
1.66 |
— |
— |
89,000 |
— |
— |
| Inferred |
20.000 |
1.37 |
— |
— |
26,000 |
— |
— |
Notes:
1.Mineral Resources are reported with an effective date of June 30, 2023 using the SAMREC Code, 2016. For the purposes of this TRS, the Mineral Resources have been classified in accordance with Item 1302(d)(1)(iii)(A) of Regulation S-K. The Qualified Person responsible for the estimate is Mr. R. Reid, FAIG, MAusIMM, whose job title is Group Resource Geologist with Harmony Gold (PNG Services) Pty Limited.
2.Mineral Resources are reported on a 50% basis as Harmony holds a 50% interest in the WGJV.
3.Mineral Resources are reported exclusive of Mineral Reserves. Mineral Resources that are not Mineral Reserves do not have demonstrated economic viability.
4.Mineral Resources at Wafi are reported assuming open pit mining methods with limited internal selectivity, and a process method that is anticipated to be a combination of CIP and CIL operation, with a flotation sulphide recovery mill process. The estimates are reported at cut-offs of 0.4g/t Au for non-refractory gold mineralization ("NRG") and 0.9g/t Au for refractory gold mineralization ("RG"). Mineral Resources are constrained within a conceptual open pit shell that uses the following input assumptions: gold price of US$1,400/oz; mining costs of US$5.40/t mined, and process and general and administrative costs of US$17.30/t processed. Metallurgical recovery is estimated at 91% gold recovery NRG and minimum of 47% recovery for RG. Pit slope approximate overall angles range from 33° in oxidized material to 65° in fresh rock.
5.Metal contents reported do not include allowances for processing losses.
6.Rounding as required by reporting guidelines may result in apparent differences between tonnes, grade and contained metal content. Rounding is to three significant figures.
Mineral Resource estimate for Nambonga, as at June 30, 2023, exclusive of the reported Mineral Reserves is summarized below:
|
|
|
|
|
|
|
|
|
|
|
|
|
|
|
|
|
|
|
|
|
|
|
|
|
|
Grade |
Metal Content |
| Mineral Resource Category |
Tonnes (Mt) |
Gold (g/t) |
Copper (%) |
Silver (g/t) |
Gold (kg) |
Copper (Mt) |
Silver (kg) |
|
|
|
|
|
|
|
|
|
|
|
|
|
|
|
|
|
|
|
|
|
|
|
|
| Measured |
— |
— |
— |
— |
— |
— |
— |
Indicated |
— |
— |
— |
— |
— |
— |
— |
Total / Ave. Measured + Indicated |
— |
— |
— |
— |
— |
— |
— |
| Inferred |
24.000 |
0.690 |
0.20 |
— |
16,000 |
0.047 |
— |
Notes:
1.Mineral Resources are reported with an effective date of June 30, 2023 using the SAMREC Code, 2016. For the purposes of this TRS, the Mineral Resources have been classified in accordance with Item 1302(d)(1)(iii)(A) of Regulation S-K. The Qualified Person responsible for the estimate is Mr. R. Reid, FAIG, MAusIMM, whose job title is Group Resource Geologist with Harmony Gold (PNG Services) Pty Limited.
2.Mineral Resources are reported on a 50% basis as Harmony holds a 50% interest in the WGJV.
3.Mineral Resources are reported exclusive of Mineral Reserves. Mineral Resources that are not Mineral Reserves do not have demonstrated economic viability.
4.Mineral Resources at Nambonga are reported assuming a bulk mining underground extraction method. The Mineral Resource is reported using an assumed 0.5g/t Au cut-off grade. This cut-off grade is based on the adjacent Golpu deposit as an analogue, assumes an overall mining, processing, and G&A operating cost estimate of about US$15.50/t, a gold price of US$1,300/oz, and a metallurgical recovery of 85% for gold. This equates to a cut-off grade of approximately 0.46g/t Au, based on gold only. Conceptual costs associated with copper and silver recovery were approximated as equivalent to 0.04g/t Au. The total cutoff grade for reporting purposes was 0.5g/t Au.
5.Metal contents reported do not include allowances for processing losses.
6.Rounding as required by reporting guidelines may result in apparent differences between tonnes, grade and contained metal content. Rounding is to three significant figures.
Mineral Reserve Estimate
The Mineral Reserves were originally prepared, classified and reported according to SAMREC, 2016. For the purposes of this report on Form 20-F, the Mineral Reserves have been classified in accordance with Item 1302(d)(1)(iii)(A) of Regulation S-K.
Mineral Reserves are derived from the Mineral Resources, a detailed business plan and the operational mine planning processes. Mine planning utilizes and takes into consideration historical technical parameters achieved. In addition, Mineral Resource conversion to Mineral Reserves considers certain modifying factors, dilution, ore losses, minimum mining widths, planned mine call and plant recovery factors.
The Mineral Reserve estimate for Golpu, as at June 30, 2022 and 2023, is summarized in the table below.
|
|
|
|
|
|
|
|
|
|
|
|
|
|
|
|
|
|
|
|
|
|
|
|
|
|
|
|
|
|
|
|
|
|
|
|
|
|
|
|
|
|
|
|
|
|
|
|
| |
Fiscal Year Ended June 30, |
|
| |
2023 |
2022 |
|
| |
|
Grade |
Metal
Content
|
|
Grade |
Metal
Content |
|
Mineral Reserve Category |
Tonnes
(Mt) |
Gold
(g/t) |
Copper
(%) |
Silver
(g/t) |
Gold
(Kg)
|
Copper
(Mt)
|
Silver
(Kg)
|
Tonnes
(Mt) |
Gold
(g/t) |
Copper
(%) |
Silver
(g/t) |
Gold
(Kg)
|
Copper
(Mt) |
Silver
(Kg)
|
%
Change |
| Proven |
- |
- |
- |
- |
- |
- |
- |
- |
- |
- |
- |
- |
- |
- |
- |
Probable |
200.0 |
|
0.86 |
|
1.20 |
|
— |
|
171,000.00 |
|
2.45 |
|
— |
|
200.0 |
|
0.86 |
|
1.20 |
|
— |
|
171.00 |
|
2.45 |
|
- |
— |
% |
|
Total / Ave.
Proven + Probable
|
200.0 |
|
0.86 |
|
1.20 |
|
— |
|
171,000.00 |
|
2.45 |
|
— |
|
200.0 |
|
0.86 |
|
1.20 |
|
— |
|
171.00 |
|
2.45 |
|
- |
— |
% |
Notes:
1.Mineral Reserves are reported with an effective date of June 30, 2023, using the SAMREC Code, 2016. For the purposes of this TRS, the Mineral Reserves have been classified in accordance with Item 1302(d)(1)(iii)(A) of Regulation S-K. The QP responsible for the estimate is Caveman Consulting.
2.Mineral Reserves are reported on a 50% basis as Harmony holds a 50% interest in the WGJV.
3.Mineral Reserves are reported using the following assumptions: block cave mining method, gold price of US$1,200/oz Au, copper price of US$3.00/lb Cu, above a NSR cut-off of US$10/t (development), US$60/t (BC44), US$40/t (BC42), US$19.15/t (BC40), variable metallurgical recoveries by metallurgical domain. The total dilution is estimated to be about 17% with toppling contributing approximately 1.5%.
4.Tonnes, grade, and content are declared as net delivered to the mills. Metal contained in tonnages do not include allowances for processing losses.
5.Rounding as required by reporting guidelines may result in apparent differences between tonnes, grade and contained metal content. Rounding is to three significant figures.
The previous Mineral Reserve estimate for Golpu as at June 30, 2022) is identical to the Mineral Reserve estimate as at June 30, 2023 and therefore no reconciliation is required.
The modifying factors are presented in the table below:
|
|
|
|
|
|
|
|
|
| Modifying Factor |
Unit |
Value |
| Gold Price |
US$/oz |
1,200 |
| Copper Price |
US$/lb |
3.00 |
| Exchange Rate |
|
|
A$ : US$ |
|
0.75 |
K : US$ |
|
3.10 |
| NSR Cutoff |
|
|
Development |
US$/t |
10.00 |
BC44 |
US$/t |
60.00 |
BC42 |
US$/t |
40.00 |
BC40 |
US$/t |
19.15 |
| Metallurgical Recoveries (by Domain) |
% |
Various |
| Total Dilution |
% |
17.00 |
Including Toppling |
% |
1.50 |
There were no Mineral Reserves at Wafi or Nambonga.
For additional information, see the TRS on each individual property, filed as an Exhibit of this annual report on Form 20-F.
Eva Copper Project
Property Description
The Eva Copper Project is located in Queensland, Australia, 76 km by road northwest of Cloncurry (pop. 3,000), and 194 km by road from the regional mining center of Mount Isa (pop. 22,000). Access to the project from Cloncurry is via the sealed Burke Developmental Road which passes 8.5 km to the east of the proposed plant site, current access is via cattle station and exploration tracks. The planned site for the plant and major infrastructure is also 11 km north of the major Dugald River Zinc Mine, which is owned by MMG Limited (MMG). The Eva Copper Project is situated at a latitude of 19'51"26 S and 140'10"15 E.
All operations on site at this stage are exploratory and feasibility studies in nature with no mining having yet commenced. The operation is proposed as a large, open-pit copper-gold mining operation with an associated gravity and flotation processing plant. The project comprises the main Little Eva and Blackard open Resources and four smaller Resources, expected to deliver an ore mixture with a maximum of 25% native copper ore to a copper concentrator processing plant adjacent to the Little Eva and Turkey Creek pits.
The following graphic illustrates the location of the Eva Project.
Operational Infrastructure
There is no operational infrastructure on site beside access roads.
Geology
The Eva Copper Project is situated in the Mary Kathleen (“MK”) domain of the Mount Isa Province of Queensland, Australia, an area that has a history of mining dating back to the 1860s. The Mount Isa area hosts numerous base metal copper, zinc and lead deposits of global significance, including the Mount Isa, Ernest Henry, Century, Dugald River, Cannington and Selwyn deposits. The Eva Project is hosted by Proterozoic-aged, metamorphosed and poly-deformed marine sedimentary and volcanic rocks of the MK domain of the Eastern Fold Belt Inlier. Deformation, metamorphism and plutonic activity took place during the Isan Orogeny, approximately 1,600 to 1,500 million years ago.
There are twelve known mineral deposits in the project area, of which six have been included in the current mine plan. Mineral deposits are grouped into two types: copper-gold and copper only. There are five of the copper-gold deposits, four of which are in the mine plan. These deposits are classified as iron oxide copper-gold deposits, where mineralization is associated with regional-scale haematite and albite alteration (red-rock alteration) and localized magnetite alteration. Copper sulphide mineralization, primarily chalcopyrite with lesser bornite, occurs as veins, breccias, fracture fill and disseminations in mafic to intermediate volcanic or intrusive rocks. Gold is generally correlated with copper and is recovered in the copper concentrate. Mineralization appears to be localized and/or bounded by faults and other deformation-related structures,
All of the deposits have a 10m to 25m thick overlying zone of oxidation, where the rock is extensively weathered and copper sulphide minerals have been leached or converted to various oxide minerals that cannot be recovered by flotation. The oxide zones are treated as waste, but tonnages and copper grades have been estimated and the oxide mineralization will be stockpiled separately.
With the exception of the Turkey Creek deposit, the copper-only deposits commonly have a significant thickness of supergene material, where carbonate has been leached from the rock, reducing hardness and density and the copper occurs as native-copper, chalcocite and other low-sulphur copper species. The carbonate-leached zone is separated from the underlying sulphide zone by a thin transition zone. Each of these mineralogical zones has been modelled so that resources can be estimated for each and the appropriate metallurgical recoveries can be applied for reserve estimation.
History
The Eva Copper Project has a long history and has been held under various tenures by a variety of exploration and mining companies. Small-scale mining dating back to the early 1900s has occurred at deposits such as Little Eva, Bedford and Lady Clayre.
Early work on the project area was undertaken by Ausminda Pty. Ltd. and CRAE between 1990 and 1996. In 1996, Pasminco Limited (“Pasminco”) acquired the property and who undertook further exploration and drilling on the copper-only deposits. Pasminco excised and retained the Dugald River zinc deposit and sold the remainder of the tenements to Universal Resources (“URL”) in 2001. URL also purchased the tenement hosting the Ivy Ann deposit from Dominion Metals Pty. Ltd. and Pan Australian Resources NL. From 2001 to 2004, exploration work on the copper-only deposits was carried out under a joint venture between URL and Bolnisi Logistics (“Bolnisi”). URL focused its own 2001–2004 drilling on the Little Eva and Bedford copper-gold deposits. In 2004, URL acquired Bolnisi and completed a 2005 feasibility study on mining and processing a blend of sulphide ore from the Little Eva and Bedford deposits with native copper ore from the Blackard and Scanlan deposits.
In 2005 URL entered into a joint venture option agreement with Xstrata, where Xstrata had the right to explore the central area of the tenements. Xstrata completed some significant work, but elected not to proceed in January 2013. URL completed a second feasibility study between 2007 and 2009 based on the same blend of sulphide ore and native copper ore used in the 2005 study.
In December 2009, URL merged with Vulcan Resources Limited, under the name of Altona Mining Limited (“Altona”). In 2012 Altona completed a definitive feasibility study based on the copper-gold sulphide deposits, but excluding the native copper deposits. Mining Leases (“MLs”) and an Environmental Authority (“EA”) were granted in 2012 based on the 2009 definitive feasibility study mine plan. Altona completed additional drilling at the Bedford, Lady Clayre, Ivy Ann, Blackard, Legend and Scanlan deposits, and discovered and delineated major prospects at Turkey Creek, Anzac, Whitcher, Matchbox and Quamby from 2015 to 2016. An EA amendment was granted in 2016 based on the revised 2012 definitive feasibility study mine plan and the integration of Turkey Creek into that mine plan.
In 2018, Altona became a wholly owned subsidiary of Copper Mountain Mining Company (“CMMC”) and was renamed CMMPL. Harmony subsequently purchased the project from CMMC in 2022. In February 2023 Harmony commenced a confirmatory and expansion drilling program and other studies designed to progress the project to a decision to mine.
Mineral Tenure
Refer to Item 4: “Information on the Company – Business Overview – Regulation – Mineral Rights – Australia” above for a summary of the regulatory environment in Australia.
The Eva Copper Project consists of five MLs and one exploration permit for minerals (“EPM”). All six of the planned pits are located within the MLs, except for the Ivy Ann deposit, which lies within the EPM.
The MLs were granted in 2012 and are currently owned by the Company’s wholly-owned subsidiary Eva Copper Mine Pty. Ltd. (“ECMPL”). The MLs total area is 143km2 and are situated across from two pastoral lease holdings and within one Native Title determination area.
The following table sets forth relevant information in relation to Harmony’s MLs as at June 30, 2023.
|
|
|
|
|
|
|
|
|
|
|
|
|
|
|
Number |
Name |
Granted |
Expiry |
Area (ha) |
90162 |
Scanlan |
Oct. 4, 2012 |
Oct. 31, 2037 |
2 096.96 |
90163 |
Longamundi |
Oct. 4, 2012 |
Oct. 31, 2037 |
1 411.29 |
90164 |
Blackard |
Nov. 13, 2012 |
Nov. 30, 2037 |
5 131.07 |
90165 |
Little Eva |
Nov. 13, 2012 |
Nov. 30, 2037 |
5 029.96 |
90166 |
Village |
Nov. 13, 2012 |
Nov. 30, 2037 |
616.08 |
ECMPL holds the following EPM as at June 30, 2023, as presented in the table below.
|
|
|
|
|
|
|
|
|
|
|
|
|
|
|
|
|
|
| Number |
Name |
Holder |
Granted |
Expiry |
Area (ha) |
| 25760 |
King |
ECMPL |
Nov. 17, 2015 |
Nov. 16, 2025 |
28,601 |
Harmony also holds 26 EPMs surrounding the MLs and in the broader Mount Isa region. These are held by the Company’s wholly-owned subsidiaries Roseby Copper Pty. Ltd. and Roseby Copper (South) Pty. Ltd. In addition, agreements exist with four pastoral landholders for both the MLs and key areas of activity in the surrounding EPMs.
Agreements exist with four pastoral landholders for both the MLs and key areas of activity in the surrounding EPMs:
•Coolullah Station, belonging to the North Australian Pastoral Company;
•Mt Roseby Station, belonging to Harold Henry McMillan;
•Dipvale Station, belonging to Grant and Anita Telford; and
•Hillside Station, belonging to the Cameron Creek Pastoral Company.
Queensland state legislation requires that, where significant disturbance will occur from exploration and mining activities, the license holder must reach an agreement for “Conduct and Compensation” with the pastoral leaseholder. Such agreements have been secured for all the MLs and those portions of the EPM where ground disturbance has occurred or is anticipated.
Mining Method
There is currently no mining occurring on the leases with all activities confined to exploratory and resource confirmation drilling. Additional work comprises geotechnical, metallurgical and hydrological drilling. Mining is to be via open pit methods using conventional drill and blast, excavators and trucks.
Mineral Processing
There is currently no processing occurring on the leases with all activities confined to exploratory and resource confirmation drilling. The feasibility study is considering a copper concentrator located close to the Little Eva deposit.
Feasibility studies are ongoing with the aim to declaring a Mineral Reserve upon completion of a successful feasibility study update.
Qualified Persons
The QPs preparing the TRS were employed on a full-time basis by Harmony. The QPs’ qualifications, areas of responsibility and personal inspection of the property are summarized in the table below:
|
|
|
|
|
|
|
|
|
|
|
|
|
|
|
| Qualified Person |
Prof. Assoc. |
Qualifications |
TRS Section Responsibility |
Personal Insp. |
| Mr R Reid |
FAIG, MAusIMM |
BSc(Hons), Grad.Dip(Sc) |
3, 4, 5, 6, 7, 8, 9, 11 |
Regular
Last Sept 2023 |
| Mr G Job |
FAusIMM |
BSc. MSc (Min Econ) |
1, 2, 3, 15, 21, 22, 23 |
Regular, last Sept 2023 |
TBA |
|
|
10, 14 |
|
Exploration
Extensive geophysical surveying, primarily induced polarization over the copper deposit areas and electromagnetic or controlled source audio-frequency magnetotellurics (“CSAMT”) over the Dugald River zinc deposit host rocks, as well as gravity and magnetic surveys, were undertaken in the area by CRAE. All of the deposits subcrop and were initially identified by surface sampling and mapping. Airborne magnetic surveys over the project area are available from various government agencies. Satellite hyperspectral surveys have also been used with some success by various companies in the area.
CRAE's bedrock and soil geochemical programs outside the Roseby copper deposits were not systematic, with minimal assessment of gold mineralization and left most of the surrounding area untested by geochemical surveys. CRAE’s focus at the time was on the copper only (no gold containing) deposits due to their relatively high grades and the Little Eva and Lady Clayre areas were of secondary exploration interest. The Little Eva copper-gold prospect was drilled by CRAE to an inferred resource status, but the gold content was not assessed. The Lady Clayre prospect was also drilled by CRAE at the time, but no resource estimate was completed. Metallurgical sampling and testing were conducted at Blackard and Lady Clayre, but not at Little Eva.
Following the acquisition of the project from CRAE by Pasminco, drilling and sampling programs focused primarily on the Lady Clayre copper-gold sulphide prospect, Caroline (Lady Clayre East) and the copper-gold potential of the Mount Rose Bee Fault area. This drilling was insufficient to define a formal resource at either deposit. Pasminco also initiated a soil and rock sampling program designed to examine the Mount Rose Bee Fault and related splay faults. While this program detected widespread but weak copper-gold mineralization, generally in close spatial relationship with copper and gold soil geochemical anomalies, Pasminco divested the Roseby copper project before the exploration program was completed.
Xstrata conducted exploration in the central Roseby area under the terms of an option and earn-in agreement with Altona. Xstrata also completed deep drilling below the Little Eva, Blackard, Great Southern and Longamundi deposits demonstrating the presence of large mineralized systems. Xstrata also discovered a mineralized system under cover at Cabbage Tree Creek some 3km north of Little Eva. Xstrata has also completed extensive geochemical, rock sampling, mapping and geophysical surveys generating numerous targets, some of which have been subject to initial drill testing with positive results.
Altona carried out systematic soil geochemistry work over much of the claim area and this work was continued by CMMC. This work has established numerous copper-in-soils targets within the Eva Project tenure and surrounding EPM. Shallow drilling of these targets has established numerous mineralized positions with opportunities to established new copper and gold mineral resources.
Since acquiring the project, exploration by Harmony during the report period to June 30, 2023 has largely focused on drilling to improve orebody knowledge for the feasibility study. 124 holes for 17,044m were drilled with work streams including infrastructure sterilization, geotechnical, hydrology, resource definition and metallurgical test work.
Across the broader tenement package, greenfield work programs undertaken by Harmony includes:
•Completion of a regional magnetotelluric survey comprising 138 stations targeting an approximate 80km x 20km, north-south oriented zone, covering the Mt Rose Bee Fault;
•765 surface soil geochemical samples on EPM9611 at the Mt Michael Prospect.
The QPs are of the opinion that the quality and quantity of the exploration methods and information gathered is sufficient to support the estimation of Mineral Resources.
Mineral Resource Estimate
The Mineral Resource estimate for the Eva Project is considered to have reasonable prospects for economic extraction. Mineral Resources are reported at a 0.17% Cu cut-off by deposit type, based on the economic assumptions presented in the table below at the effective date of June 30, 2023.
|
|
|
|
|
|
|
|
|
Description |
Unit |
Value |
Gold price |
US$/oz |
1,582 |
Copper price |
US$/lb |
5.50 |
FX rate |
US$:A$ |
0.70 |
This cut-off value represents typical costs for the mining method and preliminary mining and metallurgical recovery assumptions.
Mineral Resources for the three largest deposits were prepared by SRK and Harmony personnel, based on all drilling conducted up to October 2019. The resource models from CMMC were audited and retained for the other deposits. The Mineral Resources were originally prepared, classified and reported according to the SAMREC, 2016. For the purposes of this report on Form 20-F, the Mineral Resources have been classified in accordance with Item 1302(d)(1)(iii)(A) of Regulation S-K. The Mineral Resource estimate, as at June 30, 2023, exclusive of Mineral Reserves (however no Mineral Reserve are declared), is summarized in the table below.
|
|
|
|
|
|
|
|
|
|
|
|
|
|
|
|
|
|
|
|
|
|
|
|
|
|
|
|
|
|
|
|
|
|
|
|
|
|
|
|
|
|
|
|
|
|
|
|
|
Fiscal Year Ended June 30, |
|
|
2023 |
2022 |
|
|
|
Grade |
Metal Content |
|
Grade |
Metal Content |
|
| Mineral Resource Category |
Tonnes
(Mt) |
Gold
(g/t) |
Copper
(%) |
Silver
(g/t) |
Gold
(kg)
|
Copper
(Mt)
|
Silver
(kg)
|
Tonnes
(Mt) |
Gold
(g/t) |
Copper
(%) |
Silver
(g/t) |
Gold
(kg) |
Copper
(Mt)
|
Silver
(kg)
|
%
Change |
| Measured |
- |
- |
- |
- |
- |
- |
- |
- |
- |
- |
- |
- |
- |
- |
|
| Indicated |
275 |
0.04 |
0.43 |
|
11316 |
1174 |
|
— |
— |
— |
— |
— |
— |
— |
— |
| Total / Ave. Measured + Indicated |
275 |
0.04 |
0.43 |
— |
11316 |
1174 |
— |
— |
— |
— |
— |
— |
— |
— |
— |
| Inferred |
80 |
0.03 |
0.40 |
|
2480 |
318 |
|
— |
— |
— |
— |
— |
— |
— |
— |
Notes:
Resources are reported at a cut-off grade are based on approximate net smelter return values which equate to a copper grade of 0.17% Cu.
Mineral Resources:
1.The Mineral Reserves were originally prepared, classified and reported according to SAMREC, 2016 and CIM. For the purposes of this TRS, the Mineral Reserves have been classified in accordance with § 229.1302(d)(1)(iii)(A) (Item 1302(d)(1)(iii)(A) of Regulation S-K
2.Mineral Resources are exclusive of Mineral Reserves (however no Mineral Reserves are declared)
3.Mineral Resources are constrained within a Whittle pit shell generated with a copper price of $5.50/lb, a gold price of $1,582/oz and an exchange rate of AU$1.00 = US$0.70.
4.Density measurements were applied (ranges from 2.4 t/m3 to 3.0 t/m3).
5.Significant figures have been reduced to reflect uncertainty of estimations and therefore numbers may not add due to rounding.
Mineral Reserve Estimate
Not applicable
Mineral Reserve were declared by CMMC as report in their 43-101 2020 Feasibility Update.
During Harmony due diligence prior to acquiring the Project, a number of risks and opportunities were identified. Accordingly, upon purchase, Harmony planned and commenced a drilling program to expand and refine the Resource and commenced studies to test processing, infrastructure, water and power assumptions. Due to the significant potential change these studies may imply, it is deemed premature to release the Reserves. It is anticipated that these studies will be completed early 2024, upon which a Reserve may be declared.
Mineral Resource and Mineral Reserve Internal Controls Disclosure
Harmony’s Mineral Resources and Mineral Reserves estimates are subject to internal Competent Persons reviews administered by the Central Ore Reserve Management team and cyclically by external and independent experts.
Harmony’s Mineral Reserve is an outcome of the Company’s business planning process which runs annually. This process operates within a comprehensive framework where all inputs, including costs and capital requirements, are generated by the operation, and reviewed at a regional and corporate level within the Company, thereby providing confidence in the estimates.
Harmony follows an embedded process of third-party reviews to provide expert independent assurance regarding the Mineral Resources and Mineral Reserves estimates and compliance to the appropriate reporting codes.
In line with Harmony’s policy that each material operation will be reviewed by an independent third party on average no less than once every three years, or when triggered by a material new Mineral Resource and/or Mineral Reserve declaration, the following operations were subject to external review during 2023: Tshepong North, Tshepong South and Mine Waste Solutions. No material issues were identified in the estimation processes and LOM plans and Compliance Certificates have been issued by the independent consultants for these operations. The certificates state that the Mineral Resources and Mineral Reserves have been estimated and reported in accordance with SAMREC, 2016. Importantly, third-party audits are also configured to assist with continuous improvement regarding leading practice in Resources and Reserves estimation and reporting.
ITEM 4A. UNRESOLVED STAFF COMMENTS
Not applicable.
ITEM 5. OPERATING AND FINANCIAL REVIEW AND PROSPECTS
You should read the following discussion and analysis together with our consolidated financial statements, including the related notes, set forth beginning on page F-1.
A discussion of the changes in our financial condition and results of operations between the fiscal years ended June 30, 2021 and 2022, has been omitted from this Harmony 2023 Form 20-F, but may be found in Item 5: "Operating and Financial Review and Prospects", of the Harmony 2022 Form 20-F for the year ended June 30, 2022, filed with the SEC on October 31, 2022, which is available free of charge on the SEC’s website at www.sec.gov and our website at www.harmony.co.za.
Overview
Harmony is currently the largest producer of gold in South Africa and is furthermore an important producer in PNG. Our gold sales for fiscal 2023 were 45,690 kilograms of gold (1.47 million ounces of gold) and in fiscal 2023 we processed approximately 52.1 million tonnes of ore. As at June 30, 2023, our mining operations and projects reported total proved and probable Mineral Reserves of approximately 39.3 million gold and gold equivalent ounces, measured and indicated Mineral Resources (exclusive of Mineral Reserves) of approximately 99.4 million gold and gold equivalent ounces and inferred Mineral Resources (exclusive of Mineral Reserves) of approximately 38.4 million gold and gold equivalent ounces. For further information on the company’s Mineral Resources and Mineral Reserves, see Item 4: "Information on the Company - Property, Plant and Equipment - Mineral Resource and Mineral Reserve Summary Disclosure”.
Operating segments are reported in a manner consistent with the internal reporting provided to the CODM. See note 41 "Segment report" of our consolidated financial statements set forth beginning on page F-1 for further details.
For segment purposes, management distinguishes between “Underground” and “Surface”, with each shaft or group of shafts or open-pit mine managed by an operational team.
Our reportable segments are as follows:
•Doornkop, Joel, Kusasalethu, Masimong, Moab Khotsong, Target 1, Tshepong North and Tshepong South (from July 1, 2022), Mponeng, MWS, Bambanani (closed June 2022) and Hidden Valley; and
•all other surface operations, including those that treat historic sand dumps, WRDs and tailings dams, are grouped together under “All other surface operations”.
A. OPERATING RESULTS
Key factors affecting our results
Gold Prices
Most of our revenues are derived from the sale of gold. As a result, our operating results are directly related to the price of gold. Historically, the price of gold has fluctuated widely. The gold price is affected by numerous factors over which we do not have control, including for instance, Russia's invasion of Ukraine. See Item 3: “Key Information - Risk Factors - Strategic and Market Risks - The profitability of our operations, and cash flows generated by those operations, are affected by changes in the price of gold and other metals; a fall in the gold price below our cash cost of production and capital expenditure required to maintain production for any sustained period may lead to losses and require us to curtail or suspend certain operations”. As a general rule, we sell the majority of our gold produced at market prices to obtain the maximum benefit from increases in the prevailing gold price.
Since fiscal 2017, Harmony entered into derivative contracts to manage the variability in cash flows from the Group’s production, in order to create cash certainty and protect the Group against lower commodity prices. As at June 30, 2023 the limit set by the Board was for 20% of the production from gold over a 24-month period. As at June 30, 2023 the limit set by the Board for silver is 50% of the exposure over a 24-month period.
Management continues to top up these programs as and when opportunities arise to lock in attractive margins for the business, but are not required to maintain hedging at these levels.
A portion of the production of the South African operations is linked to Rand gold forward sale contracts. The Rand gold forward contracts have been designated as cash flow hedging instruments and hedge accounting is applied on these contracts. US$ gold forward sale contracts were entered into for the production of the Hidden Valley operation and have been designated as cash flow hedging instruments.
Harmony's indirect subsidiary, MWS, has a contract with Franco-Nevada Barbados ("Franco-Nevada"). The Franco-Nevada contract is a streaming agreement to purchase 25% of the gold production through MWS for a fixed amount of consideration until the balance of gold cap is delivered. The gold cap is a provision included in the contract, which stipulates the maximum quantity of gold to be sold to Franco-Nevada over the term of the contract. The consideration is determined as the lower of the quoted spot gold price as per the London Metals Exchange or US$400 per ounce, subject to an annual escalation adjustment. As the performance obligation to deliver gold is met, the contract liability unwinds into revenue.
Significant changes in the price of gold over a sustained period of time may lead us to increase or decrease our production in the near term.
Harmony’s Realized Gold Price
In fiscal 2023, the average gold price received by us was R1,032,646 per kilogram or $1,808/oz. This average gold price includes the net realized losses on the hedging instruments, where hedge accounting was applied.
The price of gold in US$ terms closed at US$1,920/oz on June 30, 2023, up from the closing price of US$1,807/oz on June 30, 2022. The range traded during the year reaffirms gold's safe haven status with investors during times of global uncertainty and market volatility. Despite the higher closing price, the average spot gold price received (that is, excluding the impact of hedging gains or losses) for the 2023 year was US$1,816/oz, which was unchanged from that of 2022 at US$1,815/oz.
Harmony is exposed to the impact of any significant decreases in the commodity prices on its production. This is mitigated to some extent by commodity derivatives and hedging arrangements, but as Harmony has limitations for the volume of forward sales, commodity derivatives or hedging arrangements it may enter into for its future production, it is exposed to the impact of decreases in the commodity prices on the remainder of its unhedged production. See Item 3: “Key Information - Risk Factors - Risk Related to Our Industry - We are exposed to the impact of any significant decreases in the commodity prices on our production", and “ - Strategic and Market Risks - The profitability of our operations, and cash flows generated by those operations, are affected by changes in the price of gold and other metals; a fall in the gold price below our cash cost of production and capital expenditure required to maintain production for any sustained period may lead to losses and require us to curtail or suspend certain operations”.
In addition to the US$ gold price, the gold price received is impacted by the exchange rate of the Rand and other non-US$ currencies to the US dollar. An appreciation of the Rand and other non-US$ currencies against the US dollar will result in a decrease in the revenue recorded, without considering the impact of the hedging instruments. Conversely, a depreciation of these currencies against the US dollar would result in an increase of revenue recorded. See Item 3: “Key Information - Risk Factors - Strategic and Market Risks - Foreign exchange fluctuations could have a material adverse effect on our operational results and financial condition”. During fiscal 2023, the exchange rate depreciated from R15.21/US$1 in fiscal 2022, to R17.76/US$1 in fiscal 2023. See "- Exchange Rates" below for a further discussion.
The following table sets out the average, the high and the low London Bullion Market price of gold and our average sales price during the past two fiscal years:
|
|
|
|
|
|
|
|
|
|
|
|
|
|
|
Fiscal Year Ended June 30, |
|
2023 |
|
2022 |
|
|
|
|
| Average (US$/oz) |
1,831 |
|
|
1,834 |
|
|
|
| High (US$/oz) |
2,051 |
|
|
2,052 |
|
|
|
| Low (US$/oz) |
1,622 |
|
|
1,726 |
|
|
|
Harmony’s average sales price1 (US$/oz)) |
1,808 |
|
|
1,829 |
|
|
|
Average exchange rate (R/US$) |
17.76 |
|
|
15.21 |
|
|
|
Harmony’s average sales price1 (Rand/kilogram) |
1,032,646 |
|
|
894,218 |
|
|
|
1Our average sales price differs from the average gold price due to the timing of our sales of gold within each year. In addition, the effect of hedge accounting i.e. realized gains/losses from the cash flow hedges have been included in revenue.
Costs
Our cash costs typically make up between 70% and 80% of our total costs (excluding impairments and disposal/loss on scrapping of assets). The remainder of our total costs consists primarily of exploration costs, employment termination costs, corporate and sundry expenditure, and amortization and depreciation. Our cash costs consist primarily of production costs. Production costs are incurred on labor, equipment, consumables and utilities. Labor costs are the largest component and typically comprise between 55% and 60% of our production costs.
Our US dollar translated costs are very sensitive to the exchange rate of the Rand and other non-US currencies to the US dollar. See "- Exchange Rates" below. Appreciation of the Rand and other non-US currencies against the US dollar increases working costs at our operations when those costs are translated into US dollars. See Item 3: “Key Information - Risk Factors - Strategic and Market Risks - Foreign exchange fluctuations could have a material adverse effect on our operational results and financial condition”.
All-in sustaining costs for the Group increased by 6.4% to R889,766 per kilogram in fiscal 2023 mainly due to inflationary increases in wages and salaries, increases in consumables as well as electricity tariff increases. Royalties increased due to a higher rate being applied due to higher profits, as well as the increased revenue base to which it is applied.
Our cash costs have increased from R701,024 per kilogram in fiscal 2022 to R735,634 per kilogram in fiscal 2023, mainly due to increased reagent prices, electricity costs, labor increases as well as additional diesel usage at Hidden Valley.
Management conducts a thorough review of costs at all operations to ensure that costs are properly managed and within budget. However, it should be noted that there are risks beyond our control such as safety stoppages, which would result in production being negatively affected while certain costs would still be incurred. This is discussed in more detail in Item 3: “Key Information - Risk Factors - Risks Related to ESG - Given the nature of mining and the type of gold mines we operate, we face a material risk of liability, delays and increased cash costs of production from environmental and industrial accidents and pollution compliance breaches” and “- Risks Related to Our Industry - The nature of our mining operations presents safety risks”. We are also exposed to price increases on electricity, which is regulated, as well as the implementation of other levies such as carbon tax. See Item 3: "Key Information - Risk Factors - Risks Related to Our Operations and Business - Disruptions to the supply of electricity and increases in the cost of power may adversely affect our results of operations and financial condition" and "- Risks Related to ESG - Compliance with emerging climate change regulations and other sustainability measures could result in significant costs for us".
We remain subject to risks related to the volatility of commodity prices, as well as potential shortage of supply and disruptions of supply chain due to geopolitical instability, including impacts of the conflict in Ukraine. See Item 3: "Key Information - Risk Factors - Risks Related to Our Industry - The impact from, and measures taken to address the Covid-19 pandemic, as well as other infectious diseases, such as HIV/AIDS and tuberculosis, pose risks to us in terms of productivity and costs and may adversely affect our people, and may impact our business continuity, operating results, cash flows and financial condition"- Strategic and Market Risks - Fluctuations in input production prices linked to commodities may adversely affect our operational results and financial condition" and "- Risks Related to Our Operations and Business - Actual and potential shortages of production inputs and supply chain disruptions may affect our operational results".
Production levels
In addition to gold prices, Harmony’s gold income in any year is also influenced by its level of gold production. Production levels are in turn influenced by grades, tonnages mined and processed through the plant, and metallurgical recoveries. Gold production decreased slightly between 2022 and 2023, from 1,486,517 ounces in 2022 to 1,467,715 ounces in 2023. For more information on our business and operations, see Item 4: “Information on the Company -– Business Overview” and “- Property, Plant and Equipment - Mineral Resource and Mineral Reserve Summary Disclosure”.
Exchange Rates
Our revenues are very sensitive to the exchange rate of the Rand and other non-US currencies to the US dollar. Since gold is generally sold in US dollars, most of our revenues are received in US dollars. Currently, the majority of our earnings are generated in South Africa. Appreciation of the Rand against the US dollar decreases our revenues, which serves to reduce operating margins and net income from our South African operations. Depreciation of the Rand against the US dollar increases the revenue, which serves to increase operating margins and net income from our South African operations. Accordingly, strengthening of the Rand generally results in poorer earnings for us if there is not a similar increase in the gold price.
The exchange rates obtained when converting US dollars to Rand are determined by foreign exchange markets, over which we have no control. The spot rate as at June 30, 2023 was R18.83 per US$1.00, compared with R16.27 per US$1.00 as at June 30, 2022, reflecting a depreciation of 16% of the Rand against the US dollar. The average exchange rate for fiscal 2023 was R17.76 per US$1.00, reflecting a depreciation of 17% of the Rand against the US dollar when compared with fiscal 2022. The average gold price received by us during fiscal 2023, before including the effect of the cash flow hedges, increased by R153,229 per kilogram to R1,036,682 per kilogram from R883,453 per kilogram during fiscal 2022.
The majority of our working costs are incurred in Rand and, as a result of this, any appreciation of the Rand against the US dollar would increase our working costs when translated into US dollars. Depreciation of the Rand against the US dollar would cause a decrease in our costs in US dollar terms. Similarly, at our international operations, appreciation of the Australia dollar or Kina against the US dollar would cause an increase in our costs in US dollar terms. See Item 3: “Key Information - Risk Factors - Strategic and Market Risks - Foreign exchange fluctuations could have a material adverse effect on our operational results and financial condition”.
We have several credit facilities and loans denominated in US dollars. This exposes us to the changes in the Rand against the US dollar, which would affect the borrowing amount as well as the interest recognized. This will also affect the cash flows when the borrowings are raised and repaid as well as at the time of the payments of the interest.
In fiscal 2023, the Rand weakened against the US and Australian dollar and closed at R18.83/US$1 (2022: R16.27/US$1) and R12.56/A$1 (2022: R11.25/A$1) respectively. Management believes this volatility could be a reflection of growing concern in market sentiment fears surrounding recessions in key economies and current and/or further geopolitical tensions. These movements in the currencies expose the Group's operations to foreign currency gains and losses on foreign-denominated receivables and liabilities, including derivatives. They also impact the Group’s translation of its international operating results and net assets into its Rand presentation currency, which resulted in a foreign exchange translation gain of R1,123 million for fiscal 2023 (2022: R742 million).
Harmony has entered into foreign exchange derivative contracts in the form of zero cost collars, which establish a minimum (floor) and maximum (cap) Rand/US dollar exchange rate at which to convert US dollars to Rand. The Group also uses forward exchange contracts to manage the risks. At June 30, 2023, the nominal amount of the derivative contracts was US$562 million and is over a two-year period with a weighted average cap price of US$1=R20.23 and weighted average floor price of US$1=R18.25.
Additionally, at June 30, 2023 Harmony had open forward exchange forward contracts which had a nominal amount of US$250 million spread over a two-year period at an average exchange rate of US$1 = R18.96.
The Bank of Papua New Guinea has been systematically allowed the Kina to weaken against the US dollar over several years. The Kina weakened by 0.4% and 1.4% in fiscal 2022 and fiscal 2023 respectively. Since the introduction of a 150 basis point trading band in June 2014, the Kina weakened by 47.5% against the US dollar as at June 30, 2023. Should the trading band continue and depending on the level the exchange rate is set at, it could have a negative impact on the results of the Hidden Valley operation, as well as the cost of development at Wafi-Golpu and other PNG exploration sites.
Geopolitical tensions
Our revenue may be affected by geopolitical factors. As a result of the geopolitical tensions and armed conflict between Russia and Ukraine due to Russia’s military invasion of Ukraine, the governments of the United States, the European Union (“EU”), the United Kingdom and other jurisdictions announced the imposition of various sanctions against Russia. Despite the fact that Harmony has limited commercial interests in Russia, Ukraine and the current areas of conflict, these and any additional sanctions or export controls, as well as any counter responses by Russia or other jurisdictions, have led to a sharp increase in oil and energy prices, which are important input costs for the Group’s business. Furthermore, the invasion of Ukraine and the retaliatory measures that have been taken, and could be taken in the future, by the United States, the EU, the United Kingdom, NATO and other jurisdictions have created global security concerns that could result in a regional or global conflict and otherwise have a lasting impact on regional and global economies, any or all of which could adversely affect our business. We are monitoring the developments in the armed conflict between Russia and Ukraine and their impact on various metrics such as gold price, cost of sales and capital equipment. See Item 3: "Key Information - Risk Factors - Strategic and Market Risks - Fluctuations in input production prices linked to commodities may adversely affect our operational results and financial condition” and “- Rising inflation, including as a result of Russia’s invasion of Ukraine, may have a material adverse effect on our business, operating results and financial condition”.
Inflation
Although inflation in South Africa was 5.4% at the end of fiscal 2023, down from 7.4% at the end of fiscal 2022, our operations continued to experience the impact thereof on input costs. The announcement by the energy regulator in South Africa, NERSA, of a 18.7% tariff hike in electricity is incorporated into the fiscal 2023/2024 budgeting and forecasting process. Working costs have increased considerably over the past several years resulting in significant cost pressures for the mining industry.
We have seen increases in consumable costs for our mining operations as a result of the global inflationary pressure experienced during fiscal 2023. This increase, combined with geopolitical risks and conflicts disrupting supply chains and further compounding inflationary pressure, will see continued increases through 2024. The impact of the reserve banks increasing interest rates during fiscal 2023 as a way of managing inflation is being felt, albeit slowly. The most significant increases in consumable costs have been seen on steel and general materials, chemicals and reagents, diesel and blasting and explosives costs.
On September 16, 2021, Harmony announced the acceptance of a three-year wage agreement by the unions, effective from July 2, 2021 to June 30, 2024. The agreement is applicable to 98% of Harmony employees. The total average wage increase negotiated is 7.8% in year one, 7.4% in year two and 7.0% in year three. There is still one year remaining on this wage agreement at the end of fiscal 2023.
The inflation rate in PNG at the end of fiscal 2022 was 5.5%, while inflation closed at 1.7% at the end of fiscal 2023.
Our profits and financial condition could be adversely affected if, increased costs due to inflation, are not offset by a concurrent devaluation of the Rand and other non-US currencies and/or an increase in the price of gold. See Item 3: “Key Information - Risk Factors - Strategic and Market Risks - Rising inflation, including as a result of Russia’s invasion of Ukraine, may have a material adverse effect on our business, operating results and financial condition”.
Covid-19
Although the disruption caused by Covid-19 has diminished significantly worldwide, we still maintain a precautionary approach to infectious disease control. We are actively monitoring and managing the supply of critical items to ensure that production is not affected, thereby ensuring we remain in a position to manage Covid-19 as part of normal day-to-day activities.
See Item 3: "Key Information - Risk Factors - Risk Related to Our Industry - The impact from, and measures taken to address the Covid-19 pandemic, as well as other infectious diseases, such as HIV/AIDS and tuberculosis, pose risks to us in terms of productivity and costs and may adversely affect our people, and may impact our business continuity, operating results, cash flows and financial condition", and note 4 "Impact of changes in global operating and economic environment" of our consolidated financial statements set forth beginning on page F-1 for further details.
South African Socio-Economic Environment
We are domiciled and listed in South Africa and the majority of our operations are in South Africa. As a result, we are subject to various economic, fiscal, monetary and political policies and factors that affect South African companies generally. See Item 3: “Key Information - Risk Factors - Risks Related to ESG - The socio-economic framework in the regions in which we operate may have an adverse effect on our operations and profits”.
In particular, South African companies are subject to exchange control limitations. While exchange controls have been relaxed in recent years, South African companies remain subject to restrictions on their ability to deploy capital outside of the Southern African Common Monetary Area. See Item 10: “Additional Information - Exchange Controls”.
We must also comply with the SLPs that have been developed for each of our South African operations. These SLPs are prepared in line with legislation governing the participation of HDSAs in mining assets.
We have been granted mining licenses under the MPRDA necessary for the conduct of our current operations. As such we have therefore already incurred expenses relating to HDSA participation. We believe the biggest challenge will lie in maintaining these licenses, as we will have a responsibility in respect of human resource development, procurement and local economic development. We are however unable to provide a specific amount of what the estimated cost of compliance will be, but we will continue to monitor these costs on an ongoing basis. See Item 4: "Information on the Company - Business Overview - Regulation - Mineral Rights - South Africa – The Mining Charter."
Electricity in South Africa
The South African state utility, Eskom, generates approximately 90% of the electricity used in South Africa and approximately 40% of the electricity used in Africa. Eskom generates, transmits and distributes electricity to industrial, mining, commercial, agricultural and residential customers and redistributors. During fiscal 2023, the electricity supply in South Africa remained constrained, with continued power interruptions (also referred to as load shedding). The power interruptions did not have a material impact on production at the underground operations during the current fiscal year but did have a negative impact on the surface waste rock dump volumes. Increasing global demand for energy, concerns about nuclear power and the limited growth of new supply are also impacting the price and supply of energy. Actual and proposed pricing, uncertainty around the implementation of carbon taxes as well as the potential through-flow of costs to the consumer from Eskom, unrest and potential conflict in the Middle East as well as the armed conflict between Russia and Ukraine, among other factors, has resulted in increased demand or constrained supply and escalating oil and energy prices.
The supply and demand for electricity is still very tight especially during the evening peak periods between 5:00 p.m. and 8:00 p.m. Harmony has signed up four sites in fiscal 2022, which provide pumping and/or ventilation services, to participate in a pilot from Eskom called Critical Peak Pricing. For a limited number of hours, when the electrical network is under pressure, Eskom notifies the operation that tariffs will be increased significantly. For the rest of the time there is a saving on energy tariffs compared to non-participating shafts. Harmony did not sign up for Critical Peak Pricing in fiscal 2023 due to limited benefits and operational changes that took place at the end of fiscal 2023. In addition to this, Harmony has renewed its contract agreement with an Energy Service Company (“ESCO”) to ensure that various energy saving projects are implemented and sustained.
The South African government remains committed to ensuring energy security for the country, through the roll-out of the independent power producer program as an integral part of the energy mix. It remains committed to ensuring the provision of reliable and sustainable electricity supply, as part of mitigating the risk of carbon emissions. In 2019 the South African President announced that Eskom would be unbundled into three wholly owned subsidiaries, being Generation, Transmission and Distribution to better manage the operations. The initial plan was for Transmission to be unbundled by December 31, 2021, with Generation and Distribution to follow in December 2022. Based on the latest information available from Eskom, the legally binding merger agreement to transfer its Transmissions division to its wholly-owned subsidiary was executed but is subject to the satisfaction of certain suspensive conditions. In July 2023, NERSA approved the license to operate the transmission system within the boundaries of South Africa. More recently, work to unbundle the company has hit several key milestones, with the Department of Public Enterprises ("DPE") hoping to have the process materially completed by March 2024. See Item 3: "Key Information - Risk Factors - Risks Related to Our Operations and Business - Disruptions to the supply of electricity and increases in the cost of power may adversely affect our results of operations and financial condition".
Renewable energy
Energy is the critical component of the country’s future policy mix. Future supply of electricity will be influenced by the extent to which renewables, primarily wind, are efficient, sustainable and ensure security of electricity supply at competitive economic prices.
Forecasts predict that renewable energy technologies, predominantly solar- and wind-based systems, will grow further in the coming decades, overcoming coal-based electricity around 2030 (International Energy Agency, 2015). South Africa is no exception and renewable energy has entered the country’s electricity landscape as a significant trend.
Discussions around other technologies, such as gas-to-power and nuclear energy, are also adding to this dynamic. Significant vested interests are still at play alongside substantial state support to maintain the domination of the coal industry over the electricity supply industry in South Africa. On August 12, 2021, the Minister released the exemption which raises the registration threshold for self-generation facilities from 1MW to 100MW. This allowed us to move forward with Phase 2 and Phase 3 of our solar power plans with limited restrictions, whereas Phase 1 required a lengthy approval process through the NERSA approval channels.
Harmony is also looking at its own energy security and decarbonization, as well as ways to managing the rising cost of energy supply. To this end, we have devised our phased decarbonization strategy which includes:
•Phase 1 - 30MW solar power, which is complete and has been commissioned in May 2023. It is expected to generate 70 gigawatt hours (Gwh) per annum;
•Phase 2 - 137MW solar energy, which will be installed at our longer-life mines. The procurement process for this is in process. It is expected to generate 316Gwh per annum and is expected to be completed in fiscal 2025;
•Phase 3 - 56MW of additional solar power;
•Phase 4 - 140MW of wheeling wind energy.
This will be facilitated through funding obtained including:
•Phase 1 was constructed by our independent power producer partners and consists of three 10MW solar plants in the Free State; we have a 15-year power purchase agreement in place for this project;
•R1.5 Billion Green Term Loan for phase 2 which closely matches the solar photovoltaic ("PV") projects expected cash flow and the expected energy cost savings.
All additional funding required will be drawn from our general facilities including:
•R2.5 Billion Syndicated Revolving Credit Facility; and
•US$400 million Syndicated Facility.
See Item 10: “Material Contracts - R1.5 Billion Green Term Loan” “– R2.5 Billion Syndicated Revolving Credit Facility”, and “- US$400 Syndicated Million Facility”. See also “– Governance – Social and ethics committee: Chairperson's report” on pages 249 to 250, “– Environment – Environmental management and stewardship” on pages 113 to 119 and Climate change, energy and emissions management" on page125 to 131 the Integrated Annual Report for the 20-F 2023.
Electricity tariffs
As a major electricity consumer and mostly being supplied by Eskom, Harmony is exposed to significant additional costs as a result of rising electricity tariffs. In March 2023, Eskom was granted a 18.7% tariff increase, which is effective from April 1, 2023. Eskom's unsustainable high debt and falling sales are likely to continue to contribute to further above-inflation tariff increases. This is likely to result in further self-generation activity by Eskom's customers, which could further weaken Eskom. Although a new MYPD should provide price stability, challenges remain. See Item 3: “Key Information - Risk Factors - Risks Related to Our Operations and Business - Disruptions to the supply of electricity and increases in the cost of power may adversely affect our results of operations and financial condition".
Energy efficiency
Harmony has worked closely with Eskom to manage electricity use and peak demand, underlining our commitment to reduce energy consumption. This includes demand-side management (“DSM”) strategies to reduce electricity consumption in peak periods; timing our pumping to coincide with cheaper off-peak periods, making more efficient use of Eskom tariffs that reward load-shifting, and improving the efficiency of pumping operations.
In 2016 Harmony contracted an ESCO to improve its energy management practices and aggressively mitigate the impact of higher-than-inflation electricity price increases on its operational costs. Energy management assists in maintaining the performance of implemented initiatives. This way Harmony focuses on continuously implementing new initiatives and technologies, while eliminating the risk of forfeiting the benefit of completed projects. Energy management has led to R1.7 billion (US$114 million) of saving on electricity over the contract period. For the 2023 fiscal year Harmony implemented 41 energy optimization projects resulting in an estimated energy saving of 295Gwh and a cost saving of R394 million (US$22 million).
We have implemented various energy efficiency projects in recent years. See "– Environment – Environmental management and stewardship” on pages 113 to 119 and "– Climate change, energy and emissions management" on pages 125 to 131 of the Integrated Annual Report for the 20-F 2023.
Climate Change, Environmental Factors and Carbon tax
Rising temperatures, changing rainfall patterns and severe weather conditions believed to be caused by climate change remain growing concerns for businesses, investors, broader society and governments. This has led to increased pressure on companies, including those in the mining sector, to reduce GHG emissions consistent with national commitments made by numerous countries under the Paris Agreement, to promote responsible corporate practices and to increase transparency about the risks and opportunities of transitioning to a low-carbon economy. Pressure from governments, investors and broader society for mining companies to improve environmental stewardship and reduce GHG emissions, both in terms of absolute emissions and in intensity of emissions per tonne mined, is likely to increase in the future. On June 1, 2019 the Carbon Tax Act became effective. The carbon tax has been designed to fix liability on the person who conducts an activity in South Africa that results in GHG emissions above a certain threshold. The carbon tax design requires the calculation of liability to be based on the sum of GHG emissions, which result from fuel combustion, industrial processes and fugitive emissions. Taxpayers must determine emissions in accordance with the reporting methodology approved by DFFE. The tax will be phased in over time. The first phase, which was originally expected to end on December 31, 2022, has been extended to December 31, 2025, is designed to largely be revenue-neutral in terms of its aggregated impact, given the complementary tax energy incentives and reduction or credit for the current electricity levy. Tax-free allowances will then change and fall away with the basic tax-free allowance (60%) being reduced and is likely to fall away from 2026 to 2030. In phase 2 the carbon offset allowance is due to increase by 5%, the trade exposure allowance from the current 10% and the carbon budget allowance could fall away.
The National Treasury announced an alternative increase structure which is expected to see the current carbon price (US$9 per tonne) increase to US$20 per tonne by 2026, US$30 per tonne by 2030 and finally US$120 per tonne by 2050.
Based on published legislation, commentary and governmental information, management believes that the carbon tax poses a low cost to Harmony until December 31, 2025. Gas emissions reported to the DFFE for a company’s National Greenhouse Gas Emission Reporting submission will be taxed at a base value of increasing from R320 to R552 per tonne of carbon dioxide equivalent (before allowances) making effective tax rate increase from R41 to R82 per tonne of carbon dioxide equivalent for years 2023 to 2025. From the second phase onwards, carbon tax might also affect the price of electricity. The impact of the carbon tax on the Company arising from electricity usage after December 31, 2025 has been modeled to grow over time as allowances are anticipated to fall away therefore progressively increasing from approximately R500m to R800m by the end of fiscal 2030.
Harmony has set its internal carbon price (for the South African operations) to match that of the proposed carbon tax. Harmony is also at risk due to potential pass-through costs from its suppliers in the short term from increased fuel prices. The carbon tax on liquid fuels will be imposed at the source. It is estimated that the increased fuel price would be R0.10/liter. This is expected to have an impact on the Company’s operational expenses.
Estimates are included in the life-of-mine plans and resource base models used for impairments and has affected the forecast profitability of all operations, and in some cases, the impact is significant.
Various regulators have released guidance or proposed regulations for required disclosures during the year. In June 2023, the International Sustainability Standards Board ("ISSB") issued its first two IFRS Sustainability Disclosure Standards, IFRS S1 General Requirements for Disclosure of Sustainability-related Financial Information and IFRS 2 Climate-related Disclosures. IFRS S1 and IFRS S2 are effective for annual reporting periods beginning on or after January 1, 2024. In March 2022, the SEC issued proposed rules that are intended to provide more consistent, comparable and reliable information so that investors can better evaluate the impact of climate-related matters on entities. The comment period on the proposed rules have closed and the SEC is evaluating comment letters received. The SEC’s proposed rules are expected to affect the information reported as “other information” by entities and may include specific requirements on assurance of certain ESG key performance indicators. However, the SEC’s proposal included certain disclosures in the financial statements. It is unknown at this stage if these will be retained in the final regulation.
See Item 3: "Key Information - Risk Factors - Risks Related to ESG - Compliance with emerging climate change regulations could result in significant costs for us" for further discussion on the potential impact.
Production
The information set forth under the headings, “– Delivering profitable ounces – Operational performance” on pages 67 to 108 of the Integrated Annual Report for the 20-F 2023 is incorporated herein by reference.
Results of Operations
Years Ended June 30, 2023 and 2022
Revenue
Revenue increased by R6,630 million to R49,275 million in fiscal 2023, compared to R42,645 million in fiscal 2022, mainly due to the increase in the average gold price received.
The average gold price received (including hedging) increased by 15.5% from R894,218 per kilogram in fiscal 2022 to R1,032,646 per kilogram. However, overall gold sales decreased by 1% from 46,153kg in fiscal 2022 to 45,690kg. The details of these changes are discussed below:
At Moab Khotsong, gold sold increased by 5.0% from 6,393 kilograms in fiscal 2022 to 6,715 kilograms in fiscal 2023, mainly due to the recovery grade increasing by 6.8% from 6.79g/t to 7.25g/t in fiscal 2023.
The Mponeng mine sold 7,480 kilograms, a 23.8% increase from the 6,041 kilograms sold in fiscal 2022, mainly as a result of a significant increase in the recovered grade (16.3%) from 7.25g/t to 8.43g/t in fiscal 2023. Ore milled increased by 5.2% in fiscal 2023.
At the end of fiscal 2022, a decision was taken to unbundle Tshepong Operations into Tshepong North and Tshepong South. The operations were right-sized to ensure smaller albeit more profitable mines.
•Tshepong North gold sold decreased by 10.7% from 3,799 kilograms in fiscal 2022 to 3,391 kilograms in fiscal 2023. This was driven by decreased tonnes milled of 19.5% mainly due to the planned restructuring that occurred which resulted in a reduction of production crews. This was partially offset by a 9.9% increase in recovered grade from 3.84g/t to 4.22g/t due to the planned focus on higher-grade panels.
•Tshepong South sold 7% more gold in fiscal 2023 (3,458 kilograms) compared to fiscal 2022 (3,231 kilograms). This was mainly due to a 20.2% increase in the recovery grade from 5.64g/t to 6.78g/t in fiscal 2023, offset by the 11.7% decrease in tonnes milled in fiscal 2023 to 506,000 tonnes (2022: 573,000 tonnes).
At Doornkop the gold sold increased by 22.2% from 3,464 kilograms in fiscal 2022 to 4,233 kilograms in fiscal 2023. Grade improved 19.0% to 4.69g/t in fiscal 2023 as compared to 3.94g/t in fiscal 2022 due to improved mining grades in the latter part of the year as well as mill clean-up operations during the first half of the year yielding better than expected plant recovery rates.
Joel had a 26.3% increase in gold sold from 1,555 kilograms in fiscal 2022 to 1,964 kilograms. This was due to a recovery grade of 4.48g/t in fiscal 2023, a 24.8% increase from 3.59g/t in fiscal 2022 mainly as a result of higher mining grades achieved during the year.
At Target 1, gold sold decreased by 31% from 1,821 kilograms in fiscal 2022 to 1,256 kilograms as a result of challenging mining conditions including pillar failure restricting access to high-grade ore, several power failures ultimately resulting in the flooding of certain areas and ventilation constraints. Ore milled was 365,000 tonnes in fiscal 2023, a decrease of 19.8% compared to fiscal 2022 with a lower recovered grade of 3.49g/t (2022: 3.96g/t).
At Kusasalethu, gold sold decreased by 24.1% to 3,481 kilograms from 4,586 kilograms in fiscal 2022 as a result of a 6.6% decrease in tonnes milled and the recovered grade decreasing by 18.9% from 7.52g/t in fiscal 2022 to 6.10g/t in fiscal 2023. This was caused mainly by delays in accessing some of the higher grade areas.
Gold sold at Masimong increased 3.6% from 1,911 kilograms in fiscal 2022 to 1,980 kilograms in fiscal 2023. This was mainly as a result of increased grade to 4.17g/t in fiscal 2023 from 3.93g/t. However tonnes milled decreased 3.3% from 486,000 tonnes to 470,000 tonnes in fiscal 2023.
The Bambanani mine was closed at June 30, 2022 and consequently did not contribute towards production of kilograms in fiscal 2023. Gold sold of 19 kilograms in fiscal 2023 related to inventory at the end of fiscal 2022 while gold sold in fiscal 2022 was 1,437 kilograms.
At Mine Waste Solutions gold sold decreased by 3.4% from 2,879 kilograms to 2,781 kilograms in fiscal 2023. This was as a result of a 1.6% decrease in the recovered grade, from 0.124g/t in fiscal 2022 to 0.122g/t. In addition, a 1.6% decrease in treated tonnes to 23,067,000 tonnes from 23,443,000 tonnes in fiscal 2022.
Phoenix operation saw a 10.1% increase in gold sold from 766 kilograms in fiscal 2022 to 843 kilograms in fiscal 2023. This was mainly as a result of an increase in grade of 8.9% from 0.123g/t in fiscal 2022 to 0.134g/t.
At Central Plant Reclamation, gold sold decreased 3.2% in fiscal 2023, from 591 kilograms to 572 kilograms due to marginal decrease in ore milled from 4,033 tonnes to 3,972 tonnes in fiscal 2023. The grade remained unchanged at 0.145g/t from fiscal 2022.
Gold sold at Savuka Tailings increased 16.1% from 509 kilograms in fiscal 2022 to 591 kilograms in fiscal 2023. This was mainly as a result of increased tonnes milled of 20.1% from 3,230 tonnes in fiscal 2022 to 3,880 tonnes. Recovered grade remained flat at 0.153g/t.
The gold sold from treating waste rock dumps decreased by 34.5% to 1,549 kilograms from 2,366 kilograms in fiscal 2022. This was mainly due to diminishing levels of waste rock available to be treated in certain areas resulting in lower tonnes milled in fiscal 2023 of 3,935 tonnes compared to 5,813 tonnes.
Kalgold's gold sold increased 1.8% from 1,142 kilograms to 1,163 kilograms in fiscal 2023. This was as a result of the 7.6% increase in grade achieved at the operation, increasing from 0.79g/t to 0.85g/t in fiscal 2023. This increase was offset by tonnes milled decreasing 3.8% from 1,432 tonnes in fiscal 2022 to 1,377 tonnes in fiscal 2023.
At Hidden Valley, gold sold increased 15.1% from 3,662 kilograms to 4,214 kilograms mainly as a result of an increase in tonnes milled to 3,846 tonnes in fiscal 2023, an increase of 19.1%.
Export Sales
All of our gold produced in South Africa during fiscal 2021 to 2023 was refined by Rand Refinery Proprietary Limited ("Rand Refinery"). Rand Refinery is owned by a consortium of the major gold producers in South Africa and Harmony holds a 10.4% interest at June 30, 2023. All of our gold and silver produced in PNG during fiscal 2021 to 2023 have been sold to the Australian Bullion Corporation.
Cost of sales
Cost of sales includes production costs, amortization and depreciation and other items, including employment termination and restructuring costs.
Production costs (cash costs/all-in sustaining costs)
The following table sets out, for our reportable segments, total kilograms produced and weighted average cash costs per kilogram and total kilograms sold and weighted average all-in sustaining costs per kilogram for fiscal 2022 and fiscal 2023:
|
|
|
|
|
|
|
|
|
|
|
|
|
|
|
|
|
|
|
|
|
|
|
|
|
|
|
|
|
|
|
|
|
|
Year ended June 30, 2023 |
Year ended June 30, 2022 |
Percentage
(increase)/decrease |
|
Cash costs |
All-in sustaining
costs
|
Cash costs |
All-in sustaining
costs
|
Cash
costs
per
kg |
All-in
sustain-ing
costs per
kg |
|
(kg
pro-duced)
|
(R/kg) |
(kg sold) |
(R/kg) |
(kg
pro-duced)
|
(R/kg) |
(kg sold) |
(R/kg) |
| South Africa |
|
|
|
|
|
|
|
|
|
|
| Moab Khotsong |
6,668 |
|
683,995 |
|
6,715 |
|
782,441 |
|
6,508 |
|
635,146 |
|
6,393 |
|
739,870 |
|
(8) |
|
(6) |
|
| Mponeng |
7,449 |
|
671,474 |
|
7,480 |
|
784,093 |
|
6,086 |
|
739,026 |
|
6,041 |
|
865,976 |
|
9 |
|
9 |
|
Tshepong North |
3,354 |
|
797,069 |
|
3,391 |
|
975,498 |
|
3,793 |
|
763,163 |
|
3,799 |
|
994,235 |
|
(4) |
|
2 |
|
Tshepong South |
3,431 |
|
691,925 |
|
3,458 |
|
841,983 |
|
3,229 |
|
679,169 |
|
3,231 |
|
843,688 |
|
(2) |
|
— |
|
| Doornkop |
4,213 |
|
708,908 |
|
4,233 |
|
831,553 |
|
3,444 |
|
729,965 |
|
3,464 |
|
823,966 |
|
3 |
|
(1) |
|
| Joel |
1,947 |
|
823,291 |
|
1,964 |
|
950,713 |
|
1,556 |
|
845,931 |
|
1,555 |
|
983,593 |
|
3 |
|
3 |
|
| Target 1 |
1,275 |
|
1,594,661 |
|
1,256 |
|
1,903,111 |
|
1,800 |
|
996,938 |
|
1,821 |
|
1,210,404 |
|
(60) |
|
(57) |
|
| Kusasalethu |
3,460 |
|
956,938 |
|
3,481 |
|
1,068,851 |
|
4,567 |
|
678,403 |
|
4,586 |
|
739,681 |
|
(41) |
|
(45) |
|
| Masimong |
1,961 |
|
871,508 |
|
1,980 |
|
925,703 |
|
1,910 |
|
789,912 |
|
1,911 |
|
845,299 |
|
(10) |
|
(10) |
|
Bambanani(1) |
— |
|
— |
|
19 |
|
827,789 |
|
1,433 |
|
807,652 |
|
1,437 |
|
851,977 |
|
100 |
|
3 |
|
| MWS |
2,804 |
|
649,264 |
|
2,781 |
|
721,034 |
|
2,899 |
|
549,621 |
|
2,879 |
|
608,952 |
|
(18) |
|
(18) |
|
| All other surface operations |
4,719 |
|
716,657 |
|
4,718 |
|
719,354 |
|
5,304 |
|
663,317 |
|
5,374 |
|
647,640 |
|
(8) |
|
(11) |
|
| International |
|
|
|
|
|
|
|
|
|
|
| Hidden Valley |
4,370 |
|
486,754 |
|
4,214 |
|
1,014,228 |
|
3,707 |
|
591,551 |
|
3,662 |
|
1,007,986 |
|
18 |
|
(1) |
|
| Total kg |
45,651 |
|
|
45,690 |
|
|
46,236 |
|
|
46,153 |
|
|
|
|
|
|
|
|
|
|
|
|
|
|
|
Weighted average(2) |
|
735,634 |
|
|
889,766 |
|
|
701,024 |
|
|
835,891 |
|
(5) |
|
(6) |
|
1 The Bambanani operation closed in June 2022.
2 The offsetting of the by-product income for management's reporting purposes has the effect of decreasing the cash costs and the all-in sustaining costs.
For further information about the use of Non-GAAP measures, see “Reconciliation of Non-GAAP Measures” below.
Our average cash costs increased by 4.9%, or R34,610 per kilogram, from R701,024 per kilogram in fiscal 2022 to R735,634 per kilogram in fiscal 2023. Cash costs per kilogram vary with the working costs per tonne (which are, in turn, affected by the number of tonnes processed) and grade of ore processed. Production costs increased by 5.3% from R33,099 million in fiscal 2022 to R34,866 million in fiscal 2023, mainly due to inflationary pressures on costs including labor, electricity and consumables costs. The continued conflict in Ukraine placed pressure on supply chains which were still recovering post Covid-19 and this created additional cost pressure. Further, increased electricity tariffs continue to inflate production costs year on year.
At Moab Khotsong, all-in sustaining cost increased by 5.8% from R739,870 per kilogram in fiscal 2022 to R782,441 per kilogram in fiscal 2023, mainly due to an increase in cash cost as a result of annual labor cost and electricity tariff increases as well as inflationary increases on consumables.
At Mponeng, all-in sustaining cost decreased by 9.5% from R865,976 per kilogram in fiscal 2022 to R784,093 per kilogram in fiscal 2023, mainly due to a significant improvement in gold production. Tonnes milled and recovery grade increased 5.2% and 16.3% respectively. This was mainly as a result of higher-than-anticipated average mining grades as well as good clean mining practices.
At Tshepong North, all-in sustaining cost decreased marginally by 1.9% from R994,235 per kilogram in fiscal 2022 to R975,498 per kilogram in fiscal 2023, mainly due to the planned decrease in capital expenditure as well as cash operating cost.
At Tshepong South, all-in sustaining cost remained relatively flat at R841,983 per kilogram in fiscal 2023, compared with R843,688 per kilogram in fiscal 2022, mainly due to an increase in production offsetting the increase in the base costs.
At Doornkop, all-in sustaining cost increased by 0.9% from R823,966 per kilogram in fiscal 2022 to R831,553 per kilogram in fiscal 2023. This was mainly due to annual wage increases and higher cost of consumables. Additional cost were incurred for compressed air generation and higher diesel expenditure. The increase in cash operating cost was however partially offset by an increase in gold production.
At Joel, all-in sustaining cost decreased by 3.3% from R983,593 per kilogram in fiscal 2022 to R950,713 per kilogram in fiscal 2023, mainly as a result of a 25.1% increase in gold production to 1,947 kilograms driven by a 24.8% increase in recovery grade. This is a result of higher mining grades achieved during fiscal 2023.
At Target 1, all-in sustaining costs increased significantly year on year by 57.2% from R1,210,404 per kilogram in fiscal 2022 to R1,903,111 per kilogram in fiscal 2023. This was as a result of lower gold production due to a number of issues at the operation during the year, including pillar failures in the high grade massive stopes, trackless vehicle availability as well as several power failures ultimately resulting in the flooding of certain areas of the operation. Ventilation constraints further compounded the challenges for the operation.
At Kusasalethu, all-in sustaining costs increased year on year by 44.5% from R739,681 per kilogram in fiscal 2022 to R1,068,851 per kilogram in fiscal 2023, mainly as a result of the 18.9% and 6.6% decrease in grade and tonnes milled respectively. This was caused by lower-than-anticipated grades in some of its very high-grade mining areas as well as numerous mining-related challenges that reflected in the recovered grade during fiscal 2023.
At Masimong, all-in sustaining cost increased by 9.5% from R845,299 per kilogram in fiscal 2022 to R925,703 per kilogram in fiscal 2023, mainly due to annual wage increases, electricity tariff increases as well as significant increases in consumables.
Bambanani mine was closed at the end of fiscal 2022 instead of the end of fiscal 2024 as higher seismicity compromised the mine's safe operation. No operational activities took place during fiscal 2023.
At MWS, all-in sustaining costs increased year on year by 18.4% from R608,952 per kilogram in fiscal 2022 to R721,034 per kilogram in fiscal 2023. This was mainly as a result of the increased chemicals costs, mainly cyanide, experienced during the year.
At Phoenix, all-in sustaining costs increased by 6.8% from R611,580 per kilogram in fiscal 2022 to R653,241 per kilogram in fiscal 2023. This was mainly as a result of the increased costs experienced during the year due to a significant increase in the cost of chemicals as well as annual labor and electricity increases. The increase in cash cost was however partially offset by higher gold production.
At Central Plant Reclamation, all-in sustaining cost increased by 19.5% from R529,591 per kilogram in fiscal 2022 to R633,098 per kilogram in fiscal 2023. This was mainly driven by the higher cost of chemicals as well as annual wage and electricity tariff increases.
At Savuka Tailings, all-in sustaining costs decreased year on year by 8.2% from R615,137 per kilogram in fiscal 2022 to R564,738 per kilogram in fiscal 2023. This was mainly due to a 16.1% increase in gold sold from 509 kilograms in fiscal 2022 to 591 kilograms in fiscal 2023.This also offset the higher cash operating cost, mainly as a result of higher cost of chemicals as well as annual labor and electricity increases.
At the waste rock dumps, all-in sustaining costs increased year on year by 21.9% from R705,642 per kilogram in fiscal 2022 to R859,974 per kilogram in fiscal 2023. The dumps realized a 33.5% decrease in production, from 2,319 kilograms in fiscal 2022 to 1,541 kilograms in fiscal 2023. This is a result of the diminishing levels of waste rock available to be treated in certain areas, resulting in lower tonnes milled for these operations in fiscal 2023, decreasing 32.3% to 3.9 million tonnes.
At Kalgold all-in sustaining cost increased slightly by 2.3% from R964,678 per kilogram in fiscal 2022 to R986,677 per kilogram in fiscal 2023, mainly as a result of a 5.6% increase in cash operating costs. This was as a result of higher cost of consumables, specifically diesel and chemicals compounded by the annual wage and electricity tariff increases.
At Hidden Valley, all-in sustaining cost was largely flat with an increase of 0.6% from R1,007,986 per kilogram in fiscal 2022 to R1,014,228 per kilogram in fiscal 2023.
Amortization and depreciation
Amortization and depreciation decreased from R3,683 million in fiscal 2022 to R3,454 million in fiscal 2023, primarily due to reduced carrying values of mining assets as a result of the impairment recognized in fiscal 2022. Additionally, the closure of Bambanani in June 2022 resulted in no depreciation in fiscal 2023 compared to R84 million in fiscal 2022.
Impairment of assets
No impairment charge was recorded in fiscal 2023 as compared to the impairment of R4,433 million in fiscal 2022. The results of the fiscal 2023 calculation, based on trigger assessment, resulted in headroom for the assets identified for testing, being Target 1, Kusasalethu and Kalgold. There were no reversal of impairments previously recognized during fiscal 2023 or 2022.
The Tshepong Operations were disaggregated into two separate cash generating units ("CGUs"), being the Tshepong North CGU and the Tshepong South (also known as the Phakisa section) CGU, for impairment testing at June 30, 2022. This is due to the decision taken during the fiscal 2023 budget process in June 2022 to reinvest in the two individual operations to maximize individual profitability following the change to Tshepong North's life-of-mine with the sub-75 decline project being halted. Based on the forward-looking nature of the impairment assessment, a separate impairment calculation was prepared for each of the CGUs.
A total impairment of R3,622 million was recognized on these CGUs in fiscal 2022, which is made up of the following:
•An impairment of R2,296 million on property, plant and equipment of Tshepong North was recognized at June 30, 2022. This was mainly as a result of increased cost for both production and capital expenditure and the increased post-tax discount rate of 11.7% (2021: 10.1% for Tshepong Operations). The recoverable amount was also affected by the reclassification of production for the sub-75 level from reserves in the life-of-mine plan to the resource base, which is subject to a higher discount rate of 13.7% (2021: 12.0%). The post-tax recoverable amount was determined to be R1 938 million.
•An impairment of R1,326 million on property, plant and equipment of Tshepong South was recognized at June 30, 2022. The individual life-of-mine plan included additional capital to address flexibility constraints at the operation. Costs also increased significantly as a result of inflationary pressures. The changes affected the discounted cash flows used to determine the recoverable amount of the operation. The post-tax recoverable amount, after the impact of a higher discount rate of 11.7% (2021: 10.1% for Tshepong Operations), was determined to be R1,645 million.
An impairment of R522 million on property, plant and equipment and goodwill of Moab Khotsong was recognized at June 30, 2022, of which R302 million related to goodwill. The updated life-of-mine plan included an increase in working and capital costs as a result of inflationary pressures. The updated life-of-mine plan also includes additional capital expenditure which relates to the Zaaiplaats project after finalization of its detailed design plan during fiscal 2022. This impacted the discounted cash flows used to determine the recoverable amount of the operation. The recoverable amount was further impacted by an increased post-tax discount rate of 10.4% (2021: 9.4%) which resulted in the post-tax recoverable amount decreasing to R3,748 million.
The impairment of property, plant and equipment on Kusasalethu was mainly as a result of the reduction in tonnes combined with a decrease in grade over the remainder of the operation's life, leading to a decrease in planned gold production. The reduction is due to an updated plan to mitigate safety risks that exist at the operation. These changes reduced the recoverable amount to R806 million and an impairment of R145 million was recognized.
During the December 2021 period, impairments of R144 million were recognized for property, plant and equipment and goodwill of Bambanani, of which R31 million related to goodwill. The impairment of goodwill and assets on Bambanani was as a result of a change in the life-of-mine plan, moving the closure of the mine forward from June, 2024 to June, 2022. This was as a result of increased seismicity at the operation and the related risk increasing as pillars were mined out. The post-tax recoverable amount of R36 million, at December 2021, was derived from the expected cash flows as per the life-of-mine plans. The recoverable amount of the operation was Rnil, as the operation was closed during June 2022.
Exploration expenditure
Exploration expenditure increased from R214 million in 2022 fiscal year to R506 million in 2023 fiscal year predominantly due to the feasibility study for the Eva Copper Project.
Gains/losses on derivatives
Losses on derivatives amounted to R194 million in fiscal 2023, compared to a gain of R53 million in fiscal 2022. Gains/losses on derivatives include the fair value movements of derivatives which have not been designated as hedging instruments for hedge accounting purposes or where hedge accounting has been discontinued, the amortization of day-one gains and losses for derivatives and the hedging ineffectiveness. The day-one adjustment arises from the difference between the contract price and market price on the day of the transaction. Factors affecting gains/losses on derivatives are discussed below.
(a) Foreign exchange derivatives
Harmony maintains a foreign exchange derivative program in the form of zero cost collars, which establish a floor and cap US$/Rand exchange rate at which to convert US dollars to Rand, and forward exchange contracts. As hedge accounting is not applied, the resulting gains and losses have been recorded in the income statement. In fiscal 2023, a loss amounting to R145 million was recorded compared to a loss of R16 million in fiscal 2022.
(b) US$ commodity contracts
Harmony maintains a derivative program for Hidden Valley by entering into commodity derivative contracts. The contracts comprise US$ gold forward sale derivative contracts as well as silver zero cost collars which establish a minimum (floor) and maximum (cap) silver sales price. Hedge accounting has been applied to US$ gold contracts and these are shown separately from the silver zero cost collars that are not hedge accounted. A gain of R25 million was recognized in revenue for fiscal 2023 compared to a loss of R105 million in fiscal 2022. The unamortized portion of day-one loss was R8 million in fiscal 2023, compared with R3 million in fiscal 2022. The gains and losses for the silver zero cost collars are recorded in gains/(losses) on derivatives in the income statement. In fiscal 2023, a gain on derivative of R21 million was recorded in the income statement compared to a gain of R114 million in fiscal 2022.
(c) Rand gold contracts
Harmony utilizes Rand gold forward sale derivative contracts to hedge the risk of lower Rand gold prices. Cash flow hedge accounting is applied to these contracts, resulting in the effective portion of the unrealized gains and losses being recorded in other comprehensive income (other reserves). The contracts that matured realized a gain of R602 million in fiscal 2022 compared to a loss of R209 million in fiscal 2023, which has been included in revenue.
During fiscal 2023 and 2022 a negligible amount of hedge ineffectiveness was experienced. The unamortized portion of the day-one loss increased from R28 million in fiscal 2022 to R110 million in fiscal 2023.
Foreign exchange translation gain/loss
A foreign exchange translation loss of R327 million was recorded during fiscal 2022 compared to a loss of R634 million in fiscal 2023. The loss in 2023 was predominantly caused by unfavorable translations on US dollar loan balances. The unfavorable translations on US dollar loans are attributable to the Rand weakening against the US dollar evidenced by a closing exchange rate of R18.83/US$1 (2022: R16.27/US$1). Also contributing to the loss for 2023 was the draw down of US$170 million (R2 919 million) during the year for the acquisition of the Eva Copper Project and other assets.
Other operating expenses
Other operating expenses increased to R268 million in fiscal 2023 from R1 million in fiscal 2022 principally as a result of the factors discussed below.
(a) Loss on scrapping of property, plant and equipment
A loss on scrapping of R182 million (2022: R7 million) was recorded in fiscal 2023. This related to the derecognition of property, plant and equipment that is no longer in use and no future economic benefits are expected from their use or disposal.
(b) Remeasurement of contingent consideration
A remeasurement of the contingent consideration liability of R64 million expense (2022: R61 million credit) relating to the change in the Mponeng operation’s production profile, which is based on its life-of-mine plan and the unwinding of the Eva Copper contingent consideration, which was recognized in December 2022.
(c) Silicosis settlement provision
During fiscal 2023, a credit of R183 million was recorded for the decrease in the liability for Harmony’s potential cost to settle the silicosis and TB class actions, compared to a R23 million expense in fiscal 2022, as a result of a change in the actuary model used as well as an increase in the discount rates.
(d) Insurance proceeds
During fiscal 2023, no insurance claim proceeds were received while in fiscal 2022 R83 million was received.
Acquisition-related costs
The cost of R214 million relates to acquisition of the Eva Copper assets in fiscal 2023. No such transactions were entered into during fiscal 2022.
Investment income
During fiscal 2023 investment income amounted to R663 million compared to R352 million in fiscal 2022. This was mainly due to higher interest rates experienced during fiscal 2023.
Finance costs
During fiscal 2023 finance costs amounted to R994 million compared to R718 million in fiscal 2022. The increase was mainly due to the higher US$ loan balance compared to fiscal 2022, as well as higher interest rates.
Income and mining taxes
In fiscal 2022, the tax rates for companies were 34% for mining income and 28% for non-mining income for South African companies. In fiscal 2023 the tax rates for companies was changed by the South African government to 33% for mining income and 27% for non-mining income. The income tax rate remained 30% for Australian companies and PNG mining companies.
Harmony’s effective income and mining tax rates for fiscal 2022 and 2023 are presented in the table below:
|
|
|
|
|
|
|
|
|
|
Fiscal year ended June 30, |
| Income and mining tax |
2023 |
2022 |
| Effective income and mining tax rate |
26% |
4% |
The effective tax rate for fiscal 2023 was marginally lower than the mining statutory tax rate of 33% for Harmony and our subsidiaries as a whole, mainly due to the increases in current taxation resulting from increased revenue following from the higher gold prices experienced during fiscal 2023. Refer to note 12 "Taxation" of our consolidated financial statements beginning on page F-1 for the assumptions used. These changes, together with changes in the temporary differences, had the following impacts:
•The change in rates, with the majority increasing year on year at the individual company level (other than hedge accounted derivatives), resulted in a increase in the deferred tax expense and liability to the amount of R588 million (2022: R386 million decrease);
•Increase of temporary differences related to the carrying value of property, plant and equipment resulted in an increase of R377 million in the deferred tax expense (2022: R101 million decrease); and
•Unwinding of temporary differences related to unredeemed capital expenditure balances resulted in an increase of R169 million in the deferred tax expense (2022: R86 million)
Deferred tax rates for the South African operations are calculated based on estimates of the future profitability of each ring-fenced mine when temporary differences will reverse. The future profitability of each ring-fenced mine, in turn, is determined by reference to the life-of-mine plan for that operation, which is based on parameters such as the Group’s long-term view of the US$ gold price and the Rand/US$ exchange rate, as well as the reserves declared for the operation.
As some of these parameters are based on market indicators, they differ from one year to the next. In addition, the reserves may also increase or decrease based on updated or new geological information. Changes in the future profitability of each ring-fenced mine impact the deferred tax rates used to recognize temporary differences at these operations. The movement in deferred tax on temporary differences due to changes in estimated effective tax rates results primarily from the movement in the effective deferred tax rate at Harmony (includes Masimong), Freegold (includes Joel, Tshepong North and Tshepong South), Randfontein Estates (includes Doornkop and Kusasalethu), Moab Khotsong, Mponeng and Kalahari Goldridge Mining Company Limited ("Kalgold"). The deferred tax rates of the following companies increased in fiscal 2023: Harmony, from 25.1% to 26.4%; Freegold, from 7.0% to 11.4%; Randfontein Estates, from 8.7% to 10.5%; Moab Khotsong,from 14.7% to 16.7%; Mponeng, from 12.8% to 17.7%. Kalgold decreased from 18.7% to 17.1% in fiscal 2023.
South Africa. Generally, South Africa imposes tax on worldwide income (including capital gains) of all our South African incorporated tax resident entities at a rate of 27% (2022: 28%) on non-mining income. The South African entities pay taxes separately on mining income and non-mining income. The amount of our South African mining income tax is calculated on the basis of a gold mining formula that takes into account our total revenue and profits from, and capital expenditure for, mining operations in South Africa. 5% of total mining revenue is exempt from taxation in South Africa as a result of the application of the gold mining formula. The amount of revenue subject to taxation is calculated by deducting qualifying capital expenditure from taxable mining income. The amount by which taxable mining income exceeds 5% of mining revenue constitutes taxable mining income. We and our subsidiaries account for taxes separately that are determined in respect of each entity. Hence, South Africa does not make use of any Group basis of taxation.
Previously, Harmony was able to carry forward assessed losses indefinitely and offset the total accumulated balance against taxable income in the relevant year of assessment.
However, this has been amended from fiscal year 2023. Assessed losses utilized are limited to the higher of R1 million or 80% of taxable income, and the balance remaining will be carried forward to the following year of assessment. This essentially results in a minimum taxable income of 20%. The restriction on utilizing losses has be made on the basis that the calculation of the assessed loss restriction must be determined before any capital expenditure is deducted.
South Africa has a Controlled Foreign Company regime which effectively attributes certain types of passive income derived by offshore subsidiaries and imputes that income in taxable income as if it had been derived in South Africa under South African tax rules.
Australia. Generally, Australia also imposes tax on the worldwide income (including capital gains) of all of our Australian incorporated and tax resident entities. The current income tax rate for companies is 30%.
HGA and its wholly-owned Australian subsidiary companies are recognized and taxed as a single entity, called a consolidated Group. Under the Australian Tax Consolidation rules all of the Australian subsidiary companies are treated as divisions of the Head Company, HGA. As a result, inter-company transactions between group members are generally ignored for tax purposes. This allows the Group to transfer assets between group members without any tax consequences, and deems all tax losses to have been incurred by HGA.
PNG. PNG mining projects are taxed on a project basis. Therefore, each project is taxed as a separate entity, even though it may be one of a number of projects carried on by the same company. Capital development and exploration expenditure incurred in PNG is capitalized for tax purposes and can be deducted at 25% per annum on a diminishing value basis against project income, with the deduction being limited to the lesser of 25% of the diminished value or the income of the project for the year.
PNG mining companies are taxed at a rate of tax of 30%. Mining operations in PNG are subject to a 2% royalty and 0.5% Production Levy which are payable to the PNG Government.
Operating performance per Segment
For a further discussion on operating performance on a segment basis, refer to “– Delivering profitable ounces – Operational Performance – Performance by Operation” on pages 67 to 108 of the Integrated Annual Report for the 20-F 2023. Also refer to note 41 “Segment report” to our consolidated financial statements set forth beginning on page F-1.
Reconciliation of Non-GAAP Measures
The World Gold Council (“WGC”) published industry guidance in June 2013 (which was updated in November 2018) on the calculation of “all-in sustaining costs” and “all-in cost”, both of which are non-GAAP measures, and were developed to create a better understanding of the overall costs associated with producing gold. Although Harmony is not a member of the WGC, we started disclosing all-in sustaining costs in fiscal 2014. The all-in sustaining cost measure is an extension of the existing cash cost measure (referenced below) and incorporates costs related to sustaining production.The calculation of cash costs, cash costs per ounce/kilogram, all-in sustaining costs and all-in sustaining costs per ounce/kilogram may vary significantly among gold mining companies and, by themselves, do not necessarily provide a basis for comparison with other gold mining companies. Nevertheless, Harmony believes that cash costs and all-in sustaining costs are useful indicators to investors and management as they provide an indication of profitability, efficiency and cash flows, the trend in costs as the mining operations mature over time on a consistent basis and an internal benchmark of performance to allow for comparison against other mines, both within the Group and at other gold mining companies.
Our cash costs consist primarily of production costs and are expensed as incurred. The cash costs are incurred to access ore to produce current mined reserves. Cash costs do not include capital development costs, which are incurred to allow access to the orebody for future mining operations and are capitalized and amortized when the relevant reserves are mined.
Total cash costs include mine production costs, transport and refinery costs, applicable general and administrative costs, ore stockpiles, as well as ongoing environmental rehabilitation costs as well as transfers for stripping activities and costs associated with royalties. Employee termination costs are included, however employee termination costs associated with major restructuring and shaft closures are excluded. The costs associated with movements in production inventories are excluded from total cash costs. Gold ounces/kilograms produced are used as the denominator in the total cash costs per ounce/kilogram calculation.
All-in sustaining costs include mine production costs, transport and refinery costs, applicable general and administrative costs, costs associated with movements in production inventories, ore stockpiles, as well as ongoing environmental rehabilitation costs, transfers for stripping activities and costs associated with royalties. Employee termination costs are included, however employee termination costs associated with major restructuring and shaft closures are excluded. The following costs are also included: local economic development (“LED”) expenditure for continuing operations, corporate costs, sustaining exploration costs and sustaining capital expenditure including ongoing capital development (“OCD”) expenditure and rehabilitation accretion and amortization for continuing operations. Gold ounces/kilograms sold are used as the denominator in the all-in sustaining costs per ounce/kilogram calculation. Depreciation costs are excluded.
Changes in all-in sustaining costs per ounce/kilogram and cash costs per ounce/kilogram are affected by operational performance. In US dollar terms, these measures are also affected by the changes in the currency exchange rate between the Rand and the US dollar and, in the case of the PNG operations, the Kina. All-in sustaining costs, all-in sustaining costs per ounce/kilogram, total cash costs and total cash costs per ounce/kilogram are non-GAAP measures. These measures should not be considered by investors in isolation or as an alternative to production costs, cost of sales, or any other measure of financial performance calculated in accordance with IFRS. In addition, the calculation of these measures may vary from company to company and may not be comparable to other similarly titled measures of other companies. However, we believe that all-in sustaining costs per ounce/kilogram and cash costs per ounce/kilogram are useful indicators to investors and management of a mining company’s performance as they provide (i) an indication of the cash generating capacities of our mining operations, (ii) the trends in all-in sustaining costs and cash costs as the Company’s operations mature, (iii) a measure of a company’s performance, by comparison of cash costs per ounce/kilogram to the spot price of gold and (iv) an internal benchmark of performance to allow for comparison against other companies.
While recognizing the importance of reducing all-in sustaining costs and cash costs, our chief focus is on controlling and, where possible, reducing total costs, including overhead costs. We aim to control total unit costs per ounce/kilogram produced by maintaining our low total cost structure at our existing operations. We have been able to reduce total costs by implementing a management structure and philosophy that is focused on reducing management and administrative costs.
The following is a reconciliation of total all-in sustaining costs, as a non-GAAP measure, to the nearest comparable GAAP measure, cost of sales under IFRS:
|
|
|
|
|
|
|
|
|
|
|
Fiscal year ended June 30, |
|
2023 |
2022 |
|
|
(in R millions, except for ounce/kilogram amounts) |
| Total cost of sales - under IFRS |
39,535 |
|
41,927 |
|
|
| Depreciation and amortization expense |
(3,454) |
|
(3,683) |
|
|
| Rehabilitation costs |
(32) |
|
(136) |
|
|
| Care and maintenance costs of restructured shafts |
(227) |
|
(273) |
|
|
| Employment termination and restructuring costs |
(597) |
|
(218) |
|
|
| Share-based payments |
(51) |
|
(143) |
|
|
| Impairment |
— |
|
(4,433) |
|
|
Toll treatment costs |
(323) |
|
— |
|
|
| By-products credits |
(1,325) |
|
(903) |
|
|
| Other |
364 |
|
280 |
|
|
| Capitalized stripping |
1,514 |
|
1,096 |
|
|
| LED expenditure |
189 |
|
138 |
|
|
| Corporate, administration and other expenditure costs |
1,044 |
|
1,041 |
|
|
| Capital expenditure (OCD) |
2,614 |
|
2,826 |
|
|
| Capital expenditure (Exploration, abnormal expenditure and shaft capital) |
1,402 |
|
1,058 |
|
|
| |
|
|
|
| Total all-in sustaining costs |
40,653 |
|
38,579 |
|
|
| Per kilogram calculation: |
|
|
|
| Kilogram sold |
45,690 |
|
46,153 |
|
|
| Total all-in sustaining costs per kilogram |
889,766 |
|
835,891 |
|
|
|
|
|
|
| Total all-in sustaining costs (US$ million) |
2,289 |
|
2,536 |
|
|
| Per ounce calculation: |
|
|
|
| Ounces sold |
1,468,966 |
|
1,483,853 |
|
|
| Total all-in sustaining costs per ounce |
1,558 |
|
1,709 |
|
|
The following is a reconciliation of total cash costs, as a non-GAAP measure, to the nearest comparable GAAP measure, cost of sales under IFRS:
|
|
|
|
|
|
|
|
|
|
|
|
|
|
|
Fiscal year ended June 30, |
|
2023 |
2022 |
|
|
(in R millions, except for ounce/kilogram amounts) |
| Total cost of sales - under IFRS |
39,535 |
|
41,297 |
|
|
| Depreciation and amortization expense |
(3,454) |
|
(3,683) |
|
|
| Rehabilitation costs |
(32) |
|
(136) |
|
|
| Care and maintenance costs of restructured shafts |
(227) |
|
(273) |
|
|
| Employment termination and restructuring costs |
(597) |
|
(218) |
|
|
| Share-based payments |
(51) |
|
(143) |
|
|
| Impairment |
— |
|
(4,433) |
|
|
| By-product revenue |
(1,325) |
|
(903) |
|
|
| Other |
(1,161) |
|
8 |
|
|
| Gold and uranium inventory movement |
894 |
|
267 |
|
|
|
|
|
|
| Total cash costs |
33,582 |
|
32,413 |
|
|
|
|
|
|
| Per kilogram calculation: |
|
|
|
| Kilograms produced |
45,651 |
|
46,236 |
|
|
| Total cash costs per kilogram |
735,634 |
|
701,024 |
|
|
|
|
|
|
| Total cash costs (US$) |
1,890 |
|
2,132 |
|
|
|
|
|
|
Per ounce calculation:
Ounces produced |
1,467,715 |
|
1,486,517 |
|
|
| Total cash costs per ounce |
1,288 |
|
1,434 |
|
|
Within this report, our discussion and analysis is focused on the all-in sustaining costs and total cash costs measure.
B. LIQUIDITY AND CAPITAL RESOURCES
We centrally manage our funding and treasury policies. There are no legal or economic restrictions on the ability of our subsidiaries to transfer funds to us. We have generally funded our operations and our short-term and long-term liquidity requirements from: (i) cash generated from operations; (ii) credit facilities and other borrowings and (iii) sales of equity securities.
Harmony intends to finance its capital expenditure, other purchase obligations and debt repayment requirements in 2023 from cash on hand, cash flow from operations, and existing credit facilities.
|
|
|
|
|
|
|
|
|
|
Fiscal year ended June 30, |
|
2023 |
2022 |
| |
(R in millions) |
| Operating cash flows |
9,948 |
|
6,924 |
|
| Investing cash flows |
(10,596) |
|
(6,200) |
|
| Financing cash flows |
1,194 |
|
(1,151) |
|
| Foreign exchange differences |
(127) |
|
56 |
|
| Total cash flows |
419 |
|
(371) |
|
Cash flows from operating activities
Net cash provided by operations is primarily affected by the quantities of gold sold, the gold price, the Rand/US$ exchange rate, cash costs per ounce and, in the case of the international operations, the Australian dollar and PNG Kina versus US dollar exchange rate. A significant adverse change in one or more of these parameters could materially reduce cash provided by operations as a source of liquidity. Net cash generated by operations increased from R6,924 million in fiscal 2022 to R9,948 million in fiscal 2023. This increase is mainly due to higher revenue generated through the year as a result of higher gold prices received.
Cash flows from investing activities
Net cash utilized by investing activities increased from R6,200 million in fiscal 2022 to R10,596 million in fiscal 2023. The increase principally relates to the Eva Copper acquisition (R2,996 million) that occurred during fiscal 2023 and an increase of R1,426 million in additions to property, plant and equipment.
Cash flows from financing activities
Financing activities generated R1,194 million in fiscal 2023, compared to cash utilized of R1,151 million in fiscal 2022. This was mainly due to borrowings raised and lower repayments in fiscal 2023. A total of R2,919 million was drawn down on the US$400 Million Syndicated Facility (defined below).
In fiscal 2023, borrowings repaid amounted to R2,071 million as compared to repayments of R3,601 million made during fiscal 2022. The draw down mentioned above was partially offset by the repayments made during the year, resulting in a net inflow on the borrowings of R1,548 million compared to the outflow of R544 million seen in fiscal 2022.
In fiscal 2023, a total dividend of R154 million (2022: R430 million) was recognized and relates primarily to the final dividend of 22 SA cents for the 2022 year, amounting to R136 million which was paid on October 17, 2022 (2021: 27 SA cents per share with payment of R167 million on October 18, 2021). The board did not declare an interim ordinary dividend for fiscal 2023 (2022: 40 SA cents per share totaling R247 million which was paid on April 11, 2022).
See note 32 “Borrowings", note 34 “Cash Generated by Operations” and note 40 "Subsequent events" to our consolidated financial statements set forth beginning on page F-1.
Outstanding Credit Facilities and Other Borrowings
On May 25, 2022 Harmony concluded a R1.5 billion six- and a- half-year term green loan facility with a syndicate of banks led by ABSA Bank Limited and Nedbank Limited (the "R1.5 Billion Green Term Loan"). The terms of the R1.5 Billion Green Term Loan provide that amounts borrowed may be used in respect of eligible green projects, which relate to the construction, development, acquisition, maintenance, and/or operation of renewable energy installations.
The R1.5 Billion Green Term Loan became available in four quarterly increments of R375 million starting in November 2022. During fiscal 2023, no draw down was made on the R1.5 Billion Green Term Loan.
The key terms of the R1.5 Billion Green Term Loan are:
Term facility: R1.5 billion
Margin: 2.65% over 3-month Johannesburg Interbank Average Rate ("JIBAR")
Maturity: Five and a half years
Security: Unsecured
On May 25, 2022 Harmony concluded a R2.5 billion sustainability-linked revolving credit facility with a syndicate of banks led by ABSA Bank Limited and Nedbank Limited (the “R2.5 Billion Syndicated Revolving Credit Facility”). Under the terms of the R2.5 Billion Syndicated Revolving Credit Facility all amounts borrowed must be used (i) in repayment of the R2 billion four-year syndicated term loan and revolving credit facility and (ii) for ongoing general corporate costs, working costs and working capital requirements of the Group. During April 2023 a 12-month extension was granted from May 2025.
At June 30, 2023, the full amount on the R2.5 Billion Syndicated Revolving Credit Facility facility was available.
The key terms of the R2.5 Billion Syndicated Revolving Credit Facility are:
Revolving facility: R2.5 billion
Margin on revolving facility: 2.4% over 3-month JIBAR
Maturity: Three years, plus one extension option for one year
Security: Unsecured
On May 25, 2022 Harmony and a syndicate of local and international lenders, which was jointly arranged by Nedbank Limited and ABSA Bank Limited, concluded a US$400 million sustainability-linked syndicated term loan facility (the “US$400 Million Syndicated Facility”) comprising a US$100 million term facility and a US$300 million revolving credit facility.
The US$400 Million Syndicated Facility is a sustainability-linked facility. Sustainability-linked metrics have been included into the agreement which would result in specific increases/decreases in the interest rate charged to the facility. During fiscal 2023, a total of US$300 million (R5,648 million) was drawn down on both the term loan facility and the revolving credit facility, which was used for the acquisition of Eva Copper.
The R2.5 Billion Syndicated Revolving Credit Facility and the US$400 Million Syndicated Facility are both sustainability-linked facilities. These facilities are linked to certain key performance indicators ("ESG KPIs") which will be measured annually for the current financial year as well as the next two financial years and will result in changes to interest rate margins. The rate will be adjusted annually by one basis point for each metric achieved (decrease) or not (increase), with these adjustments being cumulative over the three-year measuring period. The adjustments to interest rate margins for each financial year's ESG performance would impact the following financial year. The respective ESG KPIs are as follows:
|
|
|
|
|
|
|
|
|
|
|
|
|
|
|
|
|
|
| KPI |
Unit of Measurement |
Scope |
Sustainability performance targets |
|
|
|
FY23
Targets
|
FY24
Targets
|
FY25
Targets
|
| Greenhouse gas emissions |
‘000 tonnes of Scope 1 and Scope 2 CO2e emissions |
All operations |
4,485 |
4,279 |
4,074 |
| Renewable Energy |
Renewable energy consumption as % of total electricity consumed |
SA operations |
2 |
% |
8 |
% |
20 |
% |
| Water consumption |
Potable water consumed (Mℓ) |
SA operations |
20,453 |
19,833 |
19,436 |
Depending on Harmony's performance in relation to these ESG KPIs, the potential change in interest rate margin is as follows:
|
|
|
|
|
|
|
|
|
|
|
|
| Cumulative benefit/penalty for each financial year (basis points) |
FY23 |
FY24 |
FY25 |
| KPI |
|
|
|
| Greenhouse gas emissions |
1 |
|
2 |
|
3 |
|
| Renewable Energy |
1 |
|
2 |
|
3 |
|
| Water consumption |
1 |
|
2 |
|
3 |
|
We need to comply with certain debt covenants for the US$400 Million Syndicated Facility, the R2.5 Billion Syndicated Revolving Credit Facility and the R1.5 Billion Green Term Loan.
The debt covenant tests are as follows:
The Group’s interest cover ratio shall be more than five (EBITDA1/Total interest paid).
Leverage2 shall not be more than 2.5 times.
1 EBITDA as defined in the agreement excludes unusual items such as impairment and restructuring cost.
2 Leverage is defined as total net debt to EBITDA.
Debt covenants tests were performed for the loan facilities for both fiscal 2023 and 2022 and no breaches were noted. For fiscal 2023, the Group's interest cover ratio was 26 times (2022: 43.4 times), while the Group's leverage was 0.2 (2022: 0.1). Management believes that it is very likely that the covenant requirements will be met in the foreseeable future given the current earnings and interest levels.
Recently Retired Credit Facilities and Other Borrowings
On July 9, 2018, we entered into a four-year loan with Westpac Bank PNG Limited for the amount of US$24 million (R322 million) to finance the acquisition of fleet equipment for the Group's PNG operations (the "US$24 Million Westpac Loan"). The outstanding loan balance at June 30, 2022 of US$2 million (R25 million) was settled in July 2022 when the loan matured.
Current borrowings
Current borrowings at June 30, 2023 consist solely of accrued interest on the US$300 million revolving credit facility of US$6 million (R103 million). This was repaid on July 3, 2023.
Non-current borrowings
Non-current borrowings total R5,592 million at June 30, 2023. This is as a result of a US$300 million draw down under the US$400 Million Syndicated Facility. The amount owing consists of US$100 million on the term loan facility and US$200 million on the revolving credit facility.
Capital Expenditure
Total budgeted capital expenditures for fiscal 2024, excluding the capital outlay for renewable projects, are R9,530 million. See Item 4: “Information on the Company - Business Overview - Capital Expenditures” for details regarding the budgeted capital expenditures for each operation. We currently expect that our planned operating capital expenditures will be financed from operations, including use of our current facilities, as described in “-Outstanding Credit Facilities and Other Borrowings” above, and new borrowings as needed.
The following table sets forth our authorized capital expenditure as of June 30, 2023:
|
|
|
|
|
|
|
R’millions |
|
|
Authorized and contracted for1 |
2,053 |
|
Authorized but not yet contracted for2 |
8,525 |
|
| Total |
10,578 |
|
1 Including our share of the South-east Asia's capital expenditure of R160 million.
2 Including our share of the South-east Asia's capital expenditure of R1,625 million.
Total capital expenditure was R7,640 million in 2023, compared to R6,214 million in 2022. This represents a R1,426 million increase from 2022. This increase was mainly due to increases related to the ramping up of the Zaaiplaats and Kareerand projects of R537 million and R462 million, respectively, and capitalized stripping (R408 million) as a result of the Hidden Valley extension project, with stage 8 stripping activities underway.
Working Capital and Anticipated Financing Needs
The board believes that our working capital resources, by way of cash generated from operations, borrowings and existing cash on hand, are sufficient to meet our present working capital needs. The South African operations are generally expected to fund their capital internally. The R1.5 Billion Green Term Loan will largely fund Phase 2 of our solar PV projects at our South African mining operations which will be constructed during the next two years. The Wafi-Golpu Project in PNG and Eva Copper Project in Australia are, however, expected to require additional capital expenditure over the next two to five years and next four years respectively to complete construction, some of which will be funded from cash generated by operations and the balance by debt. We may also consider other options or structures to finance Harmony's portion of the Wafi-Golpu and the Eva Copper Project. For more information on our planned capital expenditures, see “-Capital Expenditure” above. Also see Item 3: “Key Information - Risk Factors - Risks Related to Our Operations and Business - Our operations have limited proved and probable reserves; exploration for additional resources and reserves is speculative in nature, may be unsuccessful and involves many risks”. Our board believes that we will have access to adequate financing on reasonable terms given our cash-based operations and modest leverage. Our ability to generate cash from operations could, however, be materially adversely affected by increases in cash costs, decreases in production, decreases in the price of gold and appreciation of the Rand and other non-US dollar currencies against the US dollar. In addition, South African companies are subject to significant exchange control limitations, which may impair our ability to fund overseas operations or guarantee credit facilities entered into by overseas subsidiaries. See Item 10: “Additional Information - Exchange Controls”.
The information set forth under the heading: “– Delivering profitable ounces – Operational performance” on pages 67 to 108 of the Integrated Annual Report for the 20-F 2023 is incorporated herein by reference. See also note 32 “Borrowings”, note 38 “Commitments and contingencies” and note 34 “Cash generated by operations” to our consolidated financial statements set forth beginning on page F-1.
Our contractual obligations and commercial commitments consist primarily of credit facilities, post-retirement health care and environmental obligations.
Contractual obligations and contingencies
The following table summarizes our contractual obligations as of June 30, 2023:
|
|
|
|
|
|
|
|
|
|
|
|
|
|
|
|
|
|
|
Payments Due by Period |
|
Total |
Less Than 12 Months July 1, 2023 to June 30, 2024 |
12-36 Months July 1, 2024 to June 30, 2026 |
36-60 Months July 1, 2026 To June 30, 2028 |
After 60 Months Subsequent June 30, 2028 |
|
(R’millions) |
(R’millions) |
(R’millions) |
(R’millions) |
(R’millions) |
|
|
|
|
|
|
Bank facilities1 |
6,903 |
|
812 |
|
6,091 |
|
— |
|
— |
|
Post-retirement health care2 |
264 |
|
— |
|
— |
|
— |
|
264 |
|
Environmental obligations3 |
7,930 |
|
— |
|
— |
|
— |
|
7,930 |
|
Silicosis settlement obligation4 |
696 |
|
180 |
|
270 |
|
173 |
|
73 |
|
Contingent consideration5 |
1300 |
38 |
|
265 |
|
301 |
|
696 |
|
Streaming contract liability6 |
390 |
|
285 |
|
105 |
|
— |
|
— |
|
| Total contractual obligations |
17,483 |
|
1,315 |
|
6,731 |
|
474 |
|
8,963 |
|
1 See “- Liquidity and Capital Resources - Outstanding Credit Facilities and Other Borrowings” above. The amounts include the interest payable over the terms of the facilities. Where a variable rate is applicable, the rate at the reporting date has been used for the future periods.
2 This liability relates to post-retirement medical benefits of Freegold, Moab Khotsong and Mponeng employees at the time of acquisition as well as for former employees who retired prior to December 31, 1996 and is based on actuarial valuations conducted during fiscal 2023. See note 27 “Other provisions – Retirement benefit obligations” to our consolidated financial statements set forth beginning on page F-1.
3 We make provision for environmental rehabilitation costs and related liabilities based on management’s interpretations of current environmental and regulatory requirements. See note 26 “Provision for environmental rehabilitation” to our consolidated financial statements set forth beginning on page F-1.
4 This liability relates to potential cost of settling the silicosis and TB class actions that were instituted against the Group in South Africa. See Item 3: “Key Information - Risk Factors - Risks Related to ESG - The cost of occupational health care services and the potential liabilities related to occupational health diseases may increase in future and may be substantial” and note 27 “Other provisions” to our consolidated financial statements set forth beginning on page F-1.
5 The liability was included as part of the consideration transferred for the acquisition of the Mponeng operations and related assets and, as of fiscal 2023, Eva Copper. See note 14 "Acquisitions and business combinations" and note 29 "Contingent consideration" to our consolidated financial statements set forth beginning on page F-1.
6 The liability relates to the contractual obligation to deliver the stipulated gold ounces to Franco-Nevada over the remaining term of the agreement. See note 31 “Streaming arrangements” to our consolidated financial statements set forth beginning on page F-1.
Commercial Commitments
The following table provides details regarding our commercial commitments as of June 30, 2023:
|
|
|
|
|
|
|
|
|
|
|
|
|
|
|
|
|
|
|
Amount of Commitments Expiring by Period |
|
|
|
|
|
|
|
Total |
Less Than 12 Months July 1, 2023 to June 30, 2024 |
12-36 Months July 1, 2024 to June 30, 2026 |
36-60 Months July 1, 2026 To June 30, 2028 |
After 60 Months Subsequent June 30, 2028 |
|
(R’millions) |
(R’million) |
(R’million) |
(R’million) |
(R’millions) |
|
|
|
|
|
|
Guarantees1 |
1,000 |
|
— |
|
— |
|
— |
|
1,000 |
|
Capital commitments2 |
2,053 |
|
2,053 |
|
— |
|
— |
|
— |
|
| Total commitments expiring by period |
3,053 |
|
2,053 |
|
— |
|
— |
|
1,000 |
|
1 R500 million of these guarantees relate to our environmental and rehabilitation obligation.
2 Capital commitments consist only of amounts committed to external suppliers, although a total of R10,578 million has been approved by the board for capital expenditures.
See note 38 “Commitments and contingencies” to our consolidated financial statements set forth beginning on page F-1.
Off-balance Sheet Arrangements
The Group does not have any off-balance sheet arrangements, as defined by the SEC for the purposes of the Form 20-F, that have or are reasonably likely to have a material current or future effect on the Group’s financial position or results of operations.
Recent Developments
See Item 4: “Information on the Company - History and Development of the Company - Recent Developments - Developments since June 30, 2023”.
Related Party Transactions
For a detailed discussion of related party transactions, see Item 7: "Related Party Transactions”.
Recent Accounting Pronouncements
Recently adopted accounting policies, as well as recent accounting pronouncements with the potential for impact on the consolidated financial statements, are described in note 2 “Accounting policies” to our consolidated financial statements set forth beginning on page F-1.
Accounting Policies
Harmony’s accounting policies are described in note 2 “Accounting policies” to our consolidated financial statements set forth beginning on page F-1.
Use of Estimates and Making of Assumptions
The preparation of the financial statements in conformity with IFRS requires management to make estimates and assumptions that affect the reported amounts of assets and liabilities as well as disclosure of contingent assets and liabilities at the date of the financial statements, and the reported amounts of revenues and expenses during the reporting period. Actual results could differ from those estimates. Some of our accounting policies require the application of significant judgment and estimates by management in selecting the appropriate assumptions for calculating financial estimates. By their nature, these judgments are subject to an inherent degree of uncertainty and are based on our historical experience, terms of existing contracts, management’s view on trends in the gold mining industry and information from outside sources.
Our critical accounting estimates and judgments are described in more detail in note 3 “Critical accounting estimates and judgments”, to our consolidated financial statements set forth beginning on page F-1. This discussion and analysis should be read in conjunction with such consolidated financial statements and the relevant notes.
C. RESEARCH AND DEVELOPMENT, PATENTS AND LICENSES, ETC.
Not applicable.
D. TREND INFORMATION
The information set forth under the heading: “– Delivering profitable ounces – Operational performance” on pages 67 to 108 of the Integrated Annual Report for the 20-F 2023 is incorporated herein by reference.
Other than as disclosed elsewhere in this annual report, we are not aware of any trends, uncertainties, demands, commitments or events for the year ended June 30, 2023 that are reasonably likely to have a material and adverse effect on our net revenues, income, profitability, liquidity or capital resources, or that would cause the disclosed financial information to be not necessarily indicative of future results of operations or financial conditions.
E. CRITICAL ACCOUNTING ESTIMATES
Not applicable
ITEM 6. DIRECTORS, SENIOR MANAGEMENT AND EMPLOYEES
A. DIRECTORS AND SENIOR MANAGEMENT
The information set forth under the heading:
•“– Our leadership” on pages 17 to 18
of the Integrated Annual Report for the 20-F 2023 is incorporated herein by reference.
B. COMPENSATION
The information set forth under the heading:
•“– Remuneration report” on pages 230 to 244
of the Integrated Annual Report for the 20-F 2023 is incorporated herein by reference.
C. BOARD PRACTICES
The information set forth under the headings:
•“– Corporate governance” on pages 214 to 225;
•“– Board committees” on pages 226 to 229
•“– Remuneration report” on pages 230 to 244 and
•“– Audit and risk committee: Chairperson’s report” on pages 245 to 248.
of the Integrated Annual Report for the 20-F 2023 is incorporated herein by reference.
D. EMPLOYEES
The information set forth under the heading:
•“– Caring for our employees” on pages 188 to 196
of the Integrated Annual Report for the 20-F 2023 is incorporated herein by reference.
E. SHARE OWNERSHIP
See note 37 “Related Parties” of our consolidated financial statements, set forth beginning on page F-1.
ITEM 7. MAJOR SHAREHOLDERS AND RELATED PARTY TRANSACTIONS
A. MAJOR SHAREHOLDERS
We are an independent gold producer, with no single shareholder exercising control. As of October 25, 2023, our issued share capital consisted of 619,924,711 ordinary shares. To our knowledge, (a) we are not directly or indirectly owned or controlled: (i) by another corporation; or (ii) by any foreign government, and (b) there are no arrangements (including any announced or expected takeover bid), the operation of which may at a subsequent date result in a change in our control.
The voting rights of our major shareholders do not differ from the voting rights of other holders of the same class of shares.
A list of the beneficial holders that hold 5% or more of our securities as of June 30, 2023 is set forth below:
|
|
|
|
|
|
|
|
|
| Holder |
Number of shares |
Percentage |
|
|
|
| Public Investment Corporation of South Africa |
78,348,620 |
12.68 |
% |
African Rainbow Minerals Ltd1 |
74,665,545 |
12.08 |
% |
| Van Eck Associates Corporation |
58,900,264 |
9.53 |
% |
| Lingotto Investment Management, LLP |
36,144,127 |
5.85 |
% |
|
|
|
1 Patrice Motsepe, our Chairman, has an indirect holding in African Rainbow Minerals Limited.
The table below shows the significant changes in the percentage ownership held by major shareholders, to the knowledge of Harmony's management, during the past three years.
|
|
|
|
|
|
|
|
|
|
|
|
|
Beneficial ownership as of June 30, 2023 |
|
2023 |
2022 |
2021 |
|
% |
% |
% |
| Public Investment Corporation of South Africa |
12.68 |
|
10.28 |
|
7.77 |
|
| African Rainbow Minerals Ltd |
12.08 |
|
12.12 |
|
12.12 |
|
| Van Eck Associates Corporation |
9.53 |
|
8.98 |
|
9.16 |
|
| Lingotto Investment Management, LLP |
5.85 |
|
5.30 |
|
4.08 |
|
|
|
|
|
|
|
|
|
B. RELATED PARTY TRANSACTIONS
Between July 1, 2022 and June 30, 2023, none of the directors or major shareholders of Harmony or, to the knowledge of Harmony, their families, had an interest, directly or indirectly, in any transaction or in any proposed transaction that has affected or will materially affect Harmony or its subsidiaries, other than as stated in note 37 “Related Parties” of our consolidated financial statements, set forth beginning on page F-1. Also see note 18 (b) “Other non-current assets”, note 21 “Investments in Associates” and note 22 “Investment in Joint Operations” of our consolidated financial statements, set forth beginning on page F-1.
C. INTERESTS OF EXPERTS AND COUNSEL
Not applicable.
ITEM 8. FINANCIAL INFORMATION
A. CONSOLIDATED STATEMENTS AND OTHER FINANCIAL INFORMATION
Please refer to Item 18: "Financial Statements". For a discussion of our export sales, see Item 5: "Operating and Financial Review and Prospects”.
Legal Proceedings
None of our properties is the subject of pending material legal proceedings. We have been involved in a number of claims and legal and arbitration proceedings incidental to the normal conduct of our business, such as the ones described below.
Provision for silicosis settlement
A provision of R917 million was recognized during fiscal 2017 for Harmony’s potential cost to settle the silicosis and TB class actions that have been instituted against it in South Africa. At June 30, 2023 and June 30, 2022 the provision was R549 million and R820 million respectively. The decrease in fiscal 2023 is primarily due to a change in estimate (R183 million) resulting from a change in the actuary model for actual exit data and an adjustment to the take-up rate, as well as an increase in the discount rates. Repayments of R155 million were made during the year. This was partially offset by time value of money accretion (R67 million).
The provision recorded in the financial statements is subject to adjustment or reversal in the future, depending on a number of factors, including changes in benefit take-up.
See Item 3: “Key Information - Risk Factors - Risks related to ESG - The cost of occupational health care services and the potential liabilities related to occupational health diseases may increase in future and may be substantial” and to note 27 “Other Provisions - Provision for silicosis settlement” of our consolidated financial statements set forth beginning on page F-1.
Dividend Policy
Dividends are proposed by and approved by our board of directors based on our financial performance and compliance with applicable laws, including in respect of the solvency and liquidity test contemplated in the Companies Act. Dividends are recognized when declared by the board. Our board may exercise its discretion on an annual basis, taking into consideration the prevailing market conditions, balance sheet flexibility and future capital commitments of the Group. Our dividend policy is to pay a return of 20% on net free cash generated to shareholders. Under South African law, we may declare and pay dividends from any reserves included in total shareholder’s equity (including share capital and share premium) calculated in accordance with IFRS, subject to the solvency and liquidity test.
See Item 3: “Key Information – Risk Factors – Risks Related to Our Corporate and Financing Structure and Strategy – We may not pay dividends or make similar payments to our shareholders in the future” and “– Strategic and Market Risks – Fluctuations in the exchange rate of currencies may reduce the market value of our securities, as well as the market value of any dividends or distributions paid by us”. Also see Item 10: “Additional Information – Exchange Controls – Introduction”, "– Exchange Controls – Government Regulatory Considerations – Dividends”, “– Taxation - Certain South African Tax Considerations – Dividends” and “– Certain Material United States Federal Income Tax Considerations – Taxation of Dividends”.
B. SIGNIFICANT CHANGES
See Item 4: “Information on the Company - History and Development of the Company - Recent Developments -Developments since June 30, 2023.”
ITEM 9 THE OFFER AND LISTING
A. OFFER AND LISTING DETAILS
The principal trading market for our ordinary shares is the JSE, where they trade under the symbol "HAR". Our ordinary shares trade on the NYSE in the form of ADSs, under the symbol "HMY".
B. PLAN OF DISTRIBUTION
Not applicable.
C. MARKETS
The Securities Exchange in South Africa
The JSE is the premier stock exchange in Africa and is based in South Africa where it has operated as a marketplace for the trading of financial products for over 130 years.
The JSE connects buyers and sellers in a variety of financial markets that include equities and equity derivatives, commodity derivatives, currency derivatives and interest rate instruments. It is one of the top 20 exchanges in the world in terms of market capitalization and a member of the World Federation of Exchanges.
The market capitalization of the JSE equities index (FTSE/JSE Africa All Shares Index) was R6,500 billion (US$345 billion) at June 30, 2023. The JSE mining index (FTSE/JSE Precious Metals and Mining Index) market capitalization was R738 billion (US$39 billion)1 at June 30, 2023, 5.8% of the overall JSE market capitalization.
1 Source: JP Morgan
Strate Settlement
Under Strate Pty Limited, South Africa’s Central Securities Depository (“CSD”), there are essentially two types of clients: controlled and non-controlled. A controlled client is one who elects to keep his shares and cash with his broker and these shares are held in custody at the broker’s chosen Custodian Bank, the CSD Participant (“CSDP”). A non-controlled client is one who appoints his own CSDP to act as custodian on his behalf. Equity settlements take place on a contractual T+3 (where T= trade date) settlement cycle. Securities and funds become due for settlement three business days after the trade. Contractual settlement is a market convention embodied in the rules of the JSE which states that a client has a contractual obligation to cause a JSE trade to settle on settlement day. The JSE, in its capacity as Settlement Authority, ensures that all on-market trades entered into by two JSE member firms settle three days after the trade date.
D. SELLING SHAREHOLDERS
Not applicable.
E. DILUTION
Not applicable.
F. EXPENSES OF THE ISSUE
Not applicable.
ITEM 10. ADDITIONAL INFORMATION
A. SHARE CAPITAL
Not applicable.
B. MEMORANDUM OF INCORPORATION
Information on our Memorandum of Incorporation can be found in Exhibit 1.1 filed with this Harmony 2023 Form 20-F.
Voting Rights
There are no limitations imposed by South African law or by our charter on the right of non-resident or foreign owners to hold or vote our ordinary shares.
C. MATERIAL CONTRACTS
R1.5 Billion Green Term Loan
On May 25, 2022, Harmony and a syndicate of local and international lenders entered into a R1.5 billion six and a half year syndicated green term loan. The R1.5 Billion Green Term Loan matures in November 2028.
Under the terms of the R1.5 Billion Green Term Loan, funds borrowed must be used in respect of "eligible green projects", which relate to the construction, development, acquisition, maintenance, and/or operation of renewable energy installations.
The R1.5 Billion Green Term Loan bears interest at 2.65% over three-month JIBAR.
Harmony was permitted to draw down on the R1.5 Billion Green Term Loan commencing after November 2022. As at June 30, 2023, R0 million remained outstanding on the R1.5 Billion Green Term Loan.
US$400 Million Syndicated Facility
On May 25, 2022, Harmony and a syndicate of local and international lenders, which was jointly arranged by Nedbank Limited and ABSA Bank Limited, concluded the US$400 Million Syndicated Facility comprising a US$100 million term facility and a US$300 million revolving credit facility. The US$400 Million Syndicated Facility matures in May 2025.
Under the terms of the US$400 Million Syndicated Facility funds borrowed must be used (i) in repayment of the September 2019 US$400 million three-year syndicated term loan and revolving credit facility and (ii) for exploration activities, feasibility costs, capital costs, operational costs, other corporate expenses and other strategic objectives relating to the Group outside of South Africa.
The US$100 million term loan facility bears interest of 2.85% over the three-month SOFR; the US$300 million revolving credit facility bears interest of 2.7% over three month SOFR.
During fiscal 2023, US$170 million (R2,919 million) was drawn down on the US$400 Million Syndicated Facility. US$300 million (R5,592 million) remained outstanding as at June 30, 2023.
R2.5 Billion Syndicated Revolving Credit Facility
On May 25, 2022, Harmony and a syndicate of local and international lenders entered the R2.5 Billion Syndicated Revolving Credit Facility. The R2.5 Billion Syndicated Revolving Credit Facility matures in May 2025.
Under the terms of the R2.5 Billion Syndicated Revolving Credit Facility, funds borrowed must be used (i) in repayment of the November 2018 R2 billion four-year syndicated term loan and revolving credit facility and (ii) for ongoing general corporate costs, working costs and working capital requirements of the Group.
The R2.5 Billion Syndicated Revolving Credit Facility bears interest at 2.40% over three-month JIBAR.
As at June 30, 2023, R0 million was outstanding and R2.5 billion was available under the R2.5 Billion Syndicated Revolving Credit Facility.
US$24 Million Wespac Loan
On July 9, 2018, Harmony, as a borrower, entered into the US$24 Million Westpac Loan to finance its new fleet in Hidden Valley with Westpac - Bank - PNG - Limited. The US$24 Million Westpac Loan is repayable in quarterly installments and matures in July 2022.
The US$24 Million Westpac Loan bears interest at 3.20% over three-month LIBOR.
The US$24 Million Westpac Loan is secured by a cession and pledge of vehicles and machinery purchased.
During fiscal 2023 US$2 million (R26 million) was repaid on the US$24 Million Westpac Loan therefore settling the loan with the final payment.
Harmony Renewable Energy Projects
In June 2022, Harmony entered into three Power Purchase Agreements (the "PPA") and three Land Lease Agreements with Tshepong Photovoltaic (Pty) Ltd, Eland Photovoltaic (Pty) Ltd and Nyala Photovoltaic (Pty) Ltd ("collectively, the "seller"). The details of the agreements states that Photovoltaic generation facilities ("energy facilities") will be constructed by the seller on the land that Harmony will lease to the seller and the energy output produced by the facility will be sold exclusively to Freegold, a subsidiary of Harmony. The term of the PPA is for 15 years.
Harmony will purchase energy output produced by the energy facilities, and although there is a fixed rate per megawatt-hour ("MWh"), there is no fixed volume of power to be delivered. Thus all payments are variable based on consumption. Energy output rates are stipulated as between R838 per MWh to R930 per MWh as indexed annually.
As defined in the PPA, a bank guarantee is required to be issued on behalf of Freegold to the seller for an amount equal to three months’ worth of the estimated energy output payments as at financial close. Lombards Attorneys is responsible for issuing guarantees to the seller for the required amounts as stipulated in the PPA.
D. EXCHANGE CONTROLS
Introduction
The following is a general outline of South African exchange controls. Investors should consult a professional adviser pertaining to the exchange control implications of their particular investments.
The Republic of South Africa’s exchange control regulations provide for restrictions on the exportation of capital from a Common Monetary Area member, consisting of South Africa, the Republic of Namibia, the Kingdoms of Lesotho and Eswatini. Transactions between South African residents (including corporations) and foreigners are subject to these exchange controls, which are administered by the Financial Surveillance Department of the SARB.
Since 1995 a number of exchange control regulations have been relaxed with regard to both residents and non-residents. Following the initial reforms, ongoing relaxations have been introduced with the aim of achieving a macroprudential risk-based approach to the management of foreign exchange. The reforms are being made to, among other things, enable international firms to make investments through South Africa to the rest of Africa and to further enhance opportunities for offshore portfolio diversification for resident investors.
A considerable degree of flexibility is built into the system of exchange controls, and the SARB possesses substantial discretionary powers in approving or rejecting the applications that fall outside the authority granted to authorized dealers.
These comments relate to exchange controls in force at June 30, 2023. These controls are subject to change at any time, however, the government has previously announced most changes during the annual budget statement in February. It is not possible to predict whether existing exchange controls will be changed or relaxed by the South African government in the future. Investors are urged to consult a professional adviser as to the exchange control implications of their particular investments.
Government Regulatory Considerations
Shares
A foreign investor may invest freely in shares in a South African company, whether listed on the JSE or not, through normal banking channels against settlement in foreign currency or Rand from a non-resident Rand account. A foreign investor may also sell his or her share investment in a South African company and transfer the proceeds out of South Africa without restriction. However, when the Company is not listed on the JSE, the supporting confirmation must be provided to the SARB that the sale price of any shares reflects fair market value.
Under present South African exchange control regulations, our ordinary shares and ADSs are freely transferable outside the Common Monetary Area between non-residents of the Common Monetary Area. No prior SARB approval is required for the transfer of proceeds to South Africa, in respect of shares listed on the JSE, provided these funds enter the country through the normal banking channels. In addition, the proceeds from the sale of ordinary shares on the JSE on behalf of those holders of ordinary shares who are not residents of the Common Monetary Area are freely remittable to those holders. Share certificates and warrant certificates held by non-residents will be endorsed with the words “non-resident.”
Loans
Generally, the granting of loans to us or our subsidiaries, and our ability to borrow from non-South African sources and the repatriation of dividends, interest and royalties by us will be regulated by the Financial Surveillance Department of the SARB. If a foreign investor wishes to lend capital to a South African company, the prior approval of the SARB must be sought mainly in respect of the interest rate and terms of repayment applicable to such loan.
Interest on foreign loans is subject to a withholding tax of 15% and freely remittable abroad, provided the loans received prior approval from the SARB. However, this rate may be reduced depending on the applicability of a double taxation treaty.
Investments
We are required to seek approval from the SARB to use funds held in South Africa to make investments outside of South Africa.
Dividends
Dividends declared by a listed company are subject to a withholding tax of 20% and freely transferable out of South Africa from both trading and non-trading profits earned in South Africa through a major bank as agent for the SARB to non-resident shareholders. However, this rate may be reduced depending on the applicability of a double taxation treaty.
Where 75% or more of a South African company’s capital, voting power, power of control or earnings is directly or indirectly controlled by non-residents, such a company is designated an “affected person” by the SARB, and certain restrictions are placed on its ability to obtain local financial assistance. We are not, and have never been, designated an “affected person” by the SARB.
If an affected entity made use of local borrowing facilities, the affected entity must apply for SARB approval prior to remitting dividends offshore. As a general rule, an affected entity that has accumulated historical losses may not declare dividends out of current profits unless and until such time that the affected entity’s local borrowings do not exceed the local borrowing limit.
E. TAXATION
Certain South African Tax Considerations
The summary set out in this section is based on current law and our interpretation thereof. Amendments to the law may change the tax treatment of acquiring, holding or disposing of our ordinary shares or ADSs, as applicable, which changes may possibly occur on a retrospective basis. The following summary is not a comprehensive description of all of the tax considerations that may be relevant to a decision to purchase, own or dispose of our ordinary shares or ADSs, and does not cover the tax consequences that depend upon your particular tax circumstances. This summary is not intended to constitute tax advice. This summary does not address the foreign tax consequences for persons that are not residents of South Africa and specifically excludes the tax consequences for persons (a) who are not residents of South Africa whose holding of shares or ADSs is effectively connected with a permanent establishment in South Africa through which the holder carries on business activities, or (b) who is not the beneficial recipient of the dividends, or (c ) where the source of the transaction or dividends is deemed to be in South Africa. In addition, it does not cover the tax consequences for a holder that is not entitled to the benefits of the double taxation agreement concluded between the Republic of South Africa and the United States of America signed on February 17, 1997 (“US Treaty”). It also assumes that the holders hold the ordinary shares or ADSs on capital account (that is, for investment purposes) as opposed to on revenue account (that is for speculative purposes or as trading stock). The Supreme Court of Appeal in South Africa indicated that gains will be on revenue account if they are derived as part of a business in carrying out a scheme of profit making. We recommend that you consult your own tax adviser concerning the consequences of holding our ordinary shares or ADSs, as applicable, in your particular situation.
Dividends
With effect from April 1, 2012, South Africa introduced a Dividends Tax, which is a withholding tax on dividends effectively borne by the shareholder receiving the dividend. The rate at which Dividends Tax is levied is 20% effective from February 22, 2017 (previously 15%). Dividends Tax is imposed on, amongst others, non-resident shareholders, and it is withheld by the company declaring and paying the dividend to its shareholders or the regulated intermediary, as the case may be, as a withholding agent. Dividends Tax is not payable to the extent that the recipient is, amongst others, a South African resident company that has provided the relevant declaration and undertaking to the company declaring and paying the dividend.
Article 10 of the US Treaty provides that a dividend paid by a company that is a resident of South Africa for tax purposes to a resident of the US for tax purposes may be taxed in the US. Article 10 of the US Treaty further provides that such a dividend may also be taxed in South Africa. However, the tax charged in South Africa may not exceed 5% of the gross amount of the dividends if the beneficial owner is a company that holds directly at least 10% of the voting stock of the South African company paying the dividends. In all other cases, the US Treaty provides for a withholding tax of 15% of the gross amount of the dividends.
It is deemed that an amount will be derived by a person from a source within South Africa if the amount constitutes a dividend received by or accrued to that person. Residents of the US can make use of the lower rate as provided for in the US Treaty if the relevant declaration and undertaking are provided to Harmony or the regulated intermediary beforehand. The declaration and undertaking should be renewed after a five-year period effective from July 1, 2020. No time limitation will be imposed on the validity of the declarations and undertakings if a regulated intermediary applies the Financial Intelligence Centre legislation, the common reporting standard regulations in relation to the declarations or the agreement between the Government of South Africa and the Government of the US to improve International Tax Compliance and to Implement the US Foreign Account Tax Compliance Act.
Capital Gains Tax
Capital Gains Tax (“CGT”) was introduced in South Africa with effect from October 1, 2001. In the case of an individual, 40% in respect of years of assessment commencing March 1, 2016 (previously 33.3%) of the capital gain is included in the individual’s taxable income (effectively 18%) should the individual pay tax at the marginal rate of 45% from March 1, 2017. In the case of a corporate entity or trust, 80% in respect of years of assessment commencing March 1, 2016 of such gain is included in its taxable income (effectively a rate of 22.4% previously and currently 21.6% for years assessments ending on or after March 31, 2023 for a corporate entity and 36% for a trust). CGT is only applicable to non-residents if the proceeds from the sale are sourced in South Africa or are attributable to a permanent establishment of the non-resident shareholder. The US Treaty (which will prevail in the event of a conflict) provides that the US holder of ordinary shares or ADSs will not be subject to CGT if the assets have been held as capital assets, unless they are linked to a permanent establishment of such non-resident shareholder in South Africa. To the extent that shares or ADSs are held on revenue account, a similar principle applies with reference to the payment of income tax. Subject to Article 13 of the US Treaty (as indicated below) income tax is only payable to the extent that the gain is attributable to the carrying on of a business in South Africa through a permanent establishment situated in South Africa. The current corporate rate is equal to 27%. This changed the effective CGT rate of a corporate entity to 21.6%. Any gains realized on the disposal of equity shares are automatically deemed to be of a capital nature if the equity shares have been held for a continuous period of at least three years. Such provision applies automatically and is not elective. However, this deeming provision does not include an ADS.
Generally, the domestic laws of South Africa provide that an amount received or accrued in respect of the disposal of an asset that constitutes immovable property held by that person or any interest or right of whatever nature of that person to or in intellectual property where that property is situated in South Africa is deemed to have been sourced in South Africa and be subject to South African tax. It includes the disposal of any equity shares held by a person in a company if:
•80% or more of the market value of the equity shares, ownership or right to ownership or vested interest, as the case may be, at the time of disposal thereof is attributable directly or indirectly to immovable property held otherwise than as trading stock. This requirement will include rights to variable or fixed payments as consideration for the working of, or the right to work mineral deposits, sources and other natural resources in the South Africa; and
•the person directly or indirectly holds at least 20% of the equity shares in the company or ownership or right to ownership of the other entity.
The provisions of the US Treaty override the deemed source rules to the extent applicable. Article 13 of the US Treaty provides that South Africa is entitled to tax a gain that is attributable to the alienation of real property situated in South Africa, which concept includes the equivalent of a US real property interest, even if held through means of shares.
Securities Transfer Tax
Securities Transfer Tax (“STT”) is payable in respect of the transfer of any security issued by a South African company. STT is levied at a rate of 0.25% of the taxable amount of the security concerned (generally the market value). A security is defined to include a depository receipt in a company, in addition to shares in a company. STT is not payable on the issue of any security.
Although ADSs in respect of our shares are not listed on the JSE, reference is specifically made in the legislation to the transfer of depository receipts in a South African company. As a consequence, STT will therefore be payable on the transfer of ADSs. In addition, the process of depositing shares listed on the JSE in return for ADSs, or withdrawing such shares from the deposit facility, will attract STT as and when the shares are transferred to or from the depository institution.
STT is payable by the broker or participant if a transaction is effected through a stockbroker or an exchange participant, but it may be recovered from the person acquiring the beneficial ownership of the rights concerned. In other instances, STT is payable by the person acquiring beneficial ownership.
STT is also payable on the subsequent redemption or cancellation of shares or ADSs.
Interest
South Africa has imposed a withholding tax on interest paid by any person to or for the benefit of any foreign person to the extent that the interest is regarded as having been received or accrued from a source within South Africa at the rate of 15% with effect from March 1, 2015. In terms of the US Treaty this rate is reduced to zero. However, the rate may change to 5% or 10% once the US Treaty is renegotiated. US residents can only make use of the lower rate as provided for in the US Treaty if the relevant declaration and undertaking are provided to the company paying the interest. It was recently enacted that the declaration and undertaking should be renewed after a five-year period effective from July 1, 2020. No time limitation will be imposed on the validity of the declarations and undertakings if a regulated intermediary applies the Financial Intelligence Centre legislation, the common reporting standard regulations in relation to the declarations or the agreement between the Government of South Africa and the Government of the US to improve International Tax Compliance and to Implement the US Foreign Account Tax Compliance Act.
In terms of the latest proposals that are contained in the Taxation Laws Amendment Bill interest that is incurred by a holder of debt (lender) on a loan that the lender raised in order to acquire the debt issued by Harmony may no longer be deductible from a South African perspective unless a profit is made in the process in respect of the borrowing and on lending of funds as the South African Revenue Service indicated that it will withdraw Practice Note 31 that currently allows a taxpayer to deduct interest that it incurred up to the interest accrued unless in specific circumstances.
Withholding tax on Service Fees
There is no separate withholding tax on service fees. The monitoring of service fees is now dealt with on the basis that these types of arrangements must be reported to South African Revenue Service ("SARS"). Transactions between residents and non-residents must thus be reported if they relate to consultancy, construction, engineering, installation, logistical, managerial, supervisory, technical or training services, in circumstances where the expenditure exceeds or is anticipated to exceed R10 million in aggregate and does not otherwise qualify as remuneration.
Capitalization Shares
Capitalization shares or bonus shares issued to holders of shares in lieu of cash dividends do not constitute dividends and are currently not subject to Dividends Tax. However, these shares have a base cost of zero for income tax purposes.
Certain Material United States Federal Income Tax Considerations
The following is a discussion of certain material US federal income tax consequences of acquiring, holding and disposing of the ordinary shares (for purposes of this summary, references to the ordinary shares include the ADSs, unless the context otherwise requires).
You will be a “US holder” if you are a beneficial owner of ordinary shares and you are:
•an individual who is a citizen or resident of the United States;
•a corporation (or other entity taxable as a corporation for US federal income tax purposes) organized under the laws of the United States, any state thereof, or the District of Columbia;
•an estate whose income is subject to US federal income tax regardless of its source; or
•a trust if: (i) a US court can exercise primary supervision over the trust’s administration and one or more US persons are authorized to control all substantial decisions of the trust or (ii) it has a valid election in effect under applicable US Treasury regulations to be treated as a US person.
This summary only applies to US holders that hold ordinary shares or ADSs as capital assets. This summary is based on the US Internal Revenue Code of 1986, as amended, (the “Code”), its legislative history, existing and proposed US Treasury regulations, published Internal Revenue Service ("IRS") rulings, the US Treaty and court decisions that are now in effect, any and all of which are subject to differing interpretations and which could be materially and adversely changed. Any such change could apply retroactively and could affect the continued validity of this summary. This summary does not consider the potential effects, both adverse and beneficial, of any proposed legislation which, if enacted, could be applied, possibly on a retroactive basis, at any time.
This summary does not purport to be a comprehensive description of all of the tax considerations that may be relevant to a decision to purchase the ordinary shares. In particular, this summary deals only with US holders that will hold the ordinary shares as capital assets within the meaning of Section 1221 of the Code. It does not address considerations that may be relevant to you if you are an investor that is subject to special tax rules, such as a bank, real estate investment trust, regulated investment company, insurance company, dealer in securities or currencies, trader in securities or commodities that elects mark-to-market treatment, person that will hold the ordinary shares as a hedge against currency risk or as a position in a “straddle” or conversion transaction, tax-exempt organization, person whose “functional currency” is not the US dollar, person liable for alternative minimum tax, person required to accelerate the recognition of any item of gross income with respect to shares or ADSs as a result of such income being recognized on an applicable financial statement or a person who owns directly, indirectly or by attribution, at least 10% of our stock. This summary also does not address any aspect of US federal non-income tax laws, such as gift or estate tax laws, or state, local, or non-US tax laws, or, except as discussed below, any tax reporting obligations of a holder of our ordinary shares.
If a partnership (including for this purpose any entity treated as a partnership for US federal income tax purposes) is a beneficial owner of the ordinary shares, the US federal income tax treatment of a partner in the partnership generally will depend on the status of the partner and the activities of the partnership.
A holder of the ordinary shares that is a partnership and partners in such a partnership should consult their own tax advisors about the US federal income tax consequences of acquiring, holding, and disposing of the ordinary shares.
We believe that we will not be a passive foreign investment company (“PFIC”), for US federal income tax purposes for the current taxable year and do not expect to become a PFIC in the foreseeable future. However, we cannot assure you that we will not be considered a PFIC in the current or future years. If Harmony were to be treated as a PFIC, US holders of ordinary shares or ADSs would be required (i) to pay a special US addition to tax on certain distributions and gains on sale and (ii) to pay tax on any gain from the sale of ordinary shares or ADSs at ordinary income (rather than capital gains) rates in addition to paying the special addition to tax on this gain. Such holder may also be required to file IRS Form 8621. Additionally, dividends paid by Harmony would not be eligible for the reduced rate of tax described below under "- Taxation of Dividends". The remainder of this discussion assumes that Harmony is not a PFIC for US federal income tax purposes. You should consult your own tax advisers regarding the potential application of the PFIC regime.
Each prospective purchaser should consult his or her tax advisor with respect to the US federal, state, local and non-US tax consequences of acquiring, owning, or disposing of shares or ADSs.
US holders of ADSs
For US federal income tax purposes, a US holder of ADSs generally will be treated as the owner of the corresponding number of underlying ordinary shares held by The Bank of New York Mellon as depositary ("Depositary") for the ADSs, and references to ordinary shares in the following discussion refer also to ADSs representing the ordinary shares.
Deposits and withdrawals of ordinary shares by US holders in exchange for ADSs will in general not result in the realization of gain or loss for US federal income tax purposes. Your tax basis in withdrawn ordinary shares will be the same as your tax basis in the ADSs surrendered, and your holding period for the ordinary shares will include the holding period of the ADSs.
Taxation of Dividends
Distributions paid out of Harmony’s current or accumulated earnings and profits (as determined for US federal income tax purposes), before reduction for any South African withholding tax paid by Harmony with respect thereto, will generally be taxable to you as dividend income, and will not be eligible for the dividends received deduction allowed to corporations. Distributions that exceed Harmony’s current and accumulated earnings and profits will be treated as a non-taxable return of capital to the extent of your basis in the ordinary shares and thereafter as capital gain. However, we do not maintain calculations of our earnings and profits in accordance with US federal income tax accounting principles. You should therefore assume that any distribution by us with respect to the shares will be reported as ordinary dividend income. You should consult your own tax advisers with respect to the appropriate US federal income tax treatment of any distribution received from us.
Dividends paid by Harmony generally will be taxable to non-corporate US holders at the reduced rate normally applicable to long-term capital gains, provided that either (i) Harmony qualifies for the benefits of the US Treaty, or (ii) with respect to dividends paid on the ADSs, the ADSs are considered to be "readily tradable" on the NYSE, and certain other conditions are met. You will be eligible for this reduced rate only if you are an individual, and have held the ordinary shares or ADSs for more than 60 days during the 121 day period beginning 60 days before the ex-dividend date.
For US federal income tax purposes, the amount of any dividend paid in Rand will be included in income in a US dollar amount calculated by reference to the exchange rate in effect on the date the dividends are received by you or the Depositary (in the case of ADSs), regardless of whether they are converted into US dollars at that time. If you or the Depositary, as the case may be, convert dividends received in Rand into US dollars on the day they are received, you generally will not be required to recognize foreign currency gain or loss in respect of this dividend income.
Effect of South African Withholding Taxes
As discussed above in "- Taxation - Certain South African Tax Considerations - Dividends", under current law, South Africa imposes a withholding tax of 20% on dividends paid by Harmony. A US holder will generally be entitled, subject to certain limitations, to a foreign tax credit against its US federal income tax liability, or a deduction in computing its US federal taxable income, for South African income taxes withheld by Harmony.
US holders that receive payments subject to this withholding tax will be treated, for US federal income tax purposes, as having received the amount of South African taxes withheld by Harmony, and as then having paid over the withheld taxes to the South African taxing authorities. As a result of this rule, the amount of dividend income included in gross income for US federal income tax purposes by a US holder with respect to a payment of dividends may be greater than the amount of cash actually received (or receivable) by the US holder from Harmony with respect to the payment.
The rules governing foreign tax credits are complex. Recently issued final US Treasury regulations have imposed additional requirements that must be met for a foreign tax to be creditable and Harmony has not undertaken to determine whether such requirements will be met. Recently issued final US Treasury regulations have imposed additional requirements that must be met for a foreign tax to be creditable and Harmony has not undertaken to determine whether such requirements will be met. You should consult your tax adviser concerning the foreign tax credit implications of the payment of South African withholding taxes.
Taxation of a Sale or other Disposition
Upon a sale or other disposition of ordinary shares or ADSs, other than an exchange of ADSs for ordinary shares and vice versa, you will generally recognize US source capital gain or loss for US federal income tax purposes equal to the difference between the amount realized and your adjusted tax basis in the ordinary shares or ADSs. Your tax basis in an ordinary share or ADS will generally be its US dollar cost. This capital gain or loss will be long-term capital gain or loss if your holding period in the ordinary shares or ADSs exceeds one year. However, regardless of your actual holding period, any loss may be treated as long-term capital loss to the extent you receive a dividend that qualifies for the reduced rate described above under " - Taxation of Dividends" and also exceeds 10% of your basis in the ordinary shares.
The deductibility of capital losses is subject to significant limitations.
Foreign currency received on the sale or other disposition of an ordinary share will have a tax basis equal to its US dollar value on the settlement date. Foreign currency that is purchased will generally have a tax basis equal to the US dollar value of the foreign currency on the date of purchase. Any gain or loss recognized on a sale or other disposition of a foreign currency (including its use to purchase ordinary shares or upon exchange for US dollars) will be US source ordinary income or loss.
To the extent you incur STT in connection with a transfer or withdrawal of ordinary shares as described under "-Certain South African Tax Considerations - Securities Transfer Tax" above, such securities transfer tax will not be a creditable tax for US foreign tax credit purposes.
Information with Respect to Foreign Financial Assets
US holders of “specified foreign financial assets” with an aggregate value in excess of US$50,000 at the end of the taxable year, or US$75,000 at any time during the taxable year, are generally required to file an information report with respect to such assets with their tax returns. “Specified foreign financial assets” may include financial accounts maintained by foreign financial institutions, as well as the following, but only if they are not held in accounts maintained by financial institutions: (i) stocks and securities issued by non-United States persons, (ii) financial instruments and contracts held for investment that have non-United States issuers or counter parties and (iii) interests in foreign entities. US holders are urged to consult their tax advisors regarding the application of this reporting requirement to their ownership of the ordinary shares.
US Information Reporting and Backup Withholding Rules
Payments of dividends and other proceeds with respect to ordinary shares or ADSs by US persons will be reported to you and to the IRS as may be required under applicable regulations. Backup withholding may apply to these payments if you fail to provide an accurate taxpayer identification number or certification of exempt status or fail to comply with applicable certification requirements. Some holders are not subject to backup withholding. You should consult your tax adviser as to your qualification for an exemption from backup withholding and the procedure for obtaining an exemption.
F. DIVIDENDS AND PAYING AGENTS
Not applicable.
G. STATEMENT BY EXPERTS
Not applicable.
H. DOCUMENTS ON DISPLAY
Our current Memorandum of Incorporation may be examined at our principal place of business at: Randfontein Office Park, Corner of Main Reef Road and Ward Avenue, Randfontein, 1759, South Africa.
We file annual reports on Form 20-F with, and furnish periodic reports on Form 6-K to, the SEC. You can obtain access to the documents filed via the Electronic Data Gathering, Analysis, and Retrieval (EDGAR) system on the SEC’s website (http://www.sec.gov).
This Harmony 2023 Form 20-F reports information primarily regarding Harmony’s business, operations and financial information relating to the fiscal year ended June 30, 2023. For more recent updates regarding Harmony, you may inspect any reports, statements or other information that Harmony files with the SEC.
No material referred to in this annual report as being available on our website is incorporated by reference into, or forms any part of, this annual report. References herein to our website shall not be deemed to cause such incorporation.
I. SUBSIDIARY INFORMATION
Not applicable.
ITEM 11 QUANTITATIVE AND QUALITATIVE DISCLOSURES ABOUT MARKET RISK
The information set forth under the heading “Cautionary statement about forward-looking statements” on the inside front cover is incorporated herein by reference.
General
We are exposed to market risks, including credit risk, foreign currency risk, commodity price risk and interest rate risk associated with underlying assets, liabilities and anticipated transactions. Following periodic evaluation of these exposures, we may enter into derivative financial instruments to manage these exposures. We have policies in areas such as counterparty exposure and hedging practices, which have been approved by our audit and risk committee. We do not hold or issue derivative financial instruments for trading or speculative purposes.
We did not apply hedge accounting to incidental hedges held in the past.
In accordance with IFRS 9 - Financial Instruments, we account for our derivative financial instruments as hedging transactions if the following criteria are met:
•in the case of a hedge of an anticipated future transaction, there is a high probability that the transaction will occur, and
•in the case of a cash flow hedge, the hedging instrument is expected to be highly effective.
During fiscal 2023 and 2022, we designated all of the gold forward sales contracts as cash flow hedging instruments and applied hedge accounting to these transactions. See "- Commodity Price Sensitivity" below.
Foreign Currency Sensitivity
In the ordinary course of business, we enter into transactions denominated in foreign currencies (primarily US dollars, Australian dollars and PNG Kina). In addition, we incur investments and liabilities in US dollars, Australian dollars and PNG Kina from time to time. As a result, we are subject to transaction and translation exposure from fluctuations in foreign currency exchange rates.
Harmony enters into foreign exchange hedging contracts to manage these risks. This can take the form of zero cost collars, which establish a minimum (floor) and maximum (cap) Rand/US dollar exchange rate at which to convert the US dollars we receive on our gold sales to Rand or outright forward contracts that fix the forward exchange rate. At June 30, 2023, the nominal amount of the zero cost collars is US$562 million spread over a 24-month period with a weighted average cap price of US$1=R20.23 and weighted average floor price of US$1=R18.25. Additionally, at June 30, 2023 Harmony had open foreign exchange forward contracts which had a nominal amount of US$250 million spread over a 24-month period at an average exchange rate of US$1=R18.96.
Commodity Price Sensitivity
General
Our revenues and costs are very sensitive to the exchange rate of the Rand and other non-US currencies to the US dollar because our gold is sold in US dollars, but most of our operating costs are incurred in Rand and other non-US currencies. During fiscal 2023 and 2022, Harmony entered into forward sales to establish the sales price in advance of its future gold production, which includes the foreign exchange rate. See "- Foreign Currency Sensitivity" above.
The market price of gold has a significant effect on our results of operations, our ability to pay dividends and undertake capital expenditures, and the market price of our ordinary shares.
Gold prices have historically fluctuated widely and are affected by numerous industry factors over which we do not have any control. See Item 3: “Key Information - Risk Factors - Strategic and Market Risks - The profitability of our operations, and cash flows generated by those operations, are affected by changes in the price of gold and other metals; a fall in the gold price below our cash cost of production and capital expenditure required to sustain production for any sustained period may lead to losses and require us to curtail or suspend certain operations”. The aggregate effect of these factors, all of which are beyond our control, is impossible for us to predict.
Harmony’s Hedging Policy
As a general rule, we sell our gold production at market prices. However, commencing in fiscal 2017, Harmony entered into derivative contracts to manage the variability in cash flows from the Group’s production, in order to create cash certainty and protect the Group against lower commodity prices. See Item 5: “Operating and Financial Review and Prospects - Operating Results - Revenue".
Commodity Sales Agreements
At June 30, 2023, the open Rand gold forward sale contracts amounted to 552,000 ounces spread over 24 months at an average of R1,181,209/kg. The open US$ gold forward contracts amounted to 55,000 ounces spread over 24 months at an average of US$2,043/oz. The open US$ silver zero cost collars amounted to 1,540,000 ounces spread over 24 months with a weighted average floor of US$24.62/oz and a weighted average cap of US$27.50/oz.
At June 30, 2022, the open Rand gold forward sale contracts amounted to 378,000 ounces spread over 21 months at an average of R1,035,000/kg. The open US$ gold forward contracts amounted to 57,000 ounces spread over 21 months at an average of US$1,880/oz. The open US$ silver zero cost collars amounted to 950,000 ounces spread over 20 months with a weighted average floor of US$25.31/oz and a weighted average cap of US$28.27/oz.
Interest Rate Sensitivity
Our interest rate risk arises mainly from long-term borrowings. We have variable interest rate borrowings. Variable rate borrowings expose us to cash flow interest rate risk. Interest rate risk arising from long-term borrowings is offset by cash, restricted cash and restricted investments held at variable rates.
The sensitivity analysis was performed based on 88 basis points for all Rand denominated financial assets and 185 basis points for US$ denominated borrowings in fiscal 2022 as an indicator of the potential impact of interest rate changes to the Group. Management has reassessed this during fiscal 2023 to ensure that it is still a reasonable estimation of possible changes. In fiscal 2023, the analysis was performed on a sensitivity of 15 basis points for US$ denominated borrowings and 50 basis points for Rand denominated financial assets. The analysis assumes that all other variables remain constant.
Sensitivity analysis-borrowings
|
|
|
|
|
|
|
|
|
|
|
|
|
|
|
|
|
Fiscal year ended June 30, |
|
2023 |
|
2022 |
|
|
|
(R in millions) |
|
|
|
|
|
|
|
|
|
|
|
|
|
|
|
|
|
|
| US$ denominated borrowings |
|
|
|
|
|
Increase in 15 basis points (2022:185 basis points) |
(9) |
|
|
(59) |
|
|
|
Decrease in 15 basis points (2022:185 basis points) |
9 |
|
|
59 |
|
|
|
Sensitivity analysis - financial assets
|
|
|
|
|
|
|
|
|
|
|
|
|
|
|
|
|
Fiscal year ended June 30, |
|
2023 |
|
2022 |
|
|
|
(R in millions) |
Increase in 50 basis points (2022:88 basis points) |
34 |
|
|
59 |
|
|
|
Decrease in 50 basis points (2022:88 basis points) |
(34) |
|
|
(59) |
|
|
|
For further information on sensitivities, see note 39 “Financial Risk Management” to our consolidated financial statements set forth beginning on page F-1.
ITEM 12. DESCRIPTION OF SECURITIES OTHER THAN EQUITY SECURITIES
A. DEBT SECURITIES
Not applicable.
B. WARRANTS AND RIGHTS
Not applicable.
C. OTHER SECURITIES
Not applicable.
D. AMERICAN DEPOSITARY SHARES
On October 7, 2011, Harmony appointed Deutsche Bank Trust Company Americas in place of The Bank of New York Mellon as its Depositary for the ADSs evidenced by ADRs. A copy of our form of amended and restated deposit agreement (the “Deposit Agreement”) among the Depositary, owners and beneficial owners of ADRs and Harmony was filed with the SEC as an exhibit to our Form F-6 filed on September 30, 2009.
The Depositary collects fees for delivery and surrender of ADSs directly from investors depositing shares or surrendering ADSs for the purpose of withdrawal or from intermediaries acting for them. The Depositary collects fees for making distributions to investors by deducting those fees from the amounts distributed or by selling a portion of the distributable property to pay the fees.
The principal terms regarding fees and charges that an ADS holder might have to pay, as well as any fee and other payments made by the Depositary to us as part of the Deposit Agreement, are summarized below:
Fees and Expenses
|
|
|
|
|
|
|
|
|
| Persons depositing shares or withdrawing shares holders must pay: |
|
For: |
|
|
|
| $5.00 (or less) per 100 ADSs (or portion of 100 ADSs) |
|
• The execution and delivery of ADRs |
|
|
•The surrender of ADRs |
|
|
|
| $0.02 (or less) per ADS |
|
•Any cash distribution to you |
|
|
|
| A fee equivalent to the fee that would be payable if securities distributed to you had been shares and the shares had been deposited for issuance of ADSs |
|
•Distribution of securities distributed to holders of deposited securities which are distributed by the Depositary to ADR holders |
|
|
|
| Registration or transfer fees |
|
•Transfer and registration of equity shares on our share register to or from the name of the Depositary or its agent when you deposit or withdraw shares |
|
|
|
| Expenses of the Depositary |
|
•Cable, telex and facsimile transmissions (when expressly provided in the Deposit Agreement) |
|
|
•Converting foreign currency |
|
|
|
| Taxes and other governmental charges the Depositary or the custodian have to pay on any ADR or share underlying an ADR, for example, stock transfer taxes, stamp duty or withholding taxes |
|
•As necessary |
|
|
|
| Any charges incurred by the Depositary or its agents for servicing the deposited securities |
|
•As necessary |
In addition, ADR holders must pay any tax or other governmental charge payable by the Depositary or its custodian on any ADS or ADR, deposited security or distribution. If an ADR holder owes any tax or other governmental charge, the Depositary may:
•refuse to effect any transfer of such ADRs or any withdrawal of ADSs;
•withhold any dividends or other distributions; or
•sell part or all of the ADSs evidenced by such ADR,
and may apply dividends or other distributions or the proceeds of any sale in payment of the outstanding tax or other governmental charge. The ADR holder remains liable for any shortfall.
Fees and payments made by the Depositary
The Depositary has agreed to reimburse Harmony for expenses Harmony incurs that are related to the maintenance expenses of our ADR facility. The Depositary has agreed to pay the standard out-of-pocket maintenance costs for the ADRs, which consist of the expenses of printing and distributing dividend checks, electronic filing of US federal tax information, mailing required tax forms, stationery, postage, facsimile, and telephone calls. The amount of reimbursement available to Harmony is not necessarily tied to the amount of fees the Depositary collects from investors.
During the fiscal year ended June 30, 2023, Harmony received net direct and indirect payments of R17,203,304 from the Depositary.
PART II
ITEM 13 DEFAULTS, DIVIDEND ARREARAGES AND DELINQUENCIES
Not applicable.
ITEM 14 MATERIAL MODIFICATIONS TO THE RIGHTS OF SECURITY HOLDERS AND USE OF PROCEEDS
Not applicable.
ITEM 15 CONTROLS AND PROCEDURES
A. DISCLOSURE CONTROLS AND PROCEDURES
As of June 30, 2023, Harmony's management, with the participation of our Chief Executive Officer (“CEO”) and Financial Director (“FD”), carried out an evaluation, pursuant to Rule 13a-15 promulgated under the Exchange Act of the effectiveness of our “disclosure controls and procedures”. Based on the foregoing, our management, including the CEO and FD, concluded that our disclosure controls and procedures were effective as of June 30, 2023.
B. MANAGEMENT’S ANNUAL REPORT ON INTERNAL CONTROL OVER FINANCIAL REPORTING
Harmony's management is responsible for establishing and maintaining adequate internal control over financial reporting as defined in Rule 13a-15(f) under the Exchange Act. Under Section 404 of the Sarbanes-Oxley Act of 2002 (the "Sarbanes-Oxley Act"), management is required to assess the effectiveness of our internal control over financial reporting as of the end of each financial year and report, based on that assessment, whether Harmony's internal control over financial reporting is effective.
Harmony's internal control over financial reporting is a process designed under the supervision of the CEO and FD to provide reasonable assurance regarding the reliability of our financial reporting and the preparation of financial statements for external purposes in accordance with generally accepted accounting principles.
Harmony’s internal control over financial reporting includes those policies and procedures that (i) pertain to the maintenance of records that, in reasonable detail, accurately and fairly reflect the transactions and dispositions of the assets of the Company; (ii) provide reasonable assurance that transactions are recorded as necessary to permit preparation of financial statements in accordance with generally accepted accounting principles, and that receipts and expenditures of the Company are being made only in accordance with authorizations of management and directors of the Company; and (iii) provide reasonable assurance regarding prevention or timely detection of unauthorized acquisition, use, or disposition of the Company’s assets that could have a material effect on the financial statements.
Because of its inherent limitations, internal control over financial reporting may not prevent or detect misstatements. Therefore, even those systems determined to be effective can provide only reasonable assurance with respect to financial statement preparation and presentation. Also, projections of any evaluation of effectiveness to future periods are subject to the risk that controls may become inadequate because of changes in conditions, or that the degree of compliance with the policies or procedures may deteriorate.
Management assessed the effectiveness of Harmony's internal control over financial reporting as of June 30, 2023. In making this assessment, management used the criteria set forth by the Committee of Sponsoring Organizations of the Treadway Commission in "Internal Control – Integrated Framework (2013)". Based on this assessment, our management has determined that, as of June 30, 2023, Harmony's internal control over financial reporting was effective.
PricewaterhouseCoopers Inc., an independent registered public accounting firm, which has audited the consolidated financial statements included in this Annual Report, has issued an attestation report on the effectiveness of Harmony’s internal control over financial reporting as of June 30, 2023.
C. ATTESTATION REPORT OF THE REGISTERED PUBLIC ACCOUNTING FIRM
See report of PricewaterhouseCoopers Inc., an independent registered public accounting firm, which is included on page F-2 of exhibit 99.1. The consolidated financial statements, together with the report of PricewaterhouseCoopers Inc., are incorporated by reference to exhibit 99.1 and shall be deemed filed as part of the Harmony 2023 Form 20-F.
D. CHANGES IN INTERNAL CONTROL OVER FINANCIAL REPORTING
There has been no change in Harmony’s internal control over financial reporting that occurred during fiscal 2023 that has materially affected or is reasonably likely to materially affect, Harmony’s internal control over financial reporting.
ITEM 16A. AUDIT COMMITTEE FINANCIAL EXPERT
Mr. John Wetton, independent non-executive chairman of the audit and risk committee, is regarded as being the Company’s “audit committee financial expert” as defined by the rules of the SEC.
In addition, the audit and risk committee members through their collective experience meet a majority of the definitions of the SEC for an “audit committee financial expert” in both the private and public sectors. The members have served as directors and officers of numerous public companies and have over the years developed a strong knowledge and understanding of IFRS, overseeing the preparation, audit and evaluation of financial statements. We believe that the combined knowledge, skills and experience of the audit and risk committee, and their authority to engage outside experts as they deem appropriate to provide them with advice on matters related to their responsibilities, enable them, as a group and under the guidance of Mr. Wetton, to act effectively in the fulfillment of their tasks and responsibilities required under the Sarbanes-Oxley Act.
ITEM 16B. CODE OF ETHICS
The information set forth under the heading:
•“-Corporate governance” on pages 214 to 225 of the Integrated Annual Report for the 20-F 2023 is incorporated herein by reference.
ITEM 16C. PRINCIPAL ACCOUNTANT FEES AND SERVICES
A. AUDIT FEES
The following sets forth the aggregate fees billed for each of the last two fiscal years for professional fees to our principal accountants for the audit of the annual financial statements or for services normally provided by the accountant in connection with statutory and regulatory filings or engagements for those fiscal years.
|
|
|
|
|
|
|
|
|
| Fiscal year ended June 30, 2022 |
Rand |
45 million |
| Fiscal year ended June 30, 2023 |
Rand |
51 million |
B. AUDIT-RELATED FEES
The following sets forth additional aggregate fees to those reported under “Audit Fees” in each of the last two fiscal years that were provided by the principal accountant that are reasonably related to the performance of the audit or review of the financial statements:
|
|
|
|
|
|
|
|
|
| Fiscal year ended June 30, 2022 |
Rand |
6 million |
| Fiscal year ended June 30, 2023 |
Rand |
7 million |
Fees related to interim reviews.
C. TAX FEES
The following sets forth the aggregate fees billed in each of the last two fiscal years for professional services rendered by the principal accountant for tax compliance, tax advice and tax planning:
|
|
|
|
|
|
|
|
|
| Fiscal year ended June 30, 2022 |
Rand |
— |
| Fiscal year ended June 30, 2023 |
Rand |
— |
Services comprised advice on disclosure for completion of certain tax returns.
D. ALL OTHER FEES
The following sets forth the aggregate fees billed in each of the last two fiscal years for products and services provided by the principal accountant not described above, including advisory services related to our Interactive Date File (XBRL information) in fiscal 2022:
|
|
|
|
|
|
|
|
|
| Fiscal year ended June 30, 2022 |
Rand |
1 million |
| Fiscal year ended June 30, 2023 |
Rand |
— |
E. AUDIT AND RISK COMMITTEE PRE-APPROVAL POLICIES AND PROCEDURES
Our audit and risk committee pre-approves our engagement of PricewaterhouseCoopers Inc. to render audit or non-audit services in terms of its non-audit services policy. All of the services described above were approved in terms of the Company’s delegation of authority framework and the audit and risk committee’s policy on non-audit services.
ITEM 16D. EXEMPTIONS FROM THE LISTING STANDARDS FOR AUDIT COMMITTEES
Not applicable.
ITEM 16E. PURCHASE OF EQUITY SECURITIES BY THE ISSUER AND AFFILIATED PURCHASERS
None.
ITEM 16F. CHANGE IN REGISTRANT’S CERTIFYING ACCOUNTANT
On June 27, 2022, Ernst & Young Inc. ("EY") was appointed by the Harmony Gold Mining Company Limited’s Board of Directors as the Company’s independent principal accountants for the financial year ending June 30, 2024 after a formal tender process to appoint a new independent registered public accounting firm. The appointment of EY was approved by Harmony’s shareholders at the AGM on November 29, 2022. PricewaterhouseCoopers Inc. ("PwC") will resign as independent principal accountants of the Group on conclusion of its responsibilities relating to the June 30, 2023 financial year audit, which is expected to conclude during December 2023.
The reports of PwC on the Company’s consolidated financial statements for the past two fiscal years did not contain an adverse opinion or a disclaimer of opinion, and were not qualified or modified as to uncertainty, audit scope, or accounting principles. In connection with the audits of the Company’s financial statements for each of the two fiscal years ended June 30, 2022 and 2023, there were (i) no disagreements with PwC, as that term is used in Item 16F(a)(1)(iv) of Form 20-F over any matters of accounting principles or practices, financial statement disclosure, or auditing scope or procedures, which, if not resolved to the satisfaction of PwC, would have caused PwC to make reference to the matter in their report and (ii) there were no “reportable events” as defined in Item 16F(a)(1)(v) of Form 20-F.
Harmony has provided PwC with a copy of the foregoing disclosure and has requested PwC to provide it with a letter addressed to the SEC stating whether or not PwC agrees with the above statements. A copy of such letter, dated October 31, 2023, in which PwC state they agree with such disclosure, is filed as an exhibit to this annual report on Form 20-F. See “Item 19: Exhibits to the Form 20-F—Exhibit 15.2. “Letter from PricewaterhouseCoopers Inc. to the Securities and Exchange Commission regarding a change in registrant's certifying accountant”.
ITEM 16G. CORPORATE GOVERNANCE
Significant ways in which Harmony’s corporate governance practices differ from practices followed by US domestic companies under the listing standards of the New York Stock Exchange ("NYSE").
Foreign private issuers, such as Harmony, must briefly highlight any significant ways in which their corporate governance practices differ from those followed by US domestic companies subject to the listing standards of the NYSE. Set out below is a brief summary of the significant differences.
US domestic companies are required to have a nominating/corporate governance committee and all members of this committee must be non-executive directors. The JSE Listing Requirements also require the appointment of such a committee, and stipulate that all members of this committee must be non-executive directors, the majority of whom must be independent. Harmony has a nomination committee comprised of four non-executive board members, three of whom are independent. The lead independent non-executive director serves as chairman of the nomination committee. For US domestic companies, all members of this committee are required to be independent. The current chairman of our board of directors, Dr Patrice Motsepe, is a member of the nomination committee and is also chairman of one of Harmony’s largest shareholders, African Rainbow Minerals Limited, and is thus not independent. He is, however, in terms of South African governance practices, permitted to be a member of the nomination committee.
US domestic companies are required to have a compensation committee composed entirely of independent directors. Harmony has appointed a remuneration committee, comprised of three independent non-executive board members.
The non-executive directors of US domestic companies must meet at regularly scheduled executive sessions without management. Although the JSE Listing Requirements do not require such meetings, the board meets without executives after each board meeting. The board also has unrestricted access to all company information, records, documents and property. Directors may, if necessary, take independent professional advice at the Company’s expense and non-executive directors have access to management and may meet separately with management, without the attendance of executive directors.
US domestic companies are required to have an audit committee composed entirely of independent directors. The Companies Act requires that the members of the audit committee be approved by shareholders on an annual basis at a company’s annual general meeting. Both the Companies Act and the JSE Listings Requirements require that the audit committee be composed entirely of independent directors. Harmony has appointed an audit and risk committee, currently comprising five non-executive directors, all of whom are independent, as defined under the Companies Act, the JSE Listings Requirements and the listing standards of the NYSE.
ITEM 16H. MINE SAFETY DISCLOSURE
Not applicable.
GLOSSARY OF MINING TERMS
The following explanations are not intended as technical definitions, but rather are intended to assist the general reader in understanding certain terms as used in this annual report.
Alluvial: the product of sedimentary processes in rivers, resulting in the deposition of alluvium (soil deposited by a river).
All-in sustaining costs: all-in sustaining costs include mine production costs, transport and refinery costs, applicable general and administrative costs, costs associated with movements in production inventories, ore stockpiles, as well as ongoing environmental rehabilitation costs as well as transfers for stripping activities and costs associated with royalties. Employee termination costs are included, however employee termination costs associated with major restructuring and shaft closures are excluded. The following costs are also included: LED expenditure for continuing operations, share-based payments for continuing operations, corporate costs, sustaining exploration costs and sustaining capital expenditure including OCD expenditure and rehabilitation accretion and amortization for continuing operations. Depreciation costs are excluded. All-in sustaining costs per ounce and per kilogram are attributable all-in sustaining costs divided by attributable ounces or kilograms of gold sold.
Auriferous: a substance that contains gold (Au).
Beneficiation: the process of adding value to gold products by transforming gold bullion into fabricated gold products.
By-products: Any products emanating from the core process of producing gold, including silver and uranium in South Africa and copper, silver and molybdenum in Papua New Guinea.
Carbon in leach (CIL): Gold is leached from a slurry of gold ore with cyanide in agitated tanks and adsorbed on to carbon granules in the same circuit. Granules are separated from the slurry and treated to remove the gold.
Carbon in pulp (CIP): Gold is leached conventionally from a slurry of gold ore with cyanide in agitated tanks. The leached slurry passes into the CIP circuit where carbon granules are mixed with the slurry and gold is absorbed onto the carbon. Granules are separated from the slurry and treated to remove gold.
Carbon in solution (CIS): a process similar to CIP except that the gold, which has been leached by the cyanide into solution, is separated by the process of filtration (solid/liquid separation). The solution is then pumped through six stages where the solution comes into contact with the activated carbon granules.
Cash costs: total cash costs include site costs for all mining, processing and administration, reduced by contributions from by-products and include royalties and production taxes. Depreciation, rehabilitation, corporate administration, retrenchment, capital and exploration costs are excluded. Total cash costs per ounce and per kilogram are attributable total cash costs divided by attributable ounces or kilogram of gold produced.
Conglomerate: a coarse-grained classic sedimentary rock, composed of rounded to sub-angular fragments larger than 2mm in diameter (granules, pebbles, cobbles, boulders) set in a fine-grained matrix of sand or silt, and commonly cemented by calcium carbonate, iron oxide, silica or hardened clay.
Cut-off grade: the grade (i.e. the concentration of metal or mineral in rock) that determines the destination of the material during mining. For purposes of establishing “prospects of economic extraction,” the cut-off grade is the grade that distinguishes material deemed to have no economic value (it will not be mined in underground mining or if mined in surface mining, its destination will be the waste dump) from material deemed to have economic value (its ultimate destination during mining will be a processing facility). Other terms used in similar fashion as cut-off grade include net smelter return, pay limit, and break-even stripping ratio.
Decline: an inclined underground access way.
Depletion: the decrease in quantity of ore in a deposit or property resulting from extraction or production.
Development: process of accessing an orebody through shafts or tunneling in underground mining.
Dilution: unmineralized rock that is by necessity, removed along with ore during the mining process that effectively lowers the overall grade of the ore.
Economically viable: when used in the context of Mineral Reserve determination, means that the qualified person has determined, using a discounted cash flow analysis, or has otherwise analytically determined, that extraction of the Mineral Reserve is economically viable under reasonable investment and market assumptions.
Electro-winning: the process of removing gold from solution by the action of electric currents.
Elution: removal of the gold from the activated carbon before the zinc precipitation stage.
Exploration: activities associated with ascertaining the existence, location, extent or quality of mineralized material, including economic and technical evaluations of mineralized material.
Fabricated gold: gold on which work has been performed to turn it into a product, such as jewelry, which differs from a pure investment product, such as a gold bullion bar.
Footwall: the underlying side of a fault, orebody or stope.
Forward sale: the sale of a commodity for delivery at a specified future date and price.
Gold reserves: the gold contained within proven and probable reserves on the basis of recoverable material (reported as mill delivered tons and head grade).
Gold produced: refined gold derived from the mining process, measure in ounces or kilograms in saleable form.
Grade: quantity of gold contained in a unit weight of gold-bearing material, generally expressed in ounces per short ton of ore or in kilograms per metric tonne.
Greenfield: a potential mining site of unknown quality.
Head grade: the grade of the ore as delivered to the metallurgical plant.
Indicated Mineral Resource: that part of a Mineral Resource for which quantity and grade or quality are estimated on the basis of adequate geological evidence and sampling. The level of geological certainty associated with an Indicated Mineral Resource is sufficient to allow a qualified person to apply modifying factors in sufficient detail to support mine planning and evaluation of the economic viability of the deposit. Because an Indicated Mineral Resource has a lower level of confidence than the level of confidence of a Measured Mineral Resource, an Indicated Mineral Resource may only be converted to a probable Mineral Reserve.
Inferred Mineral Resource: that part of a Mineral Resource for which quantity and grade or quality are estimated on the basis of limited geological evidence and sampling. The level of geological uncertainty associated with an Inferred Mineral Resource is too high to apply relevant technical and economic factors likely to influence the prospects of economic extraction in a manner useful for evaluation of economic viability. Because an Inferred Mineral Resource has the lowest level of geological confidence of all Mineral Resources, which prevents the application of the modifying factors in a manner useful for evaluation of economic viability, an Inferred Mineral Resource may not be considered when assessing the economic viability of a mining project and may not be converted to a Mineral Reserve.
Leaching: dissolution of gold from crushed or milled material, including reclaimed slime, prior to absorption on to activated carbon.
Level: the workings or tunnels of an underground mine that are on the same horizontal plane.
Measured Mineral Resource: that part of a Mineral Resource for which quantity and grade or quality are estimated on the basis of conclusive geological evidence and sampling. The level of geological certainty associated with a Measured Mineral Resource is sufficient to allow a qualified person to apply modifying factors, as defined in this section, in sufficient detail to support detailed mine planning and final evaluation of the economic viability of the deposit. Because a Measured Mineral Resource has a higher level of confidence than the level of confidence of either an Indicated Mineral Resource or an Inferred Mineral Resource, a Measured Mineral Resource may be converted to a Proven Mineral Reserve or to a Probable Mineral Reserve.
Measures: conversion factors from metric units to US units are provided below.
|
|
|
|
|
|
|
|
|
| Metric unit |
|
US equivalent |
| 1 tonne |
= 1 t |
= 1.10231 short tons |
| 1 gram |
= 1 g |
= 0.03215 ounces |
| 1 gram per tonne |
= 1 g/t |
= 0.02917 ounces per short ton |
| 1 kilogram per tonne |
= 1 kg/t |
= 29.16642 ounces per short ton |
| 1 kilometer |
= 1 km |
= 0.621371 miles |
| 1 meter |
= 1 m |
= 3.28084 feet |
| 1 centimeter |
= 1 cm |
= 0.3937 inches |
| 1 millimeter |
= 1 mm |
= 0.03937 inches |
| 1 hectare |
= 1 ha |
= 2.47105 acres |
Metallurgical plant: a processing plant used to treat ore and extract the contained gold.
Mill delivered tons: a quantity, expressed in tons, of ore delivered to the metallurgical plant.
Milling/mill: the comminution of the ore, although the term has come to cover the broad range of machinery inside the treatment plant where the gold is separated from the ore.
Mine Call Factor: the ratio, expressed as a percentage, of the total quantity of recovered and unrecovered mineral product after processing with the amount estimated in the ore based on sampling.
Mineralization: the presence of a target mineral in a mass of host rock.
Mineralized material: a mineralized body that has been delineated by appropriately spaced drilling and/or underground sampling to support a sufficient tonnage and average grade of metals to warrant further exploration. Such a deposit does not qualify as a reserve until a comprehensive evaluation based upon unit cost, grade, recoveries, and other material factors conclude legal and economic feasibility.
Mineral Reserves: an estimate of tonnage and grade or quality of Indicated and Measured Mineral Resources that, in the opinion of the qualified person, can be the basis of an economically viable project. More specifically, it is the economically mineable part of a Measured or Indicated Mineral Resource, which includes diluting materials and allowances for losses that may occur when the material is mined or extracted.
Mineral Resource: a concentration or occurrence of material of economic interest in or on the Earth’s crust in such form, grade or quality, and quantity that there are reasonable prospects for economic extraction. A Mineral Resource is a reasonable estimate of mineralization, taking into account relevant factors such as cut-off grade, likely mining dimensions, location or continuity, that, with the assumed and justifiable technical and economic conditions, is likely to, in whole or in part, become economically extractable. It is not merely an inventory of all mineralization drilled or sampled.
Modifying factors: the factors that a qualified person must apply to Indicated and Measured Mineral Resources and then evaluate in order to establish the economic viability of Mineral Reserves. A qualified person must apply and evaluate modifying factors to convert Measured and Indicated Mineral Resources to Proven and Probable Mineral Reserves. These factors include but are not restricted to: mining; processing; metallurgical; infrastructure; economic; marketing; legal; environmental compliance; plans, negotiations, or agreements with local individuals or groups; and governmental factors. The number, type and specific characteristics of the modifying factors applied will necessarily be a function of and depend upon the mineral, mine, property, or project.
Open-pit/Opencast/Open cut: mining in which the ore is extracted from a pit. The geometry of the pit may vary with the characteristics of the orebody.
Ore: a mixture of mineralized material from which at least one of the contained minerals can be mined and processed at an economic profit.
Ore grade: the average amount of gold contained in a ton of gold bearing ore expressed in ounces per ton or grams per tonne.
Orebody: a well-defined mass of mineralized material of sufficient mineral content to make extraction economically viable.
Ounce: one Troy ounce, which equals 31.1035 grams.
Overburden: the soil and rock that must be removed in order to expose an ore deposit.
Placer: a sedimentary deposit containing economic quantities of valuable minerals mainly formed in alluvial environments.
Pre-feasibility study: a comprehensive study of a range of options for the technical and economic viability of a mineral project that has advanced to a stage where a qualified person has determined (in the case of underground mining) a preferred mining method, or (in the case of surface mining) a pit configuration, and in all cases has determined an effective method of mineral processing and an effective plan to sell the product. A pre-feasibility study includes a financial analysis based on reasonable assumptions, based on appropriate testing, about the modifying factors and the evaluation of any other relevant factors that are sufficient for a qualified person to determine if all or part of the Indicated and Measured Mineral Resources may be converted to Mineral Reserves at the time of reporting. The financial analysis must have the level of detail necessary to demonstrate, at the time of reporting, that extraction is economically viable. A pre-feasibility study is less comprehensive and results in a lower confidence level than a feasibility study. A pre-feasibility study is more comprehensive and results in a higher confidence level than an initial assessment.
Precipitate: the solid product of chemical reaction by fluids such as the zinc precipitation referred to below.
Probable Mineral Reserves: the economically mineable part of an Indicated and, in some cases, a Measured Mineral Resource
Prospect: an area of land with insufficient data available on the mineralization to determine if it is economically recoverable, but warranting further investigation.
Prospecting license: an area for which permission to explore has been granted.
Proven Mineral Reserves: (i) quantity is computed from dimensions revealed in outcrops, trenches, workings or drill holes; grade and/or quality are computed from the results of detailed sampling; and (ii) the sites for inspection, sampling and measurement are spaced so closely and the geologic character is so well defined that size, shape, depth and mineral content of reserves are well-established.
Pyrite: a brassy-colored mineral of iron sulphide (compound of iron and sulfur).
Qualified Person: (i) a mineral industry professional with at least five years of relevant experience in the type of mineralization and type of deposit under consideration and in the specific type of activity that person is undertaking on behalf of the registrant and (ii) an eligible member or licensee in good standing of a recognized professional organization at the time the technical report is prepared.
Regulation S-K 1300 details further recognized professional organizations and also relevant experience.
Quartz: a mineral compound of silicon and oxygen.
Recovery grade: the actual grade of ore realized after the mining and treatment process.
Reef: a gold-bearing sedimentary horizon, normally a conglomerate band, which may contain economic levels of gold.
Refining: the final stage of metal production in which final impurities are removed from the molten metal by introducing air and fluxes. The impurities are removed as gases or slag.
Rehabilitation: the process of restoring mined land to a condition approximating its original state.
Sampling: taking small pieces of rock at intervals along exposed mineralization for assay (to determine the mineral content).
Shaft: a shaft provides principal access to the underground workings for transporting personnel, equipment, supplies, ore and waste. A shaft is also used for ventilation and as an auxiliary exit. It is equipped with a surface hoist system that lowers and raises conveyances for men, materials and ore in the shaft. A shaft generally has more than one conveyancing compartment.
Slimes: the finer fraction of tailings discharged from a processing plant after the valuable minerals have been recovered.
Slurry: a fluid comprising fine solids suspended in a solution (generally water containing additives).
Smelting: thermal processing whereby molten metal is liberated from beneficiated mineral or concentrate with impurities separating as lighter slag.
Spot price: the current price of a metal for immediate delivery.
Stockpile: a store of unprocessed ore.
Stope: the underground excavation within the orebody where the main gold production takes place.
Stripping: the process of removing overburden to expose ore.
Sulphide: a mineral characterized by the linkages of sulfur with a metal or semi-metal, such as pyrite, FeS.
Syncline: a basin-shaped fold.
Tailings: finely ground rock of low residual value from which valuable minerals have been extracted is discarded and stored in a designed dam facility.
Tailings dam (slimes dam): Dam facilities designed to store discarded tailings.
Ton: one ton is equal to 2,000 pounds (also known as a “short” ton).
Tonnage: quantities where the ton or tonne is an appropriate unit of measure. Typically used to measure reserves of gold-bearing material in situ or quantities of ore and waste material mined, transported or milled.
Tonne: one tonne is equal to 1,000 kilograms (also known as a “metric” tonne).
(in this Annual Report we have used metric tonnes unless specified otherwise and we may have used Ton(s) and Tonne(s) interchangeably)
Trend: the arrangement of a group of ore deposits or a geological feature or zone of similar grade occurring in a linear pattern.
Unconformity: the structural relationship between two groups of rock that are not in normal succession.
Waste: ore rock mined with an insufficient gold content to justify processing.
Waste rock: the non-mineralized rock and/or rock that generally cannot be mined economically that is hoisted to the surface for disposal on the surface normally close to the shaft on an allocated dump.
Yield: the actual grade of ore realized after the mining and treatment process.
Zinc precipitation: a chemical reaction using zinc dust that converts gold solution to a solid form for smelting into unrefined gold bars.
CERTAIN ABBREVIATIONS
|
|
|
|
|
|
Ag |
Silver |
Au |
Gold |
| b |
Barrs |
Bi |
Bismuth |
| cm |
Centimeter |
| cmg/t |
Centimeter-grams per metric tonne |
Cu |
Copper |
| dmt |
Dry metric tonne |
|
|
|
|
|
|
Fe |
Iron |
| g |
Gram |
| g/t |
Grams per metric tonne |
| ha |
Hectare |
| kg |
Kilogram |
| kg/t |
Kilogram per metric tonne |
| km |
Kilometer |
km2 |
Square kilometer |
| koz |
Thousand troy ounces |
| ktpm |
Thousand kilograms per month |
| lb |
Pound |
| m |
Meter |
| M |
Million |
| mm |
Millimeter |
| Moz |
Million troy ounces |
| Mt |
Million metric tonnes |
| Mtpa |
Million metric tonnes per annum |
Ni |
Nickel |
| oz |
Troy ounce |
| oz/kg |
Ounce per kilogram |
| ppm |
Parts per million |
Pb |
Lead |
R/kg |
South African Rand per kilogram |
R/t |
South African Rand per tonne |
| t |
Metric tonne |
t/m3 |
Metric tonne per cubic meter |
U |
Uranium |
| US$/oz |
United States dollars per troy ounce |
Zn |
Zinc |
PART III
ITEM 17 FINANCIAL STATEMENTS
Not applicable.
ITEM 18 FINANCIAL STATEMENTS
The following consolidated financial statements, together with the report of PricewaterhouseCoopers Inc. Johannesburg, Republic of South Africa (PCAOB ID No. 1308), are incorporated by reference to exhibit 99.1 and shall be deemed filed as part of the Harmony 2023 Form 20-F:
•Index to Financial Statements;
•Report of Independent Registered Public Accounting Firm; and
•Consolidated Financial Statements.
ITEM 19. EXHIBITS
|
|
|
|
|
|
| 4.2 |
Common terms agreements for Harmony Gold Mining Company Limited with Nedbank Limited (acting through its Nedbank Corporate and Investment Banking division) (as Original Lender, Original Hedge Provider, Global coordinator and Bookrunner, Mandated Lead Arranger and Sustainability Coordinator) and Nedbank Limited (London Branch) (as Original Lender) and Absa Bank Limited (acting through its Corporate and Investment Banking Division) (as Original Lender, Original Hedge Provider, Global Goordinator and Bookrunner, Mandated Lead Arranger, Sustainability Coordinator, Sustainability Agent and Facility Agent) and Firstrand Bank Limited (acting through its Rand Merchant Bank Division) (as Mandated Lead Arranger, Original Hedge Provider and Original Lender) and J.P. Morgan Securities PLC (as Lead Arranger) and Citibank, N.A., South African branch (as Lead Arranger and Original Lender) and HSBC Bank PLC - Johannesburg branch (as Arranger and Original Lender) and State Bank of India (acting through its Johannesburg Branch) (as Mandated Lead Arranger and Original Lender) and JPMORGAN Chase Bank, N.A., London branch (Original Lender) and Project and Trade Finance core fund (as Original Lender) and Federated Hermes Project and Trade Finance Tender Fund (as Original Lender) and Federated Hermes Project and Trade Finance Master Fund (as Original Lender) and Bank of China Limited, Johannesburg branch (as Mandated Lead Arranger and Original Lender) and Goldman Sachs International Bank (as Original Lender) and Industrial Development Corporation of South Africa Limited (as Original Lender) and Investec Bank Limited (acting through its Investment Banking division: Corporate Solutions) (as Original Lender and Lead Arranger) and Ninety One SA Proprietary Limited (acting as agent and portfolio manager of Ninety One Assurance Limited) (as Original Lender) and HSBC Bank PLC (as Original Hedge Provider) and JPMORGAN Chase Bank, N.A. (as Original Hedge Provider) and Citibank N.A., London branch (as Original Hedge Provider).
(incorporated by reference to Harmony’s Annual Report on Form 20-F for the fiscal year ended June 30, 2022, filed on October 31, 2022)
|
| 4.3 |
Revolving ZAR Facility Agreement, amongst Harmony Gold Mining Company Limited (as Borrower and (Obligors' Agent) with The Financial Institutions Listed on Schedule 1 and Absa Bank Limited (acting through its Corporate and Investment Banking division) (as Facility Agent)
(incorporated by reference to Harmony’s Annual Report on Form 20-F for the fiscal year ended June 30, 2022, filed on October 31, 2022)
|
| 4.4 |
Revolving USD Facility Agreement, amongst Harmony Gold Mining Company Limited (as Borrower and (Obligors' Agent) with The Financial Institutions Listed In Schedule 1 and Absa Bank Limited (acting through its Corporate and Investment Banking division) (as Facility Agent)
(incorporated by reference to Harmony’s Annual Report on Form 20-F for the fiscal year ended June 30, 2022, filed on October 31, 2022)
|
| 4.5 |
Term Facility A Agreement amongst Harmony Gold Mining Company Limited (as Borrower and Obligors' Agent) with The Financial Institutions Listed in Schedule 1 and Absa Bank Limited (acting through its Corporate and Investment Banking division) (as Facility Agent)
(incorporated by reference to Harmony’s Annual Report on Form 20-F for the fiscal year ended June 30, 2022, filed on October 31, 2022)
|
| 4.6 |
Term Facility B Agreement amongst Harmony Gold Mining Company Limited (as Borrower and Obligors' Agent) with The Financial Institutions Listed in Schedule 1 and Nedbank Limited (acting through its Nedbank Corporate and Investment Banking division) (as Sustainability Coordinator) and Absa Bank Limited (acting through its Corporate and Investment Banking division) (as Sustainability Agent, Sustainability Coordinator and Facility Agent)
(incorporated by reference to Harmony’s Annual Report on Form 20-F for the fiscal year ended June 30, 2022, filed on October 31, 2022)
|
|
|
|
|
|
|
| 4.7 |
|
4.8 |
|
4.9 |
|
4.10 |
Target Group Companies collectively, (a) the Target Entity, (b) Copper Mountain Mining Pty Ltd (ACN 090 468 018), (c) CMMC Australia Pty Ltd (ACN 623 541 079), (d) Eva Copper Mine Pty Ltd (ACN 625 712 138), (e) Roseby Copper Pty Limited (ACN 067 584 409) and (f) Roseby Copper (South) Pty Limited (ACN 148 092 291), and Target Group Company means any of them.
|
| 8.1 |
|
| †12.1 |
|
| †12.2 |
|
| †13.1 |
|
| †13.2 |
|
| ††15.1 |
|
15.2 |
|
| 96.1 |
|
96.2 |
|
96.3 |
|
96.4 |
|
96.5 |
|
96.6 |
|
96.7 |
|
|
|
|
|
|
|
96.8 |
|
96.9 |
|
96.10 |
|
96.11 |
|
96.12 |
|
96.13 |
|
96.14 |
|
| 99.1 |
|
† This certification will not be deemed “filed” for purposes of Section 18 of the of 1934, as amended (the “Exchange Act”), or otherwise subject to the liability of that section. Such certification will not be deemed to be incorporated by reference into any filing under the Securities Act of 1933, as amended (the “Securities Act”), or the Exchange Act, except to the extent that the Registrant specifically incorporates it by reference.
†† Certain of the information included in Exhibit 15.1 is incorporated by reference into the Harmony 2023 Form 20-F, as specified elsewhere in this report, in accordance with Rule 12b-23(a) of the Exchange Act. With the exception of the items so specified, the Integrated Annual Report for the 20-F 2023 is not deemed to be filed as part of Harmony 2023 Form 20-F.
|
|
|
|
|
|
101.INS
|
XBRL Instance Document
|
101.SCH
|
XBRL Taxonomy Extension Schema Linkbase Document
|
101.CAL
|
XBRL Taxonomy Extension Calculation Linkbase Document
|
101.DEF
|
XBRL Taxonomy Extension Definition Linkbase Document
|
101.LAB
|
XBRL Taxonomy Extension Label Linkbase Document
|
101.PRE
|
XBRL Taxonomy Extension Presentation Linkbase Document
|
SIGNATURES
Pursuant to the requirements of Section 12 of the Exchange Act, we hereby certify that we meet all of the requirements for filing on Form 20-F and that we have duly caused this annual report to be signed on our behalf by the undersigned, thereunto duly authorized.
HARMONY GOLD MINING COMPANY LIMITED
By: /s/ Peter Steenkamp
Peter Steenkamp
Chief Executive Officer
Date: October 31, 2023
EX-2.1
2
exhibit21nom4dec2023.htm
EX-2.1
Document
NOTICE OF ANNUAL GENERAL MEETING
|
|
|
|
|
|
|
|
|
|
|
|
|
Notice is hereby given to shareholders that the annual general meeting (“AGM”) of Harmony Gold Mining Company Limited (“Harmony or Company”) will, as contemplated by section 63(2)(a) of the Companies Act 71 of 2008, as amended (“Act”) and clause 19 of the Company's memorandum of incorporation (“MOI”), be held entirely by electronic communication on Monday, 4 December 2023 at 11:00 (SA time), to conduct the business set out below and to consider, and adopt, if deemed fit, with or without modification, the ordinary and special resolutions set out in this Notice of AGM (“Notice”) |
|
|
|
|
For more information about the online facility and the prescribed procedures and means of connecting thereto, please see the section titled “Electronic Participation” below in this Notice of AGM.
In terms of section 59(1)(a) and (b) of the Act, the board of directors of the Company (“Board”) has set the record date for the purpose of determining which shareholders of the Company are entitled to:
•receive this Notice of AGM (being the date on which a shareholder must be registered in the Company’s securities register to receive this Notice of AGM) as Friday, 20 October 2023; and
•participate in and vote at the AGM (being the date on which a shareholder must be registered in the Company’s securities register to participate in and vote at the AGM) as Friday, 24 November 2023. Accordingly, the last date to trade in order to participate in and vote at the meeting is Tuesday, 21 November 2023.
As the AGM will cater for Electronic Participation only, it will not be desirable nor practical for voting to take place by way of show of hands. Accordingly, the chairman has already determined that all voting will be by way of poll through the facility provided by the electronic online facilities. See further the section titled: “Electronic Participation” below in this Notice of AGM.
Presentation of annual financial statements
The audited consolidated annual financial statements of the Company, incorporating the reports of the auditors, the audit and risk committee, and the directors for the year ended 30 June 2023 will be presented to the shareholders of the Company at the AGM as required in terms of section 30(3)(d) of the Act, read with section 61(8)(a) of the Act.
The complete audited consolidated annual financial statements of the Company are available on Harmony’s website at www.har.co.za.
Presentation of group social and ethics committee report
In accordance with regulation 43(5)(c) of the Act, the social and ethics committee’s report in the Integrated annual report of the report to which this Notice of AGM is attached (and also available on Harmony’s website at www.har.co.za) will be presented to shareholders at the AGM.
Resolutions for consideration and adoption
1. Ordinary resolution number 1:
Re-election of a director
“RESOLVED THAT Dr Patrice Motsepe, who retires by rotation at this annual general meeting in accordance with the MOI, and who is eligible and available for re-election, be and is hereby re-elected as a director of the Company with immediate effect.” (See Dr Patrice Motsepe’s resumé below).
|
|
|
|
|
|
|
|
|
|
|
|
|
Dr Patrice Motsepe was appointed non-independent non-executive chairman on 23 September 2003. In 1994 Dr Motsepe founded Future Mining which grew rapidly to become a successful contract mining company. He then formed ARMgold in 1997 which listed on the JSE in 2002.
Dr Motsepe led ARMgold into a merger with Avmin and Harmony Gold in 2003. Following the merger Avmin changed its name to African Rainbow Minerals (ARM) and he became the founder and Executive Chairman of ARM. He was voted South Africa’s Business Leader of the Year in 2002 by the chief executive officers of the top 100 companies in South Africa. In the same year, he was the winner of the Ernst & Young Best Entrepreneur of the Year Award.
In 2017 Forbes Magazine commemorated its 100th Anniversary and honoured Dr Motsepe as one of the “100 Greatest Living Business Minds” in the world alongside many prominent global business leaders. He is the only person living on the African continent to be recognised and honoured as one of the “100 Greatest Living Business Minds” in the world.
Dr Motsepe and his wife, Dr Precious Moloi-Motsepe joined the Giving Pledge in January 2013 which was started by Warren Buffett and Bill and Melinda Gates. Dr Motsepe committed to give half of the wealth, which is owned by the Motsepe family to the poor and for philanthropic purposes during his lifetime and that of his wife and beyond. In April 2019, Forbes Magazine stated that US$500 million was donated by the Motsepe family to the poor and for philanthropic purposes.
In March 2020 Dr Motsepe announced that his family, in partnership with companies and organisations that they are associated with, including ARM, pledge R1 billion (US$57 million) to assist with South Africa and Africa’s response to the challenges presented by the Covid-19 pandemic.
Dr Motsepe is a member of the Board of Trustees of the World Economic Forum (WEF), the Global Network Advisory Board of the WEF Centre for the Fourth Industrial Revolution and the WEF International Business Council (IBC) which is made up of 100 of the most highly respected and influential chief executives from all industries. He is also a member of the Harvard Global Advisory Council and the International Council on Mining and Metals (ICMM).
Dr Patrice Motsepe was a partner in one of the largest law firms in South Africa, Bowmans and was also a visiting attorney in the USA with the law firm, McGuireWoods.
Dr Motsepe is the founder and Chairman of Ubuntu-Botho Investments, African Rainbow Capital (ARC), African Rainbow Energy and Power (AREP) and UBI General Partner Proprietary Limited. He is also the Deputy Chairman of Sanlam and Chairman of Harmony Gold.
He is the President of CAF (Confederation of African Football) and Vice President of FIFA (Fédération Internationale de Football Association). He was previously Chairman of Mamelodi Sundowns Football Club.
See Harmony’s website for further detail.
|
|
|
|
|
The percentage of voting rights required for ordinary resolution number 1 to be adopted: more than 50% (fifty percent) of the voting rights exercised on the resolution by shareholders of the Company present at the AGM or represented by proxy and entitled to exercise voting rights on ordinary resolution number 1
.
2. Ordinary resolution number 2:
Re-election of a director
“RESOLVED THAT Peter Turner, who retires by rotation at this annual general meeting in accordance with the MOI, and who is eligible and available for re-election, be and is hereby re-elected as a director of the Company with immediate effect.” (See Peter Turner’s resumé below)
|
|
|
|
|
|
|
|
|
|
|
|
|
Peter was appointed to the Harmony board on 19 February 2021. Peter has over forty years of experience in the mining industry in both open pit and deep-level underground mines. This wealth of experience was achieved through his tenures at AngloGold Ashanti Limited, Gold Fields Limited and Sibanye Stillwater Limited. He brings a wealth of expertise to the board, having managed and constructed mining operations throughout Africa (South Africa, Namibia, Mali, Tanzania and Ghana). |
|
|
|
|
The percentage of voting rights required for ordinary resolution number 2 to be adopted: more than 50% (fifty percent) of the voting rights exercised on the resolution by shareholders of the Company present at the AGM or represented by proxy and entitled to exercise voting rights on ordinary resolution number 2.
3. Ordinary resolution number 3:
Re-election of director
“RESOLVED THAT John Wetton, who retires by rotation at this annual general meeting in accordance with the MOI, and who is eligible and available for re-election, be and is hereby re-elected as a director of the Company with immediate effect.” (See John Wetton’s resumé below).
|
|
|
|
|
|
|
|
|
|
|
|
|
John was appointed to the board on 1 July 2011. He spent his professional career with Ernst & Young (EY) in the United Kingdom and South Africa mainly in corporate audit.
He attended several post qualification programmes including those presented by the University of Cape Town Graduate School of Business, Harvard Business School and Gordon Institute of Business Science.
When EY integrated globally, he had a business development role across sub-Saharan Africa and was also part of the team that led the strategic integration of EY’s practices and services throughout sub-Saharan Africa.
For several years he led EY’s mining group and acted as senior partner for many of the firm’s major mining and construction clients. He was a member of EY’s executive management committee (board) and was, until retirement, a member of the EY Africa Governance Board. |
|
|
|
|
The percentage of voting rights required for ordinary resolution number 3 to be adopted: more than 50% (fifty percent) of the voting rights exercised on the resolution by shareholders of the Company present at the AGM or represented by proxy and entitled to exercise voting rights on ordinary resolution number 3.
4. Ordinary resolution number 4:
Re-election of audit and risk committee member
“RESOLVED THAT, subject to ordinary resolution number 3 being passed, John Wetton, who is a non-executive director of the Company, be and is hereby re-elected as a member of the Company’s audit and risk committee with immediate effect to hold office until the next AGM.” (See John Wetton’s resumé under ordinary resolution number 3).
The percentage of voting rights required for ordinary resolution number 4 to be adopted: more than 50% (fifty percent) of the voting rights exercised on the resolution by shareholders of the Company present at the AGM or represented by proxy and entitled to exercise voting rights on ordinary resolution number 4.
5. Ordinary resolution number 5:
Re-election of audit and risk committee member
“RESOLVED THAT Karabo Nondumo, who is a non-executive director of the Company, be and is hereby re-elected as a member of the Company’s audit and risk committee, with immediate effect, to hold office until the next AGM.” (See Karabo Nondumo’s resumé below).
|
|
|
|
|
|
|
|
|
|
|
|
|
Karabo was appointed to the board on 3 May 2013. She is an entrepreneur who has interests in provision of Industrial supplies & Investments. She held Executive Head roles within Vodacom Business and Mergers & Acquisitions at Vodacom Group. She’s a previous CEO of AWCA Investment Holdings Limited. She was an associate as well as executive assistant to the chairman at Shanduka Group.
Karabo is a qualified Chartered Accountant and a member of the South African Institute of Chartered Accountants (SAICA) and African Women Chartered Accountants (AWCA). She has extensive experience in the Telecommunications, Financial Services and Mining sectors. She is an independent non-executive director of: Harmony Gold Mining Company Limited (Chair: social and ethics; member of nomination; investment; and audit and risk subcommittees); Sanlam Limited (Chair: social and ethics; member of risk and compliance; audit and actuarial, HR and nomination subcommittees); TCI-Tiso Proprietary Limited (Chair: finance and risk committee) and MTN Group Operating companies in Swaziland, Zambia, Uganda and Rwanda (Chair: audit and risk committee)
She is an advisory member of Senatla Capital and a trustee of Mabindu and Ubuntu-Botho Women’s Trusts.
Previous board roles include MTN Group Operating companies in Sudan and South Sudan, Brightrock Holdings Limited; Merafe Resources Limited; SA Express Airways SOC Limited; Rolfes Holdings Limited and Richards Bay Coal Terminal. |
|
|
|
|
The percentage of voting rights required for ordinary resolution number 5 to be adopted: more than 50% (fifty percent) of the voting rights exercised on the resolution by shareholders of the Company present at the AGM or represented by proxy and entitled to exercise voting rights on ordinary resolution number 5.
6. Ordinary resolution number 6:
Re-election of audit and risk committee member
“RESOLVED THAT Given Sibiya, who is a non-executive director of the Company, be and is hereby re-elected as a member of the Company’s audit and risk committee, with immediate effect, to hold office until the next AGM.” (See Given Sibiya’s resumé below).
|
|
|
|
|
|
|
|
|
|
|
|
|
Given was appointed to the board on 13 May 2019. She is a Chartered Accountant and until 31 August 2014 was Head: Internal Audit at SekelaXabiso Proprietary Limited. She has over 30 years’ experience in internal and external auditing, risk management, management consulting, corporate governance and forensic auditing. Prior to joining SekelaXabiso Proprietary Limited, she spent nine years at SizweNtsaluba VSP where she was Director: Forensics and where from 2005 she headed the Corporate Governance Services Division. She also worked for Anglo American Corporation as an internal auditor in the Group Audit Services Department from April 1994 to May 1996. Prior to that, she served articles at KPMG Aiken & Peat from 1991 to early 1994.
She has served as a member of the audit and risk committee for a number of entities, including as chairperson of the audit committee for Basil Read Holdings Limited, South African Express Airways SOC Limited and Brand South Africa. She currently serves as a non-executive director of Chapter Zero South Africa , as well as a non-executive board member of Ithala SOC Limited,, where she chairs both the audit and compliance committee and the social, ethics and sustainability committee. She was the audit committee chairperson of The Presidency until December 2022 and currently chairs the audit and risk committee of the Composers, Authors and Publishers Association (CAPASSO). |
|
|
|
|
The percentage of voting rights required for ordinary resolution number 6 to be adopted: more than 50% (fifty percent) of the voting rights exercised on the resolution by shareholders of the Company present at the AGM or represented by proxy and entitled to exercise voting rights on ordinary resolution number 6.
7. Ordinary resolution number 7:
Re-election of audit and risk committee member
“RESOLVED THAT Bongani Nqwababa, who is a non-executive director of the Company, be and is hereby re-elected as a member of the Company’s audit and risk committee, with immediate effect, to hold office until the next AGM.” (See Bongani Nqwababa’s resumé below).
|
|
|
|
|
|
|
|
|
|
|
|
|
Bongani was appointed to the board on 18 May 2022. He was Joint CEO of Sasol Limited. Prior to that, he was CFO and executive director at Sasol, Anglo American Platinum, Eskom and Shell Southern Africa.
He has over 30 years’ experience in the mining, petrochemicals, and energy sectors globally and in South Africa.
Bongani is currently an independent non-executive director of the Development Bank of Southern Africa (DBSA), Discovery Bank Limited and African Rainbow Minerals Limited. He is Chairman of Babcock Ntuthuko Engineering and Babcock Plant Services in South Africa. He previously served on the board of Old Mutual plc as an independent non-executive director and chaired the SARS Audit Committee. |
|
|
|
|
The percentage of voting rights required for ordinary resolution number 7 to be adopted: more than 50% (fifty percent) of the voting rights exercised on the resolution by shareholders of the Company present at the AGM or represented by proxy and entitled to exercise voting rights on ordinary resolution number 7.
8. Ordinary resolution number 8:
Re-election of audit and risk committee member
“RESOLVED THAT Martin Prinsloo, who is a non-executive director of the Company, be and is hereby re-elected as a member of the Company’s audit and risk committee, with immediate effect, to hold office until the next AGM.” (See Martin Prinsloo’s resumé below).
|
|
|
|
|
|
|
|
|
|
|
|
|
Martin was appointed to the board on 18 May 2022. He has 30 years of corporate, project and structured finance experience, including eight years as financial director (CFO) of a JSE-listed company. Martin’s early career progressed from KPMG through the Industrial Development Corporation after which he joined BoE Merchant Bank as director of Specialised Finance where he implemented several listing and funding transactions predominantly in the resources industry.
In 2003, he was appointed to Anglo Platinum as head of Corporate Finance and Business Development and acted in the capacity of executive head Finance (CFO) for just over a year before joining Royal Bafokeng Platinum as CFO in 2009. Martin invested into a private equity business, Fledge Capital in March 2019 and is also a non-executive director of a number of unlisted companies including Oasis Water Holdings Proprietary Limited. |
|
|
|
|
The percentage of voting rights required for ordinary resolution number 8 to be adopted: more than 50% (fifty percent) of the voting rights exercised on the resolution by shareholders of the Company present at the AGM or represented by proxy and entitled to exercise voting rights on ordinary resolution number 8.
9. Ordinary resolution number 9:
Re-appointment of external auditors
“RESOLVED THAT Ernst & Young Incorporated be and is hereby reappointed as the external auditor of the Company to hold office from this AGM until conclusion of the next AGM.”
The percentage of voting rights required for ordinary resolution number 9 to be adopted: more than 50% (fifty percent) of the voting rights exercised on the resolution by shareholders of the Company present at the AGM or represented by proxy and entitled to exercise voting rights on ordinary resolution number 9.
10. Ordinary resolution number 10:
Approval of remuneration policy
“RESOLVED, as a non-binding advisory vote in accordance with the recommendations of King IV Report on Corporate Governance for South Africa, 2016 (“King IV”), that the remuneration policy of the Company, as set out in the Integrated annual report ( available on Harmony’s website at www.har.co.za), be and is hereby approved.”
As this matter is non-binding, no minimum voting threshold is needed. However, in the event that 25% (twenty five percent) or more of the voting rights exercised on ordinary resolution number 10 are against such resolution, the Company shall engage with dissenting shareholders and implement measures, in the manner set out in the remuneration policy read with King IV.
11. Ordinary resolution number 11:
Approval of the implementation report
“RESOLVED, as a non-binding advisory vote in accordance with the recommendations of King IV, that the implementation report of the Company, as set out in the Integrated annual report (available on Harmony’s website at www.har.co.za) be and is hereby approved.”
As this matter is non-binding, no minimum voting threshold is needed. However, in the event that 25% (twenty five percent) or more of the voting rights exercised on ordinary resolution number 11 are against such resolution, the Company shall engage with dissenting shareholders and implement measures, in the manner set out in the implementation report read with King IV.
12. Ordinary resolution number 12:
General authority to issue shares for cash
“RESOLVED THAT the Board be and is hereby authorised as a general authority to issue authorised but unissued shares in the capital of the Company (including the grant or issue of options or convertible securities that are convertible into an existing class of equity securities) for cash (or the extinction of a liability, obligation or commitment, restraint or settlement of expenses) on such terms and conditions as the Board may, from time to time, in its sole discretion deem fit, subject to the provisions of the Act and the Listings Requirements of the JSE Limited (“JSE Listings Requirements” and “JSE” respectively), provided that:
(a)the equity securities which are the subject of the issue for cash must be of a class already in issue, or where this is not the case, must be limited to such securities or rights that are convertible into a class already in issue;
(b)the equity securities must be issued to public shareholders, as defined in the JSE Listings Requirements, and subject to (e) below not to related parties;
(c)securities which are the subject of general issues for cash in the aggregate may not exceed 5% (five percent) of the Company’s shares in issue as at the date of this Notice of AGM, excluding treasury shares – the number of shares available for the issue of shares for cash will therefore be limited to 30 903 598 shares, provided that;
(i)this authority shall be valid until the Company’s next AGM or for 15 (fifteen) months from the date on which this resolution is passed, whichever period is shorter, subject to the requirements of the JSE and any other restrictions set out in this authority;
(ii)the calculation of the Company’s listed equity securities must be a factual assessment of the Company’s listed equity securities as at the date of this Notice of AGM, excluding treasury shares;
(iii)any equity securities issued for cash under this authority during the period contemplated in (i) shall be deducted from the number set out in (c); and
(iv)in the event of sub-division or consolidation of issued equity securities during the period contemplated in (i), the existing authority will be adjusted accordingly to represent the same allocation ratio;
(v)the maximum discount at which equity securities may be issued is 10% (ten percent) of the weighted average traded price of such equity securities measured over the 30 (thirty) business days prior to the date that the price of the issue is agreed between the Company and the party subscribing for the securities; and
(d)this approval expressly allows related parties to participate in a general issue for cash through a bookbuild process provided that –
(i) related parties may only participate with a maximum bid price at which they are prepared to take-up shares or at book close price. In the event of a maximum bid price and the book closes at a higher price, the relevant related party will be “out of the book” and not be allocated shares; and
(ii) equity securities must be allocated equitably “in the book” through the bookbuild process and the measures to be applied must be disclosed in the SENS announcement launching the bookbuild.
In terms of the JSE Listings Requirements, the passing of ordinary resolution number 12 requires the approval of at least a 75% (seventy five percent) majority of the votes cast by shareholders of the Company present at the AGM or represented by proxy at this AGM, and entitled to exercise voting rights on ordinary resolution number 12.
13. Special resolution number 1:
Approval of Financial Assistance in terms of section 45 of the Act
“RESOLVED THAT, in terms of section 45(3)(a)(ii) of the Act, the provision by the Company, at any time during the period of 2 (two) years from the date of passing of this special resolution, of any direct or indirect financial assistance, as contemplated in section 45 of the Act, to any one or more related or inter-related companies or corporations of the Company and/or to any one or more juristic persons who are members of any such related or inter-related company or corporation and/or to any one or more juristic persons related or inter-related to any such company, corporation or member, be and is hereby approved, provided that:
a. the identity of the recipient of such financial assistance, the form, nature and extent of such financial assistance and the terms and conditions under which such financial assistance is to be provided, are determined by the Board from time to time;
b. the Board may not authorise the Company to provide any financial assistance pursuant to this special resolution unless the Board fulfils all the requirements of section 45 of the Act, which it is required to fulfil in order to authorise the Company to provide such financial assistance; and
c. such financial assistance to a recipient is, in the opinion of the Board, required for the purpose of (i) meeting all or any of such recipient’s operating expenses (including capital expenditure), and/or (ii) funding the growth, expansion, reorganisation or restructuring of the businesses or operations of such recipient, and/or (iii) providing any form of financial assistance to such recipient for any other purpose which, in the opinion of the Board, is directly or indirectly in the interests of the Company.”
The percentage of voting rights required for special resolution number 1 to be adopted: at least 75% (seventy five percent) of the voting rights exercised in favour of the resolution by shareholders present at the AGM or represented by proxy and entitled to exercise voting rights on special resolution number 1.
Notice is hereby given to shareholders of the Company in terms of section 45(5) of the Act of a resolution adopted by the Board, authorising the Company to provide such direct or indirect financial assistance as specified in special resolution number 1 on the basis that:
a. by the time that this Notice of AGM is delivered to shareholders of the Company, the Board will have adopted a resolution (“Section 45 Board Resolution”) authorising the Company to provide, subject to the shareholders approving special resolution 1, at any time and from time to time during the period of 2 (two) years commencing on the date on which special resolution number 1 is adopted, any direct or indirect financial assistance as contemplated in section 45 of the Companies Act to any one or more related or inter-related companies or corporations of the Company and/or to any one or more juristic persons who are members of any such related or inter-related company or corporation and/or to any one or more juristic persons related to any such company, corporation or member;
b. the Section 45 Board Resolution will be effective only if and to the extent that special resolution number 1 is adopted by the shareholders of the Company, and the provision of any such direct or indirect financial assistance by the Company, pursuant to such resolution, will always be subject to the Board being satisfied that (i) immediately after providing such financial assistance, the Company will satisfy the solvency and liquidity test as referred to in section 45(3)(b)(i) of the Act, and that (ii) the terms under which such financial assistance is to be given are fair and reasonable to the Company as referred to in section 45(3)(b)(ii); and
c. in as much as the Section 45 Board Resolution contemplates that such financial assistance will in the aggregate exceed 1/10 (one tenth) of 1% (one percent) of the Company’s net worth at the date of adoption of such resolution, the Company hereby provides notice of the Section 45 Board Resolution to shareholders of the Company. Such notice will also be provided to any trade union representing any employees of the Company.
14. Special resolution number 2:
Pre-approval of non-executive directors’ remuneration
“RESOLVED, in terms of section 66(8), read with section 66(9) of the Act, that the Company be and is hereby authorised to pay the following annual remuneration to its non-executive directors for their services as non-executive directors (together with the value-added tax thereon, if applicable) for a period of (two) 2 years from the date of this AGM or until the non-executive directors’ remuneration is amended by way of special resolution of the shareholders, whichever comes first:
Directors’ remuneration (R’000)
|
|
|
|
|
|
|
|
|
|
|
|
|
|
|
|
|
|
|
|
|
|
|
|
|
|
|
|
|
|
|
|
|
|
|
|
|
|
|
|
|
|
|
|
|
|
|
|
|
|
|
|
|
|
|
Board |
Committee |
|
|
|
|
|
Attendance |
|
|
|
|
|
|
|
|
|
|
|
|
|
Annual Retainer |
Fee1 |
Audit and risk |
Social and ethics |
Remuneration |
Nomination |
Investment |
Technical |
|
Chairman |
Deputy chair |
LID2 |
Member |
Member |
Chair |
Member |
Chair |
Member |
Chair |
Member |
Chair |
Member |
Chair |
Member |
Chair |
Member |
| Current |
1 794,0 |
660,1 |
591,0 |
395,9 |
31,2 |
384,3 |
193,5 |
269,2 |
146,6 |
269,2 |
146,6 |
269,2 |
146,6 |
269,2 |
146,6 |
269,2 |
146,6 |
| Proposed |
1 892,7 |
696,4 |
623,5 |
417,7 |
32,9 |
405,4 |
204,1 |
284,0 |
154,7 |
284,0 |
154,7 |
284,0 |
154,7 |
284,0 |
154,7 |
284,0 |
154,7 |
| Increase |
5,5% |
5,5% |
5,5% |
5,5% |
5,5% |
5,5% |
5,5% |
5,5% |
5,5% |
5,5% |
5,5% |
5,5% |
5,5% |
5,5% |
5,5% |
5,5% |
5,5% |
1 Only payable per board meeting attended.
2 Lead independent director.
Ad hoc fees: R22 455 ad hoc meeting/attendance to company business per day (5.5% increase).
The directors’ remuneration set out above excludes value-added tax which the Company is authorised to pay, in addition to the above directors’ remuneration, to those non-executive directors who are obliged to charge value added tax on their directors’ remuneration.
The percentage of voting rights required for special resolution number 2 to be adopted: at least 75% (seventy five percent) of the voting rights exercised on the resolution by shareholders of the Company present at the AGM or represented by proxy and entitled to exercise voting rights on special resolution number 2.
Electronic participation
In accordance with the provisions of the Act and the MOI, the AGM will be conducted entirely through electronic communication. The electronic meeting facilities will permit all participants to be able to communicate concurrently with each other without an intermediary, and to participate reasonably effectively in the meeting. Voting via the electronic facility will be the only method available to shareholders to vote their shares at the AGM.
Shareholders who wish to electronically participate in and/or vote at the AGM are required to complete the Electronic Participation Application Form attached hereto and email same to The Meeting Specialist Proprietary Limited (“TMS”) at proxy@tmsmeetings.co.za or contact them on +2781 711 4255/+2784 433 4836/ +2761 440 0654 as soon as possible, but in any event no later than 11:00 (SA time) on Thursday, 30 November 2023.
If shareholders who hold dematerialised shares without own name registration wish to participate in the AGM, they should instruct their central securities depository participant (“CSDP”) or broker to issue them with the necessary letter of representation to participate in the AGM, in the manner stipulated in their Custody Agreement. These instructions must be provided to the CSDP or broker by the cut-off time and date advised by the CSDP or broker, to accommodate such requests.
TMS will assist shareholders with the requirements for electronic participation in, and/or voting at the AGM. TMS is further obliged to validate (in correspondence with Harmony and, in particular, Harmony's transfer secretaries, JSE Investor Services Proprietary Limited (“Transfer Secretaries”) and shareholders’ CSDPs) each such shareholder’s entitlement to participate in and/or vote at the AGM, before providing it with the necessary means to access the AGM and/or the associated voting platform.
Shareholders will be liable for their own network charges in relation to electronic participation in and/ or voting at the AGM. Any such charges will not be for the account of the JSE, Harmony, the Transfer Secretaries and/or TMS.
None of Harmony, the Transfer Secretaries or TMS can be held accountable in the case of loss of network connectivity or other network failure due to insufficient airtime, internet connectivity, internet bandwidth and/or power outages which prevents any such Shareholder from participating in and/or voting at the AGM.
Shareholders are strongly encouraged to have a stable internet connection with sufficient bandwidth capabilities to participate in the AGM. Shareholders are strongly encouraged to submit their proxies beforehand, even if they intend to participate in the AGM, to ensure that their votes are counted in the event of any delays or disruptions to the shareholder’s network connectivity and/or loss of network connectivity by such shareholder during ay part of the AGM.
Identification, proxies and voting
Shareholders are reminded that:
•a shareholder eligible to participate in and vote at the AGM is entitled to appoint a proxy (or proxies) to participate in and vote at the AGM in place of the shareholder – shareholders are referred to the proxy form attached to this Notice of AGM in this regard;
•a proxy need not also be a shareholder of the Company;
•in terms of section 63(1) of the Act, any person participating in a meeting of shareholders must present reasonably satisfactory identification and the person presiding at the AGM must be reasonably satisfied that the right of any person to participate in and vote (whether as shareholder or as proxy for a shareholder) has been reasonably verified – acceptable forms of verification include a green bar-coded or smart card identification document issued by the South African Department of Home Affairs, a South African driver’s licence or a valid passport; and
•this Notice of AGM includes the attached form of proxy.
All beneficial owners whose shares have been dematerialised through a CSDP or broker, other than with “own name” registration, must provide their CSDP or broker with their voting instructions in terms of their custody agreement should they wish to vote at the AGM. Alternatively, they may request their CSDP or broker to provide them with a letter of representation, in terms of their custody agreements, should they wish to participate in the AGM.
Unless you advise your CSDP or broker, in terms of your agreement, by the cut-off time stipulated therein, that you wish to participate in the AGM or send a proxy to represent you, your CSDP or broker may assume that you do not wish to participate in the AGM or send a proxy.
Forms of proxy attached hereto must be dated and signed by the shareholder of the Company appointing a proxy and, for the sake of good order, are urged (but not required) to be submitted to the offices of the Transfer Secretaries by no later than 11:00 (SA time) on Thursday, 30 November 2023.
In compliance with section 58(8)(b)(i) of the Act, a summary of the rights of a shareholder to be represented by proxy is set out immediately below:
•An ordinary shareholder entitled participate in and vote at the AGM may appoint any individual (or individuals) as a proxy or proxies to participate in and vote at the AGM in the place of such shareholder. A proxy need not be a shareholder of the Company.
•A proxy appointment must be in writing, dated and signed by the shareholder of the Company appointing a proxy and, subject to the rights of a shareholder to revoke such appointment (as set out below), remains valid only until the end of the AGM.
•A proxy may delegate its authority to act on behalf of a shareholder of the Company to another person, subject to any restrictions set out in the instrument appointing the proxy.
•Irrespective of the form of instrument used to appoint a proxy, the appointment of a proxy is suspended at any time and to the extent that the shareholder of the Company who appointed such proxy chooses to act directly and in person in exercising any rights as a shareholder of the Company.
•Unless the proxy appointment expressly provides otherwise, the appointment of a proxy is revocable by the shareholder of the Company in question cancelling it in writing, or making a later inconsistent appointment of a proxy, and delivering a copy of the revocation instrument to the proxy and to the Company. The revocation of a proxy appointment constitutes a complete and final cancellation of the proxy’s authority to act on behalf of the shareholder of the Company as of the later of (a) the date stated in the revocation instrument, if any; and (b) the date on which the revocation instrument is delivered to the Company as required in the first sentence of this paragraph.
•If the instrument appointing the proxy or proxies has been delivered to the Company, as long as that appointment remains in effect, any notice required by the Act or the MOI to be delivered by the Company to the shareholder of the Company, must be delivered by the Company to (a) the shareholder of the Company, or (b) the proxy or proxies, if the shareholder of the Company has (i) directed the Company to do so in writing; and (ii) paid any reasonable fee charged by the Company for doing so.
Attention is also drawn to the notes to the form of proxy.
Completing a form of proxy does not preclude any shareholder of the Company from participating in the AGM.
By order of the Board
Harmony Gold Mining Company Limited
S Mohatla
Group company secretary
Randfontein
25 October 2023
Annual general meeting explanatory notes
Presentation of annual financial statements
At the AGM, the directors must present the annual financial statements for the year ended 30 June 2023 to shareholders as required in terms of section 30(3)(d) of the Act, together with the reports of the directors, audit and risk committee and the auditors.
Presentation of group social and ethics committee report
At the AGM, the social and ethics committee must report, through one of its members, on matters within its mandate as required in terms of Regulation 43(5)(c) of the Act.
Ordinary Resolution Number 1:
Re-election of a director
In accordance with the JSE Listings Requirements, the MOI, section 68(1) read with section 70(3)(b)(i) of the Act, Dr Patrice Motsepe’s appointment by the Board as a director of the Company must be confirmed at this AGM of the Company by a new election. (See Dr Patrice Motsepe’s resumé under ordinary resolution number 1).
Ordinary Resolution Number 2:
Re-election of a director
In accordance with the JSE Listings Requirements, the MOI, section 68(1) read with section 70(3)(b)(i) of the Act, Peter Turner’s appointment by the Board as a director of the Company must be confirmed at this AGM of the Company by a new election. (See Peter Turner’s resumé under ordinary resolution number 2).
Ordinary Resolutions Numbers 3:
Re-election of director
In accordance with the JSE Listings Requirements, the MOI, section 68(1) read with section 70(3)(b)(i) of the Act, John Wetton’s appointment by the Board as a director of the Company must be confirmed at this AGM of the Company by a new election. (See John Wetton’s resumé under ordinary resolution number 3).
Ordinary Resolutions Numbers 4 to 8:
Re-election of audit and risk committee
In terms of section 94(2) of the Act, a public company must, at each AGM, elect an audit committee comprising at least 3 (three) members who are directors and who meet the criteria of section 94(4) of the Act. Regulation 42 to the Act specifies that one third of the members of the audit committee must have appropriate academic qualifications or experience in the areas as listed in the regulation.
The Board is satisfied that the proposed members of the audit and risk committee meet all relevant requirements.
Ordinary Resolution Number 9:
Re-appointment of external auditors
Ernst & Young Incorporated has indicated its willingness to continue in office and ordinary resolution 9 proposes the reappointment of that firm as the Company’s auditors. Section 90(3) of the Act requires the designated audit partner to meet the criteria as set out in section 90(2) of the Act.
The Board is satisfied that both Ernst & Young Incorporated and the designated audit partner meet all relevant requirements.
Ordinary Resolution Number 10:
Remuneration policy
King IV recommends that the remuneration policy of the Company be submitted to shareholders for consideration and for an advisory, non-binding vote to give shareholders an opportunity to indicate their support for or opposition to the material provisions of the remuneration policy.
Ordinary Resolution Number 11:
Approval of Implementation report
King IV recommends that the implementation report of the Company be submitted to shareholders for consideration and for an advisory, non-binding vote to give shareholders an opportunity to indicate their support for or opposition to the material provisions of the implementation of the remuneration policy.
In the event that 25% (twenty-five percent) or more of the votes are cast against ordinary resolutions number 10 and/or 11, the company undertakes to engage with dissenting shareholders in the manner stipulated in the remuneration report read with King IV.
Ordinary Resolution Number 12:
General authority to issue shares for cash
Ordinary resolution number 12 seeks to give the directors authority to issue the Company’s listed securities for cash as permitted by the Act, the MOI and the JSE Listings Requirements.
The Board confirms that there is no specific intention to use this authority as at the date of this Notice of AGM, but considers it advantageous to have the flexibility to take advantage of any business opportunity that may arise in future.
Special Resolution Number 1:
Approval of financial assistance
In terms of section 45 of the Act, the Company may, amongst others, provide loans and other financial assistance to any one or more related or inter-related companies or corporations of the Company and/or to any one or more juristic persons who are members of any such related or inter-related company or corporation and/or to any one or more juristic persons related or inter-related to any such company, corporation or member. Shareholders are required to pass special resolution number 1 in order to grant the Board the authority to authorise the Company’s provision of such financial assistance, subject to the Board being satisfied that the Company meets the solvency and liquidity test (as per section 4 of the Act) and subject further to the financial assistance falling within the category of assistance mentioned in sub-paragraph (c) of special resolution number 1 above.
Special Resolution Number 2:
Pre-approval of non-executive directors’ remuneration
In terms of section 66(8) read with section 66(9) of the Act, companies may pay remuneration to directors for their services as directors unless otherwise provided by the MOI and on approval of shareholders by way of a special resolution. Executive directors are not specifically remunerated for their services as directors but as employees of the Company and, as such, the resolution, as included in this Notice of AGM, requests approval only for the remuneration paid to non-executive directors for their service as directors of the Company. The proposed fees are recommended for approval for a period of 2 (two) years from the date of this AGM or until such time as the non-executive directors’ remuneration is amended by way of special resolution of shareholders, whichever comes first.
General
Shareholders and proxies participating in the AGM are reminded that section 63(1) of the Act requires that reasonably satisfactory identification be presented for such shareholder or proxy to be allowed to participate in the AGM.
|
|
|
|
|
|
To be completed by certificated
shareholders and dematerialised
shareholders with ‘own name
registration only |
|
|
Harmony Gold Mining Company Limited
(Incorporated in South Africa)
(Registration number: 1950/038232/06)JSE share code: HAR ISIN:
ZAE000015228 JSE share code: HAR NYSE: HMY
(“Harmony” or the “Company”)
|
For use by certificated shareholders and dematerialised shareholders with “own-name” registration who are unable to attend and vote at the AGM to be held entirely by electronic communication on Monday, 4 December 2023 at 11:00 (South African Standard Time) or at any adjournment thereof.
Dematerialised Shareholders without “own-name” registration must not complete this Form of Proxy but should timeously inform their nominee, or, if applicable, their CSDP or stockbroker of their intention to participate in and vote at the AGM electronically and request such nominee, CSDP or stockbroker to issue them with the necessary letter of representation to attend or provide such nominee, CSDP or stockbroker with their voting instructions should they not wish to attend the AGM electronically but wish to be represented by proxy at such meeting. Such shareholders must not return this Form of Proxy to the Transfer Secretaries.
Each Shareholder is entitled to appoint a proxy (who need not be a member of the Company) to attend, speak and vote in place of that Shareholder at the AGM. Please read the notes to this form of proxy below.
|
|
|
|
|
|
| I/We (please print names in full) |
| of (address) |
| being the holder/s of |
shares in the Company, do hereby appoint: |
| 1 |
or, failing him/her |
| 2 |
or, failing him/her |
The chairman of the annual general meeting, as my/our proxy to attend, speak and, on a poll or ballot, vote on my/our behalf at this annual general meeting of members or at any adjournment, and to vote or abstain from voting as follows on the ordinary and special resolutions to be proposed at such meeting:
|
|
|
|
|
|
|
|
|
|
|
|
| ORDINARY RESOLUTIONS |
For |
Against |
Abstain |
Ordinary Resolution Number 1: To re-elect Dr Patrice Motsepe as a director |
|
|
|
Ordinary Resolution Number 2: To re-elect Peter Turner as a director |
|
|
|
Ordinary Resolution Number 3: To re-elect John Wetton as a director |
|
|
|
Ordinary Resolution Number 4: To re-elect John Wetton as a member of the audit and risk committee |
|
|
|
Ordinary Resolution Number 5: To re-elect Karabo Nondumo as a member of the audit and risk committee |
|
|
|
Ordinary Resolution Number 6: To re-elect Given Sibiya as a member of the audit and risk committee |
|
|
|
Ordinary Resolution Number 7: To elect Bongani Nqwababa as a member of the audit and risk committee |
|
|
|
Ordinary Resolution Number 8: To elect Martin Prinsloo as a member of the audit and risk committee |
|
|
|
Ordinary Resolution Number 9: To reappoint the external auditors |
|
|
|
Ordinary Resolution Number 10: To approve the remuneration policy |
|
|
|
Ordinary Resolution Number 11: To approve the implementation report |
|
|
|
Ordinary Resolution Number 12: To approve a general authority to issue shares for cash |
|
|
|
| SPECIAL RESOLUTIONS |
|
|
|
Special Resolution Number 1: To approve financial assistance in terms of section 45 of the Act |
|
|
|
Special Resolution Number 2: To pre-approve non-executive directors’ remuneration |
|
|
|
Please indicate with an ‘X’ in the appropriate spaces above how you wish your vote to be cast. If no indication is given, the proxy may vote or abstain as he/she sees fit.
|
|
|
|
|
|
|
|
|
|
|
|
| Signed at |
this |
day of |
2023 |
| Signature |
| Assisted by me, where applicable (name and signature) |
Completed Forms of Proxy must be dated and signed by the shareholder appointing a proxy and must be lodged electronically with Transfer Secretaries. Shareholders are urged (but not required) to electronically deliver their completed Form of Proxy by no later than 11:00 (South African Standard Time) on Thursday, 30 November 2023 to meetingservices@jseinvestorservices.co.za.
Please read the notes and instructions on the reverse side.
NOTES TO FORM OF PROXY
1.A Form of Proxy is only to be completed by those shareholders who are:
a.registered holders of shares in certificated form; or
b.holders of dematerialised shares of the Company in their own name.
2.If you have already dematerialised your shares through a CSDP or broker and wish to participate in and vote at the AGM, you must request your CSDP or broker to provide you with a letter of representation or instruct your CSDP or broker to vote by proxy on your behalf in terms of the agreement entered into between yourself and your CSDP or broker.
3.A shareholder may insert the name of a proxy or the names of two alternative proxies of the shareholder’s choice in the space provided. The person whose name stands first on the Form of Proxy and who is present at the AGM will be entitled to act to the exclusion of those whose names follow.
4.On a poll, a shareholder who is present or represented by proxy will be entitled to that proportion of the total votes in the Company which the aggregate amount of the nominal value of the shares held by him/her bears to the aggregate amount of the nominal value of all the shares issued by the Company.
5.A shareholder’s instructions to the proxy must be indicated by inserting the relevant numbers of votes exercisable by the shareholder in the appropriate box. Failure to comply will be deemed to authorise the proxy to vote or to abstain from voting at the AGM as he/ she deems fit in respect of all the shareholder’s votes exercisable. A shareholder or the proxy is not obliged to use all the votes exercisable by the shareholder or by the proxy, but the total of votes cast and in respect of which abstention is recorded may not exceed the total of votes exercisable by the shareholder or by the proxy.
6.Forms of Proxy (enclosed) (enclosed) must be dated and signed by the shareholder appointing a proxy and must be lodged electronically with JSE Investor Services Proprietary Limited. Shareholders are urged (but not required) to electronically deliver their completed Form of Proxy by no later than 09:00 (South African Standard Time) on Thursday, 30 November 2023 to the offices of the Transfer Secretaries, JSE Investor Services Proprietary Limited, One Exchange Square, Gwen Lane, Sandown, Sandton, 2196 (PO Box 4844, Johannesburg, 2000 email: meetingservices@jseinvestorservices.co.za).
7.Completing and lodging this Form of Proxy will not preclude the relevant shareholder from electronically attending the AGM and speaking and voting electronically to the exclusion of any proxy appointed in terms hereof.
8.Documentary evidence establishing the authority of a person signing this Form of Proxy in a representative capacity or other legal capacity must be attached to this Form of Proxy, unless previously recorded by the Transfer Secretaries or waived by the chairman of the AGM.
9.The completion of blank spaces overleaf need not be initialled. Any alteration or correction made to this Form of Proxy must be initialled by the signatory(ies).
10.Despite the aforegoing, the chairman of the AGM may waive any formalities that would otherwise be a prerequisite for a valid proxy.
11.If any shares are jointly held, all joint shareholders must sign this Form of Proxy. If more than one of those shareholders is present at the AGM either electronically or by proxy, the person whose name appears first in the Register will be entitled to vote.
ELECTRONIC PARTICIPATION FORM
|
|
|
|
|
|
Electronic participation in the Harmony
Gold Mining Company Limited electronic
annual general meeting to be held on
4 December 2023 |
|
|
Harmony Gold Mining Company Limited
(Incorporated in South Africa)
(Registration number: 1950/038232/06)JSE share code: HAR ISIN:
ZAE000015228 JSE share code: HAR NYSE: HMY
(“Harmony” or the “Company”)
|
•Shareholders or their proxies who wish to participate in the annual general meeting via electronic communication (“Participants”), must apply to the Company’s meeting scrutineers to do so by emailing the form below (“the application”) to the email address of the Company’s meeting scrutineers, The Meeting Specialist (Proprietary) Limited (“TMS”), by no later than 11:00 (SA time) on 30 November 2023. The email address is as follows: proxy@tmsmeetings.co.za
•Shareholders who have dematerialised their shares, other than those shareholders who have dematerialised their shares with ‘own name’ registration, should contact their Central Securities Depository Participant (“CSDP”) or broker in the manner and time stipulated in their agreement with their CSDP or Broker:
–to furnish them with their voting instructions; and
–in the event that they wish to participate in the meeting, to obtain the necessary authority to do so.
•Participants will be able to vote during the annual general meeting through an electronic participation platform. Such participants, should they wish to have their vote(s) counted at the annual general meeting, must provide TMS with the information requested below.
•Each shareholder, who has complied with the requirements below, will be contacted between 30 November and 4 December 2023 via email/mobile with a unique link to allow them to participate in the electronic annual general meeting.
•The cost of the participant’s phone call or data usage will be at his/her own expense and will be billed separately by his/her own telephone service provider.
•The cut-off time, for administrative purposes, to participate in the meeting will be 11:00am (SA time) on 30 November 2023.
•The participant’s unique access credentials will be forwarded to the email/mobile telephone provided below.
|
|
|
|
|
|
| Name and surname of shareholder |
|
| Name and surname of shareholder representative (if applicable) |
|
| ID number of shareholder or representative |
|
| Email address |
|
| Mobile/cell number/Telephone number |
|
|
Name of CSDP or Broker
(if shares are held in dematerialised format)
|
|
| SCA number/Broker account number or Own name account number |
|
| Number of shares |
|
| Signature |
|
By signing this form, I agree and consent to the processing of my personal information above for the purpose of participation in the general meeting.
Terms and conditions for participation at the Harmony Gold Mining Company Limited annual general meeting to be held on 4 December 2023 via electronic communication
•The cost of dialling in using a telecommunication line/webcast/web-streaming to participate in the annual general meeting is for the expense of the participant and will be billed separately by the participant’s own telephone service provider.
•The participant acknowledges that the telecommunication lines/webcast/web-streaming are provided by a third party and indemnifies Harmony Gold Mining Company Limited, the JSE Limited and TMS and/or their third-party service providers against any loss, injury, damage, penalty or claim arising in any way from the use or possession of the telecommunication lines/webcast/web-streaming, whether or not the problem is caused by any act or omission on the part of the participant or anyone else. In particular, but not exclusively, the participant acknowledges that he/she will have no claim against Harmony Gold Mining Company Limited, the JSE Limited and TMS and/or its third-party service providers, whether for consequential damages or otherwise, arising from the use of the telecommunication lines/webcast/web-streaming or any defect in it or from total or partial failure of the telecommunication lines/webcast/web-streaming and connections linking the telecommunication lines/ webcast/web-streaming to the annual general meeting.
•Participants will be able to vote during the annual general meeting through an electronic participation platform. Such participants, should they wish to have their vote(s) counted at the annual general meeting, must act in accordance with the requirements set out above.
•Once the participant has received the link, the onus to safeguard this information remains with the participant.
•The application will only be deemed successful if this application form has been fully completed and signed by the participant and delivered or emailed to TMS at proxy@tmsmeetings.co.za
|
|
|
|
|
|
| Shareholder name: |
| Signature: |
| Date: |
Important: You are required to attach a copy of your identity document/driver’s licence/passport when submitting the application.
FORWARD-LOOKING STATEMENTS
This report contains forward-looking statements within the meaning of the safe harbour provided by section 21E of the Exchange Act and section 27A of the Securities Act of 1933, as amended (the Securities Act), with respect to our financial condition, results of operations, business strategies, operating efficiencies, competitive positions, growth opportunities for existing services, plans and objectives of management, markets for stock and other matters.
These forward-looking statements, including, among others, those relating to our future business prospects, revenues, and the potential benefit of acquisitions (including statements regarding growth and cost savings) wherever they may occur in this booklet, are necessarily estimates reflecting the best judgement of our senior management and involve a number of risks and uncertainties that could cause actual results to differ materially from those suggested by the forward-looking statements. As a consequence, these forward-looking statements should be considered in light of various important factors, including those set forth in our integrated annual report.
Important factors that could cause actual results to differ materially from estimates or projections contained in the forward-looking statements include, without limitation:
•Overall economic and business conditions in South Africa, Papua New Guinea, Australia and elsewhere
•The impact from, and measures taken to address, Covid-19 and other contagious diseases, such as HIV and tuberculosis
•High and rising inflation, supply chain issues, volatile commodity costs and other inflationary pressures exacerbated by the Russian invasion of Ukraine and subsequent sanctions
•Estimates of future earnings, and the sensitivity of earnings to gold and other metals prices
•Estimates of future gold and other metals production and sales
•Estimates of future cash costs
•Estimates of future cash flows, and the sensitivity of cash flows to gold and other metals prices
•Estimates of provision for silicosis settlement
•Increasing regulation of environmental and sustainability matters such as greenhouse gas emission and climate change, and the impact of climate change on our operations
•Estimates of future tax liabilities under the Carbon Tax Act (South Africa)
•Statements regarding future debt repayments
•Estimates of future capital expenditures
•The success of our business strategy, exploration and development activities and other initiatives
•Future financial position, plans, strategies, objectives, capital expenditures, projected costs and anticipated cost savings and financing plans
•Estimates of Reserves statements regarding future exploration results and the replacement of Reserves
•The ability to achieve anticipated efficiencies and other cost savings in connection with past and future acquisitions, as well as at existing operations
•Fluctuations in the market price of gold and other metals
•The occurrence of hazards associated with underground and surface gold mining
•The occurrence of labour disruptions related to industrial action or health and safety incidents
•Power cost increases as well as power stoppages, fluctuations and usage constraints
•Ageing infrastructure, unplanned breakdowns and stoppages that may delay production
•Increase costs and industrial accidents
•Supply chain shortages and increases in the prices of production imports and the availability, terms and deployment of capital
•Our ability to hire and retain senior management, sufficiently technically-skilled employees, as well as our ability to achieve sufficient representation of historically disadvantaged persons in management positions or sufficient gender diversity in management positions or at Board level
•Our ability to comply with requirements that we operate in a sustainable manner and provide benefits to affected communities
•Potential liabilities related to occupational health diseases
•Changes in government regulation and the political environment, particularly tax and royalties, mining rights, health, safety, environmental regulation and business ownership including any interpretation thereof
•Court decisions affecting the mining industry, including, without limitation, regarding the interpretation of mining rights
•Our ability to protect our information technology and communication systems and the personal data we retain
•Risks related to the failure of internal controls
•Our ability to meet our environmental, social and corporate governance targets
•The outcome of pending or future litigation or regulatory proceedings
•Fluctuations in exchange rates and currency devaluations and other macro-economic monetary policies, as well as the impact of South African exchange control regulations
•The adequacy of the group’s insurance coverage
•Any further downgrade of South Africa’s credit rating
•Socio-economic or political instability in South Africa, Papua New Guinea and other countries in which we operate
•Changes in technical and economic assumptions underlying our Mineral Reserves estimates
•Geotechnical challenges due to the ageing of certain mines and a trend toward mining deeper pits and more complex, often deeper underground deposits
•Actual or alleged breach or breaches in governance processes, fraud, bribery or corruption at our operations that leads to censure, penalties or negative reputational impacts.
The foregoing factors and others described under Our risk and opportunity profile in our Integrated Annual Report and our Form 20-F should not be construed as exhaustive. We undertake no obligation to update publicly or release any revisions to these forward-looking statements to reflect events or circumstances after the date of this annual report or to reflect the occurrence of unanticipated events, except as required by law. All subsequent written or oral forward-looking statements attributable to Harmony or any person acting on its behalf, are qualified by the cautionary statements herein.
The forward-looking financial information has not been reviewed and reported on by the company’s auditors.
ADMINISTRATIVE AND CONTACT DETAILS
Harmony Gold Mining Company Limited
Harmony was incorporated and registered as a public
company in South Africa on 25 August 1950
Registration number: 1950/038232/06
Corporate office
Randfontein Office Park
PO Box 2, Randfontein 1760, South Africa
Corner Main Reef Road and Ward Avenue,
Randfontein, 1759, South Africa
Telephone: +27 11 411 2000
Website: www.harmony.co.za
Directors
Dr PT Motsepe* (chairman)
KT Nondumo*^ (deputy chairman)
Dr M Msimang*^ (lead independent director)
PW Steenkamp** (chief executive officer)
BP Lekubo** (financial director)
Dr HE Mashego** (executive director)
B Nqwababa*^
VP Pillay*^
MJ Prinsloo*^
GR Sibiya*^
PL Turner *^
JL Wetton*^
* Non-executive
** Executive
^ Independent
Investor relations
Email: HarmonyIR@harmony.co.za
Telephone: +27 11 411 6073 or +27 82 746 4120
Website: www.harmony.co.za
Company Secretariat
Email: companysecretariat@harmony.co.za
Telephone: +27 11 411 2359
Transfer secretaries
JSE Investor Services South Africa (Proprietary) Limited
(Registration number 2000/007239/07)
19 Ameshoff Street, 13th Floor, Hollard House, Braamfontein
Johannesburg, South Africa
PO Box 4844, Johannesburg, 2000, South Africa
Email: info@jseinvestorservices.co.za
Telephone: +27 861 546 572 (South Africa)
Fax: +27 86 674 2450
American Depositary Receipts (ADRs)
Deutsche Bank Trust Company Americas
c/o American Stock Transfer and Trust Company
Operations Centre, 6201 15th Avenue, Brooklyn,
NY11219, United States
Email queries: db@astfinancial.com
Toll free (within US): +1 886 249 2593
Int: +1 718 921 8137
Fax: +1 718 921 8334
Sponsor
JP Morgan Equities South Africa (Proprietary) Limited
1 Fricker Road, corner Hurlingham Road, Illovo,
Johannesburg, 2196, South Africa
Private Bag X9936, Sandton, 2146, South Africa
Telephone: +27 11 507 0300
Fax: +27 11 507 0503
Trading symbols
JSE: HAR
NYSE: HMY
ISIN: ZAE 000015228
EX-4.10
3
sharesaledeed.htm
EX-4.10
Document
Share Sale Deed
Table of Contents
|
|
|
|
|
|
|
|
|
|
|
|
|
|
|
| 1 |
Definitions and interpretations |
2 |
|
1.1 |
Definitions |
2 |
|
1.2 |
Interpretations |
13 |
|
1.3 |
Business Day |
14 |
|
1.4 |
Inclusive expressions |
14 |
|
1.5 |
Deed components |
14 |
| 2 |
Conditions for Completion |
14 |
|
2.1 |
Conditions precedent |
14 |
|
2.2 |
Notice |
15 |
|
2.3 |
Reasonable endeavours |
15 |
|
2.4 |
Waiver |
15 |
|
2.5 |
Cut Off Date |
16 |
|
2.6 |
No binding agreement for transfer |
16 |
| 3 |
Termination |
16 |
|
3.1 |
Termination by the Buyer |
16 |
|
3.2 |
Termination by the Seller |
16 |
|
3.3 |
Effect of termination |
17 |
|
3.4 |
No other right to terminate or rescind |
17 |
| 4 |
Sale and Purchase |
17 |
|
4.1 |
Sale Shares and the Assets |
17 |
|
4.2 |
Associated rights |
17 |
|
4.3 |
Purchase Price |
17 |
|
4.4 |
Actions on Completion |
18 |
|
4.5 |
Title and risk |
18 |
|
4.6 |
Completion Payment adjustment |
18 |
| 5 |
Period Before Completion |
18 |
|
5.1 |
Carrying on of business |
18 |
|
5.2 |
Permitted acts |
19 |
|
5.3 |
Access |
20 |
|
5.4 |
Indebtedness |
20 |
|
5.5 |
Financing |
21 |
|
5.6 |
Target Entity a member of a Consolidated Group |
21 |
| 6 |
Employees |
21 |
|
6.1 |
Incentives |
21 |
|
6.2 |
New employees and terminating employees |
21 |
|
6.3 |
Restrictions on Seller |
22 |
|
6.4 |
Restrictions on Buyer |
22 |
|
6.5 |
Workers compensation |
22 |
|
6.6 |
Excluded Employees |
23 |
| 7 |
Completion |
23 |
|
7.1 |
Time and Place |
23 |
|
7.2 |
Completion |
23 |
|
7.3 |
Notice to complete |
23 |
|
7.4 |
Completion simultaneous |
23 |
|
7.5 |
Post-Completion adjustment |
24 |
| 8 |
Warranties |
25 |
|
8.1 |
Warranties by the Seller |
25 |
|
8.2 |
Independent Warranties |
25 |
|
8.3 |
Reliance |
25 |
|
8.4 |
Tax indemnity |
26 |
|
|
|
|
|
|
|
|
|
|
|
|
|
|
|
| 9 |
Qualifications and Limitations on Claims |
26 |
|
9.1 |
Disclosure |
26 |
|
9.2 |
Awareness |
27 |
|
9.3 |
No reliance |
27 |
|
9.4 |
Opinions, estimates and forecasts |
28 |
|
9.5 |
Maximum and minimum amounts |
28 |
|
9.6 |
Time limits |
29 |
|
9.7 |
Recovery under other rights and reimbursement |
29 |
|
9.8 |
Mitigation of loss |
30 |
|
9.9 |
Exclusions |
30 |
|
9.1 |
General limitations |
30 |
|
9.11 |
Buyer benefits |
31 |
|
9.12 |
Sole remedy |
32 |
|
9.13 |
Payments affecting the Purchase Price |
32 |
|
9.14 |
Tax effect of Claims |
32 |
|
9.15 |
Independent limitations |
33 |
| 10 |
Procedures For Dealing With Claims |
33 |
|
10.1 |
Notice of Claims |
33 |
|
10.2 |
Third Party Claims |
34 |
|
10.3 |
Tax Demands |
35 |
| 11 |
Buyer Warranties |
36 |
|
11.1 |
Buyer Warranties |
36 |
|
11.2 |
Independent Warranties |
37 |
|
11.3 |
Reliance |
37 |
|
11.4 |
Notification |
37 |
| 12 |
Period after Completion |
37 |
|
12.1 |
Appointment of proxy |
37 |
|
12.2 |
Access to records by Seller |
37 |
|
12.3 |
Branding and phase out |
38 |
|
12.4 |
Tax returns |
38 |
|
12.5 |
Objections to Pre Completion Returns or the Straddle Returns |
40 |
|
12.6 |
Resolution of tax disputes |
40 |
|
12.7 |
Pre Completion Tax Events |
42 |
|
12.8 |
Insurance |
42 |
| 13 |
Confidentiality and Announcements |
42 |
|
13.1 |
Confidentiality Agreement |
42 |
|
13.2 |
Confidentiality |
43 |
| 14 |
Duties, Costs and Expenses |
43 |
|
14.1 |
Duties |
43 |
|
14.2 |
Costs and expenses |
44 |
| 15 |
GST |
44 |
|
15.1 |
Definitions and interpretation |
44 |
|
15.2 |
GST |
44 |
|
15.3 |
Tax invoices |
45 |
|
15.4 |
Reimbursement |
45 |
|
15.5 |
Information, returns and accounting to end GST Group. |
45 |
|
15.6 |
Supplies between former members of the GST Group |
45 |
| 16 |
Notices |
46 |
|
16.1 |
Form of Notice |
46 |
|
16.2 |
How Notice must be given and when Notice is received |
46 |
|
16.3 |
Notice must not be given by electronic communication. |
46 |
| 17 |
General |
46 |
|
17.1 |
Governing law and jurisdiction |
46 |
|
|
|
|
|
|
|
|
|
|
|
|
|
|
|
|
17.2 |
Service of process |
47 |
|
17.3 |
Invalidity and enforceability |
47 |
|
17.4 |
Waiver |
47 |
|
17.5 |
Variation |
47 |
|
17.6 |
Assignment |
47 |
|
17.7 |
Further action to be taken at each party’s own expense |
47 |
|
17.8 |
Relationship of the parties |
47 |
|
17.9 |
Exercise of rights |
48 |
|
17.1 |
Remedies cumulative |
48 |
|
17.11 |
Counterparts |
48 |
|
17.12 |
No merger |
48 |
|
17.13 |
Entire agreement |
48 |
|
17.14 |
No reliance |
48 |
|
17.15 |
Default Interest |
48 |
|
17.16 |
Benefits held on trust |
49 |
|
17.17 |
Attorneys |
49 |
|
17.18 |
No withholdings |
49 |
|
17.19 |
Deed |
50 |
| 18 |
Guarantee by Buyer's Guarantor |
50 |
|
18.1 |
Guarantee and indemnity |
50 |
|
18.2 |
Principal obligations |
51 |
|
18.3 |
Continuity |
51 |
|
18.4 |
Liability unaffected by other events |
51 |
|
18.5 |
Variation of rights and cumulative remedies |
52 |
|
18.6 |
No withholdings |
52 |
|
18.7 |
Currency |
52 |
|
18.8 |
No set-off |
52 |
|
|
|
|
Schedule 1 |
|
|
NOTICE DETAILS |
53 |
|
|
|
|
|
|
Schedule 2 |
|
|
CONDITIONS |
54 |
|
|
|
|
|
|
Schedule 3 |
|
|
WARRANTIES |
55 |
|
|
|
|
|
|
Schedule 4 |
|
|
BUYER WARRANTIES |
|
|
|
|
|
|
|
Schedule 5 |
|
|
COMPLETION STEPS |
63 |
|
|
|
|
|
|
Schedule 6 |
|
|
TENEMENTS |
70 |
|
|
|
|
|
|
Schedule 7 |
|
|
PROPERTIES |
72 |
|
|
|
|
|
|
|
|
|
|
|
|
|
|
|
|
|
|
|
|
|
Schedule 8 |
|
|
MATERIAL CONTRACTS |
73 |
|
|
|
|
|
|
Schedule 9 |
|
|
CONTINGENT CONSIDERATION DEED |
86 |
|
|
|
|
|
|
Schedule 10 |
|
|
TARGET GROUP COMPANIES |
87 |
|
|
|
|
|
|
Signing page |
90 |
SHARE SALE DEED
Date 6 October 2022
Between the parties
Copper Mountain Mining Corporation
a company existing under the laws of the Province of British Columbia, 700 West Pender Street, Suite 1700, Vancouver, Canada V6C 1G8
(Seller)
Harmony Gold (Australia) Pty Limited
ACN 091 439 333 of Level 2, 189 Coronation Drive, Milton Queensland 4064
(Buyer)
Harmony Gold Mining Company Limited
(Registration number 1950/038232/06) of Randfontein Office Park, Cnr Main Reef Road and Ward Avenue, Randfontein 1759, South Africa
(Buyer's Guarantor)
Recitals 1 The Seller owns the Sale Shares.
2 The Seller has agreed to sell and the Buyer has agreed to buy the Sale Shares on the terms and conditions of this deed.
This deed witnesses as follows:
1 DEFINITIONS AND INTERPRETATION
1.1 Definitions
The meanings of the terms used in this deed are set out below.
|
|
|
|
|
|
| Term |
Meaning |
|
|
| Aboriginal Heritage Acts |
Aboriginal and Torres Strait Islander Heritage Protection Act 1984 (Cth) and Aboriginal Cultural Heritage Act 2003 (Qld). |
|
|
| Agreed Announcements |
1 the announcement of the execution of this deed that may be made by the Seller, or a Seller Group Member, in the agreed form; and |
|
2 the announcement of the execution of this deed that may be made by the Buyer, or a Buyer Group Member, in the agreed form. |
|
|
| ASIC |
the Australian Securities and Investments Commission. |
|
|
| Australian Exploration Portfolio |
a district exploration tenure consisting of the Tenements listed in Part 2 – Exploration Tenements in Schedule 6. |
|
|
| Authorisation |
any approval, licence, consent, authority, exemption, declaration, waiver or permit given by a Governmental Agency, including any renewal or amendment. |
|
|
| Business |
the Eva Copper Project and the Australian Exploration Portfolio. |
|
|
| Business Day |
a day on which banks are open for business in Brisbane, Queensland, and Vancouver and Toronto, Canada, other than a Saturday, Sunday or public holiday in any of those cities. |
|
|
| Business Records |
all original and certified copies of the books, records, documents, information, accounts, Mining Information and data (whether machine readable or in printed form) in relation to the Target Group Companies owned by or in the possession of the Target Group Companies or the property of the Target Group Companies or owned by or in the possession of any other member of the Seller Group to the extent that they relate to the Target Group Companies, and any source material used to prepare them. |
|
|
| Buyer Group |
the Buyer and: |
|
1 prior to Completion, each of its Related Bodies Corporate (other than the Target Group Companies); and |
|
2 after Completion, each of its Related Bodies Corporate (including the Target Group Companies), |
|
and Buyer Group Member means any member of the Buyer Group. |
|
|
|
|
|
|
| Term |
Meaning |
|
|
| Buyer Group Representatives and Advisers |
any representative or adviser of any Buyer Group Member and any Related Bodies Corporate of such representative or adviser (or any current or former director, officer or employee of any of them). |
|
|
| Buyer Warranties |
the representations and warranties in Schedule 4. |
|
|
| Buyer’s Consolidated Group |
the Consolidated Group of which the Buyer is a member. |
|
|
| Buyer Specified Persons |
any director or officer of the Buyer and each of the following individuals: |
|
1 Johannes van Heerden, Chief Executive Officer: South-East Asia; and |
|
2 Greg Job, Executive General Manager – Growth and Resource Development. |
|
|
| Claim |
any claim, demand, legal proceedings or cause of action, including any claim, demand, legal proceedings or cause of action under common law or under statute in any way relating to this deed or the Sale, including a claim, demand, legal proceedings or cause of action arising from a breach of Warranty or Buyer Warranty (as applicable). |
|
|
| CMMC Debt |
the indebtedness owing by the Target Entity to the Seller. |
|
|
| Completion |
completion of the sale and purchase of the Sale Shares under clause 7. |
|
|
| Completion Adjustment Amount |
the meaning given in clause 7.5(a) |
|
|
| Completion Date |
the date on which Completion occurs. |
|
|
| Completion Payment |
$170,000,000, |
|
1 plus an amount equal to the Surety Amount as at the Completion Date; and |
|
2 less an amount equal to all Employment Benefits (including Leave Benefits) that have accrued as at the Completion Date.
|
|
|
|
and where the Surety Amount or the Employment Benefits are expressed in non-US dollars, they will be converted into US dollars on the basis of the noon rate of exchange quoted by the U.S. Federal Reserve on the Business Day immediately preceding the Completion Date. |
|
|
| Completion Steps |
the steps that each party must carry out, which are set out in Schedule 5. |
|
|
| Condition |
a condition set out in the table in Schedule 2. |
|
|
|
|
|
|
| Term |
Meaning |
|
|
| Confidentiality Agreement |
the confidentiality agreement dated 24 May 2022 between Seller and the Buyer. |
|
|
| Consolidated Group |
a consolidated group or a MEC group as those terms are defined in section 995- 1 of the ITAA 1997. |
|
|
| Contingent Consideration |
up to: (a) $30,000,000 of further consideration that may be payable by the Buyer in respect of the Sale Shares in accordance with the Contingent Consideration Deed, being the NSR Excess Cashflow Payment (as defined in the Contingent Consideration Deed); and (b) $30,000,000 of further consideration that may be payable by the Buyer in respect of the Sale Shares in accordance with the Contingent Consideration Deed , being the New Resource Discovery Payment (as defined in the Contingent Consideration Deed). |
|
|
| Contingent Consideration Deed |
the contingent consideration deed to be entered into on Completion substantially in the form attached as Schedule 9. |
|
|
| Corporations Act |
Corporations Act 2001 (Cth). |
|
|
| Cut Off Date |
28 February 2023, or such later date as may be agreed between the parties in writing; provided that, in the event that the Condition in item 2 of Schedule 2 is not satisfied by 28 February 2023, either the Seller or the Buyer may, in its sole discretion, extend the Cut Off Date up to 60 days by delivering notice in writing to the other party on or prior to the Cut Off Date, so long as the total extension of the Cut-Off Date is not more than 60 days. |
|
|
| Data Room |
the Seller’s “Copper Mountain Mining Corporation” virtual data room hosted by Firmex as it exists on 5 October 2022 at 11:45 PM (ET). |
|
|
| Data Room Index |
the index of documents Disclosed in the Data Room in the agreed form. |
|
|
| Demand |
a written notice of, or demand for, an amount payable. |
|
|
| Disclosed |
means fairly disclosed such that in the context of the disclosures: |
|
1 the significance of the information disclosed (including sufficient detail of the nature and scope of the matter on the face of such document) are such that it enables the Buyer to understand the nature and scope of its impact; and |
|
2 there is not omitted from the information disclosed any information which would have the effect of rendering the information so disclosed misleading in any material respect, |
|
and Disclosure shall be construed accordingly. |
|
|
| Disclosure Letter |
a letter in the agreed form dated the date of this deed together with the attachments to that letter addressed by the Seller to the Buyer disclosing facts, matters and circumstances that are, or may be, inconsistent with the Warranties. |
|
|
|
|
|
|
| Term |
Meaning |
|
|
| Disclosure Materials |
1 all documents and information referenced in the Data Room Index; |
|
2 all written answers given to written questions submitted by the Buyer, its representatives or advisers as part of the question and answer process, in the agreed form; |
|
3 the information set out in the Disclosure Letter; and |
|
4 all other information or documents (including the management presentations delivered to the Buyer) provided in writing (or electronically) to a Buyer Group Member by, or on behalf of, the Seller in respect of the Target Group Companies and the Business from the date of the Confidentiality Agreement. |
|
|
| Dispute Notice |
the meaning given in clause 7.5(b). |
|
|
| Disputed Matters |
the meaning given in clause 12.5(a). |
|
|
| Disputing Action |
in respect of a Tax Demand, any action to cause the Tax Demand to be withdrawn, reduced or postponed or to avoid, resist, object to, defend, appear against or compromise the Tax Demand and any judicial or administrative proceedings arising out of that action. |
|
|
| DRQ |
Department of Resources (Qld). |
|
|
| Duty |
any stamp, landholder, land rich, transaction or registration duty or similar charge imposed by any Governmental Agency and includes any interest, fine, penalty, charge or other amount imposed in respect of any of them, but excludes any Tax. |
|
|
| Employees |
1 the employees of the Target Entity whose names are listed in the Employee Entitlement List, who remain employed by the Target Entity immediately before Completion; and |
|
2 any other individual who becomes employed by a Target Group Company between the date of this deed and Completion, |
|
but excludes the Excluded Employees. |
|
|
| Employee Entitlement List |
a document appended to the Disclosure Letter setting out the following information for each Employee, which information must not be materially different to those terms Disclosed other than as a result of the passage of time: |
|
1 continuous period of service with the Seller Group; |
|
2 current annual remuneration (including entitlement to any Incentives); |
|
3 current annual superannuation contributions; |
|
4 redundancy and termination entitlements; and |
|
5 Leave Benefits. |
|
|
| Employment Benefits |
wages, salaries, incentive payments and benefits (including bonuses and/or retention benefits) and any other remuneration, allowances or benefit (including a superannuation benefit) payable or required to be provided to an Employee, other than Incentives. |
|
|
|
|
|
|
| Term |
Meaning |
|
|
| Encumbrance |
an interest or power: |
|
1 reserved in or over an interest in any asset; or |
|
2 created or otherwise arising in or over any interest in any asset under a security agreement, a bill of sale, mortgage, charge, lien, pledge, trust or power, by way of, or having similar commercial effect to, security for the payment of a debt, any other monetary obligation or the performance of any other obligation, and includes, but is not limited to: |
|
3 any agreement to grant or create any of the above; and |
|
4 a security interest within the meaning of section 12(1) of the PPSA. |
|
|
| Environment |
has the meaning given in the Environmental Act. |
|
|
| Environmental Act |
Environmental Protection Act 1994 (Qld). |
|
|
| Environmental Law |
any law (including all Authorisations) or provision of law relating to the Environment. |
|
|
| ERC Amount |
the estimated rehabilitation cost in respect of environmental authority EPML00899613, as decided under the Environmental Act, and which at the date of this deed is A$192,711.32 paid 100% in the form of a cash surety under the relevant Mining Act. |
|
|
| Eva Copper Project |
the Eva Copper Project being a proposed mine development located on the Tenements listed in Part 1 – Eva Tenements in Schedule 6 approximately 65 kilometres northwest of Cloncurry and approximately 95 kilometres from Mount Isa. |
|
|
| Excluded Employees |
Mike Westendorf and Joseph Tsoi. |
|
|
| Excluded Person |
1 any Seller Group Member and any Seller Group Representative or Adviser; |
|
2 any current or former director, executive, officer or employee of or contractor to any Seller Group Member or any Seller Group Representative or Adviser; and |
|
3 any current or former director, executive, officer, employee of or contractor to the any of the Target Group Companies, |
|
but not including the Seller solely in its capacity as Seller. |
|
|
| Excluded Warranty |
collectively: (a) Warranty 1 (Ownership and structure), (b) Warranty 2 (Power and authority), (c) Warranty 5(a) (Tenements), and (d) Warranty 16 (Accuracy of Information), except in respect of Warranty 16, Warranty 16 will only be an Excluded Warranty in respect of Warranty 1, Warranty 2 or Warranty 5(a). |
|
|
| Excluded Warranty Claim |
any claim, demand, legal proceedings or cause of action arising from a breach of an Excluded Warranty. |
|
|
|
|
|
|
| Term |
Meaning |
|
|
| Exit Payment |
the payment required to be made pursuant to clause 5.6 hereof and pursuant to section 721 35 of the ITAA 1997. |
|
|
| Expert |
is defined in clause 7.5(e). |
|
|
| Financial Provisioning |
any security, financial assurance, contribution and/or surety required to be provided to the State, the Scheme Manager and/or any other Governmental Agency in respect of a Tenement and/or an environmental authority for a Tenement under the Mining Act and/or the Environmental Act, including the ERC Amount. |
|
|
| Forward-looking Information |
is defined in clause 9.4(c). |
|
|
| Governmental Agency |
any government or governmental, administrative, monetary, fiscal or judicial body, department, commission, authority, tribunal, agency or entity in any part of the world. |
|
|
| GST |
goods and services tax or similar value added tax levied or imposed in Australia under the GST Law or otherwise on a supply. |
|
|
| GST Act |
A New Tax System (Goods and Services Tax) Act 1999 (Cth). |
|
|
| GST Amount |
is defined in clause 15.2(a). |
|
|
| GST Group |
has the same meaning given to that term in the GST Act. |
|
|
| GST Law |
has the same meaning given to that term in the GST Act. |
|
|
| Head Company |
the head company as that term is defined in section 995-1 of the ITAA 1997. |
|
|
| Immediately Available Funds |
cash, wire transfer or other electronic means of transfer of cleared funds into a bank account nominated in advance by the payee. |
|
|
| Incentive |
any short term incentive or long term incentive plan or scheme. |
|
|
| ITAA 1997 |
Income Tax Assessment Act 1997 (Cth). |
|
|
| law |
includes any law or legal requirement, including at common law, in equity, under any statute, regulation or by-law, any condition of any Authorisation (including a mining tenement granted under the Mining Act or an environmental authority issued under the Environmental Act), and any decision, directive, guidance, guideline or requirements of any Governmental Agency. |
|
|
|
|
|
|
| Term |
Meaning |
|
|
| Leave Benefits |
annual leave, long service leave, personal/carer’s leave, days in lieu and any other accrued but untaken leave. |
|
|
| Legal Requirements |
any present or future obligations arising under: |
|
1 legislations, regulations or by-laws; |
|
2 orders or requirements of Authorisations; and |
|
3 the terms and conditions of Governmental Agency approvals, |
|
including any rights reserved or vested in any Governmental Agency by the terms of any instrument or grant affecting the Tenements. |
|
|
| Loss |
losses, liabilities, damages, costs, charges and expenses (including reasonable legal fees) and includes Taxes, Duties and Tax Costs. |
|
|
| Management Accounts |
the management accounts consisting of a profit and loss statement and balance sheet for the Target Entity, including the consolidated management accounts for the other Target Group Companies, as at the Management Accounts Date. |
|
|
| Management Accounts Date |
June 30, 2022. |
|
|
| Material Adverse Effect |
when used in a Warranty in relation to any Target Group Company, a material and adverse effect on the financial condition or operations of the Target Group Companies (taken as a whole) when compared to what the financial condition or operations of the Target Group Companies (taken as a whole) would be if the Warranty were true. |
|
|
| Material Contracts |
the contracts listed in Schedule 8. |
|
|
| Mining Act |
Mineral Resources Act 1989 (Qld), and if the context requires, the Mineral
and Energy Resources (Common Provisions) Act 2014 (Qld) and Mineral and Energy Resources (Financial Provisioning Act) 2018 (Qld).
|
|
|
| Mining Information |
all plans, results, geological data, drawings, specifications, operating procedures and other technical data and information relating to the Tenements and which is owned by or in the possession or control of a Target Group Company or any other member of the Seller Group including all financial analysis, feasibility studies, scoping, magnetic surveys, drill logs, chips and core samples and residues for and from assaying and interpretation of geological, mineralogical, metallurgical data, legal agreements, correspondence with Governmental Agencies and third parties in respect of the relevant Tenements. |
|
|
| Native Title Act |
Native Title Act 1993 (Cth). |
|
|
| Native Title Law |
means any law applicable in Queensland relating to or applying to native title or claimed native title, including the Native Title Act, the Native Title (Queensland) Act 1993 (Qld), the Racial Discrimination Act 1975 (Cth) and any determination |
|
|
|
|
|
|
| Term |
Meaning |
|
|
|
made (including conditions imposed) by a competent entity under the Native Title Act. |
|
|
| Nordic Bonds Agreement |
the bond terms between Nordic Trustee and Seller dated 8 April 2021 in respect of $250,000,000 in senior secured bonds issued by Seller. |
|
|
| Nordic Security Documents |
collectively: (a) Specific Security Deed (Marketable Securities) between the Seller, Target Entity and Nordic Trustee dated 8 June 2021; (b) Guarantee and Indemnity between the Target Entity and Nordic Trustee dated 8 June 2021; (c) Guarantee and Indemnity between Eva Copper Mine Pty Ltd and Nordic Trustee dated 8 June 2021; (d) Guarantee and Indemnity between Copper Mountain Mining Pty Ltd and Nordic Trustee dated 8 June 2021; (e) General Security Agreement between the Seller and Nordic Trustee dated 8 June 2021; and (f) Share Transfer Form (in blank and undated) executed by the Seller in respect of the Sale Shares. |
|
|
| Nordic Trustee |
Nordic Trustee AS, a company existing under the laws of Norway with registration number 963 342 624. |
|
|
| Notice |
is defined in clause 16.1. |
|
|
| Outstanding Incentives |
the Seller Long Term Incentives to which an Employee is entitled immediately prior to Completion and that are not forfeited or terminated, particulars of which are set out in the Payment Schedule. |
|
|
| Payer |
is defined in clause 15.1(b). |
|
|
| Payment Schedule |
a schedule prepared by the Seller which sets out a list of the following as at Completion: |
|
1 each Employee entitled to an Outstanding Incentive; |
|
2 the number of Outstanding Incentives held by each relevant Employee; |
|
3 the amount to be paid per Outstanding Incentive held by each relevant Employee; and |
|
4 the total amount to be paid to each Employee in relation to their Outstanding Incentives. |
|
|
| Permitted Encumbrance |
1 a PPS Register Security Interest registered in the ordinary course of
business; |
|
2 all Encumbrances existing over the Tenements recorded or registered in the register of resource authorities kept pursuant to section 197 of the Mineral and Energy Resources (Common Provisions) Act 2014 (Qld) as at the date of execution of this deed; |
|
3 every lien or retention of title arrangement securing the unpaid balance of purchase money for property acquired, or other liens, or Taxes, over services, in the ordinary course of business, where the amount secured is not overdue or is being diligently contested and is appropriately provisioned in the Management Accounts; |
|
|
|
|
|
|
| Term |
Meaning |
|
4 any Encumbrance in relation to personal property (as defined in the PPSA and to which that Act applies) that is created or provided for by: |
|
a) a transfer of an Account or Chattel Paper; |
|
b) a PPS Lease; or |
|
c) a Commercial Consignment, |
|
that is not a security interest within the meaning of section 12(1) of the PPSA; |
|
5 Legal Requirements; |
|
6 any Financial Provisioning or rehabilitation requirements owed to any Governmental Agency in accordance with the terms of the Tenements; |
|
7 in respect of the Tenements, the terms and conditions of the Tenements; |
|
8 reservations, limitations, provisos and conditions contained in any original grants of any of the Tenements and statutory exceptions to title; |
|
9 easements, rights-of-way, restrictions, servitudes, permits, conditions, covenants, exceptions, reservations and other similar encumbrances reserved or granted in respect of the Tenements or the Properties by a Governmental Agency; |
|
10 the existence of sites of Aboriginal heritage or cultural significance, except to the extent that the existence of such sites has been omitted from, or included in, the Disclosure Materials, in each case in breach of Warranty 16 (Accuracy of Information); |
|
11 the existence of claims in respect of native title rights, except to the extent that the existence of such claims has been omitted from, or included in, the Disclosure Materials, in each case in breach of Warranty 16 (Accuracy of Information); |
|
12 Taxes or royalties due and payable on or after Completion to any Governmental Agency, including the State Government Royalty; and |
|
13 any other Encumbrances Disclosed in the Disclosure Letter. |
|
|
|
In this definition, Account, Chattel Paper, PPS Lease and Commercial Consignment have the meanings given to those terms in the PPSA. |
|
|
| PPSA |
Personal Property Securities Act 2009 (Cth). |
|
|
| PPS Register |
the register established under the PPSA. |
|
|
| Pre Completion Return |
is defined in clause 12.4(a). |
|
|
| Properties |
the property and premises listed in Schedule 7. |
|
|
| Purchase Price |
the: |
|
1 Completion Payment, plus or minus any adjustments made in accordance with this deed (as applicable) including in accordance with clause 7.5; and |
|
2 Contingent Consideration. |
|
|
| Related Body Corporate |
has the meaning given in section 9 of the Corporations Act. |
|
|
|
|
|
|
| Term |
Meaning |
|
|
| Sale |
the sale and purchase of the Sale Shares in accordance with clause 4. |
|
|
| Sale Shares |
all of the issued share capital in the Target Entity. |
|
|
| Security Interest |
a security interest as defined in the PPSA. |
|
|
| Seller Group |
the Seller and each of its Related Bodies Corporate (other than the Target Group Companies) and Seller Group Member means any member of the Seller Group. |
|
|
| Seller Group Name |
is defined in clause 12.3(a). |
|
|
| Seller Group Representative or Adviser |
any representative or adviser of any Seller Group Member and any Related Bodies Corporate of such representative or adviser (or any current or former director, officer or employee of any of them). |
|
|
| Seller Long Term Incentives |
a long term incentive issued under (a) the Seller long term incentive plan effective June 9, 2022, (b) the Seller amended stock option plan effective June 13, 2011, (c) the Seller performance share unit plan effective April 25, 2019, as amended, or (d) the Seller restricted share unit plan effective March 8, 2019, as amended. |
|
|
| Seller Specified Persons |
each of the following individuals: |
|
1 Letitia Wong (EVP, Strategy & Corporate Development); and |
|
2 Gilmour Clausen (President and Chief Executive Officer). |
|
|
| Seller’s Consolidated Group |
the Consolidated Group of which the Seller and the Target Group Companies are members. |
|
|
| Seller’s GST Group |
the GST Group which includes the Seller as a member. |
|
|
| Seller’s Head Company |
the Head Company of the Seller’s Consolidated Group. |
|
|
| SOFR |
a rate per annum equal to the secured overnight financing rate as administered by the Federal Reserve Bank of New York (or a successor administrator of the secured overnight financing rate). |
|
|
| State Government Royalty |
the royalty payable annually by the applicable Target Group Company to the Queensland State Government under the Mining Act, the Mineral Resources Regulation 2013 (Qld) and the Taxation Administration Act 2001 (Qld). |
|
|
| Straddle Return |
is defined in clause 12.4(c). |
|
|
|
|
|
|
| Term |
Meaning |
|
|
| Supplier |
is defined in clause 15.1(a). |
|
|
| Surety Amount |
A$64,450, representing the aggregate of (a) A$60,250 in cash sureties advanced in respect of the Financial Provisioning obligations (in addition to the ERC Amount) of a Target Group Company, and (b) A$4,200 in cash security deposits advanced for office leases entered into by a Target Group Company. |
|
|
| Target Entity |
Copper Mountain Mining Australia Pty Ltd (ACN 622 566 910) of Ground Floor, 159 Coronation Drive, Milton, QLD 4064. |
|
|
| Target Group Companies |
collectively, (a) the Target Entity, (b) Copper Mountain Mining Pty Ltd (ACN 090 468 018), (c) CMMC Australia Pty Ltd (ACN 623 541 079), (d) Eva Copper Mine Pty Ltd (ACN 625 712 138), (e) Roseby Copper Pty Limited (ACN 067 584 409) and (f) Roseby Copper (South) Pty Limited (ACN 148 092 291), and Target Group Company means any of them. |
|
|
| Tax |
any tax, levy, royalty, charge, impost, fee, deduction, goods and services tax, compulsory loan or withholding, that is assessed, levied, imposed or collected by any Governmental Agency and includes any interest, fine, penalty, charge, fee or any other amount imposed on, or in respect of any of the above but excludes Duty. |
|
|
| Tax Claim |
any Claim in relation to Tax, Duty or a Tax Cost. |
|
|
| Tax Cost |
all costs, and expenses incurred in: |
|
1 managing an inquiry; or |
|
2 conducting any Disputing Action, |
|
in each case in relation to a Tax Demand, but does not include any Tax. |
|
|
| Tax Demand |
1 a Demand or assessment from a Governmental Agency requiring the payment of any Tax or Duty for which the Seller may be liable under this deed; |
|
2 any document received from a Governmental Agency administering any Tax or Duty assessing, imposing, claiming or indicating an intention to claim any Tax or Duty; |
|
3 a notice to a contributing member of a Consolidated Group given under section 721-15(5) or (5A) of the ITAA 1997; or |
|
4 lodgement of a tax return or a request for an amendment under a law about self-assessment of Tax. |
|
|
| Tax Indemnity |
the indemnity in clause 8.4. |
|
|
| Tax Invoice |
includes any document or record treated by the Commissioner of Taxation as a tax invoice or as a document entitling a recipient to an input tax credit. |
|
|
| Tax Law |
any law relating to either Tax or Duty as the context requires. |
|
|
|
|
|
|
| Term |
Meaning |
|
|
| Tax Payor |
is defined in clause 10.3(d). |
|
|
| Tax Warranty |
Warranty 15. |
|
|
| Tenement |
the tenements listed in Schedule 6, and any tenement or licence that is a successor, renewal, modification, extension or substitute for the whole or part of any such tenement or licence. |
|
|
| Third Party |
any person or entity (including a Governmental Agency) other than a Seller Group Member, a Buyer Group Member or the Target Group Companies. |
|
|
| Third Party Claim |
any Claim or Demand made or brought by a Third Party, other than a Tax Demand. |
|
|
| Warranties |
the representations and warranties in Schedule 3. |
|
|
| Warranty Claim |
any claim, demand, legal proceedings or cause of action arising from a breach of a Warranty. |
|
|
| Workers Compensation Obligations |
all workers compensation obligations in connection with the Target Group Companies, including administering workers compensation payments to Employees and managing return to work obligations in connection with Employees. |
|
|
1.2 Interpretation
In this deed:
(a) headings and bold type are for convenience only and do not affect the interpretation of this deed;
(b) the singular includes the plural and the plural includes the singular;
(c) words of any gender include all genders;
(d) other parts of speech and grammatical forms of a word or phrase defined in this deed have a corresponding meaning;
(e) an expression importing a person includes any company, partnership, joint venture, association, corporation or other body corporate and any Governmental Agency as well as an individual;
(f) a reference to a clause, party, schedule, attachment or exhibit is a reference to a clause of, and a party, schedule, attachment or exhibit to, this deed;
(g) a reference to any legislation includes all delegated legislation made under it and amendments, consolidations, replacements or re-enactments of any of them;
(h) a reference to a document includes all amendments or supplements to, or replacements or novations of, that document;
(i) a reference to a party to a document includes that party’s successors and permitted assignees;
(j) a reference to a contract other than this deed includes a deed and any legally enforceable undertaking, agreement, arrangement or understanding, whether or not in writing;
(k) no provision of this deed will be construed adversely to a party because that party was responsible for the preparation of this deed or that provision;
(l) a reference to a body, other than a party to this deed (including an institute, association or authority), whether statutory or not:
(1) which ceases to exist; or
(2) whose powers or functions are transferred to another body,
is a reference to the body which replaces it or which substantially succeeds to its powers or functions;
(m) if a period of time is specified and dates from a given day or the day of an act or event, it is to be calculated exclusive of that day;
(n) a reference to a day is to be interpreted as the period of time commencing at midnight and ending 24 hours later;
(o) if an act prescribed under this deed to be done by a party on or by a given day is done after 5.00pm on that day, it is taken to be done on the next day;
(p) a reference to time is a reference to Australian Eastern Daylight Time, unless indicated otherwise;
(q) a reference to $, US$ or US dollar is to the currency of the United States of America unless denominated otherwise;
(r) a reference to A$ or Australian dollars is to the currency of Australia;
(s) an obligation to use reasonable endeavours does not require a party to incur a substantial commercial detriment or payment obligation; and
(t) a document in the ‘agreed form’ means a document in the form approved by the Buyer and the Seller as at the date of this deed and initialled by a representative of each of them for the purposes of identification.
1.3 Business Day
Where the day on or by which any thing is to be done is not a Business Day, that thing must be done on or by the next Business Day.
1.4 Inclusive expressions
Specifying anything in this deed after the words ‘include’ or ‘for example’ or similar expressions does not limit what else is included.
1.5 Deed components
This deed includes any schedule of or attachment to this deed.
2 CONDITIONS FOR COMPLETION
2.1 Conditions precedent
Clauses 4 and 7 do not become binding on the parties and are of no force or effect unless and until each of the Conditions have been satisfied or waived in accordance with clause 2.4.
2.2 Notice
Each party must promptly notify the others in writing if it becomes aware that any Condition has been satisfied or has become incapable of being satisfied.
2.3 Reasonable endeavours
(a) The Seller must use all reasonable endeavours to ensure that the Condition in item 1 of Schedule 2 is satisfied as expeditiously as possible and in any event on or before the Cut Off Date.
(b) The Buyer must use all reasonable endeavours to ensure that the Condition in item 2 of Schedule 2 is satisfied as expeditiously as possible and in any event on or before the Cut Off Date.
The Buyer and the Seller must provide all reasonable assistance to the other as is necessary to satisfy the Conditions.
(c) Without limiting this clause 2.3, each party must:
(1) promptly and, in any event in the case of the approval of item 2 of Schedule 2, within 10 Business Days following the date hereof, apply for the regulatory approvals it is responsible for (as referred to in clause 2.3(a) or 2.3(b)) including filing all notices and applications required in relation to those regulatory approvals;
(2) consult with the other party in good faith in relation to the form and content of any notices, applications and other information to be provided to any Governmental Agency in relation to those regulatory approvals before lodgement;
(3) promptly provide the other party with confirmation that any notices, applications and other information to be provided to any Governmental Agency in relation to those regulatory approvals have been lodged;
(4) respond to requests for information from the relevant Governmental Agencies at the earliest possible time; and
(5) keep the other party informed of progress in relation to those regulatory approvals (including in relation to any material matters raised by, or conditions or other arrangements proposed by, or to, any Governmental Agency in relation to a regulatory approvals) and provide the other party with all information reasonably requested in connection with the applications for, or progress of, the regulatory approvals.
2.4 Waiver
(a) A Condition may only be waived by a party who is named in the third column of the table in Schedule 2. For the avoidance of doubt, if no party is named in the third column of the table in Schedule 2, the Condition cannot be waived, and if more than one party is named in the third column of the table in Schedule 2, the Condition can only be waived by the agreement of all named parties.
(b) A party entitled to waive a Condition under this clause 2.4 may do so in its absolute discretion.
(c) A party that waives a Condition in accordance with this clause 2.4:
(1) must do so in writing to the other party; and
(2) is not prevented from bringing a Claim against the other party in respect of any breach of this deed that caused that Condition not to be satisfied.
2.5 Cut Off Date
Either the Buyer or the Seller may, by not less than 2 Business Days’ notice to the other, terminate this deed at any time before Completion if:
(a) the Conditions are not satisfied or waived in accordance with clause 2.4, by the Cut Off Date; or
(b) the Conditions become incapable of satisfaction or the Buyer and the Seller agree that any of the Conditions in Schedule 2 cannot be satisfied,
except where the relevant Condition has become incapable of satisfaction or has not been satisfied, as a direct result of a failure by the party seeking to terminate to comply with its obligations under this deed.
2.6 No binding agreement for transfer
For the avoidance of doubt, nothing in this deed will cause a binding agreement for the transfer of shares to arise unless and until the Conditions in Schedule 2 have been satisfied or waived in accordance with clause 2.4 and no person will obtain rights in relation to shares as a result of this deed unless and until those Conditions have been satisfied or waived.
3 TERMINATION
3.1 Termination by the Buyer
In addition to the circumstances described in clause 2.5 and clause 7.3(b), the Buyer may terminate this deed at any time before Completion by notice in writing to the Seller if:
(a) an order is made or an effective resolution is passed for the winding up or dissolution without winding up (otherwise than for the purposes of reconstruction or amalgamation) of the Seller or any of the Target Group Companies (other than where the order is set aside within 21 days);
(b) a receiver, receiver and manager, judicial manager, liquidator, administrator or like official is appointed over the whole or a substantial part of the undertaking or property of the Seller or any of the Target Group Companies; or
(c) a permanent injunction or other final and non-appealable order issued by any court of competent jurisdiction or Governmental Agency, or other material permanent legal restraint or prohibition, permanently restraining or enjoining or otherwise prohibiting the Sale is in effect.
3.2 Termination by the Seller
In addition to the circumstances described in clause 2.5 and clause 7.3(b), the Seller may terminate this deed at any time before Completion by notice in writing to the Buyer if:
(a) an order is made or an effective resolution is passed for the winding up or dissolution without winding up (otherwise than for the purposes of reconstruction or amalgamation) of the Buyer (other than where the order is set aside within 21 days);
(b) a receiver, receiver and manager, judicial manager, liquidator, administrator or like official is appointed over the whole or a substantial part of the undertaking or property of the Buyer;
(c) a permanent injunction or other final and non-appealable order issued by any court of competent jurisdiction or Governmental Agency, or other material permanent legal restraint or prohibition, permanently restraining or enjoining or otherwise prohibiting the Sale is in effect; or
(d) Buyer Warranty 13 ceases to be true and accurate in all respects.
3.3 Effect of termination
If this deed is terminated under clause 2.5, this clause 3 or clause 7.3(b) or by the written agreement of the Buyer and the Seller, then:
(a) each party is released from its obligations to further perform its obligations under this deed, except those expressed to survive termination;
(b) each party retains the rights it has against the other in respect of any breach of this deed occurring before termination;
(c) the Buyer must return to the Seller all documents and other materials obtained from the Seller in accordance with the terms of the Confidentiality Agreement; and
(d) the rights and obligations of each party under each of the following clauses and schedules will continue independently from the other obligations of the parties and survive termination of this deed:
(1) clause 1 (Definitions and interpretation);
(2) clause 3 (Termination);
(3) clause 13 (Confidentiality and announcements);
(4) clause 14 (Duties, costs and expenses);
(5) clause 15 (GST); and
(6) clause 17 (General).
3.4 No other right to terminate or rescind
No party may terminate or rescind this deed (including on the grounds of any breach of Warranty or misrepresentation that occurs or becomes apparent before Completion) except as permitted under clause 2.5, this clause 3 or clause 7.3(b).
4 SALE AND PURCHASE
4.1 Sale Shares and the Assets
At the time and date of Completion determined under clause 7.1, the Seller must sell, and the Buyer must buy, the Sale Shares for the Purchase Price free and clear of all Encumbrances.
4.2 Associated rights
The Seller must sell the Sale Shares to the Buyer together with all rights:
(a) attached to them as at the date of this deed; and
(b) that accrue between the date of this deed and Completion.
4.3 Purchase Price
(a) The consideration for the sale of the Sale Shares is the payment by the Buyer of the Purchase Price.
(b) The Purchase Price will be paid as follows:
(1) the Completion Payment, payable by the Buyer on Completion in accordance with clause 4.4 and clause 7; and
(2) the Contingent Consideration, if any, payable by the Buyer in accordance with the Contingent Consideration Deed.
4.4 Actions on Completion
On Completion the Buyer must pay an amount equal to the Completion Payment subject to any other adjustments to the Purchase Price payable in accordance with this deed to the Seller.
4.5 Title and risk
Title to and risk in the Sale Shares passes to the Buyer on Completion.
4.6 Completion Payment adjustment
The Seller will, 5 Business Days prior to Completion, provide the Buyer with written notice of the aggregate amount equal to all Employment Benefits (including Leave Benefits) and the Surety Amount that will have accrued as at the Completion Date for purposes of the adjustment to the Completion Payment, together with reasonable supporting documentation.
5 PERIOD BEFORE COMPLETION
5.1 Carrying on of business
(a) Subject to clause 5.2, between the date of this deed and the earlier of Completion and termination of this deed, the Seller must ensure that:
(1) operations of the Target Group Companies are conducted in the ordinary and usual course consistent in all material respects with its usual business practices;
(2) no material changes are made to the nature or scale of any activity of the Target Group Companies, including those comprised in the Eva Copper Project; and
(3) the Target Group Companies do not undertake any business or operations other than:
(A) with respect to the Target Entity, as the holding company of any of the other Target Group Companies and business consistent with the business conducted by each of them as set out in this clause 5.1(a);
(B) with respect to each of Roseby Copper Pty Limited's and Roseby Copper (South) Pty Limited's business consistent with the business conducted by each of them as set out in this clause 5.1(a),
(C) with respect to Eva Copper Mine Pty Limited, the Eva Copper Project.
(b) Subject to clause 5.2, but without limiting clause 5.1(a), the Seller must ensure that the Target Group Companies do not:
(1) distribute or return any capital to its members;
(2) buy back any of their respective shares;
(3) pass a resolution for its winding up or dissolution;
(4) issue any shares, options or securities that are convertible into shares in the Target Group Companies, nor grant or create any rights to acquire such shares, options or securities;
(5) alter their respective constitutions;
(6) approve or effect the amendment, variation, cancellation or termination of any Material Contract, other than in the ordinary course;
(7) enter into or renew any contract that has a term or a renewed term of more than 12 months under which the expected annual expenditure will be in excess of A$1,000,000;
(8) create or permit to exist any Encumbrance, other than a Permitted Encumbrance, over any material assets of the Target Group Companies;
(9) sell, lease, license, transfer or otherwise dispose of any real property outside of the ordinary course of business;
(10) approve any capital expenditures which in aggregate exceeds A$1,000,000;
(11) agree to, or permit any failure to, settle any debt other than in accordance with its terms;
(12) consent to any material regulatory condition or obligation attaching to the Tenements, except where the material regulatory condition or regulation is required by law;
(13) make any material changes to the application for an Environmental Authority (EA) major amendment in respect of EPML00899613 for the Eva Copper Project or finalising the conditions that will apply to the EA with the Department of Environment and Science without the consent of the Buyer, not to be unreasonably conditioned, delayed or withheld;
(14) submit a proposed Progressive Rehabilitation and Closure Plan for the Eva Copper Project without the consent of the Buyer, not to be unreasonably conditioned, delayed or withheld;
(15) consent to any material regulatory condition or obligation attaching to the Authorisations, except where the material regulatory condition or regulation is required by law;
(16) remove any plant and equipment owned or leased by any Target Group Company;
(17) transfer any Employee of the Seller except the Excluded Employees;
(18) engage any new employee in any Target Group Company with total annual remuneration exceeding A$150,000, or change the terms of employment of any Employee;
(19) agree to do anything referred to in the preceding provisions of this clause 5.1(b); and
(20) make or change any election or choice in respect of any Tax that might reasonably be expected to impact the Tax position of the Target Entity or any of the other Target Group Companies.
5.2 Permitted acts
Nothing in clause 5.1 restricts the Seller or a Target Group Company from doing, or requires the Seller or a Target Group Company to prevent, any of the following permitted actions:
(a) any action permitted by this deed, including actions required under clause 5 or as Disclosed in the Disclosure Materials;
(b) any action the Seller deems necessary to reasonably and prudently respond to an emergency, disaster or crisis (including the COVID-19 pandemic), including the right to take forthwith any action in good faith to respond to any actual or reasonably anticipated effect on the Target Group Companies, the Business or the safety and integrity of the Employees;
(c) any action that is required by applicable law or any Governmental Agency (including as required to comply with laws, orders, directives, guidelines or recommendations by any Governmental Agency in connection with or in response to the COVID-19 pandemic), or otherwise necessary for the Seller or the Target Group Companies to meet their legal obligations or contractual obligations provided that any material contractual obligations have been Disclosed; or
(d) any action approved by the Buyer in writing, such approval not to be unreasonably withheld, conditioned or delayed.
5.3 Access
For the purposes of assisting the Buyer to understand the business of the Target Group Companies including the Eva Copper Project and to prepare for the transition to the Buyer’s normal working procedures, the Seller must procure that from the date of this deed until Completion the Buyer is to be given reasonable access during regular business hours on reasonable notice to:
(a) the Target Group Companies, including the Eva Copper Project and Business Records; and
(b) officers and senior employees of members of the Seller Group and the Target Group Companies to whom the Buyer reasonably requires access,
provided that:
(c) the Seller is not obliged to comply with this clause 5.3 to the extent that giving such access may pose a risk to the health and safety of any person, would cause material disruption to, or have a material adverse effect on, the day to day conduct of the Target Group Companies, including the Eva Copper Project or constitute a breach by a Seller Group Member or a Target Group Company of any applicable law or of the terms of any agreement to which it is party;
(d) the Seller shall be entitled to have a representative accompany the Buyer who is given access to the Eva Copper Project or to the officers or senior employees of the members of the Seller Group and the Target Entity; and
(e) the Buyer shall indemnify and hold harmless the Seller Group and the Seller Group Representatives or Advisors from and against any damages, losses, suits and liabilities that they may suffer as a result of damages to life, limb or property as a result of the actions of the Buyer Group Representatives or Advisors during such access by the Buyer and the Buyer Group Representatives or Advisors (absent gross negligence or wilful misconduct by the Seller Group, its employees or its representatives).
5.4 Indebtedness
(a) The Seller must procure that on or before Completion all indebtedness owed by the Target Entity or any other Target Group Company to any Seller Group Member (other than a Target Group Company), together with all interest accrued, is repaid in full or otherwise discharged and extinguished in full.
(b) The Buyer and the Seller agree to work cooperatively and in good faith prior to Completion to consider whether the CMMC Debt may be repaid immediately following Completion by the Target Entity without any adverse Tax impact to the Buyer, the Seller or any of the Target Group Companies and, if they agree, to make any amendments to this Deed as may be reasonably required to reflect any agreed terms with respect to the foregoing. The Buyer and the Seller shall not be obliged to come to an agreement, and the Seller’s obligations in clause 5.4(a) will not be impacted by any failure of the Buyer and Seller to come to an agreement.
(c) Despite clause 5.1, the Seller may take, and may procure that the Target Entity and any other Target Group Company takes, such actions, including procuring that any Target Group Company executes any relevant agreements, as are necessary or reasonably required (determined by the Seller acting reasonably) to satisfy the Seller’s obligations to eliminate indebtedness under this clause 5.4, whether by netting off payables and receivables, assignment of receivables, forgiveness of payables, forgiveness of receivables or otherwise, in each case on terms reasonably acceptable to the Buyer.
5.5 Financing
Without limiting clause 3.2(d) or Buyer Warranty 13, the Buyer covenants and agrees that it shall take all reasonable steps to and shall ensure that at Completion it will have sufficient funds to pay the Purchase Price in Immediately Available Funds to the Seller in full. In the event that all or a portion of the funds to pay the Purchase Price will be provided by one or more third party financiers, the Buyer further covenants and agrees that it shall take all necessary steps, including complying with all covenants made to such financiers in connection with any such financing, and shall ensure that the commitments and documented financings of such third party financiers remain in place between the date of this deed and the Completion Date and that the Buyer will be able to draw on all such commitments immediately prior to Completion.
5.6 Target Entity a member of a Consolidated Group
The Seller must, not less than 14 Business Days before Completion (or other agreed date), notify or procure that the Seller’s Head Company notify the Buyer of any elections or choices made, or to be made, in forming the Seller’s Consolidated Group that the Seller reasonably considers will, or might reasonably be expected to, impact the Tax position of the Target Entity or any of the other Target Group Companies or the Buyer’s Consolidated Group.
6 EMPLOYEES
6.1 Incentives
(a) The Seller, subject to Completion occurring, must either pay all Outstanding Incentives held by an Employee or provide evidence to the satisfaction of the Buyer acting reasonably of the expiry or termination of such Outstanding Incentives held by an Employee, in each case on Completion in accordance with the terms of the applicable plan or entitlement.
(b) The Seller indemnifies each Buyer Group Member, and must pay on demand the amount of, any Loss suffered or incurred by any Buyer Group Member out of or in connection with any claim by an Employee in relation to any Outstanding Incentive, or in relation to any other Incentive to the extent that it relates to a period of employment prior to Completion.
6.2 New employees and terminating employees
If, before Completion:
(a) subject to any approval required by the Buyer under clause 5.1(b)(18), a new employee commences employment with a Target Group Company; or
(b) the employment of any Employee terminates for any reason, the Seller must, as soon as reasonably practicable:
(c) notify the Buyer of the identity of the relevant employee;
(d) specify whether the relevant employee is terminating or commencing employment; and
(e) identify the business area in which they did, or will, work.
6.3 Restrictions on Seller
(a) Subject to clause 6.3(b) below, the Seller must not, and must procure that the Seller Group Members and the Seller Group Representatives or Advisers do not, directly or indirectly for a period starting on the date of this deed and ending on the date 12 months after the date of this deed, induce or encourage any Employee to leave the employment of a Target Group Company or to work for or on behalf of any Seller Group Member.
(b) Clause 6.3(a) above does not prevent any Seller Group Member or any Seller Group Representative or Adviser from:
(1) advertising employment vacancies in any newspaper, website or other publication or through a recruitment agency, or advertising vacancies through internal job posting lists for the Seller Group circulated to Seller Group employees in the ordinary course of business (except where the advertisement or recruitment agency specifically targets employees of any Target Group Company) or interviewing and negotiating with any person responding to those advertisements; or
(2) employing any person who seeks employment with any Seller Group Members solely on his or her own initiative.
6.4 Restrictions on Buyer
(a) Subject to clause 6.4(b) below, the Buyer must not, and must procure that the Buyer Group Members and the Buyer Group Representatives and Advisers do not, directly or indirectly for a period starting on the date of this deed and ending on the date 12 months after the date of this deed, induce or encourage any employee of a Seller Group Member to leave the employment of any Seller Group Member or to work for or on behalf of any Buyer Group Member or Target Group Company.
(b) Clause 6.4(a) above does not prevent any Buyer Group Member or any Buyer Group Representative or Adviser from:
(1) advertising employment vacancies in any newspaper, website or other publication or through a recruitment agency (except where the advertisement or recruitment agency targets employees of any Seller Group Member) or interviewing and negotiating with any person responding to that advertisement; or
(2) employing any person who seeks employment any Buyer Group Member solely on his or her own initiative.
6.5 Workers compensation
(a) The Buyer and the Seller acknowledge that Copper Mountain Mining Pty Ltd is the current employer of the Employees and discharges all of the Workers Compensation Obligations.
(b) The Buyer and the Seller agree that the Seller will continue to discharge all of the Workers Compensation Obligations which arise out of claims made prior to Completion or relate to conduct prior to Completion, including the obligations which are imposed on the Seller.
(c) The Buyer indemnifies each Seller Group Member, and must pay on demand the amount of any Loss suffered or incurred by any Seller Group Member out of or in connection with the Workers Compensation Obligations which arise out of claims made after Completion or relate to conduct after Completion.
6.6 Excluded Employees
The Seller will procure that the employment of the Excluded Employees with the Target Group Companies terminates prior to Completion. The Seller agrees to indemnify the Buyer against any Loss suffered or incurred due to or accrued by an Excluded Employee prior to, on, or following the Completion Date, including as a result of the redundancy, or alleged redundancy of the Excluded Employee and the termination of employment of the Excluded Employee with any of the Target Group Companies.
7 COMPLETION
7.1 Time and Place
Subject to clause 3, Completion must take place at the office of Corrs Chambers Westgarth at Level 42, 111 Eagle Street, Brisbane, at 12:00pm on the day that is 3 Business Days after satisfaction or waiver of the Conditions, or such other place, time and date as the Seller and Buyer agree in writing.
7.2 Completion
(a) On or before Completion, each of the Buyer and Seller must carry out the Completion Steps referable to it in accordance with Schedule 5.
(b) Completion is taken to have occurred when each party has performed all its obligations under this clause 7 and Schedule 5.
7.3 Notice to complete
(a) If the Buyer or the Seller (Defaulting Party) fails to satisfy its obligations under clause 7.2 and Schedule 5 on the day and at the place and time for Completion determined under clause 7.1 then the other party (Notifying Party) may give the Defaulting Party a notice in writing requiring the Defaulting Party to satisfy those obligations within a period of 5 Business Days from the date of the notice and declaring time to be of the essence.
(b) If the Defaulting Party fails to satisfy those obligations within those 5 Business Days the Notifying Party may, without limitation to any other rights it may have, terminate this deed by giving written notice to the Defaulting Party.
7.4 Completion simultaneous
(a) Subject to clause 7.4(b), the actions to take place as contemplated by this clause 7 and Schedule 5 are interdependent and unless otherwise stated once performed are taken to have occurred simultaneously. If one action does not take place, then without prejudice to any rights available to any party as a consequence:
(1) there is no obligation on any party to undertake or perform any of the other actions;
(2) to the extent that such actions have already been undertaken, the parties must do everything reasonably required to reverse those actions; and
(3) the Seller and the Buyer must each return to the other all documents delivered to it under clause 7.2(a) and Schedule 5 and must each repay to the other all payments received by it under clause 7.2(a) and Schedule 5, without prejudice to any other rights any party may have in respect of that failure.
(b) The Buyer may, in its sole discretion, waive any or all of the actions that the Seller is required to perform under clause 2.1 of Schedule 5 and the Seller may, in its sole discretion, waive any or all of the actions that the Buyer is required to perform under clause 2.2 of Schedule 5.
7.5 Post-Completion adjustment
(a) As soon as practicable after Completion and in any event within 90 Business Days after the Completion Date, the Buyer must prepare and give to the Seller a statement, being a statement that details (i) all Employment Benefits paid or payable by the Buyer or the Target Group Companies that relate to the period prior to Completion that have not been deducted from the Completion Payment, and (ii) the Surety Amount as of the Completion Date to the extent it differs from the amount added to the Completion Payment, , in each case together with reasonable supporting documentation and detailing the net amount owing to the Buyer or the Seller as a result of such adjustments (Completion Adjustment Amount).
(b) Within 10 Business Days after receipt of the Completion Adjustment Amount under paragraph (a), the Seller may give a notice to the Buyer (Dispute Notice) that it does not agree with the amount of the Completion Adjustment Amount and must provide details of the reasons why, or grounds on which, it does not agree, together with reasonable supporting documentation. If the Seller does not deliver a Dispute Notice, the Seller or the Buyer, as applicable, must pay the Completion Adjustment Amount to the other within 10 Business Days following the deadline for the Seller to deliver a Dispute Notice. If the Seller gives a Dispute Notice, the Seller or the Buyer, as applicable, must pay the Completion Adjustment Amount or such other amount as agreed between the parties or determined by the Expert in accordance with this clause 7.5 within 10 Business Days of such agreement or determination.
(c) A Dispute Notice issued under paragraph (b) is not effective for any amount unless the aggregate amount in dispute is at least $20,000.
(d) If any Dispute Notice is given, the Seller and the Buyer must:
(1) each appoint a representative to meet and discuss the matters raised in the Dispute Notice; and
(2) ensure that its representative:
(A) meets with the other representative to discuss each matter raised in the Dispute Notice; and
(B) makes a genuine effort to negotiate in good faith an agreement on each such matter,
within 10 Business Days after the Dispute Notice is given.
(e) If a matter raised in a Dispute Notice is not agreed within the 10 Business Day period referred to in paragraph (d) then either party may by written notice require that all outstanding matters be referred to an independent accounting firm (Expert) for determination.
(f) If a notice is given under paragraph (e), the parties must appoint the Expert to determine the matters in dispute in accordance with this clause 7.5.
(g) The Seller and the Buyer must:
(1) sign whatever reasonable terms of engagement the Expert requires; and
(2) use reasonable endeavours to provide the Expert with any information reasonably required by the Expert.
(h) The Expert acts as an expert and not as an arbitrator and must resolve the matters raised in the Dispute Notice and must only consider the items in dispute submitted to it:
(1) having regard to the terms of this deed;
(2) according to whatever procedures the Expert decides, in the Expert's absolute discretion, but subject to the requirements of procedural fairness; and
(3) exercising the Expert's own skill, judgment and experience having regard to the material presented to it only and not any independent review.
(i) The Seller and the Buyer must each pay half of the costs of the Expert and its advisers, unless the Expert, in its absolute discretion, decides otherwise.
(j) The parties must use their respective reasonable endeavours to ensure that the Expert gives, within 20 Business Days after its appointment, a written decision to the parties.
(k) The Expert must give reasons for the decision.
(l) The Expert's decision is, in the absence of manifest error, final and binding on the parties.
8 WARRANTIES
8.1 Warranties by the Seller
Subject to the qualifications and limitations in clause 9, the Seller gives the Warranties in favour of the Buyer:
(a) in respect of each Warranty that is expressed to be given on a particular date, on that date; and
(b) in respect of each other Warranty, on the date of this deed and immediately before Completion.
8.2 Independent Warranties
Each of the Warranties is to be construed independently of the others and is not limited by reference to any other Warranty.
8.3 Reliance
The Seller acknowledges that the Buyer has entered into this deed and will complete this deed in reliance on the Warranties.
8.4 Tax indemnity
(a) The Seller indemnifies the Buyer against, and must pay the Buyer the amount of, any:
(1) Tax or Duty payable by any Target Group Company to the extent that Tax or Duty relates to any period, or part period, up to and including Completion, or to any act, matter, transaction or event occurring up to and including Completion; and
(2) Tax Costs reasonably incurred by or on behalf of any Target Group Company to the extent those Tax Costs arise from or relate to any of the matters for which the Seller is liable under clause 8.4(a)(1),
provided that the maximum aggregate liability of the Seller under this indemnity for Tax Costs cannot exceed an amount equal to 100% of the Purchase Price, and this indemnity will be the sole remedy of the Buyer and the Target Group Companies in respect of any such Tax, Duty or Tax Costs.
(b) Clauses 9.6, 9.8, 9.10(c), (e), (f), (h), (i), (j) and (m), 9.11, 9.12 and 9.13 shall apply in relation to any Tax Demand.
9 QUALIFICATIONS AND LIMITATIONS ON CLAIMS
9.1 Disclosure
(a) The Buyer acknowledges and agrees that the Seller has Disclosed against the Warranties, and the Buyer is aware of, and will be treated as having actual knowledge of, all facts, matters and circumstances that:
(1) are provided for or described in this deed;
(2) are disclosed in the Disclosure Materials; or
(3) would have been disclosed to the Buyer if it had conducted searches:
(A) on the day prior to the date of this deed of records available for public inspection maintained by ASIC, the PPS Register, registers maintained by any of the IP Australia, the who.is domain name data base, the land and water title registers maintained by Titles Queensland, the registers of environmental authorities, environmental actions and environmental notices kept by the Queensland Department of Environment and Science, , the Environmental Management Register and Contaminated Land Register, the Queensland Heritage Register maintained by the Department of Environment and Science, the Queensland resources authorities register kept under section 197 of the Mineral and Energy Resources (Common Provisions) Act 2014 (Qld) and the statutory registries maintained by the National Native Title Tribunal;
(B) on the date that is 10 days prior to the date of this deed for public inspection maintained by the High Court of Australia any Registry of the Federal Court, the Supreme Court and District Court (throughout Australia), the Land Court of Queensland, and the Planning and Environment Court of Queensland.
(b) So far as the Buyer is aware, there is no fact, matter, event or circumstance that exists as at the date of this deed that would entitle it to make a Warranty Claim.
(c) The Warranties are given subject to the Disclosures described in clause 9.1(a). A Warranty will not be regarded as being untrue by reason of facts, matters or circumstances that have been Disclosed under clause 9.1(a) and the Seller will have no liability under the Warranties to the extent that Disclosure is made against the Warranties under this clause 9.1.
(d) The Buyer must not make a Warranty Claim, and the Seller will not be in breach of a Warranty, if the facts, matters or circumstances giving rise to such Claim are Disclosed under clause 9.1(a).
9.2 Awareness
(a) Where a provision of this deed refers to ‘so far as the Seller is aware’ or a similar qualification as to the Seller’s awareness or knowledge, the Seller’s awareness is limited to and deemed only to include those facts, matters or circumstances of which a Seller Specified Person is actually aware as at the date of this deed or would have been aware had the Seller Specified Person made reasonable enquiries into the subject matter.
(b) Where a provision of this deed refers to ‘so far as the Buyer is aware’ or a similar qualification as to the Buyer’s awareness or knowledge, the Buyer’s awareness is limited to and deemed only to include those facts, matters or circumstances of which a Buyer Specified Person is actually aware as at the date of this deed or would have been aware had the Seller Specified Person made reasonable enquiries into the subject matter.
9.3 No reliance
(a) The Buyer represents and warrants to each Seller Group Member, that:
(1) except as set out in this deed (including the Warranties), at no time has:
(A) any Seller Group Member or any person on its behalf, made or given; or
(B) any Buyer Group Member relied on,
any representation, warranty, promise or undertaking (including in respect of the future financial performance or prospects of the Business, the Target Group Companies or otherwise);
(2) it has not relied on anything other than the provisions of this deed (including the Warranties) in agreeing to buy the Sale Shares, in particular, no representations, warranties, promises, undertakings, statements or conduct have:
(A) induced or influenced the Buyer to enter into, or agree to any terms or conditions of, this deed;
(B) been relied on in any way as being accurate by a Buyer Group Member;
(C) been warranted to a Buyer Group Member as being true; or
(D) been taken into account by the Buyer as being important to its decision to enter into, or agree to any or all of the terms of, this deed,
except as set out in this deed (including the Warranties);
(3) it has entered into this deed after inspection and investigation of the affairs of the Business, the Target Group Companies, including access to all the Disclosure Materials, and has had the opportunity to ask questions and receive answers from the Seller; and
(4) it has made, and it relies upon, its own searches, investigations, enquiries and evaluations in respect of the Eva Copper Project and the Target Group Companies, except to the extent expressly set out in this deed (including the Warranties).
(b) The Buyer acknowledges that the Seller has agreed to sell the Sale Shares and enters into this deed relying on the representations and warranties in this clause
9.3 and would not be prepared to sell the Sale Shares on any other basis.
9.4 Opinions, estimates and forecasts
The parties acknowledge that no Seller Group Member is under any obligation to provide any Buyer Group Member or its advisers with any information on the future financial performance or prospects of the Business or the Target Group Companies. If a Buyer Group Member has received opinions, estimates, projections, business plans or budget information in respect of the Business or the Target Group Companies, the Buyer acknowledges and agrees that:
(a) there are uncertainties inherent in attempting to make these estimates, projections, business plans and budgets and the Buyer is familiar with these uncertainties;
(b) the Buyer is taking full responsibility for making its own evaluation of the adequacy and accuracy of all estimates, projections, business plans and budgets furnished to it;
(c) the Seller has not made and is not making any warranty (including in the Warranties) in respect of any forecast, model, budget or other estimate, projection, business plan, statement of opinion or statement of intention (Forward-looking Information), whether being as to the accuracy of, or the reasonableness of any assumptions underlying such Forward-looking Information, provided to the Buyer or the Buyer Group Representatives and Advisers before the date of this deed, and the Buyer is not entering into this deed in reliance on, and may not rely on, any Forward-looking Information; and
(d) the Seller is not liable under any Claim arising out of or relating to any Forward- looking Information or other opinions, estimates, projections, business plans and budgets in respect of the Target Group Companies or the Business.
Nothing in this clause 9.4 limits or derogates from the Buyer’s representations and warranties in clause 9.3 or the Seller’s reliance on those representations and warranties.
9.5 Maximum and minimum amounts
(a) The Seller is not liable under a Warranty Claim unless the amount finally agreed or adjudicated to be payable in respect of that Claim:
(1) exceeds $500,000 of the Completion Payment; and
(2) either alone or together with the amount finally agreed or adjudicated to be payable in respect of other Claims that satisfy clause 9.5(a)(1) exceeds $1,000,000 of the Completion Payment (Deductable),
in which event, subject to clauses 9.5(b) and 9.5(c), the Seller is liable for all of that amount including the Deductable.
(b) The maximum aggregate amount that the Seller is required to pay in respect of:
(1) all Excluded Warranty Claims is limited to an amount equivalent to 100% of the Completion Payment; and
(2) all other Warranty Claims whenever made is limited to an amount equivalent to 40% of the Completion Payment, provided that, for the avoidance of doubt, the maximum aggregate liability of the Seller for all Warranty Claims cannot exceed an amount equivalent to 100% of the Completion Payment.
(c) For the purposes of clause 9.5(a)(1):
(1) Claims arising out of separate sets of facts, matters or circumstances will not be treated as one Claim, even if each set of facts, matters or circumstances may be a breach of the same Warranty; and
(2) Claims of the same or similar nature arising out of the same or similar facts, matters and circumstances will be treated as one Claim.
9.6 Time limits
The Seller may only be liable under a Claim if:
(a) the Buyer notifies the Seller of the Claim in accordance with clause 10.1 and within:
(1) 5 years after the Completion Date in the case of a Tax Claim, Tax Demand or Excluded Warranty Claim; or
(2) 18 months after Completion in all other cases; and
(b) within 6 months of the date the Buyer notifies the Seller of the Claim under clause 10:
(1) the Claim has been agreed, compromised or settled; or
(2) the Buyer has issued and served legal proceedings against the Seller in respect of the Claim.
Except for any Claim by the Seller for a breach by the Buyer of its obligations under clause 12, the Buyer may only be liable under a Claim if the Seller notifies the Buyer of the Claim within 18 months after Completion. For the avoidance of doubt, this clause does not limit the right of the Seller to make any Claim in respect of the Contingent Consideration Deed and the payment of the Contingent Consideration or making any Claim after the date which is after the date which is 18 months after Completion in respect of a breach by the Buyer of any of its obligations under clause 12.
9.7 Recovery under other rights and reimbursement
(a) The Seller is not liable under a Claim for any Loss that a Buyer Group Member or a Target Group Company recovers or is compensated for by any other means, from another source whether by way of contract, indemnity or otherwise (including under a policy of insurance or from a Governmental Agency).
(b) Where after Completion a Buyer Group Member or any Target Group Company is, or would be likely to be entitled to recover, or be compensated for by any other means, from another source whether by way of contract, indemnity or otherwise (including under a policy of insurance or from a Governmental Agency), any sum in respect of any matter which could give rise to a Claim, the Buyer must:
(1) promptly notify the Seller of such right or entitlement (provided that such notification is not prohibited by or does not void or prejudice a right to be insured under an insurance policy); and
(2) take all reasonable steps to seek recovery of that sum (provided that this will not require a claim to be made under a policy of insurance if that policy requires that other rights of indemnity be pursued before insurance can be claimed under the policy); and
(3) keep the Seller notified of the conduct of such recovery.
The Buyer must not of its own initiative alter the terms of any existing or rolled over policy of insurance such that the provisions of clauses 9.7(b)(1) or 9.7(b)(2) apply when they would not otherwise.
(c) If, after the Seller has made a payment in respect of a Claim, a Buyer Group Member or a Target Group Company recovers or is compensated for by any other means, any Loss that gave rise to the Claim, the Buyer must immediately, and in any event within 10 Business Days, pay to the Seller as an increase in the Purchase Price, the lesser of:
(1) the amount of the Loss that was recovered or compensated for (net of all reasonable out-of-pocket costs and expenses incurred to recover such Loss); and
(2) the amount paid by the Seller in respect of the Claim.
9.8 Mitigation of loss
(a) The Buyer must:
(1) take, and procure that each other Buyer Group Member and the Target Group Companies take, all reasonable actions to mitigate any Loss that may give rise to a Claim; and
(2) not omit, and procure that no other Buyer Group Member or the Target Group Companies omit, to take any reasonable action that would mitigate any Loss that may give rise to a Claim.
(b) If the Buyer does not comply with clause 9.8(a) and compliance with clause 9.8(a) would have mitigated the Loss, the Seller is not liable for the amount by which the Loss would have been reduced.
9.9 Exclusions
(a) The Buyer acknowledges and agrees that:
(1) subject to any law to the contrary, all terms, statements, representations and warranties (except the Warranties), whether express, implied, written, oral, collateral, statutory or otherwise, are excluded and, to the maximum extent permitted by law, the Seller disavows all liability in relation to them; and
(2) the Buyer agrees that, to the maximum extent permitted by law, the Buyer agrees not to make, and waives any right it may have to make, any Claim against the Seller or any Excluded Person under any provision of the Corporations Act (including section 1041H of the Corporations Act), the Competition and Consumer Act 2010 (Cth), the Australian Securities and Investments Commission Act 2001 (Cth) or any similar provisions in the legislation of any State or Territory or the Commonwealth of Australia or in any other applicable law.
(b) To the maximum extent permitted by law, the Buyer undertakes to the Seller and to any person who was at the date of this deed an Excluded Person that neither it nor any Related Body Corporate will at any time make any Claim or Demand against any Excluded Person (other than the Seller) in respect of any matter arising in connection with this deed or any transaction contemplated by this deed, which occurred before, at or after Completion, including in respect of any breach of Warranty or any Claim under an indemnity.
9.10 General limitations
The Seller is not liable under a Claim for any Loss or amount to the extent that the Loss or amount:
(a) (provision): has been included as a specific provision, allowance, reserve or accrual in the Management Accounts;
(b) (contingent losses): is a contingent Loss, unless and until the Loss becomes an actual Loss and is due and payable;
(c) (breach) arises directly from the Buyer’s breach of this deed, bad faith or wilful misconduct;
(d) (pre Completion actions): arises from an act or omission by or on behalf of a Seller Group Member or a Target Group Company before Completion that was done or made:
(1) with the written consent of a Buyer Group Member; or
(2) at the direction or instruction of a Buyer Group Member;
(e) (post Completion conduct): arises from anything done or not done after Completion by or on behalf of a Buyer Group Member or the Target Group Companies;
(f) (promoted claims): arises from a Third Party Claim that is attributable to anything done or not done after Completion by or on behalf of a Buyer Group Member or the Target Entity that was calculated or intended to cause the Third Party Claim to be made;
(g) (change of law or interpretation): arises from:
(1) the enactment or amendment of any legislation or regulations;
(2) a change in the judicial or administrative interpretation of the law; or
(3) a change in the practice or policy of any Governmental Agency,
after the date of this deed, including legislation, regulations, amendments, interpretation, practice or policy that has a retrospective effect;
(h) (change in accounting policy): would not have arisen but for a change made by the Buyer or Target Group Company after Completion in any accounting policy or practice of a Buyer Group Member or the Target Group Companies that applied before Completion;
(i) (change in Eva Copper Project): would not have arisen but for a restructure or material alteration of the Eva Copper Project, after Completion;
(j) (change in Australian Exploration Portfolio): would not have arisen but for a restructure or material alteration of the Australian Exploration Portfolio, after Completion;
(k) (consequential loss): is a special loss or damage, indirect loss or damage, consequential loss or damage (including indirect loss of profits), or punitive loss or damage;
(l) (remediable loss): is remediable, provided it is remedied to the satisfaction of the Buyer, acting reasonably, within 30 Business Days after the Seller receives written notice of the Claim under clause 10.1(a); or
(m) (Duty): is an amount for which the Buyer is liable under clause 14.1.
The Buyer is not liable under a Claim for any Loss or amount to the extent that the Loss or amount is a special loss or damage, indirect loss or damage, consequential loss or damage (including indirect loss of profits), or punitive loss or damage.
9.11 Buyer benefits
In assessing any Loss recoverable by the Buyer as a result of any Claim, there must be taken into account any benefit accruing to the Buyer Group (including any amount of any relief, allowance, exemption, exclusion, set-off, deduction, loss, rebate, refund, right to repayment or credit granted or available in respect of a Tax or Duty under any law obtained or obtainable by the Buyer Group and any amount by which any Tax for which the Buyer Group is or may be liable to be assessed or accountable is reduced or extinguished), arising directly from the matter that gives rise to that Claim.
9.12 Sole remedy
(a) To the extent permitted by law, it is the intention of the parties that the Buyer’s and Buyer Group’s sole remedies in connection with the Sale will be as set out in this deed.
(b) To the extent permitted by law, no Seller Group Member has any liability to a Buyer Group Member or the Target Group Companies:
(1) in connection with the Sale or the matters the subject of this deed or the Disclosure Materials; or
(2) resulting from or implied by conduct made in the course of communications or negotiations in respect of the Sale or the matters the subject of this deed or the Disclosure Materials,
under a Claim unless the Claim may be made under the terms of this deed or arises out of a statutory right or other claim that cannot be excluded by contract.
(c) To the extent permitted by law, the Buyer must not, and must procure that the Target Group Companies and the other Buyer Group Members do not, make a Claim:
(1) that the Buyer would not be entitled to make under this deed or that is otherwise inconsistent with the Buyer’s entitlement to make a Claim under this deed;
(2) against any current or former director, officer or employee of any Seller Group Member, other than where the Claim relates to actions for fraud or wilful misconduct; or
(3) against a Seller Group Member that is not a party to this deed,
and the Buyer acknowledges that to do so would be to seek to circumvent the parties’ intention expressed in clause 9.12(a).
9.13 Payments affecting the Purchase Price
(a) Any payment made by a Seller Group Member to a Buyer Group Member or the Target Group Companies in respect of any Claim will be in reduction of the Purchase Price.
(b) Any payment (including a reimbursement) made by a Buyer Group Member or the Target Group Companies to a Seller Group Member in respect of any Buyer Claim will be an increase in the Purchase Price.
(c) For the avoidance of doubt, the limitations set out in clause 9.5 shall be determined without regard to any adjustment to the Purchase Price made pursuant to this clause 9.13.
9.14 Tax effect of Claims
If a party (payor) is liable to pay an amount to another party (recipient) in respect of a Claim and that payment is treated as income under the Tax Law such that the payment increases the income tax payable by the recipient, or the Head Company of any Consolidated Group of which the recipient is a member, (collectively the recipient Group) under the Tax Law, then the payment must be grossed-up by such amount as is necessary to ensure that the net amount retained by the recipient Group after deduction of Tax or payment of the increased income tax equals the amount the recipient Group would have retained had the Tax or increased income tax not been payable, after taking into account any benefits or relief relating to Tax of the kind referred to in clause 9.11 obtained or to be obtained by the Buyer Group in relation to such Claim or payment.
9.15 Independent limitations
Each qualification and limitation in this clause 9 is to be construed independently of the others and is not limited by any other qualification or limitation.
10 PROCEDURES FOR DEALING WITH CLAIMS
10.1 Notice of Claims
(a) (Actual Claims): The Buyer must notify the Seller in writing as soon as reasonably practicable after the Buyer has become aware of the facts giving rise to a Warranty Claim or Tax Demand, as applicable, if:
(1) it decides to make a Claim against the Seller that either alone or together with other Claims exceeds any applicable thresholds set out in clause 9.5(a); or
(2) a Third Party Claim or Tax Demand is made that may give rise to a Claim against the Seller.
(b) (Potential Claims) Without limiting clause 10.1(a), the Buyer must also notify the Seller in writing as soon as reasonably practicable after the Buyer has become aware of the facts giving rise to a Warranty Claim or Tax Demand, as applicable, if:
(1) the Buyer believes that it would be entitled to make a Claim against the Seller (whether or not such Claim would exceed the thresholds set out in clause 9.5(a)); or
(2) the Buyer becomes aware of any events, matters or circumstances (including any potential threatened Third Party Claim or Tax Demand) that may give rise to a Claim against the Seller, whether alone or with any other Claim or circumstances or with the passage of time.
(c) (Details required): The Buyer must include in each written notice given under clause 10.1(a) or 10.1(b) all relevant details (including, if known, the amount) then known to a Buyer Group Member or the Target Entity of:
(1) the Claim and if applicable, any other Claims that together with the Claim give rise to any applicable thresholds in clause 9.5(a) being exceeded;
(2) if applicable, the Third Party Claim or Tax Demand; and
(3) the events, matters or circumstances giving rise to the Claim.
(d) (Extracts): The Buyer must also include in each written notice given under clause 10.1(a) or 10.1(b) an extract of:
(1) any part of a Demand (including a Tax Demand) that identifies the liability or amount to which the Claim relates or other evidence of the amount of the Demand to which the Claim relates; and
(2) if available or relevant, any corresponding part of any adjustment sheet or other explanatory material issued by a Governmental Agency that specifies the basis for the Demand to which the Claim relates or other evidence of that basis.
(e) (Demands): The Buyer must provide a copy of any document referred to in clause 10.1(d) to the Seller as soon as practicable of receipt of that document by a Buyer Group Member or the Target Entity.
(f) (Developments): The Buyer must also, on an on-going basis, keep the Seller informed of all material developments in relation to the Claim notified under clause 10.1(a) or 10.1(b).
(g) (Access): For the purposes of the Seller obtaining additional information in respect of a potential Third Party Claim or Tax Demand or determining whether to assume the conduct of defence of a Third Party Claim under clause 10.2 or to contest a Tax Demand under clause 10.3, the Buyer must provide, and must procure that each Buyer Group Member and the Target Group Companies provide, the Seller with all reasonable assistance requested by it in relation to the Third Party Claim or Tax Demand (or potential Third Party Claim or Tax Demand) including providing, at the Seller’s cost, access to witnesses and documentary or other evidence relevant to the Tax Demand or the Disputing Action (or potential Third Party Claim or Tax Demand), allowing it and its legal advisers to inspect and take copies of all relevant books, records, files and documents, and providing it with reasonable access to the personnel, premises and chattels of the Buyer Group Members and the Target Group Companies.
(h) (Compliance): Without limiting any other provision of this deed or other right or remedy of the Seller, if the Buyer does not fully comply with this clause 10 in respect of a Claim, the Seller shall continue to be liable under the Claim except to the extent that the defence of such Claim is prejudiced by the failure of the Buyer to fully comply with this clause.
10.2 Third Party Claims
The following additional obligations apply in respect of the Third Party Claims.
(a) (No admission): The Buyer must not, and must ensure that the Target Group Companies and Buyer Group Members do not:
(1) accept, compromise or pay;
(2) agree to arbitrate, compromise or settle; or
(3) make any admission or take any action in relation to,
a Third Party Claim that may lead to liability on the part of the Seller under a Claim without the Seller’s prior written approval (which must not be unreasonably withheld or delayed).
(b) (Defence of claim): Following receipt of a written notice under clause 10.1(a) or 10.1(b) in respect of a Claim that arises from or involves or could potentially involve a Third Party Claim, the Seller may, by giving written notice to the Buyer within 20 Business Days from the date of the notice, assume the conduct of the defence of the Third Party Claim.
(c) (Seller assumes conduct): If the Seller advises the Buyer that it wishes to assume the conduct of the defence of the Third Party Claim under
clause 10.2(b):
(1) (indemnity) provided that the Seller provides the Buyer with an indemnity against all Loss that may result from such action, the Buyer must promptly take, and must procure that each Buyer Group Member and the Target Group Companies promptly take, at the cost of the Seller, all reasonable actions requested by the Seller to avoid, contest, compromise or defend the Third Party Claim, including using professional advisers nominated by the Seller and approved by the Buyer for this purpose;
(2) (access) the Buyer must provide, and must procure that each Buyer Group Member and the Target Group Companies provide, the Seller, at the Seller’s cost, with all reasonable assistance requested by it in relation to the Third Party Claim, including providing access to witnesses and documentary or other evidence relevant to the Third Party Claim, allowing it and its legal advisers to inspect and take copies of all relevant books, records, files and documents, and providing it with reasonable access to the personnel, premises and chattels of the Seller Group Members and the Target Group Companies ; and
(3) (actions by the Seller) subject to clause 10.2(d), the Seller may take such actions as the Seller may decide about the Third Party Claim, including to negotiate, defend and/or settle the Third Party Claim and to instigate, conduct and/or settle a related counterclaim against that Third Party (and the term Third Party Claim as used in the balance of this clause includes that related counterclaim) and to recover costs incurred as a consequence of the Third Party Claim from any person.
(d) (Conduct of claim by Seller): If the Seller assumes the conduct of the defence of a Third Party Claim, in conducting any proceedings or actions in respect of that Third Party Claim the Seller must:
(1) act in good faith;
(2) liaise with the Buyer in relation to the defence of the Third Party Claim; and
(3) provide the Buyer with reasonable access to a copy of any notice, correspondence or other document relating to the Third Party Claim.
(e) (Buyer assumes conduct): If the Seller advises the Buyer that it does not wish to assume the conduct of the defence of the Third Party Claim or fails to provide written notice of its intention to assume the conduct of the Third Party Claim in accordance with clause 10.2(b), then the Buyer must procure that any Buyer Group Member or the Target Group Company that is conducting any proceedings or actions in respect of that Third Party Claim:
(1) acts in good faith;
(2) liaises with the Seller in relation to the defence of the Third Party Claim; and
(3) provides the Seller with reasonable access to a copy of any notice, correspondence or other document relating to the Third Party Claim.
10.3 Tax Demands
The following additional obligations apply in respect of Claims arising from or involving a Tax Demand.
(a) (No admission): The Buyer must not, and must ensure that the Target Group Companies and Buyer Group Members do not:
(1) accept, compromise or pay;
(2) agree to arbitrate, compromise or settle; or
(3) make any admission or take any action in relation to,
a Tax Demand that may lead to liability on the part of the Seller under a Claim without the prior written approval of the Seller (which must not be unreasonably withheld or delayed). However, the Buyer or any of the Target Group Companies may pay any Tax or Duty to a Governmental Agency by the due date for payment without affecting any of its rights under this deed.
(b) (Payment if not contesting a Tax Demand): If the Seller does not advise the Buyer that it wishes to contest the Tax Demand or fails to provide written notice of its intention to contest the Tax Demand in accordance with clause 10.3(c), then the Seller must pay in Immediately Available Funds and as a reduction in the Purchase Price the amount notified by the Buyer (as evidenced with appropriate supporting documentation) within 3 Business Days after the later of the dates given by clause 10.3(c)(1) and clause 10.3(c)(2).
(c) (Contesting a Tax Demand): Following receipt of a written notice under clause
10.1 in respect of a Claim that arises from or involves a Tax Demand, the Seller may, by written notice to the Buyer by no later than the date that is the later of:
(1) 5 Business Days before the due date for payment to the Governmental Agency; or
(2) 15 Business Days after receipt of the written notice given by the Buyer under clause 10.1,
advise the Buyer that it wishes to contest the Tax Demand.
(d) (Procedure for contesting a Tax Demand): If the Seller advises the Buyer in writing that it wishes to contest the Tax or Duty the subject of the Tax Demand under clause 10.3(c) then:
(1) (Payment of Tax) the Seller must pay the Buyer, in Immediately Available Funds and as a reduction in the Purchase Price, so much of the Tax or Duty as is required by the relevant Governmental Agency to be paid while any action is being taken under this clause 10.3 by the date that is the later of 2 Business Days before the due date for payment to the Governmental Agency and 15 Business Days after receipt of the written notice given by the Buyer under clause 10.1; and
(2) (Objection to Tax Demand or Disputing Action) at the Seller’s written request and at the Seller’s cost, the Buyer must take, or procure that the person required to pay the Tax or Duty (Tax Payor) takes such Disputing Action in a timely manner in relation to the Tax Demand as the Seller may reasonably require.
(e) (Access): The Buyer must provide, and must procure that each Buyer Group Member and the Target Group Companies provide, the Seller with all reasonable assistance requested by it in relation to the Tax Demand including providing, at the Seller’s cost, access to witnesses and documentary or other evidence relevant to the Tax Demand or the Disputing Action, allowing it and its legal advisers to inspect and take copies of all relevant books, records, files and documents, and providing it with reasonable access to the personnel, premises and chattels of the Buyer Group Members and the Target Group Companies.
(f) (Conduct of proceedings by the Seller): If the Seller contests the Tax Duty the subject of a Tax Demand then the Buyer must, at the Seller’s cost, follow, and must procure that each Buyer Group Member and the Target Entity follows, all reasonable directions of the Seller relating to the conduct of any Disputing Action contemplated by this clause 10.3(f), including using professional advisers nominated by the Seller. In making any such directions, the Seller must:
(1) act in good faith;
(2) liaise with the Buyer in relation to conduct of Disputing Action contemplated by this clause 10.3(f); and
(3) provide the Buyer with reasonable access to a copy of any notice, correspondence or other document relating to that Disputing Action.
11 BUYER WARRANTIES
11.1 Buyer Warranties
The Buyer gives the Buyer Warranties in favour of the Seller on the date of this deed and the Buyer Warranties will be deemed to be repeated immediately before Completion, except Buyer Warranty 13 which will be deemed to be repeated on each day between the date of this deed and the Completion Date (including at Completion).
11.2 Independent Warranties
Each of the Buyer Warranties is to be construed independently of the others and is not limited by reference to any other Buyer Warranty.
11.3 Reliance
The Buyer acknowledges that the Seller has entered into this deed and will complete this deed in reliance on the Buyer Warranties.
11.4 Notification
The Buyer must promptly notify the Seller in writing, and in any event within 1 Business Day, if at any time after the date of this deed the Buyer becomes aware that:
(a) Buyer Warranty 13 has ceased to be true and accurate; or
(b) an act or event has occurred that would or might reasonably be expected to result in Buyer Warranty 13 ceasing to be true and accurate at any time up to and including Completion,
and must also provide the Seller with details of that fact.
12 PERIOD AFTER COMPLETION
12.1 Appointment of proxy
(a) From Completion until the Sale Shares are registered in the name of the Buyer, the Seller must:
(1) appoint the Buyer as the sole proxy of the holders of Sale Shares to attend shareholders’ meetings and exercise the votes attaching to the Sale Shares;
(2) not attend and vote at any shareholders’ meetings; and
(3) take all other actions in the capacity of a registered holder of the Sale Shares as the Buyer directs in writing.
(b) The Seller indemnifies the Buyer against all Loss suffered or incurred by the Buyer arising out of the Seller's failure to implement any action referred to in clause 12.1(a).
(c) The Buyer indemnifies the Seller against all Loss suffered or incurred by the Seller arising out of the implementation of any action taken in accordance with the proxy referred to in clause 12.1(a).
12.2 Access to records by Seller
(a) The Buyer must procure that all Business Records are preserved in respect of the period ending on the Completion Date until the later of:
(1) 7 years from the Completion Date; and
(2) any date required by an applicable law.
(b) After Completion the Buyer must, on reasonable notice from the Seller:
(1) provide the Seller and its advisers with reasonable access to the Business Records and allow the Seller to inspect and obtain copies or certified copies of the Business Records at the Seller’s expense; and
(2) provide the Seller and its advisers with reasonable access to the personnel and premises of the Buyer Group Members and the Target Group Companies,
for the purpose of assisting the Seller Group Members to prepare tax returns, accounts and other financial statements which relate in whole or part to a period prior to Completion, or to discharge statutory obligations or comply with Tax, Duty or other Legal Requirements or to conduct legal or arbitration proceedings, in each case solely related to the transactions between the Buyer and the Seller contemplated by this deed.
(c) The Seller must reimburse the Buyer for its reasonable costs in retrieving any Business Records and making personnel and premises available under this clause 12.2.
(d) The Buyer is not obliged to waive legal professional privilege. The Seller must comply with any reasonable steps requested by the Buyer in writing to preserve confidentiality.
(e) The Buyer agrees that the Seller may retain copies of any Business Records that it may require to enable it to comply with any applicable law after the Completion Date.
12.3 Branding and phase out
(a) Subject to clause 12.3(b), on and from Completion, the Buyer must not, and must ensure that each Buyer Group Member and the Target Group Companies does not, use any trade mark, logo (either on its own or in combination with other material) get up or business, domain or company name containing any of:
(1) the word “Copper Mountain”; or
(2) any word, expression, letter, name, logo or mark that is similar to or likely to be confused with “Copper Mountain”,
(together, the Seller Group Name), including in any form that the Target Entity has used before Completion.
(b) Subject to clauses 12.3(c) and 12.3(d), the Seller agrees that it will not take any action against the Buyer or the Target Group Companies in respect of any breach of clause 12.3(a) in respect of the Seller Group Name during the period of up to 3 months after the Completion Date, provided that the Buyer has used all reasonable endeavours to avoid, or minimise the extent of, the breach and does not use the Seller Group Name in a manner that is inconsistent with its use before Completion.
(c) The Buyer must immediately discontinue, and procure that the Target Group Companies discontinue, any use of a Seller Group Name if such use would breach any law or if the breach gives rise to an offence under any law.
(d) The Seller may by not less than 5 Business Days’ notice to the Buyer withdraw its agreement in clause 12.3(b) if in its reasonable opinion any use referred to in clause 12.3(b) may adversely affect the Seller’s, or Seller Group Member’s reputation, or capacity to effectively protect the Seller Group Name.
12.4 Tax returns
(a) The Seller or the Seller’s Head Company will, at its own cost and expense, have the sole conduct and control of the preparation and filing of all Tax returns, forms or statements of, or relating to, the Target Group Companies, to the extent they relate to any periods ending on or before the Completion Date (Pre Completion Return).
(b) The Buyer must provide to the Seller at its own cost all information and assistance reasonably required by the Seller (including reasonable access to the Employees and Business Records) in connection with the preparation of the Pre Completion Returns.
(c) The Buyer will, at its own cost and expense, have the sole control of the preparation and filing of all Tax returns, forms or statements of, or relating to, the Target Group Companies, for any period that includes, but does not end on or before the Completion Date, unless the Seller’s Head Company has the responsibility under the Tax Law to prepare and file such Tax returns, forms or statements, in which case the Seller’s Head Company will have the sole conduct and control of the preparation and filing of such Tax returns, forms or statements (Straddle Return).
(d) The Buyer must procure that each Straddle Return for which it has the sole control for preparing and filing:
(1) is prepared in a manner consistent with the requirements of any Tax Law, general accepted administrative practice and the past practice of the Target Group Companies, and must deliver each Straddle Return to the Seller as soon as it is available but no later than:
(A) in the case of a monthly return, five Business Days,
(B) in any other case, 20 Business Days
before it is due to be filed (taking into account any extension of time to file the Straddle Return which has been properly obtained) for the Seller’s review and comment; and
(2) is filed by the due date for filing (taking into account any extension of time to file the Straddle Return which has been properly obtained).
(e) The Seller must provide to the Buyer at its own cost all information and assistance reasonably required by the Buyer (including reasonable access to Seller Group employees and relevant Seller Group business records) in connection with the preparation of a Straddle Return for which the Buyer has sole control for preparing and filing.
(f) The Buyer must provide to the Seller or the Seller’s Head Company at the Seller’s own cost all information and assistance reasonably required by the Seller or the Seller’s Head Company (including reasonable access to Target Entity employees and Business Records) in connection with the preparation of a Straddle Return for which the Seller’s Head Company has sole control for preparing and filing.
(g) If the Buyer provides a written notice under clause 10.1 in respect of a Claim that arises from or involves a Tax Demand, then at all times from the date of receipt of that notice the provisions of clause 10.3 will apply to that Tax Demand or the Tax or Pre Completion Tax event the subject of that Tax Demand and not this clause 12.4.
(h) Clauses 12.4(a) to 12.4(f) do not apply to the extent that clause 15.6 applies.
(i) If there is a dispute in relation to a Straddle Return under clause 12.5 which is not resolved before the due date for filing the return, the Buyer must:
(1) file the Straddle Return as prepared by the Buyer (except to the extent that the Seller has obtained an opinion from a suitably qualified tax adviser that an item required by the Buyer in a Straddle Return is inconsistent with the law or generally accepted administrative practice of the relevant Governmental Agency, in which case the Buyer must amend the Straddle Return in accordance with that advice); and
(2) ensure that an amended return, which reflects the resolution of the disputed items under clause 12.5, is filed promptly after the disputed items are resolved (if required having regard to the terms of the resolution of the disputed items).
12.5 Objections to Pre Completion Returns or the Straddle Returns
(a) If the Buyer or the Seller objects to any items set out in the Pre Completion Return or the Straddle Return (as applicable) it must give notice in writing to the other (Dispute Notice) as soon as it is aware of the objection, but no later than 10 Business Days before the Pre Completion Return or Straddle Return (as applicable) is due to be filed (taking into account any extension of time to file the Straddle Return which has been properly obtained), setting out full details of the objection including:
(1) the items in dispute;
(2) as far as possible, the amount in dispute; and
(3) as far as possible, the adjustments or amendments to the Pre Completion Return or Straddle Return which they are seeking,
(Disputed Matters).
(b) If the Buyer or the Seller gives a Dispute Notice, the Buyer and Seller must enter into good faith negotiations and use all reasonable endeavours to agree on the Disputed Matters in dispute as quickly as possible.
(c) If the Buyer and Seller cannot resolve any such dispute within ten Business Days of the objection being notified (or such other period as they agree in writing), then the Buyer and Seller must appoint an Expert to determine the proper treatment of the Disputed Matters in accordance with clause 12.6.
(d) Despite the appointment or determination of an Expert under clause 12.5(c), the Buyer and Seller may, at any time, agree in writing the treatment of any or all of the Disputed Matters.
12.6 Resolution of tax disputes
(a) If a Disputed Matter is referred for determination by an Expert in accordance with clause 12.5, the Buyer and the Seller must use reasonable endeavours (including by exchanging details in relation to potential candidates) to agree on an independent person to be appointed as the Expert as soon as practicable. Failing agreement within 10 Business Days, the Seller will request the then Chair of the Resolution Institute (or its nominee) to nominate an independent person with appropriate qualifications, who must be a partner of PricewaterhouseCoopers, Deloitte, Ernst & Young or KPMG and have at least 10 years practical taxation advisory experience relevant to determining the Disputed Matter.
(b) Where the Chair of the Resolution Institute (or its nominee) is to nominate the Expert, the parties will sign or submit all documents and the Buyer and the Seller must each pay half of all the fees necessary to allow the Chair (or its nominee) to make such appointment.
(c) The appointment of the Expert under this clause will be on the following basis:
(1) the Expert must make the determination in accordance with the terms of this clause 12.6;
(2) the Expert will only consider the unresolved Disputed Matters;
(3) the Expert will act as an independent expert and not as an arbitrator;
(4) subject to the terms of this document, the Expert will decide the procedure to be followed;
(5) all correspondence between the Expert and a party must be in writing and copied to the other parties.
(6) unless the Buyer and the Seller both agree, the Expert may not request that the parties make, and no party may make, oral submissions;
(7) the Expert will be engaged on the basis that it will use its best endeavours to make a determination within the shortest possible time;
(8) the Expert is entitled to seek its own legal or other advice in relation to the Disputed Matters to the extent that it deems necessary to professionally discharge his / her duties as an independent expert;
(9) each party will bear its own legal and other costs (excluding the costs of the Expert process) in connection with the Expert process contemplated in this clause (and to the extent that the Expert seeks to allocate such costs differently, the parties will ensure that payments are made between them to give effect to this paragraph);
(10) unless otherwise determined by the Expert (taking into account the merits of each party’s position in relation to the Disputed Matters), the Buyer and the Seller must each pay half of the costs of the Expert (including the Expert’s fee and costs incurred by the Expert in connection with the Expert process);
(11) the Buyer and the Seller must keep all information disclosed during the Expert determination confidential on the terms of this document; and
(12) the Expert must issue a written determination containing reasons.
(d) The Seller and the Buyer must provide all information and assistance the Expert reasonably requests for the purposes of resolving the dispute, including providing the Expert with a copy of the Dispute Notice and this deed. The Buyer or the Seller:
(1) may make a submission to the Expert in respect of each of the Disputed Matters within 10 Business Days of appointment of an Expert, and must provide that submission to the other party on the same day the submission is provided to the Expert; and
(2) may make a response to the submission of the other party under clause 12.6(e)(1) within 10 Business Days of receipt of the submission (dealing with matters raised in that submission only).
(e) The procedures to be used by the Expert in determining the dispute will be as follows:
(1) the Expert will review the documents submitted by the Buyer and the Seller and have the opportunity to ask specific written questions of, or request specific historical documents from, either party to clarify the Expert’s understanding of the submissions; copies of any submission, response or document submitted to or by the Expert by or to the Buyer or the Seller as contemplated in this clause will be submitted by the Expert to the other party simultaneously or as soon as received, as the case may be; and
(2) in relation to questions asked of the Buyer or the Seller, the other party may submit to the Expert written dissent to any response submitted by the first party to the Expert within 3 Business Days of receiving a copy of the written response.
(f) Except as permitted or required by this clause, the Buyer and the Seller must not:
(1) communicate with the Expert (whether in writing or otherwise); or
(2) make any documents or matter known to the Expert, without the prior written consent of the other party.
(g) The decision of the Expert in relation to the Disputed Matters will, in the absence of manifest error, be conclusive and binding on all parties and the Pre Completion Return or Straddle Return (as applicable) will be deemed to be amended accordingly and will be final.
12.7 Pre Completion Tax Events
(a) The Buyer must ensure that no Buyer Group Member amends or seeks to amend any Tax Return of the Target Group Companies which were lodged before the Completion Date without the prior written consent of the Seller (such consent not to be unreasonably withheld or delayed).
(b) Except in relation to the preparation of Pre Completion Returns and Straddle Returns, from and after Completion the Buyer must, and must ensure that each Buyer Group Company will:
(1) not disclose any information or material to a Government Agency in relation to any event, act, matter or transaction or amount derived (or deemed to be derived) or expenditure incurred before, on, or as a result of, Completion (Pre Completion Tax Event) without the prior written consent of the Seller (which consent must not be unreasonably withheld or delayed), except as required by law;
(2) not make any admission of liability, or any agreement, compromise or settlement with a Governmental Agency in relation to a Pre Completion Tax Event without the prior written consent of the Seller (which consent must not be unreasonably withheld or delayed);
(3) co-operate with and assist the Seller in relation to any Pre Completion Tax Event; and
(4) promptly provide the Seller with copies of any correspondence with, or material provided to or by, a Governmental Agency and keep the Seller informed of any oral discussions with a Governmental Agency in relation to a Pre Completion Tax Event.
12.8 Insurance
The Buyer acknowledges and agrees that, from Completion, the Buyer will be responsible for arranging any and all insurance that is necessary or desirable in relation to the Target Group Companies.
13 CONFIDENTIALITY AND ANNOUNCEMENTS
13.1 Confidentiality Agreement
(a) Subject to clause 13.1(b), the parties acknowledge and agree that they continue to be bound by the Confidentiality Agreement after the date of this deed and up until Completion and that the Confidentiality Agreement will terminate on and from Completion.
(b) The Buyer and Seller may, or a Seller Group Member and Buyer Group Member may, make the Agreed Announcements.
(c) The Buyer and the Seller agree that clause 13.2 of this deed overrides the Confidentiality Agreement to the extent of any inconsistency.
13.2 Confidentiality
(a) Each party may divulge or disclose any information relating to another party, this deed or the terms of the Sale to the extent that:
(1) the disclosure is necessary to seek satisfaction of any of the Conditions or is required for a party to exercise its rights and perform its obligations under this deed, provided that the relevant person (including a Governmental Agency) is made aware of the confidential nature of the information and is requested to keep the information secret and confidential;
(2) the disclosure is required for use in legal proceedings regarding this deed or the Sale;
(3) the disclosure is required by applicable law or the rules of any recognised stock exchange on which the shares of a party or of a Related Body Corporate of a party are listed, provided that the party has to the extent practicable having regard to the required timing of the disclosure consulted with the other party as to the form and content of the disclosure;
(4) the disclosure is made by the party to its lawyers, accountants, investment bankers, consultants or professional advisers in connection with the purchase of the Sale Shares and the Assets under this deed;
(5) the disclosure is made in connection with the Buyer’s financing of the purchase of the Sale Shares and the Assets under this deed; or
(6) the other party has consented in writing before the disclosure.
(b) Notwithstanding clause 13.2(a), any Seller Group Member may provide periodic market updates in relation to the Business as it deems necessary.
(c) In addition to the right to disclose under clause 13.2(a), from Completion, the Buyer Group Members may disclose confidential information relating to the Target Group Companies and the Business except to the extent that such information relates to a Seller Group Member or its business.
(d) Nothing in this deed is to be construed as constituting the consent of a party, with respect to a Security Interest created by this deed, to the disclosure of the terms of this deed for the purpose of section 275(7) of the PPSA. No party who is the grantor of a Security Interest under this deed will, after the date of this deed, consent to the disclosure of the terms of this deed to an interested person for the purpose of section 275 of the PPSA.
(e) To the extent not prohibited by the PPSA, each party that is the grantor of a Security Interest under this deed waives its right to receive, and the secured party is not required to give, any notice otherwise required to be given by a secured party under section 157 (verification statements) or any other provision of the PPSA.
14 DUTIES, COSTS AND EXPENSES
14.1 Duties
(a) Notwithstanding any other provision of this deed, the Buyer must pay, and indemnify the Seller for, all Duty (including any fine, interest or penalty) in respect of the execution, delivery and performance of this deed, including, for the avoidance of doubt, in relation to the Sale, and any agreement, document or transaction entered into, signed, evidenced or effected under this deed. For the avoidance of doubt, any such Duties are in addition to the Purchase Price.
(b) If a party other than the Buyer pays any Duty referred to in clause 14.1(a) (including any fine, interest or penalty), in whole or in part, the Buyer must reimburse the paying party without set-off or deduction immediately on demand.
14.2 Costs and expenses
(a) Unless otherwise provided for in this deed, each party must pay its own costs and expenses in respect of the negotiation, preparation, execution, delivery and registration of this deed and any other agreement or document entered into or signed under this deed.
(b) Any action to be taken by the Buyer or the Seller in performing its obligations under this deed must be taken at its own cost and expense unless otherwise provided in this deed.
15 GST
15.1 Definitions and interpretation
(a) Words used in this clause 15 that have a defined meaning in the GST Law have the same meaning as in the GST Law except that “Supplier” means a party who makes a supply whether on behalf of another entity or otherwise.
(b) “Payer” means a party who provides or is liable to provide consideration under this deed for a supply.
(c) Unless otherwise expressly stated, all consideration to be provided under any other provision of this deed is exclusive of GST. Any consideration that is specified to be inclusive of GST must not be taken into account in calculating the GST payable in relation to a supply for the purpose of this clause 15.
(d) A reference to supply is to a supply made under or in connection with this deed.
(e) A reference to GST payable by the Supplier includes any GST payable by the representative member of any GST group of which the Supplier (or the entity on whose behalf the Supplier is acting) is a member.
(f) A reference to input tax credits to which an entity is entitled includes any input tax credits to which the representative member of any GST group to which that entity may belong is entitled.
15.2 GST
(a) If the Supplier is or becomes liable to pay GST in respect of any supply, the Payer must pay an additional amount to the Supplier equal to the amount of that GST (GST Amount). The Payer must pay the GST Amount at the same time as the first part of any consideration is provided for that supply.
(b) If the GST Amount recovered by the Supplier from the Payer under clause 15.2(a) for a supply differs for any reason from the amount of GST paid or payable by the Supplier on that supply, then the Payer must pay to the Supplier on demand (or the Supplier credit the Payer with) the amount of that difference. If any adjustment event occurs in relation to a supply, the Supplier must give the Payer an adjustment note within 7 days after the date of the adjustment event.
15.3 Tax invoices
The Supplier must issue a Tax Invoice to the Payer of a supply before the Supplier is entitled to payment of the GST Amount.
15.4 Reimbursement
If either party is entitled under this deed to be reimbursed or indemnified by the other party for a cost or expense incurred in connection with this deed, the reimbursement or indemnity payment will be limited to the total amount paid or payable less any input tax credit to which an entity is entitled for an acquisition to which the amount relates.
15.5 Information, returns and accounting to end GST Group
After Completion:
(a) the Buyer must ensure that the Target Entity gives the representative member of the Seller’s GST Group on a timely basis, all information that the Target Entity holds that is needed to lodge any GST return; and
(b) the Seller must ensure that the representative member of the Seller’s GST Group:
(1) applies to the Commissioner of Taxation to revoke the approval of the Target Group Companies as members of the Seller’s GST Group from the Completion Date; and
(2) lodges the GST returns for the final tax period in which the Target Group Companies were members of the Seller’s GST Group and remits all amounts in respect of GST to the Commissioner of Taxation as and when required by the GST Law.
15.6 Supplies between former members of the GST Group
If:
(a) before Completion any Target Group Company is a member of the Seller’s GST Group;
(b) that Target Group Company has made a supply to, or has been the recipient of a supply made by, another member of the Seller’s GST Group;
(c) due to Completion that Target Group Company ceases to be eligible to be a member of the Seller’s GST Group;
(d) because the supply would have been to another member of the Seller’s GST Group, the supply would not have been treated as a taxable supply if it had been made while that Target Group Company was a member of the Seller’s GST Group;
(e) the supply is pursuant to an agreement made before Completion;
(f) that agreement does not contain a provision requiring the recipient to pay to the supplier any amount in respect of GST in addition to the consideration otherwise payable for the supply; and
(g) the consideration negotiated by the parties for the supply was not calculated to include GST, then
after Completion, the Seller (if the recipient of a taxable supply is not a Target Group Company) or the Buyer (if the recipient of a taxable supply is a Target Group Company) must ensure that the recipient of a taxable supply indemnifies the supplier of a taxable supply for any GST payable in respect of a supply and pays the amount of that GST in addition to the consideration for the supply.
16 NOTICES
16.1 Form of Notice
A notice or other communication to a party under this deed (Notice) must be:
(a) in writing and in English; and
(b) addressed to that party in accordance with the details nominated in Schedule 1 (or any alternative details nominated to the sending party by Notice).
16.2 How Notice must be given and when Notice is received
(a) A Notice must be given by one of the methods set out in the table below.
(b) A Notice is regarded as given and received at the time set out in the table below.
However, if this means the Notice would be regarded as given and received outside the period after 5.00pm (addressee’s time) on a Business Day (business hours period), then the Notice will instead be regarded as given and received at the start of the following business hours period.
|
|
|
|
|
|
| Method of giving Notice |
When Notice is regarded as given and received |
|
|
| By hand to the nominated address |
When delivered to the nominated address. |
|
|
| By pre-paid post to the nominated address |
At 9.00am (addressee’s time) on the fifth Business Day after the date of posting. |
|
|
| By email to the nominated email address |
When sent by the sender to the addressee’s email address (unless the sender receives a delivery failure notification indicating that the email has not been delivered to the addressee). |
16.3 Notice must not be given by electronic communication
A Notice must not be given by electronic means of communication (other than email as permitted in clause 16.2).
17 GENERAL
17.1 Governing law and jurisdiction
(a) This deed is governed by, and is to be construed in accordance with, the laws in force in Queensland, Australia.
(b) Each party irrevocably submits to the non-exclusive jurisdiction of courts exercising jurisdiction in Queensland, Australia and courts of appeal from them in respect of any proceedings arising out of or in connection with this deed. Each party irrevocably waives any objection to the venue of any legal process in these courts on the basis that the process has been brought in an inconvenient forum.
17.2 Service of process
Without preventing any other mode of service, any document in an action (including, any writ of summons or other originating process or any third or other party notice) may be served on any party by being delivered to or left for that party at its address for service of notices under clause 16.
17.3 Invalidity and enforceability
(a) If any provision of this deed is invalid under the law of any jurisdiction, the provision is enforceable in that jurisdiction to the extent that it is not invalid, whether it is in severable terms or not.
(b) Clause 17.3(a) does not apply where enforcement of the provision of this deed in accordance with clause 17.3(a) would materially affect the nature or effect of the parties’ obligations under this deed.
17.4 Waiver
(a) No party to this deed may rely on the words or conduct of any other party as a waiver of any right unless the waiver is in writing and signed by the party granting the waiver.
(b) In this clause 17.4:
(1) conduct includes delay in the exercise of a right;
(2) right means any right arising under or in connection with this deed and includes the right to rely on this clause; and
(3) waiver includes an election between rights and remedies, and conduct which might otherwise give rise to an estoppel.
(c) A provision of, or a right, discretion or authority created under, this deed may not be:
(1) waived except in writing signed by the party granting the waiver; and
(2) varied except in writing signed by the parties.
(d) A failure or delay in exercise, or partial exercise, of a power, right, authority, discretion or remedy arising from a breach of, or default under this deed does not result in a waiver of that right, power, authority, discretion or remedy.
17.5 Variation
A variation of any term of this deed must be in writing and signed by the parties.
17.6 Assignment
The rights arising out of or under this deed are not assignable by a party without the prior written consent of the other party.
17.7 Further action to be taken at each party’s own expense
Subject to clause 14, each party must, at its own expense, do all things and execute all documents necessary to give full effect to this deed and the transactions contemplated by it.
17.8 Relationship of the parties
(a) Nothing in this deed gives a party authority to bind any other party in any way.
(b) Nothing in this deed imposes any fiduciary duties on a party in relation to any other party.
17.9 Exercise of rights
(a) Unless expressly required by the terms of this deed, a party is not required to act reasonably in giving or withholding any consent or approval or exercising any other right, power, authority, discretion or remedy, under or in connection with this deed.
(b) A party may (without any requirement to act reasonably) impose conditions on the grant by it of any consent or approval, or any waiver of any right, power, authority, discretion or remedy, under or in connection with this deed. Any conditions must be complied with by the party relying on the consent, approval or waiver.
17.10 Remedies cumulative
Except as provided in this deed and permitted by law, the rights, powers and remedies provided in this deed are cumulative with and not exclusive to the rights, powers or remedies provided by law independently of this deed.
17.11 Counterparts
(a) This deed may be executed in any number of counterparts.
(b) All counterparts, taken together, constitute one instrument.
(c) A party may execute this deed by signing any counterpart.
(d) Signatures may be exchanged by e-mail. Each party agrees to be bound by its own electronic signature and that it accepts the electronic signature of the other parties.
17.12 No merger
The Warranties, Buyer Warranties, undertakings and indemnities in this deed will not merge on Completion.
17.13 Entire agreement
This deed (as supplemented by the Disclosure Letter), together with the Contingent Consideration Deed and the letter agreement dated the date hereof between the Buyer and the Seller, states all the express terms of the agreement between the parties in respect of its subject matter. This deed supersedes all prior discussions, negotiations, understandings and agreements in respect of its subject matter other than, subject to clause 13, the Confidentiality Agreement.
17.14 No reliance
No party to this deed has relied on any statement by another party not expressly included in this deed.
17.15 Default Interest
(a) If a party fails to pay any amount payable under this deed on the due date for payment, that party must in addition to a continuing liability to pay the amount unpaid pay interest on the amount unpaid at the higher of SOFR plus 5% per annum or the rate (if any) fixed or payable under any judgment or other thing into which the liability to pay the amount becomes merged.
(b) The interest payable under clause 17.15(a):
(1) accrues from day to day from the day after the due date for payment up to and including the actual date of payment, before and, as an additional and independent obligation, after any judgment or other thing into which the liability to pay the amount becomes merged; and
(2) may be capitalised by the person to whom it is payable at monthly intervals on the basis of a 360 day year.
(c) The right to require payment of interest under this clause 17.15 is without prejudice to any other rights the non-defaulting party may have against the defaulting party at law or in equity.
(d) A failure to pay any amount under this deed is not remedied until both the amount unpaid and any interest payable under this clause 17.15 have been paid in full.
17.16 Benefits held on trust
The Seller holds the benefit of each indemnity, promise and obligation in this deed expressed to be for the benefit of a director, officer or employee of a Seller Group Member, or for the benefit of a Seller Group Member or Seller Group Representative or Adviser that is not a party to this deed, on trust for that director, officer, employee, Seller Group Member or Seller Group Representative or Adviser. The provisions of this clause
17.16 may be enforced by the Seller on behalf of any director, officer or employee of a Seller Group Member, or other Seller Group Member or Seller Group Representative or Adviser.
17.17 Attorneys
Any attorney executing this deed states that it has no notice of the revocation of the power of attorney appointing it.
17.18 Withholdings
(a) In this clause:
(1) TA Act means the Taxation Administration Act 1953 (Cth)
(2) Withholding Amount means the amount that the Buyer determines that it is required to pay to the Commissioner of Taxation pursuant to Subdivision 14-D of Schedule 1 to of the TA Act in connection with the acquisition of the Sale Shares under this deed.
(b) The Buyer and the Seller must make all payments that become due under this deed, free and clear and without deduction of all present and future withholdings (including Taxes, Duties, levies, imposts, deductions and charges of Australia or any other jurisdiction) unless the deduction or withholding is permitted under this deed or required by law.
(c) If the Buyer determines that it is under an obligation to pay a Withholding Amount to the Commissioner of Taxation, the Buyer must:
(1) deduct from the Purchase Price the Withholding Amount that the Buyer determines is payable to the Commissioner of Taxation;
(2) pay the Withholding Amount to the Commissioner of Taxation; and
(3) provide the Seller with evidence that it has paid the final Withholding Amount to the Commissioner of Taxation no later than 3 Business Days following Completion.
(d) A withholding made by the Buyer under paragraph (c) fully discharges its obligation to pay the relevant part of the Purchase Price to the Seller to the extent of the Withholding Amount.
(e) If any deduction or withholding is required by law to be made from a sum payable by the Buyer or the Seller under or in connection with this deed (other than a Withholding Amount covered by paragraph (c)), then the relevant payer must:
(1) promptly notify the payee if it becomes aware of the requirement to make the deduction or withholding or any change to the rate of deduction or withholding;
(2) promptly provide the payee with copies of any correspondence with, or material provided to or by, a Governmental Agency and keep the payee informed of any oral discussions with a Governmental Agency in relation to the deduction or withholding;
(3) make only those deductions or withholdings from the relevant sum as are necessary to comply with the law;
(4) pay to the appropriate Governmental Agency any amount deducted or withheld within the time allowed and in the amount required by law; and
(5) promptly after making the deduction or withholding, provide to the payee evidence satisfactory to the payee of that payment having been made.
(f) For the avoidance of doubt,
(1) no additional amount will be payable by the Buyer or the Seller to the other party on account of any deductions or withholding required by law to be made from a sum payable under or in connection with this deed; and
(2) no additional amount is payable by the Buyer to the Seller on account of the Withholding Amount.
17.19 Deed
This deed is a deed. Factors which might suggest otherwise are to be disregarded.
18 GUARANTEE BY BUYER'S GUARANTOR
18.1 Guarantee and indemnity
(a) For valuable consideration and in order to induce the Seller to enter into this deed, the Buyer's Guarantor absolutely, unconditionally and irrevocably guarantees to the Seller, on demand, the due and punctual performance by the Buyer of all its obligations under this deed, including the obligation to make the Completion Payment and pay the Contingent Consideration if the same becomes due and payable.
(b) As a separate and additional liability, the Buyer’s Guarantor indemnifies the Seller against all Loss, actions, proceedings and judgements of any nature, incurred by, brought, made or recovered against the Seller arising from any default or delay in the due and punctual performance of the Buyer’s obligations under this document.
18.2 Principal obligations
The obligations of the Buyer's Guarantor under this clause 18 are absolute, unconditional and irrevocable and:
(a) are principal obligations of the Buyer's Guarantor and not ancillary or collateral to any other right or obligation;
(b) may be enforced against the Buyer's Guarantor without the Seller first being required to exhaust any remedy it may have against the Buyer; and
(c) extend to cover this deed, as may be amended, varied, supplemented, renewed or replaced, whether with or without the consent of the Buyer's Guarantor.
18.3 Continuity
This clause 18 is a continuing guarantee and indemnity and remains in full force and effect for so long as the Buyer has any liability or obligation to the Seller under this document and until all those liabilities and obligations are fully discharged.
18.4 Liability unaffected by other events
The liability of the Buyer's Guarantor under this clause 18 extends to and is not affected by, any circumstance, act or omission which, but for this provision, might otherwise affect it at law or in equity including, whether with or without the consent of the Buyer's Guarantor:
(a) the grant to the Buyer or any other person of any time, waiver or other indulgence or concession;
(b) the discharge or release of the Buyer or any other person from any liability or obligation;
(c) any transaction or arrangement that may take place between the Seller and the Buyer or any other person;
(d) any amalgamation, merger or reorganization of the Buyer, in which event the obligations of the Buyer’s Guarantor shall apply to the entity resulting therefrom;
(e) any amalgamation, merger or reorganization of the Buyer’s Guarantor;
(f) any sale, lease or transfer of the assets of the Buyer or the Buyer’s Guarantor;
(g) any change in the ownership of any shares in the capital of the Buyer or the Buyer’s Guarantor;
(h) the occurrence of an insolvency event in relation to the Buyer or any other person;
(i) the Seller exercising or refraining from exercising its rights under any security or any other rights, powers or remedies against the Buyer or any other person;
(j) the amendment, replacement, extinguishment, unenforceability, failure, loss, release, discharge, abandonment or transfer (whether in whole or in part and with or without consideration) of any security now or in the future held by the Seller from the Buyer or any other person or by the taking of or failure to take any security;
(k) any failure, omission or delay by the Seller or the Buyer to give notice to the Buyer's Guarantor of any default by the Buyer or any other person under this document;
(l) this document not having been duly executed by or not being binding upon (whether in whole or in part) the Buyer or any other person; and
(m) any legal limitation, disability, incapacity or other circumstances related to the Buyer or any other person.
18.5 Variation of rights and cumulative remedies
(a) The exercise of a right partially or on one occasion does not prevent any further exercise of that right in accordance with the terms of this document. Neither a forbearance to exercise a right nor a delay in the exercise of a right operates as an election between rights or a variation of the terms of this deed.
(b) The rights, powers and remedies provided to the Seller in this clause 18 are cumulative and not exclusive of any rights, powers or remedies provided at law or in equity or by any agreement.
18.6 No withholdings
The Buyer's Guarantor must make all payments which may be or become due under this clause 18 free and clear, and without deduction, of all present and future withholdings (including Taxes) unless compelled by law. If the Buyer's Guarantor is compelled by law to deduct any withholding, it must pay to the Seller an amount equal to the withholding in addition to any payment due under this clause 18.
18.7 Currency
All moneys which the Buyer's Guarantor is liable to pay to the Seller under this clause 18 are due and payable in the currency in which they are payable under this deed. All payments are to be free of any commissions and expenses relating to foreign currency conversion or any other charge or expense.
18.8 No set-off
The Buyer's Guarantor has no right to set-off, deduct or withhold any moneys which it is liable to pay to the Seller under this clause 18 against any moneys which the Seller, is liable to pay to the Buyer or the Buyer's Guarantor whether under this document or otherwise.
Schedule 1
NOTICE DETAILS
Seller
Address Suite 1700 – 700 West Pender Street Vancouver, Canada V6C 1G8
Attention Letitia Wong, Executive Vice President, Strategy and Corporate Development
Email letitia.wong@cumtn.com
Copy to: Matthew B. Langford, Vice President, General Counsel and Corporate Secretary
Suite 1700 – 700 West Pender Street Vancouver, Canada V6C 1G8
matthew.langford@cumtn.com
/
Melanie A. Shishler
Davies Ward Phillips & Vineberg LLP 155 Wellington Street West
Toronto, Canada M5V 3J7 mshishler@dwpv.com
Buyer's Guarantor
Address Randfontein Office Park,
Corner of Main Reef Road and Ward Avenue Randfontein, South Africa
Attention Shela Mohatla, Company Secretary
Email companysecretariat@harmony.co.za
Copy to: Company Secretary,
Harmony Gold (Australia) Pty Limited Level 2, 189 Coronation Drive,
Milton, Queensland 4064 Australia
HGSEA.legal@harmonyseasia.com
Buyer
Address Level 2, 189 Coronation Drive,
Milton, Queensland 4064 Australia
Attention Company Secretary
Email HGSEA.legal@harmonyseasia.com
Schedule 2
CONDITIONS
|
|
|
|
|
|
|
|
|
|
|
|
|
|
|
| No |
|
Condition |
|
Right to waive |
| 1 |
|
The Seller obtains:
(1) the (a) consent and waiver from bondholders pursuant to the Nordic Bonds Agreement for the disposal of the Target Group Companies, as contemplated by this deed; or (b) redemption of the bonds pursuant to the voluntary early redemption mechanic in the Nordic Bonds Agreement; and
(2) the release (partial or otherwise) of the Nordic Security Documents and all associated Encumbrances and the return of all pledged collateral, in each case only as such documents, Encumbrances and collateral relate to the Target Group Companies, on terms acceptable to the Parties, acting reasonably.
|
|
Seller
Buyer |
|
|
|
|
|
| 2 |
|
One of the following occurs:
(1) the Buyer has received a written notice under the Foreign Acquisitions and Takeovers Act 1975 (Cth), by or on behalf of the Treasurer of the Commonwealth of Australia (or its delegate) stating or to the effect that the Commonwealth of Australia does not object to the transactions contemplated by this deed, either unconditionally or on terms reasonably satisfactory to the
Buyer; or
(2) the Treasurer of the Commonwealth of Australia becomes precluded from making an order in relation to the transactions contemplated by this deed under the Foreign Acquisitions and Takeovers Act 1975 (Cth); or
(3) if an interim order is made under the Foreign Acquisitions and Takeovers Act 1975 (Cth) in respect of the transactions contemplated by this deed, the subsequent period for making a final order prohibiting the transactions contemplated by this deed elapses without a final order being made.
|
|
Not applicable |
|
|
|
|
|
Schedule 3
WARRANTIES
1 Ownership and structure
1.1 Interests
The Target Entity is not the holder or beneficial owner of any shares or other capital in any body corporate (wherever incorporated) except for all of the issued shares in each of the other Target Group Companies.
1.2 Ownership of the Target Entity
At Completion:
(a) the Seller is the legal and beneficial owner of the Sale Shares and has complete power and right to sell the Sale Shares to the Buyer;
(b) the Buyer will acquire all of the fully diluted issued share capital in the Target Entity; and
(c) the Buyer will acquire the full legal and beneficial ownership of the Sale Shares free and clear of all Encumbrances, subject to the registration of the Buyer in the register of shareholders.
1.3 Ownership of the other Target Group Companies
(a) At Completion the Target Entity is the legal and beneficial owner of all of the fully diluted issued share capital of each of Target Group Companies, free and clear of any Encumbrances.
(b) The information set out in Schedule 10 in respect of each of the Target Group Companies is complete and accurate.
1.4 No Encumbrances or other arrangements
For each of the Target Group Companies:
(a) its shares can be sold and transferred free of any competing rights, including pre-emptive rights or rights of first refusal;
(b) its shares have been validly issued, are fully paid and no money is owing in respect of them;
(c) it is not under an obligation to issue, and no person has the right to call for the issue or transfer of, any shares or other securities in it at any time; and
(d) it has not issued securities with conversion rights to shares or securities in it and there are no agreements or arrangements under which options or convertible notes have been issued by it.
1.5 Indebtedness
(a) At Completion, each of the Target Group Companies has no financial indebtedness of any kind, including loans and any other financial accommodation or interest-bearing liability from any bank or other financial institution, or interest rate or currency swap or hedging arrangement.
(b) At Completion, no Target Group Company is party to any guarantee or indemnity in respect of, and is not otherwise liable for, the obligations or liabilities of any Seller Group Member.
2 Power and authority
2.1 No legal impediment
The execution, delivery and performance by the Seller of this deed:
(a) complies with its constating documents; and
(b) does not constitute a breach of any law, or cause or result in a default under any Encumbrance, by which it is bound and that would prevent it from entering into and performing its obligations under this deed.
2.2 Corporate authorisations
All necessary authorisations for the execution, delivery and performance by the Seller of this deed in accordance with its terms have been obtained or will be obtained before Completion, other than the Conditions required under clause 2.1 of this deed.
2.3 Power and capacity
The Seller has the corporate power and capacity to enter into and perform its obligations under this deed, and the Seller’s obligations under this deed are valid and binding and enforceable against it in accordance with their terms.
2.4 Incorporation
The Seller is validly incorporated and subsisting in accordance with the laws of its place of incorporation.
2.5 Target Group Companies
Each Target Group Company:
(a) is duly incorporated under the laws of the place of its incorporation; and
(b) is duly registered and authorised to do business in those jurisdictions which, by the nature of its business and assets, makes registration or authorisation necessary.
3 Management Accounts
3.1 Management Accounts
The Management Accounts:
(a) have been prepared from the books of account and ledgers of the Target Entity;
(b) except to the extent detailed in the Management Accounts, have been prepared on a basis which is consistent with accounting policies, procedures and practices previously applied by the Target Group Companies;
(c) have been used as the financial accounts relating to the Target Entity which have been rolled up into the audited consolidated financial statements of Seller for the fiscal year ended December 31, 2021; and
(d) have been prepared such that the Management Accounts are not misleading or inaccurate in any material respect.
3.2 Accounting assumptions
The Seller has disclosed all material accounting assumptions to the Buyer that are used in preparing the Management Accounts.
3.3 Position since Management Accounts Date
Since the Management Accounts Date, the Target Group Companies and the Eva Copper Project have been conducted in all material respects in the ordinary and usual course of business, other than as set out in the Disclosure Materials or as contemplated by this deed including, for the avoidance of doubt, the actions required in clause 5 of this deed.
4 Contracts
4.1 Default by Target Group Companies
So far as the Seller is aware, the Target Group Companies are not in material default under any Material Contract to which a Target Group Company is a party.
4.2 Default by Third Party
So far as the Seller is aware, no other party to any Material Contract to which a Target Group Company is a party is in material default under that agreement.
4.3 Material Contracts
(a) The Material Contracts are valid and subsisting.
(b) There are no royalties granted to any party in respect of the Tenements except to the extent Disclosed in the Material Contracts.
5 Tenements
(a) Subject to Permitted Encumbrances, the Target Group Companies are the sole registered and beneficial owner of, and have good and valid title to, the Tenements for which they are the registered holder as set out in Schedule 6, and the Tenements are valid and subsisting and in good standing.
(b) So far as the Seller is aware, there is no existing, pending or threatened dispute or litigation, arbitration or other legal proceedings concerning the Tenements which will or may impair in any material way the Target Group Companies’ ability to conduct the Business.
(c) No performance bond, financial support or guarantee is required to be given in connection with the Tenements and Authorisations held by the Target Group Companies, other than those required in accordance with the conditions attaching to the Tenements or Authorisations or required in accordance with legislation applying to the Tenements.
6 Assets
6.1 The Eva Copper Project
All the material assets used by the Target Group Companies, including those used in the Eva Copper Project are:
(a) fully paid for;
(b) either the absolute property of the relevant Target Group Company free and clear of all Encumbrances (other than Permitted Encumbrances) or used by the relevant Target Group Company under a contract under which it is entitled to use the assets on the terms and conditions of such contract; or
(c) not the subject of any lease or hire purchase agreement or agreement for purchase on deferred terms, other than in the ordinary course of business,
except as provided for or taken into account in the preparation of the Management Accounts.
6.2 Encumbrances
No Encumbrances exist on any Tenement or Property registered in the name of any Target Group Company (whether in whole or in part) other than the Permitted Encumbrances.
6.3 Assets
(a) All of the assets of the Target Group Companies comprise all of the assets necessary to continue operations of the Target Group Companies, including the Eva Copper Project, substantially in the same manner as carried on as at the date of this deed by the Seller Group.
(b) At Completion, Copper Mountain Mining Australia Pty Limited has no assets or liabilities except the shares it owns in CMMC Australia Pty Limited (ACN 623 541 079) and Copper Mountain Mining Pty Ltd (ACN 090 486 018).
7 Properties
7.1 Interests in land
The Target Group Companies do not have any interest in land except for its interest in the Properties, and the information in Schedule 7 is true and correct in all material respects.
7.2 All land owned or occupied
The Properties comprise all the land and premises owned, used or wholly or partially occupied by the Target Group Companies on its own account.
8 Environmental
(a) As far as the Seller is aware, as at the date of this deed, there is no investigation by any Governmental Agency (either current, pending or threatened) of the Target Group Companies relating to a material breach by the Target Group Companies of any Environmental Law, including in respect of the Eva Copper Project, and the Target Group Companies have not received written notice of any civil, criminal or administrative action, regulatory notice or other proceeding or suit under any Environmental Law applicable to its assets, which is or may be materially prejudicial to the business of any of the Target Group Companies.
(b) So far as the Seller is aware, there are no facts or circumstances which constitute a material breach of any Environmental Law by any Target Group Company.
9 Litigation
(a) None of the Target Group Companies is as at the date of this deed a party to any material investigation, prosecution, legal proceeding, arbitration, meditation or any other form of litigation, dispute resolution process or administrative or governmental proceedings (Material Proceedings) that will, or would reasonably be likely to, have a Material Adverse Effect on any Target Group Company and, so far as the Seller is aware, no event has occurred which might reasonably be expected to give rise to such Material Proceedings.
(b) So far as the Seller is aware, none of Target Group Companies has received any written notice in respect of any Material Proceedings.
10 Compliance with law
So far as the Seller is aware, each of the Target Group Companies has complied in all material respects with applicable laws.
11 Authorisations
11.1 Authorisations
The Target Group Companies have, or will have at Completion, all necessary Authorisations material to the Target Group Companies and/or the conduct of the Eva Copper Project in the locations and in the manner in which they are conducted as at the date of this deed (Material Authorisations).
11.2 Breach
So far as the Seller is aware, neither the Seller nor any Target Group Company has received any notice in writing alleging that it is currently in breach of the terms of any Material Authorisation.
11.3 Revocation
So far as the Seller is aware, neither the Seller nor any Target Group Company has received any written notice indicating that any Material Authorisation will be revoked, suspended, modified or will not be renewed.
11.4 No events or circumstances
So far as the Seller is aware, no event has occurred and no fact or circumstance exists which with the giving of notice or lapse of time, or both, would cause the Seller or any Target Group Company to be in breach of any Material Authorisation.
11.5 Renewal of Authorisations
So far as the Seller is aware, there is no fact or matter which is likely to materially prejudice the continuance or renewal, or result in the revocation or variation in any material respect, of any Material Authorisation.
12 Employees
12.1 Employee entitlements
The Employee Entitlement List is accurate for each Employee as at the date specified in the Employee Entitlement List.
12.2 No Employee disputes
Neither the Seller nor any Target Group Company has been involved in any dispute with any union or Employee at any time within the 6 months preceding the date of this deed that will, or would reasonably be likely to, have a Material Adverse Effect on any Target Group Company.
13 Employee superannuation funds
With respect to the Employee superannuation funds, the Seller has complied with its obligations imposed under the Superannuation Guarantee (Administration) Act 1992 (Cth), including the prescribed minimum level of superannuation support in respect of each Employee has been provided so as not to incur a shortfall amount under the Superannuation Guarantee (Administration) Act 1992 (Cth).
14 Solvency
14.1 No liquidation
Neither the Seller nor any Target Group Company has:
(a) gone into, is in, or is proposed to go into, liquidation;
(b) passed a winding-up resolution or commenced steps for winding-up or dissolution; or
(c) received a deregistration notice under section 601AB of the Corporations Act or applied for deregistration under section 601AA of the Corporations Act.
14.2 No winding-up process
No petition or other process for winding-up or dissolution has been presented or threatened in writing against the Seller or any Target Group Company and, so far as the Seller is aware, there are no circumstances justifying any such petition or process.
14.3 No receiver or manager
No receiver, receiver and manager, judicial manager, liquidator, administrator or like official has been appointed over any part of the undertaking or property of the Seller or any Target Group Company.
14.4 Arrangements with creditors
Neither the Seller nor any Target Group Company has entered into, or taken steps or proposed to enter into, any arrangement, compromise or composition with or assignment for the benefit of its creditors or a class of them.
14.5 Solvency
Each of the Seller and each Target Group Company is able to pay its debts as and when they fall due. Each of the Seller and each Target Group Company is not taken under applicable laws to be unable to pay its debts or has stopped or suspended, or threatened to stop or suspend, payment of all or a class of its debts.
15 Taxes and Duties
15.1 Tax paid
Any Tax or Duty arising under any Tax Law that was due and payable by any Target Group Company before Completion has been paid on or before the due date for such payment.
15.2 No Tax audit
The Seller is not aware of any audit, investigation or review, or pending or unresolved dispute (including but not limited to an outstanding request for a ruling, voluntary disclosure or other decision or advice), in respect to any Tax or Duty relating to the Target Group Companies.
15.3 No disputes
There are no material disputes between any Target Group Company and any Governmental Agency in respect of any Tax or Duty.
15.4 Documents filed
Each of the Target Group Companies and the Seller has filed, lodged or submitted any necessary tax return, information, notices and computations as and when required by law or requested by any revenue authority in respect of any Tax relating to the relevant Target Group Company, by the due date.
15.5 No tainting
The share capital account of each of the Target Group Companies is not ‘tainted’ within the meaning of section 995-1 of the ITAA 97.
15.6 GST
Each Target Group Company:
(a) is registered for GST;
(b) has complied with the GST Law;
(c) has adequate systems to ensure it complies with the GST Law; and
(d) is entitled to full input tax credits for any GST it has paid in connection with a taxable supply made to it.
15.7 Deductions and withholding
Each Target Group Company has deducted or withheld and paid to the relevant Governmental Agency administering a Tax every amount any Tax law requires it to deduct or withhold and pay.
16 Accuracy of information
(a) As far as the Seller is aware, no information (other than as otherwise described in the Disclosure Materials) has been omitted from, or included in, the Disclosure Materials that a person acquiring the Sale Shares acting reasonably would consider to be material or would render the Disclosure Materials misleading in any material respect.
(b) For the purposes of this Warranty 16, the Disclosure Materials are deemed not to include:
(1) any financial statements;
(2) any information, document, representation statement, view or opinion to the extent that it contains or expresses a forecast, prediction or projection or is otherwise forward looking after the date of this deed.
Schedule 4
BUYER WARRANTIES
1 No legal impediment
The execution, delivery and performance by the Buyer of this deed:
(a) complies with its constitution; and
(b) does not constitute a breach of any contract, court order, process or judgement or law, or cause or result in default under any Encumbrance, by which it is bound and that would prevent it from entering into and performing its obligations under this deed.
2 Corporate authorisations
All necessary authorisation for the execution, delivery and performance of this deed by the Buyer in accordance with its terms has been obtained or will be obtained before Completion, other than the Conditions required under clause 2.1 of this deed.
3 Power and capacity
The Buyer has full power to and capacity to enter into and perform its obligations under this deed, and the Buyer’s obligations under this deed are valid and binding and enforceable against it in accordance with their terms.
4 Incorporation
The Buyer is validly incorporated, organised and subsisting in accordance with the laws of its place of incorporation.
5 No trust
The Buyer enters into and performs this deed on its own account and not as trustee for or nominee of any other person.
6 Consents
Other than set out in the Conditions, the Buyer does not require the consent or approval from any third parties or Governmental Agencies to execute, deliver and perform its obligations under this deed.
7 No liquidation
The Buyer has not:
(a) gone into, is in, or is proposed to go into, liquidation;
(b) passed a winding-up resolution or commenced steps for winding-up or dissolution; or
(c) received a deregistration notice under section 601AB of the Corporations Act (or equivalent legislation in the jurisdiction in which it is incorporated) or applied for deregistration under section 601AA of the Corporations Act (or equivalent legislation in the jurisdiction in which it is incorporated).
8 No winding-up process
No petition or other process for winding-up or dissolution has been presented or threatened in writing against the Buyer and, so far as the Buyer is aware, there are no circumstances justifying a petition or other process.
9 No receiver of manager
No receiver, receiver and manager, judicial manager, liquidator, administrator or like official has been appointed over the whole or any part of the undertaking or property of the Buyer, and, so far as the Buyer is aware, there are no circumstances justifying such an appointment.
10 Arrangements with creditors
The Buyer has not entered into, or taken steps or proposed to enter into, any arrangement, compromise or composition with or assignment for the benefit of its creditors or a class of them.
11 Solvency
The Buyer is able to pay its debts as and when they fall due. The Buyer is not taken under applicable laws to be unable to pay its debts and has not stopped or suspended, or threatened to stop or suspend, payment of all or a class of its debts.
12 No known claims
As at the date of this deed, the Buyer is not actually aware of any breach of Warranty or of any matter that may result in a Claim.
13 Financing
The Buyer either has:
(a) sufficient cash on hand; and / or
(b) committed and binding financing (documented by a commitment letter) subject to customary draw down conditions and approvals from reputable lenders satisfactory to the Seller, acting reasonably, in place,
such that at Completion the Buyer will have Immediately Available Funds equal to the Purchase Price.
Schedule 5
COMPLETION STEPS
1 Pre–Completion actions
1.1 Notifications
At least 10 Business Days before Completion the Buyer must give written notice to the Seller of:
(a) any directors, secretaries and public officers of each of the Target Group Companies whom it wishes to resign from the positions effective from Completion (with that list to include each person remaining a Seller Group Member employee after Completion);
(b) any persons it wishes to be appointed as a director, secretary or public officer of each of the Target Group Companies effective from Completion and deliver to the Seller a consent to act and notification of interests signed by each such person;
(c) any proposed changes to the signatories of any bank account maintained by the Target Group Companies, together with specimen signatures of the new signatories; and
(d) the address, if any, to which the registered office of any of the Target Group Companies is to be changed following Completion.
1.2 Board resolutions
On or before Completion the Seller must ensure that a meeting of the directors of the Target Entity (and where relevant a meeting of the directors of each of the other Target Group Companies) is convened and approves (subject to Completion occurring):
(a) the registration of the Buyer as the holder of the Sale Shares in its register of shareholders and the issue of new share certificates for the Sale Shares in the name of the Buyer, subject only to receipt of the executed share transfers referred to in clause 2.1(a) of this Schedule 5 and to payment of any Duty on the transfer of Sale Shares;
(b) the resignations, effective from Completion, of existing directors, secretaries and public officers notified under clause 1.1(a) of this Schedule 5;
(c) the appointment, effective from Completion, of each person notified under clause 1.1(b) of this Schedule 5 as a director, secretary or public officer (as applicable) of the Target Group Companies (provided that a consent to act and notification of interest signed by that person has been delivered to the Seller by the Buyer);
(d) any change of the registered office of the Target Group Companies to the address notified under clause 1.1(d) of this Schedule 5; and
(e) if the Buyer has approved new mandates for the operation of bank accounts by the Target Group Companies, the revocation of all existing mandates and the replacement of those mandates with the mandates approved by the Buyer.
2 Completion
2.1 Seller’s obligations at Completion
(a) At Completion, the Seller must give the Buyer the following documents:
Description Items to be provided
1 share certificates share certificates for the Sale Shares and any other documents necessary to establish the Buyer’s title to the Sale Shares and that may be required for registration of the transfer of the Sale Shares to the Buyer.
2 share transfers completed share transfers of the Sale Shares to the Buyer, executed by or on behalf of the Seller.
3 powers of attorney (if applicable) a copy of the powers of attorney
executed by the Seller authorising its attorney to execute any of the documents listed in this clause 2.1 of this Schedule 5 on behalf of the Seller.
4 board resolutions evidence that the board resolutions referred to in clause 1.2 of this Schedule 5 have been passed.
5 officer resignations signed resignations of each director, secretary
and public officer of the Target Group Companies notified to the Seller under clause
1.1 of this Schedule 5.
6 Receipt for the Target Entity, evidence of receipt by the Seller’s Head Company of payment of the Exit Payment.
7 Indebtedness evidence of the irrevocable elimination in full of all indebtedness owing by any Target Group Company to any Seller Group Member in accordance with clause 5.4(a) of this deed.
8 Employee Entitlement List a copy of the Employee Entitlement List,
updated to the Completion Date.
9 Deed of Release duly executed deed of release (partial or otherwise) in respect of the Nordic Security Documents and all associated Encumbrances on terms acceptable to the Parties, acting reasonably, and the return of all pledged collateral, in each case only as such documents, Encumbrances and collateral relate to the Target Group Companies.
10 Contingent Consideration Deed duly executed Contingent Consideration
Deed.
11 Outstanding Incentives reasonable evidence that the Outstanding
Incentives have been paid or terminated, as applicable
(b) At Completion, the Seller must make available to the Buyer by leaving at the office of the Target Entity:
Description Items to be provided
1 corporate documents the certificate of incorporation, common seal
(if any), duplicate seal (if any), all prescribed registers, all statutory, minute and other Business Records of the Target Group Companies and all unused share certificate forms.
2 ASIC corporate key the ASIC Corporate Key for the Target Group
Companies.
3 books and ledgers all ledgers, journals and books of account of
the Target Group Companies and all other Business Records.
4 title documents all documents of title in the possession of the Target Group Companies relating to the ownership of the Target Group Companies' assets.
5 PPS Register information all secured party group numbers, access
codes, dealing numbers and token codes for all Security Interests held by the Target Group Companies as at Completion.
2.2 Buyer’s obligations at Completion
At Completion the Buyer must:
Description Items to be provided
1 Completion Payment pay the Seller the Completion Payment in
Immediately Available Funds without counterclaim or set-off.
2 share transfers deliver completed share transfers of the Sale Shares executed by or on behalf of the Buyer.
3 consents to act if the Buyer gave notice under item 1.1 of Schedule 5 requiring a person to be appointed as a director, secretary or public officer of the Target Group Companies, a consent to act signed by the person.
4 replacement of Financial Provisioning
the Buyer must replace all Financial Provisioning (other than the Surety Amount) that has been provided by any Seller Group Member or any Target Group Company as at Completion and which has been Disclosed at the date of this Deed or otherwise provided in accordance with clause 5, and procure the return to the Seller of the applicable bonds or other documentation together with the Financial Provisioning. If the Financial Provisioning cannot be replaced, the Buyer must obtain and provide to the Seller a bond or guarantee in favour of the Seller on terms reasonably acceptable to the Buyer and the Seller, in the equivalent amount in favour of the Seller from a financial institution approved by the Seller.
5 Contingent Consideration Deed duly executed Contingent Consideration
Deed.
3 Post Completion actions
3.1 Lodgement
Immediately following Completion the Buyer must lodge with ASIC for registration the ASIC Forms 484 notifying the changes of directors, secretaries, and members, shareholding and ultimate holding company of the Target Group Companies arising from Completion.
3.2 Completion Adjustment Amount
The Seller must pay the Completion Adjustment Amount to the Buyer in accordance with clause 7.5.
Schedule 6
TENEMENTS
|
|
|
|
|
|
|
|
|
|
|
|
|
|
|
Tenement No.
|
Registered holder(s)
|
Type |
Grant date |
Expiry date |
Part 1 – Eva Tenements |
|
ML 90162
|
Eva Copper Mine Pty Ltd
|
Mining lease
|
04/10/2012 |
31/10/2037 |
|
ML 90163
|
Eva Copper Mine Pty Ltd
|
Mining lease
|
04/10/2012
|
31/10/2037
|
|
ML 90164
|
Eva Copper Mine Pty Ltd
|
Mining lease
|
13/11/2012
|
30/11/2037
|
|
ML 90165
|
Eva Copper Mine Pty Ltd
|
Mining lease
|
13/11/2012
|
30/11/2037
|
|
ML 90166
|
Eva Copper Mine Pty Ltd
|
Mining lease
|
13/11/2012
|
30/11/2037
|
|
EPM 25760
|
Eva Copper Mine Pty Ltd
|
Exploration permit for minerals
|
17/11/2015
|
16/11/2025
|
|
|
|
|
|
|
|
|
|
|
|
|
|
|
|
Part 2 – Exploration Tenements |
|
EPM 9611
|
Roseby Copper (South) Pty Ltd
|
Exploration permit for minerals
|
26/08/1993 |
25/08/2023 |
|
EPM 14363
|
Roseby Copper Pty Ltd
|
Exploration permit for minerals
|
20/04/2005
|
19/04/2026
|
|
EPM 14370
|
Roseby Copper (South) Pty Ltd
|
Exploration permit for minerals
|
21/07/2005
|
20/07/2025
|
|
EPM 25757
|
Roseby Copper Pty Ltd
|
Exploration permit for minerals
|
12/11/2015
|
11/11/2025
|
|
EPM 25759
|
Roseby Copper (South) Pty Ltd
|
Exploration permit for minerals
|
16/11/2015
|
15/11/2025
|
|
|
|
|
|
|
|
|
|
|
|
|
|
|
|
EPM 25761 |
Roseby Copper (South) Pty Ltd |
Exploration permit for minerals |
17/11/2015 |
16/11/2025 |
|
EPM 26182
|
Roseby Copper (South) Pty Ltd
|
Exploration permit for minerals
|
28/07/2016
|
27/07/2026
|
|
EPM 26280
|
Roseby Copper (South) Pty Ltd
|
Exploration permit for minerals
|
24/08/2017
|
23/08/2027
|
|
EPM 26283
|
Roseby Copper (South) Pty Ltd
|
Exploration permit for minerals
|
24/08/2017
|
23/08/2027
|
|
EPM 26284
|
Roseby Copper (South) Pty Ltd
|
Exploration permit for minerals
|
16/04/2018
|
15/04/2023
|
|
EPM 26367
|
Roseby Copper (South) Pty Ltd
|
Exploration permit for minerals
|
23/08/2017
|
22/08/2027
|
|
EPM 26566
|
Roseby Copper (South) Pty Ltd
|
Exploration permit for minerals
|
29/06/2018
|
28/06/2023
|
|
EPM 26595
|
Roseby Copper (South) Pty Ltd
|
Exploration permit for minerals
|
29/06/2018
|
28/06/2023
|
|
EPM 26605
|
Roseby Copper (South) Pty Ltd
|
Exploration permit for minerals
|
29/06/2018
|
28/06/2023
|
|
EPM 26676
|
Roseby Copper (South) Pty Ltd
|
Exploration permit for minerals
|
10/09/2018
|
09/09/2023
|
|
EPM 26811
|
Roseby Copper (South) Pty Ltd
|
Exploration permit for minerals
|
21/10/2019
|
20/10/2024
|
|
EPMA 28602
|
Roseby Copper (South) Pty Ltd (applicant)
|
Application for exploration permit for minerals
|
Lodged on 23/08/2022
|
Five-year term sought
|
|
EPMA
28603
|
Roseby Copper Pty Ltd (applicant)
|
Application for exploration permit
for minerals
|
Lodged on 24/08/2022
|
Five-year term sought
|
Schedule 7
PROPERTIES
Freehold properties
|
|
|
|
|
|
|
|
|
|
|
|
|
|
|
Title identifier
|
|
Land description
|
|
Owner
|
| 51180948 |
|
Lot 37 on Crown Plan
B15742 (Agreement
Nos. 355, 526, 1069
and 1070) |
|
Eva Copper Mine Pty Ltd
ACN 625 712 138 |
| 20171180 |
|
Lot 28 on Crown Plan
B15753 (Agreement
Nos. 355, 1069 and
1070) |
|
Eva Copper Mine Pty Ltd
ACN 625 712 138 |
Schedule 8
MATERIAL CONTRACTS
|
|
|
|
|
|
|
|
|
|
|
|
|
|
|
|
|
|
|
|
|
Dataroom ref
|
|
Contract title and description
|
|
Seller Group Member
|
|
Counterparty
|
Operational
|
Eva Copper
Phase II – I.A.1.
|
|
Glencore Offtake Agreement (14 November 2017) |
|
Copper Mountain
Mining Pty Ltd
(formerly Altona
Mining Limited),
Roseby Copper Pty
Ltd
|
|
Glencore International AG |
Finance
|
Eva Copper
Phase II – VII.E |
|
Nordic Bonds Agreement
(8 April 2021)
|
|
Copper Mountain
Mining Corporation |
|
Nordic Trustee AS |
Eva Copper
Phase II – VII.E |
|
Nordic Security Documents
(8 June 2021)
|
|
Copper Mountain
Mining Corporation,
Copper Mountain
Mining Australia
Pty Ltd,
Copper Mountain
Mining Pty Ltd, Eva
Copper Mine Pty Ltd,
Roseby Copper Pty Ltd
and Roseby Copper
(South) Pty Ltd |
|
Nordic Trustee AS |
Tax
|
Eva Copper
Phase II – II.A.3 |
|
Indirect Tax Funding Deed –
Copper Mountain Mining
Australia Pty Ltd GST Group
(undated)
|
|
Copper Mountain
Mining Australia Pty
Ltd, CMMC Australia
Pty Ltd, Copper
Mountain Mining Pty
Ltd, Eva Copper
Mine Pty Ltd, Vulcan
Resources Pty Ltd,
Roseby Copper Pty
Ltd, Roseby Copper
(South) Pty Ltd |
|
n/a |
Schedule 8 Material Contracts
|
|
|
|
|
|
|
|
|
|
|
|
|
|
|
|
|
|
|
|
|
Dataroom ref
|
|
Contract title and description
|
|
Seller Group Member
|
|
Counterparty
|
Eva Copper
Phase II – II.A.4 |
|
Indirect Tax Sharing Deed –
Copper Mountain Mining
Australia Pty Ltd GST Group
(undated)
|
|
Copper Mountain
Mining Australia Pty
Ltd, CMMC Australia
Pty Ltd, Copper
Mountain Mining Pty
Ltd, Eva Copper
Mine Pty Ltd, Vulcan
Resources Pty Ltd,
Roseby Copper Pty
Ltd, Roseby Copper
(South) Pty Ltd |
|
n/a |
Eva Copper
Phase II – II.A.5 |
|
Tax Funding Deed – Copper
Mountain Mining Australia
Pty Ltd Tax Consolidated
Group
(undated)
|
|
Copper Mountain
Mining Australia Pty
Ltd, CMMC Australia
Pty Ltd, Copper
Mountain Mining Pty
Ltd, Eva Copper
Mine Pty Ltd, Vulcan
Resources Pty Ltd,
Roseby Copper Pty
Ltd, Roseby Copper
(South) Pty Ltd |
|
n/a |
Eva Copper
Phase II – II.A.6 |
|
Tax Sharing Deed – Copper
Mountain Mining Australia
Pty Ltd Tax Consolidated
Group
(undated)
|
|
Copper Mountain
Mining Australia Pty
Ltd, CMMC Australia
Pty Ltd, Copper
Mountain Mining Pty
Ltd, Eva Copper
Mine Pty Ltd, Vulcan
Resources Pty Ltd,
Roseby Copper Pty
Ltd, Roseby Copper
(South) Pty Ltd |
|
n/a |
Intercompany Agreements
|
Eva Copper
Phase II –
VIII.D.1. |
|
CMPL Roseby Sale
Agreement (Agreement
1069)
(31 August 2018)
|
|
Roseby Copper Pty
Ltd, Copper
Mountain Mining Pty
Ltd |
|
n/a |
Eva Copper
Phase II –
VIII.D.1. |
|
CMPL ECMPL Sale
Agreement (Agreement
1070)
(31 August 2018)
|
|
Copper Mountain
Mining Pty Ltd, Eva
Copper Mine Pty Ltd |
|
n/a |
Schedule 8 Material Contracts
|
|
|
|
|
|
|
|
|
|
|
|
|
|
|
|
|
|
|
|
|
Dataroom ref
|
|
Contract title and description
|
|
Seller Group Member
|
|
Counterparty
|
Australian
Exploration –
I.D.2. |
|
Sale and Purchase
Agreement re EPMs 9611,
14370 and 14371 (Agreement
949)
(9 August 2016)
|
|
Roseby Copper Pty
Ltd, Roseby Copper
(South) Pty Ltd |
|
n/a |
Australian
Exploration –
I.D.3. |
|
Tenement Sale Agreement
(Agreement 618)
(2 April 2011)
|
|
Copper Mountain
Mining Pty Ltd
(formerly Altona
Mining Limited),
Roseby Copper Pty
Ltd, Roseby Copper
(South) Pty Ltd |
|
n/a |
Australian
Exploration –
I.D.4. |
|
Tenement Sale Agreement
(Agreement 617)
(2 April 2011)
|
|
Copper Mountain
Mining Pty Ltd
(formerly Altona
Mining Limited),
Roseby Copper Pty
Ltd |
|
n/a |
Aboriginal
|
Eva Copper –
VIII.E.1.1. |
|
Ancillary Agreement to the
Deed re Grant of Mining
Leases (No. 415)
(15 June 2006)
|
|
Copper Mountain
Mining Pty Ltd
(formerly Altona
Mining Limited and
prior to that
Universal Resources
Limited), Roseby
Copper Pty Ltd
(formerly Bolnisi
Logistics Pty Ltd) |
|
The Kalkadoon
People |
Eva Copper –
VIII.E.1.3. |
|
Deed re Grant of Mining
Leases (ML 90162, 90163,
90164, 90165 and 90166 (No.
416)
(undated)
|
|
Copper Mountain
Mining Pty Ltd
(formerly Universal
Resources Limited),
Roseby Copper Pty
Ltd (formerly Bolnisi
Logistics Pty Ltd) |
|
The Kalkadoon
People |
Eva Copper
Phase II – VI.A.6. |
|
Deed of Assumption re
Ancillary Agreement to the
Deed re Grant of Mining
Leases (No. 982)
(23 March 2017) |
|
Copper Mountain
Mining Pty Ltd
(formerly Altona
Mining Limited), |
|
Kalkadoon Native
Aboriginal
Corporation RNTBC |
Schedule 8 Material Contracts
|
|
|
|
|
|
|
|
|
|
|
|
|
|
|
|
|
|
|
|
|
Dataroom ref
|
|
Contract title and description
|
|
Seller Group Member
|
|
Counterparty
|
|
|
|
|
Roseby Copper Pty
Ltd |
|
|
Eva Copper –
VIII.E.1.2. |
|
Deed of Covenant
(Agreement No. 1099) in
respect of Ancillary
Agreement (No. 415)
(10 September 2018)
|
|
Copper Mountain
Mining Pty Ltd,
Roseby Copper Pty
Ltd, Eva Copper
Mine Pty Ltd |
|
n/a |
Eva Copper
Phase II – VI.A.5. |
|
Ancillary Agreement to the
Deed re Grant of Exploration
Permits (No. 909)
(16 October 2015)
|
|
Copper Mountain
Mining Pty Ltd
(formerly Altona
Mining Limited and
prior to that
Universal Resources
Limited), Roseby
Copper Pty Ltd
(formerly Bolnisi
Logistics Pty Ltd) |
|
Kalkadoon Native
Title Aboriginal
Corporation RNTBC |
Eva Copper
Phase II – VI.A.8. |
|
Deed of Assignment and
Assumption and Consent
(Agreement 1084)
(10 September 2018)
|
|
Copper Mountain
Mining Pty Ltd
Roseby Copper Pty
Ltd
Roseby Copper
(South) Pty Ltd
Eva Copper Mine
Pty Ltd |
|
The Kalkadoon
People (Native
Group) |
Eva Copper
Phase II –
VII.A.3. |
|
Deed of Variation re EPM
26811
(2019)
|
|
Copper Mountain
Mining Pty Ltd
Roseby Copper Pty
Ltd
Roseby Copper
(South) Pty Ltd
Eva Copper Mine
Pty Ltd |
|
The Kalkadoon
People (Native
Group) |
Eva Copper
Phase II – VI.A.7. |
|
Deed re Grant of Exploration
Permits 25757 and 25760
(No. 910)
(undated)
|
|
Roseby Copper Pty
Ltd |
|
The State of
Queensland,
Kalkadoon Native
Title Aboriginal
Corporation |
Schedule 8 Material Contracts
|
|
|
|
|
|
|
|
|
|
|
|
|
|
|
|
|
|
|
|
|
Dataroom ref
|
|
Contract title and description
|
|
Seller Group Member
|
|
Counterparty
|
Eva Copper
Phase II – VI.A.4. |
|
Deed of Assignment and
Assumption (No. 984)
(23 March 2017)
|
|
Roseby Copper Pty
Ltd, Roseby Copper
(South) Pty Ltd. |
|
Kalkadoon Native
Title Aboriginal
Corporation RNTBC
|
Australian
Exploration –
I.E.2. |
|
Native Title and Cultural
Heritage Agreement
(Mitakoodie & Mayi People
#5)
(28 March 2018)
|
|
Roseby Copper
(South) Pty Ltd |
|
Mitakoodi and Mayi
People |
Other Third-Party Access and Compensation Agreements
|
Eva Copper
Phase II –
I.E.3.1-4. |
|
Mining Compensation
Agreement – Minister of
Transport and Multicultural
Affairs (Agreement 625, 1103
and deeds of novation)
(3 October 2011 and 29 April
2019)
|
|
No. 625 – Copper
Mountain Mining
Pty Ltd (formerly
Altona Mining Limited),
Roseby Copper Pty Ltd
No. 1103 – Copper
Mountain Mining Pty Ltd,
Roseby Copper Pty Ltd,
Eva Copper Mine Pty Ltd
Deed of Variation,
Novation and Covenant –
Copper Mountain Mining
Pty Ltd, Roseby Copper
Pty Ltd
Deed of Novation and
Covenant – Copper
Mountain Mining Pty Ltd,
Eva Copper Mine Pty Ltd
|
|
No. 625 – The
Minister for Transport
and Multicultural
Affairs
No. 1103 – Minister
for Transport and
Main Roads
Deed of Variation,
Novation and
Covenant – Minister
for Transport and
Main Roads
Deed of Novation
and Covenant –
Minister for Transport
and Main Roads |
Eva Copper
Phase II –
I.E.1.1-2. |
|
Access Licence –
Department of Main Roads
(Agreement Nos. 626 and
1104)
(28 July 2011 and 29 April
2019)
|
|
No. 626 – Copper
Mountain Mining Pty
Ltd (formerly Altona
Mining Limited),
Roseby Copper Pty
Ltd
No. 1104 - Eva
Copper Mine Pty Ltd,
Copper Mountain
Mining PTY Ltd,
Roseby Copper Pty
Ltd
|
|
No. 626 – The Chief
Executive of the
Department of
Transport and Main
Roads for and on
Behalf of the State of
Queensland
No. 1104 - State of
Queensland
(Represented by
Department of |
Schedule 8 Material Contracts
|
|
|
|
|
|
|
|
|
|
|
|
|
|
|
|
|
|
|
|
|
Dataroom ref
|
|
Contract title and description
|
|
Seller Group Member
|
|
Counterparty
|
|
|
|
|
|
|
Transport and Main
Roads) |
Eva Copper
Phase II –
I.E.2.1-2. |
|
Compensation and Consent
Agreement – Minister of
Natural Resources
(Agreement Nos. 482 and
1098)
(2 May 2008 and (undated))
|
|
No. 482 – Copper
Mountain Mining Pty
Ltd (formerly Altona
Mining Limited and
prior to that
Universal Resources
Limited), Roseby
Copper Pty Ltd
(formerly Bolnisi
Logistics Pty Ltd)
No. 1098 - Copper
Mountain Mining Pty
Ltd, Roseby Copper
Pty Ltd, Eva Copper
Mine Pty Ltd
No. 1103 – Copper
Mountain Mining Pty
Ltd, Roseby Copper
Pty Ltd, Eva Copper
Mine Pty Ltd
|
|
No. 482 – Minister for
Natural Resources
and Water on behalf
of the State of
Queensland
No. 1098 – Minister
for Natural
Resources, Mines
and Energy
No. 1103 – Minister
for Transport and
Main Roads |
Eva Copper
Phase II –
I.E.4.1-7. |
|
MMG Limited Access and
Other Agreements
(Agreement Nos. 367, 368,
369, 422, 423, 604 and 1075)
(10 September 2010, 10
September 2010, 10
September 2010, 9 September
2010, 9 September 2010, 4
February 2010 and 23 August
2018)
|
|
No. 367 - Copper
Mountain Mining Pty
Ltd (formerly Altona
Mining Limited),
Roseby Copper Pty
Ltd, Eva Copper
Mine Pty Ltd
No. 368 - Copper
Mountain Mining Pty
Ltd (formerly Altona
Mining Limited),
Roseby Copper Pty
Ltd, Eva Copper
Mine Pty Ltd
No. 369 - Copper
Mountain Mining Pty
Ltd (formerly Altona
Mining Limited)
No. 422 – Copper
Mountain Mining Pty
Ltd (formerly Altona
Mining Limited and
prior to that
Universal Resources
Limited), Roseby
Copper Pty Ltd
|
|
No. 367 – MMG Australia Limited
No. 368 – MMG Australia Limited
No. 369 – MMG Australia Limited
No. 422 – MMG Australia Limited
No. 423 – MMG Australia Limited
No. 604 – Mount Isa Mines Limited, Xstrata Copper, MMG Australia Limited
No. 1075 – MMG Dugald River Pty Limited |
Schedule 8 Material Contracts
|
|
|
|
|
|
|
|
|
|
|
|
|
|
|
|
|
|
|
|
|
Dataroom ref
|
|
Contract title and description
|
|
Seller Group Member
|
|
Counterparty
|
|
|
|
|
No. 423 – Copper
Mountain Mining
Pty Ltd (formerly
Altona Mining
Limited and prior
to that Universal
Resources Limited),
Roseby Copper Pty Ltd
No. 604 – Copper
Mountain Mining
Pty Ltd (formerly
Altona Mining
Limited and prior
to that Universal
Resources Limited),
Roseby Copper Pty Ltd
No. 1075 – Copper
Mountain Mining
Pty Ltd, Roseby Copper
Pty Ltd, Eva Copper Mine
Pty Ltd
|
|
|
Eva Copper
Phase II –
I.E.5.1-2. |
|
SunWater Limited – Indemnity (Agreement Nos. 668 and 1083)
(21 February 2012 and 17 September 2018)
|
|
No. 668 – Copper Mountain Mining Pty Ltd (formerly Altona Mining Limited), Roseby Copper Pty Ltd
No. 1083 – Copper Mountain Mining Pty Ltd, Roseby Copper Pty Ltd, Eva Copper Mine Pty Ltd
|
|
No. 668 – Altona Mine Limited
No. 1083 – SunWater Limited, North West Queensland Water Pipeline Pty Ltd |
Eva Copper
Phase II –
I.E.6.1-3. |
|
Cloncurry Shire Council (Agreement Nos. 429, 1080 and ML90166)
(9 June 2008, 5 September 2018 and 10 January 2020)
|
|
No. 429 – Copper
Mountain Mining Pty Ltd
(formerly Altona Mining
Limited and prior to that
Universal Resources
Limited), Roseby Copper
Pty Ltd (formerly Bolnisi
Logistics Pty Ltd)
No. 1080 – Copper Mountain Mining Pty Ltd, Roseby Copper Pty Ltd, Eva Copper Mine Pty Ltd
No. ML90166 – Eva Copper Mine Pty Ltd
|
|
No. 429 – Cloncurry Shire Council No. 1080 – n/a
No. ML90166 – Cloncurry Shire Council |
Schedule 8 Material Contracts
|
|
|
|
|
|
|
|
|
|
|
|
|
|
|
|
|
|
|
|
|
Dataroom ref
|
|
Contract title and description
|
|
Seller Group Member
|
|
Counterparty
|
Conduct and Compensation Agreements
|
Eva Copper
Phase II –
I.C.1.1-5. |
|
Coolulah Station Conduct
and Compensation
Agreement and Deed of
Covenant (Agreement Nos.
1110, 1111, 1112, 349 and
1078)
(13 September 2019, 13
September 2019, 19
September 2019, 21 July
2008, 31 August 2018)
|
|
No. 1110 – Roseby
Copper Pty Ltd
No. 1111 – Roseby
Copper (South) Pty
Ltd
No. 1112 – Eva
Copper Mine Pty
No. 349 – Copper
Mountain Mining Pty
Ltd (formerly Altona
Mining Limited and
prior to that
Universal Resources
Limited), Roseby
Copper Pty Ltd
(formerly Bolnisi
Logistics Pty Ltd)
No. 1078 – Copper
Mountain Mining Pty
Ltd, Roseby Copper
Pty Ltd, Eva Copper
Mine Pty Ltd |
|
No. 1110 – The
North Australian
Pastoral Company
Pty Limited
No. 1111 – The
North Australian
Pastoral Company
Pty Limited
No. 1112 – The
North Australian
Pastoral Company
Pty Limited
No. 349 – The North
Australian Pastoral
Company Pty Limited
No. 1078 – Ded poll
in favour of The
North Australian
Pastoral Company
Pty Limited |
Eva Copper
Phase II –
I.C.1.a. 1-3. |
|
Coolullah Extension
Agreements (Agreement
Nos. 1149, 1150 and 1148)
(9 August 2021, 3 August 2021
and 9 August 2021)
|
|
No. 1148 – Eva
Copper Mine Pty Ltd
No. 1149 – Roseby
Copper Pty Ltd
No. 1150 – Roseby
Copper (South) Pty
Limited |
|
No. 1148 – The
North Australian
Pastoral Company
Pty Limited
No. 1149 – The
North Australian
Pastoral Company
Pty Limited
No. 1150 – The
North Australian
Pastoral Company
Pty Limited |
Eva Copper
Phase II – I.C.2.
1-3. |
|
Mt Roseby Station
(Agreement Nos. 1079 and
369)
(31 July 2017, 31 August 2018
and 30 June 2008)
|
|
No. 1079 – Copper
Mountain Mining Pty
Ltd, Roseby Copper
Pty Ltd, Eva Copper
Mine Pty Ltd
No. 369 – Copper
Mountain Mining Pty
Ltd (formerly
Universal Resources
Limited), Roseby
Copper Pty Ltd |
|
No. 1079 – Deed
executed as a deed
poll in favour of
McMillan
No. 369 – Harold
Henry McMillan |
Schedule 8 Material Contracts
|
|
|
|
|
|
|
|
|
|
|
|
|
|
|
|
|
|
|
|
|
Dataroom ref
|
|
Contract title and description
|
|
Seller Group Member
|
|
Counterparty
|
|
|
|
|
(formerly Bolnisi
Logistics Pty Ltd) |
|
|
Eva Copper
Phase II – I.C.3.
1-2. |
|
Dipvale Station Conduct and
Compensation Agreement
and Deed of Assignment and
Assumption (Agreement
Nos. 1071 and 623)
(31 August 2018 and 30
August 2011)
|
|
No. 1071 – Copper
Mountain Mining Pty
Ltd, Roseby Copper
Pty Ltd, Eva Copper
Mine Pty Ltd
No. 623 – Copper
Mountain Mining Pty
Ltd (formerly Altona
Mining Limted) |
|
No. 1071 – Deed
executed as a deed
poll in favour of
Telfords
No. 623 – Grant and
Anita Telford |
Eva Copper
Phase II –
I.C.4.1. |
|
Hillside Station Conduct and
Compensation Agreement re
EPMs 25759, 25761, 26182,
26283 (Agreement 1063)
(28 May 2018)
|
|
Eva Copper Mine
Pty
Roseby Copper
South Pty Ltd. |
|
Cameron Creek
Pastoral Company
Pty Ltd |
Australian
Exploration – I.B.
1-9. |
|
Standard Conduct and
Compensation Agreement
(Agreements 1142, 1143,
1148, 1149, 1150, 623 and
1063)
(9 August 2021, 3 August
2021, 9 August 2021, 9 August
2021, 3 August 2021, 30
August 2011, 31 July 2017, 28
May 2018 and 5 September
2018) |
|
No. 1142 – Roseby
Copper (South) Pty
Limited
No. 1143 – Roseby
Copper (South) Pty
Limited
No. 1148 – Eva
Copper Mine Pty Ltd
No. 1149 – Roseby
Copper (South) Pty
Limited
No. 1150 – Roseby
Copper (South) Pty
Limited
No. 623 – Copper
Mountain Mining Pty
Ltd (formerly Altona
Mining Limited)
No. 1063 – Roseby
Copper (South) Pty
Limited, Roseby
Copper Pty Limited
|
|
No. 1142 – McMillan
Pastoral Company
Pty Ltd (Landholder)
No. 1143 – Colin,
Judith, Rae-Anne
and Dale Saunders
No. 1148, 1149,
1150 – North
Australian Pastoral
Company Limited
No. 623 – Grant and
Anita Telford
No. 1063 – Cameron
Creek Pastoral
Company Pty Ltd |
Royalties
|
Schedule 8 Material Contracts
|
|
|
|
|
|
|
|
|
|
|
|
|
|
|
|
|
|
|
|
|
Dataroom ref
|
|
Contract title and description
|
|
Seller Group Member
|
|
Counterparty
|
Eva Copper
Phase II –
I.B.4.2.1-5. |
|
Pasminco-Lake Gold Royalty
(Agreement Nos. 355, 463,
485, 1076 and 1077)
(6 June 2001, 24 October
2000, 19 October 2000, 3
August 2001, 20 June 2001,
23 August 2018 and 23 August
2018)
|
|
No. 355 – Copper
Mountain Mining Pty
Ltd (formerly Altona
Mining Limited and
prior to that
Universal Resources
Limited)
No. 463 – Copper
Mountain Mining Pty
Ltd (formerly Altona
Mining Limited and
prior to that
Universal Resources
Limited)
No. 485 – Copper
Mountain Mining Pty
Ltd (formerly Altona
Mining Limited and
prior to that
Universal Resources
Limited)
No. 1076 – Copper
Mountain Mining Pty
Ltd, Roseby Copper
Pty Ltd, Eva Copper
Mine Pty Ltd
No. 1077 – Copper
Mountain Mining Pty
Ltd, Roseby Copper
Pty Ltd, Eva Copper
Mine Pty Ltd |
|
No. 355 – Copper
Mountain Mining Pty
Ltd (formerly Altona
Mining Limited and
prior to that Universal
Resources Limited)
No. 463 – Lake Gold
Pty Ltd
No. 485 – Lake Gold
Pty Ltd
No. 1076 – MMG
Australia Limited
(formerly Pasminco
Australia Limited)
No. 1077 – MMG
Australia Limited
(formerly Pasminco
Australia Limited),
MMG Dugal River
Pty Ltd |
Eva Copper
Phase II –
I.B.3.1. 1-4. |
|
Pasminco MMG Agreements
(Agreements 1076, 1077, 356
and 476)
(23 August 2018, 23 August
2018, 8 November 2004 and
18 June 1981)
|
|
No. 1076 – Copper
Mountain Mining Pty
Ltd, Roseby Copper
Pty Ltd, Eva Copper
Mine Pty Ltd
No. 1077 – Copper
Mountain Mining Pty
Ltd, Roseby Copper
Pty Ltd, Eva Copper
Mine Pty Ltd
No. 356 – Copper
Mountain Mining Pty
Ltd (formerly Altona
Mining Limited and
prior to that
Universal Resources
Limited)
No. 476 – n/a |
|
No. 1076 – MMG
Australia Limited
(formerly Pasminco
Australia Limited)
No. 1077 – MMG
Australia Limited
(formerly Pasminco
Australia Limited),
MMG Dugal River
Pty Ltd
No. 356 –
Queensland
Government – Office
of State Revenue
No. 476 – C.R.A.
Exploration Pty
Limited, The Kwahu
Company Limited |
Schedule 8 Material Contracts
|
|
|
|
|
|
|
|
|
|
|
|
|
|
|
|
|
|
|
|
|
Dataroom ref
|
|
Contract title and description
|
|
Seller Group Member
|
|
Counterparty
|
Eva Copper
Phase II –
I.B.5.3.1-9. |
|
PanAust (Agreement Nos.
438, 439, 440, 509, 510, 511,
512, 968 and 1072)
(2 October 2000, 23 October
2000, 21 April 2001, 2 August
2001, 18 March 2002, 8
October 2001, 29 August
2001, 26 October 2016 and 31
August 2018)
|
|
No. 438 – Copper
Mountain Mining Pty
Ltd (formerly Altona
Mining Limited and
prior to that
Universal Resources
Limited)
No. 439 – Copper
Mountain Mining Pty
Ltd (formerly Altona
Mining Limited and
prior to that
Universal Resources
Limited)
No. 440 – Copper
Mountain Mining Pty
Ltd (formerly Altona
Mining Limited and
prior to that
Universal Resources
Limited)
No. 509 – Copper
Mountain Mining Pty
Ltd (formerly Altona
Mining Limited and
prior to that
Universal Resources
Limited)
No. 510 – Copper
Mountain Mining Pty
Ltd (formerly Altona
Mining Limited and
prior to that
Universal Resources
Limited)
No. 511 – Copper
Mountain Mining Pty
Ltd (formerly Altona
Mining Limited and
prior to that
Universal Resources
Limited)
No. 512 – Copper
Mountain Mining Pty
Ltd (formerly Altona
Mining Limited and
prior to that
Universal Resources
Limited)
No. 968 – Roseby
Copper Pty Ltd,
Roseby Copper
(South) Pty Ltd
|
|
No. 438 – Pan
Australian Resources
NL
No. 439 – Pan
Australian Resources
NL
No. 440 – Pan
Australian Resources
NL
No. 509 – Pan
Australian Resources
NL
No. 510 – Pan
Australian Resources
NL
No. 511 – Pan
Australian Resources
NL
No. 512 – Pan
Australian Resources
NL
No. 968 – PanAust
Limited
No. 1072 – n/a |
Schedule 8 Material Contracts
|
|
|
|
|
|
|
|
|
|
|
|
|
|
|
|
|
|
|
|
|
Dataroom ref
|
|
Contract title and description
|
|
Seller Group Member
|
|
Counterparty
|
|
|
|
|
No. 1072 – Copper
Mountain Mining Pty
Ltd, Roseby Copper
Pty Ltd, Eva Copper
Mine Pty Ltd |
|
|
Eva Copper
Phase II –
I.B.1.4.1-8. |
|
Dominion (Agreement Nos.
388, 426, 427, 428, 484, 562,
1074 and deed of
assignment and
assumption)
(14 January 2000, 4 October
2000, 23 October 2000, 23
April 2001, 3 August 2001, 29
August 2001 and 31 August
2018)
|
|
No. 388 – Copper
Mountain Mining Pty
Ltd (formerly Altona
Mining Limited and
prior to that
Universal Resources
Limited)
No. 426 – Copper
Mountain Mining Pty
Ltd (formerly Altona
Mining Limited and
prior to that
Universal Resources
Limited)
No. 427 – Copper
Mountain Mining Pty
Ltd (formerly Altona
Mining Limited and
prior to that
Universal Resources
Limited)
No. 428 – Copper
Mountain Mining Pty
Ltd (formerly Altona
Mining Limited and
prior to that
Universal Resources
Limited)
No. 484 – Copper
Mountain Mining Pty
Ltd (formerly Altona
Mining Limited and
prior to that
Universal Resources
Limited)
No. 562 – Copper
Mountain Mining Pty
Ltd (formerly Altona
Mining Limited and
prior to that
Universal Resources
Limited)
No. 1074 – Copper
Mountain Mining Pty
Ltd, Roseby Copper
|
|
No. 388 – Dominion
Mining Ltd
No. 426 – Dominion
Metals Pty Ltd
No. 427 – Dominion
Metals Pty Ltd
No. 428 – Dominion
Metals Pty Ltd
No. 484 – Dominion
Metals Pty Ltd
No. 562 – Dominion
Metals Pty Ltd
No. 1074 – n/a
Deed of Assignment
and Assumption –
Valesco Copper Pty
Ltd (assignee),
Mekong Minerals Pty
Ltd (formerly known
as Dominion Metals
Proprietary Limited) |
Schedule 8 Material Contracts
|
|
|
|
|
|
|
|
|
|
|
|
|
|
|
|
|
|
|
|
|
Dataroom ref
|
|
Contract title and description
|
|
Seller Group Member
|
|
Counterparty
|
|
|
|
|
Pty Ltd, Eva Copper
Mine Pty Ltd
Deed of Assignment
and Assumption –
Eva Copper Mine
Pty Ltd |
|
|
Eva Copper
Phase II –
I.B.2.5.1-2. |
|
Mt. Isa Mines (Agreement
Nos. 661 and 1073)
(May 2004 and 31 August
2018)
|
|
No. 661 – Copper
Mountain Mining Pty
Ltd (formerly Altona
Mining Limited and
prior to that
Universal Resources
Limited), Roseby
Copper Pty Ltd
(formerly Bolnisi
Logistics Pty Ltd)
No. 1073 – Copper
Mountain Mining Pty
Ltd, Roseby Copper
Pty Ltd, Eva Copper
Mine Pty Ltd |
|
No. 661 – Mount Isa
Mines Limited
No. 1073 – n/a |
Schedule 9
CONTINGENT CONSIDERATION DEED
Attached.
Contingent Consideration Deed
THIS DEED is made the day of 2022
Parties
1. Eva Copper Mine Pty Ltd (ACN 625 712 138), Roseby Copper Pty Ltd (ACN 067 584 409) and Roseby Copper (South) Pty Ltd (ACN 148 092 291) (each a Tenement Holder);
2 Copper Mountain Mining Corporation of 700 West Pender Street, Suite 1700, Vancouver, Canada V6C 1G8 (Seller);
3. Harmony Gold (Australia) Pty Limited (ACN091 439 33) of Level 2, 189 Coronation Drive, Milton Queensland 4064 (Buyer); and
4. Harmony Gold Mining Company Limited (Registration number 1950/038232/06) of Randfontein Office Park, Cnr Main Reef Road and Ward Avenue, Randfontein 1759, South Africa (Parent Guarantor)
Background
A. Seller and Buyer have entered into a Share Sale Deed dated ■, 2022 (Share Sale Deed) under which Seller agrees to sell, and Buyer agrees to purchase, all of the issued shares in Copper Mountain Mining Australia Pty Ltd ACN 622566910, an entity that indirectly owns all of the issued shares of the Tenement Holders.
B. Subject to the terms of this deed, the Contingent Consideration (as defined below) comprises a portion of the consideration for the sale and purchase of the Sale Shares under the Share Sale Deed.
C. As a condition to Completion occurring under the Share Sale Deed, the parties are entering into this deed to govern the terms and conditions on which Buyer agrees to pay the Contingent Consideration.
Agreed terms
1 Definitions and interpretation
1.1 Definitions
In this deed, unless the context otherwise requires:
Additional New Resource means the positive difference between the number of pounds of copper contained in (i) an update to, recalculation of, modification to or expansion of a Baseline New Resource under the SAMREC Code (or, if Buyer and its affiliates are then subject to a mineral reporting standard other than the SAMREC Code which is generally accepted in another international jurisdiction that defines mineral resources and mineral reserves, such other standard) Disclosed by Buyer, and (ii) such Baseline New Resource plus any depletion of such Baseline New Resource that may have occurred due to mining activities and, in the event that a payment is made under this deed in respect of an Additional New Resource on a Tenement, such updated, recalculated, modified or expanded resource will form the new Baseline New Resource in respect of such Tenement going forward.
Agreed Interest Rate means the rate of interest being the average bid rate for bills (as defined in the Bills of Exchange Act 1909 (Cth)) having a tenor of 90 days which is displayed on the page of the Reuters Monitor System designated “BBSY” plus 2% calculated on a daily basis.
Allowable Deductions is defined in clause 2.6.
Annual Resource Statement means a statement delivered by Buyer to Seller on August 1 of each calendar year delineating all resources and reserves discovered on the Tenements under the SAMREC Code (or, if Buyer and its affiliates are then subject to a mineral reporting standard other than the SAMREC Code which is generally accepted in another international jurisdiction that defines mineral resources and mineral reserves, such other standard) and indicating whether such resources and reserves are Existing Resources, Baseline New Resources or Additional New Resources.
Arm’s Length Terms means prices and terms no less favourable than those which would be paid and agreed to by a Third Party in an arm’s length transaction under similar circumstances.
Audit Notice is defined in clause 5.2(a).
Average Copper Price means the average price per lb of Product sold during a Quarter (expressed in US$), calculated by dividing the Gross Revenue for Product sold by the Tenement Holders in the relevant Quarter by the total lbs of Product sold by the Tenement Holders during such Quarter.
Average Spot Price for a Quarter means the average daily official settlement price quoted in US dollars per pound of Grade “A” Copper on the London Metal Exchange (or any successor thereto) during such Quarter, as published in Fastmarkets Metal Bulletin averaged over the Quarter in question, and calculated by summing such quoted prices reported for each day during such Quarter and dividing the sum by the number of days for which such prices were reported; provided that if the London Metal Exchange is no longer in operation or does not quote the price referred to above, the parties shall mutually agree, acting reasonably, upon an appropriate pricing mechanism that accurately reflects the market value of copper.
Base Copper Price means $3.80 per lb of Grade “A” Copper.
Baseline New Resource means, when initially Disclosed, the number of pounds of contained copper in any resource under the SAMREC Code (or, if Buyer and its affiliates are then subject to a mineral reporting standard other than the SAMREC Code which is generally accepted in another international jurisdiction that defines mineral resources and mineral reserves, such other standard), including measured, indicated and inferred resources and any reserves included within such resources, Disclosed on any of the Tenements which is discovered by exploration activities undertaken by Buyer on the Tenements and which is geologically distinct and separate from the Existing Resources.
Business Day means any day other than a Saturday, Sunday or statutory holiday in the State of Queensland, Australia, or South Africa on which commercial banks in Brisbane, Australia or Johannesburg, South Africa are open to business.
Contingent Consideration means:
(a) the NSR Excess Cashflow Payment; and
(b) the New Resource Discovery Payment.
Corporations Act means the Corporations Act 2001 (Cth).
Disclosed means the earlier of (i) public disclosure by Buyer or any of its Related Entities, and
(ii) disclosure in an Annual Resource Statement.
Encumbrance means any security interest, mortgage, pledge, lien, charge, title retention arrangement, trust or power, or other form of security or interest having effect as a security for the payment of any monetary obligation or the observance of any other obligation.
Encumbrancee means:
(a) a person who, subject to the terms of this deed, is, or becomes, entitled to the benefit of an Encumbrance over the Tenements;
(b) a person who, subject to the terms of this deed, acquires the benefit of an Encumbrance for the purpose of providing financial accommodation to the Buyer or any of its Related Entities for the development and operation of a mine on the Tenements.
Existing Resources means those resources (including measured, indicated and inferred resources and any reserves included within such resources) identified in Table 1-2 of the technical report prepared and filed in accordance with National Instrument 43-101 – Standards of Disclosure for Mineral Projects titled “NI 43-101 Technical Report for the Eva Copper Project Feasibility Study Update, North West Queensland, Australia”, with an effective date of January 31, 2020 prepared for Seller and dated May 7, 2020, as they may be converted to resources for purposes of the SAMREC Code, and as such resources may be expanded, depleted, recalculated, restated or modified due to further exploration, mining activities, change in assumptions or otherwise.
Expert means an independent expert appointed under clause 9.1.
first tenement Is defined in clause 1.3.
Grade “A” Copper means copper product that is Grade “A” Copper on the London Metal Exchange.
Gross Revenue is defined in clause 2.5.
IFRS means International Financial Reporting Standards formulated by the International Accounting Standards Board, as updated and amended from time to time.
lbs means pounds.
Mineral Resources Act means the Mineral Resources Act 1989 (Qld).
New Resource means a Baseline New Resource or an Additional New Resource, as the case may be.
New Resource Discovery Payment is defined in clause 4.1(a).
Net Smelter Return is defined in clause 2.4.
NSR Excess Cashflow is defined in clause 2.2.
NSR Excess Cashflow Payment is defined in clause 2.1.
NSR Payment Cap is defined in clause 2.2(c).
NSR Payment Statement is defined in clause 3.3.
Product means all payable copper contained in concentrate produced from Project Ore.
Project Ore means ore mined from the Tenements.
Quarter means a calendar quarter.
Records is defined in clause 5.1.
Refinery means a smelter, refinery or other processing plant to which Product is sent for smelting, refining or other processing or beneficiation.
Related Entity of a person means a related body corporate within the meaning of the Corporations Act or any person acting pursuant to an agreement or understanding with that person.
relinquished area is defined in clause 7.1.
SAMREC Code means the South African Code for the Reporting of Exploration Results, Mineral Resources and Mineral Reserves prepared by the South African Mineral Resource Committee (SAMREC) under the joint auspices of the Southern African Institute of Mining and Metallurgy and the Geological Society of South Africa, as from time to time in effect.
Tax Deduction is defined in clause 10.1(a).
Tenements means the mining tenements listed in Schedule 1 to this deed applied for and granted to a Tenement Holder or its Related Entities under the Mineral Resources Act.
Third Party means a person not a party, or a Related Entity of a party, to this deed.
Trading Activities means any and all price hedging and price protection activities undertaken by the Tenement Holders or any of their respective Related Entities with respect to any Product and any streaming contracts that may result in a Tenement Holder receiving less (or more) than market value for Product, including any forward sale and/or purchase contracts, spot-deferred contracts, option contracts, speculative purchases and sales of forward, futures and option contracts, both on and off commodity exchanges but excluding refining and smelting contracts.
Trading Contracts means the agreements, contracts, instruments, confirmations and other arrangements relating to the Trading Activities but excluding refining and smelting contracts.
1.2 Other interpretative provisions
In the interpretation of this deed, unless the context otherwise requires:
(a) A reference to legislation (including subordinate legislation) is to that legislation as amended, re-enacted or replaced, and includes any regulations, ordinances, by-laws, rules and other statutory instruments made or issued under it.
(b) A singular word includes the plural, and vice versa.
(c) Unless otherwise indicated, all references to dollars or “$” are references to United States dollars.
(d) Where a term is defined in this deed, any other grammatical form of that term has a corresponding meaning unless the context otherwise requires.
(e) Unless otherwise indicated, time periods within which a payment is to be made or any other action is to be taken hereunder shall be calculated excluding the day on which the period commences and including the day on which the period ends.
(f) Whenever any payment to be made or action to be taken hereunder is required to be made or taken on a day other than a Business Day, such payment shall be made or action taken on the next following Business Day.
1.3 Reference to mining tenements
In this deed, any reference to a mining tenement (first tenement) includes a reference to any mining tenement granted in renewal or extension of the first tenement or in substitution for the whole or part of the first tenement.
2 Calculation of NSR Excess Cashflow Payment
2.1 Calculation of NSR Excess Cashflow Payment
If the Net Smelter Returns for a Quarter determined in accordance with clause 2.4 is a positive amount then Buyer will pay the NSR Excess Cashflow Payment for that Quarter, at the rate of 10% of the NSR Excess Cashflow for the Quarter (NSR Excess Cashflow Payment).
2.2 Calculation of NSR Excess Cashflow
(a) The NSR Excess Cashflow for a Quarter shall be calculated in accordance with the following formula:
NSR Excess Cashflow = [(A - B) x C] + [(1 – (F ÷ E)) x D]
A = the Average Copper Price for the Quarter
B = the Base Copper Price
C = the number of lbs of Product sold by the Tenement Holders during the Quarter
D = Where F is greater than E then nil, otherwise proceeds received by the Tenement Holders from any insurer in the case of loss of, or damage to, Product during the Quarter (after deducting therefrom all reasonable fees, costs and expenses incurred in connection with the collection of such proceeds, as evidenced by supporting documentation)
E = the Average Copper Price for the Quarter that would have applied to the Product the subject of the insurance claim in D
F = the Base Copper Price for the Quarter that would have applied to the Product the subject of the insurance claim in D
(b) The calculation of NSR Excess Cashflow in this deed is premised on the understanding that copper sales from the Tenements will be exclusively in the form of copper in concentrate produced from Project Ore. If, at any time, Tenement Holders and their Related Entities cease selling copper exclusively in such form pursuant to offtake agreements with payment terms based on the LME Cash Settlement Price, the parties agree to enter into good faith negotiations to revise the terms of this deed to ensure that the intended economics of this deed are preserved for all forms of copper sold. If the parties are unable to agree on the terms of an amended deed, either party may require that such matter be referred to an Expert for determination by sending a notice to the other party, thereby initiating the dispute resolution process in accordance with clause 9 below.
(c) The maximum aggregate amount of the NSR Excess Cashflow Payment payable by Buyer to Seller under this deed is $30 million, subject to any adjustments that may be required by the letter agreement between the Seller and the Buyer dated the date of the Share Sale Deed (NSR Payment Cap). Once the total amount of NSR Excess Cashflow Payment paid to Seller is equal to the NSR Payment Cap, no further amount will be payable by way of NSR Excess Cashflow Payment.
(d) For the avoidance of doubt, no NSR Excess Cashflow Payment shall be payable in a Quarter where the Base Copper Price is greater than or equal to the Average Copper Price for the Quarter.
(e) The Tenement Holders undertake not to sell unprocessed ore from the Tenements.
2.3 Quarterly calculation and payment
The NSR Excess Cashflow Payment will be calculated and payable in respect of each Quarter.
2.4 Net Smelter Return
The Net Smelter Return for each Quarter will be calculated as the Gross Revenue minus Allowable Deductions.
2.5 Gross Revenue
(a) The Gross Revenue for each Quarter will be the gross sales price received in immediately available funds by the Tenement Holders from the sale or other disposal of Product, including the proceeds received from an insurer in the case of loss of or damage to Product (after deducting therefrom all reasonable fees, costs and expenses incurred in connection with the collection of such proceeds, as evidenced by supporting documentation).
(b) Where Product is sold otherwise than on Arm's-Length Terms, Gross Revenue will be the amount that would have been received by the Tenement Holders if the Product had been sold on Arms-Length Terms, as agreed between the parties or if they are unable to agree, either party may require that such matter be referred to an Expert for determination by sending a notice to the other party, thereby initiating the dispute resolution process in accordance with clause 9 below.
2.6 Allowable Deductions
(a) The Allowable Deductions for each Quarter will be the following costs (exclusive of GST) paid or incurred by Buyer and/or the Tenement Holders and/or any of their Related Entities in that Quarter in connection with the smelting, refining, treatment, beneficiation, transportation and/or sale of Product:
(i) all costs of smelting and refining Product and other beneficiation processes including handling, provisional settlement fees, weighing, sampling, assaying, metal losses and penalties for impurities and all umpire charges and other processor deductions;
(ii) all freight, transportation, security and incidental costs and expenses, including forwarding, shipping, demurrage, delay and insurance costs, incurred between the mine gate at the Tenements and the point of delivery of the Product to a Refinery, including the cost of transport to and between any Refinery or other places of treatment;
(iii) all handling and incidental costs and expenses including agency, banking, assaying, sampling, weighing, loading, unloading, stockpiling and storage;
(iv) actual sales costs, and marketing and brokerage costs incurred in connection with the sale of Product;
(v) taxes, duties and like charges imposed on the production transport, export, distribution, stockholding or sale but excluding corporate tax or other taxes calculated on income, profit or revenue; and
(vi) royalties payable to the State of Queensland, all as calculated under IFRS.
(b) Allowable Deductions excludes any costs incurred by Buyer and its Related Entities in connection with exploration, development, construction, mining, crushing, treatment or concentrating within or adjacent to the Tenements.
2.7 Currency
(a) The NSR Excess Cashflow Payment will be calculated and payable in United States dollars.
(b) For the purpose of determining the amount of the NSR Excess Cashflow Payment, where applicable, all receipts and disbursements by any person in a non-United States currency will be converted into United States dollars on the basis of the noon rate of exchange quoted by the U.S. Federal Reserve on the Business Day immediately preceding the date of receipt or disbursement by such person, as the case may be.
2.8 Trading Arrangements
Nothing herein precludes a Tenement Holder or its Related Entities from undertaking Trading Activities. Any Trading Activities engaged in by a Tenement Holder or its Related Entities in respect of Product, and the profits and losses generated thereby, shall not, in any manner, be taken into account in the calculation of Gross Revenue or the NSR Excess Cashflow Payment due to Seller hereunder, whether in connection with the determination of price, the date of sale, the date any NSR Excess Cashflow Payment is due or in any other respect. In the case of sales of Product pursuant to the terms of any Trading Contract, Gross Revenue shall be calculated based on the Average Spot Price for the Quarter in which the date of sale of such Product and not the sale price under the Trading Contract. Seller acknowledges that a Tenement Holder and its Related Entities engaging in Trading Activities may result in such Tenement Holder and its Related Entities realizing from time to time lesser or greater profit for Product than does Seller, since the quantum of the NSR Excess Cashflow Payment to be made hereunder in respect of sales pursuant to Trading Contracts is to be established by the Average Spot Price of the Product for the Quarter in which the date of sale occurred. Similarly, Seller shall not be obligated to share in any losses generated by any such Trading Activities with respect to any Product.
2.9 Caveat
(a) To the extent permitted by applicable law, the Seller shall be entitled from time to time and at its sole cost and expense to register a caveat under the Mineral and Energy Resources (Common Provisions) Act 2014 over the Tenements, and the Tenement Holders shall, and shall cause any Related Entity to cooperate with the Seller to sign any document reasonably necessary to enable such caveat to be recorded over the Tenements and hereby provide their written consent to do so, at the cost and expense of the Seller.
(b) The Seller must promptly either file a notice of continuation of caveat having the effect of allowing the dealing to proceed or withdraw its caveat:
(i) upon an assignee executing a deed whereby the assignee or other recipient of an interest in the Tenements, or any rights in relation to Products extracted and recovered from the area the subject of the Tenements, agrees to assume, be bound by and perform the obligations in this deed of the party from which it acquires its interest and rights;
(ii) an Encumbrancee agrees to provide its written consent to, and sign any document reasonably necessary to, facilitate the lodgement of a subsequent caveat by the Seller over the Tenements.
(c) The Seller may re-lodge its caveat or lodge another caveat immediately after the transfer or Encumbrance is registered and the Buyer and the Encumbrancee must provide their prior written consent to, and do all other acts reasonably requested by the Seller, to facilitate the lodgement of a subsequent caveat by the Seller.
(d) Once:
(i) the total amount of NSR Excess Cashflow Payment paid to Seller is equal to the NSR Payment Cap; and
(ii) the total amount of the New Resource Discovery Payment paid to the Seller is equal to $30 million,
The Seller must take all such action at its cost to remove the caveat from all of the Tenements.
3 Payment of NSR Excess Cashflow Payment
3.1 Due date for payment
The NSR Excess Cashflow Payment for each Quarter will be payable within 30 days after the end of that Quarter.
3.2 Manner of payment
Each NSR Excess Cashflow Payment will be made in United States dollars by electronic transfer of immediately available funds to a bank account nominated by Seller.
3.3 Statements
For each Quarter, Buyer will submit to Seller a statement (NSR Payment Statement) at the same time as payment of the NSR Excess Cashflow Payment is made for that Quarter. Each NSR Payment Statement will set out the manner in which the NSR Excess Cashflow Payment has been calculated, including the following:
(a) the quantity, type and grade of Project Ore extracted during the applicable Quarter;
(b) the quantity, type and grade of Product produced from the Tenements during the Quarter;
(c) the quantity, type and grade of all Product that has been sold during the applicable Quarter;
(d) the quantity, type and grade of Product held or unsold during the applicable Quarter;
(e) details of Product sold on a provisional basis, if any;
(f) the prices determined as herein provided for Product on which a NSR Excess Cashflow Payment is due, and the calculation of the Average Copper Price for the Quarter;
(g) the calculation of any conversion of any foreign currency amounts to U.S. dollars, where applicable, in accordance with clause. 2.7;
(h) the NSR Excess Cashflow Payment for the Quarter (including details of the calculation of the NSR Excess Cashflow for such Quarter);
(i) the difference between (x) the NSR Payment Cap and (y) the aggregate of all NSR Excess Cashflow Payments paid to Seller as at the date of the NSR Payment Statement;
(j) where any commingling has occurred, details of how the allocation of metals was made between Product and materials from other tenements or properties during the applicable Quarter; and
(k) such other pertinent information, in sufficient detail, to explain the calculation of the NSR Excess Cashflow Payment for that Quarter, as may be reasonably requested by Seller.
3.4 Adjustments
In calculating the NSR Excess Cashflow Payment due to Seller for any Quarter, Buyer will make such adjustments (whether plus or minus) as may be necessary:
(a) to take account of any adjustment to amounts previously paid to Seller resulting from new or updated information;
(b) to correct any accounting or recording errors from previous Quarters; or
(c) to comply with this deed.
3.5 Interest on late payment
If Buyer fails to make the NSR Excess Cashflow Payment on or before the due date for payment, then Buyer will pay interest at the Agreed Interest Rate on the amount due calculated and compounded monthly in arrears from the date on which payment was first due, until such payment and accrued interest is paid in full (excluding the date of payment).
4 New Resource Discovery Payment
4.1 Due Date for Payment
(a) If after the date of this Deed a New Resource within any one or more of the Tenements is Disclosed then, within 14 Business Days after the date of such Disclosure, Buyer will pay to Seller an amount equal to US$0.03 multiplied by the number of pounds of contained copper contained in the New Resource, as the case may be (New Resource Discovery Payment). In addition:
(i) Each New Resource Discovery Payment will be made in United States dollars by electronic transfer of immediately available funds to a bank account nominated by Seller; and
(ii) If Buyer fails to make a New Resource Discovery Payment on or before the due date for payment, then Buyer will pay interest at the Agreed Interest Rate on the amount due calculated and compounded monthly in arrears from the date on which payment was first due, until such payment and accrued interest is paid in full (excluding the date of payment).
(b) More than one New Resource Discovery Payment may become payable by Buyer under this Deed. However, the maximum aggregate amount payable by Buyer by way of New Resource Discovery Payments is US$30 million. Once the total amount by way of New Resource Discovery Payments paid by Buyer to Seller reaches US$30 million, no further amount will be payable by way of New Resource Discovery Payments.
4.2 Covenants of Buyer
(a) On August 1 of each calendar year, Buyer will deliver to Seller an Annual Resource Statement, together with reasonable supporting documentation.
(b) In reviewing exploration results and considering whether to Disclose a New Resource on one or more of the Tenements, Buyer must act reasonably and consistently with its previous practices with regard to the calculation and reporting of mineral resources, including in respect of commodity price and other assumptions.
(c) If Buyer Discloses a New Resource within one or more of the Tenements, Buyer must at the request of Seller make available to Seller all of the information in its possession to demonstrate that the quantification of the New Resource has been calculated and determined in accordance with the SAMREC Code (or, if Buyer and its affiliates are then subject to a mineral reporting standard other than the SAMREC Code which is generally accepted in another international jurisdiction that defines mineral resources and mineral reserves, such other standard) and otherwise in accordance with generally accepted good industry mining and metallurgical practices applied reasonably and consistently with its previous practices with regard to the calculation and reporting of mineral resources, including in respect of commodity price and other assumptions.
(d) If Seller, acting reasonably, considers that a New Resource has been discovered by Buyer prior to delivery of the most recent Annual Resource Statement and such New Resource is not included in the immediately succeeding Annual Resource Statement, Seller may request information from Buyer reasonably necessary to demonstrate whether or not a New Resource has been discovered and the size of any New Resource. Buyer must promptly respond to any such request.
(e) Buyer must maintain such books and records as are reasonably necessary to determine whether a New Resource has been discovered and the size of any New Resource.
4.3 Inspection and Audit
(a) Buyer will permit Seller or its auditors access at reasonable times and on reasonable notice to inspect the books and records maintained by Buyer to determine whether a New Resource has been discovered and the size of any New Resource.
(b) Seller may provide written notice to Buyer of any New Resource which, in its opinion or in the opinion of its auditor, has been discovered for which a New Resource Discovery Payment has not been made. Seller will provide to Buyer reasonable evidence to support its conclusion and the parties will endeavour to resolve the matters identified. If the parties are unable to resolve such matters within 30 days following receipt by Buyer of the written notice, then either Buyer or Seller may require that such matters be referred to an Expert for determination by sending a notice to the other party, thereby initiating the dispute resolution process in accordance with clause 9 below.
(c) If it is agreed between the parties or determined by an Expert that a New Resource has been discovered, Buyer will Disclose such New Resource promptly (including by amending its most recent Annual Resource Statement, if necessary) and pay the applicable New Resource Discovery Payment in accordance with this Deed.
5 Books and records
5.1 Tenement Holders to maintain books and records
The Tenement Holders must maintain such books and records, in accordance with IFRS, as are reasonably necessary to verify and substantiate the amount of the NSR Excess Cashflow Payments payable for each Quarter including invoices, statements, receipts and records of quantities of Product delivered for sale (Records).
5.2 Inspection and audit of Records
(a) Seller may upon not less than 14 days’ prior written notice to Buyer and at its own cost appoint an appropriately qualified person to inspect, audit and report to Seller on the Records of one or more of the Tenement Holders in respect of a Quarter. If Seller wishes to audit the Records for any Quarter, Seller must give notice to Buyer of its intention to do so (Audit Notice) within 270 days after receiving the NSR Payment Statement for that Quarter. Any payment made hereunder shall be considered final and in full satisfaction of all obligations of Buyer and the Tenement Holders hereunder in respect of that payment unless an Audit Notice is delivered within the aforesaid 270 days following receipt of the NSR Payment Statement to which such payment relates.
(b) Each Tenement Holder must give the auditor appointed by Seller full and free access to the Records of such Tenement Holder at its offices, or elsewhere as agreed, at reasonable times for the purposes of the audit.
5.3 Consequences of financial audit
(a) If Seller notifies Buyer of any underpayment or overpayment of the NSR Excess Cashflow Payment which Seller’s auditor, in its reasonable opinion, considers exists, or the audit determines that any NSR Excess Cashflow Payment paid has been calculated in error, Seller will provide to Buyer a copy of the auditor’s report, and the parties will endeavour to resolve the matters identified in the report. If the parties are unable to resolve such matters within 30 days following receipt by Buyer of the report, then either Buyer or Seller may require that such matters be referred to an Expert for determination by sending a notice to the other party, thereby initiating the dispute resolution process in accordance with clause 9.
(b) If it is agreed between the parties or determined by an Expert that the NSR Excess Cashflow Payment properly payable has been underpaid by more than 5%, Buyer must refund to Seller the costs of the audit.
6 Commingling of production
6.1 Commingling
Tenement Holders may commingle Project Ore with other ores, metals and minerals produced elsewhere, including where Project Ore is processed through a processing plant owned by Tenement Holders or their Related Entitles along with ore from other sources. If this is the case:
(a) The allocation of total production between Project Ore and other ore will be calculated and determined in accordance with generally accepted good Australian industry mining and metallurgical practices applied reasonably.
(b) Tenement Holders will be responsible for making these metallurgical estimates, at all times acting reasonably, and such estimates will be included in the NSR Payment Statements.
(c) Tenement Holders must establish and record the methods and practices it will adopt to weigh, sample, assay and perform other measuring or testing necessary to allocate the total production between Project Ore and other ore prior to the Project Ore being comingled with the other ore. Tenement Holders agree to provide a copy of these procedures to Seller if so requested in writing.
(d) Tenement Holders and their Related Entities shall maintain records of the results of such sampling, assaying and analysis for a period of no less than 365 days from the date that Seller receives the NSR Payment Statement prepared in accordance with clause 3.3 that relates to an NSR Excess Cashflow Payment, and Seller shall be permitted the right to examine such records relating to any blending and commingling of ores, metals, minerals, and other materials not from the Tenements in accordance with the inspection rights in favour of Seller set forth in clause 5.2.
6.2 Technical audit
If clause 6.1 applies:
(a) Seller may, at reasonable times and at its own cost and risk and not more than twice in any calendar year upon reasonable written notice to Buyer, by a qualified and recognised mining engineer appointed by Seller, inspect and conduct a technical audit on the methods and practices used by Buyer, Tenement Holders and their Related Entities in weighing, sampling, assaying or other measuring or testing extracted from the Tenements, and in doing so must comply with the reasonable requirements of Buyer or the applicable Related Entity and its safety officers.
(b) Tenement Holders must provide, at Seller’s cost, all reasonable access to Seller and to the mining engineer appointed by Seller sufficient and necessary to reasonably carry out any technical audit.
(c) Seller must ensure that any audit undertaken by or on behalf of Seller is conducted and concluded promptly and diligently.
(d) Seller may give Buyer a copy of any report arising from the audit which raises, as a matter of concern, any matter concerning the weighing, sampling, assaying or any other measuring or testing practice which is not consistent with good mining and metallurgical practice in Australia applied reasonably.
(e) If the parties are unable to agree any matters arising from the audit, then either Buyer or Seller may require the disputed matters to be referred to an Expert for determination by sending a written notice to the other party, thereby initiating the dispute resolution process in accordance with clause 9.
7 Relinquishment of areas
7.1 Relinquishment
If a Tenement Holder relinquishes any Tenement or portion of a Tenement (relinquished area), including by voluntary surrender or allowing a Tenement to expire, then the relinquished area will cease to be subject to this deed.
7.2 Revival of obligations
If any part of a relinquished area is granted to or acquired by a Tenement Holder or a Related Entity of a Tenement Holder within 10 years of its relinquishment, then upon such grant or acquisition, the relevant area shall again become part of the Tenements for the purposes of this deed. A Tenement Holder shall give Seller written notice of such reacquisition within 30 days of the reacquisition but only to the extent such reacquisition occurs within the said 10-year period.
8 Assignment
8.1 Assignment by Buyer
(a) Buyer must not transfer, assign or otherwise convey, directly or indirectly, its interest in the Tenements without first obtaining from any third party assignee a deed in favour of, and in a form reasonably acceptable to, Seller by which:
(i) the assignee covenants to perform Buyer’s and the Tenement Holders’ obligations under this deed, and
(ii) the ultimate parent of Buyer agrees to guarantee the obligations of the assignee.
This deed is not assignable independently of the Tenements.
(b) Buyer, Parent Guarantor and the Tenement Holders will be relieved of their respective obligations under this deed to the extent their respective obligations are assumed by a third party assignee (or its ultimate parent, in the case of Parent Guarantor) in accordance with paragraph (a).
8.2 Encumbrances
Each Tenement Holder covenants in favour of the other parties that it will not grant any Encumbrance over the Tenements or this deed unless the Encumbrancee executes a deed of covenant in favour of the other parties under which the Encumbrancee agrees to be bound by the terms of this deed in exercising the Encumbrancee’s powers or remedies under the Encumbrance, as if it was a Tenement Holder.
8.3 Assignment by Seller
Seller must not, at any time, without the consent of the other parties to this deed, assign, transfer or otherwise convey its rights, benefits or obligations under this deed to any person or persons without the prior written consent of the other parties hereto. Notwithstanding the preceding sentence, Seller may at any time transfer, assign or otherwise convey this deed to a Related Entity of Seller without the need to obtain the consent of the other parties, provided that if such Related Entity shall cease to be a Related Entity of Seller, it shall first transfer this deed back to Seller or a Related Entity thereof.
9 Resolution of disputes
9.1 Expert determination
Where in this deed a dispute between the parties is to be determined by an Expert, or the parties agree that a dispute should be determined by an Expert, the following provisions apply:
(a) The reference to the Expert is to be made in accordance with, and subject to, The Institute of Arbitrators & Mediators Australia Expert Determination Rules.
(b) The Expert determination must be conducted by a member of a leading international mining consultancy or engineering firm agreed to by the parties (who must be independent of the parties and experienced in the matters covered by this deed).
(c) In making a determination:
(i) the Expert must act in that capacity and not as an arbitrator;
(ii) the Expert’s finding is final and binding upon the parties in the absence of manifest error or fraud;
(iii) the Expert must determine which party or parties should bear the costs of any such determination and in what proportion. In making this decision, the Expert must consider the degree to which the Expert considers such party was unreasonable in failing to agree to the matter; and
(iv) the Expert may employ consultants to assist the Expert in carrying out its duties.
9.2 Parties to continue to perform
Prior to resolution of a dispute, the parties must continue to perform their respective obligations under this deed including all pre-existing obligations the subject of the dispute, except only to the extent that lack of resolution of the dispute prevents such performance.
10 Tax Withholdings
10.1 Deductions required by law
(a) If Buyer is required by law to deduct any from a payment under or in connection with this deed (including but not limited to an NSR Excess Cashflow Payment or a New Resource Discovery Payment) (Tax Deduction), Buyer must:
(i) promptly, upon becoming aware that it is required to make the Tax Deduction, or if there is any change in the rate or the basis of the Tax Deduction, notify Seller in writing of the amount, date and proposed recipient of the required Tax Deduction;
(ii) make the Tax Deduction and pay the amount required by law to the relevant government authority within the time allowed; and
(iii) within 30 days of making either the Tax Deduction or any payment required in connection with that Tax Deduction, deliver to Seller evidence that the Tax Deduction has been made and paid as required.
(b) If the Buyer determines that it is under an obligation to pay the Commissioner of Taxation, an amount under subdivision 14-D of Schedule 1 to the Taxation Administration Act 1953 (Cth) (TAA) in respect of a payment under or in connection with this deed (including but not limited to an NSR Excess Cashflow Payment or a New Resource Discovery Payment) (a Withholding Tax Amount), the Buyer will deduct the Withholding Tax Amount (and such deduction shall be treated as a Tax Deduction for the purposes of this clause 10).
(c) If the Buyer determines that subdivision 12-G of Schedule 1 to the TAA is applicable to any payment made under or in connection with this deed (including but not limited to an NSR Excess Cashflow Payment or a New Resource Discovery Payment), the Seller must provide the Buyer with such assistance as is reasonably requested by the Buyer in order for the Buyer to comply with its obligations under that subdivision. For the avoidance of any doubt, this clause 10 shall apply to any withholding or deduction required under subdivision 12-G of Schedule 1 to the TAA (and such withholding or deduction is a Tax Deduction for the purposes of this clause 10).
(d) For the avoidance of doubt, no additional amount will be payable by the Buyer to the Seller on account of any Withholding Tax Deduction.
11 GST
(a) In this clause:
(i) GST means the same as in the GST Law.
(ii) GST Law means the same as in the A New Tax System (Goods and Services Tax) Act 1999 (Cth).
(iii) Words defined in the GST Law have the same meaning in this clause unless specifically defined in this clause.
(b) All charges and amounts payable by one party to another under this deed are stated exclusive of GST.
(c) For each taxable supply under or in connection with this deed:
(i) The supplier will be entitled to charge the recipient for any GST payable by the supplier in respect of the taxable supply.
(ii) The recipient must pay to the supplier the amount of the GST at the same time as the relevant charge applicable to the supply becomes payable.
(iii) The supplier must provide a valid tax invoice (or a valid adjustment note) to the recipient in respect of the taxable supply, and will include in the tax invoice (or adjustment note) the particulars required by the GST Law. The recipient is not obliged to pay the GST unless and until the recipient has received a tax invoice (or an adjustment note) for that supply.
(iv) If the actual GST liability of the supplier differs from the GST paid by the recipient, the supplier will promptly create an appropriate valid adjustment note, and the recipient will pay to the supplier any amount underpaid, and the supplier will refund to the recipient any amount overpaid.
(d) Each invoice issued under this deed will be in the form of a tax invoice. Each invoice issued under this deed must show the GST payable on supplies covered by that invoice.
(e) If any party is entitled to payment of any costs or expenses by way of reimbursement or indemnity, the payment must exclude any part of that cost or expense which is attributable to GST for which that party or the Representative Member of any GST Group of which that party is a Member is entitled to an Input Tax Credit.
12 Guarantee
12.1 Guarantee
Parent Guarantor guarantees to Seller, on demand, the due and punctual payment and performance by Buyer of all of its obligations under this deed, including the payment of the Contingent Consideration.
12.2 Principal Obligation
Parent Guarantor’s obligations under this guarantee are principal obligations and may be enforced against the Guarantor without Seller first being required to exhaust any remedy it may have against Buyer or a Tenement Holder or to enforce any security interest it may hold. This clause 12 is a continuing guarantee and remains in full force and effect for so long as the Buyer has any liability or obligation to the Seller under this document and until all those liabilities and obligations are fully discharged.
13 Liability unaffected
The liability of Parent Guarantor under this deed shall not be discharged, released, excused, abrogated, prejudiced or affected by the existence or occurrence of any of the following:
(a) any arrangement made between a Tenement Holder or Buyer, on one hand, and Seller, on the other hand, with or without the consent of Parent Guarantor ;
(b) any forbearance, waiver or concession given by Seller whether as to payment, time, performance or otherwise;
(c) any laches, acquiescence, failure or neglect by Seller to enforce any right or remedy against Buyer or a Tenement Holder;
(d) the amendment, termination, release or discharge of any other document;
(e) any transfer, assignment or novation by a Tenement Holder, Buyer or Seller;
(f) any change in the ownership or control of Buyer or a Tenement Holder;
(g) the insolvency or winding up of Buyer or a Tenement Holder; or
(h) any other matter whatsoever.
14 Notice
(a) Any notice or other communication required or permitted to be given hereunder shall be in writing and shall be delivered in person, transmitted by email or similar means of recorded electronic communication or sent by registered mail, charges prepaid, addressed as follows:
(i) If to Seller:
Copper Mountain Mining Corporation Suite 1700 – 700 West Pender Street Vancouver, British Columbia, Canada V6C 1G8
Attention: Vice President, General Counsel and Corporate Secretary Email: matthew.langford@cumtn.com
(ii) If to a Tenement Holder or Buyer:
Eva Copper Pty Ltd. Roseby Copper Pty Ltd
Roseby Copper (South) Pty Ltd Harmony Gold Pty (Australia) Limited Level 2, 189 Coronation Drive
Milton, Queensland 4064 Australia
Attention: Company Secretary
Email: HGSEA.legal@harmonyseasia.com
(iii) If to Parent Guarantor:
Harmony Gold Mining Company Limited Randfontein Office Park
Cnr Main Reef Road and Ward Avenue Randfontein 1759
South Africa
Attention: Shela Mohatla, Company Secretary
Email: companysecretariat@harmony.co.za
Copy to: Company Secretary,
Harmony Gold (Australia) Pty Limited Level 2, 189 Coronation Drive,
Milton, Queensland 4064 Australia
HGSEA.legal@harmonyseasia.com
(b) Any notice or other communication made in accordance with paragraph (a) shall be deemed to have been given and received on the day on which it was delivered or transmitted (or, if such day is not a Business Day or if delivery or transmission is made on a Business Day after 5:00 p.m. at the place of receipt, then on the next following Business Day) or, if mailed, on the third Business Day following the date of mailing; provided, however, that if at the time of mailing or within three Business Days thereafter there is or occurs a labour dispute or other event which might reasonably be expected to disrupt the delivery of documents by mail, any notice or other communication hereunder shall be delivered or transmitted by means of recorded electronic communication as aforesaid.
(c) Any party may at any time change its address for service from time to time by giving notice to the other party in accordance with this clause 14.
15 General
15.1 Governing law and jurisdiction
(a) This deed is governed by the law in force in the State of Queensland.
(b) Each party submits to the exclusive jurisdiction of the courts in and of the State of Queensland.
15.2 Amendment
This deed can only be amended, supplemented, replaced or novated by another document signed by the parties.
15.3 Giving effect to this deed
The parties agree to cooperate in good faith with each other and agree that each party must do anything (including the execution of any document), and must ensure that its employees and agents do anything (including the execution of any document), that the other party may reasonably require to give full effect to this deed.
15.4 Waiver of rights
A right may only be waived in writing, signed by the party giving the waiver, and no other conduct of a party (including a failure to exercise, or delay in exercising, the right) operates as a waiver of the right or otherwise prevents the exercise of the right. A waiver of a right on one or more occasions does not operate as a waiver of that right if it arises again. The exercise of a right does not prevent any further exercise of that right or of any other right.
15.5 Entire agreement
This deed contains the entire agreement between the parties about its subject matter. Any previous understanding, agreement, representation or warranty relating to that subject matter is replaced by this deed and has no further effect.
15.6 Enurement
The provisions of this deed will enure for the benefit of and be binding upon the administrators, successors in title and permitted assigns of each party.
15.7 Counterparts
This deed may be executed in any number of counterparts. All counterparts, taken together, constitute one instrument. A party may execute this letter agreement by signing any counterpart. Signatures may be exchanged by e-mail. Each Party agrees to be bound by its own electronic signature and that it accepts the electronic signature of the other Parties.
Schedule 1
Tenements
|
|
|
|
|
|
Tenement Number |
Registered holder
|
|
ML 90162
|
Eva Copper Mine Pty Ltd
|
ML 90163 |
Eva Copper Mine Pty Ltd
|
ML 90164 |
Eva Copper Mine Pty Ltd
|
ML 90165 |
Eva Copper Mine Pty Ltd
|
ML 90166 |
Eva Copper Mine Pty Ltd
|
EPM 25760 |
Eva Copper Mine Pty Ltd
|
EPM 9611 |
Roseby Copper (South) Pty Ltd
|
EPM 14363 |
Roseby Copper Pty Ltd
|
EPM 14370 |
Roseby Copper (South) Pty Ltd
|
EPM 25757 |
Roseby Copper Pty Ltd
|
EPM 25759 |
Roseby Copper (South) Pty Ltd
|
EPM 25761 |
Roseby Copper (South) Pty Ltd
|
EPM 26182 |
Roseby Copper (South) Pty Ltd
|
EPM 26280 |
Roseby Copper (South) Pty Ltd
|
EPM 26283 |
Roseby Copper (South) Pty Ltd
|
EPM 26284 |
Roseby Copper (South) Pty Ltd
|
EPM 26367 |
Roseby Copper (South) Pty Ltd
|
EPM 26566 |
Roseby Copper (South) Pty Ltd
|
EPM 26595 |
Roseby Copper (South) Pty Ltd
|
EPM 26605 |
Roseby Copper (South) Pty Ltd
|
EPM 26676 |
Roseby Copper (South) Pty Ltd
|
EPM 26811 |
Roseby Copper (South) Pty Ltd
|
EPMA 28602 |
Roseby Copper (South) Pty Ltd (applicant)
|
EPMA 28603 |
Roseby Copper (South) Pty Ltd (applicant)
|
EXECUTED as a Deed
Executed by Eva Copper Mine Pty Ltd in accordance with section 127 of the Corporations Act:
Signature of Director Signature of Secretary/other Director
Name of Director in full Name of Secretary/other Director in full
Executed by Roseby Copper Pty Ltd in accordance with section 127 of the Corporations Act:
Signature of Director Signature of Secretary/other Director
Name of Director in full Name of Secretary/other Director in full
Executed by Roseby Copper (South) Pty Ltd in accordance with section 127 of the Corporations Act:
Signature of Director Signature of Secretary/other Director
Name of Director in full Name of Secretary/other Director in full
Signed sealed and delivered by Copper Mountain Mining Corporation:
Signature of Director Signature of Secretary/other Director
Name of Director in full Name of Secretary/other Director in full
Signed sealed and delivered by Harmony Gold (Australia) Pty Limited:
Signature of Director Signature of Secretary/other Director
Name of Director in full Name of Secretary/other Director in full
Signed sealed and delivered by Harmony Gold Mining Company Limited:
/s/ Peter William Steenkamp /s/ Harry Ephraim Mashego
Signature of Director Signature of Secretary/other Director
Peter William Steenkamp Harry Ephraim Mashego
Name of Director in full Name of Secretary/other Director in full
Schedule 10
TARGET GROUP COMPANIES
1. Eva Copper Mine Pty Ltd
|
|
|
|
|
|
| ACN |
625 712 138 |
| ABN |
74 625 712 138 |
Company type |
Australian proprietary company limited by shares |
Date of incorporation/registration |
20 April 2018 |
Registered office |
G 159 Coronation Drive Milton QLD 4064 |
| Directors |
Gilmour Clausen Roland Dieter Bartsch |
| Secretary |
Eric Edward Hughes |
Capital structure (including issued capital) |
2 issued ordinary shares and paid up share capital of A$2.00 |
Copper Mountain Mining Pty Ltd (ACN 090 486 018) |
Holder of 100% of the issued share capital |
2. Roseby Copper Pty Ltd
|
|
|
|
|
|
| ACN |
067 584 409 |
| ABN |
49 067 584 409 |
Company type |
Australian proprietary company limited by shares |
Date of incorporation/registration |
19 December 1994 (Name Start Date: 17 July 2008) |
Registered office |
G 159 Coronation Drive Milton QLD 4064 |
| Directors |
Gilmour Clausen Roland Dieter Bartsch |
| Secretary |
Eric Edward Hughes |
Capital structure (including issued capital) |
5,560,901 issued ordinary shares and paid up share capital of A$5,560,901 |
Copper Mountain Mining Pty Ltd (ACN 090 486 018) |
Holder of 100% of the issued share capital |
3. Roseby Copper (South) Pty Ltd
|
|
|
|
|
|
| ACN |
148 092 291 |
| ABN |
49 148 092 291 |
Company type |
Australian proprietary company limited by shares |
Date of incorporation/registration |
6 January 2011 |
Registered office |
G 159 Coronation Drive Milton QLD 4064 |
| Directors |
Gilmour Clausen Roland Dieter Bartsch |
| Secretary |
Eric Edward Hughes |
Capital structure (including issued capital) |
1 issued ordinary share and paid up share capital of A$1.00 |
Copper Mountain Mining Pty Ltd (ACN 090 486 018) |
Holder of 100% of the issued share capital |
4. Copper Mountain Mining Pty Ltd
|
|
|
|
|
|
| ACN |
090 486 018 |
| ABN |
35 090 468 018 |
Company type |
The company was a public company and converted to an Australian proprietary company limited by shares on 1 June 2018 |
Date of incorporation/registration |
8 November 1999 (Name Start Date: 1 June 2018) |
Registered office |
G 159 Coronation Drive Milton QLD 4064 |
| Directors |
Donald Strickland
Gilmour Clausen Roland Dieter Bartsch
|
| Secretary |
Eric Edward Hughes |
Capital structure (including issued capital) |
549,682,392 issued ordinary shares and paid up share capital of A$94,128,568.96. |
Copper Mountain Mining Australia Pty Ltd (ACN 622 566 910) |
Holder of 100% of the issued share capital |
5. CMMC Australia Pty Ltd
|
|
|
|
|
|
| ACN |
623 541 079 |
| ABN |
14 623 541 079 |
Company type |
Australian proprietary company limited by shares |
Date of incorporation/registration |
21 December 2017 |
Registered office |
G 159 Coronation Drive Milton QLD 4064 |
| Directors |
Roland Dieter Barsch Gilmour Clausen |
| Secretary |
Eric Edward Hughes |
Capital structure (including issued capital) |
1 fully paid ordinary share and paid up share capital of A$1.00 |
Copper Mountain Mining Australia Pty Ltd (ACN 622 566 910) |
Holder of 100% of the issued share capital |
6. Copper Mountain Mining Australia Pty Ltd
|
|
|
|
|
|
| ACN |
622 566 910 |
| ABN |
72 622 566 910 |
Company type |
Australian proprietary company |
Date of incorporation/registration |
28 November 2017 |
Registered office |
G 159 Coronation Drive Milton QLD 4064 |
| Directors |
Gilmour Clausen Roland Dieter Bartsch |
| Secretary |
Eric Edward Hughes |
Capital structure (including issued capital) |
68,718,837 fully paid ordinary shares and paid up share capital of A$68,718,837.00 |
Copper Mountain Mining Corporation (British Columbia) |
Holder of 100% of the issued share capital |
Signing page
EXECUTED AS A DEED
Signed sealed and delivered for
Copper Mountain Mining Corporation
by
sign here /s/ Gilmour Clausen
Print name Gilmour Clausen
sign here /s/ Letitia Wong
Print name Letitia Wong
EVP, Chief Financial Officer
Signed sealed and delivered for
Harmony Gold (Australia) Pty Limited
by
sign here /s/ JJ van Heerden
Director
Print name JJ van Heerden Print name Peter William Steenkamp
sign here /s/ Aubrey Testa
Director
Print name Aubrey Testa
Signed sealed and delivered for
Harmony Gold Mining Company Limited
by
sign here /s/ Peter William Steenkamp
Director
/s/ Harry Ephraim Mashego
Director
Print name Harry Ephraim Mashego
EX-8.1
4
exhibit81significantsubsid.htm
EX-8.1
Document
SIGNIFICANT SUBSIDIARIES OF HARMONY GOLD MINING COMPANY LIMITED
|
|
|
|
|
|
|
|
|
NAME OF SUBSIDIARY |
PERCENTAGE HELD |
COUNTRY OF INCORPORATION |
Freegold (Harmony) Proprietary Limited |
100% |
South Africa |
Avgold Limited |
100% |
South Africa |
Harmony Gold Australia Proprietary Limited |
100% |
Australia |
Kalahari Goldridge Mining Company Limited |
100% |
South Africa |
Randfontein Estates Limited |
100% |
South Africa |
African Rainbow Minerals Gold Limited |
100% |
South Africa |
Harmony Moab Khotsong Operations Proprietary Limited |
100% |
South Africa |
| Golden Core Trade and Invest (Proprietary) Limited |
100% |
South Africa |
| Chemwes (Proprietary) Limited |
100% |
South Africa |
EX-12.1
5
exhibit121-petersteenkampf.htm
EX-12.1
Document
CERTIFICATION
I, Peter Steenkamp, certify that:
1.I have reviewed this annual report on Form 20-F of Harmony Gold Mining Company Limited;
2.Based on my knowledge, this report does not contain any untrue statement of a material fact or omit to state a material fact necessary to make the statements made, in light of the circumstances under which such statements were made, not misleading with respect to the period covered by this report;
3.Based on my knowledge, the financial statements, and other financial information included in this report, fairly present in all material respects the financial condition, results of operations and cash flows of the Company as of, and for, the periods presented in this report;
4.The Company’s other certifying officer(s) and I are responsible for establishing and maintaining disclosure controls and procedures (as defined in Exchange Act Rules 13a-15(e) and 15d-15(e)) and internal control over financial reporting (as defined in Exchange Act Rules 13a-15(f) and 15d-15(f)) for the Company and have:
(a) Designed such disclosure controls and procedures, or caused such disclosure controls and procedures to be designed under our supervision, to ensure that material information relating to the Company, including its consolidated subsidiaries, is made known to us by others within those entities, particularly during the period in which this report is being prepared;
(b) Designed such internal control over financial reporting, or caused such internal control over financial reporting to be designed under our supervision, to provide reasonable assurance regarding the reliability of financial reporting and the preparation of financial statements for external purposes in accordance with generally accepted accounting principles;
(c) Evaluated the effectiveness of the Company’s disclosure controls and procedures and presented in this report our conclusions about the effectiveness of the disclosure controls and procedures, as of the end of the period covered by this report based on such evaluation; and
(d) Disclosed in this report any change in the Company’s internal control over financial reporting that occurred during the period covered by the annual report that has materially affected, or is reasonably likely to materially affect, the Company’s internal control over financial reporting; and
5.The Company’s other certifying officer(s) and I have disclosed, based on our most recent evaluation of internal control over financial reporting, to the Company’s auditors and the audit committee of the Company’s board of directors (or persons performing the equivalent functions):
(a) All significant deficiencies and material weaknesses in the design or operation of internal control over financial reporting which are reasonably likely to adversely affect the Company’s ability to record, process, summarize and report financial information; and
(b) Any fraud, whether or not material, that involves management or other employees who have a significant role in the Company’s internal control over financial reporting.
Date: October 31, 2023
By: /s/ Peter Steenkamp
Peter Steenkamp
Chief Executive Officer
EX-12.2
6
exhibit122-boipelolekubofy.htm
EX-12.2
Document
CERTIFICATION
I, Boipelo Lekubo, certify that:
1.I have reviewed this annual report on Form 20-F of Harmony Gold Mining Company Limited;
2.Based on my knowledge, this report does not contain any untrue statement of a material fact or omit to state a material fact necessary to make the statements made, in light of the circumstances under which such statements were made, not misleading with respect to the period covered by this report;
3.Based on my knowledge, the financial statements, and other financial information included in this report, fairly present in all material respects the financial condition, results of operations and cash flows of the Company as of, and for, the periods presented in this report;
4.The Company’s other certifying officer(s) and I are responsible for establishing and maintaining disclosure controls and procedures (as defined in Exchange Act Rules 13a-15(e) and 15d-15(e)) and internal control over financial reporting (as defined in Exchange Act Rules 13a-15(f) and 15d-15(f)) for the Company and have:
(a) Designed such disclosure controls and procedures, or caused such disclosure controls and procedures to be designed under our supervision, to ensure that material information relating to the Company, including its consolidated subsidiaries, is made known to us by others within those entities, particularly during the period in which this report is being prepared;
(b) Designed such internal control over financial reporting, or caused such internal control over financial reporting to be designed under our supervision, to provide reasonable assurance regarding the reliability of financial reporting and the preparation of financial statements for external purposes in accordance with generally accepted accounting principles;
(c) Evaluated the effectiveness of the Company’s disclosure controls and procedures and presented in this report our conclusions about the effectiveness of the disclosure controls and procedures, as of the end of the period covered by this report based on such evaluation; and
(d) Disclosed in this report any change in the Company’s internal control over financial reporting that occurred during the period covered by the annual report that has materially affected, or is reasonably likely to materially affect, the Company’s internal control over financial reporting; and
5.The Company’s other certifying officer(s) and I have disclosed, based on our most recent evaluation of internal control over financial reporting, to the Company’s auditors and the audit committee of the Company’s board of directors (or persons performing the equivalent functions):
(a) All significant deficiencies and material weaknesses in the design or operation of internal control over financial reporting which are reasonably likely to adversely affect the Company’s ability to record, process, summarize and report financial information; and
(b) Any fraud, whether or not material, that involves management or other employees who have a significant role in the Company’s internal control over financial reporting.
Date: October 31, 2023
By: /s/ Boipelo Lekubo
Boipelo Lekubo
Financial Director
EX-13.1
7
exhibit131-petersteenkampf.htm
EX-13.1
Document
CERTIFICATION
(pursuant to 18 U.S.C. Section 1350, as adopted pursuant to Section 906 of the Sarbanes-Oxley Act of 2002)
In connection with the Annual Report on Form 20-F for the fiscal year ended June 30, 2023 of Harmony Gold Mining Company Limited (the “Company”) as filed with the U.S. Securities and Exchange Commission (the “Commission”) on the date hereof (the “Report”) and pursuant to 18 U.S.C. Section 1350, as adopted pursuant to Section 906 of the Sarbanes-Oxley Act of 2002, I, Peter Steenkamp, Chief Executive Officer of the Company, certify, that:
(1) the Report fully complies with the requirements of Section 13(a) or 15(d) of the Securities Exchange Act of 1934, as amended; and
(2) the information contained in the Report fairly presents, in all material respects, the financial condition and results of operations of the Company.
Date: October 31, 2023
By: /s/ Peter Steenkamp
Peter Steenkamp
Chief Executive Officer
A signed original of this written statement required by Section 906 has been provided and will be retained by the Company and furnished to the Commission or its staff upon request.
EX-13.2
8
exhibit132-boipelolekubofy.htm
EX-13.2
Document
CERTIFICATION
(pursuant to 18 U.S.C. Section 1350, as adopted pursuant to Section 906 of the Sarbanes-Oxley Act of 2002)
In connection with the Annual Report on Form 20-F for the fiscal year ended June 30, 2023 of Harmony Gold Mining Company Limited (the “Company”) as filed with the U.S. Securities and Exchange Commission (the “Commission”) on the date hereof (the “Report”) and pursuant to 18 U.S.C. Section 1350, as adopted pursuant to Section 906 of the Sarbanes-Oxley Act of 2002, I, Boipelo Lekubo, Financial Director of the Company, certify, that:
(1) the Report fully complies with the requirements of Section 13(a) or 15(d) of the Securities Exchange Act of 1934, as amended; and
(2) the information contained in the Report fairly presents, in all material respects, the financial condition and results of operations of the Company.
Date: October 31, 2023
By: /s/ Boipelo Lekubo
Boipelo Lekubo
Financial Director
A signed original of this written statement required by Section 906 has been provided and will be retained by the Company and furnished to the Commission or its staff upon request.
EX-15.1
9
exhibit151iar2023.htm
EX-15.1
Document
+Exhibit 15.1: Integrated Annual Report for the 20-F 2023 dated October 31, 2023
INTEGRATED ANNUAL REPORT FOR THE 20-F 2023
CONTENTS
|
|
|
|
|
|
|
|
|
|
|
|
|
| About Harmony |
|
|
|
|
| About this report |
|
|
|
|
| Who we are |
|
|
|
|
Our operations |
|
|
|
|
Our business model |
|
|
|
|
| Our leadership |
|
|
|
|
| Chairman’s review |
|
|
|
|
Chief executive officer’s review |
|
|
|
|
| Our external operating environment |
|
|
|
|
| Our risks and opportunities |
|
|
|
|
Our material matters |
|
|
|
|
| Stakeholder engagement |
|
|
|
|
| Sustainable development - delivering on responsible stewardship and SDGs |
|
|
|
|
| Delivering profitable ounces |
|
|
|
|
| Operational performance |
|
|
|
|
| Exploration and projects |
|
|
|
|
| Environment |
|
|
|
|
|
|
|
|
|
| Environmental management and stewardship |
|
|
|
|
| Land rehabilitation and management |
|
|
|
|
| Climate change, energy and emissions management |
|
|
|
|
| Water use |
|
|
|
|
| Tailings and waste management |
|
|
|
|
| Air quality |
|
|
|
|
| Biodiversity and conservation |
|
|
|
|
| Report on climate-related financial disclosure (TCFD) |
|
|
|
|
| Social |
|
|
|
|
| Our humanistic approach |
|
|
|
|
| Safety |
|
|
|
|
Health and wellness |
|
|
|
|
| Caring for our employees |
|
|
|
|
| Empowering communities |
|
|
|
|
| Impact of illegal mining |
|
|
|
|
| Governance |
|
|
|
|
| Corporate governance |
|
|
|
|
| Board committees |
|
|
|
|
| Remuneration report |
|
|
|
|
| Audit and risk committee: chairperson’s report |
|
|
|
|
| Social and ethics committee: chairperson’s report |
|
|
|
|
| Mining Charter III – compliance scorecard |
|
|
|
|
ABOUT HARMONY
ABOUT THIS REPORT
Harmony’s integrated report is the primary platform we use to provide our stakeholders with an overview of how integrated thinking and our approach to mining with purpose impact our value creation. It presents a balanced, holistic and transparent overview of our strategy, business model and performance. The report content is available for all our stakeholders, but primarily considers the information needs of our investors, financiers and other providers of financial capital.
We create, preserve or deplete value over time being short term (12 months), medium term (one to three years) and long term (more than four years), through our primary business activities and ESG commitments.
Scope and boundary
Harmony’s 2023 integrated annual report includes financial and non-financial information about our operational and ESG performance and activities in South Africa and South-east Asia (Papua New Guinea and Australia) for the financial year ended 30 June 2023 (FY23). We include significant events between year end and the date of approving this report.
Harmony acquired full ownership of the Eva Copper Project in Queensland, Australia. As it is still a project, performance data will only be included in our reporting once the mine becomes operational within the next three years.
Our overarching governance framework, using an integrated risk-based approach, guides all our decisions and is critical in ensuring and protecting value creation and delivery of our strategic objectives.
In compiling this report, we have determined our reporting boundary by taking into account:
|
|
|
|
|
|
|
|
|
|
|
|
|
|
|
|
|
|
|
|
|
|
|
|
|
|
|
|
|
|
|
|
|
|
|
|
|
|
|
|
|
|
|
|
|
|
|
|
|
|
|
|
|
|
|
|
|
|
|
|
|
|
|
|
|
|
|
|
|
|
|
|
|
|
|
|
|
|
|
|
|
|
|
|
|
|
|
|
|
|
|
|
|
|
|
|
|
|
|
|
|
|
|
|
|
|
|
|
|
|
|
|
|
|
|
|
|
| OUR REPORTING BOUNDARY |
|
Strategy
|
|
Risks and opportunities
|
|
Business model
|
|
Material matters
|
|
Operational performance
|
|
Governance
|
|
|
|
|
|
|
|
|
|
|
|
|
|
|
|
|
|
|
|
|
|
|
|
|
|
|
|
|
|
|
|
|
|
|
|
|
|
|
|
| FINANCIAL REPORTING BOUNDARY |
| Wholly-owned subsidiaries/entities |
|
Joint arrangements |
|
Investments where we have significant influence |
|
|
|
|
|
|
|
|
|
|
|
|
|
|
|
|
|
|
|
|
|
|
|
|
|
|
|
|
|
|
|
|
|
|
|
|
|
|
|
| STAKEHOLDERS |
| Investors and financiers |
|
Employees and unions |
|
Communities, traditional leaders and NGOs |
|
Government and regulators |
|
Suppliers |
Materiality
Harmony follows the principle of materiality to determine our report content. In 2023, we conducted a double materiality assessment to identify matters that impact our ability to create value (financial materiality) and our impact on society, communities and the environment (impact materiality). We consider these matters as key to our performance now and in future, and therefore our ability to deliver on our strategy.
Key to determining materiality is engaging with stakeholders to identify their primary concerns. Our materiality process and material matters and risks and opportunities are discussed in this report. These sections provide context for how we manage material matters.
Reporting frameworks, guidelines and standards
In compiling our reporting suite, we are guided by:
|
|
|
|
|
|
|
|
|
|
|
|
|
|
|
|
IAR |
ESG |
FR |
MRR |
| Integrated Reporting Framework |
ü |
ü |
|
|
| Companies Act 71 2008, as amended (Companies Act) |
ü |
ü |
ü |
|
| JSE Listings Requirements, www.jse.co.za |
ü |
ü |
ü |
ü |
King IV Report on Corporate GovernanceTM for South Africa, 2016 (King IV)* |
ü |
ü |
ü |
|
| International Financial Reporting Standards (IFRS) |
ü |
ü |
ü |
|
| CDP Water |
ü |
ü |
|
|
| Task Force on Climate-related Financial Disclosures (TCFD) |
ü |
ü |
|
|
| UN SDGs |
ü |
ü |
|
|
| World Gold Council Responsible Mining Principles |
ü |
ü |
|
|
| South African Code for the Reporting of Exploration Results, Mineral Resources and Mineral Reserves (SAMREC) |
ü |
|
|
ü |
| South African Mineral Asset Valuation Code (SAMVAL) |
ü |
|
|
ü |
Global Reporting Initiative (GRI) Standards for sustainability reporting |
ü |
ü |
|
|
| International Council on Mining and Metals – 10 principles |
ü |
ü |
|
|
| United Nations Global Compact (UNGC) |
ü |
ü |
|
|
| Voluntary Principles on Security and Human Rights |
ü |
ü |
|
|
* Copyright and trademarks are owned by the Institute of Directors in South Africa NPC and all its rights are reserved.
We have also considered the Principles for Responsible Investment, a UN-supported international network of investors, which reflect the increasing prominence of ESG issues to investors.
|
|
|
|
|
|
|
|
|
|
Our 2023 reporting suite
This report is supplemented by and should be read with our full reporting suite, comprising:
|
|
|
|
|
ESG report
This report provides insight into our ESG performance for 2023 and over the past five years, along with our aspirations. It is intended as a useful guide to support analysis and provides information about our shared value.
|
|
Mineral Resources and Mineral Reserves
We produce the statement of Harmony’s Mineral Resources and Mineral Reserves in accordance with SAMREC and section 12.13 of the JSE Listings Requirements (as updated from time to time).
|
|
|
|
|
Report to shareholders
We outline our contributions to key stakeholders and recent developments impacting these relationships in this report. It also includes the summarised consolidated financial statements, notice of annual general meeting (AGM) and proxy form.
|
|
Financial report
The financial report is a comprehensive report of our 2023 financial performance. It includes the consolidated and separate parent company annual financial statements.
|
|
|
|
|
Operational report
We provide detailed technical and operational information about our operations in this report.
|
|
Form 20-F
This is an annual report filed with the United States Securities and Exchange Commission, in compliance with the listing requirements of the New York Stock Exchange.
|
|
|
|
|
Climate-related financial disclosures (TCFD report)
Harmony made a strategic decision to align its annual reporting with international best practice in terms of global climate reporting. We use this report to disclose our TCFD governance, risk management, strategy and metrics and targets.
|
|
|
Combined assurance
We use a combined assurance model for assurance from management and internal and external providers. PricewaterhouseCoopers Inc. (PwC) audited our consolidated annual financial statements and subsequently gave an unmodified opinion thereon. Ernst & Young Inc. has been appointed as the company’s external auditor for the 2024 financial year.
RSM South Africa Inc (previously Ngubane & Co) undertook an assurance engagement on selected elements of our ESG key performance indicators (KPIs), including scope 1 and 2 greenhouse gas (GHG) emissions.
The audit and risk committee provides assurance to the board and reports annually via an audit and risk committee report, in line with the combined assurance plan. The group’s internal audit function assesses financial, operating, compliance and risk management controls. The audit and risk committee oversees the assessment.
Icons used in this report
|
|
|
|
|
|
Strategic pillars |
|
Responsible stewardship |
|
Operational excellence |
|
Cash certainty |
|
Effective capital allocation |
|
|
|
|
|
|
Capitals |
|
Human capital |
|
Financial capital |
|
Manufactured capital |
|
Intellectual capital |
|
Natural capital |
|
Social and relationship capital |
Directors’ responsibility
for the 2023 integrated annual report
The Harmony board of directors has ultimate accountability for the integrity and accuracy of this integrated annual report. The board believes this report has been prepared in accordance with the Integrated Reporting Framework. Based on the recommendations of the audit and risk committee and the social and ethics committee, the board has reviewed the report and confirms it addresses the most material issues currently facing Harmony and presents a balanced, accurate and representative view of the company and its strategy, performance in the past financial year, and future ability to create and preserve value. The remuneration report was reviewed and approved by the remuneration committee.
The board approved this report on 25 October 2023.
|
|
|
|
|
|
|
|
|
Dr Patrice Motsepe
Chairman
|
Peter Steenkamp
Chief executive officer
|
|
|
|
Boipelo Lekubo
Financial director
|
Dr Mavuso Msimang
Lead independent non-executive director
|
|
|
|
John Wetton
Chairperson: audit and risk committee
|
Karabo Nondumo
Chairperson: social and ethics committee
|
|
|
|
Vishnu Pillay
Chairperson: remuneration committee
|
|
|
|
WHO WE ARE
Harmony is a global, sustainable gold mining and exploration company with a growing copper footprint in our Tier 1 Wafi-Golpu Project as well as Eva Copper Project. We are also the largest producer of gold from the retreatment of old tailings dams, making us a major player in the circular economy of gold.
Headquartered in Randfontein, South Africa, Harmony has a primary listing on Johannesburg’s stock exchange, the JSE Limited (HAR) and an American depositary receipt programme listed on the New York Stock Exchange (HMY). Our shareholder base is geographically diverse and include some of the largest fund managers globally. The largest base is in the United States (42%), followed by South Africa (37%).
|
|
|
|
|
|
|
|
|
|
|
|
|
|
|
|
|
|
|
|
|
|
|
|
|
|
|
|
|
|
|
|
|
|
|
|
|
|
|
|
|
|
|
|
|
|
|
|
| What we do |
|
|
|
|
|
|
|
|
|
|
|
|
|
|
|
|
|
|
|
|
|
|
|
|
|
|
|
|
|
|
|
|
|
|
|
|
|
|
|
|
|
|
|
|
|
|
|
|
|
|
|
|
|
|
|
|
|
|
|
|
|
|
|
|
|
|
|
|
|
|
|
|
|
|
|
|
|
|
|
|
|
|
|
|
|
|
|
|
|
|
|
|
|
|
|
|
|
Exploration and acquisitions
Exploring for and evaluating economically viable gold-bearing orebodies and/or value-accretive acquisitions in gold and copper.
|
|
Mining and processing
Establishing, developing and operating mines, reclamation sites and related processing infrastructure. Ore mined is milled and processed by our gold plants to produce gold doré bar.
|
|
|
|
|
|
|
|
|
|
|
|
|
|
|
|
|
|
|
|
|
|
|
|
|
|
|
|
|
|
|
|
|
|
|
|
|
|
|
|
|
|
|
|
|
|
|
|
|
|
|
|
|
|
|
|
|
|
|
|
|
|
Sales and financial management
Generating revenue through the sale of gold produced and optimising efficiencies to maximise financial returns.
|
|
Stewardship and responsible mine closure
Empowering communities and employees throughout and beyond the life of our mines. Being responsible to our environment during operations. Restoring mining-impacted land for alternative economic use post-mining and approving mine closure commitments.
|
|
|
|
|
|
|
|
|
|
|
|
|
|
|
|
|
|
|
|
|
|
|
|
|
|
|
|
|
|
|
|
|
|
|
|
|
|
|
|
|
|
|
|
|
|
|
|
|
|
|
|
|
|
|
|
|
|
|
|
|
|
|
|
|
|
|
|
|
|
|
|
|
|
|
|
|
|
|
|
|
|
|
|
|
|
|
|
|
|
|
|
|
|
|
|
|
|
|
How we do it |
|
|
|
|
|
|
|
|
|
Mining with purpose
Our purpose is to be a global, sustainable gold and copper producer, creating shared value for all stakeholders while leaving a lasting positive legacy through:
•Creating longevity, profitability and sustainability
•Committing to safe, ethical, social and ecologically responsible mining
•Positioning our business to contribute to a low-carbon future.
|
|
|
|
|
|
|
|
|
|
|
|
|
|
Our mission
To create value by operating safely and sustainably, and to grow our margins.
|
|
|
|
|
|
|
|
|
|
|
|
|
|
Our values |
|
|
|
|
|
|
|
|
|
|
No matter the circumstances, safety is our main priority |
|
We are all accountable for delivering on our commitments |
|
|
Achievement is core to our success |
|
|
|
We are all connected as one team |
|
We uphold honesty in all our business dealings and communicate openly with stakeholders |
|
|
|
|
|
|
|
|
|
|
|
|
|
|
|
|
|
|
|
|
|
|
|
|
|
|
|
|
|
Delivering impact
At Harmony, we understand that our activities and the way we conduct our business affects the lives of the people we employ, the communities surrounding our mines and the environment. This impact has economic and social implications for our stakeholders and the countries where we operate.
In line with our purpose, we commit to ensuring that our overall contribution is positive and felt and that our positive legacy endures once mining stops.
|
|
|
|
|
|
|
|
|
|
|
|
|
|
|
|
|
|
70+ years’ gold mining experience in South
Africa and almost two decades operating in
Papua New Guinea
|
|
1.47Moz produced (2022: 1.49Moz) with
10.5% (154 550oz) being from reclamation
activities
|
|
Market capitalisation of R49.0 billion
(US$2.6 billion) at 30 June 2023
(2022: R32.0 billion (US$2.0 billion)
|
|
39.3Moz gold and gold equivalent
Mineral Reserves (2022: 39.8Moz)
|
|
Our investment case
|
|
|
|
|
|
|
|
|
|
|
|
|
|
|
|
|
|
|
|
|
|
|
|
|
|
|
|
|
|
|
|
|
| Our embedded sustainability practices will create lasting legacies and ensure a sustainable future for all stakeholders |
|
Quality ounces and long reserve life through organic growth and value-accretive acquisitions |
|
We are geared to the rand gold price, with rand costs and US dollar revenue |
|
Significant copper exposure through two international projects |
|
Gold mining specialists with strong technical and exploration capabilities |
|
Flexible balance sheet with good cash generation enables our growth strategy |
|
|
|
|
|
|
|
|
|
|
|
|
•Safety – a core value that always precedes production
•Focus – quality ounces and cost reduction aimed at lowering all-in sustaining costs
•Digitisation – driving further improvements in our safety journey
•Decarbonisation – greener energy mix, focusing on renewables
•Collaboration – partnership are key to enabling our communities and allow us to maximise impact.
|
|
•Meaningful value-enhancing improvement in South African recovered grade through acquisition and development
•Acquisition synergies and other investments have potential to reduce all-in sustaining costs
•Growing surface reclamation – safer, lower cost, energy efficient and higher margin operations.
|
|
•Positioned to benefit from gold price and foreign exchange (operating free cash flow highly geared to current gold price environment).
|
|
•Transition to a low-cost gold-copper miner – Wafi-Golpu, a tier 1 copper-gold asset in Papua New Guinea as well as Eva Copper in Australia. |
|
•Emerging-market specialist (South Africa and Papua New Guinea)
•Wealth of mining expertise – combined, senior executive management have decades of industry experience
•Proven track record – investing in, sustaining and prolonging operating lives of deep-level mines.
|
|
•Strengthened balance sheet supports future growth and capital returns
•Capital allocation towards high-grade underground assets and high-margin surface operations to deliver superior returns and improved cash flow generation
•Locking in high margin for future returns
•Positive shareholder returns through sustainable mining.
|
OUR OPERATIONS
With operations in South Africa and Papua New Guinea, Harmony is a profitable, sustainable gold producer creating shared value for all stakeholders and leaving a lasting positive legacy – delivering high-impact and low-carbon gold through embedding sustainability in everything we do. With an abundance of opportunities to deploy capital across the world, we carefully determine which projects will deliver optimal shareholder returns on the basis of where we operate, how we manage risk and what skills we can leverage.
We have actively pursued opportunities to extend the life of some of our larger and higher-grade assets, adding lower-risk, higher-margin ounces to our portfolio. This included re-engineering our portfolio between 2017 and 2023 through the Hidden Valley, Moab Khotsong, Mponeng and Eva Copper acquisitions and identifying substantial opportunities in our existing portfolio through exploration and brownfield projects.
Acquired in December 2022, Eva Copper strengthens our strategic exposure to copper, a critical mineral for the net zero transition, and the Tier 1 Queensland mining jurisdiction, which is poised to become a leading critical minerals province. The project positions Harmony as a positive contributor to a carbon-neutral future and augments our existing copper exposure afforded by the Wafi-Golpu Project in Papua New Guinea. Recognising our responsibility to ensure economic benefits accrue locally to the extent possible, we undertook significant outreach after the acquisition to understand the capacity and aspirations of local businesses and the long-term objectives of policymakers.
Major capital has been allocated to our high-margin surface retreatment facility at Mine Waste Solutions for the Kareerand tailings extension as well as the high-grade Zaaiplaats project at Moab Khotsong. These projects are in line with our strategy of optimal shareholder return through assets already in our portfolio. They extend the life of these operations and drive future shareholder value.
To demonstrate our commitment to good ESG practices and achieving a low-carbon future, we are accelerating the expansion and roll-out of numerous renewable energy projects.
Quality growth pipeline
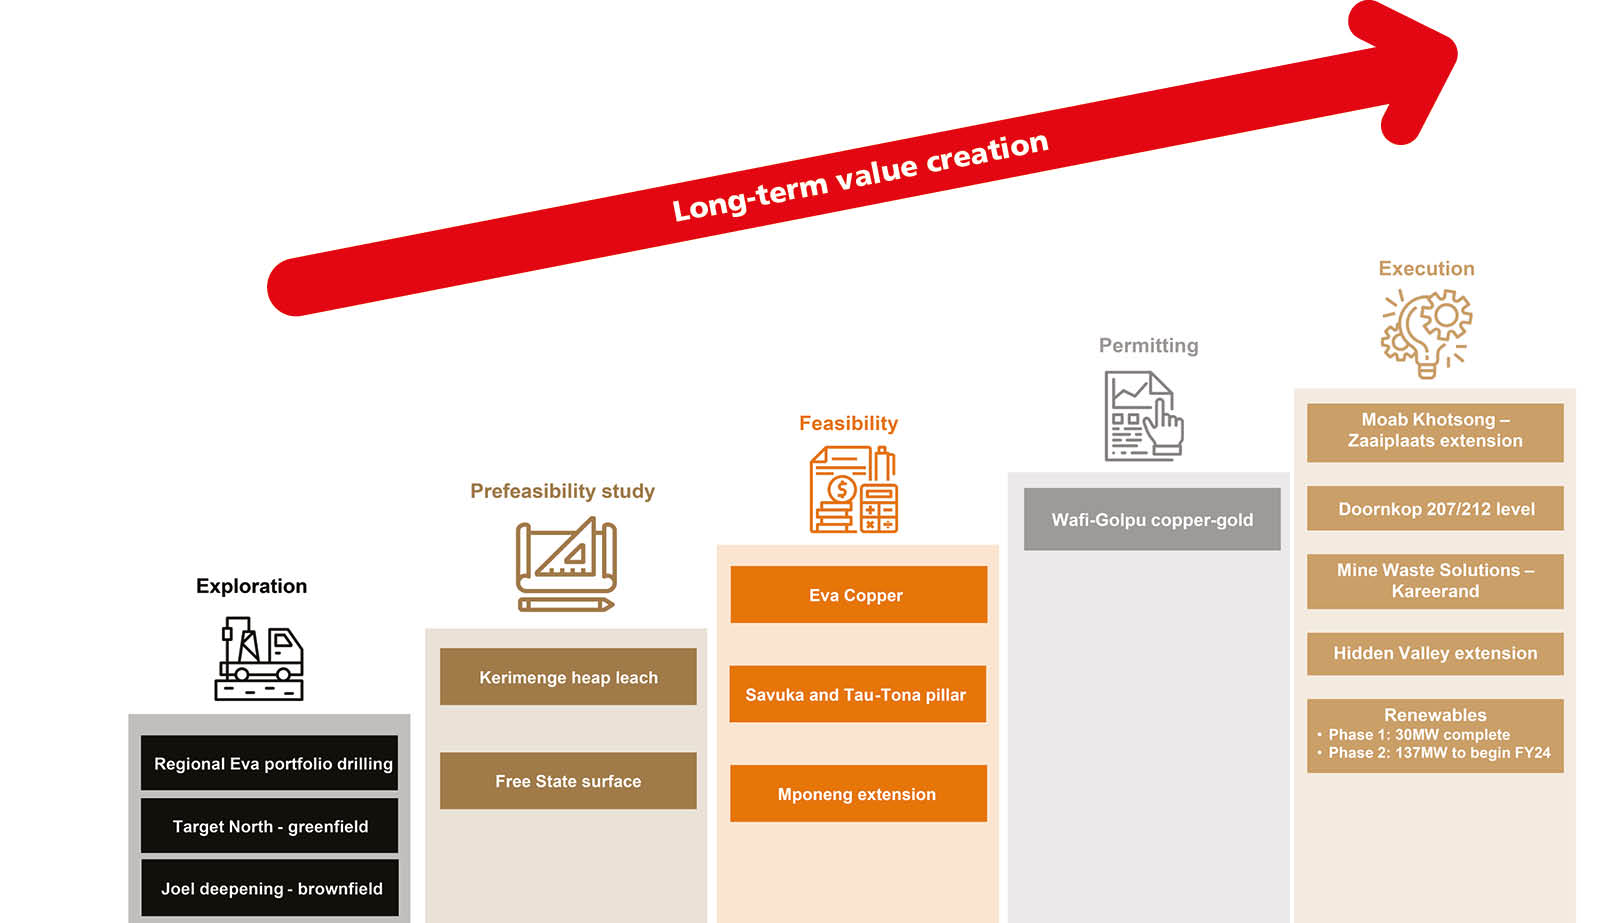
|
|
|
|
|
|
|
|
|
|
|
|
|
|
|
| South African |
|
Papua New Guinea |
|
Australia |
|
Location: Witwatersrand Basin and Kraaipan Greenstone Belt
Production: 1.33Moz (90.4%) (FY22: 1.37Moz (92.0%))
Total workforce: 43 175
Assets:
•Eight underground operations
•One open-pit mine
•Several surface source operations.
We have grouped our assets based on grade and life-of-mine (LoM) as per our equity strategy:
•High-grade underground operations: Moab Khotsong and Mponeng
•Underground optimised operations with a focus on free-cash generation: Tshepong North, Tshepong South, Doornkop, Joel, Target 1, Kusasalethu and Masimong.
Major capital allocation for our underground assets is determined by grade and returns.
Our high-margin surface assets comprise Mine Waste Solutions, Phoenix, Central Plant reclamation and dumps.
At 30 June 2023, our South African operations accounted for 65.6% of group Mineral Resources and 51.3% of group Mineral Reserves, both inclusive of gold and gold equivalent ounces.
|
|
Location: New Guinea Mobile Belt in Morobe
Production: 0.14Moz (9.6%) (FY22: 0.12Moz (8.0%))
Total workforce: 2 267
Assets:
•Hidden Valley (open-pit gold and silver mine)
•Wafi-Golpu Project (significant copper-gold portfolio)
•Multiple exploration areas.
At 30 June 2023, our Papua New Guinea operation accounted for 27.5% of group Mineral Resources and 48.7% of group Mineral Reserves, both inclusive of gold and gold equivalent ounces.
|
|
Location: Mt Isa Inlier, Queensland, Australia
Production: Project feasibility stage and exploration
Total Workforce: 104*
Assets:
•Eva Copper Project
•Rosby exploration tenements
Harmony announced the inaugural resource estimate for the Eva Copper Project, unveiling a significant resource of 1.5 million tonnes of copper and 431,000 ounces of gold. This accounts for 5.9% of group Mineral Resources. Since the acquisition of the project, Harmony has commenced an extensive drilling campaign and undertaken comprehensive studies to enhance the project's data profile. These initiatives are geared towards facilitating an informed update of the feasibility study, with anticipated release of results slated for FY24.
* Includes Australia head office.
|
|
|
|
|
|
|
|
|
|
|
|
|
|
|
|
|
|
|
| WF |
Workforce
(includes permanent employees and contractors at 30 June 2023) |
P |
Production for FY23 |
LoM |
LoM per FY24 plan |
South Africa
Underground
|
|
|
|
|
|
|
|
|
|
|
|
|
|
|
|
North West |
West Rand1 |
|
Moab Khotsong |
Doornkop |
Kusasalethu |
Mponeng |
| WF |
6 713 |
4 358 |
3 970 |
5 156 |
| P |
214 381oz
7.25g/t grade
|
135 451oz
4.69g/t grade
|
111 242oz
6.10g/t grade
|
239 490oz
8.43g/t grade
|
| LoM |
21 years2
9.5Moz Resources
3.7Moz Reserves
|
15 years
7.2Moz Resources
1.9Moz Reserves
|
3 years
3.5Moz Resources
0.4Moz Reserves
|
7 years
24.0Moz Resources
1.8Moz Reserves
|
|
|
|
|
|
|
|
|
|
|
|
|
|
|
|
|
|
|
|
Free State |
|
Tshepong
North3
|
Tshepong
South3
|
Target 1 |
Joel |
Masimong |
| WF |
3 706 |
3 386 |
2 001 |
2 062 |
2 064 |
| P |
107 834oz
4.22g/t grade
|
110 310oz
6.78g/t grade
|
40 992oz
3.49g/t grade
|
62 598oz
4.48g/t grade
|
63 047oz
4.17g/t grade
|
| LoM |
7 years
9.8Moz Resources
0.6Moz Reserves
|
7 years
14.5Moz Resources
0.9Moz Reserves
|
6 years
3.5Moz Resources
0.5Moz Reserves
|
7 years
1.9Moz Resources
0.5Moz Reserves
|
2 years
0.9Moz Resources
0.2Moz Reserves
|
1 Border between Gauteng and North West.
2 Includes Zaaiplaats.
3 From FY23, Tshepong Operations are reported on separately as Tshepong North and Tshepong South.
Surface
|
|
|
|
|
|
|
|
|
|
|
|
|
|
|
|
Surface |
Waste rock dumps |
|
Kalgold |
Free State |
North West |
West Rand |
| WF |
725 |
841* |
759* |
808* |
| P |
37 778oz
0.85g/t grade
|
29 257oz
0.44g/t grade
|
5 176oz
0.36g/t grade
|
15 111oz
0.33g/t grade
|
| LoM |
9 years
1.8Moz Resources
0.4Moz Reserves
|
±1 year
0.25Moz Resources
|
±1 year
0.04Moz Resources
|
±1 year
0.003Moz Resources
|
Tailings
|
|
|
|
|
|
|
|
|
|
|
|
|
|
|
|
North West |
Free State |
West Rand |
|
Mine Waste Solutions (MWS) |
Phoenix |
Central Plant Reclamation (CPR) |
Savuka |
| WF |
2 185 |
350 |
265 |
203 |
| P |
90 150oz
0.122g/t grade
|
26 782oz
0.134g/t grade
|
18 552oz
0.145g/t grade
|
19 066oz
0.153g/t grade
|
| LoM |
16 years
2.5Moz Resources
2.1Moz Reserves
|
5 years
0.4Moz Resources
0.3Moz Reserves
|
12 years
0.4Moz Resources
0.4Moz Reserves
|
13 years
0.4Moz Resources
0.2Moz Reserves
|
* Some of this material is treated along with reef, while some is treated at dedicated waste rock treatment plants. The numbers for the Free State, North West and West Rand facilities above exclude MWS, Phoenix, CPR and Kalgold.
Papua New Guinea
|
|
|
|
|
|
|
|
|
|
Surface |
Project |
|
Hidden Valley |
Wafi-Golpu Project |
| WF |
2 189 |
61 |
| P |
140 498oz
1.14g/t grade
|
|
| LoM |
5 years
2.9Moz Resources
1.3Moz Reserves
|
27 years
39.4Moz Resources
17.9Moz Reserves
|
Australia
|
|
|
|
|
|
|
Project |
|
Eva Copper |
| WF |
70 |
| LoM |
18 years
8.1Moz Resources
|
Our trade-off considerations and disciplined capital/resource allocation
Our business strategy aims to efficiently convert our natural capital into value across the other five capitals. Creating and optimising that value inevitably requires resource allocation and trade-offs in how and when resources are allocated. The result is an overall creation, transformation or erosion of value across the various capitals.
|
|
|
|
|
|
|
|
|
|
|
|
| Achieving zero harm |
Derisking our business and bolstering our position as a gold-copper specialist with a growing international footprint |
Decarbonising Harmony while continuing to create shared value for all our stakeholders |
Purposefully allocating capital to organic growth and value-accretive acquisitions while considering sustainability |
|
Mining is an inherently dangerous industry. However, safety is our top priority and we believe zero harm is possible. We understand that any loss of life is an unacceptable trade-off, which is why we need to increase our efforts to achieve our goal of zero harm.
To do this proactively, we have embarked on a journey of safety and digital transformation that includes updating infrastructure, installing new systems and implementing processes that offer data-driven insights through lead indicators. We are also changing behaviour in a complex and high-risk mining environment through an integrated approach to shared responsibility, ensuring our people return home safely every day.
|
A global profile split between gold and copper, underground and surface mining, and our world-class projects will continue to derisk the portfolio, improve margins and drive an increase in profitability.
As part of this process, we made the decision to acquire Eva Copper. While this offers diversification, it requires capital allocation that includes financial, human, social and relationship, and intellectual capital.
|
Guided by our decarbonisation journey, our transition pathway includes energy efficiency, portfolio re-engineering, improving our electricity mix, and adapting and decarbonising our transportation and value chain.
While this requires significant investments in the short term, we believe that the longer-term goals remain paramount.
|
Harmony is allocating significant capital towards quality ounces as we continue transitioning to a higher-margin, lower-risk gold producer with a meaningful copper footprint.
This capital allocation process also balances sustainability and how we improve our ESG credentials. |
|
|
|
|
Resources allocated |
|
|
|
|
|
|
|
|
|
|
|
|
|
|
|
|
|
|
|
| Outcomes and net impact on the capitals |
|
•Despite our continued efforts, six lives were lost – an unacceptable outcome for us.
•Shifted from a reactive to proactive safety culture through our humanistic Thibakotsi programme
• 2 155 281 hours of human capital invested in safety, skills development and training.
•Adopted safety and zero harm industry benchmarks
•Continued to improve access to real-time data through modernisation and digitisation strategy, enabling proactive decision making to mitigate risks
•Ensured fewer unplanned stoppages by maintaining infrastructure.
•R817 million (US$46.0 million) invested in training and development
•R1.8 billion (US$101.4 million) invested in mining infrastructure maintenance.
•Formed the tripartite culture transformation task team
•Continued to drive zero harm through initiatives implemented as part of mandate of the tripartite alliance.
|
•Acquisition of Eva Copper and the associated underlying natural resources.
•R 2 996 million (US$170.0 million) spent on Eva Copper acquisition.
•Started the recruitment process for each stage of the Eva Copper Project.
•Started the review of the feasibility study for Eva Copper.
•Engagements with key stakeholders around the Eva Copper Project acquisition, project planning and execution to ensure stakeholders are on board and aligned.
|
•Commissioned the first phase of our solar power programme supplying 30MW of solar power.
•R10 million (US$0.6 million) spent on our solar PV investments.
•Aligned net zero emissions targets with SBTi
•Sustainability-linked and green loans aligned to three environmental KPIs that are available till May 2026 and November 2028 respectively.
•Implemented more than 240 energy-saving initiatives, yielding a cumulative cost-saving of R1.7 billion (US$114.0 million) since 2016.
•Improved credibility with stakeholders by starting to deliver on decarbonisation goals.
|
•R2.1 billion (US$ 118 million) invested in organic growth projects
•108.0% increase in group operating free cash flow to R6 031 million (US$339.0 million) from R2 905 million (US$191.0 million)
•Final dividend of 75 SA cents (4.03 US cents) per share declared.
•Taking our key projects up the value curve
•Invested in organic growth with Zaaiplaats and Kareerand extension projects, and Target 1 optimisation project underway.
•Split our operations into four business areas, creating Harmony’s equity story in four parts.
|
|
|
|
|
Strategic pillars |
|
|
|
|
|
|
|
OUR LEADERSHIP
|
|
|
|
|
|
| COMMITTEE |
l |
Audit and risk |
| l |
Social and ethics |
l |
Remuneration |
| l |
Nomination |
| l |
Investment |
| l |
Technical |
z
Board of directors
|
|
|
|
|
|
|
|
|
| Board leadership |
|
|
|
|
Non-executive
chairman
Dr Patrice Motsepe (61)
BA, LLB, Doctor of Commerce (Honoris Causa), Doctor or Management and Commerce (Honoris Causa)
Appointed non-independent non-executive chairman on 23 September 2003
Member: l
|
Independent non-executive deputy chairperson
Karabo Nondumo (45)
BAcc, HDip (ACC), CA(SA)
Appointed 3 May 2013
Chairperson: l
Member: lll
|
Lead independent
non-executive director
Dr Mavuso Msimang (82)
MBA (Project Management), BSc
Appointed 26 March 2011
Chairperson: l
Member: l
|
|
|
|
|
|
|
|
|
|
| Executive directors |
|
|
|
|
Chief executive officer
Peter Steenkamp (63)
BEng (Mining), Mine Manager’s Certificates Metal Mines, Fiery Mines, CPIR, MDP, BLDP)
Appointed chief executive officer on 1 January 2016
|
Financial director
Boipelo Lekubo (40)
BCom (Hons), CA(SA)
Joined Harmony in June 2017 and appointed financial director on 3 March 2020
|
Executive director: stakeholder relations and corporate affairs
Dr Mashego Mashego (59)
BA (Education), BA (Hons) (Human Resources Management), Joint Management Development Programme, Global Executive Development Programme
Joined Harmony in 2005 and appointed executive director on 24 February 2010
|
|
|
|
|
|
|
|
|
|
|
|
|
| Independent non-executive directors |
|
|
|
|
|
Bongani Nqwababa (57)
BAcc (Hons), FCA, MBA
Appointed 18 May 2022
Chairperson: l
Member: ll
|
Vishnu Pillay (66)
BSc (Hons), MSc
Appointed 8 May 2013
Chairperson: l
Member: lll
|
Martin Prinsloo (54)
CA(SA)
Appointed 18 May 2022
Member: lll
|
Given Sibiya (55)
BCom, BAcc, CA(SA)
Appointed 13 May 2019
Member: ll
|
|
|
|
|
|
Peter Turner (67)
NHD Mechanical Engineering
Appointed 19 February 2021
Chairperson: l
Member: l
|
John Wetton (74)
CA(SA), FCA
Appointed 1 July 2011
Chairperson: l
Member: lll
|
|
|
Executive management
Harmony’s executive management team comprises the chief executive officer, financial director and an executive director. Together with five senior group executives, they serve as the group executive committee. This committee is supported by three corporate executives, who make up the group chief executive’s office and report to either the chief executive officer or financial director.
There are also regional executive committees for South Africa and South-east Asia (Papua New Guinea and Australia).
|
|
|
|
|
|
|
|
|
| SENIOR GROUP EXECUTIVES |
|
|
|
|
Group chief operating officer, operations
Beyers Nel (46)
BEng (Mining Engineering), MBA, Pr Eng, Mine Manager’s Certificate of Competency
|
|
Group chief operating officer, business development and growth
Johannes van Heerden (50)
BCompt (Hons), CA(SA)
|
|
|
|
|
Enterprise risk and investor relations
Marian van der Walt (50)
MBA (Oxford) (cum lLaude), BCom (Law), LLB, Higher Diploma in Tax, Diplomas in Corporate Governance and Insolvency Law, Certificate in Business Leadership and Investor Relations (UK)
|
|
Sustainable development
Melanie Naidoo-Vermaak (49)
BSc (Hons), MSc (Sustainable Development), MBA
|
|
|
|
|
Human capital
Anton Buthelezi (58)
National Diploma (Human Resources Management), Btech (Labour Relations) Management, Advanced Dip. in Labour Law, Cert. in Business Leadership
|
|
|
|
|
|
|
|
|
| CORPORATE EXECUTIVES: REPORTING TO THE GROUP CHIEF EXECUTIVE’S OFFICE |
|
|
|
Chief audit executive
Besky Maluleka-Ngunjiri (47)
BCompt (Hons), CTA, CIA, CCSA
|
Chief financial officer: treasury
Herman Perry (51)
BCom (Hons), CA(SA)
|
|
|
|
| GROUP COMPANY SECRETARY |
|
|
Shela Mohatla (38)
MBA, FCG (CGISA), BAdmin IR, PGDip Corporate Law, PMD
|
CHAIRMAN’S REVIEW
“Harmony continued to make significant progress towards transforming into a globally competitive gold-copper producer whilst delivering safe, profitable ounces and adhering to its sustainability commitments and good governance.”
Dear shareholders and stakeholders
Creating value for our shareholders and stakeholders
Harmony retained its position as South Africa's largest gold mining company by volume despite a challenging operating environment. Global supply chain disruptions and sharp input cost increases were exacerbated by the effects of the Russia-Ukraine conflict. In South Africa, the energy and water crises, accompanied by local community expectations and activism, continued amid rising inflation. Interest rates rose sharply as central banks moved decisively to curb inflation.
Against this backdrop, the gold price neared all-time highs at R1 249 714/kg (US$2 011/oz). The combination of high gold prices and strong operational performances resulted in solid financial results for Harmony.
I am pleased to report that Harmony met its production guidance of 1.4Moz – 1.5Moz. This was achieved through allocating growth capital to high-margin and long life assets, allowing Harmony to beat its underground recovered grade guidance of 5.6g/t, and contain costs below R900 000/kg, resulting in total production of 1.47Moz.
Harmony’s management took an important step in derisking the business and bolstering its position as a gold-copper miner, with a growing international footprint through the successful acquisition of the Eva Copper Project in the mining district of Queensland, Australia.
Copper is one of the critical minerals for the global transition to a clean energy future. The large, near-term, low-cost, and long-life Eva Copper Project complements our tier 1 Wafi-Golpu copper-gold project in Papua New Guinea.
Safety is at the heart of Harmony’s culture
Zero harm remains Harmony’s top priority. Safety, preventing illness and nurturing mental wellbeing are essential for the long-term success, sustainability and competitiveness of the company.
Although we have advanced in embedding a proactive culture of safety and care in everyday behaviour at work and encouraging employees to embody these values in their personal lives; regrettably, we lost six employees in mine-related incidents during the financial year. Our heartfelt condolences to their families, colleagues and people affected by these tragedies.
A dedicated team is driving business improvement initiatives across the group through research into technologies and processes that will improve safety and production.
Harmony has developed an integrated digital platform to support its safety strategy and improvement plan. This platform facilitates the flow of information to and from workplaces. It incorporates production planning, booking and reporting, supporting audit and inspection services, continuous risk assessment, critical control monitoring and reporting, action management and measurement of key processing indicators against required performance.
Demonstrating responsible stewardship through embedded sustainability practices
Harmony is demonstrating responsible stewardship by embedding sustainability practices in our core processes through:
•A proactive culture to achieve zero harm
•Integrated risk management
•Mitigating electricity costs through energy efficiencies
•Driving decarbonisation through a renewable energy programme and a green energy mix.
•Growing our investment in copper (now over 20% of Harmony’s Mineral Resources)
•Supporting the circular economy through tailings retreatment and water recycling (inextricably linked to Harmony’s social compact)
•Sharing value with all stakeholders.
Commitment to action on climate change
In addressing climate change, Harmony is decarbonising through energy efficiencies, a renewable energy programme and a green energy mix to achieve net zero emissions by 2045. The group is committed to a 63% reduction in absolute scope 1 and 2 greenhouse gas emissions by FY36 from a FY21 base. This target has been approved by the Science Based Targets Initiative.
Phase 1 of the renewable energy programme (30MW of solar power) was commissioned during FY23 and the build of the second phase (137MW) will commence in December 2023, funded from the R1.5 billion green loan.
Electricity accounts for approximately 18% of Harmony’s operating costs. To reduce the impact of escalating tariffs and drive decarbonisation, we have implemented more than 240 energy-saving initiatives. These initiatives have yielded a cumulative cost-saving of more than R1.7 billion (US$114 million) since 2016, and a reduction of more than 1.8 million tonnes of CO2 equivalent emissions.
In recognition of this and other sustainability initiatives, Harmony has been included in the FTSE Russell's FTSE4Good/Gold Index Series for the sixth consecutive year. The index measures the performance of companies demonstrating strong ESG practices and evaluates a variety of ESG criteria, including performance in corporate governance, health and safety, anti-corruption and climate change. Harmony earned a 95th percentile rank in the FTSE Russell industry classification benchmark super-sector, exceeding the mining industry and sub-sector average scores in all ESG pillars.
Harmony is also included in the Bloomberg Gender-Equality Index for the fifth consecutive year. This modified market capitalisation-weighted index, tracks the performance of public companies committed to transparency in gender data reporting across 70 metrics.
Delivering on our social compact by sharing value created by our mining operations
Through effective capital allocation, the board and management determines the most effective and efficient way to deploy our financial and other resources to the various projects and investments. As a result, we are able to deliver continued positive shareholder returns and create long-term financial and social value for our stakeholders.
Harmony contributes to the resilience and prosperity of our employees and host communities by sharing the value we create through our mining operations with them. We invest in meaningful socio-economic development projects that improves their living conditions and standards of living. The company goes beyond compliance to deliver shared value to employees, suppliers, host communities and government.
As a partner of choice, Harmony’s impact is based on building relationships of trust and collaboration with our stakeholders. We contribute meaningfully to the upliftment of our host communities by creating employment, promoting diversity and inclusion, maintaining sound labour relations and facilitating high-quality education.
We are committed to supporting governments’ socio-economic development endeavours through initiatives that empower people, particularly youth and women, to become self-sufficient with the necessary physical and social infrastructure.
In FY23 Harmony paid R1.0 billion (US$56.6 million) in taxes and royalties to the South African government, R128 million (US$7.2 million) to the State of Papua New Guinea, R17.5 billion (US$986.0 million) in salaries, and spent R16.1 billion (US$905.3 million) on local and preferential procurement.
Good governance
Guided by the King IV principles, our board and management apply the highest standards of corporate governance and global good practices.
We bid farewell to two of Harmony’s long-serving board members, Mr Andre Wilkens and Mr Joaquim Chissano, who retired at the 2022 annual general meeting. Our gratitude to both Mr Wilkens and Mr Chissano for their contributions to the Harmony board over the years.
Our board has a diversity of skills and expertise and the directors make significant contributions to the competitiveness and growth of Harmony.
Conclusion
Our CEO, Peter Steenkamp, and I met with the prime minister of Papua New Guinea, James Marape, in July 2023 to continue discussions on permitting the Wafi-Golpu Project. We are grateful to the prime minister and the government of Papua New Guinea for their ongoing support and for signing the Wafi-Golpu Framework Memorandum of Understanding in April of this year.
Harmony is committed to proceeding with this project, subject to finalisation of the permitting process and approvals by the Harmony and Newmont boards.
I am grateful for the board’s counsel and advise during the financial year under review.
I am also grateful to Harmony’s CEO, the executives, managers and employees for their hard work and contributions to making Harmony a globally competitive gold-copper producer.
Dr Patrice Motsepe
Chairman
25 October 2023
CHIEF EXECUTIVE OFFICER’S REVIEW
|
|
|
|
|
|
|
|
|
|
|
|
Improve safety performance |
Total gold produced |
Underground recovered grade |
AISC2 |
•Group LTIFR1 at 5.49 from 5.65 in FY22 |
•45 651kg
•1 467 715/oz
Met upper
end of guidance
|
•+ 8% to 5.78g/t
•Exceeded guidance of 5.45 – 5.65g/t
|
•R889 766kg
•US$1 558/oz
Within
guidance
|
|
|
|
|
Growth capital spent |
Operating free cash flow |
Strong balance sheet |
Final dividend |
•R2 billion allocated towards high-margin growth projects |
•>100% to R6.0 billion
•13% OFCF3 margin
|
•Net debt/EBITDA4 0.2X |
•75 SA cents
•~4 US cents5
|
1 LTIFR lost time injury frequency rate.
2 AISC all-in sustaining cost.
3 OFCF: operating free cash flow.
4 EBITDA: earnings before interest, taxes, depreciation and amortisation.
5 Illustrative equivalent based on the closing exchange rate of R18.83/US$1 as at 25 August 2023.
Harmony truly demonstrated resilience and dedication to mining with purpose this year despite a challenging operating landscape – building incredible momentum and successfully delivering on our strategy.
This financial year was a landmark year for Harmony. We achieved what we promised – improving our safety performance, delivering against all guidance metrics, expanding into near-term copper and investing in our organic growth. Overall, Harmony
achieved an excellent operational and financial performance.
Our commitment to operational excellence ensured that we achieved an improved safety performance and an outstanding full-year operational performance with strong cash flows. The group’s LTIFR remained below six per million hours worked for the second consecutive year, a major achievement for us as a business.
Our operational performance was boosted by high recovered grades at our South African underground mines with good momentum across the portfolio. This, coupled with a 14.9% increase in average gold price, resulted in a 14.1% increase in gold revenue and 60.3% increase in headline earnings per share. On the back of our strong performance and solid free cash flows, we are pleased to declare a full-year dividend for this reporting period.
The excellent performance this year was mostly driven and supported by our dedicated management teams, disciplined mining and operational flexibility. We are consistently meeting production, cost and grade guidance. We have maintained a stable and predictable cost base in a high inflationary environment as result of the strong grades and good cost controls. We have a well-sequenced capital profile to ensure we can execute each project affordably, which will ultimately lead to higher quality ounces and improved margins.
Our existing portfolio and pipeline of projects present substantial opportunities to convert our Resources into quality Reserves. These projects will ensure our long-term sustainability and profitability. We are allocating growth capital towards high-margin, long-life operating assets, adding higher-quality ounces and improving our margins while lowering our overall risk profile. We are also growing internationally by investing in copper – a key future-facing metal in the transition to a low-carbon economy. In addition our projects currently in execution, our two key international projects, namely Eva Copper in Queensland, Australia and the Tier 1 Wafi-Golpu copper-gold project in Papua New Guinea, will transform Harmony into a global gold-copper producer once operational.
Using our strong technical skills and extensive institutional knowledge (built up during our 73 years in operation), we continue to create long-term value by extending the operating lives of our mining assets and taking our comprehensive growth pipeline up the value curve. .
With 39.3Moz Mineral Reserves (31.0% copper) and over 137.8Moz in Mineral Resources, Harmony offers an attractive investment case. As South Africa’s largest gold producer by volume, we offer geared exposure to gold and early entry into two prospective copper projects which will transform Harmony into a low-cost global gold-copper producer in the long term.
|
|
|
| Key to Harmony’s success this year has been transforming the business into a higher-quality gold and copper producer by carefully considering the capital we allocated across our four business areas. |
Through well-considered capital allocation decisions, we will achieve our growth objectives and ensure each mine or project positively contributes to our overall success. These decisions are guided and informed by our four interlinked strategic pillars – we cannot deliver sustained value creation without:

Demonstrating true sustainability (responsible stewardship)

Delivering on our operational plans (operational excellence)

Consistently delivering positive operating free cash flow (cash certainty)

Continually improving the quality of our portfolio (effective capital allocation)
Responsible stewardship
At Harmony, we believe in actions over words. True sustainability is embedded in all our decisions that are informed by our sustainable development framework, which balances environmental, social and governance matters. Taking care of the Harmony family requires a holistic approach to safety and health. Our people’s safety is paramount, so too is the health and wellbeing of each of our employees and our host communities. Protecting and preserving the natural ecosystems surrounding our operations and the environment ensures we leave a lasting positive legacy wherever we operate. Harmony’s leadership team and strong governance structures support every effort we make to ensure every Harmonite is a responsible steward of the environment and society at large.
This financial year marks seven years since we embarked on our safety transformation journey to embed a proactive safety culture. We have seen a marked improvement in our overall safety performance through continuous risk management, regular visible felt leadership engagements and other safety awareness initiatives across our operations. We also continue to equip our teams with ongoing leadership development and training.
Group LTIFR per million hours worked improved to 5.49, which has remained below 6 for two consecutive financial years, a first in our 73-year history. This is a significant achievement for deep-level mining in South Africa and affirms our commitment to improving safety. Our South African surface operations celebrated 3.6 million loss-of-life-free shifts and our Hidden Valley operation in Papua New Guinea had no loss of life for the sixth consecutive year.
Safety will always take precedence over production, so despite these achievements and Harmony’s continued efforts, we are deeply saddened by the loss of our six colleagues. This is an unacceptable outcome for us, as one life lost is one too many. We extend our sincerest and heartfelt condolences to the families, friends and colleagues of the Harmonites who lost their lives.
|
|
|
|
|
|
In memorlam |
|
|
•Juliao Antonio Macamo
•Ernesto Euseblo Macuacua
•Bongile Mcuntula
•Luyanda Nkwane
•Tshimane Matabane
•Matli Bernard Nyama
|
Moab Khotsong, stope team
Tshepong North, equipping team leader
Kusasalethu, driller
Tshepong North, underground assistant
Kusasalethu, stope team member
Kusasalethu, stope shift team leader
|
We lost three of our colleagues after year-end. Luvuyo Sangeni, a development team member (Kusasalethu), Amahle Nodangala, rock drill operator (Kusasalethu), Mlandelwa Zide, a scrapper winch operator (Tshepong North).
I firmly believe that zero loss of life is possible. Having all of our stakeholders involved in every aspect of safety at Harmony demonstrates a unified commitment to prevent accidents through our ongoing humanistic transformation safety journey.
We remain diligently focused on embedding risk management to create a more engaged and proactive safety culture.
Harmony’s decarbonisation strategy is guiding our operations to net zero GHG emissions by 2045 with a transition pathway. The pathway includes energy efficiency, portfolio re-engineering, improving our electricity mix, adaptation and decarbonising our transportation and value chain.
We are committed to achieving net zero carbon emissions and reducing pressure on the South African grid through alternative energy sources and energy efficiency programmes. We took another big step to achieving this goal this year when we completed Phase 1 of our renewable energy programme, with Phase 2 to commence in FY24. We have also implemented over 200 energy efficiency initiatives at our operations to date. Additionally, our emission reduction targets have been approved by the SBTi.
I am pleased with our progress and how Harmony is effectively navigating the challenges and opportunities presented by the global shift to a low-carbon economy by decarbonising.
Delivering on our social compact is inextricably linked to how we are supporting the circular economy as a business. Harmony is the largest producer of gold from the retreatment of old tailings dams, making us a major player in the circular economy.
We have a transformed board and executive team, which demonstrates the diversity of our management teams and the wealth of technical capabilities.
We understand that our activities and what we do to mitigate and manage our environmental impact have potential shared benefits for our host countries and communities. We are intentional in creating shared value opportunities, which makes Harmony a partner of choice. Harmony’s waste management, such as our TSF projects, and water stewardship initiatives integrate environmental stewardship and socio-economic development imperatives in support of the circular economy.
We contribute to the resilience and prosperity of our host communities by sharing the benefits that our operations and activities create. In FY23, we invested R27 million (US$1.5 million) (FY22: R18 million (US$1.2 million)) in CSI projects with positive impacts on the lives of over 58 000 people in our host communities.
Our responsible ESG practices continue to inform our strategic direction and decision making. As guided by Harmony’s sustainable development framework, we are successfully progressing in the delivery of our ESG commitments.
We received positive external recognition for our efforts in sustainability – a reflection of our dedication and commitment to keeping our promises. We were included in the FTSE4Good Index for the sixth consecutive year, placing us in the 95th percentile. Our inclusion in the Bloomberg Gender-Equality Index for the fifth consecutive year is testimony to how we foster gender diversity and inclusivity. We have also received a score of ‘A’ from the CDP for our best practice water management strategy.
Operational excellence
Over the past few years, our disciplined mining and management teams have been key in implementing business improvement initiatives, managing costs and creating operational flexibility. This is demonstrated in our operational resilience, and our ability to consistently deliver on our operational plans while prioritising safety throughout Harmony.
A safe mine is a profitable mine and constantly striving to make further safety and productivity improvements. We are driving this through our S300 programme, which aims to achieve an average safe blasting of 300m2 per crew per month. This, along with our Thibakosti programme, will improve our safety performance and significantly enhance margins through various productivity and cost-saving initiatives.
Digitisation, data analysis and modernisation of mining all drive efficiency. Real-time monitoring of over 9 million golden controls and 135 million data points enables better informed decision making that supports our shift from a reactive to a proactive safety culture. It also provides insight into business improvement initiatives needed to not only ensure safety, but also improve productivity and efficiency.
Through successful project execution and improved operational flexibility, we met our production, cost and grade guidance as we continue to manage those factors that are within our control. As a result, we achieved a solid operational performance, despite operational headwinds, such as load curtailment.
We remain committed to maintaining operational excellence, ensuring all of our operations deliver to plan.
Cash certainty
Consistently delivering positive operating free cash flows enables Harmony to execute our growth objectives – investing in organic growth and value-accretive acquisitions – while delivering positive shareholder returns.
Investing in higher quality ounces will reduce our all in sustaining costs improve margins and ensure consistent positive operating free cash flows. Our responsible hedge strategy is aimed at locking in margins, ensuring we are well positioned to take our projects up the value curve while protecting against any adverse movements in the rand gold price.
To ensure we deliver superior returns and improve cash flow, we are investing in our high-grade underground assets, our low-risk high margin surface operations and our international copper-gold projects. Major capital allocation is prioritised in terms our capital allocation framework to ensure we mine safely and profitably.
While we are supported by a strong gold price, our stringent cost controls ensured that overall costs increases were aligned with what we had planned. Labour and electricity form the largest component of our cost base. Therefore, with planning foresight, our cost increases are predictable and controlled. On a per-unit basis, cash operating costs increased by 4.9% to R735 634/kg (US$1 288/oz) from R701 024/kg (US$1 434/oz) in FY22.
Key factors impacting our cash operating costs year on year include salary increases, electricity and water costs due to tariff increases, consumables due to the increased cyanide prices, and diesel usage at Hidden Valley. The closure of Bambanani at the end of FY22 reduced costs by R1 157 million (US$76.1 million) year on year.
Maintaining a robust and flexible balance sheet with strong liquidity is prudent as we expand internationally. With the acquisition of Eva Copper, net debt/EBITDA increased to 0.6 times. This was reduced to 0.2 times by the end of the financial year due to strong cash generation and repayment of debt.
Capital allocation
Since we embarked on our growth strategy in 2016, we have lowered the overall risk profile of our assets, improved the quality of our ounces and improved margins. Through effective capital allocation, we are continuously improving the quality of our portfolio, growing our Mineral Resources and improving the conversions of Mineral Reserves to free cash flows. We have demonstrated our ability to create value through value accretive acquisition. Our clear criteria ensure we continue creating shared value, extending not only the life of our mine, but ensures the minerals we extract benefit the lives of our host communities and employee, demonstrated our ability to create shared value by continually improving the quality of our portfolio through effective capital allocation.
We continue creating value by:
•Continuously improving our safety performance and lowering our overall risk profile
•Improving margins and lowering our all-in sustaining costs
•Maintaining a strong balance sheet
•Delivering organic and inorganic growth
•Growing our copper footprint
•Converting Mineral Resources to quality Mineral Reserves
•Generating meaningful returns
•Returning capital to shareholders in line with our dividend policy and overall growth strategy.
Our capital is strategically allocated to our organic and inorganic growth prospects, which include our emerging copper footprint in Papua New Guinea and Australia while we advance various mine life-extension projects and exploration drilling programmes across our international base. It is important that we invest now to deliver strong and sustainable future returns.
We are directing significant capital towards high-quality assets and projects which include our South African high-grade and optimised underground mines (delivering strong operating free cash flows) and our low-risk, high-margin South African retreatment operations in the Free State, West Wits and Vaal River regions (contributing to the circular economy).
In turn, these operations generate the finances we need to support our international copper-gold growth aspirations. We have advanced our investment in copper by concluding the acquisition of the Eva Copper Project. At the same time, we have continued to progress the Tier 1 Wafi-Golpu Project, one of the largest copper-gold block cave projects globally, representing approximately 45.5% of our Mineral Reserves.
Eva Copper and Wafi-Golpu provide an enviable global copper growth platform to deliver meaningful copper production into the critical minerals supply chain for decades. We are progressing well with project permitting for Wafi-Golpu. Signing the Framework MoU with the government of Papua New Guinea was a major step towards securing the mining development contract and special mining lease for Wafi-Golpu. The Eva Copper feasibility study updates are well underway, with a view to complete these before the end of 2023.
Future focus
We strive to become mine safety leaders, and as such, the group will continue to sustain the Thibakotsi programme as part of our DNA. Key to this will be further embedding integrated risk management across the business, effective engagements with our employees and behavioural risk awareness. Our leadership teams will continue driving Harmony’s safety culture as we wholeheartedly believe that zero loss-of-life is possible.
We intend to operate for another seven decades by organically growing our Mineral Reserve base and pursuing acquisitions that enhance our value proposition. Harmony has a clear roadmap to drive margin expansion over the next few years and a strong growth pipeline to support this strategy. We are continuing discussions around Wafi-Golpu permitting and will announce the results of the Eva Copper and Mponeng extension feasibility studies in the next financial year.
Conclusion
As we embark on the next phase of our growth journey, we will continue to focus on successfully executing our four strategic pillars of responsible stewardship, operational excellence, cash certainty and effective capital allocation.
Building trust and partnering with our stakeholders remains paramount for long-term shared value creation and I am confident that we will achieve new heights in the year ahead.
We will continue to invest in our mines and our people as we transform into a global gold-copper company.
We will continue mining with purpose – creating shared value for all our stakeholders as we transform into a global gold-copper company.
I am tremendously proud of these achievements and would like to thank each Harmonite for their contribution, and our shareholders and many other stakeholders for your support and sharing in the Harmony story.
Peter Steenkamp
Chief executive officer
25 October 2023
OUR EXTERNAL OPERATING ENVIRONMENT
We are committed to ensuring the resilience and sustainability of our business in a challenging external operating environment. Through mining with purpose, we can plan and respond to an ever-changing context influenced by economic, social, political and environmental pressures at a macro-economic and national level.
Economic and political uncertainty
|
|
|
|
|
|
|
|
|
|
|
|
|
|
|
|
|
|
|
|
|
|
|
|
|
|
|
|
|
|
Context |
|
|
|
|
|
|
|
|
|
| Global macro-environment |
|
|
South Africa |
|
|
Papua New Guinea |
|
|
Australia |
Globally, the economic and political environment remains uncertain, driven by the widespread consequences of Russia’s invasion of Ukraine and the lingering aftermath of Covid-19. These factors resulted in slow global growth, rising inflation, mounting sovereign debt levels, and surging energy and food prices. Continuing tensions between the United States and China further added to geopolitical uncertainty.
The aforementioned factors are impacting various elements of supply chains, resulting in increased prices, shortages in consumables as well as increasing lead times. |
|
|
The mining industry is a noteworthy contributor to South Africa’s economy.
The industry is impacted by, among others, policy and regulatory uncertainty, global competition, infrastructure decay, electricity disruptions and changing exploration strategies. |
|
|
Papua New Guinea’s minerals play an important role in its economy, which is affected by a rapidly changing external environment. Some of these challenges include balancing the government’s development aspirations in time of geopolitical uncertainty. |
|
|
Australia’s economy is resilient, and the political environment remains stable. However, the country is impacted by the volatile international context – including increased inflation and the slowdown in China. Australia has considerable reserves of natural resources, including copper, which generate significant economic and social benefits. |
| Impact on Harmony |
|
Geopolitical uncertainty affects the commodity market and gold price, which in turn, impacts our financial capital. Rising global inflation substantially increased transport, food and energy prices, affecting vulnerable people in our communities. Borrowing costs and economic growth were also affected by increased interest rates to mitigate rising inflation.
A potential positive impact on our business is likely to arise from investors using gold as a hedge against geopolitical uncertainty. Additionally, copper offers counter-cyclical diversification to our portfolio and contributes to derisking the business.
|
| Our response |
We analyse potential outcomes to ensure we respond proactively and appropriately. These responses are guided by our derivative and hedging strategies, appropriate capital allocation and restructuring underperforming assets, among others.
Our derisked and diversified portfolio continues to perform well. We have various business improvement initiatives and capital projects that futureproof our business.
We remain committed to Papua New Guinea through our Hidden Valley expansion and various exploration programmes. Negotiations with the Papua New Guinea government to secure the Wafi-Golpu special mining lease continue.
|
Market volatility
|
|
|
Context |
|
Global demand
Global demand for gold and copper remained robust. The gold market is particularly driven by continued demand for investment by central banks and other institutions. The copper market is driven by a global need to reduce environmental impacts, including advancing the energy transition. The increasing demand for copper is expected to lead to a supply shortage.
Gold price
As inflation continues to rise, so too does the uncertainty around gold, compounded by low economic growth, the increasing risk of political conflict and further supply chain disruptions. The higher US dollar gold price amid global geopolitical uncertainty and inflation concerns contributed to a higher rand gold price received. The gold price continued to rise as the world recovered from the Covid-19 aftermath.
Prices peaked at US$2 051/oz on 4 May 2023. The gold price was significantly higher than the US$1 810/oz at the beginning of FY23, increasing to US$1 920/oz at year end.
Copper price
The copper price remained volatile during the year due to global economic uncertainty and China’s slower-than expected demand. Prices peaked at US$9 364/t on 26 January 2023. The copper price was higher than the US$8 055/t at the beginning of FY23, increasing/decreasing to US$8 320/t at year end. Based on trends in the market our internal planning processes have determined a future copper price of US$8 157/t, which is inline with current market prices seen.
Currency volatility
The rand is affected by global market factors such as inflation, interest rate increases and commodity prices. In South Africa, central banking policies, domestic political uncertainty and investor sentiment around the country’s energy reliability challenges impact the rand.
|
Impact on Harmony |
|
The higher gold price positively contributed to our revenue. However, despite our stringent controls and leaner operating model, we are not immune to the effects of rising costs. As such, it is imperative for us to continue scrutinising our costs while adapting to increasing inflation with protracted supply chain disruptions. This means we can continue producing and initiating plans to invest in future projects and production.
The average of the rand depreciated against the US dollar in FY23, with an average exchange rate of R17.76/US$1 (FY22: R15.21/US$1). The depreciation of the rand, combined with the increase in the US$ gold price, positively impacted on revenue for the year as sales are US Dollar denominated and the weaker exchange rate positively impacts on the translation of sales.
A foreign exchange translation loss of R634 million (US$35.7 million) compared to a R327 million loss (US$21.5 million) in FY22. This was predominantly as a result of the weakening of the rand
and the impact this had on US dollar loan balances. The rand weakened against the US dollar as evidenced by a closing exchange rate of 18.83/US$1 at 30 June 2023 compared to R16.27/US$1 in the previous reporting period.
Since the Eva Copper Project is not yet operational, and Wafi-Golpu Project permitting still in progress, the demand for copper and its volatile trading did not impact Harmony during the year.
|
| Our response |
|
Our selective hedging approach supports stronger margins and cash flows. We will only hedge if we are certain that we can achieve a minimum margin of 25% above all-in sustaining costs and inflation. Additionally, we continue using conservative price assumptions to maintain a reasonable margin.
We achieved our revised annual total production guidance of between 1.40Moz and 1.50Moz, meeting global demand.
We are focused on maintaining production levels. Even at the relatively lower exchange rate, the group’s South African operations are generating a margin and positive cash flow. Our derivative strategy is to only lock in pricing at favourable rates. We will await further opportunities to cover up to 25% of Harmony’s foreign exchange revenue exposure.
|
Sovereign rating
|
|
|
|
|
|
|
|
|
|
|
|
|
|
|
|
|
|
|
|
|
Context |
South Africa |
|
|
Papua New Guinea |
|
|
Australia |
| South Africa’s credit rating outlook was revised from positive to stable, affirming long-term foreign (BB-) and local currency (BB) sovereign credit ratings. |
|
|
Papua New Guinea’s credit rating outlook remains stable with long-term foreign (B-) and local currency (B) sovereign credit ratings. |
|
|
Australia’s credit rating outlook is stable, affirming long-term foreign currency (AAA) and local currency (F1+) sovereign credit ratings. |
| Impact on Harmony |
Adverse credit ratings deter some investors, threatening our long-term value and affecting our market capitalisation. |
| Our response |
We regularly engage with investors to provide a realistic understanding of our potential operating and financial performance.
|
Electricity supply, reliability and cost
|
|
|
|
|
|
|
|
|
|
|
|
|
|
|
|
|
|
|
|
|
| Context |
South Africa |
|
|
Papua New Guinea |
|
|
Australia |
| Harmony’s primary energy source is electricity purchased from the state-owned power utility, Eskom, generated by coal-fired power stations. Electricity is expensive and supply inconsistent due to load shedding and curtailment. |
|
|
As an open pit mine, the Hidden Valley operation is less energy intensive and draws its power from the country’s Ramu grid, a reliable source predominately generated by hydropower (some 70%). |
|
|
In Queensland, most of the electricity generated is fed into the interconnected grid powering most of eastern and southern Australia, managed through the National Electricity Market (NEM) by the Australian Energy Market Operator (AEMO). Some areas in Queensland rely on generators within isolated networks that are not connected to the NEM. |
| Impact on Harmony |
|
Due to South Africa’s unstable power grid, Harmony is required to diversify our energy mix and rely on alternative and renewable energy sources. Electricity tariff increases result in additional operating costs, impacting our financial capital.
In Papua New Guinea, the drought constrained Hidden Valley mine’s hydropower capacity, which resulted in an increase in diesel-generated electricity. Water in Yonki Dam, serving the Ramu hydropower station, was critically low for most of the year.
|
| Our response |
|
Tactically, we have put in place operational mechanism to contain the impact of load curtailment as far as practical ensuring minimal disruption and impact to business. Our decarbonisation strategy for South Africa aims to improve efficiencies and reduce our reliance on electricity suppliers through a substitution programme while we continue lobbying regulators to contain electricity tariff increases. We also help electricity suppliers secure power through load curtailment and provide available land for renewable energy plants.
We are pursuing opportunities to isolate Hidden Valley from the Ramu grid and receive power directly from the nearby Bauine hydropower station on account of broader provincial and community energy needs.
The May 2020 Eva Copper feasibility study and December 2021 update, prepared before we acquired the asset, proposed gas-fired power as the LoM solution for the project. We are revisiting our power source and energy mix as part of our detailed review and optimisation study.
Transforming our business and diversifying our energy mix present financial and stewardship benefits with opportunities for funding through sustainability-linked loans.
|
ESG factors
Environment
|
|
|
|
|
|
|
|
|
|
|
|
|
|
|
|
|
|
|
|
|
|
|
|
Context |
| Global trends |
|
|
South Africa |
|
|
Papua New Guinea |
Australia |
|
Failure of climate change adaption and mitigation
Despite many countries committing to net zero emissions, there is still a significant gap between targets and the actions needed to achieve them. In 2023, the UN Intergovernmental Panel on Climate Change's sixth assessment report found that, if member countries meet their commitments by 2030, global warming could exceed 1.5°C. This means current commitments and actions needed to meet the Paris Agreement goals could be lacking.
|
|
|
South Africa is an energy and emissions-intensive developing country, recognising the need to play its part in the global move towards net zero carbon emissions.
Reaching net zero emissions by 2050 will require a major shift in South Africa’s economy, infrastructure and energy source. |
|
|
The deforestation in Papua New Guinea is a contributing factor to climate change. In turn, the impacts of climate change could exacerbate the country’s existing susceptibility to natural disasters such as landslides and soil erosion.
To achieve its target to be 50% carbon-neutral by 2030 and fully carbon-neutral by 2050, Papua New Guinea has embraced a shift towards inclusive economic growth through sustainable development. |
Australia is a significant contributor to CO2 pollution compared to the rest of the world.
Australia committed to reducing its GHG emissions to 43% below 2005 levels by 2030 and set a target to achieve net zero emissions by 2050. To achieve this, Australia believes climate change needs to be top of mind in all government decision making, and requires rapid deployment of the emissions reduction technologies currently available.
|
|
Natural resource crisis (including biodiversity loss and ecosystem collapse)
The mismanagement and overexploitation of critical natural resources such as food, minerals and water lead to severe commodity and natural resource supply shortages globally.
Additionally, human and economic activity have significant consequences for the environment due to destruction of natural capital caused by a reduction in or extinction of species in terrestrial and marine ecosystems.
|
|
|
South Africa’s natural resources are being depleted and mismanaged due to, among others, overwhelming development needs, and society’s dependence on natural resources and ecosystems to survive. This further exacerbates South Africa’s water scarcity.
The country’s mining activities cause significant damage to ecosystems and biodiversity loss if not properly managed. |
|
|
Agricultural expansion, mining activities and urban development, among others, cause deforestation and forest degradation in Papua New Guinea’s forests, which pose a threat to the local indigenous people who live there. |
Australia’s natural resources are significantly impacted by agriculture, mining activities and urban development, contributing to deforestation and declining land and sea ecosystems. According to Australia’s 2022 State of Environment report, Australia’s animal species are continuing to decline, with the continent having lost more mammal species than any other OECD country. |
|
Natural disasters, extreme weather and large-scale environmental incidents
Globally, extreme weather events such as floods and wildfires lead to loss of life, damage to ecosystems, destruction of property and/or financial loss.
Human activity, or the failure to co-exist with animal ecosystems cause loss of life, financial loss and damage through deregulation of industrial accidents, oil spills and radioactive contamination.
|
|
|
South Africa frequently experiences drought and floods, with the most significant impact on its environment, economy, infrastructure and people.
In the 2022 calendar year, South Africa experienced one of the worst floods in its recent history, which caused significant damage to properties, infrastructure and the environment. Many people lost their lives, homes, and sources of income. Untreated sewage seeped into rivers, harbours and the ocean after the floods, which affected people’s livelihoods, and damaged land and water ecosystems.
|
|
|
Papua New Guinea is vulnerable to floods, droughts, earthquakes, volcanic activity, tsunamis, and sea-level rise, among others.
Extreme weather events in calendar 2022 included flash floods, earthquakes and drought, which led to loss of life, damaged infrastructure and water shortages.
|
Australia's climate is increasingly impacted by global warming. Australia is prone to wildfires due to the hot climate. However, Australia experienced record-breaking extreme weather events in calendar 2022, including tropical cyclones and flooding, exacerbated by La Niña events. |
|
|
|
|
|
|
|
|
|
|
|
|
|
|
|
|
|
|
|
|
|
|
|
|
| Impact on Harmony |
|
Climate change impacts the gold mining sector through physical changes to the environment and the societal and economic mobilisation necessary to achieve net zero. TSF failure causes significant damage to the environment and communities surrounding our operations.
Inadequate water supply or flooding could disrupt our mining operations and mineral processing, and damage property or equipment.
Positively, climate change adaption and mitigation allow us to diversify our energy mix while reducing consumption, driving our goal towards net zero.
|
| Our response |
|
Our environmental strategy enables us to manage, mitigate and offset environmental risks associated with our activities. To realise a sustainable future for our operations, host communities and future generations, we aim to responsibly manage natural resources and ecosystems through:
•Reducing emissions by decarbonising Harmony’s energy profile through an orderly yet urgent transition to a low-carbon future (or economy)
•Efficiently and effectively using natural resources while managing and protecting the quality and quantity of water resources, and the health of the watershed ecosystem
•Minimising our impacted footprint by consolidating our mining footprints, especially minerals waste, to manage the physical and chemical stability of our landforms
•Protecting and restoring biodiversity and ecosystems wherever we operate to deliver associated services.
Harmony’s commitment to mitigate and manage our impact on the environment, communities and broader society is embedded in our business strategy and decision making.
|
Social
|
|
|
|
|
|
|
|
|
|
|
|
|
|
|
|
|
|
|
|
|
|
|
|
Context |
Societal needs and expectations, and social licence to operate |
|
|
South Africa |
|
|
Papua New Guinea |
Australia |
|
Globally, organisations are navigating a tight and fast-moving labour market with a shrinking pool of talent. Society is also increasingly expecting businesses and government to step up and solve systemic issues.
The nature of the extractive sector means that mining companies must pay particular attention to their social licence to operate. This is a tacit approval by local communities and other stakeholders to operate a project. To maintain a social licence to operate, companies must navigate complex social, economic and political dynamics over time to avoid conflicts with host communities.
|
|
|
Issues such as poor service delivery, poverty and inequality, high unemployment, and unprecedented political corruption drive private and public organisations to play their part in contributing to South Africa’s social upliftment.
Organisations see this as a moral imperative, and society’s expectations go beyond regulatory and legal compliance.
Poverty in the country leads to an unskilled and unemployed population, and in turn, a shrinking talent pool. |
|
|
Papua New Guinea has made significant progress in developing skilled workers, but most of the labour force is low-skilled and uneducated with grade 10 being the highest education certification completed.
Conversely, the country has an abundance of specialised technical skills and a strong foundation of soft skills. Other societal issues include crime, gender-based violence and inequality. |
Australia’s social issues include inequality and gender-based violence among others.
Society's expectations of organisations and governments in Australia are rooted in a desire for positive change, equality and social progress.
|
| Impact on Harmony |
|
National legislative requirements and needs communicated to us by our host communities influence the implementation of our socio-economic strategy. Failing to engage with stakeholders jeopardises our social licence to operate and could reduce opportunities in the market.
Our socio-economic strategy is largely dictated by requirements under the MPRDA in South Africa, and governed by the Hidden Valley MoA in Papua New Guinea. For the Eva Copper Project, we are formalising internal processes and strategies to support our delivery of obligations to the Kalkadoon native title holders through agreements under Australia’s Native Title Act 1993.
|
| Our response |
Addressing systemic issues requires a collaborative effort between Harmony and government, along with civil society and other stakeholders. Harmony aims to go beyond regulated compliance to assist government with community upliftment. We take our role as a responsible corporate citizen seriously and continuously strive to preserve our social licence to operate. Harmony’s host communities have relevant needs and expectations that we aim to understand and address through meaningful contributions, including labour and job creation, socio-economic development and economic empowerment with the SDGs in mind.
We constructively engage with stakeholders to share value, better understand and manage expectations, and secure and maintain our social licence to operate.
|
Governance
|
|
|
Context |
| ESG data quality and disclosure |
| ESG is evolving with increasing stakeholder expectations of transparent, outcome-based measurement and assurance. Rigorous reporting will become critical if companies are to meet growing stakeholder expectations and avoid accusations of “greenwashing”. Shareholders are putting pressure on companies to reposition or accelerate their business strategies, and holding them accountable to their ESG commitments. |
|
Digital innovation and cybersecurity
The digitisation of critical national and mining infrastructure increases the risk of cyberattacks. A successful cyberattack can have severe consequences, including loss of life and economic damage. Cyberattacks are becoming more frequent and severe, with the human and financial impact of attacks rising in line with the increasing digitisation of critical infrastructure.
|
| Impact on Harmony |
|
If we do not deliver on ESG commitments or report transparently, we will fail to create sustainable value for our stakeholders, and lose trust and credibility. This will ultimately impact our profitability and sustainability. Non-compliance with increasing ESG requirements or failing to meet ESG targets could impact our market capitalisation and reputation.
Our South African operations continually undergo modernisation to prevent ageing infrastructure and to remain up to date. The associated digitalisation of technology makes our systems and processes vulnerable to information security compromises, which could lead to the accidental or unlawful use, destruction, loss, alteration or disclosure of data.
|
| Our response |
|
We are enhancing our ESG commitments by including sustainability metrics in our funding agreements. We are guided by our sustainable development framework to ensure we deliver on ESG commitments and that our disclosure is credible, transparent and robust.
To meet shareholder expectations, we focus on continuously improving our ESG performance, while aligning our corporate targets with the UN SDGs and other guidelines where relevant. We have considered our most material ESG impacts and matters impacting our financial sustainability through a double materiality process, which informs our interrogation of these matters and ensures the integrity of our external reporting.
We continue enhancing our cybersecurity abilities by implementing state-of-the-art technologies and processes to identify threats, protect our environment and respond to cyber incidents. We have also introduced cybersecurity training interventions and regular communications to raise cybersecurity awareness across Harmony.
|
OUR RISKS AND OPPORTUNITY PROFILE
Harmony follows an integrated risk-based approach to business that is fully aligned with global best practice. Our exposure to risks and opportunities is inherent to mining and includes our external environment. We identify and analyse these risks and opportunities to understand their potential impact on our ability to achieve our strategy and deliver sustainable returns over time.
By identifying and understanding our material risk drivers and their interrelated dynamics, we can improve how we manage their impacts and position Harmony to capitalise on opportunities, meet future challenges and deliver on our growth prospects. This approach also creates value by enabling employees to make risk-based decisions considering Harmony’s strategy, risks and resilience through established risk management practices.
Effective governance and active management underpin our systems and processes and enable us to evaluate, manage and mitigate risks proactively. We built our expertise operating in emerging environments and have over seven decades of experience in managing socio-political challenges. This includes our ability to navigate the challenges of our stakeholders, especially at our deep-level, labour-intensive and unionised gold mines in South Africa.
Our enterprise risk management (ERM) process
Our approach is to implement and maintain an integrated risk and resilience management framework, methodology and system that enables us to apply an integrated risk-based approach to our strategy, business planning and business management, which ensures sustainability and resilience. Our process aligns with the ISO 31000:2018 risk management guidelines and our ERM framework, ensuring we implement global leading practice risk management.
Our risk management approach informs our business strategy and related objectives. To achieve our goals, it is vital to identify and understand the factors that could limit our ability to deliver on our strategy. Equally, we need to understand which factors present opportunities. The following visual depicts the strategic process the group follows to make risk-based decisions:
Our journey to becoming a risk intelligent organisation
Harmony is moving away from having risk competent risk management practices to becoming a risk intelligent organisation. We started this journey with a maturity project guided by the Institute of Risk Management South Africa. The four-year maturity project started in 2020 and will be completed by the end of 2023. Our annual independent risk maturity assessment tracks our performance. In 2022 we scored 4.5 out of 5, which re-affirms that our implementation is on track and our ERM plan is effective. In December 2022, the Institute of Risk Management South Africa recognised Harmony as the best risk management organisation in the mining industry.
A risk intelligent Harmony means the ability to:
|
|
|
|
|
|
|
|
|
|
|
|
|
|
|
|
|
|
Speak a common
risk language |
Think about risk
and uncertainty holistically |
Take the right risks for reward
(managing threats and capitalising on opportunities) |
Effectively use forward-thinking
risk concepts and tools to
make better decisions |
Create lasting value and
ensure sustainability |
Continuously learn and automate risk management |
|
|
|
|
|
|
|
|
|
|
|
|
|
|
|
|
|
|
|
|
| Summary of the risk management process |
|
|
|
|
|
Oversight of risk
governance process |
|
Executive
management |
|
Implementation and
daily management
|
|
|
|
|
|
|
Board
The Board is ultimately responsible for risk management aligned with the King IV requirements. The board oversees the risk management programme and our top strategic, operational and safety-specific risks. It also monitors risk treatment actions and the effectiveness of the actions in addressing significant risks, guided by our risk appetite and tolerance framework. Oversight of the risk governance process was delegated to the audit and risk committee and a quarterly report is sent to the technical risk committee and the board.
|
|
Quarterly review of Harmony’s strategic risk profile to:
•Assess its completeness
•Consider external and internal factors that could lead to new/emerging risks and opportunities
•Review the likelihood and impact/consequence of risks and assess any new or emerging risks and opportunities to determine residual ratings
•Review the completeness, effectiveness and/or relevance of mitigating actions and evaluate the resulting residual risk ranking.
|
|
Executive committee
Executive managers are accountable for effective risk management in their areas of responsibility, including functional and operational risk management, emergency response structures, incident command systems and situational awareness capabilities.
Governance and risk committee
The governance and risk committee oversees governance, risk and regulatory compliance, including the responsibility for executing on business principles, policies, procedures and priorities.
ERM team
This team is responsible for shaping, safeguarding and specialised servicing of risk management across Harmony by implementing and maintaining an integrated risk and resilience management framework, methodology and system that supports Harmony’s strategic pillars.
Safety
We have a four-layered, risk-based approach to manage safety in South Africa and Papua New Guinea, led by our safety team and the Harmony risk management team.
Operations
Each operation maintains, updates and regularly reviews its risk register. These are formally reviewed weekly by regional general managers, country-based executive and management teams.
|
|
|
|
|
|
Harmony’s risk management strategy
In 2018, we adopted the Harmony risk management strategy to achieve safe, profitable production at all our operations. The strategy is through active leadership and a proactive culture we will stop significant unwanted events. This strategy focuses on embedding a culture of risk awareness and mitigation in all our employees – from miners to executive management – to ensure we operate safely and productively. Modernising and digitising systems and processes across the group are key to rolling out this strategy effectively.
Our risk management strategy is supported by a four-layered risk management approach to identify, assess and control all hazards and risks that could impact our ability to achieve safe and profitable production.
|
|
|
|
|
|
|
|
|
| Layers |
|
|
Layer 1 - Baseline Risk Assessment |
|
Identify risks that lead to significant unwanted events |
|
|
|
|
|
|
Layer 2 - Bowtie Analysis |
|
Analyse circumstances surrounding a potential significant unwanted events to identify the golden controls with associated monitoring actions that prevent the event |
|
|
|
|
|
|
| Layer 3 - Task Based Assessment |
|
Assess the risk associated with a task and identify the mitigating controls |
|
|
|
|
|
|
| Layer 4 - Continuous Risk Assessment |
|
Continuously monitoring effectiveness of controls and escalating inefficiencies for action |
|
|
|
|
|
|
| Continuous Improvement |
|
Identifying and defining improvements to our risk management initiatives by regularly analysing events and control efficiencies and reporting to the correct management structures |
|
|
|
Our ongoing ERM journey includes a focus on safety and creating risk awareness throughout the group.
Determining our most significant risks and opportunities
The ERM team, senior management and the executive steering committee properly assessed the global risks and the risks that Harmony is exposed to in its operating countries. We confirm that the risks in Harmony’s risk landscape are valid, accurate, complete and evaluated properly. It is important not to look at each risk in isolation. Designing and implementing risk response strategies to address these interacting risks will require trade-offs that address some risks and exacerbate others.
Group risk exposure
•Our business is gold, with a copper footprint – a high-risk/high-reward business
•We operate across the gold mining value chain – from exploration, to feasibility studies, to building and buying mines, to operating mines, to closure followed by rehabilitation
•We are exposed to gold price and exchange rate volatility – we mitigate some of this exposure through derivative programmes
•We operate well in emerging economies and manage associated socio-political impacts
•We continue investing in exploration – one of the most effective ways to grow an orebody and create value
•We have an appetite for change and continuous improvement – we continuously look for innovative ways to improve our existing mines and acquire assets that we can improve operationally.
Risk appetite and tolerance
Purpose
The risk appetite and tolerance framework (RATF) aims to define the boundaries of risk that Harmony accepts when setting targets and making business decisions, ensuring we meet strategic objectives and the company remains resilient and sustainable.
Approach
The RATF was revised in FY23 and approved in August 2023. This aligns with the Harmony strategic pillars to allow decision-makers to make risk-based decisions that will achieve Harmony’s strategic objectives. Each strategic pillar is supported by:
•An overarching risk statement
•Supporting risk categories
•Targets.
Risk statements in support of each strategic pillar
Note: Reputational risk is implied in all of the risk categories.
|
|
|
|
|
|
|
|
|
|
|
|
|
|
|
|
|
|
|
|
|
|
|
|
|
|
|
|
Responsible stewardship |
|
Operational excellence |
|
Cash certainty |
|
Effective capital allocation |
|
|
Zero harm to employees and partnering with all stakeholders to create sustainable value |
|
Meeting approved operational, project and infrastructure plans in a safe and timely manner |
|
Operational and services budgets based on approved annual planning parameters to be met.
|
|
Invest in projects and new investments aimed at improving the quality of Harmony’s asset portfolio and meeting Harmony’s minimum requirements of: safety, sustainability, and all-in sustaining cost below the annual plan and internal rates of return exceeding 15%; balance sheet to remain robust with a net debt/EBITDA ratio of below 1x, after funding of growth and taking into account Harmony’s dividend policy |
|
|
|
|
|
|
|
|
|
|
Harmony’s strategic pillars
Responsible stewardship
|
|
|
|
|
|
|
|
|
|
|
|
| Risk category |
Appetite |
Tolerance |
Targets
(measures to track company performance aligned with our strategy
and risk appetite and tolerance levels) |
|
|
|
|
| Safety and Health |
•Zero harm
•Zero loss of life.
|
•Minor injuries require first aid/acute care only
•Temporary, minor impairment, first aid treatment or minor medical treatment
•Illnesses with short duration; acute illness requiring <2 days’ absence from work.
|
•LTIFR within approved annual budget levels
•Increase in HIV & TB treatments (90-90-90 principle based on the disease management programme)
•Increase in wellness and occupational health matters based on the disease management programme.
|
Legal and Compliance |
•Minor regulatory breaches that can be resolved within three months. |
•Breach of regulation with investigation or report to authority with prosecution and/or punitive fine up to R10 million
•Regulatory delays in the issuing of mining rights and water use licences should not exceed three months
•Regulatory universe – compliance within six months.
|
•Reduction in regulatory administration findings and suspensions
•Pro-actively managing legal risks – regular update of the risk register, emerging risks and comparison with global risk reports
•Zero material SOX findings
•Zero material stock exchange findings (JSE, NYSE).
|
|
Stakeholder Management
(including employees, communities, suppliers, media, investors, banks, assurance providers, etc.)
|
•No deviation from approved stakeholder management plans. |
•Negative media coverage and shareholder activism up to five working days
•Business interruption for up to three days.
|
•Close out resolutions of complaints within a three month period
•Embed proactive safety culture with specific Thibakotsi thresholds up to 2024
•Meeting mining charter requirements
•Succession planning for critical skills and clear career planning for employees by 2024
•15% negative deviation in Harmony’s share price in comparison to peers
•Limiting negative media coverage
•Optimising positive media coverage.
|
|
Environment
(water & electricity, carbon reduction, rehabilitation, climate change and biodiversity)
|
•Damage to the environment should be reversible and remedied within six months and limited to the mining right area. |
•Damage to the environment should be reversible and remedied within 12 months and is not associated with public health and the ecological environment. |
•Meeting environmental plan targets:*
•Sustainable water management – recycling
•Reduction in emissions usage by 7%
•Increase in renewable energy - 20% by 2026
•Reduce impacted land footprint - 1% by 2027
•20% Carbon reduction by 2026
•Zero impact on public health
•Meet requirements of sustainability-linked loan.
* Excludes Eva Copper Project and Wafi-Golpu Project
|
Operational excellence
|
|
|
|
|
|
|
|
|
|
|
|
| Risk category |
Appetite |
Tolerance |
Targets
(measures to track company performance aligned with our strategy
and risk appetite and tolerance levels) |
|
Infrastructure
(physical infrastructure, information systems and networks)
|
All facilities (mining, technology, systems) to be available 100% of the time, taking into account planned maintenance. |
Unplanned downtime on specific equipment limited to 20% to 25% of the planned time. |
•5% reduction in category 2 and 3 events
•5% increase in the availability of network, and critical applications and issues solved within the agreed time frame.
|
|
Productivity
(volumes, availability with a safety focus)
|
Production targets at budgeted levels to be met. |
•A breakdown of key information services should not exceed 24 hours
•5% variation from production budget.
|
•Meeting budget levels and business improvement programme to get to S300 requirements
–Meeting Iceberg targets to sustain flexibility
–Shaft call factor to be achieved in line with plans
•Asset management and maintenance
–95% planned downtime.
|
Cash certainty
|
|
|
|
|
|
|
|
|
|
|
|
| Risk category |
Appetite |
Tolerance |
Targets
(measures to track company performance aligned with our strategy
and risk appetite and tolerance levels) |
|
Financial sustainability
(including operational budget performance
and exploration)
|
•Meeting the approved operational, capital and funding plans
•Responsible hedging in line with approved hedging policy.
|
•Negative variance of 5% against group plans for one quarter. |
•Quarterly assessment using cash flow sensitivity
•Creating shareholder returns through regular monitoring of cash flows
•Implementing changes in a proactive, agile manner if cash certainty is threatened
•Meeting guidance in line with Board Plan
–Gold production
–All-in sustaining cost.
|
Effective capital allocation
|
|
|
|
|
|
|
|
|
|
|
|
| Risk category |
Appetite |
Tolerance |
Targets
(measures to track company performance aligned with our strategy
and risk appetite and tolerance levels) |
| Project execution |
•All projects to be delivered on time and within budget in line with approved plans. |
•All capital projects not to exceed 5% in terms of budget
•Regulatory delays not to exceed 90 days.
|
•Meeting the approved project plans
•Schedule Performance Index and Cost Performance Index, respectively, to be close to 1.
|
|
Capital allocation
(Including planning and acquisitions)
|
•Capital allocation should be aimed at producing safe, profitable ounces and increasing margins through meeting approved capital allocation parameters
•Balance sheet to remain below 1x net debt/EBITDA.
|
•For purposes of value-accretive acquisitions, net debt/ EBITDA may not exceed 1.5x and should meet all debt covenants. |
Meeting safety, production, capital and project targets; including internal rates of return as per annual budget
•Debt covenant:
– Interest cover ratio (EBITDA/Total interest paid >5x
– Net debt/EBITDA to be below 2.5x
•Value-accretive acquisition
– Net debt/EBITDA should not exceed 1.5x.
|
Our top strategic risks and opportunities
Our risk profile is based on potential events or factors that present a threat or opportunity. These downside risks and upside opportunities are considered in our daily business activities and, once identified, are integral to formulating and implementing our group strategy.
The risks and opportunities are properly reported, the risk treatment options are decided based on considering the extent of the breach and the urgency of getting the risk back within the risk appetite (which includes whether to further treat the risk, transfer, tolerate, terminate, or increase the risk exposure); and that the necessary controls are in place for all the strategic risks.
Harmony will continue to monitor the risk landscape and ensure that appropriate response strategies and risk control measures are in place to modify the risk. The ERM team is further supported by the governance and risk committee, which includes most heads of department, and serves as a platform to self-assess controls for key strategic risks.
The diagrams of our strategic risk and opportunity profiles are based on our assessment of the residual rankings and ranked in order of priority.
Harmony’s operational risk management process model
|
|
|
|
|
|
|
|
|
|
|
|
| Realistic planning |
Implementation |
Continuous monitoring and measuring |
Adapt and adjust |
|
• Dictated by safety,
orebody and operational
nameplate capacity
• Infrastructural setup
• All work scheduled.
|
• Execute work
• Routine, regular
inspection and
maintenance.
|
• Analyse and report
• Actively manage all
failures
• Monitor control
effectiveness.
|
• Identify improvements
• Share information
• Optimise assets.
|
| Four-layer risk approach: |
Identify hazards that lead to significant unwanted events
|
Identify critical controls and implement
controls
|
Identify risk associated with tasks and allocating mitigating controls |
Continuous
monitoring of control effectiveness
Identify and define improvements
|
| To achieve: SAFE, PROFITABLE PRODUCTION |
| Responsible stewardship |
Operational excellence |
Cash certainty |
Effective capital allocation |
|
Continuous improvement
Golden controls are the main controls identified to mitigate or treat a specific risk.
|
Group risk and opportunity profiles
Strategic risk profile – top risks
The below list contains risks that were reported to the audit and risk committee in the fourth quarter of FY23. The risks highlighted in red are the top strategic risks that fall outside our risk appetite and tolerance levels, and we effectively mitigate and manage these.
|
|
|
|
|
|
| Top strategic risks |
| a |
Safety and health |
| b |
Security of electricity/power supply and the impact of higher electricity costs |
| c |
Not achieving operational objectives at our critical operations |
| d |
Political tensions (geo-political and local) |
| e |
Unsuccessful project execution |
| f |
Supply chain disruptions (including supply of goods and increasing costs) |
| g |
Gold price and forex fluctuations (varying from planned levels) |
| h |
Systemic failure of public infrastructure |
Top strategic risks
|
|
|
|
|
|
a. Safety and health |
| Safety is our top value and we believe that a safe mine is a profitable mine. Safety risks are inherent in deep-level mining and could result in loss of life and other related incidents. Our safety performance directly impacts our ability to deliver safe, profitable ounces and attract capital. Our aim is zero harm. |
|
Cause
•Inherent high-risk mining environment resulting in incidents
•Fall of ground from hanging wall causing injury or loss of life
•Person coming into uncontrolled contact with machinery, attachments, rigging installations causing injury or loss of life.
|
Potential impacts
Continued loss-of-life incidents may have a catastrophic implication for Harmony. Safety breaches could stop production, affect our stakeholder relationships and reputation, lead to litigation and decrease Harmony’s overall value.
Poor safety results in:
•Investors exiting Harmony
•Loss of production
•Difficulty in attracting new capital
•Increase insurance premiums and/or a limit in the number of underwriters prepared to take on Harmony’s risk exposure
•Loss of licence to operate
•Reputational damage.
|
|
Risk treatment actions
|
|
Incorporating safety into everything we do:
•We follow a systemic and humanistic transformation programme called Thibakotsi to drive the safety culture within the group, through which we monitor LTIFR, S300 and absenteeism
•Regular reviews and specific updates (when an event occurs) on compliance protocols
•Mining Occupational Safety and Health adoption and leading practices within the group
•Rock engineering support strategy, seismic management and approved standards and monitoring procedures are in place
•Our business continuity management covers safety emergency management and incidents
•Prompt, automated risk and hazard identification and golden control monitoring through upgraded software
•Improvement to processes through visible felt leadership sessions
•Harmony’s executive management regularly reviews safety risks.
|
Strategic safety priorities
•Passionate and active leadership
•Safety strategy now embedded in Harmony at all operations, focusing on the humanistic component
•Industry-leading safety practices
•Effective risk and critical control management
•Effective safety management systems
•Ongoing organisational learning
•Proactive culture and engaged workforce
•Modernised safety systems
•Enhanced second-level safety audits by multidisciplinary team
•Loss of life risk management programme
•Dedicated operational safety days when production is suspended and all employees participate in safety-focused discussions.
|
|
|
|
|
|
|
|
|
|
|
|
|
|
|
|
|
|
|
|
|
|
|
Oversight
•Technical committee
•Board
|
Responsibility
•CEO
•Group COO
|
Movement in risk exposure
•Increased
|
Overall risk exposure
•Above risk appetite
|
Risk response strategy
•Treat
|
Strategic pillars
|
Capitals impacted
|
|
|
|
|
|
|
|
|
|
|
|
|
|
|
|
|
|
|
|
|
|
| b. Security of electricity/power supply and the impact of higher electricity costs |
|
Electricity supply has been constrained over the past decade with multiple power disruptions. The cost of electricity continues to rise by double digits – burdening the economics and viability of some marginal operations in South Africa. An unstable and increasingly costly power supply impacts our ability to produce safe and profitable production and affects the sustainability of our business.
In addition, there is growing pressure for decarbonisation by climate activists and investors, and for companies to acknowledge, disclose and reduce their carbon emissions.
|
|
Cause
In South Africa, our mining operations depend on coal-fired power generated by Eskom. The state utility’s electricity supply is unreliable due to insufficient plant maintenance and pressure on outdated infrastructure. Repairing infrastructure and carbon tax contribute to the rising cost of electricity as consumers are expected to cover these costs from the electricity they use and pay for.
There is a worldwide uptake of reducing carbon emissions (coal-fired power being a major contributor in South Africa) and achieving net zero. This is supported by increasing pressure from investors and shareholder activism holding companies accountable to their ESG targets and timelines. Companies must adopt clear plans to mitigate their negative impact.
|
Potential impacts
The unreliable power supply may negatively impact our overall costs, project budgets and ultimately our margins as operations and/or projects would not be feasible to operate anymore. It also affects the LoM of some of our operations and can impact our carbon pricing.
Continued power interruptions may result in:
•Harmony’s life of mines being shortened
•Planned production targets may not be met and some projects may be impacted.
Coal-fired power impacts our carbon footprint and, in turn, our decarbonisation journey. Mitigating the environmental impact of our operations reduces operating costs and our exposure to risk while supporting the long-term objective of leaving a positive post-mining legacy.
|
|
Risk treatment actions
•A clear strategy to improve efficiencies and to reduce reliance on Eskom through a substitution programme and reduce efficiencies and wastage from operations
•Continued involvement and efforts to influence and lobby at industry level to impact power cost increases and assist Eskom in securing power supply (through load curtailment if required) and providing available land for renewable energy plants, including lobbying and influencing regulators on regulatory reform and support interventions to the industry
•All cost and energy indicators and controls are reviewed by management and assured by RSM South Africa Inc
•Operational backup preparation plan
•Continued use of diesel generators to supply Hidden Valley operations with sufficient power
•Free State solar plant Phase 1 generates about 70 GWh
•Up to 60.0% hydro and diesel backup energy at Hidden Valley
•Business continuity plan in development
•Phase 2 for the 137MW solar plants has been approved by the board.
|
|
|
|
|
|
|
|
|
|
|
|
|
|
|
|
|
|
|
|
|
|
|
Oversight
•Social and ethics committee
•Technical committee
|
Responsibility
•Group COO
•Senior group executive: sustainable development
|
Movement in risk exposure
•Increased
|
Overall risk exposure
•Above risk appetite
|
Risk response strategy
•Treat
|
Strategic pillars
|
Capitals impacted
|
|
|
|
|
|
|
c. Not achieving operational plans at our critical operations |
| Our critical operations are mainly those that generate the highest returns, for example, Mponeng and Moab Khotsong operations. They play a critical role for Harmony’s ability to fund growth projects and a healthy cash flow within the group. If these operations do not meet their production targets, this could have a major impact throughout the business. |
|
Cause
There are numerous potential causes that may impact our production targets whereas a loss of life being the cause with the largest impact. Other causes also includes supply chain disruptions, load curtailment, average grade recovered and care and maintenance schedules.
Inflation also plays a major role in cost management.
|
Potential impacts
If the group’s critical operations do not meet their targets it may place undue pressure on operating margins and reduce earnings. Harmony’s credibility will be impacted, resulting in a decrease in our share price and our market capitalisation.
Not achieving our plans will impact our ability to fund our growth aspirations or pay dividends, resulting in a non-competitive equity story.
Production targets not being met may result in higher costs and cross subsidisation of assets (lower-risk assets subsidising higher-risk assets).
|
|
Risk treatment actions
•Manage labour complement for equipping, constructing, rigging and vamping
•Monthly rolling three-month plan assessment to maintain effective mining mix
•Critical raise line scrutiny to optimise flexibility in face length (iceberg management)
•Achieve/exceed reef and waste development plan (creating flexibility)
•Weekly forecast review meetings
•Monthly review by the senior management team and quarterly review by the Group CEO’s office.
|
|
|
|
|
|
|
|
|
|
|
|
|
|
|
|
|
|
|
|
|
|
|
Oversight
•Technical committee
|
Responsibility
•Group COO
|
Movement in risk exposure
•Remained the same
|
Overall risk exposure
•Above risk appetite
|
Risk response strategy
•Tolerate
|
Strategic pillars
|
Capitals impacted
|
|
|
|
|
|
|
|
|
|
|
|
|
|
|
|
|
|
|
|
|
|
| d. Political tensions (geo-political and local) |
Geopolitical risks will be challenging to treat in the highly interconnected global ecosystems, as it remains difficult to forecast the exact impact these risks are having or may have. Supply chain disruptions, global inflation, interest rates and political risks are material risks to monitor and treat to reduce Harmony’s overall risk exposure while local socio-political uncertainty results in increasing community unrest and expectations. |
|
Cause
The Ukraine and Russia war is causing disruptions that lead to inflation, supply chain disruption and global conflicts.
|
Potential impacts
Rising inflation could impact input prices and Harmony’s all-in sustaining cost, resulting in unsustainable mines (the margin may be too low to continue investing in it).
Higher interest rates may affect the cost of funding capital, which could impact Harmony’s cash flow, project returns and earnings.
Cost of living is continuously increasing because of high interest rates and inflation, and impacts Harmony’s employees and other stakeholders.
|
|
Risk treatment actions
•Reducing reliance on single suppliers by adding additional suppliers
•Continued stakeholder engagement through various forums
•Harmony’s hedging policy is aimed at locking in higher gold prices and suitable exchange rates to protect margins
•Harmony follows an inclusive approach with its unions, to ensure that wage expectations are managed.
|
|
|
|
|
|
|
|
|
|
|
|
|
|
|
|
|
|
|
|
|
|
|
Oversight
•Social and ethics committee
•Technical committee
|
Responsibility
•CEO
•Group COO
•Executive director: stakeholder relations
|
Movement in risk exposure
•Increased
|
Overall risk exposure
•Above risk appetite
|
Risk response strategy
•Treat
|
Strategic pillars
|
Capitals impacted
|
|
|
|
|
|
|
|
|
|
|
|
|
|
|
|
|
|
|
|
|
|
| e. Unsuccessful project execution and funding ability |
While maximum returns on capital are demanded by shareholders, Harmony takes into account all of its stakeholders when deciding how to effectively allocate capital. As such, Harmony weighs up the following capitals: natural, manufactured, human, financial, intellectual and social. It is critical that these projects are executed on time and within budget. |
|
|
|
|
|
|
|
|
|
|
|
|
|
|
|
|
|
|
|
|
|
|
Cause
Major changes in the gold price, regulatory changes/approvals, production performance and political tensions are some major factors impacting our project execution.
|
Potential impacts
Not meeting project deadlines and agreed budgets may result in increased costs, which will impact overall profitability (net present value) and reduce investors’ confidence in investing in Harmony.
Major projects running concurrently may have a cost impact on cash flow and funding plans.
|
|
Risk treatment actions
•Project governance
•Monthly reviews of major capital projects by the central projects team
•Each project is supported by a detailed schedule, budget and project manager
•Review of major capital projects quarterly by the Group CEO’s office
•Strategic discussion are being held to best position Harmony to respond to risks and opportunities that may arise from the Newmont/Newcrest transaction.
|
|
|
|
|
|
|
|
|
|
|
|
|
|
|
|
|
|
|
|
|
|
|
Oversight
•Technical committee
•Investment committee
|
Responsibility
•Group COO
|
Movement in risk exposure
•No movement
|
Overall risk exposure
•Above risk appetite, within risk tolerance levels
|
Risk response strategy
•Treat
•Tolerate
|
Strategic pillars
|
Capitals impacted
|
Emerging risks
We identify emerging risks through external environmental scanning, matters reported in the media and specific events. The purpose of this type of risk intelligence gathering is to identify potential threats and opportunities that may impact our strategy as soon as they become known.
Methods to recognise emerging risks include continuous environmental scanning, scenario planning and media tracking. Monitoring credible global and industry intelligence platforms also forms part of an emerging risk monitoring and reporting process.
Top group opportunities
Strategic opportunity profile
The below list contains seven grouped opportunities that were reported in the fourth quarter of FY23 to the audit and risk committee. Opportunities go hand in hand with our strategic risks and are very important for our future growth and sustainability aspirations.
|
|
|
|
|
|
| Top strategic opportunities |
| a |
Organic growth opportunities to increase the quality of our ounces and drive down costs |
| b |
Including copper in the Harmony share price |
| c |
Productivity improvement projects |
| d |
Exploring value-accretive merger and acquisition and divestment opportunities |
| e |
Unlocking the full potential of our surface source ounces, lower-risk, higher-cash-margin opportunities |
| f |
Reducing our reliability on Eskom and the potential impact of carbon taxes by exploring alternative ways to generate power |
| g |
Exploring Harmony water resources and supply to surrounding communities |
|
|
|
|
|
|
|
|
|
| a. Organic growth opportunities to increase the quality of our ounces and drive down costs |
|
There are opportunities to expand and capitalise on our surface sources, mainly tailings storage facilities in the Free State region and the extension of the Hidden Valley ore body, including Kerimenge.
We also have an opportunity to extend life-of-mine of Mponeng, also known as the Mponeng deepening project.
|
Potential contribution to delivering on our strategy
•Continue to invest in assets in countries that we are familiar with
•Leveraging off current infrastructure and applying the skills of our experienced mining teams, create shared long-term value for all the stakeholders of Harmony
•Some investors argue that higher value is attributable to lower-risk surface projects which deliver returns (short payback, high margins)
•Project metrics to be carefully considered to prioritise capital.
|
|
Oversight
•Investment committee
•Audit and risk committee
•Board
|
Strategic pillars
|
Capitals impacted
|
|
|
|
|
|
|
|
|
|
|
|
|
| b. Including copper in the Harmony share price |
|
Wafi-Golpu, a tier-one asset, has the potential to deliver substantial benefits to all stakeholders and contribute to Harmony’s long-term Mineral Reserve pipeline that underpins our business’s sustainability. Harmony introduced a new asset this year through acquiring the Eva Copper Project in Australia, which plays a crucial role in the longevity of our production profile and investing in safer and more sustainable assets for the future.
|
Potential contribution to delivering on our strategy
•Copper is a green metal. Introducing copper into Harmony’s production portfolio meets various ESG requirements, drives down costs and serves as counter-cyclical protection against gold
•Wafi-Golpu: The special mining lease and funding solution are critical focus areas. Once the special mining lease for Wafi-Golpu has been secured, the project has the potential to re-position Harmony in the lower-cost quartile within the mining industry
•Eva Copper’s feasibility study to be completed and board approval to be obtained before it will be regarded as value accretive
•A solid financing plan is required to convert the value of Wafi-Golpu and the Eva Copper Project into our share price.
|
|
Oversight
•Investment committee
•Technical committee
•Board
|
Strategic pillars
|
Capitals impacted
|
|
|
|
|
|
|
|
|
|
|
|
|
c. Productivity improvement projects |
| Operational excellence is key to creating an enabling environment and achieving our operational plans. Proactively managing safety and health, combined with incentives to improve technology and our workforce’s productivity, increasing flexibility and reducing unplanned stoppages are key aspects of our operational excellence approach. We aim to increase the focus on business improvement opportunities to optimise available resources. |
Potential contribution to delivering on our strategy
•Increase focus on business improvement opportunities to optimise available resources
•Pursuing several efficiency enhancements aimed at safer mining and increasing productivity
•We are exploring possible partnerships in developing new technologies to improve safety and efficiency of our mines.
|
|
Oversight
•Technical committee
•Board
|
Strategic pillars
|
Capitals impacted
|
|
|
|
|
|
|
|
|
|
|
|
|
| d. Exploring value-accretive merger and acquisition and divestment opportunities |
| We continue assessing the quality of our assets to ensure they meet investment criteria. We update the list of potential merger and acquisition opportunities regularly and pursue these at the right time. |
Potential contribution to delivering on our strategy
•Investing in safer, more profitable mines, increasing market capitalisation and unlocking value.
|
|
Oversight
•Investment committee
•Audit and risk committee
•Board
|
Strategic pillars
|
Capitals impacted
|
|
|
|
|
|
|
|
|
|
|
|
|
e. Unlocking the full potential of our surface source ounces, lower-risk, higher-cash-margin opportunities |
| With meaningful surface sources available, supported by available plants, there may be an opportunity to expand our reclamation activities to ensure optimal utilisation of our assets. Acquiring additional surface sources may also be an opportunity. |
Potential contribution to delivering on our strategy
•Proper balancing of plant productivity with nearby resources to ensure optimal throughput.
|
|
Oversight
•Investment committee
•Audit and risk committee
•Board
|
Strategic pillars
|
Capitals impacted
|
|
|
|
|
|
|
|
|
|
|
|
|
| f. Reducing our reliability on Eskom and the potential impact of carbon taxes by exploring alternative ways to generate power |
| There is a great need to reduce our reliance on one electricity supplier. As such, we have to consider investing in various alternative sources of energy, similar to the solar projects that were approved. Most of our projects consists of solar farms, but also considering alternative energy solutions including photovoltaic systems, wind and Syngas (hydrogen-rich gas). |
Potential contribution to delivering on our strategy
There is a great need to reduce our reliance on one supplier of electricity. As such, we must consider investing in various sources of energy, similar to the solar projects that were approved. Our project and environmental teams continue to assess possible solution.
|
|
Oversight
•Investment committee
•Audit and risk committee
•Board
|
Strategic pillars
|
Capitals impacted
|
|
|
|
|
|
|
|
|
|
|
|
|
g. Exploring Harmony’s water resources and supply to surrounding communities |
| The local government does not have a proactive plan to maintain water supply to operations and surrounding communities. Water is becoming a competing resource for mining vs consumption vs ecosystem health. |
Potential contribution to delivering on our strategy
As a result, water restrictions are being imposed in some areas of South Africa, which provides Harmony with an opportunity to use excess de-mineralised water for the supply to surrounding communities for consumption and vegetation.
|
|
Oversight
•Investment committee
•Board
|
Strategic pillars
|
Capitals impacted
|
OUR MATERIAL MATTERS
Integrated thinking is embedded in our approach to mining with purpose, and supports our process for identifying material matters that we impact, and matters that could affect our ability to create and preserve value over time. Each year, we assess and review these matters and consider internal and external stakeholder input.
We identify material matters using a robust materiality determination process that includes our broader impact through a double materiality lens, ie how a material matter impacts the economy, society and the environment, or how they impact our ability to create value over time. Harmony contracted Deloitte to facilitate a top-down, bottom-up and stakeholder-centric approach to determining materiality for our business. The gap analysis informed the roadmap, which has been approved by our social and ethics committee and will be rolled out in the next financial year.
The matters identified below inform the content of the integrated report, and align with the capitals we impact, our risks, opportunities and strategy, and are prioritised and grouped into material and broader themes (social, environmental, governance and business-related).
Materiality determination process
|
|
|
|
|
|
|
|
|
| External review |
|
The external review identified and prioritised:
•Macro and sector sustainability trends
•Investor priorities
•External factors identified by ratings agencies
•Industry peer material matters and themes.
|
| Internal review |
|
The internal review considered:
•Internal factors identified in our risk register and strategy
•Organisation-wide survey
•Focus group discussions
•Stakeholder interviews.
|
| Consolidation of matters |
|
•The results of the internal and external reviews were interrogated, analysed and compared to previously identified material matters
•Additional matters to be analysed were also identified
•Resulting in a list of potential matters for approval by executives and senior management.
|
| Prioritisation and approval |
|
•The identified matters were confirmed and ranked through a materiality survey
•Social and ethics committee review
•Board approval.
|
| Output |
|
25 material matters and five material themes were identified, grouped into four broader themes and used in the Integrated and ESG reports. |
Materiality matrix
Harmony’s 2023 material matters did not change significantly from the prior year, and certain key issues remain critical for the business.
|
|
|
|
|
|
|
|
|
|
|
|
|
Material themes
|
Material matters
|
Impact on business cash flows % |
Impact on economy, society and environment % |
| Social |
| Employee health and safety |
1 Ensuring employee safety
2 Protecting employee health
and mental wellbeing
|
4.61
4.29
|
4.32
4.00
|
| Supporting our people |
3 Maintaining sound labour
relations
4 Driving equity, inclusion and
diversity
5 Attracting and retaining an
engaged, enabled and
empowered workforce
8 Respecting cultural heritage
|
4.43
3.96
4.18
3.50
|
4.21
3.93
3.96
3.68
|
| Partnering for thriving, sustainable communities and our social licence to operate |
6 Stakeholder engagement
and partnerships for
sustainable communities
7 Supply chain transformation
and preferential
procurement
|
4.21
3.89
|
4.18
3.93
|
|
|
|
|
Environmental |
| Environmental stewardship |
9 Climate change and
extreme weather
susceptibility and
responsibility (including
physical and transitional
risks)
10 Addressing energy use
11 Water management
12 Circular economy
(maximising resource
efficiency and reuse/
recycling) and pollution
prevention
13 Tailings storage facility (TSF)
management and safety
14 Ensuring biodiversity and
post-closure sustainability
17 Pursuing zero emissions and
renewable alternatives
|
3.64
4.54
4.39
3.86
4.68
3.93
3.39
|
3.93
4.64
4.43
3.93
4.36
4.14
4.07
|
|
|
|
|
Business-related/financial performance and operational resilience |
Pursuing operational sustainability |
15 Navigating commodity price
and currency/forex
fluctuations
16 Managing capital access
and allocation for
profitability
18 Re-engineering our portfolio
and growing our profitable
ounces (diversifying
commodities, jurisdictions
and a mix of ultra-deep
level and surface sources)
19 Pursuing technology and
innovation for
environmental, operational
and safety improvements
|
4.71
4.64
4.82
4.18
|
4.00
3.82
3.89
3.71
|
|
|
|
|
|
|
|
|
|
|
|
|
|
|
|
|
| Governance |
| Governance, ethics and accountable leadership |
20 Crisis response and
operational resilience
21 Fair and responsible
remuneration
22 Upholding human rights
and driving responsible
procurement
23 Ensuring legal, regulatory
and compliance excellence
24 Cybersecurity
25 Transparent and ethical
business (anti-bribery and
anti-corruption)
|
4.43
3.93
4.21
4.50
4.54
4.39
|
4.04
3.61
4.25
3.89
3.71
4.21
|
|
|
|
|
Our material themes and matters
|
|
|
|
|
|
|
|
|
|
|
|
|
|
|
| Employee health and safety |
|
Mining and extractive processes pose significant health and safety risks to our people and could negatively impact their wellbeing. Safety, health and wellbeing are a core value and key focus areas for Harmony.
Moving Harmony towards zero harm with care, collaboration, conservation and action ensures a safe, healthy and resilient workforce.
|
Material matters
•Ensuring employee safety
•Protecting employee health and mental wellbeing.
|
|
Linked risks
•Safety and health
|
Linked capitals
|
Linked strategic pillars
|
Linked SDGs
|
|
|
|
|
|
|
|
|
|
|
|
|
|
|
|
| Supporting our people |
|
A meaningful employee value proposition is critical to our success as a business because it reduces potential labour-related disruptions, among other people-related risks, and ensures employee retention.
We create and maintain an engaged and empowered workforce through sound labour relations, supporting diversity, inclusivity and equality, and investing in and caring for our people. Harmony’s social initiatives positively impact employees and communities by enabling them to improve their living conditions and have better access to social services, healthcare, education and training.
Harmony is mindful of and respects the different cultures and their cultural heritage in the regions where we operate. As part of our impact assessment approach for exploration activities, new projects and expansion activities, we conduct cultural heritage investigations, and work with relevant stakeholders to create appropriate heritage management measures.
|
Material matters
•Maintaining sound labour relations
•Driving equity, inclusion and diversity
•Attracting and retaining an engaged, enabled and empowered workforce
•Respecting cultural heritage.
|
|
Linked risks
•Political tensions (geopolitical and local)
|
Linked capitals
|
Linked strategic pillars
|
Linked SDGs
|
|
|
|
|
|
|
|
|
|
|
|
|
|
|
|
| Partnering for thriving, sustainable communities and our social licence to operate |
|
Local and indigenous people have a deep understanding of the social and environmental challenges facing their communities. Acknowledging and being respectful of traditions, norms and values are key to building deep and meaningful relationships and as such, meaningful engagements and partnerships with our communities builds trust and earns our social licence to operate.
Harmony partners with communities, local municipalities, small businesses and various levels of government to ensure progress against meeting our social commitments and creating impact, including reducing inequality, supporting job creation and creating sustainable socio-economic development.
We also believe that meaningful stakeholder engagement is key to sustainable value creation and preservation.
|
Material matters
•Stakeholder engagement and partnerships for sustainable communities
•Supply chain transformation and preferential procurement
|
|
Linked risks
•Political tensions (geopolitical and local)
•Supply chain disruptions
•Systemic failure of public infrastructure.
|
Linked capitals
|
Linked strategic pillars
|
Linked SDGs
|
|
|
|
|
|
|
|
|
|
|
|
|
|
|
|
| Environmental stewardship |
|
We use and affect natural resources while conducting our business activities:
•Mining and extractive processes create pollution, deplete natural resources and disrupt land use and management
•Our operations require natural resource inputs such as energy from renewable and non-renewable sources, water and the land we mine
Harmony must manage these finite, shared and fragile resources responsibly as an ethical, social and business imperative. Mismanagement could result in financial and environmental costs, and business risk and liability.
We are committed to ecologically responsible mining, contributing to a low-carbon future, minimising and mitigating our footprint, and leaving a positive legacy in partnership with our stakeholders. Our responsible practices are embedded in everything we do and extend beyond our mine boundary to our supplier partners and market.
|
Material matters
•Climate change and extreme weather susceptibility and responsibility (including physical and transitional risks)
•Addressing energy use
•Water management
•Circular economy (maximising resource efficiency and reuse/recycling) and pollution prevention
•TSF management and safety
•Ensuring biodiversity and post-closure sustainability
•Pursuing zero emissions and renewable alternatives.
|
|
Linked risks
•Safety and health
•Security of electricity/power supply and the impact of higher electricity costs
•Not achieving operational objectives at our operations
•Supply chain disruptions (including supply of goods and increasing costs)
|
Linked capitals
|
Linked strategic pillars
|
Linked SDGs
|
|
|
|
| Business-related/financial performance and operational resilience |
|
|
|
|
|
|
|
|
|
|
|
|
|
|
|
|
Factors in our external environment and the risks and opportunities inherent to mining can affect our ability to achieve strategic objectives and generate broad sustainable value:
•Mining is a cyclical business: as commodity prices fluctuate, so too does available funding for exploration and project development. Our shareholders expect a level of performance that ensures sustainable returns on their investment. In contrast, our broader stakeholder groups expect performance that ensures sustainable benefits. Balancing these expectations is a business imperative and reflects management’s ability to navigate a changing context.
•Zero emissions: Our portfolio of assets is characterised by high energy use and will remain so, given our future deepening projects. This poses an environmental impact and cost implication linked to carbon tax. We are diversifying commodities, jurisdictions and mix of ultra-deep and surface sources to ensure a future production pipeline of quality reserves that will enable us to operate sustainably and profitably.
•New technology: We pursue related opportunities to improve safety and enhance our ability to improve cost and productivity efficiencies, as well as overall financial management. However, failure to adopt digital technologies may influence the upskilling or reskilling of existing employees and retaining talent.
It is vital for our sustainability that we anticipate, identify and understand all external influences that affect our business, and develop appropriate responses. This will ensure that we can continue investing in our business and people while rewarding investors and, as a responsible corporate citizen, honouring our socio-economic commitments.
|
Material matters
•Navigating commodity price and currency/forex fluctuations
•Managing capital access and allocation for profitability
•Re-engineering our portfolio and growing our profitable ounces (diversifying commodities, jurisdictions and a mix of ultra-deep level and surface sources)
•Pursuing technology and innovation for environmental, operational and safety improvements.
|
|
Linked risks
•Safety and health
•Security of electricity/power supply and the impact of higher electricity costs
•Not achieving operational objectives at our operations
•Unsuccessful project execution
•Supply chain disruptions (including supply of goods and increasing costs)
•Gold price and forex fluctuations
•Systemic failure of public infrastructure.
|
Linked capitals
|
Linked strategic pillars
|
Linked SDGs
|
|
|
|
|
|
|
|
|
|
|
|
|
|
|
|
| Governance, ethics and accountable leadership |
|
Changing regulatory landscapes in our operating territories create uncertainty, delay key decisions, could affect investor sentiment towards Harmony and could impact our sustainability and licence to operate.
Business continuity management (BCM) has been introduced and is in development across all South African operations. BCM contributes to operational resilience by identifying and understanding potential threats and their impact on Harmony’s business operations.
Harmony continues enhancing its cybersecurity abilities by implementing state-of-the-art technologies and processes to identify threats, protect our environment and respond to cyber incidents.
Good governance is overarching and embodies everything we do as a business. Our board has a responsibility and commitment to Harmony’s responsible corporate citizenship, ethical leadership and robust governance standards in line with global good governance practice. The annual reviews of our board composition, fair and responsible remuneration practices as well as our governance frameworks and disclosures are aligned with best practice to ensure we are held accountable for delivering on our sustainability targets and ambition.
As a responsible employer, we adhere to corporate policies, comply with applicable laws and regulations, engage with our stakeholders regularly and contribute, directly or indirectly, to the general wellbeing of communities where we operate.
Risk management is a critical part of our journey and a significant component of governance, and as such, integrated into our daily operations and corporate culture.
|
Material matters
•Crisis response and operational resilience
•Fair and responsible remuneration
•Upholding human rights and driving responsible procurement
•Ensuring legal, regulatory and compliance excellence
•Cybersecurity
•Transparent and ethical business (anti-bribery and anti-corruption).
|
|
Linked risks
•Political tensions (geopolitical and local).
|
Linked capitals
|
Linked strategic pillars
|
Linked SDGs
|
STAKEHOLDER ENGAGEMENT
|
|
|
|
|
|
|
|
|
|
|
|
|
|
|
|
|
|
|
|
|
|
|
|
|
|
|
|
|
|
|
|
|
|
|
|
|
|
|
|
|
We engage with our stakeholders, principally employees, host communities, governments, traditional authorities and suppliers as part of our strategic pillar of responsible stewardship in support of our social purpose. This is particularly important as the geographically fixed nature of mineral deposits can pose unique socio-economic, environmental, and political challenges. Through structured proactive stakeholder engagements, we can better understand our stakeholders’ aspirations, concerns, needs and expectations; while building trust, creating shared value, and fostering sustainable partnerships.
We have established stakeholder forums to engage in dialogue with our various stakeholders. By being honest and transparent and delivering on commitments, we build credibility. We work closely with our host governments through various structures to ensure that we are identifying opportunities to support our communities that align with broader development goals. Through ethical and responsible mining, we aim to drive ethical business practices, meet or exceed regulatory requirements and continue effectively partnering with key stakeholders.
|
|
|
|
|
|
|
|
|
|
Our approach
Our proactive stakeholder engagement approach aims to build and maintain trust through sustainable relationships and partnerships with our stakeholders, and manage potential risks and opportunities to enhance our social purpose.
Our stakeholder engagement framework affirms our commitment to responsible stewardship as a strategic pillar. When engaging, we are guided by our values and strategic intent to:
•Develop and maintain relationships founded on integrity, transparency and trust
•Co-create with government and communities through collaborative partnerships
•Balance and align our goals and stakeholder expectations
•Establish accountability
•Manage stakeholders’ concerns, complaints and grievances
•Support shared value creation and awareness of broader economic and ESG issues.
We have tailored and adopted a tripartite engagement approach that enables us to stay connected and attuned to and have broad-based engagements with all stakeholders including government, landowners and communities, who form part of our key stakeholder groupings. This tripartite approach applies a three-tiered stakeholders engagement model:
•Tier 1 – includes engagements with the host government that focus on licensing and regulatory matters, and include alignment with and contribution to the national/state, provincial and local government developmental agenda to ensure that our social performance contributes to broader development goals
•Tier 2 – constitutes engagements with landowners and traditional authorities mainly focused on socio-economic development of the host areas
•Tier 3 – includes broad-based engagements with all other stakeholders affected by our mining and production activities, including NGOs and other groups, to discuss and manage expectations and concerns. These engagements are facilitated through established structures and forums.
The model is steered by a cross-functional stakeholder relations committee that provides oversight and guidance on key stakeholder relations matters.
|
|
|
|
|
|
|
|
|
|
The Harmony stakeholder map and engagement approach is summarised with a diagram below.
|
|
|
|
|
|
|
|
|
|
|
|
|
|
|
|
|
|
|
|
|
|
|
|
|
|
|
|
|
|
|
|
|
|
|
|
|
|
|
|
|
|
|
|
|
|
|
|
|
|
|
|
|
|
|
|
|
|
|
|
|
|
|
|
|
|
Managing stakeholder relationships
The quality of relationships with stakeholders and how well these are managed affect our ability to deliver on our strategy. In addition, building long-term, stable, mutually beneficial relationships enhances our social purpose and creates shared value for all our stakeholders.
Our stakeholder management strategy guides a proactive and collaborative approach in managing internal and external stakeholders, including a process of managing stakeholders concerns, complaints, and grievances.
|
|
|
|
|
|
Governance
Our stakeholder engagement processes are informed by relevant legislation and industry standards on Stakeholder Engagement. They also consider King IV (in South Africa) and related recommendations on inclusive stakeholder engagement and the importance of addressing legitimate stakeholder concerns.
The social and ethics committee is responsible for governance and oversight of stakeholder relations with the board having ultimate accountability.
|
|
|
|
|
|
|
|
|
|
|
|
|
|
|
|
|
|
|
|
|
|
|
|
|
|
|
|
|
|
|
|
|
|
|
|
|
|
|
|
|
|
Our key stakeholders
Harmony has a broad stakeholder network. For the purpose of this report, we identify the most material stakeholders – those with whom we engage more frequently – based on their role in:
•Delivering our strategic goals
•Contributing to our social performance
•Addressing risks, for example, highlighting issues that could lead to significant project or business risk
Including stakeholders whose lives our business impacts either positively or negatively and with whom we have mutual dependency.
Details of engagements with each key stakeholder are presented on the following pages.
|
|
|
|
|
|
|
|
|
|
|
|
|
|
|
|
|
Distributing economic value created
|
|
|
|
|
|
|
|
|
|
|
|
|
|
|
|
|
% |
R billion |
US million |
FY23 total economic value distributed* to our stakeholders
|
R37.6 billion (US$2.1 billion) (FY22: R34.8 billion (US$2.2 billion)) |
| Dividends |
|
0.5 |
% |
0.2 |
|
9 |
|
| Sustaining the business |
|
21.5 |
% |
8.1 |
|
459 |
|
| Employees and unions |
|
46.5 |
% |
17.5 |
|
986 |
|
| Communities, traditional leaders and NGOs |
|
0.8 |
% |
0.3 |
|
14 |
|
| Governments and regulators |
|
2.9 |
% |
1.1 |
|
63 |
|
| Suppliers |
|
27.8 |
% |
10.4 |
|
547 |
|
|
|
100 |
% |
37.6 |
|
2 116 |
|
* Includes financial and economic value distributed to our employee, investor, supplier, community and government stakeholders.
Investors and financiers
Includes capital providers, current and future shareholders and, indirectly, investment analysts and financial media.
Capitals impacted
Why we engage
•Maintain the confidence of existing investors and financiers, and attract investments in our business
•Continue to deliver shareholder returns, generating positive earnings and share price growth
•Manage expectation of financial, operational and ESG performance
•Communicate our progress on delivering on strategic objectives including ESG commitments.
How we create value
•Embedding ESG in the business – responsible stewardship underpins mining with purpose
•Strengthening delivery on sustainable KPIs and the UN SDGs that apply to our business
•Generating positive margins and cash flow
•Maintaining balance sheet flexibility
•Delivering on production guidance
•Investing in organic growth
•Unlocking value from synergies after integrating acquired assets.
2023 engagement topics
•Safety performance
•Improved ESG disclosure
•Power security in South Africa and renewable energy strategy
•Capital allocation – projects, specifically Eva Copper and Wafi-Golpu, and dividend expectations
•Delivering on commitments to diversify Harmony’s geographic presence and commodity mix, and integrating new acquisitions
•Meeting production targets and controlling operational costs in the face of inflation pressure and the impact of greater ESG expectations
•Exchange rate volatility impact on margins and cash generation.
Related material matters
•Ensuring employee safety
•Stakeholder engagement and partnerships for sustainable communities
•Navigating commodity price and currency/forex fluctuations
•Managing capital access and allocation for profitability
•Re-engineering our portfolio and growing our profitable ounces (diversifying from a depleting Ore Reserve base)
•Pursuing technology and innovation for environmental, operational and safety improvements
•Ensuring legal, regulatory and compliance excellence.
Overall economic value created
Dividends paid to shareholders: R154 million (US$9.0 million) (FY22: R430 million (US$28.0 million))
Future value creation and stay-in-business (total capital and exploration expenditure): R8.1 billion (US$459 million) (FY22: R6.4 billion (US$423 million))*
South Africa
R6.0 billion (US$338 million) (FY22: R5.1 billion (US$333 million))
Papua New Guinea
R2.1 billion (US$120 million) (FY22: R1.4 billion (US$90 million))
* For the purposes of economic value created, capital and exploration expenditure is included as part of employee and supplier spending.
Employees and unions
Provide human capital, including skills and experience.
Capitals impacted
Why we engage
•To gain an understanding of employees’ needs and concerns
•Maintain stable, constructive and peaceful labour relations
•By reporting on our performance against our strategic objectives, commitments and targets, we are held to account in line with our core values.
How we create value
•Ensuring a positive, safe working environment
•Empowering employees by investing in training and development
•Employing people from host communities
•Promoting transformation and female representation
•Attracting and retaining the skills and expertise required
•Motivating and rewarding employees for value-added performance
•Promoting harmonious, cooperative relations with employees and unions. No active wage negotiations took place as our current wage agreement covers 1 July 2021 to 30 June 2024
•Making impactful social and environmental contributions that our workforce can be proud of.
2023 engagement topics
•Safety at Harmony and across the mining industry – eliminating injuries and preventing loss of life
•Health and mental wellbeing, including treatment
•Transformation and employment opportunities
–Wage agreements (including shift systems) and union disputes
–Training, upskilling and diversifying our workforce
–Protecting human rights.
Related material matters
•Ensuring employee safety
•Protecting employee health and mental wellbeing
•Maintaining sound labour relations
•Driving equity, inclusion and diversity
•Attracting and retaining an engaged workforce with the right skills and experience
•Stakeholder engagement and partnering for sustainable communities
•Fair and responsible remuneration
•Upholding human rights and driving responsible procurement
•Ensuring legal, regulatory and compliance excellence
•Transparent and ethical business (anti-bribery and anti-corruption).
Overall economic value created
Wages and salaries paid: R17.5 billion (US$1.0 billion) to 45 546 employees (FY22: R17.0 billion (US$1 billion) and 47 345 employees)
Skills development and training investment: R817 million (US$46.0 million) (FY22: R665 million (US$43.7 million))
South Africa
R16.6 billion (US$932 million) (FY22: R16.1 billion (US$1.1 billion))
Papua New Guinea
R958 million (US$53.9 million) (FY22: R829 million (US$54.5 million))
Communities, traditional authorities and NGOs
An aspect of social and relationship capital that represents responsible corporate citizenship and impacts our social licence to operate.
Capitals impacted
Why we engage
•Establish and maintain collaborative partnerships with host communities for shared value
•Identify, understand and manage our impacts and community expectations
•Proactively identify and address stakeholder concerns, complaints and grievances
•Keep host communities informed of the company’s activities and performance, including progress on commitments made to our stakeholders
•Seek input and support for future projects and initiatives
•Co-create solutions to generate lasting socio-economic development and growth in host communities
•Build capacity of NGOs to address social needs that are not catered for in government services
•Build an understanding of the risks associated with mining and the efforts to promote public health and wellbeing.
How we create value
•Investing in local economic development and corporate social investment initiatives
•Maintaining constructive relationships with communities
•Understanding, managing and addressing stakeholder expectations and concerns
•Contributing to socio-economic upliftment
•Promoting self-sustaining activities to create jobs and alleviate poverty
•Embracing safe and sustainable mining to make a positive socio-economic contribution.
2023 engagement topics
South Africa
•Procurement opportunities and incubation and development of SMMEs
•Perceived increased unemployment as a result of mine closures
•The impact of illegal mining.
Papua New Guinea
•Delayed permitting of the Wafi-Golpu Joint Venture project, translating into delayed benefits of the project to the host communities.
Australia
•Employers competing with the mining sector for employees.
Related material matters
•Stakeholder engagement and patterning for sustainable communities
•Supply chain transformation and preferential procurement
•Circular economy
•Upholding human rights and responsible procurement
•Ensuring legal, regulatory and compliance excellence.
Overall economic value created
Investments in CSI and socio-economic development initiatives: R254 million (US$14.3 million) (FY22: R193 million (US$13.0 million))
South Africa
R179 million* (US$10.1 million) (FY22: R138 million (US$9.1 million))
Papua New Guinea
R75 million (US$4.2 million) (FY22: R55 million (US$3.6 million))
*Includes SLP commitments and CSI.
Governments and regulators
Enact legislation and related regulations that Harmony must comply with to earn or retain its regulatory licence to operate, aligning and managing interests, needs and expectations.
Capitals impacted
Why we engage
•Maintain government stakeholders’ confidence in Harmony and positive relations at all government levels to promote a conducive environment for investing in Harmony’s long-term growth
•Meet or exceed regulatory requirements and ensure compliance reporting on operations/projects performance
•Understand, develop and implement plans to address issues and manage risks
•Understand and provide feedback on proposed regulatory changes and their potential impact on the mining industry
•Support governments by contributing to national revenue
•Collaborate with government on strategic initiatives
•Align our socio-economic interventions to contribute to the implementation of national, provincial and local growth and development plans
•Policy reform.
How we create value
•Contributing to national income by paying taxes and royalties on profits and earnings
•Maintaining constructive relationships with governments and regulators
•Maintaining our mining and related permits and licences in good standing.
2023 engagement topics
•Safety performance
•Greater focus on ESG funds’ disclosures following the increase in greenwashing and other ESG-related issues
•Stable and investor friendly regulatory environment
•Crime, illegal mining, corruption, and grey listing
•Relevant regulatory changes
•Job creation
•Energy security and privatisation
•Economic development through procurement.
South Africa
•Delays in prospecting rights for Kalgold.
Papua New Guinea
•Permitting of the Wafi-Golpu Project
•Undertake scheduled review of all parties performance against commitments in the Hidden Valley MoA.
Australia
•Contribute to critical (new economy) minerals development while supporting Queensland’s decarbonisation goals
•Maximise local economic benefits
•Project operates to high standards of ESG.
Related material matters
•Stakeholder engagement and partnering for sustainable communities
•Supply chain transformation and preferential procurement
•Ensuring legal, regulatory and compliance excellence.
Overall economic value created
Taxes and royalties paid: R1.0 billion (US$56.6 million) (FY22: R669 million (US$44.0 million))
Personal income tax on employee salaries and wages paid: R3.3 billion (US$184.5 million) (FY22: R3.2 billion (US$210 million))
South Africa
R1.0 billion (US$57 million) (FY22: R578 million (US$38.0 million))
Papua New Guinea
R128 million (US$7.2 million) (FY22: R91 million (US$6.0 million))
Suppliers
Provide raw materials, inputs and services essential to our business.
Capitals impacted
Why we engage
•Manage costs and align with our key policies to support delivery of our strategic objectives and long-term viability
•In South Africa, this engagement is essential in meeting procurement targets for our mining rights
•In Papua New Guinea, engagement is essential to meeting our commitments under mining-related agreements.
•In Australia, engagement is essential to fulfilling legislative requirements for an Australian Industry Participation Plan and addressing stakeholders’ expectations to maximise local benefits.
How we create value
•Focusing on local preferential procurement to support local economies
•Engaging with suppliers and contractors to build cooperative, trust-based relationships and manage costs
•Ensuring services are delivered as agreed and align with our values and strategic objectives
•Honest and timely communication
•Indirectly contributing to the broader economy.
2023 engagement topics
•Ensuring products and services are locally sourced following Mining Charter III verification requirements
•Preferential procurement
•Unethical conduct, bribery and corruption
•Carbon emissions footprint and scope 3.
Related material matters
•Stakeholder engagement and partnering for sustainable communities
•Driving equity, diversity and inclusion
•Supply chain transformation and preferential procurement
•Circular economy
•Transparent and ethical business.
Overall economic value created
Procuring goods and services: R18.5 billion (US$1.0 billion) (FY22: R16.6 billion (US$1.1 billion)
South Africa
Total procurement (discretionary) spend:
R16.5 billion (US$929 million) (FY22 R14.3 billion (US$940 million)). Of this, 85.1% (R14.0 billion (US$788 million)) was preferential procurement with BEE* entities (FY22: 78.3% or R11.2 billion (US$736 million))
Papua New Guinea
Total procurement spend:
R2.1 billion (US$117 million) (FY22: R2.3 billion (R153 million)):
In-country: 39.5% (R821 million (US$46.2 million)) (FY22: 47.6% or R1.1 billion (US$72.8 million))
Morobe: 49.1% (R574 million (US$32.3 million)) (FY22: 24.1% or R559 million (US$36.7 million))
* Refers to >25%, + 1 vote historically disadvantaged person-owned and controlled companies.
SUSTAINABLE DEVELOPMENT
ESG IN PRACTICE
Key drivers of sustainability within Harmony are reducing risk, maximising opportunities and leaving positive impact and shared value – it is why we mine with purpose.
Guided by our sustainable development framework, delivering on our ESG commitments continues to inform our strategic direction and decision making. The framework enables us to maximise our positive impact and mitigate or manage our negative impact with clear, measurable goals, while keeping our stakeholders’ needs and interests top of mind.
Our approach
|
|
|
|
|
|
|
|
|
|
|
|
|
|
|
|
|
|
|
|
|
|
|
|
|
|
|
Prioritising sustainability issues, and actioning these by delivering on our purpose, strategy and ESG pillars |
à |
Responsible stewardship |
à |
Sustainable development guidelines and frameworks |
à |
Aligning to six capital model supporting UN SDGs |
à |
Enhancing disclosure
and measuring our performance
|
Linking capitals to UN SDGs
Human capital: Addresses poverty and aims to improve the wellbeing of individuals and communities.
Financial capital: Involves investments in agricultural development and food security programmes.
Manufactured capital: Focuses on improving agricultural infrastructure and farming methods.
Intellectual capital: Encourages innovation in agriculture and food production.
Natural capital: Promotes sustainable agriculture and responsible land and water use.
Social capital: Food security and access to food are critical for community wellbeing.
Prioritising sustainability issues
Our integrated, risk-based approach to sustainability ensures that we are geared to respond to a multitude of local and global ESG drivers while going beyond compliance. We have identified sustainability-related risks and opportunities that are most important to us and our stakeholders (as shown below) that will enable us to prioritise and focus our efforts.
|
|
|
|
|
|
|
|
|
|
|
|
|
|
|
|
|
|
|
|
|
|
|
|
|
|
Value creation
Maximising positive impact
|
|
Sustainable products
What we sell
|
|
Sustainable operations
How we work
|
|
é |
|
|
Maximising positive impact through how we work |
Maximising positive impacts through what we sell |
|
|
Current opportunities being explored/implemented |
Opportunities moving to maturity |
Current opportunities being explored/implemented |
Opportunities to differentiate |
|
ç
|
•Embedding sustainability into our purpose, strategy and operating model
•Diversifying our energy mix with renewable energy
•Community relations and impact
•Maintaining sound labour relations
•Supply chain transformation and preferential procurement
•Pursuing technology and innovation for environmental, operational and safety improvements
•Productivity improvement projects.
|
•Managing capital access and allocation for profitability
•Responsible procurement
•Attracting and retaining an engaged and empowered workforce
•Diversity, equity and inclusion
•Workforce training and education
•Protecting employee health and mental wellbeing
•Circular economy
•Ensure sustainability metrics are embedded in Harmony’s roles, KPIs and incentives.
|
•Rebalancing asset portfolio (metals and minerals of the future/low-carbon economy)
•Communication and advocacy.
|
•Ensuring sustainability leadership as a differentiator
•Position Harmony’s brand around sustainability
•Exploring value-accretive merger and acquisition opportunities in critical minerals space.
|
è
|
| Minimising negative impacts through how we work |
Minimising negative impacts through what we sell |
| Critical risks |
Monitor, comply and manage |
Critical risks |
Monitor, comply and manage |
|
•Loss of life/safety
•Security of electricity/power supply
•Security of water supply
•Air quality
•Physical impacts of climate change
•Depleting the Ore Reserve base
•Unsuccessful project execution
•Supply chain disruptions
•Business ethics and code of conduct.
|
•Mine closure: rehabilitation and legacy
•Community relations
•Energy efficiency and emissions
•Tailings Storage Facility (TSF) management and safety
•Hazardous chemicals management
•Modern slavery and human rights
•Pollution prevention
•Biodiversity
•Management of legal and regulatory environment
•Transparency and disclosure.
|
•Supply chain management. |
•Responsible gold. |
|
ê |
|
|
|
Minimising negative impact
Risk management
|
|
|
We aim to achieve this by delivering on the following:
|
|
|
|
|
|
|
|
|
|
|
|
|
|
|
|
|
|
| Purpose |
|
Mining with purpose |
|
To deliver on our strategy of producing safe, profitable ounces and increasing margins |
| Business strategy and outcomes |
|
Extracting while minimising impacts, preserving and protecting the environment, leaving a cleaner, healthier planet for future generations |
Prioritising employees’ safety, health and wellbeing while cultivating talent and developing the skills required for the future |
Keeping sustainability at the centre of all strategic decisions |
To achieve our ambition of low-carbon gold, Harmony has committed to prioritising strategic investments in renewables in high-grade assets |
| Strategic pillars |
|
Responsible stewardship |
Operational excellence |
Cash certainty |
Effective capital allocation |
| Embedding sustainability strategic pillars |
|
Our embedded ESG practices will create lasting legacies and ensure a sustainable future for all our stakeholders |
|
Environmental stewardship |
Social stewardship |
Governance stewardship |
Business and operational excellence |
|
Harmony’s commitment to protecting and regenerating the environment through ecologically responsible mining involves driving environmental sustainability and leadership. We strive for a greener, zero-emissions business with a lasting positive legacy. To coexist with the natural environment it is crucial that we understand and appreciate the negative effects of our operations.
Our environmental strategy enables us to manage, mitigate and offset environmental risks associated with our activities. |
What we do as a business has a broader impact on the communities surrounding our operations and society at large.
Harmony is guided by our socio-economic strategy to deliver on our responsibility of:
•Fostering relationships of trust with our employees, suppliers, host communities and government
•Promoting shared value for all and delivering impact through going beyond compliance
•Responsibly closing our operations to ensure we create and preserve value wherever we operate.
Our social compact is further underpinned by and complies with Harmony’s Social Labour Plans SLPs and mining rights, the Hidden Valley memorandum of agreement (MoA), and the recently established Wafi-Golpu Framework memorandum of understanding (MoU).
|
Good governance lies at the heart of our performance and reporting. Guided by our policies and codes, we aim to do the right thing and tell our story honestly. Harmony is a business, but we operate in a broader, interlinked context. Considering every element of those links in our thinking and actions will make Harmony a sustainable business – poised for growth.
For Harmony, ethical mining equals ethical leadership that equals corporate trust. |
How we ensure that Harmony is pursuing operational sustainability, creating economic benefit and managing business resilience. |
To achieve our purpose, our sustainable development framework is the cornerstone of our commitment to responsible stewardship. It comprises four pillars and 13 priorities. The framework was reviewed and updated this year to ensure it remains relevant.
|
|
|
|
|
|
|
|
|
|
|
|
|
|
|
|
|
|
| Priorities |
|
Environmental stewardship |
Social stewardship |
Governance stewardship |
Business and operational excellence |
|
•Climate action: Decarbonise the business through energy efficiency and Harmony’s renewable energy programme
•Climate resilience: Ensure Harmony and its infrastructure, sites and operations are adapted to withstand and mitigate the effects of climate change
•Biodiversity: Mitigate impacts to biodiversity and work towards offsetting through restoring sustainable value to land disturbed by our operations
•Water: Prioritise security of supply, protection of resource and responsible utilisation and recycling of water resources.
|
•Health, safety and wellbeing: Prioritise a strong safety culture, ensuring employee health, safety, wellbeing and zero loss of life
•Supporting our people: Providing and promoting strong leadership and an enabling culture that ensures we attract and retain an engaged, empowered, diverse and inclusive workforce; maintaining sound labour relations; and providing workforce training and education
•Partnering for thriving, sustainable communities and our social licence to operate: Strengthen stakeholder engagement and partner for sustainable communities while driving responsible procurement and supply chain transformation.
|
•Transparent and ethical mining: Drive ethical business practices, meet or exceed regulatory requirements, and partner with key stakeholders
•Ethical and accountable leadership: Internalise our commitment and accountability to Harmony’s responsible corporate citizenship, ethical leadership and robust governance standards
•Governance excellence: Follow a proactive, strategic approach to governance, building on existing strengths to ensure best-in-class governance approaches, embedding ESG into our core strategy and taking a proactive approach to go beyond compliance with ESG legislation.
|
•Managing business resilience: Anticipate, identify and understand external influences and risks that affect our business, and develop appropriate responses to improve our economic impact and performance
•Pursuing technology and innovation for environmental, operational and safety improvements: Advance innovation capabilities to unlock and improve our sustainability
•Managing capital access and allocation for safe profitable ounces: Capital allocation is aimed at producing safe, profitable ounces and increasing margins through meeting approved capital allocation parameters.
|
We report on our progress against these priorities in the sub-sections under the environment, social and governance chapters in this report.
Reporting and disclosure
Reporting and disclosure are important components of our framework:
•We voluntarily report in accordance with guidelines issued by the GRI. Harmony has a self-declared compliance to the core level of the GRI Standards
•We report on environmental information aligned with CDP Water
•Our reporting aligns with TCFD.
Assurance
Corporate credibility is crucial to our business and reinforces the need for us to build on our reputational capital. We achieve heightened credibility through our sustainable development performance and reporting. We assure 21 material indicators, of which six are subject to reasonable assurance and 15 to limited assurance. In FY23 we assured conformance to the World Gold Council's Responsible Gold Mining Principles. .
We continue improving our assurance programme to cover key performance indicators and the level of assurance.
Accountability and responsibility
The social and ethics committee is responsible for governance of the sustainable development framework, with the board having ultimate accountability.
Responsible stewardship
As one of our four strategic pillars, responsible stewardship supports our operating philosophy of profit with purpose and guides all strategic decisions. We are mindful of our responsibilities as a corporate citizen, environmental stewards and in truly living our values. Key to delivering on this pillar is meaningful stakeholder relationships, engagement and collaboration.
Guidelines and frameworks
|
|
|
|
|
|
|
We have prioritised those SDGs to which we can meaningfully contribute through our sustainable development framework and by meeting our socio-economic development commitments.
We are committed to making a meaningful contribution to the SDGs and we understand our role in contributing to broader sustainable development issues. We have aligned our sustainable development framework to the SDGs since 2018.
|
|
|
|
The World Gold Council’s Responsible Gold Mining Principles address key ESG issues for the gold mining sector and set out clear expectations for consumers, investors and the downstream supply chain on what constitutes responsible gold mining. Harmony has concluded its third year of alignment to the World Gold Council's Responsible Gold Mining Principles (RGMPs). Subsequent to our third year on-site verification audit, Harmony can demonstrate that our operations conform to the RGMPs. The conformance was independently assured by RSM South Africa Inc as per the assurance report. |
|
|
|
For the past five years, Harmony’s transparent reporting on our climate change strategies and actions has aligned with TCFD recommendations. This has informed our approach to repositioning our business as a climate resilient operation.
|
|
|
|
To help us manage the unique water-related risks and opportunities we face in the countries where we operate, we submit an annual performance report to CDP Water.
|
|
|
|
As a member of the Minerals Council South Africa, we subscribe to its membership compact, a mandatory code of ethical business conduct, and its guiding principles. |
Our sustainable development framework is aligned to the International Council on Mining and Metals (ICMM) principles, the UNGC principles and UN Voluntary Principles on Security and Human Rights. Although not a member or signatory to these organisations, we have adopted their principles in various sustainable development policies and position statements.
Harmony considers the Organisation for Economic Co-operation and Development’s (OECD) guidelines for responsible investment.
We strive to ensure compliance with local and international guidelines by adopting tailings management best practice.
Aligning with the SDGs
|
|
|
|
By mining with purpose, Harmony contributes to broader sustainable development goals as demonstrated by our commitment to helping achieve the SDGs. In our pursuit of delivering positive impact and lessening our negative impact, Harmony collaborates with our stakeholders and makes a targeted effort to:
•Take action against climate change and fossil-fuelled energy consumption
•End poverty
•Efficiently manage our use of scarce natural resources such as water and land
•Protect biodiversity
•Observe human rights.
We are equally committed to supporting the governments in South Africa and Papua New Guinea in achieving the SDGs. We will be able to measure the extent of our broader impact in Australia as Eva Copper progresses.
|
Harmony identified and prioritised 15 SDGs that we can meaningfully impact:
•Eight SDGs directly align with our business strategy and its four pillars (direct SDGs)
•Seven SDGs indirectly align to our business strategy whereby we can meaningfully contribute through our sustainable development framework and by meeting our socio-economic development commitments.
Many of the SDGs are interconnected, and collaboration is a key SDG to all the others. SDG 17 calls for partnerships, and pooled efforts and resources to bring sustained beneficial change to our people.
|
|
|
|
|
|
| Collaboration |
|
We partner and collaborate with various stakeholders to strengthen our impact on SDGs
|
Harmony considers collaboration a critical factor in delivering on our ESG commitments because mutually beneficial relationships enable SDG achievement and are key to leaving a lasting positive legacy and value creation.
We partner with, among others, communities, municipalities, tertiary institutions, small businesses and governments, locally and nationally, for sustainable development. We continue strengthening current partnerships as well as building new partnerships by having constructive engagements and addressing our stakeholders’ needs and concerns. |
A snapshot of how we demonstrate our commitment to SDG 17
|
|
|
|
|
|
|
|
|
|
|
|
|
|
|
|
|
|
|
|
|
|
|
|
|
|
|
| The Harmony Gold Tripartite is a key partnership in creating a proactive safety culture |
|
We collaborate and partner with government institutions to implement our CSI initiatives |
|
We collaborate with industry peers on water management programmes |
|
We partner with local communities in our biodiversity conservation programmes |
|
Partnering with industry organisations like the Minerals Council to address issues such as gender-based violence facing South Africa is critical to delivering on our social commitments |
|
|
|
|
|
|
| Direct – central to our core business and strategy |
|
|
|
Ensure good health and
promote the wellbeing of all
|
We care about the safety, health and wellbeing of our employees. All employees should return home unharmed and healthy.
We contribute to the achievement of SDG 3 through our duty of care informed by our deep-seated values which ensure that our impact extends beyond the mine boundary to the communities affected by our operations and where many of our employees live. We believe that contributing to the health and wellbeing of our communities facilitates an ecosystem in which our business and all stakeholders can thrive.
|
|
|
|
Promote gender equality and empower women and girls
|
By delivering on our gender equality and inclusivity targets and actively increasing the number of women employed across the company at all levels, we contribute to achieving SDG 5. Gender equality, diversity and inclusion are an important aspect of our human resources policy. |
|
|
|
Ensure availability and sustainable management of water and sanitation for all
|
Our water management strategies consider the risks, needs and impact of each geography, mine, the surrounding environment and communities who benefit from our business.
We manage and mitigate our impact on water catchment areas by ensuring we do not degrade the quality or affect ecosystem health. Our overarching objective is to conserve this natural resource by improving our water efficiencies through reuse and recycling.
We contribute to achieving SDG 6 through socio-economic projects that include assisting municipalities in managing their waste water. |
|
|
|
Ensure access to affordable, reliable, sustainable and modern energy for all
|
We drive the achievement of SDG 7 at Harmony through reducing our consumption of grid energy through our energy efficiency programme and a pipeline of projects at different stages of development which will depressurise the grid by adding circa 200MW to the grid in the short term. We are liberating land for green energy projects that will feed into the grid.
We are also investing in alternative energy sources, including three solar photovoltaic (PV) plants. |
|
|
|
Promote sustained, inclusive
and sustainable economic growth, full and productive employment and decent work
|
We aim to be a fair and responsible employer that respects the rights of employees to associate freely. We impact SDG 8 by enhancing the lives of our 45 546 employees through enabling them to improve their living conditions, and to have better access to social services, healthcare, education and training. |
|
|
|
Ensure sustainable, responsible
consumption and production
patterns
|
A key pillar of our business strategy is operational excellence. By re-engineering our portfolio for quality assets, optimising our processes, grade management and costs, we improve and sustain productivity and efficiencies. This inherently involves the efficient use of natural resources, responsible waste management, sustainable procurement practices and regular reporting to stakeholders and therefore results in an impact on achieving SDG 12. |
|
|
|
Take urgent action to combat climate change and its impacts
|
The energy we consume is mostly generated by fossil fuels in South Africa, a contributing factor to climate change.
Our decarbonisation strategy, net zero targets and investments in alternative energy sources enable us to combat climate change and its impacts. We are contributing to SDG 13 by systematically transforming our portfolio into low-carbon assets, as demonstrated by our renewable energy programme and the acquisition of Eva Copper.
|
|
|
|
Protect, restore and promote
the sustainable use of terrestrial ecosystems, halt and reverse land degradation, and halt
biodiversity loss
|
We have a growing responsibility to contribute to SDG 15 to ensure we leave a lasting positive legacy. This is because our mining activities negatively impact natural ecosystems.
Guided by our environmental strategy and related policies and procedures, we aim to mitigate these impacts by restoring land and biodiversity, and planning for post-mine closure.
|
|
|
|
|
|
|
|
Indirect – SDGs we support through our existence and sustainable development activities
|
|
|
|
End poverty in all its forms everywhere
|
Our 45 546 employees support an estimated 475 000 dependants, local businesses and municipalities in the communities where they live.
We demonstrate our contribution to SDG 1 through many of our socio-economic initiatives. These initiatives create empowerment, employment and economic upliftment through, among others, sustainable economic activities – see SDG 11 – and help to combat poverty.
|
|
|
|
End hunger, achieve food security and promote sustainable agriculture
|
We impact SDG 2 by supporting broad-based agriculture and commercial agricultural ventures to establish alternative, sustainable economic activities and subsistence farming that will continue beyond mining operations and contribute to food security. |
|
|
|
Ensure inclusive and equitable quality education and promote lifelong learning opportunities
|
We aim to advance mathematics, science and technology at secondary schools in our South African communities. By promoting training in entrepreneurial and portable skills, and in information and communication technology among the youth, we contribute to SDG 17.
Both in South Africa and Papua New Guinea, ongoing training and skills development for our employees are a business imperative. |
|
|
|
Build resilient infrastructure, promote sustainable industrialisation and foster innovation
|
We collaborate with our peers, as members of the Minerals Council South Africa, in research and development initiatives to achieve SDG 9. We also hold the chair in rock engineering at the University of Pretoria. Our impact is evident in our pursuit of technology and innovation to modernise our operations, ensuring environmental, operational and safety improvements as well as re-engineering Harmony’s portfolio and growing profitable ounces. |
|
|
|
Reduce inequality in our host countries
|
Harmony’s gender diversity and employment equity policies and strategies, guiding our creation of equal opportunities for our employees and host communities wherever we operate, ensure we contribute to the achievement of SDG 10.
Ethical and accountable leadership drives our equity, inclusion and diversity goals. |
|
|
|
Make cities and human settlements inclusive, safe, resilient and sustainable
|
Our socio-economic development strategy focuses on agricultural, infrastructure and sustainable energy projects, which have greater potential to deliver sustainable benefits to communities. This is supported by preferential and local procurement, as well as enterprise and supplier development.
The aim is to help establish sustainable communities that are economically viable post-mining. Infrastructure projects (such as roads in South Africa and water and sanitation in Papua New Guinea) help boost host community resilience and therefore contribute to the achievement of SDG 17. |
|
|
|
Promote peaceful and inclusive societies for sustainable development, provide access to justice for all and build effective, accountable and inclusive institutions at all levels
|
Through ethical and responsible mining, we aim to drive ethical business practices, meet or exceed regulatory requirements and continue partnering with key stakeholders. This enables our continued support of SDG 16.
We have established stakeholder forums to engage in dialogue with our various stakeholders to understand their needs and expectations. By being honest and transparent and delivering on commitments, we build credibility. We work closely with our local governments through various structures to ensure that we are jointly identifying opportunities to support our communities.
In Papua New Guinea, we have assisted with law and order infrastructure, including magistrates houses and police stations, among others, to improve access to peace and justice for our communities. We have also established a memorandum of agreement that allows our asset protection department to offer reserve policing capabilities.
|
Measuring our performance and improving disclosure
Harmony largely aligns reporting with global leading practice. We consider feedback received from investors and ratings agencies to improve the consistency, transparency and granularity of our disclosure. We continuously monitor the regulatory environment to ensure Harmony remains aligned and complies with international and local ESG disclosure requirements.
We monitor our ESG scores closely, particularly any areas where we may be underperforming against our industry peers. Our ESG performance is annually assessed by global ratings agencies. In FY23, we received the following scores:
|
|
|
|
|
|
|
|
|
|
|
|
|
|
|
|
|
|
|
|
|
|
|
|
|
|
|
|
|
|
|
|
|
|
|
|
|
|
|
|
|
|
|
|
|
|
4.1 out of 5.0 FTSE Russell ESG rating:
•Environment: 4.2
•Social: 3.3
•Governance 5.0.
Harmony ranks in the 95th percentile in the Industry Classification Benchmark Supersector.
|
|
Harmony maintained the “B” rating. Overall, we performed better than the industry average. |
|
Harmony ranks in the top 50 under the gold sub-industry. |
|
Harmony achieved an overall score of 71.7% with 100.0% for disclosure and 59.6% for data quality. We have been included in the Bloomberg Gender-Equality Index for the fifth consecutive year. This demonstrates our culture of and commitment to providing an inclusive work environment that fosters gender equality, inclusivity and diversity. |
|
CDP score of “A” for water management.
|
We also measure our sustainable development performance by group aggregate targets. We have set targets in accordance with the Science Based Targets Initiative (SBTi). The SBTi has confirmed Harmony’s action plan to achieve the Paris Agreement’s goal to limit global warming to 1.5ºC with our aim to achieve net zero by 2045.
DELIVERING PROFITABLE OUNCES
OPERATIONAL PERFORMANCE
Operational excellence is one of four strategic pillars on which Harmony has built its business and is vital to delivering on our strategy – to create value by operating safely and sustainably, and by growing our margins. In striving to maintain operational excellence, we prioritise safety, ensure strict cost control and management of grades mined and encourage disciplined mining to improve productivity and efficiencies.
Our approach to improved operational performance is driven by our commitment to operational excellence and to ensuring safe, consistent, predictable and profitable production. We aim to create an enabling and safe environment to achieve our operational plans, reduce unit costs and improve productivity to maximise the generation of free cash flow. Operational excellence is central to generating cash flow.
Key focus areas of our operational excellence programme:
|
|
|
|
|
|
|
|
|
|
|
|
|
|
|
|
|
|
|
|
|
|
|
|
|
|
|
|
|
|
|
|
|
|
|
|
|
|
|
|
|
|
|
|
|
|
|
|
|
|
|
|
|
|
|
|
Safety and health
•Journey to proactive safety
•Risk management and focus on critical controls
•Bottom-up safety transformation interventions.
|
|
|
|
Grade management and mining flexibility
•Limit mining below cut-off grade
•Incorporate flexibility into our mining plans.
|
|
|
|
Capital allocation
•Prioritised and focused capital allocation for growth and to sustain the business.
|
|
|
|
|
|
|
|
|
|
|
|
|
|
|
|
|
|
|
|
|
|
|
|
|
|
|
|
|
|
|
|
|
|
|
|
|
|
|
|
|
|
|
|
|
|
|
|
|
|
|
|
|
|
|
|
|
|
Infrastructure maintenance
•Fewer unplanned stoppages.
|
|
|
|
Cost management
•Focused cost management and project delivery
•Improved productivity
•Higher grade assets will drive down costs in the long run.
|
|
|
|
Environmental and social management
•Sustainable and responsible environmental stewardship
•Community engagement and social upliftment.
|
|
|
|
|
|
|
|
|
|
|
|
|
|
|
|
|
|
|
|
|
|
|
|
|
|
|
|
|
|
|
|
|
|
|
|
|
|
|
|
|
|
|
|
|
|
|
|
|
|
|
|
|
|
|
|
|
|
|
|
|
|
|
|
|
|
|
|
|
|
|
|
|
|
|
|
|
|
|
|
Capitals affected
Directly
 Manufactured capital
 Human capital
 Intellectual capital
Indirectly
 Financial capital
 Social and relationship capital
 Natural capital
|
|
|
|
Stakeholders affected
•Employees and unions
•Investors and financiers
•Governments and regulators
•Communities, traditional leaders and NGOs
•Suppliers.
|
|
|
|
Link to strategy
Responsible stewardship
Operational excellence
Cash certainty
Effective capital allocation
|
|
|
|
|
|
|
|
|
|
|
|
|
|
|
|
|
|
|
|
|
|
|
|
|
|
|
|
|
|
|
|
|
|
|
|
|
|
|
|
|
|
|
|
|
|
|
|
|
|
|
|
|
|
|
|
|
|
|
|
|
|
|
|
|
Responsible committees
•Technical
•Social and ethics
|
|
|
|
Related risks
•Loss-of-life/safety
•Security of electricity power supply and the impact of higher electricity costs
•Not achieving operational objectives at our critical operations
•Political tensions (geo-political and local)
•Unsuccessful project execution
•Supply chain disruptions (including supply of goods and increasing costs)
•Gold price and forex fluctuations (varying from planned levels)
•Systemic failure of public infrastructure
•Depleting Ore Reserve base
•Ore Reserve/mining inflexibility (Iceberg management model)
•Labour and community unrest.
|
|
|
|
|
|
|
|
|
|
|
|
|
|
|
|
|
|
Safety and operational risk management
Managing safety risks: Safety is a material risk for Harmony. As such, it is imperative to ensure safe production, prevent loss-of-life incidents and embed a proactive safety culture across all our operations. We have adopted global best practice safety standards via a four-layered approach. The approach is based on risk management, implemented modernised safety systems, an intensified focus on leadership development and training to address behaviour to achieve our goal of ensuring that each employee safely returns home every day.
Managing operational risks: Operational risk management is an integral feature of our business and operating strategy. It entails managing risks effectively while working productively. Our risk-based approach helps ensure that all supporting systems are functioning efficiently. Safety hazards and operational business risks are identified and dealt with continuously at each of our operations.
Harmony’s top operational risks are:
•Loss-of-life/safety
•Security of electricity power supply and the impact of higher electricity costs
•Not achieving operational objectives at our critical operations
•Unsuccessful project execution
•Supply chain disruptions (including supply of goods and increasing costs).
Scope
This document has been prepared as part of Harmony’s integrated annual reporting suite. For additional information on areas disclosed in this report, refer to the following individual reports:
•Mineral Resources and Mineral Reserves report 2023
•ESG report 2023
•Financial report 2023.
Our performance FY23
The safety and health of our employees and their families remains our top priority. In FY23, we continued our safety journey to embed a proactive safety culture throughout the company. Group LTIFR for FY23 improved to 5.49 per million hours worked compared to 5.65 per million hours worked in FY22.
Group production for FY23 was flat at 1.47Moz of gold (FY22: 1.49Moz) and was at the upper end of our guidance of 1.4Moz to 1.5Moz for the year. Adjusting for the closure of Bambanani at the end of FY22, group production increased by 2% or 27 270oz year on year. Production was mainly driven by an excellent performance from our South African underground operations. The average underground recovered grade increased by 8% to 5.78g/t from 5.37g/t, mainly due to stand out performances by Mponeng, Tshepong South, Doornkop and Joel.
The average gold price received increased by 15% to R1 032 646/kg (FY22: R894 218/kg) for the financial year driven by a weaker rand to US dollar exchange rate of R17.76/US$ (FY22: R15.21/US$). Gold revenue increased 14% to R47 519 million (FY22: R41 742 million), driven by the higher gold price. Group all-in sustaining costs increased by 6% to R889 776/kg from R835 891/kg in FY22. Higher recovered grade and a stable cost base ensured all-in sustaining costs came in below the guided R900 000/kg for the financial year. This resulted in a production profit of R13 977 million, 46% higher compared with R9 546 million in FY22.
Group capital expenditure for FY23 rose 23% to R7 598 million from R6 192 million in FY22. This was mainly due to the ramp-up in capital towards growth projects as well as capitalised stripping activities at Hidden Valley. Capital expenditure related to growth projects increased 69.5% to R2 068 million compared with R1 220 million spent in FY22.
Group operating free cash flows increased by 107.6% to R6 031 million in FY23 from R2 905 million in FY22. This was mainly due to the higher underground recovered grades and the higher average gold price received. Mponeng and Moab Khotsong contributed 57.2% towards group operating free cash flows.
* Operating free cash flow = revenue – cash operating cost – capital expenditure +/- impact of run-of-mine (ROM) costs as per operating results.
|
|
|
|
|
|
|
|
|
|
|
|
|
|
|
|
|
|
|
|
|
|
|
|
|
|
|
|
|
FY23 focus areas and actions |
|
|
|
How we performed |
|
|
Continue embedding a proactive safety culture. |
|
|
|
South African lost-time injury frequency rate improved by 2.7% to 5.74 per million shifts from 5.90 in FY22. |
|
|
Ensure we meet our operational plans and generate free cash flow. |
|
|
|
Upper end of production guidance met, grade and all-in sustaining cost within guidance. Operational free cash grew 107.6% year on year to R6.0 billion. |
|
|
Create synergies in the West Wits region that will unlock value. |
|
|
|
Savuka plant started on the retreatment of slimes dams. |
|
|
Pursue organic brownfields growth strategy. |
|
|
|
Brownfield exploration at Hidden Valley and Kalgold to optimise existing open-pit operations, with brownfield exploration at our underground operations in South Africa. |
|
|
Continue to drive down unit costs by improving our safety performance, delivering on our production plans, and increasing the productivity of our mining teams. |
|
|
|
Group all-in sustaining cost increased by 6.5% year on year to R889 766/kg, well managed given the current high inflation environment being experienced globally. |
|
|
|
|
|
|
|
|
Key operational metrics FY23 – year-on-year (YoY) comparison
|
|
|
|
|
|
|
|
|
|
|
|
|
|
|
|
|
|
|
|
|
|
|
|
|
Unit |
YoY move |
YoY
% |
FY23 |
FY22 |
|
|
| Gold price |
(R/kg) |
é |
15.5 |
1 032 646 |
|
894 218 |
|
|
Average gold price received increased YoY, boosting revenue. |
| Underground yield |
(g/t) |
é |
7.6 |
5.78 |
5.37 |
|
Higher grades from most operations when compared to the previous year with notable improvements from Mponeng, Tshepong South, Doornkop and Joel. |
| Margin |
(%) |
é |
85.7 |
13 |
7 |
|
Boosted by a higher gold price and stable production with exceptional performances from Mponeng and Tshepong South recording margins of 27.0% and 20.0% respectively. |
| Gold produced |
(kg) |
ê |
-1.3 |
45 651 |
|
46 236 |
|
|
Production was steady, decreasing by only 1.3% despite the closure of Bambanani in June 2022. |
| – South Africa |
(kg) |
ê |
-2.9 |
41 281 |
|
42 529 |
|
|
The closure of Bambanani and a challenging year for Target 1 was offset by exceptional performances from Mponeng, Doornkop and Joel. |
| – Papua New Guinea |
(kg) |
é |
17.9 |
4 370 |
|
3 707 |
|
|
Improved performance for FY23 as the previous year was impacted by the overland conveyor failure. |
| All-in sustaining cost |
(R/kg) |
é |
6.4 |
889 766 |
|
835 891 |
|
|
Affected by annual salary and electricity tariff increases as well as above inflationary pressures on specific consumables such as chemicals. |
FY24 outlook
In the next financial year, gold production is estimated to be between 1.38Moz and 1.48Moz at an all-in sustaining cost of less than R975 000/kg. Underground recovered grade is planned to increase to between 5.60g/t to 5.75g/t.
Looking ahead, we have a number of growth opportunities. The Kareerand extension is underway after some regulatory delays. The Zaaiplaats project will continue to be a focus area for Moab Khotsong in FY24 with the sinking of the decline expected to start in the second half of the year. Target mine is expected to complete the infrastructure relocation project with improved production results towards the second half of the financial year.
Exploration drilling at Kalgold has yielded favourable results, with the completion of the FY24 drilling programme the operation has the potential to be further expanded. We are also drilling in the vicinity of Target North, situated in the Witwatersrand Basin.
Key focus areas and actions in FY24:
•Continue to embed a proactive safety culture
•Ensure we meet our operational plans and generate free cash flow
•Pursue organic brownfields growth strategy
•Major project execution and capital spend aligned to plan
•Continue to drive down unit costs by improving our safety performance, delivering on our production plans, and increasing the productivity of our mining teams.
FY24 production and capital guidance
|
|
|
|
|
|
|
|
|
|
|
|
|
Production |
Capital expenditure1 |
Life-of-mine |
| Operation |
(oz) |
(Rm) |
(years) |
| Moab Khotsong |
187 600 - 195 600 |
1 285 |
|
21 |
| Mponeng |
232 900 - 245 200 |
932 |
7 |
| Tshepong North |
99 300 - 104 500 |
494 |
7 |
| Tshepong South |
95 600 - 100 600 |
540 |
7 |
| Doornkop |
111 900 - 117 800 |
754 |
15 |
| Joel |
60 000 - 63 200 |
236 |
7 |
| Target 1 |
65 200 - 68 900 |
575 |
6 |
| Kusasalethu |
119 600 - 124 700 |
266 |
3 |
| Masimong |
62 900 - 66 200 |
87 |
2 |
| Underground operations – total2 |
1 035 000 - 1 086 700 |
5 169 |
|
|
| South African surface operations (tailings and waste rock dumps) |
~102 400 |
323 |
12+ |
| Mine Waste Solutions (MWS) |
99 100 - 104 400 |
1 548 |
16 |
| Kalgold |
40 400 - 42 100 |
58 |
9 |
Hidden Valley3 |
146 500 - 152 800 |
2 432 |
|
5 |
| Total |
~1 380 000 – 1 480 000 |
9 530 |
|
|
1 Excludes Eva Copper and Wafi-Golpu.
2 At an underground recovered grade of ~5.60g/t to 5.75g/t.
3 Includes capitalised stripping costs.
Forecast capital expenditure to FY26 and capital expenditure by operation for FY24
* Excludes renewables, Eva Copper and Wafi-Golpu.
# Includes: on-going capital development, shaft capital and plant capital.
* Excluded from all-in sustaining cost.
# Excluding renewables, Eva Copper and Wafi-Golpu.
PERFORMANCE BY OPERATION
South Africa – underground operations
Our high-grade mines, Mponeng and Moab Khotsong, had a strong full year performance driven by improved recovered grades. The recovered grade for these operations increased by 12% from 7.00g/t in FY22 to 7.83g/t in FY23 leading to a 12% increase in gold production at 14 117kg (453 871oz) (FY22: 12 594kg (404 906oz)) as ore milled remained flat year on year. These operations contributed 57% or R3.4 billion (US$194 million) towards the group operating free cash for FY23 (FY22: R1.3 billion, US$83 million).
Our optimised operations delivered good results for FY23 with the successful unbundling of the Tshepong Operations and Joel delivering on plan after the completion of the decline project. Gold production for these operations at 19 641kg (631 474oz) was 3% lower than the previous year (FY22: 20 299kg, 652 627oz) mainly due to disappointing performances by Target 1 and Kusasalethu. With the Target 1 infrastructure project nearing completion, production is expected to improve towards the second half of FY24. The optimised operations delivered operating free cash flows of R1.1 billion (US$63 million) in FY23 (FY22: R198 million, US$13 million).
South Africa – surface operations
Production at these operations decreased by 8% to 7 523kg (241 872oz) in FY23 from 8 203kg (263 730oz) in FY22 mainly due to the depletion of waste rock ore to be treated at the available plants. Surface dump operations produced 1 541kg (49 544oz) for FY23, 34% less than in the previous year (FY22: 2 319kg, 74 557oz). The tailings retreatment operations, which includes Mine Waste Solutions, delivered stable results for the year while Kalgold delivered another marginal improvement year on year. The South African surface operations generated operating free cash flows of R835 million (US$47 million), 40% lower than the R1.4 billion (US$91 million) in FY22.
Papua New Guinea – opencast operations
Hidden Valley’s production for FY23 improved 18% to 4 370kg (140 498oz) from 3 707kg (119 182oz) in FY22 as the overland conveyor failure had a major impact on production for the previous financial year. Silver production increased 41% to 78 386kg (2 520 163oz) from 55 687kg (1 790 378oz) in FY22. Production profit was 132% higher at R2 404 million (US$135 million) from R1 036 million (US$68 million) in FY22 while operating free cash flow improved from a negative R46 million (US$3 million) to R615 million (US$35 million) in FY23.
South Africa – underground operation
Moab Khotsong
|
|
|
|
|
|
|
|
|
|
|
|
|
|
|
|
|
FY23 |
FY22 |
FY21 |
| Number of employees |
|
|
|
|
| – Permanent |
|
5 739 |
5 562 |
5 369 |
| – Contractors |
|
974 |
956 |
840 |
| Total |
|
6 713 |
6 518 |
6 209 |
| Operational |
|
|
|
|
| Volumes milled |
(000t) (metric) |
920 |
959 |
903 |
|
(000t) (imperial) |
1 015 |
1 059 |
995 |
| Gold produced |
(kg) |
6 668 |
6 508 |
7 166 |
|
(oz) |
214 381 |
209 237 |
230 391 |
| Gold sold |
(kg) |
6 715 |
6 393 |
7 095 |
|
(oz) |
215 892 |
205 539 |
228 109 |
| Grade |
(g/t) |
7.25 |
6.79 |
7.94 |
|
(oz/t) |
0.211 |
0.198 |
0.232 |
| Productivity |
(g/TEC) |
101.54 |
97.26 |
109.73 |
| Development results |
|
|
|
|
| – Total metres (excluding capital metres) |
|
6 738 |
7 755 |
6 981 |
| – Reef metres |
|
1 026 |
1 424 |
1 144 |
| – Capital metres |
|
3 510 |
2 668 |
2 070 |
| Financial |
|
|
|
|
| Revenue |
(Rm) |
7 036 |
|
5 779 |
|
6 048 |
|
|
(US$m) |
396 |
|
380 |
|
393 |
|
| Average gold price received |
(R/kg) |
1 047 845 |
|
903 905 |
|
852 392 |
|
|
(US$/oz) |
1 835 |
|
1 848 |
|
1 722 |
|
| Cash operating cost |
(Rm) |
4 561 |
|
4 134 |
|
3 846 |
|
|
(US$m) |
257 |
|
272 |
|
250 |
|
| Production profit |
(Rm) |
2 522 |
|
1 740 |
|
2 206 |
|
|
(US$m) |
142 |
|
114 |
|
144 |
|
| Capital expenditure |
(Rm) |
1 167 |
|
894 |
|
633 |
|
|
(US$m) |
66 |
|
59 |
|
41 |
|
Operating free cash flow1 |
(Rm) |
1 309 |
|
752 |
|
1 569 |
|
|
(US$m) |
74 |
|
49 |
|
102 |
|
| Cash operating cost |
(R/kg) |
683 995 |
|
635 146 |
|
536 710 |
|
|
(US$/oz) |
1 198 |
|
1 299 |
|
1 084 |
|
| All-in sustaining cost |
(R/kg) |
782 441 |
|
739 870 |
|
626 795 |
|
|
(US$/oz) |
1 370 |
|
1 513 |
|
1 266 |
|
| Average exchange rate |
(R/US$) |
17.76 |
|
15.21 |
|
15.40 |
|
| Safety |
|
|
|
|
| Loss of life |
|
1 |
1 |
1 |
| Lost-time injury frequency rate |
per million hours worked |
6.03 |
5.65 |
7.92 |
Environment2 |
|
|
|
|
| Electricity consumption |
(GWh) |
749 |
745 |
757 |
| Water consumption – primary activities |
(Ml) |
5 932 |
6 406 |
6 191 |
| Greenhouse gas emissions |
(000tCO2e) |
780 |
804 |
903 |
| Intensity data per tonne treated |
|
|
|
|
| – Energy |
|
0.81 |
0.78 |
0.84 |
| – Water |
|
6.45 |
6.69 |
6.86 |
| – Greenhouse gas emissions |
|
0.85 |
0.84 |
0.87 |
Number of reportable environmental incidents3 |
|
— |
1 |
1 |
| Community |
|
|
|
|
Local economic development |
(Rm) |
49 |
|
23 |
|
10 |
|
| Training and development |
(Rm) |
124 |
|
85 |
|
58 |
|
1 Operating free cash flow = revenue – cash operating cost – capital expenditure as per operating results.
2 Figures include Nufcor.
3 Figures include reportable incidents in Zaaiplaats.
Moab Khotsong continued
|
|
|
|
|
|
| Other salient features |
| Status of operation |
Steady-state operation. Focus on Zaaiplaats and Great Noligwa pillar capital projects |
| Life-of-mine |
21 years (including Zaaiplaats) |
| Nameplate hoisting capacity (per month) |
160 000 tonnes (176 000 tons) |
| Compliance and certification |
•New order mining right
•ISO 14001.
|
Mineral Reserve estimates at 30 June 2023
|
|
|
|
|
|
|
|
|
|
|
|
|
|
|
|
|
|
|
|
|
|
|
|
|
|
|
|
|
|
|
Proved |
Probable |
Total |
| Reserves (metric) |
Tonnes
(Mt)
|
Grade
(g/t)
|
Gold
(000kg)
|
Tonnes
(Mt)
|
Grade
(g/t)
|
Gold
(000kg)
|
Tonnes
(Mt)
|
Grade
(g/t)
|
Gold
(000kg)
|
|
3.9 |
|
7.80 |
|
30 |
|
9.4 |
|
8.90 |
|
84 |
|
13.3 |
|
8.58 |
|
115 |
|
| Reserves (imperial) |
Tons
(Mt)
|
Grade
(oz/t)
|
Gold
(000oz)
|
Tons
(Mt)
|
Grade
(oz/t)
|
Gold
(000oz)
|
Tons
(Mt)
|
Grade
(oz/t)
|
Gold
(000oz)
|
|
4.3 |
|
0.227 |
|
977 |
|
10.4 |
|
0.260 |
|
2 704 |
|
14.7 |
|
0.250 |
|
3 681 |
|
Overview of operations
Moab Khotsong is a deep-level mine near the towns of Orkney and Klerksdorp, some 180km south-west of Johannesburg. The mine, which began producing in 2003, was acquired from AngloGold Ashanti Limited in March 2018.
Mining is based on a scattered mining method, together with an integrated backfill support system that incorporates bracket pillars. The geology at Moab Khotsong is structurally complex, with large fault-loss areas between the three mining areas (top mine (Great Noligwa), middle mine and lower mine (growth project and Zaaiplaats project in execution phase). The mine exploits the Vaal Reef as its primary orebody. The economic reef horizons are mined between 1 791m and 3 052m below surface. Ore mined is processed at the Noligwa gold plant. The plant uses the reverse gold leach method, with gold and uranium being recovered through gold cyanide and acid uranium leaching.
Operating performance FY23
Regrettably, there was one loss-of-life incident at Moab Khotsong in FY23. The lost-time injury frequency rate deteriorated to 6.03 per million hours worked in FY23 (FY22: 5.65). The management team remains committed to improving the safety performance.
The operation recorded a steady performance for FY23, affected by seismicity and other operational challenges. Gold production rose marginally to 6 668kg (214 381oz), 2% higher than the 6 508kg (209 237oz) produced in FY22. The recovered grade for FY23 increased by 7% to 7.25g/t compared to 6.79g/t in FY22 but was partially offset by lower tonnes milled. Tonnes milled for FY23 at 920 000 tonnes was 4% lower than the 959 000 tonnes recorded in FY22.
The mine is the group’s second-largest gold operation, contributing 15% of total production. Revenue increased 22% to R7 036 million (FY22: R5 779 million), mainly due to a higher gold price received. The average gold price received increased by 16% to R1 047 845/kg (FY22: R903 905/kg). Cash operating costs were 10% higher at R4 561 million (FY22: R4 134 million), mainly due to annual wage and electricity tariff increases as well as inflationary increases on consumables and other costs. MPRDA royalties increased by 56% to R142 million in FY23 (FY22: R91 million) Capital expenditure rose 31% to R1 167 million (FY22: R894 million), mainly as a result of capital expenditure for the Zaaiplaats project as well as the Great Noligwa pillar extraction accounting for 53% of the total spent. A total of R365 million was spent in respect of ongoing development.
Moab Khotsong was the second biggest contributor to operating free cash flow at R1 309 million in FY23, a significant increase over the R752 million recorded in FY22.
Our focus areas in FY24
|
|
|
Focus on starting decline sinking operations at Zaaiplaats during the second half of FY24. Planned project capital expenditure for FY24 related to the Great Noligwa pillars and Zaaiplaats project is forecast at R732 million. |
South Africa – underground operation
Mponeng
|
|
|
|
|
|
|
|
|
|
|
|
|
|
|
|
|
FY23 |
FY22 |
FY21 |
| Number of employees |
|
|
|
|
| – Permanent |
|
4 598 |
4 692 |
4 650 |
| – Contractors |
|
558 |
595 |
658 |
| Total |
|
5 156 |
5 287 |
5 308 |
| Operational |
|
|
|
|
| Volumes milled |
(000t) (metric) |
884 |
840 |
683 |
|
(000t) (imperial) |
975 |
926 |
753 |
| Gold produced |
(kg) |
7 449 |
6 086 |
5 446 |
|
(oz) |
239 490 |
195 669 |
175 092 |
| Gold sold |
(kg) |
7 480 |
6 041 |
5 299 |
|
(oz) |
240 487 |
194 222 |
170 367 |
| Grade |
(g/t) |
8.43 |
7.25 |
7.97 |
|
(oz/t) |
0.246 |
0.211 |
0.233 |
| Productivity |
(g/TEC) |
136.73 |
105.62 |
124.95 |
| Development results |
|
|
|
|
| – Total metres (excluding capital metres) |
|
8 000 |
8 331 |
6 299 |
| – Reef metres |
|
1 500 |
1 249 |
815 |
| – Capital metres |
|
— |
— |
— |
| Financial |
|
|
|
|
| Revenue |
(Rm) |
7 845 |
|
5 620 |
|
4 750 |
|
|
(US$m) |
442 |
|
369 |
|
308 |
|
| Average gold price received |
(R/kg) |
1 048 824 |
|
930 257 |
|
896 474 |
|
|
(US$/oz) |
1 836 |
|
1 902 |
|
1 811 |
|
| Cash operating cost |
(Rm) |
5 002 |
|
4 498 |
|
2 902 |
|
|
(US$m) |
282 |
|
296 |
|
188 |
|
| Production profit |
(Rm) |
2 848 |
|
1 133 |
|
1 812 |
|
|
(US$m) |
160 |
|
74 |
|
117 |
|
| Capital expenditure |
(Rm) |
704 |
|
605 |
|
493 |
|
|
(US$m) |
40 |
|
40 |
|
32 |
|
Operating free cash flow1 |
(Rm) |
2 139 |
|
517 |
|
1 356 |
|
|
(US$m) |
120 |
|
34 |
|
88 |
|
| Cash operating cost |
(R/kg) |
671 474 |
|
739 026 |
|
532 812 |
|
|
(US$/oz) |
1 176 |
|
1 511 |
|
1 076 |
|
| All-in sustaining cost |
(R/kg) |
784 093 |
|
865 976 |
|
659 760 |
|
|
(US$/oz) |
1 373 |
|
1 771 |
|
1 333 |
|
| Average exchange rate |
(R/US$) |
17.76 |
|
15.21 |
|
15.40 |
|
| Safety |
|
|
|
|
| Loss of life |
|
— |
1 |
— |
| Lost-time injury frequency rate |
per million hours worked |
8.57 |
8.71 |
8.09 |
Environment |
|
|
|
|
| Electricity consumption |
(GWh) |
938 |
908 |
680 |
| Water consumption – primary activities |
(Ml) |
2 858 |
2 798 |
2 250 |
| Greenhouse gas emissions |
(000tCO2e) |
976 |
980 |
708 |
| Intensity data per tonne treated |
|
|
|
|
| – Energy |
|
1.06 |
1.08 |
1.00 |
| – Water |
|
3.23 |
3.33 |
3.29 |
| – Greenhouse gas emissions |
|
1.10 |
1.17 |
1.04 |
| Number of reportable environmental incidents |
|
— |
— |
— |
| Community |
|
|
|
|
Local economic development |
(Rm) |
39 |
|
31 |
|
1 |
|
| Training and development |
(Rm) |
78 |
|
65 |
|
11 |
|
1 Operating free cash flow = revenue – cash operating cost – capital expenditure as per operating results.
The results and figures for FY21 in the table above are for the nine months from 1 October 2020 to 30 June 2021.
Mponeng continued
|
|
|
|
|
|
| Other salient features |
| Status of operation |
Steady-state operation: development continues |
| Life-of-mine |
7 years |
| Nameplate hoisting capacity (per month) |
165 000 tonnes (182 000 tons) |
| Compliance and certification |
•New order mining right
•ISO 14001.
|
Mineral Reserve estimates at 30 June 2023
|
|
|
|
|
|
|
|
|
|
|
|
|
|
|
|
|
|
|
|
|
|
|
|
|
|
|
|
|
|
|
Proved |
Probable |
Total |
| Reserves (metric) |
Tonnes
(Mt)
|
Grade
(g/t)
|
Gold
(000kg)
|
Tonnes
(Mt)
|
Grade
(g/t)
|
Gold
(000kg)
|
Tonnes
(Mt)
|
Grade
(g/t)
|
Gold
(000kg)
|
|
2.7 |
|
9.68 |
|
26 |
|
3.3 |
|
8.87 |
|
29 |
|
6.0 |
|
9.23 |
|
55 |
|
| Reserves (imperial) |
Tons
(Mt)
|
Grade
(oz/t)
|
Gold
(000oz)
|
Tons
(Mt)
|
Grade
(oz/t)
|
Gold
(000oz)
|
Tons
(Mt)
|
Grade
(oz/t)
|
Gold
(000oz)
|
|
3.0 |
|
0.282 |
|
834 |
|
3.7 |
|
0.259 |
|
946 |
|
6.6 |
|
0.269 |
|
1 779 |
|
Overview of operations
Mponeng is a deep-level mine near the town of Carletonville, some 90km south-west of Johannesburg. The mine, which began producing in 1986, was acquired from AngloGold Ashanti Limited in October 2020.
The orebody is extracted mostly by breast-mining methods with associated waste mining in addition to the reef being extracted. The dilution from these waste sources is captured and incorporated in the tonnage calculation, with historical performance being the benchmark. The mine exploits the Ventersdorp Contact Reef as its primary orebody. The economic reef horizons are mined between 3 160m and 3 740m below surface. Ore mined is processed at the Mponeng gold plant. The plant uses the conventional gold leach method, with gold recovered through carbon-in-pulp technology.
Operating performance FY23
Mponeng achieved 2 000 000 loss-of-life free shifts during the year under review. The operation recorded a 2% improvement in the lost-time injury frequency rate at 8.57 per million hours worked for FY23 (FY22: 8.71).
Mponeng was the group’s largest gold producer, contributing 16% of total production. In FY23, Mponeng produced 7 449kg (239 490oz) of gold, a significant 22% improvement over the 6 086kg (195 669oz) produced in FY22. This was mainly due to higher than anticipated average mining grades as well as good clean mining practices that resulted in a 16% improvement in the recovery grade to 8.43g/t for FY23 (FY22: 7.25g/t). Volumes of ore milled was 5% higher in FY23 at 884 000 tonnes (FY22: 840 000t).
Revenue increased 40% to R7 845 million (FY22: R5 620 million), mainly due to the increase in gold production supported by a higher average gold price received. The average gold price received increased 13% to R1 048 824/kg (FY22: R930 257/kg). Cash operating cost increased by 11% to R5 002 million (FY22: R4 498 million) and was mainly due to annual wage and electricity tariff increases as well as significantly higher MPRDA royalties. Capital expenditure rose 16% to R704 million (FY22: R605 million). A total of R454 million was spent in respect of ongoing development.
Mponeng was the largest contributor to operating free cash flow at R2 139 million in FY23, considerably higher than the R517 million in FY22.
Our focus areas in FY24
|
|
|
Continued focus on improving safety performance as well as achieving planned production. Study underway to determine life-of-mine extension. |
South Africa – underground operation
Tshepong North
|
|
|
|
|
|
|
|
|
|
|
|
|
|
|
|
|
FY23 |
FY22 |
FY21 |
| Number of employees |
|
|
|
|
| – Permanent |
|
3 398 |
4 920 |
4 937 |
| – Contractors |
|
308 |
533 |
492 |
| Total |
|
3 706 |
5 453 |
5 429 |
| Operational |
|
|
|
|
| Volumes milled |
(000t) (metric) |
795 |
988 |
944 |
|
(000t) (imperial) |
876 |
1 090 |
1 041 |
| Gold produced |
(kg) |
3 354 |
3 793 |
4 237 |
|
(oz) |
107 834 |
121 949 |
136 222 |
| Gold sold |
(kg) |
3 391 |
3 799 |
4 198 |
|
(oz) |
109 022 |
122 141 |
134 968 |
| Grade |
(g/t) |
4.22 |
3.84 |
4.49 |
|
(oz/t) |
0.123 |
0.112 |
0.131 |
| Productivity |
(g/TEC) |
76.95 |
66.00 |
74.09 |
| Development results |
|
|
|
|
| – Total metres (excluding capital metres) |
|
8 835 |
14 374 |
13 303 |
| – Reef metres |
|
1 654 |
1 567 |
1 319 |
| – Capital metres |
|
— |
1 126 |
1 000 |
| Financial |
|
|
|
|
| Revenue |
(Rm) |
3 530 |
|
3 429 |
|
3 540 |
|
|
(US$m) |
199 |
|
226 |
|
230 |
|
| Average gold price received |
(R/kg) |
1 041 078 |
|
902 645 |
|
843 287 |
|
|
(US$/oz) |
1 823 |
|
1 846 |
|
1 703 |
|
| Cash operating cost |
(Rm) |
2 673 |
|
2 894 |
|
2 809 |
|
|
(US$m) |
150 |
|
190 |
|
182 |
|
| Production profit |
(Rm) |
829 |
|
535 |
|
763 |
|
|
(US$m) |
47 |
|
36 |
|
50 |
|
| Capital expenditure |
(Rm) |
553 |
|
1 038 |
|
746 |
|
|
(US$m) |
31 |
|
68 |
|
48 |
|
Operating free cash flow1 |
(Rm) |
303 |
|
(503) |
|
(14) |
|
|
(US$m) |
17 |
|
(33) |
|
(1) |
|
| Cash operating cost |
(R/kg) |
797 069 |
|
763 163 |
|
662 877 |
|
|
(US$/oz) |
1 396 |
|
1 561 |
|
1 339 |
|
| All-in sustaining cost |
(R/kg) |
975 498 |
|
994 235 |
|
827 334 |
|
|
(US$/oz) |
1 708 |
|
2 033 |
|
1 671 |
|
| Average exchange rate |
(R/US$) |
17.76 |
|
15.21 |
|
15.40 |
|
| Safety |
|
|
|
|
| Loss of life |
|
2 |
— |
2 |
| Lost-time injury frequency rate |
per million hours worked |
4.63 |
5.10 |
5.44 |
| Environment |
|
|
|
|
| Electricity consumption |
(GWh) |
269 |
301 |
299 |
| Water consumption – primary activities |
(Ml) |
894 |
1 106 |
1 031 |
| Greenhouse gas emissions |
(000tCO2e) |
280 |
326 |
311 |
| Intensity data per tonne treated |
|
|
|
|
| – Energy |
|
0.34 |
0.30 |
0.32 |
| – Water |
|
1.12 |
1.12 |
1.09 |
| – Greenhouse gas emissions |
|
0.35 |
0.33 |
0.33 |
| Number of reportable environmental incidents |
|
— |
— |
— |
| Community |
|
|
|
|
Local economic development |
(Rm) |
16 |
|
15 |
|
15 |
|
| Training and development |
(Rm) |
79 |
|
77 |
|
51 |
|
1 Operating free cash flow = revenue – cash operating cost – capital expenditure as per operating results.
Tshepong North continued
|
|
|
|
|
|
| Other salient features |
| Status of operation |
Steady-state operation: restructuring successfully completed |
Life-of-mine |
7 years |
| Nameplate hoisting capacity (per month) |
192 000 tonnes (212 000 tons) |
| Compliance and certification |
•New order mining right – December 2007
•ISO 14001
•ISO 9001.
|
Mineral Reserve estimates at 30 June 2023
|
|
|
|
|
|
|
|
|
|
|
|
|
|
|
|
|
|
|
|
|
|
|
|
|
|
|
|
|
|
|
Proved |
Probable |
Total |
| Reserves (metric) |
Tonnes
(Mt)
|
Grade
(g/t)
|
Gold
(000kg)
|
Tonnes
(Mt)
|
Grade
(g/t)
|
Gold
(000kg)
|
Tonnes
(Mt)
|
Grade
(g/t)
|
Gold
(000kg)
|
|
3.0 |
4.79 |
|
14 |
0.8 |
5.73 |
|
4 |
3.8 |
4.98 |
|
19 |
| Reserves (imperial) |
Tons
(Mt)
|
Grade
(oz/t)
|
Gold
(000oz)
|
Tons
(Mt)
|
Grade
(oz/t)
|
Gold
(000oz)
|
Tons
(Mt)
|
Grade
(oz/t)
|
Gold
(000oz)
|
|
3.3 |
|
0.140 |
|
461 |
|
0.8 |
|
0.167 |
|
141 |
|
4.1 |
|
0.145 |
|
602 |
|
Overview of operations
Tshepong North is a deep-level underground mining operation in the Free State, near the town of Welkom, some 250km from Johannesburg. Tshepong North is a mature underground operation that uses conventional undercut mining in the Basal Reef while the B Reef is exploited as a high-grade secondary reef. Ore mined is processed at the Harmony One plant, with gold recovered using the gold cyanide leaching process.
Operating performance FY23
Regrettably, there were two loss-of-life incidents at Tshepong North in FY23. The lost-time injury frequency rate improved 9% to
4.63 per million hours worked (FY22: 5.10). The management team remains committed to improving the safety performance of the operation.
In FY23, Tshepong North completed the planned restructuring process successfully and managed a turnaround in operating free cash that resulted in a positive of R303 million being recorded for FY23 compared to a negative of R503 million in FY22.
As a result of the restructuring of the operation and in line with planning, the operation produced 3 354kg (107 834oz) compared to 3 793kg (121 949oz) in FY22. Tonnes milled for the operation was lower at 795 000 tonnes in FY23 (FY22: 988 0000t) but has however been partially offset by the expected improvement in recovered grade, rising 10% to 4.22g/t (FY22: 3.84g/t).
Despite the lower gold production, revenue rose 3% to R3 530 million (FY22: R3 429 million) due to a 15% increase in the average gold price to R1 041 078/kg (FY22: R902 645/kg). Cash operating costs were down 8% to R2 673 million (FY22: R2 894 million), mainly due to the restructuring of the operation. Capital expenditure decreased 47% to R553 million (FY22: R1 038 million), mainly due to the suspension of the Sub 75 decline project as well as lower expenditure for ongoing development. A total of R386 million was spent in respect of ongoing development.
Our focus areas in FY24
|
|
|
The management team’s main focus will be to continue building on the successful split of the operations and deliver safe profitable production in line with FY24 planning. |
South Africa – underground operation
Tshepong South
|
|
|
|
|
|
|
|
|
|
|
|
|
|
|
|
|
FY23 |
FY22 |
FY21 |
| Number of employees |
|
|
|
|
| – Permanent |
|
3 052 |
3 266 |
3 355 |
| – Contractors |
|
334 |
355 |
380 |
| Total |
|
3 386 |
3 621 |
3 735 |
| Operational |
|
|
|
|
| Volumes milled |
(000t) (metric) |
506 |
573 |
614 |
|
(000t) (imperial) |
557 |
631 |
677 |
| Gold produced |
(kg) |
3 431 |
3 229 |
3 182 |
|
(oz) |
110 310 |
103 814 |
102 304 |
| Gold sold |
(kg) |
3 458 |
3 231 |
3 155 |
|
(oz) |
111 177 |
103 878 |
101 436 |
| Grade |
(g/t) |
6.78 |
5.64 |
5.18 |
|
(oz/t) |
0.198 |
0.165 |
0.151 |
| Productivity |
(g/TEC) |
93.84 |
79.93 |
75.23 |
| Development results |
|
|
|
|
| – Total metres (excluding capital metres) |
|
6 655 |
7 331 |
7 510 |
| – Reef metres |
|
1 198 |
996 |
1 066 |
| – Capital metres |
|
1 119 |
— |
— |
| Financial |
|
|
|
|
| Revenue |
(Rm) |
3 607 |
|
2 922 |
|
2 674 |
|
|
(US$m) |
203 |
|
192 |
|
173 |
|
| Average gold price received |
(R/kg) |
1 043 180 |
|
904 303 |
|
847 351 |
|
|
(US$/oz) |
1 826 |
|
1 849 |
|
1 711 |
|
| Cash operating cost |
(Rm) |
2 374 |
|
2 190 |
|
2 111 |
|
|
(US$m) |
134 |
|
144 |
|
137 |
|
| Production profit |
(Rm) |
1 212 |
|
732 |
|
585 |
|
|
(US$m) |
68 |
|
48 |
|
38 |
|
| Capital expenditure |
(Rm) |
514 |
|
476 |
|
366 |
|
|
(US$m) |
29 |
|
32 |
|
24 |
|
Operating free cash flow1 |
(Rm) |
719 |
|
253 |
|
197 |
|
|
(US$m) |
40 |
|
17 |
|
13 |
|
| Cash operating cost |
(R/kg) |
691 925 |
|
679 169 |
|
663 304 |
|
|
(US$/oz) |
1 211 |
|
1 389 |
|
1 340 |
|
| All-in sustaining cost |
(R/kg) |
841 983 |
|
843 688 |
|
799 352 |
|
|
(US$/oz) |
1 474 |
|
1 725 |
|
1 614 |
|
| Average exchange rate |
(R/US$) |
17.76 |
|
15.21 |
|
15.40 |
|
| Safety |
|
|
|
|
| Loss of life |
|
— |
1 |
1 |
| Lost-time injury frequency rate |
per million hours worked |
5.24 |
7.15 |
8.07 |
| Environment |
|
|
|
|
| Electricity consumption |
(GWh) |
279 |
292 |
267 |
| Water consumption – primary activities |
(Ml) |
1 669 |
1 850 |
1 910 |
| Greenhouse gas emissions |
(000tCO2e) |
290 |
316 |
278 |
| Intensity data per tonne treated |
|
|
|
|
| – Energy |
|
0.55 |
0.51 |
0.43 |
| – Water |
|
3.29 |
3.23 |
3.11 |
| – Greenhouse gas emissions |
|
0.57 |
0.55 |
0.45 |
| Number of reportable environmental incidents |
|
— |
— |
— |
| Community |
|
|
|
|
Local economic development |
(Rm) |
10 |
|
11 |
|
10 |
|
| Training and development |
(Rm) |
64 |
|
51 |
|
35 |
|
1 Operating free cash flow = revenue – cash operating cost – capital expenditure as per operating results.
Tshepong South continued
|
|
|
|
|
|
| Other salient features |
| Status of operation |
Steady-state operation: development continues |
Life-of-mine |
7 years |
| Nameplate hoisting capacity (per month) |
91 000 tonnes (101 000 tons) |
| Compliance and certification |
•New order mining right – December 2007
•ISO 14001
•ISO 9001.
|
Mineral Reserve estimates at 30 June 2023
|
|
|
|
|
|
|
|
|
|
|
|
|
|
|
|
|
|
|
|
|
|
|
|
|
|
|
|
|
|
|
Proved |
Probable |
Total |
| Reserves (metric) |
Tonnes
(Mt)
|
Grade
(g/t)
|
Gold
(000kg)
|
Tonnes
(Mt)
|
Grade
(g/t)
|
Gold
(000kg)
|
Tonnes
(Mt)
|
Grade
(g/t)
|
Gold
(000kg)
|
|
2.9 |
7.79 |
|
22 |
0.6 |
7.06 |
|
4 |
3.4 |
7.67 |
|
26 |
| Reserves (imperial) |
Tons
(Mt)
|
Grade
(oz/t)
|
Gold
(000oz)
|
Tons
(Mt)
|
Grade
(oz/t)
|
Gold
(000oz)
|
Tons
(Mt)
|
Grade
(oz/t)
|
Gold
(000oz)
|
|
3.2 |
|
0.227 |
|
722 |
|
0.6 |
|
0.206 |
|
128 |
|
3.8 |
|
0.224 |
|
850 |
|
Overview of operations
Tshepong South is located in the Free State, near the town of Welkom, some 250km from Johannesburg. Tshepong South exploits the Basal reef with the B Reef mined as a high-grade secondary reef. and uses the conventional undercut and opencut mining method. Rock from Tshepong South is transported via a railveyor system to Nyala shaft, from where it is hoisted to surface. Mining is conducted at depths of 1 500m to 2 300m. Ore mined is processed at the Harmony One plant, with gold recovered using the gold cyanide leaching process.
Operating performance FY23
The lost-time injury frequency rate improved 27% to 5.24 per million hours worked (FY22: 7.15).
FY23 was the first year for Tshepong South being managed as a separate unit after the split of Tshepong Operations. The shaft produced 3 431kg (110 310oz) of gold, a 6% increase over the 3 229kg (103 814oz) produced in FY22. This was due to a 20% increase in the recovered grade to 6.78g/t (FY22: 5.64g/t) which is in line with the reserve grade for the operation. Ore milled for FY23 was 12% lower at 506 000 tonnes (FY22: 573 000t).
Revenue rose 23% to R3 607 million (FY22: R2 922 million) due to a 15% increase in the average gold price to R1 043 180/kg (FY22: R904 303/kg) as well as higher production. Cash operating costs were up 8% to R2 374 million (FY22: R2 193 million), mainly due to annual wage and electricity tariff increases. Capital expenditure increased 8% to R514 million (FY22: R476 million), mainly for ongoing development. Operating free cash flow of R719 million was significantly higher than the R253 million recorded in FY22, reflecting the improved production results as well as higher gold price.
Our focus areas in FY24
|
|
|
| The management team’s main focus will be to continue building on the successful split of the Tshepong operations and deliver safe profitable production in line with FY24 planning. |
South Africa – underground operation
Doornkop
|
|
|
|
|
|
|
|
|
|
|
|
|
|
|
|
|
FY23 |
FY22 |
FY21 |
| Number of employees |
|
|
|
|
| – Permanent |
|
3 612 |
3 322 |
3 374 |
| – Contractors |
|
746 |
771 |
772 |
| Total |
|
4 358 |
4 093 |
4 146 |
| Operational |
|
|
|
|
| Volumes milled |
(000t) (metric) |
898 |
874 |
851 |
|
(000t) (imperial) |
990 |
963 |
938 |
| Gold produced |
(kg) |
4 213 |
3 444 |
3 670 |
|
(oz) |
135 451 |
110 726 |
117 993 |
| Gold sold |
(kg) |
4 233 |
3 464 |
3 603 |
|
(oz) |
136 094 |
111 370 |
115 839 |
| Grade |
(g/t) |
4.69 |
3.94 |
4.31 |
|
(oz/t) |
0.137 |
0.115 |
0.126 |
| Productivity |
(g/TEC) |
97.50 |
81.17 |
89.14 |
| Development results |
|
|
|
|
| – Total metres (excluding capital metres) |
|
7 455 |
6 500 |
6 271 |
| – Reef metres |
|
1 435 |
1 449 |
1 713 |
| – Capital metres |
|
2 737 |
2 708 |
1 149 |
| Financial |
|
|
|
|
| Revenue |
(Rm) |
4 384 |
|
3 106 |
|
3 077 |
|
|
(US$m) |
247 |
|
204 |
|
200 |
|
| Average gold price received |
(R/kg) |
1 035 665 |
|
896 779 |
|
853 957 |
|
|
(US$/oz) |
1 813 |
|
1 834 |
|
1 725 |
|
| Cash operating cost |
(Rm) |
2 987 |
|
2 514 |
|
2 186 |
|
|
(US$m) |
168 |
|
165 |
|
142 |
|
| Production profit |
(Rm) |
1 375 |
|
654 |
|
937 |
|
|
(US$m) |
77 |
|
43 |
|
61 |
|
| Capital expenditure |
(Rm) |
716 |
|
491 |
|
425 |
|
|
(US$m) |
40 |
|
32 |
|
28 |
|
Operating free cash flow1 |
(Rm) |
682 |
|
102 |
|
466 |
|
|
(US$m) |
38 |
|
7 |
|
30 |
|
| Cash operating cost |
(R/kg) |
708 908 |
|
729 965 |
|
595 550 |
|
|
(US$/oz) |
1 241 |
|
1 493 |
|
1 203 |
|
| All-in sustaining cost |
(R/kg) |
831 553 |
|
823 966 |
|
680 524 |
|
|
(US$/oz) |
1 456 |
|
1 685 |
|
1 374 |
|
| Average exchange rate |
(R/US$) |
17.76 |
|
15.21 |
|
15.40 |
|
| Safety |
|
|
|
|
| Loss of life |
|
— |
2 |
1 |
| Lost-time injury frequency rate |
per million hours worked |
5.94 |
5.59 |
6.89 |
| Environment |
|
|
|
|
| Electricity consumption |
(GWh) |
223 |
214 |
212 |
| Water consumption – primary activities |
(Ml) |
1 840 |
1 011 |
787 |
| Greenhouse gas emissions |
(000tCO2e) |
240 |
231 |
222 |
| Intensity data per tonne treated |
|
|
|
|
| – Energy |
|
0.25 |
0.25 |
0.25 |
| – Water |
|
2.05 |
1.16 |
0.92 |
| – Greenhouse gas emissions |
|
0.27 |
0.27 |
0.26 |
| Number of reportable environmental incidents |
|
1 |
— |
— |
| Community |
|
|
|
|
Local economic development |
(Rm) |
7 |
|
10 |
|
6 |
|
| Training and development |
(Rm) |
73 |
|
75 |
|
53 |
|
1 Operating free cash flow = revenue – cash operating cost – capital expenditure as per operating results.
Doornkop continued
|
|
|
|
|
|
| Other salient features |
| Status of operation |
Steady-state operations with development of 207/212 level continuing |
| Life-of-mine |
15 years |
| Nameplate hoisting capacity (per month) |
103 000 tonnes (113 000 tons) |
| Compliance and certification |
•New order mining right – October 2008
•ISO 14001
•ISO 9001
•OHSAS 18001
•Cyanide code certified.
|
Mineral Reserve estimates at 30 June 2023
|
|
|
|
|
|
|
|
|
|
|
|
|
|
|
|
|
|
|
|
|
|
|
|
|
|
|
|
|
|
|
Proved |
Probable |
Total |
| Reserves (metric) |
Tonnes
(Mt)
|
Grade
(g/t)
|
Gold
(000kg)
|
Tonnes
(Mt)
|
Grade
(g/t)
|
Gold
(000kg)
|
Tonnes
(Mt)
|
Grade
(g/t)
|
Gold
(000kg)
|
|
5.2 |
|
4.35 |
|
23 |
|
8.2 |
|
4.44 |
|
36 |
|
13.4 |
|
4.41 |
|
59 |
|
| Reserves (imperial) |
Tons
(Mt)
|
Grade
(oz/t)
|
Gold
(000oz)
|
Tons
(Mt)
|
Grade
(oz/t)
|
Gold
(000oz)
|
Tons
(Mt)
|
Grade
(oz/t)
|
Gold
(000oz)
|
|
5.7 |
|
0.127 |
|
728 |
|
9.1 |
|
0.130 |
|
1 172 |
|
14.8 |
|
0.129 |
|
1 901 |
|
Overview of operations
Doornkop is a deep-level single-shaft operation in Gauteng, some 30km west of Johannesburg, on the northern rim of the Witwatersrand Basin. While a mature operation, it still has 15 years life-of-mine remaining.
The operation focuses on narrow-reef conventional mining of the South Reef gold-bearing conglomerate reef. Mining is undertaken to a depth of 2 219m below surface. Ore is processed at the Doornkop plant, which uses the carbon-in-pulp process to extract gold.
Operating performance FY23
Doornkop achieved 1 000 000 loss-of-life free shifts in the year under review. The lost-time injury frequency rate however deteriorated 6% to 5.94 per million hours worked in FY23 (FY22: 5.59). The management team remains committed to improving safety performance.
Doornkop delivered much improved results for FY23 producing 4 213kg (135 451oz) compared to 3 444kg (110 726oz), a 22% improvement over FY22. This was mainly due to a notable increase in the recovered grade to 4.69g/t (FY22: 3.94g/t) on the back of improved mining grades in the latter part of the year as well as mill clean-up operations in the first half. Ore milled increased by 3% to 898 000 tonnes (FY22: 874 000 tonnes).
Significantly higher production results reflected in revenue of R4 384 million (FY22: R3 106 million), 41% higher than the previous year, supported by a 15% rise in the gold price to R1 035 665/kg (FY22: R896 779/kg). Cash operating costs were 19% higher at R2 987 million (FY22: R2 514 million) mainly due to annual wage increases and higher cost of consumables. Additional cost relating to compressed air generation amounted to approximately R57 million and R31 million related to higher diesel expenditure. Capital expenditure increased 46% to R716 million from R491 million in FY22, mainly towards major project capital as well as on ongoing development.
Operating free cash flow of R682 million was recorded in FY23 compared to R102 million in FY22, reflecting the improved production results as well as a higher gold price.
Our focus areas in FY24
|
|
|
Continued focus on safety remains a top priority. Business improvement initiatives to deliver much needed productivity improvements in mining disciplines and restore mining flexibility. |
South Africa – underground operation
Joel
|
|
|
|
|
|
|
|
|
|
|
|
|
|
|
|
|
FY23 |
FY22 |
FY21 |
| Number of employees |
|
|
|
|
| – Permanent |
|
1 871 |
1 839 |
1 823 |
| – Contractors |
|
191 |
224 |
209 |
| Total |
|
2 062 |
2 063 |
2 032 |
| Operational |
|
|
|
|
| Volumes milled |
(000t) (metric) |
435 |
434 |
359 |
|
(000t) (imperial) |
481 |
478 |
396 |
| Gold produced |
(kg) |
1 947 |
1 556 |
1 424 |
|
(oz) |
62 598 |
50 026 |
45 783 |
| Gold sold |
(kg) |
1 964 |
1 555 |
1 414 |
|
(oz) |
63 144 |
49 994 |
45 461 |
| Grade |
(g/t) |
4.48 |
3.59 |
3.97 |
|
(oz/t) |
0.130 |
0.105 |
0.116 |
| Productivity |
(g/TEC) |
86.49 |
71.05 |
63.97 |
| Development results |
|
|
|
|
| – Total metres (excluding capital metres) |
|
3 221 |
3 364 |
3 397 |
| – Reef metres |
|
847 |
1 104 |
1 806 |
| – Capital metres |
|
— |
— |
— |
| Financial |
|
|
|
|
| Revenue |
(Rm) |
2 044 |
|
1 411 |
|
1 199 |
|
|
(US$m) |
115 |
|
93 |
|
78 |
|
| Average gold price received |
(R/kg) |
1 040 581 |
|
907 660 |
|
848 131 |
|
|
(US$/oz) |
1 822 |
|
1 856 |
|
1 713 |
|
| Cash operating cost |
(Rm) |
1 603 |
|
1 316 |
|
1 135 |
|
|
(US$m) |
90 |
|
87 |
|
74 |
|
| Production profit |
(Rm) |
427 |
|
103 |
|
75 |
|
|
(US$m) |
24 |
|
7 |
|
5 |
|
| Capital expenditure |
(Rm) |
231 |
|
225 |
|
172 |
|
|
(US$m) |
13 |
|
15 |
|
11 |
|
Operating free cash flow1 |
(Rm) |
210 |
|
(129) |
|
(108) |
|
|
(US$m) |
12 |
|
(9) |
|
(7) |
|
| Cash operating cost |
(R/kg) |
823 291 |
|
845 931 |
|
796 982 |
|
|
(US$/oz) |
1 441 |
|
1 730 |
|
1 610 |
|
| All-in sustaining cost |
(R/kg) |
950 713 |
|
983 593 |
|
936 296 |
|
|
(US$/oz) |
1 665 |
|
2 011 |
|
1 891 |
|
| Average exchange rate |
(R/US$) |
17.76 |
|
15.21 |
|
15.40 |
|
| Safety |
|
|
|
|
| Loss of life |
|
— |
— |
— |
| Lost-time injury frequency rate |
per million hours worked |
1.27 |
4.62 |
3.42 |
| Environment |
|
|
|
|
| Electricity consumption |
(GWh) |
99 |
94 |
88 |
| Water consumption – primary activities |
(Ml) |
897 |
979 |
907 |
| Greenhouse gas emissions |
(000tCO2e) |
103 |
101 |
92 |
| Intensity data per tonne treated |
|
|
|
|
| – Energy |
|
0.23 |
0.22 |
0.25 |
| – Water |
|
2.06 |
2.25 |
0.92 |
| – Greenhouse gas emissions |
|
0.24 |
0.23 |
0.26 |
| Number of reportable environmental incidents |
|
— |
— |
— |
| Community |
|
|
|
|
Local economic development |
(Rm) |
7 |
|
6 |
|
4 |
|
| Training and development |
(Rm) |
29 |
|
24 |
|
19 |
|
1 Operating free cash flow = revenue – cash operating cost – capital expenditure as per operating results.
Joel continued
|
|
|
|
|
|
| Other salient features |
| Status of operation |
Steady state |
| Life-of-mine |
7 years |
| Nameplate hoisting capacity (per month) |
60 000 tonnes (83 000 tons) |
| Compliance and certification |
•New order mining right – December 2007
•ISO 14001
•ISO 9001
•SAS 18001.
|
Mineral Reserve estimates at 30 June 2023
|
|
|
|
|
|
|
|
|
|
|
|
|
|
|
|
|
|
|
|
|
|
|
|
|
|
|
|
|
|
|
Proved |
Probable |
Total |
| Reserves (metric) |
Tonnes
(Mt)
|
Grade
(g/t)
|
Gold
(000kg)
|
Tonnes
(Mt)
|
Grade
(g/t)
|
Gold
(000kg)
|
Tonnes
(Mt)
|
Grade
(g/t)
|
Gold
(000kg)
|
|
2.9 |
|
4.87 |
|
14 |
|
0.5 |
|
4.33 |
|
2 |
|
3.5 |
|
4.79 |
|
17 |
|
| Reserves (imperial) |
Tons
(Mt)
|
Grade
(oz/t)
|
Gold
(000oz)
|
Tons
(Mt)
|
Grade
(oz/t)
|
Gold
(000oz)
|
Tons
(Mt)
|
Grade
(oz/t)
|
Gold
(000oz)
|
|
3.2 |
|
0.142 |
|
459 |
|
0.6 |
|
0.126 |
|
76 |
|
3.8 |
|
0.140 |
|
535 |
|
Overview of operations
Joel is a twin-shaft mining operation in the Free State, some 290km south-west of Johannesburg, on the southern edge of the Witwatersrand Basin.
A pre-developed scattered mining system is used. This enables unpay and geologically complex areas to be left unmined, while considering the overall panel configuration and stability of footwall development. This allows for mining to be selective, based on the proven Ore Reserve during the development phase. The primary economic reef mined is the narrow tabular Beatrix Reef deposit, accessed via conventional grid development. Mining is currently being conducted to a depth of 1 379m below collar. As the Joel plant was decommissioned in FY19, ore mined is now processed at the Harmony One plant.
Operating performance FY23
Joel achieved 2 500 000 loss-of-life free shifts during the year under review. The lost-time injury frequency rate of 1.27 per million hours worked was also the lowest among all underground operations and a 73% improvement over the previous year (FY22: 4.62).
In FY23, Joel continued to build on the previous year’s results and recorded a 25% increase in gold production to 1 947kg (62 598oz) (FY22: 1 556kg, 50 026oz). The recovered grade improved 25% to 4.48g/t in FY23 (FY22: 3.59g/t) mainly as a result of higher mining grades achieved during the year. Volume of ore milled remained flat at 435 000 tonnes (FY22: 434 000 tonnes).
The increase in gold production combined with a 15% rise in the gold price to R1 040 581/kg (FY22: R907 660/kg) resulted in a notable 45% increase in revenue to R2 044 million (FY22: R1 411 million). Cash operating costs rose 22% to R1 603 million (FY22: R1 316 million), mainly due to annual wage and electricity tariff increases as well as higher production. Capital expenditure was 3% higher at R231 million (FY22: R225 million), mainly for ongoing development.
Operating free cash flow of R210 million was recorded for FY23, a turnaround from the negative R129 million in FY22.
Our focus areas in FY24
|
|
|
The main focus in FY24 will be managing the roll out of hydropower drilling machines and maintaining volumes at planned grades. |
South Africa – underground operation
Target 1
|
|
|
|
|
|
|
|
|
|
|
|
|
|
|
|
|
FY23 |
FY22 |
FY21 |
| Number of employees |
|
|
|
|
| – Permanent |
|
1 571 |
1 516 |
1 550 |
| – Contractors |
|
430 |
343 |
315 |
| Total |
|
2 001 |
1 859 |
1 865 |
| Operational |
|
|
|
|
| Volumes milled |
(000t) (metric) |
365 |
455 |
488 |
|
(000t) (imperial) |
402 |
501 |
537 |
| Gold produced |
(kg) |
1 275 |
1 800 |
1 603 |
|
(oz) |
40 992 |
57 872 |
51 536 |
| Gold sold |
(kg) |
1 256 |
1 821 |
1 619 |
|
(oz) |
40 381 |
58 547 |
52 052 |
| Grade |
(g/t) |
3.49 |
3.96 |
3.28 |
|
(oz/t) |
0.102 |
0.116 |
0.096 |
| Productivity |
(g/TEC) |
60.67 |
90.42 |
76.55 |
| Development results |
|
|
|
|
| – Total metres (excluding capital metres) |
|
1 387 |
1 544 |
2 211 |
| – Reef metres |
|
47 |
55 |
368 |
| – Capital metres |
|
— |
194 |
96 |
| Financial |
|
|
|
|
| Revenue |
(Rm) |
1 308 |
|
1 648 |
|
1 410 |
|
|
(US$m) |
74 |
|
108 |
|
92 |
|
| Average gold price received |
(R/kg) |
1 041 564 |
|
904 992 |
|
870 640 |
|
|
(US$/oz) |
1 824 |
|
1 851 |
|
1 758 |
|
| Cash operating cost |
(Rm) |
2 033 |
|
1 794 |
|
1 662 |
|
|
(US$m) |
114 |
|
118 |
|
108 |
|
| Production profit |
(Rm) |
(701) |
|
(164) |
|
(257) |
|
|
(US$m) |
(39) |
|
(11) |
|
(16) |
|
| Capital expenditure |
(Rm) |
428 |
|
384 |
|
368 |
|
|
(US$m) |
24 |
|
25 |
|
24 |
|
Operating free cash flow1 |
(Rm) |
(1 153) |
|
(530) |
|
(621) |
|
|
(US$m) |
(65) |
|
(35) |
|
(40) |
|
| Cash operating cost |
(R/kg) |
1 594 661 |
|
996 938 |
|
1 037 115 |
|
|
(US$/oz) |
2 792 |
|
2 039 |
|
2 095 |
|
| All-in sustaining cost |
(R/kg) |
1 903 111 |
|
1 210 404 |
|
1 232 098 |
|
|
(US$/oz) |
3 332 |
|
2 475 |
|
2 488 |
|
| Average exchange rate |
(R/US$) |
17.76 |
|
15.21 |
|
15.40 |
|
| Safety |
|
|
|
|
| Loss of life |
|
— |
— |
1 |
| Lost-time injury frequency rate |
per million hours worked |
9.54 |
10.08 |
9.99 |
| Environment |
|
|
|
|
| Electricity consumption |
(GWh) |
212 |
206 |
219 |
| Water consumption – primary activities |
(Ml) |
804 |
871 |
597 |
| Greenhouse gas emissions |
(000tCO2e) |
223 |
222 |
232 |
| Intensity data per tonne treated |
|
|
|
|
| – Energy |
|
0.58 |
0.45 |
0.45 |
| – Water |
|
2.20 |
1.92 |
1.22 |
| – Greenhouse gas emissions |
|
0.61 |
0.50 |
0.48 |
| Number of reportable environmental incidents |
|
1 |
— |
— |
| Community |
|
|
|
|
Local economic development |
(Rm) |
8 |
|
5 |
|
4 |
|
| Training and development |
(Rm) |
53 |
|
43 |
|
40 |
|
1 Operating free cash flow = revenue – cash operating cost – capital expenditure as per operating results.
Target 1 continued
|
|
|
|
|
|
| Other salient features |
| Status of operation |
Optimisation project completion expected in first half of the 2024 financial year. |
| Life-of-mine |
6 years |
| Nameplate hoisting capacity (per month) |
97 000 tonnes (107 000 tons) |
| Compliance and certification |
•New order mining right – December 2007
•ISO 14001
•ISO 9001
•OHSAS 18001
•Cyanide code certified.
|
Mineral Reserve estimates at 30 June 2023
|
|
|
|
|
|
|
|
|
|
|
|
|
|
|
|
|
|
|
|
|
|
|
|
|
|
|
|
|
|
|
Proved |
Probable |
Total |
| Reserves (metric) |
Tonnes
(Mt)
|
Grade
(g/t)
|
Gold
(000kg)
|
Tonnes
(Mt)
|
Grade
(g/t)
|
Gold
(000kg)
|
Tonnes
(Mt)
|
Grade
(g/t)
|
Gold
(000kg)
|
|
2.6 |
|
4.38 |
|
11 |
|
1.2 |
|
4.46 |
|
6 |
|
3.8 |
|
4.40 |
|
17 |
|
| Reserves (imperial) |
Tons
(Mt)
|
Grade
(oz/t)
|
Gold
(000oz)
|
Tons
(Mt)
|
Grade
(oz/t)
|
Gold
(000oz)
|
Tons
(Mt)
|
Grade
(oz/t)
|
Gold
(000oz)
|
|
2.8 |
|
0.128 |
|
361 |
|
1.4 |
|
0.130 |
|
178 |
|
4.2 |
|
0.128 |
|
539 |
|
Overview of operations
Target 1 is an advanced, single-shaft, deep-level mine in the Free State, some 270km south-west of Johannesburg. It has a planned life-of-mine of six years.
While most of the ore extracted comes from mechanised mining (massive mining techniques), conventional stoping is still employed primarily to destress areas ahead of mechanised mining. The gold mineralisation currently exploited is contained in a succession of Elsburg and Dreyerskuil quartz pebble conglomerate reefs. These reefs are mined to a depth of around 2 300m below surface. Ore mined is milled and processed at the Target plant, with gold recovered by means of gold cyanide leaching.
Operating performance FY23
Target 1 achieved 1 000 000 loss-of-life free shifts during the year under review. The lost-time injury frequency rate improved 5% to 9.54 per million hours worked in FY23 (FY22: 10.08).
Target 1 had a challenging year affected by pillar failures in the high grade massive stopes, trackless vehicle availability as well as several power failures ultimately resulting in the flooding of certain areas of the operation. Ventilation constraints further compounded the challenges for the operation.
As a result, gold production was down 29% to 1 275kg (40 992oz) from 1 800kg (57 872oz) in FY22. Challenging mining conditions reflected in the ore milled at 365 000 tonnes, 20% lower than the previous year (FY22: 455 000 tonnes) and a lower recovered grade of 3.49g/t (FY22: 3.96g/t).
The substantial decrease in production is reflected in the revenue at R1 308 million, 21% lower than the R1 648 million recorded in FY22. This despite a 15% rise in the gold price to R1 041 564/kg (FY22: R904 992/kg). Cash operating costs rose 13% to R2 033 million (FY22: R1 794 million), mainly due to annual wage and electricity tariff increases as well as an increase in the cost of consumables.
Capital expenditure increased 11% to R428 million (FY22: R384 million), mainly for ongoing development and major project capital.
Our focus areas in FY24
|
|
|
Deliver the optimisation project timeously to ensure the planned production build-up for the second half of the financial year is achieved. Deliver improved ounces in line with FY24 guidance. |
South Africa – underground operation
Kusasalethu
|
|
|
|
|
|
|
|
|
|
|
|
|
|
|
|
|
FY23 |
FY22 |
FY21 |
| Number of employees |
|
|
|
|
| – Permanent |
|
3 502 |
3 648 |
3 764 |
| – Contractors |
|
468 |
479 |
496 |
| Total |
|
3 970 |
4 127 |
4 260 |
| Operational |
|
|
|
|
| Volumes milled |
(000t) (metric) |
567 |
607 |
708 |
|
(000t) (imperial) |
626 |
669 |
780 |
| Gold produced |
(kg) |
3 460 |
4 567 |
3 999 |
|
(oz) |
111 242 |
146 833 |
128 570 |
| Gold sold |
(kg) |
3 481 |
4 586 |
3 980 |
|
(oz) |
111 917 |
147 444 |
127 959 |
| Grade |
(g/t) |
6.10 |
7.52 |
5.65 |
|
(oz/t) |
0.178 |
0.219 |
0.165 |
| Productivity |
(g/TEC) |
78.76 |
98.93 |
81.32 |
| Development results |
|
|
|
|
| – Total metres (excluding capital metres) |
|
2 822 |
2 817 |
2 202 |
| – Reef metres |
|
992 |
1 025 |
282 |
| – Capital metres |
|
— |
— |
— |
| Financial |
|
|
|
|
| Revenue |
(Rm) |
3 621 |
|
4 139 |
|
3 400 |
|
|
(US$m) |
204 |
|
272 |
|
221 |
|
| Average gold price received |
(R/kg) |
1 040 274 |
|
902 634 |
|
854 201 |
|
|
(US$/oz) |
1 821 |
|
1 846 |
|
1 725 |
|
| Cash operating cost |
(Rm) |
3 311 |
|
3 098 |
|
2 969 |
|
|
(US$m) |
186 |
|
204 |
|
193 |
|
| Production profit |
(Rm) |
278 |
|
1 053 |
|
445 |
|
|
(US$m) |
16 |
|
69 |
|
29 |
|
| Capital expenditure |
(Rm) |
253 |
|
210 |
|
205 |
|
|
(US$m) |
14 |
|
14 |
|
13 |
|
Operating free cash flow1 |
(Rm) |
57 |
|
831 |
|
226 |
|
|
(US$m) |
3 |
|
55 |
|
15 |
|
| Cash operating cost |
(R/kg) |
956 938 |
|
678 403 |
|
742 452 |
|
|
(US$/oz) |
1 675 |
|
1 387 |
|
1 500 |
|
| All-in sustaining cost |
(R/kg) |
1 068 851 |
|
739 681 |
|
814 048 |
|
|
(US$/oz) |
1 871 |
|
1 513 |
|
1 644 |
|
| Average exchange rate |
(R/US$) |
17.76 |
|
15.21 |
|
15.40 |
|
| Safety |
|
|
|
|
| Loss of life |
|
3 |
8 |
2 |
| Lost-time injury frequency rate |
per million hours worked |
7.71 |
8.11 |
9.83 |
| Environment |
|
|
|
|
| Electricity consumption |
(GWh) |
591 |
612 |
636 |
| Water consumption – primary activities |
(Ml) |
2 734 |
2 877 |
2 832 |
| Greenhouse gas emissions |
(000tCO2e) |
616 |
661 |
661 |
| Intensity data per tonne treated |
|
|
|
|
| – Energy |
|
1.04 |
1.01 |
0.90 |
| – Water |
|
4.82 |
4.74 |
4.00 |
| – Greenhouse gas emissions |
|
1.09 |
1.09 |
0.93 |
| Number of reportable environmental incidents |
|
2 |
2 |
2 |
| Community |
|
|
|
|
| Local economic development |
(Rm) |
25 |
|
8 |
|
8 |
|
| Training and development |
(Rm) |
18 |
|
16 |
|
14 |
|
1 Operating free cash flow = revenue – cash operating cost – capital expenditure as per operating results.
Kusasalethu continued
|
|
|
|
|
|
| Other salient features |
| Status of operation |
Mature, steady-state operation: development continues |
| Life-of-mine |
3 years |
| Nameplate hoisting capacity (per month) |
172 000 tonnes (190 000 tons) |
| Compliance and certification |
•New order mining right – December 2007
•ISO 14001
•ISO 9001
•Cyanide code certified.
|
Mineral Reserve estimates at 30 June 2023
|
|
|
|
|
|
|
|
|
|
|
|
|
|
|
|
|
|
|
|
|
|
|
|
|
|
|
|
|
|
|
Proved |
Probable |
Total |
| Reserves (metric) |
Tonnes
(Mt)
|
Grade
(g/t)
|
Gold
(000kg)
|
Tonnes
(Mt)
|
Grade
(g/t)
|
Gold
(000kg)
|
Tonnes
(Mt)
|
Grade
(g/t)
|
Gold
(000kg)
|
|
1.7 |
|
7.44 |
|
12 |
|
0.1 |
|
5.04 |
|
0.3 |
|
1.7 |
|
7.36 |
|
13 |
|
| Reserves (imperial) |
Tons
(Mt)
|
Grade
(oz/t)
|
Gold
(000oz)
|
Tons
(Mt)
|
Grade
(oz/t)
|
Gold
(000oz)
|
Tons
(Mt)
|
Grade
(oz/t)
|
Gold
(000oz)
|
|
1.9 |
|
0.217 |
|
402 |
|
0.1 |
|
0.147 |
|
10 |
|
1.9 |
|
0.215 |
|
412 |
|
Overview of operations
Kusasalethu is a mature, deep-level mine 90km west of Johannesburg, near the border of Gauteng and North West provinces. Mining is at a depth of 3 388m with three years’ life-of-mine remaining.
The mine comprises twin vertical and twin sub-vertical shaft systems and uses conventional mining methods in a sequential grid layout. It exploits the Ventersdorp Contact Reef as its primary orebody. Ore mined is treated at the Mponeng plant.
Operating performance FY23
Regrettably, three lives were lost at Kusasalethu during FY23. The management team remains committed to improving safety performance.
Kusasalethu was affected by lower than anticipated grades in some of its very high grade mining areas as well as numerous mining-related challenges that reflected in the recovered grade. The operation achieved a recovered grade of 6.10g/t for FY23 some 19% lower than the 7.52g/t recorded in FY22. Tonnes milled was also lower by 7% at 567 000 tonnes (FY22: 607 000 tonnes) and ultimately reflected in the gold produced for FY23 at 3 460kg (111 242 oz), 24% lower than the 4 567kg (146 833 oz) achieved in FY22.
The lower production reflected in the revenue, being down 13% to R3 621 million from R4 139 million in FY22. The effect of the lower gold was however partially offset by a 15% rise in the gold price received to R1 040 274/kg in FY23 (FY22: R902 634/kg).
Cash operating costs were 7% higher at R3 311 million (FY22: R3 098 million), mainly due to annual wage and electricity tariff increases. Capital expenditure rose 20% to R253 million (FY22: R210 million), mainly for ongoing development. Operating free cash flow dropped 93% to R57 million mainly reflecting the lower production and was disappointing when compared to the R831 million achieved in FY22.
Our focus areas in FY24
|
|
|
| Continued focus on improving safety performance while achieving production targets. Exploration work underway to firm up the orebody. |
South Africa – underground operation
Masimong
|
|
|
|
|
|
|
|
|
|
|
|
|
|
|
|
|
FY23 |
FY22 |
FY21 |
| Number of employees |
|
|
|
|
| – Permanent |
|
1 938 |
1 907 |
1 943 |
| – Contractors |
|
126 |
126 |
121 |
| Total |
|
2 064 |
2 033 |
2 064 |
| Operational |
|
|
|
|
| Volumes milled |
(000t) (metric) |
470 |
486 |
510 |
|
(000t) (imperial) |
519 |
536 |
563 |
| Gold produced |
(kg) |
1 961 |
1 910 |
2 012 |
|
(oz) |
63 047 |
61 407 |
64 687 |
| Gold sold |
(kg) |
1 980 |
1 911 |
1 993 |
|
(oz) |
63 659 |
61 440 |
64 076 |
| Grade |
(g/t) |
4.17 |
3.93 |
3.95 |
|
(oz/t) |
0.121 |
0.115 |
0.115 |
| Productivity |
(g/TEC) |
88.77 |
83.86 |
81.23 |
| Development results |
|
|
|
|
| – Total metres (excluding capital metres) |
|
2 921 |
3 321 |
2 833 |
| – Reef metres |
|
1 129 |
723 |
1 044 |
| – Capital metres |
|
— |
— |
— |
| Financial |
|
|
|
|
| Revenue |
(Rm) |
2 053 |
|
1 733 |
|
1 636 |
|
|
(US$m) |
116 |
|
114 |
|
106 |
|
| Average gold price received |
(R/kg) |
1 036 670 |
|
906 822 |
|
820 780 |
|
|
(US$/oz) |
1 815 |
|
1 854 |
|
1 658 |
|
| Cash operating cost |
(Rm) |
1 709 |
|
1 509 |
|
1 440 |
|
|
(US$m) |
96 |
|
99 |
|
94 |
|
| Production profit |
(Rm) |
329 |
|
229 |
|
209 |
|
|
(US$m) |
19 |
|
15 |
|
13 |
|
| Capital expenditure |
(Rm) |
47 |
|
49 |
|
29 |
|
|
(US$m) |
3 |
|
3 |
|
2 |
|
Operating free cash flow1 |
(Rm) |
297 |
|
176 |
|
166 |
|
|
(US$m) |
17 |
|
12 |
|
11 |
|
| Cash operating cost |
(R/kg) |
871 508 |
|
789 912 |
|
715 835 |
|
|
(US$/oz) |
1 526 |
|
1 615 |
|
1 446 |
|
| All-in sustaining cost |
(R/kg) |
925 703 |
|
845 299 |
|
764 577 |
|
|
(US$/oz) |
1 621 |
|
1 729 |
|
1 544 |
|
| Average exchange rate |
(R/US$) |
17.76 |
|
15.21 |
|
15.40 |
|
| Safety |
|
|
|
|
| Loss of life |
|
— |
— |
— |
| Lost-time injury frequency rate |
per million hours worked |
3.89 |
4.18 |
2.86 |
| Environment |
|
|
|
|
| Electricity consumption |
(GWh) |
134 |
132 |
133 |
| Water consumption – primary activities |
(Ml) |
1 217 |
805 |
383 |
| Greenhouse gas emissions |
(000tCO2e) |
139 |
142 |
139 |
| Intensity data per tonne treated |
|
|
|
|
| – Energy |
|
0.28 |
0.27 |
0.26 |
| – Water |
|
2.59 |
1.66 |
0.75 |
| – Greenhouse gas emissions |
|
0.30 |
0.29 |
0.27 |
| Number of reportable environmental incidents |
|
— |
1 |
1 |
| Community |
|
|
|
|
Local economic development |
(Rm) |
9 |
|
8 |
|
5 |
|
| Training and development |
(Rm) |
32 |
|
25 |
|
23 |
|
1 Operating free cash flow = revenue – cash operating cost – capital expenditure as per operating results.
Masimong continued
|
|
|
|
|
|
| Other salient features |
| Status of operation |
Mature, single-shaft operation nearing the end of its life |
| Life-of-mine |
2 years |
| Nameplate hoisting capacity (per month) |
112 000 tonnes (124 000 tons) |
| Compliance and certification |
•New order mining right – December 2007
•ISO 14001
•ISO 9001
•OHSAS 18001.
|
Mineral Reserve estimates at 30 June 2023
|
|
|
|
|
|
|
|
|
|
|
|
|
|
|
|
|
|
|
|
|
|
|
|
|
|
|
|
|
|
|
Proved |
Probable |
Total |
| Reserves (metric) |
Tonnes
(Mt)
|
Grade
(g/t)
|
Gold
(000kg)
|
Tonnes
(Mt)
|
Grade
(g/t)
|
Gold
(000kg)
|
Tonnes
(Mt)
|
Grade
(g/t)
|
Gold
(000kg)
|
|
0.9 |
|
4.77 |
|
4 |
|
0.1 |
|
4.27 |
|
1 |
|
1.0 |
|
4.71 |
|
5 |
|
| Reserves (imperial) |
Tons
(Mt)
|
Grade
(oz/t)
|
Gold
(000oz)
|
Tons
(Mt)
|
Grade
(oz/t)
|
Gold
(000oz)
|
Tons
(Mt)
|
Grade
(oz/t)
|
Gold
(000oz)
|
|
0.9 |
|
0.139 |
|
132 |
|
0.1 |
|
0.125 |
|
18 |
|
1.1 |
|
0.137 |
|
150 |
|
Overview of operations
Masimong is a deep-level mine in the Free State, near Welkom, some 260km from Johannesburg. The operation is close to the end of its mine life, with two years of mining left. Masimong is a mine that reflects the effectiveness of Harmony’s business model.
The Masimong complex comprises two shafts with 5 shaft used as the operating shaft and 4 shaft for ventilation, pumping and a second escape outlet. Masimong exploits the Basal Reef and B Reef, using a conventional tabular narrow-reef stoping method. Mining is conducted at a depth of 1 650m to 2 010m below collar. Ore mined is processed at the nearby Harmony One plant.
Operating performance FY23
Masimong recorded three million loss-of-life free shifts during FY23. The lost-time injury frequency rate improved 7% to 3.89 per million hours worked in FY23 (FY22: 4.18).
Gold production increased by 3% to 1 961kg (63 047oz) (FY22: 1 910kg, 61 407oz), mainly due to a 6% improvement in the recovered grade to 4.17g/t (FY22: 3.93g/t). Tonnes milled was 3% lower at 470 000 tonnes (FY22: 486 000 tonnes).
A 14% increase in gold price received to R1 036 670/kg (FY22: R906 822/kg) contributed to the 18% rise in revenue to R2 053 million (FY22: R1 733 million).
Cash operating costs rose 13% to R1 709 million (FY22: R1 509 million), mainly due to annual wage increases and electricity tariff increases as well as significant increases in consumables. Capital expenditure remained flat at R47 million (FY22: R49 million).
Our focus areas in FY24
|
|
|
| The Masimong management team will continue to focus on maintaining the safety and production performance as planned. |
South Africa – underground operation
Bambanani
|
|
|
|
|
|
|
|
|
|
|
|
|
|
|
|
|
FY23 |
FY22 |
FY21 |
| Number of employees |
|
|
|
|
| – Permanent |
|
1 |
1 070 |
1 508 |
| – Contractors |
|
— |
50 |
131 |
| Total |
|
1 |
1 120 |
1 639 |
| Operational |
|
|
|
|
| Volumes milled |
(000t) (metric) |
— |
176 |
227 |
|
(000t) (imperial) |
— |
194 |
250 |
| Gold produced |
(kg) |
— |
1 433 |
1 992 |
|
(oz) |
— |
46 072 |
64 044 |
| Gold sold |
(kg) |
19 |
1 437 |
1 975 |
|
(oz) |
611 |
46 201 |
63 498 |
| Grade |
(g/t) |
— |
8.14 |
8.78 |
|
(oz/t) |
— |
0.237 |
0.256 |
| Productivity |
(g/TEC) |
— |
86.53 |
107.37 |
| Development results |
|
|
|
|
| – Total metres (excluding capital metres) |
|
— |
911 |
1 414 |
| – Reef metres |
|
— |
— |
— |
| – Capital metres |
|
— |
— |
— |
| Financial |
|
|
|
|
| Revenue |
(Rm) |
18 |
|
1 286 |
|
1 687 |
|
|
(US$m) |
1 |
|
85 |
|
110 |
|
| Average gold price received |
(R/kg) |
962 579 |
|
895 101 |
|
854 392 |
|
|
(US$/oz) |
1 686 |
|
1 830 |
|
1 726 |
|
| Cash operating cost |
(Rm) |
— |
|
1 157 |
|
1 168 |
|
|
(US$m) |
— |
|
76 |
|
76 |
|
| Production profit |
(Rm) |
3 |
|
123 |
|
531 |
|
|
(US$m) |
— |
|
8 |
|
35 |
|
| Capital expenditure |
(Rm) |
— |
|
25 |
|
71 |
|
|
(US$m) |
— |
|
2 |
|
5 |
|
Operating free cash flow1 |
(Rm) |
18 |
|
103 |
|
448 |
|
|
(US$m) |
1 |
|
7 |
|
29 |
|
| Cash operating cost |
(R/kg) |
— |
|
807 652 |
|
586 588 |
|
|
(US$/oz) |
— |
|
1 652 |
|
1 185 |
|
| All-in sustaining cost |
(R/kg) |
827 789 |
|
851 977 |
|
641 426 |
|
|
(US$/oz) |
1 448 |
|
1 742 |
|
1 295 |
|
| Average exchange rate |
(R/US$) |
17.76 |
|
15.21 |
|
15.40 |
|
| Safety |
|
|
|
|
| Loss of life |
|
— |
— |
2 |
| Lost-time injury frequency rate |
per million hours worked |
— |
2.97 |
2.70 |
| Environment |
|
|
|
|
| Electricity consumption |
(GWh) |
14 |
134 |
133 |
| Water consumption – primary activities |
(Ml) |
148 |
811 |
1 024 |
| Greenhouse gas emissions |
(000tCO2e) |
14 |
144 |
138 |
| Intensity data per tonne treated |
|
|
|
|
| – Energy |
|
— |
0.76 |
0.58 |
| – Water |
|
— |
4.59 |
4.51 |
| – Greenhouse gas emissions |
|
— |
0.82 |
0.61 |
| Number of reportable environmental incidents |
|
— |
— |
— |
| Community |
|
|
|
|
Local economic development |
(Rm) |
— |
|
6 |
|
4 |
|
| Training and development |
(Rm) |
— |
|
18 |
|
22 |
|
1 Operating free cash flow = revenue – cash operating cost – capital expenditure as per operating results.
The operation closed during June 2022. The transactions for FY23 relate to the inventory at June 2022.
Bambanani continued
|
|
|
|
|
|
| Other salient features |
| Status of operation |
Mature operation closed in FY22 (June 2022) |
| Life-of-mine |
Closed |
| Nameplate hoisting capacity (per month) |
32 000 tonnes (35 000 tons) |
| Compliance and certification |
•New order mining right – December 2007
•ISO 14001 – not certified but operates according to standard’s requirements
•ISO 9001.
|
Mineral Reserve estimates at 30 June 2023
|
|
|
|
|
|
|
|
|
|
|
|
|
|
|
|
|
|
|
|
|
|
|
|
|
|
|
|
|
|
|
Proved |
Probable |
Total |
| Reserves (metric) |
Tonnes
(Mt)
|
Grade
(g/t)
|
Gold
(000kg)
|
Tonnes
(Mt)
|
Grade
(g/t)
|
Gold
(000kg)
|
Tonnes
(Mt)
|
Grade
(g/t)
|
Gold
(000kg)
|
|
— |
|
— |
|
— |
|
— |
|
— |
|
— |
|
— |
|
— |
|
— |
|
| Reserves (imperial) |
Tons
(Mt)
|
Grade
(oz/t)
|
Gold
(000oz)
|
Tons
(Mt)
|
Grade
(oz/t)
|
Gold
(000oz)
|
Tons
(Mt)
|
Grade
(oz/t)
|
Gold
(000oz)
|
|
— |
|
— |
|
— |
|
— |
|
— |
|
— |
|
— |
|
— |
|
— |
|
Overview of operations
Bambanani is a deep-level mine in the Free State, near Welkom and some 260km south of Johannesburg. It comprises two surface shafts, with the East shaft used to convey employees and West shaft used to hoist ore to the surface. Bambanani has been one of Harmony’s most successful and profitable mines.
Bambanani has reached the end of its life, and was closed at the end of FY22. This segment has been included for comparative purposes only.
South Africa – underground operation
Unisel
|
|
|
|
|
|
|
|
|
|
|
|
|
|
|
|
|
FY23 |
FY22 |
FY21 |
| Number of employees |
|
|
|
|
| – Permanent |
|
— |
— |
— |
| – Contractors |
|
— |
— |
— |
| Total |
|
— |
— |
— |
| Operational |
|
|
|
|
| Volumes milled |
(000t) (metric) |
— |
— |
57 |
|
(000t) (imperial) |
— |
— |
63 |
| Gold produced |
(kg) |
— |
— |
247 |
|
(oz) |
— |
— |
7 941 |
| Gold sold |
(kg) |
— |
— |
242 |
|
(oz) |
— |
— |
7 780 |
| Grade |
(g/t) |
— |
— |
4.33 |
|
(oz/t) |
— |
— |
0.126 |
| Productivity |
(g/TEC) |
— |
— |
80.40 |
| Development results |
|
|
|
|
| – Total metres (excluding capital metres) |
|
— |
— |
— |
| – Reef metres |
|
— |
— |
— |
| – Capital metres |
|
— |
— |
— |
| Financial |
|
|
|
|
| Revenue |
(Rm) |
— |
|
— |
|
224 |
|
|
(US$m) |
— |
|
— |
|
15 |
|
| Average gold price received |
(R/kg) |
— |
|
— |
|
925 979 |
|
|
(US$/oz) |
— |
|
— |
|
1 870 |
|
| Cash operating cost |
(Rm) |
— |
|
— |
|
178 |
|
|
(US$m) |
— |
|
— |
|
12 |
|
| Production profit |
(Rm) |
— |
|
— |
|
42 |
|
|
(US$m) |
— |
|
— |
|
3 |
|
| Capital expenditure |
(Rm) |
— |
|
— |
|
— |
|
|
(US$m) |
— |
|
— |
|
— |
|
Operating free cash flow1 |
(Rm) |
— |
|
— |
|
46 |
|
|
(US$m) |
— |
|
— |
|
3 |
|
| Cash operating cost |
(R/kg) |
— |
|
— |
|
721 271 |
|
|
(US$/oz) |
— |
|
— |
|
1 457 |
|
| All-in sustaining cost |
(R/kg) |
— |
|
— |
|
782 126 |
|
|
(US$/oz) |
— |
|
— |
|
1 580 |
|
| Average exchange rate |
(R/US$) |
— |
|
— |
|
15.40 |
|
| Safety |
|
|
|
|
| Loss of life |
|
— |
— |
— |
| Lost-time injury frequency rate |
per million hours worked |
— |
— |
1.88 |
| Environment |
|
|
|
|
| Electricity consumption |
(GWh) |
— |
— |
18 |
Water consumption – primary activities* |
(Ml) |
2 |
43 |
269 |
| Greenhouse gas emissions |
(000tCO2e) |
— |
— |
18 |
| Intensity data per tonne treated |
|
|
|
|
| – Energy |
|
— |
— |
0.31 |
| – Water |
|
— |
— |
4.72 |
| – Greenhouse gas emissions |
|
— |
— |
0.32 |
| Number of reportable environmental incidents |
|
— |
— |
— |
| Community |
|
|
|
|
Local economic development |
(Rm) |
— |
|
— |
|
— |
|
| Training and development |
(Rm) |
— |
|
— |
|
3 |
|
1 Operating free cash flow = revenue – cash operating cost – capital expenditure as per operating results.
* FY22 figure updated to reflect final audited information.
The FY21 results and figures in the table above are for the four months until 31 October 2020.
Unisel continued
|
|
|
|
|
|
| Other salient features |
| Status of operation |
Mature operation closed in FY21 (October 2020) |
| Life-of-mine |
Closed |
| Nameplate hoisting capacity (per month) |
63 000 tonnes (69 000 tons) |
| Compliance and certification |
•New order mining right – December 2007
•ISO 9001.
|
Overview of operations
Unisel is a single-shaft, intermediate-depth mine in the Free State, near Virginia, some 270km south-west of Johannesburg. Having been in production since 1979, Unisel has reached the end of its life, and was closed in the first half of FY21. This mine served a myriad of stakeholders in the province well over its 40-year life. This segment has been included for comparative purposes only.
South Africa – surface operation
Mine Waste Solutions (tailings retreatment)
|
|
|
|
|
|
|
|
|
|
|
|
|
|
|
|
|
FY23 |
FY22 |
FY21 |
| Number of employees |
|
|
|
|
| – Permanent |
|
493 |
487 |
479 |
| – Contractors |
|
1 692 |
938 |
797 |
| Total |
|
2 185 |
1 425 |
1 276 |
| Operational |
|
|
|
|
| Volumes milled |
(000t) (metric) |
23 067 |
23 443 |
17 665 |
|
(000t) (imperial) |
25 437 |
25 851 |
19 479 |
| Gold produced |
(kg) |
2 804 |
2 899 |
2 057 |
|
(oz) |
90 150 |
93 205 |
66 133 |
| Gold sold |
(kg) |
2 781 |
2 879 |
2 043 |
|
(oz) |
89 412 |
92 563 |
65 684 |
| Grade |
(g/t) |
0.122 |
0.124 |
0.116 |
|
(oz/t) |
0.004 |
0.004 |
0.003 |
| Productivity |
(g/TEC) |
362.96 |
350.68 |
302.38 |
| Financial |
|
|
|
|
| Revenue |
(Rm) |
2 689 |
|
2 642 |
|
1 889 |
|
|
(US$m) |
151 |
|
174 |
|
123 |
|
| Average gold price received |
(R/kg) |
845 341 |
|
753 912 |
|
729 882 |
|
|
(US$/oz) |
1 480 |
|
1 542 |
|
1 474 |
|
| Cash operating cost |
(Rm) |
1 821 |
|
1 593 |
|
1 036 |
|
|
(US$m) |
102 |
|
105 |
|
67 |
|
| Production profit |
(Rm) |
879 |
|
1 054 |
|
751 |
|
|
(US$m) |
50 |
|
69 |
|
49 |
|
| Capital expenditure |
(Rm) |
932 |
|
264 |
|
70 |
|
|
(US$m) |
52 |
|
17 |
|
5 |
|
Operating free cash flow1 |
(Rm) |
(402) |
|
314 |
|
385 |
|
|
(US$m) |
(23) |
|
21 |
|
25 |
|
| Cash operating cost |
(R/kg) |
649 264 |
|
549 621 |
|
503 635 |
|
|
(US$/oz) |
1 137 |
|
1 124 |
|
1 017 |
|
| All-in sustaining cost |
(R/kg) |
721 034 |
|
608 952 |
|
601 978 |
|
|
(US$/oz) |
1 262 |
|
1 245 |
|
1 216 |
|
| Average exchange rate |
(R/US$) |
17.76 |
|
15.21 |
|
15.40 |
|
| Safety |
|
|
|
|
| Loss of life |
|
— |
— |
— |
| Lost-time injury frequency rate |
per million hours worked |
4.55 |
3.21 |
4.04 |
| Environment |
|
|
|
|
| Electricity consumption |
(GWh) |
205 |
205 |
142 |
| Water consumption – primary activities |
(Ml) |
5 714 |
6 704 |
6 222 |
| Greenhouse gas emissions |
(000tCO2e) |
222 |
222 |
154 |
| Intensity data per tonne treated |
|
|
|
|
| – Energy |
|
0.01 |
0.01 |
0.01 |
| – Water |
|
0.25 |
0.29 |
0.35 |
| – Greenhouse gas emissions |
|
0.01 |
0.01 |
0.01 |
| Number of reportable environmental incidents |
|
— |
1 |
1 |
| Community |
|
|
|
|
Local economic development |
(Rm) |
— |
|
— |
|
— |
|
| Training and development |
(Rm) |
11 |
|
7 |
|
1 |
|
1 Operating free cash flow = revenue – Franco-Nevada non-cash consideration – cash operating cost – capital expenditure as per operating results.
The results and figures for FY21 in the table above are for the nine months from 1 October 2020 to 30 June 2021.
Mine Waste Solutions (tailings retreatment) continued
|
|
|
|
|
|
| Other salient features |
| Status of operation |
Hydro-mining, tailings retreatment |
| Life-of-mine |
16 years |
Mineral Reserve estimates at 30 June 2023
|
|
|
|
|
|
|
|
|
|
|
|
|
|
|
|
|
|
|
|
|
|
|
|
|
|
|
|
|
|
|
Proved |
Probable |
Total |
| Reserves (metric) |
Tonnes
(Mt)
|
Grade
(g/t)
|
Gold
(000kg)
|
Tonnes
(Mt)
|
Grade
(g/t)
|
Gold
(000kg)
|
Tonnes
(Mt)
|
Grade
(g/t)
|
Gold
(000kg)
|
|
14.2 |
|
0.27 |
|
4 |
|
165.1 |
|
0.25 |
|
41 |
|
179.3 |
|
0.25 |
|
45 |
|
| Reserves (imperial) |
Tons
(Mt)
|
Grade
(oz/t)
|
Gold
(000oz)
|
Tons
(Mt)
|
Grade
(oz/t)
|
Gold
(000oz)
|
Tons
(Mt)
|
Grade
(oz/t)
|
Gold
(000oz)
|
|
15.7 |
|
0.008 |
|
123 |
|
182.0 |
|
0.007 |
|
1 308 |
|
197.7 |
|
0.007 |
|
1 431 |
|
Overview of operations
Mine Waste Solutions is a tailings retreatment operation near Klerksdorp in the North West province. It reprocesses low-grade material from tailing storage facilities scattered across the Vaal River and Stilfontein area to reduce the tailings footprint.
The operation was acquired from AngloGold Ashanti Limited in October 2020.
Harmony's subsidiary Chemwes Proprietary Limited, the owner of Mine Waste Solutions, has a contract with Franco-Nevada Barbados (Franco-Nevada) where Franco-Nevada is entitled to receive 25% of all the gold produced through Mine Waste Solutions.
As at 30 June 2022, the balance of gold ounces to be delivered to Franco-Nevada amounted to 61 157oz. For the year ended 30 June 2023, 22 269 has been delivered to Franco-Nevada, bringing the remaining balance of gold ounces to be delivered as at year end to 38 888oz.
Operating performance FY23
The lost-time injury frequency rate at Mine Waste Solutions deteriorated to 4.55 per million hours worked in FY23 (FY22: 3.21). The management team remains committed to improving the safety performance.
Production at Mine Waste Solutions was marginally lower at 23.1 million tonnes processed in FY23 compared with 23.4 million tonnes in FY22. The average recovered grade for FY23 was 2% lower at 0.122g/t (FY22: 0.124g/t), resulting in gold production decreasing 3% to 2 804kg (90 150oz) from 2 899kg (93 205oz) in the previous year.
Despite the marginal decrease in production revenue rose 2% to R2 689 million (FY22: R2 642 million) due to a higher gold price. The average gold price received increased 12% to R845 341/kg (FY22: R753 912/kg). Cash operating cost increased 14% to R1 821 million (FY22: R1 593 million) mainly due to the higher cost of chemicals, most notably cyanide.
Capital expenditure of R932 million was incurred in FY23. This was significantly higher than the R264 million spent in FY22 and was mainly for the Kareerand expansion project as well as the West Complex pump station.
Our focus areas in FY24
|
|
|
The successful execution of all major projects that are earmarked to extend the life-of-mine of the operation as well as the successful commissioning of the West Complex pump station to replenish depleted sources. |
South Africa – surface operation
Kalgold
|
|
|
|
|
|
|
|
|
|
|
|
|
|
|
|
|
FY23 |
FY22 |
FY21 |
| Number of employees |
|
|
|
|
| – Permanent |
|
255 |
257 |
270 |
| – Contractors |
|
470 |
427 |
430 |
| Total |
|
725 |
684 |
700 |
| Operational |
|
|
|
|
| Volumes milled |
(000t) (metric) |
1 377 |
1 432 |
1 507 |
|
(000t) (imperial) |
1 519 |
1 579 |
1 662 |
| Gold produced |
(kg) |
1 175 |
1 137 |
1 109 |
|
(oz) |
37 778 |
36 555 |
35 655 |
| Gold sold |
(kg) |
1 163 |
1 142 |
1 112 |
|
(oz) |
37 392 |
36 717 |
35 752 |
| Grade |
(g/t) |
0.85 |
0.79 |
0.74 |
|
(oz/t) |
0.025 |
0.023 |
0.021 |
| Productivity |
(g/TEC) |
106.90 |
102.32 |
121.92 |
| Financial |
|
|
|
|
| Revenue |
(Rm) |
1 212 |
|
1 029 |
|
955 |
|
|
(US$m) |
68 |
|
68 |
|
62 |
|
| Average gold price received |
(R/kg) |
1 041 891 |
|
900 713 |
|
859 070 |
|
|
(US$/oz) |
1 824 |
|
1 842 |
|
1 735 |
|
| Cash operating cost |
(Rm) |
915 |
|
867 |
|
776 |
|
|
(US$m) |
52 |
|
57 |
|
50 |
|
| Production profit |
(Rm) |
313 |
|
159 |
|
179 |
|
|
(US$m) |
18 |
|
10 |
|
12 |
|
| Capital expenditure |
(Rm) |
219 |
|
203 |
|
208 |
|
|
(US$m) |
12 |
|
13 |
|
14 |
|
Operating free cash flow1 |
(Rm) |
68 |
|
(41) |
|
(36) |
|
|
(US$m) |
4 |
|
(3) |
|
(2) |
|
| Cash operating cost |
(R/kg) |
778 997 |
|
762 547 |
|
699 546 |
|
|
(US$/oz) |
1 364 |
|
1 559 |
|
1 413 |
|
| All-in sustaining cost |
(R/kg) |
986 677 |
|
964 678 |
|
905 253 |
|
|
(US$/oz) |
1 728 |
|
1 973 |
|
1 828 |
|
| Average exchange rate |
(R/US$) |
17.76 |
|
15.21 |
|
15.40 |
|
| Safety |
|
|
|
|
| Loss of life |
|
— |
— |
— |
| Lost-time injury frequency rate |
per million hours worked |
6.59 |
8.47 |
3.21 |
| Environment |
|
|
|
|
| Electricity consumption |
(GWh) |
53 |
54 |
53 |
| Water consumption – primary activities |
(Ml) |
267 |
376 |
267 |
| Greenhouse gas emissions |
(000tCO2e) |
72 |
58 |
75 |
| Intensity data per tonne treated |
|
|
|
|
| – Energy |
|
0.04 |
0.04 |
0.03 |
| – Water |
|
0.19 |
0.26 |
0.18 |
| – Greenhouse gas emissions |
|
0.05 |
0.05 |
0.05 |
| Number of reportable environmental incidents |
|
1 |
— |
— |
| Community |
|
|
|
|
Local economic development |
(Rm) |
3 |
|
3 |
|
1 |
|
| Training and development |
(Rm) |
9 |
|
7 |
|
6 |
|
1 Operating free cash flow = revenue – cash operating cost – capital expenditure ± impact of run-of-mine costs as per operating results.
Kalgold continued
|
|
|
|
|
|
| Other salient features |
| Status of operation |
Open-pit mining operation |
| Life-of-mine |
9 years |
| Nameplate hoisting capacity (per month) |
112 000 tonnes (124 000 tons) |
| Compliance and certification |
•New order mining right – August 2008
•ISO 14001
•ISO 9001.
|
Mineral Reserve estimates at 30 June 2023
|
|
|
|
|
|
|
|
|
|
|
|
|
|
|
|
|
|
|
|
|
|
|
|
|
|
|
|
|
|
|
Proved |
Probable |
Total |
| Reserves (metric) |
Tonnes
(Mt)
|
Grade
(g/t)
|
Gold
(000kg)
|
Tonnes
(Mt)
|
Grade
(g/t)
|
Gold
(000kg)
|
Tonnes
(Mt)
|
Grade
(g/t)
|
Gold
(000kg)
|
|
5.4 |
|
0.93 |
|
5 |
|
8.5 |
|
0.85 |
|
7 |
|
13.9 |
|
0.88 |
|
12 |
|
| Reserves (imperial) |
Tons
(Mt)
|
Grade
(oz/t)
|
Gold
(000oz)
|
Tons
(Mt)
|
Grade
(oz/t)
|
Gold
(000oz)
|
Tons
(Mt)
|
Grade
(oz/t)
|
Gold
(000oz)
|
|
5.9 |
|
0.027 |
|
160 |
|
9.4 |
|
0.025 |
|
232 |
|
15.3 |
|
0.026 |
|
392 |
|
Overview of operations
Kalgold is a long-life, open-pit gold mine on the Kraaipan Greenstone Belt, 55km south-west of Mahikeng in North West province.
Mining takes place from the A-zone pit, Watertank pit as well as Windmill pit. Mined ore is processed at the carbon-in-leach Kalgold plant.
Operating performance FY23
Kalgold maintained its loss-of-life free record in FY23. The lost-time injury frequency rate improved 22% to 6.59 per million hours worked in FY23 (FY22: 8.47).
Gold production increased 3% to 1 175kg (37 778oz) (FY22: 1 137kg, 36 555oz), due to an 8% increase in the recovered grade to 0.85g/t (FY22: 0.79g/t). The increase in grade was, however, partially offset by lower tonnes milled at 1.38 million tonnes, 3% lower than the previous year (FY22: 1.43 million tonnes). Production was impacted by power supply challenges in the first and second quarters of the year.
The increase in production combined with a 16% rise in the gold price to R1 041 891/kg (FY22: R900 713/kg) resulted in a 18% increase in revenue for FY23 to R1 212 million (FY22: R1 029 million). Cash operating costs increased 6% to R915 million (FY22: R867 million), mainly due to the higher cost of consumables, specifically diesel and chemicals as well as annual wage and electricity tariff increases.
Capital expenditure increased by 8% to R219 million (FY22: R203 million), mainly for capitalised stripping costs.
Our focus areas in FY24
|
|
|
| The operation will focus on exploring incremental opportunities while sustaining the current milling plan of 130 000 tonnes per month and further access the life-of-mine stripping ratio improvements. |
South Africa – surface operation
Phoenix (tailings retreatment)
|
|
|
|
|
|
|
|
|
|
|
|
|
|
|
|
|
FY23 |
FY22 |
FY21 |
| Number of employees |
|
|
|
|
| – Permanent |
|
85 |
85 |
86 |
| – Contractors |
|
265 |
274 |
247 |
| Total |
|
350 |
359 |
333 |
| Operational |
|
|
|
|
| Volumes milled |
(000t) (metric) |
6 218 |
6 229 |
6 190 |
|
(000t) (imperial) |
6 857 |
6 868 |
6 827 |
| Gold produced |
(kg) |
833 |
767 |
779 |
|
(oz) |
26 782 |
24 659 |
25 046 |
| Gold sold |
(kg) |
843 |
766 |
777 |
|
(oz) |
27 102 |
24 627 |
24 982 |
| Grade |
(g/t) |
0.134 |
0.123 |
0.126 |
|
(oz/t) |
0.004 |
0.004 |
0.004 |
| Productivity |
(g/TEC) |
416.17 |
378.21 |
375.24 |
| Financial |
|
|
|
|
| Revenue |
(Rm) |
889 |
|
689 |
|
620 |
|
|
(US$m) |
50 |
|
45 |
|
40 |
|
| Average gold price received |
(R/kg) |
1 054 262 |
|
899 012 |
|
798 310 |
|
|
(US$/oz) |
1 846 |
|
1 838 |
|
1 612 |
|
| Cash operating cost |
(Rm) |
504 |
|
441 |
|
396 |
|
|
(US$m) |
28 |
|
29 |
|
26 |
|
| Production profit |
(Rm) |
379 |
|
249 |
|
227 |
|
|
(US$m) |
21 |
|
16 |
|
15 |
|
| Capital expenditure |
(Rm) |
37 |
|
28 |
|
4 |
|
|
(US$m) |
2 |
|
2 |
|
— |
|
Operating free cash flow1 |
(Rm) |
347 |
|
220 |
|
221 |
|
|
(US$m) |
20 |
|
14 |
|
14 |
|
| Cash operating cost |
(R/kg) |
605 167 |
|
574 438 |
|
508 162 |
|
|
(US$/oz) |
1 060 |
|
1 175 |
|
1 026 |
|
| All-in sustaining cost |
(R/kg) |
653 241 |
|
611 580 |
|
511 946 |
|
|
(US$/oz) |
1 144 |
|
1 251 |
|
1 034 |
|
| Average exchange rate |
(R/US$) |
17.76 |
|
15.21 |
|
15.40 |
|
| Safety |
|
|
|
|
| Loss of life |
|
— |
— |
— |
| Lost-time injury frequency rate |
per million hours worked |
— |
1.64 |
— |
| Environment |
|
|
|
|
| Electricity consumption |
(GWh) |
40 |
40 |
41 |
| Water consumption – primary activities |
(Ml) |
34 |
102 |
305 |
| Greenhouse gas emissions |
(000tCO2e) |
41 |
43 |
43 |
| Intensity data per tonne treated |
|
|
|
|
| – Energy |
|
0.01 |
0.01 |
0.01 |
| – Water |
|
0.01 |
0.02 |
0.05 |
| – Greenhouse gas emissions |
|
0.01 |
0.01 |
0.01 |
| Number of reportable environmental incidents |
|
— |
1 |
1 |
1 Operating free cash flow = revenue – cash operating cost – capital expenditure as per operating results.
Phoenix (tailings retreatment) continued
|
|
|
|
|
|
| Other salient features |
| Status of operation |
Hydro-mining, tailings retreatment |
| Life-of-mine |
5 years |
Mineral Reserve estimates at 30 June 2023
|
|
|
|
|
|
|
|
|
|
|
|
|
|
|
|
|
|
|
|
|
|
|
|
|
|
|
|
|
|
|
Proved |
Probable |
Total |
| Reserves (metric) |
Tonnes
(Mt)
|
Grade
(g/t)
|
Gold
(000kg)
|
Tonnes
(Mt)
|
Grade
(g/t)
|
Gold
(000kg)
|
Tonnes
(Mt)
|
Grade
(g/t)
|
Gold
(000kg)
|
|
30.4 |
|
0.28 |
|
9 |
|
— |
|
— |
|
— |
|
30.4 |
|
0.28 |
|
9 |
|
| Reserves (imperial) |
Tons
(Mt)
|
Grade
(oz/t)
|
Gold
(000oz)
|
Tons
(Mt)
|
Grade
(oz/t)
|
Gold
(000oz)
|
Tons
(Mt)
|
Grade
(oz/t)
|
Gold
(000oz)
|
|
33.5 |
|
0.008 |
|
278 |
|
— |
|
— |
|
— |
|
33.5 |
|
0.008 |
|
278 |
|
Overview of operations
Phoenix is a tailings retreatment operation in Virginia, Free State. It retreats tailings from Harmony’s tailings storage facilities in the Free State region to extract any residual gold, using the Saaiplaas plant. It is 100% owned by the black economic empowerment company, Tswelopele Beneficiation Operation Proprietary Limited, of which Harmony is a 76% shareholder.
Operating performance FY23
Phoenix maintained its good safety performance.
Gold production increased 9% to 833kg (26 782oz) from 767kg (24 659oz) in FY22. This was due to a 9% increase in the recovered grade to 0.134g/t (FY22: 0.123g/t). Volumes of ore processed remained constant at 6.2 million tonnes (FY22: 6.2 million tonnes). The higher gold production combined with a 17% rise in average gold price received to R1 054 262/kg (FY22: R899 012/kg) led to a 29% increase in revenue to R889 million (FY22: R689 million).
All-in sustaining cost rose 7% to R653 241/kg, mainly due to a 14% increase in cash operating cost. Cash cost increased mainly due to a significant increase in the cost of chemicals as well as annual labour and electricity increases. Capital expenditure for FY23 increased to R37 million (FY22: R28 million), mainly on the St Helena TSF remediation and carbon regeneration kiln.
Our focus areas in FY24
|
|
|
| Continue safe operations and deliver operational excellence through a combination of a good health and safety environment, cost competitiveness and improving process efficiencies. |
South Africa – surface operation
Central Plant Reclamation (tailings retreatment)
|
|
|
|
|
|
|
|
|
|
|
|
|
|
|
|
|
FY23 |
FY22 |
FY21 |
| Number of employees |
|
|
|
|
| – Permanent |
|
95 |
97 |
96 |
| – Contractors |
|
170 |
151 |
153 |
| Total |
|
265 |
248 |
249 |
| Operational |
|
|
|
|
| Volumes milled |
(000t) (metric) |
3 972 |
4 033 |
4 020 |
|
(000t) (imperial) |
4 380 |
4 447 |
4 434 |
| Gold produced |
(kg) |
577 |
586 |
563 |
|
(oz) |
18 552 |
18 840 |
18 101 |
| Gold sold |
(kg) |
572 |
591 |
566 |
|
(oz) |
18 391 |
19 001 |
18 197 |
| Grade |
(g/t) |
0.145 |
0.145 |
0.140 |
|
(oz/t) |
0.004 |
0.004 |
0.004 |
| Productivity |
(g/TEC) |
289.99 |
299.58 |
291.34 |
| Financial |
|
|
|
|
| Revenue |
(Rm) |
599 |
|
538 |
|
482 |
|
|
(US$m) |
34 |
|
35 |
|
31 |
|
| Average gold price received |
(R/kg) |
1 046 428 |
|
911 134 |
|
851 505 |
|
|
(US$/oz) |
1 832 |
|
1 863 |
|
1 720 |
|
| Cash operating cost |
(Rm) |
330 |
|
290 |
|
271 |
|
|
(US$m) |
19 |
|
19 |
|
18 |
|
| Production profit |
(Rm) |
272 |
|
246 |
|
211 |
|
|
(US$m) |
15 |
|
16 |
|
14 |
|
| Capital expenditure |
(Rm) |
31 |
|
18 |
|
13 |
|
|
(US$m) |
2 |
|
1 |
|
1 |
|
Operating free cash flow1 |
(Rm) |
238 |
|
231 |
|
198 |
|
|
(US$m) |
13 |
|
15 |
|
13 |
|
| Cash operating cost |
(R/kg) |
572 213 |
|
494 060 |
|
480 975 |
|
|
(US$/oz) |
1 002 |
|
1 010 |
|
971 |
|
| All-in sustaining cost |
(R/kg) |
633 098 |
|
529 591 |
|
501 947 |
|
|
(US$/oz) |
1 108 |
|
1 083 |
|
1 014 |
|
| Average exchange rate |
(R/US$) |
17.76 |
|
15.21 |
|
15.40 |
|
| Safety |
|
|
|
|
| Loss of life |
|
— |
— |
— |
| Lost-time injury frequency rate |
per million hours worked |
2.21 |
— |
— |
| Environment |
|
|
|
|
| Electricity consumption |
(GWh) |
24 |
23 |
23 |
| Water consumption – primary activities |
(Ml) |
171 |
220 |
203 |
| Greenhouse gas emissions |
(000tCO2e) |
27 |
25 |
27 |
| Intensity data per tonne treated |
|
|
|
|
| – Energy |
|
0.01 |
0.01 |
0.01 |
| – Water |
|
0.04 |
0.05 |
0.05 |
| – Greenhouse gas emissions |
|
0.01 |
0.01 |
0.01 |
| Number of reportable environmental incidents |
|
— |
— |
— |
1 Operating free cash flow = revenue – cash operating cost – capital expenditure as per operating results.
Central Plant Reclamation (tailings retreatment) continued
|
|
|
|
|
|
| Other salient features |
| Status of operation |
Hydro-mining, tailings retreatment |
| Life-of-mine |
12 years |
Mineral Reserve estimates at 30 June 2023
|
|
|
|
|
|
|
|
|
|
|
|
|
|
|
|
|
|
|
|
|
|
|
|
|
|
|
|
|
|
|
Proved |
Probable |
Total |
| Reserves (metric) |
Tonnes
(Mt)
|
Grade
(g/t)
|
Gold
(000kg)
|
Tonnes
(Mt)
|
Grade
(g/t)
|
Gold
(000kg)
|
Tonnes
(Mt)
|
Grade
(g/t)
|
Gold
(000kg)
|
|
— |
|
— |
|
— |
|
45.1 |
|
0.27 |
|
12 |
|
45.1 |
|
0.27 |
|
12 |
|
| Reserves (imperial) |
Tons
(Mt)
|
Grade
(oz/t)
|
Gold
(000oz)
|
Tons
(Mt)
|
Grade
(oz/t)
|
Gold
(000oz)
|
Tons
(Mt)
|
Grade
(oz/t)
|
Gold
(000oz)
|
|
— |
|
— |
|
— |
|
49.7 |
|
0.008 |
|
385 |
|
49.7 |
|
0.008 |
|
385 |
|
Overview of operations
Central Plant Reclamation is a tailings retreatment operation near Welkom in the Free State. Originally built to process waste-rock dumps, it was converted into a tailings retreatment facility in FY17.
Operating performance FY23
Central plant maintains a good safety record with an LTIFR of 2.21 per million hours worked recorded in FY23.
The operation had another steady production year maintaining the recovered grade at 0.145g/t for FY23 (FY22: 0.145g/t), combined with marginally lower tonnes processed at 3.97 million tonnes (FY22: 4.03 million tonnes) resulting in gold produced decreasing 2% to 577kg (18 552oz) (FY22: 586kg, 18 840oz). Revenue however increased to R599 million for FY23, 11% higher than the R538 million recorded for FY22, due to a 15% rise in the gold price received to R1 046 428/kg (FY22: R911 134/kg).
All-in sustaining cost increased 20% to R633 098/kg (FY22: R529 591/kg), mainly driven by higher cost of chemicals as well as annual wage and electricity tariff increases. Capital expenditure for FY23 rose 72% to R31 million (FY22: R18 million) mainly on higher dam maintenance costs.
Our focus areas in FY24
|
|
|
| Continue safe operations and deliver operational excellence through a combination of a good health and safety environment, cost competitiveness and improving process efficiencies. |
South Africa – surface operation
Savuka (tailings retreatment)
|
|
|
|
|
|
|
|
|
|
|
|
|
|
|
|
|
FY23 |
FY22 |
FY21 |
| Number of employees |
|
|
|
|
| – Permanent |
|
96 |
107 |
189 |
| – Contractors |
|
107 |
136 |
25 |
| Total |
|
203 |
243 |
214 |
| Operational |
|
|
|
|
| Volumes milled |
(000t) (metric) |
3 880 |
3 230 |
1 696 |
|
(000t) (imperial) |
4 278 |
3 563 |
1 870 |
| Gold produced |
(kg) |
593 |
495 |
285 |
|
(oz) |
19 066 |
15 914 |
9 172 |
| Gold sold |
(kg) |
591 |
509 |
275 |
|
(oz) |
19 001 |
16 365 |
8 827 |
| Grade |
(g/t) |
0.153 |
0.153 |
0.168 |
|
(oz/t) |
0.004 |
0.004 |
0.005 |
| Productivity |
(g/TEC) |
199.25 |
220.65 |
147.91 |
| Financial |
|
|
|
|
| Revenue |
(Rm) |
614 |
|
475 |
|
245 |
|
|
(US$m) |
35 |
|
31 |
|
16 |
|
| Average gold price received |
(R/kg) |
1 038 531 |
|
932 619 |
|
892 309 |
|
|
(US$/oz) |
1 818 |
|
1 907 |
|
1 805 |
|
| Cash operating cost |
(Rm) |
319 |
|
275 |
|
129 |
|
|
(US$m) |
18 |
|
18 |
|
8 |
|
| Production profit |
(Rm) |
296 |
|
189 |
|
117 |
|
|
(US$m) |
17 |
|
12 |
|
8 |
|
| Capital expenditure |
(Rm) |
16 |
|
28 |
|
— |
|
|
(US$m) |
1 |
|
2 |
|
— |
|
Operating free cash flow1 |
(Rm) |
278 |
|
173 |
|
117 |
|
|
(US$m) |
16 |
|
11 |
|
8 |
|
| Cash operating cost |
(R/kg) |
538 202 |
|
554 669 |
|
451 547 |
|
|
(US$/oz) |
942 |
|
1 134 |
|
911 |
|
| All-in sustaining cost |
(R/kg) |
564 738 |
|
615 137 |
|
467 905 |
|
|
(US$/oz) |
989 |
|
1 258 |
|
945 |
|
| Average exchange rate |
(R/US$) |
17.76 |
|
15.21 |
|
15.40 |
|
| Safety |
|
|
|
|
| Loss of life |
|
— |
— |
— |
| Lost-time injury frequency rate |
per million hours worked |
— |
— |
— |
|
|
|
|
|
|
|
|
|
|
|
|
|
|
|
|
|
|
|
|
|
|
|
|
|
|
|
|
|
|
|
|
|
|
|
|
|
|
|
|
|
|
|
|
|
1 Operating free cash flow = revenue – cash operating cost – capital expenditure as per operating results.
Savuka Tailings was previously included with the waste rock dumps and will in future be reported as a separate operation.
The results and figures for FY21 in the table above are for the nine months from 1 October 2020 to 30 June 2021.
Savuka (tailings retreatment) continued
|
|
|
|
|
|
| Other salient features |
| Status of operation |
Tailings retreatment |
| Life-of-mine |
5 years |
Mineral Reserve estimates at 30 June 2023
|
|
|
|
|
|
|
|
|
|
|
|
|
|
|
|
|
|
|
|
|
|
|
|
|
|
|
|
|
|
|
Proved |
Probable |
Total |
| Reserves (metric) |
Tonnes
(Mt)
|
Grade
(g/t)
|
Gold
(000kg)
|
Tonnes
(Mt)
|
Grade
(g/t)
|
Gold
(000kg)
|
Tonnes
(Mt)
|
Grade
(g/t)
|
Gold
(000kg)
|
|
— |
|
— |
|
— |
|
17.4 |
|
0.32 |
|
5 |
|
17.4 |
|
0.32 |
|
5 |
|
| Reserves (imperial) |
Tons
(Mt)
|
Grade
(oz/t)
|
Gold
(000oz)
|
Tons
(Mt)
|
Grade
(oz/t)
|
Gold
(000oz)
|
Tons
(Mt)
|
Grade
(oz/t)
|
Gold
(000oz)
|
|
— |
|
— |
|
— |
|
19.1 |
|
0.009 |
|
176 |
|
19.1 |
|
0.009 |
|
176 |
|
Overview of operations
Savuka plant is situated near the town of Carletonville and was acquired from AngloGold Ashanti Limited in October 2020. The plant originally treated both waste rock and tailings but was converted to a tailings treatment facility only in October 2021 when the milling section of the plant was decommissioned.
Operating performance FY23
The operation processed 3.88 million tonnes in FY23, 20% more than the 3.23 million tonnes processed in FY22. The recovered grade remained constant at 0.153g/t in FY23 (FY22: 0.153g/t). The higher tonnes processed resulted in a 20% increase in gold produced to 593kg (19 066oz) from 495kg (15 914oz) in FY22.
The increase in gold production combined with an 11% increase in the gold price to R1 038 531/kg (FY22: 932 619/kg) resulted in a 29% rise in revenue to R614 million (FY22: R475 million).
The increase in production also offset higher year-on-year cash operating cost for the operation with the all-in sustaining cost decreasing 8% to R564 738/kg (FY22: R615 137/kg). Capital expenditure for FY23 at R16 million was 43% lower than the previous year (FY22: R28 million), mainly for plant maintenance.
Our focus areas in FY24
|
|
|
| Continue safe operations and deliver operational excellence through a combination of a good health and safety environment, cost competitiveness and improving process efficiencies. |
South Africa – surface operation
Waste rock dumps
|
|
|
|
|
|
|
|
|
|
|
|
|
|
|
|
|
FY23 |
FY22 |
FY21 |
| Operational |
|
|
|
|
| Volumes milled |
(000t) (metric) |
3 935 |
5 813 |
8 411 |
|
(000t) (imperial) |
4 339 |
6 409 |
9 275 |
| Gold produced |
(kg) |
1 541 |
2 319 |
3 295 |
|
(oz) |
49 544 |
74 557 |
105 927 |
| Gold sold |
(kg) |
1 549 |
2 366 |
3 252 |
|
(oz) |
49 801 |
76 068 |
104 568 |
| Grade |
(g/t) |
0.392 |
0.399 |
0.392 |
|
(oz/t) |
0.011 |
0.012 |
0.011 |
| Financial |
|
|
|
|
| Revenue |
(Rm) |
1 631 |
|
2 138 |
|
2 834 |
|
|
(US$m) |
92 |
|
141 |
|
184 |
|
| Average gold price received |
(R/kg) |
1 052 903 |
|
903 464 |
|
871 323 |
|
|
(US$/oz) |
1 844 |
|
1 847 |
|
1 760 |
|
| Cash operating cost |
(Rm) |
1 313 |
|
1 647 |
|
1 998 |
|
|
(US$m) |
74 |
|
108 |
|
130 |
|
| Production profit |
(Rm) |
311 |
|
474 |
|
816 |
|
|
(US$m) |
18 |
|
31 |
|
53 |
|
| Capital expenditure |
(Rm) |
12 |
|
7 |
|
39 |
|
|
(US$m) |
1 |
|
— |
|
3 |
|
Operating free cash flow1 |
(Rm) |
306 |
|
484 |
|
796 |
|
|
(US$m) |
17 |
|
32 |
|
52 |
|
| Cash operating cost |
(R/kg) |
852 146 |
|
710 022 |
|
606 358 |
|
|
(US$/oz) |
1 492 |
|
1 452 |
|
1 225 |
|
| All-in sustaining cost |
(R/kg) |
859 974 |
|
705 642 |
|
632 528 |
|
|
(US$/oz) |
1 506 |
|
1 443 |
|
1 278 |
|
| Average exchange rate |
(R/US$) |
17.76 |
|
15.21 |
|
15.40 |
|
| Safety |
|
|
|
|
| Loss of life |
|
— |
— |
— |
| Lost-time injury frequency rate |
per million hours worked |
— |
— |
— |
| Environment |
|
|
|
|
| Electricity consumption |
(GWh) |
* |
* |
* |
| Water consumption – primary activities |
(Ml) |
* |
* |
* |
| Greenhouse gas emissions |
(000tCO2e) |
* |
* |
* |
| Intensity data per tonne treated |
|
|
|
|
| – Energy |
|
* |
* |
* |
| – Water |
|
* |
* |
* |
| – Greenhouse gas emissions |
|
* |
* |
* |
| Number of reportable environmental incidents |
|
— |
— |
— |
* Electricity and water consumption and related emission and intensity data for the respective plants at which the waste rock dumps are processed are accounted for as part of the primary operation’s environmental results.
1 Operating free cash flow = revenue – cash operating cost – capital expenditure as per operating results.
Figures for FY21 and FY22 has been adjusted to exclude Savuka Tailings which has been included as a separate operation.
Waste rock dumps continued
|
|
|
|
|
|
| Other salient features |
| Status of operation |
Processing waste-rock dumps depends on the availability of spare plant capacity and plant requirements for grinding material |
| Life-of-mine |
±1 year |
Mineral Reserve estimates at 30 June 2023
|
|
|
|
|
|
|
|
|
|
|
|
|
|
|
|
|
|
|
|
|
|
|
|
|
|
|
|
|
|
|
Proved |
Probable |
Total |
| Reserves (metric) |
Tonnes
(Mt)
|
Grade
(g/t)
|
Gold
(000kg)
|
Tonnes
(Mt)
|
Grade
(g/t)
|
Gold
(000kg)
|
Tonnes
(Mt)
|
Grade
(g/t)
|
Gold
(000kg)
|
|
— |
|
— |
|
— |
|
— |
|
— |
|
— |
|
— |
|
— |
|
— |
|
| Reserves (imperial) |
Tons
(Mt)
|
Grade
(oz/t)
|
Gold
(000oz)
|
Tons
(Mt)
|
Grade
(oz/t)
|
Gold
(000oz)
|
Tons
(Mt)
|
Grade
(oz/t)
|
Gold
(000oz)
|
|
— |
|
— |
|
— |
|
— |
|
— |
|
— |
|
— |
|
— |
|
— |
|
Overview of operations
Production from processing surface rock dumps, situated across Harmony’s operations, depends entirely on the availability of spare mill capacity at the various operational plants. Waste and waste rock dump deliveries to Kusasalethu plant (near the border of Gauteng and North West provinces) supplement mining volumes to secure sufficient backfill to use as support in stoping areas. Waste rock dumps near Orkney (acquired with Moab Khotsong operations) are treated at the Noligwa and Mispah plants. Milling of waste rock dumps at the Doornkop plant in Gauteng began in FY18. Waste rock dumps and tailings facilities acquired with Mponeng are treated at Mponeng and Kusasalethu plants. Surface ore treated at Kopanang plant was unprofitable and closed during the first quarter of FY22. The plant is currently on care and maintenance.
Operating performance FY23
The diminishing levels of waste rock available to be treated in certain areas has resulted in lower tonnes milled for these operations in FY23, decreasing 32% to 3.9 million tonnes (FY22: 5.8 million tonnes). The recovered grade for FY23 decreased to 0.392g/t, 2% lower than the 0.399g/t recorded in FY22. This resulted in lower gold production at 1 541kg (49 544oz) in FY23 and was 34% lower than the 2 319kg (74 557oz) recorded in FY22. Revenue for these operations was 24% lower at R1 631 million (FY22: R2 138 million) partially offset by a higher gold price of R1 052 903/kg for FY23 (FY22: R903 464/kg).
All-in sustaining cost rose 22% to R859 974/kg due to lower production. Capital expenditure for FY23 increased to R12 million (FY22: R7 million), mainly related to planned maintenance.
Our focus areas in FY24
|
|
|
| The priority for FY24 will be to continue safe, profitable production by maintaining costs and improving mining efficiencies. |
Papua New Guinea
Hidden Valley
|
|
|
|
|
|
|
|
|
|
|
|
|
|
|
|
|
FY23 |
FY22 |
FY21 |
| Number of employees |
|
|
|
|
| – Permanent |
|
1 422 |
1 478 |
1 474 |
| – Contractors |
|
767 |
713 |
754 |
| Total |
|
2 189 |
2 191 |
2 228 |
| Operational |
|
|
|
|
| Volumes milled |
(000t) (metric) |
3 846 |
3 229 |
3 420 |
|
(000t) (imperial) |
4 240 |
3 561 |
3 772 |
| Gold produced |
(kg) |
4 370 |
3 707 |
4 689 |
|
(oz) |
140 498 |
119 182 |
150 755 |
| Gold sold |
(kg) |
4 214 |
3 662 |
4 755 |
|
(oz) |
135 483 |
117 736 |
152 876 |
| Grade |
(g/t) |
1.14 |
1.15 |
1.37 |
|
(oz/t) |
0.033 |
0.033 |
0.040 |
| Financial |
|
|
|
|
| Revenue |
(Rm) |
4 440 |
|
3 158 |
|
4 028 |
|
|
(US$m) |
250 |
|
208 |
|
262 |
|
| Average gold price received |
(R/kg) |
1 053 611 |
|
862 505 |
|
847 027 |
|
|
(US$/oz) |
1 845 |
|
1 764 |
|
1 711 |
|
| Cash operating cost |
(Rm) |
2 127 |
|
2 193 |
|
1 670 |
|
|
(US$m) |
120 |
|
144 |
|
108 |
|
| Production profit |
(Rm) |
2 404 |
|
1 036 |
|
2 309 |
|
|
(US$m) |
135 |
|
68 |
|
150 |
|
| Capital expenditure |
(Rm) |
1 737 |
|
1 249 |
|
1 260 |
|
|
(US$m) |
98 |
|
82 |
|
82 |
|
Operating free cash flow1 |
(Rm) |
615 |
|
(46) |
|
1 117 |
|
|
(US$m) |
35 |
|
(3) |
|
73 |
|
| Cash operating cost |
(R/kg) |
486 754 |
|
591 551 |
|
356 233 |
|
|
(US$/oz) |
852 |
|
1 210 |
|
719 |
|
| All-in sustaining cost |
(R/kg) |
1 014 228 |
|
1 007 986 |
|
677 659 |
|
|
(US$/oz) |
1 785 |
|
2 067 |
|
1 383 |
|
| Average exchange rate |
(R/US$) |
17.76 |
|
15.21 |
|
15.40 |
|
| Safety |
|
|
|
|
| Loss of life |
|
— |
— |
— |
| Lost-time injury frequency rate |
per million hours worked |
0.35 |
0.21 |
— |
| Environment |
|
|
|
|
Purchased electricity consumption2 |
(GWh) |
55 |
63 |
103 |
| Water consumption – primary activities |
(Ml) |
2 186 |
1 930 |
1 983 |
| Greenhouse gas emissions |
(000tCO2e) |
186 |
171* |
158 |
| Intensity data per tonne treated |
|
|
|
|
| – Energy |
|
0.01 |
0.02 |
0.03 |
| – Water |
|
0.57 |
0.60 |
0.58 |
| – Greenhouse gas emissions |
|
0.05 |
0.05 |
0.05 |
| Number of reportable environmental incidents |
|
— |
— |
— |
1 Operating free cash flow = revenue – cash operating cost – capital expenditure ± impact of run-of-mine costs as per operating results.
2 Electricity consumption for FY23 represents consumption from the grid only.
*Figure restated
Hidden Valley continued
|
|
|
|
|
|
| Other salient features |
| Status of operation |
Open-pit mining operation producing gold and silver (by-product) |
| Life-of-mine |
5 years |
Mineral Reserve estimates at 30 June 2023
|
|
|
|
|
|
|
|
|
|
|
|
|
|
|
|
|
|
|
|
|
|
|
|
|
|
|
|
|
|
|
Proved |
Probable |
Total |
| Reserves (metric) |
Tonnes
(Mt)
|
Grade
(g/t)
|
Gold
(000kg)
|
Tonnes
(Mt)
|
Grade
(g/t)
|
Gold
(000kg)
|
Tonnes
(Mt)
|
Grade
(g/t)
|
Gold
(000kg)
|
|
1.6 |
|
0.97 |
|
2 |
|
17.8 |
|
1.78 |
|
32 |
|
19.4 |
|
1.71 |
|
33 |
|
| Reserves (imperial) |
Tons
(Mt)
|
Grade
(oz/t)
|
Gold
(000oz)
|
Tons
(Mt)
|
Grade
(oz/t)
|
Gold
(000oz)
|
Tons
(Mt)
|
Grade
(oz/t)
|
Gold
(000oz)
|
|
1.8 |
|
0.028 |
|
51 |
|
19.6 |
|
0.052 |
|
1 017 |
|
21.4 |
|
0.050 |
|
1 068 |
|
Overview of operations
The Hidden Valley Mine is an open-pit gold and silver operation in Morobe Province, Papua New Guinea, some 210km north-west of Port Moresby. The mine is located at elevations of 1 700m to 2 800m above sea level in steep mountainous and forested terrain that receives around 3m of rainfall per year. The major gold and silver deposits of Hidden Valley are in the Morobe Granodiorite of the Wau Graben.
Crushed ore is conveyed from the pit via a 5.5km overland pipe conveyor and treated at the Hidden Valley processing plant, using a two-stage crushing circuit followed by a semi-autogenous grinding mill, gravity, counter current decantation/ Merrill Crowe circuit for silver and a carbon-in-leach circuit for gold.
Operating performance FY23
Hidden Valley’s safety performance is among the best in the industry, with a seventh consecutive year of zero loss-of-life incidents and, as of FY23, has achieved over 3.6 million loss-of-life free shifts. This is testament to the culture of zero harm, safety coaching and leadership, as well as the use of critical control management that has been embedded operationally to drive safety.
Hidden Valley had a challenging start to the year as operations were affected by a shortage of blasted rock to process resulting in a slower than planned mining rate and dilution factor ultimately affecting recovered grades. The recovered grade for FY23 was marginally lower at 1.14g/t compared to 1.15g/t in FY22. The recovered grade for the final quarter was 1.58g/t, significantly higher than the preceding quarters. Tonnes milled for FY23 at 3.8 million tonnes was 19% higher than the previous year (FY22: 3.2 million tonnes). As a result, gold production increased 18% to 4 370kg (140 498oz) from 3 707kg (119 182oz) in FY22.
Revenue increased 41% to R4 440 million (FY22: R3 158 million) on the back of higher gold production as well as a rise in the gold price. The average gold price received increased 22% to R1 053 611/kg (FY22: R862 505/kg). All-in sustaining cost for FY23 was largely flat at R1 014 228/kg (US$1 785/oz) when compared to the R1 007 986/kg (US$2 067/oz) recorded in the previous year.
Our focus areas in FY24
|
|
|
| The key focus in FY24 will be to safely produce between 146 500oz and 152 800oz of gold as well as the construction of the engineered tailing storage facilities supporting the life-of-mine extension. |
EXPLORATION AND PROJECTS
|
|
|
|
|
|
|
|
|
|
|
|
| Optimal mix of investments to create value |
| CAPITAL PRIORITISATION |
VALUE REALISATION |
MAJOR PROJECTS |
EXPLORATION |
Safety and production optimisation: ZERO loss-of-life and S3001 |
Lower risk profile All ESG factors considered especially safety and climate change |
Hidden Valley extension |
Regional Eva portfolio drilling |
Debt repayment: <1x net debt/EBITDA2 |
Improving margins targeting acquisitions with AISC* <$1 400/oz |
Moab Khotsong – Zaaiplaats |
Target North |
| Organic growth and investment:focus on increasing grade and margins |
Generating returns targeting an IRR4 of 15.% and higher |
MWS – Kareerand |
Kalgold drilling |
| Inorganic growth: Value accretive mergers and acquisitions |
Improve production profile: 10-year life-of-mine at 100-200koz per annum
in gold or gold equivalents |
Doornkop expansion |
Savuka and Tau-Tona pillar |
Returning capital to shareholders:
Paying a consistent dividend consistent with policy and overall growth strategy |
Affordability:
Capital intensity vs cash flows to be manageable
|
Eva Copper Project |
Mponeng deepening |
|
|
Renewables |
Kalgold expansion |
|
|
|
Kerimenge Heap
leach project |
|
|
|
Savuka TSFs |
|
|
|
Eva Copper |
|
|
|
Wafi-Golpu |
|
|
|
|
1 S300: safety and productivity programme
2 EBITDA: earnings before interest, taxes, depreciation and amortisation
3 AISC: All-in sustaining cost.
4 IRR: Internal rate of return.
Exploration
Our exploration strategy is to predominantly pursue brownfields exploration targets close to existing infrastructure. This will drive short to medium-term organic Mineral Reserve replacement and growth to support our current strategy of increasing quality ounces and to mitigate the risk of a depleting Mineral Reserve base.
Key work streams underpinning the FY23 exploration programme include:
•Exploration at Eva Copper
•Brownfield exploration at Hidden Valley, Kerimenge and Kalgold to optimise existing open-pit operations and extend mine life
•Brownfield exploration at our underground operations in South Africa
•Greenfield exploration at Target North
•Reviewing exploration opportunities as part of our new business strategy.
|
|
|
| Eva Copper Drilling |
Since acquiring the project in December 2022, drilling has comprised 123 holes for 17 044m. The work programme forms part of major drill programme designed to validate or test various study elements including resource definition, infrastructure sterilisation, metallurgical, geotechnical aspects, construction material characterisation and water borefield exploration and development. Drilling continues. |
|
|
|
| Target North |
|
The exploration drilling programme from surface advanced and a total of 5 823 metres was drilled
Mal22 drill hole was completed and a deflection programme produced nine reef intersections
At a second drill hole Mal23, two long directional deflections were completed, to produce 10 reef intersections
Drilling continues. The Resource model of Target North will be updated once Mal23 is completed.
|
|
| Kalgold |
Resource extension drilling was carried out at the Spanover and Windmill North. A total of 34 boreholes were drilled (3 590 metres of RC drilling). Drilling returned very encouraging initial results. A Spanover and Windmill North Resource model update is planned once all assay results are obtained and verified. Exploration aimed at improving understanding of the potential to develop the Kraaipan Greenstone Belt into a new mineralised province with multiple mining centres. |
|
Major projects
We have identified substantial opportunities in our existing portfolio through exploration and brownfield projects which will extend the life of some of our larger and higher-grade assets, adding lower-risk, higher-margin ounces to Harmony’s portfolio. Each project brings multiple benefits to Harmony and exceeds all our minimum criteria for allocating capital. We will continue to focus on ensuring all our mines operate safely and optimally and will continue to invest across all our operations to ensure optimal production.
Well sequenced and manageable project capital1
1 Based on FY24 planning.
2 Subject to completion of Eva Copper feasibility studies, permitting and investment approval.
3 Funding solutions to be considered once special mining lease in place.
The salient features of our key projects are:
|
|
|
Papua New Guinea |
|
| Hidden Valley brownfield exploration |
|
Kerimenge prospect – The Kerimenge prospect is located approximately 8km to the east of the Hidden Valley Mine. Drilling to support a prefeasibility study was completed during the year. Review of existing drill data commenced with the aim of developing a new Resource estimate. Kerimenge is a historic gold deposit outlined by previous explorers that contains components of refractory and free milling oxide gold mineralisation.
|
|
|
Hidden Valley life-of-mine extension |
|
The Hidden Valley life-of-mine (LoM) extension project concept study / prefeasibility study considers the potential to convert both the 0.6M Au oz Kerimenge Resource and the 1.6 M Au oz remaining in the Hidden Valley Mineral Resource outside the current LoM to convert to a viable, low risk, high-margin mining operation. The project will assess the application of conventional Carbon-In-Leach and Heap Leach technologies for the Mineral Resources and investigate technologies to increase the tailings storage capacity, which is the current mine life constraint at Hidden Valley.
An extension of the mining lease and the amendment to the environmental permit will be required to continue operations beyond 2030.
|
Australia
|
|
|
Eva Copper Project |
The Eva Copper Project is in a feasibility update phase, project is located 75Km north east of Cloncurry in the highly prospective Mt Isa Inlier region and will involve mining native copper and copper sulphide ore from six open pits and processing through a copper concentrator. The projected mine life is predicted to extend beyond 15 years, providing a stable platform for continued growth. |
|
|
|
| South Africa |
|
| Moab -Zaaiplaats project |
|
Implementation of the project commenced in October 2021 and the project progressed with limited detailed design requirements. Development and project construction have commenced in order to support project deliverables on the 101 level to 114 level. Three new declines and associated infrastructure must be developed, equipped and commissioned below 101 level to allow the safe and economic mining of the Zaaiplaats orebody.
Further implementation of productivity improvement initiatives and project controls systems for FY24 in order to facilitate project build up and meet FY’24 requirements.
|
|
| Mponeng Deepening pre-works |
The depth extension project study considers the feasibility of extending the Mponeng LOM by exploiting both the VCR and CLR orebodies below infrastructure. Mining of the VCR reef below infrastructure requires the extension of existing infrastructure from 126 level. The CLR extension will require new infrastructure below 120 level. |
|
| MWS – Kareerand |
Mine Waste Solutions (MWS) is a reclamation operation in the Stilfontein/Orkney area treating 2.2 million tonnes per month from historical tailings facilities through the MWS plant. The residue is deposited on the existing Kareerand TSF. Kareerand TSF is a cyclone facility on a 560ha footprint and based on the current production plan will reach its authorised height of 80 metres in 2025. The existing Kareerand TSF was sized to receive the reprocessed tailings from the MWS sources. The inclusion of additional sources into the MWS business in 2012 required additional deposition facilities. The study to select the suitable site for the replacement TSF was initiated in 2016. The prefeasibility study investigated seven options and the outcome was to extend the current footprint by 340ha while increasing the height of the combined complex. The project progressed through feasibility study and detailed design. |
|
Tshepong South (Phakisa) B Reef and Sub 75 pre-works |
Exploration drilling is in progress to determine areas of economic value in the down-dip extensions of the B Reef channels being mined in the west-south area of Tshepong North shaft. There is significant potential to mine B Reef at Tshepong South shaft. A Capital drilling project has been approved to explore the area between 69 and 71 level. Capital has been approved to conduct a prefeasibility study on the block of ground below 75 level, this could potentially increase the Mineral Reserves and extend the life-of-mine of the operation. |
|
| Doornkop expansion |
| Exploration drilling is set to continue in the coming financial year. Focus will be on targeting areas with limited geological information and those that are potentially high grade in order to increase the geological confidence and payable ounces. |
|
| Renewables |
| In order to achieve the renewable energy targets as set out in the Harmony Energy Efficiency and Climate Change Strategy document, it became necessary to implement a number of renewable energy technologies, including built PV plants, wheeling of wind renewable energy, syngas (or LNG) generated electricity as well as small scale solar PV plants. |
ENVIRONMENT
ENVIRONMENTAL MANAGEMENT AND STEWARDSHIP
We are committed to being environmental stewardship advocates through pollution prevention, prudent use of natural resources, maximising the circular economy and a transition to a low-carbon future therefore remediating the impacts of our operations on the environment.
In South Africa, our activities are primarily regulated by the Mineral and Petroleum Resources Development Act and related environmental laws such as the National Environmental Management Act (and its supporting suite of Acts and regulations), the National Water Act and the National Nuclear Regulatory Act.
Our activities in Papua New Guinea are regulated by the Environment Act 2000 (administered by the Conservation and Environment Protection Authority) to ensure that we do not cause environmental harm, including through water extraction and wastewater discharge.
In Australia, Eva Copper has secured environmental authorisation under Queensland’s Environmental Protection Act 1994.
|
|
|
|
|
|
|
|
|
| GRI Standards |
|
Related SDGs |
Prepared in accordance with 3-3, 301-1, 301-2, 301-3, 302-1, 302-2, 302-3, 302-4, 302-5, 303-1, 304-1, 304-2, 304-3, 304-4, 305-1, 305-2, 305-3, 305-4, 305-5, 305-6, 305-7, 306-1, 306-2, 306-3, 306-4 and 306-5. |
|
|
Capitals affected
Natural capital
Our approach
Harmony’s environmental strategy and related policies and procedures aim to mitigate the impacts of our mining activities by focusing on:
|
|
|
|
|
|
|
|
|
|
|
|
|
|
|
|
|
|
|
|
|
Emissions reduction through energy efficiency and improved energy mix |
à |
Climate change mitigation and adaptation |
à |
Water conservation |
à |
Tailings and waste management |
| á |
|
|
|
|
|
â |
Environmental conservation |
ß |
Value
creation |
ß |
Land restoration |
ß |
Pollution prevention and resource protection |
Our environmental stewardship policies are underpinned by the following commitments, as set out in Harmony’s sustainable development framework:
•Prevent pollution or minimise, mitigate and remediate our harmful environmental impacts and a transition to a low carbon future
•Compliance with all applicable host country environmental laws and regulations as a minimum
•Actively partner with governments, communities, labour and NGOs in environmental protection and conservation programmes at international, national, regional and local levels
•Continuously improve environmental management systems with:
–Targets that promote efficient use of resources and reduce environmental exposure
–Progress reporting to internal and external stakeholders
–Responsible management of hazardous substances
•Protect biodiversity by considering ecological values and land use in investment, operational and closure decisions
•Transparent engagements with host communities about environmental matters
•Good governance and transparent reporting
Our material KPIs are independently assured every year. Technical and performance standards, incorporated into environmental management systems, and implemented according to International Organization for Standardization (ISO) 14001 (2015), guide our operations. All our operations have approved environmental management programmes with closure objectives. We compile detailed closure plans prior to closure to expedite beneficial post-mining land use where possible, and undertake activities that promote sustainable community livelihoods.
Harmony’s assets range from development projects to long and short-life operational, decommissioned and closed operations. Assets which at the beginning of FY23 had greater than five years remaining life of mine are ISO-certified. Short-life assets and decommissioned assets are compliant but not certified.
We record improvements annually.
We subscribe to global best practice. Although Harmony is not a member of the World Gold Council, we implement its Responsible Gold Mining Principles. Harmony has concluded its third year of alignment to the World Gold Council's Responsible Gold Mining Principles (RGMPs).
Subsequent to our third year on-site verification audit, Harmony can demonstrate that our operations conform to the RGMPs. The conformance was independently assured by RSM South Africa Inc.
Environmental strategy
In line with Harmony’s strategic priorities and to support our positive contribution to the SDGs, we measure our key environmental deliverables against targets.
|
|
|
|
|
|
|
|
|
|
|
|
|
Responsible stewardship: suppliers and market
Environmental impact consideration in our supply chain
We take a cradle to grave approach in terms of our environmental impacts, having to assess it from inputs, being our suppliers (including services and utilities). We also assess our own operational assets performance. Lastly, we have oversight of the refineries and end users, being predominantly financial institutions.
|
|
|
Suppliers
In compliance with our code of ethics, suppliers adhere to our environmental management policies and standards, and observe laws and regulations governing water and air quality, among others.
As our extensive supply chain indirectly contributes to scope 3 GHG emissions, we encourage our top 20 suppliers to manage their carbon and water footprints to reduce emissions and associated climate change impacts. We conducted a supplier survey to determine our suppliers’ approach and response to various environmental matters. Completed by some of our major suppliers, the survey indicated the following:
•Water security – 61.5% scored above average due to their related business activities, including the quantification of water usage and water targets being in place
•Plastics – 30.7% have mapped the use of plastics in the value chain as well as having reduction targets in place
•Climate change – 38.4% have determined their carbon footprint as the beginning of a climate change mitigation journey (irrespective of goods or services supplied).
In the next financial year, we plan to extend this survey to 80% of our supplier spend.
|
|
|
|
|
|
Market
Harmony has a 10.4% stake in Rand Refinery. The company smelts, evaluates, refines and fabricates gold for investment and retail clients. The certified gold chain of custody is independently audited as required by independent bodies and legislation.
Rand Refinery shares Harmony’s commitment to excellent environmental performance and compliance as well as internationally accepted responsible sourcing – specifically, guided by the London Bullion Market Association and the Organisation for Economic Cooperation and Development Due Diligence Guidance for Responsible Supply Chains of Minerals from Conflict-Affected and High-Risk Areas.
Harmony’s board oversees and influences Rand Refinery’s ESG strategy and performance – one of our executive directors is a non-executive director and chair of Rand Refinery’s social and ethics committee. Our collaborative cradle-to-grave approach to environmental management, with best practice in our downstream value chain, enables us to deliver gold ethically and responsibly.
|
|
|
|
|
Mitigating environmental risks
Our environmental risk matrix, included in our corporate risk register, underscores the importance of our natural capital and environmental strategy. This matrix details the most significant threats to our business, employees and communities over the medium to long term. Related risks could affect future operating costs, infrastructure requirements, operations and operating conditions, host communities and the supply chain.
Details on climate change as a risk
Material climate-related risks, with potential financial impacts include safety (due to excessive heat and heavy rainfall), regulatory changes such as South Africa’s Carbon Tax Act, Papua New Guinea’s Climate Change (Management) Act and Australia’s National Greenhouse and Energy Reporting Act 2007 as well as major infrastructure incidents such as those caused by flash flooding.
We estimate that the impact of the carbon tax to our South African operations will be in the range of R500 million (US$26.6 million) to R800 million (US$42.5 million) by 2030 based on government’s intent to increase the price of carbon and reduce allowances.
We have a pipeline of renewables projects that we are advancing with urgency to derisk this for the company whilst we continue to engage with National Treasury about reviewing their carbon pricing strategy.
We continue to add value to the business through our ESG-linked financial transactions concluded in FY22. The KPIs of this sustainability-linked funding focus on energy and associated GHG emissions and water (two major environmental concerns for Harmony and South Africa).
Water availability remains a risk to us when considering operational use and continuity of sites into the future. Future greenfields and brownfields projects require a secure water supply, and our reclamation programme is known to be water intensive. Securing adequate water supply and having access to the right quality of water is key to growing our business at Harmony. Coupled to this, ensuring that our use of water does not impact on ecosystem wellbeing in environments around us remains an important deliverable in our decision making processes.
The KPIs reflect an absolute reduction in GHG emissions, an increase in renewable energy consumption as a percentage of the total energy mix and reduction in absolute potable water consumption. These KPIs also address four of the six material environmental sustainability issues in the metals and mining industry, according to the Sustainability Accounting Standards Board materiality map: GHG emissions, air quality, energy management, water and wastewater management, waste and hazardous materials management, and ecological impacts.
Our environmental risk matrix shows how these KPIs address risks with a high business impact and a medium to high sustainability impact.
Another consideration in our environmental risk matrix is land degradation as a significant contributor to climate change. Land degradation is generally loss of CO2 absorbing plants. This loss increases the likelihood of soil erosion during rain and dust storms (particularly detrimental to high arable land) and impacts biodiversity.
Setting environmental targets
In FY23, we implemented our next set of five-year group environmental performance targets. These targets for FY23 to FY27 focus on our strategic imperatives and material risks (energy, water, waste, land and biodiversity) and are aligned with our adoption of science-based targets to achieve net zero emissions by 2045.
We committed to increase the reliance on renewable energy and to reduce absolute emissions to reach net zero by 2045. This will fundamentally improve our carbon intensity. With both organic and greenfield growth and potential mergers and acquisitions, we anticipate our absolute electricity and energy consumption to increase. Nonetheless, we still drive to ensure that much of this energy and electricity usage would be green electrons, and that intensities are still managed as a priority.
We recorded 12 months for all our assets. While consumption increased, our intensities and efficiencies improved in this reporting year.
|
|
|
|
|
|
|
|
|
|
|
|
|
|
|
|
|
|
|
|
|
| Group environmental targets |
| KPIs |
Five-year baseline (FY18-22) |
Five-year target
(FY23 to FY27)
|
Year 1 (FY23) |
Cumulative actual |
Year 31 (FY25) |
Year 5 (FY27) |
Target |
Actual |
Achieved |
| Energy |
|
|
|
|
|
|
Renewable energy group (% of total electricity consumption) |
— |
|
20 |
|
25 |
|
2¹ |
0.87 |
|
û |
Renewable energy2 (% of total electricity consumption) |
n/a |
20 |
|
25 |
|
2¹ |
0.1 |
|
û |
SBTi: Absolute carbon emissions (Mt CO2)3 |
n/a |
|
4 |
|
4.49¹ |
4.45 |
|
ü |
| Water |
|
|
|
|
|
|
Water intensity improvement (% kl/tonne treated) |
34 |
|
|
10 |
|
2 |
|
9 |
|
ü |
Water recycling (Water recycled % of total water) |
103 |
|
|
50 |
|
10 |
|
77 |
|
ü |
| Reduction in potable water consumption (% of total water used) |
n/a |
|
10 |
|
2¹ |
5 |
|
ü |
| Waste |
|
|
|
|
|
|
Non-hazardous waste recycled4 (%) |
40 |
|
|
70 |
|
14 |
|
44 |
|
ü |
| Land and biodiversity |
|
|
|
|
|
|
Reduce impacted land available for rehabilitation (%) |
— |
|
|
1 |
|
0.2 |
|
0.5 |
|
ü |
| Implement biodiversity action plans (%) |
70 |
|
|
100 |
|
76 |
|
70 |
|
û |
| Compliance |
|
|
|
|
|
|
| Environmental fines (number) |
— |
|
— |
|
— |
|
— |
|
— |
|
ü |
1 These sustainability-linked KPIs are green loan bank targets.
2 Sources that produce electricity for Harmony’s consumption. Renewable sources are based on actual consumption, only applicable in South Africa and is an assured KPI.
3 Absolute carbon emissions included for Scope 1 and 2 only.
4 Timber, steel and plastic.
Legislative framework
The legislative frameworks regulating the mining industry in South Africa, Papua New Guinea and Australia remain in flux with several new and amended Bills and draft policies before the respective parliaments. The associated implications for our business are outlined below.
|
|
|
|
|
|
|
|
|
South Africa |
Papua New Guinea |
Australia |
|
•Financial provision regulations
The mining industry continues to engage with the Department of Forestry, Fisheries and the Environment (DFFE) on financial provisioning for mitigation and rehabilitation of environmental damage caused by reconnaissance, prospecting, exploration, mining or production operations. Following draft reviews, implementation of these regulations is expected in February 2024. Harmony is concerned that some implications for our industry have not been addressed, and we have raised these issues again through our platforms with the regulators.
Proposed changes to the Carbon Tax Act include regulations that could substantially increase the base rate of the emission levy in phase 1 of carbon tax implementation (mentioned by the Minister of Finance in February 2022). In 2023, National Treasury gazetted the carbon tax rates up to 2030, but also expressed an intent to increase rates to US$120 by 2050. This will have a significant financial impact on our business and here too we remain engaged with our regulators on more relevant pricing strategies.
•Climate Change Bill
Promulgation of this legislation is expected in 2023. It will enforce mandatory carbon budgets. Harmony will have a mandatory budget for scope 1 GHG emissions. We continue to engage with DFFE and National Treasury in this regard.
We further plan to use the solar power tax incentive for businesses announced by government in February 2023.
|
•Policy changes
While the principal environmental legislation in Papua New Guinea (the Environment Act 2000) remains applicable, the authority continues to consider various national policy changes, including additional taxes and levies on resources industries.
•Mine closure
Revised mine closure policy and guidelines include provision for financial assurance as security for closure costs. Until such time legislation is amended, financial assurance is included as a condition of approval for new mining leases, or for mining lease extensions of term.
•Climate change taxes
Fees supporting the country’s Climate Change (Management) Act include taxes on carbon in fuel products and a proposed green fee (departure tax for non-residents exiting the country). We are taxed on carbon in fuel through our bulk fuel supplier at a nominal rate per litre.
•Protected Areas Bill
In March 2022, the latest draft of the proposed Protected Areas Bill was tabled in the Papua New Guinea parliament. It aims to:
–Provide for conservation and replenishment of the environment, biodiversity, land and its sacred, scenic and historical qualities
–Regulate protected area management
–Fund national biodiversity offsets.
The Papua New Guinea Chamber of Mines and Petroleum working group has engaged with the regulator about the Bill since the first draft was released in 2016. Although this remains critical, engagements were limited in FY23.
|
•Critical minerals policy
At state level, we are following the development of The Queensland Critical Minerals Strategy, which aims to support mining of critical minerals – including copper – needed for the global economic and energy transition. At Commonwealth level, the Australian Government has announced a review of its critical minerals list which, as it currently stands, does not include copper. Inclusion on the list means stronger government support. We are preparing a submission through the Association of Mining and Exploration Companies advocating for inclusion of copper on the list.
•Minerals exploration policy
In a move to stimulate minerals exploration, the Queensland Government has announced a waiver of exploration permit rents for five years commencing 1 September 2023, from which Harmony will benefit.
•Climate legislation – Safeguard mechanism
We have recently commenced a study to further our understanding of Eva Copper’s GHG gas emissions, the trajectory of these emissions over the life-of-mine, improvement opportunities, and any potential financial implications of the Safeguard Mechanism under the Australian National Greenhouse and Energy Reporting System (NGERS). Changes to the Safeguard Mechanism were introduced on 1 July 2023 which require Safeguard facilities (facilities with over 100 000 tCO2e per annum of Scope 1 emissions) to reduce their emissions in line with Australia’s climate targets.
|
|
|
|
|
|
|
|
|
|
|
|
|
|
Our response to South Africa’s carbon tax requirement
Accounting for our direct and indirect carbon tax liability
In South Africa, carbon tax is levied on operations exceeding the regulated emissions threshold. These operations must also report annual emissions to DFFE.
Harmony’s reported scope 1 GHG emissions liable for carbon tax are derived from:
•Combustion of diesel and jet fuel by generators
•Fuel combustion by boilers
•Railway diesel combustion
•Wastewater treatment and managed waste disposal sites.
|
|
|
|
|
|
Phased approach to carbon tax and allowances
Phase 1 of carbon tax implementation is due to end in 2025 until when tax-free allowances will remain applicable in calculating the carbon tax liability. Basic tax-free allowances (60.0%) will reduce and likely fall away from 2026 to 2030 (phase 2).
In phase 2, the carbon offsets allowance will increase by 5%, the trade exposure is planned to stay the same and the carbon budget allowance could fall away. Changes to the tax-free allowances may affect the direct carbon tax liability and associated pass-through from Eskom.
|
|
|
|
|
|
Decarbonisation strategy
Our carbon tax considerations align with the successful implementation of our decarbonisation strategy. Carbon is priced into our business models as is the benefits from the implementation of energy efficiency and renewable solar energy (including wheeling) projects. We are also exploring the viability of natural gas, replacing diesel in our mining vehicles and electricity in heating applications.
The decarbonisation strategy aims to address carbon tax, GHG emissions and energy security, whilst reducing energy costs.
|
|
|
|
|
FY23 focus areas and performance
|
|
|
|
|
|
|
|
|
|
|
|
|
|
|
|
|
|
|
|
|
| Annual expenditure on our environmental portfolio |
FY23 |
FY22 |
FY21 |
| Rm |
US$m |
Rm |
US$m |
Rm |
US$m |
| South Africa |
|
|
|
|
|
|
Environmental compliance |
349 |
|
19.6 |
|
249 |
|
16.4 |
|
198 |
|
12.9 |
|
| Mine rehabilitation projects |
82 |
|
4.6 |
|
52 |
|
3.4 |
|
49 |
|
3.2 |
|
| Total |
431 |
|
24.2 |
|
301 |
|
19.8 |
|
247 |
|
16.1 |
|
| Papua New Guinea |
|
|
|
|
|
|
Environmental compliance |
31 |
|
1.7 |
|
27 |
|
1.8 |
|
26 |
|
1.7 |
|
| Harmony total |
462 |
|
25.9 |
|
328 |
|
21.6 |
|
273 |
|
17.8 |
|
Compliance and certification
|
|
|
|
|
|
South Africa |
Papua New Guinea |
|
Compliance
No fines or penalties were recorded in this reporting period
The regulator issued a directive for discharging fissure water into Voëlpan from Target mine. Harmony successfully installed two water treatment plants at the facility, in response to the directive and completely ceased any further discharge to Voëlpan. In a separate incident, Doornkop Mine requested the DWS to issue a directive to assist the municipality with pumping its sewage away from the tailings facility and to enable them to access the pump station.
Certification
•All South African operations are ISO 14001-compliant (including Mponeng plants and Mine Waste Solutions)
•Bambanani and Unisel are not certified as both are in closure
•Central and Saaiplaas plants were certified in FY22
•Mponeng shaft’s recertification was completed in FY23.
|
Compliance
There were no formal regulatory inspections or audits undertaken at Hidden Valley during the year, and although the regulator was invited to site on a number of occasions, they were unable to attend.
Elevated manganese levels in seepage from the Hidden Valley mine waste rock dumps continues to result in non-compliance with the site’s Environment Permit water quality criteria for manganese. In response, the regulator has been notified and an investigation, which included a detailed kinetic test work programme of the sites waste rock, has been completed. An amended waste rock management strategy informed by the outcomes of the investigation and test work is being implemented to address the non-compliance. The overarching waste rock management strategy remains effective in limiting AMD, and manganese is not considered a significant environmental hazard at the current levels detected in the receiving environment.
Hidden Valley continues to operate in accordance with the conditions of its environmental permit, last amended in March 2021, and the supporting environmental management plan.
Certification
Hidden Valley’s environmental management system is aligned with the ISO 14001 standard.
|
Reportable environmental incidents
Harmony reports environmental incidents in terms of a risk matrix (below) that evaluates the severity of the incident against the financial and reputational implications for the group. The matrix shows levels of severity, incident descriptions, financial and legal implications, and aligns with Harmony’s enterprise risk matrix.
|
|
|
|
|
|
|
|
|
|
|
|
|
|
|
| Severity level |
Mitigation costs |
Environmental impact |
Reputation impact |
Legal impact |
| 5 |
>R10 million |
Irreversible damage to habitat or ecosystem |
International condemnation |
Potential director liability |
| 4 |
<R10 million |
Significant impact on habitat or ecosystem |
National and international concern (NGO involved) |
Very significant fines or prosecutions |
| 3 |
<R5 million |
Longer-term impacts and ecosystem compromised |
Adverse media attention (locally and nationally) |
Breach of legislation and likely consequences from the regulator |
| 2 |
<R1 million |
Moderate short-term effects but do not affect ecosystem function |
Unresolved local complaints and possible local media attention |
Minor breach of legislation |
| 1 |
<R500 000 |
Localised affected area of low impact |
Local complaints |
No major breaches of legislation |
South Africa experienced more frequent water-related incidents due to exceptionally high rainfall in FY23. All incidents were short and corrected immediately with limited impact on the receiving environments. Harmony recorded five level 3 (moderate) reportable environmental incidents in South Africa and zero in Papua New Guinea. We implemented appropriate remedial action in all instances.
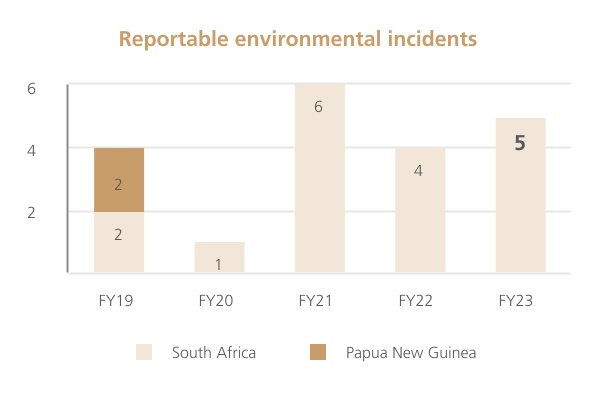
Reportable (level 3) environmental incidents in South Africa are summarised below.
|
|
|
|
|
|
|
|
|
|
|
|
|
|
|
|
|
|
|
|
|
|
|
|
|
|
|
South Africa |
|
Location |
|
|
Incident and description |
|
|
Environmental impact |
|
|
|
|
|
|
|
|
|
|
|
Target |
|
|
Due to exceptionally high rainfall, Target intercepted more underground fissure water than usual, which could not be contained in its holding facilities. The operation had to discharge excess water into Voëlpan as an intermediate measure for safety measures. Harmony successfully built two water treatment plants to eliminate the discharge within the timeframes committed to the department. |
|
|
Our contribution was of small volumes over a set period of time. Albeit that we are no longer contributing to the volumes in the pan, the flooding issues may not resolve until a solution is implemented for all water inputs into the pan. We continue to monitor quality impacts and will remediate the mining fingerprint if identified and required. |
|
|
|
|
|
|
|
|
|
|
|
Doornkop |
|
|
Exceptionally high rainfall and a non-functional municipal wastewater treatment plant caused a pan adjacent to our tailings dam to fill up, inundating properties of nearby communities. With permission from the regulator, Harmony has assisted the municipality in draining the pan to allow access to the inundated pumpstation for repairs to take place. |
|
|
Excess water inundating surrounding communities and impacting surface water environments, and may have an impact on the tailings dam if left unabated. |
|
|
|
|
|
|
|
|
|
|
|
Kalgold |
|
|
A leaking residue pipeline led to the spillage of mine waste material into the nearby Morokwa Spruit, a non-perennial river. The extent of the spillage into the river was localised, as the river was dry at the time. Clean up of the spillage was immediate and completed timeously. |
|
|
No significant environmental damage albeit that it is a non-compliance. The incident was reported to DWS whilst clean up ensued. |
|
|
|
|
|
|
|
|
|
|
|
Kusasalethu |
|
|
Two level 3 incidents were reported at the return water dam which overflowed into the Loopspruit on 31 May and 19 June 2023 respectively. The root cause identified was the extremely high rainfall event that occurred, coupled with the failure of the main pump station. Pumping infrastructure has been repaired with additional infrastructure built to prevent recurrences. |
|
|
Water quality monitoring confirmed that there was no major impact to the receiving environment. |
|
|
|
|
|
|
|
|
|
|
There were no environment-related lost production days during the year.
LAND REHABILITATION AND MANAGEMENT
We offset the impact of our mining activities by restoring sustainable value to disturbed land with respect for local ecosystems and people.
Harmony aims to reduce the group-wide environmental footprint through concurrent and final rehabilitation. We are committed to our environmental management programme, reducing our environmental liability and mitigating the risk of illegal mining by, where feasible, repurposing infrastructure for alternative use by communities, and demolishing and rehabilitating decommissioned infrastructure where it is no longer needed.
Most disturbed areas at Hidden Valley actively support ongoing operations. Progressive rehabilitation mainly intends to stabilise exposed areas, prevent ground movement near critical infrastructure and limit off-site sediment transportation.
|
|
|
|
|
|
|
|
|
|
|
|
|
GRI Standards |
|
Related SDGs |
|
Prepared in accordance with 3-3, 304-1, 304-2, 304-3 and 304-4. |
|
|
Our approach
Our rehabilitation strategy objectives are to:
•Reduce our environmental liability and impacted footprint
•Utilise land for socio-economic activities
•Promote ecological value add
•Compile a rehabilitation and closure programme with an ecologically sound focus
REHABILITATION STRATEGY
Responsible stewardship
• Responsible environmental impact management is a priority:
– Demolition and rehabilitation of mining sites
– Carbon sinks/offsets
– Biodiversity offsets where necessary
•Enhance socio-economic benefits for host communities through holistic closure planning
•Strive to create and share value through resource inputs (human, financial, natural, manufactured, and social and relationship capitals).
Supporting a green economy
•Use rehabilitated mine land for generating alter native energy sources and reducing carbon emissions
•Plant vegetation to create a carbon sink.
Revegetation
•Identify revegetation requirements to support post-mining land uses and ecosystems
•Manage alien invasive species.
Socio-economic benefits
•Develop local host community entrepreneurs in rehabilitation and restoration.
Final land use
•Support carbon removal programmes
•Conservation and biodiversity protection
•Create a net positive biodiversity gain.
FY23 focus areas and performance
The undiscounted value of land rehabilitation liabilities amounted to R7.6 billion (US$402.8 million) in FY23 (FY22: R7.1 billion/US$437.9 million). The increase was due to higher diesel prices, rising inflation, and accommodating the footprint of the Eva Copper acquisition.
Cost-effective rehabilitation of our TSFs aligns with our decarbonisation strategy. By planting trees on TSFs to mitigate nuisance dust fallout and the risk of dam failure, we also offset residual GHG emissions from our operations.
|
|
|
|
|
|
|
|
|
|
|
|
|
|
|
|
|
|
Land rehabilitation liabilities |
FY23 |
FY22 |
FY21 |
FY20 |
FY19 |
(Rm) |
|
|
|
|
|
| South Africa |
6 104 |
|
5 752 |
|
5 559¹ |
3 038 |
|
2 884 |
|
| Papua New Guinea |
1 474 |
|
1 374 |
|
1 306 |
1 378 |
|
1 039 |
|
| Group |
7 583 |
|
7 126 |
|
6 865 |
4 416 |
|
3 923 |
|
Total (US$m) |
402.8 |
|
437.9 |
|
438.0 |
|
244.0 |
|
278.0 |
|
1 Following the acquisition of Mponeng and related assets.
South Africa
Harmony’s environmental liability for its mining operations was R4.4 billion in FY23, but our total environmental liability in SA including surface operations is R6.1 billion as determined by the closure cost assessment completed in June 2023. We are fully funded as it relates to our environmental obligations in terms of the Minerals and Petroleum Resources Development Act.
Total land under our management is 88 157ha. Of this, 13 259ha is impacted by our mining-related infrastructure, services and activities, and as such, only 117ha was available for rehabilitation. In FY23, we successfully rehabilitated 72ha of the 117ha.
For over more than a decade, we have decommissioned and sealed shafts, removed headgear and demolished hostels. In FY23, we demolished buildings and concrete bases at Deelkraal plant and hostel and the security barracks in Gauteng and North West respectively. Once the demolition work was completed, the area was then profiled to ensure that it blends into the surrounding topography.
The closure and rehabilitation of our mine shafts has emerged as a crucial strategy in the ongoing battle against illegal mining activities in the regions we operate in. To date, we have demolished 46 shafts while rehabilitating broader footprints (former plants and ancillary service infrastructure). After the methane explosion, we have restated the number of closed shafts to 45 in FY23. In further effort to prevent illegal access to our underground workings, two shafts in the Free State have been sealed by a mass concrete cap. With the closure of these shafts, we don’t only get the benefit of protecting the environment from further degradation but we also safeguard our host communities from the criminal elements associated with illegal mining. Through our security patrols and arrests made from 2019, it is evident that illegal mining underground has decreased as a result of our rehabilitation efforts. It is however important to note that despite this progress, dealing with illegal mining requires a concerted effort between SAPS, government authorities and local communities to ensure its success.
In addition, and as part of our decarbonisation strategy we are continuously rehabilitating our decommissioned TSFs in the North West and Free State. To date, we have planted 84 835 trees at the toes and top of the TSFs whilst indigenous vegetation which includes turf and Rhodes grass were also planted at the top surface. The vegetating of TSFs is vital to prevent water pollution and wind erosion and should allow for the creation of sustainable basal cover that prevents both water and wind erosion. Additionally, vegetation and planting of trees also has a variety of other benefits such as the sequestration of carbon, improved visual impact, dust suppression, the potential removal of metals from the tailings material and biodiversity enhancement. Our mission remains to rehabilitate land and reduce our emissions by 2045, through the repurposing of mining land into tree plantations to sequester carbon emissions.
|
|
|
|
Rehabilitation and socio-economic development in South Africa
Integrating our environmental stewardship and socio-economic development imperatives
We integrate our environmental stewardship and socio-economic development imperatives in rehabilitating and reclaiming land, TSFs and waste rock dumps by:
•Seeking opportunities for entrepreneurs to use waste rock dumps after relevant radiation clearances
•Donating waste rock dumps with commercial quantities of recoverable gold to local communities (as per our shared ownership principle)
•Conducting extensive due diligence of community partners and providing protection against criminal groups involved in illegal mining
•Ensuring the success of these small businesses by assisting in building their technical and financial capacity.
It remains incumbent on us to contain our impacted footprint and seek responsible practices that avoid, mitigate and remediate negative impacts to create healthy ecosystems and societies. Our rehabilitation programme has already created 256 jobs, supported numerous local small businesses and decreased illegal mining activity.
Socio-economic development projects underway on rehabilitated land include:
•Labour-intensive removal of 6 655ha of invasive alien vegetation near Kusasalethu, Moab Khotsong, Kalgold and Mine Waste Solutions
•Establishing commercially viable agri-businesses as well as subsistence agriculture on rehabilitated mine-impacted land in our host provinces, focusing on small-scale and commercial production in Welkom (Free State) and Orkney (North West).
Harmony has established an innovation platform in collaboration with Institute for Technology and Society to identify sustainable socio-economic development projects at scale that will unlock the full economic value of Harmony’s land, water and redundant infrastructure. The projects aim to address Harmony’s challenges associated with contaminated land and excess fissure water while creating socio-economic benefits for host communities, including opportunities for local farmers. The institute, through its network of innovation, academic and business partners, gives Harmony access to a unique suite of innovative solutions and possible external partnerships and funding. In addition to the projects already initiated, our main focus remains on expanding feasibility of these pilot projects to a scale that can significantly offset the financial impact of Harmony’s expensive fissure water pumping costs albeit through the agriculture and food production initiative for further development on beneficiation of biomass from rehabilitation.
We also continue to support local communities generating income from waste rock reclamation near our Kusasalethu, Doornkop, Moab Khotsong and Free State operations – including a growing number of entrants to this sector in Welkom and Klerksdorp (North West).
Our approach to repurposing infrastructure and land considers:
•Sale of land for sustainable human settlement and social and enterprise development purposes
•Applications for purchase of land or non-residential properties from entities or organisations (not individuals) registered in South Africa with majority black ownership of not less than 51%
•Assessments of land and non-residential properties earmarked for sale or donation for possible contamination and, where required, rehabilitation prior to the sale transaction or donation
•Donations primarily for land redistribution purposes to the relevant national, provincial or local government department.
We also provide social responsibility property leasing at nominal rates for our host community establishments (church groups, schools, daycare centres, welfare organisations and recreational facilities) with measures that prevent theft and vandalism and minimise security and maintenance costs.
|
Papua New Guinea
We have always driven mine closure as an iterative and dynamic process that considers the environmental and social conditions as well as the economic wellbeing of the community. The Hidden Valley Mine closure-planning project progressed according to schedule in support of the submission of a final rehabilitation and mine closure plan to the state of Papua New Guinea, per statutory obligations. We pride ourselves on our efforts to engage all stakeholders and in building an understanding of our intent and design for closure. These communications lend to heightened trust between ourselves and landowners, earning us our licence to operate. In developing our closure plan, we strive to remediate our impacts and leave a productive and sustainable after use of the land. Our progress during FY23 included:
•Completing geotechnical drilling campaign and site investigations to support feasibility-level biophysical closure design
•Conducting a series of workshops, including a site visit, with the Mineral Resources Authority and Conservation and Environmental Protection Authority to consider biophysical closure risks and issues, and the associated work programmes underway to address these
•Engaging an independent peer reviewer to support the programme
•Holding the first round of engagements with landowner, local level government, district administration and provincial government representatives
•Undertaking a socio-economic survey of mine landowner villages for critical insights into closure risks and issues and community aspirations.
Future focus areas
|
|
|
|
|
|
|
|
|
|
Across the group, we are committed to reducing our impacted footprint year on year by liberating and restoring land for alternative use through our rehabilitation programme that aims for environmental dust mitigation and carbon sequestration with revegetation and related social benefits.
We will be setting five-year targets to monitor our progress.
|
In Papua New Guinea, alongside our rehabilitation activities to safeguard infrastructure, we are progressing our closure planning project, including further stakeholder engagement, to advance our understanding and readiness for eventual mine closure. In line with the country’s mine closure guidelines, our planning is focused on rehabilitated land that is physically and chemically stable and reasonably safe and healthy for humans, wildlife and the environment, and promoting a smooth socio-economic transition. |
In Australia, Queensland regulation requires all holders of mining project environmental authorisations to submit a progressive rehabilitation and mine closure plan for government approval. In compliance with these requirements, concurrently with our Eva Copper feasibility study review, we are advancing Eva Copper’s progressive rehabilitation and closure plan for submission in early 2024. The objective of this process is to plan how and where activities are carried out on the land in order to maximise progressive rehabilitation of land to a stable condition. |
|
In South Africa, we are pursuing an opportunity for local communities to participate in our rehabilitation activities who will collaborate with us through our tailings management rehabilitation programme. We could thus relieve unemployment in local municipalities hosting our sites in Gauteng, North West and Free State – and contribute a considerable amount to the GDP of these provinces. To this end, we intend to finalise donation of our Scott and Kopanang waste rock dumps to communities in the coming financial year.
Our rehabilitation strategy will support our decarbonisation strategy in the coming financial year by focusing on our tailings dam footprint. The decarbonisation plan includes employing local people to reintroduce biodiversity by planting trees on our TSFs as well as repurposing land for agricultural and other projects. We will thus rehabilitate land while striving to achieve net zero emissions by 2045.
|
CLIMATE CHANGE, ENERGY AND EMISSIONS MANAGEMENT
Our decarbonisation strategy is moving us towards a sustainable future by reducing our fossil fuel-based energy consumption and related costs.
Our current assets are predominantly deep underground mining operations, which are more energy intensive than surface mines, and in FY23 accounted for 89% of the group’s total electricity consumption. Energy accounts for around 19% of our SA operating costs.
Electricity supply security, GHG emissions, climate change and carbon tax liabilities are material risks as we mainly consume energy from South Africa’s coal-based grid. Eskom’s erratic supply and above-inflation tariff increases in South Africa significantly impact our sustainability. The Hidden Valley Mine in Papua New Guinea also experienced energy supply challenges in FY23 when drought constrained the predominately hydropower Ramu grid.
|
|
|
|
|
|
|
|
|
| GRI Standards |
|
Related SDGs |
Prepared in accordance with 3-3, 302-1, 302-2, 302-3, 302-4, 302-5, 305-1, 305-2, 305-3, 305-4, 305-5, 305-6 and 305-7. |
|
|
Our approach
Harmony’s policies and strategies acknowledge the impacts of climate change on gold mining, society, the environment and the global economy and we appreciate the urgency to be deliberate with our actions. To achieve the United Nations Framework Convention on Climate Change objectives, we are pursuing the Paris Agreement’s goal to limit global warming to 1.5°C by the end of the century with science-based targets and KPIs linked to our sustainability targets.
The group’s climate change and energy policy statement responds to our current context and future ambitions. It is based on the following commitments:
•Integrate risks and opportunities associated with climate change and energy management into Harmony’s business strategy
•Continue reducing our operations’ carbon intensity by implementing emission reduction activities over time
•Keep tracking, managing, optimising and diversifying our energy use and minimising our reliance on fossil fuel-based energy sources
•Advocate for measures that promote technological innovation, address emission reduction challenges and advance the low-carbon transition of our sector
•Prioritise capital investment in emission reduction, energy and climate adaptation projects
•Proactively integrate climate change adaptation measures into Harmony to increase the resilience of our business and communities in the face of climate change impacts
•Maintain monitoring, tracking and reporting of Harmony’s climate change impacts, actions and resilience.
|
|
|
|
Meeting the requirements of our sustainability-linked and green loan facilities
Funding for our decarbonisation strategy is facilitated by Rand Merchant Bank, African Clean Energy Developments, African Infrastructure Investment Managers, Mahlako Energy Fund, Absa and Nedbank. The facilities amount to R4 billion and include:
•R1.5 billion green loan for phase 2 of our renewable energy programme
•Sustainability-linked R2.5 billion (US$132.8 million) and US$300 million revolving credit facilities and US$100 million term loan.
The green loan will largely fund Phase 2 of our solar photovoltaic (PV) initiatives at our South African mining operations. The sustainability-linked facilities, aligned with our ESG and sustainable development targets, include the energy-related KPIs.
Our targets are independently assured by a service provider who applies the sustainability-linked loan principles issued by, among others, the Loan Market Association. When we achieve our KPIs, we will receive meaningful interest savings. If we miss our targets, we will pay penalties.
|
Decarbonisation strategy
Our decarbonisation strategy is an integral aspect of our environmental management approach. It acknowledges the global shift towards a low-carbon economy and transformation of our assets from high-energy to low-carbon consumers by:
•Advancing our surface reclamation programme to produce ounces at lower energy intensity
•Decommissioning energy-intensive and low-margin assets to avoid generating high emissions for low returns
•Driving efficiency programmes and enhancing our energy mix with a strong renewable and low-carbon energy pipeline.
In the short to medium term (FY23 to FY26), we remain focused on renewable energy sources needed for renewable electrification and transportation, ensuring we are well positioned to support the transition to a clean energy future.
We are also focused on growing our critical future metals and minerals portfolio. These sources also include our silver output from Hidden Valley and future copper output from Eva Copper and Wafi-Golpu.
Our progress and plans are summarised below.
Decarbonising Harmony
Our decarbonisation strategy for South Africa aims to improve efficiencies and reduce our reliance on electricity suppliers through a substitution programme while we continue lobbying regulators to contain electricity tariff increases. Our cost and energy indicators and controls are reviewed by management and independently audited. In FY23, 41 energy optimisation projects were implemented resulting in an estimated saving of 295Gwh and a cost saving of R394 million (US$22.2 million). Over 240 energy efficiency projects have been implemented since 2016 cumulatively saving over R1.7 billion (US$114 million) in energy costs to date, equating to around 1.8Mt of CO2 saved.
Climate change report
Transparent disclosure of quantitative and qualitative financial and non-financial data on our journey to a low-carbon economy
Our climate change report aligns with TCFD, South African carbon tax and related National Treasury requirements included in our financial modelling to enhance our understanding of the likely impact of climate change on our business. We also include carbon pricing in our strategic and operational plans.

In line with global best practice, we publish a separate report on our carbon-related performance and associated risks, concerns and opportunities. To assess climate change risks, we conduct comprehensive scenario analyses in line with TCFD recommendations. Our analyses encompass physical and transition risks, considering factors such as chronic and acute weather outcomes, policy changes, technological advancements and market shifts.
Our scenario analyses consider Intergovernmental Panel on Climate Change (IPCC) reports, including representative concentration pathways and shared socio-economic pathways so that our scenarios project global socio-economic changes up to 2100 and link physical risks from the representative concentration pathways to global climate policies and potential transition risks.

We continue to submit annual water performance reports to CDP.

As Harmony is committed to achieving net zero by 2045 in line with the Paris Agreement’s aim to limit global warming to 1.5ºC, our emission reduction targets (reducing absolute scope 1 and 2 GHG emissions by 63% by FY36 from an FY21 baseline) have been approved by the SBTi.
FY23 focus areas and performance
Energy consumption remains a significant financial and environmental concern for Harmony. Mining and extractive processes are highly energy intensive with a considerable impact on operating costs. In FY23, total electricity consumption due to underground mining was 3.6% lower.
We reduced our electricity intensity by 46% over the past 10 years with our commitments to optimise energy efficiency and climate change mitigation. The graph below illustrates the success of our energy management programme, supported by our service provider, ETA Operations.
Mponeng and Mine Waste Solutions positively impact our performance. Although Mponeng is a deep-level mine, Mine Waste Solutions is less energy intensive as a high-volume surface tailings retreatment operation. In tandem, these operations decrease energy intensity per tonne of ore treated.
Phase 1 of our renewables programmes is fully implemented and Phase 2 has been approved by the board. We have also implemented small scale solar projects at Nufcor and our Randfontein offices.
Improving energy efficiency by reducing consumption
FY23 was the first year of our SBTi-approved, five-year group environmental performance target cycle. We are on track to meet the target of 3.8Mt by FY27. In FY23, we reduced absolute carbon emissions by 0.44Mt (9%). We achieved this with ongoing investment in energy efficiency initiatives despite an 11.3% increase in scope 1 emissions as a result of greater reliance on diesel generators at Hidden Valley due to the drought constrained Ramu grid supply. Our scope 2 emissions decreased by 6.9% as a result of a lower energy consumption, as well as a 3.7% reduction in South Africa’s coal-powered grid emission factor (CO2) emissions per unit of electricity supplied.
|
|
|
|
|
|
|
|
|
|
|
|
|
|
|
|
|
|
Group energy consumption (000MWh)1 |
FY23 |
FY22 |
FY21² |
FY20 |
FY19 |
| Electricity |
4 111 |
4 254 |
4 123 |
3 171 |
3 326 |
Diesel3 |
686 |
605 |
448 |
462 |
488 |
Other sources (petrol and heating oil)4 |
64 |
66 |
60 |
5 |
5 |
| Total |
4 861 |
4 925 |
4 631 |
3 638 |
3 819 |
| Energy consumption intensity (MWh per tonnes treated) |
0.09 |
0.09 |
0.09 |
0.14 |
0.15 |
1 Annual UK government Department for Environment, Food and Rural Affairs conversion factors are used in Papua New Guinea to report GHG emissions. Technical guidelines for monitoring, reporting and verification of GHG emissions by industry are used in South Africa.
2 Acquisition of Mponeng and Mine Waste Solutions operations from October 2020 (nine months reported in FY21).
3 In Papua New Guinea, self-generated energy consumption is accounted for under diesel.
4 Heating oil reported from FY21.
|
|
|
|
|
|
|
|
|
|
|
|
|
|
|
|
|
|
Electricity consumption (000MWh) |
FY23 |
FY22 |
FY211 |
FY20 |
FY19 |
South Africa |
4 056 |
4 191 |
4 020 |
3 051 |
3 209 |
Papua New Guinea2 |
55 |
63 |
103 |
120 |
117 |
| Total |
4 111 |
4 254 |
4 123 |
3 171 |
3 326 |
| Consumption intensity (MWh per tonnes treated) |
0.08 |
0.08 |
0.08 |
0.12 |
0.13 |
1 Acquisition of Mponeng and Mine Waste Solutions operations from October 2020 (nine months reported in FY21).
2 Papua New Guinea values updated to only reflect electricity purchases from bulk suppliers.
South Africa
Despite delays in commissioning solar plants, we accelerated our renewable energy roll-out plan after the South African Revenue Service announced tax incentives for solar installations. Materials could not reach site due to community protests, excessive rainfall, underground fires and transportation constraints. In addition, the high-priced input materials such as solar panels, were not readily available.
Additional challenges included Eskom’s load curtailment (frequent requests to reduce power consumption) and tariff increases, which heightened the urgency to implement renewable energy projects. From 2006 to 20232, Eskom increased electricity tariffs by 22.1% while inflation over this period increased by 25%.
The tariff increase in FY23 was 18.7%, which translates to around R1 billion in additional operating costs. Therefore we continue to focus on reducing our electricity consumption and dependence on Eskom’s energy. We reduced reliance on Eskom by 134GWh by using 3.1% less grid electricity and adding 5.5GWh more solar power although this is not reflected in our consumption intensity as solar projects reduce carbon (not electricity) intensity. We will report the reduction in carbon intensity in FY24 as our solar projects have not yet operated for a full financial year.
While we pursue renewable energy options to reduce our dependence on fossil fuels and improve margins, we are aware of the need for more efficient energy consumption. Our energy efficiency initiatives focus on mine cooling, compressed air, water management and ventilation. We saved R395 million with these initiatives in FY23.
To date, we have implemented over 200 energy efficiency initiatives at our operations. Energy management projects generating the most significant annual savings include the following:
|
|
|
|
|
|
|
|
|
|
|
|
| FY23 energy-saving projects |
| Operation |
Project description |
Description |
Annual cost savings (Rm) |
|
|
|
|
| Kusasalethu |
IGVs on main fans |
IGV control implemented to improve ventilation supply. |
8 |
|
| Deelkraal fan optimisation |
Improved ventilation supply through main fan control. |
10 |
|
| Optimised compressor control |
Optimisation of underground users (leak fixing and compressed air valve control). |
3 |
|
| Optimised refrigeration and dewatering control |
Water system optimisation initiatives, eg services audits, water control valves and improved utilisation of available dam capacities. |
7 |
|
| Moab Khotsong |
Optimised compressor control |
Optimisation of underground users (leak fixing and compressed air valve control). |
3 |
|
| Optimised control of refrigeration units |
Improved refrigeration network control and monitoring at Great Noligwa. |
2 |
|
| Inlet Guide Vanes (IGVs) on main fans |
IGV control implemented to improve ventilation supply at Great Noligwa. |
3 |
|
| Phakisa and Nyala |
Optimised compressor control |
Implemented compressed air valve control and synchronised it with the Missing Person Locator (MPL) system. |
1 |
|
| Nyala fan optimisation |
Seasonal ventilation control based on ventilation requirements. |
3 |
|
| Tshepong |
Optimised refrigeration and dewatering control |
Improved refrigeration and dewatering network control and monitoring. Water system optimisation initiatives. |
13 |
|
| Tshepong fan optimisation |
Optimised fan running combinations according to downscaling management plan. |
7 |
|
| Mponeng |
Reverse running pump generation |
Successful implementation of Mponeng 110L reverse running pump. |
3 |
|
| IGVs on main fans |
IGV control implemented to improve ventilation supply at Tau Tona. |
1 |
|
| General |
Power Factor Correction |
Improved control and monitoring of power factor correction banks at the operations. |
7 |
|
| Small Scale Solar |
Nufcor and Office Park solar installations. |
1 |
|
Papua New Guinea
We used 41% (FY22: 52%) grid power and 59% (FY22: 48%) diesel-generated electricity at Hidden Valley. The increase in total energy consumption was attributed to increased tonnes milled and harder ore mined from the Big Red vein, which also increased the milling index (meaning more power was required to crush harder rock to the required size). Diesel-generated electricity increased when La Niña-influenced drought constrained PNG Power’s hydropower capacity. Water in Yonki Dam, serving the Ramu hydropower station, was critically low for most of the year. Smaller run-of-river hydropower plants were also restricted to approximately 30% of normal supply to the Ramu grid. This led to intense load shedding until these conditions eased and the hydropower generation recovered. Commissioning of the PNG Forest Products-owned 11.6MW Baime hydropower plant in March augmented PNG Power supply.
These events led to reconsideration of our plans to isolate Hidden Valley from the Ramu grid and receive power directly from the nearby Baime hydropower station on account of broader provincial and community energy needs. We continue monitoring this opportunity.
Australia
The May 2020 Eva Copper feasibility study and December 2021 update, prepared before we acquired the asset, proposed gas-fired power as the life-of-mine solution for the project. In keeping with our climate change commitments, we are revisiting our power source and energy mix as part of our detailed review and optimisation study. We are assessing alternative power supply options and mixes, including integration of renewables into project design and future opportunities related to the Queensland government’s CopperString project. We are working with various stakeholders, including the government-owned Powerlink Queensland, which will construct and manage CopperString, to understand future power supply options.
We expect our optimised study to present a life-of-mine strategy that provides reliable power supply to Eva Copper and advances our decarbonisation goals.
Reducing GHG emissions with renewable energy initiatives
Most of Harmony’s emissions are scope 2 as South Africa uses fossil fuel-generated electricity (evident in the graphs below). Energy efficiency initiatives ensured the reduction in our GHG emissions. Whilst we are seeing a downward trend in energy intensity since FY20, the upward climb in total emmissions since FY20 is due to the recent acquisition of the AngloGold Ashanti (AGA) assets. The AGA assets were a quality acquisition for all facets of our business, including our environmental performance. That said, the step down of total emissions in FY23 is a function of our aggressive renewable energy and efficiency programmes.
1 Scope 3 emissions for FY21 are restated from 748 016 to 870 851 as we updated the calculation methodology for sodium cyanide and caustic soda at Mine Waste Solutions.
Driving decarbonisation through renewables
We have been building and commissioning renewable energy projects at our South African operations since May 2022 to reduce Harmony’s carbon footprint. Our progress in the phased roll-out of these projects is outlined below.
|
|
|
|
|
|
|
|
|
| Phase 1 |
Phase 2 |
Phase 3 |
|
30MW solar power (commissioned in May 2023)
•Cost saving over 15 years: R340 million (US$21 million)
•Carbon reduction: 62 000t a year
•Capital investment: R5 million (US$0.3 million).
|
137MW solar power (by FY25)
•Estimated net present value (NPV) over 15 years: R2.5 billion (US$154.1 million)
•Carbon reduction over 25 years: 4.6Mt
•Capital investment: R1.7 billion (US$92 million) for the first 100MW, and the remaining 37MW allocated to an independent power producer.
|
56MW solar power (by FY25)
•Estimated NPV over 15 years: R716 million (US$44.1 million)
•Carbon reduction: 1.17Mt
•Capital investment: None as plants will be built and operated by IPPs.
|
Harmony has effectively added 30MW of installed capacity behind-the-meter solutions. As one of the first IPP projects to close under recently amended legislation, this facilitates the growth of the private power industry in South Africa. It also paves the way for companies to become more power-independent, reduce emissions and procure predictably priced power. Procurement of private power helps to diversify our energy sources and addresses the energy shortage in South Africa.
IPPs sell renewable energy through long-term power purchase agreements, at cost-effective tariffs that escalate predictably over 15 years, while generating an acceptable return for their shareholders. |
An additional 137MW of renewable PV energy, to generate 318GWh of clean power, will be installed at one of our longer-life mines (Moab Khotsong), to deliver R425 million (US$26.2 million) a year in electricity cost savings at first production. The feasibility study was completed as planned at the end of December 2022. A gatekeeping review on 30 January 2023 approved construction of a 100MW solar PV plant (Moab Khotsong, Great Noligwa and Noligwa gold plant). All required Environmental Approvals were received. Detailed designs and procurement process is in progress. Harmony will begin this project in December 2023. The balance (37MW) will be built under a power purchase agreement (PPA). |
Request for Proposal (RFP) to purchase 56MW of solar power for Harmony (under the PPA) is in progress. Negotiations are also underway with preferred service providers about wheeling (over the Eskom network) another 140MW of wind-generated energy to augment the phase 1 and 2 initiatives with 194GWh of clean power. |
Total cumulative savings over 15 years once phase 3 is operational is estimated at a NPV of R3.6 billion (US$222 million*). |
* At a future estimated exchange rate of R16.22.
Future focus areas
|
|
|
|
|
|
|
|
|
|
|
|
The group will work towards delivering its approved SBTi target. This includes our commitment to reducing absolute scope 1 and 2 GHG emissions by 63% by FY36 from a 2021 base year. |
In South Africa we focus on delivering our phase 2 and 3 solar projects timeously; we continue to enhance our energy efficiency initiatives. We will be working with our suppliers to co-create a plan for their decarbonisation journeys and we should have completed studies on decarbonising our transportation pathways. |
In Papua New Guinea, we continue to stabilise supply of hydropower and reduce our dependency on diesel. |
In Australia, we are assessing alternative power supply options and mixes as part of our review and optimisation of the Eva Copper Project design to arrive at a life-of-mine strategy aligned with advancing our decarbonisation goals. |
WATER USE
Potable water is crucial for our mining and processing activities, employees and host communities as well as our growth and development.
Harmony faces water scarcity in South Africa and Australia but a positive water balance in typically high-rainfall Papua New Guinea.
|
|
|
|
|
|
|
|
|
| GRI Standards |
|
Related SDGs |
Prepared in accordance with 3-3, 303-1, 303-2, 303-3, 303-4 and 303-5. |
|
|
Our approach
It is a business imperative to manage water consumption and secure water supply. To maintain our social licence to operate, acknowledging climate change, we manage and mitigate our impact on catchments by protecting water quality and the volume of potable water available to surrounding areas.
Our water management policy guides the group’s approach with water management strategies adapted to the different climatic conditions of each region. This understanding of water management and related risks is embedded across our operations. Water security and risks are integrated into managing long-term strategic business objectives and financial planning, driven from executive level, having evolved from a strategy to practical and relevant actions across the group.
Complying with legislation in our host countries where we return water to source, we aim to ensure responsible water treatment and discharge into the receiving environment.
Potable water consumption
As water is a vital natural resource in mining and processing activities, our objectives are to:
•Mitigate the impact of water scarcity with improved efficiencies, substitution of potable supplies and maximising recycling
•Ensure compliance with regulations
•Reduce costs and increase revenue through the establishment of water treatment plants
•Ensure that this water becomes available for our communities’ basic needs.
Absolute potable water consumption is one of the KPIs of our sustainability-linked funding agreement concluded in June 2022. This KPI is material to our core sustainability and business strategy, and addresses a relevant socio-environmental challenge in our industry.
We focus on reducing potable water demand at our operations to reduce supply pressure on constrained local water utilities. We thus also improve local municipal systems’ climate change resilience. In addition, our integrated water management and social investment strategies support our water, sanitation and hygiene programmes. Our successful water recycling initiatives drive these efforts.
FY23 focus areas and performance
Harmony’s operations measure volumes of water used and recycled at least monthly. Our focus areas for the year included:
•Proactive water risk management
•Stakeholder engagement and collaboration, including engagements about constructing additional water treatment plants
•Managing and mitigating water discharge
•Water recycling and reducing potable water intake
•Beneficiating water in partnership with our peers and utilities.
|
|
|
|
|
|
|
|
|
|
|
|
|
|
|
| Group targets |
| Water KPIs |
Five-year baseline target
(FY23 to FY27) |
Year 1 (FY23) |
| Year 5 (FY27) |
Target |
Actual |
Achieved |
Water intensity improvement (% kl/tonne treated) |
10.0 |
2.0 |
9.0 |
|
ü |
Water recycling (Water recycled % of total water) |
50.0 |
10.0 |
77.0 |
|
ü |
| Reduction in potable water consumption (% of total water used) |
10.0 |
2.0 |
5.0 |
¹ |
ü |
1 On track to achieve sustainability-linked loans target of 19 436Ml reduction in potable water consumption by FY25 from a baseline of 21 083Ml in FY21.
In the past year:
•Water withdrawal from municipal sources was 68% and 32% from surface and groundwater sources
•Water discharge decreased by 5% mainly due to the increased production at Hidden Valley and the operation of the RO plants at Harmony One plant and Target thus increasing water recycled
•We recycled 77% of our water mainly due to the increased production quantities at Hidden Valley, the RO plants that came into operation, and improved monitoring at the operations
•Water intensity decreased by 9% as potable and non-potable water consumption decreased group-wide despite production increases and Bambanani and Kopanang plant closures.
* Mponeng and Mine Waste Solutions acquired in FY21.
South Africa
We often depend on municipal water, exposing the group to tariff increases and supply shortages. Water availability is unpredictable in some parts of the water-stressed country where it is critical for our current and future operations, particularly hydraulic tailings.
Water-stressed areas are determined by the World Resources Institute’s aqueduct tool that plots water-related risks on an atlas. The baseline is the ratio of total water withdrawals (domestic, industrial, irrigation, and livestock consumptive and non-consumptive uses) to available renewable surface and groundwater supplies. Renewable water supply availability impacts upstream users and large downstream dams.
Water management strategy
Our water management strategy, committed to climate change mitigation and adaptation, supports water conservation and demand management, including optimisation to secure supply during a protracted drought. It also considers the sustainable development of businesses and host communities.
Harmony’s climate change scenario analysis indicates water security is a risk due to extreme storm and drought events and higher temperatures that could affect the underground environment and food security. We manage this risk through various initiatives and water use monitoring across our operations.
In FY23, we embarked on a proactive risk management strategy, aligned with our group water management strategy, covering three key areas:
•Water balances optimisation at all our South African operations ensuring applicability and relevance for effective strategic planning
•Digitisation (real-time data, agile responses and geographic information system and plume monitoring)
–Plume monitoring led to the recommissioning of 13 interception boreholes to intercept a possible plume towards the Vaal River, and promote reuse of this water within our processing facilities
–We intercepted approximately 4Ml/day and aim to reuse at least 8Ml of intercepted water from December 2023
•Data assurance (monthly and quarterly reviews and external audits).
Water use, treatment and discharge
Three plants treat our process water to potable quality for many of our underground operations. Recycling our process water reduces our potable water consumption and operating costs. In line with our zero discharge aspiration, we use more of our own mine water liberating fresh water for other users.
In FY23, we continued feasibility studies, and engagements with water specialists on the construction of three additional water treatment plants in the North West and Free State provinces. These plants will:
•Ensure water security and reduce pumping costs for our operations
•Treat excess water to potable standard for our operations and water suppliers (Rand Water and Midvaal)
•Provide economically viable irrigation for high-income crop cultivation in adjacent communities
•Reduce our overall potable water consumption at our operations.
In water-scarce regions such as Gauteng and the North West, our two water companies (Covalent and Margaret) add strategic value by de-risking the climate change impact on our business and communities in future.
Covalent and Margaret remain valuable assets with beneficiation and commercialisation opportunities. Harmony acquired these water companies to manage dewatering from adjacent historical mine voids. Covalent pumps an average of 20Ml/day to avoid flooding at Mponeng (5Ml/day is reused by the mine and the rest is discharged into the nearby Wonderfonteinspruit). Margaret pumps an average of 23Ml/day, mostly recycled in the Moab Khotsong and Mine Waste Solutions reticulation circuits.
Local farmers also use high-quality dolomitic water discharged by our water companies. This positively impacts the adjacent Vaal River and secures water quality for downstream users.
We ensure our water use positively impacts upstream and downstream users by engaging with stakeholders through regional water management agencies, including the Far West Rand Technical Working Group, KOSH (Klerksdorp, Orkney, Stilfontein and Hartbeesfontein) mine water forum and the Free State government task team. As orebodies are contiguous, many mines are in the same water-scarce catchments. This warrants a collaborative, coordinated approach, particularly in the KOSH area where underground fissure water increases as mines downscale.
In the western basin, we collaborate with Sibanye-Stillwater through its Cooke shafts closure programme to prevent water ingress into our Doornkop operation. High rainfall, theft and vandalism of water pipelines and electric cables thwart our efforts. This negatively impacts local reticulation systems and holding capacities, causing spillages and non-compliances.
As part of the directive received, Doornkop committed to monitoring the discharge water quality on a weekly basis, which included pH, electrical conductivity, total dissolved solids, chloride and sulphate.
During the most recent discharge that occurred, pH, electrical conductivity, chloride, sulphate, and nitrate was monitored and measured to determine if mine affected water impacted the quality of the pan. Since the Voëlpan was affected by other sources of pollution not related to Harmony’s discharge, the impact on the pan from mine affected water was considered negligible.
While striving for zero discharge, Kusasalethu discharges fissure water (an average of 1.5Ml/day). The water is treated underground before it is sent to the surface for safe discharge. Our Joel operation is also authorised to discharge purified sewage effluent into the Theronspruit (187 610m3/annum). The discharge water quality is checked on a regular basis to ensure that it meets the authorised quality parameters as stipulated in the relevant authorisation permits, especially for the following chemical parameters pH: electrical conductivity, absorbed oxygen, chemical oxygen demand, free and saline ammonia, phosphates, nitrates and faecal coliforms.
Delays in water use licence approvals by the regulator impede our strategic plans to construct infrastructure that will uphold compliance and DWS audit requirements.
|
|
|
|
|
|
|
|
|
|
|
|
|
|
|
|
|
|
|
|
|
Water use categorised by water quality (Ml)1 |
|
FY23 |
FY22 |
FY21 |
FY20 |
FY19 |
| Water withdrawal |
|
|
|
|
|
|
|
Potable water from
external sources2
|
Fresh water |
20 029 |
21 190 |
19 467 |
14 576 |
15 933 |
| Other water |
— |
— |
— |
— |
— |
| Surface water |
Fresh water |
2 252 |
2 144 |
2 695 |
2 570 |
3 252 |
| Other water |
225 |
612 |
89 |
118 |
798 |
Groundwater3 |
Fresh water |
223 |
304 |
218 |
191 |
337 |
| Other water |
6 620 |
9 166 |
7 836 |
2 238 |
2 838 |
Water discharged3,4 |
|
|
|
|
|
|
| Surface source |
Fresh water |
2 643 |
2 160 |
891 |
246 |
547 |
| Other water |
2 418 |
3 138 |
2 896 |
2 918 |
2 130 |
1 Harmony’s moisture-in-ore data is part of our water disclosure project (WDP) reports.
2 Decrease due to the operation of the Reverse Osmosis Plants at Target and Harmony One Plant, as well as the newly installed sand filters at Saaiplaas.
3 Restating FY21 water discharge figures for surface source and FY22 figures for water withdrawal from groundwater and water discharged to surface water to be aligned with the WDP reported figures.
4 Increased production at Hidden Valley and the operation of the Reverse Osmosis Plants at Target and Harmony One Plant
|
|
|
|
|
|
|
|
|
|
|
|
|
|
|
|
|
|
|
|
|
Water use categorised by water-stressed areas (Ml)1 |
|
FY23 |
FY22 |
FY21 |
FY20 |
FY19 |
| Water withdrawal |
|
|
|
|
|
|
| Potable water from external sources |
Arid and low water use |
— |
— |
— |
— |
— |
| Low |
12 641 |
14 553 |
13 669 |
11 289 |
12 597 |
| Low-medium |
1 776 |
945 |
716 |
601 |
177 |
| High |
5 612 |
5 692 |
5 083 |
2 686 |
3 159 |
| Surface water |
Arid and low water use |
— |
61 |
89 |
113 |
207 |
| Low |
2 477 |
2 695 |
2 695 |
2 575 |
3 843 |
| Low-medium |
— |
— |
— |
— |
— |
| High |
— |
— |
— |
— |
— |
Groundwater2 |
Arid and low water use |
267 |
315 |
178 |
194 |
376 |
| Low |
6 512 |
9 090 |
7 789 |
2 120 |
2 642 |
| Low-medium |
64 |
65 |
71 |
64 |
89 |
| High |
— |
— |
16 |
52 |
68 |
Water discharged2,3 |
|
|
|
|
|
|
| Surface water |
Arid and low water use |
— |
— |
— |
— |
— |
| Low |
2 521 |
3 278 |
3 031 |
3 008 |
2 130 |
| Low-medium |
309 |
392 |
— |
— |
— |
| High |
2 231 |
1 628 |
756 |
156 |
547 |
1 Harmony’s moisture-in-ore data is part of our WDP water disclosure project reports.
2 Restating FY21 water discharge figures for surface source and FY22 figures for water withdrawal from groundwater and water discharged to surface water to be aligned with the WDP reported figures..
3 Increased production at Hidden Valley and the operation of the Reverse Osmosis Plants at Target and Harmony One Plant
|
|
|
|
|
|
|
|
|
|
|
|
|
|
|
|
|
|
| Fresh water use intensity (Ml/tonnes treated) |
|
FY23 |
FY22 |
FY21 |
FY20 |
FY19 |
| Potable water from external sources |
0.384 |
0.394 |
0.395 |
0.573 |
0.613 |
| Surface water |
0.048 |
0.051 |
0.057 |
0.106 |
0.156 |
| Groundwater |
0.131 |
0.176 |
0.164 |
0.096 |
0.122 |
|
|
|
|
|
|
|
|
|
|
|
|
|
|
|
|
|
|
|
|
|
Water companies’ water use (Ml)1,2 |
|
FY23 |
FY22 |
FY21 |
FY20 |
FY19 |
| Water sold |
Covalent |
— |
|
— |
|
37 |
|
n/a |
n/a |
Margaret |
2 055 |
|
3 259 |
|
4 020 |
|
3 231 |
|
3 100 |
|
| Water pumped |
Covalent |
4 730 |
|
5 688 |
|
6 948 |
|
n/a |
n/a |
Margaret |
5 900 |
|
6 411 |
|
5 447 |
|
4 339 |
|
3 684 |
|
| Water discharged to surface source |
Covalent |
4 730 |
|
5 688 |
|
6 948 |
|
n/a |
n/a |
Margaret |
2 528 |
|
3 245 |
|
1 072 |
|
737 |
|
584 |
|
1 Harmony has a 66% share in Margaret Water Company.
2 Covalent was acquired in FY21, therefore no information is available for FY19 and FY20.
Papua New Guinea
At Hidden Valley, steep topography, high rainfall and low evaporation create a year-round positive water balance. This presents significant environmental challenges, particularly in managing water discharge from the mining site into the surrounding environment.
Water management strategy
Our management approach includes:
•Controlling rainfall run-off to prevent erosion and sediment entering the Watut River system
•Recycling site water to limit water stored in the TSF and reduce extraction from surface water sources
•Treating wastewater before discharge where necessary.
Water use, treatment and discharge
Higher production at Hidden Valley in FY23 saw a corresponding 17% increase in total water usage over the year. Per tonne of ore milled, our water use in FY23 and FY22 remained constant.
We primarily extract water from Pihema Creek, a tributary of the Watut River, and prioritise process water recycling to limit extracted volumes at Hidden Valley. A cyanide detoxification plant, beside our TSF, treats wastewater before discharge to Pihema Creek or the Upper Watut River. We measure the quality of our discharges and the potential impact of our operations at the compliance point in Nauti village, 18km downstream of Hidden Valley, in accordance with our environmental permit. This compliance monitoring continued to detect low-level exceedances of dissolved manganese during FY23. We manage this by amending our waste rock management practices to reduce manganese levels released from our waste rock dumps. Other metals remain below water quality criteria.
Verified by independent Australian consultants, the objectives of Hidden Valley’s acid and metalliferous drainage management plan, and waste rock dumping strategy, remain appropriate to limit acid and most soluble metals discharge from landforms to the Watut River system. Manganese at current levels detected in the river is unlikely to significantly impact the river system as recorded concentrations remain well below conservative international ecosystem protection guidelines. We routinely provide updates to the regulator, outlining the ongoing monitoring programme, results and potential remedial actions.
We also addressed non-compliance of permitted sewage treatment plant effluent quality criteria at the Ridgeline camp site with various initiatives to improve its performance.
Australia
We are evaluating options to secure a sustainable water supply for the Eva Copper Project where site conditions are analogous to the water-scarcity challenges experienced in South Africa. Water conservation and recycling initiatives are planned to be critical components of the water balance for developing and operating this asset. While water deficits are a challenge in this region, the project site will also be subject to extreme rainfall events and periods of flooding which pose challenges to a zero discharge philosophy. Optimising water management infrastructure is a key component of the in-progress engineering design focus for Eva Copper.
Future focus areas
|
|
|
|
|
|
|
|
|
In South Africa, to offset potable water consumption and reduce reliance on municipal supply, we will continue building water treatment plants at various operations (Mponeng and Covalent in FY24 and Margaret in FY25). We will also increase our water recycling ratio and reduce potable water intake, particularly at Doornkop, to meet efficiency targets.
We will continue to support our local government on its WaSH initiatives for doorstep communities.
|
In Papua New Guinea, to reduce manganese levels in seepage from the waste rock dumps, we will implement a number of amendments to waste rock management, dump construction, material verification, placement and monitoring. This will in turn minimise the potential for impacts to the local river system. |
In Australia, we continue to evaluate multiple water supply options as part of the Eva Copper Feasibility Study Update to define a sustainable solution for the project. We are committed to engaging with stakeholders on this matter to understand partnership and mutually beneficial opportunities for water supply within the broader region. |
| The group will remain committed to significant capital investment in increasing our water recycling ratio and reducing potable water intake by materially adjusting our water sourcing profile in line with industry best practice and local sustainable development objectives. |
TAILINGS AND WASTE MANAGEMENT
Gold mining companies worldwide acknowledge the potential harmfulness of tailings and waste, and understand the imperative to proactively mitigate associated risks to communities and the environment within our sphere of influence. We also know the inherent opportunity to reprocess this material with substantive competitive advantages including maximised benefits for the environment. It is technically low risk, non-labour intensive, non-energy intensive, safer and a lower cost option to conventional mining.
Globally, we are the largest producer of gold from the retreatment of old tailings dams, making us a major player in the circular economy. Harmony’s tailings retreatment presents a fantastic opportunity, given the abundance of resources in old gold tailings dams in the Free State, North West and Gauteng regions. We continue to invest in these low-risk, high-margin operations through our Kareerand tailing storage facility extension at Mine Waste Solutions. Construction is now fully underway following permitting delays. We are also conducting studies to determine the feasibility of converting 5.7Moz in resources to reserves in the Free State region.
Harmony manages 84 TSFs in South Africa and one in Papua New Guinea as part of the mining process, which includes deposition of waste material in TSFs.
|
|
|
|
|
|
|
|
|
| GRI Standards |
|
Related SDGs |
Prepared in accordance with 3-3, 301-1, 301-2, 301-3, 306-1, 306-2, 306-3, 306-4 and 306-5. |
|
|
Our approach
Robust and meticulous engineering and dam design, continuous risk management, and layered assurance and oversight provide integrity, stability, environmental and legal compliance for our TSFs. Responsible and effective waste management is also a priority to reduce our environmental impacts and mitigate associated liabilities. We include guidelines on mineral, non-mineral and hazardous waste materials in operations’ environmental management systems.
|
|
|
|
|
|
|
Tailings management
Our good standing is verified by:
•International Mining Industry Underwriters (IMIU) annual audits of operating TSFs
•International Cyanide Management Institute (ICMI) audits every 18 months
•Mine residue deposit updates to the Department of Mineral Resources and Energy every two years
•Quarterly reports by accredited consulting engineers in South Africa and Papua New Guinea
•Third party audits and Independent Tailings Review Board oversight in Papua New Guinea.
|
Global tailings management standard
Integrating social, environmental and technical considerations
Aspects of the Global Industry Standard on Tailings Management (GISTM) augment our protocols for optimal stabilisation of TSFs. Harmony will revisit this when the GISTM releases supporting technical guidelines. We expect the updated South African National Standard (SANS) 10286 on tailings dam design to be revised accordingly. Our final decision on GISTM implementation depends on publication of the revised SANS 10286 standard.
In the meantime, as per the GISTM’s integrated tailings management approach, published in 2020, we continue enforcing exemplary tailings dam design, engineering, operation and decommissioning standards with controls dictated by the terrain. This includes construction of buttresses around our tailings dams to improve integrity, at a cost of R200 million (US$10.6 million) over the past two years, as well as surface water management, reclamation and recycling. We increase our factors of safety to ensure that we protect downstream communities and the ecosystems.
In South Africa, we also apply ISO 14001:2015 environmental standards to our tailings facility management.
|
|
|
|
|
|
|
|
|
|
|
|
|
|
Waste management
Waste management includes generation, handling, storage and transport as well as recycling, retreatment and/or disposal.
Understanding the cost of waste management enables effective planning for new projects and mine closure. Pragmatically, we maximise recycling and waste reduction during life-of-mine, and design waste minimisation and reclamation plans (including mineral waste rock used as an aggregate in construction and infrastructure development) to curtail our total mining footprint.
|
Cyanide Code
Voluntary industry programme for safe management of cyanide, and cyanidation of mill tailings and leach solutions
Our plants uphold the International Cyanide Management Code for the Manufacture, Transport and Use of Cyanide in the Production of Gold (the Cyanide Code). The outcomes of audits by an independent third party are outlined in the table below.
|
|
| Plant |
Cyanide Code status |
ü Compliant
û Non-compliant
ý Not registered
|
Harmony One |
ü |
| Target |
ü |
| Noligwa |
ü |
| Kusasalethu |
ü |
| Doornkop |
ü |
Savuka1,2 |
ü |
| Mponeng |
ü |
Central1,3 |
û |
Saaiplaas4 |
ý |
Kalgold 4 |
ý |
Mine Waste Solutions1,4 |
ý |
Hidden Valley4 |
ý |
|
1 TSF reclamation.
2 The only compliant reclamation site.
3 Not deregistered (quarterly update submitted to the ICMI).
4 Our Kalgold, Saaiplaas and Mine Waste Solutions plants in South Africa, are not registered as these plants do not meet all Cyanide Code certification requirements however still operate under the principles of responsible cyanide management as envisioned by the cyanide code. Recertification of the Hidden Valley plant in Papua New Guinea is in progress.
|
FY23 focus areas and performance
Tailings management
Of the 84 tailings facilities under management, there are 18 operational, 11 remining, and 55 dormant and inactive facilities in South Africa – all operational facilities use upstream deposition, incorporating day wall and basin or upstream cyclone deposition.
Hidden Valley’s TSF is designed and operated in accordance with the Australian National Committee on Large Dams (ANCOLD) guidelines. The facility comprises two cross-valley embankments (main and saddle dams) constructed in terms of the downstream build methodology. It is the first large facility of this kind to operate successfully in Papua New Guinea.
Daily tailings management focus areas
|
|
|
|
|
|
|
|
|
|
|
|
|
|
|
|
|
|
|
|
|
|
|
|
|
|
|
|
|
|
|
|
|
Overtopping/Slope failure |
|
Foundation failure |
|
Progressive failure |
|
Liquefaction |
|
Operational status |
|
•Lack of freeboard
•Penstock status
•Basin shape/profile
|
|
•IMIU annual audits and monthly inspections |
|
•Seepage and sloughing
•Erosion
|
|
•Seismic events
•Pore water
•Pressure
|
|
•Infrastructure management
•Controlled/authorised deposition
|
Our interventions include, among others:
•Freeboard control
•Water management
•Maintaining stability and safety (as advised by the engineer of record)
•Erosion controls
•Monitoring and control measures implemented to ensure compliance
•Dust fallout management
•Emergency preparedness, response training and awareness sessions for communities near Harmony’s TSFs.
We conduct regular inspections, audits and meetings at various intervals with subsequent actions and reports ensuring we deliver the desired outcomes. Areas of concern are addressed and resolved by management, the appointed experienced deposition contractor and specialist consulting engineer who assist with operation, maintenance and management of the facilities to ensure global best practice.
Freeboard management (safe water levels on top of TSFs) remains critical for legal compliance at operational facilities as part of a long-term strategy. Excessive water should not accumulate on facilities except at night for controlled decant during the day. Kareerand continues to decant without ceasing as this facility holds a specific volume of water. Drone technology supports monthly freeboard surveillance. Despite extremely high rainfall in South Africa over the past two years, we maintain freeboard and stability at our TSFs.
At Hidden Valley, continuous compliance in maintaining sufficient freeboard is an important element of overall mine operating conditions as is minimising free water on the facility surface given the high annual rainfall in the area and the site’s positive water balance. Water drawn from the TSF is either recirculated to the process plant for reuse or passed through a treatment system before controlled discharge.
Our remined facilities focus on accurate water control through effective management and establishment of containment paddocks in general and mined-out areas. We remine most facilities from the top to the bottom of the face to minimise the risk of sloughing and inundation. To maintain a stable slope face, we have stopping limits on the angle-controlling monitoring gun.
On dormant and inactive facilities, we primarily use containment paddocks in the basins and berms to lower groundwater levels and dry out the tailings dam. In addition, we repair side slopes after rains while ensuring safe and proper access routes to the top of tailings facilities. We also maintain solution trenches around the tailings facilities and monitor return water to the plants.
South Africa
Internal compliance audits conducted confirmed our satisfactory tailings dam performance. In addition, independent audits by an external assurance provider concluded that 97.6% of material recommendations were closed or in the process of being closed-out. In most cases, our standards exceed legal requirements, and our surveillance and investigative work is comparable with international standards.
Remedial work was done on these TSFs:
•St Helena 123 (Saaiplaas plant): A slime buttressing programme is being implemented
•Target 1 plant: Drainage and stability improvements was completed on the eastern flank
•Dam 23 (Central plant): enhanced our drainage and rock cladded for erosion control and planned a rock buttress in FY24
•Brand D (Central plant): plan to improve drainage and build a rock buttress for overall stability.
Our TSFs comply with codes of best practice. This was evident during abnormally high rainfall in FY23 when our tailings dams remained safe and without noticeable risk. We maintained legal freeboard at all times.
International Mining Industry Underwriters (IMIU) provides annual audits on all TSFs to provide assurance that these facilities are in good condition and aligned with global practices. IMIU’s risk ratings confirmed our commitment to proactive risk management and business continuity management for the calendar year 2023. Our tailings dams are assessed against the most conservative measures to assure industry-leading stability and to align with our company strategy which includes responsible stewardship and operational excellence.
|
|
|
|
|
|
|
|
|
|
|
|
|
|
|
|
Tailings management strategy |
TSF status |
Operation |
Inspection |
Monitoring |
Periodic review |
Operating (18) |
ü |
ü |
ü |
ü |
| Remined (11) |
ü |
ü |
|
|
| Dormant (55) |
|
ü |
|
ü |
Papua New Guinea
Independent review of the Hidden Valley TSF was conducted on 6 June 2023 by GHD in accordance with ANCOLD standards. GHD found that the safety status of the Hamata TSF1 is assessed as satisfactory subject to continued review of overall stability during raising. This will ensure downstream zones are raised appropriately, while the focus remains on crest raising, and the current level of construction monitoring, surveillance and operational control is maintained.
Works on TSF2 at Hidden Valley are progressing with TSF1 reaching the final designed height at 2017mRL. TSF2, which repurposes the Hamata open pit for tailings storage, will also be compliant with ANCOLD guidelines. The new facility will have a single cross-valley embankment. Early warning systems have been installed to safeguard downstream communities in the event of an emergency.
|
|
|
|
Wafi-Golpu Project deep-sea tailings placement
We remain confident that deep-sea tailings placement is the safest, and most environmentally and socially responsible tailings management solution for the project.
The Wafi-Golpu environmental permit, secured in 2020, approves construction and operation of a deep-sea tailings placement system as the preferred solution after investigating on-land and submarine options.
Submarine tailings placement is used in six countries and at three operations in Papua New Guinea. Terrestrial tailings sites examined for the project present significant risks and constraints, given high seismicity, rainfall, topography and soil type. A surface tailings facility would severely impact heritage sites, communities, and productive and ecologically sensitive land. Alternatively, tailings deposition in the Huon Gulf, from an outfall at some 200m depth, would mix with natural sediments from various rivers as they flow down the submarine Markham Canyon and settle on its floor. The tailings would represent only a small percentage (less than 20%) of the total sediment flow in the area. Markham Canyon does not have clear water suitable for most fish life and lacks biodiversity due to significant volumes of natural sediment.
Wafi-Golpu expects to place over 360Mt of tailings over its 28-year life. After mine closure, natural sediment loads will continue and eventually bury deposited tailings. Tailings placement would occur well below the productive ocean surface layers and is not predicted to affect the coastal environment, biologically productive surface waters, community health or fisheries. At the boundary of the proposed mixing zone in the Huon Gulf, tailings discharges would be diluted to levels that meet Papua New Guinea water quality criteria as well as Australian and New Zealand water quality guidelines for marine aquatic ecosystem protection.
We continued stakeholder engagement on the Wafi-Golpu Project, including the deep-sea tailings placement method, throughout FY23.
|
Waste management
Our mining and extractive processes generate mineral and non-mineral waste. Mineral waste comprises tailings and overburden, often viewed as a Resource in waiting. Non-mineral waste is classified as hazardous and non-hazardous, and managed by recycling or reuse, off-site treatment or disposal to on-site landfills.
|
|
|
|
|
|
|
|
|
|
|
|
|
|
|
|
|
|
| Group targets |
| Waste KPIs |
Five-year baseline target
(FY18-22)
|
Five-year baseline target
(FY23-27)
|
Year 1 (FY23) |
Cumulative actual |
Year 5 (FY27) |
Target |
Actual |
Achieved |
Non-hazardous waste recycled1 (%) |
40 |
70 |
14 |
68 |
|
ü |
1 Includes timber, plastic and steel.
Mineral waste
Effective mineral waste management reduces our aesthetic and land use challenges, particularly during mine closure, as well as potential water and air pollution while maximising recovery of ore, minerals and metals with significant cost and energy savings. Although waste rock is not as valuable as a gold mineral resource, it is useful as plant grinding media and backfill plant feed. It is also a resource in the aggregate industry.
Meeting our internal five-year target to reclaim at least 10% of our total available mineral waste footprint depends on the market, provincial infrastructural needs, and capacity to support repurposing activities.
In the past year:
•Waste rock recycled decreased by 14.1% due to load curtailment at Mispah gold plant
•Slimes recycled increased by 0.6% due to increased processing at Savuka plant
•Rock mined (41.5Mt) decreased by 3.9%.
Our year-on-year increase in mineral waste is due to waste stripping in cutbacks at Hidden Valley.
Compliance at Hidden Valley
Tests confirmed that manganese in waste rock dump seepages originates from co-disposal of oxidised (weathered) and potentially acid-forming material. To limit this, we isolate high-risk material in separate waste rock dumps. This revised waste rock management practice will inform refinements to operational waste management practices and landform designs for closure.
We are also in the process of updating our acid and metalliferous drainage management plan, which identifies several additional improvements to waste rock management, dump construction and monitoring. The overarching acid and metalliferous drainage management strategy at Hidden Valley remains appropriate to limit acid and most soluble metals released from the dumps to the Watut River.
Manganese is not considered a significant environmental hazard at the current concentrations detected in the receiving environment based on scientific literature which suggests that the acute and chronic toxicity of manganese to many freshwater biota is low at these levels.
Committed to inclusive mining and our social purpose, we ring-fence some of our waste rock generated from our underground operations for local businesses and entrepreneurs in South Africa. This supports our relationships with legitimate licensed artisanal and small-scale operators in our host communities as follows:
|
|
|
|
|
|
| Gauteng |
We continue to investigate the feasibility of waste rock dumps creating employment through aggregate initiatives. This would enable local participation in economic development and make economical use of a liability.
Additionally, the land is available for rehabilitation when waste rock dumps are cleared. |
| North West |
We are engaging with host communities in Orkney on the reclamation of the Scott rock dump, which will be donated to the local municipality to benefit residents. |
| Free State |
In a commercially sustainable venture, in Welkom surplus waste rock has been processed by local aggregate producers for over a decade.
We continue to explore opportunities to work with local community representatives from Allanridge and a black economic empowerment entrepreneur to establish additional aggregate producers. |
We plan, build and operate our waste management assets at Hidden Valley in a manner that maintains rigorous governance and stakeholder support.
Non-mineral waste
We ensure responsible storage, treatment and disposal of non-mineral waste in line with group environmental standards integrated into ISO 14001 systems.
We aim to minimise hazardous waste disposal by directing our waste streams, mainly hydrocarbons, to accredited repurposing institutions, such as the Recycling Oil Saves the Environment (ROSE) Foundation, or appropriate landfills.
Other initiatives reduce, reuse and recycle effluent from our operations. This is part of our effluent management process, which monitors, measures and reports our effluent discharges to prevent pollution or minimise, mitigate and remediate its harmful impacts.
Actively promoting waste stream recycling, our reclamation programme repurposes used underground equipment and infrastructure in our salvage yards for use within our operations. We also achieve our transformation objectives by including emerging local entrepreneurs in this initiative.
|
|
|
|
|
|
|
|
|
|
|
|
|
|
|
|
|
|
Group waste generated |
FY23 |
FY22 |
FY211 |
FY20 |
FY19 |
| Oils and grease |
|
|
|
|
|
Grease used (t) |
475 |
524 |
552 |
424 |
506 |
| Lubricating and hydraulic oil used (Ml) |
2.7 |
3.0 |
3.0 |
2.5 |
3.2 |
Recycled oil – repurposing hydrocarbons to landfill (000l) |
742 |
698 |
527 |
813 |
978 |
| Hazardous waste |
|
|
|
|
|
| Tailings (Mt) |
51 |
52 |
47 |
24 |
24 |
| Waste rock deposited (Mt) |
28 |
25 |
24 |
28 |
29 |
| Hazardous waste to landfill (t) |
1 501 |
803 |
524 |
250 |
399 |
Recycled waste |
|
|
|
|
|
| Waste rock recycled (000t) |
6 599 |
7 683 |
10 405 |
6 383 |
6 575 |
| Timber (t) |
3 251 |
2 727 |
3 121 |
1 868 |
2 377 |
| Steel (t) |
13 781 |
8 889 |
8 739 |
5 863 |
7 765 |
| Plastic (t) |
489 |
591 |
625 |
509 |
479 |
| Total recycled waste (000t) |
6 617 |
7 695 |
10 417 |
6 391 |
6 586 |
|
|
|
|
|
|
| Total general waste generated from operational salvage yards |
25 644 |
20 470 |
12 485 |
8 241 |
10 621 |
Mineral waste intensity (tonne/tonne treated) |
1.52 |
1.43 |
1.44 |
2.05 |
2.05 |
General waste intensity (tonne/000tonne treated) |
0.49 |
0.38 |
0.25 |
0.32 |
0.41 |
1 Includes Mponeng and related assets.
Future focus areas
|
|
|
|
|
|
|
|
|
| In South Africa, we will maintain our successful approach to TSF management as this delivers the desired results to ensure that our dams are safe, stable and compliant. Harmony is further driving beyond compliance and this philosophy will be carried into the next financial year. |
In Papua New Guinea, we will be closely monitoring the effectiveness of our waste rock management strategy to minimise the potential for impacts to the local river system. |
In Australia, we are considering best practice in the design and future construction of our tailings dams. This presents a huge opportunity to plan for eventual closure, and we assimilate closure principles from planning to design construction and deposition.
|
| The group remains focused on managing our factors of safety to beyond compliance levels, coupled together with responsible rehabilitation of tailings dams that show no further prospects in remining. Looking for opportunities to beneficiate these dams as part of our recycling initiatives, remains top of our agenda as we complete our feasibility studies in the Free State and Carletonville areas. Part of our intention is to consolidate tailings dams for ease of management and risk mitigation. As an added bonus, land becomes available for social development opportunities. |
AIR QUALITY
Our mitigation measures aim to reduce atmospheric emissions from our gold plants and operations.
Primary atmospheric emissions from our gold plants are sulphur oxides, nitrous oxides (NOₓ) and particulate matter (PM) as well as dust fallout from our operations (including TSFs). We manage these air pollutants with an environmental strategy that aims to protect our host communities and the environment.
|
|
|
|
|
|
|
|
|
| GRI Standards |
|
Related SDGs |
Prepared in accordance with 3-3 and 305-1, 305-2, 305-3, 305-4, 305-6 and 305-7. |
|
|
Our approach
We measure our primary atmospheric emissions against the conditions of our licences for each plant, and our formal complaints system addresses public concerns with immediate investigation and corrective action.
Our gold plants meet legislated thresholds with occasional PM exceedances. We address these exceedances by ensuring we use high-quality carbon as part of our multidisciplinary risk management process, which includes GHG emission reduction programmes. We thus identify, monitor and mitigate all emissions at company and asset levels.
Our South African operations apply the American Standard for Testing and Materials method (D1739) in dust fallout monitoring and mitigation at our operations and TSFs across the group. These operations also comply with the National Environmental Management: Air Quality Act’s national dust control regulations in collecting and analysing dust fallout.
Monitoring often indicates other fugitive dust sources with tailings fallout. We record exceedances as non-compliance and implement remedial measures when exceedances are due to our mining activities. Other sources include algal growth in wet seasons as well as soil and other organics that may contaminate samples.
At our Hidden Valley operation, and Wafi-Golpu and Eva Copper Projects, we conduct monitoring programmes commensurate with our activities and informed by compliance requirements. The location of these assets affords some separation from sensitive receptors. For the Wafi-Golpu and Eva Copper assets, the respective environment permit under Papua New Guinea regulation, and environmental authority under Queensland regulation, stipulate further PM and dust deposition requirements that will come into effect when mining activities commence.
FY23 focus areas and performance
This year, our focus areas included an increase in dust suppression and an accelerated tailings rehabilitation programme to prevent fugitive dust from creating a nuisance factor for our communities.
Over the past five years:
•PM intensity decreased due to improved management practices and understanding of plant processes, refinements in sampling methodologies for more accurate results and upgrades to both the abatement equipment as well as the processes could further reduce the amount of particulate matter that is recorded. In regard to dust fallout management, vegetation of more than 21 000 trees have been planted and 25.3ha of dryland grassing on six TSFs
•Sulphur dioxide (SO2) Intensity increased in FY22 due to increased concentration at one of the processing plants although it did not exceed the Section 21 limits in terms of National Environment Management: Air Quality Act (Act 39 of 2004). In FY23, a significant decrease is noted due to the successful plant upgrades to reduce SO2 concentrations
•NOₓ intensity generally increased in the past five years as a result of the new acquisitions of operations including Mponeng and Mine Waste Solutions in FY21 that added to the group’s NOₓ accountability. However, for the past three years since FY21, there has been a steady decrease due to the improved management practices and optimising plant processes at Mponeng and Mine Waste Solutions.
South Africa
In FY23, the regulator approved all required annual national atmospheric emission reports submitted by our operations. Our Mponeng gold plant also received recognition from the Gauteng Department of Agriculture, Rural Development and Environment for its NOₓ reduction programme.
Although there were no reportable exceedances, we continued implementing our prevention interventions which included chemical suppression, netting, grassing, trees, irrigation and controlled maintenance in windy seasons. We continued to address concerns despite costly equipment theft and vandalism:
•Kusasalethu reduced the dust fallout from its TSF and improved air quality in the West Wits area with irrigation and indigenous woodland land based initiatives as part of land rehabilitation
•Mine Waste Solutions (including the Kareerand TSF extension), Moab Khotsong and Kalgold addressed PM and dust fallout exceedances through the use of better quality activated carbon (for point source emissions) as well as irrigation, chemical suppression, dust netting and vegetation initiatives being employed (for dust fallout exceedances)
•Mponeng improved NOₓ emission intensity from 35% to 25% by repairing an extractor fan in the smelter house
•Doornkop’s TSF revegetation project and dust reduction on gravel haul roads were delayed by community unrests. Work is scheduled to start imminently
•Free State operations installed or moved 25 000m of netting (wind barriers) as well as having planted vegetation on top of TSFs to reduce dust emissions, in accordance with its dust management plan
•Noligwa gold plant reduced PM emissions with higher-quality activated carbon – we are extending this practice to Mine Waste Solutions.
Papua New Guinea
At Hidden Valley Mine, dust emissions at our monitoring sites remained below permitted compliance limits and in line with historical trends. Average dust deposition levels were highest in October 2022 due to drier weather conditions experienced in the area at this time.
* Nufcor is excluded from the emission totals. Totals for SO2 and PM was restated for FY19 and FY20.
Future focus areas
|
|
|
|
|
|
|
|
|
|
|
|
|
|
|
|
|
|
|
|
|
|
|
|
|
|
|
|
In South Africa, we will continue rolling out mitigating measures (installing barriers such as artificial netting or trees, dust suppressants and rehabilitative vegetation). The success of these measures depends on communities’ cooperation in preventing theft and vandalism of equipment, including R6 million (US$0.3 million) irrigation to be installed at Doornkop in the coming year.
We will also review our dust monitoring programme to ensure it is appropriate. This will include reducing PM exceedances at operations by improving process controls, upgrading equipment where necessary and implementing preventive maintenance programmes.
|
In Papua New Guinea, our focus remains on implementing our monitoring programmes, commensurate with project phase, site activities and informed by compliance requirements. |
In Australia, our focus is on establishing our baseline monitoring programme at Eva Copper. |
Improvements in Particulate Matter emissions will continue to receive priority at our gold plants, through better operational control, the use of improved quality activated carbon and changes to more efficient abatement equipment where necessary. |
BIODIVERSITY AND CONSERVATION
Sustainable natural resource management policies govern our biodiversity impact assessments and progressive rehabilitation.
Operating in vulnerable ecosystems with various endangered and threatened species, we acknowledge the impact of our mining activities on the biodiversity and ecology of our host environments throughout life-of-mine and beyond. To limit this footprint, and mitigate and offset our impacts, we implement appropriate management systems and processes.
|
|
|
|
|
|
|
|
|
| GRI Standards |
|
Related SDGs |
Prepared in accordance with 3-3, 304-1, 304-2, 304-3 and 304-4. |
|
|
Our approach
For net positive biodiversity gain in ecologically sensitive environments, as stipulated in our biodiversity and rehabilitation statement, our approach focuses on protecting, restoring and promoting sustainable use of terrestrial ecosystems while arresting and reversing land degradation. Our environmental impact assessments identify and map sensitive and protected species and ecosystems. This approach includes:
•Developing and implementing biodiversity management and action plans
•Eradicating invasive alien plants
•Identifying and implementing conservation programmes and offset opportunities.
We consider land degradation in our environmental risk matrix as a significant contributor to climate change. Land degradation generally refers to poor vegetation cover undermining plants’ CO2 absorption, increasing the likelihood of soil erosion during rain and dust storms (particularly on high arable land) and causing biodiversity loss. We mitigate this with biodiversity assessments (part of the environmental authorisation process) when we begin new projects or identify critical biodiversity and environmentally sensitive areas. We avoid these areas, where feasible, or mitigate unavoidable impacts with specialist recommendations such as continuous invasive alien plant eradication.
FY23 focus areas and performance
We aspire to go beyond compliance with stringent environmental authorisation conditions and align our approach with our decarbonisation strategy. We cleared 6 655.5ha of invasive alien plants across the group (Kalgold: 740.0ha, Vaal River: 5 013.0ha, Moab Khotsong: 216.5ha, Kusasalethu: 610.0ha and West Wits: 76.0ha) in FY23. We replaced these plants with 13 000 trees at the toes and tops of our TSFs to manage seepage and nuisance dust fallout. Another 45 indigenous trees planted at our operations will improve air quality and address climate change.
Other ongoing activities include demolishing and sealing disused infrastructure, and rehabilitating our tailings dams, to continuously reduce our mining footprint, liberate and restore land for alternative use, and prevent illegal mining.
Challenges include illegal gold, sand and sandstone mining at Doornkop, and livestock overgrazing in local communities. This negatively impacts habitat and indigenous grasslands, and encourages invasive alien species growth. In other host communities across South Africa, untreated sewage released into the environment, including the mining area, also affects biodiversity and the conservation value of properties and pans.
In the coming year, Harmony in collaboration with the Endangered Wildlife Trust (EWT) is embarking on a journey to undertake an assessment of our biodiversity footprint, in accordance with the Biodiversity Protocol. This work will involve a gap analysis of existing data, a biodiversity footprint assessment, and target setting and scenario modelling thereafter. The ultimate goal would be to ensure that Harmony is able to implement net positive gains in the biodiversity sphere, including the consolidation of all net impact on ecosystems and material species, spatially over time.
South Africa
Implementation of our approach is summarised below.
|
|
|
|
|
|
|
|
|
|
|
|
| Biodiversity management and action plans |
Invasive alien plant eradication |
Conservation programme |
|
•Revisited our policy and strategy
•Conducted a gap analysis
•Working on management and action plans which will include:
–Sensitive habitats (such as riverine systems along the Vaal River)
–Wetland delineations
–World Heritage sites and/or protected areas
•Establishing partnerships to progress our intent in respect of conversation and protection.
|
•Programmes developed and implemented at Kusasalethu, West Wits, Moab Khotsong, Kalgold and Vaal River. |
Biodiversity offsets and trade-offs |
Land rehabilitation |
|
•Develop one offset project in each region to ensure net zero impact during life-of-mine
•Investigate carbon trading.
|
•Continue demolition and rehabilitation programmes
•Determine land use in terms of capability
•Revegetate areas with indigenous grasses or create alternative, economically viable post-closure land use.
|
Biodiversity management and action plans
Our long-life South African sites implement biodiversity management plans through mine closure and environmental management plans. These plans are based on assessments and align with biodiversity disclosure projects implemented across our operations. We plan to include biodiversity offsets for each area surrounding our operations as part of project planning.
In the North West, our Moab Khotsong operation is beside the Vaal River, the main tributary of South Africa’s largest river, the Orange River. This is a critical biodiversity area with sandy and rocky grasslands, riverine and valley bottom wetlands, and endangered, vulnerable ecosystems (including endemic vegetation such as the critically endangered Brachystelma canum and Aloe braamvanwykii). Habitat loss in this province is due to agricultural activity in recent decades. According to the International Union for Conservation of Nature Red List of Threatened Species (Red List), the only critically endangered fauna is the white-backed vulture (Gyps africanus).
Our Free State operations are in the endangered Vaal-Vet sandy grassland conservation area and the western Free State clay grassland ecosystem, with one species of conservation concern living in these habitats.
In peri-urban Gauteng, our operations are not in critically endangered, endangered or vulnerable biodiversity areas but we protect near-threatened ecosystems and species.
Invasive alien plant eradication
We map identified invasive alien plants and divide infested areas into prioritised management units. We began in FY16 at Kusasalethu (some 5 000ha of the surface mining right area cleared to date) with annual assessments and indigenous species conservation. We use the same approach at Vaal River, Moab Khotsong, Kalgold and West Wits. We plan to extend this programme to Doornkop where we preserve sensitive wetlands and rocky outcrops.
Papua New Guinea
With the third largest block of unbroken tropical forest and the largest tract of primary forest remaining in the Asia-Pacific region, Papua New Guinea supports over 5% of the world's plant and animal species. Some two thirds of flora and fauna are endemic. Morobe Province, where our Hidden Valley and Wafi-Golpu assets are located, hosts various habitats and flora and fauna communities. The Huon Peninsula, forming most of the province, has moderate to high species richness with various threatened mammal fauna. Of the province’s 3.3 million hectares, two-thirds is forest, and lowland forests are heavily deforested or degraded.
Over a long period, human activities have disturbed the area around Hidden Valley. The area is home to several mammal and bird species protected under Papua New Guinea’s Fauna (Protection and Control) Act 1976, the Red List and the Convention on International Trade in Endangered Species of Wild Fauna and Flora. Vulnerable or endangered fauna includes two tree kangaroo species (Dendrolagus dorianus and Dendrolagus goodfellowi), the long-snouted or giant echidna (Zaglossus bruijni), the rare nectar bat (Syconycteris hobbit) and the New Guinea harpy eagle (Harpyopsis novaeguineae).
Hidden Valley operations remained within a confined footprint in FY23 and for many prior years.
At Wafi-Golpu, as part of baseline characterisation, three ecological subdivisions have been used to assess the national conservation status of principal forest types across the project area:
•Floodplain forest vegetation is assessed as Vulnerable, as it has reduced by more than 30% over the past 50 years due to ongoing commercial logging across Papua New Guinea
•Mixed hill forest is not assessed as threatened, as it has an estimated occurrence of 13.3 million hectares across Papua New Guinea, and its reduction is estimated to be less than 30% over the past 50 years
•Swamp forest is not assessed as threatened, due to its difficulty to access and because drainage and clearing of swamps for agriculture is not widespread in Papua New Guinea.
We have recorded seven fauna species of conservation significance as part of ecological studies. One is classified as critically endangered, three as vulnerable, another as near-threatened and the rest as data-deficient. Two other near-threatened species, Doria's goshawk (Megatriorchis doriae) and forest bittern (Zonerodius heliosylus), are likely or potentially located in the terrestrial ecology study area.
Wafi-Golpu Project design includes extensive efforts to avoid potential biodiversity impacts, minimising unavoidable impacts, and considering restoration and offset opportunities. We will assess these findings as the project advances beyond permitting stage.
Australia
The project site for Eva Copper is located in the Cloncurry region of north-west Queensland. The project site and immediate surrounding area is comprises of native Australian vegetation communities that are commonly found within this region. The project site does not host any flora species of International or Australian national conservation significance.
The site is gently undulating across the entire tenement, with occasional sharp hilly outcrops of the Knapdale Range. The most prominent geological feature on site is the discrete north-south ridgeline rising to approximately 285m above sea level and characterised by ridges of exposed silicified rock, comprising what is known as Mount Rose Bee and Green Hills. Geological features of the Knapdale Range provide habitat for many mammal and reptile species, including the Queensland (State) listed Vulnerable purple-necked rock wallaby. Other mammal and bird species of Queensland conservation significance that are known to or may occur at the project site include Troughton’s Sheathtail Bat (Taphozous troughtoni), Black-necked Stork (Ephippiorhynchus asiaticus), Black Bittern (Ixobrachus flavicollis), Black-chinned Honeyeater (Melithreptus gularis), Pictorella Mannikin (Heteromunia pectoralis) and Square-tailed Kite (Lophoictinia isura).
Future focus areas
|
|
|
|
|
|
|
|
|
|
|
|
|
|
|
In South Africa, we will continue to focus on rehabilitation especially the eradication of the invasive alien plants. We will complete biodiversity assessments for new projects with potentially negative impacts whilst conserving protected areas. Our efforts are also channelled to building our partnerships to support the biodiversity impact offset objective. |
In Papua New Guinea, our focus is on advancing our revegetation management plan as part of Hidden Valley closure planning project activities. This, together with associated rehabilitation trials, will help to guide successful future revegetation and rehabilitation of mine disturbance areas. |
In Australia, our focus is to further enhance our baseline understanding of the ecological composition at the Eva Copper site. This will stand us in good to stead to monitor the impacts of our activities as the project moves to the next phase. |
| The group will continue focusing on planning and designing biodiversity and climate change offset programmes. We will also accelerate our rehabilitation and mine closure programmes. |
CLIMATE-RELATED FINANCIAL DISCLOSURES (TCFD) REPORT
INTRODUCTION
Harmony Gold Mining Company Limited (Harmony, the group, or the company) is a leading global gold producer with a growing copper footprint.
Our embedded commitment to sustainable development drives integrated risk-based decision making, which creates shared value for all our stakeholders. We recognise the importance of our role in contributing towards the transition to a low-carbon economy, in the context of the mining and minerals industry. Responsible stewardship is our first strategic pillar, and decarbonisation principles are fundamental to our strategy, business processes and decision making. As a testament to this, Harmony began decarbonising its operations in 2008. We pre-empted regulations and started our journey proactively.
As part of our comprehensive strategy, we are dedicated to decarbonising our direct footprint (scope 1 and 2 emissions) and actively supporting the global low-carbon transition. Our approach involves providing essential minerals and metals to facilitate the growth of renewable energy technologies while mitigating the physical and transitional risks associated with climate change. We also extend our commitment to sustainability beyond our operations by assisting and supporting our suppliers in their decarbonisation efforts. Moreover, we aim to build resilient communities and contribute to the economic development of the countries in which we operate. With our ambitious climate agenda, we strive to achieve net-zero emissions by 2045, contributing to a greener and more sustainable world.
Our journey to bolster our climate change policies and strategy intensified in 2021 following board approval of our decarbonisation strategy. In January 2022, we submitted a science-based target (SBT) to the Science Based Targets Initiative (SBTi) for validation. We set a robust emission reduction target by joining the Business Ambition for the 1.5°C campaign.
Harmony supports the climate change commitments of our host countries, South Africa, Papua New Guinea and Australia. We also align with the South African Minerals Council of South Africa’s Climate Change Position Statement. The first step of our net-zero strategy is to reduce GHG emissions through operational efficiency initiatives and, recently, our switch to renewable energy. To address latent or residual emissions reductions that may not be feasibly achievable through other means, our approach at Harmony is to utilise land under our control for carbon removals, effectively achieving the neutralisation of our carbon footprint.
Part of the Harmony strategy is to re-engineer our portfolio through value-accretive acquisitions.
We acquired Mine Waste Solutions – a reclamation business that is high volume with low energy consumption. This coupled with the acquisition of Moab Khotsong and Mponeng operations in 2018 and 2020 respectively, led to the GHG intensity of gold production to increase by approximately 14% in those years. Despite these recent acquisitions, the overall GHG intensity of our operations is decreasing, on a milling of ore basis. The implementation of our decarbonisation strategy will facilitate Harmony’s net-zero journey while we pursue growth objectives.
We initiated Phase 1 of our renewable energy programme in 2016.
STRATEGY
Corporate strategy
Climate change has presented a significant business opportunity for Harmony because we have the metal portfolio to supply the growing demand for critical minerals shown in Figure 2. Our growth strategy has been focused on bolstering our copper portfolio through the acquisition of the Eva Copper Mine Project. This adds to the resources of our existing Wafi-Golpu Tier 1 copper-gold asset.
Figure 1: Metals portfolio
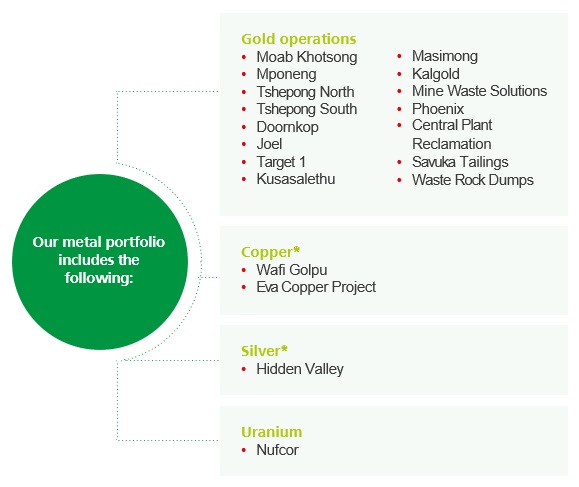
* Ore bodies include gold.
Figure 2: Critical materials in the transition to cleaner energy
Asset portfolio balance
From FY08 to FY23, we closed some of our energy-intensive shafts that reached the end of life-of-mine due to resource depletion or economic non-viability. Our increased focus on copper with the acquisition of the Eva Copper Mine Project, and processing uranium as a general by-product of gold mining, strengthens and diversifies our portfolio and can supplement the global transition to a low-carbon economy.
Our Mponeng operation, which has a better energy emission intensity when compared to our existing portfolios, have certainly enabled us to bank better performances overall. Mine Waste Solutions, our surface reclamation operation in the North West province in South Africa, and has a very low demand for energy and a much better intensity profile. The impact of these acquisitions form part of our overall strategy, as presented in Figure 3.
Decarbonisation strategy
Harmony has proactively positioned itself to address climate change since 2008. The company has taken significant strides in lowering its emissions and managing energy and water use across its operations. We decided to redirect capital towards projects that will progress our objectives of decarbonising our portfolio and addressing climate change.
In October 2021, we updated our climate change and energy policy and our climate change policy and energy efficiency strategy. Achieving the objectives of the Paris Agreement necessitates physical changes to our societal and economic mobilisation. While much progress was made through to the end of FY21, FY22 was a significant year in the evolution of Harmony’s policy and corporate commitments. These were formalised in the validation of our SBTs by the SBTi in FY23.
Policy statement and strategy
Harmony’s energy efficiency and climate change policy statement evolved in response to the physical and transition risks and impacts of climate change. The strategy to implement the policy statement focuses on the following key areas:
Figure 3: Strategy focus key areas
Our strategy considers climate change-related risks and opportunities, rebalancing our asset portfolio, driving energy efficiency, improving the reliability and sustainability of our energy mix, as well as adaptation to climate change. These points outline the background to the key performance indicators, which in turn set out the targets and their implementation at an operational level, as shown in Figure 5. We seek perpetual improvement at the meeting point of climate change and technological innovation. Our timeline of continuous improvement is shown in Figure 6.
Harmony’s transition pathway is founded on five pillars, reflecting our comprehensive approach to navigating the challenges and opportunities presented by the global shift towards a low-carbon economy.
Figure 4: The five pillars representing Harmony’s transition pathway
Figure 5: Strategy to implement policy
|
|
|
|
|
|
|
|
|
|
|
|
|
|
|
|
|
|
|
|
|
| A top-down business intent to manage and address climate-related risks |
à |
Recognition of opportunities related to operational efficiencies and GHG emission reduction |
à |
Dedicated climate adaption programmes including:
Biogas energy production and agricultural projects in South Africa Solar lighting and water, sanitation and hygiene projects in Papua New Guinea
|
à |
The move towards and continuous drive of, mining ore using methods with lower energy requirements |
Figure 6: Timeline of continuous improvement
* The years indicated in this figure are calender, not for our financial year ended 30 June.
GOVERNANCE
Historically, we focused on low-cost gold production. However, over the past decade, the energy intensity of production has played an important role in our strategy.
This shift in focus allowed us to achieve a 28% reduction in GHG intensity (against ore treated) over the past six years.
Harmony is led by a unitary board of directors that subscribes to the principles of good corporate governance. Our duty to be a responsible corporate citizen is fully supported by our directors and their commitment to ethical leadership.
The group executive management team, headed by the chief executive officer (CEO), is responsible for executing our board-approved strategy, policy and operational planning. The following table shows the different areas of governance relating to climate change:
Table 1: Governance
|
|
|
|
|
|
|
|
|
|
|
|
|
|
|
|
|
|
Governance |
The board of directors is responsible for aligning our business strategy with our climate change objectives. The board recognises that achieving our target of net-zero GHG emissions by 2045 is mission-critical. |
The board's social and ethics committee has strategic oversight regarding climate change within the group. The committee is primarily guided by our overarching responsibility to mine responsibly. In developing our strategy, the committee is guided by relevant and developing environmental legislation and our host countries’ international climate change commitments. Our strategy also considers internationally peer-reviewed science. |
The CEO is responsible for strategy implementation. He takes ownership of Harmony’s climate change policy and strategy. The CEO leadership role includes being responsible for all day-to-day management decisions, and for implementing the group’s long and short-term plan. |
The CEO is supported by the senior executive for sustainable development, who is responsible for the climate change policy and environmental strategy’s execution. South Africa and South-east Asia executives are responsible for this strategy’s engineering, operational delivery and project management. |
The audit and risk committee assists in the assessment of emerging climate change risks, their financial impacts and their mitigation. |
The investment committee reviews investments in energy efficiency and capital programmes contributing to climate change mitigation. |
Harmony has integrated the recommendations of the TCFD into the corporate reporting approach. Transparent reporting on our climate change strategies and actions informed our approach to repositioning our business as a climate-resilient operation.
RISK MANAGEMENT
Harmony places a high priority on risk management through an integrated approach to risk-based decision making. We continuously monitor risks and opportunities, with a specific focus on climate change risks at both company and asset levels. Our risk management aligns with ISO 14001, ISO 31000, and ISO 50000 standards, ensuring that we identify and manage climate and energy initiatives according to international standards.
To assess climate change risks, we have conducted a comprehensive scenario analysis in line with TCFD recommendations. This analysis encompasses both physical and transition risks, considering factors such as chronic and acute weather outcomes, policy changes, technological advancements and market shifts.
We considered the Intergovernmental Panel on Climate Change (IPCC) reports, including Representative Concentration Pathways (RCPs) in our 2020 scenario analysis. In the update to our scenario analysis this year we considered the more recent Shared Socioeconomic Pathways (SSPs) from the IPCC's Sixth Assessment Report (AR6). These scenarios project global socio-economic changes up to 2100 and link physical risks from the RCPs to global climate policies and potential transition risks. Our approach to the scenario analysis is summarised in Figure 7.
|
|
|
|
|
|
|
|
|
|
|
|
|
|
|
|
|
|
|
|
|
|
|
|
|
|
|
| Figure 7: The main steps applied in the climate change scenario analysis |
è |
Select reference scenarios |
è |
Identify risks |
è |
Determine risk materiality |
è |
Risk responses |
Scenarios used to assess climate risks
Reference scenarios 1, 2 and 3 capture different possible pathways based on the associated SSPs, RCPs, radiative forcing by 2100, average global temperature increase, shell scenarios, and others where applicable (Table 2).
Table 2: Scenario summary
|
|
|
|
|
|
|
|
|
|
|
|
| Scenario |
Scenario 1 |
Scenario 2 |
Scenario 3 |
| IPCC RCP |
RCP8.5 |
RCP6.0 |
RCP2.6 |
| Radiative forcing by 2100 |
8.5W/m2 |
6.0W/m² |
2.6W/m² |
| Average global temperature increase |
over 4°C |
2.7 to 3.7°C |
below 2°C (B2DS) |
| SSP |
SSP5 (Fossil-Led Development) |
SSP3 (Regional Rivalry) |
SSP1 (Sustainability) |
| Shell scenario |
Island |
Waves |
Sky |
| Other |
Unmitigated scenario |
Nationally Determined Contributions (NDCs) |
High mitigation scenario |
Scenario 1 is unmitigated, characterised by the high emissions trajectory of IPCC's RCP8.5, and represents a future where GHG emissions continue to increase without significant mitigation efforts. It depicts a world in which radiative forcing reaches 8.5W/m2 by the end of the century, resulting in an average global temperature increase of over 4°C. This scenario includes the Island scenario from the Shell scenarios. In terms of the SSPs, the unmitigated scenario aligns with SSP5 (Fossil-Led Development). SSP5 portrays a future where socio-economic development is heavily reliant on fossil fuel-based energy sources, with limited emphasis on climate change mitigation measures. This scenario encompasses high population growth, slow technological advancements and fragmented global co-operation on climate issues.
Scenario 2 is described by outcomes of the NDCs which represent emission reduction targets under the UN Paris Agreement. If achieved, radiative forcing might stabilise at 6.0W/m² by 2100. The current policy scenario falls short of the 1.5°C global warming target, leading to 2.7 to 3.7°C warming. These conditions relate to the outcomes of SSP3 (Regional Rivalry) and the 'Waves' Shell scenario.
Scenario 3 relates to high mitigation conditions, which aim to limit global warming to below 2°C (B2DS) based on the alignment of climate change mitigation goals. B2DS represents a best-case scenario from a climate perspective and considers revised and more ambitious NDC and technological advancements to achieve the 1.5°C target. The high mitigation scenario and B2DS are associated with RCP2.6, which represents a low GHG emissions trajectory also aimed at limiting global warming to below 2°C. In terms of the SSP, the high mitigation scenario and the B2DS are linked to SSP1 (Sustainability). SSP1 portrays a future characterised by sustainable development, strong global co-operation, socio-economic equality and environmentally friendly practices. This shared linkage to SSP1 implies that both scenarios envision a world where sustainable practices and global co-operation play a significant role in achieving climate goals and transitioning to a low-carbon economy. Furthermore, this scenario also aligns with the Sky 1.5 scenario as described by the Shell scenarios.
Implications of scenarios for Harmony
As a mining entity operating in varied regulatory settings, Harmony is exposed to multiple transition risks and opportunities across different sectors such as labour, consumables, and energy and water management. The proactive management of these risks, coupled with capitalising on the opportunities embedded within the SSP reference scenarios, can bolster Harmony's long-term sustainability, enhancing its reputation as a responsible mining operation.
Harmony has identified key physical climate risks in its operations, including increased temperatures, water scarcity and extreme weather events. Tackling these risks necessitates resilient storage facilities, proactive water management and robust contingency plans. These risks echo those found in the energy and water sectors, highlighting the need for collaboration, regulatory compliance and climate resilience measures. We have identified physical and transition risks as part of the scenario analysis, which are presented in Figure 8 and Figure 9. These figures outline material climate-related risks, intermediate drivers, and their potential financial impact.
The vulnerability of Harmony's labour force to climate change is crucial to evaluate and address. Health issues and decreased productivity can stem from chronic risks such as heatwaves, rising temperatures, water scarcity and elevated dust levels. Immediate threats to workers and their safety are posed by acute risks such as wildfires and flooding, underlining the importance of resilient infrastructure, effective contingency plans, and robust water management practices. Labour vulnerability is further aggravated by insufficient global co-operation. Although some protection is offered by the high mitigation scenario, also known as scenario 3, addressing climate-related risks remains crucial. Regarding transition risks in the labour domain, Harmony understands the importance of upskilling and reskilling its workforce to adjust to new technologies, the integration of renewable energy, and shifting market dynamics. By investing in comprehensive employee development programmes, Harmony can alleviate potential labour-related risks and present itself as a desirable employer in the evolving green economy.
The implications of physical climate risks are significant for the revenue and cost aspects of mines, particularly in relation to consumables. Chronic issues such as droughts, water scarcity and increased temperatures can hinder the availability and performance of consumables. Furthermore, acute risks like extreme weather events, wildfires and landslides can disrupt supply chains and damage infrastructure. Harmony recognises the need to reassess consumption patterns and place greater emphasis on the sustainable sourcing and usage of materials to mitigate transition risk to consumables. While initial challenges may arise, embracing sustainable consumables can lead to long-term benefits including reduced resource dependencies, cost savings, and an enhanced reputation as an environmental responsible mining company.
Harmony acknowledges the importance of proactively managing risks related to the availability and use of energy and water. Harmony can bolster operational resilience, lessen environmental impacts, and contribute to climate change mitigation by investing in energy-efficient technologies, optimising water management practices, and embracing the integration of renewable energy. It is vital for Harmony to modify its practices and engage in meaningful dialogue with stakeholders to navigate transition risks to energy and water effectively and capitalise on associated opportunities. By aligning its operations with evolving regulations, investing in responsible resource management, and collaborating with local communities, Harmony can reinforce its reputation as
a socially responsible mining entity.
Lastly, in terms of capitalising on opportunities, Harmony can leverage its gold and copper reserves during the transition to a low-carbon economy. This strategic positioning allows Harmony to contribute to the global shift towards clean energy, thanks to the growing demand for copper in renewable energy technologies.
Figure 8: Material climate-related risks
Figure 9: Climate change risks identified during the climate change scenario analysis
Overall, recognising and proactively managing climate-related risks and opportunities is of paramount importance for Harmony's long-term growth, resilience and sustainability efforts. Diversifying operations, enhancing data collection, and investing in new technologies can reduce risks and create avenues for growth and resilience. By aligning with low-carbon regulations and strategies, and seizing clean energy opportunities, Harmony can effectively navigate the challenges posed by climate change while positioning itself as a forward-thinking and responsible mining company.
PERFORMANCE AND TARGETS
FY23 emissions
Harmony’s total GHG emissions for FY23 were 5.57MtCO2e, showing a 5% reduction since FY22. The largest portion of emissions is attributed to scope 2 (77%), as shown in Figure 10. Scope 1 GHG emissions are affected by increased diesel consumption in backup generators due to limited hydroelectricity in Papua New Guinea and loadshedding in South Africa.
Figure 10: Harmony’s total GHG emissions in FY23
The emission intensity for FY23 was 0.103tCO2e per tonne treated for scope 1, 2 and 3, which is a 4.6% improvement from FY22. This is good progress against our absolute emissions target to achieve a 20% reduction by FY26.
SBTs
Our proposed long-term target is to reach net-zero emissions by 2045. Our near-term target 2021 to 2036 was approved by the SBTi in 2023. This target aims to decrease Harmony’s total emissions by 206ktCO2e annually, based on an annual reduction of 4.2% starting FY21 against FY21 as the base year. This conforms to SBTi requirements for a target aligned with Business Ambition for 1.5°C.
Figure 11: Emissions forecast against our target by 2045. South African, Papua New Guinea and Australian operations emissions are shown as stacked areas. The total emissions for all Harmony operations and our 2045 target trajectory are plotted as lines
Table 3: SBTi emission targets
|
|
|
|
|
|
|
|
|
|
Emission target
MtCO2e
|
Projected emissions
MtCO2e
|
| FY26 |
3.9 |
2.7 |
| FY31 |
2.8 |
1.0 |
| FY36 |
1.8 |
1.0 |
From FY38 onward the projections are less ideal, and our net-zero target for 2045 requires further initiatives to be achieved. Our emissions forecast for our South African operations and Wafi-Golpu are key drivers of emissions around FY38. The remaining emissions will be offset using land-based carbon sequestration and purchased carbon credits.
Our SBTi emission targets are shown in Table 3. The projected actual emissions are well below the SBTi targets at FY26, FY31 and FY36. These targets can be met, provided Harmony implements its planned initiatives..
Land-based carbon sequestration
We are planning to neutralise unavoidable emissions through carbon sequestration. One of these methods includes sequestering carbon by planting trees. Tree planting has begun at some of our closed tailings storage facilities, also assisting with mining impacted land rehabilitation. The viability of such a strategy is dependent on several factors, such as tree species, tree growth rate and carbon content.
We would need to plant up to a total of approximately 15 000 hectares of trees between 2021 and 2030 to achieve this. If 1 540 hectares are planted per year to 2030, then enough carbon will be sequestered to negate the target overshoots, 20 years later. This has been costed and we are preparing to establish a nursery that will employ local people to grow and plant the trees. We will thus rehabilitate land and reduce our emissions by 2045. The net emissions from the land-based emissions sequestration are shown in Figure 12.
Figure 12: Emissions forecast against and planned sequestration to achieve net-zero emissions
Energy efficiency
Harmony has been optimising energy use since 2016 to help reduce emissions. Through the energy efficiency programme, Harmony effected cumulative energy savings of R1.72 billion (Figure 13) up to the end of FY23. We implemented and maintained multiple energy optimisation projects throughout our operational systems in FY23. This resulted in an estimated energy saving of 295GWh and a cost saving of R394 million. Of these savings, 42GWh or R46 million originated from new projects initiated in FY23.
Figure 13: Energy efficiency milestones up to FY23
Our energy efficiency initiatives focus on mine cooling, refrigeration, compressed air, water management and ventilation. To date, we have implemented over 240 energy efficiency initiatives at our operations. The energy efficiency programme approach considers the following:
•Energy management teams at South Africa operations
•Infrastructure to enable energy metering and management
•Baseline electricity consumption at all operations
•Exploration, identification and investigation of optimisation opportunities
•Implementation of optimisation strategies and capital projects
•Maintenance of implemented initiatives
•Reporting and management controls
•Awareness programmes to encourage energy conservation.
Energy mix
Our energy mix (Figure 14) is heavily dependent on emissions related to electricity supplied by Eskom in South Africa. The outlook is to drastically reduce reliance and even start pushing electricity into the Eskom grid from FY42 to FY50. A large concern is our current and projected use of diesel. If grid electricity becomes less reliable, we need to be wary of growing dependence on diesel generators to supplement electricity needs. The same can be considered for Intermediate Fuel Oil (IFO) and liquefied natural gas (LNG). We are investigating alternatives to replace these fuels with renewable sources in the future.
Figure 14: Total annual energy supply for Harmony operations
Energy diversification
Since target approval, Harmony’s energy mix has been updated to include three main changes in energy sourcing. These include:
•Additional energy requirements associated with the Eva Copper Project in Australia, which assumes 30% renewable energy for the project initially
•An assumed later start date for the Wafi-Golpu Project on account of ongoing negotiations for the grant of the special mining lease
•In the case of FY23, limited hydroelectricity production due to drought conditions, resulting in significant reliance on diesel power generation to supplement Hidden Valley operations during the year.
Papua New Guinea
Most of the electricity for Morobe Province is sourced from the Ramu grid (60% hydropower). During FY23, La Niña-influenced drought constrained PNG Power’s hydropower capacity. Water in Yonki Dam, serving the Ramu hydropower station, was critically low for most of the year. Smaller run-of-river hydropower plants, such as the 9.4MW Upper Bauine hydropower station, were also restricted to approximately 30% of normal supply. This led to intense load shedding until these conditions eased and the hydropower generation recovered. Commissioning of the PNG Forest Products-owned 11.4MW Baime hydropower plant in March 2023 augmented PNG Power supply. These events led to reconsideration of our plans to isolate Hidden Valley from the Ramu grid and receive power directly from the nearby Bauine hydropower station on account of broader provincial and community energy needs. We continue monitoring this opportunity.
South Africa
In South Africa, our energy mix portfolio includes Eskom grid electricity which mainly relies on coal-fired power stations, and energy from independent power producers of solar, wind and natural gas energy. These projects are either under feasibility or in the build stage.
Harmony is working toward diversifying the energy mix portfolio through small-scale and large-scale projects. We decided to invest in small-scale solar projects to expedite our renewable energy drive. Projects include rooftop solar projects at our offices and administrative buildings across Harmony’s footprint. In July 2022, the threshold for exemption from licence requirements for self-generation projects was removed. This provides an opportunity for Harmony to reduce our GHG emissions and pursue renewable energy more aggressively in South Africa.
Our solar photovoltaic (PV) energy initiative is planned in three phases (Table 4). The first two phases are underway, for 30MW and 137MW of installed capacity respectively. Additional 20 MW for Phase 2 is pending Doornkop site identification. Off the back of Phase 1 of the renewable energy programme, Harmony secured a R1.5 billion green loan for Phase 2 rollout. Phase 2 is currently in the feasibility stage. Phase 2 is planned to reach commercial operation by Q3 FY25.
Harmony is exploring options for LNG or synthesis gas. Although not renewable, we are considering LNG in the mix to lower the emission intensity of our power requirements relative to the predominantly coal-fired South African electricity grid.
Table 4: Harmony planned energy diversification pipeline (South African operations)
|
|
|
|
|
|
|
|
|
|
|
|
|
|
|
|
|
|
| Parameter |
Phase 1 PV |
Phase 2 PV |
Phase 3 PV |
Wind wheeling |
LNG* |
| Size of plant (MW) |
30 |
137 |
56 |
1 |
60 |
| Energy generated per year (GWh) |
75 |
343 |
139 |
250 |
525 |
First production year |
FY23 |
FY25 |
FY26 |
FY26 |
FY25 |
* LNG is a key consideration but we are still working on sourcing thereof.
Water
Reliable water supply is critical for developing our assets, the mining process and realising our growth prospects. We have a thorough understanding of water management and water risks across the operational spectrum. We have integrated water security management and other water-related risks into our long-term business objectives, business strategy and financial plan. Harmony’s commitment to responsible water management is driven from an executive level and has evolved from a strategy into practical and relevant actions across the group.
Harmony’s water strategy sets out objectives related to water conservation, efficient water use, and the necessities surrounding water supply in the context of its host communities, including:
•Acknowledging water-related risks regarding climate change
•Recognising water as a critical resource for local communities
•Integrating efficient water management
•Planning for water management at mine closure.
Harmony can reduce its operating costs and alleviate water shortage pressures in our host communities through recycling process water. Harmony’s water strategy supports the shift towards self-generation and zero discharge of water where practical to do so. This will encourage the group’s water conservation and demand management objectives. Harmony prioritises the conservation of potable water, especially considering the potential worsening drought conditions in the regions in which we operate. Self-generating water will ensure consumption offsets and offer water supplements to host communities.
Harmony adopted a group-wide campaign to reuse process water and reduce our dependency on potable water from water utilities. In support of this, we set long-term targets to reduce potable water consumption by 10% and increase water recycled by 50% by FY27. To achieve these targets, Harmony implemented various water conservation initiatives. Progress against water usage targets is reported below:
•FY23 total potable water usage was 20Gℓ, down 5% from FY22, which totalled 21Gℓ. This is great progress against a reduction target of 10% by FY27
•FY23 average water usage intensity of potable water used per tonne milled was 0.378kℓ/t, down 4% from FY22, which averaged 0.394kℓ/t. This is great progress against the target to reduce this metric by 10% by FY27
•The absolute volume of water recycled in FY23 has increased by 11Gℓ, which is 13% up since FY22. This is great progress against our 40% target by FY27.
Harmony’s three water treatment plants in South Africa assist in securing water supply to our operations while reducing water consumption and assisting with water conservation initiatives. The water treatment plants save Harmony R5.6 million in operating costs per year.
Harmony continues to pump water out of our Margaret and Covalent shafts, some of which is used in treatment processes, with the remaining being discharged. This surplus water could provide Harmony with water resources to adapt to future water-stressed conditions. With the physical impacts of climate change posing potential threats to water security in South Africa, water from Covalent and Margaret became strategic assets for community upliftment and operational growth and development.
In 2018, the Wafi-Golpu joint venture initiated a water, sanitation and hygiene (WaSH) programme to progressively deliver 19 projects in the proposed special mining lease (SML) and Demakwa access road area, which is home to over 5 000 people. Seven projects have been completed to date; noting that the project was suspended for over two years on account of the Covid-19 pandemic. In FY23, our focus included new water supply systems to support 450 residences and school students in Papas and Wongkins communities. Further projects are planned for FY24.
STRATEGIC DIRECTION
Harmony is committed to achieving net-zero by 2045 and therefore submitted SBTi targets to be verified. These targets were approved by the SBTi and confirmed that the targets are in line with a 1.5˚C trajectory. The SBT states: “Harmony commits to reduce absolute scope 1 and 2 GHG emissions (63%) by FY36 from a FY21 baseline. By aiming to achieve these targets we will align with our goal of achieving net-zero by 2045".
FY23 was a challenging year in terms of unplanned emissions due to shortages in energy supply. The outcome of these scenarios is insights into how to drive resilience against energy insecurities and implement changes to reduce emissions. We have progressed significantly in implementing some of these changes and have started to reap the benefits of investments. We participate in business and mining industry initiatives that support decarbonisation. In the community development space, we embarked on initiatives to support our host communities’ climate resilience.
OUTLOOK
The IFRS Foundation will assume the work of TCFD work starting in 2024, marking the transition of responsibilities to the International Sustainability Standards Board (ISSB). The ISSB has introduced its first standards, IFRS S1 and IFRS S2, that incorporate TCFD recommendations and set a global benchmark for sustainability-related disclosures. We will remain committed to the target set in 2022 and will report progress against these standards. Harmony’s various strategies will enable meaningful change, and we are confident in our ability to meet our targets. Our commitment to net-zero drives our ambitions and enables the transition to a low-carbon economy. Our progress to date and commitment to strategic decision making ensure that we are well placed to continue our journey. We will continue our strategic path, and we look forward to the challenges ahead.
SOCIAL
As social partners, we commit to ensuring that we build trust which is the cornerstone for enduring relationships with our communities and employees, suppliers, labour and government. Critical to our impact is our approach to trust, collaboration and cooperation in delivering shared benefits.
We operate in a broader social context and believe our presence in our host countries is the bedrock of economic and socio-economic development. Harmony’s host communities have relevant needs and expectations that we aim to understand and address through meaningful contributions, including labour and job creation, socio-economic development and economic empowerment. Establishing more conducive communities that are healthier and safer for our people, and uplifting broader society, enables us to improve on our social compact.
We contribute meaningfully to socio-economic advancement through co-created solutions, as articulated in our social strategies outlined in this report.
This chapter details how we have performed against our social commitments, and future focus areas.
OUR HUMANISTIC APPROACH
Harmony’s policies and principles support sustainable development, reflecting our commitment to make a positive and lasting contribution in the regions where we operate.
|
|
|
|
|
|
|
|
|
|
Our safety and health policy focuses on:
•Leadership affirmation that safety and health are non-negotiable and must always be employee and contractors’ first priority
•Robust risk-based systems and processes driving ongoing safety and health improvements
•Exemplary workplace practices and critical controls to prevent fatalities, minimise injuries and eliminate occupational diseases as we advance towards our goal of zero harm
•Promoting employee wellness and delivering proactive healthcare with suitable facilities near the workplace
•Managing community health exposures and promoting wellbeing within our host communities.
|
Our human resources policies, charters and engagement contracts aim to:
•Maintain fairness and employment equity
•Recognise and capitalise on the richness of our diversity to promote inclusivity
•Foster respect for cultures, customs and practices through personalised development and training that empowers individuals to uphold local communities’ values and meet their needs
•Return benefits through impactful programmes such as employee shareholder schemes and job retention programmes
•Ensure freedom of association while recognising the value that organised labour brings.
|
Our socio-economic development programme delivers broader impact by:
•Contributing to education, skills and entrepreneurial development as well as job creation in host communities
•Enhancing broad-based local economic empowerment and enterprise development
•Collaborating openly, honestly and transparently with key stakeholders
•Building trust with our host communities through transparent dialogue and delivering on the commitments we make
•Working with communities and government to deliver valued social investment projects, such as in the areas of health, sanitation, infrastructure and roads.
|
Principal social imperatives
|
|
|
|
|
|
|
|
|
|
|
|
|
|
|
Creating a safe working environment to prevent loss of life |
Articulating human rights in our human resources policies, charters and engagement contracts |
Systematically embedding innovative safety risk management and promoting safe behaviours in our operations |
Building resilient communities through meaningful and sustainable socio-economic development |
Distributing R37.6 billion (US$2.1 billion) total economic value to employees, investors, suppliers, communities and government stakeholders |
|
|
|
|
|
|
|
|
|
|
|
|
|
|
|
|
|
|
|
|
|
|
|
|
|
|
|
|
|
|
|
|
|
|
|
|
|
|
|
|
|
|
|
|
|
Capitals affected
Directly
Human capital
Social and relationship capital
Indirectly
Financial capital
Intellectual capital
Manufactured capital
|
|
|
|
Stakeholders affected
•Employees and unions
•Communities, traditional leaders and NGOs
•Governments and regulators
•Suppliers
|
|
|
|
Link to strategy
Responsible stewardship
Operational excellence
|
|
|
|
|
|
|
|
|
|
|
|
|
|
|
|
|
|
|
|
|
|
|
|
|
|
| Governance and management |
|
Safety and health
The board's technical committee approves and monitors compliance with our safety and health policy and legislation while the social and ethics committee oversees safety and health aspects of sustainability and ESG criteria. Our CEO regularly reports safety incidents and achievements to the technical committee and board. At every board meeting, the technical committee chairperson provides feedback on safety performance. Management also considers safety as a KPI in determining remuneration.
Our chief operating officer (receiving reports from our regional executive operating officers for South Africa and South-east Asia) and chief operating officer: business development and growth report on safety to the group executive committee weekly and quarterly, and quarterly to the technical committee. Demonstrating our inclusive approach in South Africa, management, unions, Minerals Council South Africa and government representatives participate in structures focused on safety and eliminating loss of life. We also collaborate in external safety initiatives and leading best practice through the Mining Industry Occupational Safety and Health (MOSH) community-of-practice adoption process.
Safety and occupational health champions attend industry meetings and disseminate information to operations and new business divisions. Safety and health committees ensure employee participation in safety management. In FY23, we had 74 (FY22: 76) full-time safety and health representatives at operations.
|
|
|
|
|
|
|
|
|
|
Human resources and community engagement
Aligned with the International Labour Organization guidelines, our employment policies and practices comply with labour legislation in South Africa, Papua New Guinea and Australia. Recruitment initiatives for our mine workforces focus on local communities in each country. We regularly review related procedures and policies, including remuneration and incentive schemes.
Reporting to the board’s social and ethics committee, our human resources function and community engagement managers closely monitor human rights performance at operations.
The social and ethics committee oversees socio-economic development, corporate social responsibility, and public safety policy and strategies. Our management and executive teams implement sustainable development policies. Guidelines and standards informing site-specific management systems, aligned with our sustainable development framework, support discipline-specific policies.
To entrench processes and systems, social investment governance is formalised with a local economic development strategy, supported by operating procedures and a mine community development investment strategy. We thus roll out projects responsibly, successfully and sustainably.
|
|
|
|
|
|
|
|
|
|
|
|
|
|
|
|
|
|
|
|
| Related SDGs |
|
•Our employees support dependants, local businesses and municipalities in their home communities
•Harmony’s socio-economic development initiatives seek to uplift our host and labour sending communities by promoting sustainable income-generating opportunities
•Promoting preferential local procurement as well as enterprise and supplier development uplifts and economically sustains communities.
|
|
|
|
•We implement broad-based agriculture and viable commercial agricultural ventures to promote food security, sustain livelihoods and contribute to alternative sustainable post-mining economic activities. |
|
|
|
|
|
|
|
•Our employees’ health and wellness are essential for full, productive lives
•We focus on employees’ comprehensive wellbeing through proactive healthcare and mental wellness programmes
•We embed our proactive safety and health approach with lessons learnt during the Covid-19 pandemic.
|
|
|
|
•Education is a key aspect of our strategy:
–We support primary schools especially through infrastructure development
–In secondary schools, we promote mathematics, science and technology
–In tertiary institutions and communities, we develop entrepreneurial and portable skills, especially in information and communication technology, focusing on mining-related fields (engineering, surveying and environmental science, among others).
|
|
|
|
|
|
|
|
•Gender equality is an essential aspect of our human resources policies, charters and engagement contracts
•Our gender diversity targets aim to actively increase the number of women in mining.
|
|
|
|
•As a responsible employer, providing decent work includes ensuring safe workplaces so that our employees return home without harm every day
•Employees have the right to refuse to work in an unsafe workplace
•We encourage safe behaviour with training and other support systems.
|
|
|
|
|
|
|
|
•Our employment equity, diversity and inclusivity strategy aims to provide equal employment opportunities for citizens of our host countries.
|
|
|
|
•Our socio-economic development strategy, supported by preferential and local procurement as well as enterprise and supplier development, focuses on agricultural, infrastructure and sustainable energy projects with potential to deliver sustainable benefits to communities. |
|
|
|
|
|
|
|
•Collaborating with government and our peers in infrastructure projects (roads, water and sanitation) enhances community resilience and functionality. |
|
|
|
|
GRI Standards
We list the relevant GRI Standards in each section of this chapter and will include the GRI Sector Standards for Mining when published.
Related material themes and matters
|
|
|
|
|
|
|
|
|
Employee health and safety
|
Supporting our people |
Partnering for thriving, sustainable communities and our social licence to operate |
|
Ensuring employee safety
Our employees are our most important stakeholder and a vital asset to our business. Ensuring their safety is a moral and business imperative.
|
Maintaining sound labour relations
Harmony’s deep-level gold mines are labour-intensive and unionised. As such, the company must be able to navigate the challenges of multi-stakeholder labour relations to reduce the risk of labour-related stoppages or strike action.
We respect our employees’ right to freedom of association, and recognise that organised labour benefits our business, employees and contractors.
|
Stakeholder engagement and partnerships for sustainable communities
We secure our social licence to operate by addressing and responding to our stakeholders’ needs and concerns identified through fostering meaningful relationships and proactive engagements.
Harmony partners and collaborates with communities, local municipalities, small businesses and various levels of government in achieving our strategic objectives while delivering broader positive impact.
|
|
Protecting employee health and mental wellbeing
Harmony is committed to ensuring our people live healthy, productive lives, which contributes to a motivated, engaged and productive workforce. This enables us to deliver on our business strategy and create sustained and shared value for our stakeholders.
|
Driving equity, inclusion and diversity
We believe our South African workforce must represent the country’s diversity and ensure that opportunities are available to the most marginalised in our society.
In Papua New Guinea, we attract and retain locally recruited employees, particularly landowners and citizens, in alignment with our commitments under our Hidden Valley MoA and the prime minister’s aim to increase employment particularly in the mining sector.
In Australia, we will continue to drive our initiatives around Equity, Diversity and Inclusion.
|
Supply chain transformation and preferential procurement
Strategic procurement facilitates job creation and entrepreneurial development. This supports the sustainable socio-economic development of the communities and the regions where we operate – pillars supporting and maintaining healthy and robust social capital. Positive social capital reinforces a thriving ecosystem in which our business and stakeholders can thrive.
|
|
Respecting cultural heritage
Harmony is mindful of and respects the different cultures and their cultural heritage in the regions where we operate.
As part of our impact assessment approach for exploration activities, new projects and expansion activities, we conduct cultural heritage investigations, and work with relevant stakeholders to devise appropriate heritage management measures.
We avoid operating in World Heritage sites.
|
|
|
SAFETY
Keeping our employees safe is unequivocal. As our foremost value, safety is embedded in everything we do.
We apply the most stringent safety principles to offset the risks associated with the complexity of mining activities. These principles aim to eliminate loss of life and injuries in our exploration activities, underground, surface and open-pit operations.
|
|
|
|
|
|
|
|
|
|
|
|
|
|
|
|
|
|
|
|
|
| Guiding principles |
|
People management |
|
Culture and attitude |
|
Innovation |
|
|
|
|
|
|
|
|
•Our policies and practices align with the Mine Health and Safety Act in South Africa, the Mining (Safety) Act in Papua New Guinea and the Mining and Quarrying Safety and Health Act in Australia
•We ensure critical control management is consistent with the ICMM guidelines and principles
•Harmony collaborates in leading practice development and implementation through the MOSH community-of-practice adoption process.
|
|
•Our executive team drives strategic priorities and safety-related KPIs
•Visible felt safety leadership and behavioural interventions uphold MineSafe conference outcomes
•We employ full-time, well-trained safety and health stewards group-wide
•Work stops when our workplaces or actions are unsafe
•Harmony empowers employees to recognise positive and negative safety behaviour.
|
|
•Proactive risk assessment is a way of life for Harmony
•We implement lessons learnt from incidents
•Clear communication (in local languages) spreads our safety culture transformation messages
•Harmony hosts two national safety days annually.
|
|
•We continuously modernise our safety systems and processes to effectively communicate critical information to the workplace
•Our systems monitor and manage mining-related seismicity through short-term hazard assessments and long-term plans.
|
|
|
|
|
|
|
|
|
|
|
|
|
|
|
|
|
|
|
|
|
|
|
|
|
|
|
|
|
GRI Standards |
|
|
|
|
|
Related SDGs |
|
|
Prepared in accordance with 3-3, 403-1, 403-2, 403-4, 403-5, 403-6, 403-7, 403-8 and 403-9. |
|
|
|
|
|
|
|
Our approach
Our journey towards zero harm and preventing injuries is supported by:
|
|
|
|
|
|
|
|
|
|
|
|
|
|
|
|
|
|
|
|
|
Our humanistic culture transformation programme (also known as the Thibakotsi journey) |
|
Three key drivers for culture transformation, being the improvement of leadership maturity, leaders developing others and high levels of employee engagement |
|
Introducing and adopting industry leading practices |
|
A defined safety strategy that enables a proactive safety culture and uses digitisation and modernisation while adopting an embedded risk management approach |
Humanistic proactive safety culture transformation programme
|
|
|
|
|
|
|
|
|
To enable a culture of zero harm and eliminate loss of life, our Thibakotsi (Sesotho for “prevent harm”) journey empowers employees and contractors to embrace a proactive safety culture and live Harmony’s values. |
Our leaders drive Harmony’s safety culture, guided by a culture transformation framework (outlined below), with three key focus areas: |
1. How leaders show up, develop themselves and adopt a collaborative leadership style aligned with the company values |
2. How leaders engage, empower and develop middle management and supervisors |
3. How leaders empower and engage frontline employees to ensure a bottom-up approach to culture change |
Employee engagement and development
|
|
|
|
|
|
|
|
|
|
|
|
|
We are implementing our safety strategy in phases to ensure we embed risk management as part of our company culture.
Thibakotsi positively influences employees’ safety behaviour.
|
•The humanistic transformation charter guided the implementation of the culture transformation which included Thibakotsi team training as a bottom-up culture change initiative for frontline employees and their supervisors |
Employee feedback is incorporated into actions taken by management to support crews in achieving safe production. |
|
•Reinforcement of the transformation programme from 2022 to 2023 focused on sustaining Thibakotsi initiatives into operational work routines
|
•The organisational effectiveness and improvement follow-up officer visit crews post training to observe behavioural changes in the workplace (noting unplanned absenteeism and achievement of S300*, among other KPIs). Initially, we focused on management visibility and formalising feedback on issues raised by crews in training |
* S300 is a strategic objective of crews achieving an average of 300m² per month safely, without incident.
Our critical control monitoring tools included the Thibakotsi programme, which reached the halfway mark on 1 September 2022 with varying degrees of maturity at operations. Our focus shifted to impact, sustainability and integration. Stock-take engagements with management teams supported culture transformation change processes by enabling managers to voice their experiences. We thus identified the following themes:
•Humanistic focus on leadership quality
•Systemic integration of risk management into existing systems
•Health and wellness interventions.
We developed a detailed communication plan with Thibakotsi Tuesday as a central platform to convey consistent messages that raise awareness about these themes supporting Harmony’s zero harm objectives.
Industry leading practices
|
|
|
|
|
|
|
|
|
|
Harmony has a formal industry leading practice adoption process to address safety risks.
We also contribute to industry forums by sharing our innovations.
|
We are involved in the following initiatives: |
Installation of permanent steel netting in stopes and development areas emanated from one of these industry forums last year. |
•A fall-of-ground action plan forum with our peers |
•Advancing our proactive safety culture goal through a tripartite steering committee with an independent facilitator ensuring respectful engagements |
•The change management blueprint for new technology adoption at Harmony’s Central Plant with the Mandela Mining Precinct guiding the industry in implementing appropriate technology considering MOSH leading practice, successful change and risk management models, prevailing legislation and practical application throughout mine life (including ore accounting and mobile inspection technology in the digitisation of our metallurgical operations to improve reporting speed and action triggering for management to make quick decisions about safety and production risks). |
Harmony also remains committed to implementing the eight fatality-eliminating interventions emanating from a special Minerals Council meeting of mining CEOs in 2021:
|
|
|
|
|
|
| Minerals Council members’ commitments |
Harmony’s interventions |
1. Increase visible felt leadership at operations. |
•Provide visible felt leadership training for senior and middle management |
2. Stop unauthorised and uncontrolled access to old mining areas (including risk assessments and controls where work continues in previously mined areas). |
•Monitor mined not planned workplaces (mining without planning)
•Monitor and measure multidisciplinary start-up risk assessments and the pre-planning process
|
3. Implement proactive maintenance programmes. |
•Monitor engineering work planning compliance |
4. Deploy competent employees in high-risk areas for adequate supervision, oversight and risk assessment. |
•Monitor critical skills absenteeism |
5. Undertake scheduled critical control monitoring and assurance to prevent falls of ground, transport-related accidents and working area inundation. |
•Monitor critical control reporting |
6. Ensure employee incentives and bonuses do not compromise the right to stop or refuse unsafe work. |
•Recognise positive behaviour
•Monitor crew withdrawals from dangerous workplaces
|
7. Enable and monitor fatigue breaks. |
•Monitor overtime |
8. Conduct phased onboarding after employee holidays to assess physical and mental health. |
•Monitor the health aspects of our return-to-work process. |
Tripartite culture transformation task team for zero harm
|
|
|
|
|
|
|
|
|
|
|
|
|
|
|
| The Harmony Gold Tripartite is a multi-stakeholder task team consisting of: |
|
Harmony and mining industry employer organisation, the Minerals Council
|
Various unions and associations, including AMCU, NUM, NUMSA, Solidarity and UASA
|
Regulators, the DMRE and Mine Health and Safety Council
|
An independent facilitator, Team Dynamix |
Supported by the Minerals Council South Africa, Harmony works with unions and associations and the DMRE to achieve zero harm by co-creating a proactive caring culture that will safeguard employees’ safety, health and wellbeing at work and home.
Our tripartite culture transformation task team is Harmony’s response to government’s call for the South African mining industry to address disappointing health and safety performance in 2016. Harmony’s CEO was among mining principals who signed a public commitment on 17 November 2016, the Mine Health and Safety Council tripartite principals pledge (below), to work together towards zero harm.
|
|
Our approach to creating an enabling environment for zero harm is holistic, with a collective strategy mapped to:
|
Share the common goal of a safe, sustainable and viable business |
Embed a culture of trust, mutual care, dignity and respect for all employees |
Foster open, honest, respectful and transparent relationships |
Support corrective, proactive and creative actions |
Embrace collective knowledge of health and safety. |
Three working committees report to our tripartite task team, namely culture transformation (chaired by: head of organisational effectiveness and improvement), health and wellbeing (chaired by: clinical manager: medical) and capability and capacity building (chaired by: head of employee relations). |
|
|
|
| MINE HEALTH AND SAFETY COUNCIL TRIPARTITE PRINCIPALS PLEDGE |
|
Tripartite visible felt leadership and relationship building: Principals and leaders of all stakeholder groups commit to meeting for at least two facilitated sessions on health and safety matters every year. |
Trust deficit: All stakeholders will address the trust deficit in the shift from a transactional to transformative occupational health and safety approach. |
Communication: All stakeholders will improve communication across all levels to ensure the zero harm message reaches all mine employees and contractors, and thus support and permeate actions intended to improve occupational health and safety throughout the industry. |
Empowerment of supervisors and employees: Stakeholders will collectively and collaboratively empower supervisors, health and safety representatives and employees through extended visible felt leadership and empowering conversations. This will be implemented by employers and organised labour, and include challenges experienced by women in mining (safety and security, personal protective equipment and hygiene). |
Annual health and safety days: Each mining company will commit to hosting an annual health and safety day tailored to their respective needs as part of their overall health and safety campaigns. |
|
|
|
|
|
|
|
|
|
| HARMONY’S ACTIONS |
| Tripartite culture transformation task team strategic pillars |
|
Mutual co-existence and interdependence:
Building relationships and providing a safe space for co-development
|
Best practice exchange:
Sharing with others and learning from others
|
Broadening tripartism*:
Sharing the principles and ethos of tripartism, collaboration, trust and commitment
|
|
* The Chief Inspector of Mines in South Africa leads tripartite structures established in terms of the Mine Health and Safety Act. Representatives of government, employees and employers serve on these tripartite structures.
Our tripartite task team participates in executive visible felt leadership sessions, known as imbizos (Zulu for “meeting”), and presents milestones on the culture transformation journey at our CEO’s biannual principal dinner.
Engagements at each imbizo ensure that all key stakeholders are included from the start of the culture transformation journey, and change management initiatives are integrated into business processes.
An independent service provider, Team Dynamix, facilitates meetings to ensure objectivity.
|
|
|
|
Embedded risk management
|
|
|
|
|
|
|
|
|
Harmony applies a four layer risk management approach to identify and mitigate risk |
|
Our integrated risk management approach supports our humanistic safety culture transformation goals by providing the necessary tools, such as our digital business process model, which maps business processes from planning to execution with real-time data.
We thus embed our safety strategy with risk management across all business functions.
|
Layer 1
Baseline risk assessment - Identification of potential hazards and significant unwanted events
|
We are guided by our leading indicators, particularly safe declarations, golden control monitoring and LFI.
Automated systems and processes enable continuous workplace and equipment assessments to mitigate risks on surface and underground, and effectively monitor safety-related initiatives at our operations.
|
|
Layer 2
Issue-based risk assessment - Bowtie analysis of potential significant unwanted events to identify golden controls and monitoring actions
|
|
Layer 3
Task assessment - Evaluation of task-associated risks and mitigating controls that enable safe task completion
|
|
Layer 4
Continuous risk assessment - Quality of controls and task application to ensure resilience
|
|
|
|
|
|
Our risk management strategy enables us to identify leading indicators.
Leading indicators are more reliable, preventing harm, as opposed to lagging indicators, which monitor past events.
|
|
Leading indicators enable frontline employees to:
•Proactively address risks
•Implement mitigating controls
•Decrease the probability of an incident, accident or injury.
|
The leading indicators are reported daily in the miner’s work note and to relevant supervisory levels for action, thus providing crews and supervisors with information about safety, occupational health and production-related workplace risks. |
|
|
|
|
|
|
|
|
|
|
Our controls are categorised based on the nature of the control; where it lies in the hierarchy of controls and the survivability, availability and reliability rating (SAR rating) of the control and whether it is an act, object or technological system.
The most effective controls are categorised as golden controls, and are monitored and owned by management.
|
We adopted the ICMM Critical Control Management guideline in support of our strategy of stopping significant unwanted events. |
Golden controls are our key safety measures that prevent a significant unwanted event from occurring. If it does occur, these controls help us recover and minimise the impact of the significant unwanted event. |
|
The process was phased to:
•Firstly identify our significant unwanted events through baseline risk assessment
•Secondly identify the critical controls that will either stop the significant unwanted event or will minimise the consequence of the event occurring.
|
|
|
|
|
|
|
|
|
|
|
Harmony recognises the value of digitising processes and data collection. We have several digitisation initiatives to enable data collection and analysis to provide leading indicators that inform decision making (both lagging and leading).
|
Digitisation initiatives supporting a proactive Harmony |
The digitisation of our golden control monitoring provided an opportunity to move from a reactive to a proactive response to inadequate control performance.
Through the analysis of data from our integrated systems, we continuously learn and share these learnings across our organisation.
|
|
•Multidisciplinary start-up risk assessments and pre-planning of workplaces: The workplace is reviewed by specialist teams to identify risk, ensure the required controls are in place, provide specialist recommendations, ensure adequate people, material and equipment in the workplace to mine safely
•Planned maintenance and high risk work verification
•Risk assessment digitisation: Task assessment and continuous monitoring aligned to baseline risk assessment and Bowtie analysis
•Deficiency response: Control performance or deviation in standards escalated to the responsible supervisor or management structure for action
•Safe declaration, equipment pre-use inspections, planned task observations and planned workplace inspections digitally monitored.
|
|
|
|
|
FY23 focus areas and performance
|
|
|
|
Collaboration
We partner with these stakeholders to strengthen implementation of our strategy:
•MOSH (leading practice development and implementation)
•Minerals Council, Mine Health and Safety Council and unions (tripartite forum)
•Mandela Mining Precinct (public-private partnership between government’s Department of Science and Innovation and the Minerals Council)
•Minerals Council’s mining CEOs interventions.
|
Extensive employee engagements throughout the year and the Thibakotsi strategic planning session in November 2022 determined the following focus areas:
•Progressing leadership maturity (leaders taking ownership of Thibakotsi, their roles and team development)
•Implementing our employee engagement strategy with a visual route map and empowerment programmes for middle management and supervisors, as champions of the Thibakotsi journey, to support an engaged workforce
•Applying risk propensity operating procedure (proactive management actions) across operations to improve the employee risk profile
•Sustainably embedding Thibakotsi in existing operational routines as the new way of working
•Addressing Thibakotsi team training issues to foster hope, trust and respect between managers and employees while embedding a safe production culture
•Implementing culture improvements action items for each operation
•Impact analysis, change management and sustainability of the Thibakotsi programme to demonstrate value added, stakeholder involvement and commitment.
Our safety risk management strategy significantly increased our white flag (accident-free) days. Our lost-time injury frequency rate (LTIFR) in South Africa improved to 5.74 (FY22: 5.90) per million hours worked and our group LTIFR was 5.49 (FY22: 5.65) per million hours worked at year end. Our South African surface operations celebrated 3.6 million loss-of-life-free shifts (LLFS). Our Hidden Valley operation in Papua New Guinea had no loss of life for the sixth consecutive year.
Despite this progress, we tragically lost six (FY22: 13) colleagues at our South African operations. We continuously strive towards zero harm. All Harmony initiatives are guided by this principle and all learnings are applied to eliminate loss of life at Harmony.
Challenges faced in FY23 include senior management retention, availability and cost of new technology, and amended legislation governing vehicle intervention controls (level 9) for diesel-powered trackless mobile machinery.
FY23 leading indicators
•Golden controls monitored 9 million times across our operations (12% increase from FY22), an average of controls monitored 24 000 times a day across Harmony
•1.8 million line inspections conducted and digitally captured – CAT 4-8, all supervisory levels and middle to senior management
•86 thousand specialist inspections conducted and digitally captured – safety, occupational hygiene and strata control
•44 group verification audits on group and industry learnings – gauging our control performance to prevent a similar event from occurring at Harmony
•74 thousand planned maintenance tasks performed
•829 high risk Engineering tasks verified prior to conducting work
•84% actions closed out prior to escalation period, the remaining closed out after action plan execution
•34 thousand employees underwent refresher training on safety and hazard identification - refresher training runs in an 18-month continuous cycle.
Critical control management
We work continuously to identify new technology and processes to ensure that every Harmonite goes home safely everyday. Since the inception of our digitisation and critical control monitoring, we have gathered over 148 million data points (FY19 to FY23). To date, our digitisation strategy, in conjunction with our humanistic transformation, has proven to be successful in improving our safety performance with a year-on-year LTIFR improvement.
Based on the outcome of our digital monitoring, we analyse control effectiveness to identify improvement opportunities on control performance. Every effort is made to improve our response to control performance to ensure a safe and profitable mine.
As we steer Harmony towards our S300 (safe production of 300m2 of ore per production crew per month) objectives, set for our underground operations, we will continue to learn and improve.
Loss of life
Each loss of life is thoroughly investigated to ensure that the event is fully understood and that the lessons learnt are disseminated throughout the organisation to prevent similar future incidents. In addition, we ramped up our business improvement initiatives to identify feasible best practice mitigation measures.
|
|
|
|
|
|
|
|
|
|
|
|
|
|
|
|
|
|
|
FY23 |
FY22 |
FY21 |
FY20 |
FY19 |
| Loss of life (number of people) |
|
|
|
|
|
| Group |
6 |
13 |
11 |
6 |
11 |
| South Africa |
6 |
13 |
11 |
6 |
11 |
| Papua New Guinea |
— |
— |
— |
— |
— |
Loss of life injury frequency rate (per million hours worked) |
|
|
|
|
|
| Group |
0.06 |
0.13 |
0.11 |
0.08 |
0.12 |
| Lost-time injury frequency rate (per million hours worked) |
|
|
|
|
|
| Group |
5.49¹ |
5.65² |
6.18² |
6.33² |
6.16² |
| South Africa |
5.74 |
5.90 |
6.46 |
6.69 |
6.48 |
| Papua New Guinea |
0.34 |
0.17 |
— |
0.77 |
0.35 |
1 Independently assured in the period under review.
2 Independently assured in prior periods.
|
|
|
|
|
|
|
|
|
|
|
|
| In memoriam |
Cause |
| 13 August 2022 |
Juliao Antonio Macamo |
Moab Khotsong stope team leader |
Gravity-related fall of ground |
| 7 November 2022 |
Ernesto Euseblo Macuacua |
Tshepong equipping team leader |
Gravity-related fall of ground |
| 15 December 2022 |
Bongile Mcuntula |
Kusasalethu driller |
Seismic-induced fall of ground |
| 7 March 2023 |
Luyanda Nkwane |
Tshepong underground assistant |
Tools, machinery, equipment |
| 23 March 2023 |
Tshimane Matabane |
Kusasalethu stope team member |
Mudrush/inundation |
| 30 April 2023 |
Matli Bernard Nyama |
Kusasalethu night shift team leader |
Seismic-induced fall of ground |
Understanding causes of injury
In FY23, the top 10 contributors to reportable injuries were:
1.Material handling
2.Slip-and-fall incidents
3.Gravity-induced falls of ground
4.Tools/machinery/equipment
5.Rolling rocks
6.Trucks/tramming/transport
7.Seismic-inducted falls of ground
8.Falling material
9.Scraper winches
10.Foreign bodies
Each incident was investigated in terms of section 11(5) of the Mine Health and Safety Act to determine the causes and contributing factors. Lessons learnt are integrated into our LFI process.
South Africa
|
|
|
|
|
|
|
|
|
|
|
|
|
|
|
|
| LLFS and injury-free days in FY23 |
| Operations and plants |
LLFS |
|
Fall-of-ground LLFS |
Rail-bound equipment LLFS |
Consecutive white flag days |
| Operations total |
2 000 000 |
|
10 000 000 |
13 000 000 |
|
| Underground operations |
2 000 000 |
|
|
|
|
Masimong |
3 000 000 |
|
3 000 000 |
5 000 000 |
|
Masimong/Joel unit |
3 000 000 |
|
3 000 000 |
11 000 000 |
|
Tshepong |
2 500 000 |
|
|
10 000 000 |
|
Tshepong Operations |
2 500 000 |
|
4 000 000 |
14 000 000 |
|
Tshepong/Target/Phakisa unit |
3 500 000 |
|
4 000 000 |
17 000 000 |
|
Joel |
2 500 000 |
|
|
3 000 000 |
100 |
| Target |
1 000 000 |
|
1 000 000 |
10 000 000 |
|
Phakisa |
1 500 000 |
|
|
6 000 000 |
|
Doornkop |
1 000 000 |
|
4 000 000 |
1 000 000 |
|
Kusasalethu |
500 000 |
|
1 000 000 |
3 000 000 |
|
Kusasalethu/Mponeng unit |
1 000 000 |
|
2 000 000 |
7 000 000 |
|
Moab Khotsong |
1 500 000 |
|
1 000 000 |
7 000 000 |
|
|
|
|
|
|
|
|
|
|
|
|
|
|
|
|
|
| LLFS and injury-free days in FY23 |
| Operations and plants |
LLFS |
|
Fall-of-ground LLFS |
Rail-bound equipment LLFS |
Consecutive white flag days |
Moab Khotsong/Doornkop unit |
2 000 000 |
|
2 000 000 |
3 000 000 |
|
Mponeng |
2 000 000 |
|
2 000 000 |
3 000 000 |
|
Asset Management Forum |
|
|
|
|
400 |
|
|
|
|
|
|
| Operations and plants |
LLFS |
|
Production LLFS |
|
Consecutive white flag days |
| Surface operations |
3 500 000 |
|
|
|
|
Moab Khotsong Central Services |
2 500 000 |
|
|
|
1 100 |
Mponeng gold plant |
1 500 000 |
|
41 000 |
|
600 |
Kusasalethu plant |
500 000 |
|
34 000 |
|
500 |
Doornkop plant |
|
|
|
|
200 |
Target plant |
500 000 |
|
34 000 |
|
300 |
Central plant |
|
|
|
|
1 000 |
Saaiplaas plant |
1 500 000 |
|
24 000 |
|
500 |
Harmony One Plant |
2 000 000 |
|
34 000 |
|
200 |
Free State laboratory/Prep Plant |
500 000 |
|
|
|
400 |
Free State surface operations |
|
|
|
|
600 |
Free State Commercial Services/Transport |
1 500 000 |
|
|
|
2 800 |
Randfontein surface operations |
5 000 000 |
|
|
|
900 |
Randfontein Commercial Services and Transport |
1 500 000 |
|
|
|
2 000 |
Vaal River surface sources |
|
|
|
|
800 |
Vaal River Commercial Services and Transport |
|
|
|
|
1 800 |
West Wits surface operations |
500 000 |
|
|
|
200 |
Mine Waste Solutions remining and deposition |
|
|
18 000 |
|
100 |
Mine Waste Solutions gold plant |
|
|
18 000 |
|
100 |
Savuka gold plant |
4 000 000 |
|
68 000 |
|
300 |
Kalgold pit |
2 000 000 |
|
23 000 |
|
200 |
Kalgold plant |
1 500 000 |
|
23 000 |
|
200 |
Kopanang gold plant |
3 000 000 |
|
43 000 |
|
|
South Uranium plant |
5 500 000 |
|
34 000 |
|
400 |
| Noligwa gold plant |
5 000 000 |
|
34 000 |
|
900 |
| Nufcor plant |
500 000 |
|
34 000 |
|
3 200 |
|
|
|
|
Loss of life and serious injury compensation
Acknowledging the devastating impact of every loss of life and serious injury, our compensation seeks to support employees and their families.
Bereaved families receive compensation as soon as possible after the loss of an employee’s life at our operations. Compensation includes:
•Condolence letters
•Coffins, funeral services and mourner transportation
•Senior management, union and other fellow employee representatives at the funeral
•An on-mine memorial service with accommodation while attending to the deceased person’s affairs
•R30 000 Mineworkers Provident Fund advance
•R30 000 Rand Mutual Assurance funeral policy payout
•R20 000 Harmony donation
•Unlimited enrolment of children in the Harmony Education Fund
•Offer of employment at underground entry level to a family member.
Compensation for serious injury on duty includes:
•Lump sum or monthly payments (based on the Compensation for Occupational Injuries and Diseases Act disability rating)
•Alternative employment (if available)
•Two weeks’ termination payment (minimum R70 000) R75 000 as from 1 July 2023, per completed consecutive year of service (if alternative work is not available)
•Employment offer, based on available underground vacancies at entry level, to an immediate family member
•TEBA home-based care for medically incapacitated employees
•An additional termination package for paraplegic injury (including home renovation for wheelchair accessibility).
|
|
We reduced our fall-of-ground LTIFR in South Africa to 1.09 (FY22: 1.36) per million hours worked. Contributors to the improvement in fall-of-ground LTIFR:
•Robust critical control management plan on ground control
•Proactively addressing inadequate control performance
•Best practice adoption through the MOSH process at Harmony operations
•Apply learnings from the analysis of our leading and lagging indicators
•Safety culture transformation
•Dedicated focus on seismic early warning system
•Focused campaigns, communication and engagements on fall-of-ground golden controls
•Support technical specification review and optimisation process through Harmony procurement.
Papua New Guinea
Hidden Valley maintains a world-class safety record without a loss of life since 2015, equating to 3.6 million LLFS. The operation implements our safety risk management strategy with critical controls and has a proactive safety culture. Visible felt leadership and regular, focused safety training reinforce positive behaviour.
The operation is also highly mechanised so vehicle interaction is the most significant safety risk, followed by fatigue and uncontrolled energy release (hydraulic and compressed) in workshops. Mining vehicle monitors mitigate driver fatigue, prevent collisions, observe driver behaviour and track productivity. Our safety, health, security and risk manager oversees these interventions. By focusing on behaviour, controls and psychological factors, we are reducing our injuries and high potential incidents.
At our Wafi-Golpu Project, we similarly ensure proactive safety risk management with critical risk monitoring and visible felt leadership.
|
|
|
|
|
Radiation protection
Harmony has 17 certificates of registration (CoRs) from the National Nuclear Regulator (NNR)
The CoRs are managed by eight legally appointed radiation protection officers (RPOs) assisted by two permanently employed radiation protection monitors (RPMs).
No overexposure of Occupational Exposed Persons (OEPs) was reported within the Harmony group in FY23 although we have seen an increase in employee doses at Moab Khotsong over the past five years. We monitor current and projected doses monthly for early intervention, which includes moving high-risk employees to surface operations.
In FY23, we achieved:
•Average quarterly self-inspection compliance: 99%
•Average internal audit compliance: 99% (internal audits are conducted annually)
•NNR compliance: 12 inspections and audits, and only eight non-conformances were raised and these were closed out timeously with no material risk to our operations’ CoRs.(timing and the number of inspections are conducted at the NNR’s discretion).
|
|
Future focus areas
|
|
|
|
|
|
|
|
|
| The group will continue to sustain the Thibakotsi programme as part of our DNA. Surveys will rank leadership maturity, living our values and employee engagement in terms of lessons learnt and support as we strive to become mine safety leaders. |
| In South Africa, progress on our Thibakotsi journey will be mapped by operational stock-take feedback to our executive committee. Employee engagements will include robust discussions about authentic ownership of the programme to enable development of a Thibakotsi sustainability framework for the next three years. |
In Papua New Guinea, as part of our focus on behavioural risk awareness, controls and psychological factors, we are focused on the delivery of risk awareness and perception coaching across all mining operations, processing, site services and environment teams over the next 12 months. |
In Australia, we are preparing and implementing our safety and health management system, initially focusing on exploration activities and associated documentation. We are also in the process of procuring site emergency response equipment and ambulance. |
HEALTH AND WELLNESS
In line with the company’s commitment to ensuring our people live healthy, productive lives, we aim to meet our targets for occupational health through the adoption of and aligning with industry leading practices.
We safeguard our employees’ health and wellbeing through our preventive approach by providing safe and healthy workplaces with accessible healthcare services.
|
|
|
|
|
|
|
|
|
|
|
|
|
|
|
|
|
|
|
|
|
|
|
|
|
|
|
|
GRI Standards |
|
|
|
|
|
Related SDGs |
|
|
Prepared in accordance with 3-3, 403-1, 403-2, 403-3, 403-4, 403-5, 403-6, 403-7, 403-8, 403-9 and 403-10. |
|
|
|
|
|
|
|
Our approach
Our proactive, risk-based healthcare service provision aims to ensure employees are fit to work, lead healthy lifestyles and retire at a physiologically appropriate age. Robust medical surveillance enables active case finding, and early disease detection and treatment, in support of our four-pronged healthcare strategy:
1.Education, awareness and health promotion
2.Disease prevention and risk management
3.Clinical intervention (treatment programmes)
4.Continuous employee health risk profiling.
The strategic intent is to build resilience and empower our employees to proactively manage their health and wellbeing. Our electronic integrated health management system is aimed at providing a holistic view of each employee’s health status on a digital platform. This platform collates occupational and non-occupational health data for our management teams to make informed decisions for safe production. It is the foundation of the digital transformation of our health strategy.
Strategic focus areas: 2023 to 2026
|
|
|
|
|
|
|
|
|
|
|
|
|
|
|
|
|
|
|
|
|
|
|
|
|
|
|
|
|
|
|
|
|
|
|
|
|
|
|
|
|
|
|
|
|
|
|
|
|
|
|
|
|
|
|
|
|
|
|
|
|
|
|
|
|
|
|
|
|
|
|
|
|
|
|
|
|
|
|
|
|
|
|
|
|
|
|
|
|
|
|
|
|
|
|
|
|
|
|
|
|
|
|
|
|
|
|
|
|
|
|
|
|
|
|
|
|
|
|
|
|
|
|
|
|
|
|
|
|
|
|
|
|
|
|
|
|
|
|
|
|
|
|
|
|
|
|
|
|
|
|
|
|
|
|
|
|
|
|
|
|
|
|
|
Valued leaders enabled to deliver value |
|
|
|
Digitised and data-driven healthcare |
|
|
|
High quality and standards |
|
|
|
Resilient, fit-for-work and fit-for-life employees |
|
|
|
Leaders in healthcare and wellness |
|
|
|
Collaborative ways of work |
|
|
|
|
|
|
|
|
|
|
|
|
|
|
|
|
|
|
|
|
|
|
|
|
|
|
|
|
|
|
|
|
|
|
|
|
|
|
|
|
|
|
|
|
|
|
|
|
|
|
|
|
|
|
|
|
|
|
|
|
|
|
|
|
|
|
|
|
|
|
|
|
|
|
|
|
|
|
|
|
|
|
|
|
|
|
|
|
|
Develop a health team with the right people, in the right places, who create and deliver value, and are valued in the process. |
|
|
|
Enable transformation of healthcare systems, services and practices through investment in fourth industrial revolution (4IR) technology and data-driven business intelligence. |
|
|
|
Ensure high-quality healthcare practices within Harmony go beyond compliance. |
|
|
|
Ensure a holistic and proactive approach to wellbeing for resilient employees who proactively drive their own health and wellbeing. |
|
|
|
Lead the healthcare and wellness sector by adopting and advancing best practice while maintaining cost effectiveness. |
|
|
|
Ensure a collaborative approach to achieving common goals through strategic and aligned internal and sustainable external partnerships. |
|
|
|
|
|
|
|
|
|
|
|
|
|
|
|
|
|
|
|
|
|
|
|
|
|
|
|
|
|
|
|
|
|
|
|
|
South Africa
Medical scheme membership is compulsory for officials and management, and voluntary for category 4 to 8 employees who receive free comprehensive on-site healthcare services, including medicine supply in South Africa. We refer employees to external specialist service providers and to private hospitals for secondary and tertiary healthcare. We continue to provide 24-hour health service at all our operations, through our full time occupational medical practitioners, nurses and support staff.
Papua New Guinea
Employees and contractors have access to a fully equipped medical centre (with a smaller clinic at the processing plant), that are operated by Hidden Valley, with external governance and audit support provided by Aspen Medical. Online medical registers track employees’ progress from diagnosis to treatment of occupational and unrelated injuries and illnesses. Employees and contractors at Hidden Valley receive primary healthcare and occupational health surveillance services at our medical centre, which is staffed by full-time doctors and nurses. Employees and their families also receive company-funded medical insurance which provides assistance off-site. Privately owned companies supply medication, consumables and clinical advice.
|
|
|
|
|
|
|
|
|
| Occupational hygiene strategy |
| Legislation in our host countries requires mining companies to monitor and report on occupational hygiene stressors (conditions with potentially adverse health impacts). We go beyond compliance with this legislation to protect our employees from exposure to health hazards such as dust, fibres, chemicals, noise, thermal stress and radiation. We also collaborate with regulators and our peers in developing policies aiming to reduce or eliminate mine employees’ exposure to health hazards. |
| Capacity building |
|
Providing healthy and safe workplaces:
•Ventilation and cooling at underground, surface operations and plants to manage thermal stress.
|
Managing occupational health hazards:
•Risk assessments (fire, explosions, airborne pollutants and noise)
•Engineering controls
•Compliance with industry milestones.
|
Employee health risk profiles:
•All occupations profiled
•Medical surveillance.
|
FY23 focus areas and performance
|
|
|
|
Collaboration
We partner with internal and external stakeholders to strengthen the implementation of our strategy:
•Internal stakeholders, government, NGOs, unions and the Minerals Council (addressing HIV/Aids, TB, occupational health risks, gender-based violence and vaccinations)
•The Papua New Guinea Department of Health (registration and certification of our medical centre, radiology facility and outreach health programmes for TB, HIV/Aids, domestic violence, and breast and cervical cancer awareness)
•Aspen Medical (governance and audit of the Hidden Valley medical centre).
|
To maintain our licence to operate, Harmony’s medical surveillance programme is a prescript of the Mine Health and Safety Act in South Africa and, in Papua New Guinea, the Australian Institute of Occupational Hygienists’ occupational hygiene monitoring and compliance strategies. Dedicated medical hubs at our operations conducted 68 400 (FY22: 66 862) medical examinations in South Africa and 19 969 (FY22: 15 539) in Papua New Guinea.
Across South Africa, we spent R940 million (US$52.9 million) (FY22: R1 100 million/US$72.3 million) on health initiatives.
|
|
|
|
|
|
|
|
|
|
|
|
South Africa: Healthcare expenditure |
FY23 |
FY22 |
FY21 |
Total healthcare expenditure (Rm) |
940 |
|
1 100 |
|
1 000 |
|
Covid-19-related management (Rm) |
49 |
|
204 |
|
292 |
|
Free healthcare benefits: |
|
|
|
– Health benefits cost (Rm) |
552 |
|
560 |
|
465 |
|
– Employees impacted |
25 720 |
|
27 707 |
|
28 447 |
|
Medical aid schemes: |
|
|
|
– Medical aid scheme cost (Rm/month) |
28 |
|
27 |
|
26 |
|
– Employees impacted |
9 493 |
|
9 823 |
|
9 793 |
|
We spent R34 million (PGK6.7 million) (FY22: R16 million/PGK4.4 million) on medical and healthcare expenses in Papua New Guinea.
|
|
|
|
|
|
|
|
|
|
|
|
| Papua New Guinea: Healthcare expenditure (Rm) |
FY23 |
FY22 |
FY21 |
| Total excluding Covid-19 |
34 |
|
16 |
|
13 |
|
| Covid-19-related management |
— |
|
238 |
|
290 |
|
|
|
|
|
|
|
|
|
|
|
|
|
|
|
|
|
|
|
| Papua New Guinea: Health statistics |
FY23 |
FY22 |
FY21 |
FY20 |
FY19 |
| Health examinations conducted |
19 969 |
15 539 |
11 489 |
20 452 |
17 601 |
| Number of malaria cases |
90 |
127 |
*** |
*** |
*** |
| Employees treated for respiratory ailments |
2 456 |
1 545 |
707 |
1 905 |
2 191 |
*** Figures were not monitored.
Occupational medicine and hygiene
We aim to prevent occupational health incidents to protect our employees from serious health implications, and Harmony from financial liability and reputational damage.
South Africa
Our key health concerns are occupational hygiene stressors (silica dust, noise, radon gas, heat, diesel particulate matter, welding fumes and vibrations). Although we have seen a significant decline over the years, noise-induced hearing loss (NIHL), heat-related illnesses, and occupational lung diseases, particularly silicosis, remain our major risks.
Managing airborne pollutants
Our silica dust management’s primary objective is to eliminate occupational lung diseases. We aim for the industry milestone (95% of personal silica dust samples below 0.05mg/m3 by 2024) with annual dust load reduction targets. Our FY23 target was 94% (FY22: 93%) and we achieved 91.8% (FY22: 88.2%). Most metallurgical plants and one-third of our mines exceeded our 94% target. Workplace exposure to silica dust remains a risk, and long-term workplace dust control projects are progressing well at all operations.
Engineering airborne pollutant controls, informed by Mining Industry Occupational Safety and Health (MOSH) leading practice, enable consistent improvements. Harmony’s interventions include reducing exposure to rock breaking at source, in stoping, development and trackless mining. We use extraction units in laboratories and water sprays at our plants, deposition and remining sites.
In FY23, our engineered controls compliance to the planned units were as follows:
•Foggers (97.3%), covers (95%) and filters (96.1%) at main tips
•Airway sprays (95%), spray cars (94.1%), and footwall and sidewall treatment (82.9%) at main intake haulages
•Winch covers (98.4%) and in-stope atomisers (95.1%) at stopes
•Continuous real-time monitors (96.4%).
Addressing occupational lung diseases (silicosis and TB)
Silica dust exposure is a major risk as it causes silicosis, an occupational lung disease that increases susceptibility to TB, particularly among HIV patients. We address this through an integrated HIV/Aids, silicosis and TB (HAST) policy and programmes.
We submitted 115 (FY22: 108) silicosis cases for certification and possible compensation by the Medical Bureau for Occupational Diseases (MBOD). The MBOD certified 62 (FY22: 184) silicosis and silico-TB cases.
We aim to improve our performance towards the 2024 industry milestones on the elimination of occupational lung diseases and reduction, elimination of NIHL and prevention of TB and HIV/Aids. The first milestone requires that no new cases of silicosis should occur among previously unexposed individuals (those who entered the mining industry in 2009). There are two certified cases of silicosis among previously unexposed employees noted at Target Mine in 2013 and 2015. Target Mine is used as a case study to showcase a comprehensive and focused approach to risk, enhanced preventive controls, quality assurance strengthening and improved outcomes since 2019 (see below). No new cases have been noted.
We aim to meet the TB milestone (TB incidence rate should be at or below the national TB incident rate). The number of TB cases diagnosed totalled 262 (FY22: 267) which indicates a TB incidence rate of 604 (FY22: 590) per 100 000 employees tested. Covid-19 had a negative effect on our TB programme hence the slight increase in TB cases for FY23. We have implemented a turn around strategy to address the TB surge in order for us to meet the industry milestone.
Extensive work is put in through the TB/HIV programme to attain the HIV/Aids milestone (100% of employees offered HIV counselling and testing (HCT) annually and all eligible employees linked to an antiretroviral treatment (ART) programme).
|
|
|
|
|
Settling occupational lung disease claims
Tshiamiso (Setswana for “to make good” or “to correct”) describes our motivation to settle occupational lung disease claims
The Tshiamiso Trust manages claims for mineworkers who are eligible for compensation due to contracting TB or silicosis from working in certain gold mines during 12 March 1965 and 10 December 2019. The trust was established in a collaborative effort between Harmony and our peers in the Occupational Lung Disease Working Group and lawyers for affected mine employees after the High Court approved the R5.2 billion silicosis and TB class action suit settlement in 2019.
In FY23, the Tshiamiso Trust paid out R304 million to 3 343 current and former Harmony mineworkers, of which R34 million was paid out to current mineworkers. Since 2020, the trust has paid out R1.1 billion to 12 686 mineworkers, 5 941 of whom have service years at a historic Harmony operation.
We also collaborate with our peers and the Department of Health to address challenges in administering occupational lung disease compensation through our ReConnect initiative. ReConnect is used to trace former employees and assist with addressing the backlog of claims.
Through ReConnect, a paperless compensation claims management system (CCMS) was developed to help the MBOD, Compensation Commissioner for Occupational Diseases (CCOD) and the Tshiamiso Trust efficiently settle claims and pay unclaimed benefits. The CCMS reduces the average claim processing time from 500 to 90 days. The Harmony medical hubs have submitted 579 new benefit medical examinations to the MBOD during the year, of which 31% represent former Harmony mineworkers.
In FY23, 1 169 CCOD-related occupational lung disease claims to the value of R54 million were paid to current (155) and former Harmony mineworkers.
|
|
Noise management
The primary objective of our noise management programme is to eliminate NIHL. We have set a milestone of ensuring that any equipment’s total operational or process noise does not exceed a sound pressure level of 107dB(A) by December 2024 and every employee’s standard threshold shift (a sensitivity marker that identifies early hearing deterioration) does not to exceed 25dB(A). Our mitigation measures include “buy and maintain quiet” equipment as per MOSH recommendations to reduce vibration noise and reach the 107dB(A) milestone.
No equipment is above 107dB(A) at any of our operations except compressors at two operations. Controls are in place to ensure that employees are not exposed to these high noise levels. The standard threshold shift guides our occupational hygiene team in preventing progressive hearing loss, focusing on controlling noise at source. Where we risk exceeding the legislated 85dB(A) occupational exposure limit, employees wear hearing protection devices (noise clippers). The overall noise clipper usage is above 95% across all operations in South Africa. Investigation done on reportable standard threshold shift cases (exceeding 25dB) highlighted certain improvement areas and serve to strengthen our preventive controls in the workplace. To date, 14 cases were noted at South African operations. There is a continuous drive to enhance quality in the usage of early NIHL leading indicators.
The number of employees with early NIHL decreased to 158 (FY22: 226) and those compensated for NIHL to 98 (FY22:106).
Managing underground temperatures
Thermal stress and heat-related illnesses are serious risks for our operations, given the depth of some of our mines. As part of continuous monitoring of environmental working conditions, our primary focus is minimising exposure to temperatures above 30.5°C*. This is 2.0°C below the legally allowed exposure of 32.5°C*. We address thermal stress due to high underground temperatures, which could cause heat-related illness, with suitable ventilation and cooling, employee heat tolerance screening and acclimatisation programmes, and adequate hydration and support. Based on risk assessments at every mine, lower-risk occupations use natural acclimatisation to minimise the threat, including alcohol testing to avoid dehydration. We addressed underground air intake conditions above 26ºC* with booster fans and bulk air cooling plants on the surface.
We conducted 24 085 (FY22: 17 868) heat tolerance tests as part of medical surveillance and recorded 192 (FY22: 211) cases of heat-related illnesses (mostly at Mponeng and Moab Khotsong).
* Wet bulb temperature; a measure of heat stress on the human body by a thermometer covered in water-soaked cloth (the water is at ambient temperature).
|
|
|
|
|
Radiation protection
Monitoring radiation levels and exposure in South Africa
Our operations go beyond compliance with legislated radon gas dose limits of 30 millisieverts (mSv) a year (Harmony: 20mSv) and 100mSv (Harmony: 95mSv) over five years by including a limit of 50mSv over two years in our radiation protection programmes.
Employees who test above 90mSv are removed from the risk area. At Moab Khotsong, where the average dose has increased by 42% from 4.8mSv to 10.3mSv over the past five years, we test and monitor employees monthly, and our occupational hygiene team is improving air intake quality. In FY23, we moved 136 employees to lower-risk areas and 30 to surface without additional interventions. We await the outcomes of annual National Nuclear Regulator inspections of our radiation protection programmes at each operation and declassification of decommissioned sites.
|
|
Papua New Guinea
Significant occupational hygiene stressors at Hidden Valley, where we use large mining and earthmoving equipment, are NIHL, exposure to diesel particulate matter and respirable crystalline silica dust. Our robust noise monitoring programme addresses NIHL by ensuring employees wear appropriate hearing protection devices and masks, while high rainfall is a natural silica dust control in our mining areas.
Hidden Valley has a comprehensive occupational hygiene programme aligned to the health risks across the operation. The programme and work complies with international hygiene standards and practice and is periodically audited by Aspen Medical as part of the Health Governance Programme. Independent consultants also periodically undertake training and third party verification audits.
Non-occupational healthcare
Using our electronic health management system, which enables follow-ups, Harmony’s integrated lifestyle programme addresses communicable diseases such as HIV/Aids, TB and Covid-19, and non-communicable lifestyle diseases, including increasing mental health-related conditions.
In FY23, 2 355 (FY22: 2 494) employees participated in this programme.
Note: If an employee has more than one chronic disease, this is counted against each condition.
South Africa
Non-communicable chronic lifestyle diseases (illustrated below), such as hypertension, heart disease and diabetes, remain significant challenges for our employees. We also manage challenging communicable lifestyle conditions such as HIV/Aids and TB.
HIV/Aids
The scourge of HIV/Aids in South Africa continues to impact our employees and their dependants despite progress in raising awareness and prevention as well as the availability of ART. Harmony is concerned that this disease, and opportunistic infections, contribute to absenteeism and related productivity and skills losses, which negatively impact our sustainability. As motivating employees to disclose their HIV status remains challenging, worsened by the stigma and confidentiality, we focus on encouraging positive behaviour.
In FY23, 29.3% of our permanent workforce was HIV-positive and 8 934 employees (FY22: 9 595) receiving ART participated in our HIV/Aids programme. The prevalence rate in Harmony is higher than the national average due to the Harmony environment being closed and controlled as compared to the rest of the country.
We continue to distribute Dolutegravir based regimen, and other “smart drugs”, which accelerated viral suppression with fewer side effects for 82% (FY22: 78%) of employees. These drugs support South Africa’s achievement of the United Nations Programme on HIV/Aids (UNAids) 95-95-95 targets (illustrated below). Harmony’s HIV/Aids programme aligns with this global campaign. Tshepong was the first of our operations to reach and surpass the new 95% target with Doornkop also reaching the 95% target in this financial year.
|
|
|
|
|
|
|
|
|
|
|
|
|
|
|
|
|
|
|
|
|
|
|
|
|
Target
95%
|
|
|
|
Harmony’s HIV status (%) |
|
|
|
|
|
|
|
FY23 |
FY22 |
FY21 |
|
|
|
of people living with HIV will know their status |
89 |
85 |
76 |
|
|
|
of people with diagnosed HIV infection to receive sustained ART |
90 |
89 |
86 |
|
|
|
of people receiving ART to have viral suppression |
82 |
78 |
78 |
|
|
|
Employees on voluntary counselling and testing programmes |
83 |
92 |
*** |
Harmony’s HIV/Aids programme supports the realisation of the UNAids 2030 targets by creating awareness and offering voluntary counselling and testing. We participate annually in commemoration of World Aids Day with build-up campaigns starting in November in collaboration with government and our Minerals Council peers.
Employees continue to receive pre-test counselling and voluntary testing through ongoing initiatives at our healthcare hubs. In FY23, 71 563 (FY22: 67 035) employees received voluntary counselling and testing, and 59 372 (FY22: 61 565) confirmed their status. TB screening was offered to 7 054 employees and 5 936 were tested. We also identified and began treating 24 new positive cases.
Responding to disease outbreaks
We maintain our precautionary Covid-19 management approach to infectious disease control. Although Covid-19 disruption diminished significantly worldwide, we remain vigilant as new variants and cases continue to emerge. At year end, we recorded zero active cases, 80% of our 43 175 employees were fully vaccinated and 35% had received a booster dose during the financial year.17 employees tested positive and four were hospitalised and recovered. Covid-19 vaccinations were integrated into daily health management.
In collaboration with labour representatives, we encourage employees to receive Covid-19 boosters and influenza (flu) injections, particularly high-risk people. A total of 4 727 employees, 10.8% (FY22: 11%) of our South African workforce, received these vaccinations in FY23.
We are also monitoring national measles, mumps and waterborne cholera outbreaks. With symptoms similar to Covid-19, measles and mumps are highly contagious, airborne diseases common in children and unvaccinated adults. No Harmony employees have been diagnosed with measles, mumps or cholera to date.
Mental health
Enabling a caring culture, employees participated in renaming our mental health and psychosocial programme to Khethimpilo (Zulu for “choose life”). We officially launched the campaign in March 2023, focusing on suicide prevention and substance abuse. We encourage employees and their families to use the service (ongoing hybrid, on-site and telephonic counselling by resident social workers and Reality Wellness therapists). This programme is crucial to mitigate emerging risks, such as disease outbreaks and the economic climate, among others, which induce stress. At year end, we recorded 9 620 consultations addressing substance abuse, family problems, work-related challenges and other mental health concerns.
20 865 employees were reached through awareness and promotion campaigns:
•Zero tolerance to violence at work and home environments (6 900)
•Suicide prevention (3 800)
•Substance abuse prevention (1 779)
•Programme rebranding and awareness on services (8 346).
Papua New Guinea
TB and comorbid HIV/Aids as well as lifestyle diseases, such as hypertension and diabetes, are the main reasons for off-site referral for further checks and failed pre-employment medical examinations.
Given the humid climate, upper respiratory tract infections and TB are our main medical concerns. We effectively manage TB with digital X-ray, GeneXpert and other medical laboratory equipment to accurately diagnose this chronic disease as well as tropical diseases. In FY23, Harmony treated 2 456 (FY22: 1 545) employees for respiratory ailments. Good hygiene practices (regular hand washing, sanitising and wearing masks when experiencing symptoms) are emphasised regularly to reduce contagion.
Responding to disease outbreaks
Vulnerable employees are sent off site for active disease management, including for malaria and other endemic tropical diseases such as typhoid and diphtheria. Outbreaks of dengue, filariasis and Japanese encephalitis did not affect our employees.
Although rampant in Papua New Guinea, malaria does not affect our Hidden Valley operation as it is located at a high altitude. Cases recorded at Hidden Valley are typically contracted off-site with symptoms presenting when personnel return to work. Employees, contractors and communities in lower valleys, and at Wafi-Golpu, are at greater risk of contracting this disease. In FY23, at Hidden Valley, our malaria cases decreased by 29.1% to 90 (FY22: 127). At Wafi-Golpu, our employee and contractor-focused malaria management programme includes awareness and education campaigns, and mosquito net distribution. We encourage both groups to take nets home to their families.
Mental health
Increasing mental health issues are challenging to assess as most patients do not disclose necessary information. Our on-site medical team addresses this issue with continuous health promotion activities, including a topic of the month and campaigns that encourage regular health checks. As exercise is among the recommended treatments for mental health conditions, we have a gym and undercover sports facilities for employees at Hidden Valley.
|
|
|
|
|
|
|
|
|
|
|
|
|
|
|
|
|
|
|
Managing health-related absenteeism
We address health-related absenteeism with early identification and management of chronic illness or debilitating diseases that may render employees medically incapacitated
Our At Work programme continues to identify employees on extended sick leave, monitors their medical conditions, and ensures appropriate treatment and early return to work with health and productivity as goals.
The main contributing factors in South Africa are injuries, respiratory, musculoskeletal and psychological conditions. In Papua New Guinea, respiratory tract infections, due to cold night-time temperatures, cause health-related absenteeism.
|
Future focus areas
|
|
|
|
|
|
|
|
|
| Across the group, we will advance the digital transformation of our employee healthcare delivery in collaboration with cross-functional teams striving for safe production. This will enable our medical teams to deliver proactive healthcare, based on employees’ individual risk profiles in addition to annual medical examinations, and effectively address specific occupational conditions. |
In South Africa, we anticipate challenges presented by pending changes to healthcare provision legislation such as the National Health Insurance (NHI). |
In Papua New Guinea, we plan to expand our occupational hygiene programme to address noise and vibration monitoring. |
In Australia, we are developing our health and hygiene monitoring plan to address future activities at the site. |
CARING FOR OUR EMPLOYEES
Our employees are Harmony’s most valuable asset in mining with purpose. We engage with mutual respect and trust to achieve our strategic goals.
We strive to go beyond compliance with the mining charter in South Africa to create and maintain an employee profile that addresses the country's needs. Our approach includes MoA employment targets in Papua New Guinea and we are progressing well with engagements in Australia about future project opportunities for employment.
|
|
|
|
|
|
|
|
|
|
|
|
|
|
|
South Africa |
|
Papua New Guinea |
Human resources development
(ring-fenced) |
•5% (percentage of the leviable amount excluding mandatory skills development levy)
–Mining Transformation and Development Agency: 2%
–Essential skills development: 2%
–South African historically black academic institutions: 1% (70% of the budget must be spent in South Africa – half of this budget on research and development at these institutions).
|
Tiers 1 and 2: Local landowners and impacted districts |
41% |
| Tiers 3 and 4: Morobe Province and the rest of Papua New Guinea |
56% |
| Employment equity |
•Historically disadvantaged people (including women, people living with disabilities, and people with core and critical skills) representation in board and management
•Career progression aligned with social and labour plans (SLPs).
|
Tier 5: Expatriates |
3% |
| Housing and living conditions |
•Decent housing, home ownership, integrated human settlements and measures to address demand
•Affordable, equitable and sustainable healthcare services with proper nutrition.
|
Women |
15% |
|
|
|
|
|
|
|
|
|
|
|
|
|
|
|
|
|
|
|
|
|
|
|
|
|
|
|
|
|
|
|
|
|
|
|
|
|
|
|
|
|
|
|
|
|
|
|
|
|
|
|
|
|
|
|
|
|
GRI Standards |
|
|
|
|
|
Related SDGs |
|
|
|
|
Prepared in accordance with 3-3, 401-1, 401-2, 401-3, 402-1, 404-1, 404-2, 404-3, 405-1, 405-2, 406-1, 407-1, 408-1, 409-1 and 410-1. |
|
|
|
|
|
|
|
|
|
|
|
|
|
|
|
|
|
|
|
|
|
|
|
|
|
|
|
|
|
|
Our approach
Our duty of care is our moral and legal obligation borne out of our values to ensure the safety and wellbeing of our people. This starts with our employees and extends to our communities, and aims to go beyond compliance in providing uplifting support and meeting the employment needs of the countries in which we operate.
We aim to place the right people in the right roles, at the right time, with motivation to work safely and productively to create value. Harmony creates an enabling environment, supported by a human resource team focusing on talent management, engagement, diversity, equity and inclusion to benefit employees, the business, host communities and shareholders.
The tenets of our employee relations approach support employees’ wellbeing:
•Upholding equity through empowering individual development programmes
•Embracing our rich diversity with respect for local communities
•Encouraging employees to invest in the company’s success
•Ensuring freedom of association through organised labour structures that promote business improvements.
Employee Safety and Health and wellness are at the heart of our approach to ensure positive employee relations. We collaborate with internal and external stakeholders to advance our proactive safety culture and health goals, supported by industry leading strategies aiming for zero harm.
Details on the tripartite steering committee (which includes our culture transformation, health and wellness, and employee development teams).
Employment equity and human resource development committees (meeting quarterly at a corporate level, and monthly at operational level) are addressing challenges in achieving employment equity targets, particularly at junior management level, by:
•Enrolling suitable candidates in our skills and leadership development programmes
•Filling vacant positions with the correct designated group
•Awarding bursaries, internships and learnerships to historically disadvantaged people (increasing our talent pipeline in various entry-level positions).
FY23 focus areas and performance
|
|
|
|
Collaboration
We partner with these stakeholders to strengthen implementation of our strategy:
•Minerals Council South Africa, Mine Health and Safety Council and unions (tripartite forum)
•Minerals Council South Africa, Mining Qualifications Authority (MQA) and Department of Education (skills development)
•Minerals Council South Africa (gender-based violence).
|
|
|
|
|
|
|
|
|
|
| Key metrics |
South Africa |
South-east Asia (Papua New Guinea and Australia) |
| Total permanent workforce |
33 341 |
|
1 572 |
|
HDPs1 (South Africa)/local (Papua New Guinea) |
|
|
| Total workforce (%) |
74 |
|
97 |
|
Total management2 (%) |
68 |
|
29 |
|
| Employee remuneration |
|
|
| Wages and benefits (Rm) |
16 557 |
|
958 |
|
| Total training spend (Rm) |
783 |
|
34 |
1 HDPs include women and exclude white males and foreign nationals.
2 Management includes all junior to top management level employees.
Female versus male employees1 (%)
South Africa
Papua New Guinea
Australia
1 Excludes contractors.
Age profile
Our employee age profile is 57% (FY22: 57%) younger than 45 years in South Africa and 73% (FY22: 74%) in Papua New Guinea. We attribute this to recruiting youths who graduate from our South African community training programme.
Workforce profile
|
|
|
|
|
|
|
|
|
|
|
|
|
|
|
|
|
|
|
|
|
|
|
|
|
|
|
|
|
|
|
Permanent employees |
Contractors |
Employees from local communities (%) |
| Region |
FY23 |
FY22 |
FY21 |
FY23 |
FY22 |
FY21 |
FY23 |
FY22 |
FY21 |
South Africa1 |
33 341 |
35 989 |
36 873 |
9 834 |
9 013 |
8 860 |
83 |
|
82 |
|
78 |
|
Papua New Guinea2 |
1 472 |
1 527 |
1 536 |
795 |
751 |
778 |
98 |
|
98 |
|
97 |
|
| Australia |
100 |
65 |
63 |
4 |
0 |
2 |
n/a |
n/a |
n/a |
| Harmony total |
34 913 |
37 581 |
38 472 |
10 633 |
9 764 |
9 640 |
|
|
|
1 Includes South African underground and surface operations.
2 Excludes employees of the Wafi-Golpu Project.
South Africa
Our largest labour-sourcing area employs a permanent workforce of 33 341 (FY22: 35 989) people. Reductions in our permanent workforce are mainly due to natural attrition and voluntary separation packages due to Bambanani mine closure.
1157 new engagements during the period (includes SLP commitments and community learners), (866 males and 291 females).
Our employee turnover increased to 1.3% (FY22: 1.1%).
|
|
|
|
|
|
|
|
|
| Employees (%) |
|
| FY23 |
FY22 |
| South African nationals |
83 |
82 |
Foreign nationals1 |
17 |
18 |
1 Employees from neighbouring countries (primarily Lesotho and Mozambique).
Papua New Guinea
We have a permanent workforce (including contractors) of 2 267 (FY22: 2 278) people at Papua New Guinea.
Resignations continue to decrease as a result of our ongoing retention efforts. Our roster improvements, and focus on quality leadership and employee engagement have all had a positive effect on our overall turnover during a volatile PNG market. This reduced our Hidden Valley employee turnover to 21% (FY22: 28%).
|
|
|
|
|
|
|
|
|
|
|
|
|
|
|
Papua New Guinea: Hidden Valley Employees and contractors (%) |
Employees |
Contractors |
| FY23 |
FY22 |
FY23 |
FY22 |
| PNG National Employees |
94.5 |
93 |
0 |
31 |
| Expatriates |
5.4 |
7 |
0 |
69 |
Diversity, equity and inclusion
Our commitment to gender equality is recognised globally with our fifth consecutive inclusion in the Bloomberg Gender-Equality Index, which tracks the performance of public companies committed to supporting gender equality through policy development, representation and transparency.
In the year, we conducted the Gender Survey in South Africa and Papua New Guinea, and the findings of the survey including recommendations have been communicated across the group by our CEO. Action plans and a roll-out plan were developed, covering communication and awareness, cultural leadership and behaviours, targeted interventions and training, policies and practices, facilities and the work environment.
South Africa
We are among corporate citizens redressing historical imbalances, particularly at managerial levels. Our efforts aim to create and maintain a workforce that represents the cultural and gender diversity of the South African population.We have a people development strategy that aims to increase female representation across all levels, particularly management levels. The company has also refocused its uptake in the developmental programmes to increase women, such as graduate development programmes, bursaries, learnerships and internships.
To meet employment equity targets and improve gender diversity, we accelerate HDP representation in managerial positions, which has increased to 68% (FY22: 67%).
|
|
|
|
|
|
|
|
|
|
|
|
|
|
|
|
|
|
|
|
|
Employment equity performance at 30 June 2023 |
HDPs1 |
Female HDPs |
|
Target
% |
Actual
FY23 |
Actual
FY22 |
Target
% |
Actual
FY23 |
Actual
FY22 |
Board2 |
50 |
|
67 |
|
57 |
|
20 |
|
25 |
|
21 |
|
| Executive management |
50 |
|
60 |
|
55 |
|
20 |
|
25 |
|
25 |
|
| Senior management |
60 |
|
58 |
|
59 |
|
25 |
|
27 |
|
28 |
|
| Middle management |
60 |
|
60 |
|
57 |
|
25 |
|
28 |
|
27 |
|
| Junior management |
70 |
|
70 |
|
68 |
|
30 |
|
21 |
|
19 |
|
| Core and critical skills |
60 |
|
73 |
|
72 |
|
n/a |
n/a |
n/a |
| People living with disabilities |
1.5 |
|
0.3 |
|
0.1 |
|
n/a |
n/a |
n/a |
1 HDPs include women and exclude white males and foreign nationals.
2 Harmony’s three executive directors are included as board members.
Although there were notable improvements in achieving our HDP management targets, we did not achieve our gender diversity objectives at junior management level. Our transformation interventions include creating a conducive working environment for people living with disabilities.
Papua New Guinea
The proportion of female employees at leadership levels is 23% (FY22: 11%). To accommodate more female employees, we provide additional, gender-specific accommodation, and run awareness campaigns to promote gender equality and combat gender-based violence.
We support the global 16 days of activism against gender-based violence campaign from 25 November to 10 December every year.
We strive to maintain and enhance our diversity, equity and inclusion programmes across our operations.
Skills development and training
Individual development is a social and business imperative to address skills shortages and historical inequalities in education and training. Our skills development, training and talent management initiatives empower employees to achieve their full potential. Programmes, aligned with our strategic and operational needs, enable employees to acquire the skills, resources and motivation needed to optimise performance and productivity.
South Africa
When using financial year figures to determine HRD spend, we achieved 6% against a mining charter target of 5%. This equates to R783 million (US$44.1 million) (FY22: R661 million/US$43.5 million on training and skills development for 96% (FY22: 93%) of our South African workforce. Included in the 96% were 163 (FY22: 96) employees in critical positions who attended 267 training interventions.
The graph below reflects the total training hours for all employees and contractors, and includes all training types such as initial and refresher training, skills programmes and short courses.
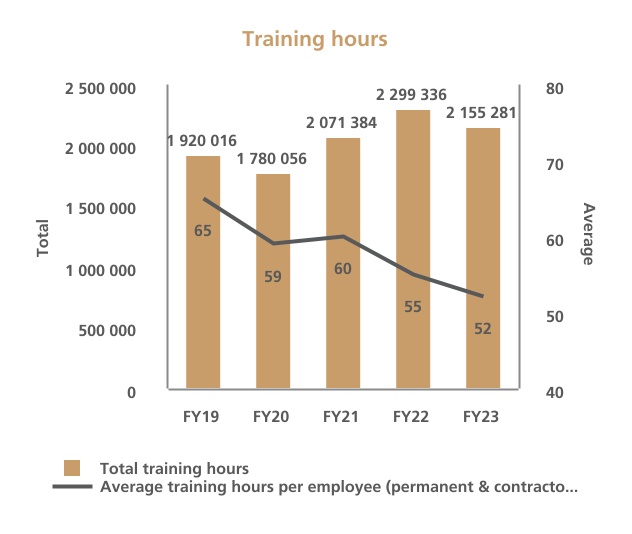
|
|
|
| Development pipeline |
|
Our succession plan includes identifying potential employees for our development forums. We onboarded four (FY22: two) new junior engineers, increasing our talent pool to nine.
Of the 440 (FY22: 357) candidates in engineering learnerships, with strong HDP representation, 342 (FY22: 290) remained in the programme as well as eight (FY22: nine) junior engineers. We were also successful in attaining accreditation to offer Minerals Processing learnerships and a total of seven employees have been registered on this learnership.
|
| Mining training |
|
Our mining training programme includes:
•Shift boss development for 32 male and 13 female employees (FY22: 34 male and five female)
•Blasting tickets awarded to 50 learner miners (FY22: 49)
•21 learners from the Ore Reserve Management discipline (FY22:14) were enrolled on the level 2 and 3 mining technical support learnerships.
|
| Adult education and training |
The company has a current literacy level of 79%. We continue to encourage employees to enrol in our adult education and training programme. Improvements in our approach includes digitisation of the programme, completed during the year, which now allows for 24/7 access for own-time learning. Own-time registrations increased to 267 (FY22: 166) and full-time based classes increased to 172 (FY22: 151). The average pass rate for own-time AET was 76% (FY22: 63%) with full-time AET decreasing to 62% (FY22: 75%). |
| Mathematics, science and language enhancement project |
In partnership with the Department of Education, Harmony helped 760 (2022: 801) grade 10 to 12 learners and teachers achieve excellent maths, science and english results in the past academic year. Committed to R7 million for the 2022 to 2024 academic years, we provided funding of R3 million to schools in the 2022 academic year with a similar amount expected for the 2023 year (2020 and 2021: R5 million). |
| Bursary programme |
Honouring our SLP commitments, we awarded bursaries to 108 (FY22: 126) students (52 female and 56 male), primarily from our host communities and labour-sending areas, at institutions of higher learning in South Africa. The total cost was R13 million (FY22: R15 million). After completing their studies, students can apply for inclusion in Harmony’s graduate development programme. |
| Graduate development programme |
Aligning current talent development plans with future leadership needs, our graduate development programme sponsored 14 (FY22: 20) students in core disciplines. We had 10 (FY22: 12) in mining and four (FY22: eight) in ore reserve management. |
| Study assistance programme |
Harmony invested R5 million (FY22: R4 million) in 258 (FY22: 117) employees completing various diploma and degree courses as part of our talent development programme. This Harmony study assistance programme augments our people development strategy, which gives employees access to formal education and training. |
|
|
|
| Leadership development |
|
Since 2018, our leadership development programme has gained traction and continues to improve organisational efficiency and innovation with additional courses for emerging and junior managers, team leaders and supervisors. We have enrolled 451 candidates in FY23 (FY22: 653):
•14 (FY22: 13) senior and executive
•67 (FY22: 51) middle and senior
•197 (FY22: 400) emerging and junior
•173 (FY22: 189) team leaders and supervisors.
In our senior and executive management talent pipeline, as part of succession planning, four candidates began the University of Cape Town Graduate School of Business Executive Master of Business Administration (EMBA) programme in February 2023.
As part of our humanistic transformation programme the Thibakotsi journey, the middle management supervisory empowerment programme was rolled out at Kusasalethu Mine during FY23.
|
| Portable skills training |
|
We provided portable skills training to 489 (FY22: 74) current and retrenched employees and their dependants through our social plan programme. This programme is aligned to the 2003 Social Plan Framework agreement between Harmony and the National Union of Mineworkers (NUM). This enables people to remain economically active beyond mining by cushioning the impact of unavoidable retrenchment or employment loss at the end of mine life.
Trainees, comprising 60% (FY22: 68%) employee dependants, are taught end-user computing, basic electrical competence and basic welding, baking and plumbing.
|
| Financial literacy programme |
Launched in 2013, our financial literacy programme provides relief to semi-skilled and skilled employees with a financial management course. |
Papua New Guinea
Historical underinvestment in Papua New Guinea's technical training facilities resulted in a shortage of adequate technical skills, particularly in the mining sector. Our workforce training initiatives focus on providing the skills local recruits need for our Hidden Valley operation and career training to advance their skill sets.
Our training initiatives include career path and professional development, production, safety compliance, National Apprenticeship and Training Accreditation Testing Board compliance, and computer software and supervisor skills.
During FY23, 27 employees in our Hidden Valley Mobile Fleet Maintenance Department were supported in obtaining trade certificates, including 19 employees achieving trade testing level 1 and eight employees receiving trade testing level 2.
Online training and skills development for 1 448 (FY22: 1 359) employees cost R33 million (US$1.9 million) (FY22: R4 million/US$0.3 million).
Women empowerment initiatives include training female haul truck operators at Hidden Valley where 32.0% (FY22: 28.0%) of employees are female and small truck operators are now at 46.0%.
The employees dependents education assistance programme has had PGK1.7 million paid out in FY23.
Addressing employee over-indebtedness
Financial over-indebtedness remains a burden for many employees in South Africa with impacts on mental health and productivity. Our financial literacy programme enabled 437 (FY22: 709) semi-skilled and skilled employees to address this scourge. Since the programme's inception in 2013, 26 149 (FY22: 25 712) employees have had financial counselling.
Employees also benefit from our verification of 11 (FY22: 33) emolument attachment (garnishee) orders and restructuring of 95 (FY22: 127) accounts before payroll processing. Our assessments reduced monthly instalments by R556 642 (US$31 342) (FY22: R415 326/US$27 306). We also helped facilitate R157 408 (US$8 863) (FY22: R142 817/US$9 390) prescribed debt write-off by creditors and removed negative listings worth R149 562 (US$8 421) (FY22: R206 666/US$13 588) from credit bureaus. This improved employees’ credit ratings to qualify for mortgages and vehicle finance. Garnishee orders declined to 901 (FY22: 928).
Freedom of association, labour disputes and strikes
Our people are our most valuable asset. We acknowledge our employees' right to freedom of association and fair labour practices. In this regard our employee relations is based on mutual respect and trust, reflecting our firm belief that each person is critical to our business strategy.
South Africa
We strive for honest and open communication with a policy framework formalising union recognition rights at each operation. A multi-union environment promotes coexistence, inclusion and collaboration.
Employee relations remained stable throughout the year. To mitigate the risk of labour disputes, we frequently engage with unions at mine and management levels in addition to direct engagement with employees. We proactively address employee and union queries through established structures and processes. We have quarterly regional meetings with unions, encouraging proactive and robust engagement on specific issues. Our general managers and human resources leaders meet daily with full-time stewards who interact at union branch level and with shaft committees.
Our regional managers meet regularly with regional union structures. Recognised unions are listed below.
|
|
|
|
|
|
|
|
|
|
|
|
|
|
|
|
|
|
| Recognised unions (%) |
FY23 |
FY22 |
FY21 |
FY20 |
FY19 |
| NUM |
52 |
53 |
52 |
58 |
58 |
| Association of Mineworkers and Construction Union (AMCU) |
29 |
28 |
28 |
23 |
24 |
| United Association of South Africa (UASA) |
5 |
5 |
5 |
5 |
6 |
| Solidarity |
2 |
2 |
3 |
2 |
3 |
| National Union of Metalworkers of South Africa (NUMSA) |
7 |
6 |
6 |
5 |
4 |
| No union |
5 |
6 |
6 |
6 |
5 |
| Coalition (NUM, UASA and Solidarity) |
59 |
60 |
60 |
65 |
67 |
Our current three-year wage agreement, in respect of wages and conditions of service, is for 1 July 2021 to 30 June 2024, signed by AMCU, NUMSA and the coalition, made up of the NUM, UASA and Solidarity:
•Category 4 to 8 employees receive a wage increase of R1 000 for each year of the wage agreement, which translates to an average increase of 8.4% for these employees
•Miners, artisans and officials receive an increase of the greater of 6% of their basic wage or CPI (average of the previous 12 months) for each year of the agreement.
•98% of Harmony employees are part of the bargaining unit covered by this wage agreement (5% of the 98% are non-unionised), while the remaining 2% is made up by management).
In addition to the basic wage increases above, employees are also entitled to receive increased benefits in relation to the following:
•To promote home ownership, a housing allowance of R2 750 increased to R3 240 over the duration of the agreement, for employees who choose to purchase a residence or have existing bond agreements
•Employees not eligible for the housing allowance an increased living-out allowance from R2 500 in the first year, to R2 700 over the duration of the agreement
•Several non-wage-related and process benefits, including maternity and paternal leave, medical incapacity and medical aid.
A key feature of the wage agreement was establishing a joint task team to evaluate future shift systems, considering operation-specific circumstances, Harmony’s overall viability and sustainability, and compliance with working hour regulations in the Basic Conditions of Employment Act 75 of 1997. Phase 1 (identifying shift arrangements not aligned to occupations) will be completed in FY24 with appropriate shifts for work that requires 24/7 availability of resources.
Papua New Guinea
Hidden Valley does not have union representation but we continuously engage with employees, contractors and government (national, provincial and local), landowners and regulators. The employee representative committee oversees industrial relations and engages with employees about wage increases through a joint management forum.
No work stoppages occurred in PNG in FY23.
Employee benefits
We have a range of employee benefits in South Africa.
Promoting home ownership
We promote home ownership through our housing and living conditions strategy. Employees can buy Harmony-owned properties at prices below market value.. Harmony also sells empty stands in proclaimed municipal areas. Of 279 (FY22: 278) empty stands, 180 (FY22: 66) were sold to employees and 32 (FY22: 212) await purchase applications. In addition, 144 (FY22: 26) employees participate in the pension-backed home loan scheme negotiated by the Minerals Council South Africa for the mining industry.
|
|
|
|
|
|
|
|
|
|
|
|
|
Access to adequate housing as a universal human right
Managing Harmony’s portfolio of land and properties by reducing running costs and associated liabilities while improving stakeholders’ access to adequate, affordable housing and commercial properties
Supporting South Africa’s land redistribution, sustainable housing and socio-economic development policies, we sell our land and non-residential properties to black-owned companies at preferential rates. We also donate unused land to the South African government.
In addition, our employee home ownership scheme offers a once-off discount of up to 45%, refurbishment, recognition of long service, and a discount on voluntary termination or retrenchment.
|
|
|
|
Accommodation and living conditions
Provision of adequate housing and decent living conditions is a constitutional right that upholds human dignity. The mining charter also requires mining right holders to improve housing and living conditions for employees, ensuring the accommodation is in line with the industry standard.
None of our employees reside in shared hostel rooms as we have converted this accommodation into single rooms. Harmony provides accommodation for 7 662 (FY22: 8 057) employees and 36 (FY22: 33) contractors while 4 146 (FY22: 6 214) reside in company-owned houses with their families.
The R651 million (US$36.7 million) (FY22: R745 million/US$49.0 million) living-out allowance enables employees to choose alternative accommodation.
|
|
|
|
|
Respect for and upholding human rights
Harmony’s code of conduct, outlining our core values and our human rights policy guide employees and suppliers to act in line with the highest standards of integrity and ethics in stakeholder engagements. We thus build trust and a culture of individuals working towards the team’s shared goals.
To maintain the highest standards, we subscribe to the Minerals Council’s membership compact (a mandatory code of ethical business conduct with guiding principles). We also uphold International Labour Organization principles with a highly unionised workforce (94%) participating in collective bargaining and an employment policy and established practices prohibiting indirect or direct compulsory, forced or child labour (we do not employ people under the age of 18). In addition, we have policies to prevent sexual harassment and workplace bullying.
Our annual training also reinforces the Voluntary Principles on Security and Human Rights as well as prevailing legislation. In addition, we regularly engage with peers, government and civil society about our policies on ethical conduct and human rights in providing security services to local communities. We will provide human rights training to security personnel from FY24.
We will conduct human rights assessments at our operations in South Africa, Papua New Guinea and Australia, and update our human resources policy accordingly, from FY24.
Despite exposure to dangerous criminals, we avoid use of force in our encounters with illegal miners. As outlined in our human rights policy, we respect the fundamental and universal human rights and freedoms of every person. Harmony’s internal and contracted security services comply with our code of conduct.
|
Future focus areas
|
|
|
|
|
|
|
|
|
|
|
|
Across the group, we will continue optimising systems and processes with technology that improves management and team cooperation.
We will also roll out our leadership programme from senior leaders to supervisors. This includes a review of our values and culture.
Our bursary programme and student training will extend to international operations. |
In South Africa, we will continue to increase our female workforce through an employment equity plan with targets for 2027.
We remain committed to ensuring a culture of gender diversity, equity and inclusion as well as being aware of shifting priorities within our communities.
|
In Papua New Guinea, we will continue our efforts to increase our female workforce, including leadership positions.
Harmony is committed to operate within the scope of the MOA agreement with the stakeholders of the Hidden Valley operation. A formal review of all parties’ performance against obligations is expected to take place in FY24.
|
In Australia we will continue to comply with legislative changes at a state level and we will continue to foster principals diversity, equity and inclusion. |
EMPOWERING COMMUNITIES
We help our host communities build resilience for posterity by supporting employees, businesses, municipalities and national socio-economic development goals through our programmes and local economic development initiatives.
Acknowledging the constitutional rights of indigenous people in our host countries, Harmony’s socio-economic impact and investments exceed compliance at every operation. At minimum, we implement legislated local economic development initiatives. In South Africa, these initiatives are outlined in SLPs attached to our mining rights. In Papua New Guinea, our commitments are set out in Hidden Valley’s MoA between government, landowners and Harmony. For the Wafi-Golpu Project, which is in permitting stage, we support a range of voluntary health and local economic development programmes, with particular focus on agribusiness.
|
|
|
|
|
|
|
|
|
|
|
|
|
|
|
|
|
|
|
|
|
|
|
|
|
|
|
|
GRI Standards |
|
|
|
|
|
Related SDGs |
|
|
Prepared in accordance with 3-3, 203-1, 203-2, 204-1, 411-1, 413-1, 413-2, 414-1 and 414-2. |
|
|
|
|
|
|
|
Our approach
We strategically implement socio-economic development initiatives aligned with national job creation and poverty alleviation imperatives. Our projects promote and support community empowerment, sustainable development and human dignity.
Harmony’s approach aims to:
•Enhance broad-based economic empowerment and enterprise development through wages, taxes and royalties, contributing to the growth of local economies and country GDPs
•Build relationships of trust through transparent dialogue and delivering on our commitments.
Our socio-economic development strategy
|
|
|
|
|
|
|
|
|
|
|
|
|
|
|
|
|
|
|
|
|
|
|
|
|
|
|
|
|
|
|
|
|
|
|
|
|
|
|
|
|
|
|
|
|
|
|
|
|
|
|
|
|
|
|
Group |
|
|
|
|
|
|
|
|
|
|
|
|
|
|
|
|
|
|
|
|
|
|
|
|
|
|
|
|
|
|
|
|
|
|
|
|
|
|
|
|
|
|
|
|
|
|
|
|
|
|
|
|
|
|
|
|
|
Delivering on our community development commitments |
|
|
|
|
|
Preferential/local procurement and enterprise and supplier development |
|
|
|
|
|
Corporate citizenship
(beyond compliance)
|
|
|
|
|
|
|
|
|
|
|
|
|
|
|
|
|
|
|
|
|
|
|
|
|
|
|
|
|
|
|
|
|
|
|
|
|
|
|
|
|
We honour our commitments to community development (SLPs in South Africa, MoA in Papua New Guinea, and native title agreements in Australia). |
|
|
|
Our procurement spend as well as enterprise and supplier development interventions stimulate economic activity (including women and youth empowerment) within communities. |
|
|
|
We supplement our commitments and other initiatives for greater good. |
|
|
|
|
|
|
|
|
|
|
|
|
|
|
|
|
|
|
|
|
|
|
|
| South Africa |
To varying degrees, legislation and needs communicated by host communities influence the implementation of our socio-economic development strategy. Our projects are primarily dictated by compliance with the Mineral and Petroleum Resources Development Act 28 of 2002 (MPRDA), which requires mining right holders to implement the commitments of the SLP. |
|
|
|
|
|
|
| Papua New Guinea |
| Community development initiatives are delivered through several channels in Papua New Guinea. The principal vehicle for our Hidden Valley operation is our MoA, which sets out a range of socio-economic development undertakings for each of the parties. |
| Hidden Valley |
Wafi-Golpu |
|
1. MoA
•Physical and social infrastructure undertaking: Harmony funds a range of interventions: education, training, healthcare (including substance abuse and HIV/Aids awareness), agriculture, water supply and identified sustainable development programmes and projects every year
•Royalty payments: Various stakeholders receive royalty payments according to the percentage distribution set out in the MoA:
–Landowners and local governments
–Future Generations Trust
–Settlers Fund
•Employment and training plan undertaking
•Business development plan undertaking.
2. Hidden Valley Mine Trust: A benefit-sharing agreement established the Hidden Valley Mine Trust in return for Hidden Valley landowners and provincial government forgoing equity interest in the mine as per an entitlement under the MoA. The trust receives quarterly fixed and variable payments for community-initiated and endorsed projects. Harmony is the trustee.
3. Primary and secondary school fees programme: Harmony contributes to school fees for Hidden Valley employees’ dependants.
4. Settlers Fund project facilitation: Harmony assists to deliver social projects, as agreed with state authorities, funded by the Settlers Fund.
5. Donations: Harmony’s ad hoc assistance includes emergency medical transport, and food for bereaved families and community events where needs arise.
|
1. Community development programme: Harmony supports local economic development initiatives (agri-business, healthcare, education, water and sanitation).
2. Donations: Harmony’s ad hoc assistance includes emergency medical transport, and food for bereaved families and community events where needs arise.
When the special mining lease is granted, Wafi-Golpu will also have an MoA (or similar), as well as workforce development, supply and procurement plans, and related commitments.
|
|
|
|
|
|
|
Australia |
Our acquisition of the Eva Copper Project in December 2022 include obligations to the Kalkadoon native title holders through agreements under Australia’s Native Title Act 1993. These obligations include consultation, employment and training opportunities, production and acreage-linked payments, and cultural heritage management provisions. Eva Copper also requires an Australian industry participation plan, under the Australian Jobs Act 2013, to ensure Australian companies are given opportunities to bid for the supply of goods and services. We are formalising internal processes and strategies to support our delivery of these commitments. |
Compliance |
Beyond compliance |
|
1. Kalkadoon native title agreements: Harmony is obligated to consult the local community, provide employment and training opportunities, pay acreage and production-linked fees, and fulfil cultural heritage management provisions.
2. Australian industry participation plan: Legislation requires Harmony to provide full, fair and reasonable opportunities for Australian businesses to supply key goods and services.
|
•Discretionary community investment: Harmony supports targeted community investment around Cloncurry and north-west Queensland. Harmony’s focus during the first six months of owning Eva Copper Project was on local cultural and business events. |
FY23 focus areas and performance
|
|
|
|
Collaboration
We partner with these stakeholders to strengthen implementation of our strategy:
•Local and national government, Unemployment Youth Forum of South Africa, MQA, Enactus South Africa and the South African Agency for Science and Technology Advancement (SAASTA) (youth upliftment and employment)
•Host and labour-sending municipalities, government departments, the Agricultural Sector Education and Training Authority (AgriSETA), Rebafenyi NPO, the Mineworkers Development Agency and Bidvest (agri-entrepreneur and infrastructure development)
•Large companies, funding institutions and original equipment manufacturers (OEMs) (skills transfer for preferential procurement/enterprise and supplier development)
•Cocoa Board of Papua New Guinea (agri-entrepreneur development)
•United States Agency for International Development
•Papua New Guinea Electrification Partnership (female entrepreneur development)
•National Agricultural Research Institute (agricultural development)
•Morobe Provincial Health Authority (healthcare)
•Papua New Guinea National Department of Health (healthcare).
|
We comply with legislation and go beyond compliance to support meaningful socio-economic impact by establishing partnerships with our suppliers and government while creating and sharing value with our stakeholders.
Our socio-economic development impact
|
|
|
|
|
|
|
|
|
|
|
|
|
|
|
|
|
|
|
|
|
|
|
|
|
|
|
|
|
|
|
|
|
|
|
|
|
|
|
|
|
|
|
|
|
|
|
|
|
|
|
|
Total group spend: R16.3 billion (US$917.8 million)
(FY22: R13.7 billion/US$900.7 million)1
|
|
South Africa |
|
|
|
|
|
|
|
|
|
|
|
|
|
|
|
|
|
|
|
Delivering on our community development commitments: R114 million (US$6.4 million)
(FY22:R93 million/US$6.1 million)
|
|
|
|
Preferential/local procurement and enterprise and supplier development: R14.0 billion (US$788.1 million)
(FY22: R11.2 billion/US$736.3 million)
|
|
|
|
Corporate citizenship (beyond compliance): R15 million (US$0.9 million)
(FY22: R11 million/US$0.7 million)
|
|
|
|
|
|
|
|
|
|
|
|
|
|
|
|
|
|
|
|
Total South Africa spend: R14.1 billion (US$793.9 million)
(FY22: R11.3 billion/US$742.9 million)
|
|
|
|
|
|
|
|
|
|
|
|
|
|
|
|
|
|
|
|
|
|
|
|
|
|
|
|
|
|
|
|
|
|
|
|
|
|
|
|
|
|
|
|
|
|
|
|
|
|
|
|
|
Papua New Guinea |
|
|
|
|
|
|
|
|
|
|
|
|
|
|
|
|
|
|
|
Delivering on our community development commitments: R63 million (US$3.5 million)
(FY22: R46 million/US$3.0 million)1
|
|
|
|
Preferential/local procurement and enterprise and supplier development: R2.1 billion (US$118.2 million)
(FY22: R2.3 billion/US$153 million)
|
|
|
|
Corporate citizenship (beyond compliance): R12 million (US$0.7 million)
(FY22: R9 million/US$0.6 million)1
|
|
|
|
|
|
|
|
|
|
|
|
|
|
|
|
|
|
|
1 Restated due to changes from Papua New Guinea.
Delivering on our community development commitments
We collaborate in directing funding to transformative projects that address the real needs of communities.
South Africa
Our third-generation SLPs ended on 31 December 2022 with total spend of R349 million through our mine community development programmes over the five-year period of implementation. We spent R114 million (US$6.4 million) (FY22: R235 million/US$15.5 million) on mine community development in FY23 up until we concluded the financial year in June 2023. When reading the Mining Charter section there will be a difference in the expenditure compliance amount due to the Charter report’s year end being December 2022.
Actual investment in third-generation mine community development programmes
1 Includes Mponeng from FY21.
We submitted our fourth-generation SLPs (1 January 2023 to 31 December 2027) to the DMRE. A thorough process was undertaken to develop and design the 4th generation SLPs which included the broad-based stakeholder engagement process – a process that enabled us to better understand the needs and expectations of our people and to co-create opportunities through the SLP to meet some of these needs. With the closure of some or our operations and planned closure of other operations in the near term, our investment profile has changed and is reflected below. Our planned investments will focus on agriculture, water infrastructure and SMME and skills development for meaningful social impact.
Planned investment in fourth-generation mine community development programmes1*
1 The investment in mine community projects for the fourth generation SLPs has decreased in comparison to the third generation SLPs due to the closure of our Bambanani and Unisel operations and reduced life- of-mine for our Kusasalethu and Masimong operations.
* The investment in mine community projects for the fourth generation SLPs have been converted using an exchange rate of R18.50/US$.
Community engagement forums on SLP progress
We maintain trust and constructive engagement between our host communities and other stakeholders, including government, through inclusive SLP update forums where community members can engage directly with Harmony, municipalities, traditional authorities and local business forum representatives. We share information on project implementation progress, assess needs and expectations, and manage perceptions to effectively address mutual concerns. Our proactive and open communication reduces disruptions and reports of discontent.
|
|
|
|
|
Training and development
Investing in community skills is integral in our socio-economic development approach to leaving a positive and lasting legacy for our host communities
We identify youth in our host communities who could benefit from bursaries, work experience, internships and learnerships. Our skills development, education and training programmes for unemployed youth prepare and equip them for the world of work and other income-generating opportunities.
Over the past five years, we have provided core mining skills training to 747 youths (87% absorbed into permanent positions at our operations). This initiative began in the Free State as a partnership between Harmony, Matjhabeng municipality and the Unemployment Youth Forum of South Africa. Supported by MQA grants, it expanded to North West and Gauteng.
|
|
Mine community development expenditure
In FY23, we focused on socio-economic development in the regions outlined below as well as our labour-sending areas (Lesotho and the Eastern Cape) to achieve our SLP commitments.
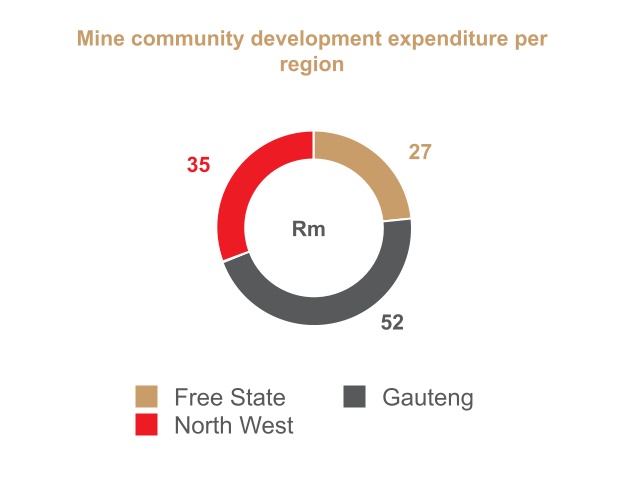
|
|
|
|
|
|
|
|
|
|
|
|
|
|
|
|
|
|
|
|
|
|
|
|
|
|
|
|
|
|
|
|
|
|
|
|
|
|
|
|
|
|
|
|
|
|
|
|
|
|
|
|
|
|
|
|
|
|
|
|
|
|
|
|
|
|
|
|
|
|
|
|
|
|
|
|
|
|
|
|
|
|
|
|
|
|
|
|
|
|
|
|
|
|
|
|
In the last five years, we have made significant investments in our communities: |
|
|
|
|
Agriculture
We support agricultural initiatives (broad-based livelihoods and commercial ventures) so that our poorest host communities have nutritious food to consume and sell.
|
|
|
|
SMMEs and youth
We facilitate income-generating opportunities by providing skills development and resources to youth and female entrepreneurs through SMME incubation hubs, workshops and commercial spaces.
|
|
|
|
Infrastructure
We collaborate in road, water and sanitation improvement projects to uplift our host communities’ living conditions.
|
|
|
Science, technology, engineering and maths
We facilitate STEM courses at secondary schools to prepare learners for academic success and future careers.
|
|
|
|
|
|
|
|
|
|
|
|
|
|
|
|
|
|
|
|
|
|
|
|
|
|
|
|
|
|
|
|
|
|
|
|
|
|
|
|
|
Ú |
|
|
|
|
Ú |
|
|
|
Ú |
|
|
|
Ú |
|
|
Ú |
|
|
FREE STATE
R149 million
|
|
|
R7 million |
|
R73 million |
|
R69 million |
|
R0 million |
|
GAUTENG
R97 million
|
|
|
R35 million |
|
R32 million |
|
R17 million |
|
R13 million |
|
NORTH WEST
R52 million
|
|
|
R12 million |
|
R20 million |
|
R20 million |
|
R0 million |
|
LABOUR-SENDING AREAS
R51 million
|
|
|
R27 million |
|
R5 million |
|
R19 million |
|
R0 million |
|
TOTAL
R349 million
|
|
|
R82 million |
|
R129 million |
|
R125 million |
|
R13 million |
|
|
|
|
|
|
|
|
|
|
|
|
| Mine community development programmes in FY23 |
Beneficiaries |
Impact |
Investment for FY23 |
| AGRICULTURE |
Wedela and Rietvallei Agriculture projects: small scale commercial farming in partnership with Mogale City and Merafong Local Municipalities, and the Department of Social Development |
44 women and youth |
Infrastructure installed for vegetable production to develop enterprises for emerging farmers who sell fresh produce to Food Lover’s Market and local communities
|
R2 million (US$0.1 million) |
Broad-based livelihoods programmes in host and labour sending communities: Support subsistence farmers and micro enterprises |
1 841 participants reached including women and youth |
Train beneficiaries to cultivate crop for subsistence farming and to develop into small scale local traders |
R15 million (US$0.9 million) |
|
Potted trees in Carletonville initiative: fruit farming for agri-processing and manufacturing of condiments.
|
six jobs created |
Introducing agri-processing and value upliftment for grown produce. 3 enterprises are commercially viable |
R5 million
(US$0.3 million)
|
SMMEs AND YOUTH DEVELOPMENT |
Virginia Sports Academy: Identify and develop rugby and soccer talent |
20 jobs, 62 family members and 50 students of Matjhabeng and Masilonyana municipalities as well as local, provincial and national rugby and soccer clubs |
Create direct employment and income-generating opportunities, and provide sports scholarships and internship programmes for school leavers (since 2003) |
R9 million
(US$0.5 million)
|
Blue Label ICT initiative at Welkom |
120 trainee agents |
A call centre has been established that has trained 120 youth, giving them accredited qualifications to enable them to be economically active |
R5 million
(US$0.3 million)
|
Youth centre refurbishment: Enable training for various sporting codes in partnership with Merafong City municipality in Carletonville |
local youth and the municipality
13 temporary jobs created during construction
six full time jobs
|
Construction and re-establishment of sporting facilities for various sporting codes for youth development |
R2 million
(US$0.1 million)
|
Matlosana and Merafong Business hubs : Establishment of containerised hubs for local informal business |
33 Local SMMEs, the community and local municipality
12 temporary jobs created during construction
22 full time jobs
|
SMMEs will benefit through occupation of fully equipped containers that are customised for operating different enterprises |
R8 million
(US$0.5 million)
|
Honey processing plant: establishing and commercialising honey production in Ngqushwa local municipality |
eight full-time local employees
56 Bee keepers
|
FaciCConstruction of facilities to enable bee keepers to supply honey for processing into products to sell in the provincial markets
|
R3 million
(US$0.1 million)
|
The Tsolo Broad-Based ED Programme aims to equip entrepreneurs (SMMEs) with business management skills through training and business advisory support. |
550 SMMEs |
Training and development for local entrepreneurs |
R5 million
(US$0.3 million)
|
|
|
|
|
|
|
|
|
|
|
|
|
| Mine community development programmes in FY23 |
Beneficiaries |
Impact |
Investment for FY23 |
| INFRASTRUCTURE |
Witpan wastewater treatment plant: Refurbish, operate and maintain infrastructure to avoid raw sewage discharge into Witpan |
Residents of Welkom in Matjhabeng municipality |
Improve the quality of water flowing into Witpan, Mostert Canal and the Sand River, and eliminated sewage overflow into communities downstream of the Sand River protecting them from health issues associated with the consumption of poor quality water |
R5 million
(US$0.3 million)
|
Witpan water pumping infrastructure: Maintain sustainable water supply from Witpan |
Operate and maintain pumping systems conveying 37Ml/day (on average) of water from Witpan to Mostert Canal for local consumption |
R2 million
(US$0.1 million)
|
Carletonville wastewater treatment plant: Re-establishing, operating and maintaining the Carletonville Waste Water Treatment Plant |
Residents of Carletonville |
Refurbishment of the plant will improve the quality of storm water in Carletonville, as well as the quality of water being pumped to the Wonderfonteinspruit which decreases health related risks associated with the consumption of poor quality water by downstream users |
R16 million
(US$0.9 million
|
Stilfontein wastewater treatment plant: Re-establishing, operating and maintaining the Stilfontein Waste Water Treatment Plant |
Residents within Stilfontein |
Eliminate the discharged of raw sewage into the Koekemoerspruit and Vaal River thereby protecting ecosystem and public health |
R9 million
(US$0.5 million)
|
Itireleng workshop for disabled people: Refurbish the Morolong centre for a self-help group |
Nine people in Madibogo village (Ratlou community) |
Develop entrepreneurial skills and a sustainable business model for job creation and income generation to alleviate poverty |
R2 million
(US$0.1 million)
|
|
|
|
|
EDUCATION |
Community Human resource development and 4IR initiatives |
16 schools - 500 primary and 700 secondary students per annum and 20 teachers trained per annum |
Develop technical and information management skills in the academic environment preparing students for opportunities in the digital sector |
R8 million
(US$0.4 million)
|
Alabama: Refurbishment and equipping of two science laboratories |
630 learners doing science at the school
22 jobs created during the construction phase
|
The building of science and technology capabilities in rural environments |
R1 million
(US$0.1 million)
|
Mavubeza Junior Secondary School: Build an administration block, ablution facilities and eight classrooms |
371 learners a year in Ngqeleni |
Access to educational facilities in that community |
R7 million
(US$0.4 million)
|
| Lesotho High School |
1570 learners
18 jobs during construction phase
|
Reduce overcrowded classrooms thus creating a conducive learning environment for students |
R2 million
(US$0.1 million)
|
Socio-economic closure planning
Our socio-economic development planning includes mitigating the impact of mine closures on our communities, particularly in the Free State where operations are nearing the end of mine life. We consider establishing alternative income-generating activities that would be sustainable post-mining. This includes SMME development and portable skills training to empower employees and broader communities.
Our land rehabilitation strategy also facilitates sustainable alternative socio-economic development initiatives. We rehabilitate disused land under our control for agricultural and agri-processing initiatives that address food security and poverty alleviation.
|
|
|
|
Contributing to socio-economic development through Harmony’s innovation platform
In collaboration with the Institute for Science and Technology, Harmony established the innovation platform to address socio-economic challenges while reducing our environmental footprint and negative impacts. Several projects have been implemented to offset the liabilities associated with excess water and to optimise the development of agricultural land. These include:
•Cradock Trees-in-Pots in the Eastern Cape established 3 500 fruit and nut trees with supporting infrastructure as well as mentorship and training by the Institute for Technology and Society in 2021 and 2022 (local black woman-owned beneficiary, Emarikeni, will take ownership of the project to continue local beneficiation and skills development as well as growing the local vendor base after three years as a self-sufficient and sustainable business)
•Mponeng Trees-in-Pots is establishing an orchard of 7 000 fruit and nut trees using treated effluent from the mine’s wastewater treatment plant for irrigation as well as planting under shade netting for adaptation to the local climate and to boost productivity (based on the emerging farmer concept employed in Cradock with ramp up to full production over the next three years while we identify a suitable local black-owned business to take ownership of the project)
•Harmony’s biofuel pellet plant at the old President Steyn rehabilitation site, where giant king grass has been planted to rehabilitate mine-impacted land, is beneficiating biomass generated by our rehabilitation and phytoremediation activities in a customised container (collaborating with Institute for Technology and Society innovation partners to produce alternative fuel for household cooking and industrial boilers as part of our decarbonisation efforts).
We plan to expand these pilot projects to a scale that could significantly offset the financial impact of Harmony’s expensive fissure water pumping costs with socio-economic benefits for our host communities, especially emerging farmers.
|
Papua New Guinea
Harmony funds physical and social infrastructure projects every year as part of our commitments under the Hidden Valley MoA. Additional projects are also delivered by the Hidden Valley Mine Trust. Our FY23 projects are outlined in the table below.
|
|
|
|
|
|
|
|
|
|
|
|
| Mine community development programmes in FY23 |
Beneficiaries |
Impact |
Commitment to date FY23 |
| HIDDEN VALLEY MoA PROJECTS |
| Morobe Province |
Police housing: Renovate houses to accommodate additional police |
Wau and Bulolo police |
Restore 18 houses in Bulolo and 10 duplexes in Wau to habitable condition. |
R4 million (PGK778 000) |
|
Nauti Road maintenance: Repair road surface, drains and culverts of 9.25km-long road
(Joint MoA and Hidden Valley Mine Trust project)
|
500 Nauti residents |
Improve vehicle access to vital government services and income streams (markets for agricultural produce sales, among others) and reduce travel time from the village from two hours to 20 minutes. |
R4 million (PGK800 000) |
Minava Road improvement: Maintenance on 14.5km-long road |
200 Minava residents |
Improve vehicle access to vital government services and income streams (markets for agricultural produce sales, among others). |
R1 million (PGK150 000) |
Kuembu Road improvements: Maintenance work on the 0.6km-long road |
300 Kuembu residents |
Improves safety of road for users. |
R1 million (PGK100 000) |
Winima Road improvements: Maintenance work on the 2.7km-long road |
160 Winima residents |
Improves safety of road for users. |
R0.2 million (PGK100 000) |
Akikanda Road improvements: Maintenance work on the 2km-long road |
320 Akikanda residents |
Improve vehicle access to vital government services and income streams (markets for agricultural produce sales, among others). |
R0.2 million (PGK 45 000) |
Neranda Bridge repair: Repairs to Neranda Bridge |
460 Neranda, Yokua and Minava residents |
Improve safety of Neranda Bridge and the associated Minava Road. |
R1 million (PGK160 000) |
Potato pilot programme: Assist farmers venturing into intensive potato farming and seed supplying businesses |
22 Nauti and Winima residents |
Support alternative income stream development in the villages, encouraging entrepreneurship; while also increasing village food supply availability and improving food security. |
R0.1 million (PGK28 000) |
|
|
|
|
|
|
|
|
|
|
|
|
Coffee programme: Provide business support to landowner farmers for coffee sales improvement |
70 Kuembu, Nauti and Winima farmers |
Support emerging coffee farmers (since 2018) with business skills development that has led to registration of the Hanama Weta Cooperative Society and potential Fairtrade certification. |
R1 million (PGK135 000) |
Poultry pilot programme: Provide training and resources for intensive poultry farming |
Nine Kuembu, Nauti and Winima residents |
Assists smallholders to improve their income-generating opportunities with business skills development and poultry farming; while also increasing village food supply availability and improving food security. |
R0.1 million (PGK28 000) |
Sewing and baking skills programmes: Facilitate training for potential entrepreneurs |
100 (60 sewing and 40 baking) Nauti, Kuembu and Winima residents |
Support small businesses with training that enables alternative income streams. |
R0.1 million (PGK15 000) each |
|
Basic bookkeeping training: Support small business sustainability |
66 Kuembu and Winima residents |
Provide financial management training for agricultural projects and other businesses. |
R0.1 million (PGK10 000) |
Tertiary scholarships programme: Merit-based support of students in mining-related fields |
Six Morobean residents |
Provide financial support, industry experience and employment to promising students. |
R1 million (PGK150 000) |
Community health outreach programme: Health patrols with the Morobe Provincial Health Authority |
800 residents of local villages |
Improve healthcare access for rural communities with breast cancer screening and other health checks (including respiratory ailments, malaria and skin diseases). |
R0.2 million (PGK32 000) |
Tekadu site transit plan: Improve access to markets and services |
800 residents of Tekadu villages |
Operate a bus service across the Hidden Valley mining lease area to reduce travel time to Wau and Bulolo. This includes establishing bus stops with shipping container shelters. |
In kind |
| HIDDEN VALLEY MINE TRUST PROJECTS |
Landowners school fees assistance: Pay school fees for landowner families |
35 learners in Nauti, Kuembu and Winima villages |
Uplift local family conditions by helping parents with school fees for their dependants. |
R2 million (PGK338 000) |
|
Nauti Road maintenance: Repair road surface, drains and culverts of 9.25km-long road
(Joint MoA and Hidden Valley Mine Trust project)
|
500 Nauti residents |
Improve vehicle access to vital government services and income streams (markets for agricultural produce sales, among others) and reduce travel time from the village from two hours to 20 minutes. |
R2 million (PGK400 000) |
Kuembu housing project: Supply materials and equipment for construction, renovation and maintenance of houses |
400 Kuembu residents |
Empower three villages to build and maintain their homes, and improve living standards. |
R2 million (PGK330 000) |
Winima community facilities: Renovate and maintain community hall, classroom and clinic |
350 Winima residents |
Improve local facilities used for education, healthcare and social purposes. |
R1 million (PGK153 000) |
Corporate citizenship (beyond compliance)
Over and above the regulated requirements for community development, we implement Corporate Social Investment (CSI) initiatives through established partnerships with government and Non-Profit Organisations (NPOs) operating within host communities. These initiatives are informed by varying socio-economic challenges within host communities. The following strategic pillars aimed at achieving the SDGs listed guide our focus areas in South Africa, Papua New Guinea and Australia:
•Quality education and youth development
•Reduction of poverty and hunger
•Health and wellbeing
•Environment and safety
•Sports, arts, culture and tradition.
In South Africa, most of our CSI initiatives are designed to empower the youth through education, skills development, and sport. For the past three years, we have facilitated access to tertiary education through our “missing middle” programme, funding 90 eligible students who otherwise will not access tertiary education, as they cannot secure bursaries or do not qualify for the National Student Financial Aid Scheme. We also help nurture an enabling environment within communities by facilitating social cohesion and supporting efforts to combat crime, gender-based violence and inequality. In FY23, we invested R26 million (US$1.5 million) (FY22: R18 million/US$1.2 million) in CSI projects with positive impacts on the lives of almost 38 000 people in our host communities. This spend includes ad hoc donations from the Harmony Gold Community Trust and R5 million on strategic collaborations with NPOs:
•Enactus South Africa that addresses unemployment, poverty and inequality with entrepreneurial skills development at tertiary education level
•Harmony has been the main sponsor of the South African Agency for Science and Technology Advancement (SAASTA) secondary school National Science Olympiad for the past 14 years.
Furthermore, the company provides for rental of non-residential properties to qualifying community development entities in host communities at nominal rental rates. These leases are categorised as “social leases”. In FY23, 30 properties were leased through this programme mostly by NPOs and education-related institutions (early childhood development centres, schools and libraries, among others). The social lease benefit provided through this programme in FY23 amounted to R8 million.
In Papua New Guinea, we deliver CSI programmes for Wafi-Golpu host communities and supplement our MoA programmes at Hidden Valley with ad hoc assistance as special needs arise, such as emergency medical transport, food and monetary support for bereaved families, and food donations to community events. Employees are also able to apply for school fees assistance for dependents. In FY23, we invested R12 million (US$0.7 million) (FY22: R9 million/US$0.6 million) with positive impacts on the lives of an estimated 20 500 people.
Significant projects and programmes in Papua New Guinea during FY23 included:
•School fees programme benefiting 517 children of 300 Hidden Valley Mine employees
•Cocoa partnership programme assisted 2060 farmers from the Babuaf Farmers’, Lower Watut, Labuta, Wabubu and Nasuapum cooperatives to generate income from cocoa farming and sales
•New water supply systems delivered for 450 residents and school students in Papas and Wongkins communities
•Solar street lights programme established 61 lights in 42 village locations in proximity to the Wafi-Golpu Project footprint, with a combined population of 20 000 people.
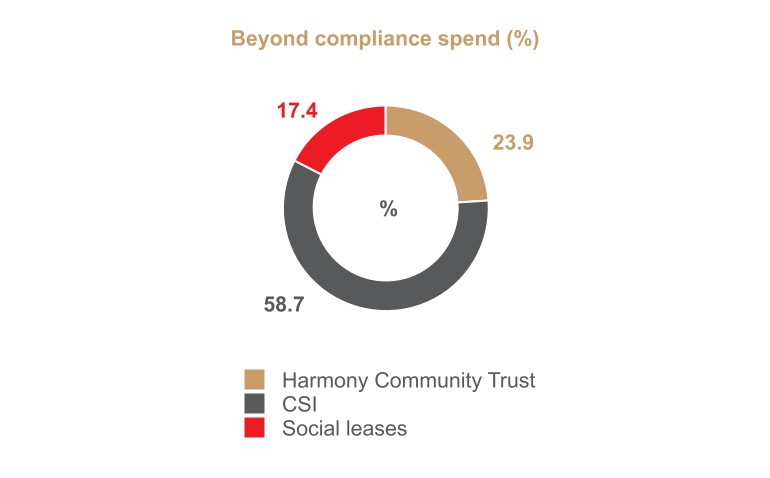
|
|
|
|
|
|
|
|
|
|
|
|
|
|
|
| Beyond compliance spend |
|
Harmony Community Trust1 |
CSI2 |
Social leases3 |
Total |
| Spend (Rm) |
11 |
|
27 |
|
8 |
|
46 |
|
| Lives positively impacted |
6 657 |
54 020 |
30 |
60 707 |
|
1 Includes a R3 million special programme that assisted 30 first year university students (R100 000 each) from our host communities, who did not have bursaries or any form of funding to access tertiary education in the 2023 academic year.
2 Initiatives implemented include those aimed at empowerment and development of the youth through education, sport, and skills development; supporting communities on the fight against crime, gender-based violence, and inequality; and reduction of poverty
3 Qualifying community development entities rent Harmony-owned commercial properties in host communities at nominal rates. In FY23, 30 properties were leased to such organisations, mostly for education (early childhood development centres, schools and libraries, among others). The social lease rates were R8 million lower than market-related rentals.
|
|
|
|
|
|
|
|
|
|
|
|
|
|
|
|
|
|
|
|
|
|
|
|
|
|
|
|
|
|
|
|
|
|
|
|
|
Non-mandatory (CSI) spend to achieve SDGs1 |
|
|
|
|
|
|
|
|
|
|
|
|
|
|
|
|
|
|
Total |
|
|
|
|
|
|
|
|
|
|
|
|
South Africa - Lives positively impacted |
16 |
506 |
15 819 |
7 846 |
1 402 |
620 |
0 |
10 230 |
70 |
1 071 |
37 580 |
|
Papua New Guinea - Lives positively impacted |
— |
|
— |
|
550 |
517 |
— |
|
2 060 |
|
20 000 |
|
— |
|
— |
|
— |
|
23 127 |
|
Total - Lives positively impacted |
16 |
|
506 |
|
16 369 |
|
8 363 |
|
1 402 |
|
2 680 |
|
20 000 |
|
10 230 |
|
70 |
|
1 071 |
|
60 707 |
|
|
|
|
|
|
|
|
|
|
|
|
|
South Africa - Spend (Rm) |
0 |
0 |
5 |
17 |
1 |
0 |
0 |
4 |
0 |
0 |
26 |
Papua New Guinea - Spend (Rm) |
0 |
0 |
2 |
9 |
0 |
1 |
0 |
0 |
0 |
0 |
12 |
Total - Spend (Rm) |
0 |
0 |
7 |
26 |
1 |
1 |
0 |
4 |
0 |
0 |
38 |
1 Donations for funerals, household essentials, health support and water sanitation and hygiene programmes, education and sports (uniform, fees, equipment, toiletries, events, research and skills development), agricultural programmes, electrification, NPOs, tree felling and planting, and used office equipment. |
|
|
|
|
|
Public safety
Our operations conducted Environmental Community Awareness campaigns in collaboration with the Federation of Sustainable Development (FSE) to promote environmental awareness in our communities. The objectives of the campaigns were to enhance the knowledge and understanding towards the community’s positive contribution to greater sustainable environmental management principles. The audience throughout the year constituted local NGOs, municipality representatives and general community members. During the campaigns, information was shared relating to tailings facility risks, general environmental related risks around our mining operations and how such risks can be managed and where possible mitigated.
|
Preferential/local procurement and enterprise and supplier development
Our strategic procurement and enterprise development approach empowers entrepreneurs to address the challenges in achieving sustainable socio-economic development.
South Africa
|
|
|
|
|
|
|
|
|
|
|
|
|
|
|
|
|
|
|
|
|
|
|
|
|
|
|
|
|
|
|
|
|
|
|
|
|
|
|
|
|
|
|
|
|
|
|
|
|
|
|
|
|
|
|
|
|
|
|
|
|
|
|
| Preferential procurement strategy |
|
Approved by the board in 2019, implementation of this strategy varies for each supplier (as outlined below). Our annual procurement plan identifies opportunities for SMMEs to participate in our enterprise and supplier incubation programme. In addition, our SMME databases identify and match vendors to our supplier value chain and subcontracting opportunities. Preferential procurement is thus embedded in our processes. Tender committees oversee costs, transformation, compliance and supplier audits. |
|
|
Red flag
(one to two-year contract)
|
|
Blue ocean
(two to three-year contract)
|
|
Greenfield
(three to five-year contract)
|
|
Brownfield
(five-year contract)
|
|
|
|
•Increase black ownership of non-black generic entities
•Fewer trusts and more technical black ownership.
|
|
|
|
•Partnerships with generic large entities
•Skills transfer
•Value chain integration
•Subcontracting.
|
|
|
|
•Find black-owned qualifying small/exempt micro enterprises (QSE/EME) already in business
•Combine QSE/EME to increase black ownership
•Capacity and capability
•Create new suppliers.
|
|
|
|
•Shift spend to local QSE/EME
•Prioritise shifting to Harmony’s current black-owned suppliers.
|
|
|
|
|
|
|
|
|
|
|
|
|
|
|
|
|
|
|
|
|
|
|
|
|
|
•High risk
•Few benefits
•Should be voluntary
•Status quo remains.
|
|
|
|
•Medium to high risk
•Force long-term commitments
•Target technical skills
•Less financial impact on Harmony
•Contract-dependent.
|
|
|
|
•Low to medium risk
•Medium to high impact
•High inclusive growth.
|
|
|
|
•Low risk
•High impact on localisation
•Increased sustainability.
|
|
|
|
|
|
|
|
|
|
|
|
|
|
|
|
|
|
|
|
|
|
|
|
|
|
|
|
|
|
|
|
|
|
|
|
|
|
|
|
|
|
|
|
|
Our preferential procurement strategy aims to accelerate the transformation of our business while facilitating meaningful transformation in our host communities and the broader economy. We are morally and ethically obligated to build capacity and capability that supports livelihoods. This secures our social licence to operate and develops our social and relationship capital. As such, our strategy focuses on:
•Supporting existing non-compliant suppliers to meet the minimum black ownership targets required by the mining charter or shift procurement spend to compliant suppliers
•Enhancing Harmony’s current supply chain model and ensuring preferential procurement is embedded in the sourcing process
•Promoting partnerships and joint ventures to encourage skills transfer and development of local partners
•Working with generic manufacturers and OEMs to invest in local enterprises, especially local manufacturing units
•Incubation creating a pipeline of SMMEs to harness procurement opportunities in core mining and engineering services, particularly women and youth.
Harmony supports government’s imperative to facilitate sustainable socio-economic development and broader participation in the economy, mainly through procurement and enterprise and supplier development. Full compliance with mining charter targets remains challenging for the mining industry largely due to dependency on multinationals and OEMs as well as limited availability of registered and approved companies producing locally manufactured goods to the required standard. Our annual procurement plan identifies procurement opportunities for SMME participation. Appropriate measures ensure genuine transformation for host communities and previously disadvantaged groups. In the wake of Covid-19, loadshedding was among the challenges in delivering our commitments, particularly procuring goods and services from businesses owned by black women and youth.
Our phased approach, which began in FY20 with 68 suppliers and achieved 97% compliance with mining charter requirement. We had 85 suppliers and achieved 84% compliance in the second phase. We completed the third phase in FY23 with 130 suppliers and achieved 95% compliance. We expect the fourth phase to address our challenges in procurement from black women and youth-owned businesses with procurement committees empowered to advance this transformation imperative through transparent governance processes. We also intend to shift spend across geographical boundaries and secure longer-term contracts with compliant suppliers.
Our progress and impact are tracked annually in terms of actual discretionary spend attributed to suppliers who are more than 25.0% black-owned and more than 50.0% black owned as illustrated in the graphs below.
In FY23, total preferential procurement spend awarded to black-owned vendors was R8.6 billion (US$484.2 million) (FY22: R7.7 billion/US$506.2 million). Although designated group performance continues to improve, this remains marginal for black women and youth-owned suppliers. Total discretionary spend was R16.5 billion (US$889.6 million) (FY22: R14.2 billion/US$933.6 million) of which R15.8 billion was spent with black SMMEs. Of this, we spent 32% (FY22: 23%) with black-owned SMMEs and 12% (FY22: 10%) with black women-owned enterprises.
* R15.8 billion was spent on goods and services and assured by RSM.
Supplier days
We facilitate supplier days through face-to-face forums in our host communities. These engagements introduce our preferential procurement strategy, and enterprise and supplier development framework, to local businesses. The sessions expose SMMEs to procurement opportunities and tendering processes. This is also a platform to discuss partnerships, contracting opportunities and, most importantly, women and youth-owned business participation. In FY23, this enabled us to spend R59 million (US$3.3 million) (FY22: R50 million/US$3.3 million) on new >51% black-owned and controlled enterprises and R12 million (US$0.7 million) (FY22: R26 million/US$1.7 million) with 23 (FY22: 45) new 100% black-owned SMMEs.
Enterprise and supplier development
Our enterprise and supplier development framework supports our preferential procurement strategy.
|
|
|
|
|
|
|
|
|
|
|
|
|
|
|
|
|
|
|
|
|
|
|
|
|
|
|
|
|
|
|
|
|
|
|
|
|
|
|
|
|
|
|
|
|
|
|
|
|
|
|
|
|
|
|
|
|
|
|
|
|
|
|
|
|
|
| Enterprise and supplier development framework |
|
|
|
|
|
|
|
|
|
|
|
|
|
|
|
|
|
|
|
|
|
|
| Entrepreneur incubation |
|
|
Integration of local suppliers in Harmony’s supply chain |
|
|
Funding with external partners and internal support |
|
|
Partnerships with OEMs and local large companies |
|
|
Access to market through Harmony’s procurement pipeline and beyond |
|
|
Supplier development key performance indicators for tenders |
|
|
|
|
|
|
|
|
|
|
|
|
|
|
|
|
|
|
|
|
|
|
| Enterprise development |
|
|
Supplier development |
|
|
|
|
|
|
|
|
|
|
|
|
|
|
|
|
|
|
|
|
|
|
| Monitoring and evaluation are the foundation of this framework to ensure transformation gaps are identified and addressed. |
Our framework focuses on:
•Enterprise development: Potential suppliers mainly drawn from our host communities with incubation centres in key areas and satellite centres supporting other communities
–209 in incubation programme
–86 assisted with business development
–24 supported through funding and other business support initiatives.
•Supplier development: Procurement opportunities for enterprises graduating from incubation centres and other QSEs
–Direct procurement opportunities and contracting
–Partnering with OEMs as subcontractor or strategic partners across the value chain
–Creating partnerships with funding institutions to support preferential procurement, buying shares in non-compliant companies and creating black industrialists.
Our entrepreneur incubation programme, launched in FY20, aims to assist 100% black, women and youth-owned enterprises to transition to suppliers of key mining and manufacturing commodities and services. Enterprises operating in the following areas are encouraged to apply:
•Mining and related value chain
•Fuel and chemicals
•Metal commodities
•Engineering products and services
•Manufacturers of mining-related products.
At the beginning of the programme, 63 women and youth-owned companies were approved to participate. In addition, we awarded procurement contracts to several enterprises in the incubation programme while others were matched with OEMs for joint ventures and downstream opportunities. As these companies graduate, they are integrated into our supply chain when opportunities arise.
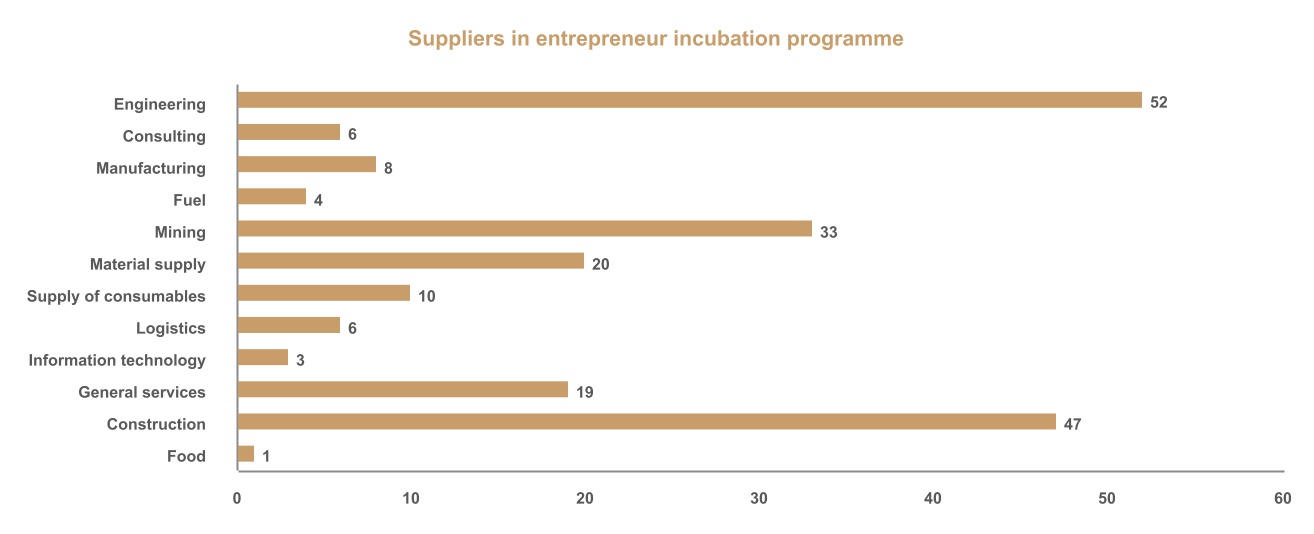
|
|
|
|
|
Mining charter procurement requirements
The mining charter III emphasises the need to increase inclusion of historically disadvantaged people, including women and youth, in procurement opportunities in addition to spending on BEE-compliant businesses.
It emphasises the creation of South African manufacturing capability by including local content requirements in procurement targets for mining goods and services. Accordingly, mining companies should purchase mining goods with local content of at least 60% and, after a two-year grace period, goods provided in the mining supply chain should have a local content certificate, issued by accredited service providers or the South African Bureau of Standards. Fuel spend is excluded from calculations, which significantly impacts the scores of large mines and opencast operations.
Our performance improved in FY23:
•Of our R16.5 billion (US$929.1 million) (FY22: R14.3 billion/US$940.1 million) discretionary spend, 85% (FY22: 79%) was preferential procurement
•Total procurement expenditure with BEE entities was R14 billion (US$788.3million) (FY22: R11.2 billion/US$736.4 million) of which R2 billion (US$113 million) (FY22: R1.4 billion/US$92 million) was spent with black women-owned businesses and R8.6 billion (US$484.2 million) (FY22: R7.7 billion/US$506.2 million) with black-owned businesses
•Compliant spend increased by 25% (FY22: 42%).
We expect to reach compliance levels for women and youth-owned businesses by 2025.
|
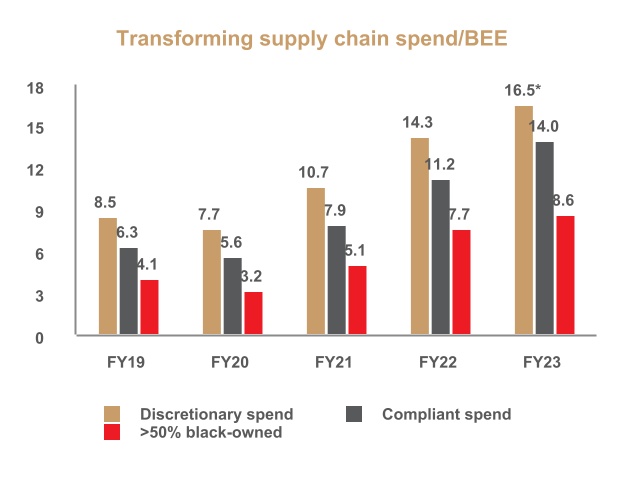
* Of the total discretionary spend for FY23, R15.8 billion relates to mining goods and services as assured.
Papua New Guinea
In alignment with our commitments under our Hidden Valley MoA, we maintain business development plans that include preferential procurement provisions for landowner, district, provincial and national suppliers. In accordance with these plans, we track our spending to reflect supplier tiers.
During FY23, our expenditure breakdown included 15% to landowner companies, 17% to suppliers based in Morobe Province, 19% to suppliers based elsewhere in Papua New Guinea, and 49.0% to overseas suppliers.
Landowner companies received R615 million (US$34.7 million /PGK122.4 million) in FY23. Major multi-year contracts held by landowner companies during the year included:
•Hidden Valley Contractors R234 million (US$13.2 million /PGK46.6 million): construction
•Pacific Cargo Transport R110 million (US$6.2 million / PGK22.1 million): in-country transport
•Quest Pacific Services R110 million (US$6.2 million / PGK22.1 million): drilling services
•NKW Holdings R110 million (US$6.2 million / PGK22.1 million): camp services and catering.
Other major services that we contract in Papua New Guinea include:
•Fuels and lubricants R302 million (US$17.1 million / PGK60.1 million)
•Komatsu spare parts R191 million (US$10.8 million / PGK38.1 million)
•Aviation services R168 million (US$9.5 million / PGK33.4 million)
•Cyanide and ammonium nitrate R123 million (US$6.9 million / PGK24.5 million)
•Mining consulting services R85 million (US$4.8 million / PGK17 million)
•Labour hire R52 million (US$2.9 million / PGK10.4 million)
•Laboratory services R28 million (US$1.6 million / PGK5.6 million).
Spending outside of Papua New Guinea typically relates to manufactured mining supplies and critical consumables and technical services that are not available in Papua New Guinea. Our procurement team makes every effort to source locally for off-contract spend goods and services.
THE IMPACTS OF ILLEGAL MINING
Illegal mining is increasing exponentially with deteriorating socio-economic conditions across southern Africa and the associated breakdown in the rule of law without adequate public enforcement resources.
|
|
|
|
|
|
|
|
|
|
|
|
Statistics show that 70% of illegal miners, known colloquially as “zama zamas” (derived from the Nguni word “ukuzama” meaning “to try”), are undocumented immigrants assisted by local communities, mine employees and contractors who receive lucrative payments in return.
Our internal and contracted security services continue to work under severe pressure to address increasing illegal mining activity that threatens our sustainability and licence to operate. |
|
|
The cost of illegal mining:
•Loss of life and injuries among illegal miners and mine employees
•Production stoppages due to safety incidents and infrastructure damage
•Soil instability and water pollution
•Security expenses
•Waning investor appetite threatening jobs and community development.
|
Illegal mining is difficult to police as it is highly organised and linked to human trafficking, forced labour, illegal weapons and explosives, tax evasion, money laundering, corruption, gang-related activities, intimidation, murder and other violent crimes. Harmony responds with significant investments in protecting employees, communities, the environment and assets by sealing redundant mines and implementing state-of-the-art security measures. Despite these investments, illegal mining activity (including infrastructure damage and shooting incidents) increased by 108% in FY23 as more criminals accessed underground works through redundant operations and ventilation shafts that connect Harmony’s mines to others. In response, our mine managers and security services (including tactical teams) increased redundant shaft sealing and patrols. For example, H5, a disused shaft that had been rehabilitated and sealed with a concrete plug, recently received media attention when a number of illegal miners (also known as zama zamas) unfortunately lost their lives due to an unforeseen methane explosion which occurred whilst they were conducting illegal mining operations underground. Whilst this incident is one of criminality and not related to Harmony’s mining activities, Harmony is cooperating with the relevant authorities in the matter and will assist where possible. Whilst we as a company fulfill our obligations in managing our own footprint, we need all stakeholders to ensure similar vigor is applied to root out these issues particularly in areas falling outside of our area of responsibility.
|
|
|
|
Collaboration
To strengthen implementation of our strategy we partner with the South African Police Service (SAPS) and a multidisciplinary national task team, comprising (mining houses, the DMRE, the South African Revenue Service, the Directorate for Priority Crime Investigation, the Department of Home Affairs and the National Prosecuting Authority. The task team is supported by the Mineral and Petroleum Resources Development Act prohibiting mining without statutory authorisation.
|
Our collaborative efforts resulted in the arrest of 163 (FY22: 78) illegal miners and 94 (FY22: 25) colluders (employees and contractors) in FY23. We also seized 74 330kg (FY22: 316 157kg) of gold-bearing material worth R2 million (FY22: R1.5 million). In total, 82 employees, contractors and illegal miners were arrested in possession of gold bearing material. In addition, 87 illegal miners were sentenced to 696 years in prison while collusion was exposed and syndicate leaders (in possession of 26 vehicles used in the commissioning of a crime worth R30 million) were arrested during the year.
Operation Knockout in the Free State has been particularly successful in arresting 5 554 illegal miners, seizing 956 979kg of gold-bearing material (worth R6 million), and seizing contraband of R5 million and R4 million in cash since 2019. With continuous risk assessment and management, and stakeholder engagement (including the SAPS), the success of this intervention will continue into the future.
|
|
|
|
|
|
|
|
|
|
|
|
|
|
|
|
|
|
|
|
|
|
|
|
|
|
|
|
|
|
|
|
|
|
|
|
|
|
|
| Surface illegal mining |
|
|
Underground illegal mining |
|
|
Artisanal mining |
|
|
|
|
|
|
|
|
|
|
|
|
|
|
•Mostly illegal immigrants from Lesotho, Zimbabwe and Mozambique trespassing on mine premises
•Targets are disused plant and shaft areas
•James Tables (extracting gold using carpets, water and gravity) identify or sample suitable mining land
•Illegal miners sell amalgam (liberated by mixing gold ore with mercury) to syndicate boss runners
•Groups from Marashian tribe-controlled areas of Lesotho provide armed protection on surface against other criminal gangs.
|
|
|
•Activities differ at operating and redundant shafts
•Highly organised in the Free State
•Structured and profitable reporting, gold sales, food supply and logistics chain.
|
|
|
•Mining companies around the world work alongside artisanal miners
•In Papua New Guinea, government encourages alluvial mining downstream of Harmony’s Hidden Valley operation
•Legal artisanal mining outside of formal mining lease areas sustains communities
•Private and public law enforcement on mining leases protects employees and assets
•South African government plans to legalise artisanal mining but this is not viable until illicit gold trading, corruption and territorial battles are addressed.
|
|
|
|
|
|
|
|
|
|
|
|
|
|
Our future focus areas
|
|
|
|
|
|
|
|
|
In South Africa, we will focus on creating a solid pipeline of businesses owned by black women and youths through our incubation programme so that we exceed our mining charter targets. At the same time, we will ensure the sustainability of existing empowered suppliers by funding OEM partnerships.
We will also continue to go beyond compliance to address food security, water supply and sanitation, quality education, and health and wellbeing in our host communities through our CSI programme. |
In Papua New Guinea, we will continue long-standing contracts with local suppliers to Hidden Valley; while advancement of the Wafi-Golpu Project will afford further opportunities for local business development and new partnerships in Morobe Province. |
In Australia, we will be finalising a local capability assessment report for Eva Copper, which will make recommendations and guide local content business engagement and related capacity-building social investment as the project advances. |
GOVERNANCE
CORPORATE GOVERNANCE
Our board of directors, committed to ethical leadership, upholds our duty to be a responsible corporate citizen.
|
|
|
|
|
|
|
|
|
| Capitals affected |
Stakeholders affected |
Link to strategy |
|
Directly
Human capital
Financial capital
Manufactured capital
Indirectly
Intellectual capital
Natural capital
Social and relationship capital
|
•Investors and financiers
•Employees and unions
•Communities, traditional leaders and non-governmental organisations (NGOs)
•Governments and regulators
•Suppliers.
|
Responsible stewardship
Operational excellence
|
|
|
|
|
|
|
| Related risks |
Related opportunities |
|
•Loss of life/safety
•Security of electricity/power supply and the impact of higher electricity costs
•Depleting Ore Reserve base
•Geopolitical risks
•Supply chain disruptions (including supply of goods and increasing costs).
|
•Mponeng deepening project
•Drive Wafi-Golpu up the value curve
•Productivity improvement projects
•Exploring value-accretive merger and acquisition opportunities
•Unlocking the full potential of our surface source ounces
•Exploring alternative sources of energy to reduce electricity costs to less than 15% of our production costs and reduce the effect of load curtailment.
|
|
|
|
|
|
|
| GRI Standards |
Related SDGs |
Prepared in accordance with 2-9, 2-10, 2-11, 2-12, 2-13, 2-14, 2-15, 2-16, 2-17, 2-18, 2-19, 2-20, 2-21, 2-22, 2-23, 2-24, 2-25, 2-26, 2-27, 2-28, 2-29, 2-30, 3-3, 205-1, 205-2, 205-3, 206-1, 405-1 and 405-2. |
|
Related material themes and matters
|
|
|
| Governance, ethics and accountable leadership |
|
Crisis response and operational resilience
To ensure continued operational resilience, employees’ safety and the security of our assets, it is imperative for Harmony to be able to quickly and effectively manage the impacts and risks of a crisis or business disruption. This relies on our ability to prevent, detect and respond to shocks, which is proactively managed through Harmony’s business continuity management (BCM). BCM contributes to operational resilience by identifying and understanding potential threats and their impact on Harmony’s business operations, enabling the development of business continuity plans and redundancy capability, should one of these threats realise.
|
|
Fair and responsible remuneration
We aim to enhance the lives of our employees by enabling them to improve their living conditions, and to have better access to social services, healthcare, education and training through fair and responsible remuneration. We are therefore also able to attract and retain key talent.
|
|
Upholding human rights and driving responsible procurement
As a responsible employer, providing decent work includes respecting human rights. We adhere to corporate policies, comply with applicable laws and regulations, have regular dialogue and engagement with our stakeholders and contribute, directly or indirectly, to the general wellbeing of communities where we operate.
|
|
Ensuring legal, regulatory and compliance excellence
In South Africa, we face increasing regulatory compliance costs, such as carbon tax, uncertainty on land expropriation, rising social demands and an inhibiting regulatory environment. In Papua New Guinea, growing regulatory uncertainty may jeopardise our existing operation and decision to proceed with future projects. As such, we aim to operate beyond compliance, ensuring we deliver on our commitments and retain our licence to operate.
|
|
Cybersecurity
An information security compromise (data breach) could lead to the accidental or unlawful use, destruction, loss, alteration or disclosure of that data. Harmony continues enhancing its cybersecurity abilities by implementing state-of-the-art technologies and processes to identify threats, protect our environment and respond to cyber incidents. We have also introduced cybersecurity training interventions and regular communications to raise cybersecurity awareness across Harmony.
We are guided by the Control Objectives for Information and Related Technologies (COBIT) recommendations in governing and controlling information systems and technology. We implement key interventions such as removing local administrative rights and USB port lockdowns to prevent cyberattacks. To close the gap between the information technology and operational technology domains, we achieved closer alignment with the engineering discipline, enabling a more detailed understanding of their current control environment. Our security operations centre continues to maintain real-time detection and response to cyber threats.
|
|
Transparent and ethical business
Good governance is the core of our performance and reporting. Guided by our policies and codes, we aim to do the right thing and disclose honest, transparent and comparable information to the market. The board’s philosophy is to adhere to sound corporate governance principles to enable strong, experienced management teams and promote a culture of shared value for all stakeholders.
|
Responsible, ethical governance
The board subscribes to the principles of good corporate governance. Accordingly, it supports the definition of corporate governance as being the exercise of ethical and effective leadership to achieve specific governance outcomes, summarised below:
|
|
|
|
|
|
|
|
|
|
|
|
|
|
|
|
|
|
|
|
|
|
|
|
|
|
|
|
|
|
|
|
|
|
|
|
|
|
|
|
|
|
|
|
|
|
|
|
|
|
|
|
|
|
|
|
|
|
|
|
|
|
|
|
|
|
|
|
|
|
|
|
|
|
|
|
|
|
|
|
|
|
|
|
|
|
|
|
|
|
|
|
|
|
Ethical culture and responsible corporate citizenship |
|
|
|
|
|
Good performance and value creation |
|
|
|
|
|
Effective control |
|
|
|
|
|
Legitimacy |
|
|
|
|
|
|
|
|
|
|
|
|
|
|
|
|
|
|
|
|
|
|
|
|
|
|
•Ethical leadership
•Organisational ethics
•Responsible corporate citizenship.
|
|
|
|
•Strategy and capital allocation
•Reporting
•Political donations
•Executive key performance indicators (KPIs) linked to ESG performance.
|
|
|
|
•Governing structures and processes
•Role of the board
•Board committees
•Appointment and delegation to management.
Functional areas
•Risk governance
•Technology and information governance
•Compliance governance
•Remuneration governance
•Assurance and internal audit.
|
|
|
|
•Inclusive stakeholder engagement model and related disclosures. |
|
|
|
|
|
Underpinned by the principles of King IV |
|
Corporate governance – an overview
The Harmony board’s philosophy is to adhere to sound corporate governance principles to enable strong, experienced management teams and promote a culture of shared value for all stakeholders.
The strong foundation of corporate governance principles continues to steer Harmony’s board and management. The safety and wellbeing of our employees and communities remains the driving force in our approach.
Strategic risk management
The board has oversight of the group’s risk governance process and progress in delivering on its strategy to produce safe, profitable ounces and increase margins. This includes a risk-based and proactive safety culture journey and value-accretive acquisitions.
Sustainable development
Harmony’s sustainable development framework and associated policies consider the SDGs and the group’s role in advancing our communities through preferential procurement, responsible environmental stewardship, employment equity and women-in-mining strategies, among others.
Adding value
The role of the board is key in supporting Harmony’s ability to create sustainable value. The interconnected pillars that drive value creation by the board are strategy, stakeholders, sustainability and ethical and responsible corporate citizenship. All four pillars correspond with the principles of King IV. By exercising ethical and effective leadership, oversight of solid risk and performance management practices as well as commitment to good corporate governance, the board drives the efficient use of resources and ensures sustainability. In addition, the diversity of the board supports a stakeholder-inclusive approach to addressing multi-stakeholder interests.
Transformation and broader diversity of the board
To further demonstrate its commitment to transformation and the promotion of broader diversity in terms of gender, age, expertise, culture, race, field of knowledge, skills and experience, the board (through the nomination committee) had over the past two years, embarked on a board representation transitional plan to strengthen Harmony’s commitment to the four key pillars of King IV for good corporate governance.
The transformation and diversity of the composition of the board is paramount. As such, the board continues to annually evaluate key gaps in terms of composition and plans to close and mitigate against those gaps are implemented. The review of the boards succession plans is an ongoing exercise to ensure that the board is consistently creating value for stakeholders through continuity, sustainability and transparency.
The board at a glance
Our duty to be a responsible corporate citizen is supported by our board of directors and their commitment to ethical leadership.
|
|
|
|
|
|
|
|
|
|
|
|
|
|
|
|
|
|
|
|
|
|
|
|
| Overarching principle |
Transformation |
Representation |
|
Board independence, broader diversity and experience
(as at 30 June 2023)
|
67% |
Eight members are historically disadvantaged persons |
25% |
Three members are women |
|
|
|
|
|
|
|
|
|
| Tenure, independence and skill areas |
|
67%
Eight members of the board are independent non-executive directors
|
|
Number of directors with skills in the following areas |
|
|
|
|
|
|
|
|
|
| Governance and compliance policies |
•Terms of reference for the board
•Terms of reference for board committees
•Board delegation of authority
•Code of conduct
•Behavioural code
•Corporate governance and compliance policy and framework
|
•Internal audit charter
•Disclosure required by section 303A.11 of the NYSE listed company manual
•Public Access to Information Act manual (PAIA)
•Whistleblower policy
|
|
|
|
|
|
|
|
|
| Foundation of corporate governance compliance |
•Companies Act, JSE Listings Requirements (primary), New York Stock Exchange requirements, memorandum of incorporation, King IV
•Voluntary compliance with the principles of the United Nations Global Compact, International Council on Mining and Metals, GRI Standards and the International Cyanide Management Code For the Manufacture, Transport and Use of Cyanide in the Production of Gold (Cyanide Code)
|
Compliance policy and framework
Harmony subscribes to the iCraft framework of ethical leadership as recommended by King IV.
With its long-standing commitment to good corporate governance, the Harmony board is satisfied that appropriate practices are in place to promote the company’s reputation as an ethical, reputable and legitimate organisation and a responsible corporate citizen.
Acknowledging the significance of corporate governance and compliance, the board, through the audit and risk committee, has a formal corporate governance and compliance policy and framework that sets out the principles of good corporate governance for the board as well as employees at all operational levels.
In terms of the JSE Listings Requirements, Harmony is required to disclose its application of the principles of King IV. The board, to the best of its knowledge, believes Harmony has satisfactorily applied the principles of King IV.
Annual General Meeting (AGM)
The AGM of the company will be held on Thursday, 4 December 2023 at 11:00 (SA time), to transact the business as stated in the Notice of AGM in the Report to shareholders.
The issued share capital of Harmony comprises of ordinary and preference shares that entitles the holder to vote on any matter to be decided by the shareholders of the company and to one vote in respect of each ordinary and preference share held.
Ethical culture and responsible corporate citizenship
Ethical leadership
The board leads by example. Each director is therefore expected to continually exhibit the characteristics of integrity, competence, responsibility, accountability, fairness and transparency in their conduct. Collectively, the board’s conduct, activities and decisions are characterised by these attributes, which also form part of the regular assessment of the board and individual directors’ performance. The board recognises that ethics is one of the pillars of sustainable business practice.
The board charter elaborates on the standard of conduct expected from members. In addition, the board policy on declaration of interests limits the potential for a conflict of interest and ensures that, in cases where conflict cannot be avoided, it is properly disclosed and proactively managed within the boundaries of the law and principles of good governance.
Organisational ethics
The board sets the group’s approach to ethics. Oversight and monitoring of organisational ethics is the mandated responsibility of the social and ethics committee on behalf of the board.
Ethics department and ethics management committee
Harmony continues to collaborate with the Ethics Institute of South Africa. To embed an ethical culture, Harmony has an ethics department that includes permanent certified ethics officers who ensure the ethics management plan and programme are executed sufficiently and communicated throughout the organisation. Our ethics management committee monitors our ethical culture and integrity, assisted by the ethics officers and the white-collar crime committee. In FY23, the Harmony increased its employee ethics-related training.
The ethics management committee also assesses declarations of interest in terms of the code of conduct and provides feedback to the executive committee, which then reports to the board’s social and ethics committee. As a result, ethics are discussed and examined at every level of management in the company.
The Ethics Institute of South Africa is currently assisting management and the social and ethics committee to embed the governance of organisational ethics.
Illegal mining remains a challenge in South Africa and for Harmony.
Responsible corporate citizenship
The mining industry introduces a unique duty and opportunity to the group to be a responsible corporate citizen. Although the board sets the tone and direction for the way in which corporate citizenship should be approached and managed, ongoing oversight and monitoring of the group’s performance against targets is part of the mandate of the social and ethics committee. Additionally, the social and ethics committee, remuneration committee and audit and risk committee are tasked with specific aspects of ESG oversight roles on behalf of the board to align Harmony’s strategy with key ESG considerations.
Extensive detail on the consequences of the group’s activities and outputs, which affect its status as a responsible corporate citizen, with relevant measures and targets are provided elsewhere in this report.
Good performance and value creation
Strategy
The board is responsible for approving the group’s short-, medium- and long-term strategy as developed by management. In doing so, it focuses on critical aspects of the strategy including the legitimate and reasonable needs, interests and expectations of material stakeholders as well as the impact of the group’s activities and output on the various capitals employed in the business process. Risks and opportunities connected to the triple context (economy, society and the environment) in which the group operates are integral to the board’s strategic reviews of the business.
Policies and operational plans supporting the approved strategy are submitted regularly by management for review and formal board approval. The board attends an annual strategy session to confirm and review the company’s strategy.
Strategy is part of the ongoing conversation in the boardroom. Regular oversight of the implementation of Harmony’s strategies and operational plans takes place against agreed performance measures and targets.
Given that the company’s reputation as a responsible corporate citizen is an invaluable attribute and asset, the consequences of activities and outputs, in terms of the capitals employed, are continuously assessed by the board through its committees. This will ensure we are able to respond responsibly and limit any negative consequences of our activities, to the extent reasonably possible. In addition, the board continuously monitors the reliance of the group on these capital inputs – our natural capital (including Mineral Resources and Reserves), employees, financial capital, communities and society at large, our mining infrastructure and our intellectual and technological know-how – as well as the solvency, liquidity and going-concern status of Harmony.
Reporting
In protecting and enhancing the legitimacy and reputation of the group, the board ensures comprehensive reporting takes place on different platforms. The FY23 suite of reports appears on the inside front cover.
The board’s intention is to meet and exceed legal requirements, as well as the legitimate and reasonable information needs of material stakeholders. The board is satisfied with management’s basis for determining the materiality of information to be included in our external reports. The audit and risk committee, assisted by the social and ethics committee, is tasked with reviewing all external reports to verify the integrity of information.
Political donations
Harmony supports the democratic processes in South Africa and Papua New Guinea, and contributes to their political parties. A policy relating to political donations has been adopted by the company. During FY23, there were no substantial donations made by Harmony.
Effective control – governing structures and processes
Role of the board
The board exercises its leadership role by:
•Steering the group and setting its strategic direction
•Approving policy and planning that gives effect to the direction provided
•Overseeing and monitoring implementation and execution by management
•Ensuring accountability for the group’s performance by means of reporting and disclosures.
The role and function of the board, including guidelines on its composition and procedures, are detailed in the board charter. This is reviewed annually (and when necessary) to ensure it remains relevant.
There is a protocol in place should any of the board members or committees need to obtain independent, external professional advice at the cost of the company on matters within the scope of their duties. Non-executive directors are also aware of the protocol for requisitioning documentation from, and setting meetings with, management. Board members have direct and unfettered access to the chief audit executive, group company secretary and members of executive management.
Based on its annual work plan, the board is satisfied that it fulfilled its responsibilities in the review period in line with its charter.
Board committees
The board has delegated particular roles and responsibilities to standing committees, based on legal requirements, what is appropriate for the group and to achieve the objectives of delegation. The board recognises that duties and responsibilities can be delegated, but accountability cannot be abdicated. The board therefore remains ultimately accountable.
The following committees have been established:
•Audit and risk
•Social and ethics
•Remuneration
•Nomination
•Investment
•Technical.
Each committee has formal terms of reference, reviewed annually (and when necessary) to ensure the content remains appropriate. The terms of reference address, the requirements of the JSE Listings Requirements, Companies Act, and the recommended items in King IV.
Effective control – functional areas
Risk governance
The board appreciates that risk is integral to the way it makes decisions and executes its duties. Risk governance encompasses both risks and opportunities as well as a consideration of the potential positive and negative effects of any risks on achieving Harmony’s objectives. The group’s risk appetite and tolerance levels, which support its strategic objectives, are considered annually. The board is supported in this area by the audit and risk committee.
Responsibility for implementing and executing effective risk management is delegated by the board to management. The board acknowledges the need to integrate and embed risk management in the business activities and culture of the group. The audit and risk committee is tasked with ensuring independent assurance on the effectiveness of risk management in the group, when deemed necessary and appropriate.
Technology and information governance
The board, assisted by the audit and risk committee, is responsible for governing technology and information to support the group in setting and achieving its strategic objectives.
A technology and information steering committee has a well-defined charter and is responsible for oversight of technology and information direction, investment and alignment with business strategy and priorities. It is chaired by the financial director and members include the head of information services and group executive committee.
Management adopted COBIT which provides recommended best practices for governance and control processes of information systems and technology to align the Information Services (IS) department with business. This high-level framework has been aligned with more detailed IT standards and good practices.
In addition, internal audit provides assurance to management and the audit and risk committee on the effectiveness of the governance of technology and information.
Compliance governance
Being an ethical and responsible corporate citizen requires zero tolerance for any incidents of legislative non-compliance. In addition, compliance with adopted non-binding rules, codes and standards is essential in achieving strategic business objectives.
The foundation of our corporate governance complies with:
•The Companies Act
•Listings Requirements of the JSE, where we have our primary listing
•Listings Requirements of the New York Stock Exchange, where we have our secondary listing
•King IV and related principles and codes of good corporate governance.
Harmony also complies voluntarily with the principles of:
•United Nations Global Compact
•International Council on Mining and Metals
•GRI Standards
•Cyanide Code.
Code of conduct
Our behavioural code and code of conduct commits Harmony, our employees and our contractors to the highest moral standards, free from conflicts of interest. The board reviews the code at least every second year, while its application in Harmony is continually monitored by management. The code of conduct was reviewed and updated in FY23. Our ethics programme is also subject to independent assurance as part of the internal audit coverage plan. The code of conduct addresses critical issues including respect for human rights, anti-corruption, gifts and entertainment and declarations of interests. It encourages employees and other stakeholders to report any suspected irregularities. This can be done anonymously through a 24-hour hotline (managed independently) and other channels. All incidents reported are investigated and monitored by the white-collar crime committee, which comprises managers representing various disciplines in the company and reporting to the management ethics committee.
Whistleblowing policy
Our whistleblowing policy encourages shareholders, employees, service providers, contractors and members of the public to report practices at any of our workplaces that are in conflict with any law, regulation, legal obligation, ethical codes or governance policies. It also provides a mechanism for our stakeholders to report these practices internally, in confidence, independent of line management, and anonymously if they wish. The whistleblowing policy informs whistleblowers of their rights. Harmony is committed to protecting whistleblowers from any reprisals or victimisation.
The identity of any employee or stakeholder who reports non-compliance with the code of conduct and other irregularities is protected. Our anonymous ethics hotline numbers are widely advertised throughout the organisation:
•South Africa: +27 (0) 800 204 256
•Papua New Guinea: +675 (0) 00 478 5280
•Australia: +61 (1) 800 940 949.
Human rights
At Harmony, we conduct our activities in a way that respects human rights as set out in the laws and constitutions of the countries in which we operate in line with the Human Rights Policy adopted in FY22. Our approach to respecting human rights includes adhering to corporate policies, complying with applicable laws and regulations, regular dialogue and engagement with our stakeholders and contributing, directly or indirectly, to the general wellbeing of communities within which we operate.
Legislative compliance
The compliance function ensures compliance with laws, codes, rules and standards applicable to the company. Compliance information and reports on the status of legislative compliance are presented at audit and risk committee meetings.
The Protection of Personal Information Act 4 2013 (POPIA) came into effect on 1 July 2021. Harmony has effected the necessary measures to adhere to the requirements of this act in support of good governance. Implementation of POPIA compliance, including promoting POPIA awareness in the organisation is ongoing.
In line with POPIA, Harmony’s appointed information officer is registered at the information regulator. This officer is responsible for managing all personal information and ensures compliance with this act.
Dealing in Harmony shares
During price-sensitive periods, our employees and directors are prohibited from dealing in Harmony shares. Written notice of these restricted periods is communicated to them by the group company secretary. In terms of regulatory and governance standards, directors, prescribed officers and the group company secretary are required to disclose any dealings in Harmony shares in line with the JSE Listings Requirements. The clearance procedure for directors, prescribed officers and the group company secretary to deal in Harmony shares is regulated by the company’s policy on trading in shares and insider trading.
Significant fines
Harmony paid no significant fines in any of its areas of operation. No actions were brought against it for anti-competitive behaviour or anti-trust or monopoly practices in FY23.
Foreign private issuers
New York Stock Exchange foreign private issuers, such as Harmony, must highlight any significant ways in which their corporate governance practices differ from those followed by United States domestic companies subject to the listing standards of the New York Stock Exchange.
Remuneration governance
Attracting and retaining the required skills depends largely on the remuneration levels and practices in any business. It is therefore vital to ensure the group remunerates fairly, responsibly and transparently to support the achievement of strategic objectives and positive outcomes in the short, medium and long term. The board is supported in this area by the remuneration committee.
Provision has been made in the notice of the 2023 annual general meeting for a non-binding advisory vote of shareholders on the remuneration policy and remuneration implementation report.
Assurance and internal audit
The audit and risk committee oversees arrangements for assurance services and functions on behalf of the board to ensure these are effective in achieving the objectives of an enabling control environment and supporting the integrity of information for internal decisions and external reporting.
A combined assurance framework effectively covers the group’s significant risks and material matters through a combination of internal functions and external service providers.
Despite the output of the combined assurance framework, board members are expected to apply an enquiring mind, form their own opinion on the integrity of information and reports, and the degree to which an effective control environment has been achieved.
Internal audit plays an important part in the overall assurance approach and effectiveness of the assurance framework. The audit and risk committee oversees the internal audit function on behalf of the board.
External independent quality assessment
In FY19, the internal audit function underwent an independent quality review conducted by the Institute of Internal Auditors South Africa. The function was found to generally conform with international standards for the professional practice of internal auditing. No material findings were noted. The external quality assessment is performed every five years. The internal audit function will be subjected to an external independent quality assessment in FY24.
Legitimacy
Inclusive stakeholder engagement model
The board sets the direction for the group’s approach to stakeholder relationships. An inclusive stakeholder engagement approach considers whether the legitimate needs, interests and expectations of all material stakeholders have been adopted.
Group organisational structure
The group is led and directed by a unitary board of directors that is guided by ethical leadership practices, supported by board and committee charters that are reviewed regularly. The group executive management team, headed by the chief executive officer, is responsible for leading implementation and execution of the board-approved strategy, policy and operational planning and governed appropriately in line with a formal delegation of authority framework.
|
|
|
|
|
|
|
|
|
|
|
|
|
|
|
|
|
|
| Board of directors |
|
The board exercises its leadership role over the group by:
•Steering its strategic direction
•Approving policy and planning that gives effect to the strategy
•Overseeing and monitoring implementation and execution by management
•Ensuring accountability for performance through reporting and disclosure.
|
| Board committees |
The board has delegated particular roles and responsibilities to standing committees, but remains ultimately accountable. The board committees’ primary functions include the consideration, oversight and monitoring of strategies, policies, practices, performance and recommendations to the board for final approval related to: |
| Audit and risk |
Social and ethics |
Remuneration |
Nomination |
Investment |
Technical |
|
•Operating an adequate system of internal control and control processes
•Accurate and appropriate reporting of financial statements
•Governance of information technology
•Risk management and overall risk governance.
|
•Occupational health and employee wellbeing, environmental management, corporate social responsibility, human resources, public safety and ethics management
•Compliance with relevant regulations
•Sustainability-related key performance indicators and levels of assurance, including ESG.
|
•Fair reward of directors and executive management for their contribution to Harmony’s performance
•Harmony’s compensation policies and practices; administration of its share incentive schemes
•Group remuneration policy.
|
•Formal and transparent procedures on board appointments
•Succession planning for directors and members of executive management
•Board self-assessment process.
|
•Potential projects, acquisitions and disposals in line with Harmony’s strategy; ensures due-diligence procedures are followed. |
•Safety, strategy and operational performance
•Review of strategic plans
•Technical guidance and support to management.
|
|
|
|
|
|
|
Group executive committee |
Led by the chief executive officer, in charge of executing board approved strategy as well as the day-to-day management of all operations. |
Board composition, chairman, independence and meeting attendance
Board broader diversity
Diversity and transformation are key focus areas for the board. Harmony has adopted a promotion of broader diversity policy at board level, specifically focused on promoting the diversity attributes of gender, race, culture, age, field of knowledge, skills and experience.
The board is satisfied that its composition reflects the appropriate mix of knowledge, skills, gender, race, culture, age, experience and independence. In addition, the composition of the board and its leadership structure ensures there is a balance of power in the boardroom and that no one director has unfettered authority of decision making.
Board composition
The board has 12 highly experienced and reputable members: nine are non-executive directors of whom eight are independent; three are executive directors; three are female and eight are historically disadvantaged persons.
The role and function of the board, including guidelines on its composition and procedures, are detailed in the board charter. This is reviewed regularly to ensure it remains relevant.
Role of chairman
The chairman of the board, Dr Patrice Motsepe is a non-executive director but is not classified as independent. The board is satisfied that, following an assessment that was undertaken during the year under review, that the lead independent director, Dr Mavuso Msimang, meets the requirements for an independent director under the Companies Act, JSE Listings Requirements, King IV, and any other criteria evidencing objectivity and independence established by the board.
The duties of the chairman and lead independent director have been included in the board charter and are based on the recommendations of King IV. The roles of the chief executive officer and chairman are separate. In addition to the chairman and lead independent director, the board also has an independent non-executive deputy chairman, Ms Karabo Nondumo.
These appointments are reviewed annually and form part of the board’s succession plan for the position of chairman, deputy chairman and lead independent director.
Guidance provided by King IV on the chairman’s membership of board committees has been applied. The board chairman is only a member of the nomination committee, which is chaired by the lead independent director.
Assessing independence of directors with tenure of over nine years
The majority of non-executive directors are classified as independent and their independence has been reviewed by the nomination committee. The board appreciates that independence is primarily a state of mind and all board members, despite their categorisation, are expected to act independently and with unfettered discretion at all times. This expectation is confirmed in the board charter.
Following an assessment undertaken by the nomination committee of Dr Mavuso Msimang who has served on the board for 12 years, Mr John Wetton (12 years), Ms Karabo Nondumo (10 years) and Mr Vishnu Pillay (10 years), during the year under review, the committee is satisfied that these individuals do not have any relationships that may impair, or appear to impair, their ability to apply independent judgement. In addition, there are no interests, positions, associations or relationships which, from the perspective of a reasonable and informed third party, are likely to influence the members unduly or cause bias in their decision making.
The board thus concluded that the members demonstrated they were independent of mind and judgement, and had objectively fulfilled their roles as independent non-executive directors, despite their tenure on the board. The wealth of experience of these members, in addition to their standing as reputable individuals of integrity and character, makes their ongoing input and contribution an invaluable asset to the board and the group.
In line with the board composition transitional plan, the board (with the assistance of its nomination committee) continued to consider its composition, structure, size and independence, to align with best practice and with the board’s broader diversity policy. As such, Mr Joaquim Chissano and Mr Andre Wilkens retired by rotation and did not seek re-election (although eligible) as of the conclusion of the 2022 annual general meeting.
Nomination, election and appointment
The nomination committee is tasked with identifying potential candidates for appointment to the board, while actual appointment is a matter for the board as a whole. The collective knowledge, skills and experience required by the board, as well as broader diversity, are all aspects considered by the board before appropriate candidates are identified for nomination. The nomination committee conducts the necessary independence checks and investigations on potential candidates, as recommended by King IV.
All new board members receive formal letters of appointment. In addition, they participate in an extensive induction programme to enable them to make the maximum contribution in the shortest possible time, and further receive, from Harmony’s appointed JSE Sponsor, a formal explanation on the nature of their responsibilities and obligations arising from the JSE Listings Requirements. Ongoing mentorship is provided to members with no or limited governance experience and they are encouraged to undergo appropriate training. Provision has also been made in the board’s annual work plan for regular briefings on legal and corporate governance developments, as well as risks and changes in the external environment of the group.
As required by the provisions of Harmony’s memorandum of incorporation, a third of the non-executive directors are expected to retire by rotation at each annual general meeting of the company. The board is comfortable in recommending their reappointment to shareholders.
The role and function of the board, including guidelines on its composition and procedures, are detailed in the board charter, which is reviewed regularly to ensure it remains relevant and applicable.
Board performance evaluations
The board fully supports the thinking that an appropriate evaluation of the board and its structures is a strategic value-adding exercise that facilitates continual improvement of its performance and effectiveness. An independent formal self-evaluation process was undertaken in FY23. This included an assessment of the performance of the board, its chairman and individual members as well as committees, chief executive officer and group company secretary.
Overall, the self-evaluation reconfirmed that the board and its committees were considered:
•Highly effective
•Appropriately positioned to discharge their governance responsibilities
•Well supported by its committees
•Working as a cohesive unit and that the highest ethical standards are applied in deliberations and decision making, enabling the board to provide effective leadership from an ethical foundation.
The consensus among board members is that the chief executive officer:
•Communicates consistently and effectively with all Harmony’s stakeholders
•Created and implemented an effective strategy, supported by management
•Demonstrates ethical and transparent leadership by living the company’s culture and reinforcing its values.
Considering the outcome of the evaluation process, the board is satisfied that the process is improving its performance and effectiveness.
Conflicts of interest
Each member of the board is required to submit a general declaration of financial, economic and other relevant interests and to update these declarations as necessary. In addition, the declaration of interests in any matter on the agenda of a board or committee meeting is a standard item at the start of every meeting. In the event of a potential conflict being declared, the board proactively manages this conflict within the boundaries of the law.
Appointment and delegation to management
The board is responsible for appointing the chief executive officer on recommendation by the nomination committee. Harmony’s chief executive officer, Mr Peter Steenkamp, is responsible for leading implementation and execution of the board-approved strategy, policy and operational planning, and serves as a link between the board and management.
He is accountable and reports to the board. He is not a member of the remuneration, audit or nomination committees. He does attend meetings of these committees as required to contribute insights and information.
Succession planning for this position forms part of the executive succession plan that is monitored on behalf of the board by the nomination committee. An emergency succession plan is also in place and reviewed annually.
A formal delegation-of-authority framework is in place and reviewed regularly by the board to ensure its appropriateness to the business. The delegation-of-authority addresses the authority to appoint executives who may serve as ex officio executive members of the board and to make other executive appointments.
Group company secretary
The group company secretary, Ms Shela Mohatla, is a full-time employee of Harmony who was appointed by the board on 14 August 2020. She is a chartered secretary by profession.
The board has direct access to the group company secretary who provides professional and independent guidance to the board as a whole and to members individually on corporate governance and legal duties. She also supports the board in coordinating the effective and efficient functioning of the board and its committees.
The group company secretary has unrestricted access to the board and, at all times, retains an arm’s-length relationship to enhance the independence of the position. She is not a member of the board but, being accountable to the board, reports to the board via the chairman on all statutory duties and related functions.
To facilitate and enhance the independence and effectiveness of the group company secretary, the board ensures the office of the group company secretary is empowered and the position carries the necessary authority. The remuneration committee considers and approves the remuneration of the group company secretary on behalf of the board.
Following the assessment of the group company secretary by the board in August 2023, the board is satisfied that the group company secretary has the necessary competence, qualifications, experience, gravitas and objectivity to provide independent guidance and support at the highest level of decision making in the group.
The board is therefore satisfied that arrangements in place for accessing professional corporate governance services are effective.
Discharge of responsibilities
The board is satisfied that the committees properly discharged their responsibilities over the past year.
Furthermore, the board complies, to the best of its knowledge, with the Companies Act and its memorandum of incorporation, monitors such compliance on an ongoing basis and operates in conformity with its memorandum of incorporation.
Board and committee attendance
|
|
|
|
|
|
|
|
|
|
|
|
|
|
|
|
|
|
|
|
|
|
|
|
|
|
|
|
|
|
|
|
|
|
|
|
|
Attendance at committee meetings |
|
| Name |
Age |
Appointed director |
Independent |
Audit
and risk* |
Social and
ethics* |
Technical* |
Investment* |
Remuneration* |
Nomination* |
Attendance at board meetings* |
| Non-executive directors |
|
|
|
|
|
|
|
|
|
|
|
Dr Patrice Motsepe (chairman) |
61 |
2003** |
|
|
|
|
|
|
2/4 |
5/5 |
100 |
% |
Ms Karabo Nondumo (deputy chairman) |
45 |
2013 |
ü |
6/6 |
7/7 |
|
6/7 |
|
4/4 |
5/5 |
100 |
% |
|
Dr Mavuso Msimang
(lead independent)
|
82 |
2011 |
ü |
|
6/7 |
|
|
|
4/4 |
5/5 |
100 |
% |
| Mr John Wetton |
74 |
2011 |
ü |
6/6 |
7/7 |
|
7/7 |
4/4 |
|
5/5 |
100 |
% |
| Mr Vishnu Pillay |
66 |
2013 |
ü |
|
|
5/7 |
5/7 |
4/4 |
4/4 |
5/5 |
100 |
% |
| Ms Given Sibiya |
55 |
2019 |
ü |
6/6 |
7/7 |
|
|
|
|
4/5 |
80 |
% |
| Mr Peter Turner |
67 |
2021 |
ü |
|
|
7/7 |
7/7 |
|
|
5/5 |
100 |
% |
| Mr Bongani Nqwababa |
57 |
2022 |
ü |
5/6 |
|
|
6/6^ |
3/3^ |
|
5/5 |
100 |
% |
| Mr Martin Prinsloo |
54 |
2022 |
ü |
6/6 |
|
5/6^ |
5/6^ |
|
|
5/5 |
100 |
% |
Mr Joaquim Chissano*** |
84 |
2005 |
ü |
|
3/4*** |
|
2/3*** |
|
|
2/2*** |
100 |
% |
Mr André Wilkens*** |
74 |
2007 |
|
|
|
3/3*** |
2/3*** |
2/2*** |
|
2/2*** |
100 |
% |
| Executive directors |
|
|
|
|
|
|
|
|
|
|
|
| Mr Peter Steenkamp |
63 |
2016 |
|
|
|
|
|
|
|
5/5 |
100 |
% |
| Ms Boipelo Lekubo |
40 |
2020 |
|
|
|
|
|
|
|
5/5 |
100 |
% |
| Mr Harry Mashego |
59 |
2010 |
|
|
|
|
|
|
|
5/5 |
100 |
% |
|
|
|
|
|
|
|
|
|
|
|
|
as at 30 June 2023 |
* Includes ad-hoc meetings for the year.
** Appointed chairman in 2004.
*** On 29 November 2022, Harmony announced the retirement of Mr Joaquim Chissano and Mr Andre Wilkens as directors from 29 November 2022.
^ On 18 August 2022, Mr Bongani Nqwababa was appointed as chairperson of the investment committee and member of the remuneration committee. Mr Martin Prinsloo was appointed member of the technical and investment committees.
BOARD COMMITTEES
The board has delegated particular roles and responsibilities to standing committees based on relevant legal requirements and what is appropriate for the group to achieve the objectives of delegation. The board recognises that duties and responsibilities can be delegated but accountability cannot be abdicated. The board, therefore, remains ultimately accountable.
The following committees have been established:
•Audit and risk
•Social and ethics
•Remuneration
•Nomination
•Investment
•Technical.
A brief description of each committee, its functions and key activities and actions in FY23 appears on the following pages.
Terms of reference
Formal terms of reference have been adopted for each board committee and are reviewed annually (and when necessary) to ensure the content remains relevant. The terms of reference address, as a minimum, the recommended items in King IV.
Committee membership
In considering committee membership, the board, assisted by the nomination committee, is mindful of the need for effective collaboration through cross-membership between committees, where required. The timing of committee meetings is coordinated to facilitate and enhance the effective functioning and contribution of each committee. Duties and responsibilities are documented to clearly define the specific role and positioning of each committee on topics that may be within the mandate of more than one committee. Committee membership has also been addressed to ensure a balanced distribution of power across committees so that no person has the ability to dominate decision making and no undue reliance is placed on any one person.
The board is satisfied that each committee, as a whole, has the necessary knowledge, skills, experience and capacity to execute its duties effectively and with reasonable care and diligence. Each committee has a minimum of three members. Members of executive and senior management are invited to attend committee meetings as deemed appropriate and necessary for the effective functioning of the committee.
In FY23, the majority of members of all board committees remained independent non-executive directors. All board committees were chaired by an independent non-executive director, except for the technical committee, chaired by André Wilkens (prior to 29 November 2022), being a non-independent and non-executive directors. The board remains confident that his leadership as chair of the technical committee (prior to 29 November 2022) was in the best interests of the company, based on his extensive knowledge of the specific areas of responsibilities of the committee.
Committee meetings
Any director who is not a member of a specific committee is entitled to attend meetings as an observer, but not entitled to participate without the consent of the committee chairperson. Such directors have no vote in meetings and will not be entitled to fees for attendance, unless specifically agreed by the board and provided for in the board fee structure as approved by shareholders. As part of the board induction process, Mr Bongani Nqwababa and Mr Martin Prinsloo (accompanied by Ms Karabo Nondumo and Mr Peter Turner) attended a site visit in for the Eva Copper Project in Australia to further acclimate them to the Harmony board.
The board considers recommendations from its committees in matters requiring its approval, but remains responsible for applying its collective mind to the information, opinions, recommendations, reports and statements presented by the committees.
Audit and risk committee
|
|
|
|
|
|
| Member |
Committee tenure |
| J Wetton (chairperson)* |
12 years |
| Karabo Nondumo |
10 years |
| Given Sibiya |
4 years |
Bongani Nqwababa |
1 year |
Martin Prinsloo |
1 year |
* Appointed as chairperson on 15 December 2021.
Primary functions
•Monitors operation of an adequate system of internal control and control processes
•Monitors preparation of accurate financial reporting and statements in compliance with all applicable legal and corporate governance requirements and accounting standards
•Monitors risk management, ensures significant risks identified are appropriately addressed and supports the board in overall governance of risk.
Social and ethics committee
|
|
|
|
|
|
| Member |
Committee tenure |
| Karabo Nondumo (chairperson)* |
1.5 years |
| John Wetton |
12 years |
| Mavuso Msimang |
12 years |
Given Sibiya |
1.5 years |
Joaquim Chissano** |
16 years |
* Appointed as chairperson on 15 December 2021.
** Retired as member and director on 29 November 2022.
Primary functions
•Oversees policy and strategies on occupational health and employee wellbeing, environmental management, corporate social responsibility, human resources, public safety and ethics management
•Monitors implementation of policies and strategies by executives and their management teams for each discipline noted above
•Assesses Harmony’s compliance against relevant regulations
•Reviews material issues in each of the above disciplines to evaluate their relevance in the reporting period, and to identify additional material issues that warrant reporting, including sustainability-related key performance indicators and levels of assurance.
Key activities and actions in FY23
•Reviewed and recommended the social and ethics committee report to be included in the integrated annual report
•Reviewed and considered the social, economic, human capital, environmental, health and safety issues affecting the company’s business and stakeholders
•Reviewed and considered the effect of the company’s operations on the economic, social and environmental wellbeing of communities, as well as significant risks within the ambit of its responsibilities
•Considered its oversight role in terms of ESG and monitored ESG risks and opportunities
•Approved material elements of sustainability reporting and key performance indicators that were externally assured
•Considered and monitored the company’s internal and external stakeholder relations
•Considered and approved Harmony’s sustainable development framework and policy
•Considered and approved the Harmony’s health and safety policy
•Considered and approved the Harmony’s human rights policy
•Considered and approved the Harmony’s whistleblowing policy
•Considered the governance of ethics and ethical leadership
•Reviewed and recommended the committee’s terms of reference to the board for approval
•Considered the company’s overall people development strategy
•Considered the company’s overall water management strategy
•Discussed the company’s gender survey results with recommendations for implementation by management
•Reviewed and recommended the company group behavioural code and code of conduct
•Attended a site visit for a detailed update on the Zaaiplaats major capital project – focusing on environmental and social matters.
Remuneration committee
|
|
|
|
|
|
| Member |
Committee tenure |
| Vishnu Pillay (chairperson)* |
6 years |
| John Wetton |
12 years |
Bongani Nqwababa |
1 year |
André Wilkens** |
14 years |
* Appointed as chairperson on 11 May 2017.
** Retired as member and director on 29 November 2022.
Primary functions
•Ensures directors and executive management are fairly rewarded for their contribution to Harmony’s performance
•Assists the board in monitoring, reviewing and approving Harmony’s compensation policies and practices, and administration of its share incentive schemes
•Operates as an independent overseer of the group remuneration policy and makes recommendations to the board for final approval.
Key activities and actions in FY23
•Reviewed benefits and remuneration principles for Harmony executive management
•Received and discussed a summary of the suite of Harmony executive management incentive schemes to obtain a holistic view
•Reviewed and recommended the committee’s terms of reference to the board for approval
•Reviewed and recommended the company’s incentive plan policy to the board for approval
•Reviewed the company’s overall retention strategy and policy based on global trends on staff retention
•Considered and recommended the remuneration policy and implementation report to the board for inclusion in the notice of annual general meeting for consideration by shareholders as non-binding advisory resolutions
•Reviewed executive directors and executive management’s remuneration benchmarks and recommended their annual salary increases to the board for approval
•Reviewed the annual salary increases of the group company secretary and chief audit executive
•Reviewed non-executive director fees with the assistance of an independent service provider
•Considered and recommended the company’s total incentive plan balanced scorecard for FY24 for board approval
•Received training on trends in sustainable remuneration.
Nomination committee
|
|
|
|
|
|
| Member |
Committee tenure |
| Mavuso Msimang (chairperson)* |
11 years |
| Dr Patrice Motsepe |
20 years |
| Vishnu Pillay |
4 years |
Karabo Nondumo |
1.5 years |
* Appointed as chairperson on 10 May 2018.
Primary functions
•Ensures procedures governing board appointments are formal and transparent
•Makes recommendations to the board on all new board appointments
•Reviews succession planning for directors and other members of the executive team and oversees the board’s self-assessment process.
Key activities and actions in FY23
•Reviewed succession planning for directors and other members of the executive team and oversaw the board’s self-assessment process
•Reviewed and recommended the committee’s terms of reference to the board for approval
•Reviewed and recommended for re-election directors who retire by rotation in terms of the company’s memorandum of incorporation
•Reviewed and made recommendations on the composition, structure and size of the board and its committees, in line with the board’s policy on gender and race diversity
•Considered the positions of the chairman and deputy chairperson of the board and lead independent director and made recommendations to the board
•Reviewed and recommended the independence of non-executive directors (especially independent non-executives serving on the board for longer than nine years)
•Reviewed and recommended immediate and long-term succession plans for the board, chairman of the board, chief executive officer, executive management and the group company secretary
•Considered the programme in place for the professional development of directors and regular briefings on legal and corporate governance developments, risks and changes in the external operating environment of the organisation
•Considered the policy on the promotion of broader diversity at board level, specifically focusing on the promotion attributes of gender, race, culture, age, field of knowledge, skills and experience.
Investment committee
|
|
|
|
|
|
| Member |
Committee tenure |
| Bongani Nqwababa (chairperson)* |
1 year |
| John Wetton |
12 years |
| Karabo Nondumo |
10 years |
| Vishnu Pillay |
10 years |
| Peter Turner |
3 years |
Martin Prinsloo |
1 year |
André Wilkens** |
15 years |
Joaquim Chissano** |
3 years |
* Appointed as chairperson on 17 August 2022.
** Retired as member and director on 29 November 2022.
Primary functions
•Considers projects, acquisitions and disposals in line with Harmony’s strategy and ensures due diligence procedures are followed
•Conducts other investment-related functions designated by the board.
Key activities and actions in FY23
•Considered investments, proposals, projects and proposed acquisitions in line with the board’s approved strategy and delegation of authority as well as the committee’s terms of reference
•Considered the company’s exploration expenditure
•Reviewed and recommended the budget and business plans for FY24
•Reviewed and recommended the committee’s terms of reference to the board for approval
•Post-investment monitoring of recent acquisitions
•Attended a site visit for a detailed update on the Zaaiplaats major capital project.
Technical committee
|
|
|
|
|
|
| Member |
Committee tenure |
Peter Turner (chairperson)* |
3 years |
| Vishnu Pillay |
10 years |
| Martin Prinsloo |
1 year |
| André Wilkens** |
14 years |
* Appointed as chairperson on 23 February 2023.
** Retired as member and director on 29 November 2022.
Primary functions
•Provides a platform to discuss strategy, performance against targets, operational results, projects and safety
•Informs the board of key developments, progress against objectives and challenges facing operations
•Reviews strategic plans before recommending to the board for approval
•Provides technical guidance and support to management.
Key activities and actions in FY23
•Monitored safety across all operations
•Monitored exploration and Ore Reserves in South Africa and Papua New Guinea
•Monitored all South African and Papua New Guinean operations
•Considered and approved the company’s health and safety policy
•Evaluated and considered Harmony’s risks, and measures taken to mitigate those risks
•Reviewed and recommended to the board the company’s annual budget and business plans for FY24
•Considered investments, proposals, projects and proposed acquisitions from a technical viewpoint
•Reviewed and recommended the committee’s terms of reference to the board for approval
•Attended a site visit for a detailed update on the Zaaiplaats major capital project.
REMUNERATION REPORT
‘’The appropriate human resource driven by diversity and appropriate pay remains the key focus of this committee.”
Dear shareholder
It gives me great pleasure to present the 2023 remuneration report on behalf of the remuneration committee (Remco).
Through the Remco, the board continues to make strides in sustaining remuneration policies and practices that are aligned with Harmony’s strategic objectives. This is outlined throughout Harmony’s integrated reporting suite.
Despite a challenging local and global macro-economic environment, the rising costs of living (driven by post pandemic inflation rates), as well as the energy crisis exacerbated by the conflict in Europe, Harmony remains committed to its growth strategy through appropriate investments to reduce its all-in sustaining costs, increase safe production and ensure operational continuity. To enable this, the appropriate human resource driven by diversity and appropriate pay remains the key focus of this committee. This is further supported by ensuring that Harmony pays a living wage to its workforce.
2023 focus areas
We have updated the measurement approach for two measures on the total incentive plan scorecard proposed for FY24 for practical reasons which we believe retains the degree of stretch in the targets for these measures.
•The Total Shareholder Return (TSR) will be measured on a trailing three-year basis as before but will be measured on 30 June of the performance year from FY24 onwards, rather than at the end of August. The reason for this change is for practical reasons, so that the measurement period is aligned with that of the other measures, and that the TSR measure can be signed off and approved earlier in the year-end governance process. This change in measurement date is unlikely to systemically advantage or disadvantage employees.
•Additions to Reserves will be measured on a three-year trailing basis rather than a year-on year basis. Again, this is unlikely to advantage or disadvantage employees on average over the medium term. Reserve additions tend to be irregular, this change will smooth the measurement process and will avoid “feast or famine” outcomes.
We have noted that the market positioning of the total on-target remuneration of our executive management, particularly the long-term incentive portion, has declined over time despite the increase in the global complexity of our business and the increase in competition for scarce mining skills. We have therefore implemented a moderate increase in the total incentive awards as a percentage of Guaranteed Package to enhance our market positioning and reflect the increased complexity of our senior executives’ roles.
We note that our incentive percentages have remained static for many years – the Total incentive percentage maintained the combined on-target values of the cash incentives and performance share awards that it replaced. The increased incentive awards remain well within market norms, are 100% subject to company performance and will assist in maintaining our competitive value proposition to attract, reward and retain people to deliver our strategy.
We continue to monitor the implementation of the multi term wage agreement, as introduced in 2021.
In the spirit of applying fair and responsible pay principles in FY23, an average increase of 6% in guaranteed remuneration packages for non-bargaining-unit employees was awarded and 7.08% for bargaining-unit employees, in line with collective bargaining agreements.
We had previously reported on the Palma Ratio of our employees’ remuneration as the measure of our “pay gap”, however the ratio of the total remuneration of the top paid 5% of our employees compared to that of the lowest paid 5% was introduced into the Companies Amendment bill that has been circulated for public comment, and so we have reported our pay gap on this basis in this report.
Growth strategy and performance highlights
In line with our strategic objectives of transitioning into a low-cost gold and copper mining company, Harmony entered into an agreement to acquire Eva Copper Project and a package of regional exploration tenements from Copper Mountain Mining Corporation on 6 October 2022. In addition, significant strides to securing the special mining lease for Wafi-Golpu Project was obtained with the signing of a framework memorandum of understanding by the Wafi-Golpu Joint Venture (to which Harmony is a partner) and the independent State of Papua New Guinea. Over and above this, the past four years saw Harmony add gold ounces by acquiring Moab Khotsong, reinvesting in Hidden Valley (Papua New Guinea), and acquiring Mponeng and related assets. We continue to demonstrate our ability to successfully integrate our new acquisitions to increase our production profile in South Africa and Papua New Guinea while sustaining communities around our mining operations and preserving jobs.
Safety
The remuneration committee acknowledges and mourns the tragic loss of six employees in the course of duty at our South African operations in FY23.
The nature of our business places an emphasis on safe production as our number one priority. To that end, we continue to follow an integrated risk management approach, which includes safety training, awareness campaigns, safety days at each operation and equipping our employees with the necessary skills to identify hazards and act safely. Safe production is a responsibility that we take very seriously.
Every person has the right to withdraw from an unsafe area and employees are encouraged to report unsafe working conditions. With each accident, a thorough investigation is conducted, and lessons learnt are shared throughout the company.
Harmony recognises that the number of loss-of-life incidents across the group is unacceptable and that every effort is continuously being made to achieve a state of reduced harm. To this end, a comprehensive broad-based strategy is being implemented across the organisation that covers medical care and wellness, risk management and individual assessment of risk propensity and a leadership learning and training programme.
It is envisaged that this intervention will take between five to seven years to fully embed and complete. We are currently in year 7 of its implementation. Initial benefits of the programme are beginning to be recorded at individual operations.
Additionally, employees are held accountable for not complying with safety regulations. Initiatives to improve safety cannot, however, focus solely on discipline and training. They also include mining practice and the use of monitoring technology. The desired safety outcomes are therefore pivotal and reinforced in our remuneration policy.
Safety carries a weighting of 15% of the total score on the balanced scorecard. A score of 14.77% was awarded in the FY23 balanced scorecard for lost-time injury frequency rate (LTIFR) as a final outcome in accordance with the policy regarding loss-of-life incidents.
Changes to the Remuneration policy for FY24
Harmony ESOP
Harmony established the Harmony Employee Share Ownership Scheme (also known as the Sisonke share scheme or ESOP) on 15 January 2019 to provide employees with an ownership interest in Harmony and to empower and create potential wealth for employees. The Harmony ESOP had a lock-in three-year period that expired on 15 January 2022.
All permanent employees in Category 4-8, Miners and Artisans, and Officials Bargaining Unit that were in service on 11 February 2019 received a once-off allocation of 225 units (shares), while new appointments from 9 May 2019 received a pro rata allocation based on the number of months these employees participated in the ESOP up to its expiry on 15 January 2022.
A new ESOP is being considered in collaboration with all stakeholders to further create and enhance shared value for all beneficiaries and will be implemented in 2024, subject to shareholder approval.
King IV principles
The remuneration committee continues to compare local and global remuneration trends with our remuneration strategy. At the 2022 annual general meeting, the non-binding advisory vote on the remuneration policy was supported by 97.69% of the votes exercised on the resolution. The implementation of the remuneration report was supported by 98.10%.
As required by the Companies Act and King IV, in the event that either the remuneration policy or the implementation report, or both, are voted against by 25% or more, the board will engage with shareholders to understand concerns raised. This engagement may be done by virtual meeting or in writing and will be implemented at a time after the release of the voting results. Where possible and prudent, objections are taken into consideration when formulating any amendments to the company’s remuneration policy and implementation report in the following financial year.
The committee is also satisfied that the remuneration policy has achieved its stated objectives for the year.
Use of consultants and their independence
During the year, we employed the services of RemChannel (Old Mutual) and Bowmans for advice on remuneration matters. The committee is satisfied that their advice was independent and objective.
Statement on effectiveness of policy
We are satisfied that our policy has generally achieved its objectives, although much room exists for improvement of our safe production performance. We remain confident that the total incentive plan will further enhance our company performance,ability to attract and retain critical skills, deliver returns to shareholders and support our growth objectives.
In closing
I remain grateful to the board, remuneration committee members and executive management for their support and commitment in FY23. The committee is confident that it has discharged its duties with diligence, ensuring that fair and responsible remuneration practices are executed equitably.
No member of the committee has a personal interest in the outcome of decisions made in the review period, and all three members are independent non-executive directors. The chairman of the board is not a member of the committee.
Vishnu Pillay
Chairperson: remuneration committee
25 October 2023
PART 1: REMUNERATION POLICY
Harmony’s reward strategy underpins our business strategy of safely producing profitable ounces, increasing our margins and expanding our Reserves and Resources through organic growth and acquisitions.
To sustain this growth, we rely on experienced, skilled teams who live our values and maintain stakeholder relationships to grow profits safely and support a sustainable company.
Our remuneration policy has been designed with our business strategy in mind – to attract and retain these experienced, skilled teams, and to motivate them to achieve our key business goals. To ensure this happens, we need to be certain that all elements of our remuneration and wider reward offerings are aligned, fair and competitive. In determining remuneration, the remuneration committee considers shareholders’ interests as well as the financial health and future of the company.
Gender and race equality
Harmony’s remuneration policy is to remunerate based on an individual’s ability, skills, knowledge and experience. Men and women, irrespective of their race or any other arbitrary factor, are paid equally for equivalent roles.
Fair and responsible pay
Harmony is committed to the concept of a living wage, which is based on the philosophy of fair and responsible pay. It embodies our initiatives to enhance the lives of our employees by enabling them to improve their living conditions, and to have better access to social services, healthcare, education and training.
Total incentive plan
The total incentive is determined every year on the following basis:
|
|
|
|
|
|
|
|
|
|
|
|
|
|
|
|
|
|
|
|
|
|
|
|
|
|
|
|
|
|
|
|
|
|
|
|
|
|
|
|
|
|
|
|
|
|
|
|
|
|
|
|
|
|
|
|
|
Total
incentive (R) |
= |
Guaranteed
pay (R) |
X |
On-target
factor (%)
|
X |
Balanced
scorecard result (%) |
|
|
|
|
|
|
|
|
|
|
|
|
|
|
|
|
|
|
|
|
|
|
|
|
The formula above has been updated so that the outcome is based on the “On-target” factor (%), rather than the maximum Participation Factor, where the On-target factor is equal to 60% of the maximum Participation Factor, and the Balanced Scorecard outcome is recalibrated to 100% for On-target performance, 67% for Threshold performance and to 167% for Stretch performance. This has no mathematical impact on the outcomes of the total incentive awards but enables more realistic communication of expected outcomes. The maximum Participation outcome is unlikely due to the low probability of reaching stretch performance for all measures simultaneously, whereas the On-target factor correctly expresses the appropriate reward for target performance. For FY23 total On-target factor for the CEO is therefore 60% of 250%, equalling 150% for Guaranteed pay, with 40% of this settled in cash (60% of guaranteed package) and 60% in deferred shares (90% of guaranteed package). For FY23 total On-target factor for the Financial director, other executive directors and prescribed officers is therefore 60% of 230%, equalling 138% for Guaranteed pay, with 40% of this settled in cash (55.2% of guaranteed package) and 60% in deferred shares (82.8% of guaranteed package).
For the reasons explained in the background statement to this report, for FY24 a moderate increase in the On-target total incentive factors has been implemented, with the CEO’s total On-target factor increasing from 150% to 180% of Guaranteed package (72% in cash and 108% in deferred shares) and the total On-target factor for the Financial director, other executive directors and prescribed officers increasing from 138% to 150% of Guaranteed package (60% in cash and 90% in deferred shares).
The balanced scorecard result includes a number of key short- and long-term company performance measures (to be measured over trailing three- and one-year periods). The measures are reviewed and defined annually with appropriate weightings.
A portion of the total incentive is paid immediately in cash and the balance is settled by means of deferred shares, which vest at a rate of 20% per annum over the next five years for executive directors and prescribed officers, and 33.33% per annum over the next three years for management.
In the event of fault termination of employment, including resignation and termination for disciplinary reasons, all unvested deferred shares are forfeited.
A provision for no fault terminations has been approved. This means that the awards of executives and management employees who leave the company in good standing, do not vest early (on a time-prorated basis) on termination of employment but will continue in force to vest on the original vesting dates.
Each element of the total incentive plan is described below.
|
|
|
|
|
|
|
|
|
|
|
|
|
|
|
| Element |
Description |
|
Guaranteed pay excludes short- and long-term incentives. To compete effectively for skills in a challenging employment market, we identify the target market to use in benchmarking guaranteed pay. This target market includes organisations or companies that employ similar skills sets to those we require. Comparisons are made predominantly within the South African mining sector to ensure that Harmony remains competitive. The median of the target market is used as the basis of our pay ranges. This same philosophy is applied to our South-east Asia operations. |
Total On-target factor (as explained more fully above) |
Employee |
% guaranteed pay |
| Chief executive officer |
150% for FY23, increased to 180% in FY24 |
| Financial director, other executive directors and prescribed officers |
138% for FY23 increased to 150% for FY24 |
| Balanced scorecard result |
Cash portion of total incentive (40%) |
A portion of the total incentive is settled in cash immediately when the balanced scorecard results for the financial year have been determined and approved by the board. |
|
| Cash portion (balance settled in deferred shares) |
% of incentive |
| Chief executive officer |
40% |
| Financial director, other executive directors and prescribed officers |
40% |
| Deferred share portion of total incentive (60%) |
The balance of the total incentive is settled in deferred shares, vesting at a rate of 20% per annum over the next five years for executive directors and prescribed officers, and 33.33% per annum over the next three years for management. |
FY24 balanced scorecard
|
|
|
|
|
|
|
|
|
|
|
|
|
|
|
|
Scorecard component |
Group
(%) |
South Africa operations
(%) |
South-east Asia operations
(%) |
| Shareholder value |
Total shareholder return (absolute) |
8.34 |
|
6.67 |
|
6.67 |
|
| Total shareholder return (relative to SA JSE-listed gold-mining comparators) |
8.33 |
|
6.67 |
|
6.67 |
|
| Total shareholder return (relative to FTSE Gold Mines Index) |
8.33 |
|
6.66 |
|
6.66 |
|
| Financial and operational |
Production |
20.00 |
|
35.00 |
|
35.00 |
|
| Total production cost |
15.00 |
|
20.00 |
|
20.00 |
|
| Free cash flow |
10.00 |
|
— |
|
— |
|
| Growth |
Development |
— |
|
10.00 |
|
10.00 |
|
| Additions to Mineral Reserves |
10.00 |
|
— |
|
— |
|
| Project execution (for future measurement) |
— |
|
— |
|
— |
|
| Sustainability |
Safety performance: Lost-time injury frequency rate (LTIFR) |
15.00 |
|
15.00 |
|
15.00 |
|
Environmental, Social and Governance (ESG) |
5.00 |
|
— |
|
— |
|
| Total |
|
100.00 |
|
100.00 |
|
100.00 |
|
|
|
|
|
|
|
|
|
|
Applicable Balanced score card for Eligible operations/divisions |
Functions |
% Participation |
| Group |
CEO Office, Prescribed Officers, Group COO – Operations, Group COO – Business development & Growth, New Business Development & Growth Managers and Corporate Services Managers exclusively allocated to a Group and Corporate function |
100% Group |
| SA Operations |
Executive Operating Officer, Executive Managers, all on-shaft SA Ops Managers and off-shaft Services Managers exclusively allocated to SA Ops Services (Free State Services, Moab Khotsong Services, Mponeng Services and Randfontein Office Services) |
100% SA |
SEA* Operations |
Executive Operating Officer, Executive Managers, all on-mine and off-mine SEA Ops Managers and SEA Managers exclusively allocated to SEA Ops |
100% SEA |
SEA* - Shared Service resources |
Specific sub-functions of Finance and commercial services, HR and other |
% Split to be determined by time spent on each function respectively between SEA and Group divisions. |
*South-east Asia
Scorecard components
Total shareholder return
Shareholder value is measured as total shareholder return (TSR) over a three-year period ending in August (for the FY23 scorecard) and ending in June of each year from FY24 onwards.
It comprises two components:
•Absolute performance over the measurement period, compared to the company’s cost of equity (COE), taking into account the growth in the company’s share price and the value of dividends paid, and
•Relative performance of the company versus SA JSE-listed gold-mining comparators and FTSE Gold Mines Index over the measurement period.
The threshold, target and stretch performance criteria for TSR (with the recalibrated scorecard outcomes as explained above) are set out below:
|
|
|
|
|
|
|
|
|
|
|
|
|
|
|
|
|
|
|
Scorecard
component |
Principle |
Threshold
67%
|
Target
100%
|
Stretch
167% |
| Shareholder value |
TSR (absolute) |
To be measured over a three-year period ending in June of each year |
COE + 0%
per year |
COE + 3%
per year |
COE + 6%
per year |
| TSR (relative) |
To be measured over a three-year period relative to South African JSE-listed
gold-mining comparators
|
On index |
Index plus 10% |
Index plus 20% |
| TSR (relative) |
To be measured over a three-year period relative to the FTSE Gold Mines Index |
On index |
Index plus 10% |
Index plus 20% |
Financial and operational performance
Financial and operational performance comprises gold production and cost management for the financial year measured against the board-approved business plan.
•Production
–Total gold production against board-approved business plan for the year
•Total production cost(SA) and (SEA)
–Total cash operating cost and total capital expenditure for the year
•Free cash flow
–Cash flow generated by operations adjusted for exploration capital, dividends and the effect of commodity price and exchange rate changes in excess of 10% (higher or lower).
The threshold, target and stretch performance criteria are set out below:
|
|
|
|
|
|
|
|
|
|
|
|
|
|
|
|
|
|
|
Scorecard
component |
Principle |
Threshold
67%
|
Target
100%
|
Stretch
167% |
| Financial and operational |
Production |
To be measured against board-approved plan |
(5)% |
Plan |
5% |
Total production cost (SA) and (SEA) |
To be measured against board-approved plan |
(5)% |
Plan |
5% |
| Free cash flow |
To be measured against board-approved plan |
(30)% |
Plan |
30% |
Growth
Growth comprises three areas:
•Development
–Development is measured against the board-approved business plan of ongoing capital development – the development of reef and waste metres (South Africa) and waste tonnes (South-east Asia) for the financial year.
•Addition to Mineral Reserves
–Addition to Mineral Reserves through acquisitions and major capital projects which will be calculated on a three-year period rolling average starting from FY24.
•Project execution.
The threshold, target and stretch performance criteria are set out below:
|
|
|
|
|
|
|
|
|
|
|
|
|
|
|
|
|
|
|
Scorecard
component |
Principle |
Threshold
67%
|
Target
100%
|
Stretch
167%
|
| Growth |
Development |
To be measured against board-approved plan as a leading indicator of medium-to long-term sustainability |
(5)% |
Plan |
5% |
| Addition to Mineral Reserves |
Will measure Ore Reserve addition on a three-year period rolling average on pre-depletion basis excluding asset sales |
+1.5Moz |
+2Moz |
+2.5Moz |
| Project execution |
For future measurement |
|
|
|
Sustainability
Sustainability comprises two components:
•Safety performance: LTIFR
–LTIFR will be measured against the board-approved plan
•ESG
–ESG will be measured on the basis of continued inclusion in the FTSE4Good Index as verified by FTSE Russell.
The threshold, target and stretch performance criteria are set out below:
|
|
|
|
|
|
|
|
|
|
|
|
|
|
|
|
|
|
|
Scorecard
component |
Principle |
Threshold
67%
|
Target
100%
|
Stretch
167%
|
| Growth |
LTIFR |
To be measured against board-approved plan |
(5)% |
Plan |
5% |
| ESG |
To be measured on the basis of continued inclusion in the FTSE4Good Index as verified by FTSE Russell |
Yes |
No |
| 5% |
N/a |
Minimum shareholding requirement
We have encouraged executive directors and prescribed officers to retain performance shares when they vest and a minimum shareholding requirement (MSR) was again confirmed in the new total incentive plan to achieve this. The requirement provides that:
•50% of the shares that will vest to an executive director or prescribed officer will, immediately prior to the applicable vesting date, be automatically locked up on the terms and in accordance with the MSR
•The lock-up will apply for as long as the relevant target MSR applicable to the executive director or prescribed officer has not been met
•Once the relevant target MSR has been met, any deferred shares that subsequently vest in and are settled to an executive director or prescribed officer will vest and be settled in accordance with the terms of the deferred share plan
•An executive director or prescribed officer may elect to voluntarily lock-up shares that vest in terms of the deferred share plan even if it results in locked-up shares exceeding the target MSR – if the locked-up shares exceed the target MSR, the excess shares will remain in lock-up until the next vesting date (in terms of any relevant Harmony share incentive plans applicable at the time) at which point the excess shares will be released from lock-up and settled in accordance with the terms of the deferred share plan.
The minimum shareholding requirement will continue to apply to an executive director or prescribed officer as long as they remain an executive director or prescribed officer.
If an executive director or prescribed officer ceases to be employed by the group for any reason, their locked-up shares will be released from the lock-up on the date of terminating employment.
Target MSR
The target MSR is the relevant target minimum shareholding value (expressed in South African Rand) that is required to be held by an executive director or prescribed officer from time to time pursuant to this MSR being a minimum of 100% of their respective cost to company.
Measurement of target MSR
Each tranche of locked-up shares will be deemed to have a value for the purposes of determining whether the target MSR has been met, equal to the one-day volume-weighted average price (VWAP) of a share in South African Rand (ZAR) at the date of such lock up, multiplied by the number of shares to be locked up in such tranche. This value will be increased yearly by the applicable consumer price index (CPI) rate for the year.
Trading restriction
Appropriate entries in the relevant registers will be made to record that all the executive director or prescribed officer’s shares, which are subject to the lock-up, will be noted by the relevant central securities depository participant in terms of section 39 of the Financial Markets Act and the appropriate flag placed on the relevant securities account.
Voting and dividends
An executive director or prescribed officer will, in respect of vested shares that are subject to the lock-up:
•Exercise all voting rights in respect of such shares
•Receive all distributions payable in respect of such shares.
Application to foreign prescribed officer
The target MSR of the foreign prescribed officer will be determined on the date on which this MSR is adopted or first applies to the foreign prescribed officer (whichever occurs first). In calculating the target MSR of the foreign prescribed officer, the company will use the cost to company (in ZAR) of the Group Chief Operating Officer-Operations.
The ZAR value of any shares that are to be locked up (in terms of this MSR) will be determined on the applicable vesting date with reference to the share price on that date.
To determine whether the target MSR has been satisfied, the pre-tax value of the locked-up shares will be taken into account.
Deferred share plan limit
The overall limit for deferred shares, issued under the 2018 deferred share plan, is 5% of the shares in issue at the time the plan was approved, amounting to 25 000 000 shares. The individual limit is 0.6%, amounting to 3 000 000 shares.
Pay mix for prescribed officers
The tables below illustrate the pay mix for prescribed officers, based on achieving minimum, on-target and stretch performance. The composition of total remuneration outcomes for FY23 and FY24 is illustrated below.
Chief executive officer
FY23 pay mix
|
|
|
|
|
|
|
|
|
|
|
|
|
Minimum (%) |
On-target (%) |
Stretch
(%) |
| Salary benefits |
85 |
|
85 |
|
85 |
|
| Retirement savings and contributions |
15 |
|
15 |
|
15 |
|
| Guaranteed pay |
100 |
|
100 |
|
100 |
|
| Short-term incentive |
— |
|
60 |
|
100 |
|
| Long-term incentive |
— |
|
90 |
|
150 |
|
| Total remuneration |
100 |
|
250 |
|
350 |
|
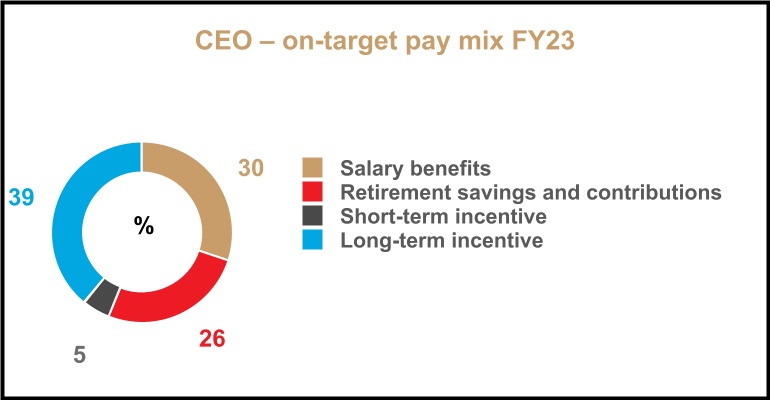
Chief executive officer
FY24 pay mix
|
|
|
|
|
|
|
|
|
|
|
|
|
Minimum (%) |
On-target (%) |
Stretch
(%) |
Salary benefits |
85 |
|
85 |
|
85 |
|
| Retirement savings and contributions |
15 |
|
15 |
|
15 |
|
| Guaranteed pay |
100 |
|
100 |
|
100 |
|
| Short-term incentive |
— |
|
72 |
|
120 |
|
| Long-term incentive |
— |
|
108 |
|
180 |
|
| Total Remuneration |
100 |
|
280 |
|
400 |
|
Other executives (financial director, other executive directors and prescribed officers)
FY23 pay mix
|
|
|
|
|
|
|
|
|
|
|
|
|
Minimum (%) |
On-target (%) |
Stretch
(%) |
| Salary benefits |
90 |
|
90 |
|
90 |
|
| Retirement savings and contributions |
10 |
|
10 |
|
10 |
|
| Guaranteed pay |
100 |
|
100 |
|
100 |
|
| Short-term incentive |
— |
|
55 |
|
92 |
|
| Long-term incentive |
— |
|
83 |
|
138 |
|
| Total remuneration |
100 |
|
238 |
|
330 |
|
Other executives (financial director, other executive directors and prescribed officers)
FY24 pay mix
|
|
|
|
|
|
|
|
|
|
|
|
|
Minimum (%) |
On-target (%) |
Stretch
(%) |
Salary benefits |
90 |
|
90 |
|
90 |
|
| Retirement savings and contributions |
10 |
|
10 |
|
10 |
|
| Guaranteed pay |
100 |
|
100 |
|
100 |
|
| Short-term incentive |
— |
|
60 |
|
100 |
|
| Long-term incentive |
— |
|
90 |
|
150 |
|
| Total Remuneration |
100 |
|
250 |
|
350 |
|
Average monthly wages and benefits underground
FY23 policy
|
|
|
|
|
|
|
|
|
| Total remuneration |
Category 4
(%) |
Category 8
(%) |
| Fixed earnings |
64 |
|
62 |
|
| Company benefits |
14 |
|
12 |
|
| Guaranteed pay |
78 |
|
74 |
|
| Variable pay |
22 |
|
26 |
|
| Total remuneration |
100 |
|
100 |
|
Each component includes:
•Fixed earning: Basic pay, service increment, 13th cheque, living-out allowance
•Variable income: Average overtime, shift allowance, average bonus, meal allowance, unemployment insurance fund/skills development levy, insurance benefit
•Company benefits: Employer provident/pension fund and medical aid.
Non-executive director fees
Market comparisons, the fiduciary risks carried by non-executive directors, their workload, time commitments, expertise and preparation expected of each non-executive director role are considered when reviewing our non-executive director fees.
Harmony’s philosophy on remunerating non-executive directors is to ensure that they are fairly rewarded for their contribution to the company’s governance. Non-executive directors’ fees are reviewed annually and compared to the market median of companies of comparable size and complexity to ensure they remain fair and competitive.
The Non-executive director fees were benchmarked against a comparator group of JSE listed mining companies and the current fee levels are reasonably aligned to the median of the comparator group. Based on this analysis an inflationary increase of 5.5% is proposed in FY24 for non-executive director fees. This is consistent with executive increases.
In line with the recommendations of King IV, our non-executive directors are paid a retainer for board meetings and attendance fee for every board meeting attended. Non-executive directors also receive a retainer for serving on a committee. In addition, a per-day ad hoc fee is paid for site visits, special meetings or attending to company business. This fee is reduced commensurately to reflect time actually spent in this regard which is shorter than a full day.
Non-executive directors do not receive share options or other incentive awards correlated with the share price or group performance, as these may impair their ability to provide impartial oversight and advice.
Performance of management
The personal performance of employees will not be taken into account in determining the total incentive plan outcome. Harmony follows a team-based balanced scorecard approach in determining incentive awards. All management employees are assessed every year against set key performance indicators which are used to guide the development and promotion of such employees.
Contracts, severance and termination
Executive directors and executive managers have employment contracts with Harmony that include notice periods of up to
90 days. There are no balloon payments on termination, automatic entitlement to bonuses or automatic entitlement to share-based payments other than in terms of the company’s approved share incentive plans.
Malus and clawback
Malus is the forfeiture of a variable pay award before it vests or is settled, and clawback refers to a requirement to repay some or all of an award after it has vested or is settled.
The remuneration committee has the discretion to determine that a prescribed officer or executive manager’s total share plan award is subject to reduction, forfeiture or clawback (in whole or in part) if:
•There is reasonable evidence of misbehaviour or material error by a prescribed officer or executive manager
•The financial performance of the group, company, employer company or relevant business unit for any financial year, used to determine an award, have subsequently appeared to be materially inaccurate
•The group, company, employer company or relevant business unit suffers a material downturn in its financial performance for which the prescribed officer or executive manager can be seen to have some liability
•The group, company, employer company or relevant business unit suffers a material failure of risk management for which the prescribed officer or executive manager can be seen to have some liability or in any other circumstances if the remuneration committee determines that it is reasonable to subject the awards of one or more prescribed officers or executive managers to reduction or forfeiture.
Procedures to impose any malus or clawback provisions must be initiated within three years of the award. To eliminate doubt, the provisions of this malus and clawback policy do not detract from any other legal rights or measures the company has as recourse for acts of fraud, wrongdoing and/or negligence by its prescribed officers or executive management.
Shareholder feedback
We maintain open communication channels with our shareholders, listen to feedback and take action where this is deemed to be in the best interests of the company.
PART 2: REMUNERATION IMPLEMENTATION REPORT ON THE POLICY APPLICABLE IN FY23
This section of the report includes details of the implementation and outcomes of the remuneration policy for FY23. We report on the increase in guaranteed packages and performance outcomes for the total incentive plan.
We have also included disclosure of total single-figure remuneration, the schedule of unvested awards and cash flows for executive directors and prescribed officers in line with the applicable King IV requirements, and with the guidance statement from the Institute of Directors and the South African Reward Association. The remuneration of non-executive directors is disclosed as required by King IV and the Companies Act.
Increases to guaranteed packages during the year
An assessment of executive remuneration was undertaken during the year. Taking into consideration prevailing market conditions, affordability and shareholders’ expectations, an average increase of 6% to guaranteed remuneration packages of management was made in FY23. The average percentage increases awarded to executives, management and bargaining-unit employees staff in, FY21, FY22 and FY23 are illustrated below.
Pay fairness and equality
In FY23, an average increase of 6% in guaranteed remuneration packages was awarded for management and executives. The bargaining-unit employees received a 7.72% increase as approved in the June 2021 wage agreement. Bargaining-unit employees have received above-inflation increases for the past six years. The average total monthly remuneration of our category 4-8 employees is set out below. We continue to focus on fairly remunerating our employees at this level to address the challenges of inequality and poverty.
Grade
|
|
|
|
|
|
|
|
|
|
|
|
|
|
|
|
Fixed
earnings
(R) |
Variable income
(R) |
Company
benefits
(R) |
Total
per month
(R) |
| Category 4 underground employee (general worker) |
17 600 |
|
6 064 |
|
3 671 |
|
27 335 |
|
| Category 8 underground employee (team leader) |
21 751 |
|
8 952 |
|
4 244 |
|
34 947 |
|
Pay gap ratio
|
|
|
|
|
|
|
|
|
|
|
|
|
|
|
|
|
|
|
|
|
|
|
|
|
Number |
Sum of Earnings (R) |
Ratio (%) |
Average Earnings (R) |
Ratio (%) |
| Number of Employees |
32 930 |
|
|
|
|
|
|
|
| 5% of employees |
1 647 |
|
of the top 5% |
2 650 557 514 |
|
|
of the top 5% |
1 609 325 |
|
|
| 5% of employees |
1 647 |
|
of the lowest 5% |
341 869 018 |
|
7.75 |
|
of the lowest 5% |
207 571 |
|
7.75 |
|
Incentive payments attributable to FY23
Total incentive plan
Actual performance outcomes based on the FY23 balanced scorecard for the period 1 July 2022 to 30 June 2023 scores on the basis of achievement out of the maximum score is as follows:
FY23 scorecard result for the group
|
|
|
|
|
|
|
|
|
|
|
|
|
|
|
|
|
|
|
|
|
|
|
|
|
|
|
| Performance drivers |
Description |
Target |
Actual |
% Achieved |
Qlfy |
Weighting |
Scorecard line result |
Final outcome |
| Shareholder value |
Total shareholder return (TSR) |
|
|
|
|
|
|
|
| – TSR absolute |
56.00 |
% |
(13.00) |
% |
(13.00) |
% |
NO |
8.34 |
|
— |
% |
— |
% |
| – TSR versus SA JSE-listed gold-mining comparators |
10.00 |
% |
(15.00) |
% |
(15.10) |
% |
NO |
8.33 |
|
— |
% |
— |
% |
| – TSR versus FTSE Gold Mines |
10.00 |
% |
2.00 |
% |
2.50 |
% |
YES |
8.33 |
|
45.00 |
% |
3.75 |
% |
| Operational and financial |
Kilograms total Harmony |
46 326 |
45 651 |
98.50 |
% |
YES |
20.00 |
|
54.20 |
% |
10.83 |
% |
Total production cost (SA)(Rm) |
36 341 |
36 738 |
98.90 |
% |
YES |
12.00 |
|
55.60 |
% |
6.68 |
% |
Total production cost (SEA) (US$/m) |
253 |
212 |
116.10 |
% |
YES |
3.00 |
|
100.00 |
% |
3.00 |
% |
| Net free cash flow |
5 262 |
6 614 |
125.70 |
% |
YES |
10.00 |
|
94.20 |
% |
9.42 |
% |
| Growth |
Reserve addition (Moz) |
|
0.728 |
|
NO |
10.00 |
|
— |
% |
— |
% |
| Sustainability |
LTIFR total SA ops |
6.03 |
5.74 |
104.80 |
% |
YES |
15.00 |
|
98.50 |
% |
14.77 |
% |
| ESG |
|
|
|
YES |
5.00 |
|
100.00 |
% |
5.00 |
% |
|
|
|
|
|
|
100.00 |
|
|
53.45 |
% |
|
|
|
|
|
|
|
|
|
|
|
|
|
|
|
|
|
|
|
|
|
|
|
|
|
FY20 |
FY21 |
FY22 |
Three-year
average |
FY23 |
%
variation |
% of LTIFR awarded |
| Loss of life incidents versus actual* |
6 |
10 |
9 |
8 |
6 |
28.00 |
% |
100.00% |
|
|
|
|
|
Final LTIFR % |
14.77% |
|
|
|
|
|
|
|
|
|
|
|
|
|
Final scorecard result** |
53.45% |
* Final LTIFR % after any adjustment for Loss of life incidents as more fully described below.
** Note that the scorecard outcome will be expressed as a percentage of target from FY24 onwards, so the equivalent score in FY24 will be 53.45/60 = 89.08%.
Transactional arrangements subsequent to group executive structural changes:
The changes to the group executive structure effected 1 February 2023 necessitated some re-alignments in the application of the balanced scorecard for the Group Chief Operating Officers.
•For the remainder of FY23, the Group COO – Operations remained on the current arrangements, i.e. 40% Group and 60% SA Ops.
•New Business Dev and Growth COO and Managers – as from 1 February 2023 these participants had a split of 7/12 months SEA and 5/12 months Group performance vesting % outcome only for FY23.
The LTIFR award percentage was adjusted as follows:
•The actual number of fatalities compared to the average fatalities over the previous 3 years
–Equal to or better than the average – full LTIFR award
–Up to 20% above the average – 60% of LTIFR award
–Between 20% and 40% above the average – 40% of LTIFR award
–More than 40% above the average – 0% of LTIFR award.
–
FY23 total incentive award calculation
|
|
|
|
|
|
|
|
|
|
|
|
|
|
|
|
|
|
|
|
|
|
|
|
|
|
|
|
|
|
|
|
|
|
|
|
|
|
|
|
|
|
|
|
|
|
|
|
|
|
|
|
|
|
|
|
|
Total
incentive (R) |
= |
Guaranteed
pay (R) |
X |
On-target
factor (%)
|
X |
Balanced
scorecard result (%) |
|
|
|
|
|
|
|
|
|
|
|
|
|
|
|
|
|
|
|
|
|
|
|
|
* Please refer to table on total single-figure remuneration below.
|
|
|
|
|
|
|
|
|
|
|
|
|
|
|
|
|
|
|
|
|
|
|
|
|
|
|
|
|
|
|
|
Total incentive plan (TIP) FY23 award |
| Executive directors and prescribed officers |
Cost to
company
|
Participation factor |
BSC
results |
TIP
value* |
% settled
in cash |
TIP cash value* |
% settled
in shares |
DSP awarded** |
Vesting
years |
|
| PW Steenkamp |
11 471 980 |
|
250 |
% |
53.45 |
% |
14 867 |
|
40 |
% |
5 947 |
|
60 |
% |
107 |
|
5 |
|
| BP Lekubo |
7 560 053 |
|
230 |
% |
53.45 |
% |
8 174 |
|
40 |
% |
3 269 |
|
60 |
% |
59 |
|
5 |
|
| HE Mashego |
5 931 734 |
|
230 |
% |
53.45 |
% |
7 292 |
|
40 |
% |
2 917 |
|
60 |
% |
52 |
|
5 |
|
| AZ Buthelezi |
5 582 808 |
|
230 |
% |
53.45 |
% |
6 863 |
|
40 |
% |
2 745 |
|
60 |
% |
49 |
|
5 |
|
| M Naidoo-Vermaak |
5 582 808 |
|
230 |
% |
53.45 |
% |
6 844 |
|
40 |
% |
2 738 |
|
60 |
% |
49 |
|
5 |
|
| BB Nel |
7 150 000 |
|
230 |
% |
56.01 |
% |
9 211 |
|
40 |
% |
3 684 |
|
60 |
% |
66 |
|
5 |
|
| MP Van Der Walt |
5 582 808 |
|
230 |
% |
53.45 |
% |
6 863 |
|
40 |
% |
2 745 |
|
60 |
% |
49 |
|
5 |
|
| JJ Van Heerden *** |
9 307 730 |
|
230 |
% |
35.18% & 53.45% |
9 161 |
|
40 |
% |
3 664 |
|
60 |
% |
66 |
|
5 |
|
* Figures in R’000.
** Figures in ‘000.
***As from 1 February 2023 the Prescribed Officer had a split of 7/12 months SEA (BSC results = 35.18%) and
5/12 months Group (BSC results = 53.45%) performance outcome and vesting for FY23.
In addition to the awards in terms of the total incentive plan detailed above a special cash-settled retention award during the financial year was granted to Mr BB Nel, of 100% of his Cost to Company package, settled in two tranches, on the first and second anniversaries of the award. This will take care of a retention period of 36 months (three years) from the date of acceptance of the retention award.This will take care of a retention period of 36 months (3 years) from the date of acceptance of the retention award.
Mr Nel is a seasoned Mining Engineer with extensive managerial experience and has an exceptional track record on delivering on the operational targets. He is a well-qualified mining operations executive with an MBA passed with distinction. His current portfolio that also includes international operations makes him particularly valuable to us. The current situation in the South African Mining Industry with various mining executive vacancies has provided the motivation for the company to retain his skills within the Organisation. His continued employment is of significant importance to maintain our current organisational and strategic objectives.
In 2021, independent market research indicated a deficit to the median of approximately 15% of the remuneration of our
Chief Operating Officers.
To address the deficit, a special adjustment over a two-year period was recommended. In FY22 a special adjustment of 7% (excluding the annual salary increase of 5%) and in FY23, a special adjustment of 4% (excluding the annual salary increase of 6%) was considered and recommended by the committee, which aligned their remuneration to market.
Remuneration of executive directors and prescribed officers
Total single-figure remuneration
Executive director and prescribed officer remuneration, in terms of total single-figure remuneration, as required by King IV and in line with the guideline note issued by the Institute of Directors South Africa and the South African Reward Association (the guideline note), is detailed below.
Remuneration paid for the year ended 30 June 2023
|
|
|
|
|
|
|
|
|
|
|
|
|
|
|
|
|
|
|
|
|
|
|
|
|
|
|
|
Salary and benefits |
Retirement savings and contributions |
Total incentive cash portion accrued |
Deferred awards accrued* |
Total single figure of remuneration |
Less: amount accrued not settled in FY23 |
Plus: amount of previous accruals settled in FY22 |
Total cash remuneration |
| Executive directors |
|
|
|
|
|
|
|
|
| PW Steenkamp |
9 687 365 |
|
1 734 379 |
|
5 946 980 |
|
8 920 470 |
|
26 289 194 |
|
(14 867 450) |
|
3 736 028 |
|
15 157 772 |
|
| BP Lekubo |
7 493 390 |
|
435 940 |
|
3 269 434 |
|
4 904 151 |
|
16 102 915 |
|
(8 173 584) |
|
2 296 544 |
|
10 225 875 |
|
| HE Mashego |
5 402 859 |
|
817 075 |
|
2 916 871 |
|
4 375 306 |
|
13 512 111 |
|
(7 292 177) |
|
1 801 904 |
|
8 021 838 |
|
| Prescribed officers |
|
|
|
|
|
|
|
|
AZ Buthelezi |
4 915 422 |
|
726 298 |
|
2 745 290 |
|
4 117 935 |
|
12 504 945 |
|
(6 863 225) |
|
1 565 812 |
|
7 207 532 |
|
M Naidoo Vermaak |
4 932 959 |
|
787 231 |
|
2 737 769 |
|
4 106 653 |
|
12 564 612 |
|
(6 844 422) |
|
1 695 910 |
|
7 416 100 |
|
| BB Nel |
6 242 431 |
|
1 066 884 |
|
3 684 338 |
|
12 676 507 |
|
23 670 159 |
|
(16 360 845) |
|
1 777 854 |
|
9 087 169 |
|
| MP van der Walt |
4 786 865 |
|
781 337 |
|
2 745 290 |
|
4 117 935 |
|
12 431 427 |
|
(6 863 225) |
|
1 551 873 |
|
7 120 075 |
|
JJ van Heerden1 |
9 080 000 |
|
329 000 |
|
3 664 368 |
|
5 496 551 |
|
18 569 919 |
|
(9 160 919) |
|
1 977 537 |
|
11 386 536 |
|
|
|
|
|
|
|
|
|
|
|
|
|
|
|
|
|
|
|
1Salary is paid in A$ and the Rand equivalent is influenced by the weakening or strengthening of the Rand/A$ exchange rate.
* Includes the Deferred Share Portion Accrued of the Total Incentive and the Special Award of R 7 150 000 to Mr BB Nel.
Non-executive directors’ fees
On the recommendation of the remuneration committee, the board proposed increases in fees ranging from 5% to 20% for
non-executive directors’ fees, depending on the extent to which the fee for the role was below benchmark, which was approved at the annual general meeting in November 2022. Non-executive director fees paid in FY22 and FY23 are set out below:
|
|
|
|
|
|
|
|
|
|
|
|
| Director (R000) |
|
20231 |
20221 |
| Dr Patrice Motsepe |
|
2 014 |
|
1 636 |
|
| Karabo Nondumo |
|
1 878 |
|
1 183 |
|
| Dr Mavuso Msimang |
|
1 222 |
|
1 076 |
|
Joaquim Chissano2 |
|
368 |
|
724 |
|
Fikile De Buck3 |
|
— |
|
637 |
|
Dr Simo Lushaba3 |
|
— |
|
591 |
|
Modise Motloba4 |
|
18 |
|
1 494 |
|
Bongani Nqwababa |
|
1 471 |
|
111 |
|
| Vishnu Pillay |
|
1 332 |
|
1 220 |
|
Martin Prinsloo |
|
1 346 |
|
111 |
|
| Given Sibiya |
|
1 006 |
|
820 |
|
| Peter Turner |
|
1 181 |
|
977 |
|
| John Wetton |
|
1 541 |
|
1 310 |
|
Andre Wilkens2 |
|
497 |
|
1 028 |
|
| Total |
|
13 874 |
|
12 918 |
|
Notes
1Directors' remuneration excludes value added tax.
2Retired as non-executive director effective 29 November 2022.
3Retired as non-executive director effective 7 December 2021.
4Resigned as non-executive director effective 27 June 2022.
AUDIT AND RISK COMMITTEE: CHAIRPERSON’S REPORT
Dear shareholder
I am pleased to present the audit and risk committee report for the financial year ended 30 June 2023 (FY23).
This report considers those material matters on which the audit and risk committee (the committee) deliberated during the reporting period. These matters extend beyond statutory compliance and relate to the committee’s role in supporting value creation and delivery on Harmony’s strategic objectives.
Introduction
This committee is an independent, statutory committee whose members are appointed annually by Harmony’s shareholders in compliance with section 94 of the South African Companies Act of 2008, as amended (the Act), and the principles of good governance. In addition to this Act, the committee’s duties are guided by the JSE Listings Requirements, the King IV Code on Corporate GovernanceTM* 2016 (King IV) and its terms of reference. Furthermore, the board of directors delegates oversight of specific functions to the committee.
* Copyrights and trademarks are owned by the Institute of Directors in South Africa NPC and all of its rights are reserved.
Terms of reference and discharge of responsibilities
The formal board approved committee terms of reference, are reviewed and updated annually (or more frequently if required) by both the committee and the board. The committee is satisfied that, during FY23, it has conducted its affairs and discharged its legal and other responsibilities in accordance with its terms of reference.
Composition and function
Members: J Wetton (Chairperson); K Nondumo; G Sibiya; B Nqwababa; M Prinsloo.
Mr Bongani Nqwababa and Mr Martin Prinsloo were elected by shareholders at the 2022 annual general meeting and the rest of the members were re-elected. All members have the appropriate academic qualifications, financial literacy, business and financial acumen. As at the date of this report, the committee has five members, all of whom (in the opinion of the board) are independent non-executive directors.
The chairman of the board is not a member of the committee but may attend meetings by invitation. Board members are entitled to attend committee meetings as observers. However, non-committee members are not entitled to participate without the consent of the chair, do not have a vote and are not entitled to fees for attendance.
The group chief executive officer (CEO) and financial director (FD) – together with members of the executive team and senior managers representing areas relevant to the discussions at the committee, as well as the external auditors, the chief audit executive and assurance providers attend meetings either by standing invitation or as and when required.
The internal and external auditors have unlimited access to the chairperson of the committee. The chief audit executive reports directly to the committee.
Responsibilities
The responsibilities of the committee are set out in the committee terms of reference and include, among others:
•To ensure the integrity of financial statements and related reporting, that they comply with International Financial Reporting Standards (IFRS), the SAICA Financial Reporting Guides and other relevant regulatory bodies stated above and fairly represent the financial position of the group, the company and our operations
•To monitor internal controls, the internal audit function, combined assurance and matters pertaining to the external auditors
•To oversee corporate governance, particularly in relation to legislative and regulatory compliance
•To oversee the management of risk, as well as information technology (IT) governance and cyber security.
The committee believes that it complied with its legal, regulatory and other responsibilities during the past financial year. No major concerns were raised in FY23.
Reporting
The committee reviewed the appropriateness of the following FY23 reports and their related processes:
•Integrated annual report and its related suite of reports
•Mineral Resource and Mineral Reserve statement
•Annual financial statements and accounting practices
•Annual report filed on Form 20-F with the United States Securities and Exchange Commission.
The committee submits that these reports represent a fair view of the group’s performance for FY23 and recommended them to the board for approval.
Duties discharged in FY23
•Reviewed the company’s quarterly, half year and annual financial results
•Ensured it has access to all the financial information of Harmony to allow the company to effectively prepare and report on its financial statements
•Monitored the internal control environment in Harmony and found it to be effective
•Discussed the appropriateness of accounting principles, critical accounting policies, management’s judgements, estimates and impairments, all of which were found to be appropriate
•Executed its responsibility by ensuring that Harmony has established the appropriate financial reporting procedures and these procedures are operating. These procedures, include consideration of all entities included in the consolidated group IFRS financial statements, to ensure that it has access to all the financial information to allow Harmony to effectively prepare and report on its financial statements
•Considered the JSE‘s latest report on the proactive monitoring of financial statements
•Considered the appointment of the external auditor, Ernst & Young Incorporated (EY), as the registered independent auditor for the ensuing year, and provided oversight for the external audit transition with PricewaterhouseCoopers Incorporated (PwC)
•Considered the suitability, and satisfied itself, of the external audit partner firm following assessment of the information provided by that firm, in terms of paragraph 3.84(g)(iii) and paragraph 22.15(h) of the JSE Listings Requirements, to determine the suitability of its appointment as the external audit firm and of the designated individual partner
•Ensured that the appointment of the external audit firm is presented and included as a resolution at the annual general meeting
•Satisfied itself that the external audit firm, EY, was suitable and independent from the company
•Reviewed and approved external audit plans, terms of engagement and fees, as well as the nature and extent of non-audit services rendered by the external auditors
•Evaluated the independence and effectiveness of the internal audit function
•Reviewed and approved internal audit budget, the internal audit charter and risk-based plans
•Evaluated and coordinated the internal audit, external audit and sustainability assurance processes
•Received and considered reports from the external and internal auditors
•Considered the appropriateness, expertise and experience of the FD and the finance function – both were found to be adequate and appropriate
•Evaluated and considered Harmony’s risks, and measures taken to mitigate those risks
•Considered whether IT risks are adequately addressed and whether appropriate controls are in place to address these risks. The committee oversees and monitors the governance of IT on behalf of the board, a task it views as a critical aspect of risk management
•Considered and confirmed the company as a going concern
•Considered and approved the company’s non-audit services policy
•Reviewed and recommended changes to the committee’s terms of reference to the board for approval
•Reviewed the adequacy of the group’s insurance coverage
•Reviewed legal matters that could have a significant impact on the company’s business.
* Refer to audit firm rotation process in the external auditor section below.
Key focus areas in FY23
Interim and annual financial statements
The annual financial statements have been prepared in accordance with IFRS, SAICA Financial Reporting Guides, the requirements of the South African Companies Act 71 of 2008, the Listings Requirements of the JSE Limited and the recommendations of King IV.
In terms of paragraph 3.84(k) of the JSE Listings Requirements, the committee reviewed and assessed the process implemented by management to enable the CEO and the FD to pronounce on the annual financial statements and the system of internal control over financial reporting. The results from the process were communicated to the committee. The committee considered any deficiencies as well as the appropriateness of management’s response including remediation, reliance on compensating controls and additional review procedures. The committee, on behalf of the board, has noted the final confirmation of the CEO and FD.
External auditor – appointment, independence and tenure
Having considered the external auditor’s previous appointments and the extent of other work undertaken for the group, the committee is satisfied that PwC and EY are independent of the group, as per section 94(8) of the Act. The committee also satisfied itself as to the suitability of PwC and the designated audit partner.
A formal procedure has been adopted to govern the process whereby the external auditor may be considered for non-audit services and the extent of these services is closely monitored by the committee. Total fees approved for the external auditor, PwC, for the year were R58.2 million, of which R58.1 million was for audit-related services, R0.1 million for non-audit services.
PwC has been Harmony’s external auditor for 73 years. At the 2022 annual general meeting, PwC was reappointed as the independent external auditor and undertook to hold office until the end of the 2023 annual general meeting on 30 November 2023.
Mr S Masondo remained the registered lead audit partner responsible for the audit for the financial year ended 30 June 2023.
As part of Harmony’s commitment to transformation, PwC partnered with Ngubane & Co, a level 1 broad-based black economic empowerment company until 31 July 2023. On 1 August 2023, Ngubane & Co merged with RSM South Africa Inc and the subcontracting arrangement was effectively terminated.
Audit firm rotation
In FY21, the committee had recommended, and the board endorsed, the appointment of EY following the conclusion of a comprehensive and rigorous tender process. Shareholders approved EY’s appointment at the annual general meeting held on 29 November 2022. The board is proposing the reappointment of EY at the annual general meeting to be held on 4 December 2023.
PwC continued to act as external auditors of the company for the 2022 and 2023 financial years, following shareholder approval at the 29 November 2022 annual general meeting.
The company, again, thanks PwC for their services over the years and looks forward to beginning a new chapter with EY.
Internal controls and internal audit
Having reviewed the design, implementation and effectiveness of the group’s system of internal financial controls, the committee is satisfied that these are effective and form a reliable basis for the preparation of the financial statements. No findings came to the attention of the committee to indicate any material breakdown in internal controls during the past financial year.
In terms of internal audit, the committee is responsible for:
•Ensuring that the group’s internal audit function is independent and has the necessary resources, standing and authority within the group to enable it to perform its duties
•Overseeing cooperation between internal audit and the external auditors, and serving as a link between the board of directors and these functions.
In line with King IV and its recommendations, the committee has confirmed the effectiveness of the group chief audit executive, Ms Besky Maluleka-Ngunjiri, and is satisfied that she has the appropriate expertise and experience to meet the responsibilities of this position. The chief audit executive reports quarterly, or as necessary, to the committee on internal audit and has direct access to the committee, primarily through its chairperson.
The committee is satisfied that internal audit follows an approved risk-based internal audit plan and regularly reviews the group’s risk profile. Internal audit submits an overall statement on the effectiveness of the group’s governance, risk management and control processes.
Combined assurance
The committee is satisfied that the group has optimised the assurance coverage obtained from management, and internal and external assurance providers. The committee is also satisfied that the various external assurances that are obtained and related systems and procedures are effective in achieving the following objectives:
•Enabling an effective internal control environment
•Supporting the integrity of information used for internal decision-making by management, the board and its committees
•Supporting the integrity of external reports
•Minimising assurance fatigue.
Governance of risk
The committee fulfils a dual function – as an audit committee and as a risk committee. Internal audit conducts regular and full assessments of the risk management function and framework, on which it reports to the committee. The committee is satisfied with the effectiveness of its oversight of risk governance in the group.
In the past year, the committee continued to monitor the newly developed enterprise risk management and resilience policy, risk management guidelines and risk management framework to ensure continued focus on the company’s material risks. The board further approves the group’s risk appetite and tolerance framework.
Appropriateness and experience of FD and effectiveness of the finance function
The committee confirms that it is satisfied that Ms Boipelo Lekubo, the current FD, possesses the appropriate expertise and experience to meet the responsibilities of this position.
Oversight of derivative programme
The committee also monitors and reviews the group’s derivative and hedging strategy. The derivative programmes currently in place were introduced in FY16. In terms of these programmes, up to 20% of gold production may be hedged while transactions for up to 25% of foreign exchange exposure may be entered into.
Technology and information governance
We recognise the increasing importance of technology as both a source of future opportunities and a means by which we conduct our business and improve organisational efficiencies. Accordingly, this committee monitors the governance of technology and information quarterly.
The committee has delegated responsibility to management for digitising the company, implementing enterprise-wide technology and information management policy, and embedding it into the organisation’s day-to-day, medium- and long-term decision-making activities and culture. This ensures operational excellence and delivery on our first strategic pillar.
Given the multiple critical information system changes implemented simultaneously across the organisation, this was a major focus area for the committee during the year. Progress was closely monitored, with management providing detailed quarterly updates on this and on challenges encountered and the steps taken to address such challenges.
In particular during the past year, as part of the process to digitize the company, the committee oversaw management’s implementation of the DMS system which digitized the Engineering maintenance and work order processes. Furthermore the Performance Management system for management employees was implemented as part of the centralized human capital resource management strategic initiatives.
Due to the nature of ever-changing cybercrime attack vectors in both the Information Technology (IT) and Operational Technology (OT) environments, significant effort and focus is required to keep pace and abreast of cyber-related threats. To this end, it is imperative to mitigate risks with controls and investment associated with these threats. This is a major focus area for the committee. As a result, effectiveness is closely monitored, with management providing detailed quarterly updates.
Dividend policy and dividends declaration
The board declared a nil interim ordinary dividend for the year ended 30 June 2023 and declared a final ordinary dividend of 75 SA cents for the year ended 30 June 2023, paid on 16 October 2023 (2022: interim ordinary dividend of 40 SA cents paid on 11 April 2022 and final ordinary dividend of 22 SA cents paid on 17 October 2022). In addition, dividend payments were made in 2022 and 2023 to the non-controlling interest holders in Tswelopele Beneficiation Operation of R16 million and R18 million, respectively.
Harmony declared an annual preference share dividend to the Harmony Gold Community Trust (the Trust). The board declared a preference dividend of R9 million and it was paid to the Trust on 15 August 2023 (2022: R9 million on 10 August 2022).
In considering the payment of dividends, the board, with the assistance of the audit and risk committee, took into account the current financial status of the company and the payment of a proposed dividend subject to the successful application of the solvency and liquidity test as set out in section 4 of the Companies Act of 2008.
The company’s dividend policy remains to pay a return of 20% on net free cash generated to shareholders, at the discretion of the board of directors.
Going concern
The committee has reviewed a documented assessment, including key assumptions prepared by management, of the going concern status of the group.
Integrated annual report
The committee has overseen the integrated reporting process, reviewed the report and has recommended the 2022 Integrated annual report and consolidated financial statements for approval by the board.
Events post year end
•On 3 July 2023 a payment of US$24 million (R450 million), comprising R20 million of capital and R4 million of interest, was made on the US$300 million RCF facility
•On 29 August 2023, a final dividend of 75 SA cents was declared, payable on 16 October 2023
•On 6 September 2023, a payment of US$32 million (R600 million) comprising US$30 million of capital and US$2 million of interest, was made on the US$300 million RCF
•On 8 September 2023, a payment of US$54 million (R994 million), comprising US$50 million of capital and US$4 million of interest, was made on the US$300 million RCF.
In closing
I wish to thank my fellow committee members for discharging their duties professionally and in accordance with the committee mandate, terms of reference and statutory responsibilities.
John L Wetton
Chairperson: audit and risk committee
25 October 2023
SOCIAL AND ETHICS COMMITTEE:
CHAIRPERSON’S REPORT
Dear stakeholder
2023 has presented several disruptive events for the global population. Harmony too has had to navigate around issues of extreme weather events, evolving macro-economic conditions and geopolitical uncertainty. Despite this, Harmony has remained steadfast and successful through these challenges. We have proceeded with our decarbonisation agenda and expanded our portfolio of future facing metals to play our part in supporting worldwide transition to a low carbon future. We remain resolute in uplifting and sharing value with employees and our host communities. We further continue to value our reputation as an ethical and values-driven business.
Mining with purpose is ingrained in our business strategy, business model and processes and is further accentuated by the work of the social and ethics committee. In this year’s ESG report, I am pleased to demonstrate how we moved forward in being purposeful and in creating shared value for our stakeholders.
The report outlines the collective impact of our ESG interventions which saw us achieve leadership positions in the ESG space. We improved our leadership position in the FTSE4Good ESG Index where we featured in the top 95th percentile in the ICB sector; we rank in the top 50 for Sustainalytics within the gold subindustry and our short term and net zero emissions targets have been approved by Science Based Target Initiative (SBTi). We also maintained our inclusion in the Bloomberg gender equality index. This is testament to the firm commitment and high performance in the sustainability conversation in the organisation.
Good corporate citizenship and tangible acts of moral responsibility are the way we do business. We have demonstrated our intent of a harmonious coexistence with host communities and working collaboratively with our suppliers, communities and partners to ensure the development of healthy, inclusive communities.
This committee has a unique mandate set out by the Companies Act. It is also responsible for overseeing governance and our performance in terms of our sustainable development activities. These include ESG considerations; ethics management; stakeholder engagement; employee relations (including empowerment, transformation, employee health and wellness); environmental management and stewardship; socio-economic development and upliftment; and public health and safety. The committee also considered the inevitable trade-offs to ensure Harmony continues to create shared value.
The committee thus complied with its regulatory, legal and other responsibilities mandated by the board. Accordingly, we have applied the principles of King IV with greater emphasis on ethical governance and conduct, as well as responsible corporate citizenship to support the sustainable growth of the company.
Value creation – Key focus areas in FY23
To demonstrate our commitment in addressing our GHG emissions, we have fully commissioned our first 30MW of solar generation capacity in the Free State (phase 1) and we have board approval for the next 137MW of renewable energy (phase 2). We secured the ESG-linked financial transactions to execute phase 2.
Not only will these transactions help us to deliver on our environmental and social obligations and undertakings, they will also derisk the business and deliver many socio-economic benefits. ‘Mining with purpose’ is ensuring that our investors and other stakeholders continue to derive value and positive returns in a global climate of energy uncertainty.
We set out ambitious targets for lowering our water footprint, including the reduction of fresh water usage in water scarce areas by 2030 and initiated many water-stewardship projects. This includes building of our own water treatment plants and water infrastructure in host communities.
Additionally, we have completed our five-year SLP programme at the end of 2022 and invested R349 million over the period in catalysing socio-economic development through our mine community development programme. The programme focuses on food security, education, infrastructure and youth employment which we believe is the bedrock for a healthy community.
As part of ongoing initiatives to create and share value, this committee continues to assess, review and approve the ethics policy, stakeholder engagement policy, environmental policy, employment equity as well as the preferential procurement policy and strategy.
Although some gaps are still being addressed, we are particularly pleased with the company’s progress against short-, medium- and long-term targets.
In the review period, the committee focused on ESG issues and its oversight role. Understanding that our business may have an impact on ecosystems, we ensured that our environmental management programmes are robust and effective.
Harmony’s energy transition
Massive traction was gained in our energy programme, through the setting of our short-term and net zero target. We are committed to achieving net zero by 2045 and are well on target to get to our first target of 20% reduction by 2026. Our targets have been endorsed by the SBTi. Similarly, we are pleased to be introducing our first green electrons into our grid and have a robust development pipeline of renewables.
Ethics management
The Ethics Institute of South Africa continued to assist management and the committee to embed and further improve the governance of organisational ethics. While the governance of ethics is mandated to this committee, the board sets the group’s approach to ethics and is equally responsible and committed to the highest standards of ethical conduct throughout Harmony.
We believe that implementing sound corporate governance practices to mine ethically cannot be compromised or negotiated – our licence to operate rests on legitimate and ethical leadership. Equally, the principles of sustainable development are fundamental in ensuring sustainability and profitability for our stakeholders.
The negative impact of illegal mining in South Africa remains a challenge for our economy and stakeholders alike. Although Harmony has intensified its partnerships to combat the issue, we remain cognisant that further partnerships and collaborations are required to develop innovative solutions in this regard. The committee continued to monitor and assess key improvement areas to address this challenge in Harmony and the industry at large.
Kareerand tailings storage facility
As part of our commitment to our strategic pillar of responsible stewardship, our responsible tailings management measures at Kareerand limit environmental impact, particularly on the nearby Vaal River which is a crucial water source for South Africa and neighbouring communities.
In 2021, board approved an investment of R2 billion in the Kareerand expansion project. The construction is well advanced in the reporting cycle and is a significant enabler to Mine Waste Solutions. As a responsible miner, we believe that mining is one of the biggest contributors to circular economies and to this end, Harmony has the largest reclamation business in the gold sector globally.
Social responsibility
As Harmony, we cannot downplay or undervalue our ability to drive transformation in our host communities. Transformation of living conditions is achieved through our SLP’s. Our next generation SLP commits to R175 million for our South African community.
Our employees, being our most valued asset, are a top priority for us. We have seen the mining industry tackle challenges pertaining to women in the industry. Gender inclusion remains very close to our values and we too have conducted a gender survey wherein we identified opportunities to improving our working environments, making this organisation more progressive and gender inclusive.
The committee continued to monitor the company’s improved stakeholder engagement to proactively reach all levels of government and host communities in South Africa, Australia and Papua New Guinea. This stakeholder-inclusive approach focuses on reactive and proactive engagements, which positions Harmony well with its stakeholders and increases our social and reputational capital.
The safety and health of our workforce remains a key focal point of Harmony’s sustainability. Safety is an important consideration for the committee in terms of ESG and during board discussions. The technical committee has specific oversight of employee safety, while this committee focuses on employee health and public safety.
The board, through the remuneration committee, ensures the implementation of Harmony’s remuneration policies as approved by shareholders. We remunerate fairly and responsibly by ensuring that our remuneration is market-related and in line with the performance of the company. Our safety and ESG outcomes are therefore carefully considered and reinforced in our remuneration policy.
In closing
Our intention and commitment remain to continue focusing on: ensuring employee safety and health, contributing to self-sustaining communities and responsible closure planning, mitigating the environmental impacts of our mining activities, ensuring an enabling culture and empowering our workforce and navigating political and regulatory uncertainty.
I thank my committee members for their valued contribution and unwavering support. To all Harmonites and partners to Harmony, I extend my gratitude for your pursuit of success through your commitment and passion for mining with purpose.
Karabo Nondumo
Chairperson: social and ethics committee
25 October 2023
MINING CHARTER III – COMPLIANCE SCORECARD
We discuss our performance against the mining charter throughout this report. The charter is focused on transformation of the South African mining industry as a whole by promoting equal access to and ownership, expanding business opportunities for historically disadvantaged persons (HDPs), redressing the imbalances of historical injustices and enhancing the social and economic welfare of employees and mine communities.
The mining charter is not a static document – it has been debated and revised a number of times, and is now in its third iteration (effective 2018 and known as Mining Charter III), Harmony will continue to work towards transformation because we believe this supports our social licence to operate. As a mining company we hold to the spirit of the Mining Charter and measure our performance against the charter as an entry point to our transformation journey.
The table summarises our performance against targets for each pillar for the calendar year to 31 December 2022 (the regulatory reporting period). Harmony considers itself to be subject to the Mining Charter. Harmony’s status under the applicable Mining charter is determinative of the applications lodged by Harmony for mining rights. The Broad-Based Black Economic Empowerment Act requires the Department of Trade and Industry to issue the Code of Good Practice on Broad- Based Black Economic Empowerment or sector codes to measure an entities black economic empowerment initiatives. The BBBEE Act and code do not require the DMRE to apply the BBBEE code when determining the qualification criteria for the granting of mining rights or the renewal of existing rights. The codes will only apply to mining companies if they wish to be scored for purposes of contract with organs of state. This means that unless Harmony wishes to be scored for the purpose of contracting with organs of state it is not obliged to obtain a BBBEE certificate. Although that is the case, we have conducted the BBBEE verification audit.
Mining Charter III scorecard for 2022 (January-December)
|
|
|
|
|
|
|
|
|
|
|
|
|
|
|
|
Measure |
Target |
Progress |
Score |
| 1 Reporting |
| Has the company reported its level of compliance with the mining charter for the calendar year? |
Report annually |
Yes |
Yes |
ü |
| 2 Ownership |
| Minimum target for effective ownership by historically disadvantaged South Africans |
Meaningful economic participation; full shareholder rights |
26% |
56 |
% |
ü |
| 3 Employment equity |
| Diversification of workplace to reflect the country’s demographics and attain competitiveness |
Representation of historically disadvantaged persons |
Board: 50% |
57 |
% |
ü |
| Executive committee: 50% |
60 |
% |
ü |
| Senior management: 60% |
59 |
% |
û |
| Middle management: 60% |
58 |
% |
û |
| Junior management: 70% |
69 |
% |
û |
| Core and critical skills: 60% |
72 |
% |
ü |
| Representation of women |
Board: 20% |
21 |
% |
ü |
| Executive committee: 20% |
25 |
% |
ü |
| Senior management: 25% |
28 |
% |
ü |
| Middle management: 25% |
27 |
% |
ü |
| Junior Management : 30% |
20 |
% |
û |
| Employees with disabilities |
1.5% |
0.1 |
% |
û |
| 4 Human resource development |
| Development of the requisite skills, particularly in exploration, mining, processing, technology efficiency, beneficiation and environmental conservation |
Human resource development expenditure as percentage of total annual leviable amount (excluding mandatory skills development levy) |
Invest 5% of leviable amount as defined in human resource development element in proportion to applicable demographics (employees and non-employees) |
4 |
% |
û |
|
|
|
|
|
|
|
|
|
|
|
|
|
|
|
|
Measure |
Target |
Progress |
Score |
| 5 Mine community development* |
| Meaningful contribution towards mine community development in keeping with the principles of the social licence to operate |
Implementation of approved commitments in the SLP |
100% |
85 |
% |
û |
| * Mine community development is reported according to Harmony’s financial year, as agreed with DMRE. This report covers mine community development for the period July 2022 to June 2023. |
| 6 Procurement and enterprise development |
| Total procurement budget spend on goods and services |
Mining goods
A minimum of 70% of total mining goods procurement spend must be spent on South Africa-manufactured goods sourced from BEE-compliant manufacturing companies. Excludes spend on utilities (electricity and water), fuels, lubricants and land rates
|
21% of total mining goods budget must be spent on South African-manufactured goods produced by 50% + 1 vote HDP-owned and controlled companies |
61 |
% |
ü |
| 5% of total mining goods budget must be spent on South Africa-manufactured goods produced by 50% + 1 women and/youth-owned and controlled companies |
10 |
% |
ü |
| 44% of total mining goods budget must be spent on South Africa-manufactured goods produced by at least level 4 BEE 25% + 1 compliant companies |
77 |
% |
ü |
|
Services
A minimum of 80% of total spend on services must be sourced from South Africa-based companies
|
50% of total services budget must be spent on South African companies that are 50% + 1 vote HDP-owned and controlled companies |
53 |
% |
ü |
| 15% of total services budget must be spent on South African companies that are 50% + 1 vote women-owned and controlled companies |
13 |
% |
û |
| 5% of total services budget must be spent on South African companies that are 50% + 1 vote youth-owned and controlled |
4 |
% |
û |
| 10% of total services budget must be spent on South African companies that are at least at level 4 BEE + 25% + 1 compliant companies |
68 |
% |
ü |
| Research and development |
A minimum of 70% of total research and development budget to be spent on South Africa-based entities |
100 |
% |
ü |
| Sample analysis |
Use South Africa-based facilities or companies for analysis of 100% of all mineral samples across mining value chain |
100 |
% |
ü |
| 7 Housing and living conditions |
|
Improve standard of housing and living conditions of mine employees |
Implement all commitments in the housing and living conditions standard |
100 |
% |
ü |
EX-15.2
10
changeinauditors.htm
EX-15.2
Document
EX-96.6
11
kalgold-sxk1300trs2023.htm
EX-96.6
Document
HARMONY GOLD MINING COMPANY LIMITED
Technical Report Summary of the
Mineral Resources and Mineral Reserves
for
Kalgold Mine
North West Province, South Africa
Effective Date: June 30, 2023
Final Report Date: August 31, 2023
Technical Report Summary for
Kalgold Mine, North West Province, South Africa
|
|
|
|
IMPORTANT NOTICE
This Technical Report Summary has been prepared for Harmony Gold Mining Company Limited in support of disclosure and filing requirements with the United States Securities and Exchange Commission’s (SEC) under Regulation S-K 1300; 229.601(b)(96). The quality of information, estimates, and conclusions contained in this Technical Report Summary apply as of the effective date of this report. Subsequent events that may have occurred since that date may have resulted in material changes to such information, estimates and conclusions in this summary. No other party is entitled to rely on this report beyond its intended use and any reliance by a third party on this report is done so at that party’s own risk.
|
Effective Date: June 30, 2023
ii
Technical Report Summary for
Kalgold Mine, North West Province, South Africa
List of Contents
|
|
|
|
|
|
|
|
|
|
|
|
|
|
|
| 1 |
|
|
| 2 |
|
|
| 3 |
|
|
|
3.1 |
|
|
|
3.2 |
|
9 |
| 4 |
|
|
|
4.1 |
|
|
|
4.2 |
|
|
|
4.3 |
|
|
| 5 |
|
|
|
5.1 |
|
|
|
5.2 |
|
|
|
5.3 |
|
|
|
5.4 |
|
|
| 6 |
|
|
|
6.1 |
|
|
|
6.2 |
|
|
|
6.3 |
|
|
|
|
6.3.1 |
|
|
|
|
6.3.2 |
|
|
|
6.4 |
|
|
|
6.5 |
|
|
|
6.6 |
|
|
| 7 |
|
|
|
7.1 |
|
|
|
7.2 |
|
|
|
7.3 |
|
|
|
|
7.3.1 |
|
|
|
|
7.3.2 |
|
|
|
|
7.3.3 |
|
|
|
|
7.3.4 |
|
|
|
|
7.3.5 |
|
|
|
|
7.3.6 |
|
|
|
|
7.3.7 |
|
|
|
|
7.3.8 |
|
|
|
7.4 |
|
|
|
7.5 |
|
|
|
7.6 |
|
|
| 8 |
|
|
|
8.1 |
|
|
|
|
8.1.1 |
|
|
|
|
8.1.2 |
|
|
|
8.2 |
|
|
|
8.3 |
|
|
|
8.4 |
|
|
|
8.5 |
|
|
|
8.6 |
|
|
|
|
8.6.1 |
|
|
|
|
8.6.2 |
|
|
|
|
8.6.3 |
|
|
Effective Date: June 30, 2023
iii
Technical Report Summary for
Kalgold Mine, North West Province, South Africa
|
|
|
|
|
|
|
|
|
|
|
|
|
|
|
|
|
8.6.4 |
|
|
|
8.7 |
|
|
| 9 |
|
|
|
9.1 |
|
|
|
9.2 |
|
|
|
9.3 |
|
36 |
| 10 |
|
|
|
10.1 |
|
|
|
10.2 |
|
|
|
10.3 |
|
|
|
10.4 |
|
|
|
10.5 |
|
38 |
| 11 |
|
|
|
11.1 |
|
|
|
11.2 |
|
|
|
|
11.2.1 |
|
|
|
|
11.2.2 |
|
|
|
11.3 |
|
40 |
|
|
11.3.1 |
|
|
|
|
11.3.2 |
|
|
|
|
11.3.3 |
|
|
|
|
11.3.4 |
|
|
|
|
11.3.5 |
|
|
|
|
11.3.6 |
|
|
|
|
11.3.7 |
|
|
|
|
11.3.8 |
|
|
|
|
11.3.9 |
|
|
|
|
11.3.10 |
|
|
|
|
11.3.11 |
|
|
|
|
11.3.12 |
|
|
|
|
11.3.13 |
|
|
|
|
11.3.14 |
|
|
|
11.4 |
|
|
|
11.5 |
|
|
|
11.6 |
|
|
|
11.7 |
|
|
|
11.8 |
|
|
| 12 |
|
|
|
12.1 |
|
|
|
12.2 |
|
|
|
12.3 |
|
|
|
12.4 |
|
|
|
12.5 |
|
|
| 13 |
|
|
|
13.1 |
|
|
|
|
13.1.1 |
|
|
|
13.2 |
|
|
|
13.3 |
|
|
|
|
13.3.1 |
|
|
|
|
13.3.2 |
|
|
|
13.4 |
|
|
Effective Date: June 30, 2023
iv
Technical Report Summary for
Kalgold Mine, North West Province, South Africa
|
|
|
|
|
|
|
|
|
|
|
|
|
|
|
|
|
13.4.1 |
|
|
|
|
13.4.2 |
|
57 |
|
|
13.4.3 |
|
|
|
|
13.4.4 |
|
|
|
|
13.4.5 |
|
|
|
13.5 |
|
|
| 14 |
|
|
|
14.1 |
|
|
|
14.2 |
|
|
|
14.3 |
|
|
|
14.4 |
|
|
| 15 |
|
|
|
15.1 |
|
|
|
|
15.1.1 |
|
|
|
|
15.1.2 |
|
|
|
|
15.1.3 |
|
|
|
|
15.1.4 |
|
|
|
|
15.1.5 |
|
|
|
|
15.1.6 |
|
|
|
15.2 |
|
|
| 16 |
|
|
|
16.1 |
|
|
|
16.2 |
|
|
|
|
16.2.1 |
|
|
|
|
16.2.2 |
|
|
|
16.3 |
|
|
|
|
16.3.1 |
|
|
|
|
16.3.2 |
|
|
|
|
16.3.3 |
|
|
|
16.4 |
|
|
|
|
16.4.1 |
|
|
|
|
16.4.2 |
|
|
|
|
16.4.3 |
|
|
|
16.5 |
|
|
|
16.6 |
|
|
| 17 |
|
|
|
17.1 |
|
|
|
17.2 |
|
|
|
17.3 |
|
|
|
17.4 |
|
|
|
17.5 |
|
|
|
17.6 |
|
|
|
17.7 |
|
|
|
17.8 |
|
|
| 18 |
|
|
|
18.1 |
|
|
|
18.2 |
|
82 |
|
18.3 |
|
|
| 19 |
|
|
|
19.1 |
|
|
|
|
19.1.1 |
|
|
Effective Date: June 30, 2023
v
Technical Report Summary for
Kalgold Mine, North West Province, South Africa
|
|
|
|
|
|
|
|
|
|
|
|
|
|
|
|
|
19.1.2 |
|
|
|
|
19.1.3 |
|
|
|
|
19.1.4 |
|
|
|
|
19.1.5 |
|
|
|
|
19.1.6 |
|
|
|
|
19.1.7 |
|
|
|
|
19.1.8 |
|
|
|
|
19.1.9 |
|
|
|
|
19.1.10 |
|
|
|
19.2 |
|
|
|
19.3 |
|
|
|
19.4 |
|
88 |
| 20 |
|
|
| 21 |
|
|
| 22 |
|
|
| 23 |
|
|
|
23.1 |
|
|
| 24 |
|
|
| 25 |
|
|
Effective Date: June 30, 2023
vi
Technical Report Summary for
Kalgold Mine, North West Province, South Africa
List of Figures
Effective Date: June 30, 2023
vii
Technical Report Summary for
Kalgold Mine, North West Province, South Africa
List of Tables
|
|
|
|
|
|
|
|
|
|
|
|
|
|
|
|
|
|
|
|
|
|
|
|
|
|
|
|
|
|
|
|
|
|
|
|
|
|
|
|
|
|
|
|
|
|
|
|
|
|
|
|
|
|
|
|
|
|
|
|
|
|
|
|
|
|
|
|
|
|
|
|
|
|
Table 16- 2 Consensus View of Forecast Gold Price |
73 |
|
|
|
|
|
|
|
|
|
|
|
|
|
|
|
|
|
|
|
|
Effective Date: June 30, 2023
viii
Technical Report Summary for
Kalgold Mine, North West Province, South Africa
Units of Measure and Abbreviations
|
|
|
|
|
|
| Unit / Abbreviation |
Description or Definition |
| °C |
degrees Celsius |
| µm |
Micrometres |
| 3D |
Three-dimensional |
| ADT |
Articulated dump truck |
| AE |
Abnormal expenditure |
| Andru Mining |
Andru Mining (Pty) Limited |
| amsl |
Above mean sea level |
| Avg. |
Average |
| BIF |
Banded iron formation |
| c. |
Approximately |
| CIL |
Carbon-in-Leach |
| cm |
Centimetre |
| cmg/t |
Centimetre-grams per tonne |
| CODM |
Chief Operating Decision-Maker |
| Company |
Harmony Gold Mining Company Limited |
| COP |
Code of Practice |
| CRM |
Certified Reference Material |
| COV |
Coefficient of Variation |
| DD |
Diamond Drilling |
| DMRE |
Department of Mineral Resources and Energy |
| DWS |
Department of Water and Sanitation |
| EIA |
Environmental Impact Assessment |
| EMPR |
Environmental Management Programme |
| EMS |
Environmental Management System |
| EMTS |
Electric Monorail Transport System |
| ESG |
Environmental Social and Governance |
| ETF |
Exchange traded fund |
| g |
Gram |
| FEL |
Front end loader |
| GHG |
Greenhouse gas |
| g/t |
Grams per metric tonne |
| GISTM |
Global Industry Standard on Tailings Management |
| HG |
High grade |
| kg |
Kilogram |
| Kalgold |
Kalahari Goldridge Mining Company Limited |
| KGB |
Kalahari Greenstone Belt |
| km |
Kilometre |
| Kpa |
Kilo Pascals |
| ktpm |
Kilo tonnes per month |
| Leapfrog |
Leapfrog Geo 4.5 software |
| LBMA |
London Bullion Market Association |
| LG |
Low grade |
| Ltd |
Limited |
| m |
Metre |
| M |
Million |
| Ma |
Million years |
| masl |
Metres above sea level |
| MCC |
Mining Charter Compliance |
| MCF |
Mine Call Factor |
Effective Date: June 30, 2023
ix
Technical Report Summary for
Kalgold Mine, North West Province, South Africa
|
|
|
|
|
|
| Unit / Abbreviation |
Description or Definition |
| NEMA |
National Environmental Management Act, 107 of 1998 |
| MPRDA |
Mineral and Petroleum Resources Development Act, 28 of 2002 |
| MRMR |
Modified Rock Mass Ratings |
| Moz |
Million troy ounces |
| Mpa |
Mega Pascals |
| Mt |
Million tonnes |
| Mtpa |
Million tonnes per annum |
| Mtpm |
Million tonnes per month |
| No. |
Number |
| NPV |
Net present value |
| OTC |
Over the counter |
| oz |
Troy ounce |
| PERC |
Percussion drilling |
| Pty |
Proprietary |
| QAQC |
Quality Assurance and Quality Control |
| QP |
Qualified Person |
| RC |
Reverse Circulation drilling |
| RCDD |
Reverse Circulation Diamond Drilling |
| RMR |
Rock Mass Ratings |
| SACNASP |
South African Council for Natural Scientific Professions |
| SAMREC |
South African Code for the Reporting of Exploration Results, Mineral Resources and Mineral Reserves |
| SANAS |
South African National Accreditation System |
| SD |
Standard Deviation |
| SEC |
Securities and Exchange Commission |
| SGS |
SGS South Africa (Pty) Limited |
| Shamrock |
Shamrock Mining and Prospecting Company |
| Shell |
Shell Limited |
| SLP |
Social Labour Plan |
| SP |
Stockpile |
| t |
Metric tonne |
| t/m3 |
tonne per cubic metre |
| TRS |
Technical Report Summary |
| TSF |
Tailings Storage Facility |
| UCS |
Uniaxial compressive strength (MPa) |
| USD |
United States Dollars |
| USD/oz |
United States Dollar per troy ounce |
| WRCM |
West Rand Consolidated Mines |
| WUL(s) |
Water Use Licence(s) |
| y-o-y |
Year on year |
| Yr |
Year |
| ZAR |
South African Rand |
| ZAR/kg |
South African Rand per kilogram |
Effective Date: June 30, 2023
x
Technical Report Summary for
Kalgold Mine, North West Province, South Africa
Glossary of Terms
|
|
|
|
|
|
| Term |
Definition |
| Co-kriging |
A method that is used to predict the value of the point at unobserved locations by sample points that are known to be spatially interconnected by adding other variables that have a correlation with the main variable or can also be used to predict 2 or more variables simultaneously. |
| Cut-off grade |
Cut-off grade is the grade (i.e., the concentration of metal or mineral in rock) that determines the destination of the material during mining. For purposes of establishing “prospects of economic extraction,” the cut-off grade is the grade that distinguishes material deemed to have no economic value (it will not be mined in underground mining or if mined in surface mining, its destination will be the waste dump) from material deemed to have economic value (its ultimate destination during mining will be a processing facility). Other terms used in similar fashion as cut-off grade include net smelter return, pay limit, and break-even stripping ratio. |
| Dilution |
Unmineralized rock that is by necessity, removed along with ore during the mining process that effectively lowers the overall grade of the ore. |
| Head grade |
The average grade of ore fed into the mill. |
| Economically viable |
Economically viable, when used in the context of Mineral Reserve determination, means that the qualified person has determined, using a discounted cash flow analysis, or has otherwise analytically determined, that extraction of the Mineral Reserve is economically viable under reasonable investment and market assumptions. |
| Harmony |
Harmony Gold Mining Company Limited |
| Indicated Mineral Resource |
Indicated Mineral Resource is that part of a Mineral Resource for which quantity and grade or quality are estimated on the basis of adequate geological evidence and sampling. The level of geological certainty associated with an Indicated Mineral Resource is sufficient to allow a qualified person to apply Modifying Factors in sufficient detail to support mine planning and evaluation of the economic viability of the deposit. Because an Indicated Mineral Resource has a lower level of confidence than the level of confidence of a Measured Mineral Resource, an Indicated Mineral Resource may only be converted to a probable Mineral Reserve. |
| Inferred Mineral Resource |
Inferred Mineral Resource is that part of a Mineral Resource for which quantity and grade or quality are estimated on the basis of limited geological evidence and sampling. The level of geological uncertainty associated with an Inferred Mineral Resource is too high to apply relevant technical and economic factors likely to influence the prospects of economic extraction in a manner useful for evaluation of economic viability. Because an Inferred Mineral Resource has the lowest level of geological confidence of all Mineral Resources, which prevents the application of the Modifying Factors in a manner useful for evaluation of economic viability, an Inferred Mineral Resource may not be considered when assessing the economic viability of a mining project and may not be converted to a Mineral Reserve. |
| Kriging |
A method of interpolation based on Gaussian process governed by prior covariances. It uses a limited set of sampled data points to estimate the value of a variable over a continuous spatial field. |
| LOM |
The Life of Mine (LOM) is a technically achievable and economically viable period, which is formed from the basis of the determined Mineral Reserves, during which the Proven and Probable Mineral Reserves of the operation are planned to be extracted |
| Mine Call Factor |
The ratio, expressed as a percentage, of the total quantity of recovered and unrecovered mineral product after processing with the amount estimated in the ore based on sampling. |
| Measured Mineral Resource |
Measured Mineral Resource is that part of a Mineral Resource for which quantity and grade or quality are estimated on the basis of conclusive geological evidence and sampling. The level of geological certainty associated with a Measured Mineral Resource is sufficient to allow a qualified person to apply Modifying Factors, as defined in this section, in sufficient detail to support detailed mine planning and final evaluation of the economic viability of the deposit. Because a Measured Mineral Resource has a higher level of confidence than the level of confidence of either an Indicated Mineral Resource or an Inferred Mineral Resource, a Measured Mineral Resource may be converted to a Proven Mineral Reserve or to a Probable Mineral Reserve. |
| Mineral Reserve |
Mineral Reserve is an estimate of tonnage and grade or quality of Indicated and Measured Mineral Resources that, in the opinion of the qualified person, can be the basis of an economically viable project. More specifically, it is the economically mineable part of a Measured or Indicated Mineral Resource, which includes diluting materials and allowances for losses that may occur when the material is mined or extracted. |
| Mineral Resource |
Mineral Resource is a concentration or occurrence of material of economic interest in or on the Earth’s crust in such form, grade or quality, and quantity that there are reasonable prospects for economic extraction. A Mineral Resource is a reasonable estimate of mineralisation, taking into account relevant factors such as cut-off grade, likely mining dimensions, location, or continuity, that, with the assumed and justifiable technical and economic conditions, is likely to, in whole or in part, become economically extractable. It is not merely an inventory of all mineralisation drilled or sampled. |
Effective Date: June 30, 2023
xi
Technical Report Summary for
Kalgold Mine, North West Province, South Africa
|
|
|
|
|
|
| Term |
Definition |
| Modifying Factors |
Modifying Factors are the factors that a qualified person must apply to Indicated and Measured Mineral Resources and then evaluate in order to establish the economic viability of Mineral Reserves. A qualified person must apply and evaluate Modifying Factors to convert Measured and Indicated Mineral Resources to Proven and Probable Mineral Reserves. These factors include but are not restricted to mining; processing; metallurgical; infrastructure; economic; marketing; legal; environmental compliance; plans, negotiations, or agreements with local individuals or groups; and governmental factors. The number, type and specific characteristics of the Modifying Factors applied will necessarily be a function of and depend upon the mineral, mine, property, or project. |
| Pre-Feasibility Study |
A pre-feasibility study (or preliminary feasibility study) is a comprehensive study of a range of options for the technical and economic viability of a mineral project that has advanced to a stage where a qualified person has determined (in the case of underground mining) a preferred mining method, or (in the case of surface mining) a pit configuration, and in all cases has determined an effective method of mineral processing and an effective plan to sell the product.
(1) A pre-feasibility study includes a financial analysis based on reasonable assumptions, based on appropriate testing, about the modifying factors and the evaluation of any other relevant factors that are sufficient for a qualified person to determine if all or part of the Indicated and Measured Mineral Resources may be converted to Mineral Reserves at the time of reporting. The financial analysis must have the level of detail necessary to demonstrate, at the time of reporting, that extraction is economically viable.
(2) A pre-feasibility study is less comprehensive and results in a lower confidence level than a feasibility study. A pre-feasibility study is more comprehensive and results in a higher confidence level than an initial assessment.
|
|
|
| Probable Mineral Reserve |
Probable Mineral Reserve is the economically mineable part of an Indicated and, in some cases, a Measured Mineral Resource. |
| Proven Mineral Reserve |
Proven Mineral Reserve is the economically mineable part of a Measured Mineral Resource and can only result from conversion of a Measured Mineral Resource. |
| Qualified Person |
A qualified person is:
(1) A mineral industry professional with at least five years of relevant experience in the type of mineralization and type of deposit under consideration and in the specific type of activity that person is undertaking on behalf of the registrant; and
(2) An eligible member or licensee in good standing of a recognized professional organization at the time the technical report is prepared. For an organization to be a recognized professional organization, it must:
(i) Be either:
A) An organization recognized within the mining industry as a reputable professional association; or
(B) A board authorized by U.S. federal, state or foreign statute to regulate professionals in the mining, geoscience or related field;
(ii) Admit eligible members primarily on the basis of their academic qualifications and experience;
(iii) Establish and require compliance with professional standards of competence and ethics;
(iv) Require or encourage continuing professional development;
(v) Have and apply disciplinary powers, including the power to suspend or expel a member regardless of where the member practices or resides; and
(vi) Provide a public list of members in good standing.
|
|
|
|
|
|
|
|
|
|
|
| Tailings |
Finely ground rock of low residual value from which valuable minerals have been extracted is discarded and stored in a designed dam facility. |
| Tailings Freeboard |
The vertical height between the beached tailings against the embankment crest and the crest itself. |
Effective Date: June 30, 2023
xii
Technical Report Summary for
Kalgold Mine, North West Province, South Africa
1Executive Summary
Section 229.601(b)(96) (1)
The Qualified Persons (“QP”) of Harmony Gold Mining Company Limited (“Harmony” or the “Company”) have prepared this Technical Report Summary (“TRS”) to disclose the Mineral Resource and Mineral Reserve estimates for the Company’s Kalahari Goldridge Mining Company Limited (“Kalgold” or “Kalgold Mine”). The TRS has been prepared in accordance with the U.S. Securities and Exchange Commission (“SEC”) property disclosure regulations, S-K 1300, with an effective date as at June 30, 2023. No material changes have occurred between the effective date and the date of signature of this TRS.
Property Description
Kalgold is a modular open gold pit mine, extracting ore from a series of satellite orebodies. The mine is in the North West Province of South Africa, 55km southwest of the town of Mahikeng. The Kalgold Mine is serviced by well-maintained sealed roads with good access to all nearby towns and cities. The mine is surrounded by farmland and the closest community is at Kraaipan, approximately 15km to the south of the mine. The Kalgold Mine has been in operation since 1995 and is the only significant mining operation in the region.
The mining rights related to Kalgold was successfully acquired as the Kalahari Goldridge Mining Company Limited in July 1999. Through a successful legislative Section 11 process undertaken in terms of the Mineral and Petroleum Resources Development Act, 2008 (“MPRDA”), Harmony is now the holder of the following mining rights:
•NW30/5/1/2/2/77MR valid from 28 August 2008 to 27 August 2038; and
•NW30/5/1/1/2/863 and 1469PR. The section 102 application in terms of the MPRDA for the Prospecting Right to be incorporated as Kalgold Mining Right was not approved. A new Prospecting Right application will be lodged. The area is currently reserved, and the Department of Mineral Resources and Energy (“DMRE”) may not accept any other applications for the area.
There is no material litigation (including violations or fines) against the Company which threatens its mineral rights, tenure, or operations.
Ownership
Kalgold is 100% owned by Harmony, including the associated mineral rights. Harmony acquired the mine as part of a transaction concluded by the company in July 1999.
Geology and Mineralisation
The Kalgold lode deposit is located within the geological terrane known as the Archaean Kraaipan Greenstone Belt ("KGB"). The KGB forms part of the Kaapvaal Craton of South Africa and comprises a linear belt of weakly metamorphosed mafic volcanic rocks with interbedded metasedimentary rocks and Banded Iron Formation (“BIF”). The belt extends in a roughly north/south direction over 250km from South Africa into southern Botswana.
The belt is intruded by several granitoid suites which range from tonalitic and trondhjemitic gneisses through to granodiorite-monzonite suites. There is a general paucity of outcrop owing to the variably developed weathering profile and to the Tertiary-to-Recent cover, including transported Kalahari sands. Due to the younger cover rocks and lack of surface exposure, the mineralisation potential of the belt was poorly understood for many years.
The Kalgold lode deposit is accessed through five discrete mining areas, namely the D Zone, A Zone and A Zone south extension (Henry), Bridge Zone, Watertank, and Windmill pits. The geology of the D Zone Pit is used as a benchmark for the other pits. The geology consists of mafic schist, which forms the immediate footwall, a BIF horizon as the main mineralised zone and a succession of clastic sediments consisting of shale, greywacke, and volcanic conglomerates as the hanging wall. Mining is currently taking place at the A Zone, Watertank, Henrys and Windmill pits.
Effective Date: June 30, 2023
1
Technical Report Summary for
Kalgold Mine, North West Province, South Africa
Mineralisation at Kalgold is essentially strata bound to the BIF packages, resulting from intense silica, carbonate, sulphide, potassium alteration and metasomatic replacement of the BIF lenses. The mineralisation is manifested primarily as quartz veined and sulphidised BIF, with sulphides dominated by pyrrhotite and pyrite. Gold predominantly occurs as small grains of native gold, in association with pyrrhotite and trace chalcopyrite and sphalerite.
Status of Exploration, Development and Operation
Kalgold is an established, existing mining operation that has been in production for over 25 years. It currently mines at rates of c.3Mtpa of ore. An average of c.1,300kg of gold is produced annually, with ore sources originating from mining and stockpile handling operations.
In the period 2017 - 2019, definition and exploration drilling were undertaken over the Kalgold line of lode deposit. This exploration was aimed at validating and expanding the Mineral Resource estimate at that time. The drilling yielded significant extensions to the Mineral Resource area, expanding on the understanding of the deposit. The drilling results were analysed and incorporated into the geological model to upgrade the Mineral Resource estimates, and in-fill the areas between the A Zone and Watertank mining pits, known as the Bridge Zone.
Further exploration drilling took place during 2021 -2022. The results from this exploration drilling extended the mineralised area beyond the current resource limits. The exploration drilling and the subsequent definition of the Mineral Resources are ongoing, and the intention is that the Mineral Resource estimate will be continuously updated as the data becomes available and incorporated into the model.
Exploratory work planned to the south of the D zone was not completed as planned due to the pending prospecting right application. This drilling was intended to support the plant Feasibility Study, aimed at increasing the current milling and processing capacity.
Overall, the current Kalgold Mine site is well established and operates uninterrupted at a steady state capacity throughout the year.
Mineral Resource Estimate
The declared Mineral Resource estimate for Kalgold is based on the February 2023 Mineral Resource model. The model was completed by the Harmony QP using Leapfrog Geo 4.5 modelling software. The QP created wireframes and block models using the Datamine RMTM modelling software. The data used for the modelling in Datamine RM was based on a validated DatamineTM (“Datamine”) Fusion database containing exploration drill hole data, obtained until February 2023. The gold grade was estimated using the Ordinary Kriging interpolation method.
For the purposes of this TRS, the Mineral Resources are classified in accordance with § 229.1302(d)(1)(iii)(A) (Item 1302(d)(1)(iii)(A) of Regulation S-K), which is similar to the South African Code for the Reporting of Exploration Results, Mineral Resources and Mineral Reserves.
The QP compiling the Mineral Resource estimates is Mr RF Gaelejwe, who is Ore Reserve Manager at Kalgold, and an employee of Harmony.
The Mineral Resource estimate, as at June 30, 2023, exclusive of the reported Mineral Reserves is summarised in Table 1-1. These Mineral Resources account for mining depletions recorded until June 30, 2023 (20 April 2023 actuals plus two months forecast). They incorporate the A Zone, Watertank, Henry's and the Windmill Zone.
Effective Date: June 30, 2023
2
Technical Report Summary for
Kalgold Mine, North West Province, South Africa
Table 1-1: Summary of the Kalgold Mineral Resources as at June 30, 2023 (Exclusive of Mineral Reserves) 1-8
|
|
|
|
|
|
|
|
|
|
|
|
| METRIC |
| Mineral Resource Category |
Tonnes (Mt) |
Gold Grade (g/t) |
Gold Content (kg) |
| Measured |
3.474 |
1.05 |
3 634 |
| Indicated |
31.832 |
1.20 |
38 187 |
| Total / Ave. Measured + Indicated |
35.306 |
1.18 |
41 821 |
| Inferred |
25.448 |
0.34 |
8 648 |
| IMPERIAL |
| Mineral Resource Category |
Tons (Mt) |
Gold Grade (oz/t) |
Gold Content (Moz) |
| Measured |
3.830 |
0.031 |
0.117 |
| Indicated |
35.089 |
0.035 |
1.228 |
| Total / Ave. Measured + Indicated |
38.918 |
0.035 |
1.345 |
| Inferred |
28.052 |
0.010 |
0.278 |
Notes:
1. Mineral Resources are reported with an effective date of June 30, 2023 were originally classified and reported according to SAMREC, 2016. For the purposes of this TRS, the Mineral Resources have been classified in accordance with § 229.1302(d)(1)(iii)(A) (Item 1302(d)(1)(iii)(A) of Regulation S-K). The Qualified Person responsible for the estimate is Mr RF Gaelejwe, who is Ore Reserve Manager at Kalgold, and a Harmony employee.
2. The Mineral Resource tonnes are reported as in-situ with reasonable prospects for economic extraction.
3. No modifying factors or dilution sources have been included to in-situ Reserve which was subtracted from the SAMREC Resource in order to obtain the S-K 1300 Resource.
4. The Mineral Resources are reported using a cut-off value of 0.54g/t and a gold price of USD1,764/oz; for an assumed plant throughput of 130Ktpa. These parameters including mining contractor mining rates schedule per bench, processing cost of R263/t, Diesel cost of R21.30/l and metallurgical recovery of 86% were used to constrain the Mineral Resource shell.
5. Tonnes are reported as rounded to three decimal places. Gold values are rounded to zero decimal places.
6. Mineral Resources are exclusive of Mineral Reserves. Mineral Resources are not Mineral Reserves and do not necessarily demonstrate economic viability.
7. Rounding as required by reporting guidelines may result in apparent summation differences.
8. The inferred portion of the Mineral Resource includes the historical Surface tailings of 6 263Kg (0,201Moz)
9. The Mineral Resource estimate is for Harmony’s 100% interest.
Mineral Reserve Estimate
The Mineral Reserves were originally prepared, classified and reported according to SAMREC, 2016. For the purposes of this TRS, the Mineral Reserves have been classified in accordance with § 229.1302(d)(1)(iii)(A) (Item 1302(d)(1)(iii)(A) of Regulation S-K).
Mineral Reserves are derived from the Mineral Resources, a detailed business plan and the operational mine planning processes. Mine planning utilises and takes into consideration historical technical parameters achieved. In addition, Mineral Resource conversion to Mineral Reserves considers Modifying Factors, dilution, ore losses, minimum mining widths and planned mine call factor. The Mineral Reserves are 0.392Moz as at June 30, 2023 (Table 1-2).
The Mineral Reserves comprise 41% Proved Reserves and 59% are Probable Reserves. In the opinion of the QP, given that Kalgold is an established operation, the Modifying Factors informing the Mineral Reserve estimates would at minimum, satisfy the confidence levels of a Pre-Feasibility Study.
The declared Mineral Reserve is depleted to generate the Kalgold cash flows. The economic analysis of the cash flows displays positive results and are deemed both technically and economically achievable. It is important to note that the Mineral Reserves are declared as delivered to the mills, except for the recovered gold content. This gold content is calculated after factoring in the plant recovery as a modifying factor.
Effective Date: June 30, 2023
3
Technical Report Summary for
Kalgold Mine, North West Province, South Africa
Table 1-2: Summary of the Kalgold Mineral Reserves as at June 30, 2023 1-5
|
|
|
|
|
|
|
|
|
|
|
|
| METRIC |
| Mineral Reserve Category |
Milled Tonnes (Mt) |
Gold Grade (g/t) |
Gold Content (kg) |
| Proved |
5.384 |
0.93 |
4 991 |
| Probable |
8.529 |
0.85 |
7 217 |
| Total (Proved + Probable) |
13.913 |
0.88 |
12 208 |
|
|
|
|
|
|
|
|
|
|
|
|
| IMPERIAL |
| Mineral Reserve Category |
Milled Tons (Mt) |
Gold Grade (oz/t) |
Gold Content (Moz) |
| Proved |
5.935 |
0.027 |
0.160 |
| Probable |
9.401 |
0.025 |
0.232 |
| Total (Proved + Probable) |
15.336 |
0.026 |
0.392 |
Notes:
1. The Mineral Reserves were originally prepared, classified and reported according to SAMREC, 2016. For the purposes of this TRS, the Mineral Reserves have been classified in accordance with § 229.1302(d)(1)(iii)(A) (Item 1302(d)(1)(iii)(A) of Regulation S-K). The Qualified Person responsible for the estimate is Mr RF Gaelejwe, who is the Kalgold Ore Reserve Manager, and a Harmony employee.
2. Tonnes, grade, and gold content are declared as net delivered to the mills.
3. Figures are fully inclusive of all mining dilutions, gold losses and are reported as mill delivered tonnes and head grades. Metallurgical recovery factors have not been applied to the reserve figures.
4. Mineral Reserves are reported using a cut-off grade of 0.60g/t determined using a gold price of USD1,582/oz gold, mining contractor mining dry rates schedule per bench, processing cost of R263/t and diesel cost of R21.30/l.
Capital and Operating Cost Estimates
The capital cost estimates for Kalgold are determined using the business plan as a basis. The capital cost elements can be mostly attributed to vehicle replacements, pumping and water control mechanisms, and slope stability monitoring. The capital and operating costs are reported in ZAR terms and on a real basis.
The capital cost estimates are shown in Table 1-3.
The operating cost estimates for Kalgold are categorised into direct and total costs. A summary of the Kalgold operating cost estimate is shown in the Table 1-4. All inclusive unit operating costs starts at R791/t year one and gradually decreases over life of mine to R351/t in financial year 2031, inline with strip ratio reduction and low grade stockpile feeding at the end of life.
The above operating unit costs are as per approved business plan submitted to the board for financial year 2024.
Permitting Requirements
Kalgold has the following valid permits and does not require any additional permits to continue with their mining operations. Environmental Management Programme (Amendment) authorisation, pending as at June 2021, has been granted by DMRE allowing the expansion of the current mining footprint within the approved Mining Right area.
Kalgold’s valid environmental permits are summarised in Table 1-5.
At this report’s effective date, Harmony was still preparing to re-submit the new Prospecting right application to secure the area where the section 102 application was refused by DMRE in 2021. The Prospecting Rights will be an extension to the current Mining Right which will be converted to a mining right as soon as the resource has been confirmed.
Effective Date: June 30, 2023
4
Technical Report Summary for
Kalgold Mine, North West Province, South Africa
Conclusions
Kalgold Mine, a 100% owned Harmony asset, is well-established and has been operating successfully for the past 25 years. The mine is accessible within national and provincial roads, with secure infrastructure. Management has a good handle on aspects pertaining to legal and environmental matters with respect to operating within the South African mining law, as regulated by the MPRDA, and supporting legislation.
Kalgold hosts a distinct gold bearing Mineral Resource. The interpretation of the regional geological setting, mineralisation and orebody deposit is well understood and provides valuable insight to the gold mining operations. The mining methods of the Mineral Reserves is of sound design and has evolved over the history of the operations. The current preferred, modular open pit mining method based on the satellite orebodies, has progressively improved, with a significant focus on increased safety, grade control and pit slope stability monitoring. The gold recovery is well monitored through continuous benchmarking initiatives against the mineral processing plants’ historical data.
Harmony is in possession of robust contracts, with the gold price showing upside potential. The economics for Kalgold Mine display positive cashflows, based on detailed operating and capital costs. The valuation of the asset is proven to be most sensitive to the gold price. The assumptions and conclusions in this TRS contain the views of QPs and does not contain any known material risks at the time of compilation.
Recommendations
The current geological model is well understood. The Mineral Resource model in use, as updated in February 2023, is drilled to a standard suitable for robust estimation. However, a significant amount of additional definition drilling would be required to increase more Mineral Resources to a Measured category, as the small high grade ore lenses that fit inside the current drill spacing, would be better defined. To this end, further exploration drilling is required to expand on the current Mineral Resource and Mineral Reserve base.
Effective Date: June 30, 2023
5
Technical Report Summary for
Kalgold Mine, North West Province, South Africa
Table 1-3: Summary of LOM Capital Cost Estimate for Kalgold
|
|
|
|
|
|
| Capital Cost Element (ZAR'000s) |
Total LOM (FY2023 - FY2033) |
| Shaft |
54 210 |
| MCC |
28 266 |
| Total |
82 476 |
Table 1-4: Summary of Operating Cost Estimates for Kalgold
|
|
|
|
|
|
| Operating Cost Element (ZAR'000) |
Total LOM (FY2023 - FY2033) |
| Wages - payroll 1 |
359 873 |
| Wages - payroll 2 |
40 794 |
| Stores and materials |
614 196 |
| Electric power and water |
20 422 |
| Outside contractors |
1 972 103 |
| Other |
265 113 |
| Direct Costs |
3 272 501 |
| Refining charge |
60 279 |
| Assay cost |
42 689 |
| Plant treatment cost |
4 222 370 |
| Re-allocated costs |
4 325 338 |
| Mine overheads re-allocated |
(145 073) |
| Total |
7 452 766 |
Table 1-5: Status of Environmental Permits and Licences
|
|
|
|
|
|
|
|
|
|
|
|
|
|
|
| Permit / Licence |
Reference No. |
Issued By |
Date Granted |
Validity |
| Environmental Management Programme (Amendment) |
NW30/5/1/2/2/77MR |
DMR |
March 8, 2022 |
LOM |
| Environmental Authorisation |
(NW) 30/5/1/2/3/2/1/77 EM |
DMR |
October 4, 2022 |
LOM |
| Water Use Licence |
07/D41B/ABCGIJ/4754 |
DWS |
February 22, 2021 |
LOM |
| Certificate of Registration Inflammable Liquids and Substances |
FS/FLM 01/06/02/2023 |
Ngaka Modiri Molema District Municipality |
June 1, 2023 |
12 Months |
| Protected Trees Permit |
01-12-2020/24NW |
DFFE |
December 2, 2020 |
December 2, 2025 |
|
|
|
|
|
|
|
|
|
|
|
|
|
|
|
|
|
|
|
|
|
|
|
|
|
|
|
|
|
|
Notes: DMR - Department of Mineral Resources, GDARD - Gauteng Department of Agriculture and Rural Development, DWS - Department of Water and Sanitation
Effective Date: June 30, 2023
6
Technical Report Summary for
Kalgold Mine, North West Province, South Africa
2Introduction
Section 229.601(b)(96) (2) (i-v)
This TRS on Kalgold has been prepared for the registrant, Harmony. The TRS has been prepared in accordance with the U.S. SEC Disclosure by Registrants Engaged in Mining Operations (disclosure regulations S-K 1300). It has been prepared to meet the requirements of Section 229.601(b)96 - Technical Report Summary. The purpose of this TRS is to provide open and transparent disclosure of all material, exploration activities, geological model, mine planning inputs, Mineral Resource and Mineral Reserve information to enable the investor to understand the Kalgold Mine, which forms part of Harmony’s activities.
The TRS was prepared with inputs from QPs employed by Kalgold or Harmony at Corporate Office. Those based at corporate office, visit the operation on ad hoc basis and they participate in the business planning process reviews.
Rock Engineer, K Le Bron, is employed on part time basis by Kalgold and he visits the mine on monthly basis to conduct inspections and participate on the planning sessions.
The QPs qualifications, areas of responsibility / contribution and personal inspections of the property are summarised in Table 2 1.
Table 2-1: List of Responsible and Contributing Authors
|
|
|
|
|
|
|
|
|
|
|
|
|
|
|
| Qualified Person |
Prof. Assoc. |
Qualifications |
TRS Section Responsibility |
Personal Insp. |
| Mr T Hewitt |
GSSA Fellow (963219) , SACNASP (400069/01) |
BSc Hons (Geology), GDE (Mining) |
1, 6, 7, 8, 9, 22 |
Full time |
| Mrs B van der Linden |
- |
B Com. Hons (Bank/Fin Mng.) |
1, 18, 19, 22 |
Full time |
| CODM |
- |
- |
1, 16, 19.1.1, 19.1.2, 22 |
Full time |
| Mr D Fourie |
SAIMM (706555) |
MSc.Eng, GDE |
1, 11, 22 |
Full time |
| Mr E Malaola |
SAGC(PMS0196), IMSSA |
NHD Mine Surveying, Mine Surveyors CoC |
1, 9, 11.3 - 11.6, 12, 22 |
Full time |
| Mr FP Coetzee |
ECSA Pr. Eng. (20100158), MMC |
B Eng. Mining, MBA |
1, 13.3, 13.4, 22 |
Full time |
| Mr J Boshoff |
SACNASP, SAIMM, GSSA |
BSc. Hons, MSc, MBA |
1, 9, 11.3 - 11.6, 12, 22 |
Full time |
| K Le Bron |
FSANIRE |
M.Sc. Eng., GDE, AREC (COM), MAP, PGCE, Blasting Cert. |
1, 13.2, 22 |
Part time |
| Ms N Mogale |
- |
BSc Hons, Environmental Science with Geography and Environmental Management |
1, 4, 17, 22 |
Full time |
| Mr N Wessels |
|
B.Eng (Mech), GCC |
1, 15, 22 |
Full time |
| Ms KN Monaisa |
AMMSA |
B-Tech (Mining Engineering), MDP, MMC |
1, 13.3, 13.4, 23 |
Full time |
| Mr R Montshonyane |
- |
BTech: Engineering Metallurgy, BT10014 |
1, 10, 14, 22 |
Full time |
| Mr R Reid |
Australian Institute of Geoscientists (FAIG: 3507) |
BSc. Hons (Earth Science), Grad. DipSc. (GIS) |
1, 6, 11, 22 |
Full time |
| Mr RF Gaelejwe |
SACNASP (400207/14) |
BSc. Hons (Geol), PgDip, EMBA |
All |
Full time |
| Mr T van Dyk |
SACNASP, GSSA |
BSc. Hons (Geology) |
1, 9, 11.3 - 11.6, 12, 22 |
Full time |
| Mr W De Wit |
- |
N.D.T. Mine Surveying, Mine Surveyors Certificate of Competency No 1605 |
1, 3,5, 16.3 |
Full time |
|
|
|
|
|
This TRS is the second filing of such a document with the SEC, an update of the 2022 report. This TRS has an effective date as at June 30, 2023.
No material changes have occurred between the effective date and the date of signature.
Effective Date: June 30, 2023
7
Technical Report Summary for
Kalgold Mine, North West Province, South Africa
3Property Description
Section 229.601(b)(96) (3) (i-vii)
Kalgold is located at latitude 26°10.0’S and longitude 25°14.5’E, 55km southwest of Mahikeng, between Mahikeng and Stella, along the Mahikeng-Vryburg road (N18) in North West Province, South Africa (Figure 3-1). The Kalgold Mine is serviced by well-maintained sealed roads with good access to all nearby towns and cities. The mine is surrounded by farmland and the closest community is at Kraaipan, approximately 15km to the south of the mine. The Kalgold Mine has been in operation since 1997 and is the only significant mining operation in the region.
3.1Mineral Tenure
South African Mining Law is regulated by the MPRDA which is the predominant piece of legislation dealing with acquisitions or rights to conduct reconnaissance, prospecting, and mining. There are several other pieces of legislation which deal with such ancillary issues such as royalties (MPRDA), title registration (Mining Titles Registration Act, 1967), and health and safety (Mine Health and Safety Act, 1996).
The Kalgold Mining Right, which encompassed 615ha, was successfully converted, executed, and registered as a New Order Mining Right on 24 February 2015 as MR12/2015 under Mining Right Protocol 574/2008. A Section 102, in terms of the MPRDA, to include portions of the farms Goldridge 632 IO and Ferndale 544 IO was executed on 9 November 2010 under Mining Right Protocol 774/2010.
The Mining Right now encompasses 988.23ha (Figure 3-2, Table 3-1). The mining right was issued for a period of 30 years, expiring on 27 August 2038, and Kalgold has the exclusive right to renew the right for a further 30 years. The Kalgold mineral rights are held by Harmony (Table 3-1, Figure 3-2). Under the MPRDA, Harmony is entitled to apply to renew the mining right on its expiry. At the effective date, Harmony was still preparing to re-submit the new Prospecting right application to secure the area where the section 102 application was refused by DMRE in 2021. The Prospecting Rights will be an extension to the current Mining Right which will be converted to a mining right as soon as the resource has been confirmed.
Figure 3-1 depicts the prospecting right boundaries of the renewed application refused by DMRE in 2021.
Table 3-1: Summary of Mineral Rights for Kalgold
|
|
|
|
|
|
|
|
|
|
|
|
|
|
|
|
|
|
| Licence Holder |
Licence Type |
Reference No. |
Effective Date |
Expiry Date |
Area (ha) |
| Harmony Gold Mining Company Limited |
MR |
NW30/5/1/2/2/77 MR |
26-Aug-08 |
27-Aug-38 |
988.23 |
| PR |
NW30/5/1/1/2/863 and 1469 PR |
Lapsed, New prospecting application to be lodged |
35 031.00 |
|
|
|
|
|
|
|
|
|
|
|
|
|
|
|
|
|
|
|
|
|
|
|
|
|
|
|
|
|
|
Notes: MR - Mining Right, PR - Prospecting Right
There is no material litigation (including violations or fines) against the Company which threatens its mineral rights, tenure, or operations.
Effective Date: June 30, 2023
8
Technical Report Summary for
Kalgold Mine, North West Province, South Africa
3.2Property Permitting Requirements
Kalgold is located on a site that has been operational for approximately 40 years. The surface rights in the Kalgold area were previously held by Shamrock Mining and Prospecting Company (“Shamrock”), a wholly owned exploration and development subsidiary of Shell Limited (“Shell”). Harmony has access to all the properties it requires to conduct its current mining activities. The surface lease and surface right areas are sufficient in size and nature to accommodate the required surface infrastructure to facilitate current and planned mining and processing operations. There are no land claims or other legal proceedings that may have an influence on the rights to mine the minerals.
Harmony monitors complaints and litigation against the Company as part of its risk management systems, policies, and procedures. There is no material litigation (including violations or fines) against the Company as at the date of this report which threatens its property permitting. QP is also not aware of any land claims pending on the property.
|
|
|
Figure 3-1: Location of Kalgold |
Effective Date: June 30, 2023
9
Technical Report Summary for
Kalgold Mine, North West Province, South Africa
|
|
|
Figure 3-2: Mineral Tenure of Kalgold |
Effective Date: June 30, 2023
10
Technical Report Summary for
Kalgold Mine, North West Province, South Africa
4Accessibility, Climate, Local Resources, Infrastructure and Physiography
Section 229.601(b)(96) (4) (i-iv)
4.1Accessibility
Kalgold is located adjacent to the N18 National Road and can be reached via the local R49 road between Mahikeng and Vryburg (Figure 3-1). The mine is surrounded by farmland. The closest community is at Kraaipan, approximately 15km to the south of the mine. Access to the mine is restricted by security fencing, security guards, booms, and lockable gates at the main entrance. In addition, a communication system and access control system monitors personnel entering and leaving the mine property.
4.2Physiology and Climate
Kalgold is situated approximately 1,250 metres above sea level (“masl”) on the south eastern edge of the Kalahari Desert. The topography around the area is generally flat to low undulating country with outcrops rare and commonly confined to low ridges and hillocks. Much of the mine area is covered in bright orange-red Kalahari sands which progressively get deeper to the north and south of the operation. A significant paleo-channel cuts the mine site to the south and another to the north of the operation.
The area comprising farmlands are devoted to cereal production and cattle farming. However, there are belts of natural vegetation present which are considered part of the Savannah Biome and forms part of the Semi-arid Bushveld. The vegetation comprises Kalahari Thornveld and shrub Bushveld which is dominated by grasses and open forest comprising trees from the genus Acacia.
The climate is in a region that is considered as sub-tropical steppe climate, synonymous to a sub-tropical desert which is hot and dry. The winters are characterised as cool to mild, experiencing a daily mean temperature of approximately 16°C and the summers are characterised as hot and humid, experiencing a daily mean temperature of approximately 31°C. The average annual rainfall for the area is approximately 100mm - 550mm, the majority of which falls during the months of November to February. The months of May through to September rarely sees rain. The average annual precipitation for the area is approximately 37mm. The wettest month experienced is February (~80mm). Rain occurs during only 17.2% of the year, while no rainfall is received for 82.8% of the year. However, the Kraaipan area can experience rare occurrences of heavy rainfall which can result in a brief stoppage of the open pit mining activities. There are no other specific climatic risks which affect the property.
4.3Local Resources and Infrastructure
Infrastructure in the region is well established. Kalgold Mine is serviced locally by well-maintained sealed roads with good access to all nearby towns and cities. Regional infrastructure also includes power transmission and distribution and communication networks. Schools, clinics and hospitals are readily available in the surrounding areas. The mine personnel are typically sourced from local communities e.g., Ratlou local municipality, in which they reside.
Operations are powered by electricity from Eskom Holdings State Owned Company (“SOC”) Limited. More detailed information on Kalgold infrastructure can be seen in Section 14.2.
Ore and waste material are transported separately, with ore being trucked from the pit to the plant ROM pad, and waste rock going to the mines waste dumps. Marginal and low-grade ore is transported by truck and stockpiled for future processing. Kalgold has its own processing plant situated adjacent to the mine.
Mining consumables, such as processing reagents, diesel, etc, are sourced from neighbouring provinces through the procurement system managed from Corporate Office located in Randfontein, Gauteng province.
Effective Date: June 30, 2023
11
Technical Report Summary for
Kalgold Mine, North West Province, South Africa
5History
Section 229.601(b)(96) (5) (i-ii)
5.1Historical Ownership and Development
Kalgold was previously known as Shamrock, formed in 1982 as a wholly owned exploration and development subsidiary of Shell.
Exploration of the Kraaipan Greenstone belt by Shell, began in the 1980s. In 1994, West Rand Consolidated Mines (“WRCM”) acquired Shamrock. The company changed its name to Kalgold in May 1996 and was listed on the Johannesburg Stock Exchange on 14 October 1996, via an issue of 18.4% of the shares of the company, as a dividend in specie, to shareholders of WRCM.
Harmony acquired 100% of Kalgold in July 1999. The historical ownership and associated activities related to Kalgold are summarised in Table 5-1.
Table 5-1: Summary of Historical Ownership Changes and Activities of Kalgold
|
|
|
|
|
|
| Year |
Asset History Highlights |
| 1982 |
Formed by Shamrock, a wholly owned exploration and development subsidiary of Shell. |
| 1987 - 1994 |
Shell conducted extensive exploration work in the Kraaipan region. In 1991, the D Zone one area was discovered on the Goldridge farm. |
| 1994 |
Shamrock was acquired by West Rand Consolidated Exploration Limited, a subsidiary of WRCM. |
| 1994 - 1996 |
WRCM intensified exploration work. Mining commences in the D-Zone, in December 1995. |
| Jan-96 |
Construction of the crushing plant and phase 1 of the metallurgical extraction plant, consisting of the heap leach and gold recovery section, began. |
| May-96 |
WRCM changed its name to Kalahari Goldridge Mining Company Limited (“Kalgold”). |
| Jul-96 |
Planned mine infrastructure activities are completed and the first gold is produced. |
| Oct-96 |
Kalgold listed on the Johannesburg Stock Exchange (JSE), via an issue of 18.4% of the shares of the company as a dividend in specie to shareholders of WRCM. |
| Dec-96 |
The D-Zone open pit was exposed to a maximum depth of 25m below surface. The plant ore processing capabilities averaged at approximately 70ktpm. 174kg of gold was produced from approximately 345kt of low-grade and near-surface heap leach ore. |
| Mar-97 |
Mills are installed and the plant ore processing capabilities was increased to an average of approximately 90ktpm. |
| May-97 |
Construction commenced on the second phase of the processing facility which included an 80ktpm carbon-in-leach (“CIL”) plant and associated Tailings Storage Facility (“TSF”). |
| Jan-98 |
The second phase of the construction was fully commissioned. The throughput in the heap leach facility was reduced. |
| Jul-99 |
Harmony acquires Kalgold. |
| 2003 |
A third mill was added to increase treatment capacity. |
| 2012 |
A Mineral Resource model was constructed by ExplorMine Consultants. |
| 2017 - 2019 |
Exploration drilling supported improvements in significantly expanding the understanding of the deposit, upgraded the Windmill and A Zone south extension (Henry) pit Mineral Resources, and provided insightful data to the areas between the A-Zone and Watertank Zone (current mining), known as the Bridge Zone. |
| 2018 |
A new Mineral Resource model was generated by the Harmony South East Asia team. The model included the updated drilling database based on the exploration drilling, and an updated geological and oxide model based on new drilling information. |
| 2019 |
The Mineral Resource model was updated by the Harmony South East Asia team. The model included the updated drilling database based on additional exploration drilling and updated implicitly geological and oxide models. |
| 2022 - 2023 |
Harmony team updated the Mineral Resource model using Datamine. The model included the updated drilling database based on additional exploration drilling and geological limb models. |
Effective Date: June 30, 2023
12
Technical Report Summary for
Kalgold Mine, North West Province, South Africa
5.2Historical Exploration
Historical technical investigations which led to the discovery of the Kalgold deposit include detailed geological mapping, soils sampling, geotechnical sampling and geophysical surveys, followed by drilling and metallurgical testwork. A total of 142,710m of exploration and evaluation drilling was completed within the area and on surrounding properties in the periods 1987 to 2017. Historical drilling completed by previous owners is summarised in Table 5-2 and includes air core (“AC”), percussion, reverse circulation (“RC”) and diamond core (“DD”) drilling. Much of the deeper historic drilling has been focused on the D Zone Pit which has been mined out.
Table 5-2: Summary of Historical Drilling at Kalgold
|
|
|
|
|
|
|
|
|
|
|
|
|
|
|
|
|
|
|
|
|
|
|
|
| Year |
Company |
No. Drill Holes |
Drill Hole ID |
Diamond Drill Hole (m) |
Percussion Drill Hole (m) |
AC or RC (m) |
Assay Lab |
| N/A |
Various |
2 805 |
ARC Series, CRC series, GDP Series, DD series, ADD Series, SDD Series, SPD Series, WDD |
18 167 |
71 820 |
21 240 |
N/A |
| 1990 |
Shell |
11 |
GDP1-GDP11 |
— |
300 |
352 |
N/A |
| 1991 |
Shell |
43 |
GDP12-GDP76 DD1-DD5 |
933 |
1 514 |
845 |
N/A |
| 1992 |
Shell |
6 |
GDP253-GDP259 |
— |
150 |
— |
N/A |
| 1993 |
Shell |
3 |
GDP331-GDP333 |
— |
— |
183 |
- |
| 1995 |
WRCM |
18 |
GDP377-GDP404 DD18-DD21 |
487 |
101 |
175 |
N/A |
| 1996 |
Kalgold |
1 |
GDP415 |
— |
— |
77 |
N/A |
| 1997 |
Kalgold |
63 |
GDP440-GD600 |
— |
1 783 |
5 870 |
N/A |
| 1998 |
Kalgold |
1 |
GDP589 |
— |
— |
528 |
N/A |
| 1999 |
Harmony |
46 |
GDP602-GD647 |
588 |
879 |
5 132 |
N/A |
| 2000 |
Harmony |
1 |
WB98 |
— |
— |
150 |
N/A |
| 2001 |
Harmony |
17 |
GDP648-GDP664 |
— |
— |
1 853 |
N/A |
| 2002 |
Harmony |
37 |
GDP668-GDP707 |
8 200 |
— |
234 |
N/A |
| 2003 |
Harmony |
6 |
GDP710-GDP716 |
1 150 |
— |
295 |
N/A |
| 2017 |
Harmony |
34 |
KG001-KG037 |
4 935 |
3 934 |
— |
SGS |
| 2018 |
Harmony |
97 |
KG029 - KG126 |
25 194 |
4 952 |
— |
SGS |
| 2019 |
Harmony |
81 |
KG127 KG204 |
3 173 |
7 370 |
— |
SGS |
| 2022 |
Harmony |
142 |
KG205-KG344 |
101 |
16 135 |
— |
SGS |
| Total |
607 |
|
62 928 |
108 938 |
36 934 |
|
Notes: Lab - Laboratory
5.3Previous Mineral Resource and Mineral Reserve Estimates
The previous Mineral Resource estimate for Kalgold was reported by Harmony on June 30, 2022 in accordance with Regulation S-K 1300; 229.601(b)(96). The Mineral Resource estimates are updated annually by Harmony, incorporating the latest exploration drilling information. The previous Mineral Resource estimate exclusive of Mineral Reserves is presented in Table 5-3. The inferred portion of the Mineral Resource includes the historical Surface tailings of 6 263Kg (0,201Moz).
Effective Date: June 30, 2023
13
Technical Report Summary for
Kalgold Mine, North West Province, South Africa
Table 5-3: Summary of the Previous Kalgold Mineral Resources as at June 30, 2022 (exclusive of Mineral Reserves)
|
|
|
|
|
|
|
|
|
|
|
|
| METRIC |
| Mineral Resource Category |
Tonnes (Mt) |
Gold Grade (g/t) |
Gold Content (kg) |
| Measured |
0.576 |
1.65 |
953 |
| Indicated |
33.099 |
1.09 |
35 970 |
| Total / Ave. Measured + Indicated |
33.675 |
1.10 |
36 923 |
| Inferred |
25.440 |
0.34 |
8 557 |
| IMPERIAL |
| Mineral Resource Category |
Tons (Mt) |
Gold Grade (oz/t) |
Gold Content (Moz) |
| Measured |
0.635 |
0.048 |
0.031 |
| Indicated |
36.485 |
0.032 |
1.156 |
| Total / Ave. Measured + Indicated |
37.120 |
0.032 |
1.187 |
| Inferred |
28.043 |
0.010 |
0.275 |
The previous Mineral Reserve estimate for Kalgold was declared by Harmony on June 30, 2022 in accordance with the SAMREC Code. Modifying Factors were considered and applied to the Mineral Resource to arrive at the Mineral Reserve estimate. These factors included the cut-off grade, the mine call factor (“MCF”), dilution, and the plant recovery factor. The previous Mineral Reserve estimate is summarised in Table 5-4 and has been superseded by the current estimate prepared by Harmony as detailed in Section 11 of this TRS.
Table 5-4: Summary of the Previous Kalgold Mineral Reserves as at June 30, 2022
|
|
|
|
|
|
|
|
|
|
|
|
| METRIC |
| Mineral Reserve Category |
Tonnes (Mt) |
Gold Grade (g/t) |
Gold Content (kg) |
| Proved |
5.616 |
0.94 |
5 303 |
| Probable |
15.789 |
1.16 |
18 262 |
| Total / Ave. Proven + Probable |
21.405 |
1.10 |
23 565 |
| IMPERIAL |
| Mineral Reserve Category |
Tons (Mt) |
Gold Grade (oz/t) |
Gold Content (Moz) |
| Proved |
6.191 |
0.028 |
0.170 |
| Probable |
17.404 |
0.034 |
0.587 |
| Total / Ave. Proven + Probable |
23.595 |
0.032 |
0.758 |
5.4Past Production
The opening up of the D Zone pit commenced in December 1995. By December 1996, ~2.1Mt of overburden waste material had been moved, to gain access to the D-Zone orebody and approximately 345kt of low-grade and near-surface heap leach ore was treated. Plant construction activities started at the Kalgold site in January 1996, with the crushing plant and Phase 1 of the metallurgical extraction plant. By 30 July 1996, when the first gold was poured, the mine infrastructure was complete.
Ore was treated by heap leaching until the installation of the first two mills in 1997. The mill rate built up to more than 90ktpm by the end of the first quarter of 1997. In May 1997 construction work commenced on the second phase of the processing facility which included an 80ktpm CIL plant and associated tailings disposal facility. In 1998, when the mill and CIL plant were fully commissioned, throughput in the heap leach facility was reduced to 50ktpm. In 2003, a third mill was added to increase treatment capacity. The D Zone pit was mined out in 2009.
Past production for Kalgold is presented in Figure 5-1 and Figure 5-2. The production numbers are reported on a 12 month Harmony Financial year calendar starting July ending June.
Effective Date: June 30, 2023
14
Technical Report Summary for
Kalgold Mine, North West Province, South Africa
|
|
|
Figure 5-1: Graph of Kalgold Production History – Tonnes and Grade |
|
|
|
Figure 5-2: Graph of Kalgold Production History – Gold Produced |
Effective Date: June 30, 2023
15
Technical Report Summary for
Kalgold Mine, North West Province, South Africa
6Geological Setting, Mineralisation and Deposit
Section 229.601(b)(96) (6) (i-iii)
6.1Regional Geology
The Kaapvaal Craton of southern Africa hosts many of the region's economic mineral deposits. The craton has been subdivided into four sectors, namely the Eastern, Central, Northern and Western Terranes. The Western Terrane hosts the KGB, Amalia, and Madibe greenstone belts, and their southerly extensions. It is also host to the Gaborone Granite Complex to the north, which intrudes the Archaean granite-greenstone basement in south-eastern Botswana (Poujol et. al, 2002).
The Kalgold deposit is located within the KGB. The KGB has received significantly less geological attention when compared to the Murchison and Barberton greenstone belts, situated in the Northern and Eastern Terranes, respectively (Hammond and Moore, 2006). Investigations conducted in the region indicated that the KGB extends approximately 250km, in a north-south direction, from southern Botswana into South Africa (Hammond and Moore, 2006) (Figure 6-1). In the north, the KGB is subdivided into three narrow, sub-parallel north-to northwest-trending belts, spaced at 30km - 40km intervals, namely the western (Stella), central (Kraaipan) and eastern (Madibeng) belts.
The KGB, consisting of metamorphosed mafic volcanic rocks and interlayered metasediments (mainly gold-hosting BIFs, jaspilite’s and ferruginous chert), are exposed as discontinuous outcrops of steeply dipping units beneath cover sequences comprising mainly late Archean volcanic rocks of the Ventersdorp Supergroup and a blanket of Tertiary-to-Recent Kalahari sands. A variety of granitoid rocks (ranging from tonalitic and trondhjemitic gneisses through to granodiorite – monzonite) intruded the KGB. This age relationship was based upon whole-rock lead dating of the BIFs which yielded an age of 3,410Ma (±61Ma – 64Ma).
The lack of exposure has made mapping of the KGB difficult. However, subdivisions of the Kraaipan Group have been proposed for the region on the basis BIFs and chert exposures (SAC, 1980). The Kraaipan Group consists of three formations, namely the Khunwana, Ferndale and Gold Ridge formations. The Gold Ridge Formation is the oldest of the three and contains gold hosting BIFs (Anon, 2017).
6.2Local Geology
The Kalgold deposit occurs within the central (Kraaipan) belt (Figure 6-1), which comprises steeply dipping gold-hosting BIFs interbedded with magnetite quartzite, chert, greywacke, shale, and schist (Figure 6-2). BIFs are rhythmically banded chemical sediments comprising alternating light and dark laminae, which vary from 10mm - 50mm in thickness (Hilliard, 1996). The assemblage is surrounded by intrusive granites and gneisses. These rocks have a complex history of deformation, which includes folding, thrusting, faulting, and shearing. Several large dykes with a predominant east-west trend have intruded the rocks.
6.3Property Geology
The geology of the Mining Right area and its immediate vicinity is characterized by ferruginous chemical and clastic sediments interbedded with meta-lavas and non-ferruginous metasedimentary rocks. Outcrops in the area are sparse and generally restricted to the ferruginous rock types which are more resistant to erosion. The Kalahari Sand cover ranges from 2m - 12m thick. Magnetite quartzite and clastic sediments form a low ridge to the west of the lease area. Eastwards of this unit the iron-rich rocks generally comprise chemical sediments represented by magnetite-rich BIF, cherty BIF, and banded chert. These units are interbedded with mafic schist, greywacke, and sparse black shale (Mathe and Hilliard, 1998).
Kalgold comprises five discrete mineralised zones, namely D Zone, A Zone, Watertank, Windmill and A Zone south extension (Henry) (Figure 6-3), which are all hosted in BIF. Watertank pit can be split into Watertank Main and North. Watertank North refers to the Northern extension of the pit. The Bridge Zone and Spanover Zone also exist at Kalgold and occur amongst the aforementioned zones. The geology of the D Zone is used as a benchmark at Kalgold. The previous mining activities have provided extensive geological information of the deposit. Pits are now well established in the A Zone and Watertank areas. However, the geology does not vary significantly from that found at D Zone. Deposit thickness ranges up to 45m, and the main line of lode containing the D Zone, A Zone and Watertank Zone extends over 4.5km of strike.
Effective Date: June 30, 2023
16
Technical Report Summary for
Kalgold Mine, North West Province, South Africa
|
|
|
Figure 6-1: Regional Geology of the Kraaipan Greenstone Belt |
Source: after Anhaeusser & Walraven, 1999
Effective Date: June 30, 2023
17
Technical Report Summary for
Kalgold Mine, North West Province, South Africa
|
|
|
Figure 6-2: Local Geology of Kalgold |
|
|
|
Figure 6-3: Property Geology of Kalgold |
Effective Date: June 30, 2023
18
Technical Report Summary for
Kalgold Mine, North West Province, South Africa
The D Zone is hosted by a sheared, cherty-BIF with associated silicification and carbonate alteration. The gold mineralisation occurs within blebs, veins, and disseminations of pyrite and pyrrhotite, which are oxidized, to goethite near the surface. This zone dips 70° east, and has a strike length of 1,500m, varying in width between 15m-45m. The footwall rocks predominantly comprise chloritic schist with subordinate BIF and carbonaceous shale. Carbonaceous shale and greywacke are exposed in the hanging wall.
The A Zone occurs to the north of the D Zone at a similar stratigraphic position. It is a composite, consisting of several mineralised cherty BIF units that are interbedded with schist and shale and is referred to as the east limb in Figure 6-4. Due to shearing in the pillow basalts between the two BIF lenses, the central schist unit thins out and both west and east limbs are very close to each other in the A Zone pit. The A Zone has an overall strike length of 850m and comprises individual zones of mineralisation which are steeply dipping and have strike length that ranges from 200m - 500m. The width of these mineralised zones or mineralised limbs range between 15m - 70m.
A section through the A Zone from the June 2019 geological model (Figure 6-4) shows the east and west limbs. The east limb and west limb are separated by a zone of sericite-chlorite schist with intercalated shale and phyllite that pinches out to the north. The A Zone west limb is situated in the footwall of the A Zone, and is separated by a chloritic schist unit that pinches out to the north. The A Zone west limb has an overall strike length of 750m and width of 20m thinning to the north.
The geology associated to the Watertank pit is a long narrow more northerly striking, hoisted by cherty BIF and is in the northern extension to the A Zone east limb mineralised BIF. The host rock BIF is steeply dipping and has a strike length of 1,200m and an average width of 45m. The mineralised zones within this unit ranges from 2m - 12m in width. Recent drilling has shown an extension of this BIF to the north, where it has intersected significant intervals of mineralised BIF. This area has been termed the Watertank North. A section through the Watertank Zone from the 2019 geological model is presented in Figure 6-5.
The Windmill Zone represented in Figure 6-6, is the smallest of the Kalgold zones but contains generally higher gold grades. It sits stratigraphically below the other three mineral zones and is hoisted by a magnetite-rich BIF unit with interbedded schist units. The host rock BIF has a strike length of 950m and thins to the north and south with a maximum width of 25m in the center. Mineralisation within this zone occurs over a length of 800m with widths ranging from 2m - 17m and is structurally complex with displacements by faulting and dips varying from 75° - 90° east.
6.3.1Lithology
The lithological sequence at the Kalgold Mine area is grouped as follows:
•footwall mafic, including metabasaltic rocks and chlorite schist;
•package of interbedded shale and BIF; and
•hanging wall metasediments comprising a succession of metamorphosed chert, conglomerate, and greywacke.
A schematic stratigraphic column of the immediate Kalgold Mine is presented in Figure 6-7 showing the thin BIF units spaced between a significant package of mafic volcanics, capped by the deep water greywacke units. The mafic volcanics show significant evidence of pillow basalts indicating these are possibly deep water volcanics, the BIFs being chemical sediments, all capped by nearer shore sedimentary package.
6.3.2Structure
The KGB within the Kalgold Mine region is strongly deformed with consistent uniform regional fabric striking ~340° and dipping 65° - 70° east (Hilliard, 1996; Wilson, 1996; Moore, 1999; Hammond and Moore, 2016). The earliest tectonic fabric developed in the area, is a bedding parallel foliation defined, aligned with phyllosilicate and carbonate grains (Hilliard, 1996; Hammond and Moore, 2006). This foliation is best developed in the footwall schists and phyllites but is also evident in the BIF units as a strong slaty cleavage.
Mineral lineations are defined by elongate quartz and sulphide grains, strained clasts in the conglomerates and rods in the BIF. They have an average plunge of 67° towards 108° (Hilliard, 1996; Hammond and Moore, 2006).
Effective Date: June 30, 2023
19
Technical Report Summary for
Kalgold Mine, North West Province, South Africa
|
|
|
Figure 6-4: Cross Section Through A Zone Pit |
|
|
|
Figure 6-5: Cross Section Through Watertank Pit |
Effective Date: June 30, 2023
20
Technical Report Summary for
Kalgold Mine, North West Province, South Africa
|
|
|
Figure 6-6: Cross Section Through the Windmill Pit |
|
|
|
Figure 6-7: Schematic Kalgold Stratigraphy |
Effective Date: June 30, 2023
21
Technical Report Summary for
Kalgold Mine, North West Province, South Africa
Small scale isoclinal folds are common in the schist and BIF, and have axial planes dipping 61° - 64°, subparallel to the foliation. The axes of the isoclinal folds are subparallel to the mineral lineations (Hammond and Moore, 2006). Large open folds extend along the entire length in the north-south direction, with subvertical axial planes and fold axes plunging steeply to the east (Hilliard, 1996; Hammond and Moore, 2006). These open folds appear to have a significant impact on the contacts of the BIFs.
Late northeast to east-northeast trending faults are present cutting across the stratigraphy with visible fault offsets of 10s - 100s of metres (Wilson, 1996). Many of the late northeast to east-northeast striking dolerite dykes follow these structures (Wilson, 1996). In many areas, the dykes show evidence of minor shearing and foliation development that indicate and pre-date the last ductile deformation event. The BIF displays centimetre-scale boudins in some mineralised sections that are defined by orthogonal fracturing of Fe-rich and siliceous bands commonly filled with quartz and carbonates (Hammond and Moore, 2006).
6.4Mineralisation
Gold mineralisation at Kalgold is BIF-hosted. The BIFs are oxidized to a depth of approximately 40m below surface. Near the surface the material is red and porous, composed of quartz, hematite, and goethite with minor magnetite. At depth the unaltered BIF consists of quartz, siderite, pyrite, pyrrhotite and magnetite with minor chlorite, calcite and stilpnomelane. In general, gold mineralisation has an erratic and localized distribution. Individual gold grains are on average less than 10µm in diameter and occur in clusters. Gold is generally associated with goethite in the weathered rocks and with pyrite and pyrrhotite in the fresh material.
Hammond (2002) established that the gold mineralisation is associated with two generations of sub horizontal quartz-carbon veins oriented approximately 20° - 40° west. The first generation consists of ladder vein sets preferentially developed in iron-rich mesobands, whilst the second generation consists of large quartz-carbon veins, which cut across the entire deposit, extending into the footwall, and hanging wall in places. Hammond (2002) indicated that major structures that control the mineralisation are related to meso-scale isoclinal folds with fold axes sub-parallel to mineral elongation lineation. Gold is closely associated with sulphides, mainly pyrite and pyrrhotite and to a lesser extent, bismuth telluride and carbonate gangue. The ore fluid responsible for gold deposition is a carbon-oxygen-hydrogen system with increased methane content attributed to localized hydrolysis reactions between interbedded carbonaceous sediments and ore fluid (Hammond, 2002; Hammond and Moore, 2006).
The mineralisation at Windmill South is strongly associated with sulphide replacement within the magnetite-rich BIF unit. These zones of sulphide replacement appear to be more structurally controlled compared to the mineralisation in the eastern and western limbs at Watertank and A zone pits, respectively. Mineralised veins and thin open fractures formed through crystallisation of hydrothermal fluids in a brittle structural environment. Alteration and mineralisation of the Kalgold deposit has been described by several previous workers and the paragenesis and associated mineral assemblages are described in detail by Hammond 2002, amongst other scholars.
6.5Deposit Type
The Kalgold deposit is a BIF hosted lode gold deposit of a type typical throughout Archean greenstone belts across the world. Gold is precipitated through the sulphidation of iron rich BIF host rock due to late movement of retrograde fluids during the later stages of deformation.
6.6Commentary on Geological Setting, Mineralisation and Deposit
The Kalgold geological model is not complicated, being based on the stratigraphy as determined through the mining and drilling.
The geological model has been well tested through years of mining and exploration drilling.
New drilling does not result in significant changes to the geological model, which has remained relatively unchanged for many years. Drilling undertaken on the Kalgold deposit to the current effective date of June 30, 2023, has confirmed this model. Continuous mining activities have also resulted in a relatively high level of confidence in the nature of the Kalgold mineralisation and its association with the cherty BIF horizons.
Effective Date: June 30, 2023
22
Technical Report Summary for
Kalgold Mine, North West Province, South Africa
7Exploration
Section 229.601(b)(96) (7) (i-vi)
Surface exploration drilling commenced in 2017 to present, in order to both infill the current Mineral Resource areas, and to identify additional potential mining targets. Infill drilling is currently targeting the Windmill North, and the Spanover ore limb next to Windmill South . The Spanover is on the footwall of the Watertank Zone.
7.1Aeromagnetic Survey
The Mining Right area is covered by a high resolution aeromagnetic and radiometric survey completed by Xcalibur Airborne Geophysics in September 2012. The survey comprised 7,680 line-km over a 47km x 8km area of the KGB at a line spacing of 50m and nominal flying height above ground of 30m. The aeromagnetic data provided detail of the magnetite bearing horizons, structural offsets to stratigraphy and intrusive bodies at a local scale. However, it was not able to differentiate mineralised from non-mineralised BIF units.
7.2Geological and Topographical Mapping
Several geological maps of the Kalgold Mine exist but they are relatively simple and sparse as much of the area is covered in Kalahari sands with very little outcrop. Therefore, reliance was largely placed on geophysical interpretation rather than ground mapping. The topography has been generated from surveyed pickups and traditional air photo mapping methods. New DTMs have recently been generated from shuttle radar topography mission data. Some detailed mapping results for the Windmill Zone has also been incorporated into the geological mapping.
Drone and GPS surveys are used for day to day data management and volume movements calculation.
7.3Surface Drilling Campaigns, Procedures, Sampling, Recoveries and Results
The location of the drilling from 2017 to 2022 is indicated in Figure 7-1. Current 2023 drilling will be reported in the 2024 report. Drill holes flagged as Not Recorded (“NR”) are generally assumed to be either AC, as in the case of shallow drill holes, or RC for the deeper drill holes. Surface drilling at Kalgold has:
•indicated significant extensions to the Mineral Resource area;
•expanded significantly on an understanding of the Kalgold deposit;
•upgraded the Windmill and A Zone south extension (Henry) pit Mineral Resources; and
•infilled the areas between the A Zone and Watertank Zone (current mining), known as the Bridge Zone.
A combination of RC only and RC pre-collars with DD tails (“RCDD”) was completed during the exploration drilling programme. The depth of the RC drill holes and pre-collars varied depending on the target depth, the depth and amount of groundwater, and the penetration rate. If penetration rates of the RC drilling decreased materially, or if groundwater inflows prevented the collection of a dry sample, then the drill hole would be continued with a DD tail. In some cases, in the hanging wall units where mineralisation was not intersected, the RC pre-collars were continued through zones of groundwater and associated wet samples to achieve the planned pre-collar depth prior to commencing the DD tail.
7.3.1AC and Percussion Drilling
Part of the historic drilling at Kalgold comprised very shallow, regional AC or percussion drill holes.
AC drilling uses blades and compressed air to obtain a sample of the top unconsolidated or semi-consolidated cover and regolith. AC drilling technique was previously used to identify presence of BIF under cover and guide exploration activities.
Percussion drilling uses hammer and compressed air to deliver samples to surface. Since the sample travels between the rods and the walls of the hole it becomes contaminated with the rocks overlying the sampled horizon. This drilling technique has not been used at Kalgold with the exception of pre-collars being drilled through the overburden for the diamond boreholes. No AC or percussion data has been used in the evaluation of the deposits.
Effective Date: June 30, 2023
23
Technical Report Summary for
Kalgold Mine, North West Province, South Africa
|
|
|
Figure 7-1: Location of Kalgold Targeted Exploratory Drilling in Relation to the Mining Pits (2017 - 2019) |
Effective Date: June 30, 2023
24
Technical Report Summary for
Kalgold Mine, North West Province, South Africa
7.3.2RC Drilling
The 2017 RC drilling was completed by Van Zyl Boorwerke drilling contractors a using a HDM400 rig with Atlas Copco compressor and booster. The RC drill holes were drilled with a 5.5-inch face‐sampling bit. The 2018 – 2019 RC drilling was completed by Major Drilling using a Hanjin DB36 multipurpose rig. RC drill holes were drilled using either a 4.5 inch or 5.5 inch face sampling bit. The inclined RC drill holes, generally varying between 60° - 70° inclinations, were drilled ~50m apart and 100m on spaced lines along strike, with infill drilling stepping this down to 50m line spacing. The down dip separation of mineralised intersections was planned at c.20m - 25m.
The infill RC drilling at selected targets re-commenced in October 2020 following a hiatus due to COVID19. This drilling was carried out by Torque Exploration using Thor 5000 and Thor 8000 rigs with Kirloskar 1200cfm compressor and Hurricane 1400cfm booster. Holes were drilled with RC 5,5-inch face sampling bit and sampling was done using rotary cone splitter.
A total of 75 boreholes covering 9,817m were drilled for the period to June 30, 2022 (Figure 7-2). Drilling focused on potential Mineral Resource extensions as well as testing the areas earmarked for infrastructure development. Latest drilling will be finalised in the 3rd quarter 2023.
7.3.3Diamond Core Drilling
The 2017 DD was completed by Van Zyl Boorwerke using two HR6 and one Everdighm diamond rigs. All drill cores were orientated using ACT III digital core orientation tool. Drilling contractors were changed during December 2017 and Major Drilling commenced operation using Hanjin DB36 multipurpose drill rigs to continue the programme. Van Zyl Boorwerke completed RC drilling for drill holes KG001 - KG037 and DD up to KG029. Major Drilling completed all RC drilling from KG038 onwards and all diamond drilling from KG033 onwards. Major Drilling utilised HQ (63.5mm), NQ2 (50.6mm) and NQ3 (45.0mm) core sizes in the drilling completed to the current effective date of June 30, 2021.
7.3.4Drilling Results
Results for the 2017 to 2022 drilling programme are presented in Table 7-1. Only the weighted average gold grade for the drill holes completed from 2017 to 2022 are summarised. Historical results are too voluminous to report. However, they have been included in the estimation of the current Mineral Resources. Much of the deeper pre 2017 historical drilling was centred on the D-Zone deposit which has been mined-out. Historical drilling in the current mining areas is predominantly shallow drilling and mining already beyond this drilling.
Table 7-1: Summary of Drilling Results
|
|
|
|
|
|
|
|
|
|
|
|
|
|
|
|
|
|
| Year |
Company |
Drill Hole ID |
No. Drill Holes |
Gold Grade (g/t Au) |
Thickness (m) |
| 2017 |
Harmony |
KG001 - KG037 |
34 |
1.36 |
16.44 |
| 2018 |
Harmony |
KG029 - KG126 |
97 |
1.45 |
15.28 |
| 2019 |
Harmony |
KG127 - KG204 |
81 |
2.44 |
13.60 |
| 2022 |
Harmony |
KG205 - KG344 |
142 |
1.54 |
10.40 |
| Total |
354 |
|
|
7.3.5Collar and Downhole Surveys
Collar surveys are completed by the Kalgold Mine survey department. Planned collar coordinates are surveyed using a hand-held Global Positioning System ("GPS"), Trimble R8 RTK GPS. The coordinate system used is the Cape Datum and the Clarke 1880 Ellipsoid. The original coordinates are stored in a database along with the transformed coordinates to WGS84 Zone 35S. The accuracy of collar surveys is ±0.1m.
Downhole surveys are completed by the drilling contractor. Due to the magnetic nature of the BIF units, downhole surveys are taken using a reflex gyro survey tool. Downhole surveys are typically completed at the end of the RC pre-collar and/or at the end of the DD. A survey reading is taken every 10m from the end-of-hole depth to the collar position. Interim downhole surveys are completed at times during drilling in cases where the drill hole deviation is required to be monitored against the planned drill hole path. In cases where sections of the drill hole are surveyed separately, a 20m - 30m overlap between the surveys is completed to ensure robust survey checks.
Effective Date: June 30, 2023
25
Technical Report Summary for
Kalgold Mine, North West Province, South Africa
|
|
|
Figure 7-2: Location of Kalgold Drill Holes (2020-2021) |
Source: Google Earth Image Date June 2019
7.3.6Sample Length and True Thickness
In areas where drill holes intersect the deposit at obtuse angles, the sampled width is corrected for true thickness using the angle of intersection and the drilled width. The true thickness is used for modelling and reporting purposes if required.
7.3.7Logging Procedure
At completion of drilling, all DD cores and RC chip trays are transported to the Kalgold core shed where they are logged. All logging is undertaken by suitably experienced or qualified Kalgold geologists. All RC chip samples are geologically logged at 1m intervals and the results captured into the LogChief logging system / Datamine Fusion. Geological attributes logged include lithology, weathering, veining, mineralogy colour and magnetic susceptibility.
DD cores are logged, with the geological attributes captured including lithology, alteration, veining, mineralogy, weathering, structural zones, orientated structure, specific gravity, colour, and magnetic susceptibility. All core is logged regardless of its mineralisation status. The DD core results are also captured into the LogChief logging system / Datamine Fusion. Basic geotechnical logging of the DD core comprises logging of two key attributes, namely core recovery and Rock Quality Description (“RQD”).
Effective Date: June 30, 2023
26
Technical Report Summary for
Kalgold Mine, North West Province, South Africa
Drill core photography is conducted at the core shed, with all core trays photographed and documented before logging and sampling occurs. The details of the logging were sufficient for use in the Mineral Resource estimation and in technical studies.
7.3.8Core Recovery
During RC drilling, weights are recorded for the bulk and split samples over the 1m interval along with the condition of the sample, whether it is dry, moist, or wet. Bulk sample weights are monitored to indicate potential intervals of poor recovery, although variation in sample weights is also associated with changes in weathering and lithology/mineralisation. Comparison of sample recovery and gold grade does not indicate any sample bias nor any preferential loss or gain in the RC samples.
For DD holes, recovery of the drill core is assessed for each ‘run’ with the length of core recovered physically measured by the geologist or field assistant using a tape measure and compared to the drilled length as recorded by the driller for the corresponding run. The driller records the run information on the shift run sheet and the details on each core block which is placed in the core tray at the end of each run.
The measured recovery data is captured by the geologist or field assistant in LogChief and synchronised to the main database. Core recovery was calculated as a percentage recovery. Typically, recoveries >95% have been achieved at Kalgold, with minimal core loss recorded in some strongly fractured zones associated with faulting.
Experienced drillers are employed by the drilling contractor to oversee and manage the drill rig to ensure maximum recovery is achieved. Core recovery and grade have been reviewed and there is no correlation between them which would lead to a bias in the sample results. Additionally, RQD versus gold shows that the gold mineralised zones generally have good quality core.
7.4Hydrogeology
Harmony has conducted several specialist studies and the risk of surface decant due to rising groundwater levels has been obviated for Kalgold. However, in capturing and analysing geological data, a secondary function is to subsequently understand and assess the mineralisation and groundwater potential in the area.
Surface and groundwater samples are collected using water bottles. In sampling surface water, the sample bottles are plunged neck downwards below the surface water. For groundwater, a bailer is used to reach the water level down the boreholes. The samples are then sent to Rocklab laboratory for analysis and testing. Techniques used for testing parameters such as permeability as per the designated laboratory’s accreditation certificate are M001 - M003, M005 - M006, M015 - M016, M018, M020, M029, M031, M052 - M054, and M090. The QAQC measures adopted are as per ISO/IEC 17025:2005. Interpretation of the analysis results by the QP indicated that the water quality at Kalgold Water quality meets required SANS 241:2015 limits. The use of groundwater is optimised through recycling initiatives at Kalgold and re-circulated as a dust alleviation technique for the open pit activities.
7.5Geotechnical Data
The slope design used in the Kalgold pit optimisation process was informed by the geotechnical analysis completed by the Rock Engineering QP. The latter include pit optimisation inputs per pit, geotechnical pit shell depth assessment to inform stacks in weathered and fresh rock and compliance verification expanded to pit shell hazard identification and risk assessment. A total of nine core holes were drilled for the purpose of collecting geotechnical data. Four holes were drilled in the A-Zone, Henry and Watertank Zone.
Two holes were drilled in Watertank North, and three holes were drilled in Windmill. Geotechnical zones were classified based on the fresh rock types, with the weathered zone was classified as a separate geotechnical zone based on the depth of weathering. The Rock Mass Ratings (“RMR”) and Modified Rock Mass Ratings (“MRMR”) was classified as Fair to Good across the different rock types in all nine holes, and only the weathered zone was classified as Poor.
A total of 45 samples was sent to Rocklab in Pretoria for the uniaxial compressive strength (“UCS”) and tensile strength testing, which included 15 samples from the hanging wall, 15 samples from the orebody and 15 samples from the footwall, for the A Zone, Henry and Watertank pits. A total of 20 samples was sent to Rocklab in Pretoria for the UCS and tensile strength testing, which included 7 samples from the hanging wall, 7 samples from the orebody and 6 samples from the footwall, for the Watertank North pit.
Effective Date: June 30, 2023
27
Technical Report Summary for
Kalgold Mine, North West Province, South Africa
A total of ten samples was sent to Rocklab in Pretoria for the UCS and tensile strength testing, which included seven samples from the hanging wall and three samples from the orebody, for the Windmill pit. Rock samples analysed at Rocklab presented findings as shown in Table 7-2.
In addition, six samples of discontinuities were taken from the drill core of the hanging wall, BIF and footwall and were sent for shear strength testing, for the A Zone, Henry, Watertank and Watertank North pits; while two samples of discontinuities were analysed for Windmill pit. The results for these peak strengths are shown in Table 7-3. The use of the geotechnical data related to Kalgold mining is discussed in more detail in Section 13.
Table 7-2: Summary of Geotechnical Drilling Results
|
|
|
|
|
|
|
|
|
|
|
|
|
|
|
|
|
|
|
|
|
|
|
|
|
|
|
|
|
|
| Area |
No. Samples |
Min. Tensile Strength (Mpa) |
Avg. Tensile Strength (Mpa) |
Max. Tensile Strength (Mpa) |
No. Samples |
Min. UCS (Mpa) |
Avg. UCS (Mpa) |
Max. UCS (Mpa) |
| A Zone, Henry and Watertank |
Hanging wall |
14 |
8.0 |
15.0 |
20.8 |
15 |
74.1 |
119.0 |
180.7 |
| Orebody |
12 |
8.0 |
15.0 |
21.8 |
15 |
50.6 |
142.0 |
283.3 |
| Footwall |
18 |
6.7 |
13.0 |
17.8 |
15 |
68.3 |
96.0 |
156.7 |
| Watertank North |
Hanging wall |
7 |
6.3 |
12.2 |
19.5 |
7 |
24.2 |
53.0 |
82.8 |
| Orebody |
7 |
9.3 |
12.6 |
18.7 |
7 |
120.4 |
191.5 |
249.4 |
| Footwall |
6 |
9.4 |
13.1 |
19.3 |
6 |
32.0 |
69.0 |
95.7 |
| Windmill |
Hanging wall |
7 |
3.8 |
12.2 |
20.5 |
7 |
12.6 |
116.0 |
197.7 |
| Orebody |
3 |
5.9 |
13.7 |
29.1 |
3 |
56.5 |
118.0 |
204.3 |
| Total |
74 |
|
|
|
75 |
|
|
|
Table 7-3: Geotechnical Drilling Results - Shear Strength Tests
|
|
|
|
|
|
|
|
|
|
|
|
| Area |
Cohesion (kpa) |
Joint Friction Angle (°) |
| A Zone, Henry and Watertank |
Hanging wall |
155 |
29 |
| Orebody |
260 |
29 |
| Footwall |
75 |
34 |
| Watertank and North Extension |
Hanging wall |
30 |
29 |
| Orebody |
130 |
29 |
| Footwall |
450 |
20 |
| Windmill |
Footwall |
230 |
41 |
7.6Commentary on Exploration
The QP is of the opinion that the drilling and survey processes, the geological, geohydrological and geotechnical logging and the sampling and assaying data is appropriate for the Kalgold modelled deposit and mineralisation style.
Effective Date: June 30, 2023
28
Technical Report Summary for
Kalgold Mine, North West Province, South Africa
8Sample Preparation, Analyses and Security
Section 229.601(b)(96) (8) (i-v)
This section summarises information relating to the sample preparation on site through to the laboratory preparation and analysis.
8.1Sampling Method and Approach
Sampling is carried out in accordance with the Harmony internal sampling procedure guidelines
Drill hole sampling data used for ore resource estimations are obtained from reverse circulation (RC) drilling, diamond drilling. Samples from RC drilling represent the most of the data used in the ore resource estimation. Inclined drill holes (generally 60 to 70 degrees) are drilled approximately 50 m apart 100 m spaced lines along strike, with infill drilling steps this down to 50 m line spacing. Most of the areas covered by RC have been mined, hence the intensified infill drilling from 2017 to improve model resource and reserve definition Historically relatively few of diamond holes had been drilled and these mainly target the deeper parts of the orebody. Where detailed geological or geo-technical information was required diamond drilling was used. Much of the current program utilises diamond drilling where target zones are below the maximum usable depth of the RC rigs. Sampling is carried out on BIF intervals at 1 m lengths, cut to geological boundaries. Cores are sawn into two halves, one half is submitted for assay and the other half is kept for reference. Core photography is conducted at the core shed with all core trays photographed and documented before logging and sampling occurs.
8.1.1RC Samples
Samples are collected as drilling chips from the RC rig using a cyclone collection unit and directed through a splitter assembly to create a 1.5kg ‐ 3.0kg sample for assay which is approximately 4% - 7% of the metre interval sampled, this is considered appropriate by the QP for the style of mineralisation and size of the RC sample over each 1m interval.
8.1.2Core Samples
After logging is completed, the DD core is transported to the Kalgold core shed, where it is subsequently marked with metre intervals. Sample numbers and their associated drill hole intervals are recorded by the responsible geologist and given to the core yard technician for cutting and sampling. The core is cut along the orientation line at the bottom of the drill hole to reduce the possibility of sample bias. The core is split using a core saw, with half core samples taken in the HQ and NQ sections.
Sampling typically commences 10m above the hanging wall contact of the mineralised BIF and continues through to 10m below the footwall contact of the BIF. Drill core within the interval designated for sampling is continuously sampled along metre intervals and not split on lithological or alteration-based boundaries. For intervals of very broken core, samples are collected by taking approximately half of the drill core over the relevant sample interval. The remaining half core is stored on site.
The core samples sent for assay are bagged in labelled calico sample bags which are then placed within larger poly weave bags for transport to the designated laboratory.
8.2Density Determination
Density measurements were undertaken using both Archimedes water displacement method and laboratory-based pycnometer method. For the Archimedes method, collection of drill core samples for bulk density testing has been completed at 30m intervals downhole. Samples were air dried, then a piece of core approximately 10cm in length selected and weighed in air followed by weighing submerged in water.
Model densities are estimated via Inverse Distance method over assigned domains in order to fill the density field with estimated values where measurements have been taken, thereafter densities are assigned as determined on lithology types with sub domains based on oxidation profiles where there were not enough samples for the estimate to run. BIF densities varies from 2.88 to 2.99 from oxides to fresh rock at depth. Surrounding Footwall and Hangingwall densities varies from 2.72 to 2.81 with depth.
Effective Date: June 30, 2023
29
Technical Report Summary for
Kalgold Mine, North West Province, South Africa
8.3Sample Security
Samples are collected by SGS from the Kalgold core shed and transported to the SGS laboratory in Randfontein. A hard copy sample submission form is sent with the samples and a digital copy along with a list of samples included in the submission is emailed to the laboratory. Upon receipt at the laboratory, the submission is sorted and checked against the sample submission form and the senior geologist is notified of any missing and/or additional samples.
All remaining RC chip trays, and DD half core samples are kept at Harmony’s core storage facility. The 1m bulk samples from the RC drilling are stored on site or at mine laydown facilities for a minimum of three months and then discarded. Coarse rejects from the assay laboratory samples are kept for three months and then discarded unless otherwise requested. This allows time for resamples or Quality Assurance and Quality Control (“QAQC”) checks. All pulp samples are returned and stored on site at the core storage facility.
8.4Laboratory Sample Preparation
Historical exploration samples were sent to independent laboratories where they were crushed and pulverized. Aliquots (portions of larger samples) weighing 30g or 50g were taken for fire assay. The primary and a second, independent laboratory were used to assay pulp duplicate samples. Several laboratories were used during various exploration phases, including Performance Laboratories, Bergstrom, and Baker (now Set Point), and the onsite Kalgold analytical laboratory. All these laboratories are currently South African National Accreditation System (“SANAS”) accredited laboratories (except for the Kalgold laboratory). However, this may not have been the case when certain phases of historical exploration were undertaken.
Sample preparation and assaying of both RC and DD samples for the 2017 to 2021 drilling programme was completed at the external SGS laboratory in Randfontein. This laboratory is SANAS accredited (No. T0265) and conforms to the requirements of ISO/IEC 17025 for specific tests.
The sample preparation and analysis flow sheet for both the RC and DD samples from the 2017 to 2021 drilling programme is outlined in Figure 8-1. Screen sizing tests after the crushing and pulverising stage are completed at every 20th sample to ensure particle size tolerances are achieved prior to further splitting of the sample. Charts of screen sizing tests from samples submitted to the current effective date of June 30, 2023, illustrate the sizing tolerances are being met by the laboratory with only minor exceptions (Screen sizing tests after the crushing (90% passing 2mm) and pulverising (95% passing 75um) stages.
8.5Assaying Methods and Analytical Procedures
The method used for gold assay of both RC and DD samples is FAA303 (Au by lead fusion followed by Atomic Absorption Spectroscopy (‘AAS’) finish). This is an accredited method and conforms to ISO/IEC 17025. The multi-element assays are completed by Inductively Coupled Plasma – Optical Emission Spectrometry (ICP-OES) and ICP- Mass Spectrometry (ICP-MS) methods, which are not SANAS accredited.
Historical assays were done by various laboratories including Performance Laboratories and Setpoint Laboratories using fire assay method with AA finish or ICP finish respectively. There are no details on the methodology of the assays done during early years of exploration.
8.6Sampling and Assay Quality Control (“QC”) Procedures and Quality Assurance (“QA”)
Routine quality control measures must be undertaken to check the precision and accuracy of analytical methods used by the laboratories. The checks involve regularly inserting blanks, duplicates, gold, and base metal standards into all batches of samples dispatched to the laboratory for analyses. The current primary analytical laboratories used for sample analysis also have several internal QAQC protocols in place.
At each interval of 20 samples a pulp Certified Reference Material ("CRM") or Gravel Blank is included as a sample. For RC drilling a duplicate field sample is taken from the splitter assembly every 50th sample and a gold assay pill is included into the sequence with the CRM standards and blanks. A photographic record of the relevant standard, blank and assay pill is captured as a record of quality control sample and corresponding sample number it was submitted as. This minimises the risk of a sample mix-up occurring in the sampling stage prior to dispatch and provides a reference point for investigations into QAQC issues at the laboratory.
The internal laboratory QAQC includes CRMs, blanks, splits at the crushing stage and repeats after the pulverising stage along with screen sizing tests and reporting of the lead button weights. The total samples submitted for the drilling program to December 2021 and QAQC ratios of both Harmony and internal laboratory samples are outlined in Table 8-1.
Effective Date: June 30, 2023
30
Technical Report Summary for
Kalgold Mine, North West Province, South Africa
Table 8-1: Summary of Sample Batches for 2018 - 2021 Drilling
|
|
|
|
|
|
| Sample Description |
Total number (No.) |
| Batches submitted to laboratories |
1 329 |
| Drill hole samples |
39 203 |
| Quality control samples |
15 920 |
| CRMs |
3 575 |
Each batch is reviewed upon receipt and any QAQC issues raised with the laboratory. Depending on the type and number of QAQC samples that are outside expected ranges, either a portion or the entire batch is re-assayed. Once the re-assay results are received and the QAQC issue rectified, these values are set as the preferred values for the relevant samples.
Effective Date: June 30, 2023
31
Technical Report Summary for
Kalgold Mine, North West Province, South Africa
|
|
|
Figure 8-1: Laboratory Sample Preparation Process |
Effective Date: June 30, 2023
32
Technical Report Summary for
Kalgold Mine, North West Province, South Africa
The impact of historical anomalous data on the Mineral Resource estimate, has been attempted to be controlled through the exclusion of some of the data from these drill holes. Holes that were misplaced or had grade profiles that did not appear to be in the correct locations, were excluded from estimating the Mineral Resource. Sampling of only mineralised material has resulted in many poorly sampled holes and gaps in the database.
However, this has been handled in the compositing process by inserting a background grade of 0.005g/t Au. It is also possible that this low grade “non-sampled” zones will have a negative impact on the Mineral Resources estimate, resulting in a lower estimate of the overall head grade.
Instead, maintaining the null value was preferred for the estimate fill blocks in low grade and waste areas, with high grade areas extrapolated over for the minute modelled intersections. Given that most of the drilling is historical, it was not possible to exclude historical drilling from the dataset. The historically adopted assay methods have evolved since the mid-nineties, and the QA data indicates the sampling methods are robust enough for inclusion into this model.
As discussed under the drilling results section, much of the deeper pre 2017 historical drilling was centred on the D-Zone deposit which has been mined-out, and in the current mining areas is predominantly shallow drilling and mining already beyond this drilling. Thus the historical drilling has minimal influence in the current resource estimate at depth and new areas which are covered by the post 2017 drilling.
8.6.1Standards
A range of CRMs derived from similar mineralisation styles were sourced from the African Minerals Standards (“AMIS”) and inserted into the sample sequence by the logging geologist. The CRM standard assigned to a particular sample depended on the expected grade of the surrounding samples and, where possible, the grade of the standard was matched to the expected grade. Results of the CRM standards submitted to December 2021 are summarised in Table 8-2.
Table 8-2: Summary of AMIS Standard Results
|
|
|
|
|
|
|
|
|
|
|
|
|
|
|
|
|
|
|
|
|
|
|
|
| |
Au Standard |
No. Samples |
Calculated Values |
| Standard |
Certified Value (g/t Au) |
Expected STD |
Mean (g/t Au) |
SD |
COV |
Bias (%) |
| AMIS0440 |
1.74 |
0.04 |
460.00 |
1.73 |
0.13 |
0.08 |
(1)% |
| AMIS0441 |
2.44 |
0.12 |
526.00 |
2.39 |
0.23 |
0.10 |
(2)% |
| AMIS0473 |
0.41 |
0.02 |
375.00 |
0.42 |
0.11 |
0.26 |
3% |
| AMIS0571 |
0.59 |
0.02 |
280.00 |
0.60 |
0.05 |
0.08 |
1% |
| AMIS0748 |
1.38 |
0.10 |
69.00 |
1.37 |
0.06 |
0.04 |
(1)% |
| AMIS0747 |
0.62 |
0.04 |
48.00 |
0.60 |
0.10 |
0.17 |
(4)% |
| AMIS0724 |
2.38 |
0.12 |
89.00 |
2.28 |
0.20 |
0.09 |
(4)% |
| AMIS0719 |
0.90 |
0.04 |
84.00 |
0.89 |
0.11 |
0.12 |
(1)% |
| AMIS0439 |
— |
— |
261.00 |
0.08 |
0.54 |
6.51 |
—% |
| AMIS0681 |
— |
— |
235.00 |
0.01 |
0.06 |
5.69 |
—% |
| Blank_Gravel |
— |
— |
903.00 |
0.03 |
0.07 |
2.57 |
—% |
| AMIS0570 |
0.86 |
0.04 |
79.00 |
0.88 |
0.22 |
0.26 |
2% |
| AMIS0519 |
1.61 |
0.05 |
166.00 |
1.59 |
0.18 |
0.11 |
(1)% |
Review of the QAQC performance of the CRMs illustrates some outliers falling outside three Standard Deviations (“3SD”) from the expected result. However, most results fall within 2SDs of the certified values.
8.6.2Blanks
Blank material initially comprising barren quartz gravel. Subsequently RC chips from barren intervals were inserted into the sample sequence for both RC and DD samples at a ratio of approximately every 30th sample. The control chart for performance blanks between 2017 – 2021 was assessed and illustrated a small number of anomalous results. Investigation of these outliers found they were the result of mix-ups during the sample preparation or assay process which resulted in partial or complete re-assay of the corresponding batch.
Effective Date: June 30, 2023
33
Technical Report Summary for
Kalgold Mine, North West Province, South Africa
8.6.3Duplicates and Repeats
Scatter plots illustrating all duplicate and repeat results were reviewed, along with field duplicate results from RC samples. No bias is apparent in laboratory duplicates, pulp splits or laboratory repeats. Outliers were predominantly associated with repeats of samples in batches that experienced sample swaps/mix-ups. However, some outliers were due to the presence of coarse gold in the original samples.
8.6.4Gold Assay Pills
A range of gold assay pills were sourced from Geostats (Pty) Limited in Perth, Australia. These comprise a 1g pill of known gold grade added to a blank sample. The expected grade is calculated from the weight of blank material and grade of pill. The advantages of the gold assay pills over pulp type CRM standards are that they are difficult to distinguish from the normal RC chip samples in the batch and test the sample size reduction and splitting processes along with the potential sample mix-ups and analytical errors. As the expected value of each inserted pill sample is different the relative difference plotted against expected grade is used to plot and review results. The target for the pill QAQC samples is required to be within ± 10% range of the expected result.
Problems were experienced with determination of the correct weight and control of the moisture content of the blank material with assay pills, which negatively affected the results. The use of assay pills was therefore discontinued. The milling of the entire sample was implemented to optimise the sample preparation process.
8.7Comment on Sample Preparation, Analyses and Security
In the QP’s opinion:
•the sampling methods are appropriate for the mineralisation styles encountered at Kalgold. No compositing of sample occurs prior to assay;
•the methods used for both the gold and multi-element assay are appropriate for the style of mineralisation; and
•anomalies created with the historical drill hole datasets has been adequately addressed, while maintaining the integrity of the drill hole database for the inclusion in the Mineral Resource estimate. Estimation techniques adopted a null value for low grade and waste areas, while keeping the extrapolation of high grade intersections to a minimum.
Effective Date: June 30, 2023
34
Technical Report Summary for
Kalgold Mine, North West Province, South Africa
9Data verification
Section 229.601(b)(96) (9) (i-iii)
The Kalgold drill hole data is stored in DatamineTM (“Datamine”) Fusion database, which can only be accessed by the geologists granted access by the QP and Technical Specialist (Exploration Manager). The backup process is managed by the Harmony IT Department and comprises a full backup of the SQL server database (HGMTSP303) run every day at 5:30am, with 21 days stored on disk, along with a full backup to tape every month, which is stored at a third-party data storage location. The latest round of drilling, which commenced in 2017, has been subject to extensive modern QAQC procedures and monitoring, which has included laboratory visits and audits by the geologists in charge.
9.1Data Verification Procedures
Data verification procedures included the following:
•the drill hole database was checked against the original logs;
•the drill hole database was checked for missing collar coordinates, collar position and elevation errors, downhole survey errors, interval errors and duplicate sample records;
•the database was exported into the modelling software to check that the drill hole collars rest on the topography;
•when assay results were returned from the laboratory, the QC sample results were assessed for performance before the primary sample results could be used for Mineral Resource estimation;
•the primary assay results captured in the database were validated by spot checking a selection of drill holes used in the current Mineral Resource estimate; and
•the assays captured in the electronic database were checked against the original laboratory certificates.
Errors identified were recorded in a spreadsheet, which was subsequently sent back to the site geologist so that they could be corrected before the data could be used for Mineral Resource estimation.
The potential impact of anomalous and historical incomplete data has been managed through the exclusion of some holes in a systematic data verification approach. Holes that were obviously misplaced or had grade profiles that did not appear to be in the correct locations were excluded from the resource. The habit of sampling only obviously mineralised material has resulted in a large number of poorly sampled holes and gaps in the database. Whilst this has been handled in the compositing process by inserting a background grade of 0.005g/t Au it is possible that these low grade “non-sampled” zones will have a negative impact on the estimate, dragging the overall head grade down. It was felt this was preferable to maintaining the Null value and having the estimate fill blocks in low grade and waste areas with high grades spilled over from the small modelled intersections. Given the majority of the drilling into the deposit is historical drilling it was not possible to exclude all historical drilling from the dataset. The assay methods used have changed little since the mid-nineties and the historical QA data reviewed indicates the sampling methods are robust enough for inclusion into this model.
9.2Limitations to the Data Verification
There has been no re-logging of the historical core and as such, lithology logs have been used as they are for creating the geological and domain models. Historical assay data is largely lacking QAQC information, however, the data that has been available has been subject to some assessment of duplicates and QAQC in the past. None of this information was supplied with the database, as such, all assay data supplied has been taken as is.
Effective Date: June 30, 2023
35
Technical Report Summary for
Kalgold Mine, North West Province, South Africa
9.3Comment on Data Verification
The sampling methods, sample preparation procedures, and analytical techniques are all considered appropriate for the estimation of Mineral Resources. The Kalgold deposit is drilled to a standard suitable for robust estimation of Mineral Resources. However, a significant amount of additional Mineral Resource definition drilling would be required to increase the level of geological confidence. Historical data is adequately handled and the drilling from 2017 has greater influence on the estimate, as most of the areas relying on the historical data has been mined-out.
10Mineral Processing and Metallurgical Testing
Section 229.601(b)(96) (10) (i-v)
Kalgold and its processing facility have been in operation since 1996, as such the processing method is considered well established for the style of mineralisation. The plant makes use of historical trends and data as a basis for their recoveries of ore mined, however when projects are planned for optimisation, appropriate test work will be performed. The latest detailed metallurgical test work program was conducted in July 2019 by Maelgwyn Mineral Services Africa for the Kalgold expansion project pre-feasibility study.
Two main composite samples (oxide and sulphide samples) as well as nine variability samples were evaluated with the objective to compare overall gold recoveries with different flowsheets including gravity, flotation, and leaching. The details and results of the tests are documented in the report entitled “Kalgold Expansion Project: Evaluation of Oxide (2019)”.
10.1Extent of Processing, Testing, and Analytical Procedures
The Kalgold ore can be described as semi-refractory and contains 3% - 5% sulphides. These sulphides negatively affect recoveries and will hence increase reagent consumption. The optimal conditions, as seen in Table 10-1, for the standard leach flowsheet, has been determined to be a grind at 80 um -75um, a 28hr leach time and a 2-pass pre-oxidation with shear reactors.
Table 10-1: Leach Flowsheet Determination
|
|
|
|
|
|
|
|
|
|
|
|
|
|
|
|
|
|
|
|
|
| Leach Condition (28hr) |
Head grade (g/t Au) |
Residue Grade (g/t Au) |
Cyanide Consump. (kg/t) |
Dissolution (%) |
Soluble Loss (%) |
Overall Recovery (%) |
| Base case |
1.43 |
0.15 |
0.31 |
88.59 |
1.50 |
87.09 |
| 2 pass pre-ox |
1.43 |
0.12 |
0.26 |
90.65 |
1.50 |
89.15 |
| 2 pass pre-ox + AAL |
1.43 |
0.14 |
0.60 |
89.51 |
1.50 |
88.01 |
Note: Consump. - Consumption
10.2Degree of Representation of the Mineral Deposit
The location of the drill holes used in the latest metallurgical test work are presented in Figure 10-1. Multiple holes were used from across the length of the deposit and are therefore deemed representative of Kalgold ore types. Nine metallurgical domains were identified based on the results of the current drilling campaign. Samples for each metallurgical domain have been obtained from the available cores and from the ROM feed to the plant.
10.3Analytical Laboratory Details
Maelgwyn Metallurgical Laboratory, established in 2009, conducts commercial mineral processing and metallurgical test work for the process design and development purposes. All leach work conducted can be validated by full metal balances including solid, liquid and carbon metal content.
The Maelgwyn Metallurgical and SGS laboratories holds an ISO quality accreditation required for commercial laboratories.
10.4Test Results and Recovery Estimates
The overall gold recovery calculated for the two options tested namely; ROM- Leach and Flotation – Leach are outlined in Table 10-2.
Table 10-2: Metallurgical Test Work Results
Effective Date: June 30, 2023
36
Technical Report Summary for
Kalgold Mine, North West Province, South Africa
|
|
|
|
|
|
|
|
|
|
|
|
| Two Options |
Recovery (%) |
NaCN Consumption (kg/t) |
Lime Consumption (kg/t) |
| ROM - Leach |
89.1 |
0.65 |
0.75 |
| Floatation - Leach |
87.1 |
4.20 |
1.41 |
|
|
|
Figure 10-1: Position of Drill Holes Used for Metallurgical Test Work |
Source: Google Earth Image June 2019
Effective Date: June 30, 2023
37
Technical Report Summary for
Kalgold Mine, North West Province, South Africa
10.5Commentary on Mineral Processing and Metallurgical Testing
Kalgold and its processing facility have been in operation since 1996, and as such the processing method is well established for the style of mineralisation processed. The plant therefore makes use of historical trends and data as a basis for their recoveries.
QP is satisfied that the metallurgical process is well-tested as part of the ongoing operations and has been subjected to reviews as part of the on going expansion project work. Kalgold ore body is quite complex and necessary adjustments on the process are carried out whenever there is a need to ensure that the stipulated metallurgical efficiency targets are attained all the time.
11Mineral Resource Estimate
Section 229.601(b)(96) (11) (i-vii)
The current Kalgold Mineral Resource estimate is based on the February 2023 geological model which was created by the Harmony QP using the following:
•Leapfrog Geo 4.5 ("Leapfrog") software for geological modelling;
•Datamine modelling software for Mineral Resource estimation and drill hole validation.
11.1Geological Database
The Kalgold Mineral Resource estimate is based on the exploration drill hole data obtained up to December 2022. The validated database contains a total of 3,269 drill holes (193,230m of drilling). Approximately 1,283 of those drill holes (146,124m) are valid and fall within the Mineral Resource model extents and were used in the estimation. The remaining of these holes have been excluded from the estimation. Around 89% of the exploration drilling assays comprise 1m long samples with the rest largely comprising samples <2m long. There is no apparent correlation between sample length and grade.
11.2Geological Interpretation
The Kalgold geological model has been constructed using drilling information, mapping information, geophysical survey and interpretation information and air photography and satellite studies. The estimation domains are controlled by the underlying geology model. Rock codes have been assigned to the different geology types as classified from drilling and mapping. The assigned codes are listed in Table 11-1.
Table 11-1: Geological Modelling Rock Codes
|
|
|
|
|
|
| Lithology |
Model Code |
| Cover |
99 |
| Eastern limb BIF |
10 |
| Central schist |
20 |
| Western limb BIF |
30 |
| Spanover BIF |
70 |
| Windmill BIF |
80 |
| Eastern Greywacke |
90 |
| Western Mafic |
91 |
| Conglomerate unit |
95 |
| Windmill Volcanics |
96 |
| Dolerite Intrusives |
100 |
There is a good general understanding of the stratigraphy and the deposit type owing to the long history of mining. As such there has been no attempt to model different interpretations of the geology. New drilling has started to indicate more complexity at the northern end, where there was historically poor drill coverage. There is some scope for changes to the interpretation, but this is all north of the current mining area. Additional drilling work in these areas are planned to firm up the interpretation in this area.
Effective Date: June 30, 2023
38
Technical Report Summary for
Kalgold Mine, North West Province, South Africa
11.2.1Oxidation
The oxidation model was built from the oxidation as logged in drilling. However, the quality of the oxidation logging was not reliable, with many drill holes logged either fresh from surface or oxidised the entire length. Most oxidation codes within the database were not specific regarding the amount of oxidation present, and this made separating the oxidation into complete/partial/fresh difficult. To this end only two oxidation domains were completed based on all available information, as shown in Table 11-2.
Table 11-2: Oxidation Domains
|
|
|
|
|
|
| Description |
Model Code |
| Oxidised |
2 |
| Not Oxidised (Fresh) |
1 |
The Kalgold area contains an overburden of Kalahari sands. Modelling of the overburden surface followed the below process:
•extracting the base of the logged overburden from the drill hole database;
•adding points to replicate the BIF outcrop along strike of the Windmill Zone; and
•modelling the surface and clipped it to the topography.
11.2.2Estimation Domains
The Kalgold estimation domains listed in Table 11-3 are based on the geology and structural domains. All wireframes generated using implicit modelling were assessed and modified using points and polylines inside Leapfrog to generate a reliable model. Wireframes were then exported to MicromineTM and DatamineTM where they were simplified by merging coincident triangles to reduce file size and make the files more manageable.
Table 11-3: Lode Estimation Domains
|
|
|
|
|
|
| Description |
Estimation Domain (Lode No.) |
| Eastern limb BIF |
10 |
| Central schist |
20 |
| Western limb BIF |
30 |
| Spanover BIF |
70 |
| Windmill BIF |
80 |
| Waste host |
90/91/95/96 |
| Kalahari sands cover |
99 |
| Dolerite intrusives |
100 |
The estimation domains (Figure 11-1) have been split into east limb BIF, central schist, west limb BIF, Spanover BIF, Windmill BIF and Waste (comprising both the western mafic unit, conglomerate unit, and the eastern greywacke). Whilst no separate waste estimate has been conducted based on the boundary analysis, the waste rock composites have been used in the estimation of certain of the BIF units. The overprinting dykes are not mineralised and stope out the mineralisation. However, they have been included here as a domain in the model to ensure these blocks are excluded from the estimate.
The strike of the BIF units varies across the deposit. As such, the estimation domains have been split into three structural domains, namely North, Central and South. This split is based on the general strike and orientation of the stratigraphy and was used to inform the search direction. The structural domains are shown in 11-2.
Effective Date: June 30, 2023
39
Technical Report Summary for
Kalgold Mine, North West Province, South Africa
11.3Mineral Resource Estimation Methods
11.3.1Exploratory Data Analysis
Analysis of exploration data has been conducted on all estimation domains. However, Domain 20 (Central schist) was not estimated due to a lack of consistent sampling resulting from a policy which did not require sampling of this schist unit. ExploreMine was contracted to complete a Mineral Resource estimate for the Spanover (Domain 70) and Windmill North(Domain 120) mineralized zone. Historic and recent exploration has indicated significant potential for the expansion to the current resource areas.
11.3.2Global Analysis
A global analysis of the data shows that the natural cut-off for the data sits around 0.2g/t, which is a good basis to develop a grade shell. However, the lack of consistent sampling downhole (selective geology-based sampling has been completed) has made it difficult to build a coherent grade shell with which to constrain the estimate. This resulted in minor smearing of grade into potentially undrilled low-grade areas. As drilling data increases into the future, the potential for smearing grade is expected to reduce.
Effective Date: June 30, 2023
40
Technical Report Summary for
Kalgold Mine, North West Province, South Africa
|
|
|
Figure 11-1: Kalgold Geological Domains Used in Mineral Resource Estimation |
Effective Date: June 30, 2023
41
Technical Report Summary for
Kalgold Mine, North West Province, South Africa
|
|
|
Figure 11-2: Distribution of the Kalgold Structural Domains |
Effective Date: June 30, 2023
42
Technical Report Summary for
Kalgold Mine, North West Province, South Africa
11.3.3Decluster Analysis
Sample cluster analysis was conducted to assess the clustering in the exploration drilling using both Isatis and GSLib. The analysis was conducted by selecting an approximate cell size based on the average drill spacing and then adjusting using a fixed variable, 160m(X) and 160m(Y) and 80m(Z).
11.3.4Data Compositing
Various composite lengths for the exploration drill hole data were assessed to select a representative composite length, which comprised 1.0m, 2.0m, 2.5m and 5.0m lengths. Statistics by domain show that there generally is a significant fall in variability between raw, 1.0m and 2.0m lengths. However, after the 2.0m length, the variability was stable. A comparison of the data before and after compositing to 2.0m is presented in Table 11-4. Compositing to 2.0m adequately reduces the sample variance whilst maintaining an adequate amount of sample for Ordinary Kriging estimation. The data in all domains was negatively skewed and showed significant variance.
Table 11-4: Comparison of Data Before and After Data Compositing to 2m Lengths
|
|
|
|
|
|
|
|
|
|
|
|
|
|
|
|
|
|
|
|
|
|
|
|
|
|
|
| Domain |
Description |
No. Samples |
Minimum (g/t Au) |
Maximum (g/t Au) |
Mean (g/t Au) |
SD (g//t Au) |
Variance |
COV |
| Eastern Limb BIF |
Raw data |
40 991 |
0.003 |
269 |
0.93 |
2.59 |
6.70 |
2.78 |
| Composited data |
20 053 |
0.004 |
134 |
0.90 |
2.00 |
3.99 |
2.21 |
| Central schist |
Raw data |
9 636 |
0.005 |
11 |
0.10 |
0.48 |
0.23 |
6.63 |
| Composited data |
6 854 |
0.005 |
11 |
0.07 |
0.32 |
0.10 |
4.60 |
| Western Limb BIF |
Raw data |
10 781 |
0.005 |
136 |
0.63 |
1.81 |
3.29 |
2.88 |
| Composited data |
5 463 |
0.005 |
68 |
0.64 |
1.39 |
1.94 |
2.20 |
| Windmill BIF |
Raw data |
2 714 |
0.005 |
37 |
0.98 |
2.76 |
7.65 |
2.81 |
| Composited data |
1 338 |
0.005 |
25 |
0.99 |
2.34 |
5.46 |
2.37 |
| Spanover BIF |
Raw data |
933 |
0.001 |
9 |
0.41 |
0.89 |
0.80 |
2.38 |
| Composited data |
933 |
0.001 |
6 |
0.38 |
0.82 |
0.67 |
2.23 |
| Windmill North BIF |
Raw data |
1 133 |
0.001 |
18 |
0.37 |
0.89 |
0.80 |
2.19 |
| Composited data |
1 133 |
0.001 |
5 |
0.39 |
0.61 |
0.37 |
1.58 |
| Total |
101 962 |
|
|
|
|
|
|
11.3.5Diffusivity and Proportional Effect
Diffusivity tests how well the grade is connected across the domain. A diffuse deposit is one where different bins of grade are connected to others, creating a smooth gradation from high-grade to low-grade. Diffuse deposits can be estimated with simple linear estimation methods like Ordinary Kriging and inverse distance. Non-Diffuse deposits (sometimes referred to as mosaic-type deposits) are not smooth. High-grades and low- grades are found adjacent to each other without a gradational pattern between them. A mosaic-type deposit does not estimate well when linear estimation types are used. In these cases, a non-linear method such as Indicator Kriging or Conditional Simulation must be used. Diffusivity is tested by generating a series of cross variograms between different grade bins.
The proportion effect is a test of variability against grade. A positive result indicates that variability increases with grade. As a precious metal deposit, this is expected.
The Kalgold deposit is both diffuse and shows a strong proportional effect. This means that whilst Ordinary Kriging is an appropriate method for this deposit care needs to be taken when constructing the variograms to ensure representativity. Standard semi-variograms are problematic in projects where a strong proportional effect is present. Harmony has resolved this problem by using correlograms for variography.
Effective Date: June 30, 2023
43
Technical Report Summary for
Kalgold Mine, North West Province, South Africa
11.3.6Contact Analysis
A domain boundary contact analysis was completed using MicromineTM (normal distance to wireframe) to understand the nature of the boundaries between the different units.
The hanging wall to the East limb BIF and the footwall to the West limb BIF were both found to be soft over 10m - 20m. However, the internal Central schist appears to have hard boundaries between it and the BIFs on either side, with significant grade drops moving from the BIF unit into the schist.
11.3.7Basis Statistics
The basic domain statistical analysis shows that the domains are strongly skewed but generally contain only low to medium grades.
11.3.8Top Cut Determination
Top cuts were determined using statistical analysis, specifically analysing where the histogram breaks down and assessing that point against the data distribution in three-dimensional (“3D”), the metal content of the cut samples and the 99th percentile. Top cuts were determined from exploration data only and, where possible, less than ~10% of contained metal was removed from a domain.
Five estimated domains were assessed, and the final top cuts are 8.00g/t for domains 10 (east limb BIF), 20 (west limb BIF) and 6.33g/t for 70 (Spanover BIF), 15.00g/t for Zone 80 (Windmill) and 4.90g/t for Zone 120 Windmill North.
The post top cut domain statistical analysis shows the domains are less strongly skewed and, while they do only contain low to medium grades, the Coefficient of Variation (“COV”) variable indicates the domains are amenable to Ordinary Kriging.
11.3.9Stationarity
To test for domain stationarity a series of grade swath plots of mean grade and SD were used as shown in Figure 11-3. These charts show that there is very little drift in the Kalgold deposit with steps in the graphs correlated to changes in deposit strike which will be handled through search parameters, staged estimation and structural domaining.
11.3.10Variography
The variography generally exhibits a high nugget effect and variograms are noisy because of the strong proportional effect seen in the Kalgold deposit. To enable a relatively robust estimate, a series of correlograms were modelled for each domain. Back transformed Gaussian variograms were also assessed to compare the parameters used. The Gaussian variograms and correlograms were generally in agreement.
Variograms tend to indicate a nugget of between 15% - 30%. The second structure tends to comprise a further 40% -60% of the variance, with the long range third structure comprising the remainder. The first structure commonly covers 70% - 80% of the total variance and 20% - 30% of the total range with distances of between 20m - 50m. This indicates that to obtain a high-quality estimate drilling needs to be spaced at the 20m - 40m spacing.
The variograms were modelled in Isatis as correlograms. Rotations were determined using the Isatis Geological Plane to ensure easy transfer, from Isatis to Leapfrog and MicromineTM. Geological Plane rotation is ZYZ rotation or Z (azimuth), Y (dip right hand down looking along the strike) and Z (pitch in plane rotated down from Azimuth direction).
Effective Date: June 30, 2023
44
Technical Report Summary for
Kalgold Mine, North West Province, South Africa
|
|
|
Figure 11-3: Variogram Ellipses Used for Each Structural Domain |
Effective Date: June 30, 2023
45
Technical Report Summary for
Kalgold Mine, North West Province, South Africa
11.3.11Block Model
The Mineral Resource model was constructed in the LO25 grid. The parameters used in constructing the block model are shown in Table 11-5.
The resulting model was then re-blocked to 10m x 10m x 5m to create the Mineral Reserve model. The Windmill Mineral Resource, which has been included in the Kalgold model, utilises the same parameters and block size as the Broader model. A trial was run utilising a smaller block size on Windmill alone as a test. However, whilst there was a slight drop in tonnes and a higher gold grade, the overall result was not significant enough to justify a separate model.
Table 11-5: Summary of Block Model Extents
|
|
|
|
|
|
|
|
|
|
|
|
| Variable |
X |
Y |
Z |
| Minimum (Origin Centroid) |
22 595 |
(95 220) |
775 |
| Maximum |
24 455 |
(91 760) |
1 355 |
| Extents |
1 860 |
3 460 |
580 |
| Parent block size |
10 |
20 |
20 |
| Sub block size |
5 |
5 |
2.5 |
| No. of blocks |
186 |
173 |
29 |
| Rotation (Bearing/Plunge/Dip) |
— |
— |
— |
11.3.12Grade Estimation
The Ordinary Kriging grade interpolation method has been selected for Kalgold based on data density and grade distribution. The variograms helped inform the data searches in combination with the level of sample support. The first pass was roughly based on half the main variogram range at the recommendation of an independent reviewer. The second pass was double the first and the third was three times the first. The purpose of the third pass was to simply inform those parts of the model not filled by the earlier passes.
The Central schist unit was not estimated due to a lack of sampling that consequently causes grade smearing during estimation. The Spanover BIF (Domain 70) and Windmill North BIF (Domain 120) was estimated and classified using the same methodology as described in detail in “Harmony Kalgold Operations Kalgold Mineral Resource Report, (R.Reid December 2019). The Windmill North BIF (Domain 70) and Spanover (Domain 120) has had a significant amount of additional drilling, which has upgraded the Mineral Resource Model.
Grade continuity is considered moderately good. Variography and 3D analysis indicates that the grade is relatively continuous and tightly constrained to the extents of the BIF units. Mapping the BIFs essentially maps the grade distribution. Within this broad envelope of the BIF there is a strong structural component to the grade distribution which results in shallow northerly plunging high grade lozenges that are contained in an overall broad tablet-type low-grade halo constrained within the BIF. These grade lozenges are in the order of 40m to 80m in length and would require a high density of drilling to accurately map them within the model, this is well inside the current drill density and this lack of drill density negatively impacts the ability of the model to accurately replicate these small high-grade lenses.
11.3.13Relative Density and Tonnage Calculation
Densities used in past were taken from the Kalgold 2017 DatamineTM Ordinary Kriging estimation macro. This is because there were not enough samples across the deposit to update the assigned density numbers. Over the past couple of years, a significant number of density measurements were obtained from the new drilling at a rate of approximately 1 every 10m. As such, the density data now covers a significant portion of the deposit. This data has been combined with grab sample data taken from the pit during the sampling process. For the current estimation, the densities used were assigned to the block model using a Datamine RMTM macro. The densities have largely been estimated into the main domains using the Inverse Distance Squared interpolation method.
The densities that were used to calculate the Mineral Resource tonnage are presented in Table 11-6. Areas not covered were extrapolated by nearest neighbour estimates.
Effective Date: June 30, 2023
46
Technical Report Summary for
Kalgold Mine, North West Province, South Africa
Table 11-6: Densities Assigned by Depth
|
|
|
|
|
|
|
|
|
| Lithology |
Depth (mRL) |
Density (t/m3) |
| BIF |
>=900 |
2.99 |
| BIF |
>=1,160 |
2.93 |
| BIF (approximate base of oxide) |
>=1,200 |
2.88 |
| Not BIF |
>=900 |
2.81 |
| Not BIF |
>=1,120 |
2.80 |
| Not BIF |
>=1,150 |
2.80 |
| Not BIF (approximate base of oxide) |
>=1,200 |
2.72 |
11.3.14Model Validation
The block model was validated and reviewed by the QP using statistical tests, visual assessments, swath plots and estimation quality parameters. Swath plots were generated to compare the block model grades to the composite and declustered composite grades for easting, northing, and elevation slices through the deposit. Block model grades generally follow the composites and display an adequate amount of smoothing.
Estimation risk was assessed using cross validation plots and a supporting Inverse Distance Squared estimate. The grade-tonnage curves from both estimates replicate each other indicating no significant estimation issues with the Ordinary Kriging estimate showing some additional smoothing related to the variograms and high nugget.
11.4Mineral Resource Evaluation
The Mineral Resources at Kalgold are considered by the QP to have reasonable prospects of economic extraction by open pit mining methods. Kalgold is an on-going operation with a well-defined set of operating parameters and costs. These parameters are used to generate a series of open pit Mineral Resource shells based on various gold prices, to constrain the Mineral Resource block model for reporting purposes. The parameters used to determine the economic cut-off grade at the current effective date of June 30, 2023 are presented in Table 11-7.
Table 11-7: Economic Parameters for Mineral Resource Shell
|
|
|
|
|
|
|
|
|
| Description |
Unit |
Value |
| Gold price |
ZAR/kg |
920 000 |
| Planned recovery factor |
% |
86 |
| Mining costs |
ZAR/t |
Modelled based on Andru mining rates |
| Processing costs |
ZAR/t |
263.00 |
| Plant throughput |
ktpm |
130 |
| Planned dilution (Weighted planned per pit) |
% |
9.3 |
The gold price, as used for the Mineral Resource shell modelling and the Mineral Resource economic analysis, corresponds to the USD1,764/oz (ZAR920,000/kg) gold price (Table 11-7). This is for the reporting period June 30, 2023, it will updated for next reporting period. The plant recovery factor is based on metallurgical test work and historical plant performance, as discussed in Section 10 of this TRS. Based on the parameters presented in Table 11-7, the cut-off grade reporting to the Kalgold Mineral Resources at the effective date is 0.54g/t gold. The cut-off grade has been updated using the BP2023/24 parameters.
The Kalgold Mineral Resource estimate is reported in situ at economic viability of 0.54g/t gold economic cut-off. The is determined taking into account the Gold Price, mining costs and the plant processing costs.
Effective Date: June 30, 2023
47
Technical Report Summary for
Kalgold Mine, North West Province, South Africa
11.5Mineral Resource Classification and Uncertainties
The Kalgold Mineral Resource model was classified into Measured, Indicated and Inferred Mineral Resource categories. The classification criteria are based on the assessment of the quality of the Kriged estimate (using population breaks in the slope of regression and Kriging efficiency parameters) and sample support (average sample distance and data spacing). Each of these parameters were considered individually and ranked in order of priority with Estimation Pass, Average Sample Distance and the Slope of Regression having the most significant impact. Histograms of this data were assessed, and break points identified in the data that equate with the parameters presented in Table 11-8.
A combination of these parameters was used to classify the Mineral Resource estimate using a set of "if-else" statements that were collated into a single automatic classification. This data was then used to generate a series of wireframes for the Measured, Indicated, and Inferred categories. The wireframes were adjusted to account for the continuity seen in the geological model that included geology, structural understanding, grade continuity, historical reconciliation, and deposit type. No further geological losses or discounts were applied additional to those modelled in the ore limb model. The measured wireframe was further adjusted 20m below the blasthole data to cater for year on year confidence upgrade.
Table 11-8: Parameters Considered for Constructing the Mineral Resource Classification Wireframes
|
|
|
|
|
|
|
|
|
|
|
|
| |
Mineral Resource Category |
| Parameter |
Measured |
Indicated |
Inferred |
| Kriging Variance |
0.2 |
0.3 |
0.4 |
| Kriging Efficiency |
0.6 |
0.3 |
0.1 |
| Slope of Regression |
0.8 |
0.5 |
0.3 |
| Average Sample Distance (m) |
20 |
40 |
100 |
| Estimation Pass |
1 |
2 |
3 |
The Kalgold geological model is considered robust by the QP, as it is based upon the well understood stratigraphic model with defined geological units that are readily mapped between drill holes and along strike. There are several poorly mapped cross-cutting faults that potentially impact the Watertank North Mineral Resource area that have not been included into the model. This adversely impacts the confidence in the model in this area and the classification is consequently downgraded.
A 3D image of the final classified Mineral Resource model prior to the application of the economic cut-off grade is shown in Figure 11-4. There is a significant amount of mineralised material outside this area that remains unclassified either due to lack of supporting data, poor chances at economic extraction, or poor estimate quality.
11.6Mineral Resource Estimate
The Mineral Resource estimate is reported as in-situ with reasonable prospects for economic extraction, classified in accordance with § 229.1302(d)(1)(iii)(A) (Item 1302(d)(1)(iii)(A) of Regulation S-K).
The location of the Mineral Resources is indicated in Figure 11-4.
The Mineral Resource estimate for Kalgold (A Zone, Henry’s and Watertank) and Windmill Zone is presented in Table 11-9 as at June 30, 2023, exclusive of Mineral Reserves. The estimate accounts for mining depletions up to June 2023. The Mineral Resource figures reported herein only consider the tonnages contained within the Mineral Resource model, with the inferred portion of the Mineral Resource including the historical Surface tailings of 6 263Kg (0,201Moz).
The QP compiling the Mineral Resource estimates is Mr RF Gaelejwe, who is the fulltime Ore Reserve Manager at Kalgold, and an employee of Harmony.
Effective Date: June 30, 2023
48
Technical Report Summary for
Kalgold Mine, North West Province, South Africa
|
|
|
Figure 11-4: Location and Classification of Kalgold’s Mineral Resources and Mineral Reserves |
Effective Date: June 30, 2023
49
Technical Report Summary for
Kalgold Mine, North West Province, South Africa
Table 11-9: Summary of the Kalgold Mineral Resources as at June 30, 2023 (Exclusive of Mineral Reserves) 1-8
|
|
|
|
|
|
|
|
|
|
|
|
| METRIC |
| Mineral Resource Category |
Tonnes (Mt) |
Gold Grade (g/t) |
Gold Content (kg) |
| Measured |
3.474 |
1.05 |
3 634 |
| Indicated |
31.832 |
1.20 |
38 187 |
| Total / Ave. Measured + Indicated |
35.306 |
1.18 |
41 821 |
| Inferred |
25.448 |
0.34 |
8 648 |
| IMPERIAL |
| Mineral Resource Category |
Tonnes (Mt) |
Gold Grade (oz/t) |
Gold Content (Moz) |
| Measured |
3.830 |
0.031 |
0.117 |
| Indicated |
35.089 |
0.035 |
1.228 |
| Total / Ave. Measured + Indicated |
38.918 |
0.035 |
1.345 |
| Inferred |
28.052 |
0.010 |
0.278 |
Notes:
1. Mineral Resources are reported with an effective date of June 30, 2023 were originally prepared, classified and reported according to SAMREC, 2016. For the purposes of this TRS, the Mineral Resources have been classified in accordance with § 229.1302(d)(1)(iii)(A) (Item 1302(d)(1)(iii)(A) of Regulation S-K). The Qualified Person responsible for the estimate is Mr RF Gaelejwe, who is Ore Reserve Manager at Kalgold, and a Harmony employee.
2. The Mineral Resource tonnes are reported as in-situ with reasonable prospects for economic extraction.
3. No modifying factors or dilution sources have been included to in-situ Reserve which was subtracted from the SAMREC Resource in order to obtain the S-K 1300 Resource.
4. The Mineral Resources are reported using a cut-off value of 0.54g/t and a gold price of USD1,764/oz; for an assumed plant throughput of 130Ktpa. These parameters including mining contractor mining rates schedule per bench, processing cost of R263/t, Diesel cost of R21.30/l and metallurgical recovery of 86% were used to constrain the Mineral Resource shell.
5. Tonnes are reported as rounded to three decimal places. Gold values are rounded to zero decimal places.
6. Mineral Resources are exclusive of Mineral Reserves. Mineral Resources are not Mineral Reserves and do not necessarily demonstrate economic viability.
7. Rounding as required by reporting guidelines may result in apparent summation differences.
8. The inferred portion of the Mineral Resource includes the historical Surface tailings of 6 263Kg (0,201Moz)
9. The Mineral Resource estimate is for Harmony’s 100% interest.
Factors that may affect the Mineral Resource estimates include the following:
•Historical Data validations assumptions
•gold price assumptions;
•exchange rate assumptions;
•operating and capital cost assumptions;
•gold recovery assumptions; and
•operational risks.
11.7Mineral Resource Reconciliation
The Measured and Indicated Mineral Resources, exclusive of Mineral Reserves, increased by 13% year on year from 1.187Moz to 1.345Moz. The Inferred Mineral Resources, exclusive of Mineral Reserves, increased from 0.074Moz in June 2022 to 0.278Moz in June 2023. The change is due to Windmill model refinement.
Overall decrease in inclusive Mineral Resources attributed to the constraining of economic pit shells at depth by increasing mining was offset by the exclusion of Watertank Main mining in the Mineral Reserves.
11.8Comment on Mineral Resource Estimates
In the opinion of the QP:
•there are no obvious geological, mining, metallurgical, environmental, social, infrastructural, legal and economic factors that could have a significant effect on the declared Mineral Resource;
•there is no known geological data that could materially influence the estimated quantity and quality of the Mineral Resource; and
•current models/interpretations are continuously subjected to ongoing review for improvements where applicable.
Effective Date: June 30, 2023
50
Technical Report Summary for
Kalgold Mine, North West Province, South Africa
12Mineral Reserve Estimate
Section 229.601(b)(96) (12) (i-iv)
The reported Mineral Reserves are derived through a business planning process by the QP. The business planning process comprises multi-functional reviews inclusive of all mining, support and service departments that are involved in the verification of the inputs and the Modifying Factors. The CODM comprises various executive roles and responsibilities. These executives assess the profitability, the revenue and production costs. The CODM also considers capital expenditure, gold production and tonnes milled when assessing the overall economic sustainability.
12.1Key Assumptions, Parameters, and Methods used to Estimate the Mineral Reserve
The results and assumptions derived from the business planning process extends over an 18-month period. The planning process carefully considers strategic plan directives; analysis of historical performance; realistic productivity, and cost parameters; Modifying Factors; and technical and economic studies that have demonstrated justified extraction, as applicable to specific portions of the Mineral Reserves.
All reported Mineral Resources and Mineral Reserves originate in situ from the orebody hosted within the Kraaipan Greenstone belts at Kalgold. The Mineral Reserves are considered based on several factors, including:
•the latest geological structure and associated Mineral Resource estimation models that constrain the layout for the mine design and LOM planning;
•pit slope stability design parameters as guided by geotechnical design and modelling;
•identified mining areas can be found in four discrete orebodies - D Zone, A Zone, Watertank, and Windmill;
•the open pit mining methodology is informed by the geological model;
•the Mineral Reserves cater for allowances in dilution sources and relevant Modifying Factors. Dilution of the orebody is predominantly expected to be incurred during mining operations; and
•only Measured and Indicated Mineral Resources are used to derive the Mineral Reserves.
No other sources of information are published as part of the Mineral Reserves for Kalgold.
12.2Modifying Factors
A summary of the Modifying Factors used to convert the Mineral Resource to the Mineral Reserve for Kalgold is presented in Table 12-1. The Modifying Factors are consistent with the modelling of the orebody, planning and computing estimates used in determining the Mineral Reserves, which are also consistent with historical performance. Plant recovery as shown in Table 12-1, closely aligns to the overall metallurgical test work and gold recovery calculated for the both the ROM-leach and flotation-leach methods, as defined in Section 10 and Section 14, respectively.
The Mineral Reserves are declared as delivered to the mills, except for the recovered gold content. The gold content is calculated after factoring in the modifying factors , as shown in the Modifying Factors (Table 12-1) and is depleted to inform the Kalgold cashflows.
Table 12-1: Kalgold Modifying Factors Used for Mineral Reserve Determination
|
|
|
|
|
|
|
|
|
| Modifying Factor |
Unit |
Value |
| Mineral Reserve cut-off - Pit Mineral Reserves |
g/t |
0.60 |
| MCF - Pit Mineral Reserves |
% |
100 |
| Dilution - Pit Mineral Reserves |
% |
9.3 (Weighted planned per pit) |
| Plant Recovery Factor - Pit Mineral Reserves |
% |
R |
86 |
| Plant Recovery Factor - Stockpile Mineral Reserves |
% |
R |
70 |
Effective Date: June 30, 2023
51
Technical Report Summary for
Kalgold Mine, North West Province, South Africa
Dilution of 9,3% over the LOM (Table 12-1) is a weighted average from different pits. In the first 3 Years dilution is A Zone, Henrys and Windmill at 10%; and Watertank North at 5%. The rest of LOM from mid-2025 planned at 10%. The latter will be refined in the next year planning.
12.3Mineral Reserve Estimate
The Mineral Reserves were originally prepared, classified and reported according to SAMREC, 2016. For the purposes of this TRS, the Mineral Reserves have been classified in accordance with § 229.1302(d)(1)(iii)(A) (Item 1302(d)(1)(iii)(A) of Regulation S-K).
Mineral Reserves are derived from the Mineral Resources, a detailed business plan and the operational mine planning processes. Mine planning utilises and takes into consideration historical technical parameters achieved. In addition, Mineral Resource conversion to Mineral Reserves considers Modifying Factors, dilution, ore losses, minimum mining widths and planned mine call factors.
The QP compiling the Mineral Resource estimates is Mr RF Gaelejwe, who is Ore Reserve Manager at Kalgold, and an employee of Harmony.
The Mineral Reserves are 13,913Mt of milled ore containing 332koz of gold and comprises 41% Proved Reserves and 59% are Probable Reserves. The Kalgold Mineral Reserves are presented in Table 12-2, whilst their locality is presented in Figure 11-4.
Table 12-2: Summary of the Kalgold Mineral Reserves as at June 30, 2023 1-5
|
|
|
|
|
|
|
|
|
|
|
|
| METRIC |
| Mineral Reserve Category |
Milled Tonnes (Mt) |
Gold Grade (g/t) |
Gold Content (kg) |
| Proved (Open pits and stockpiles) |
5.384 |
0.93 |
4 991 |
| Probable (Open pits and stockpiles |
8.529 |
0.85 |
7 217 |
| Total (Proved + Probable) |
13.913 |
0.88 |
12 208 |
| |
| IMPERIAL |
| Mineral Reserve Category |
Milled Tonnes (Mt) |
Gold Grade (oz/t) |
Gold Content (Moz) |
| Proved (Open pits and stockpiles) |
5.935 |
0.027 |
0.160 |
| Probable (Open pits and stockpiles |
9.401 |
0.025 |
0.232 |
| Total (Proved + Probable) |
15.336 |
0.026 |
0.392 |
Notes:
1. The Mineral Reserves were originally prepared, classified and reported according to SAMREC, 2016. For the purposes of this TRS, the Mineral Reserves have been classified in accordance with § 229.1302(d)(1)(iii)(A) (Item 1302(d)(1)(iii)(A) of Regulation S-K). The Qualified Person responsible for the estimate is Mr RF Gaelejwe, who is the Kalgold Ore Reserve Manager, and a Harmony employee.
2. Tonnes, grade, and gold content are declared as net delivered to the mills.
3. Figures are fully inclusive of all mining dilutions, gold losses and are reported as mill delivered tonnes and head grades. Metallurgical recovery factors have not been applied to the reserve figures.
4. Gold content is recovered gold content after taking into consideration the modifying factors.
5. Mineral Reserves are reported using a cut-off grade of 0.60g/t determined using a gold price of USD1,582/oz gold, mining contractor mining dry rates schedule per bench, processing cost of R263/t and diesel cost of R21.30/l.
12.4Mineral Reserve Reconciliation
The declared Mineral Reserve estimate increased by 42% from 0.758Moz as at June 30, 2022 to 0.392Moz as at June 30, 2023. This difference attributed to the Exclusion of Watertank Main mining from LOM due to initial 130Ktpm and 170Ktpm LOM option plans being cashflow negative. This resulted in independent optimised access/ramping designs for A Zone and Watertank North, which excluded further waste and ore mining when compared to the previous integrated access/ramping system used for mining A Zone, Watertank Main and Watertank North.
12.5Commentary on Mineral Reserve Estimate
The declared Mineral Reserves takes into consideration all Modifying Factors. The Mineral Reserves are depleted to generate the cash flows presented in Section 19 and are deemed by the relevant QP's to be appropriate and, both technically and economically achievable. Any by-products that are recovered as part of the refining process, make up an immaterial component of the total metal inventory, and is thus not reported as part of the Mineral Reserve estimate.
In the opinion of the QP, the methodologies applied in estimating the Mineral Reserve is sound.
Effective Date: June 30, 2023
52
Technical Report Summary for
Kalgold Mine, North West Province, South Africa
13Mining Method
Section 229.601(b)(96) (13) (i-v)
Kalgold is an open-pit mining operation located in the geological terrane of the Archaean KGB. Gold mineralisation is hosted by steeply dipping BIF interbedded with schist, shale, and greywacke. The nature of the orebody requires the selective mining of the ore blocks, defined by the east and west mineralised limbs, to separate the ROM destined ore, above the Mineral Reserve cut-off of 0,60g/t Au. Based on the gold grade, properties of the host rock, and shallow depth of mineralisation, open pit mining is appropriate for Kalgold. The gold deposit is mined most cost effectively, using a modular approach with multiple small to medium open pits defined by mineralised zones, as presented in Figure 13-1.
The various mineralised zones at Kalgold include the D Zone, A Zone, Watertank, Bridge Zone, Henrys, and Windmill. Some of these zones are delineated by structural geological domains, are currently being mined, or scheduled to be mined, from the following pits:
•the D Zone, located to the south of the Kalgold lease area in south domain, was mined out via the D Zone pit;
•the A Zone, located largely in the south domain with some portion in central domain, is currently being mined;
•the Watertank Zone is defined in the north domain and is currently being mined as the Watertank pit;
•the Bridge Zone extends north, from the A Zone, and is mostly located in the central domain, and is the infill area that combines the respective A Zone and Watertank pits;
•Henry’s pit located to the south of the A Zone pit, known as the A Zone south extension, is in the south domain, it started mining in Q1 of 2022; and
•the Windmill Zone, located north of the A Zone and Watertank pits, in the north domain, is planned to be mined via the Windmill South pit. This Zone also commenced mining in Q1 of 2022, along with Henry’s pit.
13.1Mine design
The mine design strategy aims at maximising the safe extraction of ore, while minimising the risk of geotechnical failures, which can result in operational disruptions and dangerous working conditions. The geological modelling, mining method, and geotechnical considerations are considered as part of the mine design process. Pit slope design work and recommendations play a critical role in the ultimate pit design and access ways.
While there are other satellite orebodies at Kalgold, the current A Zone and Watertank mining pits are discussed in detail. The A Zone and Watertank pits have an overall approximate strike of 2km and comprise two zones of mineralisation, which dip steeply towards the east. The mineralised zones range between 15m and 120m thick. A 10m bench height is used to mine the orebody. A plan view of the current designed mining pits shown in Figure 13-1.
13.1.1Mine Design Parameters
The mine design process at Kalgold incorporates the pit slope design for current and future operations. The pit slope design criteria are incorporated into the pit design and optimisation process. Mine planning and optimisation is conducted using the DatamineTM and DeswikTM software. Key mine design parameters for the current A Zone and Watertank pits are shown in Table 13-1 and Figure 13-2.
Effective Date: June 30, 2023
53
Technical Report Summary for
Kalgold Mine, North West Province, South Africa
|
|
|
Figure 13-1: Plan Showing Kalgold Mining Zones |
Table 13-1: Key Mine Design Parameters
Effective Date: June 30, 2023
54
Technical Report Summary for
Kalgold Mine, North West Province, South Africa
|
|
|
|
|
|
|
|
|
| Parameter |
Unit |
Value |
| Technical |
Dilution (Weighted planned per pit) |
% |
9.3 |
Mineral Reserve cut-off grade |
g/t |
0.6 |
MCF |
% |
100.0 |
Plant Recovery Factor |
% |
86.0 |
| Geotechnical Slope Design Angles |
| Weathered East: |
Design |
° |
60.0 |
Overall (Windmill) |
° |
46.6 |
Overall (Watertank Main)¹ |
° |
32.8 |
Overall (Henry) |
° |
49.0 |
| Weathered West: |
Design |
° |
60.0 |
Overall (Windmill) |
° |
46.4 |
Overall (Watertank Main)¹ |
° |
34.9 |
Overall (Henry)¹ |
° |
38.0 |
| Eastern |
Design |
° |
82.0 |
Overall (Windmill)¹ |
° |
48.2 |
Overall (Watertank North)¹ |
° |
51.6 |
Overall (Watertank Main)¹ |
° |
56.0 |
Overall (A-Zone)1+2 |
° |
47.6 |
Overall (Henry)2 |
° |
52.2 |
| Western |
Design |
° |
82.0 |
Overall (Windmill)2 |
° |
54.0 |
Overall (Watertank North)¹ |
° |
52.3 |
Overall (Watertank Main)1+2 |
° |
54.9 |
Overall (A-Zone) |
° |
62.4 |
Overall (Henry)1+2 |
° |
50.7 |
Notes: 1 - Including a 23.7m ramp(s), 2 - Including a 11.85m ramp(s)
13.2Mine Plan Development and Life of Mine Schedule
The modular open pit mining method is dependent on the detailed geological understanding of the various satellite orebodies. Exploratory infill drilling provides accurate geological information and is included in the final mine designs. The optimised mine design gives rise to the short-term planning and scheduling activities. These activities lead to the better grade control, safer working conditions, and improved profitability. The short-term planning is based on a monthly mining tonnage profile which considers rainy season.
At Kalgold, the LOM plan and scheduling originates with the use of the Mineral Reserves model, which is modelled at a 0.6g/t cut-off grade. The 13,913Mt (milled ore) of Mineral Reserves are included in the LOM plan and are fully accessible via the mine’s existing infrastructure. The mining rates used in determining the LOM plan are based on the current and expected operational performance, notwithstanding any unforeseen constraints. The remaining LOM for the operations is planned for 9 years. More details of the mined waste and ore tons profile, the milled ore tons, and recovered gold are presented in Section 13.4.1.
Effective Date: June 30, 2023
55
Technical Report Summary for
Kalgold Mine, North West Province, South Africa
13.3Geotechnical and Geohydrological Considerations
13.3.1Geotechnical
The main geotechnical risk in open pit mining is slope failure.
The geotechnical model used in the Kalgold Mine design shown in Table 13-1, takes the geology and geological structures, observations from other historical slope failure incidents, results of the slope stability monitoring systems, groundwater flows, and mining conditions that may potentially induce slope failure. The geotechnical model also incorporates the geohydrology of the mining areas.
Slope failure is considered as a material risk which may impact Kalgold’s Mineral Resource and Mineral Reserve estimates. Current remedial action includes pre-split blasting to protect the integrity of the high walls. The pit slope mitigation strategy is detailed and managed through the Mining and Rock engineering Code of Practice (“COP”) and is communicated, adhered to, and monitored by both the mine’s technical services and operational teams. An example of the geotechnical recommendations for the A Zone and Watertank pits highwall design, in consideration of the ramp design, is represented in Figure 13-2.
13.3.2Geohydrological and Seismic Monitoring
The semi-arid nature and rainfall patterns associated to the Kraaipan climate, currently do not pose any significant risks to the Kalgold Mine.
Nevertheless, in hard rock environments such as Kalgold, it is worth noting that deep saturated fractures in bedrock are also potential sources of groundwater and dykes are also known preferential pathways for groundwater. These deeper lying geological features, with the combined low risk potential of a rainy season, can pose a risk to the mining operations. Risks associated to the accumulation of groundwater is managed through a planned pumping strategy water drainage controls in and around the pits.
The Leica GeoMos Monitoring Solution is installed and is used for data capturing. Currently data is being collected to understand Kalgold conditions and for system fine-tuning. The monitoring system is planned to be expanded as the push backs are completed and the pit progresses deeper. Seismic monitoring includes the monitoring of pit slope stability by tracking and electronically recording prisms data points. These data points are captured via high resolution imaging from a remote monitoring location aimed at detecting movement in the pit high walls. The data data collect thus far reflect stable high walls, and will be used to fine tune the monitoring parameters for when the system migrates to live reporting.
13.4Mining Operations
Kalgold is an open-pit mining operation. There is currently one active pit, following the merger of the A Zone and Watertank pits, which is the main source of ore for the LOM plan. The LOM plan extends over the inclusive period of 2024 - 2032. ROM ore is supplied for the period 2024 - 2031. The remaining LOM plan is supported with ore from the onsite managed stockpile.
13.4.1Mining Rates
The forecasted mining production rates for Kalgold considers the planned mining areas, inclusive of the mines current infrastructure capacity. Kalgold LOM plan comprises the planned ROM ore at c.1.5Mtpa for the period 2024 – 2031. The remaining of the LOM plan consists of material supplied from the stockpiles only. The LOM plan is presented in Figure 13-3.
The planned average stripping ratio for the period 2024 - 2031 is 1,29. The waste material movement is largely due to increasing depths of the planned pits.
Ore destined for the plant consists of ore from the pit and ore from the high grade (“HG”) and low grade (“LG”) stockpiles (“SP”). The annual forecasted milled tonnages and the associated yield used for the gold recovery is shown in Figure 13-4. Recovered gold content is based on the ore milled and processed originating from the various ore sources. The annual forecasted gold produced for the LOM is shown in Figure 13-5.
Effective Date: June 30, 2023
56
Technical Report Summary for
Kalgold Mine, North West Province, South Africa
13.4.2Mining Equipment and Machinery
Mining is conducted by mining contractors, Andru Mining (Pty) Limited (“Andru Mining”), under the management of Harmony. A contractor mining approach is envisaged for the proposed LOM plan.
|
|
|
Figure 13-2: Section View of A Zone and Watertank Pit Slope and Ramp Design |
|
|
|
Figure 13-3: Kalgold LOM Plan |
|
|
|
Figure 13-4: Graph of Kalgold LOM Plan - Tonnes and Grade |
Effective Date: June 30, 2023
57
Technical Report Summary for
Kalgold Mine, North West Province, South Africa
|
|
|
Figure 13-5: Graph of Kalgold LOM Plan – Gold Produced (kg) |
Effective Date: June 30, 2023
58
Technical Report Summary for
Kalgold Mine, North West Province, South Africa
Conventional truck and shovel methods are adopted by the mining contractor using the following mining fleet for both waste and ore movement:
•7 excavators (5 x 120t and 2 x 80t); and
•35 trucks (777: 9 @ 100t, 773: 11 @80t, ADT: 16 @ 40t )
Ancillary equipment includes, but not limited to, the use of water and diesel bowsers, mechanical and electrical maintenance fleet, graders, and dozers.
Stockpile handling is also carried out by the mining contractor using the following fleet:
•4 front end loaders (“FEL”); and
•5 articulated dump trucks (“ADTs”).
The mining contract is aimed at delivering a specific volume of ore and waste mined. The contractor is bound by providing the necessary fleet, taking into consideration all equipment availability and utilisation, to deliver the required volumes.
13.4.3Grade and Dilution Control
The selective open pit mining method is used to maintain grade control through improved selectivity and flexibility using modular pits. Ore grade and dilution control is monitored through key parameters including geological grade control, mining within cut-off grade and the MCF. The Mine Planning and Geology departments perform critical grade control monitoring, to ensure the ratio of the combined ore mined is within grade tolerance limits.
Operationally grade and dilution control is mostly achieved through improved drilling and blasting practices. Drilling accuracy is achieved by holes that are drilled with minimum deviations, aimed at being correctly burdened and that are within the planned mining block limits. The ROM ore above the cut-off is earmarked for immediate processing from the ROM pad, while the low-grade ore is transported to a dedicated low-grade stockpile (Table 13-2).
Table 13-2: Stockpile Categories
|
|
|
|
|
|
| Type of Stockpile |
Grade Category (g/t) |
| ROM pad |
>0.6 |
| Low-grade |
0.35 - 0.59 |
| Mineralised zone (Waste Dump) |
<0.35 |
The annual forecasted feed grades from the respective ore sources, the average feed grade for these respective sources, and the recovered grade for the LOM is shown in Figure 13-4.
13.4.4Ore transport
Ore and waste material are transported separately, with ore being trucked from the pit to the plant ROM pad, and waste rock going to the mines waste dumps. Low-grade ore is also delivered via trucks to the low-grade ore stockpile. Material re-handling, from the stockpile, is managed by a separate small loading and hauling fleet. There are established haul roads, maintained by the mining contractor, within the pit, plant, and stockpile that are designated for ore transport.
13.4.5Mining Personnel
The mine is supported by approximately 726 employees, comprising 248 permanent employees and 471 contractors. The open pit mining operations uses a 10-hour shift system, operating a 2-shift cycle per day. All other employees work on a day shift rotation system only. The Kalgold operations are supported by the key mining personnel functions, where some individuals carry overall accountability, as per the Mine Health and Safety Act 29 of 1996 (MHSA).
Effective Date: June 30, 2023
59
Technical Report Summary for
Kalgold Mine, North West Province, South Africa
13.5Commentary on Mining Method
The open pit modular mining method is the prevalent mining method at the Kalgold Mine. This mining method works well with a robust understanding of the orebody’s geology and the ideal implementation of the pit slope design.
The mine design, planning and scheduling for the mine is developed using the DatamineTM and DeswikTM software, considering the geotechnical model and related parameters. Grade control is an important activity at Kalgold and is closely monitored through onsite stockpiling practices.
The geohydrological risks at Kalgold are low, based on the hot and dry climate conditions and the low expectancy of rain days. Potential slope failure is the main geotechnical risk, which is managed through integrated monitoring systems and operational practises. The monitoring data is incorporated into working mining models that inform daily mine planning decision-making.
The mining rates, machinery and equipment, ore transport, grade and dilution control, and labour resourcing and optimisation are driven by the mine schedule and continuous monitoring initiatives on-site.
QP is satisfied with the mining method, design and allocated labour and equipment resources to execute the plan. Geotechnical risks are addressed in the designs strategy and monitoring plan is in place through the Strata Control officer and Rock Engineer.
14Processing and Recovery Methods
Section 229.601(b)(96) (14) (i-iv)
Kalgold's gold processing facility has been in operation since 1996. The technology used to process the gold-bearing ore is well established and has proven to be suitable for the style of mineralisation.
Kalgold plant employs the cyanidation process for the gold extraction. The pre oxidation process is integrated into the process to enhance the benefit of the process. The plant has been operating with minimal challenges depending area being mined. Greater part of the mining area yields the desirable dissolution. The ore body is quite complex and necessary adjustments on the process are carried out whenever there is a need to ensure that the stipulated metallurgical efficiency targets are attained all the time.
14.1Mineral Processing Description
Kalgold processes the ore using a well-established cyanide and CIL process for their recovery of gold. The processing flowsheet is presented in Figure 14-1.
The mine ore is transported from the pit by truck and tipped into the plant ROM pad from where it is fed into the pre-primary crusher for first stage of comminution, to decrease its particle size distribution. Pre-primary product reports to the primary crusher, followed by secondary and tertiary crushing, after which the product is temporarily stored in the dome prior to milling.
Ore within the dome is fed to the A, B and C ball mills with the product ranging from 75% - 80% passing at 75μm. A and B mills are identical in capacity with C being larger (Table 14-1). The A and B mill cluster cyclone overflow gravitates onto a vibrating screen for over-size material removal, while the C mill uses a conventional linear screen for the removal of over-size material. Once the excess over-size material is removed all overflow is pumped out to the thickeners for dewatering prior to leaching.
Table 14-1: Processing Parameters at Kalgold Plant
|
|
|
|
|
|
|
|
|
| Equipment |
Unit |
Value |
| Average ROM |
ktpm |
128 |
| Moisture Content |
% |
1 |
| Rate of feed to Mill A and B |
t/hr |
55 |
| Rate of feed to Mill C |
t/hr |
105 - 110 |
| Recovery of gold at CIL |
% |
85 |
| Thickener underflow |
% |
50 - 55 |
Effective Date: June 30, 2023
60
Technical Report Summary for
Kalgold Mine, North West Province, South Africa
The thickener allows for separation of solids and liquid over time, by allowing the solids to settle at the bottom. The underflow, which is rich in gold reports to the pre-aeration tank for pre-conditioning prior to the addition of cyanide.
Cyanide is automatically added to either Leach 2 or Leach 3, depending on the degree of pre-aeration stage as Kalgold ore requires large amounts of cyanide to complete the leaching process. Generally, 75% dissolution takes place in the two leaching tanks. The remaining slurry gravitates to the CIL tanks for further leaching and adsorption.
Once the gold is dissolved into the cyanide solution it has a higher ability to adsorb (attach) onto activated carbon through the application CIL technology. There are seven stages in the CIL process with an average of 85% of gold adsorbed onto activated carbon. Once the carbon loading in the head tank reaches the required gold loading, the stream is pumped to the load make-up screen for the elution process.
The Kalgold plant employs the Zadra elution process for gold recovery where the loaded carbon is treated with a hot caustic and cyanide solution. The pregnant solution is pumped into the electro-winning circuit, where the gold will “de-absorb” from the activated carbon and attach onto stainless-steel wool.
Activated carbon can be regenerated for use again and as such once the gold has been removed from the activated carbon the eluted carbon passes through the acid column to be treated with hydrochloric acid for the removal of inorganic material. Acid-treated carbon is rinsed with high-pH water to neutralise the acid and transferred to the kiln for carbon regeneration. The regeneration process takes place at temperatures above 700°C in the absence of air to drive off the organic material.
The electro-winning cathodes are washed through the gold table and filtered through the press to retain the gold sludge, which is dried, weighed, and dispatched to Rand Refinery for refining.
Effective Date: June 30, 2023
61
Technical Report Summary for
Kalgold Mine, North West Province, South Africa
|
|
|
Figure 14-1: Schematic Flow Diagram of the Metallurgical Process |
Effective Date: June 30, 2023
62
Technical Report Summary for
Kalgold Mine, North West Province, South Africa
14.2Plant Throughput, Design, Equipment Characteristics and Specifications
The basic processing parameters for comminution, thickening, pre-oxidation followed by leach and CIL at Kalgold are shown in Table 14-1
14.3Energy, Water, Process Material and Personnel Requirements
The CIL and Zadra process requires significant amounts of reagents to achieve the 86% recovery, which are summarised in Table 14-2.
Table 14-2: Reagent Consumption
|
|
|
|
|
|
|
|
|
| Reagent |
Unit |
Value |
| Lime use |
g/t |
700 - 1,000 |
| Flocculant |
g/t |
44 477 |
| Cyanide addition |
kg/t |
0.6 -1.8 |
Kalgold Plant has a total labour force of 195 employees.
The plant main sections for the processing gold are crushing (pre-primary, secondary and tertiary), milling and carbon–in-Leach (“CIL”) processes. The Crusher section is receiving ore from Azone and Water tank open pit, the crusher section consists of pre-primary and primary jaw crushers, secondary and tertiary Symons cone crushers.
The milling plant consists of 3 tumbling ball mills to grind the ore to the required size for liberation of gold. Mill sizes are 3.66m x 4.88m for the A & B Mills at throughput of 50t/h each and 4.26m x 7.31m for the C Mill at throughput of 100t/h.
The overflow from the Mills cyclone is routed to two thickeners which are utilized to upgrade the relative density of the slurry to the required density for dissolution and adsorption which consists of one Pre-aeration tank and two leach tanks to dissolve the liberated gold and eight CIL vessels for adsorption of gold onto activated carbon. The Plant use about 224,000m3 water for processing of the Sulphide and Oxide ores. The water is reused/recirculated between the plant and the tailings dam. The is sufficient water to meet plan use demand. The power notified maximum demand for the operation is 12MVA and is available and managed from Eskom power utility grid.
The first year of LOM average planned milling tonnages per month is 125.119ktpm at the planned feed grade of 1,103g/t.
14.4Commentary on the Processing and Recovery Methods
The average historical plant recovery is 84.54%, which has shown significant variations throughout the operating years (Figure 14-2). The variability in the recovery can be attributed to the following:
•differences in ore characteristics;
•varying feed grades; and
•plant condition and operating efficiency.
QP is satisfied that the metallurgical process is well-tested as part of the ongoing operations and has been subjected to reviews as part of the on going expansion project work. Kalgold ore body is quite complex and necessary adjustments on the process are carried out whenever there is a need to ensure that the stipulated metallurgical efficiency targets are attained all the time.
|
|
|
Figure 14-2: Historical Plant Recovery |
Effective Date: June 30, 2023
63
Technical Report Summary for
Kalgold Mine, North West Province, South Africa
15Infrastructure
Section 229.601(b)(96) (15)
Kalgold is an established operation and as a result, the current infrastructure is satisfactory for the declared LOM requirements, as detailed in the Mineral Reserves statement (Section 12.2) and supported by the mine plan (Section 13.2). Kalgold is accessible via the national and provincial roads (Figure 3-1). The general layout of Kalgold Mine infrastructure, neighbouring main access roads, surrounding farmlands, stockpiles, and the pits is displayed in Figure 15-1.
A Google Earth image of the plant is presented in Figure 15-2.
15.1Surface Infrastructure
The detailed surface infrastructural layout comprises of ore process plant, on-site equipment and consumables store, Diesel storage and dispensing facilities, mining and engineering workshops, explosives storage facility, training centre, on site medical hub and administration offices. Infrastructure also includes established haul roads for the transport of ore and waste, the waste dumps, stockpiles for the associated pits and water satellite dams use for the allaying of dust.
15.1.1Ore and Waste Rock Storage Facilities
Kalgold relies on ore blending and thus the high and low-grade ore stockpiles play a crucial role in the optimum recovery of gold. The low-grade ore is transported to the north of the N18 road, adjacent to the waste rock storage facility, while the high-grade ore (above 0,6g/t) is transported to the processing plant, south of the N18 road, adjacent to the D Zone pit (Figure 15-1).
Any waste identified in the pit is mined and transported to an associated waste rock dump. The D Zone waste is currently placed on the South Waste Dump. Waste from the current A Zone and Watertank mining areas are transported to dedicated locations north of the N18 road mining (Figure 15-1). Spanover waste rock dump, located to the east of the Watertank and A Zone pits, is used for deposition of waste from current mining operations. Deposition on the Watertank rock dump resumed in Q1 of 2021, with the mining of the pushback area for the Watertank pit and subsequently Windmill pit.
Effective Date: June 30, 2023
64
Technical Report Summary for
Kalgold Mine, North West Province, South Africa
15.1.2Leach Stockpiles
Heap leach stockpiles accumulated from historical mining activities are situated adjacent to the mineral processing plant. Leach stockpile activities are closely monitored, and Kalgold satisfies the relevant environmental legislation and associated regulations. In addition, metallurgical efficiency has been improved by increasing oxidation levels to reduce the presence of weak acid dissociable cyanide.
15.1.3Tailings Storage Facilities
The D Zone, where mining began in 1995, has been mined out and is currently being used for tailings deposition. The operation comprises a single TSF which was commissioned in 1998, after the replacement of the heap leach operation with a CIL plant. The TSF is currently inactive.
The current LOM plan for Kalgold requires a total placement of approximately 21,9Mt. D Zone has remaining capacity of 23.9Mt and is adequate remaining capacity to meet the overall requirements of the LOM plan with no need to use the TSF. The tailings dam complex is currently operated, managed and controlled in a responsible and diligent manner by the Kalgold personnel, and no impairment to the integrity of the dam is anticipated, provided current practices and levels of management are control are maintained with all necessary measures undertaken in a timely manner.
15.1.4Power and Electrical
Operations are powered by electricity from Eskom Holdings State Owned Company (“SOC”) Limited. Kalgold power supply is designed to satisfy the planned LOM production and service requirements. Main power supply is managed and distributed via electrical sub-stations located on site. The Kalgold processing plant has a dedicated 20MVA transformer, with a maximum nominated demand of 12MVA, therefore a spare capacity of 8MVA is available when needed. The ball mills are the largest consumers of electricity of the processing plant and forms part of the baseline consumption of 5.2MVA under steady state running. The maximum nominated demand caters for the additional startup current consumed by large motors, as well as extra consumption required at other process startups like heating requirements.
Effective Date: June 30, 2023
65
Technical Report Summary for
Kalgold Mine, North West Province, South Africa
|
|
|
Figure 15-1: Kalgold Mine Layout and Infrastructure |
Effective Date: June 30, 2023
66
Technical Report Summary for
Kalgold Mine, North West Province, South Africa
|
|
|
Figure 15-2: Detailed Surface Infrastructure of Kalgold Plant |
Source: Google Earth Image Date March 2021
The Kalgold central offices and training centre are dependent on a rural electrical supply, supported by a 100kVA transformer. An extension of the pit, offices and workshops will be on the Eskom rural line installation with no foreseeable constraint on the line capacity.
Effective Date: June 30, 2023
67
Technical Report Summary for
Kalgold Mine, North West Province, South Africa
15.1.5Water Usage
Kalgold uses borehole water for domestic use. Boreholes have restrictions of between 20 000m³ and 30 000m³ per annum based on the Water Use licence. Return water from the plant residue material is re-used in the plant for further processing activities. Groundwater is pumped out from the pits and used for dust allaying on the haul roads, muck piles and run-of-mine pads.
15.1.6Logistics and Supplies
The procurement of supplies and equipment are handled centrally, via Harmony, and then delivered to Kalgold. Kalgold is accessed via three dedicated main entrances namely, the plant main gate accessed from the N18, the central offices and mining contractor access, located along the Kraaipan Road. All Kalgold supplies and equipment deliveries are handled at the security entrance and then transferred to the central mine stores located on-site.
15.2Commentary on Infrastructure
Kalgold is an existing mining operation equipped with the necessary infrastructure and infrastructural support to mine as per the current mine plan of 130ktpm of ROM ore. In addition, the QP is satisfied that the surrounding operational infrastructure including road, rail, offices, security services, water and power supply is adequate. The operations are powered by electricity supply from Eskom and there is service level agreement in place and the are regular engagements with Eskom on power supply management and requirements.
Overall, QP is satisfied that Kalgold is well-established with sufficient logistical and infrastructure support for the existing and planned mining operations.
16Market Studies
Section 229.601(b)(96) (16) (i-ii)
Gold is traded in a variety of markets/exchanges both in physical form through over the counter (“OTC”) markets, bullion banks and metal exchanges etc., and through passive investments such as exchange traded funds (“ETFs”), which are based on gold prices and units representing physical gold which may be in paper or dematerialised form. Demand is driven by the jewellery market, bar and coin, use in technology, ETF’s and other financial products, and by central banks. An overview of the gold market is given in the following sections based mainly on data from the World Gold Council and GoldHub websites.
16.1Market Overview
Unlike almost all mineral commodities, the gold market does not respond the same way to typical supply and demand dynamics which are founded on availability and consumption, but rather on global economic affairs, particular those of the major nations, industrial powerhouses and economic regions, such as the Eurozone. The gold market is affected by government and central bank policies, changes in interest rates, inflationary or deflationary environments and events such as stocking and de-stocking of central reserves. It is also largely affected by global events such as financial crises, geopolitical trade tensions and other geopolitical risks. Price performance is linked to global uncertainty prompted by the prolonged Russia-Ukraine war (GoldHub, Accessed July 2022). It is an asset that can preserve wealth and deliver price outperformance in an uncorrelated way and that makes it extremely attractive.
Effective Date: June 30, 2023
68
Technical Report Summary for
Kalgold Mine, North West Province, South Africa
The Gold Market and Recent Developments
The Gold Market Demand had returned to pre-COVID levels during the third quarter of 2022, with total demand at 1,181t; 28.0% higher when compared to the third quarter of 2021, while gold supply increased by a marginal 1.0% on an annual basis to reach 1,215t.
The main contributing factors of the higher gold demand during the third quarter of 2022 include:
•Jewellery consumption reached a robust 523t, recording a 10.0% increase year-on-year, despite the deteriorating global economic backdrop. Furthermore, on a year-to-date (ytd) basis gold demand was slightly firmer at 1,454t, signifying a 2.0% increase.
•Investment demand was 47.0% lower on an annual basis at 124t, reflecting weak sentiment among some investor segments. The 36% growth in bar and coin investment (to 351t) was insufficient to offset 227t of ETF outflows. Over-The-Counter (OTC) demand decreased significantly during the third quarter of 2022, confirming weak investor sentiment in ETFs and futures markets.
•Central Banks continued to invest in gold, with purchases reaching an estimated quarterly record of nearly 400t according to the World Gold Council.
•Technology Demand decreased by 8.0%, year-on-year, as the global economic downturn had a negative impact on consumer demand for electronics.
Moving into the second quarter of 2023, gold prices are gaining a lot of momentum in line with the global banking crisis and uncertainty surrounding the Federal Reserve Bank. Contagion risks from financial market fears have allowed the safe-haven appeal of gold to drive a bullish market to the cause but this can be fleeting for a quarterly period. Increased volatility has been another contributor to gold.
Markets reacted recently to the upside of the U.S. economy (which is doing better than previously thought), allowing the Fed room to hike rates further in its fight against inflation. The latest market expectations point to rates staying higher for longer with any rate cuts expectations moved to the middle of Q1 next year (2024). This is in stark contrast to expectations seen 2-3 months ago when interest rate cuts were predicted for late Q3/early Q4 this year (2023).
16.2Global Production and Supply
Gold production and supply is sourced from existing mining operations, new mines and recycling.
16.2.1New Mine Production
China remained the largest producer in the world and accounted for approximately 10% of total global production in 2022 (Gold.org, Accessed 2023). Overall, global mine production reached 3,628t in 2022, slightly higher when compared to the 3,581t recorded in 2021, and the second annual increase in production recorded since 2020. The improvement in mine production over the past two years can mainly be attributed to a mining industry free from COVID-19 disruptions and slowdowns. In 2022, some of the major producing gold countries in the world were China (375t), Russian Federation (325t), Australia (314t), Canada (195t), United States (173t), Ghana (127t), Peru (126t), Indonesia (125t) and Mexico (124t), followed by Uzbekistan (111t) and Mali (102t). South Africa produced 92.6t in 2022; lower when compared to the 113.6t recorded in 2021 (Gold.org, 2023).
Effective Date: June 30, 2023
69
Technical Report Summary for
Kalgold Mine, North West Province, South Africa
|
|
|
World Gold Council: Mine Production - Major producing Gold Countries ranked by 2022 |
16.2.2Recycling
Global annual supply of recycled gold increased marginally to 1,141t in 2022, but still remained below 1,293t recorded in 2020 and 30% below the all-time high recorded in 2009. Recycling supply experienced a modest increase in 2022 even though a record annual average gold price was recorded for the year. India and China are considered as key role players in the recycling market. In the first quarter of 2023, the supply of recycled gold increased to 310.4t, signifying a 5% increase on a year-on-year basis, and can mainly be attributed to higher gold prices (Gold Demand Trends Q1 2023, Gold.org, May 2023).
16.3Global Consumption and Demand
Annual global gold demand (excl. OTC) increased by a significant 17% to 4,706t in 2022, however during the first quarter of 2023, demand was 13.0% lower at 1,081t on a year-on-year basis. Demand from India decreased as consumption in both investment and jewellery were lower, driven by a volatile and record-high gold price. On the contrary, domestic consumption from China increased, driven by robust income growth and improved domestic economic activity during the first quarter of 2023. While continued improvement is expected in markets post-COVID in 2023, demand continues to face challenges of slowing global economic growth along with persistent high inflation levels in several markets.
16.3.1Jewellery
Total annual global jewellery consumption decreased from 2,148t in 2021 to 2,090t in 2022, amid weaker gold demand from China and India. In the first quarter of 2023, demand was relatively stable when compared to a year ago, however, a significant quarter-on-quarter decrease of 24% was recorded as high and volatile gold prices discouraged jewellery demand (Gold Demand Trends Q1 2023, Gold.org, May 2023).
Effective Date: June 30, 2023
70
Technical Report Summary for
Kalgold Mine, North West Province, South Africa
16.3.2Investment
A positive global gold demand and exchange-traded funds (ETF’s) are expected to maintain a notable upside potential from volatile interest rate conditions and recession risk. According to the World Gold Council, global bar and coin investment increased by 5% on a year-on-year basis during the first quarter of 2023, exceeding 300t for the third consecutive quarter and the first time since 2013.
A total annual gold investment demand of 1,127t was recorded by the World Gold Council for 2022, a 12% increase when compared to the annual value of 1,004t recorded in 2021. On a quarter-on-quarter basis, total investment demand increased by 9% to reach 274t in the first quarter of 2023. Furthermore, global physically-backed gold ETFs was pressured by weak investor interest, recording a net outflow of -28.7t during the first quarter of 2023, significantly lower when compared to the 270.7t recorded during the first quarter of 2022. In addition, ETF outflows recovered some of its losses and increased during for the first time in 11 months in March 2023 (Gold Demand Trends Q1 2023, Gold.org, May 2023).
Gold prices were further supported by a positive investor sentiment in the institutional segment during March 2023 as a result of an unstable banking industry and positive inflows into ETFs.
|
|
|
World Gold Council: Total Gold Supply & Demand |
16.3.3Currency
Gold holds an inverse relationship with the USD and is usually traded relative to its USD price. During the current period of uncertainty, and the rising influence of Chinese currency, central bank asset managers may likely increase their interest in gold as a result. This has been a prominent trend since the economic downturn in 2008.
Future performance of the gold market is expected to be supported by investment demand (a need for effective hedges and a low-rate environment) and will be driven by the level of risk observed in the recovery of the global economy from the effects of COVID-19, which may offset any lag in recovery of consumer demand.
The USD currency and Gold
The inverse relationship between the value of U.S. dollar (USD) and that of gold is one of the most discussed about relationships in currency markets. The U.S. Dollar (USD) is the internationally accepted currency and most of the international transactions take place in Dollar/USD equivalent. The major reason behind the relationship of gold and the USD, is that gold is used as a hedge against the adverse exchange value of the USD. As the dollar’s exchange value decreases, it takes more USD to buy gold, which increases the value of gold.
Effective Date: June 30, 2023
71
Technical Report Summary for
Kalgold Mine, North West Province, South Africa
Two other factors linked to the USD, or the strength of the USD is inflation and interest rates. Inflation has remained high throughout 2022 and well into 2023 in the U.S. and in many other countries.
Central banks like the Fed, ECB, and BoE have already hiked rates to try and bring inflation down. Rates will continue to rise while inflation remains high. High interest rates are generally seen as a negative for gold as a non-yielding asset, though high inflation is usually seen as a positive for gold as a hedge against inflation.
16.4Gold Price
16.4.1Historical Gold Price
In early August 2020, the London Bullion Market Association (“LBMA”) gold price reached historical highs and remained relatively high for the rest of the year (Figure 16-1).
The London Bullion Market Association (LBMA) gold price reached a record annual average price of US$1,800.09/oz in 2022. The upward trajectory continued into the first quarter of 2023 where gold prices averaged 10% higher at US$1,890.2/oz on a quarter-on-quarter basis. According to the World Gold Council’s May 2023 Gold Market Commentary, “Gold prices remain rangebound, having failed to establish a foothold above the psychologically important US$2 000.00 level. It appears that over the past year, gold has been more influenced by the US dollar than on average, as well as taking its cues from the 2-year US TIP yield rather than the more commonly associated 10-year.”
16.4.2Forecast Gold Price
The minimum and maximum consensus gold price range for the year 2021 Q4 to year 2025 is presented in Figure 16 2. The long-term gold prices are considered from year 2025 onwards. Forecasts as advised from various financial institutions show that gold is expected to trade in a range of USD1,652/oz - USD1,728/oz, for the period 2022 to 2025 with a long-term outlook of USD1,521/oz.
QP is of the opinion that the gold price forecast of USD1,582/oz is conservative if corroborated against a long-term broker consensus gold price outlook (Figure 16 2).
|
|
|
Figure 16-1: World Gold Council: Daily Gold Price (ZAR/oz & USD/oz) |
Effective Date: June 30, 2023
72
Technical Report Summary for
Kalgold Mine, North West Province, South Africa
Table 16- 2 Consensus View of Forecast Gold Price
|
|
|
|
|
|
|
|
|
|
|
|
| Institutions |
2022 |
2023 |
2024 |
| World Bank: Development |
1 801 |
|
1 900 |
|
1 750 |
|
| BMO Capital Markets |
1 802 |
|
1 925 |
|
1 750 |
|
| Scotiabank |
1 803 |
|
1 904 |
|
1 900 |
|
| Nedbank |
1 817 |
|
1 897 |
|
1 970 |
|
| Fitch Solutions |
1 800 |
|
1 800 |
|
1 600 |
|
| S&P Global |
1 804 |
|
1 889 |
|
1 889 |
|
| Australian Government |
1 801 |
|
1 906 |
|
1 839 |
|
| TD Economics |
1 802 |
|
1 985 |
|
2 000 |
|
| AVERAGE |
1 804 |
|
1 901 |
|
1 837 |
|
16.4.3Harmony Group Gold Hedging Policy
Harmony has a hedging policy which is managed and executed at Group treasury level on-behalf of its operating entities. The key features of the hedging programme are as follows:
•the policy provides for hedging (or forward selling) up to a maximum of 20% of expected gold production for a rolling 24-month period;
•the policy has no minimum quantity that should be hedged, and if an attractive margin above cost cannot be achieved (i.e., in a low gold price environment) then no hedges are entered into;
•Harmony enters into ZAR-denominated gold hedges for its South African operations (for the non-South African assets it enters into USD-denominated hedges);
•Individual mines do not enter into hedges in their own name but delivers bullion to Rand Refinery for refining on behalf of Harmony. Rand Refinery is one of the world’s largest single-site precious metals refining and smelting complex in the world. Rand Refinery refine all of Harmony’s gold to at least 99.5% purity, and acting as agent, sells the gold on the daily spot London fixing price and make payment to the Harmony two days later;
•gains and losses realised from the hedging program are accounted for at Group level and the financial benefit (or downside) is distributed amongst the operations proportional to their levels of gold sales; and
•Harmony does its mine planning and financial forecasts based on the estimated future gold price provided by an external source (ETSA), but its year-end actual financial results reflect the received gold price inclusive of the impact of the hedging programme. Therefore, in theory, individual mines receive a hedged gold price for a maximum of 20% of its gold sales with the balance attracting the spot price.
Effective Date: June 30, 2023
73
Technical Report Summary for
Kalgold Mine, North West Province, South Africa
|
|
|
Figure 16-1: Graph of Annual Gold Price History – ZAR/kg |
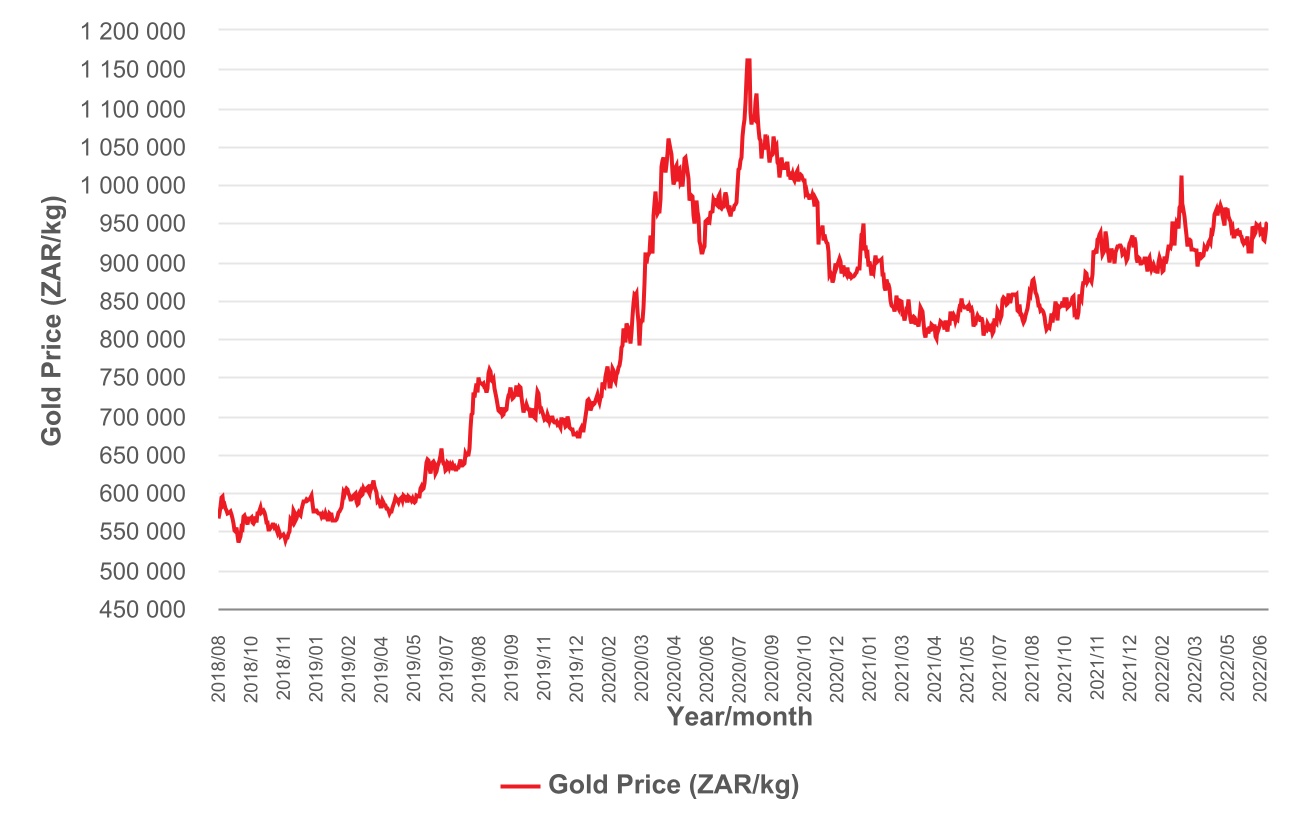
Source: https://www.gold.org/goldhub/data/gold-prices
Effective Date: June 30, 2023
74
Technical Report Summary for
Kalgold Mine, North West Province, South Africa
|
|
|
Figure 16-2: Graph of Consensus View of Forecast Gold Price |
16.5Commentary on Market Studies
The factors which affect the global gold market are well-documented as are the elements which influence the daily gold price. The gold price recorded all-time highs during both 2020 and 2022, and although it has since moderated and retracted, the price remains well above the 5-year historical average.
The positive outlook for gold will likely be sustained. Key headwinds for gold are interest rate hikes, currently at near historically low levels, but continued geopolitical risk and underperformance of stocks and bonds will support gold (Gold Mid-Year Outlook 2022, Gold.org, Accessed 2022). The gold price has experienced weaker momentum in Q2 2022, but stabilised. The gold market is expected to remain supported, and prices elevated for the balance of the financial year running into FY2023. QP on the operation is advised by the Harmony executive committee on the proposed gold price forecast. QP is of the opinion, that the gold price used for the business planning is conservative when compared to the current and last 24 months spot prices.
Harmony has a relatively conservative gold hedging policy in place, and this is used to take advantage of the movements in the gold price to maximise the average gold price received, with the benefit of this hedging programme flowing through to Kalgold.
16.6Material Contracts
As with all major businesses, Harmony and Kalgold enters into a multitude of vendor agreements for the provisions of supplies and services. These agreements are entered into on a competitive basis and typically are of a medium-term duration all with clauses providing for periodic updating of pricing, annual (or other) renewal or termination.
Harmony has contractual vendor agreements with various service providers and suppliers. The most significant of these contracts currently in place to support the Kalgold are listed in Table 16-1.
All of the listed contracts are currently valid and in good standing. Terms, rates and charges of contracts are considered consistent with industry norms. Contract management processes are in place and resourced so that contracts re-tendered and/or renewed as they approach expiry.
Effective Date: June 30, 2023
75
Technical Report Summary for
Kalgold Mine, North West Province, South Africa
Table 16-1: Material Contracts
|
|
|
|
|
|
| Vendor Name |
Nature of Service /Supply |
| Andru Mining (Pty) Ltd. |
Contract mining |
| B&E International (Pty) Ltd. |
Crushing and screening |
| Grinding Media South Africa (Pty) Ltd. |
Supply of grinding media products |
| Sasol Chemicals South Africa |
Supply of cyanide |
| Air Liquide (Pty) Ltd. |
Supply of industrial gases and services |
|
|
|
|
|
|
|
|
|
|
|
|
|
|
All the listed contracts are currently valid and in good standing. Terms, rates, and charges of contracts are considered consistent with industry norms. Contract management processes are in place and resourced so that contracts re-tendered and/or renewed as they approach expiry.
17Environmental Studies, Permitting and Plans, Negotiations, or Agreements with Local Individuals or Groups
Section 229.601(b)(96) (17) (i-vii)
The South African Government has an extensive legal framework within which mining, environmental and social aspects are managed. Harmony and its Kalgold operation is primarily regulated and managed by certain principal Acts (Section 17.3) as well as corporate policies, management systems and certain industry wide guidelines, including:
•Energy Efficiency and Climate Change Policy;
•Environmental Policy;
•Harmony Water Management Strategy;
•Biodiversity and Rehabilitation Position Statement;
•Socio-Economic Transformation Policy; and
•Corporate Social Responsibility Policy.
The latest sustainability policies and public Environmental Social and Governance (“ESG”) performance and disclosure reports are available on the corporate website. Harmony has identified the environmental risks for the business and has strategies in place to manage the risks.
17.1Results of Environmental Studies
Kalgold has completed multiple environmental impact assessments (“EIA”) for regulatory approval under the South African legal framework. The EIA identifies and predicts the likely environmental, social, and other related impacts of a mining related project. Furthermore, it establishes the measures that are necessary to avoid, minimise or offset predicted adverse impacts and, where appropriate, to incorporate these into an EMPR. The competent authority either approves or rejects the proposed projects and establishes the terms and conditions for its implementation.
Kalgold has been granted several environmental permits and licences since the commencement of operation. The most recent approvals were obtained in September 2016, February 2021 and January 2022 required for the closure of the D-Zone open pit, the amendment of existing WUL and expansion of the mining footprint, respectively.
The management measures and others are contained in the amended 2022 EMPR. All other environmental aspects and impacts emanating from mining activities (such as stockpiling of topsoil, and the location and planning of all dumps, stockpiles, and infrastructure) are captured in an environmental aspect register in line with ISO 14001:2015 standard. Kalgold has maintained its ISO 14001 certification since 2010 and the operation remains committed to eliminating or minimizing the effects of mining activities on the environment and adjacent communities.
Effective Date: June 30, 2023
76
Technical Report Summary for
Kalgold Mine, North West Province, South Africa
17.2Waste and Tailings Disposal, Monitoring & Water Management
The primary materials from mining activities and processes include the rock (ore and waste) together with liquefied petroleum gas, grease, cyanide and other chemical, fuels and lubricating and hydraulic oils. Harmony recognises that responsible and effective waste management can positively reduce its environmental impacts and mitigate associated environmental liabilities. Waste management is thus a priority focus area. Internally, guidelines on mineral, non-mineral and hazardous waste materials are included in the environmental management systems (“EMS”) implemented at Kalgold.
Tailings comprises of crushed rock and process water emitted from the gold elution process in the form of slurry, once gold has been extracted. As tailings contain impurities and pollutants, they are placed in TSF engineered to contain them, in line with Harmony's tailings management programme and the Global Industry Standard on Tailings Management (“GISTM”). Harmony's overall tailings management strategy is to ensure robust, meticulous engineering and dam design, along with a continual focus on management of risks through layered assurance and oversight.
The focus areas include, but are not limited to:
•freeboard control;
•water management;
•maintaining stability and the safety factor as advised by the engineer of record;
•erosion controls; and
•monitoring and control measures implemented to ensure continued compliance (including regular inspections, audits, and meetings on varying intervals with subsequent actions, minutes and reports).
As part of its mining, environmental and water approvals and licences, Harmony is required to implement monitoring programmes and plans to establish the operations impact on the environment. The compliance limits for the monitoring variable are included in the applicable EMPRs, WULs and environmental authorisations. The environmental monitoring implemented at Kalgold includes:
•annual EMPR performance assessments;
•monthly and quarterly ground and surface water monitoring;
•annual biomonitoring surveys;
•waste classification and quantification;
•annual Integrated waste and water management plan updates;
•annual water balance reviews;
•monthly and quarterly air quality (i.e., noise and dust) monitoring;
•periodic Greenhouse Gas emissions ("GHG") monitoring; and
•periodic licence and authorisation compliance assessments.
In addition, environmental legal compliance audits are conducted every two years by a third party to help the operation maintain its compliance with all relevant environmental legislation. Audit results show that Kalgold is environmentally compliant.
We are in the process of addressing the Waste Rock Dump angles compliance and the storm water management controls raised in the last compliance audits.
Effective Date: June 30, 2023
77
Technical Report Summary for
Kalgold Mine, North West Province, South Africa
17.3Permitting and Licences
In respect of environment, the following national Acts and the regulations promulgated thereunder provide the regulatory framework for mine permitting and licencing in South Africa:
•Mineral and Petroleum Resources Development Act, 2002 (“MPRDA”);
•National Environmental Management Act, 1998 (“NEMA”);
•National Environmental Management: Waste Act, 2008 (“NEM:WA”);
•National Environmental Management: Air Quality Act, 2004 (“NEM:AQA”); and
•National Water Act, 1998 (“NWA”).
A summary of the status of environmental permits and licences issued at the effective date related to Kalgold’s operation is presented in Table 17-1.
All relevant mining, environmental and water-use permits are in place that cover the environmental, archaeological, and hydrological components of Kalgold. All permits are audited regularly for compliance and no material risks to the operations have been identified.
Effective Date: June 30, 2023
78
Technical Report Summary for
Kalgold Mine, North West Province, South Africa
Table 17-1: Status of Environmental Permits and Licences
|
|
|
|
|
|
|
|
|
|
|
|
|
|
|
| Permit / Licence |
Reference No. |
Issued By |
Date Granted |
Validity |
| Environmental Management Programme (Amendment) |
(NW) 30/5/1/2/3/2/1/77 EM |
DMR |
2022 |
LOM |
| Environmental Authorisation |
NW30/5/1/2/2/77MR |
DMR |
2017 |
LOM |
| Water Use Licence |
07/D41B/ABCGIJ/4754 |
DWS |
22 February 2021 |
LOM |
| Certificate of Registration Inflammable Liquids and Substances |
FS/FLM 01/06/02/2023 |
Ngaka Modiri Molema District Municipality |
01 June 2023 |
12 Months |
|
|
|
|
|
Notes: DMR - Department of Mineral Resources, GDARD - Gauteng Department of Agriculture and Rural Development, DWS - Department of Water and Sanitation
Effective Date: June 30, 2023
79
Technical Report Summary for
Kalgold Mine, North West Province, South Africa
17.4Local Stakeholder Plans and Agreements
Harmony strives to create sustainable shared value within the communities it operates. Local stakeholder plans and agreements are based on the results from socio-economic information, government development strategies and EIAs undertaken. The socio-economic development programme commits to:
•contribute to areas that will have the most meaningful socioeconomic impact on communities, namely infrastructure, education and skills development, job creation and entrepreneurial development;
•enhance broad-based local and community economic empowerment and enterprise development initiatives;
•facilitate socio-economic development in local communities by means of SLPs and corporate social responsibility programmes;
•support arts, culture, and sports and recreation; and
•build relationships based on trust within host communities.
In South Africa, mining companies are required to have a SLP which forms an important component of Harmony's community investment plan. It sets out the Company’s obligation to develop and implement comprehensive human resource development programs, community development plans, housing and living condition plans and employment equity plans. The aim of the SLP is to ensure the uplift of the social and economic circumstances of local communities surrounding the mine and are a prerequisite to securing and maintaining a mining right, with progress required to be reported each year. The SLP is renewed every five years. Kalgold has committed to investment projects to the approximate total of ZAR49m within the local community over the five-year period between 2019 and 2023 as per the approved SLP. The vegetable project is one of the ongoing initiatives that aims to provide horticultural training to over 800 households. The project is expected to have the following benefits within the community surrounding Kalgold:
•sustainable food production;
•health and wellness;
•poverty alleviation; and
•income generation.
Due to the high-level of unemployment and skill shortage in the surrounding communities, there is potential risk that there will be an influx of people into the area resulting in the establishment of informal settlements. This social risk and others were considered as part of the EIA process and appropriate mitigation measures are captured in the EMPR, the SLP as well as other governance structures implemented by the mine.
17.5Mine Closure Plans
Harmony makes provision for closure and rehabilitation both for accounting purposes and as required under the MPRDA. The statutory obligation for all environmental rehabilitation at Kalgold is administered by the DMRE and requires the preparation of a closure plan, the development of a cost estimate, and financial assurance. This amount was ZAR142.32m as of June 30, 2023, which includes an allowance for management and contingency costs. The Company makes an annual submission to the DMRE setting out the cost of closure in accordance with the MPRDA and the regulations issued thereunder. Kalgold is covered under Harmony Gold Env. Trust Fund.
Kalgold Liability is fully covered with no shortfall. The required cover is calculated at R142m and the balance in the trust (R81m)+ guarantees (R75m) is R156m.
17.6Status of Issues Related to Environmental Compliance, Permitting, and Local Individuals or Groups
Kalgold has valid permits and does not require any additional permits to continue with their mining operations. The EMP amendment has been granted by DMRE, allowing the expansion of the current mining footprint within the approved Mining Right area.
Effective Date: June 30, 2023
80
Technical Report Summary for
Kalgold Mine, North West Province, South Africa
17.7Local Procurement and Hiring
Harmony is committed to investing in the future of local communities beyond the life of mine and not to only empower them, but also to mitigate the impacts its activities to ensure a positive legacy. The 2014 Mining Charter serves to guide the South African mining industry in socio-economic transformation. Local procurement (goods and services) and human resource management are key measures set under the Mining Charter and are reported on annually. Portable skills are developed through expanded learning programmes, learnerships and other programmes opened only to operating communities and areas where labour is sourced. Recruitment needs analysis takes place at a local community level and priority is given to hiring people form the immediate surrounding community.
17.8Commentary on Environmental Studies, Permitting and Plans, Negotiations, or Agreements with Local Individuals or Groups
Periodic inspections are conducted by the DMRE to verify compliance with applicable environmental laws, regulations, permits and standards. In addition, Kalgold has implemented an EMS in line with the ISO 14001 standard. The EMS is audited on an annual basis by a third party and includes the needs and expectations of interested parties.
As part of Harmony, Kalgold conducts its operation based on policies and systems that are aligned to its corporate sustainable development framework. Although Harmony is not a signatory to the International Council on Mining and Metals or the UN Global Compact, these form the guiding principles of the framework. Harmony discloses its sustainable development voluntarily in accordance with the guidelines issued by the Global Reporting Initiative (“GRI”). Further to this, Harmony discloses environmental information on the Carbon Disclosure Project (“CDP”) for both climate change and water. CDP is a global environmental disclosure system that supports companies to measure and manage their risks and opportunities on climate change, water security and deforestation.
Harmony has a good understanding of the environmental and social aspects of the operations through baseline and specialist studies previously conducted. Risk management and mitigation measures were adequately addressed in the environmental management plans and will be effective to mitigate risks and impacts to acceptable levels should the measures be implemented according to the specialists’ recommendations. Most of the required environmental authorisations are in place and only require amendments to be made to reflect the current infrastructure at Kalgold. Based on current industry norms, a realistic timeframe to obtain relevant authorisations is estimated between 12 and 18 months.
18Capital and Operating Costs
Section 229.601(b)(96) (18) (i-ii)
Economic parameters for the Harmony Group, including capital and operating costs, are determined and signed off by the CODM, before distribution to the business units, including Kalgold. The capital and operating costs are reported in ZAR terms and on a real basis. Reporting periods are done for the financial years, inclusive of the months from July - June.
18.1Capital Costs
The stay-in-business capital for Kalgold is presented in Table 18-1. The capital costs are considered for mining activities only. An average contingency of 10% is applied where the capital cost estimates have a level of uncertainty. There is no contingency applied, where capital cost estimates have a reasonable basis. The estimated capital costs presented in Table 18-1 are carried forward and modelled in the Kalgold cash flow.
Costs associated with the Mining Charter Compliance (“MCC”) are determined because of Kalgold’s SLP requirements and modelled as such. These costs are extracted from the SLP model. Shaft capital costs are costs that can be attributed to Kalgold’s open pit mining activities such as, and not limited to, site clearance, dust suppression requirements, vehicle replacements, pumping and water control mechanisms, blasting measures, and slope stability monitoring.
Effective Date: June 30, 2023
81
Technical Report Summary for
Kalgold Mine, North West Province, South Africa
18.2Operating Costs
A summary of the direct and re-allocated operating costs for Kalgold are presented in Table 18-2. The cash operating costs are used as an input into the cash flow model.
The operating cost estimates for Kalgold are categorised into direct and total costs. A summary of the Kalgold operating cost estimate is shown in the Table 18-2. All inclusive unit operating costs starts at R791/t year one and gradually decreases over life of mine to R351/t in financial year 2031, inline with strip ratio reduction and low grade stockpile feeding at the end of life.
The above operating unit costs are as per approved business plan submitted to the board for financial year 2024.
18.3Comment on Capital and Operating Costs
The capital and operating cost estimates for Kalgold are based on actual historical data, as well as budget forecasts. Therefore, the forecasted costs are reliable, and at minimum meet the confidence levels of a Pre-Feasibility Study. This approach of estimating capital and operating costs is consistent with industry practice. A record of the forecast and budget costs is maintained by the operation, allowing for an assessment of the alignment of the forecast and actual costs.
Effective Date: June 30, 2023
82
Technical Report Summary for
Kalgold Mine, North West Province, South Africa
Table 18-1: Summary of Capital Cost Estimates for Kalgold
|
|
|
|
|
|
| Capital Cost Element (ZAR'000s) |
Total LOM (FY2024 - FY2032) |
| Shaft |
54 210 |
| MCC |
28 266 |
| Total |
82 476 |
Table 18-2: Summary of Operating Cost Estimates for Kalgold
|
|
|
|
|
|
| Operating Cost Element (ZAR'000) |
Total LOM (FY2024 - FY2032) |
| Wages - payroll 1 |
359 873 |
| Wages - payroll 2 |
40 794 |
| Stores and materials |
614 196 |
| Electric power and water |
20 422 |
| Outside contractors |
1 972 103 |
| Other |
265 113 |
| Direct Costs |
3 272 500 |
| Refining charge |
60 279 |
| Assay cost |
42 689 |
| Plant treatment cost |
4 222 370 |
| Re-allocated costs |
4 325 337 |
| Mine overheads re-allocated |
(145 073) |
| Total |
7 452 765 |
Effective Date: June 30, 2023
83
Technical Report Summary for
Kalgold Mine, North West Province, South Africa
19Economic Analysis
Section 229.601(b)(96) (19) (i-iv)
19.1Key Economic Assumptions and Parameters
The CODM and QPs forms, reviews, signs-off and distributes economic assumptions to its various business units. On an annual basis, during the period October to November, long-term commodity prices and exchange rates forecasts’, are received from various financial institutions. They are analysed, cognisance is taken of the requirements of the NYSE and JSE markets, and approved parameters are communicated to the operations.
19.1.1Metallurgical Recoveries
The metallurgical recoveries used in the cash flow are provided in Table 12-1.
19.1.2Gold Price
The forecast gold price (USD1,582/oz) is the price that is used by Harmony for the Kalgold annual planning cycle and forms the basis for the spot gold price assumptions used in the Kalgold cashflow. The reader is referred to Figure 16-2 for the consensus forecast gold price. The conversions used in the calculation of the various gold prices is presented in Table 19-1.
Table 19-1: Conversions Used in Gold Price Calculations
|
|
|
|
|
|
|
|
|
|
|
|
|
|
|
| Economic Factors |
Gold Price (USD/oz) |
Conversion Factor (oz/kg) |
Exchange Rate (ZAR:USD) |
Gold Price (ZAR/kg) |
2023 Mineral Resource |
1 764 |
32.15 |
16.22 |
920 000 |
2023 Mineral Reserve |
1 582 |
32.15 |
16.22 |
825 000 |
2024 forecasted gold price |
1 582 |
32.15 |
16.22 |
825 000 |
Notes: 1. Forecasted gold price as used in the Kalgold cash flow.
19.1.3Exchange Rate
The South African Rand (ZAR) depreciated significantly since the start of 2023 to average at R17.75/US$ during the first quarter of 2023, 0.7% weaker compared to an average of R17.63/US$ recorded during the last quarter of 2022. Moving onto the second quarter of 2023, the South African Rand depreciated further by 5.2% to average at R18.67/US$ on a quarter-on-quarter basis.
The trade of the South African Rand (ZAR) to the U.S. Dollar (USD) is an important trade, as further weakness in ZAR can be expected in the medium term, after recent comments by Federal Reserve Chairman Jerome Powell alluded to further interest rate hikes to curb inflation, giving the USD further upside against the Rand.
Recent levels of the Rand (ZAR), which had seen the local currency appreciate by more than 4% against the USD, since the start of June 2023, making it the second-best-performing emerging market currency over this period and in recent trades.
The forecast exchange rate of 16.22 ZAR:USD is the exchange rate that is used by Harmony for the annual planning cycle and forms the basis for the ZAR:USD exchange rate assumptions used in the company cashflow.
Effective Date: June 30, 2023
84
Technical Report Summary for
Kalgold Mine, North West Province, South Africa
|
|
|
ETSA: Exchange Rates (Annual – Calendar year) |
Table 19-X Consensus ZAR : USD Exchange Rate Forecast
|
|
|
|
|
|
|
|
|
|
|
|
| Institutions |
2022 |
2023 |
2024 |
| Nedbank |
16.38 |
|
18.29 |
|
17.27 |
|
| Investec |
— |
|
18.20 |
|
17.65 |
|
| FNB |
16.40 |
|
18.80 |
|
18.00 |
|
| PWC |
16.37 |
|
18.20 |
|
18.70 |
|
| IDC |
16.36 |
|
18.50 |
|
18.51 |
|
| AVERAGE |
16.38 |
|
18.40 |
|
18.03 |
|
Table 19-2: ZAR:USD Exchange Rate Performance (June 2020 – June 2023)
|
|
|
|
|
|
| Period |
Average Exchange Rate (ZAR:USD) |
| July 2020 to June 2021 |
15.43 |
| July 2021 to June 2022 |
15.21 |
| July 2022 to June 2023 |
17.77 |
| 3-Year Ave. (not weighted) |
16.14 |
Effective Date: June 30, 2023
85
Technical Report Summary for
Kalgold Mine, North West Province, South Africa
|
|
|
Figure 19-1: Graph of Consensus ZAR : USD Exchange Rate Forecast |
19.1.4Royalties
Royalties are payable by the holders of mining rights to the government according to formula based on a defined earnings before interest and tax. This rate is then applied to a defined gross sales leviable amount to calculate the royalty amount due, with a minimum of 0.5% and a maximum of 5% for gold.
19.1.5Capital Expenditure
At Harmony, capital is allocated to the mines with a longer life. Kalgold currently has a relatively short LOM model, and therefore has relatively small amounts dedicated to capital expenditure. Detailed capital costs can be found in Table 18-1. The total capital costs shown Table 18-1 represents the capital costs in the Kalgold cash flow (Table 19-4).
19.1.6Operating Expenditure
The operating costs are determined as a function of the cash working costs of the mining and mineral processing plant activities, and ongoing capital development for mining. Whereas, total costs are a function of the operating costs, capital costs, and royalties. Detailed operating costs can be found in Table 18-2.
19.1.7Working Capital
Working capital is calculated at a Harmony Group level and not at an operational level.
Effective Date: June 30, 2023
86
Technical Report Summary for
Kalgold Mine, North West Province, South Africa
19.1.8Taxes
Mining tax on gold mining taxable income in South Africa is determined according to a formula, based on the taxable income from mining operations. Of that, 5% of total revenue is exempt from taxation while the remainder is taxable at a higher rate (33%) than non-mining income (27%). Accounting depreciation is eliminated when calculating the South African mining tax income. Excess capital expenditure is carried forward as unredeemed capital to be claimed against future mining taxable income.
19.1.9Closure Cost and Salvage Value
The closure cost estimates are those provided in Section 17.5. No account has been taken of any potential salvage values.
19.1.10Summary
The key assumptions used in the cash flow are summarised for Kalgold in Table 19-3.
Table 19-3: Key Economic Assumptions and Parameters
|
|
|
|
|
|
|
|
|
| Parameter |
Unit |
Value |
| Production Rate |
ktpm |
130 |
| Gold Recovery |
% |
86.00 |
| Royalty |
% |
Formula |
| Tax Rate |
% |
Formula |
| Gold Price |
ZAR/kg |
825 000 |
| Exchange Rate |
USD:ZAR |
16.22 |
| Discount Rate |
% |
12.32 |
19.2Economic Analysis
Harmony's respective business units and its associated operating sites consider the economic assumptions discussed in Section 19.1 during their respective planning and analysis processes. The past year’s average gold price is used for testing purposes. A spot price of ZAR825,000/kg is used for forecasting the revenue of the Kalgold cash flow (Table 19-3).
19.3Economic Analysis
Harmony's respective business units and its associated operating sites consider the economic assumptions during their respective planning and analysis processes. The past year’s average gold price is used for testing purposes. A price of ZAR825,000/kg is used for forecasting the revenue of the Kalgold cash flow (Table 19-4).
The discounted cash flow model is used to calculate the Net Present Value (“NPV”) of the investments. The NPV for this metal price, is approximately ZAR532m, at a discount rate of 9%. The NPV is calculated on a cash flow that accounts for factors such as:
•mining and ore processing working costs;
•royalty payments;
•capital costs, including costs allocated to ongoing development;
•any significant project work considered as major projects; and
•costs deemed as abnormal expenditure (“AE”).
Effective Date: June 30, 2023
87
Technical Report Summary for
Kalgold Mine, North West Province, South Africa
19.4Sensitivity Analysis
The economic assumptions, cash flow breakdown and economic analysis contribute to the basis for the sensitivity analysis. The sensitivities are calculated and analysed, as shown in the accompanying tables (Table 19-5 - Table 19-7).
Harmony has reviewed its exposure in terms of South Africa’s political instability, the COVID-19 pandemic, the currency exchange rate, and the gold price, on its financial assets and financial liabilities, and has determined the sensitivities for a ±11.8% variance. Management considers this range to be a reasonable change given the volatility in the market.
The sensitivity analysis is completed for variations in commodity price (ZAR/kg), total operating costs, which include capital costs and royalties paid (ZAR); and a combined analysis considering variations in commodity price, total operating costs, and changes in production.
Capital investments in Kalgold are relatively low and not expected to have any significant impact on the NPV and therefore not included in a sensitivity analysis. The base case in the analysis below is the economic results emanating from the LOM plan presented in Table 19-4.
The sensitivity analysis shown in Table 19-5 and Table 19-6 is based on a change in a single assumption while holding all other assumptions constant. In practice, this is unlikely to occur, as risks and/or opportunities will have an impact on the cash flows, and changes in some of these assumptions may be correlated. The insights that can be provided by this sensitivity analysis is that Kalgold is most sensitive to changes in the gold price (ZAR/kg).
The impact of one or a combination of risks and opportunities occurring at the same time cannot be specifically quantified so an analysis considering multi-parameters is considered. In this way the general risks, with the aid of the sensitivity table (Table 19-7) are adequately covered. The sensitivity analysis considering the 3 variations of gold price (ZAR/kg), operating costs (ZAR) and variation in production (kg gold) show that the lowering of working costs, improvement in productivity and the benefits of a higher gold price can have positive impacts for Kalgold.
Effective Date: June 30, 2023
88
Technical Report Summary for
Kalgold Mine, North West Province, South Africa
Table 19-4: Kalgold Cash Flow
|
|
|
|
|
|
|
|
|
|
|
|
|
|
|
|
|
|
|
|
|
|
|
|
|
|
|
|
|
|
| Item |
Units |
Total LOM |
FY2024 |
FY2025 |
FY2026 |
FY2027 |
FY2028 |
FY2029 |
FY2030 |
| Waste tonnes mined |
t'000 |
21 977 |
7 950 |
6 678 |
3 481 |
1 835 |
1 086 |
453 |
328 |
| Ore tonnes mined |
t'000 |
17 086 |
1 585 |
2 192 |
2 157 |
2 226 |
2 269 |
2 059 |
2 244 |
| Total tonnes mined |
t'000 |
39 064 |
9 534 |
8 869 |
5 638 |
4 060 |
3 355 |
2 512 |
2 572 |
| Milled tonnes |
t'000 |
13 917 |
1 501 |
1 500 |
1 559 |
1 559 |
1 559 |
1 559 |
1 559 |
| Yield |
g/t |
0.67 |
0.95 |
0.81 |
0.80 |
0.77 |
0.73 |
0.76 |
0.73 |
| Gold recovered |
Kg's |
10 330 |
1 424 |
1 219 |
1 246 |
1 206 |
1 143 |
1 179 |
1 139 |
| Revenue |
ZAR'000 |
8 521 894 |
1 175 127 |
1 005 856 |
1 027 954 |
995 302 |
943 228 |
972 324 |
939 456 |
| Operating costs incl. royalty |
ZAR'000 |
7 585 708 |
1 123 595 |
1 050 887 |
898 931 |
836 670 |
796 762 |
756 224 |
759 059 |
| Capital costs |
ZAR'000 |
82 476 |
23 444 |
9 132 |
12 821 |
9 247 |
7 392 |
8 492 |
3 792 |
|
|
|
|
|
|
|
|
|
|
| Profit after total costs |
ZAR'000 |
853 710 |
28 089 |
(54 163) |
116 203 |
149 384 |
139 074 |
207 608 |
176 605 |
| NPV - (low discount rate - 9%) |
ZAR'000 |
531 726 |
|
|
|
|
|
|
|
| NPV - (medium discount rate - 12%) |
ZAR'000 |
459 803 |
|
|
|
|
|
|
|
| NPV - (high discount rate - 15%) |
ZAR'000 |
399 858 |
|
|
|
|
|
|
|
Notes: 1. R/t, where t refers to tonnes milled. 2. Adjustments in tonnes due to stockpile management.
Effective Date: June 30, 2023
89
Technical Report Summary for
Kalgold Mine, North West Province, South Africa
|
|
|
|
|
|
|
|
|
|
|
|
|
| Item |
Units |
|
FY2031 |
FY2032 |
| Waste tonnes mined |
t'000 |
|
167 |
0 |
| Ore tonnes mined |
t'000 |
|
2355 |
0 |
| Total tonnes mined |
t'000 |
|
2522 |
0 |
| Milled tonnes |
t'000 |
|
1559 |
1559 |
| Yield |
g/t |
|
0.70 |
0.43 |
| Gold recovered |
Kg's |
|
1096 |
677 |
| Revenue |
ZAR'000 |
|
904347 |
558300 |
| Operating costs incl. royalty |
ZAR'000 |
|
817220 |
546362 |
| Capital costs |
ZAR'000 |
|
6492 |
1664 |
|
|
|
|
|
| Profit after total costs |
ZAR'000 |
|
80635 |
10274 |
| NPV - (low discount rate - 9%) |
ZAR'000 |
|
|
|
| NPV - (medium discount rate - 12%) |
ZAR'000 |
|
|
|
| NPV - (high discount rate - 15%) |
ZAR'000 |
|
|
|
Effective Date: June 30, 2023
90
Technical Report Summary for
Kalgold Mine, North West Province, South Africa
Table 19-5: Gold Price Sensitivity Analysis
|
|
|
|
|
|
|
|
|
|
|
|
|
|
|
|
|
|
|
|
|
| Sensitivity (%) |
Production (kg) |
Gold Price (ZAR/kg) |
Revenue (ZAR’000) |
Operating Cost (ZAR'000) |
Profit / Loss (ZAR'000) |
NPV (ZAR'000) |
| 10% |
10 330 |
907 500 |
9 374 084 |
7 668 184 |
1 705 899 |
1 115 846 |
| 5% |
10 330 |
866 250 |
8 947 989 |
7 668 184 |
1 279 805 |
823 786 |
| LOM plan |
10 330 |
825 000 |
8 521 894 |
7 668 184 |
853 710 |
531 726 |
| -5% |
10 330 |
783 750 |
8 095 800 |
7 668 184 |
427 615 |
239 665 |
| -10% |
10 330 |
742 500 |
7 669 705 |
7 668 184 |
1 520 |
-52 395 |
Table 19-6: Total Operating Costs Sensitivity Analysis
|
|
|
|
|
|
|
|
|
|
|
|
|
|
|
|
|
|
|
|
|
| Sensitivity (%) |
Production (kg) |
Gold Price (ZAR/kg) |
Revenue (ZAR’000) |
Operating Cost (ZAR'000) |
Profit / Loss (ZAR'000) |
NPV (ZAR'000) |
| 10% |
10 330 |
825 000 |
8 521 894 |
8 435 003 |
86 891 |
778 |
| 5% |
10 330 |
825 000 |
8 521 894 |
8 051 594 |
470 301 |
266 252 |
| LOM plan |
10 330 |
825 000 |
8 521 894 |
7 668 184 |
853 710 |
531 726 |
| -5% |
10 330 |
825 000 |
8 521 894 |
7 284 775 |
1 237 119 |
797 200 |
| -10% |
10 330 |
825 000 |
8 521 894 |
6 901 366 |
1 620 528 |
1 062 674 |
Table 19-7: Gold Price, Operating Costs, And Production Variation Sensitivity Analysis
|
|
|
|
|
|
|
|
|
|
|
|
|
|
|
|
|
|
|
|
|
| Sensitivity (%) |
Production (kg) |
Gold Price (ZAR/kg) |
Revenue (ZAR’000) |
Operating Cost (ZAR'000) |
Profit / Loss (ZAR'000) |
NPV (ZAR'000) |
| 10% |
11 363 |
907 500 |
10 321 474 |
8 435 003 |
1 876 489 |
1 227 431 |
| 5% |
10 846 |
866 250 |
9 395 388 |
8 051 594 |
1 343 795 |
864 975 |
| LOM plan |
10 330 |
825 000 |
8 521 894 |
7 668 184 |
853 710 |
531 726 |
| -5% |
9 813 |
783 750 |
7 691 010 |
7 284 775 |
406 234 |
227 682 |
| -10% |
9 297 |
742 500 |
6 902 734 |
6 901 366 |
1 368 |
-47 155 |
20Adjacent properties
Section 229.601(b)(96) (20) (i-iv)
Kalgold is surrounded by several tenements, namely the Goldridge Block and farms to the North of Goldridge Farm known as the Northern Farms Block (Figure 3-1). There are no other operations nearby. There are no adjacent properties that have bearing on this TRS.
21Other Relevant Data and Information
Section 229.601(b)(96) (21)
Other relevant data and information pertaining to Kalgold include a Feasibility Study with respect to an increase in the plant capacity, and details of exploration drilling. The Feasibility Study was completed in Q2 of 2021. It included a robust feasibility level mining plan to mine and process 300ktpm of ore in a new plant. The current indicative initial capital outlay required for the plant is extensive.
The possible exploratory extension of the LOM beyond 10 years that was previously indicated to add economic potential, is currently part of an exploration initiative. This initiative is currently in a regulatory approval phase. Environmental permitting and possible exploration has been identified as part of the value adding initiatives going forward.
The results from the exploration drilling at Kalgold outline an expanded, robust mineralised system that extends beyond the current Mineral Resource limits. The exploration drilling and the subsequent definition of the Mineral Resources are ongoing, and the intention is that the Mineral Resource estimate will be continuously updated as the data becomes available and incorporated into the model. The Windmill Mineral Resource extension drilling programme resumed in 2023 and it is still progress.
Effective Date: June 30, 2023
91
Technical Report Summary for
Kalgold Mine, North West Province, South Africa
The results of this drilling will be incorporated in the 2024 model.
At the effective date, Harmony was still preparing to re-submit the new Prospecting right application to secure the area where the section 102 application was refused by DMRE in 2021. The Prospecting Rights will be an extension to the current Mining Right which will be converted to a mining right as soon as the Prospecting Right has been granted by the DMRE.
The priority drilling targets lie south of the D Zone pit, within the above mentioned Prospecting Right application. If successful, it is this drilling program that has the potential to expand the Kalgold Mineral Resource estimates, which has the potential to support the above-mentioned Feasibility Study. An exploration budget for this program has been approved and the drilling will start as soon as the formal approval from the DMRE is obtained.
Other relevant information includes the public disclosure reports on Kalgold’s operational, financial, and environmental performance are available on the Company’s corporate website. The following reports are relevant to this TRS:
•Integrated annual report 2023;
•ESG report 2023;
•Financial report 2023;
•Report to shareholders 2023;
•Operational report 2023;
•TCFD report; and
Effective Date: June 30, 2023
92
Technical Report Summary for
Kalgold Mine, North West Province, South Africa
22Interpretation and Conclusions
Section 229.601(b)(96) (22)
Kalgold is a well-established mine and has been in operation since December 1995. Harmony has no known risks to conduct mining activities over the permitted mining rights’ areas, incorporated as Kalgold. In addition, no known risks are posed over surface access and activities, regarding mining related activities.
Kalgold’s regional geological setting, mineralisation and deposit is well understood. The geology is supported by high resolution aeromagnetic and radiometric survey and, surface and infill drilling findings. The geological anomalies are identified, defined, and managed by the Kalgold Geology Department. Targeted exploration for the 2022/2023 period aimed at extending the Mineral Resources south of the D Zone pit, did not materialise due to the denied Section 102 application
The sampling approach and management, density assumptions, laboratory procedures, and assaying and analysis are in keeping with industry standards and practices and is appropriate for the strata bound, BIF packages type of mineralisation. The holistic understanding of the regional geology, lithological and structural controls of the mineralisation at Kalgold is sufficient to support the estimation of Mineral Resources.
Ore mined at Kalgold is processed at the Kalgold processing facility which has been in operation since January 1996, as such the processing method is considered well established for mineralisation at Kalgold. Kalgold makes use of historical trends and data as a basis for the ore recovery. However, metallurgical test work is adopted for optimisation and Mineral estimation projects.
The data pertaining to the mineralisation, regional and geological setting, exploration findings, sample collection, preparation, and testing, inclusive of data verification and metallurgical test work gives rise to the Mineral Resource estimate. The combined Measured and Indicated Mineral Resource, exclusive of Mineral Reserves, as at June 30, 2023 is 35.306Mt at 1,18g/t gold, containing 1,1345Moz of gold, and the Inferred Mineral Resource contains 1.646Mt at 1.45g/t gold, containing 0.077Moz of gold.
Mineral Reserves are derived from the Mineral Resources, a detailed business plan and operational mine planning processes. Mine planning utilises and takes into consideration actual historical technical parameters. In addition, conversion of the Mineral Resources to Mineral Reserves considers Modifying Factors, such as cut-off grade, the MCF, dilution, and the plant recovery factor. The Mineral Reserve is 13.913Mt of milled ore at 0,88g/t gold containing 0.392Moz of gold as at June 30, 2023.
Kalgold is currently operating profitably, and the Mineral Reserve estimates show positive cash flows. Any other by-products that are recovered as part of the refining process, make up an immaterial component of the total metal inventory, and is thus not reported as part of the Mineral Reserve estimates. There are no obvious material risks that could have significant effect on the Mineral Reserves.
The Mineral Reserves are extracted via an open pit mining method using a modular pit approach, based on numerous satellite orebodies, which takes into consideration the mining and rock engineering design guidelines. This mining method increases flexibility and supports overall optimisation of the gold grade. Extracted minerals from Kalgold are recovered at an on-site processing plant. The plant initially treated ore via the heap leach processing methodologies, until January 1998 where the CIL treatment facility and TSF was fully complete.
The mine’s regional and local infrastructure is capable of fully supporting the mining and other surface related mining activities. Kalgold is accessed via national and provincial road networks, has key power transmission and distribution networks provided by the National electricity regulator, water supply networks and communication infrastructure. Overall, Kalgold is well-established with sufficient logistics and infrastructure support for the existing and planned mining operations.
Harmony and Kalgold are exposed to market risks such as exchange rate and gold price fluctuations which are partially offset by the Harmony Group hedging policy. The hedging programme considers factors effecting the global gold market and these, along with macro-economic conditions, are used to determine planning and forecasting inputs at group level for all of Harmony’s operating business units. Other non-gold related risks are addressed to some extent by Kalgold when entering into vendor agreements for the provisions of supplies and services, which are done on a competitive basis with customary price adjustment, renewal, and termination clauses.
Effective Date: June 30, 2023
93
Technical Report Summary for
Kalgold Mine, North West Province, South Africa
To successfully operate a mining operation in South Africa the state requires compliance with applicable environmental laws, regulations, permits and standards. Kalgold adheres to said compliance and regulatory standards. As part of Harmony, Kalgold conducts its operations based on policies and systems that are aligned to its corporate sustainable development framework. This is guided by the principles of the framework from the International Council on Mining and Metals or the United Nations Global Compact. Harmony discloses its sustainable development voluntarily in accordance with the guidelines issued by the GRI. Further to this, Harmony discloses environmental information on the CDP for both climate change and water.
Harmony has a good understanding of the environmental and social aspects through baseline and specialist studies previously conducted. Risk management and mitigation measures were adequately addressed in the environmental management plans. All the required environmental authorisations are in place, except for the Section 102 application, incorporating the Prospecting Rights into the Kalgold Mining Right, which was refused by the DMRE. This application incorporates other exploration drilling area outside of the existing mining lease, which is currently halted. Harmony is in the process of resubmitting the application.
The economics of Kalgold is based on the discounted cash flow model, with a gold price of ZAR825,000/kg. The NPV for the metal price, is ZAR532m, at a discount rate of 9%. The NPV is calculated on cash flows that consider factors such as: capital and operating costs; and royalties. The capital and operating cost estimates for Kalgold are based on historical data, as well as budget forecasts. This estimation technique allows for the forecast and actual costs to be aligned.
Royalties and taxes are paid to the South African government and accounted for in the Kalgold cash flow and NPV analysis. There are also specific tax relief benefits that apply to gold mining companies, where 5% of total revenue is exempt from taxation, amongst other benefits. In addition, in response to challenges faced by companies during the COVID-19 pandemic, the government have implemented various stimulus packages to provide some tax relief to companies.
The economics of Kalgold are tested for its sensitivity to commodity price (ZAR/kg), operating costs (ZAR) gold production (kg). The insights provided by the sensitivity analysis is that Kalgold Mine is most sensitive to changes in the gold price (ZAR/kg).
The TRS was prepared by a team of experienced professionals. The TRS provides a summary of the material scientific and technical information concerning the mineral exploration, Mineral Resources, Mineral Reserves, and associated production activities of the mineral asset, including references to the valuation for Kalgold. Each QP was responsible for specific sections of this TRS which they have personally supervised and reviewed. This TRS contains the expression of the QP opinions, based on the information available at the time of preparation.
Effective Date: June 30, 2023
94
Technical Report Summary for
Kalgold Mine, North West Province, South Africa
23Recommendations
Section 229.601(b)(96) (23)
23.1Additional Exploratory Drilling
The current geological model is well understood. The Mineral Resource model in use, as updated in February 2023, is drilled do a standard suitable for robust estimation. However, a significant amount of additional definition drilling would be required to increase more Mineral Resources to a Measured category, as the small high grade ore lenses that fit inside the current drill spacing, would be better defined. To this end, further exploration drilling is required to expand on the current Mineral Resource and Mineral Reserve base. This will also allow the operation to expand on the modular pit approach, which will improve the mining flexibility and LOM.
24References
Section 229.601(b)(96) (24)
Anon. 2017. Harmony Gold Mining Company Limited Mineral Resources and Mineral Reserves 2017. https://www.harmony.co.za/component/jdownloads/send/130-2017/2550-kalgold
Anhausseur, C.R. and Walraven, F. 1997. Poly Crustal Evolution of the Archean Kraaipan Granite-Greenstone Terrane, Kaapvaal Craton, South Africa. Economic Geology Research Unit, Department of Geology, University of the Witwatersrand. Information Circular No.313.
Geological Survey of South Africa, Handbook Vol 8, p 690. Lithostratigraphy of the Republic of South Africa, South West Africa/Namibia, and the Republics of Bophuthatswana, Transkei and Venda.
https://www.gold.org/goldhub/data/gold-prices. Accessed July 22, 2022.
https://www.sars.gov.za/media/tax-relief-measures/ Retrieved from Tax Relief Measures.
https://www.wits.ac.za/media/migration/files/cs-38933-fix/migrated-pdf/pdfs-8/EGRI%20313.pdf
Hammond N Q and Moore J M 2006 - Archaean lode gold mineralisation in banded iron formation at the Kalahari Goldridge deposit, Kraaipan Greenstone Belt, South Africa: in Mineralium Deposita v41 pp 483-503
Hammond N Q, Moore J M and Sheets R W, 2007 - Physico-chemical conditions of ore-forming fluids associated with genesis of the Kalahari Goldridge deposit, Kraaipan Greenstone Belt, South Africa: in Ore Geology Reviews v30 pp 106-134
Hammond, N.Q., Moore, J.M. Archaean lode gold mineralisation in banded iron formation at the Kalahari Goldridge deposit, Kraaipan Greenstone Belt, South Africa. Miner Deposita 41, 483–503 (2006). https://doi.org/10.1007/s00126-006-0074-6
Poujol. M., Robb. L.J., Anhausseur, C.R., and Gericke, B. 2002. Chronological Constraints on the Evolution of the Kaapvaal Craton, South Africa. Economic Geology Research Institute – Hugh Allsopp Laboratory, School of Geosciences, University of the Witwatersrand. Information Circular No. 360.
https://www.wits.ac.za/media/migration/files/cs-38933-fix/migrated-pdf/pdfs-7/360.pdf.
SACS (South African Committee for Stratigraphy) (1980) Stratigraphy of South Africa. Part I. (Compiler, L. E Kent).
South African Revenue Services. (July 29, 2021). South African Revenue Services.
SRK, February 2021. Review of the Kalgold Mine 2020 Mineral Resource Estimate, Report No. 557066.
World Gold Council. (July 13, 2022). World Gold Council, Gold Hub, Gold mine production: Gold Production by Country | Gold Production | Goldhub
Effective Date: June 30, 2023
95
Technical Report Summary for
Kalgold Mine, North West Province, South Africa
25Reliance on Information Provided by the Registrant
Section 229.601(b)(96) (25)
Further to Section 24, there are no additional internal specialists of the Registrant which the principal QPs and authors have relied upon.
Effective Date: June 30, 2023
96
EX-96.12
12
tshepongnorthtshepong-sxk1.htm
EX-96.12
Document
HARMONY GOLD MINING COMPANY LIMITED
Technical Report Summary of the
Mineral Resources and Mineral Reserves
for
Tshepong North
Free State Province, South Africa
Effective Date: 30 June 2023
Final Report Date: 31 August 2023
Technical Report Summary for
Tshepong North, Free State Province, South Africa
|
|
|
|
IMPORTANT NOTICE
This Technical Report Summary has been prepared for Harmony Gold Mining Company Limited in support of disclosure and filing requirements with the United States Securities and Exchange Commission’s (SEC) under Regulation S-K 1300; 229.601(b)(96). The quality of information, estimates, and conclusions contained in this Technical Report Summary apply as of the effective date of this report. Subsequent events that may have occurred since that date may have resulted in material changes to such information, estimates and conclusions in this summary. No other party is entitled to rely on this report beyond its intended use and any reliance by a third party on this report is done so at that party’s own risk.
|
Effective Date: 30 June 2023
ii
Technical Report Summary for
Tshepong North, Free State Province, South Africa
List of Contents
|
|
|
|
|
|
|
|
|
|
|
|
|
|
|
| 1 |
|
|
| 2 |
|
|
| 3 |
|
|
|
3.1 |
|
|
|
3.2 |
|
|
| 4 |
|
|
|
4.1 |
|
|
|
4.2 |
|
|
|
4.3 |
|
|
| 5 |
|
|
|
5.1 |
|
|
|
5.2 |
|
|
|
5.3 |
|
|
|
5.4 |
|
|
| 6 |
|
|
|
6.1 |
|
|
|
6.2 |
|
|
|
6.3 |
|
|
|
|
6.3.1 |
|
|
|
|
6.3.2 |
|
|
|
|
6.3.3 |
|
|
|
6.4 |
|
|
|
|
6.4.1 |
|
|
|
|
6.4.2 |
|
|
|
|
6.4.3 |
|
|
|
6.5 |
|
|
|
6.6 |
|
|
| 7 |
|
|
|
7.1 |
|
|
|
7.2 |
|
|
|
7.3 |
|
|
|
7.4 |
|
|
|
7.5 |
|
|
|
|
7.5.1 |
|
|
|
|
7.5.2 |
|
|
|
|
7.5.3 |
|
|
|
|
7.5.4 |
|
|
|
|
7.5.5 |
|
|
|
|
7.5.6 |
|
|
|
7.6 |
|
|
|
|
7.6.1 |
|
|
|
|
7.6.2 |
|
|
|
|
7.6.3 |
|
|
|
|
7.6.4 |
|
|
|
|
7.6.5 |
|
|
|
|
7.6.6 |
|
|
|
7.7 |
|
|
|
7.8 |
|
|
|
7.9 |
|
|
| 8 |
|
|
Effective Date: 30 June 2023
iii
Technical Report Summary for
Tshepong North, Free State Province, South Africa
|
|
|
|
|
|
|
|
|
|
|
|
|
|
|
|
8.1 |
|
|
|
|
8.1.1 |
|
|
|
|
8.1.2 |
|
|
|
8.2 |
|
|
|
8.3 |
|
|
|
8.4 |
|
|
|
8.5 |
|
|
|
8.6 |
|
|
|
8.7 |
|
|
|
8.8 |
|
|
|
|
8.8.1 |
|
|
|
|
8.8.2 |
|
|
|
|
8.8.3 |
|
|
|
8.9 |
|
|
| 9 |
|
|
|
9.1 |
|
|
|
9.2 |
|
|
|
9.3 |
|
|
|
9.4 |
|
|
| 10 |
|
|
|
10.1 |
|
|
|
10.2 |
|
|
|
10.3 |
|
|
|
10.4 |
|
|
| 11 |
|
|
|
11.1 |
|
|
|
11.2 |
|
|
|
11.3 |
|
|
|
11.4 |
|
|
|
11.5 |
|
|
|
11.6 |
|
|
|
11.7 |
|
|
|
11.8 |
|
|
|
11.9 |
|
|
|
11.10 |
|
|
|
11.11 |
|
|
|
11.12 |
|
|
|
11.13 |
|
|
|
11.14 |
|
|
|
11.15 |
|
|
| 12 |
|
|
|
|
|
|
|
|
|
|
|
|
|
|
|
|
|
|
|
|
|
|
|
|
|
|
|
12.2 |
|
|
|
|
12.2.1 |
|
|
|
|
12.2.2 |
|
|
|
|
12.2.3 |
|
|
|
|
12.2.4 |
|
|
|
12.3 |
|
|
| 13 |
|
|
|
13.1 |
|
|
|
|
|
|
|
|
|
13.1.2 |
|
|
|
|
13.1.3 |
|
|
Effective Date: 30 June 2023
iv
Technical Report Summary for
Tshepong North, Free State Province, South Africa
|
|
|
|
|
|
|
|
|
|
|
|
|
|
|
|
|
13.1.4 |
|
|
|
|
13.1.5 |
|
|
|
|
13.1.6 |
|
|
|
13.2 |
|
|
|
|
13.2.1 |
|
|
|
13.3 |
|
|
|
13.4 |
|
|
|
13.5 |
|
|
|
13.6 |
|
|
|
13.7 |
|
|
|
13.8 |
|
|
|
13.9 |
|
|
|
13.10 |
|
|
|
13.11 |
|
|
| 14 |
|
|
|
14.1 |
|
|
|
14.2 |
|
|
|
14.3 |
|
|
|
|
14.3.1 |
|
|
|
|
14.3.2 |
|
|
|
|
14.3.3 |
|
|
|
|
14.3.4 |
|
|
|
14.4 |
|
|
| 15 |
|
|
|
15.1 |
|
|
|
|
15.1.1 |
|
|
|
|
15.1.2 |
|
|
|
|
15.1.3 |
|
|
|
15.2 |
|
|
|
|
|
|
|
|
15.3 |
|
|
|
15.4 |
|
|
|
15.5 |
|
|
|
15.6 |
|
|
| 16 |
|
|
|
16.1 |
|
|
|
16.2 |
|
|
|
|
16.2.1 |
|
|
|
|
16.2.2 |
|
|
|
16.3 |
|
|
|
|
16.3.1 |
|
|
|
|
16.3.2 |
|
|
|
|
16.3.3 |
|
|
|
16.4 |
|
|
|
|
16.4.1 |
|
|
|
|
16.4.2 |
|
|
|
|
16.4.3 |
|
|
|
16.5 |
|
|
|
16.6 |
|
|
| 17 |
|
|
|
17.1 |
|
|
Effective Date: 30 June 2023
v
Technical Report Summary for
Tshepong North, Free State Province, South Africa
|
|
|
|
|
|
|
|
|
|
|
|
|
|
|
|
17.2 |
|
|
|
17.3 |
|
|
|
17.4 |
|
|
|
17.5 |
|
|
|
17.6 |
|
|
|
17.7 |
|
|
|
17.8 |
|
|
| 18 |
|
|
|
18.1 |
|
|
|
18.2 |
|
|
|
18.3 |
|
|
| 19 |
|
|
|
19.1 |
|
|
|
|
19.1.1 |
|
|
|
|
19.1.2 |
|
|
|
|
19.1.3 |
|
|
|
|
19.1.4 |
|
|
|
|
19.1.5 |
|
|
|
19.2 |
|
|
|
19.3 |
|
|
| 20 |
|
|
| 21 |
|
|
| 22 |
|
|
| 23 |
|
|
| 24 |
|
|
| 25 |
|
|
Effective Date: 30 June 2023
vi
Technical Report Summary for
Tshepong North, Free State Province, South Africa
List of Figures
|
|
|
|
|
|
|
|
|
|
|
|
|
|
|
|
|
|
|
|
|
|
|
|
|
|
|
|
|
|
|
|
|
|
|
|
|
|
|
|
|
|
|
|
|
|
|
|
|
|
|
|
|
|
|
|
|
|
|
|
|
|
|
|
|
|
Figure 16-1: Graph of Annual Gold Price History – ZAR/kg |
# |
Figure 16-2: Graph of Consensus View of Forecast Gold Price |
# |
|
|
Effective Date: 30 June 2023
vii
Technical Report Summary for
Tshepong North, Free State Province, South Africa
List of Tables
|
|
|
|
|
|
|
|
|
|
|
|
|
|
|
|
|
|
|
|
|
|
|
|
|
|
|
|
|
|
|
|
|
|
|
|
|
|
|
|
|
|
|
|
|
|
|
|
|
|
|
|
|
|
|
|
|
|
Table 11-4: Summary of the Phakisa Mineral Resources as at 30 June 2023 (Exclusive of Mineral Reserves) |
|
|
|
|
|
|
|
|
|
|
|
|
|
|
|
|
|
|
|
|
|
|
|
|
|
|
|
|
|
| Table 17-2: Mine Closure Liability |
87 |
| Table 17-3: Rehabilitation Assurance |
87 |
|
|
|
|
|
|
|
|
|
|
|
|
|
|
|
|
|
|
|
|
Effective Date: 30 June 2023
viii
Technical Report Summary for
Tshepong North, Free State Province, South Africa
Units of Measure and Abbreviations
|
|
|
|
|
|
| Unit / Abbreviation |
Description or Definition |
| °C |
degrees Celsius |
| µm |
Micrometres |
| 2D |
Two-dimensional |
| 3D |
Three-dimensional |
| AE |
Abnormal expenditure |
| Ag |
Silver |
| AngloGold Ashanti |
AngloGold Ashanti Limited |
| ARM |
African Rainbow Minerals Limited |
| ARMGold |
ARM Gold Division |
| Au |
Gold |
| AuBIS |
Harmony electronic database |
| Ave. |
Average |
| BLR |
Black Reef |
| BMD |
Below mine datum |
| Bn |
Billion |
| c. |
Approximately |
| CIP |
Carbon-In-Pulp |
| CLR |
Carbon Leader Reef |
| cm |
Centimetre |
| cmg/t |
Centimetre-grams per tonne |
| CODM |
Chief Operating Decision-Maker |
| Company |
Harmony Gold Mining Company Limited |
| COP |
Code of Practice |
| CRG |
Central Rand Group |
| CRM |
Certified Reference Material |
| CV |
Coefficient of Variation |
| DBH |
Dewatering borehole |
| DMRE |
Department of Mineral Resources and Energy |
| DWAFEC |
Department of Water Affairs, Forestry and Environmental Conservation |
| DWS |
Department of Water and Sanitation |
| EIA |
Environmental Impact Assessment |
| EMPR |
Environmental Management Programme |
| EMS |
Environmental Management System |
| EMTS |
Electric Monorail Transport System |
| ESG |
Environmental Social and Governance |
| ETF |
Exchange traded fund |
| FAG |
Fully autogenous |
| FX |
Foreign Exchange rate |
| g |
Gram |
| g/t |
Grams per metric tonne |
| GBH |
Groundwater boreholes |
| GDARD |
Gauteng Department of Agriculture and Rural Development |
| GHG |
Greenhouse gas |
| GISTM |
Global Industry Standard on Tailings Management |
| ha |
Hectare |
| Harmony |
Harmony Gold Mining Company Limited |
| HLS |
Heavy liquid separation |
| HPE |
Hydro-powered |
| kg |
Kilogram |
Effective Date: 30 June 2023
ix
Technical Report Summary for
Tshepong North, Free State Province, South Africa
|
|
|
|
|
|
| Unit / Abbreviation |
Description or Definition |
| km |
Kilometre |
km2 |
Square kilometre |
| kWh |
Kilowatt-hour |
| LBMA |
London Bullion Market Association |
| LIB |
Long Inclined Borehole |
| LOM |
Life of Mine |
| LOI |
Loss on ignition |
| Ltd |
Limited |
| m |
Metre |
| M |
Million |
m3/hr |
Cubic metres per hour |
| MCC |
Mining Charter Compliance |
| MCF |
Mine Call Factor |
| Moz |
Million troy ounces |
| MPRDA |
Mineral and Petroleum Resources Development Act, 28 of 2002 |
| Mt |
Million tonnes |
| Mtpa |
Million tonnes per annum |
| Mtpm |
Million tonnes per month |
| NEMA |
National Environmental Management Act, 107 of 1998 |
| No. |
Number |
| NPV |
Net present value |
| oz |
Troy ounce |
| OTC |
Over the counter |
| Phakisa |
Phakisa Mine |
| Pty |
Proprietary |
| QA/QC |
Quality Assurance/Quality Control |
| QEMSCAN |
Scanning electron microscope |
| QP |
Qualified Person |
| ROM |
Run-of-Mine |
| SACNASP |
South African Council for Natural Scientific Professions |
| SAMREC |
The South African Code for the Reporting of Exploration Results, Mineral Resources and Mineral Reserves |
| SD |
Standard Deviation |
| SEC |
Securities and Exchange Commission |
| SGM |
Sequential Grid Mining |
| SLP |
Social Labour Plan |
| t |
Metric tonne |
t/m3 |
Tonne per cubic metre |
| Target |
Target Mine |
| TCFD |
Task Force on Climate-Related Financial Disclosure |
| TMS |
Trace mineral search |
| TRS |
Technical Report Summary |
| TSF |
Tailings Storage Facility |
| Tshepong |
Tshepong Mine |
| USD |
United States Dollars |
| USD/oz |
United States Dollar per troy ounce |
| WRG |
West Rand Group |
WULA(s) |
Water Use Licence Application(s) |
| XRD |
X-ray diffraction |
| ZAR |
South African Rand |
| ZAR/kg |
South African Rand per kilogram |
Effective Date: 30 June 2023
x
Technical Report Summary for
Tshepong North, Free State Province, South Africa
Glossary of Terms
|
|
|
|
|
|
| Term |
Definition |
| Co-kriging |
A method that is used to predict the value of the point at unobserved locations by sample points that are known to be spatially interconnected by adding other variables that have a correlation with the main variable or can also be used to predict 2 or more variables simultaneously. |
| Cut-off grade |
Cut-off grade is the grade (i.e., the concentration of metal or mineral in rock) that determines the destination of the material during mining. For purposes of establishing “prospects of economic extraction,” the cut-off grade is the grade that distinguishes material deemed to have no economic value (it will not be mined in underground mining or if mined in surface mining, its destination will be the waste dump) from material deemed to have economic value (its ultimate destination during mining will be a processing facility). Other terms used in similar fashion as cut-off grade include net smelter return, pay limit, and break-even stripping ratio. |
| Dilution |
Unmineralised rock that is by necessity, removed along with ore during the mining process that effectively lowers the overall grade of the ore. |
| Head grade |
The average grade of ore fed into the mill. |
| Economically viable |
Economically viable, when used in the context of Mineral Reserve determination, means that the qualified person has determined, using a discounted cash flow analysis, or has otherwise analytically determined, that extraction of the Mineral Reserve is economically viable under reasonable investment and market assumptions. |
| Indicated Mineral Resource |
Indicated Mineral Resource is that part of a Mineral Resource for which quantity and grade or quality are estimated on the basis of adequate geological evidence and sampling. The level of geological certainty associated with an Indicated Mineral Resource is sufficient to allow a qualified person to apply modifying factors in sufficient detail to support mine planning and evaluation of the economic viability of the deposit. Because an Indicated Mineral Resource has a lower level of confidence than the level of confidence of a Measured Mineral Resource, an Indicated Mineral Resource may only be converted to a probable Mineral Reserve. |
| Inferred Mineral Resource |
Inferred Mineral Resource is that part of a Mineral Resource for which quantity and grade or quality are estimated on the basis of limited geological evidence and sampling. The level of geological uncertainty associated with an Inferred Mineral Resource is too high to apply relevant technical and economic factors likely to influence the prospects of economic extraction in a manner useful for evaluation of economic viability. Because an Inferred Mineral Resource has the lowest level of geological confidence of all Mineral Resources, which prevents the application of the modifying factors in a manner useful for evaluation of economic viability, an Inferred Mineral Resource may not be considered when assessing the economic viability of a mining project and may not be converted to a Mineral Reserve. |
| Kriging |
A method of interpolation based on Gaussian process governed by prior covariances. It uses a limited set of sampled data points to estimate the value of a variable over a continuous spatial field |
| Mine Call Factor |
The ratio, expressed as a percentage, of the total quantity of recovered and unrecovered mineral product after processing with the amount estimated in the ore based on sampling. |
| Measured Mineral Resource |
Measured Mineral Resource is that part of a Mineral Resource for which quantity and grade or quality are estimated on the basis of conclusive geological evidence and sampling. The level of geological certainty associated with a Measured Mineral Resource is sufficient to allow a qualified person to apply modifying factors, as defined in this section, in sufficient detail to support detailed mine planning and final evaluation of the economic viability of the deposit. Because a Measured Mineral Resource has a higher level of confidence than the level of confidence of either an Indicated Mineral Resource or an Inferred Mineral Resource, a Measured Mineral Resource may be converted to a Proven Mineral Reserve or to a Probable Mineral Reserve. |
| Mineral Reserve |
Mineral Reserve is an estimate of tonnage and grade or quality of Indicated and Measured Mineral Resources that, in the opinion of the qualified person, can be the basis of an economically viable project. More specifically, it is the economically mineable part of a Measured or Indicated Mineral Resource, which includes diluting materials and allowances for losses that may occur when the material is mined or extracted. |
| Mineral Resource |
Mineral Resource is a concentration or occurrence of material of economic interest in or on the Earth’s crust in such form, grade or quality, and quantity that there are reasonable prospects for economic extraction. A Mineral Resource is a reasonable estimate of mineralisation, taking into account relevant factors such as cut-off grade, likely mining dimensions, location or continuity, that, with the assumed and justifiable technical and economic conditions, is likely to, in whole or in part, become economically extractable. It is not merely an inventory of all mineralisation drilled or sampled. |
Effective Date: 30 June 2023
xi
Technical Report Summary for
Tshepong North, Free State Province, South Africa
|
|
|
|
|
|
| Term |
Definition |
| Modifying Factors |
Modifying factors are the factors that a qualified person must apply to Indicated and Measured Mineral Resources and then evaluate in order to establish the economic viability of Mineral Reserves. A qualified person must apply and evaluate modifying factors to convert Measured and Indicated Mineral Resources to Proven and Probable Mineral Reserves. These factors include but are not restricted to; mining; processing; metallurgical; infrastructure; economic; marketing; legal; environmental compliance; plans, negotiations, or agreements with local individuals or groups; and governmental factors. The number, type and specific characteristics of the modifying factors applied will necessarily be a function of and depend upon the mineral, mine, property, or project. |
| Pre-Feasibility Study |
A pre-feasibility study (or preliminary feasibility study) is a comprehensive study of a range of options for the technical and economic viability of a mineral project that has advanced to a stage where a qualified person has determined (in the case of underground mining) a preferred mining method, or (in the case of surface mining) a pit configuration, and in all cases has determined an effective method of mineral processing and an effective plan to sell the product.
(1) A pre-feasibility study includes a financial analysis based on reasonable assumptions, based on appropriate testing, about the modifying factors and the evaluation of any other relevant factors that are sufficient for a qualified person to determine if all or part of the Indicated and Measured Mineral Resources may be converted to Mineral Reserves at the time of reporting. The financial analysis must have the level of detail necessary to demonstrate, at the time of reporting, that extraction is economically viable.
(2) A pre-feasibility study is less comprehensive and results in a lower confidence level than a feasibility study. A pre-feasibility study is more comprehensive and results in a higher confidence level than an initial assessment.
|
|
|
| Probable Mineral Reserve |
Probable Mineral Reserve is the economically mineable part of an Indicated and, in some cases, a Measured Mineral Resource. |
| Proven Mineral Reserve |
Proven Mineral Reserve is the economically mineable part of a Measured Mineral Resource and can only result from conversion of a Measured Mineral Resource. |
| Qualified Person |
A qualified person is:
(1) A mineral industry professional with at least five years of relevant experience in the type of mineralisation and type of deposit under consideration and in the specific type of activity that person is undertaking on behalf of the registrant; and
(2) An eligible member or licensee in good standing of a recognized professional organization at the time the technical report is prepared. For an organization to be a recognized professional organization, it must:
(i) Be either:
(A) An organization recognized within the mining industry as a reputable professional association; or
(B) A board authorized by U.S. federal, state or foreign statute to regulate professionals in the mining, geoscience or related field;
(ii) Admit eligible members primarily on the basis of their academic qualifications and experience;
(iii) Establish and require compliance with professional standards of competence and ethics;
(iv) Require or encourage continuing professional development;
(v) Have and apply disciplinary powers, including the power to suspend or expel a member regardless of where the member practices or resides; and
(vi) Provide a public list of members in good standing.
|
|
|
|
|
|
|
|
|
|
|
| Tailings |
Finely ground rock of low residual value from which valuable minerals have been extracted is discarded and stored in a designed dam facility. |
Effective Date: 30 June 2023
xii
Technical Report Summary for
Tshepong North, Free State Province, South Africa
1Executive Summary
Section 229.601(b)(96) (1)
The Qualified Person(s) (“QP”) of Harmony Gold Mining Company Limited (“Harmony” or the “Company”) have prepared this Technical Report Summary (“TRS”) to disclose the Mineral Resource and Mineral Reserve estimates for the Company’s Tshepong North. The TRS has been prepared in accordance with the U.S. Securities and Exchange Commission (“SEC”) property disclosure regulations, S-K 1300, with an effective date as at 30 June 2023. No material changes have occurred between the effective date and the date of signature of this TRS.
Property Description
Tshepong North comprise the underground and surface assets, situated between the towns of Welkom and Odendaalsrus in the Free State Province of South Africa. The mine is a moderate to deep-level gold mine, operating at depths of between 1.6km and 2.4km below mine datum (“BMD”). The primary reef mined is the Basal Reef, with additional gold mineralisation being found in the B Reef and A Reef.
Mining at Tshepong North is carried out under the following mining right, covering both Tshepong North and Tshepong South:
•FS30/5/1/284MR, which is valid from 11 December 2007 to 10 December 2029 and covers an area of 10,798.74 hectares (“ha”).
The mining right is held in a joint venture between African Rainbow Minerals Limited (“ARM”) Gold Division (“ARMGold”) and Harmony.
All relevant underground mining and surface right permits, and any other permit related to the work conducted on the property have been obtained and are valid. There are no known legal proceedings (including violations or fines) against Harmony, which threaten its mineral rights, tenure, or operations.
Ownership
Tshepong North is wholly owned by Harmony, including the associated mineral rights. Harmony commenced acquiring the assets through the acquisition of AngloGold Ashanti Limited’s (“AngloGold Ashanti”) Free State operations in 2001, together with ARMGold. ARMGold was subsequently incorporated into Harmony in 2003, giving Harmony 100% ownership and control of Tshepong North.
Geology and Mineralisation
Tshepong North is situated in the Free State Goldfield, on the southwestern margin of the Witwatersrand Basin of South Africa, one of the most prominent gold provinces in the world. The major gold bearing conglomerate reefs are mostly confined to the Central Rand Group (“CRG”) of the Witwatersrand Supergroup.
The general orientation of the Witwatersrand Supergroup succession in this goldfield is interpreted as north-trending, within a syncline that is plunging to the north. The syncline has been divided by faults into the Odendaalsrus, Central Horst and Virginia sections. The Tshepong North mining right area is also affected by the Ophir and Dagbreek faults.
Tshepong North exploited primarily the Basal Reef, which occurs within the Harmony Formation of the Johannesburg Subgroup of the CRG.
Mineralisation also occurs within the stratigraphically higher A and B reefs of the Kimberley (formerly Aandenk) Formation, within the Turffontein subgroup of the CRG. However, only the B Reef can be economically extracted.
Mineralisation is associated with the presence of medium to coarse, clast-supported oligomictic pebble horizons. The presence of allogenic pyrite and detrital carbon is also common.
Effective Date: 30 June 2023
1
Technical Report Summary for
Tshepong North, Free State Province, South Africa
Status of Exploration, Development and Operation
The Basal Reef at Tshepong North has been extensively explored continuously . For the past 15 years B reef has also drawn attention for its economical viability and eratic nature of mineralized depositional zones with the main focus on improving confidence in the geological model, as well as adding and upgrading Mineral Resources to replace the mining depletion. Geological data has been obtained through underground chip sampling in stope faces as well as on reef development raises and from underground geological mapping of stope faces, haulages, cross cuts and on reef development raises. Initial exploration included a historical geophysical seismic survey and surface diamond core drilling. This was followed up with, closer spaced underground data gathering exercises.
Mineral Resource Estimate
The Mineral Resources for the Basal Reef and B Reef (both Tshepong North and South Mines) were estimated by the Harmony QP (Andrew Louw) in Datamine™ Studio software. The QP created block models based on a verified electronic database containing surface drill hole data, as well as underground drilling, mapping, and sampling data obtained up until December 2022. Gold values were estimated using ordinary and simple macro kriging interpolation methods.
The Mineral Resources for Tshepong North were originally prepared, classified and reported according to the South African Code for the Reporting of Exploration Results, Mineral Resources and Mineral Reserves (“SAMREC, 2016”). For the purposes of this TRS, the Mineral Resources have been classified in accordance with § 229.1302(d)(1)(iii)(A) (Item 1302(d)(1)(iii)(A) of Regulation S-K) which is similar to the SAMREC 2016 classification, by the QP.
Table 1-1: Summary of Tshepong North Mineral Resources as at 30 June 2023 (Exclusive of Mineral Reserves) 1-8
|
|
|
|
|
|
|
|
|
|
|
|
| METRIC |
| Mineral Resource Category |
Tonnes (Mt) |
Gold Grade (g/t) |
Gold Content (kg) |
| Measured |
11.920 |
12.42 |
147 989 |
| Indicated |
3.162 |
10.28 |
32 493 |
| Total / Ave. Measured + Indicated |
15.082 |
11.97 |
180 481 |
| Inferred |
9.744 |
10.20 |
99 356 |
| IMPERIAL |
| Mineral Resource Category |
Tons (Mt) |
Gold Grade (oz/t) |
Gold Content (Moz) |
| Measured |
13.139 |
0.362 |
4.758 |
| Indicated |
3.485 |
0.300 |
1.045 |
| Total / Ave. Measured + Indicated |
16.625 |
0.349 |
5.803 |
| Inferred |
10.741 |
0.297 |
3.194 |
Notes:
1. Mineral Resources are reported with an effective date of 30 June 2023 were originally prepared, classified and reported according to SAMREC, 2016. For the purposes of this TRS, the Mineral Resources have been classified in accordance with § 229.1302(d)(1)(iii)(A) (Item 1302(d)(1)(iii)(A) of Regulation S-K). The Qualified Person responsible for the estimate is Mr A Louw, who is Ore Reserve Manager at Tshepong North, and a Harmony employee.
2. The Mineral Resource tonnes are reported as in-situ with reasonable prospects for economic extraction.
3. No modifying factors or dilution sources have been included to in-situ Reserve which was subtracted from the SAMREC Resource in order to obtain the S-K 1300 Resource.
4. The Mineral Resources are reported using a cut-off value of 700cmg/t determined at a 90% profit guidance, and a gold price of USD1,764/oz.,R4075/ton operating cost with a plant recovery factor of 94.96%
5. Tonnes are reported as rounded to three decimal places. Gold values are rounded to zero decimal places.
6. Mineral Resources are exclusive of Mineral Reserves. Mineral Resources are not Mineral Reserves and do not necessarily demonstrate economic viability.
7. Rounding as required by reporting guidelines may result in apparent summation differences.
8. The Mineral Resource estimate is for Harmony’s 100% interest.
Mineral Reserve Estimate
Mineral Reserves are derived from the Mineral Resources, a detailed business plan and the operational mine planning processes. Mine planning utilises and takes into consideration historical technical parameters achieved. In addition, Mineral Resource conversion to Mineral Reserves considers Modifying Factors, dilution, ore losses, minimum mining widths, planned mine call.
Effective Date: 30 June 2023
2
Technical Report Summary for
Tshepong North, Free State Province, South Africa
Table 1-2: Summary of Tshepong North Mineral Reserves as at 30 June 2023 1-5
|
|
|
|
|
|
|
|
|
|
|
|
| METRIC |
| Mineral Reserve Category |
Tonnes (Mt) |
Gold Grade (g/t) |
Gold Content (kg) |
| Proved |
2.997 |
4.79 |
14 341 |
| Probable |
0.766 |
5.73 |
4 390 |
| Total (Proved + Probable) |
3.763 |
4.98 |
18 731 |
| IMPERIAL |
| Mineral Reserve Category |
Tons (Mt) |
Gold Grade (oz/t) |
Gold Content (Moz) |
| Proved |
3.303 |
0.140 |
0.461 |
| Probable |
0.845 |
0.167 |
0.141 |
| Total (Proved + Probable) |
4.148 |
0.145 |
0.602 |
Notes:
1. The Mineral Reserves were originally prepared, classified and reported according to SAMREC, 2016. For the purposes of this TRS, the Mineral Reserves have been classified in accordance with § 229.1302(d)(1)(iii)(A) (Item 1302(d)(1)(iii)(A) of Regulation S-K). The Qualified Person responsible for the estimate is Mr A Louw, who is Ore Reserve Manager at Tshepong North, and a Harmony employee.
2. Tonnes, grade, and gold content are declared as net delivered to the mills.
3. Figures are fully inclusive of all mining dilutions, gold losses and are reported as mill delivered tonnes and head grades. Metallurgical recovery factors have not been applied to the reserve figures.
4. Gold content has not taken metallurgical recovery factors into account.
5. Mineral Reserves are reported using a cut-off grade of 800cmg/t determined using a gold price of USD1,582/oz gold.
In the opinion of the QP, given that Tshepong North is an established operation, the modifying factors informing the Mineral Reserve estimates would at a minimum, satisfy the confidence levels of a
Pre-Feasibility Study.
The declared Mineral Reserves are depleted to generate Tshepong North cash flows. The economic analysis of the cash flows displays positive results and are deemed both technically and economically achievable.
Capital and Operating Cost Estimates
The capital cost estimates for Tshepong North is determined at a corporate level, using the business plan as the basis. The capital costs are associated with major equipment outside the main operating sections which is termed abnormal expenditure (“AE”), infrastructure development, as well as ongoing capital development (“OCD”). Costs associated with the Mining Charter Compliance (“MCC”), as per South Africa’s Social Labour Plan (“SLP”) requirements are also included in the capital estimates.
The capital costs are presented in Table 1-5.
The operating cost estimates for Tshepong North are categorised into direct and total costs. The operating cost estimates are shown in Table 1-6.
The capital and operating costs are reported in ZAR terms and on a real basis. The economic analysis, including the capital and operating costs are reported for the period comprising financial year (“FY24”)
July – June. Both, the capital and operating estimates are accounted for in the economic analysis of Tshepong North. The results of the economic analysis demonstrate positive returns over the LOM
Permitting Requirements
The permits held by Tshepong North are presented in Table 1-7.
Tshepong North have the necessary valid permits, administered and managed by various departments, and do not require any additional permits to continue with their mining operations, except for the application which have been submitted to amend the Water Use Applications.
An application to renew and amend water use licence was submitted to the respective regulator. The approval for WULA is pending at the effective date of this TRS. Based on current industry norms, a realistic timeframe to obtain relevant authorisations is estimated between 12 and 18 months.
There is no material litigation (including violations or fines) against the Company as at the date of this report which threatens its mineral rights, tenure, or operations.
Effective Date: 30 June 2023
3
Technical Report Summary for
Tshepong North, Free State Province, South Africa
Conclusions
Under the assumptions in this TRS, Tshepong North show a positive cash flow over the life-of-mine which supports the Mineral Resource and Mineral Reserve estimates. The mine plan is achievable under the set of assumptions and parameters used.
Recommendations
The gold output can be optimised through improvement of quality of mining and this will result in achieving planned shaft call factor. This impact will be realised through our currently implemented Business Initiative programme that will look at driving quality of mining through measures such as in-stope water controls and better fragmentation during blasting to contain the gold.
Table 1-5: Summary of Capital Cost Estimate for Tshepong North
|
|
|
|
|
|
| Capital Cost Element (ZAR'000s) |
Total LOM (FY2023 - FY2030) |
| AE |
155 828 |
| Shaft Projects |
65 404 |
| Major Projects |
55 635 |
|
|
| Total |
276 867 |
| OCD |
1 268 339 |
| Total (including OCD) |
1 545 206 |
Table 1-6: Summary of Operating Cost Estimate for Tshepong North
|
|
|
|
|
|
| Operating Cost Element (ZAR'000) |
Total LOM (FY2023 - FY2030) |
| Mining |
13 773 029 |
| Services |
4 060 125 |
| Medical Hub / Station |
768 026 |
| Engineering |
12 058 587 |
|
|
|
|
| Total Direct Costs |
30 659 766 |
| Mine Overheads |
1 580 186 |
| Royalties |
427 725 |
| Ongoing Capex |
1 268 339 |
| Total Cost |
33 936 016 |
Table 1-7: Status of Environmental Permits and Licences
|
|
|
|
|
|
|
|
|
|
|
|
|
|
|
| Permit / Licence |
Reference No. |
Issued By |
Date Granted |
Validity |
| Environmental Management Programme |
FS 30/5/1/2/3/2/1(84)EM |
DMRE |
16-Apr-10 |
LOM |
| Environmental Management Updated |
FS 30/5/1/2/2/84MR |
DWAFEC |
Pending Approval Submitted in 2019 |
LOM |
| Water Permit 936B. Harmony. Free State Geduld Mines. Discharge of untreated effluents |
B33/2/340/31 |
DWAFEC |
02-Apr-81 |
LOM |
| Water Permit 870B. Harmony. Discharge of untreated effluents. |
B33/2/340/25 |
DWAFEC |
27-May-91 |
LOM |
| Water Permit 1214N. Free State Consolidated Gold Mine. Tshepong, Freddie’s and Phakisa shafts. |
B33/2/340/12 |
DWAFEC |
Not indicated. |
LOM |
Notes: DWAFEC - Department of Water Affairs, Forestry and Environmental Conservation, DWA - Department of Water Affairs.
Effective Date: 30 June 2023
4
Technical Report Summary for
Tshepong North, Free State Province, South Africa
2Introduction
Section 229.601(b)(96) (2) (i-v)
This TRS on Tshepong North has been prepared for the registrant, Harmony. The TRS has been prepared in accordance with the U.S. SEC Disclosure by Registrants Engaged in Mining Operations (disclosure regulations S-K 1300). It has been prepared to meet the requirements of Section 229.601(b)96 - Technical Report Summary. The purpose of this TRS is to provide open and transparent disclosure of all material, exploration activities, Mineral Resource and Mineral Reserve information to enable the investor to understand Tshepong North, which forms part of Harmony’s activities.
This TRS has been prepared from the following sources of information:
•Harmony Operational Report 2023;
•Geological Model
•Valuation Model
•File 18 (Competency Report) Tshepong Mineral Resource and Reserve Statement FY2023;
•Technical Session Report
•Tshepong Gold Mine 2023 SAMREC Table 1;
•2023 Report to Shareholders; and
•Harmony Mineral Resources and Mineral Reserves Report at 30 June 2023 (“HAR-RR23”).
The TRS was prepared by QPs employed on a full-time basis by the registrant. The QPs qualifications, areas of responsibility and personal inspection of the property are summarised in Table 2-1.
Table 2-1: QP Qualification, Section Responsibilities and Personal Inspections
|
|
|
|
|
|
|
|
|
|
|
|
|
|
|
| Qualified Person |
Professional Organisation |
Qualification |
TRS Section Responsibility |
Personal Insp. |
| Mr. A. Louw |
SACNASP |
BSc. Hons. (Geohydro) |
All Sections (Tshepong) |
Full Time |
|
|
|
|
|
|
|
|
|
|
|
|
|
|
|
|
|
|
|
|
|
|
|
|
|
|
|
|
|
|
|
|
|
|
|
|
|
|
|
|
|
|
|
|
|
|
|
|
|
|
This TRS report is an update of the previously filed 30 June 2022 document with the SEC and has an effective date as at 30 June 2023. No material changes have occurred between the effective date and the date of signature.
Effective Date: 30 June 2023
5
Technical Report Summary for
Tshepong North, Free State Province, South Africa
3Property Description and Location
Section 229.601(b)(96) (3) (i-vii)
Tshepong North is a mature, moderate to deep-level underground operation that uses conventional undercut mining, to depths of 2,400m BMD.
The mine is located in the Free State Province of South Africa, approximately 250km southwest of Johannesburg and 15km to the north of the town of Welkom (Figure 3-1). Tshepong North is situated at a latitude of 27°51’56.45”S and longitude of 26°42’45.15”E. Phakisa is situated adjacent to the south of Tshepong North, and is located at a latitude of 27°54’1.27”S and longitude of 26°43’30.05”E.
3.1Mineral Tenure
South African Mining Law is regulated by the MPRDA which is the predominant piece of legislation dealing with acquisitions or rights to conduct reconnaissance, prospecting and mining. There are several other pieces of legislation which deal with such ancillary issues such as royalties (the Mineral and Petroleum Resources Royalty Act, 2008), title registration (the Mining Titles Registration Act, 1967), and health and safety (the Mine Health and Safety Act, 1996).
The current mining right for Tshepong North encompasses an area of 10,798.74ha (Figure 3-2). Harmony holds several mining rights in the Free State goldfields which have been successfully converted and executed as new order mining rights, some of which are still to be registered at the Mineral and Petroleum Resources Titles Office (“MPRTO”). The mining right for Tshepong North is presented in Table 3-1.
Tshepong North is wholly owned by Harmony, including the associated mineral rights. Harmony commenced acquiring the assets through the acquisition of AngloGold Ashanti Limited’s (“AngloGold Ashanti”) Free State operations in 2001, together with ARMGold. ARMGold was subsequently incorporated into Harmony in 2003, giving Harmony 100% ownership and control of Tshepong North.
Table 3-1: Summary of Mining Rights for Tshepong North
|
|
|
|
|
|
|
|
|
|
|
|
|
|
|
|
|
|
| Licence Holder |
Licence Type |
Reference No. |
Effective Date |
Expiry Date |
Area (ha) |
| ARMGold / Harmony JV |
Mining Right |
FS30/5/1/284MR |
11-Dec-2007 |
10-Dec-2029 |
10 799 |
|
|
|
|
|
|
|
|
|
|
|
|
|
|
|
|
|
|
|
|
|
|
|
|
|
|
|
|
|
|
|
|
|
|
|
|
|
|
|
|
|
|
|
|
|
|
|
|
There are no known legal proceedings (including violations or fines) against the Company which threatens its mineral rights, tenure, or operations.
3.2Property Permitting Requirements
All relevant underground mining and surface permits, and any other permit related to the work conducted on the property have been obtained and are valid.
Harmony has access to all the properties it requires to conduct its current mining activities. The surface lease and surface right areas are sufficient in size and nature to accommodate the required surface infrastructure to facilitate current and planned mining and processing operations.
Harmony monitors complaints and litigation against the Company as part of its risk management systems, policies and procedures. There is no material litigation (including violations or fines) against the Company and the QP as at the date of this report which threatens its mineral rights, tenure or operations.
Effective Date: 30 June 2023
6
Technical Report Summary for
Tshepong North, Free State Province, South Africa
|
|
|
Figure 3-1: Location of Tshepong North in the Free State Goldfield |
Effective Date: 30 June 2023
7
Technical Report Summary for
Tshepong North, Free State Province, South Africa
|
|
|
Figure 3-2: Mineral Tenure for Tshepong North |
Effective Date: 30 June 2023
8
Technical Report Summary for
Tshepong North, Free State Province, South Africa
4Accessibility, Climate, Local Resources, Infrastructure and Physiography
Section 229.601(b)(96) (4) (i-iv)
4.1Accessibility
Access to Tshepong North is accessible via the local R70 road between Welkom and Odendaalsrus
(Figure 3-1). The area has well-established rail links and an airfield within close proximity.
Entry into the mining area is restricted by security fencing, security guards, booms and lockable gates at the main entrance. In addition, a communication system and access control system monitors personnel entering and leaving the mine property.
4.2Physiography and Climate
The mine lease area is flat with an average height of around 1,344m above mean sea level (“masl”). There are no prominent topographical landmarks in the area. The topography has been affected by the presence of slimes dams, waste rock dumps and solid waste disposal sites.
Tshepong North is situated in the Free State Goldfield, a semi-arid region with an annual rainfall of between 400mm and 600mm. Local thunderstorms and showers are responsible for most of the precipitation during summer, from October to March, peaking in January. Hail is sometimes associated with thunderstorms.
The seasonal fluctuations in mean temperatures between the warmest and the coldest months vary between an average minimum of 7.7°C in winter to a maximum of 37°C in summer. The month of July is generally the coldest month with the hottest month typically being February.
Tshepong North is not restricted by climatic or seasonal variability.
4.3Local Resources and Infrastructure
The surrounding areas of Welkom and Odendaalsrus are well developed in terms of access and mining-related infrastructure, which supports the numerous operational gold mines in the area. The regional infrastructure includes national and provincial paved road networks, power transmission and distribution networks, water supply networks and communication infrastructure.
The local community is in situated in close proximity of the mine which enable the work force with transport to and from the mine. Most suppliers are locally or on site to ensure continuous operations as planned with out operational disruptions.
Tshepong North has a twin shaft system with ore and waste being hoisted to surface through the main vertical shaft (Figure 3-2).
Tshepong North ore is transported, by rail, from their respective shafts to the Harmony One Plant in Welkom for processing (Figure 3-2).
Operations are powered by electricity from Eskom Holdings State Owned Company (“SOC”) Limited.
Effective Date: 30 June 2023
9
Technical Report Summary for
Tshepong North, Free State Province, South Africa
5History
Section 229.601(b)(96) (5) (i-ii)
5.1Historical Ownership and Development
The Feasibility Study for the initial development of Tshepong North was concluded in 1984. Work to establish the site started in September 1984 and, by 1986, shaft sinking was underway. Sinking and equipping of the shaft were completed in 1991, with the mine being commissioned in November 1991.
The historical ownership and associated activities related to Tshepong North are summarised in Table 5-1.
Table 5-1: Summary of Historical Ownership Changes and Activities of Tshepong North
|
|
|
|
|
|
| Year |
Asset History Highlights |
| Tshepong |
| 1984 |
Feasibility Study for Tshepong development section concluded. Site establishment started. |
| 1986 |
Shaft sinking began. |
| 1991 |
Tshepong project was commissioned. |
| 2001 |
AngloGold announced sale of its assets in the Free State to African Rainbow Metals and Harmony Gold Mining. African Rainbow and Harmony would hold equal joint venture interests, effective January 1, 2002. |
| 2003 |
Harmony Gold and ARMGold merged. |
| 2004 |
Tshepong began production and produced 390,747oz Au. Tshepong Sub 55 Decline Project (an extension at depth of the mine from the current shaft bottom to a depth of some 2,200m) was on schedule for completion in July 2006. |
| 2005 |
Harmony completed 62% of the decline, including 1,500m of rail construction and 700m of the conveyer system. |
| 2006 |
The mine operated at full capacity and the Tshepong Decline Project had been completed. |
| 2007 |
Conversion of Harmony's old order mining rights into new order mining rights in terms of the MPRDA, including that for the Tshepong operation. |
| 2008 |
The Tshepong Sub 66 decline project in a build-up phase, and the Sub 71 Decline project was under development. |
| 2017 |
Tshepong and Phakisa merged into Tshepong Operations. |
| 2023 |
Tshepong and Phakisa operations split into separate operations. |
5.2Historical Exploration
Strong linear B-Reef value trends running from Tshepong Mine into Phakisa Mine were identified where an expected value of the area averaged 1291cmg/t. A high level capital exploration drilling project for B-Reef was approved in August 2016 for Tshepong South mine. Eight drill holes were planned, totalling of 5,180m at a total cost of ZAR5.5m. The exploration drilling programme was successfully concluded in October 2020, with the planned eight holes drilled in the target area which confirmed the extension of the Tshepong payshoot.
5.3Previous Mineral Resource and Mineral Reserve Estimates
The previous in-situ Mineral Resource estimates for Tshepong North were declared as at 30 June 2022 by Harmony, according to the 1300 SK, 2016. The previous Mineral Resource estimates, exclusive of Mineral Reserves, are summarised in Table 5-2 and Table 5-3 for Phakisa and Tshepong North, respectively. These have been superseded by the current estimate prepared by Harmony in Section 11 of this TRS.
Effective Date: 30 June 2023
10
Technical Report Summary for
Tshepong North, Free State Province, South Africa
Table 5-3: Summary of the Previous Tshepong North Mineral Resources as at 30 June 2022 (Exclusive of Mineral Reserves)
|
|
|
|
|
|
|
|
|
|
|
|
| METRIC |
| Mineral Resource Category |
Tonnes (Mt) |
Gold Grade (g/t) |
Gold Content (kg) |
| Measured |
12.484 |
12.13 |
151 437 |
| Indicated |
3.977 |
10.20 |
40 575 |
| Total / Ave. Measured + Indicated |
16.462 |
11.66 |
192 012 |
| Inferred |
9.434 |
10.18 |
96 037 |
| IMPERIAL |
| Mineral Resource Category |
Tons (Mt) |
Gold Grade (oz/t) |
Gold Content (Moz) |
| Measured |
13.762 |
0.35 |
4.869 |
| Indicated |
4.384 |
0.30 |
1.305 |
| Total / Ave. Measured + Indicated |
18.146 |
0.34 |
6.173 |
| Inferred |
10.399 |
0.30 |
3.088 |
The previous Mineral Reserve estimate for Tshepong North was declared by Harmony as at 30 June 2022 in accordance with SAMREC, 2016. Modifying Factors were applied to the in situ Mineral Resources to arrive at the Mineral Reserve estimate. The Mineral Reserve estimate represents the ore delivered to the mill. The recovered gold content considers the plant recovery factor. Dilution and modifying factors are based on historic performance.
The previous Mineral Reserve estimate is summarised in Table 5-4 and Table 5-5, respectively. These have been superseded by the current estimate prepared by Harmony as detailed in this TRS.
Table 5-5: Summary of the Previous Tshepong North Mineral Reserves as at 30 June 2022
|
|
|
|
|
|
|
|
|
|
|
|
| METRIC |
| Mineral Reserve Category |
Tonnes (Mt) |
Gold Grade (g/t) |
Gold Content (kg) |
| Proven |
4.157 |
5.15 |
21 419 |
| Probable |
0.336 |
7.63 |
2 565 |
| Total / Ave. Proven + Probable |
4.493 |
5.34 |
23 985 |
| IMPERIAL |
| Mineral Reserve Category |
Tons (Mt) |
Gold Grade (oz/t) |
Gold Content (Moz) |
| Proven |
4.583 |
0.150 |
0.689 |
| Probable |
0.371 |
0.223 |
0.082 |
| Total / Ave. Proven + Probable |
4.953 |
0.156 |
0.771 |
5.4Past Production
The annual tonnage, grade and gold production for Tshepong North is presented in Figure 5-1 and Figure 5-2.
Effective Date: 30 June 2023
11
Technical Report Summary for
Tshepong North, Free State Province, South Africa
|
|
|
Figure 5-1: Graph of Past Financial Production Year (July to June) – Tonnes and Grade |
|
|
|
Figure 5-2: Graph of Past Metal Production |
Effective Date: 30 June 2023
12
Technical Report Summary for
Tshepong North, Free State Province, South Africa
6Geological Setting, Mineralisation and Deposit
Section 229.601(b)(96) (6) (i-iii)
6.1Regional Geology
Tshepong is located on the southwestern margin of the Archean Witwatersrand Basin, one of the prominent gold provinces in the world. The Witwatersrand Basin is an approximately 7,000m thick terrigenous sequence comprising mainly arenaceous and argillaceous, together with minor rudaceous, lithologies deposited in a fluvio-deltaic environment in the centre of the Archaean Kaapvaal Craton of South Africa (Robb and Meyer, 1995). The regional geology of the Witwatersrand Basin is shown in Figure 6-1.
The Witwatersrand Basin hosts the Witwatersrand Supergroup, which either conformably or unconformably overlies the metamorphosed volcanic and minor clastic sediments of the Dominion Group (Tucker et al., 2016). The Dominion Group overlies the older granite-greenstone basement.
The majority of the Witwatersrand Supergroup is capped by the volcano-sedimentary sequence of the Ventersdorp Supergroup through an angular unconformity. The Ventersdorp Supergroup is in turn overlain by the dolomitic and quarzitic sequence of the Transvaal Supergroup, and sediments of the Karoo Supergroup (Tucker et al., 2016). Several suites of dykes and sills cut across the Archaean basement and the Witwatersrand, Ventersdorp, Transvaal and Karoo supergroups, and form important geological time-markers.
The Witwatersrand Supergroup is sub-divided into the basal West Rand Group (“WRG”) and overlying CRG (Robb and Robb, 1998). The WRG extends over an area of 43,000km2 and is up to 5,150m thick. It is sub-divided in three subgroups, namely, from bottom upwards, the Hospital Hill Subgroup; Government Subgroup and Jeppestown Subgroup. The stratigraphic succession of the WRG mainly consists of shale sediments, with occasional units of banded iron formation and conglomerate.
The CRG is up to 2,880m thick and covers an area of up to 9,750km2, with a basal extent of c.290km x 150km. It is sub-divided into the lower Johannesburg Subgroup and upper Turffontein Subgroup as shown in Figure 6-2. These subgroups are separated by the Booysens Shale Formation. The stratigraphic succession of the CRG comprises coarse-grained fluvio-deltaic sedimentary rocks.
The major gold bearing conglomerates are mostly confined to the CRG, and these conglomerate horizons are known as reefs. The most important reefs within the CRG are at six stratigraphic positions, three within the Johannesburg Sub-group and three within the Turffontein Sub-group. The reefs are mined in seven major goldfields, and a few smaller occurrences, which extend for over 400km in what has been called “The Golden Arc”. This arc is centred on the prominent Vredefort Dome, as shown in Figure 6-1, which is thought to be a major meteorite impact site in the centre of the Witwatersrand Basin (Therriault et al., 1997). The goldfields, as shown in Figure 6-1, include: East Rand, South Rand, Central Rand, West Rand, West Wits, Klerksdorp, Free State (Welkom), and Evander.
6.2Local Geology
Tshepong is located within the Free State Goldfield (Figure 6-1). The stratigraphic column of the Free State Goldfield is presented in Figure 6-2. The Johannesburg Subgroup comprises the Virginia, St Helena, Welkom, Harmony and Dagbreek formations.
The Free State Goldfield forms a triangle between the towns of Allanridge, Welkom and Virginia. The area is host to several gold mines, all of which produce gold from auriferous bearing reefs situated within sediments of the Central Rand Group of the Witwatersrand Sequence (Figure 6-2). Most of the presently exploitable reefs are situated within five stratigraphically separate placers including the Basal/Steyn, Saaiplaas Leader, B, Kimberley and Eldorado, with the majority of tonnage derived from the Basal/ Steyn and Saaiplaas Leader.
The Witwatersrand and overlying Ventersdorp lavas were deposited in a basin with significant and continual down warping to accommodate the sediments and lavas. During Platburg times, the basin underwent a significant rifting and tilting event, resulting in the region being split by significant faults. These faults are generally westerly dipping, with downthrows to the west, and strata dipping generally to the east.
Effective Date: 30 June 2023
13
Technical Report Summary for
Tshepong North, Free State Province, South Africa
|
|
|
Figure 6-1: Regional Geology of the Witwatersrand Basin |
Effective Date: 30 June 2023
14
Technical Report Summary for
Tshepong North, Free State Province, South Africa
|
|
|
Figure 6-2: Simplified stratigraphy of the Free State Goldfield |
Effective Date: 30 June 2023
15
Technical Report Summary for
Tshepong North, Free State Province, South Africa
The general orientation of the Witwatersrand Supergroup succession in the Free State Goldfield is interpreted as north-trending within a syncline that is plunging to the north (Figure 6-3). The syncline is cut by two major faults resulting in the formation of three major fault bounded blocks:
•Odendaalsrus Section to the west of the De Bron fault;
•the Central Horst between the De Bron and Homestead faults; and
•the Virginia Section to the east of the Homestead Fault.
The Central Horst was uplifted, and the Central Rand Group rocks eroded away prior to deposition of the Ventersdorp Supergroup and therefore comprises West Rand quartzites. The western margin of the Tshepong Lease is also marked by structures including the Ophir Fault that is bisected into eastern and western portions by a second, the Dagbreek Fault.
A cross section through the fault bounded blocks is presented in Figure 6-4.
6.3Property Geology
The principal gold-bearing orebody is the stratiform and strata-bound Basal Reef (or Basal Reef Zone (“BRZ”)) (Figure 6-2). A secondary reef, the B Reef, lying between 150m and 170m stratigraphically above the Basal Reef, contributes less than 20% to the mining production at Tshepong Mine.
6.3.1Basal Reef Lithology
The Basal Reef comprises a thin conglomerate, overlain by clean ‘placer’ quartzites. The Basal Reef is underlain by a thick series of siliceous and argillaceous quartzites comprising the Welkom Formation and overlain by shales and quartzites of the Harmony Formation, both of the Johannesburg Sub-group of the CRG. The Basal Reef sits unconformably on the Welkom Formation (Figure 6-2).
The Upper Cycle Black Chert facies Basal Reef prevails in the south of the Tshepong area and consists of a slightly polymictic (yellow shale specks present), matrix-supported medium-pebble conglomerate with a more gradational contact absent of carbon, where mineralisation is associated with fine disseminated and buck-shot pyrite. The conglomerate is slightly thicker compared to the Lower Cycle, but is also overlain by barren reef quartzite, the entire package being characteristically up to only 40cm thick. The lower Khaki Shale is up to 1m thicker.
There are two facies of Basal Reef on Phakisa, namely; the Lower Cycle Black Chert facies in the north and the Upper Cycle Black Chert facies in the south. The reef package ranges from 100cm to 160cm thick.
The Lower Cycle Black Chert facies predominates in the north with a northwest / southeast value trend. The reef consists of an oligomictic small pebble matrix-supported conglomerate lag with fly-speck carbon contact. The rest of the reef package constitutes barren siliceous fine-grained reef quartzite. The entire reef package reaches up to 160cm thick and is overlain by 1cm to 30cm of lower khaki shale. This in turn is overlain by the approximately 3-4m thick waxy brown leader quartzite, above which lies the 3-4m thick upper khaki shale.
6.3.2B Reef Lithology
The B Reef at Tshepong occurs approximately 150m stratigraphically (or approximately two production working levels) above the Basal Reef. Consequently, the B Reef is not normally intersected in either Basal Reef development or routine diamond drilling.
The lowest unit is a basal lag (Zone A), overlying Doornkop Quartzite Formation. Where this unit is developed (or preserved), it may be highly mineralised oligomictic or polymictic conglomerate, with visible gold, buckshot pyrite and carbon mineralisation. This unit may carry gold values of many thousands of cmg/t and represents a potentially rewarding exploration target.
The unit overlying the Zone A may be either Zone B, which comprises a mildly erosive pebbly quartzite formation, and/or the stratigraphically younger Zone C, which is a polymictic conglomerate with low values and is erosional into the underlying A and B zones.
Effective Date: 30 June 2023
16
Technical Report Summary for
Tshepong North, Free State Province, South Africa
|
|
|
Figure 6-3: Structural Geology of the Free State Goldfields |
Effective Date: 30 June 2023
17
Technical Report Summary for
Tshepong North, Free State Province, South Africa
|
|
|
Figure 6-4: Tshepong North Cross Section |
Source: Modified after Tucker et al. (2016)
Effective Date: 30 June 2023
18
Technical Report Summary for
Tshepong North, Free State Province, South Africa
The B Reef at Phakisa is located about 170m stratigraphically above the Basal Reef and varies in thickness from 30cm to 170cm. The conglomerate varies in character depending on the facies, with B1 being a small to medium pebble conglomerate and usually no more than 30cm thick with abundant carbon. The B2 facies is a small pebble lag in an argillaceous quartzite, with little to no mineralisation. B3 facies is a 20 to 150cm thick conglomerate, mature, well packed, with pebble sizes varying from small to cobble size, very polymictic, normally with abundant pyrite and some carbon. This is the most common facies
Effective Date: 30 June 2023
19
Technical Report Summary for
Tshepong North, Free State Province, South Africa
6.3.3Structure
At Tshepong, the Dagbreek Fault that strikes north-south bisects the mine into western and eastern domains. The shaft infrastructure itself is situated largely within the zone of fault loss associated with the Dagbreek Fault (Figure 6-3 and Figure 6-4).
The fault has a variable down throw to the west of approximately 350m, with no significant lateral displacement. It is interpreted as an early compressional structure that has experienced later Platberg age relaxation and subsequent extension. Reef in the eastern domain dips to the east at an average of 23° and extends from 55 Level (1,674m depth) to 66 Level (2,010m depth), which is the lowest working level of the Main shaft. Tshepong is currently developing the Sub 71 Decline Capital Project, which extends access down dip to 75 Level (2,286m depth), the lowest planned working level of the Sub 71 Decline Project.
Relative to the eastern domain, the western domain at Tshepong is more structurally deformed. This is prevalent to the north where major block rotation has occurred resulting in the reef dipping to the west. The structural complexity of this western domain necessitates an intensive, ongoing drilling programme to locate fault bounded reef blocks.
A second structural family of faults and dykes occurs on a NW-SE trend and are thought to be conjugate to and thus of a similar age to the Dagbreek Fault system, but this direction of faults tends to be associated with lateral shifts.
Many faults shown signs of lateral displacement, but the amount of this displacement is often difficult to determine. These faults are typically oriented between N-S and NNW-SSE. Maximum displacement identified thus far is approximately 200m on the Thelma Fault.
At Phakisa, there are several major faults and dykes present interpreted from surface drill holes and intersected in the development and stoping. Among these are the Enrico, Zero, Zindaba, Eland and Savannah Dykes, as well as the Southern and Phakisa Faults. The easterly limit of the ore body is not clearly defined but appears to cut off at approximately 3,000m below surface on a major component of the north-south striking Arrarat Fault.
Two principal age-based divisions in Phakisa’s intrusive structures have been identified, namely; Ventersdorp and post-Ventersdorp eras. Various subdivisions within each of these two categories have also been observed.
Yellow porphyry, acicular and quartz diorite dykes are found in the Ventersdorp suite of intrusives, while Karoo dolerites and lamprophyres occur in the post-Ventersdorp suite of intrusives. These intrusives tend to utilise any plane of weakness in their passage. It is therefore not unusual to find an intrusive infill along the various fault planes and other faults within the mine area. Accompanying gouge material, showing slicken-siding along the contacts of the intrusions, indicates that movement has taken place after these rocks were intruded.
6.4Mineralisation
The gold mineralisation in the Witwatersrand deposits is believed to have followed an episode of deep burial, fracturing and alteration. The mineralisation model is that Archean gold bearing hydrothermal fluid was introduced into the conglomerates and circulated throughout in hydrothermal cells. The fluids precipitated gold and other elements through reactions that took place at elevated temperatures along the reef horizons, which was the more favourable fluid conduit.
The generic mineralisation model for Tshepong North Basal Reef is based on structurally controlled fluid flow within a conglomerate hosted lithology. Fluid flow is dependent on the permeability of the host rock mass during mineralisation. Fluid flow, permeability and subsequent gold mineralisation are believed to be controlled by four key factors, including:
•Stratigraphy;
•the presence or absence of mineralisation age thrust faulting;
•sedimentology; and
•precipitation agent
Effective Date: 30 June 2023
20
Technical Report Summary for
Tshepong North, Free State Province, South Africa
It is the QP's view, the sedimentological parameters are more influential and predictive for gold distribution on a regional scale.
6.4.1Basal Reef
Within the Lower Cycle Black Chert facies, mineralisation is characterised by a fine disseminated interstitial pyrite, together with a carbon contact. Mineralisation is associated with the carbon contact and conglomerate, although some concentration is also found just below the upper reef contact. At the top of the reef is a granular textured often gritty quartzite with fine pyrite stringers about 10cm thick.
In the Upper Cycle Black Chert Facies, mineralisation is associated with the carbon contact and conglomerate, although some concentration is also found just below the upper reef contact. It does not have such a well-developed carbon contact as the Lower Cycle facies and is often of lower grade.
6.4.2B Reef
The B1 facies has abundant carbon and gold as associated with the carbon. The B2 facies has little to no gold mineralisation, while the B3 facies normally has abundant pyrite and some carbon. Free gold is found in association with the flyspeck carbon.
6.4.3Alteration
Alteration is evident in the Basal Reef and B Reef at Tshepong North and is a result of the hydrothermal fluids that infiltrated the reef and have overprinted on the original mineral assemblage. The reefs contain authigenic sulphides such as pyrite, and other minerals associated with alteration such as chlorite. Gold associations with these mineral assemblages indicate a strong correlation of gold mobilisation and redistribution at the time of the hydrothermal fluid influx.
While alteration is an important part of the mineralisation, alteration is not used for the identification, modelling or mining of the reefs.
6.5Deposit Type
Tshepong North deposit is classed a meta-sedimentary gold deposit. Folding and basin edge faulting have been important controls for sediment deposition and gold distribution patterns within the Witwatersrand Basin and fold trends have been employed in the economic evaluation of various reef horizons.
6.6Commentary on Geological Setting, Mineralisation and Deposit
The regional geological setting, local and property geology, mineralisation and deposit-type for Tshepong North is well established, through many decades of exploration and mining. Reliable geological models, maps and cross sections are available that support the interpretations and inform the Mineral Resource estimates.
Effective Date: 30 June 2023
21
Technical Report Summary for
Tshepong North, Free State Province, South Africa
7Exploration
Section 229.601(b)(96) (7) (i-vi)
Geological data has been obtained through initial surface drilling, followed by underground drilling, mapping and channel (chip) sampling.
Exploration from underground platforms is currently continuing for Tshepong sub-75 development, to improve geological confidence.
Tshepong Mines is continuously undergoing B reef exploration drilling to identify any potential continuation of the current pay shoots connecting these mines. Footwall development began at the Tshepong Mine during FY22 and will be used as a drilling platform to confirm and delineate the anticipated B Reef channel.
7.1Geophysical Surveys
Initial exploration included a historical geophysical seismic survey to obtain information of subsurface rock formations and geological structures using shock wave reflections and surface diamond core drilling.
7.2Topographic Surveys
As an underground operation, topographic surveys are not material to the Mineral Resource estimates.
7.3Underground Mapping
Face and reef development mapping is undertaken by a team comprising a Sampler or Geologist, and an assistant. Face tapes are setup along gullies and the stope face and secured with reference to the latest survey pegs installed in the workplaces. Reef position and other lithological and stratigraphic information is collected and measured relative to the reference tapes. The information is captured in a notebook.
Once at surface, the person responsible transfers the information from the notebook into CADSMineTM, where a mapping report is produced for each mapped workplace. The mapping reports depict the geological information graphically relative to the survey measurement points. Data from the mapping is also incorporated into the geological models.
Approximately 80-90% of all workplaces are inspected by member of the Geosciences team monthly to ensure that suitable mapping information coverage is achieved.
7.4Channel Sampling Methods and Sample Quality
Channel sampling of underground panels are carried out on monthly basis. Sampling is conducted perpendicular to the channel contact across the exposed channels. The section lines demarcating the width of the sample are drawn parallel to the reef waste contact while those demarcating the length of the sample are drawn at right angles to the reef waste contact and are marked 10cm apart. The samples are chipped out between these section lines.
Sampling of the Basal Reef stoping channels are undertaken at the advancing face on a grid spacing of 5m x 5m The sampling process is audited monthly and annually by the Geoscience Manager. Development sampling is on 4.0m intervals for Basal reef and for B reef reef at 2.0m intervals. The results are captured into the information system and plotted on a development sampling sheet.
The location of samples collected from the Basal and B Reef, to date, are shown in Figure 7-1 and Figure 7-2.
Tshepong North samples on a 5m x 5m sample grid for Basal reef and 3m x 3m grid for B reef which results in approximate 5800 underground chip samples monthly.
7.5Surface Drilling Campaigns, Procedures, Sampling, Recoveries and Results
Most surface drill holes used in the estimation of the current Mineral Resources were drilled by AngloGold Ashanti, or its forebearers, before Harmony acquired Tshepong North.
Effective Date: 30 June 2023
22
Technical Report Summary for
Tshepong North, Free State Province, South Africa
|
|
|
Figure 7-1: Location of Channel Samples Collected from the Basal Reef |
Effective Date: 30 June 2023
23
Technical Report Summary for
Tshepong North, Free State Province, South Africa
|
|
|
Figure 7-2: Location of Channel Samples Collected from the B Reef |
Effective Date: 30 June 2023
24
Technical Report Summary for
Tshepong North, Free State Province, South Africa
7.5.1Drilling Methods
The surface diamond core drilling has been undertaken using a thin-walled core barrel (AXT size core barrel) that delivers 35.51mm core. A single mother hole is drilled, typically with deflection holes drilled from it.
The drill grid spacing of the surface drill hole intersections is up to 100m and is often required to be complemented by underground drill hole intersections. The accuracy of the surface drilling intersection positions from drill holes that are from 2,000m to 3,000m in depth is the major limiting factor of achieving the planned grid. Long surface drill holes often deflect and controlling direction over that depth has always been challenging in the South African gold mining context.
7.5.2Collar and Downhole Surveys
The drill holes are surveyed to confirm both collar position and trajectory. Drill hole collar and downhole surveys are conducted on all surface drill holes.
Surface drill hole collars are surveyed by internal Land Survey Department. Underground drill hole collars are checked against layouts issued to diamond drilling.
Downhole surveying is conducted using Electronic Multishot System and non-magnetic north seeking Gyro tools as supplied by a certified and specialised downhole survey company, Digital Surveying (Pty) Limited. The instrument is a magnetic based tool and as such all readings are relevant to magnetic north.
7.5.3Logging Procedures
Upon arrival at the core yard located on-site, drill core is marked at every meter interval. The core is then orientated so that the low point of bedding is coincident with the edge of the angle iron. The cut line is defined by the low point of the bedding at the base of the reef zone, when viewed as per convention, from left to right in the direction of increasing depth, is drawn parallel to the core. The core is then rotated through 90° and a yellow line was then drawn parallel to the core, to define the retention half core.
All drill cores are photographed prior to logging and sampling. The geologist conducts the core logging.
Drill core logging is quantitative and qualitative. The following information is recorded:
•lithology;
•packing density;
•roundness;
•sorting;
•contact type, grain/pebble size;
•sediment maturity; and
•mineralisation; and alteration.
The geologist responsible for logging the core stores the original paper record. Core logging is also stored electronically using both DeswikTM and DatamineTM software. Internal peer reviewing is undertaken on the interpretation of the stratigraphy and spatial correlation of drill holes.
Observations are captured on the diamond drilling database by geologists. The logs are checked by the Senior Geologist prior to sampling. Logging procedures are conducted as per the Harmony company standards, which are used on all underground mines and are best practice and have been in place since 2001.
7.5.4Drilling Results
The location of the surface drill holes intersecting the Basal and B reefs are presented in Figure 7-3 and Figure 7-4. There are no recent surface drilling results (Table 7-1 and Table 7-2), all drilling dates back to previous project owners and is pre 2017. The results have, however, been included into the geological modelling and Mineral Resource estimation process. These drill holes were drilled to a depth of 2,373m below the surface.
Effective Date: 30 June 2023
25
Technical Report Summary for
Tshepong North, Free State Province, South Africa
|
|
|
Figure 7-3: Location of Surface and Underground Drill Holes on the Basal Reef |
Effective Date: 30 June 2023
26
Technical Report Summary for
Tshepong North, Free State Province, South Africa
|
|
|
Figure 7-4: Location of Surface and Underground Drill Holes on the B Reef |
Effective Date: 30 June 2023
27
Technical Report Summary for
Tshepong North, Free State Province, South Africa
Table 7-2: Summary of Surface and Underground Drilling for Tshepong North
|
|
|
|
|
|
|
|
|
|
|
|
|
|
|
Year |
Company |
No. Drill Holes |
Surface (m) |
Underground (m) |
| 2016 |
Harmony |
154 |
— |
18 221 |
| 2017 |
Harmony |
155 |
— |
18 358 |
| 2018 |
Harmony |
150 |
— |
17 794 |
| 2019 |
Harmony |
141 |
— |
16 745 |
| 2020 |
Harmony |
149 |
— |
17 656 |
| 2021 |
Harmony |
158 |
— |
18 669 |
| 2022 |
Harmony |
198 |
— |
21 978 |
| 2023 |
Harmony |
230 |
— |
12 633 |
| Total |
1 335 |
— |
142 054 |
7.5.5Core Recovery
Upon delivery to the core yard, and prior to logging and sampling, the drill core is checked to ensure 100% core recovery. Core recovery is determined by dividing the measured length of the recovered core by the total length of the core run.
An intersection is complete and representative if core recovery is greater than 99%. Drill holes with poor recovery are not sampled. Extra caution is taken during the drilling process to ensure maximum core recovery on reef intersections, to prevent sample bias.
Reef intersection “acceptability” is categorised as per the criteria summarised in Table 7-3 and is determined by geologists based on, amongst others, drill core condition and faulting. The acceptability is verified for each reef intersection before the assay results are used for Mineral Resource estimation.
Table 7-3: Drill hole Acceptance Criteria
|
|
|
|
|
|
| Category |
Comment |
| Acceptable |
100% core recovery in the reef zone, or very minor loss due to reef chipping. No evidence of faulting within the reef horizon or at either contact with hanging wall or footwall lithologies. |
| Minimum value |
Light to moderate disking of core in the core barrel due to drilling and/or ground conditions. Visual observations indicate that the conglomerate portion of the reef is usually more prone to disking, resulting in possible gold loss. |
| Faulted minimum value |
If the fault loss is considered to be minor, this term may be used if the geologist is certain that only low-value internal quartzite is missing from the intersection. |
| Not acceptable |
Heavy disking of core which may indicate core loss, partial known core loss due to grinding. Also faulting of any description within the reef zone. |
|
|
|
|
|
|
|
|
|
|
7.5.6Sample Length and True Thickness
Mineralisation of the reefs is perpendicular to or at an angle to the drill holes. As such, all drill hole reef intersection widths are corrected to true thickness for gold value calculation.
7.6Underground Drilling Campaigns, Procedures and Sampling
Underground exploration drilling has been ongoing throughout the operational life of Tshepong North as the mine deepens. Most of the underground drill holes used in the estimation of the current Mineral Resources were drilled by AngloGold Ashanti before Harmony acquired the mine.
7.6.1Drilling Methods
Underground diamond core drilling is conducted using hydraulic driven and pneumatic drill rigs, which typically delivers an AXT size core (35.51mm). These are short drill holes rarely exceeding 200m in length.
Fans of drill holes are drilled from diamond drilling bays, which are developed at 50m intervals along footwall developments ends (X/Cs) and 100m intervals along haulages and RAWS. The drilling fans consist of up to ten individual drill holes at inclinations ranging from -15° to +30° of vertical, or as dictated by local geological structures.
Effective Date: 30 June 2023
28
Technical Report Summary for
Tshepong North, Free State Province, South Africa
7.6.2Collar and Downhole Surveys
The drill holes used for reef delineation at Tshepong North are surveyed to confirm both collar position and trajectory. Drill hole collar and downhole surveys are conducted on long inclined borehole (“LIBs”) or long vertical boreholes (“LVBs”), as well as on most of the groundwater boreholes (“GBH”) and dewatering boreholes (“DBH”) drilled on the mine.
Surveying of exploration drill holes at Tshepong is outsourced to Digital Surveying (Pty) Limited. All underground drill hole surveys are conducted using an Electronic Multishot Survey instrument. Downhole surveys are conducted on all LIB/LVB drill holes for verification purposes, and the results are submitted together with the primary survey data used to determine the drill hole trajectories and are checked for quality and then captured on Microsoft ExcelTM and transferred to DatamineTM database.
At Phakisa, exploration holes are normally not surveyed as the maximum length of the holes are 120m and stabilisers are used to minimise the risk of deflections. LIBs drilled for the Phakisa Sub 75 Capital Project and the B reef initial drilling project before footwall development was established were all surveyed, including the deflections.
All records received from the survey company are checked for quality and then captured and stored in the electronic databases.
7.6.3Logging Procedures
Upon arrival at the core yard located on-site, drill core is marked at every meter interval. The core is then orientated so that the low point of bedding is coincident with the edge of the angle iron. The cut line is defined by the low point of the bedding at the base of the reef zone, when viewed as per convention, from left to right in the direction of increasing depth, is drawn parallel to the core. The core is then rotated through 90° and a yellow line was then drawn parallel to the core, to define the retention half core.
All drill cores are photographed prior to logging and sampling. The geologist conducts the core logging.
Drill core logging is quantitative and qualitative. The following information is recorded:
•lithology;
•packing density;
•roundness;
•sorting;
•contact type, grain/pebble size;
•sediment maturity; and
•mineralisation; and alteration.
The geologist responsible for logging the core stores the original paper record. Core logging is also stored electronically using both DeswikTM and DatamineTM software. Internal peer reviewing is undertaken on the interpretation of the stratigraphy and spatial correlation of drill holes.
Observations are captured on the diamond drilling database by geologists. The logs are checked by the Senior Geologist prior to sampling. Logging procedures are conducted as per the Harmony company standards, which are used on all underground mines and are best practice and have been in place since 2001.
7.6.4Drilling Results
The location of the underground drill holes intersecting the Basal and B reefs are presented in Figure 7-3 and Figure 7-4.
Effective Date: 30 June 2023
29
Technical Report Summary for
Tshepong North, Free State Province, South Africa
With over 182,862 Basal Reef and B Reef samples having been taken since 2003, the results indicated various geological information regarding facies, depositional environment and grades which is useful in identifying and delineating areas of economic interest. The results have, however, been included into the geological modelling and Mineral Resource estimation process.
The recent Basal Reef and B Reef underground drilling results for Phakisa are summarised in Table 7-4 and Table 7-5. A total of 32 underground drill holes were drilled in 2022 which included 29 Basal Reef intersections, two Leader Reef (minor reef) and a single B Reef intersection.
A total of 230 underground drill holes were drilled in 2023. The Basal Reef and B Reef underground drilling results for Tshepong for 2022 are summarised in Table 7-6 and Table 7-7.
7.6.5Core Recovery
Upon delivery to the core yard, and prior to logging and sampling, the drill core is checked to ensure 100% core recovery. Core recovery is determined by dividing the measured length of the recovered core by the total length of the core run.
An intersection is complete and representative if core recovery is greater than 99%. Drillholes with poor recovery are not sampled. Extra caution is taken during the drilling process to ensure maximum core recovery on reef intersections, to prevent sample bias.
Reef intersection “acceptability” is categorised as per the criteria summarised in Table 7-3 and is determined by geologists based on, amongst others, drill core condition and faulting. The acceptability is verified for each reef intersection before the assay results are used for Mineral Resource estimation.
7.6.6Sample Length and True Thickness
Mineralisation of the reefs is perpendicular to or at an angle to the drill holes. As such, all drill hole reef intersection widths are corrected to true thickness for gold value calculation.
7.7Hydrogeology
Harmony has a surface and groundwater monitoring program, managed regionally by the central environmental department to monitor the impacts of our operations on the local water resources.
Water sampling is done as per approved water sampling program for surface and groundwater, that specify type, frequency and analysis of the sampling required, i.e. surface water sample, frequency is monthly and parameters analyzed Ph, TDS, SO4, U, etc. The sampling program is aligned with the requirements of the pending Water Use License Applications submitted to DWS.
Water Quality samples is collected by external consultant (Aquatico), as per the sampling program, that follow a strict sampling procedure defining the sampling protocol and quality controls required when taking a water quality sample. Attached a copy of the sampling procedure. The water analysis is done at a external SANAS accredited laboratory according to SANAS approved procedure. All water quality data is emailed in pdf format analysis certificate and captured on a water quality database.
Water quality data is compared against different public water quality standards to and exceedances investigated. The water quality results is also communicated to DWS on 6 monthly basis.
Harmony have a good understanding of the local geology and geohydrology through numerous geohydrological and mass transport models done over the years.
7.8Geotechnical Data
Geological exploration drilling is not typically used to gather geotechnical data – these data are gathered independently by the Geotechnical Engineer. Geotechnical issues related to underground workings are discussed in more detail in Section 13.3.
Effective Date: 30 June 2023
30
Technical Report Summary for
Tshepong North, Free State Province, South Africa
Table 7-6: Summary of Recent Tshepong North Underground Drill Holes Intersecting the Basal Reef
|
|
|
|
|
|
|
|
|
|
|
|
|
|
|
|
|
|
|
|
|
|
|
|
|
|
|
| Year |
Drill Hole ID |
Gold Value (cmg/t) |
Ave. Channel Width (cm) |
|
Year |
Drill Hole ID |
Gold Value (cmg/t) |
Ave. Channel Width (cm) |
| 2023 |
GBH 8730 |
194 |
103 |
|
2023 |
GBH 8901 |
470 |
9 |
| 2023 |
GBH 8733 |
471 |
22 |
|
2023 |
GBH 8893 |
354 |
24 |
| 2023 |
GBH 8734 |
293 |
21 |
|
2023 |
GBH 8892 |
684 |
125 |
| 2023 |
GBH 8755 |
176 |
23 |
|
2023 |
GBH 8891 |
507 |
39 |
| 2023 |
GBH 8756 |
323 |
22 |
|
2023 |
GBH 8887 |
569 |
18 |
| 2023 |
GBH 8757 |
119 |
60 |
|
2023 |
GBH 8871A |
378 |
13 |
| 2023 |
GBH 8766 |
49 |
18 |
|
2023 |
GBH 8864 |
277 |
16 |
| 2023 |
GBH 8768 |
668 |
20 |
|
2023 |
GBH 8851 |
788 |
10 |
| 2023 |
GBH 8771 |
649 |
20 |
|
2023 |
GBH 8806 |
1 073 |
18 |
| 2023 |
GBH 8775 |
216 |
17 |
|
2023 |
GBH 8907 |
1 238 |
10 |
| 2023 |
GBH 8777 |
56 |
19 |
|
2023 |
GBH 8898 |
476 |
17 |
| 2023 |
GBH 8789 |
261 |
18 |
|
2023 |
GBH 8895 |
1 931 |
18 |
| 2023 |
GBH 8818 |
357 |
24 |
|
2023 |
GBH 8888 |
87 |
25 |
| 2023 |
GBH 8748 |
480 |
16 |
|
2023 |
GBH 8843 |
242 |
16 |
| 2023 |
GBH 8628A |
1 070 |
15 |
|
2023 |
GBH 8837 |
809 |
17 |
| 2023 |
PBH 29 |
324 |
4 |
|
2023 |
GBH 8836 |
766 |
18 |
| 2023 |
PBH 28 |
1 121 |
12 |
|
2023 |
GBH 8835 |
815 |
35 |
| 2023 |
PBH 27 |
5 814 |
24 |
|
2023 |
GBH 8600 |
1 382 |
21 |
| 2023 |
PBH 26 |
370 |
22 |
|
2023 |
GBH 8762 |
440 |
15 |
| 2023 |
PBH 25 |
4 409 |
18 |
|
2023 |
GBH 8657 |
429 |
20 |
| 2023 |
PBH 24 |
78 |
17 |
|
2023 |
GBH 8658 |
332 |
18 |
| 2023 |
PBH 23 |
1 029 |
32 |
|
2023 |
GBH 8668 |
71 |
17 |
| 2023 |
PBH 22 |
298 |
21 |
|
2023 |
GBH 8614 |
610 |
11 |
| 2023 |
PBH 21 |
501 |
45 |
|
2023 |
GBH 8739 |
124 |
23 |
| 2023 |
PBH 20 |
586 |
19 |
|
2023 |
GBH 8737 |
1 699 |
21 |
| 2023 |
PBH 19 |
533 |
13 |
|
2023 |
GBH 8735 |
227 |
17 |
| 2023 |
PBH 18 |
303 |
24 |
|
2023 |
GBH 8640 |
219 |
24 |
| 2023 |
PBH 17 |
19 |
33 |
|
2023 |
GBH 8729 |
453 |
26 |
| 2023 |
PBH 16 |
1 078 |
20 |
|
2023 |
GBH 8721 |
303 |
19 |
| 2023 |
PBH 15 |
1 265 |
23 |
|
2023 |
GBH 8717 |
3 091 |
21 |
| 2023 |
PBH 14 |
794 |
21 |
|
2023 |
GBH 8707 |
343 |
18 |
| 2023 |
PBH 13 |
48 |
24 |
|
2023 |
GBH 8701 |
198 |
27 |
| 2023 |
PBH 12 |
1 075 |
22 |
|
2023 |
GBH 8693 |
510 |
22 |
| 2023 |
PBH 11 |
106 |
17 |
|
2023 |
GBH 8692 |
366 |
26 |
| 2023 |
PBH 10 |
753 |
22 |
|
2023 |
GBH 8677 |
1 515 |
11 |
| 2023 |
PBH 8 |
592 |
19 |
|
2023 |
GBH 8665 |
329 |
22 |
| 2023 |
PBH 7 |
1 184 |
21 |
|
2023 |
GBH 8664 |
125 |
26 |
| 2023 |
PBH 3 |
11 |
20 |
|
2023 |
GBH 8627 |
1 289 |
16 |
| 2023 |
PBH 6 |
1 527 |
20 |
|
2023 |
GBH 8601 |
1 349 |
14 |
| 2023 |
PBH1 |
1 175 |
19 |
|
2023 |
GBH 8602 |
774 |
11 |
| 2023 |
GBH 8906 |
247 |
34 |
|
|
|
|
|
Effective Date: 30 June 2023
31
Technical Report Summary for
Tshepong North, Free State Province, South Africa
Table 7-7: Summary of Recent Tshepong North Underground Drill Holes Intersecting the B Reef
|
|
|
|
|
|
|
|
|
|
|
|
|
|
|
|
|
|
|
|
|
|
|
|
|
|
|
| Year |
Drill Hole ID |
Gold Value (cmg/t) |
Ave. Channel Width (cm) |
|
Year |
Drill Hole ID |
Gold Value (cmg/t) |
Ave. Channel Width (cm) |
| 2023 |
GBH 8620 |
251 |
98 |
|
2023 |
GBH 8749 |
31 |
157 |
| 2023 |
GBH 8643 |
122 |
148 |
|
2023 |
GBH 8758 |
33 |
138 |
| 2023 |
GBH 8715 |
8 127 |
104 |
|
2023 |
GBH 8765 |
468 |
146 |
| 2023 |
GBH 8746 |
21 |
117 |
|
2023 |
GBH 8826 |
376 |
130 |
| 2023 |
GBH 8759 |
1 400 |
129 |
|
2023 |
GBH 8809 |
1 180 |
270 |
| 2023 |
GBH 8767 |
980 |
124 |
|
2023 |
GBH 8808 |
173 |
193 |
| 2023 |
GBH 8774 |
127 |
39 |
|
2023 |
GBH 8828 |
90 |
135 |
| 2023 |
GBH 8779 |
343 |
106 |
|
2023 |
GBH 8820 |
171 |
123 |
| 2023 |
GBH 8786A |
1 288 |
107 |
|
2023 |
GBH 8822 |
411 |
135 |
| 2023 |
GBH 8793 |
521 |
85 |
|
2023 |
GBH 8801 |
949 |
152 |
| 2023 |
GBH 8794 |
122 |
113 |
|
2023 |
GBH 8800 |
950 |
98 |
| 2023 |
GBH 8798 |
986 |
115 |
|
2023 |
GBH 8785 |
445 |
163 |
| 2023 |
GBH 8803 |
187 |
226 |
|
2023 |
GBH 8738 |
1 294 |
134 |
| 2023 |
GBH 8804 |
362 |
121 |
|
2023 |
GBH 8831 |
294 |
94 |
| 2023 |
GBH 8505 |
128 |
227 |
|
2023 |
GBH 8896 |
1 702 |
216 |
| 2023 |
GBH 8811 |
427 |
91 |
|
2023 |
GBH 8867 |
3 491 |
120 |
| 2023 |
GBH 8812 |
2 148 |
94 |
|
2023 |
GBH 8855 |
135 |
106 |
| 2023 |
GBH 8813 |
437 |
136 |
|
2023 |
GBH 8604 |
106 |
177 |
| 2023 |
GBH 8814 |
304 |
117 |
|
2023 |
GBH 8606 |
96 |
49 |
| 2023 |
GBH 8815 |
318 |
78 |
|
2023 |
GBH 8709 |
7 795 |
102 |
| 2023 |
GBH 8817 |
401 |
119 |
|
2023 |
GBH 8691 |
1 751 |
110 |
| 2023 |
GBH 8824 |
791 |
117 |
|
2023 |
GBH 8619 |
139 |
336 |
| 2023 |
GBH 8827 |
928 |
50 |
|
2023 |
GBH 8546 |
1 044 |
103 |
| 2023 |
GBH 8692 |
366 |
26 |
|
2023 |
GBH 8569 |
25 |
51 |
| 2023 |
GBH 8686 |
1 784 |
67 |
|
2023 |
GBH 8631 |
284 |
92 |
| 2023 |
GBH 8698 |
480 |
146 |
|
2023 |
GBH 8635 |
10 |
40 |
| 2023 |
GBH 8700 |
178 |
178 |
|
2023 |
GBH 8644 |
111 |
132 |
| 2023 |
GBH 8690 |
21 009 |
42 |
|
2023 |
GBH 8662 |
449 |
49 |
| 2023 |
GBH 8742 |
11 265 |
135 |
|
2023 |
GBH 8670 |
566 |
54 |
| 2023 |
GBH 8778 |
2 137 |
179 |
|
2023 |
GBH 8676 |
54 |
32 |
| 2023 |
GBH 8681 |
452 |
168 |
|
2023 |
GBH 8630 |
275 |
119 |
| 2023 |
GBH 8638 |
750 |
109 |
|
2023 |
GBH 8724 |
456 |
140 |
| 2023 |
GBH 8595 |
1 174 |
52 |
|
2023 |
GBH 8713 |
262 |
127 |
| 2023 |
GBH 8816 A |
1 565 |
213 |
|
2023 |
GBH 8682 |
215 |
113 |
| 2023 |
GBH 8679 |
5 761 |
165 |
|
2023 |
GBH 8647 |
31 |
178 |
| 2023 |
GBH 8923 |
2 392 |
190 |
|
2023 |
GBH 8642 |
149 |
99 |
| 2023 |
GBH 8922 |
4 828 |
208 |
|
2023 |
GBH 8634 |
192 |
105 |
| 2023 |
GBH 8921 |
241 |
136 |
|
2023 |
GBH 8629 |
76 |
116 |
| 2023 |
GBH 8914 |
881 |
122 |
|
2023 |
GBH 8848 |
786 |
158 |
| 2023 |
GBH 8900 |
153 |
172 |
|
|
|
|
|
7.9Commentary on Exploration
Surface drilling was used as the initial exploration drilling, and this was later infilled to provide sufficient detail for geological modelling and Mineral Resource estimation. The underground infill drilling system is in place to improve data density in specific areas and are drilled from the underground development access drives.
Logging procedures are conducted as per the Harmony company standards, which are used on all surface and underground mines and are best practice and have been in place consistently since 2001. Previously extensive drilling together with 3D seismic surveys was done and the Tshepong geology and depositional environment is relatively well understood. All information is safely stored at the Harmony Steyn offices.
The QP is of the opinion that the quality and quantity of the exploration methods and information gathered is sufficient to support the estimation of Mineral Resources and Mineral Reserves.
Effective Date: 30 June 2023
32
Technical Report Summary for
Tshepong North, Free State Province, South Africa
8Sample Preparation, Analyses and Security
Section 229.601(b)(96) (8) (i-v)
This section summarises information relating to the sample preparation on site through to the laboratory preparation and analysis. Tshepong North and Phakisa have very similar sampling procedures. Therefore, they are described together in the sections to follow, with only their differences being highlighted.
8.1Sampling Method and Approach
Sample types used to support both production and geological exploration include diamond drill core samples and channel (chip) samples.
8.1.1Channel Samples
Channel sampling is (and was by Anglo previously) undertaken according to industry best practice, and presently now according to Harmony’s Underground Sampling Procedure which incorporates QAQC principles. Tshepong sampling grid on the Basal Reef stoping is a 5m by 5m interval grid and B reef sampling is on 3m by 3m interval grid.
For development, Basal reef is at 4m interval and B Reef at 2m interval due to the high nugget effect and variability, the full extent of the on-reef development must be sampled on one sidewall.
Samples are chipped from the advancing face from within clearly measured and marked channel sections, including the 2cm hanging wall and footwall width. Sample widths are measured at right angles to the dip of the reef. Individual sample widths are measured from bottom to top along the two parallel lines. Two clino-rules are used for measuring the sample widths. One ruler is held horizontally with the spirit level on strike, and another held at right angles to the dip. The two rulers must cross each other at right angles. The face measured must agree with the totals of all individual widths. All measurements are made to the nearest centimetre.
The channel and sample lines are chipped out using a standard chisel and mallet, bagged, labelled with a unique sampling number, and sealed. An adequate mass of each sample is collected to allow sufficient sized aliquots to be analysed at the designated laboratory. The minimum sample weight sent for assay is approximately 300g.
Samples are weighed and submitted to the designated laboratory for analyses. All inter-person transfers are recorded. This process continues until the samples have been submitted to the laboratory.
8.1.2Core Samples
Diamond drill core is transported to the on-site storage facility under the supervision of a Senior Geologist. Upon arrival, the core is logged and sampled according to the internal Harmony Drill hole Sampling Procedure.
Where possible the entire channel width intersected in each drill hole is split using a diamond drill core cutter and one half of the sample is bagged, tagged and sent to the designated laboratory for assay. The remaining half is retained for future reference. If the core condition is such that a successful cut cannot be achieved, then the whole core is submitted for assay.
Pertinent data captured during sampling includes sample width (cm), mass, core lithological intersection angles and a detailed visual description of the reef. The data is recorded in the drill hole database together with the unique sample number, collection date and spatial location.
All samples are assessed for quality and signed-off by the Senior Geologist for completeness and auditability, prior to laboratory dispatch.
Effective Date: 30 June 2023
33
Technical Report Summary for
Tshepong North, Free State Province, South Africa
8.2Density Determination
The relative density of samples was determined through the work conducted by the Harmony Free State central office regarding relative densities on the various shafts since August 2009.
More recently (2020), a total of 40 samples were taken from underground workings including hanging wall, reef and footwall samples. The dry mass and the submerged mass of the samples in water were measured and the density was calculated.
Tests have occasionally been conducted thereafter on samples collected from the working places.
A single relative density of 2.72 is used for Mineral Resource estimates.
8.3Sample Security
Chip samples are bagged, sealed and delivered by the samplers to the onsite coreyard on the same day as they are collected. The core yard is a secure facility with access control measures in place. Samples are delivered to the laboratory by the mine.
Cores are delivered to the core yard at the end of each day’s drilling for secure storage. Sampling only takes place at the core yard. The samples are bagged and sealed and stored until they are delivered to the laboratory.
Samples are stored in secured facility and can only be transported by a permit holder for transporting gold bearing material. Waybills and registers are checked and signed off by security. The samples are received from the mine in locked containers with seals.
The sample labels are scanned at the designated laboratory and the batches compared to the submitted sample sheets. The scanned bar codes are kept at the laboratory and compared to the work sheets that are automatically created on the system. Sample lists submitted by the mine are used to compare what is received at the laboratory.
8.4Sample Storage
All pulp samples of exploration drill hole intersections and underground chip sample are kept for a few months at the laboratory and later discarded. The remaining half of the sampled core of exploration holes is kept at the core yard for future references.
8.5Laboratories Used
Both the underground and surface exploration samples were historically sent to the SGS South Africa (Pty) Limited (“SGS”) independent laboratory, with Anglo American Laboratories used as a secondary independent laboratory. All historical data, underground chip sampling, both underground and surface borehole results from previous “Owners”(Anglo Gold Ashanti) are included in the current valuation model.
All samples are currently sent to the Harmony Assay Laboratory located in Welkom for preparation and assay. The laboratory is ISO/IEC 17025:2017 certified for chemical analysis by the South African National Accreditation System (Accreditation No. T0520). Harmony Assay Laboratory is however not an independent laboratory.
8.6Laboratory Sample Preparation
Upon receipt, the samples are dried, crushed, and milled to the appropriate size. Routine screen tests on pulps by the assay laboratory are used to check comminution of samples to contract specification. The contract specification is that the comminution should be 80% passing 75µm for Tshepong North and 80% passing 75µm for Phakisa.
The total percentage mass loss on each sample should not exceed 2%.
Effective Date: 30 June 2023
34
Technical Report Summary for
Tshepong North, Free State Province, South Africa
8.7Assaying Methods and Analytical Procedures
For the period 1 January to 30 June 2023 a total of 36,516 samples were submitted for analysis of gold. Gold is analyzed by fire assay with a gravimetric finish, while uranium is analyzed by XRD. For a period ranging from 2010 up to March 2020, the development and drill hole reef samples were also assayed for uranium.
After the preparation stage the samples are packed into trays and transported to the fluxing-room. A catch weight aliquot of ±25g and a flux aliquot of ±100g is placed into a fire assay crucible and thoroughly mixed. The samples are then transferred to the ovens for the fusion process. The cupellation process is where the precious metals are collected in a lead button and then separated from the lead by means of oxidation fusion. The gold prill is then added to a nitric acid solution to dissolve the silver and thereafter the remaining gold prill is weighed to determine its mass relative to the original sample mass.
To ensure that a high standard of analysis is maintained, each step of the analytical process and procedure,
including the adherence to safety standards, is checked by a supervisor.
8.8Sampling and Assay Quality Control (“QC”) Procedures and Quality Assurance (“QA”)
The assessment of assaying accuracy and precision is carried out using certified Standard Reference Materials (“SRM”), blanks and duplicates. SRMs, blank samples and duplicate samples are added with the underground chip sample and drill hole core sample streams prior to being sent to the assay laboratory.
In addition, regular audits of the laboratory processes and facilities are conducted by mine evaluators and regional experts to monitor compliance and quality controls.
8.8.1Standards
A range of SRMs were sourced from African Minerals Standards (“AMIS”) and inserted into the sample sequence by the logging geologist.
For analysis of surface and underground drill holes, a minimum of one gold SRM is required for every 20 drill hole samples assayed. This equates to approximately 5% of the total drill hole samples analyzed for Tshepong North, and approximately 6% for Phakisa.
Laboratory statistical control is deemed acceptable should SRMs be within two standard deviations of the recommended value. Investigative action is taken when reference materials returned exceed the standard deviation limit.
If the SRM or blank sample has been deemed to have failed, the entire batch of samples re-assayed with the failed QAQC sample having to be identified. A request must then be sent to the laboratory requesting the laboratory to repeat the assay procedure on all samples within the batch.
A second SRM or blank sample is provided to the laboratory to include with the batch of samples. Should the batch of samples fail the QAQC standards again, these samples are excluded from the sampling database (not captured in the sampling system), and the panel/drill hole will have to be resampled if necessary.
A total of 1,238 SRMs were submitted to Harmony Assay Laboratory for Tshepong between January 2022 and June 2023. The results are summarised in Table 8-1. Seventeen out of 1238 samples (0.1%) failed, and the respective sample trays deleted from the system and do not form part of model.
Table 8-2: Summary of Harmony Assay Laboratory SRM Performance for Tshepong
|
|
|
|
|
|
|
|
|
|
|
|
| Quality Control Material Type |
No. of Samples Submitted |
No. of Failed Samples |
Action Taken |
| AMIS0428 |
304 |
1 |
Failed samples were queried from the lab and re-assays were requested. If the re-assays failed the sample sheet was deleted from the system. |
| AMIS0455 |
281 |
4 |
| AMIS0460 |
254 |
2 |
| AMIS0685 |
293 |
2 |
| AMIS0694 |
106 |
8 |
|
|
|
| Total |
1 238 |
17 |
|
Effective Date: 30 June 2023
35
Technical Report Summary for
Tshepong North, Free State Province, South Africa
8.8.2Blanks
A total of 2,548 coarse blank samples were submitted to Harmony Assay Laboratory during January 2022 to June 2023 for Tshepong. The lowest detection limit at the laboratory is 0.063g/t.
Ten samples plotted outside the 3x detection limit.
Failed samples were queried from the lab and re-assays were requested. If the re-assays failed the sample sheet was deleted from the system.
8.8.3Duplicates
For the samples analysed at Harmony Assay Laboratory during January 2022 to June 2023, results of duplicate analysis indicated correlation at lower grades. A total of 2,187 duplicate samples were analysed for Tshepong and, out of the analysis, a total of 835 samples (38%) were outside the average required mean value.
Failures were queried during the central QA/QC meetings held every six months.
8.9Comment on Sample Preparation, Analyses and Security
In the opinion of the QP that:
•the drill core sampling method is appropriate for the mineralisation styles encountered at Tshepong North;
•all underground chip sampling is representative of the channel sampled;
•the sample preparation, security and analytical procedures followed for gold grade determination are adequate; and
•the results of the QAQC assessment have been appropriately addressed to ensure that the assay results of the primary samples are adequate for Mineral Resource estimation.
Effective Date: 30 June 2023
36
Technical Report Summary for
Tshepong North, Free State Province, South Africa
9Data verification
Section 229.601(b)(96) (9) (i-iii)
9.1Databases
Tshepong North drill hole and underground channel sampling data was previously captured and stored in AuBIS electronic database. Upon acquisition of the mine, Harmony has migrated to data capture in the GMSITM system.
Geological core logging is stored using both Deswik CADTM (“Deswik”) and DatamineTM Fusion (“Datamine”). This database is protected through administration rights allocated to an authorised administrator.
9.2Data Verification Procedures
Data verification procedures included the following:
•the drill hole database was checked against the original logs;
•the database was integrated with DeswikTM and DatamineTM software to check for missing collar coordinates, collar position and elevation errors, downhole survey errors, interval errors and duplicate sample records;
•when assay results were returned from the laboratory, they were captured into the electronic database by the Senior Evaluator and Geologist. The QC sample results were assessed for performance before the primary sample results could be used for Mineral Resource estimation;
•the primary assay results captured in the database were validated by spot checking a selection of drill holes used in the current Mineral Resource estimate; and
•the assays captured in the electronic database were checked against the original laboratory certificates.
The QP did data verification and did not identify any critical errors in the database.
9.3Limitations to the Data Verification
Previous data has been verified through various methodologies i.e. a “post plot” of all sample points relative to the mine workings are made in order to locate any co-ordination errors. When “manual” capturing (re-digitising old assay tracings) of data occurs, there is a risk that entire sample sheets may plotted incorrectly due to the use of incorrect projections and or scales/constants. All co-ordination errors are identified and corrected.
9.4Comment on Data Verification
The QP is of the opinion that the Tshepong drill hole and sample databases are reliable and adequate for the purposes Mineral Resource estimation.
Effective Date: 30 June 2023
37
Technical Report Summary for
Tshepong North, Free State Province, South Africa
10Mineral Processing and Metallurgical Testing
Section 229.601(b)(96) (10) (i-v)
The Harmony One plant and its processing facility have been in operation since 1986, as such the mineral processing method is well established for the style of mineralisation processed.
The most recent mineralogical test work done was in June 2020 (Mineralogical Report 19/699 and 19/648). The main objective of the investigation was to understand the mode of occurrence of the minerals present in samples that may influence lower recoveries of gold in the sample.
A six monthly representative sample of Tshepong’s material was submitted for test work (Metallurgical Report No 23/3001 dated 25 May 2023). The sample reported an average gold grade of 4.31 g/t. The results of this test work indicated that of the total contained gold, 95.8% was amenable to direct cyanidation after 28 hours of leach time. Under direct cyanidation, 2.7% of the gold was preg robbed by components occurring within the sample. 98.5% of the contained gold is expected to be recoverable via carbon-in-leach processing. Of the remaining gold, some 0.1% was found to be occluded in silica/gangue components. The Hydrochloric acid digestible mineral phase was associated with 1.3% of the gold. The Nitric acid digestion phase showed that 0.1% of the gold was associated with Nitric acid digestible minerals (e.g. Pyrite, Arsenopyrite). Mineral association have been inferred with no specific minerals being identified via the procedural diagnostic method.
10.1Extent of Processing, Testing and Analytical Procedures
The mineralogical investigation consisted of head chemical analysis, X-ray diffraction (“XRD”) analysis, scanning electron microscope (“QEMSCAN”) analysis and heavy liquid separation (“HLS”). Each HLS fraction underwent automated mineralogical analysis by QEMSCAN (concentrate/sinks). The mineralogical investigation involved determining the gold species and their occurrence in the samples, including gold grain size distribution, liberation and association.
From the two submitted samples, a representative aliquot of each sample was sub-sampled for chemical analysis, mineralogical analysis and HLS. The aliquots were pulverised and homogenised for XRD analysis and chemical analysis. The unpulverised portion was prepared into polished section for quantitative evaluation of minerals by QEMSCAN analysis and the other unpulverised 1kg of each sample was subjected to HLS.
10.2Test Results and Recovery Estimates
The chemical analysis of Beatrix Reef feed samples shows that they have a gold grade of 5.1g/t. The results also shows that in relation to major element concentrations, samples are dominated by quartz (SiO2 - c.87%) and aluminium oxide (Al2O3 - 4,2%) with minor to trace concentrations of potassium oxide (K2O), iron oxides (Fe2O3), magnesium oxide (MgO), loss on ignition (“LOI”) and calcium oxide (CaO) observed (<3%). These results suggest that the sample is composed of aluminium-silicate minerals (e.g., quartz, pyrophyllite, feldspar, chlorite and mica); limited to negligible concentrations of sulphides and carbonates and/or clays can be inferred from the relatively low LOI value of <2%.
Native gold is the only gold species detected in the two samples. From the bulk modal analysis, the presence of pyrite and carbonates were observed; these are known to be the reagent and oxygen consumers. Quartz was found to be the major mineral in the feed samples, with minor amounts of iron oxide minerals, mica, chlorite and pyrophyllite. However, most of the gangue minerals were upgraded to the floats fraction during HLS.
The trace mineral search (“TMS”) bulk mineral composition shows that the Basal Reef is 1.11% of the mass with pyrite as the main sulphide mineral at greater than 70% of the mass in all samples. The grains size distribution of the reefs from Tshepong North range IS <75μm. In general, the grain size distribution of gold grains is erratic. It is based on the premise that the phases of primary interest i.e., target phases, have a higher back-scattered electron brightness than the bulk of the gangue phases. This enables each block to be scanned for particles containing the target phase, and only those of interest are fully analyzed. As the entire block is scanned, this also produces the highest possible statistical population for the trace phase.
10.3Degree of Representation of Mineral Deposit
The two samples used were representative of the reef as the type of gold mineralization was similar. The recoveries were both in the order of 96%.
Effective Date: 30 June 2023
38
Technical Report Summary for
Tshepong North, Free State Province, South Africa
10.4Commentary of Mineral Processing and Metallurgical Testing
The metallurgical test work showed the potential to upgrade the ore through HLS. Notwithstanding there being insufficient material mass of Beatrix Reef to conduct gold fire assays, the QEMSCAN data showed that there was an upgrading of the gold grains. The QEMSCAN data further showed that most gold grains are associated with the sulphides.
It is a particularly useful analysis method for determining losses of sulphides and precious metal phases to silicate-rich tails. The process efficiency was determined to have total gold recovery typically ranging c.95% - 97% and gold not dissolved, typically c.4 %.
The test work was representative of the ore being treated at Tshepong North.
The reader is referred to the Modifying Factors Section 12.2.2, respectively, which contain the recoveries used for the LOM Plans for Tshepong North. A detailed description of the processing facilities is provided in Section 14.
Effective Date: 30 June 2023
39
Technical Report Summary for
Tshepong North, Free State Province, South Africa
11Mineral Resource Estimate
Section 229.601(b)(96) (11) (i-vii)
The current Mineral Resources for Tshepong North have been estimated using DatamineTM Studio 3 (“Datamine”) modelling software, which is linked to a customised scripting menu. This scripting menu allows for professional and easy managing of the data and building of geostatistical models.
The narrow-tabular nature of the reefs lends themselves to the estimation of grade and thickness in two-dimensional (“2D”) block models, without the requirements for geological wireframes. An independent process of building a set of three-dimensional (“3D”) wireframes of the structural interpretation to inform mine planning and the Mineral Reserve estimates is also undertaken.
The estimation method used for Measured Mineral Resource estimates at Tshepong North is ordinary kriging (“OK”), while simple macro kriging (“SMK”) is used for Indicated and Inferred Mineral Resource estimates.
11.1Geological Database
Tshepong North’s Mineral Resource estimate is based on the surface and underground exploration data obtained up to 30 December 2023. The database was exported from the electronic database to DatamineTM modelling software.
The Basal Reef validated database contains a total of 2,198 surface and underground drill holes and 517,796 underground channel (chip) samples. The B Reef validated database contains a total of 310 surface and underground drill holes, and 50,336 underground channel (chip) samples.
11.2Global Statistics
Histograms and statistics of the raw data are calculated for each geological domain for comparison purposes. The Coefficient of Variation ("COV"), calculated by dividing the standard deviation with the mean, gives a measure of the variability of the data. A high COV (>1) represents highly variable or highly skewed data, which may require some form of capping of extreme values to lower the COV to a more reasonable value (c.1).
The global statistics for the Basal and B reefs, reported according to geozones, are provided in Table 11-1.
Effective Date: 30 June 2023
40
Technical Report Summary for
Tshepong North, Free State Province, South Africa
Table 11-1: Global Statistics for Basal and B Reef
|
|
|
|
|
|
|
|
|
|
|
|
|
|
|
|
|
|
|
|
|
|
|
|
| Reef / Geozone |
No. Samples |
Minimum (cmg/t Au) |
Maximum (cmg/t Au) |
Mean (cmg/t Au) |
Variance |
SD (cmg/t Au) |
COV |
| Basal Reef |
| 1 |
3 167 |
0.700 |
1 748 |
606 |
211 055 |
459 |
0.758 |
| 2 |
59 693 |
1.000 |
4 023 |
946 |
733 146 |
856 |
0.905 |
| 3 |
126 164 |
0.140 |
6 188 |
1 542 |
1 709 257 |
1 307 |
0.848 |
| 4 |
13 850 |
1.000 |
1 807 |
644 |
213 929 |
463 |
0.719 |
| 5 |
121 150 |
0.430 |
4 454 |
1 198 |
903 156 |
950 |
0.793 |
| 6 |
44 884 |
0.280 |
3 274 |
830 |
460 670 |
679 |
0.817 |
| 7 |
29 |
18.000 |
1 528 |
270 |
71 167 |
267 |
0.990 |
| 8 |
34 757 |
1.000 |
5 073 |
1 939 |
2 393 680 |
1 547 |
0.798 |
| 9 |
19 642 |
1.000 |
3 408 |
878 |
592 857 |
770 |
0.877 |
| 10 |
40 969 |
1.000 |
7 762 |
2 291 |
3 569 370 |
1 889 |
0.825 |
| 11 |
3 862 |
1.000 |
7 336 |
2 512 |
3 737 492 |
1 933 |
0.770 |
| 12 |
46 555 |
4.000 |
3 363 |
1 278 |
738 533 |
859 |
0.672 |
| 13 |
4 |
525.000 |
1 218 |
967 |
70 255 |
265 |
0.274 |
| B Reef |
| 1 |
702 |
1.000 |
7 204 |
816 |
2 138 598 |
1 462 |
2.204 |
| 2 |
1 653 |
1.000 |
4 515 |
1 055 |
1 105 431 |
1 051 |
1.099 |
| 3 |
5 079 |
0.400 |
4 865 |
652 |
861 070 |
928 |
1.424 |
| 4 |
26 220 |
0.440 |
11 043 |
1 512 |
4 724 359 |
2 174 |
1.438 |
| 5 |
5 925 |
0.800 |
10 510 |
1 179 |
3 768 431 |
1 941 |
3.180 |
| 6 |
4 832 |
0.320 |
15 433 |
1 144 |
7 179 829 |
2 680 |
6.880 |
| 7 |
3 769 |
0.910 |
28 606 |
4 808 |
37 717 076 |
6 141 |
1.579 |
| Total |
562 906 |
|
|
|
|
|
|
11.3Geological Interpretation
The imported data is attributed to geological domains or geozones. Geozones are selected based upon continuity in facies type, as well as gold grade and channel width distribution. Geozones may be constrained by geological structures. Geozones are identified for both the Basal and B reefs.
The Basal Reef is continuous over both Tshepong North and Phakisa, and a single model is created across both mines. The area is divided into 13 geozones. The B Reef only occurs at Tshepong Mine and has been divided into a series of six geozones. The geozones for both reefs are presented in Figure 11-1.
Geozones are continuously updated based on geological information, new sampling and drilling results. Any proposed changes to the geozones are presented to the geostatistical team for approval and signed off.
11.4Structural Wireframe Model
The geological structure is interpreted by means of series of 1:1,000 structural plan overlays. These plans are vertical projections of the reef plane showing base-of-reef strike lines at 10m intervals based on elevations below datum. Interruptions in the continuity of the reef are marked by fault-reef cut-offs illustrating the loss or gain of ground and with displacement measured as vertical stratigraphic throws. Known or suspected lateral shifts are also illustrated.
A set of 3D structural wireframes is generated, representing the geological interpretation for each reef. This is informed by the geological drilling, chip sampling and underground geological mapping and is created in Datamine™ to allow subsequent mine design and planning to take cognisance of the latest geological information. These wireframes are not required for the Mineral Resource estimates.
11.5Compositing
The drill hole and chip samples are composited over the full length of the reef intersection.
Effective Date: 30 June 2023
41
Technical Report Summary for
Tshepong North, Free State Province, South Africa
11.6Capping
Outlying values (both for cmg/t and channel width) are calculated per domain at an optimal percentile using the “QUANTILE” process. The capping allows for meaningful Semi-Variogram modelling and avoids potential over-estimation due to extreme sample values. The capping values applied are shown in Table 11-2.
11.7Variography
The experimental semi-variogram is a descriptive statistical diagnostic tool for spatially characterizing regionalized variables. The semi-variogram is a mathematical function that describes how the spatial continuity of the sampled attribute changes as a function of distance and orientation.
Either an isotropic or an anisotropic model can be defined, comprising a nugget variance and up to nine individual structures, although it is rarely necessary to include more than three structures. Each structure may be either spherical, power, exponential, Gaussian or De Wijsian, although spherical models are deemed adequate for Tshepong North and Phakisa. Point-support semi-variograms were modelled for closely sampled areas eventually classified as Measured Mineral Resources; 60m x 60m declustered-support semi-variograms are modelled for the Indicated Mineral Resources and 120m x 120m declustered-support semi-variograms are modelled for the Inferred Mineral Resources.
Effective Date: 30 June 2023
42
Technical Report Summary for
Tshepong North, Free State Province, South Africa
|
|
|
Figure 11-1: Tshepong North Basal and B Reef Geozones |
Effective Date: 30 June 2023
43
Technical Report Summary for
Tshepong North, Free State Province, South Africa
Table 11-2: Capping Values by Reef and Geozone
|
|
|
|
|
|
|
|
|
|
|
|
|
|
|
|
|
|
|
|
|
| Geozone |
Gold Cut (cmg/t) (Max) |
CW Cut (cm) (Max) |
|
Geozone |
Gold Cut (cmg/t) (Max) |
CW Cut (cm) (Max) |
| Basal Reef |
|
B Reef |
| 1 |
1 748 |
20 |
|
1 |
7 204 |
170 |
| 2 |
4 023 |
123 |
|
2 |
4 515 |
215 |
| 3 |
6 154 |
137 |
|
3 |
4 907 |
232 |
| 4 |
1 807 |
20 |
|
4 |
9 923 |
219 |
| 5 |
4 474 |
28 |
|
5 |
10 510 |
199 |
| 6 |
3 226 |
28 |
|
6 |
15 433 |
172 |
| 7 |
1 528 |
32 |
|
7 |
28 606 |
216 |
| 8 |
5 073 |
77 |
|
|
|
|
| 9 |
3 408 |
100 |
|
|
|
|
| 10 |
5 266 |
74 |
|
|
|
|
| 11 |
7 336 |
27 |
|
|
|
|
| 12 |
3 363 |
58 |
|
|
|
|
| 13 |
1 218 |
45 |
|
|
|
|
11.8Mineral Resource Estimation Methods and Parameters
Grade and thickness estimates are undertaken within each geozone and informed by statistical and geostatistical analysis. Two variables are estimated namely; gold accumulation (cmg/t) (which factors in both the thickness of the reef thickness and grade) and channel width. No change of support corrections is considered necessary as it is assumed that the differing support sizes for chip samples and drill hole samples are negligible.
The orientations and ranges of each geozone’s semi-variogram are used to determine the optimised set of kriging estimation parameters. The search ellipse is aligned with respect to its range and direction, to the direction of the associated semi-variogram, as well as the range distances.
Measured Mineral Resource estimates are undertaken using OK. Estimates are generally kriged into 30m x 30m blocks for the Measured Mineral Resource from the point support data.
Indicated and Inferred Mineral Resource estimates are undertaken using SMK. The Indicated Mineral Resource is kriged into 60m x 60m block sizes. The Inferred Mineral Resource is estimated using the associated regularized variograms and kriging into 120m x 120m blocks. Any un-kriged areas in the Inferred Mineral Resource areas are then covered by global mean estimates.
The results of the Basal and B reef estimation are shown in Figure 11-2, for Tshepong North.
The current minimum and maximum sample points for the Basal Reef is:
•15 and 25 for the Basal Reef Measured Mineral Resource estimation;
•8 and 20 for Indicated Mineral Resource estimation; and
•3 and 10 for the Inferred Mineral Resource estimation.
The current minimum and maximum sample points for the B Reef is:
•12 and 30 for Measured Mineral Resource estimation;
•8 and 20 for Indicated Mineral Resource estimation; and
•3 and 15 for the Inferred Mineral Resource estimation.
Any un-kriged areas in the Inferred Mineral Resource category regions are then estimated using a global mean.
Effective Date: 30 June 2023
44
Technical Report Summary for
Tshepong North, Free State Province, South Africa
|
|
|
Figure 11-2: Tshepong North Basal Reef and B Reef Estimation Results |
Effective Date: 30 June 2023
45
Technical Report Summary for
Tshepong North, Free State Province, South Africa
The Measured Mineral Resource model is constrained using the Slope of Regression Estimation Confidence and merged with the Indicated Mineral Resource and Mineral Resource models to produce a combined kriged block model.
The channel width is estimated for all block sizes and ranges between 8cm and 34cm, averaging 18cm for Basal Reef. For B Reef, the channel width ranges between 52cm and 94cm and averages 79cm.
Effective Date: 30 June 2023
46
Technical Report Summary for
Tshepong North, Free State Province, South Africa
11.9Density Assignment
The relative density currently used for tonnage calculations at Tshepong North is 2.72t/m³. Reef volume is determined by block area multiplied by the thickness estimate. The tonnage of each reef horizon is determined by multiplying the volume by the relative density.
11.10Model Validation
The QP validated the Tshepong North Mineral Resource model using the following:
•visual comparisons with the raw drill hole data;
•comparisons of the raw drill hole data statistics with the model statistics;
•model volume; and
•visual assessment of the block model with drill hole intersections to ensure that the grades are locally honoured by the model.
The QP did not identify any critical errors in the block model.
11.11Mineral Resource Evaluation
The Mineral Resource estimate for Tshepong North done by the QP is considered to have reasonable prospects for economic extraction. This is demonstrated by the results of the cash flow for the mines. The cut-off value for the Mineral Resources is determined at 648cmg/t, Tshepong North and 780cmg/t, Phakisa for the gold based on the economic assumptions presented in Table 11-3 at the effective date 30 June 2023. This cut-off value represents typical costs for the mining method and preliminary mining and metallurgical recovery assumptions.
Table 11-3: Harmony Economic Assumptions (30 June 2023)
|
|
|
|
|
|
|
|
|
Tshepong North |
|
|
| Description |
Unit |
Value |
| Gold price |
USD/oz |
1 764 |
| FX rate |
ZAR:USD |
16.22 |
| Gold price |
ZAR/kg |
920 000 |
| Plant recovery factor |
% |
95.0 |
| Unit cost |
ZAR/t |
4 075 |
Notes: Unit cost includes cash operating cost, royalty and ongoing development capital
The gold price was derived by the Harmony Executive Committee at Head Office. Based on a market study findings the QP agrees on pricing and considers the price to be appropriate for Mineral Resource estimation and is slightly higher than that used for estimating Mineral Reserves (USD1,582/oz). The operating costs (both mining and processing) are based on historical performance and budget.
11.12Mineral Resource Classification and Uncertainties
The Tshepong North Mineral Resources have been classified into Measured, Indicated and Inferred categories, according to the S-K 1300 definitions. The classification is based on drill hole spacing, geological and geostatistical confidence.
For the geostatistical confidence, the Measured Mineral Resource model is constrained by the Slope of Regression Estimation Confidence, and the Indicated and Inferred Mineral Resource models are constrained by their kriging estimation parameters.
The QP then considers if the geostatistical confidence boundaries require modification based on the geological confidence in an area. The geological confidence could include confidence in the sedimentary facies and mineralisation model, or confidence in the structural model.
Effective Date: 30 June 2023
47
Technical Report Summary for
Tshepong North, Free State Province, South Africa
The application of the classification criteria results in the following set of approximate sample spacings for each Mineral Resource category:
•5m x 5m for Measured Mineral Resources (underground channel sampling);
•100m x 100m for Indicated Mineral Resources; and
•1,000m x 1,000m for Inferred Mineral Resources.
Mineral Resources are discounted by a geological loss to account for unknown but anticipated fault loss. The discounts used for the Basal Reef are between:
•1% and 3% for Measured Mineral Resources;
•3% and 11% for Indicated Mineral Resources; and
•7% and 60% for Inferred Mineral Resources.
Similar information applies to the for B Reef.
Factors that may affect the Mineral Resource estimates include the following:
•gold price assumptions;
•exchange rate assumptions;
•operating and capital cost assumptions;
•gold recovery assumptions;
•geology-related risks; and
•operational risks.
11.13Mineral Resource Estimate
The Mineral Resources for Tshepong North were originally prepared, classified and reported according to SAMREC, 2016. For the purposes of this TRS, the Mineral Resources have been classified in accordance with § 229.1302(d)(1)(iii)(A) (Item 1302(d)(1)(iii)(A) of Regulation S-K).
The location of the Basal Reef Mineral Resources across Tshepong North are presented in Figure 11-3. The location of the B Reef Mineral Resources is shown in Figure 11-3.
The QP compiling the Mineral Resource estimate for Tshepong North is Mr A Louw, Ore Reserve Manager at Tshepong North and employee of Harmony. The Mineral Resource estimate for Tshepong North, as at 30 June 2023, exclusive of Mineral Reserves, is summarised in Table 11-5.
Effective Date: 30 June 2023
48
Technical Report Summary for
Tshepong North, Free State Province, South Africa
|
|
|
Figure 11-3: Location and Classification of Tshepong North Mineral Resources and Mineral Reserves for the Basal Reef |
Effective Date: 30 June 2023
49
Technical Report Summary for
Tshepong North, Free State Province, South Africa
|
|
|
Figure 11-4: Location and Classification of Tshepong North Mineral Resources and Mineral Reserves for the B Reef |
Effective Date: 30 June 2023
50
Technical Report Summary for
Tshepong North, Free State Province, South Africa
Table 11-5: Summary of Tshepong North Mineral Resources as at 30 June 2023 (Exclusive of Mineral Reserves) 1-8
|
|
|
|
|
|
|
|
|
|
|
|
| METRIC |
| Mineral Resource Category |
Tonnes (Mt) |
Gold Grade (g/t) |
Gold Content (kg) |
| Measured |
11.920 |
12.42 |
147 989 |
| Indicated |
3.162 |
10.28 |
32 493 |
| Total / Ave. Measured + Indicated |
15.082 |
11.97 |
180 481 |
| Inferred |
9.744 |
10.20 |
99 356 |
| IMPERIAL |
| Mineral Resource Category |
Tons (Mt) |
Gold Grade (oz/t) |
Gold Content (Moz) |
| Measured |
13.139 |
0.362 |
4.758 |
| Indicated |
3.485 |
0.300 |
1.045 |
| Total / Ave. Measured + Indicated |
16.625 |
0.349 |
5.803 |
| Inferred |
10.741 |
0.297 |
3.194 |
Notes:
1. Mineral Resources are reported with an effective date of 30 June 2023 were originally prepared, classified and reported according to SAMREC, 2016. For the purposes of this TRS, the Mineral Resources have been classified in accordance with § 229.1302(d)(1)(iii)(A) (Item 1302(d)(1)(iii)(A) of Regulation S-K). The Qualified Person responsible for the estimate is Mr A Louw, who is Ore Reserve Manager at Tshepong North, and a Harmony employee.
2. The Mineral Resource tonnes are reported as in-situ with reasonable prospects for economic extraction.
3. No modifying factors or dilution sources have been included to in-situ Reserve which was subtracted from the SAMREC Resource in order to obtain the S-K 1300 Resource.
4. The Mineral Resources are reported using a cut-off value of 700cmg/t determined at a 90% profit guidance, and a gold price of USD1,764/oz.
5. Tonnes are reported as rounded to three decimal places. Gold values are rounded to zero decimal places.
6. Mineral Resources are exclusive of Mineral Reserves. Mineral Resources are not Mineral Reserves and do not necessarily demonstrate economic viability.
7. Rounding as required by reporting guidelines may result in apparent summation differences.
8. The Mineral Resource estimate is for Harmony’s 100% interest.
11.14Tshepong North Measured and Indicated Mineral Resource gold content estimate, exclusive of Mineral Reserves, decreased by 0.371Moz from 6.173Moz gold as at June 2022 to 5.803Moz gold as at June 2023. The decrease is mainly a result of the increase in the cut off grade from 648cmgt to 700cmgt.
11.15Comment on Mineral Resource Estimates
The QP is of the opinion that Mineral Resources were estimated using industry accepted practices and conform to SAMREC, 2016. The Mineral Resources have also been reported in accordance with the S-K 1300 guidelines.
There are no other environmental, legal, title, taxation, socioeconomic, marketing, political or other relevant factors known to the QP that would materially affect the estimation of Mineral Resources that are not discussed in this TRS.
Effective Date: 30 June 2023
51
Technical Report Summary for
Tshepong North, Free State Province, South Africa
12Mineral Reserve Estimate
Section 229.601(b)(96) (12) (i-iv)
The reported Mineral Reserves are derived through a business planning process and consideration by the Chief Operating Decision-Maker (“CODM”) and the QP. The business planning process comprises multi-functional reviews inclusive of all mining, support and service departments that are involved in the verification of the inputs and the Modifying Factors. The CODM consists of various executive roles and responsibilities. These executives assess the profitability, the revenue and production costs. The CODM also considers capital expenditure, gold production and tonnes milled when assessing the overall economic sustainability.
12.1Tshepong North
12.2.1Key Assumptions, Parameters, and Methods Used to Estimate the Mineral Reserve
The results and assumptions derived from the business planning process extends over an 18-month period. The planning process carefully considers strategic plan directives; analysis of historical performance; realistic productivity, and cost parameters; Modifying Factors; and technical and economic studies that have demonstrated justified extraction, as applicable to specific portions of the Mineral Reserves.
All reported Mineral Reserves originate from the Basal Reef, and to a lesser extent, the B Reef. The Mineral Reserves are considered based on several factors, including:
•the latest geological structure and associated Mineral Resource estimation models that constrain the layout for the mine design and LOM planning;
•the need for regional rock engineering stability pillars;
•the extent of pillar mining, mining of remnant areas, reclamation of broken ore out of old areas, tailings, or any other source;
•the SGM method in use,
•the sources of dilution and other dilution and other Modifying Factors; and
•only Measured and Indicated Mineral Resources are used to derive Mineral Reserves.
A combination of modelling exercises forms an integrated model informing the LOM plan and the Phakisa Mine Mineral Reserves estimates, and includes the:
•geological block model;
•structural model depicting prominent geological features;
•isopach model highlighting the mine’s sedimentology and shale formations; and
•geotechnical model including interpreted data, modelled in the form of support pillars.
12.2.2Modifying Factors
The Modifying Factors used to convert the Mineral Resource to a Mineral Reserve for Phakisa are presented in Table 12-3. The Modifying Factors are consistent with the modelling, planning and computing estimates used in determining the Mineral Reserves, which are also consistent with historical performance. The plant recovery as shown in Table 12-3, is also consistent with the processing and recovery methods.
Effective Date: 30 June 2023
52
Technical Report Summary for
Tshepong North, Free State Province, South Africa
Table 12-3: Tshepong North Modifying Factors Used for Mineral Reserve Determination
|
|
|
|
|
|
|
|
|
| Modifying Factor |
Unit |
Value |
| Relative Density |
t/m3 |
2.72 |
| Stoping Width |
cm |
118 |
| Gully |
% |
8.90 |
| Off Reef |
% |
4.81 |
| Waste to Reef |
% |
0.80 |
| Flushing tons |
% |
2.28 |
| Discrepancy |
% |
5.06 |
| Mine Call Factor |
% |
72.00 |
| Plant Recover Factor |
% |
94.96 |
| Mine Recover Factor |
% |
68.37 |
| Plant Call Factor |
% |
100 |
| Mineral Reserve cut-off |
cmg/t |
800 |
Notes: Development waste to reef, including the decline development.
12.2.3Mineral Reserve Estimate
The Mineral Reserves for Tshepong were originally prepared, classified and reported according to SAMREC, 2016. For the purposes of this TRS, the Mineral Reserves have been classified in accordance with § 229.1302(d)(1)(iii)(A) (Item 1302(d)(1)(iii)(A) of Regulation S-K) and is in alignment with previously reporting regulations of SAMREC code 2016
The location of the Basal and B Reef Mineral Reserves are presented in Figure 11-3 and Figure 11-4.
The QP compiling the Mineral Resource estimate for Tshepong North is Mr A Louw, Ore Reserve Manager at Tshepong North and employee of Harmony.The Mineral Reserve estimate for Tshepong, as at 30 June 2023 is summarised in Table 12-4.
Table 12-4: Summary of Tshepong Mineral Reserves as at 30 June 2023 1-5
|
|
|
|
|
|
|
|
|
|
|
|
| METRIC |
| Mineral Reserve Category |
Tonnes (Mt) |
Gold Grade (g/t) |
Gold Content (kg) |
| Proved |
2.997 |
4.79 |
14 341 |
| Probable |
0.766 |
5.73 |
4 390 |
| Total (Proved + Probable) |
3.763 |
4.98 |
18 731 |
| IMPERIAL |
| Mineral Reserve Category |
Tons (Mt) |
Gold Grade (oz/t) |
Gold Content (Moz) |
| Proved |
3.303 |
0.140 |
0.461 |
| Probable |
0.845 |
0.167 |
0.141 |
| Total (Proved + Probable) |
4.148 |
0.145 |
0.602 |
Notes:
1. The Mineral Reserves were originally prepared, classified and reported according to SAMREC, 2016. For the purposes of this TRS, the Mineral Reserves have been classified in accordance with § 229.1302(d)(1)(iii)(A) (Item 1302(d)(1)(iii)(A) of Regulation S-K). The Qualified Person responsible for the estimate is Mr A Louw, who is Ore Reserve Manager at Tshepong North, and a Harmony employee.
2. Tonnes, grade, and gold content are declared as net delivered to the mills.
3. Figures are fully inclusive of all mining dilutions, gold losses and are reported as mill delivered tonnes and head grades. Metallurgical recovery factors have not been applied to the reserve figures.
4. Gold content has not taken metallurgical recovery factors into account.
5. Mineral Reserves are reported using a cut-off grade of 800cmg/t determined using a gold price of USD1,582/oz gold.
12.2.4Mineral Reserve Reconciliation
The declared Mineral Reserve decreased from 0.771Moz as at 30 June 2022 to 0.602Moz as at 30 June 2023. Decrease mainly as a result in the increase in the cut off grade from 650cmgt to 800cmgt.
12.2Commentary on Mineral Reserve Estimate
The declared Mineral Reserves takes into consideration all Modifying Factors, respective to the mining area. The declared Mineral Reserves are depleted to generate Tshepong North cash flows.
Effective Date: 30 June 2023
53
Technical Report Summary for
Tshepong North, Free State Province, South Africa
Any by-products that are recovered as part of the refining process, make up an immaterial component of the total metal inventory, and is thus not reported as part of the Mineral Reserve estimate.
There are no obvious material risks that could have significant effect on the Mineral Reserves.
In the opinion of the QP, given that Tshepong mine is an established operation, the modifying factors informing the Mineral Reserve estimates would at a minimum, satisfy the confidence levels of a Feasibility Study.
Effective Date: 30 June 2023
54
Technical Report Summary for
Tshepong North, Free State Province, South Africa
13Mining Methods
Section 229.601(b)(96) (13) (i-v)
Tshepong North may be classified as moderate to deep level underground gold mines currently operating at depths of up to 2,427m below surface (Phakisa) and 2,161m below surface (Tshepong North).
13.1Mining Operations
Tshepong North utilise three main shafts (Figure 3-2). Tshepong and Phakisa shafts operate semi-independently with respect to ventilation requirements, ore and waste hoisting and men and material movement.More information on the details of the shaft operations, any interdependencies and the railway systems are described in Section 15.
13.1.1Tshepong
The Tshepong Mine is a mature underground section and is made up of two mineable reefs namely the Basal Reef and B Reef. The reefs at Tshepong are accessed via a single underground vertical shaft and a twin decline system.
Currently five working levels are being mined from the Tshepong Shaft and four working levels are being mined in the decline. The decline system was constructed as a 1,700m extension to access the Basal Reef.
The characteristics of the Basal Reef at the Tshepong Mine are synonymous to the characteristics of the reef at the Phakisa Mine. Tshepong Mine extracts the Basal Reef via undercut mining methods, leaving a quartzite beam in the hanging wall to ensure the stability of the overlaying shale.
The B Reef is stratigraphically located two production working levels above the Basal Reef. The B Reef occurs in three facies, with varying widths of 30cm - 170cm and displays erratic high-grade distributions. B Reef are extracted per annum which typically does not exceed 32% of the total production volume. The reef is extracted via open stoping mining operations. It is also supported by a separate development of footwall infrastructure based on its stratigraphic location.
Structurally, the Dagbreek Fault is the most prominent feature at the Tshepong Mine, and largely hosts the shaft infrastructure. Since the Tshepong Shaft is in a fault loss zone, there is no associated shaft pillar.
13.1.2Sequential Grid Mining (“SGM”)
SGM is the preferred mining method used at Tshepong North. This method makes use of dip pillars and reduced mining spans with pre-developed tunnels, aimed at further control of stresses experienced in rock movement.
The SGM sequence is a V-shaped configuration, colloquially referred to as the “inverted Christmas tree”. A schematic representation of the SGM sequence used at Tshepong North is shown in Figure 13-1.
The SGM mining methods are suitable for underground, narrow reef mining. A common feature of the SGM method is the layout of the primary and secondary development. Primary development is done off-reef (in waste rock), while secondary development is done on-reef (in the mineralised zone). In primary development, horizontal haulages are developed from the vertical shaft, extending to the extremities of the mining level. Inter-level spacing is the perpendicular distance between two consecutive level stations underground. Further development is done at set intervals along the haulages towards the mineralised zones in the form of crosscuts. For secondary development, an inclined excavation that connects two levels is established, referred to a raise or winze, depending on the upwards or downwards direction of the development.
The SGM is employed for a deeper mining approach and offers various advantages, the critical one being increased safety. A noticeable characteristic of the SGM method is that mining from the raises is advanced in only one direction at a time, which is directed towards the stabilizing or regional pillars. This SGM mining sequence eliminates the creation of remnant pillars reducing the risk of seismicity.
Effective Date: 30 June 2023
55
Technical Report Summary for
Tshepong North, Free State Province, South Africa
13.1.3Open Stoping
While Tshepong North business plan is based primarily on the SGM methodology and sequencing, there are sections of the mine that are operating using the breast, undercut and open stoping mining methods.
Minor amounts of the B Reef that do not exceed 32% of the on-reef mined per annum, are extracted as an open stoping mining operation. Reason for mining at open stoping is as a result of the erratic nature of the channel width and the support design specific to B reef mining. This mining method is practised, without much reliance on the other operating mining sections, and based on its location, poses a low risk to geotechnical considerations.
13.1.4Breast Mining
A key feature of breast mining is that the mine design includes pillars in the stoping areas that are designed to cave in a planned and controlled manner. These pillars are referred to as crush pillars and the dimensions of the pillars are determined by the geotechnical properties of the host rock. The use of crush pillars minimises the risk of unpredicted collapse of stoping areas. These collapses can compromise the safety of mining operations and may lead to permanent closure of stoping panels or sterilisation of ore.
The breast mining method has consequently evolved into the SGM.
13.1.5Integrated Approach
The differences of the reef formations and mining conditions at the respective shafts have led to the application of an integrated mining method approach. The objective of the adopted mining methods is aimed at the safe and profitable extraction of the Mineral Reserves, while reducing the occurrence of large seismic events.
13.2Mine Design
The mine design strategy aims at maximising the safe extraction of ore, while minimising the risk of geotechnical failures, which can result in operational disruptions and dangerous working conditions. The Basal Reef is modelled and designed across Tshepong North. In addition, Tshepong Mine considers the B Reef for design and planning.
Both, the Basal and B Reef horizons have been subject to faulting and intrusions by igneous dykes and sills that cut across the reefs. The most significant form of control at Tshepong North for rockfalls and rockbursts is the systematic modelling and design processes. Dip stabilising, bracket and strike pillars are considered for an integrated support system. The central raise line maintains stability, during stoping operations, using support packs. Additional in stope net support is also done on both Basal Reef and B reef which consist of a steel net installed on the stope face as well as the advance strike gullies All footwall development is is also supported on the face and side walls to prevent falls of ground.
Effective Date: 30 June 2023
56
Technical Report Summary for
Tshepong North, Free State Province, South Africa
|
|
|
Figure 13-1: Schematic Representation of the SGM Sequence |
Effective Date: 30 June 2023
57
Technical Report Summary for
Tshepong North, Free State Province, South Africa
The occurrence of geological faults is also a source of groundwater intersections during mining operations which may lead to production delays, geotechnical risks, and the potential of flooding. Depending on the geology of the dyke or sill, a change in the mining direction may be required, or as in the case of low-risk scenarios the Rock Engineering department may suggest a safety and support strategy to mitigate the associated geotechnical risk. A change in mining direction may result in Mineral Resource losses, or an increase in dilution.
Based on the latest geological structure model and the SGM method the geotechnical team design a suitable pillar layout based on modelling results. A detailed mine design and schedule is done based on the pillar design taking cognisance of uneconomical areas which are excluded on macro scale. This design and schedule are the basis of the mine plan and the declared Mineral Reserves.
A mine design that is sufficiently informed, with geological data, is progressed to the mine planning phase. Mine planning is done on a macro scale as well as on a micro scale. On a macro scale, the material below cut-off is excluded from the mining model. On a micro scale, the mining model is then subject to constraints that are applied because of the geotechnical design and other limitations.
The geotechnical modelling is driven by the most recent information from mining operations, which ensures that the model is an accurate representation of the current operational conditions.
Development is done by either mechanised, mechanical or conventional method depending on the most suitable method for the specific requirements. The Tshepong Mine is essentially a conventional mine design with trackless mining in the twin decline.
Mining production is accessed through underground excavations, developed as haulages and cross cuts. Crosscuts are primary development, in the direction of the mine workings. Inclined secondary development is used to access the reef contact, and advanced from the position of respective crosscuts. Ore is extracted from stoping panels established from the inclined development.
13.2.1Mine Design Parameters
Mine design is done internally, with the mine designs for the Basal Reef and B Reef horizons done separately, using the DatamineTM software. The geological models, and the geotechnical parameters formulated by the Rock Engineers, are used as a basis of the mine planning process. The mine design parameters used for Tshepong Mine, are shown in Table 13-1 and Table 13-2, respectively.
Table 13-2: Tshepong Mine Design Parameters
|
|
|
|
|
|
|
|
|
| Parameter |
Unit |
Value |
| Regional Stability |
| Dip stabilizing pillar dimensions |
Strike span |
m |
v |
Dip span |
m |
180 |
Strike stability pillar spacing¹ |
m |
N/A |
Access haulages middling to reef |
m |
90 |
| Primary Development |
| Advance |
m/month |
28 |
| Crosscut spacing |
m |
200 |
| Secondary Development |
| Advance |
m/month |
N/A |
| Stoping Parameters |
| CW < 80cm |
m |
105 |
| CW > 80cm |
m |
120 |
| Economic Parameters |
| Cut-off grade (planning) |
cmg/t |
800 |
| RD |
|
2.72 |
Notes: 1. Pillar spacing is measured skin to skin.
Effective Date: 30 June 2023
58
Technical Report Summary for
Tshepong North, Free State Province, South Africa
13.3Geotechnical Considerations and Seismic Monitoring
Tshepong North maintains working geotechnical and Isopach models, to manage and control seismicity risk. The geotechnical and Isopach models for Tshepong North take the latest geological structural model and the SGM method into account to design a suitable pillar layout.
The purpose of the pillar designs, regardless of the pillar type, is to customize them to the prevailing mining conditions, with the objective of making the mine design safe, practical, easy to implement, and profitable. These pillars include dip stabilizing, bracket and strike pillars. The details of the pillar design can be found in Table 13-1 Tshepong Mine. The dimensions depicted for the pillars are standard and are adjusted depending on planned bracketing of geological structures or if patches of low value reef are encountered.
The Rock Engineers follow the following geotechnical modelling and approach:
•evaluate the principal stress directions using seismic source mechanisms and update the input parameters for numerical modelling;
•using seismic source mechanisms, delineate planar features to confirm and/or detect the position and orientation of geological structures;
•confirm the expected ground motion produced by large, potentially damaging seismic events, and calibrate the Ground Motion Prediction Equation; and
•monitor mine-wide seismic activity and test each geotechnical region for deviation from the expected co-seismic rockmass response, which tests the release of seismic energy.
The geotechnical stress model is also used to manage and monitor the occurrence of seismic hazards. Seismic hazards are categorically measured as per mine planning cycles of short, medium and long term. Events for the last 100 - 200 days definitively estimated, to accurately determine the intermediate probabilities of occurrence. The behaviour of identified medium term events are then monitored daily. Alarms are raised, and people are evacuated in the event of a predicted or anomalous seismic pattern is identified and people are removed from the specific danger areas.
Tshepong Mine uses an Integrated Seismic System supplied by Institute of Mine Seismology to record seismic events on the property.
The seismic systems consist of 17 three-component geophones. The digital seismic data is transmitted from the underground seismic stations through to the surface monitoring stations via manual and automated recording systems, based on available infrastructure at the mine. The data is recorded continuously and reported on an annual basis.
13.4Geohydrological Considerations
Apart from the geotechnical risks that can be caused by the existence of geological structures, the presence of water and gas also pose risks to Tshepong North. The geotechnical models are used as a basis to manage and monitor the occurrence of ground water and gas intersections. Cover holes are drilled in all flat development ends to identify water or gas. Water or gas intersections are plotted in a 1:200 survey sheet plan and section view, with a detailed 1:100 profile description. These intersections are plotted against a stope plan indicating the geology, structural features, reef contours, pillar layout, faults with associated losses or gains, reef elevation, grade and channel width. These geospatially refenced plots articulacy help the mining team execute the mine plan, in relation to the operation’s geotechnical requirements and assist in the early detection of the presence of water or gas.
Daily management of influx water is handled through a series of diversion strategies aimed at re-directing and controlling the flow, temperature regulation, and re-circulation of water. The water strategies at Tshepong North are supported by the Integrated Waste and Water Management Plan (“IWWMP”). Both Tshepong North and Phakisa maintain graphical and numerical databases of the operations geohydrological conditions.
Water reticulation around the mine has been designed to maximise water re-use minimise the amount of water pumped to surface. The 76-level pump station is used to transfer water from various levels into small inter-level dams and eventually into the mine’s respective main settling dams.
Effective Date: 30 June 2023
59
Technical Report Summary for
Tshepong North, Free State Province, South Africa
13.5Mine Plan Development and Life of Mine (“LOM”) Schedule
Tshepong Mine has significant Mineral Reserves to maintain a long-term mine life, however, extraction of ore from isolated blocks of ground will become more important as the life of mine progresses, but volumetrically these Mineral Reserves are not significant.
The preferred SGM mining method is dependent on development staying ahead of the mining front, so that accurate geological information is gathered and included in final designs before mining commences. This also enables, planning and scheduling activities to be accurately sequenced, which leads to better planning, safer working conditions, and improved profitability.
At Tshepong Mine, the LOM plan and scheduling originates with the use of the Mineral Reserves model, which is modelled at a 800cmg/t cut-off grade. The 3.303Mt of Mineral Reserves are included in the LOM plan and are fully accessible through the existing infrastructure at the Tshepong Mine. The mining rates used in determining the LOM plan are based on the current and expected operational performance, notwithstanding any unforeseen underground mining constraints. The remaining LOM for the operations is planned for seven years, with a planned mining rate averaging at approximately 0.696ktpa (milled tons) over the LOM period. The extent of the Tshepong Mine LOM plan is shown in Figure 13-2. The milled ore and gold recovered for Tshepong Mine are presented in Figure 13-5 and Figure 13-6, respectively.
Effective Date: 30 June 2023
60
Technical Report Summary for
Tshepong North, Free State Province, South Africa
|
|
|
Figure 13-2: Tshepong North LOM Plan |
Effective Date: 30 June 2023
61
Technical Report Summary for
Tshepong North, Free State Province, South Africa
|
|
|
Figure 13-5: Graph of Tshepong Mine LOM Plan – Tonnes and Grade |
|
|
|
Figure 13-6: Graph of Tshepong Mine LOM Plan – Gold Produced (oz) |
Effective Date: 30 June 2023
62
Technical Report Summary for
Tshepong North, Free State Province, South Africa
13.6Mining Rates
Mining rates are based on current and expected performance depending on underground conditions and constraints. Dilution is included in the production plan mainly from external waste sources from the stoping operations, but allowances are also made for dilution occurred in the ore flow process. The LOM plan considers the planned and available working areas, inclusive of the mine’s current infrastructure capacity.
13.7Grade and Dilution Control
The selected SGM mining method is planned and designed to better support recovered grade because of the improved selectivity, flexibility, and reduced off-reef mining. Mine grades are currently decreasing as mining moves away from the central pay-shoot and the planned Sub 75 Capital Project is aimed at alleviating this risk.
Ore grade and dilution control is done using a Quality Index monitoring tool. This Quality Index considers key parameters including Mine Call Factor, stoping width, proportion of ore lock-up, and an on-reef index (percentage of On-Reef vs Off-Reef mining due to geological features such as faults and dykes, etc.). During the mine design and planning process, external dilution control is implemented by applying an adapted mine recovery factor.
Operationally, grade and dilution control are mostly achieved through improved drilling (marking sticks used on undercut mining) and blasting practices and compliance to blasting barricades on stopes >350. Drilling accuracy is achieved by holes that are drilled parallel, aimed at being correctly burdened and that are within the stoping limits. This ensures consistent and economic rock breaking, without dilution.
Tshepong Mine also adopts electronic blasting technology consisting of an integrated electronic system, which allows for precision timing and improved control of rock breaking. This technique controls stoping width and protects the integrity of the footwall and hanging wall, aimed at minimising dilution.
13.8Mining Equipment and Machinery
There are various machinery and equipment used at Tshepong North, depending on the type of mining or development activity. The following equipment can be found at the frontline of mining production:
•haulages and associated development: Hydro-powered (“HPE”) drill rigs are used for underground excavations and tunnelling. These rigs are preferred as they are versatile and capable of angular, horizontal, and vertical drilling;
•production drilling in stopes: Two types of drilled holes are used in a stoping panel, namely production drilling and pre-conditioned drilling. Pre-conditioning is a methodology aimed at transferring the stresses away from the stope face, therefore reducing the potential for face burst damage. Pre-conditioned holes are drilled longer than production holes and are blasted with the production round. Equipment used for this type of drilling is compressed air hand-held drills;
•raise boring: Is a drilling technique used for ventilation development purposes and ore passes. Raise boring and control mechanisms are currently operated via control modules connected through the mine’s underground and shaft communication networks, conducted on surface by a contractor. The benefits of this allow personnel to be removed from dangerous underground workings and have the upside of productivity achieved through automation;
•rock movement: Ore from the stoping ore passes is loaded directly into hoppers from the box-front chutes and then trammed to the shaft to the inter-level tips, then transferred to the main loading bins for hoisting to the surface. Waste rock from development operations is loaded into similar hoppers and trammed and hoisted in the same manner as the ore movement but is done using in a dedicated waste system to prevent diluting the ore grade;
•material movement: Tshepong North uses the Battery charged monotrains and to a lesser extent diesel monotrains. The monotrain was partially adopted at Tshepong North, decline operations due to their consistent maintenance of speed in steep and changing gradients, while allowing for varying weight bearing capacities, works as efficiently in undulating floor conditions, and is almost impossible to de-rail due to the L-shaped sliding beam design.
•Small articulated dump trucks, graders, and crawler mounted bulldozers for dump, waste and marginal ore movement also support the Tshepong North Mine operations.
Effective Date: 30 June 2023
63
Technical Report Summary for
Tshepong North, Free State Province, South Africa
13.9Ore transport
The blasted ore from the stoping panels is moved with winch-operated scrapers along gullies to ore passes where it gravitates down to the loading boxes in the footwall crosscuts below the stopes. The ore is discharged into rail hoppers and transported, via front-driven locomotives, to dedicated inter-level transfer systems that gravity feed to the main silos. Once hoisted up the main vertical shaft to surface, the ore is transported to the Harmony One Plant via conveyor belt.
13.10Mining Personnel
Tshepong North is labour intensive, with the mines being supported by over 3,737 employees, with 91% being permanent staff and the remainder contractors.
The underground mining operations uses an 11 day fortnight shift system, operating a 3-shift cycle per day. The underground work force is essentially split into two categories that are either involved in production activities or they provide supporting services required underground. Production activities are directly related to the mining of ore and non-production personnel provide supporting services such as safety, engineering functions, maintenance, decline conveyor management and underground store controls. The mining personnel for the respective mines is presented in Table 13-3 and Table 13-4.
Table 13-4: Tshepong North Mine Mining Personnel
|
|
|
|
|
|
| Labour Requirement |
No. of Employees |
| Services |
378 |
| Engineering |
810 |
| Mining |
2 138 |
| Contractors |
411 |
| Total Employees |
3 737 |
Effective Date: 30 June 2023
64
Technical Report Summary for
Tshepong North, Free State Province, South Africa
|
|
|
Figure 13-7: Tshepong North Shaft and Underground Infrastructure |
Effective Date: 30 June 2023
65
Technical Report Summary for
Tshepong North, Free State Province, South Africa
13.11Commentary on Mining Methods
The SGM mining method is the main mining method utilized at Tshepong North and is appropriate for the reef characteristics and the mine depth. The mine design, planning and scheduling for the mine is developed using the DatamineTM and DeswikTM geological software, respectively, considering the geotechnical model and related parameters.
The main geotechnical and geohydrological risks at Tshepong North include the presence of gas, ground water and seismicity, which are managed through the integrated monitoring systems, and incorporated into working mining models that inform daily mine planning decision-making.
The mining rates, machinery and equipment, ore transport, grade and dilution control, and labor resourcing and optimization are driven by the mine schedule and improvement initiatives.
Effective Date: 30 June 2023
66
Technical Report Summary for
Tshepong North, Free State Province, South Africa
14Processing and Recovery Methods
Section 229.601(b)(96) (14) (i-iv)
All ore mined at Tshepong North is processed at Harmony One Plant located west of Welkom (Figure 3-1). Harmony One Plant is Harmony’s largest gold processing plant and processes underground ore from multiple shafts, as well as surface ore from nearby mine waste facilities. The plant was commissioned in 1986 and comprises three independent modules, each consisting of four feed silos, two ROM mills, two conventional thickeners, cyanide leach, carbon in pulp (“CIP”) adsorption, elution, zinc precipitation and smelting. The plant CIP process reflects the technology which was current at the time of construction and has been operating with no significant challenges and target metallurgical recoveries have been achieved.
14.1Mineral Processing Description
The processing flow sheet is presented in Figure 14-1.
Ore delivered to the plant is fed from the concrete silos via two mill feed conveyors through vibrating feeders directly into the ROM mills. Fully autogenous (“FAG”) milling is a milling process in which the entire ROM ore stream is fed directly into the mills and where the grinding media is generated within the mill from suitably sized pieces of ROM ore itself. The average feed rate to the mills is 65tph. The milling circuit consists of two single stage ROM mills that are controlled on maximum power for optimum milling. Each ROM mill is 4.27m in diameter and 10m in length and grinds the ore to 75% - 90% passing minus 75 microns.
Milling is followed by a conventional gold leach process (cyanidation).The cyanidation process is one of the most utilized methods for the recovery of gold from auriferous ores. The use of cyanide leaching for gold recovery is based on gold’s properties, mainly its solubility (ability to dissolve) in cyanide solutions. Once the gold is dissolved into the cyanide solution it has a higher ability to adsorb (attach) onto activated carbon through the application of carbon in pulp (“CIP”) technology.
The loaded carbon then enters the elution columns, which are high pressure vessels that circulate the loaded carbon extracting the gold. The gold will “de-absorb” from the activated carbon and attach onto stainless-steel wool by means of electrowinning. The CIP circuit makes use of gravity flow of slime between the consecutive counter-flow stages to recover recirculate the activated carbon back into the system.
Following this process, the cathode steel wool is smelted (induction furnaces) after drying in the calcining ovens. The doré bars are then dispatched to Rand Refinery Limited, located near Johannesburg in Gauteng Province.
The tailings residue is pumped from the plant to one of two TSFs, the FSS8 West/East complex, which is the biggest facility with a total deposition capacity of 320,000tpm. The second TSF is the FSS2 facility with a capacity of 160,000tpm. The combined capacity of the two TSFs are 480,000tpm which is well above the plants designed capacity thus, creating some flexibility in the deposition strategy.
Both TSFs are conventional day wall paddock facilities with a fixed penstock tower arrangement that would be the primary means of draining excess water from the facility which is pumped back to the plant to be used in the process again.
Effective Date: 30 June 2023
67
Technical Report Summary for
Tshepong North, Free State Province, South Africa
|
|
|
Figure 14-1: Schematic Flow Diagram of the Metallurgical Process |
Effective Date: 30 June 2023
68
Technical Report Summary for
Tshepong North, Free State Province, South Africa
14.2Plant Throughput, Design, Equipment Characteristics and Specifications
The Harmony One Plant has a steady state design capacity of 390ktpm with its conventional CIP flowsheet. The design parameters and equipment specifications are presented in Table 14 1. The Harmony One plant is in good working condition and the equipment is also in good order with audits done on regular bases to check the operating performance of the plant.
Table 14-1: Key Design Parameters and Equipment Specifications
|
|
|
|
|
|
|
|
|
|
|
|
| Process |
Parameter |
Unit |
Value |
| Overall Plant |
Recovery |
% |
95 |
| Availability |
% |
100 |
| Milling |
Throughput ROM |
t/hr |
90 -100 |
| Densification |
Desired pH |
pH |
>10.5 |
| Desired Density |
g/cm3 |
1.50 - 1.55 |
| Leaching |
Residence Time |
hr |
27 |
| Acid wash and elution |
Elution Temperature |
°C |
130 (Ambient) |
14.3Energy, Water, Process Material and Personnel Requirements
14.3.1Energy
The average monthly power consumption is 12,064,464KWh. (Available all the time although load curtailment)
14.3.2Water
The average monthly water consumption is 20,655kL. (Available all the time)
14.3.3Process Material
The reagents and their consumption rates are presented in Table 14-2.
Table 14-2: Harmony One Plant Consumables
|
|
|
|
|
|
|
|
|
| Equipment |
Unit |
Value |
| Lime |
tpm |
341.00 |
| Flocculant |
tpm |
0.71 |
| Cyanide |
tpm |
9.06 |
| Carbon |
tpm |
190.00 |
14.3.4Personnel
The personnel is provided in Table 14-3.
Table 14-3: Harmony One Plant Personnel
|
|
|
|
|
|
| Personnel |
No. |
| Services |
57 |
| Engineering |
77 |
| Metallurgy |
138 |
| Contractors |
245 |
| Total |
517 |
14.4Commentary on the Processing and Recovery Methods
The metallurgical process is a well-tested CIP technology which has been in operation at the Harmony One plant since 1986. Recoveries used in the business plan were based on historic performance. The methodology applied considered the historical metallurgical recovery (18-month period) (Figure 14-2) for the relevant ore sources at the plant.
Effective Date: 30 June 2023
69
Technical Report Summary for
Tshepong North, Free State Province, South Africa
It should be noted that since the Harmony One plant processes ore from multiple sources a metal accounting operating procedure is required to manage the input feed delivered to the plant and gold output produced. A basic overview of the procedure is as follows:
•each operation delivers ore to the plant and is booked against each source;
•a delivery sheet reflects each shaft/operations figures; and
•from total ore processed, each shaft/operations equivalent proportion of gold is determined out of the monthly full gold produced.
|
|
|
Figure 14-2: Graph of Tshepong North Historical Recovery Factor (18 month actual) |
Effective Date: 30 June 2023
70
Technical Report Summary for
Tshepong North, Free State Province, South Africa
15Infrastructure
Section 229.601(b)(96) (15)
The proximity of Tshepong North and Phakisa allows for the integration of infrastructural requirements by using the excess hoisting capacity and underused infrastructure available at Tshepong. This has also enabled the debottlenecking of Phakisa’s infrastructure. Tshepong North have adequate access to the infrastructure required to meet the planned LOM production schedules.
15.1Surface Infrastructure
The surface infrastructure associated with Tshepong North is presented in Figure 15-1, whilst Google Earth images for each of the shafts and Harmony One Plant are presented in Figure 15-2, Figure 15-3, Figure 15-4 and Figure 15-5.
The Tshepong North’ mining area is well developed in terms of access and mining-related infrastructure. Access to the shafts is via well-maintained roads. Adequately maintained gravel roads is used to access other areas of the mine such as the explosives magazines, sewage works, slimes dam and the evaporation ponds.
The infrastructural layout includes hoisting facilities; logistical support for core handling, sampling, and transporting; ore and waste facilities; tailings and leaching infrastructure; roads; water and power supply; ventilation and refrigeration systems; stores and workshop support; electrical supply; offices; housing and security.
15.1.1Ore and Waste Rock Storage Facilities
Ore mined at Tshepong North is hoisted at Nyala Shaft where it is stored in silos on surface before being transported by rail to the Harmony One Plant for processing (Figure 15-1 and Figure 15-5). Ore is stored in silos located at the plant prior to processing.
The ore and waste hoisting for the Phakisa Mine is done using two rock winders via the Nyala Shaft and is delivered via the RailVeyorTM. Waste rock is deposited in waste silos and transported to the plant. The Nyala (“WRDs”) is not currently used, but is available adjacent to the respective shafts (Figure 15-1).
Waste at the Tshepong Mine is hoisted separately via the skips and stored at the waste rock dump on the Northern side of the shaft. Sufficient storage is available for the current LOM profile.
15.1.2Tailings Storage Facilities
Harmony One Plant pumps tailings as slurry to two TSFs namely FS2 and St Helena No.4, located to the south of the plant. All TSFs and are currently owned and operated by Harmony.
The current LOM plans for Tshepong North require a total collective placement of approximately 0.77Mt of tailings. The capacity remaining in the two TSFs is sufficient until 2024. Currently the project department is urgently looking at various options to ensure that Harmony 1 Plant has deposition capacity post June 2024. Some of these options entail to keep depositing on some of the existing tailings dams in order to buy time until the new tailings dam will come on line in July 2026. Even if it means down scaling the operations at Harmony 1 Plant to only accommodate the reef and very little waste. The option that is currently investigated is to convert St Helena 4 tailings dam to a cyclone dam that can take 200,000 tons per month until July 2026. The new tailings facility will be located in the area of North 1 and 2 tailings facilities. The TSF sites have full engineering records including design, construction, operation, and maintenance plans.
15.1.3Rail
A railway line which traverses the Tshepong North Mining Right area is used to transport hoisted ore to the Harmony One Plant (Figure 15-1).
Effective Date: 30 June 2023
71
Technical Report Summary for
Tshepong North, Free State Province, South Africa
|
|
|
Figure 15-1: Tshepong North Surface Layout and Infrastructure |
Effective Date: 30 June 2023
72
Technical Report Summary for
Tshepong North, Free State Province, South Africa
|
|
|
Figure 15-3: Tshepong Detailed Surface Infrastructure |
Effective Date: 30 June 2023
73
Technical Report Summary for
Tshepong North, Free State Province, South Africa
|
|
|
Figure 15-5: Harmony One Plant Detailed Surface Infrastructure |
Source: Google Earth Image Date: September 202
Effective Date: 30 June 2023
74
Technical Report Summary for
Tshepong North, Free State Province, South Africa
15.2Underground Infrastructure and Shafts
The Tshepong North shaft and underground infrastructure is schematically depicted in Figure 13-7. The underground workings are accessed and mined via four vertical shafts and a sub-vertical shaft and a decline shaft.
At Tshepong North, the main vertical shaft system extends from surface to 71 level, at 2,161m below surface. The ventilation shaft system extends to 2,148m below surface and the sub 66 decline shaft system extends from 66 level to 77 level.
There are four refrigeration plants on surface, serving the Tshepong Mine. Bulk air is supplied via the Tshepong North shaft to an inter-level refrigeration system on 63 level, assisted by cooling cars and coils. Two underground booster fans will be installed on 66 Level, to increase the return air capacity to the decline section.
15.3Power and Electrical
Power is supplied by Eskom. Tshepong North power supply is designed to satisfy the planned LOM production and service requirements. Main power supply is managed and distributed via electrical sub-stations located adjacent to the respective shafts (Figure 15-2, Figure 15-3, Figure 15-4).
Power lines traverse the mine property to connect the shafts, reduction works and hostel complexes.
In addition, Tshepong North have an onsite emergency power generator system, sufficient to support the critical mining and mineral processing activities in case of emergencies. The operation has capacity to supply of 35MW, however currently only 31MW is utilized. Currently no ore processing is undertaken at the shaft.
15.4Water Usage
Tshepong North has four underground water dams on 66 level and 69 level. Water for the use of dust suppression, footwall and sidewall treatment is re-purposed at the Tshepong Mine.
As the Sedibeng municipality water supply is reliable, there is no dedicated surface water supply storage. A water storage dam, with capacity of +- 8ML, is in the process of being built at surface. Water usage at Phakisa shaft is approximately 4ML daily average use for ice production as well as for water drinking and sanitizing
The storage facilities have sufficient water to supply water to the operation for up to 72 hours if the bulk water supply was interrupted.
15.5Logistics and Supply
The procurement of supplies and equipment are handled centrally, via Harmony, and then delivered to Tshepong North.
Harmony operates its own rail system which connects the shafts, reduction works, shaft stores, explosives magazine and the mine workshops. This system is used to transport ore between shafts and to transport consumables between the surface stores to the respective locations, as required. It is also connected to the regional Transnet railway system, which transports ore to the Harmony One Plant. All capacities for the shaft requirement to ensure optimum production as planned is provided for.
15.6Commentary on Infrastructure
The operational infrastructure including road, rail, offices, security services, refrigeration, Compressors, pump stations, chairlift, ice plant and RailVeyorTM, water and power supply is adequate to satisfy the Tshepong North LOM plan. Operations are powered by electricity from Eskom. Overall, Tshepong North are well-established with sufficient logistical and infrastructure support for the existing and planned mining operations.
Effective Date: 30 June 2023
75
Technical Report Summary for
Tshepong North, Free State Province, South Africa
16Market Studies
Section 229.601(b)(96) (16) (i-ii)
Gold is traded in a variety of markets/exchanges both in physical form through over the counter (“OTC”) markets, bullion banks and metal exchanges etc., and through passive investments such as exchange traded funds (“ETFs”), which are based on gold prices and units representing physical gold which may be in paper or dematerialised form. Demand is driven by the jewellery market, bar and coin, use in technology, ETF’s and other financial products, and by central banks. An overview of the gold market is given in the following sections based mainly on data from the World Gold Council and GoldHub websites.
16.1Market Overview
Unlike almost all mineral commodities, the gold market does not respond the same way to typical supply and demand dynamics which are founded on availability and consumption, but rather on global economic affairs, particular those of the major nations, industrial powerhouses and economic regions, such as the Eurozone. The gold market is affected by government and central bank policies, changes in interest rates, inflationary or deflationary environments and events such as stocking and de-stocking of central reserves. It is also largely affected by global events such as financial crises, geopolitical trade tensions and other geopolitical risks. Price performance is linked to global uncertainty prompted by the prolonged Russia-Ukraine war (GoldHub, Accessed July 2022). It is an asset that can preserve wealth and deliver price outperformance in an uncorrelated way and that makes it extremely attractive.
The Gold Market and Recent Developments
The Gold Market Demand had returned to pre-COVID levels during the third quarter of 2022, with total demand at 1,181t; 28.0% higher when compared to the third quarter of 2021, while gold supply increased by a marginal 1.0% on an annual basis to reach 1,215t.
The main contributing factors of the higher gold demand during the third quarter of 2022 include:
•Jewellery consumption reached a robust 523t, recording a 10.0% increase year-on-year, despite the deteriorating global economic backdrop. Furthermore, on a year-to-date (ytd) basis gold demand was slightly firmer at 1,454t, signifying a 2.0% increase.
•Investment demand was 47.0% lower on an annual basis at 124t, reflecting weak sentiment among some investor segments. The 36% growth in bar and coin investment (to 351t) was insufficient to offset 227t of ETF outflows. Over-The-Counter (OTC) demand decreased significantly during the third quarter of 2022, confirming weak investor sentiment in ETFs and futures markets.
•Central Banks continued to invest in gold, with purchases reaching an estimated quarterly record of nearly 400t according to the World Gold Council.
•Technology Demand decreased by 8.0%, year-on-year, as the global economic downturn had a negative impact on consumer demand for electronics.
Moving into the second quarter of 2023, gold prices are gaining a lot of momentum in line with the global banking crisis and uncertainty surrounding the Federal Reserve Bank. Contagion risks from financial market fears have allowed the safe-haven appeal of gold to drive a bullish market to the cause but this can be fleeting for a quarterly period. Increased volatility has been another contributor to gold.
Markets reacted recently to the upside of the U.S. economy (which is doing better than previously thought), allowing the Fed room to hike rates further in its fight against inflation. The latest market expectations point to rates staying higher for longer with any rate cuts expectations moved to the middle of Q1 next year (2024). This is in stark contrast to expectations seen 2-3 months ago when interest rate cuts were predicted for late Q3/early Q4 this year (2023).
16.2Global Production and Supply
Gold production and supply is sourced from existing mining operations, new mines and recycling.
Effective Date: 30 June 2023
76
Technical Report Summary for
Tshepong North, Free State Province, South Africa
16.2.1New Mine Production
China remained the largest producer in the world and accounted for approximately 10% of total global production in 2022 (Gold.org, Accessed 2023). Overall, global mine production reached 3,628t in 2022, slightly higher when compared to the 3,581t recorded in 2021, and the second annual increase in production recorded since 2020. The improvement in mine production over the past two years can mainly be attributed to a mining industry free from COVID-19 disruptions and slowdowns. In 2022, some of the major producing gold countries in the world were China (375t), Russian Federation (325t), Australia (314t), Canada (195t), United States (173t), Ghana (127t), Peru (126t), Indonesia (125t) and Mexico (124t), followed by Uzbekistan (111t) and Mali (102t). South Africa produced 92.6t in 2022; lower when compared to the 113.6t recorded in 2021 (Gold.org, 2023).
|
|
|
| World Gold Council: Mine Production - Major Gold Producing Countries Ranked 2023 |
16.2.2Recycling
Global annual supply of recycled gold increased marginally to 1,141t in 2022, but still remained below 1,293t recorded in 2020 and 30% below the all-time high recorded in 2009. Recycling supply experienced a modest increase in 2022 even though a record annual average gold price was recorded for the year. India and China are considered as key role players in the recycling market. In the first quarter of 2023, the supply of recycled gold increased to 310.4t, signifying a 5% increase on a year-on-year basis, and can mainly be attributed to higher gold prices (Gold Demand Trends Q1 2023, Gold.org, May 2023).
16.3Global Consumption and Demand
Annual global gold demand (excl. OTC) increased by a significant 17% to 4,706t in 2022, however during the first quarter of 2023, demand was 13.0% lower at 1,081t on a year-on-year basis. Demand from India decreased as consumption in both investment and jewellery were lower, driven by a volatile and record-high gold price. On the contrary, domestic consumption from China increased, driven by robust income growth and improved domestic economic activity during the first quarter of 2023. While continued improvement is expected in markets post-COVID in 2023, demand continues to face challenges of slowing global economic growth along with persistent high inflation levels in several markets.
16.3.1Jewellery
Total annual global jewellery consumption decreased from 2,148t in 2021 to 2,090t in 2022, amid weaker gold demand from China and India. In the first quarter of 2023, demand was relatively stable when compared to a year ago, however, a significant quarter-on-quarter decrease of 24% was recorded as high and volatile gold prices discouraged jewellery demand (Gold Demand Trends Q1 2023, Gold.org, May 2023).
Effective Date: 30 June 2023
77
Technical Report Summary for
Tshepong North, Free State Province, South Africa
16.3.2Investment
A positive global gold demand and exchange-traded funds (ETF’s) are expected to maintain a notable upside potential from volatile interest rate conditions and recession risk. According to the World Gold Council, global bar and coin investment increased by 5% on a year-on-year basis during the first quarter of 2023, exceeding 300t for the third consecutive quarter and the first time since 2013.
A total annual gold investment demand of 1,127t was recorded by the World Gold Council for 2022, a 12% increase when compared to the annual value of 1,004t recorded in 2021. On a quarter-on-quarter basis, total investment demand increased by 9% to reach 274t in the first quarter of 2023. Furthermore, global physically-backed gold ETFs was pressured by weak investor interest, recording a net outflow of -28.7t during the first quarter of 2023, significantly lower when compared to the 270.7t recorded during the first quarter of 2022. In addition, ETF outflows recovered some of its losses and increased during for the first time in 11 months in March 2023 (Gold Demand Trends Q1 2023, Gold.org, May 2023).
Gold prices were further supported by a positive investor sentiment in the institutional segment during March 2023 as a result of an unstable banking industry and positive inflows into ETFs.
|
|
|
| World Gold Council : Total Gold Supply & Demand |
16.3.3Currency
Gold holds an inverse relationship with the USD and is usually traded relative to its USD price. During the current period of uncertainty, and the rising influence of Chinese currency, central bank asset managers may likely increase their interest in gold as a result. This has been a prominent trend since the economic downturn in 2008.
Future performance of the gold market is expected to be supported by investment demand (a need for effective hedges and a low-rate environment) and will be driven by the level of risk observed in the recovery of the global economy from the effects of COVID-19, which may offset any lag in recovery of consumer demand.
Effective Date: 30 June 2023
78
Technical Report Summary for
Tshepong North, Free State Province, South Africa
The USD currency and Gold
The inverse relationship between the value of U.S. dollar (USD) and that of gold is one of the most discussed about relationships in currency markets. The U.S. Dollar (USD) is the internationally accepted currency and most of the international transactions take place in Dollar/USD equivalent. The major reason behind the relationship of gold and the USD, is that gold is used as a hedge against the adverse exchange value of the USD. As the dollar’s exchange value decreases, it takes more USD to buy gold, which increases the value of gold. Two other factors linked to the USD, or the strength of the USD is inflation and interest rates. Inflation has remained high throughout 2022 and well into 2023 in the U.S. and in many other countries.
Central banks like the Fed, ECB, and BoE have already hiked rates to try and bring inflation down. Rates will continue to rise while inflation remains high. High interest rates are generally seen as a negative for gold as a non-yielding asset, though high inflation is usually seen as a positive for gold as a hedge against inflation.
16.4Gold Price
16.4.1Historical Gold Price
In early August 2020, the London Bullion Market Association (“LBMA”) gold price reached historical highs and remained relatively high for the rest of the year (Figure 16-1).
The London Bullion Market Association (LBMA) gold price reached a record annual average price of US$1,800.09/oz in 2022. The upward trajectory continued into the first quarter of 2023 where gold prices averaged 10% higher at US$1,890.2/oz on a quarter-on-quarter basis. According to the World Gold Council’s May 2023 Gold Market Commentary, “Gold prices remain rangebound, having failed to establish a foothold above the psychologically important US$2,000.00 level. It appears that over the past year, gold has been more influenced by the US dollar than on average, as well as taking its cues from the 2-year US TIP yield rather than the more commonly associated 10-year.”
16.4.2Forecast Gold Price
The minimum and maximum consensus gold price range for the year 2021 to year 2025 is presented in Figure 16.2. The long-term gold prices are considered from year 2025 onwards by the QP. Forecasts as advised from various financial institutions show that gold is expected to trade in a range of USD1,804/oz - USD1,901/oz, for the period 2022 to 2025 with a long-term outlook of USD1,521/oz.
The gold price forecast of USD1,521/oz is conservative if corroborated against a long-term broker consensus gold price outlook (Figure 16 2).
Effective Date: 30 June 2023
79
Technical Report Summary for
Tshepong North, Free State Province, South Africa
|
|
|
| World Gold Council: Daily Gold Price (ZAR/Oz & USD/Oz) |
Table 16-X Consensus View of Forecast Gold Price
|
|
|
|
|
|
|
|
|
|
|
|
| Institutions |
2022 |
2023 |
2024 |
| World Bank: Development |
1 801 |
|
1 900 |
|
1 750 |
|
| BMO Capital Markets |
1 802 |
|
1 925 |
|
1 750 |
|
| Scotiabank |
1 803 |
|
1 904 |
|
1 900 |
|
| Nedbank |
1 817 |
|
1 897 |
|
1 970 |
|
| Fitch Solutions |
1 800 |
|
1 800 |
|
1 600 |
|
| S&P Global |
1 804 |
|
1 889 |
|
1 889 |
|
| Australian Government |
1 801 |
|
1 906 |
|
1 839 |
|
| TD Economics |
1 802 |
|
1 985 |
|
2 000 |
|
| AVERAGE |
1 804 |
|
1 901 |
|
1 837 |
|
16.4.3Harmony Group Gold Hedging Policy
Harmony has a hedging policy which is managed and executed at Group treasury level on-behalf of its operating entities. The key features of the hedging programme are as follows:
•the policy provides for hedging (or forward selling) up to a maximum of 20% of expected gold production for a rolling 24-month period;
•the policy has no minimum quantity that should be hedged, and if an attractive margin above cost cannot be achieved (i.e., in a low gold price environment) then no hedges are entered into;
•Harmony enters into ZAR-denominated gold hedges for its South African operations (for the non-South African assets it enters into USD-denominated hedges);
•Individual mines do not enter into hedges in their own name but delivers bullion to Rand Refinery for refining on behalf of Harmony. Rand Refinery is one of the world’s largest single-site precious metals refining and smelting complex in the world. Rand Refinery refine all of Harmony’s gold to at least 99.5% purity, and acting as agent, sells the gold on the daily spot London fixing price and make payment to the Harmony two days later;
•gains and losses realised from the hedging program are accounted for at Group level and the financial benefit (or downside) is distributed amongst the operations proportional to their levels of gold sales; and
Effective Date: 30 June 2023
80
Technical Report Summary for
Tshepong North, Free State Province, South Africa
•Harmony does its mine planning and financial forecasts based on the estimated future gold price provided by an external source (ETSA), but its year-end actual financial results reflect the received gold price inclusive of the impact of the hedging programme. Therefore, in theory, individual mines receive a hedged gold price for a maximum of 20% of its gold sales with the balance attracting the spot price
16.5Commentary on Market Studies
The factors which affect the global gold market are well-documented as are the elements which influence the daily gold price. The gold price recorded all-time highs during both 2020 and 2022, and although it has since moderated and retracted, the price remains well above the 5-year historical average.
The positive outlook for gold will likely be sustained. Key headwinds for gold are interest rate hikes, currently at near historically low levels, but continued geopolitical risk and underperformance of stocks and bonds will support gold (Gold Mid-Year Outlook 2022, Gold.org, Accessed 2022). The gold price has experienced weaker momentum in Q2 2022, but stabilised. The gold market is expected to remain supported, and prices elevated for the balance of the financial year running into FY2023.
Harmony has a relatively conservative gold hedging policy in place, and this is used to take advantage of the movements in the gold price to maximise the average gold price received, with the benefit of this hedging programme flowing through to Tshepong North.
16.6Material Contracts
As with all major businesses, Harmony and Tshepong North enters into a multitude of vendor agreements for the provisions of supplies and services. These agreements are entered into on a competitive basis and typically are of a medium-term duration all with clauses providing for periodic updating of pricing, annual (or other) renewal or termination.
Harmony has contractual vendor agreements with various service providers and suppliers. The most significant of these contracts currently in place to support Tshepong North are listed in Table 16-1.
All of the listed contracts are currently valid and in good standing. Terms, rates and charges of contracts are considered consistent with industry norms. Contract management processes are in place and resourced so that contracts re-tendered and/or renewed as they approach expiry.
Effective Date: 30 June 2023
81
Technical Report Summary for
Tshepong North, Free State Province, South Africa
Table 16-1: Material Contracts
|
|
|
|
|
|
| Vendor Name |
Nature of Service / Supply |
| Axis Mining & Construction cc |
Underground Support services |
| Transnet Limited (t/a Spoornet) |
Rail transportation of ore and waste |
| Genflo Mine Vacuum Systems SA (Pty) Ltd |
Shaft Bottom Cleaning at Nyala Shaft |
| Bidvest Protea Coin (Pty) Ltd |
Security services |
| Lesedi Drilling & Mining Company (Pty) Limited |
Underground diamond drilling at Phakisa and Tshepong operations |
|
|
|
|
|
|
|
|
|
|
|
|
|
|
|
|
|
|
|
|
Effective Date: 30 June 2023
82
Technical Report Summary for
Tshepong North, Free State Province, South Africa
17Environmental Studies, Permitting and Plans, Negotiations, or Agreements with Local Individuals or Groups
Section 229.601(b)(96) (17) (i-vii)
The South African Government has an extensive legal framework within which mining, environmental and social aspects of the industry are managed. Harmony and its Tshepong Operation is primarily regulated and managed by certain principal Acts (as listed in Section 17.3) as well as corporate policies, management systems and certain industry-wide guidelines, including:
•Energy Efficiency and Climate Change Policy;
•Environmental Policy;
•Harmony Water Management Strategy;
•Biodiversity and Rehabilitation Position Statement;
•Socio-Economic Transformation Policy; and
•Corporate Social Responsibility Policy.
The latest sustainability policies and public environmental social and governance (“ESG”) performance and disclosure report(s) are available on the corporate website. Harmony has identified the environmental risks for the business and has strategies in place to manage the risks.
17.1Results of Environmental Studies
Tshepong North have prepared multiple environmental impact assessments (“EIA”) for regulatory approval, which under the current legal framework, require stakeholder engagement. The most recent EIA was undertaken in 2022. The results of the studies have been incorporated into the Harmony business planning process. The results of all the studies are too voluminous to include in this TRS and therefore the reader is directed to EMP PAR (Environmental Management Programme Performance Assessment) Harmony Tshepong, Matjhabeng and ARM(Reference Number FS 30/5/1/2/2/84MR).
Harmony is committed to maintaining good relationships with regulatory authorities, industries, communities, business partners and surrounding stakeholders.
17.2Waste and Tailings Disposal, Monitoring & Water Management
The process of mining and beneficiation produce significant waste, typically consisting of 1) solid waste in the form of waste rock and overburden, 2) liquid wastes in the form of wastewater and tailings slurry and 3) gaseous emissions such as liquefied petroleum gas.
Measures have been put in place for the handling and disposal of all hazardous chemicals (e.g., cyanide), hydrocarbons (i.e., hydraulic oils and diesel) and other chemicals to ensure the protection of human health and its potential impact on the environment.
Harmony recognises that responsible and effective waste management can positively reduce its environmental impacts and mitigate associated environmental liabilities. Waste management is thus a priority focus area. Internally, guidelines on mineral, non-mineral and hazardous waste materials are included in the environmental management systems (“EMS”) implemented at Tshepong North.
Tailings comprises of crushed rock and process water emitted from the gold elution process in the form of slurry once gold has been extracted. As tailings contain impurities and pollutants, they are placed in TSF engineered to contain them, in line with Harmony's tailings management programme and the Global Industry Standard on Tailings Management (“GISTM”).
Effective Date: 30 June 2023
83
Technical Report Summary for
Tshepong North, Free State Province, South Africa
Harmony's overall tailings management strategy is to ensure robust, meticulous engineering and dam design, along with a continual focus on management of risks through layered assurance and oversight. The focus areas include, but are not limited to:
•freeboard control;
•water management;
•maintaining stability and the safety factor as advised by the engineer of record;
•erosion controls; and
•monitoring and control measures implemented to ensure continued compliance (including regular inspections, audits, and meetings on varying intervals with subsequent actions, minutes and reports).
As part of its mining, environmental and water approvals and licences, Harmony is required to implement monitoring programmes and plans to establish the operations impact on the environment. The compliance limits for the monitoring variable are included in the applicable EMPR(s), WULA(s) and environmental authorisations. The environmental monitoring implemented at Tshepong includes:
•ground and surface water monitoring
•biodiversity monitoring;
•waste classification and quantification;
•integrated waste and water management plan (“IWWMP”) updates;
•water balance reviews;
•licence and authorisation compliance reviews; and
•air quality (i.e., noise and dust) and greenhouse gas emissions ("GHG") monitoring.
A focus area during the next financial year will be on creating effective awareness and implementation of its waste and waste management procedures such as the IWWMP. This plan provides water conservation management measures to help reduce the demand for water from external and natural sources.
17.3Permitting and Licences
In respect of environment, the following national Acts and the regulations promulgated thereunder provide the regulatory framework for mine permitting and licencing in South Africa:
•Mineral and Petroleum Resources Development Act, 2002 (“MPRDA”);
•National Environmental Management Act, 1998 (“NEMA”);
•National Environmental Management: Waste Act, 2008 (“NEM:WA”);
•National Environmental Management: Air Quality Act, 2004 (“NEM:AQA”); and
•National Water Act, 1998 (“NWA”).
A summary of the status of environmental permits and licences issued at the effective date related to Tshepong North is presented in Table 17-1.
All relevant mining, environmental and water-use permits are in place that cover the environmental, archaeological, and hydrological components of the Tshepong Operation. All permits are audited regularly for compliance and no material risks to the operations have been identified.
There are applications submitted or being considered by the relevant authorities to ensure compliance and alignment with operations LOM requirements. To this end, Water Use Licence Applications were submitted / lodged in 2020 with DWS. Environmental Management Programme Amendments were submitted / lodged in 2019 with DMRE. Tshepong North are awaiting approval from the regulator at the effective date of this TRS. These pending environmental permits and licences do not pose a material risk to the continuation of the operation.
Effective Date: 30 June 2023
84
Technical Report Summary for
Tshepong North, Free State Province, South Africa
Table 17-1: Status of Environmental Permits and Licences
|
|
|
|
|
|
|
|
|
|
|
|
|
|
|
| Permit / Licence |
Reference No. |
Issued By |
Date Granted |
Validity |
| Environmental Management Programme |
FS 30/5/1/2/3/2/1(84)EM |
DMRE |
April 16, 2010 |
LOM |
| Environmental Management Updated |
FS 30/5/1/2/2/84MR |
DWAFEC |
Pending Approval Submitted in 2019 |
LOM |
| Water Permit 936B. Harmony. Free State Geduld Mines. Discharge of untreated effluents |
B33/2/340/31 |
DWAFEC |
April 2, 1981 |
LOM |
| Water Permit 870B. Harmony. Discharge of untreated effluents. |
B33/2/340/25 |
DWAFEC |
May 27, 1991 |
LOM |
| Water Permit 1214N. Free State Consolidated Gold Mine. Tshepong, Freddie’s and Phakisa shafts. |
B33/2/340/12 |
DWAFEC |
Not indicated. |
LOM |
|
|
|
|
|
|
|
|
|
|
|
|
|
|
|
|
|
|
|
|
|
|
|
|
|
|
|
|
|
|
Notes: DWAFEC - Department of Water Affairs, Forestry and Environmental Conservation, DWA - Department of Water Affairs.
17.4Local Stakeholder Plans and Agreements
Harmony strives to create sustainable shared value within the communities it operates. Local stakeholder plans and agreements are based on the results from socio-economic information, government development strategies and EIAs undertaken. The socio-economic development programme commits to:
•contribute to areas that will have the most meaningful socioeconomic impact on communities, namely infrastructure, education and skills development, job creation and entrepreneurial development;
•enhance broad-based local and community economic empowerment and enterprise development initiatives;
•facilitate socio-economic development in local communities by means of social and labour plan(s) (“SLP”) and corporate social responsibility programmes;
•support arts, culture, and sports and recreation; and
•build relationships based on trust within host communities.
In South Africa, mining companies are required to have a SLP, which forms an important component of Harmony's community investment plan. It sets out the Company’s obligation to develop and implement comprehensive human resource development programs, community development plans, housing and living condition plans and employment equity plans. The aim of the SLP is to ensure the uplift of the social and economic circumstances of local communities surrounding the mine. The SLP is a prerequisite to securing and maintaining a mining right, with progress required to be reported annually.
Harmony has budgeted to spend approximately ZAR155.6m (FY24) to meet its SLP commitments.
17.5Mine Closure Plans
Harmony makes provision for closure and rehabilitation both for accounting purposes and as required under the MPRDA. The statutory obligation for all environmental rehabilitation at Tshepong North is administered by the DMRE and requires the preparation of a closure plan, the development of a cost estimate, and financial assurance. The Company makes an annual submission to the DMRE setting out the cost of closure in accordance with the MPRDA and the regulations issued thereunder.
Harmony appointed Digby Wells and Associates (South Africa) (Pty) Ltd, independent environmental consultants, to review and update the Closure Cost Assessment for unscheduled closure associated with the Tshepong and Matjhabeng Mining Operations. The Matjhabeng Mining Operations is a Harmony operation, e located north of the town of Welkom in the Free State Province. The mine closure assessment was done in terms of regulation 53 and 54 of the MPRDA and in accordance with the requirements of NEMA. The closure cost as at 30 June 2023, was calculated to be approximately ZAR484.5m.
Harmony is required to make funding available in an amount equal to the cost of closure as determined under the MPRDA in the form of a trust fund and/or bank guarantees.
Effective Date: 30 June 2023
85
Technical Report Summary for
Tshepong North, Free State Province, South Africa
|
|
|
|
|
|
| Table 17-2: Mine Closure Liability |
| Area |
Total Closure Cost (ZAR) |
| Western Holdings 5 Shaft |
9,262,719 |
| Eland Shaft and Freddies 6 |
17,607,193 |
| Nyala Shaft |
75,305,600 |
| Tailings Dams - North |
331,145,091 |
| Phakisa |
18,755,892 |
| North Shaft/Tshepong |
39,819,418 |
| Sable Shaft |
5,478,213 |
| Kudu Shaft |
7,892,699 |
| Sewage Treatment Plant |
5,066,139 |
| Floatation Plant |
6,807,863 |
| Grand Total |
517,140,826 |
|
|
|
|
|
|
|
|
|
|
|
|
|
|
|
|
| Table 17-3: Rehabilitation Assurance |
|
|
| Area |
Trust Fund (ZAR) |
Bank Guarantee (ZAR) |
Total (ZAR) |
| Tshepong and Matjhabeng Operation |
2,830,511,252 |
0.00 |
2,830,511,252 |
| Phakisa |
Included in above |
|
|
| Total |
2,830,511,252 |
— |
2,830,511,252 |
17.6Status of Issues Related to Environmental Compliance, Permitting, and Local Individuals or Groups
Most of the required environmental authorisations are in place and only require amendments to be approved to reflect the planned infrastructure at Tshepong North.
17.7Local Procurement and Hiring
Harmony is committed to investing in the future of local communities beyond the LOM and not to only empower them, but also to mitigate the impacts its activities to ensure a positive legacy. The 2014 Mining Charter serves to guide the south African mining industry in socio-economic transformation. Local procurement (goods and services) and human resource management are key measures set under the Mining Charter and are reported on annually. Refer to the Company’s corporate website on updated information pertaining to its compliance to the Mining Charter.
Portable skills are developed internally as well as through expanded learning programmes, learnerships and other programmes opened only to operating communities. Local procurement is being supported where there is a skills shortage. Some of the portable skills training offered to its employees include but not limited to basic plumbing, electrical appliance repair, welding, catering and baking, sewing and clothing manufacturing.
17.8Commentary on Environmental Studies, Permitting and Plans, Negotiations, or Agreements with Local Individuals or Groups
Periodic inspections are conducted by the DMRE to verify compliance with applicable environmental laws, regulations, permits and standards. In addition, Tshepong North has implemented an EMS in line with the ISO 14001 standard. The EMS is audited on an annual basis by a third party and includes the needs and expectations of interested parties.
As part of Harmony, Tshepong North conducts its operation based on policies and systems that are aligned to its corporate sustainable development framework. Although Harmony is not a signatory to the International Council on Mining and Metals or the UN Global Compact, these form the guiding principles of the framework. Harmony discloses its sustainable development voluntarily in accordance with the guidelines issued by the Global Reporting Initiative (“GRI”).
Effective Date: 30 June 2023
86
Technical Report Summary for
Tshepong North, Free State Province, South Africa
Further to this, Harmony discloses environmental information on the Carbon Disclosure Project (“CDP”) for both climate change and water. The CDP runs the global environmental disclosure system that supports companies to measure and manage their risks and opportunities on climate change, water security and deforestation.
Harmony has a good understanding of the environmental and social aspects of the operations through baseline and specialist studies previously conducted. Risk management and mitigation measures were adequately addressed in the environmental management plans and will be effective to mitigate risks and impacts to acceptable levels should the measures be implemented according to the specialists’ recommendations.
The QP is of the opinion that most of the required environmental authorisations are in place and only require amendments to be made to reflect the current infrastructure. Based on current industry norms, a realistic timeframe to obtain relevant authorisations is estimated between 12 and 18 months.
Effective Date: 30 June 2023
87
Technical Report Summary for
Tshepong North, Free State Province, South Africa
18Capital and Operating Costs
Section 229.601(b)(96) (18) (i-ii)
Economic parameters for the Harmony Group, including capital and operating costs, are determined, and signed off by the CODM, before distribution to the business units, including Tshepong North. The capital and operating costs are reported in ZAR terms and on a real basis. Rounding of figures may result in minor computational discrepancies.
18.1Capital Costs
The estimated capital costs for Tshepong North are reported according to costs associated with major equipment outside the main operating sections which is termed AE, infrastructure development, as well as operating capital, as presented in Table 18-1.
An average contingency of 10% is applied where the capital cost estimates have a level of uncertainty, for example, where a capital project is an isolated occurrence. Where the capital cost estimates have a reasonable basis, there is no contingency applied. The estimated capital costs are carried forward and modelled in the Tshepong North cash flow.
18.2Operating Costs
A summary of the direct and indirect operating costs for Tshepong North as per LOM 2024 are presented in Table 18-2. Operating costs are based on historic performance while applying any changes expected within the new financial year (such as electricity requirements, increased/decreased labour) and are used as an input into the Tshepong North’ cash flow model.
18.3Comment on Capital and Operating Costs
The capital and operating cost estimates for Tshepong North are based on actual historical data, as well as budget forecasts. Therefore, the forecasted costs are reliable, and at minimum meet the confidence levels of a Pre-Feasibility Study. This approach of estimating capital and operating costs is consistent with industry practice. A record of the forecast and budget costs is maintained by the operation, allowing for an assessment of the alignment of the forecast and actual costs.
Table 18-1: Summary of Capital Cost Estimate for Tshepong North
|
|
|
|
|
|
| Capital Cost Element (ZAR'000s) |
Total LOM (FY23 - FY30) |
| AE |
155.828 |
| Shaft Projects |
65.404 |
| Major Projects |
55.635 |
|
|
| Total |
276.867 |
| OCD |
1 268.339 |
| Total (including OCD) |
1 545.206 |
Table 18-2: Summary of Operating Cost Estimate for Tshepong North
|
|
|
|
|
|
| Operating Cost Element (ZAR'000) |
Total LOM (FY23 - FY30) |
| Mining |
13 773.029 |
| Services |
4 060.125 |
| Medical Hub / Station |
768.026 |
| Engineering |
12 058.587 |
|
|
|
|
| Total Direct Costs |
30 659.766 |
| Mine Overheads |
1 580.186 |
| Royalties |
427.725 |
| Ongoing Capex |
1 268.339 |
| Total Cost |
33 936.016 |
Effective Date: 30 June 2023
88
Technical Report Summary for
Tshepong North, Free State Province, South Africa
19Economic Analysis
Section 229.601(b)(96) (19) (i-iv)
19.1Key Economic Assumptions and Parameters
The QP and CODM forms, reviews, signs-off and distributes economic assumptions to its various business units. On an annual basis, during the period October to November, long-term commodity prices and exchange rates forecasts’, are received from various financial institutions. In addition, a specialist in Economics from a reputable economics company based in South Africa, provides expert views on the global markets, forward looking commodity prices, exchange rates, consumer price index, production price index, electricity cost and consumable increases. All factors are analysed, cognisance is taken of the requirements of the NYSE and JSE markets, and a proposal is presented to the CODM for recommendation and approval. These assumptions are then applied at Tshepong North, along with specific operational considerations.
19.1.1Gold Price
The forecast gold price (USD1,582/oz) is the price that is used by Harmony for the Tshepong North annual planning cycle and forms the basis for the spot gold price assumptions used in the Tshepong North cashflow. The reader is referred to Figure 16-2 for the consensus forecast gold price. The conversions used in the calculation of the various gold prices is presented in Table 19-1.
Table 19-1: Conversions Used in Gold Price Calculations
|
|
|
|
|
|
|
|
|
|
|
|
|
|
|
| Economic Factors |
Gold Price (USD/oz) |
Conversion Factor (oz/kg) |
Exchange Rate (ZAR:USD) |
Gold Price (ZAR/kg) |
| 2023 Mineral Resource |
1 764 |
32.15 |
16.22 |
920 000 |
| 2023 Mineral Reserve |
1 582 |
32.15 |
16.22 |
825 000 |
| 2024 gold price forecast¹ |
1 582 |
32.15 |
16.22 |
825 000 |
Notes: 1. The forecast gold price as used in the Tshepong North cash flow.
19.1.2Exchange Rate
The South African Rand (ZAR) depreciated significantly since the start of 2023 to average at R17.75/US$ during the first quarter of 2023, 0.7% weaker compared to an average of R17.63/US$ recorded during the last quarter of 2022. Moving onto the second quarter of 2023, the South African Rand depreciated further by 5.2% to average at R18.67/US$ on a quarter-on-quarter basis.
The trade of the South African Rand (ZAR) to the U.S. Dollar (USD) is an important trade, as further weakness in ZAR can be expected in the medium term, after recent comments by Federal Reserve Chairman Jerome Powell alluded to further interest rate hikes to curb inflation, giving the USD further upside against the Rand.
Recent levels of the Rand (ZAR), which had seen the local currency appreciate by more than 4% against the USD, since the start of June 2023, making it the second-best-performing emerging market currency over this period and in recent trades.
The proposed spot exchange rate of 16.22 ZAR:USD is the exchange rate that is used by Harmony for the annual planning cycle and forms the basis for the ZAR:USD exchange rate assumptions used in the company cashflow.
Table 19-2: ZAR:USD Exchange Rate Performance (June 2019 – June 2022)
|
|
|
|
|
|
| Period |
Average Exchange Rate (ZAR:USD) |
| July 2020 to June 2021 |
15.43 |
| July 2021 to June 2022 |
15.21 |
| July 2022 to June 2023 |
17.77 |
| 3-Year Ave. (not weighted) |
16.14 |
Effective Date: 30 June 2023
89
Technical Report Summary for
Tshepong North, Free State Province, South Africa
19.1.3Royalties
Royalty is an expense paid to the government of South Africa and is accounted for in the Tshepong North cash flow models. In terms of the mining ring-fencing application, each ring-fenced mine is treated separately, and deductions can normally only be utilised against mining income generated from the relevant ring-fenced mine.
|
|
|
Figure 19-1: Graph of Consensus ZAR : USD Exchange Rate Forecast |
19.1.4Taxes
Mining tax on gold mining taxable income in South Africa is determined according to a formula, based on the taxable income from mining operations. Of that, 5% of total revenue is exempt from taxation while the remainder is taxable at a higher rate (33%) than non-mining income (27%). Accounting depreciation is eliminated when calculating the South African mining tax income. Excess capital expenditure is carried forward as unredeemed capital to be claimed against future mining taxable income.
19.1.5Summary
The key assumptions used in the cash flow are summarised for Tshepong North in Table 19-3.
Table 19-3: Key Economic Assumptions and Parameters for Tshepong North Cash Flow
|
|
|
|
|
|
|
|
|
| Parameter |
Unit |
Value |
| Production Rate |
tpm |
63 999.00 |
| Gold Recovery |
% |
94.96 |
| Royalty |
% of xx |
0,05 |
| Tax Rate |
% |
Formula |
| Gold Price |
ZAR/kg |
825 000 |
| Exchange Rate |
USD:ZAR |
Variable |
| Discount Rate |
% |
9,00 |
Effective Date: 30 June 2023
90
Technical Report Summary for
Tshepong North, Free State Province, South Africa
19.2Economic Analysis
Harmony's respective business units and its associated operating sites consider the economic assumptions discussed in Section 19.1 during their respective planning and analysis processes. The past year’s average gold price is used for testing purposes. A gold price of ZAR825,000/kg is used for forecasting the revenue of the Tshepong North cash flow (Table 19-4).
The discounted cash flow model is used to calculate the Net Present Value (“NPV”) of the investments. The NPV for the spot metal price, for Tshepong North is approximately ZAR -123.958 Ml, at a discount rate of 9%. The NPV is calculated on a cash flow that accounts for factors such as:
•mining and ore processing working costs;
•royalty payments;
•capital costs, including costs allocated to ongoing development;
•any significant project work considered as major projects; and
•costs deemed as abnormal expenditure.
19.3Sensitivity Analysis
The economic assumptions, cash flow breakdown and economic analysis contribute to the basis for the sensitivity analysis. The sensitivities are calculated and analysed, as shown in the accompanying Table 19-5, Table 19-6 and Table 19-7.
Harmony has reviewed its exposure in terms of South Africa’s political instability, the COVID-19 pandemic, the currency exchange rate, and the gold price, on its financial assets and financial liabilities, and has determined the sensitivities for a ±10% variance. Management considers this range to be a reasonable change given the volatility in the market.
The sensitivity analysis is completed for variations in commodity price (ZAR/kg), total operating costs, which include capital costs and royalties paid (ZAR); and a combined analysis considering variations in commodity price, total operating costs, and changes in production. Capital investments in Tshepong North are relatively low and not expected to have any significant impact on the NPV and therefore not included in a sensitivity analysis. The base case in the analysis below is the economic results emanating from the LOM plan (Table 19-4).
The sensitivity analysis (Table 19-5 and Table 19-6) is based on a change in a single assumption while holding all other assumptions constant. In practice, this is unlikely to occur, as risks and/or opportunities will have an impact on the cash flows, and changes in some of these assumptions may be correlated. The insights that can be provided by this sensitivity analysis is that Tshepong North is most sensitive to gold price, closely followed by changes in costs.
The impact of one or a combination of risks and opportunities occurring at the same time cannot be specifically quantified so an analysis considering multi-parameters is considered. In this way the general risks, with the aid of the sensitivity table (Table 19-7) are adequately covered. The sensitivity analysis considering the 3 variations of gold price (ZAR/kg), operating costs (ZAR) and variation in production (kg Au) show that the lowering of working costs, improvement in productivity and the benefits of a higher gold price can have positive impacts on the Tshepong North Mine.
Effective Date: 30 June 2023
91
Technical Report Summary for
Tshepong North, Free State Province, South Africa
Table 19-4: Tshepong North Cash Flow
|
|
|
|
|
|
|
|
|
|
|
|
|
|
|
|
|
|
|
|
|
|
|
|
|
|
|
|
|
|
|
| Item |
Units |
LOM Total |
FY2024 |
FY2025 |
FY2026 |
FY2027 |
FY2028 |
FY2029 |
FY2030 |
|
| Mining advance |
m2 |
1 324 881 |
193 473 |
193 635 |
193 557 |
193 539 |
194 301 |
194 277 |
162 099 |
|
| Total OCD |
m |
27 733 |
5 964 |
5 368 |
5 915 |
5 727 |
3 118 |
1 312 |
329 |
|
| Milled tons |
t '000 |
4 870 |
710 |
710 |
720 |
710 |
710 |
710 |
590 |
|
| Yield |
g/t |
5.802 |
4.67 |
4.73 |
4.95 |
4.84 |
4.93 |
4.80 |
4.88 |
|
| Gold recovered |
kg |
24 789 |
3 455 |
3 569 |
3 757 |
3 662 |
3 722 |
3 610 |
3 013 |
|
| Revenue |
ZAR'000 |
20 451 163 |
2 850 775 |
2 944 673 |
3 099 147 |
3 021 299 |
3 070 752 |
2 978 389 |
2 486 130 |
|
| Total operating costs |
ZAR'000 |
18 609 859 |
2 739 803 |
2 724 031 |
2 737 169 |
2 727 321 |
2 681 127 |
2 647 763 |
2 352 645 |
|
| Capital (including OCD) |
ZAR'000 |
0 |
0 |
0 |
0 |
0 |
0 |
0 |
0 |
|
| Royalty |
ZAR'000 |
185 886 |
14 254 |
14 723 |
15 496 |
15 106 |
41 173 |
48 522 |
36 612 |
|
| Total costs (including capital and royalty) |
ZAR'000 |
20 442 728 |
3 175 609 |
3 064 987 |
3 084 896 |
3 046 252 |
2 895 953 |
2 774 713 |
2 400 317 |
|
| Profit (after OCD and capital) |
ZAR'000 |
8 435 |
-324 834 |
-120 314 |
14 250 |
-24 954 |
174 799 |
203 676 |
85 813 |
|
| NPV - (low discount rate - 9%) |
@9% |
-123 958 |
|
|
|
|
|
|
|
|
| NPV - (medium discount rate - 12%) |
@12% |
-150 469 |
|
|
|
|
|
|
|
|
| NPV - (high discount rate - 15%) |
@15% |
-171 116 |
|
|
|
|
|
|
|
|
|
|
|
|
|
|
|
|
|
|
|
|
|
|
|
|
|
|
|
|
|
|
|
|
|
|
|
|
|
|
|
|
|
|
|
|
|
|
|
|
|
|
|
|
|
|
|
|
|
|
|
|
|
|
|
|
|
|
|
|
|
|
|
|
|
|
|
|
|
|
|
|
|
|
|
|
|
|
|
|
|
|
|
|
|
|
|
|
|
|
|
|
|
|
|
|
|
|
|
|
|
|
|
|
|
|
|
|
|
|
|
|
|
|
|
|
|
|
|
|
|
|
|
|
|
|
|
|
|
|
|
|
|
|
|
|
|
|
|
|
|
|
|
Effective Date: 30 June 2023
92
Technical Report Summary for
Tshepong North, Free State Province, South Africa
Table 19-5: Gold Price Sensitivity Analysis
|
|
|
|
|
|
|
|
|
|
|
|
|
|
|
|
|
|
|
|
|
| Sensitivity (%) |
Production (kg) |
Gold Price (ZAR/kg) |
Revenue (ZAR’000) |
Operating Cost (ZAR'000) |
Profit / Loss (ZAR'000) |
NPV (ZAR'000) |
| 10% |
24 789 |
907 500 |
22 496 279 |
20 442 728 |
2 053 551 |
1 351 944 |
| 5% |
24 789 |
866 250 |
21 473 721 |
20 442 728 |
1 030 993 |
613 993 |
| LOM plan |
24 789 |
825 000 |
20 451 163 |
20 442 728 |
8 435 |
(123 958) |
| -5% |
24 789 |
783 750 |
19 428 605 |
20 442 728 |
(1 014 123) |
(861 910) |
| -10% |
24 789 |
742 500 |
18 406 047 |
20 442 728 |
(2 036 681) |
(1 599 861) |
Table 19-6: Total Operating Cost Sensitivity Analysis
|
|
|
|
|
|
|
|
|
|
|
|
|
|
|
|
|
|
|
|
|
| Sensitivity (%) |
Production (kg) |
Gold Price (ZAR/kg) |
Revenue (ZAR’000) |
Operating Cost (ZAR'000) |
Profit / Loss (ZAR'000) |
NPV (ZAR'000) |
| 10% |
24 789 |
825 000 |
20 451 163 |
23 542 028 |
(3 090 865) |
(2 274 939) |
| 5% |
24 789 |
825 000 |
20 451 163 |
21 992 378 |
(1 541 215) |
(1 199 449) |
| LOM plan |
24 789 |
825 000 |
20 451 163 |
20 442 728 |
8 435 |
(123 958) |
| -5% |
24 789 |
825 000 |
20 451 163 |
18 618 507 |
1 832 656 |
1 173 068 |
| -10% |
24 789 |
825 000 |
20 451 163 |
17 343 428 |
3 107 735 |
2 027 023 |
Table 19-7: Gold price, Operating Costs, and Production Variation Sensitivity Analysis
|
|
|
|
|
|
|
|
|
|
|
|
|
|
|
|
|
|
|
|
|
| Sensitivity (%) |
Production (kg) |
Gold Price (ZAR/kg) |
Revenue (ZAR’000) |
Operating Cost (ZAR'000) |
Profit / Loss (ZAR'000) |
NPV (ZAR'000) |
| 10% |
27 268 |
907 500 |
24 745 907 |
22 338 976 |
2 406 931 |
1 384 510 |
| 5% |
26 029 |
866 250 |
22 547 407 |
21 522 056 |
1 025 351 |
471 490 |
| LOM plan |
24 789 |
825 000 |
20 451 163 |
20 442 728 |
8 435 |
(123 958) |
| -5% |
23 550 |
783 750 |
18 457 175 |
19 556 445 |
(1 099 270) |
(819 680) |
| -10% |
22 310 |
742 500 |
16 565 442 |
18 711 389 |
(2 145 947) |
(1 476 394) |
Effective Date: 30 June 2023
93
Technical Report Summary for
Tshepong North, Free State Province, South Africa
20Adjacent properties
Section 229.601(b)(96) (20) (i-iv)
Tshepong North and Phakisa are 100% owned by Harmony. Tshepong North is bounded to the north by the dormant Jeanette Mine and the present-day Target Mine. The Phakisa Mine lies to the south-east of the Tshepong North Mine. The Eland Mine is located south-east of Phakisa, while the Welkom 4 Shaft is further south from the Phakisa Mine.
Effective Date: 30 June 2023
94
Technical Report Summary for
Tshepong North, Free State Province, South Africa
21Other Relevant Data and Information
Section 229.601(b)(96) (21)
Other relevant data and information pertaining to Tshepong North is the Sub 75 Capital Project. The objective of this capital project is to extend development below the current working level to 77 level and access higher grades at depth. Tentative timelines include a project kick-off in Q1 2025 and an envisaged completion in Q4 2027. The project is critical in grade control over the LOM plan.
Sub 75 project has been stopped for FY23 LOM. After numerous planning and designing strategies it has been decided to restart the engineering civil work for the project to start up in FY25.
Other relevant information includes the public disclosure reports on Tshepong North operational, financial and environmental performance are available on the Company’s corporate website. The following reports are relevant to this TRS:
•Integrated annual report 2023;
•ESG report 2023;
•Financial report 2023;
•Report to shareholders 2023;
•Operational report 2023; and
•TCFD report.
Effective Date: 30 June 2023
95
Technical Report Summary for
Tshepong North, Free State Province, South Africa
22Interpretation and Conclusions
Section 229.601(b)(96) (22)
The QP has no known risks to conduct mining activities over the permitted mining rights’ areas, incorporated as Tshepong North. In addition, no known risks are posed over surface access and activities, regarding mining related activities.
Tshepong North’ regional geological setting, mineralisation and deposit is well understood. The geology is supported by historical geophysical surveys, surface diamond core drilling and underground channel (chip) sampling and mapping. Economic mineralisation occurs in the Basal Reef and B Reefs . The former is mind at both Tshepong and Phakisa, while the latter is only mined at Tshepong.
The sampling approach and management, density assumptions, laboratory procedures, and assaying and analysis are in keeping with industry standards and practices and is appropriate for the mineralisation at the Central Rand Group. The holistic understanding of the regional geology, lithological and structural controls of the mineralisation at Tshepong North is sufficient to support the estimation of Mineral Resources.
Gold bearing ore mined at Tshepong North is processed at the Harmony One Plant facility which has been in operation since 1986. As such, the processing method is considered well established for the mineralisation at Tshepong North. The plant makes use of historical trends and data as a basis for their recoveries of Basal and B reefs.
The data pertaining to the mineralisation, regional and geological setting, exploration findings, sample collection, preparation, and testing, inclusive of data verification and metallurgical test work gives rise to the Mineral Resource estimate.
The combined Measured and Indicated Mineral Resource, exclusive of Mineral Reserves, for Tshepong Mine, as at 30 June 2023 is 15.082Mt at a grade of 11.97g/t, containing 5.803Moz of gold, and the Inferred Mineral Resource contains 10.741Mt at a gold grade of 9.56g/t, containing 3.194Moz of gold.
Mineral Reserves are derived from the Mineral Resources, a detailed business plan and operational mine planning processes. Mine planning utilises and takes into consideration actual historical technical parameters. In addition, conversion of the Mineral Resources to Mineral Reserves considers Modifying Factors, dilution, ore losses, minimum mining widths, planned mine call and plant recovery factors.
The Mineral Reserves are extracted via the SGM method, with minor undercut and open stoping methods used at the Tshepong Mine. Mining methods take into consideration the mining and rock engineering design guidelines. The integrated selection of the mining method increases flexibility, safety and minimises seismic events.
Extracted minerals from Tshepong North are recovered at the Harmony One Plant. The metallurgical process is well-tested technology, based on sound historic operating parameters.
The mine’s regional and local infrastructure is capable of fully supporting the mining and surface related activities. Tshepong North is accessed via national and provincial road networks, has key power transmission and distribution networks provided by the National electricity regulator, water supply networks and communication infrastructure. Overall, Tshepong North is well-established with sufficient logistics and infrastructure support for the existing and planned mining operations.
Harmony and Tshepong North are exposed to market risks such as exchange rate and gold price fluctuations which are partially offset by the Harmony Group hedging policy. The hedging programme considers factors effecting the global gold market and these, along with macro-economic conditions, are used to determine planning and forecasting inputs at group level for all of Harmony’s operating business units. Other non-gold related risks are addressed to some extent by Tshepong North entering into vendor agreements for the provisions of supplies and services which are done on a competitive basis with customary price adjustment, renewal and termination clauses.
Effective Date: 30 June 2023
96
Technical Report Summary for
Tshepong North, Free State Province, South Africa
To successfully operate a mining operation in South Africa the state requires compliance with applicable environmental laws, regulations, permits and standards. Tshepong North adheres to said compliance and regulatory standards and have, in addition, implemented an Environmental Management System in line with the ISO 14001.
As part of Harmony, Tshepong North conducts its operations based on policies and systems that are aligned to its corporate sustainable development framework. This is guided by the principles of the framework from the International Council on Mining and Metals or the UN Global Compact. Harmony discloses its sustainable development voluntarily in accordance with the guidelines issued by the Global Reporting Initiative. Further to this, Harmony discloses environmental information on the Carbon Disclosure Project for both climate change and water.
Harmony has a good understanding of the environmental and social aspects through baseline and specialist studies previously conducted. Risk management and mitigation measures were adequately addressed in the environmental management plans. Most of the required environmental authorisations are in place and only require amendments to be made to reflect the current infrastructure at Tshepong North. Based on current industry norms, a realistic timeframe to obtain relevant authorisations is estimated between 12 and 18 months.
One of the ways Harmony aims to grow and develop the people and assets and provide sustainable value to all stakeholders is through economic regeneration.
The economics of Tshepong North is based on the discounted cash flow model, with a metal price of ZAR825,000/kg. The NPV for the metal price, is ZAR-123,958Ml, at a discount rate of 9%. The NPV is calculated on cash flow taking into account factors such as: capital and operating costs; and royalties. The capital and operating cost estimates for Tshepong North are based on historical data, as well as budget forecasts. This estimation technique allows for the forecast and actual costs to be aligned.
Royalties and taxes are paid to the South African government and accounted for in the Tshepong North cash flow and NPV analysis. There are also specific tax relief benefits that apply to gold mining companies, where 5% of total revenue is exempt from taxation, amongst other benefits. In addition, in response to challenges faced by companies during the COVID-19 pandemic, the government have implemented various stimulus packages to provide some tax relief to companies.
The economics of Tshepong North are tested for its sensitivity to commodity price (ZAR/kg), operating costs (ZAR) gold production (kg). The insights provided by the sensitivity analysis is that Tshepong North is most sensitive to changes in the gold price (ZAR/kg), closely followed by changes in total operating costs (ZAR).
This TRS was prepared by a team of experienced professionals. The TRS provides a summary of the material scientific and technical information concerning the mineral exploration, Mineral Resources, Mineral Reserves, and associated production activities of the mineral asset, including references to the valuation for Tshepong North. Each QP was responsible for specific sections of this TRS which they have personally supervised and reviewed. This TRS contains the expression of the QP opinions, based on the information available at the time of preparation.
Effective Date: 30 June 2023
97
Technical Report Summary for
Tshepong North, Free State Province, South Africa
23Recommendations
Section 229.601(b)(96) (23)
The gold output can be optimised through improvement of quality of mining and this will result in achieving planned shaft call factor. This impact will be realised through our currently implemented Business Initiative programme that will look at driving quality of mining through measures such as in-stope water controls and better fragmentation during blasting to contain the gold.
Effective Date: 30 June 2023
98
Technical Report Summary for
Tshepong North, Free State Province, South Africa
24References
Section 229.601(b)(96) (24)
Dankert, B.T., and Hein, K.A.A., 2010. Evaluating the structural character and tectonic history of the Witwatersrand Basin. Precambrian Research 177, 1–22.
https://www.gold.org/goldhub/data/gold-prices. Accessed 22 July 2022.
Robb, L.J., and Meyer, F., 1995. The Witwatersrand Basin, South Africa: Geological framework and mineralisation processes. Ore Geology Reviews, 10(2), 67-94.
Robb, L.J., Robb, V.M., 1998. Gold in the Witwatersrand Basin. In: Wilson, M.G.C., Anhaeusser, C.R. (Eds.), The Mineral Resources of South Africa. Handbook. Council for Geoscience, 294–349.
South African Revenue Services. (2021, July 29). South African Revenue Services. Retrieved from Tax Relief Measures: https://www.sars.gov.za/media/tax-relief-measures/
Therriault, A.M., Grieve, R.A.F., Reimold, W.U., 1997. Original size of the Vredefort Structure: Implications for the geological evolution of the Witwatersrand Basin. Meteoritics and Planetary Science 32, 71–77.
Tucker, R.F., Viljoen, R.P., and Viljoen, M.J., 2016. A Review of the Witwatersrand Basin The World’s Greatest Goldfield, accessed from https:// www.researchgate.net /publication /305924249 _A_Review_of_the_Witwatersrand_Basin_-_The_World's_Greatest_Goldfield.
World Gold Council. (2022, July 13). World Gold Council, Gold Hub, Gold mine production: Gold Production by Country | Gold Production | Goldhub
Effective Date: 30 June 2023
99
Technical Report Summary for
Tshepong North, Free State Province, South Africa
25Reliance on Information Provided by the Registrant
Section 229.601(b)(96) (25)
Further to Section 24, in the preparation of this TRS, the principal QPs and authors relied upon information provided by the Registrant and other internal specialists with regards to mining rights, surface rights, contractual agreements, historical operating expenditures, community relations and other matters. The work conducted by these specialists was completed under the supervision and direction of the respective QPs. The specialists who assisted the principal authors and QPs are listed in Table 25-1.
Table 25-1: Other Specialists
|
|
|
|
|
|
|
|
|
|
|
|
| Name |
Specialist |
Area of Responsibility |
Association / Company |
| S Sabelo |
HOD Geology |
Geology |
Tshepong |
| R du Toit |
Section Valuator |
Valuation and Estimation |
Tshepong |
| H Groenewald |
Section Planner |
Mine planning and design |
Tshepong |
| I Prinsloo |
Senior Planner |
Mine planning and design |
Tshepong |
| C Norton |
Financial Manager |
Finance and costing |
Tshepong |
| J Powell |
Geostatistician |
Geostatistics Central |
Tshepong |
| K Obelholzer |
Senior Engineer |
Engineering |
Tshepong |
| J van der Merwe |
Rock Engineer |
Rock engineering |
Tshepong |
| C Mokoena |
Cost Accountant |
Finance and costing |
Tshepong |
| A Oosthuizen |
Senior Hygienist |
Occupational, Environmental, Ventilation |
Tshepong & Phakisa |
|
|
|
|
|
|
|
|
|
|
|
|
|
|
|
|
|
|
|
|
|
|
|
|
Effective Date: 30 June 2023
100
EX-96.13
13
tshepongsouthphakisas-k130.htm
EX-96.13
Document
HARMONY GOLD MINING COMPANY LIMITED
Technical Report Summary of the
Mineral Resources and Mineral Reserves
for
Tshepong South
Free State Province, South Africa
Effective Date: 30 June 2023
Final Report Date: 31 August 2023
Technical Report Summary for
Tshepong South, Free State Province, South Africa
|
|
|
|
IMPORTANT NOTICE
This Technical Report Summary has been prepared for Harmony Gold Mining Company Limited in support of disclosure and filing requirements with the United States Securities and Exchange Commission’s (SEC) under Regulation S-K 1300; 229.601(b)(96). The quality of information, estimates, and conclusions contained in this Technical Report Summary apply as of the effective date of this report. Subsequent events that may have occurred since that date may have resulted in material changes to such information, estimates and conclusions in this summary. No other party is entitled to rely on this report beyond its intended use and any reliance by a third party on this report is done so at that party’s own risk.
|
Effective Date: 30 June 2023
ii
Technical Report Summary for
Tshepong South, Free State Province, South Africa
List of Contents
|
|
|
|
|
|
|
|
|
|
|
|
|
|
|
| 1 |
|
|
| 2 |
|
|
| 3 |
|
|
|
3.1 |
|
|
|
3.2 |
|
|
| 4 |
|
|
|
4.1 |
|
|
|
4.2 |
|
|
|
4.3 |
|
|
| 5 |
|
|
|
5.1 |
|
|
|
5.2 |
|
|
|
5.3 |
|
|
|
5.4 |
|
|
| 6 |
|
|
|
6.1 |
|
|
|
6.2 |
|
|
|
6.3 |
|
|
|
|
6.3.1 |
|
|
|
|
6.3.2 |
|
|
|
|
6.3.3 |
|
|
|
6.4 |
|
|
|
|
6.4.1 |
|
|
|
|
6.4.2 |
|
|
|
|
6.4.3 |
|
|
|
6.5 |
|
|
|
6.6 |
|
|
| 7 |
|
|
|
7.1 |
|
|
|
7.2 |
|
|
|
7.3 |
|
|
|
7.4 |
|
|
|
7.5 |
|
|
|
|
7.5.1 |
|
|
|
|
7.5.2 |
|
|
|
|
7.5.3 |
|
|
|
|
7.5.4 |
|
|
|
|
7.5.5 |
|
|
|
|
7.5.6 |
|
|
|
7.6 |
|
|
|
|
7.6.1 |
|
|
|
|
7.6.2 |
|
|
|
|
7.6.3 |
|
|
|
|
7.6.4 |
|
|
|
|
7.6.5 |
|
|
Effective Date: 30 June 2023
iii
Technical Report Summary for
Tshepong South, Free State Province, South Africa
|
|
|
|
|
|
|
|
|
|
|
|
|
|
|
|
|
7.6.6 |
|
|
|
7.7 |
|
|
|
7.8 |
|
|
|
7.9 |
|
|
| 8 |
|
|
|
8.1 |
|
|
|
|
8.1.1 |
|
|
|
|
8.1.2 |
|
|
|
8.2 |
|
|
|
8.3 |
|
|
|
8.4 |
|
|
|
8.5 |
|
|
|
8.6 |
|
|
|
8.7 |
|
|
|
8.8 |
|
|
|
|
8.8.1 |
|
|
|
|
8.8.2 |
|
|
|
|
8.8.3 |
|
|
|
8.9 |
|
|
| 9 |
|
|
|
9.1 |
|
|
|
9.2 |
|
|
|
9.3 |
|
|
|
9.4 |
|
|
| 10 |
|
|
|
10.1 |
|
|
|
10.2 |
|
|
|
10.3 |
|
|
|
10.4 |
|
|
| 11 |
|
|
|
11.1 |
|
|
|
11.2 |
|
|
|
11.3 |
|
|
|
11.4 |
|
|
|
11.5 |
|
|
|
11.6 |
|
|
|
11.7 |
|
|
|
11.8 |
|
|
|
11.9 |
|
|
|
11.10 |
|
|
|
11.11 |
|
|
|
11.12 |
|
|
|
11.13 |
|
|
|
11.14 |
|
|
|
11.15 |
|
|
| 12 |
|
|
Effective Date: 30 June 2023
iv
Technical Report Summary for
Tshepong South, Free State Province, South Africa
|
|
|
|
|
|
|
|
|
|
|
|
|
|
|
|
12.1 |
|
|
|
|
12.1.1 |
|
|
|
|
12.1.2 |
|
|
|
|
12.1.3 |
|
|
|
|
12.1.4 |
|
|
|
12.3 |
|
|
| 13 |
|
|
|
13.1 |
|
|
|
|
13.1.1 |
|
|
|
|
13.1.2 |
|
|
|
|
13.1.3 |
|
|
|
|
13.1.4 |
|
|
|
13.2 |
|
|
|
|
13.2.1 |
|
|
|
13.3 |
|
|
|
13.4 |
|
|
|
13.5 |
|
|
|
13.6 |
|
|
|
13.7 |
|
|
|
13.8 |
|
|
|
13.9 |
|
|
|
13.10 |
|
|
|
13.11 |
|
|
| 14 |
|
|
|
14.1 |
|
|
|
14.2 |
|
|
|
14.3 |
|
|
|
|
14.3.1 |
|
|
|
|
14.3.2 |
|
|
|
|
14.3.3 |
|
|
|
|
14.3.4 |
|
|
|
14.4 |
|
|
| 15 |
|
|
|
15.1 |
|
|
|
|
15.1.1 |
|
|
|
|
15.1.2 |
|
|
|
|
15.1.3 |
|
|
|
15.2 |
|
|
|
|
15.2.1 |
|
|
|
15.3 |
|
|
|
15.4 |
|
|
|
15.5 |
|
|
|
15.6 |
|
|
| 16 |
|
|
|
16.1 |
|
|
Effective Date: 30 June 2023
v
Technical Report Summary for
Tshepong South, Free State Province, South Africa
|
|
|
|
|
|
|
|
|
|
|
|
|
|
|
|
16.2 |
|
|
|
|
16.2.1 |
|
|
|
|
16.2.2 |
|
|
|
16.3 |
|
|
|
|
16.3.1 |
|
|
|
|
16.3.2 |
|
|
|
|
16.3.3 |
|
|
|
16.4 |
|
|
|
|
16.4.1 |
|
|
|
|
16.4.2 |
|
|
|
|
16.4.3 |
|
|
|
16.5 |
|
|
|
16.6 |
|
|
| 17 |
|
|
|
17.1 |
|
|
|
17.2 |
|
|
|
17.3 |
|
|
|
17.4 |
|
|
|
17.5 |
|
|
|
17.6 |
|
|
|
17.7 |
|
|
|
17.8 |
|
|
| 18 |
|
|
|
18.1 |
|
|
|
18.2 |
|
|
|
18.3 |
|
|
| 19 |
|
|
|
19.1 |
|
|
|
|
19.1.1 |
|
|
|
|
19.1.2 |
|
|
|
|
19.1.3 |
|
|
|
|
19.1.4 |
|
|
|
|
19.1.5 |
|
|
|
19.2 |
|
|
|
19.3 |
|
|
| 20 |
|
|
| 21 |
|
|
| 22 |
|
|
| 23 |
|
|
| 24 |
|
|
| 25 |
|
|
Effective Date: 30 June 2023
vi
Technical Report Summary for
Tshepong South, Free State Province, South Africa
List of Figures
|
|
|
|
|
|
|
|
| Figure 3-2: Mineral Tenure for Tshepong South |
|
| Figure 5-1: Graph of Past Production – Tonnes and Grade |
|
| Figure 5-2: Graph of Past Metal Production |
|
| Figure 6-1: Regional Geology of the Witwatersrand Basin |
|
| Figure 6-2: Simplified stratigraphy of the Free State Goldfield |
|
| Figure 6-3: Structural Geology of the Free State Goldfields |
|
| Figure 6-4: Tshepong South Cross Section |
|
| Figure 7-1: Location of Channel Samples Collected from the Basal Reef |
|
| Figure 7-2: Location of Channel Samples Collected from the B Reef |
|
| Figure 7-3: Location of Surface and Underground Drill Holes on the Basal Reef |
|
| Figure 7-4: Location of Surface and Underground Drill Holes on the B Reef |
|
| Figure 11-1: Tshepong South Basal and B Reef Geozones |
|
| Figure 11-2: Tshepong South Basal Reef and B Reef Estimation Results |
|
| Figure 11-3: Location and Classification of Tshepong South Mineral Resources and Mineral Reserves for the Basal Reef |
|
| Figure 11-4: Location and Classification of Tshepong South Mineral Resources and Mineral Reserves for the B Reef |
55 |
| Figure 13-1: Schematic Representation of the SGM Sequence |
|
| Figure 13-1A: Schematic Representation of the Sequential Mining Method |
61 |
| Figure 13-2: Tshepong South LOM Plan |
|
|
|
|
66 |
|
|
|
|
|
|
|
|
|
|
|
|
|
|
|
|
|
|
|
|
Effective Date: 30 June 2023
vii
Technical Report Summary for
Tshepong South, Free State Province, South Africa
List of Tables
|
|
|
|
|
|
|
|
|
|
|
|
|
|
|
|
|
|
|
|
|
|
|
|
|
|
|
|
|
|
|
|
|
|
|
|
|
|
|
|
|
|
|
|
|
|
|
|
|
|
|
|
|
|
|
|
|
|
|
|
|
|
|
|
| Table 17-2: Mine Closure Liability |
|
| Table 17-3: Rehabilitation Assurance |
|
|
|
|
|
|
|
|
|
|
|
|
|
|
|
|
|
|
|
|
|
Effective Date: 30 June 2023
viii
Technical Report Summary for
Tshepong South, Free State Province, South Africa
Units of Measure and Abbreviations
|
|
|
|
|
|
| Unit / Abbreviation |
Description or Definition |
| °C |
degrees Celsius |
| µm |
Micrometres |
| 2D |
Two-dimensional |
| 3D |
Three-dimensional |
| AE |
Abnormal expenditure |
| Ag |
Silver |
| AngloGold Ashanti |
AngloGold Ashanti Limited |
| ARM |
African Rainbow Minerals Limited |
| ARMGold |
ARM Gold Division |
| Au |
Gold |
| AuBIS |
Harmony electronic database |
| Ave. |
Average |
| BLR |
Black Reef |
| BMD |
Below mine datum |
| Bn |
Billion |
| c. |
Approximately |
| CIP |
Carbon-In-Pulp |
| CLR |
Carbon Leader Reef |
| cm |
Centimetre |
| cmg/t |
Centimetre-grams per tonne |
| CODM |
Chief Operating Decision-Maker |
| Company |
Harmony Gold Mining Company Limited |
| COP |
Code of Practice |
| CRG |
Central Rand Group |
| CRM |
Certified Reference Material |
| CV |
Coefficient of Variation |
| DBH |
Dewatering borehole |
| DMRE |
Department of Mineral Resources and Energy |
| DWAFEC |
Department of Water Affairs, Forestry and Environmental Conservation |
| DWS |
Department of Water and Sanitation |
| EIA |
Environmental Impact Assessment |
| EMPR |
Environmental Management Programme |
| EMS |
Environmental Management System |
| EMTS |
Electric Monorail Transport System |
| ESG |
Environmental Social and Governance |
| ETF |
Exchange traded fund |
| FAG |
Fully autogenous |
| FX |
Foreign Exchange rate |
| g |
Gram |
| g/t |
Grams per metric tonne |
| GBH |
Groundwater boreholes |
| GDARD |
Gauteng Department of Agriculture and Rural Development |
| GHG |
Greenhouse gas |
| GISTM |
Global Industry Standard on Tailings Management |
| ha |
Hectare |
| Harmony |
Harmony Gold Mining Company Limited |
| HLS |
Heavy liquid separation |
| HPE |
Hydro-powered |
| kg |
Kilogram |
Effective Date: 30 June 2023
ix
Technical Report Summary for
Tshepong South, Free State Province, South Africa
|
|
|
|
|
|
| Unit / Abbreviation |
Description or Definition |
| km |
Kilometre |
km2 |
Square kilometre |
| kWh |
Kilowatt-hour |
| LBMA |
London Bullion Market Association |
| LIB |
Long Inclined Borehole |
| LOM |
Life of Mine |
| LOI |
Loss on ignition |
| Ltd |
Limited |
| m |
Metre |
| M |
Million |
m3/hr |
Cubic metres per hour |
| MCC |
Mining Charter Compliance |
| MCF |
Mine Call Factor |
| Moz |
Million troy ounces |
| MPRDA |
Mineral and Petroleum Resources Development Act, 28 of 2002 |
| Mt |
Million tonnes |
| Mtpa |
Million tonnes per annum |
| Mtpm |
Million tonnes per month |
| NEMA |
National Environmental Management Act, 107 of 1998 |
| No. |
Number |
| NPV |
Net present value |
| oz |
Troy ounce |
| OTC |
Over the counter |
| Tshepong South |
Tshepong South Mine |
| Pty |
Proprietary |
| QA/QC |
Quality Assurance/Quality Control |
| QEMSCAN |
Scanning electron microscope |
| QP |
Qualified Person |
| ROM |
Run-of-Mine |
| SACNASP |
South African Council for Natural Scientific Professions |
| SAMREC |
The South African Code for the Reporting of Exploration Results, Mineral Resources and Mineral Reserves |
| SD |
Standard Deviation |
| SEC |
Securities and Exchange Commission |
| SGM |
Sequential Grid Mining |
| SLP |
Social Labour Plan |
| t |
Metric tonne |
t/m3 |
Tonne per cubic metre |
| Target |
Target Mine |
| TCFD |
Task Force on Climate-Related Financial Disclosure |
| TMS |
Trace mineral search |
| TRS |
Technical Report Summary |
| TSF |
Tailings Storage Facility |
| Tshepong |
Tshepong Mine |
| USD |
United States Dollars |
| USD/oz |
United States Dollar per troy ounce |
| WRG |
West Rand Group |
| WUL(s) |
Water Use Licence(s) |
| XRD |
X-ray diffraction |
| ZAR |
South African Rand |
| ZAR/kg |
South African Rand per kilogram |
Effective Date: 30 June 2023
x
Technical Report Summary for
Tshepong South, Free State Province, South Africa
Glossary of Terms
|
|
|
|
|
|
| Term |
Definition |
| Co-kriging |
A method that is used to predict the value of the point at unobserved locations by sample points that are known to be spatially interconnected by adding other variables that have a correlation with the main variable or can also be used to predict 2 or more variables simultaneously. |
| Cut-off grade |
Cut-off grade is the grade (i.e., the concentration of metal or mineral in rock) that determines the destination of the material during mining. For purposes of establishing “prospects of economic extraction,” the cut-off grade is the grade that distinguishes material deemed to have no economic value (it will not be mined in underground mining or if mined in surface mining, its destination will be the waste dump) from material deemed to have economic value (its ultimate destination during mining will be a processing facility). Other terms used in similar fashion as cut-off grade include net smelter return, pay limit, and break-even stripping ratio. |
| Dilution |
Unmineralised rock that is by necessity, removed along with ore during the mining process that effectively lowers the overall grade of the ore. |
| Head grade |
The average grade of ore fed into the mill. |
| Economically viable |
Economically viable, when used in the context of Mineral Reserve determination, means that the qualified person has determined, using a discounted cash flow analysis, or has otherwise analytically determined, that extraction of the Mineral Reserve is economically viable under reasonable investment and market assumptions. |
| Indicated Mineral Resource |
Indicated Mineral Resource is that part of a Mineral Resource for which quantity and grade or quality are estimated on the basis of adequate geological evidence and sampling. The level of geological certainty associated with an Indicated Mineral Resource is sufficient to allow a qualified person to apply modifying factors in sufficient detail to support mine planning and evaluation of the economic viability of the deposit. Because an Indicated Mineral Resource has a lower level of confidence than the level of confidence of a Measured Mineral Resource, an Indicated Mineral Resource may only be converted to a probable Mineral Reserve. |
| Inferred Mineral Resource |
Inferred Mineral Resource is that part of a Mineral Resource for which quantity and grade or quality are estimated on the basis of limited geological evidence and sampling. The level of geological uncertainty associated with an Inferred Mineral Resource is too high to apply relevant technical and economic factors likely to influence the prospects of economic extraction in a manner useful for evaluation of economic viability. Because an Inferred Mineral Resource has the lowest level of geological confidence of all Mineral Resources, which prevents the application of the modifying factors in a manner useful for evaluation of economic viability, an Inferred Mineral Resource may not be considered when assessing the economic viability of a mining project and may not be converted to a Mineral Reserve. |
| Kriging |
A method of interpolation based on Gaussian process governed by prior covariances. It uses a limited set of sampled data points to estimate the value of a variable over a continuous spatial field |
| Mine Call Factor |
The ratio, expressed as a percentage, of the total quantity of recovered and unrecovered mineral product after processing with the amount estimated in the ore based on sampling. |
| Measured Mineral Resource |
Measured Mineral Resource is that part of a Mineral Resource for which quantity and grade or quality are estimated on the basis of conclusive geological evidence and sampling. The level of geological certainty associated with a Measured Mineral Resource is sufficient to allow a qualified person to apply modifying factors, as defined in this section, in sufficient detail to support detailed mine planning and final evaluation of the economic viability of the deposit. Because a Measured Mineral Resource has a higher level of confidence than the level of confidence of either an Indicated Mineral Resource or an Inferred Mineral Resource, a Measured Mineral Resource may be converted to a Proven Mineral Reserve or to a Probable Mineral Reserve. |
| Mineral Reserve |
Mineral Reserve is an estimate of tonnage and grade or quality of Indicated and Measured Mineral Resources that, in the opinion of the qualified person, can be the basis of an economically viable project. More specifically, it is the economically mineable part of a Measured or Indicated Mineral Resource, which includes diluting materials and allowances for losses that may occur when the material is mined or extracted. |
| Mineral Resource |
Mineral Resource is a concentration or occurrence of material of economic interest in or on the Earth’s crust in such form, grade or quality, and quantity that there are reasonable prospects for economic extraction. A Mineral Resource is a reasonable estimate of mineralisation, taking into account relevant factors such as cut-off grade, likely mining dimensions, location or continuity, that, with the assumed and justifiable technical and economic conditions, is likely to, in whole or in part, become economically extractable. It is not merely an inventory of all mineralisation drilled or sampled. |
Effective Date: 30 June 2023
xi
Technical Report Summary for
Tshepong South, Free State Province, South Africa
|
|
|
|
|
|
| Term |
Definition |
| Modifying Factors |
Modifying factors are the factors that a qualified person must apply to Indicated and Measured Mineral Resources and then evaluate in order to establish the economic viability of Mineral Reserves. A qualified person must apply and evaluate modifying factors to convert Measured and Indicated Mineral Resources to Proven and Probable Mineral Reserves. These factors include but are not restricted to; mining; processing; metallurgical; infrastructure; economic; marketing; legal; environmental compliance; plans, negotiations, or agreements with local individuals or groups; and governmental factors. The number, type and specific characteristics of the modifying factors applied will necessarily be a function of and depend upon the mineral, mine, property, or project. |
| Pre-Feasibility Study |
A pre-feasibility study (or preliminary feasibility study) is a comprehensive study of a range of options for the technical and economic viability of a mineral project that has advanced to a stage where a qualified person has determined (in the case of underground mining) a preferred mining method, or (in the case of surface mining) a pit configuration, and in all cases has determined an effective method of mineral processing and an effective plan to sell the product.
(1) A pre-feasibility study includes a financial analysis based on reasonable assumptions, based on appropriate testing, about the modifying factors and the evaluation of any other relevant factors that are sufficient for a qualified person to determine if all or part of the Indicated and Measured Mineral Resources may be converted to Mineral Reserves at the time of reporting. The financial analysis must have the level of detail necessary to demonstrate, at the time of reporting, that extraction is economically viable.
(2) A pre-feasibility study is less comprehensive and results in a lower confidence level than a feasibility study. A pre-feasibility study is more comprehensive and results in a higher confidence level than an initial assessment.
|
|
|
| Probable Mineral Reserve |
Probable Mineral Reserve is the economically mineable part of an Indicated and, in some cases, a Measured Mineral Resource. |
| Proven Mineral Reserve |
Proven Mineral Reserve is the economically mineable part of a Measured Mineral Resource and can only result from conversion of a Measured Mineral Resource. |
| Qualified Person |
A qualified person is:
(1) A mineral industry professional with at least five years of relevant experience in the type of mineralisation and type of deposit under consideration and in the specific type of activity that person is undertaking on behalf of the registrant; and
(2) An eligible member or licensee in good standing of a recognized professional organization at the time the technical report is prepared. For an organization to be a recognized professional organization, it must:
(i) Be either:
(A) An organization recognized within the mining industry as a reputable professional association; or
(B) A board authorized by U.S. federal, state or foreign statute to regulate professionals in the mining, geoscience or related field;
(ii) Admit eligible members primarily on the basis of their academic qualifications and experience;
(iii) Establish and require compliance with professional standards of competence and ethics;
(iv) Require or encourage continuing professional development;
(v) Have and apply disciplinary powers, including the power to suspend or expel a member regardless of where the member practices or resides; and
(vi) Provide a public list of members in good standing.
|
|
|
|
|
|
|
|
|
|
|
| Tailings |
Finely ground rock of low residual value from which valuable minerals have been extracted is discarded and stored in a designed dam facility. |
Effective Date: 30 June 2023
xii
Technical Report Summary for
Tshepong South, Free State Province, South Africa
1Executive Summary
Section 229.601(b)(96) (1)
The Qualified Person(s) (“QP”) of Harmony Gold Mining Company Limited (“Harmony” or the “Company”) have prepared this Technical Report Summary (“TRS”) to disclose the Mineral Resource and Mineral Reserve estimates for the Company’s Tshepong South. The TRS has been prepared in accordance with the U.S. Securities and Exchange Commission (“SEC”) property disclosure regulations, S-K 1300, with an effective date as at June 30, 2023. No material changes have occurred between the effective date and the date of signature of this TRS.
Property Description
Tshepong South comprise the underground and surface assets associated with one mine, namely Tshepong South (“Tshepong South” or “Tshepong South Mine”), situated between the towns of Welkom and Odendaalsrus in the Free State Province of South Africa. The mine is a moderate to deep-level gold mine, operating at depths of between 1.6km and 2.4km below mine datum (“BMD”). The primary reef mined is the Basal Reef, with additional gold mineralisation being found in the B Reef and A Reef.
Mining at Tshepong South is carried out under the following mining right, covering both Tshepong North and Tshepong South:
•FS30/5/1/284MR, which is valid from 11 December 2007 to 10 December 2029 and covers an area of 10,798.74 hectares (“ha”).
The mining right was originally held in a joint venture between African Rainbow Minerals Limited (“ARM”) Gold Division (“ARMGold”) and Harmony until ARMGold was incorporated into Harmony.
All relevant underground mining and surface right permits, and any other permit related to the work conducted on the property have been obtained and are valid. There are no known legal proceedings (including violations or fines) against Harmony, which threaten its mineral rights, tenure, or operations.
Ownership
Tshepong South is wholly owned by Harmony, including the associated mineral rights. Harmony commenced acquiring the assets through the acquisition of AngloGold Ashanti Limited (“AngloGold Ashanti”) Free State operations in 2001, together with ARMGold. ARMGold was subsequently incorporated into Harmony in 2003, giving Harmony 100% ownership and control of the Tshepong South.
Geology and Mineralisation
Tshepong South is situated in the Free State Goldfield, on the southwestern margin of the Witwatersrand Basin of South Africa, one of the most prominent gold provinces in the world. The major gold bearing conglomerate reefs are mostly confined to the Central Rand Group (“CRG”) of the Witwatersrand Supergroup.
The general orientation of the Witwatersrand Supergroup succession in this goldfield is interpreted as north-trending, within a syncline that is plunging to the north. The syncline has been divided by faults into the Odendaalsrus, Central Horst and Virginia sections. The Tshepong South mining right area is also affected by the Ophir and Dagbreek faults.
Tshepong South exploited primarily the Basal Reef, which occurs within the Harmony Formation of the Johannesburg Subgroup of the CRG.
Mineralisation also occurs within the stratigraphically higher A and B reefs of the Kimberley (formerly Aandenk) Formation, within the Turffontein subgroup of the CRG. However, only the B Reef can be economically extracted.
Mineralisation is associated with the presence of medium to coarse, clast-supported oligomictic pebble horizons. The presence of allogenic pyrite and detrital carbon is also common.
Effective Date: 30 June 2023
1
Technical Report Summary for
Tshepong South, Free State Province, South Africa
Status of Exploration, Development and Operation
The Basal Reef at Tshepong South has been extensively explored from historic borehole data collected during initial Shaft Sinking stage beginning of 1994 and vigorous data collection (Borehole and Chip sample) in the early 2007 when development from the Station commenced. Recent exploration has mainly focused on improving confidence in the geological model, as well as adding and upgrading Mineral Resources to replace the mining depletion. Geological data has been obtained through underground channel sampling, mapping and exploration drilling. Initial exploration included a historical geophysical seismic survey and surface diamond core drilling comprising of nine mother holes. This was followed up with closer spaced underground data gathering exercises.
Mineral Resource Estimate
The Mineral Resources for the Basal Reef and B Reef were estimated by the Harmony QP in Datamine™ Studio software. The QP created block models based on a verified electronic database containing surface drill hole data, as well as underground drilling, mapping, and sampling data obtained up until December 2022. Gold values were estimated using ordinary and simple macro kriging interpolation methods.
The Mineral Resources for Tshepong South were correspondingly originally prepared, classified and reported in accordance with the South African Code for the Reporting of Exploration Results, Mineral Resources and Mineral Reserves (“SAMREC, 2016”). For the purposes of this TRS, the Mineral Resources have been classified in accordance with § 229.1302(d)(1)(iii)(A) (Item 1302(d)(1)(iii)(A) of Regulation S-K).
The QP compiling the Mineral Resource estimate for Tshepong South is Ms Bothepha Phetlhu, Ore Reserve Manager at Tshepong South and an employee of Harmony.
The Mineral Resource estimate for Tshepong South, as at June 30, 2023, exclusive of the reported Mineral Reserves is summarised in Table 1-1.
Table 1-1: Summary of Tshepong South Mineral Resources as at June 30, 2023 (Exclusive of Mineral Reserves) 1-8
|
|
|
|
|
|
|
|
|
|
|
|
| METRIC |
| Mineral Resource Category |
Tonnes (Mt) |
Gold Grade (g/t) |
Gold Content (kg) |
| Measured |
5.661 |
13.02 |
73 695 |
| Indicated |
6.680 |
11.67 |
77 950 |
| Total / Ave. Measured + Indicated |
12.341 |
12.29 |
151 645 |
| Inferred |
25.090 |
10.67 |
267 678 |
| IMPERIAL |
| Mineral Resource Category |
Tons (Mt) |
Gold Grade (oz/t) |
Gold Content (Moz) |
| Measured |
6.241 |
0.380 |
2.369 |
| Indicated |
7.363 |
0.340 |
2.506 |
| Total / Ave. Measured + Indicated |
13.604 |
0.358 |
4.875 |
| Inferred |
27.657 |
0.311 |
8.606 |
Notes:
1. Mineral Resources are reported with an effective date of June 30, 2023 were originally prepared, classified and reported according to SAMREC, 2016. For the purposes of this TRS, the Mineral Resources have been classified in accordance with § 229.1302(d)(1)(iii)(A) (Item 1302(d)(1)(iii)(A) of Regulation S-K). The Qualified Person responsible for the estimate is Ms B Phetlhu, who is Ore Reserve Manager at Tshepong South, and a Harmony employee.
2. The Mineral Resource tonnes are reported as in-situ with reasonable prospects for economic extraction.
3. No modifying factors or dilution sources have been included to in-situ Reserve which was subtracted from the SAMREC Resource in order to obtain the S-K 1300 Resource.
4. The Mineral Resources are reported using a cut-off value of 780cmg/t determined at a 90% profit guidance, and a gold price of USD1,764/oz. A unit cost of 4411 R/Tonne.
5. Tonnes are reported as rounded to three decimal places. Gold values are rounded to zero decimal places.
6. Mineral Resources are exclusive of Mineral Reserves. Mineral Resources are not Mineral Reserves and do not necessarily demonstrate economic viability.
7. Rounding as required by reporting guidelines may result in apparent summation differences.
8. The Mineral Resource estimate is for Harmony’s 100% interest.
Effective Date: 30 June 2023
2
Technical Report Summary for
Tshepong South, Free State Province, South Africa
Mineral Reserve Estimate
Mineral Reserves are derived from the Mineral Resources, a detailed business plan and the operational mine planning processes. Mine planning utilises and takes into consideration historical technical parameters achieved. In addition, Mineral Resource conversion to Mineral Reserves considers Modifying Factors, dilution, ore losses and minimum mining widths.
Ore Reserves for Tshepong South were tested using the prescribed Optimiser, a macro driven programme that takes into consideration all Signed-off modifying and economic factors. The 18 month history also plays an integral part of Reserve Classification. The results indicated an economically viable reserve above the 791cmg/t cut-off. The Mineral Reserves for Tshepong South were originally prepared, classified and reported according to SAMREC, 2016. For the purposes of this TRS, the Mineral Reserves have been classified in accordance with § 229.1302(d)(1)(iii)(A) (Item 1302(d)(1)(iii)(A) of Regulation S-K). The Mineral Reserve estimate for Tshepong South, as at June 30, 2023, is summarised in Table 1-3. The same criteria was used in both classifications and no differences exist between the two.
The QP compiling the Mineral Resource estimate for Tshepong South is Ms B Phetlhu, Ore Reserve Manager at Tshepong South and employee of Harmony.
Effective Date: 30 June 2023
3
Technical Report Summary for
Tshepong South, Free State Province, South Africa
Table 1-2: Summary of Tshepong South Mineral Reserves as at June 30, 2023 1-5
|
|
|
|
|
|
|
|
|
|
|
|
| METRIC |
| Mineral Reserve Category |
Tonnes (Mt) |
Gold Grade (g/t) |
Gold Content (kg) |
| Proved |
2.882 |
7.79 |
22 466 |
| Probable |
0.563 |
7.06 |
3 972 |
| Total (Proved + Probable) |
3.445 |
7.67 |
26 438 |
|
|
|
|
|
|
|
|
|
|
|
|
| IMPERIAL |
| Mineral Reserve Category |
Tons (Mt) |
Gold Grade (oz/t) |
Gold Content (Moz) |
| Proved |
3.177 |
0.227 |
0.722 |
| Probable |
0.620 |
0.206 |
0.128 |
| Total (Proved + Probable) |
3.797 |
0.224 |
0.850 |
Notes:
1. The Mineral Reserves were originally prepared, classified and reported according to SAMREC, 2016. For the purposes of this TRS, the Mineral Reserves have been classified in accordance with § 229.1302(d)(1)(iii)(A) (Item 1302(d)(1)(iii)(A) of Regulation S-K). The Qualified Person responsible for the estimate is Ms B Phetlhu, who is Ore Reserve Manager at Tshepong South, and a Harmony employee.
2. Tonnes, grade, and gold content are declared as net delivered to the mills.
3. Figures are fully inclusive of all mining dilutions, gold losses and are reported as mill delivered tonnes and head grades. Metallurgical recovery factors have not been applied to the reserve figures.
4. Gold content has not taken metallurgical recovery factors into account.
5. Mineral Reserves are reported using a cut-off grade of 791cmg/t determined using a gold price of USD1,582/oz gold. A unit cost of R4,411/Tonne.
Capital and Operating Cost Estimates
The capital cost estimates for Tshepong South are determined at a corporate level, using the business plan as the basis. The capital costs are associated with major equipment outside the main operating sections which is termed abnormal expenditure (“AE”), infrastructure development, as well as ongoing capital development (“OCD”). Costs associated with the Mining Charter Compliance (“MCC”), as per South Africa’s Social Labour Plan (“SLP”) requirements are also included in the capital estimates.
The capital costs are presented in Table 1-5. The accuracy level of the capital cost is high as quotations are required first to get to the financials presented.
The operating cost (4411R/Tonne) estimates for Tshepong South are categorised into direct and total costs. The operating cost estimates are shown in Table 1-6.
The capital and operating costs are reported in ZAR terms and on a real basis. The economic analysis, including the capital and operating costs are reported for the period comprising the financial year (“FY24”) July – June. Both the capital and operating estimates are accounted for in the economic analysis of Tshepong South. The results of the economic analysis demonstrate positive returns over the LOM.
Permitting Requirements
The permits held by Tshepong South are presented in Table 1-5.
Tshepong South has the necessary valid permits, administered and managed by various departments, and do not require any additional permits to continue with their mining operations, except for the application which has been submitted to amend the Water Use Applications.
An application to renew and amend the Water Use License Applications (WULA) was submitted to the respective regulator. The approval for these environmental permits is still pending at the effective date of this TRS. Based on current industry norms, a realistic timeframe to obtain relevant authorisations is estimated between 12 and 18 months.
There is no material litigation (including violations or fines) against the Company as at the date of this report which threatens its mineral rights, tenure, or operations.
Effective Date: 30 June 2023
4
Technical Report Summary for
Tshepong South, Free State Province, South Africa
Conclusions
Under the assumptions in this TRS, Tshepong South shows a positive cash flow over the life-of-mine which supports the Mineral Resource and Mineral Reserve estimates. The mine plan is achievable under the set of assumptions and parameters used.
Recommendations
The gold output can be optimised through improvement of quality of mining and this will result in achieving planned shaft call factor. This impact will be realised through our currently implemented Business Initiative programme that will look at driving quality of mining through measures such as in-stope water controls and better fragmentation during blasting to contain the gold.
Table 1-3: Summary of Capital Cost Estimate for Tshepong South
|
|
|
|
|
|
| Capital Cost Element (ZAR'000s) |
Total LOM (FY2024 - FY2030) |
| AE |
172 126 |
| Shaft Projects |
152 201 |
| Major Projects |
264 521 |
| MCC |
97 871 |
| Total |
686 719 |
| OCD |
1 261 098 |
| Total (including OCD) |
1 947 817 |
Table 1-4: Summary of Operating Cost Estimate for Tshepong South
|
|
|
|
|
|
| Operating Cost Element (ZAR'000) |
Total LOM (FY2024 - FY2030) |
| Mining |
7 775 322 |
| Services |
1 818 105 |
| Medical Hub / Station |
441 944 |
| Engineering |
7 569 980 |
|
|
|
|
| Total Direct Costs |
17 605 351 |
| Mine Overheads |
901 690 |
| Royalties |
203 461 |
| Ongoing Capex |
1 261 098 |
| Total Cost |
19 971 600 |
Table 1-5: Status of Environmental Permits and Licences
|
|
|
|
|
|
|
|
|
|
|
|
|
|
|
| Permit / Licence |
Reference No. |
Issued By |
Date Granted |
Validity |
| Environmental Management Programme |
FS 30/5/1/2/3/2/1(84)EM |
DMRE |
April 6 1910 |
LOM |
| Environmental Management Updated |
FS 30/5/1/2/2/84MR |
DWAFEC |
Pending Approval Submitted in 2020 |
LOM |
| Water Permit 936B. Harmony. Free State Geduld Mines. Discharge of untreated effluents |
B33/2/340/31 |
DWAFEC |
April 2 1981 |
LOM |
| Water Permit 870B. Harmony. Discharge of untreated effluents. |
B33/2/340/25 |
DWAFEC |
May 27 1991 |
LOM |
| Water Permit 1214N. Free State Consolidated Gold Mine. Tshepong, Freddie’s and Phakisa shafts. |
B33/2/340/12 |
DWAFEC |
Not indicated. |
LOM |
Notes: DWAFEC - Department of Water Affairs, Forestry and Environmental Conservation, DWA - Department of Water Affairs.
Effective Date: 30 June 2023
5
Technical Report Summary for
Tshepong South, Free State Province, South Africa
2Introduction
Section 229.601(b)(96) (2) (i-v)
This TRS on Tshepong South has been prepared for the registrant, Harmony. The TRS has been prepared in accordance with the U.S. SEC Disclosure by Registrants Engaged in Mining Operations (disclosure regulations S-K 1300). It has been prepared to meet the requirements of Section 229.601(b)96 - Technical Report Summary. The purpose of this TRS is to provide open and transparent disclosure of all material, exploration activities, Mineral Resource and Mineral Reserve information to enable the investor to understand Tshepong South, which forms part of Harmony’s activities.
This TRS has been prepared from the following sources of information:
•Harmony Operational Report 2023;
•File 18 (Competency Report) Tshepong South Mineral Resource and Reserve Statement FY24;
•Tshepong South Gold Mine 2023 SAMREC Table 1;
•Tshepong South Gold Mine 2023 SAMREC Table 1;
•2023 Report to Shareholders;
•Harmony Mineral Resources and Mineral Reserves Report at June 30, 2023 (“HAR-RR21”);
•Base Geological and Mine Planning data; and
•Integrated Internal Technical Report FY24.
The TRS was prepared by QPs employed on a full-time basis by the registrant. The QPs qualifications, areas of responsibility and personal inspection of the property are summarised in Table 2-1.
Table 2-1: QP Qualification, Section Responsibilities and Personal Inspections
|
|
|
|
|
|
|
|
|
|
|
|
|
|
|
| Qualified Person |
Professional Organisation |
Qualification |
TRS Section Responsibility |
Personal Insp. |
| Ms. B. Phetlhu |
SACNASP |
BTech. (Geol), M (Eng) |
All Sections (Phakisa) |
Full Time |
|
|
|
|
|
|
|
|
|
|
|
|
|
|
|
|
|
|
|
|
|
|
|
|
|
|
|
|
|
|
|
|
|
|
|
|
|
|
|
|
|
|
|
|
|
|
|
|
|
|
This TRS report is an update of the previously filed 30 June 2022 document with the SEC and has an effective date as at June 30, 2023. No material changes have occurred between the effective date and the date of signature.
Effective Date: 30 June 2023
6
Technical Report Summary for
Tshepong South, Free State Province, South Africa
3Property Description and Location
Section 229.601(b)(96) (3) (i-vii)
Tshepong South comprises one operating underground gold mine namely “Tshepong South”. Tshepong South is a mature, moderate to deep-level underground operation using conventional underground mining methods to depths of 2,427m BMD. The mine utilises the Tshepong North and Nyala shafts. Tshepong South’s success is greatly dependent on the services rendered via Nyala. Four main compressors and Tshepong South’s ore is transported 5.2km’s via the railveyor system that runs underground on 55 level to Nyala where it is then hoisted and transported via Rail system to the plant.
The mines are located in the Free State Province of South Africa, approximately 250 km southwest of Johannesburg and 15 km to the north of the town of Welkom (Figure 3-1).Tshepong South is situated adjacent to the south of Tshepong North, and is located at a latitude of 27°54’1.27”S and longitude of 26°43’30.05”E.
3.1Mineral Tenure
South African Mining Law is regulated by the MPRDA which is the predominant piece of legislation dealing with acquisitions or rights to conduct reconnaissance, prospecting and mining. There are several other pieces of legislation which deal with such ancillary issues such as royalties (the Mineral and Petroleum Resources Royalty Act, 2008), title registration (the Mining Titles Registration Act, 1967), and health and safety (the Mine Health and Safety Act, 1996).
The current mining right for Tshepong (Tshepong South and Tshepong North) encompasses an area of 10,798.74ha (Figure 3-2). Harmony holds several mining rights in the Free State goldfields which have been successfully converted and executed as new order mining rights, some of which are still to be registered at the Mineral and Petroleum Resources Titles Office (“MPRTO”). The mining right for Tshepong South is presented in Table 3-1.
Tshepong South is wholly owned by Harmony, including the associated mineral rights. Harmony commenced acquiring the assets through the acquisition of AngloGold Ashanti Limited (“AngloGold Ashanti”) Free State operations in 2001, together with ARMGold. ARMGold was subsequently incorporated into Harmony in 2003, giving Harmony 100% ownership and control of Tshepong South.
Table 3-1: Summary of Mining Rights for Tshepong South
|
|
|
|
|
|
|
|
|
|
|
|
|
|
|
|
|
|
| Licence Holder |
Licence Type |
Reference No. |
Effective Date |
Expiry Date |
Area (ha) |
| ARMGold / Harmony JV |
Mining Right |
FS30/5/1/284MR |
11-Dec-2007 |
10-Dec-2029 |
10798.74 |
|
|
|
|
|
|
|
|
|
|
|
|
|
|
|
|
|
|
|
|
|
|
|
|
|
|
|
|
|
|
|
|
|
|
|
|
|
|
|
|
|
|
|
|
|
|
|
|
There are no known legal proceedings (including violations or fines) against the Company which threatens its mineral rights, tenure, or operations.
3.2Property Permitting Requirements
All relevant underground mining and surface permits, and any other permit related to the work conducted on the property have been obtained and are valid. An application to renew and amend the water use license applications (WULA) was submitted to the respective regulator as per Table 1-5.
Harmony has access to all the properties it requires to conduct its current mining activities. The surface lease and surface right areas are sufficient in size and nature to accommodate the required surface infrastructure to facilitate current and planned mining operations.
Harmony monitors complaints and litigation against the Company as part of its risk management systems, policies and procedures. There is no material litigation (including violations or fines) against the Company as at the date of this report which threatens its mineral rights, tenure or operations.
Effective Date: 30 June 2023
7
Technical Report Summary for
Tshepong South, Free State Province, South Africa
|
|
|
Figure 3-1: Location of Tshepong South in the Free State Goldfield |
Effective Date: 30 June 2023
8
Technical Report Summary for
Tshepong South, Free State Province, South Africa
|
|
|
Figure 3-2: Mineral Tenure for Tshepong South |
Effective Date: 30 June 2023
9
Technical Report Summary for
Tshepong South, Free State Province, South Africa
4Accessibility, Climate, Local Resources, Infrastructure and Physiography
Section 229.601(b)(96) (4) (i-iv)
4.1Accessibility
Access to Tshepong South is accessible via the local R70 road between Welkom and Odendaalsrus (Figure 3-1). The area has well-established rail links and an airfield within close proximity.
Entry into the mining area is restricted by security fencing, security guards, booms and lockable gates at the main entrance. In addition, a communication system and access control system monitors personnel entering and leaving the mine property.
4.2Physiography and Climate
The mine lease area (Tshepong South) is flat with an average height of around 1,344m above mean sea level (“amsl”). There are no prominent topographical landmarks in the area. The topography has been affected by the presence of slimes dams, waste rock dumps and solid waste disposal sites.
Tshepong South is situated in the Free State Goldfield, a semi-arid region with an annual rainfall of between 400mm and 600mm. Local thunderstorms and showers are responsible for most of the precipitation during summer, from October to March, peaking in January. Hail is sometimes associated with thunderstorms.
The seasonal fluctuations in mean temperatures between the warmest and the coldest months vary between an average minimum of 7.7°C in winter to a maximum of 37°C in summer. The month of July is generally the coldest month with the hottest month typically being February.
Tshepong South is not restricted by climatic or seasonal variability.
4.3Local Resources and Infrastructure
The surrounding areas of Welkom and Odendaalsrus are well developed in terms of access and mining-related infrastructure, which supports the numerous operational gold mines in the area. The regional infrastructure includes national and provincial paved road networks, power transmission and distribution networks, water supply networks and communication infrastructure.
As part of the Social Labour Plan members from the surrounding community are trained and skilled on a rotational basis and placed back in the community to create a talent pool of available people that are available as needed. Higher skilled and senior positions are managed and maintained through talent pools and succession planning.
Availability of consumables is handled through the IMS (Internal Material Supply) system as part of the on-site Finance department. Lead times are taken into account and material and supplies ordered and delivery scheduled to ensure a constant supply to the shaft.
Tshepong South operates a single vertical shaft for man and materials. Rock is transported from the underground working via a RailVeyorTM system to the Nyala Shaft for hoisting.
Tshepong South ore is transported, by rail, from Nyala shaft to the Harmony One Plant in Welkom for processing (Figure 3-2).
Tshepong South is powered by electricity from Eskom Holdings State Owned Company (“SOC”) Limited.
Effective Date: 30 June 2023
10
Technical Report Summary for
Tshepong South, Free State Province, South Africa
5History
Section 229.601(b)(96) (5) (i-ii)
5.1Historical Ownership and Development
Tshepong South “Phakisa” was formerly known as FSG 4, Freddies 4 and Tshepong South. Tshepong South development commenced in October 1993 and shaft sinking was started in February 1994. In 1995, shaft sinking was halted on 59 Level due to the prevailing low gold price. Operations at Tshepong South recommenced in September 1996 and sinking was completed to 75 Level, before being halted again in 1999.
Harmony acquired Tshepong South as part of the acquisition from AngloGold Ashanti’s Free State operations (previously known as Freegold), which completed in September 2003. Sinking and equipping was completed to a depth of 2,427m in 2006.
Tshepong South and Tshepong North were merged into Tshepong Operations by Harmony in 2017 and split into separate operations in 2023.
The historical ownership and associated activities related to Tshepong are summarised in Table 5-1.
Table 5-1: Summary of Historical Ownership Changes and Activities of Tshepong South
|
|
|
|
|
|
| Year |
Asset History Highlights |
| Tshepong South |
| 1994 |
Shaft sinking began. |
| 2002 |
Harmony (as part of a 50:50 joint venture with ARMGold) acquired Phakisa from AngloGold Ashanti. |
| 2003 |
The Phakisa Shaft Project began development. ARMGold and Harmony merged. |
| 2005 |
Phakisa shaft completed and shaft equipping underway. |
| 2008 |
Phakisa started production with full-scale production planned by June 2011. |
| 2009 |
Five ice plants commissioned, improving ventilation and cooling. |
| 2011 |
Phakisa reached full production. |
| 2017 |
Tshepong and Phakisa merged into Tshepong Operations |
| 2023 |
Tshepong and Phakisa operations split into separate operations. |
|
|
|
|
|
|
|
|
|
|
|
|
|
|
|
|
|
|
5.2Historical Exploration
A total of nine surface holes were drilled into Tshepong South. Two surface holes UT3 and EV10 had B Reef intersection values of 845 cmg/t and 1429cmg/t respectively. Strong linear B-Reef value trends running from Tshepong North Mine into Tshepong South Mine were also identified where an expected value of the area averaged 1291cmg/t. A high level capital exploration drilling project for B-Reef was approved in August 2016 for Tshepong South Mine. Eight drill holes were planned, totalling 5,180m at a total cost of ZAR5.5m. The exploration drilling programme was successfully concluded in October 2020, with the planned eight holes drilled in the target area which confirmed the extension of the Tshepong payshoot.
5.3Previous Mineral Resource and Mineral Reserve Estimates
The previous in-situ Mineral Resource estimates for Tshepong South were declared as at June 30, 2022 by Harmony, according to the SK 1300 TRS documentation. The previous Mineral Resource estimates, exclusive of Mineral Reserves, are summarised in Table 5-2. These have been superseded by the current estimate prepared by Harmony in Section 11 of this TRS.
Effective Date: 30 June 2023
11
Technical Report Summary for
Tshepong South, Free State Province, South Africa
Table 5-2: Summary of the Previous Tshepong South Mineral Resources as at June 30, 2022 (Exclusive of Mineral Reserves)
|
|
|
|
|
|
|
|
|
|
|
|
| METRIC |
| Mineral Resource Category |
Tonnes (Mt) |
Gold Grade (g/t) |
Gold Content (kg) |
| Measured |
4.741 |
13.25 |
62 797 |
| Indicated |
7.264 |
11.27 |
81 831 |
| Total / Ave. Measured + Indicated |
12.005 |
12.05 |
144 627 |
| Inferred |
27.491 |
10.77 |
295 943 |
| IMPERIAL |
| Mineral Resource Category |
Tons (Mt) |
Gold Grade (oz/t) |
Gold Content (Moz) |
| Measured |
5.226 |
0.386 |
2.019 |
| Indicated |
8.007 |
0.329 |
2.631 |
| Total / Ave. Measured + Indicated |
13.233 |
0.351 |
4.650 |
| Inferred |
30.303 |
0.314 |
9.515 |
Table 5-3: Summary of the Previous Tshepong South Mineral Reserves as at June 30, 2022
|
|
|
|
|
|
|
|
|
|
|
|
| METRIC |
| Mineral Reserve Category |
Tonnes (Mt) |
Gold Grade (g/t) |
Gold Content (kg) |
| Proven |
3.759 |
6.98 |
26 243 |
| Probable |
0.176 |
6.49 |
1 143 |
| Total / Ave. Proven + Probable |
3.935 |
6.96 |
27 386 |
| IMPERIAL |
| Mineral Reserve Category |
Tons (Mt) |
Gold Grade (oz/t) |
Gold Content (Moz) |
| Proven |
4.144 |
0.204 |
0.844 |
| Probable |
0.194 |
0.189 |
0.037 |
| Total / Ave. Proven + Probable |
4.338 |
0.203 |
0.880 |
5.4Past Production
The annual Financial Year’s tonnage, grade and gold production for Tshepong South is presented in Figure 5-1 and Figure 5-2. The reader should note that the figures are reported separately from Tshepong North and the Financial year period runs from July to June the following year (12 months).
Effective Date: 30 June 2023
12
Technical Report Summary for
Tshepong South, Free State Province, South Africa
|
|
|
Figure 5-1: Graph of Past Production – Tonnes and Grade |
|
|
|
Figure 5-2: Graph of Past Metal Production |
Effective Date: 30 June 2023
13
Technical Report Summary for
Tshepong South, Free State Province, South Africa
6Geological Setting, Mineralisation and Deposit
Section 229.601(b)(96) (6) (i-iii)
6.1Regional Geology
Tshepong South is located on the southwestern margin of the Archean Witwatersrand Basin, one of the prominent gold provinces in the world. The Witwatersrand Basin is an approximately 7,000m thick terrigenous sequence comprising mainly arenaceous and argillaceous, together with minor rudaceous, lithologies deposited in a fluvio-deltaic environment in the centre of the Archaean Kaapvaal Craton of South Africa (Robb and Meyer, 1995). The regional geology of the Witwatersrand Basin is shown in Figure 6-1.
The Witwatersrand Basin hosts the Witwatersrand Supergroup, which either conformably or unconformably overlies the metamorphosed volcanic and minor clastic sediments of the Dominion Group (Tucker et al., 2016). The Dominion Group overlies the older granite-greenstone basement.
The majority of the Witwatersrand Supergroup is capped by the volcano-sedimentary sequence of the Ventersdorp Supergroup through an angular unconformity. The Ventersdorp Supergroup is in turn overlain by the dolomitic and quartizitic sequence of the Transvaal Supergroup, and sediments of the Karoo Supergroup (Tucker et al., 2016). Several suites of dykes and sills cut across the Archaean basement and the Witwatersrand, Ventersdorp, Transvaal and Karoo supergroups, and form important geological time-markers.
The Witwatersrand Supergroup is sub-divided into the basal West Rand Group (“WRG”) and overlying CRG (Robb and Robb, 1998). The WRG extends over an area of 43,000km2 and is up to 5,150m thick. It is sub-divided in three subgroups, namely, from bottom upwards, the Hospital Hill Subgroup; Government Subgroup and Jeppestown Subgroup. The stratigraphic succession of the WRG mainly consists of shale sediments, with occasional units of banded iron formation and conglomerate.
The CRG is up to 2,880m thick and covers an area of up to 9,750km2, with a basal extent of c.290 km x 150 km. It is sub-divided into the lower Johannesburg Subgroup and upper Turffontein Subgroup as shown in Figure 6-2. These subgroups are separated by the Booysens Shale Formation. The stratigraphic succession of the CRG comprises coarse-grained fluvio-deltaic sedimentary rocks.
The major gold bearing conglomerates are mostly confined to the CRG, and these conglomerate horizons are known as reefs. The most important reefs within the CRG are at six stratigraphic positions, three within the Johannesburg Sub-group and three within the Turffontein Sub-group. The reefs are mined in seven major goldfields, and a few smaller occurrences, which extend for over 400km in what has been called “The Golden Arc”. This arc is centred on the prominent Vredefort Dome, as shown in Figure 6-1,. which is thought to be a major meteorite impact site in the centre of the Witwatersrand Basin (Therriault et al., 1997). The goldfields, as shown in Figure 6-1, include: East Rand, South Rand, Central Rand, West Rand, West Wits, Klerksdorp, Free State (Welkom), and Evander.
6.2Local Geology
Tshepong South is located within the Free State Goldfield (Figure 6-1). The stratigraphic column of the Free State Goldfield is presented in Figure 6-2. The Johannesburg Subgroup comprises the Virginia, St Helena, Welkom, Harmony and Dagbreek formations.
The Free State Goldfield forms a triangle between the towns of Allanridge, Welkom and Virginia. The area is host to several gold mines, all of which produce gold from auriferous bearing reefs situated within sediments of the Central Rand Group of the Witwatersrand Sequence (Figure 6-2). Most of the presently exploitable reefs are situated within five stratigraphically separate placers including the Basal/Steyn, Saaiplaas Leader, B, Kimberley and Eldorado, with the majority of tonnage derived from the Basal/ Steyn and Saaiplaas Leader.
The Witwatersrand and overlying Ventersdorp lavas were deposited in a basin with significant and continual down warping to accommodate the sediments and lavas. During Platburg times, the basin underwent a significant rifting and tilting event, resulting in the region being split by significant faults. These faults are generally westerly dipping, with downthrows to the west, and strata dipping generally to the east.
Effective Date: 30 June 2023
14
Technical Report Summary for
Tshepong South, Free State Province, South Africa
|
|
|
Figure 6-1: Regional Geology of the Witwatersrand Basin |
Effective Date: 30 June 2023
15
Technical Report Summary for
Tshepong South, Free State Province, South Africa
|
|
|
Figure 6-2: Simplified stratigraphy of the Free State Goldfield |
Effective Date: 30 June 2023
16
Technical Report Summary for
Tshepong South, Free State Province, South Africa
The general orientation of the Witwatersrand Supergroup succession in the Free State Goldfield is interpreted as north-trending within a syncline that is plunging to the north (Figure 6-3). The syncline is cut by two major faults resulting in the formation of three major fault bounded blocks:
•Odendaalsrus Section to the west of the De Bron fault;
•the Central Horst between the De Bron and Homestead faults; and
•the Virginia Section to the east of the Homestead Fault.
The Central Horst was uplifted, and the Central Rand Group rocks eroded away prior to deposition of the Ventersdorp Supergroup and therefore comprises West Rand quartzites. The western margin of Tshepong South mining right area is also affected by the Tribute fault (~270m) and Ararat Fault (~180m) to the far south-east of the shaft.
A cross section through the fault bounded blocks is presented in Figure 6-4.
6.3Property Geology
The principal gold-bearing orebody is the stratiform and strata-bound Basal Reef (or Basal Reef Zone (“BRZ”)) (Figure 6-2). A secondary reef, the B Reef, lying between 150m and 170m stratigraphically above the Basal Reef, contributes less than 20% to the mining production at Tshepong South Mine.
6.3.1Basal Reef Lithology
The Basal Reef comprises a thin conglomerate, overlain by clean ‘placer’ quartzites. The Basal Reef is underlain by a thick series of siliceous and argillaceous quartzites comprising the Welkom Formation and overlain by shales and quartzites of the Harmony Formation, both of the Johannesburg Sub-group of the CRG. The Basal Reef sits unconformably on the Welkom Formation (Figure 6-2).
The Upper Cycle Black Chert facies Basal Reef prevails in the South of Tshepong South’s area and consists of a slightly polymictic (yellow shale specks present), matrix-supported medium-pebble conglomerate with a more gradational contact absent of carbon, where mineralisation is associated with fine disseminated and buck-shot pyrite. The conglomerate is slightly thicker compared to the Lower Cycle, but is also overlain by barren reef quartzite, the entire package being characteristically up to only 40cm thick. The lower Khaki Shale is up to 1m thicker.
There are two facies of Basal Reef on Tshepong South, namely; the Lower Cycle Black Chert facies in the north and the Upper Cycle Black Chert facies in the south. The reef package ranges from 100cm to 160cm thick.
The Lower Cycle Black Chert facies predominates in the north with a northwest / southeast value trend. The reef consists of an oligomictic small pebble matrix-supported conglomerate lag with fly-speck carbon contact. The rest of the reef package constitutes barren siliceous fine-grained reef quartzite. The entire reef package reaches up to 160cm thick and is overlain by 1cm to 30cm of lower khaki shale. This in turn is overlain by the approximately 3-4m thick waxy brown leader quartzite, above which lies the 3-4m thick upper khaki shale.
6.3.2B Reef Lithology
The B Reef at Tshepong South is located about 170m stratigraphically above the Basal Reef and varies in thickness from 30cm to 170cm. The conglomerate varies in character depending on the facies, with B1 being a small to medium pebble conglomerate and usually no more than 30cm thick with abundant carbon. The B2 facies is a small pebble lag in an argillaceous quartzite, with little to no mineralisation. B3 facies is a 20cm to 150cm thick conglomerate, mature, well packed, with pebble sizes varying from small to cobble size, very polymictic, normally with abundant pyrite and some carbon. This is the most common facie.
The lowest unit is a basal lag (Zone A), overlying Doornkop Quartzite Formation. Where this unit is developed (or preserved), it may be a highly mineralised oligomictic or polymictic conglomerate, with visible gold, buckshot pyrite and carbon mineralisation. This unit may carry gold values of many thousands of cmg/t and represents a potentially rewarding exploration target.
Effective Date: 30 June 2023
17
Technical Report Summary for
Tshepong South, Free State Province, South Africa
The unit overlying the Zone A may be either Zone B, which comprises a mildly erosive pebbly quartzite formation, and/or the stratigraphically younger Zone C, which is a polymictic conglomerate with low values and is erosional into the underlying A and B zones.
|
|
|
Figure 6-3: Structural Geology of the Free State Goldfields |
Effective Date: 30 June 2023
18
Technical Report Summary for
Tshepong South, Free State Province, South Africa
|
|
|
Figure 6-4: Tshepong South Cross Section |
Source: Modified after Tucker et al. (2016)
Effective Date: 30 June 2023
19
Technical Report Summary for
Tshepong South, Free State Province, South Africa
6.3.3Structure
At Tshepong South, there are several major faults and dykes present interpreted from surface drill holes and intersected in the development and stoping. Among these are the Enrico, Zero, Zindaba, Eland and Savannah Dykes, as well as the Southern and Tshepong South Faults. The easterly limit of the ore body is not clearly defined but appears to cut off at approximately 3,000m below surface on a major component of the north-south striking Ararat Fault.
Two principal age-based divisions in Tshepong South’s intrusive structures have been identified, namely; Ventersdorp and post-Ventersdorp eras. Various subdivisions within each of these two categories have also been observed.
Yellow porphyry, acicular and quartz diorite dykes are found in the Ventersdorp suite of intrusives, while Karoo dolerites and lamprophyres occur in the post-Ventersdorp suite of intrusives. These intrusives tend to utilise any plane of weakness in their passage. It is therefore not unusual to find an intrusive infill along the various fault planes and other faults within the mine area. Accompanying gouge material, showing slicken-siding along the contacts of the intrusions, indicates that movement has taken place after these rocks were intruded.
Effective Date: 30 June 2023
20
Technical Report Summary for
Tshepong South, Free State Province, South Africa
6.4Mineralisation
The gold mineralisation in the Witwatersrand deposits is believed to have followed an episode of deep burial, fracturing and alteration. The mineralisation model is that Archean gold bearing hydrothermal fluid was introduced into the conglomerates and circulated throughout in hydrothermal cells. The fluids precipitated gold and other elements through reactions that took place at elevated temperatures along the reef horizons, which was the more favourable fluid conduit.
The generic mineralisation model for Tshepong South Basal Reef is based on structurally controlled fluid flow within a conglomerate hosted lithology. Fluid flow is dependent on the permeability of the host rock mass during mineralisation. Fluid flow, permeability and subsequent gold mineralisation are believed to be controlled by four key factors, including:
•chanical stratigraphy;
•the presence or absence of mineralisation age thrust faulting;
•sedimentology; and
•precipitation agent
It is the QP's view, the sedimentological parameters are more influential and predictive for gold distribution on a regional scale.
The gold mineralisation is related to the facies-type, and the mineralisation characteristics within the facies are similar between Tshepong North and Tshepong South and are hence simply described by facies in the section to follow.
6.4.1Basal Reef
Within the Lower Cycle Black Chert facies, mineralisation is characterised by a fine disseminated interstitial pyrite, together with a carbon contact. Mineralisation is associated with the carbon contact and conglomerate, although some concentration is also found just below the upper reef contact. At the top of the reef is a granular textured often gritty quartzite with fine pyrite stringers about 10cm thick.
In the Upper Cycle Black Chert Facies, mineralisation is associated with the carbon contact and conglomerate, although some concentration is also found just below the upper reef contact. It does not have such a well-developed carbon contact as the Lower Cycle facies and is often of lower grade.
6.4.2B Reef
The B1 facies has abundant carbon and gold as associated with the carbon. The B2 facies has little to no gold mineralisation, while the B3 facies normally has abundant pyrite and some carbon. Free gold is found in association with the flyspeck carbon.
6.4.3Alteration
Alteration is evident in the Basal Reef and B Reef at Tshepong South and is a result of the hydrothermal fluids that infiltrated the reef and have overprinted on the original mineral assemblage. The reefs contain authigenic sulphides such as pyrite, and other minerals associated with alteration such as chlorite. Gold associations with these mineral assemblages indicate a strong correlation of gold mobilisation and redistribution at the time of the hydrothermal fluid influx.
While alteration is an important part of the mineralisation, alteration is not used for the identification, modelling or mining of the reefs.
6.5Deposit Type
Tshepong South’s deposits are classed a meta-sedimentary gold deposit. Folding and basin edge faulting have been important controls for sediment deposition and gold distribution patterns within the Witwatersrand Basin and fold trends have been employed in the economic evaluation of various reef horizons.
Effective Date: 30 June 2023
21
Technical Report Summary for
Tshepong South, Free State Province, South Africa
6.6Commentary on Geological Setting, Mineralisation and Deposit
The regional geological setting, local and property geology, mineralisation and deposit-type for Tshepong South is well established, through many decades of exploration and mining. Reliable geological models, maps and cross sections are available that support the interpretations and inform the Mineral Resource estimates.
Effective Date: 30 June 2023
22
Technical Report Summary for
Tshepong South, Free State Province, South Africa
7Exploration
Section 229.601(b)(96) (7) (i-vi)
Geological data has been obtained through initial surface drilling, followed by underground drilling, mapping and channel (chip) sampling.
Tshepong South is undergoing B reef exploration drilling to identify any potential continuation of the current pay shoots connecting Tshepong South and Tshepong North mines. Footwall development began at Tshepong South during FY20 and will be used as a drilling platform to confirm and delineate the anticipated B Reef channel.
7.1Geophysical Surveys
Initial exploration included a historical geophysical seismic survey which entails ground based physical sensing technique that produces a detail image or map of area of economic interest.
7.2Topographic Surveys
As an underground operation, topographic surveys are not material to the Mineral Resource estimates.
7.3Underground Mapping
Face and reef development mapping is undertaken by a team comprising a Sampler or Geologist, and an assistant. Face tapes are setup along gullies and the stope face and secured with reference to the latest survey pegs installed in the workplaces. Reef position and other lithological and stratigraphic information is collected and measured relative to the reference tapes. The information is captured in a notebook.
Once at surface, the person responsible transfers the information from the notebook into CADSMineTM, where a mapping report is produced for each mapped workplace. The mapping reports depict the geological information graphically relative to the survey measurement points. Data from the mapping is also incorporated into the geological models.
Approximately 80-90% of all workplaces are inspected by members of the Geosciences team monthly to ensure that suitable mapping information coverage is achieved.
7.4Channel Sampling Methods and Sample Quality
Channel sampling of underground panels are carried out on a monthly basis. Sampling is conducted perpendicular to the channel contact across the exposed channels. The section lines demarcating the width of the sample are drawn parallel to the reef waste contact while those demarcating the length of the sample are drawn at right angles to the reef waste contact and are marked 10cm apart. The samples are chipped out between these section lines.
Sampling of the Basal Reef stoping channels are undertaken at the advancing face on a grid spacing of 5m x 6m at Tshepong South. The sampling process is audited monthly and annually by the Geoscience Manager. Development sampling is on a smaller grid at 4m x 4m for Basal and 2m x 2m for B Reef. Development sampling is done in addition to the face sampling. The results are captured into the information system and plotted on a development sampling sheet.
The location of samples collected from the Basal and B Reef, to date, are shown in Figure 7-1 and Figure 7-2.
A total of 1739 gold samples on average are taken monthly 1664 Basal Reef and 75 B Reef.
7.5Surface Drilling Campaigns, Procedures, Sampling, Recoveries and Results
Most surface drill holes used in the estimation of the current Mineral Resources were drilled by AngloGold Ashanti, or its forebearers, before Harmony acquired Tshepong South.
Effective Date: 30 June 2023
23
Technical Report Summary for
Tshepong South, Free State Province, South Africa
|
|
|
Figure 7-1: Location of Channel Samples Collected from the Basal Reef |
Effective Date: 30 June 2023
24
Technical Report Summary for
Tshepong South, Free State Province, South Africa
|
|
|
Figure 7-2: Location of Channel Samples Collected from the B Reef |
Effective Date: 30 June 2023
25
Technical Report Summary for
Tshepong South, Free State Province, South Africa
7.5.1Drilling Methods
The surface diamond core drilling has been undertaken using a thin-walled core barrel (AXT size core barrel) that delivers 35.51mm core. A single mother hole is drilled, typically with multiple deflection holes drilled from it.
The drill grid spacing of the surface drill hole intersections is up to 100m and is often required to be complemented by underground drill hole intersections. The accuracy of the surface drilling intersection positions from drill holes that are from 2,000m to 3,000m in depth is the major limiting factor of achieving the planned grid. Long surface drill holes often deflect and controlling direction over that depth has always been challenging in the South African gold mining context.
7.5.2Collar and Downhole Surveys
The drill holes are surveyed to confirm both collar position and trajectory. Drill hole collar and downhole surveys are conducted on all surface drill holes.
Surface drill hole collars are surveyed by the internal Land Survey Department. Underground drill hole collars are checked against layouts issued to diamond drilling.
Downhole surveying is conducted using Electronic Multishot System and non-magnetic north seeking Gyro tools as supplied by a certified and specialised downhole survey company, Digital Surveying (Pty) Limited. The instrument is a magnetic based tool and as such all readings are relevant to magnetic north.
7.5.3Logging Procedures
Upon arrival at the core yard located on-site, drill core is marked at every meter interval. The core is then orientated so that the low point of bedding is coincident with the edge of the angle iron. The cut line is defined by the low point of the bedding at the base of the reef zone, when viewed as per convention, from left to right in the direction of increasing depth, is drawn parallel to the core. The core is then rotated through 90° and a yellow line is then drawn parallel to the core, to define the retention half core.
All drill cores are photographed prior to logging and sampling. The geologist conducts the core logging.
Drill core logging is quantitative and qualitative. The following information is recorded:
•lithology;
•packing density;
•roundness;
•sorting;
•contact type, grain/pebble size;
•sediment maturity; and
•mineralisation; and alteration.
The geologist responsible for logging the core stores the original paper record. Core logging is also stored electronically using both DeswikTM and DatamineTM software. Internal peer reviewing is undertaken on the interpretation of the stratigraphy and spatial correlation of drill holes.
Observations are captured on the diamond drilling database by geologists. The logs are checked by the Senior Geologist prior to sampling. Logging procedures are conducted as per the Harmony company standards, which are used on all underground mines and are best practice and have been in place since 2001.
Effective Date: 30 June 2023
26
Technical Report Summary for
Tshepong South, Free State Province, South Africa
7.5.4Drilling Results
The location of the surface drill holes intersecting the Basal and B reefs are presented in Figure 7-3 and Figure 7-4. There are no recent surface drilling results (Table 7-1 and Table 7-2), all drilling dates back to previous project owners and is pre 2017. The results have, however, been included into the geological modelling and Mineral Resource estimation process. These drill holes were drilled to a depth of 2,373m below the surface.
Effective Date: 30 June 2023
27
Technical Report Summary for
Tshepong South, Free State Province, South Africa
|
|
|
Figure 7-3: Location of Surface and Underground Drill Holes on the Basal Reef |
Effective Date: 30 June 2023
28
Technical Report Summary for
Tshepong South, Free State Province, South Africa
|
|
|
Figure 7-4: Location of Surface and Underground Drill Holes on the B Reef |
Effective Date: 30 June 2023
29
Technical Report Summary for
Tshepong South, Free State Province, South Africa
Table 7-1: Summary of Surface and Underground Drilling for Tshepong South
|
|
|
|
|
|
|
|
|
|
|
|
|
|
|
Year |
Company |
No. Drill Holes |
Surface (m) |
Underground (m) |
| 2018 |
Harmony |
129 |
— |
11 081 |
| 2019 |
Harmony |
105 |
— |
7 305 |
| 2020 |
Harmony |
58 |
— |
4 265 |
| 2021 |
Harmony |
113 |
— |
7 190 |
| 2022 |
Harmony |
32 |
— |
2 132 |
| 2023 |
Harmony |
108 |
— |
8 145 |
| Total |
545 |
— |
40 118 |
7.5.5Core Recovery
Upon delivery to the core yard, and prior to logging and sampling, the drill core is checked to ensure 100% core recovery. Core recovery is determined by dividing the measured length of the recovered core by the total length of the core run.
An intersection is complete and representative if core recovery is greater than 99%. Drill holes with poor recovery are not sampled. Extra caution is taken during the drilling process to ensure maximum core recovery on reef intersections, to prevent sample bias.
Reef intersection “acceptability” is categorised as per the criteria summarised in Table 7-3 and is determined by geologists based on, amongst others, drill core condition and faulting. The acceptability is verified for each reef intersection before the assay results are used for Mineral Resource estimation.
Table 7-2: Drill hole Acceptance Criteria
|
|
|
|
|
|
| Category |
Comment |
| Acceptable |
100% core recovery in the reef zone, or very minor loss due to reef chipping. No evidence of faulting within the reef horizon or at either contact with hanging wall or footwall lithologies. |
| Minimum value |
Light to moderate disking of core in the core barrel due to drilling and/or ground conditions. Visual observations indicate that the conglomerate portion of the reef is usually more prone to disking, resulting in possible gold loss. |
| Faulted minimum value |
If the fault loss is considered to be minor, this term may be used if the geologist is certain that only low-value internal quartzite is missing from the intersection. |
| Not acceptable |
Heavy disking of core which may indicate core loss, partial known core loss due to grinding. Also faulting of any description within the reef zone. |
|
|
|
|
|
|
|
|
|
|
7.5.6Sample Length and True Thickness
Mineralisation of the reefs is perpendicular to or at an angle to the drill holes. As such, all drill hole reef intersection widths are corrected to true thickness for gold value calculation.
Effective Date: 30 June 2023
30
Technical Report Summary for
Tshepong South, Free State Province, South Africa
7.6Underground Drilling Campaigns, Procedures and Sampling
Underground exploration drilling has been ongoing throughout the operational life of Tshepong South as the mine deepens. Most of the underground drill holes used in the estimation of the current Mineral Resources were drilled by AngloGold Ashanti before Harmony acquired the mine.
7.6.1Drilling Methods
Underground diamond core drilling is conducted using hydraulic driven and pneumatic drill rigs, which typically delivers an AXT size core (35.51mm). These are short drill holes rarely exceeding 200m in length.
Fans of drill holes are drilled from diamond drilling bays, which are developed at 50m intervals along footwall developments ends (X/Cs) and 100m intervals along haulages and RAWS. The drilling fans consist of up to ten individual drill holes at inclinations ranging from +5° to +90° of vertical, or as dictated by local geological structures.
7.6.2Collar and Downhole Surveys
At Tshepong South, exploration holes are normally not surveyed as the maximum length of the holes are 150m and stabilizers are used to minimize the risk of deflections. In exceptional cases where drilling provides unexpected or anomalous data, or where high accuracy is absolutely required, exploration holes with stabilizers have been surveyed and the results have generally shown the stabilizers to be effective. LIBs drilled for Tshepong South Sub 75 Capital Project and the B reef initial drilling project before footwall development was established were all surveyed, including the deflections.
Boreholes related to Capital projects are generally surveyed to ensure accurate interpretation, as these tend to be longer holes (up to 300m) drilled with special rigs designed for the purpose. The company used for the surveys is DownHole Survey, based in Fochville. A magnetic tool is used to record X, Y, Z and inclination points every 3 meters, with the hole collar being the base. The survey is provided as a spreadsheet containing the relevant information at the specific intervals. The point data can be imported directly to Deswik™ and printed to scale, which makes tracing onto a plan quick and accurate.
With normal exploration and cover holes the collar position is measured from a known survey peg, as well as the distance above or below the grade line. This is done by the drill contractor and provided to the relevant geologist. The geologist will also do spot checks when passing by a drill rig. Exact XYZ coordinates can then be read from the plan after the collar is plotted.
7.6.3Logging Procedures
Upon arrival at the core yard located on-site, drill core is marked at every meter interval. The core is then orientated so that the low point of bedding is coincident with the edge of the angle iron. The cut line is defined by the low point of the bedding at the base of the reef zone, when viewed as per convention, from left to right in the direction of increasing depth, is drawn parallel to the core. The core is then rotated through 90° and a yellow line is then drawn parallel to the core, to define the retention half core.
All drill cores are photographed prior to logging and sampling. The geologist conducts the core logging.
Drill core logging is quantitative and qualitative. The following information is recorded:
•lithology;
•packing density;
•roundness;
•sorting;
•contact type, grain/pebble size;
•sediment maturity; and
•mineralisation; and alteration.
Effective Date: 30 June 2023
31
Technical Report Summary for
Tshepong South, Free State Province, South Africa
The geologist responsible for logging the core stores the original paper record. Core logging is also stored electronically using DatamineTM “Fusion” software. Internal peer reviewing is undertaken on the interpretation of the stratigraphy and spatial correlation of drill holes.
Observations are captured on the diamond drilling database by geologists. The logs are checked by the Senior Geologist prior to sampling. Logging procedures are conducted as per the Harmony company standards, which are used on all underground mines and are best practice and have been in place since 2001.
7.6.4Drilling Results
The location of the underground drill holes intersecting the Basal and B reefs are presented in Figure 7-3 and Figure 7-4.
With over 2508 Basal Reef and B Reef surface and underground drill holes in the database, the results are too voluminous to be reported in this report. The results have, however, been included into the geological modelling and Mineral Resource estimation process.
The recent Basal Reef and B Reef underground drilling results for Tshepong South are summarised in Table 7-4 and Table 7-5. A total of 108 underground drill holes were drilled in 2023 which included 96 Basal Reef intersections and 12 B Reef intersections.
7.6.5Core Recovery
Upon delivery to the core yard, prior to logging and sampling, the drill core is checked to ensure 100% core recovery. Core recovery is determined by dividing the measured length of the recovered core by the total length of the core run.
An intersection is complete and representative if core recovery is greater than 99%. Drillholes with poor recovery are not sampled. Extra caution is taken during the drilling process to ensure maximum core recovery on reef intersections, to prevent sample bias.
Reef intersection “acceptability” is categorised as per the criteria summarised in Table 7-3 and is determined by geologists based on, amongst others, drill core condition and faulting. The acceptability is verified for each reef intersection before the assay results are used for Mineral Resource estimation.
7.6.6Sample Length and True Thickness
Mineralisation of the reefs is perpendicular to or at an angle to the drill holes. As such, all drill hole reef intersection widths are corrected to true thickness for gold value calculation.
7.7Hydrogeology
Harmony has a surface and groundwater monitoring program, managed regionally by the central environmental department to monitor the impacts of our operations on the local water resources.
Water sampling is done as per approved water sampling programme for surface and groundwater, that specify type, frequency and analysis of the sampling required, i.e. surface water sample, frequency is monthly and parameters analyzed Ph, TDS, SO4, U, etc.
The sampling programme is aligned with the requirements of the pending Water Use License Applications submitted to DWS.
Water Quality samples are collected by an external consultant (Aquatico), as per the sampling program, that follow a strict sampling procedure defining the sampling protocol and quality controls required when taking a water quality sample. The sampling procedure followed is available for perusal on the operation. The water analysis is done at an external SANAS accredited laboratory according to SANAS approved procedure. All water quality data is emailed as an analysis certificate (.pdf format) and captured on a water quality database.
Effective Date: 30 June 2023
32
Technical Report Summary for
Tshepong South, Free State Province, South Africa
Water quality data is compared against different public water quality standards and where standards are exceeded the results are investigated. The water quality results are also communicated to DWS on 6 monthly basis.
Harmony has a good understanding of the local geology and geohydrology through numerous geohydrological and mass transport models done over the years.
7.8Geotechnical Data
Geological exploration drilling is not typically used to gather geotechnical data – these data are gathered independently by the Geotechnical Engineer. Geotechnical issues related to underground workings are discussed in more detail in Section 13.3.
Effective Date: 30 June 2023
33
Technical Report Summary for
Tshepong South, Free State Province, South Africa
Table 7-3: Summary of Recent Tshepong South Underground Drill Holes Intersecting the Basal Reef
|
|
|
|
|
|
|
|
|
|
|
|
|
|
|
|
|
|
|
|
|
|
|
|
|
|
|
|
|
|
|
|
|
|
|
|
|
|
|
|
|
|
Year |
Drill Hole ID |
Gold Value (cmg/t) |
Ave. Channel Width (cm) |
|
Year |
Drill Hole ID |
Gold Value (cmg/t) |
Ave. Channel Width (cm) |
|
Year |
Drill Hole ID |
Gold Value (cmg/t) |
Ave. Channel Width (cm) |
| 2022 |
CDD 2318 |
1 965 |
59 |
|
2023 |
GDD 2414 |
2 528 |
39 |
|
2023 |
GDD 2536 |
364 |
47 |
| 2022 |
GDD 2268 |
2 315 |
37 |
|
2023 |
GDD 2453 |
2 585 |
35 |
|
2023 |
GDD 2545 |
9 |
2 |
| 2022 |
GDD 2274 |
1 879 |
42 |
|
2023 |
GDD 2428 |
2 397 |
23 |
|
2023 |
GDD 2533 |
231 |
85 |
| 2022 |
GDD 2276 |
2 731 |
67 |
|
2023 |
GDD 2457 |
876 |
53 |
|
2023 |
GDD 2437 |
251 |
21 |
| 2022 |
GDD 2292 |
1 263 |
41 |
|
2023 |
GDD 2435 |
94 |
19 |
|
2023 |
GDD 2549 |
332 |
18 |
| 2022 |
GDD 2298 |
3 479 |
43 |
|
2023 |
GDD 2435 |
40 |
19 |
|
2023 |
GDD 2537 |
839 |
49 |
| 2022 |
GDD 2302 |
1 500 |
39 |
|
2023 |
GDD 2460 |
300 |
50 |
|
2023 |
GDD 2560 |
2 242 |
39 |
| 2022 |
GDD 2310 |
2 568 |
37 |
|
2023 |
GDD 2432 |
1 519 |
3 |
|
2023 |
GDD 2561 |
577 |
137 |
| 2022 |
GDD 2311 |
2 089 |
38 |
|
2023 |
GDD 2450 |
5 474 |
36 |
|
2023 |
GDD 2562 |
2 588 |
14 |
| 2022 |
GDD 2312 |
658 |
48 |
|
2023 |
GDD 2466 |
277 |
86 |
|
2023 |
GDD 2563 |
366 |
126 |
| 2022 |
GDD 2313 |
397 |
47 |
|
2023 |
GDD 2447 |
1 023 |
38 |
|
2023 |
GDD 2567 |
956 |
75 |
| 2022 |
GDD 2316 |
2 625 |
115 |
|
2023 |
GDD 2423 |
483 |
34 |
|
2023 |
GDD 2548 |
364 |
32 |
| 2022 |
GDD 2326 |
400 |
23 |
|
2023 |
GDD 2423 |
1 245 |
46 |
|
2023 |
GDD 2573 |
524 |
13 |
| 2022 |
GDD 2333 |
943 |
140 |
|
2023 |
GDD 2473 |
218 |
162 |
|
2023 |
GDD 2568 |
1 509 |
52 |
| 2022 |
GDD 2335 |
629 |
44 |
|
2023 |
GDD 2441 |
2 990 |
50 |
|
2023 |
GDD 2578 |
2 701 |
173 |
| 2022 |
GDD 2336 |
2 625 |
46 |
|
2023 |
GDD 2476 |
513 |
37 |
|
2023 |
GDD 2538 |
1 042 |
50 |
| 2022 |
GDD 2337 |
367 |
21 |
|
2023 |
GDD 2468 |
2 160 |
54 |
|
2023 |
GDD 2530 |
2 191 |
197 |
| 2022 |
GDD 2341 |
5 139 |
43 |
|
2023 |
GDD 2467 |
909 |
63 |
|
2023 |
GDD 2586 |
67 |
76 |
| 2022 |
GDD 2356 |
223 |
111 |
|
2023 |
GDD 2485 |
499 |
23 |
|
2023 |
GDD 2552 |
457 |
52 |
| 2022 |
GDD 2357 |
510 |
165 |
|
2023 |
GDD 2469 |
1 316 |
55 |
|
2023 |
GDD 2574 |
1 363 |
69 |
| 2022 |
GDD 2363 |
822 |
113 |
|
2023 |
GDD 2424 |
33 |
35 |
|
2023 |
GDD 2554 |
27 |
44 |
| 2022 |
GDD 2368 |
1 450 |
50 |
|
2023 |
GDD 2438 |
38 |
43 |
|
2023 |
GDD 2569 |
611 |
39 |
| 2022 |
GDD 2372 |
1 187 |
33 |
|
2023 |
CDD 2462 |
141 |
27 |
|
2023 |
GDD 2531 |
665 |
112 |
| 2022 |
GDD 2375 |
1 930 |
333 |
|
2023 |
CDD 2454 |
257 |
141 |
|
2023 |
GDD 2572 |
1 004 |
51 |
| 2022 |
GDD 2384 |
2 959 |
58 |
|
2023 |
GDD 2451 |
1 750 |
43 |
|
2023 |
GDD 2587 |
1 650 |
49 |
| 2022 |
GDD 2386 |
Faulted |
56 |
|
2023 |
GDD 2463 |
5 378 |
42 |
|
2023 |
GDD 2575 |
1 206 |
61 |
| 2022 |
GDD 2387 |
685 |
169 |
|
2023 |
GDD 2501 |
9 |
41 |
|
2023 |
GDD 2517 |
107 |
1 |
| 2022 |
GDD 2394 |
1 613 |
57 |
|
2023 |
GDD 2487 |
464 |
158 |
|
2023 |
GDD 2456 |
88 |
4 |
| 2022 |
GDD 2400 |
337 |
40 |
|
2023 |
GDD 2461 |
177 |
16 |
|
2023 |
GDD 2507 |
12 |
25 |
| 2023 |
GDD 2312 |
658 |
48 |
|
2023 |
GDD 2493 |
7 894 |
38 |
|
|
|
|
|
| 2023 |
GDD 2337 |
367 |
21 |
|
2023 |
GDD 2494 |
339 |
80 |
|
|
|
|
|
| 2023 |
GDD 2372 |
1 187 |
33 |
|
2023 |
GDD 2507 |
86 |
7 |
|
|
|
|
|
| 2023 |
GDD 2405 |
2 009 |
34 |
|
2023 |
GDD 2505 |
445 |
34 |
|
|
|
|
|
| 2023 |
GDD 2399 |
1 986 |
32 |
|
2023 |
GDD 2489 |
1 528 |
35 |
|
|
|
|
|
| 2023 |
GDD 2398 |
602 |
30 |
|
2023 |
GDD 2425 |
1 435 |
38 |
|
|
|
|
|
Effective Date: 30 June 2023
34
Technical Report Summary for
Tshepong South, Free State Province, South Africa
|
|
|
|
|
|
|
|
|
|
|
|
|
|
|
|
|
|
|
|
|
|
|
|
|
|
|
|
|
|
|
|
|
|
|
|
|
|
|
|
|
|
| 2023 |
GDD 2410 |
455 |
24 |
|
2023 |
GDD 2509 |
3 820 |
14 |
|
|
|
|
|
| 2023 |
GDD 2411 |
1 178 |
51 |
|
2023 |
GDD 2492 |
333 |
36 |
|
|
|
|
|
| 2023 |
GDD 2417 |
769 |
44 |
|
2023 |
GDD 2504 |
951 |
35 |
|
|
|
|
|
| 2023 |
GDD 2404 |
269 |
53 |
|
2023 |
GDD 2495 |
1 991 |
40 |
|
|
|
|
|
| 2023 |
CDD 2370 |
2 219 |
51 |
|
2023 |
GDD 2496 |
3 292 |
118 |
|
|
|
|
|
| 2023 |
GDD 2397 |
859 |
30 |
|
2023 |
GDD 2519 |
705 |
75 |
|
|
|
|
|
| 2023 |
GDD 2412 |
698 |
39 |
|
2023 |
GDD 2535 |
61 |
44 |
|
|
|
|
|
| 2023 |
GDD 2402 |
1 253 |
75 |
|
2023 |
GDD 2474 |
591 |
119 |
|
|
|
|
|
| 2023 |
GDD 2427 |
4 235 |
16 |
|
2023 |
GDD 2497 |
1 101 |
38 |
|
|
|
|
|
| 2023 |
GDD 2413 |
2 190 |
64 |
|
2023 |
GDD 2516 |
1 461 |
48 |
|
|
|
|
|
| 2023 |
GDD 2445 |
1 661 |
42 |
|
2023 |
GDD 2520 |
1 116 |
33 |
|
|
|
|
|
| 2023 |
CDD 2422 |
4 384 |
64 |
|
2023 |
GDD 2522 |
4 166 |
53 |
|
|
|
|
|
| 2023 |
GDD 2415 |
440 |
37 |
|
2023 |
CDD 2544 |
429 |
29 |
|
|
|
|
|
Table 7-4: Summary of Recent Tshepong South Underground Drill Holes Intersecting the B Reef
|
|
|
|
|
|
|
|
|
|
|
|
| Year |
Drill Hole ID |
Gold Value (cmg/t) |
Ave. Channel Width (cm) |
| <2017 |
GDD1357 |
670 |
169 |
| <2017 |
HBD1368A |
36 |
162 |
| 2018 |
HBD 1368 |
2 |
29 |
| 2018 |
HBD 1368 |
36 |
162 |
| 2022 |
GDD 2296 |
38 |
47 |
| 2023 |
GDD 2377 |
103 |
150 |
| 2023 |
GDD 2420 |
94 |
152 |
| 2023 |
GDD 2421 |
99 |
238 |
| 2023 |
CDD 2364 |
86 |
68 |
| 2023 |
GDD 2431 |
543 |
176 |
| 2023 |
GDD 2443 |
375 |
130 |
| 2023 |
GDD 2374 |
979 |
105 |
| 2023 |
GDD 2449 |
197 |
144 |
| 2023 |
GDD 2488 |
228 |
175 |
| 2023 |
GDD 2499 |
131 |
30 |
| 2023 |
GDD 2512 |
102 |
47 |
| 2023 |
GDD 2564 |
170 |
185 |
Effective Date: 30 June 2023
35
Technical Report Summary for
Tshepong South, Free State Province, South Africa
7.9Commentary on Exploration
Surface drilling was used as the initial exploration drilling, and this was later infilled to provide sufficient detail for geological modelling and Mineral Resource estimation. The underground infill drilling system is in place to improve data density in specific areas and are drilled from the underground development access drives.
Logging procedures are conducted as per the Harmony company standards, which are used on all surface and underground mines and are best practice and have been in place consistently since 2001.
Previous to this system surface exploration holes (historical drilling) were drilled by Anglo and detailed logs exist in a safe room at the Harmony Steyn offices.
The QP is of the opinion that the quality and quantity of the exploration methods and information gathered is sufficient to support the estimation of Mineral Resources and Mineral Reserves.
Effective Date: 30 June 2023
36
Technical Report Summary for
Tshepong South, Free State Province, South Africa
8Sample Preparation, Analyses and Security
Section 229.601(b)(96) (8) (i-v)
This section summarises information relating to the sample preparation on site through to the laboratory preparation and analysis.
8.1Sampling Method and Approach
Sample types used to support both production and geological exploration include diamond drill core samples and channel (chip) samples.
8.1.1Channel Samples
Channel sampling is (and was by Anglo previously) undertaken according to industry best practice, and presently now according to Harmony’s Underground Sampling Procedure which incorporates QAQC principles.
Tshepong South’s standard is to achieve 100% stope sampling coverage.The sampling grid in the Basal Reef stoping is a 5m interval along dip and a 6m interval on strike creating a 5m x 6m grid.
For 100% development coverage on Tshepong South, the full extent of the on-reef development must be sampled on one sidewall every 4m. Due to the high nugget effect and variability associated with B Reef, these intervals may be increased where appropriate (currently 2m interval).
Samples are chipped from the advancing face from within clearly measured and marked channel sections, including the 2cm hanging wall and footwall width. Sample widths are measured at right angles to the dip of the reef. Individual sample widths are measured from bottom to top along the two parallel lines. Two clino-rules are used for measuring the sample widths. One ruler is held horizontally with the sprit level on strike, and another held at right angles to the dip. The two rulers must cross each other at right angles. The face measured must agree with the totals of all individual widths. All measurements are made to the nearest centimetre.
The channel and sample lines are chipped out using a standard chisel and mallet, bagged, labelled with a unique sampling number, and sealed. An adequate mass of each sample is collected to allow sufficient sized aliquots to be analysed at the designated laboratory. The minimum sample weight sent for assay is approximately 300g.
Samples are weighed and submitted to the designated laboratory for analyses. All inter-person transfers are recorded. This process continues until the samples have been submitted to the laboratory.
8.1.2Core Samples
Diamond drill core is transported to the on-site storage facility under the supervision of a Senior Geologist. Upon arrival, the core is logged and sampled according to the internal Harmony Drill hole Sampling Procedure.
Where possible the entire channel width intersected in each drill hole is split using a diamond drill core cutter and one half of the sample is bagged, tagged and sent to the designated laboratory for assay. The remaining half is retained for future reference. If the core condition is such that a successful cut cannot be achieved, then the whole core is submitted for assay.
Pertinent data captured during sampling includes sample width (cm), mass, core lithological intersection angles and a detailed visual description of the reef. The data is recorded in the drill hole database together with the unique sample number, collection date and spatial location.
All samples are assessed for quality and signed-off by the Senior Geologist for completeness and auditability, prior to laboratory dispatch.
Effective Date: 30 June 2023
37
Technical Report Summary for
Tshepong South, Free State Province, South Africa
8.2Density Determination
The relative density of samples was determined through the work conducted by the Harmony Free State central office regarding relative densities on the various shafts since August 2009.
More recently 2023, a total of 50 samples were taken from underground workings including hanging wall, reef and footwall samples. The dry mass and the submerged mass of the samples in water were measured and the density was calculated.
Tests have occasionally been conducted thereafter on samples collected from the working places.
A single relative density of 2.72t/m3 is used for Mineral Resource estimates.
8.3Sample Security
Chip samples are bagged, sealed and delivered by the samplers to the onsite coreyard on the same day as they are collected. The core yard is a secure facility with access control measures in place. Samples are delivered to the laboratory by the mine.
Cores are delivered to the core yard at the end of each day’s drilling for secure storage. Sampling only takes place at the core yard. The samples are bagged and sealed and stored until they are delivered to the laboratory.
Samples are stored in secured a facility and can only be transported by a permit holder for transporting gold bearing material. Waybills and registers are checked and signed off by security. The samples are received from the mine in locked containers with seals.
The sample labels are scanned at the designated laboratory and the batches compared to the submitted sample sheets. The scanned bar codes are kept at the laboratory and compared to the work sheets that are automatically created on the system. Sample lists submitted by the mine are used to compare what is received at the laboratory.
8.4Sample Storage
All pulp samples of exploration drill hole intersections and underground chip samples are kept for a few months at the laboratory and later discarded. The remaining half of the sampled core of exploration holes is kept at the core yard for future references.
8.5Laboratories Used
Both the underground and surface exploration samples were historically sent to the SGS South Africa (Pty) Limited (“SGS”) independent laboratory, with Anglo American Laboratories used as a secondary independent laboratory.
All samples are currently sent to the Harmony Assay Laboratory located in Welkom for preparation and assay. The laboratory is ISO/IEC 17025:2017 certified for chemical analysis by the South African National Accreditation System (Accreditation No. T0520). Harmony Assay Laboratory is however not an independent laboratory.
8.6Laboratory Sample Preparation
Upon receipt, the samples are dried, crushed, and milled to the appropriate size. Routine screen tests on pulps by the assay laboratory are used to check comminution of samples to contract specification. The contract specification is that the comminution should be 80% passing 75µm for Tshepong North and 80% passing 75µm for Tshepong South.
The total percentage mass loss on each sample should not exceed 2%.
Effective Date: 30 June 2023
38
Technical Report Summary for
Tshepong South, Free State Province, South Africa
8.7Assaying Methods and Analytical Procedures
For the period 1 July 2022 to June 30, 2023 , Tshepong South submitted a total of 20,867 samples for analysis of gold. Gold is analysed by fire assay with a gravimetric finish, while uranium is analysed by XRD. For a period ranging from 2010 up to March 2020, the development and drill hole reef samples were also assayed for uranium.
After the preparation stage the samples are packed into trays and transported to the fluxing-room. A catch weight aliquot of ±25g and a flux aliquot of ±100g is placed into a fire assay crucible and thoroughly mixed. The samples are then transferred to the ovens for the fusion process. The cupellation process is where the precious metals are collected in a lead button and then separated from the lead by means of oxidation fusion. The gold prill is then added to a nitric acid solution to dissolve the silver and thereafter the remaining gold prill is weighed to determine its mass relative to the original sample mass.
To ensure that a high standard of analysis is maintained, each step of the analytical process and procedure,
including the adherence to safety standards, is checked by a supervisor.
8.8Sampling and Assay Quality Control (“QC”) Procedures and Quality Assurance (“QA”)
The assessment of assaying accuracy and precision is carried out using certified Standard Reference Materials (“SRM”), blanks and duplicates. SRMs, blank samples and duplicate samples are added with the underground chip sample and drill hole core sample streams prior to being sent to the assay laboratory.
In addition, regular audits of the laboratory processes and facilities are conducted by mine evaluators and regional experts to monitor compliance and quality controls.
8.8.1Standards
A range of SRMs were sourced from African Minerals Standards (“AMIS”) and inserted into the sample sequence by the logging geologist.
For analysis of surface and underground drill holes, a minimum of one gold SRM is required for every 20 drill hole samples assayed. This equates to approximately 5% of the total drill hole samples analysed for Tshepong North, and approximately 6% for Tshepong South.
Laboratory statistical control is deemed acceptable should SRMs be within two standard deviations of the recommended value. Investigative action is taken when reference materials returned exceed the standard deviation limit.
If the SRM or blank sample has been deemed to have failed, the entire batch of samples re-assayed with the failed QAQC sample having to be identified. A request must then be sent to the laboratory requesting the laboratory to repeat the assay procedure on all 24 samples within the batch.
A second SRM or blank sample is provided to the laboratory to include with the batch of samples. Should the batch of samples fail the QAQC standards again, these samples are excluded from the sampling database (not captured in the sampling system), and the panel/drill hole will have to be resampled if necessary.
A total of 510 SRMs were submitted to Harmony Assay Laboratory for Tshepong South between July 2022 and June 2023. The results are summarised in Table 8-1. One out of 508 samples (0.2%) failed, and the respective sample trays were deleted from the system and do not form part of the model.
Table 8-1: Summary of Harmony Assay Laboratory SRM Performance for Tshepong South
|
|
|
|
|
|
|
|
|
|
|
|
| Quality Control Material Type |
No. of Samples Submitted |
No. of Failed Samples |
Action Taken |
| AMIS0866 |
30 |
1 |
Values accepted on 2nd tray repeat |
| AMIS0694 |
478 |
3 |
One tray failed(not used) and two trays passed on re-essay |
| Total |
508 |
4 |
|
Effective Date: 30 June 2023
39
Technical Report Summary for
Tshepong South, Free State Province, South Africa
8.8.2Blanks
A total of 569 coarse blank samples were submitted to Harmony Assay Laboratory during July 2022 to June 2023 for Tshepong South . The lowest detection limit at the laboratory is 0.063g/t.
For Tshepong South, 569 blank samples were analysed. The control chart for performance indicated that 71 outliers (results outside two standard deviations) were observed. Only six of the 569 samples plotted outside the 3x detection limit. For Tshepong South, 20 samples plotted outside the 3x detection limit.
Failed samples were queried from the lab and re-assays were requested. If the re-assays failed the sample sheet was deleted from the system.
8.8.3Duplicates
For the samples analysed at Harmony Assay Laboratory during July 2022 to June 2023, results of duplicate analysis indicated correlation at lower grades. A total of 433 duplicate samples were analysed for Tshepong South and, out of the analysis, a total of 118 samples (59%) were outside the average required mean value.
Failures were queried during the central QA/QC meetings held every six months.
8.9Comment on Sample Preparation, Analyses and Security
In the opinion of the QP that:
•The drill core sampling method is appropriate for the mineralisation styles encountered at Tshepong South;
•All underground chip sampling is representative of the channel sampled;
•The sample preparation, security and analytical procedures followed for gold grade determination are adequate; and
•The results of the QAQC assessment have been appropriately addressed to ensure that the assay results of the primary samples are adequate for Mineral Resource estimation.
Effective Date: 30 June 2023
40
Technical Report Summary for
Tshepong South, Free State Province, South Africa
9Data verification
Section 229.601(b)(96) (9) (i-iii)
9.1Databases
Tshepong South drill hole and underground channel sampling data was previously captured and stored in AuBIS electronic database. Upon acquisition of the mine, Harmony has migrated to data capture in the GMSITM system.
Geological core logging is stored using the DatamineTM Fusion (“Datamine”). This database is protected through administration rights allocated to an authorised administrator.
9.2Data Verification Procedures
Data verification procedures included the following:
•the drill hole database was checked against the original logs;
•the database was integrated with DeswikTM and DatamineTM software to check for missing collar coordinates, collar position and elevation errors, downhole survey errors, interval errors and duplicate sample records;
•when assay results were returned from the laboratory, they were captured into the electronic database by the Senior Evaluator and Geologist. The QC sample results were assessed for performance before the primary sample results could be used for Mineral Resource estimation;
•the primary assay results captured in the database were validated by spot checking a selection of drill holes used in the current Mineral Resource estimate; and
•the assays captured in the electronic database were checked against the original laboratory certificates.
The QP did not identify any critical errors in the database.
9.3Limitations to the Data Verification
Previous data has been verified through various methodologies i.e. a “post plot” of all sample points relative to the mine workings are made in order to locate any co-ordination errors. When “manual” capturing (re-digitising old assay tracings) of data occurs, there is a risk that entire sample sheets may plotted incorrectly due to the use of incorrect projections and or scales/constants. All co-ordination errors are identified and corrected.
9.4Comment on Data Verification
The QP is of the opinion that Tshepong South and Tshepong North drill hole and sample databases are reliable and adequate for the purpose of Mineral Resource estimation.
Effective Date: 30 June 2023
41
Technical Report Summary for
Tshepong South, Free State Province, South Africa
10Mineral Processing and Metallurgical Testing
Section 229.601(b)(96) (10) (i-v)
The Harmony One plant and its processing facility have been in operation since 1986, as such the mineral processing method is considered well established for the style of mineralisation processed.
The most recent mineralogical test work done was in June 2020 (Mineralogical Report 19/699 and 19/648). The main objective of the investigation was to understand the mode of occurrence of the minerals present in samples that may influence lower recoveries of gold in the sample.
A six monthly representative sample of Tshepong South’s material was submitted for test work (Metallurgical Report No 23/3001 dated 25 May 2023). The sample reported an average gold grade of 4.31 g/t. The results of this test work indicated that of the total contained gold, 95.8% was amenable to direct cyanidation after 28 hours of leach time. Under direct cyanidation, 2.7% of the gold was preg robbed by components occurring within the sample. 98.5% of the contained gold is expected to be recoverable via carbon-in-leach processing.
Of the remaining gold, some 0.1% was found to be occluded in silica/gangue components. The Hydrochloric acid digestible mineral phase was associated with 1.3% of the gold. The Nitric acid digestion phase showed that 0.1% of the gold was associated with Nitric acid digestible minerals (e.g. Pyrite, Arsenopyrite). Mineral association have been inferred with no specific minerals being identified via the procedural diagnostic method.
10.1Extent of Processing, Testing and Analytical Procedures
The mineralogical investigation consisted of head chemical analysis, X-ray diffraction (“XRD”) analysis, scanning electron microscope (“QEMSCAN”) analysis and heavy liquid separation (“HLS”). Each HLS fraction underwent automated mineralogical analysis by QEMSCAN (concentrate/sinks). The mineralogical investigation involved determining the gold species and their occurrence in the samples, including gold grain size distribution, liberation and association.
From the two submitted samples, a representative aliquot of each sample was sub-sampled for chemical analysis, mineralogical analysis and HLS. The aliquots were pulverised and homogenised for XRD analysis and chemical analysis. The unpulverised portion was prepared into polished section for quantitative evaluation of minerals by QEMSCAN analysis and the other unpulverised 1kg of each sample was subjected to HLS.
10.2Test Results and Recovery Estimates
The chemical analysis of Beatrix Reef feed samples shows that they have a gold grade of 5.1g/t. The results also shows that in relation to major element concentrations, samples are dominated by quartz (SiO2 - c.87%) and aluminium oxide (Al2O3 - 4,2%) with minor to trace concentrations of potassium oxide (K2O), iron oxides (Fe2O3), magnesium oxide (MgO), loss on ignition (“LOI”) and calcium oxide (CaO) observed (<3%). These results suggest that the sample is composed of aluminium-silicate minerals (e.g., quartz, pyrophyllite, feldspar, chlorite and mica); limited to negligible concentrations of sulphides and carbonates and/or clays can be inferred from the relatively low LOI value of <2%.
Native gold is the only gold species detected in the two samples. From the bulk modal analysis, the presence of pyrite and carbonates were observed; these are known to be the reagent and oxygen consumers. Quartz was found to be the major mineral in the feed samples, with minor amounts of iron oxide minerals, mica, chlorite and pyrophyllite. However, most of the gangue minerals were upgraded to the floats fraction during HLS.
The trace mineral search (“TMS”) bulk mineral composition shows that the Basal Reef is 1.11% of the mass with pyrite as the main sulphide mineral at greater than 70% of the mass in all samples. The grains size distribution of the reefs from Tshepong (South and North) range IS <75μm. In general, the grain size distribution of gold grains is erratic. It is based on the premise that the phases of primary interest i.e., target phases, have a higher back-scattered electron brightness than the bulk of the gangue phases. This enables each block to be scanned for particles containing the target phase, and only those of interest are fully analysed. As the entire block is scanned, this also produces the highest possible statistical population for the trace phase.
Effective Date: 30 June 2023
42
Technical Report Summary for
Tshepong South, Free State Province, South Africa
10.3Degree of Representation of Mineral Deposit
The two samples used were representative of the reef as the type of gold mineralization was similar. The recoveries were both in the order of 96%.
10.4Commentary of Mineral Processing and Metallurgical Testing
The metallurgical test work showed the potential to upgrade the ore through HLS. Notwithstanding there being insufficient material mass of Beatrix Reef to conduct gold fire assays, the QEMSCAN data showed that there was an upgrading of the gold grains. The QEMSCAN data further showed that most gold grains are associated with the sulphides.
It is a particularly useful analysis method for determining losses of sulphides and precious metal phases to silicate-rich tails. The process efficiency was determined to have total gold recovery typically ranging c.95% - 97% and gold not dissolved, typically c.4 %.
The testwork done on the Beatrix Reef was representative of the Basal Reef ore being treated at Tshepong South.
The reader is referred to the Modifying Factors for the Tshepong South Mine in Section 12.1.2, which contain the recoveries used for the LOM Plans for the Operation. A detailed description of the processing facilities is provided in Section 14.
Effective Date: 30 June 2023
43
Technical Report Summary for
Tshepong South, Free State Province, South Africa
11Mineral Resource Estimate
Section 229.601(b)(96) (11) (i-vii)
The current Mineral Resources for Tshepong South have been estimated using DatamineTM Studio 3 (“Datamine”) modelling software, which is linked to a customised scripting menu. This scripting menu allows for professional and easy managing of the data and building of geostatistical models.
The narrow-tabular nature of the reefs lends themselves to the estimation of grade and thickness in two-dimensional (“2D”) block models, without the requirements for geological wireframes. An independent process of building a set of three-dimensional (“3D”) wireframes of the structural interpretation to inform mine planning and the Mineral Reserve estimates is also undertaken.
The estimation method used for Measured Mineral Resource estimates at Tshepong South is ordinary kriging (“OK”), while simple macro kriging (“SMK”) is used for Indicated and Inferred Mineral Resource estimates.
11.1Geological Database
Tshepong South Mineral Resource estimate is based on the surface and underground exploration data obtained up to 30 December 2022. The database was exported from the electronic database to DatamineTM modelling software.
The Basal Reef validated database contains a total of 2198 surface and underground drill holes and 517,796 underground channel (chip) samples. The B Reef validated database contains a total of 310 surface and underground drill holes, and 50,336 underground channel (chip) samples which is approximately 90% of the B Reef database.
11.2Global Statistics
Histograms and statistics of the raw data are calculated for each geological domain for comparison purposes. The Coefficient of Variation ("COV"), calculated by dividing the standard deviation with the mean, gives a measure of the variability of the data. A high COV (>1) represents highly variable or highly skewed data, which may require some form of capping of extreme values to lower the COV to a more reasonable value (c.1).
The global statistics for the Basal and B reefs, reported according to geozones, are provided in Table 11-1.
Effective Date: 30 June 2023
44
Technical Report Summary for
Tshepong South, Free State Province, South Africa
Table 11-1: Global Statistics for Basal and B Reef
|
|
|
|
|
|
|
|
|
|
|
|
|
|
|
|
|
|
|
|
|
|
|
|
| Reef / Geozone |
No. Samples |
Minimum (cmg/t Au) |
Maximum (cmg/t Au) |
Mean (cmg/t Au) |
Variance |
SD (cmg/t Au) |
COV |
| Basal Reef |
| 1 |
3 167 |
0.70 |
1 748 |
606 |
211 055 |
459 |
0.758 |
| 2 |
59 693 |
1.00 |
4 023 |
946 |
733 146 |
856 |
0.905 |
| 3 |
126 164 |
0.14 |
6 188 |
1 542 |
1 709 257 |
1 307 |
0.848 |
| 4 |
13 850 |
1.00 |
1 807 |
644 |
213 929 |
463 |
0.719 |
| 5 |
121 150 |
0.43 |
4 454 |
1 198 |
903 156 |
950 |
0.793 |
| 6 |
44 884 |
0.28 |
3 274 |
830 |
460 670 |
679 |
0.817 |
| 7 |
29 |
18.00 |
1 528 |
270 |
71 167 |
267 |
0.990 |
| 8 |
34 757 |
1.00 |
5 073 |
1 939 |
2 393 680 |
1 547 |
0.798 |
| 9 |
19 642 |
1.00 |
3 408 |
878 |
592 857 |
770 |
0.877 |
| 10 |
40 969 |
1.00 |
7 762 |
2 291 |
3 569 370 |
1 889 |
0.825 |
| 11 |
3 862 |
1.00 |
7 336 |
2 512 |
3 737 492 |
1 933 |
0.770 |
| 12 |
46 555 |
4.00 |
3 363 |
1 278 |
738 533 |
859 |
0.672 |
| 13 |
4 |
525.00 |
1 218 |
967 |
70 255 |
265 |
0.274 |
| B Reef |
| 1 |
702 |
1 000.00 |
7 204 |
816 |
2 138 598 |
1 462 |
2.204 |
| 2 |
1 653 |
1 000.00 |
4 515 |
1 055 |
1 105 431 |
1 051 |
1.099 |
| 3 |
5 079 |
400.00 |
4 865 |
652 |
861 070 |
928 |
1.424 |
| 4 |
26 220 |
440.00 |
11 043 |
1 512 |
4 724 359 |
2 174 |
1.438 |
| 5 |
5 925 |
800.00 |
10 510 |
1 179 |
3 768 431 |
1 941 |
3.180 |
| 6 |
4 832 |
320.00 |
15 433 |
1 144 |
7 179 829 |
2 680 |
6.880 |
| 7 |
3 769 |
910.00 |
28 606 |
4 808 |
37 717 076 |
6 141 |
1.579 |
| Total |
562 906 |
|
|
|
|
|
|
11.3Geological Interpretation
The imported data is attributed to geological domains or geozones. Geozones are selected based upon continuity in facies type, as well as gold grade and channel width distribution. Geozones may be constrained by geological structures. Geozones are identified for both the Basal and B reefs.
The Basal Reef is continuous over both Tshepong South and Tshepong North, and a single model is created across both mines. The area is divided into 13 geozones. The B Reef geozones from Tshepong (Tshepong South, Tshepong North) have been divided into a series of seven geozones and projected through to Tshepong South shaft. The geozones for both reefs are presented in Figure 11-1.
Geozones are continuously updated based on geological information, new sampling and drilling results. Any proposed changes to the geozones are presented to the geostatistical team for approval and signed off.
11.4Structural Wireframe Model
The geological structure is interpreted by means of series of 1:1,000 structural plan overlays. These plans are vertical projections of the reef plane showing base-of-reef strike lines at 10m intervals based on elevations below datum. Interruptions in the continuity of the reef are marked by fault-reef cut-offs illustrating the loss or gain of ground and with displacement measured as vertical stratigraphic throws. Known or suspected lateral shifts are also illustrated.
A set of 3D structural wireframes is generated, representing the geological interpretation for each reef. This is informed by the geological drilling, chip sampling and underground geological mapping and is created in Datamine™ to allow subsequent mine design and planning to take cognisance of the latest geological information. These wireframes are not required for the Mineral Resource estimates.
11.5Compositing
The drill hole and chip samples are composited over the full length of the reef intersection.
Effective Date: 30 June 2023
45
Technical Report Summary for
Tshepong South, Free State Province, South Africa
11.6Capping
Outlying values (both for cmg/t and channel width) are calculated per domain at an optimal percentile using the “QUANTILE” process. The capping allows for meaningful Semi-Variogram modelling and avoids potential over-estimation due to extreme sample values. The capping values applied are shown in Table 11-2.
11.7Variography
The experimental semi-variogram is a descriptive statistical diagnostic tool for spatially characterizing regionalized variables. The semi-variogram is a mathematical function that describes how the spatial continuity of the sampled attribute changes as a function of distance and orientation.
Either an isotropic or an anisotropic model can be defined, comprising a nugget variance and up to nine individual structures, although it is rarely necessary to include more than three structures. Each structure may be either spherical, power, exponential, Gaussian or De Wijsian, although spherical models are deemed adequate for Tshepong North and Tshepong South. Point-support semi-variograms are modelled for the Measured Mineral Resources; 60m x 60m declustered-support semi-variograms are modelled for the Indicated Mineral Resources and 120m x 120m declustered-support semi-variograms are modelled for the Inferred Mineral Resources.
Effective Date: 30 June 2023
46
Technical Report Summary for
Tshepong South, Free State Province, South Africa
|
|
|
Figure 11-1: Tshepong Operations Basal and B Reef Geozones |
Effective Date: 30 June 2023
47
Technical Report Summary for
Tshepong South, Free State Province, South Africa
Table 11-2: Capping Values by Reef and Geozone
|
|
|
|
|
|
|
|
|
|
|
|
|
|
|
|
|
|
|
|
|
| Geozone |
Gold Cut (cmg/t) (Max) |
CW Cut (cm) (Max) |
|
Geozone |
Gold Cut (cmg/t) (Max) |
CW Cut (cm) (Max) |
| Basal Reef |
|
B Reef |
| 1 |
1 748 |
20 |
|
1 |
7 204 |
170 |
| 2 |
4 023 |
123 |
|
2 |
4 515 |
215 |
| 3 |
6 188 |
137 |
|
3 |
4 865 |
233 |
| 4 |
1 807 |
20 |
|
4 |
11 043 |
222 |
| 5 |
4 454 |
31 |
|
5 |
10 510 |
199 |
| 6 |
3 274 |
27 |
|
6 |
15 433 |
172 |
| 7 |
1 528 |
33 |
|
7 |
28 606 |
216 |
| 8 |
5 073 |
77 |
|
|
|
|
| 9 |
3 408 |
98 |
|
|
|
|
| 10 |
7 762 |
60 |
|
|
|
|
| 11 |
7 336 |
27 |
|
|
|
|
| 12 |
3 363 |
58 |
|
|
|
|
| 13 |
1 218 |
46 |
|
|
|
|
11.8Mineral Resource Estimation Methods and Parameters
Grade and thickness estimates are undertaken within each geozone and informed by statistical and geostatistical analysis. Two variables are estimated namely; gold accumulation (cmg/t) (which factors in both the thickness of the reef thickness and grade) and channel width. No change of support corrections is considered necessary as it is assumed that the differing support sizes for chip samples and drill hole samples are negligible.
The orientations and ranges of each geozone’s semi-variogram are used to determine the optimised set of kriging estimation parameters. The search ellipse is aligned with respect to its range and direction, to the direction of the associated semi-variogram, as well as the range distances.
Measured Mineral Resource estimates are undertaken using OK. Estimates are generally kriged into 30m x 30m blocks for the Measured Mineral Resource from the point support data.
Indicated and Inferred Mineral Resource estimates are undertaken using SMK. The Indicated Mineral Resource is kriged into 60m x 60m block sizes. The Inferred Mineral Resource is estimated using the associated regularized variograms and kriging into 120m x 120m blocks. Any un-kriged areas in the Inferred Mineral Resource areas are then covered by global mean estimates.
The results of the Basal and B reef estimation are shown in Figure 11-2, for Tshepong.
The current minimum and maximum sample points for the Basal Reef is:
•15 and 25 for the Basal Reef Measured Mineral Resource estimation;
•8 and 20 for Indicated Mineral Resource estimation; and
•3 and 10 for the Inferred Mineral Resource estimation.
The current minimum and maximum sample points for the B Reef is:
•12 and 30 for Measured Mineral Resource estimation;
•8 and 20 for Indicated Mineral Resource estimation; and
•3 and 15 for the Inferred Mineral Resource estimation.
Any un-kriged areas in the Inferred Mineral Resource category regions are then estimated using a global mean. The Measured Mineral Resource model is constrained using the Slope of Regression Estimation Confidence and merged with the Indicated Mineral Resource and Mineral Resource models to produce a combined kriged block model.
Effective Date: 30 June 2023
48
Technical Report Summary for
Tshepong South, Free State Province, South Africa
The channel width is estimated for all block sizes and ranges between 8cm and 34cm, averaging 18cm for Basal Reef. For B Reef, the channel width ranges between 52cm and 94cm and averages 79cm.
Effective Date: 30 June 2023
49
Technical Report Summary for
Tshepong South, Free State Province, South Africa
|
|
|
Figure 11-2: Tshepong Operations Basal Reef and B Reef Estimation Results |
Effective Date: 30 June 2023
50
Technical Report Summary for
Tshepong South, Free State Province, South Africa
11.9Density Assignment
The relative density currently used for tonnage calculations at the Tshepong (Tshepong South and Tshepong North) is 2.72t/m3. Reef volume is determined by block area multiplied by the thickness estimate. The tonnage of each reef horizon is determined by multiplying the volume by the relative density.
11.10Model Validation
The QP validated the Tshepong Mineral Resource model using the following:
•visual comparisons with the raw drill hole data; (Figures 7-3 and 7-4)
•comparisons of the raw drill hole data statistics with the model statistics;
•model volume; and
•visual assessment of the block model with drill hole intersections to ensure that the grades are locally honoured by the model.
The QP did not identify any critical errors in the block model.
11.11Mineral Resource Evaluation
The Mineral Resource estimate for Tshepong (Tshepong South, Tshepong North) is considered by the QP to have reasonable prospects for economic extraction. This is demonstrated by the results of the cash flow for the mines. The cut-off value for the Mineral Resources is determined at 780cmg/t for Tshepong South for the gold based on the economic assumptions presented in Table 11-3 at the effective date June 30, 2023. This cut-off value represents typical costs for the mining method and preliminary mining and metallurgical recovery assumptions.
Table 11-3: Harmony Economic Assumptions (June 30, 2023)
|
|
|
|
|
|
|
|
|
|
|
|
| |
Tshepong South |
|
|
| |
Description |
Unit |
Value |
| |
Gold price |
USD/oz |
1 764 |
| |
FX rate |
ZAR:USD |
16.22 |
| |
Gold price |
ZAR/kg |
920 000 |
| |
Plant recovery factor |
% |
95,2 |
| |
Unit cost |
ZAR/t |
4 411 |
Notes: Unit cost includes cash operating cost, royalty and ongoing development capital
The expected gold price was derived by the Harmony Executive Committee at Head Office. Based on current market trends the QP agrees with the set price and considers the price to be appropriate for Mineral Resource estimation and is slightly higher than that used for estimating Mineral Reserves (USD1,582/oz). The operating costs (both mining and processing) are based on historical performance and budget.
11.12Mineral Resource Classification and Uncertainties
The Tshepong (Tshepong South and Tshepong North) Mineral Resources have been classified into Measured, Indicated and Inferred categories, according to the S-K 1300 definitions. The classification is based on drill hole spacing, geological and geostatistical confidence.
For the geostatistical confidence, the Measured Mineral Resource model is constrained by the Slope of Regression Estimation Confidence, and the Indicated and Inferred Mineral Resource models are constrained by their kriging estimation parameters.
The QP then considers if the geostatistical confidence boundaries require modification based on the geological confidence in an area. The geological confidence could include confidence in the sedimentary facies and mineralisation model, or confidence in the structural model.
Effective Date: 30 June 2023
51
Technical Report Summary for
Tshepong South, Free State Province, South Africa
The application of the classification criteria results in the following set of approximate sample spacings for each Mineral Resource category:
•5m x 5m for Measured Mineral Resources (underground channel sampling);
•100m x 100m for Indicated Mineral Resources; and
•1,000m x 1,000m for Inferred Mineral Resources.
Mineral Resources are discounted by a geological loss to account for unknown but anticipated fault loss. The discounts used for the Basal Reef are between:
•1% and 3% for Measured Mineral Resources;
•3% and 11% for Indicated Mineral Resources; and
•7% and 60% for Inferred Mineral Resources.
Similar information applies to the B Reef.
Factors that may affect the Mineral Resource estimates include the following:
•gold price assumptions;
•exchange rate assumptions;
•operating and capital cost assumptions;
•gold recovery assumptions;
•geology-related risks; and
•operational risks.
11.13Mineral Resource Estimate
The Mineral Resources for Tshepong South and Tshepong North were originally prepared, classified and reported according to SAMREC, 2016. For the purposes of this TRS, the Mineral Resources have been classified in accordance with § 229.1302(d)(1)(iii)(A) (Item 1302(d)(1)(iii)(A) of Regulation S-K).
The location of the Basal Reef Mineral Resources across both Tshepong South and Tshepong North are presented in Figure 11-3. The location of the B Reef Mineral Resources is shown in Figure 11-3.
The QP compiling the Mineral Resource estimate for Tshepong South is Ms B Phetlhu, Ore Reserve Manager at Tshepong South and employee of Harmony. The Mineral Resource estimate for Tshepong South, as at June 30, 2023, exclusive of Mineral Reserves, is summarised in Table 11-4.
Effective Date: 30 June 2023
52
Technical Report Summary for
Tshepong South, Free State Province, South Africa
|
|
|
Figure 11-3: Location and Classification of Tshepong Operations Mineral Resources and Mineral Reserves for the Basal Reef |
Effective Date: 30 June 2023
53
Technical Report Summary for
Tshepong South, Free State Province, South Africa
|
|
|
Figure 11-4: Location and Classification of Tshepong Operations Mineral Resources and Mineral Reserves for the B Reef |
Effective Date: 30 June 2023
54
Technical Report Summary for
Tshepong South, Free State Province, South Africa
Table 11-4: Summary of Tshepong South Mineral Resources as at June 30, 2023 (Exclusive of Mineral Reserves) 1-8
|
|
|
|
|
|
|
|
|
|
|
|
| METRIC |
| Mineral Resource Category |
Tonnes (Mt) |
Gold Grade (g/t) |
Gold Content (kg) |
| Measured |
5.661 |
13.02 |
73 695 |
| Indicated |
6.680 |
11.67 |
77 950 |
| Total / Ave. Measured + Indicated |
12.341 |
12.29 |
151 645 |
| Inferred |
25.090 |
10.67 |
267 678 |
| IMPERIAL |
| Mineral Resource Category |
Tons (Mt) |
Gold Grade (oz/t) |
Gold Content (Moz) |
| Measured |
6.241 |
0.380 |
2.369 |
| Indicated |
7.363 |
0.340 |
2.506 |
| Total / Ave. Measured + Indicated |
13.604 |
0.358 |
4.875 |
| Inferred |
27.657 |
0.311 |
8.606 |
Notes:
1. Mineral Resources are reported with an effective date of June 30, 2023 were originally prepared, classified and reported according to SAMREC, 2016. For the purposes of this TRS, the Mineral Resources have been classified in accordance with § 229.1302(d)(1)(iii)(A) (Item 1302(d)(1)(iii)(A) of Regulation S-K). The Qualified Person responsible for the estimate is Ms B Phetlhu, who is Ore Reserve Manager at Tshepong South, and a Harmony employee.
2. The Mineral Resource tonnes are reported as in-situ with reasonable prospects for economic extraction.
3. No modifying factors or dilution sources have been included to in-situ Reserve which was subtracted from the SAMREC Resource in order to obtain the S-K 1300 Resource.
4. The Mineral Resources are reported using a cut-off value of 780cmg/t determined at a 90% profit guidance, and a gold price of USD1,764/oz.A unit cost of R4,411/Tonne.
5. Tonnes are reported as rounded to three decimal places. Gold values are rounded to zero decimal places.
6. Mineral Resources are exclusive of Mineral Reserves. Mineral Resources are not Mineral Reserves and do not necessarily demonstrate economic viability.
7. Rounding as required by reporting guidelines may result in apparent summation differences.
8. The Mineral Resource estimate is for Harmony’s 100% interest.
11.14Mineral Resource Reconciliation
Tshepong South’s Measured and Indicated Mineral Resource gold content estimate, exclusive of Mineral Reserves, increased by approximately 4.8%, from 4,650Moz gold as at June 2022 to 4,875Moz gold as at June 2023. The major difference in the reconciled Mineral Resources between June 2022 and June 2023 is due to the increase in the grade model year on year and the additional B Reef mining on 71 level.
11.15Comment on Mineral Resource Estimates
The QP is of the opinion that Mineral Resources were estimated using industry accepted practices and conform to SAMREC, 2016. The Mineral Resources have also been reported in accordance with the S-K 1300 guidelines.
There are no other environmental, legal, title, taxation, socioeconomic, marketing, political or other relevant factors known to the QP that would materially affect the estimation of Mineral Resources that are not discussed in this TRS.
Effective Date: 30 June 2023
55
Technical Report Summary for
Tshepong South, Free State Province, South Africa
12Mineral Reserve Estimate
Section 229.601(b)(96) (12) (i-iv)
The reported Mineral Reserves are derived through a business planning process and consideration by the Chief Operating Decision-Maker (“CODM”). The business planning process comprises multi-functional reviews inclusive of all mining, support and service departments that are involved in the verification of the inputs and the Modifying Factors. The CODM consists of various executive roles and responsibilities. These executives assess the profitability, the revenue and production costs. The CODM also considers capital expenditure, gold production and tonnes milled when assessing the overall economic sustainability.
The QP is in agreement and accountable for the final integrated report.
12.1Tshepong South
12.1.1Key Assumptions, Parameters, and Methods Used to Estimate the Mineral Reserve
The results and assumptions derived from the business planning process extends over an 18-month period. The planning process carefully considers strategic plan directives; analysis of historical performance; realistic productivity, and cost parameters; Modifying Factors; and technical and economic studies that have demonstrated justified extraction, as applicable to specific portions of the Mineral Reserves.
All reported Mineral Reserves originate in situ from the Basal Reef. The Mineral Reserves are considered based on several factors, including:
•the latest geological structure and associated Mineral Resource estimation models that constrain the layout for the mine design and LOM planning;
•the need for regional rock engineering stability pillars;
•the extent of pillar mining, mining of remnant areas, reclamation of broken ore out of old areas, tailings, or any other source;
•the Scattered Grid Mining method in use at the mine,
•the sources of dilution and other Modifying Factors; and
•only Measured and Indicated Mineral Resources are used to derive Mineral Reserves.
A combination of modelling exercises forms an integrated model informing the LOM plan and the Tshepong South Mine Mineral Reserves estimates, and includes the:
•geological block model;
•structural model depicting prominent geological features;
•isopach model highlighting the mine’s sedimentology and shale formations; and
•geotechnical model including interpreted data, modelled in the form of support pillars.
12.1.2Modifying Factors
The Modifying Factors used to convert the Mineral Resource to a Mineral Reserve for Tshepong South are presented in Table 12-1.
Effective Date: 30 June 2023
56
Technical Report Summary for
Tshepong South, Free State Province, South Africa
Table 12-1: Tshepong South Modifying Factors Used for Mineral Reserve Determination
|
|
|
|
|
|
|
|
|
| Modifying Factor |
Unit |
Value |
| Relative Density |
t/m3 |
2.72 |
| Stoping Width |
cm |
130 |
| Gully |
% |
6.91 |
| Off Reef |
% |
4.72 |
| Waste to Reef |
% |
0.23 |
| Flushing tons |
% |
— |
| Discrepancy |
% |
11.07 |
| Mine Call Factor |
% |
83 |
| Plant Recover Factor |
% |
95.20 |
| Mine Recover Factor |
% |
79.02 |
| Plant Call Factor |
% |
100 |
| Mineral Reserve cut-off |
cmg/t |
791 |
Notes: Development waste to reef, including the decline development.
The Modifying Factors are consistent with the modelling, planning and computing estimates used in determining the Mineral Reserves, which are also consistent with historical performance. The plant recovery as shown in Table 12-1, is also consistent with the processing and recovery methods.
12.1.3Mineral Reserve Estimate
The Mineral Reserves for Tshepong South were originally prepared, classified and reported according to SAMREC, 2016. For the purposes of this TRS, the Mineral Reserves have been classified in accordance with § 229.1302(d)(1)(iii)(A) (Item 1302(d)(1)(iii)(A) of Regulation S-K) and is still in alignment with SAMREC, 2016. The Mineral Reserve estimate for Tshepong South, as at June 30, 2022, is summarised in Table 12-2.
The location of Tshepong South’s Basal and B Reef Mineral Reserves are presented in Figure 11-3 and Figure 11-4, respectively.
The QP compiling the Mineral Resource estimate for Tshepong South is Ms B Phetlhu, Ore Reserve Manager at Tshepong South and employee of Harmony.
Effective Date: 30 June 2023
57
Technical Report Summary for
Tshepong South, Free State Province, South Africa
Table 12-2: Summary of Tshepong South Mineral Reserves as at June 30, 2023 1-5
|
|
|
|
|
|
|
|
|
|
|
|
| METRIC |
| Mineral Reserve Category |
Tonnes (Mt) |
Gold Grade (g/t) |
Gold Content (kg) |
| Proved |
2.882 |
7.79 |
22 466 |
| Probable |
0.563 |
7.06 |
3 972 |
| Total (Proved + Probable) |
3.445 |
7.67 |
26 438 |
| |
|
|
|
| IMPERIAL |
| Mineral Reserve Category |
Tons (Mt) |
Gold Grade (oz/t) |
Gold Content (Moz) |
| Proved |
3.177 |
0.227 |
0.722 |
| Probable |
0.620 |
0.206 |
0.128 |
| Total (Proved + Probable) |
3.797 |
0.224 |
0.850 |
Notes:
1. The Mineral Reserves were originally prepared, classified and reported according to SAMREC, 2016. For the purposes of this TRS, the Mineral Reserves have been classified in accordance with § 229.1302(d)(1)(iii)(A) (Item 1302(d)(1)(iii)(A) of Regulation S-K). The Qualified Person responsible for the estimate is Ms B Phetlhu, who is Ore Reserve Manager at Tshepong South, and a Harmony employee.
2. Tonnes, grade, and gold content are declared as net delivered to the mills.
3. Figures are fully inclusive of all mining dilutions, gold losses and are reported as mill delivered tonnes and head grades. Metallurgical recovery factors have not been applied to the reserve figures.
4. Gold content has not taken metallurgical recovery factors into account.
5. Mineral Reserves are reported using a cut-off grade of 791cmg/t determined using a gold price of USD1,582/oz gold.A unit cost of R4,411/Tonne.
12.1.4Mineral Reserve Reconciliation
The declared Mineral Reserve decreased from 0.880Moz as at June 30, 2022 to 0.850Moz as at June 30, 2023. The key variances can be attributed to:
•Mining depletion loss;
•Geological structures fault loss discounts increased to the South due to Tribute fault loss;
•Abandoned Blocks loss;
•Additional B Reef on 71 level gain;
•Mineral Reserve Model increase gain.
12.2Commentary on Mineral Reserve Estimate
The declared Mineral Reserves takes into consideration all Modifying Factors, respective to the mining area. The declared Mineral Reserves are depleted to generate Tshepong South’s cash flows. The economic analysis of the cash flows displays positive results and are deemed both technically and economically achievable.
Any by-products that are recovered as part of the refining process, make up an immaterial component of the total metal inventory, and is thus not reported as part of the Mineral Reserve estimate.
With respect to risk – Tshepong South maintains working and robust Isopach models, to manage the geotechnical risk and the stress model to manage the seismicity risk. The geotechnical and Isopach models for Tshepong South take the latest geological structural model into account and the data update is dynamic as mining progresses. Geotechnical models are also used as a basis to manage and monitor the occurrence of ground water and gas intersections.
There are no obvious material risks that could have significant effect on the Mineral Reserves based on above risk management systems in place.
In the opinion of the QP, given that Tshepong South is an established operation, the modifying factors informing the Mineral Reserve estimates would at a minimum, satisfy the confidence levels of a Feasibility Study.
Effective Date: 30 June 2023
58
Technical Report Summary for
Tshepong South, Free State Province, South Africa
13Mining Methods
Section 229.601(b)(96) (13) (i-v)
Tshepong South may be classified as moderate to deep level underground gold mine currently operating at depths of up to 2,427m below surface.
13.1Mining Operations
Tshepong resulted from the integration and consolidation of the Tshepong South and Tshepong North mines. This was to enable Harmony to optimize existing synergies, reduce costs and make better use of the Tshepong section’s underused infrastructure, though a decision was taken to report results separately as of FY24.
Tshepong South utilise three main shafts (Figure 3-2). Tshepong South, The Nyala Shaft (Ore handling) to a lesser extent and Tshepong North shaft for Cross tramming of ore. The three shafts operate semi-independently with respect to ventilation requirements, ore and waste hoisting and men and material movement. An underground lightweight electric rail system, referred to as the RailVeyorTM is used to transport ore and waste from the working sections to the Nyala Shaft from Tshepong North where it is hoisted to surface. More information on the details of the shaft operations, any interdependencies and the railway systems are described in Section 15.
13.1.1Tshepong South
The Tshepong South Mine was established approximately 8 years after the Tshepong North Mine. Production from the Tshepong South Mine is attributable to the Basal Reef with development currently underway to access the B Reef. The B Reef is expected to start mining towards the end of FY24. The Tshepong South Mine is accessed via a single underground vertical shaft. The mine is also assisted by two other shafts for the supply of air for ventilation and cooling.
All working levels are accessed via the single vertical shaft system. The strata-bound Basal Reef has a shaly roof and, in some instances, a waxy brown quartzite hanging wall. The Basal Reef contributes approximately 80% to the total production volume and the B Reef contributing approximately 20%. Development and stoping operations are based on conventional mining methods.
13.1.2Scattered Mining Method
The orebody at Tshepong South Mine is broken up into blocks by geological structures with large throws. Due to the orebody being broken up into these small blocks, a Scattered mining method is used at Tshepong South Mine. Scattered mining is when mining is done between the major geological structures. The mine design criteria is based on the sequential grid mining method where the crosscuts are spaced at fixed distance of 160m however additional development can be required in some instances and/or crosscut spacing reduced/increased depending on the prevailing geological structures. Primary Waste Development is done ahead of the stoping front in the virgin stress environment.
Primary development is done off-reef (in waste rock), while secondary development is done on-reef (in the mineralised zone). In primary development, horizontal haulages are developed from the vertical shaft, extending to the extremities of the mining level. Inter-level spacing is the perpendicular distance between two consecutive level stations underground. Further development is done at set intervals along the haulages towards the mineralised zones in the form of crosscuts. For secondary development, an inclined excavation that connects two levels is established, referred to a raise or winze, depending on the upwards or downwards direction of the development.
A key feature of Scattered mining is that the mine design includes pillars in the stoping areas that are designed to cave in a planned and controlled manner. These pillars are referred to as crush pillars and the dimensions of the pillars are determined by the geotechnical properties of the host rock. The use of crush pillars minimises the risk of unpredicted collapse of stoping areas. These collapses can compromise the safety of mining operations and may lead to permanent closure of stoping panels or sterilisation of ore.
Effective Date: 30 June 2023
59
Technical Report Summary for
Tshepong South, Free State Province, South Africa
13.1.3Open Stoping and Undercut Stoping
While Tshepong South’s business plan is based primarily on the Scattered mining methodology, there are sections of the mine that are operating using the breast, undercut and open stoping mining methods.
Due to the presence of shale in the hanging wall of the Basal reef, undercut and open stoping mining methods are used at Tshepong South Mine. The open stoping is used in the Southern part of the mine where the shale is inter-layered with Waxy Brown Leader Quartzite where the thin beam of shale immediately above the reef is taken out with the blast. The undercut stoping method is used in the Northern part of the mine (only approximately 20cm of the bottom-loaded Basal Reef channel needs to be removed, leaving a beam 80cm to 100cm thick). The shale layer above the reef is very thick (up to 5m) and friable by its nature and if exposed it cannot be supported but most of the time runs (collapses) into the open excavation leading to excessive dilutions.
Minor amounts of the B Reef that do not exceed 20% of the on-reef mined per annum, are extracted as an open stoping mining operation. Reason for mining at open stoping is as a result of the erratic nature of the channel width and the support design specific to B reef mining. This mining method is practiced, without much reliance on the other operating mining sections, and based on its location, poses a low risk to geotechnical considerations.
13.1.4Integrated Approach
The differences of the reef formations and mining conditions at the respective parts of the mine (North and South) have led to the application of an integrated mining method approach. The objective of the adopted mining methods is aimed at the safe and profitable extraction of the Mineral Reserves, while reducing the occurrence of large seismic events.
13.2Mine Design
The mine design strategy aims at maximising the safe extraction of ore, while minimising the risk of geotechnical failures, which can result in operational disruptions and dangerous working conditions. The Basal Reef is modelled and designed across the Tshepong South Mine. In addition, the Tshepong South Mine considers the B Reef for design and planning.
Both the Basal and B Reef horizons have been subject to faulting and intrusions by igneous dykes and sills that cut across the reefs. The most significant form of control at the Tshepong South Mine for rockfalls and rockbursts is the systematic modelling and design processes. Bracket and strike pillars are considered for an integrated support system. The central raise line maintains stability, during stoping operations, using support packs.
|
|
|
Figure 13-1: Schematic Representation of the Scattered Mining Sequence |
Effective Date: 30 June 2023
60
Technical Report Summary for
Tshepong South, Free State Province, South Africa
|
|
|
| Figure 13-1A: Schematic Representation of the Sequential Mining Method. |
Effective Date: 30 June 2023
61
Technical Report Summary for
Tshepong South, Free State Province, South Africa
The occurrence of geological faults is also a source of groundwater intersections during mining operations which may lead to production delays, geotechnical risks, and the potential of flooding. Depending on the geology of the dyke or sill, a change in the mining direction may be required, or as in the case of low-risk scenarios the Rock Engineering department may suggest a safety and support strategy to mitigate the associated geotechnical risk. A change in mining direction may result in Mineral Resource losses, or an increase in dilution.
Based on the latest geological structure model,the geotechnical team designed a suitable pillar layout based on modelling results. A detailed mine design and schedule is done based on the pillar design taking cognisance of uneconomical areas which are excluded on macro scale. This design and schedule are the basis of the mine plan and the declared Mineral Reserves.
A mine design that is sufficiently informed, with geological data, is progressed to the mine planning phase. Mine planning is done on a macro scale as well as on a micro scale. On a macro scale, the material below cut-off is excluded from the mining model. On a micro scale, the mining model is then subject to constraints that are applied because of the geotechnical design and other limitations.
The geotechnical modelling is driven by the most recent information from mining operations, which ensures that the model is an accurate representation of the current operational conditions.
Development is done by either mechanised, mechanical or conventional method depending on the most suitable method for the specific requirements. Tshepong South is essentially a conventional mine design with trackless mining in the twin decline.
Mining production is accessed through underground excavations, developed as haulages and cross cuts. Crosscuts are primary development, in the direction of the mine workings. Inclined secondary development is used to access the reef contact, and advanced from the position of respective crosscuts. Ore is extracted from stoping panels established from the inclined development.
13.2.1Mine Design Parameters
Mine design is done internally, with the mine designs for the Basal Reef and B Reef horizons done separately, using the DatamineTM software. The geological models, and the geotechnical parameters formulated by the Rock Engineers, are used as a basis of the mine planning process. The mine design parameters used for Tshepong South and Tshepong Mine are shown in Table 13-1 and Table 13-2, respectively.
Table 13-1: Tshepong South Mine Design Parameters
|
|
|
|
|
|
|
|
|
| Parameter |
Unit |
Value |
| Regional Stability |
| Dip stabilizing pillar dimensions |
Strike span |
m |
160 |
Dip span |
m |
N/A |
Strike stability pillar spacing¹ |
m |
N/A |
Access haulages middling to reef |
m |
90 |
| Primary Development |
| Advance |
m/month |
35 |
| Crosscut spacing |
m |
160 |
| Secondary Development |
| Advance |
m/month |
N/A |
| Stoping Parameters |
| CW < 80cm |
m |
105 |
| CW > 80cm |
m |
130 |
| Economic Parameters |
| Cut-off grade (planning) |
cmg/t |
791 |
| RD |
|
2.72 |
Notes: 1. Pillar spacing is measured skin to skin.
Effective Date: 30 June 2023
62
Technical Report Summary for
Tshepong South, Free State Province, South Africa
13.3Geotechnical Considerations and Seismic Monitoring
With respect to Risk – Tshepong South maintains working and robust Isopach models, to manage the geotechnical risk and the stress model to manage the seismicity risk. The geotechnical and Isopach models for Tshepong South take the latest geological structural model into account and the data update is dynamic as mining progresses.
The purpose of the pillar designs, regardless of the pillar type, is to customize them to the prevailing mining conditions, with the objective of making the mine design safe, practical, easy to implement, and profitable. These pillars include bracket and strike pillars. The details of the pillar design can be found in Table 13-1. The dimensions depicted for the pillars are standard and are adjusted depending on planned bracketing of geological structures or if patches of low value reef are encountered.
The Rock Engineers follow the following geotechnical modelling and approach:
•evaluate the principal stress directions using seismic source mechanisms and update the input parameters for numerical modelling;
•using seismic source mechanisms, delineate planar features to confirm and/or detect the position and orientation of geological structures;
•confirm the expected ground motion produced by large, potentially damaging seismic events, and calibrate the Ground Motion Prediction Equation; and
•monitor mine-wide seismic activity and test each geotechnical region for deviation from the expected co-seismic rock mass response, which tests the release of seismic energy.
The geotechnical stress model is also used to manage and monitor the occurrence of seismic hazards. Seismic hazards are categorically measured as per mine planning cycles of short, medium and long term. Events for the last 100 - 200 days definitively estimated, to accurately determine the intermediate probabilities of occurrence. The behaviour of identified medium term events are then monitored daily. Alarms are raised, and people are evacuated in the event of a predicted or anomalous seismic pattern is identified and people are removed from the specific danger areas.
Tshepong South Mine uses an Integrated Seismic System supplied by Institute of Mine Seismology to record seismic events on the property.
Effective Date: 30 June 2023
63
Technical Report Summary for
Tshepong South, Free State Province, South Africa
The seismic systems for Tshepong South consist of 20 three-component geophones. The digital seismic data is transmitted from the underground seismic stations through to the surface monitoring stations via manual and automated recording systems, based on available infrastructure at the mine. The data is recorded continuously and reported on a daily basis.
13.4Geohydrological Considerations
Apart from the geotechnical risks that can be caused by the existence of geological structures, the presence of water and gas also pose risks to Tshepong South. The geotechnical models are used as a basis to manage and monitor the occurrence of ground water and gas intersections. Cover holes are drilled in all flat development ends to identify water or gas. Water or gas intersections are plotted in a 1:200 survey sheet plans. These intersections are plotted against a stope plan indicating the geology, structural features, reef contours, pillar layout, faults with associated losses or gains, reef elevation, grade and channel width. These geospatially referenced plots articulacy help the mining team execute the mine plan, in relation to the operation’s geotechnical requirements and assist in the early detection of the presence of water or gas.
Daily management of influx water is handled through a series of diversion strategies aimed at re-directing and controlling the flow, temperature regulation, and re-circulation of water. The water strategies at Tshepong South are supported by the Integrated Waste and Water Management Plan (“IWWMP”). Tshepong South maintain graphical and numerical databases of the operations geohydrological conditions.
Water reticulation around the mine has been designed to maximise water re-use and minimise the amount of water pumped to surface. The 77-level pump station is used to transfer water from various levels back to 55/59 level ice dam where it is cooled by addition of ice from the surfaces ice plants and returned via PRV’s to the different working levels. From the workings, water is pumped via vertical spindle pumps and drain system to the shaft, cascading back to 77 level pump station via NX holes and two settlers. Excess water gets pumped via Railveyor haulage to Nyala Shaft’s 57 level dams, to 35 level dams and then to the surface dam. The water is cleaned via RO plant and supplied to Tshepong North residence and the Nyala Shaft as potable water. Excess water can also be diverted to Tshepong North via 66 level in case of emergency at rate of approximately 35l/s.
13.5Mine Plan Development and Life of Mine (“LOM”) Schedule
The Tshepong South Mine has significant Mineral Reserves to maintain a long-term mine life, however, extraction of ore from Isolated Blocks of Ground (IBG’s) will become more important as the life of mine progresses, but volumetrically these Mineral Reserves are not significant.
The preferred mining method is dependent on development staying ahead of the mining front, so that accurate geological information is gathered and included in final designs before mining commences. This also enables, planning and scheduling activities to be accurately sequenced, which leads to better planning, safer working conditions, and improved profitability.
At Tshepong South Mine, the LOM plan and scheduling originates with the use of the Mineral Reserves model, which is modelled at a 791cmg/t cut-off grade. The 3.445Mt of Mineral Reserves are included in the LOM plan and are fully accessible through the existing infrastructure at the Tshepong South Mine. The mining rates used in determining the LOM plan are based on the current and expected operational performance, notwithstanding any unforeseen underground mining constraints. The remaining LOM for the operation is planned for Seven years, with a planned mining rate averaging at approximately 585ktpa (milled tons) over the LOM period. The extent of the Tshepong South Mine LOM plan is shown in Figure 13-2. The milled ore and gold recovered for Tshepong South Mine are presented in Figure 13-3.
Effective Date: 30 June 2023
64
Technical Report Summary for
Tshepong South, Free State Province, South Africa
|
|
|
Figure 13-2 Tshepong South Mine LOM Plan |
|
|
|
Figure 13-3: Graph of Tshepong South Mine LOM Plan – Tonnes and Grade |
Effective Date: 30 June 2023
65
Technical Report Summary for
Tshepong South, Free State Province, South Africa
|
|
|
Figure 13-4: Graph of Tshepong South Mine LOM Plan – Gold Produced (oz) |
Effective Date: 30 June 2023
66
Technical Report Summary for
Tshepong South, Free State Province, South Africa
13.6Mining Rates
Mining rates are based on current and expected performance depending on underground conditions and constraints. Dilution is included in the production plan mainly from external waste sources from the stoping operations, but allowances are also made for dilution occurred in the ore flow process. The LOM plan considers the planned and available working areas, inclusive of the mine’s current infrastructure capacity.
Tshepong South will be mined at an average rate of 48,760tpm.
13.7Grade and Dilution Control
The selected Scattered mining method is planned and designed to better support recovered grade because of the improved selectivity, flexibility, and reduced off-reef mining. Mine grades are currently increasing as mining moves towards further South into the Eland mine payshoot.
Ore grade and dilution control is done using a Quality Index monitoring tool. This Quality Index considers key parameters including Mine Call Factor, stoping width, proportion of ore lock-up, and an On-Reef index (percentage of On-Reef vs Off-Reef mining due to faulting, dykes, etc.). During the mine design and planning process, external dilution control is implemented by applying an adapted mine recovery factor.
Operationally, grade and dilution control are mostly achieved through improved drilling (marking sticks used on undercut mining) and blasting practices and compliance to blasting barricades on stopes <35 degrees. Drilling accuracy is achieved by holes that are drilled parallel, aimed at being correctly burdened and that are within the stoping limits. This ensures consistent and economic rock breaking, without dilution.
The Tshepong South Mine also adopts electronic blasting technology consisting of an integrated electronic system, which allows for precision timing and improved control of rock breaking. This technique controls stoping width and protects the integrity of the footwall and hanging wall, aimed at minimising dilution.
13.8Mining Equipment and Machinery
There are various machinery and equipment used at Tshepong South, depending on the type of mining or development activity. The following equipment can be found at the frontline of mining production:
•haulages and associated development: Hydro-powered (“HPE”) drill rigs are used for underground excavations and tunnelling. These rigs are preferred as they are versatile and capable of angular, horizontal, and vertical drilling;
•production drilling in stopes: Two types of drilled holes are used in a stoping panel, namely production drilling and pre-conditioned drilling. Pre-conditioning is a methodology aimed at transferring the stresses away from the stope face, therefore reducing the potential for face burst damage. Pre-conditioned holes are drilled longer than production holes and are blasted with the production round. Equipment used for this type of drilling is compressed air hand-held drills;
•raise boring: Is a drilling technique used for ventilation development purposes and ore passes. Raise boring and control mechanisms are currently operated via control modules connected through the mine’s underground and shaft communication networks, conducted on surface by a contractor. The benefits of this allow personnel to be removed from dangerous underground workings and have the upside of productivity achieved through automation;
•rock movement: Ore from the stoping ore passes is loaded from the box-front chutes directly into spans of hoppers pulled by battery powered locomotives and then trammed to the shaft inter-level tips. Ore is then transferred to the main loading bins for hoisting to the surface. Waste rock from development operations is loaded into similar hoppers and trammed and hoisted in the same manner as the ore movement but is done using in a dedicated waste system to prevent diluting the ore grade;
•Tshepong South utilises battery charged locomotives for transportation of ore from the workings to the shaft; and
•ancillary equipment: Area where draw points are not available in the workings i.e box front chutes, Salzgitter loaders are used.
Effective Date: 30 June 2023
67
Technical Report Summary for
Tshepong South, Free State Province, South Africa
13.9Ore transport
The blasted ore from the stoping panels is moved with winch-operated scrapers along gullies to ore passes where it gravitates down to the loading boxes in the footwall crosscuts below the stopes. The ore is discharged into rail hoppers and transported, via battery locomotives, to dedicated inter-level transfer systems that gravity feed to the main silos. Once hoisted up the main vertical shaft at Nyala to surface, the ore is transported to the Harmony One Plant via Rail system.
The existing Tshepong South Shaft is connected to the Tshepong Shaft. At the Tshepong South Shaft, broken rock handling on all levels is rail-bound. Several inter-level sub-vertical transfer systems feed the main silos on 55 level. From 77 level, the rock is hoisted to 55 level where a RailVeyorTM system transports the rock from Tshepong South to the Nyala Shaft, from where the rock is hoisted to surface by means of the rock winder, and then transported to Harmony One Plant by train (Figure 3-1).
13.10Mining Personnel
Tshepong South is labour intensive, with the mine being supported by over 3,357 employees, with 89% being permanent staff and the remainder contractors.
The underground mining operation uses an 11 day fortnight shift system, operating a 3-shift cycle per day. The underground work force is essentially split into two categories that are either involved in production activities or they provide supporting services required underground. Production activities are directly related to the mining of ore and non-production personnel provide supporting services such as safety, engineering functions, maintenance and underground store controls. The mining personnel for Tshepong South is presented in Table 13-2.
Table 13-2: Tshepong South Mine Mining Personnel
|
|
|
|
|
|
| Labour Requirement |
No. of Employees |
| Services |
307 |
| Engineering |
674 |
| Mining |
2 021 |
| Contractors |
355 |
| Total Employees |
3 357 |
Effective Date: 30 June 2023
68
Technical Report Summary for
Tshepong South, Free State Province, South Africa
|
|
|
Figure 13-5: Tshepong South Shaft and Underground Infrastructure |
Effective Date: 30 June 2023
69
Technical Report Summary for
Tshepong South, Free State Province, South Africa
13.11Commentary on Mining Methods
The Scattered mining method is the main mining method utilised at Tshepong South and is appropriate for the reef characteristics and the mine depth. The mine design, planning and scheduling for the mine is developed using the DatamineTM and DeswikTM geological software, respectively, considering the geotechnical model and related parameters.
The main geotechnical and geohydrological risks at Tshepong South include the presence of gas, ground water and seismicity, which are managed through the integrated monitoring systems, and incorporated into working mining models that inform daily mine planning decision-making.
The mining rates, machinery and equipment, ore transport, grade and dilution control, and labour resourcing and optimisation are driven by the mine schedule and improvement initiatives at the respective mine sites.
Effective Date: 30 June 2023
70
Technical Report Summary for
Tshepong South, Free State Province, South Africa
14Processing and Recovery Methods
Section 229.601(b)(96) (14) (i-iv)
All ore mined at Tshepong South is processed at Harmony One Plant located west of Welkom (Figure 3-1). Harmony One Plant is Harmony’s largest gold processing plant and processes underground ore from multiple shafts, as well as surface ore from nearby mine waste facilities. The plant was commissioned in 1986 and comprises three independent modules, each consisting of four feed silos, two ROM mills, two conventional thickeners, cyanide leach, carbon in pulp (“CIP”) adsorption, elution, zinc precipitation and smelting. The plant CIP process reflects the technology which was current at the time of construction.Overall the plant has been operating with no significant challenges and target metallurgical recoveries have been achieved. The Harmony One plant is in good working condition and the equipment is also in good order with audits done on regular bases to check the operating performance of the plant.
14.1Mineral Processing Description
The processing flow sheet is presented in Figure 14-1.
Ore delivered to the plant is fed from the concrete silos via two mill feed conveyors through vibrating feeders directly into the ROM mills. Fully autogenous (“FAG”) milling is a milling process in which the entire ROM ore stream is fed directly into the mills and where the grinding media is generated within the mill from suitably sized pieces of ROM ore itself. The average feed rate to the mills is 65tph. The milling circuit consists of two single stage ROM mills that are controlled on maximum power for optimum milling. Each ROM mill is 4.27m in diameter and 10m in length and grinds the ore to 75% - 90% passing minus 75 microns.
Milling is followed by a conventional gold leach process (cyanidation).The cyanidation process is one of the most utilised methods for the recovery of gold from auriferous ores. The use of cyanide leaching for gold recovery is based on gold’s properties, mainly its solubility (ability to dissolve) in cyanide solutions. Once the gold is dissolved into the cyanide solution it has a higher ability to adsorb (attach) onto activated carbon through the application of carbon in pulp (“CIP”) technology.
The loaded carbon then enters the elution columns, which are high pressure vessels that circulate the loaded carbon extracting the gold. The gold will “de-absorb” from the activated carbon and attach onto stainless-steel wool by means of electrowinning. The CIP circuit makes use of gravity flow of slime between the consecutive counter-flow stages to recover and recirculate the activated carbon back into the system.
Following this process, the cathode steel wool is smelted (induction furnaces) after drying in the calcining ovens. The doré bars are then dispatched to Rand Refinery Limited, located near Johannesburg in Gauteng Province.
The tailings residue is pumped from the plant to one of two TSFs, the FSS8 West/East complex, which is the biggest facility with a total deposition capacity of 320,000tpm. The second TSF is the FSS2 facility with a capacity of 160,000tpm. The combined capacity of the two TSFs are 480,000tpm which is well above the plants designed capacity thus, creating some flexibility in the deposition strategy.
Both TSFs are conventional day wall paddock facilities with a fixed penstock tower arrangement that would be the primary means of draining excess water from the facility which is pumped back to the plant to be used in the process again.
Effective Date: 30 June 2023
71
Technical Report Summary for
Tshepong South, Free State Province, South Africa
|
|
|
Figure 14-1: Schematic Flow Diagram of the Metallurgical Process |
Effective Date: 30 June 2023
72
Technical Report Summary for
Tshepong South, Free State Province, South Africa
14.2Plant Throughput, Design, Equipment Characteristics and Specifications
The Harmony One Plant has a steady state design capacity of 390ktpm with its conventional CIP flowsheet. The design parameters and equipment specifications are presented in Table 14 1. The Harmony One plant is in good working condition and the equipment is also in good order with audits done on regular bases to check the operating performance of the plant.
Table 14-1: Key Design Parameters and Equipment Specifications
|
|
|
|
|
|
|
|
|
|
|
|
| Process |
Parameter |
Unit |
Value |
| Overall Plant |
Recovery |
% |
94,7 |
| Availability |
% |
9 999 |
| Milling |
Throughput ROM |
t/hr |
90 -100 |
| Densification |
Desired pH |
pH |
>10.5 |
| Desired Density |
g/cm3 |
1.50 - 1.55 |
| Leaching |
Residence Time |
hr |
27 |
| Acid wash and elution |
Elution Temperature |
°C |
130 (Ambient) |
14.3Energy, Water, Process Material and Personnel Requirements
14.3.1Energy
The average monthly power consumption is 12,064,464KWh with power available all the time.
14.3.2Water
The average monthly water consumption is 20,655kL with water available all the time.
14.3.3Process Material
The reagents and their consumption rates are presented in Table 14-2.
Table 14-2: Harmony One Plant Consumables
|
|
|
|
|
|
|
|
|
| Equipment |
Unit |
Value |
| Lime |
tpm |
341.00 |
| Flocculant |
tpm |
0.71 |
| Cyanide |
tpm |
9.06 |
| Carbon |
tpm |
190.00 |
14.3.4Personnel
The personnel is provided in Table 14-3.
Table 14-3: Harmony One Plant Personnel
|
|
|
|
|
|
| Personnel |
No. |
| Services |
57 |
| Engineering |
77 |
| Metallurgy |
138 |
| Contractors |
245 |
| Total |
517 |
14.4Commentary on the Processing and Recovery Methods
The metallurgical process is a well-tested CIP technology which has been in operation at the Harmony One plant since 1986. Recoveries used in the business plan were based on historic performance. The methodology applied considered the historical metallurgical recovery (18-month period) (Figure 14-2) for the relevant ore sources at the plant.
Effective Date: 30 June 2023
73
Technical Report Summary for
Tshepong South, Free State Province, South Africa
It should be noted that since the Harmony One plant processes ore from multiple sources a metal accounting operating procedure is required to manage the input feed delivered to the plant and gold output produced. A basic overview of the procedure is as follows:
•each operation delivers ore to the plant and is booked against each source;
•a delivery sheet reflects each shaft/operations figures; and
•from total ore processed, each shaft/operations equivalent proportion of gold is determined out of the monthly full gold produced.
Effective Date: 30 June 2023
74
Technical Report Summary for
Tshepong South, Free State Province, South Africa
|
|
|
Figure 14-2: Graph of Tshepong South Historical Recovery Factor (18 month actual) |
Effective Date: 30 June 2023
75
Technical Report Summary for
Tshepong South, Free State Province, South Africa
15Infrastructure
Section 229.601(b)(96) (15)
The proximity of Tshepong South to Tshepong North allows for the integration of infrastructural requirements by using the excess hoisting capacity and underused infrastructure available at Tshepong North. This has also enabled the debottlenecking of Tshepong South’s infrastructure. Tshepong South therefore has adequate access to the infrastructure required to meet the planned LOM production schedules.
15.1Surface Infrastructure
The surface infrastructure associated with Tshepong South is presented in Figure 15-1, whilst Google Earth images of the shaft and Harmony One Plant are presented in Figure 15-2, Figure 15-3, Figure 15-4 and Figure 15-5.
Tshepong South’s mining area is well developed in terms of access and mining-related infrastructure. Access to the shafts is via well-maintained roads. Adequately maintained gravel roads is used to access other areas of the mine such as the explosives magazines, sewage works, slimes dam and the evaporation ponds.
The infrastructural layout includes hoisting facilities; logistical support for core handling, sampling, and transporting; ore and waste facilities; tailings and leaching infrastructure; roads; water and power supply; ventilation and refrigeration systems; stores and workshop support; electrical supply; offices; housing and security.
15.1.1Ore and Waste Rock Storage Facilities
Ore mined at Tshepong South is hoisted at Nyala Shaft where it is stored in silos on surface before being transported by rail to the Harmony One Plant for processing (Figure 15-1 and Figure 15-5). Ore is stored in silos located at the plant prior to processing.
The ore and waste hoisting for the Tshepong South Mine is done using two rock winders via the Nyala Shaft and is delivered via the RailVeyorTM. Waste rock is deposited in waste silos and transported to the plant. The Nyala (“WRDs”) is not currently used, but is available adjacent to the respective shafts (Figure 15-1).
15.1.2Tailings Storage Facilities
Harmony One Plant pumps tailings as a slurry to two TSFs namely FS2 and St Helena No.4, located to the south of the plant. All TSFs are currently owned and operated by Harmony.
The current LOM plans for Tshepong (Tshepong South and Tshepong North) require a total collective placement of approximately 0.77Mt of tailings. The capacity remaining in the two TSFs is sufficient until 2024. Currently the project department is urgently looking at various options to ensure that Harmony One Plant has deposition capacity post June 2024. Some of these options entail to keep depositing on some of the existing tailings dams in order to buy time until the new tailings dam will come on line around July 2026. Even if it means downscaling the operations at Harmony One Plant to only accommodate the reef and very little waste. The option that is currently investigated is to convert St Helena 4 tailings dam to a cyclone dam that can take 200,000 tons per month until July 2026. The new tailings facility will be located in the area of North One and Two tailings facilities.
The TSF sites have full engineering records including design, construction, operation, and maintenance plans.
15.1.3Rail
A railway line which traverses the Tshepong South Mining Right area is used to transport hoisted ore to the Harmony One Plant (Figure 15-1).
Effective Date: 30 June 2023
76
Technical Report Summary for
Tshepong South, Free State Province, South Africa
|
|
|
Figure 15-1: Tshepong Operations Surface Layout and Infrastructure |
Effective Date: 30 June 2023
77
Technical Report Summary for
Tshepong South, Free State Province, South Africa
|
|
|
Figure 15-2: Tshepong South Detailed Surface Infrastructure |
Effective Date: 30 June 2023
78
Technical Report Summary for
Tshepong South, Free State Province, South Africa
|
|
|
Figure 15-3: Nyala Detailed Surface Infrastructure |
Source: Google Earth Image Date May 2021
Effective Date: 30 June 2023
79
Technical Report Summary for
Tshepong South, Free State Province, South Africa
|
|
|
Figure 15-4: Harmony One Plant Detailed Surface Infrastructure |
Source: Google Earth Image Date: September 2021
Effective Date: 30 June 2023
80
Technical Report Summary for
Tshepong South, Free State Province, South Africa
15.2Underground Infrastructure and Shafts
The Tshepong South shaft and underground infrastructure is schematically depicted in Figure 13-7. The underground workings are accessed and mined via four vertical shafts and a sub-vertical shaft.
At Tshepong South, the main vertical shaft system extends from surface to 54 level. A sub-vertical extends from 55 level to 66 level. A RailVeyorTM connects the 54 level and 55 level. A Koepe winder is used at the Nyala shaft for rock hoisting. There are two pump stations located at the Tshepong South shaft 71 level and 76 level. Tshepong South and Tshepong North shafts are connected laterally at 54 level and 66 level.
Mine ventilation systems are well established. The Nyala Shaft supports the Tshepong North operations with the supply of compressed air, water handling and rock hoisting. Four compressors installed on surface feed air down the Nyala shaft for the Tshepong South workings. Refrigeration systems for Tshepong South shaft are installed on 55 level to cool the working places. The main return airway for the Tshepong South Shaft is predominantly via the Tshepong Shaft on 66 Level, 69 Level and 73 Level. The current additional holing, booster fan installations and pressure upgrades will significantly assist with the return air capacity and the refrigeration on the shaft.
15.2.1RailVeyorTM
A 5.4km RailVeyorTM system connects the Tshepong South Shaft through 55 level to the Nyala Shaft. The RailVeyorTM is used to transport the rock from Tshepong South to the Nyala Shaft.
The RailVeyorTM was initially installed by the RailVeyorTM company. It is a remote controlled, electrically powered friction light-rail haulage solution. The system comprises four trains and is maintained with a dedicated maintenance bay and digital monitoring systems. The RailVeyorTM system is maintained by Tshepong South, where support can be provided by the company as required.
15.3Power and Electrical
Power is supplied by Eskom. Tshepong South’s power supply is designed to satisfy the planned LOM production and service requirements. Main power supply is managed and distributed via electrical sub-stations located adjacent to the Mine shafts (Figure 15-2, Figure 15-3).
Power lines traverse the mine property to connect the shafts, reduction works and hostel complexes.
In addition, Tshepong South has an onsite emergency power generator system, sufficient to support the critical mining and mineral processing activities in case of emergencies. The Phakisa South operation has an installed capacity to supply of 40MVA, however currently only 27MVA is utilised. At Nyala where hoisting and compressors are installed the installed capacity is 40MVA and currently only 22MVA is utilised.
15.4Water Usage
The primary source of bulk water supply is from Sedibeng municipality. The processing plant, refrigeration plant and underground mining activities are the three largest water consumers.
The Tshepong South underground water supply is supported by two operational settlers. The main pump stations at the Nyala shaft are situated on 35 level and 57 level. The water that reports at the Nyala shaft is mainly excess water from Tshepong South, melted ice and drinking water, and an estimated 1Ml of fissure from surrounding shafts.
Tshepong South has two underground water dams on 77 level and one on 55 level. Water for the use of dust suppression, footwall and sidewall treatment is re-purposed at the Tshepong South Mine.
To ensure continuous availability of water supply during municipality challenges/breakdowns of the system, there is a total of three potable water storage dams installed with a buffer capacity of 7.5ML between water outages. Water usage at Tshepong South shaft is approximately 4ML daily average use for ice production as well as for water drinking and sanitizing.
The storage facilities have sufficient water to supply water to the operation for up to 60 hours if the bulk water supply was interrupted.
Effective Date: 30 June 2023
81
Technical Report Summary for
Tshepong South, Free State Province, South Africa
15.5Logistics and Supply
The procurement of supplies and equipment are handled centrally, via Harmony, and then delivered to Tshepong South.
Harmony operates its own rail system which connects the shafts, reduction works, shaft stores, explosives magazine and the mine workshops. This system is used to transport ore between shafts and to transport consumables between the surface stores to the respective locations, as required. It is also connected to the regional Transnet railway system, which transports ore to the Harmony One Plant.
15.6Commentary on Infrastructure
The operational infrastructure including road, rail, offices, security services, refrigeration, Compressors, pump stations, chairlift, ice plant and RailVeyorTM, water and power supply is adequate to satisfy the Tshepong South LOM plan. The Operations is powered by electricity from Eskom. Overall, Tshepong South is well-established with sufficient logistical and infrastructure support for the existing and planned mining operations.
Effective Date: 30 June 2023
82
Technical Report Summary for
Tshepong South, Free State Province, South Africa
16Market Studies
Section 229.601(b)(96) (16) (i-ii)
Gold is traded in a variety of markets/exchanges both in physical form through over the counter (“OTC”) markets, bullion banks and metal exchanges etc., and through passive investments such as exchange traded funds (“ETFs”), which are based on gold prices and units representing physical gold which may be in paper or dematerialised form. Demand is driven by the jewellery market, bar and coin, use in technology, ETF’s and other financial products, and by central banks. An overview of the gold market is given in the following sections based mainly on data from the World Gold Council and GoldHub websites.
16.1Market Overview
Unlike almost all mineral commodities, the gold market does not respond the same way to typical supply and demand dynamics which are founded on availability and consumption, but rather on global economic affairs, particular those of the major nations, industrial powerhouses and economic regions, such as the Eurozone. The gold market is affected by government and central bank policies, changes in interest rates, inflationary or deflationary environments and events such as stocking and de-stocking of central reserves. It is also largely affected by global events such as financial crises, geopolitical trade tensions and other geopolitical risks. Price performance is linked to global uncertainty prompted by the prolonged Russia-Ukraine war (GoldHub, Accessed July 2022). It is an asset that can preserve wealth and deliver price outperformance in an uncorrelated way and that makes it extremely attractive.
The Gold Market and Recent Developments
The Gold Market Demand had returned to pre-COVID levels during the third quarter of 2022, with total demand at 1,181t; 28.0% higher when compared to the third quarter of 2021, while gold supply increased by a marginal 1.0% on an annual basis to reach 1,215t.
The main contributing factors of the higher gold demand during the third quarter of 2022 include:
•Jewellery consumption reached a robust 523t, recording a 10.0% increase year-on-year, despite the deteriorating global economic backdrop. Furthermore, on a year-to-date (ytd) basis gold demand was slightly firmer at 1,454t, signifying a 2.0% increase.
•Investment demand was 47.0% lower on an annual basis at 124t, reflecting weak sentiment among some investor segments. The 36% growth in bar and coin investment (to 351t) was insufficient to offset 227t of ETF outflows. Over-The-Counter (OTC) demand decreased significantly during the third quarter of 2022, confirming weak investor sentiment in ETFs and futures markets.
•Central Banks continued to invest in gold, with purchases reaching an estimated quarterly record of nearly 400t according to the World Gold Council.
•Technology Demand decreased by 8.0%, year-on-year, as the global economic downturn had a negative impact on consumer demand for electronics.
Moving into the second quarter of 2023, gold prices are gaining a lot of momentum in line with the global banking crisis and uncertainty surrounding the Federal Reserve Bank. Contagion risks from financial market fears have allowed the safe-haven appeal of gold to drive a bullish market to the cause but this can be fleeting for a quarterly period. Increased volatility has been another contributor to gold.
Markets reacted recently to the upside of the U.S. economy (which is doing better than previously thought), allowing the Fed room to hike rates further in its fight against inflation. The latest market expectations point to rates staying higher for longer with any rate cuts expectations moved to the middle of Q1 next year (2024). This is in stark contrast to expectations seen 2-3 months ago when interest rate cuts were predicted for late Q3/early Q4 this year (2023).
16.2Global Production and Supply
Gold production and supply is sourced from existing mining operations, new mines and recycling.
Effective Date: 30 June 2023
83
Technical Report Summary for
Tshepong South, Free State Province, South Africa
16.2.1New Mine Production
China remained the largest producer in the world and accounted for approximately 10% of total global production in 2022 (Gold.org, Accessed 2023). Overall, global mine production reached 3,628t in 2022, slightly higher when compared to the 3,581t recorded in 2021, and the second annual increase in production recorded since 2020. The improvement in mine production over the past two years can mainly be attributed to a mining industry free from COVID-19 disruptions and slowdowns. In 2022, some of the major producing gold countries in the world were China (375t), Russian Federation (325t), Australia (314t), Canada (195t), United States (173t), Ghana (127t), Peru (126t), Indonesia (125t) and Mexico (124t), followed by Uzbekistan (111t) and Mali (102t). South Africa produced 92.6t in 2022; lower when compared to the 113.6t recorded in 2021 (Gold.org, 2023).
|
|
|
| World Gold Council: Mine Production - Major producing Gold Countries ranked by 2022 |
16.2.2Recycling
Global annual supply of recycled gold increased marginally to 1,141t in 2022, but still remained below 1,293t recorded in 2020 and 30% below the all-time high recorded in 2009. Recycling supply experienced a modest increase in 2022 even though a record annual average gold price was recorded for the year. India and China are considered as key role players in the recycling market. In the first quarter of 2023, the supply of recycled gold increased to 310.4t, signifying a 5% increase on a year-on-year basis, and can mainly be attributed to higher gold prices (Gold Demand Trends Q1 2023, Gold.org, May 2023).
16.3Global Consumption and Demand
Annual global gold demand (excl. OTC) increased by a significant 17% to 4,706t in 2022, however during the first quarter of 2023, demand was 13.0% lower at 1,081t on a year-on-year basis. Demand from India decreased as consumption in both investment and jewellery were lower, driven by a volatile and record-high gold price. On the contrary, domestic consumption from China increased, driven by robust income growth and improved domestic economic activity during the first quarter of 2023. While continued improvement is expected in markets post-COVID in 2023, demand continues to face challenges of slowing global economic growth along with persistent high inflation levels in several markets.
Effective Date: 30 June 2023
84
Technical Report Summary for
Tshepong South, Free State Province, South Africa
16.3.1Jewellery
Total annual global jewellery consumption decreased from 2,148t in 2021 to 2,090t in 2022, amid weaker gold demand from China and India. In the first quarter of 2023, demand was relatively stable when compared to a year ago, however, a significant quarter-on-quarter decrease of 24% was recorded as high and volatile gold prices discouraged jewellery demand (Gold Demand Trends Q1 2023, Gold.org, May 2023).
16.3.2Investment
A positive global gold demand and exchange-traded funds (ETF’s) are expected to maintain a notable upside potential from volatile interest rate conditions and recession risk. According to the World Gold Council, global bar and coin investment increased by 5% on a year-on-year basis during the first quarter of 2023, exceeding 300t for the third consecutive quarter and the first time since 2013.
A total annual gold investment demand of 1,127t was recorded by the World Gold Council for 2022, a 12% increase when compared to the annual value of 1,004t recorded in 2021. On a quarter-on-quarter basis, total investment demand increased by 9% to reach 274t in the first quarter of 2023. Furthermore, global physically-backed gold ETFs was pressured by weak investor interest, recording a net outflow of -28.7t during the first quarter of 2023, significantly lower when compared to the 270.7t recorded during the first quarter of 2022. In addition, ETF outflows recovered some of its losses and increased during for the first time in 11 months in March 2023 (Gold Demand Trends Q1 2023, Gold.org, May 2023).
Gold prices were further supported by a positive investor sentiment in the institutional segment during March 2023 as a result of an unstable banking industry and positive inflows into ETFs.
|
|
|
World Gold Council: Total Gold Supply & Demand |
16.3.3Currency
Gold holds an inverse relationship with the USD and is usually traded relative to its USD price. During the current period of uncertainty, and the rising influence of Chinese currency, central bank asset managers may likely increase their interest in gold as a result. This has been a prominent trend since the economic downturn in 2008.
Future performance of the gold market is expected to be supported by investment demand (a need for effective hedges and a low-rate environment) and will be driven by the level of risk observed in the recovery of the global economy from the effects of COVID-19, which may offset any lag in recovery of consumer demand.
Effective Date: 30 June 2023
85
Technical Report Summary for
Tshepong South, Free State Province, South Africa
The USD currency and Gold
The inverse relationship between the value of U.S. dollar (USD) and that of gold is one of the most discussed about relationships in currency markets. The U.S. Dollar (USD) is the internationally accepted currency and most of the international transactions take place in Dollar/USD equivalent. The major reason behind the relationship of gold and the USD, is that gold is used as a hedge against the adverse exchange value of the USD. As the dollar’s exchange value decreases, it takes more USD to buy gold, which increases the value of gold. Two other factors linked to the USD, or the strength of the USD is inflation and interest rates. Inflation has remained high throughout 2022 and well into 2023 in the U.S. and in many other countries.
Central banks like the Fed, ECB, and BoE have already hiked rates to try and bring inflation down. Rates will continue to rise while inflation remains high. High interest rates are generally seen as a negative for gold as a non-yielding asset, though high inflation is usually seen as a positive for gold as a hedge against inflation.
16.4Gold Price
16.4.1Historical Gold Price
In early August 2020, the London Bullion Market Association (“LBMA”) gold price reached historical highs and remained relatively high for the rest of the year (Figure 16-1).
The London Bullion Market Association (LBMA) gold price reached a record annual average price of US$1,800.09/oz in 2022. The upward trajectory continued into the first quarter of 2023 where gold prices averaged 10% higher at US$1,890.2/oz on a quarter-on-quarter basis. According to the World Gold Council’s May 2023 Gold Market Commentary, “Gold prices remain rangebound, having failed to establish a foothold above the psychologically important US$2 000.00 level. It appears that over the past year, gold has been more influenced by the US dollar than on average, as well as taking its cues from the 2-year US TIP yield rather than the more commonly associated 10-year.”
16.4.2Forecast Gold Price
The minimum and maximum consensus gold price range for the year 2021 Q4 to year 2025 is presented in Figure 16-2. The long-term gold prices are considered from year 2025 onwards. Forecasts as advised from various financial institutions show that gold is expected to trade in a range of USD1,804/oz - USD1,901/oz, for the period 2022 to 2025 with a long-term outlook of USD1,521/oz.
The gold price forecast of USD1,521/oz is conservative if corroborated against a long-term broker consensus gold price outlook (Figure 16-2).
Effective Date: 30 June 2023
86
Technical Report Summary for
Tshepong South, Free State Province, South Africa
|
|
|
| World Gold Council: Daily Gold Price (ZAR/oz & USD/oz) |
Table 16-X Consensus View of Forecast Gold Price
|
|
|
|
|
|
|
|
|
|
|
|
| Institutions |
2022 |
2023 |
2024 |
| World Bank: Development |
1 801 |
|
1 900 |
|
1 750 |
|
| BMO Capital Markets |
1 802 |
|
1 925 |
|
1 750 |
|
| Scotiabank |
1 803 |
|
1 904 |
|
1 900 |
|
| Nedbank |
1 817 |
|
1 897 |
|
1 970 |
|
| Fitch Solutions |
1 800 |
|
1 800 |
|
1 600 |
|
| S&P Global |
1 804 |
|
1 889 |
|
1 889 |
|
| Australian Government |
1 801 |
|
1 906 |
|
1 839 |
|
| TD Economics |
1 802 |
|
1 985 |
|
2 000 |
|
| AVERAGE |
1 804 |
|
1 901 |
|
1 837 |
|
16.4.3Harmony Group Gold Hedging Policy
Harmony has a hedging policy which is managed and executed at Group treasury level on-behalf of its operating entities. The key features of the hedging programme are as follows:
•The policy provides for hedging (or forward selling) up to a maximum of 20% of expected gold production for a rolling 24-month period;
•The policy has no minimum quantity that should be hedged, and if an attractive margin above cost cannot be achieved (i.e., in a low gold price environment) then no hedges are entered into;
•Harmony enters into ZAR-denominated gold hedges for its South African operations (for the non-South African assets it enters into USD-denominated hedges);
•Individual mines do not enter into hedges in their own name but delivers bullion to Rand Refinery for refining on behalf of Harmony. Rand Refinery is one of the world’s largest single-site precious metals refining and smelting complex in the world. Rand Refinery refine all of Harmony’s gold to at least 99.5% purity, and acting as agent, sells the gold on the daily spot London fixing price and make payment to the Harmony two days later;
•Gains and losses realised from the hedging program are accounted for at Group level and the financial benefit (or downside) is distributed amongst the operations proportional to their levels of gold sales; and
Effective Date: 30 June 2023
87
Technical Report Summary for
Tshepong South, Free State Province, South Africa
•Harmony does its mine planning and financial forecasts based on the estimated future gold price provided by an external source (ETSA), but its year-end actual financial results reflect the received gold price inclusive of the impact of the hedging programme. Therefore, in theory, individual mines receive a hedged gold price for a maximum of 20% of its gold sales with the balance attracting the spot price.
16.5Commentary on Market Studies
The factors which affect the global gold market are well-documented as are the elements which influence the daily gold price. The gold price recorded all-time highs during both 2020 and 2022, and although it has since moderated and retracted, the price remains well above the 5-year historical average.
The positive outlook for gold will likely be sustained. Key headwinds for gold are interest rate hikes, currently at near historically low levels, but continued geopolitical risk and underperformance of stocks and bonds will support gold (Gold Mid-Year Outlook 2022, Gold.org, Accessed 2022). The gold price has experienced weaker momentum in Q2 2022, but stabilised. The gold market is expected to remain supported, and prices elevated for the balance of the financial year running into FY2023.
Harmony has a relatively conservative gold hedging policy in place, and this is used to take advantage of the movements in the gold price to maximise the average gold price received, with the benefit of this hedging programme flowing through to Tshepong (South and North).
16.6Material Contracts
As with all major businesses, Harmony and Tshepong South enters into a multitude of vendor agreements for the provisions of supplies and services. These agreements are entered into on a competitive basis and typically are of a medium-term duration all with clauses providing for periodic updating of pricing, annual (or other) renewal or termination.
Harmony has contractual vendor agreements with various service providers and suppliers. The most significant of these contracts currently in place to support Tshepong South are listed in Table 16-1.
All of the listed contracts are currently valid and in good standing. Terms, rates and charges of contracts are considered consistent with industry norms. Contract management processes are in place and resourced so that contracts re-tendered and/or renewed as they approach expiry.
Table 16-1: Material Contracts
|
|
|
|
|
|
| Vendor Name |
Nature of Service / Supply |
| Axis Mining & Construction cc |
Underground Support services |
| Genflo Mine Vacuum Systems SA (Pty) Ltd |
Shaft Bottom Cleaning at Nyala Shaft |
| Transnet Limited (t/a Spoornet) |
Rail transportation of ore and waste |
| Lesedi Drilling & Mining Company (Pty) Limited |
Underground diamond drilling at Phakisa and Tshepong operations |
| Bidvest Protea Coin (Pty) Ltd |
Security services |
|
|
|
|
|
|
|
|
|
|
|
|
|
|
|
|
|
|
|
|
Effective Date: 30 June 2023
88
Technical Report Summary for
Tshepong South, Free State Province, South Africa
17Environmental Studies, Permitting and Plans, Negotiations, or Agreements with Local Individuals or Groups
Section 229.601(b)(96) (17) (i-vii)
The South African Government has an extensive legal framework within which mining, environmental and social aspects of the industry are managed. Harmony and its Tshepong South Operation is primarily regulated and managed by certain principal Acts (as listed in Section 17.3) as well as corporate policies, management systems and certain industry-wide guidelines, including:
•Energy Efficiency and Climate Change Policy;
•Environmental Policy;
•Harmony Water Management Strategy;
•Biodiversity and Rehabilitation Position Statement;
•Socio-Economic Transformation Policy; and
•Corporate Social Responsibility Policy.
The latest sustainability policies and public environmental social and governance (“ESG”) performance and disclosure report(s) are available on the corporate website. Harmony has identified the environmental risks for the business and has strategies in place to manage the risks.
17.1Results of Environmental Studies
Tshepong South has prepared multiple environmental impact assessments (“EIA”) for regulatory approval, which under the current legal framework, require stakeholder engagement. The most recent EIA was undertaken in 2022. The results of the studies have been incorporated into the Harmony business planning process. The results of all the studies are too voluminous to include in this TRS and therefore the reader is directed to EMP PAR (Environmental Management Programme Performance Assessment) Harmony Tshepong, Matjhabeng and ARM(Reference Number FS 30/5/1/2/2/84MR).
Harmony is committed to maintaining good relationships with regulatory authorities, industries, communities, business partners and surrounding stakeholders.
17.2Waste and Tailings Disposal, Monitoring & Water Management
The process of mining and beneficiation produce significant waste, typically consisting of 1) solid waste in the form of waste rock and overburden, 2) liquid wastes in the form of wastewater and tailings slurry and 3) gaseous emissions such as liquefied petroleum gas.
Measures have been put in place for the handling and disposal of all hazardous chemicals (e.g., cyanide), hydrocarbons (i.e., hydraulic oils and diesel) and other chemicals to ensure the protection of human health and its potential impact on the environment.
Harmony recognises that responsible and effective waste management can positively reduce its environmental impacts and mitigate associated environmental liabilities. Waste management is thus a priority focus area. Internally, guidelines on mineral, non-mineral and hazardous waste materials are included in the environmental management systems (“EMS”) implemented at Tshepong South.
Tailings comprises of crushed rock and process water emitted from the gold elution process in the form of slurry once gold has been extracted. As tailings contain impurities and pollutants, they are placed in TSF engineered to contain them, in line with Harmony's tailings management programme and the Global Industry Standard on Tailings Management (“GISTM”).
Harmony's overall tailings management strategy is to ensure robust, meticulous engineering and dam design, along with a continual focus on management of risks through layered assurance and oversight. The focus areas include, but are not limited to:
•freeboard control;
•water management;
Effective Date: 30 June 2023
89
Technical Report Summary for
Tshepong South, Free State Province, South Africa
•maintaining stability and the safety factor as advised by the engineer of record;
•erosion controls; and
•monitoring and control measures implemented to ensure continued compliance (including regular inspections, audits, and meetings on varying intervals with subsequent actions, minutes and reports).
As part of its mining, environmental and water approvals and licences, Harmony is required to implement monitoring programmes and plans to establish the operations impact on the environment. The compliance limits for the monitoring variable are included in the applicable EMPR(s), WULA(s) and environmental authorisations. The environmental monitoring implemented at Tshepong South includes:
•ground and surface water monitoring
•biodiversity monitoring;
•waste classification and quantification;
•integrated waste and water management plan (“IWWMP”) updates;
•water balance reviews;
•licence and authorisation compliance reviews; and
•air quality (i.e., noise and dust) and greenhouse gas emissions ("GHG") monitoring.
A focus area during the next financial year will be on creating effective awareness and implementation of its waste and waste management procedures such as the IWWMP. This plan provides water conservation management measures to help reduce the demand for water from external and natural sources.
17.3Permitting and Licences
In respect of environment, the following national Acts and the regulations promulgated thereunder provide the regulatory framework for mine permitting and licencing in South Africa:
•Mineral and Petroleum Resources Development Act, 2002 (“MPRDA”);
•National Environmental Management Act, 1998 (“NEMA”);
•National Environmental Management: Waste Act, 2008 (“NEM:WA”);
•National Environmental Management: Air Quality Act, 2004 (“NEM:AQA”); and
•National Water Act, 1998 (“NWA”).
A summary of the status of environmental permits and licences issued at the effective date related to Tshepong South is presented in Table 17-1.
All relevant mining, environmental and water-use permits are in place that cover the environmental, archaeological, and hydrological components of Tshepong South. All permits are audited regularly for compliance and no material risks to the operations have been identified.
There are applications submitted or being considered by the relevant authorities to ensure compliance and alignment with operations LOM requirements. To this end, Water Use Licence Applications were submitted / lodged in 2020 with DWS. Environmental Management Programme Amendments were submitted / lodged in 2020 with DMRE. Tshepong Operations (South and North) are still awaiting approval from the regulator at the effective date of this TRS. These pending environmental permits and licences do not pose a material risk to the continuation of the operation.
Effective Date: 30 June 2023
90
Technical Report Summary for
Tshepong South, Free State Province, South Africa
Table 17-1: Status of Environmental Permits and Licences
|
|
|
|
|
|
|
|
|
|
|
|
|
|
|
| Permit / Licence |
Reference No. |
Issued By |
Date Granted |
Validity |
| Environmental Management Programme |
FS 30/5/1/2/3/2/1(84)EM |
DMRE |
April 16, 2010 |
LOM |
| Environmental Management Updated |
FS 30/5/1/2/2/84MR |
DWAFEC |
Pending Approval Submitted in 2020 |
LOM |
| Water Permit 936B. Harmony. Free State Geduld Mines. Discharge of untreated effluents |
B33/2/340/31 |
DWAFEC |
April 2, 1981 |
LOM |
| Water Permit 870B. Harmony. Discharge of untreated effluents. |
B33/2/340/25 |
DWAFEC |
May 27, 1991 |
LOM |
| Water Permit 1214N. Free State Consolidated Gold Mine. Tshepong, Freddie’s and Phakisa shafts. |
B33/2/340/12 |
DWAFEC |
Not indicated. |
LOM |
|
|
|
|
|
|
|
|
|
|
|
|
|
|
|
|
|
|
|
|
|
|
|
|
|
|
|
|
|
|
Notes: DWAFEC - Department of Water Affairs, Forestry and Environmental Conservation, DWA - Department of Water Affairs.
17.4Local Stakeholder Plans and Agreements
Harmony strives to create sustainable shared value within the communities it operates. Local stakeholder plans and agreements are based on the results from socio-economic information, government development strategies and EIAs undertaken. The socio-economic development programme commits to:
•contribute to areas that will have the most meaningful socioeconomic impact on communities, namely infrastructure, education and skills development, job creation and entrepreneurial development;
•enhance broad-based local and community economic empowerment and enterprise development initiatives;
•facilitate socio-economic development in local communities by means of social and labour plan(s) (“SLP”) and corporate social responsibility programmes;
•support arts, culture, and sports and recreation; and
•build relationships based on trust within host communities.
In South Africa, mining companies are required to have a SLP, which forms an important component of Harmony's community investment plan. It sets out the Company’s obligation to develop and implement comprehensive human resource development programs, community development plans, housing and living condition plans and employment equity plans. The aim of the SLP is to ensure the uplift of the social and economic circumstances of local communities surrounding the mine. The SLP is a prerequisite to securing and maintaining a mining right, with progress required to be reported annually.
Harmony has budgeted to spend approximately ZAR11.51m over FY24 to meet its SLP commitments for Tshepong South respectively.
17.5Mine Closure Plans
Harmony makes provision for closure and rehabilitation both for accounting purposes and as required under the MPRDA. The statutory obligation for all environmental rehabilitation at Tshepong South is administered by the DMRE and requires the preparation of a closure plan, the development of a cost estimate, and financial assurance. The Company makes an annual submission to the DMRE setting out the cost of closure in accordance with the MPRDA and the regulations issued thereunder.
Harmony appointed Digby Wells and Associates (South Africa) (Pty) Ltd, independent environmental consultants, to review and update the Closure Cost Assessment for unscheduled closure associated with Tshepong (South and North) and Matjhabeng Mining Operations. The Matjhabeng Mining Operations is a Harmony operation, located north of the town of Welkom in the Free State Province. The mine closure assessment was done in terms of regulation 53 and 54 of the MPRDA and in accordance with the requirements of NEMA.The closure cost as at June 30, 2023, was calculated to be approximately ZAR517.1m for the total mining right as indicated in Table 17-2.
Harmony is required to make funding available in an amount equal to the cost of closure as determined under the MPRDA in the form of a trust fund and/or bank guarantees, see Table 17-3 Rehabilitation Assurance Costs.
Effective Date: 30 June 2023
91
Technical Report Summary for
Tshepong South, Free State Province, South Africa
Table 17-2: Mine Closure Liability
|
|
|
|
|
|
| Area |
Total Closure Cost (ZAR) |
| Western Holdings 5 Shaft |
9 262 719 |
| Eland Shaft and Freddies 6 |
17 607 193 |
| Nyala Shaft |
75 305 600 |
| Tailings Dams - North |
331 145 091 |
| Tshepong South (Phakisa) |
18 755 892 |
| North Shaft/Tshepong |
39 819 418 |
| Sable Shaft |
5 478 213 |
| Kudu Shaft |
7 892 699 |
| Sewage Treatment Plant |
5 066 139 |
| Floatation Plant |
6 807 863 |
| Grand Total |
517 140 826 |
Table 17-3: Rehabilitation Assurance
|
|
|
|
|
|
|
|
|
|
|
|
| Area |
Trust Fund (ZAR) |
Bank Guarantee (ZAR) |
Total (ZAR) |
| Tshepong and Matjhabeng Operation |
2 830 511 252 |
0 |
2 830 511 252 |
| Tshepong South (Phakisa) |
Included in above |
|
|
| Total |
2 830 511 252 |
0 |
2 830 511 252 |
17.6Status of Issues Related to Environmental Compliance, Permitting, and Local Individuals or Groups
The required environmental authorisations are in place and only require renewal and amendments to be made to reflect the current infrastructure at Tshepong South (WULA permit application submitted, awaiting resolution). Based on current industry norms, a realistic timeframe to obtain relevant authorisations is estimated between 12 and 18 months. With the delays emanating from the Department side, and whilst still in anticipation of the approval, continuous monitoring systems are in place and results submitted on six months bases to the Department.These pending environmental permits and licences do not pose a material risk to the continuation of the operation.. Harmony has been working very closely with the department these last few months to finalise the WULA submitted in 2020.
17.7Local Procurement and Hiring
Harmony is committed to investing in the future of local communities beyond the LOM and not to only empower them, but also to mitigate the impacts its activities to ensure a positive legacy. The 2014 Mining Charter serves to guide the south African mining industry in socio-economic transformation. Local procurement (goods and services) and human resource management are key measures set under the Mining Charter and are reported on annually. Refer to the Company’s corporate website on updated information pertaining to its compliance to the Mining Charter.
Portable skills are developed internally as well as through expanded learning programmes, learnerships and other programmes opened only to operating communities. Local procurement is being supported where there is a skills shortage. Some of the portable skills training offered to its employees include but not limited to basic plumbing, electrical appliance repair, welding, catering and baking, sewing and clothing manufacturing.
17.8Commentary on Environmental Studies, Permitting and Plans, Negotiations, or Agreements with Local Individuals or Groups
Periodic inspections are conducted by the DMRE to verify compliance with applicable environmental laws, regulations, permits and standards. In addition, Tshepong South has implemented an EMS in line with the ISO 14001 standard. The EMS is audited on an annual basis by a third party and includes the needs and expectations of interested parties.
Effective Date: 30 June 2023
92
Technical Report Summary for
Tshepong South, Free State Province, South Africa
As part of Harmony, Tshepong South conducts its operation based on policies and systems that are aligned to its corporate sustainable development framework. Although Harmony is not a signatory to the International Council on Mining and Metals or the UN Global Compact, these form the guiding principles of the framework. Harmony discloses its sustainable development voluntarily in accordance with the guidelines issued by the Global Reporting Initiative (“GRI”). Further to this, Harmony discloses environmental information on the Carbon Disclosure Project (“CDP”) for both climate change and water. The CDP runs the global environmental disclosure system that supports companies to measure and manage their risks and opportunities on climate change, water security and deforestation.
Harmony has a good understanding of the environmental and social aspects of the operations through baseline and specialist studies previously conducted. Risk management and mitigation measures were adequately addressed in the environmental management plans and will be effective to mitigate risks and impacts to acceptable levels should the measures be implemented according to the specialists’ recommendations.
The required environmental authorisations are in place and only require amendments to be made to reflect the current infrastructure at Tshepong South (WUL permit application submitted, awaiting resolution). Based on current industry norms, a realistic timeframe to obtain relevant authorisations is estimated between 12 and 18 months.
Effective Date: 30 June 2023
93
Technical Report Summary for
Tshepong South, Free State Province, South Africa
18Capital and Operating Costs
Section 229.601(b)(96) (18) (i-ii)
Economic parameters for the Harmony Group, including capital and operating costs, is determined, and signed off by the CODM, before distribution to the business units, including Tshepong South. The capital and operating costs are reported in ZAR terms and on a real basis. Rounding of figures may result in minor computational discrepancies.
18.1Capital Costs
The estimated capital costs for Tshepong South is reported according to costs associated with major equipment outside the main operating sections which is termed AE, infrastructure development, as well as operating capital, as presented in Table 18-1.
An average contingency of 10% is applied where the capital cost estimates have a level of uncertainty, for example, where a capital project is an isolated occurrence. Where the capital cost estimates have a reasonable basis, there is no contingency applied. The estimated capital costs are carried forward and modelled in the Tshepong South cash flow.
18.2Operating Costs
A summary of the direct and indirect operating costs for Tshepong South is presented in Table 18-2. Operating costs are based on historic performance while applying any changes expected within the new financial year (such as electricity requirements, increased/decreased labour) and are used as an input into the Tshepong South cash flow model.
18.3Comment on Capital and Operating Costs
The capital and operating cost estimates for Tshepong South is based on actual historical data, as well as budget forecasts. Therefore, the forecasted costs are reliable, and at minimum meet the confidence levels of a Feasibility Study. This approach of estimating capital and operating costs is consistent with industry practice. A record of the forecast and budget costs is maintained by the operation, allowing for an assessment of the alignment of the forecast and actual costs.
Table 18-1: Summary of Capital Cost Estimate for Tshepong South
|
|
|
|
|
|
| Capital Cost Element (ZAR'000s) |
Total LOM (FY2024 - FY2030) |
| AE |
172 126 |
| Shaft Projects |
152 201 |
| Major Projects |
264 521 |
| MCC |
97 871 |
| Total |
686 719 |
| OCD |
1 261 098 |
| Total (including OCD) |
1 947 817 |
Table 18-2: Summary of Operating Cost Estimate for Tshepong South
|
|
|
|
|
|
| Operating Cost Element (ZAR'000) |
Total LOM (FY2024 - FY2030) |
| Mining |
7 775 322 |
| Services |
1 818 105 |
| Medical Hub / Station |
441 944 |
| Engineering |
7 569 980 |
|
|
|
|
| Total Direct Costs |
17 605 351 |
| Mine Overheads |
901 690 |
| Royalties |
203 461 |
| Ongoing Capex |
1 261 098 |
| Total Cost |
19 971 600 |
Effective Date: 30 June 2023
94
Technical Report Summary for
Tshepong South, Free State Province, South Africa
19Economic Analysis
Section 229.601(b)(96) (19) (i-iv)
19.1Key Economic Assumptions and Parameters
The CODM forms, reviews, signs-off and distributes economic assumptions to its various business units. On an annual basis, during the period October to November, long-term commodity prices and exchange rates forecasts’, are received from various financial institutions. In addition, a specialist in Economics from a reputable economics company based in South Africa, provides expert views on the global markets, forward looking commodity prices, exchange rates, consumer price index, production price index, electricity cost and consumable increases. All factors are analysed, cognisance is taken of the requirements of the NYSE and JSE markets, and a proposal is presented to the CODM for recommendation and approval. These assumptions are then applied at Tshepong South, along with specific operational considerations.
19.1.1Gold Price
The forecast gold price (USD1,582/oz) is the price that is used by Harmony for the Tshepong South annual planning cycle and forms the basis for the spot gold price assumptions used in the Tshepong South cash flow. The reader is referred to Figure 16-2 for the consensus forecast gold price. The conversions used in the calculation of the various gold prices is presented in Table 19-1.
Table 19-1: Conversions Used in Gold Price Calculations
|
|
|
|
|
|
|
|
|
|
|
|
|
|
|
| Economic Factors |
Gold Price (USD/oz) |
Conversion Factor (oz/kg) |
Exchange Rate (ZAR:USD) |
Gold Price (ZAR/kg) |
| 2023 Mineral Resource |
1 764 |
32.15 |
16.22 |
920 000 |
| 2023 Mineral Reserve |
1 582 |
32.15 |
16.22 |
825 000 |
| 2024 Gold Price Forecast¹ |
1 582 |
32.15 |
16.22 |
825 000 |
Notes: 1. The forecast gold price as used in the Tshepong South cash flow.
19.1.2Exchange Rate
The South African Rand (ZAR) depreciated significantly since the start of 2023 to average at R17.75/US$ during the first quarter of 2023, 0.7% weaker compared to an average of R17.63/US$ recorded during the last quarter of 2022. Moving onto the second quarter of 2023, the South African Rand depreciated further by 5.2% to average at R18.67/US$ on a quarter-on-quarter basis.
The trade of the South African Rand (ZAR) to the U.S. Dollar (USD) is an important trade, as further weakness in ZAR can be expected in the medium term, after recent comments by Federal Reserve Chairman Jerome Powell alluded to further interest rate hikes to curb inflation, giving the USD further upside against the Rand.
Recent levels of the Rand (ZAR), which had seen the local currency appreciate by more than 4% against the USD, since the start of June 2023, making it the second-best-performing emerging market currency over this period and in recent trades.
The forecast spot exchange rate of 16.22 ZAR:USD is the exchange rate that is used by Harmony for the annual planning cycle and forms the basis for the ZAR:USD exchange rate assumptions used in the company cashflow.
Table 19-2: ZAR:USD Exchange Rate Performance (July 2020 – June 2023)
|
|
|
|
|
|
| Period |
Average Exchange Rate (ZAR:USD) |
| July 2020 to June 2021 |
15.43 |
| July 2021 to June 2022 |
15.21 |
| July 2022 to June 2023 |
17.77 |
| 3-Year Ave. (not weighted) |
16.14 |
Effective Date: 30 June 2023
95
Technical Report Summary for
Tshepong South, Free State Province, South Africa
|
|
|
ETSA: Exchange Rates (Annual – Calendar year) |
Table 19-X Consensus ZAR : USD Exchange Rate Forecast
|
|
|
|
|
|
|
|
|
|
|
|
| Institutions |
2022 |
2023 |
2024 |
| Nedbank |
16.38 |
|
18.29 |
|
17.27 |
|
| Investec |
— |
|
18.20 |
|
17.65 |
|
| FNB |
16.40 |
|
18.80 |
|
18.00 |
|
| PWC |
16.37 |
|
18.20 |
|
18.70 |
|
| IDC |
16.36 |
|
18.50 |
|
18.51 |
|
| AVERAGE |
16.38 |
|
18.40 |
|
18.03 |
|
19.1.3Royalties
Royalty is an expense paid to the government of South Africa and is accounted for in the Tshepong South cash flow models. In terms of the mining ring-fencing application, each ring-fenced mine is treated separately, and deductions can normally only be utilised against mining income generated from the relevant ring-fenced mine. Royalty is calculated as (Gross sales of mineral resources during the year x 0.5% +(earnings before interest and taxes/gross sales in respect of refined mineral resources x 12.5) x 100)
Effective Date: 30 June 2023
96
Technical Report Summary for
Tshepong South, Free State Province, South Africa
|
|
|
Figure 19-1: Graph of Consensus ZAR : USD Exchange Rate Forecast |
19.1.4Taxes
Mining tax on gold mining taxable income in South Africa is determined according to a formula, based on the taxable income from mining operations. Of that, 5% of total revenue is exempt from taxation while the remainder is taxable at a higher rate (33%) than non-mining income (27%). Accounting depreciation is eliminated when calculating the South African mining tax income. Excess capital expenditure is carried forward as unredeemed capital to be claimed against future mining taxable income.
19.1.5Summary
The key assumptions used in the cash flow are summarised for Tshepong South in Table 19-3.
Table 19-3: Key Economic Assumptions and Parameters for Tshepong South Cash Flow
|
|
|
|
|
|
|
|
|
| Parameter |
Unit |
Value |
| Production Rate |
tpm |
48 760 |
| Gold Recovery |
% |
95 |
| Royalty |
% of xx |
0,05 |
| Tax Rate |
% |
Formula |
| Gold Price |
ZAR/kg |
825 000 |
| Exchange Rate |
USD:ZAR |
Variable |
| Discount Rate |
% |
9,00 |
19.2Economic Analysis
Harmony's respective business units and its associated operating sites consider the economic assumptions discussed in Section 19.1 during their respective planning and analysis processes. The past year’s average gold price is used for testing purposes. A spot price of ZAR825,000/kg is used for forecasting the revenue of Tshepong South cash flow (Table 19-4).
Effective Date: 30 June 2023
97
Technical Report Summary for
Tshepong South, Free State Province, South Africa
The discounted cash flow model is used to calculate the Net Present Value (“NPV”) of the investments. The NPV for the spot metal price, for Tshepong South is approximately ZAR1,320Bn, at a discount rate of 9%. The NPV is calculated on a cash flow that accounts for factors such as:
•mining and ore processing working costs;
•royalty payments;
•capital costs, including costs allocated to ongoing development;
•any significant project work considered as major projects; and
•costs deemed as abnormal expenditure.
19.3Sensitivity Analysis
The economic assumptions, cash flow breakdown and economic analysis contribute to the basis for the sensitivity analysis. The sensitivities are calculated and analysed, as shown in the accompanying Table 19-5, Table 19-6 and Table 19-7.
Harmony has reviewed its exposure in terms of South Africa’s political instability, the COVID-19 pandemic, the currency exchange rate, and the gold price, on its financial assets and financial liabilities, and has determined the sensitivities for a ±10% variance. Management considers this range to be a reasonable change given the volatility in the market.
The sensitivity analysis is completed for variations in commodity price (ZAR/kg), total operating costs, which include capital costs and royalties paid (ZAR); and a combined analysis considering variations in commodity price, total operating costs, and changes in production. Capital investments in Tshepong South are relatively low and not expected to have any significant impact on the NPV and therefore not included in a sensitivity analysis. The base case in the analysis below is the economic results emanating from the LOM plan (Table 19-4).
The sensitivity analysis (Table 19-5 and Table 19-6) is based on a change in a single assumption while holding all other assumptions constant. In practice, this is unlikely to occur, as risks and/or opportunities will have an impact on the cash flows, and changes in some of these assumptions may be correlated. The insights that can be provided by this sensitivity analysis is that Tshepong Operations is most sensitive to gold price, closely followed by changes in costs.
The impact of one or a combination of risks and opportunities occurring at the same time cannot be specifically quantified so an analysis considering multi-parameters is considered. In this way the general risks, with the aid of the sensitivity table (Table 19-7) are adequately covered. The sensitivity analysis considering the 3 variations of gold price (ZAR/kg), operating costs (ZAR) and variation in production (kg Au) show that the lowering of working costs, improvement in productivity and the benefits of a higher gold price can have positive impacts on the Tshepong South Mine.
Effective Date: 30 June 2023
98
Technical Report Summary for
Tshepong South, Free State Province, South Africa
Table 19-4: Tshepong Operations Cash Flow
|
|
|
|
|
|
|
|
|
|
|
|
|
|
|
|
|
|
|
|
|
|
|
|
|
|
|
|
|
|
|
|
|
Yr 1 |
Yr 2 |
Yr 3 |
Yr 4 |
Yr 5 |
Yr 6 |
Yr 7 |
| Item |
Units |
LOM Total |
FY2024 |
FY2025 |
FY2026 |
FY2027 |
FY2028 |
FY2029 |
FY2030 |
| Mining advance |
m2 |
984 |
116 |
133 |
143 |
154 |
154 |
155 |
128 |
| Total OCD |
m |
25 566 |
5 982 |
6 776 |
5 504 |
5 111 |
1 108 |
818 |
267 |
| Milled tons |
t '000 |
4 096 |
472 |
564 |
602 |
646 |
643 |
641 |
527 |
| Yield |
g/t |
5 802 |
706 |
676 |
695 |
624 |
703 |
661 |
679 |
| Gold recovered |
kg |
27 699 |
3 329 |
3 813 |
4 188 |
4 032 |
4 520 |
4 239 |
3 579 |
| Revenue |
ZAR'000 |
22 851 570 |
2 746 026 |
3 145 336 |
3 455 484 |
3 326 095 |
3 729 324 |
3 496 962 |
2 952 343 |
| Working costs |
ZAR'000 |
18 507 041 |
2 528 354 |
2 576 365 |
2 697 232 |
2 775 770 |
2 765 763 |
2 763 338 |
2 400 219 |
| Capital (including OCD) |
ZAR'000 |
1 947 817 |
494 044 |
515 926 |
450 574 |
300 930 |
101 129 |
71 875 |
13 340 |
| Royalty |
ZAR'000 |
203 461 |
13 730 |
15 727 |
17 277 |
16 630 |
47 335 |
54 147 |
38 615 |
| Total costs (including capital and royalty) |
ZAR'000 |
20 658 319 |
3 036 128 |
3 108 017 |
3 165 083 |
3 093 331 |
2 914 226 |
2 889 360 |
2 452 174 |
| Profit (after OCD and capital) |
ZAR'000 |
2 193 252 |
(290 102) |
37 319 |
290 402 |
232 764 |
815 098 |
607 602 |
500 169 |
| NPV - (low discount rate - 9%) |
@9% |
1 320 062 |
|
|
|
|
|
|
|
| NPV - (medium discount rate - 12%) |
@12% |
1 121 948 |
|
|
|
|
|
|
|
| NPV - (high discount rate - 15%) |
@15% |
955 946 |
|
|
|
|
|
|
|
Effective Date: 30 June 2023
99
Technical Report Summary for
Tshepong South, Free State Province, South Africa
Table 19-5: Gold Price Sensitivity Analysis
|
|
|
|
|
|
|
|
|
|
|
|
|
|
|
|
|
|
|
|
|
| Sensitivity (%) |
Production (kg) |
Gold Price (ZAR/kg) |
Revenue (ZAR’000) |
Operating Cost (ZAR'000) |
Profit / Loss (ZAR'000) |
NPV (ZAR'000) |
| 10% |
27 699 |
907 500 |
25 136 728 |
20 658 319 |
4 478 409 |
2 951 579 |
| 5% |
27 699 |
866 250 |
23 994 149 |
20 658 319 |
3 335 830 |
2 135 821 |
| LOM plan |
27 699 |
825 000 |
22 851 570 |
20 658 319 |
2 193 252 |
1 320 062 |
| -5% |
27 699 |
783 750 |
21 708 992 |
20 658 319 |
1 050 673 |
504 303 |
| -10% |
27 699 |
742 500 |
20 566 413 |
20 658 319 |
(91 906) |
(311 456) |
Table 19-6: Total Operating Cost Sensitivity Analysis
|
|
|
|
|
|
|
|
|
|
|
|
|
|
|
|
|
|
|
|
|
| Sensitivity (%) |
Production (kg) |
Gold Price (ZAR/kg) |
Revenue (ZAR’000) |
Operating Cost (ZAR'000) |
Profit / Loss (ZAR'000) |
NPV (ZAR'000) |
| 10% |
27 699 |
825 000 |
22 851 570 |
22 724 151 |
127 420 |
(179 450) |
| 5% |
27 699 |
825 000 |
22 851 570 |
21 691 235 |
1 160 336 |
570 306 |
| LOM plan |
27 699 |
825 000 |
22 851 570 |
20 658 319 |
2 193 252 |
1 320 062 |
| -5% |
27 699 |
825 000 |
22 851 570 |
19 625 403 |
3 226 167 |
2 069 817 |
| -10% |
27 699 |
825 000 |
22 851 570 |
18 592 487 |
4 259 083 |
2 819 573 |
Table 19-7: Gold price, Operating Costs, and Production Variation Sensitivity Analysis
|
|
|
|
|
|
|
|
|
|
|
|
|
|
|
|
|
|
|
|
|
| Sensitivity (%) |
Production (kg) |
Gold Price (ZAR/kg) |
Revenue (ZAR’000) |
Operating Cost (ZAR'000) |
Profit / Loss (ZAR'000) |
NPV (ZAR'000) |
| 10% |
30 469 |
907 500 |
27 650 400 |
22 724 151 |
4 926 249 |
3 246 737 |
| 5% |
29 084 |
866 250 |
23 994 149 |
21 691 235 |
2 302 914 |
2 242 612 |
| LOM plan |
27 699 |
825 000 |
22 851 570 |
20 658 319 |
2 193 252 |
1 320 062 |
| -5% |
26 314 |
783 750 |
21 708 992 |
19 625 403 |
2 083 589 |
479 088 |
| -10% |
24 929 |
742 500 |
20 566 413 |
18 592 487 |
1 973 926 |
(280 310) |
Effective Date: 30 June 2023
100
Technical Report Summary for
Tshepong South, Free State Province, South Africa
20Adjacent properties
Section 229.601(b)(96) (20) (i-iv)
Tshepong South is 100% owned by Harmony. The Tshepong South Mine lies to the south-east of the Tshepong Mine. The Eland Mine is located south-east of Tshepong South, while the Welkom 4 Shaft is further south from the Tshepong South Mine.
Effective Date: 30 June 2023
101
Technical Report Summary for
Tshepong South, Free State Province, South Africa
21Other Relevant Data and Information
Section 229.601(b)(96) (21)
Other relevant data and information pertaining to Tshepong South is its separate reporting structure as of Financial Year 2024. Tshepong South previously reported under the Tshepong entity.
Other relevant information includes the public disclosure reports on Tshepong South operational, financial and environmental performance are available on the Company’s corporate website. The following reports are relevant to this TRS:
•Integrated annual report 2023;
•ESG report 2023;
•Financial report 2023;
•Report to shareholders 2023;
•Operational report 2023; and
•TCFD report.
Effective Date: 30 June 2023
102
Technical Report Summary for
Tshepong South, Free State Province, South Africa
22Interpretation and Conclusions
Section 229.601(b)(96) (22)
Tshepong South and Tshepong North mine were merged into a single operation in 2017 and were collectively called the Tshepong Operations. Tshepong Operations are well-established with Tshepong North having been in operation since 1986, and Tshepong South since 1994. Harmony acquired the operations in 2001.In Financial Year 2024 “FY24” the two mines were split and reporting separately as Tshepong South and Tshepong.
Harmony has no known risks to conduct mining activities over the permitted mining rights’ areas, incorporated as Tshepong Operations. In addition, no known risks are posed over surface access and activities, regarding mining related activities.
Tshepong’s regional geological setting, mineralisation and deposit is well understood. The geology is supported by historical geophysical surveys, surface diamond core drilling and underground channel (chip) sampling and mapping. Economic mineralisation occurs in the Basal Reef and B Reefs . The former is mined at 100 % currently , while the latter is still under development which will complete in FY24.
The sampling approach and management, density assumptions, laboratory procedures, and assaying and analysis are in keeping with industry standards and practices and is appropriate for the mineralisation at the Central Rand Group. The holistic understanding of the regional geology, lithological and structural controls of the mineralisation at Tshepong South is sufficient to support the estimation of Mineral Resources.
Gold bearing ore mined at Tshepong South is processed at the Harmony One Plant facility which has been in operation since 1986. As such, the processing method is considered well established for the mineralisation at Tshepong South. The plant makes use of historical trends and data as a basis for their recoveries of Basal and B reefs.
The data pertaining to the mineralisation, regional and geological setting, exploration findings, sample collection, preparation, and testing, inclusive of data verification and metallurgical test work gives rise to the Mineral Resource estimate.
The combined Measured and Indicated Mineral Resource, exclusive of Mineral Reserves, for the Tshepong South Mine, as at June 30, 2023 is 12.341Mt at a grade of 12.29g/t, containing 4.875Moz of gold, and the Inferred Mineral Resource contains 25.090Mt at a gold grade of 10.67g/t, containing 8.606Moz of gold.
Mineral Reserves are derived from the Mineral Resources, a detailed business plan and operational mine planning processes. Mine planning utilises and takes into consideration actual historical technical parameters. In addition, conversion of the Mineral Resources to Mineral Reserves considers Modifying Factors, dilution, ore losses, minimum mining widths, planned mine call and plant recovery factors.
The Mineral Reserves for the Tshepong South Mine, as at June 30, 2023 is 3.445Mt of milled ore at a grade of 7.67g/t, containing 0.850Moz and comprise of 85% Proved Reserves and 15% Probable Reserves.
Tshepong South is currently mining profitably, and the NPV shows a positive result. Any by-products that are recovered as part of the refining process, make up an immaterial component of the total metal inventory, and is thus not reported as part of the Mineral Reserve estimates. There are no obvious material risks that could have significant effect on the Mineral Reserves.
The Mineral Reserves are extracted via the Scattered method, with minor undercut and open stoping methods. Mining methods take into consideration the mining and rock engineering design guidelines. The integrated selection of the mining method increases flexibility, safety and minimises seismic events.
Extracted minerals from Tshepong South are recovered at the Harmony One Plant. The metallurgical process is well-tested technology, based on sound historic operating parameters.
The mine’s regional and local infrastructure is capable of fully supporting the mining and surface related activities. Tshepong South is accessed via national and provincial road networks, has key power transmission and distribution networks provided by the National electricity regulator, water supply networks and communication infrastructure.
Effective Date: 30 June 2023
103
Technical Report Summary for
Tshepong South, Free State Province, South Africa
Overall, Tshepong South is well-established with sufficient logistics and infrastructure support for the existing and planned mining operations.
Harmony and Tshepong South is exposed to market risks such as exchange rate and gold price fluctuations which are partially offset by the Harmony Group hedging policy. The hedging programme considers factors effecting the global gold market and these, along with macro-economic conditions, are used to determine planning and forecasting inputs at group level for all of Harmony’s operating business units. Other non-gold related risks are addressed to some extent by Tshepong South entering into vendor agreements for the provisions of supplies and services which are done on a competitive basis with customary price adjustment, renewal and termination clauses.
To successfully operate a mining operation in South Africa the state requires compliance with applicable environmental laws, regulations, permits and standards. Tshepong South adheres to said compliance and regulatory standards and have, in addition, implemented an Environmental Management System in line with the ISO 14001.
As part of Harmony, Tshepong South conducts its operations based on policies and systems that are aligned to its corporate sustainable development framework. This is guided by the principles of the framework from the International Council on Mining and Metals or the UN Global Compact. Harmony discloses its sustainable development voluntarily in accordance with the guidelines issued by the Global Reporting Initiative. Further to this, Harmony discloses environmental information on the Carbon Disclosure Project for both climate change and water.
Harmony has a good understanding of the environmental and social aspects through baseline and specialist studies previously conducted. Risk management and mitigation measures were adequately addressed in the environmental management plans. Most of the required environmental authorisations are in place and only require amendments to be made to reflect the current infrastructure at Tshepong South (WULA permit application submitted, awaiting resolution). Based on current industry norms, a realistic timeframe to obtain relevant authorisations is estimated between 12 and 18 months.
One of the ways Harmony aims to grow and develop the people and assets and provide sustainable value to all stakeholders is through economic regeneration.
The economics of Tshepong South is based on the discounted cash flow model, with a metal price of ZAR825,000/kg. The NPV for the metal price, is ZAR1,320Bn, at a discount rate of 9%. The NPV is calculated on cash flow that takes factors such as: capital and operating costs; and royalties. The capital and operating cost estimates for Tshepong South is based on historical data, as well as budget forecasts. This estimation technique allows for the forecast and actual costs to be aligned.
Royalties and taxes are paid to the South African government and accounted for in the Tshepong South cash flow and NPV analysis. There are also specific tax relief benefits that apply to gold mining companies, where 5% of total revenue is exempt from taxation, amongst other benefits. In addition, in response to challenges faced by companies during the COVID-19 pandemic, the government have implemented various stimulus packages to provide some tax relief to companies.
The economics of Tshepong South is tested for its sensitivity to commodity price (ZAR/kg), operating costs (ZAR) gold production (kg). The insights provided by the sensitivity analysis is that Tshepong South is most sensitive to changes in the gold price (ZAR/kg), closely followed by changes in total operating costs (ZAR).
This TRS was prepared by a team of experienced professionals. The TRS provides a summary of the material scientific and technical information concerning the mineral exploration, Mineral Resources, Mineral Reserves, and associated production activities of the mineral asset, including references to the valuation for Tshepong South. Each person (as per table 25-1 “Other Specialists”) was responsible for specific sections of this TRS which they have personally supervised and reviewed. This TRS contains the expression of the QP opinions, based on the information available at the time of preparation.
Effective Date: 30 June 2023
104
Technical Report Summary for
Tshepong South, Free State Province, South Africa
23Recommendations
Section 229.601(b)(96) (23)
The gold output can be optimised through improvement of quality of mining and this will result in achieving planned shaft call factor. This impact will be realised through our currently implemented Business Initiative programme that will look at driving quality of mining through measures such as in-stope water controls and better fragmentation during blasting to contain the gold.
Effective Date: 30 June 2023
105
Technical Report Summary for
Tshepong South, Free State Province, South Africa
24References
Section 229.601(b)(96) (24)
Dankert, B.T., and Hein, K.A.A., 2010. Evaluating the structural character and tectonic history of the Witwatersrand Basin. Precambrian Research 177, 1–22.
https://www.gold.org/goldhub/data/gold-prices. Accessed 22 July 2022.
Robb, L.J., and Meyer, F., 1995. The Witwatersrand Basin, South Africa: Geological framework and mineralisation processes. Ore Geology Reviews, 10(2), 67-94.
Robb, L.J., Robb, V.M., 1998. Gold in the Witwatersrand Basin. In: Wilson, M.G.C., Anhaeusser, C.R. (Eds.), The Mineral Resources of South Africa. Handbook. Council for Geoscience, 294–349.
South African Revenue Services. (2021, July 29). South African Revenue Services. Retrieved from Tax Relief Measures: https://www.sars.gov.za/media/tax-relief-measures/
Therriault, A.M., Grieve, R.A.F., Reimold, W.U., 1997. Original size of the Vredefort Structure: Implications for the geological evolution of the Witwatersrand Basin. Meteoritics and Planetary Science 32, 71–77.
Tucker, R.F., Viljoen, R.P., and Viljoen, M.J., 2016. A Review of the Witwatersrand Basin The World’s Greatest Goldfield, accessed from https:// www.researchgate.net /publication /305924249 _A_Review_of_the_Witwatersrand_Basin_-_The_World's_Greatest_Goldfield.
World Gold Council. (2022, July 13). World Gold Council, Gold Hub, Gold mine production: Gold Production by Country | Gold Production | Goldhub
Effective Date: 30 June 2023
106
Technical Report Summary for
Tshepong South, Free State Province, South Africa
25Reliance on Information Provided by the Registrant
Section 229.601(b)(96) (25)
Further to Section 24, in the preparation of this TRS, the principal QP’s and authors relied upon information provided by the Registrant and other internal specialists with regards to mining rights, surface rights, contractual agreements, historical operating expenditures, community relations and other matters. The work conducted by these specialists was completed under the supervision and direction of the respective QP’s. The specialists who assisted the principal authors and QP’s are listed in Table 25-1.
Table 25-1: Other Specialists
|
|
|
|
|
|
|
|
|
|
|
|
| Name |
Specialist |
Area of Responsibility |
Association / Company |
| C Pienaar |
HOD Geology |
Geology |
Phakisa |
| B Reinders |
Senior Valuator |
Valuation and Estimation |
Phakisa |
| R du Toit |
Section Valuator |
Valuation and Estimation |
Tshepong |
| R du Bruyn |
Senior Planner |
Mine planning and design |
Phakisa |
| B Erasmus |
Financial Manager |
Finance and costing |
Phakisa |
| J Powell |
Geostatistician |
Geostatistics Central |
Central |
| J Basson |
Senior Engineer |
Engineering |
Phakisa |
| D Nkomo |
Rock Engineering Manager |
Rock engineering |
Phakisa |
| A Oosthuizen |
Senior Hygienist |
Occupational, Environmental, Ventilation |
Tshepong |
|
|
|
|
|
|
|
|
|
|
|
|
|
|
|
|
|
|
|
|
|
|
|
|
|
|
|
|
Effective Date: 30 June 2023
107
EX-96.14
14
evacopperproject-sxk1300tr.htm
EX-96.14
Document
HARMONY GOLD MINING COMPANY LIMITED
Technical Report Summary of the
Eva Copper Project
North West Queensland, Australia
Effective Date: 30 June 2023
Report Date:31 August 2023
Technical Report Summary of the
Eva Copper Project, North West Queensland, Australia
|
|
|
|
IMPORTANT NOTICE
This Technical Report Summary has been prepared for Harmony Gold Mining Company Limited in support of disclosure and filing requirements with the United States Securities and Exchange Commission’s (SEC) under Regulation S-K 1300; 229.601(b)(96). The quality of information, estimates, and conclusions contained in this Technical Report Summary apply as of the effective date of this report. Subsequent events that may have occurred since that date may have resulted in material changes to such information, estimates and conclusions in this summary. No other party is entitled to rely on this report beyond its intended use and any reliance by a third party on this report is done so at that party’s own risk.
|
Effective date: 30 June 2023
i
Technical Report Summary of the
Eva Copper Project, North West Queensland, Australia
List of Contents
|
|
|
|
|
|
|
|
|
|
|
|
|
|
|
| 1 |
|
|
| 2 |
|
|
|
2.1 |
|
|
|
2.2 |
|
|
|
2.3 |
|
|
|
2.4 |
|
|
| 3 |
|
|
|
3.1 |
|
|
|
3.2 |
|
|
|
3.3 |
|
|
|
3.4 |
|
|
|
3.5 |
|
|
|
|
3.5.1 |
|
|
|
|
3.5.2 |
|
|
|
3.6 |
|
|
| 4 |
ACCESSIBILITY, CLIMATE, LOCAL RESOURCES, INFRASTRUCTURE, AND PHYSIOGRAPHY |
|
|
4.1 |
Accessibility and Infrastructure |
|
|
4.2 |
Climate and Surface Water |
|
|
4.3 |
Landforms and Vegetation |
|
|
4.4 |
Local Mining Industry |
|
| 5 |
HISTORY |
|
|
5.1 |
Prior Ownership and Changes |
|
|
5.2 |
Mineral Resource Estimates History |
|
|
|
5.2.1 |
Little Eva Deposit |
|
|
|
5.2.2 |
Turkey Creek Deposit |
|
|
|
5.2.3 |
Bedford Deposit |
|
|
|
5.2.4 |
Lady Clayre Deposit |
|
|
|
5.2.5 |
Ivy Ann Deposit |
|
|
|
5.2.6 |
Blackard Deposit |
|
|
|
5.2.7 |
Scanlan Deposit |
|
| 6 |
GEOLOGICAL SETTING AND MINERALIZATION |
|
|
6.1 |
Regional Geology |
|
|
|
6.1.1 |
Regional Stratigraphy |
|
|
|
6.1.2 |
Regional Deformation |
|
|
6.2 |
Project Geology |
|
|
|
6.2.1 |
Little Eva Deposit Geology |
|
|
|
6.2.2 |
Turkey Creek |
|
|
|
6.2.3 |
Blackard and Scanlan |
|
|
|
6.2.4 |
Lady Clayre |
|
|
|
6.2.5 |
Ivy Ann |
|
|
|
6.2.6 |
Bedford |
|
| 7 |
DEPOSIT TYPES |
|
|
7.1 |
Copper-Gold Deposits |
|
|
7.2 |
Copper-Only Deposits |
|
| 8 |
EXPLORATION |
|
| 9 |
DRILLING |
|
|
9.1 |
Drill Hole Data Description |
|
|
|
9.1.1 |
Little Eva |
|
|
|
9.1.2 |
Turkey Creek |
|
|
|
9.1.3 |
Blackard |
|
Effective date: 30 June 2023
ii
Technical Report Summary of the
Eva Copper Project, North West Queensland, Australia
|
|
|
|
|
|
|
|
|
|
|
|
|
|
|
|
|
9.1.4 |
Scanlan |
|
|
|
9.1.5 |
Bedford |
|
|
|
9.1.6 |
Ivy Ann |
|
|
|
9.1.7 |
Lady Clayre |
|
|
9.2 |
Drill Hole Collar Survey Control |
|
|
|
9.2.1 |
Little Eva |
|
|
|
9.2.2 |
Turkey Creek |
|
|
|
9.2.3 |
Blackard |
|
|
|
9.2.4 |
Scanlan |
|
|
|
9.2.5 |
Bedford |
|
|
|
9.2.6 |
Ivy Ann |
|
|
|
9.2.7 |
Lady Clayre |
|
|
9.3 |
Downhole Surveys |
|
|
|
9.3.1 |
Little Eva |
|
|
|
9.3.2 |
Turkey Creek |
|
|
|
9.3.3 |
Blackard, Scanlan, and Bedford |
|
|
|
9.3.4 |
Ivy Ann |
|
|
|
9.3.5 |
Lady Clayre |
|
|
9.4 |
Drill Hole Logging |
|
|
|
9.4.1 |
Little Eva |
|
|
|
9.4.2 |
Turkey Creek, Blackard, Scanlan, and Bedford |
|
|
|
9.4.3 |
Ivy Ann |
|
|
|
9.4.4 |
Lady Clayre |
|
|
9.5 |
Core and RC Sampling Methods |
|
| 10 |
SAMPLE PREPARATION, ANALYSES, AND SECURITY |
|
|
10.1 |
Little Eva |
|
|
|
10.1.1 |
Universal 2002 Program |
|
|
|
10.1.2 |
Universal 2003–2006 Program |
|
|
|
10.1.3 |
Universal 2007 Program |
|
|
|
10.1.4 |
Altona 2011 Program |
|
|
|
10.1.5 |
Altona-Sichuan Railway Investment Group 2015 Program |
|
|
|
10.1.6 |
CMMC Work 2018 to 2022 |
|
|
|
10.1.7 |
Quality Control Procedures |
|
|
10.2 |
Turkey Creek |
|
|
10.3 |
Blackard and Scanlan |
|
|
10.4 |
Bedford |
|
|
10.5 |
Ivy Ann |
|
|
10.6 |
Lady Clayre |
|
|
10.7 |
Security |
|
| 11 |
DATA VERIFICATION |
|
| 12 |
METALLURGICAL TESTING |
|
|
12.1 |
Introduction |
|
|
12.2 |
Little Eva Deposit |
|
|
|
12.2.1 |
Mineralogy |
|
| 13 |
MINERAL RESOURCE ESTIMATE |
|
|
13.1 |
Introduction |
|
|
13.2 |
Resource Estimation Procedures. |
|
|
13.3 |
Geological and Mineralization Models and Domains |
|
|
|
13.3.1 |
Little Eva |
|
|
|
13.3.2 |
Turkey Creek |
|
|
|
13.3.3 |
Blackard and Scanlan |
|
Effective date: 30 June 2023
iii
Technical Report Summary of the
Eva Copper Project, North West Queensland, Australia
|
|
|
|
|
|
|
|
|
|
|
|
|
|
|
|
|
13.3.4 |
Ivy Ann |
|
|
|
13.3.5 |
Lady Clayre |
|
|
|
13.3.6 |
Bedford |
|
|
|
13.3.7 |
Block Models |
|
|
13.4 |
Database and Statistical Analysis |
|
|
|
13.4.1 |
Drill Hole Database |
|
|
|
13.4.2 |
Deposit Assay Data Statistics |
|
|
|
13.4.3 |
Data Conditioning and Assay Composites |
|
|
13.5 |
Bulk Density |
|
|
13.6 |
Variography |
|
|
13.7 |
Grade Interpolation |
|
|
13.8 |
Classification and Mineral Resource Statement |
|
|
13.9 |
Resource Verification |
|
| 14-21 |
MINERAL RESERVE ESTIMATES |
|
| 30 |
ADJACENT PROPERTIES |
|
|
30.1 |
Mining Properties (Regional) |
|
|
30.2 |
Mining Properties (Adjacent) |
|
|
30.3 |
Non-Mining Properties |
|
| 31 |
INTERPRETATION AND CONCLUSIONS |
|
|
31.1 |
Geology, Mineral Resources, and Mineral Reserves |
|
|
31.2 |
Mining |
|
|
31.3 |
Metallurgical Testwork and Mineral Processing |
|
|
31.4 |
Process Plant |
|
|
31.5 |
Infrastructure |
|
|
31.6 |
Environmental, Permitting, and Social Considerations |
|
|
31.7 |
Capital and Operating Costs |
|
|
31.8 |
Economics |
|
| 32 |
RECOMMENDATIONS |
|
|
32.1 |
Mineral Resources and Mineral Reserves |
|
| 33 |
REFERENCES, ACRONYMS, AND UNITS OF MEASURE |
|
|
33.1 |
References |
|
Effective date: 30 June 2023
iv
Technical Report Summary of the
Eva Copper Project, North West Queensland, Australia
List of Figures
|
|
|
|
|
|
| Figure 1-1: Eva Copper Project Location, Tenure, Plant, and Regional Infrastructure |
|
| Figure 2-1: Location, Tenure, Plant, and Regional Infrastructure |
|
| Figure 3-1: Project Location |
|
| Figure 3-2: Eva Copper Project Tenements |
|
| Figure 3-3: Pastoral Lease Holdings and Current Conduct and Compensation Agreement Areas (Colour indicates landowner) |
|
| Figure 4-1: Infrastructure, Major Mines, Deposits, and Eva Copper Project Tenure |
|
| Figure 6-1: Geological Domains of the Mount Isa Province and Project Location |
|
| Figure 6-2: Schematic Stratigraphic Diagram of the Little Eva Deposit Area |
|
| Figure 6-3: Geological Domains and Principal Stratigraphic Units of the Eva Copper Project Area |
|
| Figure 6-4: Project Area Geology with Outline of Project Tenure and Major Deposits |
|
| Figure 6-5: Geology and Mineralization at the Little Eva Deposit |
|
| Figure 6-6: Geological Cross-Sections through the Little Eva Deposit from North to South |
|
| Figure 6-7: Drill Core Illustrating the Principal Mineralization and Alteration Styles at Little Eva Deposit |
|
| Figure 6-8: Turkey Creek Deposit Mineralization |
|
| Figure 6-9: Geological Cross-Sections through the Southern Zone of the Turkey Creek Deposit |
|
| Figure 6-10: Plan View of the Blackard Deposit with Location of Cross-Sections |
|
| Figure 6-11: Geological Cross-Sections through the Blackard Deposit Illustrating the Distribution of Mineralogical/Metallurgical Zones Produced by Weathering |
|
| Figure 6-12: Photographs of Drill Core from the Blackard Deposit |
|
| Figure 6-13: Plan View of the Scanlan Deposit with Cross-Section Line |
|
| Figure 6-14: Cross-Section of Scanlan Deposit Illustrating Mineralization Zones |
|
| Figure 6-15: Geology and Mineralization at Lady Clayre |
|
| Figure 6-16: Geological Cross-Section through the Lady Clayre Deposit Zone F |
|
| Figure 6-17: Plan of Ivy Ann Mineralization and Geological Cross-Section of the Ivy Ann Deposit |
|
| Figure 6-18: Bedford Deposit Mineralization Plan |
|
| Figure 6-19: Geological Cross-Sections through the Bedford Deposit |
|
| Figure 8-1: Surface Copper Anomalism with Defined Deposits and the Cameron Project Area Indicated |
|
| Figure 9-1: Little Eva Drill Collar Plan |
|
| Figure 9-2: Turkey Creek Drilling Locations by Type |
|
| Figure 9-3: Blackard Deposit Drill Hole Locations by Type |
|
| Figure 9-4: Scanlan Deposit Drill Hole Locations by Type |
|
| Figure 9-5: Bedford North Drill Hole Plan |
|
| Figure 9-6: Bedford South Drill Hole Plan |
|
| Figure 9-7: Ivy Ann Drill Collar Plan |
|
| Figure 9-8: Lady Clayre Drill Collar Plan. |
|
| Figure 12-1: Drill Hole LED495, Specimen 94975, Scale 4.6 mm |
|
| Figure 12-2: Drill Hole LED495, Specimen 94966, Scale 1.6 mm |
|
| Figure 13-1: Little Eva Block Model 0.1% Cu Domain Containing the Estimation Domains |
|
| Figure 13-2: Isometric View of the Blackard estimation domain with internal high grades. |
|
| Figure 13-3: Little Eva Drill Collar Plan by Company |
|
| Figure 13-4: Number of Little Eva Drill Holes by Year and Company |
|
| Figure 13-5: Little Eva Drill Collar Plan with Drill Holes Colour Coded by Orientation |
|
| Figure 13-6: Plan View of Drill Collars Colour-Coded by Drill Type |
|
| Figure 13-7: Plan View of Drill Collars, Colour-Coded by Type for the Blackard Deposit with Reserve Pit Shell Shown |
|
| Figure 13-8: Plan View of Drill Collars for the Scanlan Deposit Showing the Resource Shell and Reserve Pit Outlines |
|
| Figure 13-9: Log Histogram for Raw Assay Data from Little Eva Deposit |
|
| Figure 13-10: Log Histogram of 2.5 m Copper Composites, Little Eva Deposit |
|
| Figure 13-11: Cumulative Probability Plot for Cu Assays, Little Eva |
|
| Figure 13-12: Log Histogram of Copper Assays from Lady Clayre Deposit |
|
| Figure 13-13: Log Probability Plot of Copper Assays from Lady Clayre Deposit |
|
Effective date: 30 June 2023
v
Technical Report Summary of the
Eva Copper Project, North West Queensland, Australia
|
|
|
|
|
|
| Figure 13-14: Bulk Density Histograms |
|
| Figure 13-15: Variogram for Little Eva |
|
| Figure 13-16: Variograms for Central (top) and South (Bottom) Domains of the Little Eva Deposit |
|
| Figure 13-17: Gold Variograms for the North Domain |
|
| Figure 13-18: Gold Variogram for the Central Domain |
|
| Figure 13-19: Oblique View of the Little Eva estimation domains, with major structures |
|
| Figure 13-20: Little Eva Deposit Plan View of Colour-Coded Block Grades at 120 m Elevation within Reserve Pit |
|
| Figure 13-21: Cross-Section 7,772,100N (see plan above) Displaying Colour-Coded Block Grades |
|
| Figure 13-22: Wire framed Domains for the Turkey Creek Deposit |
|
| Figure 13-23: Turkey Creek Cross-Section at 7,771,500N (mid-point of Main Zone) of Colour-Coded Block Grades within Design Pit |
|
| Figure 13-24: Turkey Creek Plan View of Colour-Coded Block Grades at 120 m Elevation within Reserve Pit |
|
| Figure 13-25: Structural Domains of the Blackard Deposit in Plan |
|
| Figure 13-26: Blackard Deposit Cross-Section at 7,765,150N |
|
| Figure 13-27: Plan View of the Scanlan Deposit with Structural Domains Displayed |
|
| Figure 13-28: Cross-Section of Scanlan Deposit with Drill Hole, Block Grades and Resource Constraining Shell Displayed. |
|
| Figure 13-29: Isometric View (looking south) of the Resource Block Model at 0.17% Cut-off at Top of Sulphide Zone, within Reserve Pit |
|
| Figure 13-30: Cross-Section through the North End of the Eva Deposit with Block Grades and Drill Hole Composites from Drilling completed Post Estimation. No assays were returned for the Diamond Tail at the base of hole LER1067. |
|
| Figure 13-31: Cross-Section through the North End of the Eva Deposit with Block Grades and Drill Hole Composites |
|
| Figure 13-32: Cross-Section 7,772,000N in Little Eva Deposit |
|
| Figure 13-33: Mean Assay, Composite, and M&I Block Grades for the Different Resource Domains in the Little Eva Deposit |
|
| Figure 13-34: Mean Assay, Composite, and Block Grades for Domains in the Little Eva Deposit at a 0.17% Cu Cut-off Grade |
|
| Figure 13-35: Examples of Swath plots for Little Eva (top) and Blackard (bottom), showing the block grades replicate the composit grades. |
|
| Figure 30-1: Adjacent Mining Properties and Major Mines around the Eva Copper Project |
|
Effective date: 30 June 2023
vi
Technical Report Summary of the
Eva Copper Project, North West Queensland, Australia
List of Tables
|
|
|
|
|
|
| Table 1-1: Eva Copper Project Summary |
|
| Table 1-2: Eva Copper Project Mineral Resources, June 30, 2023 |
|
|
|
|
|
|
|
|
|
|
|
|
|
|
|
|
|
|
|
|
|
|
|
|
|
| Table 2-1: Scope of Responsibility |
|
| Table 3-1: Eva Copper Project Mining Leases |
|
| Table 3-2: Eva Copper Project Exploration Permit for Minerals |
|
| Table 3-3: Royalties Applicable to Portions of the Mineral Reserves at Various Deposits |
|
| Table 5-1: Little Eva Resource Estimate History |
|
| Table 5-2: Turkey Creek Resource Estimate History |
|
| Table 5-3: Bedford Resource Estimate History |
|
| Table 5-4: Lady Clayre Resource Estimate History |
|
| Table 5-5: Ivy Ann Resource Estimate History |
|
| Table 5-6: Blackard Resource Estimate History |
|
| Table 5-7: Scanlan Resource Estimate History |
|
| Table 9-1: Little Eva Drilling Summary |
|
| Table 9-2: Turkey Creek Drilling Summary |
|
| Table 9-3: Blackard Drilling Summary |
|
| Table 9-4: Scanlan Drilling Summary |
|
| Table 9-5: Bedford Drilling Summary |
|
| Table 9-6: Ivy Ann Drilling Summary |
|
| Table 9-7: Lady Clayre Drilling Summary |
|
|
|
|
|
|
|
|
|
|
|
| Table 13-1: 3D Block Model Limits (UTM Coordinates and MineRL (AMD+1000 m) |
|
| Table 13-2: Summary of Exploration Drilling by Company |
|
| Table 13-3: Summary of Assay Statistics by Deposit |
|
| Table 13-4: Summary of Cu Assay Statistics for Little Eva by Company Drill Data |
|
| Table 13-5: Summary of Basic Statistics for RC vs. Diamond Drill Hole Assays for Little Eva |
|
| Table 13-6: Basic Statistics for Raw Assays by Domain at Little Eva |
|
| Table 13-7: Cu% Assay Statistics Based on Drill Hole Orientation at Little Eva |
|
| Table 13-8: Cu% Assay Statistics by Resource Domain for the Blackard Deposit |
|
| Table 13-9: Cu% Assay Statistics by Drill Type for the Blackard Deposit |
|
| Table 13-10: Basic Statistics for 2 m Composites by Domain at Little Eva |
|
| Table 13-11: Basic Statistics for 2 m Composites by Domain at Turkey Creek |
|
| Table 13-12: Basic Statistics for 2 m Composite Grades in Blackard Deposit by Structural and Mineralogical Domains |
|
| Table 13-13: Basic Statistics for Composites by Mineralogical Zone for the Scanlan Deposit .14-24 Table 14-14: |
|
| Table 13-14: Basic Statistics for 2.5 m Composites by Domain at Bedford |
|
| Table 13-15: Basic Statistics for 2.5 m Composites by Domain at Lady Clayre |
|
| Table 13-16: Basic Statistics for 2.5 m Composites by Domain at Ivy Ann |
|
| Table 13-17: Bulk Density Data and Average or Assigned Values |
|
| Table 13-18: Bulk Density Used for Blackard and Scanlan Deposits |
|
| Table13-19:Copper indicator semi-variogram models |
|
| Table 13-20: Gold indicator semi-variogram models |
|
| Table 13-21: Search Ellipse for Interpolation for Little Eva |
|
| Table 13-22: Search Criteria for Interpolation for Turkey Creek and Blackard |
|
| Table 13-23: Search Criteria for Interpolation for the Scanlan Deposit |
|
| Table 13-24: Search Criteria for Interpolation for the Bedford Deposit |
|
| Table 13-25: Search Ellipse Parameters by Domain for the Bedford Deposit |
|
| Table 13-26: Search Criteria for Interpolation for the Lady Clayre Deposit |
|
| Table 13-27: Search Ellipse Parameters by Domain for the Lady Clayre Deposit |
|
| Table 13-28: Search Criteria for Interpolation for the Ivy Ann Deposit |
|
| Table 13-29: Search Ellipse Parameters by Domain for the Ivy Ann Deposit |
|
Effective date: 30 June 2023
vii
Technical Report Summary of the
Eva Copper Project, North West Queensland, Australia
|
|
|
|
|
|
| Table 13-30: Eva Copper Project Resources by Category and Deposit at 0.17% Cu Cut-off Grade |
|
Table 13-31: Oxide material for the Eva Copper Project |
|
| Table 13-32: Historical Resource Estimates for Copper-Only Deposit Mineral Resources |
|
|
|
|
|
|
|
|
|
|
|
|
|
|
|
|
|
|
|
|
|
|
|
|
|
|
|
|
|
|
|
|
|
|
|
|
|
|
|
|
|
|
|
|
|
|
|
|
|
|
|
|
|
|
|
|
|
|
|
|
|
|
|
|
|
|
|
|
|
|
|
|
|
|
|
|
|
|
|
|
|
|
|
|
|
|
|
|
|
|
|
|
|
|
|
|
|
|
|
|
|
|
|
|
|
|
|
|
|
|
|
Effective date: 30 June 2023
viii
Technical Report Summary of the
Eva Copper Project, North West Queensland, Australia
1Executive Summary
Section 229.601(b)(96)(1)
The Qualified Persons (“QP”) of Harmony Gold Mining Company Limited (“Harmony” or the “Company”) have prepared this Technical Report Summary (“TRS”) to disclose the Mineral Resource estimates for the Company’s Eva Copper Project (the Project). The TRS has been prepared in accordance with the U.S. Securities and Exchange Commission (“SEC”) property disclosure regulations, S-K 1300, with an effective date as at June 30, 2023. No material changes have occurred between the effective date and the date of signature of this TRS.
The Project is 100% owned by Harmony Eva Copper Limited, a subsidiary of Harmony Gold Mining Company Ltd. The Project is in North West Queensland, approximately 76 kilometres (km) northwest of Cloncurry, and 194 km northeast of Mount Isa.
The Project is in the Feasibility Study stage that is testing a multiple open pit operation feeding a copper concentrator to produce copper concentrate for sale. There are seven deposits informing the Resource and in order of size are Little Eva, Blackard, Scanlan, Turkey Creek, Lady Clayre, Bedford, and Ivy Ann.
Existing major infrastructure closely surrounding the Project site includes the Burke Developmental Road, located 8.5 km to the east of the Project, which connects Cloncurry with Normanton. A power transmission line installed by MMG Limited for their Dugald River mine, located 11 km south of the Project. A water pipeline that runs from Lake Julius to the Ernest Henry Mine traverses the southern portion of the Project site. A residential area, known as the Mount Roseby Homestead, is located approximately 17.5 km to the south of the Project plant site. Current infrastructure located on the Project site itself is minor, and includes dirt tracks for exploration, water points, and fences.
Key Facts
Units of measurement used in this report conform to the metric system. All currency is United States dollars (US$) unless otherwise noted.
Table 1-1: Eva Copper Project Summary
|
|
|
|
|
|
|
|
|
|
|
|
|
|
|
|
|
|
|
|
|
|
Contained Metal |
| Mineral Resources |
Tonnes (Mt) |
Copper Grade (%) |
Gold Grade (g/t) |
Copper (Mlb) |
Gold (koz) |
Total Mineral Resources – Measured and Indicated |
275.3 |
|
0.43 |
|
0.07 |
|
2 588 |
|
355 |
|
– Inferred |
79.5 |
|
0.40 |
|
0.07 |
|
702 |
|
80 |
|
Total Mineral Reserves – Proven and Probable |
— |
|
— |
|
— |
|
— |
|
— |
|
Notes
1. Mineral Resources are reported in accordance with the SAMREC Code, 2016 and have an effective date of June 30, 2023. For the purposes of this TRS, the Mineral Resources have been classified in accordance with § 229.1302(d)(1)(iii)(A) (Item 1302(d)(1)(iii)(A) of Regulation S-K). The Qualified Person responsible for the estimate is Mr R Reid, Group Resource Geologist, and employee of Harmony (PNG Services) Pty Ltd.
2. Mineral Resources are reported on a 100% basis. Harmony holds a 100% interest.
5. Mineral Resources are reported exclusive of Mineral Reserves. Mineral Resources that are not Mineral Reserves do not have demonstrated economic viability.
6. Mineral Resources at EVA are reported assuming bulk open pit mining with metallurgical recovery for copper and gold by sulphide flotation. Mineral Resources are reported above a copper grade cut-off of 0.17% based on the results of a profit algorithm NSR calculation that equates to a marginal ore cut-off grade. The profit algorithm takes account of metal price, grade, ore processing route, recoveries of 90% (Cu Sulphide), 63% (Cu Native Copper) and 78% (Au) and costs. Metal price assumptions are USD1,250/oz gold, USD2.75/Lb copper and a 0.73 USD/AusD exchange rate. Adjustments to these figures will potentially impact upon the economic cut-off grade.
7. Tonnages are metric tonnes. Copper pounds, and Gold and silver ounces are estimates of metal contained in tonnages and do not include allowances for processing losses.
8. Rounding as required by reporting guidelines may result in apparent differences between tonnes, grade and contained metal content. Rounding is to three significant figures.
Effective date: 30 June 2023
1
Technical Report Summary of the
Eva Copper Project, North West Queensland, Australia
Project Overview
Eva Copper Mine Pty Ltd is a wholly owned subsidiary of Harmony Gold Company Mining Limited which owns 100% of the Project. Harmony acquired the Project from Copper Mountain Mining Pty. Ltd. in December 2022.
Eva Copper is located approximately 76 km northwest of Cloncurry in North West Queensland, Australia, and has extensive exploration potential in the approximately 4,000 km2 (379,000 hectare [ha]) mineralized land package (Figure 1-1).
CMMC reported a technically and financially viable operation through its 2020 Feasibility Study Update in which it declared Reserves. This operation consisted of seven (7) open pit mines with ore processed through a copper concentrator to produce a copper concentrate for sale. During its due diligence phase, Harmony identified a number of risks and opportunities it wished to test in an update of the study. These studies are ongoing and not yet complete. Due to the preliminary nature of some of this work Harmony is not in position to declare Reserves at this point in time.
|
|
|
| Figure 1-1: Eva Copper Project Location, Tenure, and Regional Infrastructure |
Ownership
The Eva Copper Project is owned by Harmony Eva Services Pty Ltd, a 100% owned subsidiary of Harmony.
Reliance on Other Experts
The QPs’ opinions contained herein are based on public and private information provided by Harmony and others throughout the course of the study. The authors have carried out due diligence reviews of the information provided to them by Harmony and others for preparation of this report. The authors are satisfied that the information was accurate at the time of writing, and that the interpretations and opinions expressed are reasonable and are based on a current understanding of the mining and processing techniques and costs, economics, mineralization processes, and the host geological setting. The authors have made reasonable efforts to verify the accuracy of the data relied on for this report.
Effective date: 30 June 2023
2
Technical Report Summary of the
Eva Copper Project, North West Queensland, Australia
Property Description and Location
The Eva Copper Project is located 76 km northwest by road from Cloncurry, and 194 km northeast by road from Mount Isa, a regional mining centre (Figure 1-1). Access to the Project is via the sealed Burke Developmental Road from Cloncurry. This road passes 8.5 km to the east of the proposed processing plant site and the Little Eva and Turkey Creek pits. The site is also 11 km north of the major operating Dugald River zinc mine.
The Mineral Resources are within five granted Mining Leases (ML), except for the Ivy Ann pit, which is within the Exploration Permit for Minerals (EPM) 25760 (King). The MLs total an area of 143 km2, and are situated across from two pastoral lease holdings and within one Native Title grant. There are two freehold lots granted in the late 1800s, and 100% owned by the Company, that lie within the MLs; the first sits over part of the Little Eva deposit, the second over part of the Longamundi deposit.
Necessary agreements are secured with the pastoral leaseholders and Native Title party (Kalkadoon People) that set out conduct and compensation terms for the future mining activities to proceed.
Numerous royalties apply to the Project. Royalties on minerals are payable annually to the Queensland State Government on an ad valorem basis, with various costs being permitted as a deduction from sales revenue. Copper and gold royalty rates vary between 2.5% and 5.0% of value, depending on average metal prices, as per Schedule 3 of the Mineral Resources Regulation of 2003. No state royalty on copper is applicable to the two freehold lots owned by the Company Several royalties also apply to the Project from purchase agreements and are payable to several parties variably across portions of the Project area. These apply to all of the deposits in the Project mine plan: a total 1.5% net smelter return (NSR) royalty is applicable to the Little Eva, Blackard, Scanlan, Turkey Creek, Bedford, and Lady Clayre deposits, and a 2% NSR royalty is applicable to the Ivy Ann deposit. Compensation for the effects of mining activities on the Native Title of the Kalkadoon People has been agreed upon.
Accessibility, Climate, Local Resources, Infrastructure, and Physiography
Current site access is by way of gravel roads from a sealed road that passes 8.5 km to the east of the proposed plant site. The site is also 11 km north of the major operating Dugald River zinc mine, owned by MMG.
The town of Cloncurry is located on the railway line from Townsville to Mount Isa, and has container handling facilities, an airport that hosts both commercial and fly-in/fly-out (FIFO) jet aircraft services, and a regional fuel depot. It also has schools, hospitals, and other services. The Project lies within the Shire of Cloncurry, which is the local government administrative area. The Shire offices are also based in Cloncurry.
Grid power is generated in Mount Isa at two gas-fired power stations, and is transmitted from Mount Isa to Cloncurry. A 220 kV power line has been constructed from the Chumvale substation near Cloncurry to the Dugald River mine.
The Cloncurry region is semi-arid, with a distinct hot, wet season from November to March, which is typical of inland northern Australia. Average monthly temperatures range from 10.6°C to 38.5°C, with extremes recorded from 1.8°C to 46.9°C. Rainfall in the wet season largely occurs as storms. Rainfall is highly variable from year to year, with the region often experiencing both multi-year droughts and large-scale flooding from major rainfall events.
The Project site is serviced by a complex system of surface drainages that flow generally northward. On the western side of the processing plant and Little Eva pit is Cabbage Tree Creek, which is joined by other creeks flowing northward to become a tributary of the Leichhardt River. Creeks and rivers flow only during, and for a brief period following, the wet season.
The Project has groundwater sources from both hard rock fracture zone systems and from a graben-like structure infilled with Phanerozoic sediments and alluvial deposits within a paleodrainage adjacent to the current course of Cabbage Tree Creek.
Effective date: 30 June 2023
3
Technical Report Summary of the
Eva Copper Project, North West Queensland, Australia
The mine site and broader operation area is gently undulating flat topography, with the predominant land use being low-intensity cattle grazing, although exploration and mining activities have been conducted over the area since the late 1800s. The site is currently crossed by several gravel roads from pastoral and exploration activities. Additionally, SunWater Limited’s water pipeline from Lake Julius to the Ernest Henry mine crosses the lease area from west to east.
History
The Project has a long history, and has been held under various tenures by a variety of exploration and mining companies. Small-scale mining dating back to the early 1900s has occurred at deposits such as Little Eva, Bedford, and Lady Clayre. Early explorers that contributed significantly to the Project with the discovery of the copper-only or native copper deposits are Ausminda Pty. Ltd., and then CRA Exploration (CRAE), who completed the first substantive work between 1990 and 1996, also defining a small resource at Little Eva. CRAE sold its interest in the Project to Pasminco in 1998. Universal Resources (URL) acquired the Project in 2001. URL also purchased the tenement hosting the Ivy Ann deposit from Dominion Metals Pty. Ltd. (Dominion) and Pan Australian Resources NL (PanAust).
The remaining property was acquired by purchasing tenure from both Pasminco and Lake Gold Pty. Ltd. in a 50:50 ownership split between URL and Roseby Copper Pty. Ltd. (RCPL). In 2004, URL purchased RCPL, and thus URL held 100% of the Eva Copper Project resources. Until 2009, work focused extensively on the copper-only resources, with completion of two feasibility studies based on blends of sulphide ore and copper-only ore. In 2010 URL merged with Vulcan Resources to become Altona Mining Limited, Altona took over ownership of the Eva Copper Project. From 2010 to 2012, Altona carried out additional drilling, resulting in Mineral Resource upgrades at the Little Eva, Bedford, Lady Clayre, Ivy Ann, Blackard, Legend, and Scanlan deposits. Little Eva’s resource estimate was doubled based on the additional drilling.
In 2012, Altona completed a Feasibility Study based on the increased resources at the copper-gold sulphide deposits, and excluding the Blackard and Scanlan deposits. Altona published Mineral Reserves for the Little Eva, Bedford, Lady Clayre, and Ivy Ann deposits as part of the 2012 Feasibility Study. Altona published updates to the Feasibility Study in 2014 and 2017. The 2017 update incorporated the subsequently delineated significant Mineral Resource at Turkey Creek.
MLs and an EA were granted in 2012 based on the 2009 Feasibility Study mine plan. Following EA amendments, the Project is currently authorised by EA EMPL00899613, granted 18 November 2022.
Altona completed a DFS update in 2017, incorporating the Turkey Creek deposit in the mine plan and significant layout changes that included changes to the size and location of the TSF and a Cabbage Tree Creek diversion channel at Little Eva pit. To support the previous studies, the Little Eva, Bedford, Lady Clayre, and Ivy Ann deposits have had a number of formal Mineral Resource estimates that reflect stages of resource definition dating from 2006 to 2017. The Mineral Resource estimate for Turkey Creek was completed in 2015. Estimates were largely undertaken by external independent experts, initially by McDonald Speijers, and most recently Optiro, based on data and geological models provided by the CMMC.
In December 2022 Harmony (HMY) purchased the project from CMMC. In February 2023 Harmony commenced a confirmatory and expansion drilling program and other studies designed to progress the project to a decision to mine.
Geological Setting and Mineralization
The Project area is situated within the Mount Isa and North West Region of Queensland, Australia, an area that is one of the premier base metal-bearing areas of Australia, with mining activities having taken place since the discovery of copper and gold near Cloncurry in the 1860s. The Mount Isa area hosts numerous base metal copper, zinc, and lead deposits of global significance, including the Mount Isa, Ernest Henry, Century, Dugald River, Cannington, and Selwyn deposits. The Eva Copper Project is hosted by Proterozoic-aged, metamorphosed and poly-deformed marine sedimentary and volcanic rocks of the Mary Kathleen domain of the Eastern Fold Belt Inlier. Deformation, metamorphism, and plutonic activity took place during the Isan Orogeny, approximately 1,600 to 1,500 million years (Ma) ago.
There are twelve known mineral deposits in the Project area, of which six have been included in the current mine plan. Mineral deposits are grouped into two types: copper-gold, and copper only. There are five of the copper-gold deposits, four of which are in the mine plan. These deposits are classified as iron oxide copper-gold (IOCG) deposits, where mineralization is associated with regional-scale haematite and albite alteration (red-rock alteration), and localized magnetite alteration.
Effective date: 30 June 2023
4
Technical Report Summary of the
Eva Copper Project, North West Queensland, Australia
Copper sulphide mineralization, primarily chalcopyrite with lesser bornite, occurs as veins, breccias, fracture fill, and disseminations in mafic to intermediate volcanic or intrusive rocks. Gold is generally correlated with copper, and is recovered in the copper concentrate. Mineralization appears to be localized and/or bounded by faults and other deformation-related structures.
Effective date: 30 June 2023
5
Technical Report Summary of the
Eva Copper Project, North West Queensland, Australia
The copper-only deposits are stratabound, locally stratiform, and most occur within metamorphosed calcareous metasedimentary rocks, forming an approximately linear trend stretching over 7 km. The origin of these deposits is uncertain; they may be deformed and metamorphosed versions of sedimentary or red-bed type copper deposits, or they could be more closely related to the IOCG deposits, but with enhanced stratigraphic controls related to the calcareous beds being particularly reactive with hydrothermal fluids.
All of the deposits have a 10 m to 25 m thick overlying zone of oxidation, where the rock is extensively weathered, and copper sulphide minerals have been leached or converted to various oxide minerals that cannot be recovered by flotation. The oxide zones are treated as waste, but tonnages and copper grades have been estimated and the oxide mineralization will be stockpiled separately. With the exception of the Turkey Creek deposit, the copper-only deposits commonly have a significant thickness of supergene material, where carbonate has been leached from the rock, reducing hardness and density, and the copper occurs as native-copper, chalcocite, and other low-sulphur copper species. The carbonate-leached zone is separated from the underlying sulphide zone by a thin transition zone. Each of these mineralogical zones has been modelled so that resources can be estimated for each and the appropriate metallurgical recoveries can be applied for reserve estimation.
Drilling
Although exploration work has been recorded within the Eva Copper Project area since 1963, usable drill data dates back to 1988. Total drilling in the seven deposits with planned production includes 1,470 drill holes for 208,637 m. All the drill holes used for Mineral Resource estimation have accurate collar and downhole surveys, including the older holes, which were subsequently resurveyed by later exploration companies (URL, or more recently, Altona). Most of the drilling was done by reverse circulation (RC) methods, with a small percentage being diamond drill holes (DDH).
Statistical analysis of the type of drilling, age, and operating company does not indicate any bias to the drill hole assay data. Assay data from two DDHs completed by Sichuan Railway Investment Group (SRIG) in 2017, and two DDH completed in 2018 by CMMC within the Little Eva deposit, provided material for metallurgical testing and were used to verify the resource block model. Two holes were drilled in the Turkey Creek deposit in 2018 and 2019 for grade verification and metallurgical material. Eighteen reverse circulation (RC) holes were drilled in the Blackard deposit in 2019 by CMMC to upgrade resource classification. Assay data from the 2019 RC drilling within the Blackard deposit is statistically indistinguishable from historical drilling. Since obtaining the Project, Harmony has commenced an extensive infill drilling campaign designed to confirm, and extend confidence in, the Resource and geological models.
Exploration
Mineral exploration on lands of the Eva Copper Project dates back more than 40 years. The exploration database for the area contains information from numerous geological, geophysical, and geochemical surveys carried out by the current and previous operators, in addition to regional government data on geology and geophysics. Almost all data from historical geophysical and geochemical work is compiled in the Company database, and has been used in the design and guidance of current exploration work.
The most useful historical geophysical work includes ground and airborne magnetics and gravity surveys which, when combined with soil geochemistry, provide good drill targeting tools. Induced polarization (IP) and electromagnetic (EM) geophysical surveys have also proven to be useful or have some benefit in the right circumstances. Continuous improvements in electronic instrumentation, computer data processing, inversion technology for geophysics, and multi-element analysis (particularly in handheld, portable X-ray fluorescence (XRF) units), provide significant rationale to continue geophysical and geochemical surveying on the property.
Effective date: 30 June 2023
6
Technical Report Summary of the
Eva Copper Project, North West Queensland, Australia
Deposit Types
Copper deposits of the Eva Copper Project are of two types. The most significant are those of the IOCG type, which are hydrothermal copper-gold deposits associated with relatively high contents of iron oxide minerals (magnetite or haematite), a general lack of quartz, and extensive sodic alteration. The hydrothermal fluids are believed to be sourced from, and/or driven by, magmatic systems with possible addition of basin brines; however, mineralization is commonly distal (or spatially distinct) from the causative plutonic rocks. Mineralization can take many forms, but the dominant ones are vein networks, breccias, dissemination, and replacement. Both structure (fault or fracture systems) and lithology (chemistry and rheology) are key features in localization of mineralization. The second type of copper deposit is termed copper-only; these deposits do not contain significant gold, and are typically hosted within deformed and metamorphosed calcareous sedimentary rocks as stratabound mineralization. One deposit, Turkey Creek, is a strataform copper-only deposit within calc-silicate and schistose rocks, but has processing characteristics similar to those for the copper-gold deposits.
There are 12 defined deposits within the Eva Copper Project, ranging in size from 0.7 Mt to over 100 Mt, six of which are included within the current mine plan. Three are copper-gold deposits, and three are copper-only deposits. Metallurgical recoveries for the copper-gold deposits are favourable, due to relatively coarse-grained chalcopyrite and lesser bornite. All of the deposits have a thin, 10 m to 40 m weathered or oxide zone at surface, for which tonnage and grades have been estimated, but which have been treated as waste within the mine plan. The copper-only deposits hosted within calcareous metasedimentary rocks have additional zones of weathering and/or acid leaching, which has removed carbonate, reducing rock strength and density in addition to changing sulphide mineralogy. In the two such deposits, Blackard and Scanlan, a supergene zone termed native copper occurs below the oxide zone, and contains abundant native copper in addition to chalcocite, cuprite, and other low-sulphur copper species and some copper locked in hydrobiotite. Extensive metallurgical testing has been carried out on these deposits, with appropriate processing design and estimation of recoveries. Within these deposits a narrow transition zone occurs between the copper zone and underlying sulphide zone.
Sample Preparation, Analyses, and Security
There is very little documentation about sample collection, preparation, and security for the pre-1997 drilling campaigns, although the nature of the exploration programs, preservation of data, and logging records all indicate that the drilling programs were carried out in a professional and competent manner. Later exploration programs by Universal (beginning in 2002) and Altona (in 2011), which provided the vast majority of the drill data, were carried out with above industry-standard sample collection methods, and appropriate quality assurance and quality control (QA/QC) protocols. RC drilling accounts for more than 90% of the Project samples, and these samples were collected using standard cyclones and splitters at the drill site. Samples lengths were initially 2 m for Universal; however, they were changed to 1 m in 2003. Almost all of Altona’s samples were 1 m in length.
Samples were bagged and sealed in the field, and shipped to commercial laboratories in either Townsville or Brisbane. Regular duplicate samples of RC chips were inserted into the sample stream at a rate of 1 in every 20, and triplicate samples collected at the time of drilling were inserted into the sample stream at the rate of 1 in every 40. Appropriate reference standards and blank samples were inserted at rates of 1 in every 20 and 1 in every 45, respectively. Much of the sample material has been retained, mostly as pulp samples; however, there is some coarse reject material, and it is stored in carefully organized warehouses, which also contain split diamond drill core. All analytical information has been carefully archived in an electronic database, which has been reviewed for accuracy by independent consultants and Harmony.
Data Verification
Historical drill locations were checked and resurveyed by subsequent operators, and assay data has been examined and checked by third-party consultants involved in previous Feasibility Studies. There is no apparent bias in the assay data from drill campaigns involving four different companies. The resource QP examined drill core on site and found adequate agreement between geology and historical logs, and visual estimates of copper grade were in agreement with assays. Assay results from drill holes completed to obtain metallurgical samples in the Little Eva and Turkey Creek deposits in 2018, and in the Blackard deposit in 2019 and additional drilling completed by Harmony during 2023, compare favourably to adjacent block grades within the block models, supporting both the database and Mineral Resource estimation.
Effective date: 30 June 2023
7
Technical Report Summary of the
Eva Copper Project, North West Queensland, Australia
Metallurgical Testwork and Process Design
This section summarizes both historical and recent test work associated with the various mineralisation types on the Project property. This report generalizes the various ore sources into one of two classes for design purposes: sulphides, and native copper. The various ore sources were studied from the perspective of newer technologies including direct flotation reactors for flotation.
The Little Eva deposit is the largest deposit in the Project. This deposit has been well studied, with 145 flotation tests from multiple sources that ranged in scope from benchtop to pilot plant. This mineralisation consistently demonstrates high recovery performance with a high degree of liberation at relatively coarse grinds. The average feed competency lies near the 50th percentile of the JK database, with medium to hard Bond work indices. Copper is present as chalcopyrite with trace amounts of pyrite. Strong flotation kinetics result in high recoveries, concentrating to a good final concentrate grade following a nominal regrind with no pH modification. Overall, this material type presents low technical risk.
The sulphide satellite deposits, comprising Turkey Creek, Bedford, Lady Clayre, and Ivy Ann, are smaller sources. These mineralisation types are generally similar to Little Eva from both a comminution and flotation perspective. Some differences include a stronger deportment of copper to bornite, and varying grade distribution. Overall, these deposits show average copper recoveries of 88% to 95%, and represent sources of high recovery material. The specific recoveries for each pit are used as inputs into the mine schedule and financial model.
The copper-only deposits, Blackard and Scanlan, are distinctly different from other deposits in the area, containing oxide cap, native copper, sulphide transition, and sulphide zones. The native copper zones are the largest copper-bearing zones within these deposits, containing a relatively fine distribution of native copper with varying quantities of sulphides. These deposits were studied by previous owners; however, several recent updates have been completed. In total, 410 flotation tests (including blended ore feed) have been completed, ranging from benchtop to pilot scale work. On a flotation basis, the native copper zones typically achieve 60% recovery, with an additional 2% to 3% achievable by gravity methods. Recovery is highly variable as deportment shifts from native copper to sulphides, requiring flexibility within any processing flowsheet between gravity and flotation operations to achieve an average of 63% overall recovery. This ore is typically very soft, resulting in low comminution costs and high mill throughputs. Below the native copper- bearing zones of both Blackard and Scanlan are sulphide zones containing bornite and chalcopyrite, behaving similarly to Turkey Creek ore. The flotation response of the ore from the native copper to the sulphide transition zone increases with sulphide content, as expected.
In total, the abovementioned work has been sourced from 25 metallurgical testing campaigns completed at established metallurgical labs throughout Australia and British Columbia, Canada, from 1996 to 2019.
Concentrate Characterization
Detailed chemical analyses were performed on the concentrates produced from the testwork programs, and the results indicate that there appear to be no impurity elements present in the concentrate at a level that will incur smelter penalties. Provision for separate dewatering and containment of gravity concentrates is included in the plant design for future sampling or marketing opportunities.
Tailings Handling
Tailings generated from the bulk samples processed during the DFR testwork were sent to Paterson & Cooke in Denver, Colorado, for tailings characterization. The samples were examined both separately and as a blend. In both cases no concerns were highlighted with tailings settling performance. A reasonable target of 63% solids was selected for tailings thickener underflow design.
Mineral Resources Estimate
Eva Copper Project Resources
Mineral Resource estimates for the three largest deposits (being Little Eva, Blackard and Turkey Creek) were prepared by SRK and Harmony personnel, based on all drilling conducted up to October 2019. The Resource models from CMMC audited and retained for the other deposits.The effective date of the resource estimates is June 30, 2023.
Effective date: 30 June 2023
8
Technical Report Summary of the
Eva Copper Project, North West Queensland, Australia
The resource estimates were built using Ordinary Kriging for Blackard and Turkey Creek, Multiple Indicator Kriging for Little Eva, and all other deposits utilised Inverse distance weighting. Block sizes were selected based on the drillhole spacing to ensure the estimate is fully informed, Block sizes were matched to the anticipated mining methods and mining equipment sizes.
Resource domains were based on an assessment of the lithology, alteration, grade distribution and structure. The grade-based domains resulted from an analysis of the grade distribution from the assay table. For the IOCG deposits the domains were based on the 0.1% copper grade shell which equates to the first visual occurrence of chalcopyrite in logging. For the Native copper deposits, a 0.2% copper grade shell was selected based on a statistical break in the data separating the deposit from the background rock. Turkey Creek was constrained by a 0.1% copper shell, again defined by statistical analysis of the drill hole data.
At the Little Eva deposit the underlying lithology does not appear to have a significant impact on grade distribution overall and so was not included in the domain construction, likewise for the oxidation profile. There are, however several significant faults that have an impact on the deposit and these were incorporated into the estimate, dividing the Little Eva estimation domain into 3 parts. While Turkey Creek comprises of two sub-parallel high grade domains with a central low grade core, these domains were not used in the estimate. Lithology and oxidation profiles, while assessed for impact were found to not be significant contributors to grade distribution and did not inform the grade domains. A significant fault, the Turkey Creek Fault, cuts across the northern end of the deposit and splits the domain into two components. Blackard and Scanlan are both native copper deposits and analysis of these deposits indicate a 0.2% copper shell was appropriate. Both these deposits are folded and comprise antiform/synform pairs that were used to inform the estimate, Blackard utilised dynamic anisotropy, guided by the fold surface, Scanlan was divided into several separate domains in order to handle the changing anisotropy. Lady Clayre comprises five separate mineralized zones, defined by copper shells at 0.1% based on analysis of the grade distribution. The geology is strongly deformed and the various domains define the different components of this folded stratigraphy. The Bedford deposit is a narrow mineralized shear zone, and the estimation domain is controlled by the 0.1% copper shell which defines the boundaries of the shear, the estimation domain is entirely geologically based. The Ivy Ann deposit estimation domain is based on the 0.1% Cu shell equating to the first occurrence of chalcopyrite and comprises several independent structural domains.
The constraining pit shells for defining the limits of Inferred resources are based on copper prices, costs and metallurgical recoveries determined from work carried out, and described, in this report. Resources were constrained by Whittle pit shells generated using metal prices of US$3.70/lb Cu, US$1,582/oz Au and an exchange rate of 0.70 Aus$:US$. The Whittle shell was based on the following parameters:
•Plant throughput of 11.4 Mtpa, with a mining rate of 60 Mtpa
•A mining reference cost of AU$2.97/tonne, incremented at AU$0.12/vertical 10m.
•Approximately AU$9.00/t Ore processing cost.
•Ore Haulage cost of AU$0.35/t/km
•Slope angles informed by historic studies with an average of 43 degrees.
•Copper Recovery 84% (25% Native Copper blend, recoveries of 63% Native Copper and 95% Sulphide.)
•A 10mx10mx10m diluted block model.
A zone of oxidation overlies all of the seven deposits in the Eva Copper Project. The base of the oxidized zone is generally sharp (±2 m), and was modelled during resource estimation. In the current mine plan, the oxidized material is treated as waste, as currently there does not appear to be any form of economic extraction; however, grades have been modelled and tonnages tabulated for general interest and in the event of a possible processing path being identified in the future. The tonnage and grade of oxidized material were determined in the same manner and at the same time as the other resource estimations.
Effective date: 30 June 2023
9
Technical Report Summary of the
Eva Copper Project, North West Queensland, Australia
Table 1-2: Eva Copper Project Mineral Resources, June 30, 2023
|
|
|
|
|
|
|
|
|
|
|
|
|
|
|
|
|
|
|
Tonnes (kt) |
Cu Grade (% Cu) |
Au Grade (g/t) |
Cu Pounds (Mlb) |
Au Ounces (koz) |
| Measured |
Little Eva |
— |
|
— |
|
— |
|
— |
|
— |
|
Turkey Creek |
— |
|
— |
|
— |
|
— |
|
— |
|
Blackard |
— |
|
— |
|
— |
|
— |
|
— |
|
Scanlan |
— |
|
— |
|
— |
|
— |
|
— |
|
| Bedford |
— |
|
— |
|
— |
|
— |
|
— |
|
Lady Clayre |
— |
|
— |
|
— |
|
— |
|
— |
|
Ivy Ann |
— |
|
— |
|
— |
|
— |
|
— |
|
Total Measured |
— |
|
— |
|
— |
|
— |
|
— |
|
| Indicated |
Little Eva |
136 114 |
|
0.39 |
|
0.07 |
|
1 168 |
|
302 |
|
Turkey Creek |
25 417 |
|
0.45 |
|
— |
|
253 |
|
— |
|
Blackard |
82 538 |
|
0.45 |
|
— |
|
826 |
|
— |
|
Scanlan |
18 228 |
|
0.38 |
|
— |
|
225 |
|
— |
|
| Bedford |
2 658 |
|
0.60 |
|
0.15 |
|
35 |
|
13 |
|
Lady Clayre |
5 097 |
|
0.38 |
|
0.15 |
|
42 |
|
24 |
|
Ivy Ann |
5 202 |
|
0.34 |
|
0.07 |
|
39 |
|
12 |
|
Total Indicated |
275 254 |
|
0.43 |
|
0.07 |
|
2 589 |
|
352 |
|
Measured + Indicated |
Little Eva |
136 114 |
|
0.39 |
|
0.07 |
|
1 168 |
|
302 |
|
Turkey Creek |
25 417 |
|
0.45 |
|
— |
|
253 |
|
— |
|
Blackard |
82 538 |
|
0.45 |
|
— |
|
826 |
|
— |
|
Scanlan |
18 228 |
|
0.38 |
|
— |
|
225 |
|
— |
|
| Bedford |
2 658 |
|
0.60 |
|
0.15 |
|
35 |
|
13 |
|
Lady Clayre |
5 097 |
|
0.38 |
|
0.15 |
|
42 |
|
24 |
|
Ivy Ann |
5 202 |
|
0.34 |
|
0.07 |
|
39 |
|
12 |
|
Total Measured + Indicated |
275 254 |
|
0.43 |
|
0.07 |
|
2 589 |
|
352 |
|
| Inferred |
Little Eva |
31 095 |
|
0.36 |
|
0.06 |
|
246 |
|
64 |
|
Turkey Creek |
2 473 |
|
0.40 |
|
— |
|
22 |
|
— |
|
Blackard |
33 591 |
|
0.43 |
|
— |
|
321 |
|
— |
|
Scanlan |
8 465 |
|
0.37 |
|
— |
|
79 |
|
— |
|
| Bedford |
1 527 |
|
0.46 |
|
0.13 |
|
16 |
|
6 |
|
Lady Clayre |
1 141 |
|
0.37 |
|
0.08 |
|
9 |
|
3 |
|
Ivy Ann |
1 163 |
|
0.33 |
|
0.07 |
|
9 |
|
3 |
|
Total Inferred |
79 455 |
|
0.40 |
|
0.03 |
|
701 |
|
80 |
|
Notes:
Resources are reported at a cut-off grade are based on approximate NSR values which equate to a copper grade of 0.17% Cu.
Mineral Resources:
1. SAMREC and CIM definitions were followed for Mineral Resources.
2. Mineral Resources are exclusive of Mineral Reserves (however no Mineral Reserve are declared)
3. Mineral Resources are constrained within a Whittle pit shell generated with a copper price of $5.50/lb, a gold price of $1,582/oz and an exchange rate of AU$1.00 = US$0.70.
4. Density measurements were applied (ranges from 2.4 t/m3 to 3.0 t/m3).
5. Significant figures have been reduced to reflect uncertainty of estimations and therefore numbers may not add due to rounding.
6. Tonnes are Metric Units (1t = 1000Kg)
Mineral Reserve Estimate
Not applicable to the TRS
Mineral Reserves were declared by CMMC as reported in their 43-101 2020 Feasibility Update.
Effective date: 30 June 2023
10
Technical Report Summary of the
Eva Copper Project, North West Queensland, Australia
During Harmony due diligence prior to acquiring the Project, a number of risks and opportunities were identified. Accordingly , upon purchase, Harmony planned and commenced a drilling program to expand and refine the resource and commenced studies to test processing, infrastructure, water and power assumptions. Due to the significant potential change these studies may imply, it is deemed premature to release the Reserves. It is anticipated that these studies will be completed in 2024, upon which a Reserve may be declared.
Royalties
State of Queensland royalties apply to all lands except freehold claims prior to 1904. State royalties range between 2.5% and 5.0% of metal value, less certain allowable expenses. If the concentrate is processed in Queensland (Mount Isa) there is a 20% reduction in the copper royalty. 100% of the royalty savings from the Queensland Government is for the account of the Seller (CMMC). Royalties are discussed in detail in Section 4.
Environment, Permitting, Social, or Community Impact
To support environmental assessments and project studies, flora and fauna surveys, groundwater programs and waste and tailings rock characterization, amongst others, have been undertaken to support an appreciation of the environment and its sensitivities, to predict impacts and inform mitigation and control measures. This dataset continues to be supplemented by contemporary studies and monitoring data.
A total of 12 regional ecosystems are mapped within the Project area based on the Queensland Government regulated vegetation mapping. All regional ecosystems are classed as Least Concern under the Vegetation Management Act 1999. In accordance with the project's EA, significant residual impacts to prescribed environmental matters, are not authorised with the exception of:
•Regional ecosystems (not within an urban area) within the defined distance from the defining banks of a relevant watercourse on the vegetation management watercourse map.
•Habitat for an animal that is vulnerable wildlife – Purple-necked Rock-wallaby Monitoring Program (Petrogale purpureicollis).
The maximum extent of impact to each authorised prescribed environmental matter must be offset in accordance with the Environmental Offsets Act 2014 and the QLD Environmental Offsets Policy. An Offsets Delivery Plan will be prepared and submitted to the Department of Environment and Science for approval prior to commencement of surface disturbance activities that impact on matters of state environmental significance. In the event that on-lease impacts to groundwater dependent ecosystems cannot be avoided (i.e., as a result of groundwater drawdown), an offset strategy will also be proposed for these impacts.
Tailings and waste characterization work has shown the majority of samples to be geochemically benign. The risks associated with release of contaminants into the environment have been considered with the TSF, waste rock dump (WRD), and processing plant area designs incorporating surface water management control dams, cut-off drains, monitoring, and low permeability base for the TSF.
As a condition of the EA, water and sediment management requires surface water and groundwater monitoring programs prior to commencement of mining activities. Baseline water and sediment quality monitoring programs have been in place since 2012 and are reviewed frequently to align with the prevailing project design and the scale of any site activities.
The closest sensitive receptor to the Project is the Mount Roseby homestead, approximately 17.5 km southeast of Little Eva pit and processing plant while the closest pit, Scanlan is 1.1 km west of Mount Roseby. Noise and air quality monitoring is a requirement of the EA, and dust baseline monitoring has been completed. A Compensation Agreement is in place which includes conditions to be implemented throughout the life of mine with respect to the Mount Roseby station and its Lands.
The evidence of European history in the area is not of local or State significance. The recognized traditional owners and Native Title holders of the Project area are the Kalkadoon People. The Company has a Cultural Heritage and Access Agreement and Management Plan with the Native Title holders covering the full area of the Project MLs. The ML area has been the subject of systematic Indigenous cultural heritage clearing which remains ongoing.
Effective date: 30 June 2023
11
Technical Report Summary of the
Eva Copper Project, North West Queensland, Australia
In addition to managing environmental and heritage responsibilities the Company recognizes and has reflected the importance it places on building and training its workforce, supporting the local community and stakeholders, and a commitment to achieve the highest standards of safety and health for its business practices. Through our agreement with the Kalkadoon People, the Company will strive to provide employment opportunities for local Indigenous people. The key community risk requiring management from commencement of operations through the LOM will be the additional vehicular traffic along the Burke Developmental Road and through Cloncurry.
Adjacent Properties
The Eva Copper Project is located within a world-class mineral province richly endowed with an attractive number of commodities and deposit types. It is commonly known that the Mount Isa – Cloncurry region is one of the premier base-metal producing districts in the world with mining dating back to 1867, first at Cloncurry, then from the larger Mount Isa mining centre starting in 1923. There are numerous historical and active mines in the region, with the major, internationally important mines closest to the Project being the Dugald River lead-zinc-silver mine and the Ernest Henry copper-gold mine. Dugald River is the closest, located approximately 11 km south of the proposed Eva Copper Project processing plant site.
Mining properties that surround the Eva Copper Project are predominantly Exploration Permits for Minerals held by Harmony. These permits cover a highly prospective north-south corridor, with similar geology to that which hosts the Project’s Mineral Resources. Numerous copper-gold mineralized prospects have been established and are being systematically explored.
Immediate non-mining key local stakeholders associated with the Eva Copper Project are landowners, leaseholders, state, and local governments. The Company has been in contact with the stakeholders for many years and has appropriate agreements in place to allow mining and exploration.
Human Rights
The Company is committed to uphold fundamental human rights and respect cultures, customs, and values in dealing with communities, employees, and others affected by the Company’s activities.
Project Due-Diligence and Pre-Engagement
The Company is committed to remain informed of the political, economic, social, technical, and environmental characteristics of the area in which it operates. Sound data obtained will contribute to the design and structure of risk management strategies, as well as pre-engagement processes such as preparation for field activities.
Community and Aboriginal Engagement and Enhancement
The Company is committed to develop long-lasting economic, environmental, and social benefits through the building of meaningful and transparent relationships with local communities and Native Title holders.
Human Resource Development
The Company is committed to provide long-term benefits for the community through areas, such as employment, training, and education.
Environmental Integrity and Performance
The Company is committed to manage all operations in a manner that is compatible with environmental protection standards and integrate closure requirements into all stages of the Company’s activities.
Health and Safety Performance
The Company is committed to provide a safe environment for employees, contractors, and visitors to the Company’s facilities, and a commitment to support leadership in preventive and responsive attitudes and behaviours at all levels of the organization to ensure a safe environment.
Effective date: 30 June 2023
12
Technical Report Summary of the
Eva Copper Project, North West Queensland, Australia
Recommendations
Mineral Resources
Drill targets below and within the current pit designs are being drilled to convert Inferred Resources to Indicated Resource. Additional drilling to perform geotechnical slope studies on the Turkey Creek, Little Eva, and Blackard deposits is ongoing.
Effective date: 30 June 2023
13
Technical Report Summary of the
Eva Copper Project, North West Queensland, Australia
2Introduction
The Eva Copper Project (the Project) is located approximately 76 kilometres (km) northwest of Cloncurry in North West Queensland, Australia (Figure 2-1), and has extensive exploration potential in the approximately 4,000 square kilometres (km2) (379,000 hectare (ha)) mineralized land package.
|
|
|
Figure 2-1: Location, Tenure, Plant, and Regional Infrastructure |
2.1Report Section Responsibilities
Table 2-1 shows a list of all the sections included in this Technical Report Summary under Subpart 1300 of Regulation S-K, and the respective QPs.
Effective date: 30 June 2023
14
Technical Report Summary of the
Eva Copper Project, North West Queensland, Australia
Table 2-1: Scope of Responsibility
|
|
|
|
|
|
|
|
|
|
|
|
Item |
Content |
Qualified Person |
Compiled by |
1 |
Summary |
|
All |
2 |
Introduction |
GJ |
HMY |
3 |
Reliance on Other Experts |
|
All |
4 |
Property Description and Location |
GJ |
HMY |
5 |
Accessibility, Climate, Local Resources, Infrastructure, and Physiography |
RR, GJ |
HMY |
6 |
History |
RR |
HMY |
7 |
Geological Setting and Mineralization |
RR |
HMY |
8 |
Deposit Types |
RR |
HMY |
9 |
Exploration |
RR |
HMY |
10 |
Drilling |
RR |
HMY |
11 |
Sample Preparation, Analyses, and Security |
RR |
HMY |
12 |
Data Verification |
RR |
HMY |
13 |
Mineral Processing and Metallurgical Testing |
AM |
HMY |
14 |
Mineral Resource Estimate |
RR |
HMY |
15 |
Mineral Reserve Estimate |
n/a |
|
16 |
Mining Methods |
n/a |
|
17 |
Recovery Methods |
n/a |
|
18 |
Project Infrastructure |
n/a |
|
19 |
Market Studies and Contracts |
n/a |
|
20 |
Environmental Studies |
n/a |
|
21 |
Capital and Operating |
n/a |
|
22 |
Economic Analysis |
n/a |
|
23 |
Adjacent Properties |
RR |
|
24 |
Other Relevant Data and Information |
|
All |
25 |
Interpretation and Conclusions |
|
All |
26 |
Recommendations |
|
All |
27 |
References |
|
All |
28 |
Certificates of Qualified Persons |
|
All |
Notes:
Qualified Persons and their acronyms are listed below. The following individuals, by education, experience, and professional association, are considered QPs as defined in the Subpart 1300 of Regulation S-K "Disclosure by Registrants Engaged in Mining Operations", and they are members in good standing with appropriate professional institutions or associations. The QPs are solely responsible for the specific report sections listed with their abbreviations in Table 2-1.
2.2Personal Inspection
The Resource Estimate QP (Ronald Reid) most recently visited the Project site in August, 2023.
Greg Job most recently visited the project site in August 2023.
Andrew Millar most recently visited the Project site in July 2023
2.3Effective Date
The effective date of the Mineral Resource statement in this report is June 30, 2023.
2.4Abbreviations and Units of Measure
Units of measure used in this report conform to the metric system, unless noted otherwise. All currency is United States dollars (US$) unless noted otherwise. A glossary containing a comprehensive list of acronyms and units of measure is included in Section 27.
Effective date: 30 June 2023
15
Technical Report Summary of the
Eva Copper Project, North West Queensland, Australia
3Property description and location
3.1Location
The Eva Copper Project is located 76 km by road northwest of Cloncurry, a town of about 3,000 inhabitants, and 194 km by road from Mount Isa, a regional mining centre with a population of about 22,000 people (Figure 3-1). Townsville on the east coast is 770 km from Cloncurry. Access to the Project is from the sealed Burke Developmental Road, which originates in Cloncurry. This road passes 8.5 km to the east of the proposed plant site, and current access is via cattle station and exploration tracks. The planned site for the plant and major infrastructure is also 11 km north of the major Dugald River Zinc Mine, which was commissioned in November 2017 and is owned by MMG Limited (MMG). The Eva Copper Project is situated at a latitude of 19°51'26”S and longitude of 140°10’15”E.
|
|
|
| Figure 3-1: Project Location |
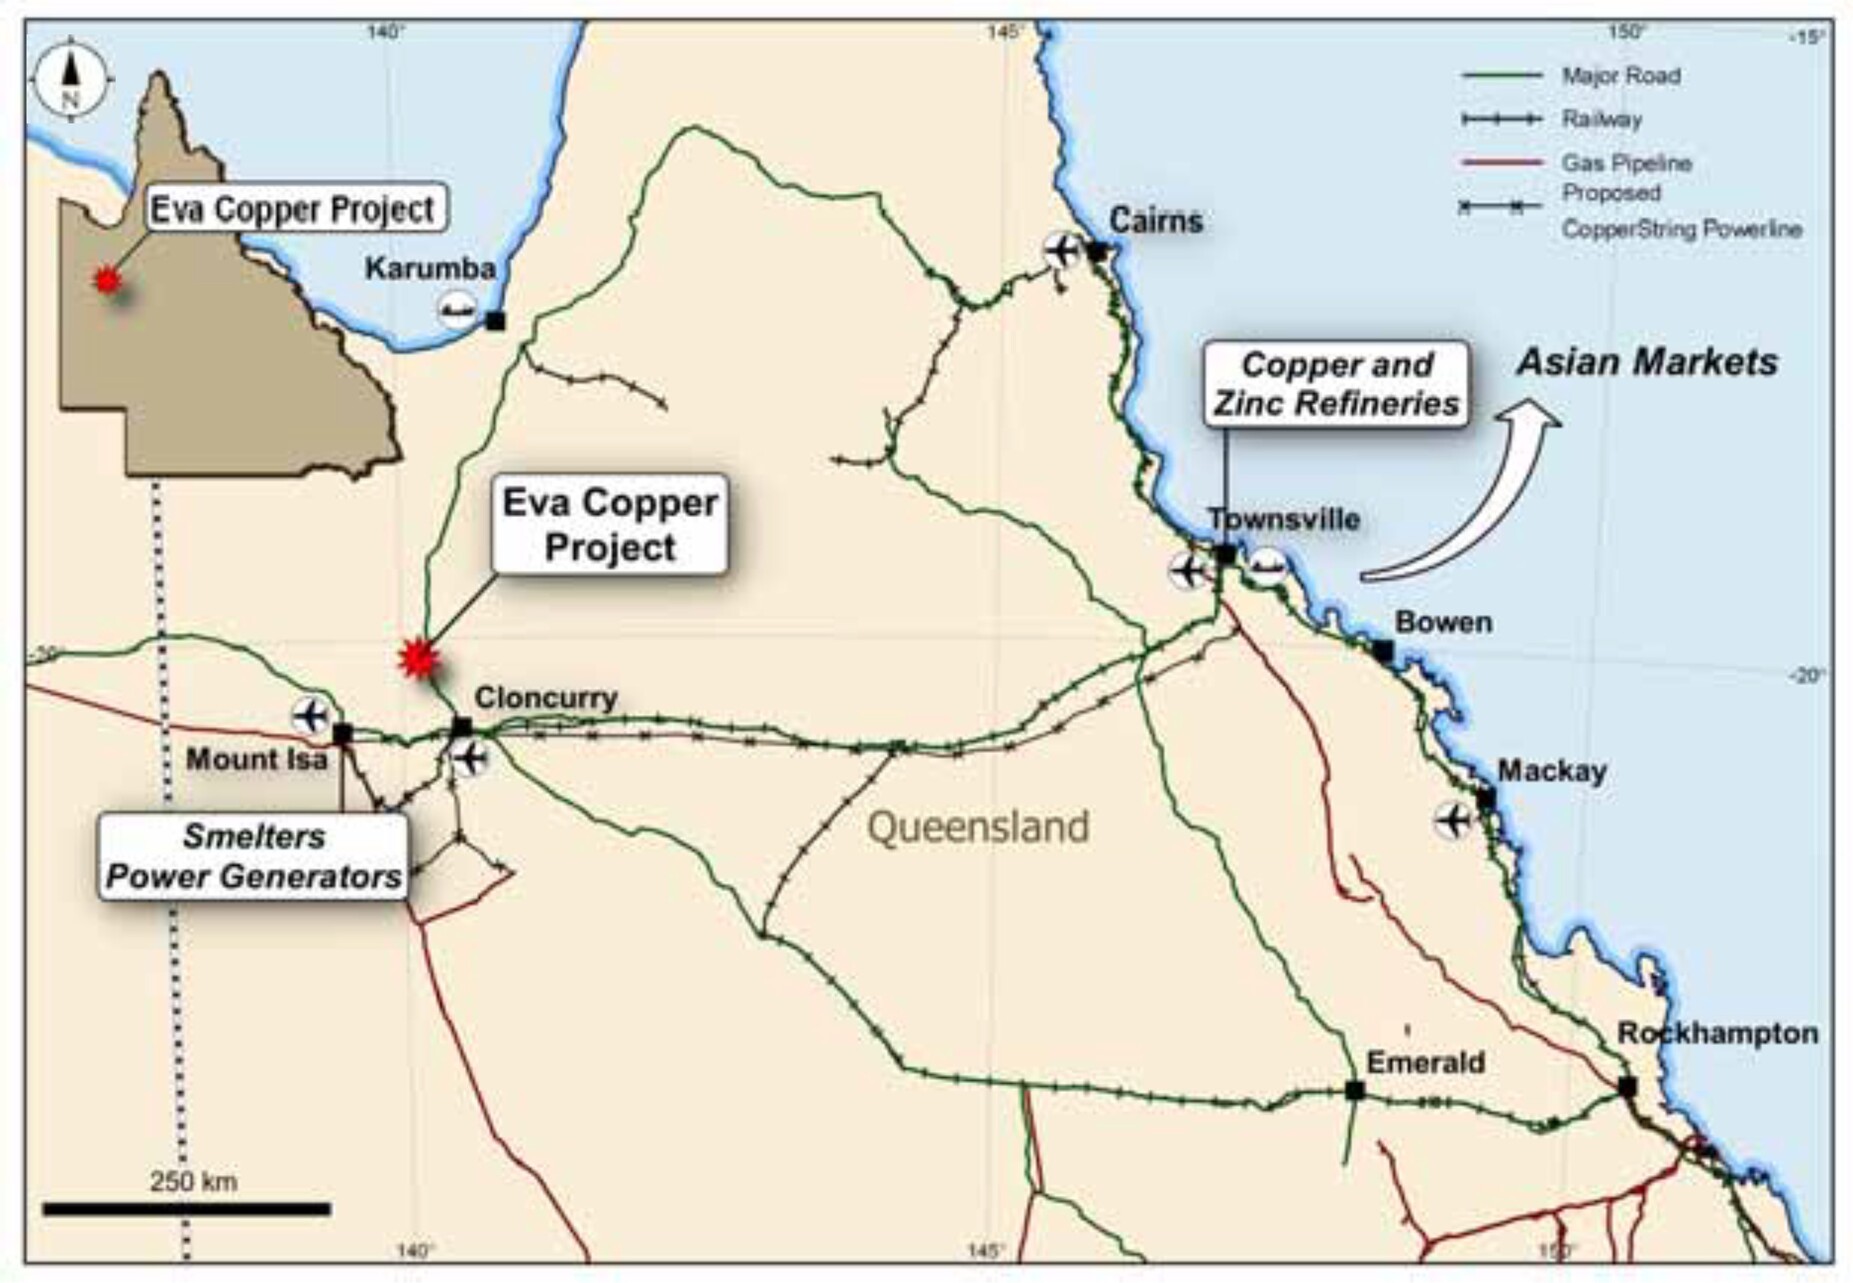
3.2Land Use and Mining Tenure
The Eva Copper Project consists of five Mining Leases (ML) and one Exploration Permit for Minerals (EPM). All six of the deposits are located within the MLs, except for the Ivy Ann deposit, which lies within EPM 25760 (King).
Queensland state legislation requires that, where significant disturbance will occur from exploration and mining activities, the license holder must reach agreement for “Conduct and Compensation” with the pastoral leaseholder. Harmony has secured such agreements for all the MLs, the Ivy Ann deposit, and those portions of the EPM where ground disturbance has occurred or is anticipated.
3.3Mining Leases
The MLs were granted in 2012 and are currently owned by the Company’s wholly owned subsidiary Eva Copper Mine Pty. Ltd. (ECMPL) (Table 3-1). The MLs total area is 143 km2 and are situated across from two pastoral lease holdings and within one Native Title determination area.
Effective date: 30 June 2023
16
Technical Report Summary of the
Eva Copper Project, North West Queensland, Australia
Table 3-1: Eva Copper Project Mining Leases
|
|
|
|
|
|
|
|
|
|
|
|
|
|
|
Number |
Name |
Granted |
Expiry |
Area (ha) |
90162 |
Scanlan |
Oct. 4, 2012 |
Oct. 31, 2037 |
2 096.96 |
|
90163 |
Longamundi |
Oct. 4, 2012 |
Oct. 31, 2037 |
1 411.29 |
|
90164 |
Blackard |
Nov. 13, 2012 |
Nov. 30, 2037 |
5 131.07 |
|
90165 |
Little Eva |
Nov. 13, 2012 |
Nov. 30, 2037 |
5 029.96 |
|
90166 |
Village |
Nov. 13, 2012 |
Nov. 30, 2037 |
616.08 |
|
3.4Exploration Permits for Minerals
As shown in Table 3-2, the Company’s wholly owned subsidiary ECMPL holds the EPM 25760 (King), which encompasses the Ivy Ann deposit.
Table 3-2: Eva Copper Project Exploration Permit for Minerals
|
|
|
|
|
|
|
|
|
|
|
|
|
|
|
|
|
|
Number |
Name |
Holder |
Granted |
Expiry |
Area (ha) |
25760 |
King |
ECMPL |
Nov. 17, 2015 |
Nov. 16, 2025 |
28,601 |
The Company also holds 26 EPMs surrounding the MLs and in the broader Mount Isa region (Figure 3-2). These are held by the Company’s wholly owned subsidiaries Roseby Copper Pty. Ltd. and Roseby Copper (South) Pty. Ltd. (RCSPL).
Agreements exist with four pastoral landholders for both the MLs and key areas of activity in the surrounding EPMs:
•Coolullah Station, belonging to the North Australian Pastoral Company (NAPCO)
•Mt. Roseby Station, belonging to Harold Henry McMillan
•Dipvale Station, belonging to Grant and Anita Telford
•Hillside Station, belonging to the Cameron Creek Pastoral Company.
The locations of the Pastoral Lease boundaries intercepted by the Project tenements and various mineralized areas are shown in Figure 3-3; in relation to the Project tenements and the areas subject to Conduct and Compensation Agreements.
Effective date: 30 June 2023
17
Technical Report Summary of the
Eva Copper Project, North West Queensland, Australia
|
|
|
| Figure 3-2: Eva Copper Project Tenements |
Effective date: 30 June 2023
18
Technical Report Summary of the
Eva Copper Project, North West Queensland, Australia
|
|
|
| Figure 3-3: Pastoral Lease Holdings and Current Conduct and Compensation Agreement Areas (Colour indicates landowner) |
Notes: (NAPCO (red-brown), McMillan (green), Telford (blue) and Cameron Creek Pastoral Company (brown) showing
deposits (mine symbols))
3.5Freehold Land
Two freehold lots that were granted in the late 1800s sit within the MLs. One sits over part of the Little Eva deposit, the second over part of the Longamundi deposit.
Effective date: 30 June 2023
19
Technical Report Summary of the
Eva Copper Project, North West Queensland, Australia
3.5.1Lot 37 (Agreement Numbers 355, 526, 1069, and 1070)
Lot 37 (on Crown Plan B15752) is located within ML 90165 and overlies the Little Eva deposit. It is owned 100% by the Company; 50% was purchased from Pasminco (referred to as Mineral Selection 3072), and 50% deeded to the Company by The Public Trustee of Queensland from an intestate deceased estate. The Lot was previously subject to mining tenure Mineral Development Licence 12 (also purchased from Pasminco), and has also been referred to as the Kwahu Moiety area.
3.5.2Lot 28 (Agreement Numbers 355, 1069, and 1070)
Lot 28 (on Crown Plan B15753) is located within ML90163, overlies the Longamundi deposit, and is owned 100% by the Company. It was purchased from Pasminco (referred to by them as Mineral Freehold 13961). The lot was previously subject to ML 7497 (also purchased from Pasminco).
3.6Royalties
Numerous royalties apply to the Project area, and are payable to six parties with an average royalty payable of 5% on Reserves. Table 3-3 summarizes the royalties applicable to various deposits.
Table 3-3: Royalties Applicable to Portions of the Mineral Reserves at Various Deposits
|
|
|
|
|
|
|
|
|
|
|
|
|
|
|
|
|
|
|
|
|
|
|
|
| Deposit |
Area |
State |
MMG |
Lake Gold/MMG |
KD |
PanAust |
DOM |
Little Eva |
Lake Gold |
x |
|
x |
x |
|
|
Little Eva |
Freehold |
|
x |
|
x |
|
|
Little Eva |
|
x |
x |
|
x |
|
|
| Blackard |
|
x |
|
x |
x |
|
|
| Scanlan |
|
x |
x |
|
x |
|
|
Turkey Creek |
|
x |
|
x |
x |
|
|
Lady Clayre |
Lake Gold |
x |
|
x |
x |
|
|
Lady Clayre |
|
x |
x |
|
x |
|
|
| Bedford |
|
x |
|
x |
x |
|
|
Ivy Ann |
|
x |
|
|
x |
x |
x |
Notes: KD = Kalkadoon; DOM = Dominion
Effective date: 30 June 2023
20
Technical Report Summary of the
Eva Copper Project, North West Queensland, Australia
4Accessibility, climate, local resources, infrastructure, and physiography.
Section 229.601(b)(96) (4) (i‐iv)
4.1Accessibility and Infrastructure
The Project tenements are in North West Queensland and are shown in Figure 4-1. Access to the Project is by the sealed Barkly Highway from Mount Isa to Cloncurry, then on the sealed Burke Developmental Road, through Quamby. The highway passes 8.5 km to the east of the proposed plant site, and current access is by way of a gravel road. The planned site for the plant and major infrastructure is 11 km due north of the Dugald River zinc mine owned by MMG, which had first production in November 2017.
The Project is located about 65 km (76 km by road) northwest of Cloncurry, a town of about 3,000 inhabitants, and about 95 km (194 km by road) from Mount Isa, a regional mining centre with a population of about 22,000 people.
Cloncurry is located on the railway line from Townsville to Mount Isa and has container handling facilities, an airport (which hosts both commercial and fly-in/fly-out (FIFO) jet aircraft services), and a regional fuel depot. Cloncurry also has schools, hospitals, and other services. The Project lies within the Shire of Cloncurry local government administrative area and the Shire offices are based in Cloncurry.
Quamby is a tiny hamlet to the southeast of the proposed plant site, with a now-closed roadhouse on the highway, and a Telstra communications tower.
Kajabbi is a small hamlet to the north of the area and has stockyards that were used for loading cattle onto a railway line that used to run south through Quamby to Cloncurry. The railway line from Cloncurry north to Kajabbi has been removed, and all that remains is the easement, which is still owned by Queensland Transport.
Grid power is reticulated from Mount Isa to Cloncurry, and power is generated in Mount Isa at two gas-fired power stations. A 220-kV power line has been constructed from the Chumvale substation near Cloncurry to the Dugald River mine, 11 km from Little Eva.
A water pipeline operated by SunWater passes within 4 km of Little Eva and is fed from Lake Julius, 41 km to the west, and reticulated to the Ernest Henry mine, and the Cloncurry townsite. Dugald River also has a water take-off from this pipeline. The pipeline has a capacity of seven gigalitres per year (GL/a).
4.2Climate and Surface Water
The Bureau of Meteorology weather station closest to the Project site is located on McIlwraith Street, Cloncurry, and has records dating back to 1884. The mean annual maximum temperature is 32.2°C, and the average annual rainfall for the region is 474 mm/a.
Mean temperatures in the dry season range from 26.2°C to 36.4°C from April to October. Temperatures range from mean monthly highs of 26.2°C to 38.5°C, to monthly lows of 10.6°C to 24.8°C. Minimum and maximum recorded temperatures range from to 1.8°C to 46.9°C. The hottest months correspond with the wet season, between November and March.
Mean wind speeds measured at the Mount Isa Airport weather station shows that the later months of the year exhibit the highest wind speeds, peaking in October at an average speed of 15.8 km/h. Wind speeds are lowest in the cooler months of the year, at an average of 9.5 km/h in June. Maximum wind gusts range from a low of 63 km/h in July up to 128 km/h in January.
The relative humidity at the Cloncurry weather station peaks in February, typically reaching 39% at 3:00 p.m., and 61% at 9:00 a.m. The peak fire season for the Project area is winter to spring (July to September), when the vegetation is at its driest.
Rainfall is seasonal, largely occurring between November and March (wet season), and generally occurs in large storms. Rainfall is highly variable from year to year, with the region often experiencing multi-year droughts and large-scale flooding from major rainfall events. After the dry season, storm rains of approximately 25 mm/d may occur, which may include intense periods equivalent to 24 mm/h, which would generate runoff in the smaller creeks.
Effective date: 30 June 2023
21
Technical Report Summary of the
Eva Copper Project, North West Queensland, Australia
The Project site is serviced by a complex system of surface drainages that flow generally northward. On the western side of the plant and Little Eva pit is Cabbage Tree Creek, which is joined by other creeks flowing northward to become a tributary of the Leichhardt River. The central parts of the Mining Leases (ML) drain into the Dugald River. Numerous other minor ephemeral watercourses cross the Project area.
Creeks and rivers only flow during, and for a brief period following, the wet season. Intensive rains, with cumulative falls up to 50 mm over a few days, generate flows in the larger creeks, such as Cabbage Tree Creek and Dugald River. Peak flows are generally of short duration. Most stream flow ceases within days or a few weeks after intensive wet periods, after which the flow channel breaks into isolated pools. The rivers and creeks have a composite profile consisting of a steep-sided main channel 1 m to 1.5 m in depth in which flows occur annually, often to bank height. Isolated pools in the riverbeds can persist through the dry season in sand, gravel, and crystalline rock fractures. Water can generally be found below the riverbeds at a depth of one to two metres.
The Project has groundwater sources from both hard rock fracture zone systems and from a graben- like structure filled in with Phanerozoic sediments. In addition to this geological feature, the main creeks are associated with extensive thin sheets of colluvial outwash and alluvial deposits, with groundwater present in the deeper parts of these deposits.
4.3Landforms and Vegetation
The Project site and broader operation area is gently undulating, with the Knapdale range of hills rising quite sharply from the plain to the south of the proposed operations area, with a length of approximately 12 km, and rising to an average height of 300 Australian Height Datum metres above sea level (mASL). A discrete north–south ridgeline, which includes Mount Rose Bee and the Green Hills, transects the area on the western side of the Bedford deposit. Mount Rose Bee (approximately 285 mASL) is characterized by ridges of exposed silicified rock.
The site is currently crossed by several access tracks from farming and exploration activities. SunWater’s water pipeline from Lake Julius to the Ernest Henry mine crosses the lease area from west to east.
The predominant land use is low-intensity cattle grazing, although exploration and mining activities have been conducted over the area since the late 1800s. Soils of the Project site are typically slightly acid to moderately alkaline, and non-sodic and therefore non-dispersive in nature, meaning they are not chemically predisposed to erosion. Most of the erosion potential of these soils originates from the short duration, high intensity rainfall events that can occur during the summer period (December to March).
4.4Local Mining Industry
Mount Isa was established on the discovery of world-scale copper-zinc-lead deposits in 1923. A major mining complex and a town of 22,000 people has grown on the site in the last 94 years, with multiple open pit and underground mines, smelters, mills, flotation plants, and a sulphuric acid plant. The town of Mount Isa hosts many mining suppliers, service organizations, and a number of skilled mining industry people, as well as having two electric-powered generators supplied by a natural gas pipeline from South Australia, an airport, rail line, and other services.
Cloncurry was established much earlier than Mount Isa, on the discovery of copper by Ernest Henry in 1867, and the town was founded in 1884.
There are several active mines in the area, as shown in Figure 4-1. In addition to Mount Isa, there are five major active mines: the Ernest Henry copper-gold mine and Lady Loretta lead-zinc-silver mine, both owned by Glencore; the Cannington silver-lead mine owned by South 32; the Dugald River zinc-lead-silver mine owned by MMG; and the Capricorn Copper copper-gold mine owned by Capricorn Copper. All are major, internationally important mines.
Smaller operations (active and in care and maintenance) include: Osborne copper-gold mine, owned by Inova; Mount Colin copper mine, owned by Aeris Resources Limited, Lady Annie copper-gold mine, owned by Austral Resources; Mount Cuthbert Copper mine, owned by Mt Cuthbert Resources; Rocklands copper- gold mine, owned by Mt Cuthbert Resources; and Eloise copper-gold mine, owned by AIC Mines.
Closed major mines include the Mary Kathleen uranium mine.
Effective date: 30 June 2023
22
Technical Report Summary of the
Eva Copper Project, North West Queensland, Australia
|
|
|
| Figure 4-1: Infrastructure, Major Mines, Deposits, and Eva Copper Project Tenure |
Effective date: 30 June 2023
23
Technical Report Summary of the
Eva Copper Project, North West Queensland, Australia
5History
Section 229.601(b)(96) (5) (i‐ii)
5.1Prior Ownership and Changes
The Project area has a long history of exploration and development. Early work was undertaken by Ausminda Pty. Ltd. and CRA Exploration (CRAE) between 1990 and 1996. CRAE’s principal focus was the copper-only deposits where they were successful in discovering a number of deposits. The Little Eva and Lady Clayre deposits were of secondary interest to CRAE, who drilled the Little Eva deposit to define a small deposit of 9 Mt assayed at 0.70% copper (Cu), gold (Au) grade was not reported.
In 1996, the property was acquired by Pasminco Limited (Pasminco), who undertook further exploration and drilling on the copper-only deposits. Pasminco excised and retained the Dugald River zinc deposit, and sold the remainder of the tenements to Universal Resources (URL) in 2001. The Little Eva deposit was first fully delineated by URL. Pasminco was taken over by Zinifex in 2002, and in 2008 Zinifex merged with Oxiana to become Oz Minerals. Oz Minerals’ interest in the Dugald River zinc deposit was acquired in 2009 by MMG, a subsidiary of China Minmetals.
From 2001 to 2004, exploration work on the Blackard, Scanlan, and Longamundi copper-only deposits was carried out under a joint venture (JV) between URL and Bolnisi Logistics. In 2004, URL acquired Bolnisi Logistics and assumed full management of the Project. Bolnisi Logistics then changed its name to Roseby Copper Pty. Ltd. URL focused its 2001–2004 drilling on the Little Eva and Bedford copper-gold deposits, and completed a Feasibility Study in 2005 based on mining and processing a blend of sulphide ore from the Little Eva and Bedford deposits with native copper ore from the Blackard and Scanlan deposits; however, URL did not proceed with development.
Universal Resources entered into a JV Option Agreement with Xstrata in 2005, where Xstrata had the right to explore in the central area of the tenements. Xstrata discovered the Cabbage Tree Creek prospect, and significant sulphide mineralization beneath the Blackard deposit. Xstrata elected not to proceed with the option to purchase an interest in the Project in January 2013. URL completed a second Feasibility Study between 2007 and 2009 based on the same blend of sulphide ore and native copper ore used in the 2005 study.
In December 2009, Universal Resources merged with Vulcan Resources Limited, and the company name changed to Altona Mining Limited (Altona). Altona drilled out the Little Eva deposit, doubling the Mineral Resource, and in 2012 completed a Definitive Feasibility Study (DFS) based on the increased resources of copper-gold sulphide deposits, with this report excluding the Blackard and Scanlan deposits. Altona’s philosophy was to take a simpler approach that did not rely on ore blending and to address mining and processing of native copper ores once operations were established, in the context of extending mine life or increasing the production rate.
Altona completed drilling at the Bedford, Lady Clayre, Ivy Ann, Blackard, Legend, and Scanlan deposits, and published Mineral Resource upgrades for all these deposits. Altona published Mineral Reserves for the Little Eva, Bedford, Lady Clayre, and Ivy Ann deposits as part of their 2012 DFS. Altona discovered a significant resource at Turkey Creek and published Mineral Resource and Mineral Reserve estimates for the deposit in 2015 and 2016, respectively. Altona also discovered and delineated major prospects at Anzac, Whitcher, Matchbox, and Quamby from 2015 to 2016.
Mining Leases (ML) and an EA were granted in 2012 based on the 2009 DFS mine plan. An EA amendment was granted in 2016 based on the revised 2012 DFS mine plan and the integration of Turkey Creek into that mine plan.
Effective date: 30 June 2023
24
Technical Report Summary of the
Eva Copper Project, North West Queensland, Australia
Altona and the project was acquired by Copper Mountain Mining Corp. (CMMC) in 2018. The project was subsequently acquired by Harmony in 2023.
Prior to the acquisition by Harmony, and excluding acquisition costs, approximately $63 million has been expended on exploration, resource development, metallurgical and engineering studies, compensation payments, and government fees and charges by the various parties involved over the past 27 years, including:
|
|
|
|
|
|
| CRAE (estimate) |
$7.4 million |
| Zinifex/Pasminco |
$0.7 million |
| Bolnisi |
$4.1 million |
| Universal |
$24.2 million |
| Xstrata |
$8.5 million |
| Altona |
$18.4 million |
Note: Exchange rate AU$1.35:US$1.00
5.2Mineral Resource Estimates History
5.2.1Little Eva Deposit
The Little Eva deposit has had several formal Mineral Resource estimates that reflect stages of resource definition (Table 5-1). The 2008 and 2012 Mineral Resource estimates include both sulphide and oxide material, while the 2014 estimate is for sulphide material only, with the oxide material excluded.
Table 5-1: Little Eva Resource Estimate History
|
|
|
|
|
|
|
|
|
|
|
|
Model |
Authors |
Mineral Resource Estimate |
Comment |
Oct 2008* |
MacDonald Speijers |
30.4 Mt at 0.78% Cu, 0.09 g/t Au. (0.3% Cu cut-off grade). |
Superseded following additional drilling Includes Inferred resource. |
Mar 2012* |
Optiro and Altona |
108 Mt at 0.52% Cu, 0.9 g/t Au. Sulphide mineralization – 100.3 Mt at 0.53% Cu and 0.09 g/t Au at a
0.2% Cu cut-off grade.
|
Basis for 2012 DFS and Mineral Reserve estimation.
Primary sulphide and oxide mineralization. Includes Inferred resource.
|
May 2014* |
Altona and Optiro |
105.9 Mt at 0.52% Cu, 0.09 g/t Au at a 0.2% Cu cut-off grade. |
Sulphide mineralization only. Includes Inferred resource. |
Nov 2018 |
CMMC |
121.8 Mt at 0.36% Cu, 0.07 g/t Au at a 0.17% Cu cut-off grade. |
Nominal additional infill drill data only. Sulphide mineralization only.
Excludes Inferred resource.
|
Source: *Altona Mining Limited, Cloncurry Copper Project – DFS, August 2017.
Total estimated Mineral Resource including Inferred; reported in accordance with the Joint Ore Reserves Code (JORC).
In October 2008, McDonald Speijers completed a Mineral Resource estimate for the Little Eva deposit, reported in accordance with JORC, 2004 Edition (JORC, 2004), which was incorporated into Universal’s 2009 Roseby Copper Project Feasibility Study. The Mineral Resource amounted to 30.4 Mt at 0.78% Cu and 0.9 g/t Au, with a 0.3% Cu cut-off grade. Geological domains were poorly constrained.
In March 2012, Altona, in conjunction with Optiro, reported a Mineral Resource that incorporated newly acquired assay and geological data provided by extensive drill programs. The published estimate of 108 Mt at 0.52% Cu and 0.09 g/t Au includes both sulphide and oxide mineralization. This estimate formed the basis of pit optimizations used in the 2012 DFS and 2014 DFS update.
Effective date: 30 June 2023
25
Technical Report Summary of the
Eva Copper Project, North West Queensland, Australia
In May 2014, Altona published a revised Mineral Resource estimate. Geological models were limited in former estimates, because of inconsistent drill hole logging between multiple corporations and programs. The 2014 used a new geological model based on a detailed drill hole relogging program by Altona in 2013-2014. The estimate of 105.9 Mt at 0.52% Cu and 0.09 g/t Au is for primary sulphide geotechnical mineralization only, and excludes oxide mineralization, which is not amenable to processing through the proposed Eva Copper Project plant. No additional drilling was added after the 2012 estimate leading up to the 2014 estimate, and differences between the 2012 and 2014 Mineral Resource estimates were not considered material; however, confidence in the geological models was improved. The 2014 estimate was used for pit optimizations undertaken by Orelogy, and to relocate mine and waste dump layouts and develop schedules to accommodate Turkey Creek into the mine plan. This work was undertaken for the 2016 EA Amendment. These optimizations were not used in the mine design or financial modelling of the August 2017 Altona DFS.
In November 2018, CMMC published a Mineral Resource estimate, which incorporated limited newly acquired assay and geological data provided by diamond core holes drilled for metallurgical, geotechnical, and due diligence purposes. The published estimate of 121.8 Mt at 0.36% Cu and 0.07 g/t Au includes sulphide mineralization only. This estimate formed the basis of pit optimizations used in CMMC’s 2018 Feasibility Study and the 2019 Feasibility Study update.
Limited additional drilling was added after the 2014 estimate; differences between the 2014 and 2018 Mineral Resource estimates reflect a lower minimum reporting cut-off grade, different modelling approach, and exclusion of material classified as Inferred from the reported total.
5.2.2Turkey Creek Deposit
Turkey Creek was discovered in September 2012 after the 2012 DFS was completed. The only Mineral Resource estimate for Turkey Creek was completed in 2015 by Optiro and Altona. Altona was responsible for the data and 3D geological model. Mineral Resource estimation and block modelling was conducted by Optiro (Table 5-2). The estimate was 21 Mt grading 0.59% Cu, and it includes both sulphide and oxide mineralization.
Table 5-2: Turkey Creek Resource Estimate History
|
|
|
|
|
|
|
|
|
|
|
|
Model |
Authors |
Mineral Resource Estimate |
Comment |
Mar 2015* |
Optiro and Altona |
21 Mt at 0.59% Cu (0.3% Cu cut-off grade) |
Primary sulphide and oxide mineralization. Include Inferred resources. |
Nov 2018 |
CMMC |
13.8 Mt at 0.46% Cu
(0.17% Cu cut-off grade)
|
Nominal additional infill diamond drill data only.
Primary sulphide mineralization only. Excludes Inferred resources.
|
Source: *Courtesy Altona Mining Limited, Cloncurry Copper Project – Definitive Feasibility Study, August 2017. Total estimated Mineral Resource including Inferred; reported in accordance with JORC.
The 2015 resource model was used by Orelogy to generate pit designs and waste volumes included in the mine plan, and was used to generate a new layout of pits, waste dumps, and the tailings storage facility (TSF) for the 2016 EA. The Orelogy pit optimizations were based on primary sulphide mineralization only. The sulphide resource was estimated at 16.5 Mt at 0.59% Cu.
In November 2018, CMMC published a Mineral Resource estimate, which incorporated limited newly acquired assay and geological data provided by diamond core holes drilled for metallurgical, geotechnical, and due diligence purposes. The published estimate of 13.8 Mt at 0.46% Cu includes sulphide mineralization only and formed the basis of pit optimizations used in CMMC’s 2018 Feasibility Study and their 2019 Feasibility Study update.
The 2015 Mineral Resource for Turkey Creek included an oxide component, while the other deposits modelled did not. There was a reasonable expectation of achieving acceptable recoveries from the oxide material based on the mineralogy using the Controlled Potential Sulphidization (CPS) technique for flotation processing. However, initial metallurgical testing of this processing method produced poor recoveries, and the oxide material was excluded from the 2018 Mineral Resource.
Effective date: 30 June 2023
26
Technical Report Summary of the
Eva Copper Project, North West Queensland, Australia
Limited additional drilling was added after the 2015 estimate, and differences between the 2015 and 2018 Mineral Resource estimates reflect a lower minimum reporting cut-off grade, different modelling approach, and exclusion of material classified as Inferred from the reported total.
5.2.3Bedford Deposit
The Bedford deposit has had several formal Mineral Resource estimates completed that reflect stages of resource definition, as shown in Table 5-3. The 2012 and 2017 estimates are for sulphide material only.
In October 2006, McDonald Speijers completed an initial Mineral Resource estimate. In May 2012, Optiro completed an estimate based on nominal additional drilling. There was no significant change in the Mineral Resource of 1.7 Mt at 0.99% Cu and 0.20 g/t Au.
Geological models forming the basis of these estimates were poorly constrained, with isolated individual structures within a broader shear zone showing limited continuity.
Table 5-3: Bedford Resource Estimate History
|
|
|
|
|
|
|
|
|
|
|
|
Model |
Authors |
Mineral Resource Estimate |
Comment |
Oct 2006* |
McDonald Speijers |
1.77 Mt at 0.93% Cu, 0.24 g/t Au (0.3% Cu cut-off grade) |
Superseded following nominal additional drilling.
Includes Inferred resource.
|
May 2012* |
Optiro |
1.7 Mt at 0.99% Cu, 0.20 g/t Au (0.3% Cu cut-off grade) |
Basis for 2012 DFS and Mineral Reserve estimate.
Primary sulphide mineralization only. Includes Inferred resource.
|
Feb 2017* |
Altona |
4.8 Mt at 0.80% Cu, 0.21 g/t Au (0.3% Cu cut-off grade) |
Assay data from two additional drill holes. Additional geological data showing continuity of structures.
Primary sulphide mineralization only. Includes Inferred resource.
|
Nov 2018 |
CMMC |
3.0 Mt at 0.54% Cu and 0.14 g/t Au (0.17% Cu cut-off grade) |
Primary sulphide mineralization only. Excludes Inferred resource. |
Source: Altona Mining Limited, Cloncurry Copper Project – Definitive Feasibility Study, August 2017.
*Total estimated Mineral Resource including Inferred; reported in accordance with JORC.
In February 2017, Altona completed a new Mineral Resource estimate of 4.8 Mt at a grade of 0.80% Cu and 0.21 g/t Au that includes primary sulphide mineralization only. The increase from the 2012 estimate resulted primarily from a better understanding of geological continuity and geometry.
Mineralized structures were better defined by mapping of surface workings and high-resolution copper- in-soil sampling. An increase in tonnage was a result of more accurate bulk density data obtained from diamond drill core, therefore replacing prior bulk density estimates.
In November 2018, CMMC published a Mineral Resource estimate of 3.0 Mt at 0.54% Cu and 0.14 g/t Au includes sulphide mineralization only.
No significant new drill data was added after the 2017 estimate, and differences between the 2017 and 2018 Mineral Resource estimates reflect a lower minimum reporting cut-off grade, different modelling approach, and exclusion of material classified as Inferred from the reported total.
5.2.4Lady Clayre Deposit
The Lady Clayre deposit has had several formal Mineral Resource estimates that reflect stages of resource definition, as shown in Table 5-4.
In October 2006, McDonald Speijers completed a Mineral Resource estimate that was reported in accordance with JORC 2004 for the Lady Clayre deposit. This was incorporated into Universal’s 2009 Feasibility Study.
Effective date: 30 June 2023
27
Technical Report Summary of the
Eva Copper Project, North West Queensland, Australia
Table 5-4: Lady Clayre Resource Estimate History
|
|
|
|
|
|
|
|
|
|
|
|
| Model |
Authors |
Mineral Resource Estimate |
Comment |
Oct 2006* |
McDonald Speijers |
3.7 Mt grading 0.88% Cu, 0.48 g/t Au (0.3% Cu cut-off grade |
Superseded following expanded drilling. |
May 2012* |
Optiro |
14 Mt grading 0.56% Cu, 0.20 g/t Au (0.3% Cu cut-off grade |
Primary sulphide mineralization only.
Includes Inferred resource.
|
Nov 2018 |
CMMC |
7.3 Mt at 0.31% Cu and 0.14 g/t Au (0.17% Cu cut-off grade) |
Basis for this study.
Primary sulphide mineralization only. Excludes Inferred resource.
|
Source: Courtesy Altona Mining Limited, Cloncurry Copper Project – Definitive Feasibility Study, August 2017.
*Total estimated Mineral Resource including Inferred; reported in accordance with JORC.
In November 2018, CMMC published a Mineral Resource estimate of 7.3 Mt at 0.31% Cu and 0.14 g/t Au that included sulphide mineralization only.
Significant new drill data was added after the 2012 estimate; the updated CMMC model used the new drill hole assay data but was not constrained by the revised geological model. Differences between the 2012 and 2018 Mineral Resource estimates reflected new drilling data, a lower minimum reporting cut- off grade, different modelling approach, and exclusion of material classified as Inferred from the reported total.
5.2.5Ivy Ann Deposit
The Ivy Ann deposit has had three Mineral Resource estimates, as shown in Table 5-5.
Table 5-5: Ivy Ann Resource Estimate History
|
|
|
|
|
|
|
|
|
|
|
|
Model |
Authors |
Mineral Resource Estimate |
Comment |
Jan 2006* |
Universal |
3.98 Mt at 0.93% Cu, 0.24 g/t Au (0.3% Cu cut-off grade) |
Superseded following expanded drilling. |
May 2012* |
Optiro |
7.5 Mt at 0.57% Cu, 0.07 g/t Au (0.3% Cu cut-off grade) |
Primary sulphide mineralization only. Includes Inferred resource. |
Nov 2018 |
CMMC |
5.1 Mt at 0.36% Cu and 0.08 g/t Au (0.17% Cu cut-off grade) |
Primary sulphide mineralization only. Excludes Inferred resource. |
Source: Altona Mining Limited, Cloncurry Copper Project – Definitive Feasibility Study, August 2017
Copper Mountain Mining Corp, Eva Copper Project - Definitive Feasibility Study, January 2020.
*Total estimated Mineral Resource including Inferred; reported in accordance with JORC.
In January 2006, Universal completed a Mineral Resource estimate for the Ivy Ann deposit.
In May 2012, Optiro completed an estimate of resources for the Ivy Ann deposit that incorporated additional drilling. The published estimate of 7.5 Mt at 0.57% Cu, and 0.07 g/t Au includes sulphide mineralization only.
In November 2018, CMMC published the Mineral Resource estimate of 5.1 Mt at 0.36% Cu and 0.08 g/t Au which includes sulphide mineralization only.
No significant new drill data was added after the 2012 estimate, and differences between the 2012 and 2018 Mineral Resource estimates reflects a lower minimum reporting cut-off grade, different modelling approach, and exclusion of material classified as Inferred from the reported total.
Effective date: 30 June 2023
28
Technical Report Summary of the
Eva Copper Project, North West Queensland, Australia
5.2.6Blackard Deposit
The Blackard deposit has had several formal Mineral Resource estimates that reflect stages of resource definition, as shown in Table 5-6. While early estimates from 2003 included all mineralization (oxide, copper, transition, and sulphide zones) the 2012 Mineral Resource estimate only included native copper, transition and primary sulphide, the oxide zone was excluded.
In December 2005, McDonald Speijers completed a Mineral Resource estimate for the Blackard deposit. In February 2007, McDonald Speijers completed another Mineral Resource estimate update.
In May 2012, Optiro completed an estimate of recoverable resources for the Blackard deposit. The estimate of 76.4 Mt at 0.62% Cu includes native copper, transition, and primary sulphide mineralization only. This estimate incorporated newly acquired data from substantial additional drilling since the 2006 estimate.
Table 5-6: Blackard Resource Estimate History
|
|
|
|
|
|
|
|
|
|
|
|
| Model |
Authors |
Mineral Resource Estimate |
Comment |
May 1996 |
Newbery and Lai (for CRAE) |
27 Mt at 0.73% Cu (0.5% Cu cut-off grade) |
Superseded by new model for Bolnisi. Oxide (malachite), native copper, and transition mineralization only.
Indicated resource only.
|
Feb 2003* |
Hellman & Schofield |
26.8 Mt at 0.75% Cu
(0.5% Cu cut-off grade)
|
Superseded following expanded drilling. Oxide (malachite), native copper, transition, and primary sulphide mineralization.
Includes Inferred resource.
|
Dec 2005* |
McDonald Speijers |
43.7 Mt at 0.65% Cu
(0.3% Cu cut-off grade)
|
Superseded following expanded drilling. Oxide (malachite), native copper, transition, mineralization only.
Includes Inferred resource.
|
Jan 2007* |
McDonald Speijers |
46.25 Mt at 0.63% Cu
(0.3% Cu cut-off grade)
|
Superseded following expanded drilling. Oxide (malachite), native copper, transition, and primary sulphide mineralization.
Includes Inferred resource.
|
Jul 2012* |
Optiro |
76.4 Mt at 0.62% Cu
(0.3% Cu cut-off grade)
|
Resource estimate.
Native copper, transition, and primary sulphide mineralization only.
Includes Inferred resource.
|
Oct 2019 |
CMMC |
77.3 Mt at 0.49% Cu
(0.23% Cu, 0.20% Cu, and
0.17% Cu cut-off grade for copper, transition, and sulphide zone, respectively)
|
Native copper, transition, and primary sulphide mineralization only.
Excludes Inferred resource.
|
Source: Altona Library, resource estimation reports for Altona and previous Project operators.
*Total estimated Mineral Resource including Inferred; reported in accordance with JORC.
Data from 18 new drill holes was added to the 2019 resource estimate by CMMC. Differences between the reported 2012 and 2019 Mineral Resource estimates reflect lower cut-off grades, different modelling approach, and exclusion of Inferred resources.
Effective date: 30 June 2023
29
Technical Report Summary of the
Eva Copper Project, North West Queensland, Australia
5.2.7Scanlan Deposit
The Scanlan deposit has had three Mineral Resource estimates, as shown in Table 5-7.
In November 2006, McDonald Speijers completed a Mineral Resource estimate for the Scanlan deposit. This was incorporated into Universal’s 2006 and 2009 Feasibility Studies. In both cases the estimates were used for pit optimizations with resultant Ore Reserve estimates.
Table 5-7: Scanlan Resource Estimate History
|
|
|
|
|
|
|
|
|
|
|
|
| Model |
Authors |
Mineral Resource Estimate |
Comment |
May 1995 |
Newbery and Lai (for CRAE) |
15 Mt at 0.81% Cu (0.5% Cu cut-off grade) |
Superseded by new model for Bolnisi. Oxide (malachite), native copper, and transition mineralization only.
Indicated resource only.
|
Nov 2006* |
McDonald Speijers |
19.62 Mt at 0.68% Cu
(0.3% Cu cut-off grade)
|
Superseded following additional drilling. |
Jul 2012* |
Optiro |
22.2 Mt at 0.65% Cu
(0.3% Cu cut-off grade)
|
Native copper, transition, and primary sulphide mineralization only.
Includes Inferred resource.
|
Jan 2020 |
CMMC |
21.7 Mt at 0.57% Cu
(0.26% Cu, 0.20% Cu, and 0.17% Cu
cut-off grade for copper transition and sulphide zones, respectively)
|
Excludes Inferred resource. |
Source:
Altona Library, resource estimation reports for Altona and previous Project operators.
Total estimated Mineral Resource including Inferred; reported in accordance with JORC.
In July 2012, Optiro completed an estimate for the Scanlan deposit. The estimate of 22.2 Mt at 0.65% Cu included native copper, transition, and primary sulphide mineralization only. This estimate incorporated newly acquired data from substantial additional drilling completed since the 2006 estimate.
No significant drill data has been added to the deposit since 2012.
Effective date: 30 June 2023
30
Technical Report Summary of the
Eva Copper Project, North West Queensland, Australia
6Geological setting and mineralization
Section 229.601(b)(96) (6) (i‐iii)
6.1Regional Geology
The Project is located within the Proterozoic rocks of the Mount Isa Province of Queensland, Australia. The region is one of the world’s premier base metal provinces, with mining continuing uninterrupted since discovery of copper and gold near Cloncurry in the 1860s. The Mount Isa Province hosts numerous copper mines, including several of global significance. The Mount Isa Province also hosts the world’s two largest lead producers, the second largest silver producer, and until recently was the world leading source of zinc. Economic accumulations of various other commodities, including gold, molybdenum, rare earth elements, uranium, and phosphate, occur throughout the area.
The Project is situated within the Mary Kathleen domain, and to a lesser extent the Canobie domain of the late Palaeoproterozoic Eastern Fold Belt of the Mount Isa Inlier (Figure 6-1), which largely comprises metamorphosed marine sedimentary and volcanic rocks some 1,590 to 1,790 Ma old.
Numerous granite and mafic intrusions were emplaced at various times before 1,100 Ma.
The Project area rocks have undergone polyphase deformation, metamorphism, and metasomatism during the Isan Orogeny (1,600–1,500 Ma), which resulted in east-west shortening and extensive plutonism. The orogeny formed the major north-south trending upright folds and structural domains that characterize the province. Deformation and late- to post-orogenic plutonism is most pronounced in the Eastern Fold Belt where it is associated with widespread high temperature sodium-iron metasomatism expressed as magnetite or haematite alteration assemblages. Iron-oxide-copper gold (IOCG) mineralization is a variant of the Na-Fe metasomatism and the Project deposits are examples of such mineralization. IOCG mineralization developed in the waning stages of the Isan Orogeny, and is prevalent throughout the Eastern Fold Belt.
North- and north-easterly-trending crustal scale faulting transects the Province, bounding and cutting geological domains. The structures are the locus of major base and precious metal deposits. The deformation recorded by faulting and folding is complex, dominated at different stages by extension, shortening, and transcurrent faulting. The major faults have long reactivation histories during the Proterozoic, with evidence of recurrent activity in the Phanerozoic. During the latter part of the Isan Orogeny, at the time of IOCG mineralization, the pre-existing faults were reactivated into a dominantly strike-slip wrench system, with east-west to southeast-northwest directed shortening accompanying emplacement of the William Batholiths (1,530–1,490 Ma).
The Project deposits are located within the Mary Kathleen (MK) domain, which is an elongate belt on the east side of the Kalkadoon-Leichhardt domain, has a length of 180 km and an approximate width of 20 km, and was modified by the Wonga extensional event (approx. 1,740 Ma) which included emplacement of the Wonga Suite granites. The MK domain hosts the Dugald River zinc deposit, the Tick Hill gold deposit, the Mary Kathleen uranium deposit, and the Phosphate Hill phosphate deposit, in addition to the Project’s copper-gold deposits.
The Canobie domain is located east of the Mary Kathleen domain, and the two are juxtaposed by the Fountain Range and Pilgrim Faults. The Canobie domain is fault bounded, poorly exposed, largely defined by highly magnetic and buried William-Naraku intrusions and is host to the Ernest Henry copper-gold deposit.
Effective date: 30 June 2023
31
Technical Report Summary of the
Eva Copper Project, North West Queensland, Australia
|
|
|
| Figure 6-1: Geological Domains of the Mount Isa Province and Project Location |
Note: Little Eva deposit denoted by red star
Effective date: 30 June 2023
32
Technical Report Summary of the
Eva Copper Project, North West Queensland, Australia
6.1.1Regional Stratigraphy
The Little Eva deposit, which contains most of the resources in the Eva Copper Project, lies within the northern exposed portion of the Mount Isa Eastern Succession. Rocks within this area include a variety of Palaeoproterozoic sediments and volcanic and intrusive rocks, as illustrated in Figure 6-2 and Figure 6-3. The Palaeorproterozoic age (1,770±5 Ma) Corella Formation dominates the deposit area, and comprises scapolitic calcareous metasediments, quartzites, and granofels (Betts et al., 2011).
|
|
|
| Figure 6-2: Schematic Stratigraphic Diagram of the Little Eva Deposit Area |
Approximately 1,740 Ma, deposition of the Mount Isa eastern succession was terminated by a period of significant extension referred to as the Wonga Event. The Wonga Event was accompanied by dominantly felsic extrusive and intrusive magmatism (Greenwood & Dhnaram, 2013). Sedimentation resumed following the Wonga Event, with deposition of the Knapdale quartzite (feldspathic and micaceous sandstone and quartzite) at 1,728±5 Ma (Greenwood & Dhnaram, 2013; Betts et al., 2012). Additional sedimentation occurred with deposition of material that would become the Mount Roseby Schist, the Dugald River Shale Member, (host to the Ag-Pb-Zn deposit of the same name), and the overlying Lady Clayre dolomite (host to the Lady Clayre Cu-Au deposit), which has been dated at 1691±7Ma (Carson et al., 2011).
Sedimentation ended with the onset of the Isan Orogeny (approx. 1,600–1,510 Ma), which in its waning stages was accompanied by widespread emplacement of potassium-rich “A-type” granites. Williams and Naruku batholiths (approx. 1,550–1,500 Ma) are exposed east of the Project area (Malakoff granite). IOCG mineralization has a close temporal relationship with granite formation, and it has been proposed that mineralizing fluids were generated though magma mixing and/or fractionation.
Sedimentation was reinitiated during the Cambrian, with deposition of fine- to medium-grained sandstones and limestone in basin grabens, including the Landsborough Graben located directly east of the Little Eva deposit.
6.1.2Regional Deformation
Deformation of Proterozoic units within the Mary Kathleen domain resulted from the approximately 1,600–1,510 Ma Isan Orogeny. On a regional scale, the orogeny can be divided into three broad stages characterized by different principal stress directions and subsequent deformation responses. The Early Isan Orogeny (D1, approximately 1,600–1,570 Ma) was accompanied by north-south to northwest- southeast compression, which led to the formation of east-west trending folds and related axial plane cleavages. The Middle Isan Orogeny (D2, approximately 1,570–1,525 Ma) involved east-west compression, resulting in the development of north-south striking folds and foliation, ubiquitous in the Mary Kathleen domain. The Late Isan Orogeny (D3, approximately 1,525–1,500 Ma) represented a transition to dominantly brittle deformation, with the development of wrench-style faulting.
Effective date: 30 June 2023
33
Technical Report Summary of the
Eva Copper Project, North West Queensland, Australia
6.2Project Geology
The Project area straddles the northern part of a north-south striking corridor up to 10 km wide and 80 km long, bounded to the east by the regionally significant Rose Bee Fault, and to the west by the Coolullah Fault, which is also the eastern bounding fault of the Phanerozoic Landsborough Graben. These faults terminate into the regional scale Fountain Range and Quamby faults, which continue south to intersect the Mary Kathleen domain’s eastern margin (Figure 6-3 and Figure 6-4).
The Project area predominantly consists of variably metamorphosed sedimentary and igneous rocks of Proterozoic age that typically outcrop with limited residual regolith cover. Regolith cover tends to thicken east of the Rose Bee Fault and a thick sequence of Phanerozoic sediments overlies Proterozoic rock to the west of the Coolullah Fault in the Landsborough Graben. The graben contains Cambrian limestone and sandstone, mostly covered by Mesozoic and Cainozoic sediments.
Amphibolite facies schists of the Boomarra Metamorphic Belt are the oldest rocks within the area, outcrop east of the Rose Bee Fault (Figure 6-3), and are unconformably overlain by metamorphosed fine-grained sediments and intercalated volcanic rocks of the Corella Formation. The Little Eva copper-gold deposit is hosted by intermediate to mafic composition volcanic rocks within the Corella Formation, similar to rocks situated further to the south-east that have been dated, as coeval to the Wonga Suite intrusions (approximately 1,740 Ma).
The Knapdale Quartzite is a metamorphosed sequence of massive siliciclastics forming a prominent, 12-km long hill on the western side of the Project area, referred to as the Knapdale Range. The range is interpreted as a nappe structure, with east-directed thrust faulting juxtaposing older siliciclastics over younger Mount Roseby Schist (Roseby Schist).
The Roseby Schist, consisting of fine-grained, grey muscovite-quartz-biotite ± scapolite schists interbedded with carbonate-rich layers, has been structurally juxtaposed against the Corella Formation by major faults. The Roseby Schist within the Project area is overturned and contains distinctive scapolite porphyroblast-rich units and is also distinguished by a lack of Wonga Suite felsic intrusions.
Effective date: 30 June 2023
34
Technical Report Summary of the
Eva Copper Project, North West Queensland, Australia
|
|
|
| Figure 6-3: Geological Domains and Principal Stratigraphic Units of the Eva Copper Project Area |
Effective date: 30 June 2023
35
Technical Report Summary of the
Eva Copper Project, North West Queensland, Australia
|
|
|
| Figure 6-4: Project Area Geology with Outline of Project Tenure and Major Deposits |
Overlying the Roseby Schist is the Dugald River shale member (carbonaceous zinc-rich slates), which hosts the Dugald River zinc-lead-silver deposit of 63 Mt at 12.5% Zn, 1.9% Pb, and 31 g/t Ag. The Dugald River deposit is localized along the highly deformed and faulted eastern margin of the Knapdale Range. On the western side of the Knapdale Range, similar zinc-rich shales occur in the Coocerina Formation, which is also overlain by dolomites, and therefore is likely a structural repetition of the Dugald River deposit host stratigraphy.
Effective date: 30 June 2023
36
Technical Report Summary of the
Eva Copper Project, North West Queensland, Australia
Dating indicates maximum ages for the Roseby Schist and the Dugald River Shale Member at approximately 1,686 Ma. The units have temporal equivalents (1,690–1,645 Ma) throughout the Mount Isa Inlier, which are host to many of the region’s significant deposits, including Mount Isa, Hilton, Cannington, Lady Annie, Lady Loretta, Osborne, and Mount Elliot.
The Neoproterozoic (approx. 1,500 Ma) Quamby Conglomerate forms a ridge in the southern part of the Project area. Comprising polymictic conglomerate and medium- to coarse-grained sandstone, the Quamby rocks are relatively undeformed, generally flat-lying with broad open folds. The conglomerate unconformably overlies Corella Formation rocks in a small graben developed along the Rose Bee Fault during late Isan Orogeny wrench-fault reactivation. The conglomerate hosts gold mineralization that was initially mined by prospectors in the 1920s, and then later in the 1990s.
The Rose Bee Fault is a prominent topographic feature forming linear ridges where it is pervasively silicified and quartz-veined. Locally, the silicification overprints copper mineralization and may have developed during the Phanerozoic reactivation of the fault.
6.2.1Little Eva Deposit Geology
The Little Eva deposit is currently the major example of hydrothermal IOCG mineralization and is the largest single copper deposit within the Eva Copper Project area. Little Eva is a close analogue of the Ernest Henry deposit. Indicated and Inferred resources are 167 Mt grading 0.38% Cu and 0.07 g/t Au at a 0.17% Cu cut-off grade. Gold is strongly correlated with copper and is recovered in the copper concentrate. The deposit is 1.4 km in length and between 20 m to 370 m wide with mineralization extending from surface to the limits of drilling at 350 m vertical depth below surface (165 mRL) (Figure 6-5 and Figure 6-6). The deposit is sub-cropping on a flat plain with thin and variable (<3 m) in-situ soil and alluvium cover. Fresh rock is overlain by a 5 m to 25 m thickness of weathered rock. Copper occurs as primary sulphide minerals in fresh rock, and as secondary oxide minerals within the weathered zone.
Mineralization is hosted by a large body of faulted subvolcanic porphyritic and amygdaloidal intermediate rock that displays pervasive sodium and potassium feldspar, haematite, and magnetite metasomatic alteration assemblages. Intermediate volcanic rocks on the western margin of the deposit are cut by felsic intrusions that are also mineralized. Most of the mineralization is structurally controlled within breccias, fracture fill and veinlet stockworks. Chalcopyrite is the dominant copper mineral with lesser amounts of bornite. Mineralization is coarse and readily recovered through flotation concentration.
The igneous rocks hosting the Little Eva deposit occur within intercalated folded calc-silicate, marble, quartzite, and biotite-scapolite schists. The feldspar-phyric and amygdaloidal intermediate rocks are presumed to be volcanic flows, but probably include some subvolcanic sills as documented at Ernest Henry. In the northern part of the deposit the volcanic rocks are interpreted to be striking north and dipping to the east at approximately 60 to 70 degrees, while the mineralization appears to have a moderately west-dipping (45 to 65 degree) ladder-like grade distribution. In the central part of the deposit the volcanic stratigraphy is sub-vertical to westerly dipping, with dips shallowing to the south (Figure 6-6) The intrusive rocks are dominantly mafic to intermediate in composition, fine- to medium-grained with feldspar-phyric and amygdaloidal textures. There is a minor porphyritic felsic intrusion along the western margin of the deposit. In plan, the intrusive rock package has a lenticular shape, imbricated by mineralized breccias and post-mineral faulting, and is enclosed by metasedimentary rocks. The western contact between igneous rocks and metasediments is, in part, highly strained and fractured. Copper mineralization is rare within the metasediments.
Folding and extensive cross-faulting have resulted in a complex array of fracturing, crackle brecciation, and veining, particularly within the more competent rocks associated with copper-gold mineralization. Late, post-mineralization, strong shearing, and fracturing occurs parallel to the footwall contact against calc-silicate rocks, and it is interpreted that more strain took place in the less competent rocks.
Effective date: 30 June 2023
37
Technical Report Summary of the
Eva Copper Project, North West Queensland, Australia
Copper-gold mineralization is high-grade but relatively narrow in the north and has progressively moderating grades associated with greater width in the southern half of the deposit. Higher-grade zones in the north occur in stacked zones of breccia, veining, and fracturing. Intervening zones are lower grade with disseminated and veinlet-hosted mineralization (Figure 6-7). The breccia zones typically dip west at 45 to 65 degrees, with north-northeast strikes. The breccias occasionally display multiple re-brecciation. Lower-grade mineralization in the south is more evenly distributed in fractures, veinlets, and disseminations. Low-grade mineralization averages 0.1% Cu to 0.3% Cu over lengths of 25 m to 150 m, whereas breccia zones are in the order 0.8% Cu and 0.12 g/t Au over widths of 15 m and display gradational contacts.
The mineralized intermediate rock is variably and pervasively altered by multiple stages of alteration. Initial alteration assemblages of amphibole, magnetite, and biotite (dark grey coloured) are overprinted by assemblages comprising albite, haematite, magnetite, and carbonate ± chalcopyrite (red coloured).
The mineralization is open beyond the extents of drilling: the northern tapered high-grade zone is terminated or offset by faulting or plunges steeply to the north; while the southern extent is poorly constrained by drilling, with higher-grade mineralization appearing to plunge to the south.
The sulphide mineralization is generally coarsely crystalline, and metallurgical tests have demonstrated recoveries greater than 95% for copper. No deleterious elements were present in the trial flotation concentrates. The deposit is generally low in sulphur and concentrations of pyrite greater than chalcopyrite are relatively rare. Many of the drill holes average less than 0.8% sulphur.
A shallow 15m to 25m thick oxidation profile, a result of weathering, contains goethite-haematite with minor malachite, chrysocolla, covellite, azurite, neotocite, and cuprite. The weathering profile indicates a “dry” oxidation, as there is no leached zone and no supergene zone. There is a thin transition zone where predominately oxide copper changes over to predominately sulphide copper over 1 m to 2 m. Chalcopyrite can occur locally at surface. Zones of strong shearing and fracturing locally exhibit deeper oxidation.
Effective date: 30 June 2023
38
Technical Report Summary of the
Eva Copper Project, North West Queensland, Australia
|
|
|
| Figure 6-5: Geology and Mineralization at the Little Eva Deposit |
Note: See Figure 7-6 for locations
Effective date: 30 June 2023
39
Technical Report Summary of the
Eva Copper Project, North West Queensland, Australia
|
|
|
| Figure 6-6: Geological Cross-Sections through the Little Eva Deposit from North to South |
Effective date: 30 June 2023
40
Technical Report Summary of the
Eva Copper Project, North West Queensland, Australia
|
|
|
| Figure 6-7: Drill Core Illustrating the Principal Mineralization and Alteration Styles at Little Eva Deposit |
(a) High-grade hydrothermal breccia, with variably altered intermediate igneous clasts in a feldspar (FD),
hematite (HE), chalcopyrite (CP), magnetite (MT), and carbonate (CB) matrix (4.8% Cu, 0.2 ppm Au).
(b) Feldspar phyric intermediate igneous rock (dark domain, right), overprinted by texturally destructive feldspar-hematite (FD-HE) alteration (red domain, left) host to a chalcopyrite (CP), magnetite (MT), and carbonate (CB)
filled veinlet network (0.5% Cu, 0.05 ppm Au).
(c) Feldspar-phyric intermediate igneous rock with quartz (QZ) filled amygdales, patchy weak feldspar-hematite
(FD-HE) alteration, and low-grade disseminated chalcopyrite (CP) mineralization (0.2% Cu, 0.02 ppm Au).
Effective date: 30 June 2023
41
Technical Report Summary of the
Eva Copper Project, North West Queensland, Australia
6.2.2Turkey Creek
The Turkey Creek deposit is located 1.5 km east of the Little Eva deposit. The sulphide resources in the Indicated and inferred categories are 27.9 Mt grading 0.45% Cu. Mineralization at Turkey Creek is very low in gold. The deposit is sub-cropping in a relatively flat to gently undulating area with thin (<0.5 m) in-situ soils and alluvium cover. Fresh rock is overlain by a 25-m to 90-m thickness of weathering and oxide mineralization. Copper occurs as primary sulphides in fresh rock and as secondary oxide copper minerals dominated by copper silicates (chrysocolla, hydrobiotite) and minor malachite within the weathered zone.
The deposit extends over 1.8 km in length with mineralization extending from surface, to drilled depths of 150 m vertically below surface (Figure 6-8 and Figure 6-9), with a simple tabular geometry that displays excellent continuity along strike and down-dip. True widths vary from 10 m to 30 m at the southern end, to 30 m to 50 m at the northern end. The main part of the deposit strikes north and dips 60 degrees to the east. At the northern end, the mineralization and host stratigraphy are folded sharply eastwards into a curved synform which plunges steeply south. The northern zone is slightly offset by faulting from the main southern zone.
The tabular deposit has an upper and lower zone of stronger copper mineralization with a more sporadically mineralized central zone. Primary copper mineralization comprises finely disseminated chalcocite, with subordinate bornite and chalcopyrite, that are disseminated and also occur within minor carbonate veinlets. Copper sulphide minerals in the upper zone are dominated by chalcopyrite, and in the lower zone by chalcocite and bornite. Gangue minerals primarily consist of quartz, calcite, scapolite, white mica, and minor biotite.
The sulphide mineralization is stratabound and hosted within a sequence of interbedded metasediments (biotite schists, biotite scapolite schists, and carbonate-rich rocks or marble) The host rocks are variably altered to carbonate and albite-haematite assemblages.
A consistent 20-m to 30-m thickness of weathering with oxide mineralization blankets the southern zone. It includes a zone of complete oxidation, and a thin transition zone with minor secondary and remnant primary copper sulphides. Copper oxide mineralization comprises minor malachite, rare occurrences of azurite, and native copper, with most of the native copper thought to be associated with hydrobiotite similar to the Blackard deposit. The transition zone is dominated by malachite, minor degraded chalcopyrite, chalcocite, and rare native copper.
Effective date: 30 June 2023
42
Technical Report Summary of the
Eva Copper Project, North West Queensland, Australia
|
|
|
| Figure 6-8: Turkey Creek Deposit Mineralization |
Effective date: 30 June 2023
43
Technical Report Summary of the
Eva Copper Project, North West Queensland, Australia
|
|
|
| Figure 6-9: Geological Cross-Sections through the Southern Zone of the Turkey Creek Deposit |
6.2.3Blackard and Scanlan
The Blackard and Scanlan deposits are located approximately 5 km and 17 km, respectively, south of the Eva deposit. The deposits are geologically very similar and therefore are described together. A thin northwesterly extension of mineralization from the Blackard deposit is called the Legend deposit.
An additional 18 RC drill holes were completed on the Blackard deposit in 2019, and extensive metallurgical testing was carried out on Blackard and Scanlan samples which has defined metallurgical recoveries for the mineralogical zones within the deposits. Indicated and Inferred resources for the Blackard deposit are 116 Mt grading 0.45% Cu using a cut-off grades of 0.17% copper. Indicated and Inferred resources for the Scanlan deposit total 27 Mt grading 0.38% Cu using a cut-off grade 0.17% copper.
Effective date: 30 June 2023
44
Technical Report Summary of the
Eva Copper Project, North West Queensland, Australia
The Blackard and Scanlan deposits are hosted by the Mount Roseby Schist, which comprises intercalated marls and carbonaceous sediments that represent a shallow marine to lagoonal depositional environment. The unit has been metamorphosed to calc-silicates, and variable scapolite, biotite and/or muscovite schists that have undergone polyphase deformation. The most significant folding event forming northerly-trending folds, likely coinciding with peak amphibolite grade metamorphism. Fold geometry has been inferred from data collected from diamond drill core and field mapping, and has been variably described as isoclinal, through tight to open, depending upon location, but primary layering cannot be determined from RC chips and is only rarely visible in drill core, making interpretation at the deposit scale difficult. The Scanlan through to Blackard-Legend deposits form a 7 km long trend of mineralization that appears to follow stratigraphy as it curves around the east side of the Knapdale Quartzite (Figure 6-4).
The Blackard deposit morphology is a function of folded stratigraphy and/or faulting having a strike length of 3.5 km and a maximum plan width of 350 m (Figure 6-10 amd Figure 6-11). The stratigraphic width of the deposit is only 60 m to 90 m, but a series of parasitic folds and/or fault repetitions results in a much wider deposit. Fault movement along axial planes may have resulted in rootless folds. The southern area of the deposit is relatively narrow, steeply dipping to the west, and northerly trending. The deposit width and depth extent increases to the north, with a gradual shallowing of the westerly- dipping mineralization (45 degrees) and a flattening of mineralization to the east. It is, however, difficult to constrain the mineralized rock within a symmetrical fold pattern and the slight variations in strike orientation of higher-grade zones in plan suggest the possibility of an east-west stacking of mineralization along possible north-south (~010o N) faults. To the north, the deposit narrows to a moderately-dipping 50 m to 60 m thick band that gradually steepens and thins northwards.
Mining and processing of Blackard and Scanlan deposits will be affected by the deep weathering profiles, which has resulted in extensive modification of the host rock and localized remobilization of copper. Much of the carbonate has been leached from the upper parts of the deposits creating voids between less soluble or insoluble mineral grains and reducing the mass of the rock (Figure 6-12). Copper released by oxidation of sulphide minerals has mostly formed native copper particles many of which are very fine-grained. Some of the copper occurs as ultra-fine particles (<10 µm) within altered biotite (termed hydrobiotite) which is unrecoverable with any known commercial processing methods. Four zones defined by weathering and copper speciation have been determined for the deposits, and extensive testing has determined probable metallurgical recoveries for each zone. From upper to lower, the zones are:
•Oxide Zone. The deposits are capped by a weathered, ferruginous zone that is typically 20 m to 30 m thick and has a sharp contact with the next underlying zone. In some areas of the Oxide Zone almost all copper has been leached but other areas have significant copper grades, with copper occurring as malachite, azurite, hydrobiotite, and Fe-Mn-Cu mineraloids known as neotocite. Testing suggests copper in this zone it is not economically extractable.
•Native Copper Zone. The Native Copper Zone is defined by the presence of native copper with lesser cuprite, copper-bearing hydrobiotite, and chalcocite. Leaching of carbonates has reduced the mass and created a very soft rock. The Native Copper Zone has a variable thickness, reaching a maximum of 120 m. Extensive testing has defined a viable process for extracting a significant percentage of the native and sulphide copper.
•Transition Zone. A relatively narrow zone ranging from 1 m to 15 m in thickness that marks the transition from the native Copper Zone to the Copper Sulphide Zone and carries mineral phases of both adjacent zones. Copper grades tend to be high due to the presence of supergene chalcocite. The base of this zone is defined by the “top of fresh rock” (TOFR in Figure 6-11).
•Sulphide Zone. Defined by unweathered (fresh) rock with copper sulphide species of bornite, chalcocite, chalcopyrite, and pyrite, this zone contains sulphide disseminations and clots which are strongly associated with carbonate veinlets. Metallurgical recoveries from this zone are favourable. Silver is locally present but was not estimated.
The Scanlan deposit has a strike length of 1,500 m and a maximum width in plan of 500 m (Figure 6-13). In the southern half, the deposit is composed of a 10 m to 50 m thick horizon, with the thicker part folded into a “V” shaped synform on the eastern side, and the thinner part forming a nearly flat antiform to the east, resembling an extended square root symbol in section, with a 320 degree, northwesterly trend (Figure 6-14). The east dipping part of the synform is not present in the northern part of the deposit, eroded or possibly faulted off, and the mineralization swings to a 12 degrees northerly trend, becoming a steeply west-, then east-dipping panel of mineralization, and gradually thinning to uneconomic widths.
Effective date: 30 June 2023
45
Technical Report Summary of the
Eva Copper Project, North West Queensland, Australia
There are two possibilities for the origin of mineralization in the copper-only deposits. The first ascribes a hypogene hydrothermal source that occurred during the waning stages of the Isan Orogeny due to features that include orientation of sulphide minerals along foliation planes and/or brittle fractures or pre- existing carbonate veins, as well as sulphide-phased overprinting metamorphic minerals. Timing of this mineralizing event would closely correspond with the copper-gold deposits in the district. The second hypothesis for the mineralization is that the deposits represent typical stratiform copper deposits that form from metalliferous basin brines, post-deposition but pre-orogeny. Stratiform-type copper deposits are typically formed by redox reactions within marine sediments with moderate to high sulphur contents.
These deposits commonly display an inwards pyrite-chalcopyrite-bornite-chalcocite-native copper zonation as the redox reactions progressively use up the available sulphur; a zonation that may be inferred based on the deeper, down-dip parts of the Blackard deposit. Additionally, the lower sulphide zones within the copper-only deposits have virtually no gold but relatively high silver contents, locally, with Cu:Ag ratios typical of many occurrences of stratiform copper mineralization. A stratiform origin may also explain the similar stratigraphic position of all the copper-only deposits (with the exception of Turkey Creek) around the Dugald River Shale and Knapdale Quartzite units. Many of the sulphide textures ascribed to the hypogene origin are compatible with metamorphism of earlier formed sulphide deposits within carbonaceous rocks, where sulphides and some carbonate would be partially remobilized and likely to recrystalize after formation of the metamorphic silicate minerals. The extensive leaching of carbonate from the upper parts of these deposits indicates the possibility of weathering of an overlying high-sulphide zone (pyrite-chalcopyrite) to produce the necessary acid. The origin of the deposits is inconsequential to grades and mining but may have some significance for future exploration.
|
|
|
| Figure 6-10: Plan View of the Blackard Deposit with Location of Cross-Sections |
Effective date: 30 June 2023
46
Technical Report Summary of the
Eva Copper Project, North West Queensland, Australia
|
|
|
| Figure 6-11: Geological Cross-Sections through the Blackard Deposit Illustrating the Distribution of Mineralogical/Metallurgical Zones Produced by Weathering |
Effective date: 30 June 2023
47
Technical Report Summary of the
Eva Copper Project, North West Queensland, Australia
|
|
|
| Figure 6-12: Photographs of Drill Core from the Blackard Deposit |
Note: The upper photograph is an example of core from Oxide Zone containing ferruginous metasediments with clay alteration associated with leaching of carbonate. The lower photograph is core from the copper zone consisting of chemically oxidized scapolitic schist, leached of carbonate. Copper assay values for 1 m samples shown. Horizontal field of view approximately 70 cm.
Effective date: 30 June 2023
48
Technical Report Summary of the
Eva Copper Project, North West Queensland, Australia
|
|
|
| Figure 6-13: Plan View of the Scanlan Deposit with Cross-Section Line |
|
|
|
| Figure 6-14: Cross-Section of Scanlan Deposit Illustrating Mineralization Zones |
Effective date: 30 June 2023
49
Technical Report Summary of the
Eva Copper Project, North West Queensland, Australia
6.2.4Lady Clayre
Lady Clayre is located approximately 19 km south of Little Eva and is the third largest copper-gold deposit within the Project area. The deposit contains Indicated resources of 5.1 Mt grading 0.38% Cu and 0.17 g/t Au, plus an additional 1.1 Mt grading 0.37% Cu and 0.09 g/t Au in the Inferred category. The deposit has been drilled to a vertical depth of 200 m and is open at depth.
The deposit is sub-cropping with thin (<0.5 m) in-situ soil cover. Fresh rock is covered by a thin, 15 m to 25 m, weathered zone of oxide mineralization. Copper occurs as primary sulphides in fresh rock and as secondary oxide minerals within the weathered zone.
Mapping and surface sampling have defined multiple zones of surface mineralization. Zones A and F (Figure 6-15 and Figure 6-16) have been the focus of drilling, which has delineated a series of moderate to steep dipping planar mineralized bodies. Zone A mineralization strikes north-northwest, dips approximately 80 degrees to the west, and extends along strike for 700 m. Zone F mineralization strikes north-east, dips 70 to 75 degrees to the west, and extends along strike for a total of 480 m.
Lady Clayre is situated in a structurally complex area, with evidence for a number of ductile and brittle deformation events. The deposit is located close to the junction of two regional faults near the southern termination of the Knapdale Quartzite. Copper-gold mineralization is structurally controlled, associated with faulting/shearing sub-parallel to bedding in a folded sequence of shale, metasiltstone, schist, and dolomite. The metasedimentary package is intruded by intensely altered, narrow (0.5 m to 5 m) sheets of mafic intrusive. Alteration mineral assemblages associated with mineralization are dominated by carbonate, feldspar, quartz, and tremolite.
The main sulphide ore mineral is chalcopyrite, often associated with lesser pyrite and/or pyrrhotite. Molybdenite is also noted. Mineralization is coarse-grained, occurring in sulphide or carbonate- sulphide vein arrays and as sulphide disseminations in intensely altered rocks. Breccia infill can also be locally significant. The dominant copper mineral in the oxide zone is malachite, with limonite and goethite.
Mineralization remains open along strike and down dip in Zones A and F, while a series of additional areas of surface mineralization remain untested by drilling
Effective date: 30 June 2023
50
Technical Report Summary of the
Eva Copper Project, North West Queensland, Australia
|
|
|
| Figure 6-15: Geology and Mineralization at Lady Clayre |
Effective date: 30 June 2023
51
Technical Report Summary of the
Eva Copper Project, North West Queensland, Australia
|
|
|
| Figure 6-16: Geological Cross-Section through the Lady Clayre Deposit Zone F |
6.2.5Ivy Ann
Ivy Ann is a modest sized copper-gold deposit located approximately 35 km south-southeast of Little Eva. The Indicated Resource is estimated at 5.2 Mt at 0.34% Cu and 0.09 g/t Au at a 0.17% Cu cut-off grade, there is a further 1.2Mt @ 0.33% Cu and 0.11g/t Au classified as inferred. The deposit has been drilled to a vertical depth of 125 m and is open at depth. Ivy Ann lies to the east of, and adjacent to, the broad Quamby Fault Zone, which is manifest as a 1-km wide high-strain zone with evidence for dextral displacement (Figure 6-17).
The deposit is sub-cropping in a relatively flat to gently undulating area with thin (<0.5 m) in- situ soils and transported alluvium cover. There is a 15-m to 30-m-thick weathered zone of oxide mineralization on top of the deposit.
The deposit is a lenticular shaped body striking north-northeast with numerous lenses hosted within steeply east-dipping structures, striking north-south to north-northeasterly. Mineralization has been defined in two separate deposits, Ivy Ann and Ivy Ann North. The overall mineralization extends over a strike length of 3 km. The main Ivy Ann deposit is defined over a strike length of 630 m, with a width of 20 to 130 m, and a steep easterly dip; it’s a wedge-shaped body striking north-south subparallel to the host lithologies. The Ivy Ann North deposit is defined over a 420-m strike length with a width of 10 to 30 m and is vertical or dips steeply to the east.
The copper-gold mineralization is fault hosted and associated with breccias and networks of veins and micro-veinlets within a folded sequence of metamorphosed sediments (psammite) and amphibolite. Fold axes are north-south with interpreted moderate southward plunges (>45 degrees). Main sulphide ore minerals are chalcopyrite with lesser pyrite and pyrrhotite. Sulphide grain size is relatively coarse.
Effective date: 30 June 2023
52
Technical Report Summary of the
Eva Copper Project, North West Queensland, Australia
Alteration mineral assemblages associated with the copper mineralization are dominated by albite, quartz, hematite, biotite, and magnetite. Breccias are best developed in albite-quartz-hematite altered rocks, which sit in the hinge of a tight southward-plunging antiform. The metasediments, fault zones, and fold axes are cut by a swarm of thin (<5 m) pegmatite dykes.
An irregular 15-m to 30-m thick zone of weathering with oxide mineralization blankets the deposit. The dominant copper oxide mineral is malachite, present with goethite and hematite, and lesser amounts of chrysocolla, tenorite, and cuprite. The zone is poorly constrained by current drilling.
|
|
|
| Figure 6-17: Plan of Ivy Ann Mineralization and Geological Cross-Section of the Ivy Ann Deposit |
Effective date: 30 June 2023
53
Technical Report Summary of the
Eva Copper Project, North West Queensland, Australia
6.2.6Bedford
Bedford is a modest sized copper-gold deposit located 6 km southeast of the Little Eva deposit. The Indicated Resource is estimated at 2.7 Mt at 0.60% Cu and 0.23 g/t Au at a 0.17% Cu cut-off grade, with a further 1.5Mt @ 0.46% Cu and 0.13g/t Au in inferred Resource. The deposit has been drilled to a vertical depth of 140 m and is open at depth. Bedford lies to the east of the Rose Bee Fault.
The deposit is sub-cropping in a relatively flat to gently undulating area with thin (<0.5 m) soils and limited alluvium cover. The deposit is overlain by a 20-m to 30-m-thick weathered zone of oxide mineralization.
The deposit is hosted within a steeply west-dipping shear zone striking north to north-northeast (Figure 6-18 and Figure 6-19). The shear zone varies from 50 m to 120 m wide with internal arrays of mineralized structures and splays. Mineralization has been defined in two separate zones, Bedford North, and Bedford South, within a continuous structure. The deposit extends over a strike length of 2.5 km. The northern zone is 1.15 km, and the southern zone is 850 m long. Within the shear zone individual mineralized structures associated with mineralization (>0.3% Cu) true widths ranging from 5 m to 12 m. Mineralization remains open to north and south along strike, down dip, and between the two zones.
Host rocks are a north to north-northeast-striking, moderately to steeply west-dipping interlayered sequence of amphibolite and biotite schist underlain by psammite and intruded concordantly by narrow planar granite and pegmatite dykes or sills. In Bedford South, mineralized structures are interpreted to be bedding or foliation parallel. In Bedford North, the main mineralized structures are interpreted to trend north-south, stepping across the north-northeast-striking stratigraphy, with the development of a set of secondary north-northeast linking structures along bedding or foliation. An irregular, 20-m to 30-m-thick zone of weathering with oxide mineralization blankets the deposit. Although the base of oxidation is well defined, variability of copper mineral species within the weathering profile is not well understood.
Magnetite-biotite alteration assemblages with quartz veining are concentrated in the ore zones, above a strongly feldspar-hematite altered footwall.
The dominant ore mineral is coarse-grained chalcopyrite (with minor magnetite, pyrite, pyrrhotite, and gold), which occurs within quartz veins, breccia fill, and disseminations within the host shear zone.
Effective date: 30 June 2023
54
Technical Report Summary of the
Eva Copper Project, North West Queensland, Australia
|
|
|
| Figure 6-18:Bedford Deposit Mineralization Plan |
Note: In Bedford North the main mineralized structures trend north-south stepping
across north-northeast-striking stratigraphy of intercalated amphibolite, biotite schist,
and narrow granite and pegmatitic dykes/sills. In Bedford South the mineralized structure
is bedding or foliation parallel.
Effective date: 30 June 2023
55
Technical Report Summary of the
Eva Copper Project, North West Queensland, Australia
|
|
|
| Figure 6-19: Geological Cross-Sections through the Bedford Deposit |
Effective date: 30 June 2023
56
Technical Report Summary of the
Eva Copper Project, North West Queensland, Australia
7Deposit Types
Section 229.601(b)(96) (6) (i‐iii)
The copper-gold deposits within the Project are of the IOCG style of hydrothermal mineralization. Significant examples of Australian IOCG deposits include Olympic Dam and Prominent Hill in South Australia and Ernest Henry in Queensland, which is located some 60 km from Little Eva.
Mineral deposits occurring within IOCG systems are associated with relatively high temperature, iron- rich hydrothermal alteration (typically hematite or magnetite), which is both spatially and temporally related to felsic plutons. Mineralization can manifest in a variety of styles including vein networks, breccias, disseminations, and replacements. Deposits are typically localized in dilation zones of structures active during pluton emplacement and cooling.
Within the Eastern Mount Isa Inlier, deposits are interpreted to have formed during the waning stages of the Isan Orogeny (1,530–1,495 Ma), in association with intrusion of the Williams-Naraku batholith suites. This is coincident with wrench reactivation of earlier large, crustal-scale faults, which saw dextral displacement on north-northwest trending transfer faults, and some regional north-south structures, suggesting northwest-southeast compression.
In the Project area, deposits fit into two categories: copper-gold, and copper-only. The copper-only deposits are a distinct, metasediment-hosted stratabound mineralization style in the region, unique to the Roseby Schist. The copper-gold deposits are more typical of the IOCG deposits in the Eastern Mount Isa Inlier. The copper-gold deposits occur within structural-lithological settings that facilitate dilational sites during deformation, typically within igneous rocks or intercalated metamorphosed igneous and sedimentary rocks peripheral to Roseby Schist. The copper-only deposits are interpreted from the available data to be gold-poor end members of the IOCG mineralizing event prevalent throughout the district (varying primarily due to host rock controls) an alternative hypothesis is that they are stratiform deposits related to an earlier mineralising event during basin dewatering.
7.1Copper-Gold Deposits
Four copper-gold deposits are scheduled for mining: Little Eva, Lady Clayre, Ivy Ann, and Bedford (which contains two separate zones, Bedford North, and South).
Little Eva, the largest copper deposit within the Project, is considered an IOCG type, and is a close analogue of the Ernest Henry deposit. The deposit contains gold, which has a strong correlation with copper, and is recovered in the copper concentrate. The deposit is hosted by a large body of faulted, porphyritic, and amygdaloidal intermediate rock, which likely represents volcanic flows, and possibly sub-volcanic intrusive rocks. All rocks display pervasive sodium and potassium feldspar, hematite, and magnetite-bearing metasomatic alteration assemblages. The mineralization is structurally controlled within breccia and veinlet stockworks. Chalcopyrite is the dominant copper mineral.
Mineralization is generally coarse-grained, and readily recovered through flotation concentration.
Bedford, Lady Clayre, and Ivy Ann have a similar metal association to Little Eva. These are smaller shear zone-, fault-, and vein-hosted deposits within thinly intercalated metasedimentary and igneous rocks. Gold grades within these deposits are typically higher than at Little Eva.
All the deposits are sub-cropping, covered by a relatively shallow (approximately 25 m) oxidized cap.
Effective date: 30 June 2023
57
Technical Report Summary of the
Eva Copper Project, North West Queensland, Australia
7.2Copper-Only Deposits
There are three copper-only deposits which are planned for mining: Turkey Creek, Blackard, and Scanlan. Other copper-only type deposits within the Project tenures currently excluded from the mine plan, as they are currently insufficiently explored, are: Legend, Longamundi, Great Southern, Caroline, and Charlie Brown. The copper-only deposits contain trace amounts of gold locally, but generally not in economic quantities as with the copper-gold deposits. Low tenor silver may be present in the sulphide zones, although data is minimal. The mineralization appears to be stratabound, if not stratiform, and in the case of Blackard and Scanlan has been deformed by folding. Except for Turkey Creek, these deposits are distributed around the eastern margin of the Knapdale Range over a strike length of 16 km and hosted within a sequence of metamorphosed calcareous sediments. The deposits are not associated with magnetite enrichment and exhibit some characteristics of stratiform-copper type deposits. Primary sulphide mineralization is dominated by bornite, with minor chalcopyrite and chalcocite, however the deposits have been modified by supergene processes and extensive leaching of carbonate, that has produced four distinct mineralogical zones as listed below:
•The oxide zone begins at surface, and extends to depths of 15 m to 25 m. The zone is defined by oxidation of copper and iron bearing minerals to malachite, limonite, goethite, and copper bearing Fe-Mn mineraloids (neotocite).
•The copper zone occurs below the oxide zone, and can extend to depths of 120 m. The copper zone contains a significant amount of native or metallic copper, which can account for up to 65% of the contained copper. Significant copper also occurs in the lattice of altered biotite referred to as hydrobiotite, which is not recoverable by flotation. Other copper minerals include cuprite, chalcocite and residual bornite. Carbonate is extensively leached. Almost complete leaching of carbonate has produced very friable rock.
•The transition zone is a zone that transitions between the copper and sulphide zones. This zone contains minor secondary and remnant primary copper sulphides (chalcocite, cuprite, tenorite, bornite, and chalcopyrite), and may contain some metallic copper.
•The sulphide zone, is primary mineralisation in fresh rock containing copper as disseminated bornite, chalcocite and chalcopyrite.
The copper-only mineralization is associated with a specific stratigraphic interval that has ubiquitous low-tenor copper anomalism wherever it is exposed or intersected by drilling and displays complex folding and fault patterns. Fold axes are predominantly north-northwest-trending but can have variable plunges. At Blackard and Scanlan, mineralization occurs within shallow-plunging anticlines, with steeply-dipping to locally overturned western limbs, and flatter, east-dipping limbs.
Effective date: 30 June 2023
58
Technical Report Summary of the
Eva Copper Project, North West Queensland, Australia
8Exploration
Section 229.601(b)(96) (7) (i‐vi)
Early exploration in the area that contributed significantly to the database for this Project included that completed by Ausminda Pty. Ltd., CRA Exploration (CRAE), and Pasminco, with later exploration by Altona, prior to Project acquisition by Copper Mountain.
Extensive geophysical surveying, primarily induced polarization (IP) over the copper deposit areas, and Electromagnetic (EM) or Controlled Source Audio-Frequency Magnetotellurics (CSAMT) over the Dugald River zinc deposit host rocks, as well as gravity and magnetic surveys, were undertaken in the area by CRAE. All the Project deposits subcrop and were initially identified by surface sampling and mapping. The most valuable result from the geophysical work was the identification aided definition of the copper-only deposits, the most valuable were the EM and gravity surveys. Gravity lows are registered over the copper-only deposits due to deep weathering, while the metallic copper in the supergene zones were mapped as EM anomalies. Airborne magnetic surveys over the Project area are available from various government agencies. Satellite hyperspectral surveys have also been used with some success by various companies in the area.
CRAE's bedrock and soil geochemical programs outside the Roseby copper deposits were not systematic, with minimal assessment of gold mineralization, and left most of the surrounding area untested by geochemical surveys. CRAE’s focus at the time was on the copper only (no gold containing) deposits due to their relatively high grades and the Little Eva and Lady Clayre areas were of secondary exploration interest. The Little Eva copper-gold prospect was drilled by CRAE to an Inferred resource status, but the gold content was not assessed. The Lady Clayre prospect was also drilled by CRAE at the time, but no resource estimate was completed. Metallurgical sampling and testing were conducted at Blackard and Lady Clayre, but not at Little Eva.
Following the acquisition of the Project from CRAE by Pasminco/Zinifex, drilling, and sampling programs focused primarily on the Lady Clayre copper-gold sulphide prospect, Caroline (Lady Clayre East), and the copper-gold potential of the Mount Rose Bee Fault area. This drilling was insufficient to define a formal resource at either deposit. Pasminco also initiated a soil and rock sampling program designed to examine the Mount Rose Bee Fault and related splay faults. While this program detected widespread but weak copper-gold mineralization, generally in close spatial relationship with copper and gold soil geochemical anomalies, Pasminco divested the Roseby Copper Project before the exploration program was completed.
Xstrata conducted exploration in the central Roseby area under the terms of an option and earn-in agreement with Altona. Xstrata also completed deep drilling below the Little Eva, Blackard, Great Southern, and Longamundi deposits demonstrating the presence of large mineralized systems. Xstrata also discovered a mineralized system under cover at Cabbage Tree Creek some 3 km north of Little Eva. Xstrata has also completed extensive geochemical, rock sampling, mapping, and geophysical surveys generating numerous targets, some of which have been subject to initial drill testing with positive results.
Altona carried out systematic soil geochemistry work over much of the claim area, and this work was continued by CMMC. This work has established numerous copper-in-soils targets within the Project tenure and surrounding Exploration Permit for Minerals (EPM) held by Harmony (Figure 8-1). Shallow drilling of these targets has established numerous mineralized positions with opportunities to established new copper and gold mineral resources.
Effective date: 30 June 2023
59
Technical Report Summary of the
Eva Copper Project, North West Queensland, Australia
|
|
|
| Figure 8-1: Surface Copper Anomalism with Defined Deposits and the Cameron Project Area Indicated |
Exploration carried out by CMMPL in 2018 and 2019 included grade confirmation and metallurgical drilling in the Little Eva, Turkey Creek, and Blackard deposits, in addition to exploration drilling on some targets in the Project area. Additionally, exploration drilling was also completed on the prospective areas Quamby and Matchbox, which are located in the Cameron area south of the Project (Figure 8-1). Compilation of geophysical surveys and inversion of historical IP geophysical data were completed, as were new surveys in a few areas. Testing of aquifers for potential water sources near the proposed mine area was successfully conducted in both 2018, 2019 and 2023.
Effective date: 30 June 2023
60
Technical Report Summary of the
Eva Copper Project, North West Queensland, Australia
9Drilling
Section 229.601(b)(96) (8) (i‐v)
The seven deposits in this report have relatively lengthy exploration histories, including multiple periods of drilling implemented and managed primarily by three companies: CRA Exploration (CRAE), Universal Resources Limited (Universal), Altona, CMMC and Harmony. All drill data was collected to industry standards, and the procedures were well documented. Quality control and data verification are discussed in following sections, and demonstrate that the data is reliable and suitable for Mineral Resource estimations.
9.1Drill Hole Data Description
9.1.1Little Eva
A total of 77,226 m of drilling in 516 holes was completed at Little Eva. Of these, some 86% are reverse circulation (RC) (448 holes), and 14% are diamond drilling (75 holes). Holes were generally inclined at -55 to -60° or subvertical, drilled on 50 m spaced section lines, and 40 m along line spacing. Some areas are more densely drilled or include holes aligned in alternative directions.
Diamond drilling was conducted for resource definition, metallurgical testwork sampling, geotechnical, and twinning of RC holes for quality assurance/quality control (QA/QC). Diamond drill holes were commonly drilled with shallow RC pre-collars.
The drilling history for the Little Eva deposit is summarized in Table 9-1, and hole locations are shown in Figure 9-1. The earliest recorded drilling at Little Eva was undertaken by CRAE in 1963, and consisted of a single diamond drill hole (DDH). Most drilling was conducted by three companies; CRAE (1963 to 1998), Universal (2002 to 2009), and Altona (2011 to 2018).
Effective date: 30 June 2023
61
Technical Report Summary of the
Eva Copper Project, North West Queensland, Australia
Table 9-1: Little Eva Drilling Summary
|
|
|
|
|
|
|
|
|
|
|
|
|
|
|
Year |
Company |
Hole Type |
Hole Count |
Metres Drilled |
1963 |
CRAE |
DD |
1 |
193 |
1977 |
CRAE |
DD |
1 |
254 |
1978 |
CRAE |
DD |
5 |
1 159 |
|
1988 |
CRAE |
RC |
24 |
823 |
1990 |
CRAE |
RC |
5 |
480 |
1992 |
CRAE |
DD |
1 |
543 |
1992 |
CRAE |
RC |
12 |
1 182 |
|
1994 |
CRAE |
RC |
13 |
1 627 |
|
1995 |
CRAE |
DD |
3 |
757 |
1995 |
CRAE |
RC |
6 |
1 031 |
|
1996 |
CRAE |
DD |
3 |
1 201 |
|
1996 |
CRAE |
RC |
1 |
150 |
2002 |
Universal |
RC |
14 |
2 138 |
|
2003 |
Universal |
RC |
5 |
1 249 |
|
2004 |
Universal |
RC |
83 |
9 987 |
|
2005 |
Universal |
DD |
18 |
2 698 |
|
2005 |
Universal |
RC |
147 |
20 875 |
|
2006 |
Universal |
RC |
34 |
3 633 |
|
2006 |
Universal |
DD |
12 |
1 338 |
|
2006 |
Xstrata |
DD |
2 |
984 |
2007 |
Universal |
DD |
10 |
1 103 |
|
2011 |
Altona |
RC |
104 |
21 085 |
|
2011 |
Altona |
DD |
7 |
2 041 |
|
2015 |
SRIG |
DD |
2 |
480 |
2015 |
Altona |
DD |
2 |
51 |
2018 |
CMMC |
DD |
1 |
164 |
| Total |
516 |
|
77 226 |
|
Effective date: 30 June 2023
62
Technical Report Summary of the
Eva Copper Project, North West Queensland, Australia
|
|
|
| Figure 9-1: Little Eva Drill Collar Plan |
Effective date: 30 June 2023
63
Technical Report Summary of the
Eva Copper Project, North West Queensland, Australia
9.1.2Turkey Creek
A total of 8,218 m of drilling in 58 holes was completed at Turkey Creek. Of these, some 91% are RC (53 holes), and 9% are DDHs (5 holes). Holes were typically inclined at -60° and drilled along 100 m spaced section lines with 50 m spacing between drill holes. Diamond drilling was conducted for the primary purpose of metallurgical testwork sampling and geotechnical data.
The drilling history is summarized in Table 9-2, and hole locations are shown in Figure 9-2. The earliest hole at Turkey Creek area was a diamond hole drilled by Carpentaria Exploration in 1963, but the location details of this hole are uncertain, and the hole has been disregarded. The majority of drilling was conducted by Altona from 2012 to 2015.
RC drilling typically utilized face sampling hammers (5.5"), and diamond drilling provided either NQ or HQ core samples.
Table 9-2: Turkey Creek Drilling Summary
|
|
|
|
|
|
|
|
|
|
|
|
|
|
|
Year |
Company |
Hole Type |
Hole Count |
Metres Drilled |
| 1993 |
CRAE |
RC |
2 |
218 |
|
| 2011 |
Xstrata |
RC |
2 |
300 |
|
| 2012 |
Altona |
RC |
7 |
1 272 |
|
| 2014 |
Altona |
RC |
42 |
6 024 |
|
| 2015 |
Altona |
DD |
5 |
404 |
|
| Total |
58 |
8 218 |
Effective date: 30 June 2023
64
Technical Report Summary of the
Eva Copper Project, North West Queensland, Australia
|
|
|
| Figure 9-2: Turkey Creek Drilling Locations by Type |
Effective date: 30 June 2023
65
Technical Report Summary of the
Eva Copper Project, North West Queensland, Australia
9.1.3Blackard
A total of 58,388.4m of drilling in 376 holes has been completed at the Blackard deposit. Components of the drilling include 291 RC, 79 diamond, and 6 percussion drill holes completed since 1991. While early RC drill holes were relatively short and vertical, follow-up drilling was angled to keep drilling approximately perpendicular to mineralization as the deposit geometry was better understood. Drilling has been carried out relatively systematically on 50 m spaced sections, with 50 m or more tightly spaced holes along the sections. Drill holes are spaced much closer on alternating section lines (100 m spaced). A number of sections contain large step-out holes that tested for down-dip extensions of the deposit. Diamond drilling was conducted for the primary purpose of metallurgical test sampling.
The drilling history is summarized in Table 9-3, and hole locations are shown in Figure 9-3.
RC drilling typically utilized face sampling hammers (5.25", 5.5", or 6"), and diamond drilling mainly used HQ3 or NQ3 core sizes. Early rotary air blast (RAB) drilling was carried out, but these holes were not used for resource estimation.
Table 9-3: Blackard Drilling Summary
|
|
|
|
|
|
|
|
|
|
|
|
|
|
|
Year |
Company |
Hole Type |
Hole Count |
Metres Drilled |
| 1991 |
CRAE |
DD |
2 |
411.7 |
|
|
|
RC |
1 |
87.0 |
|
| 1992 |
CRAE |
DD |
5 |
1 361.7 |
|
|
|
RC |
4 |
631.0 |
|
| 1993 |
CRAE |
RC |
1 |
100.0 |
|
| 1994 |
CRAE |
PERC |
6 |
613.0 |
|
|
|
DD |
8 |
1 936.0 |
|
|
|
RC |
2 |
302.0 |
|
| 1995 |
CRAE |
DD |
4 |
1 060.2 |
|
| 2002 |
Bolnisi |
DD |
7 |
924.8 |
|
| 2005 |
Universal |
RC |
121 |
13 558.0 |
|
|
|
DD |
19 |
4 081.5 |
|
|
|
RC |
81 |
10 563.0 |
|
| 2006 |
Universal |
DD |
10 |
1 415.0 |
|
|
|
RC |
36 |
3 138.0 |
|
| 2008 |
Xstrata |
DD |
11 |
4 358.4 |
|
| 2009 |
Xstrata |
DD |
6 |
2 564.1 |
|
| 2010 |
Altona |
DD |
4 |
2 324.2 |
|
|
|
RC |
7 |
1 687.0 |
|
| 2011 |
Altona |
DD |
3 |
548.8 |
|
|
|
RC |
20 |
4 028.0 |
|
| 2019 |
CMMC |
RC |
18 |
2 695.0 |
|
| Total |
376 |
58 388.4 |
Effective date: 30 June 2023
66
Technical Report Summary of the
Eva Copper Project, North West Queensland, Australia
|
|
|
| Figure 9-3: Blackard Deposit Drill Hole Locations by Type |
Effective date: 30 June 2023
67
Technical Report Summary of the
Eva Copper Project, North West Queensland, Australia
9.1.4Scanlan
Scanlan is a relatively near-surface deposit, and has been defined by a total of 173 drill holes for 18,979 m. Drilling is predominately RC, with only 20 of the holes being core drilling. Drill holes are either vertical or inclined, depending upon the interpreted dip of the mineralization. Drilling has been carried out on approximately 50 m spacing along 50 m spaced section lines, although alternating, or 100 m section lines, have more drill holes. In general, drill holes are more widely spaced on the northern part of the deposit, where the mineralization is narrow and vertically oriented.
The drilling history is summarized in Table 9-4, and hole locations are shown Figure 9-4. CRAE drilled 5 RC holes in 1990. Universal carried out an RAB program in 2003 as a precursor to resource- definition RC drilling from 2004 to 2009. Although the RAB holes were not used in resource estimation they did provide additional information on deposit morphology.
RC drilling typically utilized face sampling hammers (5.25", 5.5", or 6"), and diamond drilling mainly used HQ3 or NQ3 core sizes.
Table 9-4: Scanlan Drilling Summary
|
|
|
|
|
|
|
|
|
|
|
|
|
|
|
Year |
Company |
Hole Type |
Hole Count |
Metres Drilled |
| 1991 |
CRAE |
RC |
24 |
1 086.0 |
|
| 1992 |
CRAE |
AC |
3 |
110.0 |
|
|
|
RC |
39 |
3 646.0 |
|
| 1993 |
CRAE |
RC |
24 |
1 516.0 |
|
| 1994 |
CRAE |
RC |
10 |
1 305.0 |
|
|
|
DD |
5 |
1 403.7 |
|
| 1995 |
CRAE |
DD |
1 |
232.2 |
|
| 2002 |
Bolnisi |
RC |
2 |
397.0 |
|
| 2005 |
Universal |
DD |
9 |
1 594.3 |
|
|
|
RC |
45 |
5 358.0 |
|
| 2006 |
Universal |
DD |
2 |
208.9 |
|
| 2007 |
Xstrata |
DD |
1 |
447.0 |
|
| 2008 |
Xstrata |
DD |
1 |
351.2 |
|
| 2010 |
Universal |
RC |
7 |
1 324.0 |
|
| Total |
173 |
18 979.3 |
Effective date: 30 June 2023
68
Technical Report Summary of the
Eva Copper Project, North West Queensland, Australia
|
|
|
| Figure 9-4: Scanlan Deposit Drill Hole Locations by Type |
Effective date: 30 June 2023
69
Technical Report Summary of the
Eva Copper Project, North West Queensland, Australia
9.1.5Bedford
A total of 12,240 m of drilling in 149 holes was completed at Bedford. Of these, some 68% are RC (102 holes), 30% are RAB (47 holes), and 3% are core (4 holes). RAB holes are vertical. RC and core holes were generally inclined at around -60°, drilled on 25 m spacing along 25 m spaced section lines. Section line spacing increases to 50 m and then to 100 m outside the main mineralized zones. Diamond drilling was primarily conducted for metallurgical sampling.
The drilling history is summarized in Table 9-5, and hole locations are shown in Figure 9-5 and Figure 9-6. CRAE drilled 5 RC holes in 1990. Universal carried out an RAB program in 2003 as a precursor to resource definition RC drilling from 2004 to 2009.
RC drilling typically utilized face sampling hammers (5.25", 5.5", or 6"), and diamond drilling mainly used HQ3 or NQ3 core sizes. RAB drilling accounts for some 13% of drilled metres, but was not used for resource estimation.
Table 9-5: Bedford Drilling Summary
|
|
|
|
|
|
|
|
|
|
|
|
|
|
|
Year |
Company |
Hole Type |
Hole Count |
Metres Drilled |
| 1990 |
CRAE |
RC |
5 |
420.0 |
|
| 2003 |
Universal |
RAB |
43 |
1 680.0 |
|
| 2004 |
Universal |
RC |
18 |
1 918.0 |
|
| 2005 |
Universal |
DD |
1 |
160.0 |
|
| 2005 |
Universal |
RC |
11 |
1 280.0 |
|
| 2006 |
Universal |
DD |
2 |
182.0 |
|
| 2006 |
Universal |
RC |
60 |
5 836.0 |
|
| 2009 |
Universal |
RC |
8 |
728.0 |
|
| 2015 |
Altona |
DD |
1 |
36.0 |
|
| Total |
149 |
12 240.0 |
Effective date: 30 June 2023
70
Technical Report Summary of the
Eva Copper Project, North West Queensland, Australia
|
|
|
| Figure 9-5: Bedford North Drill Hole Plan |
Effective date: 30 June 2023
71
Technical Report Summary of the
Eva Copper Project, North West Queensland, Australia
|
|
|
| Figure 9-6: Bedford South Drill Hole Plan |
Effective date: 30 June 2023
72
Technical Report Summary of the
Eva Copper Project, North West Queensland, Australia
9.1.6Ivy Ann
A total of 15,145 m of drilling in 153 drill holes was completed at Ivy Ann. Of these, some 53% are RC (81 holes), 46% are percussion (PERC) (70 holes) and 1% are diamond (2 holes). Holes were generally inclined -50° to -60°, generally drilled on 50 m spaced section lines, and 20 m to 50 m along line spacing. Section line spacing increases to 100 m in Ivy Ann North.
The drilling history is summarized in Table 9-6, and hole locations are shown in Figure 9-7. Exploration on the Ivy Ann prospect began in 1992. Note that Bruce Resources became PanAust in 1995.
Table 9-6: Ivy Ann Drilling Summary
|
|
|
|
|
|
|
|
|
|
|
|
|
|
|
Year |
Company |
Hole Type |
Hole Count |
Metres Drilled |
| 1992 |
Dominion |
PERC |
26 |
863 |
|
| 1992 |
Dominion |
RC |
13 |
1 309 |
|
| 1993 |
Dominion |
RC |
2 |
282 |
|
| 1995 |
Bruce Resources |
RC |
18 |
1 902 |
|
| 1996 |
PanAust |
PERC |
44 |
1 972 |
|
| 1996 |
PanAust |
RC |
3 |
450 |
|
| 1997 |
PanAust |
DD |
2 |
714 |
|
| 2003 |
Universal |
RC |
5 |
515 |
|
| 2005 |
Universal |
RC |
4 |
462 |
|
| 2006 |
Universal |
RC |
4 |
412 |
|
| 2009 |
Universal |
RC |
5 |
816 |
|
| 2011 |
Altona |
RC |
15 |
2 850 |
|
| 2012 |
Altona |
RC |
12 |
2 598 |
|
| Total |
153 |
15 145 |
Effective date: 30 June 2023
73
Technical Report Summary of the
Eva Copper Project, North West Queensland, Australia
|
|
|
| Figure 9-7: Ivy Ann Drill Collar Plan |
Effective date: 30 June 2023
74
Technical Report Summary of the
Eva Copper Project, North West Queensland, Australia
9.1.7Lady Clayre
A total of 25,092 m of drilling in 145 holes was completed at Lady Clayre. Of these, some 79% are RC (114 holes), 20% are diamond (DD) (29 holes) and 1% are open hole percussion (PERC) (2 holes). Holes were generally inclined -50° to -60°, generally drilled on 50 m spaced section lines, and 20 m to 50 m along line spacing.
The drilling history is summarized in Table 9-7, and hole locations are shown in Figure 9-8. Exploration on the Lady Clayre prospect began in 1978 with a single diamond hole drilled by CRAE.
RC drilling typically used 5.25", 5.5", or 6" hammers, and DDHs provided either HQ or NQ core samples.
Table 9-7: Lady Clayre Drilling Summary
|
|
|
|
|
|
|
|
|
|
|
|
|
|
|
Year |
Company |
Hole Type |
Hole Count |
Metres Drilled |
| 1978 |
CRAE |
DD |
1 |
134 |
|
| 1992 |
CRAE |
PERC |
2 |
192 |
|
| 1992 |
CRAE |
RC |
11 |
1 188 |
|
| 1993 |
CRAE |
DD |
1 |
294 |
|
| 1993 |
CRAE |
RC |
9 |
1 250 |
|
| 1994 |
CRAE |
DD |
3 |
1 163 |
|
| 1994 |
CRAE |
RC |
1 |
102 |
|
| 1995 |
CRAE |
DD |
19 |
5 369 |
|
| 1995 |
CRAE |
RC |
5 |
464 |
|
| 1996 |
CRAE |
DD |
2 |
503 |
|
| 1996 |
CRAE |
RC |
10 |
1 484 |
|
| 1998 |
Pasminco |
DD |
1 |
180 |
|
| 1998 |
Pasminco |
RC |
11 |
1 092 |
|
| 2002 |
Universal |
RC |
5 |
1 368 |
|
| 2003 |
Universal |
RC |
10 |
1 651 |
|
| 2005 |
Universal |
RC |
11 |
1 503 |
|
| 2006 |
Universal |
DD |
2 |
154 |
|
| 2006 |
Universal |
RC |
11 |
1 353 |
|
| 2009 |
Universal |
RC |
3 |
460 |
|
| 2011 |
Altona |
RC |
10 |
1 266 |
|
| 2012 |
Altona |
RC |
17 |
3 922 |
|
| Total |
145 |
25 092 |
Effective date: 30 June 2023
75
Technical Report Summary of the
Eva Copper Project, North West Queensland, Australia
|
|
|
| Figure 9-8: Lady Clayre Drill Collar Plan |
Effective date: 30 June 2023
76
Technical Report Summary of the
Eva Copper Project, North West Queensland, Australia
9.2Drill Hole Collar Survey Control
9.2.1Little Eva
Collar coordinates for drill holes completed at Little Eva prior to 2002 were determined with reference to an informal local grid established by CRAE. In 2002, Universal resurveyed old hole collar positions at Little Eva using Differential Global Positioning System (DGPS) techniques; the work was completed by a survey contractor. In a few cases, the original collar could not be located, and earlier survey determinations by the CRAE surveyor in 1994 have been retained.
From mid-2003 through 2011, all survey work was undertaken by licensed surveyors using Trimble DGPS equipment with a minimum accuracy of ±0.05 m. All data was collected in AGD84 coordinates. From late 2011, Altona completed DGPS surveys in house using a Hemisphere R320 OmniSTAR HP GPS receiver. The system allows for real time horizontal accuracies of 10 cm to 15 cm.
Of the 523 holes drilled at Little Eva, six holes have no DGPS survey available, and the original, local grid-based, or GPS coordinate, was converted to a GPS coordinate. Geographic transformations have been used to convert original grid coordinates to GDA20 / MGA zone 54 coordinates.
9.2.2Turkey Creek
All holes drilled by Altona, comprising the vast majority of the drilling used in defining the Mineral Resource, were surveyed with high resolution (±0.5 m) DGPS equipment. The two CRAE holes have low accuracy (±10 m).
9.2.3Blackard
Of the 376 drill holes used in the resource estimate, 319 (85%) were surveyed by DGPS (or traditional theodolite surveys for 2 holes) with better than 0.1 m confidence. The other 57 holes were located by field GPS with an accuracy of between 3 and 10 m.
9.2.4Scanlan
All but six of the drill holes used for resource estimation were surveyed by DGPS with better than
0.1 m accuracy. Two holes were surveyed by field GPS with accuracy of between 3 and 10 m, and another two holes have undetermined survey methods.
9.2.5Bedford
Apart from one hole, all RC holes drilled by Universal have been located by DGPS by licensed surveyors using Trimble DGPS equipment with a minimum accuracy of ±0.02 m. All data was collected in AGD84 coordinates. The early CRAE holes (five) were initially located on local grids. Pasminco relocated the holes and recorded GPS locations for them, with a lower accuracy (±10 m). All holes drilled by Altona were surveyed with high resolution (±0.1 m) DGPS equipment.
Geographic transformations have been used to convert original grid coordinates to GDA20 / MGA zone 54 coordinates.
9.2.6Ivy Ann
Dominion established a local grid on the prospect: all drilling carried out by Dominion and PanAust is referenced to this local grid. Universal calculated a coordinate conversion based on the locations of two early drill hole collars, and used this to transform the original local coordinates for holes drilled between 1992 and 1997 into GDA20 / MGA zone 54 coordinates.
Except for four holes drilled by Universal in 2006, all drilling completed from 2003 to 2009 has been surveyed by DGPS using Trimble DGPS equipment with a minimum accuracy of ±0.05 m. From 2011, Altona drill collars were surveyed using a Hemisphere R320 OmniSTAR HP DGPS system with horizontal accuracy of ±0.015 m.
Geographic transformations have been used to convert original grid coordinates to GDA20 / MGA zone 54 coordinates.
Effective date: 30 June 2023
77
Technical Report Summary of the
Eva Copper Project, North West Queensland, Australia
9.2.7Lady Clayre
All holes drilled by CRAE from 1992 to 1994 were relocated and surveyed using DGPS by a registered surveyor in 1994. Holes drilled by CRAE, Pasminco, and Universal from 1995 to 2002 were relocated where possible and surveyed with DGPS by Universal. Survey control protocols for Universal and Altona holes are as for Little Eva.
Geographic transformations have been used to convert original grid coordinates to GDA20 / MGA zone 54 coordinates.
9.3Downhole Surveys
9.3.1Little Eva
All drill holes have a collar inclination and azimuth measurement in the database. The levels of hole deviation shown in Figure 9-1 are within expected ranges.
Downhole surveying of CRAE DDHs LE006 and LE076 was carried out using Eastman single shot downhole survey cameras. Survey shots were taken at approximately 40 m intervals. RC holes drilled by CRAE only have collar orientations, the original DH survey data were unable to be sourced from Rio Tinto/CRAE.
Much of the RC and diamond drilling completed by Universal and Altona from 2002 to 2011 was surveyed with a variety of instruments, including those manufactured by Eastman, Camteq, Ranger, and Reflex. Survey measurements were typically taken at 40 m intervals where possible.
To overcome potential issues with the older, magnetic-based survey techniques caused by variable, and sometimes considerable, concentrations of magnetite in the rocks, Universal resurveyed all available open holes in 2005 and 2006, including those previously drilled by CRAE. A combination of a multi-shot downhole camera and a downhole gyro instrument (for magnetically quiet and active areas, respectively) was used. Multi-shot camera survey measurements are generally at 10 m intervals, and the gyro instrument surveys give semi-continuous measurements at intervals of 1 m or less. Where a hole was not open to depth, the attitude of the hole at 0 m was determined.
At the end of Altona’s 2011 program, selected holes were resurveyed using a FlexIT GyroSmart tool with readings at 5 m intervals.
From 2012 on, all Altona holes were monitored during drilling using a single or multi-shot camera, typically with completion surveys using a GyroMax isGyro.
9.3.2Turkey Creek
All Altona holes drilled in the Turkey Creek deposit were monitored during drilling using a REFLEX EZ-TRAC camera. On completion of drilling, downhole surveys were conducted using a GyroMax isGyro, overcoming any magnetic influences inherent in the EZ-TRAC survey.
9.3.3Blackard, Scanlan, and Bedford
The majority of the RC and diamond drilling completed by Universal and Altona from 2002 to 2018 was surveyed with downhole cameras (~69%) or gyro systems (25%), and 6% have collar orientations only. For Universal and Altona holes drilled between 2002 and present, the azimuth and inclination of the hole at the collar was measured using a compass clinometer. For the earlier holes it is unclear whether these measurements were made by survey instrument or by clinometer at the collar.
9.3.4Ivy Ann
RC and PERC drilling completed by Dominion and PanAust only have collar orientations, and all but two of these holes are aligned along local grid directions (270° and 90°). The two DDHs completed by PanAust have downhole dip measurements, and the surface azimuths have been extrapolated down the hole. There is no record of how these dip determinations were made.
Effective date: 30 June 2023
78
Technical Report Summary of the
Eva Copper Project, North West Queensland, Australia
Universal and Altona used a variety of downhole camera systems to survey their drilling from 2003 to 2011. Measurements were taken at approximately 50 m intervals. Two holes only have a collar survey. In addition, Universal resurveyed selected holes in 2009 and 2011 with detailed gyro surveys. In 2009, measurements were taken at 20 m intervals, and this was reduced to 5 m in 2011. Gyro surveys were completed in 2012 on Ivy Ann drill holes completed by Altona.
9.3.5Lady Clayre
CRAE holes drilled before 1996 only have a collar orientation. Starting in 1996, CRAE drill holes were surveyed with a downhole instrument (Eastman camera), and have at least one such measurement.
All Pasminco holes were surveyed with a downhole instrument with readings at approximately 30 m intervals, with at least one survey close to the surface, and one at the end of the hole.
Universal used a variety of downhole cameras to survey their drilling from 2002 to 2011. Measurements were taken at approximately 50 m intervals. Several holes only have a collar survey. In addition, in 2005 and 2009, Universal resurveyed selected holes with detailed multi-shot camera and gyro surveys.
All but one Altona drill hole was surveyed using a FlexIT GyroSmart tool, with readings at 5 m intervals.
9.4Drill Hole Logging
9.4.1Little Eva
Original hard copy drill logs or typed drilling summaries prepared by CRAE geological staff for all CRAE drill holes at Little Eva are retained in the Altona library. These are descriptive logs that were coded into the Altona system and stored in the Altona drilling database.
CRAE logged its diamond holes on variable intervals determined by lithological changes in the core. RC holes were logged on regular 1 m intervals. The early descriptive logging yielded up to two lithologies per interval, together with grain size, texture, and colour, on recoding into the digital system. Alteration and ore mineralogy were recorded as mineral species and abundance. Veining, mainly observed in core, is also logged as mineral composition and abundance. Structural and geotechnical logging of diamond holes has been done routinely from 1995 on, with orientations of veins and structures provided as dip and strike angles. The core orientation method used by CRAE is not recorded.
Universal prepared similar descriptive logs for its drilling between 2002 and 2005 that are also retained in the Altona library. RC logging was done primarily on 1 m intervals, and data was captured from these logs into the digital system in the same way as the CRAE data was captured, to provide lithology, alteration, mineralization, and veining logs. The DDH logs produced in this period were logged on intervals based on lithological changes, and included detailed structural and geotechnical logs.
Universal introduced a digital logging system based on the Surpac Logmate in 2005, and from that time on all logging has been captured digitally in coded form in the field. The templates and libraries used by this system preserved the style of logging used by both CRAE and Universal. The original digital logs produced by this system were loaded into the Altona drilling database and stored in the Altona library.
The Logmate system was replaced by Field Marshal software in 2011, and this system was used throughout the 2011 season by Altona, but the same logging procedures were followed as in prior campaigns.
In 2014, Altona completed a comprehensive lithology relogging program of available historical RC chips and diamond core. This program has provided a consistent dataset of lithology across the deposit used for resource domaining.
9.4.2Turkey Creek, Blackard, Scanlan, and Bedford
Logging protocols, data collection and storage are all as described above for Little Eva.
Effective date: 30 June 2023
79
Technical Report Summary of the
Eva Copper Project, North West Queensland, Australia
9.4.3Ivy Ann
There are no original drill logs available for the drilling completed by Dominion in 1992 and 1993, and no logging is recorded in the Altona database. RC drilling completed by PanAust in 1995 was descriptively logged on 1 m intervals, with magnetic susceptibility measurements were completed in 1996. Detailed logs for the 1997 RC and diamond program contain quantitative estimates of mineralization, veining, and alteration, as well as lithological descriptions. RC holes were logged on 1 m intervals, while diamond holes were logged over lithological intervals. Drill hole logging protocols for Universal and Altona are as for Little Eva.
9.4.4Lady Clayre
Original hard copy drill logs and/or summary logs prepared by CRAE geological staff are held in the library. The logs contain a description of the lithology, and visual estimates of economic mineralization and alteration. Overburden sections of RC holes and RC pre-collars on diamond holes were logged on 3 m intervals, the logging and sampling interval reduces to 1 m in mineralized sections. Diamond holes were logged over intervals determined by the lithology, and include a graphic log of the cored sections together with structural information in the interval description. CRAE began using a lithology code during this period, which has been recoded in the database.
Pasminco logs were very similar in style to CRAE for the single diamond hole and the 11 RC holes it drilled in 1998. RC holes and pre-collars were logged on 2 m intervals, while the diamond hole was logged on intervals determined by lithology. Logs included an uncoded lithological description, as well as visual estimates of mineralization and alteration Drill hole logging protocols for Universal and Altona are as for Little Eva.
9.5Core and RC Sampling Methods
In general, sampling methodology was consistent among all deposits, with minor variations between the different companies and years of the program. More detailed descriptions by deposit are provided in Section 10.
Early RC sampling by CRAE used a rotary splitter mounted on the drill rig to produce 3 kg to 4 kg subsamples, which were collected in calico bags and dried on site, then sealed in polyethylene bags for shipment to the laboratory. However, in the 1994 RC sampling, CRAE used a spear to collect an approximate 3 kg sample from the cuttings. Similarly, during the 2002–2003 programs, Bolnisi employed a rig-mounted cyclone and splitter to collect 12.5% of the cuttings for dry samples, but used the spear to collect the subsample from wet cuttings. The same sampling methods were also used by Universal, Altona, and Copper Mountain Mining Corp. (CMMC) for their RC programs.
During the early programs (1991 or earlier), drill samples were collected as 3 m samples, but from 1992 onwards sampling was in 1 m or 2 m increments. During the later programs beginning with Universal, samples from RC and diamond drilling were collected and bagged in pre-numbered calico bags at the drill site during drilling. Unique sample numbers were retained during the whole process. Diamond core was sawn with a diamond saw after logging, and the half core was collected as 1 m or 2 m samples. RC samples were taken via a cyclone and rotary splitter mounted on the drill, producing 3 kg to 4 kg of material that was air-dried in the field.
The remainder of the cuttings were bagged and laid out alongside the drill. All samples were catalogued and sealed prior to dispatch to laboratory. Samples were either delivered to SGS Analabs as they were collected, or stored in facilities in Cloncurry prior to transport to Townsville. An extensive catalogued library of core, assay sample pulps, and RC chips are retained in the Company’s Cloncurry exploration office for inspection.
Effective date: 30 June 2023
80
Technical Report Summary of the
Eva Copper Project, North West Queensland, Australia
10Sample Preparation, analysis and security
Section 229.601(b)(96) (8) (i‐v)
The operations and information in this section were compiled prior to Harmony’s acquisition of the Project, but have been reviewed for reasonableness and accuracy, and updated where appropriate.
The QP is of the opinion tha sampling procedures, analytical quality, and integrity of data meet and/or exceed standards required for Mineral Reserve estimation.
10.1Little Eva
There is very little documentary information available about sample collection and preparation for the CRA Exploration Pty. Ltd. (CRAE) drilling campaigns. The available documents covering exploration during this era lack descriptive detail when describing the mechanics of drilling and sampling procedures. The documents on the exploration work tend to assume that sampling was carried out in line with CRAE standard procedures, but these procedures are not recorded.
CRAE diamond drill holes (DDH) were sampled on approximately 2 m intervals. It is implied that the core was split or sawn and half the core retained, since the holes were later relogged by CRAE. Reverse circulation (RC) holes from LE009 to LE033 were sampled in 1 m intervals, but from LE034 to LE075 the sample interval was expanded to 2 m.
10.1.1Universal 2002 Program
Two metre composite samples of about 2.5 kg were collected from RC chips using a modified trailer- mounted splitter. Intervals of interest were identified after the first-pass composite assays were received, and the original 1 m samples were submitted for analysis. The samples were submitted to Australian Laboratory Services (ALS) in Townsville. Sample preparation involved drying, crushing, and pulverizing the entire sample to a nominal 85% passing 75 µm. The primary analysis was by three-acid digestion followed by Atomic Adsorption Spectroscopy (AAS) for copper, and fire assay on a 30 g subsample for gold.
10.1.2Universal 2003–2006 Program
From 2003 to 2006, Universal followed a similar procedure, except that all samples were collected on 1 m intervals using a trailer-mounted cyclone and triple-deck splitter, or similar arrangement. The major differences over the years were an increasing refinement of the QC program and a change from ALS to Analabs/SGS as the laboratory selected to do the primary analysis in 2003.
Analabs/SGS used methods that included an aqua regia digestion followed by AAS for gold, and three-acid digestion followed by AAS for copper.
The DDHs completed during this period were drilled for geotechnical and metallurgical purposes, and only the upper parts drilled with RC methods were sampled, except for two diamond holes drilled to extend RC holes that had failed to reach target depths because of poor ground conditions. Core from the extended holes was half-sawn, and samples collected in 1 m intervals for submission to Analabs.
10.1.3Universal 2007 Program
In 2007, Universal conducted a metallurgical drill program of 10 diamond holes drilled with 1 m samples assayed at Ultratrace Laboratories, using a four-acid digestion, and analyzed by inductively coupled plasma-optical emission spectrometry (ICP-OES) for copper, and fire assay with an ICP-OES finish for gold.
Effective date: 30 June 2023
81
Technical Report Summary of the
Eva Copper Project, North West Queensland, Australia
10.1.4Altona 2011 Program
For the 2011 drilling program, Altona continued with the procedures for RC sampling established by Universal, but returned to using ALS in Townsville for the primary analysis. The methods requested were ME-ICP41 (aqua regia with inductively coupled plasma-atomic emission spectroscopy (ICP-AES)) for copper, and Au-AA25 (fire assay with AAS) for gold. Copper analyses over 1% were reanalyzed with an ore grade ICP-AES method (Cu-OG46).
Two diamond holes, drilled primarily for metallurgical testing, were quarter-sawn, sampled in 1 m intervals, and submitted to ALS for analysis along with the RC samples. In addition, the core from four geotechnical holes drilled in 2005 and 2006 was recovered from the core storage, half-sawn, and submitted to ALS for analysis.
The methods requested were ME-ICP61 (four-acid digestion with ICP-AES finish), and later ME-ICP41 (aqua regia with ICP-AES) for copper, and Au-AA25 (fire assay with AAS) for gold. Copper analyses over 1% were reanalyzed with an ore grade ICP-AES method (Cu-OG46).
10.1.5Altona-Sichuan Railway Investment Group 2015 Program
As part of a due diligence of the Project assets, Sichuan Railway Investment Group (SRIG) drilled two confirmatory triple-tube diamond holes at Little Eva using HQ core. An independent consultant for SRIG managed the program. The holes were submitted to ALS for cutting (half core) and analysis.
Altona drilled two diamond holes for metallurgical testwork. These were quarter-sawn and sent to ALS Perth to be assayed using ME-MS41 (aqua regia with ICP-MS) for copper and Au-AA25 (fire assay with AAS) for gold. Copper analyses over 1% were reanalyzed with an ore grade ICP-AES method (Cu-OG46).
Four DDHs, drilled for geotechnical purposes in 2005 and 2011, were half-sawn and submitted to ALS for analysis. The methods requested were ME-ICP41 (aqua regia with ICP-AES) for copper, and Au-AA25 (fire assay with AAS) for gold. Copper analyses over 1% were reanalyzed with an ore grade ICP-AES method (Cu-OG46).
10.1.6CMMC Work 2018 to 2022
Copper Mountain completed 29 additional HQ-sized diamond core holes within the prospect area for resource, geotechnical and metallurgical studies. Additionally, they completed 95 RC holes across the planned Mill and Tailings Dam areas for sterilisation purposes, and to test for water.
10.1.7Quality Control Procedures
The QC procedures employed by CRAE are poorly recorded, and appear to have been at a low level by modern standards. For the programs from 2002 onwards, Universal implemented quality control programs which meet with currently accepted practices, and included field duplicates, triplicates, reference standards, and blanks. No problems within the resource data were revealed by the quality assurance and quality control (QA/QC) program.
The data quality and QC procedures were reviewed in December 2009 in the Independent Mineral Specialist Report prepared by Optiro (Glacken, 2009). Optiro noted that good industry QA/QC practices were applied, with reasonable rates of inserted standards, repeats, and blanks.
Later programs continued with the QC procedures established by Universal in 2006, which included:
•Regular duplicate sampling of RC cuttings at a rate of 1 in 20 primary samples.
•Triplicate samples collected at the time of drilling at a rate of 1 in 40 primary samples, submitted to an umpire laboratory.
•Submission of Certified Reference Materials (CRMs) or standard samples at an overall rate of 1 in 20.
•Submission of blank samples at an overall rate of 1 in 45 primary samples.
Effective date: 30 June 2023
82
Technical Report Summary of the
Eva Copper Project, North West Queensland, Australia
10.2Turkey Creek
All RC drilling between 2012 and 2014 was completed using either a 140 mm or 5.5" hammer drill. RC chips were collected at 1 m intervals, as per Altona Mining’s standard procedures.
QA/QC protocols for the 2012 and 2014 drilling programs at Turkey Creek included the insertion of CRMs at a ratio of 1 in 20. Field duplicates were taken from the RC drilling using a riffle splitter on site, also at 1 in 20 rates. All samples were sent to ALS Townsville, and a standard sample protocol of drying, crushing, splitting, and pulverizing was followed, resulting in 250 g pulp samples. These were submitted for ME-MS41 (aqua regia digestion with ICP-MS finish). The aqua regia digestion dissolves sulphide and oxide minerals, but does not dissolve silicates, so the copper contained in the hydrobiotite will not be reported. Copper analyses over 1% were reanalyzed with an ore grade ICP- AES method (Cu-OG46). Gold was determined via Au-AA25 (fire assay with AAS).
In 2015, Altona drilled five diamond holes for metallurgical samples. Core from these holes was sent to ALS Ammtec in Perth, where whole core samples were taken at 1 m intervals and assayed using ME-MS41 (aqua regia with ICP-MS) for copper, and Au-AA25 (fire assay with AAS) for gold. Copper analyses over 1% were reanalyzed with an ore grade ICP-AES method (Cu-OG46).
10.3Blackard and Scanlan
Early campaigns of diamond drilling by Bolnisi and CRAE at Blackard and Scanlan produced core of various sizes, including 4.5", 5.375", NQ, NQ2, HQ, and HQ3. Half-core or quarter-core samples were routinely cut at intervals of either 1 m or 2 m.
RC drilling by CRAE and Bolini was predominantly drilled with a 130 mm diameter hammer drill. Percussion drilling by CRAE was completed using either a 4.5" or 5.5" hammer drill. Chip samples were collected on either 1 m, 2 m, or 3 m intervals using standard CMMPL procedures.
Samples submitted by CRAE and Bolnisi were typically assayed by Analabs using either four-acid digestion (hydrofluoric, perchloric, hydrochloric, and nitric) with an AAS finish, or aqua regia digestion with an ICP-OES finish.
Diamond core drilled by Universal and Xstrata at the Blackard and Scanlan deposits were typically either of NQ or HQ3 diameter, and routinely sampled as either half or quarter core at either 1 m or 2 m intervals within mineralized domains. Material drilled in the barren hanging wall was cut as either half or quarter core at intervals of up to 6 m. Diamond core drilled by Altona Mining for metallurgical purposes was typically drilled with a HQ3 bit at 1 m intervals, and sawn to quarter core.
RC drilling completed by Universal and Xstrata typically utilized a 5" hammer drill, with samples collected at either 1 m or 2 m intervals, as per standard CMMPL procedures. RC drilling by Altona Mining was completed with a 5.5" hammer drill and sampled at 1 m intervals using standard Altona procedures as outlined for Little Eva.
Samples were typically submitted by Universal and Xstrata to either SGS, Analabs, or ALS Townsville (or ALS Mount Isa) for either:
•ME-ICP41 (trace level analysis of 34 elements by aqua regia digestion with ICP-AES finish)
•MEMS-61 (ultra trace level analysis of 47 elements by four-acid “near total” digestion [HF-HNO3- HClO4 acid digestion, HCl leach] and a combination of ICP-MS and ICP-AES finishes)
•Hot aqua regia digestion, diluted HCl added to residue, with an AAS finish
•Cu-OG46 ore grade copper analysis by aqua regia digestion, with either AAS or ICP-AES finish.
Samples were submitted by Altona Mining to ALS Townsville for either ME-ICP41 (trace level analysis of 34 elements by aqua regia digestion with ICP-AES finish), or Cu-OG46 (ore grade copper analysis by aqua regia digestion, with either AAS or ICP-AES finish).
CMMC completed 18 RC drill holes in 2019 at Blackard with a 5.75" hammer drill. Samples were collected using standard CMMPL procedures at intervals of 2 m.
Effective date: 30 June 2023
83
Technical Report Summary of the
Eva Copper Project, North West Queensland, Australia
Samples were submitted by CMMPL to ALS Townsville for either ME-ICP61 (trace level analysis of 27 elements by four-acid “near total” digestion [HF-HNO3-HClO4 acid digestion, HCl leach] and an ICP-AES finish) or Cu-OG62 (ore grade copper analysis by HF-HNO3-HClO4 digestion, HCl leach for use as over-range, with either AAS or ICP-AES finish).
Early QC procedures used by CRAE consisted of duplicate samples (1 in 15) and repeat assays (1 in 15), but insertion of blanks or standards into the sample stream was not documented. Comparison of sample and analytical duplicates raises no concerns. Bolnisi implemented a QC protocol for their drill programs by using field duplicates at the rate of 1 in 50 and inserting native copper standards at the rate of 1 in 40. It is assumed that the native copper standards were used due to potential problems during assaying, which may have included the potential for native copper to smear on grinding plates and contaminate subsequent samples, and segregation of metallic particles during processing yielding poor reproducibility. From 2005 on, Universal implemented a QC program for RC drilling that used CRMs (1 in 30), field duplicates (1 in 20), and blanks (1 in 40). Results indicated that variability of assay data in the native copper zone is significant in a modest number of the samples, and therefore use of an umpire laboratory check at the rate of 1 sample in 40 was implemented in 2004.
Universal designed sampling and specific analytical protocols for oxide or native copper, samples, and sulphide zone drill programs. These protocols have been maintained or only slightly modified since that time. The sampling for oxide and primary mineralization is the same, using a trailer-mounted cyclone and triple-deck splitter that divides the RC cuttings into 12.5% and 87.5% volume splits. The larger sample is stored on site in plastic bags. Subsamples are collected from the larger split, on every tenth sample in the native copper zone, and every 20th sample in the sulphide zone, and inserted into the sample shipment stream. Additionally, a sequence of CRMs and blanks are inserted into the sample stream at the rate of 1 in every 40 samples. Finally, a second subsample is collected from the larger split, at a frequency of 1 in 30 for the native copper zone, and 1 in 40 for the sulphide zone, and shipped to a second laboratory.
The analytical protocol for the sulphide analysis is as follows: oven-dry entire sample and pulverize to 85% passing 75 µm, then remove a 1 g subsample with a duplicate sample at the rate of 1 in 20; insert blank and reference samples into the sample stream, each at the rate of 1 in 50; use three-acid digestion, and analyze for copper by AAS.
The analytical protocol for the native copper zone samples is more involved. Samples are oven-dried and then weighed, jaw crushed to -6 mm, then ground in a disc mill (Analabs Supercrunch) to -500 µm. One in 20 samples are reweighed to check for weight loss. Riffle-split into a 1 kg subsample and residual. A duplicate sample is taken from every 20th residual sample. Subsamples are pulverized to P85 75 µm in a ring mill. A 20 g split is taken, with another duplicate at 1 in 20.
Blanks and reference standards are inserted at a rate of 1 in 50. Aqua regia digestion is used, and analyzed by AAS.
10.4Bedford
Sampling and QA/QC protocols for Bedford are as for Little Eva, except during 2009; the sampling procedure employed by Universal in 2009 was essentially unchanged from their earlier work.
Universal initially used a 6" hammer drill, then later a 5.375" hammer drill for RC drilling. The majority of samples were collected at 1 m intervals, with a small number of early samples collected at 2 m intervals using standard Universal procedures. Universal drilled several diamond holes with either NQ3 or HQ3 core diameter. This core was cut to half- or quarter-core subsamples for laboratory submission.
Early Universal sampling was submitted to Analabs Townsville for mixed acid, ore grade AAS analysis (old code GA145). Later sampling was submitted to SGS, with methods modified to include a multi-element ICP-OES method (ICP21R) for Ag, Al, As, Ba, Bi, Ca, Cd, Co, Cr, Cu, Fe, K, Mg, Mn, Mo, Na, Ni, P, Pb, S, Sb, Se, Sn, Sr, Ti, U, V, Zn, and Zr. Gold was determined by method FAA505 (50 g fire assay, followed by AAS).
In 2015, Altona drilled one diamond hole for metallurgical testwork that was quarter-cored and sent to ALS Perth to be assayed using ME-MS41 (aqua regia with ICP-MS) for copper, and Au-AA25 (fire assay with AAS) for gold. Copper analyses over 1% were reanalyzed with an ore grade ICP-AES method (Cu-OG46).
Effective date: 30 June 2023
84
Technical Report Summary of the
Eva Copper Project, North West Queensland, Australia
10.5Ivy Ann
The sampling procedures used by Dominion in 1992 and 1993 are not recorded, but all RC and PERC drill holes were sampled on a uniform 2 m interval and analyzed for copper and gold. From 1995 to 1996, all RC holes were sampled on 2 m intervals and riffle-split to produce a nominal 4 kg sample for analysis. Samples were dispatched to ALS for analysis for copper and cobalt using method G001 (perchloric acid digestion followed by flame AAS), and using method PM203 for gold (fire assay with AAS). Approximately 1 in 20 samples were resampled at the drill as field duplicates, but there is no report or evidence that CRMs or blanks were used in the program. In 1997, the analytical method for base metals was changed to ICP method, and the suite was extended to include Pb, Zn, As, Ni, and Mo.
The two-DDHs completed in 1997 were sampled on 1 m intervals, and submitted to ALS for assay for the same elements as the RC drilling.
RC drilling completed by Altona in 2012 utilized a 140 mm hammer drill, with samples collected at 1 m intervals, as per standard Altona procedures.
Altona submitted samples to ALS Townsville for analysis by ME-MS41 (aqua regia with ICP-MS) for copper, and Au-AA25 (fire assay with AAS) for gold. Copper analyses over 1% were reanalyzed with an ore grade ICP-AES method (Cu-OG46).
10.6Lady Clayre
All CRAE diamond holes from 1992 through 1996 were sampled on 1 m intervals. CRAE RC drilling and RC pre-collars on diamond holes for the 1992 campaign were routinely sampled in 3 m intervals in non-mineralized sections and pre-collars. Mineralized sections were sampled on 1 m intervals. In later years, CRAE standardized to 2 m intervals for all RC holes. Details of the laboratories and analytical procedures used are not recorded.
Pasminco drilled one RC/diamond hole and 11 RC holes into the Lady Clayre prospect in 1998. The RC sections were sampled in 2 m intervals, and the diamond sections were sampled in 1 m intervals. Samples were analyzed by Amdel Analytical laboratories (Amdel) using fire assay/AAS for gold, and mixed acid/ICP-OES for copper and base metals.
RC drilling completed by Altona in 2012 utilized a 140 mm hammer drill with samples collected at 1 m intervals, as per standard Altona procedures.
Altona submitted samples to ALS Townsville for analysis by ME-MS41 (aqua regia with ICP-MS) for copper, and Au-AA25 (fire assay with AAS) for gold. Copper analyses over 1% were reanalyzed with an ore grade ICP-AES method (Cu-OG46).
10.7Security
Samples from RC and diamond drilling programs were collected and bagged into pre-numbered calico bags at the drill site during drilling operations. Unique sample numbers were retained during the entire project. All samples were then catalogued and sealed prior to dispatch to laboratory or secure storage facilities. Samples were either collected daily and delivered to Analabs/SGS, or delivered to and stored in Company facilities in Cloncurry prior to shipment to laboratories in Townsville.
A catalogued and extensive library of core, assay sample pulps, and RC chips is retained in the Company’s Cloncurry exploration office for inspection.
Effective date: 30 June 2023
85
Technical Report Summary of the
Eva Copper Project, North West Queensland, Australia
11Data verification
Section 229.601(b)(96) (9) (i‐iii)
Estimation of Mineral Resources and Mineral Reserves relies on analytical data (assays) from samples collected from drill holes, and the position of those samples in 3D space. The methods and quality of the sample collection procedures and analytical data have been examined previously by independent consultants who found the data quality to be approproate for the puropses of Resource Estimation. Additionally, data validation and verification has been undertaken by Harmony. Physical verification of drill hole locations and additional drilling was only completed on the Little Eva, Turkey Creek, and Blackard deposits, the three largest deposits. The quality of the assay databases was investigated by the QP for all deposits but primarily focused on the three largest deposits.
Altona maintained a very extensive and high-quality database using Datashed software and has carefully preserved historical records and thoroughly documented checks and resurveys of drill hole collar locations and downhole surveys. Collars were probed using a Gyro Survey instrument by Universal Resources to obtain an accurate collar survey record for all historic drill holes. All drill collars checked in the field with handheld Global Positioning System (GPS) units on the Little Eva deposit were found to be correctly positioned.
Review of drill holes on section did not reveal any anomalies with respect to drill hole locations or deflections, any deviations found where checked and corrected by the QP. Checking the database against analytical certificates for approximately 200 samples did not reveal any discrepancies, and confirmed placement of standards and blanks into the sample stream. Visual examination and estimation of copper grades in drill core and cuttings at the core storage yard was consistent with recorded analytical data. Previous checks by third-party consultants, including SRK and Optiro, reported similar satisfaction with data quality.
Statistical analysis of the Project drill data separated by company and/or year of drilling, as reported in Section 13, indicates that there is no systematic bias to the data, either by company or drill type. New drilling by Harmony at the Little Eva, Blackard and Turkey Creek closely matches block grades within the resource block model, providing additional validation of the dataset and estimation methodology.
It is the opinion of the QP that the databases for all deposits of interest are suitable for use in resource estimation.
Effective date: 30 June 2023
86
Technical Report Summary of the
Eva Copper Project, North West Queensland, Australia
12Metallurgical testing
Section 229.601(b)(96) (10) (i‐v)
12.1Introduction
This section summarizes both historical and recent testwork associated with the various ore types on the Project property. For additional information, please reference the 2018 Feasibility Study completed by Hatch for CMMC in 2018, the GR Engineering Services (GRES) Definitive Feasibility Study (DFS) for Altona in 2014, and the GRES DFS for Universal in 2009. The previous feasibility studies discuss in detail the metallurgical performance of ores from Little Eva and associated deposits, which contain classic, flotation-amenable copper sulphide ore types.
The Little Eva pit will be the main ore source for the Project. This deposit has been well studied, with 145 flotation tests from multiple core and RC chip sources that ranged in scope from benchtop to pilot plant. This ore consistently demonstrates high recovery performance with a high degree of liberation at relatively coarse grinds. The average ore competency lies near the 50th percentile of the JK database, with medium to hard Bond work indices. Copper is present as chalcopyrite with trace amounts of pyrite. Strong flotation kinetics result in high recoveries, concentrating to a saleable final concentrate grade following a nominal regrind with no pH modification. The gold is predominantly associated with the chalcopyrite and reports to the copper concentrate. Overall, this ore type presents low technical risk.
The sulphide satellite deposits, comprising Turkey Creek, Bedford, Lady Clayre, and Ivy Ann, are smaller ore sources. These ore types are generally similar to Little Eva from both a comminution and flotation perspective. Some differences include a stronger deportment of copper to bornite and varying grade distribution. Overall, these pits show average copper recoveries of 88% to 95%, and represent sources of high recovery material.
The native copper-bearing deposits, Blackard and Scanlan, are distinctly different from other deposits in the area, containing oxide cap, native copper, sulphide transition, and sulphide zones. The native copper zones are the largest copper-bearing zones within these deposits, containing a relatively fine distribution of native copper with varying quantities of sulphides. These pits were studied by previous owners; however, several recent updates have been completed. In total, 410 flotation tests (including blended ore feed) have been completed, ranging from benchtop to pilot scale work. On a flotation basis, the native copper zones typically achieve 60% recovery, with an additional 2% to 3% achievable by gravity methods. Recovery is highly variable as deportment shifts from native copper to sulphides, requiring flexibility within the processing flowsheet between gravity and flotation operations to achieve an average of 63% overall native copper recovery. This ore is typically very soft, resulting in low comminution costs and high mill throughputs. Below the native copper-bearing zones of both Blackard and Scanlan are sulphide zones containing bornite and chalcopyrite, behaving similarly to Turkey Creek ore. The flotation response of the ore from the native copper to the sulphide transition zone increases with sulphide content, as expected.
12.2Little Eva Deposit
The Little Eva deposit is classified as an iron oxide copper gold (IOCG) deposit. Copper is present as chalcopyrite, with trace amounts of bornite and chalcocite. The host rock contains high levels of iron oxides such as hematite and magnetite. Most of the deposit contains trace quantities of pyrite requiring no pH modification at the rougher and cleaner stage. Chalcopyrite is present in relatively coarse grain sizes, resulting in 95% liberation at 212 µm. Overall, this ore presents minimal challenges from a metallurgical perspective, as it has average comminution characteristics and yields high copper recovery.
Effective date: 30 June 2023
87
Technical Report Summary of the
Eva Copper Project, North West Queensland, Australia
12.2.1Mineralogy
Previous mineralogical studies of Little Eva highlighted that the ore is predominantly feldspar, quartz, carbonate, amphibole, biotite mica and iron oxide minerals, with minor to trace amounts of copper and iron sulphides. The deposit is low in overall sulphur content, with sulphur assays commonly being less than 0.8% but ranging as high as 1.6%. QEMSCAN analysis of the bulk flotation feed and the tailings composite samples has identified chalcopyrite (CuFeS2) as the main copper- bearing mineral, locally ranging in abundance from 0.1% to 2%. Trace bornite (Cu5FeS4) usually occurs intergrown with chalcopyrite, and is less than one tenth the abundance of chalcopyrite. Pyrite (FeS2) and chalcocite (Cu2S) occur in ultra-trace amounts of about one hundredth the abundance of chalcopyrite. A scanning electron microscope (SEM) analysis of hand-panned flotation concentrate identified very fine particles (ranging in size from 2 μm to 9 μm) of electrum (gold ± silver) associated with pyrite and/or chalcopyrite. Figure 12-1 and Figure 12-2 show typical chalcopyrite and bornite associations with gangue minerals within the host rock.
|
|
|
| Figure 12-1: Drill Hole LED495, Specimen 94975, Scale 4.6 mm |
|
|
|
| Figure 12-2: Drill Hole LED495, Specimen 94966, Scale 1.6 mm |
Effective date: 30 June 2023
88
Technical Report Summary of the
Eva Copper Project, North West Queensland, Australia
13Mineral Resource estimate
Section 229.601(b)(96) (11) (i‐vii)
13.1Introduction
The Eva Copper Project is currently composed of six deposits; in order of importance, they are Little Eva, Turkey Creek, Blackard, Scanlan, Bedford, and Lady Clayre. Little Eva is the main deposit, hosting a majority of the Mineral Resource and Reserve, while the others are considered satellite or supplemental deposits. As there are significant differences in the deposits with respect to tonnage, metal grades, nature of mineralization, and drill density, different resource estimation strategies were employed for each deposit. The geology, structural setting, and mineralization of each of the deposits has been described in previous sections and will only be touched upon in this section as is required for understanding resource estimation.
All deposits have had previous resource and reserve estimates carried out. Some additional drilling has been carried out on the Little Eva, Turkey Creek, and Blackard deposits since the previous resource estimates were made, but the amount of drilling, in comparison to past work, was relatively minor, as the new drilling was mostly for verification of historical data and to collect material for metallurgical testing. For the most part, resources have been re-estimated using different techniques and block sizes to better match proposed mining equipment and incorporate anticipated mining dilution and ore losses associated with the larger equipment. The type of mineralization is such that the larger mining equipment, while increasing mining efficiency, will likely result in higher levels of dilution with resultant lower grades. However, the amount of contained metal within the earlier and current estimates is similar. It is anticipated that there will be opportunities to increase grades delivered to the mill through enhanced grade control procedures during mining together with the use of stockpiling strategies. Resource estimates leading to reserves that form the basis of pit design should be conservative. Mineral Resources were estimated under the supervision of Mr. Ronald Reid, B.Sc.(Hons), FAIG., Harmony’s QP responsible for Mineral Resources.
13.2Resource Estimation Procedures
The resource estimation methodology was similar for all deposits, and involved the following procedures:
•Understanding, to the extent possible, geological controls of mineralization and grade distribution, and determination of domains
•Deposit description and mineralization domains based on geology, structure, and weathering profiles
•Determine suitable block model sizes and extents for each deposit
•Describe drill hole database, validate drill data, and extract the relevant data required for resource estimation
•Analyze the data through univariate and bivariate statistical data analysis Determine what, if any, data conditioning (capping and compositing) is required
•Variography on deposits and deposit domains (required for kriging interpolations)
•Grade interpolation
•Resource, classification, and validation
•Mineral Resource Statement.
13.3Geological and Mineralization Models and Domains
The following sections describe the criteria for the definition of the geological and mineralization models at the deposits. Domains for grade estimation are based on structural orientation and/or lithological controls on mineralization as well as metallurgical/mineralogical zones related to weathering profiles. The weathering profile for all the copper-gold deposits is reasonably consistent, with an upper zone of oxidized rock generally between 15 m and 25 m in depth, with a relatively sharp boundary between fresh rock or supergene zones, depending upon the deposit. The oxide and supergene zones are defined by observation during core or chip logging and verified by sulphur analyses on a subset of the drill holes within the deposit. Deposit geology and figures describing weathering or supergene domains used for resource estimation are presented in Section 6. Domains defined by structural or lithological orientation are described in Sections 13.5 and 13.8.
Effective date: 30 June 2023
89
Technical Report Summary of the
Eva Copper Project, North West Queensland, Australia
13.3.1Little Eva
Three major structural-lithological domains, separated by faults, have been defined for the Little Eva deposit, each domain with differing orientations of mineralization continuity. Previous workers defined additional subzones of either high- or mid-grade domains based on drill hole copper grades. Recent work, both with the data and limited drill core examination, determined that the subdomain boundaries were gradational and not likely to be visually distinct during mining. Attempts to define the high-grade zones with variography were not successful and therefore these subdomains were not maintained during grade interpolation. A plan view and typical drill sections illustrating the four larger domains (and earlier subdomains) are provided in Figure 6-5 and Figure 6-6.
The upper part of the deposit is oxidized, usually to a depth of 15 m to 25 m, and the transition to sulphide mineralization is quite sharp. The oxidized zone contains copper in native form as well as neotocite (Fe-Mn-Cu mineraloid) and carbonate copper species. Additional testing for recovery of copper from the oxide zone has been carried out, and no economical method of copper extraction has been determined and consequently, the oxide zone is considered to be waste. The oxide zone is present over top of all structural-lithological domains. The contact between the oxide zone and fresh rock was treated as ‘soft’ during interpolation as grade changes across the boundary were minimal.
13.3.2Turkey Creek
The Turkey Creek deposit was the most recent discovery at the Eva Copper Project and is a copper- only deposit (without gold). Resource estimation of the Turkey Creek deposit was constrained within a stratigraphically controlled grade shell above 0.1% Cu. The Turkey Creek deposit occurs as two tabular higher-grade zones separated by a lower grade zone. Although a lower grade internal core has been defined as a domain, these domain boundaries were not used during the interpolation as it may not be possible to segregate this zone during mining. However, interpolated block grades, clearly define the medial low-grade zone indicating that grade interpolation correctly honours drill data, as well as the potential for selective removal during mining, depending upon applied cut-off grade. Changes in orientation of the mineralization on the north end of the deposit, to the north of the Turkey Creek Fault, resulted in two additional domains.
13.3.3Blackard and Scanlan
Blackard and Scanlan are very similar deposits geologically, being stratabound with locally deep weathered profiles containing native copper. Additional drilling on Blackard and metallurgical testing on both Blackard and Scanlan has been completed and will be used to inform a mine plan.
Blackard and Scanlan are nearly identical geologically and metallurgically, both occurring near- surface and within deformed and metamorphosed carbonate rich sediments. Folded stratigraphy and changes in copper mineralization due to weathering require modification to the resource estimation procedures employed for the Little Eva deposit. Both the Blackard and Scanlan deposits appear to occur as thin (10 m) to thick (100 m) bands of mineralization folded into a tight synform and open antiform pair. The deposits contain weathering profiles that include an upper oxide zone, which is treated as waste (although grades are interpolated within the zone), followed by the copper zone where a significant proportion of the copper is contained as fine native copper, followed by a narrow transition zone of mixed metallic copper and sulphide species, and a lowermost sulphide zone. In both deposits, the weathering profile and related native copper zone is much deeper or more extensively developed over the synform part of the deposit areas. The silver content of the sulphide zone is locally significant but was not included in the resource estimates. Only the Blackard Resource was updated by Harmony in time for this report.
Effective date: 30 June 2023
90
Technical Report Summary of the
Eva Copper Project, North West Queensland, Australia
The Blackard deposit strikes northerly and has been subdivided into structural domains based on the dip and/or plunge of the mineralization. An outer 0.2% copper shell that reflects interpreted folded stratigraphy, and separates barren rock from mineralization on drill sections, was used to constrain the resource estimates. Mineralization is folded and curved, whereas interpolation searches are generally linear, so to account for the folded stratigraphy dynamic anisotropy was used to follow the fold curvature. Histograms of assay grades on drill sections display high variability of grade down hole, but in some areas, particularly within the Blackard deposit, alternating high and lower grade bands were noted to align over moderate distances, both on section and along strike these bands were used to guide the orientation of the interpolation search rather than the outline of the grade shell. The boundaries between mineralogical domains are treated as soft during resource estimation but are used as hard boundaries for assigning metallurgical recoveries. The three structural domains at Blackard were treated as hard boundaries for estimation.
13.3.4Ivy Ann
Ivy Ann is a copper-gold mineralized trend that consists of two deposits hosted within steep, east- dipping zones, with strikes to the north and northeast. The two deposits are separated by 700 m of barren rock and are termed Ivy Ann and Ivy Ann North. The mineralization domain at Ivy Ann includes a main structural zone and two minor hanging wall structures, defined within an outer grade shell at a copper cut-off of 0.1%. At Ivy Ann North there are 14 separate mineralized structures interpreted which were interpolated within a single outer grade shell defined by a copper cut-off of 0.1%.
The Ivy Ann deposit is not currently being considered by Harmony in the current mining study due to its size and distance from the Mill.
13.3.5Lady Clayre
Mineralization at Lady Clayre occurs in a variety of orientations with multiple geological controls, both structure and lithology exert control on mineralisation within a sequence of poly-deformed shales, siltstones, schists, and dolomites. Copper-gold mineralization is coarse-grained and commonly occurs within brecciated rocks. Five zones were defined by Altona based on 0.1% Cu grade shells. Mineralization in the northern part of the deposit strikes northwesterly and dips moderately to steeply to the west, while mineralization to the south strikes northeast and also dips moderately to steeply to the west. The deposit area was divided into two domains based on orientation of mineralization, but neither enclosing grade shells nor smaller subdomains were used for estimation. A separate domain was created for the oxide zone, which consists of a 15 m to 25 m thick layer with both oxide and carbonate copper species (Figure 6-16).
13.3.6Bedford
Bedford geology was reinterpreted by Altona in 2016, integrating drill data, surface mapping, high- resolution soil geochemistry, and geophysics into a structural analysis. The confidence in the geological interpretation is moderate to high, based on well-defined local and regional controls on the mineralization geometry. Mineralization outcrops at surface and has been tested to a depth of 140m, and remains open. The Bedford mineralization is hosted within a steep westerly- dipping shear zone 50m to 120m wide, striking north-northeast. Within the broad shear zone there is an array of mineralized structures with typical widths of 5m to 12m, which anastomose but follow the broad overall shear zone trend. Drilling has defined two separate areas of mineralization within the shear zone (Bedford South and Bedford North) where sufficient mineralization is present to be extracted by open pit mining.
The Bedford mineralization is narrow and anastomosing, which makes segregation of ore and waste at lower cut-off grades is difficult. Consequently, the deposit was estimated without constraints using a relatively narrow search ellipse. The potential for high grades is possible with careful grade control and mining practices. Both the North and South deposits were subdivided at the base of oxidation, which is an irregular 20m to 30m thick layer.
Effective date: 30 June 2023
91
Technical Report Summary of the
Eva Copper Project, North West Queensland, Australia
13.3.7Block Models
Mineral resources are estimated by interpolating composited drill hole grades into a block model, which models the space containing the mineralization into rectangles or cubes (blocks). The appropriate block size is determined by considering the smallest selective mining unit (SMU), which is a function of either the size and type of mining equipment to be used or the spacing planned for grade control drilling, and the spacing of the data used to interpolate grades into the blocks. Differences in the size and shapes of the deposits, and different data densities within the Project area result in different blocksizes. Each block is assigned a geological rock type code, oxidation code or domain code by intersecting the block model with 3D wireframe models of the geology.
The software used for grade interpolation is determined by the estimator or consultancy undertaking the work. The Bedford, Scanlan and Lady Clayre Resources were estimated by CMMC using GemCom Gems software. The 2023 Resource updates for Harmony were completed by SRK in Maptek Vulcan 2023, Datamine RM, and Isatis.Neo. Micromine 2023 was used to validate the estimates and Vulcan 2023 report the Resources.
Deposit block models are usually laid out as 3D rectilinear shapes that will fully envelop all known mineralization. Details of the deposit block models are provided in Table 13-1.
Table 13-1: 3D Block Model Limits (UTM Coordinates and MineRL (AMD+1000 m)
|
|
|
|
|
|
|
|
|
|
|
|
|
|
|
|
|
|
| Deposit |
Direction |
Minimum |
Maximum |
Block Size |
No. of Blocks |
Little Eva |
Easting |
410 000 |
411 440 |
|
15 |
|
96 |
|
| Northing |
7 771 000 |
7 773 125 |
|
25 |
|
85 |
|
| Elevation |
600 |
1 200 |
|
5 |
|
120 |
|
Turkey Creek |
Easting |
412 000 |
413 100 |
|
10 |
|
110 |
|
| Northing |
7 770 750 |
7 772 510 |
|
20 |
|
88 |
|
| Elevation |
650 |
1 250 |
|
5 |
|
120 |
|
| Blackard |
Easting |
411 800 |
413 400 |
|
10 |
|
160 |
|
| Northing |
7 764 300 |
7 766 800 |
|
20 |
|
125 |
|
| Elevation |
500 |
1 400 |
|
5 |
|
180 |
|
| Scanlan |
Easting |
411 900 |
412690 |
5 |
158 |
| Northing |
7 753 650 |
7755550 |
5 |
380 |
| Elevation |
760 |
1 260 |
|
5 |
|
100 |
| Bedford |
Easting |
414 721 |
415221 |
5 |
100 |
| Northing |
7 765 598 |
7768493 |
5 |
579 |
| Elevation |
1 000 |
1 210 |
|
5 |
|
42 |
Lady Clayre |
Easting |
409 132 |
410492 |
5 |
|
272 |
| Northing |
7 751 523 |
7753283 |
5 |
352 |
| Elevation |
400 |
1 400 |
|
5 |
|
200 |
Ivy Ann |
Easting |
425 100 |
427000 |
5 |
380 |
| Northing |
7 741 000 |
7744600 |
5 |
720 |
| Elevation |
900 |
1 280 |
|
5 |
|
76 |
All block models are in metric units without any rotation and generally are rectangular shaped, with the long axis to the north and the shorter axis to the east due to the north-south trending deposits. 5m high RL blocks were used for all deposits to allow for bench heights of 5m, 10m, or 15m depending on deposit size. Where blocks are cut by a domain boundary (e.g., ore-waste boundary), a sub-block of 5x5x5m has been used to define the boundary. All block models are in GDA2020 / MGA Zone 54 projection and in Mine RL, which is AHD + 1000 m.
Effective date: 30 June 2023
92
Technical Report Summary of the
Eva Copper Project, North West Queensland, Australia
A variety of information is stored in the block model, including interpolated grades for copper and gold (where present), geological codes, specific gravities (SGs), and royalty requirements (Discussed in Section 4.6), various kriging parameters, metallurgical zones, and block classifications. Block models for Little Eva, Turkey Creek, Blackard, Scanlan, and Bedford are coded according to domains defined by computer solids models built on geological wireframes that represent mineralization boundaries and/or any distinct structural areas or breccia zones. Outer domain boundaries for the Little Eva, Turkey Creek, Blackard, Scanlan, and Bedford deposits, and all structural boundaries were treated as hard, as the boundary is in most cases geological, and any drill data outside the boundary was not used for interpolation of block grades.
However, boundaries between mineral-type domains are soft, and data on either side of the boundary can be used by the interpolation. Blocks are segregated by all domain boundaries. For the Scanlan deposit, all drill data were available for interpolation, although not all data were used, as many isolated holes were too distant to have an adjacent hole within the search area, which was a requirement of interpolation protocol. Only blocks that were inside the geological (or grade) shell were used to report the Resources.
|
|
|
| Figure 13-1: Little Eva Block Model 0.1% Cu Domain Containing the Estimation Domains |
Note:
The Little Eva deposit showing three main structural domains.
Image view is southwest with north to bottom right.
|
|
|
| Figure 13-2: Isometric View of the Blackard estimation domain with internal high grades. |
Note:
The Blackard deposit showing internal higher grade core.
Image view is northeast with north to the left
Effective date: 30 June 2023
93
Technical Report Summary of the
Eva Copper Project, North West Queensland, Australia
13.4Database and Statistical Analysis
13.4.1Drill Hole Database
The Harmony drill hole database is stored on the company server and SQL format and is accessed via a Maxwells Datashed front end. Data for each of the deposits was uploaded to a Micromine workspace, where it was reviewed and analyzed. Little Eva, Turkey Creek, Blackard, and Scanlan databases were uploaded directly from the previously defined file structure used for the 2012–2015 Optiro resource estimates and any data from recent drilling was added to the appropriate data base. Data quality was reviewed and combined with Altona’s extensive previous validation work by third-party consultants, the data was determined to be of high quality, and valid for use in resource estimation.
Standard checks (missing intervals, missing holes, overlapping intervals) did not reveal any errors in the database, although there were a small number of copper assays without a corresponding gold assay. The Project database includes collar, survey, assay, and lithological information, as well as drill hole type, year drilled, and company information from the various historical drill campaigns (see Table 13-2).
Both, diamond and RC drilling have taken place throughout all the deposits by many companies, including Universal, Dominion, Bruce Resources, PanAust, Xstrata, Altona and CMMC. A small amount of drilling for due diligence and/or to collect metallurgical sample material was carried out by Sichuan Railway Investment Group (SRIG) and CMMC in between 2016 and 2018 and an 18-hole RC program on the Blackard deposit was completed in 2019. Table 13-2 gives the breakdown of the drill data by company, the number of drill holes, and the years that the drilling occurred in all the current resource areas.
The drilling history of the Eva Copper Project dates to the late 1970s, when CRAE began drilling in the Little Eva and Lady Clayre areas (Figure 13-3, Table 13-2). Since then, numerous campaigns of RAB, RC, and Diamond Drilling have taken place throughout the Project area and on all the deposits by many companies including: Universal, Dominion, Bruce Resources, Pan Australian, Xstrata, Altona and CMMC. A small amount of drilling for grade confirmation and to obtain fresh samples for metallurgical testing was carried out by SRIG (2016-2017) and CMMC in 2018 and 2019.
Most of the drilling on the Project was focused on the Little Eva (36%) (Figure 13-4) and Blackard (28%) deposits while Lady Clayre has 11% of total drilled metres, followed by Scanlan, Bedford, Ivy Ann, and Turkey Creek, with 9%, 6%, 6%, and 4%, respectively. Much of the RAB drilling was for exploration outside of the deposit areas, and due to possible contamination issues with RAB samples, no RAB holes were used in the resource estimations.
Table 13-2: Summary of Exploration Drilling by Company
|
|
|
|
|
|
|
|
|
|
|
|
|
|
|
|
|
|
|
|
|
Deposit |
Year |
Company |
Hole Type |
Hole Count |
Metres |
% of Total |
Little Eva |
1978–1996 |
CRAE |
DD |
6 |
2 330 |
|
35 |
% |
|
|
RC |
61 |
|
5 293 |
|
2002–2006 |
Universal |
RC |
281 |
|
37 855 |
|
|
|
DD |
30 |
|
4 037 |
|
2006 |
Xstrata |
DD |
2 |
984 |
|
2011–2018 |
Altona |
RC |
102 |
|
20 899 |
|
|
|
DD |
11 |
|
2 572 |
|
2018 |
CMMC |
DD |
4 |
202 |
|
Turkey Creek |
1993 |
CRAE |
RC |
2 |
218 |
|
4 |
% |
2011 |
Xstrata |
RC |
2 |
300 |
|
2012–2015 |
Altona |
RC |
49 |
|
7 296 |
|
|
|
DD |
5 |
404 |
|
2019 |
CMMC |
DD |
1 |
132 |
|
Effective date: 30 June 2023
94
Technical Report Summary of the
Eva Copper Project, North West Queensland, Australia
|
|
|
|
|
|
|
|
|
|
|
|
|
|
|
|
|
|
|
|
|
Deposit |
Year |
Company |
Hole Type |
Hole Count |
Metres |
% of Total |
| Blackard |
1991–1995 |
CRAE |
DD |
19 |
|
4 770 |
|
26 |
% |
|
|
RC |
8 |
1 120 |
|
|
|
PERC |
6 |
613 |
|
2002 |
Bolnisi Logistics |
DD |
7 |
927.8 |
|
|
RC |
121 |
|
13 558 |
|
2005–2009 |
Universal |
DD |
46 |
|
12 419 |
|
|
|
RC |
117 |
|
13 746 |
|
2011 |
Altona |
DD |
3 |
548 |
|
|
|
RC |
21 |
|
4 049 |
|
2019 |
CMMC |
RC |
18 |
|
2 695 |
|
| Scanlan |
1991–1995 |
CRAE |
RC |
97 |
|
7 553 |
|
9 |
% |
|
|
DD |
5 |
1 636 |
|
|
|
AC |
3 |
110 |
|
2002 |
Bolnisi Logistics |
RC |
2 |
397 |
|
2005–2006 |
Universal |
RC |
45 |
|
5 358 |
|
|
|
DD |
11 |
|
1 803 |
|
2007–2008 |
Xstrata |
DD |
2 |
798.2 |
2010 |
Universal |
RC |
7 |
1 324 |
|
| Bedford |
1990 |
CRAE |
RC |
5 |
420 |
|
6 |
% |
2003–2009 |
Universal |
RAB* |
43 |
|
1 680 |
|
|
|
RC |
97 |
|
9 762 |
|
|
|
DD |
1 |
160 |
|
2015 |
Altona |
DD |
1 |
36 |
|
Ivy Ann |
1992–1993 |
Dominion |
RAB* |
26 |
|
863 |
|
7 |
% |
|
|
RC |
15 |
|
1 591 |
|
1995 |
Bruce Resources |
RC |
11 |
|
1 084 |
|
1995–1996 |
Pan Australian |
RC |
10 |
|
1 268 |
|
|
|
RAB |
44 |
|
1 972 |
|
|
2003–2009 |
Universal |
RC |
18 |
|
2 205 |
|
|
2011–2012 |
Altona |
RC |
27 |
|
5 448 |
|
Lady Clayre |
1978–1998 |
CRAE |
RAB* |
50 |
|
471 |
|
13 |
% |
|
|
RC |
46 |
|
5 477 |
|
|
|
DD |
30 |
|
7 994 |
|
2002–2009 |
Universal |
RAB |
39 |
|
1 913 |
|
|
|
RC |
40 |
|
4 967 |
|
|
|
DD |
2 |
154 |
|
2011–2012 |
Altona |
RC |
27 |
|
5 188 |
|
| Total |
|
|
|
1 626 |
|
208 600 |
|
|
Notes: DD = diamond drilling, RC = reverse circulation, RAB = rotary air blast
* denotes holes not used in resource estimates.
Effective date: 30 June 2023
95
Technical Report Summary of the
Eva Copper Project, North West Queensland, Australia
|
|
|
| Figure 13-3: Little Eva Drill Collar Plan by Company |
Effective date: 30 June 2023
96
Technical Report Summary of the
Eva Copper Project, North West Queensland, Australia
|
|
|
| Figure 13-4: Number of Little Eva Drill Holes by Year and Company |
Note: Chart shows all drilling at Little Eva
13.4.2Deposit Assay Data Statistics
Assay datasets for each deposit were examined using univariate statistics to provide an understanding of ranges, distribution, and variance to determine the appropriate methods of resource estimation. In some cases, outlying holes which did not intersect the area of mineralization were removed prior to statistical analysis. A summary of assay statistics for each deposit is provided in Table 13-3, and selected histograms of assay data and composites are presented in the various figures and tables that follow in this section.
The Little Eva deposit has lognormal distributions of both copper and gold, with high, but acceptable coefficient of variation (CoV), drilling was composited to 2m intervals to assist with stationarity. Turkey Creek mineralization is a much smaller dataset, and is unusual in that it is negatively skewed, with the number of samples increasing towards higher grades, likely a function of visually distinct mineralized zones favouring sampling within the mineralization. The Bedford, lady Clayre, and Ivy Ann deposits all have high maximums and correspondingly high CoVs, with low median values due to multiple relatively narrow zones of mineralization separated by non-mineralized material. The Blackard and Scanlan deposits both have log-normal distributions with relatively low CoV’s and have similar statistics to each other with slightly higher median and mean grades in the Scanlan deposit.
Table 13-3: Summary of Assay Statistics by Deposit
|
|
|
|
|
|
|
|
|
|
|
|
|
|
|
|
|
|
|
Deposits
|
Statistics
|
Raw Assays* Uncapped |
2m Composite used in Estimate** |
Cu (%) |
Au (g/t) |
Cu (%) |
Au (g/t) |
Little Eva |
Count |
66 096 |
|
66 096 |
|
4 967 |
|
10 023 |
|
| Mean |
0.32 |
|
0.06 |
0.62 |
|
0.28 |
|
| Median |
0.06 |
|
0.03 |
0.31 |
|
0.19 |
|
| Minimum |
— |
|
— |
|
— |
|
— |
|
| Maximum |
18.89 |
|
8.90 |
|
15.05 |
|
8.21 |
|
Std. Dev. |
0.63 |
0.15 |
|
0.88 |
|
0.32 |
|
| CoV |
1.99 |
|
2.61 |
|
1.41 |
|
1.14 |
|
Effective date: 30 June 2023
97
Technical Report Summary of the
Eva Copper Project, North West Queensland, Australia
|
|
|
|
|
|
|
|
|
|
|
|
|
|
|
|
|
|
|
Deposits
|
Statistics
|
Raw Assays* Uncapped |
2m Composite used in Estimate** |
Cu (%) |
Au (g/t) |
Cu (%) |
Au (g/t) |
Turkey Creek |
Count |
9 190 |
|
8 711 |
|
1 450 |
|
1 450 |
|
| Mean |
0.17 |
|
0.02 |
|
0.46 |
|
0.02 |
|
| Median |
0.02 |
|
0.01 |
|
0.37 |
|
0.01 |
|
| Minimum |
— |
|
— |
|
— |
|
— |
|
| Maximum |
4.50 |
|
2.62 |
|
2.66 |
|
1.46 |
|
Std. Dev. |
0.32 |
|
0.05 |
|
0.36 |
|
0.05 |
|
| CoV |
1.82 |
|
2.17 |
|
0.77 |
|
2.47 |
|
| Bedford |
Count |
9 446 |
|
4 167 |
|
4 942 |
|
2 569 |
|
| Mean |
0.37 |
0.11 |
0.25 |
0.12 |
| Median |
0.07 |
0.03 |
0.04 |
0.04 |
| Minimum |
— |
|
0.01 |
— |
|
0.01 |
| Maximum |
11.5 |
6.46 |
11.5 |
1.5 |
Std. Dev. |
0.84 |
0.28 |
0.68 |
0.21 |
| CoV |
2.29 |
2.6 |
2.69 |
1.8 |
Lady Clayre |
Count |
19 157 |
|
19 218 |
|
19 157 |
|
19 218 |
|
| Mean |
0.16 |
0.07 |
0.16 |
0.07 |
| Median |
0.03 |
0.01 |
0.03 |
0.01 |
| Minimum |
— |
|
— |
|
— |
|
— |
|
| Maximum |
20.7 |
45.1 |
20.7 |
45.1 |
Std. Dev. |
0.48 |
0.49 |
0.48 |
0.49 |
| CoV |
3.09 |
7.43 |
3.09 |
7.43 |
Ivy Ann |
Count |
11 458 |
|
11 458 |
|
11 458 |
|
11 458 |
|
| Mean |
0.17 |
0.03 |
0.17 |
0.03 |
| Median |
0.03 |
0 |
0.03 |
0 |
| Minimum |
— |
|
— |
|
— |
|
— |
|
| Maximum |
23.5 |
3.18 |
23.5 |
3.18 |
Std. Dev. |
0.51 |
0.08 |
0.51 |
0.08 |
| CoV |
3.09 |
3.22 |
3.09 |
3.22 |
| Blackard |
Count |
39 524 |
|
— |
|
28 719 |
|
— |
|
| Mean |
0.26 |
|
— |
|
0.26 |
|
— |
|
| Median |
0.10 |
|
— |
|
0.10 |
|
— |
|
| Minimum |
— |
|
— |
|
— |
|
— |
|
| Maximum |
6.66 |
|
— |
|
5.16 |
|
— |
|
Std. Dev. |
0.39 |
|
— |
|
0.38 |
|
— |
|
| CoV |
1.50 |
|
— |
|
1.47 |
|
— |
|
| Scanlan |
Count |
9 424 |
|
— |
|
9 424 |
|
— |
|
| Mean |
0.31 |
— |
|
0.31 |
— |
|
| Median |
0.14 |
|
— |
|
0.138 |
— |
|
| Minimum |
0 |
— |
|
— |
|
— |
|
| Maximum |
6.85 |
— |
|
6.85 |
— |
|
Std. Dev. |
0.46 |
— |
|
0.46 |
— |
|
| CoV |
1.51 |
— |
|
1.51 |
— |
|
Note: *Assay data from both sulphide and oxide zones. **. Scanlan, Lady Clayre, Ive Ann and Bedford use 2.5m composites.
More detailed analysis was carried out on the Little Eva, Blackard, and Scanlan deposits to evaluate potential for data bias between drill hole type, company, and drill hole orientation. Comparisons of statistics between exploration programs by company for Little Eva are shown in Table 13-4. In general, the statistics are quite similar, except for the mean grade, which is lower for the Altona holes due to the additional drilling around the edges of the deposit, as can be observed in the drill hole plan (Figure 13-3), which shows the collars colour-coded by company. Similarly, Table 13-5 compares basic statistics between reverse circulation and diamond drill holes (DDH); the higher mean and medians for the DDHs are a result of the DDHs being preferentially drilled in the north-central, higher grade area of the deposit as illustrated in Figure 13-5.
Effective date: 30 June 2023
98
Technical Report Summary of the
Eva Copper Project, North West Queensland, Australia
13.4.2.1Little Eva Deposit
Drill hole data for the Little Eva deposit was examined for any form of bias related to different drill programs by different companies, or differing drill equipment or drill hole orientations. While differences are noted in Table 13-4 and Table 13-5, it is believed these differences are more reflective of the location of the drill holes as opposed to any inherent bias. Table 13-6 shows the global raw assay data for the estimation domains at Little Eva. The database is deemed good for resource estimation.
Table 13-4: Summary of Cu Assay Statistics for Little Eva by Company Drill Data
|
|
|
|
|
|
|
|
|
|
|
|
|
CRAE |
Universal |
Altona |
| Count |
1 760 |
|
30 136 |
|
14 185 |
|
| Mean |
0.41 |
0.385 |
0.283 |
|
| Median |
0.19 |
0.19 |
0.164 |
|
| Minimum |
0 |
0 |
0 |
| Maximum |
16.8 |
18.9 |
13.9 |
|
Std. Dev. |
0.79 |
0.68 |
0.45 |
|
Log Variance |
1.61 |
1.67 |
1.94 |
|
| CoV |
1.96 |
1.75 |
1.59 |
|
Table 13-5: Summary of Basic Statistics for RC vs. Diamond Drill Hole Assays for Little Eva
|
|
|
|
|
|
|
|
|
|
RC |
DD |
| Count |
42 596 |
|
3 485 |
|
| Mean |
0.34 |
0.48 |
| Median |
0.18 |
0.22 |
| Minimum |
0 |
0 |
| Maximum |
18.9 |
13.15 |
Std. Dev. |
0.6 |
0.83 |
Log Variance |
1.77 |
1.71 |
| CoV |
1.75 |
1.73 |
A review of drill hole orientation was undertaken on the Little Eva deposit to assess for any grade bias in the data. Drill holes were partitioned based on either easterly orientations (azimuth 50–140), westerly orientations (azimuth 230–320) or vertical holes (dip ≥ -80). A very small sub-set of holes were drilled towards the south or north and are not included (Figure 13-6). Statistics for copper assays based on drill hole orientation is provided in Table 13-7, and indicates that there is little difference between westerly- inclined drill holes and easterly-inclined drill holes. Vertical drill holes have a higher mean grade, probably related to a concentration of these holes in the higher-grade central and northerly parts of the deposit. Examination of the detailed drill sections indicates that mineralization is not systematically vertically oriented, and therefore vertical drill holes are unlikely to produce grade bias.
Table 13-6: Basic Statistics for Raw Assays by Domain at Little Eva
|
|
|
|
|
|
|
|
|
|
|
|
|
|
|
|
|
|
|
|
|
|
|
|
|
|
|
|
North |
Central |
South |
Total |
Cu% |
Au g/t |
Cu% |
Au g/t |
Cu% |
Au g/t |
Cu% |
Au g/t |
| Count |
9 646 |
17 576 |
20 256 |
72 863 |
| Mean |
0.62 |
|
0.09 |
|
0.45 |
|
0.07 |
|
0.28 |
|
0.06 |
|
0.32 |
|
0.06 |
|
| Minimum |
0.001 |
0.001 |
0.001 |
0.001 |
0.001 |
0.001 |
— |
|
0.001 |
| Maximum |
18.89 |
|
5.58 |
|
16.80 |
|
8.90 |
|
16.09 |
7.57 |
|
18.89 |
|
8.90 |
|
Std. Dev. |
1.03 |
|
0.18 |
|
0.73 |
|
0.20 |
|
0.39 |
|
0.13 |
|
0.63 |
|
0.15 |
|
| CoV |
1.67 |
|
2.12 |
|
1.62 |
|
2.75 |
|
1.40 |
|
2.04 |
|
1.99 |
|
2.61 |
|
Note:
Effective date: 30 June 2023
99
Technical Report Summary of the
Eva Copper Project, North West Queensland, Australia
Table 13-7: Cu% Assay Statistics Based on Drill Hole Orientation at Little Eva
|
|
|
|
|
|
|
|
|
|
|
|
|
East Dip |
West Dip |
Vertical |
| Count |
30 707 |
|
6 618 |
|
8 537 |
|
| Mean |
0.32 |
0.37 |
0.45 |
| Median |
0.17 |
0.18 |
0.21 |
| Minimum |
— |
|
— |
|
— |
|
| Maximum |
16.80 |
|
16.09 |
18.89 |
Std. Dev. |
0.54 |
0.69 |
0.78 |
| CoV |
1.70 |
|
1.87 |
1.72 |
|
|
|
| Figure 13-5: Little Eva Drill Collar Plan with Drill Holes Colour Coded by Orientation |
Note: The concentration of vertical holes in the northern, higher-grade end of the deposit.
Effective date: 30 June 2023
100
Technical Report Summary of the
Eva Copper Project, North West Queensland, Australia
|
|
|
| Figure 13-6: Plan View of Drill Collars Colour-Coded by Drill Type |
Effective date: 30 June 2023
101
Technical Report Summary of the
Eva Copper Project, North West Queensland, Australia
13.4.2.2 Blackard Deposit
A combination of drilling was used on the Blackard deposit and potential for bias between drill types was examined. Additionally, basic statistics between domains were examined to support the use of soft domain boundaries during interpolation. Examples of assay data statistics for Blackard domains are provided below in Table 13-8, whereas examples of statistical analysis of composited data for the various deposits is provided in Section 13.5.3.
Basic statistical analysis of copper assays was initially carried out on each mineralogical/structural domain; however, a better comparison is provided by data above a very low-grade cut-off value as shown in Table 13-8. For statistical analysis two structural or orientation domains were defined for the Blackard deposit: variable west dipping (tilt) and horizontal (flat) mineralization, which was a simplification of a curvilinear deposit (a vertical domain was defined later for resource estimation). The model was estimated using dynamic anisotropy where the search ellipse follows the curvilinear fold of the deposit but the statistics have been split into various domains to show the variation across the deposit.
Domains that are evenly divisible by 10 are dipping domains on the western and northern parts of the deposit and those that are evenly divisible by 5 are flat-lying domains on the eastern side. The oxide zone typically has lower grades than the other zones which is as expected since copper has been leached from this zone; however, the leaching is more pronounced above the dipping mineralization than in the flat-lying mineralization. A similar effect, but less pronounced is also evident in the copper zone, whereas there is no statistical difference between the dipping and flat-lying sulphide mineralization. The relatively small differences in statistical measures between the zones supports the use of soft boundaries.
Table 13-8: Cu% Assay Statistics by Resource Domain for the Blackard Deposit
|
|
|
|
|
|
|
|
|
|
|
|
|
|
|
|
|
|
|
|
|
|
|
|
| Zone |
Oxide |
Native Cu |
Transition |
Sulphide |
| Domains |
10 (Tilt) |
15 (Flat) |
20 (Tilt) |
25 (Flat) |
30 (Tilt) |
40 (Tilt) |
45 (Flat) |
Blackard Deposit Assay Statistics (All assays) |
| Count |
4 118 |
|
1 630 |
|
10 879 |
|
1 786 |
|
1 167 |
|
11 982 |
|
2 144 |
|
| Mean |
0.151 |
0.344 |
0.381 |
0.504 |
0.336 |
0.175 |
0.162 |
| Median |
0.070 |
|
0.260 |
|
0.230 |
|
0.410 |
|
0.151 |
0.035 |
0.028 |
| Mode |
0.030 |
|
0.030 |
|
0.030 |
|
0.040 |
|
0.020 |
|
0.001 |
0.005 |
| Minimum |
— |
|
0.001 |
— |
|
0.003 |
0.001 |
— |
|
— |
|
| Maximum |
2.500 |
|
1.620 |
|
6.660 |
|
3.790 |
|
5.110 |
|
5.530 |
|
6.660 |
|
Std. Dev. |
0.209 |
0.297 |
0.429 |
0.422 |
0.542 |
0.350 |
|
0.416 |
| CoV |
1.385 |
0.863 |
1.125 |
0.837 |
1.614 |
2.002 |
2.566 |
Assays at, or >0.05% Cu Cut-off |
| Count |
2 610 |
|
1 448 |
|
9 243 |
|
1 664 |
|
866 |
5 366 |
|
843 |
| Mean |
0.224 |
0.384 |
0.445 |
0.540 |
|
0.445 |
0.375 |
0.392 |
| Median |
0.131 |
0.300 |
|
0.310 |
|
0.450 |
|
0.250 |
|
0.206 |
0.205 |
| Mode |
0.050 |
|
0.150 |
|
0.050 |
|
0.150 |
|
0.040 |
|
0.050 |
|
0.050 |
|
| Minimum |
0.050 |
|
0.050 |
|
0.050 |
|
0.050 |
|
0.050 |
|
0.050 |
|
0.050 |
|
| Maximum |
2.500 |
|
1.620 |
|
6.660 |
|
3.790 |
|
5.110 |
|
5.530 |
|
6.660 |
|
Std. Dev. |
0.233 |
0.291 |
0.436 |
0.416 |
0.591 |
0.449 |
0.593 |
| CoV |
1.042 |
0.758 |
0.979 |
0.771 |
1.329 |
1.197 |
1.514 |
Basic statistics were also examined by drill type for Blackard. The differing statistics between core drilling and RC drilling is believed to reflect the different locations of the drill holes (Table 13-9).
Diamond drill holes were used for deep step-outs, and therefore drilled much greater distances in weakly mineralized or unmineralized areas than the RC drilling, which is more concentrated within the deposit area. There are no significant statistical differences when grades within the deposit shell were compared for the two drill types.
Effective date: 30 June 2023
102
Technical Report Summary of the
Eva Copper Project, North West Queensland, Australia
Table 13-9: Cu% Assay Statistics by Drill Type for the Blackard Deposit
|
|
|
|
|
|
|
|
|
Drill Hole Type |
Core |
RC |
| Count |
13 069 |
|
21 096 |
|
| Mean |
0.220 |
|
0.291 |
|
| Median |
0.046 |
0.140 |
|
| Minimum |
— |
|
— |
|
| Maximum |
6.660 |
|
6.660 |
|
Std. Dev. |
0.392 |
0.390 |
|
| CoV |
1.778 |
1.341 |
|
|
|
|
| Figure 13-7: Plan View of Drill Collars, Colour-Coded by Hole Type for the Blackard Deposit |
Effective date: 30 June 2023
103
Technical Report Summary of the
Eva Copper Project, North West Queensland, Australia
13.4.2.3Scanlan Deposit
Most of the drilling on the Scanlan deposit was by RC, with only the deeper (down-dip) and metallurgical holes completed by diamond drilling, as displayed by the drill plan in Figure 13-8. Therefore, a significant amount of the diamond drilling was peripheral to the ore zone. Grades within metallurgical holes drilled proximal to RC holes are similar and no bias between drill types has been detected.
|
|
|
| Figure 13-8: Plan View of Drill Collars for the Scanlan Deposit Showing the Resource grade shell |
Effective date: 30 June 2023
104
Technical Report Summary of the
Eva Copper Project, North West Queensland, Australia
13.4.3Data Conditioning and Assay Composites
Data populations were examined using histograms and probability plots. Histograms indicate that distribution of both copper and gold grades are log-normal, with varying amounts and directions of skewness between deposits. Compositing of all drill hole assays to equal lengths is required for interpolation. The choice of composite length is determined by raw data distribution and block size: composite lengths must be less than the block size, and half the block height is a common and convenient selection. Compositing the predominately 1m assays to a length of 2m smooths out the histograms, and indicates a reasonably uniform distribution of values, apart from spikes at, or near, analytical detection limits as illustrated in Figure 13-9 and Figure 13-10.
Cumulative probability plots were examined to determine whether capping would be required (Figure 13-11). Basic statistics, for 2m composites by domain for the Little Eva, Blackard and Turkey Creek deposits, 2.5m was used for the other deposits are provided in Table 13-10 through Table 13-16, and can be compared with the raw data statistics (Table 13-3). Some high assay values (> 6.5% Cu) in the drill data from Little Eva and Lady Clayre remained after compositing, however, these values were neither random nor isolated anomalies but part of a continuous population distribution. The number of high-value composites is very small (for example in Little Eva deposit the number of composites >4.0%Cu is less than 0.0026% of the total number of composites) and would have a negligible impact on resource values. Consequently, capping of copper assays or composites was not required. The single very high assay in the Lady Clayre deposit was from a very narrow sample and was reduced to 4% Cu by the compositing process.
|
|
|
| Figure 13-9: Log Histogram for Raw Assay Data from Little Eva Deposit |
Effective date: 30 June 2023
105
Technical Report Summary of the
Eva Copper Project, North West Queensland, Australia
|
|
|
| Figure 13-10: Log Histogram of 2 m Copper Composites, Little Eva Deposit |
Note: Bold values below the histograms are arithmetic.
|
|
|
| Figure 13-11: Cumulative Probability Plot for Cu Assays, Little Eva |
Effective date: 30 June 2023
106
Technical Report Summary of the
Eva Copper Project, North West Queensland, Australia
Table 13-10: Basic Statistics for 2 m Composites by Domain at Little Eva
|
|
|
|
|
|
|
|
|
|
|
|
|
|
|
|
|
|
|
|
|
|
|
|
|
|
|
|
North |
Central |
South |
Total |
Cu % |
Au g/t |
Cu % |
Au g/t |
Cu % |
Au g/t |
Cu % |
Au g/t |
| Count |
4 967 |
|
9 304 |
|
10 023 |
|
24 294 |
|
| Mean |
0.618 |
|
0.086 |
|
0.446 |
|
0.074 |
|
0.278 |
|
0.063 |
|
0.412 |
|
0.072 |
|
| Median |
0.305 |
|
0.049 |
|
0.262 |
|
0.037 |
|
0.191 |
|
0.038 |
|
0.233 |
|
0.040 |
|
| Mode |
0.010 |
|
0.005 |
|
0.160 |
|
0.005 |
|
0.120 |
|
0.005 |
|
0.010 |
|
0.005 |
|
| Minimum |
0.001 |
|
0.001 |
0.001 |
0.001 |
0.001 |
|
0.001 |
|
— |
|
— |
|
| Maximum |
15.050 |
|
4.453 |
|
16.800 |
|
4.824 |
|
8.208 |
|
3.710 |
|
16.800 |
|
4.824 |
|
Std. Dev. |
0.884 |
|
0.154 |
|
1.410 |
|
0.153 |
|
0.316 |
|
0.099 |
0.608 |
|
0.134 |
|
| CoV |
1.43 |
|
1.81 |
|
1.41 |
|
2.07 |
|
1.14 |
|
1.57 |
|
1.48 |
|
1.87 |
|
The Turkey Creek deposit has been defined by 53 RC, and 5 DDH for a total of 8,218m. Twenty-two of the holes, and an extension to one hole (together totalling 2,778m), were completed during November and December 2014. The mineralization is strongly tabular and stratabound, striking north- south and dipping east at 60°. At the northern end of the deposit, the strike of the mineralization swings sharply towards the east, and dips steeply south (Figure 13-19). Basic statistics of composite assays by domain are provided in Table 13-11. Although the number of composites is low in comparison to the to the other deposits, the grade continuity of mineralization within the narrow, tabular zones is sufficient for defining Indicated resources.
Table 13-11: Basic Statistics for 2 m Composites by Domain at Turkey Creek
|
|
|
|
|
|
|
|
|
|
|
|
|
|
|
|
South Zone Sulphide (Cu) |
North Zone Sulphide (Cu) |
South Zone Oxide (Cu) |
North Zone Oxide (Cu) |
| Count |
867 |
|
178 |
|
197 |
|
208 |
|
| Mean |
0.443 |
|
0.378 |
|
0.527 |
|
0.561 |
|
| Minimum |
0.001 |
0.002 |
0.015 |
0.010 |
|
| Maximum |
2.146 |
|
1.178 |
|
1.795 |
|
2.660 |
|
Std. Dev. |
0.330 |
|
0.274 |
|
0.378 |
|
0.458 |
|
| CoV |
0.745 |
|
0.724 |
|
0.718 |
|
0.896 |
|
Table 13-12: Basic Statistics for 2 m Composite Grades in Blackard Deposit Mineralogical Domains
|
|
|
|
|
|
|
|
|
|
|
|
|
|
|
| Domain |
110 |
120 |
130 |
140 |
Mineral Zone |
Oxide |
|
Copper |
Transition |
Sulphide |
| Count |
3 417 |
|
9 174 |
|
885 |
|
4 444 |
|
| Mean |
0.297 |
|
0.467 |
|
0.405 |
|
0.298 |
|
| Minimum |
0.001 |
|
0.010 |
|
0.005 |
|
0.005 |
|
| Maximum |
2.500 |
|
5.160 |
|
4.995 |
|
5.020 |
|
Std. Dev. |
0.273 |
|
0.438 |
|
0.595 |
|
0.413 |
|
| CoV |
0.919 |
|
0.938 |
|
1.469 |
|
1.385 |
|
Note: *Refer to Figure 7-10 for mineralogical domains.
Table 13-13: Basic Statistics for Composites by Mineralogical Zone for the Scanlan Deposit
|
|
|
|
|
|
|
|
|
|
|
|
|
|
|
|
|
|
|
Oxide |
Copper Zone |
Transitional |
Sulphide Zone* |
Total |
| Count |
1 267 |
|
4 098 |
|
254 |
1 244 |
|
6 933 |
|
| Mean |
0.152 |
0.412 |
0.211 |
0.108 |
0.299 |
| Median |
0.076 |
0.238 |
0.072 |
0.030 |
|
0.130 |
|
| Mode |
0.01 |
0.001 |
— |
|
0 |
0 |
| Minimum |
0 |
0 |
0 |
— |
|
— |
|
| Maximum |
1.58 |
5.41 |
2.08 |
2.66 |
5.41 |
Std. Dev. |
0.200 |
|
0.52 |
0.37 |
0.24 |
0.45 |
| CoV |
1.33 |
1.26 |
1.77 |
2.25 |
1.500 |
|
Note: * Includes all drilling below the deposit.
Effective date: 30 June 2023
107
Technical Report Summary of the
Eva Copper Project, North West Queensland, Australia
The mineralization at the Bedford deposit is separated into two deposits, Bedford North and South, which are 600m apart and lie within the same structure. Previously, narrow high-grade structures were modelled using a sectional approach for the Bedford estimates to constrain the resource.
However, the estimate was only constrained within the broader low-grade envelope (originally modelled by Altona) using a larger block size of 5m3. Blocks were interpolated based on two passes, which generated both Indicated and Inferred resources.
Table 13-14: Basic Statistics for 2.5 m Composites by Domain at Bedford
|
|
|
|
|
|
|
|
|
|
|
|
|
|
|
|
Primary |
Oxide |
Cu |
Au |
Cu |
Au |
| Count |
2 486 |
|
2 486 |
|
799 |
799 |
| Mean |
0.25 |
0.07 |
0.24 |
0.06 |
| Median |
0.06 |
0.01 |
0.06 |
0.01 |
| Minimum |
— |
|
— |
|
— |
|
— |
|
| Maximum |
6.07 |
4.49 |
7.5 |
2.4 |
Std. Dev. |
0.54 |
0.19 |
0.60 |
|
0.17 |
Coefficient of Variance |
2.18 |
2.82 |
2.51 |
2.62 |
Mineralization at Lady Clayre has been separated into two zones, East and West, which together form a V shape. The West zone mineralization trends north-south and was previously interpreted into 11 different domains defined by modelled grade shells. The East zone was also split into multiple domains. As with Bedford, two zones were modelled within the low-grade envelope based on a 0.1% Cu cut-off and use different search parameters for each zone based on the interpreted generalized trends to the mineralization.
|
|
|
| Figure 13-12: Log Histogram of Copper Assays from Lady Clayre Deposit |
Effective date: 30 June 2023
108
Technical Report Summary of the
Eva Copper Project, North West Queensland, Australia
|
|
|
| Figure 13-13: Log Probability Plot of Copper Assays from Lady Clayre Deposit |
Table 13-15: Basic Statistics for 2.5 m Composites by Domain at Lady Clayre
|
|
|
|
|
|
|
|
|
|
|
|
|
|
|
|
|
|
|
|
|
|
West Zone – Primary |
East Zone – Primary |
Oxide Zone – All |
Cu |
Au |
Cu |
Au |
Cu |
Au |
| Count |
5 904 |
|
5 904 |
|
4 438 |
|
4 438 |
|
1 407 |
|
1 407 |
|
| Mean |
0.14 |
0.06 |
0.15 |
0.07 |
0.17 |
0.07 |
| Median |
0.044 |
0.01 |
0.04 |
0.01 |
0.06 |
0.01 |
| Min. |
— |
|
— |
|
— |
|
— |
|
— |
|
— |
|
| Max. |
17.00 |
|
10.43 |
7.37 |
10.52 |
3.6 |
10.5 |
Std. Dev. |
0.42 |
0.29 |
0.36 |
0.36 |
0.32 |
0.36 |
| CoV |
2.89 |
4.94 |
2.37 |
5.31 |
1.91 |
5.30 |
|
Table 13-16: Basic Statistics for 2.5 m Composites by Domain at Ivy Ann
|
|
|
|
|
|
|
|
|
|
|
|
|
|
|
|
|
|
|
|
|
|
|
|
|
|
|
|
Ivy Ann – Primary |
Ivy Ann – Oxide |
Ivy Ann North – Primary |
Ivy Ann North – Oxide |
Cu |
Au |
Cu |
Au |
Cu |
Au |
Cu |
Au |
| Count |
3 825 |
|
3 825 |
|
702 |
702 |
815 |
815 |
|
440 |
440 |
| Mean |
0.18 |
0.03 |
0.15 |
0.02 |
0.07 |
0.01 |
|
0.04 |
— |
|
| Median |
0.04 |
— |
|
0.04 |
— |
|
0.02 |
— |
|
0.01 |
— |
|
| Minimum |
— |
|
— |
|
— |
|
— |
|
— |
|
— |
|
— |
|
— |
|
| Maximum |
4.00 |
|
0.30 |
|
2.58 |
0.35 |
2.85 |
0.50 |
|
0.5 |
0.2 |
Std. Dev. |
0.35 |
0.05 |
0.28 |
0.04 |
0.18 |
0.03 |
|
0.06 |
0.02 |
| CoV |
1.97 |
1.95 |
1.86 |
1.92 |
2.53 |
3.54 |
|
1.62 |
3.93 |
Effective date: 30 June 2023
109
Technical Report Summary of the
Eva Copper Project, North West Queensland, Australia
13.5Bulk Density
There are 1,862 bulk density measurements in the Little Eva deposit data base. The measurements were made on drill core using the “weigh in water, weigh in air” method. A histogram of the density measurements (Figure 13-14) indicates multiple populations: separating the data by rock type shows the separate populations. There were 1,386 bulk density measurements collected from rocks classified as the fresh volcanic package which has a mean bulk density of 2.80 t/m3. A further 371 measurements were collected from the metasedimentary rocks, with a mean bulk density of 2.70 t/m3. A total of 70 measurements were made on the felsic intrusive rocks, which yielded a mean bulk density of 2.63 t/m3.
The mean bulk density values that were assigned to the Little Eva block model is presented in Table 13-17.
The oxide zone did not have enough bulk density data points for detailed statistical analysis. A bulk density of 2.5 t/m3 was assigned to all the oxide zone blocks in the block model. This value is based on the McDonald Speijers resource report from 2006.
Table 13-17: Bulk Density Data and Average or Assigned Values
|
|
|
|
|
|
|
|
|
| Description |
Bulk Density* |
Sample Count |
| Overburden |
1.5 |
0 |
Volcanics (Fresh) |
2.8 |
1 386 |
|
Volcanics (Oxide) |
2.5 |
18 |
Felsic Intrusive (Fresh) |
2.63 |
70 |
Felsic Intrusive (Oxide) |
2.5 |
0 |
Metasediments (Fresh) |
2.7 |
371 |
Metasediments (Oxide) |
2.5 |
17 |
Limited bulk density measurements have been collected at Turkey Creek but are similar to the other zones and therefore a bulk density of 2.5 t/m3 was assigned to the oxide material, and a bulk density of 2.7 t/m3 was assigned to the fresh material. Bulk densities for the Blackard and Scanlan deposits were assigned to blocks based on their mineralogical domains, as shown in Table 13-18. The density determinations were derived from a limited, but relatively consistent, set of measurements completed during exploration and metallurgical testing. The density determinations were derived from over 618 historical data records (sourced from previous project operators) and the recent completion of 24 bulk sample tests on the Blackard deposit to confirm the historical findings.
Density measurements for the Ivy Ann, Bedford, and Lady Clayre deposits are limited. The oxide zones were assigned a value of 2.11 t/m3, and for the sulphide zones and/or fresh rock a bulk density of 2.58 t/m3 was assigned. Samples from the Bedford deposit suggest a higher density (2.78 t/m3), which should be considered in future work.
Table 13-18: Bulk Density Used for Blackard and Scanlan Deposits
|
|
|
|
|
|
| Description |
Bulk Density |
Oxide zone |
2.08 |
Copper zone |
2.18 |
Transition zone |
2.35 |
Sulphide zone |
2.50 |
|
Effective date: 30 June 2023
110
Technical Report Summary of the
Eva Copper Project, North West Queensland, Australia
|
|
|
| Figure 13-14: Little Eva Bulk Density Histograms |
Note: For all samples (top), volcanic rocks (2nd from top), metasediments (3rd from top), felsic intrusive (bottom)
Effective date: 30 June 2023
111
Technical Report Summary of the
Eva Copper Project, North West Queensland, Australia
13.6Variography
A review of the Little Eva deposit variography was undertaken by SRK South Africa and both downhole and directional Gaussian variograms were generated on assay data within each of the three domains. Indicator variograms were run on eight indicators for each of the three domains at Little Eva , for both copper and gold. A review of the Turkey Creek and Blackard deposit variography was undertaken by SRK Perth and both downhole and directional variograms were generated on assay data within each of the domains. Variography was only undertaken on the other deposits to investigate data continuity within the larger domains, but kriging interpolations were not used due to the limited size and shape of most of the domains and an ID2 interpolation was used.
Variography is required to provide the necessary inputs to use the ordinary kriging (OK) method of interpolation. The semi-variogram is used to determine the spatial continuity of mineralization in 3D. The direction with the best continuity is referred to as the major axis, with the semi-major being the next-best direction of continuity, and the minor being the direction of least continuity in an orthogonal coordinate system. Semi-variograms provide measurements of three components of continuity: the nugget, the sill, and the range. The nugget is a measure of the randomness of samples, or put another way, the variability between samples over very short distances. There is an implicit assumption in grade modelling of mineral deposits that a spatial relationship exists between samples, and that this relationship is stronger between closely spaced samples but diminishes with increasing distance between samples. The sill is a measure of the point at which the maximum variability between samples is reached and this distance is referred to as the range. In addition to the variogram axes, nugget, sill, and range, the curve of the semi-variogram is modelled, and the type of model (e.g., spherical, exponential) is also used by the kriging program during interpolation.
3D analysis and the resulting semi-variograms were produced for copper in all the Little Eva domains. Geometric anisotropy was demonstrated in most cases, and nested exponential models were fitted to the data. Variogram maps, generated by the process of determining the orientations of maximum mineralization continuity and the appropriate lag distances, are displayed in Figure 13-15 and Figure 13-16. An example of a variogram (in Gaussian space) is provided in Figure 13-17 and the variogram parameters for Little Eva are summarized in the Table 13-19 for copper and Table 13-20 for gold.
|
|
|
| Figure 13-15: Variogram for Little Eva |
Note: These variograms are in Gaussian space, the parameters are transformed back to normal space before use.
Effective date: 30 June 2023
112
Technical Report Summary of the
Eva Copper Project, North West Queensland, Australia
|
|
|
| Figure 13-16: Variograms for Central (top) and South (Bottom) Domains of the Little Eva Deposit |
Note: Both domains show high nugget, but consistent variograms.
Effective date: 30 June 2023
113
Technical Report Summary of the
Eva Copper Project, North West Queensland, Australia
|
|
|
| Figure 13-17: Gold Variograms for the North Domain |
Note: Very high Nugget values
|
|
|
| Figure 13-18: Gold Variogram for the Central Domain |
Note: Relatively High Nugget Values, and a Range of around 45-100 m
Effective date: 30 June 2023
114
Technical Report Summary of the
Eva Copper Project, North West Queensland, Australia
Table13-19:Copper indicator semi-variogram models for Little Eva.
|
|
|
|
|
|
|
|
|
|
|
|
|
|
|
|
|
|
|
|
|
|
|
|
|
|
|
|
|
|
|
|
|
|
|
|
|
|
|
|
|
|
|
|
|
|
|
|
|
|
|
| Domain |
Variable |
Indicator |
Nugget |
Dip |
Dip Azimuth |
Pitch |
Struct |
Sill 1 |
Range - Major (m) |
Range - Semi (m) |
Range - Minor (m) |
Struct |
Sill 2 |
Range - Major (m) |
Range - Semi (m) |
Range - Minor (m) |
| North |
Cu |
0.02% |
0.0108 |
50 |
100 |
250 |
Spherical |
0.0026 |
16.85 |
65 |
18 |
Spherical |
0.0105 |
94.93 |
130 |
28.33 |
| North |
Cu |
0.17% |
0.1268 |
50 |
100 |
250 |
Spherical |
0.0578 |
31.92 |
65.85 |
15.24 |
Spherical |
0.0376 |
203.42 |
180.35 |
203.42 |
| North |
Cu |
0.24% |
0.1385 |
50 |
100 |
250 |
Spherical |
0.0848 |
34.89 |
57.38 |
17.95 |
Spherical |
0.0139 |
5 |
109.13 |
134.19 |
| North |
Cu |
0.30% |
0.1132 |
50 |
100 |
250 |
Spherical |
0.1096 |
12.71 |
16.63 |
12.92 |
Spherical |
0.0184 |
74.38 |
87.31 |
67 |
| North |
Cu |
0.43% |
0.1081 |
50 |
100 |
250 |
Spherical |
0.1083 |
15.83 |
16.63 |
12.92 |
Spherical |
0.0059 |
66.01 |
87.31 |
67 |
| North |
Cu |
0.98% |
0.0641 |
50 |
100 |
250 |
Spherical |
0.0569 |
11.97 |
10.63 |
10.92 |
Spherical |
0.0122 |
82.54 |
35 |
67 |
| North |
Cu |
1.14% |
0.0772 |
50 |
100 |
250 |
Spherical |
0.0281 |
15.45 |
22 |
18 |
Spherical |
0.0173 |
174.61 |
8.75 |
25 |
| North |
Cu |
1.27% |
0.0704 |
50 |
100 |
250 |
Spherical |
0.0215 |
15.06 |
24.81 |
12 |
Spherical |
0.0176 |
129.24 |
22.78 |
25 |
| Central |
Cu |
0.02% |
0.0021 |
80 |
260 |
260 |
Spherical |
0.0046 |
14.07 |
6.96 |
25 |
Spherical |
0.0004 |
100 |
100 |
28 |
| Central |
Cu |
0.17% |
0.1323 |
80 |
260 |
260 |
Spherical |
0.0607 |
14 |
14 |
32.65 |
Spherical |
0.013 |
131.59 |
97.06 |
87.88 |
| Central |
Cu |
0.24% |
0.1698 |
80 |
260 |
260 |
Spherical |
0.0518 |
17.95 |
14 |
23.26 |
Spherical |
0.0231 |
110.74 |
72.8 |
36.39 |
| Central |
Cu |
0.30% |
0.1828 |
80 |
260 |
260 |
Spherical |
0.0386 |
23.62 |
39.73 |
25.98 |
Spherical |
0.0265 |
77.19 |
51.21 |
14 |
| Central |
Cu |
0.43% |
0.1493 |
80 |
260 |
260 |
Spherical |
0.0246 |
22 |
25 |
10 |
Spherical |
0.0444 |
49.27 |
45 |
25 |
| Central |
Cu |
0.98% |
0.0662 |
80 |
260 |
260 |
Spherical |
0.0223 |
24.13 |
38.99 |
12 |
Spherical |
0.0139 |
49.39 |
60 |
37 |
| Central |
Cu |
1.14% |
0.0533 |
80 |
260 |
260 |
Spherical |
0.021 |
25.11 |
14.81 |
14 |
Spherical |
0.0067 |
23.67 |
278.94 |
24.07 |
| Central |
Cu |
1.27% |
0.0448 |
80 |
260 |
260 |
Spherical |
0.0224 |
32.18 |
28 |
14 |
Spherical |
0.0047 |
14 |
60 |
38 |
| South |
Cu |
0.02% |
0.0018 |
70 |
240 |
270 |
Spherical |
0.0029 |
4.8 |
24 |
22 |
Spherical |
0.001 |
33.37 |
55 |
45 |
| South |
Cu |
0.17% |
0.1665 |
70 |
240 |
270 |
Spherical |
0.0736 |
34 |
23.96 |
15 |
Spherical |
0.004 |
121.81 |
58.62 |
22 |
| South |
Cu |
0.24% |
0.1599 |
70 |
240 |
270 |
Spherical |
0.0707 |
37.68 |
23.96 |
19.52 |
Spherical |
0.0038 |
121.81 |
58.62 |
147.13 |
| South |
Cu |
0.30% |
0.1344 |
70 |
240 |
270 |
Spherical |
0.0368 |
27.81 |
8 |
18.51 |
Spherical |
0.0332 |
80.17 |
25 |
38.11 |
| South |
Cu |
0.43% |
0.1027 |
70 |
240 |
270 |
Spherical |
0.0209 |
26.83 |
8.37 |
25 |
Spherical |
0.0132 |
79.99 |
17 |
44 |
| South |
Cu |
0.98% |
0.0184 |
70 |
240 |
270 |
Spherical |
0.0018 |
7 |
9 |
9.46 |
Spherical |
0.0135 |
25 |
12 |
26.83 |
| South |
Cu |
1.14% |
0.0066 |
70 |
240 |
270 |
Spherical |
0.0115 |
8.04 |
5 |
13.08 |
Spherical |
0.0056 |
23.1 |
25 |
17 |
| South |
Cu |
1.27% |
0.0015 |
70 |
240 |
270 |
Spherical |
0.0142 |
6.51 |
8.89 |
20.14 |
Spherical |
0.005 |
33.06 |
16 |
29.31 |
Effective date: 30 June 2023
115
Technical Report Summary of the
Eva Copper Project, North West Queensland, Australia
13.7Grade Interpolation
Grade interpolation is dependent on the deposit being modelled. Little Eva was modelled by SRK South Africa estimated using Isatis.Neo and was estimated using Multiple Indicator Kriging with the etype average written to the Cu and Au fields. Blackard and Turkey Creek were modelled by SRK Perth, Australia and was estimated using Ordinary Kriging and dynamic aniostropy. For all other deposits, the grade interpolation was carried out with Gemcom software by CMMC and were interpolated using ID2 methods. Copper and gold (where appropriate) were interpolated within “3D solids models” that enclose the mineralized area below overburden. Both Blackard and Turkey Creek domains were templated on the previously defined 3D models from CMMC geologists. The Little Eva 3D geological model was build by Harmony using Leapfrog Geo software and was based on detailed analysis of the composite data and the regional geology. The Scanlan deposit was created by CMMC and was designed to outline interpreted fold geometry and provide reasonable geological limits to linear interpolations. Interpolation of the Bedford deposit was constrained by an outer grade- shell, while the two southern deposits, Lady Clayre and Ivy Ann, were interpolated unconstrained due to poorly understood geometry of controls on mineralization.
Boundaries between domains in the Little Eva deposit were hard boundaries, where the search ellipse can not use data across the boundary, the outer boundaries were also hard. For all blocks that were estimated by MIK within the Little Eva deposit, the interpolation was conducted in a series of three passes with the dimensions and orientations of the search ellipsoid in each pass related to the semi-variogram parameters listed in Table 13-19 and Table 13-20. Blackard and Turkey Creek were estimated using Ordinary Kriging and used dynamic anisotropy to ensure the folded grade trends are modelled. All the other deposits, which were interpolated with ID2 methods, blocks were also estimated with three passes of increasing search size to ensure the models are fully estimated.
The search ellipsoid is defined by three orthogonal axis which are given lengths and orientations which reflects the interpreted continuity of mineralization in each domain (Figure 13-19). Thus, the shape of the search ellipse attempts to mimic the anisotropy of mineralization in each structural domain for each deposit. Orientation and dimensions of the searches are listed in tables for each deposit. The search orientations are given as the strike and plunge of the primary and secondary axis, the minor or tertiary axis is not required as it is perpendicular to the plane, which contains the primary and secondary axis. For a block to be estimated it must fit defined criteria of the search ellipse as listed in Table 13-21 for the Little Eva deposit, Table 13-22 for Blackard and Turkey Creek and in subsequent tables for the other deposits. The search criteria include the dimensions of the search ellipse, and the minimum and maximum number of grade composites required collectively, as well as the minimum and maximum number of composites required from any drill hole. The three passes are carried out with increasing dimensions of the search ellipse, to where the resource model is fully informed. The different passes are usually multiples of the average sample distance. For the deposits interpolated with ID2, variography from the larger, structurally linear sections of the deposit was used to provide support for search distances in smaller domains that were determined by a combination of visual inspection of grade distribution and drill spacing. For blocks that did not fit the estimation criteria in the first pass, a second pass was completed with a larger search ellipse. A third and final pass was completed for any blocks that were not interpolated in the first two passes. If a block still is not interpolated by the third pass, then it is left blank. A maximum number of composites per drill hole is specified to ensure that an appropriate amount of data form adjacent drill holes is used. The maximum number of composites used per drillhole is typically a maximum of 3 or 6 composites from any particular drill hole. Criteria for the interpolations within each deposit are listed in Table 13-24 through Table 13-29.
Effective date: 30 June 2023
116
Technical Report Summary of the
Eva Copper Project, North West Queensland, Australia
Table 13-20: Gold indicator semi-variogram models
|
|
|
|
|
|
|
|
|
|
|
|
|
|
|
|
|
|
|
|
|
|
|
|
|
|
|
|
|
|
|
|
|
|
|
|
|
|
|
|
|
|
|
|
|
|
|
|
|
|
|
| Domain |
Variable |
Indicator |
Nugget |
Dip (°) |
Dip Azimuth (°) |
Pitch (°) |
Struct |
Sill 1 |
Range - Major (m) |
Range - Semi (m) |
Range - Minor (m) |
Struct |
Sill 2 |
Range - Major (m) |
Range - Semi (m) |
Range - Minor (m) |
| North |
Au |
0.007 g/t |
0.0573 |
50 |
100 |
250 |
Spherical |
0.0438 |
44.96 |
71.21 |
28.97 |
Spherical |
0.0064 |
266.39 |
74.69 |
8.12 |
| North |
Au |
0.020 g/t |
0.1026 |
50 |
100 |
250 |
Spherical |
0.0726 |
37.71 |
80.27 |
18.64 |
Spherical |
0.0199 |
203.43 |
5.58 |
45 |
| North |
Au |
0.040 g/t |
0.1437 |
50 |
100 |
250 |
Spherical |
0.0663 |
30.39 |
63.4 |
16.16 |
Spherical |
0.042 |
203.43 |
107.79 |
170.24 |
| North |
Au |
0.081 g/t |
0.1197 |
50 |
100 |
250 |
Spherical |
0.0866 |
35.4 |
14.16 |
17.61 |
Spherical |
0.0198 |
402.89 |
131.13 |
402.89 |
| North |
Au |
0.131 g/t |
0.0902 |
50 |
100 |
250 |
Spherical |
0.0295 |
14.46 |
12 |
10 |
Spherical |
0.0278 |
79.97 |
37.04 |
35 |
| North |
Au |
0.155 g/t |
0.0838 |
50 |
100 |
250 |
Spherical |
0.0178 |
78.53 |
23.36 |
12 |
Spherical |
0.018 |
13.8 |
35 |
31.24 |
| North |
Au |
0.160 g/t |
0.0857 |
50 |
100 |
250 |
Spherical |
0.016 |
78.95 |
23.25 |
22 |
Spherical |
0.0111 |
14.27 |
35 |
35 |
| North |
Au |
0.190 g/t |
0.0622 |
50 |
100 |
250 |
Spherical |
0.0085 |
61 |
21.59 |
10 |
Spherical |
0.0159 |
7.57 |
23.23 |
25 |
| Central |
Au |
0.007 g/t |
0.0756 |
90 |
160 |
290 |
Spherical |
0.0234 |
24.12 |
80 |
6 |
Spherical |
0.0247 |
65.41 |
12 |
14 |
| Central |
Au |
0.020 g/t |
0.1555 |
90 |
160 |
290 |
Spherical |
0.0347 |
42 |
24.97 |
8 |
Spherical |
0.0234 |
120 |
121.54 |
24 |
| Central |
Au |
0.040 g/t |
0.1603 |
90 |
160 |
290 |
Spherical |
0.0796 |
38.63 |
14 |
14 |
Spherical |
0.0096 |
284.84 |
43.15 |
48 |
| Central |
Au |
0.081 g/t |
0.1218 |
90 |
160 |
290 |
Spherical |
0.0352 |
19.46 |
18.35 |
14.55 |
Spherical |
0.0312 |
63 |
36 |
40 |
| Central |
Au |
0.131 g/t |
0.0787 |
90 |
160 |
290 |
Spherical |
0.0279 |
28.36 |
10 |
14.08 |
Spherical |
0.0109 |
73.3 |
43.44 |
25 |
| Central |
Au |
0.155 g/t |
0.0648 |
90 |
160 |
290 |
Spherical |
0.0214 |
26.37 |
14 |
14 |
Spherical |
0.0096 |
63.1 |
14 |
52 |
| Central |
Au |
0.160 g/t |
0.0629 |
90 |
160 |
290 |
Spherical |
0.0199 |
27.39 |
14 |
14 |
Spherical |
0.0093 |
60.49 |
14 |
48 |
| Central |
Au |
0.190 g/t |
0.05 |
90 |
160 |
290 |
Spherical |
0.0153 |
20.53 |
14 |
8 |
Spherical |
0.0094 |
61.02 |
49 |
25 |
| South |
Au |
0.007 g/t |
0.0485 |
70 |
240 |
280 |
Spherical |
0.0283 |
26.06 |
60 |
8 |
Spherical |
0.0076 |
119.63 |
65 |
21 |
| South |
Au |
0.020 g/t |
0.1072 |
70 |
240 |
280 |
Spherical |
0.0624 |
31.16 |
69.92 |
8 |
Spherical |
0.0371 |
108.46 |
104 |
17 |
| South |
Au |
0.040 g/t |
0.1147 |
70 |
240 |
280 |
Spherical |
0.0806 |
31.05 |
11.11 |
8 |
Spherical |
0.0586 |
88.57 |
113 |
31 |
| South |
Au |
0.081 g/t |
0.1156 |
70 |
240 |
280 |
Spherical |
0.0376 |
19.74 |
8 |
18.03 |
Spherical |
0.0288 |
47.52 |
35 |
25 |
| South |
Au |
0.131 g/t |
0.0673 |
70 |
240 |
280 |
Spherical |
0.0205 |
5.76 |
21.7 |
8 |
Spherical |
0.0104 |
23.13 |
25 |
21 |
| South |
Au |
0.155 g/t |
0.023 |
70 |
240 |
280 |
Spherical |
0.0376 |
6.11 |
11.26 |
9.12 |
Spherical |
0.015 |
23.17 |
21.98 |
23 |
| South |
Au |
0.160 g/t |
0.0213 |
70 |
240 |
280 |
Spherical |
0.0348 |
6.11 |
8 |
11 |
Spherical |
0.0139 |
23.17 |
21.98 |
23 |
| South |
Au |
0.190 g/t |
0.0151 |
70 |
240 |
280 |
Spherical |
0.0246 |
6.11 |
8 |
11 |
Spherical |
0.011 |
23.17 |
15 |
15 |
Effective date: 30 June 2023
117
Technical Report Summary of the
Eva Copper Project, North West Queensland, Australia
Table 13-21: Search Ellipse for Interpolation for Little Eva
|
|
|
|
|
|
|
|
|
|
|
|
|
|
|
|
|
|
|
|
|
|
|
|
|
|
|
|
|
|
|
|
|
|
|
|
|
Domain
|
No. Sectors |
Dip |
Dip Azi |
Pitch |
Z
(m)
|
Min Samp |
Max Samp |
Max/Hole |
Search Major |
Search Int. |
Search Minor |
Cu % North |
4 |
80 |
260 |
|
260 |
|
20 |
6 |
|
10 |
|
6 |
|
65 m |
65 m |
20 m |
Cu % Central |
4 |
50 |
100 |
|
250 |
|
30 |
6 |
|
10 |
|
6 |
|
65 m |
65 m |
20 m |
Cu % South |
4 |
70 |
240 |
|
270 |
|
40 |
6 |
|
10 |
|
6 |
|
65 m |
65 m |
20 m |
Au g/t North |
4 |
50 |
100 |
|
250 |
|
20 |
6 |
|
8 |
|
6 |
|
65 m |
65 m |
20 m |
Au g/t Central |
4 |
90 |
160 |
|
290 |
|
30 |
6 |
|
10 |
|
6 |
|
65 m |
65 m |
20 m |
Au g/t South |
4 |
70 |
240 |
|
280 |
|
40 |
6 |
|
10 |
|
6 |
|
65 m |
65 m |
20 m |
Note: Rotation is Geological dip, dip direction and pitch inside the plane from the north. A second pass was run for all domains where search ranges were doubled, all other parameters stayed the same.
Effective date: 30 June 2023
118
Technical Report Summary of the
Eva Copper Project, North West Queensland, Australia
|
|
|
| Figure 13-19: Oblique View of the Little Eva estimation domains, with major structures |
Note: Estimation domains are North = blue, Central = yellow and South = green.
Effective date: 30 June 2023
119
Technical Report Summary of the
Eva Copper Project, North West Queensland, Australia
|
|
|
| Figure 13-20: Little Eva Deposit Plan View of Colour-Coded Block Grades at 120 m Elevation |
Note: Two benches below the top of the sulphide zone.
Effective date: 30 June 2023
120
Technical Report Summary of the
Eva Copper Project, North West Queensland, Australia
|
|
|
| Figure 13-21: Cross-Section 7,772,100 mN (see plan above) Displaying Colour-Coded Block Grades |
Note: See above plan for location
At Turkey Creek, assay data above 0.01% Cu was examined and an inflection in the data distribution on the cumulative probability plot was noted at approximately 0.2% Cu. This confirms Altona’s application of a 0.2% nominal grade for interpretation of a grade-shell outlining the copper mineralization.
The original CMMC wireframe models were redigitised by SRK(WA) resulting in an improved copper mineralization domain at Turkey Creek. Mineralization within the Southern zone is generally tabular and is oriented north-south with dips at 60° to the east. At the northern end of the deposit, the strike of the mineralization swings sharply towards the east and dips steeply south: this zone is referred to as the Northern fold area and was estimated using dynamic anisotropy. The mineralization within the Southern zone is truncated to the south and north by fault zones, (Figure 13-22). The mineralization within the Southern zone contains both hanging wall and footwall zones, with a narrow band of low-grade or waste between them. There is evidence of lower grade mineralization within the central part of the Northern fold area; however, drilling is too widely spaced to permit a robust interpretation of that horizon.
Effective date: 30 June 2023
121
Technical Report Summary of the
Eva Copper Project, North West Queensland, Australia
|
|
|
| Figure 13-22: Wire framed Domains for the Turkey Creek Deposit |
Table 13-22: Search Criteria for Interpolation for Turkey Creek and Blackard
|
|
|
|
|
|
|
|
|
|
|
|
|
|
|
|
|
|
|
|
|
Deposit |
Pass |
Search |
|
Turkey Creek |
| Radius (m) |
Dip Direction |
Min Samp |
Max Samp |
Max/Hole |
Blackard |
1 |
50x50x10 |
DA |
8 |
24 |
8 |
2 |
100x100x10 |
DA |
8 |
24 |
8 |
3 |
200x200x20 |
DA |
6 |
24 |
8 |
Turkey Creek |
1 |
50x50x10 |
DA |
8 |
24 |
8 |
2 |
100x100x10 |
DA |
8 |
24 |
8 |
3 |
150x200x15 |
DA |
4 |
24 |
8 |
Note: Estimation used Dynamic Anisotropy (DA) where the search parameters are coded into the block model and the search ellipse follows a predetermined trend defined by a wireframe - this wireframe defines the folded nature of the deposit.
Effective date: 30 June 2023
122
Technical Report Summary of the
Eva Copper Project, North West Queensland, Australia
|
|
|
| Figure 13-23: Turkey Creek Cross-Section at 7,771,500N (mid-point of Main Zone) of Colour-Coded Block Grades |
Effective date: 30 June 2023
123
Technical Report Summary of the
Eva Copper Project, North West Queensland, Australia
|
|
|
| Figure 13-24: Turkey Creek Plan View of Colour-Coded Block Grades at 120 m Elevation |
Note: Two benches below the top of the sulphide zone.
Effective date: 30 June 2023
124
Technical Report Summary of the
Eva Copper Project, North West Queensland, Australia
The Blackard deposit was divided into a single folded estimation domain to reflect folded nature of the deposit. To handle the folded nature of the orebody the estimate used dynamic anisotropy, a limited the number of composites from a single drill hole was also used, and the block grades reliably reflect grade changes within the drill holes. The estimation domains are illustrated in a plan view in Figure 13-25. Drill spacing at depth was insufficient to meet the distance requirements of the interpolation, even for the Inferred category, and therefore block grades were not estimated; however, the areas with insufficient drill density for estimation are generally will below the designed pit shell. Specifying the number of grade composites used by the search ellipse during the interpolation is used both to ensure a requisite number of drill holes are used for a particular classification, and also to limit the composites used to preserve sharp grade changes.
|
|
|
| Figure 13-25: Structural Domains of the Blackard Deposit in Plan |
Note: Copper mineralogy domains are displayed in Figure 14-20
Effective date: 30 June 2023
125
Technical Report Summary of the
Eva Copper Project, North West Queensland, Australia
|
|
|
| Figure 13-26: Blackard Deposit Cross-Section at 7,765,150N |
Notes: Colour-coded block grades within model can be compared to drill hole grades (bold).
The Scanlan deposit is folded so that there are generally three different dip directions of mineralization across the deposit, which together with some fault offsets and changes in the deposit strike orientation results in multiple domains as illustrated in Figure 13-27. The smaller Bedford, Lady Clayre, and Ivy Ann deposits were estimated with just 2 or 3 domains, all interpolation parameters for these smaller deposits are listed in Tables 13-24 through to 13-29. Given these deposits are not material to the operation they are not covered in depth here.
Effective date: 30 June 2023
126
Technical Report Summary of the
Eva Copper Project, North West Queensland, Australia
|
|
|
| Figure 13-27: Plan View of the Scanlan Deposit with Structural Domains Displayed |
Note: Each domain has differing mineralization trends which required corresponding search orientations for block grade interpolation. Details of the interpolation ellipse orientation are provided in Table 13-25.
Effective date: 30 June 2023
127
Technical Report Summary of the
Eva Copper Project, North West Queensland, Australia
Table 13-23: Search Criteria for Interpolation for the Scanlan Deposit
|
|
|
|
|
|
|
|
|
|
|
|
|
|
|
|
|
|
|
|
|
|
|
|
|
|
|
|
|
|
|
|
|
|
|
|
Structural Domains |
Class |
X (m) |
Y (m) |
Z (m) |
Mini. No. Comp. |
Max. No. Comp. |
Max. No. Comp./DH |
1st Azimuth |
Plunge |
2nd Azimuth |
Plunge |
|
110
|
Measured |
40 |
5 |
70 |
9 |
16 |
4 |
330
|
0
|
60
|
-60
|
| Indicated |
60 |
7 |
80 |
7 |
16 |
4 |
| Inferred |
80 |
10 |
90 |
5 |
12 |
4 |
|
120
|
Measured |
40 |
5 |
70 |
9 |
16 |
4 |
330
|
0
|
240
|
-60
|
| Indicated |
60 |
7 |
80 |
7 |
16 |
4 |
| Inferred |
80 |
10 |
90 |
5 |
12 |
4 |
|
130
|
Measured |
45 |
6 |
80 |
9 |
16 |
4 |
330
|
0
|
240
|
0
|
| Indicated |
60 |
8 |
100 |
7 |
16 |
4 |
| Inferred |
75 |
12 |
120 |
5 |
12 |
4 |
|
140
|
Measured |
40 |
5 |
70 |
9 |
16 |
4 |
355
|
0
|
265
|
0
|
| Indicated |
60 |
7 |
80 |
7 |
16 |
4 |
| Inferred |
80 |
10 |
90 |
5 |
12 |
4 |
|
150
|
Measured |
50 |
6 |
80 |
9 |
16 |
4 |
355
|
0
|
265
|
-60
|
| Indicated |
70 |
8 |
100 |
7 |
16 |
4 |
| Inferred |
90 |
12 |
120 |
5 |
12 |
4 |
|
160
|
Measured |
45 |
5 |
80 |
9 |
16 |
4 |
355
|
0
|
265
|
0
|
| Indicated |
65 |
7 |
90 |
7 |
16 |
4 |
| Inferred |
85 |
10 |
100 |
5 |
12 |
4 |
|
170
|
Measured |
50 |
6 |
80 |
9 |
16 |
4 |
12
|
0
|
282
|
-60
|
| Indicated |
60 |
8 |
90 |
7 |
16 |
4 |
| Inferred |
80 |
10 |
100 |
5 |
12 |
4 |
|
180
|
Measured |
40 |
5 |
70 |
9 |
16 |
4 |
12
|
0
|
282
|
0
|
| Indicated |
60 |
7 |
80 |
7 |
16 |
4 |
| Inferred |
80 |
10 |
90 |
5 |
12 |
4 |
|
190
|
Measured |
45 |
6 |
80 |
9 |
16 |
4 |
12
|
0
|
102
|
-40
|
| Indicated |
70 |
8 |
100 |
7 |
16 |
4 |
| Inferred |
95 |
12 |
120 |
5 |
12 |
4 |
|
200
|
Measured |
40 |
5 |
70 |
9 |
16 |
4 |
12
|
0
|
282
|
-55
|
| Indicated |
60 |
7 |
80 |
7 |
16 |
4 |
| Inferred |
80 |
10 |
90 |
5 |
12 |
4 |
|
210
|
Measured |
45 |
6 |
80 |
9 |
16 |
4 |
12
|
0
|
102
|
-70
|
| Indicated |
70 |
8 |
90 |
7 |
16 |
4 |
| Inferred |
90 |
12 |
120 |
5 |
12 |
4 |
Effective date: 30 June 2023
128
Technical Report Summary of the
Eva Copper Project, North West Queensland, Australia
|
|
|
| Figure 13-28: Cross-Section of Scanlan Deposit with Drill Hole, Block Grades and Mineralisation zones displayed |
Table 13-24: Search Criteria for Interpolation for the Bedford Deposit
|
|
|
|
|
|
|
|
|
|
|
|
Pass |
Criteria |
Bedford |
North |
South |
|
Indicated
|
Minimum No. of Composites |
4 |
4 |
Maximum No. of Composites |
12 |
12 |
Maximum No of Composites/Hole |
3 |
3 |
|
Inferred
|
Minimum No. of Composites |
4 |
4 |
Maximum No. of Composites |
12 |
12 |
Maximum No. of Composites/Hole |
3 |
3 |
Table 13-25: Search Ellipse Parameters by Domain for the Bedford Deposit
|
|
|
|
|
|
|
|
|
|
|
|
|
|
|
|
|
|
|
|
|
|
|
|
|
|
|
|
|
|
Domain |
Pass |
Class |
X
(m)
|
Y
(m)
|
Z
(m)
|
1st Azimuth |
Plunge |
2nd Azimuth |
Plunge |
| North |
1 |
Indicated |
9 |
40 |
20 |
|
|
|
|
2 |
Inferred |
15 |
60 |
30 |
0 |
0 |
270 |
-70 |
| South |
1 |
Indicated |
9 |
40 |
20 |
|
|
|
|
2 |
Inferred |
15 |
60 |
30 |
|
|
|
|
Note: *Gems Search anisotropy: Azimuth, Dip, Azimuth
Table 13-26: Search Criteria for Interpolation for the Lady Clayre Deposit
|
|
|
|
|
|
|
|
|
|
|
|
|
Pass
|
Criteria
|
Lady Clayre |
East |
West |
|
Measured
|
Minimum No. of Composites |
5 |
5 |
Maximum No. of Composites |
15 |
15 |
Maximum No. of Composites/Hole |
3 |
3 |
|
Indicated
|
Minimum No. of Composites |
5 |
5 |
Maximum No. of Composites |
15 |
15 |
Maximum No. of Composites/Hole |
3 |
3 |
|
Inferred
|
Minimum No. of Composites |
5 |
5 |
Maximum No. of Composites |
15 |
15 |
Maximum No. of Composites/Hole |
3 |
3 |
Effective date: 30 June 2023
129
Technical Report Summary of the
Eva Copper Project, North West Queensland, Australia
Table 13-27: Search Ellipse Parameters by Domain for the Lady Clayre Deposit
|
|
|
|
|
|
|
|
|
|
|
|
|
|
|
|
|
|
|
|
|
|
|
|
|
|
|
|
|
|
Domain |
Pass |
Class |
X (m) |
Y (m) |
Z (m) |
1st Azimuth |
Plunge |
2nd Azimuth |
Plunge |
|
East (77)
|
1 |
Measured |
25 |
30 |
10 |
|
|
|
|
2 |
Indicated |
30 |
37.5 |
12.5 |
35 |
0 |
305 |
-45 |
3 |
Inferred |
50 |
60 |
25 |
|
|
|
|
|
West (66)
|
1 |
Measured |
25 |
30 |
10 |
|
|
|
|
2 |
Indicated |
30 |
37.5 |
12.5 |
345 |
0 |
255 |
-50 |
3 |
Inferred |
50 |
60 |
25 |
|
|
|
|
Note: see Table 24-21 for orientation information
Table 13-28: Search Criteria for Interpolation for the Ivy Ann Deposit
|
|
|
|
|
|
|
|
|
|
|
|
Pass |
Criteria |
Ivy Ann |
Ivy Ann |
Ivy Ann North |
|
Measured
|
Minimum No. of Composites |
5 |
5 |
Maximum No. of Composites |
15 |
15 |
Maximum No. of Composites/Hole |
3 |
3 |
|
Indicated
|
Minimum No. of Composites |
5 |
5 |
Maximum No. of Composites |
15 |
15 |
Maximum No. of Composites/Hole |
3 |
3 |
|
Inferred
|
Minimum No. of Composites |
5 |
5 |
Maximum No. of Composites |
15 |
15 |
Maximum No. of Composites/Hole |
3 |
3 |
Table 13-29: Search Ellipse Parameters by Domain for the Ivy Ann Deposit
|
|
|
|
|
|
|
|
|
|
|
|
|
|
|
|
|
|
|
|
|
|
|
|
|
|
|
|
|
|
Domain |
Pass |
Class |
X
(m)
|
Y
(m)
|
Z
(m)
|
Principal Azimuth |
Principal Plunge |
Intermediate Azimuth |
Intermediate Plunge |
|
Ivy Ann South
|
1 |
Measured |
20 |
25 |
5 |
26
|
0
|
116
|
-46
|
2 |
Indicated |
40 |
45 |
20 |
3 |
Inferred |
70 |
80 |
40 |
|
Ivy Ann North
|
1 |
Measured |
20 |
25 |
5 |
35
|
0
|
125
|
-80
|
2 |
Indicated |
40 |
45 |
20 |
3 |
Inferred |
70 |
80 |
40 |
Note: *Gems Search anisotropy: Azimuth, Dip, Azimuth
13.8Classification and Mineral Resource Statement
Estimated blocks within the different deposit models were tabulated between an upper and lower surface. For the sulphide part of the deposits, the upper surface was the base of the oxide or top of the sulphide zone boundary, and the lower surface was the constraining Whittle pit shell.
The constraining pit shells for defining the limits of Inferred resources and to define reasonable prospects for economic extraction are based on copper prices, costs and metallurgical recoveries determined from work carried out, and described, in this report. Resources were constrained by Whittle pit shells generated using metal prices of US$3.70/lb Cu, US$1,582/oz Au and an exchange rate of 0.70 AU$:US$. The Whittle shell was based on the following parameters:
•Plant throughput of 11.4 Mtpa, with a mining rate of 60 Mtpa
•A mining reference cost of AU$2.97/tonne, incremented at AU$0.12/vertical 10m.
•Approximately AU$9.00/t Ore processing cost.
•Ore Haulage cost of AU$0.35/t/km
•Slope angles informed by historic studies with an average of 43 degrees.
•Copper Recovery 84% (25% Native Copper blend, recoveries of 63% Native Copper and 95% Sulphide.)
•A 10mx10mx10m diluted block model.
For the copper-only deposits, the blocks were tabulated between surfaces defined by the base of the oxide zone, base of copper zone, base of transition zone, and the constraining resource shell.
Effective date: 30 June 2023
130
Technical Report Summary of the
Eva Copper Project, North West Queensland, Australia
Classification of the resources is based on definitions from SAMREC (2016) in accordance with Subpart 1300 of Regulation S-K. Classification was completed using wireframes that outlined regions of similar support, geological continuity and estimation strength (based on average search distances and estimate robustness via Kriging slope of regression and Kriging variance). There were no Measured Resources declared as the QP felt the data support did not warrant a Measured classification in this instance, as Indicated Resources are adequate for mine studies. Resources are reported at a 0.17% Cu cut-off by deposit type and a classification of Indicated and inferred resources for each deposit are reported in Table 13-30.
Table 13-30: Eva Copper Project Resources by Category and Deposit at 0.17% Cu Cut-off Grade
|
|
|
|
|
|
|
|
|
|
|
|
|
|
|
|
|
|
|
Tonnes (kt) |
Cu Grade (% Cu) |
Au Grade (g/t) |
Cu Pounds (Mlb) |
Au Ounces (koz) |
| Measured |
|
|
|
|
|
Little Eva |
— |
|
— |
|
— |
|
— |
|
— |
|
Turkey Creek |
— |
|
— |
|
— |
|
— |
|
— |
|
Blackard |
— |
|
— |
|
— |
|
— |
|
— |
|
Scanlan |
— |
|
— |
|
— |
|
— |
|
— |
|
| Bedford |
— |
|
— |
|
— |
|
— |
|
— |
|
Lady Clayre |
— |
|
— |
|
— |
|
— |
|
— |
|
Ivy Ann |
— |
|
— |
|
— |
|
— |
|
— |
|
Total Measured |
— |
|
— |
|
— |
|
— |
|
— |
|
| Indicated |
|
|
|
|
|
Little Eva |
136 114 |
|
0.39 |
|
0.07 |
|
1 168 |
|
302 |
|
Turkey Creek |
25 417 |
|
0.45 |
|
— |
|
253 |
|
— |
|
Blackard |
82 538 |
|
0.45 |
|
— |
|
826 |
|
— |
|
Scanlan |
18 228 |
|
0.38 |
|
— |
|
225 |
|
— |
|
| Bedford |
2 658 |
|
0.60 |
|
0.15 |
|
35 |
|
13 |
|
Lady Clayre |
5 097 |
|
0.38 |
|
0.15 |
|
42 |
|
24 |
|
Ivy Ann |
5 202 |
|
0.34 |
|
0.07 |
|
39 |
|
12 |
|
Total Indicated |
275 254 |
|
0.43 |
|
0.07 |
|
2 589 |
|
352 |
|
Measured + Indicated |
Little Eva |
136 114 |
|
0.39 |
|
0.07 |
|
1 168 |
|
302 |
|
Turkey Creek |
25 417 |
|
0.45 |
|
— |
|
253 |
|
— |
|
Blackard |
82 538 |
|
0.45 |
|
— |
|
826 |
|
— |
|
Scanlan |
18 228 |
|
0.38 |
|
— |
|
225 |
|
— |
|
| Bedford |
2 658 |
|
0.60 |
|
0.15 |
|
35 |
|
13 |
|
Lady Clayre |
5 097 |
|
0.38 |
|
0.15 |
|
42 |
|
24 |
|
Ivy Ann |
5 202 |
|
0.34 |
|
0.07 |
|
39 |
|
12 |
|
Total Measured + Indicated |
275 254 |
|
0.43 |
|
0.07 |
|
2 589 |
|
352 |
|
| Inferred |
Little Eva |
31 095 |
|
0.36 |
|
0.06 |
|
246 |
|
64 |
|
Turkey Creek |
2 473 |
|
0.40 |
|
— |
|
22 |
|
— |
|
Blackard |
33 591 |
|
0.43 |
|
— |
|
321 |
|
— |
|
Scanlan |
8 465 |
|
0.37 |
|
— |
|
79 |
|
— |
|
| Bedford |
1 527 |
|
0.46 |
|
0.13 |
|
16 |
|
6 |
|
Lady Clayre |
1 141 |
|
0.37 |
|
0.08 |
|
9 |
|
3 |
|
Ivy Ann |
1 163 |
|
0.33 |
|
0.07 |
|
9 |
|
3 |
|
Total Inferred |
79 455 |
|
0.40 |
|
0.03 |
|
701 |
|
80 |
|
Note:
Mineral Resources
1. SAMREC and Subpart 1300 of Regulation S-K definitions were followed for Mineral Resources.
2. Mineral Resources are exclusive of Mineral Reserves.
3. Mineral Resources are constrained within a Whittle pit shell generated with a copper price of $5.50/lb, a gold price of $1,582/oz and an exchange rate of Aus$0.70 = US$1.00.
4. Density measurements were applied
5. Significant figures have been reduced to reflect uncertainty of estimations and therefore numbers may not add due to rounding.
Effective date: 30 June 2023
131
Technical Report Summary of the
Eva Copper Project, North West Queensland, Australia
Two grade bins will be used to separate waste material from expected low-grade and high-grade mill feed to allow the mine to maximize NPV using a stock-piling strategy. The oxide material overlies all the deposits and carries potentially economic copper grades and was estimated at the same time and with the same methods used for the sulphide material. Oxide resources were tabulated between the bottom of the oxide zone and topographic surface. At present, there is no demonstrated process to economically recover copper from the oxide zones; however, as this oxide material will be removed by mining, it will be stockpiled for potential processing at some future date. Oxide material has been modelled, and will be stockpiled for possible future processing, but not included into the Resource figures nor the Reserve. The oxide material are presented by deposit and classification in Table 13-31.
Table 13-31: Oxide material for the Eva Copper Project
|
|
|
|
|
|
|
|
|
|
|
|
|
|
|
|
|
|
|
Deposit
|
Tonnes (kt) |
Cu (%) |
Au (g/t) |
Cu Pound (Mlb) |
Au Ounces (koz) |
Little Eva |
3 983 |
|
0.40 |
|
0.07 |
|
35 |
|
9 |
|
Blackard |
13 471 |
|
0.37 |
|
— |
|
111 |
|
— |
|
Turkey Creek |
7 468 |
|
0.50 |
|
— |
|
82 |
|
— |
|
| Bedford |
806 |
|
0.46 |
|
0.11 |
|
8 |
|
2 |
|
Lady Clayre |
2 387 |
|
0.27 |
|
0.09 |
|
14 |
|
7 |
|
Scanlan |
1 735 |
|
0.46 |
|
— |
|
18 |
|
— |
|
Total Inferred |
29 851 |
|
0.41 |
|
0.03 |
|
268 |
|
29 |
|
Notes:
Mineral Resource:
1. SAMREC and Subpart 1300 of Regulation S-K definitions were followed for Mineral Resources.
2. Oxide materials are constrained within the same Whittle spatial constraint used to report the Mineral Resources as detailed in section 14.8 above.
3. Density value of 2.5 t/m3 was applied to all oxide zones.
4. Significant figures have been reduced to reflect uncertainty of estimations and therefore numbers may not add due to rounding.
The Eva Project hosts additional copper-only deposits that have received exploration attention in the past for which historical resource estimates exist as listed in Table 13-32. These copper-only deposits are similar to the Blackard and Scanlan deposits, hosted within the same stratigraphy and with the same deep weathering profiles, containing a mix of copper oxide minerals, native copper and other copper bearing minerals, transitioning to sulphide minerals at depth. Assuming the same processing method that is planned for use with the Blackard and Scanlan deposits, these deposits should be considered for further exploration, in particular the Legend deposit, which is the northern extension of the Blackard system and is proximal to the proposed processing plant.
Effective date: 30 June 2023
132
Technical Report Summary of the
Eva Copper Project, North West Queensland, Australia
|
|
|
| Figure 13-29: Isometric View (looking south) of the Little Eva Resource Block Model at 0.17% Cut-off |
Table 13-32: Historical Resource Estimates for Copper-Only Deposit Mineral Resources
|
|
|
|
|
|
|
|
|
|
|
|
Deposits |
Tonnes (Mt) |
Cu (%) |
Cu Pounds (Mlb) |
| Legend |
17.4 |
0.54 |
|
207 |
Great Southern |
6.0 |
|
0.61 |
|
81 |
| Longamundi |
10.4 |
0.66 |
|
151 |
| Caroline |
3.6 |
0.53 |
|
42 |
Charlie Brown |
0.7 |
0.40 |
|
6 |
| Total |
38.1 |
0.58 |
|
487 |
Notes:
Mineral Resource:
1. Historical Resources should not be relied upon.
2. Significant figures have been reduced to reflect uncertainty of estimations and therefore numbers may not add due to rounding.
13.9Resource Verification
The resource block models were examined for validity and reasonableness by several methods:
•Visual comparison of block grades relative to drill holes on cross-sections
•Comparison of statistical summary of assay, composite, and block grades
•Comparison of different method of interpolations such as OK to ID2 or Nearest Neighbour (NN)
•Comparison to past estimations
A basic method of validation is to compare drill hole composites to adjacent block grades on plans and sections. While this method demonstrates that block grades are reasonable and accurately reflect drill data, since block grades are interpolated from data at some distance from the section, it does not necessarily follow that the block grade will exactly match the proximal drill hole. Additionally, it is not possible to examine every block value, thus this method may only reveal significant problems with an interpolation. Examination of drill hole grades relative to adjacent block grades demonstrates a good degree of correspondence, suggesting that block grades are fairly representing drill hole composites, as illustrated in Figure 13-30 through Figure 13-34.
Effective date: 30 June 2023
133
Technical Report Summary of the
Eva Copper Project, North West Queensland, Australia
Drill hole composites from drilling completed after the Resource was run are plotted for Little Eva along with block grades on a cross-section in Figure 13-30 and are well correlated, indicating that the interpolation is working well in this location. Comparison of mean copper grades from raw assays, drill hole composites, and blocks by each domain from the Little Eva deposit are displayed graphically in Figure 13-33 and Figure 13-34. As would be expected, the mean of the composite grades is lower than the mean grades from the raw samples, whereas mean grades of blocks are lower again. The difference between the mean grade of assays and the mean grades of the blocks is a function of smoothing, sample support and volume variance and indicates the incorporation of lower-grade or barren material as the sample volume is increased. Since data used to estimate block grades is taken from a number of composites within the search ellipse, it is expected that some low-grade or barren material will be incorporated as dilution, a feature that becomes more accentuated by selecting data above the copper cut-off grade (Figure 13-35).
|
|
|
| Figure 13-30: Cross-Section through the North End of the Eva Deposit with Block Grades and Drill Hole Composites from Drilling completed Post Estimation. |
|
|
|
| Figure 13-31: Cross-Section through the Central part of the Eva Deposit with Block Grades and Drill Hole Composites |
Effective date: 30 June 2023
134
Technical Report Summary of the
Eva Copper Project, North West Queensland, Australia
|
|
|
| Figure 13-32: Cross-Section 7,772,000N in Little Eva Deposit |
Note: Illustrates Colour-Coded Drill Hole Composites Relative to block grades in upper image and a close-up (box) with printed grades in lower.
Effective date: 30 June 2023
135
Technical Report Summary of the
Eva Copper Project, North West Queensland, Australia
|
|
|
| Figure 13-33: Mean Assay, Composite, and M&I Block Grades for the Different Resource Domains in the Little Eva Deposit |
|
|
|
| Figure 13-34: Mean Assay, Composite, and Block Grades for Domains in the Little Eva Deposit at a 0.17% Cu Cut-off Grade |
Example swath plots which plot the average grades over a slice width for both the composite grades and the block models are shown for the Little Eva deposit and the Blackard deposit are shown in Figure 13-35. It is expected that the block grades closely match the composite grades, but are slightly more smoothed. This can be seen in the Little Eva plot where the red line of the block model grades closely matches the green of the composites. Also evident in the example from Blackard where the black line of the block estimate closely matches the red of the composite file.
Effective date: 30 June 2023
136
Technical Report Summary of the
Eva Copper Project, North West Queensland, Australia
|
|
|
| Figure 13-35: Examples of Swath plots for Little Eva (top) and Blackard (bottom), showing the block grades replicate the composit grades. |
ID2 interpolations produce similar results to OK methods, particularly when the same composite and block sizes are used; the variation in composite grades is reasonable (CoV <1.7), and the drill hole data is not excessively clustered. As these conditions were generally met by the other deposits, it is reasonable that resource estimates in this report were similar to previous methods where kriging and or other methodology had been used.
Every deposit at the Eva Project was estimated using a variety of methodologies, Little Eva via MIK to combat the stockwork nature of the mineralisation, Blackard and Turkey Creek using Ordinary Kriging and dynamic anisotropyy to account for the folding, and Scanlan, Lady Clayre, Bedford and Ivy Ann using Inverse distance weighting were the variography was not well formed due to sample support. In all cases the models were validated and in the opinion of the QP are robust enough for use in further studies. Overall, the resource estimates for all the deposits within the Eva Copper Project are suitable for further studies.
Effective date: 30 June 2023
137
Technical Report Summary of the
Eva Copper Project, North West Queensland, Australia
14Mineral Reserve Estimates
Not applicable to this report
15Mining Methods
Conventional open pit mining using drill and blast, backhoe excavators and haul trucks is being considered at Eva Copper Project. Work to assess these extraction methods is well advanced. Harmony has engaged with mining contractors to develop benchmark pricing. Optimisations have been run using US$3.70/lb copper price run multiple optimisations that show economic returns before capital is considered.
Geotechnical, and hydrogeological studies have been completed that inform the basis of design for the optimisation.
The QP considers the results of these studies, together with the metallurgy and other modifying factors, satisfies the requirement for reasonable prospect for eventual economic extraction
16Recovery Methods
Not applicable to this report
17Project infrastructure
Not applicable to this report
18Market Studies and Contracts
Not applicable to this report
19Environmental Studies, Permitting and Social or Community Impact
Not applicable to this report
20Capital and Operating Costs
Not applicable to this report
21Economic Analysis
Not applicable to this report
Effective date: 30 June 2023
138
Technical Report Summary of the
Eva Copper Project, North West Queensland, Australia
22Mineral Reserve Estimates
Not applicable to this report
23Mining Methods
Not applicable to this report
24Recovery Methods
Not applicable to this report
25Project infrastructure
Not applicable to this report
26Market Studies and Contracts
Not applicable to this report
27Environmental Studies, Permitting and Social or Community Impact
Not applicable to this report
28Capital and Operating Costs
Not applicable to this report
29Economic Analysis
Not applicable to this report
Effective date: 30 June 2023
139
Technical Report Summary of the
Eva Copper Project, North West Queensland, Australia
30Adjacent properties
Section 229.601(b)(96) (20) (i‐iv)
30.1Mining Properties (Regional)
Mount Isa was established on the discovery of world-scale copper-zinc-lead deposits in 1923. A major mining complex and a city of 22,000 people have grown on the site in the last 94 years, with multiple open pit and underground mines, smelters, mills and flotation plants, and a sulphuric acid plant. The town hosts many mining suppliers and service organizations, and has a deep pool of skilled mining industry people. Mt. Isa has two electric power generators supplied by a natural gas pipeline from South Australia, an airport, rail, and other services.
Cloncurry was established much earlier than Mount Isa, in 1867, on the discovery of copper by Ernest Henry, and the town was founded in 1884.
There are numerous active mines in the area. In addition to Mount Isa, there are five major active mines: Ernest Henry copper-gold mine and Lady Loretta lead-zinc-silver mine, both owned by Glencore; Cannington silver-lead mine, owned by South 32; the Dugald River zinc-lead-silver mine, owned by MMG; and the Mount Gordon copper-gold mine, owned by Capricorn Copper. All are major, internationally important mines.
Smaller operations (active or in care and maintenance) include Osborne copper-gold mine, owned by Chinova; Mount Colin copper mine, owned by Round Oak Minerals, Lady Annie copper-gold mine, owned by CST Mining; Mount Cuthbert Copper mine, owned by Malaco Mining; Rocklands copper- gold mine, owned by Cudeco; and Eloise copper-gold mine, owned by FMR Investments.
The only major closed mine is the Mary Kathleen Uranium mine.
30.2Mining Properties (Adjacent)
Mining properties that surround the Eva Project are predominantly Exploration Permit for Minerals (EPM) held by the company. These properties cover a highly prospective north–south corridor with similar geology to that which hosts the Project’s Mineral Resources, where numerous copper-gold mineralized prospects have been established and are being systematically explored. No additional Mineral Resources have as yet been defined.
The major Dugald River zinc-lead-silver mine owned by MMG is located 11 km south of the planned Eva Copper Project mine site, within a Mining Leases (ML) surrounded by MLs and EPMs held by the Company. The mine was commissioned in November 2017. MMG indicates that the mine will process an average 1.7 Mt/a of ore, to initially produce 170,000 tonnes of zinc concentrate, plus by-products. The mine will operate over an estimated 25 years while the ore body remains open at depth. The mine is an underground operation accessed via declines. Published Measured, Indicated, and Inferred Mineral Resources are: zinc resources of 64.8 Mt at 12% Zn, 2.2% Pb, and 31 g/t Ag (plus stockpiles of 0.23 Mt at 10.8% Zn, 1.7 Pb, and 49 g/t); and copper resources of 4.4 Mt at 1.8% Cu and 0.2 g/t Au. Published Proven and Probable Ore Reserves are 32.8 Mt at 11.9% Zn, 2.2% Pb, and 44 g/t Ag. Resources and Reserves are from MMG 2017 statements published in accordance with Joint Ore Reserves Code (JORC) 2012 edition (JORC, 2012). Stratigraphy interpreted to be prospective for similar zinc mineralization is identified within the tenure held by the Company surrounding the Dugald River Project.
Effective date: 30 June 2023
140
Technical Report Summary of the
Eva Copper Project, North West Queensland, Australia
|
|
|
| Figure 30-1: Adjacent Mining Properties and Major Mines around the Eva Copper Project |
Effective date: 30 June 2023
141
Technical Report Summary of the
Eva Copper Project, North West Queensland, Australia
30.3Non-Mining Properties
Immediate key local non-mining stakeholders associated with the Eva Copper Project are landowners, leaseholders, the Kalkadoon people, and state and local governments. They are:
•Landowner: Harold MacMillan (Mt. Roseby Homestead)
•Landowner: North Australian Pastoral Company (Coolullah Homestead)
•Kalkadoon people
•Commonwealth and Queensland State departments
•Cloncurry Shire Council.
CMMPL has been in continuous communication with the above stakeholders for many years. Refer to Section 4.4 regarding Pastoral Leases and Compensation Agreements with the four pastoral landholders for both the MLs and key areas of activity in the surrounding EPMs.
Effective date: 30 June 2023
142
Technical Report Summary of the
Eva Copper Project, North West Queensland, Australia
31Interpretation and conclusion
31.1Geology, Mineral Resources
The Eva Copper Project Mineral Resources are IOCG deposits that vary according to setting. The main deposit, Little Eva, is similar to Ernest Henry.
Mineralization primarily occurs as chalcopyrite, with subordinate bornite and chalcocite. The Native coper orebodies comprise Native Copper with varying amounts of copper bearing hydrobiotite, and contain a Sulphide copper portion at depth.
The mineralized zones typically trend north to south, and are moderately to steeply dipping.
Allmodels are sufficent for further studies.
31.2Mining
This Resource is suitable for conventional open pit mining methods and typical processing through a copper concentrate. Mining studies will be orientated around this approach.
31.3Metallurgical Testwork and Mineral Processing
Little Eva, being the largest source of sulphide ore, is expected to see 95% Cu recovery. The remaining sulphide ore sources are expected to see between 88% to 95% recoveries, depending on the mineralogy.
Blackard and Scanlan native copper zones are expected to achieve 63% recovery through gravity and flotation recovery methods
The recovery within the native copper zone of Blackard will be variable; however, it will average 63%, as shown in the testwork. The sulphide zone located below this, is expected to behave similarly to Turkey Creek, at an anticipated 88% recovery.
Extensive work has been done on Blackard. Scanlan has not seen the same degree of study; however, pilot flotation work and geological observations on Scanlan have shown it to have similar mineralogical characteristics as Blackard.
31.4Process Plant
N/A
31.5Infrastructure
N/A
31.6Environmental, Permitting, and Social Considerations
N/A
31.7Capital and Operating Costs
N/A
31.8Economics
N/A
Effective date: 30 June 2023
143
Technical Report Summary of the
Eva Copper Project, North West Queensland, Australia
32Recommendations
32.1Mineral Resources and Mineral Reserves
Targets below and within the current pit designs should be targeted to convert Inferred Resources to Indicated Resources.
At the Little Eva pit, conduct development drilling ahead of mining to improve the quality of the Mineral Reserves, and optimize mining selectivity and grade control costs/strategy.
Perform geotechnical slope studies on the Blackard, Scanlan, Turkey Creek, Lady Clayre, and Bedford deposits.
Continue detailed mine design and mine planning on the Eva Copper Project prior to production.
Develop detailed dewatering plans for the Little Eva, Blackard, Scanlan, and Turkey Creek pits.
Effective date: 30 June 2023
144
Technical Report Summary of the
Eva Copper Project, North West Queensland, Australia
33REFERENCES
33.1References
Section 229.601(b)(96) (24)
AARC (2007). Roseby Copper Project, Environmental Impact Statement (EIS) Supplementary Report. (L2800).
AARC (2008). Roseby Copper Project, Environmental Impact Statement (EIS) Response to Information Request. (L2800).
AARC (2011). Roseby Copper Project, Environmental Management Plan. (L3428). AARC (2019). Eva Project, Ecology Report. (L10479)
ALS AMMTEC (2012a). Metallurgical Testwork conducted upon Copper Ore Samples from the Roseby Copper Project for Altona Mining Limited Report A13828 September 2012. Perth: ALS AMMTEC. (L8464).
ALS AMMTEC (2012b). Quantitative Automated Mineralogical Analysis conducted on Five (5) Copper Core Samples from the Roseby Project for Altona Resources (Project A14159). Perth: ALS AMMTEC. (L7842).
ALS AMMTEC (2012c). Quantitative Automated Mineralogical Analysis conducted on Two (2) Flotation Feed and Two (2) Flotation Tail Samples for Altona Resources (Project A13828). Perth: ALS AMMTEC. (L7844).
ALS Metallurgy (2016). Metallurgical Testwork conducted upon Turkey Creek and Little Eva Copper Ores. Perth: ALS Metallurgy. (L9654).
Altona & Department of Natural Resources and Mines. (2017). Query to the Department of Natural Resources and Mines, Queensland, about Water License requirements for the Little Eva Project. Queensland: Altona & DNRM) (L9714).
Altona Mining Limited (Altona) (2014a). ALT2014004/005 Turkey Creek Drill Programme Completion Report. Perth: Altona (L9719).
Altona (2014). Little Eva Mineral Resource Update. Perth: Altona (L9111).
Altona (2014a). Little Eva Geotechnical Review Version 2. Perth: Altona. (L5561). Altona (2014b). Little Eva Geological Report. Perth: Altona (L9110).
Altona (2014b). Review of Little Eva Unconfined Compressive Strength Measurements. Perth: Altona. (L9759).
Altona (2017). ALT2015009 Metallurgical Drilling Programme Completion Report. Perth: Altona (L9748).
Altona (2017). Detailed Metallurgical Review, Cloncurry Copper Project. Perth: Altona. (L9782). Altona (2017). Detailed Metallurgical Review. Perth: Altona. (L978).
Altona (2017). Query to the Department of Natural Resources and Mines, Queensland, about Water License Requirements for the Little Eva Project. Perth: Altona. (L9714).
AMML (2007a). Bond Ball Mill Work Index Tests on Little Eva Ore Samples for Universal Resources Limited. Perth: AMML. (L2902).
AMML (2007b). AMML Interim Report 0013-2, Batch and Locked Cycle Flotation on Little Eva Ore Samples. Sydney: AMML. (L2901).
AMMTEC (2006a). Comminution Testing Conducted Upon Samples from the Roseby Copper Project for Universal Resources Limited, Report A10110. Perth: AMMTEC. (L1356).
AMMTEC (2007b). Comminution Testwork Conducted Upon Sulphide Composite Samples from the Little Eva Copper Deposit (Roseby Copper Project) for Universal Resources Limited, Report A10997. Perth: AMMTEC. (L2904).
Effective date: 30 June 2023
145
Technical Report Summary of the
Eva Copper Project, North West Queensland, Australia
AMMTEC Consultants PLLC (AMMTEC). (2005a). Metallurgical Testwork Conducted Upon Samples of Ore from the Roseby Copper Deposit, Report A9761. Perth: AMMTEC. (L1260).
AMMTEC. (2005b). Flotation Testwork on Bedford, Little Eva and Lady Clayre Samples for Universal Resources, Report A9656. Perth: AMMTEC. (L3380).
AMMTEC. (2006b). Bench Scale Flotation Testwork on Roseby Ore Samples for Universal Resources Limited, Report No. A9880, Part B. Perth: AMMTEC. (L1352).
AMMTEC. (2006c). Pilot Grinding and Preliminary Pilot Flotation on Ore Sample Composites from the Roseby Copper Project for Universal Resources Limited, Report No. A9880 Part C. Perth: AMMTEC Ltd. (L1353).
AMMTEC. (2007). Flotation Testwork on Blend Master Composites for Universal Resources Limited.
Report No. A10851-D, Perth: AMMTEC. (L2905).
Ausenco (2020). Process Plant and Facilities Layout Drawings, Ausenco, February 2020. AustralAsian Resource Consultants (AARC). (2007). Roseby Copper Project, Environmental Impact
Statement (EIS). (L2800).
Browning, F. (2016). Thesis: Geological Model and Resource Estimate for the Bedford Copper-Gold Deposit, Mount Isa Inlier, North West Queensland. Cornwall: University of Exeter (L9754) [Report Only].
Chadwick, R. (1992). Ivy Ann Prospect, EPM 8059 "Cameron River,” 1992 Exploration Summary and Discussion. Perth: Dominion Mining Limited. (L987).
CITIC-SMCC Process Technology (2018). Review of the Equipment Selection for the Comminution Circuit of the Cloncurry Project, January 2018.
Copper Mountain Mining Corporation (CCMC). (2018). Copper Mountain Concentrator, July 2018.
Eva Flotation Testwork Progress Report No. 1.
CRAE. (1996). The Geology and Origin of the Blackard, Lady Clayre and CRA Flat Cu and Cu-Au Prospects within the Mount Roseby Area. Brisbane: CRA Exploration Pty. Ltd. (L852).
Department of Environment and Heritage Protection (DEHP), Queensland. (2012). Environmental Authority MIN102973311 (ML90162, ML90163, ML90164, ML 90165, and ML90166) for
Altona Mining Limited and Roseby Copper Pty. Ltd. Cairns: DEHP. (L8299).
DEHP, Queensland. (2013). Amendment of Environmental Authority EPML00899613 (ML90162, ML90163, ML90164, ML 90165, and ML90166) for Altona Mining Limited and Roseby Copper Pty. Ltd. Cairns: DEHP. (L8299).
DEHP, Queensland. (2016). Amendment of Environmental Authority EPML00899613 (ML90162, ML90163, ML90164, ML 90165, and ML90166) for Altona Mining Limited and Roseby Copper Pty. Ltd. Cairns: DEHP. (L8299).
EHW (1996). Report on Field Mapping and Proposed Diamond Drill Holes at Ivy Ann. Perth: EHW. (L991).
Environmental Geochemistry International. (2006). Geochemical Characterisation and ARD Assessment of Samples from the Roseby Copper Project. Perth: Environmental Geochemistry International. (L2959).
Gekko Systems (Gekko) (2019). Eva Copper Project Gravity and Flotation Testwork, December 2019 Geological Survey of Queensland. (2011). Northwest Queensland Mineral and Energy Province
Report. Brisbane: Department of Employment, Economic Development and Innovation (L8418) [Report Only].
Effective date: 30 June 2023
146
Technical Report Summary of the
Eva Copper Project, North West Queensland, Australia
George Orr and Associates (George Orr) (2006). Little Eva Deposit: Geotechnical Evaluation for Mining Feasibility Purposes, July 2006, updated 2012.
George Orr (2006). Roseby Copper Project: Little Eva Deposit, Geotechnical Evaluation for Mining Feasibility Purpose. Perth: George Orr. (L1349).
George Orr (2012). Roseby Copper Project, Little Eva Deposit, Definitive Mining Feasibility Study: Geotechnical Evaluation for Open Pit Mining. Perth: George Orr. (L7821).
Gilbride Management (2011). Altona Mining Limited, Little Eva Project, Definitive Feasibility Study, Appendix 9.1, Logistics Study. Perth: Gilbride Management. (L8443).
GR Engineering Services (GRES) (2012). Altona Mining Limited, Little Eva Project, Definitive Feasibility Study. Perth: GRES. (L8443).
GRES (2015). Turkey Creek Slighter Testwork. Perth: GRES. (L9347).
Habermann, P. (1999). Thesis: Alteration and Mineralization at the Lady Clayre Cu-Au Prospect, Mount Isa, Eastern Succession, NW Queensland. Townsville: James Cook University. (L1064).
Hatch (2018). The Eva Copper Project Feasibility Study Report, Copper Mountain Mining Corp, November 2018.
Hatch (2018). 3D Process Plant Layout Drawings for the Eva Copper Feasibility Study. Vancouver: Hatch.
Hatch (2018). Electrical Single Line Diagrams for the Eva Copper Feasibility Study. Vancouver: Hatch.
Hatch (2018). Mass Balance and Water Balance for the Eva Copper Feasibility Study. Vancouver: Hatch.
Hatch (2018). Mechanical Equipment List for the Eva Copper Feasibility Study. Vancouver: Hatch. Hatch (2018). Process Design Criteria for the Eva Copper Feasibility Study. Vancouver: Hatch.
Hatch (2018). Process Flow Diagrams for the Eva Copper Feasibility Study. Vancouver: Hatch.
Kendrick, S. (2013). Email: Altona's Little Eva Project Preliminary Questions [GRES- PROJECTS.FID2795]. Perth: GRES. (L8907).
KH Morgan and Associates (KH Morgan) (2009). Hydrogeology Report, December 2009.
KH Morgan and Associates (KH Morgan) (2011). Hydrogeology Report, Environmental Management Plan, Roseby Copper Project, Northwest Queensland. Perth: KH Morgan. (L1536).
KH Morgan (2012). Dewatering Procedures Impact and Water Resources, Little Eva Pit, Altona Mining Limited. Perth: KH Morgan. (L8414).
Klohn Crippen Berger (KCB) (2019). Eva Project Tailings Characterization Factual Report, September 2019.
KCB (2010). Definitive Feasibility Study review and update of the Tailings Storage Facility for the Eva Copper Project, Klohn Crippen Berger, December 2019.
Knight Piésold Pty. Ltd. (Knight Piésold) (2012). Altona Mining Limited, Little Eva Project, Definitive Feasibility Study, Appendix. Perth: Knight Piésold.
Knight Piésold (2016). Tailings Storage Facility Preliminary Design Report (Incorporates Regional Surface Water Management Design). Perth: Knight Piésold. (L9566).
Knight Piésold (2016a). Tailings Storage Facility Preliminary Design Report (Incorporates Regional Surface Water Management Design). Perth: Knight Piésold. (L9566).
Knight Piésold (2016b). Cabbage Tree Creek Inundation Study and Little Eva Pit Diversion. Perth: Knight Piésold. (L9567).
Effective date: 30 June 2023
147
Technical Report Summary of the
Eva Copper Project, North West Queensland, Australia
Knight Piésold (2018). Tailings Storage Facility Definitive Feasibility Study, Book A. Geotechnical, Tailings, and Water Management Report; and Book B. Geotechnical Interpretative Report, October 2018.
Knight Piésold (2019). Eva Copper Project, Cabbage Tree Creek Inundation Study and Little Eva Pit Diversion. Perth: Knight Piésold. (L10498).
Knight Piésold (2019). Eva Project, Definitive Feasibility Study – Geotechnical, Tailings and Water Management Report. Perth: Knight Piésold. (L10397).
Knight Piésold (2019). Eva Project, Definitive Feasibility Study – Geotechnical Interpretative Report.
Perth: Knight Piésold. (L10399).
Knight Piésold (2019). Cabbage Tree Creek Inundation Study and Little Eva Pit Diversion Update, Knight Piésold, December 2019.
Lane, G., Foggiatto, B. and Bueno, M.P. (2013). Power-based comminution calculations using Ausgrind. In Alvarez, M., Doll, A., Kracht, W. and Kuyvenhoven, R. (Eds.), Proceedings of 10th International Mineral Processing Conference (Procemin 2013), pp. 85-96. Santiago: Gecamin.
LAROX (2008). Test Report 7.2.12 – Pilot Produced Final Copper Concentrate. Perth: LAROX. (L3294).
Li, C. (1996). Lady Clayre Prospect – Locked Cycle Testing. Melbourne: CRA ATD. (L930).
Mason Geoscience (2003). Petrographic Descriptions for Twenty-two Drill Core Rock Samples from Lady Clayre and Little Eva Prospects (Eastern Succession, Mount Isa Inlier, Queensland) Report 2811. Adelaide: Mason Geoscience. (L1058).
Mason Geoscience (2004). Petrographic and Minerographic Descriptions for Sixteen Drill Chip Rock Samples from the Little Eva, Lady Clayre, Bedford and Tin Lizzie Prospects (Roseby Project, Cloncurry Region, Queensland). Report # 2966. Adelaide: Mason Geoscience. (L1061).
Mason Geoscience (2005). Mineralogy of Three Cu-Bearing Ores: LED197, LED198, and BC Master Composite (Roseby Project, Queensland). Perth: Mason Geoscience Pty. Ltd. (L1188).
MBS Environmental (MBS). (2011). Roseby Copper Project Tailings Characterization and Acid Mine Drainage Management. Perth: Martinick Bosch Sell Pty. Ltd. (L3402).
MBS (2011). Roseby Copper Project, Waste Rock Characterisation and Acid Mine Drainage Management. Perth: MBS. (L3403).
MBS (2012). Altona Mining Limited, Little Eva Project, Definitive Feasibility Study, Appendix 10.2, Geochemical Assessment of Little Eva Tailings. Perth: MBS. (L8443).
MBS (2012). Roseby Copper Project, Surface Water and Sediment Quality Monitoring (March 2012). Perth: MBS. (L8613).
MBS (2015). Roseby Copper Project 2014/15 Water and Sediment Quality Monitoring Summary.
Perth: MBS. (L9352).
MBS (2016). Little Eva Project, Environmental Authority Amendment Application Supporting Document. Perth: MBS. (L9609).
MBS (2016). Little Eva Project, Environmental Authority Amendment Application Supporting Document. Perth: MBS. (L9609).
MBS (2016). Memorandum: Environmental Approvals, Little Eva Project. Perth: MBS (L9768). MBS (2016). Memorandum: Environmental Offsets Act 2014. (L9767).
MBS (2016). Roseby Copper Project 2015/16 Water and Sediment Quality Monitoring Summary May 2016. (L9655).
Effective date: 30 June 2023
148
Technical Report Summary of the
Eva Copper Project, North West Queensland, Australia
MBS (2016). Waste Rock Characterisation, Little Eva Project, Satellite Deposits (Turkey Creek, Bedford, Lady Clayre). Perth: MBS. (L9569).
MBS (2017). Cloncurry Copper Project 2016/17 Water and Sediment Quality Monitoring Summary. (L9772).
Merit and Sedgman (2017). CMMC Business Case Analysis Completed in October 2017.
Metso Corporation (Metso) (2019). Eva Copper HPGR Testwork (April 2019), and Little Eva-Blackard Blend Testwork, November 2019.
Milligan, S. & C. Li. (1996). Lady Clayre Prospect – Metallurgical Characterisation, Melbourne: CRA ATD. (L0842).
MMG Limited (2019). Mineral Resources and Ore Reserves. Available at: https://www.mmg.com/our- business/mineral-resources-and-ore-reserves/, accessed April 23, 2020.
NeoProTec Pty. Ltd. (NeoProTec) (2003). Testwork Report for Universal Resources Limited.
Metallurgical Testwork Program, Little Eva, UR0301. Perth: NeoProTec. (L3022).
NeoProTec (2003b). Testwork Report for Universal Resources Limited. Metallurgical Testwork Program, Little Eva, UR0301. Perth: NeoProTec. (L3440).
NeoProTec (2005). Preliminary Flotation Response of: 1. Little Eva Low-grade and its Revenue Impact on Little Eva. 2. Lady Clayre. 3. Bedford. Ref: UR 05011, Perth: NeoProTec Pty. Ltd. (L1175).
NeoProTec (2006). Roseby Project. Comminution Testwork. Perth: NeoProTec. (L1388).
NeoProTec (2008). Roseby Copper Project – DFS Metallurgical Summary Report. Perth: NeoProTec. Optimet Laboratories (Optimec) (2003). Metallurgical Testing of Roseby Copper Project Report P0013. Adelaide: Optimet. (L1580 & L1581).
Optimet (2005). Report P0117 Universal Resources Little Eva/Roseby Project Oxide/Sulphide Blend Flotation. Adelaide: Optimet. (L1577).
Orway Mineral Consultants. (2006). Universal Resource Ltd. Roseby Copper Project Feasibility Study Comminution Circuit Design, Report 46203. Perth: Lycopodcium Engineering Pty. Ltd. (L8434).
Outotec (2008). SUPAFLO® Thickener Test Data Report S394TA. Perth: Outotec. (L3292) Paterson & Cooke (2019). Blackard Ore Pumping Conceptual Study, November 2019.
Paterson & Cooke (2019). Eva Tailings Dewatering Conceptual Study, November 2019. Paterson & Cooke (2019). Tailings and Ore Characterization, November 2019.
Queensland Department of Environment and Heritage Protection (2016). Amendment of Environmental Authority EPML00899613, July 2016.
Rockwater Hydrogeological and Environmental Consultants (Rockwater). (2018). Water Supply Investigation for the Eva Copper Project.
Rockwater (2011). Little Eva Copper-Gold Deposit Water Supply Investigation. Results or RC Exploration Drilling. Perth: Rockwater. (L7816).
RPS Group plc. (2019). Little Eva Mine Site LiDAR. RPS Reference PR139400-1. (L10479). SRK Consulting (SRK) (2014). Review of the Roseby Project Queensland. Perth: SRK (L9096).
Sedgman Limited (Sedgman) (2017). Cloncurry Copper Project Business Case Analysis, CMMC, and Merit, October 2017.
Taylor, R.G. (2009). Petrological Observations and Overview Comments Concerning 18 Samples from the Little Eva Copper-Gold Prospect, Cloncurry Region, Queensland, Australia.
Effective date: 30 June 2023
149
Technical Report Summary of the
Eva Copper Project, North West Queensland, Australia
Townsville: School of Earth and Environmental Science, James Cook University. (L8850).
Townend (2015). Semiquantitative Analysis of Eight Metallurgical Samples. Perth: Townend Mineralogy Laboratory. (In L9347).
Universal Resources Inc., Como Engineers Pty. Ltd., & GR Engineering Services (2009). Roseby Copper Project 5MT/A Definitive Feasibility Study. (L1585).
Walker, Newman & Associates (2012). Altona Mining Limited, Little Eva Project, Definitive Feasibility Study, Appendix 9.2, Telecommunications and IT Cost Estimate. Perth: Walker, Newman & Associates. (L8443).
Withnal, I.W. & L.C. Cranfield (2013). Geological Framework of Queensland. Geological Survey of Queensland. Brisbane: Department of Natural Resources and Minerals.
Woodgrove Technologies (2019). Eva Project DFR Pilot Plant Report, May 2019.
Effective date: 30 June 2023
150
|
|
|
|
|
|
Harmony Gold Mining Company Limited |
| Report of the Independent Registered Public Accounting Firm |
|
Group Income Statement for the years ended 30 June 2023, 2022 and 2021 |
|
Group Statement of Comprehensive Income for the years ended 30 June 2023, 2022 and 2021 |
|
Group Balance Sheet at 30 June 2023 and 2022 |
|
Group Statement of Changes in Shareholders' Equity for the years ended 30 June 2023, 2022 and 2021 |
|
Group Cash Flow Statement for the years ended 30 June 2023, 2022 and 2021 |
|
| Notes to the Group Financial Statements |
|
Report of Independent Registered Public Accounting Firm
To the Board of Directors and Shareholders of Harmony Gold Mining Company Limited
Opinions on the Financial Statements and Internal Control over Financial Reporting
We have audited the accompanying group balance sheets of Harmony Gold Mining Company Limited and its subsidiaries (the “Company”) as of 30 June 2023 and 30 June 2022, and the related group income statements, statements of comprehensive income, statements of changes in shareholders’ equity, and cash flow statements for each of the three years in the period ended 30 June 2023, including the related notes (collectively referred to as the “consolidated financial statements”). We also have audited the Company's internal control over financial reporting as of 30 June 2023, based on criteria established in Internal Control - Integrated Framework (2013) issued by the Committee of Sponsoring Organizations of the Treadway Commission (COSO).
In our opinion, the consolidated financial statements referred to above present fairly, in all material respects, the financial position of the Company as of 30 June 2023 and 30 June 2022, and the results of its operations and its cash flows for each of the three years in the period ended 30 June 2023 in conformity with International Financial Reporting Standards as issued by the International Accounting Standards Board. Also in our opinion, the Company maintained, in all material respects, effective internal control over financial reporting as of 30 June 2023, based on criteria established in Internal Control - Integrated Framework (2013) issued by the COSO.
Basis for Opinions
The Company's management is responsible for these consolidated financial statements, for maintaining effective internal control over financial reporting, and for its assessment of the effectiveness of internal control over financial reporting, included in Management's Annual Report on Internal Control over Financial Reporting appearing under Item 15B. Our responsibility is to express opinions on the Company’s consolidated financial statements and on the Company's internal control over financial reporting based on our audits. We are a public accounting firm registered with the Public Company Accounting Oversight Board (United States) (PCAOB) and are required to be independent with respect to the Company in accordance with the U.S. federal securities laws and the applicable rules and regulations of the Securities and Exchange Commission and the PCAOB.
We conducted our audits in accordance with the standards of the PCAOB. Those standards require that we plan and perform the audits to obtain reasonable assurance about whether the consolidated financial statements are free of material misstatement, whether due to error or fraud, and whether effective internal control over financial reporting was maintained in all material respects.
Our audits of the consolidated financial statements included performing procedures to assess the risks of material misstatement of the consolidated financial statements, whether due to error or fraud, and performing procedures that respond to those risks. Such procedures included examining, on a test basis, evidence regarding the amounts and disclosures in the consolidated financial statements. Our audits also included evaluating the accounting principles used and significant estimates made by management, as well as evaluating the overall presentation of the consolidated financial statements. Our audit of internal control over financial reporting included obtaining an understanding of internal control over financial reporting, assessing the risk that a material weakness exists, and testing and evaluating the design and operating effectiveness of internal control based on the assessed risk. Our audits also included performing such other procedures as we considered necessary in the circumstances. We believe that our audits provide a reasonable basis for our opinions.
Definition and Limitations of Internal Control over Financial Reporting
A company’s internal control over financial reporting is a process designed to provide reasonable assurance regarding the reliability of financial reporting and the preparation of financial statements for external purposes in accordance with generally accepted accounting principles. A company’s internal control over financial reporting includes those policies and procedures that (i) pertain to the maintenance of records that, in reasonable detail, accurately and fairly reflect the transactions and dispositions of the assets of the company; (ii) provide reasonable assurance that transactions are recorded as necessary to permit preparation of financial statements in accordance with generally accepted accounting principles, and that receipts and expenditures of the company are being made only in accordance with authorizations of management and directors of the company; and (iii) provide reasonable assurance regarding prevention or timely detection of unauthorized acquisition, use, or disposition of the company’s assets that could have a material effect on the financial statements.
Because of its inherent limitations, internal control over financial reporting may not prevent or detect misstatements. Also, projections of any evaluation of effectiveness to future periods are subject to the risk that controls may become inadequate because of changes in conditions, or that the degree of compliance with the policies or procedures may deteriorate.
Critical Audit Matters
The critical audit matter communicated below is a matter arising from the current period audit of the consolidated financial statements that was communicated or required to be communicated to the audit committee and that (i) relates to accounts or disclosures that are material to the consolidated financial statements and (ii) involved our especially challenging, subjective, or complex judgments. The communication of critical audit matters does not alter in any way our opinion on the consolidated financial statements, taken as a whole, and we are not, by communicating the critical audit matter below, providing a separate opinion on the critical audit matter or on the accounts or disclosures to which it relates.
Impairment of property, plant and equipment
As described in notes 2.5, 6 and 15 to the consolidated financial statements, property, plant and equipment has a carrying value of R41 507 million at 30 June 2023. Management conducts an impairment test for non-financial assets whenever events or changes in circumstances indicate that the carrying amount for a cash generating unit (“CGU”) may exceed its recoverable amount. Indicators for impairment were identified for Kalgold, Kusasalethu and Target 1 and therefore an impairment assessment was performed for these CGUs. The recoverable amounts for these CGUs were determined on a fair value less cost of disposal basis utilising real discounted future cash flows (post-tax). Key assumptions for the calculations of the CGUs’ recoverable amounts are commodity prices, market discount rates, exchange rates and the annual life-of-mine plans. In determining the commodity prices to be used, management assesses the views of several institutions on future commodity prices and based on this, derives the future commodity prices. The life-of-mine plans are based on proved and probable reserves as included in the Reserve Declaration, which are determined by management in terms of the South African Code for the Reporting of Exploration Results, Mineral Resources and Mineral Reserves (SAMREC), as well as resources where management has high confidence in the orebody and economical recovery of gold, based on historic and similar geological experience. No impairment charge was recorded for the year ended 30 June 2023.
The principal considerations for our determination that performing procedures relating to the impairment of property, plant and equipment is a critical audit matter are (i) the significant judgment applied by management in determining the recoverable amount for each CGU identified for impairment testing; (ii) a high degree of auditor judgment, subjectivity, and effort in performing procedures to evaluate management’s future cash flows and significant assumptions, including commodity prices, market discount rates, exchange rates and the annual life-of-mine plans; and (iii) the audit effort involved the use of professionals with specialised skill and knowledge to assist in performing these procedures and evaluating the audit evidence obtained from these procedures.
Addressing the matter involved performing procedures and evaluating audit evidence obtained in connection with forming our overall opinion on the consolidated financial statements. These procedures included testing the effectiveness of controls relating to management's impairment indicator assessment and resulting impairment calculations where impairment indicators were identified. This included controls over management’s process for developing their estimate of the recoverable amount for each CGU being tested for impairment and controls over significant assumptions used in the calculation. These procedures also included, among others, testing management’s process for calculating the recoverable amount for each CGU, evaluating the appropriateness of the discounted cash flows models per CGU, testing the completeness, accuracy and relevance of the underlying data used in the discounted cash flows, and evaluating the significant assumptions used by management. These significant assumptions included commodity prices, market discount rates, exchange rates and annual life-of-mine plans. Evaluating management’s significant assumptions related to life-of-mine plans involved (i) evaluating the reasonableness of management’s commodity price, market discount rates and exchange rates against external market and third party data, (ii) evaluating the reasonableness of the cash flow forecasts used in the life-of-mine plans by comparing the cash flow forecasts to current and historical operational results, the mineral resources and reserves approved by the Company’s Competent Person as part of the Mineral Resources and Reserves declaration, and agreeing these to final approved long-term business plans, and (iii) performing a retrospective comparison of forecasted cash flows to actual past performance and previous forecasts.
Professionals with specialised skill and knowledge were used to assist in the evaluation of management’s impairment calculations and certain significant assumptions including commodity prices, market discount rates and exchange rates.
/s/ PricewaterhouseCoopers Inc.
Johannesburg, Republic of South Africa
31 October 2023
We have served as the Company’s auditor since 1950, which includes periods before the Company became
subject to SEC reporting requirements.
Group income statement
For the year ended 30 June 2023
|
|
|
|
|
|
|
|
|
|
|
|
|
|
|
|
|
|
|
SA Rand |
|
|
| Figures in million |
Notes |
2023 |
2022 |
2021 |
|
|
| Revenue |
5 |
49 275 |
|
42 645 |
|
41 733 |
|
|
|
| Cost of sales |
6 |
(39 535) |
|
(41 927) |
|
(35 489) |
|
|
|
| Production costs |
|
(34 866) |
|
(33 099) |
|
(29 774) |
|
|
|
| Amortisation and depreciation |
|
(3 454) |
|
(3 683) |
|
(3 875) |
|
|
|
| Impairment of assets |
|
— |
|
(4 433) |
|
(1 124) |
|
|
|
| Other items |
|
(1 215) |
|
(712) |
|
(716) |
|
|
|
|
|
|
|
|
|
|
| Gross profit |
|
9 740 |
|
718 |
|
6 244 |
|
|
|
| Corporate, administration and other expenditure |
7 |
(1 044) |
|
(984) |
|
(1 068) |
|
|
|
| Exploration expenditure |
|
(506) |
|
(214) |
|
(177) |
|
|
|
| Gains/(losses) on derivatives |
19 |
(194) |
|
53 |
|
1 022 |
|
|
|
| Foreign exchange translation gain/(loss) |
8 |
(634) |
|
(327) |
|
670 |
|
|
|
| Other operating expenses |
9 |
(268) |
|
(1) |
|
(241) |
|
|
|
| Operating profit/(loss) |
|
7 094 |
|
(755) |
|
6 450 |
|
|
|
| Gain on bargain purchase |
14 |
— |
|
— |
|
303 |
|
|
|
| Acquisition-related costs |
14 |
(214) |
|
— |
|
(124) |
|
|
|
| Share of profits from associate |
21 |
57 |
|
63 |
|
83 |
|
|
|
| Investment income |
10 |
663 |
|
352 |
|
331 |
|
|
|
| Finance costs |
11 |
(994) |
|
(718) |
|
(661) |
|
|
|
| Profit/(loss) before taxation |
|
6 606 |
|
(1 058) |
|
6 382 |
|
|
|
| Taxation |
12 |
(1 723) |
|
46 |
|
(1 258) |
|
|
|
| Net profit/(loss) for the year |
|
4 883 |
|
(1 012) |
|
5 124 |
|
|
|
| Attributable to: |
|
|
|
|
|
|
| Non-controlling interest |
|
63 |
|
40 |
|
37 |
|
|
|
| Owners of the parent |
|
4 820 |
|
(1 052) |
|
5 087 |
|
|
|
| Earnings/(loss) per ordinary share (cents) |
|
|
|
|
|
|
| Total earnings/(loss) |
13 |
780 |
|
(172) |
|
842 |
|
|
|
| Diluted earnings/(loss) per ordinary share (cents) |
|
|
|
|
|
|
| Total earnings/(loss) |
13 |
777 |
|
(172) |
|
825 |
|
|
|
The accompanying notes are an integral part of these consolidated financial statements.
Group statement of comprehensive income
For the year ended 30 June 2023
|
|
|
|
|
|
|
|
|
|
|
|
|
|
|
|
|
SA Rand |
| Figures in million |
Notes |
2023 |
2022 |
2021 |
| Net profit/(loss) for the year |
|
4 883 |
|
(1 012) |
|
5 124 |
|
| Other comprehensive income for the year, net of income tax |
|
(80) |
|
202 |
|
3 251 |
|
| Items that may be reclassified subsequently to profit or loss |
25 |
(110) |
|
171 |
|
3 233 |
|
| Foreign exchange translation gain/(loss) |
|
1 123 |
|
742 |
|
(1 234) |
|
| Remeasurement of gold hedging contracts |
|
(1 233) |
|
(571) |
|
4 467 |
|
|
|
|
|
|
|
|
|
|
|
|
|
|
|
|
|
|
|
|
|
|
|
|
|
|
| Items that will not be reclassified to profit or loss |
25 |
30 |
|
31 |
|
18 |
|
|
|
|
|
|
| Total comprehensive income for the year |
|
4 803 |
|
(810) |
|
8 375 |
|
| Attributable to: |
|
|
|
|
| Non-controlling interest |
|
63 |
|
40 |
|
58 |
|
| Owners of the parent |
|
4 740 |
|
(850) |
|
8 317 |
|
The accompanying notes are an integral part of these consolidated financial statements.
Group balance sheet
As at 30 June 2023
|
|
|
|
|
|
|
|
|
|
|
|
|
|
|
|
SA Rand |
|
|
| Figures in million |
Notes |
At 30 June
2023 |
At 30 June 2022 |
|
|
|
|
|
|
|
|
| Assets |
|
|
|
|
|
| Non-current assets |
|
|
|
|
|
| Property, plant and equipment |
15 |
41 507 |
|
32 872 |
|
|
|
| Intangible assets |
16 |
33 |
|
48 |
|
|
|
| Restricted cash and investments |
17 |
6 121 |
|
5 555 |
|
|
|
| Investments in associates |
21 |
111 |
|
125 |
|
|
|
| Deferred tax assets |
12 |
189 |
|
203 |
|
|
|
| Other non-current assets |
18 |
332 |
|
374 |
|
|
|
| Derivative financial assets |
19 |
269 |
|
137 |
|
|
|
| Total non-current assets |
|
48 562 |
|
39 314 |
|
|
|
| Current assets |
|
|
|
|
|
| Inventories |
23 |
3 265 |
|
2 818 |
|
|
|
| Restricted cash and investments |
17 |
41 |
|
27 |
|
|
|
| Trade and other receivables |
20 |
2 395 |
|
1 682 |
|
|
|
| Derivative financial assets |
19 |
110 |
|
519 |
|
|
|
| Cash and cash equivalents |
34 |
2 867 |
|
2 448 |
|
|
|
| Total current assets |
|
8 678 |
|
7 494 |
|
|
|
| Total assets |
|
57 240 |
|
46 808 |
|
|
|
| Equity and liabilities |
|
|
|
|
|
| Share capital and reserves |
|
|
|
|
|
| Attributable to equity holders of the parent company |
|
34 757 |
|
30 039 |
|
|
|
| Share capital and premium |
24 |
32 934 |
|
32 934 |
|
|
|
| Other reserves |
25 |
6 778 |
|
6 744 |
|
|
|
| Accumulated loss |
|
(4 955) |
|
(9 639) |
|
|
|
| Non-controlling interest |
|
123 |
|
78 |
|
|
|
| Total equity |
|
34 880 |
|
30 117 |
|
|
|
| Non-current liabilities |
|
|
|
|
|
| Deferred tax liabilities |
12 |
2 294 |
|
1 586 |
|
|
|
| Provision for environmental rehabilitation |
26 |
5 473 |
|
5 013 |
|
|
|
| Other provisions |
27 |
633 |
|
932 |
|
|
|
| Borrowings |
32 |
5 592 |
|
3 180 |
|
|
|
| Contingent consideration liability |
29 |
589 |
|
356 |
|
|
|
| Other non-current liabilities |
30 |
337 |
|
268 |
|
|
|
| Derivative financial liabilities |
19 |
470 |
|
3 |
|
|
|
| Streaming contract liability |
31 |
105 |
|
378 |
|
|
|
| Total non-current liabilities |
|
15 493 |
|
11 716 |
|
|
|
| Current liabilities |
|
|
|
|
|
| Other provisions |
27 |
180 |
|
139 |
|
|
|
| Borrowings |
32 |
103 |
|
25 |
|
|
|
| Trade and other payables |
33 |
5 238 |
|
4 494 |
|
|
|
| Derivative financial liabilities |
19 |
1 061 |
|
8 |
|
|
|
| Streaming contract liability |
31 |
285 |
|
309 |
|
|
|
| Total current liabilities |
|
6 867 |
|
4 975 |
|
|
|
| Total equity and liabilities |
|
57 240 |
|
46 808 |
|
|
|
The accompanying notes are an integral part of these consolidated financial statements.
Group statement of changes in shareholders’ equity
For the year ended 30 June 2023
|
|
|
|
|
|
|
|
|
|
|
|
|
|
|
|
|
|
|
|
|
|
Number of ordinary shares issued |
Share capital and premium |
Accumulated loss |
Other reserves |
Non-controlling interest |
Total |
| Notes |
24 |
24 |
|
25 |
|
|
|
|
|
|
|
|
|
| Figures in million (SA Rand) |
|
|
|
|
|
|
| Balance – 30 June 2020 |
603 142 706 |
|
32 937 |
|
(12 583) |
|
3 017 |
|
4 |
|
23 375 |
|
|
|
|
|
|
|
|
|
|
|
|
|
|
|
| Issue of shares |
|
|
|
|
|
|
| – Exercise of employee share options |
12 909 491 |
|
— |
|
— |
|
— |
|
— |
|
— |
|
| Share issue costs |
— |
|
(3) |
|
— |
|
— |
|
— |
|
(3) |
|
| Share-based payments |
— |
|
— |
|
— |
|
156 |
|
— |
|
156 |
|
| Partial purchase of non-controlling interest |
— |
|
— |
|
— |
|
(4) |
|
(1) |
|
(5) |
|
| Net profit for the year |
— |
|
— |
|
5 087 |
|
— |
|
37 |
|
5 124 |
|
| Other comprehensive income for the year |
— |
|
— |
|
— |
|
3 230 |
|
21 |
|
3 251 |
|
| Dividends paid |
— |
|
— |
|
(677) |
|
— |
|
(7) |
|
(684) |
|
| Balance – 30 June 2021 |
616 052 197 |
|
32 934 |
|
(8 173) |
|
6 399 |
|
54 |
|
31 214 |
|
| Issue of shares |
|
|
|
|
|
|
|
|
|
|
|
|
|
| – Exercise of employee share options |
473 505 |
|
— |
|
— |
|
— |
|
— |
|
— |
|
|
|
|
|
|
|
|
| Share-based payments |
— |
|
— |
|
— |
|
143 |
|
— |
|
143 |
|
|
|
|
|
|
|
|
| Net profit/(loss) for the year |
— |
|
— |
|
(1 052) |
|
— |
|
40 |
|
(1 012) |
|
| Other comprehensive income for the year |
— |
|
— |
|
— |
|
202 |
|
— |
|
202 |
|
| Dividends paid |
— |
|
— |
|
(414) |
|
— |
|
(16) |
|
(430) |
|
| Balance – 30 June 2022 |
616 525 702 |
|
32 934 |
|
(9 639) |
|
6 744 |
|
78 |
|
30 117 |
|
| Issue of shares |
|
|
|
|
|
|
|
|
|
|
|
|
|
| – Exercise of employee share options |
1 546 270 |
|
— |
|
— |
|
— |
|
— |
|
— |
|
|
|
|
|
|
|
|
| Share-based payments |
— |
|
— |
|
— |
|
114 |
|
— |
|
114 |
|
|
|
|
|
|
|
|
| Net profit for the year |
— |
|
— |
|
4 820 |
|
— |
|
63 |
|
4 883 |
|
| Other comprehensive income for the year |
— |
|
— |
|
— |
|
(80) |
|
— |
|
(80) |
|
| Dividends paid |
— |
|
— |
|
(136) |
|
— |
|
(18) |
|
(154) |
|
| Balance – 30 June 2023 |
618 071 972 |
|
32 934 |
|
(4 955) |
|
6 778 |
|
123 |
|
34 880 |
|
The accompanying notes are an integral part of these consolidated financial statements.
Group cash flow statement
For the year ended 30 June 2023
|
|
|
|
|
|
|
|
|
|
|
|
|
|
|
|
|
SA Rand |
| Figures in million |
Notes |
2023 |
2022 |
2021 |
| Cash flow from operating activities |
|
|
|
|
| Cash generated by operations |
34 |
10 589 |
|
7 378 |
|
9 741 |
|
| Dividends received |
|
75 |
|
74 |
|
85 |
|
| Interest received |
|
165 |
|
87 |
|
171 |
|
| Interest paid |
11 |
(363) |
|
(319) |
|
(234) |
|
| Income and mining taxes paid |
|
(518) |
|
(296) |
|
(584) |
|
| Cash generated by operating activities |
|
9 948 |
|
6 924 |
|
9 179 |
|
| Cash flow from investing activities |
|
|
|
|
| Increase in restricted cash and investments |
17 |
(138) |
|
(128) |
|
(48) |
|
| Amounts refunded from restricted cash and investments |
17 |
58 |
|
53 |
|
34 |
|
| Acquisition of Eva Copper |
14 |
(2 996) |
|
— |
|
— |
|
| Redemption of preference shares from associates |
|
— |
|
— |
|
36 |
|
| Acquisition of Mponeng operations and related assets |
14 |
— |
|
— |
|
(3 363) |
|
| ARM BBEE Trust loan repayment |
18 |
74 |
|
65 |
|
264 |
|
| ARM BBEE Trust loan advanced |
|
— |
|
— |
|
(264) |
|
| Capital distributions from investments |
|
— |
|
— |
|
8 |
|
| Proceeds from disposal of property, plant and equipment |
|
46 |
|
24 |
|
11 |
|
| Additions to property, plant and equipment |
34 |
(7 640) |
|
(6 214) |
|
(5 142) |
|
| Cash utilised by investing activities |
|
(10 596) |
|
(6 200) |
|
(8 464) |
|
| Cash flow from financing activities |
|
|
|
|
| Borrowings raised |
32 |
3 619 |
|
3 057 |
|
— |
|
| Borrowings repaid |
32 |
(2 071) |
|
(3 601) |
|
(3 491) |
|
|
|
|
|
|
| Partial repurchase of non-controlling interest |
|
— |
|
— |
|
(5) |
|
| Dividend paid |
13 |
(154) |
|
(430) |
|
(684) |
|
| Lease payments |
28 |
(200) |
|
(177) |
|
(119) |
|
| Cash generated/(utilised) from financing activities |
|
1 194 |
|
(1 151) |
|
(4 299) |
|
| Foreign currency translation adjustments |
|
(127) |
|
56 |
|
46 |
|
| Net increase/(decrease) in cash and cash equivalents |
|
419 |
|
(371) |
|
(3 538) |
|
| Cash and cash equivalents – beginning of year |
|
2 448 |
|
2 819 |
|
6 357 |
|
| Cash and cash equivalents – end of year |
|
2 867 |
|
2 448 |
|
2 819 |
|
The accompanying notes are an integral part of these consolidated financial statements.
Notes to the group financial statements
For the year ended 30 June 2023
1 General information
Harmony Gold Mining Company Limited (the company) and its subsidiaries (collectively Harmony or the group) are engaged in gold mining and related activities, including exploration, extraction and processing. Gold bullion, the group’s principal product, is currently produced at its operations in South Africa and Papua New Guinea (PNG). Uranium and silver are produced as by-products.
The company is a public company, incorporated and domiciled in South Africa. The address of its registered office is Randfontein Office Park, Corner Main Reef Road and Ward Avenue, Randfontein, 1759.
The consolidated financial statements were authorised for issue by the board of directors on 31 October 2023.
2 Accounting policies
Basis of preparation
The principal accounting policies applied in the preparation of the consolidated financial statements have been consistently applied in all years presented, except for the changes as described under "Recent accounting developments" below and the toll treatment services disclosed as a separate revenue category. During the 2023 financial year additional toll treatment services contracts were entered into, which increased the amounts recognised significantly. As a result, the service fees have been included as a separate revenue stream for 2023, with the associated costs included in Cost of Sales. The amount for the 2022 year was not significant and therefore it has not been reclassified from other operating income/expenses where it was previously recognised, along with the associated costs. Refer to note 5, 6 and 9.
The consolidated financial statements have been prepared in accordance with International Financial Reporting Standards as issued by the International Accounting Standards Board (IASB) and IFRS Interpretations Committee (IFRIC) Interpretations (collectively IFRS).
The consolidated financial statements have been prepared on a going concern basis.
During the year ended 30 June 2023, the Tshepong Operations were reported on as two separate reportable segments, namely Tshepong North and Tshepong South, following the restructuring of the Tshepong Operations in the 2022 financial year. In accordance with the requirements of IFRS, the prior year comparative information has been re-presented in the segment report as well as in other notes where disclosure is required at a segment level.
The consolidated financial statements have been prepared to the nearest million and rounding may cause differences.
Recent accounting developments
New standards, amendments to standards and interpretations to existing standards adopted by the group
During the financial year, the following new standards, amendments to standards and interpretations to existing standards were adopted by the group. No other standards and amendments to standards that became effective during the 2023 year were relevant to the consolidated financial statements.
Financial reporting standards
IFRS 9 Financial Instruments (Amendment)
The amendment to IFRS 9 clarifies the fees a company includes when assessing whether the terms of a new or modified financial liability are substantially different from the terms of the original financial liability. This amendment is effective for annual periods beginning on or after 1 January 2022. After consideration of all areas impacted, Harmony concluded that the amendments did not have a material impact on the group.
IAS 16 Property, Plant and Equipment (Amendment)
The IASB issued Property, Plant and Equipment—Proceeds before Intended Use, which prohibit a company from deducting from the cost of property, plant and equipment amounts received from selling items produced while the company is preparing the asset for its intended use. Instead, a company will recognise such sales proceeds and related costs in profit or loss. This amendment is effective for annual periods beginning on or after 1 January 2022. Management performed an assessment in the prior year and concluded that any major project where incidental gold is mined during the development phase will no longer have a credit to capital expenditure while it is an asset under construction. Cost associated with the extraction and treatment thereof have been included in production costs for all financial years presented. This is not expected to impact on the assessment of the production start date. At implementation date, there were no projects that required retrospective adjustment and therefore the amendment did not have a material impact on the group.
IAS 37 Provisions, Contingent Liabilities and Contingent Assets (Amendment)
The IASB issued Onerous Contracts–Cost of Fulfilling a Contract, which specifies which costs an entity includes in determining the cost of fulfilling a contract for the purpose of assessing whether the contract is onerous. This amendment is effective for annual periods beginning on or after 1 January 2022. After consideration of all areas impacted, Harmony concluded that the amendments did not have a material impact on the group.
Notes to the group financial statements continued
For the year ended 30 June 2023
2 Accounting policies continued
Recent accounting developments continued
New standards, amendments to standards and interpretations to existing standards that are not yet effective and have not been early adopted
At the date of authorisation of these financial statements, the standards, amendments to standards and interpretations listed below were in issue but not yet effective. These new standards and interpretations have not been early adopted by the group and the group plans on adopting these standards, amendments to standards and interpretations on the dates when they become effective. Management has distinguished between financial reporting standards as issued by the IASB and non-financial reporting standards issued by other regulators such as the International Sustainability Standards Board (ISSB), which are topical for investors and other key stakeholders currently and may have an impact on financial information presented in the financial statements going forward.
Financial reporting standards
IAS 1 Presentation of Financial Statements (Amendment)
The IASB issued amendments to IAS 1 Presentation of Financial Statements to clarify its requirements for the presentation of liabilities in the statement of financial position. The amendments are effective from annual reporting periods beginning on or after 1 January 2023. The amendments are not expected to have a material impact on the group.
IAS 1 Presentation of Financial Statements (Amendment)
The IASB amended paragraphs 117 – 122 of IAS 1 to require entities to disclose their material accounting policy information rather than their significant accounting policies. The amendments are effective from annual reporting periods beginning on or after 1 January 2023. The amendments are not expected to have a material impact on the group.
IAS 1 Non-current liabilities with covenants (Amendments to IAS 1)
The amendments improved the information an entity provides when its right to defer settlement of a liability for at least twelve months is subject to compliance with covenants. The amendments also responded to stakeholders’ concerns about the classification of such a liability as current or non-current. The amendments are effective for annual reporting periods beginning on or after 1 January 2024. The amendments are not expected to have a material impact on the group.
IAS 8 Accounting policies, Changes in Accounting Estimates and Errors (Amendment)
The amendments introduce the definition of accounting estimates and included other amendments to IAS 8 to help entities distinguish changes in accounting policies from changes in accounting estimates. The amendments are effective for annual reporting periods beginning on or after 1 January 2023. The amendments are not expected to have a material impact on the group.
IAS 12 Income taxes (Amendment)
The IASB issued Deferred tax related to Assets and Liabilities arising from a Single Transaction (Amendment to IAS 12) to narrow the scope of IAS 12 recognition exemption so that it no longer applies to transactions that, on initial recognition, give rise to equal taxable and deductible temporary differences. The amendments are effective for annual reporting periods beginning on or after 1 January 2023. The amendments are not expected to have a material impact on the group.
IAS 12 Income taxes (Amendment)
In May 2023, the IASB issued International Tax Reform—Pillar Two Model Rules, which amended IAS 12 Income Taxes. The amendments introduced a temporary exception to the requirements to recognise and disclose information about deferred tax assets and liabilities related to Pillar Two income taxes. The amendment also introduced targeted disclosure requirements for affected entities. The amendments are effective for annual reporting periods beginning on or after 1 January 2023. Harmony is still assessing the impact of the amendment on the group. None of the jurisdictions that Harmony operates in have substantively enacted the legislation and therefore it has no impact at year end.
Measurement basis
The financial statements have been prepared under the historical cost convention except for certain financial assets and financial liabilities which are measured at fair value through profit or loss or other comprehensive income – refer to note 39.
Group accounting policies
Accounting policies are included in the relevant notes to the consolidated financial statements and have been highlighted between red lines in the notes to the consolidated financial statements. The accounting policies that follow are applied throughout the financial statements.
Notes to the group financial statements continued
For the year ended 30 June 2023
2 Accounting policies continued
Group accounting policies continued
2.1 Consolidation
The group recognises that control is the single basis for consolidation for all types of entities in accordance with IFRS 10 Consolidated Financial Statements. The consolidated financial information includes the financial statements of the company, its subsidiaries, interest in associates and joint arrangements and structured entities. Where the group has no control over an entity, that entity is not consolidated.
Control
The group, regardless of the nature of its involvement with an entity, shall determine whether it is a parent by assessing whether it controls the investee. The group controls an entity when it is exposed, or has rights, to variable returns from its involvement with the entity and has the ability to affect those returns through its power to direct the activities of the entity.
(i) Subsidiaries
Subsidiaries are entities over which the group has control. Subsidiaries are fully consolidated from the date on which control is transferred to the group up until when that control ceases. Intercompany transactions, balances and unrealised gains or losses on transactions between group companies are eliminated. Accounting policies of subsidiaries have been changed to ensure consistency with the policies adopted by the group.
The group uses the acquisition method of accounting to account for business combinations. The consideration transferred for the acquisition of an acquiree is the fair value of the assets transferred, liabilities incurred and the equity interests issued by the group. The consideration transferred includes the fair value of any asset or liability resulting from a contingent consideration arrangement. Acquisition-related costs are expensed as incurred. Identifiable assets acquired and liabilities and contingent liabilities assumed in a business combination are measured initially at their fair values at the acquisition date. On an acquisition-by-acquisition basis, the group recognises any non-controlling interests in the acquiree either at fair value or at the non-controlling interest’s proportionate share of the acquiree’s net assets.
The excess of the sum of the consideration transferred, the amount of any non-controlling interest in the acquiree and the acquisition-date fair value of any previously held equity interest in the acquiree over the fair value of the group’s share of the identifiable net assets acquired is recorded as goodwill. If this is less than the fair value of the net assets of the subsidiary acquired, in the case of a bargain purchase, the difference is recognised directly in the income statement below operating profit or loss.
(ii) Associates
Associates are entities in which the group has significant influence, but not control, over operational and financial policies. This may be when there is a shareholding of between 20% and 50% of the voting rights or when significant influence can be otherwise demonstrated, for example where the group has the right of representation on the board of directors, or other governing body, of the entity.
Investments in associates are accounted for by using the equity method of accounting, and are initially recognised at cost. The group’s investment in associates includes goodwill identified on acquisition. Cumulative post-acquisition movements are adjusted against the carrying amount of the investment. The group’s share of the associates’ post-acquisition profits or losses is recognised in the income statement, and its share of post-acquisition movement in reserves is recognised in other reserves. When the group’s share of losses in an associate equals or exceeds its interest in the associate, the group does not recognise further losses, unless it has incurred obligations or made payments on behalf of the associate. The carrying value of an associate is reviewed on a regular basis and, if impairment in the carrying value has occurred, it is written off in the period in which such impairment is identified.
Accounting policies of associates have been reviewed to ensure consistency with the policies adopted by the group.
(iii) Joint arrangements
Joint arrangements are arrangements of which two or more parties have joint control and are contractually bound. The joint arrangement can either be a joint operation or a joint venture. A joint operation is a joint arrangement whereby the parties that have joint control of the arrangement and have the right to the assets, and obligations for the liabilities, relating to the arrangement. These parties are called joint operators. A joint venture is a joint arrangement where the parties that have joint control of the arrangement have rights to the net assets of the arrangement. Those parties are called joint venturers.
For interest in joint operations, the group includes its share of the joint operations' individual income and expenses, assets and liabilities and cash flows on a line-by-line basis with similar items in the group’s financial statements.
Where an additional interest in a joint operation is acquired, the principles of IFRS 3 are applied to account for the transaction.
The group recognises the portion of gains or losses on the sale of assets by the group to the joint operation that is attributable to the other joint operators. The group does not recognise its share of profits or losses from the joint operation that results from the purchase of assets by the group from the joint operation until it resells the assets to an independent party. However, if a loss on the transaction provides evidence of a reduction in the net realisable value of current assets or an impairment loss, the loss is recognised immediately. The group recognises its interest in a joint venture as an investment and accounts for it using the equity accounting method.
Notes to the group financial statements continued
For the year ended 30 June 2023
2 Accounting policies continued
Group accounting policies continued
2.1 Consolidation continued
(iv) Structured entities
A structured entity is an entity that has been designed so that voting or similar rights are not the dominant factor in deciding who controls the entity, such as when any voting rights relate to administrative tasks only and the relevant activities are directed by means of contractual arrangements.
The accounting treatment for a structured entity will fall into one of the aforementioned categories (i to iii) depending on whether the group has control over that structured entity.
2.2 Foreign currency translation
(i) Functional and presentation currency
Items included in the financial statements of each of the group’s entities are measured using the currency of the primary economic environment in which the entity operates (the functional currency). The consolidated financial statements are presented in South African Rand, which is the group’s presentation currency.
References to “A$” refers to Australian currency, “R” to South African currency, “$” or “US$” to United States currency and “PGK” or “Kina” to Papua New Guinean currency.
(ii) Transactions and balances
Foreign exchange gains and losses resulting from the settlement of foreign currency transactions and from the translation to year-end exchange rates of monetary assets and liabilities denominated in foreign currencies are recognised in the income statement. This includes the gains and losses on the translation of the US$-denominated facilities.
(iii) Group companies
The results and financial position of all group entities (none of which has the currency of a hyperinflationary economy) that have a functional currency different from the presentation currency are translated into the presentation currency as follows:
•Assets and liabilities for each balance sheet presented are translated at the closing rate at the date of that balance sheet while equity items are translated at historic rates
•Income and expenses for each income statement are translated at average exchange rates (the rate on the date of the transaction is used if the average is not a reasonable rate for the translation of the transaction)
•All resulting exchange differences are recognised as a separate component of other comprehensive income.
On consolidation, exchange differences arising from the translation of the net investment in foreign operations, and of borrowings and other currency instruments designated as hedges of such investments, are taken to other comprehensive income. When a foreign operation is sold or control is otherwise lost, exchange differences that were recorded in other comprehensive income are recognised in profit or loss in the period of the disposal or change in control. Goodwill and fair value adjustments arising on the acquisition of a foreign operation are treated as assets and liabilities of the foreign entity and translated at the closing rate.
2.3 Derivatives and hedging activities
Derivatives are initially recognised at fair value on the date a derivative contract is entered into and are subsequently remeasured to their fair value at the end of each reporting period. The accounting for subsequent changes in fair value depends on whether the derivative is designated as a hedging instrument, and if so, the nature of the item being hedged.
The difference between the fair value of the derivative at initial recognition and expected forward transaction price is deferred and recognised as a day one gain or loss. The day one gain or loss is amortised over the derivative contract period and recognised in profit or loss in gains/losses on derivatives.
The full fair value of a derivative is classified as a non-current asset or liability when the remaining maturity is more than 12 months; it is classified as a current asset or liability when the remaining maturity is less than 12 months.
(i) Cash flow hedge
The group designates certain derivatives as hedges of a particular risk associated with the cash flows of highly probable forecast transactions (cash flow hedges). At inception of the hedge relationship, the group documents the economic relationship between hedging instruments and hedged items, including whether changes in the cash flows of the hedging instruments are expected to offset changes in the cash flows of hedged items. The group documents its risk management objective and strategy for undertaking its hedge transactions.
The effective portion of changes in the fair value of derivatives that are designated and qualify as cash flow hedges is recognised in other comprehensive income and accumulated in reserves in equity. The gain or loss relating to the ineffective portion is recognised immediately in profit or loss within gains/losses on derivatives.
Notes to the group financial statements continued
For the year ended 30 June 2023
2 Accounting policies continued
Group accounting policies continued
2.3 Derivatives and hedging activities continued
(i) Cash flow hedge continued
Amounts accumulated in equity are reclassified to profit or loss in the periods when the forecast sale that is hedged takes place and affects profit or loss. The gain or loss relating to the effective portion of the Rand and US$ gold forward sales contracts is recognised in profit or loss within revenue.
When a hedging instrument expires or is sold or terminated, or when a hedge no longer meets the criteria for hedge accounting, any cumulative gain or loss existing in equity at that time remains in equity and is recognised when the forecast transaction that was hedged is ultimately recognised in profit or loss. When a forecast transaction is no longer expected to occur, the cumulative gain or loss that was reported in equity is immediately reclassified to profit or loss.
(ii) Derivatives not designated for hedge accounting purposes
Certain derivative instruments do not qualify for hedge accounting. Changes in the fair value as well as gains and losses on expiry, disposal or termination of any derivative instrument that does not qualify for hedge accounting are recognised immediately in profit or loss and are included in gains/losses on derivatives.
2.4 Exploration expenditure
The group expenses all exploration and evaluation expenditures until it is concluded that the project is technically feasible and commercially viable, and that future economic benefits are therefore probable. The information used to make that determination depends on the level of exploration as well as the degree of confidence in the ore body as set out below.
Exploration and evaluation expenditure on greenfield sites, being those where the group does not have any mineral deposits which are already being mined or developed, is expensed as incurred until the technical and commercial viability of the project has been demonstrated usually through the completion of a final feasibility study. However, in certain instances, the technical and commercial viability of the deposit may be demonstrated at an earlier stage, for example where an extended feasibility study is conducted and the underlying feasibility study in respect of specific components of the mineral deposit has advanced to such a stage that significant commercially viable reserves has been established, and the other criteria for the recognition of an asset have been met. At this point the expenditure is capitalised as mine development cost to the extent that future economic benefits are expected.
Exploration and evaluation expenditure on brownfield sites, being those adjacent to mineral deposits which are already being mined or developed, is expensed as incurred until the group is able to demonstrate that future economic benefits are probable through the completion of a feasibility study, after which the expenditure is capitalised as mine development cost to the extent that future economic benefits are expected. A “feasibility study” consists of a comprehensive study of the viability of a mineral project that has advanced to a stage where the mining method has been established, and which, if an effective method of mineral processing has been determined, includes a financial analysis based on reasonable assumptions of technical, engineering, operating economic factors and the evaluation of other relevant factors. The feasibility study, when combined with existing knowledge of the mineral property that is adjacent to mineral deposits that are already being mined or developed, allows the group to conclude that the project is technically feasible and commercially viable.
Exploration and evaluation expenditure relating to extensions of mineral deposits which are already being mined or developed, including expenditure on the definition of mineralisation of such mineral deposits, is capitalised as a mine development cost following the completion of an economic evaluation equivalent to a feasibility study. This economic evaluation is distinguished from a feasibility study in that some of the information that would normally be determined in a feasibility study is instead obtained from the existing mine or development. This information, when combined with existing knowledge of the mineral property already being mined or developed, allows the directors to conclude that the project is technically feasible and commercially viable.
2.5 Impairment of non-financial assets
Assets that have an indefinite useful life are not subject to amortisation or depreciation and are tested annually for impairment or when there is an indication of impairment.
Assets that are subject to amortisation are reviewed annually on 30 June for impairment or whenever events or changes in circumstances indicate that the carrying amount may not be recoverable.
An impairment loss is recognised in the income statement for the amount by which the asset’s carrying amount exceeds its recoverable amount. The recoverable amount is the higher of an asset’s fair value less costs to sell and value in use. For the purposes of assessing impairment, assets are grouped at the lowest levels for which there are separately identifiable cash flows (cash generating unit or CGU). Each operating shaft, along with allocated common assets such as plants and administrative offices, is considered to be a cash generating unit as each shaft is largely independent from the cash flows of other shafts and assets belonging to the group.
Notes to the group financial statements continued
For the year ended 30 June 2023
2 Accounting policies continued
Group accounting policies continued
2.5 Impairment of non-financial assets continued
Fair value less cost to sell is generally determined by using discounted estimated after-tax future cash flows. Future cash flows are estimated based on quantities of recoverable minerals, expected commodity prices (considering current and historical prices, price trends and related factors), production levels and cash costs of production, all based on life-of-mine (LoM) plans. Future cash flows are discounted to their present value using a post-tax discount rate that reflects current market assessments of the time value of money and risk specific to the asset. Refer to note 15 for detail.
The term “recoverable minerals” refers to the estimated amount of gold that will be obtained from reserves and resources and all related exploration stage mineral interests (except for other mine-related exploration potential and greenfields exploration potential discussed separately below) after taking into account losses during ore processing and treatment. Estimates of recoverable minerals from such related exploration stage mineral interests will be risk adjusted based on management’s relative confidence in such materials.
In estimating future cash flows, assets are grouped at the lowest level for which there are identifiable cash flows that are largely independent of cash flows from other asset groups. Except for other mine-related exploration potential and greenfields exploration potential, estimates of future undiscounted cash flows are included on an area of interest basis, which generally represents an individual operating mine, even if the mines are included in a larger mine complex.
In the case of mineral interests associated with other mine-related exploration potential and greenfields exploration potential, cash flows and fair values are individually evaluated based primarily on recent exploration results and recent transactions involving sales of similar properties, if any. Assumptions underlying future cash flow estimates are subject to significant risks and uncertainties.
Impairment losses on goodwill are recognised immediately in the income statement and are not reversed. The impairment testing is performed annually on 30 June or when events or changes in circumstances indicate that it may be impaired.
Non-financial assets other than goodwill that suffered an impairment are reviewed annually for possible reversal of the impairment at 30 June. Reversal of impairments is also considered when there is objective evidence to indicate that the asset is no longer impaired. Where an impairment subsequently reverses, the carrying amount of the asset or CGU is increased to the revised estimate of its recoverable amount, but not higher than the carrying value that would have been determined had no impairment been recognised in prior years.
2.6 Operating profit
The group defines operating profit as the profit earned from the normal core mining operations. In reporting operating profit in the income statement, capital transactions involving subsidiaries, joint arrangements and associates are excluded from operating profit as these are not considered to be part of the mining operations of the Harmony group. Any gains or losses on capital transactions are presented below the operating profit line.
3 Critical accounting estimates and judgements
The preparation of the financial statements in conformity with IFRS requires the group’s management to make estimates and assumptions that affect the reported amounts of assets and liabilities as well as disclosure of contingent assets and liabilities at the date of the financial statements, and the reported amounts of revenues and expenses during the reporting period. Actual results could differ from those estimates.
Key accounting estimates and assumptions applied:
•Estimate of taxation – note 12
•Recognition of deferred tax asset – note 12 and 14
•Valuation of cash generating units acquired – note 14
•Fair value of identifiable net assets acquired – note 14
•Estimate of deferred tax rates on acquisition date – note 14
•Gold mineral reserves and resources – note 15
•Production start date – note 15
•Stripping activities – note 15
•Impairment of assets – note 15
•Depreciation of property plant and equipment – note 15
•Exploration and evaluation assets – note 15
•Impairment of goodwill – note 16
•Provision for stock obsolescence – note 23
•Estimate of exposure and liabilities with regard to rehabilitation costs – note 26
•Estimate of provision for silicosis settlement – note 27
•Leases – note 28
•Valuation of contingent consideration liability – note 29
•Streaming contract liability – note 31
•Assessment of contingencies – note 38
•Valuation of derivative financial instruments – note 39.
Other accounting estimates and assumptions applied:
•Valuation of interest in associate – note 21
•Estimate of employee benefit liabilities – note 27
•Fair value of share-based payments – note 36 .
Notes to the group financial statements continued
For the year ended 30 June 2023
4 Impact of changes in global operating and economic environment
Covid-19
Although the disruption caused by Coronavirus (Covid-19) has diminished significantly worldwide, Harmony still maintains a precautionary approach to infectious disease control. Harmony is actively monitoring and managing the supply of critical items to ensure that production is not affected, thereby ensuring the company remains in a position to manage Covid-19 as part of normal day-to-day activities.
In South Africa, the national lockdown that began on 27 March 2020 to curb the spread of the Coronavirus came to an end during April 2022. This led to the discontinuance of all Covid-19 regulations which had been put in place. In Papua New Guinea, where the Hidden Valley operation is located, significant decreases in positive cases have been experienced for the first part of the 2022 calendar year. In 2021, the group had been able to carry out its operations in Papua New Guinea during the state of emergency which had been imposed by the government.
Cost and inflationary pressures
During the 2023 financial year, Harmony continued to experience heightened input costs driven by inflationary pressures. The effect has been especially pronounced on certain key items such as oil (directly affecting diesel supply and cost), electricity and certain chemical reagents used by treatment plants. Refer to note 6. The announcement by the energy regulator in South Africa, NERSA, of a 18.65% tariff hike in electricity is incorporated into the 2023/2024 budgeting and forecasting process. This brings further impetus to Harmony's renewable energy programme.
The cost inflation seen in 2023 started during the second half of the 2022 financial year, driven by inflationary pressures related to global supply chain constraints due to the Covid-19 pandemic, which was then further exacerbated by Russia’s invasion of Ukraine. These cost pressures had an impact on, among others, the FY23 budget and life-of-mine planning process, determination of deferred tax rates for the group’s mining entities and impairment assessments performed for the group’s cash generating units. Refer to notes 12 and 15 respectively for further disclosure.
Interest rates
Over the past year, central banks globally have been increasing interest rates as a measure of combating rising inflation. In the current financial year, the US Federal Reserve raised interest rates by 350 basis points (2022: 150 basis points) (2021: no increase/decrease), while the South African Reserve Bank (SARB) similarly raised the repurchase interest rate by 350 basis points (2022: 125 basis points) (2021: 25 basis points decrease). This contributed to increased finance costs and investment income for the 2023 financial year (refer to notes 10 and 11). The increase in interest rates also contributed to higher bond yields in the market, which affected the risk-free rates used for discounting of the provision for environmental rehabilitation (refer to note 26) and the provision for silicosis settlement (refer to note 27).
Commodity prices and exchange rates
Gold traded within a range of US$1 622/oz and US$2 051/oz (2022: US$1 726/oz and US$2 052/oz) (2021: US$1 681/oz and US$2 063/oz) during the current financial year, reaffirming its safe haven status with investors during times of global uncertainty and market volatility. These uncertainties have also resulted in increased volatility in the R/US$ and R/A$ exchange rates. The currencies traded in ranges of R16.17/US$1 to R19.81/US$1 (2022: R14.15/US$1 to R16.30/US$1) (2021: R13.43/US$1 to R17.68/US$1) and R11.19/A$1 to R12.94/A$1 (2022: R10.43/A$1 to R11.63/A$1) (2021: R10.41/A$1 to R12.66/A$1) during the current financial year. These movements in the currencies expose the group's operations to foreign currency gains and losses on foreign-denominated receivables and liabilities, including derivatives, and also impact the group’s translation of its international operating results and net assets into its Rand presentation currency, which resulted in a foreign exchange translation gain of R1.1 billion for the 2023 year (2022: R742 million) (2021: R1.2 billion loss).
As part of the underlying assumptions used in valuing certain line items, management used a consensus of market analysts’ forecasts in determining short-, medium- and long-term commodity prices and exchange rates. These economic assumptions are used in certain fair value calculations. Based on the consensus forecasts used, a marked increase was seen in US$ gold price and R/US$ exchange rate assumptions applied. Refer to note 15 for disclosed assumptions.
ESG and climate change-related financial disclosures
Due to the increased focus on sustainability, Environmental, Social and Governance (ESG) matters and climate change, various regulators have released guidance or proposed regulations for required disclosures.
During March 2022, the Securities and Exchange Commission (SEC) issued proposed rules that are intended to provide more consistent, comparable and reliable information so that investors can better evaluate the impact of climate-related matters on entities. The comment period on the proposed rules have closed and the SEC is evaluating comment letters received. The SEC’s proposed rules are expected to affect the information reported as “other information” by entities and may include specific requirements on assurance of certain ESG key performance indicators. However, the SEC’s proposal included certain disclosures in the financial statements. It is unknown at this stage if these will be retained in the final regulation.
Management will continue to monitor announcements made that will affect the reporting by the group.
Notes to the group financial statements continued
For the year ended 30 June 2023
5 Revenue
Accounting policy
(a) Commodities
Revenue from metal sales include the sale of gold, silver and uranium. Revenue from metal sales is recognised when the group satisfies its performance obligations under its contract with the customer, by transferring such metals to the customer's control. Transfer of control is generally determined to be when the risk and title to the metals passes to the customer. Revenue is measured based on the consideration specified in the contract with the customer and is driven by the quoted market prices of the metals.
(b) Toll treatment
The group has entered into agreements with various third parties to treat gold-bearing material at certain of the group's metallurgical plants in South Africa. The determination of the consideration receivable is set out in each individual contract, based on the third parties' specific circumstances. Revenue from toll treatment services is recognised as the group satisfies its single performance obligation under its contract with the third parties, which is the recovery of the gold through the treatment process and the facilitation of the ultimate sale of recovered gold. This is satisfied over time. The gold-bearing material, and thereafter recovered gold, remains at all times under control of the third parties until the ultimate sale of the recovered gold. Harmony therefore acts as agent in treating the gold-bearing material. Settlement is done in the month following the sale of gold (see below).
Subsequent to treatment, the group delivers the recovered gold on behalf of the third parties to Rand Refinery for further refining, whereafter it is sold. The group acts as an agent in the sales process, receiving payment on behalf of the third parties before transferring the amounts owed to them.
(c) Hedging
The effective portion of gains or losses on the derivatives designated as cash flow hedging items (forecast sales transactions) are recognised in revenue when the forecast sales transactions occur. See the accounting policy for derivatives and hedging activities in note 2.
|
|
|
|
|
|
|
|
|
|
|
|
|
|
|
SA Rand |
|
Figures in million |
2023 |
2022 |
2021 |
|
Commodities |
|
|
|
|
Gold (a) |
47 366 |
|
40 774 |
|
42 597 |
|
|
Silver (b) |
1 021 |
|
663 |
|
857 |
|
|
Uranium (c) |
304 |
|
240 |
|
178 |
|
|
|
48 691 |
|
41 677 |
|
43 632 |
|
|
Toll treatment services (d) |
430 |
|
— |
|
— |
|
|
Revenue from contracts with customers |
49 121 |
|
41 677 |
|
43 632 |
|
|
Consideration from streaming contract (e) |
338 |
|
471 |
|
397 |
|
|
Hedging gain/(loss) (f) |
(184) |
|
497 |
|
(2 296) |
|
|
Total revenue1 |
49 275 |
|
42 645 |
|
41 733 |
|
1 A geographical analysis of revenue is provided in the segment report. Refer to note 41 for further information.
Below are the average commodity prices received for the financial years:
|
|
|
|
|
|
|
|
|
|
|
|
|
|
|
2023 |
2022 |
2021 |
|
Gold1 |
|
|
|
|
– US$ per ounce (US$/oz) |
1 808 |
|
1 829 |
|
1 719 |
|
|
– Rand per kilogram (R/kg) |
1 032 646 |
|
894 218 |
|
851 045 |
|
|
Silver |
|
|
|
|
– US$ per ounce (US$/oz) |
21.89 |
23.09 |
25.45 |
|
– Rand per kilogram (R/kg) |
12 505 |
|
11 293 |
|
12 602 |
|
|
Uranium |
|
|
|
|
– US$ per pound (US$/lb) |
50.05 |
45.14 |
29.76 |
|
– Rand per kilogram (R/kg) |
1 960 |
|
1 514 |
|
1 010 |
|
1 The gold price includes the realised effective portion of the hedge-accounted gold derivatives.
Notes to the group financial statements continued
For the year ended 30 June 2023
5 Revenue continued
Revenue from contracts with customers
The points of transfer of control are as follows:
|
|
|
|
|
|
|
|
|
|
|
|
|
|
Gold: South Africa (excluding streaming contract) |
|
|
Gold is delivered and a certificate of sale is issued. |
|
Gold and silver: Hidden Valley |
|
|
Metal is collected from Hidden Valley and a confirmation of collection is sent to and accepted by the customer. |
|
Uranium |
|
|
Confirmation of transfer is issued. |
|
Toll treatment services |
|
|
As the gold-bearing material is treated and processed over time. |
|
Streaming contract |
|
|
Gold is delivered and credited into the Franco-Nevada designated gold account. |
(a) The increase in gold revenue during the 2023 financial year is mainly due to the weakening of the Rand/US$ exchange rate from an average of R15.21/US$ to R17.76/US$. This resulted in an increase in the average gold spot price received by 17%, from R883 453/kg in the 2022 year to R1 036 682/kg in 2023. The increase in revenue was partially offset by the closure of Bambanani in June 2022, which contributed revenue of R1 286 million in 2022.
The decrease in gold revenue during the 2022 financial year is mainly due to the decrease in gold production by 3% to 46 236kg in 2022 from 47 755kg in 2021. The decrease is a result of mining constraints at Doornkop, Moab Khotsong, Tshepong North and Tshepong South resulting in lower grades recovered, the seismic issues experienced at Bambanani as well as the geotechnical instability affecting Stage 6 and a conveyor belt failure at Hidden Valley. In addition, the average gold spot price received decreased by 2% from R899 563/kg in the 2021 year to R883 453/kg in 2022. The decrease was partially offset by an increase in production at Mponeng and Mine Waste Solutions as they contributed for the full year compared to nine months in 2021.
(b) Silver is derived from the Hidden Valley mine in Papua New Guinea. The increase in silver revenue in the 2023 financial year is due to an increase in production by 38% to 82 093kg from 59 489kg in 2022. This was due to a general improvement in the operating environment at Hidden Valley. The average silver price increased by 11% to R12 505/kg in 2023.
Silver produced decreased by 12% to 59 489kg in 2022 from 67 295kg in 2021 as a result of operational challenges experienced at Hidden Valley. The average silver price decreased by 10% to R11 293/kg in 2022.
(c) Uranium is derived from the Moab Khotsong operation. Uranium produced increased by 42% to 237 438kg from 167 696kg in 2022 and the average uranium price increased by 30% to R1 960/kg in 2023.
Uranium produced increased by 11% to 167 696kg in 2022 from 150 778kg in 2021 and the average uranium price increased by 50% to R1 514/kg in 2022.
(d) The fees for services rendered for the treatment of third-party gold-bearing material at the Doornkop and Moab operations have been included separately as of 2023. Refer to note 2 for details.
(e) The streaming arrangement results in the non-cash consideration recognised as part of revenue for the streaming arrangement. Refer to note 31 for further information.
(f) The realised effective portion of the hedge-accounted gold derivatives was impacted by the average gold market spot price during the 2023 financial year of R1 045 527/kg (2022: R896 712/kg) compared to the average forward price of matured contracts of R1 028 764/kg (2022: R940 536/kg). Refer to note 19 for further information.
Notes to the group financial statements continued
For the year ended 30 June 2023
6 Cost of sales
|
|
|
|
|
|
|
|
|
|
|
|
|
|
|
SA Rand |
|
Figures in million |
2023 |
2022 |
2021 |
|
|
|
|
|
|
Production costs (a) |
34 866 |
|
33 099 |
|
29 774 |
|
|
Amortisation and depreciation of mining assets (b) |
3 355 |
|
3 622 |
|
3 777 |
|
|
Amortisation and depreciation of assets other than mining assets |
99 |
|
61 |
|
98 |
|
|
Rehabilitation expenditure (c) |
32 |
|
136 |
|
135 |
|
|
Care and maintenance costs of restructured shafts (d) |
227 |
|
273 |
|
144 |
|
|
Employment termination and restructuring costs (e) |
597 |
|
218 |
|
332 |
|
|
Share-based payments (f) |
51 |
|
143 |
|
114 |
|
|
Impairment of assets (g) |
— |
|
4 433 |
|
1 124 |
|
|
Toll treatment costs (h) |
323 |
|
— |
|
— |
|
|
Other |
(15) |
|
(58) |
|
(9) |
|
|
Total cost of sales |
39 535 |
|
41 927 |
|
35 489 |
|
(a) Production costs include mine production, transport and refinery costs, applicable general administrative costs, movement in inventories and ore stockpiles, ongoing environmental rehabilitation costs and transfers for stripping activities. Employee termination costs are included, except for employee termination costs associated with major restructuring and shaft closures, which are separately disclosed.
Production costs increased by R1 767 million (5% year on year) during 2023. These costs increased mainly due to inflationary pressures on costs including labour, electricity and consumables costs. The royalty tax increased due to a higher rate being applied due to higher profits, as well as the increased revenue base to which it is applied. The increase in production costs was offset by the closure of Bambanani at the end of June 2022 as well as an increase of R408 million in the capitalised stripping credit at Hidden Valley.
Production costs increased by R3 325 million (11% year on year) during the 2022 year. These costs increased mainly due to the inclusion of the Mponeng operations and related assets for a full financial year, and inflationary pressures on costs including labour, electricity and consumables. This was partially offset by a reduction in the royalty expense due to lower profits which impacted the rates at which the royalties are calculated.
Production costs, analysed by nature, consist of the following:
|
|
|
|
|
|
|
|
|
|
|
|
|
|
|
SA Rand |
|
Figures in million |
2023 |
2022 |
2021 |
|
|
|
|
|
|
Labour costs, including contractors |
19 760 |
|
19 350 |
|
17 585 |
|
|
Consumables |
9 982 |
|
8 581 |
|
7 218 |
|
|
Water and electricity |
6 342 |
|
6 009 |
|
5 138 |
|
|
Insurance1 |
551 |
|
230 |
|
208 |
|
|
Transportation1 |
281 |
|
185 |
|
177 |
|
|
Change in inventory |
(11) |
|
21 |
|
69 |
|
|
Capitalisation of mine development costs |
(2 349) |
|
(2 576) |
|
(2 117) |
|
|
Stripping activities |
(1 514) |
|
(1 096) |
|
(1 047) |
|
|
Royalty expense |
652 |
|
360 |
|
637 |
|
|
Other |
1 172 |
|
2 035 |
|
1 906 |
|
|
Total production costs |
34 866 |
|
33 099 |
|
29 774 |
|
1 Line item has been disaggregated from the Other line item and shown as a separate line item for the current year, based on the materiality thereof. The 2022 and 2021 amounts were amended accordingly.
(b) The decrease for the 2023 year is predominantly due to impairment of assets recognised in the 2022 year which reduced the carrying value of mining assets of certain operations (refer to (g) below), resulting in lower depreciation for the 2023 year. Additionally, the closure of Bambanani in June 2022 resulted in no depreciation in 2023 compared to R84 million in 2022.
The decrease for the 2022 year is predominantly as a result of the operational challenges experienced at the Hidden Valley operation, which resulted in lower production and therefore a decrease in depreciation year on year of R651 million. This was partially offset by increased depreciation at the other operations. Notably, Mine Waste Solutions had a year-on-year increase of R227 million, primarily due to new assets being brought into use. Mponeng also recorded an increase, due to the consolidation for the full year for 2022 compared to nine months for 2021, amounting to R54 million. With the closure of Bambanani earlier than initially planned, additional depreciation of R56 million was recorded due to the shortened life of the operation.
Notes to the group financial statements continued
For the year ended 30 June 2023
6 Cost of sales continued
(c) For the assumptions used to calculate the rehabilitation costs, refer to note 26. This expense includes the change in estimate for the rehabilitation provision where an asset no longer exists as well as costs related to the rehabilitation process. For 2023, R90 million (2022: R65 million) (2021: R15 million) was spent on rehabilitation in South Africa. Refer to note 26.
(d) The increase in the 2022 year is mainly due to the Vaal River surface operations and Kopanang gold plant being placed on care and maintenance at the end of the 2021 year, which contributed R117 million to the costs for 2022.
(e) Employment termination and restructuring cost increased in 2023 as a result of the changes in the number of employees taking up voluntary severance packages. The increase is attributable to the voluntary severance packages that were taken up following the closure of Bambanani and disaggregation of the Tshepong Operations into Tshepong North and Tshepong South. The bulk of the employees from these operations have been accommodated at other operations within the group.
During 2021, a new programme for voluntary and medical severance packages was offered to employees, partially related to the closure of Unisel. The decrease in 2022 is due to a lower number of employees taking up voluntary severance packages year on year.
(f) Refer to note 36 for details on the share-based payment schemes implemented by the group.
(g) Management performed an assessment for indicators of impairment as well as indicators of reversal of previously recorded impairment losses in terms of IAS 36 Impairment of Assets. Specific circumstances surrounding each of the individual cash generating units (CGUs) were considered in this assessment in order to identify significant changes in the current financial year.
The Target 1, Kalgold and Kusasalethu CGUs experienced operational issues during the year ended 30 June 2023. These operational issues were considered to be indicators of potential impairment and therefore an impairment assessment was performed for these CGUs. Based on the impairment tests performed, no impairments were recorded for the 2023 financial year.
As a result of the group net asset value exceeding Harmony's market capitalisation as at 30 June 2022 and 2021, impairment assessments were performed for all CGUs.
The recoverable amounts for the CGUs tested were determined on a fair value less cost to sell basis using assumptions in the discounted cash flow models and attributable resource values. These are fair value measurements classified as level 3.
Where CGUs had previously been impaired, management considered whether the impairment loss (or the contributors to the previously recognised impairment loss) no longer exists or might have decreased. Management considered general and specific factors for each CGU and concluded that although overall the gold price had improved from the time that the impairment losses had been recognised, the specific circumstances that led to the original impairments had not reversed. Furthermore, the service potential of the asset has not increased. Management therefore deemed it appropriate for no reversal of previously recognised impairment losses to be recorded for the year ended 30 June 2023. There also was no reversal of impairment for the 2022 or 2021 financial years.
Refer to note 15 for further information.
The impairment of assets consists of the following:
|
|
|
|
|
|
|
|
|
|
|
|
|
|
|
SA Rand |
|
Figures in million |
2023 |
2022
Re-presented |
2021
Re-presented |
|
Tshepong North |
— |
|
2 296 |
|
651 |
|
|
Tshepong South |
— |
|
1 326 |
|
108 |
|
|
|
|
|
|
|
Moab Khotsong |
— |
|
522 |
|
— |
|
|
Kusasalethu |
— |
|
145 |
|
— |
|
|
Bambanani |
— |
|
144 |
|
187 |
|
|
|
|
|
|
|
|
|
|
|
|
|
|
|
|
|
Target 3 |
— |
|
— |
|
178 |
|
|
Total impairment of assets |
— |
|
4 433 |
|
1 124 |
|
The Tshepong Operations were disaggregated into two separate CGUs being the Tshepong North CGU and the Tshepong South (also known as the Phakisa section) CGU, for impairment testing at 30 June 2022. This was due to the decision taken during the FY23 budget process in June 2022, to reinvest in the two individual operations to maximise individual profitability following the change to Tshepong North's life-of-mine with the sub-75 decline project being halted. Based on the forward-looking nature of the impairment assessment, a separate impairment calculation was prepared for each of the CGUs. Tshepong North and Tshepong South are disclosed as separate reportable segments for the 2023 financial year, therefore the disclosures for 2022 and 2021 have been re-presented accordingly. Refer to note 2 and 41 for more information.
Notes to the group financial statements continued
For the year ended 30 June 2023
6 Cost of sales continued
(g) Impairment of assets continued
The recoverable amounts of the CGUs where impairments were recognised as at 30 June 2022 are as follows:
|
|
|
|
|
|
|
|
|
|
|
|
|
|
|
SA Rand |
|
|
Recoverable amount |
|
Figures in million |
Life-of-mine plan |
Resource
base |
Total |
|
Tshepong South |
|
|
|
|
For Tshepong South, the individual life-of-mine plan included additional capital to address flexibility constraints at the operation. Costs also increased significantly as a result of inflationary pressures. These changes along with a higher post-tax discount rate of 11.67% (2021: 10.11% for Tshepong Operations), negatively affected the discounted cash flows used to determine the recoverable amount of the operation. |
1 645 |
|
— |
|
1 645 |
|
|
Tshepong North |
|
|
|
|
The impairment of Tshepong North was as a result of increased cost of both production and capital expenditure and an increased post-tax discount rate of 11.67% (2021: 10.11% for Tshepong Operations). The recoverable amount was also affected by the reclassification of production for the sub-75 level from reserves in the life-of-mine plan to the resource base, which is subject to a higher discount rate of 13.75% (2021: 12.02%). |
1 088 |
|
850 |
|
1 938 |
|
|
Moab Khotsong |
|
|
|
|
The updated life-of-mine plan included an increase in working and capital costs as a result of inflationary pressures. The updated life-of-mine plan also includes additional capital expenditure which relates to the Zaaiplaats project after finalisation of its detailed design plan during the 2022 financial year. This impacted the discounted cash flows used to determine the recoverable amount of the operation. The recoverable amount was further impacted by an increased post-tax discount rate of 10.44% (2021: 9.35%). |
3 748 |
|
— |
|
3 748 |
|
|
Kusasalethu |
|
|
|
|
A decrease in tonnes combined with a decrease in grade over the remainder of the life-of-mine of the operation lead to a decrease in gold production. The reduction is due to an updated plan to mitigate safety risks that exist at the operation. |
806 |
|
— |
|
806 |
|
|
Bambanani |
|
|
|
|
The life-of-mine plan of the operation was revised in the period ended 31 December 2021, bringing the closure of the operation forward from June 2024 to June 2022. This was as a result of the increased seismicity and related risk increasing as pillars were mined out. At
31 December 2021, the post-tax recoverable amount was derived from expected cash flows as per the life-of-mine plans and amounted to
R36 million. The recoverable amount is now Rnil, as the operation was closed down during June 2022. The assumptions used in the December impairment assessment included a gold price of US$1 782/oz, an exchange rate of R15.36/US$1, a final gold price of R880 000/kg and a post-tax real discount rate of 12.59%. This resulted in a post-tax recoverable amount of R36 million at 31 December 2021.
|
— |
|
— |
|
— |
|
Notes to the group financial statements continued
For the year ended 30 June 2023
6 Cost of sales continued
(g) Impairment of assets continued
The recoverable amounts of the CGUs where impairments were recognised as at 30 June 2021 are as follows:
|
|
|
|
|
|
|
|
|
|
|
|
|
|
|
SA Rand |
|
|
Recoverable amount |
|
Figures in million |
Life-of-mine plan |
Resource
base |
Total |
|
Tshepong South |
|
|
|
|
The updated life-of-mine plan included a reduction in planned gold resulting from lower grade. There was also a change in the mining profile in the revised life-of-mine plan, which impacted on the timing of cash flows, which were then later than in comparison to the prior-year plan. These changes affected the discounted cash flows used to determine the recoverable amount of the operation. |
1 691 |
|
— |
|
1 691 |
|
|
Tshepong North |
|
|
|
|
The updated life-of-mine plan included a reduction in planned gold resulting from lower grade. There was also a change in the mining profile in the revised life-of-mine plan, which impacted on the timing of cash flows, which were then later than in comparison to the prior-year plan. These changes affected the discounted cash flows used to determine the recoverable amount of the operation. |
3 156 |
|
936 |
|
4 092 |
|
|
Bambanani |
|
|
|
|
The impairment of goodwill on Bambanani was mainly as a result of a reduction in grade over the remainder of the operation's life. The reduction in grade is due to unexpected changes in the orebody and a lower mine call factor. |
341 |
|
— |
|
341 |
|
|
Target 3 |
|
|
|
|
Previous plans to explore the sale of the operation have been abandoned and further development is not a viable option at this stage. Therefore management has determined a recoverable amount of Rnil. |
— |
|
— |
|
— |
|
(h) Relates to costs associated with services rendered for the treatment of third-party gold-bearing material. Refer to note 5 for further detail.
7 Corporate, administration and other expenditure
|
|
|
|
|
|
|
|
|
|
|
|
|
|
|
SA Rand |
|
Figures in million |
2023 |
2022 |
2021 |
|
Professional and legal fees |
87 |
|
61 |
|
52 |
|
|
Compliance and assurance costs |
63 |
|
62 |
|
51 |
|
|
|
|
|
|
|
Corporate business development (a) |
20 |
|
39 |
|
221 |
|
|
Corporate office expenditure |
847 |
|
797 |
|
707 |
|
|
|
|
|
|
|
Other corporate and administration expenses |
27 |
|
25 |
|
37 |
|
|
Total corporate, administration and other expenditure |
1 044 |
|
984 |
|
1 068 |
|
(a) The corporate business development in 2021 is largely attributable to integration costs incurred in relation to the acquisition of Mponeng operations and related assets. These expenses were not incurred in the 2022 and 2023 financial years.
Notes to the group financial statements continued
For the year ended 30 June 2023
8 Foreign exchange translation gain/(loss)
|
|
|
|
|
|
|
|
|
|
|
|
|
|
|
SA Rand |
|
Figures in million |
2023 |
2022 |
2021 |
|
Borrowings (a) |
(820) |
|
(411) |
|
894 |
|
|
Other items (b) |
186 |
|
84 |
|
(224) |
|
|
Total foreign exchange translation gain/(loss) |
(634) |
|
(327) |
|
670 |
|
(a)The losses in 2023 and 2022 were predominantly caused by unfavourable translations on US dollar loan balances. The unfavourable translations on US dollar loans are attributable to the Rand weakening against the US dollar, evidenced by a closing exchange rate of R18.83/US$1 (2022: R16.27/US$1) (2021:14.27 /US$1). Also contributing to the loss for 2023 was the draw down of US$170 million (R2 919 million) during the year for the acquisition of the Eva Copper Project and other assets. Refer to note 32 and 14 respectively for details.
(b)This relates mainly to the translation of metal trade receivables and cash denominated in a foreign currency to the functional currencies of the operating entities.
9 Other operating expenses
|
|
|
|
|
|
|
|
|
|
|
|
|
|
|
SA Rand |
|
Figures in million |
2023 |
2022 |
2021 |
|
Social investment expenditure |
208 |
|
145 |
|
126 |
|
|
Loss on scrapping of property, plant and equipment (a) |
182 |
|
7 |
|
161 |
|
|
Silicosis settlement provision (b) |
(183) |
|
23 |
|
80 |
|
|
Loss allowance |
4 |
|
22 |
|
47 |
|
|
Remeasurement of contingent consideration (c) |
64 |
|
(61) |
|
(127) |
|
|
Income from third-party toll treatment fee (d) |
— |
|
(25) |
|
— |
|
|
Other (income)/expense – net (e) |
(7) |
|
(110) |
|
(46) |
|
|
Total other operating expenses |
268 |
|
1 |
|
241 |
|
(a) These losses arise from the derecognition of property, plant and equipment that is no longer in use. No future economic benefits are expected from the use or disposal of these assets. Refer to note 15 for further detail on the accounting policy as well as the amounts per asset category.
(b) Refer to note 27 for details on the movement in the silicosis settlement provision.
(c) Refer to note 29 for details on the remeasurement of the contingent consideration.
(d) The amount relates to fees received from a third party for the treatment of ore at the Doornkop plant. Refer to note 2 for detail on the change in presentation during 2023.
(e) The 2022 year mainly comprises of insurance claim proceeds of R83 million and profit on the sale of property, plant and equipment of R24 million. There were no such transactions in the 2023 year.
Notes to the group financial statements continued
For the year ended 30 June 2023
10 Investment income
Accounting policy
Interest income is recognised on the effective interest method, taking into account the principal outstanding and the effective rate over the period to maturity, when it is determined that such income will accrue to the group. Dividend income is recognised when the shareholder's right to receive payment is established. This is recognised at the last date of registration.
Cash flows from interest and dividends received are classified under operating activities in the cash flow statement.
|
|
|
|
|
|
|
|
|
|
|
|
|
|
|
SA Rand |
|
Figures in million |
2023 |
2022 |
2021 |
|
Interest income from financial assets at amortised cost1 |
425 |
|
276 |
|
265 |
|
|
Dividend income |
19 |
|
24 |
|
23 |
|
|
Net gain on financial instruments2 |
219 |
|
52 |
|
43 |
|
|
Total investment income |
663 |
|
352 |
|
331 |
|
1 Interest income on restricted cash and investments and bank balances increased mainly due to higher interest rates during 2023.
2 Primarily relates to the environmental trust funds (refer to note 17) and the ARM BBEE Trust loan (refer to note 18). In 2023, fair value gains on the equity-linked deposits that form part of restricted investments increased by R167 million mainly due to the improved performance of the JSE Top 40 index to which they are linked.
11 Finance costs
Accounting policy
Borrowing costs are capitalised to the extent that they are directly attributable to the acquisition and construction of qualifying assets. Qualifying assets are assets that take a substantial time to get ready for their intended use. These costs are capitalised until the asset moves into the production phase. Other borrowing costs are expensed. The foreign exchange translation loss is included in the borrowing cost calculation to the extent that it is considered to be a part of interest. In a year where a foreign exchange gain is recognised on the borrowings’ translation, the potential impact thereof on the rate as well as the borrowing costs is disregarded. Borrowing costs capitalised is presented as part of interest paid under operating activities in the cash flow statement.
|
|
|
|
|
|
|
|
|
|
|
|
|
|
|
SA Rand |
|
Figures in million |
2023 |
2022 |
2021 |
|
Financial liabilities |
|
|
|
|
Borrowings (a) |
467 |
|
238 |
|
228 |
|
|
Other creditors and liabilities |
29 |
|
22 |
|
14 |
|
|
Total finance costs from financial liabilities |
496 |
|
260 |
|
242 |
|
|
Non-financial liabilities |
|
|
|
|
Time value of money for other provisions |
97 |
|
79 |
|
74 |
|
|
Streaming arrangements |
41 |
|
67 |
|
71 |
|
|
Time value of money and inflation component of rehabilitation costs |
483 |
|
377 |
|
296 |
|
|
Total finance costs from non-financial liabilities |
621 |
|
523 |
|
441 |
|
|
Total finance costs before interest capitalised |
1 117 |
|
783 |
|
683 |
|
|
Interest capitalised (b) |
(123) |
|
(65) |
|
(22) |
|
|
Total finance costs |
994 |
718 |
|
661 |
|
(a)The increase in finance costs on borrowings in 2023 is as a result of the US$ drawdowns made and higher interest rates during the 2023 financial year. Refer to note 32 for further detail.
This amount includes accrued interest and amortisation of commitment fees, which are treated as non-cash adjustments for the determination of interest paid in the cash flow statement.
(b)The capitalisation rate used to determine capitalised borrowing costs is:
|
|
|
|
|
|
|
|
|
|
|
|
|
|
|
Percent (%) |
|
|
2023 |
2022 |
2021 |
|
Capitalisation rate |
9.2 |
|
6.8 |
|
3.8 |
|
The capitalisation rate for 2023 and 2022 includes the impact of the foreign exchange loss for the year where the Rand equivalent rate is used.
Notes to the group financial statements continued
For the year ended 30 June 2023
12 Taxation
Accounting policy
Taxation is made up of current and deferred taxation. The current income tax charge is calculated on the basis of the tax laws enacted or substantively enacted at the balance sheet date in the countries where the group operates and generates taxable income. Management periodically evaluates positions taken in tax returns with respect to situations in which applicable tax regulations are subject to interpretation and establishes provisions, where appropriate, on the basis of amounts expected to be paid to the tax authorities.
Deferred taxation is recognised on temporary differences existing at each reporting date between the tax base of all assets and liabilities and their carrying amounts. Substantively enacted tax rates are used to determine future anticipated effective tax rates which in turn are used in the determination of deferred taxation, except to the extent that deferred tax arises from the initial recognition of an asset or liability in a transaction that is not a business combination and does not affect the accounting or taxable profit or loss at the time of the transaction. Deferred tax is charged to profit or loss, except where the tax relates to items recognised in other comprehensive income or directly in equity, in which case the tax is also recognised in other comprehensive income or directly in equity. The effect on deferred tax of any changes in tax rates is recognised in the income statement, except to the extent that it relates to items previously charged or credited directly to equity.
The principal temporary differences arise from amortisation and depreciation on property, plant and equipment, provisions, unutilised tax losses, unutilised capital allowances carried forward and unrealised gains and losses on the gold forward sale contracts. Deferred tax assets relating to the carry forward of unutilised tax losses and unutilised capital allowances are recognised to the extent that it is probable that future taxable profit will be available against which the unutilised tax losses and unutilised capital allowances can be utilised. The recoverability of these assets is reviewed at each reporting date and adjusted if recovery is no longer probable.
Deferred income tax is provided on temporary differences arising from investments in subsidiaries, joint ventures and associates, except where the timing of the reversal of the temporary difference is controlled by the group and it is probable that the temporary difference will not reverse in the foreseeable future.
Deferred income tax assets and liabilities are offset when there is a legally enforceable right to offset current tax assets against current tax liabilities and when the deferred income tax assets and liabilities relate to income taxes levied by the same taxation authority on either the taxable entity or different taxable entities where there is an intention to settle the balances on a net basis.
Critical accounting estimates and judgements
The group is subject to income tax in several jurisdictions. Significant judgement is required in determining the worldwide provision for income taxes due to the complexity of legislation. There are many transactions and calculations for which the ultimate tax determination is uncertain during the ordinary course of business. Where the final tax outcome is different from the amounts that were initially recorded, such differences will impact the income tax and deferred tax provisions in the period in which such determination is made.
Deferred tax assets and liabilities are measured at the tax rates that are expected to apply to the period when the asset is realised or the liability is settled. When different tax rates apply to different levels of taxable income, deferred tax assets and liabilities are measured using the average tax rates that are expected to apply to the taxable profit (tax loss) of the periods in which the temporary differences are expected to reverse. At the group’s South African operations, such average tax rates are directly impacted by the profitability of the relevant mine. The deferred tax rate is therefore based on the current estimate of future profitability of an operation when temporary differences will reverse, based on tax rates and tax laws that have been enacted at the balance sheet date. The future profitability of each mine, in turn, is determined by reference to the life-of-mine (LoM) plan for that operation. The LoM plan is influenced by factors as disclosed in note 15, which may differ from one year to the next and normally result in the deferred tax rate changing from one year to the next.
Management has to exercise judgement with regard to deferred tax assets. The recoverability of deferred tax assets is assessed with reference to the current estimate of future profitability of the relevant legal entity’s operations. Where it is not probable that future taxable income may flow against which these assets can be offset, the deferred tax assets are not recognised.
Notes to the group financial statements continued
For the year ended 30 June 2023
12 Taxation continued
The taxation (expense)/credit for the year is as follows:
|
|
|
|
|
|
|
|
|
|
|
|
|
|
|
SA Rand |
|
Figures in million |
2023 |
2022 |
2021 |
|
SA taxation |
|
|
|
|
Mining tax (a) |
(631) |
|
(182) |
|
(464) |
|
|
– current year |
(633) |
|
(194) |
|
(467) |
|
|
– prior year |
2 |
|
12 |
|
3 |
|
|
Non-mining tax (b) |
(12) |
|
(125) |
|
(80) |
|
|
– current year |
(6) |
|
(121) |
|
(81) |
|
|
– prior year |
(6) |
|
(4) |
|
1 |
|
|
Deferred tax (c) |
(1 080) |
|
353 |
|
(714) |
|
|
– current year |
(1 080) |
|
353 |
|
(714) |
|
|
|
|
|
|
|
Total taxation (expense)/credit |
(1 723) |
|
46 |
|
(1 258) |
|
(a) Mining tax on gold mining taxable income in South Africa is determined according to a formula, based on the taxable income from mining operations. 5% of total revenue is exempt from taxation, while the remainder is taxable at a higher rate (up to a maximum of 33%) than non-mining income (27%) as a result of applying the gold mining formula. Mining and non-mining income of Australian and PNG entities are taxed at a standard rate of 30%.
All qualifying mining capital expenditure is deducted from taxable mining income to the extent that it does not result in an assessed loss. Accounting depreciation is eliminated when calculating the South African mining taxable income. Excess capital expenditure is carried forward as unredeemed capital to be claimed from future mining taxable income. The group has several tax paying entities in South Africa. In terms of the mining ring-fencing application, each ring-fenced mine is treated separately and deductions can normally only be utilised against mining income generated from the relevant ring-fenced mine.
The increased mining tax expense for the 2023 financial year is mainly attributable to taxes recognised by Golden Core Trade and Invest (Pty) Ltd (Golden Core) of R272 million (2022: Rnil) and Harmony Moab Khotsong Operations (Pty) Ltd (Moab) of R260 million (2022: R130 million). The higher gold prices and production led to increased taxable income for the two entities. The expense in Golden Core was offset by the utilisation of its remaining unredeemed capital expenditure balance of R845 million. The movement in foreign exchange translation from gains in the 2021 year to losses in 2022 and a decline in mining taxable income resulted in the decrease in the current tax expense during the 2022 year.
Due to the changes announced in the 2022 budget speech, the mining tax rate changed from 34% in 2022 and 2021 to 33% for the current year. Further, the annual limitation of assessed loss utilisation to 80% of taxable income came into effect.
(b) Non-mining taxable income of mining companies and the taxable income for non-mining companies are taxed at the statutory corporate rate of 27% for the 2023 financial year.The expense for the 2022 and 2021 financial years relates to non-mining tax arising from derivative gains (realised and unrealised) recognised on the foreign currency derivatives as well as the realised gains on the commodity forward sale contracts. The decreased non-mining taxes for the 2023 financial year can be attributed to the significantly lower derivative gains from both commodity and foreign currency contracts compared to the 2022 financial year. Refer to note 19 for details on the group's derivative gains and losses recorded.
Due to the changes announced in the 2022 budget speech, the corporate tax rate applied to non-mining taxable income has been amended to 27% (2022: 28%) (2021: 28%) for the current year. Further, the annual limitation of assessed loss utilisation to 80% of taxable income came into effect.
(c) The deferred tax rate used to calculate deferred tax is based on the current estimate of future profitability when temporary differences will reverse based on tax rates and tax laws that have been enacted at the balance sheet date. Depending on the profitability of the operations, the deferred tax rate can consequently be significantly different from year to year.
Following the completion of the annual life-of-mine plans, management revised the weighted average deferred tax rates for all the South African operations. The higher gold price assumptions used resulted in an increase in the estimated profitability and consequently higher rates than in the prior year for most subsidiaries. Refer to note 15 for assumptions used.
Notes to the group financial statements continued
For the year ended 30 June 2023
12 Taxation continued
(c) Deferred tax continued
Changes to the deferred income tax rates were significant for the following entities:
|
|
|
|
|
|
|
|
|
|
|
|
|
Percent (%) |
|
2023 |
2022 |
2021 |
| Harmony |
26.4 |
|
25.1 |
|
27.4 |
|
| Freegold (Harmony) (Proprietary) Limited |
11.4 |
|
7.0 |
|
12.1 |
|
| Randfontein Estates Limited (Randfontein) |
10.5 |
|
8.7 |
|
5.1 |
|
Kalahari Goldridge Mining Company Limited (Kalgold) |
17.1 |
|
18.7 |
|
19.7 |
|
| Harmony Moab Khotsong Operations (Proprietary) Limited (Moab) |
16.7 |
|
14.7 |
|
17.6 |
|
| Golden Core Trade and Invest (Proprietary) Limited (Mponeng) |
17.7 |
|
12.8 |
|
11.3 |
|
These changes, together with changes in the temporary differences, had the following impacts:
•The change in rates, with the majority increasing year on year at the individual company level (other than hedge accounted derivatives), resulted in a increase in the deferred tax expense and liability to the amount of R588 million (2022: R386 million decrease) (2021: R55 million increase)
•Increase of temporary differences related to the carrying value of property, plant and equipment resulted in an increase of R377 million in the deferred tax expense (2022: R101 million decrease) (2021: R52 million decrease)
•Unwinding of temporary differences related to unredeemed capital expenditure balances resulted in an increase of R169 million in the deferred tax expense (2022: R86 million) (2021: R301 million).
Income and mining tax rates
Major items causing the group's income tax provision to differ from the South African mining statutory tax rate of 33% (2022 and 2021: 34%) were:
|
|
|
|
|
|
|
|
|
|
|
|
|
|
|
|
SA Rand |
|
|
Figures in million |
2023 |
2022 |
2021 |
|
|
Tax (expense)/credit on net profit/loss at the mining statutory tax rate |
(2 180) |
|
360 |
|
(2 170) |
|
|
|
Non-allowable deductions and non-taxable items |
(314) |
|
(328) |
|
(153) |
|
|
|
Equity-settled share-based payments |
(32) |
|
(49) |
|
(49) |
|
|
|
Gain on bargain purchase |
— |
|
— |
|
102 |
|
|
|
|
|
|
|
|
|
Acquisition- and integration-related costs |
— |
|
— |
|
(75) |
|
|
|
Impairment of goodwill |
— |
|
(114) |
|
(64) |
|
|
|
Exploration expenditure |
(25) |
|
(79) |
|
(15) |
|
|
|
Finance costs |
(145) |
|
(52) |
|
(50) |
|
|
|
Other |
(112) |
|
(34) |
|
(2) |
|
|
|
Movement in temporary differences related to property, plant and equipment1 |
(333) |
|
(1 447) |
|
378 |
|
|
|
Movements in temporary differences related to other assets and liabilities |
80 |
|
(174) |
|
(465) |
|
|
|
Difference between effective mining tax rate and statutory mining rate on mining income |
303 |
|
125 |
|
145 |
|
|
|
Difference between non-mining tax rate and statutory mining rate on non-mining income |
1 |
|
26 |
|
17 |
|
|
|
Effect on temporary differences due to changes in effective tax rates2 |
(588) |
|
386 |
|
(55) |
|
|
|
Prior-year adjustment |
— |
|
10 |
|
(4) |
|
|
|
Capital allowances3 |
1 059 |
|
973 |
|
860 |
|
|
|
Deferred tax asset not recognised4 |
249 |
|
115 |
|
189 |
|
|
|
|
|
|
|
|
|
Income and mining taxation (expense)/credit |
(1 723) |
|
46 |
|
(1 258) |
|
|
|
Effective income and mining tax rate (%) |
26 |
|
4 |
|
20 |
|
|
1 The change in 2023 is mainly as a result of an increase in the unredeemed capital expenditure balance of Avgold Limited (Avgold). This was partially offset by an increase in the net carrying value of property, plant and equipment of Moab and Chemwes (Pty) Ltd (Chemwes).
2 Refer to (c) above for detail of the deferred tax rate changes.
3 This relates to the additional capital allowance that may be deducted from taxable income from mining operations in South Africa. A significant portion relates to Avgold which has a 0% effective tax rate.
4 This relates to tax losses and deductible temporary differences for which future taxable profits are uncertain and are not considered probable.
Notes to the group financial statements continued
For the year ended 30 June 2023
12 Taxation continued
Deferred tax
The analysis of deferred tax assets and liabilities is as follows:
|
|
|
|
|
|
|
|
|
|
|
|
SA Rand |
|
Figures in million |
2023 |
2022 |
|
Deferred tax assets |
(1 261) |
|
(1 183) |
|
|
Deferred tax asset to be recovered after more than 12 months |
(983) |
|
(1 091) |
|
|
Deferred tax asset to be recovered within 12 months |
(278) |
|
(92) |
|
|
Deferred tax liabilities |
3 366 |
|
2 566 |
|
|
Deferred tax liability to be recovered after more than 12 months |
2 971 |
|
2 192 |
|
|
Deferred tax liability to be recovered within 12 months |
395 |
|
374 |
|
|
|
|
|
|
Net deferred tax liability |
2 105 |
|
1 383 |
|
Deferred tax liabilities and assets on the balance sheet as of 30 June 2023 and 30 June 2022 relate to the following:
|
|
|
|
|
|
|
|
|
|
|
|
SA Rand |
|
Figures in million |
2023 |
2022 |
|
Gross deferred tax liabilities |
3 366 |
|
2 566 |
|
|
Amortisation and depreciation1 |
3 266 |
|
2 375 |
|
|
Derivative financial instruments |
48 |
|
143 |
|
|
Other |
52 |
|
48 |
|
|
Gross deferred tax assets |
(1 261) |
|
(1 183) |
|
|
Unredeemed capital expenditure2 |
(3 761) |
|
(3 863) |
|
|
Provisions, including non-current provisions |
(1 220) |
|
(1 133) |
|
|
Derivative financial instruments |
(272) |
|
— |
|
|
Contingent consideration liability |
(63) |
|
(39) |
|
|
Streaming contract liability |
(43) |
|
(86) |
|
|
Other |
(2) |
|
(3) |
|
|
Tax losses3 |
(1 925) |
|
(1 524) |
|
|
Deferred tax asset not recognised4 |
6 025 |
|
5 465 |
|
|
|
|
|
|
Net deferred tax liability |
2 105 |
|
1 383 |
|
1 The increase in amortisation and depreciation year on year is as a result of the increase in the carrying amount of property plant and equipment, mainly relating to asset additions, refer to note 15.
2 Unredeemed capital expenditure mainly consists of Hidden Valley R3 512 million (2022: R3 521 million).
3 The majority of the amount relates to Hidden Valley's tax losses of R1 657 million (2022: R1 417 million).
4 The deferred tax asset not recognised relates to Harmony's PNG operations.
Movement in the net deferred tax liability recognised in the balance sheet is as follows:
|
|
|
|
|
|
|
|
|
|
|
|
SA Rand |
|
Figures in million |
2023 |
2022 |
|
|
|
|
|
Balance at beginning of year |
1 383 |
|
1 906 |
|
|
Expense/(credit) per income statement |
1 080 |
|
(353) |
|
|
|
|
|
|
Tax directly charged to other comprehensive income1 |
(358) |
|
(170) |
|
|
Balance at end of year |
2 105 |
|
1 383 |
|
|
Deferred tax assets per balance sheet |
(189) |
|
(203) |
|
|
Deferred tax liabilities per balance sheet |
2 294 |
|
1 586 |
|
1 Relates predominantly to hedge-accounted derivative financial instruments. Refer to note 19 and 25.
A deferred tax asset continues to be recognised for Harmony at 30 June 2023. The net deferred tax asset balance of Harmony company has increased to R189 million (2022: R179 million). At 30 June 2023, it is considered probable that sufficient future taxable profits will be available against which the remaining deductible temporary differences existing at the reporting date can be utilised.
Notes to the group financial statements continued
For the year ended 30 June 2023
12 Taxation continued
Deferred tax continued
|
|
|
|
|
|
|
|
|
|
|
|
SA Rand |
|
Figures in million |
2023 |
2022 |
|
As at 30 June, the group had the following potential future tax deductions: |
|
|
|
Unredeemed capital expenditure available for utilisation against future mining taxable income1 |
49 478 |
|
45 408 |
|
|
Tax losses carried forward utilisable against mining taxable income2 |
9 620 |
|
7 445 |
|
|
Capital gains tax (CGT) losses available to be utilised against future CGT gains4 |
570 |
|
583 |
|
|
As at 30 June, the group has not recognised the following deferred tax asset amounts relating to the above: |
18 004 |
|
15 978 |
|
|
The unrecognised temporary differences are: |
|
|
|
Unredeemed capital expenditure3 |
47 968 |
|
42 859 |
|
|
Tax losses2 |
8 848 |
|
6 471 |
|
|
CGT losses4 |
570 |
|
583 |
|
1 Includes Avgold R30 538 million (2022: R27 133 million), Randfontein R327 million (2022: R502 million), Mponeng R145 million (2022: R978 million), Chemwes R748 million (2022: R260 million) and Hidden Valley R17 430 million (2022: R15 725 million). These have an unlimited carry-forward period.
2 Relates mainly to Hidden Valley R6 053 million (2022: R4 718 million), Randfontein R543 million (2022: R708 million), and Avgold R2 772 million (2022: R1 761 million). These have an unlimited carry-forward period.
3 Relates to Avgold and Hidden Valley.
4 The CGT losses relate to the gross CGT losses available to be utilised against future CGT gains.
Dividend tax (DT)
The withholding tax on dividends remained unchanged at 20%.
13 Earnings/(loss) per share
Basic earnings/(loss) per share
Basic earnings/(loss) per share is calculated by dividing the net income attributable to shareholders by the weighted number of ordinary shares in issue during the year.
|
|
|
|
|
|
|
|
|
|
|
|
|
|
|
2023 |
2022 |
2021 |
|
Ordinary shares in issue (000) |
618 072 |
|
616 526 |
|
616 052 |
|
|
Adjustment for weighted number of ordinary shares in issue (000) |
(428) |
|
(121) |
|
(5 582) |
|
|
Weighted number of ordinary shares in issue (000) |
617 644 |
|
616 405 |
|
610 470 |
|
|
Adjustment for weighted number of treasury shares (000)1,2 |
(47) |
|
(3 950) |
|
(6 184) |
|
|
Basic weighted average number of ordinary shares in issue (000) |
617 597 |
|
612 455 |
|
604 286 |
|
|
|
|
|
|
|
|
|
|
SA Rand |
|
|
2023 |
2022 |
2021 |
|
Total net profit/(loss) attributable to shareholders (million) |
4 820 |
|
(1 052) |
|
5 087 |
|
|
Total basic earnings/(loss) per share (cents) |
780 |
|
(172) |
|
842 |
|
1 These are the weighted number of treasury shares for the years presented. Refer to note 24 for the actual number of treasury shares that are in issue.
2 During 2022, the lock-in period expired for the Harmony ESOP Trust (Sisonke Scheme). Settlements and share distributions were made and the shares were no longer classified as treasury shares. For the 2022 year, the impact of the shares on the basic weighted average number of shares was 3 902 418 (2021: 6 137 053).
Notes to the group financial statements continued
For the year ended 30 June 2023
13 Earnings/(loss) per share continued
Diluted earnings/(loss) per share
For diluted earnings/(loss) per share, the weighted average number of ordinary shares in issue is adjusted to assume conversion of all potential dilutive ordinary shares as a result of share options granted to employees under the share option schemes in issue. A calculation is performed to determine the number of shares that could have been acquired at fair value, determined as the average annual market share price of the company's shares, based on the monetary value of the subscription rights attached to the outstanding share options. The number of shares calculated as above is compared with the number of shares that would have been issued assuming the exercise of the share options.
|
|
|
|
|
|
|
|
|
|
|
|
|
|
|
2023 |
2022 |
2021 |
|
Weighted average number of ordinary shares in issue (000) |
617 597 |
|
612 455 |
|
604 286 |
|
|
Potential ordinary shares (000)1,2 |
2 877 |
|
2 159 |
|
12 099 |
|
|
Weighted average number of ordinary shares for diluted earnings per share (000)1 |
620 474 |
|
614 614 |
|
616 385 |
|
|
|
|
|
|
|
|
|
|
|
|
|
|
|
|
|
|
SA Rand |
|
|
2023 |
2022 |
2021 |
|
Total diluted earnings/(loss) per share (cents) |
777 |
|
(172) |
|
825 |
|
1 The inclusion of the share options as potential ordinary shares had a dilutive effect on earnings per share in 2023 and 2021, whereas it had the opposite effect in 2022 due to the net loss attributable to shareholders.
2 The issue price and the exercise of share options issued to the employees include the fair value of any services to be supplied to the entity in the future under the share option or other share-based payment arrangements.
13 Earnings/(loss) per share continued
Dividends
Accounting policy
Dividends declared are recognised in the period in which they are approved by the board of directors. Dividends are payable in South African Rand.
Cash flows from dividends paid are classified under financing activities in the cash flow statement.
•The board did not declare an interim ordinary dividend for the year ended 30 June 2023 (2022: 40 SA cents and R247 million was paid on 11 April 2022) (2021: 110 SA cents and R677 million was paid on 19 April 2021).
•For the 2022 year, a final dividend of 22 SA cents (2021: 27 SA cents), was declared by the board, amounting to R136 million which was paid on 17 October 2022. For 2021, an amount of R167 million was paid on 18 October 2021.
•The board declared a final ordinary dividend of 75 SA cents for the year ended 30 June 2023 on 29 August 2023, which was paid on 16 October 2023.
•Harmony declares an annual preference share dividend to the Harmony Gold Community Trust (the Trust). The board declared a preference dividend of R9 million which was paid to the Trust on 15 August 2023 (2022 and 2021: R9 million on 11 August 2022 and 10 August 2021 respectively).
•During 2023, dividend payments of R18 million were made to the non-controlling interest holders in Tswelopele Beneficiation Operation (Proprietary) Limited (TBO) (2022: R16 million) (2021: R7 million).
|
|
|
|
|
|
|
|
|
|
|
|
|
|
|
SA Rand |
|
|
2023 |
2022 |
2021 |
|
Dividends declared (millions) |
136 |
|
414 |
|
677 |
|
|
Dividend per share (cents) |
22 |
|
67 |
|
110 |
|
Notes to the group financial statements continued
For the year ended 30 June 2023
14 Acquisitions and business combinations
Acquisition of Eva Copper
On 6 October 2022, Harmony announced that it had entered into an agreement to acquire the entity which owns 100% of the Eva Copper Project and a package of regional exploration tenements from Copper Mountain Mining Corporation (collectively Eva Copper). The acquisition is in line with the group's strategic objective of transitioning into a low-cost gold and copper mining company. Diversifying into copper enables Harmony to participate in the global transition to a low-carbon economy.
The last condition precedent for the acquisition was fulfilled during December 2022, resulting in an acquisition date of 16 December 2022. Based on management's assessment, the transaction met the definition of a business combination as defined by IFRS 3 Business Combinations. This is based on the feasibility study, mine development plan and organised workforce acquired constituting substantive processes which significantly contributes to the ability to generate outputs. Management also opted to not apply the optional concentration test as per IFRS 3.
The Eva Copper Project was identified as a cash generating unit (CGU).
Consideration transferred
Consideration for the transaction amounted to a cash payment of R2 996 million (US$170 million), paid during December 2022, and contingent consideration subject to the following criteria:
•A maximum of US$30 million payable via a 10% sharing of net incremental revenue above US$3.80/Ib Cu (excess payment)
•A maximum US$30 million payable on a new copper resource discovered and declared within the acquired tenements, calculated using a resource multiple of US$0.03/Ib Cu (new resource payment).
These criteria are applicable for the entire life of the operation until the maximum payments are reached.
As at 16 December 2022, the contingent consideration was valued at R169 million by using a probability weighted method for the new resource payment and a discounted cash flow valuation for the excess payment, both discounted at a post-tax nominal rate of 12.9%. All other assumptions applied in the valuation are consistent with those used in the valuation of identified assets acquired and liabilities assumed (refer below). The fair value calculated for the contingent consideration is level 3 in the fair value hierarchy due to the use of unobservable inputs. The remeasurement of the liability will be included in other operating expenses. Refer to note 29 for the measurement of the liability at 30 June 2023.
The amount disclosed in the cash flow statement for cash paid for the acquisition of Eva Copper is equal to the cash consideration paid of R2 996 million.
Acquisition and integration costs
The total of R214 million for acquisition-related costs for the financial year ended 30 June 2023 relates to various costs directly attributable to the acquisition process. These costs include professional services fees and Australian stamp duty costs paid.
Notes to the group financial statements continued
For the year ended 30 June 2023
14 Acquisitions and business combinations continued
Acquisition of Eva Copper continued
Identifiable assets acquired and liabilities assumed
Critical accounting estimates and judgements
The fair value of the identifiable net assets acquired was determined using the expected discounted cash flows based on the feasibility study of the Eva Copper Project. Key assumptions for the level 3 fair value measurement of Eva Copper are the copper price, marketable discount rates, exchange rates and the feasibility study previously performed for the Eva Copper Project. Mineral resources acquired which were not included in the discounted cash flows were valued using a copper resource multiple price of US$0.03/lbs. The post-tax real discount rate used was 10.7%, the long-term A$/US$ exchange rate used was A$1.40/US$1 and a real long-term copper price of US$3.50/lbs was used. The valuation was performed as at 16 December 2022.
The tax rates used to calculate deferred tax is based on Australian tax rates and tax laws that have been enacted at acquisition date. The deferred tax rate used as at 16 December 2022 was 30%. Following the finalisation of the effective tax values of assets acquired and liabilities assumed from the acquisition, a net deferred tax asset position of R224 million was determined. In line with IAS 12 Income Taxes, management assessed that at the acquisition date it is not yet probable that sufficient future taxable profits will be generated from Eva Copper against which the net deferred tax asset could be recognised. This was due to an update to the final feasibility study being outstanding at acquisition date. It was therefore opted to not recognise the net deferred tax asset position arising from the acquisition.
Fair value determination of acquired operations
For the period ended 31 December 2022 the fair value exercise, also known as the purchase price allocation, was prepared on a provisional basis in accordance with IFRS 3. During the measurement period, being 12 months permitted in terms of IFRS 3 for completion of the fair value exercise, Harmony concluded the process of determining the effective tax values for assets acquired and liabilities assumed from the business combination. This resulted in a change in the value of deferred tax and property, plant and equipment. Harmony also received new information relating to trade and other receivables that existed at acquisition date. No other key valuation assumptions were revised.
Management considers the revised purchase price allocation to be final and the accounting for the acquisition to be concluded as at 30 June 2023.
The final fair values for the identifiable assets acquired and liabilities assumed as at the acquisition date are as follows:
|
|
|
|
|
|
|
|
|
|
|
|
|
2023 |
| Figures in million |
Provisional fair
value |
Measurement
period
adjustment |
Final fair value |
| Non-current assets |
|
|
|
| Property, plant and equipment |
3 785 |
|
(631) |
|
3 154 |
|
| Current assets |
|
|
|
| Restricted cash and investments |
4 |
|
— |
|
4 |
|
| Trade and other receivables |
12 |
|
(5) |
|
7 |
|
| Non-current liabilities |
|
|
|
| Deferred tax liabilities |
(636) |
|
636 |
|
— |
|
| Fair value of net identifiable assets acquired at 16 December 2022 |
3 165 |
|
— |
|
3 165 |
|
Since the final fair value of net identifiable assets acquired is within a reasonable range of the fair value of the consideration transferred, no gain on bargain purchase or goodwill is recognised for the transaction.
Performance of acquired operation
Immaterial costs were incurred for Eva Copper relating to the year ended 30 June 2023 and therefore no proforma information has been disclosed.
Acquisition of AngloGold Ashanti’s remaining South African Operations
Effective 1 October 2020, the group acquired the Mponeng operations and related assets from AngloGold Ashanti on a going concern basis. The assets acquired and liabilities assumed constituted a business as defined by IFRS 3. The cash consideration paid to acquire the Mponeng operations and related assets amounted to R3.4 billion (US$200 million). The group also assumed the contingent consideration liability, which was initially valued at R544 million on 1 October 2020. A gain on bargain purchase of R303 million was recognised from the acquisition. The group incurred acquisition-related costs of R124 million in 2021 on advisory and legal fees. Furthermore, the group incurred R205 million on the integration of the operation in 2021. These costs are included in corporate, administration and other expenditure in the income statement.
Notes to the group financial statements continued
For the year ended 30 June 2023
15 Property, plant and equipment
|
|
|
|
|
|
|
|
|
|
|
|
SA Rand |
|
Figures in million |
2023 |
2022 |
|
|
|
|
|
Mining assets |
28 618 |
|
25 320 |
|
|
Mining assets under construction |
5 051 |
|
3 132 |
|
|
Undeveloped properties |
7 385 |
|
4 004 |
|
|
Other non-mining assets |
453 |
|
416 |
|
|
Total property, plant and equipment |
41 507 |
|
32 872 |
|
Mining assets
Accounting policy
Mining assets, including mine development costs and mine plant facilities, are initially recorded at cost, whereafter they are measured at cost less accumulated depreciation and impairment. Costs include expenditure that is directly attributable to the acquisition of the items. Subsequent costs are included in the asset’s carrying amount or recognised as a separate asset, as appropriate, only when it is probable that future economic benefits associated with the item will flow to the group and the cost of the item can be measured reliably.
The net assets of operations placed on care and maintenance are impaired to their recoverable amount. Expenditure on the care and maintenance of these operations is charged against income, as incurred. Mineral and surface use rights represent mineral and surface use rights for parcels of land, both owned and not owned by the group.
Mineral and surface rights include acquired mineral use rights in production, development and exploration phase properties. The amount capitalised related to a mineral and surface right, either as an individual asset purchase or as part of a business combination, is the fair value at acquisition.
The group’s mineral use rights are enforceable regardless of whether proved or probable reserves have been established. In certain limited situations, the nature of use changes from an exploration right to a mining right upon the establishment of proved and probable reserves. The group has the ability and intent to renew mineral use rights where the existing term is not sufficient to recover all identified and valued proved and probable reserves and/or undeveloped mineral interests.
Depreciation
Depreciation of mining assets is computed principally by the units-of-production method over life-of-mine based on estimated quantities of economically recoverable proved and probable reserves, which can be recovered in future from known mineral deposits.
In most instances, proved and probable reserves provide the best indication of the useful life of the group’s mines (and related assets). However, in some instances, proved and probable reserves may not provide a realistic indication of the useful life of the mine (and related assets). This may be the case, for example, where management is confident that further inferred resources will be converted into measured and indicated resources and if they are economically recoverable, they can also be classified as proved and probable reserves. Management is approaching economic decisions affecting the mine on this basis, but has chosen to delay the work required to designate them formally as reserves.
In assessing which resources to include so as to best reflect the useful life of the mine, management considers resources that have been included in the life-of-mine plan. To be included in the life-of-mine plan, resources need to be above the cut-off grade set by management, which means that the resource can be economically mined and is therefore commercially viable. This consistent systematic method for inclusion in the life-of-mine plan takes management’s view of the gold price, exchange rates as well as cost inflation into account.
In declaring the resource, management would have had to obtain a specified level of confidence of the existence of the resource through drilling as required by the South African Code for Reporting Exploration Results, Mineral Resources and Mineral Reserves (SAMREC).
Additional confidence in the existence, commercial viability and economical recovery of such resources may be based on historical experience and available geological information, such as geological information obtained from other operations that are contiguous to the group’s operations, as well as where the group mines continuations of these other operations’ orebodies and reefs. This is in addition to the drilling results obtained by the group and management’s knowledge of the geological setting of the surrounding areas, which would enable simulations and extrapolations to be done with a reasonable degree of accuracy.
Notes to the group financial statements continued
For the year ended 30 June 2023
15 Property, plant and equipment continued
Mining assets continued
Accounting policy continued
In instances where management is able to demonstrate the economic recovery of such resources with a high level of confidence, such additional resources, which may also include certain, but not all, of the inferred resources, as well as the associated future development costs of accessing those resources, are included in the calculation of depreciation. The future development costs are those costs that need to be incurred to access these inferred resources, for example the costs to complete a decline or level, which may include infrastructure and equipping costs. These amounts have been extracted from the cash flow projections for the life-of-mine plans.
Mineral rights associated with production phase mineral interests are amortised over the life-of-mine using the units-of-production method in order to match the amortisation with the expected underlying future cash flows.
Impairment
Testing for impairment is done in terms of the group policy as discussed in note 2.5.
Scrapping of assets
Where significant adverse changes have taken place relating to the useful life of an asset, that asset is tested for impairment in terms of the group policy as discussed in note 2.5. Whether or not an impairment is recognised, it is then necessary to review the useful lives and residual values of the assets within the CGU – this is reviewed at least annually. Where necessary, the useful lives and residual values of the individual assets are revised.
Where the useful life of an asset is nil as a result of no future economic benefit expected from the use or disposal of that asset, it is necessary to derecognise the asset. The loss arising from the derecognition is included in profit or loss in the period in which the asset was derecognised.
Stripping activities
The removal of overburden and other mine waste materials is often necessary during the initial development of an opencast mine site, in order to access the mineral ore deposit. The directly attributable cost of this activity is capitalised in full within mining assets under construction, until the point at which the mine is considered to be capable of commercial production. The removal of waste material after the point at which a mine is capable of commercial production is referred to as production stripping.
When the waste removal activity improves access to ore extracted in the current period, the costs of production stripping are charged to the income statement as operating costs in accordance with the principles of IAS 2 Inventories.
Where production stripping activity both produces inventory and improves access to ore in future periods the associated costs of waste removal are allocated between the two elements. The portion which benefits future ore extraction is capitalised within stripping and development capital expenditure. If the amount to be capitalised cannot be specifically identified, it is determined based on the volume of waste extracted compared to expected volume for the identified component of the orebody. Components are specific volumes of a mine’s orebody that are determined by reference to the life-of-mine plan.
In certain instances significant levels of waste removal may occur during the production phase with little or no associated production. The cost of this waste removal is capitalised in full.
All amounts capitalised in respect of waste removal are depreciated using the units-of-production method based on proved and probable ore reserves of the component of the orebody to which they relate.
The effects of changes to the life-of-mine plan on the expected cost of waste removal or remaining reserves for a component are accounted for prospectively as a change in estimate.
Notes to the group financial statements continued
For the year ended 30 June 2023
15 Property, plant and equipment continued
Mining assets continued
Critical accounting estimates and judgements – Gold Mineral Reserves and Resources
Gold mineral reserves and resources are estimates of the amount of ounces that can be economically and legally extracted from the group’s properties. In order to calculate the gold mineral reserves and resources, estimates and assumptions are required about a range of geological, technical and economic factors, including quantities, grades, production techniques, recovery rates, production costs, commodity prices and exchange rates. Estimating the quantities and/or grade of the reserves and resources requires the size, shape and depth of the orebodies to be determined by analysing geological data such as the logging and assaying of drill samples. This process may require complex and difficult geological judgements and calculations to interpret the data.
Because the economic assumptions used to estimate the gold mineral reserves and resources change from year to year, and because additional geological data is generated during the course of operations, estimates of the mineral reserves and resources may change from year to year. Changes in the reserves and resources may affect the group’s financial results and financial position in a number of ways, including:
•Asset carrying values may be affected due to changes in estimated cash flows
•Scrapping of assets to be recorded in the income statement following the derecognition of assets as no future economic benefit expected
•Depreciation and amortisation charged in the income statement may change as they are calculated on the units-of-production method
•Environmental provisions may change as the timing and/or cost of these activities may be affected by the change in mineral reserves
•Useful life and residual values may be affected by the change in mineral reserves.
At the end of each financial year, the estimate of proved and probable gold mineral reserves and resources is updated. Depreciation of mining assets is prospectively adjusted, based on these changes.
Critical accounting estimates and judgements – production start date
Various relevant criteria are considered in order to assess when the mine is substantially complete and ready for its intended use and moves into the production phase. Some of the criteria would include but are not limited to the following:
• The level of capital expenditure compared to the total project cost estimates
• The ability to produce gold in a saleable form (where more than an insignificant amount of gold has been produced)
• The ability to sustain the ongoing production of gold.
Critical accounting estimates and judgements – stripping activities
The determination of the volume of waste extracted and the expected volume for the identified component of the orebody is dependent on an individual mine’s design and life-of-mine plan and therefore changes to the design or life-of-mine plan will result in changes to these estimates. Identification of the components of a mine’s orebody is made by reference to the life-of-mine plan. The assessment depends on a range of factors including each mine’s specific operational features and materiality.
Critical accounting estimates and judgements – impairment of assets
The recoverable amount of mining assets is generally determined utilising real discounted future cash flows (post tax). No material difference in recoverable amounts is expected should real future cash flows be discounted on a pre-tax basis. Management also considers such factors as the quality of the individual orebody, market risk, asset-specific risks and country risk in determining the fair value.
Key assumptions for the calculations of the mining assets’ recoverable amounts are the commodity prices, resource values, market discount rates, costs to sell, exchange rates and the annual life-of-mine plans. In determining the commodity prices and resource values to be used, management assesses the long-term views of several reputable institutions on commodity prices and based on this, derives the commodity prices and resource values.
The life-of-mine plans are based on the proved and probable reserves as included in the Reserve Declaration, which are determined in terms of SAMREC, as well as resources where management has high confidence in the orebody and economical recovery of gold, based on historic and similar geological experience.
Notes to the group financial statements continued
For the year ended 30 June 2023
15 Property, plant and equipment continued
Mining assets continued
Critical accounting estimates and judgements – impairment of assets continued
During the years under review, the group calculated the recoverable amounts (generally fair value less costs to sell) of CGUs for which indicators of impairment were identified (refer to note 6). These recoverable amounts are based on updated life-of-mine plans and the following relevant assumptions:
|
|
|
|
|
|
|
|
|
|
|
|
|
|
|
2023 |
2022 |
2021 |
|
US$ gold price per ounce |
|
|
|
|
– Year 1 |
1 932 |
|
1 861 |
|
1 805 |
|
|
– Year 2 |
1 844 |
|
1 744 |
|
1 673 |
|
|
– Year 3 |
1 725 |
|
1 664 |
|
1 582 |
|
|
– Long term (Year 4 onwards) |
1 582 |
|
1 546 |
|
1 500 |
|
|
US$ silver price per ounce |
|
|
|
|
– Year 1 |
n/a |
23.85 |
|
25.72 |
|
|
– Year 2 |
n/a |
22.42 |
|
23.22 |
|
|
– Year 3 |
n/a |
21.46 |
|
21.70 |
|
|
– Long term (Year 4 onwards) |
n/a |
19.38 |
|
20.70 |
|
|
US$ copper price per pound |
n/a |
3.30 |
3.00 |
|
Exchange rate (R/US$) |
|
|
|
|
– Year 1 |
18.28 |
|
15.55 |
|
14.54 |
|
|
– Year 2 |
17.44 |
|
15.34 |
|
14.36 |
|
|
– Year 3 |
17.13 |
|
15.26 |
|
14.44 |
|
|
– Long term (Year 4 onwards) |
16.22 |
|
15.35 |
|
14.51 |
|
|
Exchange rate (PGK/US$) |
n/a |
3.50 |
|
3.50 |
|
|
Rand gold price (R/kg) |
|
|
|
|
– Year 1 |
1 135 000 |
|
931 000 |
|
843 000 |
|
|
– Year 2 |
1 034 000 |
|
860 000 |
|
772 000 |
|
|
– Year 3 |
950 000 |
|
816 000 |
|
735 000 |
|
|
– Long term (Year 4 onwards) |
825 000 |
|
763 000 |
|
700 000 |
|
The following are the attributable gold resource value assumptions:
|
|
|
|
|
|
|
|
|
|
|
|
|
|
|
|
|
|
|
|
|
|
|
|
South Africa |
Hidden Valley |
|
US dollar per ounce |
2023 |
2022 |
2021 |
2023 |
2022 |
2021 |
|
Underground resources |
|
|
|
|
|
|
|
Measured |
n/a |
16.50 |
|
16.50 |
|
n/a |
n/a |
n/a |
|
Indicated |
n/a |
9.00 |
|
9.00 |
|
n/a |
n/a |
n/a |
|
Inferred |
n/a |
3.60 |
|
3.60 |
|
n/a |
n/a |
n/a |
|
Surface resources |
|
|
|
|
|
|
|
Measured |
n/a |
30.00 |
|
30.00 |
|
n/a |
n/a |
n/a |
|
Indicated |
n/a |
17.50 |
|
17.50 |
|
n/a |
9.00 |
|
9.00 |
|
|
Inferred |
n/a |
8.00 |
|
8.00 |
|
n/a |
n/a |
n/a |
The recoverable amount of mining assets is determined utilising real discounted future cash flows. Certain CGUs’ recoverable amounts included resource multiple valuations in the case of undeveloped properties and certain resource bases. The underground resource value has been applied to Target North, Doornkop's Kimberly Reef and the Wafi-Golpu Project (refer to note 22). The surface resource values have been applied to the Mispah Tailings resource, Vaal River and West Wits surface sources. For the 2023 financial year, no resource multiple valuations were determined as the CGUs to which they are attributed to were not tested for impairment. Refer to note 6 for more information regarding CGUs tested for impairment.
Notes to the group financial statements continued
For the year ended 30 June 2023
15 Property, plant and equipment continued
Mining assets continued
Critical accounting estimates and judgements – impairment of assets continued
One of the most significant assumptions that influence the group's operations' life-of-mine plans, and therefore the impairment assessment, is the expected commodity prices. Management continues to differentiate between short-, medium- and long-term assumptions used in the models. The long-term price was determined as part of the annual budgeting process and is used in the life-of-mine plans and is also the cut-off price for calculating reserves included in the declaration of reserves and resources in terms of SAMREC.
For 2022, the resource multiple values remained consistent with the prior year, as they were assessed to still be reasonable and appropriate for valuing the relevant undeveloped properties and resource bases. In 2021, the resource multiple values were updated based on the transaction between AGA and Harmony for the purchase of the Mponeng operations and related assets.
The discounted cash flow models for 2023 include the estimated production cost and carbon tax savings arising from the rollout of Harmony's renewable energy programme, as part of its greater decarbonisation strategy.
Due to the volatilities experienced in the markets and the uncertainty in forecasting future cash flows as a result of the impact of the Covid-19 pandemic, management used various probability scenarios in determining the recoverable amounts for the CGUs at 30 June 2021. As discussed in note 4, the uncertainty that existed in prior years surrounding the potential impact of Covid-19 has dissipated and therefore management believes that it is no longer appropriate to apply Covid-adjusted probability scenarios in determining recoverable amounts for the CGUs at 30 June 2023 and 2022.
The most significant factors considered in the Covid-19 scenarios for 2021 were infection rates and the timing of the expected peaks in the areas that Harmony's operations are situated in along with the expected disruptions to production and mitigation strategies management had in place. The potential impact on production and therefore on the revenue cash flows were determined based on historical trends that have been extrapolated to account for varying disruption levels. The duration of potential disruptions to production applied, ranged from 12 months to 24 months.
The post-tax real discount rates used in determining the recoverable amounts of CGUs tested for impairment in 2023 ranged between 11.69% and 13.15% (2022: 10.20% and 13.10%) (2021: 9.40% and 12.00%). Refer to note 6 for more information regarding CGUs tested for impairment. Cash flows used in the impairment calculations are based on life-of-mine plans which exceed five years for the majority of the mines. Cash flows from potential projects, life-of-mine extensions and residual ounces can also be included in the impairment assessment where deemed appropriate. An additional risk premium is added to the post-tax real discount rates in these instances.
Should management’s estimate of the future not reflect actual events, further impairments may be identified.
Factors affecting the estimates include:
•Changes to proved and probable ore reserves
•Economical recovery of resources
•The grade of the ore reserves may vary significantly from time to time
•Review of strategy
•Unforeseen operational issues at the mines
•Differences between actual commodity prices and commodity price assumptions
•Changes in the discount rate and foreign exchange rates
•Changes in capital, operating mining, processing and reclamation costs
•Mines' ability to convert resources into reserves
•Potential production stoppages for indefinite periods
•The implementation of Harmony’s renewable energy programme
•Carbon tax.
Notes to the group financial statements continued
For the year ended 30 June 2023
15 Property, plant and equipment continued
Mining assets continued
Sensitivity analysis – impairment of assets
One of the most significant assumptions that influence the life-of-mine plans and therefore impairment assessments is the expected commodity prices. Management determined a reasonably possible long-term change of 11.8% in gold prices based on the standard deviation of both Harmony's long-term gold price assumption over the past five financial years and market analysts' forecasted long-term gold price assumptions. A 11.8% increase/decrease in the gold price and resource values used (with all other variables held constant and not taking any actions, such as stopping capital projects, into account) would have resulted in the following post-tax impairment being recorded (including the impairments recorded in the current period) as at 30 June 2023:
|
|
|
|
|
|
|
|
|
|
|
|
SA Rand |
|
Figures in million |
2023 |
2022 |
|
11.8% decrease (2022: 10% decrease) |
|
|
|
Tshepong North |
n/a |
4 074 |
|
|
Moab Khotsong1 |
n/a |
3 869 |
|
|
Tshepong South |
n/a |
2 339 |
|
|
Doornkop |
n/a |
1 690 |
|
|
Mponeng |
n/a |
1 443 |
|
|
Target 1 |
1 719 |
|
1 121 |
|
|
Joel |
n/a |
762 |
|
|
Kusasalethu |
— |
|
689 |
|
|
Mine Waste Solutions |
n/a |
493 |
|
|
Kalgold |
475 |
|
304 |
|
|
Other assets |
n/a |
208 |
|
|
Hidden Valley |
n/a |
96 |
|
|
Central Plant Reclamation |
n/a |
32 |
|
|
|
|
|
|
|
|
|
|
11.8% increase (2022: 10% increase) |
|
|
|
Tshepong South |
n/a |
224 |
|
|
|
|
|
1 The carrying amount of this CGU include goodwill and any impairment losses is allocated first to goodwill and then to the identifiable assets.
At all other operations, the relevant increase in the gold price would have resulted in no impairments being recorded.
As a result of the significant increase in discount rates experienced during the 2022 financial year, management opted to assess the sensitivity of a reasonably possible change in discount rates on impairments of assets for all CGUs as at 30 June 2022. Management assessed an increase/decrease of 50 basis points to be a reasonably possible change, based on the standard deviation of the group's base weighted average cost of capital rate over the past five financial years. This change was factored into the individual CGUs' discount rates and did not result in a material impact on the impairment that would have been recognised for any CGUs. This was not a consideration for the 2021 or 2023 years.
Notes to the group financial statements continued
For the year ended 30 June 2023
15 Property, plant and equipment continued
Mining assets continued
The movement in the mining assets is as follows:
|
|
|
|
|
|
|
|
|
|
|
|
SA Rand |
|
Figures in million |
2023 |
2022 |
|
Cost |
|
|
|
Balance at beginning of year |
70 587 |
|
64 979 |
|
|
Fully depreciated assets no longer in use derecognised (a) |
(1 419) |
|
(110) |
|
|
Additions (b) |
5 930 |
|
5 307 |
|
|
|
|
|
|
|
|
|
|
Scrapping of assets (c) |
(772) |
|
(1 752) |
|
|
Adjustment to rehabilitation asset (d) |
(111) |
|
(248) |
|
|
Transfers and other movements (e) |
596 |
|
511 |
|
|
Translation |
1 963 |
|
1 900 |
|
|
Balance at end of year |
76 774 |
|
70 587 |
|
|
Accumulated depreciation and impairments |
|
|
|
Balance at beginning of year |
45 267 |
|
38 493 |
|
|
Fully depreciated assets no longer in use derecognised (a) |
(1 419) |
|
(110) |
|
|
Impairment of assets (f) |
— |
|
3 429 |
|
|
|
|
|
|
Scrapping of assets (c) |
(590) |
|
(1 745) |
|
|
Depreciation |
3 368 |
|
3 627 |
|
|
Translation |
1 530 |
|
1 573 |
|
|
Balance at end of year |
48 156 |
|
45 267 |
|
|
Net carrying value |
28 618 |
|
25 320 |
|
(a)Primarily relates to fully depreciated assets derecognised at the Hidden Valley, Tshepong North, Moab Khotsong and Doornkop operations.
(b)Included in additions for 2023 is an amount of R188 million (2022: R137 million) for capitalised depreciation associated with stripping activities at the Hidden Valley operations.
(c)Refer to note 9 for the total loss on scrapping recognised. Primarily relates to the Tshepong North and Kusasalethu operations.
(d)Refer to note 26 for details on the adjustment to the rehabilitation asset.
(e)Transfer of assets mainly relates to assets under construction transferred to mining assets. During the 2023 year an amount of R539 million (2022: R513 million) was transferred to mining assets at Hidden Valley. This related to ongoing mining development costs.
(f)Refer to note 6 for details on the impairments recognised.
Stripping activities
Included in the balance for mining assets is an amount of R184 million (2022: R174 million) relating to Kalgold and R1 330 million (2022: R922 million) relating to Hidden Valley. Depreciation of R41 million (2022: R26 million) and R514 million (2022: R482 million) was recorded for Kalgold and Hidden Valley respectively.
Notes to the group financial statements continued
For the year ended 30 June 2023
15 Property, plant and equipment continued
Mining assets under construction
Accounting policy
At the group’s surface mines, when it has been determined that a mineral property can be economically developed as a result of establishing proved and probable reserves, costs incurred to develop the property are capitalised as incurred until the mine is considered to have moved into the production phase. These costs include costs to further delineate the orebody and remove overburden to initially expose the orebody.
At the group’s underground mines, all costs incurred to develop the property, including costs to access specific ore blocks or other areas of the underground mine, are capitalised to the extent that such costs will provide future economic benefits. These costs include the cost of shaft sinking and access, the costs of building access ways, lateral development, drift development, ramps, box cuts and other infrastructure development.
Where a depreciable asset is used in the construction or extension of a mine, the depreciation is capitalised against the mine’s cost.
Exploration properties acquired are recognised in the balance sheet within development cost and are shown at cost less provisions for impairment determined in accordance with the group’s accounting policy on impairment of non-financial assets.
Mineral interests associated with development and exploration phase mineral interests are not amortised until such time as the underlying property is converted to the production stage.
Capitalisation of pre-production costs ceases when commercial levels of production are reached. Commercial levels of production are discussed under “production start date” above.
The movement in the mining assets under construction is as follows:
|
|
|
|
|
|
|
|
|
|
|
|
SA Rand |
|
Figures in million |
2023 |
2022 |
|
Cost |
|
|
|
Balance at beginning of year |
3 802 |
|
2 732 |
|
|
Additions1 |
2 053 |
|
1 278 |
|
|
Depreciation capitalised |
— |
|
4 |
|
|
Finance costs capitalised3 |
123 |
|
65 |
|
|
Transfers and other movements |
(539) |
|
(513) |
|
|
Translation |
282 |
|
236 |
|
|
Balance at end of year |
5 721 |
|
3 802 |
|
|
Accumulated impairments |
|
|
|
Balance at beginning of year |
670 |
|
— |
|
|
Impairment2 |
— |
|
670 |
|
|
|
|
|
|
Balance at end of year |
670 |
|
670 |
|
|
Net carrying value |
5 051 |
|
3 132 |
|
1 Mainly relates to Great Noligwa Shaft Pillar project of R80 million (2022: R192 million), Zaaiplaats project of R537 million (2022: R184 million), Doornkop 207/212 Level project of R304 million (2022: R159 million) and Kareerand TSF Expansion project R462 million (2022: R24 million). In 2022, Tshepong North’s Sub 75 Decline project incurred R170 million before it was ceased in June 2022.
2 Relates to Tshepong North.
3 Refer to note 11 for further detail on the capitalisation rate applied.
Wafi-Golpu development
Capitalisation of certain project expenses on Wafi-Golpu was halted from 1 July 2019 following delays in the permitting of the project (refer to note 22). All ongoing expenses since were for holding purposes and did not result in future economic benefits. These have been included in exploration expenditure in the income statement and amounted to R48 million (2022: R58 million) for the year.
Undeveloped properties
Accounting policy
Undeveloped properties are initially recognised at cost, which is generally based on the fair value of resources obtained through acquisitions. The carrying values of these properties are tested for impairment or reversal of previously recognised impairment when an indicator is identified. Once development commences, these properties are transferred to mining assets and accounted for in accordance with the related accounting policy.
Notes to the group financial statements continued
For the year ended 30 June 2023
15 Property, plant and equipment continued
Undeveloped properties continued
Critical accounting estimates and judgements – exploration and evaluation assets
The recoverability of exploration and evaluation expenditure is assessed at the end of each reporting period. The balances assessed include undeveloped properties and assets under construction. Significant judgement is required as to whether an area of activity is to be carried forward on the balance sheet, or written off through the identification of areas of activity which have not yet reached a stage that permits a reasonable assessment of the existence of economically recoverable reserves, where there is no continuing significant activity plan in relation to the area.
Currently the assets assessed are the Wafi-Golpu Project, Target North and the Eva Copper Project. For further details regarding the permitting process and other developments of the Wafi-Golpu Project, refer to note 22.
The movement in the undeveloped properties is as follows:
|
|
|
|
|
|
|
|
|
|
|
|
SA Rand |
|
Figures in million |
2023 |
2022 |
|
Cost |
|
|
|
Balance at beginning of year |
5 478 |
|
5 461 |
|
|
Acquisitions1 |
3 154 |
|
— |
|
|
Translation |
229 |
|
17 |
|
|
Balance at end of year |
8 861 |
|
5 478 |
|
|
Accumulated depreciation and impairments |
|
|
|
Balance at beginning of year |
1 474 |
|
1 473 |
|
|
|
|
|
|
Translation |
2 |
|
1 |
|
|
Balance at end of year |
1 476 |
|
1 474 |
|
|
Net carrying value |
7 385 |
|
4 004 |
|
1 Refer to note 14 for details on the fair value of assets acquired following the Eva Copper acquisition.
Other non-mining assets
Accounting policy
Land is shown at cost and not depreciated. Other non-mining fixed assets are shown at cost less accumulated depreciation and accumulated impairment losses. Other non-mining fixed assets are depreciated on a straight-line basis over their estimated useful lives as follows:
•Vehicles at 20% per year
•Computer equipment at 33.3% per year
•Furniture and equipment at 16.67% per year.
The assets’ residual values and useful lives are reviewed, and adjusted if appropriate, at each balance sheet date.
The movement in the non-mining assets is as follows:
|
|
|
|
|
|
|
|
|
|
|
|
SA Rand |
|
Figures in million |
2023 |
2022 |
|
Cost |
|
|
|
Balance at beginning of year |
895 |
|
821 |
|
|
Fully depreciated assets no longer in use derecognised |
(7) |
|
— |
|
|
|
|
|
|
|
|
|
|
Additions |
108 |
|
74 |
|
|
Translation |
4 |
|
— |
|
|
Balance at end of year |
1 000 |
|
895 |
|
|
Accumulated depreciation and impairments |
|
|
|
Balance at beginning of year |
479 |
|
431 |
|
|
Fully depreciated assets no longer in use derecognised |
(7) |
|
— |
|
|
Depreciation |
74 |
|
47 |
|
|
Impairment |
— |
|
1 |
|
|
Translation |
1 |
|
— |
|
|
Balance at end of year |
547 |
|
479 |
|
|
Net carrying value |
453 |
|
416 |
|
Notes to the group financial statements continued
For the year ended 30 June 2023
16 Intangible assets
Accounting policy
Intangible assets consist of all identifiable non-monetary assets without physical substance. They are stated at cost less accumulated amortisation and accumulated impairment losses, if any. The following are the main categories of intangible assets:
Goodwill
Goodwill is an intangible asset with an indefinite useful life which is not amortised but tested for impairment on an annual basis, or when there is an indication of impairment. The excess of consideration transferred over the amount of any non-controlling interest in the acquiree and the acquisition-date fair value of any previously held equity interest in the acquiree over the fair value of the group’s share of the identifiable net assets acquired is recorded as goodwill. Goodwill on acquisition of subsidiaries, joint operations and businesses is included in intangible assets. Goodwill on acquisition of associates is included in investments in associates and tested for impairment as part of the overall balance.
Goodwill is tested annually for impairment and carried at cost less accumulated impairment losses. Goodwill is allocated to cash generating units for the purpose of impairment testing. The allocation is made to those cash generating units or groups of cash generating units that are expected to benefit from the business combination in which the goodwill arose. If the composition of one or more cash generating units to which goodwill has been allocated changes due to a re-organisation, the goodwill is re-allocated to the units affected.
The gain or loss on disposal of an entity includes the carrying amount of goodwill relating to the entity sold.
Technology-based assets
Acquired computer software licences that require further internal development are capitalised on the basis of costs incurred to acquire and bring to use the specific software. These technology-based assets are classified as intangible assets with a finite useful life. These assets are amortised on a straight-line basis over their estimated useful lives, which are reviewed annually, as follows:
•Computer software at 20% per year.
Critical accounting estimates and judgements – impairment of goodwill
Due to the wasting nature of mining assets and the finite life of a mine's reserves, the allocation of goodwill to a mine or cash generating unit will eventually result in an impairment charge for the goodwill. The group tests annually whether separately identifiable goodwill has suffered any impairment in accordance with the accounting policy stated in note 2.5. These calculations use estimates as per note 15.
|
|
|
|
|
|
|
|
|
|
|
|
SA Rand |
|
Figures in million |
2023 |
2022 |
|
|
|
|
|
Goodwill |
— |
|
— |
|
|
Technology-based assets |
33 |
|
48 |
|
|
Total intangible assets |
33 |
|
48 |
|
Goodwill
The movement in goodwill is as follows:
|
|
|
|
|
|
|
|
|
|
|
|
SA Rand |
|
Figures in million |
2023 |
2022 |
|
Cost |
|
|
|
Balance at beginning and end of year |
2 675 |
|
2 675 |
|
|
Accumulated amortisation and impairments |
|
|
|
Balance at beginning of year |
2 675 |
|
2 342 |
|
|
Impairment1 |
— |
|
333 |
|
|
Balance at end of year |
2 675 |
|
2 675 |
|
|
Net carrying value |
— |
|
— |
|
1 In 2022 the goodwill for the Bambanani and Moab Khotsong operations was impaired in full as the carrying value exceeded the recoverable amount of the related cash generating units. Refer to note 6 for further details on the impairment assessment.
Notes to the group financial statements continued
For the year ended 30 June 2023
Accounting policy – financial assets (applicable to notes 17, 18, 19 and 20)
Financial assets are initially recognised when the group becomes a party to their contractual arrangements. On initial recognition, a financial asset is classified as measured at:
•Amortised cost
•Fair value through other comprehensive income (FVTOCI) or
•Fair value through profit or loss (FVTPL).
A financial asset is classified as measured at amortised cost if it is held within the business model whose objective is to hold assets to collect contractual cash flows and its contractual terms give rise, on specified dates, to cash flows that are solely payments of principal and interest on the principal amount outstanding.
The group measures a financial asset initially at its fair value plus, in the case of a financial asset not at FVTPL, transaction costs that are directly attributable to the acquisition of the financial asset. Transaction costs of financial assets carried at FVTPL are expensed. The subsequent measurement of financial assets is discussed below.
|
|
|
|
|
|
|
|
|
|
|
|
| Financial asset category |
|
|
Description |
|
|
|
|
| Debt instruments at amortised cost |
|
|
Financial assets at amortised cost consist of restricted cash, restricted investments, loans, trade receivables and cash and cash equivalents. Interest income from these financial assets is included in investment income using the effective interest rate method. Any gain or loss arising on derecognition is recognised directly in profit or loss. Impairment losses are presented in other operating expenses in the income statement. |
| Debt instruments at fair value through profit or loss |
|
|
Equity-linked investments which are held to meet rehabilitation liabilities are classified as FVTPL. Debt instruments where the contractual cash flows fail to meet the solely payments of principal and interest (SPPI) criteria are also classified as FVTPL. A gain or loss on a debt investment that is subsequently measured at FVTPL is recognised in profit or loss and presented net within investment income in the period in which it arises. On derecognition of a financial asset, the difference between the proceeds received or receivable and the carrying amount of the asset is included in profit or loss. |
| Equity instruments designated at fair value through OCI |
|
|
The group's equity investments are designated as FVTOCI. The group subsequently measures all equity investments at fair value. Where the group's management has elected to present fair value gains and losses on equity investments in OCI, there is no subsequent reclassification of fair value gains and losses to profit or loss following the derecognition of the investment. Dividends from such investments are recognised when the group’s right to receive payments is established either in profit or loss as other income or as a deduction against the asset if the dividend clearly represents a recovery of part of the cost of the investment. Residual values in OCI are reclassified to retained earnings on derecognition of the related FVTOCI instruments. |
Impairment losses on financial assets at amortised cost are assessed using the forward-looking expected credit loss (ECL) approach. ECLs are a probability-weighted estimate of credit losses. Credit losses are measured as the present value of all cash shortfalls (ie the difference between the cash flows due to the entity in accordance with the contract and the cash flows that the group expects to receive). At each reporting date, the group assesses whether financial assets carried at amortised cost are credit impaired. A financial asset is ‘‘credit impaired’’ when one or more events that have a detrimental impact on the estimated future cash flows of the financial asset have occurred. Trade receivable loss allowances are measured at an amount equal to lifetime ECLs. Loss allowances are deducted from the gross carrying amount of the assets.
Financial assets and liabilities are offset and the net amount reported in the balance sheet when there is a legally enforceable right to offset the recognised amounts and there is an intention to settle on a net basis, or realise the asset and settle the liability simultaneously.
Notes to the group financial statements continued
For the year ended 30 June 2023
17 Restricted cash and investments
|
|
|
|
|
|
|
|
|
|
|
|
SA Rand |
|
Figures in million |
2023 |
2022 |
|
|
|
|
|
Restricted cash |
475 |
|
319 |
|
|
Restricted investments |
5 687 |
|
5 263 |
|
|
Total restricted cash and investments |
6 162 |
|
5 582 |
|
|
Current portion of restricted cash and investments |
41 |
|
27 |
|
|
Non-current portion of restricted cash and investments |
6 121 |
|
5 555 |
|
Restricted cash
|
|
|
|
|
|
|
|
|
|
|
|
SA Rand |
|
Figures in million |
2023 |
2022 |
|
Non-current |
434 |
|
292 |
|
|
Current |
41 |
|
27 |
|
|
Total restricted cash |
475 |
|
319 |
|
The restricted cash consist of funds set aside for:
|
|
|
|
|
|
|
|
|
|
|
|
|
|
SA Rand |
|
Figures in million |
2023 |
|
2022 |
|
Environmental guarantees and rehabilitation (a) |
183 |
|
152 |
|
|
Guarantee - Tshiamiso Trust (b) |
225 |
|
116 |
|
|
PNG communities (c) |
45 |
|
29 |
|
|
Other |
22 |
|
22 |
|
|
Total restricted cash |
475 |
|
319 |
|
(a) The amount primarily relates to funds set aside to serve as collateral against guarantees made to the Department of Mineral Resources and Energy (DMRE) in South Africa for environmental and rehabilitation obligations. Refer to note 26. The funds are invested in short-term money market funds and call accounts, which require third-party approval for release.
(b) Refer to note 27 for details on the silicosis settlement and the arrangement with the trust. The increase year on year is due to additional collateral for the guarantees provided to the trust.
(c) Relates to monies set aside for affected communities in the group’s PNG operations.
Restricted investments
|
|
|
|
|
|
|
|
|
|
|
|
SA Rand |
|
Figures in million |
2023 |
2022 |
|
Investments held by environmental trust funds |
5 673 |
|
5 244 |
|
|
Investments held by the Social Trust Fund |
14 |
|
19 |
|
|
Total restricted investments (non-current) |
5 687 |
|
5 263 |
|
Environmental trust funds
Accounting policy
Contributions are made to the group's environmental trust funds, created in accordance with statutory requirements, to fund the estimated cost of pollution control, rehabilitation and mine closure at the end of the life of the group's mines. The trusts are consolidated into the group as the group exercises control of the trusts. The measurement of the investments held by the trust funds is dependent on their classification under financial assets. Income received and gains are treated in accordance with these classifications. The equity-linked notes and investment in unit trusts are classified and measured at fair value through profit or loss, while the equity investments are classified and measured at fair value through other comprehensive income. Interest-bearing short-term investments as well as investments in government bonds are classified and measured as debt instruments at amortised cost.
Notes to the group financial statements continued
For the year ended 30 June 2023
17 Restricted cash and investments continued
Restricted investments continued
Environmental trust funds continued
The environmental trust funds are irrevocable trusts under the group's control. Contributions to the trusts are invested in various instruments which include the following: listed equity securities, unit trusts, government bonds, interest-bearing short-term and medium-term cash investments and medium-term equity-linked notes. The equity-linked notes are issued by commercial banks that provide guaranteed interest and additional interest or growth linked to the growth of the Top 40 index of the JSE. These investments provide for the estimated cost of rehabilitation at the end of the life of the group's mines. Income earned on the investments is retained in the funds and reinvested.
The environmental trust funds consist of:
|
|
|
|
|
|
|
|
|
|
|
|
SA Rand |
|
Figures in million |
2023 |
2022 |
|
Fixed deposits |
3 385 |
|
3 056 |
|
|
Cash equivalents |
58 |
|
528 |
|
|
Equity-linked deposits |
1 493 |
|
1 094 |
|
|
Government bonds |
234 |
|
225 |
|
|
Equity investments |
305 |
|
292 |
|
|
Collective investment scheme (unit trusts) |
198 |
|
49 |
|
|
|
|
|
|
Total environmental trust funds |
5 673 |
|
5 244 |
|
Reconciliation of the movement in the investments held by environmental trust funds:
|
|
|
|
|
|
|
|
|
|
|
|
SA Rand |
|
Figures in million |
2023 |
2022 |
|
Balance at beginning of year |
5 244 |
|
5 064 |
|
|
|
|
|
|
Interest income |
258 |
|
185 |
|
|
Fair value gain through profit and loss |
184 |
|
18 |
|
|
Fair value gain through other comprehensive income |
30 |
|
15 |
|
|
Dividend received |
13 |
|
14 |
|
|
Acquisition/(maturity) of Equity-linked deposits |
229 |
|
(260) |
|
|
Acquisition/(maturity) of Fixed deposits |
154 |
|
(21) |
|
|
Acquisition/(maturity) of Collective investment schemes (unit trusts) |
141 |
|
— |
|
|
Net transfer of cash equivalents |
(524) |
|
281 |
|
|
Withdrawal of funds for rehabilitation work performed |
(56) |
|
(52) |
|
|
|
|
|
|
Balance at end of year |
5 673 |
|
5 244 |
|
The Social Trust Fund
The Social Trust Fund is an irrevocable trust under the group's control. The purpose of the trust is to fund the social plan to reduce the negative effects of restructuring on the group's workforce, to put measures in place to ensure that the technical and life skills of the group's workforce are developed and to develop the group's workforce in such a manner as to avoid or minimise the effect of job losses and a decline in employment through turnaround or redeployment strategies.
The Social Trust Fund investment comprises a unit trust portfolio that is exposed to the fair value changes in the equity market and is classified as a fair value through profit or loss investment.
Notes to the group financial statements continued
For the year ended 30 June 2023
18 Other non-current assets
|
|
|
|
|
|
|
|
|
|
|
|
SA Rand |
|
Figures in million |
2023 |
2022
|
|
Debt instruments |
116 |
|
163 |
|
|
Loans to associates (a) |
116 |
|
116 |
|
|
Loan to ARM BBEE Trust (b) |
101 |
|
148 |
|
|
Other loans |
15 |
|
15 |
|
|
Loss allowance (a) |
(116) |
|
(116) |
|
|
Equity instruments |
78 |
|
75 |
|
|
Rand Mutual Assurance (c) |
69 |
|
67 |
|
|
Other investments |
9 |
|
8 |
|
|
Inventories |
138 |
|
136 |
|
|
Non-current portion of gold in lock-up (d) |
138 |
|
136 |
|
|
|
|
|
|
Total other non-current assets |
332 |
|
374 |
|
|
|
|
|
|
|
|
|
|
|
|
|
(a)A loan of R116 million (2022: R116 million) owed by Pamodzi Gold Limited (Pamodzi) which was placed into liquidation during 2009, was provided for in full. Harmony is a concurrent creditor in the Pamodzi Orkney liquidation.
(b)During 2021, Harmony advanced R264 million to the ARM Broad-Based Economic Empowerment Trust (the ARM BBEE Trust), a shareholder of African Rainbow Minerals Limited (ARM), after the restructuring of the original loan advanced in 2016. The ARM BBEE Trust is controlled and consolidated by ARM, who holds 12.08% of Harmony's shares at 30 June 2023. Harmony is a trustee of the ARM BBEE Trust. The loan under the revised loan agreement is interest-free and is receivable on the maturity of the loan on 30 June 2035. The loan is unsubordinated and unsecured.
The loan does not meet the requirements for amortised cost measurement as it fails the solely payments of principal and interest test and was therefore classified as fair value through profit and loss (refer to the fair value determination section in note 39 for detail). The group determined that the contractual terms include exposure to risk and volatility that is inconsistent with a basic lending arrangement. In making this assessment the group considered contingent events that would change the amount and timing of cash flows and potential limits on the group's claim to cash flows from specified assets (eg non-recourse asset arrangements).
During the 2023 financial year, repayments of R74 million (2022: R65 million) were received on the loan.
(c)Refer to note 39 for the fair value valuation technique used to measure the investment and note 10 for details of dividends received.
(d)Refer to note 23 for further details on inventories.
Notes to the group financial statements continued
For the year ended 30 June 2023
19 Derivative financial instruments
The group has the following derivative financial instruments:
|
|
|
|
|
|
|
|
|
|
|
|
|
|
|
|
|
|
|
|
|
Figures in million (SA Rand) |
Rand gold hedging contracts
(a) |
US$ gold hedging contracts
(b) |
US$ silver contracts
(b) |
Foreign exchange contracts
(c) |
|
Total |
|
|
|
|
|
|
|
|
|
At 30 June 2023 |
|
|
|
|
|
|
|
|
|
|
|
|
|
|
|
Derivative financial assets |
179 |
|
67 |
|
44 |
|
89 |
|
|
379 |
|
|
Non-current |
135 |
|
33 |
|
16 |
|
85 |
|
|
269 |
|
|
Current |
44 |
|
34 |
|
28 |
|
4 |
|
|
110 |
|
|
|
|
|
|
|
|
|
|
Derivative financial liabilities |
(1 291) |
|
(19) |
|
— |
|
(221) |
|
|
(1 531) |
|
|
Non-current |
(401) |
|
— |
|
— |
|
(69) |
|
|
(470) |
|
|
Current |
(890) |
|
(19) |
|
— |
|
(152) |
|
|
(1 061) |
|
|
|
|
|
|
|
|
|
|
Net derivative financial instruments |
(1 112) |
|
48 |
|
44 |
|
(132) |
|
|
(1 152) |
|
|
|
|
|
|
|
|
|
|
|
|
|
|
|
|
|
|
Unrealised gains/(losses) included in other reserves, net of tax |
(808) |
|
55 |
|
— |
|
— |
|
|
(753) |
|
|
|
|
|
|
|
|
|
|
Movements for the year ended
30 June 2023 |
|
|
|
|
|
|
|
|
|
|
|
|
|
|
|
Realised gains/(losses) included in revenue |
(209) |
|
25 |
|
— |
|
— |
|
|
(184) |
|
|
Unrealised losses on gold contracts recognised in other comprehensive income |
(1 748) |
|
(34) |
|
— |
|
— |
|
|
(1 782) |
|
|
|
|
|
|
|
|
|
|
Gains/(losses) on derivatives |
— |
|
— |
|
21 |
|
(145) |
|
|
(124) |
|
|
|
|
|
|
|
|
|
|
Day one loss amortisation |
(66) |
|
(4) |
|
— |
|
— |
|
|
(70) |
|
|
|
|
|
|
|
|
|
|
Total gains/(losses) on derivatives |
(66) |
|
(4) |
|
21 |
|
(145) |
|
|
(194) |
|
|
Hedge effectiveness |
|
|
|
|
|
|
|
|
|
|
|
|
|
|
|
Changes in the fair value of the hedging instrument used as the basis for recognising hedge ineffectiveness |
(1 748) |
|
(34) |
|
— |
|
— |
|
|
(1 782) |
|
|
Changes in the fair value of the hedged item used as the basis for recognising hedge ineffectiveness |
1 748 |
|
34 |
|
— |
|
— |
|
|
1 782 |
|
Notes to the group financial statements continued
For the year ended 30 June 2023
19 Derivative financial instruments continued
|
|
|
|
|
|
|
|
|
|
|
|
|
|
|
|
|
|
|
|
|
Figures in million (SA Rand) |
Rand gold hedging contracts
(a) |
US$ gold hedging contracts
(b) |
US$ silver
contracts
(b) |
Foreign exchange contracts
(c) |
|
Total |
|
At 30 June 2022 |
|
|
|
|
|
|
|
|
|
|
|
|
|
|
|
Derivative financial assets |
523 |
|
44 |
|
77 |
|
12 |
|
|
656 |
|
|
Non-current |
113 |
|
18 |
|
6 |
|
— |
|
|
137 |
|
|
Current |
410 |
|
26 |
|
71 |
|
12 |
|
|
519 |
|
|
|
|
|
|
|
|
|
|
Derivative financial liabilities |
— |
|
(11) |
|
— |
|
— |
|
|
(11) |
|
|
Non-current |
— |
|
(3) |
|
— |
|
— |
|
|
(3) |
|
|
Current |
— |
|
(8) |
|
— |
|
— |
|
|
(8) |
|
|
|
|
|
|
|
|
|
|
Net derivative financial instruments |
523 |
|
33 |
|
77 |
|
12 |
|
|
645 |
|
|
|
|
|
|
|
|
|
|
|
|
|
|
|
|
|
|
Unrealised gains included in other reserves, net of tax |
441 |
|
39 |
|
— |
|
— |
|
|
480 |
|
|
Movements for the year ended
30 June 2022 |
|
|
|
|
|
|
|
|
|
|
|
|
|
|
|
Realised gains/(losses) included in revenue |
602 |
|
(105) |
|
— |
|
— |
|
|
497 |
|
|
Unrealised gains/(losses) on gold contracts
recognised in other comprehensive income |
(292) |
|
50 |
|
— |
|
— |
|
|
(242) |
|
|
|
|
|
|
|
|
|
|
Gains/(losses) on derivatives |
— |
|
— |
|
114 |
|
(16) |
|
|
98 |
|
|
|
|
|
|
|
|
|
|
Day one loss amortisation |
(39) |
|
(6) |
|
— |
|
— |
|
|
(45) |
|
|
|
|
|
|
|
|
|
|
Total gains/(losses) on derivatives |
(39) |
|
(6) |
|
114 |
|
(16) |
|
|
53 |
|
|
Hedge effectiveness |
|
|
|
|
|
|
|
Changes in the fair value of the hedging instrument used as the basis for recognising hedge ineffectiveness |
(292) |
|
50 |
|
— |
|
— |
|
|
(242) |
|
|
Changes in the fair value of the hedged item used as the basis for recognising hedge ineffectiveness |
292 |
|
(50) |
|
— |
|
— |
|
|
242 |
|
|
|
|
|
|
|
|
|
|
|
|
|
|
|
|
|
|
|
|
|
|
|
|
Figures in million (SA Rand) |
Rand gold hedging contracts
(a) |
US$ gold hedging contracts
(b) |
US$ silver
contracts
(b) |
Foreign exchange contracts
(c) |
Rand gold derivative contracts
(a) |
Total |
|
Movements for the year ended
30 June 2021 |
|
|
|
|
|
|
|
|
|
|
|
|
|
|
|
Realised losses included in revenue |
(2 023) |
|
(273) |
|
— |
|
— |
|
— |
|
(2 296) |
|
|
Unrealised gains/(losses) on gold contracts recognised in other comprehensive income |
2 999 |
|
(7) |
|
— |
|
— |
|
— |
|
2 992 |
|
|
|
|
|
|
|
|
|
|
Gains/(losses) on derivatives |
— |
|
— |
|
(256) |
|
1 217 |
|
111 |
|
1 072 |
|
|
|
|
|
|
|
|
|
|
Day one loss amortisation |
(42) |
|
(8) |
|
— |
|
— |
|
— |
|
(50) |
|
|
|
|
|
|
|
|
|
|
Total gains/(losses) on derivatives |
(42) |
|
(8) |
|
(256) |
|
1 217 |
|
111 |
|
1 022 |
|
Notes to the group financial statements continued
For the year ended 30 June 2023
19 Derivative financial instruments continued
Hedge accounting
Harmony has entered into gold forward sale derivative contracts to hedge the risk of lower gold prices. Cash flow hedge accounting is applied to the majority of these contracts, resulting in the effective portion of the unrealised gains and losses being recorded in other comprehensive income (other reserves – refer to note 25). Refer to note 39 for a summary of the risk management strategy applied and the balances relating to designated hedging instruments as at reporting date.
Hedge effectiveness is determined at the inception of the hedge relationship and through periodic prospective effectiveness assessments. The group enters into gold forward contracts that have similar terms as the hedged item, such as notional amount, maturity date and reference gold spot price thereby ensuring that an economic relationship exists between the hedging instrument and the hedged item and resulting in a hedge ratio of 1:1. Potential sources of hedge ineffectiveness include counterparty and own credit risk, day one gains and losses, a mismatch in the timing of the derivative and underlying gold sale maturities, location differential and the refining margin. Hedge ineffectiveness is measured by comparing the change in the expected cash flows from a forward sale contract versus the sale of an equivalent quantity of gold in the open market. Ineffectiveness results when the changes in the fair values in the hedging instruments exceed the fair value changes in the hedged item. A negligible amount of hedge ineffectiveness was experienced in the years presented.
The gains and losses from derivative contracts to which hedge accounting is not applied is included in gains/(losses) on derivatives in profit or loss.
(a)Rand gold contracts
All Rand gold forward contracts entered into after 1 October 2020 were apportioned to the South African operations which included Mponeng and Mine Waste Solutions operation.
As a result of the original 21-day lockdown announced to curb the Covid-19 pandemic the gold forwards’ hedged items were no longer probable and in order to better match the cash flows relating to the underlying exposure, certain of the Rand gold forwards with maturities between 15 April 2020 and 31 May 2020 were effectively extended to mature between the periods July 2020 and March 2021. The restructured gold forwards retained the pricing of the original forwards and they were not designated as hedging instruments. Unrealised losses relating to the hedges previously recognised in other comprehensive income were immediately reclassified to profit or loss as gains/losses on derivatives. All subsequent gains and losses on the restructured hedges were recognised in profit or loss. As at 30 June 2021, all the restructured gold forwards had matured.
(b)US$ commodity contracts
Harmony maintains a derivative programme for Hidden Valley by entering into commodity derivative contracts. The contracts comprise US$ gold forward sale contracts as well as silver zero cost collars which establish a minimum (floor) and maximum (cap) silver sales price. Hedge accounting is applied to all US$ gold forward sale contracts and these are shown separately from the silver zero cost collars that are not hedge accounted.
(c)Foreign exchange contracts
Harmony maintains a foreign exchange derivative programme in the form of zero cost collars, which sets a floor and cap Rand/US$ exchange rate at which to convert US dollars to Rands, and foreign exchange forward contracts (FECs). Hedge accounting is not applied to these contracts.
Notes to the group financial statements continued
For the year ended 30 June 2023
19 Derivative financial instruments continued
The following table shows the open position at the reporting date:
|
|
|
|
|
|
|
|
|
|
|
|
|
|
|
|
|
|
|
|
|
|
|
|
|
|
|
|
|
|
|
|
|
2024 |
2025 |
TOTAL |
|
|
Q1 |
Q2 |
Q3 |
Q4 |
Q1 |
Q2 |
Q3 |
Q4 |
|
|
Foreign exchange contracts |
|
|
|
|
|
|
|
|
|
|
Zero cost collars |
|
|
|
|
|
|
|
|
|
|
US$m |
78 |
|
78 |
|
78 |
|
78 |
|
78 |
|
76 |
|
66 |
|
30 |
|
562 |
|
|
Average floor – R/US$ |
17.47 |
|
17.64 |
|
17.81 |
|
18.04 |
|
18.25 |
|
18.72 |
|
19.33 |
|
19.98 |
|
18.25 |
|
|
Average cap – R/US$ |
19.38 |
|
19.58 |
|
19.76 |
|
20.03 |
|
20.25 |
|
20.73 |
|
21.35 |
|
22.01 |
|
20.23 |
|
|
Forward contracts |
|
|
|
|
|
|
|
|
|
|
US$m |
36 |
|
36 |
|
36 |
|
36 |
|
36 |
|
33 |
|
24 |
|
13 |
|
250 |
|
|
Average forward rate – R/US$ |
18.49 |
|
18.65 |
|
18.83 |
|
19.06 |
|
19.39 |
|
19.67 |
|
20.19 |
|
20.50 |
|
18.96 |
|
|
Commodity contracts |
|
|
|
|
|
|
|
|
|
|
Rand gold hedging contracts |
|
|
|
|
|
|
|
|
|
|
000 oz – cash flow hedge |
78 |
|
78 |
|
78 |
|
72 |
|
72 |
|
72 |
|
66 |
|
36 |
|
552 |
|
|
Average R'000/kg |
1 074 |
|
1 099 |
|
1 134 |
|
1 159 |
|
1 185 |
|
1 230 |
|
1 315 |
|
1 388 |
|
1 181 |
|
|
US$ gold hedging contracts |
|
|
|
|
|
|
|
|
|
|
000 oz – cash flow hedge |
9 |
|
9 |
|
9 |
|
9 |
|
9 |
|
6 |
|
3 |
|
1 |
|
55 |
|
|
Average US$/oz |
1 860 |
|
1 941 |
|
2 052 |
|
2 106 |
|
2 127 |
|
2 150 |
|
2 171 |
|
2 187 |
|
2 043 |
|
|
Total gold |
|
|
|
|
|
|
|
|
|
|
000 oz |
87 |
|
87 |
|
87 |
|
81 |
|
81 |
|
78 |
|
69 |
|
37 |
|
607 |
|
|
US$ silver contracts |
|
|
|
|
|
|
|
|
|
|
000 oz |
240 |
|
240 |
|
240 |
|
240 |
|
210 |
|
210 |
|
120 |
|
40 |
|
1 540 |
|
|
Average floor – US$/oz |
24.09 |
|
24.35 |
|
24.53 |
|
24.54 |
|
24.66 |
|
24.92 |
|
25.59 |
|
25.86 |
|
24.62 |
|
|
Average cap – US$/oz |
26.87 |
|
27.12 |
|
27.31 |
|
27.42 |
|
27.66 |
|
27.92 |
|
28.59 |
|
28.86 |
|
27.50 |
|
Refer to note 39 for the details on the fair value measurements.
20 Trade and other receivables
|
|
|
|
|
|
|
|
|
|
|
|
SA Rand |
|
Figures in million |
2023 |
2022 |
|
|
|
|
|
|
|
|
|
|
|
|
|
|
|
|
|
|
|
|
|
|
|
|
|
|
|
|
|
|
|
|
|
|
|
|
|
|
|
|
|
|
|
|
|
Financial assets |
|
|
|
Trade receivables (metals)1 |
1 179 |
|
571 |
|
|
Other trade receivables |
460 |
|
343 |
|
|
Loss allowance |
(211) |
|
(204) |
|
|
Trade receivables - net |
1 428 |
|
710 |
|
|
Interest and other receivables |
121 |
|
213 |
|
|
|
|
|
|
Employee receivables |
12 |
|
15 |
|
|
Non-financial assets |
|
|
|
Prepayments |
189 |
|
160 |
|
|
Value added tax and general sales tax |
570 |
|
545 |
|
|
Income and mining taxes |
75 |
|
39 |
|
|
Total trade and other receivables |
2 395 |
|
1 682 |
|
1 The increase year on year is predominantly due to an increase in the gold debtor as a result of timing of receipts.
The movement in the loss allowance for trade and other receivables during the year was as follows (refer to note 39 for details):
|
|
|
|
|
|
|
|
|
|
|
|
SA Rand |
|
Figures in million |
2023 |
2022 |
|
Balance at beginning of year |
204 |
|
179 |
|
|
Increase in loss allowance recognised during the year |
155 |
|
80 |
|
|
Reversal of loss allowance during the year |
(148) |
|
(55) |
|
|
|
|
|
|
Balance at end of year |
211 |
|
204 |
|
The movement relates to various individually immaterial debtors.
Notes to the group financial statements continued
For the year ended 30 June 2023
20 Trade and other receivables continued
The loss allowance for trade and other receivables stratified according to the ageing profile at the reporting date is as follows:
|
|
|
|
|
|
|
|
|
|
|
|
SA Rand |
|
Figures in million |
Gross |
Loss
allowance |
|
30 June 2023 |
|
|
|
Not past due1 |
1 331 |
|
— |
|
|
Past due by 1 to 30 days |
64 |
|
29 |
|
|
Past due by 31 to 60 days |
22 |
|
14 |
|
|
Past due by 61 to 90 days |
42 |
|
9 |
|
|
Past due by more than 90 days |
42 |
|
38 |
|
|
Past due by more than 361 days |
138 |
|
121 |
|
|
Total |
1 639 |
|
211 |
|
|
30 June 2022 |
|
|
|
Not past due1 |
689 |
|
20 |
|
|
Past due by 1 to 30 days |
26 |
|
11 |
|
|
Past due by 31 to 60 days |
26 |
|
9 |
|
|
Past due by 61 to 90 days |
8 |
|
5 |
|
|
Past due by more than 90 days |
72 |
|
66 |
|
|
Past due by more than 361 days |
93 |
|
93 |
|
|
Total |
914 |
|
204 |
|
1 The gross amount includes the full trade receivables (metals) balance, which has no attributable loss allowance.
There were no renegotiations of the terms of any receivables during 2023 and 2022. As at 30 June 2023 and 30 June 2022, there was no collateral pledged or held for any of the receivables.
21 Investments in associates
Critical accounting estimates and judgements
The investments in associates are evaluated for impairment by comparing the entire carrying value of the investment (including loans to associates and preference shares) to the recoverable amount, which is the higher of value in use or fair value less costs to sell. Discounted cash flow models are used to calculate the net present value of the investments. The cash flows in the models include expected interest and capital payments on loans, dividends, redemption amounts and proceeds on disposal.
(a) Harmony acquired a 32.40% interest in Pamodzi on 27 February 2008, initially valued at R345 million. Pamodzi was listed on the JSE and had interests in operating gold mines in South Africa. Pamodzi was placed in liquidation in March 2009. As at 30 June 2023, to the best of our knowledge, the liquidation process has not been concluded. Refer to note 18(a) for details of the loan and provision of impairment of the loan.
(b) Rand Refinery provides precious metal smelting and refining services in South Africa. Harmony holds a 10.38% share in Rand Refinery. This investment is a strategic investment for the group as Rand Refinery is the only company that provides such services in South Africa. Although the group holds less than 20% of the equity shares of Rand Refinery, the group is able to exercise significant influence by virtue of having a right to appoint a director on the board. Through the 10.38% shareholding and the right to appoint a director on the board, the investment has been accounted for as an associate.
Rand Refinery has a 31 August financial year-end.
The movement in the investments in associates during the year is as follows:
|
|
|
|
|
|
|
|
|
|
|
|
SA Rand |
|
Figures in million |
2023 |
2022 |
|
Balance at beginning of year |
125 |
|
126 |
|
|
Dividend received |
(71) |
|
(64) |
|
|
Share of profit in associate |
57 |
|
63 |
|
|
|
|
|
|
|
|
|
|
Balance at end of year |
111 |
|
125 |
|
Notes to the group financial statements continued
For the year ended 30 June 2023
22 Investment in joint operations
The group has a 50% interest in certain mining and exploration assets located in the Morobe province, PNG. Newcrest Mining Limited owns the remaining 50% interest in these assets. The asset in the joint arrangement is the Wafi-Golpu project. The joint arrangement is accounted for as a joint operation.
State participation
Under the conditions of the Wafi-Golpu exploration tenements, the PNG government (the State) has reserved the right prior to the commencement of mining to take up an equity interest of up to 30% of any mineral discovery within the Wafi-Golpu tenements. The right is exercisable by the State once at any time prior to the commencement of mining. If the State exercises this right, the exercise price is a pro-rata share of the accumulated exploration expenditure. Once the right is exercised, the State is responsible for its proportionate share of ongoing exploration and project development costs. The State has indicated its intention to exercise its option in full, however, as at 30 June 2023, this option has not been exercised.
Permitting
Special Mining Lease
In August 2016, application was made to the Mineral Resources Authority for a Special Mining Lease (SML) under the PNG Mining Act 1992. The application was subsequently updated and amended in March 2018.
Notwithstanding that the Prime Minister has publicly stated the Wafi-Golpu Project is of national importance and therefore the State’s objective is to permit the project as soon as possible, there have been considerable delays in the permitting process. These include a judicial review instituted in 2019 by the Governor and Government of Morobe Province. This related to a memorandum of agreement entered into between the State of PNG and the project proponents in connection with the progress towards and terms of a Mining Development Contract (MDC) to be entered into under the PNG Mining Act, which review stayed the conduct of negotiations. The memorandum of agreement was subsequently withdrawn, however, meaningful negotiations with the PNG State Negotiating Team only recommenced in the second half of 2022.
During the last quarter of 2022, senior Harmony executives met with the Prime Minister, Hon James Marape MP. Harmony confirmed its continued commitment to invest and grow in PNG. At the request of the Prime Minister, a follow-up meeting took place during May 2022 between the project proponents, the Prime Minister, various members of the National Negotiating Team, the Minerals Policy Institute and the Mineral Resources Authority, and other senior administrators.
Following the PNG national general election that ended in August 2022, Hon James Marape MP was reappointed for a further term of office. Subsequently. permitting negotiations resumed in April 2023 and the project proponents entered into a Framework Memorandum of Understanding with the State, setting out the key terms and principles to guide the negotiation and preparation of the formal agreements relating to the permitting, development and operation of the project. The Wafi-Golpu Project will progress to development only once SML 10 and all other associated tenements and permits are granted, and all relevant project agreements and landholder compensation agreements have been entered into. Permitting and other contract negotiations are ongoing.
Any potential future development of the Wafi-Golpu Project is subject to further studies, completion of the remaining statutory processes, receipt of all necessary or desirable government permissions and approvals, market and operating conditions as well as approval by the board of directors of the Wafi-Golpu Joint Venture and of both Newcrest Mining Limited and Harmony.
Environment Permit
In July 2018, application was made to the Conservation and Environment Protection Authority for an Environment Permit under the PNG Environment Act 2000, by the submission under the Act of an Environmental Impact Statement. The Environment Permit was granted in December 2020.
During March 2021, the Governor and Government of the Morobe Province instituted a judicial review in the Lae National Court against the grant by the Minister for the Environment of the Environment Permit, pending the resolution of which review the grant of an SML was stayed. Following an appeal to the Supreme Court, the National Court stay order was itself stayed, and the Supreme Court will now set directions for a substantive hearing of the appeal. The project proponents are not parties to this proceeding.
In December 2022, landholders represented by the Centre for Environmental Law and Community Rights Inc (CELCOR) commenced legal proceedings also seeking judicial review of the grant of the environment permit. An application by CELCOR for the proceedings to be joined with those of the governor and Morobe Provincial Government was dismissed by the Supreme Court, and the review is presently proceeding independently.
Either of the proceedings, if determined against the State and the Minister for Environment, could result in the setting aside of the Environment Permit, the staying of the permitting process or the grant of the SML. Such an event could delay the development progress of the project.
Notes to the group financial statements continued
For the year ended 30 June 2023
22 Investment in joint operations continued
Carrying amount and impairment considerations
The carrying amount of the project amounts to R3.1 billion (2022: R2.7 billion). The majority of the change year on year relates to foreign exchange translation. There was no indicator of impairment at 30 June 2023. At 30 June 2022, the recoverable amount of the Wafi-Golpu Project was determined and an impairment assessment was performed in terms of IFRS 6. No impairment was recognised at 30 June 2022.
The recoverable amount for the project was determined on a resource multiple valuation approach using the same values as those for South African underground resources. Refer to note 15 for the assumptions used in the valuation. This is a level 3 fair value measurement.
23 Inventories
Accounting policy
Inventories, which include bullion on hand, gold-in-process, gold in lock-up, ore stockpiles and consumables, are measured at the lower of cost and net realisable value. Net realisable value is assessed at each reporting date and is determined with reference to relevant market prices.
The cost of bullion, gold-in-process and gold in lock-up is determined by reference to production cost, including amortisation and depreciation at the relevant stage of production. Ore stockpiles are valued at average production cost. Stockpiles and gold in lock-up are classified as non-current assets where the stockpile's volume exceeds current processing capacity and where a portion of static gold in lock-up is expected to be recovered more than 12 months after balance sheet date.
Gold-in-process inventories represent materials that are currently in the process of being converted to a saleable product. In-process material is measured based on assays of the material fed to process and the projected recoveries at the respective plants. In-process inventories are valued at the average cost of the material fed to process attributable to the source material coming from the mine or stockpile plus the in-process conversion costs, including the applicable depreciation relating to the process facility, incurred to that point in the process. Gold-in-process includes gold in lock-up, which is generally measured from the plants onwards. Gold in lock-up is expected to be extracted when plants are demolished at the end of their useful lives, which is largely dependent on the estimated useful life of the operations feeding the plants.
At the group’s open pit operations, gold-in-process represents production in broken ore form.
Consumables are valued at weighted average cost value after appropriate allowances for slow-moving and redundant items.
Critical accounting estimates and judgements
Judgement is applied in estimating the provision for stock obsolescence. The provision is recognised on items not considered critical as a percentage of the value of the inventory, depending on the period elapsed since the inventory was purchased or issued. Inventory held for longer than five years is written down to zero unless there is sufficient evidence of a recoverable amount.
|
|
|
|
|
|
|
|
|
|
|
|
SA Rand |
|
Figures in million |
2023 |
2022 |
|
Gold in lock-up |
138 |
|
136 |
|
|
Gold-in-process, ore stockpiles and bullion on hand |
1 095 |
|
1 054 |
|
|
Consumables at weighted average cost (net of provision) (a) |
2 170 |
|
1 764 |
|
|
|
|
|
|
Total inventories |
3 403 |
|
2 954 |
|
|
Non-current portion of gold in lock-up and gold-in-process included in Other non-current assets |
(138) |
|
(136) |
|
|
|
|
|
|
Total current portion of inventories |
3 265 |
|
2 818 |
|
|
|
|
|
|
Included in the balance above is: |
|
|
|
Inventory valued at net realisable value |
138 |
|
136 |
|
|
|
|
|
(a)The increase year on year is mainly due to an increase in key components of operations at Hidden Valley, predominantly diesel, as a result of higher volumes held to support the increased production. The weakening of the Rand/A$ exchange rate further increased the translated balance year on year for South-east Asia.
During the year, an increase of R85 million (2022: R115 million increase) to the provision for slow-moving and redundant stock was made. The total provision at 30 June 2023 was R492 million (2022: R407 million).
Notes to the group financial statements continued
For the year ended 30 June 2023
24 Share capital
Accounting policy
Ordinary shares are classified as equity, incremental costs directly attributable to the issue of new shares or options are shown in equity as a deduction, net of tax, from the proceeds.
The cost of treasury shares is eliminated against the share capital balance.
Authorised
1 200 000 000 (2022: 1 200 000 000) ordinary shares with no par value.
4 400 000 (2022: 4 400 000) convertible preference shares with no par value.
Issued
618 071 972 (2022: 616 525 702) ordinary shares with no par value. All issued shares are fully paid.
4 400 000 (2022: 4 400 000) convertible preference shares with no par value.
Share issues
Share issues relating to employee share options
An additional 1 546 270 (2022: 473 505) shares were issued to settle the exercise of share options by employees relating to Harmony's management share option schemes. Note 36 sets out the details in respect of the share option schemes.
Treasury shares
Included in the total of issued shares are the following treasury shares:
|
|
|
|
|
|
|
|
|
|
|
Number of shares |
2023 |
2022 |
|
Ordinary shares |
|
|
|
Lydenburg Exploration Limited1 |
335 |
|
335 |
|
|
Kalgold Share Trust2 |
47 046 |
|
47 046 |
|
|
Convertible preference shares |
|
|
|
Harmony Gold Community Trust3 |
4 400 000 |
|
4 400 000 |
|
1 A wholly-owned subsidiary.
2 Trust controlled by the group.
3 The issue of the convertible preference shares did not impact the group's consolidated financial statements as the Harmony Gold Community Trust is controlled by the group.
25 Other reserves
|
|
|
|
|
|
|
|
|
|
|
|
SA Rand |
|
Figures in million |
2023 |
2022 |
|
Foreign exchange translation reserve (a) |
4 220 |
|
3 097 |
|
|
Hedge reserve (b) |
(753) |
|
480 |
|
|
Share-based payments (c) |
3 363 |
|
3 249 |
|
|
Post-retirement benefit actuarial gain/(loss) (d) |
— |
|
(5) |
|
|
Equity instruments designated at fair value through other comprehensive income (e) |
178 |
|
153 |
|
|
Acquisition of non-controlling interest in subsidiary (f) |
(381) |
|
(381) |
|
|
Equity component of convertible bond (g) |
277 |
|
277 |
|
|
Repurchase of equity interest (h) |
(98) |
|
(98) |
|
|
Other |
(28) |
|
(28) |
|
|
Total other reserves |
6 778 |
|
6 744 |
|
(a)The foreign exchange translation reserve movement represents the cumulative translation effect of the group's off-shore operations. Refer to note 4 and 39 for details on the exchange rate movements year on year.
Notes to the group financial statements continued
For the year ended 30 June 2023
25 Other reserves continued
(b)Harmony has entered into gold hedging contracts. Cash flow hedge accounting is applied to these contracts, resulting in the effective portion of the unrealised gains and losses being recorded in other comprehensive income (other reserves). Refer to note 19 for further information.
The reconciliation of the hedge reserve is as follows:
|
|
|
|
|
|
|
|
|
|
|
|
SA Rand |
|
Figures in million |
2023 |
2022 |
|
Balance at beginning of year |
480 |
|
1 051 |
|
|
Remeasurement of gold hedging contracts |
(1 233) |
|
(571) |
|
|
Unrealised gain/(loss) on gold hedging contracts |
(1 782) |
|
(242) |
|
|
Released to revenue on maturity of the gold hedging contracts |
184 |
|
(497) |
|
|
Foreign exchange translation |
6 |
|
(2) |
|
|
Deferred taxation thereon |
359 |
|
170 |
|
|
|
|
|
|
Balance at end of year |
(753) |
|
480 |
|
|
Attributable to: |
|
|
|
Rand gold hedging contracts |
(808) |
|
441 |
|
|
US dollar gold hedging contracts |
55 |
|
39 |
|
(c)The reconciliation of the movement in the share-based payments is as follows:
|
|
|
|
|
|
|
|
|
|
|
|
SA Rand |
|
Figures in million |
2023 |
2022 |
|
Balance at beginning of year |
3 249 |
|
3 106 |
|
|
Share-based payments expensed (i) |
114 |
|
143 |
|
|
Balance at end of year |
3 363 |
|
3 249 |
|
(i) The group issues equity-settled instruments to certain qualifying employees under an employee share option scheme and employee share ownership plan (ESOP) to award shares from the company’s authorised but unissued ordinary shares. Equity share-based payments are measured at the fair value of the equity instruments at the grant date and are expensed over the vesting period, based on the group’s estimate of the shares that are expected to vest. Refer to note 36 for more details.
(d)The actuarial gains or losses related to the post-retirement benefit obligation will not be reclassified to the income statement Refer to note 27.
(e)Includes R114 million (2022: R112 million) related to the cumulative fair value movement of Harmony's interest in Rand Mutual Assurance. Refer to note 18.
(f)On 15 March 2004, Harmony announced that it had made an off-market cash offer to acquire all the ordinary shares, listed and unlisted options of Abelle Limited, held by non-controlling interests. The excess of the purchase price of R579 million over the carrying amount of non-controlling interest acquired, amounting to R381 million, has been accounted for under other reserves.
(g)On 24 May 2004, the group issued a convertible bond. The amount representing the value of the equity conversion component is included in other reserves, net of deferred income taxes. The equity conversion component is determined on the issue of the bonds and is not changed in subsequent periods. The convertible bonds were repaid in 2009.
(h)On 19 March 2010, Harmony Gold Mining Company Limited concluded an agreement with African Vanguard Resources (Proprietary) Limited (AVRD), for the purchase of its 26% share of the mining titles of the Doornkop South Reef. The original sale of the 26% share in the mining titles was accounted for as an in-substance call option by AVRD over the 26% mineral right. The agreement to purchase AVRD's 26% interest during the 2010 financial year was therefore considered to be a repurchase of the option (equity interest). The 26% interest was transferred from AVRD to Harmony in exchange for Harmony repaying the AVRD Nedbank loan and the issue of 2 162 359 Harmony shares. The difference between the value of the shares issued of R152 million, the liability to the AVRD and transaction costs, have been taken directly to equity.
Notes to the group financial statements continued
For the year ended 30 June 2023
Accounting policy – provisions (applicable to notes 26, 27 and 30)
Provisions are recognised when the group has a present legal or constructive obligation as a result of past events where it is probable that an outflow of resources embodying economic benefits will be required to settle the obligation, and a reliable estimate of the amount of the obligation can be made.
The amount recognised as a provision is the net present value of the best estimate of the expenditure required to settle the present obligation at balance sheet date. It is calculated using a pre-tax rate that reflects the current market assessment of the time value of money and the risks specific to the obligation. The estimate takes into account the associated risks and uncertainties. The increase in the provision due to the passage of time is recognised as interest expense.
Provisions are reviewed at each balance sheet date and adjusted to reflect the current best estimate. If it is no longer probable that an outflow of economic benefits will be required, the provision is reversed.
26 Provision for environmental rehabilitation
Accounting policy
Estimated long-term environmental obligations, comprising pollution control, rehabilitation and mine closure, are based on the group’s environmental management plans in compliance with current technological, environmental and regulatory requirements.
Based on disturbances to date, the net present value of expected rehabilitation cost estimates is recognised and provided for in full in the financial statements. The estimates are reviewed annually and are discounted using a pre-tax risk-free rate that is adjusted to reflect the current market assessments of the time value of money and the risks specific to the obligation.
Annual changes in the provision consist of finance costs relating to the change in the present value of the provision and inflationary increases in the provision estimate, as well as changes in estimates. The present value of environmental disturbances created is capitalised to mining assets against an increase in the rehabilitation provision. If a decrease in the liability exceeds the carrying amount of the asset, the excess is recognised immediately in the income statement. If the asset value is increased and there is an indication that the revised carrying value is not recoverable, impairment is assessed in accordance with the accounting policy dealing with impairments of non-financial assets (refer to note 2.5). Rehabilitation projects undertaken included in the estimates are charged to the provision as incurred. The cost of ongoing current programmes to prevent and control pollution is charged against income as incurred. Over time, the liability is increased to reflect an interest element, and the capitalised cost is depreciated over the life of the related asset.
Critical accounting estimates and judgements
Significant judgement is applied in estimating the ultimate rehabilitation cost that will be required in future to rehabilitate the group’s mines, related surface infrastructure and tailings dams. Ultimate cost may significantly differ from current estimates. The following rates were used in the calculation of the provision:
|
|
|
|
|
|
|
|
|
|
|
|
|
|
% |
2023 |
2022 |
2021 |
|
South African operations |
|
|
|
|
Inflation rate |
|
|
|
|
– short term (Year 1) |
6.59 |
|
6.55 |
|
5.11 |
|
|
– short term (Year 2) |
5.65 |
|
5.20 |
|
4.99 |
|
|
– medium term (Year 3)1 |
5.68 |
|
n/a |
n/a |
|
– long term (Year 3 onwards)1 |
n/a |
5.50 |
|
5.25 |
|
|
– long term (Year 4 onwards)1 |
5.64 |
|
n/a |
n/a |
|
Discount rates2 |
|
|
|
|
– 12 months |
9.30 |
|
5.50 |
|
4.90 |
|
|
– one to five years |
9.20 |
|
8.30 |
|
7.30 |
|
|
– six to nine years |
10.60 |
|
9.90 |
|
9.00 |
|
|
– ten years or more |
12.10 |
|
10.90 |
|
10.30 |
|
|
PNG operations |
|
|
|
|
Inflation rate |
4.84 |
|
5.33 |
|
4.45 |
|
|
Discount rate |
9.33 |
|
8.45 |
|
6.20 |
|
1 In 2023, management refined the approach for applying inflation rate assumptions in the calculation.
2 Refer to note 4 for a discussion on the changes affecting these assumptions.
The group’s mining and exploration activities are subject to extensive environmental laws and regulations. The group has made, and expects to make in the future, expenditures to comply with such laws and regulations, but cannot predict the full amount of such future expenditures. Estimated future reclamation costs are based principally on legal and regulatory requirements.
Notes to the group financial statements continued
For the year ended 30 June 2023
26 Provision for environmental rehabilitation continued
The following is a reconciliation of the total provision for environmental rehabilitation:
|
|
|
|
|
|
|
|
|
|
|
|
SA Rand |
|
Figures in million |
2023 |
2022 |
|
Balance at beginning of year |
5 013 |
|
4 662 |
|
|
Change in estimate – Balance sheet1 |
(111) |
|
(248) |
|
|
Change in estimate – Income statement1 |
32 |
|
136 |
|
|
Utilisation of provision |
(120) |
|
(65) |
|
|
Time value of money and inflation component of rehabilitation costs |
483 |
|
377 |
|
|
|
|
|
|
Translation |
176 |
|
151 |
|
|
Balance at end of year |
5 473 |
|
5 013 |
|
1 Changes to life-of-mine plans for certain operations in 2022 impacted the discounting of the cash flows. In 2023, there were no significant changes other than an increase in discount rates.
The environmental provision for PNG amounts to R1 478 million (2022: R1 185 million) and is unfunded due to regulations in the operating country.
While the ultimate amount of rehabilitation costs to be incurred in the future is uncertain, the group has estimated that, based on current environmental and regulatory requirements, the total undiscounted cost for the operations, in current monetary terms, is as follows:
|
|
|
|
|
|
|
|
|
|
|
|
SA Rand |
|
Figures in million |
2023 |
2022 |
|
Future net undiscounted obligation |
|
|
|
Ultimate estimated rehabilitation cost |
7 930 |
|
7 126 |
|
|
Amounts invested in environmental trust funds (refer to note 17) |
(5 673) |
|
(5 244) |
|
|
Total future net undiscounted obligation |
2 257 |
|
1 882 |
|
The group's South African mines are required to comply with the National Environmental Act's (NEMA) financial provision requirements. They are also required to substantively review and align their financial provision in accordance with these regulations during the relevant transitional period, which has now been extended to 19 February 2024. The group intends to finance the ultimate rehabilitation costs from the money invested in environmental trust funds as well as the proceeds on the sale of assets and gold from plant clean-up at the time of mine closure. The group has guarantees in place, some cash-backed, relating to some of the environmental liabilities. Refer to notes 17 and 38.
Notes to the group financial statements continued
For the year ended 30 June 2023
27 Other provisions
|
|
|
|
|
|
|
|
|
|
|
|
SA Rand |
|
Figures in million |
2023 |
2022 |
|
Provision for silicosis settlement (a) |
549 |
|
820 |
|
|
Retirement benefit obligation (b) |
264 |
|
251 |
|
|
Total other provisions |
813 |
|
1 071 |
|
|
Current portion of other provisions |
180 |
|
139 |
|
|
Non-current portion of other provisions |
633 |
|
932 |
|
.
(a)Provision for silicosis settlement
Critical accounting estimates and judgements
Significant judgement is applied in estimating the cost that will be required in future to settle any claims against certain of the group’s mines. The ultimate cost may differ from current estimates.
The provision amount was based on estimates of the number of potential claimants, levels of disease progression and take-up rates. These estimates were informed by historic information, published academic research and professional opinion. The key assumptions that were made in the determination of the provision amount include:
•Silicosis prevalence rates
•Estimated settlement per claimant
•Benefit take-up rates
•Disease progression rates
•Timing of cash flows.
A discount rate of 9.5% (2022: 6.5%) (2021: 6.2%) was used, based on South African government bonds with similar terms to the obligation. Refer to note 4 for a discussion on the changes in interest rates that impacted this assumption in 2023.
There is uncertainty with regard to the rate at which potential claims would be reported as well as the benefit take-up rates. Refer to sensitivity analysis on the key assumptions below.
Harmony and certain of its subsidiaries (Harmony group), together with other mining companies, were named in a class action suit for silicosis and tuberculosis which was certified by the Johannesburg High Court in May 2016. On 26 July 2019, the Johannesburg High Court approved the settlement of the silicosis and tuberculosis class action suit between the Occupational Lung Disease Gold Working Group (the Working Group) – representing Gold Fields, African Rainbow Minerals, Anglo American SA, AngloGold Ashanti, Harmony and Sibanye Stillwater – and lawyers representing affected mineworkers (settlement agreement). The mandatory three-month period, during which potential beneficiaries could opt out of the settlement agreement and the audit thereof was completed in December 2019. The Tshiamiso Trust will oversee the tracking and tracing of class members, process all submitted claims, including the undertaking of benefit medical examinations, and pay benefits to eligible claimants. A jointly controlled Special Purpose Vehicle has been set up to act as an agent for the Working Group in relation to certain matters set out in the settlement agreement and trust deed. Claims will be accepted for a twelve-year period with an effective date of December 2019.
The Working Group paid the legal costs of the claimants’ attorneys and other initial amounts as set out in the settlement agreement in 2021. On 31 January 2020, the Working Group commenced the payment of their quarterly administration and benefit contributions to the Tshiamiso Trust to enable the trustees to settle benefits of eligible claimants. Those payments are revisited as necessary annually, based on activities and claims.
Harmony has provided for the estimated cost of the settlement based on actuarial assessments. A portion of the provision has been transferred to current liabilities. The nominal amount for Harmony group is R696 million.
Notes to the group financial statements continued
For the year ended 30 June 2023
27 Other provisions continued
(a)Provision for silicosis settlement continued
The following is a reconciliation of the total provision for the silicosis settlement:
|
|
|
|
|
|
|
|
|
|
|
|
SA Rand |
|
Figures in million |
2023 |
2022 |
|
Balance at beginning of year |
820 |
|
854 |
|
|
Change in estimate1 |
(183) |
|
23 |
|
|
Time value of money and inflation component |
67 |
|
52 |
|
|
Payments2 |
(155) |
|
(109) |
|
|
Balance at end of year |
549 |
|
820 |
|
|
Current portion of silicosis settlement provision |
180 |
|
139 |
|
|
Non-current portion of silicosis settlement provision |
369 |
|
681 |
|
1 The change in estimate relates mainly to a change in the assumptions due to the availability of actual exit data and an adjustment to the take-up rate, as well as an increase in the discount rates, which resulted in a decrease of the estimated obligation as at 30 June 2023.
2 These payments comprise of the administration and benefit contributions to the Tshiamiso Trust.
Sensitivity analysis
Management has considered the information available regarding key assumptions, as well as the uncertainties and term of the projections, and determined variances for a reasonable (possible) range to apply to the key assumptions. Information considered included medical data and evidence from the silicosis claim process, which has not changed significantly since the liability was recognised. Management also considered the guidance provided by the actuarial specialists as to what could be a reasonably possible change for each item. The impact of these reasonable possible changes on the assumptions would increase or decrease the provision amount by the following amounts:
|
|
|
|
|
|
|
|
|
|
|
|
SA Rand |
|
Figures in million |
2023 |
2022 |
|
Effect of an increase in the assumption: |
|
|
|
Change in benefit take-up rate1 |
81 |
|
91 |
|
|
Change in silicosis prevalence2 |
81 |
|
91 |
|
|
Change in disease progression rates3 |
61 |
|
49 |
|
|
Effect of a decrease in the assumption: |
|
|
|
Change in benefit take-up rate1 |
(81) |
|
(91) |
|
|
Change in silicosis prevalence2 |
(81) |
|
(91) |
|
|
Change in disease progression rates3 |
(61) |
|
(49) |
|
1Change in benefit take-up rate: the take-up rate does not significantly affect the administration fees, but a 10% change results in a proportionate change in the base compensation values.
2Change in the silicosis prevalence: the assumptions that will result in a change in the estimated number of cases are either a 10% change in the assumed labour numbers or a 10% change in the disease risk.
3Change in disease progression rates: a 10% shorter/longer disease progression period was used, which results in more advanced silicosis cases. This assumption is not applicable to the dependant or TB classes.
The above sensitivity analysis is based on a change in an assumption while holding all other assumptions constant. In practice, this is unlikely to occur, and changes in some of the assumptions may be correlated. A change in the settlement claim amount would result in a change in the provision amount on a Rand for Rand basis.
The ultimate outcome of this matter remains uncertain, with the number of eligible potential claimants successfully submitting claims and receiving compensation being uncertain. The provision recorded in the financial statements is consequently subject to adjustment or reversal in the future.
(b)Retirement benefit obligation
Accounting policy
The group provides medical cover to current employees and certain retirees through certain funds. The medical accounting costs for the defined benefit plan are assessed using the projected unit credit method. The healthcare obligation is measured at the present value of the estimated future cash outflows using government bond interest rates consistent with the terms and risks of the obligation. Actuarial gains and losses as a result of these valuations are recognised in other comprehensive income (OCI) at revaluation date. Actuarial gains and losses recognised in OCI will not be recycled to profit or loss. The future liability for current and retired employees and their dependants is accrued in full based on actuarial valuations obtained annually.
Notes to the group financial statements continued
For the year ended 30 June 2023
27 Other provisions continued
(b)Retirement benefit obligation continued
Critical accounting estimates and judgements
An updated actuarial valuation is carried out at the end of each financial year. Assumptions used to determine the liability include a discount rate of 13.5%, no increases in employer subsidies (in terms of the agreement), mortality rates according to the SA 1956/62 mortality table (SA ”a mf” tables) (retirement age of 60) and a medical inflation rate of 10.1%
(2022: discount rate of 12.3%, retirement age of 60 and 9.0% inflation rate) (2021: discount rate of 11.2%, retirement age of 60 and 8.5% inflation rate). Management determined the discount rate by assessing South African government bonds with similar terms to the liability. The changes to the discount rate and medical inflation rate are similar to changes in interest and inflation rates in South Africa.
Pension and provident funds
The group contributes to several pension and provident funds governed by the Pension Funds Act, 1956 for the employees of its South African subsidiaries. The pension funds are multi-employer defined contribution industry plans. The group’s liability is therefore limited to its monthly determined contributions. The provident funds are funded on a “monetary accumulative basis” with the member’s and employer’s contributions having been fixed in the constitution of the funds. The Australian group companies make contributions to each employee’s superannuation (pension) funds in accordance with the Superannuation Guarantee Scheme (SGS). The SGS is a Federal Government initiative enforced by law which compels employers to make regular payments to regulated funds providing for each employee on their retirement. The SGS was set at a minimum of 10.5% of gross salary and wages for the 2023 year (2022: 10.0%). The fund is a defined contribution plan. The PNG Superannuation Act 2002 requires a compulsory employer contribution of 8.4% (2022: 8.4%) into an approved superannuation (pension) fund if an employee is appointed for a period of three months or more. The approved superannuation funds are defined contribution plans.
Substantially all the group’s employees are covered by the above mentioned retirement benefit plans. Funds contributed by the group for the 2023 financial year amounted to R1 146 million (2022: R1 125 million).
Post-retirement benefits other than pensions
Harmony inherited post-retirement medical benefit obligations with the Freegold acquisition in 2002, the Moab Khotsong acquisition in 2018 and the Mponeng acquisition in 2021. Except for the above mentioned employees, Harmony has no other post-retirement benefit obligation for the other group employees.
The group’s obligation is to pay a subsidy of 2% for every completed year of employment up to a maximum of 50% of total medical aid contributions, commencing on date of retirement. Should the employee die, either in service or after retirement, this benefit will transfer to his/her dependants. The medical aid tariffs are based on the Bestmed medical scheme (Bestmed) options.
The principal actuarial assumptions used to determine the present value of unfunded obligations are discussed above. In addition, the following was also considered:
•It is assumed that all Continuation and Widow Members (CAWMs) will remain on the current benefit option and income band. For employed members, post-employment contributions were assumed to be equal to the average payable for the current CAWMs membership
•It is assumed that not all employed members will remain employed until retirement therefore estimated resignation and ill-health retirement rates are also taken into account
•It is assumed that 90% of employed members will be married at retirement or earlier death and that wives are four years younger than their husbands.
Through the post-employment medical plan, the group is exposed to a number of risks, the most significant of which are discussed below:
•Change in bond yields: A decrease in the bond yields will increase the plan liability
•Inflation risk: The obligation is linked to inflation and higher inflation will lead to a higher liability
•Life expectancy: The obligation is to provide benefits for the life of the member, so increases in life expectancy will result in an increase in the plan’s liabilities.
The liability is unfunded and will be settled out of cash and cash equivalents when it becomes due. The liability is based on an actuarial valuation conducted during the year ended 30 June 2023, using the projected unit credit method. The next actuarial valuation will be performed on 30 June 2024.
Notes to the group financial statements continued
For the year ended 30 June 2023
27 Other provisions continued
(b) Retirement benefit obligation continued
Post-retirement benefits other than pensions continued
|
|
|
|
|
|
|
|
|
|
|
|
SA Rand |
|
Figures in million |
2023 |
2022 |
|
Present value of all unfunded obligations |
264 |
|
251 |
|
|
Current employees |
100 |
|
99 |
|
|
Retired employees |
164 |
|
152 |
|
|
|
|
|
|
The movement in the retirement benefit obligation is as follows: |
|
|
|
Balance at beginning of year |
251 |
|
247 |
|
|
|
|
|
|
Contributions paid |
(14) |
|
(13) |
|
|
Other expenses included in staff costs/current service cost |
3 |
|
4 |
|
|
Finance costs |
30 |
|
27 |
|
|
Net actuarial gain recognised in other comprehensive income during the year |
(6) |
|
(14) |
|
|
|
|
|
|
Balance at end of year (non-current) |
264 |
|
251 |
|
The net actuarial gain for 2023 and 2022 is due to the results of the higher real rate of discount assumed and used.
|
|
|
|
|
|
|
|
|
|
|
|
SA Rand |
|
Figures in million |
2023 |
2022 |
|
The net liability of the defined benefit plan is as follows: |
|
|
|
Present value of defined benefit obligation |
264 |
|
251 |
|
|
Fair value of plan assets |
— |
|
— |
|
|
|
|
|
|
Net liability of defined benefit plan |
264 |
|
251 |
|
Management considered whether a reasonably possible change in any of the key assumptions would have a material impact on the obligation, service cost or finance costs. It was determined that changes would result in an immaterial increase or decrease.
The group expects to contribute approximately R14 million to the benefit plan in 2024. The weighted average duration of the defined benefit obligation is 15.5 years.
28 Leases
Accounting policy
The group assesses the presence of a lease in a contract as at the commencement date of the agreement. Having determined that a contract contains a lease asset (and respective contractual cash obligations), Harmony recognises a right-of-use asset and lease liability. The group discloses expensed amounts for contracts assessed as variable leases, low value asset leases and short-term leases. The disclosed value of these expensed leases is either determined on a straight-line basis over the duration of the lease or on a systematic basis that fairly indicates the consumption of the lease contract. All expensed lease contracts are recognised in production costs, corporate, administration and other expenditure in the income statement.
The group applies the following practical expedients when assessing lease contracts:
•The low value lease exemption – the group has elected to take the low value exemption with a value of R50 000 for the individual leased asset value and also applied its accounting policy on capitalisation of assets based on IAS 1 materiality assessment
•The short-term lease exemption – leases with a duration of less than a year will be expensed in the income statement on a straight-line basis
•Non-lease components – the group has applied the practical expedient not to separate non-lease components from lease components, and instead account for each lease component and any associated non-lease components as a single lease component for the classes of the underlying asset where it is appropriate to do so.
The lease liability is initially measured at the present value of the lease payments that are not paid at the commencement date, discounted by using the rate implicit in the lease. If this rate cannot be readily determined, the group uses its incremental borrowing rate. The group has applied the IFRS 16 portfolio approach in determining the discount rate for leases. As such, a single discount rate has been used for contracts that share similar characteristics. The group has determined that a portfolio of contracts that are denominated in the same currency may use a single discount rate. This rate has been determined using various factors including in-country borrowings as well as other sources of finance. The nature of the right-of-use assets was also considered.
Notes to the group financial statements continued
For the year ended 30 June 2023
28 Leases continued
Accounting policy continued
Lease payments included in the measurement of the lease liability comprise:
•Fixed lease payments (including in-substance fixed payments), less any lease incentives
•Variable lease payments that depend on an index or rate, initially measured using the index or rate at the commencement date
•The amount expected to be payable by the lessee under residual value guarantees
•The exercise price of purchase options, if the lessee is reasonably certain to exercise the options
•Payments of penalties for terminating the lease, if the lease term reflects the exercise of an option to terminate the lease.
The non-current and current portions of the lease liability is included in other non-current liabilities and trade and other payables in the balance sheet respectively.
The lease liability is subsequently measured by increasing the carrying amount to reflect interest on the lease liability (using the effective interest method) and by reducing the carrying amount to reflect the lease payments made. The group remeasures the lease liability (and makes a corresponding adjustment to the related right-of-use asset) whenever:
•The lease term has changed or there is a change in the assessment of exercise of a purchase option, in which case the lease liability is remeasured by discounting the revised lease payments using a revised discount rate
•The lease payments change due to changes in an index or rate or a change in expected payment under a guaranteed residual value, in which cases the lease liability is remeasured by discounting the revised lease payments using the initial discount rate (unless the lease payments change is due to a change in a floating interest rate, in which case a revised discount rate is used)
•A lease contract is modified and the lease modification is not accounted for as a separate lease, in which case the lease liability is remeasured by discounting the revised lease payments using a revised discount rate.
The right-of-use assets comprise the initial measurement of the corresponding lease liability, lease payments made at or before the commencement day, any initial direct costs and restoration costs as described below. They are subsequently measured at cost less accumulated depreciation and impairment losses.
The lease term shall be determined as the non-cancellable period of a lease, together with:
•Periods covered by an option to extend the lease if management is reasonably certain to make use of that option and/or
•Periods covered by an option to terminate the lease, if management is reasonably certain not to make use of that option.
Whenever the group incurs an obligation for costs to dismantle and remove a leased asset, restore the site on which it is located or restore the underlying asset to the condition required by the terms and conditions of the lease, a provision is recognised and measured under IAS 37 Provisions, Contingent Liabilities and Contingent Assets. The costs are included in the related right-of-use asset, unless those costs are incurred to produce inventories.
Right-of-use assets are depreciated over the shorter period of lease term and useful life of the underlying asset. If a lease transfers ownership of the underlying asset or the cost of the right-of-use asset reflects that the group expects to exercise a purchase option, the related right-of-use asset is depreciated over the useful life of the underlying asset. The depreciation starts at the commencement date of the lease.
The right-of-use assets are presented in mining assets and non-mining assets as part of the property, plant and equipment line in the balance sheet. The group applies its existing accounting policy on impairment of non-financial assets to determine whether a right-of-use asset is impaired and accounts for any identified impairment loss accordingly.
Critical accounting estimates and judgements
Key judgements applied in determining the right-of-use assets and lease liability are:
•Assessing whether an arrangement contains a lease: various factors are considered, including whether a service contract includes the implicit right to the majority of the economic benefit from assets used in providing the service
•Determining the lease term: management considers all facts and circumstances that create an economic incentive to exercise an extension option, or not exercise a termination option. Extension options (or periods after termination options) are only included in the lease term if the lease is reasonably certain to be extended (or not terminated). The assessment is reviewed if a significant event or a significant change in circumstances occurs which affects this assessment and that is within the control of the lessee. The company applies the considerations for short-term leases where leases are modified to extend the period by 12 months or less on expiry and these modifications are assessed on a standalone basis
•Determining the discount rate: in determining the incremental borrowing rates, management considers the term of the lease, the nature of the asset being leased, the currency in which the lease payments are denominated, in country borrowings as well as other sources of finance
•Determination of whether Harmony has control over the special purpose entities (SPVs) owning the solar generation facilities of the Phase 1 renewable energy program. Harmony was assessed to not have control over the SPVs based on the assessment that Harmony does not have substantive rights to direct the relevant activities of the SPVs. The payments made for electricity generated by the Phase 1 solar generation facilities is to be accounted for as variable lease payments once the facilities have been commissioned.
Notes to the group financial statements continued
For the year ended 30 June 2023
28 Leases continued
The movement in the right-of-use assets is as follows:
|
|
|
|
|
|
|
|
|
|
|
|
SA Rand |
|
Figures in million |
2023 |
2022 |
|
Balance at beginning of year |
480 |
|
262 |
|
|
Additions |
240 |
|
353 |
|
|
Modifications |
17 |
|
(2) |
|
|
Depreciation |
(259) |
|
(166) |
|
|
Terminations |
(45) |
|
— |
|
|
Translation |
120 |
|
33 |
|
|
Balance at end of year |
553 |
|
480 |
|
The non-current and current portions of the lease liability are included in other non-current liabilities and trade and other payables in the balance sheet respectively.
The movement in the lease liabilities is as follows:
|
|
|
|
|
|
|
|
|
|
|
|
SA Rand |
|
Figures in million |
2023 |
2022 |
|
Balance at beginning of year |
442 |
|
261 |
|
|
Additions |
228 |
|
315 |
|
|
Modifications |
17 |
|
(2) |
|
|
Interest expense on lease liabilities |
28 |
|
19 |
|
|
Lease payments made |
(229) |
|
(177) |
|
|
|
|
|
|
Translation |
40 |
|
26 |
|
|
Balance at end of year |
526 |
|
442 |
|
|
Current portion of lease liabilities |
216 |
|
197 |
|
|
Non-current portion of lease liabilities |
310 |
|
245 |
|
The maturity of the group's undiscounted lease payments is as follows:
|
|
|
|
|
|
|
|
|
|
|
|
SA Rand |
|
Figures in million |
2023 |
2022 |
|
Less than and including one year |
235 |
|
206 |
|
|
Between one and five years |
273 |
|
205 |
|
|
Five years and more |
128 |
|
133 |
|
|
Total |
636 |
|
544 |
|
The amounts included in the income statement relating to leases:
|
|
|
|
|
|
|
|
|
|
|
|
SA Rand |
|
Figures in million |
2023 |
2022 |
|
Depreciation of right-of-use assets1 |
259 |
|
166 |
|
|
Interest expense on lease liabilities2 |
28 |
|
19 |
|
|
Short-term leases expensed3 |
154 |
|
134 |
|
|
Leases of low value assets expensed3 |
28 |
|
21 |
|
|
Variable lease payments expensed3, 4 |
1 678 |
|
1 050 |
|
1Included in depreciation and amortisation.
2Included in finance costs.
3Included in production costs and corporate, administration and other expenditure.
4These payments relate mostly to mining and drilling contracts. Variable lease payments comprise 80% of the total lease payments made during the period. The majority of the variable lease payments made relate to the contracting of specialists for mining operations at Harmony's open-pit mines and are determined on a per tonne or square metre basis.
Notes to the group financial statements continued
For the year ended 30 June 2023
28 Leases continued
The total cash outflows for leases are:
|
|
|
|
|
|
|
|
|
|
|
|
SA Rand |
|
Figures in million |
2023 |
2022 |
|
Principal and interest payments made for lease liabilities |
229 |
|
177 |
|
|
Short-term lease payments |
154 |
|
134 |
|
|
Lease payments of low value assets leased |
28 |
|
21 |
|
|
Variable lease payments |
1 678 |
|
1 050 |
|
|
Total cash outflows for leases |
2 089 |
|
1 382 |
|
During 2022, Harmony reached financial close on power purchase agreements for the procurement of electricity from 30 MW photovoltaic generation facilities. These agreements constitute variable lease contracts that Harmony is committed to. The variable lease payments from these contracts are determined with reference to the quantity of megawatt hours (MWh) generated by the facilities. As at 30 June 2023, these facilities were fully constructed, however they were only producing incidental amounts of electricity, and as such were considered to be in the testing phase. The commercial operating date for the three plants was achieved during August 2023.
29 Contingent consideration
Accounting policy
Contingent consideration is initially recognised at fair value in accordance with IFRS 3. Changes in the fair value of the liability subsequent to initial recognition are included in other operating expenses.
Critical accounting estimates and judgements
The contingent consideration liability comprises of the contingent consideration included as part of the consideration transferred for the acquisition of the Mponeng operations and related assets and Eva Copper (refer to note 14).
The Mponeng contingent consideration liability was initially valued at R544 million on 1 October 2020 using the discounted cash flow valuation method, discounted at a post-tax real rate of 10.6%. Other assumptions are the forecast Rand/US dollar exchange rate and life-of-mine plans. Subsequent to initial recognition, the assumptions applied for the valuation of the liability were updated. As at 30 June 2023, the contingent consideration was valued using a post-tax real discount rate of 9.6% (2022: 10.2%) (2021: 10.3%). Refer to note 15 for exchange rate assumptions and other estimates used in the life-of-mine plans.
As at 1 October 2020, and at the end of the 2021 to 2023 financial years, the contingent consideration attributable to the below infrastructure ounces of gold was valued at Rnil, as no ounces from below infrastructure sections of the orebody have been included in the life-of-mine plan of Mponeng.
The Eva Copper contingent consideration was initially valued at R169 million on 16 December 2022 using a probability weighted method for the new resource payment and a discounted cash flow valuation for the excess payment, both discounted at a post-tax nominal rate of 12.9%. Refer to note 14 for further details on the assumptions applied on initial recognition. As at 30 June 2023, the liability has been subsequently remeasured to R185 million.
The fair value calculated for the contingent consideration liability is level 3 in the fair value hierarchy due to the use of unobservable inputs.
The movement in the contingent consideration liability is as follows:
|
|
|
|
|
|
|
|
|
|
|
|
SA Rand |
|
Figures in million |
2023 |
2022 |
|
Balance at beginning of year |
356 |
417 |
|
|
Acquisitions1 |
169 |
|
— |
|
|
Remeasurement of contingent consideration2 |
64 |
|
(61) |
|
|
Balance at end of year |
589 |
|
356 |
|
1 Initial recognition of the Eva Copper contingent consideration.
2 Relates to a change in the Mponeng operation’s production profile, which is based on Mponeng’s life-of-mine plan as well as in 2023 the passage of time resulted in a movement in the Eva Copper contingent consideration since initial recognition.
Notes to the group financial statements continued
For the year ended 30 June 2023
30 Other non-current liabilities
|
|
|
|
|
|
|
|
|
|
|
|
SA Rand |
|
Figures in million |
2023 |
2022 |
|
Sibanye Beatrix ground swap royalty1 |
22 |
|
18 |
|
|
Lease liability – non-current2 |
310 |
|
245 |
|
|
Provision for Harmony Education Benefit Fund |
5 |
|
5 |
|
|
Total non-current liabilities |
337 |
|
268 |
|
1 The increase in royalty provision is because of an increase in gold prices and a decrease in the discount rate for Joel.
2 Refer to note 28 for an analysis of the lease liability.
31 Streaming arrangements
Accounting policy
The streaming contract was assessed and has been accounted for as an own-use customer contract. At acquisition, the streaming contract was initially recognised at a fair value of R1.4 billion in accordance with IFRS 3. The fair value of the contract took into consideration the existing unfavourable gold price terms at acquisition, in relation to the comparative market gold price.
The obligation to deliver the contractually stipulated ounces over the remaining term of the agreement results in a significant financing component. The interest accrues on the contract liability over the remaining contractual term. As the performance obligation to deliver gold is met, the contract liability unwinds into revenue classified as "consideration from streaming contract" in note 5.
The current portion of the liability is determined with reference to the current production profile of the operation for the next 12 months.
Critical accounting estimates and judgements
The fair value of the unfavourable contract liability, which forms part of the streaming arrangement with Franco-Nevada, was measured as the difference between a market analyst consensus of gold prices and the fixed cash consideration to be received for gold delivered. A post-tax real rate of 11.6% was used to discount the liability over the expected period of delivery to settle the contract.
Changes in the production plan will affect the subsequent measurement prospectively. This is the only input that is considered for subsequent measurement. Harmony's cost of debt of 7.7% was used to impute the finance cost for the significant financing component recognised on the streaming contract liability.
Streaming arrangement with Franco-Nevada Barbados
Harmony's subsidiary, Chemwes, which owns the Mine Waste Solutions operation (MWS), has a contract with Franco-Nevada Barbados (Franco-Nevada). Franco-Nevada is entitled to receive 25% of all the gold produced through MWS. As part of the acquisition of MWS, Harmony assumed the obligations enforced by the Franco-Nevada contract.
The contract is a streaming agreement that commenced on 17 December 2008 for which Franco-Nevada paid US$125 million upfront for the right to purchase 25% of the gold production through MWS for a fixed amount of consideration until the balance of gold cap is delivered. As at 1 October 2020, the US$125 million upfront payment has been settled. The gold cap is a provision included in the contract, which stipulates the maximum quantity of gold to be sold to Franco-Nevada over the term of the agreement. The consideration is determined as the lower of the quoted spot gold price as per the London Metals Exchange or US$400 per ounce, adjusted with an annual escalation adjustment.
Contract liability and gold delivered
Reconciliation of the ounces owed to Franco-Nevada:
|
|
|
|
|
|
|
|
|
|
|
|
|
|
| Figures in ounces (oz) |
2023 |
2022 |
| Balance at beginning of year |
61 157 |
|
84 429 |
|
|
|
|
| Delivered |
(22 269) |
|
(23 272) |
|
| Balance at end of year |
38 888 |
|
61 157 |
|
Notes to the group financial statements continued
For the year ended 30 June 2023
31 Streaming arrangements continued
Contract liability and gold delivered continued
The contract price receivable in US$/oz for each ounce of gold delivered is as follows:
•1 October 2020 – 16 December 2020: US$433/oz
•17 December 2020 – 16 December 2021: US$437/oz
•17 December 2021 – 16 December 2022: US$442/oz
•17 December 2022 – 30 June 2023: US$446/oz.
Reconciliation of the streaming contract liability:
|
|
|
|
|
|
|
|
|
|
|
|
|
|
|
|
SA Rand |
|
Figures in million |
2023 |
2022 |
|
Balance at beginning of year |
687 |
|
1 091 |
|
|
|
|
|
|
Finance costs related to significant financing component |
41 |
|
67 |
|
|
Non-cash consideration for delivery of gold ounces (included in Revenue) |
(338) |
|
(471) |
|
|
Balance at end of year |
390 |
|
687 |
|
|
Current portion of streaming contract liability |
285 |
|
309 |
|
|
Non-current portion of streaming contract liability |
105 |
|
378 |
|
Accounting policy – financial liabilities (applicable to notes 32 and 33)
Financial liabilities are initially measured at fair value when the group becomes a party to its contractual arrangements. Transaction costs are included in the initial measurement of financial liabilities, except for financial liabilities classified at fair value through profit or loss. The subsequent measurement of financial liabilities is discussed below. A financial liability is derecognised when the obligation under the liability is discharged, cancelled or expires. The group classifies financial liabilities as follows:
•Borrowings are initially recognised at fair value net of transaction costs incurred and subsequently measured at amortised cost, comprising original debt and accrued interest less principal payments and amortisation, using the effective yield method. Any difference between proceeds (net of transaction cost) and the redemption value is recognised in the income statement over the period of the borrowing using the effective interest rate method. Extension options of borrowings facilities are treated as loan commitments.
Fees paid on the establishment of the loan facilities are capitalised as a pre-payment and amortised over the period of the facility to which it relates, to the extent it is probable that some or all of the facility will be drawn down. To the extent there is no evidence that it is probable that some or all of the facility will be drawn down, the fee is expensed.
Borrowings are classified as current liabilities unless the group has an unconditional right to defer settlement of the liability for at least 12 months after the balance sheet date.
•Trade and other payables are recognised initially at fair value and subsequently measured at amortised cost using the effective interest method. Payables are classified as current liabilities if payment is due within a year or less. If not, they are presented as non-current liabilities.
Notes to the group financial statements continued
For the year ended 30 June 2023
32 Borrowings
|
|
|
|
|
|
|
|
|
|
|
|
|
|
|
|
|
|
|
|
|
|
|
|
|
|
|
|
|
|
|
|
Summary of facilities' terms |
|
|
Commenced |
Tenor (years) |
Matures |
Secured |
Security |
Interest
payment basis |
Interest charge |
Repayment term |
Repaid |
|
Existing |
|
|
|
|
|
|
|
|
|
|
R2.5 billion revolving credit facility – sustainability linked |
May 2022 |
Four years |
May 20262 |
No |
Unsecured |
Variable |
JIBAR + 2.40% |
On maturity |
n/a |
|
US$400 million facility – sustainability linked |
May 2022 |
Four years |
May 20262 |
No |
Unsecured |
Variable |
|
On maturity |
n/a |
|
- US$100 million term facility |
|
|
|
|
|
|
SOFR + 2.85% |
|
|
|
- US$300 million revolving credit facility |
|
|
|
|
|
|
SOFR + 2.70% |
|
|
|
|
|
|
|
|
|
|
|
|
|
|
|
|
|
|
|
|
|
|
|
|
|
R1.5 billion facility (green term loan)1 |
May 2022 |
Six years, six months |
November 2028 |
No |
Unsecured |
Variable |
JIBAR + 2.65% |
Bi-annual3 |
n/a |
|
|
|
|
|
|
|
|
|
|
|
|
Matured |
|
|
|
|
|
|
|
|
|
|
R2 billion facility |
November 2018 |
Four years |
November 2022 |
Yes |
Cession and pledge of operating subsidiaries' shares and claims |
Variable |
|
|
May 2022 |
|
R600 million term loan |
|
|
|
|
|
|
JIBAR + 2.90% |
Eight equal quarterly instalments starting from February 2021 with the final instalment on maturity |
|
|
R1.4 billion revolving credit facility |
|
|
|
|
|
|
JIBAR + 2.80% |
On maturity |
|
|
|
|
|
|
|
|
|
|
|
|
|
|
|
|
|
|
|
|
|
|
|
|
US$400 million facility |
September 2019 |
Three years |
September 2023 |
Yes |
Cession and pledge of operating subsidiaries' shares and claims |
Variable |
|
On maturity |
May 2022 |
|
- US$200 million revolving credit facility |
|
Extendable by one year |
|
|
|
|
LIBOR + 2.90% |
|
|
|
- US$200 million term loan |
|
|
|
|
|
|
LIBOR + 3.10% |
|
|
|
|
|
|
|
|
|
|
|
|
|
|
US$24 million Westpac loan |
July
2018 |
Four years |
July
2022 |
Yes |
Cession and pledge of vehicles and machinery |
Variable |
LIBOR + 3.20% |
Quarterly instalments |
July 2022 |
|
|
|
|
|
|
|
|
|
|
|
1 This facility can only be drawn down for qualifying projects after November 2022.
2 During April 2023 a 12-month extension was granted from May 2025. A further 12-month extension is available and not taken into account.
3 Ten equal bi-annual instalments starting from May 2024 with the final instalment on maturity.
Notes to the group financial statements continued
For the year ended 30 June 2023
32 Borrowings continued
Summary of facilities' terms continued
The Green loan can only be used for eligible renewable energy projects as defined in the agreement.
The Rand Revolving Credit Facility (RCF), US$ RCF and US$ term loan are linked to certain sustainability-linked key performance indicators (ESG KPIs), which will be measured annually for the current financial year as well as the next two and will result in changes to interest rate margins. The rate will be adjusted annually by one basis point for each metric achieved (decrease) or not (increase), with these adjustments being cumulative over the three-year measuring period. The adjustments to interest rate margins for each financial year's ESG performance would impact the following financial year. The respective ESG KPIs are as follows:
|
|
|
|
|
|
|
|
|
|
|
|
|
|
|
|
|
|
| KPI |
Unit of measurement |
Scope |
Sustainability performance targets |
|
|
|
FY23
Targets |
FY24
Targets |
FY25
Targets |
| Greenhouse gas emissions |
000 tonnes of Scope 1 and Scope 2 CO2e emissions |
All operations |
4 485 |
4 279 |
4 074 |
| Renewable energy |
Renewable energy consumption as % of total electricity consumed |
SA operations |
2 |
% |
8 |
% |
20 |
% |
| Water consumption |
Potable water consumed (Mℓ) |
SA operations |
20 453 |
19 833 |
19 436 |
Based on the 2023 performance, the interest rates of the related loans will be adjusted accordingly for the 2024 financial year.
Debt covenants
The debt covenant tests for both the Rand and US dollar facilities are as follows:
•The group's interest cover ratio shall be more than five times (EBITDA1/ Total interest paid)
•Leverage2 shall not be more than 2.5 times.
1Earnings before interest, taxes, depreciation and amortisation (EBITDA), as defined in the agreement, excludes unusual items such as impairment and restructuring cost.
2Leverage is defined as total net debt to EBITDA.
Debt covenants tests were performed for the loan facilities for the 2023 and 2022 financial years and no breaches were noted. For the 2023 financial year, the group's interest cover ratio was 26 times (2022: 43.4 times), while the group's leverage was 0.2 (2022: 0.1). Management believes that it is very likely that the covenant requirements will be met in the foreseeable future given the current earnings and interest levels.
Notes to the group financial statements continued
For the year ended 30 June 2023
32 Borrowings continued
Interest-bearing borrowings
|
|
|
|
|
|
|
|
|
|
|
|
SA Rand |
|
Figures in million |
2023 |
2022 |
|
Non-current borrowings |
|
|
|
|
|
|
|
|
|
|
|
R2 billion facility |
— |
|
— |
|
|
Balance at beginning of year |
— |
|
153 |
|
|
|
|
|
|
Repayments |
— |
|
(450) |
|
|
Transferred (to)/from current liabilities |
— |
|
300 |
|
|
Amortisation of issue cost |
— |
|
(3) |
|
|
|
|
|
|
Westpac fleet loan |
— |
|
— |
|
|
Balance at beginning of year |
— |
|
22 |
|
|
Repayments |
— |
|
(94) |
|
|
Transferred from current liabilities |
— |
|
62 |
|
|
Translation |
— |
|
10 |
|
|
|
|
|
|
R2.5 billion facility – sustainability linked |
— |
|
— |
|
|
Balance at beginning of year |
— |
|
— |
|
|
Draw down |
700 |
|
— |
|
|
Repayments |
(700) |
|
— |
|
|
Amortisation of issue costs |
7 |
|
— |
|
|
Issue costs |
— |
|
(26) |
|
|
Reclassification to/(from) prepayments (Trade receivables) |
(7) |
|
26 |
|
|
|
|
|
|
|
|
|
|
R1.5 billion term facility (Green loan) |
— |
|
— |
|
|
Balance at beginning of year |
— |
|
— |
|
|
|
|
|
|
|
|
|
|
Issue costs |
— |
|
(15) |
|
|
|
|
|
|
Reclassification to prepayments (Trade receivables) |
— |
|
15 |
|
|
|
|
|
|
|
|
|
|
US$400 million facility – sustainability linked |
5 592 |
|
3 180 |
|
|
Balance at beginning of year |
3 180 |
|
— |
|
|
Draw down |
2 919 |
|
3 057 |
|
|
Issue cost |
— |
|
(76) |
|
|
Repayments |
(1 345) |
|
— |
|
|
Amortisation of issue costs |
19 |
|
1 |
|
|
Translation |
819 |
|
198 |
|
|
|
|
|
|
|
|
|
|
|
|
|
|
|
|
|
|
|
|
|
|
|
|
|
|
US$400 million facility |
— |
|
— |
|
|
Balance at beginning of year |
— |
|
2 799 |
|
|
|
|
|
|
|
|
|
|
Repayments |
— |
|
(3 057) |
|
|
Amortisation of issue costs |
— |
|
55 |
|
|
Translation |
— |
|
203 |
|
|
|
|
|
|
Total non-current borrowings |
5 592 |
|
3 180 |
|
Notes to the group financial statements continued
For the year ended 30 June 2023
32 Borrowings continued
Interest-bearing borrowings continued
|
|
|
|
|
|
|
|
|
|
|
|
SA Rand |
|
Figures in million |
2023 |
2022 |
|
Current borrowings |
|
|
|
US$400 million facility – sustainability linked |
103 |
|
— |
|
|
|
|
|
|
Interest accrued |
103 |
|
— |
|
|
R2 billion facility |
— |
|
— |
|
|
Balance at beginning of year |
— |
|
300 |
|
|
Transferred (to)/from non-current liabilities |
— |
|
(300) |
|
|
Westpac fleet loan |
— |
|
25 |
|
|
Balance at beginning of year |
25 |
|
87 |
|
|
Repayments |
(26) |
|
— |
|
|
Translation |
1 |
|
— |
|
|
Transferred to non-current liabilities |
— |
|
(62) |
|
|
|
|
|
|
Total current borrowings |
103 |
|
25 |
|
|
Total interest-bearing borrowings |
5 695 |
|
3 205 |
|
|
|
|
|
|
|
|
|
|
|
|
|
SA Rand |
|
Figures in million |
2023 |
2022 |
|
The maturity of borrowings is as follows: |
|
|
|
Current |
103 |
|
25 |
|
|
Between one to two years |
— |
|
— |
|
|
Between two to three years |
5 592 |
|
3 180 |
|
|
|
5 695 |
|
3 205 |
|
|
|
|
|
|
|
|
|
|
|
|
|
SA Rand |
|
Figures in million |
2023 |
2022 |
|
Undrawn committed borrowing facilities |
|
|
|
Expiring within one year |
— |
|
— |
|
|
Expiring after one year |
5 883 |
|
7 254 |
|
|
|
5 883 |
|
7 254 |
|
|
|
|
|
|
|
|
|
|
|
|
|
2023 |
2022 |
|
Effective interest rates (%) |
|
|
|
R2 billion facility |
— |
|
6.7 |
|
|
Westpac fleet loan |
3.4 |
|
3.4 |
|
|
US$400 million facility |
— |
|
3.4 |
|
|
R2.5 billion RCF – sustainability linked |
9.2 |
|
— |
|
|
US$400 million – sustainability linked |
6.8 |
|
4.3 |
|
Notes to the group financial statements continued
For the year ended 30 June 2023
33 Trade and other payables
Accounting policy
The group accrues for the cost of the leave days granted to employees during the period in which the leave days accumulate.
|
|
|
|
|
|
|
|
|
|
|
|
SA Rand |
|
Figures in million |
2023 |
2022 |
|
Financial liabilities |
|
|
|
Trade payables |
1 205 |
|
1 266 |
|
|
Lease liability – current1 |
216 |
|
197 |
|
|
Other liabilities2 |
601 |
|
328 |
|
|
Non-financial liabilities |
|
|
|
Payroll accruals |
888 |
|
832 |
|
|
Leave liabilities (a) |
794 |
|
770 |
|
|
Shaft-related liabilities3 |
1 016 |
|
841 |
|
|
Other accruals |
173 |
|
92 |
|
|
Value added tax |
176 |
|
156 |
|
|
Income and mining tax4 |
169 |
|
12 |
|
|
Total trade and other payables |
5 238 |
|
4 494 |
|
1Refer to note 28 for an analysis of the lease liability.
2Increase year on year is predominantly due to receipts on behalf of third parties in terms of toll treatment agreements increasing by R195 million.
3The increase in certain cost categories contributed to the change year on year – refer to note 4 and 6 respectively.
4Refer to note 12 for further detail on the movement.
(a) Employee entitlements to annual leave are recognised on an ongoing basis. An accrual is made for the estimated liability for annual leave as a result of services rendered by employees up to the balance sheet date. The movement in the liability recognised in the balance sheet is as follows:
|
|
|
|
|
|
|
|
|
|
|
|
SA Rand |
|
Figures in million |
2023 |
2022 |
|
Balance at beginning of year |
770 |
|
731 |
|
|
Benefits paid |
(803) |
|
(762) |
|
|
Total expense per income statement |
807 |
|
787 |
|
|
Translation loss |
20 |
|
14 |
|
|
Balance at end of year |
794 |
|
770 |
|
Notes to the group financial statements continued
For the year ended 30 June 2023
34 Cash generated by operations
|
|
|
|
|
|
|
|
|
|
|
|
|
|
|
SA Rand |
|
Figures in million |
2023 |
2022 |
2021 |
|
Reconciliation of profit/(loss) before taxation to cash generated by operations |
|
|
|
|
Profit/(loss) before taxation |
6 606 |
|
(1 058) |
|
6 382 |
|
|
Adjustments for: |
|
|
|
|
Amortisation and depreciation |
3 454 |
|
3 683 |
|
3 877 |
|
|
Impairment of assets |
— |
|
4 433 |
|
1 124 |
|
|
Share-based payments |
112 |
|
145 |
|
160 |
|
|
Net decrease in provision for post-retirement benefits |
(15) |
|
(14) |
|
(13) |
|
|
Net increase/(decrease) in provision for environmental rehabilitation |
(88) |
|
71 |
|
135 |
|
|
Profit on sale of property, plant and equipment |
(46) |
|
(24) |
|
(11) |
|
|
Loss on scrapping of property, plant and equipment |
182 |
|
7 |
|
161 |
|
|
Profit from associates |
(57) |
|
(63) |
|
(83) |
|
|
Investment income |
(663) |
|
(352) |
|
(244) |
|
|
ARM BBEE day one expense |
— |
|
— |
|
(87) |
|
|
Finance costs |
994 |
|
718 |
|
661 |
|
|
Inventory-related adjustments |
31 |
|
32 |
|
61 |
|
|
Foreign exchange translation differences |
795 |
|
338 |
|
(810) |
|
|
Non-cash portion of (gains)/losses on derivatives |
253 |
|
252 |
|
(1 204) |
|
|
Day one loss amortisation |
(45) |
|
(49) |
|
(47) |
|
|
Streaming contract revenue |
(338) |
|
(471) |
|
(397) |
|
|
Silicosis settlement provision – net |
(338) |
|
(86) |
|
(90) |
|
|
Gain on bargain purchase |
— |
|
— |
|
(303) |
|
|
Contingent consideration remeasurement |
64 |
|
(61) |
|
(127) |
|
|
Other non-cash adjustments |
5 |
|
36 |
|
5 |
|
|
Effect of changes in operating working capital items |
|
|
|
|
(Increase)/decrease in Receivables |
(627) |
|
21 |
|
(339) |
|
|
Increase in Inventories |
(308) |
|
(232) |
|
(37) |
|
|
Increase in Payables |
618 |
|
52 |
|
967 |
|
|
Cash generated by operations |
10 589 |
|
7 378 |
|
9 741 |
|
Additional cash flow information
The income and mining taxes paid in the statement of cash flow represents actual cash paid less refunds received. Investment income from restricted investments is considered non-cash for the purposes of the cash flow statement. Included in investment income is interest earned from restricted investments of R258 million (2022:R185 million ) (2021:R174 million).
At 30 June 2023, R5 883 million (2022: R7 254 million) (2021: R4 254 million) of borrowing facilities had not been drawn and are therefore available for future operational activities and future capital commitments. Refer to note 32.
(a)Acquisitions of investments/business
The conditions precedent for the acquisition of the entity which owns 100% of the Eva Copper Project and a package of regional exploration tenements from Eva Copper were fulfilled on 16 December 2023. Refer to note 14 for details on the consideration paid.
(b) Principal non-cash transactions
Share-based payments (refer to note 36).
(c)Property, plant and equipment additions
The additions as per note 15 include right-of-use assets which are treated as non-cash adjustments for the determination of additions to property, plant and equipment in the statement of cash flows.
(d)Cash and cash equivalents
Cash and cash equivalents comprises cash on hand and demand deposits.
Notes to the group financial statements continued
For the year ended 30 June 2023
35 Employee benefits
Accounting policy
•Pension, provident and medical benefit plans are funded through monthly contributions. The group pays fixed contributions into a separate entity in terms of the defined contribution pension, provident and medical plans which are charged to the income statement in the year to which they relate. The group's liability is limited to its monthly determined contributions and it has no further liability, legal or constructive, if the fund does not hold sufficient assets to pay all employees the benefits relating to employee service in the current and prior periods. Refer to note 27 for details of the post-retirement medical benefit plan.
•Termination benefits are payable when employment is terminated before the normal retirement date, or whenever an employee accepts voluntary redundancy in exchange for these benefits. The group recognises termination benefits at the earlier of the following dates: (a) when the group can no longer withdraw the offer of those benefits; and (b) when the entity recognises costs for a restructuring that is within the scope of IAS 37 Provisions, Contingent Liabilities and Contingent Assets, and involves the payment of termination benefits. In the case of an offer made to encourage voluntary redundancy, the termination benefits are measured based on the number of employees expected to accept the offer. Benefits falling due more than 12 months after balance sheet date are discounted to present value.
|
|
|
|
|
|
|
|
|
|
|
|
2023 |
2022 |
|
Number of permanent employees as at 30 June: |
|
|
|
South African operations |
33 341 |
|
35 989 |
|
|
International operations1 |
1 572 |
|
1 592 |
|
|
Total number of permanent employees |
34 913 |
|
37 581 |
|
|
|
|
|
|
|
|
|
|
|
|
|
SA Rand |
|
Figures in million |
2023 |
2022 |
|
Aggregate earnings |
|
|
|
The aggregate earnings of employees including executive directors were: |
|
|
|
Salaries and wages and other benefits (excluding share-based payments) |
15 988 |
|
15 485 |
|
|
Retirement benefit costs |
1 146 |
|
1 125 |
|
|
Medical aid contributions |
382 |
|
363 |
|
|
Total aggregated earnings2 |
17 516 |
|
16 973 |
|
1The Wafi-Golpu joint operation and Eva Copper Project employees included in the total is 31 (2022: 30) and 32 (2022: nil) respectively.
2These amounts have been included in cost of sales, corporate expenditure and capital expenditure.
During the 2023 financial year, termination costs included in payroll costs increased to R609 million (2022: R227 million). Termination costs include the cost relating to the voluntary retrenchment and restructuring process as well as retrenchments due to shaft closures (refer to note 6 for further details).
36 Share-based payments
Accounting policy
The group operates the following employee share incentive plans where the group granted share options to certain employees in exchange for services received:
•The equity-settled Sisonke Employee Share Ownership Plan (Sisonke ESOP) initially awarded in 2019
•The equity-settled Management Deferred Share Plan (DSP) initially awarded in 2020.
Equity-settled share-based payments are measured at fair value that includes market performance conditions but excludes the impact of any service and non-market performance conditions of the equity instruments at the date of the grant. The share-based payments are expensed over the vesting period, based on the group's estimate of the shares that are expected to eventually vest. The group used an appropriate option pricing model in determining the fair value of the options granted. Non-market vesting conditions are included in assumptions about the number of options that are expected to vest. At each balance sheet date, the estimates of the number of options that are expected to become exercisable are revised.
The impact of the revision of original estimates, if any, is recognised in the income statement, with a corresponding adjustment to equity. The proceeds received (if any) net of any directly attributable transaction costs are credited to share capital and premium when the options are exercised.
Notes to the group financial statements continued
For the year ended 30 June 2023
36 Share-based payments continued
Critical accounting estimates and judgements
The fair value of options granted under the DSP:
|
|
|
|
|
|
|
Fair value |
| 18 September 2019 - First issue |
R45.89- R56.87 |
| 18 September 2020 - Second issue |
R74.90 |
| 20 September 2021 - Third issue |
R45.58- R57.93 |
| 19 September 2022 - Fourth Issue |
R42.48 - R47.25 |
The fair value of the first and second issue of options granted under the DSP was based on the Harmony spot share price at each grant date, as there were no market conditions attached to the grant. The fair value of the third and forth issue of options granted under the DSP was determined using a Black-Scholes valuation model. The significant inputs into the model are:
|
|
|
|
|
|
|
DSP |
| 19 September 2022 - Fourth issue |
|
Risk-free interest rate1 |
7.91% - 8.67% |
Expected volatility2 |
59.34% - 65.33% |
Expected dividend yield3 |
2.28% - 2.38% |
| Spot price on grant date |
R47.86 - R50.60 |
Vesting period (from grant date)4 |
3/5 years |
1 The risk-free rate was derived from a zero-coupon curve stripped from forward rate agreements and swap inputs.
2 The volatility was estimated on the historical returns of the Harmony share price over a period matching the time to maturity of the shares.
3 The dividend yield was based on Harmony’s dividend forecasts and estimates of future share prices.
4 Please refer to Vesting under Options granted under the Management Deferred Share Plan below.
Employee share-based payments
The objective of these schemes is to recognise the contributions of employees to the group's financial position and performance and to retain key employees.
Executive management is encouraged to retain shares when they vest and a minimum shareholding requirement has been introduced to achieve this. This shareholding is meant to align shareholder and executive objectives to grow total shareholder return.
The total cost relating to employee share-based payments is made up as follows:
|
|
|
|
|
|
|
|
|
|
|
|
SA Rand |
|
Figures in million |
2023 |
2022 |
|
|
|
|
|
Sisonke ESOP |
— |
|
91 |
|
|
Management DSP |
114 |
|
109 |
|
|
Total employee share-based payments |
114 |
|
200 |
|
The directors are authorised to issue up to 60 011 669 ordinary shares to participants who have received awards in accordance with Harmony's employee share incentive schemes. Subsequent to the annual general meeting held on 1 December 2010, 53 482 588 shares have been issued in terms of the various share schemes. At 30 June 2022, no share option awards were outstanding for the Sisonke ESOP Plan.
In December 2018, the board approved the new Total Incentive Plan for management which includes deferred shares. The first allocations under the new plan occurred in October 2019, the subsequent allocations occurring in October of each year since then. Our shareholders have authorised up to 25 000 000 shares of the issued share capital to be used for this plan.
Options granted under the Sisonke ESOP
In December 2017, Harmony approved the establishment of the Sisonke ESOP with the aim to facilitate beneficial interest and ownership by non-managerial employees in South Africa (the beneficiaries) of Harmony shares in order to:
•Facilitate economic empowerment of Harmony’s employees
•Incentivise Harmony’s employees, so as to promote the shared interests of employees and shareholders in the value growth of Harmony
•Further align the interests of the Harmony shareholders and those of the employees of Harmony.
The shares were issued to the Harmony ESOP Trust (the Trust) on 15 January 2019, which is also the date on which the required service period of three years commenced. Each beneficiary under the scheme was awarded 225 Participation Units (PU). The Sisonke ESOP is equity-settled. The participation units (PU) vested on 15 January 2022. All participants still employed at this time received Harmony shares.
Notes to the group financial statements continued
For the year ended 30 June 2023
36 Share-based payments continued
Employee share-based payments continued
Options granted under the Sisonke ESOP continued
Activity on share options
|
|
|
|
|
|
|
|
|
|
|
|
Number of PU |
|
Activity on PU granted but not exercised |
2023 |
2022 |
|
Balance at beginning of year |
— |
|
6 311 667 |
|
|
Options granted |
— |
|
40 064 |
|
|
Options exercised |
— |
|
(6 254 608) |
|
|
Options forfeited and lapsed |
— |
|
(97 123) |
|
|
Balance at end of year |
— |
|
— |
|
|
|
|
|
|
|
|
|
|
|
|
|
2023 |
2022 |
|
Gain realised by participants on options exercised during the year (R million) |
— |
|
397 |
|
|
Weighted average share price at the date of exercise (SA Rand) |
— |
|
58.2 |
|
|
|
|
|
|
|
|
Options granted under the Management Deferred Share Plan
Harmony implemented the Total Incentive Plan, comprising a long-term Deferred Share Plan (DSP) and a short-term annual cash payment with effect from 1 July 2019. The total incentive for each management-level employee is determined every year through a balanced scorecard calculation.
The balanced scorecard result includes a number of key short- and long-term company performance measures (to be measured over trailing three- and one-year periods). The measures are reviewed and defined annually with appropriate weightings. A portion of the total incentive is paid immediately in cash and the balance is settled by means of deferred shares.
|
|
|
|
|
|
|
|
|
|
|
|
|
|
Award |
Vesting |
|
Performance criteria |
|
DS* |
The awards will vest at a rate of 20% per annum over the following five years for executive directors and prescribed officers, and one-third per annum over the following three years for qualifying management. |
|
The participant is still employed within the group. |
* Deferred shares.
During December 2021 shareholders approved the introduction of “no fault” termination effective 7 December 2021.
Termination of employees' participation in the share scheme is based on "no fault" and "fault" definitions:
|
|
|
|
|
|
|
|
•Fault |
All unvested and unexercised DS not yet vested are lapsed and cancelled |
|
•No fault |
All unvested and unexercised DS will continue in force to vest on the original vesting dates in accordance with the rules of the plan. |
The update of “no fault” termination will ensure that executives who leave the company in good standing, for example due to retirement, will continue to be exposed to the company share price for the remainder of the vesting periods of unvested awards.
It will encourage and reward their focus on sustainability and succession during their tenure.
Notes to the group financial statements continued
For the year ended 30 June 2023
36 Share-based payments continued
Employee share-based payments continued
Options granted under the Management Deferred Share Plan continued
|
|
|
|
|
|
|
|
|
|
|
|
2023 |
2022 |
|
18 September 2019 – 3 years |
|
|
|
Gain realised by participants on options exercised during the year (R million) |
12 |
|
13 |
|
|
Weighted average share price at the date of exercise (SA Rand) |
41.00 |
|
47.24 |
|
|
Remaining life (years) |
— |
0.2 |
|
18 September 2019 – 5 years |
|
|
|
Gain realised by participants on options exercised during the year (R million) |
2 |
|
2 |
|
|
Weighted average share price at the date of exercise (SA Rand) |
47.41 |
|
51.74 |
|
|
Remaining life (years) |
1.2 |
2.2 |
|
18 September 2020 – 3 years |
|
|
|
Gain realised by participants on options exercised during the year (R million) |
11 |
|
13 |
|
|
Weighted average share price at the date of exercise (SA Rand) |
41.50 |
|
47.24 |
|
|
Remaining life (years) |
0.2 |
1.2 |
|
18 September 2020 – 5 years |
|
|
|
Gain realised by participants on options exercised during the year (R million) |
2 |
2 |
|
|
Weighted average share price at the date of exercise (SA Rand) |
47.41 |
49.6 |
|
Remaining life (years) |
2.2 |
3.2 |
|
18 September 2021 – 3 years |
|
|
|
Gain realised by participants on options exercised during the year (R million) |
31 |
— |
|
|
Weighted average share price at the date of exercise (SA Rand) |
40.21 |
— |
|
Remaining life (years) |
1.2 |
— |
|
18 September 2021 – 5 years |
|
|
|
Gain realised by participants on options exercised during the year (R million) |
4 |
— |
|
|
Weighted average share price at the date of exercise (SA Rand) |
47.41 |
— |
|
Remaining life (years) |
3.2 |
— |
Activity on share options
|
|
|
|
|
|
|
|
|
|
|
|
Number of DS |
|
Activity on DS granted but not exercised |
2023 |
2022 |
|
Balance at beginning of year |
4 449 291 |
|
2 102 523 |
|
|
Options granted |
2 318 254 |
|
3 298 489 |
|
|
Options exercised |
(1 480 166) |
|
(641 562) |
|
|
Options forfeited and lapsed |
(201 859) |
|
(310 159) |
|
|
Balance at end of year |
5 085 520 |
|
4 449 291 |
|
|
|
|
|
|
|
|
|
|
|
|
List of options granted but not yet exercised (listed by grant date) |
Number of options |
Remaining life (years) |
|
As at 30 June 2023 |
|
|
|
Deferred shares |
|
|
|
|
|
|
|
18 September 2019 – 5 years |
128 334 |
|
1.2 |
|
|
18 September 2020 – 3 years |
269 919 |
|
0.2 |
|
|
18 September 2020 – 5 years |
229 091 |
|
2.2 |
|
|
20 September 2021 – 3 years |
1 478 246 |
|
1.2 |
|
|
20 September 2021 – 5 years |
705 413 |
|
3.2 |
|
|
19 September 2022 – 3 years |
1 620 124 |
|
2.2 |
|
|
19 September 2022 – 5 years |
654 393 |
|
4.2 |
|
|
Total options granted but not yet exercised |
5 085 520 |
|
|
Notes to the group financial statements continued
For the year ended 30 June 2023
37 Related parties
None of the directors or major shareholders of Harmony or, to the knowledge of Harmony, their close families, had an interest, directly or indirectly, in any transaction from 1 July 2020 or in any proposed transaction that has affected or will materially affect Harmony or its subsidiaries, other than as stated below.
Directors and other key management
Key management personnel are those persons having authority and responsibility for planning, directing and controlling the activities of the group, directly or indirectly, including any director (whether executive or otherwise) of the group.
The directors' remuneration is as follows:
|
|
|
|
|
|
|
|
|
|
|
|
SA Rand |
|
Figures in million |
Executive directors |
Non-executive directors |
|
2023 |
|
|
|
Salaries |
23 |
|
— |
|
|
Retirement contributions |
3 |
|
— |
|
|
Bonuses |
8 |
|
— |
|
|
Exercise/settlement of share options |
6 |
|
— |
|
|
Directors' fees |
— |
|
14 |
|
|
Total |
40 |
|
14 |
|
|
2022 |
|
|
|
Salaries |
21 |
|
— |
|
|
Retirement contributions |
3 |
|
— |
|
|
Bonuses |
14 |
|
— |
|
|
Exercise/settlement of share options |
2 |
|
— |
|
|
Directors' fees |
— |
|
13 |
|
|
Total |
40 |
|
13 |
|
On 29 November 2022, Harmony announced the retirement by rotation of Mr Andre Wilkens, non-executive director, and
Mr Joaquim Chissano, independent non-executive director, with effect from 29 November 2022.
The following directors and prescribed officers owned shares in Harmony at year-end. The balance of shares held is attributable to shares held privately and in terms of the minimum shareholding requirement as set out in our remuneration policy:
|
|
|
|
|
|
|
|
|
|
|
|
Number of shares |
|
Name of director/prescribed officer |
2023 |
2022 |
|
Directors |
|
|
|
Peter Steenkamp |
598 513 |
|
772 589 |
|
|
Boipelo Lekubo |
24 753 |
|
15 988 |
|
|
Harry Mashego |
28 975 |
|
14 875 |
|
|
Prescribed officers |
|
|
|
Beyers Nel |
54 195 |
|
110 207 |
|
|
Marian van der Walt |
66 870 |
|
100 000 |
|
|
Melanie Naidoo-Vermaak |
7 966 |
|
7 966 |
|
|
Johannes van Heerden |
42 310 |
|
30 734 |
|
Modise Motloba, Harmony’s former deputy chairman resigned effective 27 June 2022. He is a director of Tysys (Proprietary) Limited (Tysys) which entered into a contract with the group during the 2017 financial year to provide services relating to the group’s small and medium enterprise development projects. Approximately R5 million was paid during the 2022 financial year relating to services rendered in that year.
There were no other changes to the directors' interest between the reporting date and the date of the approval of the financial statements other than indicated above.
Notes to the group financial statements continued
For the year ended 30 June 2023
37 Related parties continued
Other related parties
The services rendered to joint operations relate to professional and technical services. All the production of the group’s South African operations is sent to Rand Refinery in which Harmony holds a 10.38% interest. Refer to note 21.
|
|
|
|
|
|
|
|
|
|
|
|
SA Rand |
|
Figures in million |
2023 |
2022 |
|
Sales and services rendered to related parties |
|
|
|
Joint operations |
4 |
|
4 |
|
|
Total |
4 |
|
4 |
|
|
|
|
|
|
|
|
|
|
|
|
|
SA Rand |
|
Figures in million |
2023 |
2022 |
|
Purchases and services acquired from related parties |
|
|
|
Directors |
— |
|
5 |
|
|
Associates |
69 |
|
51 |
|
|
Total |
69 |
|
56 |
|
38 Commitments and contingencies
Commitments and guarantees
|
|
|
|
|
|
|
|
|
|
|
|
SA Rand |
|
Figures in million |
2023 |
2022 |
|
Capital expenditure commitments |
|
|
|
Contracts for capital expenditure |
1 893 |
|
1 839 |
|
|
Share of joint operation's contracts for capital expenditure |
160 |
|
105 |
|
|
Authorised by the directors but not contracted for1 |
8 525 |
|
6 300 |
|
|
Total capital commitments |
10 578 |
|
8 244 |
|
1 The increase mainly relates to solar projects of approximately R1 700 million as well as additional capital for the ramping up of the Zaaiplaats and Kareerand projects, and an increase in the translation of the Hidden Valley mine commitments due to the weakening of the Rand to the US$.
The solar projects will be financed through the green loan (refer to note 32), with the rest of the expenditure being financed from existing resources and where appropriate, borrowings.
Contractual obligations in respect of mineral tenement leases amount to R23 million (2022: R16 million). This relates to the Wafi-Golpu joint operation.
|
|
|
|
|
|
|
|
|
|
|
|
SA Rand |
|
Figures in million |
2023 |
2022 |
|
Guarantees |
|
|
|
Guarantees and suretyships1 |
500 |
|
500 |
|
|
Environmental guarantees2 |
500 |
|
479 |
|
|
Total guarantees |
1 000 |
|
979 |
|
1 The guarantees and suretyships mainly relate to Eskom guarantees.
2 At 30 June 2023 R181 million (2022: R150 million) has been pledged as collateral for environmental guarantees in favour of certain financial institutions. Refer to note 17.
Contingent liabilities
Critical accounting estimates and judgements
Contingencies will only realise when one or more future events occur or fail to occur. The exercise of significant judgement and estimates of the outcome of future events are required during the assessment of the impact of such contingencies.
Litigation and other judicial proceedings as a rule raise difficult and complex legal issues and are subject to uncertainties and complexities including, but not limited to, the facts and circumstances of each particular case, issues regarding the jurisdiction in which the suit is brought and differences in applicable law. Upon resolution of any pending legal matter, the group may be forced to incur charges in excess of the presently established provisions and related insurance coverage. It is possible that the financial position, results of operations or cash flows of the group could be materially affected by the outcome of the litigation.
Notes to the group financial statements continued
For the year ended 30 June 2023
38 Commitments and contingencies continued
Contingent liabilities continued
The following contingent liabilities have been identified:
(a) On 1 December 2008, Harmony issued 3 364 675 Harmony shares to Rio Tinto Limited (Rio Tinto) for the purchase of Rio Tinto’s rights to the royalty agreement entered into prior to our acquisition of the Wafi deposits in PNG. The shares were valued at R242 million on the transaction date. An additional US$10 million in cash will be payable when the decision to mine is made. Of this amount, Harmony is responsible for paying the first US$7 million, with the balance of US$3 million being borne equally by the joint operators.
(b) The group may have a potential exposure to rehabilitate groundwater and radiation that may exist where the group has and/or continues to operate. The group has initiated analytical assessments to identify, quantify and mitigate impacts if and when (or as and where) they arise. Numerous scientific, technical and legal studies are underway to assist in determining the magnitude of the contamination and to find sustainable remediation solutions. The group has instituted processes to reduce future potential seepage and it has been demonstrated that Monitored Natural Attenuation (MNA) by the existing environment will contribute to improvement in some instances. Water treatment facilities were successfully implemented at Doornkop, Tshepong West, Kusasalethu and Harmony One Plant. These facilities are now assisting in reducing our dependency on state-supplied potable water and will be key in managing any post closure decant should it arise.
In terms of Free State operations, Harmony has taken the initiative to develop a comprehensive regional closure plan in addition to updating the regional water balance, which will ensure that there is sufficient water for our organic growth initiatives. The geohydrological studies confirm that there is no risk of decant in Welkom.
Should the studies result in different solutions than the ones initially proposed, or the regulators do not approve the proposed plans, which then results in the group being required to record and account for the contingencies as liabilities, it could then have a material impact on the financial statements of the group.
(c) Due to the interconnected nature of mining operations in South Africa, any proposed solution for potential flooding and potential decant risk posed by deep groundwater needs to be a combined one, supported by all the mines located in these goldfields. As a result, the Department of Mineral Resources and Energy and affected mining companies require the development of a regional mine closure strategy.
Harmony operations have conducted a number of specialist studies and the risk of surface decant due to rising groundwater levels has been obviated at the entire Free State region and Kalgold. Additional studies have been commissioned at Doornkop and Kusasalethu. Studies that have been conducted indicate that there is no risk of decant from Doornkop, Kusasalethu and Mponeng, but it is recommended that confirmatory studies be completed.
Preliminary studies have also been completed to manage and mitigate the seepage from tailings facilities acquired as part of the Mponeng operations and related assets. Seepage is evident at these facilities and desktop studies have been completed to mitigate the seepage. Further feasibility studies will be conducted to refine these estimates in the future.
Should the additional studies result in different solutions than the ones initially proposed, or the regulators do not approve the proposed plans, it might result in a change in estimate to the recorded liabilities or the group recording liabilities over and above the current provisions.
(d) The individual Harmony mining operations have applied for the respective National Water Act, Section 21 Water Use Licenses to the Department of Water and Sanitation (DWS). The respective Water Use License Applications have subsequently not yet been approved by DWS for our Free State operations and Doornkop. Notably, the Department issued a Water Use Licence for the expansion of the Kareerand Tailings Facility operated by Mine Waste Solutions. The Water Use Licence conditions for the respective operations without a Water Use License are subsequently not yet known and the subsequent potential water resource impact liability as part of the mine rehabilitation and closure process (to which DWS is an important participant and decision maker) is uncertain. All operations continue to operate legally and responsibly.
(e) In terms of the sale agreements entered into with Rand Uranium, Harmony retained financial exposure relating to environmental disturbances and degradation caused by it before the effective date, in excess of R75 million of potential claims. Rand Uranium is therefore liable for all claims up to R75 million and retains legal liability. The likelihood of potential claims cannot be determined presently and no provision for any liability has been made in the financial statements.
Notes to the group financial statements continued
For the year ended 30 June 2023
38 Commitments and contingencies continued
Contingent liabilities continued
(f) Randfontein Estates Limited (REL), a subsidiary of Harmony has an existing legal dispute with the Merafong Municipality (Merafong) relating to rates payable in terms of Merafong's Supplementary Valuation Roll 6 (SVR6). REL lodged appeals against the market values contained in SVR6. Merafong is contending for total rates payable of between R194 million and R257 million under SVR6, while Harmony is contending for total rates payable of R17 million on the basis that certain items of the mining operations are not rateable and/or disregarded for valuation purposes and that depreciation, rehabilitation, phasing-in and category use changes are favourably considered by the Merafong Valuation Appeal Board (Merafong VAB). Payment arrangements have been concluded between REL and Merafong in relation to these rates disputes. The Merafong VAB hearings are currently underway with other mining companies with similar legal disputes. Harmony's appeal hearings are set to conclude by the end of the 2024 financial year, where the outcome of the matter will be decided upon by the Merafong VAB.
39 Financial risk management
The group's operating activities expose it to a variety of financial risks: market risk (including commodity price risk, foreign exchange risk, interest rate risk and other price risk), credit risk and liquidity risk. The group may use derivative financial instruments to hedge certain risk exposures.
The group's financial assets and liabilities are classified as set out below:
|
|
|
|
|
|
|
|
|
|
|
|
|
|
|
|
|
|
|
|
|
|
|
|
SA Rand |
|
Figures in million |
Debt instruments at amortised cost |
Equity instruments designated
at fair value through OCI |
Derivatives designated as cash flow hedges |
Derivatives at fair value through profit or loss |
Debt instruments at fair value through profit or loss |
Financial liabilities at amortised cost |
|
At 30 June 2023 |
|
|
|
|
|
|
|
Financial assets |
|
|
|
|
|
|
|
Restricted cash and investments |
4 152 |
|
305 |
|
— |
|
— |
|
1 705 |
|
— |
|
|
Other non-current assets |
15 |
|
78 |
|
— |
|
— |
|
101 |
|
— |
|
|
Non-current derivative financial instruments |
— |
|
— |
|
168 |
|
101 |
|
— |
|
— |
|
|
– Rand gold hedging contracts |
— |
|
— |
|
135 |
|
— |
|
— |
|
— |
|
|
– US$ gold hedging contracts |
— |
|
— |
|
33 |
|
— |
|
— |
|
— |
|
|
– Foreign exchange contracts |
— |
|
— |
|
— |
|
85 |
|
— |
|
— |
|
|
– US$ silver contracts |
— |
|
— |
|
— |
|
16 |
|
— |
|
— |
|
|
Current derivative financial instruments |
— |
|
— |
|
78 |
|
32 |
|
— |
|
— |
|
|
– Rand gold hedging contracts |
— |
|
— |
|
44 |
|
— |
|
— |
|
— |
|
|
– US$ gold hedging contracts |
— |
|
— |
|
34 |
|
— |
|
— |
|
— |
|
|
– Foreign exchange contracts |
— |
|
— |
|
— |
|
4 |
|
— |
|
— |
|
|
– US$ silver contracts |
— |
|
— |
|
— |
|
28 |
|
— |
|
— |
|
|
Trade and other receivables |
1 561 |
|
— |
|
— |
|
— |
|
— |
|
— |
|
|
Cash and cash equivalents |
2 867 |
|
— |
|
— |
|
— |
|
— |
|
— |
|
|
Financial liabilities |
|
|
|
|
|
|
|
Non-current derivative financial instruments |
— |
|
— |
|
401 |
|
69 |
|
— |
|
— |
|
|
– Rand gold hedging contracts |
— |
|
— |
|
401 |
|
— |
|
— |
|
— |
|
|
– Foreign exchange contracts |
— |
|
— |
|
— |
|
69 |
|
— |
|
— |
|
|
Current derivative financial instruments |
— |
|
— |
|
909 |
|
152 |
|
— |
|
— |
|
|
– Rand gold hedging contracts |
— |
|
— |
|
890 |
|
— |
|
— |
|
— |
|
|
– US$ gold hedging contracts |
— |
|
— |
|
19 |
|
— |
|
— |
|
— |
|
|
– Foreign exchange contracts |
— |
|
— |
|
— |
|
152 |
|
— |
|
— |
|
|
Borrowings |
— |
|
— |
|
— |
|
— |
|
— |
|
5 695 |
|
|
Contingent consideration liability |
— |
|
— |
|
— |
|
— |
|
589 |
|
— |
|
|
Other non-current liabilities |
— |
|
— |
|
— |
|
— |
|
— |
|
332 |
|
|
Trade and other payables |
— |
|
— |
|
— |
|
— |
|
— |
|
2 022 |
|
Notes to the group financial statements continued
For the year ended 30 June 2023
39 Financial risk management continued
|
|
|
|
|
|
|
|
|
|
|
|
|
|
|
|
|
|
|
|
|
|
|
|
SA Rand |
|
Figures in million |
Debt instruments
at amortised cost |
Equity instruments designated
at fair value through OCI |
Derivatives designated
as cash flow hedges |
Derivatives
at fair value through
profit or loss |
Debt instruments
at fair value through
profit or loss |
Financial liabilities at amortised
cost |
|
At 30 June 2022 |
|
|
|
|
|
|
|
Financial assets |
|
|
|
|
|
|
|
Restricted cash and investments |
4 128 |
|
292 |
|
— |
|
— |
|
1 162 |
|
— |
|
|
Other non-current assets |
15 |
|
75 |
|
— |
|
— |
|
148 |
|
— |
|
|
Non-current derivative financial instruments |
— |
|
— |
|
131 |
|
6 |
|
— |
|
— |
|
|
– Rand gold hedging contracts |
— |
|
— |
|
113 |
|
— |
|
— |
|
— |
|
|
– US$ gold hedging contracts |
— |
|
— |
|
18 |
|
— |
|
— |
|
— |
|
|
– US$ silver contracts |
— |
|
— |
|
— |
|
6 |
|
— |
|
— |
|
|
Current derivative financial instruments |
— |
|
— |
|
436 |
|
83 |
|
— |
|
— |
|
|
– Rand gold hedging contracts |
— |
|
— |
|
410 |
|
— |
|
— |
|
— |
|
|
– US$ gold hedging contracts |
— |
|
— |
|
26 |
|
— |
|
— |
|
— |
|
|
– Foreign exchange contracts |
— |
|
— |
|
— |
|
12 |
|
— |
|
— |
|
|
– US$ silver contracts |
— |
|
— |
|
— |
|
71 |
|
— |
|
— |
|
|
Trade and other receivables |
938 |
|
— |
|
— |
|
— |
|
— |
|
— |
|
|
Cash and cash equivalents |
2 448 |
|
— |
|
— |
|
— |
|
— |
|
— |
|
|
Financial liabilities |
|
|
|
|
|
|
|
Non-current derivative financial instruments |
— |
|
— |
|
3 |
|
— |
|
— |
|
— |
|
|
– US$ gold hedging contracts |
— |
|
— |
|
3 |
|
— |
|
— |
|
— |
|
|
Current derivative financial instruments |
— |
|
— |
|
8 |
|
— |
|
— |
|
— |
|
|
– US$ gold hedging contracts |
— |
|
— |
|
8 |
|
— |
|
— |
|
— |
|
|
Borrowings |
— |
|
— |
|
— |
|
— |
|
— |
|
3 205 |
|
|
Contingent consideration liability |
— |
|
— |
|
— |
|
— |
|
356 |
|
— |
|
|
Other non-current liabilities |
— |
|
— |
|
— |
|
— |
|
— |
|
263 |
|
|
Trade and other payables |
— |
|
— |
|
— |
|
— |
|
— |
|
1 791 |
|
Risk management is carried out by a central treasury department (Group treasury) under policies approved by the board of directors. Group treasury identifies, evaluates and hedges certain selected financial risks in close cooperation with the group's operating units. The audit and risk committee and the board provide written principles for overall risk management, as well as written policies covering specific areas, such as commodity price risk, foreign exchange risk, interest rate risk, credit risk, use of derivative financial instruments and non-derivative financial instruments, and the investment of excess liquidity.
Market risk
Foreign exchange risk
The group operates internationally and is exposed to foreign exchange risk arising from various currency exposures, primarily with respect to the US dollar (US$). Foreign exchange risk arises when future commercial transactions or recognised financial assets or liabilities are denominated in a currency that is not the entity’s functional currency. Harmony’s revenues are sensitive to the R/US$ exchange rate as all revenues are generated by commodity sales denominated in US$. Harmony may enter into hedging transactions to reduce this risk. The limit currently set by the board is 25% of the group's foreign exchange risk exposure for a period of 24 months. Refer to note 19 and the fair value determination for financial assets and liabilities section below for details of the contracts. The audit and risk committee reviews the details of the programme quarterly.
The Rand weakened during the 2023 year by 15.7%, from a closing rate of R16.27/US$1 on 30 June 2022 to R18.83/US$1 on
30 June 2023. The volatility in the exchange rate is driven by global economic factors. Refer to note 4 for a discussion on some of the factors and their impact. The weakening negatively impacted on the derivative valuations of contracts that were outstanding at 30 June 2023.
Notes to the group financial statements continued
For the year ended 30 June 2023
39 Financial risk management continued
Market risk continued
Foreign exchange risk continued
The group is exposed to foreign exchange risk arising from borrowings and cash denominated in a currency other than the functional currency of that entity (refer to note 2.2 for details on the group's functional currencies). These exposures are mainly to the US$. The Rand's levels impacted negatively on the translation of the US$ debt facilities at 30 June 2023. Refer to note 32 for further detail.
Translation of the international net assets was impacted by a weakening of the Rand against the Australian dollar from
R11.25/A$1 at 30 June 2022 to R12.56/A$1 on 30 June 2023. A gain of R1 123 million has been recognised in other comprehensive income relating to the translation of the international net assets to Rand.
The group has reviewed its foreign currency exposure on financial assets and financial liabilities and has identified the following sensitivities in the exchange rates that would affect profit and loss before tax:
•Rand/US$ exchange rate – 5% (2022: 4%) based on the standard deviation from a one-year forecast of various financial institution outlooks
•A$/US$ exchange rate – 4% (2022: 4%) based on the standard deviation from a one-year forecast of various financial institution outlooks
Only material foreign currency exposure balances were considered when determining the need for a sensitivity analysis and therefore management has not performed a sensitivity analysis on PGK/US$ exchange rates.
|
|
|
|
|
|
|
|
|
|
|
|
SA Rand |
|
Figures in million |
2023 |
2022 |
|
Sensitivity analysis – borrowings |
|
|
|
Rand against US$ |
|
|
|
Balance at 30 June |
5 695 |
|
3 180 |
|
|
Strengthen by 5% (FY22: 4%) |
285 |
|
127 |
|
|
Weaken by 5% (FY22: 4%) |
(285) |
|
(127) |
|
|
Closing rate |
18.83 |
|
16.27 |
|
|
|
|
|
|
|
|
|
|
|
|
|
|
|
|
|
|
|
|
|
|
Sensitivity analysis – contingent consideration liability: Mponeng |
|
|
|
Rand against US$ |
|
|
|
Balance at 30 June |
404 |
|
356 |
|
|
Strengthen by 5% (FY22: 4%) |
20 |
|
14 |
|
|
Weaken by 5% (FY22: 4%) |
(20) |
|
(14) |
|
|
Closing rate |
18.83 |
|
16.27 |
|
|
Sensitivity analysis – contingent consideration liability: Eva Copper |
|
|
|
US$ against A$ |
|
|
|
Balance at 30 June |
185 |
|
— |
|
|
Strengthen by 4% (FY22: 4%) |
7 |
|
— |
|
|
Weaken by 4% (FY22:4%) |
(8) |
|
— |
|
|
Closing rate |
0.67 |
|
— |
|
|
|
|
|
|
|
|
|
|
|
|
|
SA Rand |
|
Figures in million |
2023 |
2022 |
|
Sensitivity analysis – other financial instruments |
|
|
|
Rand against US$ |
|
|
|
Balance at 30 June |
(132) |
|
12 |
|
|
Strengthen by 5% (FY22: 4%) |
495 |
|
26 |
|
|
Weaken by 5% (FY22: 4%) |
(615) |
|
(19) |
|
|
Closing rate |
18.83 |
|
16.27 |
|
|
US$ against A$ |
|
|
|
Balance at 30 June |
408 |
|
268 |
|
|
Strengthen by 4% (FY22: 4%) |
16 |
|
10 |
|
|
Weaken by 4% (FY22:4%) |
(17) |
|
(11) |
|
|
Closing rate |
0.67 |
|
0.69 |
|
Notes to the group financial statements continued
For the year ended 30 June 2023
39 Financial risk management continued
Market risk continued
Commodity price sensitivity
The profitability of the group’s operations, and the cash flows generated by those operations, are affected by changes in the market price of gold, and in the case of Hidden Valley, silver as well. Harmony entered into derivative contracts to manage the variability in cash flows from the group’s production to create cash certainty and protect the group against lower commodity prices. The general limit for gold hedging currently set by the Board is 20% for a 24-month period. The limit set by the Board is 50% of silver exposure over a 24-month period. Management continues to top up these programmes as and when opportunities arise to lock in attractive margins for the business, but are not required to maintain hedging at these levels. The audit and risk committee reviews the details of the programme quarterly.
The exposure to the variability in the price of gold is managed by entering into gold forward sales contracts for a portion of the group's production. A portion of the production of the South African operations is linked to Rand gold forward contracts and US$ gold forward contracts were entered into for the production from Hidden Valley. The exposure to the variability in the price of silver for Hidden Valley is managed by entering into US$/silver zero cost collars. These contracts have not been designated as hedging instruments for hedge accounting and the gains and losses are accounted for in the income statement. Refer to note 19 and the fair value determination for financial assets and liabilities section below for further detail on these contracts.
The spot gold prices exceeded the forward prices on the rand gold hedging contracts for the majority of the 2023 year. This resulted in a negative impact on the contracts that matured during the year as well as those that were outstanding at the reporting date. Refer to note 4 for a discussion on the impact of commodity prices and exchange rates.
The group has reviewed its exposure to commodity-linked instruments and identified a sensitivity of 7% (2022: 9%), based on the standard deviation of a one-year forecast gold price from various financial institution outlooks. The estimated sensitivity would affect other comprehensive income.
Only material commodity balances were considered when determining the need for a sensitivity analysis and therefore management has not performed a sensitivity analysis on silver commodities.
|
|
|
|
|
|
|
|
|
|
|
|
SA Rand |
|
Figures in million |
2023 |
2022 |
|
Sensitivity analysis |
|
|
|
Rand gold derivatives |
|
|
|
Other comprehensive income |
|
|
|
Increase by 7% (FY22: 9%) |
(1 472) |
|
(1 001) |
|
|
Decrease by 7% (FY22: 9%) |
1 314 |
|
998 |
|
|
US$ gold derivatives |
|
|
|
Other comprehensive income |
|
|
|
Increase by 7% (FY22: 9%) |
(141) |
|
(152) |
|
|
Decrease by 7% (FY22: 9%) |
137 |
|
150 |
|
Other price risk
The group is exposed to the risk of fluctuations in the fair value of fair value through profit or loss financial assets as a result of changes in market prices (other than changes in interest rates and foreign currencies). Harmony generally does not use any derivative instruments to manage this risk.
Sensitivity analysis
Certain of the restricted investments are linked to the Top 40 Index on the JSE. Management considered a sensitivity of 6% (2022: 13%) as appropriate, based on the average fluctuations within the last year’s historical data. A 6% increase in the Top 40 index at the reporting date, with all other variables held constant, would have increased profit or loss before tax by R43 million (2022: R97 million) and an equal change in the opposite direction would have decreased profit or loss before tax by
R38 million (2022: R79 million).
Notes to the group financial statements continued
For the year ended 30 June 2023
39 Financial risk management continued
Market risk continued
Interest rate risk
The group's interest rate risk arises mainly from borrowings. The group has variable interest rate borrowings. Variable rate borrowings expose the group to cash flow interest rate risk.
During the 2023 year the US Fed and SARB increased interest rates by 350 basis points. The higher interest rates together with the increased borrowings, led to an unfavourable impact on the group's cost of debt. However, the increased interest rates had a positive effect on the investment income earned on cash balances and restricted cash and investments. Although higher interest rates along with increased debt levels had an unfavourable impact on the group's finance costs for the 2023 year, the group has not entered into interest rate swap agreements as the interest rate risk continues to be assessed as low. The audit and risk committee reviews the group's risk exposure quarterly.
Interest rate risk arising from borrowings is offset by cash and restricted cash and investments held at variable rates. As at 30 June 2023, management reasonably expects profit or loss before tax to increase/(decrease) by the following sensitivities:
•A 15 basis points (2022: 185 basis point) finance cost movement based on the average of a one-year forecast US Fed rate from various financial institution outlooks
•A 50 basis points (2022: 88 basis points) sensitivity on interest received based on an average of a one-year forecast of the South African prime interest rate from various financial institution outlooks.
The above analysis assumes that all other variables remain constant.
|
|
|
|
|
|
|
|
|
|
|
|
SA Rand |
|
Figures in million |
2023 |
2022 |
|
Sensitivity analysis – borrowings (finance costs) |
|
|
|
|
|
|
|
|
|
|
|
|
|
|
|
|
|
|
|
US$-denominated borrowings |
|
|
|
Increase by 15 basis point (FY22: 185 basis point) |
(9) |
|
(59) |
|
|
Decrease by 15 basis points (FY22: 185 basis point) |
9 |
|
59 |
|
|
Sensitivity analysis – financial assets (interest received) |
|
|
|
Increase by 50 basis points (FY22: 88 basis points) |
34 |
|
59 |
|
|
Decrease by 50 basis points (FY22: 88 basis points) |
(34) |
|
(59) |
|
Credit risk
Credit risk is the risk that a counterparty may default or not meet its obligations in a timely manner. Financial instruments that are subject to credit risk are restricted cash and investments, derivative financial instruments and cash and cash equivalents, as well as trade and other receivables (excluding non-financial instruments).
Assessment of credit risk
In assessing the creditworthiness of local institutions, management uses the national scale long-term ratings. The credit risk arising from cash and cash equivalents, restricted cash and investments, and derivative financial assets is managed by ensuring amounts are only invested with financial institutions of good credit quality based on external credit ratings and by assessing the underlying source of where the funds are invested. The group has policies that limit the amount of credit exposure to any one financial institution. The audit and risk committee reviews the exposure on a quarterly basis. Exposure to credit risk on trade and other receivables is monitored on a regular basis by management.
At 30 June 2023, the rating of major SA banks remained unchanged at AA+, which is in line with the group's credit risk policy. The credit rating of the group's Australian counterparts remained unchanged at A+, resulting in the assessed ECL on cash and cash equivalents as well as restricted cash and investments remaining immaterial.
An assessment of the expected credit losses for the financial assets measured at amortised cost at 30 June 2023 resulted in an immaterial amount for each instrument, in line with the assessment performed in 2022 (refer to the expected credit loss assessment below for further detail).
The group’s maximum exposure to credit risk is represented by the carrying amount of all financial assets determined to be exposed to credit risk, amounting to R10 780 million as at 30 June 2023 (2022: R9 495 million).
Notes to the group financial statements continued
For the year ended 30 June 2023
39 Financial risk management continued
Credit risk continued
The group has restricted investments that are invested in various collective investment schemes totalling R212 million
(2022: R68 million) and equity investments of R305 million (2022: R292 million).
Financial institutions' credit rating by exposure (source: Fitch Ratings and Global Credit Ratings)
|
|
|
|
|
|
|
|
|
|
|
|
SA Rand |
|
Figures in million |
2023 |
2022 |
|
Cash and cash equivalents |
|
|
|
AA+ |
2 093 |
|
1 711 |
|
|
A+ |
774 |
|
737 |
|
|
Total |
2 867 |
|
2 448 |
|
|
Restricted cash and investments (refer to note 17) |
|
|
|
AAA |
234 |
|
225 |
|
|
AA+ |
5 411 |
|
4 997 |
|
|
Total |
5 645 |
|
5 222 |
|
|
Derivative financial assets (refer to note 19) |
|
|
|
AA+ |
117 |
|
226 |
|
|
AA |
— |
|
115 |
|
|
AA- |
127 |
|
110 |
|
|
A+ |
135 |
|
205 |
|
|
Total |
379 |
|
656 |
|
Expected credit loss assessment
The group recognises loss allowances for expected credit losses (ECLs) on financial assets measured at amortised cost. The group's debt instruments at amortised cost consist of cash and cash equivalents, a portion of restricted cash and investments and trade and other receivables. The assessment of ECLs for the different debt instruments is discussed below:
Cash and cash equivalents
The cash and cash equivalents are held with banks and financial institutions which are rated between A+ and AA+ (see above). The ECL on cash and cash equivalents has been determined using the simplification that allows the group to assume that the credit risk on financial instruments determined to have low credit risk at the reporting date, has not increased significantly since initial recognition of the financial instrument. The ECL was estimated with reference to a probability of default model using external credit ratings in determining the default risk of counterparties. The ECL was determined to be immaterial.
Restricted cash and investments
The restricted cash and investments relate largely to the environmental trust funds. These funds are held with banks and financial institutions that are rated AA+ (see above). Impairment of investments with investment-grade ratings has been determined using the simplification that allows the group to assume that the credit risk on financial instruments determined to have low credit risk at the reporting date, has not increased significantly since initial recognition of the financial instrument. The group considers that the majority of its restricted cash and investments have low credit risk based on the external credit ratings of the counterparties with which the funds are deposited. The ECL was estimated with reference to a probability of default model using external credit ratings in determining the default risk of counterparties. Concentration of credit risk on restricted cash and investments is considered minimal due to the group’s investment risk management and counterparty exposure risk management policies.
Trade and other receivables
The group’s exposure to credit risk arising from trade receivables (metals) and other trade receivables is influenced mainly by the individual characteristics of each customer.
Trade receivables result largely from the sale of gold and are fully performing. Exposure to credit risk on receivables from gold sales is limited through payment terms of two to three days after recognition of revenue for gold sales. The majority of other receivables comprise a limited number of individually significant customers. The group determines the ECL on trade receivables and individually significant other receivable balances with reference to a probability of default model using external credit ratings in determining the default risk of counterparties. The external credit ratings used range between BBB to AA-. The ECL was determined to be immaterial.
Loss allowances on individually insignificant other trade receivables has been determined using the simplified ECL approach using a provision matrix and reflects the short-term maturities of the exposures and past experienced credit judgement. Refer to note 20 for details on the amount of the loss allowance recognised and the stratification of trade and other receivables for purposes of the assessment.
Notes to the group financial statements continued
For the year ended 30 June 2023
39 Financial risk management continued
Liquidity risk
Prudent liquidity risk management implies maintaining sufficient cash and marketable securities, and the availability of funding through an adequate amount of committed credit facilities.
In the ordinary course of business, the group receives cash from its operations and is required to fund working capital and capital expenditure requirements. Management prepares cash flow forecasts weekly and ensures that surplus funds are invested in a manner to achieve market-related returns and to provide sufficient liquidity at the minimum risk. The group maintains and refinances committed credit facilities as medium-term forecasts require. The audit and risk committee reviews the updated forecasts quarterly. The group is able to actively source financing at competitive rates. Where necessary, funds will be drawn from its revolving credit facilities (refer to note 32).
The following are the undiscounted contractual maturities of financial liabilities (including principal and interest payments assuming the closing R/US$ exchange rate and interest rate at year end):
|
|
|
|
|
|
|
|
|
|
|
|
|
|
|
|
|
|
SA Rand |
|
Figures in million |
2023 |
2022 |
|
|
Current |
More than
1 year |
Current |
More than
1 year |
|
Contingent consideration liability1 |
|
|
|
|
|
Due between 0 to five years |
— |
|
604 |
|
— |
|
515 |
|
|
Due between six to 10 years |
— |
|
225 |
|
— |
|
— |
|
|
Due between 10 to 15 years |
— |
|
471 |
|
— |
|
— |
|
|
Other non-current liabilities2 |
— |
|
22 |
|
— |
|
18 |
|
|
Lease liability3 |
235 |
|
401 |
|
206 |
|
338 |
|
|
Trade and other payables (excluding non-financial liabilities)2,4 |
1 806 |
|
— |
|
1 594 |
|
— |
|
|
Derivative financial liabilities4 |
|
|
|
|
|
Due between 0 to six months |
609 |
|
— |
|
2 |
|
— |
|
|
Due between six to 12 months |
639 |
|
— |
|
7 |
|
— |
|
|
Due between one to two years |
— |
|
812 |
|
— |
|
3 |
|
|
Borrowings4 |
|
|
|
|
|
Due between 0 to six months |
597 |
|
— |
|
97 |
|
— |
|
|
Due between six to 12 months |
215 |
|
— |
|
68 |
|
— |
|
|
Due between one to two years |
— |
|
431 |
|
— |
|
137 |
|
|
Due between two to three years5 |
— |
|
5 660 |
|
— |
|
3 251 |
|
|
Total |
4 101 |
|
8 626 |
|
1 974 |
|
4 262 |
|
1The increase in the settlement period is due to the inclusion of Eva Copper. The Mponeng consideration will be settled within 3 – 4 years of R511 million.
2These balances exclude the lease liability as it has been disclosed separately.
3Refer to note 28 for details of the maturity periods.
4The group will utilise its cash generated from operations to settle outstanding obligations.
5Final repayment of capital amount of R5 271 million in May 2026, taking into account a 12-month extension that was granted in April 2023. The final payment for 2022 was R3 126 million in May 2025.
Capital risk management
The primary objective of managing the group’s capital is to ensure that there is sufficient capital available to support the funding requirements of the group, in a way that optimises the cost of capital and matches the current strategic business plan.
The group manages and makes adjustments to the capital structure, which consists of debt and equity, as and when borrowings mature or when funding is required. This may take the form of raising equity, market or bank debt or hybrids thereof. In doing so, the group ensures it stays within the debt covenants agreed with lenders. The group may also sell assets to reduce debt or schedule projects to manage the capital structure.
The consideration of R2 996 million for the acquisition of Eva Copper is the main contributor to the group's increased net debt compared to 30 June 2022. It remains the group's objective to adhere to a conservative approach to debt and maintain low levels of gearing.
Notes to the group financial statements continued
For the year ended 30 June 2023
39 Financial risk management continued
Capital risk management continued
Net debt is as follows:
|
|
|
|
|
|
|
|
|
|
|
|
SA Rand |
|
Figures in million |
2023 |
2022 |
|
Cash and cash equivalents |
2 867 |
|
2 448 |
|
|
Borrowings |
(5 695) |
|
(3 205) |
|
|
Net debt |
(2 828) |
|
(757) |
|
There were no changes to the group's approach to capital management during the year.
Fair value determination for financial assets and liabilities
The fair value levels of hierarchy are as follows:
Level 1: Quoted prices (unadjusted) in active markets
Level 2: Inputs other than quoted prices included within level 1 that are observable for the asset, either directly (that is, as prices) or indirectly (that is, derived from other prices)
Level 3: Inputs for the asset that are not based on observable market data (that is, unobservable inputs).
The following table sets out the group’s assets and liabilities measured at fair value by level within the fair value hierarchy:
|
|
|
|
|
|
|
|
|
|
|
|
|
|
|
|
|
|
|
|
|
|
|
|
SA Rand |
|
Figures in million |
At 30 June 2023 |
At 30 June 2022 |
|
|
Level 1 |
Level 2 |
Level 3 |
Level 1 |
Level 2 |
Level 3 |
|
Fair value through other comprehensive income |
|
|
|
|
|
|
|
Other non-current assets (a) |
— |
|
— |
|
78 |
|
— |
|
— |
|
75 |
|
|
Restricted cash and investments (b) |
305 |
— |
|
— |
|
292 |
|
— |
|
— |
|
|
Fair value through profit or loss |
|
|
|
|
|
|
|
Restricted cash and investments (b) |
— |
|
1 705 |
|
— |
|
— |
|
1 162 |
|
— |
|
|
Derivative financial assets (c) |
— |
|
379 |
|
— |
|
— |
|
656 |
|
— |
|
|
Derivative financial liabilities (c) |
— |
|
(1 531) |
|
— |
|
— |
|
(11) |
|
— |
|
|
Loan to ARM BBEE Trust (d) |
— |
|
— |
|
101 |
|
— |
|
— |
|
148 |
|
|
Contingent consideration liability (e) |
— |
|
— |
|
(589) |
|
— |
|
— |
|
(356) |
|
(a)The majority of the balance relates to the equity investment in Rand Mutual Assurance. The fair value of the investment was estimated with reference to an independent valuation. A combination of the "Embedded Valuation" and "Net Asset Value" techniques were applied to revalue the investment at the reporting dates. In evaluating the group's share of the business, common practice marketability and minority discounts as well as additional specific risk discounts were applied. There are no inputs to the valuation that a reasonably possible change would result in a material change in the fair value of the investment.
(b)The majority of the level 2 valued assets are directly derived from the Top 40 index on the JSE, and are discounted at market interest rates. This relates to equity-linked deposits in the group's environmental rehabilitation trust funds. The level 1 valued assets comprise listed equity securities designated as fair value through other comprehensive income instruments. The remaining balance of the environmental trust funds is carried at amortised cost and therefore not disclosed here.
(c)The mark-to-market remeasurement of the derivative contracts (refer to note 19 for further details) was determined as follows:
•Foreign exchange contracts comprise zero cost collars and FECs: The zero cost collars were valued using a Black-Scholes valuation technique derived from spot Rand/US$ exchange rate inputs, implied volatilities on the Rand/US$ exchange rate, Rand/US$ inter-bank interest rates and discounted at a market interest rate (zero-coupon interest rate curve). The value of the FECs is derived from the forward Rand/US$ exchange rate and discounted at a market interest rate (zero coupon interest rate curve)
•Rand gold contracts (forward sale contracts): spot Rand/US$ exchange rate, Rand and dollar interest rates (forward points), spot US$ gold price, differential between the US interest rate and gold lease interest rate which is discounted at a market interest rate
•US$ gold contracts (forward sale contracts): spot US$ gold price, differential between the US interest rate and gold lease interest rate and discounted at a market interest rate
•Silver contracts (zero cost collars): a Black-Scholes valuation technique, derived from the spot US$ silver price, strike price, implied volatilities, time to maturity and interest rates and discounted at a market interest rate
Notes to the group financial statements continued
For the year ended 30 June 2023
39 Financial risk management continued
Fair value determination for financial assets and liabilities continued
(d)At 30 June 2023, the fair value movement was calculated using a discounted cash flow model, taking into account forecast dividend payments over the estimated repayment period of the loan at a rate of 12.7% (2021: 9.3%). A 37 basis points (2022: 99 basis points) change in the discount rate, which would represent a reasonably possible change based on expected movements in lending rates, would not cause a material change in the fair value of the loan. The loan balance forms part of other non-current assets in the balance sheet. In the 2023 year, repayments to the value of R74 million (2022: R65 million) were received.
(e)Contingent consideration liabilities consist of the follow:
•Mponeng operation
The contingent consideration liability related to the Mponeng operation (refer to note 29) was determined using the expected gold production profile for Mponeng. At 30 June 2023, the liability was valued at R404 million
(2022: R356 million) at a post-tax real rate of 9.6% (2022: 10.2%). Should the expected gold production profile increase by 9.8% or decrease by 9.8%, the contingent consideration liability would increase by R411 million (2022: R251 million at 7.6%) or decrease by R314 million (2022: R189 million at 7.6%) respectively. This represents reasonably expected changes which were determined based on the standard deviation of previous years' production of the Mponeng operation. No other reasonably expected changes in key unobservable inputs would have caused a material change in the fair value of the liability.
•Eva Copper
The consideration for Eva Copper includes contingent consideration valued at R185 million at 30 June 2023. Refer to
note 14 for further information. There are no inputs to the valuation that a reasonably possible change would result in a material change in the fair value of the liability.
The carrying values (less any impairment allowance) of short-term financial instruments are assumed to approximate their fair values. This includes restricted cash and investments carried at amortised cost. The fair values of borrowings (level 2) are not materially different to their carrying amounts since the interest payable on those borrowings is at floating interest rates.
40 Subsequent events
(a)On 3 July 2023 a payment of US$24 million (R450 million), comprising US$20 million of capital and US$4 million of interest, was made on the US$300 million RCF.
(b)On 29 August 2023, a final dividend of 75 SA cents was declared, paid on 16 October 2023.
(c)On 6 September 2023 a payment of US$32 million (R600 million), comprising US$30 million of capital and US$2 million of interest, was made on the US$300 million RCF.
(d)On 8 September 2023 a payment of US$54 million (R994 million), comprising US$50 million of capital and US$4 million of interest, was made on the US$300 million RCF.
41 Segment report
Accounting policy
Operating segments are reported in a manner consistent with the internal reporting provided to the chief operating decision maker (CODM). The CODM has been identified as the Group CEO's office.
The group has one main economic product, being gold. In order to determine operating and reportable segments, management reviewed various factors, including geographical location as well as managerial structure. It was determined that an operating segment consists of a shaft or a group of shafts or open pit mine managed by an operational management team.
As of 1 July 2022, Tshepong North and Tshepong South are disclosed as separate operating segments based on the requirements of IFRS 8 Operating Segments. Refer to note 2 for more details.
After applying the qualitative and quantitative thresholds from IFRS 8 Operating Segments, the reportable segments were determined as: Tshepong North, Tshepong South, Moab Khotsong, Bambanani, Joel, Doornkop, Target 1, Kusasalethu, Masimong, Mponeng, Mine Waste Solutions and Hidden Valley. All other operating segments have been grouped together under all other surface operations.
Notes to the group financial statements continued
For the year ended 30 June 2023
41 Segment report continued
The CODM has been identified as the Group CEO's office consisting of the:
•Chief executive officer
•Financial director
•Executive director: Stakeholder relations and Corporate affairs
•Group Chief operating officer: Operations
•Group Chief operating officer: Business Development and Growth
•Chief financial officer: Treasury
•Senior executive: Enterprise risk and Investor relations
•Senior executive: Sustainable Development
•Senior executive: Human Capital
•Executive: Ore Reserve Management.
When assessing profitability, the CODM considers the revenue and production costs of each segment. The net of these amounts is the production profit or loss. Therefore, production profit has been disclosed in the segment report as the measure of profit or loss. The CODM also considers capital expenditure, gold production and tonnes milled when assessing the overall economic sustainability of each segment. The CODM, however, does not consider depreciation or impairment and therefore these amounts have not been disclosed in the segment report.
Segment assets consist of mining assets and mining assets under construction included under property, plant and equipment which can be attributed to the segment. Current and non-current group assets that are not allocated at a segment level form part of the reconciliation to total assets.
A reconciliation of the segment totals to the group financial statements has been included in note 42.
Notes to the group financial statements continued
For the year ended 30 June 2023
41 Segment report continued
|
|
|
|
|
|
|
|
|
|
|
|
|
|
|
|
|
|
|
|
|
|
|
|
|
|
|
|
|
|
|
|
|
|
|
|
|
|
|
|
|
|
|
|
|
|
|
|
|
|
|
|
|
|
|
|
|
|
|
|
|
|
|
|
|
|
|
|
|
Revenue
30 June |
Production cost
30 June |
Production
profit/(loss)
30 June |
Segment assets
30 June |
Capital expenditure#
30 June
|
Kilograms produced*
30 June |
Tonnes milled*
30 June |
|
|
2023 |
2022 |
2021 |
2023 |
2022 |
2021 |
2023 |
2022 |
2021 |
2023 |
2022 |
2021 |
2023 |
2022 |
2021 |
2023 |
2022 |
2021 |
2023 |
2022 |
2021 |
|
|
Rand million |
Rand million |
Rand million |
Rand million |
Rand million |
Kg |
000t |
|
South Africa |
|
|
|
|
|
|
|
|
|
|
|
|
|
|
|
|
|
|
|
|
|
|
Underground |
|
|
|
|
|
|
|
|
|
|
|
|
|
|
|
|
|
|
|
|
|
|
Moab Khotsong |
7 036 |
|
5 779 |
|
6 048 |
|
4 515 |
|
4 038 |
|
3 842 |
|
2 521 |
|
1 741 |
|
2 206 |
|
5 125 |
|
4 324 |
|
4 008 |
|
1 167 |
|
894 |
|
633 |
|
6 668 |
|
6 508 |
|
7 166 |
|
920 |
|
959 |
|
903 |
|
|
Mponeng |
7 845 |
|
5 620 |
|
4 750 |
|
4 997 |
|
4 487 |
|
2 938 |
|
2 848 |
|
1 133 |
|
1 812 |
|
4 630 |
|
4 433 |
|
4 321 |
|
704 |
|
605 |
|
493 |
|
7 449 |
|
6 086 |
|
5 446 |
|
884 |
|
840 |
|
683 |
|
|
Tshepong North1 |
3 530 |
|
3 429 |
|
3 540 |
|
2 701 |
|
2 894 |
|
2 777 |
|
829 |
|
535 |
|
763 |
|
2 226 |
|
2 049 |
|
4 273 |
|
553 |
|
1 038 |
|
746 |
|
3 354 |
|
3 793 |
|
4 237 |
|
795 |
|
988 |
|
944 |
|
|
Tshepong South1 |
3 607 |
|
2 922 |
|
2 674 |
|
2 395 |
|
2 190 |
|
2 088 |
|
1 212 |
|
732 |
|
586 |
|
2 043 |
|
1 730 |
|
2 268 |
|
514 |
|
476 |
|
366 |
|
3 431 |
|
3 229 |
|
3 182 |
|
506 |
|
573 |
|
614 |
|
|
Doornkop |
4 384 |
|
3 106 |
|
3 077 |
|
3 009 |
|
2 453 |
|
2 140 |
|
1 375 |
|
653 |
|
937 |
|
3 624 |
|
3 222 |
|
2 994 |
|
716 |
|
491 |
|
425 |
|
4 213 |
|
3 444 |
|
3 670 |
|
898 |
|
874 |
|
851 |
|
|
Joel |
2 044 |
|
1 411 |
|
1 199 |
|
1 616 |
|
1 308 |
|
1 124 |
|
428 |
|
103 |
|
75 |
|
1 306 |
|
1 244 |
|
1 166 |
|
231 |
|
225 |
|
172 |
|
1 947 |
|
1 556 |
|
1 424 |
|
435 |
|
434 |
|
359 |
|
|
Target 1 |
1 308 |
|
1 648 |
|
1 410 |
|
2 009 |
|
1 812 |
|
1 667 |
|
(701) |
|
(164) |
|
(257) |
|
1 745 |
|
1 517 |
|
1 367 |
|
428 |
|
384 |
|
368 |
|
1 275 |
|
1 800 |
|
1 603 |
|
365 |
|
455 |
|
488 |
|
|
Kusasalethu |
3 621 |
|
4 139 |
|
3 400 |
|
3 343 |
|
3 086 |
|
2 955 |
|
278 |
|
1 053 |
|
445 |
|
634 |
|
822 |
|
1 057 |
|
253 |
|
210 |
|
205 |
|
3 460 |
|
4 567 |
|
3 999 |
|
567 |
|
607 |
|
708 |
|
|
Masimong |
2 053 |
|
1 733 |
|
1 636 |
|
1 724 |
|
1 504 |
|
1 427 |
|
329 |
|
229 |
|
209 |
|
16 |
|
17 |
|
26 |
|
47 |
|
49 |
|
29 |
|
1 961 |
|
1 910 |
|
2 012 |
|
470 |
|
486 |
|
510 |
|
|
Bambanani2 |
18 |
|
1 286 |
|
1 687 |
|
16 |
|
1 163 |
|
1 156 |
|
2 |
|
123 |
|
531 |
|
— |
|
— |
|
327 |
|
— |
|
25 |
|
71 |
|
— |
|
1 433 |
|
1 992 |
|
— |
|
176 |
|
227 |
|
|
Surface |
|
|
|
|
|
|
|
|
|
|
|
|
|
|
|
|
|
|
|
|
|
|
Mine Waste Solutions |
2 689 |
|
2 642 |
|
1 889 |
|
1 809 |
|
1 588 |
|
1 137 |
|
880 |
|
1 054 |
|
752 |
|
2 060 |
|
1 027 |
|
1 031 |
|
932 |
|
264 |
|
70 |
|
2 804 |
|
2 899 |
|
2 057 |
|
23 067 |
|
23 443 |
|
17 665 |
|
|
All other surface operations |
4 945 |
|
4 868 |
|
5 136 |
|
3 371 |
|
3 551 |
|
3 587 |
|
1 574 |
|
1 317 |
|
1 549 |
|
1 234 |
|
1 066 |
|
890 |
|
316 |
|
282 |
|
265 |
|
4 719 |
|
5 304 |
|
6 031 |
|
19 382 |
|
20 737 |
|
21 824 |
|
|
Total South Africa |
43 080 |
|
38 583 |
|
36 670 |
|
31 505 |
|
30 074 |
|
27 020 |
|
11 575 |
|
8 509 |
|
9 650 |
|
24 643 |
|
21 451 |
|
23 728 |
|
5 861 |
|
4 943 |
|
3 843 |
|
41 281 |
|
42 529 |
|
43 066 |
|
48 289 |
|
50 572 |
|
45 833 |
|
|
International |
|
|
|
|
|
|
|
|
|
|
|
|
|
|
|
|
|
|
|
|
|
|
Hidden Valley |
4 440 |
|
3 159 |
|
4 028 |
|
2 036 |
|
2 122 |
|
1 719 |
|
2 404 |
|
1 037 |
|
2 309 |
|
5 766 |
|
4 141 |
|
3 128 |
|
1 737 |
|
1 249 |
|
1 260 |
|
4 370 |
|
3 707 |
|
4 689 |
|
3 846 |
|
3 229 |
|
3 420 |
|
|
Total international |
4 440 |
|
3 159 |
|
4 028 |
|
2 036 |
|
2 122 |
|
1 719 |
|
2 404 |
|
1 037 |
|
2 309 |
|
5 766 |
|
4 141 |
|
3 128 |
|
1 737 |
|
1 249 |
|
1 260 |
|
4 370 |
|
3 707 |
|
4 689 |
|
3 846 |
|
3 229 |
|
3 420 |
|
|
Total operations |
47 520 |
|
41 742 |
|
40 698 |
|
33 541 |
|
32 196 |
|
28 739 |
|
13 979 |
|
9 546 |
|
11 959 |
|
30 409 |
|
25 592 |
|
26 856 |
|
7 598 |
|
6 192 |
|
5 103 |
|
45 651 |
|
46 236 |
|
47 755 |
|
52 135 |
|
53 801 |
|
49 253 |
|
|
Reconciliation of segment information to the consolidated income
statement and balance sheet |
1 755 |
|
903 |
|
1 035 |
|
1 325 |
|
903 |
|
1 035 |
|
430 |
|
— |
|
— |
|
26 831 |
|
21 216 |
|
21 947 |
|
— |
|
— |
|
— |
|
— |
|
— |
|
— |
|
— |
|
— |
|
— |
|
|
|
49 275 |
|
42 645 |
|
41 733 |
|
34 866 |
|
33 099 |
|
29 774 |
|
14 409 |
|
9 546 |
|
11 959 |
|
57 240 |
|
46 808 |
|
48 803 |
|
7 598 |
|
6 192 |
|
5 103 |
|
45 651 |
|
46 236 |
|
47 755 |
|
52 135 |
|
53 801 |
|
49 253 |
|
# Capital expenditure for international operations excludes expenditure spent on Wafi-Golpu and Eva Copper of R41 million (2022: R22 million) (2021: R34 million).
* Production statistics are unaudited.
1 The Tshepong Operations were split into Tshepong North and Tshepong South in order to optimise the profits of each operation following the halting of the sub-75 decline at Tshepong North and the resulting reduced Life of Mine. Refer to note 2 for more details.
2 The Bambanani operation closed during June 2022. The transactions in the current year relate to the inventory at 30 June 2022.
Notes to the group financial statements continued
For the year ended 30 June 2023
42 Reconciliation of segment information to consolidated income statement and balance sheet
|
|
|
|
|
|
|
|
|
|
|
|
|
|
|
SA Rand |
|
Figures in million |
2023 |
2022 |
2021 |
|
Reconciliation of production profit to consolidated profit/(loss)
before taxation |
|
|
|
|
Revenue per segment report |
47 520 |
|
41 742 |
|
40 698 |
|
|
Revenue per income statement |
49 275 |
|
42 645 |
|
41 733 |
|
|
Other metal sales treated as by-product credits in the segment report |
(1 325) |
|
(903) |
|
(1 035) |
|
|
Toll treatment services |
(430) |
|
— |
|
— |
|
|
Production costs per segment report |
(33 541) |
|
(32 196) |
|
(28 739) |
|
|
Production costs per income statement |
(34 866) |
|
(33 099) |
|
(29 774) |
|
|
Other metal sales treated as by-product credits in the segment report |
1 325 |
|
903 |
|
1 035 |
|
|
|
|
|
|
|
Production profit per segment report |
13 979 |
|
9 546 |
|
11 959 |
|
|
Revenue not included in segments |
430 |
|
— |
|
— |
|
|
Cost of sales items other than production costs |
(4 669) |
|
(8 828) |
|
(5 715) |
|
|
Amortisation and depreciation of mining assets |
(3 355) |
|
(3 622) |
|
(3 777) |
|
|
Amortisation and depreciation of assets other than mining assets |
(99) |
|
(61) |
|
(98) |
|
|
Rehabilitation expenditure |
(32) |
|
(136) |
|
(135) |
|
|
Care and maintenance cost of restructured shafts |
(227) |
|
(273) |
|
(144) |
|
|
Employment termination and restructuring costs |
(597) |
|
(218) |
|
(332) |
|
|
Share-based payments |
(51) |
|
(143) |
|
(114) |
|
|
Impairment of assets |
— |
|
(4 433) |
|
(1 124) |
|
|
Toll treatment costs |
(323) |
|
— |
|
— |
|
|
Other |
15 |
|
58 |
|
9 |
|
|
|
|
|
|
|
Gross profit |
9 740 |
|
718 |
|
6 244 |
|
|
Corporate, administration and other expenditure |
(1 044) |
|
(984) |
|
(1 068) |
|
|
Exploration expenditure |
(506) |
|
(214) |
|
(177) |
|
|
Gains/(losses) on derivatives |
(194) |
|
53 |
|
1 022 |
|
|
Foreign exchange translation gain/(loss) |
(634) |
|
(327) |
|
670 |
|
|
Other operating expenses |
(268) |
|
(1) |
|
(241) |
|
|
|
|
|
|
|
Operating profit/(loss) |
7 094 |
|
(755) |
|
6 450 |
|
|
Gain on bargain purchase |
— |
|
— |
|
303 |
|
|
Acquisition-related costs |
(214) |
|
— |
|
(124) |
|
|
Share of profit from associate |
57 |
|
63 |
|
83 |
|
|
Investment income |
663 |
|
352 |
|
331 |
|
|
Finance costs |
(994) |
|
(718) |
|
(661) |
|
|
|
|
|
|
|
Profit/(loss) before taxation |
6 606 |
|
(1 058) |
|
6 382 |
|
Notes to the group financial statements continued
For the year ended 30 June 2023
42 Reconciliation of segment information to consolidated income statement and balance sheet continued
|
|
|
|
|
|
|
|
|
|
|
|
|
|
|
SA Rand |
|
Figures in million |
2023 |
2022 |
2021 |
|
Reconciliation of total segment assets to consolidated assets
includes the following: |
|
|
|
|
Non-current assets |
|
|
|
|
Property, plant and equipment not allocated to a segment |
11 098 |
|
7 280 |
|
6 741 |
|
|
Mining assets (a) |
1 080 |
|
943 |
|
757 |
|
|
Undeveloped property (b) |
7 384 |
|
4 004 |
|
3 989 |
|
|
Other non-mining assets |
516 |
|
510 |
|
411 |
|
|
Assets under construction (c) |
2 118 |
|
1 823 |
|
1 584 |
|
|
Intangible assets |
33 |
|
48 |
|
365 |
|
|
Restricted cash and investments |
6 121 |
|
5 555 |
|
5 232 |
|
|
Investments in associates |
111 |
|
125 |
|
126 |
|
|
Deferred tax assets |
189 |
|
203 |
|
272 |
|
|
Other non-current assets |
332 |
|
374 |
|
332 |
|
|
Derivative financial assets |
269 |
|
137 |
|
328 |
|
|
Current assets |
|
|
|
|
Inventories |
3 265 |
|
2 818 |
|
2 542 |
|
|
Restricted cash and investments |
41 |
|
27 |
|
67 |
|
|
Trade and other receivables |
2 395 |
|
1 682 |
|
1 652 |
|
|
Derivative financial assets |
110 |
|
519 |
|
1 471 |
|
|
Cash and cash equivalents |
2 867 |
|
2 448 |
|
2 819 |
|
|
Total |
26 831 |
|
21 216 |
|
21 947 |
|
(a) These balances relate to Wafi-Golpu assets and assets that provide services to several CGUs, such as Harmony One Plant.
(b) Undeveloped properties comprise the Target North property, Eva Copper (refer to note 14) and Wafi-Golpu’s undeveloped properties.
(c) Assets under construction consist of the Wafi-Golpu assets.