2023Q2false0001349436--12-31http://fasb.org/us-gaap/2023#DerivativeAssetsCurrentP3Y00013494362023-01-012023-06-3000013494362023-07-27xbrli:shares00013494362023-06-30iso4217:USD00013494362022-12-31iso4217:USDxbrli:shares00013494362023-04-012023-06-3000013494362022-04-012022-06-3000013494362022-01-012022-06-300001349436us-gaap:CommonStockMember2022-12-310001349436us-gaap:WarrantMember2022-12-310001349436us-gaap:AdditionalPaidInCapitalMember2022-12-310001349436us-gaap:RetainedEarningsMember2022-12-310001349436us-gaap:CommonStockMember2023-01-012023-03-310001349436us-gaap:AdditionalPaidInCapitalMember2023-01-012023-03-3100013494362023-01-012023-03-310001349436us-gaap:RetainedEarningsMember2023-01-012023-03-310001349436us-gaap:CommonStockMember2023-03-310001349436us-gaap:WarrantMember2023-03-310001349436us-gaap:AdditionalPaidInCapitalMember2023-03-310001349436us-gaap:RetainedEarningsMember2023-03-3100013494362023-03-310001349436us-gaap:CommonStockMember2023-04-012023-06-300001349436us-gaap:AdditionalPaidInCapitalMember2023-04-012023-06-300001349436us-gaap:RetainedEarningsMember2023-04-012023-06-300001349436us-gaap:CommonStockMember2023-06-300001349436us-gaap:WarrantMember2023-06-300001349436us-gaap:AdditionalPaidInCapitalMember2023-06-300001349436us-gaap:RetainedEarningsMember2023-06-300001349436us-gaap:CommonStockMember2021-12-310001349436us-gaap:WarrantMember2021-12-310001349436us-gaap:AdditionalPaidInCapitalMember2021-12-310001349436us-gaap:RetainedEarningsMember2021-12-3100013494362021-12-310001349436us-gaap:CommonStockMember2022-01-012022-03-3100013494362022-01-012022-03-310001349436us-gaap:AdditionalPaidInCapitalMember2022-01-012022-03-310001349436us-gaap:RetainedEarningsMember2022-01-012022-03-310001349436us-gaap:CommonStockMember2022-03-310001349436us-gaap:WarrantMember2022-03-310001349436us-gaap:AdditionalPaidInCapitalMember2022-03-310001349436us-gaap:RetainedEarningsMember2022-03-3100013494362022-03-310001349436us-gaap:CommonStockMember2022-04-012022-06-300001349436us-gaap:AdditionalPaidInCapitalMember2022-04-012022-06-300001349436us-gaap:RetainedEarningsMember2022-04-012022-06-300001349436us-gaap:CommonStockMember2022-06-300001349436us-gaap:WarrantMember2022-06-300001349436us-gaap:AdditionalPaidInCapitalMember2022-06-300001349436us-gaap:RetainedEarningsMember2022-06-3000013494362022-06-300001349436us-gaap:FairValueMeasurementsRecurringMemberus-gaap:CommodityContractMember2023-06-300001349436us-gaap:FairValueMeasurementsRecurringMemberus-gaap:FairValueInputsLevel1Memberus-gaap:CommodityContractMember2022-12-310001349436us-gaap:FairValueMeasurementsRecurringMemberus-gaap:CommodityContractMemberus-gaap:FairValueInputsLevel2Member2022-12-310001349436us-gaap:FairValueMeasurementsRecurringMemberus-gaap:FairValueInputsLevel3Memberus-gaap:CommodityContractMember2022-12-310001349436us-gaap:FairValueMeasurementsRecurringMemberus-gaap:FairValueMeasuredAtNetAssetValuePerShareMemberus-gaap:CommodityContractMember2022-12-310001349436us-gaap:FairValueMeasurementsRecurringMemberus-gaap:CommodityContractMember2022-12-310001349436sd:CommodityDerivativesMember2023-06-300001349436sd:CommodityDerivativesMember2023-04-012023-06-300001349436sd:CommodityDerivativesMember2022-04-012022-06-300001349436sd:CommodityDerivativesMember2023-01-012023-06-300001349436sd:CommodityDerivativesMember2022-01-012022-06-300001349436sd:CurrentAssetsMembersd:NaturalGasAndNGLsPriceSwapsMember2022-12-310001349436us-gaap:LandMember2023-06-300001349436us-gaap:LandMember2022-12-310001349436us-gaap:ElectricTransmissionAndDistributionMember2023-06-300001349436us-gaap:ElectricTransmissionAndDistributionMember2022-12-310001349436us-gaap:OtherCapitalizedPropertyPlantAndEquipmentMember2023-06-300001349436us-gaap:OtherCapitalizedPropertyPlantAndEquipmentMember2022-12-310001349436us-gaap:BuildingMember2023-06-300001349436us-gaap:BuildingMember2022-12-310001349436us-gaap:PendingLitigationMembersd:SandRidgeMississippianTrustIMember2023-01-012023-06-30sd:individual0001349436us-gaap:PendingLitigationMembersd:SandRidgeMississippianTrustIMember2023-06-300001349436us-gaap:DomesticCountryMember2023-06-300001349436us-gaap:StateAndLocalJurisdictionMember2023-06-300001349436srt:MinimumMember2023-01-012023-06-300001349436srt:MaximumMember2023-01-012023-06-300001349436us-gaap:RestrictedStockMember2023-06-300001349436us-gaap:RestrictedStockUnitsRSUMember2023-06-300001349436us-gaap:PerformanceSharesMember2023-06-300001349436us-gaap:EmployeeStockOptionMember2023-06-300001349436sd:SeriesAWarrantsMember2023-01-012023-06-300001349436sd:SeriesBWarrantsMember2023-01-012023-06-300001349436sd:SeriesAWarrantsMember2023-06-300001349436sd:SeriesBWarrantsMember2023-06-3000013494362023-05-3100013494362023-06-072023-06-0700013494362023-05-012023-05-310001349436sd:TheTaxBenefitsPreservationPlanMember2020-07-010001349436sd:TheTaxBenefitsPreservationPlanMemberus-gaap:PreferredStockMember2020-07-01sd:shareholderxbrli:pure0001349436srt:OilReservesMember2023-04-012023-06-300001349436srt:OilReservesMember2022-04-012022-06-300001349436srt:OilReservesMember2023-01-012023-06-300001349436srt:OilReservesMember2022-01-012022-06-300001349436srt:NaturalGasReservesMember2023-04-012023-06-300001349436srt:NaturalGasReservesMember2022-04-012022-06-300001349436srt:NaturalGasReservesMember2023-01-012023-06-300001349436srt:NaturalGasReservesMember2022-01-012022-06-300001349436srt:NaturalGasLiquidsReservesMember2023-04-012023-06-300001349436srt:NaturalGasLiquidsReservesMember2022-04-012022-06-300001349436srt:NaturalGasLiquidsReservesMember2023-01-012023-06-300001349436srt:NaturalGasLiquidsReservesMember2022-01-012022-06-300001349436sd:RevenueReceivableFromContractWithCustomersMember2023-06-300001349436sd:RevenueReceivableFromContractWithCustomersMember2022-12-310001349436us-gaap:SubsequentEventMembersd:NorthwestStackPlayMember2023-07-122023-07-12sd:produceWell0001349436us-gaap:SubsequentEventMember2023-08-012023-08-01
UNITED STATES
SECURITIES AND EXCHANGE COMMISSION
Washington, D.C. 20549
(Mark One)
|
|
|
|
|
|
| ☑ |
QUARTERLY REPORT PURSUANT TO SECTION 13 OR 15(d) OF THE SECURITIES EXCHANGE ACT OF 1934 |
For the quarterly period ended June 30, 2023
OR
|
|
|
|
|
|
| ☐ |
TRANSITION REPORT PURSUANT TO SECTION 13 OR 15(d) OF THE SECURITIES EXCHANGE ACT OF 1934 |
For the transition period from to
Commission File Number: 001-33784
|
|
|
|
|
|
|
|
|
|
|
|
| SANDRIDGE ENERGY, INC. |
| (Exact name of registrant as specified in its charter) |
|
|
|
|
|
|
|
|
|
|
|
|
| Delaware |
|
20-8084793 |
(State or other jurisdiction of incorporation or organization) |
|
(I.R.S. Employer Identification No.) |
|
|
|
|
1 E. Sheridan Ave, Suite 500
Oklahoma City, Oklahoma
|
|
73104 |
(Address of principal executive offices) |
|
(Zip Code) |
Registrant’s telephone number, including area code: (405) 429-5500
Former name, former address and former fiscal year, if changed since last report: Not applicable
Securities registered pursuant to Section 12(b) of the Act:
|
|
|
|
|
|
|
|
|
|
|
|
|
|
|
| Title of each class |
|
Trading Symbol |
|
Name of each exchange on which registered |
| Common Stock, $.001 par value |
|
SD |
|
New York Stock Exchange |
Indicate by check mark whether the registrant (1) has filed all reports required to be filed by Section 13 or 15 (d) of the Securities Exchange Act of 1934 during the preceding 12 months (or for such shorter period that the registrant was required to file such reports), and (2) has been subject to such filing requirements for the past 90 days. Yes þ No o
Indicate by check mark whether the registrant has submitted electronically every Interactive Data File required to be submitted pursuant to Rule 405 of Regulation S-T during the preceding 12 months (or for such shorter period that the registrant was required to submit such files). Yes ☑ No ☐
Indicate by check mark whether the registrant is a large accelerated filer, an accelerated filer, a non-accelerated filer, a smaller reporting company, or an emerging growth company. See the definitions of “large accelerated filer,” “accelerated filer,” “smaller reporting company,” and “emerging growth company” in Rule 12b-2 of the Exchange Act.
|
|
|
|
|
|
|
|
|
|
|
|
|
|
|
| Large accelerated filer |
☐ |
|
Accelerated filer |
☑ |
| Non-accelerated filer |
☐ |
|
Smaller reporting company |
☐ |
|
|
|
Emerging growth company |
☐ |
If an emerging growth company, indicate by check mark if the registrant has elected not to use the extended transition period for complying with any new or revised financial accounting standards provided pursuant to Section 13(a) of the Exchange Act. o
Indicate by check mark whether the registrant is a shell company (as defined in Rule 12b-2 of the Exchange Act). Yes ☐ No þ
The number of shares outstanding of the registrant’s common stock, par value $0.001 per share, as of the close of business on July 27, 2023, was 36,965,688.
References in this report to the “Company,” “SandRidge,” “we,” “our,” and “us” mean SandRidge Energy, Inc., including its consolidated subsidiaries and its proportionately consolidated share of SandRidge Mississippian Trust I and SandRidge Mississippian Trust II, (collectively, the “Royalty Trusts”).
DISCLOSURES REGARDING FORWARD-LOOKING STATEMENTS
This Quarterly Report on Form 10-Q (“Quarterly Report”) of the Company includes “forward-looking statements” as defined by the SEC. These forward-looking statements may include projections and estimates concerning our capital expenditures, liquidity, capital resources and debt profile, the timing and success of specific projects, the potential impact of international negotiations on the supply and demand of oil, natural gas and natural gas liquids (“NGL”), outcomes and effects of litigation, claims and disputes, elements of our business strategy, compliance with governmental regulation of the oil, natural gas and NGL industry, including environmental regulations, acquisitions and divestitures and the potential effects on our financial condition and other statements concerning our operations, financial performance and financial condition.
Forward-looking statements are generally accompanied by words such as “estimate,” “assume,” “target,” “project,” “predict,” “believe,” “expect,” “anticipate,” “potential,” “could,” “may,” “foresee,” “plan,” “goal,” “should,” “intend” or other words that convey the uncertainty of future events or outcomes. These forward-looking statements are based on certain assumptions and analyses based on our experience and perception of historical trends, current conditions and expected future developments as well as other factors we believe are appropriate under the circumstances. Such statements are not guarantees of future performance and actual results or developments may differ materially from those projected. The Company disclaims any obligation to update or revise these forward-looking statements unless required by law, and it cautions readers not to rely on them unduly. While we consider these expectations and assumptions to be reasonable, they are inherently subject to significant business, economic, competitive, regulatory and other risks, contingencies and uncertainties relating to, among other matters, the risks and uncertainties discussed in “Risk Factors” in Item 1A of the Company’s Annual Report on Form 10-K for the fiscal year ended December 31, 2022 (the “2022 Form 10-K”) filed with the Securities and Exchange Commission on March 15, 2023 and in Item 1A of this Quarterly Report.
SANDRIDGE ENERGY, INC. AND SUBSIDIARIES
FORM 10-Q
Quarter Ended June 30, 2023
INDEX
|
|
|
|
|
|
|
|
|
|
|
|
|
ITEM 1. |
|
|
|
|
|
|
|
|
|
|
|
|
|
|
|
|
|
ITEM 2. |
|
|
ITEM 3. |
|
|
ITEM 4. |
|
|
|
|
|
|
|
|
|
ITEM 1. |
|
|
ITEM 1A. |
|
|
ITEM 2. |
|
|
ITEM 3. |
|
|
| ITEM 4. |
|
|
| ITEM 5. |
|
|
ITEM 6. |
|
|
|
|
|
PART I. Financial Information
ITEM 1. Financial Statements
SANDRIDGE ENERGY, INC. AND SUBSIDIARIES
CONDENSED CONSOLIDATED BALANCE SHEETS (Unaudited)
(In thousands)
|
|
|
|
|
|
|
|
|
|
|
|
|
June 30,
2023 |
|
December 31,
2022 |
ASSETS |
|
|
|
| Current assets |
|
|
|
| Cash and cash equivalents |
$ |
222,359 |
|
|
$ |
255,722 |
|
| Restricted cash - other |
1,668 |
|
|
1,746 |
|
| Accounts receivable, net |
23,908 |
|
|
34,735 |
|
| Derivative contracts |
— |
|
|
4,429 |
|
| Prepaid expenses |
1,815 |
|
|
523 |
|
| Other current assets |
4,744 |
|
|
7,747 |
|
| Total current assets |
254,494 |
|
|
304,902 |
|
| Oil and natural gas properties, using full cost method of accounting |
|
|
|
| Proved |
1,527,475 |
|
|
1,507,690 |
|
| Unproved |
11,565 |
|
|
11,516 |
|
| Less: accumulated depreciation, depletion and impairment |
(1,385,569) |
|
|
(1,380,574) |
|
|
153,471 |
|
|
138,632 |
|
| Other property, plant and equipment, net |
89,295 |
|
|
92,244 |
|
| Other assets |
272 |
|
|
190 |
|
| Deferred tax assets |
64,529 |
|
|
64,529 |
|
| Total assets |
$ |
562,061 |
|
|
$ |
600,497 |
|
|
|
|
|
|
|
|
|
|
|
|
|
|
|
|
|
| LIABILITIES AND SHAREHOLDERS’ EQUITY |
|
|
|
| Current liabilities |
|
|
|
| Accounts payable and accrued expenses |
$ |
39,506 |
|
|
$ |
46,335 |
|
|
|
|
|
| Asset retirement obligation |
15,647 |
|
|
16,074 |
|
| Other current liabilities |
691 |
|
|
870 |
|
| Total current liabilities |
55,844 |
|
|
63,279 |
|
|
|
|
|
| Asset retirement obligation |
49,434 |
|
|
47,635 |
|
| Other long-term obligations |
2,085 |
|
|
1,661 |
|
| Total liabilities |
107,363 |
|
|
112,575 |
|
Commitments and contingencies (Note 6) |
|
|
|
| Shareholders’ Equity |
|
|
|
Common stock, $0.001 par value; 250,000 shares authorized; 36,966 issued and outstanding at June 30, 2023 and 36,868 issued and outstanding at December 31, 2022 |
37 |
|
|
37 |
|
|
|
|
|
| Additional paid-in capital |
1,078,070 |
|
|
1,151,689 |
|
| Accumulated deficit |
(623,409) |
|
|
(663,804) |
|
| Total shareholders’ equity |
454,698 |
|
|
487,922 |
|
| Total liabilities and shareholders’ equity |
$ |
562,061 |
|
|
$ |
600,497 |
|
The accompanying notes are an integral part of these condensed consolidated financial statements.
SANDRIDGE ENERGY, INC. AND SUBSIDIARIES
CONDENSED CONSOLIDATED INCOME STATEMENTS (Unaudited)
(In thousands, except per share data)
|
|
|
|
|
|
|
|
|
|
|
|
|
|
|
|
|
|
|
|
|
|
|
|
|
Three Months Ended June 30, |
|
Six Months Ended June 30, |
|
2023 |
|
2022 |
|
2023 |
|
2022 |
| Revenues |
|
|
|
|
|
|
|
| Oil, natural gas and NGL |
$ |
33,419 |
|
|
$ |
69,760 |
|
|
$ |
76,566 |
|
|
$ |
127,247 |
|
|
|
|
|
|
|
|
|
| Total revenues |
33,419 |
|
|
69,760 |
|
|
76,566 |
|
|
127,247 |
|
| Expenses |
|
|
|
|
|
|
|
| Lease operating expenses |
8,802 |
|
|
9,512 |
|
|
20,496 |
|
|
20,374 |
|
| Production, ad valorem, and other taxes |
2,740 |
|
|
4,799 |
|
|
6,491 |
|
|
8,909 |
|
| Depreciation and depletion — oil and natural gas |
3,744 |
|
|
2,826 |
|
|
7,198 |
|
|
5,227 |
|
| Depreciation and amortization — other |
1,615 |
|
|
1,563 |
|
|
3,233 |
|
|
3,138 |
|
|
|
|
|
|
|
|
|
| General and administrative |
2,476 |
|
|
2,171 |
|
|
5,385 |
|
|
4,701 |
|
| Restructuring expenses |
262 |
|
|
433 |
|
|
301 |
|
|
642 |
|
| Employee termination benefits |
— |
|
|
— |
|
|
19 |
|
|
— |
|
| (Gain) loss on derivative contracts |
— |
|
|
— |
|
|
(1,447) |
|
|
1,064 |
|
|
|
|
|
|
|
|
|
| Other operating (income) expense |
(27) |
|
|
(51) |
|
|
(121) |
|
|
(115) |
|
| Total expenses |
19,612 |
|
|
21,253 |
|
|
41,555 |
|
|
43,940 |
|
| Income from operations |
13,807 |
|
|
48,507 |
|
|
35,011 |
|
|
83,307 |
|
| Other income (expense) |
|
|
|
|
|
|
|
| Interest income (expense), net |
2,828 |
|
|
(27) |
|
|
5,327 |
|
|
(179) |
|
| Other income, net |
2 |
|
|
12 |
|
|
57 |
|
|
88 |
|
| Total other income (expense) |
2,830 |
|
|
(15) |
|
|
5,384 |
|
|
(91) |
|
| Income before income taxes |
16,637 |
|
|
48,492 |
|
|
40,395 |
|
|
83,216 |
|
| Income tax (benefit) expense |
— |
|
|
— |
|
|
— |
|
|
— |
|
| Net income |
$ |
16,637 |
|
|
$ |
48,492 |
|
|
$ |
40,395 |
|
|
$ |
83,216 |
|
| Net income per share |
|
|
|
|
|
|
|
| Basic |
$ |
0.45 |
|
|
$ |
1.32 |
|
|
$ |
1.10 |
|
|
$ |
2.27 |
|
| Diluted |
$ |
0.45 |
|
|
$ |
1.30 |
|
|
$ |
1.09 |
|
|
$ |
2.24 |
|
| Weighted average number of common shares outstanding |
|
|
|
|
|
|
|
| Basic |
36,892 |
|
|
36,699 |
|
|
36,876 |
|
|
36,667 |
|
| Diluted |
37,097 |
|
|
37,185 |
|
|
37,085 |
|
|
37,107 |
|
The accompanying notes are an integral part of these condensed consolidated financial statements.
SANDRIDGE ENERGY, INC. AND SUBSIDIARIES
CONDENSED CONSOLIDATED STATEMENTS OF CHANGES IN SHAREHOLDERS’ EQUITY (Unaudited)
(In thousands)
|
|
|
|
|
|
|
|
|
|
|
|
|
|
|
|
|
|
|
|
|
|
|
|
|
|
|
|
|
|
|
|
|
|
|
|
|
|
|
|
|
|
|
|
|
|
|
|
|
Common Stock |
|
Warrants |
|
Additional Paid-In Capital |
|
|
|
Accumulated Deficit |
|
Total |
|
|
Shares |
|
Amount |
|
Shares |
|
Amount |
|
|
|
|
| Six Months Ended June 30, 2023 |
|
|
|
|
|
|
|
|
|
|
|
|
|
|
|
|
Balance at January 1, 2023 |
|
36,868 |
|
|
$ |
37 |
|
|
— |
|
|
$ |
— |
|
|
$ |
1,151,689 |
|
|
|
|
$ |
(663,804) |
|
|
$ |
487,922 |
|
| Issuance of stock awards, net of cancellations |
|
34 |
|
|
— |
|
|
— |
|
|
— |
|
|
— |
|
|
|
|
— |
|
|
— |
|
| Tax withholdings paid in exchange for shares withheld on employee vested stock awards |
|
— |
|
|
— |
|
|
— |
|
|
— |
|
|
(211) |
|
|
|
|
— |
|
|
(211) |
|
| Stock-based compensation |
|
— |
|
|
— |
|
|
— |
|
|
— |
|
|
396 |
|
|
|
|
— |
|
|
396 |
|
Net income |
|
— |
|
|
— |
|
|
— |
|
|
— |
|
|
— |
|
|
|
|
23,758 |
|
|
23,758 |
|
| Balance at March 31, 2023 |
|
36,902 |
|
|
$ |
37 |
|
|
— |
|
|
$ |
— |
|
|
$ |
1,151,874 |
|
|
|
|
$ |
(640,046) |
|
|
$ |
511,865 |
|
| Issuance of stock awards, net of cancellations |
|
64 |
|
|
— |
|
|
— |
|
|
— |
|
|
— |
|
|
|
|
— |
|
|
— |
|
|
|
|
|
|
|
|
|
|
|
|
|
|
|
|
|
|
| Stock-based compensation |
|
— |
|
|
— |
|
|
— |
|
|
— |
|
|
576 |
|
|
|
|
— |
|
|
576 |
|
| Dividends to shareholders |
|
— |
|
|
— |
|
|
— |
|
|
— |
|
|
(74,380) |
|
|
|
|
— |
|
|
(74,380) |
|
Net income |
|
— |
|
|
— |
|
|
— |
|
|
— |
|
|
— |
|
|
|
|
16,637 |
|
|
16,637 |
|
Balance at June 30, 2023 |
|
36,966 |
|
|
$ |
37 |
|
|
— |
|
|
$ |
— |
|
|
$ |
1,078,070 |
|
|
|
|
$ |
(623,409) |
|
|
$ |
454,698 |
|
|
|
|
|
|
|
|
|
|
|
|
|
|
|
|
|
|
|
|
|
|
|
|
|
|
|
|
|
|
|
|
|
|
|
|
|
|
|
|
|
|
|
|
|
|
|
|
|
|
|
|
|
|
|
|
|
|
|
|
|
|
|
|
|
|
|
|
|
|
|
|
|
|
|
|
|
|
|
|
|
|
|
|
|
|
| Six Months Ended June 30, 2022 |
|
|
|
|
|
|
|
|
|
|
|
|
|
|
|
|
Balance at January 1, 2022 |
|
36,675 |
|
|
$ |
37 |
|
|
6,981 |
|
|
$ |
88,520 |
|
|
$ |
1,062,737 |
|
|
|
|
$ |
(905,972) |
|
|
$ |
245,322 |
|
| Issuance of stock awards, net of cancellations |
|
51 |
|
|
— |
|
|
— |
|
|
— |
|
|
— |
|
|
|
|
— |
|
|
— |
|
| Tax withholdings paid in exchange for shares withheld on employee vested stock awards |
|
— |
|
|
— |
|
|
— |
|
|
— |
|
|
(235) |
|
|
|
|
— |
|
|
(235) |
|
| Stock-based compensation |
|
— |
|
|
— |
|
|
— |
|
|
— |
|
|
384 |
|
|
|
|
— |
|
|
384 |
|
Net income |
|
— |
|
|
— |
|
|
— |
|
|
— |
|
|
— |
|
|
|
|
34,724 |
|
|
34,724 |
|
| Balance at March 31, 2022 |
|
36,726 |
|
|
$ |
37 |
|
|
6,981 |
|
|
$ |
88,520 |
|
|
$ |
1,062,886 |
|
|
|
|
$ |
(871,248) |
|
|
$ |
280,195 |
|
| Issuance of stock awards, net of cancellations |
|
16 |
|
|
— |
|
|
— |
|
|
— |
|
|
— |
|
|
|
|
— |
|
|
— |
|
|
|
|
|
|
|
|
|
|
|
|
|
|
|
|
|
|
| Stock-based compensation |
|
— |
|
|
— |
|
|
— |
|
|
— |
|
|
440 |
|
|
|
|
— |
|
|
440 |
|
Net income |
|
— |
|
|
— |
|
|
— |
|
|
— |
|
|
— |
|
|
|
|
48,492 |
|
|
48,492 |
|
| Balance at June 30, 2022 |
|
36,742 |
|
|
$ |
37 |
|
|
$ |
6,981 |
|
|
$ |
88,520 |
|
|
$ |
1,063,326 |
|
|
|
|
$ |
(822,756) |
|
|
$ |
329,127 |
|
|
|
|
|
|
|
|
|
|
|
|
|
|
|
|
|
|
|
|
|
|
|
|
|
|
|
|
|
|
|
|
|
|
|
|
|
|
|
|
|
|
|
|
|
|
|
|
|
|
|
|
|
|
|
|
|
|
|
|
|
|
|
|
|
|
|
|
|
|
|
|
|
|
|
|
|
|
|
|
|
|
|
|
|
|
|
|
|
|
|
|
|
|
|
|
|
|
|
|
|
|
|
The accompanying notes are an integral part of these condensed consolidated financial statements.
SANDRIDGE ENERGY, INC. AND SUBSIDIARIES
CONDENSED CONSOLIDATED STATEMENTS OF CASH FLOWS (Unaudited)
(In thousands)
|
|
|
|
|
|
|
|
|
|
|
|
|
Six Months Ended June 30, |
|
2023 |
|
2022 |
| CASH FLOWS FROM OPERATING ACTIVITIES |
|
|
|
| Net income |
$ |
40,395 |
|
|
$ |
83,216 |
|
| Adjustments to reconcile net income to net cash provided by operating activities |
|
|
|
|
|
|
|
| Depreciation, depletion, and amortization |
10,431 |
|
|
8,365 |
|
|
|
|
|
|
|
|
|
|
|
|
|
|
|
|
|
|
|
|
|
|
|
|
|
|
|
|
|
| (Gain) loss on derivative contracts |
(1,447) |
|
|
1,064 |
|
| Realized settlement gains (losses) on derivative contracts |
5,876 |
|
|
(1,085) |
|
|
|
|
|
|
|
|
|
|
|
|
|
| Stock-based compensation |
946 |
|
|
754 |
|
| Other |
77 |
|
|
76 |
|
| Changes in operating assets and liabilities |
7,574 |
|
|
(13,234) |
|
| Net cash provided by operating activities |
63,852 |
|
|
79,156 |
|
| CASH FLOWS FROM INVESTING ACTIVITIES |
|
|
|
| Capital expenditures for property, plant and equipment |
(24,327) |
|
|
(11,959) |
|
| Acquisition of assets |
— |
|
|
(1,431) |
|
| Purchase of other property and equipment |
(31) |
|
|
(49) |
|
| Proceeds from sale of assets |
1,334 |
|
|
306 |
|
| Net cash used in investing activities |
(23,024) |
|
|
(13,133) |
|
| CASH FLOWS FROM FINANCING ACTIVITIES |
|
|
|
|
|
|
|
|
|
|
|
| Dividends paid to shareholders |
(73,823) |
|
|
— |
|
| Reduction of financing lease liability |
(261) |
|
|
(197) |
|
|
|
|
|
| Proceeds from exercise of stock options |
26 |
|
|
70 |
|
|
|
|
|
| Tax withholdings paid in exchange for shares withheld on employee vested stock awards |
(211) |
|
|
(235) |
|
| Net cash used in financing activities |
(74,269) |
|
|
(362) |
|
| NET (DECREASE) INCREASE IN CASH, CASH EQUIVALENTS and RESTRICTED CASH |
(33,441) |
|
|
65,661 |
|
| CASH, CASH EQUIVALENTS and RESTRICTED CASH, beginning of year |
257,468 |
|
|
139,524 |
|
| CASH, CASH EQUIVALENTS and RESTRICTED CASH, end of period |
$ |
224,027 |
|
|
$ |
205,185 |
|
| Supplemental Disclosure of Cash Flow Information |
|
|
|
| Cash paid for interest, net of amounts capitalized |
$ |
(54) |
|
|
$ |
(167) |
|
|
|
|
|
| Supplemental Disclosure of Noncash Investing and Financing Activities |
|
|
|
| Capital expenditures for property, plant and equipment in accounts payables and accrued expenses |
$ |
1,775 |
|
|
$ |
10,858 |
|
| Right-of-use assets obtained in exchange for financing lease obligations |
$ |
260 |
|
|
$ |
117 |
|
| Inventory material transfers to oil and natural gas properties |
$ |
1,205 |
|
|
$ |
— |
|
| Asset retirement obligation capitalized |
$ |
12 |
|
|
$ |
— |
|
|
|
|
|
|
|
|
|
| Dividend payable |
$ |
(557) |
|
|
$ |
— |
|
|
|
|
|
The accompanying notes are an integral part of these condensed consolidated financial statements.
SANDRIDGE ENERGY, INC. AND SUBSIDIARIES
NOTES TO CONDENSED CONSOLIDATED FINANCIAL STATEMENTS
(Unaudited)
1. Basis of Presentation
Nature of Business. SandRidge Energy, Inc. is an oil and natural gas acquisition, development and production company headquartered in Oklahoma City, Oklahoma with a principal focus on developing and producing hydrocarbon resources in the United States Mid-Continent region (“Mid-Con”).
Principles of Consolidation. The condensed consolidated financial statements include the accounts of the Company and its wholly owned or majority-owned subsidiaries, including its proportionate share of the Royalty Trusts. All intercompany accounts and transactions have been eliminated in consolidation.
Interim Financial Statements. The accompanying unaudited condensed consolidated financial statements and notes should be read in conjunction with the audited financial statements and notes contained in the Company’s 2022 Form 10-K. Certain information and disclosures normally included in financial statements prepared in accordance with accounting principles generally accepted in the United States of America (“GAAP”) have been condensed or omitted, although the Company believes that the disclosures contained herein are adequate to make the information presented not misleading. In the opinion of management, the financial statements include all adjustments, which consist of normal recurring adjustments unless otherwise disclosed, necessary to fairly state the Company’s unaudited condensed consolidated financial statements.
Significant Accounting Policies. The unaudited condensed consolidated financial statements were prepared in accordance with the accounting policies stated in the Company’s 2022 Form 10-K, as well as the items noted below.
Use of Estimates. The preparation of the unaudited condensed consolidated financial statements in conformity with GAAP requires management to make estimates and assumptions that affect the reported amounts of assets and liabilities and disclosure of contingent assets and liabilities at the date of the financial statements and the reported amounts of revenues and expenses during the reporting period.
The more significant areas requiring the use of assumptions, judgments and estimates include: oil, natural gas, and NGL reserves; impairment tests of long-lived assets; the carrying value of unproved oil and natural gas properties; depreciation, depletion and amortization; asset retirement obligations; determinations of significant alterations to the full cost pool and related estimates of fair value used to allocate the full cost pool net book value to divested properties, as necessary; valuation allowances for deferred tax assets; income taxes; valuation of derivative instruments; contingencies; and accrued revenue and related receivables. Although management believes the estimates used in the areas noted above are reasonable, actual results could differ significantly from those estimates.
2. Fair Value Measurements
The Company measures and reports certain assets and liabilities on a fair value basis and has classified and disclosed its fair value measurements using the levels of the fair value hierarchy noted below. The carrying values of cash, restricted cash, accounts receivable, prepaid expenses, accounts payable and accrued expenses and other current liabilities included in the unaudited condensed consolidated balance sheets approximated fair value at June 30, 2023 and December 31, 2022.
|
|
|
|
|
|
| Level 1 |
Unadjusted quoted prices in active markets that are accessible at the measurement date for identical, unrestricted assets or liabilities. |
|
|
| Level 2 |
Quoted prices in markets that are not active, or inputs which are observable, either directly or indirectly, for substantially the full term of the asset or liability. |
|
|
| Level 3 |
Measurement based on prices or valuation models that require inputs that are both significant to the fair value measurement and less observable from objective sources (i.e., supported by little or no market activity). |
SANDRIDGE ENERGY, INC. AND SUBSIDIARIES
NOTES TO CONDENSED CONSOLIDATED FINANCIAL STATEMENTS - CONTINUED
(Unaudited)
Assets and liabilities that are measured at fair value are classified based on the lowest level of input that is significant to the fair value measurement. The Company’s assessment of the significance of a particular input to the fair value measurement requires judgment, which may affect the valuation of the fair value of assets and liabilities and their placement within the fair value hierarchy levels. The determination of the fair values, stated below, considers the market for the Company’s financial assets and liabilities, the associated credit risk and other factors. The Company considers active markets as those in which transactions for the assets and liabilities occur in sufficient frequency and volume to provide pricing information on an ongoing basis. The Company had assets classified in Level 2 of the hierarchy as of December 31, 2022 and none as of June 30, 2023.
Level 2 Fair Value Measurements
Commodity Derivative Contracts. As applicable, the fair values of the Company’s oil, natural gas and NGL fixed price swaps are based upon inputs that are either readily available in the public market, such as oil, natural gas and NGL futures prices, volatility factors and discount rates, or can be corroborated from active markets. As applicable, if the Company has a commodity derivative contract in place, the fair value is determined through the use of a discounted cash flow model or option pricing model using the applicable inputs discussed above. The Company applies a weighted average credit default risk rating factor for its counterparties or gives effect to its credit default risk rating, as applicable, in determining the fair value of these derivative contracts. Credit default risk ratings are based on current published credit default swap rates.
Fair Value - Recurring Measurement Basis
There were no open commodity derivative contracts as of June 30, 2023. As of December 31, 2022 the following table summarizes the Company’s assets measured at fair value on a recurring basis by the fair value hierarchy (in thousands):
December 31, 2022
|
|
|
|
|
|
|
|
|
|
|
|
|
|
|
|
|
|
|
|
|
|
|
|
|
|
|
|
|
|
|
Fair Value Measurements |
|
Netting |
|
Assets at Fair Value |
|
Level 1 |
|
Level 2 |
|
Level 3 |
|
|
|
|
|
|
|
|
|
|
|
|
|
|
|
|
|
|
|
|
|
|
|
|
|
|
|
|
|
|
| Assets |
|
|
|
|
|
|
|
|
|
| Commodity derivative contracts |
$ |
— |
|
|
$ |
4,429 |
|
|
$ |
— |
|
|
$ |
— |
|
|
$ |
4,429 |
|
| Total |
$ |
— |
|
|
$ |
4,429 |
|
|
$ |
— |
|
|
$ |
— |
|
|
$ |
4,429 |
|
3. Derivatives
Commodity Derivatives
The Company is exposed to commodity price risk, which impacts the predictability of its cash flows from the sale of oil, natural gas and NGL. On occasion, the Company has attempted to manage this risk on a portion of its forecasted oil, natural gas or NGL production sales through the use of commodity derivative contracts. There were no open commodity derivative contracts as of June 30, 2023.
Historically, the Company has not designated any of its derivative contracts as hedges for accounting purposes. As applicable, if the Company has open derivative contracts, the Company has recorded such contracts at fair value with changes in derivative contract fair values recognized as a gain or loss on derivative contracts in the condensed consolidated income statements. Commodity derivative contracts were settled on a monthly basis, and the commodity derivative contract valuations were adjusted on a mark-to-market valuation basis quarterly.
SANDRIDGE ENERGY, INC. AND SUBSIDIARIES
NOTES TO CONDENSED CONSOLIDATED FINANCIAL STATEMENTS - CONTINUED
(Unaudited)
The following table summarizes derivative activity for the three and six-month periods ended June 30, 2023 and 2022 (in thousands):
|
|
|
|
|
|
|
|
|
|
|
|
|
|
|
|
|
|
|
|
|
|
|
|
|
Three Months Ended June 30, |
|
Six Months Ended June 30, |
|
2023 |
|
2022 |
|
2023 |
|
2022 |
| (Gain) loss on derivative contracts |
$ |
— |
|
|
$ |
— |
|
|
$ |
(1,447) |
|
|
$ |
1,064 |
|
| Realized settlement gains (losses) on derivative contracts |
$ |
— |
|
|
$ |
— |
|
|
$ |
5,876 |
|
|
$ |
(1,085) |
|
Master Netting Agreements and the Right of Offset. As applicable, the Company historically has had master netting agreements with all of its commodity derivative counterparties and has presented its derivative assets and liabilities with the same counterparty on a net basis in the unaudited condensed consolidated balance sheets. As a result of the netting provisions, the Company's maximum amount of loss under commodity derivative transactions due to credit risk is limited to the net amounts due from its counterparties. There were no open commodity derivatives contracts as of June 30, 2023. As of December 31, 2022, the Company’s open commodity derivative contracts were held with one counterparty.
There were no open derivative positions as of June 30, 2023. The following table summarizes (i) the Company's commodity derivative contracts on a gross basis, (ii) the effects of netting assets and liabilities for which the right of offset exists based on master netting arrangements and (iii) the Company’s net derivative asset position as of December 31, 2022 (in thousands):
|
|
|
|
|
|
|
|
|
|
|
|
|
|
|
|
|
|
|
|
|
|
|
|
|
|
|
|
|
|
|
|
|
|
|
Gross Amounts |
|
Gross Amounts Offset |
|
Amounts Net of Offset |
|
Financial Collateral |
|
Net Amount |
| Assets |
|
|
|
|
|
|
|
|
|
|
Derivative contracts - current |
|
$ |
4,429 |
|
|
$ |
— |
|
|
$ |
4,429 |
|
|
$ |
— |
|
|
$ |
4,429 |
|
Total |
|
$ |
4,429 |
|
|
$ |
— |
|
|
$ |
4,429 |
|
|
$ |
— |
|
|
$ |
4,429 |
|
Because we did not designate any of our derivative contracts as hedges for accounting purposes, changes in the fair value of our derivative contracts were recognized as gains and losses in the earnings of the relevant period. As a result, and as applicable, our current period earnings could have been significantly affected by changes in the fair value of our commodity derivative contracts. Changes in fair value were principally measured based on a comparison of future prices to the contract price at the end of the period.
Fair Value of Derivatives
The following table presents the fair value of the Company’s derivative contracts on a net basis with the same counterparty (in thousands):
|
|
|
|
|
|
|
|
|
|
|
|
|
|
|
|
|
| Type of Contract |
|
Balance Sheet Classification |
|
December 31, 2022 |
|
|
|
|
|
|
|
|
|
|
|
|
|
|
|
|
|
|
|
|
|
|
|
|
|
|
|
|
|
|
|
|
|
|
|
|
|
|
|
|
|
|
|
|
| Natural Gas |
|
Current assets - Derivative Contracts |
|
$ |
4,429 |
|
|
|
|
|
|
|
|
|
|
|
|
|
|
|
|
|
| Total net derivative contracts |
|
$ |
4,429 |
|
|
|
See Note 2 for additional discussion of the fair value measurement of the Company’s derivative contracts.
SANDRIDGE ENERGY, INC. AND SUBSIDIARIES
NOTES TO CONDENSED CONSOLIDATED FINANCIAL STATEMENTS - CONTINUED
(Unaudited)
4. Property, Plant and Equipment
Property, plant and equipment consists of the following (in thousands):
|
|
|
|
|
|
|
|
|
|
|
|
|
June 30,
2023 |
|
December 31,
2022 |
Oil and natural gas properties |
|
|
|
Proved |
$ |
1,527,475 |
|
|
$ |
1,507,690 |
|
Unproved |
11,565 |
|
|
11,516 |
|
Total oil and natural gas properties |
1,539,040 |
|
|
1,519,206 |
|
| Less: accumulated depreciation, depletion and impairment |
(1,385,569) |
|
|
(1,380,574) |
|
| Net oil and natural gas properties |
153,471 |
|
|
138,632 |
|
|
|
|
|
| Land |
200 |
|
|
200 |
|
| Electrical infrastructure |
121,819 |
|
|
121,819 |
|
| Other non-oil and natural gas equipment |
1,658 |
|
|
1,644 |
|
| Building and structures |
3,603 |
|
|
3,603 |
|
| Financing leases |
1,347 |
|
|
1,468 |
|
| Total |
128,627 |
|
|
128,734 |
|
| Less: accumulated depreciation and amortization |
(39,332) |
|
|
(36,490) |
|
Other property, plant and equipment, net |
89,295 |
|
|
92,244 |
|
Total property, plant and equipment, net |
$ |
242,766 |
|
|
$ |
230,876 |
|
5. Accounts Payable and Accrued Expenses
Accounts payable and accrued expenses consist of the following (in thousands):
|
|
|
|
|
|
|
|
|
|
|
|
|
|
June 30,
2023 |
|
|
December 31,
2022 |
| Accounts payable and other accrued expenses |
$ |
13,500 |
|
|
|
$ |
17,989 |
|
| Production payable |
22,521 |
|
|
|
22,290 |
|
| Payroll and benefits |
2,889 |
|
|
|
3,471 |
|
| Taxes payable |
596 |
|
|
|
2,585 |
|
|
|
|
|
|
|
|
|
|
|
|
|
|
|
|
| Total accounts payable and accrued expenses |
$ |
39,506 |
|
|
|
$ |
46,335 |
|
6. Commitments and Contingencies
Included below is a discussion of the Company's various future commitments and contingencies as of June 30, 2023. The Company has provided accruals where necessary for contingent liabilities, based on ASC 450, Contingencies, when it has determined that a liability is probable and reasonably estimable. The Company continuously assesses the potential liability related to the Company's pending litigation and revises its estimates when additional information becomes available. Additionally, the Company currently expenses all legal costs as they are incurred. The commitments and contingencies under these arrangements are not recorded in the accompanying consolidated balance sheets.
Legal Proceedings. As previously disclosed, on May 16, 2016, the Company and certain of its direct and indirect subsidiaries (collectively, the “Debtors”) filed voluntary petitions for reorganization under Chapter 11 of the United States Bankruptcy Code in the United States Bankruptcy Court for the Southern District of Texas (the “Bankruptcy Court”). The Bankruptcy Court confirmed the joint plan of organization (the “Plan”) of the Debtors on September 9, 2016, and the Debtors subsequently emerged from bankruptcy on October 4, 2016.
Pursuant to the Plan, claims against the Company were discharged without recovery in each of the following consolidated cases (the “Cases”):
SANDRIDGE ENERGY, INC. AND SUBSIDIARIES
NOTES TO CONDENSED CONSOLIDATED FINANCIAL STATEMENTS - CONTINUED
(Unaudited)
• In re SandRidge Energy, Inc. Securities Litigation, Case No. 5:12-cv-01341-LRW, USDC, Western District of Oklahoma (“In re SandRidge Energy, Inc. Securities Litigation”); and
• Ivan Nibur, Lawrence Ross, Jase Luna, Matthew Willenbucher, and the Duane & Virginia Lanier Trust v. SandRidge Mississippian Trust I, et al., Case No. 5:15-cv-00634-SLP, USDC, Western District of Oklahoma (“Lanier Trust”)
Both cases were settled with all defendants except the SandRidge Mississippian Trust I (“the Trust”), which is being sued by a class of purchasers of units under Sections 11, 12(a)(2), and 15 of the Securities Act of 1933 and Sections 10(b) and 20(a) of the Securities Exchange Act of 1934, and Rule 10b-5 promulgated thereunder, based on allegations that the Trust, made misrepresentations or omissions concerning various topics including the performance of wells operated by the Company. The Company is contractually obligated to indemnify the Trust for losses, claims, damages, liabilities and expenses, including reasonable costs of investigation and attorney’s fees and expenses, which it is required to advance. Such indemnification is not covered by insurance. Considering the status of the Lanier Trust matter, and the facts, circumstances and legal theories relating thereto, the Company is not able to determine the likelihood of an outcome or provide an estimate of any reasonably possible loss or range of possible loss related thereto. However, such losses, if incurred, could be material. The Company has not established any liabilities relating to the Lanier Trust matter and believes that the plaintiffs’ claims are without merit.
Separately, the Company had received a demand by two of the settling individual defendants to fund a proposed settlement of $17 million with those defendants. The Company refused and filed an action in Oklahoma state court seeking a declaratory judgment that the defendants were not entitled to indemnification. The insurance carriers funded the settlement of $17 million and filed a counterclaim, which seeks reimbursement of the $17 million settlement, with each carrier to receive their funded portion of the $17 million. The Company disputes any liability, as it believes it has meritorious defenses. Considering the status of this matter, and the facts, circumstances and legal theories thereto, the Company is not able to determine the likelihood of an outcome. The Company has not established any liabilities relating to this matter.
In addition to the matters described above, the Company is involved in various lawsuits, claims and proceedings, which are being handled and defended by the Company in the ordinary course of business.
7. Income Taxes
For each interim reporting period, the Company estimates the effective tax rate expected for the full fiscal year and uses that estimated rate in providing for income taxes on a current year-to-date basis.
Deferred income taxes are provided to reflect the future tax consequences of temporary differences between the tax basis of assets and liabilities and their reported amounts in the financial statements. In assessing the realizability of the deferred tax assets, we consider whether it is more likely than not that some or all of the deferred tax assets will not be realized. The ultimate realization of the deferred tax assets is dependent upon the generation of future income in periods in which the deferred tax assets can be utilized. In prior years, we determined that the deferred tax assets did not meet the more likely than not threshold of being utilized and thus recorded a valuation allowance. During the year ended December 31, 2022, we partially released our valuation allowance on our deferred tax assets by $64.5 million. We anticipate being able to utilize these deferred tax assets based on the generation of future income. A change in the estimate of future income could cause the valuation allowance to be adjusted in subsequent periods. The Company had no federal or state income tax expense or benefit for the three and six-month periods ended June 30, 2023 and 2022.
Internal Revenue Code (“IRC”) Section 382 addresses company ownership changes and specifically limits the utilization of certain deductions and other tax attributes on an annual basis following an ownership change. As a result of the Chapter 11 reorganization and related transactions, the Company experienced an ownership change within the meaning of IRC Section 382 during 2016 that subjected certain of the Company’s tax attributes, including net operating losses (“NOLs”), to an IRC Section 382 limitation. This limitation has not resulted in cash taxes for any period subsequent to the ownership change. Since the 2016 ownership change, the Company has generated additional NOLs and other tax attributes that are not currently subject to an IRC Section 382 limitation. The Company adopted the Tax Benefits Preservation Plan, as amended on March 16, 2021, and June 20, 2023, in order to protect the Company’s ability to use its tax NOLs and certain other tax benefits.
SANDRIDGE ENERGY, INC. AND SUBSIDIARIES
NOTES TO CONDENSED CONSOLIDATED FINANCIAL STATEMENTS - CONTINUED
(Unaudited)
As of June 30, 2023, the Company had approximately $1.6 billion of federal NOL carryforwards, net of NOLs expected to expire unused due to the 2016 IRC Section 382 limitation. Of the $1.6 billion of federal NOL carryforwards, $0.7 billion expire during the years 2025 through 2037, while the remaining $0.9 billion do not have an expiration date. In addition, the Company had approximately $1.1 billion of state NOL carryforwards, net of NOLs expected to expire unused due to the 2016 IRC Section 382 limitation. Of the $1.1 billion in state NOL carryforwards, approximately $200.0 million are derived from states the Company currently does not operate in. Of the remaining state NOL carryforwards, $658.1 million do not have an expiration date and $247.0 million expire during the years 2026 through 2037. Additionally, the Company had federal tax credits in excess of $33.5 million which begin expiring in 2029.
The Company did not have unrecognized tax benefits at June 30, 2023 and December 31, 2022.
The Company’s only taxing jurisdiction is the United States (federal and state). The Company’s tax years 2019 to present remain open for federal examination. Additionally, tax years 2005 through 2018 remain subject to examination for the purpose of determining the amount of federal NOL and other carryforwards. The number of years open for state tax audits varies, depending on the state, but are generally from three to five years.
8. Equity
Capital Stock and Equity Awards. Our authorized capital stock consists of 300 million shares, which include 250 million shares of common stock, $0.001 par value per share (“Common Stock”) and 50 million shares of preferred stock, par value $0.001 per share. At June 30, 2023, the Company had 37.0 million shares of common stock issued and outstanding. Further, at June 30, 2023, the Company had 0.1 million of unvested restricted stock awards, 0.3 million shares of unvested restricted stock units, an immaterial amount of unvested performance share units, and 0.2 million unvested stock options outstanding.
Warrants. During the fourth quarter of 2016, the Company issued approximately 4.9 million Series A warrants and 2.1 million Series B warrants to certain holders of general unsecured claims as defined in the 2016 bankruptcy reorganization plan. These warrants were exercisable until October 4, 2022 for one share of common stock per warrant at initial exercise prices of $41.34 and $42.03 per share, respectively, subject to adjustments pursuant to the terms of the warrants. The warrants contained customary anti-dilution adjustments in the event of any stock split, reverse stock split, reclassification, stock dividend or other distributions. Upon expiration, the entirety of the 4.9 million Series A warrants and 2.1 million Series B warrants were cancelled and the carrying value was transferred to Additional paid-in capital in the accompanying condensed consolidated balance sheets.
Share Repurchase Program. In May 2023, the Company's Board of Directors (the “Board”) approved a share repurchase program (the “Program”) authorizing the Company to repurchase up to an aggregate of $75.0 million of the Company’s outstanding common stock with the Company’s cash on hand. The Program replaced the prior share repurchase program previously approved by the Board in August 2021. Purchases under the Program are intended to meet the requirements of Rule 10b5-1 of the Exchange Act. The Program does not require any specific number of shares to be acquired, and can be modified or discontinued by the Board at any time. The Company did not repurchase any common stock under the Program during the three and six-month periods ended June 30, 2023. There were no repurchases for the three and six-month periods ended June 30, 2023 under the Company’s prior share repurchase program.
Dividends. In May 2023, the Board approved a one-time cash dividend of $2.00 per share of the Company’s common stock, which was paid on June 7, 2023 to shareholders of record as of the close of business on May 24, 2023. The aggregate total payout was approximately $73.8 million. Additionally, in May 2023, the Board announced that it plans a regular quarterly dividend of $0.10 per share of the Company’s common stock, to commence after the second quarter and to be first payable in August 2023, subject to quarterly approval by the Board.
SANDRIDGE ENERGY, INC. AND SUBSIDIARIES
NOTES TO CONDENSED CONSOLIDATED FINANCIAL STATEMENTS - CONTINUED
(Unaudited)
The Tax Benefits Preservation Plan. On July 1, 2020, the Board declared a dividend distribution of one right (a “Right”) for each outstanding share of Company Common Stock to shareholders of record at the close of business on July 13, 2020. On June 20, 2023, the Company entered into an amendment to the Tax Benefits Preservation Plan to extend the expiration time of the Tax Benefits Preservation Plan from July 1, 2023 to July 1, 2026. Each Right entitles its holder, under certain circumstances, to purchase from the Company one one-thousandth of a share of Series A Junior Participating Preferred Stock of the Company, par value $0.001 per share, at an exercise price of $5.00 per Right, subject to adjustment. The description and terms of the Rights are set forth in the tax benefits preservation plan, dated as of July 1, 2020, as amended, between the Company and American Stock Transfer & Trust Company, LLC, as rights agent (and any successor rights agent, the “Rights Agent”). The Tax Benefits Preservation Plan will expire on the earliest of: (i) the time at which the Rights are redeemed pursuant to the Tax Benefits Preservation Plan, (ii) the time at which the Rights are exchanged pursuant to the Tax Benefits Preservation Plan, (iii) the closing of any merger or other acquisition transaction involving the Company pursuant to an agreement of the type described in Section 13(f) of the Tax Benefits Preservation Plan, at which time, the Rights are terminated, (iv) the time at which the Board determines that the NOLs are utilized in all material respects or that an ownership change under Section 382 would not adversely impact in any material respect the time period in which the Company could use the NOLs, or materially impair the amount of the NOLs that could be used by the Company in any particular time period, for applicable tax purposes and (v) the Close of Business on July 1, 2026. The Board plans to request shareholder approval for the Tax Benefits Preservation Plan at the 2024 annual meeting.
The Company adopted the Tax Benefits Preservation Plan, as amended on March 16, 2021, and June 20, 2023, in order to protect shareholder value against a possible limitation on the Company’s ability to use its tax net operating losses (the “NOLs”) and certain other tax benefits to reduce potential future U.S. federal income tax obligations. The NOLs are a valuable asset to the Company, which may inure to the benefit of the Company and its shareholders. However, if the Company experiences an “ownership change,” as defined in Section 382 of the Internal Revenue Code of 1986, as amended (the “Code”), its ability to fully utilize the NOLs and certain other tax benefits will be substantially limited and the timing of the usage of the NOLs and such other benefits could be substantially delayed, which could significantly impair the value of those assets. Generally, an “ownership change” occurs if the percentage of the Company’s stock owned by one or more of its “five-percent shareholders” (as such term is defined in Section 382 of the Code) increases by more than 50 percentage points over the lowest percentage of stock owned by such shareholder or shareholders at any time over a three-year period. The Tax Benefits Preservation Plan is intended to prevent against such an “ownership change” by deterring any person or group from acquiring beneficial ownership of 4.9% or more of the Company’s securities.
9. Revenues
The following table disaggregates the Company’s revenue by source for the three and six-month periods ended June 30, 2023 and 2022:
|
|
|
|
|
|
|
|
|
|
|
|
|
|
|
|
|
|
|
|
|
|
|
|
|
Three Months Ended June 30, |
|
Six Months Ended June 30, |
|
2023 |
|
2022 |
|
2023 |
|
2022 |
|
|
|
|
|
|
|
|
|
(In thousands) |
| Oil |
$ |
19,584 |
|
|
$ |
22,602 |
|
|
$ |
38,994 |
|
|
$ |
42,383 |
|
| Natural gas |
6,805 |
|
|
27,705 |
|
|
20,195 |
|
|
47,669 |
|
| NGL |
7,030 |
|
|
19,453 |
|
|
17,377 |
|
|
37,195 |
|
|
|
|
|
|
|
|
|
| Total revenues |
$ |
33,419 |
|
|
$ |
69,760 |
|
|
$ |
76,566 |
|
|
$ |
127,247 |
|
Oil, natural gas and NGL revenues. The Company’s revenues come from the sale of oil, natural gas and NGLs and are recorded at a point in time when control of the oil, natural gas and NGL production passes to the purchaser at the inlet of the processing plant or pipeline, or the delivery point for onloading to a delivery truck. As the Company’s purchaser obtains control of the production prior to selling it to other end customers, the Company presents its revenues on a net basis, rather than on a gross basis.
SANDRIDGE ENERGY, INC. AND SUBSIDIARIES
NOTES TO CONDENSED CONSOLIDATED FINANCIAL STATEMENTS - CONTINUED
(Unaudited)
Pricing for the Company’s oil, natural gas and NGL contracts is variable and is based on either an index price, net of deductions, or a percentage of the sales price obtained by the purchaser. The transaction price is allocated on a pro-rata basis to each unit of oil, natural gas or NGL sold based on the terms of the contract. oil, natural gas and NGL revenues are also recorded net of royalties, discounts and allowances, and transportation costs, as applicable. Taxes assessed by governmental authorities on oil, natural gas and NGL sales are presented separately from revenues and are included in production, ad valorem, and other tax expense in the condensed consolidated income statements.
Revenues Receivable. The Company records an asset in accounts receivable, net on its condensed consolidated balance sheet for revenues receivable from contracts with purchasers at the end of each period. Pricing for revenues receivable is estimated using current month crude oil, natural gas and NGL prices, net of deductions. Revenues receivable are typically collected the month after the Company delivers the related production to its purchaser. As of June 30, 2023 and December 31, 2022, the Company had revenues receivable of $13.5 million and $21.8 million, respectively. The Company did not record any bad debt expense on revenues receivable nor write-offs during the three and six and six-month periods ended June 30, 2023 and 2022, as the Company’s purchasers of oil, natural gas and NGL have had no issues of payment collectability or lack of credit worthiness with the Company.
SANDRIDGE ENERGY, INC. AND SUBSIDIARIES
NOTES TO CONDENSED CONSOLIDATED FINANCIAL STATEMENTS - CONTINUED
(Unaudited)
10. Earnings per Share
The following table summarizes the calculation of weighted average common shares outstanding used in the computation of diluted earnings per share:
|
|
|
|
|
|
|
|
|
|
|
|
|
|
|
|
Earnings |
|
Weighted Average Shares |
Earnings Per Share |
|
|
|
|
|
|
(In thousands, except per share amounts) |
| Three Months Ended June 30, 2023 |
|
|
|
|
Basic earnings per share |
$ |
16,637 |
|
|
36,892 |
|
$ |
0.45 |
|
| Effect of dilutive securities |
|
|
|
|
| Restricted stock units |
— |
|
|
177 |
|
|
| Restricted stock awards |
— |
|
|
— |
|
|
| Performance share units (1) |
— |
|
|
— |
|
|
| Stock options |
— |
|
|
28 |
|
|
|
|
|
|
|
Diluted earnings per share (2) |
$ |
16,637 |
|
|
37,097 |
|
$ |
0.45 |
|
| Three Months Ended June 30, 2022 |
|
|
|
|
| Basic earnings per share |
$ |
48,492 |
|
|
36,699 |
|
$ |
1.32 |
|
| Effect of dilutive securities |
|
|
|
|
| Restricted stock units |
— |
|
|
339 |
|
|
| Restricted stock awards |
— |
|
|
34 |
|
|
| Performance share units (1) |
— |
|
|
— |
|
|
| Stock options |
— |
|
|
113 |
|
|
|
|
|
|
|
Diluted earnings per share (2) |
$ |
48,492 |
|
|
37,185 |
|
$ |
1.30 |
|
| Six Months Ended June 30, 2023 |
|
|
|
|
Basic earnings per share |
$ |
40,395 |
|
|
36,876 |
|
$ |
1.10 |
|
| Effect of dilutive securities |
|
|
|
|
| Restricted stock units |
— |
|
|
168 |
|
|
| Restricted stock awards |
— |
|
|
— |
|
|
| Performance share units (1) |
— |
|
|
— |
|
|
| Stock options |
— |
|
|
41 |
|
|
|
|
|
|
|
Diluted earnings per share (2) |
$ |
40,395 |
|
|
37,085 |
|
$ |
1.09 |
|
| Six Months Ended June 30, 2022 |
|
|
|
|
| Basic earnings per share |
$ |
83,216 |
|
|
36,667 |
|
$ |
2.27 |
|
| Effect of dilutive securities |
|
|
|
|
| Restricted stock units |
— |
|
|
323 |
|
|
| Restricted stock awards |
|
|
42 |
|
|
| Performance share units (1) |
— |
|
|
— |
|
|
| Stock options |
— |
|
|
75 |
|
|
|
|
|
|
|
Diluted earnings per share (2) |
$ |
83,216 |
|
|
37,107 |
|
$ |
2.24 |
|
____________________
(1)The performance share unit awards are contingently issuable and are considered in the calculation of diluted earnings per share. The Company assesses the number of awards that would be issuable, if any, under the terms of the agreement if the end of the reporting period were the end of the contingency period.
(2)The incremental shares of potentially dilutive restricted stock units and stock options were included for the three and six-month periods ended June 30, 2023 and 2022 as their effect was dilutive under the treasury stock method.
SANDRIDGE ENERGY, INC. AND SUBSIDIARIES
NOTES TO CONDENSED CONSOLIDATED FINANCIAL STATEMENTS - CONTINUED
(Unaudited)
11. Subsequent Events
On July 11, 2023, the Company closed an acquisition that increased its interest in twenty-six producing wells operated by the Company within the Northwest Stack play for approximately $11.3 million, with an effective date of April 1, 2023.
On August 1, 2023, the Board declared a cash dividend of $0.10 per share of the Company’s Common Stock, payable on August 28, 2023 to shareholders of record on August 14, 2023.
ITEM 2. Management’s Discussion and Analysis of Financial Condition and Results of Operations
Introduction
The following discussion and analysis is intended to help the reader understand our business, financial condition, results of operations, liquidity and capital resources. This discussion and analysis should be read in conjunction with the accompanying unaudited condensed consolidated financial statements and the accompanying notes included in this Quarterly Report, as well as our audited consolidated financial statements and the accompanying notes included in the 2022 Form 10-K. Our discussion and analysis includes the following subjects:
•Overview;
•Consolidated Results of Operations;
•Liquidity and Capital Resources; and
•Critical Accounting Policies and Estimates.
The financial information with respect to the three and six-month periods ended June 30, 2023 and 2022, discussed below, is unaudited. In the opinion of management, this information contains all adjustments, which consist only of normal recurring adjustments unless otherwise disclosed, necessary to state fairly the accompanying unaudited condensed consolidated financial statements. The results of operations for the interim periods are not necessarily indicative of the results of operations for the full fiscal year.
Overview
We are an independent oil and natural gas company with a principal focus on acquisition, development and production activities in the U.S. Mid-Continent region (“Mid-Con”).
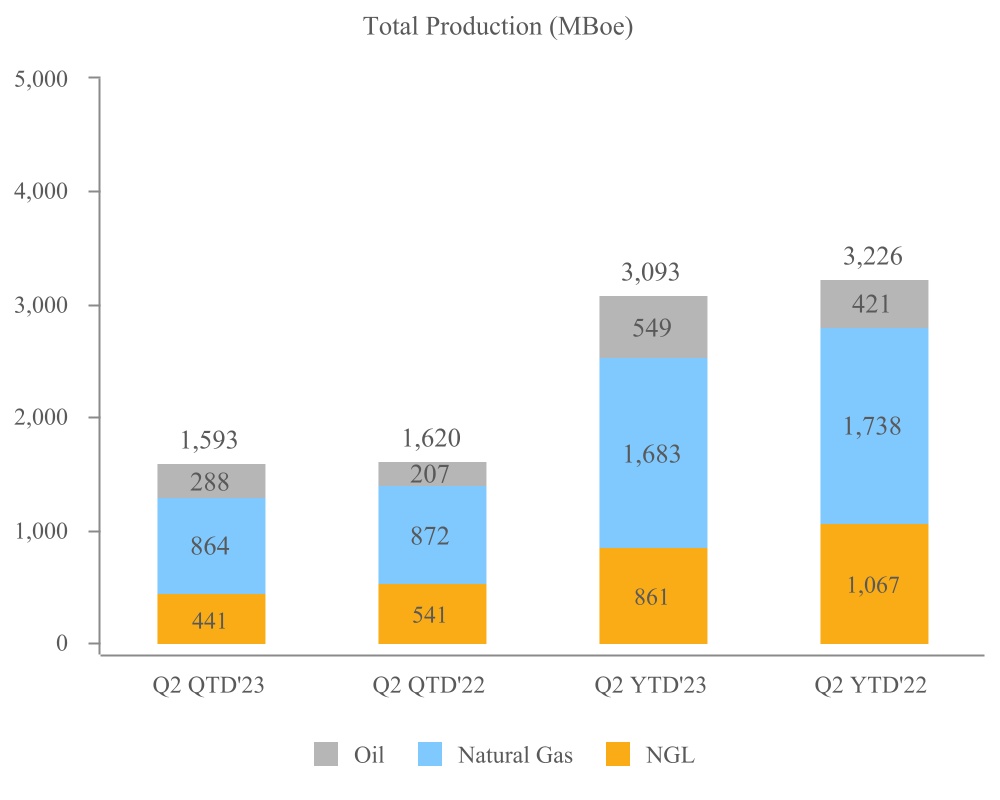
The chart below shows production by product for the three and six-month periods ended June 30, 2023 and 2022:
Total MBoe production for the three-month period ended June 30, 2023 was comprised of approximately 18.1% oil, 54.2% natural gas and 27.7% NGL compared to 12.8% oil, 53.8% natural gas and 33.4% NGL in 2022. The increase in oil production was primarily driven by the newly drilled wells as part of the Company’s capital development program. The decrease in total MBoe was primarily driven by a reduction of NGL production, as one of the Company’s purchasers elected to retain more ethane in the natural gas stream, which had more favorable market pricing at the time of sales.
Total MBoe production for the six-month period ended June 30, 2023 was comprised of approximately 17.8% oil, 54.4% natural gas and 27.8% NGL compared to 13.1% oil, 53.8% natural gas and 33.1% NGL in 2022.
Recent Events
•In May 2023, the Board approved a one-time cash dividend of $2.00 per share of the Company’s common stock, which was paid on June 7, 2023 to shareholders of record as of the close of business on May 24, 2023. The aggregate total payout was approximately $73.8 million. Additionally, in May 2023, the Board announced that it plans a regular quarterly dividend of $0.10 per share of the Company’s common stock, to commence after the second quarter and to be first payable in August 2023, subject to quarterly approval by the Board.
•In May 2023, the Board approved a stock buyback program authorizing the repurchase of up to $75 million of the Company’s outstanding common stock in open market transactions.
•On July 12, 2023, the Company announced the closing of an acquisition which increases its interest in twenty-six producing wells operated by the Company within the Northwest Stack play for approximately $11.3 million, with an effective date of April 1, 2023. Average net production associated with the acquired interests for the first quarter of 2023 was approximately 500 barrels of oil equivalent per day (~30% oil). We expect the low decline profile and oilier content associated with these properties and interests further strengthen the Company’s commodity price realizations, operating margins and cash flow.
•On August 1, 2023, the Board declared a cash dividend of $0.10 per share of the Company’s common stock, payable on August 28, 2023 to shareholders of record on August 14, 2023.
Outlook
We will continue to focus on growing the cash value generation capability of our asset base in a safe, responsible and efficient manner, while exercising prudent capital allocations to projects we believe provide high rates of returns in the current commodity price environment. These projects include (1) a continuation of our well reactivation program, (2) artificial lift conversions to more efficient and cost effective systems and (3) limited opportunistic leasing in proven areas around or adjacent to our area of operations that could further bolster future development. Given near term commodity price dynamics, and that our Mid-Con assets are 99% held by production, which preserves the tenor of our development option, we concluded our drilling and completion program in the second quarter of 2023. We will continue to monitor forward-looking commodity prices, results, costs and other factors that could influence returns on investments, which will continue to shape our disciplined development decisions in 2023 and beyond. We will also continue to maintain optionality to execute on value accretive merger and acquisition opportunities that could bring synergies, leverage our core competencies, compliment our portfolio of assets, further utilize our NOLs or otherwise yield attractive returns for our shareholders.
Consolidated Results of Operations
Our consolidated revenues and cash flows are generated from the production and sale of oil, natural gas and NGL. Our revenues, profitability and future growth depend substantially on prevailing prices received for our production, the quantity of oil, natural gas and NGL we produce, and our ability to find and economically develop and produce our reserves. Prices for oil, natural gas and NGL fluctuate widely and are difficult to predict. To provide information on the general trend in pricing, the average New York Mercantile Exchange ("NYMEX") prices for oil and natural gas are shown in the tables below:
|
|
|
|
|
|
|
|
|
|
|
|
|
|
|
|
|
|
|
|
|
|
|
|
|
|
|
|
|
|
|
|
|
|
|
|
|
|
|
|
|
|
|
|
|
|
|
Three-month periods ended |
|
|
|
|
|
|
June 30, 2023 |
|
March 31, 2023 |
|
December 31, 2022 |
|
September 30, 2022 |
|
June 30, 2022 |
|
|
|
|
| NYMEX Oil (per Bbl) |
|
|
|
|
|
$ |
73.54 |
|
|
$ |
75.93 |
|
|
$ |
82.79 |
|
|
$ |
93.06 |
|
|
$ |
108.83 |
|
|
|
|
|
| NYMEX Natural gas (per Mcf) |
|
|
|
|
|
$ |
2.26 |
|
|
$ |
2.74 |
|
|
$ |
5.76 |
|
|
$ |
8.32 |
|
|
$ |
7.76 |
|
|
|
|
|
In order to reduce our exposure to price fluctuations, from time to time we may enter into commodity derivative contracts for a portion of our anticipated future oil, natural gas and NGL production as discussed in
“Item 3. Quantitative and Qualitative Disclosures About Market Risk.” During periods where the strike prices for our commodity derivative contracts are below market prices at the time of settlement, we may not fully benefit from increases in the market price of oil and natural gas. Conversely, during periods of declining oil and natural gas market prices, our commodity derivative contracts may partially offset declining revenues and cash flows to the extent strike prices for our contracts are above market prices at the time of settlement. See
“Note 3 — Derivatives” to the accompanying unaudited condensed consolidated financial statements included in this Quarterly Report for additional information regarding our commodity derivatives.
Revenues
Consolidated revenues for the three and six-month periods ended June 30, 2023 and 2022 are presented in the table below (in thousands):
|
|
|
|
|
|
|
|
|
|
|
|
|
|
|
|
|
|
|
|
|
|
|
|
|
|
|
|
|
|
|
|
|
|
|
|
|
|
|
|
|
Three Months Ended June 30, |
|
Six Months Ended June 30, |
|
2023 |
|
2022 |
|
Change |
|
|
|
2023 |
|
2022 |
|
Change |
|
|
| Oil |
$ |
19,584 |
|
|
$ |
22,602 |
|
|
$ |
(3,018) |
|
|
|
|
$ |
38,994 |
|
|
$ |
42,383 |
|
|
$ |
(3,389) |
|
|
|
| Natural gas |
6,805 |
|
|
27,705 |
|
|
(20,900) |
|
|
|
|
20,195 |
|
|
47,669 |
|
|
(27,474) |
|
|
|
| NGL |
7,030 |
|
|
19,453 |
|
|
(12,423) |
|
|
|
|
17,377 |
|
|
37,195 |
|
|
(19,818) |
|
|
|
|
|
|
|
|
|
|
|
|
|
|
|
|
|
|
|
| Total revenues |
$ |
33,419 |
|
|
$ |
69,760 |
|
|
$ |
(36,341) |
|
|
|
|
$ |
76,566 |
|
|
$ |
127,247 |
|
|
$ |
(50,681) |
|
|
|
Oil, Natural Gas and NGL Production and Pricing
Our production and pricing information for the three and six-month periods ended June 30, 2023 and 2022 is shown in the
table below:
|
|
|
|
|
|
|
|
|
|
|
|
|
|
|
|
|
|
|
|
|
|
|
|
|
|
|
|
|
|
|
|
|
|
|
|
|
|
|
|
|
Three Months Ended June 30, |
|
Six Months Ended June 30, |
|
|
|
|
|
|
|
|
|
|
|
|
|
|
|
|
|
2023 |
|
2022 |
|
Change |
|
|
|
2023 |
|
2022 |
|
Change |
|
|
| Production data |
|
|
|
|
|
|
|
|
|
|
|
|
|
|
|
| Oil (MBbls) |
288 |
|
|
207 |
|
|
81 |
|
|
|
|
549 |
|
|
421 |
|
|
128 |
|
|
|
| Natural gas (MMcf) |
5,185 |
|
|
5,231 |
|
|
(46) |
|
|
|
|
10,097 |
|
|
10,426 |
|
|
(329) |
|
|
|
| NGL (MBbls) |
441 |
|
|
541 |
|
|
(100) |
|
|
|
|
861 |
|
|
1,067 |
|
|
(206) |
|
|
|
| Total volumes (MBoe) |
1,593 |
|
|
1,620 |
|
|
(27) |
|
|
|
|
3,093 |
|
|
3,226 |
|
|
(133) |
|
|
|
| Average daily total volumes (MBoe/d) |
17.5 |
|
|
17.8 |
|
|
(0.3) |
|
|
|
|
17.1 |
|
|
17.8 |
|
|
(0.7) |
|
|
|
| Average prices—as reported (1) |
|
|
|
|
|
|
|
|
|
|
|
|
|
|
|
| Oil (per Bbl) |
$ |
68.02 |
|
|
$ |
109.06 |
|
|
$ |
(41.04) |
|
|
|
|
$ |
70.99 |
|
|
$ |
100.57 |
|
|
$ |
(29.58) |
|
|
|
| Natural gas (per Mcf) |
$ |
1.31 |
|
|
$ |
5.30 |
|
|
$ |
(3.99) |
|
|
|
|
$ |
2.00 |
|
|
$ |
4.57 |
|
|
$ |
(2.57) |
|
|
|
| NGL (per Bbl) |
$ |
15.97 |
|
|
$ |
35.96 |
|
|
$ |
(19.99) |
|
|
|
|
$ |
20.19 |
|
|
$ |
34.86 |
|
|
$ |
(14.67) |
|
|
|
| Total (per Boe) |
$ |
20.99 |
|
|
$ |
43.07 |
|
|
$ |
(22.08) |
|
|
|
|
$ |
24.76 |
|
|
$ |
39.45 |
|
|
$ |
(14.69) |
|
|
|
| Average prices—including impact of derivative contract settlements |
|
|
|
|
|
|
|
|
|
|
|
|
|
|
|
| Oil (per Bbl) |
$ |
68.02 |
|
|
$ |
109.06 |
|
|
$ |
(41.04) |
|
|
|
|
$ |
70.99 |
|
|
$ |
100.57 |
|
|
$ |
(29.58) |
|
|
|
| Natural gas (per Mcf) |
$ |
1.31 |
|
|
$ |
5.30 |
|
|
$ |
(3.99) |
|
|
|
|
$ |
2.58 |
|
|
$ |
4.50 |
|
|
$ |
(1.92) |
|
|
|
| NGL (per Bbl) |
$ |
15.97 |
|
|
$ |
35.96 |
|
|
$ |
(19.99) |
|
|
|
|
$ |
20.19 |
|
|
$ |
34.57 |
|
|
$ |
(14.38) |
|
|
|
| Total (per Boe) |
$ |
20.99 |
|
|
$ |
43.07 |
|
|
$ |
(22.08) |
|
|
|
|
$ |
26.66 |
|
|
$ |
39.11 |
|
|
$ |
(12.45) |
|
|
|
__________________
(1) Prices represent actual average sales prices for the periods presented and do not include effects of derivative settlements.
Variances in oil, natural gas and NGL revenues attributable to changes in the average prices received for our production and total production volumes sold for the three and six-month periods ended June 30, 2023 are shown in the table below (in thousands):
|
|
|
|
|
|
|
|
|
|
|
|
|
Three Months Ended June 30, 2023 |
|
Six Months Ended June 30, 2023 |
| 2022 oil, natural gas and NGL revenues |
$ |
69,760 |
|
|
$ |
127,247 |
|
| Change due to production volumes |
(588) |
|
|
(3,318) |
|
| Change due to average prices |
(35,753) |
|
|
(47,363) |
|
| 2023 oil, natural gas and NGL revenues |
$ |
33,419 |
|
|
$ |
76,566 |
|
Revenue for the three and six-month periods ended June 30, 2023 decreased almost entirely due to a reduction in commodity prices. See "Item 1A—Risk Factors" included in our 2022 Form 10-K for additional discussion of the potential impact these events may have on our future revenues.
Operating Expenses
Operating expenses for the three and six-month periods ended June 30, 2023 and 2022 consisted of the following (in thousands):
|
|
|
|
|
|
|
|
|
|
|
|
|
|
|
|
|
|
|
|
|
|
|
|
|
|
|
|
|
|
|
|
|
|
|
|
|
|
|
|
|
Three Months Ended June 30, |
|
Six Months Ended June 30, |
|
|
|
|
|
|
|
|
|
|
|
|
|
|
|
|
|
2023 |
|
2022 |
|
Change |
|
|
|
2023 |
|
2022 |
|
Change |
|
|
|
|
|
|
|
|
|
|
|
|
|
|
|
|
|
|
| Lease operating expenses |
$ |
8,802 |
|
|
$ |
9,512 |
|
|
$ |
(710) |
|
|
|
|
$ |
20,496 |
|
|
$ |
20,374 |
|
|
$ |
122 |
|
|
|
| Production, ad valorem, and other taxes |
2,740 |
|
|
4,799 |
|
|
(2,059) |
|
|
|
|
6,491 |
|
|
8,909 |
|
|
(2,418) |
|
|
|
| Depreciation and depletion—oil and natural gas |
3,744 |
|
|
2,826 |
|
|
918 |
|
|
|
|
7,198 |
|
|
5,227 |
|
|
1,971 |
|
|
|
| Depreciation and amortization—other |
1,615 |
|
|
1,563 |
|
|
52 |
|
|
|
|
3,233 |
|
|
3,138 |
|
|
95 |
|
|
|
| Total operating expenses |
$ |
16,901 |
|
|
$ |
18,700 |
|
|
$ |
(1,799) |
|
|
|
|
$ |
37,418 |
|
|
$ |
37,648 |
|
|
$ |
(230) |
|
|
|
|
|
|
|
|
|
|
|
|
|
|
|
|
|
|
|
| Lease operating expenses ($/Boe) |
$ |
5.53 |
|
|
$ |
5.87 |
|
|
$ |
(0.34) |
|
|
|
|
$ |
6.63 |
|
|
$ |
6.32 |
|
|
$ |
0.31 |
|
|
|
| Production, ad valorem, and other taxes ($/Boe) |
$ |
1.72 |
|
|
$ |
2.96 |
|
|
$ |
(1.24) |
|
|
|
|
$ |
2.10 |
|
|
$ |
2.76 |
|
|
$ |
(0.66) |
|
|
|
| Depreciation and depletion—oil and natural gas ($/Boe) |
$ |
2.35 |
|
|
$ |
1.74 |
|
|
$ |
0.61 |
|
|
|
|
$ |
2.33 |
|
|
$ |
1.62 |
|
|
$ |
0.71 |
|
|
|
| Production, ad valorem, and other taxes (% of oil, natural gas and NGL revenue) |
8.2 |
% |
|
6.9 |
% |
|
1.3 |
% |
|
|
|
8.5 |
% |
|
7.0 |
% |
|
1.5 |
% |
|
|
The decrease in lease operating expenses for the three-month period ended June 30, 2023 was primarily due to a reduction in utility costs and lower workover expenses. Despite market driven inflationary pressures and higher production costs associated with more producing wells from the Company’s well reactivation and development programs, lease operating expenses for the six-month period ended June 30, 2023 were kept relatively consistent, compared to the same period in 2022.
Production, ad valorem, and other taxes for the three and six-month periods ended June 30, 2023 decreased primarily due to lower commodity prices and related revenues. Production, ad valorem, and other taxes for the three and six-month periods ended June 30, 2023 increased as a percentage of oil, natural gas and NGL revenue due to an increase in ad valorem taxes as a result of higher oil and gas property valuation assessments by local jurisdictions who use historical commodity price averages that were higher than current commodity prices, when determining ad valorem tax assessments.
The increase in depreciation and depletion for oil and natural gas properties was primarily the result of capital expenditures for the third quarter of 2022 through the second quarter of 2023 and a decrease in proved reserves at June 30, 2023, primarily as a result of lower SEC prices (as defined below), which increased our depletion rate.
Impairment
A ceiling limitation calculation is performed at the end of each quarter. If the full cost pool balance exceeds the ceiling limitation, an impairment of the full cost pool is required. Calculation of the full cost ceiling test is based on, among other factors, trailing twelve-month first-day-of-the-month index prices (“SEC prices”) as adjusted for price differentials and other contractual arrangements. The SEC prices utilized in the calculation of proved reserves included in the full cost ceiling test at June 30, 2023 were $82.82 per barrel of oil and $4.76 per MMBtu of natural gas, before price differential adjustments.
The ceiling limitation was not exceeded; therefore, no full cost ceiling limitation impairments were recorded during the three and six-month periods ended June 30, 2023 or 2022. During certain periods within the past five years, the SEC prices used in the full cost ceiling test have been lower than the SEC prices used for the June 30, 2023 full cost ceiling test and resulted in material ceiling limitation impairments. Full cost pool ceiling limitation impairments have no impact to our cash flow or liquidity.
Based on the SEC prices over the trailing ten months ended July 31, 2023, as well as two months of NYMEX strip pricing for August and September of 2023 as of July 18, 2023, we estimate the SEC prices utilized in the September 30, 2023 full cost ceiling test may be $77.22 per barrel of oil and $3.43 per MMBtu of natural gas (the "estimated third quarter prices"). Applying these estimated third quarter prices, and holding all other inputs constant to those used in the calculation of our June 30, 2023 ceiling test, we expect that no full cost ceiling limitation impairment is indicated for the third quarter of 2023.
Any actual full cost ceiling limitation impairment recognized in future quarters may fluctuate significantly from projected amounts based on the outcome of numerous other factors such as declines in the actual trailing twelve-month SEC prices, lower NGL pricing, changes in estimated future development costs and operating expenses, and other adjustments to our levels of proved reserves.
Other Operating Expenses
Other operating expenses for the three and six-month periods ended June 30, 2023 and 2022 consisted of the following (in thousands):
|
|
|
|
|
|
|
|
|
|
|
|
|
|
|
|
|
|
|
|
|
|
|
|
|
|
|
|
|
|
|
|
|
|
|
|
|
|
|
|
|
Three Months Ended June 30, |
|
Six Months Ended June 30, |
|
|
|
|
|
|
|
|
|
|
|
|
|
|
|
|
|
2023 |
|
2022 |
|
Change |
|
|
|
2023 |
|
2022 |
|
Change |
|
|
| General and administrative |
$ |
2,476 |
|
|
$ |
2,171 |
|
|
$ |
305 |
|
|
|
|
$ |
5,385 |
|
|
$ |
4,701 |
|
|
$ |
684 |
|
|
|
| Restructuring expenses |
262 |
|
|
433 |
|
|
(171) |
|
|
|
|
301 |
|
|
642 |
|
|
(341) |
|
|
|
| Employee termination benefits |
— |
|
|
— |
|
|
— |
|
|
|
|
19 |
|
|
— |
|
|
19 |
|
|
|
| (Gain) loss on derivative contracts |
— |
|
|
— |
|
|
— |
|
|
|
|
(1,447) |
|
|
1,064 |
|
|
(2,511) |
|
|
|
|
|
|
|
|
|
|
|
|
|
|
|
|
|
|
|
| Other operating (income) expense |
(27) |
|
|
(51) |
|
|
24 |
|
|
|
|
(121) |
|
|
(115) |
|
|
(6) |
|
|
|
| Total other operating expenses |
$ |
2,711 |
|
|
$ |
2,553 |
|
|
$ |
158 |
|
|
|
|
$ |
4,137 |
|
|
$ |
6,292 |
|
|
$ |
(2,155) |
|
|
|
The change in general and administrative expenses for the three and six-month periods ended June 30, 2023 is primarily due to a one-time $0.4 million legal retainer refund received in the second quarter of 2022, related to the 2016 bankruptcy, which lowered general and administrative expenses for the three and six-month periods ended June 30, 2022.
The following table summarizes derivative activity for the three and six-month periods ended June 30, 2023 and 2022 (in thousands):
|
|
|
|
|
|
|
|
|
|
|
|
|
|
|
|
|
|
|
|
|
|
|
|
|
Three Months Ended June 30, |
|
Six Months Ended June 30, |
|
2023 |
|
2022 |
|
2023 |
|
2022 |
| (Gain) loss on derivative contracts |
$ |
— |
|
|
$ |
— |
|
|
$ |
(1,447) |
|
|
$ |
1,064 |
|
| Realized settlement gains (losses) on derivative contracts |
$ |
— |
|
|
$ |
— |
|
|
$ |
5,876 |
|
|
$ |
(1,085) |
|
As applicable, our derivative contracts were not designated as accounting hedges and, as a result, changes in their fair values were recorded each quarter as a component of operating expenses. Internally, management has historically viewed the settlement of commodity derivative contracts at contractual maturity as adjustments to the price received for oil, natural gas and NGL production to determine “effective prices.” In general, cash is received on settlement of contracts due to lower oil and natural gas prices at the time of settlement, compared to the contract price for our commodity derivative contracts; and, cash is paid on settlement of contracts due to higher oil, natural gas and NGL prices at the time of settlement, compared to the contract price for our commodity derivative contracts. See further discussion of derivative contracts in
“Item 3. Quantitative and Qualitative Disclosures about Market Risk” included in Part I of this Quarterly Report.
Other Income (Expense)
Our other income (expense) for the three and six-month periods ended June 30, 2023 and 2022 are presented in the table below (in thousands):
|
|
|
|
|
|
|
|
|
|
|
|
|
|
|
|
|
|
|
|
|
|
|
|
|
Three Months Ended June 30, |
|
Six Months Ended June 30, |
|
2023 |
|
2022 |
|
2023 |
|
2022 |
Other income (expense) |
|
|
|
|
|
|
|
| Interest income (expense), net |
$ |
2,828 |
|
|
$ |
(27) |
|
|
$ |
5,327 |
|
|
$ |
(179) |
|
| Other income, net |
2 |
|
|
12 |
|
|
57 |
|
|
88 |
|
| Total other income (expense) |
$ |
2,830 |
|
|
$ |
(15) |
|
|
$ |
5,384 |
|
|
$ |
(91) |
|
Interest income (expense), net during the three and six-month periods ended June 30, 2023 is primarily comprised of interest income received from cash deposits. Interest expense incurred during the three and six-month ended June 30, 2022 is primarily comprised of interest related to letters of credit and interest paid on royalty obligations.
Liquidity and Capital Resources
As of June 30, 2023, our cash and cash equivalents, including restricted cash was $224.0 million. For the next twelve months, we expect to have ample liquidity with cash on hand and cash from operations. We had no outstanding term or revolving debt obligations as of June 30, 2023.
Working Capital and Sources and Uses of Cash
Our principal sources of liquidity for the next year include cash flows from operations and cash on hand.
Our working capital decreased to $198.7 million at June 30, 2023, compared to $241.6 million at December 31, 2022. The decrease in working capital was primarily the result of a decrease in cash and cash equivalents due to our dividend payment to shareholders of $73.8 million and $24.3 million in capital expenditures, offset by cash flows from operations.
In May 2023, the Board approved a one-time cash dividend of $2.00 per share of the Company’s common stock, which was paid on June 7, 2023 to shareholders of record as of the close of business on May 24, 2023. The aggregate total payout was approximately $73.8 million. Additionally, in May 2023, the Board announced that it plans a regular quarterly dividend of $0.10 per share of the Company’s common stock, to commence after the second quarter and to be first payable in August 2023, subject to quarterly approval by the Board.
Cash Flows
Our cash flows from operations are substantially dependent on current and future prices for oil, natural gas and NGL, which historically have been, and may continue to be, volatile. Cash flows from operations are also affected by timing of cash receipts and disbursements and changes in other working capital assets and liabilities.
Our cash flows for the six-month periods ended June 30, 2023 and 2022 are presented in the following table and discussed below (in thousands):
|
|
|
|
|
|
|
|
|
|
|
|
|
Six Months Ended June 30, |
|
2023 |
|
2022 |
| Cash flows provided by operating activities |
$ |
63,852 |
|
|
$ |
79,156 |
|
| Cash flows used in investing activities |
(23,024) |
|
|
(13,133) |
|
| Cash flows used in financing activities |
(74,269) |
|
|
(362) |
|
| Net (decrease) increase in cash and cash equivalents and restricted cash |
$ |
(33,441) |
|
|
$ |
65,661 |
|
Cash Flows from Operating Activities
The $15.3 million decrease in cash flows from operations for the six-month period ended June 30, 2023 compared to the same period in 2022 is primarily due to a decrease in revenues from lower commodity prices and production.
Cash Flows from Investing Activities
Our cash flows used in investing activities during the six-month period ended June 30, 2023 reflects capital expenditures of $24.3 million primarily related to capital expenditures made for drilling, capital workovers, and well reactivations. We received $1.3 million of proceeds from the sale of equipment related to our oil and gas assets.
Our cash flows used in investing activities during the six-month period ended June 30, 2022 reflects capital expenditures of $12.0 million primarily related to capital expenditures made for drilling, capital workovers, well reactivations, inventory purchases and $1.4 million related to an acquisition of proved reserves, which increased interests in properties operated by the Company. We received $0.3 million of proceeds from the sale of assets.
Capital expenditures for the six-month periods ended June 30, 2023 and 2022 are summarized below (in thousands):
|
|
|
|
|
|
|
|
|
|
|
|
|
Six Months Ended June 30, |
|
2023 |
|
2022 |
| Capital Expenditures |
|
|
|
| Drilling and completion |
$ |
18,481 |
|
|
$ |
16,185 |
|
| Capital workovers |
2,866 |
|
|
4,974 |
|
| Leasehold and geophysical |
(191) |
|
|
629 |
|
|
|
|
|
|
|
|
|
| Capital expenditures (on an accrual basis) |
21,156 |
|
|
21,788 |
|
| Acquisitions |
— |
|
|
1,431 |
|
| Capital expenditures, including acquisitions |
21,156 |
|
|
23,219 |
|
| Changes in accounts payable and accrued expenses |
4,376 |
|
|
(9,829) |
|
| Inventory material transfers to oil and natural gas properties |
(1,205) |
|
|
— |
|
| Total cash paid for capital expenditures |
$ |
24,327 |
|
|
$ |
13,390 |
|
Cash Flows from Financing Activities
Cash used in financing activities for the six-month period ended June 30, 2023 consisted primarily of $73.8 million in cash dividends, $0.2 million of cash used for tax withholdings paid in exchange for shares withheld on employee vested stock awards that were settled by net exercise, and finance lease payments of $0.3 million. Cash used in financing activities for the six-month period ended June 30, 2022 consisted primarily of $0.2 million of cash used to pay employee tax obligations, for vested stock awards that were settled by net exercise, and finance lease payments of $0.2 million offset by immaterial proceeds from the exercise of stock options. Net exercises of stock awards allows the holder of a stock award to tender back to us a number of shares at fair value upon the vesting of such stock award, that equals the employee payroll tax obligation due. We then remit a cash payment to the relevant taxing authority on behalf of the employee for their payroll tax obligations resulting from the vesting of their stock award.
Contractual Obligations and Off-Balance Sheet Arrangements
At June 30, 2023, our contractual obligations included asset retirement obligations, leases and other individually insignificant obligations. Additionally, we have certain financial instruments representing potential commitments that were incurred in the normal course of business to support our operations, including surety bonds. The underlying liabilities insured by these instruments are reflected in our balance sheets, where applicable. Therefore, no additional liability is reflected for the surety bonds or other instruments.
There were no other significant changes in total contractual obligations and off-balance sheet arrangements from those reported in the 2022 Form 10-K.
Critical Accounting Policies and Estimates
ITEM 3. Quantitative and Qualitative Disclosures About Market Risk
General
This discussion provides information about the financial instruments we have historically used to manage commodity prices. All contracts were settled in cash and did not require the actual delivery of a commodity at settlement. Additionally, our exposure to credit risk and interest rate risk is also discussed.
Commodity Price Risk. Our most significant market risk relates to the prices we receive for our oil, natural gas and NGLs. Due to the historical price volatility of these commodities, from time to time, we have historically entered, depending upon our view of opportunities under the then-prevailing current market conditions, we enter into commodity derivative contracts for a portion of our anticipated production volumes for the purpose of reducing the impact of the variability of oil and natural gas prices.
We have used, and may use, a variety of commodity-based derivative contracts, including fixed price swaps, basis swaps and collars. At June 30, 2023, we had no open commodity derivative contracts or obligations to enter into commodity derivative contracts.
Because we historically have not designated any of our derivative contracts as hedges for accounting purposes, changes in the fair value of our derivative contracts were recognized as gains and losses in current period earnings. As a result, and when applicable, current period earnings could have been significantly affected by changes in the fair value of our commodity derivative contracts. Changes in fair value were principally measured based on a comparison of future prices to the contract price at the end of the period.
The following table summarizes derivative activity for the three and six-month periods ended June 30, 2023 and 2022 (in thousands):
|
|
|
|
|
|
|
|
|
|
|
|
|
|
|
|
|
|
|
|
|
|
|
|
|
Three Months Ended June 30, |
|
Six Months Ended June 30, |
|
2023 |
|
2022 |
|
2023 |
|
2022 |
| (Gain) loss on derivative contracts |
$ |
— |
|
|
$ |
— |
|
|
$ |
(1,447) |
|
|
$ |
1,064 |
|
| Realized settlement gains (losses) on derivative contracts |
$ |
— |
|
|
$ |
— |
|
|
$ |
5,876 |
|
|
$ |
(1,085) |
|
See
“Note 3 — Derivatives” to the accompanying unaudited condensed consolidated financial statements included in this Quarterly Report for additional information regarding our commodity derivatives.
Credit Risk. As applicable, we were exposed to credit risk related to counterparties to our derivative financial contracts. All of our derivative transactions have been carried out in the over-the-counter market. The use of derivative transactions in over-the-counter markets involves the risk that the counterparties may be unable to meet the financial terms of the transactions. The counterparties for all of our derivative transactions have had an “investment grade” credit rating. We have historically monitored the credit ratings of our derivative counterparties and considered our counterparties’ credit default risk ratings in determining the fair value of our derivative contracts. Our derivative contracts have historically been with multiple counterparties to minimize exposure to any individual counterparty, and in addition our counterparties have been large financial institutions.
We did not require collateral or other security from counterparties to support derivative instruments. We historically had master netting agreements with our derivative contract counterparties, which allowed us to net our derivative assets and liabilities by commodity type with the same counterparty. As a result of the netting provisions, our maximum amount of loss under derivative transactions due to credit risk was limited to the net amounts due from the counterparties under the commodity derivative contracts. Therefore, we were not required to post additional collateral under our commodity derivative contracts.
We are also exposed to credit risk related to the collection of receivables from our joint interest partners for their proportionate share of expenditures on wells and properties we operate. Historically, our credit losses on joint interest receivables have been immaterial.
ITEM 4. Controls and Procedures
Disclosure Controls and Procedures
Under the supervision and with the participation of the Company’s management, including the Company’s CEO and CFO, the Company performed an evaluation of the effectiveness of the design and operation of its disclosure controls and procedures pursuant to Exchange Act Rules 13a-15 and 15d-15 as of the end of the period covered by this Quarterly Report. Based on that evaluation, the Company’s CEO and CFO concluded that the Company’s disclosure controls and procedures were effective as of June 30, 2023, to provide reasonable assurance that the information required to be disclosed by the Company in its reports filed or submitted under the Exchange Act is recorded, processed, summarized and reported within the time periods specified in the rules and forms of the Securities and Exchange Commission, and such information is accumulated and communicated to management, as appropriate to allow timely decisions regarding required disclosure.
Changes in Internal Control Over Financial Reporting
There was no change in the Company’s internal control over financial reporting during the quarter ended June 30, 2023 that has materially affected, or is reasonably likely to materially affect, the Company’s internal control over financial reporting.
PART II. Other Information
ITEM 1. Legal Proceedings
See "Note 6—Commitments and Contingencies” to the accompanying condensed consolidated financial statements in Part I, Item 1 of this Quarterly Report.
ITEM 1A. Risk Factors
Information regarding our risk factors appears in Item 1A. of our 2022 Form 10-K for the year ended December 31, 2022. These risk factors describe some of the assumptions, risks, uncertainties and other factors that could adversely affect our business or that could otherwise result in changes that differ materially from our expectations. In addition, the following amends our discussion of risk factors contained our 2022 Form 10-K for the year ended December 31, 2022:
Adverse developments and instability in financial institutions and markets may adversely impact our business and financial condition.
The global macroeconomic environment could be negatively affected by, among other things, disruptions to the banking system and financial market volatility resulting from recent bank failures and actions to reduce inflation. The Company utilizes and typically maintains material balances of cash and cash equivalents and is therefore reliant on banks and financial institutions to safeguard and allow ready access to these assets. The Company has approximately $224.0 million in cash and cash equivalents as of June 30, 2023 held by various financial institutions.
We maintain cash and cash equivalents at banks and third-party financial institutions in excess of Federal Deposit Insurance Corporation insurance limits. Accordingly, the failure of a bank, or other adverse conditions in the financial markets, impacting the institutions or counterparties with which the Company, or its customers or vendors, maintain deposits or financing activities, could impact our timely access to liquid assets or its financial performance. There are no assurances or guarantees that deposits greater than the Federal Deposit Insurance Corporation limits will be protected by the U.S. government or that any bank, government or financial institution will be able to obtain the needed liquidity in the event of a failure or similar crisis. If financial institutions are unable to provide timely access to deposits and funds, the Company may be required to seek additional financing which may not be available. As a result of uncertainty in the broader financial markets, there may be additional impacts to our business that cannot be predicted at this time.
ITEM 2. Unregistered Sales of Equity Securities and Use of Proceeds
Our current equity-based compensation plans include provisions that allow for the “net exercise” of share-settled vested awards by all plan participants. In a net exercise, any required payroll taxes, federal withholding taxes and exercise price of the shares due from the share-based award holders are settled by having the holder tender back to us a number of shares at fair value equal to the amounts due. Net exercises are treated as purchases and retirements of shares. There were no share repurchases made by the Company during the three month-period ended June 30, 2023.
ITEM 3. Defaults Upon Senior Securities
None.
ITEM 4. Mine Safety Disclosures
Not applicable.
ITEM 5. Other Information
None.
ITEM 6. Exhibits
|
|
|
|
|
|
|
|
|
|
|
|
|
|
|
|
|
|
|
|
|
|
|
|
|
|
|
|
|
|
|
|
|
|
|
Incorporated by Reference |
|
|
|
Exhibit
No.
|
Exhibit Description |
Form |
|
SEC
File No.
|
|
Exhibit |
|
Filing Date |
|
Filed
Herewith
|
| 2.1 |
|
8-A |
|
001-33784 |
|
2.1 |
|
10/4/2016 |
|
|
| 3.1 |
|
8-A |
|
001-33784 |
|
3.1 |
|
10/4/2016 |
|
|
| 3.2 |
|
8-A |
|
001-33784 |
|
3.2 |
|
10/4/2016 |
|
|
| 4.1 |
|
8-K |
|
001-33784 |
|
4.1 |
|
6/20/2023 |
|
|
| 22.1 |
|
10-K |
|
001-33784 |
|
22.1 |
|
3/4/2021 |
|
|
| 31.1 |
|
|
|
|
|
|
|
|
|
* |
| 31.2 |
|
|
|
|
|
|
|
|
|
* |
| 32.1 |
|
|
|
|
|
|
|
|
|
* |
| 101.INS |
XBRL Instance Document - the instance document does not appear in the Interactive Data File because its XBRL tags are embedded within the Inline XBRL document. |
|
|
|
|
|
|
|
|
* |
| 101.SCH |
XBRL Taxonomy Extension Schema Document |
|
|
|
|
|
|
|
|
* |
| 101.CAL |
XBRL Taxonomy Extension Calculation Linkbase Document |
|
|
|
|
|
|
|
|
* |
| 101.DEF |
XBRL Taxonomy Extension Definition Document |
|
|
|
|
|
|
|
|
* |
| 101.LAB |
XBRL Taxonomy Extension Label Linkbase Document |
|
|
|
|
|
|
|
|
* |
| 101.PRE |
XBRL Taxonomy Extension Presentation Linkbase Document |
|
|
|
|
|
|
|
|
* |
| 104 |
Cover Page Interactive Data File (formatted as Inline XBRL and contained in Exhibit 101) |
|
|
|
|
|
|
|
|
* |
|
|
|
|
|
|
|
|
|
|
SIGNATURE
Pursuant to the requirements of the Securities Exchange Act of 1934, the registrant has duly caused this report to be signed on its behalf by the undersigned thereunto duly authorized.
|
|
|
|
|
|
|
|
|
|
SandRidge Energy, Inc. |
|
|
|
Date: August 3, 2023 |
By: |
/s/ Salah Gamoudi |
|
|
Salah Gamoudi
Executive Vice President, Chief Financial Officer and Chief Accounting Officer (Principal Financial and Accounting Officer)
|
EX-31.1
2
ex311ceo302certification06.htm
EX-31.1
Document
Exhibit 31.1
Certification of the Company’s Chief Executive Officer Pursuant to
Section 302 of the Sarbanes-Oxley Act of 2002 (18 U.S.C. Section 7241)
I, Grayson Pranin, certify that:
1.I have reviewed this quarterly report on Form 10-Q of SandRidge Energy, Inc.;
2.Based on my knowledge, this report does not contain any untrue statement of a material fact or omit to state a material fact necessary to make the statements made, in light of the circumstances under which such statements were made, not misleading with respect to the period covered by this report;
3.Based on my knowledge, the financial statements, and other financial information included in this report, fairly present in all material respects the financial condition, results of operations and cash flows of the registrant as of, and for, the periods presented in this report;
4.The registrant’s other certifying officer and I are responsible for establishing and maintaining disclosure controls and procedures (as defined in Exchange Act Rules 13a-15(e) and 15d-15(e)) and internal control over financial reporting (as defined in Exchange Act Rules 13a-15(f) and 15d-15(f)) for the registrant and have:
a.Designed such disclosure controls and procedures, or caused such disclosure controls and procedures to be designed under our supervision, to ensure that material information relating to the registrant, including its consolidated subsidiaries, is made known to us by others within those entities, particularly during the period in which this report is being prepared;
b.Designed such internal control over financial reporting, or caused such internal control over financial reporting to be designed under our supervision, to provide reasonable assurance regarding the reliability of financial reporting and the preparation of financial statements for external purposes in accordance with generally accepted accounting principles;
c.Evaluated the effectiveness of the registrant’s disclosure controls and procedures and presented in this report our conclusions about the effectiveness of the disclosure controls and procedures, as of the end of the period covered by this report based on such evaluation; and
d.Disclosed in this report any change in the registrant’s internal control over financial reporting that occurred during the registrant’s most recent fiscal quarter (the registrant’s fourth quarter in the case of an annual report) that has materially affected, or is reasonably likely to materially affect, the registrant’s internal control over financial reporting; and
5.The registrant’s other certifying officer and I have disclosed, based on our most recent evaluation of internal control over financial reporting, to the registrant’s auditors and the audit committee of the registrant’s board of directors (or persons performing the equivalent functions):
a.All significant deficiencies and material weaknesses in the design or operation of internal control over financial reporting which are reasonably likely to adversely affect the registrant’s ability to record, process, summarize and report financial information; and
b.Any fraud, whether or not material, that involves management or other employees who have a significant role in the registrant’s internal control over financial reporting.
|
|
|
/s/ Grayson Pranin |
Grayson Pranin |
President, Chief Executive Officer and Chief Operating Officer |
Date: August 3, 2023
EX-31.2
3
ex312cfo302certification06.htm
EX-31.2
Document
Exhibit 31.2
Certification of the Company’s Chief Financial Officer Pursuant to
Section 302 of the Sarbanes-Oxley Act of 2002 (18 U.S.C. Section 7241)
I, Salah Gamoudi, certify that:
1.I have reviewed this quarterly report on Form 10-Q of SandRidge Energy, Inc.;
2.Based on my knowledge, this report does not contain any untrue statement of a material fact or omit to state a material fact necessary to make the statements made, in light of the circumstances under which such statements were made, not misleading with respect to the period covered by this report;
3.Based on my knowledge, the financial statements, and other financial information included in this report, fairly present in all material respects the financial condition, results of operations and cash flows of the registrant as of, and for, the periods presented in this report;
4.The registrant’s other certifying officer and I are responsible for establishing and maintaining disclosure controls and procedures (as defined in Exchange Act Rules 13a-15(e) and 15d-15(e)) and internal control over financial reporting (as defined in Exchange Act Rules 13a-15(f) and 15d-15(f)) for the registrant and have:
a.Designed such disclosure controls and procedures, or caused such disclosure controls and procedures to be designed under our supervision, to ensure that material information relating to the registrant, including its consolidated subsidiaries, is made known to us by others within those entities, particularly during the period in which this report is being prepared;
b.Designed such internal control over financial reporting, or caused such internal control over financial reporting to be designed under our supervision, to provide reasonable assurance regarding the reliability of financial reporting and the preparation of financial statements for external purposes in accordance with generally accepted accounting principles;
c.Evaluated the effectiveness of the registrant’s disclosure controls and procedures and presented in this report our conclusions about the effectiveness of the disclosure controls and procedures, as of the end of the period covered by this report based on such evaluation; and
d.Disclosed in this report any change in the registrant’s internal control over financial reporting that occurred during the registrant’s most recent fiscal quarter (the registrant’s fourth quarter in the case of an annual report) that has materially affected, or is reasonably likely to materially affect, the registrant’s internal control over financial reporting; and
5.The registrant’s other certifying officer and I have disclosed, based on our most recent evaluation of internal control over financial reporting, to the registrant’s auditors and the audit committee of the registrant’s board of directors (or persons performing the equivalent functions):
a.All significant deficiencies and material weaknesses in the design or operation of internal control over financial reporting which are reasonably likely to adversely affect the registrant’s ability to record, process, summarize and report financial information; and
b.Any fraud, whether or not material, that involves management or other employees who have a significant role in the registrant’s internal control over financial reporting.
|
|
|
| /s/ Salah Gamoudi |
| Salah Gamoudi |
| Executive Vice President, Chief Financial Officer and Chief Accounting Officer |
Date: August 3, 2023
EX-32.1
4
ex321section906certificati.htm
EX-32.1
Document
Exhibit 32.1
Certification of the Company’s Chief Executive Officer and Chief Financial Officer Pursuant to
Section 906 of the Sarbanes-Oxley Act of 2002 (18 U.S.C. Section 1350)
Pursuant to 18 U.S.C. § 1350, the undersigned officers of SandRidge Energy, Inc. (the “Company”), hereby certify that the Company’s Quarterly Report on Form 10-Q for the quarterly period ended June 30, 2023 (the “Report”), fully complies with the requirements of Section 13(a) or 15(d), as applicable, of the Securities Exchange Act of 1934 and that the information contained in the Report fairly presents, in all material respects, the financial condition and results of operations of the Company.
|
|
|
/s/ Grayson Pranin |
Grayson Pranin |
President, Chief Executive Officer and Chief Operating Officer |
August 3, 2023
|
|
|
| /s/ Salah Gamoudi |
| Salah Gamoudi |
| Executive Vice President, Chief Financial Officer and Chief Accounting Officer |
August 3, 2023