false2023FY0001176948--12-31http://fasb.org/us-gaap/2022#AccountsPayableAndAccruedLiabilitiesCurrentAndNoncurrenthttp://fasb.org/us-gaap/2022#AccountsPayableAndAccruedLiabilitiesCurrentAndNoncurrenthttp://fasb.org/us-gaap/2022#Liabilitieshttp://fasb.org/us-gaap/2022#Liabilitieshttp://fasb.org/us-gaap/2022#GainLossOnInvestmentshttp://fasb.org/us-gaap/2022#GainLossOnInvestmentshttp://fasb.org/us-gaap/2022#GainLossOnInvestmentshttp://fasb.org/us-gaap/2022#GainLossOnInvestmentsP5YP1Yhttp://fasb.org/us-gaap/2022#OtherAssetshttp://fasb.org/us-gaap/2022#OtherAssetshttp://fasb.org/us-gaap/2022#AccountsPayableAndAccruedLiabilitiesCurrentAndNoncurrenthttp://fasb.org/us-gaap/2022#AccountsPayableAndAccruedLiabilitiesCurrentAndNoncurrent00011769482023-01-012023-03-310001176948us-gaap:CommonClassAMember2023-05-02xbrli:shares0001176948us-gaap:NonvotingCommonStockMember2023-05-020001176948us-gaap:CommonClassBMember2023-05-020001176948us-gaap:CommonClassCMember2023-05-020001176948srt:ParentCompanyMember2023-03-31iso4217:USD0001176948srt:ParentCompanyMember2022-12-310001176948ares:CarriedInterestMembersrt:ParentCompanyMember2023-03-310001176948ares:CarriedInterestMembersrt:ParentCompanyMember2022-12-310001176948ares:ConsolidatedFundsMember2023-03-310001176948ares:ConsolidatedFundsMember2022-12-3100011769482023-03-3100011769482022-12-310001176948ares:AresOperatingGroupMember2023-03-310001176948ares:AresOperatingGroupMember2022-12-310001176948us-gaap:CommonClassAMember2022-12-31iso4217:USDxbrli:shares0001176948us-gaap:CommonClassAMember2023-03-310001176948us-gaap:NonvotingCommonStockMember2022-12-310001176948us-gaap:NonvotingCommonStockMember2023-03-310001176948us-gaap:CommonClassBMember2022-12-310001176948us-gaap:CommonClassBMember2023-03-310001176948us-gaap:CommonClassCMember2022-12-310001176948us-gaap:CommonClassCMember2023-03-310001176948us-gaap:ManagementServiceMember2023-01-012023-03-310001176948us-gaap:ManagementServiceMember2022-01-012022-03-310001176948ares:CarriedInterestMember2023-01-012023-03-310001176948ares:CarriedInterestMember2022-01-012022-03-310001176948us-gaap:ManagementServiceIncentiveMember2023-01-012023-03-310001176948us-gaap:ManagementServiceIncentiveMember2022-01-012022-03-310001176948ares:PrincipalInvestmentIncomeMember2023-01-012023-03-310001176948ares:PrincipalInvestmentIncomeMember2022-01-012022-03-310001176948us-gaap:AdministrativeServiceMember2023-01-012023-03-310001176948us-gaap:AdministrativeServiceMember2022-01-012022-03-3100011769482022-01-012022-03-310001176948ares:ConsolidatedFundsMember2023-01-012023-03-310001176948ares:ConsolidatedFundsMember2022-01-012022-03-310001176948ares:AresOperatingGroupMember2023-01-012023-03-310001176948ares:AresOperatingGroupMember2022-01-012022-03-310001176948us-gaap:NonvotingCommonStockMember2023-01-012023-03-310001176948us-gaap:CommonClassAMember2023-01-012023-03-310001176948us-gaap:NonvotingCommonStockMember2022-01-012022-03-310001176948us-gaap:CommonClassAMember2022-01-012022-03-310001176948ares:AresManagementCorporationMembersrt:ParentCompanyMember2023-01-012023-03-310001176948ares:AresManagementCorporationMembersrt:ParentCompanyMember2022-01-012022-03-310001176948us-gaap:CommonClassAMemberus-gaap:CommonStockMember2022-12-310001176948us-gaap:CommonStockMemberus-gaap:NonvotingCommonStockMember2022-12-310001176948us-gaap:CommonStockMemberus-gaap:CommonClassCMember2022-12-310001176948us-gaap:AdditionalPaidInCapitalMember2022-12-310001176948us-gaap:RetainedEarningsMember2022-12-310001176948us-gaap:AccumulatedOtherComprehensiveIncomeMember2022-12-310001176948us-gaap:NoncontrollingInterestMemberares:AresOperatingGroupMember2022-12-310001176948ares:ConsolidatedFundsMemberus-gaap:NoncontrollingInterestMember2022-12-310001176948us-gaap:CommonClassAMemberus-gaap:CommonStockMember2023-01-012023-03-310001176948us-gaap:CommonStockMemberus-gaap:CommonClassCMember2023-01-012023-03-310001176948us-gaap:AdditionalPaidInCapitalMember2023-01-012023-03-310001176948us-gaap:NoncontrollingInterestMemberares:AresOperatingGroupMember2023-01-012023-03-310001176948ares:ConsolidatedFundsMemberus-gaap:NoncontrollingInterestMember2023-01-012023-03-310001176948us-gaap:RetainedEarningsMember2023-01-012023-03-310001176948us-gaap:AccumulatedOtherComprehensiveIncomeMember2023-01-012023-03-310001176948us-gaap:CommonClassAMemberus-gaap:CommonStockMember2023-03-310001176948us-gaap:CommonStockMemberus-gaap:NonvotingCommonStockMember2023-03-310001176948us-gaap:CommonStockMemberus-gaap:CommonClassCMember2023-03-310001176948us-gaap:AdditionalPaidInCapitalMember2023-03-310001176948us-gaap:RetainedEarningsMember2023-03-310001176948us-gaap:AccumulatedOtherComprehensiveIncomeMember2023-03-310001176948us-gaap:NoncontrollingInterestMemberares:AresOperatingGroupMember2023-03-310001176948ares:ConsolidatedFundsMemberus-gaap:NoncontrollingInterestMember2023-03-310001176948us-gaap:CommonClassAMemberus-gaap:CommonStockMember2021-12-310001176948us-gaap:CommonStockMemberus-gaap:NonvotingCommonStockMember2021-12-310001176948us-gaap:CommonStockMemberus-gaap:CommonClassCMember2021-12-310001176948us-gaap:AdditionalPaidInCapitalMember2021-12-310001176948us-gaap:RetainedEarningsMember2021-12-310001176948us-gaap:AccumulatedOtherComprehensiveIncomeMember2021-12-310001176948us-gaap:NoncontrollingInterestMemberares:AresOperatingGroupMember2021-12-310001176948ares:ConsolidatedFundsMemberus-gaap:NoncontrollingInterestMember2021-12-3100011769482021-12-310001176948us-gaap:CommonClassAMemberus-gaap:CommonStockMember2022-01-012022-03-310001176948us-gaap:CommonStockMemberus-gaap:CommonClassCMember2022-01-012022-03-310001176948us-gaap:AdditionalPaidInCapitalMember2022-01-012022-03-310001176948us-gaap:NoncontrollingInterestMemberares:AresOperatingGroupMember2022-01-012022-03-310001176948ares:ConsolidatedFundsMemberus-gaap:NoncontrollingInterestMember2022-01-012022-03-310001176948us-gaap:RetainedEarningsMember2022-01-012022-03-310001176948us-gaap:AccumulatedOtherComprehensiveIncomeMember2022-01-012022-03-310001176948us-gaap:CommonClassAMemberus-gaap:CommonStockMember2022-03-310001176948us-gaap:CommonStockMemberus-gaap:NonvotingCommonStockMember2022-03-310001176948us-gaap:CommonStockMemberus-gaap:CommonClassCMember2022-03-310001176948us-gaap:AdditionalPaidInCapitalMember2022-03-310001176948us-gaap:RetainedEarningsMember2022-03-310001176948us-gaap:AccumulatedOtherComprehensiveIncomeMember2022-03-310001176948us-gaap:NoncontrollingInterestMemberares:AresOperatingGroupMember2022-03-310001176948ares:ConsolidatedFundsMemberus-gaap:NoncontrollingInterestMember2022-03-3100011769482022-03-310001176948us-gaap:CommonClassAMemberus-gaap:CommonStockMember2022-04-012022-06-300001176948us-gaap:CommonStockMemberus-gaap:CommonClassCMember2022-04-012022-06-300001176948us-gaap:AdditionalPaidInCapitalMember2022-04-012022-06-300001176948us-gaap:NoncontrollingInterestMemberares:AresOperatingGroupMember2022-04-012022-06-300001176948ares:ConsolidatedFundsMemberus-gaap:NoncontrollingInterestMember2022-04-012022-06-3000011769482022-04-012022-06-300001176948us-gaap:RetainedEarningsMember2022-04-012022-06-300001176948us-gaap:AccumulatedOtherComprehensiveIncomeMember2022-04-012022-06-300001176948us-gaap:CommonClassAMemberus-gaap:CommonStockMember2022-06-300001176948us-gaap:CommonStockMemberus-gaap:NonvotingCommonStockMember2022-06-300001176948us-gaap:CommonStockMemberus-gaap:CommonClassCMember2022-06-300001176948us-gaap:AdditionalPaidInCapitalMember2022-06-300001176948us-gaap:RetainedEarningsMember2022-06-300001176948us-gaap:AccumulatedOtherComprehensiveIncomeMember2022-06-300001176948us-gaap:NoncontrollingInterestMemberares:AresOperatingGroupMember2022-06-300001176948ares:ConsolidatedFundsMemberus-gaap:NoncontrollingInterestMember2022-06-3000011769482022-06-300001176948us-gaap:CommonClassAMemberus-gaap:CommonStockMember2022-07-012022-09-300001176948us-gaap:CommonStockMemberus-gaap:CommonClassCMember2022-07-012022-09-300001176948us-gaap:AdditionalPaidInCapitalMember2022-07-012022-09-300001176948us-gaap:NoncontrollingInterestMemberares:AresOperatingGroupMember2022-07-012022-09-300001176948ares:ConsolidatedFundsMemberus-gaap:NoncontrollingInterestMember2022-07-012022-09-3000011769482022-07-012022-09-300001176948us-gaap:RetainedEarningsMember2022-07-012022-09-300001176948us-gaap:AccumulatedOtherComprehensiveIncomeMember2022-07-012022-09-300001176948us-gaap:CommonClassAMemberus-gaap:CommonStockMember2022-09-300001176948us-gaap:CommonStockMemberus-gaap:NonvotingCommonStockMember2022-09-300001176948us-gaap:CommonStockMemberus-gaap:CommonClassCMember2022-09-300001176948us-gaap:AdditionalPaidInCapitalMember2022-09-300001176948us-gaap:RetainedEarningsMember2022-09-300001176948us-gaap:AccumulatedOtherComprehensiveIncomeMember2022-09-300001176948us-gaap:NoncontrollingInterestMemberares:AresOperatingGroupMember2022-09-300001176948ares:ConsolidatedFundsMemberus-gaap:NoncontrollingInterestMember2022-09-3000011769482022-09-300001176948us-gaap:CommonClassAMemberus-gaap:CommonStockMember2022-10-012022-12-310001176948us-gaap:CommonStockMemberus-gaap:CommonClassCMember2022-10-012022-12-310001176948us-gaap:AdditionalPaidInCapitalMember2022-10-012022-12-310001176948us-gaap:NoncontrollingInterestMemberares:AresOperatingGroupMember2022-10-012022-12-310001176948ares:ConsolidatedFundsMemberus-gaap:NoncontrollingInterestMember2022-10-012022-12-3100011769482022-10-012022-12-310001176948us-gaap:RetainedEarningsMember2022-10-012022-12-310001176948us-gaap:AccumulatedOtherComprehensiveIncomeMember2022-10-012022-12-310001176948srt:ParentCompanyMember2023-01-012023-03-310001176948srt:ParentCompanyMember2022-01-012022-03-310001176948srt:ParentCompanyMember2021-12-310001176948srt:ParentCompanyMember2022-03-310001176948ares:AresSSGsFeeGeneratingBusinessMember2023-01-012023-03-31xbrli:pure0001176948us-gaap:CommonClassAMemberares:AresAcquisitionCorporationMember2023-01-012023-03-310001176948us-gaap:CommonClassAMemberares:AresAcquisitionCorporationMember2023-03-310001176948ares:CollateralManagementContractsMember2023-01-012023-03-310001176948ares:CollateralManagementContractsMember2023-03-310001176948ares:CollateralManagementContractsMember2022-12-310001176948us-gaap:CustomerRelationshipsMember2023-01-012023-03-310001176948us-gaap:CustomerRelationshipsMember2023-03-310001176948us-gaap:CustomerRelationshipsMember2022-12-310001176948us-gaap:TradeNamesMember2023-01-012023-03-310001176948us-gaap:TradeNamesMember2023-03-310001176948us-gaap:TradeNamesMember2022-12-310001176948us-gaap:OtherIntangibleAssetsMember2023-01-012023-03-310001176948us-gaap:OtherIntangibleAssetsMember2023-03-310001176948us-gaap:OtherIntangibleAssetsMember2022-12-310001176948ares:CollateralManagementContractsMember2023-03-310001176948ares:CollateralManagementContractsMember2022-12-310001176948us-gaap:TradeNamesMember2023-01-012023-03-310001176948us-gaap:SellingGeneralAndAdministrativeExpensesMember2023-01-012023-03-310001176948us-gaap:SellingGeneralAndAdministrativeExpensesMember2022-01-012022-03-310001176948ares:TradableCreditGroupMember2022-12-310001176948ares:PrivateEquityGroupMember2022-12-310001176948ares:RealEstateGroupMember2022-12-310001176948ares:SecondarySolutionsGroupMember2022-12-310001176948us-gaap:AllOtherSegmentsMember2022-12-310001176948ares:TradableCreditGroupMember2023-01-012023-03-310001176948ares:PrivateEquityGroupMember2023-01-012023-03-310001176948ares:RealEstateGroupMember2023-01-012023-03-310001176948ares:SecondarySolutionsGroupMember2023-01-012023-03-310001176948us-gaap:AllOtherSegmentsMember2023-01-012023-03-310001176948ares:TradableCreditGroupMember2023-03-310001176948ares:PrivateEquityGroupMember2023-03-310001176948ares:RealEstateGroupMember2023-03-310001176948ares:SecondarySolutionsGroupMember2023-03-310001176948us-gaap:AllOtherSegmentsMember2023-03-310001176948ares:FromAresSSGToCreditGroupMember2023-01-012023-03-310001176948ares:PrivateInvestmentPartnershipInterestsMembersrt:ParentCompanyMember2023-03-310001176948ares:PrivateInvestmentPartnershipInterestsMembersrt:ParentCompanyMember2022-12-310001176948ares:PrivateInvestmentPartnershipInterestsOtherMembersrt:ParentCompanyMember2023-03-310001176948ares:PrivateInvestmentPartnershipInterestsOtherMembersrt:ParentCompanyMember2022-12-310001176948ares:OtherPrivateInvestmentPartnershipInterestsMembersrt:ParentCompanyMember2023-03-310001176948ares:OtherPrivateInvestmentPartnershipInterestsMembersrt:ParentCompanyMember2022-12-310001176948ares:PrivateInvestmentPartnershipInterestsMembersrt:ParentCompanyMember2023-03-310001176948ares:PrivateInvestmentPartnershipInterestsMembersrt:ParentCompanyMember2022-12-310001176948us-gaap:CollateralizedLoanObligationsMembersrt:ParentCompanyMember2023-03-310001176948us-gaap:CollateralizedLoanObligationsMembersrt:ParentCompanyMember2022-12-310001176948us-gaap:FixedIncomeInvestmentsMembersrt:ParentCompanyMember2023-03-310001176948us-gaap:FixedIncomeInvestmentsMembersrt:ParentCompanyMember2022-12-310001176948ares:CollateralizedLoanObligationsAndOtherFixedIncomeSecuritiesMembersrt:ParentCompanyMember2023-03-310001176948ares:CollateralizedLoanObligationsAndOtherFixedIncomeSecuritiesMembersrt:ParentCompanyMember2022-12-310001176948us-gaap:EquitySecuritiesMembersrt:ParentCompanyMember2023-03-310001176948us-gaap:EquitySecuritiesMembersrt:ParentCompanyMember2022-12-310001176948ares:ConsolidatedFundsMemberus-gaap:BondsMemberus-gaap:FixedIncomeSecuritiesMember2023-03-310001176948ares:ConsolidatedFundsMemberus-gaap:BondsMemberus-gaap:FixedIncomeSecuritiesMember2022-12-310001176948ares:ConsolidatedFundsMemberus-gaap:LoansMemberus-gaap:FixedIncomeSecuritiesMember2023-03-310001176948ares:ConsolidatedFundsMemberus-gaap:LoansMemberus-gaap:FixedIncomeSecuritiesMember2022-12-310001176948ares:ConsolidatedFundsMemberares:InvestmentsHeldInTrustAccountMemberus-gaap:FixedIncomeSecuritiesMember2023-03-310001176948ares:ConsolidatedFundsMemberares:InvestmentsHeldInTrustAccountMemberus-gaap:FixedIncomeSecuritiesMember2022-12-310001176948ares:ConsolidatedFundsMemberus-gaap:CollateralizedLoanObligationsMemberus-gaap:FixedIncomeSecuritiesMember2023-03-310001176948ares:ConsolidatedFundsMemberus-gaap:CollateralizedLoanObligationsMemberus-gaap:FixedIncomeSecuritiesMember2022-12-310001176948ares:ConsolidatedFundsMemberus-gaap:FixedIncomeSecuritiesMember2023-03-310001176948ares:ConsolidatedFundsMemberus-gaap:FixedIncomeSecuritiesMember2022-12-310001176948ares:ConsolidatedFundsMemberus-gaap:EquitySecuritiesMember2023-03-310001176948ares:ConsolidatedFundsMemberus-gaap:EquitySecuritiesMember2022-12-310001176948ares:ConsolidatedFundsMembersrt:PartnershipInterestMember2023-03-310001176948ares:ConsolidatedFundsMembersrt:PartnershipInterestMember2022-12-310001176948us-gaap:FairValueInputsLevel1Memberares:CollateralizedLoanObligationsAndOtherFixedIncomeSecuritiesMembersrt:ParentCompanyMember2023-03-310001176948us-gaap:FairValueInputsLevel2Memberares:CollateralizedLoanObligationsAndOtherFixedIncomeSecuritiesMembersrt:ParentCompanyMember2023-03-310001176948us-gaap:FairValueInputsLevel3Memberares:CollateralizedLoanObligationsAndOtherFixedIncomeSecuritiesMembersrt:ParentCompanyMember2023-03-310001176948us-gaap:FairValueMeasuredAtNetAssetValuePerShareMemberares:CollateralizedLoanObligationsAndOtherFixedIncomeSecuritiesMembersrt:ParentCompanyMember2023-03-310001176948ares:CollateralizedLoanObligationsAndOtherFixedIncomeSecuritiesMembersrt:ParentCompanyMember2023-03-310001176948us-gaap:FairValueInputsLevel1Membersrt:ParentCompanyMember2023-03-310001176948us-gaap:FairValueInputsLevel2Membersrt:ParentCompanyMember2023-03-310001176948us-gaap:FairValueInputsLevel3Membersrt:ParentCompanyMember2023-03-310001176948us-gaap:FairValueMeasuredAtNetAssetValuePerShareMembersrt:ParentCompanyMember2023-03-310001176948us-gaap:ForeignExchangeContractMemberus-gaap:FairValueInputsLevel1Membersrt:ParentCompanyMember2023-03-310001176948us-gaap:FairValueInputsLevel2Memberus-gaap:ForeignExchangeContractMembersrt:ParentCompanyMember2023-03-310001176948us-gaap:FairValueInputsLevel3Memberus-gaap:ForeignExchangeContractMembersrt:ParentCompanyMember2023-03-310001176948us-gaap:FairValueMeasuredAtNetAssetValuePerShareMemberus-gaap:ForeignExchangeContractMembersrt:ParentCompanyMember2023-03-310001176948us-gaap:ForeignExchangeContractMembersrt:ParentCompanyMember2023-03-310001176948ares:ConsolidatedFundsMemberus-gaap:CorporateBondSecuritiesMemberus-gaap:FairValueInputsLevel1Member2023-03-310001176948ares:ConsolidatedFundsMemberus-gaap:CorporateBondSecuritiesMemberus-gaap:FairValueInputsLevel2Member2023-03-310001176948ares:ConsolidatedFundsMemberus-gaap:FairValueInputsLevel3Memberus-gaap:CorporateBondSecuritiesMember2023-03-310001176948ares:ConsolidatedFundsMemberus-gaap:CorporateBondSecuritiesMemberus-gaap:FairValueMeasuredAtNetAssetValuePerShareMember2023-03-310001176948ares:ConsolidatedFundsMemberus-gaap:CorporateBondSecuritiesMember2023-03-310001176948ares:ConsolidatedFundsMemberus-gaap:LoansMemberus-gaap:FairValueInputsLevel1Member2023-03-310001176948ares:ConsolidatedFundsMemberus-gaap:LoansMemberus-gaap:FairValueInputsLevel2Member2023-03-310001176948ares:ConsolidatedFundsMemberus-gaap:LoansMemberus-gaap:FairValueInputsLevel3Member2023-03-310001176948ares:ConsolidatedFundsMemberus-gaap:LoansMemberus-gaap:FairValueMeasuredAtNetAssetValuePerShareMember2023-03-310001176948ares:ConsolidatedFundsMemberus-gaap:LoansMember2023-03-310001176948ares:ConsolidatedFundsMemberares:InvestmentsHeldInTrustAccountMemberus-gaap:FairValueInputsLevel1Member2023-03-310001176948ares:ConsolidatedFundsMemberares:InvestmentsHeldInTrustAccountMemberus-gaap:FairValueInputsLevel2Member2023-03-310001176948ares:ConsolidatedFundsMemberares:InvestmentsHeldInTrustAccountMemberus-gaap:FairValueInputsLevel3Member2023-03-310001176948ares:ConsolidatedFundsMemberares:InvestmentsHeldInTrustAccountMemberus-gaap:FairValueMeasuredAtNetAssetValuePerShareMember2023-03-310001176948ares:ConsolidatedFundsMemberares:InvestmentsHeldInTrustAccountMember2023-03-310001176948ares:ConsolidatedFundsMemberus-gaap:CollateralizedLoanObligationsMemberus-gaap:FairValueInputsLevel1Member2023-03-310001176948ares:ConsolidatedFundsMemberus-gaap:CollateralizedLoanObligationsMemberus-gaap:FairValueInputsLevel2Member2023-03-310001176948ares:ConsolidatedFundsMemberus-gaap:FairValueInputsLevel3Memberus-gaap:CollateralizedLoanObligationsMember2023-03-310001176948ares:ConsolidatedFundsMemberus-gaap:CollateralizedLoanObligationsMemberus-gaap:FairValueMeasuredAtNetAssetValuePerShareMember2023-03-310001176948ares:ConsolidatedFundsMemberus-gaap:CollateralizedLoanObligationsMember2023-03-310001176948ares:ConsolidatedFundsMemberus-gaap:FairValueInputsLevel1Member2023-03-310001176948ares:ConsolidatedFundsMemberus-gaap:FairValueInputsLevel2Member2023-03-310001176948ares:ConsolidatedFundsMemberus-gaap:FairValueInputsLevel3Member2023-03-310001176948ares:ConsolidatedFundsMemberus-gaap:FairValueMeasuredAtNetAssetValuePerShareMember2023-03-310001176948ares:ConsolidatedFundsMemberus-gaap:ForeignExchangeContractMemberus-gaap:FairValueInputsLevel1Member2023-03-310001176948ares:ConsolidatedFundsMemberus-gaap:FairValueInputsLevel2Memberus-gaap:ForeignExchangeContractMember2023-03-310001176948ares:ConsolidatedFundsMemberus-gaap:FairValueInputsLevel3Memberus-gaap:ForeignExchangeContractMember2023-03-310001176948ares:ConsolidatedFundsMemberus-gaap:FairValueMeasuredAtNetAssetValuePerShareMemberus-gaap:ForeignExchangeContractMember2023-03-310001176948ares:ConsolidatedFundsMemberus-gaap:ForeignExchangeContractMember2023-03-310001176948ares:ConsolidatedFundsMemberus-gaap:WarrantMemberus-gaap:FairValueInputsLevel1Member2023-03-310001176948ares:ConsolidatedFundsMemberus-gaap:WarrantMemberus-gaap:FairValueInputsLevel2Member2023-03-310001176948ares:ConsolidatedFundsMemberus-gaap:FairValueInputsLevel3Memberus-gaap:WarrantMember2023-03-310001176948ares:ConsolidatedFundsMemberus-gaap:FairValueMeasuredAtNetAssetValuePerShareMemberus-gaap:WarrantMember2023-03-310001176948ares:ConsolidatedFundsMemberus-gaap:WarrantMember2023-03-310001176948ares:ConsolidatedFundsMemberus-gaap:OtherContractMemberus-gaap:FairValueInputsLevel1Member2023-03-310001176948ares:ConsolidatedFundsMemberus-gaap:OtherContractMemberus-gaap:FairValueInputsLevel2Member2023-03-310001176948ares:ConsolidatedFundsMemberus-gaap:OtherContractMemberus-gaap:FairValueInputsLevel3Member2023-03-310001176948ares:ConsolidatedFundsMemberus-gaap:OtherContractMemberus-gaap:FairValueMeasuredAtNetAssetValuePerShareMember2023-03-310001176948ares:ConsolidatedFundsMemberus-gaap:OtherContractMember2023-03-310001176948us-gaap:FairValueInputsLevel1Memberares:CollateralizedLoanObligationsAndOtherFixedIncomeSecuritiesMembersrt:ParentCompanyMember2022-12-310001176948us-gaap:FairValueInputsLevel2Memberares:CollateralizedLoanObligationsAndOtherFixedIncomeSecuritiesMembersrt:ParentCompanyMember2022-12-310001176948us-gaap:FairValueInputsLevel3Memberares:CollateralizedLoanObligationsAndOtherFixedIncomeSecuritiesMembersrt:ParentCompanyMember2022-12-310001176948us-gaap:FairValueMeasuredAtNetAssetValuePerShareMemberares:CollateralizedLoanObligationsAndOtherFixedIncomeSecuritiesMembersrt:ParentCompanyMember2022-12-310001176948ares:CollateralizedLoanObligationsAndOtherFixedIncomeSecuritiesMembersrt:ParentCompanyMember2022-12-310001176948us-gaap:FairValueInputsLevel1Membersrt:ParentCompanyMember2022-12-310001176948us-gaap:FairValueInputsLevel2Membersrt:ParentCompanyMember2022-12-310001176948us-gaap:FairValueInputsLevel3Membersrt:ParentCompanyMember2022-12-310001176948us-gaap:FairValueMeasuredAtNetAssetValuePerShareMembersrt:ParentCompanyMember2022-12-310001176948us-gaap:ForeignExchangeContractMemberus-gaap:FairValueInputsLevel1Membersrt:ParentCompanyMember2022-12-310001176948us-gaap:FairValueInputsLevel2Memberus-gaap:ForeignExchangeContractMembersrt:ParentCompanyMember2022-12-310001176948us-gaap:FairValueInputsLevel3Memberus-gaap:ForeignExchangeContractMembersrt:ParentCompanyMember2022-12-310001176948us-gaap:FairValueMeasuredAtNetAssetValuePerShareMemberus-gaap:ForeignExchangeContractMembersrt:ParentCompanyMember2022-12-310001176948us-gaap:ForeignExchangeContractMembersrt:ParentCompanyMember2022-12-310001176948ares:ConsolidatedFundsMemberus-gaap:CorporateBondSecuritiesMemberus-gaap:FairValueInputsLevel1Member2022-12-310001176948ares:ConsolidatedFundsMemberus-gaap:CorporateBondSecuritiesMemberus-gaap:FairValueInputsLevel2Member2022-12-310001176948ares:ConsolidatedFundsMemberus-gaap:FairValueInputsLevel3Memberus-gaap:CorporateBondSecuritiesMember2022-12-310001176948ares:ConsolidatedFundsMemberus-gaap:CorporateBondSecuritiesMemberus-gaap:FairValueMeasuredAtNetAssetValuePerShareMember2022-12-310001176948ares:ConsolidatedFundsMemberus-gaap:CorporateBondSecuritiesMember2022-12-310001176948ares:ConsolidatedFundsMemberus-gaap:LoansMemberus-gaap:FairValueInputsLevel1Member2022-12-310001176948ares:ConsolidatedFundsMemberus-gaap:LoansMemberus-gaap:FairValueInputsLevel2Member2022-12-310001176948ares:ConsolidatedFundsMemberus-gaap:LoansMemberus-gaap:FairValueInputsLevel3Member2022-12-310001176948ares:ConsolidatedFundsMemberus-gaap:LoansMemberus-gaap:FairValueMeasuredAtNetAssetValuePerShareMember2022-12-310001176948ares:ConsolidatedFundsMemberus-gaap:LoansMember2022-12-310001176948ares:ConsolidatedFundsMemberares:InvestmentsHeldInTrustAccountMemberus-gaap:FairValueInputsLevel1Member2022-12-310001176948ares:ConsolidatedFundsMemberares:InvestmentsHeldInTrustAccountMemberus-gaap:FairValueInputsLevel2Member2022-12-310001176948ares:ConsolidatedFundsMemberares:InvestmentsHeldInTrustAccountMemberus-gaap:FairValueInputsLevel3Member2022-12-310001176948ares:ConsolidatedFundsMemberares:InvestmentsHeldInTrustAccountMemberus-gaap:FairValueMeasuredAtNetAssetValuePerShareMember2022-12-310001176948ares:ConsolidatedFundsMemberares:InvestmentsHeldInTrustAccountMember2022-12-310001176948ares:ConsolidatedFundsMemberus-gaap:FairValueInputsLevel1Member2022-12-310001176948ares:ConsolidatedFundsMemberus-gaap:FairValueInputsLevel2Member2022-12-310001176948ares:ConsolidatedFundsMemberus-gaap:FairValueInputsLevel3Member2022-12-310001176948ares:ConsolidatedFundsMemberus-gaap:FairValueMeasuredAtNetAssetValuePerShareMember2022-12-310001176948ares:ConsolidatedFundsMemberus-gaap:ForeignExchangeContractMemberus-gaap:FairValueInputsLevel1Member2022-12-310001176948ares:ConsolidatedFundsMemberus-gaap:FairValueInputsLevel2Memberus-gaap:ForeignExchangeContractMember2022-12-310001176948ares:ConsolidatedFundsMemberus-gaap:FairValueInputsLevel3Memberus-gaap:ForeignExchangeContractMember2022-12-310001176948ares:ConsolidatedFundsMemberus-gaap:FairValueMeasuredAtNetAssetValuePerShareMemberus-gaap:ForeignExchangeContractMember2022-12-310001176948ares:ConsolidatedFundsMemberus-gaap:ForeignExchangeContractMember2022-12-310001176948ares:ConsolidatedFundsMemberus-gaap:WarrantMemberus-gaap:FairValueInputsLevel1Member2022-12-310001176948ares:ConsolidatedFundsMemberus-gaap:WarrantMemberus-gaap:FairValueInputsLevel2Member2022-12-310001176948ares:ConsolidatedFundsMemberus-gaap:FairValueInputsLevel3Memberus-gaap:WarrantMember2022-12-310001176948ares:ConsolidatedFundsMemberus-gaap:FairValueMeasuredAtNetAssetValuePerShareMemberus-gaap:WarrantMember2022-12-310001176948ares:ConsolidatedFundsMemberus-gaap:WarrantMember2022-12-310001176948ares:ConsolidatedFundsMemberus-gaap:OtherContractMemberus-gaap:FairValueInputsLevel1Member2022-12-310001176948ares:ConsolidatedFundsMemberus-gaap:OtherContractMemberus-gaap:FairValueInputsLevel2Member2022-12-310001176948ares:ConsolidatedFundsMemberus-gaap:OtherContractMemberus-gaap:FairValueInputsLevel3Member2022-12-310001176948ares:ConsolidatedFundsMemberus-gaap:OtherContractMemberus-gaap:FairValueMeasuredAtNetAssetValuePerShareMember2022-12-310001176948ares:ConsolidatedFundsMemberus-gaap:OtherContractMember2022-12-310001176948us-gaap:EquitySecuritiesMembersrt:ParentCompanyMember2022-12-310001176948us-gaap:FixedIncomeSecuritiesMembersrt:ParentCompanyMember2022-12-310001176948us-gaap:EquitySecuritiesMembersrt:ParentCompanyMember2023-01-012023-03-310001176948us-gaap:FixedIncomeSecuritiesMembersrt:ParentCompanyMember2023-01-012023-03-310001176948us-gaap:EquitySecuritiesMembersrt:ParentCompanyMember2023-03-310001176948us-gaap:FixedIncomeSecuritiesMembersrt:ParentCompanyMember2023-03-310001176948ares:ConsolidatedFundsMemberus-gaap:EquitySecuritiesMember2022-12-310001176948ares:ConsolidatedFundsMemberus-gaap:FixedIncomeSecuritiesMember2022-12-310001176948ares:ConsolidatedFundsMemberares:PrivateInvestmentPartnershipInterestsMember2022-12-310001176948ares:ConsolidatedFundsMemberares:OtherFinancialInstrumentMember2022-12-310001176948ares:ConsolidatedFundsMemberus-gaap:EquitySecuritiesMember2023-01-012023-03-310001176948ares:ConsolidatedFundsMemberus-gaap:FixedIncomeSecuritiesMember2023-01-012023-03-310001176948ares:ConsolidatedFundsMemberares:PrivateInvestmentPartnershipInterestsMember2023-01-012023-03-310001176948ares:ConsolidatedFundsMemberares:OtherFinancialInstrumentMember2023-01-012023-03-310001176948ares:ConsolidatedFundsMemberus-gaap:EquitySecuritiesMember2023-03-310001176948ares:ConsolidatedFundsMemberus-gaap:FixedIncomeSecuritiesMember2023-03-310001176948ares:ConsolidatedFundsMemberares:PrivateInvestmentPartnershipInterestsMember2023-03-310001176948ares:ConsolidatedFundsMemberares:OtherFinancialInstrumentMember2023-03-310001176948us-gaap:EquitySecuritiesMembersrt:ParentCompanyMember2021-12-310001176948us-gaap:FixedIncomeSecuritiesMembersrt:ParentCompanyMember2021-12-310001176948ares:PrivateInvestmentPartnershipInterestsMembersrt:ParentCompanyMember2021-12-310001176948ares:BusinessAcquisitionContingentConsiderationMembersrt:ParentCompanyMember2021-12-310001176948us-gaap:EquitySecuritiesMembersrt:ParentCompanyMember2022-01-012022-03-310001176948us-gaap:FixedIncomeSecuritiesMembersrt:ParentCompanyMember2022-01-012022-03-310001176948ares:PrivateInvestmentPartnershipInterestsMembersrt:ParentCompanyMember2022-01-012022-03-310001176948ares:BusinessAcquisitionContingentConsiderationMembersrt:ParentCompanyMember2022-01-012022-03-310001176948us-gaap:EquitySecuritiesMembersrt:ParentCompanyMember2022-03-310001176948us-gaap:FixedIncomeSecuritiesMembersrt:ParentCompanyMember2022-03-310001176948ares:PrivateInvestmentPartnershipInterestsMembersrt:ParentCompanyMember2022-03-310001176948ares:BusinessAcquisitionContingentConsiderationMembersrt:ParentCompanyMember2022-03-310001176948ares:ConsolidatedFundsMemberus-gaap:EquitySecuritiesMember2021-12-310001176948ares:ConsolidatedFundsMemberus-gaap:FixedIncomeSecuritiesMember2021-12-310001176948ares:ConsolidatedFundsMemberares:PrivateInvestmentPartnershipInterestsMember2021-12-310001176948ares:ConsolidatedFundsMemberares:OtherFinancialInstrumentMember2021-12-310001176948ares:ConsolidatedFundsMember2021-12-310001176948ares:ConsolidatedFundsMemberus-gaap:EquitySecuritiesMember2022-01-012022-03-310001176948ares:ConsolidatedFundsMemberus-gaap:FixedIncomeSecuritiesMember2022-01-012022-03-310001176948ares:ConsolidatedFundsMemberares:PrivateInvestmentPartnershipInterestsMember2022-01-012022-03-310001176948ares:ConsolidatedFundsMemberares:OtherFinancialInstrumentMember2022-01-012022-03-310001176948ares:ConsolidatedFundsMemberus-gaap:EquitySecuritiesMember2022-03-310001176948ares:ConsolidatedFundsMemberus-gaap:FixedIncomeSecuritiesMember2022-03-310001176948ares:ConsolidatedFundsMemberares:PrivateInvestmentPartnershipInterestsMember2022-03-310001176948ares:ConsolidatedFundsMemberares:OtherFinancialInstrumentMember2022-03-310001176948ares:ConsolidatedFundsMember2022-03-310001176948us-gaap:FairValueInputsLevel3Memberares:EVMarketMultipleAnalysisValuationTechniqueMembersrt:ParentCompanyMemberares:EquitySecuritiesOneMember2023-03-310001176948ares:MeasurementInputBookValueMultipleMemberus-gaap:FairValueInputsLevel3Memberares:EVMarketMultipleAnalysisValuationTechniqueMembersrt:ParentCompanyMemberares:EquitySecuritiesOneMember2023-03-310001176948ares:MeasurementInputBookValueMultipleMemberus-gaap:FairValueInputsLevel3Membersrt:WeightedAverageMemberares:EVMarketMultipleAnalysisValuationTechniqueMembersrt:ParentCompanyMemberares:EquitySecuritiesOneMember2023-03-310001176948us-gaap:FairValueInputsLevel3Memberares:EVMarketMultipleAnalysisValuationTechniqueMemberares:EquitySecuritiesTwoMembersrt:ParentCompanyMember2023-03-310001176948ares:MeasurementInputBookValueMultipleMemberus-gaap:FairValueInputsLevel3Memberares:EVMarketMultipleAnalysisValuationTechniqueMemberares:EquitySecuritiesTwoMembersrt:ParentCompanyMember2023-03-310001176948ares:MeasurementInputBookValueMultipleMemberus-gaap:FairValueInputsLevel3Membersrt:WeightedAverageMemberares:EVMarketMultipleAnalysisValuationTechniqueMemberares:EquitySecuritiesTwoMembersrt:ParentCompanyMember2023-03-310001176948us-gaap:FairValueInputsLevel3Memberares:RecentTransactionPriceValuationTechniqueMembersrt:ParentCompanyMember2023-03-310001176948ares:BrokerQuotesAndThirdPartyPricingServicesValuationTechniqueMemberus-gaap:FairValueInputsLevel3Membersrt:ParentCompanyMember2023-03-310001176948us-gaap:FairValueInputsLevel3Memberares:OtherValuationTechniqueMembersrt:ParentCompanyMember2023-03-310001176948ares:ConsolidatedFundsMemberus-gaap:ValuationTechniqueDiscountedCashFlowMemberus-gaap:FairValueInputsLevel3Member2023-03-310001176948ares:ConsolidatedFundsMemberus-gaap:MeasurementInputDiscountRateMembersrt:MinimumMemberus-gaap:ValuationTechniqueDiscountedCashFlowMemberus-gaap:FairValueInputsLevel3Member2023-03-310001176948ares:ConsolidatedFundsMemberus-gaap:MeasurementInputDiscountRateMemberus-gaap:ValuationTechniqueDiscountedCashFlowMemberus-gaap:FairValueInputsLevel3Membersrt:MaximumMember2023-03-310001176948ares:ConsolidatedFundsMemberus-gaap:MeasurementInputDiscountRateMemberus-gaap:ValuationTechniqueDiscountedCashFlowMemberus-gaap:FairValueInputsLevel3Membersrt:WeightedAverageMember2023-03-310001176948ares:ConsolidatedFundsMemberares:MeasurementInputBookValueMultipleMemberus-gaap:FairValueInputsLevel3Memberares:EVMarketMultipleAnalysisValuationTechniqueMember2023-03-310001176948ares:ConsolidatedFundsMembersrt:MinimumMemberares:MeasurementInputBookValueMultipleMemberus-gaap:FairValueInputsLevel3Memberares:EVMarketMultipleAnalysisValuationTechniqueMember2023-03-310001176948ares:ConsolidatedFundsMemberares:MeasurementInputBookValueMultipleMemberus-gaap:FairValueInputsLevel3Memberares:EVMarketMultipleAnalysisValuationTechniqueMembersrt:MaximumMember2023-03-310001176948ares:ConsolidatedFundsMemberares:MeasurementInputBookValueMultipleMemberus-gaap:FairValueInputsLevel3Membersrt:WeightedAverageMemberares:EVMarketMultipleAnalysisValuationTechniqueMember2023-03-310001176948ares:ConsolidatedFundsMemberus-gaap:FairValueInputsLevel3Memberares:EVMarketMultipleAnalysisValuationTechniqueMemberares:MeasurementInputNetIncomeMultipleMember2023-03-310001176948ares:ConsolidatedFundsMembersrt:MinimumMemberus-gaap:FairValueInputsLevel3Memberares:EVMarketMultipleAnalysisValuationTechniqueMemberares:MeasurementInputNetIncomeMultipleMember2023-03-310001176948ares:ConsolidatedFundsMemberus-gaap:FairValueInputsLevel3Membersrt:WeightedAverageMemberares:EVMarketMultipleAnalysisValuationTechniqueMemberares:MeasurementInputNetIncomeMultipleMember2023-03-310001176948ares:ConsolidatedFundsMemberus-gaap:FairValueInputsLevel3Memberus-gaap:MeasurementInputEbitdaMultipleMemberares:EVMarketMultipleAnalysisValuationTechniqueMember2023-03-310001176948ares:ConsolidatedFundsMembersrt:MinimumMemberus-gaap:FairValueInputsLevel3Memberus-gaap:MeasurementInputEbitdaMultipleMemberares:EVMarketMultipleAnalysisValuationTechniqueMember2023-03-310001176948ares:ConsolidatedFundsMemberus-gaap:FairValueInputsLevel3Memberus-gaap:MeasurementInputEbitdaMultipleMemberares:EVMarketMultipleAnalysisValuationTechniqueMembersrt:MaximumMember2023-03-310001176948ares:ConsolidatedFundsMemberus-gaap:FairValueInputsLevel3Membersrt:WeightedAverageMemberus-gaap:MeasurementInputEbitdaMultipleMemberares:EVMarketMultipleAnalysisValuationTechniqueMember2023-03-310001176948ares:ConsolidatedFundsMemberus-gaap:FairValueInputsLevel3Memberares:OtherValuationTechniqueMember2023-03-310001176948ares:ConsolidatedFundsMemberares:BrokerQuotesAndThirdPartyPricingServicesValuationTechniqueMemberus-gaap:FairValueInputsLevel3Member2023-03-310001176948ares:ConsolidatedFundsMemberus-gaap:FairValueInputsLevel3Memberares:EVMarketMultipleAnalysisValuationTechniqueMemberares:MeasurementInputYieldMember2023-03-310001176948ares:ConsolidatedFundsMembersrt:MinimumMemberus-gaap:FairValueInputsLevel3Memberares:EVMarketMultipleAnalysisValuationTechniqueMemberares:MeasurementInputYieldMember2023-03-310001176948ares:ConsolidatedFundsMemberus-gaap:FairValueInputsLevel3Memberares:EVMarketMultipleAnalysisValuationTechniqueMembersrt:MaximumMemberares:MeasurementInputYieldMember2023-03-310001176948ares:ConsolidatedFundsMemberus-gaap:FairValueInputsLevel3Membersrt:WeightedAverageMemberares:EVMarketMultipleAnalysisValuationTechniqueMemberares:MeasurementInputYieldMember2023-03-310001176948ares:ConsolidatedFundsMemberus-gaap:FairValueInputsLevel3Memberares:OtherValuationTechniqueMembersrt:ParentCompanyMember2023-03-310001176948us-gaap:FairValueInputsLevel3Memberares:EVMarketMultipleAnalysisValuationTechniqueMembersrt:ParentCompanyMemberares:EquitySecuritiesOneMember2022-12-310001176948ares:MeasurementInputBookValueMultipleMemberus-gaap:FairValueInputsLevel3Memberares:EVMarketMultipleAnalysisValuationTechniqueMembersrt:ParentCompanyMemberares:EquitySecuritiesOneMember2022-12-310001176948ares:MeasurementInputBookValueMultipleMemberus-gaap:FairValueInputsLevel3Membersrt:WeightedAverageMemberares:EVMarketMultipleAnalysisValuationTechniqueMembersrt:ParentCompanyMemberares:EquitySecuritiesOneMember2022-12-310001176948us-gaap:FairValueInputsLevel3Memberares:EVMarketMultipleAnalysisValuationTechniqueMemberares:EquitySecuritiesTwoMembersrt:ParentCompanyMember2022-12-310001176948ares:MeasurementInputBookValueMultipleMemberus-gaap:FairValueInputsLevel3Memberares:EVMarketMultipleAnalysisValuationTechniqueMemberares:EquitySecuritiesTwoMembersrt:ParentCompanyMember2022-12-310001176948ares:MeasurementInputBookValueMultipleMemberus-gaap:FairValueInputsLevel3Membersrt:WeightedAverageMemberares:EVMarketMultipleAnalysisValuationTechniqueMemberares:EquitySecuritiesTwoMembersrt:ParentCompanyMember2022-12-310001176948us-gaap:FairValueInputsLevel3Memberares:RecentTransactionPriceValuationTechniqueMembersrt:ParentCompanyMember2022-12-310001176948ares:BrokerQuotesAndThirdPartyPricingServicesValuationTechniqueMemberus-gaap:FairValueInputsLevel3Membersrt:ParentCompanyMember2022-12-310001176948us-gaap:FairValueInputsLevel3Memberares:OtherValuationTechniqueMembersrt:ParentCompanyMember2022-12-310001176948ares:ConsolidatedFundsMemberus-gaap:ValuationTechniqueDiscountedCashFlowMemberus-gaap:FairValueInputsLevel3Member2022-12-310001176948ares:ConsolidatedFundsMemberus-gaap:MeasurementInputDiscountRateMembersrt:MinimumMemberus-gaap:ValuationTechniqueDiscountedCashFlowMemberus-gaap:FairValueInputsLevel3Member2022-12-310001176948ares:ConsolidatedFundsMemberus-gaap:MeasurementInputDiscountRateMemberus-gaap:ValuationTechniqueDiscountedCashFlowMemberus-gaap:FairValueInputsLevel3Membersrt:MaximumMember2022-12-310001176948ares:ConsolidatedFundsMemberus-gaap:MeasurementInputDiscountRateMemberus-gaap:ValuationTechniqueDiscountedCashFlowMemberus-gaap:FairValueInputsLevel3Membersrt:WeightedAverageMember2022-12-310001176948ares:ConsolidatedFundsMemberares:MeasurementInputBookValueMultipleMemberus-gaap:FairValueInputsLevel3Memberares:EVMarketMultipleAnalysisValuationTechniqueMember2022-12-310001176948ares:ConsolidatedFundsMembersrt:MinimumMemberares:MeasurementInputBookValueMultipleMemberus-gaap:FairValueInputsLevel3Memberares:EVMarketMultipleAnalysisValuationTechniqueMember2022-12-310001176948ares:ConsolidatedFundsMemberares:MeasurementInputBookValueMultipleMemberus-gaap:FairValueInputsLevel3Memberares:EVMarketMultipleAnalysisValuationTechniqueMembersrt:MaximumMember2022-12-310001176948ares:ConsolidatedFundsMemberares:MeasurementInputBookValueMultipleMemberus-gaap:FairValueInputsLevel3Membersrt:WeightedAverageMemberares:EVMarketMultipleAnalysisValuationTechniqueMember2022-12-310001176948ares:ConsolidatedFundsMemberus-gaap:FairValueInputsLevel3Memberares:EVMarketMultipleAnalysisValuationTechniqueMemberares:MeasurementInputNetIncomeMultipleMember2022-12-310001176948ares:ConsolidatedFundsMemberus-gaap:FairValueInputsLevel3Membersrt:WeightedAverageMemberares:EVMarketMultipleAnalysisValuationTechniqueMemberares:MeasurementInputNetIncomeMultipleMember2022-12-310001176948ares:ConsolidatedFundsMemberus-gaap:FairValueInputsLevel3Memberus-gaap:MeasurementInputEbitdaMultipleMemberares:EVMarketMultipleAnalysisValuationTechniqueMember2022-12-310001176948ares:ConsolidatedFundsMembersrt:MinimumMemberus-gaap:FairValueInputsLevel3Memberus-gaap:MeasurementInputEbitdaMultipleMemberares:EVMarketMultipleAnalysisValuationTechniqueMember2022-12-310001176948ares:ConsolidatedFundsMemberus-gaap:FairValueInputsLevel3Memberus-gaap:MeasurementInputEbitdaMultipleMemberares:EVMarketMultipleAnalysisValuationTechniqueMembersrt:MaximumMember2022-12-310001176948ares:ConsolidatedFundsMemberus-gaap:FairValueInputsLevel3Membersrt:WeightedAverageMemberus-gaap:MeasurementInputEbitdaMultipleMemberares:EVMarketMultipleAnalysisValuationTechniqueMember2022-12-310001176948ares:ConsolidatedFundsMemberus-gaap:FairValueInputsLevel3Memberares:OtherValuationTechniqueMember2022-12-310001176948ares:ConsolidatedFundsMemberus-gaap:MeasurementInputDiscountRateMemberus-gaap:ValuationTechniqueDiscountedCashFlowMemberus-gaap:FairValueInputsLevel3Member2022-12-310001176948ares:ConsolidatedFundsMemberares:BrokerQuotesAndThirdPartyPricingServicesValuationTechniqueMemberus-gaap:FairValueInputsLevel3Member2022-12-310001176948ares:ConsolidatedFundsMemberus-gaap:FairValueInputsLevel3Memberares:EVMarketMultipleAnalysisValuationTechniqueMember2022-12-310001176948ares:ConsolidatedFundsMembersrt:MinimumMemberus-gaap:FairValueInputsLevel3Memberares:EVMarketMultipleAnalysisValuationTechniqueMemberares:MeasurementInputYieldMember2022-12-310001176948ares:ConsolidatedFundsMemberus-gaap:FairValueInputsLevel3Memberares:EVMarketMultipleAnalysisValuationTechniqueMembersrt:MaximumMemberares:MeasurementInputYieldMember2022-12-310001176948ares:ConsolidatedFundsMemberus-gaap:FairValueInputsLevel3Membersrt:WeightedAverageMemberares:EVMarketMultipleAnalysisValuationTechniqueMemberares:MeasurementInputYieldMember2022-12-310001176948ares:ConsolidatedFundsMemberus-gaap:FairValueInputsLevel3Memberares:RecentTransactionPriceValuationTechniqueMember2022-12-310001176948us-gaap:FairValueMeasuredAtNetAssetValuePerShareMemberares:OperationsManagementGroupMember2023-03-310001176948us-gaap:FairValueMeasuredAtNetAssetValuePerShareMemberares:OperationsManagementGroupMember2022-12-310001176948ares:ConsolidatedFundsMemberus-gaap:FairValueMeasuredAtNetAssetValuePerShareMemberares:OperationsManagementGroupMember2023-03-310001176948ares:ConsolidatedFundsMemberus-gaap:FairValueMeasuredAtNetAssetValuePerShareMemberares:OperationsManagementGroupMember2022-12-310001176948ares:CreditFacilityOfCompanyMembersrt:ParentCompanyMember2023-03-310001176948ares:CreditFacilityOfCompanyMembersrt:ParentCompanyMember2022-12-310001176948ares:SeniorNotes2024Membersrt:ParentCompanyMember2023-03-310001176948ares:SeniorNotes2024Membersrt:ParentCompanyMember2022-12-310001176948ares:SeniorNotes2030Membersrt:ParentCompanyMember2023-03-310001176948ares:SeniorNotes2030Membersrt:ParentCompanyMember2022-12-310001176948ares:SeniorNotes2052Membersrt:ParentCompanyMember2023-03-310001176948ares:SeniorNotes2052Membersrt:ParentCompanyMember2022-12-310001176948ares:SubordinatedNotes2051Membersrt:ParentCompanyMember2023-03-310001176948ares:SubordinatedNotes2051Membersrt:ParentCompanyMember2022-12-310001176948us-gaap:SecuredOvernightFinancingRateSofrOvernightIndexSwapRateMemberares:CreditFacilityOfCompanyMembersrt:ParentCompanyMember2023-01-012023-03-310001176948ares:CreditFacilityOfCompanyMembersrt:ParentCompanyMember2023-01-012023-03-310001176948ares:SeniorNotes2024Membersrt:ParentCompanyMember2014-10-012014-10-310001176948ares:SeniorNotes2030Membersrt:ParentCompanyMember2020-06-012020-06-300001176948ares:SeniorNotes2052Membersrt:ParentCompanyMember2022-01-012022-01-310001176948ares:SubordinatedNotes2051Membersrt:ParentCompanyMember2021-06-300001176948us-gaap:UsTreasuryUstInterestRateMemberares:SubordinatedNotes2051Membersrt:ParentCompanyMember2021-06-300001176948ares:SubordinatedNotes2051Membersrt:ParentCompanyMember2021-06-012021-06-300001176948ares:SeniorNotesOfTheCompanyMembersrt:ParentCompanyMember2022-12-310001176948ares:SubordinatedNotesOfTheCompanyMembersrt:ParentCompanyMember2022-12-310001176948ares:SeniorNotesOfTheCompanyMembersrt:ParentCompanyMember2023-01-012023-03-310001176948ares:SubordinatedNotesOfTheCompanyMembersrt:ParentCompanyMember2023-01-012023-03-310001176948ares:SeniorNotesOfTheCompanyMembersrt:ParentCompanyMember2023-03-310001176948ares:SubordinatedNotesOfTheCompanyMembersrt:ParentCompanyMember2023-03-310001176948ares:ConsolidatedFundsMemberus-gaap:SeniorNotesMemberus-gaap:CollateralizedLoanObligationsMember2023-03-310001176948ares:ConsolidatedFundsMemberus-gaap:SeniorNotesMemberus-gaap:CollateralizedLoanObligationsMember2023-01-012023-03-310001176948ares:ConsolidatedFundsMemberus-gaap:SeniorNotesMemberus-gaap:CollateralizedLoanObligationsMember2022-12-310001176948ares:ConsolidatedFundsMemberus-gaap:SeniorNotesMemberus-gaap:CollateralizedLoanObligationsMember2022-01-012022-12-310001176948ares:ConsolidatedFundsMemberus-gaap:CollateralizedLoanObligationsMemberus-gaap:SubordinatedDebtMember2023-03-310001176948ares:ConsolidatedFundsMemberus-gaap:CollateralizedLoanObligationsMemberus-gaap:SubordinatedDebtMember2023-01-012023-03-310001176948ares:ConsolidatedFundsMemberus-gaap:CollateralizedLoanObligationsMemberus-gaap:SubordinatedDebtMember2022-12-310001176948ares:ConsolidatedFundsMemberus-gaap:CollateralizedLoanObligationsMemberus-gaap:SubordinatedDebtMember2022-01-012022-12-310001176948ares:ConsolidatedFundsMemberus-gaap:CollateralizedLoanObligationsMember2023-03-310001176948ares:ConsolidatedFundsMemberus-gaap:CollateralizedLoanObligationsMember2022-12-310001176948ares:ConsolidatedFundsMemberares:CreditFacilityMaturingPeriodOneMember2023-03-310001176948ares:ConsolidatedFundsMemberares:CreditFacilityMaturingPeriodOneMember2022-12-310001176948ares:ConsolidatedFundsMemberares:CreditFacilityMaturingPeriodTwoMember2023-03-310001176948ares:ConsolidatedFundsMemberares:CreditFacilityMaturingPeriodTwoMember2022-12-310001176948ares:ConsolidatedFundsMemberares:CreditFacilityMaturingPeriodThreeMember2023-03-310001176948ares:ConsolidatedFundsMemberares:CreditFacilityMaturingPeriodThreeMember2022-12-310001176948ares:ConsolidatedFundsMemberares:CreditFacilityMaturingPeriodFourMember2023-03-310001176948ares:ConsolidatedFundsMemberares:CreditFacilityMaturingPeriodFourMember2022-12-310001176948ares:ConsolidatedFundsMemberares:CreditFacilityMaturingPeriodFiveMember2023-03-310001176948ares:ConsolidatedFundsMemberares:CreditFacilityMaturingPeriodFiveMember2022-12-310001176948ares:InfrastructureDebtAcquisitionMember2022-06-300001176948ares:InfrastructureDebtAcquisitionMember2023-01-012023-03-310001176948ares:RevenueTargetMemberares:InfrastructureDebtAcquisitionMember2022-10-012022-12-31ares:infrastructureDebtFund0001176948ares:RevenueTargetMemberares:InfrastructureDebtAcquisitionMember2022-01-012022-12-310001176948ares:RevenueTargetMemberares:InfrastructureDebtAcquisitionMember2022-12-310001176948ares:RevenueTargetMemberares:InfrastructureDebtAcquisitionMember2022-01-012022-03-310001176948ares:InfrastructureDebtAcquisitionMember2023-03-310001176948ares:InfrastructureDebtAcquisitionMember2022-01-012022-12-310001176948ares:InfrastructureDebtAcquisitionMember2022-12-310001176948ares:InfrastructureDebtAcquisitionMember2022-01-012022-03-310001176948ares:PerformanceFeesReversalsMember2023-03-310001176948ares:PerformanceFeesReversalsMember2022-12-310001176948srt:MinimumMember2023-03-310001176948srt:MaximumMember2023-03-310001176948srt:AffiliatedEntityMembersrt:ParentCompanyMember2023-03-310001176948srt:AffiliatedEntityMembersrt:ParentCompanyMember2022-12-310001176948ares:ConsolidatedFundsMembersrt:AffiliatedEntityMember2023-03-310001176948ares:ConsolidatedFundsMembersrt:AffiliatedEntityMember2022-12-310001176948us-gaap:RestrictedStockUnitsRSUMember2023-01-012023-03-310001176948us-gaap:RestrictedStockUnitsRSUMember2022-01-012022-03-310001176948us-gaap:EmployeeStockOptionMember2023-01-012023-03-310001176948us-gaap:EmployeeStockOptionMember2022-01-012022-03-310001176948srt:ParentCompanyMember2022-01-010001176948us-gaap:RestrictedStockUnitsRSUMember2023-01-012023-03-310001176948us-gaap:RestrictedStockUnitsRSUMember2022-01-012022-03-3100011769482023-03-172023-03-170001176948us-gaap:RestrictedStockUnitsRSUMembersrt:ExecutiveOfficerMember2023-01-012023-03-310001176948us-gaap:RestrictedStockUnitsRSUMember2022-12-310001176948us-gaap:RestrictedStockUnitsRSUMember2023-03-310001176948us-gaap:EmployeeStockOptionMember2023-01-012023-03-310001176948us-gaap:EmployeeStockOptionMember2022-12-310001176948us-gaap:EmployeeStockOptionMember2022-01-012022-12-310001176948us-gaap:EmployeeStockOptionMember2023-03-310001176948us-gaap:CommonClassAMember2023-02-280001176948us-gaap:CommonClassBMember2023-01-012023-03-310001176948us-gaap:CommonClassCMember2023-01-012023-03-310001176948us-gaap:CommonClassAMemberares:AresOperatingGroupMember2023-01-012023-03-310001176948us-gaap:NonvotingCommonStockMemberares:AresOperatingGroupMember2023-01-012023-03-310001176948us-gaap:CommonClassBMemberares:AresOperatingGroupMember2023-01-012023-03-310001176948ares:AresOperatingGroupMemberus-gaap:CommonClassCMember2023-01-012023-03-310001176948ares:AresOperatingGroupMember2023-03-310001176948ares:AresOperatingGroupMemberares:AresOperatingGroupMember2023-03-310001176948ares:AresOperatingGroupMember2022-12-310001176948ares:AresOperatingGroupMemberares:AresOperatingGroupMember2022-12-310001176948ares:AresOperatingGroupMemberares:AresOperatingGroupMember2023-01-012023-03-310001176948ares:AresOperatingGroupMemberares:AresOperatingGroupMember2022-01-012022-03-310001176948ares:AresOwnersHoldingsLpMember2023-03-310001176948ares:AresOperatingGroupMemberares:AresOwnersHoldingsLpMember2023-03-310001176948ares:AresOwnersHoldingsLpMember2022-12-310001176948ares:AresOperatingGroupMemberares:AresOwnersHoldingsLpMember2022-12-310001176948ares:AresOperatingGroupMemberares:AresOwnersHoldingsLpMember2023-01-012023-03-310001176948ares:AresOperatingGroupMemberares:AresOwnersHoldingsLpMember2022-01-012022-03-310001176948ares:AresOperatingGroupMember2023-03-310001176948ares:AresOperatingGroupMember2022-12-310001176948ares:AresOperatingGroupMember2021-12-310001176948ares:AresOperatingGroupMember2022-03-310001176948ares:AresOperatingGroupMember2022-04-012022-06-300001176948ares:AresOperatingGroupMember2022-06-300001176948ares:AresOperatingGroupMember2022-07-012022-09-300001176948ares:AresOperatingGroupMember2022-09-300001176948ares:AresOperatingGroupMember2022-10-012022-12-310001176948ares:ConsolidatedFundsMember2022-04-012022-06-300001176948ares:ConsolidatedFundsMember2022-06-300001176948ares:ConsolidatedFundsMember2022-07-012022-09-300001176948ares:ConsolidatedFundsMember2022-09-300001176948ares:ConsolidatedFundsMember2022-10-012022-12-310001176948us-gaap:OperatingSegmentsMemberares:CreditGroupMemberus-gaap:ManagementServiceMembersrt:ParentCompanyMember2023-01-012023-03-310001176948ares:PrivateEquityGroupMemberus-gaap:OperatingSegmentsMemberus-gaap:ManagementServiceMembersrt:ParentCompanyMember2023-01-012023-03-310001176948ares:RealEstateGroupMemberus-gaap:OperatingSegmentsMemberus-gaap:ManagementServiceMembersrt:ParentCompanyMember2023-01-012023-03-310001176948ares:SecondariesGroupMemberus-gaap:OperatingSegmentsMemberus-gaap:ManagementServiceMembersrt:ParentCompanyMember2023-01-012023-03-310001176948us-gaap:AllOtherSegmentsMemberus-gaap:OperatingSegmentsMemberus-gaap:ManagementServiceMembersrt:ParentCompanyMember2023-01-012023-03-310001176948us-gaap:OperatingSegmentsMemberus-gaap:ManagementServiceMembersrt:ParentCompanyMember2023-01-012023-03-310001176948us-gaap:ManagementServiceMemberus-gaap:CorporateNonSegmentMember2023-01-012023-03-310001176948ares:OperatingSegmentsAndCorporateNonSegmentMemberus-gaap:ManagementServiceMember2023-01-012023-03-310001176948ares:FeeRelatedPerformanceRevenuesMemberus-gaap:OperatingSegmentsMemberares:CreditGroupMembersrt:ParentCompanyMember2023-01-012023-03-310001176948ares:PrivateEquityGroupMemberares:FeeRelatedPerformanceRevenuesMemberus-gaap:OperatingSegmentsMembersrt:ParentCompanyMember2023-01-012023-03-310001176948ares:RealEstateGroupMemberares:FeeRelatedPerformanceRevenuesMemberus-gaap:OperatingSegmentsMembersrt:ParentCompanyMember2023-01-012023-03-310001176948ares:SecondariesGroupMemberares:FeeRelatedPerformanceRevenuesMemberus-gaap:OperatingSegmentsMembersrt:ParentCompanyMember2023-01-012023-03-310001176948us-gaap:AllOtherSegmentsMemberares:FeeRelatedPerformanceRevenuesMemberus-gaap:OperatingSegmentsMembersrt:ParentCompanyMember2023-01-012023-03-310001176948ares:FeeRelatedPerformanceRevenuesMemberus-gaap:OperatingSegmentsMembersrt:ParentCompanyMember2023-01-012023-03-310001176948ares:FeeRelatedPerformanceRevenuesMemberus-gaap:CorporateNonSegmentMember2023-01-012023-03-310001176948ares:OperatingSegmentsAndCorporateNonSegmentMemberares:FeeRelatedPerformanceRevenuesMember2023-01-012023-03-310001176948us-gaap:OperatingSegmentsMemberares:CreditGroupMemberus-gaap:ServiceOtherMembersrt:ParentCompanyMember2023-01-012023-03-310001176948ares:PrivateEquityGroupMemberus-gaap:OperatingSegmentsMemberus-gaap:ServiceOtherMembersrt:ParentCompanyMember2023-01-012023-03-310001176948ares:RealEstateGroupMemberus-gaap:OperatingSegmentsMemberus-gaap:ServiceOtherMembersrt:ParentCompanyMember2023-01-012023-03-310001176948ares:SecondariesGroupMemberus-gaap:OperatingSegmentsMemberus-gaap:ServiceOtherMembersrt:ParentCompanyMember2023-01-012023-03-310001176948us-gaap:AllOtherSegmentsMemberus-gaap:OperatingSegmentsMemberus-gaap:ServiceOtherMembersrt:ParentCompanyMember2023-01-012023-03-310001176948us-gaap:OperatingSegmentsMemberus-gaap:ServiceOtherMembersrt:ParentCompanyMember2023-01-012023-03-310001176948us-gaap:ServiceOtherMemberus-gaap:CorporateNonSegmentMember2023-01-012023-03-310001176948ares:OperatingSegmentsAndCorporateNonSegmentMemberus-gaap:ServiceOtherMember2023-01-012023-03-310001176948us-gaap:OperatingSegmentsMemberares:CreditGroupMembersrt:ParentCompanyMember2023-01-012023-03-310001176948ares:PrivateEquityGroupMemberus-gaap:OperatingSegmentsMembersrt:ParentCompanyMember2023-01-012023-03-310001176948ares:RealEstateGroupMemberus-gaap:OperatingSegmentsMembersrt:ParentCompanyMember2023-01-012023-03-310001176948ares:SecondariesGroupMemberus-gaap:OperatingSegmentsMembersrt:ParentCompanyMember2023-01-012023-03-310001176948us-gaap:AllOtherSegmentsMemberus-gaap:OperatingSegmentsMembersrt:ParentCompanyMember2023-01-012023-03-310001176948us-gaap:OperatingSegmentsMembersrt:ParentCompanyMember2023-01-012023-03-310001176948us-gaap:CorporateNonSegmentMember2023-01-012023-03-310001176948ares:OperatingSegmentsAndCorporateNonSegmentMember2023-01-012023-03-310001176948us-gaap:OperatingSegmentsMemberares:CreditGroupMemberus-gaap:ManagementServiceMembersrt:ParentCompanyMember2022-01-012022-03-310001176948ares:PrivateEquityGroupMemberus-gaap:OperatingSegmentsMemberus-gaap:ManagementServiceMembersrt:ParentCompanyMember2022-01-012022-03-310001176948ares:RealEstateGroupMemberus-gaap:OperatingSegmentsMemberus-gaap:ManagementServiceMembersrt:ParentCompanyMember2022-01-012022-03-310001176948ares:SecondariesGroupMemberus-gaap:OperatingSegmentsMemberus-gaap:ManagementServiceMembersrt:ParentCompanyMember2022-01-012022-03-310001176948us-gaap:AllOtherSegmentsMemberus-gaap:OperatingSegmentsMemberus-gaap:ManagementServiceMembersrt:ParentCompanyMember2022-01-012022-03-310001176948us-gaap:OperatingSegmentsMemberus-gaap:ManagementServiceMembersrt:ParentCompanyMember2022-01-012022-03-310001176948us-gaap:ManagementServiceMemberus-gaap:CorporateNonSegmentMember2022-01-012022-03-310001176948ares:OperatingSegmentsAndCorporateNonSegmentMemberus-gaap:ManagementServiceMember2022-01-012022-03-310001176948ares:FeeRelatedPerformanceRevenuesMemberus-gaap:OperatingSegmentsMemberares:CreditGroupMembersrt:ParentCompanyMember2022-01-012022-03-310001176948ares:PrivateEquityGroupMemberares:FeeRelatedPerformanceRevenuesMemberus-gaap:OperatingSegmentsMembersrt:ParentCompanyMember2022-01-012022-03-310001176948ares:RealEstateGroupMemberares:FeeRelatedPerformanceRevenuesMemberus-gaap:OperatingSegmentsMembersrt:ParentCompanyMember2022-01-012022-03-310001176948ares:SecondariesGroupMemberares:FeeRelatedPerformanceRevenuesMemberus-gaap:OperatingSegmentsMembersrt:ParentCompanyMember2022-01-012022-03-310001176948us-gaap:AllOtherSegmentsMemberares:FeeRelatedPerformanceRevenuesMemberus-gaap:OperatingSegmentsMembersrt:ParentCompanyMember2022-01-012022-03-310001176948ares:FeeRelatedPerformanceRevenuesMemberus-gaap:OperatingSegmentsMembersrt:ParentCompanyMember2022-01-012022-03-310001176948ares:FeeRelatedPerformanceRevenuesMemberus-gaap:CorporateNonSegmentMember2022-01-012022-03-310001176948ares:OperatingSegmentsAndCorporateNonSegmentMemberares:FeeRelatedPerformanceRevenuesMember2022-01-012022-03-310001176948us-gaap:OperatingSegmentsMemberares:CreditGroupMemberus-gaap:ServiceOtherMembersrt:ParentCompanyMember2022-01-012022-03-310001176948ares:PrivateEquityGroupMemberus-gaap:OperatingSegmentsMemberus-gaap:ServiceOtherMembersrt:ParentCompanyMember2022-01-012022-03-310001176948ares:RealEstateGroupMemberus-gaap:OperatingSegmentsMemberus-gaap:ServiceOtherMembersrt:ParentCompanyMember2022-01-012022-03-310001176948ares:SecondariesGroupMemberus-gaap:OperatingSegmentsMemberus-gaap:ServiceOtherMembersrt:ParentCompanyMember2022-01-012022-03-310001176948us-gaap:AllOtherSegmentsMemberus-gaap:OperatingSegmentsMemberus-gaap:ServiceOtherMembersrt:ParentCompanyMember2022-01-012022-03-310001176948us-gaap:OperatingSegmentsMemberus-gaap:ServiceOtherMembersrt:ParentCompanyMember2022-01-012022-03-310001176948us-gaap:ServiceOtherMemberus-gaap:CorporateNonSegmentMember2022-01-012022-03-310001176948ares:OperatingSegmentsAndCorporateNonSegmentMemberus-gaap:ServiceOtherMember2022-01-012022-03-310001176948us-gaap:OperatingSegmentsMemberares:CreditGroupMembersrt:ParentCompanyMember2022-01-012022-03-310001176948ares:PrivateEquityGroupMemberus-gaap:OperatingSegmentsMembersrt:ParentCompanyMember2022-01-012022-03-310001176948ares:RealEstateGroupMemberus-gaap:OperatingSegmentsMembersrt:ParentCompanyMember2022-01-012022-03-310001176948ares:SecondariesGroupMemberus-gaap:OperatingSegmentsMembersrt:ParentCompanyMember2022-01-012022-03-310001176948us-gaap:AllOtherSegmentsMemberus-gaap:OperatingSegmentsMembersrt:ParentCompanyMember2022-01-012022-03-310001176948us-gaap:OperatingSegmentsMembersrt:ParentCompanyMember2022-01-012022-03-310001176948us-gaap:CorporateNonSegmentMember2022-01-012022-03-310001176948ares:OperatingSegmentsAndCorporateNonSegmentMember2022-01-012022-03-310001176948ares:FeeRelatedPerformanceRevenuesMember2022-01-012022-03-310001176948ares:ConsolidatedFundsMemberus-gaap:IntersegmentEliminationMemberus-gaap:ManagementServiceMember2023-01-012023-03-310001176948ares:ConsolidatedFundsMemberus-gaap:IntersegmentEliminationMemberus-gaap:ManagementServiceMember2022-01-012022-03-310001176948ares:ConsolidatedFundsMemberares:CarriedInterestMemberus-gaap:IntersegmentEliminationMember2023-01-012023-03-310001176948ares:ConsolidatedFundsMemberares:CarriedInterestMemberus-gaap:IntersegmentEliminationMember2022-01-012022-03-310001176948ares:ConsolidatedFundsMemberus-gaap:IntersegmentEliminationMemberus-gaap:ManagementServiceIncentiveMember2023-01-012023-03-310001176948ares:ConsolidatedFundsMemberus-gaap:IntersegmentEliminationMemberus-gaap:ManagementServiceIncentiveMember2022-01-012022-03-310001176948ares:ConsolidatedFundsMemberus-gaap:MaterialReconcilingItemsMemberus-gaap:AdministrativeServiceMember2023-01-012023-03-310001176948ares:ConsolidatedFundsMemberus-gaap:MaterialReconcilingItemsMemberus-gaap:AdministrativeServiceMember2022-01-012022-03-310001176948us-gaap:MaterialReconcilingItemsMemberus-gaap:AdministrativeServiceMember2023-01-012023-03-310001176948us-gaap:MaterialReconcilingItemsMemberus-gaap:AdministrativeServiceMember2022-01-012022-03-310001176948us-gaap:MaterialReconcilingItemsMemberares:PrincipalInvestmentIncomeMember2023-01-012023-03-310001176948us-gaap:MaterialReconcilingItemsMemberares:PrincipalInvestmentIncomeMember2022-01-012022-03-310001176948us-gaap:MaterialReconcilingItemsMemberus-gaap:NoncontrollingInterestMembersrt:SubsidiariesMember2023-01-012023-03-310001176948us-gaap:MaterialReconcilingItemsMemberus-gaap:NoncontrollingInterestMembersrt:SubsidiariesMember2022-01-012022-03-310001176948us-gaap:MaterialReconcilingItemsMember2023-01-012023-03-310001176948us-gaap:MaterialReconcilingItemsMember2022-01-012022-03-310001176948ares:ConsolidatedFundsMemberus-gaap:OperatingSegmentsMember2023-01-012023-03-310001176948ares:ConsolidatedFundsMemberus-gaap:OperatingSegmentsMember2022-01-012022-03-310001176948ares:ConsolidatedFundsMemberus-gaap:MaterialReconcilingItemsMember2023-01-012023-03-310001176948ares:ConsolidatedFundsMemberus-gaap:MaterialReconcilingItemsMember2022-01-012022-03-310001176948ares:ConsolidatedFundsMemberus-gaap:IntersegmentEliminationMember2023-01-012023-03-310001176948ares:ConsolidatedFundsMemberus-gaap:IntersegmentEliminationMember2022-01-012022-03-310001176948us-gaap:OperatingSegmentsMember2023-01-012023-03-310001176948us-gaap:OperatingSegmentsMember2022-01-012022-03-310001176948us-gaap:OperatingSegmentsMembersrt:SubsidiariesMember2023-01-012023-03-310001176948us-gaap:OperatingSegmentsMembersrt:SubsidiariesMember2022-01-012022-03-310001176948us-gaap:VariableInterestEntityNotPrimaryBeneficiaryMember2023-03-310001176948us-gaap:VariableInterestEntityNotPrimaryBeneficiaryMember2022-12-310001176948us-gaap:VariableInterestEntityPrimaryBeneficiaryMember2023-03-310001176948us-gaap:VariableInterestEntityPrimaryBeneficiaryMember2022-12-310001176948ares:ConsolidatedFundsMemberus-gaap:VariableInterestEntityPrimaryBeneficiaryMember2023-03-310001176948ares:ConsolidatedFundsMemberus-gaap:VariableInterestEntityPrimaryBeneficiaryMember2022-12-310001176948us-gaap:CollateralizedLoanObligationsMember2023-03-310001176948us-gaap:CollateralizedLoanObligationsMember2022-12-310001176948ares:ConsolidatedFundsMemberus-gaap:VariableInterestEntityPrimaryBeneficiaryMember2023-01-012023-03-310001176948ares:ConsolidatedFundsMemberus-gaap:VariableInterestEntityPrimaryBeneficiaryMember2022-01-012022-03-310001176948srt:ReportableLegalEntitiesMembersrt:ParentCompanyMember2023-03-310001176948srt:ConsolidationEliminationsMembersrt:ParentCompanyMember2023-03-310001176948ares:ConsolidatedFundsMembersrt:ReportableLegalEntitiesMember2023-03-310001176948srt:ConsolidationEliminationsMemberares:ConsolidatedFundsMember2023-03-310001176948srt:ConsolidationEliminationsMember2023-03-310001176948srt:ReportableLegalEntitiesMemberares:AresOperatingGroupMembersrt:ParentCompanyMember2023-03-310001176948srt:ReportableLegalEntitiesMemberares:AresOperatingGroupMember2023-03-310001176948srt:ConsolidationEliminationsMemberares:AresOperatingGroupMember2023-03-310001176948us-gaap:CommonClassAMembersrt:ReportableLegalEntitiesMembersrt:ParentCompanyMember2023-03-310001176948us-gaap:CommonClassAMembersrt:ParentCompanyMember2023-03-310001176948srt:ReportableLegalEntitiesMemberus-gaap:NonvotingCommonStockMembersrt:ParentCompanyMember2023-03-310001176948us-gaap:NonvotingCommonStockMembersrt:ParentCompanyMember2023-03-310001176948srt:ReportableLegalEntitiesMemberus-gaap:CommonClassBMembersrt:ParentCompanyMember2023-03-310001176948us-gaap:CommonClassBMembersrt:ParentCompanyMember2023-03-310001176948srt:ReportableLegalEntitiesMembersrt:ParentCompanyMemberus-gaap:CommonClassCMember2023-03-310001176948srt:ParentCompanyMemberus-gaap:CommonClassCMember2023-03-310001176948srt:ReportableLegalEntitiesMembersrt:ParentCompanyMember2022-12-310001176948srt:ConsolidationEliminationsMembersrt:ParentCompanyMember2022-12-310001176948ares:ConsolidatedFundsMembersrt:ReportableLegalEntitiesMember2022-12-310001176948srt:ConsolidationEliminationsMemberares:ConsolidatedFundsMember2022-12-310001176948srt:ConsolidationEliminationsMember2022-12-310001176948srt:ReportableLegalEntitiesMemberares:AresOperatingGroupMembersrt:ParentCompanyMember2022-12-310001176948srt:ReportableLegalEntitiesMemberares:AresOperatingGroupMember2022-12-310001176948srt:ConsolidationEliminationsMemberares:AresOperatingGroupMember2022-12-310001176948us-gaap:CommonClassAMembersrt:ReportableLegalEntitiesMembersrt:ParentCompanyMember2022-12-310001176948us-gaap:CommonClassAMembersrt:ParentCompanyMember2022-12-310001176948srt:ReportableLegalEntitiesMemberus-gaap:NonvotingCommonStockMembersrt:ParentCompanyMember2022-12-310001176948us-gaap:NonvotingCommonStockMembersrt:ParentCompanyMember2022-12-310001176948us-gaap:CommonClassBMembersrt:ParentCompanyMember2022-12-310001176948srt:ReportableLegalEntitiesMembersrt:ParentCompanyMemberus-gaap:CommonClassCMember2022-12-310001176948srt:ParentCompanyMemberus-gaap:CommonClassCMember2022-12-310001176948srt:ReportableLegalEntitiesMemberus-gaap:ManagementServiceMembersrt:ParentCompanyMember2023-01-012023-03-310001176948srt:ConsolidationEliminationsMemberus-gaap:ManagementServiceMember2023-01-012023-03-310001176948ares:CarriedInterestMembersrt:ReportableLegalEntitiesMembersrt:ParentCompanyMember2023-01-012023-03-310001176948srt:ConsolidationEliminationsMemberares:CarriedInterestMember2023-01-012023-03-310001176948srt:ReportableLegalEntitiesMembersrt:ParentCompanyMemberus-gaap:ManagementServiceIncentiveMember2023-01-012023-03-310001176948srt:ConsolidationEliminationsMemberus-gaap:ManagementServiceIncentiveMember2023-01-012023-03-310001176948srt:ReportableLegalEntitiesMemberares:PrincipalInvestmentIncomeMembersrt:ParentCompanyMember2023-01-012023-03-310001176948srt:ConsolidationEliminationsMemberares:PrincipalInvestmentIncomeMember2023-01-012023-03-310001176948srt:ReportableLegalEntitiesMemberus-gaap:AdministrativeServiceMembersrt:ParentCompanyMember2023-01-012023-03-310001176948srt:ConsolidationEliminationsMemberus-gaap:AdministrativeServiceMember2023-01-012023-03-310001176948srt:ReportableLegalEntitiesMembersrt:ParentCompanyMember2023-01-012023-03-310001176948ares:ConsolidatedFundsMembersrt:ReportableLegalEntitiesMember2023-01-012023-03-310001176948srt:ConsolidationEliminationsMember2023-01-012023-03-310001176948srt:ConsolidationEliminationsMemberares:ConsolidatedFundsMember2023-01-012023-03-310001176948srt:ReportableLegalEntitiesMemberares:AresOperatingGroupMembersrt:ParentCompanyMember2023-01-012023-03-310001176948srt:ReportableLegalEntitiesMemberus-gaap:ManagementServiceMembersrt:ParentCompanyMember2022-01-012022-03-310001176948srt:ConsolidationEliminationsMemberus-gaap:ManagementServiceMember2022-01-012022-03-310001176948ares:CarriedInterestMembersrt:ReportableLegalEntitiesMembersrt:ParentCompanyMember2022-01-012022-03-310001176948srt:ReportableLegalEntitiesMembersrt:ParentCompanyMemberus-gaap:ManagementServiceIncentiveMember2022-01-012022-03-310001176948srt:ConsolidationEliminationsMemberus-gaap:ManagementServiceIncentiveMember2022-01-012022-03-310001176948srt:ReportableLegalEntitiesMemberares:PrincipalInvestmentIncomeMembersrt:ParentCompanyMember2022-01-012022-03-310001176948srt:ConsolidationEliminationsMemberares:PrincipalInvestmentIncomeMember2022-01-012022-03-310001176948srt:ReportableLegalEntitiesMemberus-gaap:AdministrativeServiceMembersrt:ParentCompanyMember2022-01-012022-03-310001176948srt:ConsolidationEliminationsMemberus-gaap:AdministrativeServiceMember2022-01-012022-03-310001176948srt:ReportableLegalEntitiesMembersrt:ParentCompanyMember2022-01-012022-03-310001176948ares:ConsolidatedFundsMembersrt:ReportableLegalEntitiesMember2022-01-012022-03-310001176948srt:ConsolidationEliminationsMember2022-01-012022-03-310001176948srt:ConsolidationEliminationsMemberares:ConsolidatedFundsMember2022-01-012022-03-310001176948ares:ConsolidatedFundsMembersrt:ReportableLegalEntitiesMembersrt:ParentCompanyMember2022-01-012022-03-310001176948srt:ReportableLegalEntitiesMemberares:AresOperatingGroupMembersrt:ParentCompanyMember2022-01-012022-03-310001176948srt:ReportableLegalEntitiesMemberares:AresOperatingGroupMember2022-01-012022-03-310001176948srt:ConsolidationEliminationsMembersrt:ParentCompanyMember2023-01-012023-03-310001176948srt:ReportableLegalEntitiesMember2023-01-012023-03-310001176948srt:ConsolidationEliminationsMembersrt:ParentCompanyMember2022-01-012022-03-310001176948srt:ReportableLegalEntitiesMember2022-01-012022-03-310001176948srt:ReportableLegalEntitiesMembersrt:ParentCompanyMember2021-12-310001176948ares:ConsolidatedFundsMembersrt:ReportableLegalEntitiesMember2021-12-310001176948srt:ConsolidationEliminationsMember2021-12-310001176948srt:ReportableLegalEntitiesMembersrt:ParentCompanyMember2022-03-310001176948ares:ConsolidatedFundsMembersrt:ReportableLegalEntitiesMember2022-03-310001176948srt:ConsolidationEliminationsMember2022-03-310001176948us-gaap:SubsequentEventMemberus-gaap:NonvotingCommonStockMember2023-04-012023-04-300001176948us-gaap:CommonClassAMemberus-gaap:SubsequentEventMember2023-04-012023-04-30
UNITED STATES
SECURITIES AND EXCHANGE COMMISSION
Washington, D.C. 20549
FORM 10-Q
|
|
|
|
|
|
| ☒ |
QUARTERLY REPORT PURSUANT TO SECTION 13 OR 15(d) OF THE SECURITIES EXCHANGE ACT OF 1934 |
For the quarterly period ended March 31, 2023
OR
|
|
|
|
|
|
| ☐ |
TRANSITION REPORT PURSUANT TO SECTION 13 OR 15(d) OF THE SECURITIES EXCHANGE ACT OF 1934 |
For the transition period from to
Commission File No. 001-36429
ARES MANAGEMENT CORPORATION
(Exact name of Registrant as specified in its charter)
|
|
|
|
|
|
| Delaware |
80-0962035 |
(State or other jurisdiction of
incorporation or organization) |
(I.R.S. Employer
Identification Number) |
2000 Avenue of the Stars, 12th Floor, Los Angeles, CA 90067
(Address of principal executive office) (Zip Code)
(310) 201-4100
(Registrant’s telephone number, including area code)
N/A
(Former name, former address and former fiscal year, if changed since last report)
Securities registered pursuant to Section 12(b) of the Act:
|
|
|
|
|
|
|
|
|
| Title of each class |
Trading Symbol(s) |
Name of each exchange on which registered |
| Class A common stock, par value $0.01 per share |
ARES |
New York Stock Exchange |
Indicate by check mark whether the registrant (1) has filed all reports required to be filed by Section 13 or 15(d) of the Securities Exchange Act of 1934 during the preceding 12 months (or for such shorter period that the registrant was required to file such reports), and (2) has been subject to such filing requirements for the past 90 days: Yes x No ¨
Indicate by check mark whether the registrant has submitted electronically every Interactive Data File required to be submitted pursuant to Rule 405 of Regulation S-T (§232.405 of this chapter) during the preceding 12 months (or for such shorter period that the registrant was required to submit such files). Yes x No ¨
Indicate by check mark whether the registrant is a large accelerated filer, an accelerated filer, a non-accelerated filer, a smaller reporting company, or an emerging growth company. See definitions of “large accelerated filer,” “accelerated filer,” “smaller reporting company.” and “emerging growth company” in Rule 12b-2 of the Exchange Act.
|
|
|
|
|
|
|
|
|
|
|
|
|
|
|
|
|
|
|
|
|
|
|
|
|
|
|
|
|
|
| Large Accelerated Filer |
x |
Accelerated Filer |
☐ |
Non-Accelerated Filer |
☐ |
Smaller Reporting Company |
☐ |
Emerging Growth Company |
☐ |
If an emerging growth company, indicate by check mark if the registrant has elected not to use the extended transition period for complying with any new or revised financial accounting standards provided pursuant to Section 13(a) of the Exchange Act. ¨
Indicate by check mark whether the registrant is a shell company (as defined in Rule 12b-2 of the Exchange Act). Yes ☐ No x
As of May 2, 2023 there were 178,481,331 of the registrant’s shares of Class A common stock outstanding, 3,489,911 of the registrant’s shares of non-voting common stock outstanding, 1,000 shares of the registrant’s Class B common stock outstanding, and 120,438,398 of the registrant’s Class C common stock outstanding.
Cautionary Note Regarding Forward-Looking Statements
This report contains forward-looking statements within the meaning of Section 27A of the Securities Act of 1933, as amended (the “Securities Act”), and Section 21E of the Securities Exchange Act of 1934, as amended (the “Exchange Act”), which reflect our current views with respect to, among other things, future events, operations and financial performance. You can identify these forward-looking statements by the use of forward-looking words such as “outlook,” “believes,” “expects,” “potential,” “continues,” “may,” “will,” “should,” “seeks,” “predicts,” “intends,” “plans,” “estimates,” “anticipates,” “foresees” or negative versions of those words, other comparable words or other statements that do not relate to historical or factual matters. The forward-looking statements are based on our beliefs, assumptions and expectations of our future performance, taking into account all information currently available to us. Such forward-looking statements are subject to various risks and uncertainties and assumptions relating to our operations, financial results, financial condition, business prospects, growth strategy and liquidity. Some of these factors are described in this report and in our
Annual Report on Form 10-K for the year ended December 31, 2022, under the headings “Item 7. Management’s Discussion and Analysis of Financial Condition and Results of Operations” and “Item 1A. Risk Factors.” These factors should not be construed as exhaustive and should be read in conjunction with the risk factors and other cautionary statements that are included in this report and in our other periodic filings. If one or more of these or other risks or uncertainties materialize, or if our underlying assumptions prove to be incorrect, our actual results may vary materially from those indicated in these forward-looking statements. New risks and uncertainties arise over time, and it is not possible for us to predict those events or how they may affect us. Therefore, you should not place undue reliance on these forward-looking statements. Any forward-looking statement speaks only as of the date on which it is made. We do not undertake any obligation to publicly update or review any forward-looking statement, whether as a result of new information, future developments or otherwise, except as required by law.
References in this Quarterly Report on Form 10-Q to the “Ares Operating Group” refer to Ares Holdings L.P. (“Ares Holdings”). References in this Quarterly Report on Form 10-Q to an “Ares Operating Group Unit” or an “AOG Unit” refers to a partnership unit in the Ares Operating Group entity.
The use of any defined term in this report to mean more than one entities, persons, securities or other items collectively is solely for convenience of reference and in no way implies that such entities, persons, securities or other items are one indistinguishable group. For example, notwithstanding the use of the defined terms “Ares,” “we” and “our” in this report to refer to Ares Management Corporation and its subsidiaries, each subsidiary of Ares Management Corporation is a standalone legal entity that is separate and distinct from Ares Management Corporation and any of its other subsidiaries.
Under generally accepted accounting principles in the United States (“GAAP”), we are required to consolidate (a) entities other than limited partnerships and entities similar to limited partnerships in which we hold a majority voting interest or have majority ownership and control over the operational, financial and investing decisions of that entity, including Ares-affiliates and affiliated funds and co-investment vehicles, for which we are presumed to have controlling financial interests, and (b) entities that we concluded are variable interest entities (“VIEs”), including limited partnerships and collateralized loan obligations, for which we are deemed to be the primary beneficiary. When an entity is consolidated, we reflect the assets, liabilities, revenues, expenses and cash flows of the entity in our unaudited condensed consolidated financial statements on a gross basis, subject to eliminations from consolidation, including the elimination of the management fees, carried interest, incentive fees and other fees that we earn from the entity. However, the presentation of performance related compensation and other expenses associated with generating such revenues is not affected by the consolidation process. In addition, as a result of the consolidation process, the net income attributable to third-party investors in consolidated entities is presented as net income attributable to non-controlling interests in Consolidated Funds within Condensed Consolidated Statements of Operations. We also consolidate joint ventures that we have established with third-party investors for strategic distribution and expansion purposes. The results of these entities are reflected on a gross basis in the unaudited condensed consolidated financial statements, subject to eliminations from consolidation, and net income attributable to third-party investors in the consolidated joint ventures is presented within net income attributable to redeemable interest and non-controlling interests in Ares Operating Group entities.
In this Quarterly Report on Form 10-Q, in addition to presenting our results on a consolidated basis in accordance with GAAP, we present revenues, expenses and other results on a (i) “segment basis,” which deconsolidates the consolidated funds and removes the proportional results attributable to third-party investors in the consolidated joint ventures, and therefore shows the results of our operating segments without giving effect to the consolidation of these entities and (ii) “unconsolidated reporting basis,” which shows the results of our operating segments on a combined segment basis together with our Operations Management Group. In addition to our operating segments, we have an Operations Management Group (the “OMG”). The OMG consists of shared resource groups to support our operating segments by providing infrastructure and administrative support in the areas of accounting/finance, operations, information technology, legal, compliance, human resources, strategy and relationship management and distribution. The OMG includes Ares Wealth Management Solutions, LLC (“AWMS”) that facilitates the product development, distribution, marketing and client management activities for investment offerings in the global wealth management channel.
Additionally, the OMG provides services to certain of the Company’s managed funds and vehicles, which reimburse the OMG for expenses equal to the costs of services provided. The OMG’s revenues and expenses are not allocated to our operating segments but we consider the cost structure of the OMG when evaluating our financial performance. This information constitutes non-GAAP financial information within the meaning of Regulation G, as promulgated by the SEC. Our management uses this information to assess the performance of our operating segments and the OMG, and we believe that this information enhances the ability of shareholders to analyze our performance. For more information, see “Note 13. Segment Reporting,” within our unaudited condensed consolidated financial statements included in this Quarterly Report on Form 10-Q.
Glossary
When used in this report, unless the context otherwise requires:
•“American-style waterfall” generally refers to carried interest that the general partner is entitled to receive after a fund investment is realized and the investors in the fund have received distributions in excess of the capital contributed for that investment and all prior realized investments (including allocable expenses) plus a preferred return;
•“ARCC Part II Fees” refers to fees from Ares Capital Corporation (NASDAQ: ARCC) (“ARCC”) that are paid in arrears as of the end of each calendar year when the cumulative aggregate realized capital gains exceed the cumulative aggregate realized capital losses and aggregate unrealized capital depreciation, less the aggregate amount of ARCC Part II Fees paid in all prior years since inception;
•“Ares”, the “Company”, “AMC”, “we”, “us” and “our” refer to Ares Management Corporation and its subsidiaries;
•“Ares Operating Group Unit” or an “AOG Unit” refers to, collectively, a partnership unit in the Ares Operating Group entities including Ares Holdings and any future entity designated by our board of directors in its sole discretion as an Ares Operating Group entity;
•“assets under management” or “AUM” generally refers to the assets we manage. For our funds other than CLOs, our AUM represents the sum of the net asset value (“NAV”) of such funds, the drawn and undrawn debt (at the fund-level including amounts subject to restrictions) and uncalled committed capital (including commitments to funds that have yet to commence their investment periods). NAV refers to the fair value of the assets of a fund less the fair value of the liabilities of the fund. For the CLOs we manage, our AUM is equal to initial principal amounts adjusted for paydowns. AUM also includes the proceeds raised in the initial public offering of a special purpose acquisition company (“SPAC”) sponsored by us;
•“AUM not yet paying fees” (also referred to as “shadow AUM”) refers to AUM that is not currently paying fees and is eligible to earn management fees upon deployment;
•“available capital” (also referred to as “dry powder”) is comprised of uncalled committed capital and undrawn amounts under credit facilities and may include AUM that may be canceled or not otherwise available to invest;
•“catch-up fees” refers to management fees that are one-time in nature and represents management fees charged to fund investors in subsequent closings of a fund that apply to the time period between the fee initiation date and the subsequent closing date;
•“CLOs” refers to “our funds” that are structured as collateralized loan obligations;
•“Consolidated Funds” refers collectively to certain Ares funds, co-investment vehicles, CLOs and SPACs that are required under GAAP to be consolidated in our consolidated financial statements;
•“Credit Facility” refers to the revolving credit facility of the Ares Operating Group;
•“effective management fee rate” represents the annualized fees divided by the average fee paying AUM for the period, excluding the impact of one-time catch-up fees;
•“European-style waterfall” generally refers to carried interest that the general partner is entitled to receive after the investors in a fund have received distributions in an amount equal to all prior capital contributions plus a preferred return;
•“fee paying AUM” or “FPAUM” refers to the AUM from which we directly earn management fees. FPAUM is equal to the sum of all the individual fee bases of our funds that directly contribute to our management fees. For our funds other than CLOs, our FPAUM represents the amount of limited partner capital commitments for certain closed-end funds within the reinvestment period, the amount of limited partner invested capital for the aforementioned closed-end funds beyond the reinvestment period and the portfolio value, gross asset value or NAV. For the CLOs we manage, our FPAUM is equal to the gross amount of aggregate collateral balance, at par, adjusted for defaulted or discounted collateral;
•“fee related earnings” or “FRE”, a non-GAAP measure, is used to assess core operating performance by determining whether recurring revenue, primarily consisting of management fees and fee related performance revenues, is sufficient to cover operating expenses and to generate profits. FRE differs from income before taxes computed in accordance with GAAP as FRE excludes net performance income, investment income from our funds and certain other items that we believe are not indicative of our core operating performance. Fee related performance revenues, together with fee related performance compensation, is presented within FRE because it represents incentive fees from perpetual capital vehicles that are measured and received on a recurring basis and are not dependent on realization events from the underlying investments;
•“fee related performance revenues” refers to incentive fees from perpetual capital vehicles that are (i) measured and expected to be received on a recurring basis and (ii) not dependent on realization events from the underlying investments. Certain vehicles are subject to hold back provisions that limit the amounts paid in a particular year. Such hold back amounts may be paid in subsequent years, subject to their extended performance conditions;
•“GAAP” refers to accounting principles generally accepted in the United States of America;
•“Holdco Members” refers to Michael Arougheti, David Kaplan, Antony Ressler, Bennett Rosenthal, Ryan Berry and R. Kipp deVeer;
•“Incentive eligible AUM” or “IEAUM” generally refers to the AUM of our funds and other entities from which carried interest and incentive fees may be generated, regardless of whether or not they are currently generating carried interest and incentive fees. It generally represents the NAV plus uncalled equity or total assets plus uncalled debt, as applicable, of our funds for which we are entitled to receive carried interest and incentive fees, excluding capital committed by us and our professionals (from which we generally do not earn carried interest and incentive fees), as well as proceeds raised in the initial public offering of a SPAC sponsored by us. With respect to ARCC’s AUM, only ARCC Part II Fees may be generated from IEAUM;
•“Incentive generating AUM” or “IGAUM” refers to the AUM of our funds and other entities that are currently generating carried interest and incentive fees on a realized or unrealized basis. It generally represents the NAV or total assets of our funds, as applicable, for which we are entitled to receive carried interest and incentive fees, excluding capital committed by us and our professionals (from which we generally do not earn carried interest and incentive fees). ARCC is only included in IGAUM when ARCC Part II Fees are being generated;
•“management fees” refers to fees we earn for advisory services provided to our funds, which are generally based on a defined percentage of fair value of assets, total commitments, invested capital, net asset value, net investment income, total assets or par value of the investment portfolios managed by us. Management fees include Part I Fees, a quarterly fee based on the net investment income of certain funds;
•“net inflows of capital” refers to net new commitments during the period, including equity and debt commitments and gross inflows into our open-ended managed accounts and sub-advised accounts, as well as new debt and equity issuances by our publicly-traded vehicles minus redemptions from our open-ended funds, managed accounts and sub-advised accounts;
•“net performance income” refers to performance income net of related compensation that is typically payable to our professionals;
•“our funds” refers to the funds, alternative asset companies, trusts, co-investment vehicles and other entities and accounts that are managed or co-managed by the Ares Operating Group, and which are structured to pay fees. It also includes funds managed by Ivy Hill Asset Management, L.P., a wholly owned portfolio company of ARCC and an SEC-registered investment adviser;
•“Part I Fees” refers to a quarterly fee on the net investment income of ARCC and CION Ares Diversified Credit Fund (“CADC”). Such fees are classified as management fees as they are predictable and recurring in nature, not subject to contingent repayment and generally cash-settled each quarter, unless subject to a payment deferral;
•“performance income” refers to income we earn based on the performance of a fund that is generally based on certain specific hurdle rates as defined in the fund’s investment management or partnership agreements and may be either performance revenue or carried interest, but in all cases excludes fee related performance revenues;
•“performance revenue” refers to all incentive fees other than those presented as fee related performance revenues;
•“perpetual capital” refers to the AUM of (i) ARCC, Ares Commercial Real Estate Corporation (NYSE: ACRE) (“ACRE”), Ares Private Markets Fund (“APMF”), Ares Dynamic Credit Allocation Fund, Inc. (NYSE: ARDC) (“ARDC”), Ares Strategic Income Fund (“ASIF”) and CADC, (ii) our non-traded Real Estate Investment Trusts (“REITs”), (iii) Aspida Holdings Ltd. (together with its subsidiaries, “Aspida”), and (iv) certain other commingled funds and managed accounts that have an indefinite term, are not in liquidation, and for which there is no immediate requirement to return invested capital to investors upon the realization of investments. Perpetual Capital - Commingled Funds refers to commingled funds that meet the Perpetual Capital criteria. Perpetual Capital - Managed Accounts refers to managed accounts for single investors primarily in illiquid strategies that meet the Perpetual Capital criteria. Perpetual Capital may be withdrawn by investors under certain conditions, including through an election to redeem an investor’s fund investment or to terminate the investment management agreement, which in certain cases may be terminated on 30 days’ prior written notice. In addition, the investment management or advisory agreements of certain of our publicly-traded and non-traded vehicles have one year terms, which are subject to annual renewal by such vehicles;
•“realized income” or “RI”, a non-GAAP measure, is an operating metric used by management to evaluate performance of the business based on operating performance and the contribution of each of the business segments to that performance, while removing the fluctuations of unrealized income and losses, which may or may not be eventually realized at the levels presented and whose realizations depend more on future outcomes than current business operations. RI differs from income before taxes by excluding (i) operating results of our Consolidated Funds, (ii) depreciation and amortization expense, (iii) the effects of changes arising from corporate actions, (iv) unrealized gains and losses related to carried interest, incentive fees and investment performance and (v) certain other items that we believe are not indicative of our operating performance. Changes arising from corporate actions include equity-based compensation expenses, the amortization of intangible assets, transaction costs associated with mergers, acquisitions and capital activities, underwriting costs and expenses incurred in connection with corporate reorganization. RI is reduced by a placement fee adjustment that represents the net portion of either expense deferral or amortization that is required to match the timing of expense recognition with the period over which management fees are expected to be earned from the associated fund for segment purposes but have been expensed up front in accordance with GAAP. For periods in which the amortization of placement fees for segment purposes is higher than the GAAP expense, the placement fee adjustment is presented as a reduction to RI;
•“SEC” refers to the Securities and Exchange Commission;
•“2024 Senior Notes” refers to senior notes issued by a wholly owned subsidiary of Ares Holdings in October 2014 with a maturity in October 2024;
•“2030 Senior Notes” refers to senior notes issued by a wholly owned subsidiary of Ares Holdings in June 2020 with a maturity in June 2030;
•“2051 Subordinated Notes” refers to subordinated notes issued by a wholly owned subsidiary of Ares Holdings in June 2021 with a maturity in June 2051; and
•“2052 Senior Notes” refers to senior notes issued by a wholly owned subsidiary of Ares Holdings in January 2022 with a maturity in February 2052.
Many of the terms used in this report, including AUM, FPAUM, FRE and RI, may not be comparable to similarly titled measures used by other companies. In addition, our definitions of AUM and FPAUM are not based on any definition of AUM or FPAUM that is set forth in the agreements governing the investment funds that we manage and may differ from definitions of AUM or FPAUM set forth in other agreements to which we are a party or definitions used by the SEC or other regulatory bodies. Further, FRE and RI are not measures of performance calculated in accordance with GAAP. We use FRE and RI as measures of operating performance, not as measures of liquidity. FRE and RI should not be considered in isolation or as substitutes for operating income, net income, operating cash flows, or other income or cash flow statement data prepared in accordance with GAAP. The use of FRE and RI without consideration of related GAAP measures is not adequate due to the adjustments described above. Our management compensates for these limitations by using FRE and RI as supplemental measures to our GAAP results. We present these measures to provide a more complete understanding of our performance as our management measures it.
Amounts and percentages throughout this report may reflect rounding adjustments and consequently totals may not appear to sum.
PART I—FINANCIAL INFORMATION
Item 1. Financial Statements
Ares Management Corporation
Condensed Consolidated Statements of Financial Condition
(Amounts in Thousands, Except Share Data)
|
|
|
|
|
|
|
|
|
|
|
|
|
|
As of |
|
| |
March 31, 2023 |
|
December 31, 2022 |
|
|
(unaudited) |
|
|
|
| Assets |
|
|
|
|
| Cash and cash equivalents |
$ |
272,249 |
|
|
$ |
389,987 |
|
|
Investments (includes accrued carried interest of $3,236,418 and $3,106,577 at March 31, 2023 and December 31, 2022, respectively) |
4,100,683 |
|
|
3,974,734 |
|
|
| Due from affiliates |
707,804 |
|
|
758,472 |
|
|
| Other assets |
267,068 |
|
|
381,137 |
|
|
| Right-of-use operating lease assets |
154,970 |
|
|
155,950 |
|
|
| Intangible assets, net |
1,166,607 |
|
|
1,208,220 |
|
|
| Goodwill |
998,937 |
|
|
999,656 |
|
|
| Assets of Consolidated Funds: |
|
|
|
|
| Cash and cash equivalents |
754,934 |
|
|
724,641 |
|
|
| Investments held in trust account |
484,901 |
|
|
1,013,382 |
|
|
| Investments, at fair value |
12,641,251 |
|
|
12,191,251 |
|
|
| Due from affiliates |
10,878 |
|
|
15,789 |
|
|
| Receivable for securities sold |
305,418 |
|
|
124,050 |
|
|
| Other assets |
62,882 |
|
|
65,570 |
|
|
| Total assets |
$ |
21,928,582 |
|
|
$ |
22,002,839 |
|
|
| Liabilities |
|
|
|
|
| Accounts payable, accrued expenses and other liabilities |
$ |
261,298 |
|
|
$ |
231,921 |
|
|
| Accrued compensation |
214,135 |
|
|
510,130 |
|
|
| Due to affiliates |
183,451 |
|
|
252,798 |
|
|
| Performance related compensation payable |
2,365,230 |
|
|
2,282,209 |
|
|
| Debt obligations |
2,369,292 |
|
|
2,273,854 |
|
|
| Operating lease liabilities |
191,090 |
|
|
190,616 |
|
|
| Liabilities of Consolidated Funds: |
|
|
|
|
| Accounts payable, accrued expenses and other liabilities |
187,505 |
|
|
168,286 |
|
|
| Due to affiliates |
— |
|
|
4,037 |
|
|
| Payable for securities purchased |
549,415 |
|
|
314,193 |
|
|
| CLO loan obligations, at fair value |
10,918,007 |
|
|
10,701,720 |
|
|
| Fund borrowings |
103,046 |
|
|
168,046 |
|
|
| Total liabilities |
17,342,469 |
|
|
17,097,810 |
|
|
| Commitments and contingencies |
|
|
|
|
| Redeemable interest in Consolidated Funds |
484,801 |
|
|
1,013,282 |
|
|
| Redeemable interest in Ares Operating Group entities |
21,942 |
|
|
93,129 |
|
|
| Non-controlling interests in Consolidated Funds |
1,171,402 |
|
|
1,074,356 |
|
|
| Non-controlling interests in Ares Operating Group entities |
1,238,074 |
|
|
1,135,023 |
|
|
| Stockholders’ Equity |
|
|
|
|
|
|
|
|
|
Class A common stock, $0.01 par value, 1,500,000,000 shares authorized (177,674,055 shares and 173,892,036 shares issued and outstanding at March 31, 2023 and December 31, 2022, respectively) |
1,777 |
|
|
1,739 |
|
|
Non-voting common stock, $0.01 par value, 500,000,000 shares authorized (3,489,911 shares issued and outstanding at March 31, 2023 and December 31, 2022) |
35 |
|
|
35 |
|
|
Class B common stock, $0.01 par value, 1,000 shares authorized (1,000 shares issued and outstanding at March 31, 2023 and December 31, 2022) |
— |
|
|
— |
|
|
Class C common stock, $0.01 par value, 499,999,000 shares authorized (120,638,398 shares and 117,231,288 shares issued and outstanding at March 31, 2023 and December 31, 2022, respectively) |
1,206 |
|
|
1,172 |
|
|
| Additional paid-in-capital |
2,100,043 |
|
|
1,970,754 |
|
|
| Accumulated deficit |
(420,822) |
|
|
(369,475) |
|
|
| Accumulated other comprehensive loss, net of tax |
(12,345) |
|
|
(14,986) |
|
|
| Total stockholders’ equity |
1,669,894 |
|
|
1,589,239 |
|
|
| Total equity |
4,079,370 |
|
|
3,798,618 |
|
|
| Total liabilities, redeemable interest, non-controlling interests and equity |
$ |
21,928,582 |
|
|
$ |
22,002,839 |
|
|
See accompanying notes to the unaudited condensed consolidated financial statements.
Ares Management Corporation
Condensed Consolidated Statements of Operations
(Amounts in Thousands, Except Share Data)
(unaudited)
|
|
|
|
|
|
|
|
|
|
|
|
|
|
|
|
|
|
| |
|
|
Three months ended March 31, |
| |
|
|
|
|
2023 |
|
2022 |
|
|
| Revenues |
|
|
|
|
|
|
|
|
|
| Management fees |
|
|
|
|
$ |
600,516 |
|
|
$ |
477,332 |
|
|
|
| Carried interest allocation |
|
|
|
|
151,488 |
|
|
178,289 |
|
|
|
| Incentive fees |
|
|
|
|
8,923 |
|
|
16,422 |
|
|
|
| Principal investment income |
|
|
|
|
22,758 |
|
|
8,326 |
|
|
|
| Administrative, transaction and other fees |
|
|
|
|
29,677 |
|
|
34,630 |
|
|
|
| Total revenues |
|
|
|
|
813,362 |
|
|
714,999 |
|
|
|
| Expenses |
|
|
|
|
|
|
|
|
|
| Compensation and benefits |
|
|
|
|
360,781 |
|
|
357,243 |
|
|
|
| Performance related compensation |
|
|
|
|
111,658 |
|
|
129,405 |
|
|
|
| General, administrative and other expenses |
|
|
|
|
148,345 |
|
|
120,523 |
|
|
|
|
|
|
|
|
|
|
|
|
|
| Expenses of Consolidated Funds |
|
|
|
|
7,852 |
|
|
4,513 |
|
|
|
| Total expenses |
|
|
|
|
628,636 |
|
|
611,684 |
|
|
|
| Other income (expense) |
|
|
|
|
|
|
|
|
|
| Net realized and unrealized gains on investments |
|
|
|
|
1,515 |
|
|
8,109 |
|
|
|
| Interest and dividend income |
|
|
|
|
3,839 |
|
|
1,502 |
|
|
|
| Interest expense |
|
|
|
|
(24,986) |
|
|
(15,646) |
|
|
|
| Other income (expense), net |
|
|
|
|
(923) |
|
|
1,784 |
|
|
|
| Net realized and unrealized gains on investments of Consolidated Funds |
|
|
|
|
10,700 |
|
|
15,968 |
|
|
|
| Interest and other income of Consolidated Funds |
|
|
|
|
222,938 |
|
|
120,290 |
|
|
|
| Interest expense of Consolidated Funds |
|
|
|
|
(156,687) |
|
|
(74,013) |
|
|
|
| Total other income, net |
|
|
|
|
56,396 |
|
|
57,994 |
|
|
|
| Income before taxes |
|
|
|
|
241,122 |
|
|
161,309 |
|
|
|
| Income tax expense |
|
|
|
|
33,806 |
|
|
20,411 |
|
|
|
| Net income |
|
|
|
|
207,316 |
|
|
140,898 |
|
|
|
| Less: Net income attributable to non-controlling interests in Consolidated Funds |
|
|
|
|
26,693 |
|
|
47,382 |
|
|
|
| Net income attributable to Ares Operating Group entities |
|
|
|
|
180,623 |
|
|
93,516 |
|
|
|
| Less: Net income (loss) attributable to redeemable interest in Ares Operating Group entities |
|
|
|
|
(1,824) |
|
|
399 |
|
|
|
| Less: Net income attributable to non-controlling interests in Ares Operating Group entities |
|
|
|
|
88,408 |
|
|
47,254 |
|
|
|
|
|
|
|
|
|
|
|
|
|
|
|
|
|
|
|
|
|
|
|
|
|
|
|
|
|
|
|
|
|
| Net income attributable to Ares Management Corporation Class A and non-voting common stockholders |
|
|
|
|
$ |
94,039 |
|
|
$ |
45,863 |
|
|
|
| Net income per share of Class A and non-voting common stock: |
|
|
|
|
|
|
|
|
|
| Basic |
|
|
|
|
$ |
0.49 |
|
|
$ |
0.24 |
|
|
|
| Diluted |
|
|
|
|
$ |
0.49 |
|
|
$ |
0.24 |
|
|
|
| Weighted-average shares of Class A and non-voting common stock: |
|
|
|
|
|
|
|
|
|
| Basic |
|
|
|
|
178,976,022 |
|
|
174,215,251 |
|
|
|
| Diluted |
|
|
|
|
178,976,022 |
|
|
174,215,251 |
|
|
|
Substantially all revenue is earned from affiliated funds of the Company.
See accompanying notes to the unaudited condensed consolidated financial statements.
Ares Management Corporation
Condensed Consolidated Statements of Comprehensive Income
(Amounts in Thousands)
(unaudited)
|
|
|
|
|
|
|
|
|
|
|
|
|
|
|
|
|
|
|
|
|
|
|
|
Three months ended March 31, |
|
|
|
| |
|
2023 |
|
2022 |
|
|
|
|
|
|
|
| Net income |
|
$ |
207,316 |
|
|
$ |
140,898 |
|
|
|
|
|
|
|
|
| Other comprehensive income: |
|
|
|
|
|
|
|
|
|
|
|
| Foreign currency translation adjustments, net of tax |
|
6,639 |
|
|
(12,393) |
|
|
|
|
|
|
|
|
| Total comprehensive income |
|
213,955 |
|
|
128,505 |
|
|
|
|
|
|
|
|
| Less: Comprehensive income attributable to non-controlling interests in Consolidated Funds |
|
29,083 |
|
|
42,287 |
|
|
|
|
|
|
|
|
| Comprehensive income attributable to Ares Operating Group entities |
|
184,872 |
|
|
86,218 |
|
|
|
|
|
|
|
|
| Less: Comprehensive income (loss) attributable to redeemable interest in Ares Operating Group entities |
|
(1,972) |
|
|
68 |
|
|
|
|
|
|
|
|
| Less: Comprehensive income attributable to non-controlling interests in Ares Operating Group entities |
|
90,164 |
|
|
44,451 |
|
|
|
|
|
|
|
|
| Comprehensive income attributable to Ares Management Corporation |
|
$ |
96,680 |
|
|
$ |
41,699 |
|
|
|
|
|
|
|
|
See accompanying notes to the unaudited condensed consolidated financial statements.
Ares Management Corporation
Condensed Consolidated Statements of Changes in Equity
(Amounts in Thousands)
(unaudited)
|
|
|
|
|
|
|
|
|
|
|
|
|
|
|
|
|
|
|
|
|
|
|
|
|
|
|
|
|
|
|
|
|
|
|
|
|
|
|
|
|
|
|
|
|
|
|
|
|
|
|
|
|
|
|
|
|
|
|
|
|
|
|
Class A Common Stock |
|
Non-voting Common Stock |
|
Class C Common Stock |
|
Additional Paid-in-Capital |
|
Accumulated Deficit |
|
Accumulated Other Comprehensive Income (loss) |
|
Non-Controlling Interest in Ares Operating Group Entities |
|
Non-Controlling Interest in Consolidated Funds |
|
Total Equity |
| Balance at December 31, 2022 |
|
|
|
$ |
1,739 |
|
|
$ |
35 |
|
|
$ |
1,172 |
|
|
$ |
1,970,754 |
|
|
$ |
(369,475) |
|
|
$ |
(14,986) |
|
|
$ |
1,135,023 |
|
|
$ |
1,074,356 |
|
|
$ |
3,798,618 |
|
| Changes in ownership interests and related tax benefits |
|
|
|
19 |
|
|
— |
|
|
34 |
|
|
(36,777) |
|
|
— |
|
|
— |
|
|
87,541 |
|
|
(4,689) |
|
|
46,128 |
|
| Issuances of common stock |
|
|
|
14 |
|
|
— |
|
|
— |
|
|
115,350 |
|
|
— |
|
|
— |
|
|
— |
|
|
— |
|
|
115,364 |
|
| Capital contributions |
|
|
|
— |
|
|
— |
|
|
— |
|
|
— |
|
|
— |
|
|
— |
|
|
1,172 |
|
|
93,585 |
|
|
94,757 |
|
| Dividends/Distributions |
|
|
|
— |
|
|
— |
|
|
— |
|
|
— |
|
|
(145,386) |
|
|
— |
|
|
(103,363) |
|
|
(20,933) |
|
|
(269,682) |
|
| Net income |
|
|
|
— |
|
|
— |
|
|
— |
|
|
— |
|
|
94,039 |
|
|
— |
|
|
88,408 |
|
|
26,693 |
|
|
209,140 |
|
| Currency translation adjustment, net of tax |
|
|
|
— |
|
|
— |
|
|
— |
|
|
— |
|
|
— |
|
|
2,641 |
|
|
1,756 |
|
|
2,390 |
|
|
6,787 |
|
| Equity compensation |
|
|
|
— |
|
|
— |
|
|
— |
|
|
41,541 |
|
|
— |
|
|
— |
|
|
27,537 |
|
|
— |
|
|
69,078 |
|
| Stock option exercises |
|
|
|
5 |
|
|
— |
|
|
— |
|
|
9,175 |
|
|
— |
|
|
— |
|
|
— |
|
|
— |
|
|
9,180 |
|
| Balance at March 31, 2023 |
|
|
|
$ |
1,777 |
|
|
$ |
35 |
|
|
$ |
1,206 |
|
|
$ |
2,100,043 |
|
|
$ |
(420,822) |
|
|
$ |
(12,345) |
|
|
$ |
1,238,074 |
|
|
$ |
1,171,402 |
|
|
$ |
4,079,370 |
|
|
|
|
|
|
|
|
|
|
|
|
|
|
|
|
|
|
|
|
|
|
|
|
|
|
|
|
|
|
|
|
|
|
|
|
|
|
|
|
|
|
|
|
|
|
|
|
|
|
|
|
|
|
|
|
|
|
|
|
|
|
|
|
|
|
|
|
|
|
|
|
|
|
|
|
|
|
|
|
|
|
|
|
|
|
|
|
|
|
|
|
|
|
|
|
|
|
|
|
|
|
|
|
|
|
|
|
|
|
|
|
|
|
|
|
|
|
|
|
|
|
|
|
|
|
|
|
|
|
|
|
|
|
|
|
|
|
|
|
|
|
|
|
|
|
|
|
|
|
|
|
|
|
|
|
|
|
|
|
|
|
|
|
|
|
|
|
|
|
|
|
|
|
|
|
|
|
|
|
|
|
|
|
|
|
|
|
|
|
|
|
|
|
|
|
|
|
|
|
|
|
|
|
|
|
|
|
|
|
|
|
|
|
|
|
|
|
|
|
|
|
|
|
|
|
|
|
|
|
|
|
|
|
|
|
|
|
|
|
|
|
|
|
|
|
|
|
|
|
|
|
|
|
|
|
|
|
|
|
|
|
|
|
|
|
|
|
|
|
|
|
|
|
|
|
|
|
|
|
|
|
|
|
|
|
|
|
|
|
|
|
|
|
|
|
|
|
|
|
|
|
|
|
|
|
|
|
|
|
|
|
|
|
|
|
|
|
|
|
|
|
|
|
|
|
|
|
|
|
|
|
|
|
|
|
|
|
|
|
|
|
|
|
|
|
|
|
|
|
|
|
|
|
|
|
|
|
|
|
|
|
|
|
|
|
|
|
|
|
|
|
|
|
|
|
|
|
|
|
|
|
|
|
|
|
|
|
|
|
|
|
|
|
|
|
|
|
|
|
|
|
|
|
|
|
|
|
|
|
|
|
|
|
|
|
|
|
|
|
|
|
|
|
|
|
|
|
|
|
|
|
|
|
|
|
|
|
|
|
|
|
See accompanying notes to the unaudited condensed consolidated financial statements.
Ares Management Corporation
Condensed Consolidated Statements of Changes in Equity
(Amounts in Thousands)
(unaudited)
|
|
|
|
|
|
|
|
|
|
|
|
|
|
|
|
|
|
|
|
|
|
|
|
|
|
|
|
|
|
|
|
|
|
|
|
|
|
|
|
|
|
|
|
|
|
|
|
|
|
|
|
|
|
|
|
|
|
|
|
|
|
|
Class A Common Stock |
|
Non-voting Common Stock |
|
Class C Common Stock |
|
Additional Paid-in-Capital |
|
Accumulated Deficit |
|
Accumulated Other Comprehensive Income (loss) |
|
Non-Controlling Interest in Ares Operating Group Entities |
|
Non-Controlling Interest in Consolidated Funds |
|
Total Equity |
| Balance at December 31, 2021 |
|
|
|
$ |
1,684 |
|
|
$ |
35 |
|
|
$ |
1,186 |
|
|
$ |
1,913,559 |
|
|
$ |
(89,382) |
|
|
$ |
(1,855) |
|
|
$ |
1,397,747 |
|
|
$ |
591,452 |
|
|
$ |
3,814,426 |
|
|
|
|
|
|
|
|
|
|
|
|
|
|
|
|
|
|
|
|
|
|
| Changes in ownership interests and related tax benefits |
|
|
|
28 |
|
|
— |
|
|
(1) |
|
|
(110,577) |
|
|
— |
|
|
— |
|
|
(90,843) |
|
|
19,202 |
|
|
(182,191) |
|
| Issuances of common stock |
|
|
|
1 |
|
|
|
|
— |
|
|
12,834 |
|
|
— |
|
|
— |
|
|
— |
|
|
— |
|
|
12,835 |
|
| Capital contributions |
|
|
|
— |
|
|
— |
|
|
— |
|
|
— |
|
|
— |
|
|
— |
|
|
1,079 |
|
|
82,930 |
|
|
84,009 |
|
| Dividends/Distributions |
|
|
|
— |
|
|
— |
|
|
— |
|
|
— |
|
|
(111,406) |
|
|
— |
|
|
(100,480) |
|
|
(34,958) |
|
|
(246,844) |
|
| Net income |
|
|
|
— |
|
|
— |
|
|
— |
|
|
— |
|
|
45,863 |
|
|
— |
|
|
47,254 |
|
|
47,382 |
|
|
140,499 |
|
| Currency translation adjustment, net of tax |
|
|
|
— |
|
|
— |
|
|
— |
|
|
— |
|
|
— |
|
|
(4,164) |
|
|
(2,803) |
|
|
(5,095) |
|
|
(12,062) |
|
| Equity compensation |
|
|
|
— |
|
|
— |
|
|
— |
|
|
31,896 |
|
|
— |
|
|
— |
|
|
21,706 |
|
|
— |
|
|
53,602 |
|
| Stock option exercises |
|
|
|
2 |
|
|
|
|
— |
|
|
3,345 |
|
|
— |
|
|
— |
|
|
— |
|
|
— |
|
|
3,347 |
|
| Balance at March 31, 2022 |
|
|
|
1,715 |
|
|
35 |
|
|
1,185 |
|
|
1,851,057 |
|
|
(154,925) |
|
|
(6,019) |
|
|
1,273,660 |
|
|
700,913 |
|
|
3,667,621 |
|
|
|
|
|
|
|
|
|
|
|
|
|
|
|
|
|
|
|
|
|
|
| Changes in ownership interests and related tax benefits |
|
|
|
— |
|
|
— |
|
|
(1) |
|
|
(5,599) |
|
|
— |
|
|
— |
|
|
(3,135) |
|
|
5,815 |
|
|
(2,920) |
|
|
|
|
|
|
|
|
|
|
|
|
|
|
|
|
|
|
|
|
|
|
| Capital contributions |
|
|
|
— |
|
|
— |
|
|
— |
|
|
— |
|
|
— |
|
|
— |
|
|
969 |
|
|
135,350 |
|
|
136,319 |
|
|
|
|
|
|
|
|
|
|
|
|
|
|
|
|
|
|
|
|
|
|
| Dividends/Distributions |
|
|
|
— |
|
|
— |
|
|
— |
|
|
— |
|
|
(111,506) |
|
|
— |
|
|
(82,958) |
|
|
(18,680) |
|
|
(213,144) |
|
| Net income (loss) |
|
|
|
— |
|
|
— |
|
|
— |
|
|
— |
|
|
39,731 |
|
|
— |
|
|
29,354 |
|
|
(15,022) |
|
|
54,063 |
|
| Currency translation adjustment, net of tax |
|
|
|
— |
|
|
— |
|
|
— |
|
|
— |
|
|
— |
|
|
(11,173) |
|
|
(7,575) |
|
|
(9,900) |
|
|
(28,648) |
|
| Equity compensation |
|
|
|
— |
|
|
— |
|
|
— |
|
|
29,569 |
|
|
— |
|
|
— |
|
|
19,990 |
|
|
— |
|
|
49,559 |
|
| Stock option exercises |
|
|
|
3 |
|
|
— |
|
|
— |
|
|
5,294 |
|
|
— |
|
|
— |
|
|
— |
|
|
— |
|
|
5,297 |
|
| Balance at June 30, 2022 |
|
|
|
1,718 |
|
|
35 |
|
|
1,184 |
|
|
1,880,321 |
|
|
(226,700) |
|
|
(17,192) |
|
|
1,230,305 |
|
|
798,476 |
|
|
3,668,147 |
|
|
|
|
|
|
|
|
|
|
|
|
|
|
|
|
|
|
|
|
|
|
| Changes in ownership interests and related tax benefits |
|
|
|
3 |
|
|
— |
|
|
(1) |
|
|
(3,173) |
|
|
— |
|
|
— |
|
|
(4,354) |
|
|
(479) |
|
|
(8,004) |
|
|
|
|
|
|
|
|
|
|
|
|
|
|
|
|
|
|
|
|
|
|
| Capital contributions |
|
|
|
— |
|
|
— |
|
|
— |
|
|
— |
|
|
— |
|
|
— |
|
|
1,549 |
|
|
80,366 |
|
|
81,915 |
|
| Dividends/Distributions |
|
|
|
— |
|
|
— |
|
|
— |
|
|
— |
|
|
(111,952) |
|
|
— |
|
|
(88,041) |
|
|
(50,794) |
|
|
(250,787) |
|
| Net income (loss) |
|
|
|
— |
|
|
— |
|
|
— |
|
|
— |
|
|
(35,546) |
|
|
— |
|
|
(29,666) |
|
|
16,340 |
|
|
(48,872) |
|
| Currency translation adjustment, net of tax |
|
|
|
— |
|
|
— |
|
|
— |
|
|
— |
|
|
— |
|
|
(11,627) |
|
|
(7,852) |
|
|
(9,199) |
|
|
(28,678) |
|
| Equity compensation |
|
|
|
— |
|
|
— |
|
|
— |
|
|
28,704 |
|
|
— |
|
|
— |
|
|
19,336 |
|
|
— |
|
|
48,040 |
|
| Stock option exercises |
|
|
|
3 |
|
|
— |
|
|
— |
|
|
5,884 |
|
|
— |
|
|
— |
|
|
— |
|
|
— |
|
|
5,887 |
|
| Balance at September 30, 2022 |
|
|
|
1,724 |
|
|
35 |
|
|
1,183 |
|
|
1,911,736 |
|
|
(374,198) |
|
|
(28,819) |
|
|
1,121,277 |
|
|
834,710 |
|
|
3,467,648 |
|
|
|
|
|
|
|
|
|
|
|
|
|
|
|
|
|
|
|
|
|
|
| Changes in ownership interests and related tax benefits |
|
|
|
12 |
|
|
— |
|
|
(11) |
|
|
22,936 |
|
|
— |
|
|
— |
|
|
(7,348) |
|
|
(20,532) |
|
|
(4,943) |
|
|
|
|
|
|
|
|
|
|
|
|
|
|
|
|
|
|
|
|
|
|
| Capital contributions |
|
|
|
— |
|
|
— |
|
|
— |
|
|
— |
|
|
— |
|
|
— |
|
|
1,598 |
|
|
250,750 |
|
|
252,348 |
|
| Dividends/Distributions |
|
|
|
— |
|
|
— |
|
|
— |
|
|
— |
|
|
(112,770) |
|
|
— |
|
|
(115,364) |
|
|
(73,859) |
|
|
(301,993) |
|
| Net income |
|
|
|
— |
|
|
— |
|
|
— |
|
|
— |
|
|
117,493 |
|
|
— |
|
|
105,950 |
|
|
70,633 |
|
|
294,076 |
|
| Currency translation adjustment, net of tax |
|
|
|
— |
|
|
— |
|
|
— |
|
|
— |
|
|
— |
|
|
13,833 |
|
|
9,416 |
|
|
12,654 |
|
|
35,903 |
|
| Equity compensation |
|
|
|
— |
|
|
— |
|
|
— |
|
|
29,411 |
|
|
— |
|
|
— |
|
|
19,494 |
|
|
— |
|
|
48,905 |
|
| Stock option exercises |
|
|
|
3 |
|
|
— |
|
|
— |
|
|
6,671 |
|
|
— |
|
|
— |
|
|
— |
|
|
— |
|
|
6,674 |
|
| Balance at December 31, 2022 |
|
|
|
$ |
1,739 |
|
|
$ |
35 |
|
|
$ |
1,172 |
|
|
$ |
1,970,754 |
|
|
$ |
(369,475) |
|
|
$ |
(14,986) |
|
|
$ |
1,135,023 |
|
|
$ |
1,074,356 |
|
|
$ |
3,798,618 |
|
See accompanying notes to the unaudited condensed consolidated financial statements.
Ares Management Corporation
Condensed Consolidated Statements of Cash Flows
(Amounts in Thousands)
(unaudited)
|
|
|
|
|
|
|
|
|
|
|
|
|
|
| |
Three months ended March 31, |
| |
2023 |
|
2022 |
|
|
| Cash flows from operating activities: |
|
|
|
|
|
| Net income |
$ |
207,316 |
|
|
$ |
140,898 |
|
|
|
|
|
|
|
|
|
| Adjustments to reconcile net income to net cash provided by operating activities |
121,761 |
|
|
53,473 |
|
|
|
|
|
|
|
|
|
|
|
|
|
|
|
|
|
|
|
|
|
|
|
|
|
|
|
|
|
|
|
|
|
|
|
|
|
|
|
|
|
|
|
|
|
|
|
|
|
|
|
| Adjustments to reconcile net income to net cash provided by operating activities allocable to non-controlling interests in Consolidated Funds |
328,840 |
|
|
(97,772) |
|
|
|
|
|
|
|
|
|
|
|
|
|
|
|
|
|
|
|
|
|
|
|
|
|
|
|
|
|
|
|
|
|
| Cash flows due to changes in operating assets and liabilities |
7,071 |
|
|
132,346 |
|
|
|
|
|
|
|
|
|
|
|
|
|
|
|
|
|
|
|
|
|
|
|
|
|
|
|
|
|
|
|
|
|
| Cash flows due to changes in operating assets and liabilities allocable to redeemable and non-controlling interest in Consolidated Funds |
42,584 |
|
|
(4,795) |
|
|
|
|
|
|
|
|
|
|
|
|
|
|
|
|
|
|
|
|
|
|
|
|
|
|
|
| Net cash provided by operating activities |
707,572 |
|
|
224,150 |
|
|
|
| Cash flows from investing activities: |
|
|
|
|
|
| Purchase of furniture, equipment and leasehold improvements, net of disposals |
(8,877) |
|
|
(8,524) |
|
|
|
| Acquisitions, net of cash acquired |
— |
|
|
(301,624) |
|
|
|
| Net cash used in investing activities |
(8,877) |
|
|
(310,148) |
|
|
|
| Cash flows from financing activities: |
|
|
|
|
|
|
|
|
|
|
|
| Proceeds from Credit Facility |
245,000 |
|
|
860,000 |
|
|
|
| Proceeds from issuance of senior notes |
— |
|
|
488,915 |
|
|
|
|
|
|
|
|
|
| Repayments of Credit Facility |
(150,000) |
|
|
(905,000) |
|
|
|
|
|
|
|
|
|
| Dividends and distributions |
(251,632) |
|
|
(211,886) |
|
|
|
|
|
|
|
|
|
|
|
|
|
|
|
|
|
|
|
|
|
| Stock option exercises |
9,180 |
|
|
3,347 |
|
|
|
| Taxes paid related to net share settlement of equity awards |
(113,431) |
|
|
(183,027) |
|
|
|
| Other financing activities |
483 |
|
|
856 |
|
|
|
| Allocable to redeemable and non-controlling interests in Consolidated Funds: |
|
|
|
|
|
| Contributions from redeemable and non-controlling interests in Consolidated Funds |
93,585 |
|
|
82,930 |
|
|
|
| Distributions to non-controlling interests in Consolidated Funds |
(20,933) |
|
|
(34,958) |
|
|
|
| Redemptions of redeemable interests in Consolidated Funds |
(538,985) |
|
|
— |
|
|
|
| Borrowings under loan obligations by Consolidated Funds |
2,914 |
|
|
49,317 |
|
|
|
| Repayments under loan obligations by Consolidated Funds |
(97,325) |
|
|
(57,457) |
|
|
|
| Net cash provided by (used in) financing activities |
(821,144) |
|
|
93,037 |
|
|
|
| Effect of exchange rate changes |
4,711 |
|
|
(4,652) |
|
|
|
| Net change in cash and cash equivalents |
(117,738) |
|
|
2,387 |
|
|
|
| Cash and cash equivalents, beginning of period |
389,987 |
|
|
343,655 |
|
|
|
| Cash and cash equivalents, end of period |
$ |
272,249 |
|
|
$ |
346,042 |
|
|
|
| Supplemental disclosure of non-cash financing activities: |
|
|
|
|
|
| Issuance of Class A common stock in connection with acquisition-related activity |
$ |
115,364 |
|
|
$ |
12,835 |
|
|
|
| Issuance of AOG Units in connection with settlement of management incentive program |
$ |
245,647 |
|
|
$ |
— |
|
|
|
|
|
|
|
|
|
|
|
|
|
|
|
|
|
|
|
|
|
|
|
|
|
|
|
|
|
|
|
|
|
|
|
|
|
|
|
|
|
|
|
|
|
|
|
|
|
|
|
|
|
|
|
|
|
|
|
|
|
|
|
See accompanying notes to the unaudited condensed consolidated financial statements.
Ares Management Corporation
Notes to the Unaudited Condensed Consolidated Financial Statements
(Dollars in Thousands, Except Share Data and As Otherwise Noted)
1. ORGANIZATION
Ares Management Corporation (the “Company”), a Delaware corporation, together with its subsidiaries, is a leading global alternative investment manager operating integrated groups across Credit, Private Equity, Real Assets and Secondaries. Information about segments should be read together with “Note 13. Segment Reporting.” Subsidiaries of the Company serve as the general partners and/or investment managers to various investment funds and managed accounts within each investment group (the “Ares Funds”). These subsidiaries provide investment advisory services to the Ares Funds in exchange for management fees.
The accompanying unaudited financial statements include the condensed consolidated results of the Company and its subsidiaries. The Company is a holding company that operates and controls all of the businesses and affairs of and conducts all of its material business activities through Ares Holdings L.P. (“Ares Holdings”). Ares Holdings represents all the activities of the “Ares Operating Group” or “AOG” and may be referred to interchangeably. The Company, indirectly through its wholly owned subsidiary, Ares Holdco LLC, is the general partner of the Ares Operating Group entity.
The Company and its wholly owned subsidiaries manages or controls certain entities that have been consolidated in the accompanying financial statements as described in “Note 2. Summary of Significant Accounting Policies.” These entities include Ares funds, co-investment vehicles, collateralized loan obligations or funds (collectively “CLOs”) and a special purpose acquisition company (“SPAC”) (collectively, the “Consolidated Funds”).
Including the results of the Consolidated Funds significantly increases the reported amounts of the assets, liabilities, revenues, expenses and cash flows within the accompanying unaudited condensed consolidated financial statements. However, the Consolidated Funds results included herein have no direct effect on the net income attributable to Ares Management Corporation or to its Stockholders’ Equity, except where accounting for a redemption or liquidation preference requires the reallocation of ownership based on specific terms of a profit sharing agreement. Instead, economic ownership interests of the investors in the Consolidated Funds are reflected as redeemable and non-controlling interests in Consolidated Funds. Further, cash flows allocable to redeemable and non-controlling interest in Consolidated Funds are specifically identifiable within the Condensed Consolidated Statements of Cash Flows.
2. SUMMARY OF SIGNIFICANT ACCOUNTING POLICIES
Basis of Presentation
The accompanying unaudited condensed consolidated financial statements are prepared in accordance with the generally accepted accounting principles in the United States (“GAAP”) for interim financial information and instructions to the Quarterly Report on Form 10-Q. The unaudited condensed consolidated financial statements, including these notes, are unaudited and exclude some of the disclosures required in annual financial statements. Management believes it has made all necessary adjustments so that the unaudited condensed consolidated financial statements are presented fairly and that estimates made in preparing its unaudited condensed consolidated financial statements are reasonable and prudent, and that all such adjustments are of a normal recurring nature. The operating results presented for interim periods are not necessarily indicative of the results that may be expected for any other interim period or for the entire year. These unaudited condensed consolidated financial statements should be read in conjunction with the audited consolidated financial statements included in the Annual Report on Form 10-K for the year ended December 31, 2022 filed with the Securities and Exchange Commission (“SEC”).
The unaudited condensed consolidated financial statements include the accounts and activities of the AOG entities, their consolidated subsidiaries and certain Consolidated Funds. All intercompany balances and transactions have been eliminated upon consolidation.
The Company has reclassified certain prior period amounts to conform to the current year presentation.
Non-Controlling Interests in Ares Operating Group Entities
The non-controlling interests in AOG entities represent a component of equity and net income attributable to the owners of the Ares Operating Group Units (“AOG Units”) that are not held directly or indirectly by the Company. These owners consist predominantly of Ares Owners Holdings L.P. but also include other strategic distribution partnerships with whom the Company has established joint ventures and other non-controlling strategic investors.
Ares Management Corporation
Notes to the Unaudited Condensed Consolidated Financial Statements (Continued)
(Dollars in Thousands, Except Share Data and As Otherwise Noted)
Non-controlling interests in AOG entities are adjusted for contributions to and distributions from AOG during the reporting period and are allocated income from the AOG entities either based on their historical ownership percentage for the proportional number of days in the reporting period or based on the activity associated with certain membership interests.
Redeemable Interest
On July 1, 2020, the Company completed its acquisition of a majority interest in SSG Capital Holdings Limited and its operating subsidiaries (“SSG”) (the “SSG Acquisition”). In connection with the SSG Acquisition, the former owners of SSG retained a 20% ownership interest in the operations acquired by the Company. In certain circumstances, the Company had the ability to acquire full ownership of SSG pursuant to a contractual arrangement to be initiated by the Company or by the former owners of SSG. Since the acquisition of the remaining interest in SSG was not within the Company's sole discretion, the ownership interest held by the former owners of SSG was classified as a redeemable interest and represented mezzanine equity.
Redeemable interest in AOG entities was initially recorded at fair value on the date of the SSG Acquisition within mezzanine equity within the Condensed Consolidated Statements of Financial Condition. Income (loss) was allocated based on the ownership percentage attributable to the redeemable interest. As of the date of acquisition, the Company determined that the redemption of the redeemable interest was probable. At each balance sheet date, the carrying value of the redeemable interest is presented at the redemption amount, as defined in accordance with the terms of a contractual arrangement between the Company and the former owners of SSG, to the extent that the redemption amount exceeded the initial measurement on the date of acquisition. The Company recognizes changes in the redemption amount with corresponding adjustments against retained earnings, or additional paid-in-capital in the absence of retained earnings, within stockholders’ equity within the Condensed Consolidated Statements of Financial Condition.
In connection with a merger agreement to acquire the remaining 20% ownership interest in the Ares SSG fee-generating business that was retained by the former owners of SSG (the “SSG Buyout”), a portion of the redeemable interest in AOG entities was purchased on March 31, 2023 and the Company now owns 100% of Ares SSG’s fee-generating business. The SSG Buyout was effectuated through newly issued shares of Class A common stock. The remaining redeemable interest in AOG entities represents ownership in certain investments that were not included in the SSG Buyout and continues to be presented at the redemption amount within mezzanine equity within the Condensed Consolidated Statements of Financial Condition.
Redeemable interest in Consolidated Funds represent the Class A ordinary shares issued by Ares Acquisition Corporation (NYSE: AAC) (“AAC”) that are redeemable for cash by the public shareholders in the event that AAC does not complete a business combination or tender offer associated with stockholder approval provisions. The Class A ordinary shareholders have redemption rights that are considered to be outside of AAC’s control. At each balance sheet date, the carrying value of the redeemable interest is presented at the redemption amount. During the three months ended March 31, 2023, in connection with the extension of the period to complete a business combination, AAC shareholders elected to redeem an aggregate amount of $539.0 million that was paid from AAC’s trust account. At March 31, 2023, the remaining 46,997,081 Class A ordinary shares of AAC continues to be presented at the redemption amount within mezzanine equity within the Condensed Consolidated Statements of Financial Condition.
Recent Accounting Pronouncements
The Company considers the applicability and impact of all accounting standard updates (“ASU”) issued by the Financial Accounting Standards Board (“FASB”). ASUs were assessed and determined either to be not applicable or expected to have an immaterial impact on its unaudited condensed consolidated financial statements.
Ares Management Corporation
Notes to the Unaudited Condensed Consolidated Financial Statements (Continued)
(Dollars in Thousands, Except Share Data and As Otherwise Noted)
3. GOODWILL AND INTANGIBLE ASSETS
Intangible Assets, Net
The following table summarizes the carrying value, net of accumulated amortization, of the Company’s intangible assets:
|
|
|
|
|
|
|
|
|
|
|
|
|
|
|
|
|
|
|
|
|
|
|
|
|
|
|
Weighted Average Amortization Period (in years) as of March 31, 2023 |
|
As of March 31, 2023 |
|
As of December 31, 2022 |
| Management contracts |
4.8 |
|
$ |
580,692 |
|
|
$ |
586,077 |
|
| Client relationships |
9.4 |
|
262,301 |
|
|
262,301 |
|
| Trade name |
0.0 |
|
— |
|
|
11,079 |
|
| Other |
1.6 |
|
500 |
|
|
500 |
|
| Finite-lived intangible assets |
|
|
843,493 |
|
|
859,957 |
|
| Foreign currency translation |
|
|
461 |
|
|
935 |
|
| Total finite-lived intangible assets |
|
|
843,954 |
|
|
860,892 |
|
| Less: accumulated amortization |
|
|
(245,147) |
|
|
(220,472) |
|
| Finite-lived intangible assets, net |
|
|
598,807 |
|
|
640,420 |
|
| Management contracts |
|
|
567,800 |
|
|
567,800 |
|
|
|
|
|
|
|
| Indefinite-lived intangible assets |
|
|
567,800 |
|
|
567,800 |
|
| Intangible assets, net |
|
|
$ |
1,166,607 |
|
|
$ |
1,208,220 |
|
During the three months ended March 31, 2023, the Company rebranded Ares SSG as Asia credit and discontinued the use of the SSG trade name. As a result, the Company recorded a non-cash impairment charge equal to the SSG trade name’s carrying value of $7.8 million to accelerate the amortization expense for the three months ended March 31, 2023.
Amortization expense associated with intangible assets, excluding the accelerated amortization described above, was $33.6 million and $33.2 million for the three months ended March 31, 2023 and 2022, respectively, and is presented within general, administrative and other expenses within the Condensed Consolidated Statements of Operations. During the first quarter of 2023, the Company removed $16.5 million of impaired and fully-amortized intangible assets.
Goodwill
The following table summarizes the carrying value of the Company’s goodwill:
|
|
|
|
|
|
|
|
|
|
|
|
|
|
|
|
|
|
|
|
|
|
|
|
|
|
|
|
|
|
|
|
|
|
|
|
|
Credit Group |
|
Private
Equity Group |
|
Real
Assets Group |
|
Secondaries Group |
|
Other |
|
Total |
|
|
|
|
|
|
|
|
|
|
|
|
|
|
|
|
|
|
|
|
|
|
|
|
|
|
|
|
|
|
|
|
|
|
|
|
|
|
|
|
|
|
|
|
|
|
|
|
| Balance as of December 31, 2022 |
$ |
32,196 |
|
|
$ |
48,070 |
|
|
$ |
277,183 |
|
|
$ |
417,620 |
|
|
$ |
224,587 |
|
|
$ |
999,656 |
|
| Acquisitions |
— |
|
|
— |
|
|
22 |
|
|
— |
|
|
— |
|
|
22 |
|
| Reallocation |
224,587 |
|
|
— |
|
|
— |
|
|
— |
|
|
(224,587) |
|
|
— |
|
| Foreign currency translation |
(744) |
|
|
— |
|
|
— |
|
|
3 |
|
|
— |
|
|
(741) |
|
| Balance as of March 31, 2023 |
$ |
256,039 |
|
|
$ |
48,070 |
|
|
$ |
277,205 |
|
|
$ |
417,623 |
|
|
$ |
— |
|
|
$ |
998,937 |
|
In connection with the SSG Buyout described in “Note 2. Summary of Significant Accounting Policies,” the former Ares SSG reporting unit has been transferred in its entirety to the Credit Group and the total goodwill of $224.6 million has been reallocated accordingly.
There was no impairment of goodwill recorded during the three months ended March 31, 2023 and 2022. The impact of foreign currency translation is reflected within other comprehensive income within the Condensed Consolidated Statements of Comprehensive Income.
Ares Management Corporation
Notes to the Unaudited Condensed Consolidated Financial Statements (Continued)
(Dollars in Thousands, Except Share Data and As Otherwise Noted)
4. INVESTMENTS
The Company’s investments are comprised of the following:
|
|
|
|
|
|
|
|
|
|
|
|
|
|
|
|
|
|
|
|
|
|
|
|
|
|
|
Percentage of total investments |
|
|
|
|
|
|
|
|
|
March 31, 2023 |
|
December 31, 2022 |
|
March 31, 2023 |
|
December 31, 2022 |
| Equity method investments: |
|
|
|
|
|
|
|
Equity method - carried interest |
$ |
3,236,418 |
|
|
$ |
3,106,577 |
|
|
78.9% |
|
78.2% |
| Equity method private investment partnership interests - principal |
535,922 |
|
|
543,592 |
|
|
13.1 |
|
13.7 |
| Equity method private investment partnership interests and other (held at fair value) |
126,458 |
|
|
123,170 |
|
|
3.1 |
|
3.1 |
| Equity method private investment partnership interests and other |
48,390 |
|
|
47,439 |
|
|
1.2 |
|
1.2 |
| Total equity method investments |
3,947,188 |
|
|
3,820,778 |
|
|
96.3 |
|
96.2 |
|
|
|
|
|
|
|
|
| Collateralized loan obligations |
22,653 |
|
|
25,163 |
|
|
0.6 |
|
0.6 |
| Other fixed income |
52,516 |
|
|
51,771 |
|
|
1.3 |
|
1.2 |
| Collateralized loan obligations and other fixed income, at fair value |
75,169 |
|
|
76,934 |
|
|
1.9 |
|
1.8 |
|
|
|
|
|
|
|
|
| Common stock, at fair value |
78,326 |
|
|
77,022 |
|
|
1.8 |
|
2.0 |
| Total investments |
$ |
4,100,683 |
|
|
$ |
3,974,734 |
|
|
|
|
|
|
|
|
|
|
|
|
|
Equity Method Investments
The Company’s equity method investments include investments that are not consolidated but over which the Company exerts significant influence. The Company evaluates each of its equity method investments to determine if any were significant as defined by guidance from the SEC. As of and for the three months ended March 31, 2023 and 2022, no individual equity method investment held by the Company met the significance criteria.
The Company recognized net gains related to its equity method investments of $23.9 million and $15.2 million for the three months ended March 31, 2023 and 2022, respectively. The net gains were included within principal investment income, net realized and unrealized gains on investments, and interest and dividend income within the Condensed Consolidated Statements of Operations.
With respect to the Company’s equity method investments, the material assets are expected to generate either long term capital appreciation and/or interest income, the material liabilities are debt instruments collateralized by, or related to, the financing of the assets and net income is materially comprised of the changes in fair value of these net assets.
Investments of the Consolidated Funds
Investments held in the Consolidated Funds are summarized below:
|
|
|
|
|
|
|
|
|
|
|
|
|
|
|
|
|
|
|
|
|
|
|
|
|
Fair Value at |
|
Percentage of total investments as of |
|
|
|
|
|
March 31, |
|
December 31, |
|
March 31, |
|
December 31, |
|
2023 |
|
2022 |
|
2023 |
|
2022 |
| Fixed income investments: |
|
|
|
|
|
|
|
| Bonds |
$ |
563,275 |
|
|
$ |
786,961 |
|
|
4.3% |
|
6.0% |
| Loans |
9,516,748 |
|
|
9,280,522 |
|
|
72.5 |
|
70.3 |
| Investments held in trust account |
484,901 |
|
|
1,013,382 |
|
|
3.7 |
|
7.7 |
| Collateralized loan obligations |
82,100 |
|
|
— |
|
|
0.6 |
|
— |
| Total fixed income investments |
10,647,024 |
|
|
11,080,865 |
|
|
81.1 |
|
84.0 |
| Equity securities |
933,296 |
|
|
731,599 |
|
|
7.1 |
|
5.5 |
| Partnership interests |
1,545,832 |
|
|
1,392,169 |
|
|
11.8 |
|
10.5 |
| Total investments, at fair value |
$ |
13,126,152 |
|
|
$ |
13,204,633 |
|
|
|
|
|
As of March 31, 2023 and December 31, 2022, no single issuer or investment, including derivative instruments and underlying portfolio investments of the Consolidated Funds, had a fair value that exceeded 5.0% of the Company’s total assets.
Ares Management Corporation
Notes to the Unaudited Condensed Consolidated Financial Statements (Continued)
(Dollars in Thousands, Except Share Data and As Otherwise Noted)
5. FAIR VALUE
Fair Value of Financial Instruments Held by the Company and Consolidated Funds
The following tables summarize the financial assets and financial liabilities measured at fair value for the Company and the Consolidated Funds as of March 31, 2023:
|
|
|
|
|
|
|
|
|
|
|
|
|
|
|
|
|
|
|
|
|
|
|
|
|
|
|
|
|
|
|
|
|
| Financial Instruments of the Company |
|
Level I |
|
Level II |
|
Level III |
|
Investments
Measured
at NAV |
|
Total |
Assets, at fair value |
|
|
|
|
|
|
|
|
|
|
Investments: |
|
|
|
|
|
|
|
|
|
|
Collateralized loan obligations and other fixed income |
|
$ |
— |
|
|
$ |
— |
|
|
$ |
75,169 |
|
|
$ |
— |
|
|
$ |
75,169 |
|
| Common stock and other equity securities |
|
— |
|
|
78,326 |
|
|
125,073 |
|
|
— |
|
|
203,399 |
|
| Partnership interests |
|
— |
|
|
— |
|
|
— |
|
|
1,385 |
|
|
1,385 |
|
| Total investments, at fair value |
|
— |
|
|
78,326 |
|
|
200,242 |
|
|
1,385 |
|
|
279,953 |
|
| Derivatives-foreign currency forward contracts |
|
— |
|
|
3,151 |
|
|
— |
|
|
— |
|
|
3,151 |
|
| Total assets, at fair value |
|
$ |
— |
|
|
$ |
81,477 |
|
|
$ |
200,242 |
|
|
$ |
1,385 |
|
|
$ |
283,104 |
|
| Liabilities, at fair value |
|
|
|
|
|
|
|
|
|
|
| Derivatives-foreign currency forward contracts |
|
$ |
— |
|
|
$ |
(2,266) |
|
|
$ |
— |
|
|
$ |
— |
|
|
$ |
(2,266) |
|
|
|
|
|
|
|
|
|
|
|
|
| Total liabilities, at fair value |
|
$ |
— |
|
|
$ |
(2,266) |
|
|
$ |
— |
|
|
$ |
— |
|
|
$ |
(2,266) |
|
|
|
|
|
|
|
|
|
|
|
|
|
|
|
|
|
|
|
|
|
|
|
|
|
|
|
|
|
|
|
|
|
|
| Financial Instruments of the Consolidated Funds |
|
Level I |
|
Level II |
|
Level III |
|
Investments
Measured
at NAV |
|
Total |
| Assets, at fair value |
|
|
|
|
|
|
|
|
|
|
| Investments: |
|
|
|
|
|
|
|
|
|
|
| Fixed income investments: |
|
|
|
|
|
|
|
|
|
|
| Bonds |
|
$ |
— |
|
|
$ |
559,547 |
|
|
$ |
3,728 |
|
|
$ |
— |
|
|
$ |
563,275 |
|
| Loans |
|
— |
|
|
8,847,972 |
|
|
668,776 |
|
|
— |
|
|
9,516,748 |
|
| Investments held in trust account |
|
484,901 |
|
|
— |
|
|
— |
|
|
— |
|
|
484,901 |
|
| Collateralized loan obligations |
|
— |
|
|
21,800 |
|
|
60,300 |
|
|
— |
|
|
82,100 |
|
| Total fixed income investments |
|
484,901 |
|
|
9,429,319 |
|
|
732,804 |
|
|
— |
|
|
10,647,024 |
|
| Equity securities |
|
661 |
|
|
— |
|
|
932,635 |
|
|
— |
|
|
933,296 |
|
| Partnership interests |
|
— |
|
|
— |
|
|
374,049 |
|
|
1,171,783 |
|
|
1,545,832 |
|
| Total investments, at fair value |
|
485,562 |
|
|
9,429,319 |
|
|
2,039,488 |
|
|
1,171,783 |
|
|
13,126,152 |
|
|
|
|
|
|
|
|
|
|
|
|
| Derivatives-foreign currency forward contracts |
|
— |
|
|
2,440 |
|
|
— |
|
|
— |
|
|
2,440 |
|
|
|
|
|
|
|
|
|
|
|
|
|
|
|
|
|
|
|
|
|
|
|
| Total assets, at fair value |
|
$ |
485,562 |
|
|
$ |
9,431,759 |
|
|
$ |
2,039,488 |
|
|
$ |
1,171,783 |
|
|
$ |
13,128,592 |
|
| Liabilities, at fair value |
|
|
|
|
|
|
|
|
|
|
| Derivatives: |
|
|
|
|
|
|
|
|
|
|
| Warrants |
|
$ |
(17,600) |
|
|
$ |
— |
|
|
$ |
— |
|
|
$ |
— |
|
|
$ |
(17,600) |
|
| Foreign currency forward contracts |
|
— |
|
|
(2,414) |
|
|
— |
|
|
— |
|
|
(2,414) |
|
| Asset swaps |
|
— |
|
|
— |
|
|
(1,698) |
|
|
— |
|
|
(1,698) |
|
| Total derivative liabilities, at fair value |
|
(17,600) |
|
|
(2,414) |
|
|
(1,698) |
|
|
— |
|
|
(21,712) |
|
| Loan obligations of CLOs |
|
— |
|
|
(10,918,007) |
|
|
— |
|
|
— |
|
|
(10,918,007) |
|
| Total liabilities, at fair value |
|
$ |
(17,600) |
|
|
$ |
(10,920,421) |
|
|
$ |
(1,698) |
|
|
$ |
— |
|
|
$ |
(10,939,719) |
|
Ares Management Corporation
Notes to the Unaudited Condensed Consolidated Financial Statements (Continued)
(Dollars in Thousands, Except Share Data and As Otherwise Noted)
The following tables summarize the financial assets and financial liabilities measured at fair value for the Company and the Consolidated Funds as of December 31, 2022:
|
|
|
|
|
|
|
|
|
|
|
|
|
|
|
|
|
|
|
|
|
|
|
|
|
|
|
|
|
|
|
|
|
| Financial Instruments of the Company |
|
Level I |
|
Level II |
|
Level III |
|
Investments
Measured
at NAV |
|
Total |
Assets, at fair value |
|
|
|
|
|
|
|
|
|
|
Investments: |
|
|
|
|
|
|
|
|
|
|
Collateralized loan obligations and other fixed income |
|
$ |
— |
|
|
$ |
— |
|
|
$ |
76,934 |
|
|
$ |
— |
|
|
$ |
76,934 |
|
| Common stock and other equity securities |
|
— |
|
|
77,022 |
|
|
121,785 |
|
|
— |
|
|
198,807 |
|
| Partnership interests |
|
— |
|
|
— |
|
|
— |
|
|
1,385 |
|
|
1,385 |
|
| Total investments, at fair value |
|
— |
|
|
77,022 |
|
|
198,719 |
|
|
1,385 |
|
|
277,126 |
|
| Derivatives-foreign currency forward contracts |
|
— |
|
|
4,173 |
|
|
— |
|
|
— |
|
|
4,173 |
|
| Total assets, at fair value |
|
$ |
— |
|
|
$ |
81,195 |
|
|
$ |
198,719 |
|
|
$ |
1,385 |
|
|
$ |
281,299 |
|
| Liabilities, at fair value |
|
|
|
|
|
|
|
|
|
|
| Derivatives-foreign currency forward contracts |
|
$ |
— |
|
|
$ |
(3,423) |
|
|
$ |
— |
|
|
$ |
— |
|
|
$ |
(3,423) |
|
|
|
|
|
|
|
|
|
|
|
|
| Total liabilities, at fair value |
|
$ |
— |
|
|
$ |
(3,423) |
|
|
$ |
— |
|
|
$ |
— |
|
|
$ |
(3,423) |
|
|
|
|
|
|
|
|
|
|
|
|
|
|
|
|
|
|
|
|
|
|
|
|
|
|
|
|
|
|
|
|
|
|
| Financial Instruments of the Consolidated Funds |
|
Level I |
|
Level II |
|
Level III |
|
Investments Measured
at NAV |
|
Total |
| Assets, at fair value |
|
|
|
|
|
|
|
|
|
|
| Investments: |
|
|
|
|
|
|
|
|
|
|
| Fixed income investments: |
|
|
|
|
|
|
|
|
|
|
| Bonds |
|
$ |
— |
|
|
$ |
534,137 |
|
|
$ |
252,824 |
|
|
$ |
— |
|
|
$ |
786,961 |
|
| Loans |
|
— |
|
|
8,663,678 |
|
|
616,844 |
|
|
— |
|
|
9,280,522 |
|
| Investments held in trust account |
|
1,013,382 |
|
|
— |
|
|
— |
|
|
— |
|
|
1,013,382 |
|
| Total fixed income investments |
|
1,013,382 |
|
|
9,197,815 |
|
|
869,668 |
|
|
— |
|
|
11,080,865 |
|
| Equity securities |
|
719 |
|
|
— |
|
|
730,880 |
|
|
— |
|
|
731,599 |
|
| Partnership interests |
|
— |
|
|
— |
|
|
368,655 |
|
|
1,023,514 |
|
|
1,392,169 |
|
| Total investments, at fair value |
|
1,014,101 |
|
|
9,197,815 |
|
|
1,969,203 |
|
|
1,023,514 |
|
|
13,204,633 |
|
|
|
|
|
|
|
|
|
|
|
|
| Derivatives-foreign currency forward contracts |
|
— |
|
|
2,900 |
|
|
— |
|
|
— |
|
|
2,900 |
|
|
|
|
|
|
|
|
|
|
|
|
|
|
|
|
|
|
|
|
|
|
|
| Total assets, at fair value |
|
$ |
1,014,101 |
|
|
$ |
9,200,715 |
|
|
$ |
1,969,203 |
|
|
$ |
1,023,514 |
|
|
$ |
13,207,533 |
|
| Liabilities, at fair value |
|
|
|
|
|
|
|
|
|
|
| Derivatives: |
|
|
|
|
|
|
|
|
|
|
| Warrants |
|
$ |
(9,326) |
|
|
$ |
— |
|
|
$ |
— |
|
|
$ |
— |
|
|
$ |
(9,326) |
|
| Foreign currency forward contracts |
|
— |
|
|
(2,942) |
|
|
— |
|
|
— |
|
|
(2,942) |
|
| Asset swaps |
|
— |
|
|
— |
|
|
(3,556) |
|
|
— |
|
|
(3,556) |
|
| Total derivative liabilities, at fair value |
|
(9,326) |
|
|
(2,942) |
|
|
(3,556) |
|
|
— |
|
|
(15,824) |
|
| Loan obligations of CLOs |
|
— |
|
|
(10,701,720) |
|
|
— |
|
|
— |
|
|
(10,701,720) |
|
| Total liabilities, at fair value |
|
$ |
(9,326) |
|
|
$ |
(10,704,662) |
|
|
$ |
(3,556) |
|
|
$ |
— |
|
|
$ |
(10,717,544) |
|
Ares Management Corporation
Notes to the Unaudited Condensed Consolidated Financial Statements (Continued)
(Dollars in Thousands, Except Share Data and As Otherwise Noted)
The following tables set forth a summary of changes in the fair value of the Level III measurements for the three months ended March 31, 2023:
|
|
|
|
|
|
|
|
|
|
|
|
|
|
|
|
|
|
|
|
|
|
|
|
|
|
|
|
|
|
| Level III Assets of the Company |
|
Equity
Securities |
|
Fixed Income |
|
|
|
|
|
Total |
|
| Balance, beginning of period |
|
$ |
121,785 |
|
|
$ |
76,934 |
|
|
|
|
|
|
$ |
198,719 |
|
|
|
|
|
|
|
|
|
|
|
|
|
|
|
|
|
|
|
|
|
|
|
|
|
|
Purchases(1) |
|
52 |
|
|
1,194 |
|
|
|
|
|
|
1,246 |
|
|
Sales/settlements(2) |
|
45 |
|
|
(1,536) |
|
|
|
|
|
|
(1,491) |
|
|
|
|
|
|
|
|
|
|
|
|
|
|
| Realized and unrealized appreciation (depreciation), net |
|
3,191 |
|
|
(1,423) |
|
|
|
|
|
|
1,768 |
|
|
| Balance, end of period |
|
$ |
125,073 |
|
|
$ |
75,169 |
|
|
|
|
|
|
$ |
200,242 |
|
|
| Change in net unrealized appreciation/depreciation and fair value included in earnings related to financial assets still held at the reporting date |
|
$ |
2,978 |
|
|
$ |
(1,211) |
|
|
|
|
|
|
$ |
1,767 |
|
|
|
|
|
|
|
|
|
|
|
|
|
|
|
|
|
|
|
|
|
|
|
|
|
|
|
|
|
|
|
|
|
|
|
| Level III Net Assets of Consolidated Funds |
|
Equity
Securities |
|
Fixed
Income |
|
Partnership
Interests |
|
Derivatives, Net |
|
Total |
| Balance, beginning of period |
|
$ |
730,880 |
|
|
$ |
869,668 |
|
|
$ |
368,655 |
|
|
$ |
(3,556) |
|
|
$ |
1,965,647 |
|
|
|
|
|
|
|
|
|
|
|
|
| Transfer in |
|
— |
|
|
284,198 |
|
|
— |
|
|
— |
|
|
284,198 |
|
| Transfer out |
|
— |
|
|
(447,536) |
|
|
— |
|
|
— |
|
|
(447,536) |
|
Purchases(1) |
|
180,372 |
|
|
188,232 |
|
|
49,000 |
|
|
— |
|
|
417,604 |
|
Sales/settlements(2) |
|
(122) |
|
|
(173,502) |
|
|
(48,889) |
|
|
— |
|
|
(222,513) |
|
| Amortized discounts/premiums |
|
— |
|
|
749 |
|
|
— |
|
|
— |
|
|
749 |
|
| Realized and unrealized appreciation, net |
|
21,505 |
|
|
10,995 |
|
|
5,283 |
|
|
1,858 |
|
|
39,641 |
|
| Balance, end of period |
|
$ |
932,635 |
|
|
$ |
732,804 |
|
|
$ |
374,049 |
|
|
$ |
(1,698) |
|
|
$ |
2,037,790 |
|
| Change in net unrealized appreciation/depreciation included in earnings related to financial assets still held at the reporting date |
|
$ |
21,436 |
|
|
$ |
(20,602) |
|
|
$ |
5,283 |
|
|
$ |
1,848 |
|
|
$ |
7,965 |
|
(1)Purchases include paid-in-kind interest and securities received in connection with restructurings.
(2)Sales/settlements include distributions, principal redemptions and securities disposed of in connection with restructurings.
Ares Management Corporation
Notes to the Unaudited Condensed Consolidated Financial Statements (Continued)
(Dollars in Thousands, Except Share Data and As Otherwise Noted)
The following tables set forth a summary of changes in the fair value of the Level III measurements for the three months ended March 31, 2022:
|
|
|
|
|
|
|
|
|
|
|
|
|
|
|
|
|
|
|
|
|
|
|
|
|
|
|
|
|
|
|
|
|
|
|
|
|
|
| Level III Assets and Liabilities of the Company |
|
Equity
Securities |
|
Fixed Income |
|
Partnership Interests |
|
Contingent Consideration |
|
|
|
Total |
| Balance, beginning of period |
|
$ |
108,949 |
|
|
$ |
52,397 |
|
|
$ |
2,575 |
|
|
$ |
(57,435) |
|
|
|
|
$ |
106,486 |
|
| Transfer in due to changes in consolidation |
|
1,491 |
|
|
— |
|
|
— |
|
|
— |
|
|
|
|
1,491 |
|
|
|
|
|
|
|
|
|
|
|
|
|
|
|
|
|
|
|
|
|
|
|
|
|
|
|
Sales/settlements(1) |
|
(213) |
|
|
(885) |
|
|
— |
|
|
47,873 |
|
|
|
|
46,775 |
|
| Change in fair value |
|
— |
|
|
— |
|
|
— |
|
|
(988) |
|
|
|
|
(988) |
|
| Realized and unrealized appreciation (depreciation), net |
|
4,272 |
|
|
(54) |
|
|
— |
|
|
— |
|
|
|
|
4,218 |
|
| Balance, end of period |
|
$ |
114,499 |
|
|
$ |
51,458 |
|
|
$ |
2,575 |
|
|
$ |
(10,550) |
|
|
|
|
$ |
157,982 |
|
| Change in net unrealized appreciation/depreciation included in earnings related to financial assets and liabilities still held at the reporting date |
|
$ |
4,272 |
|
|
$ |
(54) |
|
|
$ |
— |
|
|
$ |
(988) |
|
|
|
|
$ |
3,230 |
|
|
|
|
|
|
|
|
|
|
|
|
|
|
|
|
|
|
|
|
|
|
|
|
|
|
|
|
|
|
|
|
|
|
| Level III Net Assets of Consolidated Funds |
|
Equity
Securities |
|
Fixed
Income |
|
Partnership Interests |
|
Derivatives, Net |
|
Total |
| Balance, beginning of period |
|
$ |
339,183 |
|
|
$ |
742,952 |
|
|
$ |
238,673 |
|
|
$ |
(3,105) |
|
|
$ |
1,317,703 |
|
|
|
|
|
|
|
|
|
|
|
|
| Transfer in |
|
— |
|
|
171,945 |
|
|
— |
|
|
— |
|
|
171,945 |
|
| Transfer out |
|
— |
|
|
(90,417) |
|
|
— |
|
|
— |
|
|
(90,417) |
|
Purchases(2) |
|
7,320 |
|
|
143,577 |
|
|
24,000 |
|
|
— |
|
|
174,897 |
|
Sales/settlements(1) |
|
(10,189) |
|
|
(97,975) |
|
|
(21,500) |
|
|
(2) |
|
|
(129,666) |
|
| Amortized discounts/premiums |
|
— |
|
|
654 |
|
|
— |
|
|
— |
|
|
654 |
|
| Realized and unrealized appreciation (depreciation), net |
|
14,826 |
|
|
(11,435) |
|
|
(50) |
|
|
(55) |
|
|
3,286 |
|
| Balance, end of period |
|
$ |
351,140 |
|
|
$ |
859,301 |
|
|
$ |
241,123 |
|
|
$ |
(3,162) |
|
|
$ |
1,448,402 |
|
| Change in net unrealized appreciation/depreciation included in earnings related to financial assets still held at the reporting date |
|
$ |
20 |
|
|
$ |
(9,031) |
|
|
$ |
(50) |
|
|
$ |
(112) |
|
|
$ |
(9,173) |
|
(1)Sales/settlements include distributions, principal redemptions, securities disposed of in connection with restructurings and contingent consideration payments.
(2)Purchases include paid-in-kind interest and securities received in connection with restructurings.
.
Transfers out of Level III were generally attributable to certain investments that experienced a more significant level of market activity during the period and thus were valued using observable inputs either from independent pricing services or multiple brokers. Transfers into Level III were generally attributable to certain investments that experienced a less significant level of market activity during the period and thus were only able to obtain one or fewer quotes from a broker or independent pricing service.
Ares Management Corporation
Notes to the Unaudited Condensed Consolidated Financial Statements (Continued)
(Dollars in Thousands, Except Share Data and As Otherwise Noted)
The following tables summarize the quantitative inputs and assumptions used for the Company’s and the Consolidated Funds’ Level III measurements as of March 31, 2023:
|
|
|
|
|
|
|
|
|
|
|
|
|
|
|
|
|
|
|
|
|
|
|
|
|
|
|
|
|
|
|
|
|
| Level III Measurements of the Company |
|
Fair Value |
|
Valuation Technique(s) |
|
Significant Unobservable Input(s) |
|
Range |
|
Weighted Average |
| Assets |
|
|
|
|
|
|
|
|
|
|
| Equity securities |
|
|
|
|
|
|
|
|
|
|
|
|
$ |
61,934 |
|
|
Market approach |
|
Multiple of book value |
|
3.0x |
|
3.0x |
|
|
47,643 |
|
|
Market approach |
|
Multiple of book value |
|
1.3x |
|
1.3x |
|
|
15,496 |
|
|
Transaction price(1) |
|
N/A |
|
N/A |
|
N/A |
|
|
|
|
|
|
|
|
|
|
|
| Collateralized loan obligations |
|
22,653 |
|
|
Broker quotes and/or 3rd party pricing services |
|
N/A |
|
N/A |
|
N/A |
| Other fixed income |
|
|
|
|
|
|
|
|
|
|
|
|
30,934 |
|
|
Transaction price(1) |
|
N/A |
|
N/A |
|
N/A |
|
|
21,582 |
|
|
Other |
|
N/A |
|
N/A |
|
N/A |
| Total assets |
|
$ |
200,242 |
|
|
|
|
|
|
|
|
|
|
|
|
|
|
|
|
|
|
|
|
|
|
|
|
|
|
|
|
|
|
|
|
|
|
|
|
|
|
|
|
|
|
|
|
|
|
|
|
|
|
|
|
|
|
|
|
|
|
|
|
|
|
|
|
|
|
|
|
|
|
|
|
|
|
|
|
|
|
|
|
|
|
|
|
|
|
|
|
|
|
|
|
|
|
|
|
|
| Level III Measurements of the Consolidated Funds |
|
Fair Value |
|
Valuation Technique(s) |
|
Significant Unobservable Input(s) |
|
Range |
|
Weighted Average |
| Assets |
|
|
|
|
|
|
|
|
|
|
| Equity securities |
|
|
|
|
|
|
|
|
|
|
|
|
$ |
534,676 |
|
|
Discounted cash flow |
|
Discount rate |
|
8.0% - 18.0% |
|
12.0% |
|
|
360,533 |
|
|
Market approach |
|
Multiple of book value |
|
1.0x - 1.2x |
|
1.2x |
|
|
34,621 |
|
|
Market approach |
|
Net income multiple |
|
30.0x |
|
30.0x |
|
|
2,156 |
|
|
Market approach |
|
EBITDA multiple(2) |
|
6.3x - 38.5x |
|
17.1x |
|
|
|
|
|
|
|
|
|
|
|
|
|
|
|
|
|
|
|
|
|
|
|
|
|
|
|
|
|
|
|
|
|
|
|
|
|
|
|
|
|
|
|
|
|
|
649 |
|
|
Other |
|
N/A |
|
N/A |
|
N/A |
|
|
|
|
|
|
|
|
|
|
|
| Partnership interest |
|
374,049 |
|
|
Discounted cash flow |
|
Discount rate |
|
11.2% - 23.7% |
|
22.0% |
| Fixed income investments |
|
|
|
|
|
|
|
|
|
|
|
|
636,026 |
|
|
Broker quotes and/or 3rd party pricing services |
|
N/A |
|
N/A |
|
N/A |
|
|
91,030 |
|
|
Market approach |
|
Yield |
|
0.8% - 44.7% |
|
13.2% |
|
|
3,331 |
|
|
Market approach |
|
EBITDA multiple |
|
0.1x - 9.0x |
|
8.7x |
|
|
|
|
|
|
|
|
|
|
|
|
|
|
|
|
|
|
|
|
|
|
|
|
|
|
|
|
|
|
|
|
|
|
|
|
|
|
|
|
|
|
|
|
|
|
2,417 |
|
|
Other |
|
N/A |
|
N/A |
|
N/A |
|
|
|
|
|
|
|
|
|
|
|
|
|
|
|
|
|
|
|
|
|
|
| Total assets |
|
$ |
2,039,488 |
|
|
|
|
|
|
|
|
|
| Liabilities |
|
|
|
|
|
|
|
|
|
|
| Derivative instruments |
|
$ |
(1,698) |
|
|
Broker quotes and/or 3rd party pricing services |
|
NA |
|
N/A |
|
N/A |
| Total liabilities |
|
$ |
(1,698) |
|
|
|
|
|
|
|
|
|
(1)Transaction price consists of securities purchased or restructured. The Company determined that there was no change to the valuation based on the underlying assumptions used at the closing of such transactions.
(2)“EBITDA” in the table above is a non-GAAP financial measure and refers to earnings before interest, tax, depreciation and amortization.
Ares Management Corporation
Notes to the Unaudited Condensed Consolidated Financial Statements (Continued)
(Dollars in Thousands, Except Share Data and As Otherwise Noted)
The following tables summarize the quantitative inputs and assumptions used for the Company’s and the Consolidated Funds’ Level III measurements as of December 31, 2022:
|
|
|
|
|
|
|
|
|
|
|
|
|
|
|
|
|
|
|
|
|
|
|
|
|
|
|
|
|
|
|
|
|
| Level III Measurements of the Company |
|
Fair Value |
|
Valuation Technique(s) |
|
Significant Unobservable Input(s) |
|
Range |
|
Weighted Average |
| Assets |
|
|
|
|
|
|
|
|
|
|
| Equity securities |
|
|
|
|
|
|
|
|
|
|
|
|
$ |
62,129 |
|
|
Market approach |
|
Multiple of book value |
|
3.2x |
|
3.2x |
|
|
44,166 |
|
|
Market approach |
|
Multiple of book value |
|
1.3x |
|
1.3x |
|
|
15,490 |
|
|
Transaction price(1) |
|
N/A |
|
N/A |
|
N/A |
|
|
|
|
|
|
|
|
|
|
|
|
|
|
|
|
|
|
|
|
|
|
| Collateralized loan obligations |
|
25,163 |
|
|
Broker quotes and/or 3rd party pricing services |
|
N/A |
|
N/A |
|
N/A |
| Other fixed income |
|
|
|
|
|
|
|
|
|
|
|
|
30,189 |
|
|
Transaction price(1) |
|
N/A |
|
N/A |
|
N/A |
|
|
21,582 |
|
|
Other |
|
N/A |
|
N/A |
|
N/A |
| Total assets |
|
$ |
198,719 |
|
|
|
|
|
|
|
|
|
|
|
|
|
|
|
|
|
|
|
|
|
|
|
|
|
|
|
|
|
|
|
|
|
|
|
|
|
|
|
|
|
|
|
|
|
|
|
|
|
|
|
|
|
|
|
|
|
|
|
|
|
|
|
|
|
|
|
|
|
|
|
|
|
|
|
|
|
|
|
|
|
|
|
|
|
|
|
|
|
|
|
|
|
|
|
|
|
| Level III Measurements of the Consolidated Funds |
|
Fair Value |
|
Valuation Technique(s) |
|
Significant Unobservable Input(s) |
|
Range |
|
Weighted Average |
| Assets |
|
|
|
|
|
|
|
|
|
|
| Equity securities |
|
|
|
|
|
|
|
|
|
|
|
|
$ |
401,229 |
|
|
Discounted cash flow |
|
Discount rate |
|
8.0% - 18.0% |
|
12.0% |
|
|
290,258 |
|
|
Market approach |
|
Multiple of book value |
|
1.0x - 1.2x |
|
1.2x |
| |
|
36,681 |
|
|
Market approach |
|
Net income multiple |
|
30.0x |
|
30.0x |
|
|
2,064 |
|
|
Market approach |
|
EBITDA multiple(2) |
|
6.3x - 31.0x |
|
13.6x |
|
|
648 |
|
|
Other |
|
N/A |
|
N/A |
|
N/A |
| Partnership interests |
|
368,655 |
|
|
Discounted cash flow |
|
Discount rate |
|
10.3% - 22.0% |
|
18.9% |
| Fixed income investments |
|
|
|
|
|
|
|
|
|
|
|
|
731,708 |
|
|
Broker quotes and/or 3rd party pricing services |
|
N/A |
|
N/A |
|
N/A |
|
|
125,612 |
|
|
Market approach |
|
Yield |
|
6.6% - 21.7% |
|
12.8% |
|
|
6,155 |
|
|
Transaction price |
|
N/A |
|
N/A |
|
N/A |
|
|
4,479 |
|
|
Market approach |
|
EBITDA multiple |
|
8.0x - 9.0x |
|
8.5x |
|
|
1,714 |
|
|
Other |
|
N/A |
|
N/A |
|
N/A |
|
|
|
|
|
|
|
|
|
|
|
| Total assets |
|
$ |
1,969,203 |
|
|
|
|
|
|
|
|
|
| Liabilities |
|
|
|
|
|
|
|
|
|
|
| Derivative instruments |
|
$ |
(3,556) |
|
|
Broker quotes and/or 3rd party pricing services |
|
N/A |
|
N/A |
|
N/A |
| Total liabilities |
|
$ |
(3,556) |
|
|
|
|
|
|
|
|
|
(1)Transaction price consists of securities purchased or restructured. The Company determined that there has been no change to the valuation based on the underlying assumptions used at the closing of such transactions.
(2)“EBITDA” in the table above is a non-GAAP financial measure and refers to earnings before interest, tax, depreciation and amortization.
The Company has an insurance-related investment in a private fund managed by a third party that is valued using NAV per share. The terms and conditions of this fund do not allow for redemptions without certain events or approvals that are outside the Company’s control. This investment had a fair value of $1.4 million as of March 31, 2023 and December 31, 2022. The Company has no unfunded commitments for this investment.
The Consolidated Funds have limited partnership interests in private equity funds managed by the Company that are valued using NAV per share. The terms and conditions of these funds do not allow for redemptions without certain events or approvals that are outside the Company’s control. As of March 31, 2023, these investments had a fair value of $1,171.8 million and unfunded commitments of $1,025.3 million. As of December 31, 2022, these investments had a fair value of $1,023.5 million and unfunded commitments of $869.0 million.
Ares Management Corporation
Notes to the Unaudited Condensed Consolidated Financial Statements (Continued)
(Dollars in Thousands, Except Share Data and As Otherwise Noted)
6. DEBT
The following table summarizes the Company’s and its subsidiaries’ debt obligations:
|
|
|
|
|
|
|
|
|
|
|
|
|
|
|
|
|
|
|
|
|
|
|
|
|
|
|
|
|
|
|
|
|
|
|
|
|
|
|
|
|
|
|
|
|
|
|
|
|
As of March 31, 2023 |
|
As of December 31, 2022 |
|
|
|
|
|
|
|
|
|
|
|
|
|
|
|
|
|
|
|
Debt Origination Date |
|
Maturity |
|
Original Borrowing Amount |
|
Carrying
Value |
|
Interest Rate |
|
Carrying
Value |
|
Interest Rate |
Credit Facility(1) |
Revolving |
|
3/31/2027 |
|
N/A |
|
$ |
795,000 |
|
|
5.88% |
|
$ |
700,000 |
|
|
5.37% |
2024 Senior Notes(2) |
10/8/2014 |
|
10/8/2024 |
|
$ |
250,000 |
|
|
248,872 |
|
|
4.21 |
|
248,693 |
|
|
4.21 |
2030 Senior Notes(3) |
6/15/2020 |
|
6/15/2030 |
|
400,000 |
|
|
396,713 |
|
|
3.28 |
|
396,602 |
|
|
3.28 |
2052 Senior Notes(4) |
1/21/2022 |
|
2/1/2052 |
|
500,000 |
|
|
483,904 |
|
|
3.77 |
|
483,802 |
|
|
3.77 |
2051 Subordinated Notes(5) |
6/30/2021 |
|
6/30/2051 |
|
450,000 |
|
|
444,803 |
|
|
4.13 |
|
444,757 |
|
|
4.13 |
| Total debt obligations |
|
|
|
|
|
|
$ |
2,369,292 |
|
|
|
|
$ |
2,273,854 |
|
|
|
(1)The revolver commitments were $1.325 billion as of March 31, 2023. Ares Holdings is the borrower under the Credit Facility. The Credit Facility has a variable interest rate based on Secured Overnight Financing Rate (“SOFR”) or a base rate plus an applicable margin, which is subject to adjustment based on the achievement of certain environmental, social and governance-related targets, with an unused commitment fee paid quarterly, which is subject to change with the Company’s underlying credit agency rating. As of March 31, 2023, base rate loans bear interest calculated based on the base rate and the SOFR loans bear interest calculated based on SOFR plus 1.00%. The unused commitment fee is 0.10% per annum. There is a base rate and SOFR floor of zero.
(2)The 2024 Senior Notes were issued in October 2014 by Ares Finance Co. LLC, an indirect subsidiary of the Company, at 98.27% of the face amount with interest paid semi-annually. The Company may redeem the 2024 Senior Notes prior to maturity, subject to the terms of the indenture governing the 2024 Notes.
(3)The 2030 Senior Notes were issued in June 2020 by Ares Finance Co. II LLC, an indirect subsidiary of the Company, at 99.77% of the face amount with interest paid semi-annually. The Company may redeem the 2030 Senior Notes prior to maturity, subject to the terms of the indenture governing the 2030 Notes.
(4)The 2052 Senior Notes were issued in January 2022 by Ares Finance Co. IV LLC, an indirect subsidiary of the Company, at 97.78% of the face amount with interest paid semi-annually. The Company may redeem the 2052 Senior Notes prior to maturity, subject to the terms of the indenture governing the 2052 Notes.
(5)The 2051 Subordinated Notes were issued in June 2021 by Ares Finance Co. III LLC, an indirect subsidiary of the Company with interest paid semi-annually at a fixed rate of 4.125%. Beginning June 30, 2026, the interest rate will reset on every fifth year based on the five-year U.S. Treasury Rate plus 3.237%. The Company may redeem the 2051 Subordinated Notes prior to maturity or defer interest payments up to five consecutive years, subject to the terms of the indenture governing the 2051 Subordinated Notes.
As of March 31, 2023, the Company and its subsidiaries were in compliance with all covenants under the debt obligations.
The Company typically incurs and pays debt issuance costs when entering into a new debt obligation or when amending an existing debt agreement. Debt issuance costs related to the 2024, 2030 and 2052 Senior Notes (the “Senior Notes”) and 2051 Subordinated Notes are recorded as a reduction of the corresponding debt obligation, and debt issuance costs related to the Credit Facility are included within other assets within the Condensed Consolidated Statements of Financial Condition. All debt issuance costs are amortized over the remaining term of the related obligation into interest expense within the Condensed Consolidated Statements of Operations.
The following table presents the activity of the Company’s debt issuance costs:
|
|
|
|
|
|
|
|
|
|
|
|
|
|
|
|
|
|
|
|
|
|
|
Credit Facility |
|
Senior
Notes |
|
Subordinated Notes |
|
|
|
|
|
|
|
|
|
|
|
|
|
|
|
|
|
|
|
|
|
|
|
|
|
|
|
|
|
|
|
|
|
|
|
|
|
|
|
|
|
|
|
|
| Unamortized debt issuance costs as of December 31, 2022 |
$ |
5,510 |
|
|
$ |
8,393 |
|
|
$ |
5,243 |
|
|
|
|
|
|
|
|
|
|
|
|
|
|
|
| Amortization of debt issuance costs |
(324) |
|
|
(198) |
|
|
(46) |
|
|
|
|
|
|
|
|
|
|
|
|
|
|
|
| Unamortized debt issuance costs as of March 31, 2023 |
$ |
5,186 |
|
|
$ |
8,195 |
|
|
$ |
5,197 |
|
|
|
|
|
Loan Obligations of the Consolidated CLOs
Loan obligations of the Consolidated Funds that are CLOs (“Consolidated CLOs”) represent amounts due to holders of debt securities issued by the Consolidated CLOs. The Company measures the loan obligations of the Consolidated CLOs using the fair value of the financial assets of its Consolidated CLOs.
Ares Management Corporation
Notes to the Unaudited Condensed Consolidated Financial Statements (Continued)
(Dollars in Thousands, Except Share Data and As Otherwise Noted)
The following loan obligations were outstanding and classified as liabilities of the Consolidated CLOs:
|
|
|
|
|
|
|
|
|
|
|
|
|
|
|
|
|
|
|
|
|
|
|
|
|
|
|
|
|
|
|
|
|
|
|
|
|
|
|
|
|
|
As of March 31, 2023 |
|
|
As of December 31, 2022 |
|
|
|
|
|
|
|
|
|
|
|
|
|
|
Fair Value of
Loan Obligations |
|
Weighted
Average
Interest Rate |
|
Weighted
Average
Remaining Maturity
(in years) |
|
|
Fair Value of Loan Obligations |
|
Weighted
Average
Interest Rate |
|
Weighted
Average
Remaining
Maturity
(in years) |
| Senior secured notes |
|
|
$ |
10,293,114 |
|
|
5.46% |
|
8.5 |
|
|
$ |
10,142,545 |
|
|
4.84% |
|
8.8 |
Subordinated notes(1) |
|
|
624,893 |
|
|
N/A |
|
7.5 |
|
|
559,175 |
|
|
N/A |
|
7.8 |
| Total loan obligations of Consolidated CLOs |
|
|
$ |
10,918,007 |
|
|
|
|
|
|
|
$ |
10,701,720 |
|
|
|
|
|
(1)The notes do not have contractual interest rates; instead, holders of the notes receive distributions from the excess cash flows generated by each Consolidated CLO.
Loan obligations of the Consolidated CLOs are collateralized by the assets held by the Consolidated CLOs, consisting of cash and cash equivalents, corporate loans, corporate bonds and other securities. The assets of one Consolidated CLO may not be used to satisfy the liabilities of another Consolidated CLO. Loan obligations of the Consolidated CLOs include floating rate notes, deferrable floating rate notes, revolving lines of credit and subordinated notes. Amounts borrowed under the notes are repaid based on available cash flows subject to priority of payments under each Consolidated CLO’s governing documents. Based on the terms of these facilities, the creditors of the facilities have no recourse to the Company.
Credit Facilities of the Consolidated Funds
Certain Consolidated Funds maintain credit facilities to fund investments between capital drawdowns. These facilities generally are collateralized by the unfunded capital commitments of the Consolidated Funds’ limited partners, bear an annual commitment fee based on unfunded commitments and contain various affirmative and negative covenants and reporting obligations, including restrictions on additional indebtedness, liens, margin stock, affiliate transactions, dividends and distributions, release of capital commitments and portfolio asset dispositions. The creditors of these facilities have no recourse to the Company and only have recourse to a subsidiary of the Company to the extent the debt is guaranteed by such subsidiary. As of March 31, 2023 and December 31, 2022, the Consolidated Funds were in compliance with all covenants under such credit facilities.
The Consolidated Funds had the following revolving bank credit facilities outstanding:
|
|
|
|
|
|
|
|
|
|
|
|
|
|
|
|
|
|
|
|
|
|
|
|
|
|
|
|
|
|
|
|
|
|
|
|
|
|
|
|
|
|
|
|
|
|
|
|
|
As of March 31, 2023 |
|
|
As of December 31, 2022 |
|
|
|
|
|
|
|
|
|
|
|
|
|
|
|
|
|
|
|
| Consolidated Funds’ Debt Facilities |
|
Maturity Date |
|
Total Capacity |
|
Outstanding Loan(1) |
|
Effective Rate |
|
|
Outstanding Loan(1) |
|
Effective Rate |
|
| Credit Facilities: |
|
|
|
|
|
|
|
|
|
|
|
|
|
|
|
|
10/13/2023 |
|
$ |
112,817 |
|
|
$ |
77,496 |
|
|
6.31% |
|
|
$ |
77,496 |
|
|
5.89% |
|
|
|
7/1/2023 |
|
18,000 |
|
|
15,550 |
|
|
6.50 |
|
|
15,550 |
|
|
6.25 |
|
|
|
7/23/2024 |
|
100,000 |
|
|
10,000 |
|
|
7.78 |
|
|
75,000 |
|
|
7.28 |
|
|
|
9/24/2026 |
|
150,000 |
|
|
— |
|
|
N/A |
|
|
— |
|
|
N/A |
|
|
|
9/12/2027 |
|
54,000 |
|
|
— |
|
|
N/A |
|
|
— |
|
|
N/A |
|
| Total borrowings of Consolidated Funds |
|
|
|
|
|
$ |
103,046 |
|
|
|
|
|
$ |
168,046 |
|
|
|
|
(1)The fair values of the borrowings approximate the carrying value as the interest rate on the borrowings is a floating rate.
7. COMMITMENTS AND CONTINGENCIES
Indemnification Arrangements
Consistent with standard business practices in the normal course of business, the Company enters into contracts that contain indemnities for affiliates of the Company, persons acting on behalf of the Company or such affiliates and third parties. The terms of the indemnities vary from contract to contract and the Company’s maximum exposure under these arrangements cannot be determined and has not been recorded within the Condensed Consolidated Statements of Financial Condition. As of March 31, 2023, the Company has not had prior claims or losses pursuant to these contracts and expects the risk of loss to be remote.
Ares Management Corporation
Notes to the Unaudited Condensed Consolidated Financial Statements (Continued)
(Dollars in Thousands, Except Share Data and As Otherwise Noted)
Commitments
As of March 31, 2023 and December 31, 2022, the Company had aggregate unfunded commitments to invest in funds it manages or to support certain strategic initiatives of $952.3 million and $677.9 million, respectively.
Guarantees
The Company has entered into agreements with financial institutions to guarantee credit facilities held by certain funds. In the ordinary course of business, the guarantee of credit facilities held by funds may indicate control and result in consolidation of the fund. As of March 31, 2023 and December 31, 2022, the Company’s maximum exposure to losses from guarantees was $76.7 million and $31.5 million, respectively.
Contingent Liabilities
In connection with the acquisition of AMP Capital’s Infrastructure Debt platform (the “Infrastructure Debt Acquisition”) during the first quarter of 2022, the Company established a management incentive program (the “Infrastructure Debt MIP”) with certain professionals. The Infrastructure Debt MIP represents a contingent liability not to exceed $48.5 million and is based on the achievement of revenue targets from the fundraising of certain infrastructure debt funds during the measurement periods.
The Company expects to settle each portion of the liability with a combination of 15% cash and 85% equity awards. Expense associated with the cash components are recognized ratably over the respective measurement periods, which will end on the final fundraising date for each of the infrastructure debt funds included in the Infrastructure Debt MIP agreement. Expense associated with the equity component is recognized ratably over the service periods, which will continue for four years beyond each of the measurement period end dates. The Infrastructure Debt MIP is remeasured each period with incremental changes in fair value included within compensation and benefits expense within the Condensed Consolidated Statements of Operations. Following each of the measurement period end dates, the cash component will be paid and restricted units for the portion of the Infrastructure Debt MIP award earned will be granted at fair value. The unpaid liability at the respective measurement period end dates will be reclassified from liability to additional paid-in-capital and any difference between the fair value of the Infrastructure Debt MIP award earned at the respective measurement period end date and the previously recorded compensation expense will be recognized over the remaining four year service period as equity-based compensation expense.
The revenue target was achieved for one of the infrastructure debt funds during the fourth quarter of 2022. As of December 31, 2022, the fair value of the contingent liability related to this portion of the award was $21.8 million and the Company recorded $7.0 million within accrued compensation within the Condensed Consolidated Statements of Financial Condition. During the three months ended March 31, 2023, the associated liability for this portion of the award was settled with a $3.4 million cash payment and the remaining amount equity-settled and reclassified to additional paid-in-capital. For the three months ended March 31, 2022, compensation expense of $1.1 million related to the achieved portion of the award is presented within compensation and benefits within the Condensed Consolidated Statements of Operations.
As of March 31, 2023, the maximum contingent liability associated with the remaining Infrastructure Debt MIP is $15.0 million. As of March 31, 2023 and December 31, 2022, the fair value of the contingent liability was $13.5 million. As of March 31, 2023 and December 31, 2022, the Company has recorded $2.7 million and $2.2 million, respectively, within accrued compensation within the Condensed Consolidated Statements of Financial Condition. Compensation expense associated with the remaining Infrastructure Debt MIP of $0.6 million and $0.3 million for the three months ended March 31, 2023 and 2022, respectively, is presented within compensation and benefits within the Condensed Consolidated Statements of Operations.
Carried Interest
Carried interest is affected by changes in the fair values of the underlying investments in the funds that are advised by the Company. Valuations, on an unrealized basis, can be significantly affected by a variety of external factors including, but not limited to, public equity market volatility, industry trading multiples and interest rates. Generally, if at the termination of a fund (and increasingly at interim points in the life of a fund), the fund has not achieved investment returns that (in most cases) exceed the preferred return threshold or (in all cases) the general partner receives net profits over the life of the fund in excess of its allocable share under the applicable partnership agreement, the Company will be obligated to repay carried interest that was received by the Company in excess of the amounts to which the Company is entitled.
Ares Management Corporation
Notes to the Unaudited Condensed Consolidated Financial Statements (Continued)
(Dollars in Thousands, Except Share Data and As Otherwise Noted)
This contingent obligation is normally reduced by income taxes paid by the Company related to its carried interest.
Senior professionals of the Company who have received carried interest distributions are responsible for funding their proportionate share of any contingent repayment obligations. However, the governing agreements of certain of the Company’s funds provide that if a current or former professional does not fund his or her respective share for such fund, then the Company may have to fund additional amounts beyond what was received in carried interest, although the Company will generally retain the right to pursue any remedies under such governing agreements against those carried interest recipients who fail to fund their obligations.
Additionally, at the end of the life of the funds there could be a payment due to a fund by the Company if the Company has recognized more carried interest than was ultimately earned. The general partner obligation amount, if any, will depend on final realized values of investments at the end of the life of the fund.
At March 31, 2023 and December 31, 2022, if the Company assumed all existing investments were worthless, the amount of carried interest subject to potential repayment, net of tax distributions, which may differ from the recognition of revenue, would have been approximately $122.4 million and $128.4 million, respectively, of which approximately $96.2 million and $101.0 million, respectively, is reimbursable to the Company by certain professionals who are the recipients of such carried interest. Management believes the possibility of all of the investments becoming worthless is remote. As of March 31, 2023 and December 31, 2022, if the funds were liquidated at their fair values, there would be no contingent repayment obligation or liability.
Litigation
From time to time, the Company is named as a defendant in legal actions relating to transactions conducted in the ordinary course of business. Although there can be no assurance of the outcome of such legal actions, in the opinion of management, the Company does not have a potential liability related to any current legal proceeding or claim that would individually or in the aggregate materially affect its results of operations, financial condition or cash flows.
Leases
The Company leases office space and certain office equipment. The Company’s leases have remaining lease terms of one to 11 years. The tables below present certain supplemental quantitative disclosures regarding the Company’s leases:
|
|
|
|
|
|
|
|
|
|
|
|
|
|
|
|
|
|
|
|
|
|
|
|
|
As of March 31, |
|
As of December 31, |
|
|
|
|
|
|
|
Classification |
|
2023 |
|
2022 |
| Operating lease assets |
|
Right-of-use operating lease assets |
|
$ |
154,970 |
|
|
$ |
155,950 |
|
| Finance lease assets |
|
Other assets(1) |
|
280 |
|
|
400 |
|
| Total lease assets |
|
|
|
$ |
155,250 |
|
|
$ |
156,350 |
|
|
|
|
|
|
|
|
| Operating lease liabilities |
|
Operating lease liabilities |
|
$ |
191,090 |
|
|
$ |
190,616 |
|
| Finance lease obligations |
|
Accounts payable, accrued expenses and other liabilities |
|
300 |
|
|
330 |
|
| Total lease liabilities |
|
|
|
$ |
191,390 |
|
|
$ |
190,946 |
|
(1) Finance lease assets are recorded net of accumulated amortization of $2.1 million as of March 31, 2023 and December 31, 2022.
Ares Management Corporation
Notes to the Unaudited Condensed Consolidated Financial Statements (Continued)
(Dollars in Thousands, Except Share Data and As Otherwise Noted)
|
|
|
|
|
|
|
|
|
|
|
|
|
|
|
|
|
|
|
As of March 31, 2023 |
| Maturity of lease liabilities |
|
|
Operating Leases |
|
Finance Leases |
| 2023 |
|
|
$ |
35,727 |
|
|
$ |
134 |
|
| 2024 |
|
|
44,063 |
|
|
162 |
|
| 2025 |
|
|
39,069 |
|
|
12 |
|
| 2026 |
|
|
27,254 |
|
|
— |
|
| 2027 |
|
|
17,902 |
|
|
— |
|
| Thereafter |
|
|
42,331 |
|
|
— |
|
| Total future payments |
|
|
206,346 |
|
|
308 |
|
| Less: interest |
|
|
15,256 |
|
|
8 |
|
| Total lease liabilities |
|
|
$ |
191,090 |
|
|
$ |
300 |
|
|
|
|
|
|
|
|
|
|
|
|
|
|
|
|
|
|
|
|
|
|
|
|
|
|
|
|
|
|
|
|
Three months ended March 31, |
|
|
|
|
|
|
|
|
|
|
|
|
|
Classification |
|
2023 |
|
2022 |
|
|
|
|
|
|
| Operating lease expense |
|
General, administrative and other expenses |
|
$ |
11,888 |
|
|
$ |
10,063 |
|
|
|
|
|
|
|
| Finance lease expense: |
|
|
|
|
|
|
|
|
|
|
|
|
| Amortization of finance lease assets |
|
General, administrative and other expenses |
|
120 |
|
|
162 |
|
|
|
|
|
|
|
| Interest on finance lease liabilities |
|
Interest expense |
|
2 |
|
|
5 |
|
|
|
|
|
|
|
| Total lease expense |
|
|
|
$ |
12,010 |
|
|
$ |
10,230 |
|
|
|
|
|
|
|
|
|
|
|
|
|
|
|
|
|
|
|
|
|
|
|
|
|
|
|
|
|
Three months ended March 31, |
| Other information |
|
2023 |
|
2022 |
|
|
| Cash paid for amounts included in the measurement of lease liabilities: |
|
|
|
|
|
|
| Operating cash flows for operating leases |
|
$ |
10,911 |
|
|
$ |
11,125 |
|
|
|
| Operating cash flows for finance leases |
|
2 |
|
|
5 |
|
|
|
| Financing cash flows for finance leases |
|
42 |
|
|
389 |
|
|
|
|
|
|
|
|
|
|
| Leased assets obtained in exchange for new operating lease liabilities |
|
12,047 |
|
|
1,378 |
|
|
|
|
|
|
|
|
|
|
|
|
|
|
|
|
|
|
|
|
|
|
As of March 31, |
|
As of December 31, |
|
|
|
|
| Lease term and discount rate |
|
|
2023 |
|
2022 |
| Weighted-average remaining lease terms (in years): |
|
|
|
|
|
| Operating leases |
|
|
5.6 |
|
5.5 |
| Finance leases |
|
|
1.8 |
|
2.1 |
| Weighted-average discount rate: |
|
|
|
|
|
| Operating leases |
|
|
2.92% |
|
2.72% |
| Finance leases |
|
|
3.00% |
|
2.99% |
8. RELATED PARTY TRANSACTIONS
Substantially all of the Company’s revenue is earned from its affiliates. The related accounts receivable are included within due from affiliates within the Condensed Consolidated Statements of Financial Condition, except that accrued carried interest allocations, which is predominantly due from affiliated funds, is presented separately within investments within the Condensed Consolidated Statements of Financial Condition.
The Company has investment management agreements with the Ares Funds that it manages. In accordance with these agreements, these Ares Funds may bear certain operating costs and expenses which are initially paid by the Company and subsequently reimbursed by the Ares Funds.
The Company is reimbursed for expenses incurred in providing administrative services to certain related parties, including our public vehicles, and with certain private funds that pay administrative fees based on invested capital. The Company is also party to agreements with certain real estate funds which pay fees to the Company to provide various services, such as administration, acquisition, development, property management and the sale and distribution of fund shares in our non-traded vehicles, among others.
Ares Management Corporation
Notes to the Unaudited Condensed Consolidated Financial Statements (Continued)
(Dollars in Thousands, Except Share Data and As Otherwise Noted)
Employees and other related parties may be permitted to participate in co-investment vehicles that generally invest in Ares funds alongside fund investors. Participation is limited by law to individuals who qualify under applicable securities laws. These co-investment vehicles generally do not require these individuals to pay management fees, carried interest or incentive fees.
Carried interest and incentive fees from the funds can be distributed to professionals or their related entities on a current basis, subject, in the case of carried interest programs, to repayment by the subsidiary of the Company that acts as general partner of the relevant fund in the event that certain specified return thresholds are not ultimately achieved. The professionals have personally guaranteed, subject to certain limitations, the obligations of these subsidiaries in respect of this general partner obligation. Such guarantees are several, and not joint, and are limited to distributions received by the relevant recipient.
The Company considers its professionals and non-consolidated funds to be affiliates. Amounts due from and to affiliates were composed of the following:
|
|
|
|
|
|
|
|
|
|
|
|
| |
As of March 31, |
|
As of December 31, |
|
|
| |
2023 |
|
2022 |
| Due from affiliates: |
|
|
|
| Management fees receivable from non-consolidated funds |
$ |
551,095 |
|
|
$ |
456,314 |
|
| Incentive fee receivable from non-consolidated funds |
18,621 |
|
|
169,979 |
|
| Payments made on behalf of and amounts due from non-consolidated funds and employees |
138,088 |
|
|
132,179 |
|
| Due from affiliates—Company |
$ |
707,804 |
|
|
$ |
758,472 |
|
| Amounts due from non-consolidated funds |
$ |
10,878 |
|
|
$ |
15,789 |
|
| Due from affiliates—Consolidated Funds |
$ |
10,878 |
|
|
$ |
15,789 |
|
| Due to affiliates: |
|
|
|
| Management fee received in advance and rebates payable to non-consolidated funds |
$ |
3,918 |
|
|
$ |
8,701 |
|
| Tax receivable agreement liability |
113,978 |
|
|
118,466 |
|
| Undistributed carried interest and incentive fees |
61,177 |
|
|
121,332 |
|
| Payments made by non-consolidated funds on behalf of and payable by the Company |
4,378 |
|
|
4,299 |
|
| Due to affiliates—Company |
$ |
183,451 |
|
|
$ |
252,798 |
|
| Amounts due to portfolio companies and non-consolidated funds |
$ |
— |
|
|
$ |
4,037 |
|
| Due to affiliates—Consolidated Funds |
$ |
— |
|
|
$ |
4,037 |
|
Due from and Due to Ares Funds and Portfolio Companies
In the normal course of business, the Company pays certain expenses on behalf of Consolidated Funds and non-consolidated funds for which it is reimbursed. Conversely, Consolidated Funds and non-consolidated funds may pay certain expenses that are reimbursed by the Company. Amounts advanced on behalf of Consolidated Funds are eliminated in consolidation. Certain expenses initially paid by the Company, primarily professional services, travel and other costs associated with particular portfolio company holdings, are subject to reimbursement by the portfolio companies.
9. INCOME TAXES
The Company’s income tax provision includes corporate income taxes and other entity level income taxes, as well as income taxes incurred by certain affiliated funds that are consolidated in these financial statements. For the three months ended March 31, 2023 and 2022, the Company recorded income tax expense of $33.8 million and $20.4 million, respectively.
The Company’s effective income tax rate is dependent on many factors, including the estimated nature and amounts of income and expenses allocated to the non-controlling interests without being subject to federal, state and local income taxes at the corporate level. Additionally, the Company’s effective tax rate is influenced by the amount of income tax provision recorded for any affiliated funds and co-investment vehicles that are consolidated in the Company’s unaudited condensed consolidated financial statements. For the three months ended March 31, 2023 and 2022, the Company recorded its interim income tax provision utilizing the estimated annual effective tax rate.
Ares Management Corporation
Notes to the Unaudited Condensed Consolidated Financial Statements (Continued)
(Dollars in Thousands, Except Share Data and As Otherwise Noted)
The income tax effects of temporary differences give rise to significant portions of deferred tax assets and liabilities, which are presented on a net basis. As of March 31, 2023 and December 31, 2022, the Company recorded a net deferred tax asset of $28.4 million and $68.9 million, respectively, within other assets within the Condensed Consolidated Statements of Financial Condition.
The Company files its tax returns as prescribed by the tax laws of the jurisdictions in which it operates. In the normal course of business, the Company is subject to examination by U.S. federal, state, local and foreign tax authorities. With limited exceptions, the Company is generally no longer subject to corporate income tax audits by taxing authorities for any years prior to 2019. Although the outcome of tax audits is always uncertain, the Company does not believe the outcome of any future audit will have a material adverse effect on the Company’s unaudited condensed consolidated financial statements.
10. EARNINGS PER SHARE
The Company has Class A and non-voting common stock outstanding. The non-voting common stock has the same economic rights as the Class A common stock; therefore, earnings per share is presented on a combined basis. Income of the Company has been allocated on a proportionate basis to the two common stock classes.
Basic earnings per share of Class A and non-voting common stock is computed by using the two-class method. Diluted earnings per share of Class A and non-voting common stock is computed using the more dilutive method of either the two-class method or the treasury stock method. For the three months ended March 31, 2023 and 2022, the two-class method was the more dilutive method.
The following table presents the computation of basic and diluted earnings per common share:
|
|
|
|
|
|
|
|
|
|
|
|
|
|
|
|
|
|
|
Three months ended March 31, |
|
|
|
2023 |
|
2022 |
|
|
|
|
|
|
| Basic earnings per share of Class A and non-voting common stock: |
|
|
|
|
|
|
|
|
|
| Net income attributable to Ares Management Corporation Class A and non-voting common stockholders |
$ |
94,039 |
|
|
$ |
45,863 |
|
|
|
|
|
|
|
| Distributions on unvested restricted units |
(5,314) |
|
|
(3,585) |
|
|
|
|
|
|
|
|
|
|
|
|
|
|
|
|
|
| Net income available to Class A and non-voting common stockholders |
$ |
88,725 |
|
|
$ |
42,278 |
|
|
|
|
|
|
|
| Basic weighted-average shares of Class A and non-voting common stock |
178,976,022 |
|
|
174,215,251 |
|
|
|
|
|
|
|
| Basic earnings per share of Class A and non-voting common stock |
$ |
0.49 |
|
|
$ |
0.24 |
|
|
|
|
|
|
|
|
|
|
|
|
|
|
|
|
|
| Diluted earnings per share of Class A and non-voting common stock: |
|
|
|
|
|
|
|
|
|
| Net income attributable to Ares Management Corporation Class A and non-voting common stockholders |
$ |
94,039 |
|
|
$ |
45,863 |
|
|
|
|
|
|
|
| Distributions on unvested restricted units |
(5,314) |
|
|
(3,585) |
|
|
|
|
|
|
|
| Net income available to Class A and non-voting common stockholders |
$ |
88,725 |
|
|
$ |
42,278 |
|
|
|
|
|
|
|
| Effect of dilutive shares: |
|
|
|
|
|
|
|
|
|
| Restricted units |
— |
|
|
— |
|
|
|
|
|
|
|
| Options |
— |
|
|
— |
|
|
|
|
|
|
|
|
|
|
|
|
|
|
|
|
|
| Diluted weighted-average shares of Class A and non-voting common stock |
178,976,022 |
|
|
174,215,251 |
|
|
|
|
|
|
|
| Diluted earnings per share of Class A and non-voting common stock |
$ |
0.49 |
|
|
$ |
0.24 |
|
|
|
|
|
|
|
|
|
|
|
|
|
|
|
|
|
| Dividend declared and paid per Class A and non-voting common stock |
$ |
0.77 |
|
|
$ |
0.61 |
|
|
|
|
|
|
|
Ares Management Corporation
Notes to the Unaudited Condensed Consolidated Financial Statements (Continued)
(Dollars in Thousands, Except Share Data and As Otherwise Noted)
11. EQUITY COMPENSATION
Equity Incentive Plan
Equity-based compensation is granted under the Company’s 2014 Equity Incentive Plan (as amended, the “Equity Incentive Plan”). The total number of shares available to be issued under the Equity Incentive Plan resets based on a formula defined in the Equity Incentive Plan and may increase on January 1 of each year. On January 1, 2023, the total number of shares available for issuance under the Equity Incentive Plan reset to 51,149,100 shares and as of March 31, 2023, 45,074,879 shares remained available for issuance.
Generally, unvested restricted units are forfeited upon termination of employment in accordance with the Equity Incentive Plan. The Company recognizes forfeitures as a reversal of previously recognized compensation expense in the period the forfeiture occurs.
Equity-based compensation expense, net of forfeitures, recorded by the Company is presented in the following table:
|
|
|
|
|
|
|
|
|
|
|
|
|
|
|
|
|
|
|
|
|
Three months ended March 31, |
|
|
|
|
| |
2023 |
|
2022 |
|
|
|
|
|
|
|
|
| Restricted units |
$ |
69,252 |
|
|
$ |
53,650 |
|
|
|
|
|
|
|
|
|
|
|
|
|
|
|
|
|
|
|
|
|
|
|
|
|
|
|
|
|
|
|
|
|
| Equity-based compensation expense |
$ |
69,252 |
|
|
$ |
53,650 |
|
|
|
|
|
|
|
|
|
Restricted Units
Each restricted unit represents an unfunded, unsecured right of the holder to receive a share of the Company’s Class A common stock on a specific date. The restricted units generally vest and are settled in shares of Class A common stock either (i) at a rate of one-third per year, beginning on the third anniversary of the grant date, (ii) at a rate of one quarter per year, beginning on the second anniversary of the grant date or the holder’s employment commencement date, or (iii) at a rate of one-third per year, beginning on the first anniversary of the grant date, in each case generally subject to the holder’s continued employment as of the applicable vesting date (subject to accelerated vesting upon certain qualifying terminations of employment or retirement eligibility provisions). Compensation expense associated with restricted units is recognized on a straight-line basis over the requisite service period of the award.
Restricted units are delivered net of the holder’s payroll related taxes upon vesting. For the three months ended March 31, 2023, 3.3 million restricted units vested and 1.9 million shares of Class A common stock were delivered to the holders. For the three months ended March 31, 2022, 5.1 million restricted units vested and 2.8 million shares of Class A common stock were delivered to the holders.
The holders of restricted units, other than awards that have not yet been issued as described in the subsequent sections, generally have the right to receive as current compensation an amount in cash equal to (i) the amount of any dividend paid with respect to a share of Class A common stock multiplied by (ii) the number of restricted units held at the time such dividends are declared (“Dividend Equivalent”). During the three months ended March 31, 2023, the Company declared dividends of $0.77 per share to Class A common stockholders at the close of business on March 17, 2023. For the three months ended March 31, 2023, Dividend Equivalents were made to the holders of restricted units in the aggregate amount of $12.0 million, which are presented as dividends within the Condensed Consolidated Statements of Changes in Equity. When units are forfeited, the cumulative amount of Dividend Equivalents previously paid is reclassified to compensation and benefits expense within the Condensed Consolidated Statements of Operations.
During the first quarter of 2023, the Company approved the future grant of restricted units to certain senior executives in each of 2024, 2025 and 2026, subject to the holder’s continued employment and acceleration in certain instances. The vesting period of these awards are at a rate of 25% per year, beginning on the second anniversary of the grant date. Given that these future restricted units have been communicated to the recipient, the Company accounts for these awards as if they have been granted and recognizes the compensation expense on a straight-line basis over the service period. The restricted units that have been approved and communicated but not yet granted are not eligible to receive a Dividend Equivalent until the grant date.
Ares Management Corporation
Notes to the Unaudited Condensed Consolidated Financial Statements (Continued)
(Dollars in Thousands, Except Share Data and As Otherwise Noted)
The following table presents unvested restricted units’ activity:
|
|
|
|
|
|
|
|
|
|
|
|
|
|
| |
Restricted Units |
|
Weighted Average
Grant Date Fair
Value Per Unit |
|
|
| Balance - December 31, 2022 |
16,662,999 |
|
|
$ |
48.76 |
|
|
|
| Granted |
4,683,244 |
|
|
78.71 |
|
|
|
| Vested |
(3,260,427) |
|
|
37.86 |
|
|
|
| Forfeited |
(94,023) |
|
|
49.78 |
|
|
|
| Balance - March 31, 2023 |
17,991,793 |
|
|
$ |
58.53 |
|
|
|
The total compensation expense expected to be recognized in all future periods associated with the restricted units is approximately $840.1 million as of March 31, 2023 and is expected to be recognized over the remaining weighted average period of 3.8 years.
Options
Upon exercise, each option entitles the holders to purchase from the Company one share of Class A common stock at the stated exercise price. The term of the options is generally 10 years, beginning on the grant date.
A summary of options activity during the three months ended March 31, 2023 is presented below:
|
|
|
|
|
|
|
|
|
|
|
|
|
|
|
|
|
|
|
|
|
|
|
|
| |
Options |
|
Weighted Average Exercise Price |
|
Weighted Average
Remaining Life
(in years) |
|
Aggregate Intrinsic Value |
| Balance - December 31, 2022 |
5,170,219 |
|
|
$ |
19.00 |
|
|
1.3 |
|
$ |
255,616 |
|
|
|
|
|
|
|
|
|
| Exercised |
(483,126) |
|
|
19.00 |
|
|
— |
|
|
— |
|
| Expired |
— |
|
|
— |
|
|
— |
|
|
— |
|
| Forfeited |
— |
|
|
— |
|
|
— |
|
|
— |
|
| Balance - March 31, 2023 |
4,687,093 |
|
|
$ |
19.00 |
|
|
1.1 |
|
$ |
302,036 |
|
| Exercisable at March 31, 2023 |
4,687,093 |
|
|
$ |
19.00 |
|
|
1.1 |
|
$ |
302,036 |
|
Net cash proceeds from exercises of stock options were $9.2 million for the three months ended March 31, 2023. The Company realized tax benefits of approximately $4.5 million from those exercises.
12. EQUITY AND REDEEMABLE INTEREST
Common Stock
The Company’s common stock consists of Class A, Class B, Class C and non-voting common stock, each $0.01 par value per share. The non-voting common stock has the same economic rights as the Class A common stock. Sumitomo Mitsui Banking Corporation (“SMBC”) is the sole holder of the non-voting common stock. The Class B common stock and Class C common stock are non-economic and holders are not entitled to dividends from the Company or to receive any assets of the Company in the event of any dissolution, liquidation or winding up of the Company. Ares Management GP LLC is the sole holder of the Class B common stock and Ares Voting LLC (“Ares Voting”) is the sole holder of the Class C common stock.
In February 2023, the Company's board of directors authorized the renewal of the stock repurchase program that allows for the repurchase of up to $150 million of shares of Class A common stock. Under the program, shares may be repurchased from time to time in open market purchases, privately negotiated transactions or otherwise, including in reliance on Rule 10b5-1 of the Securities Act. The program is scheduled to expire in March 2024. Repurchases under the program, if any, will depend on the prevailing market conditions and other factors. During the three months ended March 31, 2023, the Company did not repurchase any shares as part of the stock repurchase program.
Ares Management Corporation
Notes to the Unaudited Condensed Consolidated Financial Statements (Continued)
(Dollars in Thousands, Except Share Data and As Otherwise Noted)
The following table presents the changes in each class of common stock:
|
|
|
|
|
|
|
|
|
|
|
|
|
|
|
|
|
|
|
|
|
|
|
|
|
|
|
|
|
|
|
Class A Common Stock |
|
Non-Voting Common Stock |
|
Class B Common Stock |
|
Class C Common Stock |
|
Total |
| Balance - December 31, 2022 |
173,892,036 |
|
|
3,489,911 |
|
|
1,000 |
|
|
117,231,288 |
|
|
294,614,235 |
|
| Issuance of stock |
1,382,596 |
|
|
— |
|
|
— |
|
|
— |
|
|
1,382,596 |
|
Issuance of AOG Units(1) |
— |
|
|
— |
|
|
— |
|
|
3,473,026 |
|
|
3,473,026 |
|
| Exchanges of AOG Units |
65,916 |
|
|
— |
|
|
— |
|
|
(65,916) |
|
|
— |
|
|
|
|
|
|
|
|
|
|
|
| Stock option exercises, net of shares withheld for tax |
483,126 |
|
|
— |
|
|
— |
|
|
— |
|
|
483,126 |
|
|
|
|
|
|
|
|
|
|
|
| Vesting of restricted stock awards, net of shares withheld for tax |
1,850,381 |
|
|
— |
|
|
— |
|
|
— |
|
|
1,850,381 |
|
|
|
|
|
|
|
|
|
|
|
| Balance - March 31, 2023 |
177,674,055 |
|
|
3,489,911 |
|
|
1,000 |
|
|
120,638,398 |
|
|
301,803,364 |
|
(1) Represents issuance of AOG Units to the recipients of the management incentive program from the acquisition of Black Creek Group’s real estate investment advisory and distribution business (the “Black Creek Acquisition”), which relieved the associated liability following the maximum contingent payment being met as of December 31, 2022. Pursuant to an agreement with the recipients of the Black Creek Acquisition management incentive program, a portion of such AOG Units were issued in lieu of cash consideration which was payable pursuant to the Black Creek Acquisition management incentive program. Issuances of Class C Common stock corresponds with increases in Ares Owners Holdings L.P.’s ownership interest in the AOG entities.
The following table presents each partner’s AOG Units and corresponding ownership interest in each of the Ares Operating Group entities, as well as its daily average ownership of AOG Units in each of the Ares Operating Group entities:
|
|
|
|
|
|
|
|
|
|
|
|
|
|
|
|
|
|
|
|
|
|
|
|
|
|
|
|
|
|
|
|
|
|
|
|
|
|
|
|
|
|
|
|
|
|
|
|
|
|
|
|
|
|
|
|
|
|
|
Daily Average Ownership |
|
|
As of March 31, 2023 |
|
As of December 31, 2022 |
|
|
|
Three months ended March 31, |
|
|
AOG Units |
|
Direct Ownership Interest |
|
AOG Units |
|
Direct Ownership Interest |
|
|
|
|
|
2023 |
|
2022 |
|
|
|
| Ares Management Corporation |
|
181,163,966 |
|
|
60.03 |
% |
|
177,381,947 |
|
|
60.21 |
% |
|
|
|
|
|
60.14 |
% |
|
59.51 |
% |
|
|
|
| Ares Owners Holdings, L.P. |
|
120,638,398 |
|
|
39.97 |
|
|
117,231,288 |
|
|
39.79 |
|
|
|
|
|
|
39.86 |
|
|
40.49 |
|
|
|
|
| Total |
|
301,802,364 |
|
|
100.00 |
% |
|
294,613,235 |
|
|
100.00 |
% |
|
|
|
|
|
|
|
|
|
|
|
Ares Management Corporation
Notes to the Unaudited Condensed Consolidated Financial Statements (Continued)
(Dollars in Thousands, Except Share Data and As Otherwise Noted)
Redeemable Interest
The following table summarizes the activities associated with the redeemable interest in Ares Operating Group entities:
|
|
|
|
|
|
|
|
|
Total |
Balance - December 31, 2021 |
$ |
96,008 |
|
| Changes in ownership interests and related tax benefits |
231 |
|
| Net income |
399 |
|
| Currency translation adjustment, net of tax |
(331) |
|
| Equity compensation |
48 |
|
| Distributions |
(8) |
|
|
|
Balance - March 31, 2022 |
96,347 |
|
| Changes in ownership interests and related tax benefits |
(1,445) |
|
| Net loss |
(457) |
|
| Currency translation adjustment, net of tax |
(996) |
|
| Equity compensation |
77 |
|
| Distributions |
(8) |
|
|
|
Balance- June 30, 2022 |
93,518 |
|
| Changes in ownership interests and related tax benefits |
1,214 |
|
| Net income |
93 |
|
| Currency translation adjustment, net of tax |
(933) |
|
| Equity compensation |
77 |
|
| Distributions |
(1,861) |
|
|
|
Balance- September 30, 2022 |
92,108 |
|
|
|
| Net loss |
(886) |
|
| Currency translation adjustment, net of tax |
1,834 |
|
| Equity compensation |
83 |
|
| Distribution |
(10) |
|
|
|
Balance - December 31, 2022 |
93,129 |
|
| Changes in ownership interests and related tax benefits |
(66,506) |
|
| Net loss |
(1,824) |
|
| Currency translation adjustment, net of tax |
(148) |
|
| Equity compensation |
174 |
|
| Distributions |
(2,883) |
|
|
|
Balance - March 31, 2023 |
$ |
21,942 |
|
|
|
|
|
|
|
|
|
|
|
|
|
|
|
|
|
|
|
|
|
|
|
|
|
|
|
|
|
|
|
|
|
|
|
|
|
The following table summarizes the activities associated with the redeemable interest in Consolidated Funds:
|
|
|
|
|
|
|
Total |
| Balance - December 31, 2021 |
$ |
1,000,000 |
|
| Change in redemption value |
— |
|
| Balance - March 31, 2022 |
1,000,000 |
|
| Change in redemption value |
— |
|
| Balance - June 30, 2022 |
1,000,000 |
|
| Change in redemption value |
4,994 |
|
| Balance - September 30, 2022 |
1,004,994 |
|
| Change in redemption value |
8,288 |
|
| Balance - December 31, 2022 |
1,013,282 |
|
| Change in redemption value |
10,504 |
|
| Redemption |
(538,985) |
|
| Balance - March 31, 2023 |
$ |
484,801 |
|
|
|
|
|
|
|
|
|
|
|
|
|
Ares Management Corporation
Notes to the Unaudited Condensed Consolidated Financial Statements (Continued)
(Dollars in Thousands, Except Share Data and As Otherwise Noted)
13. SEGMENT REPORTING
The Company operates through its distinct operating segments. On March 31, 2023, the Company executed the SSG Buyout. The Company rebranded Ares SSG as Ares Asia and the Ares SSG credit business, including the Asian special situations, Asian secured lending and APAC direct lending strategies, as Asia credit. Asia credit has been reclassified effective January 1, 2023 and is now presented within the Credit Group. In connection with this reclassification, the Company will no longer use Strategic Initiatives to describe all other operating segments, instead reporting the collective results as Other. The Company reclassified activities of Asia credit to the Credit Group to better align the segment presentation with the global asset classes and investment strategies. The Company has modified historical results to conform with its current presentation. The Company operating segments are summarized below:
Credit Group: The Credit Group manages credit strategies across the liquid and illiquid spectrum, including liquid credit, alternative credit and direct lending. Our liquid credit investment solutions help traditional fixed income investors access the syndicated loan and high yield bond markets and capitalize on opportunities across multi-asset credit. The syndicated loans strategy focuses on evaluating individual credit opportunities related primarily to non-investment grade senior secured loans and primarily targets first lien secured debt, with a secondary focus on second lien secured loans and subordinated and other unsecured loans. The high yield bond strategy seeks to deliver a diversified portfolio of liquid, traded non-investment grade corporate bonds, including secured, unsecured and subordinated debt instruments. Multi-asset credit is a “go anywhere” strategy designed to offer investors a flexible solution to global credit investing by allowing us to tactically allocate between multiple asset classes in various market conditions. The alternative credit strategy seeks to capitalize on asset-focused investment opportunities that fall outside of traditional, well-defined markets such as corporate debt, real estate and private equity. The alternative credit strategy emphasizes downside protection and capital preservation through a focus on investments that tend to share the following key attributes: asset security, covenants, structural protections and cash flow velocity. The direct lending strategy is one of the largest self-originating direct lenders, lending in the U.S., European and Asia-Pacific markets with a multi-channel origination strategy designed to address a broad set of investment opportunities in the middle market. The direct lending team maintains a flexible investment strategy with the capability to invest in first lien senior secured loans (including unitranche loans which are loans that combine senior and subordinated debt, generally in a first lien position), second lien senior secured loans, subordinated debt, preferred equity and non-control equity co-investments in private middle market companies. U.S. direct lending activities are managed through a publicly-traded business development company (“BDC”), Ares Capital Corporation (“ARCC”), our non-traded BDC, Ares Strategic Income Fund (“ASIF”), as well as through private commingled funds and separately managed accounts (“SMAs”). Our Asia credit platform provides flexible, value-add capital solutions to complex situations through our local origination presence and experience.
Private Equity Group: The Private Equity Group broadly categorizes its investment strategies as corporate private equity and special opportunities. In the corporate private equity strategy, the Company targets four principal transactions types: (i) prudently leveraged control buyouts; (ii) growth equity; (iii) rescue capital; and (iv) distressed-for-control. This differentiated strategy, together with the broad resources of the Ares platform, widens our universe of potential investment opportunities and allows us to remain active across various market environments and to be highly selective in making investments by identifying the most attractive relative value opportunities. In the special opportunities strategy, the Company employs a flexible capital strategy to finance debt and non-control equity solutions in middle market companies undergoing transformational change or stress. The strategy seeks to consistently invest in a range of private, special-situation opportunities and flex into distressed public market debt when attractive.
Real Assets Group: The Real Assets Group manages comprehensive equity and debt strategies across real estate and infrastructure investments.
The real estate strategy focuses on activities categorized as core/core-plus, value-add, opportunistic and debt. Real estate equity strategies involve high-quality properties and locations and de-risked developments with an opportunity to create value through repositioning, lease-up, re-tenanting, redevelopment, and/or complex recapitalizations. The U.S. core/core-plus investment activities focuses on the acquisition of assets with strong long-term cash flow potential and durable tenancy diversified across end-user industries and geographies. The value-add investment activities focus on acquiring underperforming, income-producing, institutional-quality assets that can be improved through select value-creation initiatives across the U.S. and Europe. The opportunistic activities focus on capitalizing on distressed and special situations, repositioning underperforming assets and undertaking select development and redevelopment projects across the U.S. and Europe. The real estate debt strategy primarily focuses on directly originating a wide range of financing opportunities in the U.S. and Europe leveraging the Real Asset Group’s diverse sources of capital. In addition to managing private commingled funds and SMAs investing in equity and debt strategies, the real estate strategy also makes investments through Ares Real Estate Income Trust, Inc. (“AREIT”) and Ares Industrial Real Estate Income Trust, Inc. (“AIREIT”), its non-traded REITs, and ACRE, a publicly traded commercial mortgage REIT.
Ares Management Corporation
Notes to the Unaudited Condensed Consolidated Financial Statements (Continued)
(Dollars in Thousands, Except Share Data and As Otherwise Noted)
The infrastructure strategy focuses on investment strategies broadly categorized as infrastructure opportunities and infrastructure debt. Infrastructure opportunities is a market leader in infrastructure and power investing with a focus on climate infrastructure, natural gas generation and energy transportation sectors. The infrastructure opportunities strategy targets essential infrastructure assets and companies with stable cash flow profiles through long-term contracts and high-barriers to entry. The infrastructure debt strategy targets global assets and businesses with defensive characteristics across the digital, transport, energy and utility sectors. Leveraging the established long standing relationships, the strategy seeks to generate exclusive deal flow and high-quality investment opportunities.
Secondaries Group: The Secondaries Group invests in secondary markets across a range of alternative asset class strategies, including private equity, real estate, infrastructure and credit. The Company acquires interests across a range of partnership vehicles, including funds, multi-asset portfolios and single asset joint ventures. Activities within each strategy include recapitalizing and restructuring the funds, including transactions that can address pending fund maturity, strategy change or the need for additional equity capital. The private equity secondaries strategy seeks to achieve attractive secondary cash flow and diversification characteristics by investing across the spectrum of private equity secondaries transactions. In the real estate secondaries strategy, the Company seeks broad diversification by property sector and geography and to drive investment results through underwriting, transaction structuring and portfolio construction. In the infrastructure secondaries strategy, the Company focuses on achieving diversification through a portfolio that provides inflation protection and exposure to uncorrelated assets. The credit secondaries strategy seeks to create a highly diversified portfolio of primarily senior secured private credit interests across North America and Europe, acquired directly or indirectly through secondary market transactions.
Other: Other represents a compilation of operating segments and strategic investments that seek to expand the Company’s reach and its scale in new and existing global markets but individually do not meet reporting thresholds. These results include activities from (i) Ares Insurance Solutions (“AIS”), the Company’s insurance platform that provides solutions to insurance clients including asset management, capital solutions and corporate development and (ii) AAC, among others.
The OMG consists of shared resource groups to support the Company’s operating segments by providing infrastructure and administrative support in the areas of accounting/finance, operations, information technology, legal, compliance, human resources, strategy, relationship management and distribution. The OMG includes Ares Wealth Management Solutions, LLC (“AWMS”) that facilitates the product development, distribution, marketing and client management activities for investment offerings in the global wealth management channel. Additionally, the OMG provides services to certain of the Company’s managed funds and vehicles, which reimburse the OMG for expenses equal to the costs of services provided. The OMG’s revenues and expenses are not allocated to the Company’s operating segments but the Company does consider the financial results of the OMG when evaluating its financial performance.
Segment Profit Measures: These measures supplement and should be considered in addition to, and not in lieu of, the Condensed Consolidated Statements of Operations prepared in accordance with GAAP.
Fee related earnings (“FRE”) is used to assess core operating performance by determining whether recurring revenue, primarily consisting of management fees and fee related performance revenues, is sufficient to cover operating expenses and to generate profits. FRE differs from income before taxes computed in accordance with GAAP as it excludes net performance income, investment income from the Consolidated Funds and non-consolidated funds and certain other items that the Company believes are not indicative of its core operating performance. Fee related performance revenues, together with fee related performance compensation, is presented within FRE because it represents incentive fees from perpetual capital vehicles that is measured and received on a recurring basis and not dependent on realization events from the underlying investments.
Realized income (“RI”) is an operating metric used by management to evaluate performance of the business based on operating performance and the contribution of each of the business segments to that performance, while removing the fluctuations of unrealized income and expenses, which may or may not be eventually realized at the levels presented and whose realizations depend more on future outcomes than current business operations. RI differs from income before taxes by excluding (i) operating results of the Consolidated Funds, (ii) depreciation and amortization expense, (iii) the effects of changes arising from corporate actions, (iv) unrealized gains and losses related to carried interest, incentive fees and investment performance and (v) certain other items that the Company believes are not indicative of operating performance. Changes arising from corporate actions include equity-based compensation expenses, the amortization of intangible assets, transaction costs associated with mergers, acquisitions and capital activities, underwriting costs and expenses incurred in connection with corporate reorganization. RI is reduced by a placement fee adjustment that represents the net portion of either expense deferral or amortization that is required to match the timing of expense recognition with the period over which management fees are expected to be earned from the associated fund for segment purposes but have been expensed up front in accordance with GAAP.
Ares Management Corporation
Notes to the Unaudited Condensed Consolidated Financial Statements (Continued)
(Dollars in Thousands, Except Share Data and As Otherwise Noted)
For periods in which the amortization of placement fees for segment purposes is higher than the GAAP expense, the placement fee adjustment is presented as a reduction to RI. Management believes RI is a more appropriate metric to evaluate the Company’s current business operations.
Management makes operating decisions and assesses the performance of each of the Company’s business segments based on financial and operating metrics and other data that is presented before giving effect to the consolidation of any of the Consolidated Funds. Consequently, all segment data excludes the assets, liabilities and operating results related to the Consolidated Funds and non-consolidated funds. Total assets by segments is not disclosed because such information is not used by the Company’s chief operating decision maker in evaluating the segments.
Ares Management Corporation
Notes to the Unaudited Condensed Consolidated Financial Statements (Continued)
(Dollars in Thousands, Except Share Data and As Otherwise Noted)
The following tables present the financial results for the Company’s operating segments, as well as the OMG:
|
|
|
|
|
|
|
|
|
|
|
|
|
|
|
|
|
|
|
|
|
|
|
|
|
|
|
|
|
|
|
|
|
|
|
|
|
|
|
|
|
|
|
|
|
|
|
|
|
|
|
|
|
|
|
|
|
|
|
|
|
|
|
|
|
|
|
|
|
|
|
|
|
|
|
|
|
|
|
|
|
|
|
|
|
|
|
|
|
|
|
|
|
|
|
|
|
|
|
|
|
|
|
|
|
|
|
|
|
|
|
|
|
|
|
|
|
|
|
|
|
|
|
|
|
|
|
|
|
|
|
|
|
|
|
|
|
|
|
|
|
|
|
|
|
|
|
|
|
|
|
|
|
|
|
|
|
|
|
|
|
|
|
|
|
|
|
|
|
|
|
|
|
|
|
|
|
|
|
|
|
|
|
|
|
|
|
|
|
|
|
|
|
|
|
|
|
|
|
|
|
|
|
|
|
|
|
|
|
|
|
|
|
|
|
|
|
|
|
|
|
|
|
|
|
|
|
|
|
|
|
|
|
|
|
|
|
|
|
|
|
|
|
|
|
|
|
|
|
|
|
|
|
|
|
|
|
|
|
|
|
|
|
|
|
|
|
|
|
|
|
|
|
|
|
|
|
|
|
|
|
|
|
|
|
|
|
|
|
|
|
|
|
|
|
|
|
|
|
|
|
|
|
|
|
|
|
|
|
|
|
|
|
|
|
|
|
|
|
|
|
|
|
|
|
|
|
|
|
|
|
|
|
|
|
|
|
|
|
|
|
|
|
|
|
|
|
|
|
|
|
|
|
|
|
|
|
|
|
|
|
|
|
|
|
|
|
|
|
|
|
|
|
|
|
|
|
|
|
|
|
|
|
|
|
|
|
|
|
|
|
|
|
|
|
|
|
|
|
|
|
|
|
|
|
|
|
|
|
|
|
|
|
|
|
|
|
|
|
|
|
|
|
|
|
|
|
|
|
|
|
|
|
|
|
|
|
|
|
|
|
|
|
|
|
|
|
|
|
|
|
|
|
|
|
|
|
|
|
|
|
|
|
|
|
|
|
|
|
|
|
|
|
|
|
|
|
|
|
|
|
|
|
|
|
|
|
|
|
|
|
|
|
|
|
|
|
|
|
|
|
|
|
|
|
|
|
|
|
|
|
|
|
|
|
|
|
|
|
|
|
|
|
|
|
|
|
|
|
|
|
|
|
|
|
|
|
|
|
|
|
|
|
|
|
|
|
|
|
|
|
|
|
|
|
|
|
|
|
|
|
|
|
|
|
|
|
|
|
|
|
|
|
|
|
|
|
|
|
|
|
|
|
|
|
|
|
|
|
|
|
|
|
|
|
|
|
|
|
|
|
|
|
|
|
|
|
|
|
|
|
|
|
Three months ended March 31, 2023 |
|
Credit Group |
|
Private Equity Group |
|
Real
Assets Group |
|
Secondaries Group |
|
Other |
|
Total
Segments |
|
OMG |
|
Total |
| Management fees |
$ |
405,650 |
|
|
$ |
54,657 |
|
|
$ |
97,470 |
|
|
$ |
39,863 |
|
|
$ |
4,979 |
|
|
$ |
602,619 |
|
|
$ |
— |
|
|
$ |
602,619 |
|
| Fee related performance revenues |
600 |
|
|
— |
|
|
— |
|
|
3,271 |
|
|
— |
|
|
3,871 |
|
|
— |
|
|
3,871 |
|
| Other fees |
8,870 |
|
|
673 |
|
|
6,462 |
|
|
— |
|
|
50 |
|
|
16,055 |
|
|
4,640 |
|
|
20,695 |
|
| Compensation and benefits |
(116,216) |
|
|
(22,310) |
|
|
(37,986) |
|
|
(13,412) |
|
|
(3,140) |
|
|
(193,064) |
|
|
(84,967) |
|
|
(278,031) |
|
| General, administrative and other expenses |
(21,595) |
|
|
(9,566) |
|
|
(12,284) |
|
|
(4,292) |
|
|
(608) |
|
|
(48,345) |
|
|
(46,172) |
|
|
(94,517) |
|
| Fee related earnings |
277,309 |
|
|
23,454 |
|
|
53,662 |
|
|
25,430 |
|
|
1,281 |
|
|
381,136 |
|
|
(126,499) |
|
|
254,637 |
|
| Performance income—realized |
6,593 |
|
|
18,457 |
|
|
6,086 |
|
|
— |
|
|
— |
|
|
31,136 |
|
|
— |
|
|
31,136 |
|
| Performance related compensation—realized |
(4,997) |
|
|
(15,104) |
|
|
(3,758) |
|
|
— |
|
|
— |
|
|
(23,859) |
|
|
— |
|
|
(23,859) |
|
| Realized net performance income |
1,596 |
|
|
3,353 |
|
|
2,328 |
|
|
— |
|
|
— |
|
|
7,277 |
|
|
— |
|
|
7,277 |
|
| Investment income (loss)—realized |
506 |
|
|
879 |
|
|
(1,772) |
|
|
— |
|
|
170 |
|
|
(217) |
|
|
— |
|
|
(217) |
|
| Interest and other investment income (expense)—realized |
6,418 |
|
|
1,861 |
|
|
1,821 |
|
|
1,225 |
|
|
6,348 |
|
|
17,673 |
|
|
(92) |
|
|
17,581 |
|
| Interest expense |
(7,820) |
|
|
(5,615) |
|
|
(3,896) |
|
|
(2,305) |
|
|
(5,324) |
|
|
(24,960) |
|
|
(26) |
|
|
(24,986) |
|
| Realized net investment income (loss) |
(896) |
|
|
(2,875) |
|
|
(3,847) |
|
|
(1,080) |
|
|
1,194 |
|
|
(7,504) |
|
|
(118) |
|
|
(7,622) |
|
| Realized income |
$ |
278,009 |
|
|
$ |
23,932 |
|
|
$ |
52,143 |
|
|
$ |
24,350 |
|
|
$ |
2,475 |
|
|
$ |
380,909 |
|
|
$ |
(126,617) |
|
|
$ |
254,292 |
|
|
|
|
|
|
|
|
|
|
|
|
|
|
|
|
|
|
Three months ended March 31, 2022 |
|
Credit Group |
|
Private Equity Group |
|
Real
Assets Group |
|
Secondaries Group |
|
Other |
|
Total
Segments |
|
OMG |
|
Total |
| Management fees |
$ |
317,489 |
|
|
$ |
45,957 |
|
|
$ |
72,487 |
|
|
$ |
44,504 |
|
|
$ |
2,484 |
|
|
$ |
482,921 |
|
|
$ |
— |
|
|
$ |
482,921 |
|
| Fee related performance revenues |
12,353 |
|
|
— |
|
|
358 |
|
|
— |
|
|
— |
|
|
12,711 |
|
|
— |
|
|
12,711 |
|
| Other fees |
5,766 |
|
|
297 |
|
|
7,866 |
|
|
— |
|
|
50 |
|
|
13,979 |
|
|
5,876 |
|
|
19,855 |
|
Compensation and benefits |
(110,711) |
|
|
(19,566) |
|
|
(33,637) |
|
|
(11,640) |
|
|
(2,386) |
|
|
(177,940) |
|
|
(64,067) |
|
|
(242,007) |
|
| General, administrative and other expenses |
(18,193) |
|
|
(6,288) |
|
|
(7,637) |
|
|
(3,078) |
|
|
(230) |
|
|
(35,426) |
|
|
(32,384) |
|
|
(67,810) |
|
| Fee related earnings |
206,704 |
|
|
20,400 |
|
|
39,437 |
|
|
29,786 |
|
|
(82) |
|
|
296,245 |
|
|
(90,575) |
|
|
205,670 |
|
| Performance income—realized |
7,363 |
|
|
2,212 |
|
|
34,293 |
|
|
— |
|
|
— |
|
|
43,868 |
|
|
— |
|
|
43,868 |
|
| Performance related compensation—realized |
(4,580) |
|
|
(1,786) |
|
|
(22,209) |
|
|
— |
|
|
— |
|
|
(28,575) |
|
|
— |
|
|
(28,575) |
|
| Realized net performance income |
2,783 |
|
|
426 |
|
|
12,084 |
|
|
— |
|
|
— |
|
|
15,293 |
|
|
— |
|
|
15,293 |
|
| Investment income—realized |
415 |
|
|
1,603 |
|
|
3,453 |
|
|
— |
|
|
861 |
|
|
6,332 |
|
|
— |
|
|
6,332 |
|
| Interest and other investment income (expense)—realized |
5,728 |
|
|
1,502 |
|
|
2,777 |
|
|
644 |
|
|
1 |
|
|
10,652 |
|
|
(284) |
|
|
10,368 |
|
| Interest expense |
(3,468) |
|
|
(3,373) |
|
|
(2,389) |
|
|
(465) |
|
|
(5,784) |
|
|
(15,479) |
|
|
(167) |
|
|
(15,646) |
|
| Realized net investment income (loss) |
2,675 |
|
|
(268) |
|
|
3,841 |
|
|
179 |
|
|
(4,922) |
|
|
1,505 |
|
|
(451) |
|
|
1,054 |
|
| Realized income |
$ |
212,162 |
|
|
$ |
20,558 |
|
|
$ |
55,362 |
|
|
$ |
29,965 |
|
|
$ |
(5,004) |
|
|
$ |
313,043 |
|
|
$ |
(91,026) |
|
|
$ |
222,017 |
|
|
|
|
|
|
|
|
|
|
|
|
|
|
|
|
|
|
|
|
|
|
|
|
|
|
|
|
|
|
|
|
|
Ares Management Corporation
Notes to the Unaudited Condensed Consolidated Financial Statements (Continued)
(Dollars in Thousands, Except Share Data and As Otherwise Noted)
The following table presents the components of the Company’s operating segments’ revenue, expenses and realized net investment income:
|
|
|
|
|
|
|
|
|
|
|
|
|
|
|
|
|
|
|
Three months ended March 31, |
|
|
|
2023 |
|
2022 |
|
|
|
|
|
|
| Segment revenues |
|
|
|
|
|
|
|
|
|
| Management fees |
$ |
602,619 |
|
|
$ |
482,921 |
|
|
|
|
|
|
|
| Fee related performance revenues |
3,871 |
|
|
12,711 |
|
|
|
|
|
|
|
| Other fees |
16,055 |
|
|
13,979 |
|
|
|
|
|
|
|
| Performance income—realized |
31,136 |
|
|
43,868 |
|
|
|
|
|
|
|
| Total segment revenues |
$ |
653,681 |
|
|
$ |
553,479 |
|
|
|
|
|
|
|
| Segment expenses |
|
|
|
|
|
|
|
|
|
| Compensation and benefits |
$ |
193,064 |
|
|
$ |
177,940 |
|
|
|
|
|
|
|
| General, administrative and other expenses |
48,345 |
|
|
35,426 |
|
|
|
|
|
|
|
| Performance related compensation—realized |
23,859 |
|
|
28,575 |
|
|
|
|
|
|
|
| Total segment expenses |
$ |
265,268 |
|
|
$ |
241,941 |
|
|
|
|
|
|
|
| Segment realized net investment income (expense) |
|
|
|
|
|
|
|
|
|
| Investment income (loss)—realized |
$ |
(217) |
|
|
$ |
6,332 |
|
|
|
|
|
|
|
| Interest and other investment income —realized |
17,673 |
|
|
10,652 |
|
|
|
|
|
|
|
| Interest expense |
(24,960) |
|
|
(15,479) |
|
|
|
|
|
|
|
| Total segment realized net investment income (expense) |
$ |
(7,504) |
|
|
$ |
1,505 |
|
|
|
|
|
|
|
The following table reconciles the Company’s consolidated revenues to segment revenue:
|
|
|
|
|
|
|
|
|
|
|
|
|
|
|
|
|
|
|
Three months ended March 31, |
|
|
|
2023 |
|
2022 |
|
|
|
|
|
|
| Total consolidated revenue |
$ |
813,362 |
|
|
$ |
714,999 |
|
|
|
|
|
|
|
| Performance income—unrealized |
(127,713) |
|
|
(133,532) |
|
|
|
|
|
|
|
| Management fees of Consolidated Funds eliminated in consolidation |
11,601 |
|
|
11,479 |
|
|
|
|
|
|
|
| Carried interest allocation of Consolidated Funds eliminated in consolidation |
3,407 |
|
|
— |
|
|
|
|
|
|
|
| Incentive fees of Consolidated Funds eliminated in consolidation |
138 |
|
|
34 |
|
|
|
|
|
|
|
| Administrative, transaction and other fees of Consolidated Funds eliminated in consolidation |
4,843 |
|
|
4,769 |
|
|
|
|
|
|
|
Administrative fees(1) |
(13,650) |
|
|
(19,475) |
|
|
|
|
|
|
|
| OMG revenue |
(4,640) |
|
|
(5,876) |
|
|
|
|
|
|
|
|
|
|
|
|
|
|
|
|
|
|
|
|
|
|
|
|
|
|
|
| Principal investment income, net of eliminations |
(22,758) |
|
|
(8,326) |
|
|
|
|
|
|
|
| Net revenue of non-controlling interests in consolidated subsidiaries |
(10,909) |
|
|
(10,593) |
|
|
|
|
|
|
|
| Total consolidation adjustments and reconciling items |
(159,681) |
|
|
(161,520) |
|
|
|
|
|
|
|
| Total segment revenue |
$ |
653,681 |
|
|
$ |
553,479 |
|
|
|
|
|
|
|
(1)Represents administrative fees from expense reimbursements that are presented within administrative, transaction and other fees within the Company’s Condensed Consolidated Statements of Operations and are netted against the respective expenses for segment reporting.
Ares Management Corporation
Notes to the Unaudited Condensed Consolidated Financial Statements (Continued)
(Dollars in Thousands, Except Share Data and As Otherwise Noted)
The following table reconciles the Company’s consolidated expenses to segment expenses:
|
|
|
|
|
|
|
|
|
|
|
|
|
|
|
|
|
|
|
Three months ended March 31, |
|
|
|
2023 |
|
2022 |
|
|
|
|
|
|
| Total consolidated expenses |
$ |
628,636 |
|
|
$ |
611,684 |
|
|
|
|
|
|
|
| Performance related compensation-unrealized |
(85,150) |
|
|
(91,198) |
|
|
|
|
|
|
|
| Expenses of Consolidated Funds added in consolidation |
(19,641) |
|
|
(16,077) |
|
|
|
|
|
|
|
| Expenses of Consolidated Funds eliminated in consolidation |
12,132 |
|
|
11,564 |
|
|
|
|
|
|
|
Administrative fees(1) |
(13,277) |
|
|
(18,890) |
|
|
|
|
|
|
|
| OMG expenses |
(131,139) |
|
|
(96,451) |
|
|
|
|
|
|
|
| Acquisition and merger-related expense |
(4,955) |
|
|
(9,042) |
|
|
|
|
|
|
|
| Equity compensation expense |
(69,077) |
|
|
(53,602) |
|
|
|
|
|
|
|
Acquisition-related compensation expense(2) |
(642) |
|
|
(48,001) |
|
|
|
|
|
|
|
| Placement fee adjustment |
3,232 |
|
|
693 |
|
|
|
|
|
|
|
| Depreciation and amortization expense |
(45,659) |
|
|
(38,126) |
|
|
|
|
|
|
|
|
|
|
|
|
|
|
|
|
|
Expense of non-controlling interests in consolidated subsidiaries |
(9,192) |
|
|
(10,613) |
|
|
|
|
|
|
|
| Total consolidation adjustments and reconciling items |
(363,368) |
|
|
(369,743) |
|
|
|
|
|
|
|
| Total segment expenses |
$ |
265,268 |
|
|
$ |
241,941 |
|
|
|
|
|
|
|
(1)Represents administrative fees from expense reimbursements that are presented within administrative, transaction and other fees within the Company’s Condensed Consolidated Statements of Operations and are netted against the respective expenses for segment reporting.
(2)Represents contingent obligations resulting from the acquisition of Landmark Partners, LLC (the “Landmark Acquisition”), the Black Creek Acquisition and the Infrastructure Debt Acquisition that are recorded as compensation expense and are presented within compensation and benefits within the Company’s Condensed Consolidated Statements of Operations.
The following table reconciles the Company’s consolidated other income to segment realized net investment income:
|
|
|
|
|
|
|
|
|
|
|
|
|
|
|
|
|
|
|
Three months ended March 31, |
|
|
|
2023 |
|
2022 |
|
|
|
|
|
|
| Total consolidated other income |
$ |
56,396 |
|
|
$ |
57,994 |
|
|
|
|
|
|
|
| Investment (income) loss—unrealized |
(28,985) |
|
|
7,854 |
|
|
|
|
|
|
|
| Interest and other investment (income) loss—unrealized |
208 |
|
|
(6,032) |
|
|
|
|
|
|
|
| Other income from Consolidated Funds added in consolidation, net |
(62,917) |
|
|
(66,848) |
|
|
|
|
|
|
|
| Other expense from Consolidated Funds eliminated in consolidation, net |
(4,451) |
|
|
(7,518) |
|
|
|
|
|
|
|
| OMG other expense |
651 |
|
|
4,593 |
|
|
|
|
|
|
|
|
|
|
|
|
|
|
|
|
|
| Principal investment income |
35,457 |
|
|
14,490 |
|
|
|
|
|
|
|
Other expense, net |
91 |
|
|
1,981 |
|
|
|
|
|
|
|
| Other income of non-controlling interests in consolidated subsidiaries |
(3,954) |
|
|
(5,009) |
|
|
|
|
|
|
|
| Total consolidation adjustments and reconciling items |
(63,900) |
|
|
(56,489) |
|
|
|
|
|
|
|
| Total segment realized net investment income (expense) |
$ |
(7,504) |
|
|
$ |
1,505 |
|
|
|
|
|
|
|
Ares Management Corporation
Notes to the Unaudited Condensed Consolidated Financial Statements (Continued)
(Dollars in Thousands, Except Share Data and As Otherwise Noted)
The following table presents the reconciliation of income before taxes as reported in the Condensed Consolidated Statements of Operations to segment results of RI and FRE:
|
|
|
|
|
|
|
|
|
|
|
|
|
|
|
|
|
|
|
Three months ended March 31, |
|
|
|
2023 |
|
2022 |
|
|
|
|
|
|
| Income before taxes |
$ |
241,122 |
|
|
$ |
161,309 |
|
|
|
|
|
|
|
| Adjustments: |
|
|
|
|
|
|
|
|
|
| Depreciation and amortization expense |
45,659 |
|
|
38,126 |
|
|
|
|
|
|
|
| Equity compensation expense |
68,704 |
|
|
53,017 |
|
|
|
|
|
|
|
Acquisition-related compensation expense(1) |
642 |
|
|
48,001 |
|
|
|
|
|
|
|
|
|
|
|
|
|
|
|
|
|
| Acquisition and merger-related expense |
4,955 |
|
|
9,042 |
|
|
|
|
|
|
|
| Placement fee adjustment |
(3,232) |
|
|
(693) |
|
|
|
|
|
|
|
| OMG expense, net |
127,150 |
|
|
95,168 |
|
|
|
|
|
|
|
Other expense, net |
91 |
|
|
1,981 |
|
|
|
|
|
|
|
| Net income of non-controlling interests in consolidated subsidiaries |
(5,671) |
|
|
(4,989) |
|
|
|
|
|
|
|
| Income before taxes of non-controlling interests in Consolidated Funds, net of eliminations |
(27,171) |
|
|
(47,407) |
|
|
|
|
|
|
|
| Total performance income—unrealized |
(127,713) |
|
|
(133,532) |
|
|
|
|
|
|
|
| Total performance related compensation—unrealized |
85,150 |
|
|
91,198 |
|
|
|
|
|
|
|
| Total investment (income) loss—unrealized |
(28,777) |
|
|
1,822 |
|
|
|
|
|
|
|
| Realized income |
380,909 |
|
|
313,043 |
|
|
|
|
|
|
|
| Total performance income—realized |
(31,136) |
|
|
(43,868) |
|
|
|
|
|
|
|
| Total performance related compensation—realized |
23,859 |
|
|
28,575 |
|
|
|
|
|
|
|
| Total investment income—realized |
7,504 |
|
|
(1,505) |
|
|
|
|
|
|
|
| Fee related earnings |
$ |
381,136 |
|
|
$ |
296,245 |
|
|
|
|
|
|
|
(1)Represents contingent obligations resulting from the Landmark Acquisition, the Black Creek Acquisition and the Infrastructure Debt Acquisition that are recorded as compensation expense and are presented within compensation and benefits within the Company’s Condensed Consolidated Statements of Operations.
Ares Management Corporation
Notes to the Unaudited Condensed Consolidated Financial Statements (Continued)
(Dollars in Thousands, Except Share Data and As Otherwise Noted)
14. CONSOLIDATION
Investments in Consolidated Variable Interest Entities
The Company consolidates entities in which the Company has a variable interest and as the general partner or investment manager, has both the power to direct the most significant activities and a potentially significant economic interest. Investments in the consolidated VIEs are reported at fair value and represent the Company’s maximum exposure to loss.
Investments in Non-Consolidated Variable Interest Entities
The Company holds interests in certain VIEs that are not consolidated as the Company is not the primary beneficiary. The Company’s interest in such entities generally is in the form of direct equity interests, fixed fee arrangements or both. The maximum exposure to loss represents the potential loss of assets by the Company relating to these non-consolidated entities. Investments in the non-consolidated VIEs are carried at fair value.
The Company’s interests in consolidated and non-consolidated VIEs, as presented within the Condensed Consolidated Statements of Financial Condition, its respective maximum exposure to loss relating to non-consolidated VIEs, and its net income attributable to non-controlling interests related to consolidated VIEs, as presented within the Condensed Consolidated Statements of Operations, are as follows:
|
|
|
|
|
|
|
|
|
|
|
|
|
As of March 31, |
|
As of December 31, |
|
|
|
2023 |
|
2022 |
Maximum exposure to loss attributable to the Company’s investment in non-consolidated VIEs(1) |
$ |
370,402 |
|
|
$ |
393,549 |
|
Maximum exposure to loss attributable to the Company’s investment in consolidated VIEs(1) |
552,278 |
|
|
537,239 |
|
Assets of consolidated VIEs |
13,781,266 |
|
|
13,128,088 |
|
Liabilities of consolidated VIEs |
12,108,023 |
|
|
11,593,867 |
|
(1)As of March 31, 2023 and December 31, 2022, the Company’s maximum exposure of loss for CLO securities was equal to the cumulative fair value of our capital interest in CLOs and totaled $81.0 million and $82.0 million, respectively.
|
|
|
|
|
|
|
|
|
|
|
|
|
|
|
|
|
|
|
Three months ended March 31, |
|
|
|
2023 |
|
2022 |
|
|
|
|
|
|
| Net income attributable to non-controlling interests related to consolidated VIEs |
$ |
37,131 |
|
|
$ |
38,462 |
|
|
|
|
|
|
|
Ares Management Corporation
Notes to the Unaudited Condensed Consolidated Financial Statements (Continued)
(Dollars in Thousands, Except Share Data and As Otherwise Noted)
Consolidating Schedules
The following supplemental financial information illustrates the consolidating effects of the Consolidated Funds on the Company’s financial condition, results from operations and cash flows:
|
|
|
|
|
|
|
|
|
|
|
|
|
|
|
|
|
|
|
|
|
|
|
|
| |
As of March 31, 2023 |
| |
Consolidated
Company
Entities |
|
Consolidated
Funds |
|
Eliminations |
|
Consolidated |
| Assets |
|
|
|
|
|
|
|
| Cash and cash equivalents |
$ |
272,249 |
|
|
$ |
— |
|
|
$ |
— |
|
|
$ |
272,249 |
|
Investments (includes $3,236,418 of accrued carried interest) |
4,666,602 |
|
|
— |
|
|
(565,919) |
|
|
4,100,683 |
|
| Due from affiliates |
1,035,397 |
|
|
— |
|
|
(327,593) |
|
|
707,804 |
|
| Other assets |
267,068 |
|
|
— |
|
|
— |
|
|
267,068 |
|
| Right-of-use operating lease assets |
154,970 |
|
|
— |
|
|
— |
|
|
154,970 |
|
| Intangible assets, net |
1,166,607 |
|
|
— |
|
|
— |
|
|
1,166,607 |
|
| Goodwill |
998,937 |
|
|
— |
|
|
— |
|
|
998,937 |
|
| Assets of Consolidated Funds |
|
|
|
|
|
|
|
| Cash and cash equivalents |
— |
|
|
754,934 |
|
|
— |
|
|
754,934 |
|
| Investments held in trust account |
— |
|
|
484,901 |
|
|
— |
|
|
484,901 |
|
| Investments, at fair value |
— |
|
|
12,636,458 |
|
|
4,793 |
|
|
12,641,251 |
|
| Due from affiliates |
— |
|
|
21,711 |
|
|
(10,833) |
|
|
10,878 |
|
| Receivable for securities sold |
— |
|
|
305,418 |
|
|
— |
|
|
305,418 |
|
| Other assets |
— |
|
|
62,882 |
|
|
— |
|
|
62,882 |
|
| Total assets |
$ |
8,561,830 |
|
|
$ |
14,266,304 |
|
|
$ |
(899,552) |
|
|
$ |
21,928,582 |
|
| Liabilities |
|
|
|
|
|
|
|
| Accounts payable, accrued expenses and other liabilities |
$ |
272,131 |
|
|
$ |
— |
|
|
$ |
(10,833) |
|
|
$ |
261,298 |
|
| Accrued compensation |
214,135 |
|
|
— |
|
|
— |
|
|
214,135 |
|
| Due to affiliates |
183,451 |
|
|
— |
|
|
— |
|
|
183,451 |
|
| Performance related compensation payable |
2,365,230 |
|
|
— |
|
|
— |
|
|
2,365,230 |
|
| Debt obligations |
2,369,292 |
|
|
— |
|
|
— |
|
|
2,369,292 |
|
|
|
|
|
|
|
|
|
| Operating lease liabilities |
191,090 |
|
|
— |
|
|
— |
|
|
191,090 |
|
| Liabilities of Consolidated Funds |
|
|
|
|
|
|
|
| Accounts payable, accrued expenses and other liabilities |
— |
|
|
200,998 |
|
|
(13,493) |
|
|
187,505 |
|
| Due to affiliates |
— |
|
|
322,800 |
|
|
(322,800) |
|
|
— |
|
| Payable for securities purchased |
— |
|
|
549,415 |
|
|
— |
|
|
549,415 |
|
| CLO loan obligations, at fair value |
— |
|
|
11,013,602 |
|
|
(95,595) |
|
|
10,918,007 |
|
| Fund borrowings |
— |
|
|
103,046 |
|
|
— |
|
|
103,046 |
|
| Total liabilities |
5,595,329 |
|
|
12,189,861 |
|
|
(442,721) |
|
|
17,342,469 |
|
| Commitments and contingencies |
|
|
|
|
|
|
|
| Redeemable interest in Consolidated Funds |
— |
|
|
484,801 |
|
|
— |
|
|
484,801 |
|
| Redeemable interest in Ares Operating Group entities |
21,942 |
|
|
— |
|
|
— |
|
|
21,942 |
|
| Non-controlling interest in Consolidated Funds |
— |
|
|
1,591,642 |
|
|
(420,240) |
|
|
1,171,402 |
|
| Non-controlling interest in Ares Operating Group entities |
1,252,700 |
|
|
— |
|
|
(14,626) |
|
|
1,238,074 |
|
| Stockholders’ Equity |
|
|
|
|
|
|
|
|
|
|
|
|
|
|
|
Class A common stock, $0.01 par value, 1,500,000,000 shares authorized (177,674,055 shares issued and outstanding) |
1,777 |
|
|
— |
|
|
— |
|
|
1,777 |
|
Non-voting common stock, $0.01 par value, 500,000,000 shares authorized (3,489,911 shares issued and outstanding) |
35 |
|
|
— |
|
|
— |
|
|
35 |
|
Class B common stock, $0.01 par value, 1,000 shares authorized (1,000 shares issued and outstanding) |
— |
|
|
— |
|
|
— |
|
|
— |
|
Class C common stock, $0.01 par value, 499,999,000 shares authorized (120,638,398 shares issued and outstanding) |
1,206 |
|
|
— |
|
|
— |
|
|
1,206 |
|
| Additional paid-in-capital |
2,122,008 |
|
|
— |
|
|
(21,965) |
|
|
2,100,043 |
|
| Accumulated deficit |
(420,822) |
|
|
— |
|
|
— |
|
|
(420,822) |
|
| Accumulated other comprehensive loss, net of tax |
(12,345) |
|
|
— |
|
|
— |
|
|
(12,345) |
|
| Total stockholders’ equity |
1,691,859 |
|
|
— |
|
|
(21,965) |
|
|
1,669,894 |
|
| Total equity |
2,944,559 |
|
|
1,591,642 |
|
|
(456,831) |
|
|
4,079,370 |
|
| Total liabilities, redeemable interest, non-controlling interests and equity |
$ |
8,561,830 |
|
|
$ |
14,266,304 |
|
|
$ |
(899,552) |
|
|
$ |
21,928,582 |
|
Ares Management Corporation
Notes to the Unaudited Condensed Consolidated Financial Statements (Continued)
(Dollars in Thousands, Except Share Data and As Otherwise Noted)
|
|
|
|
|
|
|
|
|
|
|
|
|
|
|
|
|
|
|
|
|
|
|
|
| |
As of December 31, 2022 |
| |
Consolidated
Company
Entities |
|
Consolidated
Funds |
|
Eliminations |
|
Consolidated |
| Assets |
|
|
|
|
|
|
|
| Cash and cash equivalents |
$ |
389,987 |
|
|
$ |
— |
|
|
$ |
— |
|
|
$ |
389,987 |
|
Investments (includes $3,106,577 of accrued carried interest) |
4,515,955 |
|
|
— |
|
|
(541,221) |
|
|
3,974,734 |
|
| Due from affiliates |
949,532 |
|
|
— |
|
|
(191,060) |
|
|
758,472 |
|
| Other assets |
381,137 |
|
|
— |
|
|
— |
|
|
381,137 |
|
| Right-of-use operating lease assets |
155,950 |
|
|
— |
|
|
— |
|
|
155,950 |
|
| Intangible assets, net |
1,208,220 |
|
|
— |
|
|
— |
|
|
1,208,220 |
|
| Goodwill |
999,656 |
|
|
— |
|
|
— |
|
|
999,656 |
|
| Assets of Consolidated Funds |
|
|
|
|
|
|
|
| Cash and cash equivalents |
— |
|
|
724,641 |
|
|
— |
|
|
724,641 |
|
| Investments held in trust account |
— |
|
|
1,013,382 |
|
|
— |
|
|
1,013,382 |
|
| Investments, at fair value |
— |
|
|
12,187,392 |
|
|
3,859 |
|
|
12,191,251 |
|
| Due from affiliates |
— |
|
|
26,531 |
|
|
(10,742) |
|
15,789 |
|
| Receivable for securities sold |
— |
|
|
124,050 |
|
|
— |
|
124,050 |
|
| Other assets |
— |
|
|
65,570 |
|
|
— |
|
65,570 |
|
| Total assets |
$ |
8,600,437 |
|
|
$ |
14,141,566 |
|
|
$ |
(739,164) |
|
|
$ |
22,002,839 |
|
| Liabilities |
|
|
|
|
|
|
|
| Accounts payable, accrued expenses and other liabilities |
$ |
242,663 |
|
|
$ |
— |
|
|
$ |
(10,742) |
|
|
$ |
231,921 |
|
| Accrued compensation |
510,130 |
|
|
— |
|
|
— |
|
|
510,130 |
|
| Due to affiliates |
252,798 |
|
|
— |
|
|
— |
|
|
252,798 |
|
| Performance related compensation payable |
2,282,209 |
|
|
— |
|
|
— |
|
|
2,282,209 |
|
| Debt obligations |
2,273,854 |
|
|
— |
|
|
— |
|
|
2,273,854 |
|
| Operating lease liabilities |
190,616 |
|
|
— |
|
|
— |
|
|
190,616 |
|
| Liabilities of Consolidated Funds |
|
|
|
|
|
|
|
| Accounts payable, accrued expenses and other liabilities |
— |
|
|
175,435 |
|
|
(7,149) |
|
|
168,286 |
|
| Due to affiliates |
— |
|
|
191,238 |
|
|
(187,201) |
|
|
4,037 |
|
| Payable for securities purchased |
— |
|
|
314,193 |
|
|
— |
|
|
314,193 |
|
| CLO loan obligations, at fair value |
— |
|
|
10,797,332 |
|
|
(95,612) |
|
|
10,701,720 |
|
| Fund borrowings |
— |
|
|
168,046 |
|
|
— |
|
|
168,046 |
|
| Total liabilities |
5,752,270 |
|
|
11,646,244 |
|
|
(300,704) |
|
|
17,097,810 |
|
| Commitments and contingencies |
|
|
|
|
|
|
|
| Redeemable interest in Consolidated Funds |
— |
|
|
1,013,282 |
|
|
— |
|
|
1,013,282 |
|
| Redeemable interest in Ares Operating Group entities |
93,129 |
|
|
— |
|
|
— |
|
|
93,129 |
|
| Non-controlling interest in Consolidated Funds |
— |
|
|
1,482,040 |
|
|
(407,684) |
|
|
1,074,356 |
|
| Non-controlling interest in Ares Operating Group entities |
1,147,269 |
|
|
— |
|
|
(12,246) |
|
|
1,135,023 |
|
| Stockholders’ Equity |
|
|
|
|
|
|
|
|
|
|
|
|
|
|
|
Class A common stock, $0.01 par value, 1,500,000,000 shares authorized (173,892,036 shares issued and outstanding) |
1,739 |
|
|
— |
|
|
— |
|
|
1,739 |
|
Non-voting common stock, $0.01 par value, 500,000,000 shares authorized (3,489,911 shares issued and outstanding) |
35 |
|
|
— |
|
|
— |
|
|
35 |
|
Class B common stock, $0.01 par value, 1,000 shares authorized ($1,000 shares issued and outstanding) |
— |
|
|
— |
|
|
— |
|
|
— |
|
Class C common stock, $0.01 par value, 499,999,000 shares authorized (117,231,288 shares issued and outstanding) |
1,172 |
|
|
— |
|
|
— |
|
|
1,172 |
|
| Additional paid-in-capital |
1,989,284 |
|
|
— |
|
|
(18,530) |
|
|
1,970,754 |
|
| Accumulated deficit |
(369,475) |
|
|
— |
|
|
— |
|
|
(369,475) |
|
| Accumulated other comprehensive loss, net of tax |
(14,986) |
|
|
— |
|
|
— |
|
|
(14,986) |
|
| Total stockholders’ equity |
1,607,769 |
|
|
— |
|
|
(18,530) |
|
|
1,589,239 |
|
| Total equity |
2,755,038 |
|
|
1,482,040 |
|
|
(438,460) |
|
|
3,798,618 |
|
| Total liabilities, redeemable interest, non-controlling interests and equity |
$ |
8,600,437 |
|
|
$ |
14,141,566 |
|
|
$ |
(739,164) |
|
|
$ |
22,002,839 |
|
Ares Management Corporation
Notes to the Unaudited Condensed Consolidated Financial Statements (Continued)
(Dollars in Thousands, Except Share Data and As Otherwise Noted)
|
|
|
|
|
|
|
|
|
|
|
|
|
|
|
|
|
|
|
|
|
|
|
|
| |
Three months ended March 31, 2023 |
| |
Consolidated
Company
Entities |
|
Consolidated
Funds |
|
Eliminations |
|
Consolidated |
| Revenues |
|
|
|
|
|
|
|
| Management fees |
$ |
612,117 |
|
|
$ |
— |
|
|
$ |
(11,601) |
|
|
$ |
600,516 |
|
| Carried interest allocation |
154,895 |
|
|
— |
|
|
(3,407) |
|
|
151,488 |
|
| Incentive fees |
9,061 |
|
|
— |
|
|
(138) |
|
|
8,923 |
|
| Principal investment income |
35,457 |
|
|
— |
|
|
(12,699) |
|
|
22,758 |
|
| Administrative, transaction and other fees |
34,520 |
|
|
— |
|
|
(4,843) |
|
|
29,677 |
|
| Total revenues |
846,050 |
|
|
— |
|
|
(32,688) |
|
|
813,362 |
|
| Expenses |
|
|
|
|
|
|
|
| Compensation and benefits |
360,781 |
|
|
— |
|
|
— |
|
|
360,781 |
|
| Performance related compensation |
111,658 |
|
|
— |
|
|
— |
|
|
111,658 |
|
| General, administrative and other expense |
148,688 |
|
|
— |
|
|
(343) |
|
|
148,345 |
|
| Expenses of the Consolidated Funds |
— |
|
|
19,641 |
|
|
(11,789) |
|
|
7,852 |
|
| Total expenses |
621,127 |
|
|
19,641 |
|
|
(12,132) |
|
|
628,636 |
|
| Other income (expense) |
|
|
|
|
|
|
|
| Net realized and unrealized gains on investments |
7,852 |
|
|
— |
|
|
(6,337) |
|
|
1,515 |
|
| Interest and dividend income |
7,176 |
|
|
— |
|
|
(3,337) |
|
|
3,839 |
|
| Interest expense |
(24,986) |
|
|
— |
|
|
— |
|
|
(24,986) |
|
| Other expense, net |
(1,014) |
|
|
— |
|
|
91 |
|
|
(923) |
|
| Net realized and unrealized gains (losses) on investments of the Consolidated Funds |
— |
|
|
(2,069) |
|
|
12,769 |
|
|
10,700 |
|
| Interest and other income of the Consolidated Funds |
— |
|
|
223,029 |
|
|
(91) |
|
|
222,938 |
|
| Interest expense of the Consolidated Funds |
— |
|
|
(158,043) |
|
|
1,356 |
|
|
(156,687) |
|
| Total other income (expense), net |
(10,972) |
|
|
62,917 |
|
|
4,451 |
|
|
56,396 |
|
| Income before taxes |
213,951 |
|
|
43,276 |
|
|
(16,105) |
|
|
241,122 |
|
| Income tax expense |
33,328 |
|
|
478 |
|
|
— |
|
|
33,806 |
|
| Net income |
180,623 |
|
|
42,798 |
|
|
(16,105) |
|
|
207,316 |
|
| Less: Net income attributable to non-controlling interests in Consolidated Funds |
— |
|
|
42,798 |
|
|
(16,105) |
|
|
26,693 |
|
| Net income attributable to Ares Operating Group entities |
180,623 |
|
|
— |
|
|
— |
|
|
180,623 |
|
| Less: Net loss attributable to redeemable interest in Ares Operating Group entities |
(1,824) |
|
|
— |
|
|
— |
|
|
(1,824) |
|
| Less: Net income attributable to non-controlling interests in Ares Operating Group entities |
88,408 |
|
|
— |
|
|
— |
|
|
88,408 |
|
|
|
|
|
|
|
|
|
|
|
|
|
|
|
|
|
|
|
|
|
|
|
|
|
| Net income attributable to Ares Management Corporation Class A and non-voting common stockholders |
$ |
94,039 |
|
|
$ |
— |
|
|
$ |
— |
|
|
$ |
94,039 |
|
Ares Management Corporation
Notes to the Unaudited Condensed Consolidated Financial Statements (Continued)
(Dollars in Thousands, Except Share Data and As Otherwise Noted)
|
|
|
|
|
|
|
|
|
|
|
|
|
|
|
|
|
|
|
|
|
|
|
|
| |
Three months ended March 31, 2022 |
| |
Consolidated
Company
Entities |
|
Consolidated
Funds |
|
Eliminations |
|
Consolidated |
| Revenues |
|
|
|
|
|
|
|
| Management fees |
$ |
488,811 |
|
|
$ |
— |
|
|
$ |
(11,479) |
|
|
$ |
477,332 |
|
| Carried interest allocation |
178,289 |
|
|
— |
|
|
— |
|
|
178,289 |
|
| Incentive fees |
16,456 |
|
|
— |
|
|
(34) |
|
|
16,422 |
|
| Principal investment income |
14,490 |
|
|
— |
|
|
(6,164) |
|
|
8,326 |
|
| Administrative, transaction and other fees |
39,399 |
|
|
— |
|
|
(4,769) |
|
|
34,630 |
|
| Total revenues |
737,445 |
|
|
— |
|
|
(22,446) |
|
|
714,999 |
|
| Expenses |
|
|
|
|
|
|
|
| Compensation and benefits |
357,243 |
|
|
— |
|
|
— |
|
|
357,243 |
|
| Performance related compensation |
129,405 |
|
|
— |
|
|
— |
|
|
129,405 |
|
| General, administrative and other expense |
120,523 |
|
|
— |
|
|
— |
|
|
120,523 |
|
| Expenses of the Consolidated Funds |
— |
|
|
16,077 |
|
|
(11,564) |
|
|
4,513 |
|
| Total expenses |
607,171 |
|
|
16,077 |
|
|
(11,564) |
|
|
611,684 |
|
| Other income (expense) |
|
|
|
|
|
|
|
| Net realized and unrealized gains (losses) on investments |
(4,926) |
|
|
— |
|
|
13,035 |
|
|
8,109 |
|
| Interest and dividend income |
3,410 |
|
|
— |
|
|
(1,908) |
|
|
1,502 |
|
| Interest expense |
(15,646) |
|
|
— |
|
|
— |
|
|
(15,646) |
|
| Other income, net |
790 |
|
|
— |
|
|
994 |
|
|
1,784 |
|
| Net realized and unrealized gains on investments of the Consolidated Funds |
— |
|
|
23,011 |
|
|
(7,043) |
|
|
15,968 |
|
| Interest and other income of the Consolidated Funds |
— |
|
|
121,284 |
|
|
(994) |
|
|
120,290 |
|
| Interest expense of the Consolidated Funds |
— |
|
|
(77,447) |
|
|
3,434 |
|
|
(74,013) |
|
| Total other income (expense), net |
(16,372) |
|
|
66,848 |
|
|
7,518 |
|
|
57,994 |
|
| Income before taxes |
113,902 |
|
|
50,771 |
|
|
(3,364) |
|
|
161,309 |
|
| Income tax expense |
20,386 |
|
|
25 |
|
|
— |
|
|
20,411 |
|
| Net income |
93,516 |
|
|
50,746 |
|
|
(3,364) |
|
|
140,898 |
|
| Less: Net income attributable to non-controlling interests in Consolidated Funds |
— |
|
|
50,746 |
|
|
(3,364) |
|
|
47,382 |
|
| Net income attributable to Ares Operating Group entities |
93,516 |
|
|
— |
|
|
— |
|
|
93,516 |
|
| Less: Net income attributable to redeemable interest in Ares Operating Group entities |
399 |
|
|
— |
|
|
— |
|
|
399 |
|
| Less: Net income attributable to non-controlling interests in Ares Operating Group entities |
47,254 |
|
|
— |
|
|
— |
|
|
47,254 |
|
|
|
|
|
|
|
|
|
|
|
|
|
|
|
|
|
|
|
|
|
|
|
|
|
| Net income attributable to Ares Management Corporation Class A and non-voting common stockholders |
$ |
45,863 |
|
|
$ |
— |
|
|
$ |
— |
|
|
$ |
45,863 |
|
Ares Management Corporation
Notes to the Unaudited Condensed Consolidated Financial Statements (Continued)
(Dollars in Thousands, Except Share Data and As Otherwise Noted)
|
|
|
|
|
|
|
|
|
|
|
|
|
|
|
|
|
|
|
|
|
|
|
|
| |
Three months ended March 31, 2023 |
| |
Consolidated
Company
Entities |
|
Consolidated
Funds |
|
Eliminations |
|
Consolidated |
| Cash flows from operating activities: |
|
|
|
|
|
|
|
| Net income |
$ |
180,623 |
|
|
$ |
42,798 |
|
|
$ |
(16,105) |
|
|
$ |
207,316 |
|
| Adjustments to reconcile net income to net cash provided by operating activities |
100,469 |
|
|
— |
|
|
21,292 |
|
|
121,761 |
|
|
|
|
|
|
|
|
|
|
|
|
|
|
|
|
|
|
|
|
|
|
|
|
|
|
|
|
|
|
|
|
|
|
|
|
|
|
|
|
|
|
|
|
|
|
|
|
|
|
|
|
|
|
|
|
|
|
|
|
|
|
|
|
|
| Adjustments to reconcile net income to net cash provided by operating activities allocable to non-controlling interests in Consolidated Funds |
— |
|
|
341,609 |
|
|
(12,769) |
|
|
328,840 |
|
|
|
|
|
|
|
|
|
|
|
|
|
|
|
|
|
|
|
|
|
|
|
|
|
|
|
|
|
|
|
|
|
|
|
|
|
|
|
|
|
| Cash flows due to changes in operating assets and liabilities |
(132,777) |
|
|
— |
|
|
139,848 |
|
|
7,071 |
|
|
|
|
|
|
|
|
|
|
|
|
|
|
|
|
|
|
|
|
|
|
|
|
|
|
|
|
|
|
|
|
|
|
|
|
|
|
|
|
|
| Cash flows due to changes in operating assets and liabilities allocable to non-controlling interest in Consolidated Funds |
— |
|
|
202,877 |
|
|
(160,293) |
|
|
42,584 |
|
|
|
|
|
|
|
|
|
|
|
|
|
|
|
|
|
|
|
|
|
|
|
|
|
|
|
|
|
|
|
|
|
| Net cash provided by operating activities |
148,315 |
|
|
587,284 |
|
|
(28,027) |
|
|
707,572 |
|
| Cash flows from investing activities: |
|
|
|
|
|
|
|
| Purchase of furniture, equipment and leasehold improvements, net of disposals |
(8,877) |
|
|
— |
|
|
— |
|
|
(8,877) |
|
| Acquisitions, net of cash acquired |
— |
|
|
— |
|
|
— |
|
|
— |
|
| Net cash used in investing activities |
(8,877) |
|
|
— |
|
|
— |
|
|
(8,877) |
|
| Cash flows from financing activities: |
|
|
|
|
|
|
|
|
|
|
|
|
|
|
|
| Proceeds from Credit Facility |
245,000 |
|
|
— |
|
|
— |
|
|
245,000 |
|
|
|
|
|
|
|
|
|
| Repayments of Credit Facility |
(150,000) |
|
|
— |
|
|
— |
|
|
(150,000) |
|
|
|
|
|
|
|
|
|
| Dividends and distributions |
(251,632) |
|
|
— |
|
|
— |
|
|
(251,632) |
|
|
|
|
|
|
|
|
|
|
|
|
|
|
|
|
|
|
|
|
|
|
|
|
|
| Stock option exercises |
9,180 |
|
|
— |
|
|
— |
|
|
9,180 |
|
| Taxes paid related to net share settlement of equity awards |
(113,431) |
|
|
— |
|
|
— |
|
|
(113,431) |
|
| Other financing activities |
483 |
|
|
— |
|
|
— |
|
|
483 |
|
| Allocable to redeemable and non-controlling interests in Consolidated Funds: |
|
|
|
|
|
|
|
| Contributions from redeemable and non-controlling interests in Consolidated Funds |
— |
|
|
103,808 |
|
|
(10,223) |
|
|
93,585 |
|
| Distributions to non-controlling interests in Consolidated Funds |
— |
|
|
(28,890) |
|
|
7,957 |
|
|
(20,933) |
|
| Redemptions of redeemable interests in Consolidated Funds |
— |
|
|
(538,985) |
|
|
— |
|
|
(538,985) |
|
| Borrowings under loan obligations by Consolidated Funds |
— |
|
|
2,914 |
|
|
— |
|
|
2,914 |
|
| Repayments under loan obligations by Consolidated Funds |
— |
|
|
(97,325) |
|
|
— |
|
|
(97,325) |
|
| Net cash used in financing activities |
(260,400) |
|
|
(558,478) |
|
|
(2,266) |
|
|
(821,144) |
|
| Effect of exchange rate changes |
3,224 |
|
|
1,487 |
|
|
— |
|
|
4,711 |
|
| Net change in cash and cash equivalents |
(117,738) |
|
|
30,293 |
|
|
(30,293) |
|
|
(117,738) |
|
| Cash and cash equivalents, beginning of period |
389,987 |
|
|
724,641 |
|
|
(724,641) |
|
|
389,987 |
|
| Cash and cash equivalents, end of period |
$ |
272,249 |
|
|
$ |
754,934 |
|
|
$ |
(754,934) |
|
|
$ |
272,249 |
|
| Supplemental disclosure of non-cash financing activities: |
|
|
|
|
|
|
|
| Issuance of Class A common stock in connection with acquisition-related activity |
$ |
115,364 |
|
|
$ |
— |
|
|
$ |
— |
|
|
$ |
115,364 |
|
| Issuance of AOG Units in connection with settlement of management incentive program |
$ |
245,647 |
|
|
$ |
— |
|
|
$ |
— |
|
|
$ |
245,647 |
|
|
|
|
|
|
|
|
|
|
|
|
|
|
|
|
|
|
|
|
|
|
|
|
|
|
|
|
|
|
|
|
|
|
|
|
|
|
|
|
|
|
|
|
|
|
|
|
|
|
|
|
|
|
|
|
|
Ares Management Corporation
Notes to the Unaudited Condensed Consolidated Financial Statements (Continued)
(Dollars in Thousands, Except Share Data and As Otherwise Noted)
|
|
|
|
|
|
|
|
|
|
|
|
|
|
|
|
|
|
|
|
|
|
|
|
| |
Three months ended March 31, 2022 |
| |
Consolidated
Company
Entities |
|
Consolidated
Funds |
|
Eliminations |
|
Consolidated |
| Cash flows from operating activities: |
|
|
|
|
|
|
|
| Net income |
$ |
93,516 |
|
|
$ |
50,746 |
|
|
$ |
(3,364) |
|
|
$ |
140,898 |
|
| Adjustments to reconcile net income to net cash provided by operating activities |
43,970 |
|
|
— |
|
|
9,503 |
|
|
53,473 |
|
|
|
|
|
|
|
|
|
|
|
|
|
|
|
|
|
|
|
|
|
|
|
|
|
|
|
|
|
|
|
|
|
|
|
|
|
|
|
|
|
|
|
|
|
|
|
|
|
|
|
|
|
|
|
|
|
| Adjustments to reconcile net income to net cash used in operating activities allocable to non-controlling interests in Consolidated Funds |
— |
|
|
(104,815) |
|
|
7,043 |
|
|
(97,772) |
|
|
|
|
|
|
|
|
|
|
|
|
|
|
|
|
|
|
|
|
|
|
|
|
|
|
|
|
|
|
|
|
|
|
|
|
|
|
|
|
|
| Cash flows due to changes in operating assets and liabilities |
125,246 |
|
|
— |
|
|
7,100 |
|
|
132,346 |
|
|
|
|
|
|
|
|
|
|
|
|
|
|
|
|
|
|
|
|
|
|
|
|
|
|
|
|
|
|
|
|
|
|
|
|
|
|
|
|
|
| Cash flows due to changes in operating assets and liabilities allocable to non-controlling interest in Consolidated Funds |
— |
|
|
(568,394) |
|
|
563,599 |
|
|
(4,795) |
|
|
|
|
|
|
|
|
|
|
|
|
|
|
|
|
|
|
|
|
|
|
|
|
|
|
|
|
|
|
|
|
|
| Net cash provided by (used in) operating activities |
262,732 |
|
|
(622,463) |
|
|
583,881 |
|
|
224,150 |
|
| Cash flows from investing activities: |
|
|
|
|
|
|
|
| Purchase of furniture, equipment and leasehold improvements, net of disposals |
(8,524) |
|
|
— |
|
|
— |
|
|
(8,524) |
|
| Acquisitions, net of cash acquired |
(301,624) |
|
|
— |
|
|
— |
|
|
(301,624) |
|
| Net cash used in investing activities |
(310,148) |
|
|
— |
|
|
— |
|
|
(310,148) |
|
| Cash flows from financing activities: |
|
|
|
|
|
|
|
|
|
|
|
|
|
|
|
| Proceeds from Credit Facility |
860,000 |
|
|
— |
|
|
— |
|
|
860,000 |
|
| Proceeds from senior notes |
488,915 |
|
|
— |
|
|
— |
|
|
488,915 |
|
|
|
|
|
|
|
|
|
| Repayments of Credit Facility |
(905,000) |
|
|
— |
|
|
— |
|
|
(905,000) |
|
| Dividends and distributions |
(211,886) |
|
|
— |
|
|
— |
|
|
(211,886) |
|
|
|
|
|
|
|
|
|
|
|
|
|
|
|
|
|
| Stock option exercises |
3,347 |
|
|
— |
|
|
— |
|
|
3,347 |
|
| Taxes paid related to net share settlement of equity awards |
(183,027) |
|
|
— |
|
|
— |
|
|
(183,027) |
|
| Other financing activities |
856 |
|
|
— |
|
|
— |
|
|
856 |
|
| Allocable to redeemable and non-controlling interests in Consolidated Funds: |
|
|
|
|
|
|
|
| Contributions from redeemable and non-controlling interests in Consolidated Funds |
— |
|
|
104,803 |
|
|
(21,873) |
|
|
82,930 |
|
| Distributions to non-controlling interests in Consolidated Funds |
— |
|
|
(38,931) |
|
|
3,973 |
|
|
(34,958) |
|
|
|
|
|
|
|
|
|
| Borrowings under loan obligations by Consolidated Funds |
— |
|
|
49,317 |
|
|
— |
|
|
49,317 |
|
| Repayments under loan obligations by Consolidated Funds |
— |
|
|
(57,457) |
|
|
— |
|
|
(57,457) |
|
| Net cash provided by financing activities |
53,205 |
|
|
57,732 |
|
|
(17,900) |
|
|
93,037 |
|
| Effect of exchange rate changes |
(3,402) |
|
|
(1,250) |
|
|
— |
|
|
(4,652) |
|
| Net change in cash and cash equivalents |
2,387 |
|
|
(565,981) |
|
|
565,981 |
|
|
2,387 |
|
| Cash and cash equivalents, beginning of period |
343,655 |
|
|
1,049,191 |
|
|
(1,049,191) |
|
|
343,655 |
|
| Cash and cash equivalents, end of period |
$ |
346,042 |
|
|
$ |
483,210 |
|
|
$ |
(483,210) |
|
|
$ |
346,042 |
|
| Supplemental disclosure of non-cash financing activities: |
|
|
|
|
|
|
|
| Issuance of Class A common stock in connection with acquisition-related activity |
$ |
12,835 |
|
|
$ |
— |
|
|
$ |
— |
|
|
$ |
— |
|
|
|
|
|
|
|
|
|
|
|
|
|
|
|
|
|
|
|
|
|
|
|
|
|
Ares Management Corporation
Notes to the Unaudited Condensed Consolidated Financial Statements (Continued)
(Dollars in Thousands, Except Share Data and As Otherwise Noted)
15. SUBSEQUENT EVENTS
The Company evaluated all events or transactions that occurred after March 31, 2023 through the date the unaudited condensed consolidated financial statements were issued. During this period, the Company had the following material subsequent events that require disclosure:
In April 2023, the Company’s board of directors declared a quarterly dividend of $0.77 per share of Class A and non-voting common stock payable on June 30, 2023 to common stockholders of record at the close of business on June 16, 2023.
Item 2. Management’s Discussion and Analysis of Financial Condition and Results of Operations
Ares Management Corporation is a Delaware corporation. Unless the context otherwise requires, references to “Ares,” “we,” “us,” “our,” and the “Company” are intended to mean the business and operations of Ares Management Corporation and its consolidated subsidiaries. The following discussion analyzes the financial condition and results of operations of the Company. “Consolidated Funds” refers collectively to certain Ares funds, co-investment vehicles, CLOs and special purpose acquisition companies that are required under generally accepted accounting principles in the United States (“GAAP”) to be consolidated in our unaudited condensed consolidated financial statements included in this Quarterly Report on Form 10-Q. Additional terms used by the Company are defined in the Glossary and throughout the Management’s Discussion and Analysis in this Quarterly Report on Form 10-Q.
The following discussion and analysis should be read in conjunction with the unaudited condensed consolidated financial statements of Ares Management Corporation and the related notes included in this Quarterly Report on Form 10-Q and the audited financial statements and the related notes included in the 2022
Annual Report on Form 10-K of Ares Management Corporation.
Amounts and percentages presented throughout our discussion and analysis of financial condition and results of operations may reflect rounded results in thousands (unless otherwise indicated) and consequently, totals may not appear to sum. In addition, illustrative charts may not be presented at scale.
“Period-over-period analysis of current year compared to prior year may be deemed to be not meaningful and is designated as “NM” within the discussion and analysis of financial condition and results of operations.
Trends Affecting Our Business
We believe that our disciplined investment philosophy across our distinct but complementary investment groups contributes to the stability of our performance throughout market cycles. For the three months ended March 31, 2023, approximately 95% of our management fees were derived from perpetual capital vehicles and other long-dated funds. Our funds have a stable base of committed capital enabling us to invest in assets with a long-term focus over different points in a market cycle and to take advantage of market volatility. However, our results of operations, including the fair value of our AUM, are affected by a variety of factors, particularly in the U.S., Western Europe and Asia, including conditions in the global financial markets and the economic and political environments.
Global markets started the year strong but remained volatile during the first quarter of 2023. Leveraged credit spreads tightened near quarter-end as certain actions by governments and central banks alleviated fears from the recent strain on the banking system. In the U.S., the ICE BAML High Yield Master II Index, a high yield bond index, returned 3.7% for the quarter, while the Credit Suisse Leveraged Loan Index (“CSLLI”), a leveraged loan index, returned 3.1% for the quarter. In Europe, the ICE BAML European Currency High Yield Index returned 2.7% for the quarter, while the Credit Suisse Western European Leveraged Loan Index returned 3.6% for the quarter.
Asian markets also started off the year with positive sentiments on the growth outlook as global energy costs fell and China’s economy reopened. Amid volatility in the public markets in the region, private credit activity in the region remained active and resilient throughout the quarter as there has been consistent demand for alternative sources of capital.
The global equity markets rallied to start the year strong after broad declines in 2022. The S&P 500 Index returned 7.5%, while the MSCI All Country World Index ex USA returned 6.9%, for the quarter.
Volatility in the private equity markets continued due to sustained increases in interest rates, which impacted the cost of financing available for leveraged buyout transactions. Valuations continue to experience downward pressure from the macroeconomic environment. The current market environment has had a more pronounced negative impact on certain industries, including energy and retail, which are industries in which some of our funds have made investments. As of March 31, 2023, approximately 2% of our total AUM was invested in the energy sector (of which approximately 1% of our total AUM was invested in midstream investments and also includes oil and gas exploration) and approximately 2% of our total AUM was invested in the retail sector. We believe that the current environment could lead to opportunities for distressed investments in the near to medium term. Continued asset selectivity, portfolio diversification and a differentiated view to drive value creation, will be instrumental in delivering attractive returns to investors.
The commercial real estate markets also continued to be impacted by the macroeconomic environment in the first quarter of 2023. Pan-European and U.S. real estate deal activity was subdued with limited transactional liquidity. Property valuations have continued to adjust downwards, with capitalization rate compressions waning and yields widening.
However, we believe certain of these market trends will be offset by continued strong fundamentals, such as occupancy and rental rates, in certain property types, including multifamily and industrial. The FTSE EPRA/NAREIT Developed Europe and the FTSE NAREIT All Equity REITs indices declined 4.5% and returned 1.7%, respectively, for the quarter.
We believe our portfolios across all strategies are well positioned for a rising interest rate environment. On a market value basis, approximately 87% of our debt assets and 58% of our total assets were floating rate instruments as of March 31, 2023.
Recent Transactions
On April 25, 2023, Ares Acquisition Corporation II (NYSE: AACT), Ares’ second sponsored SPAC, consummated its initial public offering. The initial public offering generated gross proceeds of $500.0 million, which includes the partial exercise of the underwriters’ option to purchase additional shares at the initial public offering price to cover over-allotments.
Managing Business Performance
Operating Metrics
We measure our business performance using certain operating metrics that are common to the alternative asset management industry, which are discussed below.
Assets Under Management
AUM refers to the assets we manage and is viewed as a metric to measure our investment and fundraising performance as it reflects assets generally at fair value plus available uncalled capital.
The tables below present rollforwards of our total AUM by segment ($ in millions):
|
|
|
|
|
|
|
|
|
|
|
|
|
|
|
|
|
|
|
|
|
|
|
|
|
|
|
|
|
|
|
|
|
|
|
|
|
|
|
|
|
|
|
|
|
|
|
|
|
|
|
|
|
|
|
|
|
|
|
|
|
|
|
|
|
|
|
|
|
|
|
|
|
|
|
|
|
|
|
|
|
|
|
|
|
|
|
|
|
|
|
|
|
|
|
|
|
|
|
|
|
|
|
|
|
|
|
|
|
|
|
|
|
|
|
|
|
|
|
|
|
|
|
|
|
|
|
|
|
|
|
|
|
|
|
|
|
|
|
|
|
|
|
|
|
|
|
|
|
|
|
|
|
|
|
|
|
|
|
|
|
|
|
|
|
|
|
|
|
|
|
|
|
|
|
|
|
|
|
|
|
|
|
|
|
|
|
|
|
|
|
|
|
|
|
|
|
|
|
|
|
|
|
|
|
|
|
|
|
|
|
|
|
|
|
|
|
|
|
|
|
|
|
|
|
|
|
|
|
|
|
|
|
|
|
|
|
|
|
|
|
|
|
|
|
|
|
|
|
|
|
|
|
|
|
|
|
|
|
|
|
|
|
|
|
|
|
|
|
|
|
|
|
|
|
|
|
|
|
|
|
|
|
|
|
|
|
|
|
|
|
|
|
|
|
|
|
|
|
|
|
|
|
|
|
|
|
|
|
|
|
|
|
|
|
|
|
|
|
|
|
|
|
|
|
|
|
Credit
Group |
|
Private Equity Group |
|
Real Assets
Group |
|
Secondaries Group |
|
Other |
|
Total AUM |
Balance at 12/31/2022 |
|
$ |
225,579 |
|
|
$ |
34,749 |
|
|
$ |
66,061 |
|
|
$ |
21,961 |
|
|
$ |
3,647 |
|
|
$ |
351,997 |
|
|
|
|
|
|
|
|
|
|
|
|
|
|
| Net new par/equity commitments |
9,859 |
|
|
50 |
|
|
765 |
|
|
1,246 |
|
|
2,662 |
|
|
14,582 |
|
| Net new debt commitments |
|
1,423 |
|
|
— |
|
|
— |
|
|
— |
|
|
— |
|
|
1,423 |
|
| Capital reductions |
|
(2,081) |
|
|
(3) |
|
|
(403) |
|
|
— |
|
|
— |
|
|
(2,487) |
|
| Distributions |
|
(1,530) |
|
|
(327) |
|
|
(1,663) |
|
|
(424) |
|
|
(1,917) |
|
|
(5,861) |
|
| Redemptions |
|
(1,376) |
|
|
— |
|
|
(538) |
|
|
— |
|
|
(539) |
|
|
(2,453) |
|
| Change in fund value |
|
3,269 |
|
|
178 |
|
|
(108) |
|
|
111 |
|
|
(356) |
|
|
3,094 |
|
Balance at 3/31/2023 |
|
$ |
235,143 |
|
|
$ |
34,647 |
|
|
$ |
64,114 |
|
|
$ |
22,894 |
|
|
$ |
3,497 |
|
|
$ |
360,295 |
|
|
|
|
|
|
|
|
|
|
|
|
|
|
|
|
Credit
Group |
|
Private Equity Group |
|
Real Assets
Group |
|
Secondaries Group |
|
Other |
|
Total AUM |
Balance at 12/31/2021 |
|
$ |
201,405 |
|
|
$ |
33,404 |
|
|
$ |
45,919 |
|
|
$ |
22,119 |
|
|
$ |
2,928 |
|
|
$ |
305,775 |
|
| Acquisitions |
|
— |
|
|
— |
|
|
8,184 |
|
|
199 |
|
|
— |
|
|
8,383 |
|
Net new par/equity commitments(1) |
5,391 |
|
|
570 |
|
|
3,058 |
|
|
1,080 |
|
|
(48) |
|
|
10,051 |
|
| Net new debt commitments |
|
2,340 |
|
|
— |
|
|
1,105 |
|
|
— |
|
|
— |
|
|
3,445 |
|
| Capital reductions |
|
(402) |
|
|
(3) |
|
|
(262) |
|
|
— |
|
|
— |
|
|
(667) |
|
| Distributions |
|
(1,165) |
|
|
(383) |
|
|
(1,128) |
|
|
(575) |
|
|
8 |
|
|
(3,243) |
|
| Redemptions |
|
(410) |
|
|
— |
|
|
(136) |
|
|
— |
|
|
— |
|
|
(546) |
|
| Change in fund value |
|
(453) |
|
|
(23) |
|
|
1,787 |
|
|
645 |
|
|
(135) |
|
|
1,821 |
|
Balance at 3/31/2022 |
|
$ |
206,706 |
|
|
$ |
33,565 |
|
|
$ |
58,527 |
|
|
$ |
23,468 |
|
|
$ |
2,753 |
|
|
$ |
325,019 |
|
|
|
|
|
|
|
|
|
|
|
|
|
|
| (1) Reallocation of capital among the segments may occur for pools of capital with investment mandates in more than one investment strategy. This reallocation activity is presented within net new par/equity commitments and may result in balances presented to be negative. |
The components of our AUM are presented below ($ in billions):
|
|
|
|
|
|
|
|
|
|
|
|
|
|
|
|
|
|
|
FPAUM |
|
Non-fee paying(1) |
|
AUM not yet paying fees |
(1) Includes $14.6 billion and $12.0 billion of AUM of funds from which we indirectly earn management fees as of March 31, 2023 and 2022, respectively and includes $3.7 billion and $3.4 billion of non-fee paying AUM based on our general partner commitment as of March 31, 2023 and 2022, respectively.
Please refer to “— Results of Operations by Segment” for a more detailed presentation of AUM by segment for each of the periods presented.
Fee Paying Assets Under Management
FPAUM refers to AUM from which we directly earn management fees and is equal to the sum of all the individual fee bases of our funds that directly contribute to our management fees.
The tables below present rollforwards of our total FPAUM by segment ($ in millions):
|
|
|
|
|
|
|
|
|
|
|
|
|
|
|
|
|
|
|
|
|
|
|
|
|
|
|
|
|
|
|
|
|
|
|
|
|
|
|
|
|
|
|
|
|
|
|
|
|
|
|
|
|
|
|
|
|
|
|
|
|
|
|
|
|
|
|
|
|
|
|
|
|
|
|
|
|
|
|
|
|
|
|
|
|
|
|
|
|
|
|
|
|
|
|
|
|
|
|
|
|
|
|
|
|
|
|
|
|
|
|
|
|
|
|
|
|
|
|
|
|
|
|
|
|
|
|
|
|
|
|
|
|
|
|
|
|
|
|
|
|
|
|
|
|
|
|
|
|
|
|
|
|
|
|
|
|
|
|
|
|
|
|
|
|
|
|
|
|
|
|
|
|
|
|
|
|
|
|
|
|
|
|
|
|
|
|
|
|
|
|
|
|
|
|
|
|
|
|
|
|
|
|
|
|
|
|
|
|
|
|
|
|
|
|
|
|
|
|
|
|
|
|
|
|
|
|
|
|
|
|
|
|
|
|
|
|
|
|
|
|
|
|
|
|
|
|
|
|
|
|
|
|
|
|
|
|
|
|
|
|
|
|
|
|
|
|
|
|
|
|
|
|
|
|
|
|
|
|
|
|
|
|
|
|
|
|
|
|
|
|
|
|
|
|
|
|
|
|
|
|
|
|
|
|
|
|
|
|
|
|
|
|
|
|
|
|
|
|
|
|
|
|
|
|
|
|
|
|
|
|
|
|
|
|
|
|
|
|
|
|
|
|
|
|
|
|
|
|
|
|
Credit
Group |
|
Private Equity Group |
|
Real Assets
Group |
|
Secondaries Group |
|
Other |
|
Total |
Balance at 12/31/2022 |
|
$ |
151,275 |
|
|
$ |
18,447 |
|
|
$ |
41,607 |
|
|
$ |
17,668 |
|
|
$ |
2,064 |
|
|
$ |
231,061 |
|
|
|
|
|
|
|
|
|
|
|
|
|
|
| Commitments |
|
1,900 |
|
|
— |
|
|
596 |
|
|
107 |
|
|
1,553 |
|
|
4,156 |
|
| Deployment/subscriptions/increase in leverage |
4,281 |
|
|
703 |
|
|
221 |
|
|
110 |
|
|
— |
|
|
5,315 |
|
| Capital reductions |
|
(1,533) |
|
|
— |
|
|
(279) |
|
|
— |
|
|
— |
|
|
(1,812) |
|
| Distributions |
|
(2,139) |
|
|
(400) |
|
|
(632) |
|
|
(197) |
|
|
(642) |
|
|
(4,010) |
|
| Redemptions |
|
(1,377) |
|
|
— |
|
|
(538) |
|
|
— |
|
|
— |
|
|
(1,915) |
|
| Change in fund value |
|
1,342 |
|
|
— |
|
|
(47) |
|
|
108 |
|
|
(240) |
|
|
1,163 |
|
| Change in fee basis |
|
— |
|
|
— |
|
|
— |
|
|
(49) |
|
|
— |
|
|
(49) |
|
Balance at 3/31/2023 |
|
$ |
153,749 |
|
|
$ |
18,750 |
|
|
$ |
40,928 |
|
|
$ |
17,747 |
|
|
$ |
2,735 |
|
|
$ |
233,909 |
|
|
|
|
|
|
|
|
|
|
|
|
|
|
|
|
Credit
Group |
|
Private Equity Group |
|
Real Assets
Group |
|
Secondaries Group |
|
Other |
|
Total |
Balance at 12/31/2021 |
|
$ |
122,110 |
|
|
$ |
16,689 |
|
|
$ |
28,615 |
|
|
$ |
18,364 |
|
|
$ |
2,067 |
|
|
$ |
187,845 |
|
| Acquisitions |
|
— |
|
|
— |
|
|
4,855 |
|
|
131 |
|
|
— |
|
|
4,986 |
|
Commitments(1) |
|
3,722 |
|
|
— |
|
|
2,184 |
|
|
697 |
|
|
(8) |
|
|
6,595 |
|
| Deployment/subscriptions/increase in leverage |
7,374 |
|
|
115 |
|
|
909 |
|
|
69 |
|
|
— |
|
|
8,467 |
|
| Capital reductions |
|
(2,596) |
|
|
— |
|
|
— |
|
|
— |
|
|
— |
|
|
(2,596) |
|
| Distributions |
|
(1,957) |
|
|
(446) |
|
|
(891) |
|
|
(472) |
|
|
(1) |
|
|
(3,767) |
|
| Redemptions |
|
(396) |
|
|
— |
|
|
(138) |
|
|
— |
|
|
— |
|
|
(534) |
|
| Change in fund value |
|
(560) |
|
|
— |
|
|
1,418 |
|
|
738 |
|
|
(211) |
|
|
1,385 |
|
| Change in fee basis |
|
(836) |
|
|
(217) |
|
|
(825) |
|
|
(1,457) |
|
|
— |
|
|
(3,335) |
|
Balance at 3/31/2022 |
|
$ |
126,861 |
|
|
$ |
16,141 |
|
|
$ |
36,127 |
|
|
$ |
18,070 |
|
|
$ |
1,847 |
|
|
$ |
199,046 |
|
|
|
|
|
|
|
|
|
|
|
|
|
|
| (1) Reallocation of capital among the segments may occur for pools of capital with investment mandates in more than one investment strategy. This reallocation activity is presented within commitments and may result in balances presented to be negative. |
The charts below present FPAUM by its fee bases ($ in billions):
|
|
|
|
|
|
|
|
|
|
|
|
|
|
|
|
FPAUM: $233.9 |
|
FPAUM: $199.0 |
|
|
|
|
|
|
|
|
|
|
|
|
|
|
|
|
|
|
|
|
|
|
|
|
|
|
Invested capital/other(1) |
|
Market value(2) |
|
Collateral balances (at par) |
|
Capital commitments |
(1)Other consists of ACRE’s FPAUM, which is based on ACRE’s stockholders’ equity.
(2)Includes $55.3 billion and $48.6 billion from funds that primarily invest in illiquid strategies as of March 31, 2023 and 2022, respectively. The underlying investments held in these funds are generally subject to less market volatility than investments held in liquid strategies.
Please refer to “— Results of Operations by Segment” for detailed information by segment of the activity affecting total FPAUM for each of the periods presented.
Incentive Eligible Assets Under Management, Incentive Generating Assets Under Management and Available Capital
IEAUM generally represents the NAV plus uncalled equity or total assets plus uncalled debt, as applicable, of our funds from which we are entitled to receive carried interest and incentive fees, excluding capital committed by us and our professionals (from which we do not earn carried interest and incentive fees). With respect to ARCC’s AUM, only ARCC Part II Fees may be generated from IEAUM.
IGAUM generally represents the AUM of our funds that are currently generating carried interest and incentive fees on a realized or unrealized basis. It represents the basis on which we are entitled to receive carried interest and incentive fees. The basis is typically the NAV or total assets of the fund, excluding amounts on which we do not earn carried interest and incentive fees, such as capital committed by us and our professionals. ARCC is only included in IGAUM when ARCC Part II Fees are being generated.
The charts below present our IEAUM and IGAUM by segment ($ in billions):
|
|
|
|
|
|
|
|
|
|
|
|
|
|
|
|
|
|
|
|
|
|
|
|
|
|
|
|
|
|
|
Credit |
|
Private Equity |
|
Real Assets |
|
Secondaries |
|
Other |
The charts below present our available capital and AUM not yet paying fees by segment ($ in billions):
|
|
|
|
|
|
|
|
|
|
|
|
|
|
|
|
|
|
|
|
|
|
|
|
|
|
|
|
|
|
|
Credit |
|
Private Equity |
|
Real Assets |
|
Secondaries |
|
Other |
As of March 31, 2023, AUM Not Yet Paying Fees includes $50.5 billion of AUM available for future deployment that could generate approximately $483.0 million in potential incremental annual management fees. As of March 31, 2022, AUM Not Yet Paying Fees included $58.2 billion of AUM available for future deployment that could generate approximately $557.0 million in potential incremental annual management fees.
The chart below presents our perpetual capital AUM by segment ($ in billions):
|
|
|
|
|
|
|
|
|
|
|
|
|
|
|
|
|
|
|
|
|
|
|
|
|
Credit |
|
Real Assets |
|
Secondaries |
|
Other |
As of March 31, 2023, perpetual capital AUM of $95.4 billion included 75% from commingled funds and 25% from managed accounts and perpetual capital IGAUM from which we are generating fee related performance revenues totaled $12.9 billion, composed of $12.6 billion from managed accounts within the Credit Group and $0.3 billion from commingled funds within the Secondaries Group. As of March 31, 2022, perpetual capital AUM of $82.7 billion included 75% from commingled funds and 25% from managed accounts.
Management Fees By Type
We view the duration of funds we manage as a metric to measure the stability of our future management fees. For the three months ended March 31, 2023 and 2022, 95% and 94%, respectively, of management fees were earned from perpetual capital or long-dated funds. The charts below present the composition of our segment management fees by the initial fund duration:
|
|
|
|
|
|
|
|
|
|
|
|
|
|
|
|
|
|
|
|
|
|
|
|
|
Long-Dated Funds(1) |
|
Perpetual Capital - Commingled Funds |
|
Perpetual Capital - Managed Accounts |
|
Other |
(1) Long-dated funds generally have a contractual life of five years or more at inception.
Fund Performance Metrics
Fund performance information for our investment funds considered to be “significant funds” is included throughout this discussion with analysis to facilitate an understanding of our results of operations for the periods presented. Our significant funds are commingled funds that either contributed at least 1% of our total management fees or represented at least 1% of the Company’s total FPAUM for the past two consecutive quarters. In addition to management fees, each of our significant funds may generate carried interest and incentive fees upon the achievement of performance hurdles. The fund performance information reflected in this discussion and analysis is not indicative of our overall performance. An investment in Ares is not an investment in any of our funds. Past performance is not indicative of future results. As with any investment, there is always the potential for gains as well as the possibility of losses. There can be no assurance that any of these funds or our other existing and future funds will achieve similar returns.
Fund performance metrics for significant funds may be marked as “NM” as they may not be considered meaningful due to the limited time since the initial investment and/or early stage of capital deployment.
To further facilitate an understanding of the impact a significant fund may have on our results, we present our drawdown funds as either harvesting investments or deploying capital to indicate the fund’s stage in its life cycle. A fund harvesting investments is generally not seeking to deploy capital into new investment opportunities, while a fund deploying capital is generally seeking new investment opportunities.
Consolidation and Deconsolidation of Ares Funds
Consolidated Funds represented approximately 5% of our AUM as of March 31, 2023, 2% of our management fees and 2% of our carried interest and incentive fees for the three months ended March 31, 2023. As of March 31, 2023, we consolidated 25 CLOs, 10 private funds and one SPAC, and as of March 31, 2022, we consolidated 23 CLOs, 10 private funds and one SPAC.
The activity of the Consolidated Funds is reflected within the unaudited condensed consolidated financial statement line items indicated by reference thereto. The impact of the Consolidated Funds also typically will decrease management fees, carried interest allocation and incentive fees reported under GAAP to the extent these amounts are eliminated upon consolidation.
The assets and liabilities of our Consolidated Funds are held within separate legal entities and, as a result, the liabilities of our Consolidated Funds are typically non-recourse to us. Generally, the consolidation of our Consolidated Funds has a significant gross-up effect on our assets, liabilities and cash flows but has no net effect on the net income attributable to us or our stockholders’ equity, except where accounting for a redemption or liquidation preference requires the reallocation of ownership based on specific terms of a profit sharing agreement. The net economic ownership interests of our Consolidated Funds, to which we have no economic rights, are reflected as redeemable and non-controlling interests in the Consolidated Funds within our unaudited condensed consolidated financial statements. Redeemable interest in Consolidated Funds represent the shares issued by Ares Acquisition Corporation (NYSE: AAC) (“AAC”) that are redeemable for cash by the public shareholders in connection with AAC’s failure to complete a business combination or tender offer associated with stockholder approval provisions.
We generally deconsolidate funds and CLOs when we are no longer deemed to have a controlling interest in the entity. During the three months ended March 31, 2023 and 2022, we did not deconsolidate any entities.
The performance of our Consolidated Funds is not necessarily consistent with, or representative of, the combined performance trends of all of our funds.
For the actual impact that consolidation had on our results and further discussion on consolidation and deconsolidation of funds, see “Note 14. Consolidation” within our unaudited condensed consolidated financial statements included herein.
Results of Operations
Consolidated Results of Operations
We consolidate funds and entities where we are deemed to hold a controlling financial interest. The Consolidated Funds are not necessarily the same entities in each year presented due to changes in ownership, changes in limited partners’ or investor rights, and the creation and termination of funds and entities. The consolidation of these funds and entities had no effect on net income attributable to us for the periods presented. Although the consolidated results presented below include the results of our operations together with those of the Consolidated Funds and other joint ventures, we separate our analysis of those items primarily impacting the Company from those of the Consolidated Funds.
The following table presents our summarized consolidated results of operations ($ in thousands):
|
|
|
|
|
|
|
|
|
|
|
|
|
|
|
|
|
|
|
|
|
|
|
|
|
|
|
|
|
|
|
|
|
|
|
|
|
|
|
|
|
|
|
|
|
Three months ended March 31, |
|
Favorable (Unfavorable) |
|
|
|
|
|
|
|
|
|
2023 |
|
2022 |
|
$ Change |
|
% Change |
| Total revenues |
|
|
|
|
|
|
|
|
$ |
813,362 |
|
|
$ |
714,999 |
|
|
$ |
98,363 |
|
|
14% |
| Total expenses |
|
|
|
|
|
|
|
|
(628,636) |
|
|
(611,684) |
|
|
(16,952) |
|
|
(3) |
| Total other income, net |
|
|
|
|
|
|
|
|
56,396 |
|
|
57,994 |
|
|
(1,598) |
|
|
(3) |
|
|
|
|
|
|
|
|
|
|
|
|
|
|
|
|
| Income tax expense |
|
|
|
|
|
|
|
|
(33,806) |
|
|
(20,411) |
|
|
(13,395) |
|
|
(66) |
| Net income |
|
|
|
|
|
|
|
|
207,316 |
|
|
140,898 |
|
|
66,418 |
|
|
47 |
| Less: Net income attributable to non-controlling interests in Consolidated Funds |
|
|
|
|
|
|
|
|
26,693 |
|
|
47,382 |
|
|
(20,689) |
|
|
(44) |
| Net income attributable to Ares Operating Group entities |
|
|
|
|
|
|
|
|
180,623 |
|
|
93,516 |
|
|
87,107 |
|
|
93 |
| Less: Net income (loss) attributable to redeemable interest in Ares Operating Group entities |
|
|
|
|
|
|
|
|
(1,824) |
|
|
399 |
|
|
(2,223) |
|
|
NM |
| Less: Net income attributable to non-controlling interests in Ares Operating Group entities |
|
|
|
|
|
|
|
|
88,408 |
|
|
47,254 |
|
|
41,154 |
|
|
87 |
|
|
|
|
|
|
|
|
|
|
|
|
|
|
|
|
|
|
|
|
|
|
|
|
|
|
|
|
|
|
|
|
|
|
|
|
|
|
|
|
|
|
|
|
|
|
|
|
| Net income attributable to Ares Management Corporation Class A and non-voting common stockholders |
|
|
|
|
|
|
|
|
$ |
94,039 |
|
|
$ |
45,863 |
|
|
48,176 |
|
|
105 |
Three Months Ended March 31, 2023 Compared to Three Months Ended March 31, 2022
Consolidated Results of Operations of the Company
The following discussion sets forth information regarding our consolidated results of operations:
Revenues.
|
|
|
|
|
|
|
|
|
|
|
|
|
|
|
|
|
|
|
|
|
|
|
|
|
|
|
|
|
|
|
|
|
|
|
|
|
Three months ended March 31, |
|
Favorable (Unfavorable) |
|
|
|
|
|
|
|
|
|
2023 |
|
2022 |
|
$ Change |
|
% Change |
| Revenues |
|
|
|
|
|
|
|
|
|
|
|
|
|
|
|
| Management fees |
|
|
|
|
|
|
|
|
$ |
600,516 |
|
|
$ |
477,332 |
|
|
$ |
123,184 |
|
|
26% |
| Carried interest allocation |
|
|
|
|
|
|
|
|
151,488 |
|
|
178,289 |
|
|
(26,801) |
|
|
(15) |
| Incentive fees |
|
|
|
|
|
|
|
|
8,923 |
|
|
16,422 |
|
|
(7,499) |
|
|
(46) |
| Principal investment income |
|
|
|
|
|
|
|
|
22,758 |
|
|
8,326 |
|
|
14,432 |
|
|
173 |
| Administrative, transaction and other fees |
|
|
|
|
|
|
|
|
29,677 |
|
|
34,630 |
|
|
(4,953) |
|
|
(14) |
| Total revenues |
|
|
|
|
|
|
|
|
$ |
813,362 |
|
|
$ |
714,999 |
|
|
98,363 |
|
|
14 |
Management Fees. Capital deployment in direct lending funds within the Credit Group led to a rise in FPAUM and additional management fees of $41.8 million over the comparative periods. Part I Fees contributed to an increase of $35.2 million for the comparative periods primarily due to an increase in pre-incentive fee net investment income generated by ARCC and CADC, driven by an increase in the average size of their portfolios as well as the impact of rising interest rates, given their primarily floating-rate loan portfolios. Within the Real Assets Group, the non-traded REITs contributed additional fees of $8.0 million from additional capital raised and the acquisition of AMP Capital’s infrastructure debt platform (the “Infrastructure Debt Acquisition”), which was completed on February 10, 2022, contributed additional fees of $6.0 million for the three months ended March 31, 2023 when compared to the three months ended March 31, 2022. For detail regarding the fluctuations of management fees within each of our segments see “—Results of Operations by Segment.”
Carried Interest Allocation. The activity was principally composed of the following ($ in millions):
|
|
|
|
|
|
|
|
|
|
|
|
|
|
|
|
|
|
|
|
|
|
|
|
|
|
|
|
|
|
|
|
|
|
|
|
|
|
|
|
|
|
|
|
|
|
|
|
|
|
|
|
|
|
|
|
Three months ended March 31, 2023 |
Primary Drivers |
Three months ended March 31, 2022 |
Primary Drivers |
| Credit funds |
$ |
116.7 |
|
Primarily from four direct lending funds and one alternative credit fund with $23.8 billion of IGAUM generating returns in excess of their hurdle rates. Ares Capital Europe V, L.P. (“ACE V”) generated carried interest allocation of $44.8 million driven by net investment income on an increasing invested capital base. Ares Capital Europe IV, L.P. (“ACE IV”), Ares Private Credit Solutions, L.P. (“PCS I”), Ares Capital Europe III, L.P. (“ACE III”) and Ares Pathfinder Fund, L.P. (“Pathfinder”) generated carried interest allocation of $24.0 million, $14.6 million, $9.3 million and $3.4 million, respectively, primarily driven by net investment income during the period. Our credit funds have benefited from rising interest rates on predominately floating-rate loans. |
$ |
74.3 |
|
Primarily from four direct lending funds and one alternative credit fund with $18.9 billion of IGAUM generating returns in excess of their hurdle rates. ACE V, PCS I and ACE IV generated carried interest allocation of $20.4 million, $10.6 million and $9.6 million, respectively. The carried interest allocation generated by these funds was driven by net investment income on an increasing invested capital base. ACE III generated carried interest allocation of $6.5 million primarily driven by net investment income during the period. In addition, Pathfinder generated carried interest allocation of $14.3 million that was primarily driven by market appreciation of various investments. |
| Private equity funds |
48.2 |
|
Appreciation across several portfolio company investments, driven by improving operating performance metrics from portfolio companies that primarily operate in industries such as services and retail, generated carried interest allocation of $53.1 million from Ares Special Situations Fund IV, L.P. (“SSF IV”), $25.3 million from Ares Special Opportunities Fund, L.P. (“ASOF I”) and $10.1 million from Ares Corporate Opportunities Fund VI, L.P. (“ACOF VI”). The appreciation was partially offset by the reversal of unrealized carried interest allocation of $36.5 million and $2.1 million from Ares Corporate Opportunities Fund V, L.P. (“ACOF V”) and Ares Corporate Opportunities Fund III, L.P. (“ACOF III”), respectively, primarily driven by lower operating performance metrics and market depreciation of certain portfolio companies that primarily operate in the healthcare industry. |
(3.2) |
|
Market depreciation across several investments that led to the reversal of unrealized carried interest allocation of $51.6 million for Ares Corporate Opportunities Fund IV, L.P. (“ACOF IV”) primarily due to market depreciation of its investment in the AZEK Company (“AZEK”) driven by global equity market volatility. The market depreciation was partially offset by market appreciation across several portfolio company investments, primarily operating in services, technology, retail and healthcare industries that generated carried interest allocation of $17.0 million from ACOF V, $21.0 million from ASOF I and $11.3 million from ACOF VI. |
| Real assets funds |
(12.8) |
|
Reversal of unrealized carried interest of $16.5 million from three European real estate equity funds and $5.6 million from three U.S. real estate equity funds primarily driven by market depreciation of certain properties. In addition, reversal of unrealized carried interest of $7.8 million from Ares Energy Investors Fund V, L.P. (“EIF V”) primarily due to lower valuations in certain investments. Increased operating income and market appreciation of certain properties generated carried interest allocation of $7.5 million from two U.S. real estate equity funds and $1.1 million from Ares U.S. Real Estate Opportunity Fund III, L.P. (“AREOF III”). Ares Climate Infrastructure Partners, L.P. (“ACIP”) generated carried interest allocation of $4.6 million driven by market appreciation of certain investments and Ares Infrastructure Debt Fund V L.P. (“IDF V”) generated carried interest allocation of $6.4 million driven by net investment income. |
54.5 |
|
Market appreciation from properties within real estate equity funds, primarily driven by gains from several industrial and multifamily assets, generated carried interest allocation of $16.8 million from AREOF III, $9.7 million from U.S. Real Estate Fund VIII, L.P. (“US VIII”), $16.7 million from U.S. Real Estate Fund IX, L.P. (“US IX”) and $13.6 million from four real estate equity funds. The market appreciation was partially offset by market depreciation that led to the reversal of unrealized carried interest allocation of $15.7 million from EIF V primarily due to lower valuations in certain investments due to volatility in the energy markets. |
Secondaries funds |
(0.6) |
|
Reversal of unrealized carried interest from Landmark Equity Partners XVI, L.P. (“LEP XVI”), driven primarily by market depreciation of certain portfolio investments. |
52.7 |
|
Market appreciation of certain investments held in LEP XVI and Landmark Real Estate Partners VIII, L.P. (“LREP VIII”) that generated carried interest allocation of $15.8 million and $24.4 million, respectively. |
|
|
|
|
|
| Carried interest allocation |
$ |
151.5 |
|
|
$ |
178.3 |
|
|
Incentive Fees. The activity was principally composed of the following ($ in millions):
|
|
|
|
|
|
|
|
|
|
|
|
|
|
|
|
|
|
|
|
|
|
|
|
|
|
|
|
|
|
|
|
|
|
|
|
|
|
|
|
|
|
|
|
|
|
Three months ended March 31, 2023 |
Primary Drivers |
Three months ended March 31, 2022 |
Primary Drivers |
| Credit funds |
$ |
1.1 |
|
Incentive fee adjustments from various direct lending vehicles following the measurement period. |
$ |
15.4 |
|
Incentive fees from three direct lending vehicles and an alternative credit vehicle. |
| Real assets funds |
4.5 |
|
Incentive fees generated from an industrial real estate fund. |
1.0 |
|
Incentive fees generated from an industrial real estate fund and ACRE. |
Secondaries funds |
3.3 |
|
Incentive fees generated from APMF. |
— |
|
N/A |
| Incentive fees |
$ |
8.9 |
|
|
$ |
16.4 |
|
|
Principal Investment Income. The activity for the three months ended March 31, 2023 was primarily composed of market appreciation of certain special opportunities and European direct lending investments and dividend income from various investments in funds within our special opportunities strategy.
The activity for the three months ended March 31, 2022 was primarily driven by (i) increasing operating income from underlying properties associated with funds in our U.S. real estate equity and real estate secondaries strategies and (ii) market appreciation of various investments across funds in our private equity secondaries and special opportunities strategies.
Administrative, Transaction and Other Fees. The decrease in administrative, transaction and other fees primarily resulted from lower administrative service fees generated from ARCC and our non-traded REITs of $5.7 million for the three months ended March 31, 2023 compared to the same period in 2022. In addition, there was a decrease in facilitation fees, which are generated when investors contribute real property through a like-kind 1031 exchange for fund shares, of $2.6 million for the three months ended March 31, 2023 compared to the same period in 2022.
The decrease in administrative, transaction and other fees was partially offset by an increase in (i) transaction fees of $2.1 million from a portion of the loan origination income that were mostly generated from certain affiliated credit funds and (ii) administrative service fees of $1.7 million earned from certain private funds that pay on invested capital, where the increase in fees was due to increase in fee basis from additional deployment for the three months ended March 31, 2023 compared to the same period in 2022.
Expenses.
|
|
|
|
|
|
|
|
|
|
|
|
|
|
|
|
|
|
|
|
|
|
|
|
|
|
|
|
|
|
|
|
|
|
|
|
|
Three months ended March 31, |
|
Favorable (Unfavorable) |
|
|
|
|
|
|
|
|
|
2023 |
|
2022 |
|
$ Change |
|
% Change |
| Expenses |
|
|
|
|
|
|
|
|
|
|
|
|
|
|
|
| Compensation and benefits |
|
|
|
|
|
|
|
|
$ |
360,781 |
|
|
$ |
357,243 |
|
|
$ |
(3,538) |
|
|
(1)% |
| Performance related compensation |
|
|
|
|
|
|
|
|
111,658 |
|
|
129,405 |
|
|
17,747 |
|
|
14 |
| General, administrative and other expenses |
|
|
|
|
|
|
|
|
148,345 |
|
|
120,523 |
|
|
(27,822) |
|
|
(23) |
|
|
|
|
|
|
|
|
|
|
|
|
|
|
|
|
| Expenses of Consolidated Funds |
|
|
|
|
|
|
|
|
7,852 |
|
|
4,513 |
|
|
(3,339) |
|
|
(74) |
| Total expenses |
|
|
|
|
|
|
|
|
$ |
628,636 |
|
|
$ |
611,684 |
|
|
(16,952) |
|
|
(3) |
Compensation and Benefits. The increase in compensation and benefits was primarily driven by (i) increase in salary expense of $20.9 million for the three months ended March 31, 2023 compared to the same period in 2022, primarily attributable to headcount growth to support the expansion of our business, (ii) higher Part I Fees compensation of $19.7 million for the three months ended March 31, 2023 compared to the same period in 2022 and (iii) higher equity-based compensation expense of $15.6 million as discussed below. Average headcount for the quarter-to-date period increased by 21% to 2,558 professionals for the 2023 period from 2,113 professionals for the same period in 2022.
The increase in compensation and benefits is partially offset by a decrease of $47.4 million in compensation expense recognized in relation to the performance-based, acquisition-related compensation arrangements (“earnouts”) that were established in connection with the Landmark Acquisition, Black Creek Acquisition and Infrastructure Debt Acquisition, which were based on the achievement of revenue targets for certain funds. As all earnouts are subject to the continued and future services of senior professionals and advisors, they are required to be recorded as compensation expense and recognized ratably over the respective service periods.
The revenue targets for the Black Creek Acquisition earnout were achieved and the maximum contingent payment was recorded during the third quarter of 2022. Compensation expense related to the Black Creek earnout was $37.7 million for the three months ended March 31, 2022.
In connection with the fundraising for an acquired Landmark private equity secondaries fund, the revenue targets on which the Landmark earnout were contingent were not achieved and the associated compensation expense was reversed during the third quarter of 2022. Compensation expense related to the Landmark earnout was $8.9 million for the three months ended March 31, 2022.
The revenue target for one of the infrastructure debt funds from the Infrastructure Debt Acquisition earnout was achieved during the fourth quarter of 2022. In connection with the achievement of the earnout for the one infrastructure debt fund, a portion of the associated liability was paid in cash and the remaining portion was equity-settled. The excess fair value of $14.8 million over the liability at the time the earnout was achieved will be recognized over the remaining four year service period as equity-based compensation expense, including $0.9 million that was recognized during the three months ended March 31, 2023. Compensation expense related to the other infrastructure debt funds subject to the Infrastructure Debt earnout was $0.6 million and $0.3 million for the three months ended March 31, 2023 and 2022, respectively. See “Note 7. Commitments and Contingencies” for a further description of the contingent liabilities related to the Infrastructure Debt Acquisition arrangement.
The following table presents equity-based compensation expense based on the different types of restricted unit awards ($ in thousands):
|
|
|
|
|
|
|
|
|
|
|
|
|
|
|
|
|
|
|
|
|
|
|
|
|
|
|
|
|
|
|
|
|
|
|
|
|
|
|
|
|
|
|
|
|
|
|
|
|
|
|
|
|
|
|
|
|
|
|
|
|
| |
|
|
|
|
Three months ended March 31, |
|
|
|
Favorable (Unfavorable) |
|
|
|
|
|
|
|
|
|
|
|
|
|
|
2023 |
|
2022 |
|
|
|
$ Change |
|
% Change |
|
|
|
|
|
|
| Awards that do not recur annually: |
|
|
|
|
|
|
|
|
|
|
|
|
|
|
|
|
|
|
|
|
|
|
|
|
| Multi-year future grants |
|
|
|
|
|
|
|
|
|
$ |
12,216 |
|
|
$ |
10,192 |
|
|
|
|
$ |
(2,024) |
|
|
(20)% |
|
|
|
|
|
|
|
|
|
|
|
|
|
|
|
|
|
|
|
|
|
|
|
|
|
|
|
|
|
|
|
|
|
|
|
|
|
|
|
|
|
|
|
|
|
|
|
|
|
|
|
|
|
|
|
|
| Other awards that do not recur annually |
|
|
|
|
|
|
|
|
|
2,547 |
|
|
2,524 |
|
|
|
|
(23) |
|
|
(1) |
|
|
|
|
|
|
| Total awards that do not recur annually |
|
|
|
|
|
|
|
|
|
14,763 |
|
|
12,716 |
|
|
|
|
(2,047) |
|
|
(16) |
|
|
|
|
|
|
| Recurring annual awards: |
|
|
|
|
|
|
|
|
|
|
|
|
|
|
|
|
|
|
|
|
|
|
|
|
| Discretionary awards |
|
|
|
|
|
|
|
|
|
28,206 |
|
|
20,968 |
|
|
|
|
(7,238) |
|
|
(35) |
|
|
|
|
|
|
| Bonus awards |
|
|
|
|
|
|
|
|
|
26,283 |
|
|
19,966 |
|
|
|
|
(6,317) |
|
|
(32) |
|
|
|
|
|
|
| Total recurring annual awards |
|
|
|
|
|
|
|
|
|
54,489 |
|
|
40,934 |
|
|
|
|
(13,555) |
|
|
(33) |
|
|
|
|
|
|
| Equity-based compensation expense |
|
|
|
|
|
|
|
|
|
$ |
69,252 |
|
|
$ |
53,650 |
|
|
|
|
(15,602) |
|
|
(29) |
|
|
|
|
|
|
The increase in equity-based compensation expense was primarily attributable to the increase in awards granted under our recurring annual award programs, which included one-time expenses of $10.0 million and $7.5 million for the three months ended March 31, 2023 and 2022, respectively, in association with immediate vesting of certain awards.
For detail regarding the fluctuations of compensation and benefits within each of our segments see “—Results of Operations by Segment.”
Performance Related Compensation. Changes in performance related compensation are directly associated with the changes in carried interest allocation and incentive fees described above and include associated payroll-related tax expenses and performance allocations to charitable organizations as part of our philanthropic initiatives.
General, Administrative and Other Expenses. In connection with a merger agreement to acquire the remaining 20% ownership interest in the Ares SSG fee-generating business that was retained by the former owners of SSG (the “SSG Buyout”), we made the decision to rebrand Ares SSG as Asia credit and discontinued the ongoing use of the SSG trade name. As a result, the Company recorded a non-cash impairment charge of $7.8 million representing the carrying value of SSG’s trade name for the three months ended March 31, 2023.
Other operating expenses, most notably travel and marketing sponsorships, collectively increased by $10.3 million for the three months ended March 31, 2023 compared to the same period in 2022 as we (i) conducted more in-person company meetings and events with a focus on promoting collaboration and (ii) continued to increase our marketing efforts, primarily to grow our retail distribution platform through Ares Wealth Management Solutions, LLC (“AWMS”) over the comparative periods. Certain expenses have also increased during the current period, including occupancy costs to support our growing headcount, as well as information services and information technology costs to support the expansion of our business. Collectively, these expenses increased by $5.9 million for the three months ended March 31, 2023 compared to the same period in 2022. Additionally, professional service fees have increased by $4.9 million for the three months ended March 31, 2023, primarily due to professional service fees to support the expanding platform and to the reorganization of our income tax compliance function.
Acquisition-related costs decreased by $4.1 million for the three months ended March 31, 2023 compared to the same period in 2022 due to timing of strategic opportunities. Acquisition-related costs generally precede a business combination, vary with the complexity of the transaction and may occur even when acquisitions are not successfully completed.
Other income, net.
|
|
|
|
|
|
|
|
|
|
|
|
|
|
|
|
|
|
|
|
|
|
|
|
|
|
|
|
|
|
|
|
|
|
|
|
|
Three months ended March 31, |
|
Favorable (Unfavorable) |
|
|
|
|
|
|
|
|
|
2023 |
|
2022 |
|
$ Change |
|
% Change |
| Other income (expense) |
|
|
|
|
|
|
|
|
|
|
|
|
|
|
|
| Net realized and unrealized gains on investments |
|
|
|
|
|
|
|
|
$ |
1,515 |
|
|
$ |
8,109 |
|
|
$ |
(6,594) |
|
|
(81)% |
| Interest and dividend income |
|
|
|
|
|
|
|
|
3,839 |
|
|
1,502 |
|
|
2,337 |
|
|
156 |
| Interest expense |
|
|
|
|
|
|
|
|
(24,986) |
|
|
(15,646) |
|
|
(9,340) |
|
|
(60) |
| Other income (expense), net |
|
|
|
|
|
|
|
|
(923) |
|
|
1,784 |
|
|
(2,707) |
|
|
NM |
| Net realized and unrealized gains on investments of Consolidated Funds |
|
|
|
|
|
|
|
|
10,700 |
|
|
15,968 |
|
|
(5,268) |
|
|
(33) |
| Interest and other income of Consolidated Funds |
|
|
|
|
|
|
|
|
222,938 |
|
|
120,290 |
|
|
102,648 |
|
|
85 |
| Interest expense of Consolidated Funds |
|
|
|
|
|
|
|
|
(156,687) |
|
|
(74,013) |
|
|
(82,674) |
|
|
(112) |
| Total other income, net |
|
|
|
|
|
|
|
|
$ |
56,396 |
|
|
$ |
57,994 |
|
|
(1,598) |
|
|
(3) |
Net Realized and Unrealized Gains on Investments. The activity for the three months ended March 31, 2023 and 2022 was primarily attributable to unrealized gains from certain strategic investments made in connection with our acquisition of SSG and to unrealized losses from our investments in the subordinated notes of U.S. CLOs. The activity for the three months ended March 31, 2023 was also attributable to unrealized gains from APMF.
Interest Expense. Higher average interest rates, driven by rising SOFR rates, and a higher average outstanding balance of the Credit Facility contributed to an increase in interest expense for the three months ended March 31, 2023 compared to the same period in 2022.
Other Income (Expense), Net. The activity for the three months ended March 31, 2023 and 2022 included transaction gains (losses) associated with currency fluctuations impacting the revaluation of assets and liabilities denominated in foreign currencies other than an entity’s functional currency. Transaction losses of $0.9 million for the three months ended March 31, 2023 were primarily attributable to the British pound strengthening against the Euro, while transaction gains of $3.1 million during the three months ended March 31, 2022 were primarily attributable to the British pound weakening against Euro.
Other income (expense), net also included $1.0 million of expense for the three months ended March 31, 2022 related to the change in fair value of a contingent obligation recognized in connection with the Black Creek Acquisition. The purchase agreement with Black Creek contains provisions that required us to record separate contingent consideration liabilities that are dependent on the achievement of revenue targets for certain funds that were acquired in the Black Creek Acquisition. The revenue targets for the Black Creek earnout were fully achieved and the maximum contingent payment was recorded during the third quarter of 2022.
Income Tax Expense.
|
|
|
|
|
|
|
|
|
|
|
|
|
|
|
|
|
|
|
|
|
|
|
|
|
|
|
|
|
|
|
|
|
|
|
|
|
Three months ended March 31, |
|
Favorable (Unfavorable) |
|
|
|
|
|
|
|
|
|
2023 |
|
2022 |
|
$ Change |
|
% Change |
| Income before taxes |
|
|
|
|
|
|
|
|
$ |
241,122 |
|
|
$ |
161,309 |
|
|
$ |
79,813 |
|
|
49% |
| Income tax expense |
|
|
|
|
|
|
|
|
(33,806) |
|
|
(20,411) |
|
|
(13,395) |
|
|
(66) |
| Net income |
|
|
|
|
|
|
|
|
$ |
207,316 |
|
|
$ |
140,898 |
|
|
66,418 |
|
|
47 |
Income Tax Expense The increase in income tax expense was attributable to higher net income allocable to AMC for the three months ended March 31, 2023 compared to the three months ended March 31, 2022. The increase in income before taxes for the three months ended March 31, 2023 compared to the same period in the prior year was primarily attributable to income attributable to AMC as income attributable to non-controlling interests in Consolidated Funds, which is generally not subject to corporate income taxes, decreased over the comparative period. The calculation of income taxes is also sensitive to any changes in weighted average daily ownership. The weighted average daily ownership for AMC common stockholders increased from 59.5% for the three months ended March 31, 2022 to 60.1% for the three months ended March 31, 2023. The changes in ownership were primarily driven by the issuance of Class A common stock in connection with stock option exercises and vesting of restricted stock awards. The increase in the weighted average daily ownership for AMC common stockholders was partially offset by the issuance of AOG Units in connection with the settlement of the Black Creek earnout that increased the ownership of AOG Units not held by AMC.
Redeemable and Non-Controlling Interests.
|
|
|
|
|
|
|
|
|
|
|
|
|
|
|
|
|
|
|
|
|
|
|
|
|
|
|
|
|
|
|
|
|
|
|
|
|
Three months ended March 31, |
|
Favorable (Unfavorable) |
|
|
|
|
|
|
|
|
|
2023 |
|
2022 |
|
$ Change |
|
% Change |
| Net income |
|
|
|
|
|
|
|
|
$ |
207,316 |
|
|
$ |
140,898 |
|
|
$ |
66,418 |
|
|
47% |
|
|
|
|
|
|
|
|
|
|
|
|
|
|
|
|
| Less: Net income attributable to non-controlling interests in Consolidated Funds |
|
|
|
|
|
|
|
|
26,693 |
|
|
47,382 |
|
|
(20,689) |
|
|
(44) |
| Net income attributable to Ares Operating Group entities |
|
|
|
|
|
|
|
|
180,623 |
|
|
93,516 |
|
|
87,107 |
|
|
93 |
| Less: Net income (loss) attributable to redeemable interest in Ares Operating Group entities |
|
|
|
|
|
|
|
|
(1,824) |
|
|
399 |
|
|
(2,223) |
|
|
NM |
| Less: Net income attributable to non-controlling interests in Ares Operating Group entities |
|
|
|
|
|
|
|
|
88,408 |
|
|
47,254 |
|
|
41,154 |
|
|
87 |
|
|
|
|
|
|
|
|
|
|
|
|
|
|
|
|
|
|
|
|
|
|
|
|
|
|
|
|
|
|
|
|
|
|
|
|
|
|
|
|
|
|
|
|
|
|
|
|
| Net income attributable to Ares Management Corporation Class A and non-voting common stockholders |
|
|
|
|
|
|
|
|
$ |
94,039 |
|
|
$ |
45,863 |
|
|
48,176 |
|
|
105 |
Redeemable and Non-Controlling Interests. Net income (loss) attributable to redeemable and non-controlling interests in AOG entities represents results attributable to the holders of AOG Units and other ownership interests that are not held by AMC. In connection with the SSG Acquisition, the former owners of SSG retained an ownership interest in a subsidiary of an AOG entity that is reflected as redeemable interest in AOG entities. Net income (loss) attributable to redeemable interest in AOG entities is allocated based on the ownership percentage for periods presented. In connection with the SSG Buyout, a portion of the redeemable interest in AOG entities was purchased on March 31, 2023 and the Company now owns 100% of Ares SSG’s fee-generating business. As the SSG Buyout was completed on the last day of the quarter, there was no impact to the allocation of income for the periods presented. In future periods, 100% of the income associated with Ares SSG’s fee generating business will be attributable to AOG entities and the remaining redeemable interest in AOG entities from ownership in certain investments that were not included in the SSG Buyout will continue to be allocated based on ownership percentage.
Net income attributable to non-controlling interests in AOG entities is generally allocated based on the weighted average daily ownership of the other AOG unitholders, except for income (loss) generated from certain joint venture partnerships. Net income (loss) is allocated to other strategic distribution partners with whom we have established joint ventures based on the respective ownership percentages and based on the activity of certain membership interests. Net income of $7.5 million and $4.6 million for the three months ended March 31, 2023 and 2022, respectively, was allocated based on ownership percentages of the strategic distribution partners and the activity of those membership interests.
The change over the comparative period is a result of the respective change in income before taxes and weighted average daily ownership. The weighted average daily ownership for the non-controlling AOG unitholders decreased from 40.5% for the three months ended March 31, 2022 to 39.9% for the three months ended March 31, 2023.
Consolidated Results of Operations of the Consolidated Funds
The following table presents the results of operations of the Consolidated Funds ($ in thousands):
|
|
|
|
|
|
|
|
|
|
|
|
|
|
|
|
|
|
|
|
|
|
|
|
|
|
|
|
|
|
|
|
|
|
|
|
|
|
|
|
|
|
|
|
|
|
|
|
|
|
|
|
|
|
|
|
|
| |
|
|
|
|
Three months ended March 31, |
|
|
|
|
|
Favorable (Unfavorable) |
|
|
|
|
|
|
|
|
|
|
2023 |
|
2022 |
|
|
|
|
|
|
|
$ Change |
|
% Change |
| Expenses of the Consolidated Funds |
|
|
|
|
|
|
|
|
|
$ |
(7,852) |
|
|
$ |
(4,513) |
|
|
|
|
|
|
|
|
$ |
(3,339) |
|
|
(74)% |
| Net realized and unrealized gains on investments of Consolidated Funds |
|
|
|
|
|
|
|
|
|
10,700 |
|
|
15,968 |
|
|
|
|
|
|
|
|
(5,268) |
|
|
(33) |
| Interest and other income of Consolidated Funds |
|
|
|
|
|
|
|
|
|
222,938 |
|
|
120,290 |
|
|
|
|
|
|
|
|
102,648 |
|
|
85 |
| Interest expense of Consolidated Funds |
|
|
|
|
|
|
|
|
|
(156,687) |
|
|
(74,013) |
|
|
|
|
|
|
|
|
(82,674) |
|
|
(112) |
| Income before taxes |
|
|
|
|
|
|
|
|
|
69,099 |
|
|
57,732 |
|
|
|
|
|
|
|
|
11,367 |
|
|
20 |
| Income tax expense of Consolidated Funds |
|
|
|
|
|
|
|
|
|
(478) |
|
|
(25) |
|
|
|
|
|
|
|
|
(453) |
|
|
NM |
| Net income |
|
|
|
|
|
|
|
|
|
68,621 |
|
|
57,707 |
|
|
|
|
|
|
|
|
10,914 |
|
|
19 |
| Less: Revenues attributable to Ares Management Corporation eliminated upon consolidation |
|
|
|
|
|
|
|
|
|
32,688 |
|
|
22,446 |
|
|
|
|
|
|
|
|
10,242 |
|
|
46 |
| Less: Other income (expense), net attributable to Ares Management Corporation eliminated upon consolidation (loss) |
|
|
|
|
|
|
|
|
|
9,583 |
|
|
(12,121) |
|
|
|
|
|
|
|
|
21,704 |
|
|
NM |
| General, administrative and other expense attributable to Ares Management Corporation eliminated upon consolidation |
|
|
|
|
|
|
|
|
|
343 |
|
|
— |
|
|
|
|
|
|
|
|
(343) |
|
|
NM |
| Net income attributable to non-controlling interests in Consolidated Funds |
|
|
|
|
|
|
|
|
|
$ |
26,693 |
|
|
$ |
47,382 |
|
|
|
|
|
|
|
|
(20,689) |
|
|
(44) |
The results of operations of the Consolidated Funds primarily represents activity from certain CLOs that we are deemed to control. Expenses primarily reflect professional service fees that were incurred as a result of debt issuance costs related to the issuance of new, refinanced or restructured CLOs. These fees were expensed in the period incurred, as CLO debt is recorded at fair value on our Condensed Consolidated Statements of Financial Condition. As of March 31, 2023 and March 31, 2022, we consolidated 25 and 23 CLOs, respectively. The increase in expenses for the three months ended March 31, 2023 compared to the same period in 2022 was driven by higher professional service fees incurred by AAC in connection with a potential business combination. The lower net realized and unrealized gains on investments over the comparative periods was primarily driven by the decline in value of certain investments from an Asian corporate private equity fund. The increases in interest and other income and interest expense were primarily attributable to the impact from rising interest rates on our consolidated CLOs. Interest and other income and interest expense also increased due to two consolidated CLOs that were launched subsequent to the first quarter of 2022. The CSLLI returned 3.1% for the first quarter of 2023 compared to a negative return of 0.1% for the first quarter of 2022.
Revenues, other income (expense), net and general, administrative and other expense attributable to AMC represents management fees, incentive fees, principal investment income, administrative, transaction and other fees and general, administrative and other expense that are attributable to AMC’s proportional share of the results of the Consolidated Funds that is eliminated from the respective components of AMC’s results upon consolidation. The increase in revenues attributable to AMC for the three months ended March 31, 2023 compared to the same period in 2022 was primarily attributable to higher principal investment income and carried interest allocation from a fund invested in insurance companies.
Other income (expense), net attributable to AMC for the three months ended March 31, 2023 and 2022 was primarily attributable to unrealized gains and losses on our investment in AAC that were recognized during each period.
Segment Analysis
For segment reporting purposes, revenues and expenses are presented before giving effect to the results of our Consolidated Funds and the results attributable to non-controlling interests of joint ventures that we consolidate. As a result, segment revenues from management fees, fee related performance revenues, performance income and investment income are different than those presented on a consolidated basis in accordance with GAAP. Revenues recognized from Consolidated Funds are eliminated in consolidation and results attributable to the non-controlling interests of joint ventures have been excluded by us. Furthermore, expenses and the effects of other income (expense) are different than related amounts presented on a consolidated basis in accordance with GAAP due to the exclusion of the results of Consolidated Funds and the non-controlling interests of joint ventures.
Non-GAAP Financial Measures
We use the following non-GAAP measures to make operating decisions, assess performance and allocate resources:
•Fee Related Earnings (“FRE”)
•Realized Income (“RI”)
These non-GAAP financial measures supplement and should be considered in addition to and not in lieu of, the results of operations, which are discussed further under “—Components of Consolidated Results of Operations” and are prepared in accordance with GAAP. We operate through our distinct operating segments. On March 31, 2023, we executed the SSG Buyout. We rebranded Ares SSG as Ares Asia and the Ares SSG credit business, including the Asian special situations, Asian secured lending and APAC direct lending strategies, as Asia credit. Asia credit has been reclassified effective January 1, 2023 and is now presented within the Credit Group. In connection with this reclassification, we will no longer use Strategic Initiatives to describe all other operating segments, instead reporting the collective results as Other. Historical periods have been modified to conform to the current period presentation. The following table sets forth FRE and RI by reportable segment and OMG ($ in thousands):
|
|
|
|
|
|
|
|
|
|
|
|
|
|
|
|
|
|
|
|
|
|
|
|
|
|
|
|
|
|
|
|
|
|
|
|
|
|
|
|
|
|
|
|
|
|
| |
|
|
|
|
|
Three months ended March 31, |
|
Favorable (Unfavorable) |
|
|
|
|
|
|
|
|
|
|
2023 |
|
2022 |
|
$ Change |
|
% Change |
| Fee Related Earnings: |
|
|
|
|
|
|
|
|
|
|
|
|
|
|
|
|
| Credit Group |
|
|
|
|
|
|
|
|
|
$ |
277,309 |
|
|
$ |
206,704 |
|
|
$ |
70,605 |
|
|
34% |
| Private Equity Group |
|
|
|
|
|
|
|
|
|
23,454 |
|
|
20,400 |
|
|
3,054 |
|
|
15 |
| Real Assets Group |
|
|
|
|
|
|
|
|
|
53,662 |
|
|
39,437 |
|
|
14,225 |
|
|
36 |
Secondaries Group |
|
|
|
|
|
|
|
|
|
25,430 |
|
|
29,786 |
|
|
(4,356) |
|
|
(15) |
Other |
|
|
|
|
|
|
|
|
|
1,281 |
|
|
(82) |
|
|
1,363 |
|
|
NM |
| Operations Management Group |
|
|
|
|
|
|
|
|
|
(126,499) |
|
|
(90,575) |
|
|
(35,924) |
|
|
(40) |
| Fee Related Earnings |
|
|
|
|
|
|
|
|
|
$ |
254,637 |
|
|
$ |
205,670 |
|
|
48,967 |
|
|
24 |
| Realized Income: |
|
|
|
|
|
|
|
|
|
|
|
|
|
|
|
|
| Credit Group |
|
|
|
|
|
|
|
|
|
$ |
278,009 |
|
|
$ |
212,162 |
|
|
$ |
65,847 |
|
|
31% |
| Private Equity Group |
|
|
|
|
|
|
|
|
|
23,932 |
|
|
20,558 |
|
|
3,374 |
|
|
16 |
| Real Assets Group |
|
|
|
|
|
|
|
|
|
52,143 |
|
|
55,362 |
|
|
(3,219) |
|
|
(6) |
| Secondaries Group |
|
|
|
|
|
|
|
|
|
24,350 |
|
|
29,965 |
|
|
(5,615) |
|
|
(19) |
Other |
|
|
|
|
|
|
|
|
|
2,475 |
|
|
(5,004) |
|
|
7,479 |
|
|
NM |
| Operations Management Group |
|
|
|
|
|
|
|
|
|
(126,617) |
|
|
(91,026) |
|
|
(35,591) |
|
|
(39) |
| Realized Income |
|
|
|
|
|
|
|
|
|
$ |
254,292 |
|
|
$ |
222,017 |
|
|
32,275 |
|
|
15 |
Income before provision for income taxes is the GAAP financial measure most comparable to RI and FRE. The following table presents the reconciliation of income before taxes as reported within the Condensed Consolidated Statements of Operations to RI and FRE of the reportable segments and OMG ($ in thousands):
|
|
|
|
|
|
|
|
|
|
|
|
|
|
|
|
|
Three months ended March 31, |
|
|
|
2023 |
|
2022 |
|
|
|
|
| Income before taxes |
$ |
241,122 |
|
|
$ |
161,309 |
|
|
|
|
|
| Adjustments: |
|
|
|
|
|
|
|
| Depreciation and amortization expense |
45,659 |
|
|
38,126 |
|
|
|
|
|
| Equity compensation expense |
68,704 |
|
|
53,017 |
|
|
|
|
|
Acquisition-related compensation expense(1) |
642 |
|
|
48,001 |
|
|
|
|
|
|
|
|
|
|
|
|
|
| Acquisition and merger-related expense |
4,955 |
|
|
9,042 |
|
|
|
|
|
| Placement fee adjustment |
(3,232) |
|
|
(693) |
|
|
|
|
|
| Other expense, net |
91 |
|
|
1,981 |
|
|
|
|
|
| Net income of non-controlling interests in consolidated subsidiaries |
(5,671) |
|
|
(4,989) |
|
|
|
|
|
| Income before taxes of non-controlling interests in Consolidated Funds, net of eliminations |
(27,171) |
|
|
(47,407) |
|
|
|
|
|
| Total performance income—unrealized |
(127,713) |
|
|
(133,532) |
|
|
|
|
|
| Total performance related compensation—unrealized |
85,150 |
|
|
91,198 |
|
|
|
|
|
| Total net investment (income) loss—unrealized |
(28,244) |
|
|
5,964 |
|
|
|
|
|
| Realized Income |
254,292 |
|
|
222,017 |
|
|
|
|
|
| Total performance income—realized |
(31,136) |
|
|
(43,868) |
|
|
|
|
|
| Total performance related compensation—realized |
23,859 |
|
|
28,575 |
|
|
|
|
|
| Total investment (income) loss—realized |
7,622 |
|
|
(1,054) |
|
|
|
|
|
| Fee Related Earnings |
$ |
254,637 |
|
|
$ |
205,670 |
|
|
|
|
|
(1)Represents earnouts in connection with the Landmark Acquisition, the Black Creek Acquisition and the Infrastructure Debt Acquisition that are recorded as compensation expense and are presented within compensation and benefits within the Company’s Condensed Consolidated Statements of Operations.
For the specific components and calculations of these non-GAAP measures, as well as additional reconciliations to the most comparable measures in accordance with GAAP, see “Note 13. Segment Reporting” within our unaudited condensed consolidated financial statements included in this Quarterly Report on Form 10-Q. Discussed below are our results of operations for our reportable segments and OMG.
Results of Operations by Segment
Credit Group—Three Months Ended March 31, 2023 Compared to Three Months Ended March 31, 2022
Fee Related Earnings:
The following table presents the components of the Credit Group’s FRE ($ in thousands):
|
|
|
|
|
|
|
|
|
|
|
|
|
|
|
|
|
|
|
|
|
|
|
|
|
|
|
|
|
|
|
|
| |
|
|
|
Three months ended March 31, |
|
Favorable (Unfavorable) |
|
|
|
|
|
|
|
|
|
2023 |
|
2022 |
|
$ Change |
|
% Change |
| Management fees |
|
|
|
|
|
|
|
|
$ |
405,650 |
|
|
$ |
317,489 |
|
|
$ |
88,161 |
|
|
28% |
| Fee related performance revenues |
|
|
|
|
|
|
|
|
600 |
|
|
12,353 |
|
|
(11,753) |
|
|
(95) |
| Other fees |
|
|
|
|
|
|
|
|
8,870 |
|
|
5,766 |
|
|
3,104 |
|
|
54 |
| Compensation and benefits |
|
|
|
|
|
|
|
|
(116,216) |
|
|
(110,711) |
|
|
(5,505) |
|
|
(5) |
| General, administrative and other expenses |
|
|
|
|
|
|
|
|
(21,595) |
|
|
(18,193) |
|
|
(3,402) |
|
|
(19) |
| Fee Related Earnings |
|
|
|
|
|
|
|
|
$ |
277,309 |
|
|
$ |
206,704 |
|
|
70,605 |
|
|
34 |
Management Fees. The chart below presents Credit Group management fees and effective management fee rates ($ in millions):
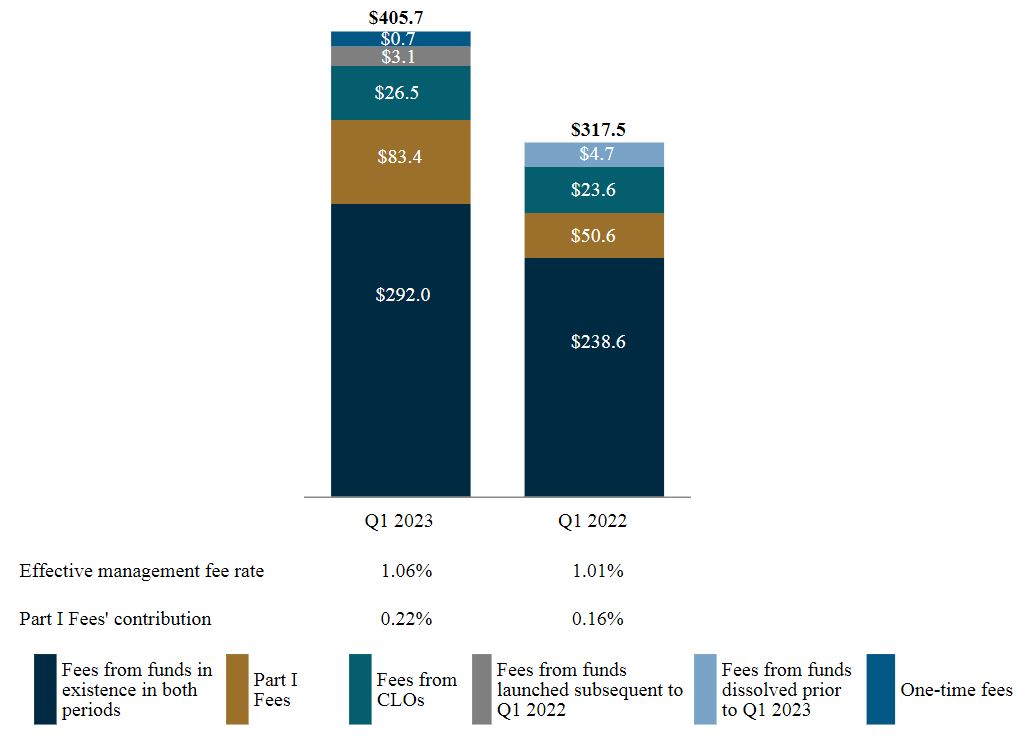
Management fees on existing funds increased primarily from deployment of capital with Pathfinder, our open-end core alternative credit fund, ACE V, PCS II and Ares Senior Direct Lending Fund II, L.P. (“SDL II”) collectively generating additional fees of $30.8 million for the three months ended March 31, 2023, compared to the three months ended March 31, 2022. Management fees from ARCC, excluding Part I Fees described below, increased by $6.0 million for the three months ended March 31, 2023, primarily due to an increase in the average size of ARCC’s portfolio. The remaining increase in management fees from funds in existence in both periods was primarily driven by deployment of capital in other direct lending funds and SMAs. Management fees from CLOs also increased for the three months ended March 31, 2023 compared to the same period in 2022 primarily due to the net addition of eight CLOs subsequent to March 31, 2022.
Part I Fees increased for the three months ended March 31, 2023 compared to the three months ended March 31, 2022 primarily due to an increase in pre-incentive fee net investment income generated by ARCC and CADC, driven by an increase in the average size of their portfolios as well as the impact of rising interest rates, given their primarily floating-rate loan portfolios.
The increase in effective management fee rate for the three months ended March 31, 2023 compared to the three months ended March 31, 2022 was primarily driven by the increase in Part I Fees contribution to the effective management fee rate and deployment in ACE V, which has a higher effective management fee rate than the Credit Group’s average effective management fee rate.
Fee Related Performance Revenues. We expect the majority of our fee related performance revenues to be recognized in the fourth quarter in connection with the typical measurement period end date of each applicable fund’s performance against the annual performance hurdles. The decrease for the three months ended March 31, 2023 compared to the three months ended March 31, 2022 was primarily attributable to timing of incentive fees recognized from direct lending funds once the associated performance conditions were met and the fees were no longer subject to reversal.
Other Fees. The increase in other fees for the three months ended March 31, 2023 compared to the same period in 2022 was primarily driven by (i) higher transaction fees, which generally represents fees from a portion of the loan origination income generated from certain affiliated credit funds, of $2.0 million and (ii) higher administrative service fees of $1.1 million earned from certain private funds that pay on invested capital, driven by additional deployment.
Compensation and Benefits. The increase in compensation and benefits was primarily driven by (i) higher Part I Fees compensation of $19.7 million for the three months ended March 31, 2023 compared to the same period in 2022 and (ii) increase in salary expense of $3.1 million for the three months ended March 31, 2023 compared to the same period in 2022, primarily attributable to headcount growth to support the expansion of our business. The increase in compensation and benefits for the three months ended March 31, 2023 compared to the same period in 2022 was partially offset by (i) lower fee related performance compensation of $7.8 million in correspondence with the decrease in fee related performance revenues, (ii) a decrease in payroll related taxes of $4.3 million from the same period in 2022, primarily attributable to fewer restricted units vesting during 2023 and (iii) lower incentive-based compensation that we believe will increase throughout the year and exceed prior year levels.
Average headcount for the quarter-to-date period increased by 15% to 545 investment and investment support professionals for the 2023 period from 473 professionals for the same period in 2022 as we continued to add professionals to support our growing U.S. and European direct lending, alternative credit and Asia credit platforms.
General, Administrative and Other Expenses. Travel and marketing collectively increased by $1.8 million for the three months ended March 31, 2023 compared to the same period in 2022, as marketing efforts continued to increase driven by more investor meetings and events. Certain expenses, primarily the occupancy costs, information technology and information services, have also increased by $1.8 million for the three months ended March 31, 2023 compared to the same period in 2022, to support headcount growth and our expanding credit platform.
Realized Income:
The following table presents the components of the Credit Group’s RI ($ in thousands):
|
|
|
|
|
|
|
|
|
|
|
|
|
|
|
|
|
|
|
|
|
|
|
|
|
|
|
|
|
|
|
|
|
|
|
|
Three months ended March 31, |
|
Favorable (Unfavorable) |
|
|
|
|
|
|
|
|
|
2023 |
|
2022 |
|
$ Change |
|
% Change |
| Fee Related Earnings |
|
|
|
|
|
|
|
|
$ |
277,309 |
|
|
$ |
206,704 |
|
|
$ |
70,605 |
|
|
34% |
| Performance income—realized |
|
|
|
|
|
|
|
|
6,593 |
|
|
7,363 |
|
|
(770) |
|
|
(10) |
| Performance related compensation—realized |
|
|
|
|
|
|
|
|
(4,997) |
|
|
(4,580) |
|
|
(417) |
|
|
(9) |
| Realized net performance income |
|
|
|
|
|
|
|
|
1,596 |
|
|
2,783 |
|
|
(1,187) |
|
|
(43) |
| Investment income—realized |
|
|
|
|
|
|
|
|
506 |
|
|
415 |
|
|
91 |
|
|
22 |
| Interest and other investment income—realized |
|
|
|
|
|
|
|
|
6,418 |
|
|
5,728 |
|
|
690 |
|
|
12 |
| Interest expense |
|
|
|
|
|
|
|
|
(7,820) |
|
|
(3,468) |
|
|
(4,352) |
|
|
(125) |
| Realized net investment income (loss) |
|
|
|
|
|
|
|
|
(896) |
|
|
2,675 |
|
|
(3,571) |
|
|
NM |
| Realized Income |
|
|
|
|
|
|
|
|
$ |
278,009 |
|
|
$ |
212,162 |
|
|
65,847 |
|
|
31 |
Realized net performance income was primarily attributable to distributions from a U.S. direct lending fund and a European direct lending fund for three months ended March 31, 2023. Realized net performance income for the three months ended March 31, 2022 was primarily attributable to distributions from two European direct lending funds and incentive fees on one alternative credit fund.
Realized net investment loss for the three months ended March 31, 2023 largely represents interest expense exceeding net investment and other income during the period. Interest expense, which is allocated based on the cost basis of balance sheet investments, increased over the comparative periods primarily due to rising SOFR rates and a higher average outstanding balance of the Credit Facility. The activity for the three months ended March 31, 2023 and 2022 included realized net investment income attributable to interest income generated from our CLO investments and income recognized in connection with distributions from a commercial finance fund.
Credit Group—Performance Income
The following table presents the accrued carried interest, also referred to as accrued performance income, and related performance compensation for the Credit Group. Accrued net performance income excludes net performance income that has been realized but not yet received as of the reporting date ($ in thousands):
|
|
|
|
|
|
|
|
|
|
|
|
|
|
|
|
|
|
|
|
|
|
|
|
|
|
|
|
|
|
|
|
|
|
|
|
|
As of March 31, 2023 |
|
As of December 31, 2022 |
|
|
|
|
|
|
|
Accrued Performance Income |
|
Accrued Performance Compensation |
|
Accrued Net Performance Income |
|
Accrued Performance Income |
|
Accrued Performance Compensation |
|
Accrued Net Performance Income |
| ACE III |
$ |
110,062 |
|
|
$ |
66,038 |
|
|
$ |
44,024 |
|
|
$ |
100,774 |
|
|
$ |
60,465 |
|
|
$ |
40,309 |
|
| ACE IV |
191,834 |
|
|
118,937 |
|
|
72,897 |
|
|
168,204 |
|
|
104,286 |
|
|
63,918 |
|
| ACE V |
158,398 |
|
|
95,038 |
|
|
63,360 |
|
|
115,969 |
|
|
69,581 |
|
|
46,388 |
|
| PCS I |
112,984 |
|
|
66,765 |
|
|
46,219 |
|
|
98,143 |
|
|
57,994 |
|
|
40,149 |
|
|
|
|
|
|
|
|
|
|
|
|
|
| Pathfinder |
92,328 |
|
|
78,478 |
|
|
13,850 |
|
|
88,879 |
|
|
75,547 |
|
|
13,332 |
|
| Other credit funds |
110,968 |
|
|
63,806 |
|
|
47,162 |
|
|
93,640 |
|
|
52,482 |
|
|
41,158 |
|
| Total Credit Group |
$ |
776,574 |
|
|
$ |
489,062 |
|
|
$ |
287,512 |
|
|
$ |
665,609 |
|
|
$ |
420,355 |
|
|
$ |
245,254 |
|
The following table presents the change in accrued performance income for the Credit Group ($ in thousands):
|
|
|
|
|
|
|
|
|
|
|
|
|
|
|
|
|
|
|
|
|
|
|
|
|
|
|
|
|
|
|
|
|
|
|
|
|
|
|
|
|
|
|
|
|
|
|
|
|
|
|
|
|
|
|
|
|
|
|
|
|
|
|
|
|
|
|
|
|
|
|
|
|
|
|
|
|
|
|
|
|
|
|
|
|
|
|
|
|
|
|
|
|
|
|
|
|
|
|
|
|
|
|
|
|
|
|
|
|
|
|
|
|
|
|
|
|
|
|
|
|
|
|
|
|
|
|
|
|
|
|
|
|
|
|
|
|
|
|
|
|
|
|
|
|
|
|
|
|
|
|
|
|
|
|
|
|
|
|
|
|
|
|
|
|
|
|
|
|
|
|
|
|
|
|
|
|
|
| |
|
|
|
As of December 31, 2022 |
|
Activity during the period |
|
As of March 31, 2023 |
|
|
|
Waterfall Type |
|
Accrued
Performance
Income |
|
Change in Unrealized |
|
Realized |
|
Other Adjustments |
|
Accrued
Performance
Income |
|
| Accrued Carried Interest |
|
|
|
|
|
|
|
|
|
|
|
|
|
| ACE III |
|
European |
|
$ |
100,774 |
|
|
$ |
9,288 |
|
|
$ |
— |
|
|
$ |
— |
|
|
$ |
110,062 |
|
|
| ACE IV |
|
European |
|
168,204 |
|
|
24,035 |
|
|
(405) |
|
|
— |
|
|
191,834 |
|
|
| ACE V |
|
European |
|
115,969 |
|
|
44,839 |
|
|
(2,410) |
|
|
— |
|
|
158,398 |
|
|
| PCS I |
|
European |
|
98,143 |
|
|
14,619 |
|
|
— |
|
|
222 |
|
|
112,984 |
|
|
|
|
|
|
|
|
|
|
|
|
|
|
|
|
| Pathfinder |
|
European |
|
88,879 |
|
|
3,449 |
|
|
— |
|
|
— |
|
|
92,328 |
|
|
| Other credit funds |
|
European |
|
91,997 |
|
|
19,579 |
|
|
(1,757) |
|
|
48 |
|
|
109,867 |
|
|
| Other credit funds |
|
American |
|
1,643 |
|
|
842 |
|
|
(1,327) |
|
|
(57) |
|
|
1,101 |
|
|
| Total accrued carried interest |
|
|
|
665,609 |
|
|
116,651 |
|
|
(5,899) |
|
|
213 |
|
|
776,574 |
|
|
|
|
|
|
|
|
|
|
|
|
|
|
|
|
Other credit funds |
|
Incentive |
|
— |
|
|
694 |
|
|
(694) |
|
|
— |
|
|
— |
|
|
| Total Credit Group |
|
|
|
$ |
665,609 |
|
|
$ |
117,345 |
|
|
$ |
(6,593) |
|
|
$ |
213 |
|
|
$ |
776,574 |
|
|
Credit Group—Assets Under Management
The tables below present rollforwards of AUM for the Credit Group ($ in millions):
|
|
|
|
|
|
|
|
|
|
|
|
|
|
|
|
|
|
|
|
|
|
|
|
|
|
|
|
|
|
|
|
|
|
|
|
|
|
|
|
|
|
|
|
|
|
|
|
|
|
|
|
|
|
|
|
|
|
|
|
|
|
|
|
|
|
|
|
|
|
|
|
|
|
|
|
|
|
|
|
|
|
|
|
|
|
|
|
|
|
|
|
|
|
|
|
|
|
|
|
|
|
|
|
|
|
|
|
|
|
|
|
|
|
|
|
|
|
|
|
|
|
|
|
|
|
|
|
|
|
|
|
|
|
|
|
|
|
|
|
|
|
|
|
|
|
|
|
|
|
|
|
|
|
|
|
|
|
|
|
|
|
|
|
|
|
|
|
|
|
|
|
|
|
|
|
|
|
|
|
|
|
|
|
|
|
|
|
|
|
|
|
|
|
|
|
|
|
|
|
|
|
|
|
|
|
|
|
|
|
|
|
|
|
|
|
|
|
|
|
|
|
|
|
|
|
|
|
|
|
|
|
|
|
|
|
|
|
|
|
|
|
|
|
|
|
|
|
|
|
|
|
|
|
|
|
|
|
|
|
|
|
|
|
|
|
|
|
|
|
|
|
|
|
|
|
|
|
|
|
|
|
|
|
|
|
|
|
|
|
|
|
|
|
|
|
|
|
|
|
|
|
|
|
|
|
|
|
|
|
|
|
|
|
|
|
|
|
|
|
|
|
|
|
|
|
|
|
|
|
|
|
|
|
|
|
|
|
|
|
|
|
|
|
|
|
|
|
|
|
|
|
|
|
|
|
|
|
|
|
|
|
|
|
|
|
|
|
|
|
|
|
|
|
|
|
|
|
|
|
|
|
|
|
Liquid
Credit |
|
Alternative Credit |
|
U.S. Direct Lending |
|
European Direct Lending |
|
Asia
Credit |
|
Other(1) |
|
Total Credit Group |
| Balance at 12/31/2022 |
|
$ |
43,864 |
|
|
$ |
21,363 |
|
|
$ |
98,327 |
|
|
$ |
50,642 |
|
|
$ |
11,383 |
|
|
$ |
— |
|
|
$ |
225,579 |
|
|
|
|
|
|
|
|
|
|
|
|
|
|
|
|
| Net new par/equity commitments |
|
405 |
|
|
3,104 |
|
|
1,776 |
|
|
4,324 |
|
|
— |
|
|
250 |
|
|
9,859 |
|
| Net new debt commitments |
|
466 |
|
|
— |
|
|
740 |
|
|
217 |
|
|
— |
|
|
— |
|
|
1,423 |
|
| Capital reductions |
|
(62) |
|
|
— |
|
|
(838) |
|
|
(1,181) |
|
|
— |
|
|
— |
|
|
(2,081) |
|
| Distributions |
|
(143) |
|
|
(251) |
|
|
(704) |
|
|
(397) |
|
|
(35) |
|
|
— |
|
|
(1,530) |
|
| Redemptions |
|
(545) |
|
|
(739) |
|
|
(92) |
|
|
— |
|
|
— |
|
|
— |
|
|
(1,376) |
|
| Change in fund value |
|
511 |
|
|
340 |
|
|
1,003 |
|
|
1,429 |
|
|
(14) |
|
|
— |
|
|
3,269 |
|
| Balance at 3/31/2023 |
|
$ |
44,496 |
|
|
$ |
23,817 |
|
|
$ |
100,212 |
|
|
$ |
55,034 |
|
|
$ |
11,334 |
|
|
$ |
250 |
|
|
$ |
235,143 |
|
|
|
|
|
|
|
|
|
|
|
|
|
|
|
|
|
|
Liquid
Credit |
|
Alternative Credit |
|
U.S. Direct Lending |
|
European Direct Lending |
|
Asia
Credit |
|
Other |
|
Total Credit Group |
| Balance at 12/31/2021 |
|
$ |
40,335 |
|
|
$ |
17,424 |
|
|
$ |
85,849 |
|
|
$ |
49,102 |
|
|
$ |
8,695 |
|
|
$ |
— |
|
|
$ |
201,405 |
|
|
|
|
|
|
|
|
|
|
|
|
|
|
|
|
| Net new par/equity commitments |
|
979 |
|
|
1,588 |
|
|
1,526 |
|
|
66 |
|
|
1,232 |
|
|
— |
|
|
5,391 |
|
| Net new debt commitments |
|
1,010 |
|
|
— |
|
|
1,330 |
|
|
— |
|
|
— |
|
|
— |
|
|
2,340 |
|
| Capital reductions |
|
(73) |
|
|
— |
|
|
(324) |
|
|
— |
|
|
(5) |
|
|
— |
|
|
(402) |
|
| Distributions |
|
(20) |
|
|
(145) |
|
|
(562) |
|
|
(276) |
|
|
(162) |
|
|
— |
|
|
(1,165) |
|
| Redemptions |
|
(172) |
|
|
(203) |
|
|
(35) |
|
|
— |
|
|
— |
|
|
— |
|
|
(410) |
|
| Change in fund value |
|
(444) |
|
|
(70) |
|
|
613 |
|
|
(575) |
|
|
23 |
|
|
— |
|
|
(453) |
|
| Balance at 3/31/2022 |
|
$ |
41,615 |
|
|
$ |
18,594 |
|
|
$ |
88,397 |
|
|
$ |
48,317 |
|
|
$ |
9,783 |
|
|
$ |
— |
|
|
$ |
206,706 |
|
|
|
|
|
|
|
|
|
|
|
|
|
|
|
|
|
| (1) Activity within Other represents equity commitments to the platform that have not yet been allocated to an investment strategy. |
The components of our AUM for the Credit Group are presented below ($ in billions):
|
|
|
|
|
|
|
|
|
|
|
|
|
|
|
|
|
|
|
|
|
|
|
FPAUM |
|
Non-fee paying(1) |
|
AUM not yet paying fees |
(1) Includes $14.6 billion and $12.0 billion of AUM of funds from which we indirectly earn management fees as of March 31, 2023 and 2022, respectively, and includes $1.3 billion and $1.2 billion of non-fee paying AUM based on our general partner commitment as of March 31, 2023 and 2022, respectively.
Credit Group—Fee Paying AUM
The tables below present rollforwards of fee paying AUM for the Credit Group ($ in millions):
|
|
|
|
|
|
|
|
|
|
|
|
|
|
|
|
|
|
|
|
|
|
|
|
|
|
|
|
|
|
|
|
|
|
|
|
|
|
|
|
|
|
|
|
|
|
|
|
|
|
|
|
|
|
|
|
|
|
|
|
|
|
|
|
|
|
|
|
|
|
|
|
|
|
|
|
|
|
|
|
|
|
|
|
|
|
|
|
|
|
|
|
|
|
|
|
|
|
|
|
|
|
|
|
|
|
|
|
|
|
|
|
|
|
|
|
|
|
|
|
|
|
|
|
|
|
|
|
|
|
|
|
|
|
|
|
|
|
|
|
|
|
|
|
|
|
|
|
|
|
|
|
|
|
|
|
|
|
|
|
|
|
|
|
|
|
|
|
|
|
|
|
|
|
|
|
|
|
|
|
|
|
|
|
|
|
|
|
|
|
|
|
|
|
|
|
|
|
|
|
|
|
|
|
|
|
|
|
|
|
|
|
|
|
|
|
|
|
|
|
|
|
|
|
|
|
|
|
|
|
|
|
|
|
|
|
|
|
|
|
|
|
|
|
|
|
|
|
|
|
|
|
|
|
|
|
|
|
|
|
|
|
|
|
|
|
|
|
|
|
|
|
|
|
|
|
|
|
|
|
|
|
|
|
|
|
|
|
|
|
|
|
|
|
|
|
|
|
|
|
|
|
|
|
|
|
|
|
|
|
|
|
|
|
|
|
|
|
|
|
|
|
|
|
|
|
|
|
|
|
|
|
|
|
|
|
|
|
|
|
|
|
|
|
|
|
|
|
|
|
|
|
|
|
|
|
|
|
|
|
|
|
|
|
|
|
|
|
|
|
|
|
|
|
|
|
|
|
|
|
|
|
|
|
|
|
|
|
|
|
|
|
|
|
|
|
|
|
Liquid Credit |
|
Alternative Credit |
|
U.S. Direct Lending |
|
European Direct Lending |
|
Asia
Credit |
|
|
|
Total Credit Group |
| Balance at 12/31/2022 |
$ |
42,191 |
|
|
$ |
15,904 |
|
|
$ |
57,568 |
|
|
$ |
29,561 |
|
|
$ |
6,051 |
|
|
|
|
$ |
151,275 |
|
|
|
|
|
|
|
|
|
|
|
|
|
|
|
| Commitments |
419 |
|
|
840 |
|
|
641 |
|
|
— |
|
|
— |
|
|
|
|
1,900 |
|
| Deployment/subscriptions/increase in leverage |
254 |
|
|
987 |
|
|
1,415 |
|
|
1,359 |
|
|
266 |
|
|
|
|
4,281 |
|
| Capital reductions |
(62) |
|
|
— |
|
|
(1,279) |
|
|
(3) |
|
|
(189) |
|
|
|
|
(1,533) |
|
| Distributions |
(105) |
|
|
(882) |
|
|
(738) |
|
|
(40) |
|
|
(374) |
|
|
|
|
(2,139) |
|
| Redemptions |
(544) |
|
|
(656) |
|
|
(92) |
|
|
(85) |
|
|
— |
|
|
|
|
(1,377) |
|
| Change in fund value |
479 |
|
|
68 |
|
|
384 |
|
|
414 |
|
|
(3) |
|
|
|
|
1,342 |
|
|
|
|
|
|
|
|
|
|
|
|
|
|
|
| Balance at 3/31/2023 |
$ |
42,632 |
|
|
$ |
16,261 |
|
|
$ |
57,899 |
|
|
$ |
31,206 |
|
|
$ |
5,751 |
|
|
|
|
$ |
153,749 |
|
|
|
|
|
|
|
|
|
|
|
|
|
|
|
|
|
Liquid Credit |
|
Alternative Credit |
|
U.S. Direct Lending |
|
European Direct Lending |
|
Asia
Credit |
|
|
|
Total Credit Group |
| Balance at 12/31/2021 |
$ |
38,673 |
|
|
$ |
8,742 |
|
|
$ |
46,128 |
|
|
$ |
23,847 |
|
|
$ |
4,720 |
|
|
|
|
$ |
122,110 |
|
|
|
|
|
|
|
|
|
|
|
|
|
|
|
| Commitments |
991 |
|
|
286 |
|
|
973 |
|
|
— |
|
|
1,472 |
|
|
|
|
3,722 |
|
| Deployment/subscriptions/increase in leverage |
6 |
|
|
2,454 |
|
|
2,473 |
|
|
1,986 |
|
|
455 |
|
|
|
|
7,374 |
|
| Capital reductions |
(73) |
|
|
(11) |
|
|
(1,344) |
|
|
(1,157) |
|
|
(11) |
|
|
|
|
(2,596) |
|
| Distributions |
(25) |
|
|
(223) |
|
|
(1,216) |
|
|
(237) |
|
|
(256) |
|
|
|
|
(1,957) |
|
| Redemptions |
(168) |
|
|
(147) |
|
|
(35) |
|
|
(46) |
|
|
— |
|
|
|
|
(396) |
|
| Change in fund value |
(361) |
|
|
14 |
|
|
208 |
|
|
(302) |
|
|
(119) |
|
|
|
|
(560) |
|
| Change in fee basis |
— |
|
|
— |
|
|
— |
|
|
— |
|
|
(836) |
|
|
|
|
(836) |
|
| Balance at 3/31/2022 |
$ |
39,043 |
|
|
$ |
11,115 |
|
|
$ |
47,187 |
|
|
$ |
24,091 |
|
|
$ |
5,425 |
|
|
|
|
$ |
126,861 |
|
|
|
|
|
|
|
|
|
|
|
|
|
|
|
|
|
The charts below present FPAUM for the Credit Group by its fee bases ($ in billions):
|
|
|
|
|
|
|
|
|
|
|
|
|
|
|
|
FPAUM: $153.7 |
|
FPAUM: $126.9 |
|
|
|
|
|
|
|
|
|
|
|
|
|
|
|
|
|
|
|
|
|
|
|
|
|
|
|
|
Invested capital |
|
Market value(1) |
|
Collateral balances (at par) |
|
Capital commitments |
|
|
(1)Includes $30.9 billion and $27.3 billion from funds that primarily invest in illiquid strategies as of March 31, 2023 and 2022, respectively. The underlying investments held in these funds are generally subject to less market volatility than investments held in liquid strategies.
Credit Group—Fund Performance Metrics as of March 31, 2023
ARCC contributed approximately 38% of the Credit Group’s total management fees for the three months ended March 31, 2023. In addition, eight other significant funds, CADC, SDL I, ACE IV, ACE V, PCS II, Pathfinder, SDL II and our open-ended core alternative credit fund, collectively contributed approximately 28% of the Credit Group’s management fees for the three months ended March 31, 2023.
The following table presents the performance data for our significant funds that are not drawdown funds in the Credit Group as of March 31, 2023 ($ in millions):
|
|
|
|
|
|
|
|
|
|
|
|
|
|
|
|
|
|
|
|
|
|
|
|
|
|
|
|
|
|
|
|
|
|
|
|
|
|
|
|
|
|
|
|
|
|
| |
|
|
|
|
|
|
|
Returns(%) |
|
|
|
Year of Inception |
|
AUM |
|
|
|
Quarter-To-Date |
|
Since Inception(1) |
|
Primary
Investment Strategy |
| Fund |
|
|
|
|
|
|
Gross |
|
Net |
|
Gross |
|
Net |
|
ARCC(2) |
2004 |
|
$ |
25,720 |
|
|
|
|
|
|
N/A |
|
2.9 |
|
N/A |
|
11.8 |
|
U.S. Direct Lending |
CADC(3) |
2017 |
|
4,373 |
|
|
|
|
|
|
N/A |
|
2.8 |
|
N/A |
|
5.4 |
|
U.S. Direct Lending |
|
|
|
|
|
|
|
|
|
|
|
|
|
|
|
|
|
|
|
|
|
|
|
|
|
|
|
|
|
|
|
|
|
|
|
|
(1)Since inception returns are annualized.
(2)Returns are time-weighted rates of return and include the reinvestment of income and other earnings from securities or other investments and reflect the deduction of all trading expenses. Net returns are calculated using the fund’s NAV and assume dividends are reinvested at the closest quarter-end NAV to the relevant quarterly ex-dividend dates. Additional information related to ARCC can be found in its filings with the SEC, which are not part of this report.
(3)Returns are time-weighted rates of return and include the reinvestment of income and other earnings from securities or other investments and reflect the deduction of all trading expenses. Returns are shown for institutional share class. Shares of other classes may have lower returns due to higher selling commissions and fees. Net returns are calculated using the fund’s NAV and assume distributions are reinvested at the NAV on the date of distribution. Additional information related to CADC can be found in its filings with the SEC, which are not part of this report.
The following table presents the performance data of our significant drawdown funds as of March 31, 2023 ($ in millions):
|
|
|
|
|
|
|
|
|
|
|
|
|
|
|
|
|
|
|
|
|
|
|
|
|
|
|
|
|
|
|
|
|
|
|
|
|
|
|
|
|
|
|
|
|
|
|
|
|
|
|
|
|
|
|
|
|
|
|
|
|
|
|
|
|
|
|
|
|
|
|
|
|
Year of Inception |
|
AUM |
|
Original Capital Commitments |
|
Capital Invested to Date |
|
Realized Value(1) |
|
Unrealized Value(2) |
|
Total Value |
|
MoIC |
|
IRR(%) |
|
Primary Investment Strategy |
| Fund |
|
|
|
|
|
|
|
Gross(3) |
|
Net(4) |
|
Gross(5) |
|
Net(6) |
|
| Fund Harvesting Investment |
|
|
|
|
|
|
|
|
|
|
|
|
|
|
|
|
|
|
|
|
| SDL I Unlevered |
2018 |
|
$ |
5,168 |
|
|
$ |
922 |
|
|
$ |
872 |
|
|
$ |
224 |
|
|
$ |
765 |
|
|
$ |
989 |
|
|
1.2x |
|
1.2x |
|
8.3 |
|
6.3 |
|
U.S. Direct Lending |
| SDL I Levered |
|
|
2,045 |
|
|
2,022 |
|
|
716 |
|
|
1,781 |
|
|
2,497 |
|
|
1.3x |
|
1.2x |
|
14.9 |
|
10.8 |
|
ACE IV Unlevered(7) |
2018 |
|
10,208 |
|
|
2,851 |
|
|
2,265 |
|
|
564 |
|
|
2,176 |
|
|
2,740 |
|
|
1.3x |
|
1.2x |
|
8.5 |
|
6.1 |
|
European Direct Lending |
ACE IV Levered(7) |
|
|
4,819 |
|
|
3,848 |
|
|
1,230 |
|
|
3,838 |
|
|
5,068 |
|
|
1.4x |
|
1.3x |
|
12.4 |
|
9.1 |
|
| Funds Deploying Capital |
|
|
|
|
|
|
|
|
|
|
|
|
|
|
|
|
|
|
|
|
|
|
|
|
|
|
|
|
|
|
|
|
|
|
|
|
|
|
|
|
|
|
|
|
|
|
|
|
|
|
|
|
|
|
|
|
|
|
|
|
|
|
|
|
|
|
|
ACE V Unlevered(8) |
2020 |
|
16,846 |
|
|
7,026 |
|
|
5,101 |
|
|
216 |
|
|
5,320 |
|
|
5,536 |
|
|
1.1x |
|
1.1x |
|
11.7 |
|
8.6 |
|
European Direct Lending |
ACE V Levered(8) |
|
|
6,376 |
|
|
4,642 |
|
|
314 |
|
|
4,945 |
|
|
5,259 |
|
|
1.2x |
|
1.1x |
|
18.9 |
|
13.2 |
|
| PCS II |
2020 |
|
5,291 |
|
|
5,114 |
|
|
3,170 |
|
|
99 |
|
|
3,111 |
|
|
3,210 |
|
|
1.0x |
|
1.0x |
|
3.3 |
|
1.1 |
|
U.S. Direct Lending |
| Pathfinder |
2020 |
|
4,026 |
|
|
3,683 |
|
|
2,246 |
|
|
140 |
|
|
2,479 |
|
|
2,619 |
|
|
1.2x |
|
1.2x |
|
18.7 |
|
13.3 |
|
Alternative Credit |
| SDL II Unlevered |
2021 |
|
13,751 |
|
|
1,989 |
|
|
995 |
|
|
47 |
|
|
1,006 |
|
|
1,053 |
|
|
1.1x |
|
1.1x |
|
10.3 |
|
7.6 |
|
U.S. Direct Lending |
| SDL II Levered |
|
|
6,047 |
|
|
2,778 |
|
|
246 |
|
|
2,804 |
|
|
3,050 |
|
|
1.1x |
|
1.1x |
|
18.1 |
|
13.0 |
|
Open-ended core alternative credit fund(9) |
2021 |
|
3,509 |
|
|
3,479 |
|
|
2,213 |
|
|
100 |
|
|
2,241 |
|
|
2,341 |
|
|
1.1x |
|
1.1x |
|
9.8 |
|
|
7.1 |
|
|
Alternative Credit |
(1)Realized value represents the sum of all cash distributions to all partners and if applicable, exclude tax and incentive distributions made to the general partner.
(2)Unrealized value represents the fund’s NAV reduced by the accrued incentive allocation, if applicable. There can be no assurance that unrealized values will be realized at the valuations indicated.
(3)The gross multiple of invested capital (“MoIC”) is calculated at the fund-level and is based on the interests of the fee-paying limited partners and if applicable, excludes interests attributable to the non-fee paying limited partners and/or the general partner which does not pay management fees or carried interest. The gross MoIC is before giving effect to management fees, carried interest and other expenses, as applicable, but after giving effect to credit facility interest expenses, as applicable. The funds may utilize a credit facility during the investment period and for general cash management purposes. Early in the life of a fund, the gross fund-level MoICs would generally have been lower had such fund called capital from its limited partners instead of utilizing the credit facility.
(4)The net MoIC is calculated at the fund-level and is based on the interests of the fee-paying limited partners and if applicable, excludes those interests attributable to the non-fee paying limited partners and/or the general partner which does not pay management fees or carried interest. The net MoIC is after giving effect to management fees and carried interest, other expenses and credit facility interest expenses, as applicable. The funds may utilize a credit facility during the investment period and for general cash management purposes. Early in the life of a fund, the net fund-level MoICs would generally have been lower had such fund called capital from its limited partners instead of utilizing the credit facility.
(5)The gross IRR is an annualized since inception gross internal rate of return of cash flows to and from the fund and the fund’s residual value at the end of the measurement period. Gross IRR reflects returns to the fee-paying limited partners and, if applicable, excludes interests attributable to the non-fee paying limited partners and/or the general partner which does not pay management fees or carried interest. The cash flow dates used in the gross IRR calculation are based on the actual dates of the cash flows. The gross IRRs are calculated before giving effect to management fees, carried interest and other expenses, as applicable, but after giving effect to credit facility interest expenses, as applicable. The funds may utilize a credit facility during the investment period and for general cash management purposes. Gross fund-level IRRs would generally have been lower had such fund called capital from its limited partners instead of utilizing the credit facility.
(6)The net IRR is an annualized since inception net internal rate of return of cash flows to and from the fund and the fund’s residual value at the end of the measurement period. Net IRRs reflect returns to the fee-paying limited partners and, if applicable, exclude interests attributable to the non-fee paying limited partners and/or the general partner which does not pay management fees or carried interest. The cash flow dates used in the net IRR calculations are based on the actual dates of the cash flows. The net IRRs are calculated after giving effect to management fees and carried interest, other expenses and credit facility interest expenses, as applicable. The funds may utilize a credit facility during the investment period and for general cash management purposes. Net fund-level IRRs would generally have been lower had such fund called capital from its limited partners instead of utilizing the credit facility.
(7)ACE IV is made up of four parallel funds, two denominated in Euros and two denominated in pound sterling: ACE IV (E) Unlevered, ACE IV (G) Unlevered, ACE IV (E) Levered and ACE IV (G) Levered. The gross and net IRR and MoIC presented in the table are for ACE IV (E) Unlevered and ACE IV (E) Levered. Metrics for ACE IV (E) Levered are inclusive of a U.S. dollar denominated feeder fund, which has not been presented separately The gross and net IRR for ACE IV (G) Unlevered are 10.0% and 7.3%, respectively. The gross and net MoIC for ACE IV (G) Unlevered are 1.3x and 1.2x, respectively. The gross and net IRR for ACE IV (G) Levered are 13.7% and 9.9%, respectively. The gross and net MoIC for ACE IV (G) Levered are 1.5x and 1.3x, respectively. Original capital commitments are converted to U.S. dollars at the prevailing exchange rate at the time of the fund’s closing. All other values for ACE IV Unlevered and ACE IV Levered are for the combined levered and unlevered parallel funds and are converted to U.S. dollars at the prevailing quarter-end exchange rate.
(8)ACE V is made up of four parallel funds, two denominated in Euros and two denominated in pound sterling: ACE V (E) Unlevered, ACE V (G) Unlevered, ACE V (E) Levered, and ACE V (G) Levered, and two feeder funds: ACE V (D) Levered and ACE V (Y) Unlevered. ACE V (E) Levered includes the ACE V (D) Levered feeder fund and ACE V (E) Unlevered includes the ACE V (Y) Unlevered feeder fund. The gross and net IRR and gross and net MoIC presented in the table are for ACE V (E) Unlevered and ACE V (E) Levered. Metrics for ACE V (E) Levered exclude the ACE V (D) Levered feeder fund and metrics for ACE V (E) Unlevered exclude the ACE V (Y) Unlevered feeder fund. The gross and net IRR for ACE V (G) Unlevered are 13.9% and 10.2%, respectively. The gross and net MoIC for ACE V (G) Unlevered are 1.1x and 1.1x, respectively. The gross and net IRR for ACE V (G) Levered are 19.5% and 13.9%, respectively. The gross and net MoIC for ACE V (G) Levered are 1.2x and 1.1x, respectively. The gross and net IRR for ACE V (D) Levered are 17.6% and 12.7%, respectively. The gross and net MoIC for ACE V (D) Levered are 1.2x and 1.1x, respectively. The gross and net IRR for ACE V (Y) Unlevered are 12.1% and 8.7%, respectively. The gross and net MoIC for ACE V (Y) Unlevered are 1.1x and 1.1x, respectively. Original capital commitments are converted to U.S. dollars at the prevailing exchange rate at the time of the fund's closing. All other values for ACE V Unlevered and ACE V Levered are for the combined levered and unlevered parallel funds and are converted to U.S. dollars at the prevailing quarter-end exchange rate.
(9)Performance for the open-ended core alternative credit fund, a perpetual capital vehicle, is presented as a drawdown fund as investor commitments to the fund are drawn sequentially in order of closing date, typically over a period of approximately 12 to 18 months. The fund is made up of a Class M (“Main Class”) and a Class C (“Constrained Class”). The Main Class includes investors electing to participate in all investments and the Constrained Class includes investors electing to be excluded from exposure to liquid investments. The gross and net IRR and gross and net MoIC presented in the table are for the Main Class. The gross and net IRRs for the Constrained Class are 9.7% and 7.0%, respectively. The gross and net MoIC for the Constrained Class are 1.1x and 1.1.x, respectively.
Private Equity Group—Three Months Ended March 31, 2023 Compared to Three Months Ended March 31, 2022
Fee Related Earnings:
The following table presents the components of the Private Equity Group’s FRE ($ in thousands):
|
|
|
|
|
|
|
|
|
|
|
|
|
|
|
|
|
|
|
|
|
|
|
|
|
|
|
|
|
|
|
|
|
|
|
|
|
|
|
|
|
|
|
|
|
|
|
|
|
|
|
|
|
Three months ended March 31, |
|
Favorable (Unfavorable) |
|
|
|
|
|
|
|
|
|
2023 |
|
2022 |
|
$ Change |
|
% Change |
| Management fees |
|
|
|
|
|
|
|
|
$ |
54,657 |
|
|
$ |
45,957 |
|
|
$ |
8,700 |
|
|
19% |
| Other fees |
|
|
|
|
|
|
|
|
673 |
|
|
297 |
|
|
376 |
|
|
127 |
| Compensation and benefits |
|
|
|
|
|
|
|
|
(22,310) |
|
|
(19,566) |
|
|
(2,744) |
|
|
(14) |
| General, administrative and other expenses |
|
|
|
|
|
|
|
|
(9,566) |
|
|
(6,288) |
|
|
(3,278) |
|
|
(52) |
| Fee Related Earnings |
|
|
|
|
|
|
|
|
$ |
23,454 |
|
|
$ |
20,400 |
|
|
3,054 |
|
|
15 |
Management Fees. The chart below presents Private Equity Group management fees and effective management fee rates ($ in millions):
Management fees increased for the three months ended March 31, 2023 compared to the three months ended March 31, 2022 primarily driven by deployment in Ares Special Opportunities Fund II, L.P. (“ASOF II”), which contributed $11.2 million to the increase in management fees. Management fees from ACOF IV decreased by $1.5 million for the three months ended March 31, 2023 compared to three months ended March 31, 2022 as the fund stopped paying fees during the fourth quarter of 2022.
The increase in effective management fee rate for the three months ended March 31, 2023 compared to the same period in 2022 was primarily driven by deployment of capital in ASOF II, which has a higher effective management fee rate than the Private Equity Group’s average effective management fee rate.
Compensation and Benefits. The increase in compensation and benefits was primarily driven by non-recurring payments of $2.0 million during the three months ended March 31, 2023 compared to the same period in 2022. The increase in compensation and benefits was also driven by headcount growth as we added professionals to support our growing special opportunities platform. Average headcount for the quarter-to-date period increased by 11% to 128 investment and investment support professionals for the 2023 period from 115 professionals for the same period in 2022.
General, Administrative and Other Expenses. Travel and marketing collectively increased by $1.0 million for the three months ended March 31, 2023 compared to the same period in 2022 due to the timing of annual marketing events that occurred during the three months ended March 31, 2023 but were held in the second quarter in the previous year. In connection with our fundraising efforts, amortization of placement fees increased by $1.1 million for the three months ended March 31, 2023 compared to the same period in 2022, primarily driven by the amortization of new commitments to ASOF II and ACOF VI subsequent to the first quarter of 2022.
Realized Income:
The following table presents the components of the Private Equity Group’s RI ($ in thousands):
|
|
|
|
|
|
|
|
|
|
|
|
|
|
|
|
|
|
|
|
|
|
|
|
|
|
|
|
|
|
|
|
|
|
|
|
|
Three months ended March 31, |
|
Favorable (Unfavorable) |
|
|
|
|
|
|
|
|
|
2023 |
|
2022 |
|
$ Change |
|
% Change |
| Fee Related Earnings |
|
|
|
|
|
|
|
|
$ |
23,454 |
|
|
$ |
20,400 |
|
|
$ |
3,054 |
|
|
15% |
| Performance income—realized |
|
|
|
|
|
|
|
|
18,457 |
|
|
2,212 |
|
|
16,245 |
|
|
NM |
| Performance related compensation—realized |
|
|
|
|
|
|
|
|
(15,104) |
|
|
(1,786) |
|
|
(13,318) |
|
|
NM |
| Realized net performance income |
|
|
|
|
|
|
|
|
3,353 |
|
|
426 |
|
|
2,927 |
|
|
NM |
| Investment income—realized |
|
|
|
|
|
|
|
|
879 |
|
|
1,603 |
|
|
(724) |
|
|
(45) |
| Interest and other investment income—realized |
|
|
|
|
|
|
|
|
1,861 |
|
|
1,502 |
|
|
359 |
|
|
24 |
| Interest expense |
|
|
|
|
|
|
|
|
(5,615) |
|
|
(3,373) |
|
|
(2,242) |
|
|
(66) |
| Realized net investment loss |
|
|
|
|
|
|
|
|
(2,875) |
|
|
(268) |
|
|
(2,607) |
|
|
NM |
| Realized Income |
|
|
|
|
|
|
|
|
$ |
23,932 |
|
|
$ |
20,558 |
|
|
3,374 |
|
|
16 |
Realized net performance income for the three months ended March 31, 2023 was primarily attributable to realized gains from the partial sale of ACOF IV’s investment in AZEK.
Realized net investment loss for the three months ended March 31, 2023 and 2022 largely represents interest expense exceeding net gains during these periods. Interest expense, which is allocated based on the cost basis of balance sheet investments, increased over the comparative periods primarily due to rising SOFR rates and a higher average outstanding balance of the Credit Facility.
Private Equity Group—Performance Income
The following table presents the accrued carried interest, also referred to as accrued performance income, and related performance compensation for the Private Equity Group ($ in thousands):
|
|
|
|
|
|
|
|
|
|
|
|
|
|
|
|
|
|
|
|
|
|
|
|
|
|
|
|
|
|
|
|
|
|
|
|
| |
As of March 31, 2023 |
|
As of December 31, 2022 |
|
|
|
|
|
|
|
Accrued Performance Income |
|
Accrued Performance Compensation |
|
Accrued Net Performance Income |
|
Accrued Performance Income |
|
Accrued Performance Compensation |
|
Accrued Net Performance Income |
|
|
|
|
|
|
|
|
|
|
|
|
| ACOF IV |
$ |
264,974 |
|
|
$ |
211,979 |
|
|
$ |
52,995 |
|
|
$ |
282,624 |
|
|
$ |
226,099 |
|
|
$ |
56,525 |
|
| ACOF V |
706,500 |
|
|
565,199 |
|
|
141,301 |
|
|
742,962 |
|
|
594,369 |
|
|
148,593 |
|
| ACOF VI |
157,279 |
|
|
125,823 |
|
|
31,456 |
|
|
147,185 |
|
|
117,748 |
|
|
29,437 |
|
| ASOF I |
350,961 |
|
|
245,672 |
|
|
105,289 |
|
|
326,471 |
|
|
228,529 |
|
|
97,942 |
|
|
|
|
|
|
|
|
|
|
|
|
|
| Other funds |
162,014 |
|
|
113,988 |
|
|
48,026 |
|
|
108,997 |
|
|
75,583 |
|
|
33,414 |
|
| Total Private Equity Group |
$ |
1,641,728 |
|
|
$ |
1,262,661 |
|
|
$ |
379,067 |
|
|
$ |
1,608,239 |
|
|
$ |
1,242,328 |
|
|
$ |
365,911 |
|
The following table presents the change in accrued carried interest for the Private Equity Group ($ in thousands):
|
|
|
|
|
|
|
|
|
|
|
|
|
|
|
|
|
|
|
|
|
|
|
|
|
|
|
|
|
|
|
|
|
|
|
|
|
|
|
|
| |
|
|
|
As of December 31, 2022 |
|
Activity during the period |
|
As of March 31, 2023 |
|
|
Waterfall Type |
|
Accrued Carried Interest |
|
Change in Unrealized |
|
Realized |
|
Other Adjustments |
|
Accrued Carried
Interest |
|
|
|
|
|
|
|
|
|
|
|
|
|
|
|
| ACOF IV |
|
American |
|
$ |
282,624 |
|
|
$ |
(264) |
|
|
$ |
(17,386) |
|
|
$ |
— |
|
|
$ |
264,974 |
|
|
| ACOF V |
|
American |
|
742,962 |
|
|
(36,462) |
|
|
— |
|
|
— |
|
|
706,500 |
|
|
| ACOF VI |
|
American |
|
147,185 |
|
|
10,094 |
|
|
— |
|
|
— |
|
|
157,279 |
|
|
| ASOF I |
|
European |
|
326,471 |
|
|
25,307 |
|
|
(817) |
|
|
— |
|
|
350,961 |
|
|
| Other funds |
|
European |
|
92,509 |
|
|
51,618 |
|
|
(254) |
|
|
3,782 |
|
|
147,655 |
|
|
| Other funds |
|
American |
|
16,488 |
|
|
(2,129) |
|
|
— |
|
|
— |
|
|
14,359 |
|
|
| Total Private Equity Group |
|
|
|
$ |
1,608,239 |
|
|
$ |
48,164 |
|
|
$ |
(18,457) |
|
|
$ |
3,782 |
|
|
$ |
1,641,728 |
|
|
Private Equity Group—Assets Under Management
The tables below present rollforwards of AUM for the Private Equity Group ($ in millions):
|
|
|
|
|
|
|
|
|
|
|
|
|
|
|
|
|
|
|
|
|
|
|
|
|
|
|
|
|
|
|
|
|
|
|
|
|
|
|
|
|
|
|
|
|
|
|
|
|
|
|
|
|
|
|
|
|
|
|
|
|
|
|
|
|
|
|
|
|
|
|
|
|
|
|
|
|
|
|
|
|
|
|
|
|
|
|
|
|
|
|
|
|
|
|
|
|
|
|
|
|
|
|
|
|
|
|
|
|
|
|
|
|
|
|
|
|
|
|
|
|
|
|
|
|
|
|
|
|
|
|
|
|
|
|
|
|
|
|
|
|
|
|
|
|
|
|
|
|
|
|
|
|
|
|
|
|
|
|
|
|
Corporate Private Equity |
|
Special Opportunities |
|
Total Private Equity Group |
| Balance at 12/31/2022 |
$ |
21,029 |
|
|
$ |
13,720 |
|
|
$ |
34,749 |
|
|
|
|
|
|
|
| Net new par/equity commitments |
50 |
|
|
— |
|
|
50 |
|
|
|
|
|
|
|
| Capital reductions |
(3) |
|
|
— |
|
|
(3) |
|
| Distributions |
(266) |
|
|
(61) |
|
|
(327) |
|
|
|
|
|
|
|
| Change in fund value |
(154) |
|
|
332 |
|
|
178 |
|
| Balance at 3/31/2023 |
$ |
20,656 |
|
|
$ |
13,991 |
|
|
$ |
34,647 |
|
|
|
|
|
|
|
|
|
|
Corporate Private Equity |
|
Special Opportunities |
|
Total Private Equity Group |
| Balance at 12/31/2021 |
$ |
21,639 |
|
|
$ |
11,765 |
|
|
$ |
33,404 |
|
|
|
|
|
|
|
| Net new par/equity commitments |
— |
|
|
570 |
|
|
570 |
|
|
|
|
|
|
|
| Capital reductions |
(3) |
|
|
— |
|
|
(3) |
|
| Distributions |
(285) |
|
|
(98) |
|
|
(383) |
|
|
|
|
|
|
|
| Change in fund value |
(145) |
|
|
122 |
|
|
(23) |
|
| Balance at 3/31/2022 |
$ |
21,206 |
|
|
$ |
12,359 |
|
|
$ |
33,565 |
|
The components of our AUM for the Private Equity Group are presented below ($ in billions):
|
|
|
|
|
|
|
|
|
|
|
|
|
|
|
|
|
|
|
FPAUM |
|
Non-fee paying(1) |
|
AUM not yet paying fees |
(1) Includes $1.3 billion of non-fee paying AUM based on our general partner commitment as of March 31, 2023 and 2022.
Private Equity Group—Fee Paying AUM
The tables below present rollforwards of fee paying AUM for the Private Equity Group ($ in millions):
|
|
|
|
|
|
|
|
|
|
|
|
|
|
|
|
|
|
|
|
|
|
|
|
|
|
|
|
|
|
|
|
|
|
|
|
|
|
|
|
|
|
|
|
|
|
|
|
|
|
|
|
|
|
|
|
|
|
|
|
|
|
|
|
|
|
|
|
|
|
|
|
|
|
|
|
|
|
|
|
|
|
|
|
|
|
|
|
|
|
|
|
|
|
|
|
|
|
|
|
|
|
|
|
|
|
|
|
|
|
|
|
|
|
|
|
|
|
|
|
|
|
|
|
|
|
|
|
|
|
|
|
|
|
|
|
|
|
|
|
|
|
|
|
|
|
|
|
|
|
|
|
|
|
|
|
|
|
|
|
|
|
|
|
|
|
|
|
|
|
|
|
Corporate Private Equity |
|
Special Opportunities |
|
Total Private Equity Group |
| Balance at 12/31/2022 |
$ |
11,281 |
|
|
$ |
7,166 |
|
|
$ |
18,447 |
|
|
|
|
|
|
|
|
|
|
|
|
|
| Deployment/subscriptions/increase in leverage |
— |
|
|
703 |
|
|
703 |
|
|
|
|
|
|
|
| Distributions |
— |
|
|
(400) |
|
|
(400) |
|
|
|
|
|
|
|
|
|
|
|
|
|
|
|
|
|
|
|
| Balance at 3/31/2023 |
$ |
11,281 |
|
|
$ |
7,469 |
|
|
$ |
18,750 |
|
|
|
|
|
|
|
|
|
|
Corporate Private Equity |
|
Special Opportunities |
|
Total Private Equity Group |
| Balance at 12/31/2021 |
$ |
12,473 |
|
|
$ |
4,216 |
|
|
$ |
16,689 |
|
|
|
|
|
|
|
|
|
|
|
|
|
| Deployment/subscriptions/increase in leverage |
17 |
|
|
98 |
|
|
115 |
|
|
|
|
|
|
|
| Distributions |
(87) |
|
|
(359) |
|
|
(446) |
|
|
|
|
|
|
|
|
|
|
|
|
|
| Change in fee basis |
(217) |
|
|
— |
|
|
(217) |
|
| Balance at 3/31/2022 |
$ |
12,186 |
|
|
$ |
3,955 |
|
|
$ |
16,141 |
|
The charts below present FPAUM for the Private Equity Group by its fee bases ($ in billions):
|
|
|
|
|
|
|
|
|
|
|
|
|
|
|
|
FPAUM: $18.8 |
|
FPAUM: $16.1 |
|
|
|
|
|
|
|
|
|
|
|
|
|
|
|
|
|
|
|
|
|
|
Invested capital |
|
|
Capital commitments |
|
Private Equity Group—Fund Performance Metrics as of March 31, 2023
Four significant funds, ACOF V, ASOF I, ACOF VI and ASOF II, collectively contributed approximately 88% of the Private Equity Group’s management fees for the three months ended March 31, 2023.
The following table presents the performance data of our significant drawdown funds as of March 31, 2023 ($ in millions):
|
|
|
|
|
|
|
|
|
|
|
|
|
|
|
|
|
|
|
|
|
|
|
|
|
|
|
|
|
|
|
|
|
|
|
|
|
|
|
|
|
|
|
|
|
|
|
|
|
|
|
|
|
|
|
|
|
|
|
|
|
|
|
|
|
|
|
|
|
|
|
|
|
Year of Inception |
|
AUM |
|
Original Capital Commitments |
|
Capital Invested to Date |
|
Realized Value(1) |
|
Unrealized Value(2) |
|
Total Value |
|
MoIC |
|
IRR(%) |
|
Primary Investment Strategy |
| Fund |
|
|
|
|
|
|
|
Gross(3) |
|
Net(4) |
|
Gross(5) |
|
Net(6) |
|
| Fund Harvesting Investments |
|
|
|
|
|
|
|
|
|
|
|
|
|
|
|
|
|
|
|
|
|
|
|
|
|
|
|
|
|
|
|
|
|
|
|
|
|
|
|
|
|
|
|
|
|
|
| ACOF V |
2017 |
|
$ |
9,014 |
|
|
$ |
7,850 |
|
|
$ |
7,415 |
|
|
$ |
3,428 |
|
|
$ |
8,308 |
|
|
$ |
11,736 |
|
|
1.6x |
|
1.4x |
|
13.8 |
|
9.4 |
|
Corporate Private Equity |
| Funds Deploying Capital |
|
|
|
|
|
|
|
|
|
|
|
|
|
|
|
|
|
|
|
|
|
|
| ASOF I |
2019 |
|
5,626 |
|
|
3,518 |
|
|
5,390 |
|
|
3,641 |
|
|
4,154 |
|
|
7,795 |
|
|
1.7x |
|
1.6x |
|
30.0 |
|
23.2 |
|
Special Opportunities |
| ACOF VI |
2020 |
|
6,531 |
|
|
5,743 |
|
|
4,283 |
|
|
358 |
|
|
5,048 |
|
|
5,406 |
|
|
1.2x |
|
1.2x |
|
23.1 |
|
16.0 |
|
Corporate Private Equity |
| ASOF II |
2021 |
|
6,977 |
|
|
7,128 |
|
|
3,986 |
|
|
466 |
|
|
3,464 |
|
|
3,930 |
|
|
1.0x |
|
0.9x |
|
NM |
|
NM |
|
Special Opportunities |
(1)Realized value represents the sum of all cash dividends, interest income, other fees and cash proceeds from realizations of interests in portfolio investments. Realized value excludes any proceeds related to bridge financings.
(2)Unrealized value represents the fair market value of remaining investments. Unrealized value does not take into account any bridge financings. There can be no assurance that unrealized investments will be realized at the valuations indicated.
(3)The gross MoIC is calculated at the fund-level and is based on the interests of the fee-paying limited partners and if applicable, excludes interests attributable to the non-fee paying limited partners and/or the general partner which does not pay management fees or carried interest. The gross MoIC is before giving effect to management fees, carried interest as applicable, and other expenses, but after giving effect to credit facility interest expenses, as applicable. The gross MoICs are also calculated before giving effect to any bridge financings. The funds may utilize a credit facility during the investment period and for general cash management purposes. Early in the life of a fund, the gross fund-level MoICs would generally have been lower had such fund called capital from its limited partners instead of utilizing the credit facility.
(4)The net MoIC is calculated at the fund-level. The net MoIC is based on the interests of the fee-paying limited partners and if applicable, excludes interests attributable to the non-fee paying limited partners and/or the general partner which does not pay management fees or performance fees. The net MoIC is after giving effect to management fees, carried interest, as applicable, and other expenses. The net MoICs are also calculated before giving effect to any bridge financings. Inclusive of bridge financings, the net MoIC would be 1.3x for ACOF V and 1.1x for ACOF VI. The funds may utilize a credit facility during the investment period and for general cash management purposes. Early in the life of a fund, the net fund-level MoICs would generally have been lower had such fund called capital from its limited partners instead of utilizing the credit facility.
(5)The gross IRR is an annualized since inception gross internal rate of return of cash flows to and from the fund’s residual value at the end of the measurement period. Gross IRRs reflect returns to the fee-paying limited partners and, if applicable, excludes interests attributable to the non-fee paying limited partners and/or the general partner which does not pay management fees or carried interest. The cash flow dates used in the gross IRR calculation are based on the actual dates of the cash flows. The gross IRRs are calculated before giving effect to management fees, carried interest, as applicable, and other expenses, but after giving effect to credit facility interest expenses, as applicable. The gross IRRs are also calculated before giving effect to any bridge financings. The funds may utilize a credit facility during the investment period and for general cash management purposes. Gross fund-level IRRs would generally have been lower had such fund called capital from its limited partners instead of utilizing the credit facility.
(6)The net IRR is an annualized since inception net internal rate of return of cash flows to and from the fund and the fund’s residual value at the end of the measurement period. Net IRRs reflect returns to the fee-paying limited partners and if applicable, exclude interests attributable to the non-fee paying limited partners and/or the general partner which does not pay management fees or carried interest. The cash flow dates used in the net IRR calculation are based on the actual dates of the cash flows. The net IRRs are calculated after giving effect to management fees, carried interest as applicable, and other expenses and exclude commitments by the general partner and Schedule I investors who do not pay either management fees or carried interest. The funds may utilize a credit facility during the investment period and for general cash management purposes. Net fund-level IRRs would generally have been lower had such fund called capital from its limited partners instead of utilizing the credit facility. The net IRRs are also calculated before giving effect to any bridge financings. Inclusive of bridge financings, the net IRRs would be 9.5% for ACOF V and 14.6% for ACOF VI.
Real Assets Group—Three Months Ended March 31, 2023 Compared to Three Months Ended March 31, 2022
Fee Related Earnings:
The following table presents the components of the Real Assets Group’s FRE ($ in thousands):
|
|
|
|
|
|
|
|
|
|
|
|
|
|
|
|
|
|
|
|
|
|
|
|
|
|
|
|
|
|
|
|
|
|
|
|
|
|
|
|
|
|
|
|
|
|
|
|
|
|
|
|
|
Three months ended March 31, |
|
Favorable (Unfavorable) |
|
|
|
|
|
|
|
|
|
2023 |
|
2022 |
|
$ Change |
|
% Change |
| Management fees |
|
|
|
|
|
|
|
|
$ |
97,470 |
|
|
$ |
72,487 |
|
|
$ |
24,983 |
|
|
34% |
| Fee related performance revenues |
|
|
|
|
|
|
|
|
— |
|
|
358 |
|
|
(358) |
|
|
(100) |
| Other fees |
|
|
|
|
|
|
|
|
6,462 |
|
|
7,866 |
|
|
(1,404) |
|
|
(18) |
| Compensation and benefits |
|
|
|
|
|
|
|
|
(37,986) |
|
|
(33,637) |
|
|
(4,349) |
|
|
(13) |
| General, administrative and other expenses |
|
|
|
|
|
|
|
|
(12,284) |
|
|
(7,637) |
|
|
(4,647) |
|
|
(61) |
| Fee Related Earnings |
|
|
|
|
|
|
|
|
$ |
53,662 |
|
|
$ |
39,437 |
|
|
14,225 |
|
|
36 |
Management Fees. The chart below presents Real Assets Group management fees and effective management fee rates ($ in millions):
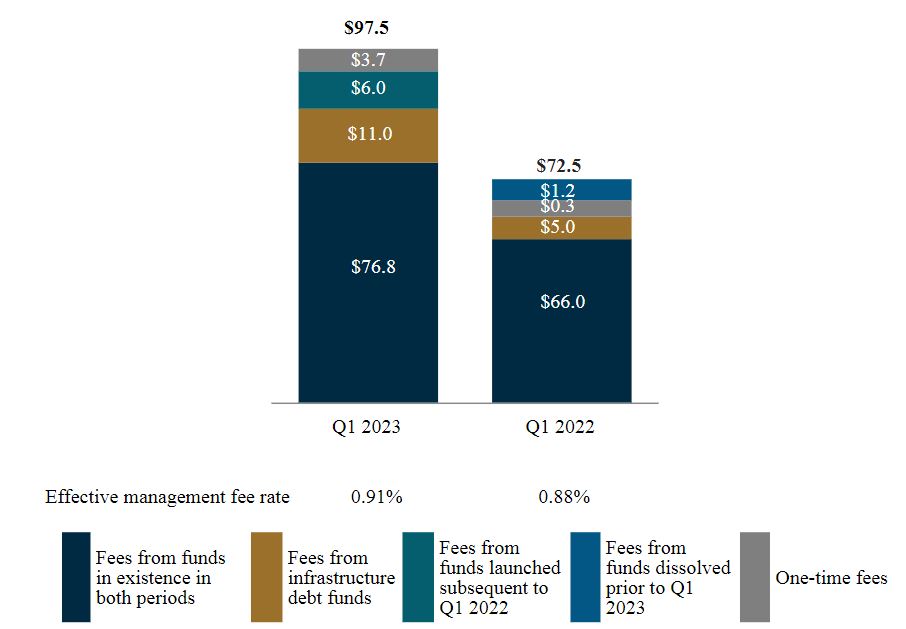
Management fees from Ares Real Estate Income Trust, Inc. (“AREIT”) and Ares Industrial Real Estate Income Trust, Inc. (“AIREIT”) collectively increased by $8.0 million due to additional capital raised in these funds. Management fees from Infrastructure Debt Fund IV (“IDF IV”) and IDF V collectively increased by $5.2 million for the three months ended March 31, 2023 compared to the three months ended March 31, 2022, primarily due to fees earned for the full period following the close of the Infrastructure Debt Acquisition on February 10, 2022 and deployment within IDF V. Excluding one-time catch-up fees of $0.2 million for the three months ended March 31, 2023, management fees from our sixth European real estate equity fund increased by $2.5 million for the three months ended March 31, 2023 compared to the same period in 2022. Excluding one-time catch-up fees of $0.3 million for the three months ended March 31, 2022, management fees from Ares U.S. Real Estate Fund X, L.P. (“US X”) increased by $3.1 million for the three months ended March 31, 2023 compared to the same period in 2022. The increase in management fees over the comparative periods from our sixth European real estate equity fund and US X was driven by new commitments to those funds. Excluding one-time catch-up fees of $0.2 million, the launch of our fourth U.S. opportunistic real estate equity fund contributed $1.9 million to the increase in management fees for the three months ended March 31, 2023 compared to the three months ended March 31, 2022. Our most recent real estate equity funds pay a fee on committed capital that increases once that capital is invested.
Management fees for the three months ended March 31, 2023 also included one-time make-whole termination fees of $3.3 million driven by the early termination of the advisory agreements of two U.S. real estate equity funds, which resulted in the acceleration of contractual management fees.
The increase in effective management fee rate for the three months ended March 31, 2023 compared to the three months ended March 31, 2022 was primarily due to additional capital raised in our non-traded REITs, which have effective management fee rates between 1.10% and 1.25%.
Other Fees. The decrease in other fees for the three months ended March 31, 2023 compared to the same period in 2022 primarily resulted from a $1.0 million decrease in program administration fees, which are advisory services fees resulting from the management and creation of our 1031 exchange program that is used by our non-traded REITs.
Compensation and Benefits. The increase in compensation and benefits was primarily driven by headcount growth to support the expansion of our business as we added professionals to our growing U.S. real estate equity and infrastructure debt platforms. Average headcount for the quarter-to-date period increased by 25% to 347 investment and investment support professionals for three months ended March 31, 2023 from 278 professionals for the same period in 2022. The increase in compensation and benefits was partially offset by lower incentive-based compensation that we believe will increase throughout the year and exceed prior year levels.
General, Administrative and Other Expenses. Travel and marketing collectively increased by $1.6 million for the three months ended March 31, 2023 compared to the same period in 2022, driven by continued increase in marketing and communication efforts driven by more meetings and events with an expanding group of investors. In connection with our fundraising efforts, amortization of placement fees increased by $0.9 million for the three months ended March 31, 2023 compared to the same period in 2022, primarily attributable to new commitments to US X and IDF V. Certain expenses, primarily the occupancy costs, information technology and information services, have also increased by $1.0 million for the three months ended March 31, 2023 compared to the same period in 2022, to support the expanding platform. Expenses for the three months ended March 31, 2023 also reflect the full period following the Infrastructure Debt Acquisition.
Realized Income:
The following table presents the components of the Real Assets Group’s RI ($ in thousands):
|
|
|
|
|
|
|
|
|
|
|
|
|
|
|
|
|
|
|
|
|
|
|
|
|
|
|
|
|
|
|
|
|
|
|
|
|
Three months ended March 31, |
|
Favorable (Unfavorable) |
|
|
|
|
|
|
|
|
|
|
|
|
|
2023 |
|
2022 |
|
$ Change |
|
% Change |
| Fee Related Earnings |
|
|
|
|
|
|
|
|
$ |
53,662 |
|
|
$ |
39,437 |
|
|
$ |
14,225 |
|
|
36% |
| Performance income—realized |
|
|
|
|
|
|
|
|
6,086 |
|
|
34,293 |
|
|
(28,207) |
|
|
(82) |
| Performance related compensation—realized |
|
|
|
|
|
|
|
|
(3,758) |
|
|
(22,209) |
|
|
18,451 |
|
|
83 |
| Realized net performance income |
|
|
|
|
|
|
|
|
2,328 |
|
|
12,084 |
|
|
(9,756) |
|
|
(81) |
| Investment income (loss)—realized |
|
|
|
|
|
|
|
|
(1,772) |
|
|
3,453 |
|
|
(5,225) |
|
|
NM |
| Interest and other investment income—realized |
|
|
|
|
|
|
|
|
1,821 |
|
|
2,777 |
|
|
(956) |
|
|
(34) |
| Interest expense |
|
|
|
|
|
|
|
|
(3,896) |
|
|
(2,389) |
|
|
(1,507) |
|
|
(63) |
| Realized net investment income (loss) |
|
|
|
|
|
|
|
|
(3,847) |
|
|
3,841 |
|
|
(7,688) |
|
|
NM |
| Realized Income |
|
|
|
|
|
|
|
|
$ |
52,143 |
|
|
$ |
55,362 |
|
|
(3,219) |
|
|
(6) |
Realized net performance income for the three months ended March 31, 2023 was primarily attributable to incentive fees from an open-ended industrial real estate fund.
Realized net investment loss for the three months ended March 31, 2023 largely represents interest expense exceeding net gains during the period. Interest expense, which is allocated based on the cost basis of balance sheet investments, increased over the comparative periods primarily due to rising SOFR rates and a higher average outstanding balance of the Credit Facility. Realized net investment loss for the three months ended March 31, 2023 also included realized losses recognized from a real estate debt vehicle, driven by interest expense with no associated investment income during the period. The activity for the three months ended March 31, 2023 was partially offset by distributions of net investment income from an infrastructure opportunities and an infrastructure debt vehicle.
Realized net performance income and realized net investment income for the three months ended March 31, 2022 were primarily attributable to distributions from US VIII, driven by sales of investments in two multifamily properties. Realized net investment income for the three months ended March 31, 2022 also included operating income recognized from a real estate debt vehicle.
Real Assets Group—Performance Income
The following table presents the accrued carried interest, also referred to as accrued performance income, and related performance compensation for the Real Assets Group. Accrued net performance income excludes net performance income that has been realized but not yet received as of the reporting date ($ in thousands):
|
|
|
|
|
|
|
|
|
|
|
|
|
|
|
|
|
|
|
|
|
|
|
|
|
|
|
|
|
|
|
|
|
|
|
|
| |
As of March 31, 2023 |
|
As of December 31, 2022 |
|
|
|
|
|
|
|
Accrued Performance Income |
|
Accrued Performance Compensation |
|
Accrued Net Performance Income |
|
Accrued Performance Income |
|
Accrued Performance Compensation |
|
Accrued Net Performance Income |
| US VIII |
$ |
33,796 |
|
|
$ |
21,629 |
|
|
$ |
12,167 |
|
|
$ |
36,822 |
|
|
$ |
23,566 |
|
|
$ |
13,256 |
|
| US IX |
83,763 |
|
|
51,933 |
|
|
31,830 |
|
|
86,905 |
|
|
53,881 |
|
|
33,024 |
|
| EF IV |
61,464 |
|
|
36,879 |
|
|
24,585 |
|
|
61,791 |
|
|
37,075 |
|
|
24,716 |
|
|
|
|
|
|
|
|
|
|
|
|
|
| AREOF III |
42,610 |
|
|
25,566 |
|
|
17,044 |
|
|
41,463 |
|
|
24,878 |
|
|
16,585 |
|
| EIF V |
86,586 |
|
|
64,723 |
|
|
21,863 |
|
|
94,398 |
|
|
70,562 |
|
|
23,836 |
|
| Other real assets funds |
170,613 |
|
|
108,842 |
|
|
61,771 |
|
|
165,972 |
|
|
104,140 |
|
|
61,832 |
|
| Total Real Assets Group |
$ |
478,832 |
|
|
$ |
309,572 |
|
|
$ |
169,260 |
|
|
$ |
492,868 |
|
|
$ |
317,964 |
|
|
$ |
174,904 |
|
The following table presents the change in accrued performance income for the Real Assets Group ($ in thousands):
|
|
|
|
|
|
|
|
|
|
|
|
|
|
|
|
|
|
|
|
|
|
|
|
|
|
|
|
|
|
|
|
|
|
|
|
|
|
|
|
|
|
|
|
|
|
|
|
|
|
|
|
|
|
|
|
|
|
|
|
|
|
|
|
|
|
|
|
|
|
|
|
|
|
|
|
|
|
|
|
|
|
|
|
|
|
|
|
|
|
|
|
|
|
|
|
|
|
|
|
|
|
|
|
|
|
|
|
|
|
|
|
|
|
|
|
|
|
|
|
|
|
|
|
|
|
|
|
|
|
|
|
|
|
|
|
|
|
|
|
|
|
|
|
|
|
|
|
|
|
|
|
|
|
|
|
|
|
|
|
|
|
|
|
|
|
|
|
|
|
|
|
|
|
|
|
|
|
| |
|
|
|
As of December 31, 2022 |
|
Activity during the period |
|
As of March 31, 2023 |
|
|
|
Waterfall
Type |
|
Accrued Performance
Income |
|
Change in Unrealized |
|
Realized |
|
Other
Adjustments |
|
Accrued Performance
Income |
|
| Accrued Carried Interest |
|
|
|
|
|
|
|
|
|
|
|
|
|
| US VIII |
|
European |
|
$ |
36,822 |
|
|
$ |
(1,416) |
|
|
$ |
(1,610) |
|
|
$ |
— |
|
|
$ |
33,796 |
|
|
| US IX |
|
European |
|
86,905 |
|
|
(3,142) |
|
|
— |
|
|
— |
|
|
83,763 |
|
|
| EF IV |
|
American |
|
61,791 |
|
|
(327) |
|
|
— |
|
|
— |
|
|
61,464 |
|
|
|
|
|
|
|
|
|
|
|
|
|
|
|
|
| AREOF III |
|
European |
|
41,463 |
|
|
1,147 |
|
|
— |
|
|
— |
|
|
42,610 |
|
|
| EIF V |
|
European |
|
94,398 |
|
|
(7,812) |
|
|
— |
|
|
— |
|
|
86,586 |
|
|
| Other real assets funds |
|
European |
|
114,782 |
|
|
15,332 |
|
|
— |
|
|
346 |
|
|
130,460 |
|
|
| Other real assets funds |
|
American |
|
56,707 |
|
|
(16,554) |
|
|
— |
|
|
— |
|
|
40,153 |
|
|
|
|
|
|
|
|
|
|
|
|
|
|
|
|
|
|
|
|
|
|
|
|
|
|
|
|
|
|
| Total accrued carried interest |
|
|
|
492,868 |
|
|
(12,772) |
|
|
(1,610) |
|
|
346 |
|
|
478,832 |
|
|
| Other real assets funds |
|
Incentive |
|
— |
|
|
4,476 |
|
|
(4,476) |
|
|
— |
|
|
— |
|
|
| Total Real Assets Group |
|
|
|
$ |
492,868 |
|
|
$ |
(8,296) |
|
|
$ |
(6,086) |
|
|
$ |
346 |
|
|
$ |
478,832 |
|
|
Real Assets Group—Assets Under Management
The tables below present rollforwards of AUM for the Real Assets Group ($ in millions):
|
|
|
|
|
|
|
|
|
|
|
|
|
|
|
|
|
|
|
|
|
|
|
|
|
|
|
|
|
|
|
|
|
|
|
|
|
|
|
|
|
|
|
|
|
|
|
|
|
|
|
|
|
|
|
|
|
|
|
|
|
|
|
|
|
|
|
|
|
|
|
|
|
|
|
|
|
|
|
|
|
|
|
|
|
|
|
|
|
|
|
|
|
|
|
|
|
|
|
|
|
|
|
|
|
|
|
|
|
|
|
|
|
|
|
|
|
|
|
|
|
|
|
|
|
|
|
|
|
|
|
|
|
|
|
|
|
|
|
|
|
|
|
|
|
|
|
|
|
|
|
|
|
|
|
|
|
|
|
|
|
|
|
|
|
|
|
|
|
|
|
|
|
|
|
|
|
|
|
|
|
|
|
|
|
|
|
|
|
|
|
|
|
|
|
|
|
|
|
|
|
|
|
|
|
|
|
|
|
|
|
|
|
|
|
|
|
|
|
|
|
|
|
|
|
|
|
|
|
|
|
|
|
|
|
|
|
|
|
|
|
|
|
|
|
|
|
|
|
|
|
|
|
|
|
|
|
|
|
|
|
|
|
|
|
|
|
|
|
|
|
|
|
|
|
|
|
|
|
|
|
|
|
|
|
|
|
|
|
|
|
|
|
|
|
|
|
|
|
|
|
U.S. Real Estate Equity |
|
European Real Estate Equity |
|
Real Estate
Debt |
|
Infrastructure Opportunities |
|
Infrastructure Debt |
|
Total Real Assets Group |
| Balance at 12/31/2022 |
$ |
31,460 |
|
|
$ |
8,561 |
|
|
$ |
11,161 |
|
|
$ |
5,194 |
|
|
$ |
9,685 |
|
|
$ |
66,061 |
|
|
|
|
|
|
|
|
|
|
|
|
|
| Net new par/equity commitments |
588 |
|
|
15 |
|
|
162 |
|
|
— |
|
|
— |
|
|
765 |
|
|
|
|
|
|
|
|
|
|
|
|
|
| Capital reductions |
(245) |
|
|
— |
|
|
(158) |
|
|
— |
|
|
— |
|
|
(403) |
|
| Distributions |
(1,508) |
|
|
(14) |
|
|
(62) |
|
|
(17) |
|
|
(62) |
|
|
(1,663) |
|
| Redemptions |
(256) |
|
|
— |
|
|
(282) |
|
|
— |
|
|
— |
|
|
(538) |
|
| Change in fund value |
(201) |
|
|
(29) |
|
|
5 |
|
|
(2) |
|
|
119 |
|
|
(108) |
|
| Balance at 3/31/2023 |
$ |
29,838 |
|
|
$ |
8,533 |
|
|
$ |
10,826 |
|
|
$ |
5,175 |
|
|
$ |
9,742 |
|
|
$ |
64,114 |
|
|
|
|
|
|
|
|
|
|
|
|
|
|
U.S. Real Estate Equity |
|
European Real Estate Equity |
|
Real Estate
Debt |
|
Infrastructure Opportunities |
|
Infrastructure Debt |
|
Total Real Assets Group |
| Balance at 12/31/2021 |
$ |
24,677 |
|
|
$ |
6,827 |
|
|
$ |
9,659 |
|
|
$ |
4,756 |
|
|
$ |
— |
|
|
$ |
45,919 |
|
| Acquisitions |
— |
|
|
— |
|
|
— |
|
|
— |
|
|
8,184 |
|
|
8,184 |
|
| Net new par/equity commitments |
1,598 |
|
|
1,183 |
|
|
227 |
|
|
— |
|
|
50 |
|
|
3,058 |
|
| Net new debt commitments |
705 |
|
|
— |
|
|
400 |
|
|
— |
|
|
— |
|
|
1,105 |
|
| Capital reductions |
(234) |
|
|
— |
|
|
(28) |
|
|
— |
|
|
— |
|
|
(262) |
|
| Distributions |
(750) |
|
|
(308) |
|
|
(47) |
|
|
(23) |
|
|
— |
|
|
(1,128) |
|
| Redemptions |
(91) |
|
|
— |
|
|
(45) |
|
|
— |
|
|
— |
|
|
(136) |
|
| Change in fund value |
2,056 |
|
|
(19) |
|
|
59 |
|
|
(309) |
|
|
— |
|
|
1,787 |
|
| Balance at 3/31/2022 |
$ |
27,961 |
|
|
$ |
7,683 |
|
|
$ |
10,225 |
|
|
$ |
4,424 |
|
|
$ |
8,234 |
|
|
$ |
58,527 |
|
The components of our AUM for the Real Assets Group are presented below ($ in billions):
|
|
|
|
|
|
|
|
|
|
|
|
|
|
|
|
|
|
|
FPAUM |
|
Non-fee paying(1) |
|
AUM not yet paying fees |
(1) Includes $0.6 billion and $0.5 billion of non-fee paying AUM based on our general partner commitment as of March 31, 2023 and 2022, respectively.
Real Assets Group—Fee Paying AUM
The tables below present rollforwards of fee paying AUM for the Real Assets Group ($ in millions):
|
|
|
|
|
|
|
|
|
|
|
|
|
|
|
|
|
|
|
|
|
|
|
|
|
|
|
|
|
|
|
|
|
|
|
|
|
|
|
|
|
|
|
|
|
|
|
|
|
|
|
|
|
|
|
|
|
|
|
|
|
|
|
|
|
|
|
|
|
|
|
|
|
|
|
|
|
|
|
|
|
|
|
|
|
|
|
|
|
|
|
|
|
|
|
|
|
|
|
|
|
|
|
|
|
|
|
|
|
|
|
|
|
|
|
|
|
|
|
|
|
|
|
|
|
|
|
|
|
|
|
|
|
|
|
|
|
|
|
|
|
|
|
|
|
|
|
|
|
|
|
|
|
|
|
|
|
|
|
|
|
|
|
|
|
|
|
|
|
|
|
|
|
|
|
|
|
|
|
|
|
|
|
|
|
|
|
|
|
|
|
|
|
|
|
|
|
|
|
|
|
|
|
|
|
|
|
|
|
|
|
|
|
|
|
|
|
|
|
|
|
|
|
|
|
|
|
|
|
|
|
|
|
|
|
|
|
|
|
|
|
|
|
|
|
|
|
|
|
|
|
|
|
|
|
|
|
|
|
|
|
|
|
|
|
|
|
|
|
|
|
|
|
|
|
|
|
|
|
|
|
|
|
|
|
|
|
|
|
|
|
|
|
|
|
|
|
|
|
|
|
|
|
|
|
|
|
|
|
|
|
|
|
|
|
|
|
|
|
|
|
|
|
|
|
|
|
|
|
|
|
|
|
|
U.S. Real Estate Equity |
|
European Real Estate Equity |
|
Real Estate
Debt |
|
Infrastructure Opportunities |
|
Infrastructure Debt |
|
Total Real Assets Group |
| Balance at 12/31/2022 |
$ |
21,788 |
|
|
$ |
5,634 |
|
|
$ |
3,691 |
|
|
$ |
4,524 |
|
|
$ |
5,970 |
|
|
$ |
41,607 |
|
|
|
|
|
|
|
|
|
|
|
|
|
| Commitments |
581 |
|
|
15 |
|
|
— |
|
|
— |
|
|
— |
|
|
596 |
|
| Deployment/subscriptions/increase in leverage |
19 |
|
|
18 |
|
|
39 |
|
|
46 |
|
|
99 |
|
|
221 |
|
| Capital reductions |
(245) |
|
|
— |
|
|
(34) |
|
|
— |
|
|
— |
|
|
(279) |
|
| Distributions |
(396) |
|
|
(55) |
|
|
(63) |
|
|
— |
|
|
(118) |
|
|
(632) |
|
| Redemptions |
(256) |
|
|
— |
|
|
(282) |
|
|
— |
|
|
— |
|
|
(538) |
|
| Change in fund value |
(191) |
|
|
73 |
|
|
14 |
|
|
— |
|
|
57 |
|
|
(47) |
|
|
|
|
|
|
|
|
|
|
|
|
|
| Balance at 3/31/2023 |
$ |
21,300 |
|
|
$ |
5,685 |
|
|
$ |
3,365 |
|
|
$ |
4,570 |
|
|
$ |
6,008 |
|
|
$ |
40,928 |
|
|
|
|
|
|
|
|
|
|
|
|
|
|
|
|
U.S. Real Estate Equity |
|
European Real Estate Equity |
|
Real Estate
Debt |
|
Infrastructure Opportunities |
|
Infrastructure Debt |
|
Total Real Assets Group |
| Balance at 12/31/2021 |
$ |
15,687 |
|
|
$ |
4,916 |
|
|
$ |
3,516 |
|
|
$ |
4,496 |
|
|
$ |
— |
|
|
$ |
28,615 |
|
| Acquisitions |
— |
|
|
— |
|
|
— |
|
|
— |
|
|
4,855 |
|
|
4,855 |
|
| Commitments |
1,026 |
|
|
1,155 |
|
|
3 |
|
|
— |
|
|
— |
|
|
2,184 |
|
| Deployment/subscriptions/increase in leverage |
355 |
|
|
94 |
|
|
369 |
|
|
48 |
|
|
43 |
|
|
909 |
|
|
|
|
|
|
|
|
|
|
|
|
|
| Distributions |
(416) |
|
|
(208) |
|
|
(46) |
|
|
(221) |
|
|
— |
|
|
(891) |
|
| Redemptions |
(91) |
|
|
— |
|
|
(47) |
|
|
— |
|
|
— |
|
|
(138) |
|
| Change in fund value |
1,484 |
|
|
(126) |
|
|
60 |
|
|
— |
|
|
— |
|
|
1,418 |
|
| Change in fee basis |
(6) |
|
|
(819) |
|
|
— |
|
|
— |
|
|
— |
|
|
(825) |
|
| Balance at 3/31/2022 |
$ |
18,039 |
|
|
$ |
5,012 |
|
|
$ |
3,855 |
|
|
$ |
4,323 |
|
|
$ |
4,898 |
|
|
$ |
36,127 |
|
The charts below present FPAUM for the Real Assets Group by its fee bases ($ in billions):
|
|
|
|
|
|
|
|
|
|
|
|
|
|
|
|
FPAUM: $40.9 |
|
FPAUM: $36.1 |
|
|
|
|
|
|
|
|
|
|
|
|
|
|
|
|
|
|
|
|
Market value(1) |
|
Invested capital/other(2) |
|
Capital commitments |
(1)Amounts represent FPAUM from funds that primarily invest in illiquid strategies. The underlying investments held in these funds are generally subject to less market volatility than investments held in liquid strategies.
(2)Other consists of ACRE’s FPAUM, which is based on ACRE’s stockholders’ equity.
Real Assets Group—Fund Performance Metrics as of March 31, 2023
Four significant funds, AIREIT, AREIT, IDF IV and an open-ended industrial real estate fund, collectively contributed approximately 41% of the Real Assets Group’s management fees for the three months ended March 31, 2023.
The following table presents the performance data for our significant funds that are not drawdown funds in the Real Assets Group as of March 31, 2023 ($ in millions):
|
|
|
|
|
|
|
|
|
|
|
|
|
|
|
|
|
|
|
|
|
|
|
|
|
|
|
|
|
|
|
|
|
|
|
|
|
|
|
|
|
|
|
|
|
|
| |
|
|
|
|
|
|
|
|
Returns(%) |
|
|
|
Year of Inception |
|
AUM |
|
|
|
Quarter-To-Date |
|
Since Inception(1) |
|
Primary
Investment Strategy |
| Fund |
|
|
|
|
|
|
Gross |
|
Net |
|
Gross |
|
Net |
|
AREIT(2) |
2012 |
|
$ |
5,181 |
|
|
|
|
|
|
N/A |
|
(1.1) |
|
N/A |
|
7.6 |
|
U.S. Real Estate Equity |
AIREIT(3) |
2017 |
|
8,316 |
|
|
|
|
|
|
N/A |
|
(0.9) |
|
N/A |
|
13.2 |
|
U.S. Real Estate Equity |
Open-ended industrial real estate fund(4) |
2017 |
|
5,370 |
|
|
|
|
|
|
(2.6) |
|
(2.4) |
|
24.4 |
|
20.0 |
|
U.S. Real Estate Equity |
(1)Since inception returns are annualized.
(2)Performance is measured by total return, which includes income and appreciation and reinvestment of all distributions for the respective time period. Returns are shown for institutional share class. Shares of other classes may have lower returns due to higher selling commissions and fees. Actual individual stockholder returns will vary. Net returns are calculated using the fund’s NAV and assume distributions are reinvested at the NAV on the date of distribution. The inception date used in the calculation of the since inception return is the date in which the first shares of common stock were sold after converting to a NAV-based REIT. Additional information related to AREIT can be found in its filings with the SEC, which are not part of this report.
(3)Performance is measured by total return, which includes income and appreciation and reinvestment of all distributions for the respective time period. Returns are shown for institutional share class. Shares of other classes may have lower returns due to higher selling commissions and fees. Actual individual stockholder returns will vary. Net returns are calculated using the fund’s NAV and assume distributions are reinvested at the NAV on the date of distribution. Additional information related to AIREIT can be found in its filings with the SEC, which are not part of this report.
(4)Returns are time-weighted rates of return and include the reinvestment of income and other earnings from securities or other investments and reflect the deduction of all trading expenses. Gross returns do not reflect the deduction of management fees, incentive fees, as applicable, or other expenses. Net returns are calculated by subtracting the applicable management fees, incentive fees, as applicable and other expenses from the gross returns on a quarterly basis.
The following table presents the performance data of our significant drawdown fund as of March 31, 2023 ($ in millions):
|
|
|
|
|
|
|
|
|
|
|
|
|
|
|
|
|
|
|
|
|
|
|
|
|
|
|
|
|
|
|
|
|
|
|
|
|
|
|
|
|
|
|
|
|
|
|
|
|
|
|
|
|
|
|
|
|
|
|
|
|
|
|
|
|
|
|
|
|
|
|
|
|
Year of Inception |
|
AUM |
|
Original Capital Commitments |
|
Capital Invested to Date |
|
Realized Value(1) |
|
Unrealized Value(2) |
|
Total Value |
|
MoIC |
|
IRR(%) |
|
Primary Investment Strategy |
| Fund |
|
|
|
|
|
|
|
Gross(3) |
|
Net(4) |
|
Gross(5) |
|
Net(6) |
|
| Fund Harvesting Investments |
|
|
|
|
|
|
|
|
|
|
|
|
|
|
|
|
|
|
|
IDF IV(7) |
2018 |
|
$ |
3,621 |
|
|
$ |
4,012 |
|
|
$ |
4,440 |
|
|
$ |
1,708 |
|
|
$ |
3,405 |
|
|
$ |
5,113 |
|
|
1.2x |
|
1.2x |
|
9.1 |
|
|
6.8 |
|
|
Infrastructure Debt |
|
|
|
|
|
|
|
|
|
|
|
|
|
|
|
|
|
|
|
|
|
|
|
|
(1)Realized value includes distributions of operating income, sales and financing proceeds received.
(2)Unrealized value represents the fair market value of remaining investments. Unrealized value does not take into account any bridge financings. There can be no assurance that unrealized investments will be realized at the valuations indicated.
(3)The gross MoIC is calculated at the fund level and is based on the interests of the fee-paying limited partners and if applicable, excludes interests attributable to the non-fee paying limited partners and/or the general partner which does not pay management fees or carried interest. The gross MoIC is before giving effect to management fees, carried interest as applicable and other expenses, but after giving effect to credit facility interest expenses, as applicable. The funds may utilize a credit facility during the investment period and for general cash management purposes. Early in the life of a fund, the gross fund-level MoICs would generally have been lower had such fund called capital from its limited partners instead of utilizing the credit facility.
(4)The net MoIC is calculated at the fund-level and is based on the interests of the fee-paying limited partners and, if applicable, excludes interests attributable to the non fee-paying limited partners and/or the general partner which does not pay management fees or carried interest. The net MoIC is after giving effect to management fees, carried interest, as applicable, credit facility interest expense, as applicable, and other expenses. The funds may utilize a credit facility during the investment period and for general cash management purposes. Early in the life of a fund, the net fund-level MoICs would generally have been lower had such fund called capital from its limited partners instead of utilizing the credit facility.
(5)The gross IRR is an annualized since inception gross internal rate of return of cash flows to and from the fund and the fund’s residual value at the end of the measurement period. Gross IRR reflects returns to the fee-paying limited partners and, if applicable, excludes interests attributable to the non-fee paying limited partners and/or the general partner which does not pay management fees or carried interest. The cash flow dates used in the gross IRR calculation are based on the actual dates of the cash flows. The gross IRRs are calculated before giving effect to management fees, carried interest and other expenses, but after giving effect to credit facility interest expenses, as applicable, as applicable. The funds may utilize a credit facility during the investment period and for general cash management purposes. Gross fund-level IRRs would generally have been lower had such fund called capital from its limited partners instead of utilizing the credit facility.
(6)The net IRR is an annualized since inception net internal rate of return of cash flows to and from the fund and the fund’s residual value at the end of the measurement period. Net IRRs reflect returns to the fee-paying limited partners and, if applicable, exclude interests attributable to the non-fee paying limited partners and/or the general partner which does not pay management fees or carried interest. The cash flow dates used in the net IRR calculations are based on the actual dates of the cash flows. The net IRRs are calculated after giving effect to management fees and carried interest, other expenses and credit facility interest expenses, as applicable. The funds may utilize a credit facility during the investment period and for general cash management purposes. Net fund-level IRRs would generally have been lower had such fund called capital from its limited partners instead of utilizing the credit facility.
(7)IDF IV is made up of U.S. Dollar hedged, U.S. Dollar unhedged, Euro unhedged, Yen hedged parallel funds and a single investor U.S. Dollar parallel fund. The gross and net IRR and MoIC presented in the table are for the U.S. Dollar hedged parallel fund. The gross and net IRR for the U.S. Dollar unhedged parallel fund are 8.2% and 5.9%, respectively. The gross and net MoIC for the U.S. Dollar unhedged parallel fund are 1.2x and 1.1x, respectively. The gross and net IRR for the Euro unhedged parallel fund are 9.2% and 6.8%, respectively. The gross and net MoIC for the Euro unhedged parallel fund are 1.2x and 1.2x, respectively. The gross and net IRR for the Yen hedged parallel fund are 7.7% and 5.4%, respectively. The gross and net MoIC for the Yen hedged parallel fund are 1.2x and 1.1x, respectively. The gross and net IRR for the single investor U.S. Dollar parallel fund are 7.6% and 5.4%, respectively. The gross and net MoIC for the single investor U.S. Dollar parallel fund are 1.1x and 1.1x, respectively. Original capital commitments are converted to U.S. Dollars at the prevailing exchange rate at the time of fund's closing. All other values for IDF IV are for the combined fund and are converted to U.S. Dollars at the prevailing quarter-end exchange rate.
Secondaries Group—Three Months Ended March 31, 2023 Compared to Three Months Ended March 31, 2022
Fee Related Earnings:
The following table presents the components of the Secondaries Group’s FRE ($ in thousands):
|
|
|
|
|
|
|
|
|
|
|
|
|
|
|
|
|
|
|
|
|
|
|
|
|
|
|
|
|
|
|
|
|
|
|
|
|
|
|
|
|
|
|
|
|
|
|
|
|
|
|
|
|
Three months ended March 31, |
|
Favorable (Unfavorable) |
| ($ in thousands) |
|
|
|
|
|
|
|
|
2023 |
|
2022 |
|
$ Change |
|
% Change |
| Management fees |
|
|
|
|
|
|
|
|
$ |
39,863 |
|
|
$ |
44,504 |
|
|
$ |
(4,641) |
|
|
(10)% |
| Fee related performance revenues |
|
|
|
|
|
|
|
|
3,271 |
|
|
— |
|
|
3,271 |
|
|
NM |
|
|
|
|
|
|
|
|
|
|
|
|
|
|
|
|
| Compensation and benefits |
|
|
|
|
|
|
|
|
(13,412) |
|
|
(11,640) |
|
|
(1,772) |
|
|
(15) |
| General, administrative and other expenses |
|
|
|
|
|
|
|
|
(4,292) |
|
|
(3,078) |
|
|
(1,214) |
|
|
(39) |
| Fee Related Earnings |
|
|
|
|
|
|
|
|
$ |
25,430 |
|
|
$ |
29,786 |
|
|
(4,356) |
|
|
(15) |
Management Fees. The chart below presents Secondaries Group management fees and effective management fee rates ($ in millions):
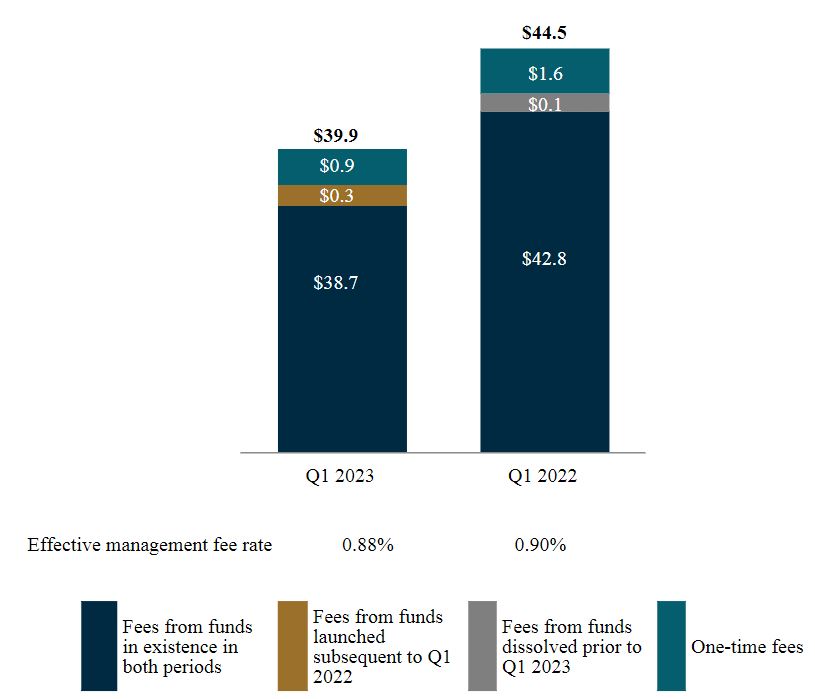
Management fees from Landmark Equity Partners XV, L.P. (“LEP XV”) and LREP VIII decreased by $3.7 million and $1.6 million, respectively, for the three months ended March 31, 2023 compared to the three months ended March 31, 2022. The decrease was due to the changes in fee base of both funds to reported value, which largely reflects the NAV of each funds’ limited partnership interests, from called capital plus unfunded commitments for LEP XV and from committed capital for LREP VIII. The decrease was partially offset by management fees from new commitments to our ninth real estate secondaries fund that generated additional fees of $1.3 million, excluding one-time catch-up fees from both periods. Excluding one-time catch-up fees of $1.5 million for the three months ended March 31, 2022, management fees from Landmark Equity Partners XVII, L.P. (“LEP XVII”) increased by $0.8 million for the three months ended March 31, 2023 compared to the three months ended March 31, 2022 due to new commitments.
The decrease in effective management fee rate for the three months ended March 31, 2023 compared to the same period in 2022 was primarily driven by APMF, which launched subsequent to March 31, 2022, as we contractually agreed to reduce the management fee rate to 0.25% until March 31, 2023, after which the management fee rate will increase to 1.40%.
Fee Related Performance Revenues. Fee related performance revenues reflects incentive fees recognized from APMF for the three months ended March 31, 2023. Incentive fees from APMF are calculated based on 12.5% of its investment return each quarter, including income and net appreciation, subject to certain net loss carry-forward provisions.
Compensation and Benefits. The increase in compensation and benefits for the three months ended March 31, 2023 compared to the same period in 2022 was primarily driven by (i) higher fee related performance compensation of $2.0 million and (ii) increase in salaries and benefits, primarily attributable to headcount growth to support the expansion of our business. Average headcount for the quarter-to-date period increased by 5% to 100 investment and investment support professionals for the three months ended March 31, 2023 from 95 professionals for the same period in 2022. The increase in compensation and benefits was partially offset by the reduction in non-recurring payments.
General, Administrative and Other Expenses. Travel and marketing collectively increased by $0.9 million for the three months ended March 31, 2023 compared to the same period in 2022, as we continued to increase our marketing efforts. Additionally, professional service fees have increased by $0.2 million for the three months ended March 31, 2023 compared to the same period in 2022, primarily due to recruiting fees to support the expanding platform.
Realized Income:
The following table presents the components of the Secondaries Group’s RI ($ in thousands):
|
|
|
|
|
|
|
|
|
|
|
|
|
|
|
|
|
|
|
|
|
|
|
|
|
|
|
|
|
|
|
|
|
|
|
|
|
|
|
|
|
|
|
|
|
|
|
|
|
|
|
|
|
Three months ended March 31, |
|
Favorable (Unfavorable) |
| ($ in thousands) |
|
|
|
|
|
|
|
|
2023 |
|
2022 |
|
$ Change |
|
% Change |
| Fee Related Earnings |
|
|
|
|
|
|
|
|
$ |
25,430 |
|
|
$ |
29,786 |
|
|
$ |
(4,356) |
|
|
(15)% |
|
|
|
|
|
|
|
|
|
|
|
|
|
|
|
|
|
|
|
|
|
|
|
|
|
|
|
|
|
|
|
|
|
|
|
|
|
|
|
|
|
|
|
|
|
|
|
|
|
|
|
|
|
|
|
|
|
|
|
|
|
|
|
|
| Interest and other investment income—realized |
|
|
|
|
|
|
|
|
1,225 |
|
|
644 |
|
|
581 |
|
|
90 |
| Interest expense |
|
|
|
|
|
|
|
|
(2,305) |
|
|
(465) |
|
|
(1,840) |
|
|
NM |
| Realized net investment income (loss) |
|
|
|
|
|
|
|
|
(1,080) |
|
|
179 |
|
|
(1,259) |
|
|
NM |
| Realized Income |
|
|
|
|
|
|
|
|
$ |
24,350 |
|
|
$ |
29,965 |
|
|
(5,615) |
|
|
(19) |
Realized net investment loss for the three months ended March 31, 2023 largely represents interest expense exceeding realization activity during the period. Interest expense, which is allocated based on the cost basis of balance sheet investments, increased over the comparative periods primarily due to rising SOFR rates and a higher average outstanding balance of the Credit Facility. The three months ended March 31, 2023 also included dividend income received from APMF, while the three months ended March 31, 2022 included dividend income received from a real estate secondaries fund.
Secondaries Group—Performance Income
In the Secondaries Group, we are entitled to carried interest from the funds with closings subsequent to the completion of the Landmark Acquisition and to carried interest we acquired through the purchase of ownership interests in certain Landmark GP entities. The following table presents the accrued carried interest, also referred to as accrued performance income, and related performance compensation for the Secondaries Group. Accrued net performance income excludes net performance income that has been realized but not yet received as of the reporting date ($ in thousands):
|
|
|
|
|
|
|
|
|
|
|
|
|
|
|
|
|
|
|
|
|
|
|
|
|
|
|
|
|
|
|
|
|
|
|
|
|
|
|
|
|
|
| |
As of March 31, 2023 |
|
As of December 31, 2022 |
|
|
|
Accrued Performance Income |
|
Accrued Performance Compensation |
|
Accrued Net Performance Income |
|
Accrued Performance Income |
|
Accrued Performance Compensation |
|
Accrued Net Performance Income |
|
|
|
|
|
|
| LEP XVI |
$ |
139,573 |
|
|
$ |
119,335 |
|
|
$ |
20,238 |
|
|
$ |
141,122 |
|
|
$ |
120,659 |
|
|
$ |
20,463 |
|
|
|
|
|
|
|
| LREP VIII |
109,630 |
|
|
94,282 |
|
|
15,348 |
|
|
109,928 |
|
|
94,538 |
|
|
15,390 |
|
|
|
|
|
|
|
|
|
|
|
|
|
|
|
|
|
|
|
|
|
|
|
|
|
|
|
|
|
|
|
|
|
|
|
|
|
|
|
|
|
|
|
|
|
|
|
|
|
|
|
|
|
|
|
|
|
|
|
|
|
| Other secondaries funds |
58,209 |
|
|
49,790 |
|
|
8,419 |
|
|
58,135 |
|
|
49,726 |
|
|
8,409 |
|
|
|
|
|
|
|
Total Secondaries Group |
$ |
307,412 |
|
|
$ |
263,407 |
|
|
$ |
44,005 |
|
|
$ |
309,185 |
|
|
$ |
264,923 |
|
|
$ |
44,262 |
|
|
|
|
|
|
|
The following table presents the change in accrued performance income for the Secondaries Group ($ in thousands):
|
|
|
|
|
|
|
|
|
|
|
|
|
|
|
|
|
|
|
|
|
|
|
|
|
|
|
|
|
|
|
|
|
|
|
| |
|
|
|
As of December 31, 2022 |
|
Activity during the period |
|
|
|
As of March 31, 2023 |
|
|
Waterfall Type |
|
Accrued Carried Interest |
|
Change in Unrealized |
|
Realized |
|
|
|
Accrued Carried Interest |
| Accrued Carried Interest |
|
|
|
|
|
|
|
|
|
|
|
|
| LEP XVI |
|
European |
|
$ |
141,122 |
|
|
$ |
(1,549) |
|
|
$ |
— |
|
|
|
|
$ |
139,573 |
|
| LREP VIII |
|
European |
|
109,928 |
|
|
(298) |
|
|
— |
|
|
|
|
109,630 |
|
|
|
|
|
|
|
|
|
|
|
|
|
|
|
|
|
|
|
|
|
|
|
|
|
|
|
|
|
|
|
|
|
|
|
|
|
|
|
|
Other secondaries funds |
|
European |
|
58,135 |
|
|
74 |
|
|
— |
|
|
|
|
58,209 |
|
|
|
|
|
|
|
|
|
|
|
|
|
|
|
|
|
|
|
|
|
|
|
|
|
|
|
Total Secondaries Group |
|
|
|
$ |
309,185 |
|
|
$ |
(1,773) |
|
|
$ |
— |
|
|
|
|
$ |
307,412 |
|
|
|
|
|
|
|
|
|
|
|
|
|
|
Secondaries Group—Assets Under Management
The table below presents the rollforwards of AUM for the Secondaries Group ($ in millions):
|
|
|
|
|
|
|
|
|
|
|
|
|
|
|
|
|
|
|
|
|
|
|
|
|
|
|
|
|
|
|
|
|
|
|
|
|
|
|
|
|
|
|
|
|
|
|
|
|
|
|
|
|
|
|
|
|
|
|
|
|
|
|
|
|
|
|
|
|
|
|
|
|
|
|
|
|
|
|
|
|
|
|
|
|
|
|
|
|
|
|
|
|
|
|
|
|
|
|
|
|
|
|
|
|
|
|
|
|
|
|
|
|
|
|
|
|
|
|
|
|
|
|
|
|
|
|
|
|
|
|
|
|
|
|
|
|
|
|
|
|
|
|
|
|
|
|
|
|
|
|
|
|
|
|
|
|
|
|
|
|
|
|
|
|
|
|
|
|
|
|
|
|
|
|
|
|
|
|
|
|
|
|
|
|
|
|
|
|
|
|
|
|
|
|
|
|
|
|
|
|
|
|
|
|
|
|
|
|
|
|
|
|
|
|
|
|
|
|
|
|
|
|
|
|
|
|
|
|
|
|
|
|
|
|
|
|
|
|
|
|
|
|
|
|
|
|
|
|
|
|
|
|
|
|
|
|
|
|
|
|
|
|
|
|
|
|
|
|
|
|
|
|
|
|
|
|
|
|
|
|
|
|
|
|
|
|
|
|
|
|
|
|
|
|
|
|
|
|
|
|
Private Equity Secondaries |
|
Real Estate Secondaries |
|
Infrastructure Secondaries |
|
Credit Secondaries |
|
Other(1) |
|
Total Secondaries Group |
| Balance at 12/31/2022 |
$ |
12,769 |
|
|
$ |
7,552 |
|
|
$ |
1,640 |
|
|
$ |
— |
|
|
$ |
— |
|
|
$ |
21,961 |
|
|
|
|
|
|
|
|
|
|
|
|
|
| Net new par/equity commitments |
21 |
|
|
237 |
|
|
— |
|
|
938 |
|
|
50 |
|
|
1,246 |
|
|
|
|
|
|
|
|
|
|
|
|
|
|
|
|
|
|
|
|
|
|
|
|
|
| Distributions |
(258) |
|
|
(96) |
|
|
(70) |
|
|
— |
|
|
— |
|
|
(424) |
|
|
|
|
|
|
|
|
|
|
|
|
|
| Change in fund value |
138 |
|
|
(26) |
|
|
(1) |
|
|
— |
|
|
— |
|
|
111 |
|
| Balance at 3/31/2023 |
$ |
12,670 |
|
|
$ |
7,667 |
|
|
$ |
1,569 |
|
|
$ |
938 |
|
|
$ |
50 |
|
|
$ |
22,894 |
|
|
|
|
|
|
|
|
|
|
|
|
|
|
Private Equity Secondaries |
|
Real Estate Secondaries |
|
Infrastructure Secondaries |
|
Credit Secondaries |
|
Other |
|
Total Secondaries Group |
| Balance at 12/31/2021 |
$ |
13,833 |
|
|
$ |
6,662 |
|
|
$ |
1,624 |
|
|
$ |
— |
|
|
$ |
— |
|
|
$ |
22,119 |
|
| Acquisitions |
199 |
|
|
— |
|
|
— |
|
|
— |
|
|
— |
|
|
199 |
|
| Net new par/equity commitments |
168 |
|
|
912 |
|
|
— |
|
|
— |
|
|
— |
|
|
1,080 |
|
|
|
|
|
|
|
|
|
|
|
|
|
|
|
|
|
|
|
|
|
|
|
|
|
| Distributions |
(109) |
|
|
(420) |
|
|
(46) |
|
|
— |
|
|
— |
|
|
(575) |
|
|
|
|
|
|
|
|
|
|
|
|
|
| Change in fund value |
214 |
|
|
376 |
|
|
55 |
|
|
— |
|
|
— |
|
|
645 |
|
| Balance at 3/31/2022 |
$ |
14,305 |
|
|
$ |
7,530 |
|
|
$ |
1,633 |
|
|
$ |
— |
|
|
$ |
— |
|
|
$ |
23,468 |
|
|
|
|
|
|
|
|
|
|
|
|
|
| (1) Activity within Other represents equity commitments to the platform that have not yet been allocated to an investment strategy. |
The components of our AUM for the Secondaries Group are presented below ($ in billions):
|
|
|
|
|
|
|
|
|
|
|
|
|
|
|
|
|
|
|
FPAUM |
|
AUM not yet paying fees |
|
Non-fee paying(1) |
(1) Includes $0.5 billion and $0.4 billion of non-fee paying AUM based on our general partner commitment as of March 31, 2023 and 2022, respectively.
Secondaries Group—Fee Paying AUM
The table below presents the rollforwards of fee paying AUM for the Secondaries Group ($ in millions):
|
|
|
|
|
|
|
|
|
|
|
|
|
|
|
|
|
|
|
|
|
|
|
|
|
|
|
|
|
|
|
|
|
|
|
|
|
|
|
|
|
|
|
|
|
|
|
|
|
|
|
|
|
|
|
|
|
|
|
|
|
|
|
|
|
|
|
|
|
|
|
|
|
|
|
|
|
|
|
|
|
|
|
|
|
|
|
|
|
|
|
|
|
|
|
|
|
|
|
|
|
|
|
|
|
|
|
|
|
|
|
|
|
|
|
|
|
|
|
|
|
|
|
|
|
|
|
|
|
|
|
|
|
|
|
|
|
|
|
|
|
|
|
|
|
|
|
|
|
|
|
|
|
|
|
|
|
|
|
|
|
|
|
|
|
|
|
|
|
|
|
|
|
|
|
|
|
|
|
|
|
|
|
|
|
|
|
|
|
|
|
|
|
|
|
|
|
|
|
|
|
|
|
|
|
|
|
|
|
|
|
|
|
|
|
|
|
|
|
|
|
|
|
|
|
|
|
|
|
|
|
|
|
|
|
|
|
|
|
|
|
|
|
|
|
|
|
|
|
|
|
|
|
|
|
|
|
|
|
|
|
|
|
|
|
|
|
|
|
|
|
|
|
|
|
|
|
|
|
|
|
|
|
|
|
|
|
|
|
|
|
|
|
|
|
|
|
|
|
|
|
|
|
|
|
|
|
|
|
|
|
|
|
|
|
|
|
Private Equity Secondaries |
|
Real Estate Secondaries |
|
Infrastructure Secondaries |
|
|
|
|
|
Total Secondaries Group |
| Balance at 12/31/2022 |
$ |
11,062 |
|
|
$ |
5,313 |
|
|
$ |
1,293 |
|
|
|
|
|
|
$ |
17,668 |
|
|
|
|
|
|
|
|
|
|
|
|
|
| Commitments |
21 |
|
|
86 |
|
|
— |
|
|
|
|
|
|
107 |
|
| Deployment/subscriptions/increase in leverage |
71 |
|
|
32 |
|
|
7 |
|
|
|
|
|
|
110 |
|
|
|
|
|
|
|
|
|
|
|
|
|
| Distributions |
(43) |
|
|
(96) |
|
|
(58) |
|
|
|
|
|
|
(197) |
|
|
|
|
|
|
|
|
|
|
|
|
|
| Change in fund value |
(78) |
|
|
152 |
|
|
34 |
|
|
|
|
|
|
108 |
|
| Change in fee basis |
(35) |
|
|
(14) |
|
|
— |
|
|
|
|
|
|
(49) |
|
| Balance at 3/31/2023 |
$ |
10,998 |
|
|
$ |
5,473 |
|
|
$ |
1,276 |
|
|
|
|
|
|
$ |
17,747 |
|
|
|
|
|
|
|
|
|
|
|
|
|
|
Private Equity Secondaries |
|
Real Estate Secondaries |
|
Infrastructure Secondaries |
|
|
|
|
|
Total Secondaries Group |
| Balance at 12/31/2021 |
$ |
11,787 |
|
|
$ |
5,389 |
|
|
$ |
1,188 |
|
|
|
|
|
|
$ |
18,364 |
|
| Acquisitions |
131 |
|
|
— |
|
|
— |
|
|
|
|
|
|
131 |
|
| Commitments |
117 |
|
|
580 |
|
|
— |
|
|
|
|
|
|
697 |
|
| Deployment/subscriptions/increase in leverage |
57 |
|
|
— |
|
|
12 |
|
|
|
|
|
|
69 |
|
|
|
|
|
|
|
|
|
|
|
|
|
| Distributions |
(11) |
|
|
(417) |
|
|
(44) |
|
|
|
|
|
|
(472) |
|
|
|
|
|
|
|
|
|
|
|
|
|
| Change in fund value |
(154) |
|
|
841 |
|
|
51 |
|
|
|
|
|
|
738 |
|
| Change in fee basis |
(33) |
|
|
(1,424) |
|
|
— |
|
|
|
|
|
|
(1,457) |
|
| Balance at 3/31/2022 |
$ |
11,894 |
|
|
$ |
4,969 |
|
|
$ |
1,207 |
|
|
|
|
|
|
$ |
18,070 |
|
The chart below presents FPAUM for the Secondaries Group by its fee bases ($ in billions):
|
|
|
|
|
|
|
|
|
| FPAUM: $17.8 |
|
FPAUM: $18.1 |
|
|
|
|
|
|
|
|
|
|
|
|
|
|
|
|
|
|
|
Market value(1) |
|
Capital commitments |
|
Invested capital/other |
(1)Amounts represent FPAUM from funds that primarily invest in illiquid strategies. The underlying investments held in these funds are generally subject to less market volatility than investments held in liquid strategies.
Secondaries Group—Fund Performance Metrics as of March 31, 2023
Two significant funds, LEP XVI and LREP VIII, collectively contributed approximately 44% of the Secondaries Group’s management fees for the three months ended March 31, 2023.
The following table presents the performance data of our significant drawdown funds as of March 31, 2023 ($ in millions):
|
|
|
|
|
|
|
|
|
|
|
|
|
|
|
|
|
|
|
|
|
|
|
|
|
|
|
|
|
|
|
|
|
|
|
|
|
|
|
|
|
|
|
|
|
|
|
|
|
|
|
|
|
|
|
|
|
|
|
|
|
|
|
|
|
|
|
|
|
|
|
|
|
Year of Inception |
|
AUM |
|
Original Capital Commitments |
|
Capital Invested to Date |
|
Realized Value(1) |
|
Unrealized Value(2) |
|
Total Value |
|
MoIC |
|
IRR(%) |
|
Primary Investment Strategy |
| Fund |
|
|
|
|
|
|
|
Gross(3) |
|
Net(4) |
|
Gross(5) |
|
Net(6) |
|
| Funds Harvesting Investments |
|
|
|
|
|
|
|
|
|
|
|
|
|
|
|
|
|
|
|
|
|
|
LEP XVI(7) |
2016 |
|
$ |
4,883 |
|
|
$ |
4,896 |
|
|
$ |
3,203 |
|
|
$ |
1,929 |
|
|
$ |
2,659 |
|
|
$ |
4,588 |
|
|
1.6x |
|
1.4x |
|
34.1 |
|
22.9 |
|
Private Equity Secondaries |
LREP VIII(7) |
2016 |
|
3,453 |
|
|
3,300 |
|
|
2,182 |
|
|
1,324 |
|
|
1,734 |
|
|
3,058 |
|
|
1.5x |
|
1.4x |
|
26.4 |
|
18.5 |
|
Real Estate Secondaries |
For all funds in the Secondaries Group, returns are calculated from results of the underlying portfolio that are generally reported on a three month lag and may not include the impact of economic and market activities occurring in the current reporting period.
(1)Realized value represents the sum of all cash distributions to all limited partners and if applicable, exclude tax and incentive distributions made to the general partner.
(2)Unrealized value represents the limited partners’ share of fund’s NAV reduced by the accrued incentive allocation, if applicable. There can be no assurance that unrealized values will be realized at the valuations indicated.
(3)The gross MoIC is calculated at the fund-level and is based on the interests of all partners. If applicable, limiting the gross MoIC to exclude interests attributable to the non-fee paying limited partners and/or the general partner who does not pay management fees or carried interest would have no material impact on the result. The gross MoIC is before giving effect to management fees, carried interest as applicable and other expenses, but after giving effect to credit facility interest expenses, as applicable. The funds may utilize a short-term credit facility for general cash management purposes, as well as a long-term credit facility as permitted by the respective fund’s governing documentation. The gross fund-level MoIC would have generally been lower had such fund called capital from its partners instead of utilizing the credit facility.
(4)The net MoIC is calculated at the fund-level and is based on the interests of the fee-paying limited partners and if applicable, excludes those interests attributable to the non-fee paying limited partners and/or the general partner which does not pay management fees or carried interest. The net MoIC is after giving effect to management fees and other expenses, carried interest and credit facility interest expense, as applicable. The funds may utilize a short-term credit facility for general cash management purposes, as well as a long-term credit facility as permitted by the respective fund’s governing documentation. The net fund-level MoICs would generally have been lower had such fund called capital from its limited partners instead of utilizing the credit facility.
(5)The gross IRR is an annualized since inception gross internal rate of return of cash flows to and from the fund and the fund’s residual value at the end of the measurement period. Gross IRR reflects returns to all partners. If applicable, limiting the gross IRR to exclude interests attributable to the non-fee paying limited partners and/or the general partner who does not pay management fees or carried interest would have no material impact on the result. The cash flow dates used in the gross IRR calculation are based on the actual dates of the cash flows. The gross IRRs are calculated before giving effect to management fees, carried interest, as applicable, and other expenses, but after giving effect to credit facility interest expenses, as applicable. The funds may utilize a short-term credit facility for general cash management purposes, as well as a long-term credit facility as permitted by the respective fund’s governing documents. The gross fund-level IRR would generally have been lower had such fund called capital from its partners instead of utilizing the credit facility.
(6)The net IRR is an annualized since inception net internal rate of return of cash flows to and from the fund and the fund’s residual value at the end of the measurement period. Net IRRs reflect returns to the fee-paying limited partners and, if applicable, exclude interests attributable to the non-fee paying limited partners and/or the general partner who does not pay management fees or carried interest. The cash flow dates used in the net IRR calculations are based on the actual dates of the cash flows. The net IRRs are calculated after giving effect to management fees and other expenses, carried interest and credit facility interest expenses, as applicable. The funds may utilize a short-term credit facility for general cash management purposes, as well as a long-term credit facility as permitted by the respective fund’s governing documents. Net fund-level IRRs would generally have been lower had such fund called capital from its limited partners instead of utilizing the credit facility.
(7)The results of each fund is presented on a combined basis with the affiliated parallel funds or accounts, given that the investments are substantially the same.
Operations Management Group—Three Months Ended March 31, 2023 Compared to Three Months Ended March 31, 2022
Fee Related Earnings:
The following table presents the components of the Operations Management Group’s FRE ($ in thousands):
|
|
|
|
|
|
|
|
|
|
|
|
|
|
|
|
|
|
|
|
|
|
|
|
|
|
|
|
|
|
|
|
|
|
|
|
|
|
|
|
|
|
|
|
|
|
|
|
|
|
|
|
|
Three months ended March 31, |
|
Favorable (Unfavorable) |
|
|
|
|
|
|
|
|
|
2023 |
|
2022 |
|
$ Change |
|
% Change |
| Other fees |
|
|
|
|
|
|
|
|
$ |
4,640 |
|
|
$ |
5,876 |
|
|
$ |
(1,236) |
|
|
(21)% |
| Compensation and benefits |
|
|
|
|
|
|
|
|
(84,967) |
|
|
(64,067) |
|
|
(20,900) |
|
|
(33) |
| General, administrative and other expenses |
|
|
|
|
|
|
|
|
(46,172) |
|
|
(32,384) |
|
|
(13,788) |
|
|
(43) |
| Fee Related Earnings |
|
|
|
|
|
|
|
|
$ |
(126,499) |
|
|
$ |
(90,575) |
|
|
(35,924) |
|
|
(40) |
Other Fees. The decrease in other fees for the three months ended March 31, 2023 compared to the same period in 2022 was driven by a $2.6 million decrease in sales-based facilitation fees, which are generated when investors contribute real property through a like-kind 1031 exchange for fund shares. The decrease in other fees was partially offset by net distribution fees that increased by $1.7 million from the prior year comparative period. Net distribution fees represent asset-based fees that are offset by amounts reallowed to participating broker-dealers.
Compensation and Benefits. The increase in compensation and benefits was primarily driven by (i) the expansion of our strategy and relationship management teams to support global fundraising, (ii) the expansion of our business operations teams to support the growth of our business and other strategic initiatives and (iii) higher incentive-based compensation that we believe will increase throughout the year and exceed prior year levels. Average headcount for the quarter-to-date period increased by 25% to 1,415 operations management professionals from 1,136 professionals for the same period in 2022.
Our engagement of a third party subject matter expert to support the reorganization of our income tax compliance function during the third quarter of 2022 further reduced salaries and benefits by $3.5 million for the three months ended March 31, 2023, leading to a corresponding increase in general, administrative and other expenses. The impact of this reorganization is expected to continue through the third quarter.
Employee commissions, which are earned in connection with the sale and distribution of fund shares in our non-traded REITs and private placements of our exchange programs, have been de-emphasized as a component of AWMS’ compensation structure; therefore, sales volumes of our retail products will create limited expense volatility in future periods.
General, Administrative and Other Expenses. Travel and marketing collectively increased by $4.7 million for the three months ended March 31, 2023 compared to the same period in 2022, inclusive of $1.9 million from AWMS, driven by more meetings and events as marketing and communication efforts continued to increase with our expanding retail distribution platform. We also conducted more in-person company meetings and events with a focus on promoting collaboration. As we build out our retail distribution infrastructure and capabilities to support prospective sales and AUM growth, we expect marketing and distribution expenses, including travel, to increase in future periods.
Additionally, professional service fees have increased by $6.4 million for the three months ended March 31, 2023, primarily due to the reorganization of our income tax compliance function and to legal and recruiting fees to support the expanding platform. Certain expenses have also increased during the current year to support the growing headcount. Most notably, occupancy costs and information technology costs increased by $2.3 million for the three months ended March 31, 2023 compared to the same period in 2022.
Realized Income:
The following table presents the components of the OMG’s RI ($ in thousands):
|
|
|
|
|
|
|
|
|
|
|
|
|
|
|
|
|
|
|
|
|
|
|
|
|
|
|
|
|
|
|
|
|
|
|
|
|
|
|
|
|
|
|
|
|
|
|
|
|
|
|
|
|
Three months ended March 31, |
|
Favorable (Unfavorable) |
|
|
|
|
|
|
|
|
|
2023 |
|
2022 |
|
$ Change |
|
% Change |
| Fee Related Earnings |
|
|
|
|
|
|
|
|
$ |
(126,499) |
|
|
$ |
(90,575) |
|
|
$ |
(35,924) |
|
|
(40)% |
|
|
|
|
|
|
|
|
|
|
|
|
|
|
|
|
| Interest and other investment loss—realized |
|
|
|
|
|
|
|
|
(92) |
|
|
(284) |
|
|
192 |
|
|
68 |
| Interest expense |
|
|
|
|
|
|
|
|
(26) |
|
|
(167) |
|
|
141 |
|
|
84 |
| Realized net investment loss |
|
|
|
|
|
|
|
|
(118) |
|
|
(451) |
|
|
333 |
|
|
74 |
| Realized Income |
|
|
|
|
|
|
|
|
$ |
(126,617) |
|
|
$ |
(91,026) |
|
|
(35,591) |
|
|
(39) |
Liquidity and Capital Resources
Management assesses liquidity in terms of our ability to generate cash to fund operating, investing and financing activities. Management believes that the Company is well-positioned and its liquidity will continue to be sufficient for its foreseeable working capital needs, contractual obligations, dividend payments, pending acquisitions and strategic initiatives.
Sources and Uses of Liquidity
Our sources of liquidity are (1) cash on hand, (2) net working capital, (3) cash from operations, including management fees and fee related performance revenues, which are collected monthly, quarterly or semi-annually, and net realized performance income, which may be unpredictable as to amount and timing, (4) fund distributions related to our investments that are unpredictable as to amount and timing and (5) net borrowing from the Credit Facility. As of March 31, 2023, our cash and cash equivalents were $272.2 million, and we had $795.0 million borrowings outstanding under our Credit Facility. Our ability to draw from the Credit Facility is subject to leverage and other covenants. We remain in compliance with all covenants as of March 31, 2023. We believe that these sources of liquidity will be sufficient to fund our working capital requirements and to meet our commitments in the ordinary course of business and under the current market conditions for the foreseeable future. Cash flows from management fees may be impacted by a slowdown or declines in deployment, declines or write downs in valuations, or a slowdown or negatively impacted fundraising. In addition, management fees may be subject to deferral and fee related performance revenues may be subject to hold backs. Declines or delays and transaction activity may impact our fund distributions and net realized performance income which could adversely impact our cash flows and liquidity. Market conditions may make it difficult to extend the maturity or refinance our existing indebtedness or obtain new indebtedness with similar terms.
We expect that our primary liquidity needs will continue to be to (1) provide capital to facilitate the growth of our existing investment management businesses, (2) fund our investment commitments, (3) provide capital to facilitate our expansion into businesses that are complementary to our existing investment management businesses as well as other strategic growth initiatives, (4) pay operating expenses, including cash compensation to our employees, and make payments under the tax receivable agreement (“TRA”), (5) fund capital expenditures, (6) service our debt, (7) pay income taxes, (8) make dividend payments to our Class A and non-voting common stockholders in accordance with our dividend policy and (9) pay distributions to AOG unitholders.
In the normal course of business, we expect to pay dividends to our Class A and non-voting common stockholders that are aligned with our expected fee related earnings after an allocation of current taxes paid. For the purposes of determining this amount, we allocate the current taxes paid to FRE and to realized incentive and investment income in a manner that may be disproportionate to earnings generated by these metrics, and the actual taxes paid on these metrics should they be considered separately. Additionally, our methodology uses the tax benefits from certain expenses that are not included in these non-GAAP metrics, such as equity-based compensation from the vesting of restricted units and the exercise of stock options and from the amortization of intangible assets, among others. We allocate the taxes by multiplying the statutory tax rate currently in effect by our realized performance and net investment income and removing this amount from total current taxes. The remaining current tax paid is the amount that we allocate to FRE. We use this method to allocate the current provision for income taxes to approximate the amount of cash that is available to pay dividends to our stockholders. If cash flows from operations were insufficient to fund dividends over a sustained period of time, we expect that we would suspend or reduce paying such dividends. In addition, there is no assurance that dividends would continue at the current levels or at all.
Our ability to obtain debt financing and complete stock offerings provides us with additional sources of liquidity. For further discussion of financing transactions occurring in the current period, see “Cash Flows” within this section and “Note 6. Debt” and “Note 12. Equity and Redeemable Interest” within our unaudited condensed consolidated financial statements included in this Quarterly Report on Form 10-Q.
Our unaudited condensed consolidated financial statements reflect the cash flows of our operating businesses as well as those of our Consolidated Funds. The assets of our Consolidated Funds, on a gross basis, are significantly larger than the assets of our operating businesses and therefore have a substantial effect on our reported cash flows. The primary cash flow activities of our Consolidated Funds include: (1) raising capital from third-party investors, which is reflected as non-controlling interests of our Consolidated Funds, (2) financing certain investments by issuing debt, (3) purchasing and selling investment securities, (4) generating cash through the realization of certain investments, (5) collecting interest and dividend income and (6) distributing cash to investors. Our Consolidated Funds are generally accounted for as investment companies under GAAP; therefore, the character and classification of all Consolidated Fund transactions are presented as cash flows from operations. Liquidity available at our Consolidated Funds is not available for corporate liquidity needs, and debt of the Consolidated Funds is non–recourse to the Company except to the extent of the Company’s investment in the fund.
Cash Flows
We consolidate funds where we are deemed to hold a controlling interest. The Consolidated Funds are not necessarily the same entities in each year presented due to changes in ownership, changes in limited partners’ rights and the creation or termination of funds. The consolidation of these funds had no effect on cash flows attributable to us for the periods presented. As such, we evaluate the activity of the Consolidated Funds and the eliminations resulting from consolidation separately. The following tables and discussion summarize our condensed consolidated statements of cash flows by activities attributable to the Company and to our Consolidated Funds. For more details on the activity of the Company and Consolidated Funds, refer to “Note 14. Consolidation” within our unaudited condensed consolidated financial statements included in this Quarterly Report on Form 10-Q.
|
|
|
|
|
|
|
|
|
|
|
|
| |
Three months ended March 31, |
($ in thousands) |
2023 |
|
2022 |
| Net cash provided by operating activities |
$ |
148,315 |
|
|
$ |
262,732 |
|
| Net cash provided by (used in) the Consolidated Funds’ operating activities, net of eliminations |
559,257 |
|
|
(38,582) |
|
| Net cash provided by operating activities |
707,572 |
|
|
224,150 |
|
| Net cash used in the Company’s investing activities |
(8,877) |
|
|
(310,148) |
|
| Net cash provided by (used in) the Company’s financing activities |
(260,400) |
|
|
53,205 |
|
| Net cash provided by (used in) the Consolidated Funds’ financing activities, net of eliminations |
(560,744) |
|
|
39,832 |
|
| Net cash provided by (used in) financing activities |
(821,144) |
|
|
93,037 |
|
| Effect of exchange rate changes |
4,711 |
|
|
(4,652) |
|
| Net change in cash and cash equivalents |
$ |
(117,738) |
|
|
$ |
2,387 |
|
Operating Activities
In the table below cash flows from operations have been summarized to present (i) cash generated from our core operating activities, primarily consisting of profits generated principally from management fees and fee related performance revenues after covering for operating expenses and fee related performance compensation, (ii) net realized performance income and (iii) net cash from investment related activities including purchases, sales, net realized investment income and interest payments. We generated meaningful cash flow from operations in each period presented.
|
|
|
|
|
|
|
|
|
|
|
|
|
|
|
|
|
|
|
|
|
|
|
|
|
Three months ended March 31, |
|
Favorable (Unfavorable) |
|
2023 |
|
2022 |
|
$ Change |
|
% Change |
| Core operating activities |
$ |
135,392 |
|
|
$ |
256,012 |
|
|
$ |
(120,620) |
|
|
(47)% |
| Net realized performance income |
5,037 |
|
|
58,284 |
|
|
(53,247) |
|
|
(91) |
| Net cash provided by (used in) investment related activities |
7,886 |
|
|
(51,564) |
|
|
59,450 |
|
|
(115) |
| Net cash provided by operating activities |
$ |
148,315 |
|
|
$ |
262,732 |
|
|
(114,417) |
|
|
(44) |
Although our fee revenues have continued to grow, cash generated from our core operating activities has decreased primarily due to timing of cash collection, including deferring cash collection of our fourth quarter 2022 Part I Fees from the first quarter of 2023 to April 2023. Net realized performance income represents a source of cash and includes incentive fees that are realized annually at the end of the measurement period, which is typically at the end of the calendar year. Cash from these realizations are generally received in the period subsequent to the measurement period. Our incentive fee realizations were higher in the fourth quarter of 2021 compared to the fourth quarter of 2022, which resulted in a decrease in cash payments received over the comparative periods.
Net cash provided by (used in) investment related activities for the three months ended March 31, 2023 primarily represents sales of capital commitments to employees, purchases associated with funding capital commitments in our investment portfolio and interest payments on our debt obligations. Although our capital commitments continue to increase with our growing assets under management, cash generated from our investment related activities has exceeded cash used in investment related activities for the three months ended March 31, 2023. Our investment related activities may fluctuate depending on timing of capital investments and distributions of each fund from year to year. For further discussion of our capital commitments, see “Note 7. Commitments and Contingencies,” within our unaudited condensed consolidated financial statements included in this Quarterly Report on Form 10-Q.
Net cash provided by the Consolidated Funds’ operating activities for the three months ended March 31, 2023 was primarily attributable to sale of U.S. Treasury securities associated with the redemption of Class A ordinary shares in AAC by public shareholders.
Net cash used in the Consolidated Funds’ operating activities for three months ended March 31, 2022 was principally attributable to net purchases of investment securities by recently launched funds during the period.
Our working capital needs are generally rising to support the growth of our business, while the capital requirements needed to support fund-related activities vary based upon the specific investment activities being conducted during such period.
Investing Activities
|
|
|
|
|
|
|
|
|
|
|
|
|
Three months ended March 31, |
|
2023 |
|
2022 |
| Purchase of furniture, equipment and leasehold improvements, net of disposals |
$ |
(8,877) |
|
|
$ |
(8,524) |
|
| Acquisitions, net of cash acquired |
— |
|
|
(301,624) |
|
| Net cash used in investing activities |
$ |
(8,877) |
|
|
$ |
(310,148) |
|
Net cash used in the Company’s investing activities was principally composed of cash to purchase furniture, fixtures, equipment and leasehold improvements during both years to support the growth in our staffing levels and to expand our global presence. Net cash used in the Company’s investing activities for the three months ended March 31, 2022 also included cash used to complete the Infrastructure Debt Acquisition.
Financing Activities
|
|
|
|
|
|
|
|
|
|
|
|
|
Three months ended March 31, |
|
2023 |
|
2022 |
|
|
|
|
| Net borrowings (repayments) of Credit Facility |
$ |
95,000 |
|
|
$ |
(45,000) |
|
| Proceeds from issuance of senior notes |
— |
|
|
488,915 |
|
|
|
|
|
| Class A and non-voting common stock dividends |
(145,386) |
|
|
(111,406) |
|
| AOG unitholder distributions |
(106,246) |
|
|
(100,480) |
|
|
|
|
|
|
|
|
|
|
|
|
|
| Stock option exercises |
9,180 |
|
|
3,347 |
|
| Taxes paid related to net share settlement of equity awards |
(113,431) |
|
|
(183,027) |
|
| Other financing activities |
483 |
|
|
856 |
|
| Net cash provided by (used in) the Company’s financing activities |
$ |
(260,400) |
|
|
$ |
53,205 |
|
As a result of generating higher fee related earnings, we increased the level of dividends paid to a growing shareholder base of Class A and non-voting common stockholders and distributions paid to AOG unitholders, resulting in net cash used in the Company’s financing activities for the three months ended March 31, 2023.
In connection with the vesting of restricted units that are granted to our employees under the Equity Incentive Plan, we withhold shares equal to the fair value of our employee’s withholding tax liabilities and pay the taxes on their behalf. This use of cash decreased from the prior year primarily as a result of a lower number of restricted units that vested in the current year, partially offset by our higher stock price, which is the basis on which employee compensation is recognized. The restricted units that vested in the prior year period were higher primarily due to certain awards that vested in their entirety on the fifth anniversary of the grant date. The net settlement of shares minimizes the dilutive impact of our Equity Incentive Plan as fewer shares are issued upon vesting. For the three months ended March 31, 2023 and 2022, we retained and did not issue 1.4 million shares and 2.3 million shares, respectively.
Net cash provided by the Company’s financing activities for the three months ended March 31, 2022 also included net proceeds from the issuance of the 2052 Senior Notes. These proceeds were used primarily to fund the Infrastructure Debt Acquisition.
|
|
|
|
|
|
|
|
|
|
|
|
|
Three months ended March 31, |
|
2023 |
|
2022 |
| Contributions from redeemable and non-controlling interests in Consolidated Funds, net of eliminations |
$ |
93,585 |
|
|
$ |
82,930 |
|
| Distributions to non-controlling interests in Consolidated Funds, net of eliminations |
(20,933) |
|
|
(34,958) |
|
| Redemptions of redeemable interest in Consolidated Funds |
(538,985) |
|
|
— |
|
| Borrowings under loan obligations by Consolidated Funds |
2,914 |
|
|
49,317 |
|
| Repayments under loan obligations by Consolidated Funds |
(97,325) |
|
|
(57,457) |
|
| Net cash provided by (used in) the Consolidated Funds’ financing activities |
$ |
(560,744) |
|
|
$ |
39,832 |
|
Net cash used in the Consolidated Funds’ financing activities for the three months ended March 31, 2023 was primarily attributable to the redemption of Class A ordinary shares in AAC by public shareholders.
Net cash provided by the Consolidated Funds’ financing activities for the three months ended March 31, 2022 was principally attributable to contributions to a Consolidated Fund to fund investments in limited partnership interests in private equity funds managed by the Company.
Capital Resources
We intend to use a portion of our available liquidity to pay cash dividends to our Class A and non-voting common stockholders on a quarterly basis in accordance with our dividend policy. Our ability to make cash dividends is dependent on a myriad of factors, including among others: general economic and business conditions; our strategic plans and prospects; our business and investment opportunities; timing of capital calls by our funds in support of our commitments; our financial condition and operating results; working capital requirements and other anticipated cash needs; contractual restrictions and obligations; legal, tax and regulatory restrictions; restrictions on the payment of distributions by our subsidiaries to us and other relevant factors.
We are required to maintain minimum net capital balances for regulatory purposes for our broker-dealer entities. These net capital requirements are met in part by retaining cash, cash equivalents and investment securities. Additionally, certain of our subsidiaries operating outside the U.S. are also subject to capital adequacy requirements in each of the applicable jurisdictions. As a result, we may be restricted in our ability to transfer cash between different operating entities and jurisdictions. As of March 31, 2023, we were required to maintain approximately $52.3 million in net assets within these subsidiaries to meet regulatory net capital and capital adequacy requirements. We remain in compliance with all regulatory requirements.
Holders of AOG Units, subject to the terms of the exchange agreement, may exchange their AOG Units for shares of our Class A common stock on a one-for-one basis. These exchanges are expected to result in increases in the tax basis of the tangible and intangible assets of AMC that otherwise would not have been available. These increases in tax basis may increase depreciation and amortization for U.S. income tax purposes and thereby reduce the amount of tax that we would otherwise be required to pay in the future. We entered into the TRA that provides payment to the TRA recipients of 85% of the amount of actual cash savings, if any, in U.S. federal, state, local and foreign income tax or franchise tax that we actually realize as a result of these increases in tax basis and of certain other tax benefits related to entering into the TRA, including tax benefits attributable to payments under the TRA and interest accrued thereon. Future payments under the TRA in respect of subsequent exchanges are expected to be substantial. The TRA liability balance was $114.0 million and $118.5 million as of March 31, 2023 and December 31, 2022, respectively.
For a discussion of our debt obligations, including the debt obligations of our consolidated funds, see “Note 6. Debt,” within our unaudited condensed consolidated financial statements included in this Quarterly Report on Form 10-Q.
Critical Accounting Estimates
We prepare our unaudited condensed consolidated financial statements in accordance with GAAP. In applying many of these accounting principles, we need to make assumptions, estimates or judgments that affect the reported amounts of assets, liabilities, revenues and expenses in our unaudited condensed consolidated financial statements. We base our estimates and judgments on historical experience and other assumptions that we believe are reasonable under the circumstances. These assumptions, estimates or judgments, however, are both subjective and subject to change, and actual results may differ from our assumptions and estimates. If actual amounts are ultimately different from our estimates, the revisions are included in our results of operations for the period in which the actual amounts become known. For a summary of our significant accounting policies, see “Note 2. Summary of Significant Accounting Policies,” to our unaudited condensed consolidated financial statements included in this Quarterly Report on Form 10-Q and in our Annual Report on Form 10-K for the year ended December 31, 2022. For a summary of our critical accounting estimates, please see "Management’s Discussion and Analysis of Financial Condition and Results of Operations—Critical Accounting Estimates" in our Annual Report on Form 10-K.
Recent Accounting Pronouncements
Information regarding recent accounting pronouncements and their impact on the Company can be found in “Note 2. Summary of Significant Accounting Policies,” within our unaudited condensed consolidated financial statements included in this Quarterly Report on Form 10-Q.
Commitments and Contingencies
In the normal course of business, we enter into contractual obligations that may require future cash payments. We may also engage in off-balance sheet arrangements, including transactions in derivatives, guarantees, capital commitments to funds, indemnifications and potential contingent payment obligations. For further discussion of these arrangements, see “Note 7. Commitments and Contingencies” to our unaudited condensed consolidated financial statements included in this Quarterly Report on Form 10-Q.
Item 3. Quantitative and Qualitative Disclosures About Market Risk
Our primary exposure to market risk is related to our role as general partner or investment adviser to our investment funds and the sensitivity to movements in the fair value of their investments, including the effect on management fees, performance income and investment income.
Market Risk
The market price of investments may significantly fluctuate during the period of investment. Investments may decline in value due to factors affecting securities markets generally or particular industries represented in the securities markets. The value of an investment may decline due to general market conditions, which are not specifically related to such investment, such as real or perceived adverse economic conditions, changes in the general outlook for corporate earnings, changes in interest or currency rates or adverse investor sentiment generally. It may also decline due to factors that affect a particular industry or industries, such as labor shortages or increased production costs, supply chain constraints and competitive conditions within an industry.
Our credit orientation has been a central tenet of our business across our debt and equity investment strategies. We believe the combination of high-quality proprietary information flow and a consistent, rigorous approach to managing investments across our strategies has been, and we believe will continue to be, a major driver of our strong risk-adjusted returns and the stability and predictability of our income.
Credit Risk
We are party to agreements providing for various financial services and transactions that contain an element of risk in the event that the counterparties are unable to meet the terms of such agreements. In such agreements, we depend on the counterparty to make payment or otherwise perform. We generally endeavor to minimize our risk of exposure by limiting to reputable financial institutions the counterparties with which we enter into financial transactions. In other circumstances, availability of financing from financial institutions may be uncertain due to market events, and we may not be able to access these financing markets.
In the ordinary course of business, we may extend loans to our funds or guarantee credit facilities held by our funds and could be subject to risk of loss or repayment if our funds do not perform.
Certain of our funds’ investments include lower-rated and comparable quality unrated distressed investments and other instruments. These issuers can be more sensitive to adverse market conditions, such as a recession or increasing interest rates, as compared to higher rated issuers. We seek to minimize risk exposure by subjecting each prospective investment to our rigorous, credit-oriented investment approach.
At March 31, 2023 and December 31, 2022, we had cash balances with financial institutions in excess of Federal Deposit Insurance Corporation insured limits. We seek to mitigate this exposure by monitoring the credit standing of these financial institutions. However, uncertainty surrounding global financial stability, including the liquidity of certain banks given the recent strain on the banking system, may have an adverse impact on us. For further consideration, see “Item 1A. Risk Factors—Our business is dependent on bank relationships and the recent strain on the banking system may adversely impact us.”
There have been no material changes in our market risks for the three months ended March 31, 2023. For additional information on our market risks, refer to our Annual Report on Form 10-K for the year ended December 31, 2022, which is accessible on the SEC’s website at www.sec.gov.
Item 4. Controls and Procedures
Evaluation of Disclosure Controls and Procedures
We maintain disclosure controls and procedures (as that term is defined in Rules 13a-15(e) and 15d-15(e) under the Exchange Act) that are designed to ensure that information required to be disclosed in our reports under the Exchange Act is recorded, processed, summarized and reported within the time periods specified in the SEC’s rules and forms, and that such information is accumulated and communicated to our management, including our principal executive officer and principal financial officer, as appropriate, to allow timely decisions regarding required disclosures. Any controls and procedures, no matter how well designed and operated, can provide only reasonable assurance of achieving the desired control objectives. Our management, with the participation of our principal executive officer and principal financial officer, has evaluated the effectiveness of the design and operation of our disclosure controls and procedures as of March 31, 2023. Based upon that evaluation and subject to the foregoing, our principal executive officer and principal financial officer concluded that, as of March 31, 2023, the design and operation of our disclosure controls and procedures were effective to accomplish their objectives at the reasonable assurance level.
Changes in Internal Control over Financial Reporting
There have been no changes in our internal control over financial reporting (as defined in Rule 13a-15(f) and 15d-15(f) under the Exchange Act) during the quarter ended March 31, 2023 that have materially affected, or that are reasonably likely to materially affect, our internal control over financial reporting.
PART II.
Item 1. Legal Proceedings
From time to time we are involved in various legal proceedings, lawsuits and claims incidental to the conduct of our business, some of which may be material. As of March 31, 2023 and December 31, 2022, we were not subject to any material pending legal proceedings. Our businesses are also subject to extensive regulation, which may result in regulatory proceedings or investigations against us or our funds and their investment advisers, respectively. While the outcome of any such future legal or regulatory proceedings cannot be predicted with certainty, neither we nor our funds or their investment advisers expect that any such future proceedings will have a material effect upon our financial condition or results of operations.
Item 1A. Risk Factors
In addition to the other information set forth in this report, you should carefully consider the risk factors described below and in Part I, “Item 1A. Risk Factors” in our Annual Report on Form 10-K for the year ended December 31, 2022, which is accessible on the SEC’s website at www.sec.gov. The risks described below and in our Annual Report on Form 10-K for the year ended December 31, 2022 are not the only risks facing us. These risks and additional risks and uncertainties not currently known to us or that we currently deem to be immaterial also may materially and adversely affect our business, financial condition and/or operating results.
Our business is dependent on bank relationships and the recent strain on the banking system may adversely impact us and our funds.
The financial markets recently have encountered volatility associated with concerns about the balance sheets of banks, especially small and regional banks who may have significant losses associated with investments that make it difficult to fund demands to withdraw deposits and other liquidity needs. Although the federal government has announced measures to assist these banks and protect depositors, some banks have already been impacted and others may be materially and adversely impacted. However, concerns involving liquidity, insolvency, defaults, or non-performance by financial institutions remain, in part, because related future developments are difficult to quantify or assess with certainty. Moreover, future events or developments, like the degree or type of responsive government or regulatory action, and the related market reaction, also remain unknown or uncertain.
Our and our funds’ business are dependent on bank relationships and we are proactively monitoring the financial health of such bank relationships. Continued strain on the banking system may adversely impact our and our funds’ business, financial condition and results of operations. It is also possible that the current, developing situation could result in increased regulation and new rules for public companies, banks, financial institutions and other industry participants in the U.S. and global markets. Complying with the requirements of any such rules or regulations may subject us and our funds to increased compliance costs and administrative burdens, even if not adopted.
Item 2. Unregistered Sales of Equity Securities and Use of Proceeds
We did not sell any equity securities during the period covered in this report that were not registered under the Securities Act.
Except as set forth below, all unregistered purchases of equity securities during the period covered by this Quarterly Report were previously disclosed in our current reports on Form 8-K or quarterly reports on Form 10-Q ($ in thousands; except share data):
|
|
|
|
|
|
|
|
|
|
|
|
|
|
|
|
|
|
|
|
|
|
|
|
|
|
|
| Period |
|
Total Number of Shares Purchased |
|
Average Price Paid Per Share |
|
Total Number of Shares Purchased as Part of Publicly Announced Plans or Programs |
|
Approximate Dollar Value of Shares That May Yet be Purchased Under the Plans or Programs (1) |
January 1, 2023 - January 31, 2023 |
|
— |
|
$ |
— |
|
|
— |
|
$ |
150,000 |
|
February 1, 2023 - February 28, 2023 |
|
— |
|
— |
|
|
— |
|
150,000 |
|
March 1, 2023 - March 31, 2023 |
|
— |
|
— |
|
|
— |
|
150,000 |
|
| Total |
|
— |
|
|
|
— |
|
|
(1)In February 2023, our board of directors approved the renewal of our stock repurchase program that authorizes the repurchase of up to $150 million of shares of our Class A common stock. Under this stock repurchase program, shares may be repurchased from time to time in open market purchases, privately negotiated transactions or otherwise, including in reliance on Rule 10b5-1 of the Securities Act. The program is scheduled to expire in March 2024. Repurchases under the program depend on the prevailing market conditions and other factors.
As permitted by our policies and procedures governing transactions in our securities by our directors, executive officers and other employees, from time to time some of these persons may establish plans or arrangements complying with Rule 10b5-1 under the Exchange Act, and similar plans and arrangements relating to our Class A common stock.
Item 3. Defaults Upon Senior Securities
None.
Item 4. Mine Safety Disclosures
Not applicable.
Item 5. Other Information
None.
Item 6. Exhibits, Financial Statement Schedules
(a)Exhibits.
The following is a list of all exhibits filed or furnished as part of this report.
|
|
|
|
|
|
|
|
|
| Exhibit No. |
|
Description |
|
|
Second Amended and Restated Certificate of Incorporation of Ares Management Corporation. |
|
|
Bylaws of Ares Management Incorporation (incorporated by reference to Exhibit 99.4 to the Registrant’s Current Report on Form 8-K (File No. 001-36429) filed with the SEC on November 15, 2018). |
|
|
Fourth Amended and Restated Tax Receivable Agreement, dated May 1, 2023. |
|
|
Certification of the Chief Executive Officer pursuant to Rule 13a-14(a). |
|
|
Certification of the Chief Financial Officer pursuant to Rule 13a-14(a). |
|
|
Certification of the Chief Executive Officer and Chief Financial Officer pursuant to 18 U.S.C. Section 1350. |
| 101.INS |
|
XBRL Instance Document - the instance document does not appear in the Interactive Data File because its XBRL tags are embedded within the Inline XBRL document. |
| 101.SCH |
|
Inline XBRL Taxonomy Extension Schema Document. |
| 101.CAL |
|
Inline XBRL Taxonomy Extension Calculation Linkbase Document. |
| 101.DEF |
|
Inline XBRL Taxonomy Extension Definition Linkbase Document. |
| 101.LAB |
|
Inline XBRL Taxonomy Extension Label Linkbase Document. |
| 101.PRE |
|
Inline XBRL Taxonomy Extension Presentation Linkbase Document. |
| 104.0 |
|
Cover Page Interactive Data File - the cover page interactive data file does not appear in the Interactive Data File because its XBRL tags are embedded within the Inline XBRL document. |
* Filed herewith.
** These certifications are not deemed filed by the SEC and are not to be incorporated by reference in any filing we make under the Securities Act of 1933 or the Securities Exchange Act of 1934, irrespective of any general incorporation language in any filings.
SIGNATURES
Pursuant to the requirements of the Securities Exchange Act of 1934, the registrant has duly caused this report to be signed on its behalf by the undersigned thereunto duly authorized.
|
|
|
|
|
|
|
|
|
|
|
|
| |
ARES MANAGEMENT CORPORATION |
| |
|
|
|
| |
|
|
|
| Dated: May 8, 2023 |
|
By: |
/s/ Michael J Arougheti |
| |
|
Name: |
Michael J Arougheti |
| |
|
Title: |
Co-Founder, Chief Executive Officer & President (Principal Executive Officer) |
|
|
|
|
|
|
|
|
| Dated: May 8, 2023 |
|
By: |
/s/ Jarrod Phillips |
|
|
Name: |
Jarrod Phillips |
|
|
Title: |
Chief Financial Officer
(Principal Financial & Accounting Officer) |
|
|
|
|
|
|
|
|
EX-10.1
2
a2023q1exhibit101.htm
EX-10.1
Document
FOURTH AMENDED AND RESTATED TAX RECEIVABLE AGREEMENT
This FOURTH AMENDED AND RESTATED TAX RECEIVABLE AGREEMENT (this “Agreement”), dated as of May 1, 2023 (the “Effective Date”), is entered into by and among Ares Management Corporation, a Delaware corporation (the “Parent”), Ares Holdings L.P., a Delaware limited partnership (“Ares Holdings”), all other Persons (as defined herein) in which the Parent or any of its Subsidiaries (as defined herein) acquires a partnership interest or similar interest after the Effective Date and who execute and deliver a joinder contemplated in Section 7.12 (together with Ares Holdings, the “Partnerships”), Ares Owners Holdings L.P., a Delaware limited partnership (“AOH”), Alleghany Insurance Holdings LLC, a Delaware limited liability company (“Alleghany”) and each of the parties set forth on Schedule A maintained by the Parent (the “Limited Partners” and together with AOH and Alleghany, the “TRA Holders”).
RECITALS
WHEREAS, TRA Holders directly or indirectly hold limited partnership interests in each of the Partnerships (“Partnership Units”), and each of the Partnerships is classified as a partnership for U.S. federal income tax purposes;
WHEREAS, as of the Effective Date, the Parent or its direct or indirect Subsidiary is the general partner of the Partnership in which the Parent owns an interest;
WHEREAS, pursuant to and subject to the provisions of the Exchange Agreement (as defined below), TRA Holders are entitled to surrender Partnership Units to the Partnerships in exchange for the delivery by the Partnerships of Class A Shares, cash or other consideration and the general partners of the Partnerships have a superseding right to acquire such Partnership Units for Class A Shares, cash or other consideration;
WHEREAS, each of the Partnerships will, and certain of their direct and indirect Subsidiaries that are treated as partnerships for U.S. federal income tax purposes may, have in effect an election under Section 754 of the Code, for each Taxable Year in which a taxable exchange of Partnership Units for Class A Shares, cash or other consideration occurs, which election is intended to result in an adjustment to the tax basis of the assets owned by the Partnerships at the time of such an exchange of Partnership Units for Class A Shares, cash or other consideration (collectively, an “Exchange”, the date of such Exchange, the “Exchange Date”, and such assets and any asset whose tax basis is determined, in whole or in part, by reference to the adjusted basis of any such asset, the “Reference Assets”) by reason of such Exchange and the receipt of payments under this Agreement;
WHEREAS, the income, gain, loss, expense and other Tax items of (i) the Partnerships solely with respect to the Parent may be affected by the Basis Adjustment (as defined below) and (ii) the Parent may be affected by the Imputed Interest (as defined below);
WHEREAS, effective as of March 1, 2018, Ares Management, L.P., a Delaware limited partnership and the predecessor of the Parent (“Ares LP”), elected to be classified as an association taxable as a corporation for U.S. federal income tax purposes pursuant to Treasury Regulation Section 301.7701-3(c) (the “Tax Election”);
WHEREAS, certain of the parties to this Agreement entered into the Amended and Restated Tax Receivable Agreement, effective as of March 1, 2018, to make certain arrangements with respect to the effect of the Basis Adjustment and Imputed Interest on the actual liability for Taxes of the Parent (and, prior to the Internal Restructuring (as defined below), Ares Holdings Inc., a Delaware Corporation (“Holdings Inc.”);
WHEREAS, effective as of November 26, 2018, Ares LP filed with the Secretary of State of the State of Delaware a Certificate of Conversion to convert to the Parent, in accordance with the Delaware General Corporation Law and the Delaware Revised Uniform Limited Partnership Act (the “Conversion”); WHEREAS, certain of the parties to this Agreement entered into the Second Amended & Restated Tax Receivable Agreement, effective as of November 26, 2018 (the “A&R Agreement”), in connection with the Conversion, on the terms and subject to the conditions set forth therein;
WHEREAS, effective as of April 1, 2021, (a) Holdings Inc. merged with and into Ares Holdco LLC (“Ares Holdco LLC”), with Ares Holdco LLC continuing as the surviving entity, (b) Ares Offshore Holdings, Ltd. merged with and into Ares Silo Merger Sub LLC (“Merger LLC”), with Merger LLC continuing as the surviving entity, (c) Merger LLC merged with and into Ares Holdco LLC, with Ares Holdco LLC continuing as the surviving entity, (d) Ares AI Holdings, L.P. merged with and into AI Holdco LLC (“AI Holdco LLC”), with AI Holdco LLC continuing as the surviving entity, (e) AI Holdco LLC merged with and into Ares Holdco LLC, with Ares Holdco LLC continuing as the surviving entity, (f) AOF Holdco LLC merged with and into Ares Holdco LLC, with Ares Holdco LLC continuing as the surviving entity, (g) Ares Investments L.P. merged with and into Ares Holdings, with Ares Holdings continuing as the surviving entity, and (h) Ares Offshore Holdings Delaware L.P. merged with and into Ares Holdings, with Ares Holdings continuing as the surviving entity (collectively, the “Internal Restructuring”);
WHEREAS, in connection with the Internal Restructuring, certain of the parties to this Agreement entered into this Third Amended and Restated Tax Receivable Agreement, effective as of April 2, 2021 (the “Third A&R Agreement”); and
WHEREAS, certain parties to the Agreement now desire to amend and restate the Third A&R Agreement as set forth below.
NOW, THEREFORE, the parties agree as follows:
ARTICLE I
DEFINITIONS
Section 1.01. Definitions. As used in this Agreement, the terms set forth in this Article I shall have the following meanings.
“A&R Agreement” is defined in the Recitals of this Agreement.
“Advisory Firm” means Kirkland & Ellis LLP, other advisors as indicated by the Parent or any other accounting firm or law firm that is nationally recognized as being expert in Tax matters and that is designated as such by the Board.
“Advisory Firm Letter” means a letter from the Advisory Firm stating that the relevant schedule, notice or other information to be provided or made available by the Parent to TRA Holders or the Principals, as the case may be, and all supporting schedules and work papers were prepared in a manner consistent with the terms of this Agreement and, to the extent not expressly provided in this Agreement, on a reasonable basis in light of the facts and law in existence on the date such schedule, notice or other information is delivered or made available to the TRA Holders or the Principals, as the case may be.
“Affiliate” means, with respect to any Person, any other Person that directly or indirectly, through one or more intermediaries, Controls, is Controlled by, or is under common Control with, such first Person.
“Agreed Rate” means SOFR plus 100 basis points.
“Agreement” is defined in the Preamble of this Agreement.
“AI Holdco LLC” is defined in the Recitals of this Agreement.
“Alleghany” is defined in the Preamble of this Agreement.
“Amended Schedule” is defined in Section 2.04(b) of this Agreement.
“AOH” is defined in the Preamble of this Agreement.
“AOH Partnership Agreement” means the limited partnership agreement of AOH.
“AOH Units” means limited partnership interests in AOH.
“Ares Group” means, collectively, the Parent, the Partnerships and any other entity designated by the Board as being a member of the Ares Group.
“Ares Holdco LLC” is defined in the Recitals of this Agreement.
“Ares Holdings” is defined in the Preamble of this Agreement.
“Ares LP” is defined in the Recitals of this Agreement.
“Bankruptcy Code” means The Bankruptcy Reform Act of 1978, codified as 11 U.S.C. Section 101 et seq.
“Basis Adjustment” means the adjustment to the tax basis of a Reference Asset under Sections 1012, 732, 734(b), 743(b) and 754 of the Code and, in each case, comparable sections of U.S. state and local and foreign tax laws (as calculated under Section 2.01 of this Agreement) as a result of an Exchange and the payments made pursuant to this Agreement. In the case of an interest in a Partnership that owns a Reference Asset and that has been the subject of an Exchange, if at any time after such Exchange, the interest is transferred to (i) the Parent or (ii) any entity that is owned directly or indirectly in whole or in part by the Parent or that is a member of an affiliated or consolidated group of corporations described in Section 7.11(b) that includes the Parent, the Basis Adjustment for such Reference Asset shall include, to the extent reasonably determined to be appropriate by the Parent, any adjustment to the tax basis of the Reference Asset under Sections 1012, 732, 734(b), 743(b) and 754 of the Code and, in each case, comparable sections of U.S. state and local and foreign tax laws (as calculated under Section 2.01 of this Agreement) as a result of such transfer to the extent such adjustment does not exceed the unamortized Basis Adjustment for the Reference Asset as determined immediately before such transfer. Notwithstanding any other provision of this Agreement, the amount of any Basis Adjustment resulting from an Exchange of one or more Partnership Units shall be determined separately for each such Exchange and without regard to any Pre-Exchange Transfer of such Partnership Units and as if any such Pre-Exchange Transfer had not occurred.
A “Beneficial Owner” of a security is a Person who directly or indirectly, through any contract, arrangement, understanding, relationship or otherwise has or shares: (i) voting power, which includes the power to vote, or to direct the voting of, such security or (ii) investment power, which includes the power to dispose, or to direct the disposition of, such security. The terms “Beneficially Own” and “Beneficial Ownership” shall have correlative meanings.
“Board” means the board of directors of the Parent.
“Business Day” means Monday through Friday of each week, except that a legal holiday recognized as such by the U.S. government or the State of New York shall not be regarded as a Business Day.
“Change of Control” means the occurrence of any of the following events:
(i) any Person or any group of Persons acting together which would constitute a “group” for purposes of Section 13(d) of the Securities and Exchange Act of 1934, excluding a group of Persons, which, if it includes any Principal or any of its Affiliates, includes all Principals then employed by the Parent or any of its Affiliates, is or becomes the Beneficial Owner, directly or indirectly, of securities of the Parent representing more than 50% of the combined voting power of the Parent’s then outstanding voting securities; or (ii) the stockholders of the Parent approve a plan of complete liquidation or dissolution of the Parent or there is consummated an agreement or series of related agreements for the sale or other disposition, directly, or indirectly, by the Parent of all or substantially all of the Parent’s assets, other than such sale or other disposition by the Parent of all or substantially all of the Parent’s assets to an entity, at least 50% of the combined voting power of the voting securities of which are owned by stockholders of the Parent in substantially the same proportions as their ownership of the Parent immediately prior to such sale.
Notwithstanding the foregoing, a “Change of Control” shall not be deemed to have occurred (i) by virtue of the consummation of any transaction or series of integrated transactions immediately following which the record holders of the stock of the Parent immediately prior to such transaction or series of transactions continue to have substantially the same proportionate ownership in an entity which owns all or substantially all of the assets of the Parent immediately following such transaction or series of transactions, or (ii) as a result of the Conversion.
“Class A Shares” means shares of Class A common stock of the Parent.
“Code” means the Internal Revenue Code of 1986.
“Control” means the possession, direct or indirect, of the power to direct or cause the direction of the management and policies of a Person, whether through ownership of voting securities, by contract or otherwise.
“Conversion” is defined in the Recitals of this Agreement.
“Default Rate” means SOFR plus 500 basis points.
“Delaware General Corporation Law” means the General Corporation Law of the State of Delaware, 8 Del. C. § 101, et seq.
“Delaware Revised Uniform Limited Partnership Act” means the Revised Uniform Limited Partnership Act of the State of Delaware, 6 Del. C. §17-101, et seq.
“Determination” has the meaning ascribed to such term in Section 1313(a) of the Code or similar provision of U.S. state and local and foreign tax law, as applicable, or any other event (including the execution of an IRS Form 870-AD (Waiver of Restrictions on Assessment and Collection of Deficiency in Tax and Acceptance of Overassessment)) that finally and conclusively establishes the amount of any liability for Tax.
“Early Termination Date” means the date of an Early Termination Notice for purposes of determining the Early Termination Payment.
“Early Termination Notice” is defined in Section 4.02 of this Agreement.
“Early Termination Objection Notice” is defined in Section 4.02 of this Agreement.
“Early Termination Schedule” is defined in Section 4.02 of this Agreement.
“Early Termination Payment” is defined in Section 4.03(b) of this Agreement.
“Early Termination Rate” means the lesser of (i) 6.5% and (ii) the Agreed Rate.
“Effective Date” is defined in the Preamble of this Agreement.
“Exchange” is defined in the Recitals of this Agreement.
“Exchange Agreement” means the Fifth Amended and Restated Exchange Agreement among the Parent, the Partnerships and the other parties thereto.
“Exchange Basis Schedule” is defined in Section 2.02 of this Agreement.
“Exchange Date” is defined in the Recitals of this Agreement.
“Exchange Payment” means any Tax Benefit Payment or Early Termination Payment required to be made by the Parent to the TRA Holders under this Agreement.
“Exchange Price” is the amount of cash, Class A Shares or other consideration transferred to a holder of Partnership Units pursuant to an Exchange as payment for the exchanged Partnership Units, other than amounts payable pursuant to this Agreement.
“Expert” is defined in Section 7.09 of this Agreement.
“Holdcos” means, collectively, the Parent and any other entity designated as a Holdco by the Board.
“Holdings Inc.” is defined in the Recitals of this Agreement.
“Imputed Interest” means any interest imputed under Section 1272, 1274, 483 or other provision of the Code and any similar provision of state, local and foreign tax law with respect to payment obligations under this Agreement.
“Internal Restructuring” is defined in the Recitals of this Agreement.
“IRS” means the U.S. Internal Revenue Service.
“Limited Partner” is defined in the Preamble of this Agreement.
“Market Value” means the closing price of the Class A Shares on the applicable Exchange Date on the national securities exchange or interdealer quotation system on which such Class A Shares are then traded or listed (the “National Exchange”), as reported in the principal consolidated transaction reporting system of the National Exchange. If the closing price is not so reported on the applicable Exchange Date, then the Market Value shall mean the closing price of the Class A Shares on the Business Day immediately preceding such Exchange Date on the National Exchange, as reported in the principal consolidated transaction reporting system of the National Exchange. If the Class A Shares are not then listed on a national securities exchange or interdealer quotation system, “Market Value” shall mean the cash consideration paid for Class A Shares, or the fair market value of the other property delivered for Class A Shares, as determined by the Parent in good faith.
“Merger LLC” is defined in the Recitals of this Agreement.
“Net Tax Benefit” is defined in Section 3.01(b) of this Agreement.
“Non-Stepped Up Tax Basis” means, with respect to any asset at any time, the tax basis that such asset would have had at such time if no Basis Adjustment had been made.
“Non-Stepped Up Tax Liability” means, with respect to any Taxable Year, the liability for Taxes of the Parent or any Partnership in which the Parent directly or indirectly owns an interest, but only with respect to Taxes imposed on such Partnership and allocable to the Parent, but using the Non-Stepped Up Tax Basis instead of the tax basis of the Reference Assets attributable to each Partnership and excluding any deduction attributable to the Imputed Interest.
“Objection Notice” is defined in Section 2.04(a) of this Agreement.
“Parent” is defined in the Preamble of this Agreement.
“Partnership Agreement” means, with respect to a Partnership, the limited partnership agreement or similar agreement of such Partnership.
“Partnership Units” is defined in the Recitals of this Agreement.
“Partnerships” is defined in the Preamble of this Agreement.
“Payment Date” means any date on which a payment is required to be made pursuant to this Agreement.
“Person” means any individual, corporation, firm, partnership, joint venture, limited liability company, estate, trust, business association, organization, governmental entity or other entity.
“Pre-Exchange Transfer” means any direct or indirect transfer of one or more Partnership Units (i) that occurs prior to an Exchange of such Partnership Units, and (ii) to which either Section 734(b) or 743(b) of the Code applies.
“Principals” means the Persons set forth on Schedule B hereto and any additional Persons who may from time to time be designated by the Board as Principals; provided that (i) unless the Parent determines otherwise, if any Principal is an employee of the Parent or one or more of its Subsidiaries or Affiliates as of April 1, 2021 or thereafter-, such Person shall cease to be a Principal once such Person ceases to be an employee of the Parent or one or more of its Subsidiaries or Affiliates and (ii) a Person will be a Principal only with respect to the provisions of this Agreement, and subject to the limitations, set forth on Schedule B.
“Put Right” means a contractual right, pursuant to which a TRA Holder has the right, but not the obligation, to cause the Partnerships or their Affiliates to redeem all, or a portion of, such TRA Holder’s Partnership Units at a predetermined price.
“Realized Tax Benefit” means, for a Taxable Year, the excess, if any, of the Non-Stepped Up Tax Liability over the actual liability for Taxes of the Parent or any Partnership in which the Parent directly or indirectly owns an interest, but only with respect to Taxes imposed on such Partnership and allocable to the Parent, using the “with or without” methodology. If all or a portion of the actual tax liability for Taxes for the Taxable Year arises as a result of an audit by a Taxing Authority of any Taxable Year, such liability shall not be included in determining the Realized Tax Benefit unless and until there has been a Determination.
“Realized Tax Detriment” means, for a Taxable Year, the excess, if any, of the actual liability for Taxes of the Parent or any Partnership in which the Parent directly or indirectly owns an interest, but only with respect to Taxes imposed on such Partnership and allocable to the Parent, over the Non-Stepped Up Tax Liability for such Taxable Year using the “with or without” methodology. If all or a portion of the actual tax liability for Taxes for the Taxable Year arises as a result of an audit by a Taxing Authority of any Taxable Year, such liability shall not be included in determining the Realized Tax Detriment unless and until there has been a Determination.
“Reconciliation Dispute” is defined in Section 7.09 of this Agreement.
“Reconciliation Procedures” means those procedures set forth in Section 7.09 of this Agreement.
“Reference Assets” is defined in the Recitals of this Agreement.
“Schedule” means any Exchange Basis Schedule, Tax Benefit Schedule and the Early Termination Schedule.
“SOFR” means a rate per annum equal to (a) the forward-looking secured overnight financing rate for a borrowing of one month as published by the SOFR Administrator on the SOFR Administrator’s Website on the day immediately following the applicable measurement date plus (b) 0.10%. Such measurement date shall be: (i) the due date (without extensions) for filing the Parent’s Tax Return with respect to Taxes for such Taxable Year for purposes of calculating the Agreed Rate and (ii) the due date in respect of any Exchange Payment not made for purposes of calculating the Default Rate. Notwithstanding the foregoing, if at any time, for any reason, SOFR shall no longer be publicly available, the Parent will replace SOFR with a successor rate.
“SOFR Administrator” means the NYFRB (or a successor administrator of the secured overnight financing rate).
“SOFR Administrator’s Website” means the website of the NYFRB, currently at http://www.newyorkfed.org, or any successor source for the secured overnight financing rate identified as such by the SOFR Administrator from time to time.
“Subsequent Exchange” is defined in Section 4.01 of this Agreement.
“Subsidiaries” means, with respect to any Person, any other Person as to which such Person, owns, directly or indirectly, or otherwise controls more than 50% of the voting shares or other similar interests or the general partner interest, managing member interest or similar interest of such Person.
“Tax Benefit Payment” is defined in Section 3.01(b) of this Agreement.
“Tax Benefit Schedule” is defined in Section 2.03 of this Agreement.
“Tax Election” is defined in the Recitals of this Agreement.
“Tax Return” means any return, declaration, report or similar statement required to be filed with respect to Taxes (including any attached schedules), including any information return, claim for refund, amended return and declaration of estimated Tax.
“Taxable Year” means a taxable year as defined in Section 441(b) of the Code or comparable section of state, local or foreign tax law, as applicable, (and, therefore, for the avoidance of doubt, may include a period of less than 12 months for which a Tax Return is made) ending on or after the Exchange Date in which there is a Basis Adjustment due to an Exchange.
“Taxes” means any and all U.S. federal, state, local and foreign taxes, assessments or similar charges measured with respect to net income or profits and any interest related to such Tax.
“Taxing Authority” means any domestic, foreign, federal, national, state, county or municipal or other local government, any subdivision, agency, commission or authority thereof, or any quasi-governmental body exercising any taxing authority or any other authority exercising Tax regulatory authority.
“Third A&R Agreement” is defined in the Recitals of this Agreement.
“TRA Holder” is defined in the Preamble of this Agreement, and for the avoidance of doubt shall not include any direct or indirect holder of Partnership Units that is not a party to this Agreement.
“Treasury Regulations” means the final, temporary and proposed regulations under the Code promulgated from time to time (including corresponding provisions and succeeding provisions) as in effect for the relevant taxable period.
“Valuation Assumptions” means, as of an Early Termination Date, with respect to the Parent, the assumptions that (1) in each Taxable Year ending on or after such Early Termination Date, the Parent will have taxable income sufficient to fully utilize the tax benefits arising from the Basis Adjustment and the Imputed Interest during such Taxable Year, (2) the federal income tax rates and state, local and foreign income tax rates that will be in effect for each such Taxable Year will be those specified for each such Taxable Year by the Code and other law as in effect on the Early Termination Date, (3) any loss carryovers generated by the Basis Adjustment or the Imputed Interest and available as of the date of the Early Termination Schedule will be utilized by the Parent on a pro rata basis from the date of the Early Termination Date through the scheduled expiration date of such loss carryovers, (4) any non-amortizable assets are deemed to be disposed of (A) with respect to fund related assets, pro-rata over the number of years remaining under the original fund agreement until expected liquidation (without extensions) of the applicable fund (or, (y) if such expected liquidation date has passed, on the Early Termination Date and (z) if with respect to “evergreen” funds, after eighteen (18) months) and (B) with respect to all other assets, on the fifteenth anniversary of the earlier of the Basis Adjustment and the Early Termination Date and (5) if an Early Termination is effected prior to an Exchange of Partnership Units, the first sentence of Section 2.01 shall be read to include the cash, Class A Shares or other consideration that would be transferred if the Exchange occurred on the Early Termination Date.
Section 1.02. Interpretation. Unless a clear contrary intention appears: (i) the defined terms herein shall apply equally to both the singular and plural forms of such terms; (ii) reference to any Person includes such Person’s successors and assigns but, if applicable, only if such successors and assigns are not prohibited by this Agreement, and reference to a Person in a particular capacity excludes such Person in any other capacity or individually; (iii) any pronoun shall include the corresponding masculine, feminine and neuter forms; (iv) reference to any agreement, document or instrument means such agreement, document or instrument as amended or modified and in effect from time to time in accordance with the terms thereof; (v) reference to any law, rule or regulation means such law, rule or regulation as amended, modified, codified, replaced or reenacted, in whole or in part, and in effect from time to time, including rules and regulations promulgated thereunder, and reference to any section or other provision of any law, rule or regulation means that provision of such law, rule or regulation from time to time in effect and constituting the substantive amendment, modification, codification, replacement or reenactment of such section or other provision; (vi) “hereunder,” “hereof,” “hereto,” and words of similar import shall be deemed references to this Agreement as a whole and not to any particular article, section or other provision hereof; (vii) numbered or lettered articles, sections and subsections herein contained refer to articles, sections and subsections of this Agreement; (viii) “including” (and with correlative meaning “include”) means including without limiting the generality of any description preceding such term; (ix) “or” is used in the inclusive sense of “and/or”; (x) references to documents, instruments or agreements shall be deemed to refer as well to all addenda, exhibits, schedules or amendments thereto; and (xi) reference to dollars or $ shall be deemed to refer to U.S. dollars.
ARTICLE II
DETERMINATION OF REALIZED TAX BENEFIT
Section 2.01. Basis Adjustment. The Parent and the Partnerships, on the one hand, and the TRA Holders, on the other hand, acknowledge that, as a result of an Exchange, the Parent’s tax basis in the applicable Reference Assets shall be increased, if at all, as provided in the definition of Basis Adjustment. For the avoidance of doubt, payments made under this Agreement shall not be treated as resulting in a Basis Adjustment to the extent such payments are treated as Imputed Interest. The parties agree that (i) all Tax Benefit Payments attributable to the Basis Adjustments (other than amounts treated as interest under the Code) (A) will be treated as purchase price adjustments that result in additional Basis Adjustments to the Reference Assets for the Parent and (B) have the effect of creating additional Basis Adjustments to the Reference Assets for the Parent in the year such Tax Benefit Payments are made, and (ii) as a result, such additional Basis Adjustments will be included in computing the current year’s Tax Benefit Payment calculation and included in computing future years’ Tax Benefit Payment calculations, as appropriate.
Section 2.02. Exchange Basis Schedule. Within 90 calendar days after the filing of the U.S. federal income tax return of the Parent for each Taxable Year in which any Exchange has been effected, the Parent shall deliver to the Principals, at any Principal’s request, a schedule (an “Exchange Basis Schedule”) that shows, in reasonable detail, for purposes of Taxes, (i) the actual unadjusted tax basis of the Reference Assets as of each applicable Exchange Date, (ii) the Basis Adjustment with respect to the Reference Assets as a result of the Exchanges effected in such Taxable Year, calculated in the aggregate and separately stated for each applicable TRA Holder, (iii) the period or periods, if any, over which the Reference Assets are amortizable or depreciable and (iv) the period or periods, if any, over which each Basis Adjustment is amortizable or depreciable (which, for non-amortizable assets shall be based on the Valuation Assumptions). For the avoidance of doubt, after a Principal has surrendered all of its Partnership Units under the Exchange Agreement, the Parent shall no longer be obligated to provide an Exchange Basis Schedule (other than an Amended Schedule or an Exchange Basis Schedule for any previous Taxable Year in which the Principal surrendered its Partnership Units under the Exchange Agreement) with respect to such Principal under this Section 2.02.
Section 2.03. Tax Benefit Schedule. Within 90 calendar days after the filing of the U.S. federal income tax return of the Parent for any Taxable Year in which there is a Realized Tax Benefit or Realized Tax Detriment, the Parent shall provide to the Principals, at any Principal’s request, a schedule showing, in reasonable detail, the calculation of the Realized Tax Benefit or Realized Tax Detriment for such Taxable Year setting forth the Realized Tax Benefit or Realized Tax Detriment, as the case may be, for each TRA Holder (a “Tax Benefit Schedule”). The Schedule will become final as provided in Section 2.04(a) and may be amended as provided, and subject to the procedures set forth, in Section 2.04(b). For the avoidance of doubt, if a Principal has surrendered all of its Partnership Units under the Exchange Agreement and is no longer entitled to receive a Tax Benefit Payment under this Agreement, the Parent shall no longer be obligated to provide a Tax Benefit Schedule (other than an Amended Schedule or a Tax Benefit Schedule for any previous Taxable Year with respect to which the Principal received a Tax Benefit Payment) with respect to such Principal under this Section 2.03.
Section 2.04. Procedures, Amendments
(a) Procedure. Every time the Parent delivers to the Principals an applicable Schedule under this Agreement, including any Amended Schedule delivered pursuant to Section 2.04(b), but excluding any Early Termination Schedule or amended Early Termination Schedule, the Parent shall also (x) deliver to the Principals schedules and work papers providing reasonable detail regarding the preparation of the Schedule and an Advisory Firm Letter supporting such Schedule and (y) allow the Principals reasonable access at no cost to the appropriate representatives at the Parent and the Advisory Firm in connection with a review of such Schedule. The applicable Schedule shall become final and binding on all parties unless a Principal, within 30 calendar days after receiving an Exchange Basis Schedule or amendment thereto or 30 calendar days after receiving a Tax Benefit Schedule or amendment thereto, provides the Parent with notice (an “Objection Notice”) of a material objection to such Schedule made in good faith; provided that only Principals (or their designees) shall have the right to object to any Schedule or Amended Schedule pursuant to this Section 2.04. If the parties, for any reason, are unable to successfully resolve the issues raised in such Objection Notice within 30 calendar days of receipt by the Parent of the Objection Notice, if with respect to an Exchange Basis Schedule, or 30 calendar days of receipt by the Parent of the Objection Notice, if with respect to a Tax Benefit Schedule, after such Schedule was delivered to the Principals, the Parent and such Principal shall employ the Reconciliation Procedures.
(b) Amended Schedule. The applicable Schedule for any Taxable Year may be amended from time to time by the Parent (i) in connection with a Determination affecting such Schedule, (ii) to correct material inaccuracies in the Schedule identified as a result of the receipt of additional factual information relating to a Taxable Year after the date the Schedule was made available to the Principals, (iii) to comply with the Expert’s determination under the Reconciliation Procedures, (iv) to reflect a material change in the Realized Tax Benefit or Realized Tax Detriment for such Taxable Year attributable to a carryback or carryforward of a loss or other tax item to such Taxable Year, (v) to reflect a material change in the Realized Tax Benefit or Realized Tax Detriment for such Taxable Year attributable to an amended Tax Return filed for such Taxable Year, or (vi) to adjust the Exchange Basis Schedule to take into account payments made pursuant to this Agreement (such Schedule, an “Amended Schedule”).
ARTICLE III
TAX BENEFIT PAYMENTS
Section 3.01. Payments
(a) Payments. Within five calendar days of a Tax Benefit Schedule (or any amendment thereto) becoming final in accordance with Section 2.04(a) the Parent shall pay to each applicable TRA Holder for such Taxable Year the Tax Benefit Payment determined pursuant to Section 3.01(b). The portion of such Tax Benefit Payment that is payable to a particular TRA Holder shall be determined by taking into account (A) in the case of an Exchange by a TRA Holder (other than pursuant to the exercise of a Put Right), the portion of such Tax Benefit Payment attributable to such TRA Holder’s Exchanges and (B) in the case of AOH, the portion of such Tax Benefit Payment attributable to: (x) an Exchange pursuant to the exercise of a Put Right or (y) an Exchange prior to the Effective Date by a holder of Partnership Units who is not a TRA Holder, in all cases, for such Taxable Year, relative to the aggregate Tax Benefit Payments attributable to all Exchanges for such Taxable Year, provided that such accounting shall be determined by the Parent in good faith and exercising reasonable discretion. Each such Tax Benefit Payment shall be made by wire transfer of immediately available funds to a bank account previously designated by the applicable TRA Holder. For the avoidance of doubt, no Tax Benefit Payment shall be made in respect of estimated tax payments, including federal income tax payments. For the avoidance of doubt, (A) no Tax Benefit Payment shall be made to any current or former holder of AOH Units or Partnership Units that is not a party to this Agreement and (B) AOH shall not be entitled to Tax Benefit Payments attributable to Exchanges on or after the Effective Date by holders of Partnership Units who are not TRA Holders. Notwithstanding anything herein to the contrary, in no event shall the aggregate Tax Benefit Payments to any TRA Holder (other than amounts treated as interest under the Code) in respect of the Exchanges under this Agreement exceed an amount equal to 85% of the portion of the Exchange Price paid to such TRA Holder (or in the case of AOH, the Exchange Price paid to the holders of Partnership Units who are not party to this Agreement and who effect their Exchanges prior to the Effective Date or the Exchange Price paid pursuant to the exercise of a Put Right, as applicable) pursuant to such Exchanges.
(b) A “Tax Benefit Payment” means an amount, not less than zero, equal to 85% of the sum of the Net Tax Benefit and the Interest Amount. The “Net Tax Benefit” shall equal: (1) the Parent’s Realized Tax Benefit, if any, for a Taxable Year plus (2) the excess of the Realized Tax Benefit reflected on an amended Tax Benefit Schedule for a previous Taxable Year over the Realized Tax Benefit (or Realized Tax Detriment (expressed as a negative number)) reflected on the Tax Benefit Schedule for such previous Taxable Year, minus (3) an amount equal to the Parent’s Realized Tax Detriment (if any) for the current or any previous Taxable Year, minus (4) the excess of the Realized Tax Benefit reflected on a Tax Benefit Schedule for a previous Taxable Year over the Realized Tax Benefit (or Realized Tax Detriment (expressed as a negative number)) reflected on the amended Tax Benefit Schedule for such previous Taxable Year; provided that (x) to the extent the amounts described in 3.01(b)(2), (3) and (4) were taken into account in determining any Tax Benefit Payment in a preceding Taxable Year, such amounts shall not be taken into account in determining a Tax Benefit Payment attributable to any other Taxable Year and (y) no TRA Holder shall be required to return any portion of any previously made Tax Benefit Payment. The “Interest Amount” shall equal the interest on the Net Tax Benefit calculated at the Agreed Rate from the due date (without extensions) for filing the Parent’s Tax Return with respect to Taxes for such Taxable Year until the Payment Date. For the avoidance of doubt, the Net Tax Benefit shall be calculated based on the Parent’s consolidated taxable income pursuant to Section 7.11(b), but the Imputed Interest shall be calculated based on the portion of the Tax Benefit Payment attributable to the Realized Tax Benefit generated by each Partnership. Notwithstanding the foregoing, for each Taxable Year ending on or after the date of a Change of Control, all Tax Benefit Payments, whether paid with respect to Partnership Units that were exchanged (i) prior to the date of such Change of Control or (ii) on or after the date of such Change of Control, shall be calculated by utilizing Valuation Assumptions (1), (3), and (4), substituting in each case the terms “the closing date of a Change of Control” for an “Early Termination Date”.
Section 3.02. No Duplicative Payments. It is intended that the above provisions of this Agreement will not result in duplicative payment of any amount (including interest) required under this Agreement. It is also intended that the provisions of this Agreement provide that 85% of the Parent’s Realized Tax Benefit and Interest Amount is paid to the TRA Holders pursuant to this Agreement. The provisions of this Agreement shall be construed in the appropriate manner so that such intentions are realized.
Section 3.03. Pro Rata Payments. For the avoidance of doubt, to the extent the Parent’s utilization of Tax benefits with respect to a Basis Adjustment is limited in a particular Taxable Year, or the Parent lacks sufficient funds to satisfy its obligations to make all Tax Benefit Payments due in a particular taxable year, the limitation on such Tax benefit shall be taken into account, or the Tax Benefit Payments shall be made, as the case may be, to each TRA Holder on a pro rata basis which reflects the proportion of the total amount of Tax benefits attributable to such TRA Holder relative to the aggregate Tax benefits for all of the TRA holders (as determined by the Parent in good faith and exercising reasonable discretion).
ARTICLE IV
TERMINATION
Section 4.01. Early Termination and Breach of Agreement.
(a) The Parent may terminate this Agreement with respect to all of the Partnership Units held (or previously held and exchanged) by the TRA Holders, or indirectly held by holders of AOH Units, at any time by paying to the TRA Holders the Early Termination Payment; provided that (a) this Agreement shall only terminate upon the receipt of the Early Termination Payment by the TRA Holders, and (b) the Parent may withdraw any notice to execute its termination rights under this Section 4.01 prior to the time at which any Early Termination Payment has been paid. Upon payment of the Early Termination Payments by the Parent, the Parent shall not have any further payment obligations under this Agreement in respect of the TRA Holders, other than for any (a) Tax Benefit Payment agreed to by the Parent and the Principals as due and payable but unpaid as of the Early Termination Notice and (b) Tax Benefit Payment due for the Taxable Year ending with or including the date of the Early Termination Notice (except to the extent that the amount described in clause (b) is included in the Early Termination Payment). If an Exchange occurs after the Parent exercises its termination rights under this Section 4.01, the Parent shall have no obligations under this Agreement with respect to such Exchange.
(b) If the Parent breaches any of its material obligations under this Agreement, whether as a result of failure to make any payment when due, failure to honor any other material obligation required hereunder or by operation of law as a result of the rejection of this Agreement in a case commenced under the Bankruptcy Code or otherwise, then all obligations hereunder shall be accelerated and such obligations shall be calculated as if an Early Termination Notice had been delivered on the date of such breach and shall include, but not be limited to, (1) the Early Termination Payment calculated as if an Early Termination Notice had been delivered on the date of a breach, (2) any Tax Benefit Payment agreed to by the Parent and any TRA Holders as due and payable but unpaid as of the date of a breach, and (3) any Tax Benefit Payment due for the Taxable Year ending with or including the date of a breach. Notwithstanding the foregoing, if the Parent breaches this Agreement, the TRA Holders shall be entitled to elect to receive the amounts set forth in (1), (2) and (3), above or to seek specific performance of the terms hereof. The failure to make any payment due pursuant to this Agreement within three months of the date such payment is due shall be deemed to be a breach of a material obligation under this Agreement for all purposes of this Agreement; provided that it will not be considered to be a breach of a material obligation under this Agreement to make a payment due pursuant to this Agreement if such payment is made within three months of the date such payment is due.
(c) The undersigned parties agree that the aggregate value of the Tax Benefit Payments cannot be ascertained with any reasonable certainty for U.S. federal income tax purposes.
Section 4.02. Early Termination Notice. If the Parent chooses to exercise its right of early termination under Section 4.01 above, the Parent shall deliver to the TRA Holders notice of such intention to exercise such right (“Early Termination Notice”) and shall deliver to the Principals a schedule (the “Early Termination Schedule”) specifying the Parent’s intention to exercise such right and showing in reasonable detail the calculation of the Early Termination Payment. The applicable Early Termination Schedule shall become final and binding on all parties unless a Principal, within 30 calendar days after receiving the Early Termination Schedule thereto provides the Parent with notice (“Early Termination Objection Notice”) of a material objection to such Schedule made in good faith. If the parties, for any reason, are unable to successfully resolve the issues raised in such notice within 30 calendar days after receipt by the Parent of the Early Termination Objection Notice, the Parent and a Principal shall employ the Reconciliation Procedures as described in Section 7.09 of this Agreement.
Section 4.03. Payment upon Early Termination. (a) Within three calendar days after agreement between the Principals and the Parent of the Early Termination Schedule, the Parent shall pay to the TRA Holders an amount equal to the Early Termination Payment. Such payment shall be made by wire transfer of immediately available funds to the bank accounts designated by each of the TRA Holders.
(b) The “Early Termination Payment” as of the date of the delivery of an Early Termination Schedule shall equal with respect to a TRA Holder the present value, discounted at the Early Termination Rate as of such date, of all Tax Benefit Payments that would be required to be paid by the Parent to such TRA Holder beginning from the Early Termination Date assuming the Valuation Assumptions are applied.
ARTICLE V
LATE PAYMENTS
Section 5.01. Late Payments by the Parent. The amount of all or any portion of any Exchange Payment not made to the TRA Holders when due under the terms of this Agreement shall be payable together with any interest thereon, computed at the Default Rate and commencing from the date on which such Exchange Payment was due and payable.
ARTICLE VI
NO DISPUTES; CONSISTENCY; COOPERATION
Section 6.01. Principal Participation in the Parent’s and Partnerships’ Tax Matters. Except as otherwise provided herein, the Parent shall have full responsibility for, and sole discretion over, all Tax matters concerning the Parent and the Partnerships, including the preparation, filing or amending of any Tax Return and defending, contesting or settling any issue pertaining to Taxes. Notwithstanding the foregoing, the Parent shall notify each Principal of, and keep the Principals reasonably informed with respect to the portion of any audit of the Parent and the Partnerships by a Taxing Authority the outcome of which is reasonably expected to affect any TRA Holder’s rights and obligations under this Agreement, and shall provide to the Principals reasonable opportunity to provide information and other input to the Parent, the Partnerships and their respective advisors concerning the conduct of any such portion of such audit; provided that the Parent and each of the Partnerships shall not be required to take any action that is inconsistent with any provision of any of the Partnership Agreements.
Section 6.02. Consistency. Except upon the written advice of an Advisory Firm, the Parent and the TRA Holders agree to report and cause to be reported for all purposes, including federal, state, local and foreign tax purposes and financial reporting purposes, all Tax-related items (including the Basis Adjustment and each Tax Benefit Payment) in a manner consistent with that specified by the Parent in any Schedule required to be provided by or on behalf of the Parent under this Agreement.
Section 6.03. Cooperation. The TRA Holders shall (a) furnish to the Parent in a timely manner such information, documents and other materials as the Parent may reasonably request for purposes of making any determination or computation necessary or appropriate under this Agreement, preparing any Tax Return or contesting or defending any audit, examination or controversy with any Taxing Authority, (b) make themselves reasonably available to the Parent and its representatives to provide explanations of documents and materials and such other information as the Parent or its representatives may reasonably request in connection with any of the matters described in clause (a) above, and (c) reasonably cooperate in connection with any such matter, and the Parent shall reimburse the TRA Holders for any reasonable and documented third-party costs and expenses incurred pursuant to this Section 6.03.
ARTICLE VII
MISCELLANEOUS
Section 7.01. Notices. All notices, requests, claims, demands and other communications hereunder shall be in writing and shall be deemed duly given and received (a) on the date of delivery if delivered personally, or by email upon confirmation of transmission by the sender’s server if sent on a Business Day (or otherwise on the next Business Day) or (b) on the first Business Day following the date of dispatch if delivered by a recognized next-day courier service. All notices hereunder shall be delivered as set forth below or pursuant to such other instructions as may be designated in writing by the party to receive such notice:
If to the Parent, to:
Ares Management Corporation
2000 Avenue of the Stars, 12th Floor
Los Angeles, California 90067
(T) (310) 201-4100
Attention: General Counsel
Email: GeneralCounsel@aresmgmt.com
with a copy to:
Kirkland & Ellis LLP
2049 Century Park East, Suite 3700
Los Angeles, California 90067
(T) (310) 552-4200
Attention: Philippa Bond, P.C.
Jonathan Benloulou, P.C.
Email: Philippa Bond, P.C.
jonathan.benloulou@kirkland.com
If to the Parent, any Partnership or AOH, to:
c/o Ares Management Corporation
2000 Avenue of the Stars, 12th Floor
Los Angeles, California 90067
(T) (310) 201-4100
Attention: General Counsel
Email: GeneralCounsel@aresmgmt.com
with a copy to:
Kirkland & Ellis LLP
2049 Century Park East, Suite 3700
Los Angeles, California 90067
(T) (310) 552-4200
Attention: Philippa Bond, P.C.
Jonathan Benloulou, P.C.
Email: pippa.bond@kirkland.com
jonathan.benloulou@kirkland.com
If to Alleghany, to:
The address and electronic mail address set forth in the records of the Partnerships.
If to a Limited Partner, to:
The address and electronic mail address set forth in the records of AOH.
Any party may change its address or electronic mail address by giving the other party written notice of such new address in the manner set forth above.
Section 7.02. Counterparts. This Agreement may be executed in one or more counterparts (including by facsimile or electronic transmission), all of which shall constitute one and the same instrument.
Section 7.03. Entire Agreement; No Third Party Beneficiaries. This Agreement constitutes the entire agreement and supersedes all prior agreements and understandings, both written and oral, among the parties with respect to the subject matter hereof. This Agreement shall be binding upon and inure solely to the benefit of each party hereto and their respective successors and permitted assigns, and nothing in this Agreement, express or implied, is intended to or shall confer upon any other Person any right, benefit or remedy of any nature whatsoever under or by reason of this Agreement.
Section 7.04. Governing Law. This Agreement shall be construed and enforced, along with any rights, remedies, or obligations provided for hereunder, in accordance with the laws of the State of Delaware applicable to contracts made and to be performed entirely within the State of Delaware by residents of the State of Delaware; provided, that the enforceability of Section 7.08 shall be governed by the Federal Arbitration Act, 9 U.S.C. § 1 et seq., and not the laws of the State of Delaware.
Section 7.05. Severability. Whenever possible, each provision or portion of any provision of this Agreement shall be interpreted in such manner as to be effective and valid under applicable law, but if any provision or portion of any provision of this Agreement is held to be invalid, illegal or unenforceable in any respect under any applicable law or rule in any jurisdiction, such invalidity, illegality or unenforceability shall not affect any other provision or portion of any provision in such jurisdiction, and this Agreement shall be reformed, construed and enforced in such jurisdiction as if such invalid, illegal or unenforceable provision or portion of any provision had never been contained herein, if the economic and legal substance of the arrangements contemplated hereby are not affected in any manner materially adverse to any party hereto. Upon such a determination, the Parent and the Principals shall negotiate in good faith to modify this Agreement so as to effect the original intent of the parties as closely as possible in an acceptable manner that the transactions contemplated hereby shall be consummated as originally contemplated to the fullest extent possible.
Section 7.06. Successors; Assignment; Amendments; Waivers. No TRA Holder may assign this Agreement to any Person without the prior written consent of the Parent; provided that (i) except with respect to a transfer of Partnership Units (including indirectly through a transfer of AOH Units), to the extent the Partnership Units are effectively transferred by a TRA Holder (including indirectly through a transfer of AOH Units) in accordance with the terms of the relevant Partnership Agreements (or the AOH Partnership Agreement), the transferring TRA Holder shall have the option to assign to the transferee of such Partnership Units (including indirectly through a transfer of AOH Units) the transferring TRA Holder’s rights under this Agreement, as long as such transferee has executed and delivered, or, in connection with such transfer, executes and delivers, a joinder to this Agreement, in form and substance reasonably satisfactory to the Parent, agreeing to become a “TRA Holder” for all purposes of this Agreement, except as otherwise provided in such joinder, and (ii) once an Exchange has occurred, any and all payments that may become payable to a TRA Holder pursuant to this Agreement with respect to such Exchange may be assigned to any Person or Persons, as long as any such Person has executed and delivered, or, in connection with such assignment, executes and delivers, a joinder to this Agreement, in form and substance reasonably satisfactory to the Parent. For the avoidance of doubt, to the extent a Principal or other Person transfers Partnership Units (including indirectly through a transfer of AOH Units) to another Principal, the Principal receiving such Partnership Units (including indirectly through a transfer of AOH Units) shall have all rights under this Agreement with respect to such transferred Partnership Units as such Principal has, under this Agreement, with respect to the other Partnership Units directly or indirectly held by such Principal.
No provision of this Agreement may be amended unless such amendment is approved in writing by the Parent and by the Principals that control, directly or indirectly, at least two-thirds of the Partnership Units held by all Principals; provided that no such amendment shall be effective if such amendment will have a disproportionate adverse effect on the payments certain TRA Holders will or may receive under this Agreement unless all such TRA Holders disproportionately adversely affected consent in writing. No provision of this Agreement may be waived unless such waiver is in writing and signed by the party against whom the waiver is to be effective.
All of the terms and provisions of this Agreement shall be binding upon, shall inure to the benefit of and shall be enforceable by the parties hereto and their respective successors, assigns, heirs, executors, administrators and legal representatives. The Parent shall require and cause any direct or indirect successor (whether by purchase, merger, consolidation or otherwise) to all or substantially all of the business or assets of the Parent, by written agreement, expressly to assume and agree to perform this Agreement in the same manner and to the same extent that the Parent would be required to perform if no such succession had taken place.
Notwithstanding anything to the contrary herein, if a Principal transfers Partnership Units (including indirectly through a transfer of AOH Units), to a Permitted Transferee (as defined in the relevant Partnership Agreements), excluding any other Principal, such Principal shall have the right, on behalf of such transferee, to enforce the provisions of Sections 2.04, 4.02 or 6.01 with respect to such transferred Partnership Units.
Section 7.07. Headings. All headings herein are inserted only for convenience and ease of reference and are not to be considered in the construction or interpretation of any provision of this Agreement.
Section 7.08. Resolution of Disputes. (a) Any and all disputes, claims or controversies arising out of or relating to this Agreement, including any and all disputes, claims or controversies arising out of or relating to (i) the parties to this Agreement, (ii) any party’s rights and obligations hereunder, (iii) the validity or scope of any provision of this Agreement, (iv) whether a particular dispute, claim or controversy is subject to arbitration under this Section 7.08, and (v) the power and authority of any arbitrator selected hereunder, that are not resolved by mutual agreement shall be submitted to final, binding and confidential arbitration in Los Angeles, California, before one arbitrator, conducted by the Judicial Arbitration and Mediation Services/Endispute, Inc. (“JAMS”), or its successor. Disputes shall be resolved in accordance with the Federal Arbitration Act, 9 U.S.C. §§1–16, and JAMS’ Comprehensive Arbitration Rules and Procedures then in effect. The arbitrator will have the same, but no greater, remedial authority than would a court of law and shall issue a written decision including the arbitrator’s essential findings and conclusions and a statement of the award. Judgment upon the award rendered by the arbitrator may be entered by any court having jurisdiction thereof. The prevailing party in any such arbitration proceeding, as determined by the arbitrator, or in any proceeding to enforce the arbitration award, will be entitled, to the extent permitted by law, to reimbursement from the other party for all of the prevailing party’s costs (including but not limited to the arbitrator’s compensation), expenses and attorneys’ fees. If no party entirely prevails in such arbitration or proceeding, the arbitrator or court shall apportion an award of such fees based on the relative success of each party. In the event of a conflict between this provision and any provision in the applicable rules of JAMS, the provisions of this Agreement will prevail. The parties to the arbitration shall participate in the arbitration in good faith.
(b) The provisions of this Section 7.08 may be enforced by any court of competent jurisdiction, and, to the extent permitted by law, the party seeking enforcement shall be entitled to an award of all costs, fees and expenses, including attorneys’ fees, to be paid by the party against whom enforcement is ordered. Notwithstanding any provision of this Agreement to the contrary, a party to an arbitration pursuant to this Section 7.08 shall be entitled to seek a restraining order or injunction in any court of competent jurisdiction to prevent any violation of the provisions of this Agreement pending a final determination on the merits by the arbitrator, and each party consents that such a restraining order or injunction may be granted without the necessity of posting any bond.
(c) The details of any arbitration pursuant to this Section 7.08, including the existence and/or outcome of such arbitration and any information obtained in connection with any such arbitration, shall be kept strictly confidential and shall not be disclosed or discussed with any person not a party to the arbitration; provided that such party may make such disclosures as are required by applicable law or legal process; provided further that such party may make such disclosures to its, his or her attorneys, accountants or other agents and representatives who reasonably need to know the disclosed information in connection with any arbitration pursuant to this Section 7.08 and who are obligated to keep such information confidential to the same extent as such party. If either party to the arbitration, as the case may be, receives a subpoena or other request for information from a third party that seeks disclosure of any information that is required to be kept confidential pursuant to the prior sentence, or otherwise believes that it, he or she may be required to disclose any such information, such the party to the arbitration, as the case may be, shall (i) promptly notify the other party to the arbitration and (ii) reasonably cooperate with such other party in taking any legal or otherwise appropriate actions, including the seeking of a protective order, to prevent the disclosure, or otherwise protect the confidentiality, of such information.
Section 7.09. Reconciliation. If the Parent and a Principal are unable to resolve a disagreement with respect to the matters governed by Sections 2.04, 4.02 and 6.02 within the relevant period designated in this Agreement (“Reconciliation Dispute”), the Reconciliation Dispute shall be submitted for determination to a nationally recognized expert (the “Expert”) in the particular area of disagreement mutually acceptable to both parties.
The Expert shall be a partner in a nationally recognized accounting firm or a law firm (other than the Advisory Firm), and the Expert shall not, and the firm that employs the Expert shall not, have any material relationship with the Parent, an Affiliate of the Parent or such Principal or other actual or potential conflict of interest. If the parties are unable to agree on an Expert within 15 days of receipt by the respondent(s) of written notice of a Reconciliation Dispute, the Expert shall be appointed by the International Chamber of Commerce Centre for Expertise. The Expert shall resolve any matter relating to the Exchange Basis Schedule or an amendment thereto or the Early Termination Schedule or an amendment thereto within 30 calendar days and shall resolve any matter relating to a Tax Benefit Schedule or an amendment thereto within 15 calendar days or as soon thereafter as is reasonably practicable, in each case after the matter has been submitted to the Expert for resolution. Notwithstanding the preceding sentence, if the matter is not resolved before any payment that is the subject of a disagreement is due or any Tax Return reflecting the subject of a disagreement is due, such payment shall be made on the date prescribed by this Agreement and such Tax Return may be filed as prepared by the Parent, subject to adjustment or amendment upon resolution. The costs and expenses relating to the engagement of such Expert or amending any Tax Return shall be borne by the Parent; except as provided in the next sentence. The Parent and each Principal shall bear their own costs and expenses of such proceeding, unless the Principal has a prevailing position that is more than 10% of the payment at issue, in which case the Parent shall reimburse such Principal for any reasonable out-of-pocket costs and expenses in such proceeding. Any dispute as to whether a dispute is a Reconciliation Dispute within the meaning of this Section 7.09 shall be decided by the Expert. The determinations of the Expert pursuant to this Section 7.09 shall be final and binding on the Parent and such Principal and may be entered and enforced in any court having jurisdiction.
Section 7.10. Withholding. The Parent shall be entitled to deduct and withhold from any payment payable pursuant to this Agreement such amounts as the Parent is required to deduct and withhold with respect to the making of such payment under the Code, or any provision of state, local or foreign tax law. To the extent that amounts are so withheld and paid over to the appropriate Taxing Authority by the Parent, such withheld amounts shall be treated for all purposes of this Agreement as having been paid to such TRA Holder. The TRA Holders shall provide the Parent with such withholding and other tax certificates (including all required attachments) as may be reasonably requested from time to time.
Section 7.11. Affiliated Corporations of the Holdcos; Consolidated Group; Transfers of Corporate Assets.
(a) Holdcos (other than the Parent) shall provide that all provisions of this Agreement shall correspondingly apply, including the payment of Tax Benefit Payments by any corporation owned directly or indirectly in whole or in part, now or in the future, by such Holdcos, with respect to any Realized Tax Benefit with respect to limited partnership interests in the other Ares Group entities, that are part of the Exchange and in which such corporation owns an interest, under the same terms and conditions as set forth in this Agreement, and such Holdcos shall cause such corporation to execute and deliver a joinder to this Agreement to such effect. If any Holdco (other than the Parent) elects to be treated or is otherwise treated as a corporation for tax purposes (which, for the avoidance of doubt, shall include the Parent for this purpose), then the provisions of this Agreement shall apply (w) to such Holdco or such entity as the case may be in the same manner as it applies to the Parent and (x) to each partnership, limited partnership and limited liability company Controlled by any such Holdco as if each such entity were a Partnership; provided that, if any Partnership Units or limited partnership interests in other Ares Group entities were Exchanged prior to an event described in the foregoing clause above or prior to the effectiveness of the Tax Election, then (y) such Exchange shall be treated for purposes of this Agreement as having occurred immediately after such event at the Market Value in existence at the time of such prior Exchange, and (z) the entity that is to be treated in the same manner as the Parent shall be required to make, or the Parent shall make on its behalf, the same Tax Benefit Payments pursuant to the terms of this Agreement that it would have been required to make had it been treated in the same manner as the Parent on the date of such Exchange; provided that such Tax Benefit Payments shall be payable only with respect to (I) Reference Assets that are still owned at the time of the event described in the foregoing clause above or prior to the effectiveness of the Tax Election, and (II) taxable years of such entity ending on or after the date of the event described in the foregoing clause above or ending on or after the effectiveness of the Tax Election.
(b) Each of the parties hereto agree that (i) the Parent is the common parent of an affiliated or consolidated group of corporations that files a consolidated income tax return pursuant to Sections 1501 et seq. of the Code, and (ii) the liability for Taxes of the Parent shall be calculated based on the consolidated net income of such affiliated or consolidated group and the provisions of this Agreement shall be applied with respect to such group as a whole and Tax Benefit Payments shall be computed with reference to the consolidated taxable income of such group as a whole, including with respect to any Holdco that elects to be treated or is otherwise treated as a corporation for tax purposes that becomes a member of such group.
(c) If any entity that is obligated to make an Exchange Payment hereunder transfers one or more assets to a corporation with which such entity does not file a consolidated tax return pursuant to Section 1501 of the Code or any corresponding provisions of state, local or foreign law, such entity, for purposes of calculating the amount of any Exchange Payment (e.g., calculating the gross income of the entity and determining the Realized Tax Benefit of such entity) due hereunder, shall be treated as having disposed of such asset in a fully taxable transaction on the date of such contribution. The consideration deemed to be received by such entity shall be equal to the fair market value of the contributed asset, plus (i) the amount of debt to which such asset is subject, in the case of a contribution of an encumbered asset or (ii) the amount of debt allocated to such asset, in the case of a contribution of a partnership interest.
Section 7.12. Partnerships. The Parent agrees that, to the extent it acquires a general partnership interest, managing member interest or similar interest in any Person after the Effective Date, it shall cause such Person to execute and deliver a joinder to this Agreement and become a “Partnership” for all purposes of this Agreement.
Section 7.13. Conclusive Nature of Calculations. All determinations, interpretations, calculations, adjustments and other actions of the Parent or any Partnership or a designee of any of the foregoing that are within such Person’s authority hereunder (including in connection with the preparation of any Schedule) shall be made in good faith by such Person and shall be binding and conclusive absent manifest error. In connection with any such determination, interpretation, calculation, adjustment or other action, the Parent or any Partnership or the designee of any of the foregoing shall be entitled to resolve any ambiguity with respect to the manner in which such determination, interpretation, calculation, adjustment or other action is to be made or taken, and shall be entitled to interpret the provisions of this Agreement, in such a manner as it determines to be fair and equitable, and such resolution or interpretation shall be binding and conclusive absent manifest error.
[Signatures on following pages]
IN WITNESS WHEREOF, the parties hereto have duly executed this Agreement as of the date first written above.
|
|
|
|
|
|
|
|
|
|
Ares Management Corporation |
|
|
|
|
|
|
|
By: |
/s/ Naseem Sagati Aghili |
|
Name: |
Naseem Sagati Aghili |
|
Title: |
Authorized Signatory |
|
|
|
|
|
|
|
|
|
|
Ares Holdings L.P |
|
By: |
Ares Holdco LLC, its general partner |
|
|
|
|
|
|
|
By: |
/s/ Naseem Sagati Aghili |
|
Name: |
Naseem Sagati Aghili |
|
Title: |
Authorized Signatory |
|
|
|
|
Ares Owners Holdings L.P. |
|
By: |
Ares Partners Holdco LLC, its general partner |
|
|
|
|
|
|
|
By: |
/s/ Naseem Sagati Aghili |
|
Name: |
Naseem Sagati Aghili |
|
Title: |
Authorized Signatory |
Limited Partner signatures on file with the Parent.
Schedule A
[On file with the Parent]
Schedule B
Michael J Arougheti (for all purposes)
David B. Kaplan (for all purposes)
John H. Kissick (for all purposes)
Antony P. Ressler (for all purposes)
Bennett Rosenthal (for all purposes)
EX-31.1
3
a2023q1exhibit311.htm
EX-31.1
Document
Exhibit 31.1
Certification of Chief Executive Officer
of Periodic Report Pursuant to Rule 13a-14(a) and Rule 15d- 14(a)
I, Michael J Arougheti, certify that:
1.I have reviewed this Quarterly Report on Form 10-Q of Ares Management Corporation;
2.Based on my knowledge, this report does not contain any untrue statement of a material fact or omit to state a material fact necessary to make the statements made, in light of the circumstances under which such statements were made, not misleading with respect to the period covered by this report;
3.Based on my knowledge, the financial statements, and other financial information included in this report, fairly present in all material respects the financial condition, results of operations and cash flows of the registrant as of, and for, the periods presented in this report;
4.The registrant’s other certifying officer(s) and I are responsible for establishing and maintaining disclosure controls and procedures (as defined in Exchange Act Rules 13a-15(e) and 15d-15(e)) and internal control over financial reporting (as defined in Exchange Act Rules 13a-15(f) and 15d-15(f)) for the registrant and have:
(a)Designed such disclosure controls and procedures, or caused such disclosure controls and procedures to be designed under our supervision, to ensure that material information relating to the registrant, including its consolidated subsidiaries, is made known to us by others within those entities, particularly during the period in which this report is being prepared;
(b)Designed such internal control over financial reporting, or caused such internal control over financial reporting to be designed under our supervision, to provide reasonable assurance regarding the reliability of financial reporting and the preparation of financial statements for external purposes in accordance with generally accepted accounting principles;
(c)Evaluated the effectiveness of the registrant’s disclosure controls and procedures and presented in this report our conclusions about the effectiveness of the disclosure controls and procedures, as of the end of the period covered by this report based on such evaluation;
(d)Disclosed in this report any change in the registrant’s internal control over financial reporting that occurred during the registrant’s most recent fiscal quarter (the registrant’s fourth fiscal quarter in the case of an annual report) that has materially affected, or is reasonably likely to materially affect, the registrant’s internal control over financial reporting; and
5.The registrant’s other certifying officer(s) and I have disclosed, based on our most recent evaluation of internal control over financial reporting, to the registrant’s auditors and the audit committee of the registrant’s board of directors (or persons performing the equivalent functions):
(a)All significant deficiencies and material weaknesses in the design or operation of internal control over financial reporting which are reasonably likely to adversely affect the registrant’s ability to record, process, summarize and report financial information; and
(b)Any fraud, whether or not material, that involves management or other employees who have a significant role in the registrant’s internal control over financial reporting.
Date: May 8, 2023
|
|
|
|
|
|
|
/s/ Michael J Arougheti |
| Name: |
Michael J Arougheti |
| Title: |
Co-Founder, Chief Executive Officer & President (Principal Executive Officer) |
EX-31.2
4
a2023q1exhibit312.htm
EX-31.2
Document
Exhibit 31.2
Certification of Chief Financial Officer
of Periodic Report Pursuant to Rule 13a-14(a) and Rule 15d-14(a)
I, Jarrod Phillips, certify that:
1.I have reviewed this Quarterly Report on Form 10-Q of Ares Management Corporation;
2.Based on my knowledge, this report does not contain any untrue statement of a material fact or omit to state a material fact necessary to make the statements made, in light of the circumstances under which such statements were made, not misleading with respect to the period covered by this report;
3.Based on my knowledge, the financial statements, and other financial information included in this report, fairly present in all material respects the financial condition, results of operations and cash flows of the registrant as of, and for, the periods presented in this report;
4.The registrant’s other certifying officer(s) and I are responsible for establishing and maintaining disclosure controls and procedures (as defined in Exchange Act Rules 13a-15(e) and 15d-15(e)) and internal control over financial reporting (as defined in Exchange Act Rules 13a-15(f) and 15d-15(f)) for the registrant and have:
(a)Designed such disclosure controls and procedures, or caused such disclosure controls and procedures to be designed under our supervision, to ensure that material information relating to the registrant, including its consolidated subsidiaries, is made known to us by others within those entities, particularly during the period in which this report is being prepared;
(b)Designed such internal control over financial reporting, or caused such internal control over financial reporting to be designed under our supervision, to provide reasonable assurance regarding the reliability of financial reporting and the preparation of financial statements for external purposes in accordance with generally accepted accounting principles;
(c)Evaluated the effectiveness of the registrant’s disclosure controls and procedures and presented in this report our conclusions about the effectiveness of the disclosure controls and procedures, as of the end of the period covered by this report based on such evaluation;
(d)Disclosed in this report any change in the registrant’s internal control over financial reporting that occurred during the registrant’s most recent fiscal quarter (the registrant’s fourth fiscal quarter in the case of an annual report) that has materially affected, or is reasonably likely to materially affect, the registrant’s internal control over financial reporting; and
5.The registrant’s other certifying officer(s) and I have disclosed, based on our most recent evaluation of internal control over financial reporting, to the registrant’s auditors and the audit committee of the registrant’s board of directors (or persons performing the equivalent functions):
(a)All significant deficiencies and material weaknesses in the design or operation of internal control over financial reporting which are reasonably likely to adversely affect the registrant’s ability to record, process, summarize and report financial information; and
(b)Any fraud, whether or not material, that involves management or other employees who have a significant role in the registrant’s internal control over financial reporting.
Date: May 8, 2023
|
|
|
|
|
|
|
/s/ Jarrod Phillips |
| Name: |
Jarrod Phillips |
| Title: |
Chief Financial Officer (Principal Financial & Accounting Officer) |
EX-32.1
5
a2023q1exhibit321.htm
EX-32.1
Document
Exhibit 32.1
Certification of Chief Executive Officer and Chief Financial Officer
Pursuant to
18 U.S.C. Section 1350
In connection with the Quarterly Report on Form 10-Q of Ares Management Corporation (the “Company”) for the quarter ended March 31, 2023 as filed with the Securities and Exchange Commission on the date hereof (the “Report”), Michael J Arougheti, as Chief Executive Officer of the Company, and Jarrod Phillips, as Chief Financial Officer of the Company, each hereby certifies, pursuant to 18 U.S.C. Section 1350, as adopted pursuant to Section 906 of the Sarbanes-Oxley Act of 2002, that, to the best of my knowledge:
1.The Report fully complies with the requirements of Section 13(a) or 15(d) of the Securities Exchange Act of 1934; and
2.The information contained in the Report fairly presents, in all material respects, the financial condition and results of operations of the Company.
Date: May 8, 2023
|
|
|
|
|
|
|
/s/ Michael J Arougheti |
| Name: |
Michael J Arougheti |
| Title: |
Co-Founder, Chief Executive Officer & President (Principal Executive Officer) |
|
|
|
/s/ Jarrod Phillips |
| Name: |
Jarrod Phillips |
| Title: |
Chief Financial Officer (Principal Financial & Accounting Officer) |
A signed original of this written statement required by Section 906, or other document authenticating, acknowledging, or otherwise adopting the signature that appears in typed form within the electronic version of this written statement required by Section 906, has been provided to Ares Management Corporation and will be retained by Ares Management Corporation and furnished to the Securities and Exchange Commission or its staff upon request.