Q2 2024 Results
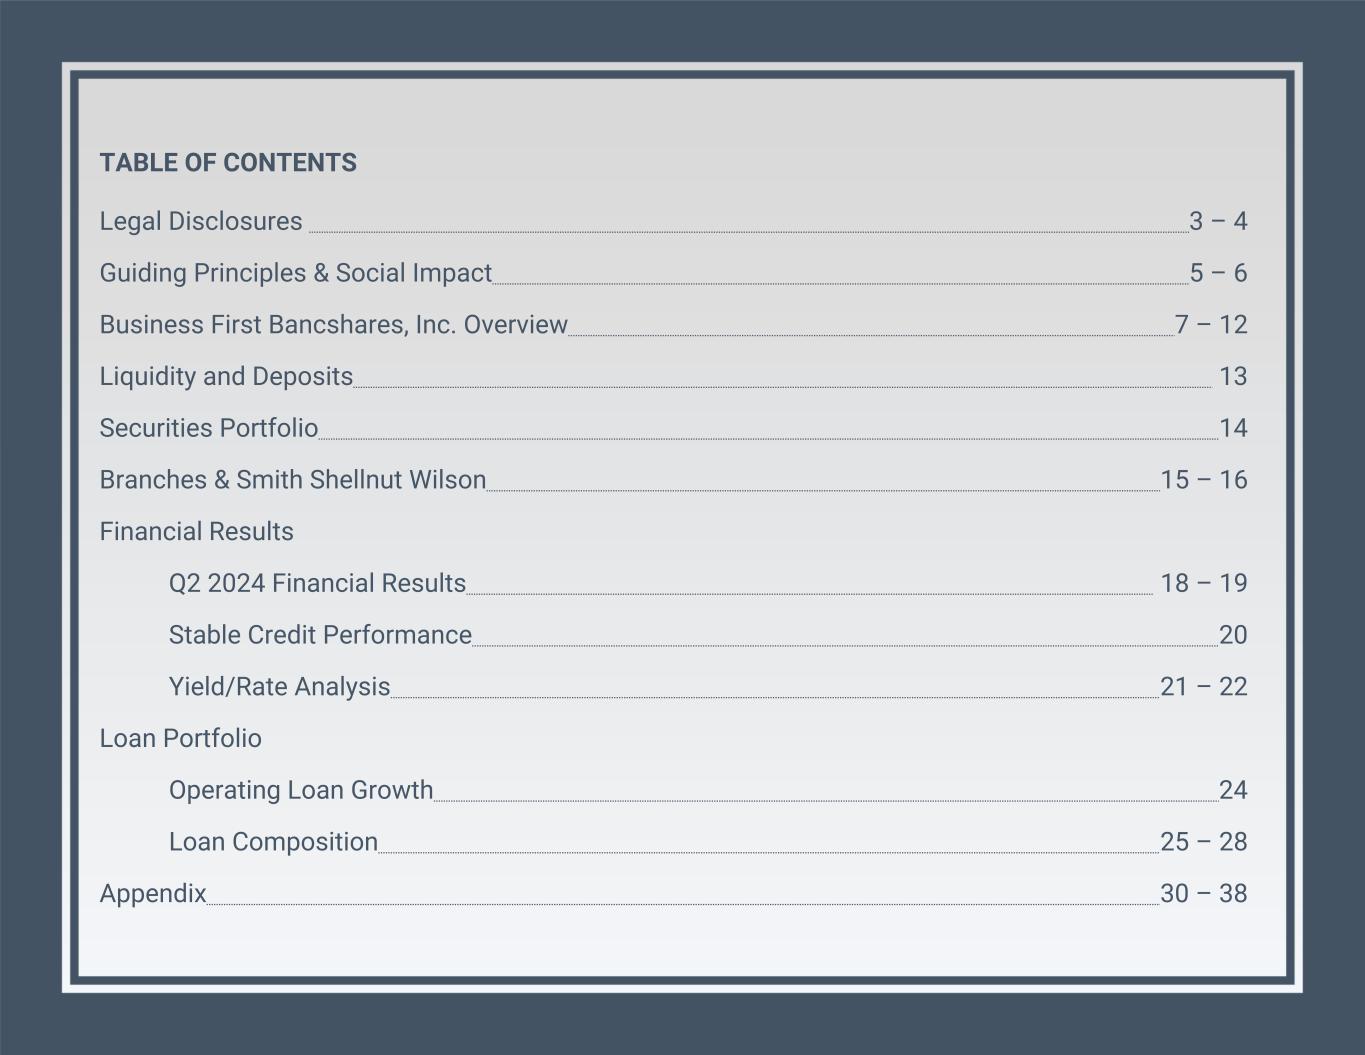
2 TABLE OF CONTENTS Legal Disclosures 3 – 4 Guiding Principles & Social Impact 5 – 6 Business First Bancshares, Inc. Overview 7 – 12 Liquidity and Deposits 13 Securities Portfolio 14 Branches & Smith Shellnut Wilson 15 – 16 Financial Results Q2 2024 Financial Results 18 – 19 Stable Credit Performance 20 Yield/Rate Analysis 21 – 22 Loan Portfolio Operating Loan Growth 24 Loan Composition 25 – 28 Appendix 30 – 38
3 LEGAL DISCLOSURES Special Note Concerning Forward-Looking Statements This investor presentation contains “forward-looking statements” within the meaning of Section 27A of the Securities Act and Section 21E of the Exchange Act made pursuant to the safe harbor provisions of the Private Securities Litigation Reform Act of 1995. All statements other than statements of historical fact are forward-looking statements. You can identify these forward-looking statements in some cases through the Company’s use of words such as “believes,” “anticipates,” “expects,” “may,” “will,” “assumes,” “should,” “predicts,” “could,” “would,” “intends,” “targets,” “estimates,” “projects,” “plans,” “potential” and other similar words and expressions of the future or otherwise regarding the Company’s future business and financial performance and/or the performance of the banking and mortgage industry and economy in general. Forward-looking statements are based on the information known to, and current beliefs and expectations of, the Company’s management and are subject to significant risks and uncertainties. Actual results may differ materially from those contemplated by such forward-looking statements. A number of important factors could cause actual results to differ materially from those contemplated by the forward-looking statements in this presentation including, without limitation, the risks set forth in “Forward Looking Statements” and “Risk Factors” in the Company’s Annual Report on Form 10-K for the year ended December 31, 2023, filed with the SEC on March 1, 2024 (as may be amended in the Company’s Quarterly Reports on Form 10-Q). Many of these factors are difficult to foresee and are beyond the Company’s ability to control or predict. The Company believes the forward-looking statements contained herein are reasonable; however, undue reliance should not be placed on any forward-looking statements, which are based on current expectations and speak only as of the date that they are made. The Company does not assume any obligation to update any forward-looking statements as a result of new information, future developments or otherwise, except as otherwise may be required by law. Non-GAAP Financial Measures This presentation includes certain financial measures that are not measures recognized under U.S. generally accepted accounting principles (“GAAP”) and therefore are considered non-GAAP financial measures. The Company’s management uses these non-GAAP financial measures in their analysis of the Company’s performance, financial condition and the efficiency of its operations. Management believes that these non-GAAP financial measures provide a greater understanding of the ongoing operations and enhance comparability of results with prior periods. The Company’s management also believes that investors find these non-GAAP financial measures useful as they assist investors in understanding the Company’s underlying operating performance and the analysis of ongoing operating trends. However, the non-GAAP financial measures discussed herein should not be considered in isolation or as a substitute for the most directly comparable or other financial measures calculated in accordance with GAAP. Moreover, the manner in which the Company calculates the non-GAAP financial measures discussed herein may differ from the reporting measures with similar names as used by other companies. You should understand how such other banking organizations calculate their non-GAAP financial measures with names similar to the non-GAAP financial measures discussed herein when comparing such information. Reconciliations of non-GAAP financial measures to GAAP financial measures are provided in the Appendix to this presentation.
4 LEGAL DISCLOSURES Additional Information and Where to Find It This communication is being made with respect to the proposed transaction involving BFST and Oakwood. This material is not a solicitation of any vote or approval of the Oakwood shareholders and is not a substitute for the proxy statement/prospectus or any other documents that BFST and Oakwood may send to their respective shareholders in connection with the proposed transaction. This communication does not constitute an offer to sell or the solicitation of an offer to buy any securities. In connection with the proposed transaction between BFST and Oakwood, BFST has filed with the SEC a Registration Statement on Form S-4 (the “Registration Statement”), which will include a proxy statement of Oakwood and a prospectus of BFST, as well as other relevant documents concerning the proposed transaction. Before making any voting or investment decisions, investors and shareholders are urged to read carefully the Registration Statement and the proxy statement/prospectus regarding the proposed transaction, as well as any other relevant documents filed with the SEC and any amendments or supplements to those documents, because they will contain important information. Oakwood will mail the proxy statement/prospectus to its shareholders. Shareholders are also urged to carefully review and consider BFST’s public filings with the SEC, including, but not limited to, its proxy statements, its Annual Reports on Form 10-K, its Quarterly Reports on Form 10-Q, and its Current Reports on Form 8-K. Copies of the Registration Statement and proxy statement/prospectus and other filings incorporated by reference therein, as well as other filings containing information about BFST, may be obtained, free of charge, as they become available at the SEC’s website at www.sec.gov. You will also be able to obtain these documents, when they are filed, free of charge, from BFST at www.b1BANK.com. Copies of the proxy statement/prospectus can also be obtained, when they become available, free of charge, by directing a request to Business First Bancshares, Inc., 500 Laurel Street, Suite 101, Baton Rouge, LA 70801, Attention: Corporate Secretary, Telephone: 225-248-7600. Participants in the Solicitation BFST, Oakwood and certain of their respective directors, executive officers and employees may, under the SEC’s rules, be deemed to be participants in the solicitation of proxies of Oakwood’s shareholders in connection with the proposed transaction. Information about BFST’s directors and executive officers is available in its definitive proxy statement relating to its 2024 annual meeting of shareholders, which was filed with the SEC on April 10, 2024, and other documents filed by BFST with the SEC. Other information regarding the persons who may, under the SEC’s rules, be deemed to be participants in the solicitation of proxies of Oakwood’s shareholders in connection with the proposed transaction, and a description of their direct and indirect interests, by security holdings or otherwise, will be contained in the proxy statement/prospectus regarding the proposed transaction and other relevant materials to be filed with the SEC when they become available. Free copies of these documents may be obtained as described in the preceding paragraph.
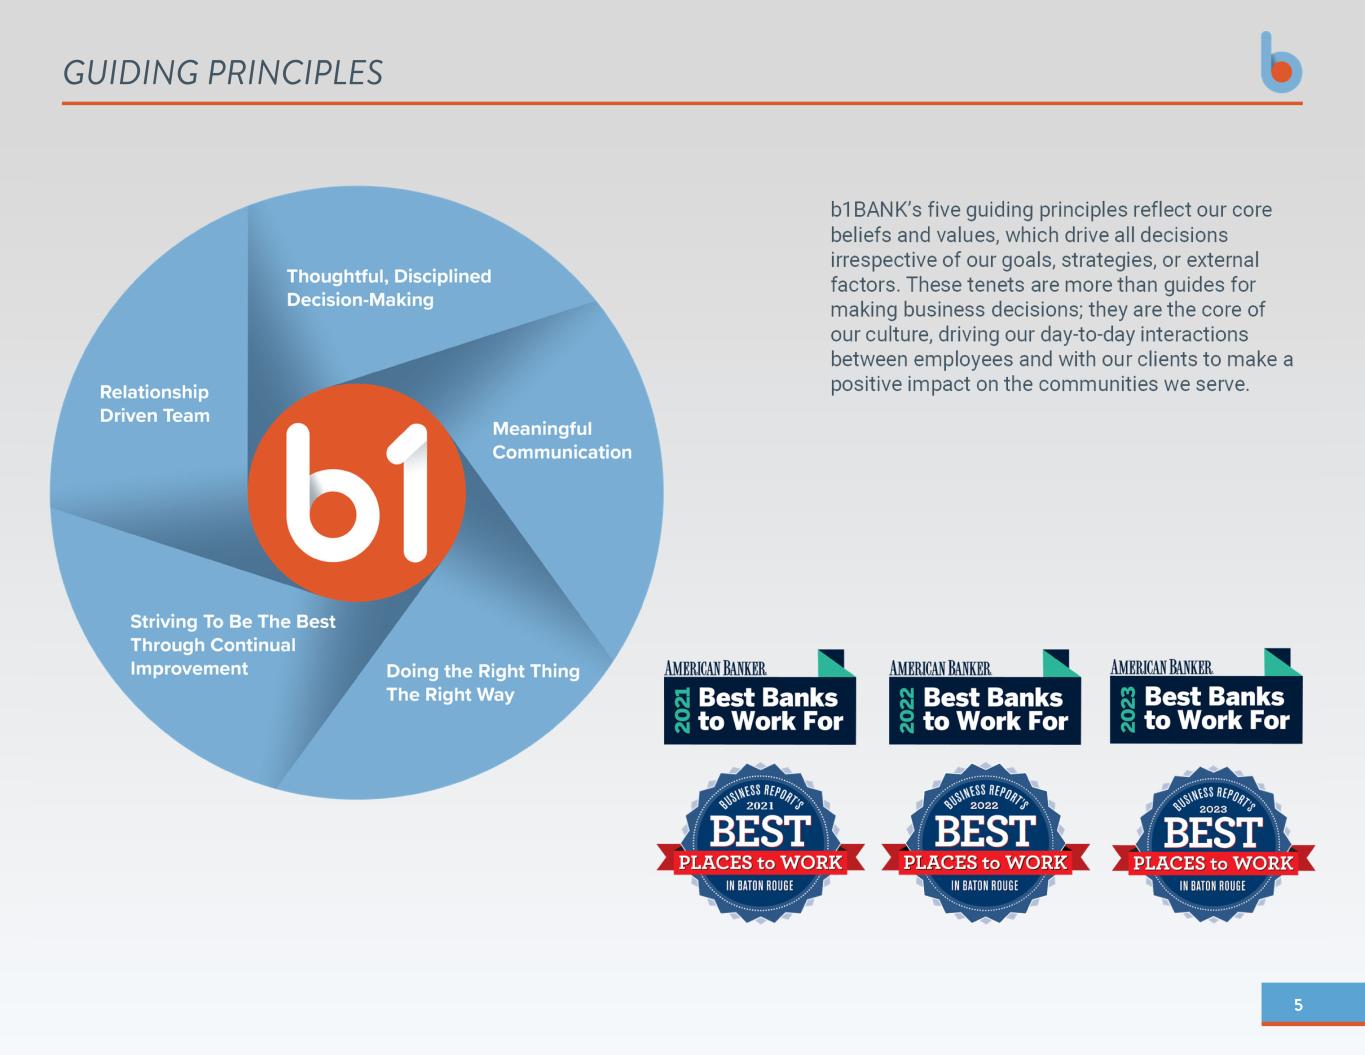
5 GUIDING PRINCIPLES b1BANK’s five guiding principles reflect our core beliefs and values, which drive all decisions irrespective of our goals, strategies, or external factors. These tenets are more than guides for making business decisions; they are the core of our culture, driving our day-to-day interactions between employees and with our clients to make a positive impact on the communities we serve.
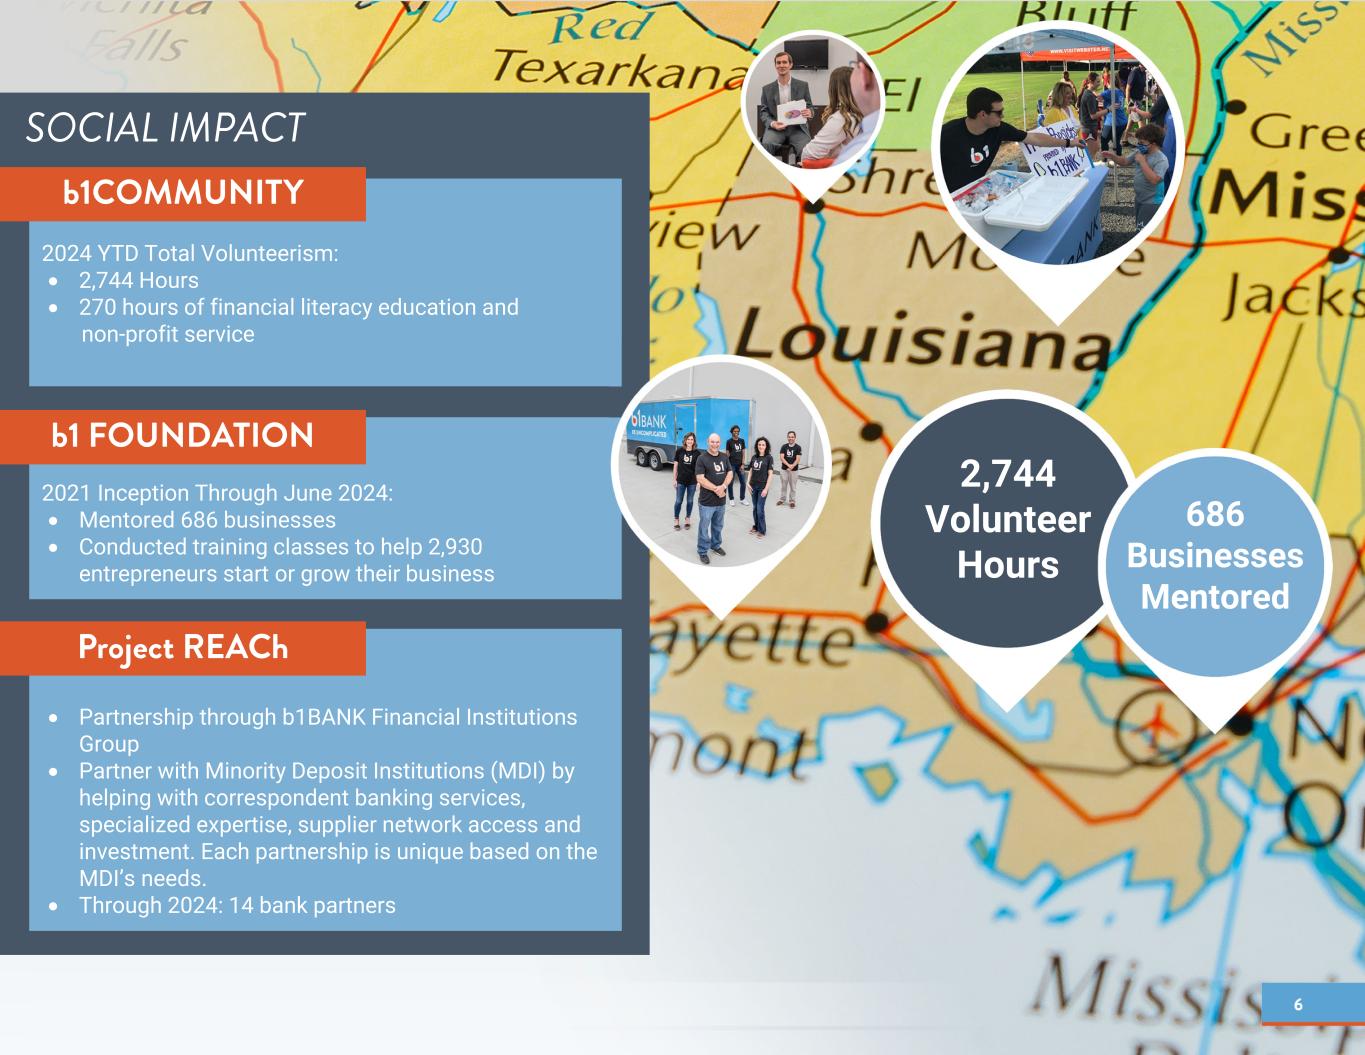
6 SOCIAL IMPACT 2024 YTD Total Volunteerism: • 2,744 Hours • 270 hours of financial literacy education and non-profit service • Partnership through b1BANK Financial Institutions Group • Partner with Minority Deposit Institutions (MDI) by helping with correspondent banking services, specialized expertise, supplier network access and investment. Each partnership is unique based on the MDI’s needs. • Through 2024: 14 bank partners 2021 Inception Through June 2024: • Mentored 686 businesses • Conducted training classes to help 2,930 entrepreneurs start or grow their business Project REACh b1 FOUNDATION b1COMMUNITY 2,744 Volunteer Hours 686 Businesses Mentored
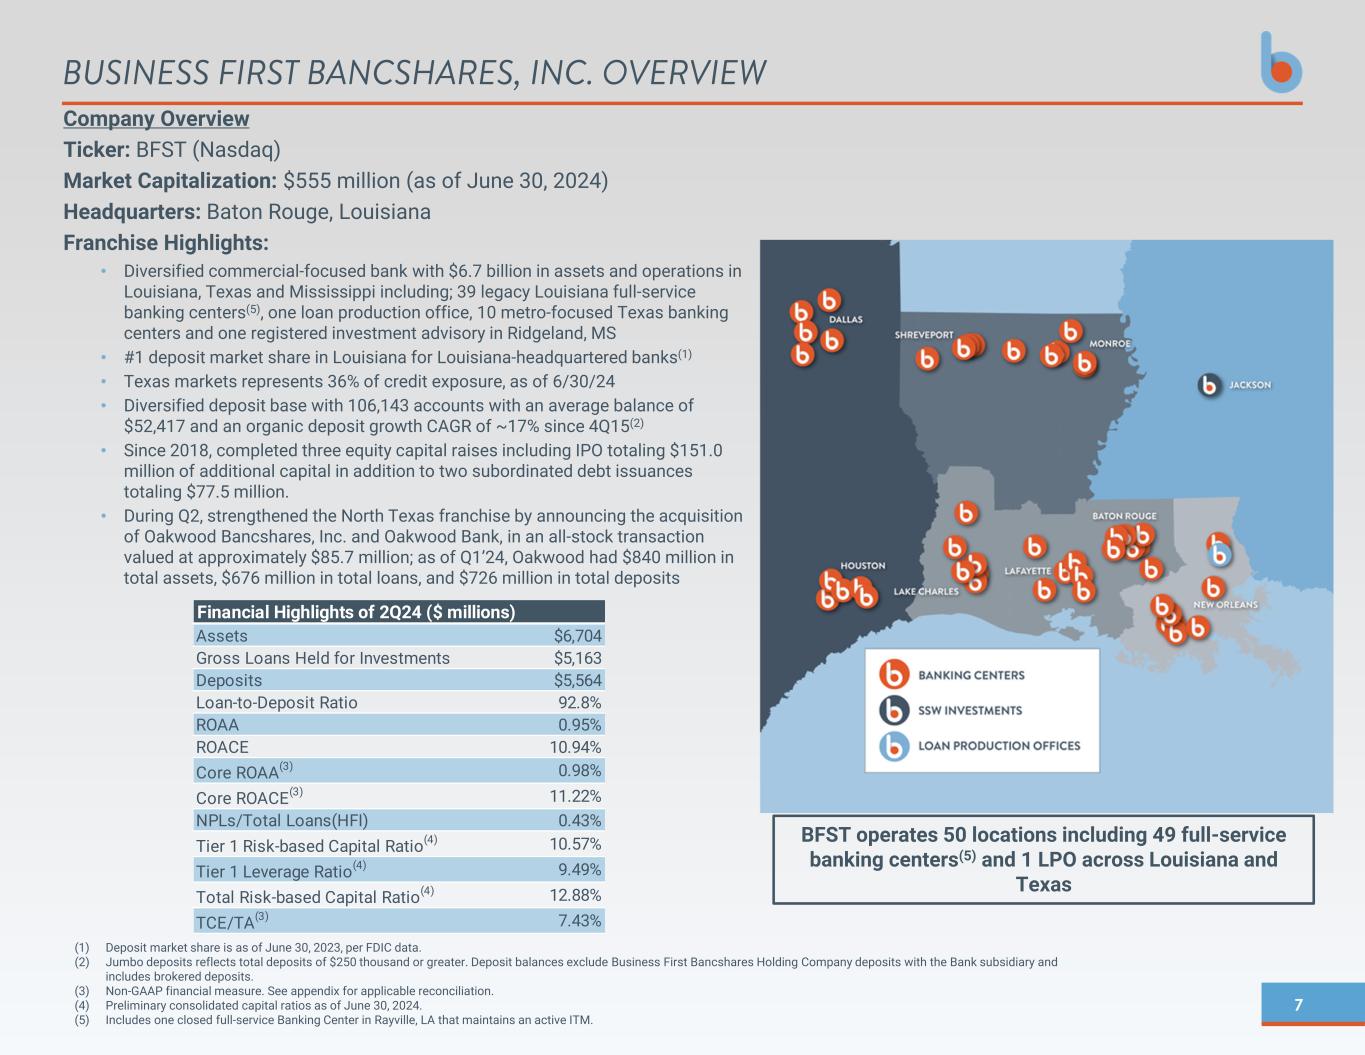
7 BUSINESS FIRST BANCSHARES, INC. OVERVIEW Company Overview Ticker: BFST (Nasdaq) Market Capitalization: $555 million (as of June 30, 2024) Headquarters: Baton Rouge, Louisiana Franchise Highlights: • Diversified commercial-focused bank with $6.7 billion in assets and operations in Louisiana, Texas and Mississippi including; 39 legacy Louisiana full-service banking centers(5), one loan production office, 10 metro-focused Texas banking centers and one registered investment advisory in Ridgeland, MS • #1 deposit market share in Louisiana for Louisiana-headquartered banks(1) • Texas markets represents 36% of credit exposure, as of 6/30/24 • Diversified deposit base with 106,143 accounts with an average balance of $52,417 and an organic deposit growth CAGR of ~17% since 4Q15(2) • Since 2018, completed three equity capital raises including IPO totaling $151.0 million of additional capital in addition to two subordinated debt issuances totaling $77.5 million. • During Q2, strengthened the North Texas franchise by announcing the acquisition of Oakwood Bancshares, Inc. and Oakwood Bank, in an all-stock transaction valued at approximately $85.7 million; as of Q1’24, Oakwood had $840 million in total assets, $676 million in total loans, and $726 million in total deposits BFST operates 50 locations including 49 full-service banking centers(5) and 1 LPO across Louisiana and Texas (1) Deposit market share is as of June 30, 2023, per FDIC data. (2) Jumbo deposits reflects total deposits of $250 thousand or greater. Deposit balances exclude Business First Bancshares Holding Company deposits with the Bank subsidiary and includes brokered deposits. (3) Non-GAAP financial measure. See appendix for applicable reconciliation. (4) Preliminary consolidated capital ratios as of June 30, 2024. (5) Includes one closed full-service Banking Center in Rayville, LA that maintains an active ITM. BFST Footprint Assets $6,704 Gross Loans Held for Investments $5,163 Deposits $5,564 Loan-to-Deposit Ratio 92.8% ROAA 0.95% ROACE 10.94% Core ROAA(3) 0.98% Core ROACE(3) 11.22% NPLs/Total Loans(HFI) 0.43% Tier 1 Risk-based Capital Ratio(4) 10.57% Tier 1 Leverage Ratio(4) 9.49% Total Risk-based Capital Ratio(4) 12.88% TCE/TA(3) 7.43% Financial Highlights of 2Q24 ($ millions)
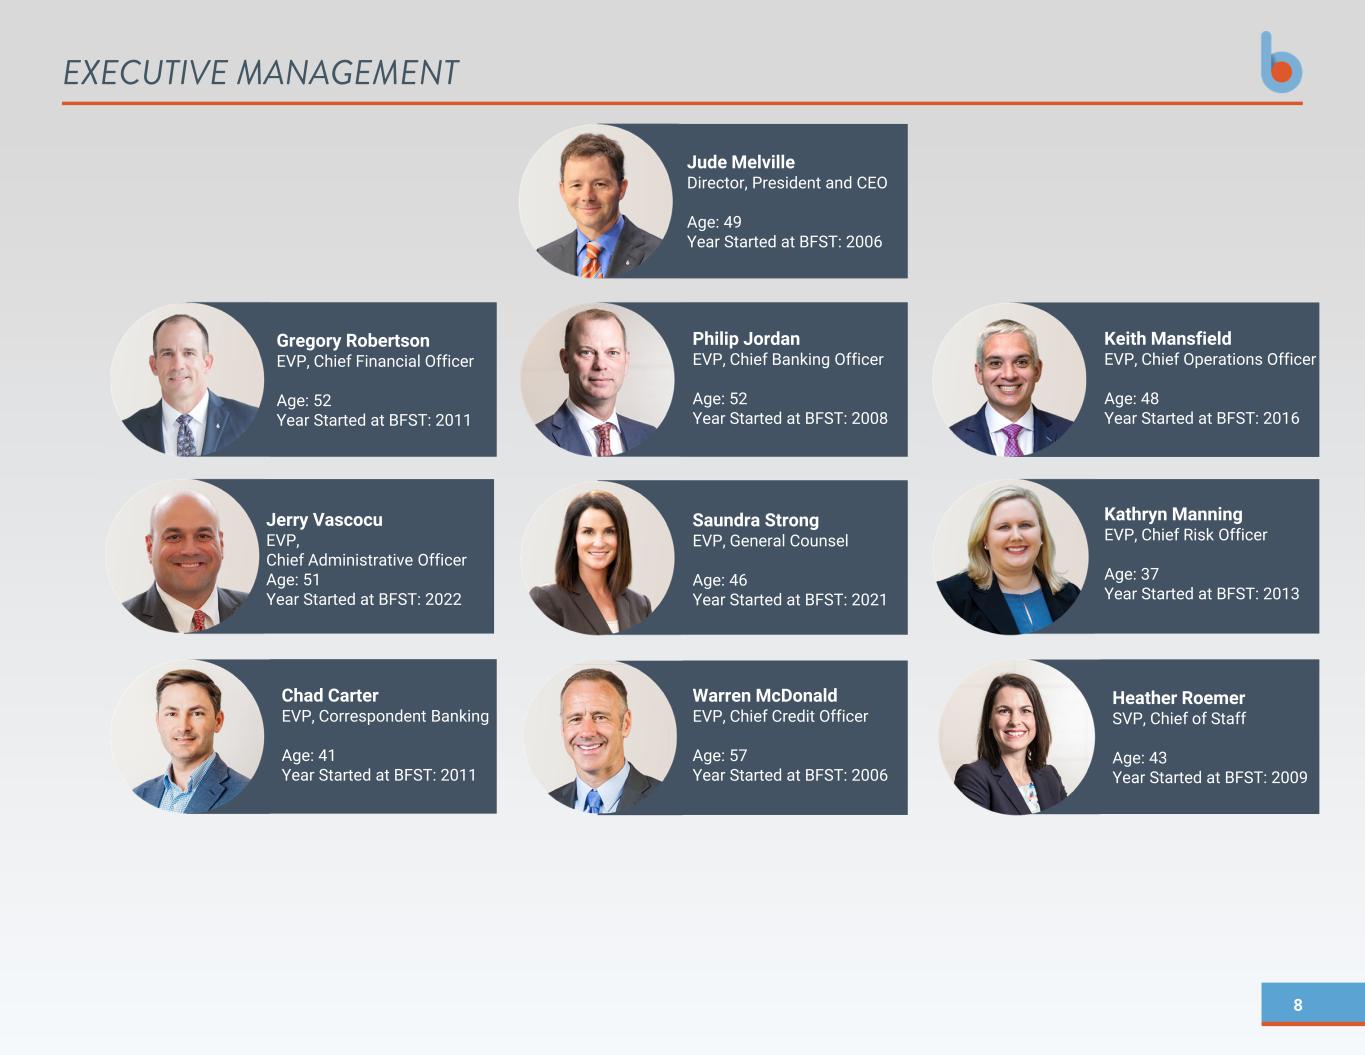
8 EXECUTIVE MANAGEMENT Jude Melville Director, President and CEO Age: 49 Year Started at BFST: 2006 Philip Jordan EVP, Chief Banking Officer Age: 52 Year Started at BFST: 2008 Keith Mansfield EVP, Chief Operations Officer Age: 48 Year Started at BFST: 2016 Chad Carter EVP, Correspondent Banking Age: 41 Year Started at BFST: 2011 Gregory Robertson EVP, Chief Financial Officer Age: 52 Year Started at BFST: 2011 Heather Roemer SVP, Chief of Staff Age: 43 Year Started at BFST: 2009 Saundra Strong EVP, General Counsel Age: 46 Year Started at BFST: 2021 Kathryn Manning EVP, Chief Risk Officer Age: 37 Year Started at BFST: 2013 Warren McDonald EVP, Chief Credit Officer Age: 57 Year Started at BFST: 2006 Jerry Vascocu EVP, Chief Administrative Officer Age: 51 Year Started at BFST: 2022
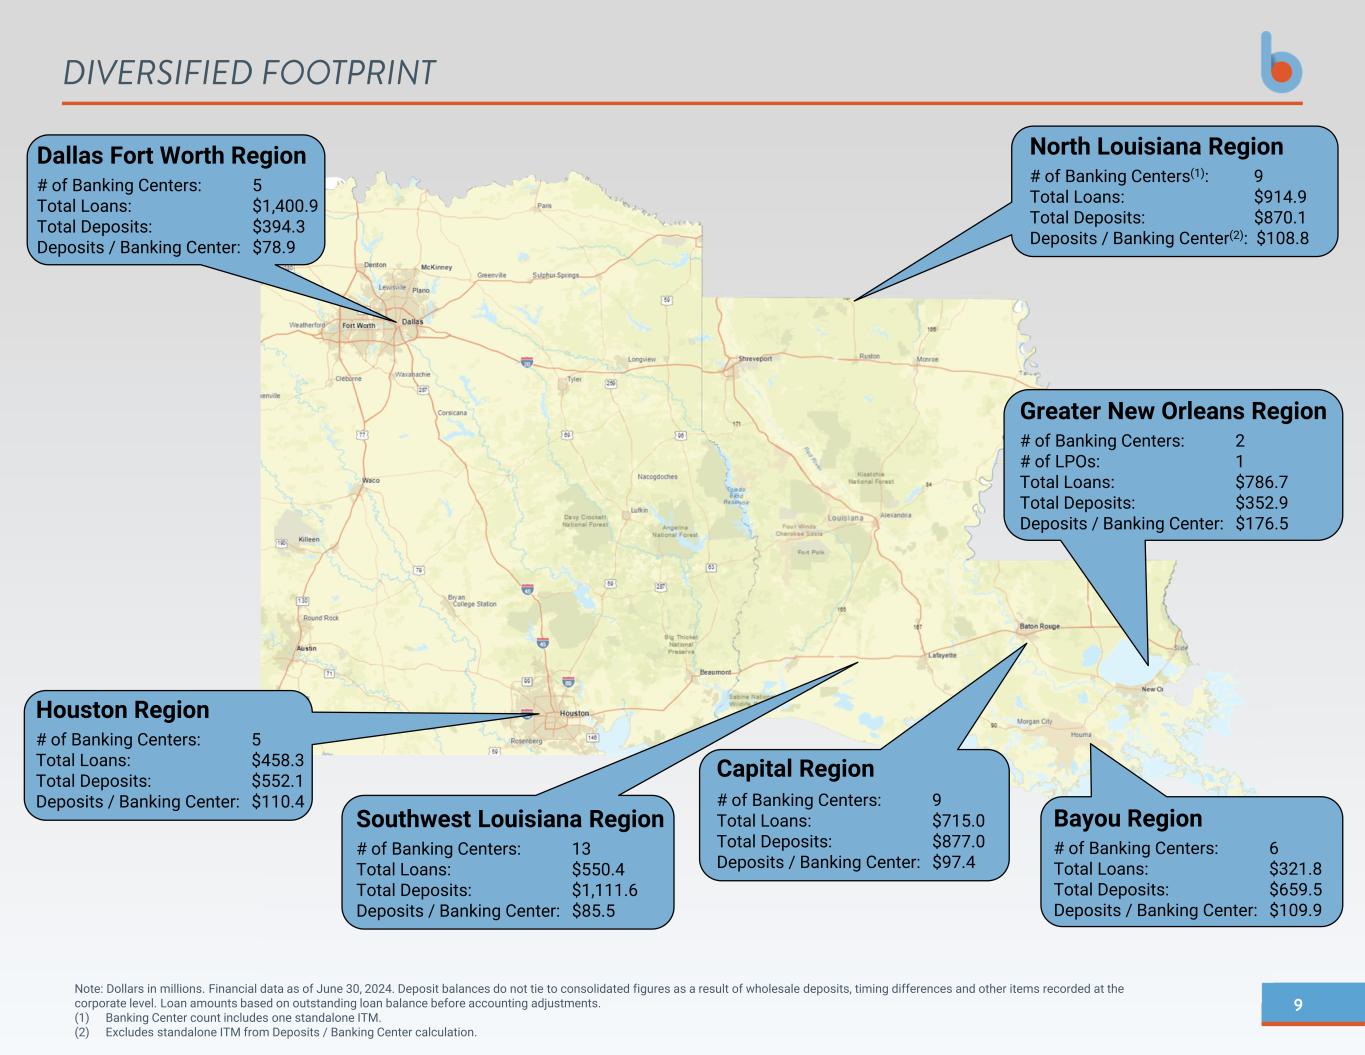
9 DIVERSIFIED FOOTPRINT Note: Dollars in millions. Financial data as of June 30, 2024. Deposit balances do not tie to consolidated figures as a result of wholesale deposits, timing differences and other items recorded at the corporate level. Loan amounts based on outstanding loan balance before accounting adjustments. (1) Banking Center count includes one standalone ITM. (2) Excludes standalone ITM from Deposits / Banking Center calculation. Dallas Fort Worth Region # of Banking Centers: 5 Total Loans: $1,400.9 Total Deposits: $394.3 Deposits / Banking Center: $78.9 Houston Region # of Banking Centers: 5 Total Loans: $458.3 Total Deposits: $552.1 Deposits / Banking Center: $110.4 Southwest Louisiana Region # of Banking Centers: 13 Total Loans: $550.4 Total Deposits: $1,111.6 Deposits / Banking Center: $85.5 Bayou Region # of Banking Centers: 6 Total Loans: $321.8 Total Deposits: $659.5 Deposits / Banking Center: $109.9 Greater New Orleans Region # of Banking Centers: 2 # of LPOs: 1 Total Loans: $786.7 Total Deposits: $352.9 Deposits / Banking Center: $176.5 Capital Region # of Banking Centers: 9 Total Loans: $715.0 Total Deposits: $877.0 Deposits / Banking Center: $97.4 North Louisiana Region # of Banking Centers(1): 9 Total Loans: $914.9 Total Deposits: $870.1 Deposits / Banking Center(2): $108.8
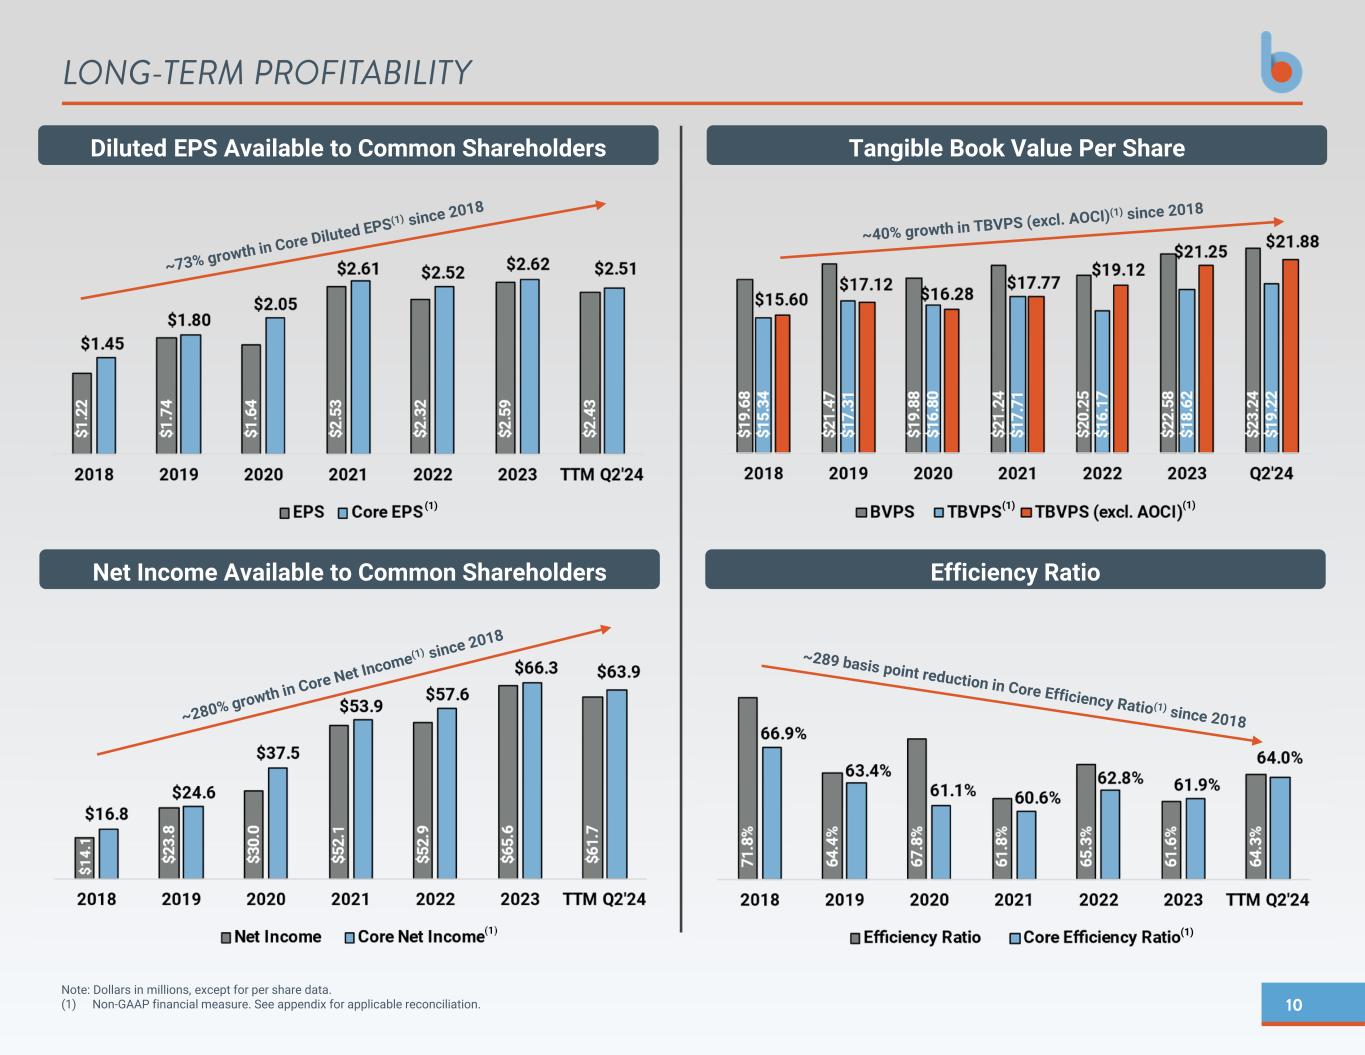
10 LONG-TERM PROFITABILITY Note: Dollars in millions, except for per share data. (1) Non-GAAP financial measure. See appendix for applicable reconciliation. (1) (1) (1) (1) (1) Diluted EPS Available to Common Shareholders Tangible Book Value Per Share Net Income Available to Common Shareholders Efficiency Ratio
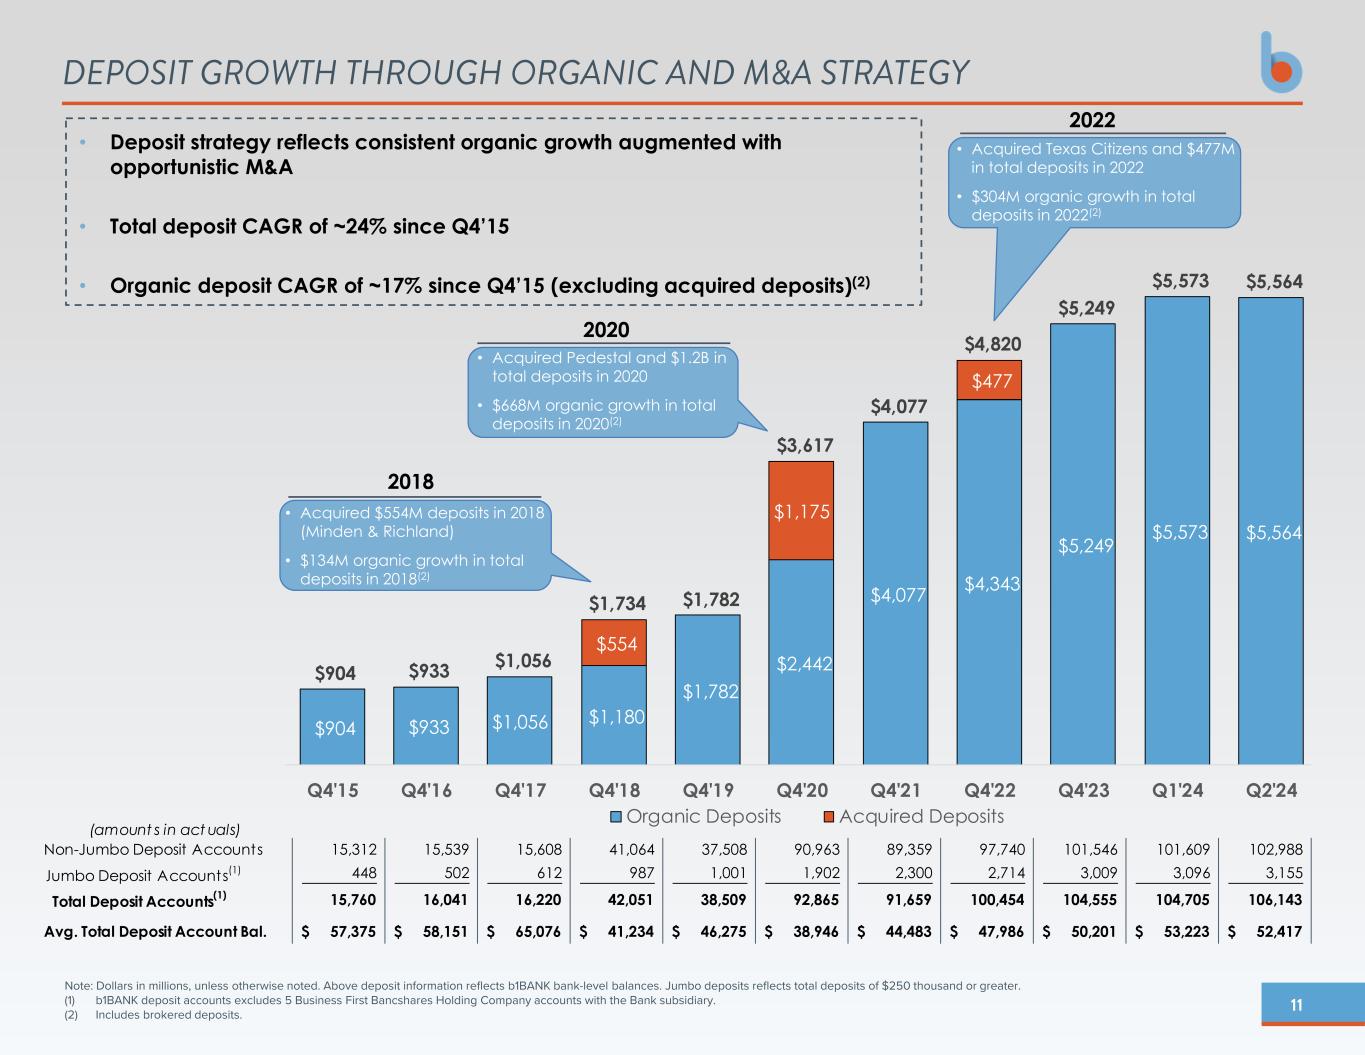
11 (amount s in act uals) Non-Jumbo Deposit Accounts 15,312 15,539 15,608 41,064 37,508 90,963 89,359 97,740 101,546 101,609 102,988 Jumbo Deposit Accounts(1) 448 502 612 987 1,001 1,902 2,300 2,714 3,009 3,096 3,155 Total Deposit Accounts(1) 15,760 16,041 16,220 42,051 38,509 92,865 91,659 100,454 104,555 104,705 106,143 Avg. Total Deposit Account Bal. 57,375$ 58,151$ 65,076$ 41,234$ 46,275$ 38,946$ 44,483$ 47,986$ 50,201$ 53,223$ 52,417$ $904 $933 $1,056 $1,180 $1,782 $2,442 $4,077 $4,343 $5,249 $5,573 $5,564 $554 $1,175 $477 $904 $933 $1,056 $1,734 $1,782 $3,617 $4,077 $4,820 $5,249 $5,573 $5,564 Q4'15 Q4'16 Q4'17 Q4'18 Q4'19 Q4'20 Q4'21 Q4'22 Q4'23 Q1'24 Q2'24 Organic Deposits Acquired Deposits DEPOSIT GROWTH THROUGH ORGANIC AND M&A STRATEGY • Deposit strategy reflects consistent organic growth augmented with opportunistic M&A • Total deposit CAGR of ~24% since Q4’15 • Organic deposit CAGR of ~17% since Q4’15 (excluding acquired deposits)(2) • Acquired Texas Citizens and $477M in total deposits in 2022 • $304M organic growth in total deposits in 2022(2) 2022 Note: Dollars in millions, unless otherwise noted. Above deposit information reflects b1BANK bank-level balances. Jumbo deposits reflects total deposits of $250 thousand or greater. (1) b1BANK deposit accounts excludes 5 Business First Bancshares Holding Company accounts with the Bank subsidiary. (2) Includes brokered deposits. • Acquired Pedestal and $1.2B in total deposits in 2020 • $668M organic growth in total deposits in 2020(2) 2020 • Acquired $554M deposits in 2018 (Minden & Richland) • $134M organic growth in total deposits in 2018(2) 2018
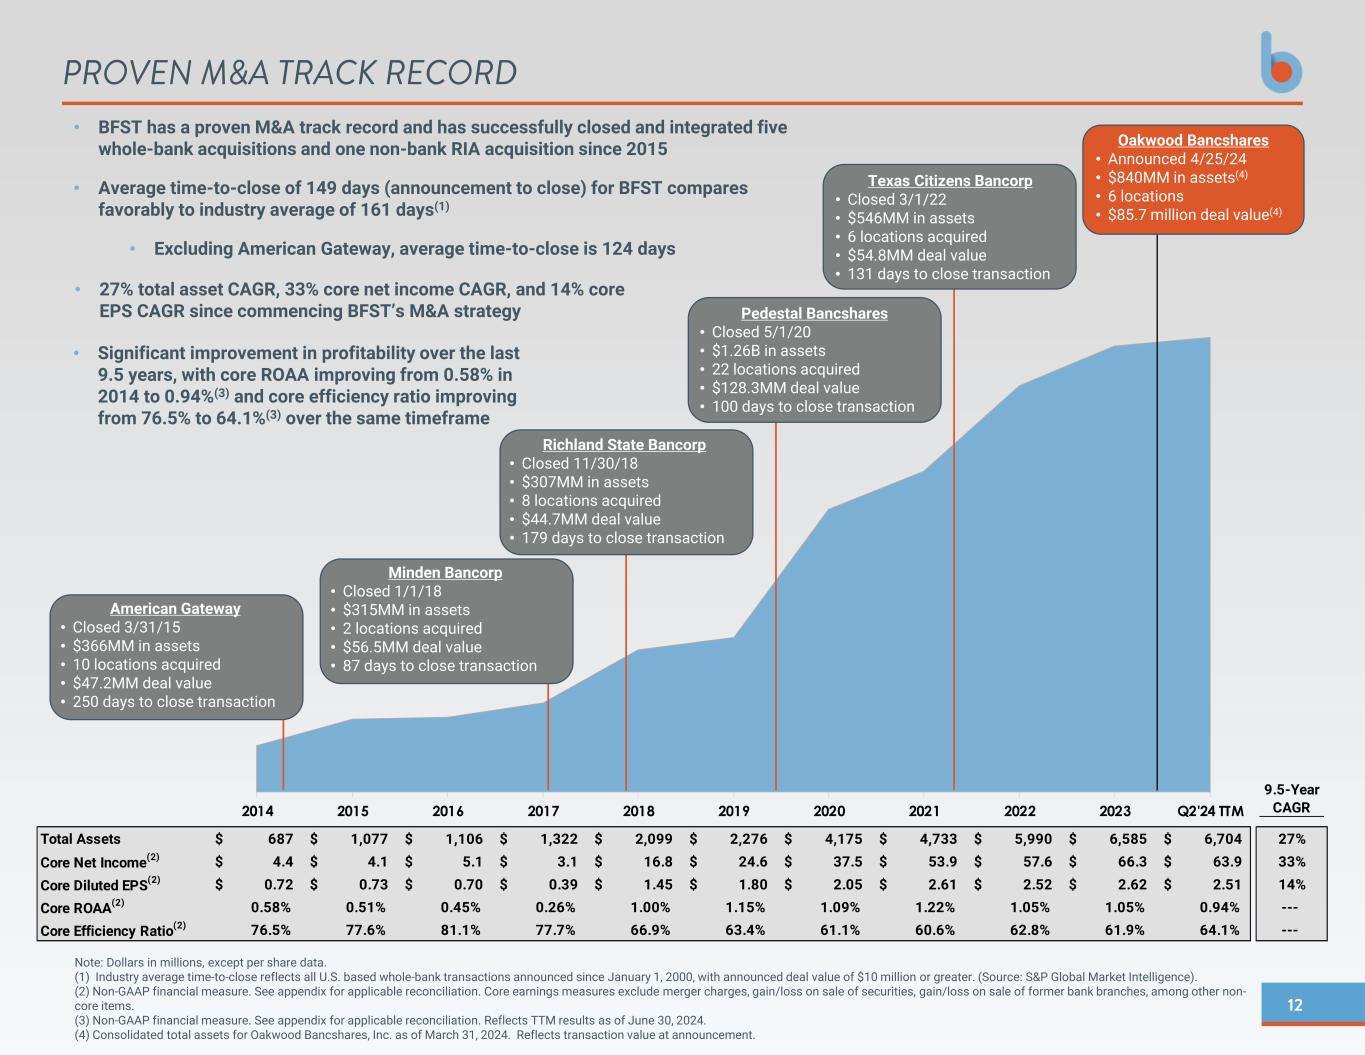
12 9.5-Year CAGR Total Assets 687$ 1,077$ 1,106$ 1,322$ 2,099$ 2,276$ 4,175$ 4,733$ 5,990$ 6,585$ 6,704$ 27% Core Net Income(2) 4.4$ 4.1$ 5.1$ 3.1$ 16.8$ 24.6$ 37.5$ 53.9$ 57.6$ 66.3$ 63.9$ 33% Core Diluted EPS(2) 0.72$ 0.73$ 0.70$ 0.39$ 1.45$ 1.80$ 2.05$ 2.61$ 2.52$ 2.62$ 2.51$ 14% Core ROAA(2) 0.58% 0.51% 0.45% 0.26% 1.00% 1.15% 1.09% 1.22% 1.05% 1.05% 0.94% --- Core Efficiency Ratio(2) 76.5% 77.6% 81.1% 77.7% 66.9% 63.4% 61.1% 60.6% 62.8% 61.9% 64.1% --- 2014 2015 2016 2017 2018 2019 2020 2021 2022 2023 Q2'24 TTM Texas Citizens Bancorp • Closed 3/1/22 • $546MM in assets • 6 locations acquired • $54.8MM deal value • 131 days to close transaction PROVEN M&A TRACK RECORD Note: Dollars in millions, except per share data. (1) Industry average time-to-close reflects all U.S. based whole-bank transactions announced since January 1, 2000, with announced deal value of $10 million or greater. (Source: S&P Global Market Intelligence). (2) Non-GAAP financial measure. See appendix for applicable reconciliation. Core earnings measures exclude merger charges, gain/loss on sale of securities, gain/loss on sale of former bank branches, among other non- core items. (3) Non-GAAP financial measure. See appendix for applicable reconciliation. Reflects TTM results as of June 30, 2024. (4) Consolidated total assets for Oakwood Bancshares, Inc. as of March 31, 2024. Reflects transaction value at announcement. American Gateway • Closed 3/31/15 • $366MM in assets • 10 locations acquired • $47.2MM deal value • 250 days to close transaction Minden Bancorp • Closed 1/1/18 • $315MM in assets • 2 locations acquired • $56.5MM deal value • 87 days to close transaction Richland State Bancorp • Closed 11/30/18 • $307MM in assets • 8 locations acquired • $44.7MM deal value • 179 days to close transaction Pedestal Bancshares • Closed 5/1/20 • $1.26B in assets • 22 locations acquired • $128.3MM deal value • 100 days to close transaction • BFST has a proven M&A track record and has successfully closed and integrated five whole-bank acquisitions and one non-bank RIA acquisition since 2015 • Average time-to-close of 149 days (announcement to close) for BFST compares favorably to industry average of 161 days(1) • Excluding American Gateway, average time-to-close is 124 days • 27% total asset CAGR, 33% core net income CAGR, and 14% core EPS CAGR since commencing BFST’s M&A strategy • Significant improvement in profitability over the last 9.5 years, with core ROAA improving from 0.58% in 2014 to 0.94%(3) and core efficiency ratio improving from 76.5% to 64.1%(3) over the same timeframe Oakwood Bancshares • Announced 4/25/24 • $840MM in assets(4) • 6 locations • $85.7 million deal value(4)
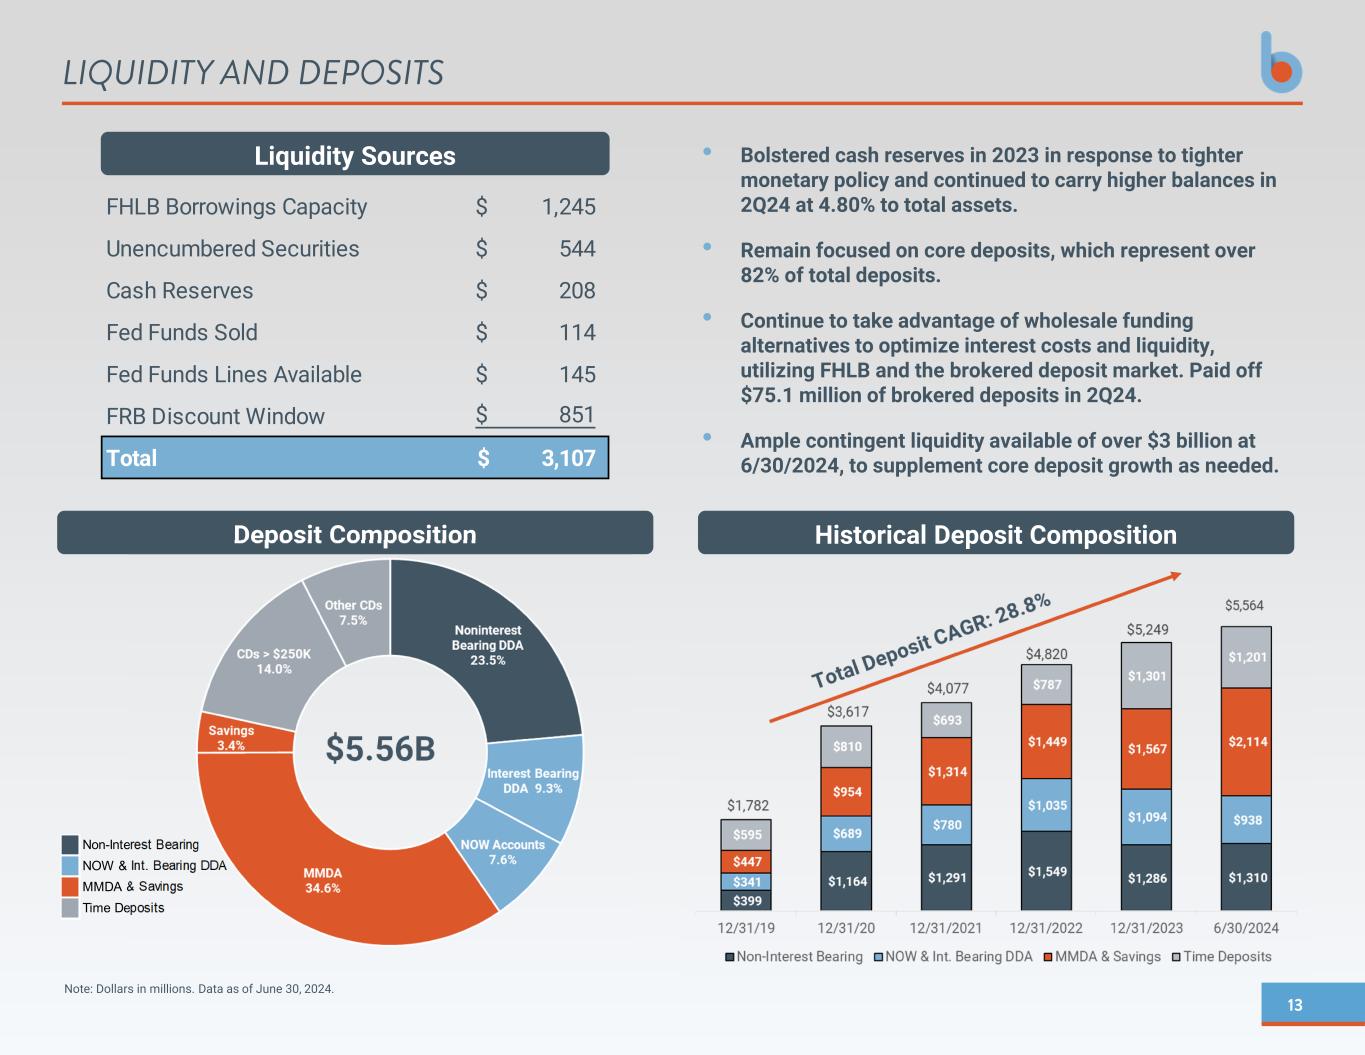
13 LIQUIDITY AND DEPOSITS Deposit Composition Non-Interest Bearing NOW & Int. Bearing DDA MMDA & Savings Time Deposits • Bolstered cash reserves in 2023 in response to tighter monetary policy and continued to carry higher balances in 2Q24 at 4.80% to total assets. • Remain focused on core deposits, which represent over 82% of total deposits. • Continue to take advantage of wholesale funding alternatives to optimize interest costs and liquidity, utilizing FHLB and the brokered deposit market. Paid off $75.1 million of brokered deposits in 2Q24. • Ample contingent liquidity available of over $3 billion at 6/30/2024, to supplement core deposit growth as needed. $5.56B Note: Dollars in millions. Data as of June 30, 2024. Historical Deposit Composition Liquidity Sources FHLB Borrowings Capacity 1,245$ Unencumbered Securities 544$ Cash Reserves 208$ Fed Funds Sold 114$ Fed Funds Lines Available 145$ FRB Discount Window 851$ Total 3,107$
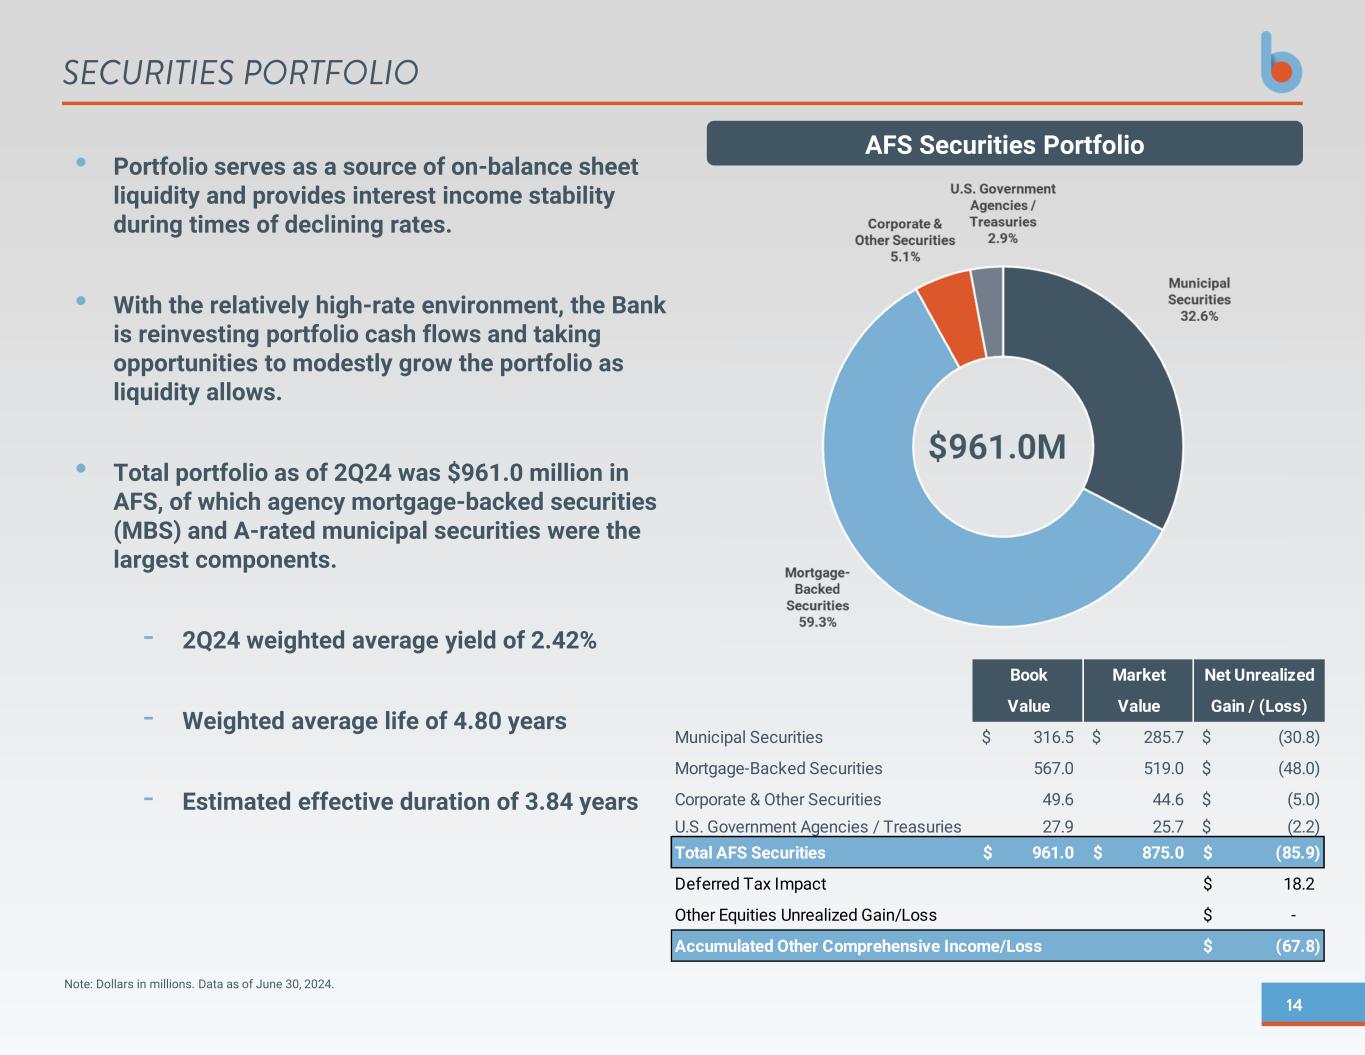
14 SECURITIES PORTFOLIO AFS Securities Portfolio• Portfolio serves as a source of on-balance sheet liquidity and provides interest income stability during times of declining rates. • With the relatively high-rate environment, the Bank is reinvesting portfolio cash flows and taking opportunities to modestly grow the portfolio as liquidity allows. • Total portfolio as of 2Q24 was $961.0 million in AFS, of which agency mortgage-backed securities (MBS) and A-rated municipal securities were the largest components. - 2Q24 weighted average yield of 2.42% - Weighted average life of 4.80 years - Estimated effective duration of 3.84 years $961.0M Note: Dollars in millions. Data as of June 30, 2024. Book Market Net Unrealized Value Value Gain / (Loss) Municipal Securities 316.5$ 285.7$ (30.8)$ Mortgage-Backed Securities 567.0 519.0 (48.0)$ Corporate & Other Securities 49.6 44.6 (5.0)$ U.S. Government Agencies / Treasuries 27.9 25.7 (2.2)$ Total AFS Securities 961.0$ 875.0$ (85.9)$ Deferred Tax Impact 18.2$ Other Equities Unrealized Gain/Loss -$ Accumulated Other Comprehensive Income/Loss (67.8)$
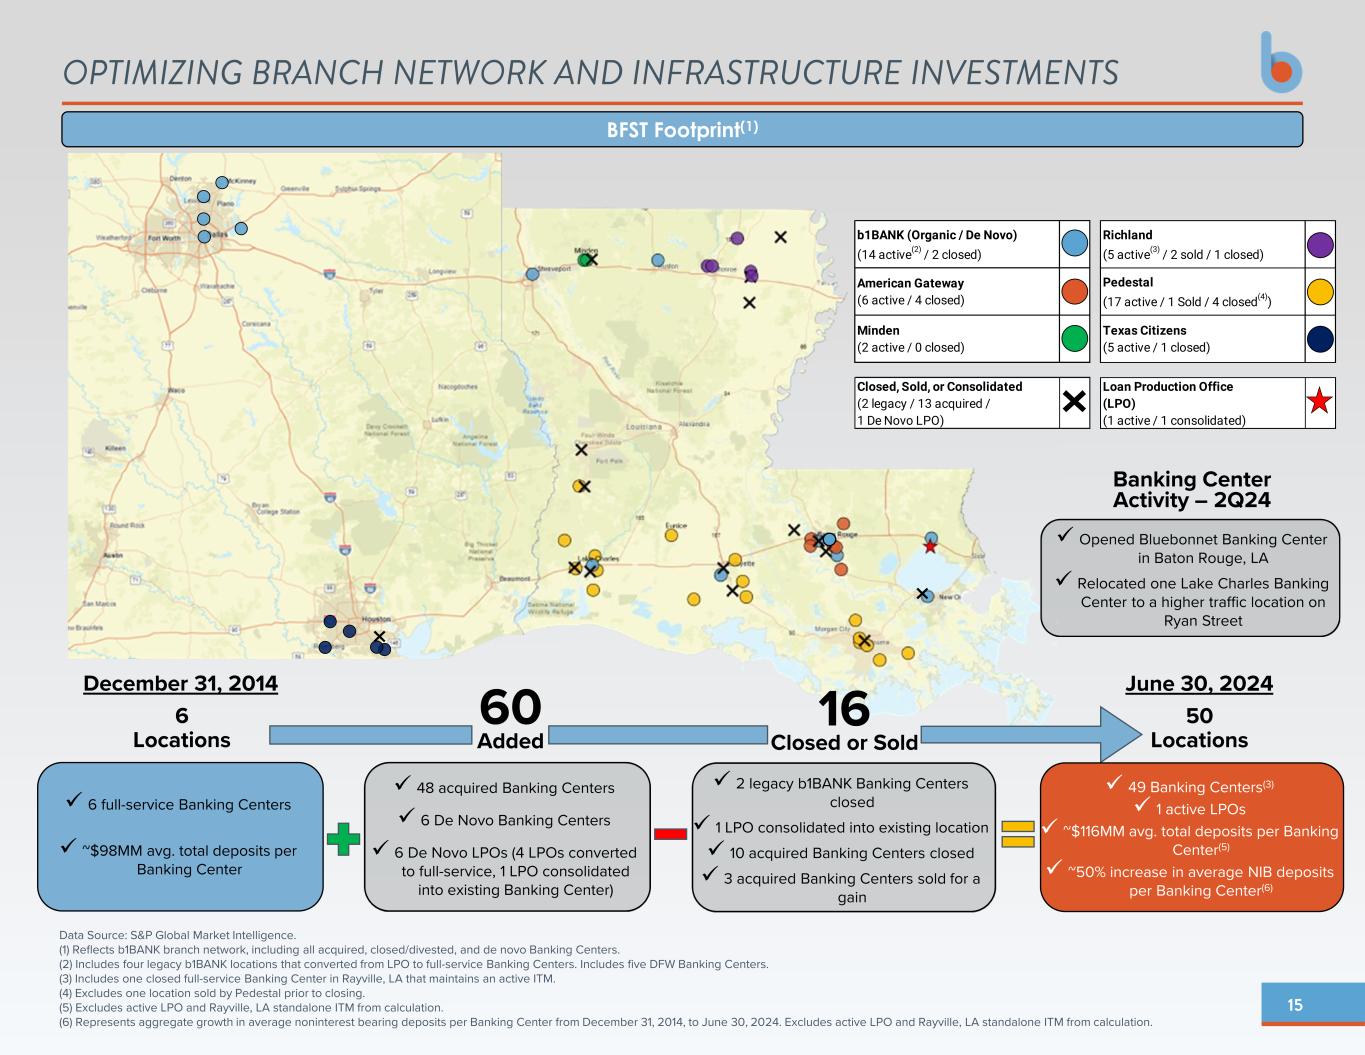
15 Data Source: S&P Global Market Intelligence. (1) Reflects b1BANK branch network, including all acquired, closed/divested, and de novo Banking Centers. (2) Includes four legacy b1BANK locations that converted from LPO to full-service Banking Centers. Includes five DFW Banking Centers. (3) Includes one closed full-service Banking Center in Rayville, LA that maintains an active ITM. (4) Excludes one location sold by Pedestal prior to closing. (5) Excludes active LPO and Rayville, LA standalone ITM from calculation. (6) Represents aggregate growth in average noninterest bearing deposits per Banking Center from December 31, 2014, to June 30, 2024. Excludes active LPO and Rayville, LA standalone ITM from calculation. OPTIMIZING BRANCH NETWORK AND INFRASTRUCTURE INVESTMENTS 6 full-service Banking Centers ~$98MM avg. total deposits per Banking Center December 31, 2014 48 acquired Banking Centers 6 De Novo Banking Centers 6 De Novo LPOs (4 LPOs converted to full-service, 1 LPO consolidated into existing Banking Center) 2 legacy b1BANK Banking Centers closed 1 LPO consolidated into existing location 10 acquired Banking Centers closed 3 acquired Banking Centers sold for a gain 49 Banking Centers(3) 1 active LPOs ~$116MM avg. total deposits per Banking Center(5) ~50% increase in average NIB deposits per Banking Center(6) June 30, 2024 6 Locations 50 Locations 60 Added BFST Footprint(1) 16 Closed or Sold b1BANK (Organic / De Novo) (14 active(2) / 2 closed) Richland (5 active(3) / 2 sold / 1 closed) American Gateway (6 active / 4 closed) Pedestal (17 active / 1 Sold / 4 closed(4)) Minden (2 active / 0 closed) Texas Citizens (5 active / 1 closed) Closed, Sold, or Consolidated (2 legacy / 13 acquired / 1 De Novo LPO) Loan Production Office (LPO) (1 active / 1 consolidated) Banking Center Activity – 2Q24 Opened Bluebonnet Banking Center in Baton Rouge, LA Relocated one Lake Charles Banking Center to a higher traffic location on Ryan Street
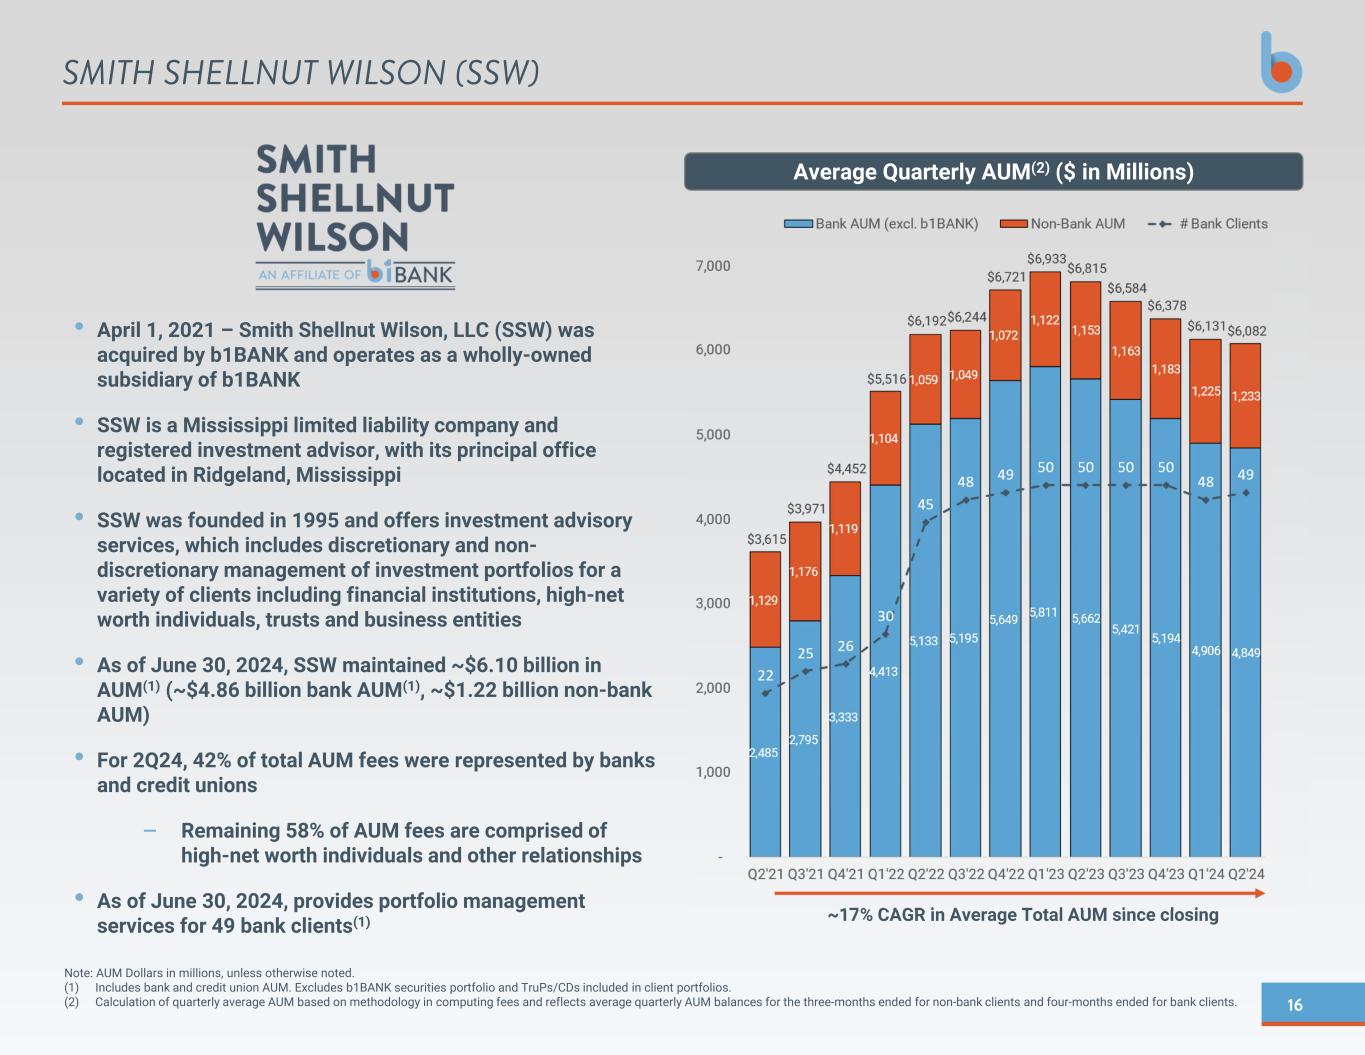
16 Note: AUM Dollars in millions, unless otherwise noted. (1) Includes bank and credit union AUM. Excludes b1BANK securities portfolio and TruPs/CDs included in client portfolios. (2) Calculation of quarterly average AUM based on methodology in computing fees and reflects average quarterly AUM balances for the three-months ended for non-bank clients and four-months ended for bank clients. SMITH SHELLNUT WILSON (SSW) • April 1, 2021 – Smith Shellnut Wilson, LLC (SSW) was acquired by b1BANK and operates as a wholly-owned subsidiary of b1BANK • SSW is a Mississippi limited liability company and registered investment advisor, with its principal office located in Ridgeland, Mississippi • SSW was founded in 1995 and offers investment advisory services, which includes discretionary and non- discretionary management of investment portfolios for a variety of clients including financial institutions, high-net worth individuals, trusts and business entities • As of June 30, 2024, SSW maintained ~$6.10 billion in AUM(1) (~$4.86 billion bank AUM(1), ~$1.22 billion non-bank AUM) • For 2Q24, 42% of total AUM fees were represented by banks and credit unions – Remaining 58% of AUM fees are comprised of high-net worth individuals and other relationships • As of June 30, 2024, provides portfolio management services for 49 bank clients(1) Average Quarterly AUM(2) ($ in Millions) ~17% CAGR in Average Total AUM since closing
17 Financial Results
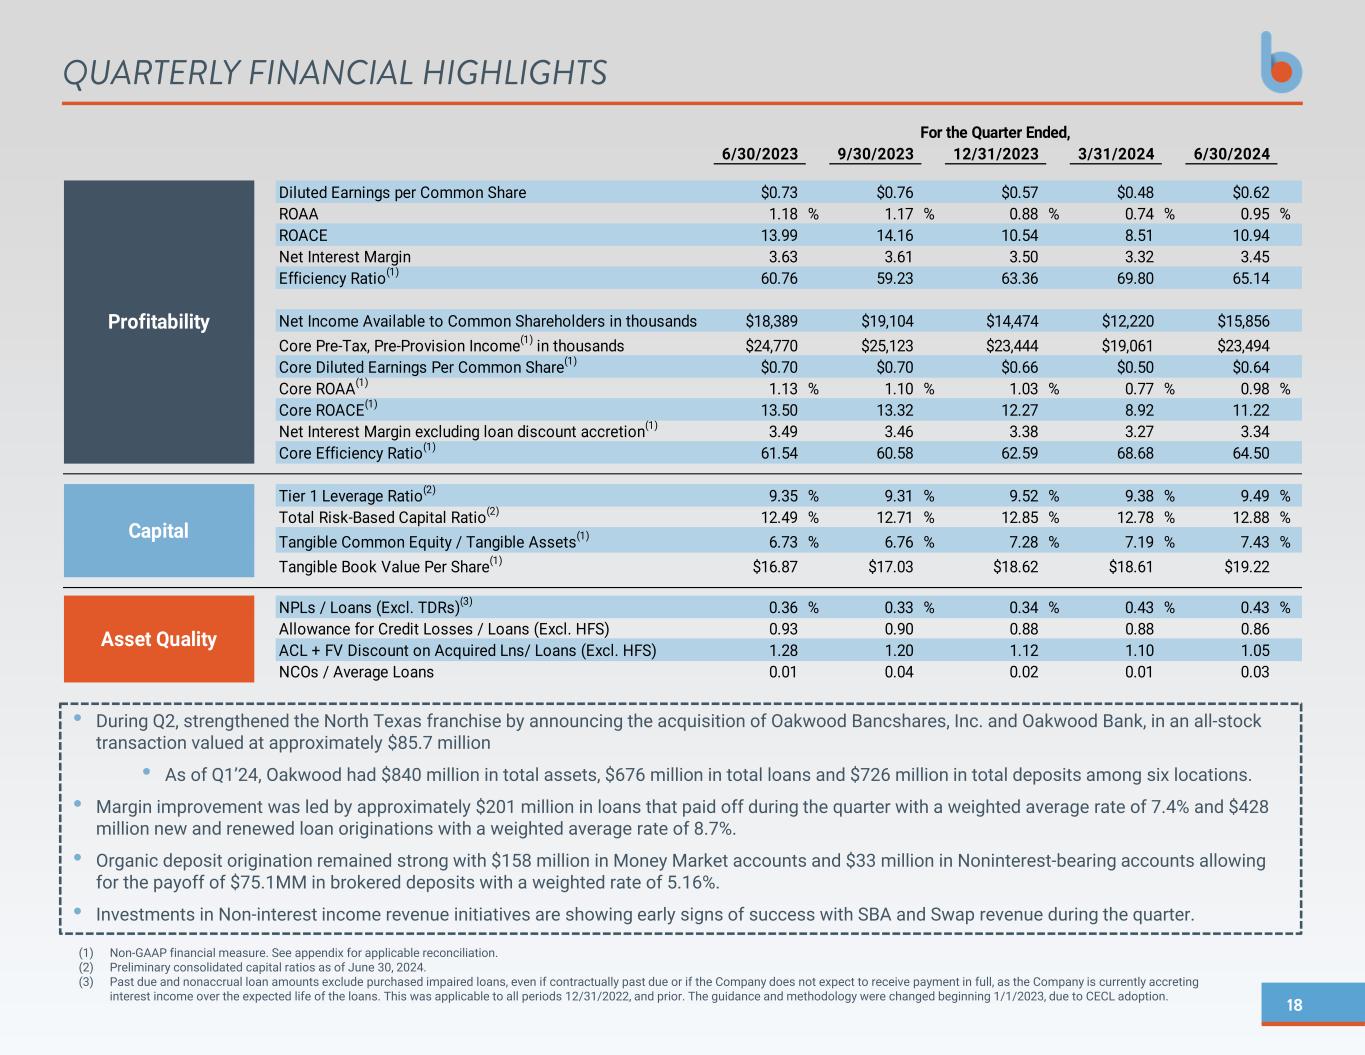
18 (1) Non-GAAP financial measure. See appendix for applicable reconciliation. (2) Preliminary consolidated capital ratios as of June 30, 2024. (3) Past due and nonaccrual loan amounts exclude purchased impaired loans, even if contractually past due or if the Company does not expect to receive payment in full, as the Company is currently accreting interest income over the expected life of the loans. This was applicable to all periods 12/31/2022, and prior. The guidance and methodology were changed beginning 1/1/2023, due to CECL adoption. QUARTERLY FINANCIAL HIGHLIGHTS • During Q2, strengthened the North Texas franchise by announcing the acquisition of Oakwood Bancshares, Inc. and Oakwood Bank, in an all-stock transaction valued at approximately $85.7 million • As of Q1’24, Oakwood had $840 million in total assets, $676 million in total loans and $726 million in total deposits among six locations. • Margin improvement was led by approximately $201 million in loans that paid off during the quarter with a weighted average rate of 7.4% and $428 million new and renewed loan originations with a weighted average rate of 8.7%. • Organic deposit origination remained strong with $158 million in Money Market accounts and $33 million in Noninterest-bearing accounts allowing for the payoff of $75.1MM in brokered deposits with a weighted rate of 5.16%. • Investments in Non-interest income revenue initiatives are showing early signs of success with SBA and Swap revenue during the quarter. 6/30/2023 9/30/2023 12/31/2023 3/31/2024 6/30/2024 Diluted Earnings per Common Share $0.73 $0.76 $0.57 $0.48 $0.62 ROAA 1.18 % 1.17 % 0.88 % 0.74 % 0.95 % ROACE 13.99 14.16 10.54 8.51 10.94 Net Interest Margin 3.63 3.61 3.50 3.32 3.45 Efficiency Ratio(1) 60.76 59.23 63.36 69.80 65.14 Net Income Available to Common Shareholders in thousands $18,389 $19,104 $14,474 $12,220 $15,856 Core Pre-Tax, Pre-Provision Income(1) in thousands $24,770 $25,123 $23,444 $19,061 $23,494 Core Diluted Earnings Per Common Share(1) $0.70 $0.70 $0.66 $0.50 $0.64 Core ROAA(1) 1.13 % 1.10 % 1.03 % 0.77 % 0.98 % Core ROACE(1) 13.50 13.32 12.27 8.92 11.22 Net Interest Margin excluding loan discount accretion(1) 3.49 3.46 3.38 3.27 3.34 Core Efficiency Ratio(1) 61.54 60.58 62.59 68.68 64.50 Tier 1 Leverage Ratio(2) 9.35 % 9.31 % 9.52 % 9.38 % 9.49 % Total Risk-Based Capital Ratio(2) 12.49 % 12.71 % 12.85 % 12.78 % 12.88 % Tangible Common Equity / Tangible Assets(1) 6.73 % 6.76 % 7.28 % 7.19 % 7.43 % Tangible Book Value Per Share(1) $16.87 $17.03 $18.62 $18.61 $19.22 NPLs / Loans (Excl. TDRs)(3) 0.36 % 0.33 % 0.34 % 0.43 % 0.43 % Allowance for Credit Losses / Loans (Excl. HFS) 0.93 0.90 0.88 0.88 0.86 ACL + FV Discount on Acquired Lns/ Loans (Excl. HFS) 1.28 1.20 1.12 1.10 1.05 NCOs / Average Loans 0.01 0.04 0.02 0.01 0.03 Asset Quality Profitability Capital For the Quarter Ended,
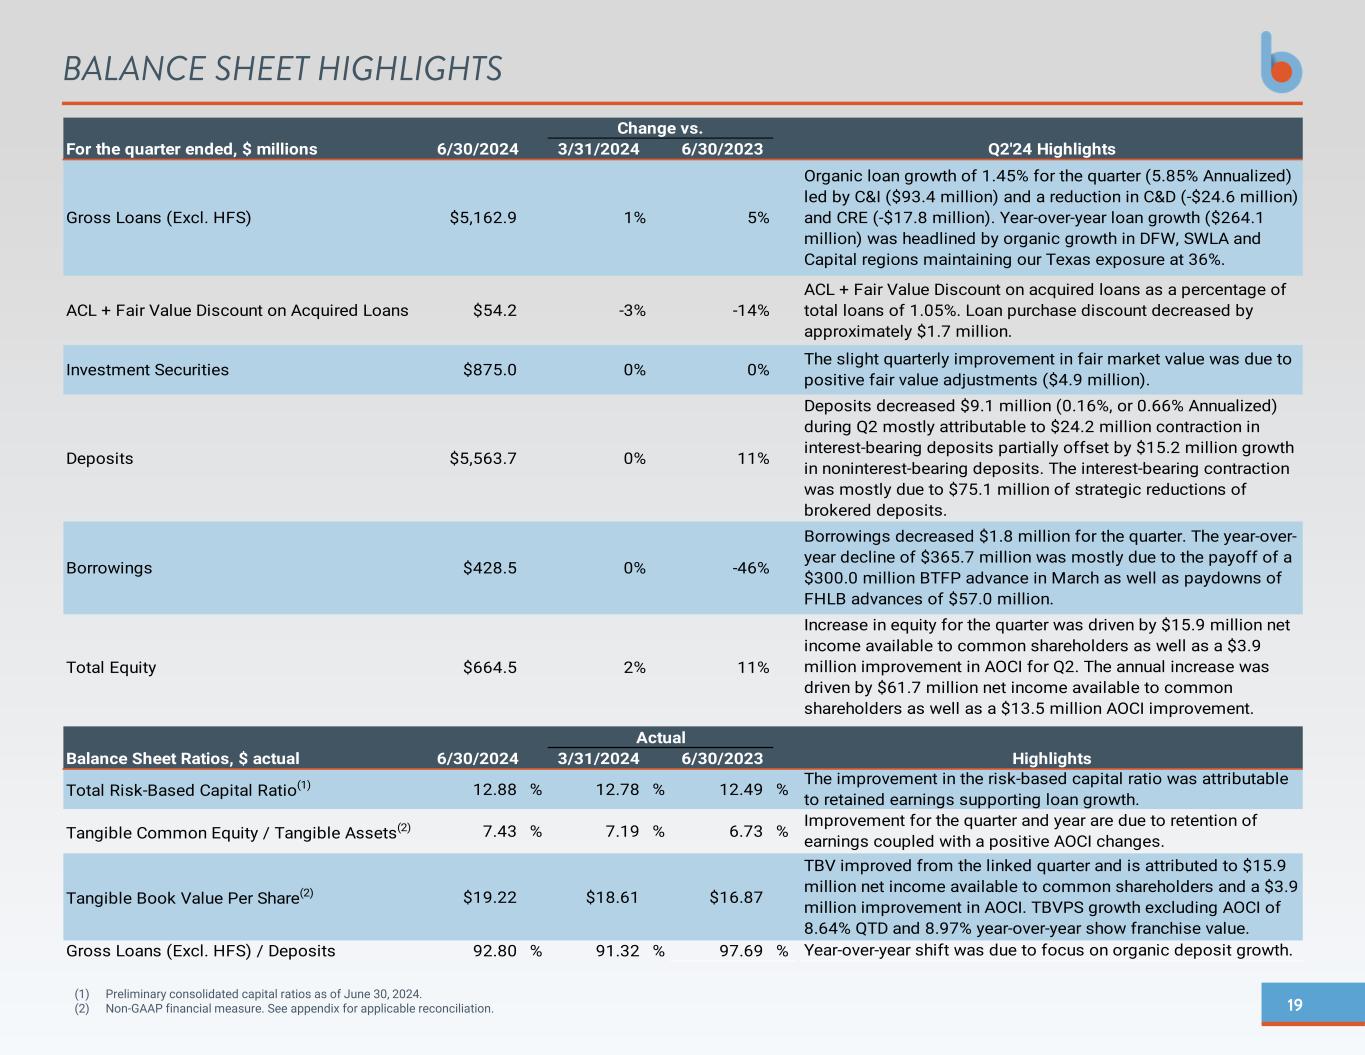
19 BALANCE SHEET HIGHLIGHTS (1) Preliminary consolidated capital ratios as of June 30, 2024. (2) Non-GAAP financial measure. See appendix for applicable reconciliation. For the quarter ended, $ millions 6/30/2024 3/31/2024 6/30/2023 Gross Loans (Excl. HFS) $5,162.9 1% 5% ACL + Fair Value Discount on Acquired Loans $54.2 -3% -14% Investment Securities $875.0 0% 0% Deposits $5,563.7 0% 11% Borrowings $428.5 0% -46% Total Equity $664.5 2% 11% Balance Sheet Ratios, $ actual 6/30/2024 3/31/2024 6/30/2023 Total Risk-Based Capital Ratio(1) 12.88 % 12.78 % 12.49 % Tangible Common Equity / Tangible Assets(2) 7.43 % 7.19 % 6.73 % Tangible Book Value Per Share(2) $19.22 $18.61 $16.87 Gross Loans (Excl. HFS) / Deposits 92.80 % 91.32 % 97.69 % Year-over-year shift was due to focus on organic deposit growth. Borrowings decreased $1.8 million for the quarter. The year-over- year decline of $365.7 million was mostly due to the payoff of a $300.0 million BTFP advance in March as well as paydowns of FHLB advances of $57.0 million. Increase in equity for the quarter was driven by $15.9 million net income available to common shareholders as well as a $3.9 million improvement in AOCI for Q2. The annual increase was driven by $61.7 million net income available to common shareholders as well as a $13.5 million AOCI improvement. Highlights Improvement for the quarter and year are due to retention of earnings coupled with a positive AOCI changes. TBV improved from the linked quarter and is attributed to $15.9 million net income available to common shareholders and a $3.9 million improvement in AOCI. TBVPS growth excluding AOCI of 8.64% QTD and 8.97% year-over-year show franchise value. The improvement in the risk-based capital ratio was attributable to retained earnings supporting loan growth. Actual Change vs. Q2'24 Highlights Organic loan growth of 1.45% for the quarter (5.85% Annualized) led by C&I ($93.4 million) and a reduction in C&D (-$24.6 million) and CRE (-$17.8 million). Year-over-year loan growth ($264.1 million) was headlined by organic growth in DFW, SWLA and Capital regions maintaining our Texas exposure at 36%. Deposits decreased $9.1 million (0.16%, or 0.66% Annualized) during Q2 mostly attributable to $24.2 million contraction in interest-bearing deposits partially offset by $15.2 million growth in noninterest-bearing deposits. The interest-bearing contraction was mostly due to $75.1 million of strategic reductions of brokered deposits. ACL + Fair Value Discount on acquired loans as a percentage of total loans of 1.05%. Loan purchase discount decreased by approximately $1.7 million. The slight quarterly improvement in fair market value was due to positive fair value adjustments ($4.9 million).
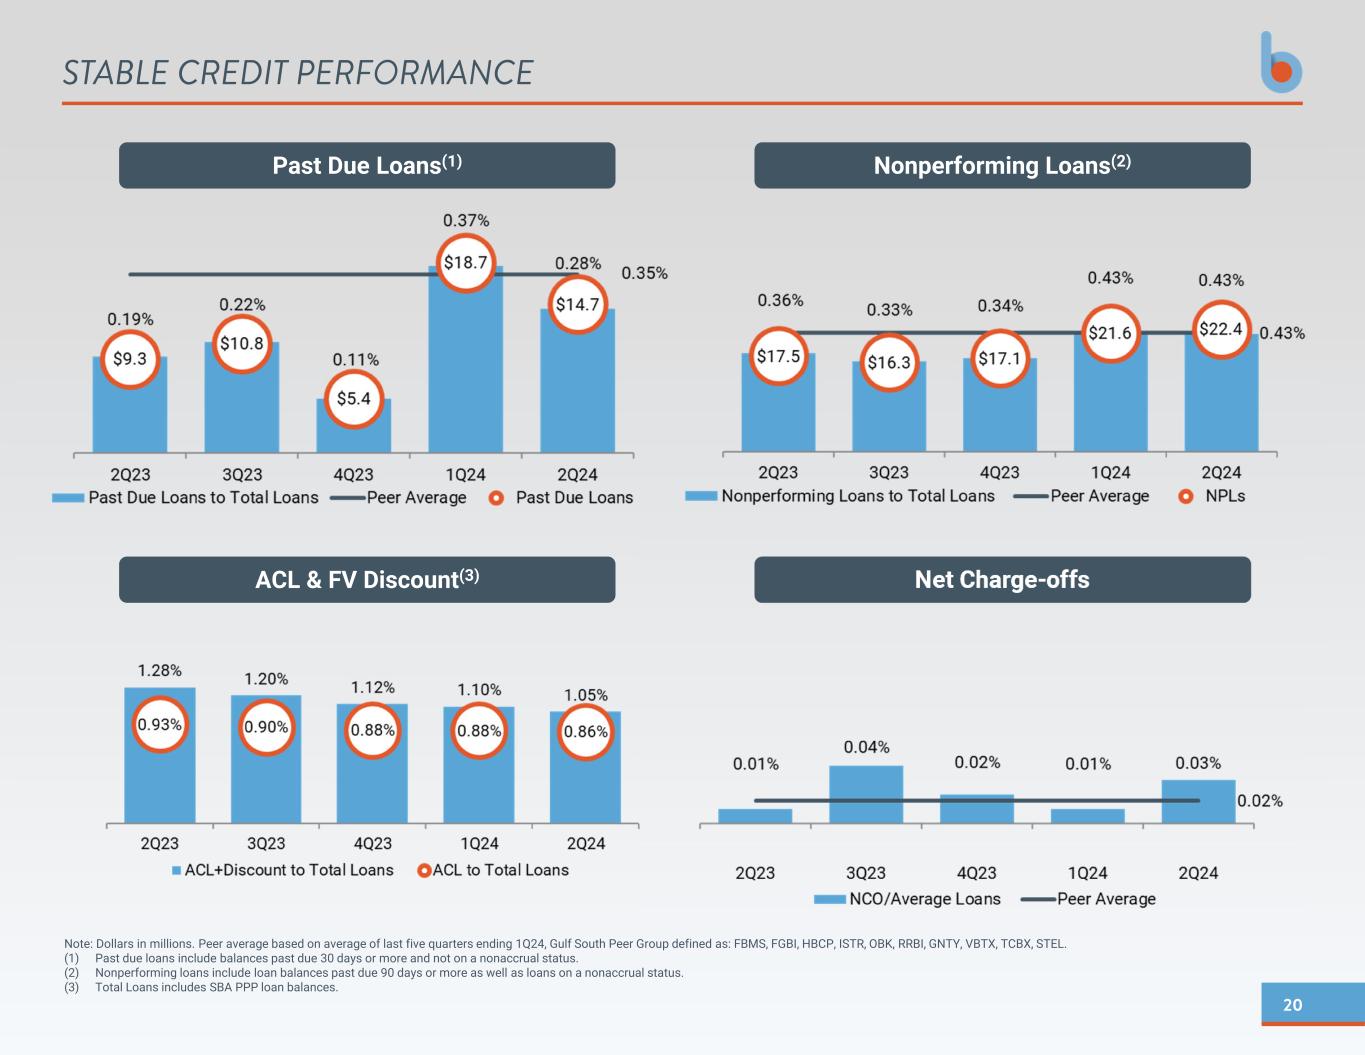
20 ACL & FV Discount(3) Past Due Loans(1) Note: Dollars in millions. Peer average based on average of last five quarters ending 1Q24, Gulf South Peer Group defined as: FBMS, FGBI, HBCP, ISTR, OBK, RRBI, GNTY, VBTX, TCBX, STEL. (1) Past due loans include balances past due 30 days or more and not on a nonaccrual status. (2) Nonperforming loans include loan balances past due 90 days or more as well as loans on a nonaccrual status. (3) Total Loans includes SBA PPP loan balances. STABLE CREDIT PERFORMANCE Nonperforming Loans(2) Net Charge-offs
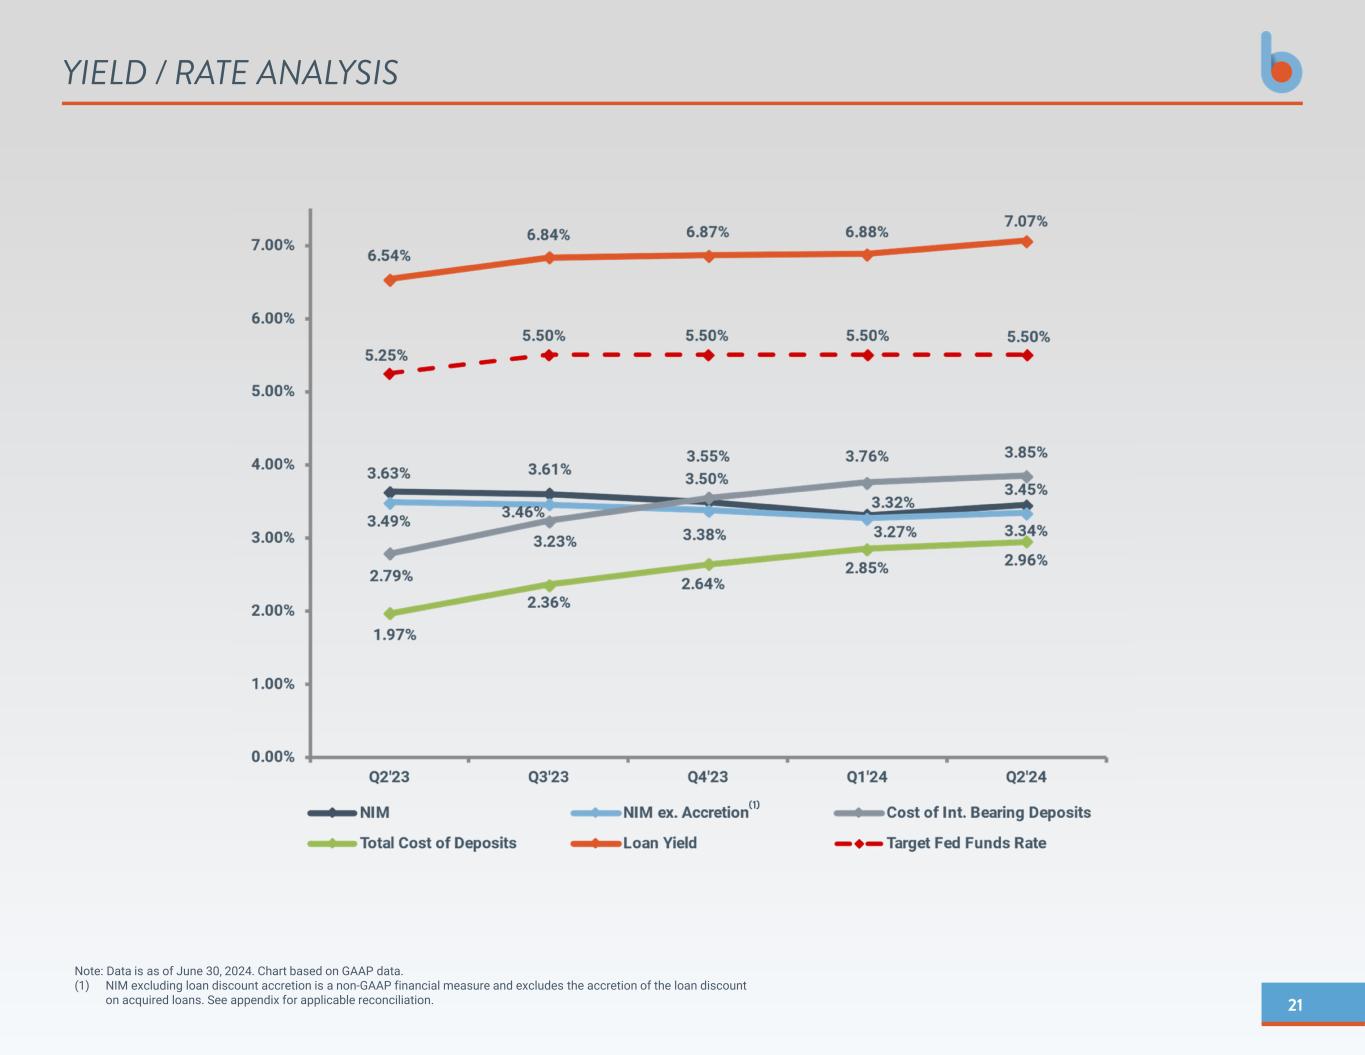
21 Note: Data is as of June 30, 2024. Chart based on GAAP data. (1) NIM excluding loan discount accretion is a non-GAAP financial measure and excludes the accretion of the loan discount on acquired loans. See appendix for applicable reconciliation. YIELD / RATE ANALYSIS (1)
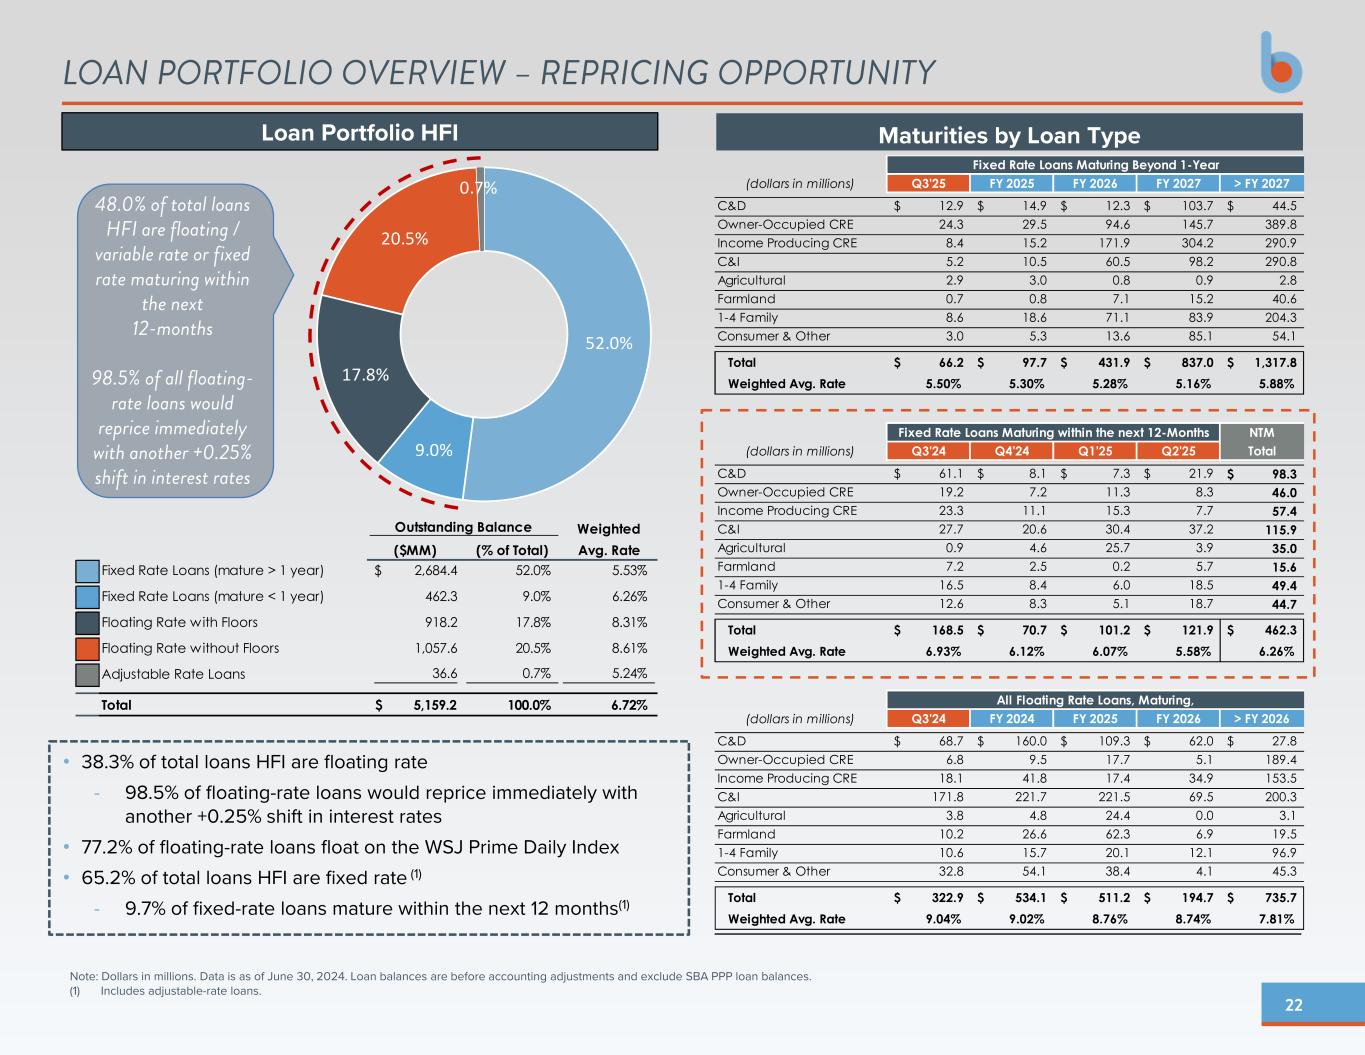
22 Loan Portfolio HFI Note: Dollars in millions. Data is as of June 30, 2024. Loan balances are before accounting adjustments and exclude SBA PPP loan balances. (1) Includes adjustable-rate loans. • 38.3% of total loans HFI are floating rate - 98.5% of floating-rate loans would reprice immediately with another +0.25% shift in interest rates • 77.2% of floating-rate loans float on the WSJ Prime Daily Index • 65.2% of total loans HFI are fixed rate (1) - 9.7% of fixed-rate loans mature within the next 12 months(1) LOAN PORTFOLIO OVERVIEW – REPRICING OPPORTUNITY Maturities by Loan Type Outstanding Balance Weighted ($MM) (% of Total) Avg. Rate Fixed Rate Loans (mature > 1 year) 2,684.4$ 52.0% 5.53% Fixed Rate Loans (mature < 1 year) 462.3 9.0% 6.26% Floating Rate with Floors 918.2 17.8% 8.31% Floating Rate without Floors 1,057.6 20.5% 8.61% Adjustable Rate Loans 36.6 0.7% 5.24% Total 5,159.2$ 100.0% 6.72% 52.0% 9.0% 17.8% 20.5% 0.7% 48.0% of total loans HFI are floating / variable rate or fixed rate maturing within the next 12-months 98.5% of all floating- rate loans would reprice immediately with another +0.25% shift in interest rates Fixed Rate Loans Maturing Beyond 1-Year (dollars in millions) Q3'25 FY 2025 FY 2026 FY 2027 > FY 2027 C&D 12.9$ 14.9$ 12.3$ 103.7$ 44.5$ Owner-Occupied CRE 24.3 29.5 94.6 145.7 389.8 Income Producing CRE 8.4 15.2 171.9 304.2 290.9 C&I 5.2 10.5 60.5 98.2 290.8 Agricultural 2.9 3.0 0.8 0.9 2.8 Farmland 0.7 0.8 7.1 15.2 40.6 1-4 Family 8.6 18.6 71.1 83.9 204.3 Consumer & Other 3.0 5.3 13.6 85.1 54.1 Total 66.2$ 97.7$ 431.9$ 837.0$ 1,317.8$ Weighted Avg. Rate 5.50% 5.30% 5.28% 5.16% 5.88% Fixed Rate Loans Maturing within the next 12-Months NTM (dollars in millions) Q3'24 Q4'24 Q1'25 Q2'25 Total C&D 61.1$ 8.1$ 7.3$ 21.9$ 98.3$ Owner-Occupied CRE 19.2 7.2 11.3 8.3 46.0 Income Producing CRE 23.3 11.1 15.3 7.7 57.4 C&I 27.7 20.6 30.4 37.2 115.9 Agricultural 0.9 4.6 25.7 3.9 35.0 Farmland 7.2 2.5 0.2 5.7 15.6 1-4 Family 16.5 8.4 6.0 18.5 49.4 Consumer & Other 12.6 8.3 5.1 18.7 44.7 Total 168.5$ 70.7$ 101.2$ 121.9$ 462.3$ Weighted Avg. Rate 6.93% 6.12% 6.07% 5.58% 6.26% All Floating Rate Loans, Maturing, (dollars in millions) Q3'24 FY 2024 FY 2025 FY 2026 > FY 2026 C&D 68.7$ 160.0$ 109.3$ 62.0$ 27.8$ Owner-Occupied CRE 6.8 9.5 17.7 5.1 189.4 Income Producing CRE 18.1 41.8 17.4 34.9 153.5 C&I 171.8 221.7 221.5 69.5 200.3 Agricultural 3.8 4.8 24.4 0.0 3.1 Farmland 10.2 26.6 62.3 6.9 19.5 1-4 Family 10.6 15.7 20.1 12.1 96.9 Consumer & Other 32.8 54.1 38.4 4.1 45.3 Total 322.9$ 534.1$ 511.2$ 194.7$ 735.7$ Weighted Avg. Rate 9.04% 9.02% 8.76% 8.74% 7.81%

23 Loan Portfolio
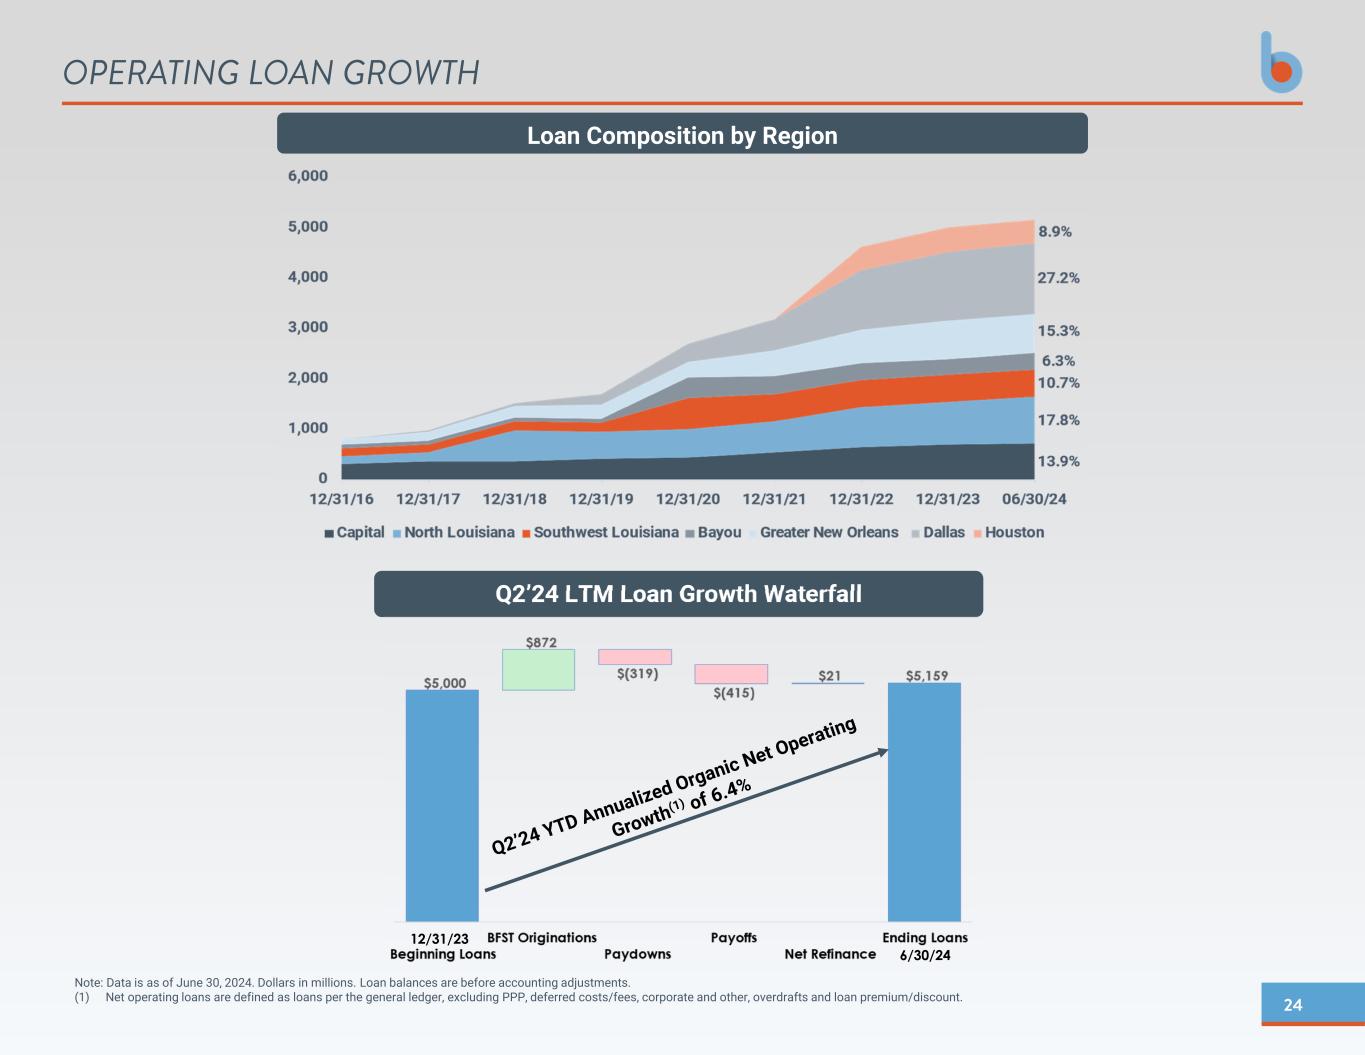
24 Note: Data is as of June 30, 2024. Dollars in millions. Loan balances are before accounting adjustments. (1) Net operating loans are defined as loans per the general ledger, excluding PPP, deferred costs/fees, corporate and other, overdrafts and loan premium/discount. OPERATING LOAN GROWTH Loan Composition by Region Q2’24 LTM Loan Growth Waterfall 12/31/23 6/30/24
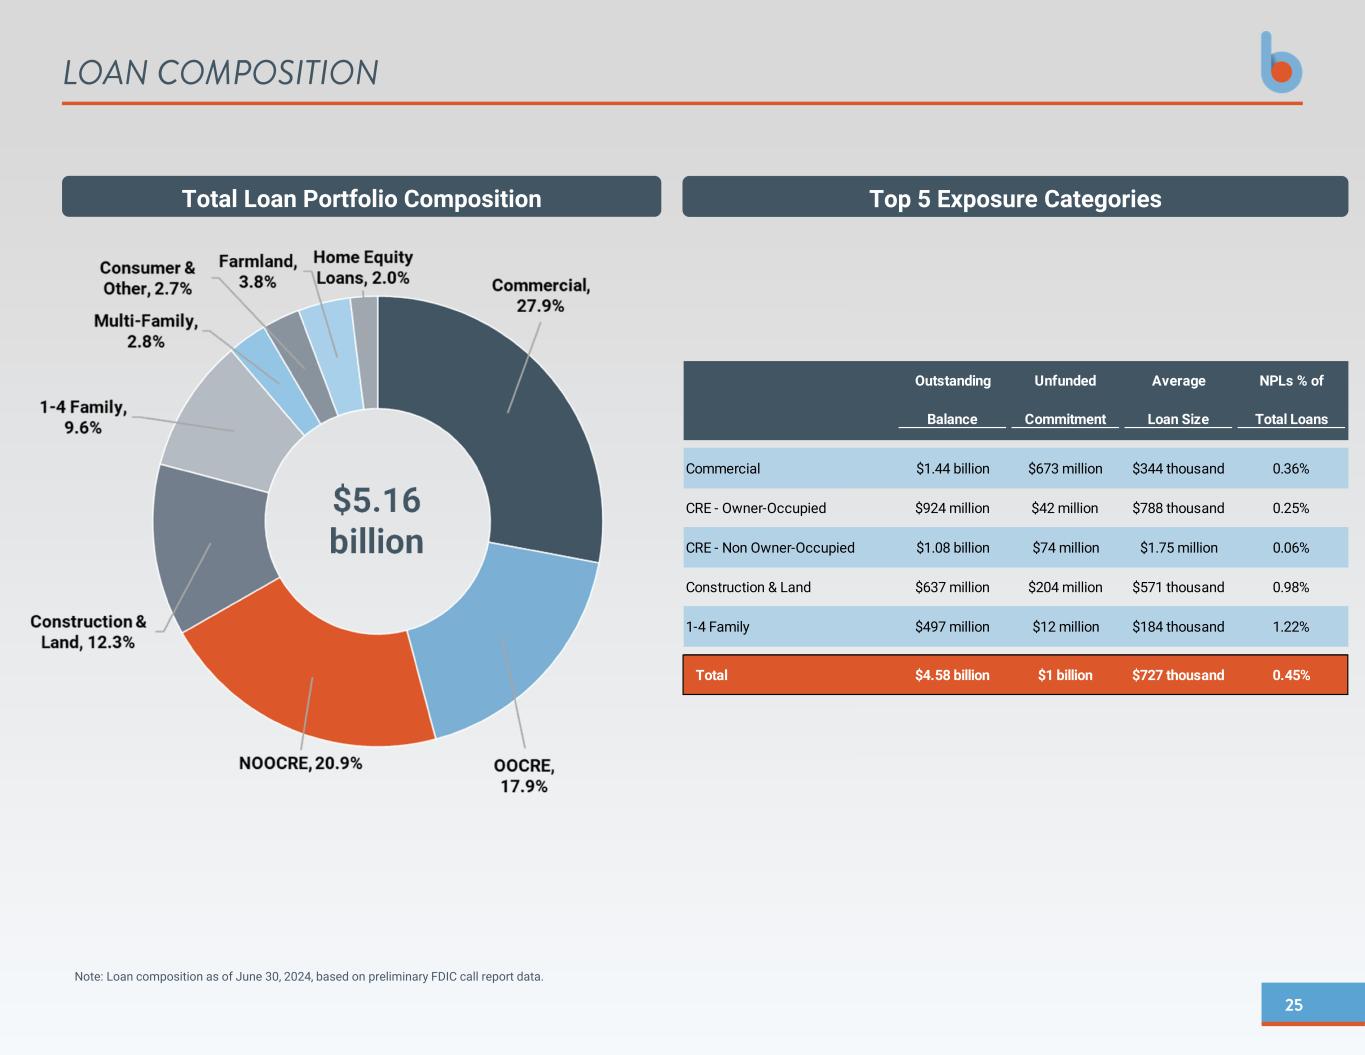
25 Note: Loan composition as of June 30, 2024, based on preliminary FDIC call report data. LOAN COMPOSITION $5.16 billion Total Loan Portfolio Composition Top 5 Exposure Categories Outstanding Unfunded Average NPLs % of Balance Commitment Loan Size Total Loans Commercial $1.44 billion $673 million $344 thousand 0.36% CRE - Owner-Occupied $924 million $42 million $788 thousand 0.25% CRE - Non Owner-Occupied $1.08 billion $74 million $1.75 million 0.06% Construction & Land $637 million $204 million $571 thousand 0.98% 1-4 Family $497 million $12 million $184 thousand 1.22% Total $4.58 billion $1 billion $727 thousand 0.45%
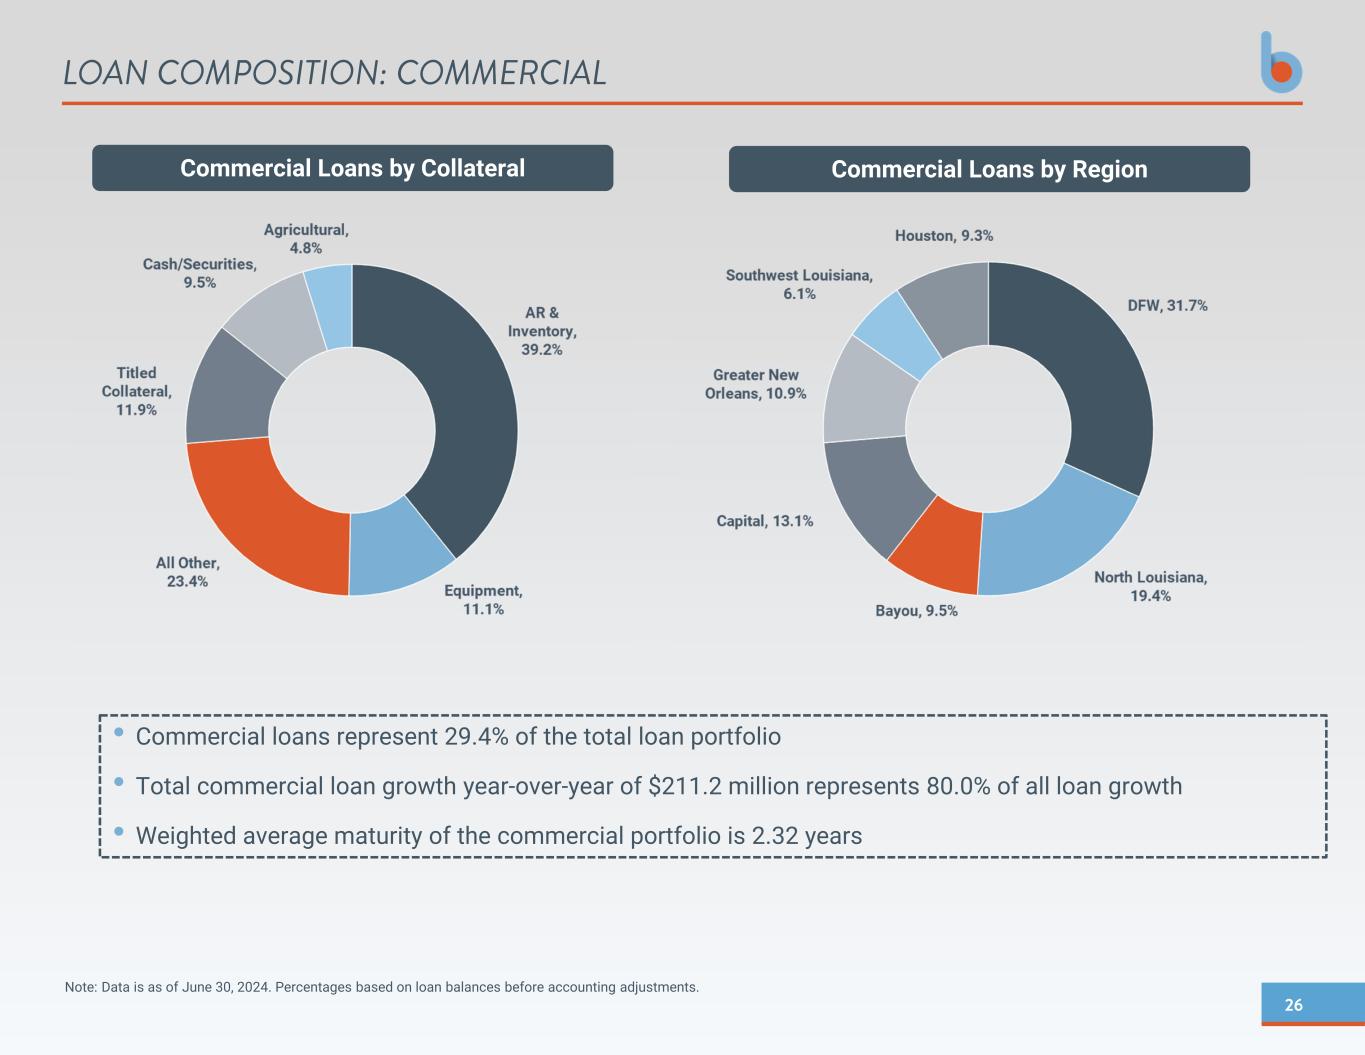
26 LOAN COMPOSITION: COMMERCIAL Note: Data is as of June 30, 2024. Percentages based on loan balances before accounting adjustments. • Commercial loans represent 29.4% of the total loan portfolio • Total commercial loan growth year-over-year of $211.2 million represents 80.0% of all loan growth • Weighted average maturity of the commercial portfolio is 2.32 years Commercial Loans by Collateral Commercial Loans by Region
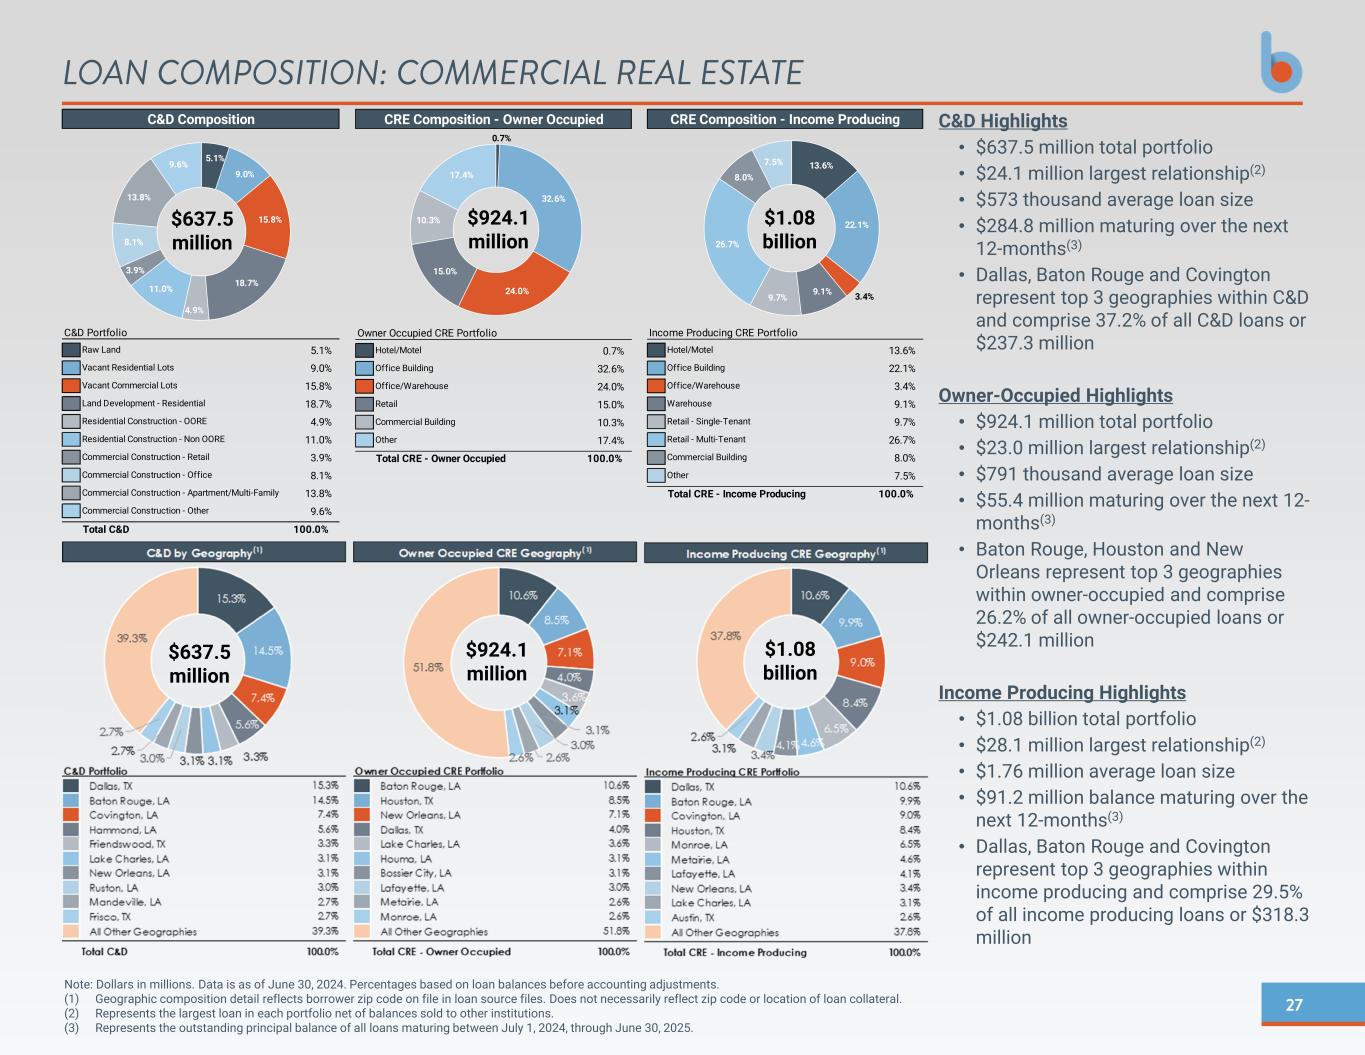
27 Note: Dollars in millions. Data is as of June 30, 2024. Percentages based on loan balances before accounting adjustments. (1) Geographic composition detail reflects borrower zip code on file in loan source files. Does not necessarily reflect zip code or location of loan collateral. (2) Represents the largest loan in each portfolio net of balances sold to other institutions. (3) Represents the outstanding principal balance of all loans maturing between July 1, 2024, through June 30, 2025. LOAN COMPOSITION: COMMERCIAL REAL ESTATE C&D Highlights • $637.5 million total portfolio • $24.1 million largest relationship(2) • $573 thousand average loan size • $284.8 million maturing over the next 12-months(3) • Dallas, Baton Rouge and Covington represent top 3 geographies within C&D and comprise 37.2% of all C&D loans or $237.3 million Owner-Occupied Highlights • $924.1 million total portfolio • $23.0 million largest relationship(2) • $791 thousand average loan size • $55.4 million maturing over the next 12- months(3) • Baton Rouge, Houston and New Orleans represent top 3 geographies within owner-occupied and comprise 26.2% of all owner-occupied loans or $242.1 million Income Producing Highlights • $1.08 billion total portfolio • $28.1 million largest relationship(2) • $1.76 million average loan size • $91.2 million balance maturing over the next 12-months(3) • Dallas, Baton Rouge and Covington represent top 3 geographies within income producing and comprise 29.5% of all income producing loans or $318.3 million $637.5 million $924.1 million $1.08 billion $637.5 million $924.1 million $1.08 billion C&D Composition C&D Portfolio Raw Land 5.1% Vacant Residential Lots 9.0% Vacant Commercial Lots 15.8% Land Development - Residential 18.7% Residential Construction - OORE 4.9% Residential Construction - Non OORE 11.0% Commercial Construction - Retail 3.9% Commercial Construction - Office 8.1% Commercial Construction - Apartment/Multi-Family 13.8% Commercial Construction - Other 9.6% Total C&D 100.0% 5.1% 9.0% 15.8% 18.7% 4.9% 11.0% 3.9% 8.1% 13.8% 9.6% CRE Composition - Owner Occupied Owner Occupied CRE Portfolio Hotel/Motel 0.7% Office Building 32.6% Office/Warehouse 24.0% Retail 15.0% Commercial Building 10.3% Other 17.4% Total CRE - Owner Occupied 100.0% 0.7% 32.6% 24.0% 15.0% 10.3% 17.4% CRE Composition - Income Producing Income Producing CRE Portfolio Hotel/Motel 13.6% Office Building 22.1% Office/Warehouse 3.4% Warehouse 9.1% Retail - Single-Tenant 9.7% Retail - Multi-Tenant 26.7% Commercial Building 8.0% Other 7.5% Total CRE - Income Producing 100.0% 13.6% 22.1% 3.4% 9.1% 9.7% 26.7% 8.0% 7.5%
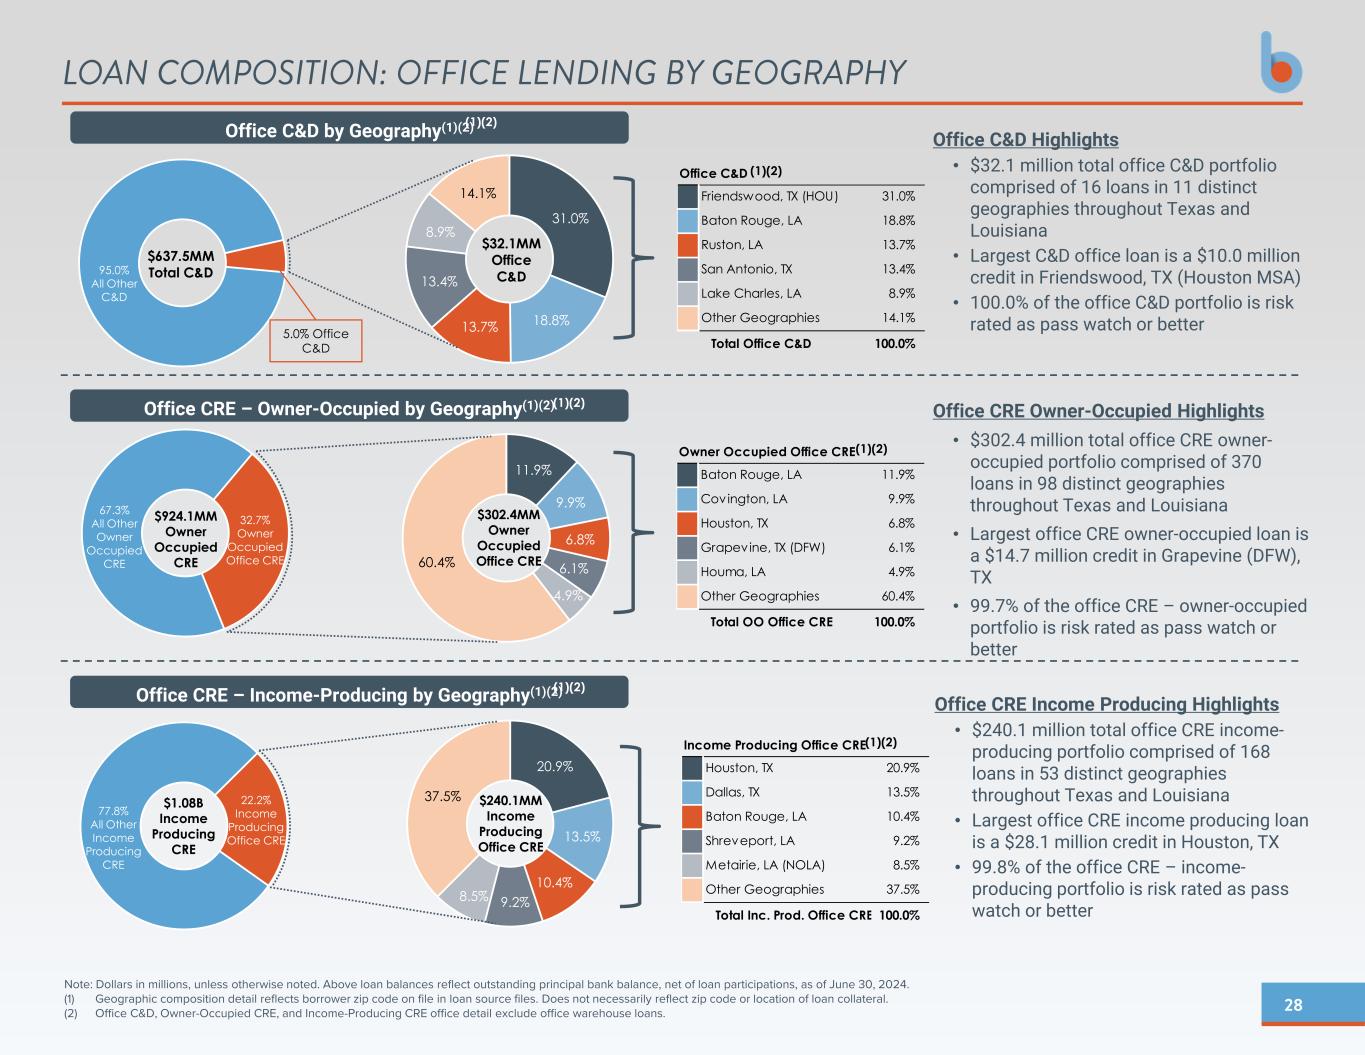
28 Office CRE – Income-Producing by Geography(1)(2) Office CRE – Owner-Occupied by Geography(1)(2) Office C&D by Geography(1)(2) Note: Dollars in millions, unless otherwise noted. Above loan balances reflect outstanding principal bank balance, net of loan participations, as of June 30, 2024. (1) Geographic composition detail reflects borrower zip code on file in loan source files. Does not necessarily reflect zip code or location of loan collateral. (2) Office C&D, Owner-Occupied CRE, and Income-Producing CRE office detail exclude office warehouse loans. LOAN COMPOSITION: OFFICE LENDING BY GEOGRAPHY 31.0% 18.8% 13.7% 13.4% 8.9% 14.1% Office C&D Friendswood, TX (HOU) 31.0% Baton Rouge, LA 18.8% Ruston, LA 13.7% San Antonio, TX 13.4% Lake Charles, LA 8.9% Other Geographies 14.1% Total Office C&D 100.0% $637.5MM Total C&D $32.1MM Office C&D 11.9% 9.9% 6.8% 6.1% 4.9% 60.4% Owner Occupied Office CRE Baton Rouge, LA 11.9% Covington, LA 9.9% Houston, TX 6.8% Grapevine, TX (DFW) 6.1% Houma, LA 4.9% Other Geographies 60.4% Total OO Office CRE 100.0% $302.4MM Owner Occupied Office CRE $924.1MM Owner Occupied CRE 20.9% 13.5% 10.4% 9.2% 8.5% 37.5% $1.08B Income Producing CRE $240.1MM Income Producing Office CRE Income Producing Office CRE Houston, TX 20.9% Dallas, TX 13.5% Baton Rouge, LA 10.4% Shreveport, LA 9.2% Metairie, LA (NOLA) 8.5% Other Geographies 37.5% Total Inc. Prod. Office CRE 100.0% 22.2% Income Producing Office CRE 77.8% All Other Income Producing CRE 67.3% All Other Owner Occupied CRE 32.7% Owner Occupied Office CRE 95.0% All Other C&D 5.0% Office C&D Office C&D Highlights • $32.1 million total office C&D portfolio comprised of 16 loans in 11 distinct geographies throughout Texas and Louisiana • Largest C&D office loan is a $10.0 million credit in Friendswood, TX (Houston MSA) • 100.0% of the office C&D portfolio is risk rated as pass watch or better Office CRE Owner-Occupied Highlights • $302.4 million total office CRE owner- occupied portfolio comprised of 370 loans in 98 distinct geographies throughout Texas and Louisiana • Largest office CRE owner-occupied loan is a $14.7 million credit in Grapevine (DFW), TX • 99.7% of the office CRE – owner-occupied portfolio is risk rated as pass watch or better Office CRE Income Producing Highlights • $240.1 million total office CRE income- producing portfolio comprised of 168 loans in 53 distinct geographies throughout Texas and Louisiana • Largest office CRE income producing loan is a $28.1 million credit in Houston, TX • 99.8% of the office CRE – income- producing portfolio is risk rated as pass watch or better (1)(2) (1)(2) (1)(2) (1)(2) (1)(2) (1)(2)
29 APPENDIX
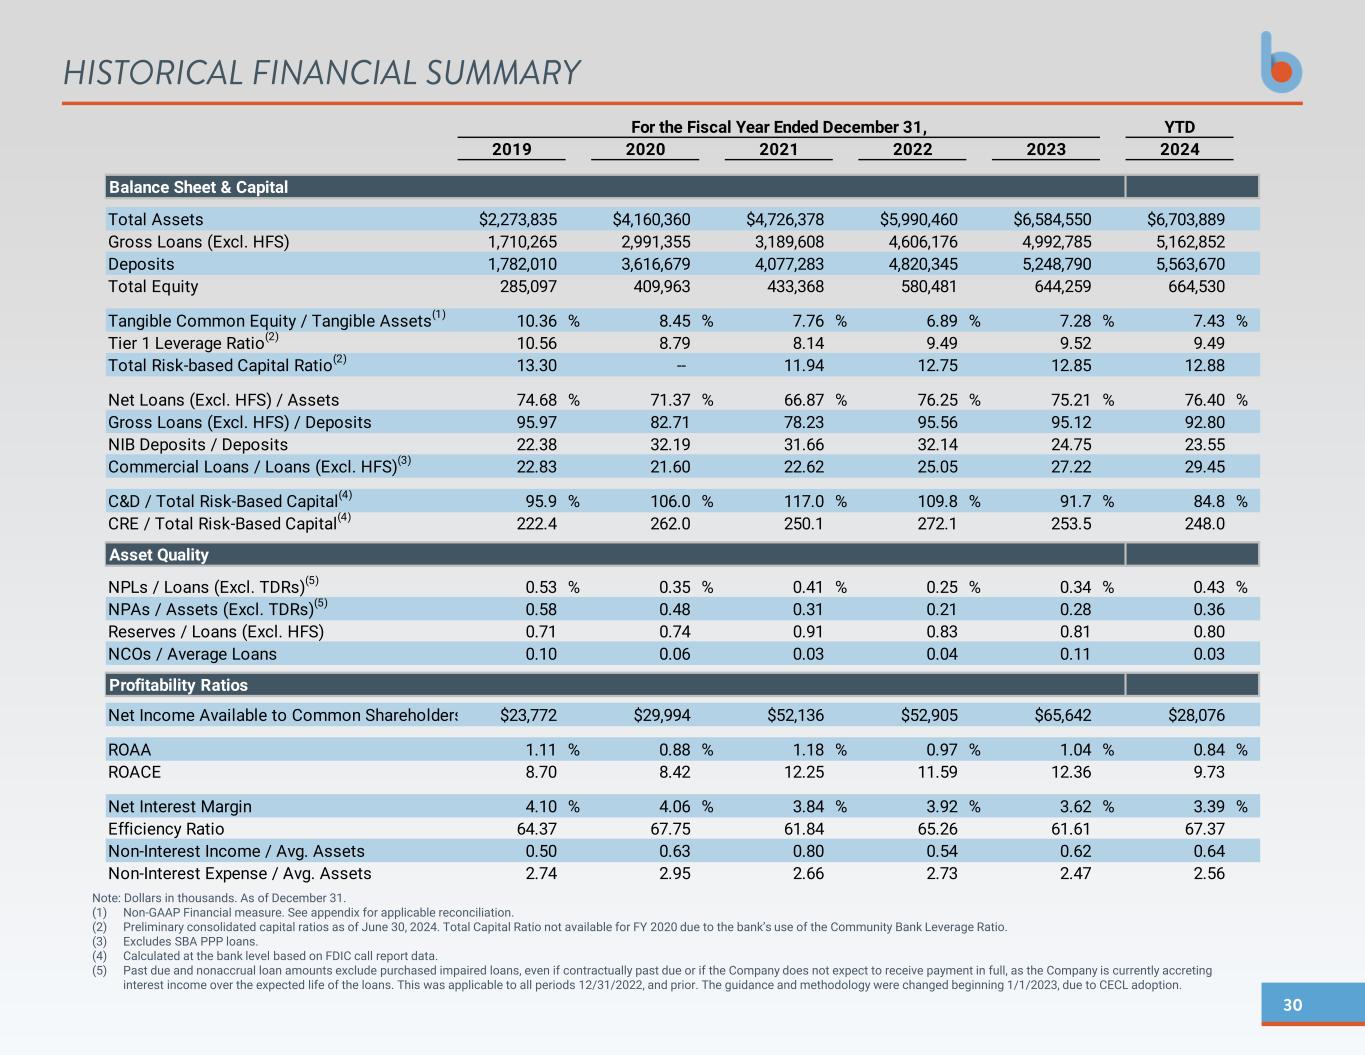
30 Note: Dollars in thousands. As of December 31. (1) Non-GAAP Financial measure. See appendix for applicable reconciliation. (2) Preliminary consolidated capital ratios as of June 30, 2024. Total Capital Ratio not available for FY 2020 due to the bank’s use of the Community Bank Leverage Ratio. (3) Excludes SBA PPP loans. (4) Calculated at the bank level based on FDIC call report data. (5) Past due and nonaccrual loan amounts exclude purchased impaired loans, even if contractually past due or if the Company does not expect to receive payment in full, as the Company is currently accreting interest income over the expected life of the loans. This was applicable to all periods 12/31/2022, and prior. The guidance and methodology were changed beginning 1/1/2023, due to CECL adoption. HISTORICAL FINANCIAL SUMMARY YTD 2019 2020 2021 2022 2023 2024 Balance Sheet & Capital Total Assets $2,273,835 $4,160,360 $4,726,378 $5,990,460 $6,584,550 $6,703,889 Gross Loans (Excl. HFS) 1,710,265 2,991,355 3,189,608 4,606,176 4,992,785 5,162,852 Deposits 1,782,010 3,616,679 4,077,283 4,820,345 5,248,790 5,563,670 Total Equity 285,097 409,963 433,368 580,481 644,259 664,530 Tangible Common Equity / Tangible Assets(1) 10.36 % 8.45 % 7.76 % 6.89 % 7.28 % 7.43 % Tier 1 Leverage Ratio(2) 10.56 8.79 8.14 9.49 9.52 9.49 Total Risk-based Capital Ratio(2) 13.30 -- 11.94 12.75 12.85 12.88 Net Loans (Excl. HFS) / Assets 74.68 % 71.37 % 66.87 % 76.25 % 75.21 % 76.40 % Gross Loans (Excl. HFS) / Deposits 95.97 82.71 78.23 95.56 95.12 92.80 NIB Deposits / Deposits 22.38 32.19 31.66 32.14 24.75 23.55 Commercial Loans / Loans (Excl. HFS)(3) 22.83 21.60 22.62 25.05 27.22 29.45 C&D / Total Risk-Based Capital(4) 95.9 % 106.0 % 117.0 % 109.8 % 91.7 % 84.8 % CRE / Total Risk-Based Capital(4) 222.4 262.0 250.1 272.1 253.5 248.0 Asset Quality NPLs / Loans (Excl. TDRs)(5) 0.53 % 0.35 % 0.41 % 0.25 % 0.34 % 0.43 % NPAs / Assets (Excl. TDRs)(5) 0.58 0.48 0.31 0.21 0.28 0.36 Reserves / Loans (Excl. HFS) 0.71 0.74 0.91 0.83 0.81 0.80 NCOs / Average Loans 0.10 0.06 0.03 0.04 0.11 0.03 Profitability Ratios Net Income Available to Common Shareholders $23,772 $29,994 $52,136 $52,905 $65,642 $28,076 ROAA 1.11 % 0.88 % 1.18 % 0.97 % 1.04 % 0.84 % ROACE 8.70 8.42 12.25 11.59 12.36 9.73 Net Interest Margin 4.10 % 4.06 % 3.84 % 3.92 % 3.62 % 3.39 % Efficiency Ratio 64.37 67.75 61.84 65.26 61.61 67.37 Non-Interest Income / Avg. Assets 0.50 0.63 0.80 0.54 0.62 0.64 Non-Interest Expense / Avg. Assets 2.74 2.95 2.66 2.73 2.47 2.56 For the Fiscal Year Ended December 31,
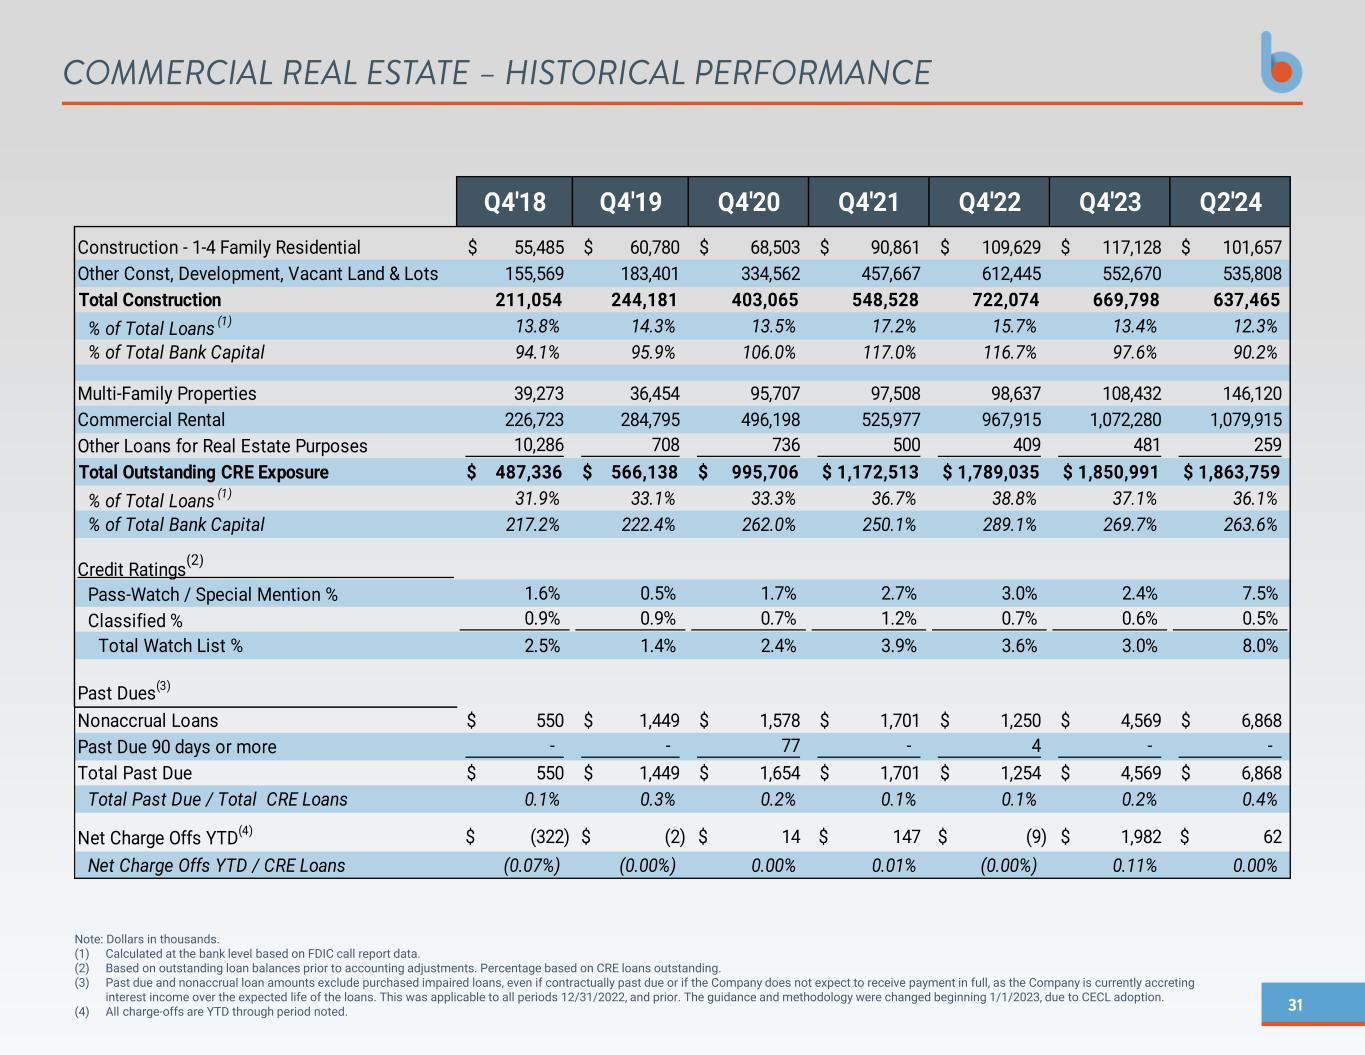
31 COMMERCIAL REAL ESTATE – HISTORICAL PERFORMANCE Note: Dollars in thousands. (1) Calculated at the bank level based on FDIC call report data. (2) Based on outstanding loan balances prior to accounting adjustments. Percentage based on CRE loans outstanding. (3) Past due and nonaccrual loan amounts exclude purchased impaired loans, even if contractually past due or if the Company does not expect to receive payment in full, as the Company is currently accreting interest income over the expected life of the loans. This was applicable to all periods 12/31/2022, and prior. The guidance and methodology were changed beginning 1/1/2023, due to CECL adoption. (4) All charge-offs are YTD through period noted. Q4'18 Q4'19 Q4'20 Q4'21 Q4'22 Q4'23 Q2'24 Construction - 1-4 Family Residential 55,485$ 60,780$ 68,503$ 90,861$ 109,629$ 117,128$ 101,657$ Other Const, Development, Vacant Land & Lots 155,569 183,401 334,562 457,667 612,445 552,670 535,808 Total Construction 211,054 244,181 403,065 548,528 722,074 669,798 637,465 % of Total Loans (1) 13.8% 14.3% 13.5% 17.2% 15.7% 13.4% 12.3% % of Total Bank Capital 94.1% 95.9% 106.0% 117.0% 116.7% 97.6% 90.2% Multi-Family Properties 39,273 36,454 95,707 97,508 98,637 108,432 146,120 Commercial Rental 226,723 284,795 496,198 525,977 967,915 1,072,280 1,079,915 Other Loans for Real Estate Purposes 10,286 708 736 500 409 481 259 Total Outstanding CRE Exposure 487,336$ 566,138$ 995,706$ 1,172,513$ 1,789,035$ 1,850,991$ 1,863,759$ % of Total Loans (1) 31.9% 33.1% 33.3% 36.7% 38.8% 37.1% 36.1% % of Total Bank Capital 217.2% 222.4% 262.0% 250.1% 289.1% 269.7% 263.6% Credit Ratings(2) Pass-Watch / Special Mention % 1.6% 0.5% 1.7% 2.7% 3.0% 2.4% 7.5% Classified % 0.9% 0.9% 0.7% 1.2% 0.7% 0.6% 0.5% Total Watch List % 2.5% 1.4% 2.4% 3.9% 3.6% 3.0% 8.0% Past Dues(3) Nonaccrual Loans 550$ 1,449$ 1,578$ 1,701$ 1,250$ 4,569$ 6,868$ Past Due 90 days or more - - 77 - 4 - - Total Past Due 550$ 1,449$ 1,654$ 1,701$ 1,254$ 4,569$ 6,868$ Total Past Due / Total CRE Loans 0.1% 0.3% 0.2% 0.1% 0.1% 0.2% 0.4% Net Charge Offs YTD(4) (322)$ (2)$ 14$ 147$ (9)$ 1,982$ 62$ Net Charge Offs YTD / CRE Loans (0.07%) (0.00%) 0.00% 0.01% (0.00%) 0.11% 0.00%
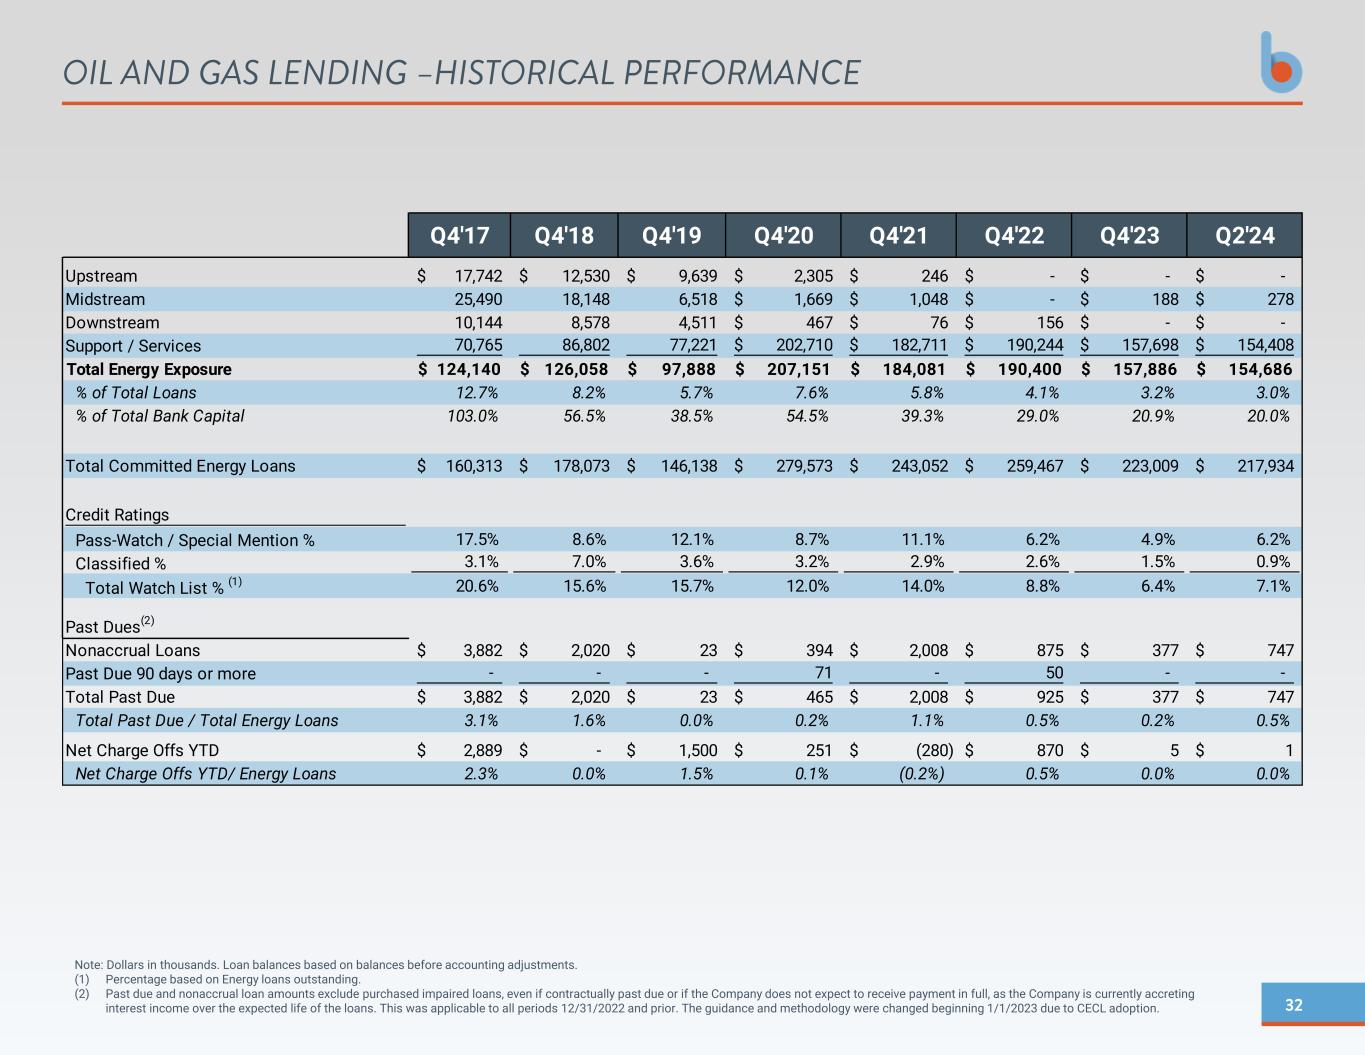
32 Note: Dollars in thousands. Loan balances based on balances before accounting adjustments. (1) Percentage based on Energy loans outstanding. (2) Past due and nonaccrual loan amounts exclude purchased impaired loans, even if contractually past due or if the Company does not expect to receive payment in full, as the Company is currently accreting interest income over the expected life of the loans. This was applicable to all periods 12/31/2022 and prior. The guidance and methodology were changed beginning 1/1/2023 due to CECL adoption. OIL AND GAS LENDING –HISTORICAL PERFORMANCE Q4'17 Q4'18 Q4'19 Q4'20 Q4'21 Q4'22 Q4'23 Q2'24 Upstream 17,742$ 12,530$ 9,639$ 2,305$ 246$ -$ -$ -$ Midstream 25,490 18,148 6,518 1,669$ 1,048$ -$ 188$ 278$ Downstream 10,144 8,578 4,511 467$ 76$ 156$ -$ -$ Support / Services 70,765 86,802 77,221 202,710$ 182,711$ 190,244$ 157,698$ 154,408$ Total Energy Exposure 124,140$ 126,058$ 97,888$ 207,151$ 184,081$ 190,400$ 157,886$ 154,686$ % of Total Loans 12.7% 8.2% 5.7% 7.6% 5.8% 4.1% 3.2% 3.0% % of Total Bank Capital 103.0% 56.5% 38.5% 54.5% 39.3% 29.0% 20.9% 20.0% Total Committed Energy Loans 160,313$ 178,073$ 146,138$ 279,573$ 243,052$ 259,467$ 223,009$ 217,934$ Credit Ratings Pass-Watch / Special Mention % 17.5% 8.6% 12.1% 8.7% 11.1% 6.2% 4.9% 6.2% Classified % 3.1% 7.0% 3.6% 3.2% 2.9% 2.6% 1.5% 0.9% Total Watch List % (1) 20.6% 15.6% 15.7% 12.0% 14.0% 8.8% 6.4% 7.1% Past Dues(2) Nonaccrual Loans 3,882$ 2,020$ 23$ 394$ 2,008$ 875$ 377$ 747$ Past Due 90 days or more - - - 71 - 50 - - Total Past Due 3,882$ 2,020$ 23$ 465$ 2,008$ 925$ 377$ 747$ Total Past Due / Total Energy Loans 3.1% 1.6% 0.0% 0.2% 1.1% 0.5% 0.2% 0.5% Net Charge Offs YTD 2,889$ -$ 1,500$ 251$ (280)$ 870$ 5$ 1$ Net Charge Offs YTD/ Energy Loans 2.3% 0.0% 1.5% 0.1% (0.2%) 0.5% 0.0% 0.0%
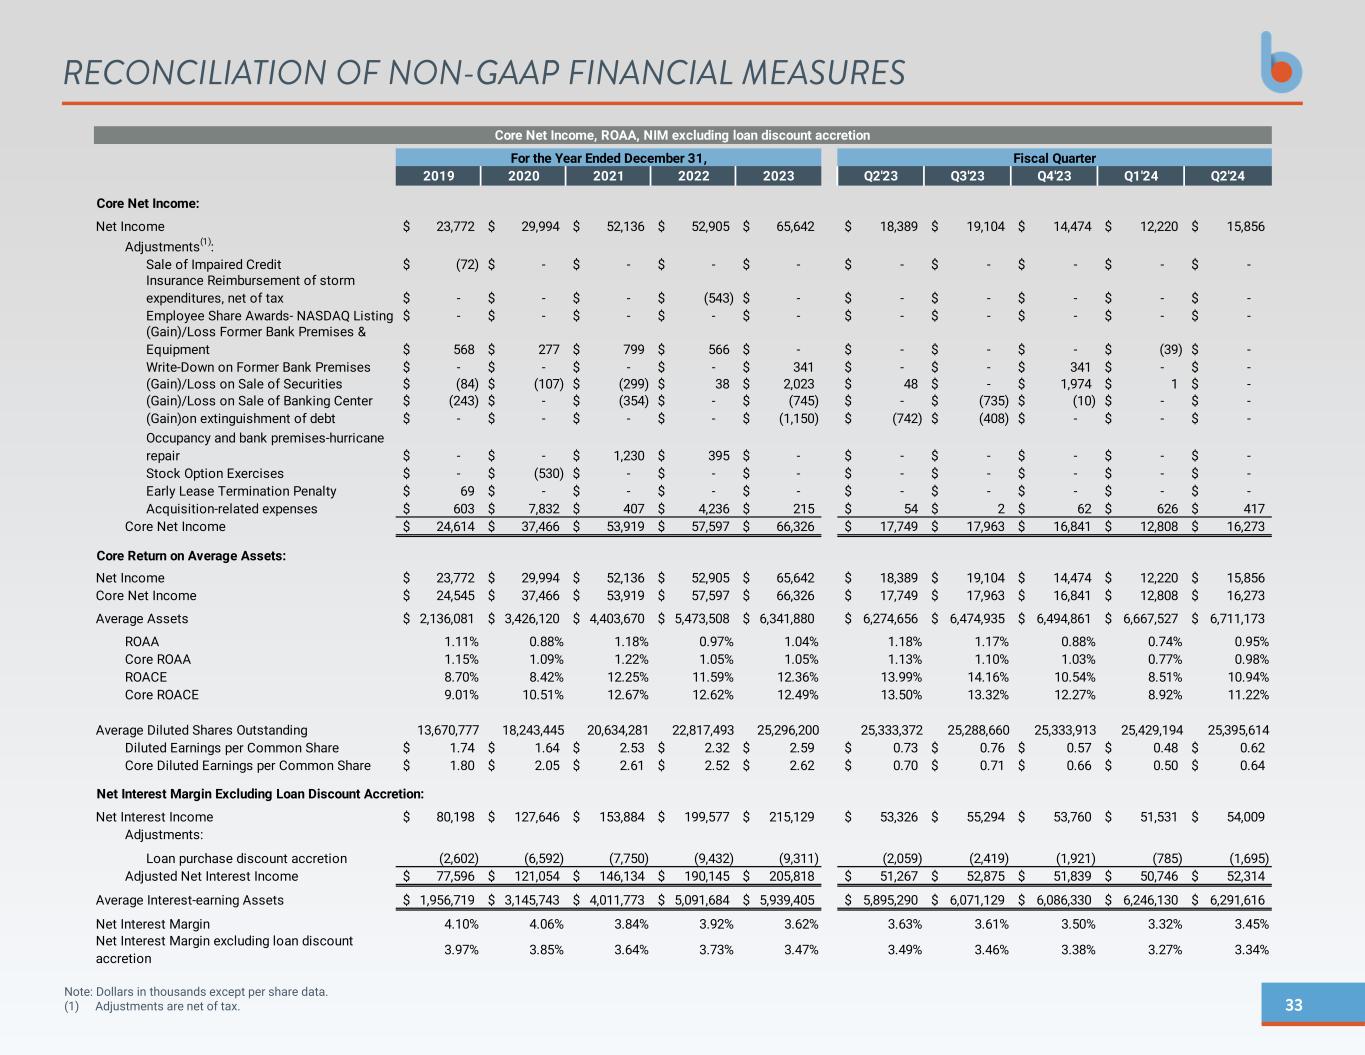
33 Note: Dollars in thousands except per share data. (1) Adjustments are net of tax. RECONCILIATION OF NON-GAAP FINANCIAL MEASURES 2019 2020 2021 2022 2023 Q2'23 Q3'23 Q4'23 Q1'24 Q2'24 Core Net Income: Net Income 23,772$ 29,994$ 52,136$ 52,905$ 65,642$ 18,389$ 19,104$ 14,474$ 12,220$ 15,856$ Adjustments(1): (72)$ -$ -$ -$ -$ -$ -$ -$ -$ -$ -$ -$ -$ (543)$ -$ -$ -$ -$ -$ -$ -$ -$ -$ -$ -$ -$ -$ -$ -$ -$ 568$ 277$ 799$ 566$ -$ -$ -$ -$ (39)$ -$ -$ -$ -$ -$ 341$ -$ -$ 341$ -$ -$ (84)$ (107)$ (299)$ 38$ 2,023$ 48$ -$ 1,974$ 1$ -$ (243)$ -$ (354)$ -$ (745)$ -$ (735)$ (10)$ -$ -$ -$ -$ -$ -$ (1,150)$ (742)$ (408)$ -$ -$ -$ -$ -$ 1,230$ 395$ -$ -$ -$ -$ -$ -$ -$ (530)$ -$ -$ -$ -$ -$ -$ -$ -$ 69$ -$ -$ -$ -$ -$ -$ -$ -$ -$ 603$ 7,832$ 407$ 4,236$ 215$ 54$ 2$ 62$ 626$ 417$ Core Net Income 24,614$ 37,466$ 53,919$ 57,597$ 66,326$ 17,749$ 17,963$ 16,841$ 12,808$ 16,273$ Core Return on Average Assets: Net Income 23,772$ 29,994$ 52,136$ 52,905$ 65,642$ 18,389$ 19,104$ 14,474$ 12,220$ 15,856$ Core Net Income 24,545$ 37,466$ 53,919$ 57,597$ 66,326$ 17,749$ 17,963$ 16,841$ 12,808$ 16,273$ Average Assets 2,136,081$ 3,426,120$ 4,403,670$ 5,473,508$ 6,341,880$ 6,274,656$ 6,474,935$ 6,494,861$ 6,667,527$ 6,711,173$ ROAA 1.11% 0.88% 1.18% 0.97% 1.04% 1.18% 1.17% 0.88% 0.74% 0.95% Core ROAA 1.15% 1.09% 1.22% 1.05% 1.05% 1.13% 1.10% 1.03% 0.77% 0.98% ROACE 8.70% 8.42% 12.25% 11.59% 12.36% 13.99% 14.16% 10.54% 8.51% 10.94% Core ROACE 9.01% 10.51% 12.67% 12.62% 12.49% 13.50% 13.32% 12.27% 8.92% 11.22% Average Diluted Shares Outstanding 13,670,777 18,243,445 20,634,281 22,817,493 25,296,200 25,333,372 25,288,660 25,333,913 25,429,194 25,395,614 Diluted Earnings per Common Share 1.74$ 1.64$ 2.53$ 2.32$ 2.59$ 0.73$ 0.76$ 0.57$ 0.48$ 0.62$ Core Diluted Earnings per Common Share 1.80$ 2.05$ 2.61$ 2.52$ 2.62$ 0.70$ 0.71$ 0.66$ 0.50$ 0.64$ Net Interest Margin Excluding Loan Discount Accretion: Net Interest Income 80,198$ 127,646$ 153,884$ 199,577$ 215,129$ 53,326$ 55,294$ 53,760$ 51,531$ 54,009$ Adjustments: (2,602) (6,592) (7,750) (9,432) (9,311) (2,059) (2,419) (1,921) (785) (1,695) Adjusted Net Interest Income 77,596$ 121,054$ 146,134$ 190,145$ 205,818$ 51,267$ 52,875$ 51,839$ 50,746$ 52,314$ Average Interest-earning Assets 1,956,719$ 3,145,743$ 4,011,773$ 5,091,684$ 5,939,405$ 5,895,290$ 6,071,129$ 6,086,330$ 6,246,130$ 6,291,616$ Net Interest Margin 4.10% 4.06% 3.84% 3.92% 3.62% 3.63% 3.61% 3.50% 3.32% 3.45% 3.97% 3.85% 3.64% 3.73% 3.47% 3.49% 3.46% 3.38% 3.27% 3.34% Stock Option Exercises Early Lease Termination Penalty Acquisition-related expenses Loan purchase discount accretion Net Interest Margin excluding loan discount accretion (Gain)/Loss Former Bank Premises & Equipment Write-Down on Former Bank Premises (Gain)/Loss on Sale of Securities (Gain)/Loss on Sale of Banking Center (Gain)on extinguishment of debt Occupancy and bank premises-hurricane repair Core Net Income, ROAA, NIM excluding loan discount accretion For the Year Ended December 31, Fiscal Quarter Sale of Impaired Credit Insurance Reimbursement of storm expenditures, net of tax Employee Share Awards- NASDAQ Listing
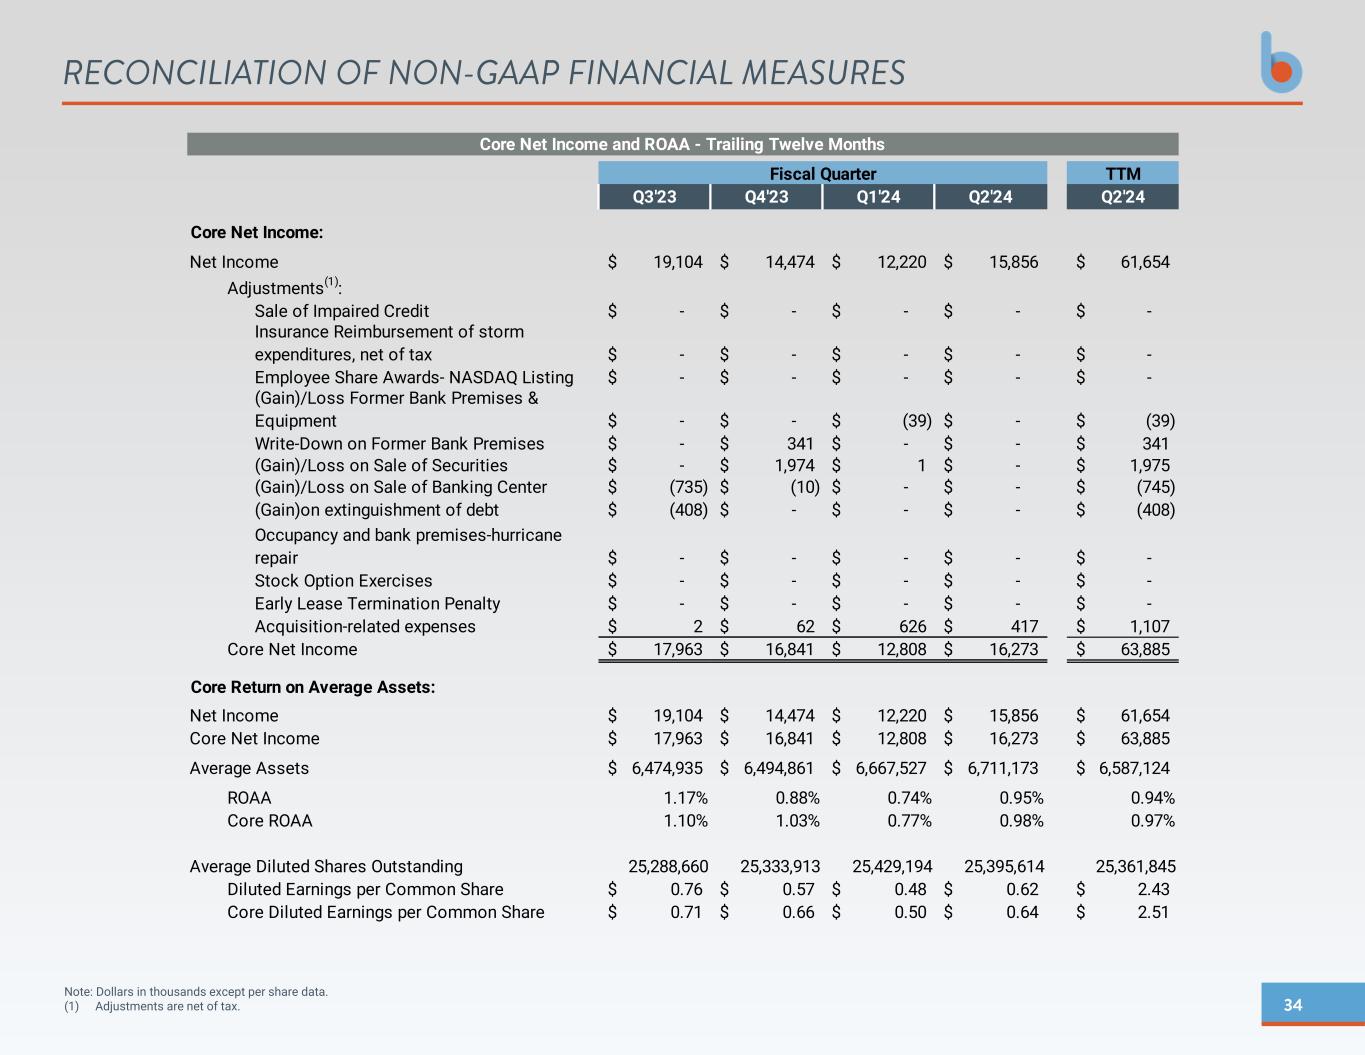
34 Note: Dollars in thousands except per share data. (1) Adjustments are net of tax. RECONCILIATION OF NON-GAAP FINANCIAL MEASURES TTM Q3'23 Q4'23 Q1'24 Q2'24 Q2'24 Core Net Income: Net Income 19,104$ 14,474$ 12,220$ 15,856$ 61,654$ Adjustments(1): -$ -$ -$ -$ -$ -$ -$ -$ -$ -$ -$ -$ -$ -$ -$ -$ -$ (39)$ -$ (39)$ -$ 341$ -$ -$ 341$ -$ 1,974$ 1$ -$ 1,975$ (735)$ (10)$ -$ -$ (745)$ (408)$ -$ -$ -$ (408)$ -$ -$ -$ -$ -$ -$ -$ -$ -$ -$ -$ -$ -$ -$ -$ 2$ 62$ 626$ 417$ 1,107$ Core Net Income 17,963$ 16,841$ 12,808$ 16,273$ 63,885$ Core Return on Average Assets: Net Income 19,104$ 14,474$ 12,220$ 15,856$ 61,654$ Core Net Income 17,963$ 16,841$ 12,808$ 16,273$ 63,885$ Average Assets 6,474,935$ 6,494,861$ 6,667,527$ 6,711,173$ 6,587,124$ ROAA 1.17% 0.88% 0.74% 0.95% 0.94% Core ROAA 1.10% 1.03% 0.77% 0.98% 0.97% Average Diluted Shares Outstanding 25,288,660 25,333,913 25,429,194 25,395,614 25,361,845 Diluted Earnings per Common Share 0.76$ 0.57$ 0.48$ 0.62$ 2.43$ Core Diluted Earnings per Common Share 0.71$ 0.66$ 0.50$ 0.64$ 2.51$ Early Lease Termination Penalty Acquisition-related expenses Write-Down on Former Bank Premises (Gain)/Loss on Sale of Securities (Gain)/Loss on Sale of Banking Center (Gain)on extinguishment of debt Occupancy and bank premises-hurricane repair Stock Option Exercises Core Net Income and ROAA - Trailing Twelve Months Fiscal Quarter Sale of Impaired Credit Insurance Reimbursement of storm expenditures, net of tax Employee Share Awards- NASDAQ Listing (Gain)/Loss Former Bank Premises & Equipment
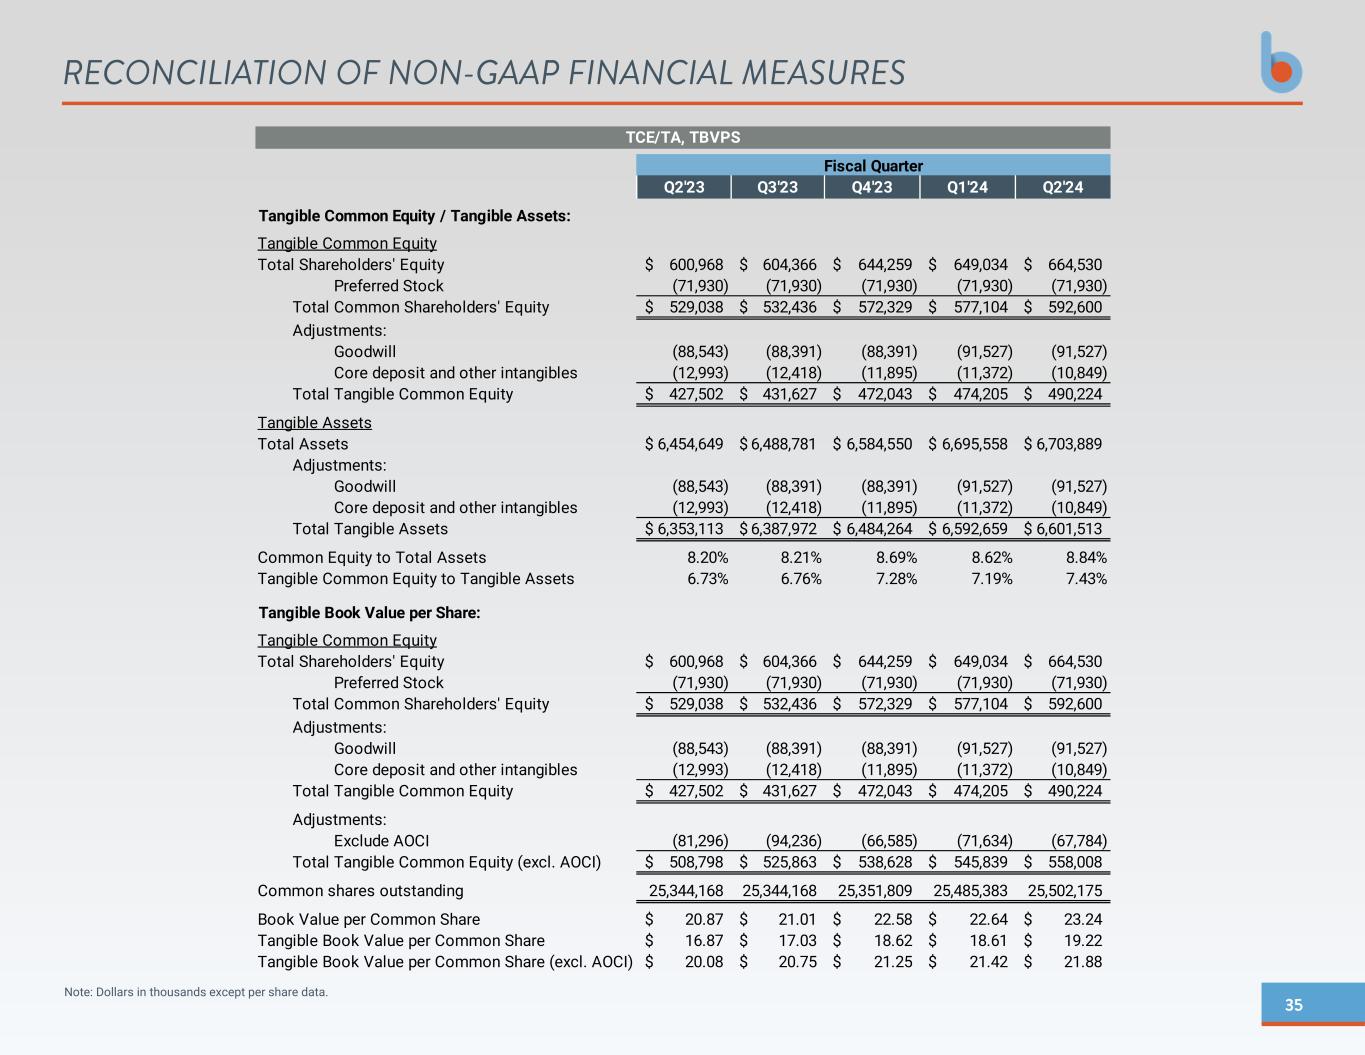
35 Note: Dollars in thousands except per share data. RECONCILIATION OF NON-GAAP FINANCIAL MEASURES Q2'23 Q3'23 Q4'23 Q1'24 Q2'24 Tangible Common Equity / Tangible Assets: Tangible Common Equity Total Shareholders' Equity 600,968$ 604,366$ 644,259$ 649,034$ 664,530$ Preferred Stock (71,930) (71,930) (71,930) (71,930) (71,930) Total Common Shareholders' Equity 529,038$ 532,436$ 572,329$ 577,104$ 592,600$ Adjustments: Goodwill (88,543) (88,391) (88,391) (91,527) (91,527) Core deposit and other intangibles (12,993) (12,418) (11,895) (11,372) (10,849) Total Tangible Common Equity 427,502$ 431,627$ 472,043$ 474,205$ 490,224$ Tangible Assets Total Assets 6,454,649$ 6,488,781$ 6,584,550$ 6,695,558$ 6,703,889$ Adjustments: Goodwill (88,543) (88,391) (88,391) (91,527) (91,527) Core deposit and other intangibles (12,993) (12,418) (11,895) (11,372) (10,849) Total Tangible Assets 6,353,113$ 6,387,972$ 6,484,264$ 6,592,659$ 6,601,513$ Common Equity to Total Assets 8.20% 8.21% 8.69% 8.62% 8.84% Tangible Common Equity to Tangible Assets 6.73% 6.76% 7.28% 7.19% 7.43% Tangible Book Value per Share: Tangible Common Equity Total Shareholders' Equity 600,968$ 604,366$ 644,259$ 649,034$ 664,530$ Preferred Stock (71,930) (71,930) (71,930) (71,930) (71,930) Total Common Shareholders' Equity 529,038$ 532,436$ 572,329$ 577,104$ 592,600$ Adjustments: Goodwill (88,543) (88,391) (88,391) (91,527) (91,527) Core deposit and other intangibles (12,993) (12,418) (11,895) (11,372) (10,849) Total Tangible Common Equity 427,502$ 431,627$ 472,043$ 474,205$ 490,224$ Adjustments: Exclude AOCI (81,296) (94,236) (66,585) (71,634) (67,784) Total Tangible Common Equity (excl. AOCI) 508,798$ 525,863$ 538,628$ 545,839$ 558,008$ Common shares outstanding 25,344,168 25,344,168 25,351,809 25,485,383 25,502,175 Book Value per Common Share 20.87$ 21.01$ 22.58$ 22.64$ 23.24$ Tangible Book Value per Common Share 16.87$ 17.03$ 18.62$ 18.61$ 19.22$ Tangible Book Value per Common Share (excl. AOCI) 20.08$ 20.75$ 21.25$ 21.42$ 21.88$ TCE/TA, TBVPS Fiscal Quarter
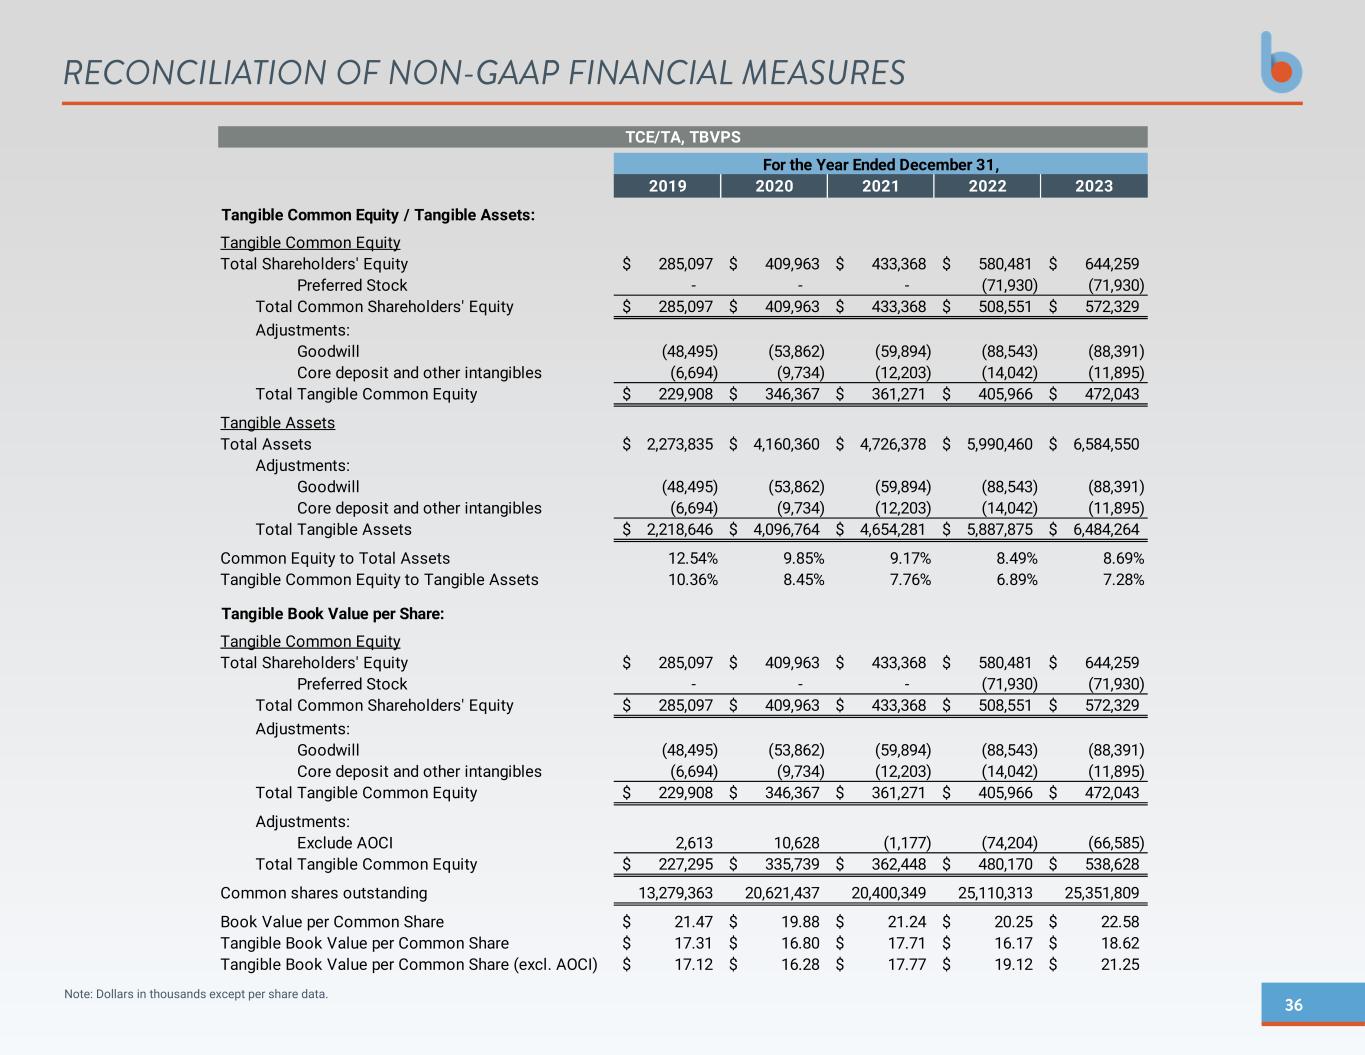
36 Note: Dollars in thousands except per share data. RECONCILIATION OF NON-GAAP FINANCIAL MEASURES 2019 2020 2021 2022 2023 Tangible Common Equity / Tangible Assets: Tangible Common Equity Total Shareholders' Equity 285,097$ 409,963$ 433,368$ 580,481$ 644,259$ Preferred Stock - - - (71,930) (71,930) Total Common Shareholders' Equity 285,097$ 409,963$ 433,368$ 508,551$ 572,329$ Adjustments: Goodwill (48,495) (53,862) (59,894) (88,543) (88,391) Core deposit and other intangibles (6,694) (9,734) (12,203) (14,042) (11,895) Total Tangible Common Equity 229,908$ 346,367$ 361,271$ 405,966$ 472,043$ Tangible Assets Total Assets 2,273,835$ 4,160,360$ 4,726,378$ 5,990,460$ 6,584,550$ Adjustments: Goodwill (48,495) (53,862) (59,894) (88,543) (88,391) Core deposit and other intangibles (6,694) (9,734) (12,203) (14,042) (11,895) Total Tangible Assets 2,218,646$ 4,096,764$ 4,654,281$ 5,887,875$ 6,484,264$ Common Equity to Total Assets 12.54% 9.85% 9.17% 8.49% 8.69% Tangible Common Equity to Tangible Assets 10.36% 8.45% 7.76% 6.89% 7.28% Tangible Book Value per Share: Tangible Common Equity Total Shareholders' Equity 285,097$ 409,963$ 433,368$ 580,481$ 644,259$ Preferred Stock - - - (71,930) (71,930) Total Common Shareholders' Equity 285,097$ 409,963$ 433,368$ 508,551$ 572,329$ Adjustments: Goodwill (48,495) (53,862) (59,894) (88,543) (88,391) Core deposit and other intangibles (6,694) (9,734) (12,203) (14,042) (11,895) Total Tangible Common Equity 229,908$ 346,367$ 361,271$ 405,966$ 472,043$ Adjustments: Exclude AOCI 2,613 10,628 (1,177) (74,204) (66,585) Total Tangible Common Equity 227,295$ 335,739$ 362,448$ 480,170$ 538,628$ Common shares outstanding 13,279,363 20,621,437 20,400,349 25,110,313 25,351,809 Book Value per Common Share 21.47$ 19.88$ 21.24$ 20.25$ 22.58$ Tangible Book Value per Common Share 17.31$ 16.80$ 17.71$ 16.17$ 18.62$ Tangible Book Value per Common Share (excl. AOCI) 17.12$ 16.28$ 17.77$ 19.12$ 21.25$ TCE/TA, TBVPS For the Year Ended December 31,
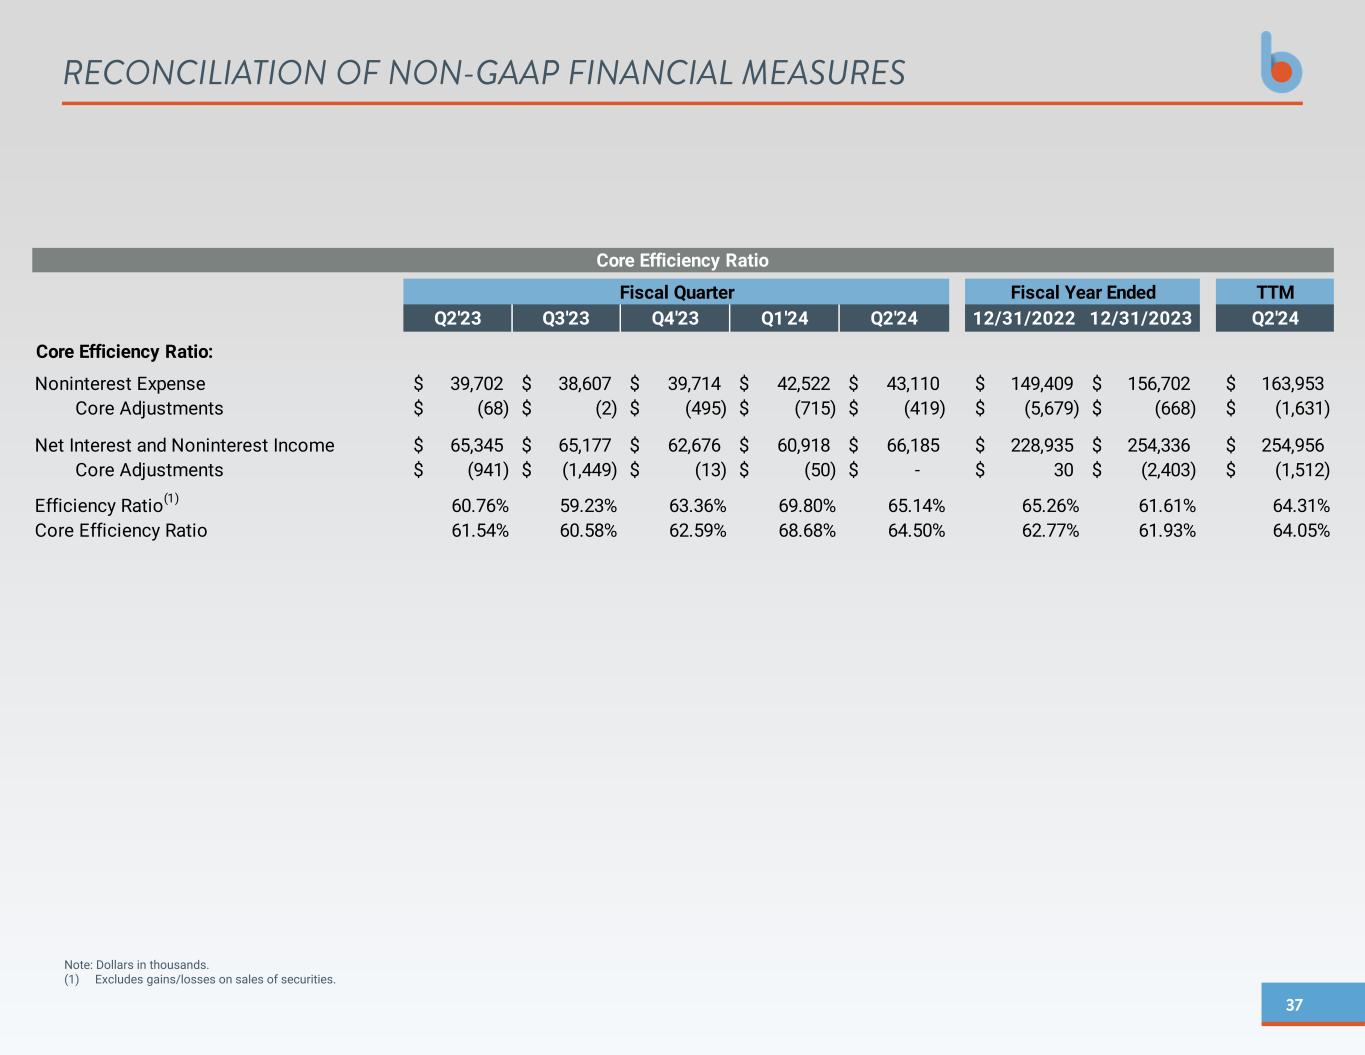
37 RECONCILIATION OF NON-GAAP FINANCIAL MEASURES Note: Dollars in thousands. (1) Excludes gains/losses on sales of securities. TTM Q2'23 Q3'23 Q4'23 Q1'24 Q2'24 12/31/2022 12/31/2023 Q2'24 Core Efficiency Ratio: Noninterest Expense 39,702$ 38,607$ 39,714$ 42,522$ 43,110$ 149,409$ 156,702$ 163,953$ Core Adjustments (68)$ (2)$ (495)$ (715)$ (419)$ (5,679)$ (668)$ (1,631)$ Net Interest and Noninterest Income 65,345$ 65,177$ 62,676$ 60,918$ 66,185$ 228,935$ 254,336$ 254,956$ Core Adjustments (941)$ (1,449)$ (13)$ (50)$ -$ 30$ (2,403)$ (1,512)$ Efficiency Ratio(1) 60.76% 59.23% 63.36% 69.80% 65.14% 65.26% 61.61% 64.31% Core Efficiency Ratio 61.54% 60.58% 62.59% 68.68% 64.50% 62.77% 61.93% 64.05% Core Efficiency Ratio Fiscal Quarter Fiscal Year Ended
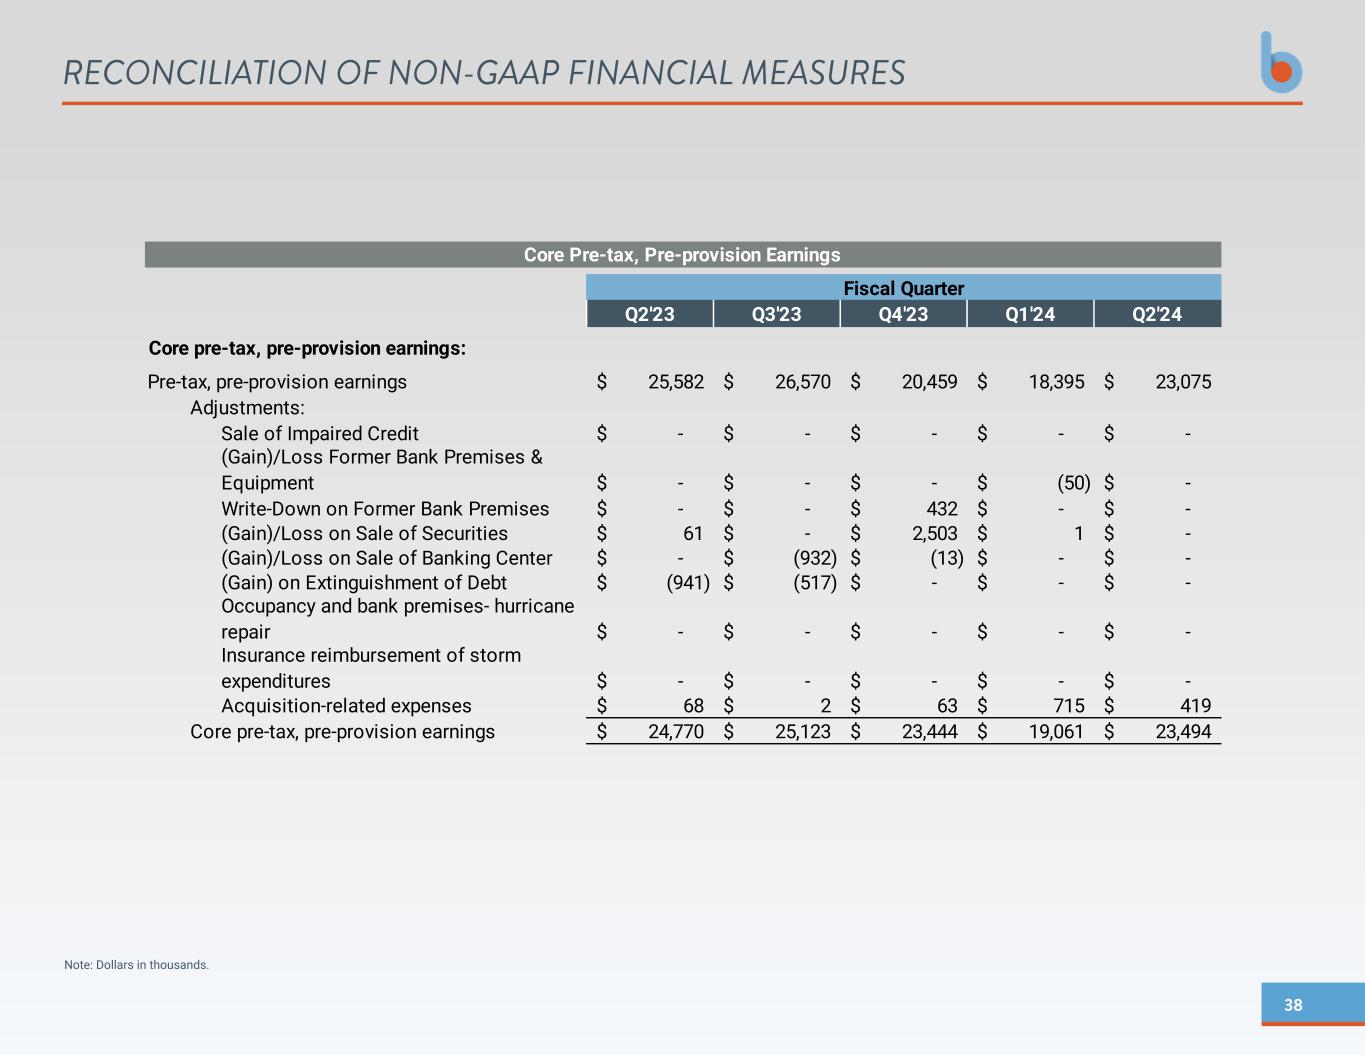
38 RECONCILIATION OF NON-GAAP FINANCIAL MEASURES Note: Dollars in thousands. Q2'23 Q3'23 Q4'23 Q1'24 Q2'24 Core pre-tax, pre-provision earnings: Pre-tax, pre-provision earnings 25,582$ 26,570$ 20,459$ 18,395$ 23,075$ Adjustments: Sale of Impaired Credit -$ -$ -$ -$ -$ -$ -$ -$ (50)$ -$ -$ -$ 432$ -$ -$ 61$ -$ 2,503$ 1$ -$ -$ (932)$ (13)$ -$ -$ (941)$ (517)$ -$ -$ -$ -$ -$ -$ -$ -$ -$ -$ -$ -$ -$ 68$ 2$ 63$ 715$ 419$ Core pre-tax, pre-provision earnings 24,770$ 25,123$ 23,444$ 19,061$ 23,494$ (Gain) on Extinguishment of Debt Occupancy and bank premises- hurricane repair Insurance reimbursement of storm expenditures Acquisition-related expenses Core Pre-tax, Pre-provision Earnings Fiscal Quarter (Gain)/Loss Former Bank Premises & Equipment Write-Down on Former Bank Premises (Gain)/Loss on Sale of Securities (Gain)/Loss on Sale of Banking Center
