| Delaware | 001-37388 | 47-1197305 | ||||||||||||
|
(State or other jurisdiction of
incorporation or organization)
|
(Commission File Number) |
(IRS Employer
Identification No.)
|
||||||||||||
| ☐ | Written communications pursuant to Rule 425 under the Securities Act (17 CFR 230.425) | ||||
| ☐ | Soliciting material pursuant to Rule 14a-12 under the Exchange Act (17 CFR 240.14a-12) | ||||
| ☐ | Pre-commencement communications pursuant to Rule 14d-2(b) under the Exchange Act (17 CFR 240.14d-2(b)) | ||||
| ☐ | Pre-commencement communications pursuant to Rule 13e-4(c) under the Exchange Act (17 CFR 240.13e-4(c)) | ||||
| Title of each class | Trading Symbol(s) |
Name of each exchange on which registered |
||||||||||||
| Common stock, par value $0.001 per share | TLN | The Nasdaq Global Select Market | ||||||||||||
| Exhibit No. | Description. | ||||
| 23.1 | |||||
| 23.2 | |||||
| 99.1 | |||||
| 99.2 | |||||
| 99.3 | |||||
| 99.4 | |||||
| 99.5 | |||||
| 99.6 | |||||
| 104 | Cover Page Interactive Data File (cover page XBRL tags embedded within the Inline XBRL document). | ||||
| TALEN ENERGY CORPORATION | |||||||||||
| Date: | October 6, 2025 | By: | /s/ Terry L. Nutt |
||||||||
| Name: | Terry L. Nutt | ||||||||||
| Title: | Chief Financial Officer | ||||||||||


| For the Three and Six Months Ended June 30, 2025 | ||
| INDEPENDENT AUDITORS' REPORT | |||||
| CONSOLIDATED BALANCE SHEET AS OF JUNE 30, 2025 | F-2 | ||||
| CONSOLIDATED STATEMENT OF COMPREHENSIVE LOSS FOR THE THREE AND SIX MONTHS ENDED JUNE 30, 2025 | F-3 | ||||
| CONSOLIDATED STATEMENT OF CHANGES IN STOCKHOLDERS’ DEFICIT FOR THE THREE AND SIX MONTHS ENDED JUNE 30, 2025 | F-4 | ||||
| CONSOLIDATED STATEMENT OF CASH FLOWS FOR THE SIX MONTHS ENDED JUNE 30, 2025 | F-5 | ||||
| NOTES TO CONSOLIDATED FINANCIAL STATEMENTS | F-6 to F-17 | ||||
| /s/ KMPG LLP | ||
| Philadelphia, Pennsylvania | ||
| September 15, 2025 | ||
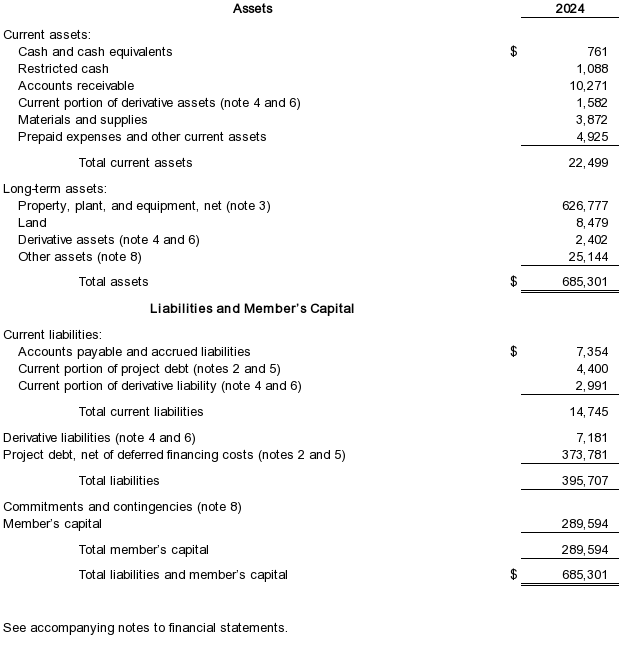
| June 30, 2025 | December 31, 2024 | |||||||||||||||||||
| Assets | ||||||||||||||||||||
| Current assets | ||||||||||||||||||||
Cash and cash equivalents |
$ | 882 | $ | 761 | ||||||||||||||||
Restricted cash |
12,663 | 1,088 | ||||||||||||||||||
Current portion of derivative assets |
3,226 | 1,582 | ||||||||||||||||||
Accounts receivable |
16,824 | 10,271 | ||||||||||||||||||
Materials and supplies |
3,852 | 3,872 | ||||||||||||||||||
Prepaid expenses and other current assets |
675 | 4,925 | ||||||||||||||||||
| Total current assets | 38,122 | 22,499 | ||||||||||||||||||
| Property, plant & equipment | 613,660 | 626,777 | ||||||||||||||||||
| Land | 8,479 | 8,479 | ||||||||||||||||||
| Long term portion of derivative assets | — | 2,402 | ||||||||||||||||||
| Other assets | 24,295 | 25,144 | ||||||||||||||||||
| Total assets | $ | 684,556 | $ | 685,301 | ||||||||||||||||
| Liabilities and Members’ Capital | ||||||||||||||||||||
| Current liabilities | ||||||||||||||||||||
Accounts payable and accrued expenses |
$ | 16,064 | $ | 7,354 | ||||||||||||||||
Current portion of project loan and subordinated loan |
4,400 | 4,400 | ||||||||||||||||||
Current portion of derivative liabilities |
10,890 | 2,991 | ||||||||||||||||||
| Total current liabilities | 31,354 | 14,745 | ||||||||||||||||||
| Derivative liabilities | 5,936 | 7,181 | ||||||||||||||||||
| Project loan | 350,789 | 373,781 | ||||||||||||||||||
| Total liabilities | 388,079 | 395,707 | ||||||||||||||||||
| Members’ capital | 296,477 | 289,594 | ||||||||||||||||||
| Total member's Capital | 296,477 | 289,594 | ||||||||||||||||||
| Total liabilities and members’ capital | $ | 684,556 | $ | 685,301 | ||||||||||||||||
| Three Months Ended June 30, 2025 |
Six Months Ended June 30, 2025 |
|||||||||||||||||||
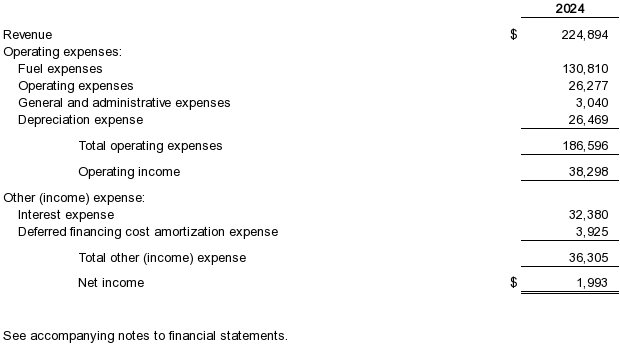
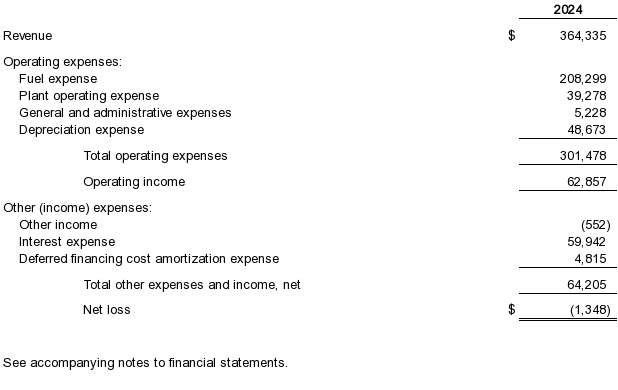
| Revenue: | ||||||||||||||||||||
| Electricity sales | $ | 79,115 | $ | 159,203 | ||||||||||||||||
| Total revenue | 79,115 | 159,203 | ||||||||||||||||||
| Operating expenses: | ||||||||||||||||||||
| Fuel expenses | 33,387 | 84,792 | ||||||||||||||||||
| Plant operating expenses | 6,786 | 14,422 | ||||||||||||||||||
| General and administrative expense | 763 | 1,490 | ||||||||||||||||||
| Depreciation expense | 6,624 | 13,248 | ||||||||||||||||||
| Total operating expenses | 47,560 | 113,952 | ||||||||||||||||||
| Operating income | 31,555 | 45,251 | ||||||||||||||||||
| Other expenses: | ||||||||||||||||||||
| Deferred financing cost amortization expense | 870 | 1,798 | ||||||||||||||||||
| Interest expense | 9,183 | 19,831 | ||||||||||||||||||
| Total other expenses | 10,053 | 21,629 | ||||||||||||||||||
| Net income | $ | 21,502 | $ | 23,622 | ||||||||||||||||
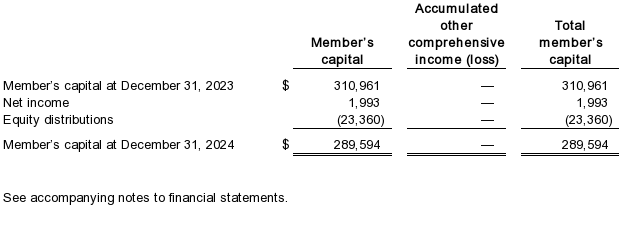
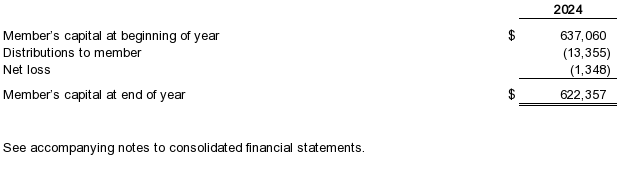
| Total Member's Capital | |||||||||||
| Member’s capital at December 31, 2024 | $ | 289,594 | |||||||||
| Net income | 23,622 | ||||||||||
| Equity distributions | (16,739) | ||||||||||
| Member’s capital at June 30, 2025 | $ | 296,477 | |||||||||
|
Six Months Ended
June 30, 2025
|
|||||||||||
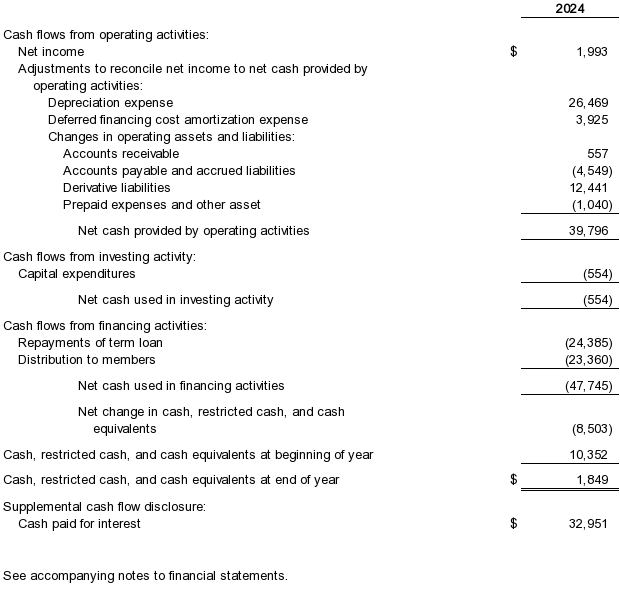
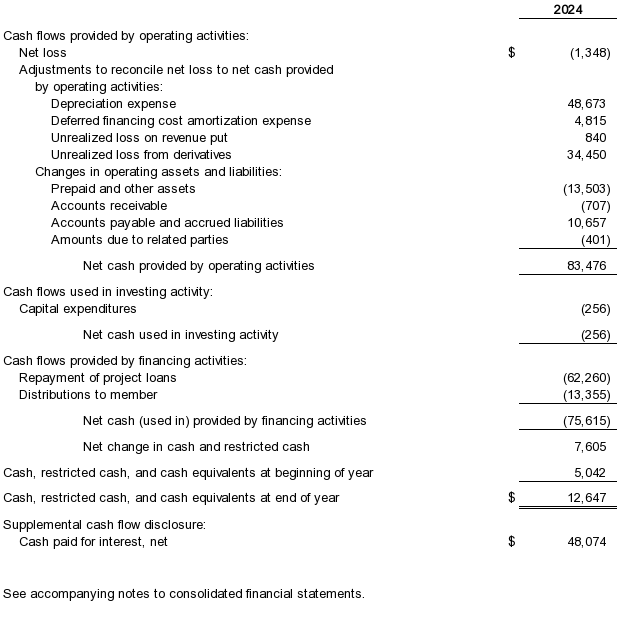
| Cash flows from operating activities: | |||||||||||
| Net income | $ | 23,622 | |||||||||
| Adjustments to reconcile net income to net cash provided by (used in) operating activities: | |||||||||||
Depreciation expense |
13,248 | ||||||||||
Deferred financing cost amortization expense |
1,798 | ||||||||||
Unrealized loss on power swaps |
1,095 | ||||||||||
Unrealized loss on gas swaps |
1,965 | ||||||||||
Unrealized loss on interest rate swaps |
4,352 | ||||||||||
Change in operating assets and liabilities: |
|||||||||||
Accounts receivable |
(6,553) | ||||||||||
Accounts payable, accrued expenses and accrued interest |
8,712 | ||||||||||
Prepaid expenses and other assets |
5,118 | ||||||||||
Net cash provided by operating activities |
53,357 | ||||||||||
| Cash flows from investing activities: | |||||||||||
Capital expenditures |
(131) | ||||||||||
Net cash used in investing activities |
(131) | ||||||||||
| Cash flows from financing activities: | |||||||||||
Payment of principal |
(24,791) | ||||||||||
Distribution to member |
(16,739) | ||||||||||
Net cash used in financing activities |
(41,530) | ||||||||||
| Net change in cash and cash equivalents | 11,696 | ||||||||||
| Cash, restricted cash and cash equivalents at beginning of year | 1,849 | ||||||||||
| Cash, restricted cash and cash equivalents at end of year | $ | 13,545 | |||||||||
| Supplemental cash flow information: | |||||||||||
| Cash paid for interest | $ | 15,016 | |||||||||
| 2025 | 2026 | |||||||||||||
| Expected capacity revenues | $ | 36,823 | $ | 30,019 | ||||||||||
| Three Month Ended June 30, 2025 |
Six Months Ended June 30, 2025 |
|||||||||||||||||||
| Contracts earned under 606: | ||||||||||||||||||||
| Capacity | $ | 9,021 | $ | 13,473 | ||||||||||||||||
| Energy | 51,477 | 146,286 | ||||||||||||||||||
| Ancillary sales | 825 | 1,602 | ||||||||||||||||||
| Contracts earned under 815: | ||||||||||||||||||||
| Realized gain (loss) on derivative instruments | 1,789 | (1,063) | ||||||||||||||||||
| Unrealized gain (loss) on derivative instruments | 16,003 | (1,095) | ||||||||||||||||||
| $ | 79,115 | $ | 159,203 | |||||||||||||||||
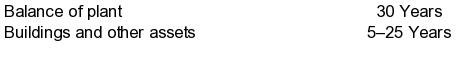
| Balance of plant | 30 years | |||||||
| Buildings and other assets | 5-25 years | |||||||
| June 30, 2025 | December 31, 2024 | |||||||||||||||||||
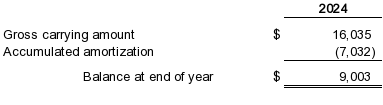
| Gross carrying amount | $ | 16,035 | $ | 16,035 | ||||||||||||||||
| Accumulated amortization | (8,830) | (7,032) | ||||||||||||||||||
Balance at end of period |
$ | 7,205 | $ | 9,003 | ||||||||||||||||
| June 30, 2025 | December 31, 2024 | |||||||||||||||||||
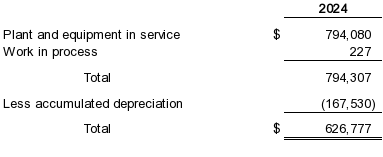
| Plant and equipment in service | $ | 794,080 | $ | 794,080 | ||||||||||||||||
| Work in process | 357 | 227 | ||||||||||||||||||
Total |
794,437 | 794,307 | ||||||||||||||||||
| Less: accumulated depreciation | (180,777) | (167,530) | ||||||||||||||||||
Total property, plant, and equipment, net |
$ | 613,660 | $ | 626,777 | ||||||||||||||||
| June 30, 2025 | ||||||||||||||||||||||||||||||||||||||
| Level 1 | Level 2 | Level 3 | Total | |||||||||||||||||||||||||||||||||||
| Derivative assets: | ||||||||||||||||||||||||||||||||||||||
Interest rate swap |
$ | - | $ | 759 | $ | - | $ | 759 | ||||||||||||||||||||||||||||||
Power swap |
- | - | 2,467 | 2,467 | ||||||||||||||||||||||||||||||||||
Total assets measured at fair value |
$ | - | $ | 759 | $ | 2,467 | $ | 3,226 | ||||||||||||||||||||||||||||||
| Derivative liabilities: | ||||||||||||||||||||||||||||||||||||||
Interest rate swap |
$ | - | $ | 1,131 | $ | - | $ | 1,131 | ||||||||||||||||||||||||||||||
Power swap |
- | - | 13,730 | 13,730 | ||||||||||||||||||||||||||||||||||
Gas swap |
- | 1,965 | - | 1,965 | ||||||||||||||||||||||||||||||||||
Total liabilities measured at fair value |
$ | - | $ | 3,096 | $ | 13,730 | $ | 16,826 | ||||||||||||||||||||||||||||||
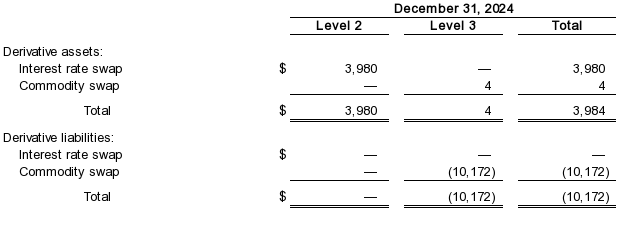
| December 31, 2024 | ||||||||||||||||||||||||||||||||||||||
| Level 1 | Level 2 | Level 3 | Total | |||||||||||||||||||||||||||||||||||
| Derivative assets: | ||||||||||||||||||||||||||||||||||||||
Interest rate swap |
$ | - | $ | 3,980 | $ | - | $ | 3,980 | ||||||||||||||||||||||||||||||
Power swap |
- | - | 4 | 4 | ||||||||||||||||||||||||||||||||||
Total assets measured at fair value |
$ | - | $ | 3,980 | $ | 4 | $ | 3,984 | ||||||||||||||||||||||||||||||
| Derivative liabilities: | ||||||||||||||||||||||||||||||||||||||
Power swap |
$ | - | $ | - | $ | 10,172 | $ | 10,172 | ||||||||||||||||||||||||||||||
Total liabilities measured at fair value |
$ | - | $ | - | $ | 10,172 | $ | 10,172 | ||||||||||||||||||||||||||||||
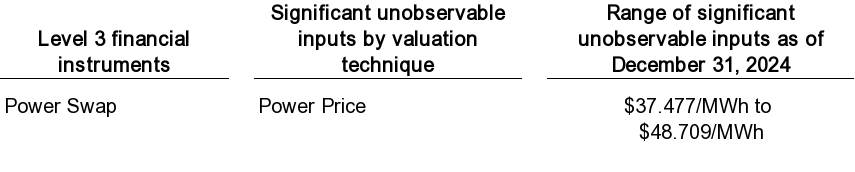
| Range of Significant Unobservable Inputs | ||||||||||||||||||||
| Level 3 Financial Instruments | Significant Unobservable Inputs by Valuation Technique | June 30, 2025 | December 31, 2024 | |||||||||||||||||
| Power Swap | Power Price | $34.650/MWh to $51.467/MWh | $37.477/MWh to $48.709/MWh | |||||||||||||||||
| 2025 | |||||||||||
| Balance at beginning of period, net | $ | (10,168) | |||||||||
| Unrealized loss on power swaps | (1,095) | ||||||||||
| Balance at end of period, net | $ | (11,263) | |||||||||
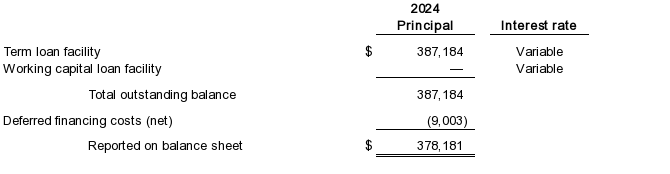
| June 30, 2025 | December 31, 2024 | Interest Rate | ||||||||||||||||||||||||
| Term loan facility | $ | 362,394 | $ | 387,184 | Variable | |||||||||||||||||||||
| Working capital loan facility | - | - | Variable | |||||||||||||||||||||||
Total outstanding balance |
362,394 | 387,184 | ||||||||||||||||||||||||
| Less: deferred financing costs (net) | (7,205) | (9,003) | ||||||||||||||||||||||||
| Less: current portion of project loan | (4,400) | (4,400) | ||||||||||||||||||||||||
Total project loan |
$ | 350,789 | $ | 373,781 | ||||||||||||||||||||||
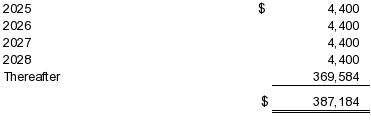
| 2025 (remaining six months) | $ | 2,200 | |||||||||
| 2026 | 4,400 | ||||||||||
| 2027 | 4,400 | ||||||||||
| 2028 | 4,400 | ||||||||||
| 2029 | 346,994 | ||||||||||
| Thereafter | - | ||||||||||
| Total | $ | 362,394 | |||||||||
| Three Months Ended June 30, 2025 | ||||||||||||||||||||||||||||||||||||||
| Gas Derivatives (Level 2) |
Interest Rate Derivatives (Level 2) |
Power Derivatives (Level 3) |
Total Derivatives | |||||||||||||||||||||||||||||||||||
| Realized and unrealized gains (losses): | ||||||||||||||||||||||||||||||||||||||
Settlements |
$ | - | $ | 523 | $ | 1,789 | $ | 2,312 | ||||||||||||||||||||||||||||||
Fair value adjustments |
(1,815) | (1,566) | 16,003 | 12,622 | ||||||||||||||||||||||||||||||||||
Total gains (losses) |
$ | (1,815) | $ | (1,043) | $ | 17,792 | $ | 14,934 | ||||||||||||||||||||||||||||||
| Statement of operations recognition: | ||||||||||||||||||||||||||||||||||||||
Revenue |
$ | - | $ | - | $ | 17,792 | $ | 17,792 | ||||||||||||||||||||||||||||||
Fuel expense |
(1,815) | (1,815) | ||||||||||||||||||||||||||||||||||||
Interest expense |
- | (1,043) | - | (1,043) | ||||||||||||||||||||||||||||||||||
Total gains (losses) |
$ | (1,815) | $ | (1,043) | $ | 17,792 | $ | 14,934 | ||||||||||||||||||||||||||||||
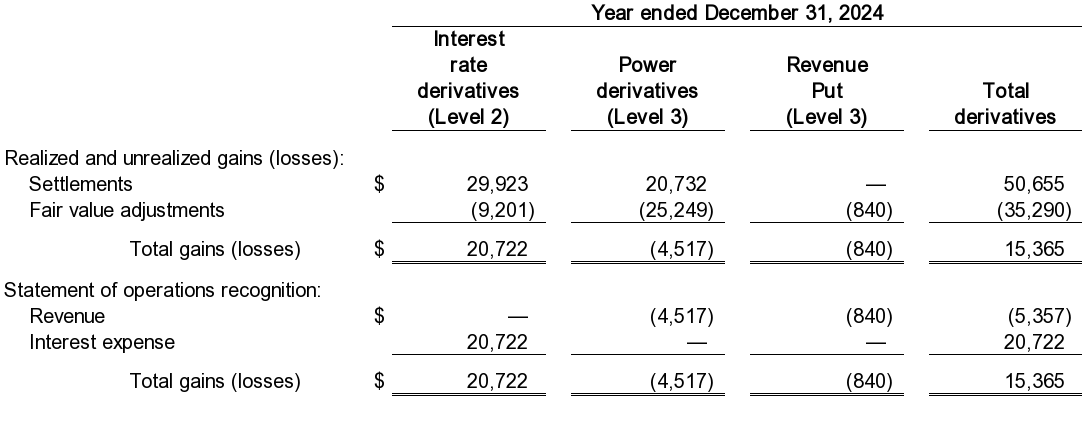
| Six Months Ended June 30, 2025 | ||||||||||||||||||||||||||||||||||||||
| Gas Derivatives (Level 2) |
Interest Rate Derivatives (Level 2) |
Power Derivatives (Level 3) |
Total Derivatives | |||||||||||||||||||||||||||||||||||
| Realized and unrealized gains (losses): | ||||||||||||||||||||||||||||||||||||||
Settlements |
$ | - | $ | 1,103 | $ | (1,063) | $ | 40 | ||||||||||||||||||||||||||||||
Fair value adjustments |
(1,965) | (4,352) | (1,095) | (7,412) | ||||||||||||||||||||||||||||||||||
Total gains (losses) |
$ | (1,965) | $ | (3,249) | $ | (2,158) | $ | (7,372) | ||||||||||||||||||||||||||||||
| Statement of operations recognition: | ||||||||||||||||||||||||||||||||||||||
Revenue |
$ | - | $ | - | $ | (2,158) | $ | (2,158) | ||||||||||||||||||||||||||||||
Fuel expense |
(1,965) | - | - | (1,965) | ||||||||||||||||||||||||||||||||||
Interest expense |
- | (3,249) | - | (3,249) | ||||||||||||||||||||||||||||||||||
Total gains (losses) |
$ | (1,965) | $ | (3,249) | $ | (2,158) | $ | (7,372) | ||||||||||||||||||||||||||||||
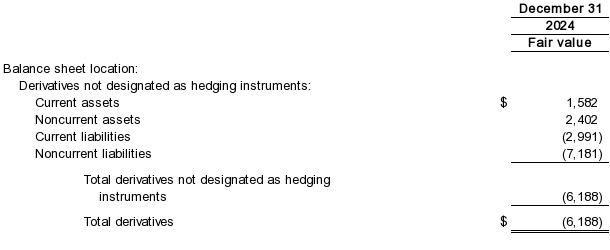
| June 30, 2025 | December 31, 2024 | |||||||||||||||||||
| Balance sheet location: | ||||||||||||||||||||
Derivatives not designated as hedging instruments: |
||||||||||||||||||||
Current assets |
$ | 3,227 | $ | 1,582 | ||||||||||||||||
Noncurrent assets |
- | 2,402 | ||||||||||||||||||
Current liabilities |
(10,890) | (2,991) | ||||||||||||||||||
Noncurrent liabilities |
(5,936) | (7,181) | ||||||||||||||||||
Total derivatives not designated as hedging instruments |
(13,599) | (6,188) | ||||||||||||||||||
Total derivatives |
$ | (13,599) | $ | (6,188) | ||||||||||||||||
| June 30, 2025 | |||||||||||||||||
| Committed amount | Fee percentage | ||||||||||||||||
| Working capital commitment fee | $ | 6,500 | 6.25 | % | |||||||||||||


| For the Three and Six Months Ended June 30, 2025 | ||
| INDEPENDENT AUDITORS' REPORT | |||||
| CONSOLIDATED BALANCE SHEET AS OF JUNE 30, 2025 | F-2 | ||||
| CONSOLIDATED STATEMENT OF COMPREHENSIVE LOSS FOR THE THREE AND SIX MONTHS ENDED JUNE 30, 2025 | F-3 | ||||
| CONSOLIDATED STATEMENT OF CHANGES IN STOCKHOLDERS’ DEFICIT FOR THE THREE AND SIX MONTHS ENDED JUNE 30, 2025 | F-4 | ||||
| CONSOLIDATED STATEMENT OF CASH FLOWS FOR THE SIX MONTHS ENDED JUNE 30, 2025 | F-5 | ||||
| NOTES TO CONSOLIDATED FINANCIAL STATEMENTS | F-6 to F-21 | ||||
| /s/ KMPG LLP | ||
| Philadelphia, Pennsylvania | ||
| September 15, 2025 | ||
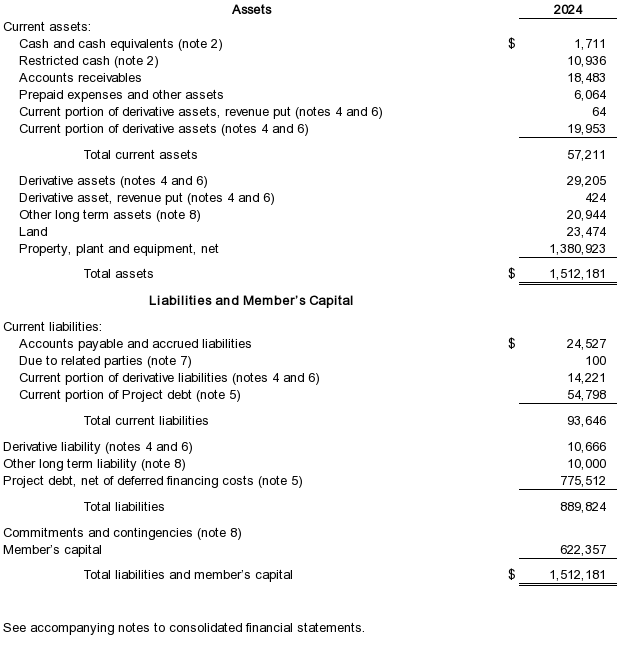
| June 30, 2025 | December 31, 2024 | |||||||||||||||||||
| Assets | ||||||||||||||||||||
| Current assets | ||||||||||||||||||||
Cash and cash equivalents |
$ | 1,662 | $ | 1,711 | ||||||||||||||||
Restricted cash |
21,696 | 10,936 | ||||||||||||||||||
Current portion of derivative assets |
20,905 | 20,017 | ||||||||||||||||||
Accounts receivable |
30,366 | 18,483 | ||||||||||||||||||
Prepaid expenses and other current assets |
1,724 | 6,064 | ||||||||||||||||||
| Total current assets | 76,353 | 57,211 | ||||||||||||||||||
| Long term portion of derivative assets | 14,751 | 29,629 | ||||||||||||||||||
| Property, plant & equipment | 1,356,231 | 1,380,923 | ||||||||||||||||||
| Land | 23,474 | 23,474 | ||||||||||||||||||
| Other assets | 21,888 | 20,944 | ||||||||||||||||||
| Total assets | $ | 1,492,697 | $ | 1,512,181 | ||||||||||||||||
| Liabilities and Members’ Capital | ||||||||||||||||||||
| Current liabilities | ||||||||||||||||||||
Accounts payable and accrued expenses |
$ | 31,078 | $ | 24,527 | ||||||||||||||||
Due to related party |
134 | 100 | ||||||||||||||||||
Current portion of project loan and subordinated loan |
55,514 | 54,798 | ||||||||||||||||||
Current portion of derivative liabilities |
30,459 | 14,221 | ||||||||||||||||||
| Total current liabilities | 117,185 | 93,646 | ||||||||||||||||||
| Other liabilities | 5,000 | 10,000 | ||||||||||||||||||
| Derivative liabilities | 5,895 | 10,666 | ||||||||||||||||||
| Project loan | 749,519 | 775,512 | ||||||||||||||||||
| Total liabilities | 877,599 | 889,824 | ||||||||||||||||||
| Members’ capital | 615,098 | 622,357 | ||||||||||||||||||
| Total member's Capital | 615,098 | 622,357 | ||||||||||||||||||
| Total liabilities and members’ capital | $ | 1,492,697 | $ | 1,512,181 | ||||||||||||||||
| Three Months Ended June 30, 2025 |
Six Months Ended June 30, 2025 |
|||||||||||||||||||
| Revenue: | ||||||||||||||||||||
| Electricity sales | $ | 115,161 | $ | 246,762 | ||||||||||||||||
| Total revenue | 115,161 | 246,762 | ||||||||||||||||||
| Operating expenses: | ||||||||||||||||||||
| Fuel expenses | 57,509 | 152,505 | ||||||||||||||||||
| Plant operating expenses | 7,523 | 14,376 | ||||||||||||||||||
| General and administrative expense | 1,532 | 2,623 | ||||||||||||||||||
| Depreciation expense | 12,167 | 24,336 | ||||||||||||||||||
| Total operating expenses | 78,731 | 193,840 | ||||||||||||||||||
| Operating income | 36,430 | 52,922 | ||||||||||||||||||
| Other expenses: | ||||||||||||||||||||
| Interest expense | 18,929 | 40,628 | ||||||||||||||||||
| Deferred financing cost amortization expense | 1,200 | 2,401 | ||||||||||||||||||
| Total other expenses | 20,129 | 43,029 | ||||||||||||||||||
| Net income | $ | 16,301 | $ | 9,893 | ||||||||||||||||
| Total Member's Capital | |||||||||||
| Member’s capital at December 31, 2024 | $ | 622,357 | |||||||||
| Net income | 9,893 | ||||||||||
| Equity distributions | (17,152) | ||||||||||
| Member’s capital at June 30, 2025 | $ | 615,098 | |||||||||
|
Six Months Ended
June 30, 2025
|
|||||||||||
| Cash flows from operating activities: | |||||||||||
| Net income | $ | 9,893 | |||||||||
| Adjustments to reconcile net income to net cash provided by (used in) operating activities: | |||||||||||
Depreciation expense |
24,336 | ||||||||||
Deferred financing cost amortization expense |
2,401 | ||||||||||
Unrealized loss on power swaps |
6,017 | ||||||||||
Unrealized loss on gas swaps |
2,173 | ||||||||||
Unrealized loss on interest rate swaps |
17,267 | ||||||||||
Change in operating assets and liabilities: |
|||||||||||
Accounts receivable |
(11,883) | ||||||||||
Prepaid and other assets |
(1,604) | ||||||||||
Accounts payable and accrued liabilities |
6,550 | ||||||||||
Amounts due to related parties |
34 | ||||||||||
Net cash provided by operating activities |
55,184 | ||||||||||
| Cash flows from investing activities: | |||||||||||
Capital expenditures |
356 | ||||||||||
Net cash provided by investing activities |
356 | ||||||||||
| Cash flows from financing activities: | |||||||||||
Proceeds/repayment of project debt, net |
(27,677) | ||||||||||
Distributions to partners |
(17,152) | ||||||||||
Net cash used in financing activities |
(44,829) | ||||||||||
| Net change in cash and cash equivalents | 10,711 | ||||||||||
| Cash, restricted cash and cash equivalents at beginning of year | 12,647 | ||||||||||
| Cash, restricted cash and cash equivalents at end of year | $ | 23,358 | |||||||||
| Supplemental cash flow information: | |||||||||||
| Cash paid for interest | $ | 23,252 | |||||||||
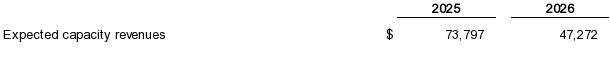
| 2025 | 2026 | |||||||||||||
| Expected capacity revenues | $ | 57,987 | $ | 47,272 | ||||||||||
| Three Month Ended June 30, 2025 |
Six Months Ended June 30, 2025 |
|||||||||||||||||||
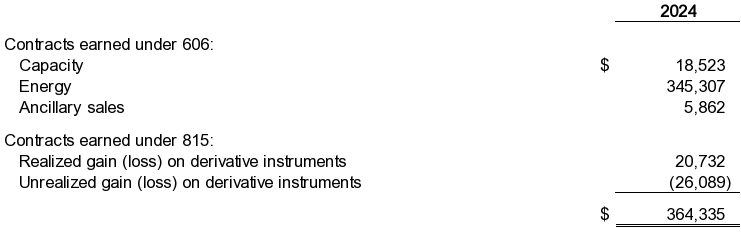
| Contracts earned under 606: | ||||||||||||||||||||
| Capacity | $ | 12,650 | $ | 16,771 | ||||||||||||||||
| Energy | 86,940 | 235,217 | ||||||||||||||||||
| Ancillary sales | 572 | 1,898 | ||||||||||||||||||
| Contracts earned under 815: | ||||||||||||||||||||
| Realized gain (loss) on derivative instruments | 1,573 | (1,107) | ||||||||||||||||||
| Unrealized gain (loss) on derivative instruments | 13,426 | (6,017) | ||||||||||||||||||
| $ | 115,161 | $ | 246,762 | |||||||||||||||||
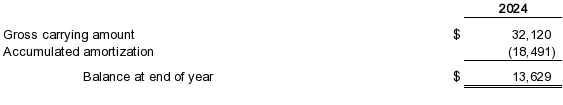
| June 30, 2025 | December 31, 2024 | |||||||||||||||||||
| Gross carrying amount | $ | 22,378 | $ | 32,120 | ||||||||||||||||
| Accumulated amortization | (11,149) | (18,491) | ||||||||||||||||||
Balance at end of period |
$ | 11,229 | $ | 13,629 | ||||||||||||||||
| Balance of plant | 30 years | |||||||
| Buildings and other assets | 5-25 years | |||||||
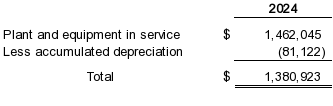
| June 30, 2025 | December 31, 2024 | |||||||||||||||||||
| Plant and equipment in service | $ | 1,460,689 | $ | 1,462,045 | ||||||||||||||||
| Work in process | 999 | - | ||||||||||||||||||
Total |
1,461,688 | 1,462,045 | ||||||||||||||||||
| Less: accumulated depreciation | (105,457) | (81,122) | ||||||||||||||||||
Total property, plant, and equipment, net |
$ | 1,356,231 | $ | 1,380,923 | ||||||||||||||||
| June 30, 2025 | ||||||||||||||||||||||||||||||||||||||
| Level 1 | Level 2 | Level 3 | Total | |||||||||||||||||||||||||||||||||||
| Derivative assets: | ||||||||||||||||||||||||||||||||||||||
Revenue put |
$ | - | $ | - | $ | 2,345 | $ | 2,345 | ||||||||||||||||||||||||||||||
Power swap |
- | - | 1,434 | 1,434 | ||||||||||||||||||||||||||||||||||
Gas swap |
- | 27 | - | 27 | ||||||||||||||||||||||||||||||||||
Interest rate swap |
- | 31,850 | - | 31,850 | ||||||||||||||||||||||||||||||||||
Total assets measured at fair value |
$ | - | $ | 31,877 | $ | 3,779 | $ | 35,656 | ||||||||||||||||||||||||||||||
| Derivative liabilities: | ||||||||||||||||||||||||||||||||||||||
Power swap |
$ | - | $ | - | $ | 34,154 | $ | 34,154 | ||||||||||||||||||||||||||||||
Gas swap |
2,200 | - | 2,200 | |||||||||||||||||||||||||||||||||||
Total liabilities measured at fair value |
$ | - | $ | 2,200 | $ | 34,154 | $ | 36,354 | ||||||||||||||||||||||||||||||
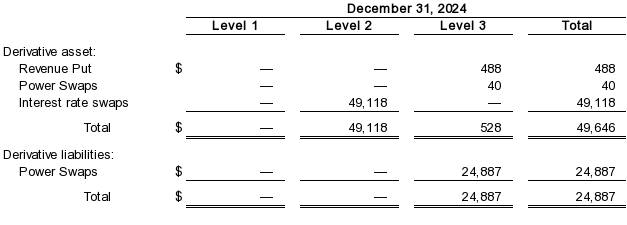
| December 31, 2024 | ||||||||||||||||||||||||||||||||||||||
| Level 1 | Level 2 | Level 3 | Total | |||||||||||||||||||||||||||||||||||
| Derivative assets: | ||||||||||||||||||||||||||||||||||||||
Revenue put |
$ | - | $ | - | $ | 488 | $ | 488 | ||||||||||||||||||||||||||||||
Power swap |
- | - | 40 | 40 | ||||||||||||||||||||||||||||||||||
Interest rate swap |
- | 49,118 | - | 49,118 | ||||||||||||||||||||||||||||||||||
Total assets measured at fair value |
$ | - | $ | 49,118 | $ | 528 | $ | 49,646 | ||||||||||||||||||||||||||||||
| Derivative liabilities: | ||||||||||||||||||||||||||||||||||||||
Power swap |
$ | - | $ | - | $ | 24,887 | $ | 24,887 | ||||||||||||||||||||||||||||||
Total liabilities measured at fair value |
$ | - | $ | - | $ | 24,887 | $ | 24,887 | ||||||||||||||||||||||||||||||
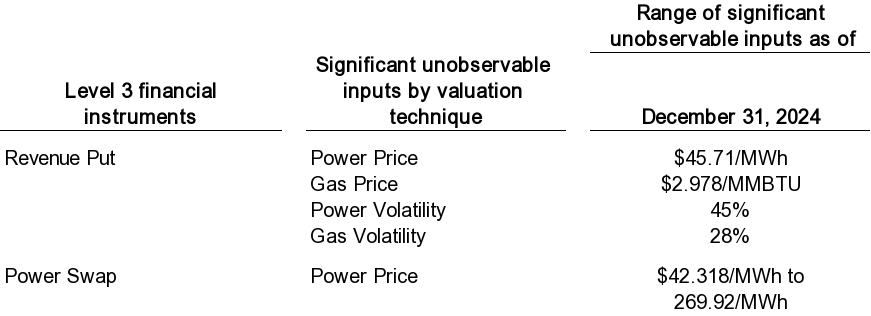
| Range of Significant Unobservable Inputs | ||||||||||||||||||||
| Level 3 Financial Instruments | Significant Unobservable Inputs by Valuation Technique | June 30, 2025 | December 31, 2024 | |||||||||||||||||
| Revenue Put | Power Price | $49.18/MWh | $45.71/MWh | |||||||||||||||||
| Gas Price | $3.085/MMBTU | $2.978/MMBTU | ||||||||||||||||||
| Power Volatility | 45% | 45% | ||||||||||||||||||
| Gas Volatility | 25% | 28% | ||||||||||||||||||
| Power Swap | Power Price | $42.879/MWh to $269.92/MWh | $42.318/MWh to $269.92/MWh | |||||||||||||||||
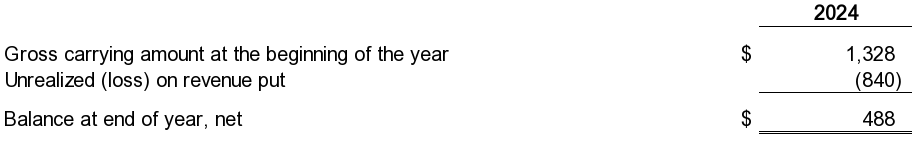
| 2025 | |||||||||||
| Balance at beginning of period, net | $ | 488 | |||||||||
| Unrealized gain on revenue put | 1,857 | ||||||||||
| Balance at end of period, net | $ | 2,345 | |||||||||
| 2025 | |||||||||||
| Balance at beginning of period, net | $ | (24,847) | |||||||||
| Unrealized loss on power swaps | (7,873) | ||||||||||
| Balance at end of period, net | $ | (32,720) | |||||||||
| June 30, 2025 | Maturity Date | Interest Rate | Payments | Fair Market Value as of June 30, 2025 | |||||||||||||||||||||||||||||||
| Term loan facility | $ | 816,262 | October 31, 2027 | Various | Quarterly (Mar 31, Jun 30, Sept 30, Dec 31) |
$ | 816,463 | ||||||||||||||||||||||||||||
Total outstanding balance |
816,262 | $ | 816,463 | ||||||||||||||||||||||||||||||||
| Less: deferred financing costs (net) | (11,229) | ||||||||||||||||||||||||||||||||||
| Less: current portion of project loan | (55,514) | ||||||||||||||||||||||||||||||||||
Total project loan |
$ | 749,519 | |||||||||||||||||||||||||||||||||
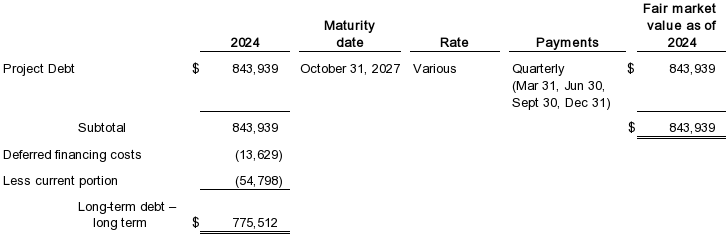
| December 31, 2024 | Maturity Date | Interest Rate | Payments | Fair Market Value as of December 31, 2024 | |||||||||||||||||||||||||||||||
| Term loan facility | $ | 843,939 | October 31, 2027 | Various | Quarterly (Mar 31, Jun 30, Sept 30, Dec 31) |
$ | 843,939 | ||||||||||||||||||||||||||||
Total outstanding balance |
843,939 | $ | 843,939 | ||||||||||||||||||||||||||||||||
| Less: deferred financing costs (net) | (13,629) | ||||||||||||||||||||||||||||||||||
| Less: current portion of project loan | (54,798) | ||||||||||||||||||||||||||||||||||
Total project loan |
$ | 775,512 | |||||||||||||||||||||||||||||||||
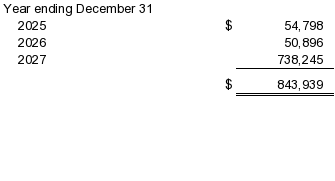
| 2025 (remaining six months) | $ | 27,120 | |||||||||
| 2026 | 50,896 | ||||||||||
| 2027 | 738,246 | ||||||||||
| 2028 | - | ||||||||||
| 2029 | - | ||||||||||
| Thereafter | - | ||||||||||
| Total | $ | 816,262 | |||||||||
| Three Months Ended June 30, 2025 | |||||||||||||||||||||||||||||||||||||||||||||||
| Gas Derivatives (Level 2) |
Interest Rate Derivatives (Level 2) |
Power Derivatives (Level 3) |
Revenue Put (Level 3) |
Total Derivatives | |||||||||||||||||||||||||||||||||||||||||||
| Realized and unrealized gains (losses): | |||||||||||||||||||||||||||||||||||||||||||||||
Settlements |
$ | - | $ | 5,482 | $ | 1,573 | $ | - | $ | 7,055 | |||||||||||||||||||||||||||||||||||||
Fair value adjustments |
(2,064) | (7,065) | 11,452 | 1,974 | 4,297 | ||||||||||||||||||||||||||||||||||||||||||
Total gains (losses) |
$ | (2,064) | $ | (1,583) | $ | 13,025 | $ | 1,974 | $ | 11,352 | |||||||||||||||||||||||||||||||||||||
| Statement of operations recognition: | |||||||||||||||||||||||||||||||||||||||||||||||
Revenue |
$ | - | $ | - | $ | 13,025 | $ | 1,974 | $ | 14,999 | |||||||||||||||||||||||||||||||||||||
Fuel expense |
(2,064) | - | - | - | (2,064) | ||||||||||||||||||||||||||||||||||||||||||
Interest expense |
- | (1,583) | - | - | (1,583) | ||||||||||||||||||||||||||||||||||||||||||
Total gains (losses) |
$ | (2,064) | $ | (1,583) | $ | 13,025 | $ | 1,974 | $ | 11,352 | |||||||||||||||||||||||||||||||||||||
| Six Months Ended June 30, 2025 | |||||||||||||||||||||||||||||||||||||||||||||||
| Gas Derivatives (Level 2) |
Interest Rate Derivatives (Level 2) |
Power Derivatives (Level 3) |
Revenue Put (Level 3) |
Total Derivatives | |||||||||||||||||||||||||||||||||||||||||||
| Realized and unrealized gains (losses): | |||||||||||||||||||||||||||||||||||||||||||||||
Settlements |
$ | (1,041) | $ | 11,055 | $ | (1,107) | $ | $ | 8,907 | ||||||||||||||||||||||||||||||||||||||
Fair value adjustments |
(2,173) | (17,267) | (7,873) | 1,856 | (25,457) | ||||||||||||||||||||||||||||||||||||||||||
Total gains (losses) |
$ | (3,214) | $ | (6,212) | $ | (8,980) | $ | 1,856 | $ | (16,550) | |||||||||||||||||||||||||||||||||||||
| Statement of operations recognition: | |||||||||||||||||||||||||||||||||||||||||||||||
Revenue |
$ | - | $ | - | $ | (8,980) | $ | 1,856 | $ | (7,124) | |||||||||||||||||||||||||||||||||||||
Fuel expense |
(3,214) | - | - | - | (3,214) | ||||||||||||||||||||||||||||||||||||||||||
Interest expense |
- | (6,212) | - | - | (6,212) | ||||||||||||||||||||||||||||||||||||||||||
Total gains (losses) |
$ | (3,214) | $ | (6,212) | $ | (8,980) | $ | 1,856 | $ | (16,550) | |||||||||||||||||||||||||||||||||||||
| Period 6/30/2021-9/29/2023 | Period 9/29/2023 - term | |||||||||||||||||||
| Institution: | ||||||||||||||||||||
Credit Agricole |
1.441 | % | 1.226 | % | ||||||||||||||||
Societe Generale |
1.441 | % | 1.211 | % | ||||||||||||||||
Nomura |
1.441 | % | 1.218 | % | ||||||||||||||||
Investec |
1.441 | % | 1.228 | % | ||||||||||||||||
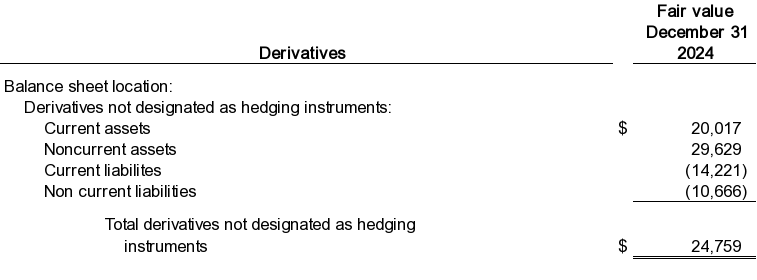
| June 30, 2025 | December 31, 2024 | |||||||||||||||||||
| Balance sheet location: | ||||||||||||||||||||
Derivatives not designated as hedging instruments: |
||||||||||||||||||||
Current assets |
$ | 20,905 | $ | 20,017 | ||||||||||||||||
Noncurrent assets |
14,751 | 29,629 | ||||||||||||||||||
Current liabilities |
(30,459) | (14,221) | ||||||||||||||||||
Noncurrent liabilities |
(5,895) | (10,666) | ||||||||||||||||||
Total derivatives not designated as hedging instruments |
(698) | 24,759 | ||||||||||||||||||
Total derivatives |
$ | (698) | $ | 24,759 | ||||||||||||||||
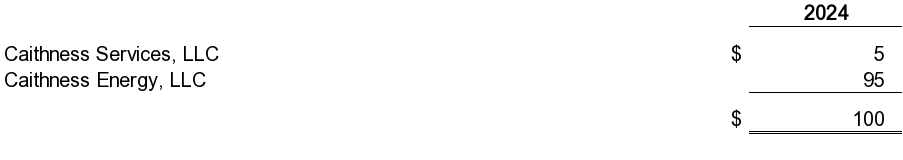
| June 30, 2025 | December 31, 2024 | |||||||||||||||||||
| Caithness Services, LLC | $ | 5 | 5 | |||||||||||||||||
| Caithness Energy, LLC | 129 | 95 | ||||||||||||||||||
| $ | 134 | 100 | ||||||||||||||||||
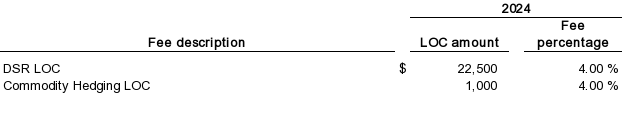
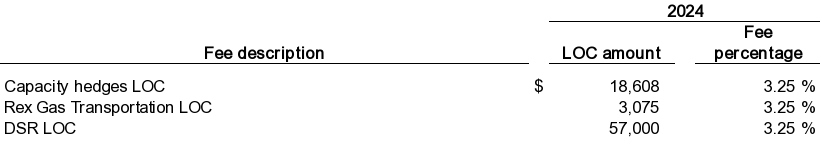
| June 30, 2025 | December 31, 2024 | |||||||||||||||||||||||||||||||
| Fee Description | LOC Amount | Fee Percentage | LOC Amount | Fee Percentage | ||||||||||||||||||||||||||||
| Capacity Hedges LOC | $ | 18,608 | 3.25 | % | $ | 18,608 | 3.25 | % | ||||||||||||||||||||||||
| Rex Gas Transportation LOC | 3,075 | 3.25 | % | 3,075 | 3.25 | % | ||||||||||||||||||||||||||
| DSR LOC | 51,000 | 3.25 | % | 57,000 | 3.25 | % | ||||||||||||||||||||||||||
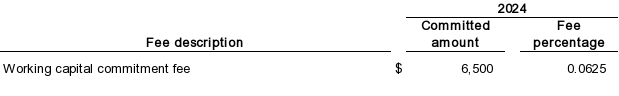
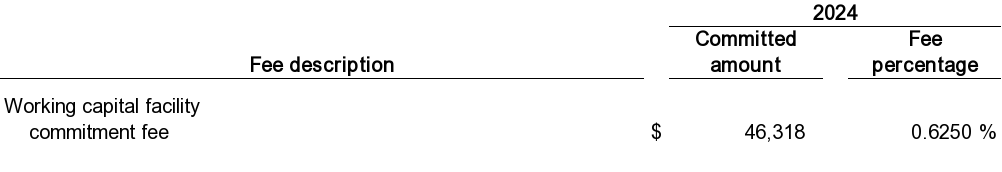
| June 30, 2025 | December 31, 2024 | ||||||||||||||||||||||||||||
| Fee Description | Committed Amount | Fee Percentage | Committed Amount | Fee Percentage | |||||||||||||||||||||||||
| Working capital facility commitment fee | $ | 52,318 | 0.6250 | % | $ | 46,318 | 0.6250 | % | |||||||||||||||||||||
| (Millions of Dollars, except share data) | Historical Talen Energy Corporation | Historical Acquired Entities as Reclassified (a) |
Acquisition Accounting Adjustments | Other Accounting Adjustments | Pro Forma Combined | |||||||||||||||||||||||||||
| Assets | ||||||||||||||||||||||||||||||||
| Cash and cash equivalents | $ | 122 | $ | 3 | $ | (3,788) | 4(a) | $ | 3,840 | 5(a) | $ | 174 | ||||||||||||||||||||
| (3) | 4(b) | |||||||||||||||||||||||||||||||
| Restricted cash and cash equivalents | 13 | 34 | (34) | 4(b) | — | 13 | ||||||||||||||||||||||||||
| Accounts receivable | 226 | 47 | — | — | 273 | |||||||||||||||||||||||||||
| Inventory, net | 224 | 4 | — | — | 228 | |||||||||||||||||||||||||||
| Derivative instruments | 80 | 24 | (18) | 4(c) | $ | — | 86 | |||||||||||||||||||||||||
| Other current assets | 165 | 3 | — | — | 168 | |||||||||||||||||||||||||||
| Total current assets | 830 | 115 | (3,843) | 3,840 | 942 | |||||||||||||||||||||||||||
| Property, plant and equipment, net | 3,089 | 2,002 | 2,401 | 4(d) | — | 7,492 | ||||||||||||||||||||||||||
| Nuclear decommissioning trust funds | 1,790 | — | — | — | 1,790 | |||||||||||||||||||||||||||
| Derivative instruments | — | 15 | (15) | 4(c) | — | — | ||||||||||||||||||||||||||
| Other noncurrent assets | 118 | 46 | — | — | 164 | |||||||||||||||||||||||||||
| Total Assets | $ | 5,827 | $ | 2,178 | $ | (1,457) | $ | 3,840 | $ | 10,388 | ||||||||||||||||||||||
| Liabilities and Equity | ||||||||||||||||||||||||||||||||
| Revolving credit facilities | $ | 70 | $ | — | $ | — | $ | — | $ | 70 | ||||||||||||||||||||||
| Long-term debt, due within one year | 17 | 60 | (60) | 4(b) | $ | — | 17 | |||||||||||||||||||||||||
| Accrued interest | 30 | — | — | — | 30 | |||||||||||||||||||||||||||
| Accounts payable and other accrued liabilities | 226 | 47 | 25 | 4(e) | — | 298 | ||||||||||||||||||||||||||
| Derivative instruments | 32 | 41 | — | — | 73 | |||||||||||||||||||||||||||
| Other current liabilities | 77 | — | — | — | 77 | |||||||||||||||||||||||||||
| Total current liabilities | 452 | 148 | (35) | — | 565 | |||||||||||||||||||||||||||
| Long-term debt | 2,972 | 1,101 | (1,101) | 4(b) | 3,840 | 5(a) | 6,812 | |||||||||||||||||||||||||
| Liabilities subject to compromise | — | — | — | — | — | |||||||||||||||||||||||||||
| Derivative instruments | 62 | 12 | (1) | 4(c) | — | 73 | ||||||||||||||||||||||||||
| Contract liabilities | 617 | 4(f) | — | 617 | ||||||||||||||||||||||||||||
| Postretirement benefit obligations | 282 | — | — | — | 282 | |||||||||||||||||||||||||||
| Asset retirement obligations and accrued environmental costs | 478 | — | — | — | 478 | |||||||||||||||||||||||||||
| Deferred income taxes | 297 | — | — | — | 297 | |||||||||||||||||||||||||||
| Other noncurrent liabilities | 38 | 5 | — | — | 43 | |||||||||||||||||||||||||||
| Total Liabilities | $ | 4,581 | $ | 1,266 | $ | (520) | $ | 3,840 | $ | 9,167 | ||||||||||||||||||||||
| Stockholders' Equity | ||||||||||||||||||||||||||||||||
Common stock ($0.001 par value 350,000,000 shares authorized) (b) |
$ | — | $ | — | — | 4(g) | $ | — | $ | — | ||||||||||||||||||||||
| Additional paid-in capital | 1,711 | 912 | (912) | 4(g) | — | 1,711 | ||||||||||||||||||||||||||
| Accumulated retained earnings (deficit) | (456) | — | (25) | 4(e) | — | (481) | ||||||||||||||||||||||||||
| Accumulated other comprehensive income (loss) | (9) | — | — | — | (9) | |||||||||||||||||||||||||||
| Total Stockholders' Equity | $ | 1,246 | $ | 912 | $ | (937) | $ | — | $ | 1,221 | ||||||||||||||||||||||
| Total Liabilities and Stockholders' Equity | $ | 5,827 | $ | 2,178 | $ | (1,457) | $ | 3,840 | $ | 10,388 | ||||||||||||||||||||||
| (Millions of Dollars, except share data) | Historical Talen Energy Corporation | Historical Acquired Entities as Reclassified (a) |
Acquisition Accounting Adjustments | Other Accounting Adjustments | Pro Forma Combined | |||||||||||||||||||||||||||
| Capacity revenues | $ | 137 | $ | 30 | $ | — | $ | — | $ | 167 | ||||||||||||||||||||||
| Energy and other revenues | 948 | 383 | — | — | 1,331 | |||||||||||||||||||||||||||
| Unrealized gain (loss) on derivative instruments | (65) | (7) | — | — | (72) | |||||||||||||||||||||||||||
| Operating Revenues | 1,020 | 406 | — | — | 1,426 | |||||||||||||||||||||||||||
| Fuel and energy purchases | (418) | (232) | 43 | 4(f) | — | (607) | ||||||||||||||||||||||||||
| Nuclear fuel amortization | (44) | — | — | — | (44) | |||||||||||||||||||||||||||
| Unrealized gain (loss) on derivative instruments | (25) | (4) | — | — | (29) | |||||||||||||||||||||||||||
| Energy Expenses | (487) | (236) | 43 | — | (680) | |||||||||||||||||||||||||||
| Operating Expenses | ||||||||||||||||||||||||||||||||
| Operation, maintenance and development | (338) | (27) | 3 | 4(b) | — | (362) | ||||||||||||||||||||||||||
| General and administrative | (75) | — | — | — | (75) | |||||||||||||||||||||||||||
| Depreciation, amortization and accretion | (144) | (37) | 37 | 4(h) | — | (205) | ||||||||||||||||||||||||||
| (61) | 4(i) | |||||||||||||||||||||||||||||||
| Other operating income (expense), net | (16) | — | — | — | (16) | |||||||||||||||||||||||||||
| Operating Income (Loss) | (40) | 106 | 22 | — | 88 | |||||||||||||||||||||||||||
| Nuclear decommissioning trust funds gain (loss), net | 68 | — | — | — | 68 | |||||||||||||||||||||||||||
| Interest expense and other finance charges | (136) | (65) | 56 | 4(j) | (132) | 5(b) | (268) | |||||||||||||||||||||||||
| 9 | 4(c) | |||||||||||||||||||||||||||||||
| Gain (loss) on sale of assets, net | 11 | — | — | — | 11 | |||||||||||||||||||||||||||
| Other non-operating income (expense), net | 7 | — | — | — | 7 | |||||||||||||||||||||||||||
| Income (Loss) Before Income Taxes | (90) | 41 | 87 | (132) | (94) | |||||||||||||||||||||||||||
| Income tax benefit (expense) | 27 | — | (27) | 4(k) | 28 | 5(d) | 28 | |||||||||||||||||||||||||
| Net Income (Loss) Attributable to Stockholders | $ | (63) | $ | 41 | $ | 60 | $ | (104) | $ | (66) | ||||||||||||||||||||||
Per Common Share (b) |
||||||||||||||||||||||||||||||||
| Net Income (Loss) Attributable to Stockholders - Basic | $ | (1.38) | $ | (1.44) | ||||||||||||||||||||||||||||
| Net Income (Loss) Attributable to Stockholders - Diluted | $ | (1.38) | $ | (1.44) | ||||||||||||||||||||||||||||
| Weighted-Average Number of Common Shares Outstanding - Basic (in thousands) | 45,699 | 45,699 | ||||||||||||||||||||||||||||||
| Weighted-Average Number of Common Shares Outstanding - Diluted (in thousands) | 45,699 | 45,699 | ||||||||||||||||||||||||||||||
| (Millions of Dollars, except share data) | Historical Talen Energy Corporation | Historical Acquired Entities as Reclassified (a) |
Acquisition Accounting Adjustments | Other Accounting Adjustments | Pro Forma Combined | |||||||||||||||||||||||||||
| Capacity revenues | $ | 192 | $ | 35 | $ | — | $ | — | $ | 227 | ||||||||||||||||||||||
| Energy and other revenues | 1,881 | 594 | — | — | 2,475 | |||||||||||||||||||||||||||
| Unrealized gain (loss) on derivative instruments | 42 | (40) | — | — | 2 | |||||||||||||||||||||||||||
| Operating Revenues | 2,115 | 589 | — | — | 2,704 | |||||||||||||||||||||||||||
| Fuel and energy purchases | (694) | (331) | 89 | 4(f) | — | (936) | ||||||||||||||||||||||||||
| Nuclear fuel amortization | (123) | — | — | — | (123) | |||||||||||||||||||||||||||
| Unrealized gain (loss) on derivative instruments | 20 | — | — | — | 20 | |||||||||||||||||||||||||||
| Energy Expenses | (797) | (331) | 89 | — | (1,039) | |||||||||||||||||||||||||||
| Operating Expenses | ||||||||||||||||||||||||||||||||
| Operation, maintenance and development | (592) | (63) | 7 | 4(b) | — | (648) | ||||||||||||||||||||||||||
| General and administrative | (163) | — | — | — | (163) | |||||||||||||||||||||||||||
| Depreciation, amortization and accretion | (298) | (76) | 76 | 4(h) | — | (420) | ||||||||||||||||||||||||||
| (122) | 4(i) | — | ||||||||||||||||||||||||||||||
| Impairments | (1) | — | — | — | (1) | |||||||||||||||||||||||||||
| Other operating income (expense), net | (38) | — | (25) | 4(e) | — | (63) | ||||||||||||||||||||||||||
| Operating Income (Loss) | 226 | 119 | 25 | — | 370 | |||||||||||||||||||||||||||
| Nuclear decommissioning trust funds gain (loss), net | 178 | — | — | — | 178 | |||||||||||||||||||||||||||
| Interest expense and other finance charges | (238) | (101) | 128 | 4(j) | (264) | 5(b) | (521) | |||||||||||||||||||||||||
| (27) | 4(c) | (19) | 5(c) | |||||||||||||||||||||||||||||
| Gain (loss) on sale of assets, net | 884 | — | — | — | 884 | |||||||||||||||||||||||||||
| Other non-operating income (expense), net | 61 | 1 | — | — | 62 | |||||||||||||||||||||||||||
| Income (Loss) Before Income Taxes | 1,111 | 19 | 126 | (283) | 973 | |||||||||||||||||||||||||||
| Income tax benefit (expense) | (98) | — | (30) | 4(k) | 59 | 5(d) | (69) | |||||||||||||||||||||||||
| Net Income (Loss) | $ | 1,013 | $ | 19 | $ | 96 | $ | (224) | $ | 904 | ||||||||||||||||||||||
| Less: Net income (loss) attributable to noncontrolling interest | 15 | — | — | — | 15 | |||||||||||||||||||||||||||
| Net Income (Loss) Attributable to Stockholders | $ | 998 | $ | 19 | $ | 96 | $ | (224) | $ | 889 | ||||||||||||||||||||||
Per Common Share (b) |
||||||||||||||||||||||||||||||||
| Net Income (Loss) Attributable to Stockholders - Basic | $ | 18.40 | $ | 16.39 | ||||||||||||||||||||||||||||
| Net Income (Loss) Attributable to Stockholders - Diluted | $ | 17.67 | $ | 15.74 | ||||||||||||||||||||||||||||
| Weighted-Average Number of Common Shares Outstanding - Basic (in thousands) | 54,254 | 54,254 | ||||||||||||||||||||||||||||||
| Weighted-Average Number of Common Shares Outstanding - Diluted (in thousands) | 56,486 | 56,486 | ||||||||||||||||||||||||||||||
| Consideration transferred | Freedom | Guernsey | Total | |||||||||||||||||
| Base purchase price | $ | 1,458 | $ | 2,330 | $ | 3,788 | ||||||||||||||
| Estimated total consideration transferred | $ | 3,788 | ||||||||||||||||||
Estimated Fair Value |
||||||||||||||||||||
Preliminary purchase price allocation |
Freedom |
Guernsey |
Total |
|||||||||||||||||
| Assets acquired: | ||||||||||||||||||||
| Accounts receivable | $ | 17 | $ | 30 | $ | 47 | ||||||||||||||
| Inventory | 4 | — | 4 | |||||||||||||||||
| Derivative instruments (current asset) | 3 | 3 | 6 | |||||||||||||||||
| Other current assets | 1 | 2 | 3 | |||||||||||||||||
| Property, plant, and equipment, net | 1,510 | 2,893 | 4,403 | |||||||||||||||||
| Derivative instruments (noncurrent asset) | — | — | — | |||||||||||||||||
| Other noncurrent assets | 24 | 22 | 46 | |||||||||||||||||
Total assets acquired |
$ | 1,559 | $ | 2,950 | $ | 4,509 | ||||||||||||||
| Liabilities assumed: | ||||||||||||||||||||
| Accounts payable and other accrued liabilities | $ | 16 | $ | 31 | $ | 47 | ||||||||||||||
| Derivative instruments (current liability) | 11 | 30 | 41 | |||||||||||||||||
| Derivative instruments (noncurrent liability) | 5 | 6 | 11 | |||||||||||||||||
| Contract liabilities | 75 | 542 | 617 | |||||||||||||||||
| Other noncurrent liabilities | — | 5 | 5 | |||||||||||||||||
Total liabilities assumed |
$ | 107 | $ | 614 | $ | 721 | ||||||||||||||
Net assets |
$ | 1,452 | $ | 2,336 | $ | 3,788 | ||||||||||||||
| Presentation in Unaudited Pro Forma Condensed Combined Financial Statements | Historical Freedom Before Reclassification | Historical Guernsey Before Reclassification | Total Reclassifications | Historical Acquired Entities as Reclassified | ||||||||||||||||||||||
| Assets | ||||||||||||||||||||||||||
| Cash and cash equivalents | $ | 1 | $ | 2 | $ | — | $ | 3 | ||||||||||||||||||
| Restricted cash and cash equivalents | 12 | 22 | — | 34 | ||||||||||||||||||||||
| Accounts receivable | 17 | 30 | — | 47 | ||||||||||||||||||||||
| Inventory, net | 4 | — | — | 4 | ||||||||||||||||||||||
| Derivative instruments | 3 | 21 | — | 24 | ||||||||||||||||||||||
| Other current assets | 1 | 2 | — | 3 | ||||||||||||||||||||||
| Total Current Assets | 38 | 77 | — | 115 | ||||||||||||||||||||||
| Property, plant, and equipment, net | 614 | 1,356 | 32 | (a) | 2,002 | |||||||||||||||||||||
| Derivative instruments | — | 15 | — | 15 | ||||||||||||||||||||||
| Land | 9 | 23 | (32) | (a) | — | |||||||||||||||||||||
| Other noncurrent assets | 24 | 22 | — | 46 | ||||||||||||||||||||||
| Total Assets | $ | 685 | $ | 1,493 | $ | — | $ | 2,178 | ||||||||||||||||||
| Liabilities and Equity | ||||||||||||||||||||||||||
| Long-term debt, due within one year | $ | 4 | $ | 56 | $ | — | $ | 60 | ||||||||||||||||||
| Accounts payable and other accrued liabilities | 16 | 31 | — | 47 | ||||||||||||||||||||||
| Derivative instruments | 11 | 30 | — | 41 | ||||||||||||||||||||||
| Total Current Liabilities | 31 | 117 | — | 148 | ||||||||||||||||||||||
| Long-term debt | 351 | 750 | — | 1,101 | ||||||||||||||||||||||
| Derivative instruments | 6 | 6 | — | 12 | ||||||||||||||||||||||
| Other noncurrent liabilities | — | 5 | — | 5 | ||||||||||||||||||||||
| Total Liabilities | $ | 388 | $ | 878 | $ | — | $ | 1,266 | ||||||||||||||||||
| Stockholders' Equity | ||||||||||||||||||||||||||
| Additional Paid in Capital | $ | 297 | $ | 615 | $ | — | $ | 912 | ||||||||||||||||||
| Total Stockholders' Equity | $ | 297 | $ | 615 | $ | — | $ | 912 | ||||||||||||||||||
| Total Liabilities and Equity | $ | 685 | $ | 1,493 | $ | — | $ | 2,178 | ||||||||||||||||||
| Presentation in Unaudited Pro Forma Condensed Combined Financial Statements | Historical Freedom Before Reclassification | Historical Guernsey Before Reclassification | Total Reclassifications | Total Accounting Policy Adjustment | Historical Acquired Entities as reclassified with aligned policies | |||||||||||||||||||||||||||
| Capacity revenues | $ | — | $ | — | $ | 30 | (a) | $ | — | $ | 30 | |||||||||||||||||||||
| Energy and other revenues | 159 | 247 | (23) | (a) (b) |
— | 383 | ||||||||||||||||||||||||||
| Unrealized gain (loss) on derivative instruments | — | — | (7) | (b) | — | (7) | ||||||||||||||||||||||||||
| Operating Revenues | 159 | 247 | — | — | 406 | |||||||||||||||||||||||||||
| Fuel and energy purchases | (85) | (153) | 4 | (c) | 1 | (g) | (232) | |||||||||||||||||||||||||
| 1 | (d) | |||||||||||||||||||||||||||||||
| Nuclear fuel amortization | — | — | — | — | — | |||||||||||||||||||||||||||
| Unrealized gain (loss) on derivative instruments | — | — | (4) | (c) | — | (4) | ||||||||||||||||||||||||||
| Energy Expenses | (85) | (153) | 1 | 1 | (236) | |||||||||||||||||||||||||||
| Operating Expenses | ||||||||||||||||||||||||||||||||
| Operation, maintenance and development | (14) | (14) | (4) | (e) | 6 | (g) | (27) | |||||||||||||||||||||||||
| (1) | (d) | — | ||||||||||||||||||||||||||||||
| General and administrative | (1) | (3) | 4 | (e) | — | — | ||||||||||||||||||||||||||
| Depreciation, amortization and accretion | (13) | (24) | — | — | (37) | |||||||||||||||||||||||||||
| Other operating income (expense), net | — | — | — | — | — | |||||||||||||||||||||||||||
| Operating Income (Loss) | 46 | 53 | — | 7 | 106 | |||||||||||||||||||||||||||
| Nuclear decommissioning trust funds gain (loss), net | — | — | — | — | — | |||||||||||||||||||||||||||
| Interest expense and other finance charges | (20) | (41) | (4) | (f) | — | (65) | ||||||||||||||||||||||||||
| Deferred financing cost amortization expense | (2) | (2) | 4 | (f) | — | — | ||||||||||||||||||||||||||
| Gain (loss) on sale of assets, net | — | — | — | — | — | |||||||||||||||||||||||||||
| Other non-operating income (expense), net | — | — | — | — | — | |||||||||||||||||||||||||||
| Income (Loss) Before Income Taxes | $ | 24 | $ | 10 | $ | — | $ | 7 | $ | 41 | ||||||||||||||||||||||
| Presentation in Unaudited Pro Forma Condensed Combined Financial Statements | Historical Freedom Before Reclassification | Historical Guernsey Before Reclassification | Total Reclassifications | Total Accounting Policy Adjustment | Historical Acquired Entities as Reclassified with Aligned Policies | |||||||||||||||||||||||||||
| Capacity revenues | $ | — | $ | — | $ | 35 | (a) | $ | — | $ | 35 | |||||||||||||||||||||
| Energy and other revenues | 225 | 364 | 5 | (a) (b) |
— | 594 | ||||||||||||||||||||||||||
| Unrealized gain (loss) on derivative instruments | — | — | (40) | (b) | — | (40) | ||||||||||||||||||||||||||
| Operating Revenues | 225 | 364 | — | — | 589 | |||||||||||||||||||||||||||
| Fuel and energy purchases | (131) | (208) | 1 | (c) | 7 | (f) | (331) | |||||||||||||||||||||||||
| Nuclear fuel amortization | — | — | — | — | — | |||||||||||||||||||||||||||
| Unrealized gain (loss) on derivative instruments | — | — | — | — | — | |||||||||||||||||||||||||||
| Energy Expenses | (131) | (208) | 1 | 7 | (331) | |||||||||||||||||||||||||||
| Operating Expenses | ||||||||||||||||||||||||||||||||
| Operation, maintenance and development | (26) | (39) | (1) | (c) | 10 | (f) | (63) | |||||||||||||||||||||||||
| (8) | (d) | — | ||||||||||||||||||||||||||||||
| General and administrative | (3) | (5) | 8 | (d) | — | — | ||||||||||||||||||||||||||
| Depreciation, amortization and accretion | (27) | (49) | — | — | (76) | |||||||||||||||||||||||||||
| Other operating income (expense), net | — | — | — | — | — | |||||||||||||||||||||||||||
| Operating Income (Loss) | 38 | 63 | (1) | 17 | 119 | |||||||||||||||||||||||||||
| Nuclear decommissioning trust funds gain (loss), net | — | — | — | — | — | |||||||||||||||||||||||||||
| Interest expense and other finance charges | (32) | (60) | (9) | (e) | — | (101) | ||||||||||||||||||||||||||
| Deferred financing cost amortization expense | (4) | (5) | 9 | (e) | — | — | ||||||||||||||||||||||||||
| Other non-operating income (expense), net | — | 1 | — | — | 1 | |||||||||||||||||||||||||||
| Income (Loss) Before Income Taxes | $ | 2 | $ | (1) | $ | — | $ | 17 | $ | 19 | ||||||||||||||||||||||
June 30, 2025 |
||||||||||||||||||||
| Freedom | Guernsey | Total | ||||||||||||||||||
| Cash and cash equivalents | $ | 1 | $ | 2 | $ | 3 | ||||||||||||||
| Restricted cash | 12 | 22 | 34 | |||||||||||||||||
| Long-term debt, due within one year | 4 | 56 | 60 | |||||||||||||||||
| Long-term debt | 351 | 750 | 1,101 | |||||||||||||||||
| Six Months Ended June 30, 2025 | Year Ended December 31, 2024 | |||||||||||||||||||||||||||||||||||||
| Freedom | Guernsey | Total | Freedom | Guernsey | Total | |||||||||||||||||||||||||||||||||
Asset management agreement |
$ | 1 | $ | 2 | $ | 3 | $ | 3 | $ | 4 | $ | 7 | ||||||||||||||||||||||||||
June 30, 2025 |
||||||||||||||||||||
| Derivative instruments | Freedom | Guernsey | Total | |||||||||||||||||
| Current assets | $ | 1 | $ | 17 | $ | 18 | ||||||||||||||
| Non-current assets | — | 15 | 15 | |||||||||||||||||
| Current liabilities | — | — | — | |||||||||||||||||
| Non-current liabilities | (1) | — | (1) | |||||||||||||||||
| Interest rate swaps | Six Months Ended June 30, 2025 | Year Ended December 31, 2024 | ||||||||||||||||||||||||||||||||||||
| Freedom | Guernsey | Total | Freedom | Guernsey | Total | |||||||||||||||||||||||||||||||||
| Unrealized gain (loss) on derivative instruments | $ | (4) | $ | (17) | $ | (21) | $ | 1 | $ | (9) | $ | (8) | ||||||||||||||||||||||||||
| Interest expense and other finance charges | 1 | 11 | 12 | 5 | 30 | 35 | ||||||||||||||||||||||||||||||||
| Total | $ | (9) | $ | 27 | ||||||||||||||||||||||||||||||||||
June 30, 2025 |
||||||||||||||||||||
| Property, plant, and equipment, net | Freedom | Guernsey | Total | |||||||||||||||||
Fair value |
$ | 1,510 | $ | 2,893 | $ | 4,403 | ||||||||||||||
Less: Historical value |
623 | 1,379 | 2,002 | |||||||||||||||||
Step-up |
$ | 887 | $ | 1,514 | $ | 2,401 | ||||||||||||||
Unfavorable contract liabilities (a) |
Remaining Contact Term (years) | Preliminary Fair Value | ||||||||||||||||||||||||
| Freedom | Guernsey | Total | ||||||||||||||||||||||||
| Gas supply agreements | 2 - 8 | $ | 75 | $ | 542 | $ | 617 | |||||||||||||||||||
| Amortization of unfavorable contract liabilities | Six Months Ended June 30, 2025 | Year Ended December 31, 2024 | ||||||||||||||||||||||||||||||||||||
| Freedom | Guernsey | Total | Freedom | Guernsey | Total | |||||||||||||||||||||||||||||||||
| Amortization | $ | 9 | $ | 34 | $ | 43 | $ | 19 | $ | 70 | $ | 89 | ||||||||||||||||||||||||||
| Six Months Ended June 30, 2025 | Year Ended December 31, 2024 | |||||||||||||||||||||||||||||||||||||
| Freedom | Guernsey | Total | Freedom | Guernsey | Total | |||||||||||||||||||||||||||||||||
| Depreciation, amortization and accretion | $ | 13 | $ | 24 | $ | 37 | $ | 27 | $ | 49 | $ | 76 | ||||||||||||||||||||||||||
June 30, 2025 |
||||||||||||||||||||||||||
| Property, plant and equipment, net | Estimated Useful Life (years) | Preliminary Fair Value | ||||||||||||||||||||||||
| Freedom | Guernsey | Total | ||||||||||||||||||||||||
| Land | n/a | $ | 9 | $ | 23 | $ | 32 | |||||||||||||||||||
| Plant and equipment | 33 - 38 |
1,501 | 2,870 | 4,371 | ||||||||||||||||||||||
| Total | $ | 1,510 | $ | 2,893 | $ | 4,403 | ||||||||||||||||||||
| Depreciation | Six Months Ended June 30, 2025 | Year Ended December 31, 2024 | ||||||||||||||||||||||||||||||||||||
| Freedom | Guernsey | Total | Freedom | Guernsey | Total | |||||||||||||||||||||||||||||||||
| Land | n/a | n/a | n/a | n/a | n/a | n/a | ||||||||||||||||||||||||||||||||
| Plant and equipment | 23 | 38 | 61 | 46 | 76 | 122 | ||||||||||||||||||||||||||||||||
| Total | $ | 61 | $ | 122 | ||||||||||||||||||||||||||||||||||
| Interest expense and other finance charges | Six Months Ended June 30, 2025 | Year Ended December 31, 2024 | ||||||||||||||||||||||||||||||||||||
| Freedom | Guernsey | Total | Freedom | Guernsey | Total | |||||||||||||||||||||||||||||||||
| Interest expense | $ | 17 | $ | 35 | $ | 52 | $ | 38 | $ | 81 | $ | 119 | ||||||||||||||||||||||||||
Amortization of deferred financing costs |
2 | 2 | 4 | 4 | 5 | 9 | ||||||||||||||||||||||||||||||||
| Total | $ | 56 | $ | 128 | ||||||||||||||||||||||||||||||||||
| Pro forma earnings per share | Six Months Ended June 30, 2025 | Year Ended December 31, 2024 | ||||||||||||
Pro forma net income attributable to Talen |
$ | (66) | $ | 889 | ||||||||||
| Basic: | ||||||||||||||
Historical weighted average of Talen common shares outstanding (in thousands) |
45,699 | 54,254 | ||||||||||||
| Pro forma earnings per share - basic | $ | (1.44) | $ | 16.39 | ||||||||||
| Diluted: | ||||||||||||||
Historical weighted average of Talen common shares outstanding (in thousands) |
45,699 | 56,486 | ||||||||||||
| Pro forma earnings per share - diluted | $ | (1.44) | $ | 15.74 | ||||||||||
| June 30, 2025 | ||||||||||||||||||||
Long-term debt |
Long-Term Debt | Associated Fees | Total (Net of Debt) | |||||||||||||||||
New Term B Facility |
$ | 1,200 | $ | 15 | $ | 1,185 | ||||||||||||||
New unsecured debt |
2,690 | 35 | 2,655 | |||||||||||||||||
| Pro forma adjustment to long-term debt | $ | 3,890 | $ | 50 | $ | 3,840 | ||||||||||||||
Interest expense |
Six Months Ended June 30, 2025 | Year Ended December 31, 2024 | ||||||||||||
Interest expense associated with Debt Financings |
$ | 129 | $ | 258 | ||||||||||
| Amortization of new debt issuance costs | 3 | 6 | ||||||||||||
| Pro forma adjustment to interest expense | $ | 132 | $ | 264 | ||||||||||
Increase (decrease) in interest expense |
Six Months Ended June 30, 2025 | Year Ended December 31, 2024 | ||||||||||||
0.125% increase in interest rate |
$ | 2 | $ | 5 | ||||||||||
0.125% decrease in interest rate |
(3) | (5) | ||||||||||||