
1 Third Quarter 2024 Shareholder Letter NOW SERVING: BLACK TRUFFLE BURGERS
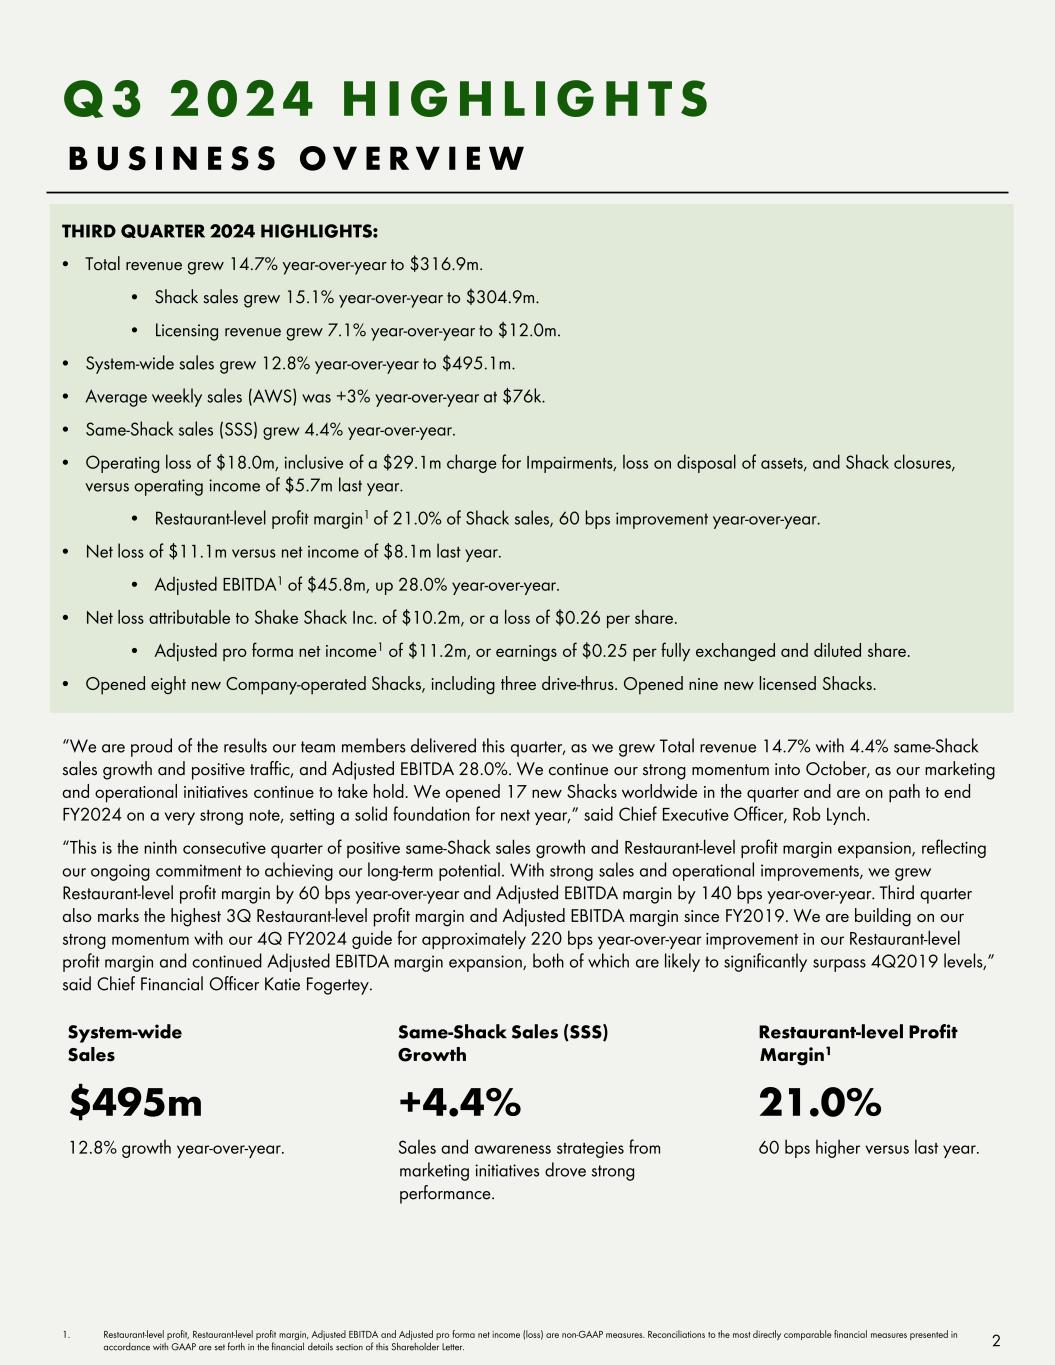
THIRD QUARTER 2024 HIGHLIGHTS: • Total revenue grew 14.7% year-over-year to $316.9m. • Shack sales grew 15.1% year-over-year to $304.9m. • Licensing revenue grew 7.1% year-over-year to $12.0m. • System-wide sales grew 12.8% year-over-year to $495.1m. • Average weekly sales (AWS) was +3% year-over-year at $76k. • Same-Shack sales (SSS) grew 4.4% year-over-year. • Operating loss of $18.0m, inclusive of a $29.1m charge for Impairments, loss on disposal of assets, and Shack closures, versus operating income of $5.7m last year. • Restaurant-level profit margin1 of 21.0% of Shack sales, 60 bps improvement year-over-year. • Net loss of $11.1m versus net income of $8.1m last year. • Adjusted EBITDA1 of $45.8m, up 28.0% year-over-year. • Net loss attributable to Shake Shack Inc. of $10.2m, or a loss of $0.26 per share. • Adjusted pro forma net income1 of $11.2m, or earnings of $0.25 per fully exchanged and diluted share. • Opened eight new Company-operated Shacks, including three drive-thrus. Opened nine new licensed Shacks. Q 3 2 0 2 4 H I G H L I G H T S System-wide Sales $495m 12.8% growth year-over-year. Same-Shack Sales (SSS) Growth +4.4% Sales and awareness strategies from marketing initiatives drove strong performance. Restaurant-level Profit Margin1 21.0% 60 bps higher versus last year. 2 B U S I N E S S O V E R V I E W 1. Restaurant-level profit, Restaurant-level profit margin, Adjusted EBITDA and Adjusted pro forma net income (loss) are non-GAAP measures. Reconciliations to the most directly comparable financial measures presented in accordance with GAAP are set forth in the financial details section of this Shareholder Letter. “We are proud of the results our team members delivered this quarter, as we grew Total revenue 14.7% with 4.4% same-Shack sales growth and positive traffic, and Adjusted EBITDA 28.0%. We continue our strong momentum into October, as our marketing and operational initiatives continue to take hold. We opened 17 new Shacks worldwide in the quarter and are on path to end FY2024 on a very strong note, setting a solid foundation for next year,” said Chief Executive Officer, Rob Lynch. “This is the ninth consecutive quarter of positive same-Shack sales growth and Restaurant-level profit margin expansion, reflecting our ongoing commitment to achieving our long-term potential. With strong sales and operational improvements, we grew Restaurant-level profit margin by 60 bps year-over-year and Adjusted EBITDA margin by 140 bps year-over-year. Third quarter also marks the highest 3Q Restaurant-level profit margin and Adjusted EBITDA margin since FY2019. We are building on our strong momentum with our 4Q FY2024 guide for approximately 220 bps year-over-year improvement in our Restaurant-level profit margin and continued Adjusted EBITDA margin expansion, both of which are likely to significantly surpass 4Q2019 levels,” said Chief Financial Officer Katie Fogertey.
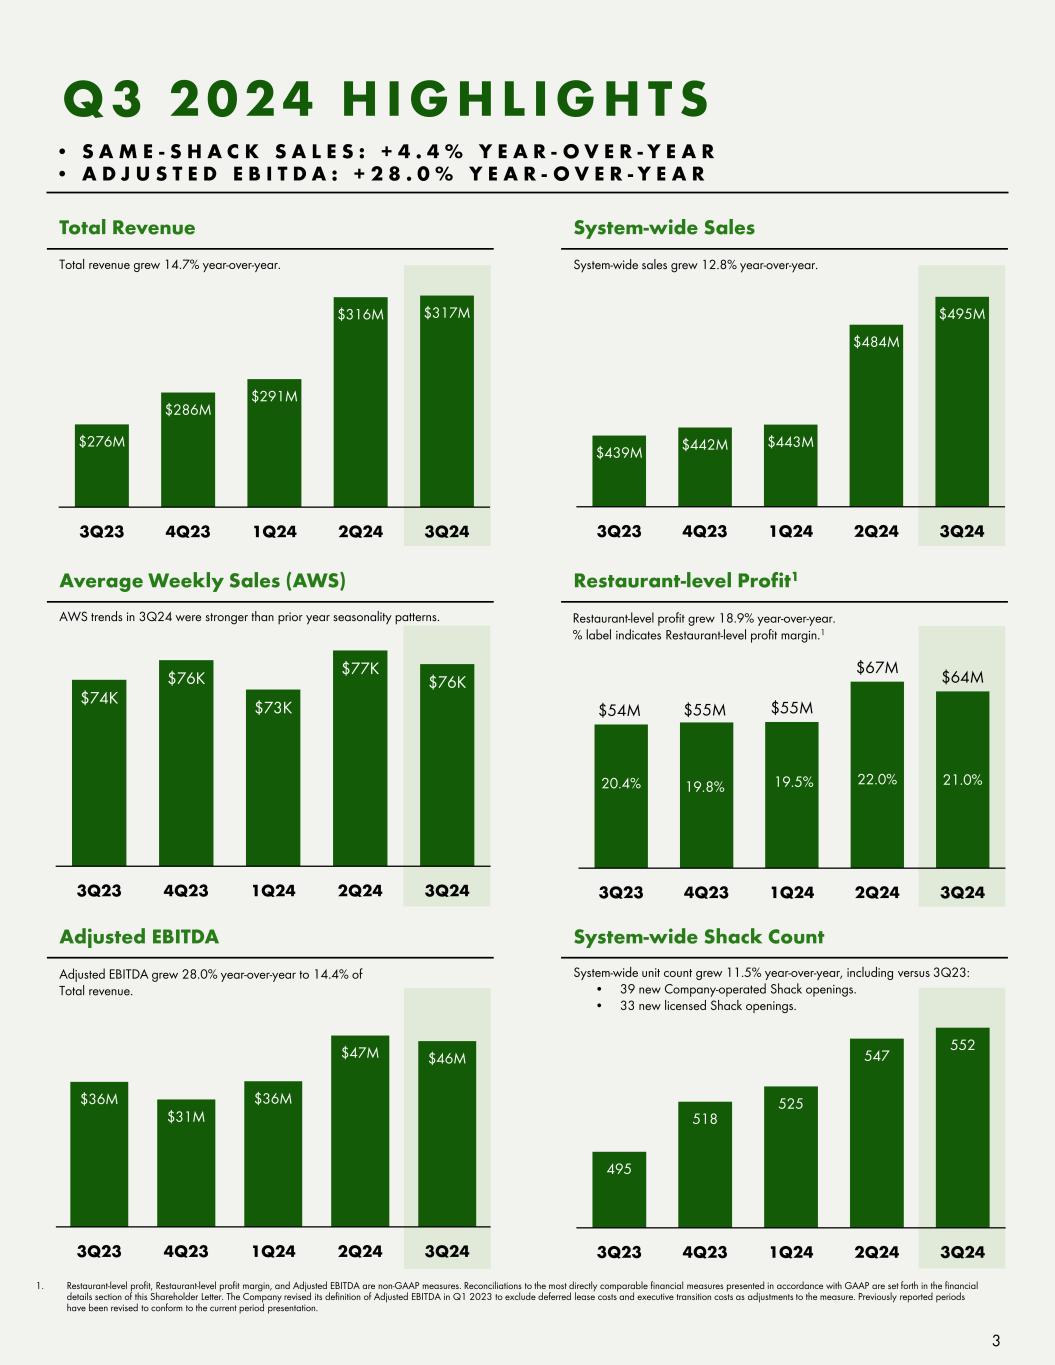
$74K $76K $73K $77K $76K 3Q23 4Q23 1Q24 2Q24 3Q24 $276M $286M $291M $316M $317M 3Q23 4Q23 1Q24 2Q24 3Q24 495 518 525 547 552 3Q23 4Q23 1Q24 2Q24 3Q24 $439M $442M $443M $484M $495M 3Q23 4Q23 1Q24 2Q24 3Q24 1. Restaurant-level profit, Restaurant-level profit margin, and Adjusted EBITDA are non-GAAP measures. Reconciliations to the most directly comparable financial measures presented in accordance with GAAP are set forth in the financial details section of this Shareholder Letter. The Company revised its definition of Adjusted EBITDA in Q1 2023 to exclude deferred lease costs and executive transition costs as adjustments to the measure. Previously reported periods have been revised to conform to the current period presentation. Total Revenue Adjusted EBITDA Average Weekly Sales (AWS) System-wide Shack Count System-wide Sales Q 3 2 0 2 4 H I G H L I G H T S • S A M E - S H A C K S A L E S : + 4 . 4 % Y E A R - O V E R - Y E A R • A D J U S T E D E B I T D A : + 2 8 . 0 % Y E A R - O V E R - Y E A R 3 Total revenue grew 14.7% year-over-year. System-wide sales grew 12.8% year-over-year. AWS trends in 3Q24 were stronger than prior year seasonality patterns. System-wide unit count grew 11.5% year-over-year, including versus 3Q23: • 39 new Company-operated Shack openings. • 33 new licensed Shack openings. $36M $31M $36M $47M $46M 3Q23 4Q23 1Q24 2Q24 3Q24 Adjusted EBITDA grew 28.0% year-over-year to 14.4% of Total revenue. $54M $55M $55M $67M $64M 20.4% 19.8% 19.5% 22.0% 21.0% 18.0% 18.5% 19.0% 19.5% 20.0% 20.5% 21.0% 21.5% 22.0% 22.5% $10.0 $20.0 $30.0 $40.0 $50.0 $60.0 $70.0 3Q23 4Q23 1Q24 2Q24 3Q24 Restaurant-level Profit1 % label indicates Restaurant-level profit margin.1 Restaurant-level profit grew 18.9% year-over-year.
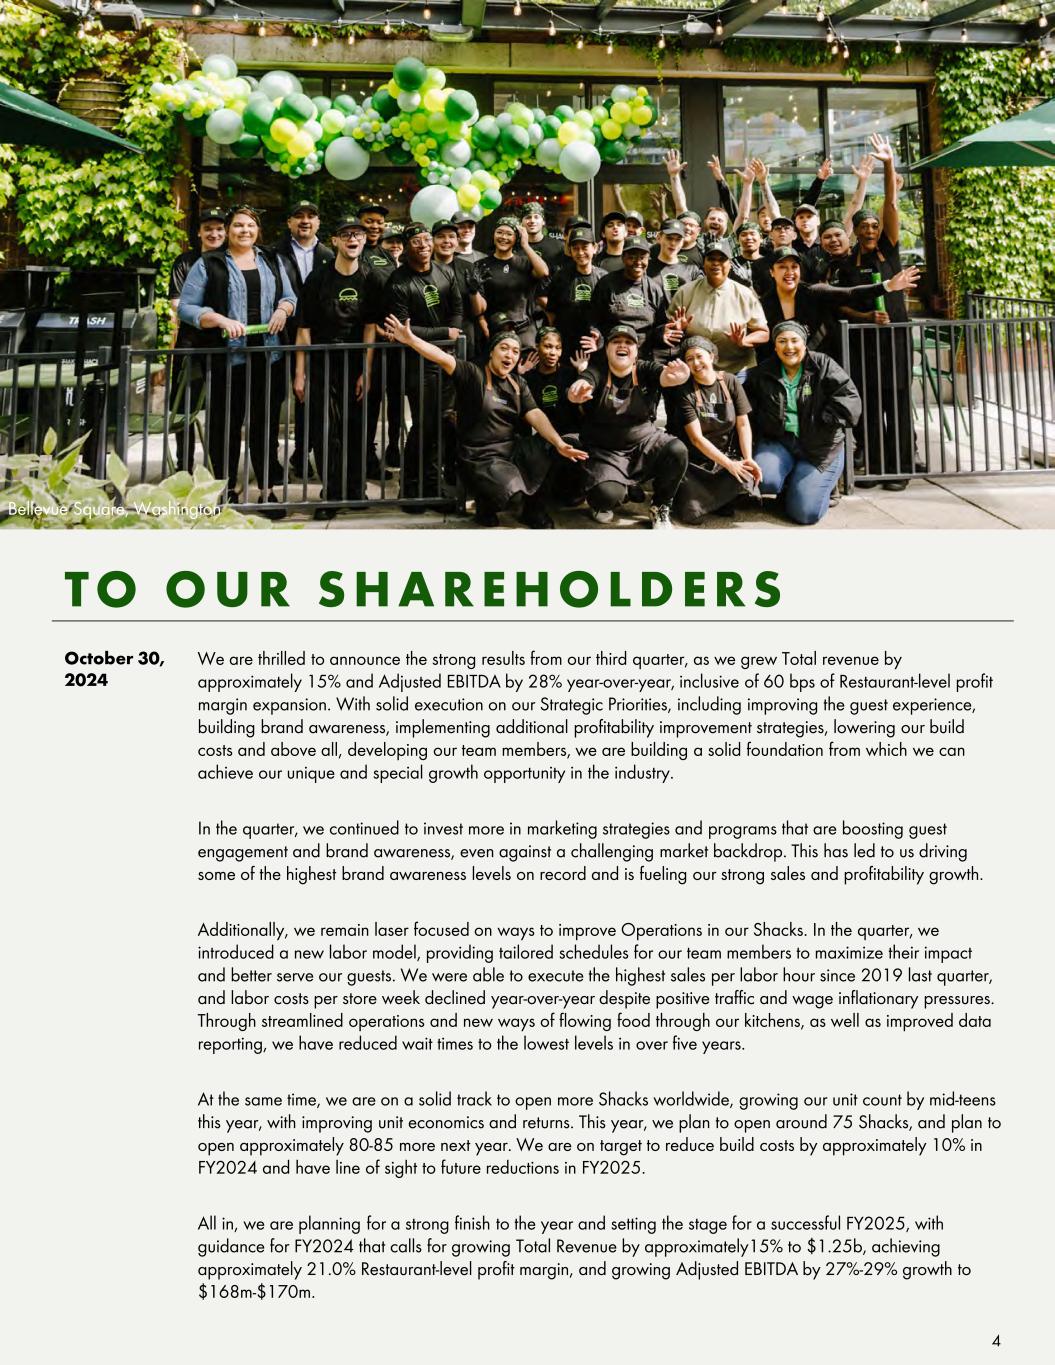
4 TO O U R S H A R E H O L D E R S We are thrilled to announce the strong results from our third quarter, as we grew Total revenue by approximately 15% and Adjusted EBITDA by 28% year-over-year, inclusive of 60 bps of Restaurant-level profit margin expansion. With solid execution on our Strategic Priorities, including improving the guest experience, building brand awareness, implementing additional profitability improvement strategies, lowering our build costs and above all, developing our team members, we are building a solid foundation from which we can achieve our unique and special growth opportunity in the industry. In the quarter, we continued to invest more in marketing strategies and programs that are boosting guest engagement and brand awareness, even against a challenging market backdrop. This has led to us driving some of the highest brand awareness levels on record and is fueling our strong sales and profitability growth. Additionally, we remain laser focused on ways to improve Operations in our Shacks. In the quarter, we introduced a new labor model, providing tailored schedules for our team members to maximize their impact and better serve our guests. We were able to execute the highest sales per labor hour since 2019 last quarter, and labor costs per store week declined year-over-year despite positive traffic and wage inflationary pressures. Through streamlined operations and new ways of flowing food through our kitchens, as well as improved data reporting, we have reduced wait times to the lowest levels in over five years. At the same time, we are on a solid track to open more Shacks worldwide, growing our unit count by mid-teens this year, with improving unit economics and returns. This year, we plan to open around 75 Shacks, and plan to open approximately 80-85 more next year. We are on target to reduce build costs by approximately 10% in FY2024 and have line of sight to future reductions in FY2025. All in, we are planning for a strong finish to the year and setting the stage for a successful FY2025, with guidance for FY2024 that calls for growing Total Revenue by approximately15% to $1.25b, achieving approximately 21.0% Restaurant-level profit margin, and growing Adjusted EBITDA by 27%-29% growth to $168m-$170m. October 30, 2024 Bellevue Square, Washington
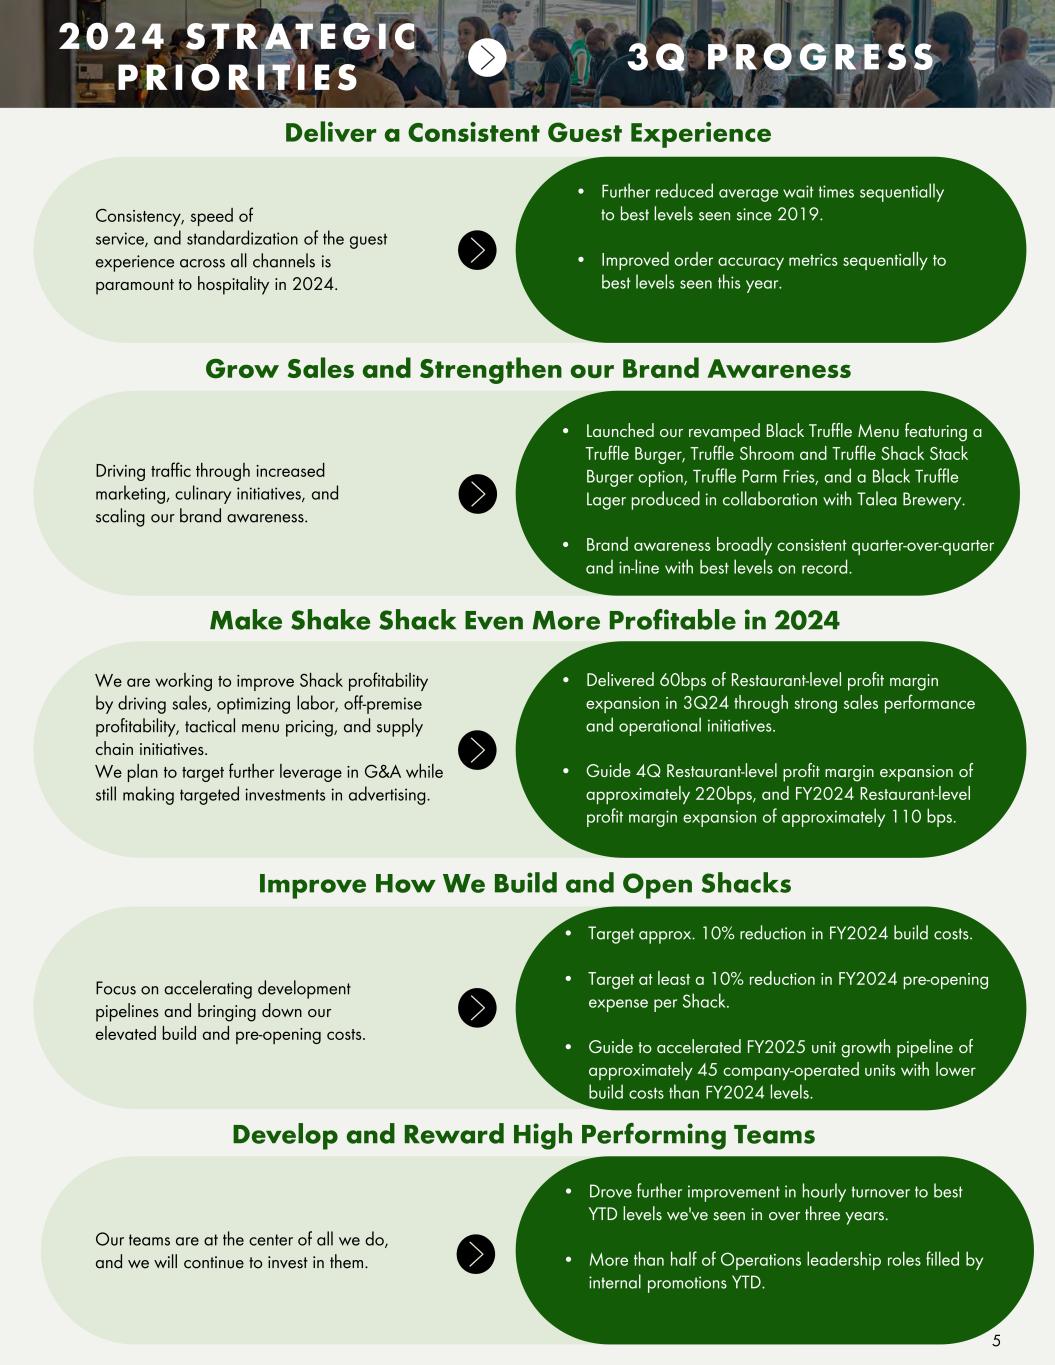
5 Deliver a Consistent Guest Experience Grow Sales and Strengthen our Brand Awareness Make Shake Shack Even More Profitable in 2024 Improve How We Build and Open Shacks Develop and Reward High Performing Teams Consistency, speed of service, and standardization of the guest experience across all channels is paramount to hospitality in 2024. • Further reduced average wait times sequentially to best levels seen since 2019. • Improved order accuracy metrics sequentially to best levels seen this year. Driving traffic through increased marketing, culinary initiatives, and scaling our brand awareness. • Launched our revamped Black Truffle Menu featuring a Truffle Burger, Truffle Shroom and Truffle Shack Stack Burger option, Truffle Parm Fries, and a Black Truffle Lager produced in collaboration with Talea Brewery. • Brand awareness broadly consistent quarter-over-quarter and in-line with best levels on record. We are working to improve Shack profitability by driving sales, optimizing labor, off-premise profitability, tactical menu pricing, and supply chain initiatives. We plan to target further leverage in G&A while still making targeted investments in advertising. • Delivered 60bps of Restaurant-level profit margin expansion in 3Q24 through strong sales performance and operational initiatives. • Guide 4Q Restaurant-level profit margin expansion of approximately 220bps, and FY2024 Restaurant-level profit margin expansion of approximately 110 bps. Focus on accelerating development pipelines and bringing down our elevated build and pre-opening costs. • Target approx. 10% reduction in FY2024 build costs. • Target at least a 10% reduction in FY2024 pre-opening expense per Shack. • Guide to accelerated FY2025 unit growth pipeline of approximately 45 company-operated units with lower build costs than FY2024 levels. Our teams are at the center of all we do, and we will continue to invest in them. • Drove further improvement in hourly turnover to best YTD levels we've seen in over three years. • More than half of Operations leadership roles filled by internal promotions YTD. 2 0 2 4 S T R AT E G I C P R I O R I T I E S 3 Q P R O G R E S S
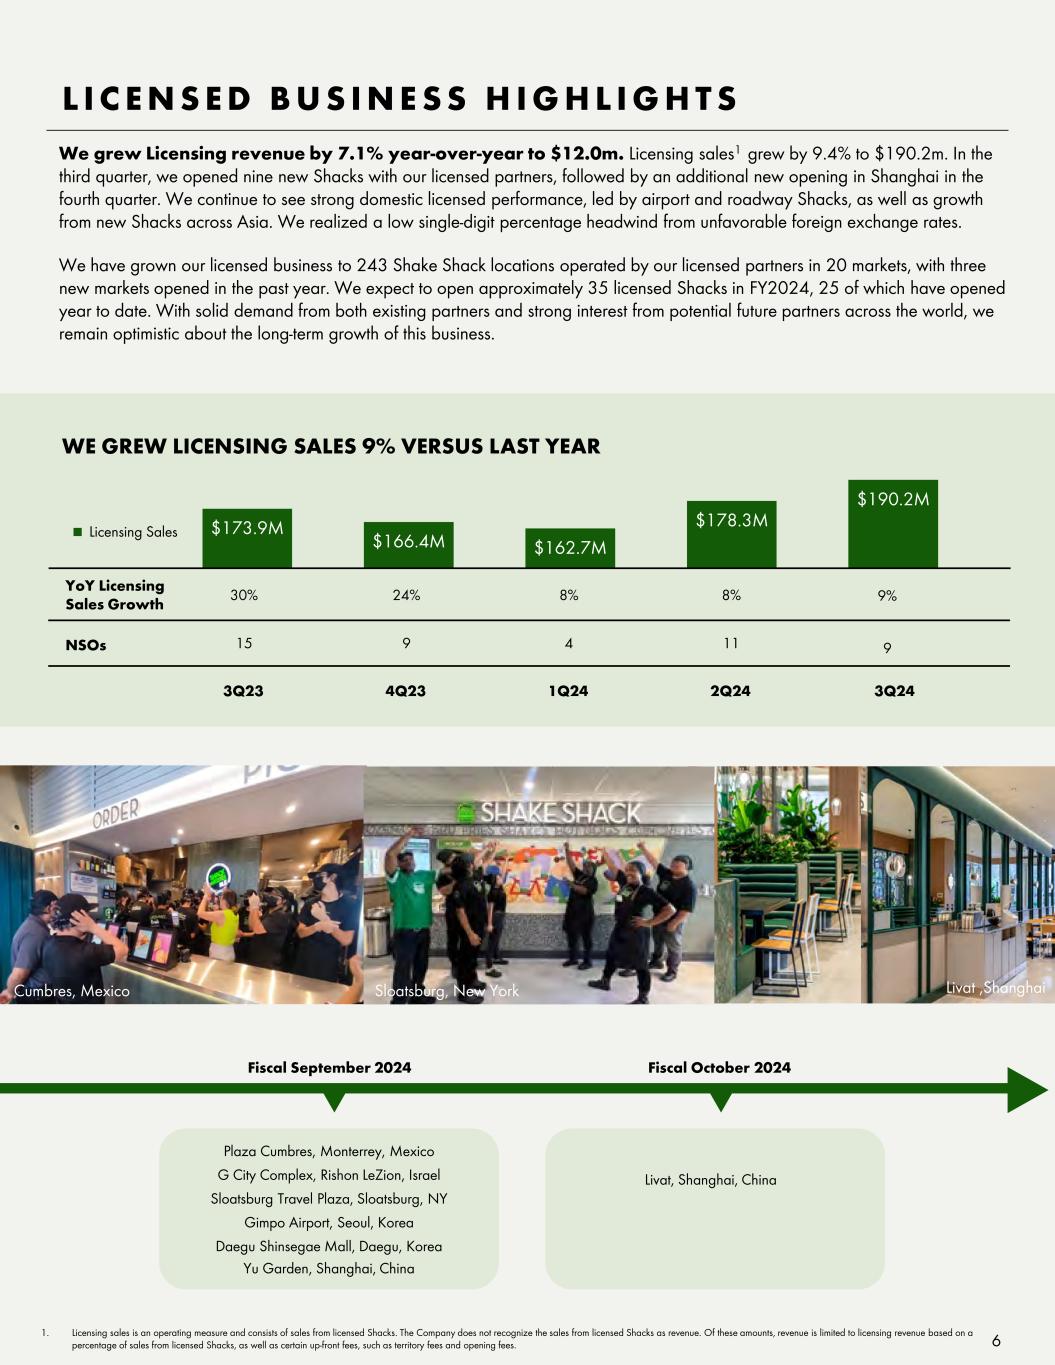
L I C E N S E D B U S I N E S S H I G H L I G H T S 1. Licensing sales is an operating measure and consists of sales from licensed Shacks. The Company does not recognize the sales from licensed Shacks as revenue. Of these amounts, revenue is limited to licensing revenue based on a percentage of sales from licensed Shacks, as well as certain up-front fees, such as territory fees and opening fees. 6 Fiscal September 2024 Fiscal October 2024 $173.9M $166.4M $162.7M $178.3M $190.2M Licensing Sales 9% WE GREW LICENSING SALES 9% VERSUS LAST YEAR 30% 24% YoY Licensing Sales Growth 8% 8% 15 9 4 11NSOs We grew Licensing revenue by 7.1% year-over-year to $12.0m. Licensing sales1 grew by 9.4% to $190.2m. In the third quarter, we opened nine new Shacks with our licensed partners, followed by an additional new opening in Shanghai in the fourth quarter. We continue to see strong domestic licensed performance, led by airport and roadway Shacks, as well as growth from new Shacks across Asia. We realized a low single-digit percentage headwind from unfavorable foreign exchange rates. We have grown our licensed business to 243 Shake Shack locations operated by our licensed partners in 20 markets, with three new markets opened in the past year. We expect to open approximately 35 licensed Shacks in FY2024, 25 of which have opened year to date. With solid demand from both existing partners and strong interest from potential future partners across the world, we remain optimistic about the long-term growth of this business. 3Q23 4Q23 1Q24 2Q24 3Q24 Plaza Cumbres, Monterrey, Mexico G City Complex, Rishon LeZion, Israel Sloatsburg Travel Plaza, Sloatsburg, NY Gimpo Airport, Seoul, Korea Daegu Shinsegae Mall, Daegu, Korea Yu Garden, Shanghai, China Livat, Shanghai, China 9 Cumbres, Mexico Livat ,ShanghaiSloatsburg, New York
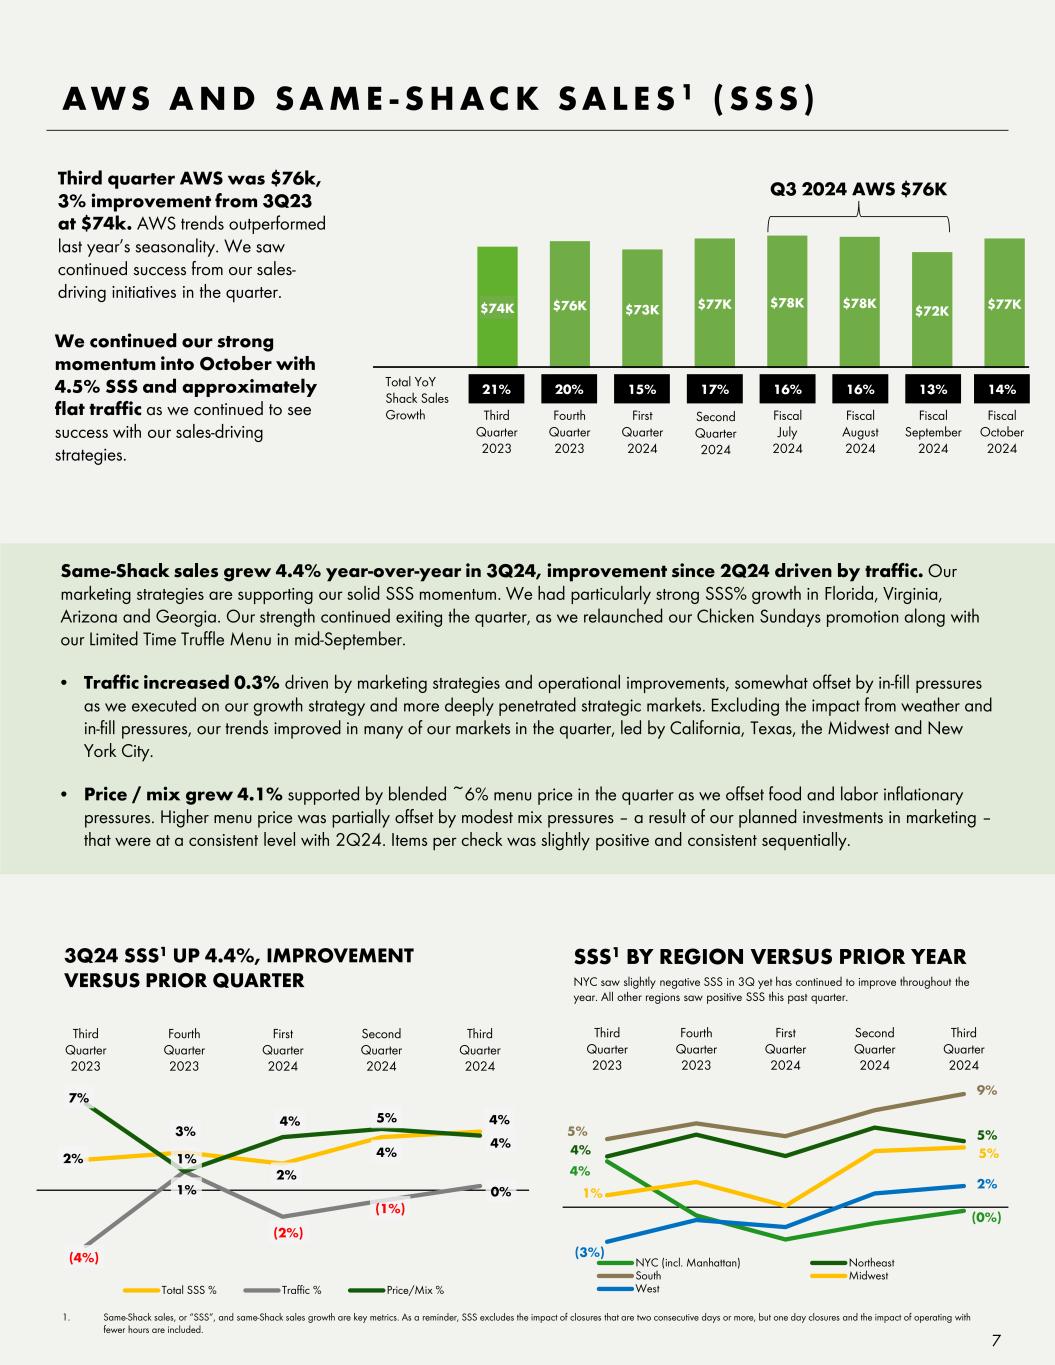
2% 3% 2% 4% 4% (4%) 1% (2%) (1%) 0% 7% 1% 4% 5% 4% Third Quarter 2023 Fourth Quarter 2023 First Quarter 2024 Second Quarter 2024 Third Quarter 2024 Total SSS % Traffic % Price/Mix % Same-Shack sales grew 4.4% year-over-year in 3Q24, improvement since 2Q24 driven by traffic. Our marketing strategies are supporting our solid SSS momentum. We had particularly strong SSS% growth in Florida, Virginia, Arizona and Georgia. Our strength continued exiting the quarter, as we relaunched our Chicken Sundays promotion along with our Limited Time Truffle Menu in mid-September. • Traffic increased 0.3% driven by marketing strategies and operational improvements, somewhat offset by in-fill pressures as we executed on our growth strategy and more deeply penetrated strategic markets. Excluding the impact from weather and in-fill pressures, our trends improved in many of our markets in the quarter, led by California, Texas, the Midwest and New York City. • Price / mix grew 4.1% supported by blended ~6% menu price in the quarter as we offset food and labor inflationary pressures. Higher menu price was partially offset by modest mix pressures – a result of our planned investments in marketing – that were at a consistent level with 2Q24. Items per check was slightly positive and consistent sequentially. 3Q24 SSS1 UP 4.4%, IMPROVEMENT VERSUS PRIOR QUARTER AW S A N D S A M E - S H A C K S A L E S 1 ( S S S ) 7 1. Same-Shack sales, or “SSS”, and same-Shack sales growth are key metrics. As a reminder, SSS excludes the impact of closures that are two consecutive days or more, but one day closures and the impact of operating with fewer hours are included. SSS1 BY REGION VERSUS PRIOR YEAR 4% (0%) 4% 5% 5% 9% 1% 5% (3%) 2% Third Quarter 2023 Fourth Quarter 2023 First Quarter 2024 Second Quarter 2024 Third Quarter 2024 NYC (incl. Manhattan) Northeast South Midwest West Third quarter AWS was $76k, 3% improvement from 3Q23 at $74k. AWS trends outperformed last year’s seasonality. We saw continued success from our sales- driving initiatives in the quarter. $74K $76K $73K $77K $78K $78K $72K $77K Q3 2024 AWS $76K Total YoY Shack Sales Growth Fiscal September 2024 21% Fourth Quarter 2023 17% 16% First Quarter 2024 20% Second Quarter 2024 15% Third Quarter 2023 13% Fiscal August 2024 16% Fiscal July 2024 We continued our strong momentum into October with 4.5% SSS and approximately flat traffic as we continued to see success with our sales-driving strategies. NYC saw slightly negative SSS in 3Q yet has continued to improve throughout the year. All other regions saw positive SSS this past quarter. Fiscal October 2024 14%

8 D E V E L O P M E N T U P D AT E S Development Highlights: • In 3Q24, we opened eight new Company-operated Shacks, three of which are drive-thrus. • Year-to-date, we opened 28 new Company-operated Shacks, inclusive of four openings so far in 4Q24. • Recently opened Shacks have exceeded our initial sales expectations. • We are on track to reduce net build costs by approximately 10% year-over-year. • Made meaningful progress to our goal of opening new Shacks more efficiently this year and are on track to reduce pre-opening expense per Shack by at least 10% year-over-year. $2.0M $2.1M $2.5M $2.6M 14.3% 16.8% 17.5% 19.9% 2020 2021 2022 2023 2024E Net Build Cost by Shack Class Restaurant-level Profit Margin by Fiscal Year Improving unit economics ~21% Expectations for FY2025 and beyond: • Our teams have been building on our strong pipeline for growth, and we expect to open approximately 45 Company-operated Shacks in FY2025 across a variety of formats, including core and drive-thru, with a focus on infill strategies to build out market strength. • We expect to show continued improvement on lowering our cost to build and pre-opening expense in FY2025 as we continue to execute on strategic initiatives in development and operations. We guide for Restaurant-level profit margin to expand by ~110 bps and for net build costs to decline by approximately 10% in FY2024. Targeting ~10% reduction in net build costs in FY2024 Torrance, California St Johns Town Center, FloridaBellevue Square, Washington Henrietta, New York 1 1. Restaurant-level profit margin is a non-GAAP measure. Reconciliations to the most directly comparable financial measures presented in accordance with GAAP are set forth in the financial details section of this Shareholder Letter. 2. Net build costs exclude permanent Shack closures. 2

9 R E S T A U R A N T - L E V E L P R O F I T Third quarter Restaurant-level profit1 grew 18.9% year-over-year to $64m, and Restaurant-level profit margin stood at 21.0% of Shack sales, 60 bps higher than last year. We continue to execute on our Strategic Priorities, which helped us achieve our highest third quarter Restaurant-level profit margin since 2019. Restaurant-level costs in the third quarter (covered in more detail on the following pages) are as follows: • Food and paper costs were 28.2% of Shack sales. • Labor and related expenses were 28.0% of Shack sales. • Other operating expenses were 14.9% of Shack sales. • Occupancy and related expenses were 7.7% of Shack sales. We are on a solid path of Restaurant-level profit margin expansion in FY2024 as we execute on supply chain savings, continued improvements in labor, progress on kiosk strategy rollouts, and additional strategies to build on throughput and flow-through gains. We expect to end the year on a strong note with fourth quarter Restaurant-level profit margin to exceed 2019 levels and guide FY2024 Restaurant-level profit margin of approximately 21%, expanding approximately 110 bps year-over-year. 1. Restaurant-level profit and Restaurant-level profit margin are non-GAAP measures. A reconciliation to the most directly comparable financial measure presented in accordance with GAAP is set forth in the financial details section of this Shareholder Letter. $54M $55M $55M $67M $64M 3Q23 4Q23 1Q24 2Q24 3Q24 Restaurant-level Profit1 ($) 20.4% 19.8% 19.5% 22.0% 21.0% 3Q23 4Q23 1Q24 2Q24 3Q24 Restaurant-level Profit Margin1 (%) Restaurant-level profit grew 18.9% year-over-year. Restaurant-level profit margin expanded 60 bps year-over-year.
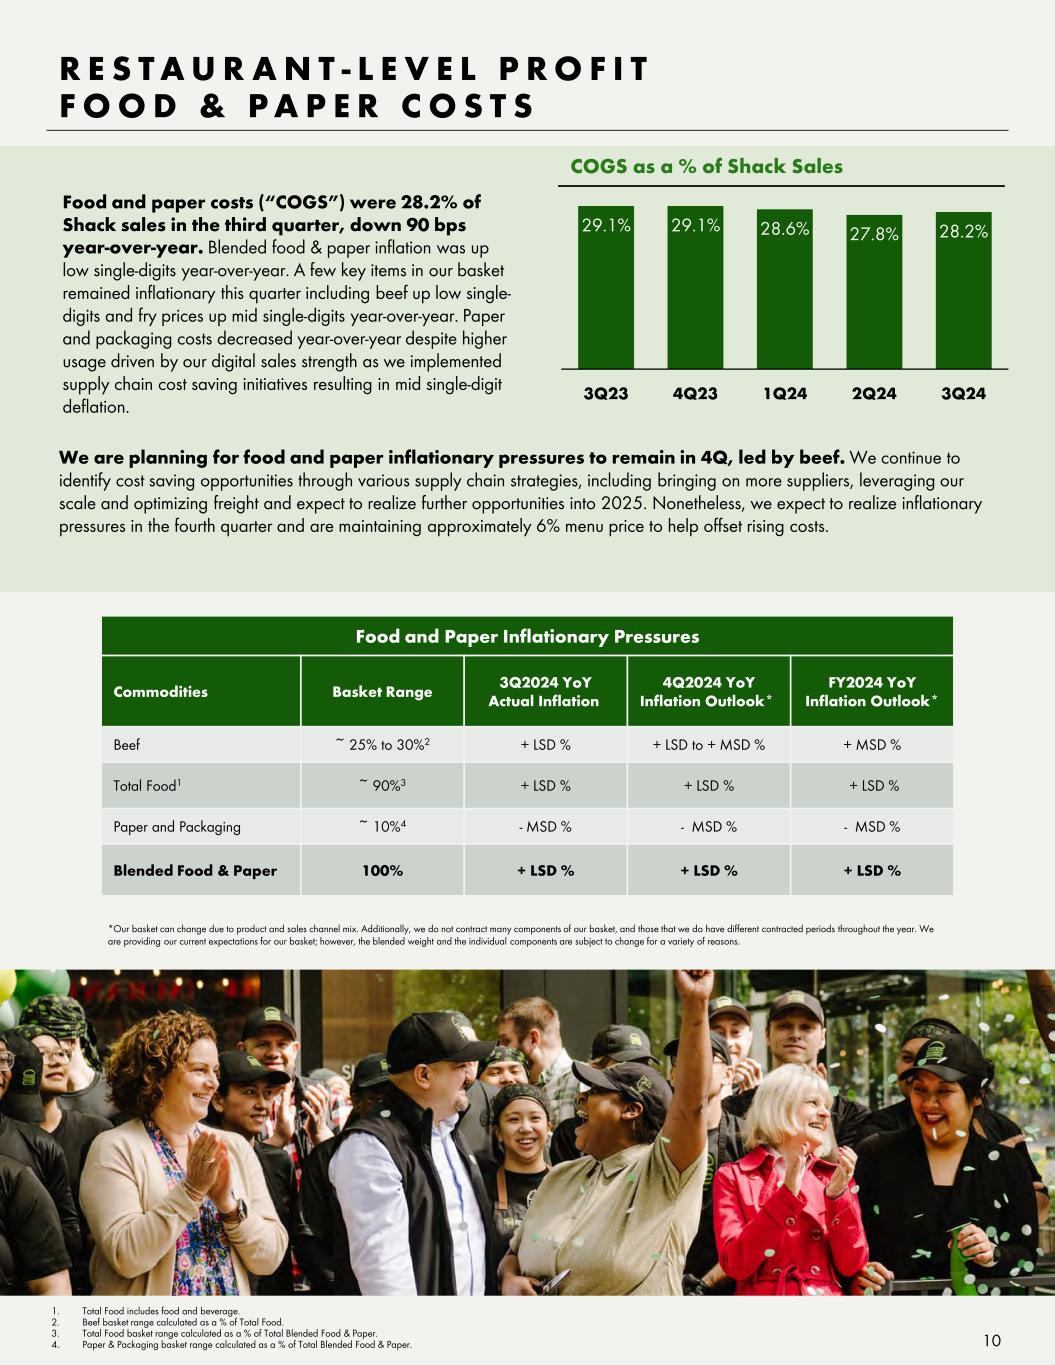
10 R E S T A U R A N T - L E V E L P R O F I T F O O D & P A P E R C O S T S Food and paper costs (“COGS”) were 28.2% of Shack sales in the third quarter, down 90 bps year-over-year. Blended food & paper inflation was up low single-digits year-over-year. A few key items in our basket remained inflationary this quarter including beef up low single- digits and fry prices up mid single-digits year-over-year. Paper and packaging costs decreased year-over-year despite higher usage driven by our digital sales strength as we implemented supply chain cost saving initiatives resulting in mid single-digit deflation. COGS as a % of Shack Sales Food and Paper Inflationary Pressures Commodities Basket Range 3Q2024 YoY Actual Inflation 4Q2024 YoY Inflation Outlook* FY2024 YoY Inflation Outlook* Beef ~ 25% to 30%2 + LSD % + LSD to + MSD % + MSD % Total Food1 ~ 90%3 + LSD % + LSD % + LSD % Paper and Packaging ~ 10%4 - MSD % - MSD % - MSD % Blended Food & Paper 100% + LSD % + LSD % + LSD % We are planning for food and paper inflationary pressures to remain in 4Q, led by beef. We continue to identify cost saving opportunities through various supply chain strategies, including bringing on more suppliers, leveraging our scale and optimizing freight and expect to realize further opportunities into 2025. Nonetheless, we expect to realize inflationary pressures in the fourth quarter and are maintaining approximately 6% menu price to help offset rising costs. *Our basket can change due to product and sales channel mix. Additionally, we do not contract many components of our basket, and those that we do have different contracted periods throughout the year. We are providing our current expectations for our basket; however, the blended weight and the individual components are subject to change for a variety of reasons. 1. Total Food includes food and beverage. 2. Beef basket range calculated as a % of Total Food. 3. Total Food basket range calculated as a % of Total Blended Food & Paper. 4. Paper & Packaging basket range calculated as a % of Total Blended Food & Paper. 29.1% 29.1% 28.6% 27.8% 28.2% 3Q23 4Q23 1Q24 2Q24 3Q24
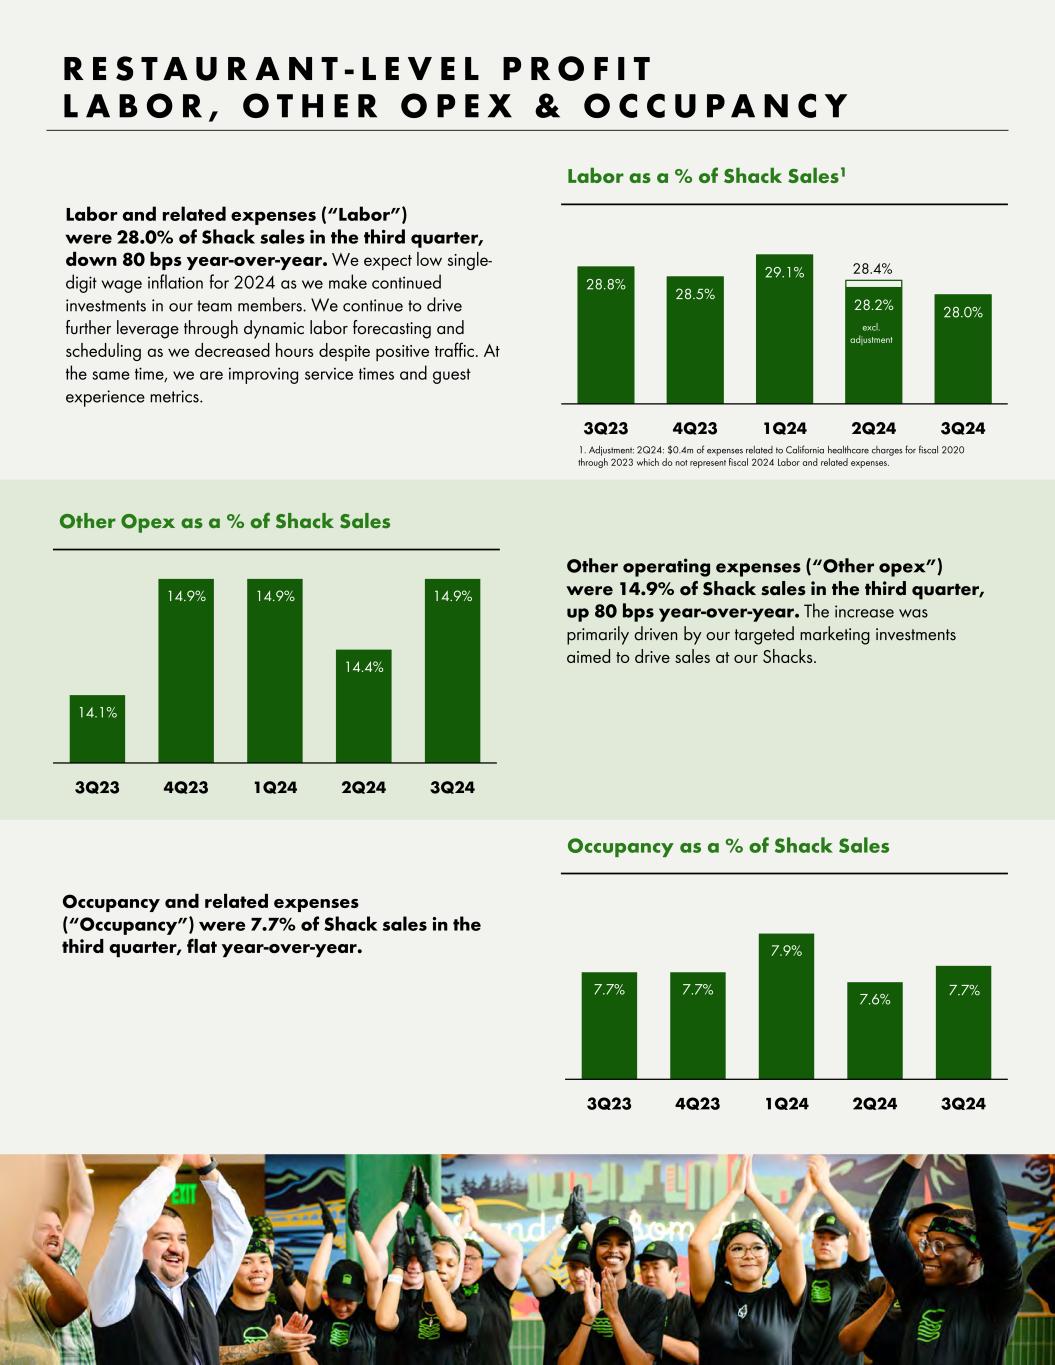
Occupancy and related expenses (“Occupancy”) were 7.7% of Shack sales in the third quarter, flat year-over-year. Other operating expenses (“Other opex”) were 14.9% of Shack sales in the third quarter, up 80 bps year-over-year. The increase was primarily driven by our targeted marketing investments aimed to drive sales at our Shacks. 7.7% 7.7% 7.9% 7.6% 7.7% 3Q23 4Q23 1Q24 2Q24 3Q24 14.1% 14.9% 14.9% 14.4% 14.9% 3Q23 4Q23 1Q24 2Q24 3Q24 R E S T A U R A N T - L E V E L P R O F I T L A B O R , O T H E R O P E X & O C C U P A N C Y 28.8% 28.5% 29.1% 28.2% 28.0% 3Q23 4Q23 1Q24 2Q24 3Q24 Labor as a % of Shack Sales1 Labor and related expenses (“Labor”) were 28.0% of Shack sales in the third quarter, down 80 bps year-over-year. We expect low single- digit wage inflation for 2024 as we make continued investments in our team members. We continue to drive further leverage through dynamic labor forecasting and scheduling as we decreased hours despite positive traffic. At the same time, we are improving service times and guest experience metrics. Occupancy as a % of Shack Sales Other Opex as a % of Shack Sales 11 28.4% excl. adjustment 1. Adjustment: 2Q24: $0.4m of expenses related to California healthcare charges for fiscal 2020 through 2023 which do not represent fiscal 2024 Labor and related expenses.
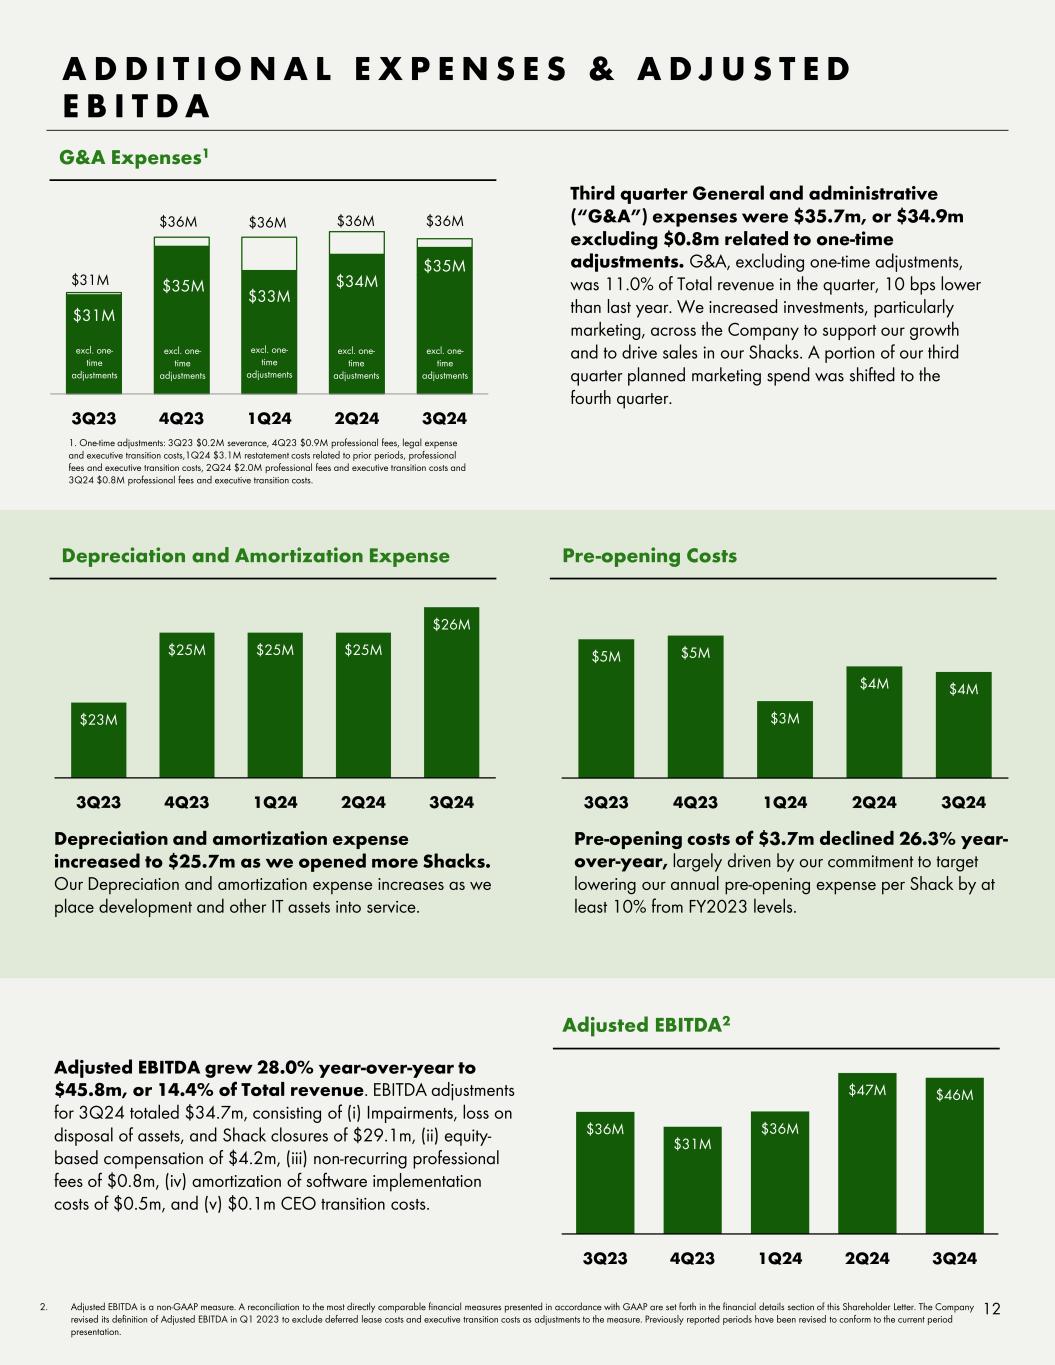
$31M $35M $33M $34M $35M 3Q23 4Q23 1Q24 2Q24 3Q24 G&A Expenses1 Third quarter General and administrative (“G&A”) expenses were $35.7m, or $34.9m excluding $0.8m related to one-time adjustments. G&A, excluding one-time adjustments, was 11.0% of Total revenue in the quarter, 10 bps lower than last year. We increased investments, particularly marketing, across the Company to support our growth and to drive sales in our Shacks. A portion of our third quarter planned marketing spend was shifted to the fourth quarter. $23M $25M $25M $25M $26M 3Q23 4Q23 1Q24 2Q24 3Q24 Depreciation and Amortization Expense $5M $5M $3M $4M $4M 3Q23 4Q23 1Q24 2Q24 3Q24 Pre-opening Costs A D D I T I O N A L E X P E N S E S & A D J U S T E D E B I T D A 2. Adjusted EBITDA is a non-GAAP measure. A reconciliation to the most directly comparable financial measures presented in accordance with GAAP are set forth in the financial details section of this Shareholder Letter. The Company revised its definition of Adjusted EBITDA in Q1 2023 to exclude deferred lease costs and executive transition costs as adjustments to the measure. Previously reported periods have been revised to conform to the current period presentation. Adjusted EBITDA grew 28.0% year-over-year to $45.8m, or 14.4% of Total revenue. EBITDA adjustments for 3Q24 totaled $34.7m, consisting of (i) Impairments, loss on disposal of assets, and Shack closures of $29.1m, (ii) equity- based compensation of $4.2m, (iii) non-recurring professional fees of $0.8m, (iv) amortization of software implementation costs of $0.5m, and (v) $0.1m CEO transition costs. $36M $31M $36M $47M $46M 3Q23 4Q23 1Q24 2Q24 3Q24 Adjusted EBITDA2 12 1. One-time adjustments: 3Q23 $0.2M severance, 4Q23 $0.9M professional fees, legal expense and executive transition costs,1Q24 $3.1M restatement costs related to prior periods, professional fees and executive transition costs, 2Q24 $2.0M professional fees and executive transition costs and 3Q24 $0.8M professional fees and executive transition costs. excl. one- time adjustments $36M $36M Depreciation and amortization expense increased to $25.7m as we opened more Shacks. Our Depreciation and amortization expense increases as we place development and other IT assets into service. Pre-opening costs of $3.7m declined 26.3% year- over-year, largely driven by our commitment to target lowering our annual pre-opening expense per Shack by at least 10% from FY2023 levels. $36M $31M $36M excl. one- time adjustments excl. one- time adjustments excl. one- time adjustments excl. one- time adjustments

Fiscal fourth quarter and fiscal year 2024 and 2025 guidance is derived from preliminary, unaudited results based on information currently available to the Company, including an assumption of a degree of pressure on the consumer spending landscape and ongoing inflationary headwinds and does not reflect any additional unknown development delays. While the Company believes these estimates are meaningful, they could differ from the actual results that the Company ultimately reports in its Annual Report on Form 10-K for the fiscal year ending December 25, 2024. F I N A N C I A L O U T L O O K 13 1. G&A includes approximately $14m of the approximately $16m total Equity-based compensation. 2. G&A guidance excludes $3.1m of adjustments from 1Q24, $2.0m of adjustments from 2Q24, and $0.8m of adjustments from 3Q24. Including these expenses, G&A guidance would be $150m to $151m. 3. Adjusted EBITDA is a non-GAAP measure. A reconciliation to the most directly comparable financial measures presented in accordance with GAAP are set forth in the financial details section of this Shareholder Letter. The Company is not able to reconcile the guided non-GAAP estimates to the most directly comparable GAAP financial measure without unreasonable effort because it is unable to predict, forecast or determine the probable significance of various reconciling items with a reasonable degree of accuracy. Accordingly, the most directly comparable guided GAAP estimates are not provided. The Company revised its definition of Adjusted EBITDA to exclude deferred lease costs and executive transition costs as adjustments to the measure. Previously reported periods have been revised to conform to the current period presentation. These forward-looking projections are subject to known and unknown risks, uncertainties and other important factors that may cause actual results to be materially different from these projections. Factors that may cause such differences include those discussed in the Company's Form 10-K for the fiscal year ended December 25, 2024, and our Cautionary Note On Forward-Looking Statements herein. These forward-looking projections should be reviewed in conjunction with the consolidated financial statements and the section titled “Cautionary Note Regarding Forward-Looking Statements”, within the Company’s Form 10-K, which form the basis of our assumptions used to prepare these forward-looking projections. You should not attribute undue certainty to these projections, and we undertake no obligation to revise or update any forward-looking information, except as required by law. Company-operated openings Licensed openings Total revenue Licensing revenue Same-Shack sales versus 2023 Restaurant-level profit margin Company-operated openings Licensed openings Total revenue Licensing revenue Same-Shack sales versus 2023 Restaurant-level profit margin General and administrative expenses Equity-based compensation Depreciation and amortization expense Pre-opening costs Adjusted EBITDA3 Adjusted Pro Forma Tax Rate Company-operated openings Licensed openings Approximately 16 Approximately 11 $322.6m - $327.0m $11.6m - $12.0m Approximately 3% - 4% Approximately 22.0% Approximately 40 Approximately 35 ~$1.25b $44.6m - $45m +3.3% - 3.6% Approximately 21.0% $144m - $145m1 Approximately $16m Approximately $103m Approximately $17m $168m - $170m Approximately 22.5% Approximately 45 Approximately 35-40 Q4 2024 Guidance FY 2024 Guidance FY 2025 Guidance
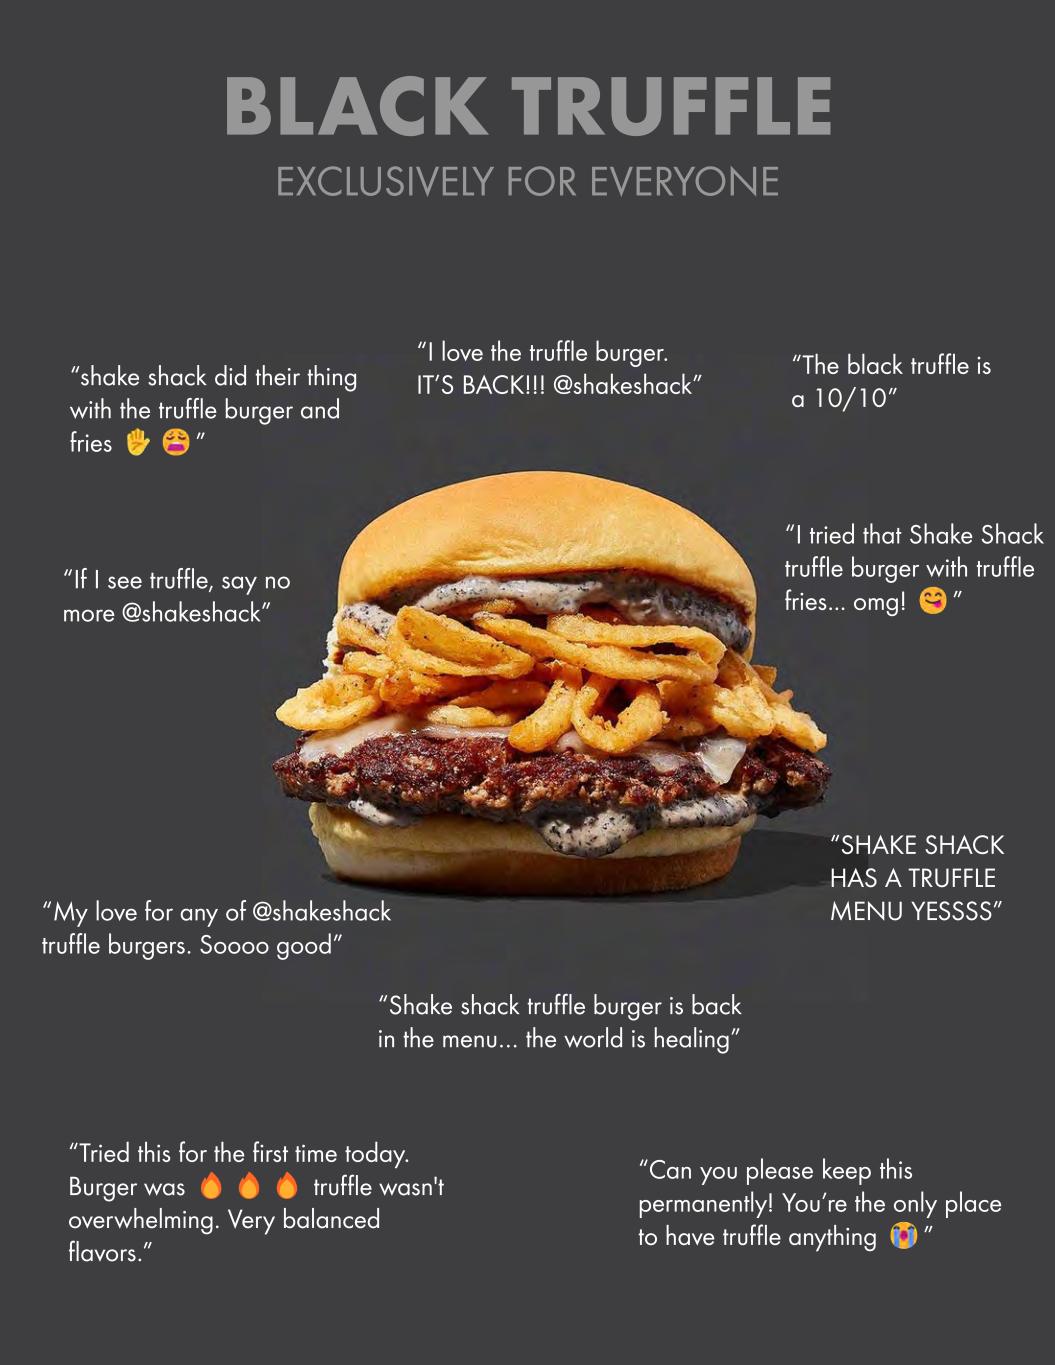
“shake shack did their thing with the truffle burger and fries ” “I tried that Shake Shack truffle burger with truffle fries... omg! ” “I love the truffle burger. IT’S BACK!!! @shakeshack” “The black truffle is a 10/10” “Can you please keep this permanently! You’re the only place to have truffle anything ” “If I see truffle, say no more @shakeshack” “Shake shack truffle burger is back in the menu… the world is healing” “SHAKE SHACK HAS A TRUFFLE MENU YESSSS” “Tried this for the first time today. Burger was truffle wasn't overwhelming. Very balanced flavors.” “My love for any of @shakeshack truffle burgers. Soooo good” BLACK TRUFFLE EXCLUSIVELY FOR EVERYONE

Financial Details & Definitions
C A U T I O N A RY N O T E O N F O R WA R D - L O O K I N G S TAT E M E N T S 16 This presentation contains forward-looking statements, within the meaning of the Private Securities Litigation Reform Act of 1995 ("PSLRA"), which are subject to known and unknown risks, uncertainties and other important factors that may cause actual results to be materially different from the statements made herein. All statements other than statements of historical fact included in this presentation are forward-looking statements, including, but not limited to, the Company's strategic initiatives, expected financial results and operating performance for fiscal 2024, expected development targets, including expected Shack construction and openings, expected same-Shack sales growth, average weekly sales and trends in the Company’s operations, the expansion of the Company’s delivery services, the Company's kiosk, digital, drive-thru and multiple format investments and strategies, 2024 guidance, and statements relating to the impact of COVID-19. Forward-looking statements discuss the Company’s current expectations and projections relating to its financial position, results of operations, plans, objectives, future performance and business. You can identify forward-looking statements by the fact that they do not relate strictly to historical or current facts. These statements may include words such as "aim," "anticipate," "believe," "estimate," "expect," "forecast," "future," "intend," "outlook," "potential," "preliminary," "project," "projection," "plan," "seek," "may," "could," "would," "will," "should," "can," "can have," "likely," the negatives thereof and other similar expressions. All forward- looking statements are expressly qualified in their entirety by these cautionary statements. Some of the factors which could cause results to differ materially from the Company’s expectations include the continuing impact of the COVID-19 pandemic, including the potential impact of any COVID-19 variants, the Company's ability to develop and open new Shacks on a timely basis, increased costs or shortages or interruptions in the supply and delivery of the Company's products, increased labor costs or shortages, inflationary pressures, the Company's management of its digital capabilities and expansion into new channels including drive-thru and multiple format investments, the Company's ability to maintain and grow sales at its existing Shacks, risks relating to the restaurant industry generally, and the impact of any material weakness in the Company's internal controls over financial reporting identified in connection with the restatement described in the Company's Annual Report on Form 10-K filed with the SEC on February 29, 2024 or otherwise. You should evaluate all forward-looking statements made in this presentation in the context of the risks and uncertainties disclosed in the Company’s Annual Report on Form 10-K for the fiscal year ended December 27, 2023 as filed with the Securities and Exchange Commission ("SEC"). All of the Company's SEC filings are available online at www.sec.gov, www.shakeshack.com or upon request from Shake Shack Inc. The forward-looking statements included in this presentation are made only as of the date hereof. The Company undertakes no obligation to publicly update or revise any forward-looking statement as a result of new information, future events or otherwise, except as otherwise required by law.
D E F I N I T I O N S 17 The following definitions, and definitions on the subsequent pages, apply to terms as used in this shareholder letter: "Shack sales" is defined as the aggregate sales of food, beverages, gift card breakage income, and Shake Shack branded merchandise at Company-operated Shacks and excludes sales from licensed Shacks. “System-wide sales” is an operating measure and consists of sales from Company-operated Shacks and licensed Shacks. The Company does not recognize the sales from licensed Shacks as revenue. Of these amounts, revenue is limited to licensing revenue based on a percentage of sales from licensed Shacks, as well as certain up-front fees, such as territory fees and opening fees. "Same-Shack sales" or “SSS” represents Shack sales for the comparable Shack base, which is defined as the number of Company- operated Shacks open for 24 full fiscal months or longer. For consecutive days that Shacks were temporarily closed, the comparative period was also adjusted. "Average weekly sales" or “AWS” is calculated by dividing total Shack sales by the number of operating weeks for all Shacks in operation during the period. For Shacks that are not open for the entire period, fractional adjustments are made to the number of operating weeks open such that it corresponds to the period of associated sales. “Adjusted pro forma net income," a non-GAAP measure, represents Net income (loss) attributable to Shake Shack Inc. assuming the full exchange of all outstanding SSE Holdings, LLC membership interests ("LLC Interests") for shares of Class A common stock, adjusted for certain non-recurring and other items that the Company does not believe directly reflect its core operations and may not be indicative of the Company’s recurring business operations. “EBITDA,” a non-GAAP measure, is defined as Net income (loss) before interest expense (net of interest income), Income tax expense (benefit), and Depreciation and amortization expense. “Adjusted EBITDA,” a non-GAAP measure, is defined as EBITDA (as defined above), excluding equity-based compensation expense, Impairments, loss on disposal of assets and Shack closures, amortization of cloud-based software implementation costs, as well as certain non-recurring items that the Company does not believe directly reflect its core operations and may not be indicative of the Company's recurring business operations. “Adjusted EBITDA margin,” a non-GAAP measure, is defined as Net income (loss) before interest expense (net of interest income), Income tax expense (benefit) and Depreciation and amortization expense, which also excludes equity-based compensation expense, Impairments, loss on disposal of assets and Shack closures, amortization of cloud-based software implementation costs, as well as certain non-recurring items that the Company does not believe directly reflect its core operations and may not be indicative of the Company's recurring business operations, as a percentage of Total revenue. “Restaurant-level profit,” a non-GAAP measure, formerly referred to as Shack-level operating profit, is defined as Shack sales less Shack-level operating expenses, including Food and paper costs, Labor and related expenses, Other operating expenses, and Occupancy and related expenses. "Restaurant-level profit margin," a non-GAAP measure, formerly referred to as Shack-level operating profit margin, is defined as Shack sales less Shack-level operating expenses, including Food and paper costs, Labor and related expenses, Other operating expenses and Occupancy and related expenses as a percentage of Shack sales.
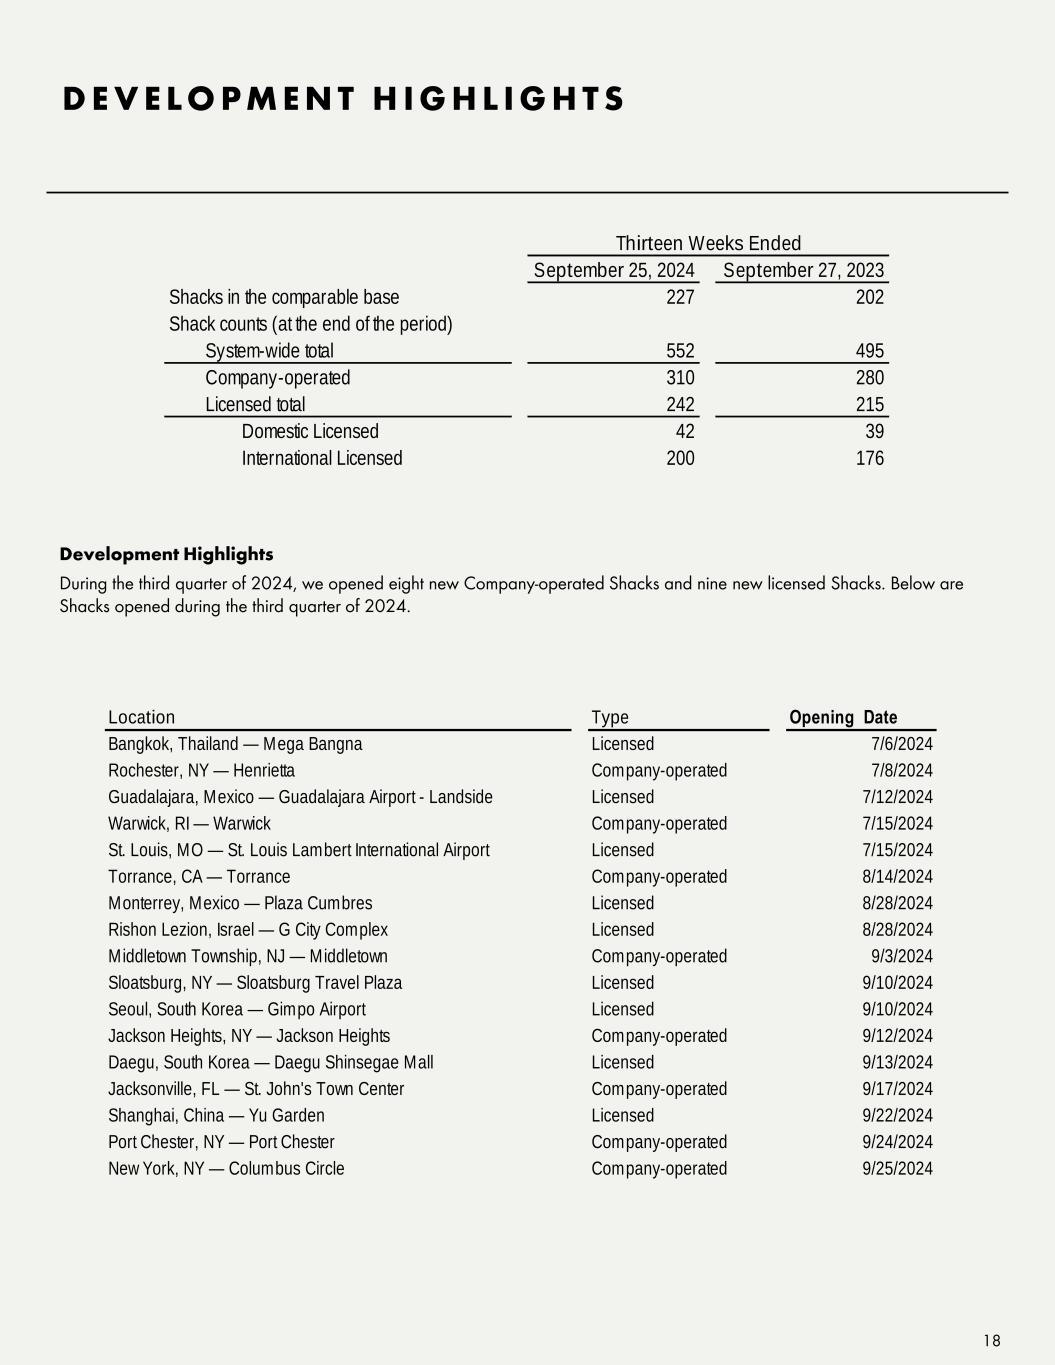
D E V E L O P M E N T H I G H L I G H T S 18 Development Highlights During the third quarter of 2024, we opened eight new Company-operated Shacks and nine new licensed Shacks. Below are Shacks opened during the third quarter of 2024. Location Type Opening Date Bangkok, Thailand — Mega Bangna Licensed 7/6/2024 Rochester, NY — Henrietta Company-operated 7/8/2024 Guadalajara, Mexico — Guadalajara Airport - Landside Licensed 7/12/2024 Warwick, RI — Warwick Company-operated 7/15/2024 St. Louis, MO — St. Louis Lambert International Airport Licensed 7/15/2024 Torrance, CA — Torrance Company-operated 8/14/2024 Monterrey, Mexico — Plaza Cumbres Licensed 8/28/2024 Rishon Lezion, Israel — G City Complex Licensed 8/28/2024 Middletown Township, NJ — Middletown Company-operated 9/3/2024 Sloatsburg, NY — Sloatsburg Travel Plaza Licensed 9/10/2024 Seoul, South Korea — Gimpo Airport Licensed 9/10/2024 Jackson Heights, NY — Jackson Heights Company-operated 9/12/2024 Daegu, South Korea — Daegu Shinsegae Mall Licensed 9/13/2024 Jacksonville, FL — St. John's Town Center Company-operated 9/17/2024 Shanghai, China — Yu Garden Licensed 9/22/2024 Port Chester, NY — Port Chester Company-operated 9/24/2024 New York, NY — Columbus Circle Company-operated 9/25/2024 September 25, 2024 September 27, 2023 Shacks in the comparable base 227 202 Shack counts (at the end of the period) System-wide total 552 495 Company-operated 310 280 Licensed total 242 215 Domestic Licensed 42 39 International Licensed 200 176 Thirteen Weeks Ended
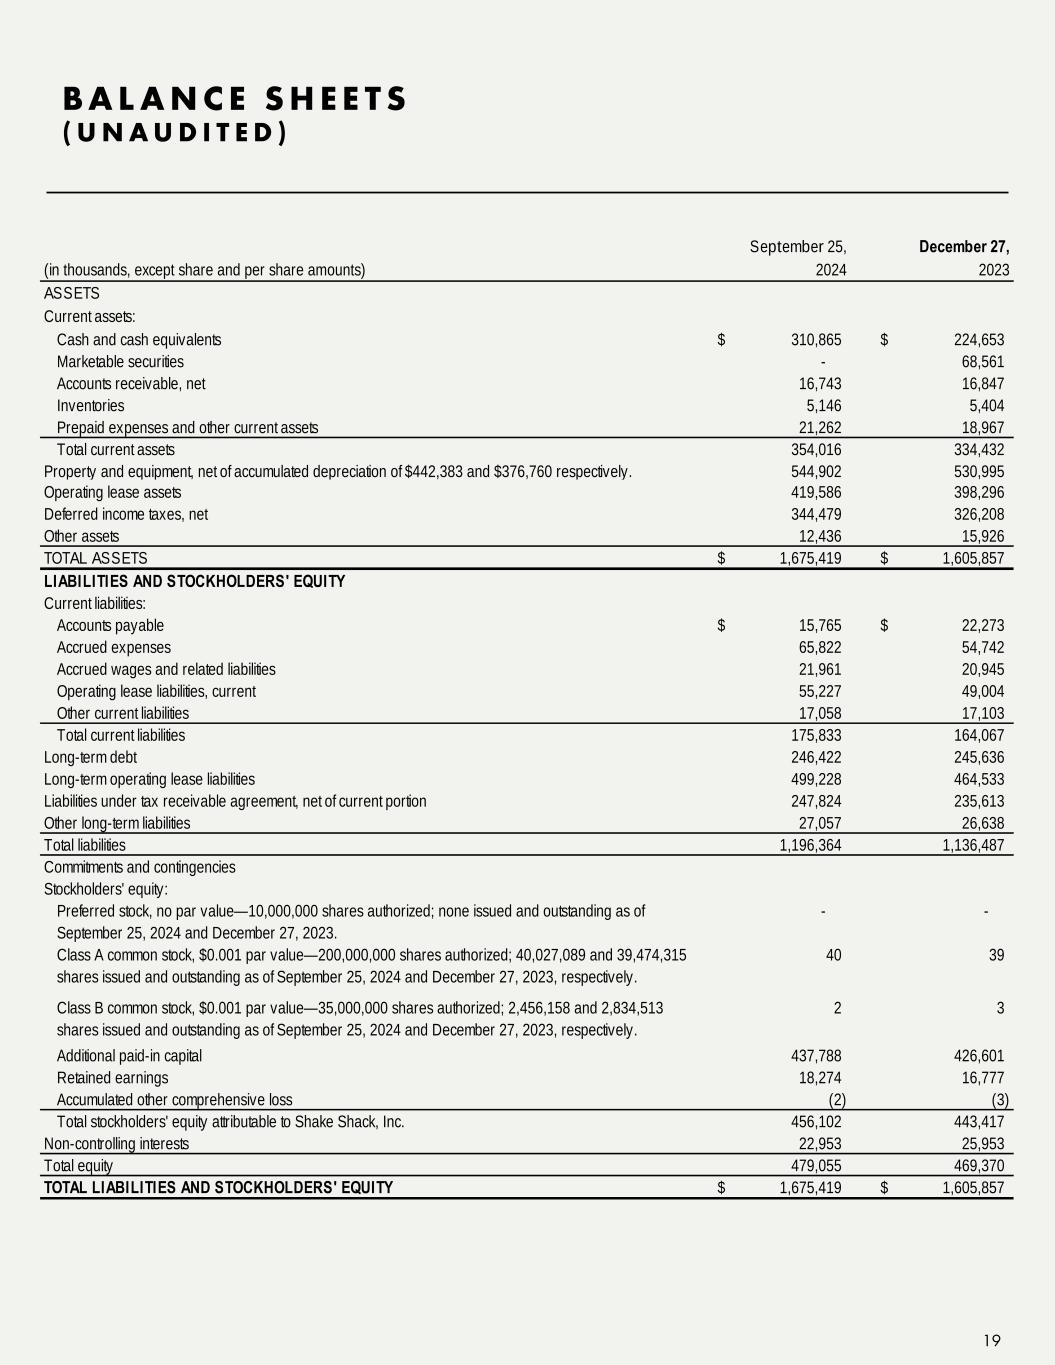
B A L A N C E S H E E T S ( U N A U D I T E D ) 19 September 25, December 27, 2024 2023 ASSETS Current assets: Cash and cash equivalents 310,865$ 224,653$ Marketable securities - 68,561 Accounts receivable, net 16,743 16,847 Inventories 5,146 5,404 Prepaid expenses and other current assets 21,262 18,967 Total current assets 354,016 334,432 Property and equipment, net of accumulated depreciation of $442,383 and $376,760 respectively. 544,902 530,995 Operating lease assets 419,586 398,296 Deferred income taxes, net 344,479 326,208 Other assets 12,436 15,926 TOTAL ASSETS 1,675,419$ 1,605,857$ LIABILITIES AND STOCKHOLDERS' EQUITY Current liabilities: Accounts payable 15,765$ 22,273$ Accrued expenses 65,822 54,742 Accrued wages and related liabilities 21,961 20,945 Operating lease liabilities, current 55,227 49,004 Other current liabilities 17,058 17,103 Total current liabilities 175,833 164,067 Long-term debt 246,422 245,636 Long-term operating lease liabilities 499,228 464,533 Liabilities under tax receivable agreement, net of current portion 247,824 235,613 Other long-term liabilities 27,057 26,638 Total liabilities 1,196,364 1,136,487 Commitments and contingencies Stockholders' equity: Preferred stock, no par value—10,000,000 shares authorized; none issued and outstanding as of September 25, 2024 and December 27, 2023. - - Class A common stock, $0.001 par value—200,000,000 shares authorized; 40,027,089 and 39,474,315 shares issued and outstanding as of September 25, 2024 and December 27, 2023, respectively. 40 39 Class B common stock, $0.001 par value—35,000,000 shares authorized; 2,456,158 and 2,834,513 shares issued and outstanding as of September 25, 2024 and December 27, 2023, respectively. 2 3 Additional paid-in capital 437,788 426,601 Retained earnings 18,274 16,777 Accumulated other comprehensive loss (2) (3) Total stockholders' equity attributable to Shake Shack, Inc. 456,102 443,417 Non-controlling interests 22,953 25,953 Total equity 479,055 469,370 TOTAL LIABILITIES AND STOCKHOLDERS' EQUITY 1,675,419$ 1,605,857$ (in thousands, except share and per share amounts)
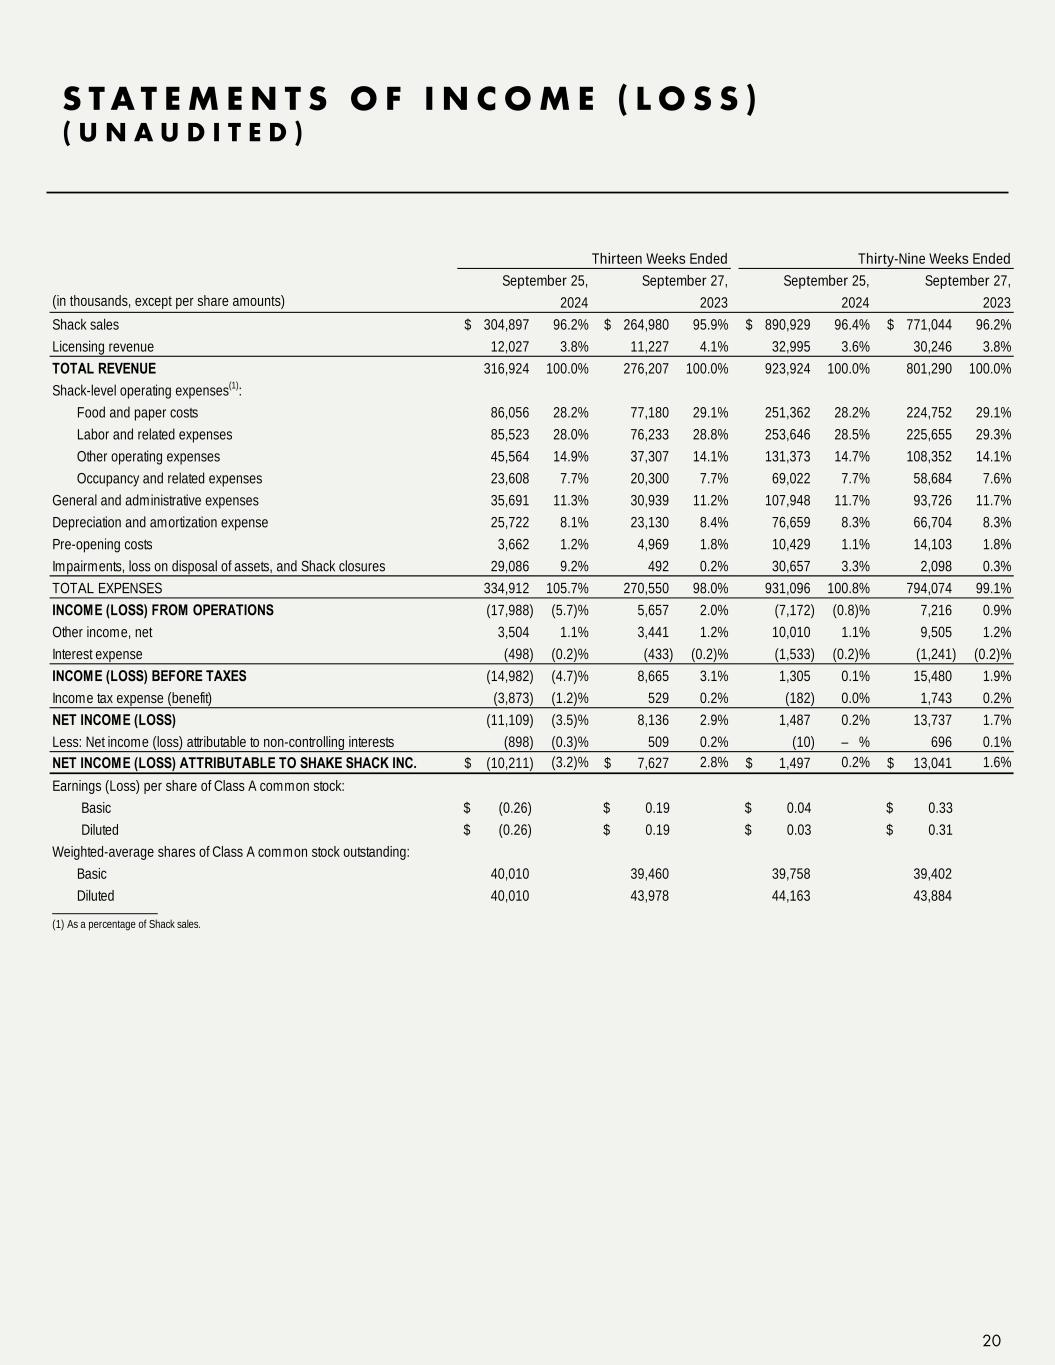
S T A T E M E N T S O F I N C O M E ( L O S S ) ( U N A U D I T E D ) 20 Shack sales 304,897$ 96.2% 264,980$ 95.9% 890,929$ 96.4% 771,044$ 96.2% Licensing revenue 12,027 3.8% 11,227 4.1% 32,995 3.6% 30,246 3.8% TOTAL REVENUE 316,924 100.0% 276,207 100.0% 923,924 100.0% 801,290 100.0% Shack-level operating expenses(1): Food and paper costs 86,056 28.2% 77,180 29.1% 251,362 28.2% 224,752 29.1% Labor and related expenses 85,523 28.0% 76,233 28.8% 253,646 28.5% 225,655 29.3% Other operating expenses 45,564 14.9% 37,307 14.1% 131,373 14.7% 108,352 14.1% Occupancy and related expenses 23,608 7.7% 20,300 7.7% 69,022 7.7% 58,684 7.6% General and administrative expenses 35,691 11.3% 30,939 11.2% 107,948 11.7% 93,726 11.7% Depreciation and amortization expense 25,722 8.1% 23,130 8.4% 76,659 8.3% 66,704 8.3% Pre-opening costs 3,662 1.2% 4,969 1.8% 10,429 1.1% 14,103 1.8% Impairments, loss on disposal of assets, and Shack closures 29,086 9.2% 492 0.2% 30,657 3.3% 2,098 0.3% TOTAL EXPENSES 334,912 105.7% 270,550 98.0% 931,096 100.8% 794,074 99.1% INCOME (LOSS) FROM OPERATIONS (17,988) (5.7)% 5,657 2.0% (7,172) (0.8)% 7,216 0.9% Other income, net 3,504 1.1% 3,441 1.2% 10,010 1.1% 9,505 1.2% Interest expense (498) (0.2)% (433) (0.2)% (1,533) (0.2)% (1,241) (0.2)% INCOME (LOSS) BEFORE TAXES (14,982) (4.7)% 8,665 3.1% 1,305 0.1% 15,480 1.9% Income tax expense (benefit) (3,873) (1.2)% 529 0.2% (182) 0.0% 1,743 0.2% NET INCOME (LOSS) (11,109) (3.5)% 8,136 2.9% 1,487 0.2% 13,737 1.7% Less: Net income (loss) attributable to non-controlling interests (898) (0.3)% 509 0.2% (10) – % 696 0.1% NET INCOME (LOSS) ATTRIBUTABLE TO SHAKE SHACK INC. (10,211)$ (3.2)% 7,627$ 2.8% 1,497$ 0.2% 13,041$ 1.6% Earnings (Loss) per share of Class A common stock: Basic $ (0.26) $ 0.19 $ 0.04 $ 0.33 Diluted $ (0.26) $ 0.19 $ 0.03 $ 0.31 Weighted-average shares of Class A common stock outstanding: Basic 40,010 39,460 39,758 39,402 Diluted 40,010 43,978 44,163 43,884 _______________ September 27, September 27, Thirteen Weeks Ended Thirty-Nine Weeks Ended (in thousands, except per share amounts) 2024 2023 2024 2023 (1) As a percentage of Shack sales. September 25, September 25,
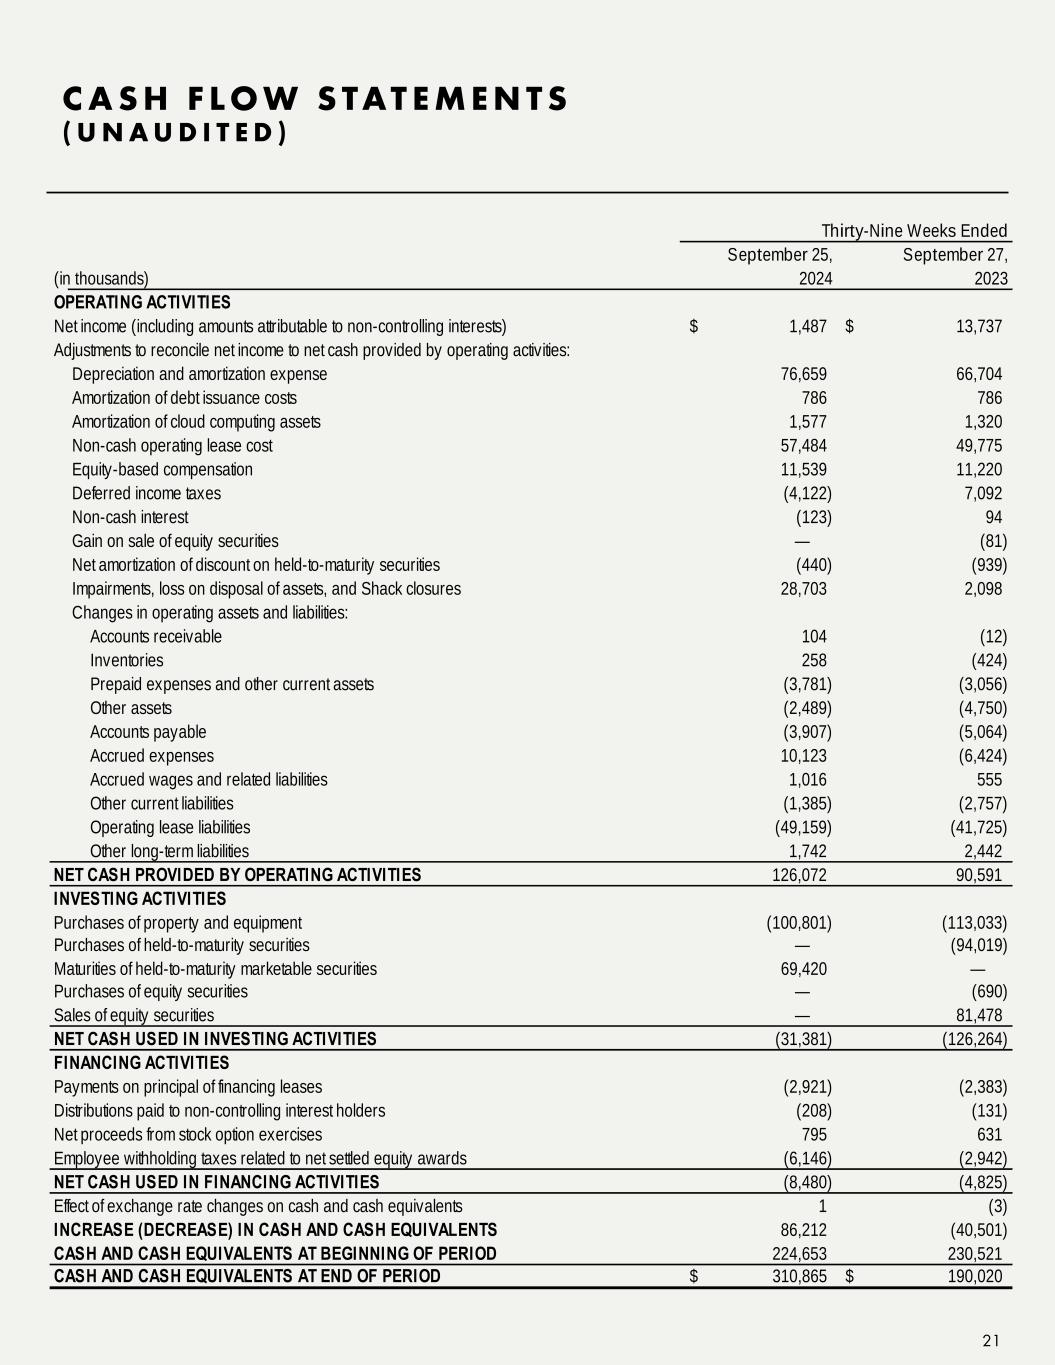
C A S H F L O W S TAT E M E N T S ( U N A U D I T E D ) 21 September 25, September 27, (in thousands) 2024 2023 OPERATING ACTIVITIES Net income (including amounts attributable to non-controlling interests) 1,487$ 13,737$ Adjustments to reconcile net income to net cash provided by operating activities: Depreciation and amortization expense 76,659 66,704 Amortization of debt issuance costs 786 786 Amortization of cloud computing assets 1,577 1,320 Non-cash operating lease cost 57,484 49,775 Equity-based compensation 11,539 11,220 Deferred income taxes (4,122) 7,092 Non-cash interest (123) 94 Gain on sale of equity securities — (81) Net amortization of discount on held-to-maturity securities (440) (939) Impairments, loss on disposal of assets, and Shack closures 28,703 2,098 Changes in operating assets and liabilities: Accounts receivable 104 (12) Inventories 258 (424) Prepaid expenses and other current assets (3,781) (3,056) Other assets (2,489) (4,750) Accounts payable (3,907) (5,064) Accrued expenses 10,123 (6,424) Accrued wages and related liabilities 1,016 555 Other current liabilities (1,385) (2,757) Operating lease liabilities (49,159) (41,725) Other long-term liabilities 1,742 2,442 NET CASH PROVIDED BY OPERATING ACTIVITIES 126,072 90,591 INVESTING ACTIVITIES Purchases of property and equipment (100,801) (113,033) Purchases of held-to-maturity securities — (94,019) Maturities of held-to-maturity marketable securities 69,420 — Purchases of equity securities — (690) Sales of equity securities — 81,478 NET CASH USED IN INVESTING ACTIVITIES (31,381) (126,264) FINANCING ACTIVITIES Payments on principal of financing leases (2,921) (2,383) Distributions paid to non-controlling interest holders (208) (131) Net proceeds from stock option exercises 795 631 Employee withholding taxes related to net settled equity awards (6,146) (2,942) NET CASH USED IN FINANCING ACTIVITIES (8,480) (4,825) Effect of exchange rate changes on cash and cash equivalents 1 (3) INCREASE (DECREASE) IN CASH AND CASH EQUIVALENTS 86,212 (40,501) CASH AND CASH EQUIVALENTS AT BEGINNING OF PERIOD 224,653 230,521 CASH AND CASH EQUIVALENTS AT END OF PERIOD 310,865$ 190,020$ Thirty-Nine Weeks Ended
R E S TA U R A N T - L E V E L P R O F I T D E F I N I T I O N S 22 Restaurant-Level Profit “Restaurant-level profit,” a non-GAAP measure, formerly referred to as Shack-level operating profit, is defined as Shack sales less Shack-level operating expenses, including Food and paper costs, Labor and related expenses, Other operating expenses, and Occupancy and related expenses. Restaurant-level Profit Margin "Restaurant-level profit margin," a non-GAAP measure, formerly referred to as Shack-level operating profit margin, is defined as Shack sales less Shack-level operating expenses, including Food and paper costs, Labor and related expenses, Other operating expenses and Occupancy and related expenses as a percentage of Shack sales. How This Measure Is Useful When used in conjunction with GAAP financial measures, Restaurant-level profit and Restaurant-level profit margin are supplemental measures of operating performance that the Company believes are useful measures to evaluate the performance and profitability of its Shacks. Additionally, Restaurant-level profit and Restaurant-level profit margin are key metrics used internally by management to develop internal budgets and forecasts, as well as assess the performance of its Shacks relative to budget and against prior periods. It is also used to evaluate employee compensation as it serves as a metric in certain performance-based employee bonus arrangements. The Company believes presentation of Restaurant-level profit and Restaurant-level profit margin provides investors with a supplemental view of its operating performance that can provide meaningful insights to the underlying operating performance of the Shacks, as these measures depict the operating results that are directly impacted by the Shacks and exclude items that may not be indicative of, or are unrelated to, the ongoing operations of the Shacks. It may also assist investors to evaluate the Company's performance relative to peers of various sizes and maturities and provides greater transparency with respect to how management evaluates the business, as well as the financial and operational decision-making. Limitations of the Usefulness of this Measure Restaurant-level profit and Restaurant-level profit margin may differ from similarly titled measures used by other companies due to different methods of calculation. Presentation of Restaurant-level profit and Restaurant-level profit margin is not intended to be considered in isolation or as a substitute for, or superior to, the financial information prepared and presented in accordance with GAAP. Restaurant-level profit excludes certain costs, such as General and administrative expenses and Pre-opening costs, which are considered normal, recurring cash operating expenses and are essential to support the operation and development of the Company's Shacks. Therefore, this measure may not provide a complete understanding of the Company's operating results as a whole and Restaurant-level profit and Restaurant-level profit margin should be reviewed in conjunction with the Company’s GAAP financial results. A reconciliation of Restaurant-level profit to operating income (loss), the most directly comparable GAAP financial measure, is set forth on next slide.

R E S TA U R A N T - L E V E L P R O F I T 23 (dollar amounts in thousands) September 25, 2024 September 27, 2023 September 25, 2024 September 27, 2023 Income (loss) from operations (17,988)$ 5,657$ (7,172)$ 7,216$ Less: Licensing revenue 12,027 11,227 32,995 30,246 Add: General and administrative expenses 35,691 30,939 107,948 93,726 Depreciation and amortization expense 25,722 23,130 76,659 66,704 Pre-opening costs 3,662 4,969 10,429 14,103 Impairments, loss on disposal of assets, and Shack closures 29,086 492 30,657 2,098 Adjustment: Employee benefit charges(1) 8 - 453 - Restaurant-level profit 64,154$ 53,960$ 185,979$ 153,601$ Total revenue 316,924$ 276,207$ 923,924$ 801,290$ Less: Licensing revenue 12,027 11,227 32,995 30,246 Shack sales 304,897$ 264,980$ 890,929$ 771,044$ Restaurant-level profit margin(2) 21.0% 20.4% 20.9% 19.9% (1) (2) As a percentage of Shack sales. Thirteen Weeks Ended Thirty-Nine Weeks Ended Expenses related to California healthcare charges for fiscal 2020 through 2023 which do not represent fiscal 2024 Labor and related expenses.
EBITDA and Adjusted EBITDA EBITDA, a non-GAAP measure, is defined as Net income (loss) before interest expense (net of interest income), Income tax expense (benefit) and Depreciation and amortization expense. Adjusted EBITDA, a non-GAAP measure, is defined as EBITDA (as defined above) excluding equity-based compensation expense, Impairments, loss on disposal of assets and Shack closures, amortization of cloud-based software implementation costs, as well as certain non-recurring items that the Company does not believe directly reflect its core operations and may not be indicative of the Company's recurring business operations. How These Measures Are Useful When used in conjunction with GAAP financial measures, EBITDA and adjusted EBITDA are supplemental measures of operating performance that the Company believes are useful measures to facilitate comparisons to historical performance and competitors' operating results. Adjusted EBITDA is a key metric used internally by management to develop internal budgets and forecasts and also serves as a metric in its performance-based equity incentive programs and certain bonus arrangements. The Company believes presentation of EBITDA and adjusted EBITDA provides investors with a supplemental view of the Company's operating performance that facilitates analysis and comparisons of its ongoing business operations because they exclude items that may not be indicative of the Company's ongoing operating performance. Limitations of the Usefulness of These Measures EBITDA and adjusted EBITDA may differ from similarly titled measures used by other companies due to different methods of calculation. Presentation of EBITDA and adjusted EBITDA is not intended to be considered in isolation or as a substitute for, or superior to, the financial information prepared and presented in accordance with GAAP. EBITDA and adjusted EBITDA exclude certain normal recurring expenses. Therefore, these measures may not provide a complete understanding of the Company's performance and should be reviewed in conjunction with the GAAP financial measures. A reconciliation of EBITDA and adjusted EBITDA to Net income (loss), the most directly comparable GAAP measure, is set forth on next slide. A DJ U S T E D E B I T D A D E F I N I T I O N S 24
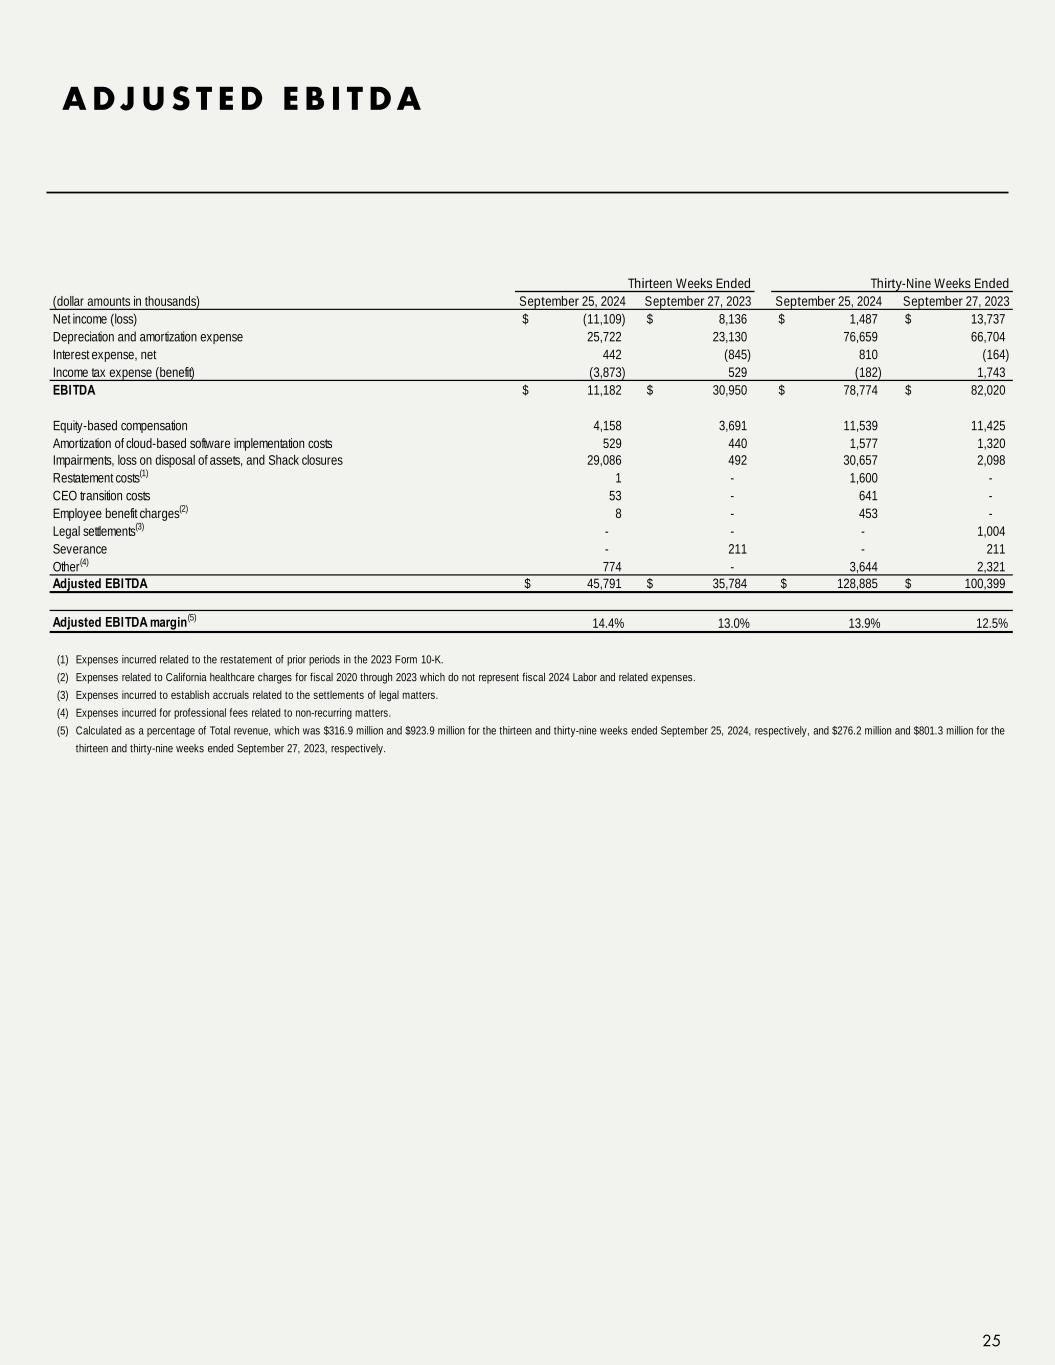
A DJ U S T E D E B I T D A 25 (dollar amounts in thousands) September 25, 2024 September 27, 2023 September 25, 2024 September 27, 2023 Net income (loss) (11,109)$ 8,136$ 1,487$ 13,737$ Depreciation and amortization expense 25,722 23,130 76,659 66,704 Interest expense, net 442 (845) 810 (164) Income tax expense (benefit) (3,873) 529 (182) 1,743 EBITDA 11,182$ 30,950$ 78,774$ 82,020$ Equity-based compensation 4,158 3,691 11,539 11,425 Amortization of cloud-based software implementation costs 529 440 1,577 1,320 Impairments, loss on disposal of assets, and Shack closures 29,086 492 30,657 2,098 Restatement costs(1) 1 - 1,600 - CEO transition costs 53 - 641 - Employee benefit charges(2) 8 - 453 - Legal settlements(3) - - - 1,004 Severance - 211 - 211 Other(4) 774 - 3,644 2,321 Adjusted EBITDA 45,791$ 35,784$ 128,885$ 100,399$ Adjusted EBITDA margin(5) 14.4% 13.0% 13.9% 12.5% (1) (2) Expenses related to California healthcare charges for fiscal 2020 through 2023 which do not represent fiscal 2024 Labor and related expenses. (3) (4) (5) Calculated as a percentage of Total revenue, which was $316.9 million and $923.9 million for the thirteen and thirty-nine weeks ended September 25, 2024, respectively, and $276.2 million and $801.3 million for the thirteen and thirty-nine weeks ended September 27, 2023, respectively. Thirteen Weeks Ended Thirty-Nine Weeks Ended Expenses incurred to establish accruals related to the settlements of legal matters. Expenses incurred related to the restatement of prior periods in the 2023 Form 10-K. Expenses incurred for professional fees related to non-recurring matters.
Adjusted Pro Forma Net Income (Loss) and Adjusted Pro Forma Earnings (Loss) Per Fully Exchanged and Diluted Share Adjusted pro forma net loss represents Net loss attributable to Shake Shack Inc. assuming the full exchange of all outstanding SSE Holdings, LLC membership interests ("LLC Interests") for shares of Class A common stock, adjusted for certain non-recurring items that the Company does not believe are directly related to its core operations and may not be indicative of recurring business operations. Adjusted pro forma loss per fully exchanged and diluted share is calculated by dividing adjusted pro forma net loss by the weighted-average shares of Class A common stock outstanding, assuming the full exchange of all outstanding LLC Interests, after giving effect to the dilutive effect of outstanding equity-based awards. How These Measures Are Useful When used in conjunction with GAAP financial measures, adjusted pro forma net income (loss) and adjusted pro forma earnings (loss) per fully exchanged and diluted share are supplemental measures of operating performance that the Company believes are useful measures to evaluate performance period over period and relative to its competitors. By assuming the full exchange of all outstanding LLC Interests, the Company believes these measures facilitate comparisons with other companies that have different organizational and tax structures, as well as comparisons period over period because it eliminates the effect of any changes in Net income (loss) attributable to Shake Shack Inc. driven by increases in its ownership of SSE Holdings, which are unrelated to the Company's operating performance, and excludes items that are non-recurring or may not be indicative of ongoing operating performance. Limitations of the Usefulness of These Measures Adjusted pro forma net income (loss) and adjusted pro forma earnings (loss) per fully exchanged and diluted share may differ from similarly titled measures used by other companies due to different methods of calculation. Presentation of adjusted pro forma net income (loss) and adjusted pro forma earnings (loss) per fully exchanged and diluted share should not be considered alternatives to Net income (loss) and earnings (loss) per share, as determined under GAAP. While these measures are useful in evaluating the Company's performance, it does not account for the earnings attributable to the non-controlling interest holders and therefore does not provide a complete understanding of the Net income (loss) attributable to Shake Shack Inc. Adjusted pro forma net income (loss) and adjusted pro forma earnings (loss) per fully exchanged and diluted share should be evaluated in conjunction with GAAP financial results. A DJ U S T E D P R O F O R M A N E T I N C O M E ( L O S S ) A N D I N C O M E ( L O S S ) P E R S H A R E D E F I N I T I O N S 26
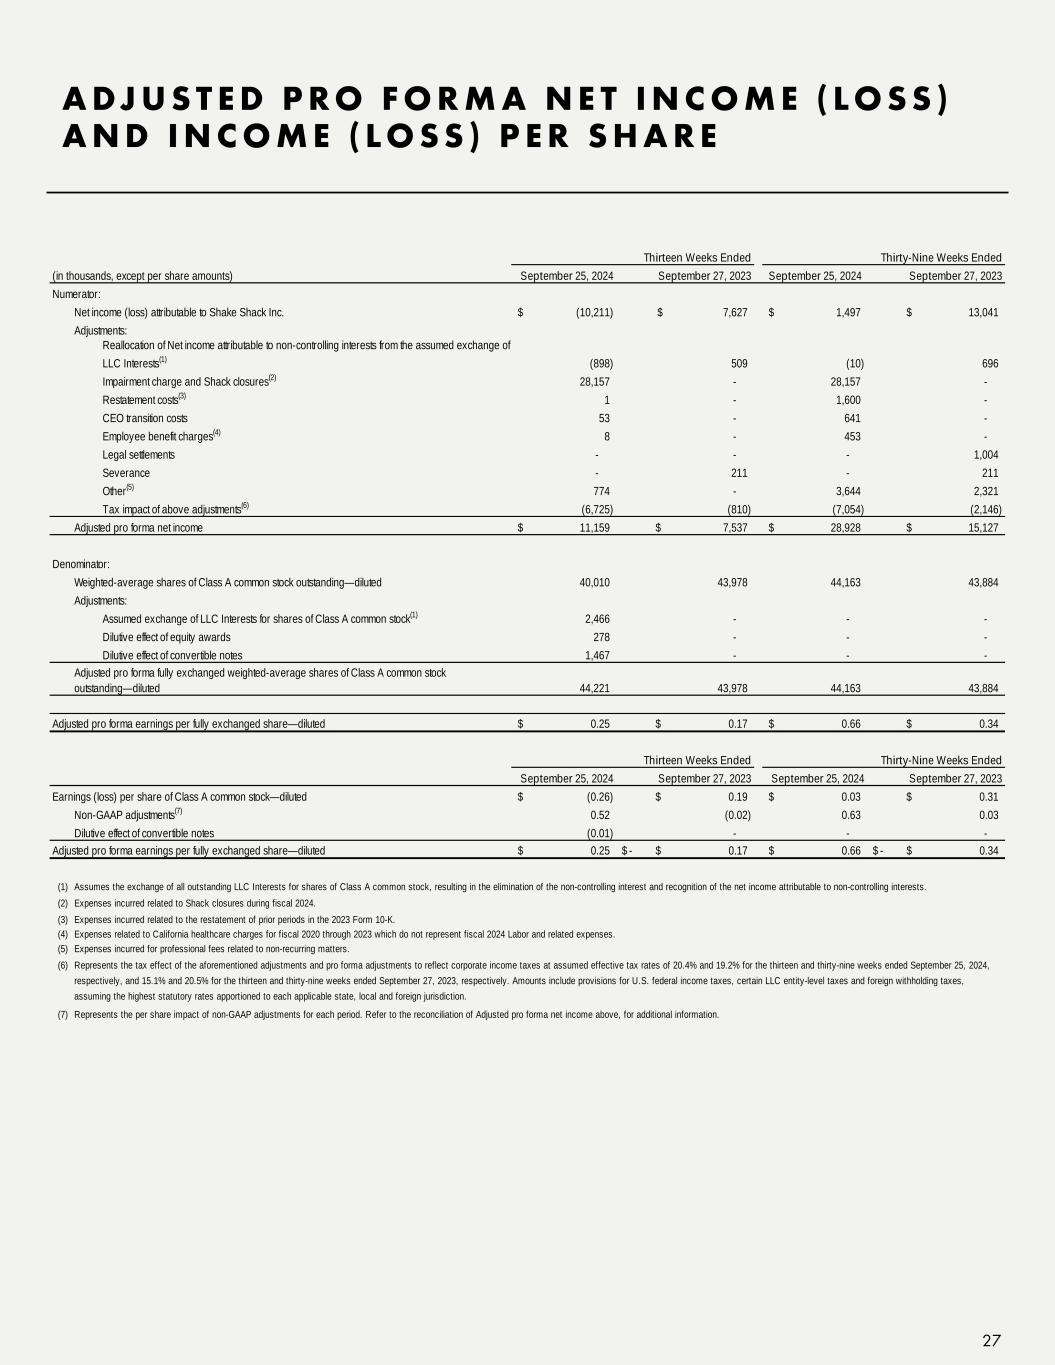
A DJ U S T E D P R O F O R M A N E T I N C O M E ( L O S S ) A N D I N C O M E ( L O S S ) P E R S H A R E 27 (in thousands, except per share amounts) September 25, 2024 September 27, 2023 September 25, 2024 September 27, 2023 Numerator: Net income (loss) attributable to Shake Shack Inc. (10,211)$ 7,627$ 1,497$ 13,041$ Adjustments: Reallocation of Net income attributable to non-controlling interests from the assumed exchange of LLC Interests(1) (898) 509 (10) 696 Impairment charge and Shack closures(2) 28,157 - 28,157 - Restatement costs(3) 1 - 1,600 - CEO transition costs 53 - 641 - Employee benefit charges(4) 8 - 453 - Legal settlements - - - 1,004 Severance - 211 - 211 Other(5) 774 - 3,644 2,321 Tax impact of above adjustments(6) (6,725) (810) (7,054) (2,146) Adjusted pro forma net income 11,159$ 7,537$ 28,928$ 15,127$ Denominator: Weighted-average shares of Class A common stock outstanding—diluted 40,010 43,978 44,163 43,884 Adjustments: Assumed exchange of LLC Interests for shares of Class A common stock(1) 2,466 - - - Dilutive effect of equity awards 278 - - - Dilutive effect of convertible notes 1,467 - - - 44,221 43,978 44,163 43,884 Adjusted pro forma earnings per fully exchanged share—diluted 0.25$ 0.17$ 0.66$ 0.34$ September 25, 2024 September 27, 2023 September 25, 2024 September 27, 2023 Earnings (loss) per share of Class A common stock—diluted (0.26)$ 0.19$ 0.03$ 0.31$ Non-GAAP adjustments(7) 0.52 (0.02) 0.63 0.03 Dilutive effect of convertible notes (0.01) - - - Adjusted pro forma earnings per fully exchanged share—diluted 0.25$ -$ 0.17$ 0.66$ -$ 0.34$ (1) (2) (3) (4) (5) (6) (7) Represents the tax effect of the aforementioned adjustments and pro forma adjustments to reflect corporate income taxes at assumed effective tax rates of 20.4% and 19.2% for the thirteen and thirty-nine weeks ended September 25, 2024, respectively, and 15.1% and 20.5% for the thirteen and thirty-nine weeks ended September 27, 2023, respectively. Amounts include provisions for U.S. federal income taxes, certain LLC entity-level taxes and foreign withholding taxes, assuming the highest statutory rates apportioned to each applicable state, local and foreign jurisdiction. Expenses incurred related to the restatement of prior periods in the 2023 Form 10-K. Represents the per share impact of non-GAAP adjustments for each period. Refer to the reconciliation of Adjusted pro forma net income above, for additional information. Thirteen Weeks Ended Thirty-Nine Weeks Ended Expenses incurred for professional fees related to non-recurring matters. Adjusted pro forma fully exchanged weighted-average shares of Class A common stock outstanding—diluted Assumes the exchange of all outstanding LLC Interests for shares of Class A common stock, resulting in the elimination of the non-controlling interest and recognition of the net income attributable to non-controlling interests. Thirteen Weeks Ended Thirty-Nine Weeks Ended Expenses related to California healthcare charges for fiscal 2020 through 2023 which do not represent fiscal 2024 Labor and related expenses. Expenses incurred related to Shack closures during fiscal 2024.

Adjusted Pro Forma Effective Tax Rate Adjusted pro forma effective tax rate represents the effective tax rate assuming the full exchange of all outstanding SSE Holdings, LLC membership interests ("LLC Interests") for shares of Class A common stock, adjusted for certain non-recurring items that the Company does not believe are directly related to its core operations and may not be indicative of its recurring business operations. How This Measure Is Useful When used in conjunction with GAAP financial measures, adjusted pro forma effective tax rate is a supplemental measure of operating performance that the Company believes is useful to evaluate its performance period over period and relative to its competitors. By assuming the full exchange of all outstanding LLC Interests, the Company believes this measure facilitates comparisons with other companies that have different organizational and tax structures, as well as comparisons period over period because it eliminates the effect of any changes in effective tax rate driven by increases in its ownership of SSE Holdings, which are unrelated to the Company's operating performance, and excludes items that are non-recurring or may not be indicative of ongoing operating performance. Limitations of the Usefulness of this Measure Adjusted pro forma effective tax rate may differ from similarly titled measures used by other companies due to different methods of calculation. Presentation of adjusted pro forma effective tax rate should not be considered an alternative to effective tax rate, as determined under GAAP. While this measure is useful in evaluating the Company's performance, it does not account for the effective tax rate attributable to the non-controlling interest holders and therefore does not provide a complete understanding of effective tax rate. Adjusted pro forma effective tax rate should be evaluated in conjunction with GAAP financial results. A reconciliation of adjusted pro forma effective tax rate, the most directly comparable GAAP measure, is set forth on next slide. A DJ U S T E D P R O F O R M A E F F E C T I V E TA X R AT E D E F I N I T I O N S 28
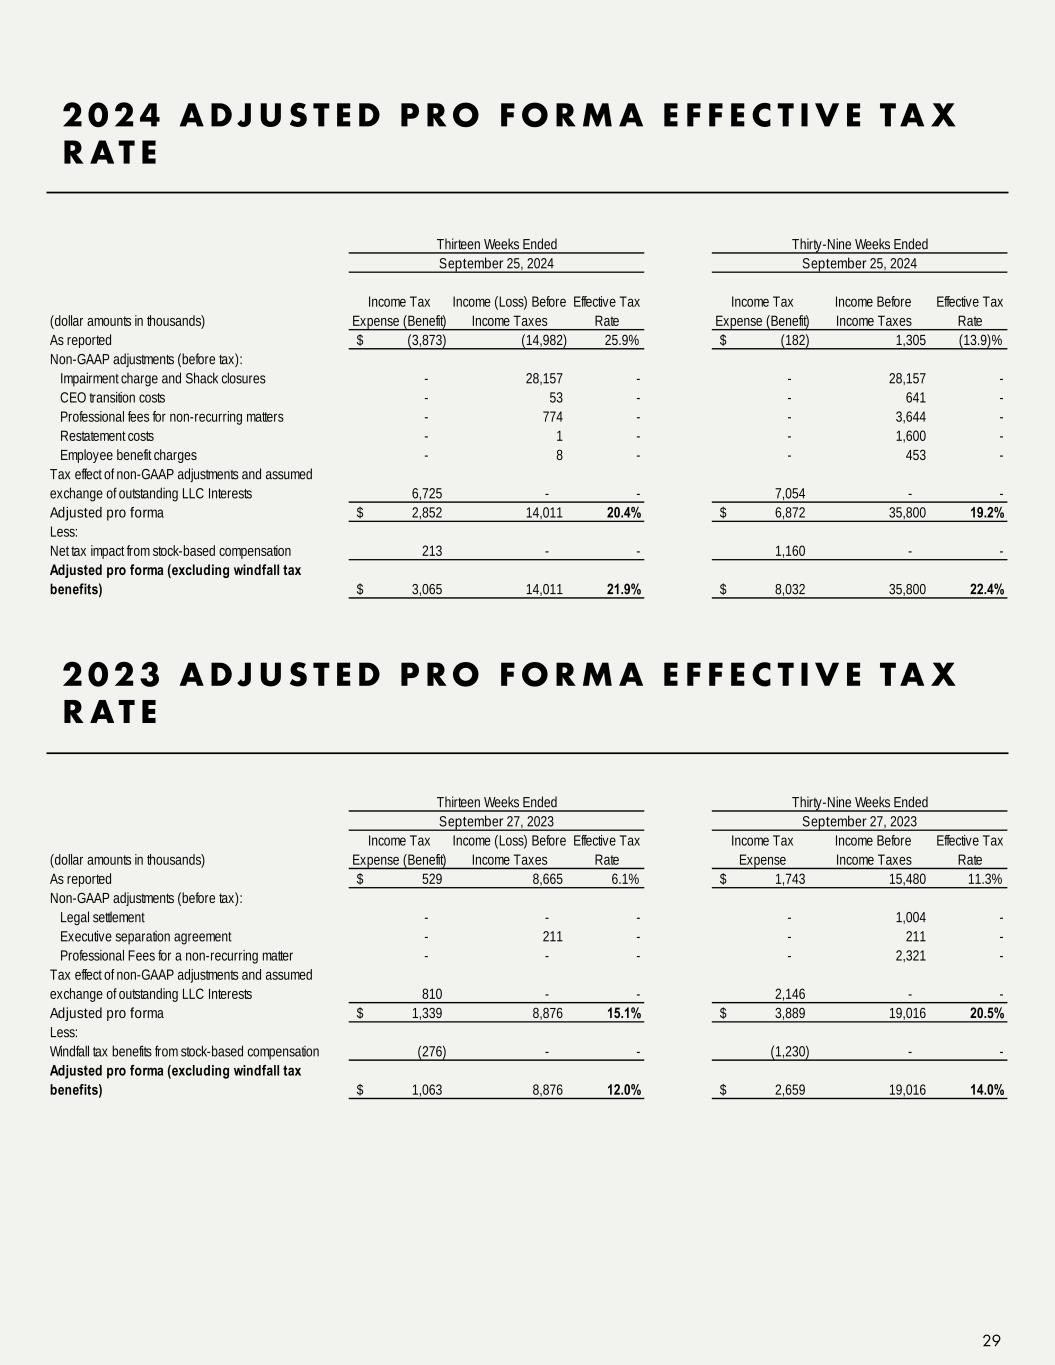
2 0 2 4 A DJ U S T E D P R O F O R M A E F F E C T I V E TA X R AT E 29 2 0 2 3 A DJ U S T E D P R O F O R M A E F F E C T I V E TA X R AT E (dollar amounts in thousands) Income Tax Expense (Benefit) Income (Loss) Before Income Taxes Effective Tax Rate Income Tax Expense (Benefit) Income Before Income Taxes Effective Tax Rate As reported (3,873)$ (14,982) 25.9% (182)$ 1,305 (13.9)% Non-GAAP adjustments (before tax): Impairment charge and Shack closures - 28,157 - - 28,157 - CEO transition costs - 53 - - 641 - Professional fees for non-recurring matters - 774 - - 3,644 - Restatement costs - 1 - - 1,600 - Employee benefit charges - 8 - - 453 - Tax effect of non-GAAP adjustments and assumed exchange of outstanding LLC Interests 6,725 - - 7,054 - - Adjusted pro forma 2,852$ 14,011 20.4% 6,872$ 35,800 19.2% Less: Net tax impact from stock-based compensation 213 - - 1,160 - - Adjusted pro forma (excluding windfall tax benefits) 3,065$ 14,011 21.9% 8,032$ 35,800 22.4% Thirteen Weeks Ended Thirty-Nine Weeks Ended September 25, 2024 September 25, 2024 (dollar amounts in thousands) Income Tax Expense (Benefit) Income (Loss) Before Income Taxes Effective Tax Rate Income Tax Expense Income Before Income Taxes Effective Tax Rate As reported 529$ 8,665 6.1% 1,743$ 15,480 11.3% Non-GAAP adjustments (before tax): Legal settlement - - - - 1,004 - Executive separation agreement - 211 - - 211 - Professional Fees for a non-recurring matter - - - - 2,321 - Tax effect of non-GAAP adjustments and assumed exchange of outstanding LLC Interests 810 - - 2,146 - - Adjusted pro forma 1,339$ 8,876 15.1% 3,889$ 19,016 20.5% Less: Windfall tax benefits from stock-based compensation (276) - - (1,230) - - Adjusted pro forma (excluding windfall tax benefits) 1,063$ 8,876 12.0% 2,659$ 19,016 14.0% September 27, 2023 September 27, 2023 Thirteen Weeks Ended Thirty-Nine Weeks Ended

INVESTOR CONTACT Melissa Calandruccio, ICR Michelle Michalski, ICR (844) Shack-04 (844-742-2504) investor@shakeshack.com MEDIA CONTACT Meg Davis, Shake Shack mcastranova@shakeshack.com CONTACT INFORMATION

