0001285785false2023FY12/31P3YP3Yhttp://fasb.org/us-gaap/2023#OtherAssetsNoncurrenthttp://fasb.org/us-gaap/2023#AccruedLiabilitiesCurrenthttp://fasb.org/us-gaap/2023#AccruedLiabilitiesCurrenthttp://fasb.org/us-gaap/2023#OtherLiabilitiesNoncurrenthttp://fasb.org/us-gaap/2023#OtherLiabilitiesNoncurrenthttp://fasb.org/us-gaap/2023#LiabilitiesTotalMemberhttp://fasb.org/us-gaap/2023#LiabilitiesTotalMemberhttp://fasb.org/us-gaap/2023#PropertyPlantAndEquipmentNethttp://fasb.org/us-gaap/2023#PropertyPlantAndEquipmentNethttp://fasb.org/us-gaap/2023#LongTermDebtAndCapitalLeaseObligationsCurrenthttp://fasb.org/us-gaap/2023#LongTermDebtAndCapitalLeaseObligationsCurrenthttp://fasb.org/us-gaap/2023#LongTermDebtAndCapitalLeaseObligationshttp://fasb.org/us-gaap/2023#LongTermDebtAndCapitalLeaseObligationshttp://fasb.org/us-gaap/2023#LiabilitiesTotalMemberhttp://fasb.org/us-gaap/2023#LiabilitiesTotalMemberhttp://fasb.org/us-gaap/2023#OtherAssetsNoncurrenthttp://fasb.org/us-gaap/2023#OtherAssetsNoncurrent3.80.150.0http://fasb.org/us-gaap/2023#AccruedLiabilitiesCurrenthttp://fasb.org/us-gaap/2023#OperatingIncomeLoss00012857852023-01-012023-12-3100012857852023-12-31iso4217:USD00012857852024-02-16xbrli:shares00012857852023-10-012023-12-3100012857852022-01-012022-12-3100012857852021-01-012021-12-31iso4217:USDxbrli:shares00012857852022-12-3100012857852021-12-3100012857852020-12-310001285785us-gaap:CommonStockMember2020-12-310001285785us-gaap:AdditionalPaidInCapitalMember2020-12-310001285785us-gaap:RetainedEarningsMember2020-12-310001285785us-gaap:AccumulatedOtherComprehensiveIncomeMember2020-12-310001285785us-gaap:NoncontrollingInterestMember2020-12-310001285785us-gaap:RetainedEarningsMember2021-01-012021-12-310001285785us-gaap:AccumulatedOtherComprehensiveIncomeMember2021-01-012021-12-310001285785us-gaap:NoncontrollingInterestMember2021-01-012021-12-310001285785us-gaap:CommonStockMember2021-01-012021-12-310001285785us-gaap:AdditionalPaidInCapitalMember2021-01-012021-12-310001285785us-gaap:CommonStockMember2021-12-310001285785us-gaap:AdditionalPaidInCapitalMember2021-12-310001285785us-gaap:RetainedEarningsMember2021-12-310001285785us-gaap:AccumulatedOtherComprehensiveIncomeMember2021-12-310001285785us-gaap:NoncontrollingInterestMember2021-12-310001285785us-gaap:RetainedEarningsMember2022-01-012022-12-310001285785us-gaap:AccumulatedOtherComprehensiveIncomeMember2022-01-012022-12-310001285785us-gaap:NoncontrollingInterestMember2022-01-012022-12-310001285785us-gaap:CommonStockMember2022-01-012022-12-310001285785us-gaap:AdditionalPaidInCapitalMember2022-01-012022-12-310001285785us-gaap:CommonStockMember2022-12-310001285785us-gaap:AdditionalPaidInCapitalMember2022-12-310001285785us-gaap:RetainedEarningsMember2022-12-310001285785us-gaap:AccumulatedOtherComprehensiveIncomeMember2022-12-310001285785us-gaap:NoncontrollingInterestMember2022-12-310001285785us-gaap:RetainedEarningsMember2023-01-012023-12-310001285785us-gaap:AccumulatedOtherComprehensiveIncomeMember2023-01-012023-12-310001285785us-gaap:NoncontrollingInterestMember2023-01-012023-12-310001285785us-gaap:CommonStockMember2023-01-012023-12-310001285785us-gaap:AdditionalPaidInCapitalMember2023-01-012023-12-310001285785us-gaap:CommonStockMember2023-12-310001285785us-gaap:AdditionalPaidInCapitalMember2023-12-310001285785us-gaap:RetainedEarningsMember2023-12-310001285785us-gaap:AccumulatedOtherComprehensiveIncomeMember2023-12-310001285785us-gaap:NoncontrollingInterestMember2023-12-310001285785mos:MiskiMayoJointVentureMember2018-01-08xbrli:pure0001285785mos:MaadenWaadAlShamalPhosphateCompanyMembermos:MaadenWaadAlShamalPhosphateCompanyMember2023-12-310001285785mos:MaadenWaadAlShamalPhosphateCompanyMember2023-01-012023-12-310001285785srt:MaximumMember2023-01-012023-12-310001285785mos:CanpotexMember2023-12-310001285785mos:CanpotexMember2022-12-310001285785mos:CanpotexMember2023-01-012023-12-310001285785mos:CanpotexMember2022-01-012022-12-310001285785mos:CanpotexMember2021-01-012021-12-310001285785srt:MinimumMemberus-gaap:MachineryAndEquipmentMember2023-12-310001285785srt:MaximumMemberus-gaap:MachineryAndEquipmentMember2023-12-310001285785srt:MinimumMemberus-gaap:LandAndBuildingMember2023-12-310001285785srt:MaximumMemberus-gaap:LandAndBuildingMember2023-12-310001285785us-gaap:LandMember2023-12-310001285785us-gaap:LandMember2022-12-310001285785us-gaap:MiningPropertiesAndMineralRightsMember2023-12-310001285785us-gaap:MiningPropertiesAndMineralRightsMember2022-12-310001285785us-gaap:BuildingImprovementsMember2023-12-310001285785us-gaap:BuildingImprovementsMember2022-12-310001285785us-gaap:MachineryAndEquipmentMember2023-12-310001285785us-gaap:MachineryAndEquipmentMember2022-12-310001285785us-gaap:ConstructionInProgressMember2023-12-310001285785us-gaap:ConstructionInProgressMember2022-12-310001285785mos:EquityMethodInvesteeRiverBendAgMember2023-12-310001285785mos:EquityMethodInvesteeIFCMember2023-12-310001285785mos:MaadenWaadAlShamalPhosphateCompanyMemberus-gaap:EquityMethodInvesteeMember2023-12-310001285785mos:EquityMethodInvesteeCanpotexMember2023-12-310001285785us-gaap:EquityMethodInvestmentsMember2023-01-012023-12-310001285785us-gaap:EquityMethodInvestmentsMember2022-01-012022-12-310001285785us-gaap:EquityMethodInvestmentsMember2021-01-012021-12-310001285785us-gaap:EquityMethodInvestmentsMember2023-12-310001285785us-gaap:EquityMethodInvestmentsMember2022-12-310001285785us-gaap:EquityMethodInvestmentsMember2021-12-310001285785mos:MaadenWaadAlShamalPhosphateCompanyMemberus-gaap:EquityMethodInvesteeMember2023-01-012023-12-310001285785mos:MaadenWaadAlShamalPhosphateCompanyMemberus-gaap:EquityMethodInvesteeMember2022-01-012022-12-310001285785mos:MaadenWaadAlShamalPhosphateCompanyMemberus-gaap:EquityMethodInvesteeMember2021-01-012021-12-310001285785mos:MaadenWaadAlShamalPhosphateCompanyMemberus-gaap:EquityMethodInvesteeMember2016-07-012016-07-010001285785mos:PotashSegmentMember2021-12-310001285785mos:MosaicFertilizantesMember2021-12-310001285785mos:CorporateEliminationsAndOtherSegmentMember2021-12-310001285785mos:PotashSegmentMember2022-01-012022-12-310001285785mos:MosaicFertilizantesMember2022-01-012022-12-310001285785mos:CorporateEliminationsAndOtherSegmentMember2022-01-012022-12-310001285785mos:PotashSegmentMember2022-12-310001285785mos:MosaicFertilizantesMember2022-12-310001285785mos:CorporateEliminationsAndOtherSegmentMember2022-12-310001285785mos:PotashSegmentMember2023-01-012023-12-310001285785mos:MosaicFertilizantesMember2023-01-012023-12-310001285785mos:CorporateEliminationsAndOtherSegmentMember2023-01-012023-12-310001285785mos:PotashSegmentMember2023-12-310001285785mos:MosaicFertilizantesMember2023-12-310001285785mos:CorporateEliminationsAndOtherSegmentMember2023-12-310001285785srt:MinimumMember2023-01-012023-12-3100012857852021-08-190001285785us-gaap:RevolvingCreditFacilityMember2023-12-310001285785us-gaap:RevolvingCreditFacilityMember2022-12-310001285785us-gaap:RevolvingCreditFacilityMember2023-01-012023-12-3100012857852021-01-012021-08-1900012857852021-08-202021-12-310001285785us-gaap:RevolvingCreditFacilityMember2021-01-012021-12-310001285785mos:MosaicCreditFacilityMember2023-12-3100012857852020-01-070001285785mos:InventoryFinancingArrangementMember2023-01-012023-12-310001285785mos:ReceivablePurchasingAgreementDomain2023-01-012023-12-310001285785mos:ReceivablePurchasingAgreementMember2023-01-012023-12-310001285785mos:ReceivablePurchasingAgreementMember2022-01-012022-12-310001285785us-gaap:CommercialPaperMember2023-12-310001285785us-gaap:CommercialPaperMember2023-01-012023-12-310001285785us-gaap:CommercialPaperMember2022-12-310001285785us-gaap:CommercialPaperMember2022-01-012022-12-310001285785us-gaap:ShortTermDebtMember2023-12-310001285785us-gaap:SeniorNotesMembermos:SeniorNotesDue2022Member2023-12-310001285785mos:SeniorNotesDue2027Memberus-gaap:SeniorNotesMember2023-12-310001285785us-gaap:SeniorNotesMembermos:SeniorNotesDue2022Member2022-12-310001285785us-gaap:SeniorLoansMembermos:SeniorUnsecuredTermLoanFacilityMember2023-12-310001285785mos:SeniorNotesDue2028Memberus-gaap:SeniorNotesMember2023-12-310001285785mos:SeniorNotesDue2033Memberus-gaap:SeniorNotesMember2023-12-310001285785us-gaap:SeniorNotesMembermos:SeniorNotesDue2043Member2023-12-310001285785us-gaap:SeniorNotesMembermos:SeniorNotesDue2041Member2023-12-310001285785mos:SeniorNotesDue2023Memberus-gaap:SeniorNotesMember2023-01-012023-12-310001285785mos:SeniorNotesDue2023Memberus-gaap:SeniorNotesMember2023-12-310001285785mos:DebenturesDue2028Memberus-gaap:NotesPayableOtherPayablesMember2023-12-310001285785srt:MinimumMembermos:UnsecuredNotesMember2023-12-310001285785srt:MaximumMembermos:UnsecuredNotesMember2023-12-310001285785mos:UnsecuredNotesMember2023-12-310001285785mos:UnsecuredNotesMember2022-12-310001285785srt:MaximumMembermos:UnsecuredDebenturesMember2023-12-310001285785mos:UnsecuredDebenturesMember2023-12-310001285785mos:UnsecuredDebenturesMember2022-12-310001285785srt:MaximumMembermos:TermLoanMemberus-gaap:SecuredOvernightFinancingRateSofrOvernightIndexSwapRateMember2023-12-310001285785mos:TermLoanMember2023-12-310001285785mos:SeniorUnsecuredTermLoanFacilityMember2023-12-310001285785mos:SeniorUnsecuredTermLoanFacilityMember2022-12-310001285785srt:MinimumMemberus-gaap:CapitalLeaseObligationsMember2023-12-310001285785srt:MaximumMemberus-gaap:CapitalLeaseObligationsMember2023-12-310001285785us-gaap:CapitalLeaseObligationsMember2023-12-310001285785us-gaap:CapitalLeaseObligationsMember2022-12-310001285785mos:OtherTypesOfDebtMembersrt:MinimumMember2023-12-310001285785srt:MaximumMembermos:OtherTypesOfDebtMember2023-12-310001285785mos:OtherTypesOfDebtMember2023-12-310001285785mos:OtherTypesOfDebtMember2022-12-310001285785us-gaap:RevolvingCreditFacilityMember2022-01-012022-12-3100012857852016-08-310001285785us-gaap:CashAndCashEquivalentsMemberus-gaap:FairValueInputsLevel1Member2023-12-310001285785us-gaap:FairValueInputsLevel2Memberus-gaap:CorporateDebtSecuritiesMember2023-12-310001285785us-gaap:FairValueInputsLevel2Memberus-gaap:MunicipalBondsMember2023-12-310001285785us-gaap:FairValueInputsLevel2Memberus-gaap:USTreasuryAndGovernmentMember2023-12-310001285785us-gaap:CashAndCashEquivalentsMemberus-gaap:FairValueInputsLevel1Member2022-12-310001285785us-gaap:FairValueInputsLevel2Memberus-gaap:CorporateDebtSecuritiesMember2022-12-310001285785us-gaap:FairValueInputsLevel2Memberus-gaap:MunicipalBondsMember2022-12-310001285785us-gaap:FairValueInputsLevel2Memberus-gaap:USTreasuryAndGovernmentMember2022-12-310001285785us-gaap:FairValueInputsLevel2Memberus-gaap:AssetBackedSecuritiesMember2022-12-310001285785us-gaap:CorporateDebtSecuritiesMember2023-12-310001285785us-gaap:CorporateDebtSecuritiesMember2022-12-310001285785us-gaap:MunicipalBondsMember2023-12-310001285785us-gaap:MunicipalBondsMember2022-12-310001285785us-gaap:USTreasuryAndGovernmentMember2023-12-310001285785us-gaap:USTreasuryAndGovernmentMember2022-12-310001285785us-gaap:DebtSecuritiesMember2023-12-310001285785us-gaap:DomesticCountryMember2023-01-012023-12-310001285785mos:ValeFertilizantesS.A.Member2023-01-012023-12-310001285785us-gaap:DomesticCountryMember2022-01-012022-12-310001285785mos:ValeFertilizantesS.A.Member2022-01-012022-12-310001285785us-gaap:DomesticCountryMember2021-01-012021-12-310001285785us-gaap:ForeignCountryMember2021-01-012021-12-310001285785mos:EsterhazyMineClosureMember2021-01-012021-12-310001285785mos:AnticipatoryForeignTaxCreditCarryforwardMember2023-12-310001285785mos:AnticipatoryForeignTaxCreditCarryforwardMember2022-12-310001285785mos:NetOperatingLossCarryforwardMember2023-12-310001285785us-gaap:CapitalLossCarryforwardMember2023-12-310001285785mos:ForeignTaxCreditCarryforwardMember2023-12-310001285785us-gaap:NonUsMember2023-12-310001285785us-gaap:ForeignCountryMembermos:NetOperatingLossCarryforwardMember2023-12-310001285785us-gaap:ForeignCountryMember2023-01-012023-12-310001285785mos:TaxYear2026OrEarlierMembermos:ForeignTaxCreditCarryforwardMember2023-12-310001285785mos:ForeignTaxCreditCarryforwardMembermos:TaxYear2029OrEarlierMember2023-12-310001285785mos:TaxYear2030OrEarlierMembermos:ForeignTaxCreditCarryforwardMember2023-12-310001285785mos:TaxYear2033OrEarlierMembermos:ForeignTaxCreditCarryforwardMember2023-12-310001285785us-gaap:ForeignCountryMember2023-01-012023-12-310001285785us-gaap:ForeignCountryMember2022-01-012022-12-310001285785country:US2022-12-310001285785mos:ValeFertilizantesS.A.Member2021-01-012021-12-310001285785country:US2021-12-310001285785us-gaap:NonUsMember2023-01-012023-12-310001285785mos:USandnonUSDomain2023-01-012023-12-310001285785us-gaap:UnfavorableRegulatoryActionMember2023-12-310001285785us-gaap:UnfavorableRegulatoryActionMember2022-12-310001285785mos:A2015ConsentDecreesWithEPAMemberus-gaap:UnfavorableRegulatoryActionMember2023-12-310001285785mos:PlantCityandBonnieFacilitiesMember2023-12-310001285785mos:BonnieFacilityTrustMember2018-07-270001285785mos:PlantCityandBonnieFacilitiesMember2022-12-310001285785us-gaap:InterestRateSwapMember2022-12-310001285785us-gaap:InterestRateSwapMember2023-12-310001285785us-gaap:ForeignExchangeContractMember2023-12-310001285785us-gaap:ForeignExchangeContractMember2022-12-310001285785us-gaap:CommodityContractMember2023-12-31utr:MMBTU0001285785us-gaap:CommodityContractMember2022-12-310001285785us-gaap:FairValueMeasurementsRecurringMemberus-gaap:ForeignExchangeContractMember2023-01-012023-12-310001285785us-gaap:FairValueMeasurementsRecurringMemberus-gaap:ForeignExchangeContractMember2023-12-310001285785us-gaap:FairValueMeasurementsRecurringMemberus-gaap:ForeignExchangeContractMember2022-12-310001285785us-gaap:FairValueMeasurementsRecurringMemberus-gaap:CommodityContractMember2023-12-310001285785us-gaap:FairValueMeasurementsRecurringMemberus-gaap:CommodityContractMember2022-12-310001285785us-gaap:CarryingReportedAmountFairValueDisclosureMember2023-12-310001285785us-gaap:EstimateOfFairValueFairValueDisclosureMember2023-12-310001285785us-gaap:CarryingReportedAmountFairValueDisclosureMember2022-12-310001285785us-gaap:EstimateOfFairValueFairValueDisclosureMember2022-12-310001285785us-gaap:PensionPlansDefinedBenefitMember2022-01-012022-12-310001285785us-gaap:PensionPlansDefinedBenefitMember2023-01-012023-12-310001285785srt:NorthAmericaMemberus-gaap:PensionPlansDefinedBenefitMember2023-12-310001285785srt:NorthAmericaMemberus-gaap:PensionPlansDefinedBenefitMember2022-12-310001285785us-gaap:PensionPlansDefinedBenefitMember2022-12-310001285785us-gaap:PensionPlansDefinedBenefitMember2021-12-310001285785us-gaap:PensionPlansDefinedBenefitMember2023-12-310001285785us-gaap:FixedIncomeSecuritiesMember2023-12-310001285785us-gaap:EquitySecuritiesMember2023-12-310001285785us-gaap:CashMember2023-12-310001285785mos:NorthAmericanOtherPostretirementBenefitsPlanMember2023-12-310001285785mos:NorthAmericanOtherPostretirementBenefitsPlanMember2022-12-310001285785srt:MinimumMembermos:NorthAmericanOtherPostretirementBenefitsPlanMember2023-12-310001285785mos:BrazilOtherPostretirementBenefitsPlanMember2023-12-310001285785mos:BrazilOtherPostretirementBenefitsPlanMember2022-12-310001285785mos:BrazilOtherPostretirementBenefitsPlanMember2021-12-310001285785mos:BrazilOtherPostretirementBenefitsPlanMember2023-01-012023-12-310001285785mos:BrazilOtherPostretirementBenefitsPlanMember2022-01-012022-12-310001285785us-gaap:AccumulatedTranslationAdjustmentMember2020-12-310001285785us-gaap:AccumulatedDefinedBenefitPlansAdjustmentMember2020-12-310001285785us-gaap:AociDerivativeQualifyingAsHedgeExcludedComponentParentMember2020-12-310001285785us-gaap:AccumulatedNetUnrealizedInvestmentGainLossMember2020-12-310001285785us-gaap:AccumulatedTranslationAdjustmentMember2021-01-012021-12-310001285785us-gaap:AccumulatedDefinedBenefitPlansAdjustmentMember2021-01-012021-12-310001285785us-gaap:AociDerivativeQualifyingAsHedgeExcludedComponentParentMember2021-01-012021-12-310001285785us-gaap:AccumulatedNetUnrealizedInvestmentGainLossMember2021-01-012021-12-310001285785us-gaap:AccumulatedTranslationAdjustmentMember2021-12-310001285785us-gaap:AccumulatedDefinedBenefitPlansAdjustmentMember2021-12-310001285785us-gaap:AociDerivativeQualifyingAsHedgeExcludedComponentParentMember2021-12-310001285785us-gaap:AccumulatedNetUnrealizedInvestmentGainLossMember2021-12-310001285785us-gaap:AccumulatedTranslationAdjustmentMember2022-01-012022-12-310001285785us-gaap:AccumulatedDefinedBenefitPlansAdjustmentMember2022-01-012022-12-310001285785us-gaap:AociDerivativeQualifyingAsHedgeExcludedComponentParentMember2022-01-012022-12-310001285785us-gaap:AccumulatedNetUnrealizedInvestmentGainLossMember2022-01-012022-12-310001285785us-gaap:AccumulatedTranslationAdjustmentMember2022-12-310001285785us-gaap:AccumulatedDefinedBenefitPlansAdjustmentMember2022-12-310001285785us-gaap:AociDerivativeQualifyingAsHedgeExcludedComponentParentMember2022-12-310001285785us-gaap:AccumulatedNetUnrealizedInvestmentGainLossMember2022-12-310001285785us-gaap:AccumulatedTranslationAdjustmentMember2023-01-012023-12-310001285785us-gaap:AccumulatedDefinedBenefitPlansAdjustmentMember2023-01-012023-12-310001285785us-gaap:AociDerivativeQualifyingAsHedgeExcludedComponentParentMember2023-01-012023-12-310001285785us-gaap:AccumulatedNetUnrealizedInvestmentGainLossMember2023-01-012023-12-310001285785us-gaap:AccumulatedTranslationAdjustmentMember2023-12-310001285785us-gaap:AccumulatedDefinedBenefitPlansAdjustmentMember2023-12-310001285785us-gaap:AociDerivativeQualifyingAsHedgeExcludedComponentParentMember2023-12-310001285785us-gaap:AccumulatedNetUnrealizedInvestmentGainLossMember2023-12-310001285785mos:ShareRepurchaseProgram2022Member2023-12-310001285785mos:AcceleratedShareRepurchaseAgreementMember2023-01-012023-12-310001285785mos:AcceleratedShareRepurchaseAgreementMember2023-12-3100012857852023-03-012023-03-310001285785mos:AcceleratedShareRepurchaseAgreement2023Member2023-01-012023-12-310001285785mos:ShareRepurchaseProgram2022Member2023-01-012023-12-310001285785mos:AcceleratedShareRepurchaseAgreement2023Member2022-12-310001285785mos:AcceleratedShareRepurchaseAgreementMember2022-01-012022-12-310001285785mos:ShareRepurchaseProgram2021Member2022-01-012022-12-310001285785mos:ValeFertilizantesS.A.Member2022-01-012022-12-310001285785mos:A2023StockAndIncentivePlanMember2023-12-310001285785mos:A2014StockandIncentivePlanMember2023-12-310001285785mos:OmnibusStockAndIncentivePlan2004Member2023-12-310001285785us-gaap:EmployeeStockOptionMember2023-01-012023-12-310001285785us-gaap:EmployeeStockOptionMember2020-01-012020-12-310001285785us-gaap:EmployeeStockOptionMember2022-12-310001285785us-gaap:EmployeeStockOptionMember2023-12-310001285785mos:A2014StockandIncentivePlanMemberus-gaap:EmployeeStockOptionMember2023-12-310001285785mos:OmnibusStockAndIncentivePlan2004Memberus-gaap:EmployeeStockOptionMember2023-12-310001285785us-gaap:RestrictedStockUnitsRSUMember2023-01-012023-12-310001285785us-gaap:RestrictedStockUnitsRSUMember2022-12-310001285785us-gaap:RestrictedStockUnitsRSUMember2023-12-310001285785mos:TSRPerformanceUnitsMember2023-01-012023-12-310001285785mos:PerformanceUnitsCashSettledMember2023-01-012023-12-310001285785mos:PerformanceUnitsCashSettledMember2022-01-012022-12-310001285785mos:PerformanceUnitsCashSettledMember2021-01-012021-12-310001285785mos:TSRPerformanceUnitsMember2022-01-012022-12-310001285785mos:TSRPerformanceUnitsMember2021-01-012021-12-310001285785us-gaap:PerformanceSharesMember2022-12-310001285785us-gaap:PerformanceSharesMember2023-01-012023-12-310001285785us-gaap:PerformanceSharesMember2023-12-310001285785mos:PerformanceUnitsCashSettledMember2023-12-310001285785mos:PerformanceUnitsCashSettledMember2022-12-310001285785mos:InventoriesAtPriceTiedToNaturalGasMember2023-01-012023-12-31utr:t0001285785mos:NewWalesPhaseIIEastStackMember2023-12-310001285785mos:NewWalesPhaseIIWestStackMember2023-12-310001285785srt:MaximumMembermos:BraziliansubsidiaryjudicialandadministrativeproceedingsMember2023-12-310001285785mos:BraziliansubsidiaryjudicialandadministrativeproceedingsMember2023-12-310001285785srt:MaximumMembermos:BraziliansubsidiarylaborclaimsMember2023-12-310001285785mos:BraziliansubsidiarylaborclaimsMember2023-12-310001285785srt:MaximumMembermos:BrazilianNonIncomeTaxProceedingsMember2023-12-310001285785srt:MaximumMembermos:BrazilianNonIncomeTaxProceedingsMemberus-gaap:IndemnificationGuaranteeMember2023-12-310001285785srt:MaximumMembermos:PISAndCofinsCasesMembermos:BrazilianNonIncomeTaxProceedingsMember2023-12-310001285785us-gaap:RelatedPartyMember2023-12-310001285785us-gaap:RelatedPartyMember2022-12-310001285785us-gaap:RelatedPartyMember2023-01-012023-12-310001285785us-gaap:RelatedPartyMember2022-01-012022-12-310001285785us-gaap:RelatedPartyMember2021-01-012021-12-310001285785us-gaap:EquityMethodInvesteeMember2023-01-012023-12-310001285785us-gaap:EquityMethodInvesteeMember2022-01-012022-12-310001285785us-gaap:EquityMethodInvesteeMember2021-01-012021-12-310001285785mos:PhosphatesSegmentMember2023-01-012023-12-310001285785mos:PhosphatesSegmentMember2022-01-012022-12-310001285785mos:PhosphatesSegmentMember2021-01-012021-12-310001285785mos:PotashSegmentMember2021-01-012021-12-310001285785mos:MosaicFertilizantesMember2021-01-012021-12-310001285785mos:CorporateEliminationsAndOtherSegmentMember2021-01-012021-12-310001285785mos:PhosphatesSegmentMember2023-12-310001285785mos:PhosphatesSegmentMember2022-12-310001285785mos:PhosphatesSegmentMember2021-12-310001285785mos:ChinaandIndiadistributionoperationsMembermos:CorporateEliminationsAndOtherSegmentMember2023-01-012023-12-310001285785mos:ChinaandIndiadistributionoperationsMembermos:CorporateEliminationsAndOtherSegmentMember2022-01-012022-12-310001285785mos:ChinaandIndiadistributionoperationsMembermos:CorporateEliminationsAndOtherSegmentMember2021-01-012021-12-310001285785country:BRus-gaap:TransferredAtPointInTimeMember2023-01-012023-12-310001285785country:BRus-gaap:TransferredAtPointInTimeMember2022-01-012022-12-310001285785country:BRus-gaap:TransferredAtPointInTimeMember2021-01-012021-12-310001285785us-gaap:TransferredAtPointInTimeMembermos:CanpotexMember2023-01-012023-12-310001285785us-gaap:TransferredAtPointInTimeMembermos:CanpotexMember2022-01-012022-12-310001285785us-gaap:TransferredAtPointInTimeMembermos:CanpotexMember2021-01-012021-12-310001285785country:CNus-gaap:TransferredAtPointInTimeMember2023-01-012023-12-310001285785country:CNus-gaap:TransferredAtPointInTimeMember2022-01-012022-12-310001285785country:CNus-gaap:TransferredAtPointInTimeMember2021-01-012021-12-310001285785country:CAus-gaap:TransferredAtPointInTimeMember2023-01-012023-12-310001285785country:CAus-gaap:TransferredAtPointInTimeMember2022-01-012022-12-310001285785country:CAus-gaap:TransferredAtPointInTimeMember2021-01-012021-12-310001285785country:INus-gaap:TransferredAtPointInTimeMember2023-01-012023-12-310001285785country:INus-gaap:TransferredAtPointInTimeMember2022-01-012022-12-310001285785country:INus-gaap:TransferredAtPointInTimeMember2021-01-012021-12-310001285785country:PYus-gaap:TransferredAtPointInTimeMember2023-01-012023-12-310001285785country:PYus-gaap:TransferredAtPointInTimeMember2022-01-012022-12-310001285785country:PYus-gaap:TransferredAtPointInTimeMember2021-01-012021-12-310001285785country:JPus-gaap:TransferredAtPointInTimeMember2023-01-012023-12-310001285785country:JPus-gaap:TransferredAtPointInTimeMember2022-01-012022-12-310001285785country:JPus-gaap:TransferredAtPointInTimeMember2021-01-012021-12-310001285785country:MXus-gaap:TransferredAtPointInTimeMember2023-01-012023-12-310001285785country:MXus-gaap:TransferredAtPointInTimeMember2022-01-012022-12-310001285785country:MXus-gaap:TransferredAtPointInTimeMember2021-01-012021-12-310001285785us-gaap:TransferredAtPointInTimeMembercountry:CO2023-01-012023-12-310001285785us-gaap:TransferredAtPointInTimeMembercountry:CO2022-01-012022-12-310001285785us-gaap:TransferredAtPointInTimeMembercountry:CO2021-01-012021-12-310001285785country:PEus-gaap:TransferredAtPointInTimeMember2023-01-012023-12-310001285785country:PEus-gaap:TransferredAtPointInTimeMember2022-01-012022-12-310001285785country:PEus-gaap:TransferredAtPointInTimeMember2021-01-012021-12-310001285785country:ARus-gaap:TransferredAtPointInTimeMember2023-01-012023-12-310001285785country:ARus-gaap:TransferredAtPointInTimeMember2022-01-012022-12-310001285785country:ARus-gaap:TransferredAtPointInTimeMember2021-01-012021-12-310001285785us-gaap:TransferredAtPointInTimeMembercountry:AU2023-01-012023-12-310001285785us-gaap:TransferredAtPointInTimeMembercountry:AU2022-01-012022-12-310001285785us-gaap:TransferredAtPointInTimeMembercountry:AU2021-01-012021-12-310001285785country:HNus-gaap:TransferredAtPointInTimeMember2023-01-012023-12-310001285785country:HNus-gaap:TransferredAtPointInTimeMember2022-01-012022-12-310001285785country:HNus-gaap:TransferredAtPointInTimeMember2021-01-012021-12-310001285785country:DOus-gaap:TransferredAtPointInTimeMember2023-01-012023-12-310001285785country:DOus-gaap:TransferredAtPointInTimeMember2022-01-012022-12-310001285785country:DOus-gaap:TransferredAtPointInTimeMember2021-01-012021-12-310001285785country:THus-gaap:TransferredAtPointInTimeMember2023-01-012023-12-310001285785country:THus-gaap:TransferredAtPointInTimeMember2022-01-012022-12-310001285785country:THus-gaap:TransferredAtPointInTimeMember2021-01-012021-12-310001285785us-gaap:TransferredAtPointInTimeMembermos:OtherForeignMember2023-01-012023-12-310001285785us-gaap:TransferredAtPointInTimeMembermos:OtherForeignMember2022-01-012022-12-310001285785us-gaap:TransferredAtPointInTimeMembermos:OtherForeignMember2021-01-012021-12-310001285785mos:TotalForeignMemberus-gaap:TransferredAtPointInTimeMember2023-01-012023-12-310001285785mos:TotalForeignMemberus-gaap:TransferredAtPointInTimeMember2022-01-012022-12-310001285785mos:TotalForeignMemberus-gaap:TransferredAtPointInTimeMember2021-01-012021-12-310001285785country:USus-gaap:TransferredAtPointInTimeMember2023-01-012023-12-310001285785country:USus-gaap:TransferredAtPointInTimeMember2022-01-012022-12-310001285785country:USus-gaap:TransferredAtPointInTimeMember2021-01-012021-12-310001285785mos:TotalGeographyMember2023-01-012023-12-310001285785mos:TotalGeographyMember2022-01-012022-12-310001285785mos:TotalGeographyMember2021-01-012021-12-310001285785country:BR2023-01-012023-12-310001285785country:CN2023-01-012023-12-310001285785country:BD2023-01-012023-12-310001285785country:IN2023-01-012023-12-310001285785mos:OtherCountriesMember2023-01-012023-12-310001285785country:CA2023-12-310001285785country:CA2022-12-310001285785country:BR2023-12-310001285785country:BR2022-12-310001285785mos:OtherForeignMember2023-12-310001285785mos:OtherForeignMember2022-12-310001285785mos:TotalForeignMember2023-12-310001285785mos:TotalForeignMember2022-12-310001285785country:US2023-12-310001285785country:US2022-12-310001285785mos:ProductTypeOneMemberus-gaap:TransferredAtPointInTimeMember2023-01-012023-12-310001285785mos:ProductTypeOneMemberus-gaap:TransferredAtPointInTimeMember2022-01-012022-12-310001285785mos:ProductTypeOneMemberus-gaap:TransferredAtPointInTimeMember2021-01-012021-12-310001285785mos:ProductTypeTwoMemberus-gaap:TransferredAtPointInTimeMember2023-01-012023-12-310001285785mos:ProductTypeTwoMemberus-gaap:TransferredAtPointInTimeMember2022-01-012022-12-310001285785mos:ProductTypeTwoMemberus-gaap:TransferredAtPointInTimeMember2021-01-012021-12-310001285785mos:ProductTypeThreeMemberus-gaap:TransferredAtPointInTimeMember2023-01-012023-12-310001285785mos:ProductTypeThreeMemberus-gaap:TransferredAtPointInTimeMember2022-01-012022-12-310001285785mos:ProductTypeThreeMemberus-gaap:TransferredAtPointInTimeMember2021-01-012021-12-310001285785mos:ProductTypeFourMemberus-gaap:TransferredAtPointInTimeMember2023-01-012023-12-310001285785mos:ProductTypeFourMemberus-gaap:TransferredAtPointInTimeMember2022-01-012022-12-310001285785mos:ProductTypeFourMemberus-gaap:TransferredAtPointInTimeMember2021-01-012021-12-310001285785us-gaap:TransferredAtPointInTimeMembermos:ProductTypeFiveMember2023-01-012023-12-310001285785us-gaap:TransferredAtPointInTimeMembermos:ProductTypeFiveMember2022-01-012022-12-310001285785us-gaap:TransferredAtPointInTimeMembermos:ProductTypeFiveMember2021-01-012021-12-310001285785us-gaap:TransferredAtPointInTimeMembermos:OtherProductTypesMember2023-01-012023-12-310001285785us-gaap:TransferredAtPointInTimeMembermos:OtherProductTypesMember2022-01-012022-12-310001285785us-gaap:TransferredAtPointInTimeMembermos:OtherProductTypesMember2021-01-012021-12-310001285785us-gaap:FacilityClosingMemberus-gaap:PropertyPlantAndEquipmentMember2021-01-012021-12-310001285785us-gaap:AssetRetirementObligationCostsMemberus-gaap:FacilityClosingMember2021-01-012021-12-310001285785us-gaap:OtherCurrentAssetsMemberus-gaap:FacilityClosingMember2021-01-012021-12-31
UNITED STATES
SECURITIES AND EXCHANGE COMMISSION
Washington, D.C. 20549
______________________________
FORM 10-K
______________________________
☒ ANNUAL REPORT PURSUANT TO SECTION 13 OR 15(d) OF
THE SECURITIES EXCHANGE ACT OF 1934
For the year ended December 31, 2023
☐ TRANSITION REPORT PURSUANT TO SECTION 13 OR 15(d) OF
THE SECURITIES EXCHANGE ACT OF 1934
For the transition period from _____ to _____
Commission file number 001-32327
______________________________
The Mosaic Company
(Exact name of registrant as specified in its charter)
______________________________
|
|
|
|
|
|
|
|
|
| Delaware |
|
20-1026454 |
(State or other jurisdiction of
incorporation or organization) |
|
(I.R.S. Employer
Identification No.) |
101 East Kennedy Blvd
Suite 2500
Tampa, Florida 33602
(800) 918-8270
(Address and zip code of principal executive offices and registrant’s telephone number, including area code)
______________________________
Securities registered pursuant to Section 12(b) of the Act:
|
|
|
|
|
|
|
|
|
| Title of each class |
Trading symbol |
Name of each exchange on which registered |
| Common Stock, par value $0.01 per share |
MOS |
New York Stock Exchange |
______________________________
Securities registered pursuant to Section 12(g) of the Act: NONE
Indicate by check mark if the registrant is a well-known seasoned issuer, as defined in Rule 405 of the Securities Act. Yes ☒ No ☐
Indicate by check mark if the registrant is not required to file reports pursuant to Section 13 or Section 15(d) of the Act. Yes ☐ No ☒
Indicate by check mark whether the registrant: (1) has filed all reports required to be filed by Section 13 or 15(d) of the Securities Exchange Act of 1934 during the preceding 12 months (or for such shorter period that the registrant was required to file such reports); and (2) has been subject to such filing requirements for the past 90 days. Yes ☒ No ☐
Indicate by check mark whether the registrant has submitted electronically every Interactive Data File required to be submitted pursuant to Rule 405 of Regulation S-T (§232.405 of this chapter) during the preceding 12 months (or for such shorter period that the registrant was required to submit such files). Yes ☒ No ☐
Indicate by check mark whether the registrant is a large accelerated filer, an accelerated filer, a non-accelerated filer, a smaller reporting company, or an emerging growth company. See the definitions of “large accelerated filer,” “accelerated filer,” “smaller reporting company,” and “emerging growth company” in Rule 12b-2 of the Exchange Act. (Check one): Large accelerated filer ☒ Accelerated filer ☐ Non-accelerated filer ☐ Smaller reporting company ☐ Emerging growth company ☐
If an emerging growth company, indicate by check mark if the registrant has elected not to use the extended transition period for complying with any new or revised financial accounting standards provided pursuant to Section 13(a) of the Exchange Act. ☐
Indicate by check mark whether the registrant has filed a report on and attestation to its management’s assessment of the effectiveness of its internal control over financial reporting under Section 404(b) of the Sarbanes-Oxley Act (15 U.S.C. 7262(b)) by the registered public accounting firm that prepared or issued its audit report. ☒
If securities are registered pursuant to Section 12(b) of the Act, indicate by check mark whether the financial statements of the registrant included in the filing reflect the correction of an error to previously issued financial statements. ☐
Indicate by check mark whether any of those error corrections are restatements that required a recovery analysis of incentive-based compensation received by any of the registrant’s executive officers during the relevant recovery period pursuant to §240.10D-1(b) ☐
Indicate by check mark whether the registrant is a shell company (as defined in Rule 12b-2 of the Exchange Act). Yes ☐ No ☒
As of June 30, 2023, the aggregate market value of the registrant’s voting common stock held by stockholders, other than directors, executive officers, subsidiaries of the Registrant and any other person known by the Registrant as of the date hereof to beneficially own ten percent or more of any class of Registrant’s outstanding voting common stock, and consisting of shares of Common Stock, was approximately $11.6 billion based upon the closing price of a share of Common Stock on the New York Stock Exchange on that date.
Indicate the number of shares outstanding of each of the registrant’s classes of common stock: 321,688,938 shares of Common Stock as of February 16, 2024.
DOCUMENTS INCORPORATED BY REFERENCE
1.Portions of the registrant’s definitive proxy statement to be delivered in conjunction with the 2024 Annual Meeting of Stockholders (Part III)
2023 ANNUAL REPORT ON FORM 10-K CONTENTS
|
|
|
|
|
|
|
|
|
| Part I: |
|
Page |
| Item 1. |
|
|
|
|
|
|
|
|
|
|
|
|
|
|
|
|
|
|
|
|
|
|
|
| Item 1A. |
|
|
| Item 1B. |
|
|
| Item 1C. |
|
|
| Item 2. |
|
|
| Item 3. |
|
|
| Item 4. |
|
|
| Part II: |
|
|
| Item 5. |
|
|
| Item 6. |
|
|
| Item 7. |
|
|
| Item 7A. |
|
|
| Item 8. |
|
|
| Item 9. |
|
|
| Item 9A. |
|
|
| Item 9B. |
|
|
| Part III: |
|
|
| Item 10. |
|
|
| Item 11. |
|
|
| Item 12. |
|
|
| Item 13. |
|
|
| Item 14. |
|
|
| Part IV. |
|
|
| Item 15. |
|
|
| Item 16. |
|
|
|
|
|
|
PART I.
Item 1. Business.
OVERVIEW
The Mosaic Company is the world’s leading producer and marketer of concentrated phosphate and potash crop nutrients. Through our broad product offering, we are a single source supplier of phosphate- and potash-based crop nutrients and animal feed ingredients. We serve customers in approximately 40 countries. We are the second largest integrated phosphate producer in the world and one of the largest producers and marketers of phosphate-based animal feed ingredients in North America and Brazil. We are the leading fertilizer production and distribution company in Brazil. We mine phosphate rock in Florida, Brazil and Peru. We process rock into finished phosphate products at facilities in Florida, Louisiana and Brazil. We are typically one of the top four global potash producers in the world. We mine potash in Saskatchewan, New Mexico and Brazil. We have other production, blending or distribution operations in Brazil, China, India and Paraguay, as well as an equity investment in a joint venture that operates a phosphate rock mine and chemical complexes in the Kingdom of Saudi Arabia. Our operations serve the top four nutrient-consuming countries in the world: China, India, U.S. and Brazil.
The Mosaic Company is a Delaware corporation that was incorporated in March 2004 and serves as the parent company of the business that was formed through the October 2004 combination of IMC Global Inc. (“IMC”) and the fertilizer businesses of Cargill, Incorporated. We are publicly traded on the New York Stock Exchange under the ticker symbol “MOS” and are headquartered in Tampa, Florida.
We conduct our business through wholly- and majority-owned subsidiaries as well as businesses in which we own less than a majority or a non-controlling interest. We are organized into three reportable business segments: Phosphates, Potash and Mosaic Fertilizantes. Intersegment eliminations, unrealized mark-to-market gains/losses on derivatives, debt expenses, and the results of the China and India distribution businesses are included within Corporate, Eliminations and Other.
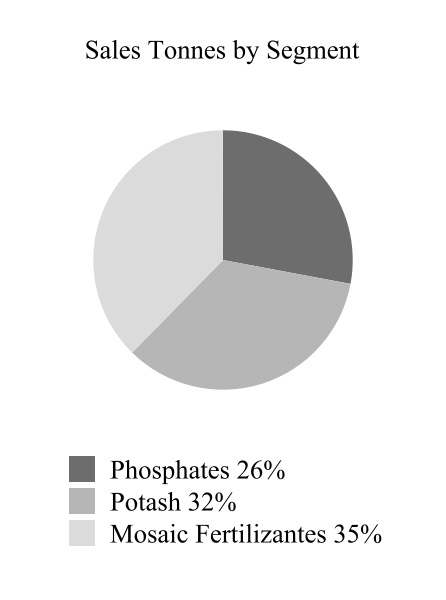
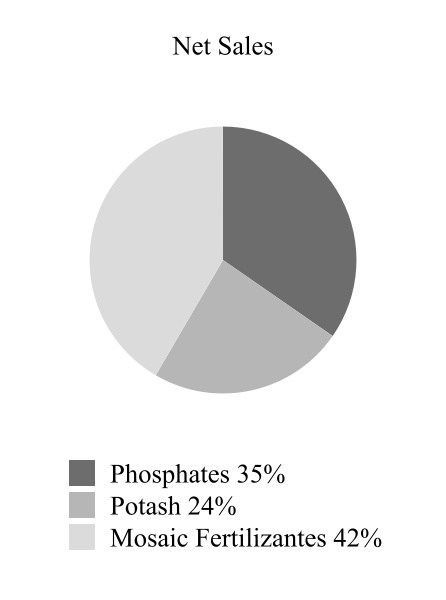
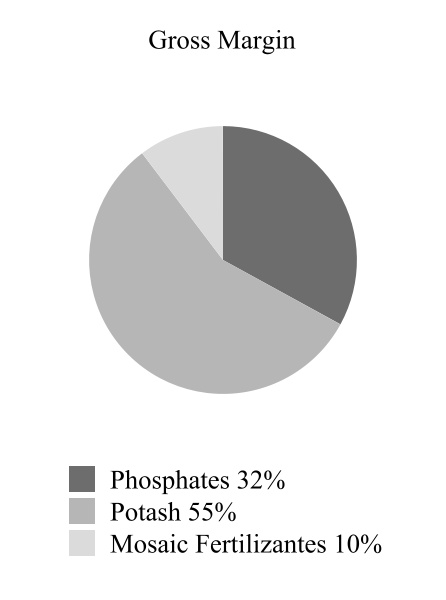
The following charts show the respective contributions to 2023 sales volumes, net sales and gross margin for each of our business segments in effect at December 31, 2023:
We account for approximately 12% of estimated global annual phosphate production. We also account for approximately 13% of estimated global annual potash production.
Phosphates Segment–We sell phosphate-based crop nutrients and animal feed ingredients throughout North America and internationally. We account for approximately 80% of estimated North American annual production of concentrated phosphate crop nutrients.
Potash Segment–We sell potash throughout North America and internationally, principally as fertilizer, but also for use in industrial applications and, to a lesser degree, as animal feed ingredients. We account for approximately 35% of estimated North American annual potash production.
Mosaic Fertilizantes Segment–We produce and sell phosphate- and potash-based crop nutrients, and animal feed ingredients, in Brazil. In addition to five phosphate rock mines, four chemical plants and a potash mine in Brazil, this segment consists of sales offices, crop nutrient blending and bagging facilities, port terminals and warehouses in Brazil and Paraguay. The Mosaic Fertilizantes segment also serves as a distribution outlet for our Phosphates and Potash segments. We account for approximately 72% of estimated annual production of concentrated phosphate crop nutrients in Brazil and 100% of estimated annual potash production in Brazil.
As used in this report:
•“Mosaic” or “Company” means The Mosaic Company;
•“we,” “us,” and “our” refer to Mosaic and its direct and indirect subsidiaries, individually or in any combination;
•“Cargill” means Cargill, Incorporated and its direct and indirect subsidiaries, individually or in any combination;
•“Cargill Crop Nutrition” means the crop nutrient business we acquired from Cargill in the Combination;
•“Combination” means the October 22, 2004 combination of IMC and Cargill Crop Nutrition; and
statements as to our industry position reflect information from the most recent period available.
Business Developments during 2023
•In January 2023, we completed the sale of the Streamsong Resort® (the “Resort”) and the approximately 7,000 acres on which it sits for net proceeds of $158 million. The Resort is a destination resort and conference center, which we developed in an area of previously mined land as part of our long-term business strategy to maximize the value and utility of our extensive land holdings in Florida. In addition to a hotel and conference center, the Resort includes multiple golf courses, a clubhouse and ancillary facilities. The sale resulted in a gain of $57 million.
•In the first quarter of 2023, we purchased the other 50% interest of equity of Gulf Sulphur Services (“GSS”), which gives us full ownership and secures control of our sulfur supply chain in the Gulf of Mexico.
•In the first quarter of 2023, our Board of Directors approved a special dividend of $0.25 per share to be distributed in March to our stockholders of record as of March 15, 2023. In the fourth quarter of 2023, our Board of Directors approved a regular dividend increase to $0.84 per share annually from $0.80, beginning with the dividend declared in December 2023.
•In February 2023, pursuant to existing stock repurchase authorizations, we entered into an accelerated share repurchase agreement (the “2023 ASR Agreement”) with a third-party financial institution to repurchase $300 million of our Common Stock. In 2023, we repurchased 16,879,059 shares of Common Stock in the open market for approximately $748 million. This includes 5,624,574 shares that we purchased under the 2023 ASR Agreement.
•In May 2023, we entered into a 10-year senior unsecured term loan facility pursuant to which we can draw up to $700 million. The term loan matures on May 18, 2033. We may voluntarily prepay the outstanding principal without premium or penalty. As of December 31, 2023, $500 million has been drawn under this facility.
•In 2023, we paid the outstanding balance of $900 million on our 4.25% senior notes, due November 15, 2023, without premium or penalty. On December 4, 2023, we issued new 5.375% senior notes consisting of $400 million aggregate principal, amount due 2028.
•In 2021, the U.S. Department of Commerce (“DOC”) issued countervailing duty (“CVD”) orders on imports of phosphate fertilizers from Morocco and Russia, in response to petitions filed by Mosaic. The orders were based on DOC's determination that the imports were unfairly subsidized and the U.S. International Trade Commission's (“ITC”) determination that the imports materially injure the U.S. fertilizer industry. The purpose of the CVD orders was to remedy the injury and thereby restore fair competition. CVD orders normally stay in place for at least five years, with possible extensions.
Moroccan and Russian producers have initiated actions at the U.S. Court of International Trade (“CIT”) seeking to overturn the orders. Mosaic has also made claims contesting certain aspects of DOC’s final determinations that, we believe, failed to capture the full extent of Moroccan and Russian subsidies.
These litigation challenges remain underway. Most recently, in January 2024, DOC and the ITC issued revised determinations on remand from the CIT, upholding their original determinations that Moroccan phosphate fertilizer is unfairly subsidized, and that Moroccan and Russian imports materially injure the U.S. industry, respectively. The CIT is now reviewing these remand determinations. Also in January 2024, the CIT issued a ruling affirming DOC's original determinations that Russian phosphate fertilizer is unfairly subsidized.
When a CVD order is in place, DOC normally conducts annual administrative reviews, which establish a final CVD assessment rate for past imports during a defined period, and a CVD cash deposit rate for future imports. In November 2023, DOC announced the final results of the first administrative reviews for the CVD orders on phosphate fertilizers for Russia and Morocco, covering the period November 30, 2020 to December 31, 2021. DOC calculated new subsidy rates of 2.12% for Moroccan producer OCP and 28.50% for Russian producer PhosAgro. Mosaic, foreign producers, and a U.S. importer have appealed these decisions to the CIT. DOC is also conducting administrative reviews covering the period January 1, 2022 to December 31, 2022. The applicable final CVD assessment rates and cash deposit rates for imports of phosphate fertilizer from Morocco and Russia could change as a result of these various proceedings and potential associated appeals, whether in federal courts or at the World Trade Organization.
We have included additional information about these and other developments in our business during 2023 in our Management’s Discussion and Analysis of Financial Condition and Results of Operations (“Management’s Analysis”) and in the Notes to Consolidated Financial Statements.
Throughout the discussion below, we measure units of production, sales and raw materials in metric tonnes, which are the equivalent of 2,205 pounds, or 1.102 tons (U.S. standard), unless we specifically state that we mean short or long ton(s), which are the equivalent of 2,000 pounds and 2,240 pounds, respectively. In addition, we measure natural gas, a raw material used in the production of our products, in MM BTU, which stands for one million British Thermal Units (“BTU”). One BTU is equivalent to 1.06 Joules.
Information concerning our mining properties in this Annual Report on Form 10-K has been prepared in accordance with Subpart 1300 of Regulation S-K (“S-K 1300”). S-K 1300 requires us to disclose our mineral resources, in addition to our mineral reserves, as of the end of our most recently completed fiscal year, both in the aggregate and for each of our individually material mining properties. We have four material properties: Belle Plaine, Esterhazy, Florida and Tapira. See Item 2. “Properties,” for further information regarding mineral reserves and resource and discussion of our material mining properties.
This report includes market share and industry data and forecasts that we obtained from publicly available information and industry publications, surveys, market research, internal company surveys and consultant surveys. We believe these sources to be reliable, but there can be no assurance as to the accuracy and completeness of such information. We have not independently verified the data from third-party sources, nor have we ascertained the underlying economic assumptions relied upon therein. Similarly, internal company surveys, industry forecasts and market research, which we believe to be reliable based upon management’s knowledge of the industry, have not been verified by any independent sources.
BUSINESS SEGMENT INFORMATION
The discussion below of our business segment operations should be read in conjunction with the following information that we have included in this report:
•The risk factors discussed in this report in Part I, Item 1A, “Risk Factors”.
•Our Management’s Analysis.
•The financial statements and supplementary financial information in our Consolidated Financial Statements (“Consolidated Financial Statements”).
This information is incorporated by reference into this section from Part II, Item 8, “Financial Statements and Supplementary Data”.
Phosphates Segment
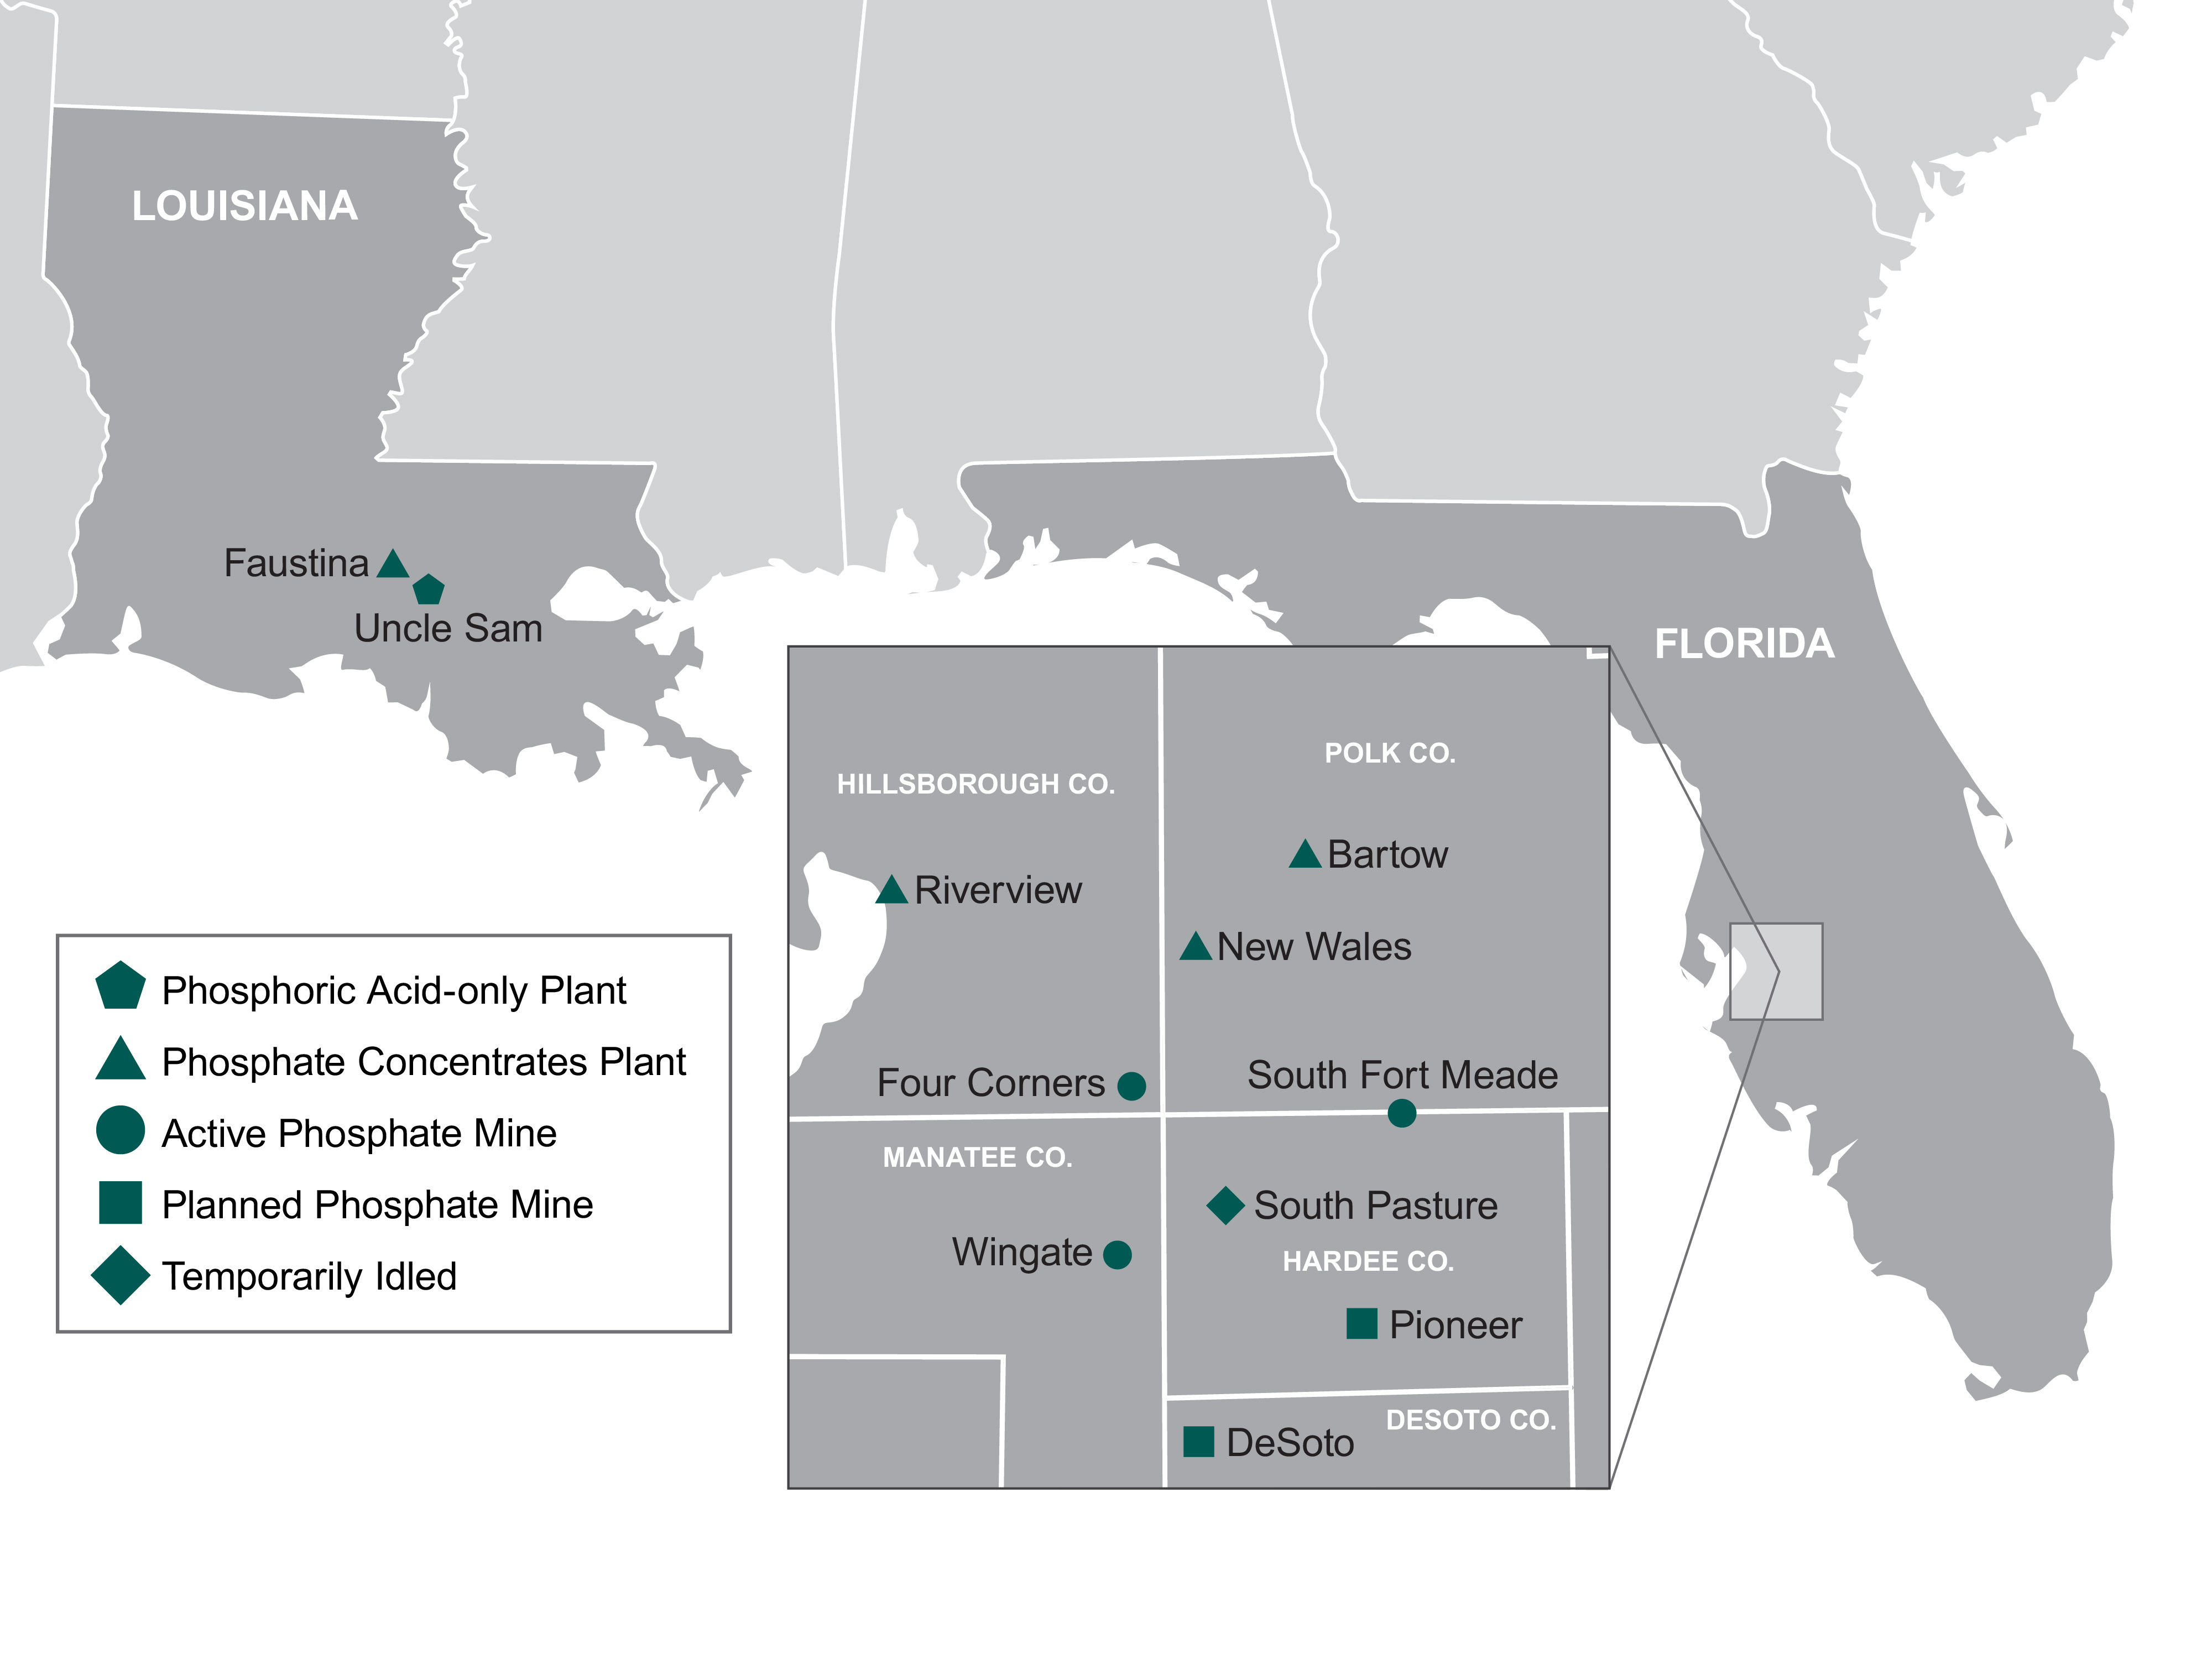
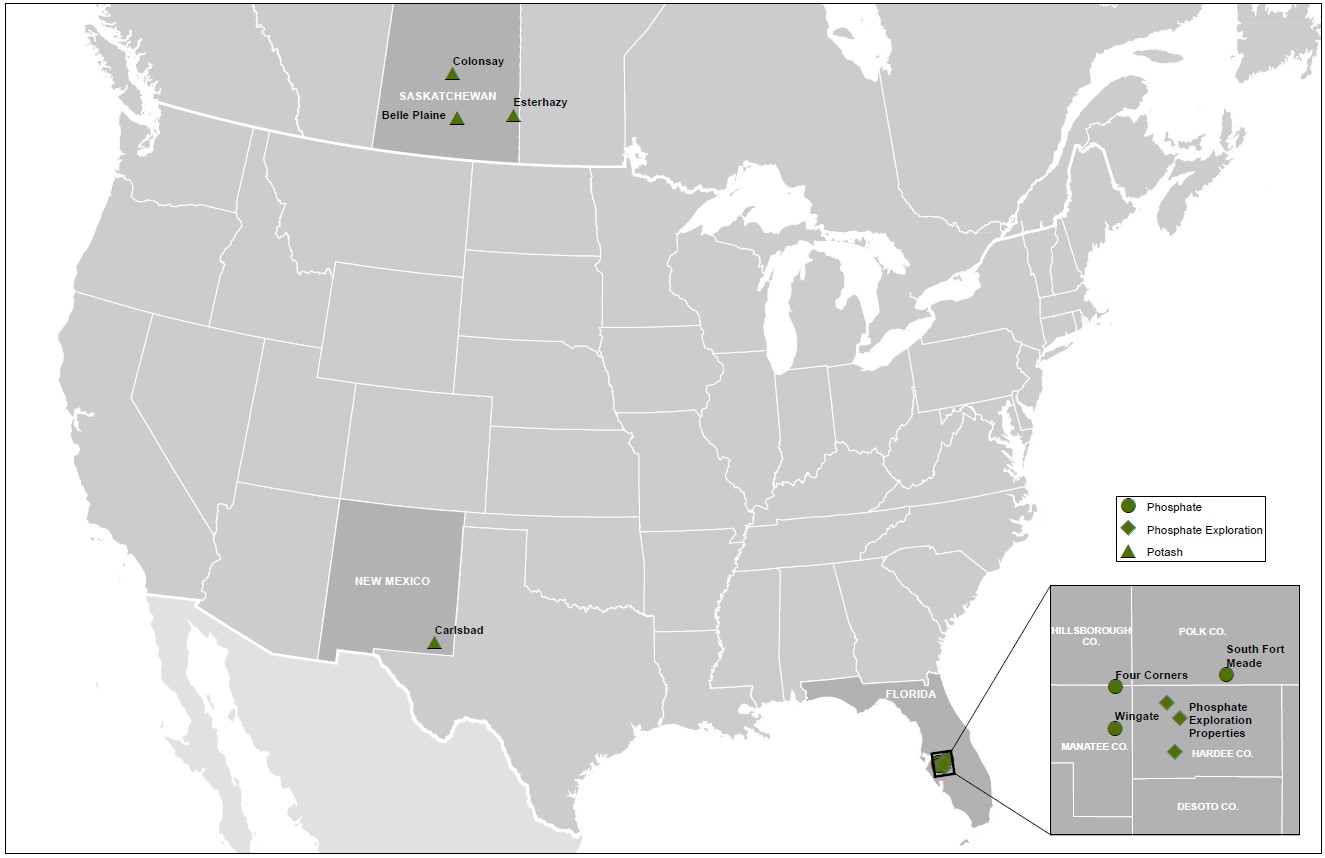
Our Phosphates business segment owns and operates mines and production facilities in Florida which produce concentrated phosphate crop nutrients and phosphate-based animal feed ingredients, and processing plants in Louisiana which produce concentrated phosphate crop nutrients. We have a 75% economic interest in the Miski Mayo Phosphate Mine in Peru (“Miski Mayo Mine”), which is included in the results of our Phosphates segment.
The following map shows the locations of each of our phosphate concentrates plants in the U.S. and each of our active, temporarily idled, and planned phosphate mine locations, including beneficiation plants, in Florida. The reserves associated with our Ona, Florida location have been allocated to other active mines based on our future mining plans:
U.S. Phosphate Crop Nutrients and Animal Feed Ingredients
Our U.S. Phosphate operations have capacity to produce approximately 4.5 million tonnes of phosphoric acid (“P2O5”) per year, or about 7% of world annual capacity and about 60% of North American annual capacity. P2O5 is produced by reacting finely ground phosphate rock with sulfuric acid. P2O5 is the key building block for the production of high analysis or concentrated phosphate crop nutrients and animal feed products and is the most comprehensive measure of phosphate capacity and production and a commonly used benchmark in our industry. Our U.S. P2O5 production totaled approximately 3.0 million tonnes during 2023. Our U.S. operations account for approximately 6% of estimated global annual production and 54% of estimated North American annual output.
Our phosphate crop nutrient products are marketed worldwide to crop nutrient manufacturers, distributors, retailers and farmers. Our principal phosphate crop nutrient products are:
•Diammonium Phosphate (18-46-0): Diammonium Phosphate (“DAP”) is the most widely used high-analysis phosphate crop nutrient worldwide. DAP is produced by first combining phosphoric acid with anhydrous ammonia in a reaction vessel. This initial reaction creates a slurry that is then pumped into a granulation plant where it is reacted with additional ammonia to produce DAP. DAP is a solid granular product that is applied directly or blended with other solid plant nutrient products, such as urea and potash.
•Monoammonium Phosphate (11-52-0): Monoammonium Phosphate (“MAP”) is the second most widely used high-analysis phosphate crop nutrient. MAP is also produced by first combining phosphoric acid with anhydrous ammonia in a reaction vessel. The resulting slurry is then pumped into the granulation plant where it is reacted with additional P2O5 to produce MAP. MAP is a solid granular product that is applied directly or blended with other solid plant nutrient products.
•MicroEssentials® is a value-added ammoniated phosphate product that is enhanced through a patented process that creates very thin platelets of sulfur and other micronutrients, such as zinc, on the granulated product. The patented process incorporates both the sulfate and elemental forms of sulfur, providing season-long availability to crops.
Production of our animal feed ingredients products is located at our New Wales, Florida facility. We market our feed phosphate primarily under the leading brand names of Biofos® and Nexfos®.
Annual capacity by plant as of December 31, 2023 and production volumes by plant for 2023 are listed below:
|
|
|
|
|
|
|
|
|
|
|
|
|
|
|
|
|
|
|
|
|
|
|
|
|
|
|
| (tonnes in millions) |
|
Phosphoric Acid |
|
Processed Phosphate(a)/DAP/MAP/ MicroEssentials®/Feed Phosphate |
| |
|
Operational Capacity(b) |
|
|
|
Operational Capacity(b) |
|
|
| Facility |
|
Production(c) |
|
Production(c) |
| Florida: |
|
|
|
|
|
|
|
|
| Bartow |
|
1.1 |
|
|
0.8 |
|
|
2.5 |
|
|
1.9 |
|
| New Wales |
|
1.7 |
|
|
1.1 |
|
|
4.0 |
|
|
2.4 |
|
| Riverview |
|
0.9 |
|
|
0.7 |
|
|
1.8 |
|
|
1.4 |
|
|
|
3.7 |
|
|
2.6 |
|
|
8.3 |
|
|
5.7 |
|
| Louisiana: |
|
|
|
|
|
|
|
|
| Faustina |
|
— |
|
|
— |
|
|
1.6 |
|
|
0.9 |
|
| Uncle Sam |
|
0.8 |
|
|
0.4 |
|
|
— |
|
|
— |
|
|
|
0.8 |
|
|
0.4 |
|
|
1.6 |
|
|
0.9 |
|
| Total |
|
4.5 |
|
|
3.0 |
|
|
9.9 |
|
|
6.6 |
|
______________________________
(a)Our ability to produce processed phosphates has been less than our annual operational capacity stated in the table above, except to the extent we purchase P2O5. Factors affecting actual production are described in note (c) below.
(b)Operational capacity is our estimated long-term capacity based on an average amount of scheduled down time, including maintenance and scheduled turnaround time, and product mix, and no significant modifications to operating conditions, equipment or facilities.
(c)Actual production varies from annual operational capacity shown in the above table due to factors that include, among others, the level of demand for our products, maintenance and turnaround time, accidents, mechanical failure, product mix, and other operating conditions.
The P2O5 produced at Uncle Sam is shipped to Faustina, where it is used to produce DAP, MAP and MicroEssentials®. Our Faustina plant also manufactures ammonia that is mostly consumed in our concentrate plants.
We produced approximately 6.2 million tonnes of concentrated phosphate crop nutrients during 2023 and accounted for approximately 80% of estimated North American annual production.
Phosphate Rock
Phosphate rock is the key mineral used to produce phosphate crop nutrients and feed phosphate. Our Florida phosphate rock mines produced approximately 10.0 million tonnes in 2023 and accounted for approximately 47% of estimated North American annual production. We are the world’s second largest miner of phosphate rock (excluding China) and currently operate four mines in North America with a combined annual capacity of approximately 18.0 million tonnes.
Additionally, we own 75% of the Miski Mayo Mine, which has an annual capacity of 4.8 million tonnes. Production of one tonne of DAP requires between 1.6 and 1.7 tonnes of phosphate rock.
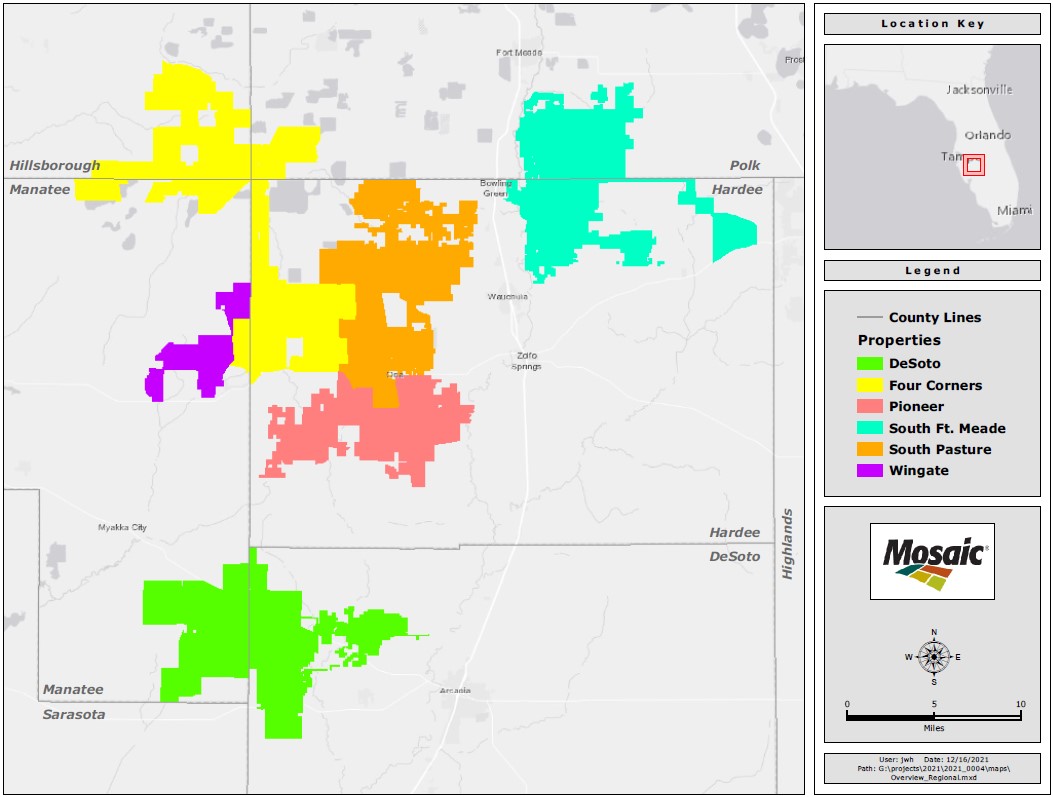
All of our wholly-owned phosphate mines and related mining operations in North America are located in central Florida. During 2023, we operated three active mines in Florida: Four Corners, South Fort Meade and Wingate. We plan to explore and develop the DeSoto property and the South Pasture property, which was previously idled, to offset future depletion at our Florida properties. We have a 75% economic interest in the Miski Mayo Mine, which allows us to supplement our other produced rock to meet our overall fertilizer production needs and is the primary source of rock for our Louisiana operations. We have the right to use or sell to third parties 75% of the Miski Mayo Mine’s annual production.
See “Item 2. Properties” for a discussion of our phosphate mining properties, including processing methods, facilities, production and summaries of our mineral resources and reserves, both in the aggregate and for our individual material phosphate mining properties.
Investment in Ma’aden Wa’ad Al Shamal Phosphate Company (“MWSPC”)
We own a 25% interest in MWSPC and, in connection with our equity share, we are entitled to market approximately 25% of MWSPC’s production. MWSPC consists of a mine and two chemical complexes (the “Project”) that produce phosphate fertilizers and other downstream phosphates products in the Kingdom of Saudi Arabia. The greenfield project was built in the northern region of Saudi Arabia at Wa’ad Al Shamal Minerals Industrial City and included further expansion of processing plants in Ras Al Khair Minerals Industrial City, which is located on the east coast of Saudi Arabia. Ammonia operations commenced in late 2016 and on December 1, 2018, MWSPC commenced commercial operations of the phosphate plant, thereby bringing the entire project to the commercial production phase and an annual production capacity of 3.0 million tonnes. Actual phosphate production was 3.1 million tonnes in 2023. The Project benefits from the availability of key raw nutrients from sources within Saudi Arabia.
Sulfur
We use molten sulfur at our phosphates concentrates plants to produce sulfuric acid, primarily for use in our production of P2O5. We purchased approximately 3.3 million long tons of sulfur during 2023. We purchase the majority of this sulfur from North American oil and natural gas refiners who are required to remove or recover sulfur during the refining process. Production of one tonne of DAP requires approximately 0.40 long tons of sulfur. We procure our sulfur from multiple sources and receive it by truck, rail, barge and vessel, either directly at our phosphate plants or have it sent for gathering to terminals that are located on the U.S. gulf coast. In addition, we use formed sulfur received through Tampa, Florida ports, which are delivered by truck to our New Wales facility and melted through our sulfur melter.
We own and operate sulfur terminals in Riverview and Tampa, Florida, along with Galveston, Texas and Faustina, Louisiana. We also lease terminal space in Beaumont, Texas. We have long-term time charters on two ocean-going tugs/barges and one ocean-going vessel that transports molten sulfur from the Texas terminals to Tampa. We then further transport by truck to our Florida phosphate plants. Our sulfur logistic assets also include a large fleet of leased railcars that supplement our marine sulfur logistic system. Our Louisiana operations are served by truck from nearby refineries.
Although sulfur is readily available from many different suppliers and can be transported to our phosphate facilities by a variety of means, sulfur is an important raw material used in our business that has in the past been, and may in the future, be the subject of volatile pricing and availability. Alternative transportation and terminaling facilities might not have sufficient capacity to fully serve all of our facilities in the event of a disruption to current transportation or terminaling facilities. Changes in the price of sulfur or disruptions to sulfur transportation or terminaling facilities could have a material impact on our business. We have included a discussion of sulfur prices in our Management’s Analysis.
Ammonia
We use ammonia together with P2O5 to produce DAP, MAP and MicroEssentials®. We consumed approximately 1.0 million tonnes of ammonia during 2023. Production of one tonne of DAP requires approximately 0.23 tonnes of ammonia. We purchase approximately one-third of our ammonia from various suppliers in the spot market with the remaining two-thirds either purchased through our ammonia supply agreement (the “CF Ammonia Supply Agreement”) with an affiliate of CF Industries Inc. (“CF”) or produced internally at our Faustina, Louisiana location.
Our Florida ammonia needs are currently supplied under multi-year contracts with both domestic and offshore producers. Ammonia for our Florida plants is terminaled through owned ammonia facilities at the Port of Tampa and Port Sutton, Florida. Ammonia is transported by pipeline from the terminals to our production facilities. We have service agreements with the operators of the pipelines for Bartow, New Wales and Riverview, which provide service through June 30, 2025 with two year auto-renewal provisions unless either party objects.
Under the CF Ammonia Supply Agreement, we purchased 562,000 metric tonnes in 2023. On October 14, 2022, we received notice from CF to exercise the bilateral, contractual right to end the ammonia supply agreement in its current form, effective January 1, 2025. We are confident that we will continue to have adequate sources of supply for ammonia at competitive pricing.
We produce ammonia at Faustina, Louisiana primarily for our own consumption. Our annual capacity is approximately 530,000 tonnes. From time to time, we sell surplus ammonia to unrelated parties and/or may transport surplus ammonia to the Port of Tampa. In certain circumstances, we source ammonia from alternative sources to receive at Faustina.
Although ammonia is readily available from many different suppliers and can be transported to our Phosphate facilities by a variety of means, ammonia is an important raw material used in our business that has in the past been, and may in the future be, the subject of volatile pricing. In addition, alternative transportation and terminaling facilities might not have sufficient capacity to fully serve all of our facilities in the event of a disruption to existing transportation or terminaling facilities. Changes in the price of ammonia or disruptions to ammonia transportation or terminaling could have a material impact on our business. We have included a discussion of ammonia prices in our Management’s Analysis.
Natural Gas for Phosphates
Natural gas is the primary raw material used to manufacture ammonia. At our Faustina facility, ammonia is manufactured on site. The majority of natural gas is purchased through firm delivery contracts based on published index-based prices and is sourced from Texas and Louisiana via pipelines interconnected to the Henry Hub. We use over-the-counter swap and/or option contracts to forward price portions of future natural gas purchases. We typically purchase approximately 15.5 million MM BTU of natural gas per year for use in ammonia production at Faustina.
Our ammonia requirements for our Florida operations are purchased rather than manufactured on site. Therefore, while we typically purchase approximately 2.7 million MM BTU of natural gas per year in Florida, it is only used as a thermal fuel for various phosphate production processes.
Florida Land Holdings
We are a significant landowner in the State of Florida, which has in the past been considered one of the fastest areas of population growth in the U.S. We have land holdings totaling over 368,000 acres. These landholdings give Mosaic access to phosphate rock reserves and exist as fee simple, mining agreements or mineral rights. Some of our land holdings are needed to operate our Phosphates business, while a portion of our land assets, such as certain reclaimed properties, are no longer required for our ongoing operations. As a general matter, more of our reclaimed property becomes available for uses other than for phosphate operations each year. Our real property assets are generally comprised of concentrates plants, port facilities, phosphate mines and other property which we have acquired through our presence in Florida. Our long-term future land use strategy is to optimize the value of our land assets.
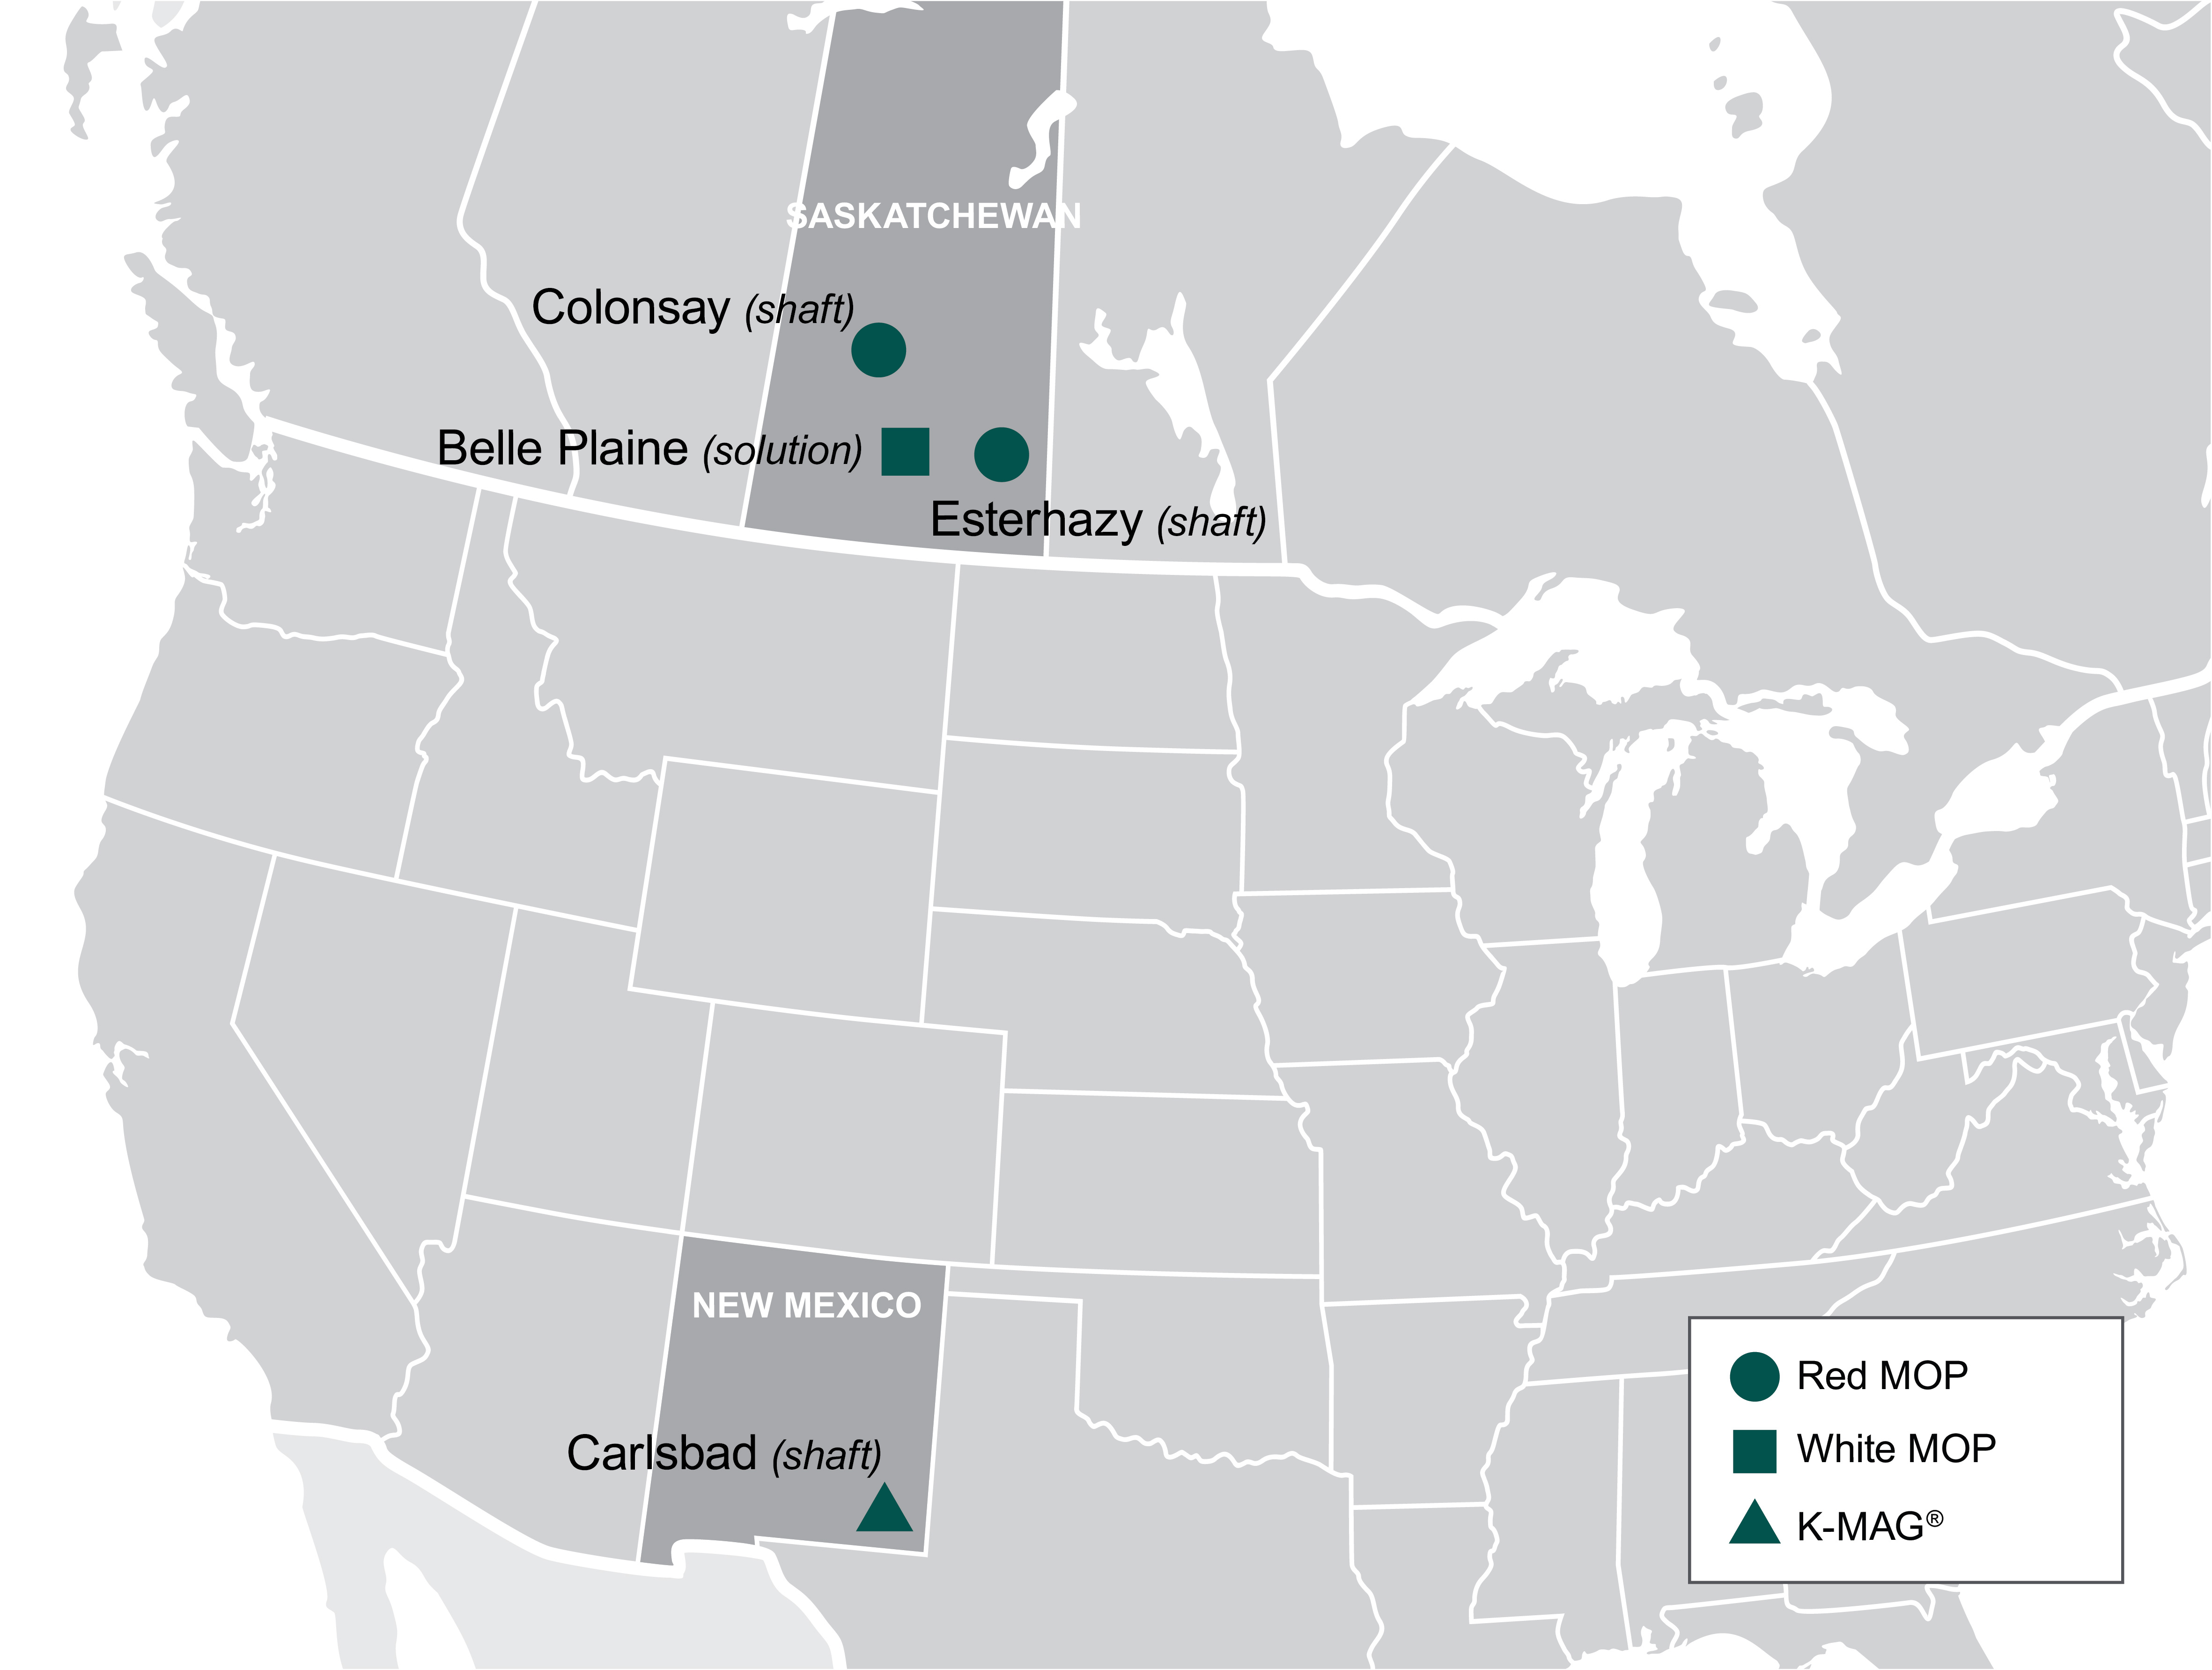
Potash Segment
We are one of the leading potash producers in the world. We mine and process potash in Canada and the U.S. and sell potash in North America and internationally. The term “potash” applies generally to the common salts of potassium. Muriate of potash (“MOP”) is the primary source of potassium for the crop nutrient industry. Red MOP has traces of iron oxide. The granular and standard grade red MOP products are well suited for direct fertilizer application and bulk blending. White MOP has a higher percent potassium oxide (“K2O”). White MOP, besides being well suited for the agricultural market, is used in many industrial applications. We also produce a double sulfate of potash magnesia product, which we market under our brand name K-Mag®, at our Carlsbad, New Mexico facility.
Our potash products are marketed worldwide to crop nutrient manufacturers, distributors and retailers and are also used in the manufacturing of mixed crop nutrients and, to a lesser extent, in animal feed ingredients. We also sell potash to customers for industrial use. In addition, our potash products are used for de-icing and as a water softener regenerant.
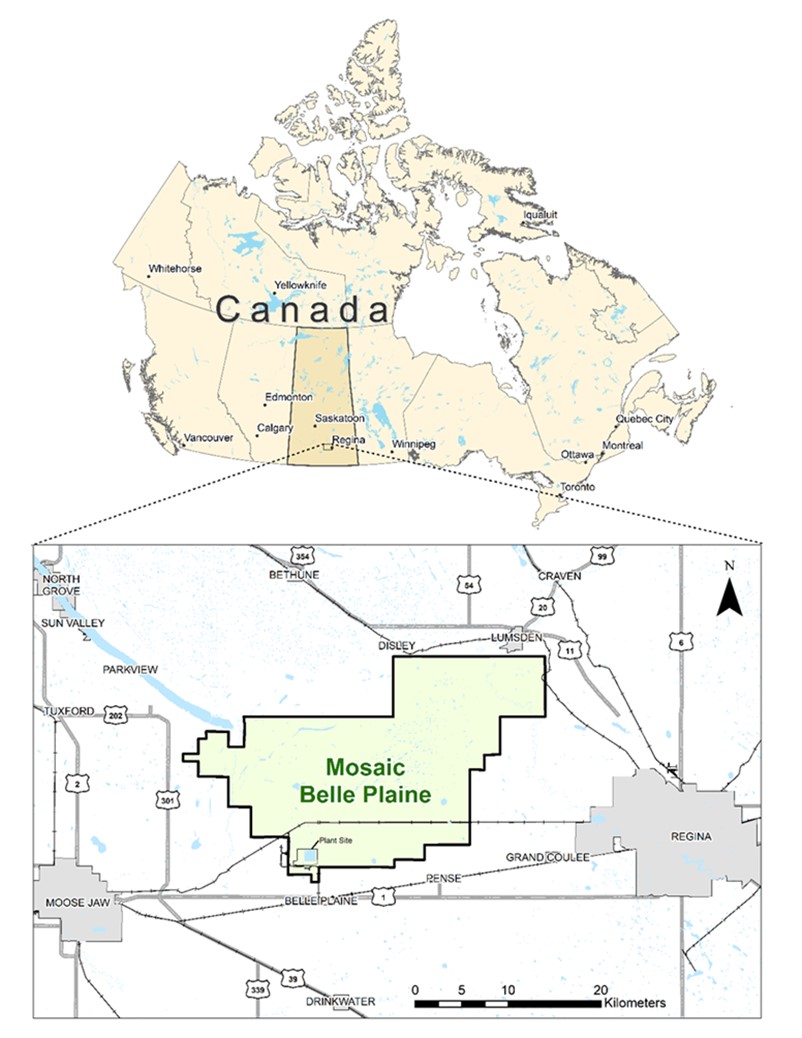
In 2023, we operated three potash mines in Canada, including two shaft mines and one solution mine, as well as one potash shaft mine in the U.S. Esterhazy, the largest Potash mine in the world, is expected to complete full ramp up of capacity and production during 2024 or early 2025. The K3 expansion has been supplying the capacity and production needed since the closure of the K1 and K2 mines in the second quarter of 2021. Decommissioning of the K1 and K2 shafts at our Esterhazy, Saskatchewan mine was completed in 2022. The Colonsay mine was idled through the first half of 2023 and returned to production in July 2023. We utilize the Colonsay mine as needed to help meet market demand.
Mosaic leases approximately 291,500 acres of mineral rights from the government of Saskatchewan, and approximately 99,700 acres of freehold mineral rights in the Kronau/Regina area, which have not been developed.
We pay Canadian resource taxes consisting of the Potash Production Tax and resource surcharge. The Potash Production Tax is a Saskatchewan provincial tax on potash production and consists of a base payment and a profits tax. We also pay a percentage of the value of resource sales from our Saskatchewan mines. In addition to the Canadian resource taxes, royalties are payable to the mineral owners in respect of potash reserves or production of potash. We have included a further discussion of the Canadian resource taxes and royalties in our Management’s Analysis.
The map below shows the location of each of our potash properties:
Our North American potash annualized operational capacity totals 11.5 million tonnes of product per year and accounts for approximately 14% of world annual capacity and 41% of North American annual operational capacity. Production during 2023 totaled 8.3 million tonnes. We account for approximately 13% of estimated world annual production and 35% of estimated North American annual production.
The following table shows, for each of our potash mines, annual capacity as of December 31, 2023 and finished product output for 2023:
|
|
|
|
|
|
|
|
|
|
|
|
|
|
|
|
|
|
|
|
|
|
|
|
|
|
|
|
|
|
|
|
|
| (tonnes in millions) |
|
|
|
|
|
|
|
|
|
|
|
|
| Facility |
Annualized
Proven
Peaking
Capacity
(a)(c)
|
|
Annual
Operational
Capacity
(a)(b)(e)
|
|
|
|
|
Finished
Product(b)
|
|
|
|
|
|
|
|
|
|
|
|
|
| Canada |
|
|
|
|
|
|
|
|
|
|
|
|
|
|
|
|
|
|
|
|
Belle Plaine—MOP(d) |
3.9 |
|
|
3.0 |
|
|
|
|
|
2.8 |
|
|
|
|
|
|
|
|
|
|
|
|
|
Colonsay—MOP (d)(f) |
2.6 |
|
|
1.5 |
|
|
|
|
|
0.6 |
|
|
|
|
|
|
|
|
|
|
|
|
|
Esterhazy—MOP(d)(g) |
6.3 |
|
|
6.3 |
|
|
|
|
|
4.4 |
|
|
|
|
|
|
|
|
|
|
|
|
|
| Canadian Total |
12.8 |
|
|
10.8 |
|
|
|
|
|
7.8 |
|
|
|
|
|
|
|
|
|
|
|
|
|
| United States |
|
|
|
|
|
|
|
|
|
|
|
|
|
|
|
|
|
|
|
|
Carlsbad—K-Mag®(h) |
0.9 |
|
|
0.7 |
|
|
|
|
|
0.5 |
|
|
|
|
|
|
|
|
|
|
|
|
|
| United States Total |
0.9 |
|
|
0.7 |
|
|
|
|
|
0.5 |
|
|
|
|
|
|
|
|
|
|
|
|
|
| Totals |
13.7 |
|
|
11.5 |
|
|
|
|
|
8.3 |
|
|
|
|
|
|
|
|
|
|
|
|
|
______________________________
(a)Finished product.
(b)Actual production varies from annual operational capacity shown in the above table due to factors that include, among others, the level of demand for our products, maintenance and turnaround time, the quality of the reserves and the nature of the geologic formations we are mining at any particular time, accidents, mechanical failure, product mix, and other operating conditions.
(c)Represents full capacity assuming no turnaround or maintenance time.
(d)The annualized proven peaking capacity shown above is the capacity currently used to determine our share of Canpotex, Limited (“Canpotex”) sales. Canpotex members’ respective shares of Canpotex sales are based upon the members’ respective proven peaking capacities for producing potash. When a Canpotex member expands an existing mine, the new capacity is added to that member’s proven peaking capacity based on either a 90-day production run at the maximum production levels or an engineering audit of the expansion performed by an independent engineering firm in accordance with approved protocols. The annual operational capacity of a mine reported in the table above can exceed the annualized proven peaking capacity until the proving run or engineering audit has been completed. Subject to Note (g), our current entitlement percentage of Canpotex is 36.2%.
(e)Annual operational capacity is our estimated potash production capacity based on the quality of reserves and the nature of the geologic formations expected to be mined, milled and/or processed over the long term, average amount of scheduled down time, including maintenance and scheduled turnaround time, and product mix, and no significant modifications to operating conditions, equipment or facilities. Operational capacities will continue to be updated to the extent new production results impact ore grades assumptions.
(f)Our Colonsay mine operates as a swing mine to meet market demands. We have the ability to reach an annual operating capacity of 2.1 million tonnes over time by increasing our staffing levels and investment in mine development activities.
(g)Following completion of our Esterhazy K3 expansion project, a third-party audit assessed our Esterhazy Facility's nameplate capacity at 7.8 million tonnes. We are currently working with Canpotex through established procedures to determine our adjusted Canpotex entitlement percentage based on our Esterhazy Facility's audited productive capacity.
(h)K-Mag® is a specialty product that we produce at our Carlsbad facility.
See Item 2. “Properties” for a discussion of our potash mining properties, including processing methods, facilities, production and summaries of our mineral resources and reserves, both in the aggregate and for our individual material potash mining properties.
Natural Gas
Natural gas is used at our Belle Plaine solution mine as a fuel to produce steam and to dry potash products. The steam is used to generate electricity and provide thermal energy to the evaporation, crystallization and solution mining processes. The Belle Plaine solution mine typically accounts for approximately 80% of our Potash segment’s total natural gas requirements for potash production. At our shaft mines, natural gas is used as a fuel to heat fresh air supplied to the shaft mines and for drying potash products. Combined natural gas usage for both the solution and shaft mines totaled 16.6 million MM BTU during 2023. We purchase our natural gas requirements on firm delivery index price-based physical contracts and on short-term spot-priced physical contracts. Our Canadian operations purchase physical natural gas from companies in Alberta and Saskatchewan using AECO price indices references and transport the gas to our plants via the TransGas pipeline system. The U.S. potash operation in New Mexico purchases physical gas in the southwest respective regional market using the El Paso San Juan Basin market pricing reference.
We use financial derivative contracts to manage the pricing on portions of our natural gas requirements.
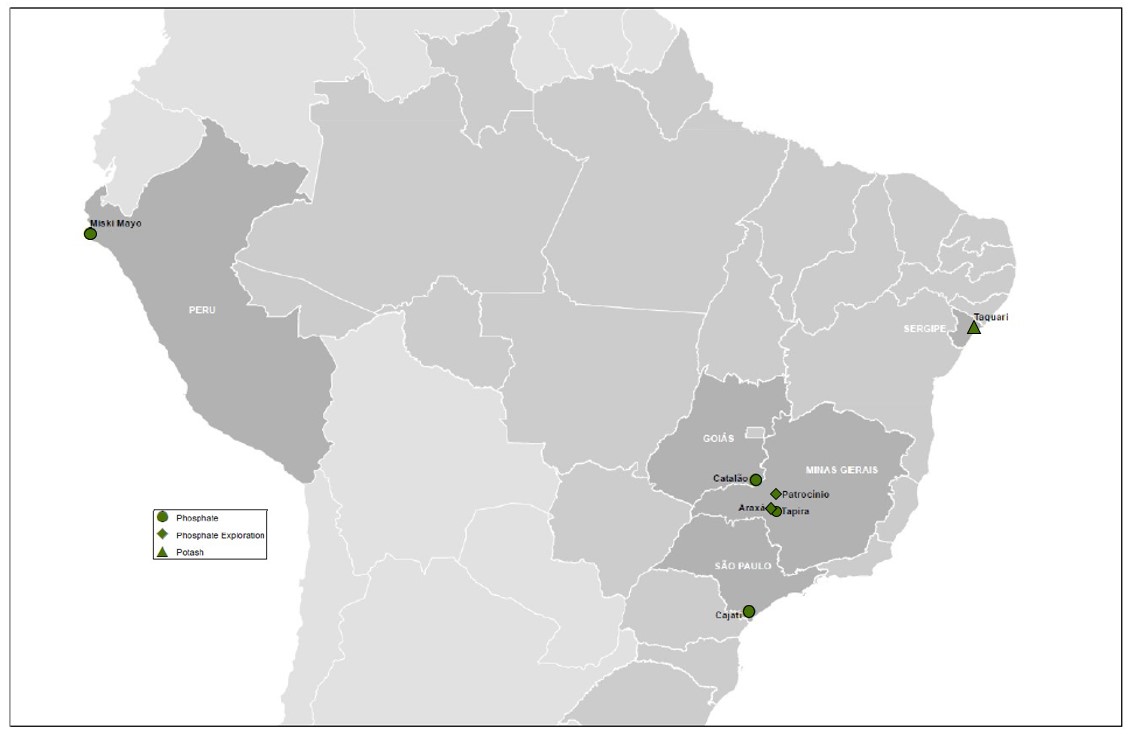
Mosaic Fertilizantes Segment
Our Mosaic Fertilizantes segment owns and operates mines, chemical plants, crop nutrient blending and bagging facilities, port terminals and warehouses in Brazil and Paraguay, which produce and sell concentrated phosphates crop nutrients, phosphate-based animal feed ingredients and potash fertilizer. The following map shows the locations of our operations in Brazil and Paraguay:
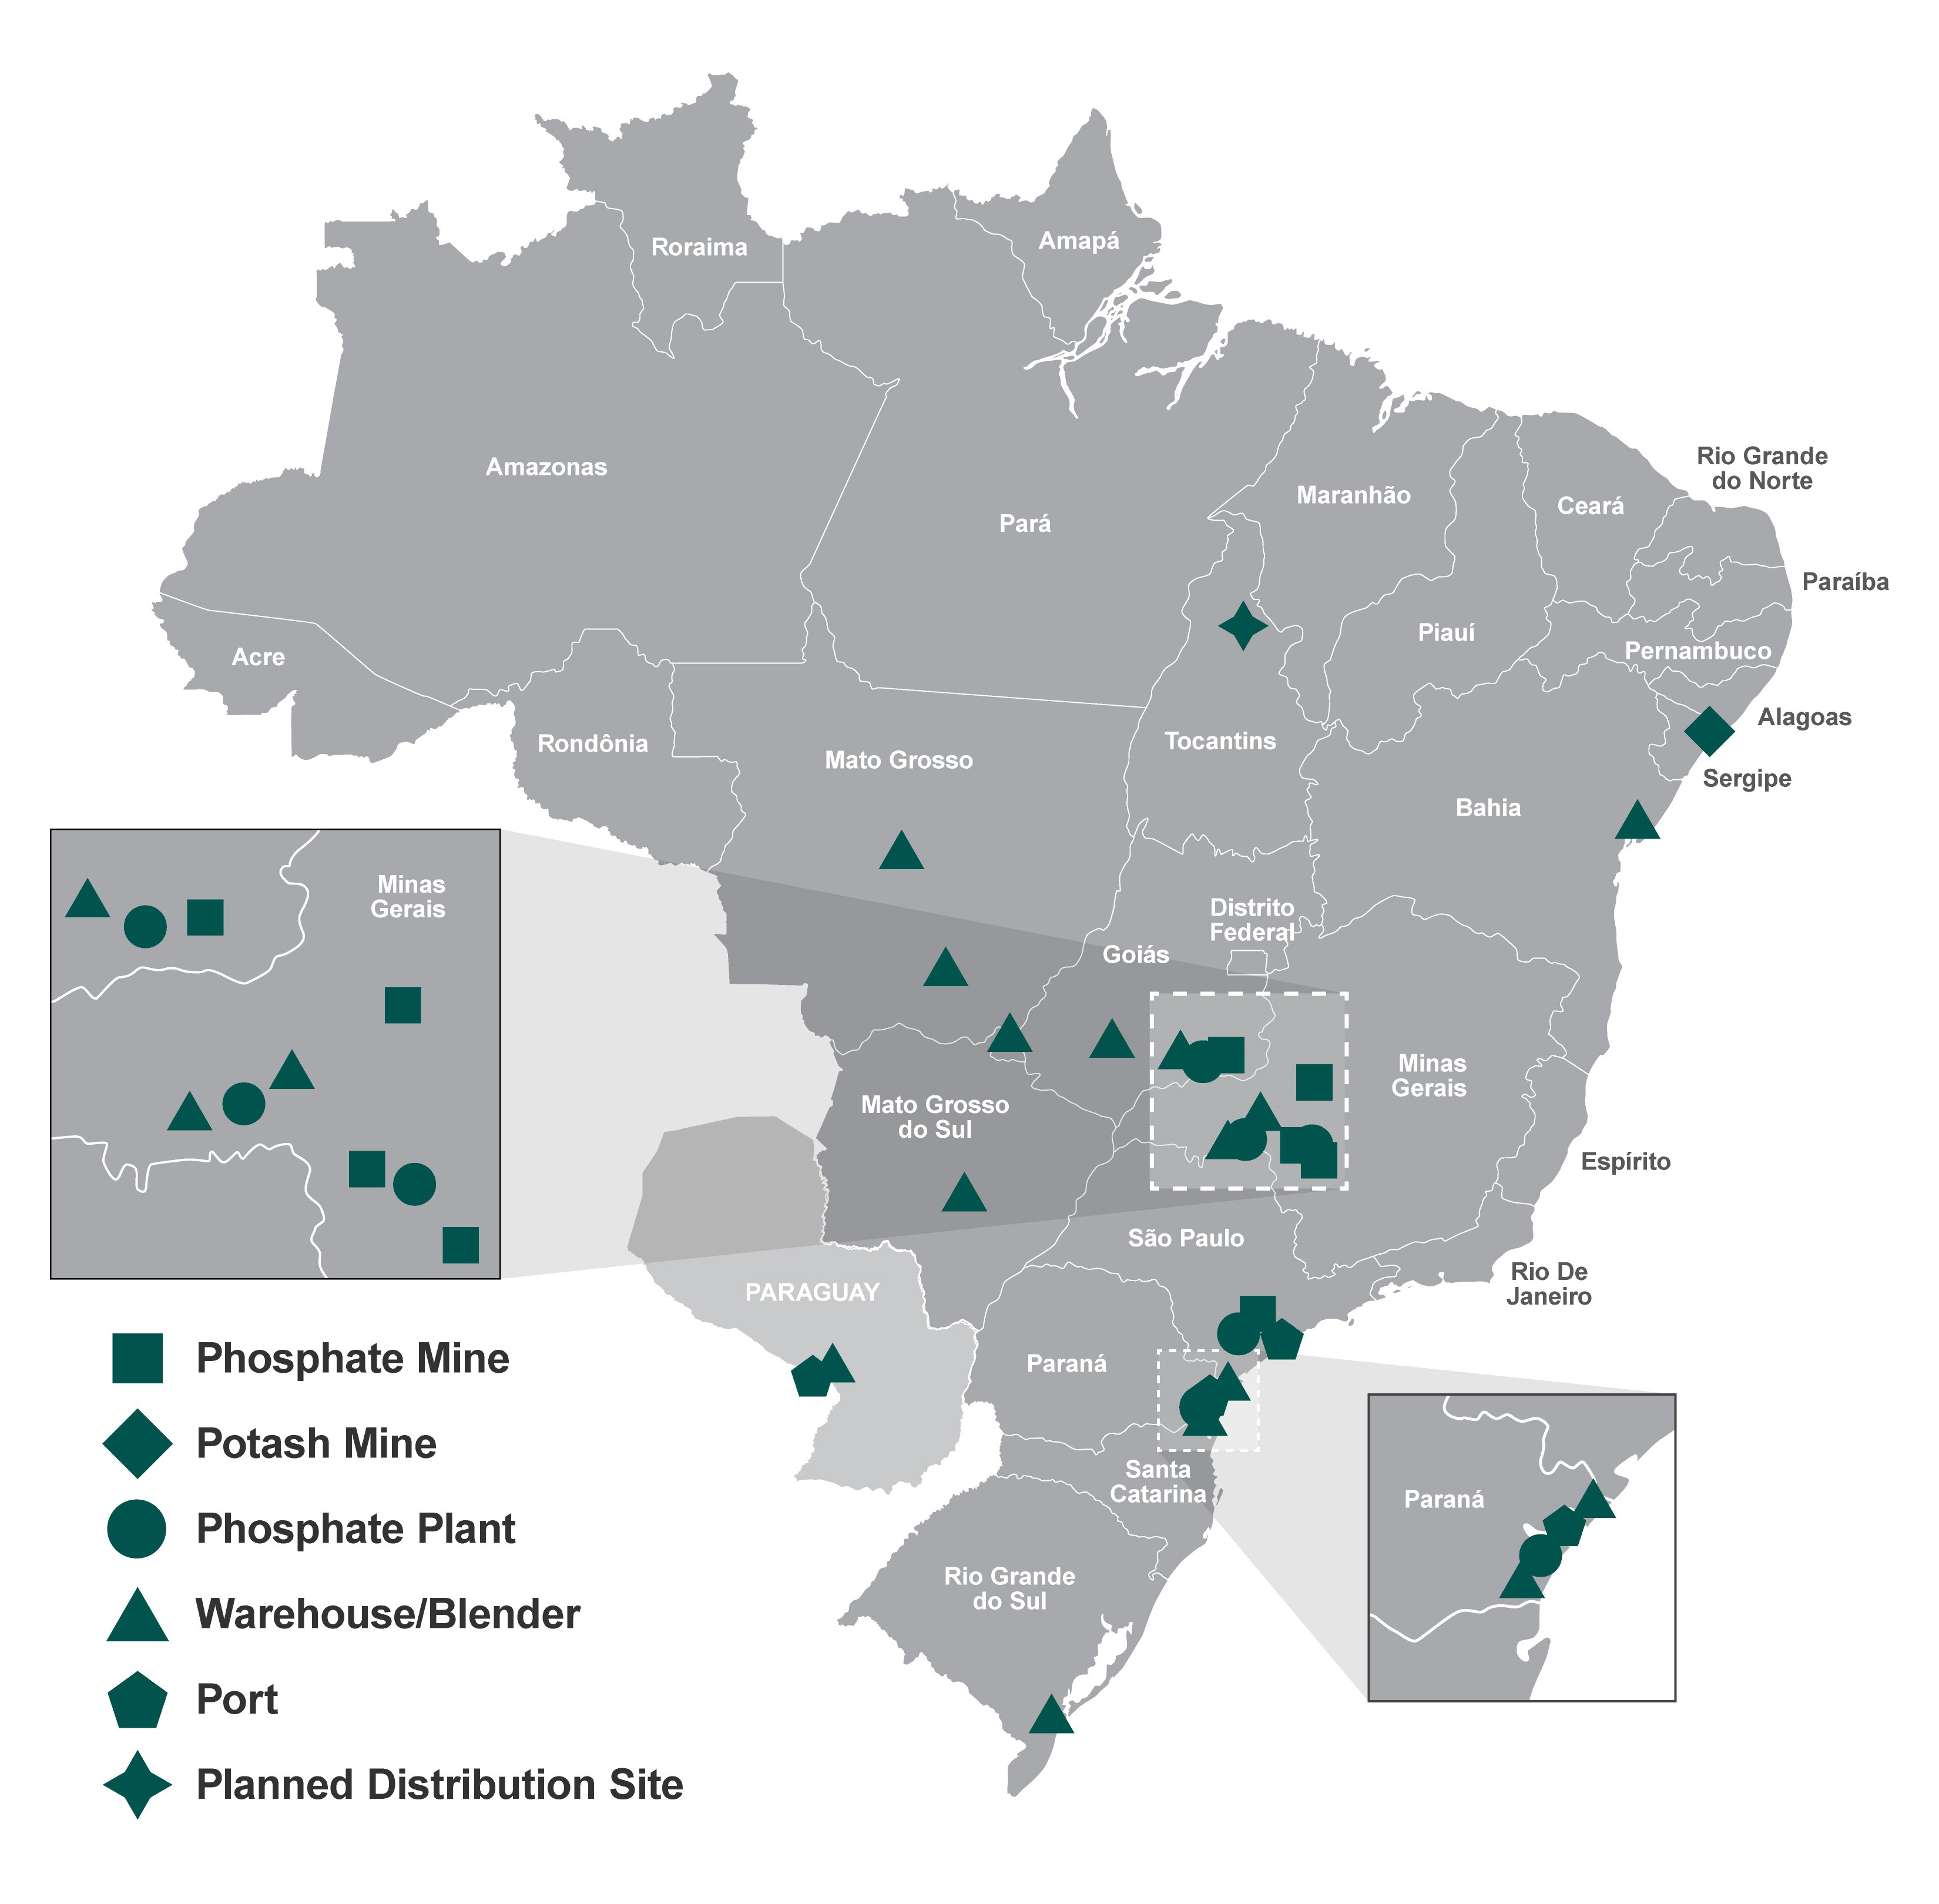
We are the largest producer and one of the largest distributors of blended crop nutrients for agricultural use in Brazil. We produce and sell phosphate- and potash-based crop nutrients, and animal feed ingredients through our operations. Our operations in Brazil include five phosphate mines, four chemical plants and a potash mine. We own and operate ten blending plants in Brazil and one blending plant and port in Paraguay. We are currently constructing a one million tonne distribution facility in northern Brazil in Palmeirante. In addition, we lease several other warehouses and blending units depending on sales and production levels. We also have a 62% ownership interest in Fospar, S.A. (“Fospar”). Fospar owns and operates an SSP (defined below) granulation plant, which produces approximately 0.5 million tonnes of SSP per year, and a deep-water port and throughput warehouse terminal facility in Paranagua, Brazil. The port facility at Paranagua handles approximately 3.6 million tonnes of imported crop nutrients.
In 2023, Mosaic Fertilizantes sold approximately 9.7 million tonnes of crop nutrient products and accounted for approximately 20% of fertilizer shipments in Brazil.
We have the capability to annually produce approximately 4.5 million tonnes of phosphate- and potash-based crop nutrients and animal feed ingredients. Crop nutrient products produced are marketed to crop nutrient manufacturers, distributors, retailers and farmers.
In addition to producing crop nutrients, Mosaic Fertilizantes purchases phosphates, potash and nitrogen products which are either used to produce blended crop nutrients (“Blends”) or for resale. In 2023, Mosaic Fertilizantes purchased 1.4 million tonnes of phosphate-based products, primarily MicroEssentials®, from our Phosphates segment, and 2.1 million tonnes of potash products from our Potash segment and Canpotex.
Phosphate Crop Nutrients and Animal Feed Ingredients
Our Brazilian phosphates operations have capacity to produce approximately 1.1 million tonnes of P2O5 per year, or about 70% of Brazilian annual capacity. Phosphoric acid is produced by reacting ground phosphate rock with sulfuric acid. P2O5 is the key building block for the production of high analysis or concentrated phosphate crop nutrients and animal feed products and is the most comprehensive measure of phosphate capacity and production and a commonly used benchmark in our industry. Our Brazilian phosphoric acid production totaled approximately 1.0 million tonnes in 2023 and accounted for approximately 84% of Brazilian annual output.
Our principal phosphate crop nutrient products are:
•Monoammonium Phosphate (11-52-0) (“MAP”): MAP is a crop nutrient composed of two macronutrients, nitrogen and phosphoric acid. This slurry is added inside a rotary drum type granulator with ammonia to complete the neutralization reaction and produce MAP.
•Triple superphosphate (“TSP”): TSP is a highly concentrated phosphate crop nutrient. TSP is produced from the phosphate rock reaction with phosphoric acid in a kuhlmann type reactor. The process for the production of TSP in Brazil is run of pile where the product undergoes a curing process of approximately seven days for later granulation.
•Single superphosphate (“SSP”): SSP is a crop nutrient with a low concentration of phosphorus that is used in agriculture because of the sulfur content in its formulation. SSP is produced from mixing phosphate rock with sulfuric acid in a kuhlmann or malaxador type reactor. After the reaction, the product goes to the curing process and then feeds the granulation units.
•Dicalcium phosphate (“DCP”): Dicalcium phosphate is produced by the reaction of desulphurized phosphoric acid with limestone. At Uberaba, it is produced from the reaction of concentrated phosphoric acid with limestone slurry. At Cajati, the phosphoric acid is diluted with dry limestone. The reaction of the DCP occurs in a kuhlmann or spinden type reactor.
Our primary mines and chemical plants are located in the states of Minas Gerais, São Paulo, and Goias. Production of our animal feed ingredients products is located at our Uberaba, Minas Gerais and Cajati, São Paulo facilities. We market our feed phosphate primarily under the brand name Foscálcio.
Annual capacity and production volume by plant as of December 31, 2023 are listed below:
|
|
|
|
|
|
|
|
|
|
|
|
|
|
|
|
|
|
|
|
|
|
|
|
| (tonnes of ore in millions) |
|
Phosphoric Acid |
|
Processed Phosphate(a) (MAP/TSP/SSP/DCP/Feed) |
| Facility |
|
Capacity(b) |
|
Production(c) |
|
Capacity(b) |
Production(c) |
| Phosphate |
|
|
|
|
|
|
|
| Uberaba |
|
0.9 |
|
|
0.8 |
|
|
2.0 |
|
1.6 |
|
| Cajati |
|
0.2 |
|
|
0.2 |
|
|
0.5 |
|
0.4 |
|
| Araxá |
|
— |
|
|
— |
|
|
1.1 |
|
0.8 |
|
| Catalão |
|
— |
|
|
— |
|
|
0.4 |
|
0.3 |
|
| Total |
|
1.1 |
|
|
1.0 |
|
|
4.0 |
|
3.1 |
|
______________________________
(a)Our ability to produce processed phosphates has been less than our annual operational capacity as stated in the table above, except to the extent we purchase phosphoric acid. Factors affecting actual production are described in note (c) below.
(b)The annual production capacity was calculated using the hourly capacity, days stopped for annual maintenance and OEE (historical utilization factor and capacity factor).
(c)Actual production varies from annual operational capacity shown in the table above due to factors that include, among others, the level of demand for our products, maintenance and turnaround time, accidents and mechanical failure.
The phosphoric acid produced at Cajati is used to produce DCP. The phosphoric acid produced at Uberaba is used to produce MAP, TSP and DCP.
We produced approximately 2.6 million tonnes of concentrated phosphate crop nutrients during 2023 which accounted for approximately 48% of estimated Brazilian annual production.
Phosphate Rock
Phosphate rock is the key mineral used to produce phosphate crop nutrients and animal feed product. Our phosphate rock production in Brazil totaled approximately 3.9 million tonnes in 2023, which accounted for approximately 70% of estimated Brazilian annual production. We are the largest producer of phosphate rock in Brazil and currently have an annual capacity of approximately 4.6 million tonnes. During 2023, we operated five properties; Araxá, Patrocínio and Tapira, in the state of Minas Gerais; Catalão, in the state of Goiás; and Cajati, in the state of São Paulo.
Production of one tonne of MAP requires 1.6 to 1.7 tonnes of phosphate rock. Production of one tonne of SSP requires between 0.6 to 0.7 tonnes of phosphate rock. Production of one tonne of TSP requires 1.4 tonnes of phosphate rock.
See Item 2. “Properties” for a discussion of our Brazilian mining properties, including processing methods, facilities, production and summaries of our mineral resources and reserves, both in the aggregate and for our individually material Brazilian properties.
We are required to pay royalties to mineral owners and resource taxes to the Brazilian government for phosphate and potash production. The resource taxes, known as Compensação Financeira pela Exploração de Recursos Minerais or CFEM, are regulated by the National Mining Agency. In 2023, we paid royalties and resource taxes of approximately $15.5 million.
Sulfur
We use molten sulfur at our phosphates concentrates plants to produce sulfuric acid, one of the key components used in the production of phosphoric acid. We consumed approximately 1.2 million long tons of sulfur for our own production during 2023. We purchase approximately 21% of the volume under annual supply agreements from oil and natural gas refiners, who are required to remove or recover sulfur during the refining process. The remaining 79% is purchased in the spot market. Sulfur is imported through the Tiplam port and transported by rail to the Uberaba plant and by truck to the Araxá and Cajati locations.
Although sulfur is readily available from many different suppliers and can be transported to our phosphate facilities by a variety of means, sulfur is an important raw material used in our business that has in the past been, and could in the future be, subject to volatile pricing and availability. Alternative transportation and terminaling facilities might not have sufficient capacity to fully serve all of our facilities in the event of a disruption to current transportation or terminaling facilities. Changes in the price of sulfur or disruptions to sulfur transportation or terminaling facilities could have a material impact on our business.
Ammonia
We use ammonia, together with phosphoric acid, to produce MAP, and to a lesser extent for SSP production. We consumed approximately 129,710 tonnes of ammonia during 2023. Production of one tonne of MAP requires approximately 0.137 tonnes of ammonia. We purchase all of our ammonia under a long-term supply agreement with two suppliers. Ammonia is imported through the Tiplam port and transported by truck to Uberaba, Araxá and Catalão.
We own approximately 1% of the Tiplam terminal in Santos, São Paulo. Our ownership percentage, along with a contractual agreement, guarantee us unloading priority for ammonia and also provide us unloading capacity for rock, sulfur and crop nutrients.
Although ammonia is readily available from many different suppliers and can be transported to our phosphates facilities by a variety of means, ammonia is an important raw material used in our business that has in the past been, and in the future could be, subject to volatile pricing. Alternative transportation and terminaling facilities might not have sufficient capacity to fully serve all of our facilities in the event of a disruption to existing transportation or terminaling facilities. Changes in the price of ammonia or disruptions to ammonia transportation or terminaling could have a material impact on our business.
Brazilian Potash
We conduct potash operations through the leased Taquari-Vassouras shaft mine, which is the only potash mine in Brazil, located in Rosário do Catete in the Brazilian state of Sergipe. We also own a related refinery at the site. We produce and sell potash product domestically. MOP is the primary source of potassium for the crop nutrient industry in Brazil. Red MOP has traces of iron oxide. The granular and standard grade red MOP products are well-suited for direct fertilizer application and bulk blending. Our potash product is marketed in Brazil to crop nutrient manufacturers, distributors and retailers and is also used in the manufacturing of crop nutrients.
In 2023, we paid royalties of approximately $9.8 million related to the leasing of potash assets and mining rights for Taquari.
Land Holdings
Mosaic Fertilizantes owns properties and the surface rights of certain rural lands comprising over 34,000 hectares (84,000 acres) in the States of São Paulo, Minas Gerais, Goiás, Paraná, Mato Grosso, Santa Catarina, Bahia and Sergipe, and has the right to mine additional properties which contain phosphate rock or potash reserves. Most of our land holdings are needed to operate our phosphate and potash production and fertilizer distribution businesses. A portion of our land assets may no longer be required for our current operations and may be leased to third parties, for agricultural or other purposes, or may be set aside for mineral or environmental conservation. Our real property assets are generally comprised of concentrates plants, port facilities and phosphate and potash mines, crop nutrient blending and bagging facilities and other properties which we have acquired through our presence in Brazil.
India and China Distribution Businesses
Our China and India distribution businesses market phosphate-, potash- and nitrogen-based crop nutrients and provide other ancillary services to wholesalers, cooperatives, independent retailers, and farmers in the Asia-Pacific regions. These operations provide our Phosphates and Potash segments access to key markets outside of North and South America and serve as a marketing agent for our Phosphates segment. In 2023, the India and China operations purchased 341,047 tonnes of phosphate-based products from our Phosphates segment and MWSPC, and 742,528 tonnes of potash products from our Potash segment and Canpotex. They also purchase phosphates, potash and nitrogen products from unrelated third parties, which we either use to produce blended crop nutrients or for resale.
In China, we own two 300,000-tonne per year capacity blending plants. In 2023, we sold approximately 271,000 tonnes of Blends and distributed another 1,073,000 tonnes of phosphate and potash crop nutrients in China.
In India, we have distribution facilities to import and sell crop nutrients. In 2023, we distributed approximately 536,000 tonnes of phosphate and potash crop nutrient products in India.
SALES AND DISTRIBUTION ACTIVITIES
United States and Canada
We have a U.S. and Canada sales and marketing team that serves our business segments. We sell to wholesale distributors, retail chains, cooperatives, independent retailers and national accounts.
Customer service and the ability to effectively minimize the overall supply chain costs are key competitive factors in the crop nutrient and animal feed ingredients businesses. In addition to our production facilities, to service the needs of our customers, we own or have contractual throughput or other arrangements at strategically located distribution warehouses along or near the Mississippi and Ohio Rivers, as well as in other key agricultural regions of the U.S. and Canada. From these facilities, we distribute Mosaic-produced phosphate and potash products for customers who in turn resell the product into the distribution channel or directly to farmers in the U.S. and Canada.
We own port facilities in Tampa, Florida which have deep water berth capabilities providing access to the Gulf of Mexico. We also own warehouse distribution facilities in: Rosemount, Minnesota; Pekin, Illinois; and Henderson, Kentucky.
In addition to the facilities that we own, our U.S. distribution operations also include leased distribution space or contractual throughput agreements in other key geographical areas including California, Florida, Illinois, Indiana, Iowa, Kentucky, Louisiana, Minnesota, Missouri, Nebraska, North Dakota, Ohio, Oklahoma, Texas and Wisconsin.
Our Canadian customers include independent dealers and national accounts. We also lease or own warehouse facilities in Saskatchewan, Ontario, Quebec and Manitoba in Canada.
International
Outside of the U.S. and Canada, we market our Phosphates segment’s products through our Mosaic Fertilizantes segment and our China and India distribution businesses, as well as a salesforce focused on geographies outside of North America. The countries that account for the largest amount of our phosphates sales outside the U.S., by volume, are Brazil, Canada, Mexico and Colombia.
Our sales of potash products outside of the U.S. and Canada are made through Canpotex. Canpotex sales are allocated among its members based on peaking capacity. In 2023, our entitlement percentage of Canpotex was 36.2%.
Our potash exports from Carlsbad are sold through our own sales force. We also market our Potash segment’s products through our Mosaic Fertilizantes segment and our China and India distribution businesses, which acquire potash primarily through Canpotex. The countries that account for the largest amount of international potash sales, by volume, are Brazil, China, Indonesia, India and Malaysia.
To service the needs of our customers, our Mosaic Fertilizantes segment includes a network of strategically located sales offices, crop nutrient blending and bagging facilities, port terminals and warehouse distribution facilities that we own and operate. The blending and bagging facilities primarily produce Blends from phosphate, potash and nitrogen. The average product mix in our Blends (by volume) contains approximately 19% nitrogen, 51% phosphate and 30% potash, although this mix differs based on seasonal and other factors. All of our production in Brazil is consumed within the country.
Our India and China distribution businesses also includes a network of strategically located sales offices, crop nutrient blending and bagging facilities, port terminals and warehouse distribution facilities. These businesses serve primarily as a sales outlet for our North American phosphates production, as well as additional phosphate production we market from our MWSPC joint venture, both for resale and as an input for Blends. Our Potash segment also has historically furnished the majority of the raw materials needs for the production of Blends, primarily via Canpotex, and is expected to continue to do so in the future.
Other Products
With a strong brand position in a multi-billion dollar animal feed ingredients global market, our Phosphates segment supplies animal feed ingredients for poultry and livestock to customers in North America, Latin America and Asia. Our potash sales to non-agricultural users are primarily to large industrial accounts and the animal feed industry. Additionally, in North America, we sell potash for de-icing and as a water softener regenerant. In Brazil, we also sell phosphogypsum.
In 2023, we announced the formation of the Mosaic Biosciences platform, a global initiative to bring the latest science and innovation to the agricultural market. The Mosaic Biosciences portfolio includes biological fertilizer complements which improve nutrient use efficiency and enhance plant growth and vigor.
COMPETITION
Because crop nutrients are global commodities available from numerous sources, crop nutrition companies compete primarily on the basis of delivered price. Other competitive factors include product quality, cost and availability of raw materials, customer service, plant efficiency and availability of product. As a result, markets for our products are highly competitive. We compete with a broad range of domestic and international producers, including farmer cooperatives, subsidiaries of larger companies, and independent crop nutrient companies. Foreign competitors may have access to less expensive raw materials, may not have to comply with as stringent regulatory requirements or are owned or subsidized by governments and, as a result, may have cost advantages over North American companies. We believe that our extensive North American and international production and distribution system provides us with a competitive advantage by allowing us to achieve economies of scale, transportation and storage efficiencies, and obtain market intelligence.
Also, we believe our performance products, such as MicroEssentials®, provide us a competitive advantage with customers in North and South America.
Unlike many of our competitors, we have our own distribution system to sell phosphate- and potash-based crop nutrients and animal feed ingredients, whether produced by us or by other third parties, around the globe. In North America, we have one of the largest and most strategically located distribution systems for crop nutrients, including warehouse facilities in key agricultural regions. We also have an extensive network of distribution facilities internationally, including in the key growth regions of South America and Asia, with port terminals, warehouses, and blending plants in Brazil, Paraguay, China, and India. Our global presence allows us to efficiently serve customers in approximately 40 countries.
Phosphates Segment
Our Phosphates segment operates in a highly competitive global market. Among the competitors in the global phosphate industry are domestic and foreign companies, as well as foreign government-supported producers in Asia and North Africa. Phosphate producers compete primarily based on price, as well as product quality, service and innovation. Major integrated producers of feed phosphates are located in the U.S., Europe and China. Many smaller producers are located in emerging markets around the world. Many of these smaller producers are not miners of phosphate rock or manufacturers of phosphoric acid and are required to purchase this material on the open market.
We believe that we are a low-cost integrated producer of phosphate-based crop nutrients, due in part to our scale, vertical integration and strategic network of production and distribution facilities. As the world’s second largest producer of concentrated phosphates, as well as the second largest miner of phosphate rock in the world and the largest in the U.S., we maintain an advantage over some competitors as the scale of operations effectively reduces production costs per unit. We are also vertically integrated to captively supply one of our key inputs, phosphate rock, to our phosphate production facilities. We believe that our position as an integrated producer of phosphate rock provides us with a significant cost advantage over competitors that are non-integrated phosphate producers. In addition, our ownership in the Miski Mayo Mine allows us to supplement our overall phosphate rock needs. MWSPC enables us to not only further diversify our sources of phosphates but also improve our access to key agricultural countries in Asia.
We produce ammonia at our Faustina, Louisiana concentrates plant in quantities sufficient to meet approximately one third of our total ammonia needs in North America. We do not have ammonia production capacity within Florida to serve our Florida operations, but we have capacity to supply a portion of our requirements by transporting produced ammonia from Louisiana to Florida. We purchase additional ammonia from world markets and thus are subject to significant volatility in our purchase price of ammonia. The CF Ammonia Supply Agreement provides us with a supply of a substantial volume of ammonia at prices based on the price of natural gas.
With our dedicated sulfur transportation barges and tugs, and our ownership of GSS, we are also well-positioned to source an adequate, flexible and cost-effective supply of sulfur, our third key input, to our Florida and Louisiana phosphate production facilities. We believe that our investments in sulfur logistical and melting assets continue to afford us a competitive advantage compared to other producers in cost and access to sulfur.
With facilities in both central Florida and Louisiana, we are logistically well positioned to fulfill our material needs at very competitive prices. Those multiple production points also afford us the flexibility to optimally balance supply and demand.
Potash Segment
Potash is a commodity available from several geographical regions around the world and, consequently, the market is highly competitive. Through our participation in Canpotex, we compete outside of North America against various independent and state-owned potash producers. Canpotex has substantial expertise and logistical resources for the international distribution of potash, including strategically located export assets in Portland, Oregon, St. John, New Brunswick and Vancouver, British Columbia. Our principal methods of competition with respect to the sale of potash include product pricing and offering consistent, high-quality products and superior service. We believe that our potash cost structure is competitive in the industry and should improve as we continue to complete our potash expansion projects.
Mosaic Fertilizantes
The Mosaic Fertilizantes segment operates in a highly competitive market in Brazil. We compete with a broad range of domestic and international producers, including farmer cooperatives, subsidiaries of larger companies, and independent crop nutrient companies. We believe that having a vertically integrated business, internationally but also in Brazil, provides us with a competitive advantage by allowing us to achieve economies of scale, transportation and storage efficiencies, and obtain market intelligence.
Mosaic Fertilizantes has a wide variety of customers including farmers, blenders, and other local distributors. We compete with local businesses that offer a wide variety of products that are available from many sources. We believe the strategic location of our mines and chemical plants, in close proximity to our customers, and the benefit of our own distribution network, gives us an advantage over most of our competitors. The vertical integration of our wholly-owned production, along with our distribution network, as well as our focus on product innovation and customer solutions, position us with an advantage over many of our competitors. We have a strong brand in Brazil. In addition to having access to our own production, our distribution activities have the capability to supply a wide variety of crop nutrients to our dealer and farmer customer base.
FACTORS AFFECTING DEMAND
Our results of operations historically have reflected the effects of several external factors which are beyond our control and have in the past produced significant downward and upward swings in operating results. Revenues are highly dependent upon conditions in the agriculture industry and can be affected by, among other factors: crop conditions; changes in agricultural production practices; worldwide economic conditions, including the increasing world population, household incomes, and demand for more protein-rich food, particularly in developing regions such as China, India and Latin America; changing demand for biofuels; variability in commodity pricing; governmental policies; the level of inventories in the crop nutrient distribution channels; customer expectations regarding farmer economics, future crop nutrient prices and availability, and transportation costs, among other matters; market trends in raw material costs; market prices for crop nutrients; and weather. Furthermore, our crop nutrients business is seasonal to the extent farmers and agricultural enterprises in the markets in which we compete purchase more crop nutrient products during the spring and fall. The international scope of our business, spanning the northern and southern hemispheres, reduces to some extent the seasonal impact on our business. The degree of seasonality of our business can change significantly from year to year due to conditions in the agricultural industry and other factors. The seasonal nature of our businesses requires significant working capital for inventory in advance of the planting seasons.
We sell products throughout the world. Unfavorable changes in trade protection laws, policies and measures, government policies and other regulatory requirements affecting trade; unexpected changes in tax and trade treaties; and strengthening or weakening of foreign economies as well as political relations with the U.S. may cause sales trends to customers in one or more foreign countries to differ from sales trends in the U.S.
Our international operations are subject to risks from changes in foreign currencies, or government policy, which can affect local farmer economics.
OTHER MATTERS
Employees
We had 14,049 employees as of December 31, 2023, consisting of approximately 10,352 salaried and 3,697 hourly employees. This includes approximately 289 salaried and 424 hourly employees at the Miski Mayo Mine, of which we own 75% and its results are consolidated within our results of operations.
Labor Relations
As of December 31, 2023:
•We had eight collective bargaining agreements with unions covering certain hourly employees in the U.S. and Canada. Of these employees, approximately 33% are covered under agreements that expire in 2024. All are expected to collectively bargain for new contracts in 2024.
•We had agreements with 35 unions covering all employees in Brazil. More than one agreement may govern our relations with each of these unions. In general, the agreements are renewable on an annual basis.
Failure to renew any of our union agreements could result in a strike or labor stoppage that could have a material adverse effect on our operations. However, we have not experienced a significant work stoppage in many years and historically have had good labor relations.
Information Available on our Website
Our Annual Report Form on 10-K (“Form 10-K”), Quarterly Reports on Form 10-Q (“Form 10-Q”), Current Reports on Form 8-K (“Form 8-K”), and amendments thereto, filed with the Securities and Exchange Commission (“SEC”) pursuant to Section 13(a) of the Securities Exchange Act of 1934, as amended, and the rules and regulations thereunder are made available free of charge on our website (www.mosaicco.com) as soon as reasonably practicable after we electronically file such material with, or furnish it to, the SEC. These reports are also available on the SEC’s website (www.sec.gov). The information contained on our website and the SEC’s website is not being incorporated in this report.
HUMAN CAPITAL
Our employees are the foundation of our Company. Our 14,049 colleagues embody Mosaic’s core values of innovation, collaboration, drive and responsibility, and are the key to enabling us to execute our mission to help the world grow the food it needs.
As of December 31, 2023, our regular employee base was made up of the following:
|
|
|
|
|
|
|
|
|
|
|
|
|
|
|
|
|
|
Country |
Male |
|
Female |
|
Total |
| Brazil |
5,853 |
|
|
1,325 |
|
|
7,178 |
|
| United States |
3,273 |
|
|
627 |
|
|
3,900 |
|
| Canada |
1,674 |
|
|
300 |
|
|
1,974 |
|
| Peru |
635 |
|
|
78 |
|
|
713 |
|
| China |
107 |
|
|
51 |
|
|
158 |
|
| India |
60 |
|
|
7 |
|
|
67 |
|
| Paraguay |
34 |
|
|
17 |
|
|
51 |
|
| Saudi Arabia |
8 |
|
|
— |
|
|
8 |
|
Total |
11,644 |
|
|
2,405 |
|
|
14,049 |
|
Mosaic is committed to the well-being and development of our employees by creating and cultivating an innovative and collaborative workplace that welcomes, values and respects diversity of people, thoughts, and perspectives; a workplace free of discrimination and intolerant of bias. As part of Mosaic’s strategic priorities, we are committed to prioritizing our internal culture and external partnerships to meet our commitments to our employees and stakeholders and to be an employer of choice for generations to come.
Employee Health and Safety–Safety is a top priority and we strive for zero harm to people and zero environmental incidents. Through the implementation of the Mosaic Management System, we have established a structured approach to effectively manage and control risk for the safety and well-being of our colleagues, the environment and our stockholders. The management system defines processes that help support a safe work environment and establish a continuous improvement cycle to adjust for changing conditions and identified risks.
Global Worker Wellness–extending beyond safety, our wellness programs seek to improve the well-being of our employees – and their families – in the areas of physical and psychological health, and financial security. These programs include health screenings, insurance plans, psychological health training and mental health resources, as well as our Environmental, Health and Safety (“EHS”) Risk Reduction Program, various trainings and flexible schedules.
Development–Mosaic believes in continually investing in people and their lifelong learning. Mosaic holds training events throughout the year across all of our locations, invests in leadership competencies through facilitated learning opportunities and hosts an online education platform through Workday Learning, which all employees are encouraged to access for mandatory and self-guided education. Mosaic offers companywide educational reimbursement programs to help employees in each of our operating companies acquire new skills and capabilities to better meet their job responsibilities and provide for future career opportunities within the Company.
Mosaic supports membership in numerous professional associations and encourages participation in work-related external networking groups
•In 2023, Mosaic continued its programs to help employees gain the knowledge and skills that we believe will be necessary for the next evolution of our business. Like any company, Mosaic experiences turnover and the need to replace talent related to retirement and succession. Mosaic seeks to minimize unwanted turnover through its talent review, succession management, performance management, and compensation processes. For certain roles critical to our operations, such as engineering, operations, and employee health and safety professionals, we maintain specific talent programs, internal development strategies, apprentice and Co-Op programs and recruitment pipelines.
Community–Mosaic is a thoughtful and engaged neighbor who invests carefully and generously through long-term partnerships with organizations that are making a difference. We are proud to support organizations and initiatives that create growth and leave a lasting impact in our communities in three main focus areas: food, water and local community. In 2023, we invested $16.7 million. In addition to philanthropic grants and sponsorships of local programs, we also support and facilitate volunteerism by our employees. Similarly, we participate on local committees, boards, and associations focused on contributing to the vitality of the people and communities around us.
•2023 was the third year of the Mosaic Employee Giving Program (the “Program”) that provides employees with flexibility to connect their personal causes to corporate giving, matching and volunteerism opportunities. The Program aligns to Mosaic’s strategic priorities, our 2025 Environmental, Social and Governance performance targets, and companywide 2030 global diversity and inclusion goals. Employees can take advantage of Company matching funds through financial contributions, volunteering on personal time, or both - in North America this can be up to $2,000 annually. Our 2030 diversity and inclusion goal for community investment provides intentional focus to support underserved or underrepresented populations in regions where we operate. In 2023, 29 percent of our global giving met this focus.
Diversity, Inclusion and Equal Opportunities–in 2023, Mosaic’s Diversity and Inclusion Program continued to advance progress, engaging in several initiatives to advance Mosaic’s commitments to our employees and stakeholders, increase accountability, and promote a more diverse and inclusive environment. Initiatives included launching a self-identification campaign which gives employees the opportunity to voluntarily provide personal characteristics that create more individual visibility and provides Mosaic with a better and deeper understanding of our workforce, helping to identify meaningful policies, programs and benefits that lead to a more inclusive culture. We continued to make progress towards our previously announced global 2030 representation goals and are driving accountability into the business units by establishing business-level initiatives and programs to address opportunities to progress towards a more diverse and inclusive workforce. We continued to build leadership competencies by providing education on enabling authentic connections, establishing trust and modeling inclusive behaviors and provided an online, curated, self-directed learning platform to employees to continue their own learning journeys. We are building awareness and recognition through embedded learning moments, leader-led roundtable discussions and a quarterly Diversity & Inclusion Newsletter. We continue to refocus and expand our recruitment efforts to create a more diverse talent pipeline, partnering with our executive-led Employee Inclusion Networks to help identify additional opportunities to attract qualified, diverse talent and are working towards advancing our talent acquisition processes to be more inclusive. Additional information about our human capital, including our diversity and inclusion goals for 2030, is available in the sustainability report posted on our website. The information contained on our website is not being incorporated in this report.
•Pay equity is fundamental to our compensation philosophy and our commitment to diversity and inclusion. Mosaic annually evaluates pay equity and compensation practices to ensure fair and equitable treatment of employees based on our pay-for-performance framework. In 2023, Mosaic established internal analytical capabilities and restructured our pay equity process to bring more employees within scope across our global operations and to enhance our assessment of pay disparities. The results of our assessment revealed outliers without adequate business justifications. Mosaic intends to address each of the instances during our 2024 compensation cycle. Pay equity will be reviewed internally every year and we expect to conduct external independent reviews every three years.
INFORMATION ABOUT OUR EXECUTIVE OFFICERS
Information regarding our executive officers as of February 22, 2024 is set forth below:
|
|
|
|
|
|
|
|
|
|
|
|
|
|
|
| Name |
|
Age |
|
Position |
| Philip E. Bauer |
|
51 |
|
|
Senior Vice President, General Counsel and Corporate Secretary |
| Bruce M. Bodine Jr. |
|
52 |
|
|
Chief Executive Officer, President and Director |
| Clint C. Freeland |
|
55 |
|
|
Executive Vice President and Chief Financial Officer |
| Walter F. Precourt III |
|
59 |
|
|
Senior Vice President and Chief Administrative Officer |
| Corrine D. Ricard |
|
60 |
|
|
Senior Vice President - Digital Strategy |
| Karen A. Swager |
|
53 |
|
|
Executive Vice President - Operations |
| Yijun (“Jenny”) Wang |
|
56 |
|
|
Executive Vice President - Commercial |
Philip E. Bauer. Mr. Bauer was promoted to Senior Vice President, General Counsel and Corporate Secretary in January 2023. Since joining Mosaic in 2007, Mr. Bauer has managed legal support for business development activities, potash operations, offshore finance, commercial transactions and corporate governance. Most recently, he was the Vice President - Growth and Development where he helped drive strategic vision across the organization. Prior to Mosaic, he was a partner at an international law firm where he focused his practice on mergers and acquisitions, public and private securities offerings and public company compliance matters, as well as general business advising. Mr. Bauer earned his Juris Doctor degree from The George Washington University Law School in Washington D.C., his Bachelor of Science in Foreign Service with honors from Georgetown University’s School of Foreign Service where he majored in international politics, and his Master of Business Administration from the Kellogg School of Management at Northwestern University.
Bruce M. Bodine Jr. Mr. Bodine was elected our Chief Executive Officer effective January 2024 and our President effective August 2023. He previously served as our Senior Vice President - North America from April 2020 to August 2023, and as our Senior Vice President - Phosphates from January 2019 to April 2020 during which time he also provided executive oversight for the corporate procurement organization. Prior to that, Mr. Bodine served as Senior Vice President - Potash (from June 2016 to December 31, 2018); as Vice President - Potash (from April to May 2016); as Vice President - Supply Chain (from August 2015 to March 2016); as Vice President - Operations Business Development (from October 2014 to August 2015); as Vice President - Operations for our Esterhazy and Colonsay potash production facilities (from July 2013 to October 2014); as the General Manager, Esterhazy (from September 2012 to June 2013); and as the General Manager, Four Corners (from March 2010 to August 2012). Before that, Mr. Bodine held various plant and mine development management positions in the Phosphates segment beginning with Mosaic’s formation in 2004.
Clint C. Freeland. Mr. Freeland was elected our Executive Vice President and Chief Financial Officer in November 2023 and had previously served as our Senior Vice President and Chief Financial Officer since June 2018. Prior to joining Mosaic, Mr. Freeland served as Executive Vice President and Chief Financial Officer of Dynegy Inc. from July 2011 until Dynegy’s merger with Vistra Energy Corp. in April 2018. Mr. Freeland was responsible for Dynegy’s financial affairs, including finance and accounting, treasury, tax and banking and credit agency relationships. Prior to joining Dynegy, Mr. Freeland served as Senior Vice President, Strategy & Financial Structure of NRG Energy, Inc (“NRG”). from February 2009 to July 2011. Mr. Freeland served as NRG’s Senior Vice President and Chief Financial Officer from February 2008 to February 2009 and its Vice President and Treasurer from April 2006 to February 2008. Prior to joining NRG, Mr. Freeland held various key financial roles within the energy sector.
Walter F. Precourt III. Mr. Precourt was elected our Senior Vice President and Chief Administrative Officer in November 2023. In this role, Mr. Precourt has responsibility for the Company’s Human Resources, Public Affairs, Procurement and Shared Services teams. He had previously served as our Senior Vice President - Strategy and Growth since January 1, 2019. From June 2016 through March 2020 he also provided executive oversight for the EHS organization. He previously served as Senior Vice President - Phosphates and provided executive oversight for the corporate procurement organization from June 2016 until January 1, 2019, as Senior Vice President - Potash Operations from May 2012 to June 2016, and before that he led the Environment, Health and Safety organization since joining Mosaic in 2009. Prior to joining Mosaic, Mr. Precourt was employed by cement and mineral component producer Holcim (U.S.) where he initially led its safety transformation and later became Vice President of Environment and Government Affairs. Mr. Precourt started his career at The Dow Chemical Company where he served in a variety of roles in Operations, Technology, Capital Project Management, and Environmental, Health and Safety.
Mr. Precourt served as a director and was the past Chairman of the Board of the Saskatchewan Potash Producers Association and was a director of Fertilizer Canada.
Corrine D. Ricard. Ms. Ricard was elected Mosaic’s Senior Vice President – Digital Strategy in January 2024 after serving as our Senior Vice President - Mosaic Fertilizantes since November 15, 2019. Prior to that she served as Senior Vice President - Commercial since February 2017, Senior Vice President - Human Resources from April 2012 to February 2017, and before that she held a number of other leadership positions at Mosaic, including Vice President - International Distribution, Vice President - Business Development and Vice President - Supply Chain. Prior to Mosaic’s formation, Ms. Ricard worked for Cargill in various roles, including risk management, supply chain and commodity trading. Ms. Ricard serves on the board of directors for Canpotex Limited, the Canadian potash marketing association, and Carlisle Companies, a publicly traded company.
Karen A. Swager. Ms. Swager was elected our Executive Vice President – Operations in November 2023. In this role, Ms. Swager is responsible for the Company’s enterprise-wide operations, including the Environment, Health and Safety (“EHS”) organization, and the North America Supply Chain organization. Ms. Swager had previously served as our Senior Vice President - Supply Chain, including executive oversite for the Procurement and corporate EHS teams, since April 1, 2020. From January 1, 2019 until her appointment as Senior Vice President - Supply Chain, she served as Senior Vice President - Potash. Previously, Ms. Swager held leadership positions at Mosaic, including Vice President - Minerals, Vice President - Mining Operations and General Manager in our Phosphates business. She also led the mine planning and strategy group for the Phosphates business. Ms. Swager serves as a director of MVM Resources International, B.V., the general partner of Compañia Minera Miski Mayo S.R.L., the joint venture that operates the mines in Peru, and as a director of SSR Mining Inc., a publicly traded company.
Yijun (“Jenny”) Wang. Ms. Wang was elected Executive Vice President – Commercial in January 2024 after serving as the Company’s Senior Vice President – Global Strategic Marketing since May 2023. From January 2022 until May 2023, Ms. Wang served as our Senior Vice President - Global Strategic Marketing, Head of China and India. From October 15, 2020 until her current appointment, Ms. Wang served as Vice President - Global Strategic Marketing. Prior to October 2020, Ms. Wang served as Vice President - Global Product Management and International Distribution and before May 2019, Ms. Wang served as Country Head for China. Ms. Wang serves on the Board of Directors of Canpotex Limited, the Canadian potash marketing association.
Our executive officers are generally elected to serve until their respective successors are elected and qualified or until their earlier death, resignation or removal. No “family relationships,” as that term is defined in Item 401(d) of Regulation S-K, exist among any of the listed officers or between any such officer and any member of our Board of Directors.
Item 1A. Risk Factors.
Our business, financial condition or results of operations could be materially adversely affected by any of the risks and uncertainties described below.
Operational Risks
Our operating results are highly dependent upon and fluctuate based upon business, economic and other conditions and governmental policies affecting the agricultural industry in which we or our customers operate. These factors are outside of our control and may significantly affect our profitability.
The most important factors are:
•weather and field conditions (particularly during periods of traditionally high crop nutrients application);
•quantities of crop nutrients imported and exported;
•current and projected inventories and prices, which are heavily influenced by U.S. exports and world-wide markets; and
•governmental policies, including farm and biofuel policies, which may directly or indirectly influence the number of acres planted, the level of inventories, the mix of crops planted or crop prices or otherwise negatively affect our operating results.
International market conditions and the effects of recent countervailing duty orders, which are also outside of our control, may also significantly influence our operating results.
The international market for crop nutrients is influenced by such factors as the relative value of the U.S. dollar and its impact upon the cost of importing crop nutrients, foreign agricultural policies, including subsidy policies, the existence of, or changes in, import or foreign currency exchange barriers in certain foreign markets, changes in the hard currency demands of certain countries and other regulatory policies of foreign governments, as well as the laws and policies of the U.S. affecting foreign trade and investment, including use of tariffs.
In 2021, the DOC issued CVD orders on imports of phosphate fertilizers from Morocco and Russia, in response to petitions filed by Mosaic. The orders were based on DOC’s determination that the imports were unfairly subsidized, and the U.S. International Trade Commission’s determination that the imports materially injure the U.S. phosphate fertilizer industry. The purpose of the CVD orders was to remedy the injury and thereby restore fair competition. CVD orders normally stay in place for at least five years, with possible extensions.
Moroccan and Russian producers have initiated actions at the CIT seeking to overturn the orders. Mosaic has also made claims contesting certain aspects of DOC’s final determinations that, we believe, failed to capture the full extent of Moroccan and Russian subsidies. These litigation challenges remain underway. Most recently, in January 2024, DOC and the ITC issued revised determinations on remand from the CIT, upholding their original determinations that Moroccan phosphate fertilizer is unfairly subsidized, and that Moroccan and Russian imports materially injure the U.S. industry, respectively. The CIT is now reviewing these remand determinations. Also in January 2024, the CIT issued a ruling affirming DOC’s original determinations that Russian phosphate fertilizer is unfairly subsidized.
When a CVD order is in place, DOC normally conducts annual administrative reviews, which establish a final CVD assessment rate for past imports during a defined period, and a CVD cash deposit rate for future imports. In November 2023, DOC announced the final results of the first administrative reviews for the CVD orders on phosphate fertilizers for Russia and Morocco, covering the period November 30, 2020 to December 31, 2021. DOC calculated new subsidy rates of 2.12% for Moroccan producer OCP and 28.50% for Russian producer PhosAgro. Mosaic, foreign producers, and a U.S. importer have appealed these decisions to the CIT. DOC is also conducting administrative reviews covering the period January 1, 2022 to December 31, 2022. The applicable final CVD assessment rates and cash deposit rates for imports of phosphate fertilizer from Morocco and Russia could change as a result of these various proceedings and potential associated appeals, whether in federal courts or at the World Trade Organization. A reversal of, or change in, the ITC’s or DOC’s prior determination in the CVD investigations could have an adverse effect on our business, financial condition or operating results.
Pandemics, epidemics or other health outbreaks could materially adversely affect our business operations and financial condition.
Pandemics, epidemics or other health outbreaks have, and could again, adversely affect the global economy and have, and could again, significantly disrupt our operations, key suppliers or third-party logistics providers, customers and ultimate end-users. These disruptions could arise due to the spread of the outbreak and/or from measures to contain or mitigate it such as quarantines and extended closures of businesses mandated by government authorities. For example, the Covid-19 pandemic adversely affected our businesses in multiple ways, including by creating short-term labor shortages, due to illness, and transportation issues, such as trucking delays and port congestion, which slowed delivery of inputs to our facilities and products to our end customers.
The full impact of another public health event depends on various factors any of which could materially increase our costs, negatively impact our revenue and/or adversely impact our results of operations and liquidity, possibly to a significant degree. A public health event could also have the effect of heightening many of the other risks described in this Item 1A of this Form 10-K.
Unfavorable worldwide economic and market conditions could adversely affect our business, financial condition or operating results.
Economic and market conditions, including inflation, supply chain challenges, high interest rates and foreign exchange volatility, have and may continue to have an impact on our business. Our production costs have increased due to higher prices for raw materials, including purchased nitrogen, sulfur and ammonia, as well as supply chain challenges, including increased costs and delays caused by transportation and labor shortages. These adverse economic events have adversely affected, and may continue to adversely affect our operating results.
Our crop nutrient business is seasonal and varies based on application rates, which may result in carrying significant amounts of inventory and seasonal variations in working capital, and our inability to predict future seasonal crop nutrient demand accurately may result in excess inventory or product shortages.
The use of crop nutrients is seasonal and varies based on application rates. Farmers tend to apply crop nutrients during two short application periods, the strongest one in the spring, before planting, and the other in the fall, after harvest. As a result, the strongest demand for our products typically occurs during the spring planting season, with a second period of strong demand following the fall harvest. In contrast, we generally produce our products throughout the year. As a result, we and our customers generally build inventories during the low demand periods of the year in order to provide timely product availability during the peak sales seasons. The seasonality of crop nutrient demand results in our sales volumes and net sales typically being the highest during the North American spring season and our working capital requirements typically being the highest just prior to the start of the spring season. Our quarterly financial results can vary significantly from one year to the next due to weather-related shifts in planting schedules and purchasing patterns.
If seasonal demand exceeds our projections, we will not have enough product, which would negatively impact our profitability. If seasonal demand is less than we expect, we will have excess inventory and higher working capital and liquidity requirements. The degree of seasonality of our business can change significantly from year to year due to conditions in the agricultural industry and other factors.
Changes in transportation costs can affect our sales volumes and selling prices.
Delivery costs are a significant factor in the total cost to customers. As a result, changes in transportation costs, or in customer expectations about them, may adversely affect our sales volumes and prices.
A disruption at our production, distribution or terminaling facilities could have a material adverse impact on our business. The risk of material disruption increases when demand for our products results in high operating rates at our facilities.
We conduct our operations through a limited number of key production, distribution and terminaling facilities. These facilities include our phosphate mines and concentrates plants; our potash mines; and the ports and other distribution facilities through which we, Canpotex and the other joint ventures in which we participate, conduct our respective businesses, as well as other commercial arrangements with unrelated third parties. Any disruption of operations at any of these facilities may significantly negatively affect our production or our ability to distribute our products.
Examples of the types of events that could result, and have resulted, in a disruption at these facilities include: adverse weather; strikes or other work stoppages; civil unrest; deliberate, malicious acts, including acts of terrorism and armed conflict; political or economic instability; cyberattacks; changes in permitting, financial assurance or certain environmental, health and safety laws or other changes in the regulatory environment in which we operate; legal and regulatory proceedings; our relationships with the other member of Canpotex and the other joint ventures in which we participate and their or our exit from participation in such joint ventures; other changes in our commercial arrangements with unrelated third parties; brine inflows at our Esterhazy, Saskatchewan mine or our other shaft mines; mechanical failure and accidents or other failures occurring in the course of operating activities, including at our gypstacks, clay settling areas and tailing dams; accidents occurring in the course of operating activities; lack of truck, rail, barge or ship transportation; and other factors.
Reduced oil refinery operating rates in North America could have a material adverse impact on our business, financial condition or operating results.
Reduced oil refinery operating rates in the U.S. and Canada could, and have resulted in, the past, in decreased availability of molten sulfur, which could increase costs of sulfur procurement or decrease availability of sulfur needed in our phosphate fertilizer production operations. If it becomes necessary to procure sulfur at higher costs, and if we are unable to pass those costs on in our product prices, or if we are unable to procure sulfur at volumes necessary for our operations, such events could have a material adverse effect on our phosphate business, and/or our financial condition or operating results.
Key inputs for the production of our finished goods, including fertilizer, sulfur and ammonia, and energy used in our businesses in the past have been and may in the future be the subject of volatile pricing and availability. Changes in
the price or availability of these key inputs for production of finished goods have had, and could again have, a material adverse impact on our businesses.
Fertilizer is a key input for production of our blended finished goods products. Natural gas, ammonia and sulfur are key raw materials used in the manufacture of phosphate crop nutrient products. Natural gas is used as both a chemical feedstock and a fuel to produce anhydrous ammonia, which is a raw material used in the production of concentrated phosphate products. Natural gas is also a significant energy source used in the potash solution mining process. From time to time, our profitability has been and may in the future be adversely impacted by the price and availability of these key inputs and other energy costs. For example, the ongoing conflict between Russia and Ukraine and the related sanctions have led, and may continue to lead, to disruption and instability in global markets, supply chains and volatile pricing and availability of these key inputs and raw materials. Because most of our products are commodities, there can be no assurance that we will be able to pass through increased costs to our customers. A significant increase in the price of fertilizer, natural gas, ammonia, sulfur or energy costs that is not recovered through an increase in the price of our related crop nutrients products could have a material adverse impact on our business. In addition, under an ammonia supply agreement with CF, we have agreed to purchase approximately 545,000 to 725,000 tonnes of ammonia per year at a price to be determined by a formula based on the prevailing price of U.S. natural gas. If the price of natural gas rises or the market price for ammonia falls outside of the range anticipated at execution of this agreement, we may not realize a cost benefit from the natural gas-based pricing over the term of the agreement, or the cost of our ammonia under the agreement could become a competitive disadvantage. At times, we have paid considerably more for ammonia under the agreement than what we would have paid had we purchased it in the spot market. On October 14, 2022, we received notice from CF to exercise the bilateral, contractual right to end the ammonia supply agreement in its current form, effective January 1, 2025. The contract allows for either party to exercise rights on certain dates through 2032 that can result in changes to terms and conditions.
We are subject to risks associated with our international sales and operations, which could negatively affect our sales to customers in foreign countries as well as our operations and assets in foreign countries. Some of these factors may also make it less attractive to distribute cash generated by our operations outside the U.S. to our stockholders, or to utilize cash generated by our operations in one country to fund our operations or repayments of indebtedness in another country or to support other corporate purposes.
In 2023, we derived approximately 66% of our net sales from customers located outside of the U.S. As a result, we are subject to numerous risks and uncertainties relating to international sales and operations, including:
•difficulties and costs associated with complying with a wide variety of complex laws, treaties and regulations;
•unpredictable changes in regulatory environments;
•increased government regulation of the economy in the countries we serve;
•political and economic instability, inflation and adverse economic conditions resulting from governmental attempts to reduce inflation, such as imposition of higher interest rates and wage and price controls;
•unpredictable tax audit practices of various governments;
•nationalization of properties by foreign governments;
•the imposition of tariffs, exchange controls, trade barriers or other restrictions, or government-imposed increases in the cost of resources and materials necessary for the conduct of our operations or the completion of strategic initiatives, including with respect to our joint ventures; and
•currency exchange rate fluctuations between the U.S. dollar and foreign currencies, particularly the Brazilian real and the Canadian dollar.
The occurrence of any of the above in the countries in which we operate or elsewhere could jeopardize or affect our ability to transact business there and could adversely affect our revenues and operating results and the value of our assets located outside of the U.S.
In addition, tax regulations and tax audit practices, currency exchange controls and other restrictions may also make it economically unattractive to:
•distribute cash generated by our operations outside the U.S. to our stockholders; or
•utilize cash generated by our operations in one country to fund our operations or repayments of indebtedness in another country or to support other corporate purposes.
Our assets outside of North America are located in countries with volatile conditions, which could subject us and our assets to significant risks.
We are a global business with substantial assets located outside of North America. Our operations in Brazil, China, India and Paraguay are fundamental to our business. We have a majority interest in the joint venture entity operating the Miski Mayo Mine that supplies phosphate rock to us. We also have a minority joint venture investment in MWSPC, which operates a mine and chemical complexes that produce phosphate fertilizers and other downstream products in the Kingdom of Saudi Arabia. Volatile economic, market and political conditions may have a negative impact on our operations, operating results and financial condition. In addition, unfavorable changes in trade protection laws, policies and measures, or governmental actions and policies and other regulatory requirements affecting trade and the pricing and sourcing of our raw materials, may also have a negative impact on our operations, operating results and financial condition.
Natural resource extraction is an important part of the economy in Peru, and, in the past, there have been protests against other natural resource operations in Peru. There remain numerous social conflicts that exist within the natural resource extraction sector in Peru, and there is potential for active protests against natural resource extraction companies. If the Government of Peru’s proactive efforts to address the social and environmental issues surrounding natural resource activities are not successful, protests could extend to or impact the Miski Mayo Mine and adversely affect our interest in the Miski Mayo joint venture or the supply of phosphate rock to us from the mine.
Adverse weather conditions, including hurricanes, and excess heat, cold, snow, rainfall and drought, have in the past, and may in the future, adversely affect our operations, and result in increased costs, decreased sales or production and potential liabilities.
Adverse weather conditions have in the past and may in the future adversely affect our operations, particularly our Phosphates operations. In the past, hurricanes have resulted in physical damage to our facilities in Florida and Louisiana.
Additionally, water treatment costs tend to increase significantly following excess rainfall. Some of our Florida and Louisiana facilities have had, and others could have, high water levels that have required, or may require, treatment. High water balances in the past at phosphate facilities in Florida also led the Florida Department of Environmental Protection (“FDEP”) to adopt rules requiring phosphate production facilities to meet more stringent process water management objectives for phosphogypsum stack systems. In addition to the FDEP, the U.S. Environmental Protection Agency (“EPA”) and the Louisiana Department of Environmental Quality also have similar requirements for water management objectives as outlined in our U.S. Resource Conservation and Recovery Act (“RCRA”) Consent Decree’s.
If adverse weather occurs in coming years, our facilities may be required to take additional measures to manage process water to comply with existing or future requirements and these measures could potentially have a material effect on our business and financial condition.
Adverse weather may also cause a loss of production and may disrupt our supply chain or adversely affect delivery of our products to our customers. For example, oil refineries that supply sulfur to us may suspend operations as a result of a hurricane, and incoming shipments of ammonia can be delayed, disrupting production at our Florida or Louisiana facilities and delivery of our products. In the second half of 2021, we experienced production impacts related to Hurricane Ida at our Louisiana operations. We also experienced down time and delayed shipments caused by impacts from Hurricane Ian which occurred at the end of the third quarter in 2022.
Excess rainfall and drought have in the past, and may in the future, adversely affect us. For example, in 2019, we experienced the wettest year in North America in nearly 50 years, which reduced fertilizer applications by farmers. Excess rainfall also resulted in higher river levels which adversely affected delivery of our products. Drought can reduce farmers’ crop yields and the uptake of phosphates and potash, reducing the need for application of additional phosphates and potash for the next planting season. Drought can also lower river levels, adversely affecting delivery of our products to our customers. For example, the Mississippi River was in drought condition for parts of 2022 and 2023, affecting barge movement on the river.
Climate change could adversely affect us.
The impact of climate change on our operations and those of our customers remains uncertain. The impacts of climate change could include changes in rainfall patterns, water shortages, changing sea levels, changing storm patterns and intensities, and changing temperature levels and that these changes could be severe. These impacts could vary by geographic location. Severe climate change could impact our costs and operating activities, the location and cost of global grain and oilseed production, and the supply and demand for grains and oilseeds.
At the present time, we cannot predict the prospective impact of climate change on our results of operations, liquidity or capital resources, or whether any such effects could be material to us.
We do not own a controlling equity interest in our non-consolidated companies, some of which are foreign companies, and therefore our operating results and cash flow may be materially affected by how the governing boards and majority owners operate such businesses. There may also be limitations on monetary distributions from these companies that are outside of our control. Together, these factors may lower our equity earnings or cash flow from such businesses and negatively impact our results of operations.
In 2013, we entered into an agreement to form MWSPC, a joint venture in which we hold a 25% interest, to develop a mine and chemical complexes for an estimated $8.0 billion cost, that produces phosphate fertilizers and other downstream products in the Kingdom of Saudi Arabia. MWSPC is now operational, but the success of its operations depends on, among other matters, the availability and affordability of necessary resources and materials and access to appropriate infrastructure, availability and affordability of transportation, operational decisions of MWSPC management, ability to operate without material disruption to the facilities, as well as the general economic and political stability of the region.
We also hold minority ownership interests in other companies that are not controlled by us. The operations and results of MWSPC and some of the other companies are significant to us, and their operations can affect our earnings. Because we do not control these companies either at the board or stockholder levels and because local laws in foreign jurisdictions and contractual obligations may place restrictions on monetary distributions by these companies, we cannot ensure that these companies will operate efficiently, pay dividends, or generally follow the desires of our management by virtue of our board or stockholder representation. As a result, these companies may contribute less than anticipated to our earnings and cash flow, negatively impacting our results of operations and liquidity.
Strikes or other forms of work stoppage or slowdown could disrupt our business and lead to increased costs.
Our financial performance is dependent on a reliable and productive work force. A significant portion of our workforce, and that of the joint ventures in which we participate, is covered by collective bargaining agreements with unions. Unsuccessful contract negotiations or adverse labor relations could result in strikes or slowdowns. Any disruption may decrease our production and sales or impose additional costs to resolve disputes. The risk of adverse labor relations may increase as our profitability increases because labor unions’ expectations and demands generally rise at those times.
Our underground potash shaft mines are subject to risks of water inflows.
Over the past century, several potash mines experiencing water inflow problems have flooded. Since December 1985, we have had inflows of brine water into our Esterhazy, Saskatchewan K1 and K2 potash mines. Due to an acceleration of brine inflows, on June 4, 2021, the Company announced a closure of our K1 and K2 potash mine shafts. Our potash mines at Colonsay, Saskatchewan, Carlsbad, New Mexico and our Esterhazy, Saskatchewan K3 mine (though not contiguous with the K1/K2 underground inflow region) are also subject to risks from inflow. Though minor inflows are regularly managed, it is possible that significant water inflows could occur which may present risks to our employees and our operations, and which may require us to incur brine management costs, change our mining processes, or abandon our operating mines.
See “Key Factors that can Affect Results of Operations and Financial Condition” and “Potash Net Sales and Gross Margin” sections of our Management’s Analysis in this Form 10-K and the Esterhazy closure costs in Note 26 of this Form 10-K, which sections are incorporated herein by reference, for a discussion of costs, risks and other information relating to the brine inflows.
Accidents or equipment failures occurring in the course of our operating activities could result in significant liabilities, interruptions or shutdowns of facilities or the need for significant safety or other expenditures.
We engage in mining and industrial activities, including rail transportation, that can result in serious accidents or experience equipment failures. If our procedures are not effective, or if an accident or equipment failure were to occur, we could be subject to liabilities arising out of property damage, personal injuries or death, our operations could be interrupted and we might have to shut down or abandon affected facilities. Accidents could cause us to expend significant amounts to remediate safety issues or to repair damaged facilities and could result in significant liabilities and/or impact on the financial performance of the Company, including material adverse effects on our results of operations, liquidity or financial condition. For example:
•Some of our facilities are subject to potential damage from seismic activity or other geologic concerns.
The excavation of mines in some parts of the world can result in potential seismic events or can increase the likelihood or potential severity of a seismic event. Our Esterhazy mine and Louisiana facilities have experienced minor seismic events from time to time. A significant seismic event at one our facilities or mines could result in serious injuries or death, or damage to or flooding of operations, or damage to adjoining properties or facilities of unrelated third parties. Geologic features may affect the integrity of our impoundments, particularly in central Florida. Our efforts to deploy new technologies to identify and repair features to mitigate impacts and risk may not be successful, adversely impacting our operations or could cause us to incur significant costs.
•Our underground potash shaft mines are subject to risk from fire. In addition, fire at one of our underground shaft mines could halt our operations at the affected mine or for longer periods for remedial work or otherwise.
Our underground potash shaft mines are subject to risk from fire. In the event of a fire, if our emergency procedures are not successful, we could have significant injuries or deaths, or shutdowns of our facilities, or could cause us to expend significant amounts to remediate safety issues or repair damaged facilities.
•We handle significant quantities of ammonia at several of our facilities.
We produce ammonia at our Faustina, Louisiana phosphate concentrates plant, use ammonia in significant quantities at all of our Florida and Louisiana phosphates concentrates plants and store ammonia at some of our distribution facilities. In Florida, ammonia is received at terminals in Tampa and transported by pipelines and trucks to our facilities. We also use ammonia in our Brazil phosphate operations. Our ammonia is generally stored and transported at high pressures or cryogenically. Accidents at any of our ammonia facilities could result in serious injury or death and could adversely impact our operations.
•We also use or produce other hazardous chemicals at some of our facilities. If our safety procedures are not effective, an accident involving these other hazardous chemicals could result in serious injuries or death, or result in the shutdown of our facilities.
We use sulfuric acid to produce concentrated phosphates in our Florida and Louisiana operations and our Brazil operations. We also use or produce other hazardous chemicals at some of our facilities. An accident involving any of these chemicals could result in serious injuries or death, or evacuation of areas near an accident. An accident could also result in property damage or shutdown of our facilities, or cause us to expend significant amounts to remediate safety issues or to repair damaged facilities.
Our business operations rely on our information systems and any material disruption or slowdown of our systems could cause operational delays or loss of revenue.
We depend on information systems to, among other things, manage our inventory, process transactions, operate our websites, purchase and ship goods on a timely basis, and maintain cost-effective operations. We have invested significant capital and expect future capital expenditures associated with the implementation and integration of our information technology systems across our businesses. This process involves the replacement and consolidation of technology platforms, resulting in operational efficiencies and reduced costs. Our inability to effectively implement or convert our operations to the new systems could cause delays in product fulfillment and reduced efficiency in our operations and could have a material impact on our financial condition or operating results.
Regulatory Risks
Environmental, health and safety regulations and requirements to which we are subject may have a material adverse effect on our business, financial condition and results of operations.
We are subject to numerous environmental, health and safety laws and regulations (“EHS laws”) in countries in which we operate. These EHS laws govern a wide range of matters, including environmental controls, land reclamation, discharges to air and water, remediation of hazardous substance releases and in some cases, demonstration of financial assurance. They significantly affect our operating activities as well as the level of our operating costs and capital expenditures. In some jurisdictions, environmental laws change frequently and it may be challenging for us to achieve and maintain compliance with all material environmental laws at all times.
If we are not in compliance, we may be subject to enforcement or third-party claims, and may require new investment in our business. In those circumstances, our financial condition and results of operations may be materially adversely affected.
The U.S. Comprehensive Environmental Response, Compensation, and Liability Act (“CERCLA”) imposes liability, including for cleanup costs, without regard to fault or to the legality of a party’s conduct, on certain categories of persons, including current and former owners and operators of a site and parties who are considered to have contributed to the release of “hazardous substances” into the environment. Under CERCLA, or various U.S. state analogues, a party may, under certain circumstances, be required to bear more than its proportional share of cleanup costs at a site where it has liability if payments cannot be obtained from other responsible parties. We periodically have incurred and may incur liabilities and cleanup costs, under CERCLA and other environmental laws, with regard to our current or former facilities, adjacent or nearby third-party facilities or offsite disposal locations.
Our operations are dependent on having the required permits and approvals from governmental authorities. Denial or delay by a government agency in issuing any of our permits and approvals or imposition of restrictive conditions on us with respect to these permits and approvals may impair our business and operations.
Our operations, including our mines, are dependent on having the required permits and approvals from governmental authorities. Denial or delay by a government agency in issuing, modifying or renewing any of our permits and approvals or imposition of restrictive or cost prohibitive conditions on us with respect to these permits and approvals may impair our business and operations and could have a material adverse effect on our business, financial condition or results of operations. For example, in Florida, local community involvement has become an increasingly important factor in the permitting process for mining companies, and various counties and other parties in Florida have in the past filed and continue to file lawsuits challenging the issuance or renewal of some of the permits we require. These actions can significantly delay issuance of the permits we need to operate or expand operations.
We have included additional discussion about permitting for our phosphate mines in Florida under “Environmental, Health, Safety and Security Matters–Operating Requirements and Impacts–Permitting” in our Management’s Analysis.
We are, and may in the future be, involved in legal and regulatory proceedings that could be material to us.
We have in the past been, are currently, and in the future may be, subject to legal and regulatory proceedings that could be material to our business, results of operations, liquidity or financial condition. Joint ventures in which we participate could also become subject to these sorts of proceedings. These proceedings may be brought by the government or private parties and may arise out of a variety of matters, including:
•Allegations that we have violated environmental, health and safety laws and regulations or that we are responsible for adversely affecting nearby properties. We are currently involved in proceedings alleging that, or to review whether, we have violated environmental laws in the U.S. and Brazil.
•Allegations by private parties that our operations have resulted in personal injury, property damage or damage to business operations.
•Antitrust, commercial, tax (including tax audits) and other disputes.
The legal and regulatory proceedings to which we are currently or may in the future be subject may, depending on the circumstances, result in monetary damage awards, fines, penalties, other liabilities, injunctions or other court or administrative rulings that interrupt, impede or otherwise materially affect our business operations or criminal sanctions.
We have included additional information with respect to pending legal and regulatory proceedings in Note 23 of our Notes to Consolidated Financial Statements and in this Form 10-K in Part I, Item 3. “Legal Proceedings”.
Environmental, health and safety and food and crop laws and regulations to which we are subject may become more stringent over time. This could increase the effects on us of these laws and regulations, and the increased effects could be materially adverse to our business, operations, liquidity and/or results of operations.
Heightened regulation on food and crop inputs (including crop nutrients) and environmental, health and safety issues in countries in which we operate can be expected to result in requirements that apply to us and our operations that may be more stringent than those described elsewhere in this report. These requirements may include:
•Increased levels of future investments and expenditures for environmental controls at ongoing operations, which will be charged against income from future operations; increased levels of the financial assurance requirements to which we are subject, and increased efforts or costs to obtain permits or denial of permits.
•New or interpretations of existing statutes or regulations that impose new or more stringent standards, restrictions or liabilities related to elevated levels of naturally-occurring radiation that arise on formerly mined land and other matters that could increase our expenses, capital requirements or liabilities or adversely affect our business, liquidity or financial condition.
Environmental justice considerations could have a material adverse effect on our business, financial condition or results of operations.
The U.S. federal and some state governments increasingly are adopting standards or policies requiring environmental justice reviews in some permitting actions. In general, they require governmental agencies to evaluate projects for disproportionate impacts to disadvantaged or already burdened communities. If such conditions are found, they might result in a permit denial, or restrictive or cost prohibitive conditions imposed on our operations and may impair our business and operations and could have a material adverse effect on our business, financial condition or results of operations.
We are subject to financial assurance requirements as part of our routine business operations. If we were unable to satisfy financial assurance requirements, we might not be able to obtain or maintain permits we need to operate our business as we have in the past. In addition, our compliance with these requirements could materially affect our business, results of operations or financial condition.
In many cases, as a condition to obtaining or maintaining permits and approvals or otherwise, we are required to comply with financial assurance requirements of governmental authorities. The purpose of these requirements is to provide comfort to the government that sufficient funds will be available for the ultimate closure, post-closure care or reclamation of our facilities.
In some cases, we comply through the satisfaction of applicable state financial strength tests; but if we are unable to do so, we must utilize alternative methods of complying with these requirements; if we do not, we would be prevented from continuing our operations and also could be subject to enforcement proceedings brought by relevant government agencies. Alternative compliance methods include providing credit support in the form of cash escrows or trusts, surety bonds from surety or insurance companies, letters of credit from banks, or other forms of financial instruments or collateral to satisfy the financial assurance requirements. Use of alternative means of financial assurance imposes additional expense on us and could affect our liquidity.
We have included additional discussion about financial assurance requirements under “Off-Balance Sheet Arrangements and Obligations–Other Commercial Commitments” in our Management’s Analysis.
Regulatory restrictions on greenhouse gas emissions and climate change regulations in the U.S., Canada or elsewhere could adversely affect us, and these effects could be material.
Various governmental initiatives to limit greenhouse gas emissions are under way or under consideration around the world. These initiatives could restrict our operating activities, require us to make changes in our operating activities that would increase our operating costs, reduce our efficiency or limit our output, require us to make capital improvements to our facilities, increase our energy, raw material and transportation costs or limit their availability, or otherwise adversely affect our results of operations, liquidity or capital resources, and these effects could be material to us.
Governmental greenhouse gas emission initiatives include, among others, the December 2015 agreement (the “Paris Agreement”) which was the outcome of the 21st session of the Conference of the Parties under the United Nations Framework Convention on Climate Change (“UNFCCC”). The Paris Agreement, which was signed by nearly 200 nations, including the U.S. and Canada, entered into force in late 2016 and sets out a goal of limiting the average rise in temperatures for this century to below 2 degrees Celsius. Each signatory is expected to develop its own plan (referred to as a Nationally Determined Contribution, or “NDC”) for reaching that goal.
Previously, the U.S. had submitted an NDC aiming to achieve, by 2025, an economy-wide target of reducing greenhouse gas emissions by 26-28% below its 2005 level. The NDC also aims to use best efforts to reduce emissions by 28%. The U.S. target covers all greenhouse gases that were a part of the 2014 Inventory of Greenhouse Gas Emissions and Sinks. While the status of this NDC is unclear, various legislative or regulatory initiatives relating to greenhouse gases have been adopted or considered by the U.S. Congress, the EPA or various states and those initiatives already adopted may be used to implement a U.S. NDC. Additionally, more stringent laws and regulations may be enacted to accomplish the goals set out in the NDC.
Brazil ratified the Paris Agreement in September 2016, committing to an NDC that includes an economy-wide target of 1.3 GtCO2e by 2025 and 1.2 GtCO2e by 2030. In 2020, Brazil submitted a new NDC, which reaffirms the country’s commitment to reducing total net greenhouse gas emissions by 37% in 2025 and by 43% in 2030. The NDC further commits to achieving climate neutrality in 2060. Complete details surrounding Brazil’s plan for achieving the greenhouse gas emissions reductions and climate neutrality are uncertain. The government of Brazil may intervene with new or different policy instruments to meet the goals set out in the 2020 NDC.
Canada’s intended NDC aims to achieve, by 2030, an economy-wide target of reducing greenhouse gas emissions by 40-45% below 2005 levels. The Canadian federal government has also introduced legislation establishing a long-term target of “net-zero” greenhouse gas emissions by 2050. More stringent laws and regulations may be enacted to accomplish the goals set out in Canada’s NDC and Canada’s own long-term emissions reduction targets.
In March 2022, the SEC issued proposed rules on climate change disclosure requirements that, if adopted as proposed, will require disclosure of extensive detailed climate-related information. The Company is monitoring the SEC’s proposed rules and recently enacted standards in the European Union and California on climate change disclosure and is taking necessary steps to plan for the anticipated or adopted disclosure requirements. It is possible that such legislation and other future legislation or regulation addressing climate change, including the Paris Agreement or any new international agreements, could adversely affect our operating activities, energy, raw material and transportation costs, results of operations, liquidity or capital resources, and these effects could be material or adversely impact our competitive advantage. In addition, to the extent climate change restrictions imposed in countries where our competitors operate, such as India, China, Russia, Belarus or Morocco, are less stringent than in the U.S., Canada or Brazil, our competitors could gain cost or other competitive advantages over us.
We use tailings, sediments and water dams and other impoundments to manage residual materials generated by our facilities, including Brazilian mining operations. If our safety procedures are not effective, an accident involving these impoundments could result in serious injuries or death, damage to property or the environment, or result in the shutdown of our facilities, any of which could materially adversely affect our results of operations.
Mining and processing of potash and phosphate generate residual materials that must be managed both during the operation of the facility and upon facility closure. Potash tailings, consisting primarily of salt and clay, are stored in surface disposal sites. Phosphate residuals from mining or processing are deposited in large tailing dams and in clay settling areas and phosphogypsum stacks. They are regularly monitored to evaluate structural stability and for leaks. The failure of or a breach at any of our impoundments at any of our operations could cause severe property and environmental damage and loss of life, could result in the shut down or idling of our facilities and could have a material adverse effect on our results of operations.
Brazilian federal and state governments have new rules regarding tailings dam safety, construction, licensing and operations. We cannot predict the full impact of these rules or potentially related judicial actions, or future actions, or whether or how it would affect our Brazilian operations or customers.
Any accident involving our tailings or other dams, or any shut down or idling of our related mines, could have a material adverse effect on our results of operations.
Competitive Risks
Our competitive position could be adversely affected if we are unable to participate in continuing industry consolidation.
Most of our products are readily available from a number of competitors, and price and other competition in the crop nutrient industry is intense. In addition, crop nutrient production facilities and distribution activities frequently benefit from economies of scale. As a result, particularly during pronounced cyclical troughs, the crop nutrient industry has a long history of consolidation. Mosaic itself is the result of a number of industry consolidations. We expect consolidation among crop nutrient producers to continue. Our competitive position could suffer to the extent we are not able to expand our own resources either through consolidations, acquisitions, joint ventures or partnerships. In the future, we may not be able to find suitable companies to combine with, assets to purchase or joint venture or partnership opportunities to pursue. Even if we are able to locate desirable opportunities, we may not be able to enter into transactions on economically acceptable terms.
If we do not successfully participate in continuing industry consolidation, our ability to compete successfully could be adversely affected and result in the loss of customers or an uncompetitive cost structure, which could adversely affect our sales and profitability.
Our strategy for managing market and interest rate risk may not be effective.
Our businesses are affected by fluctuations in market prices for our products, the purchase price of key inputs to operations, freight and shipping costs, foreign currency exchange rates and interest rates. We periodically enter into derivatives and forward purchase contracts to mitigate some of these risks. However, our strategy may not be successful in minimizing our exposure to these fluctuations. See “Market Risk” in our Management’s Analysis and Note 15 of our Notes to Consolidated Financial Statements which sections are incorporated herein by reference.
A shortage or unavailability of trucks, railcars, tugs, barges and ships for carrying our products and the raw materials we use in our business could result in customer dissatisfaction, loss of production or sales and higher transportation or equipment costs.
We rely heavily upon truck, rail, tug, barge and ocean freight transportation to obtain raw materials needed at our mines and concentrates facilities and to deliver our products to our customers. In addition, the cost of transportation is an important part of the final sale price of our products. Finding affordable and dependable transportation is important in obtaining our raw materials and to supply our customers. Higher costs for these transportation services or an interruption or slowdown due to factors including high demand, high fuel prices, labor disputes, layoffs or other factors affecting the availability of qualified transportation workers, adverse weather or other environmental events, or changes to rail, barge or ocean freight systems, could negatively affect our ability to produce our products or deliver them to our customers, which could affect our performance and results of operations.
Strong demand for grain and other products and a strong world economy increases the demand for and reduces the availability of transportation, both domestically and internationally. Shortages of railcars, barges and ocean transport for carrying product and increased transit time may result in customer dissatisfaction, loss of sales and higher equipment and transportation costs. In addition, during periods when the shipping industry has a shortage of ships, the substantial time needed to build new ships prevents rapid market response. Delays and missed shipments due to transportation shortages, including vessels, barges, railcars and trucks, could result in customer dissatisfaction or loss of sales potential, which could negatively affect our performance and results of operations.
Our success will continue to depend on our ability to attract and retain highly qualified and motivated employees.
Our continued success depends on the collective abilities and efforts of our employees. A significant number of our employees, including some of our most highly skilled employees with specialized expertise in general corporate matters, potash and phosphates operations, will approach retirement age throughout the next decade. In addition, we compete for a talented workforce with other businesses, particularly within the mining and chemicals industries, in general, and the crop nutrients industry, in particular. Our expansion plans are highly dependent on our ability to attract, retain and train highly qualified and motivated employees who are essential to the success of our ongoing operations as well as to our expansion plans. If we were to be unsuccessful in attracting, retaining and training the employees we require, our ongoing operations and expansion plans could be materially and adversely affected.
Our most important products are global commodities, and we face intense global competition from other crop nutrient producers that can affect our prices and volumes.
Our most important products are concentrated phosphate crop nutrients, including diammonium phosphate, or DAP, monoammonium phosphate, or MAP, MicroEssentials® and muriate of potash, or MOP. We sell most of our DAP, MAP and MOP as global commodities. Our sales of these products face intense global competition from other crop nutrient producers.
Changes in competitors’ production or shifts in their marketing focus have in the past significantly affected both the prices at which we sell our products and the volumes that we sell, and are likely to continue to do so in the future. Increases in the global supply of DAP, MAP and MOP or competitors’ increased sales into regions in which we have significant sales could adversely affect our prices and volumes.
Competitors and new entrants in the markets for both concentrated phosphate crop nutrients and potash have in recent years expanded capacity, or begun, or announced plans, to expand capacity or build new facilities.
The extent to which current global or local economic and financial conditions, changes in global or local economic and financial conditions, or other factors may cause delays or cancellation of some of these ongoing or planned projects, or result in the acceleration of existing or new projects, is unclear. In addition, certain of our products sold to China may be subject to additional tariffs due to ongoing trade tensions between China and the U.S. The level of exports by Chinese producers of concentrated phosphate crop nutrients depends to a significant extent on Chinese government actions to curb exports through, among other measures, prohibitive export taxes at times when the government believes it desirable to assure ample domestic supplies of concentrated phosphate crop nutrients to stimulate grain and oilseed production.
The other member of Canpotex is among our competitors who may, in the future, independently expand its potash production capacity at a time when each Canpotex member’s respective shares of Canpotex sales is based upon that member’s respective proven peaking capacity for producing potash. When a Canpotex member expands its production capacity, the new capacity is added to that member’s proven peaking capacity based on a proving run at the maximum production level. Alternatively, Canpotex members may elect to rely on an independent engineering firm and approved protocols to calculate their proven peaking capacity. Antitrust and competition laws prohibit the members of Canpotex from coordinating their production decisions, including the timing of their respective proving runs. Worldwide potash production levels could exceed then-current market demand, resulting in an oversupply of potash and lower potash prices.
All of the foregoing events are beyond our control. The effects of any of these events occurring could be materially adverse to our results of operations.
Some of our competitors and potential competitors have greater resources than we do, which may place us at a competitive disadvantage and adversely affect our sales and profitability. These competitors include state-owned and government-subsidized entities in other countries.
We compete with a number of producers throughout the world, including state-owned and government-subsidized entities. Some have greater total resources than we do, and may be less dependent on earnings from crop nutrients sales than we are. In addition, some of these entities have access to lower cost or government-subsidized natural gas supplies, mining rights and reserves, financing, transportation and tax incentives, placing us at a competitive disadvantage. Furthermore, certain governments as owners of some of our competitors may be willing to accept lower prices and profitability on their products in order to support domestic employment or other political or social goals. To the extent other producers of crop nutrients enjoy competitive advantages or are willing to accept lower profit levels, the price of our products, our sales volumes and our profits may be adversely affected.
Industry Risks
Future product or technological innovation could affect our business.
Future product or technological innovations by third parties, such as the development of seeds that require less crop nutrients, the development of substitutes for our products or developments in the application of crop nutrients, if they occur, could have the potential to adversely affect the demand for our products and our results of operations, liquidity and capital resources.
The success of our strategic initiatives depends on our ability to effectively manage them, and to successfully integrate and grow acquired businesses.
We have significant ongoing strategic initiatives. They involve capital and other expenditures and require effective project management and, in the case of potential strategic acquisitions, successful integration. To the extent the processes we (or, for our joint venture, we together with our joint venture partners) put in place to manage these initiatives or integrate and grow acquired businesses are not effective, our capital expenditure and other costs may exceed our expectations or the benefits we expect from these initiatives might not be fully realized, or both, thereby resulting in adverse effects on our operating results and financial condition.
Cyberattacks could disrupt our operations and have a material adverse impact on our business.
We utilize and rely upon information technology systems in many aspects of our business, including internal and external communications and the management of our accounting, financial, production and supply chain functions. As we become more dependent on information technologies to conduct our operations, and as the number and sophistication of cyberattacks increase, the risks associated with cybersecurity increase. These risks apply to us, our employees, and to third parties on whose systems we rely to conduct our business. To our knowledge, we have not experienced any material cybersecurity incidents of our technology systems.
Failure to effectively anticipate, prevent, detect and recover from the increasing number and sophistication of cyberattacks could result in theft, loss or misuse of, or damage or modification of our information, and cause disruptions or delays in our business, reputational damage and third-party claims, which could have a material adverse effect on our results of operations or financial condition.
Our crop nutrients and other products are subject to price and demand volatility resulting from periodic imbalances of supply and demand, which may cause our results of operations to fluctuate.
Historically, the market for crop nutrients has been cyclical, and prices and demand for our products have fluctuated significantly. Periods of high demand, increasing profits and high capacity utilization tend to lead to new plant investment and increased production in the industry. This growth increases supply until the market is over-saturated, leading to declining prices and declining capacity utilization until the cycle repeats.
As a result, crop nutrient prices and volumes have been, and are expected to continue to be, volatile. This volatility may cause our results of operations to fluctuate and potentially deteriorate. The price at which we sell our crop nutrient products and our sales volumes could fall in the event of industry oversupply conditions, which could have a material adverse effect on our business, financial condition and results of operations. In contrast, high prices may lead our customers and farmers to delay purchasing decisions in anticipation of future lower prices, thus impacting our sales volumes.
Due to reduced market demand, depressed agricultural economic conditions and other factors, we have at various times suspended or curtailed production at some of our facilities. The extent to which we utilize available capacity at our facilities will cause fluctuations in our results of operations, as we will incur costs for any temporary or indefinite shutdowns of our facilities. In addition, lower sales tend to lead to higher fixed costs as a percentage of sales.
Financial Risks
During periods when the prices for our products are falling because of falling raw material prices, we could be required to write-down the value of our inventories. Any such write-down could adversely affect our results of operations and the value of our assets.
We carry our inventories at the lower of cost or market. In periods when the market prices for our products are falling rapidly, including in response to falling market prices for raw materials, it is possible that we could be required to write-down the value of our inventories if market prices fall below our costs. Any such write-down could adversely affect our results of operations and the value of our assets. Any such effect could be material.
Our estimates of future selling prices reflect in part the purchase commitments we have from our customers. As a result, defaults on these existing purchase commitments because of the global or local economic and financial conditions or for other reasons could adversely affect our estimates of future selling prices and require additional inventory write-downs.
We may incur significant non-cash charges if our goodwill or long-lived assets become impaired in the future.
Under accounting principles generally accepted in the U.S. (“GAAP”), we review goodwill for impairment on an annual basis or more frequently if events or circumstances indicate that their carrying value may not be recoverable. Other long-lived assets, including property, plant and equipment, are reviewed if events or circumstances indicate that their carrying value may not be recoverable. The process of impairment testing involves a number of judgments and estimates made by management, including the fair values of assets and liabilities, future cash flows, our interpretation of current economic indicators and market conditions, overall economic conditions and our strategic operational plans with regard to our business units. If the judgments and estimates used in our analysis are not realized or change due to external factors, then actual results may not be consistent with these judgments and estimates, and our goodwill and intangible assets may become impaired in future periods. If our goodwill or long-lived assets are determined to be impaired in the future, we may be required to record non-cash charges to earnings during the period in which the impairment is determined, which could be significant and have an adverse effect on our financial condition and results of operations. We have, in the past, and may in the future, be required to write down the value of our goodwill or other long-lived assets, and such future write downs could be material. See Note 10, Goodwill and Note 26, Mine Closure Costs, in the accompanying consolidated financial statements for further information related to charges incurred in 2019.
Changes in tax laws or regulations or their interpretation, or exposure to additional tax liabilities, could materially adversely affect our operating results and financial condition.
We are subject to taxes, including income taxes, resource taxes and royalties, and non-income based taxes in countries where we operate. Changes in tax laws or regulations or their interpretation could result in higher taxes, which could materially adversely affect our operating results and financial condition.
We are subject to periodic audits by various tax authorities in all countries where we have meaningful operations. The due process, audit and appeal practices and procedures of such authorities may vary significantly by jurisdiction, may be unpredictable (and unreliable) in nature and may result in significant risk to us. For various reasons, some governments may issue significant reassessments on audit based positions not fully grounded in law or fact, even though, upon disputing the reassessments, a great many are overturned on administrative appeal and through the court system. Certain systems involve tax litigation as a common practice. In certain countries, there are requirements to pay a reassessment (even though the matter has not been finally decided by the tax administration or a court of law) while the taxpayer has a well-supported objection and appeals administratively or in court. This may result in tying up significant funds and/or creating adverse treasury and credit risks that may interrupt, impede or otherwise materially affect our business operations.
We extend trade credit to our customers and guarantee the financing that some of our customers use to purchase our products. Our results of operations may be adversely affected if these customers are unable to repay the trade credit from us or financing from their banks. Increases in prices for crop nutrient, other agricultural inputs and grain may increase this risk.
We extend trade credit to our customers throughout the world, in some cases for extended periods of time. In Brazil, where there are fewer third-party financing sources available to farmers, we also have several programs under which we guarantee customers’ financing from financial institutions that they use to purchase our products. As our exposure to longer trade credit extends throughout the world and use of guarantees in Brazil increases, we are increasingly exposed to the risk that some of our customers will not pay us or the amounts we have guaranteed. Additionally, we become increasingly exposed to risk due to weather and crop growing conditions, fluctuations in crop nutrient prices, commodity prices or foreign currencies, and other factors that influence the price, supply and demand for agricultural commodities. Significant defaults by our customers could adversely affect our financial condition and results of operations.
Due to the global nature of our operations, we are exposed to currency exchange rate changes, which may cause fluctuations in earnings and cash flows.
Our primary foreign currency exposures are the Canadian dollar and Brazilian real. The functional currency for our Brazilian subsidiaries is the Brazilian real. However, we finance our Brazilian inventory purchases with U.S. dollar-denominated liabilities. The functional currency of several of our Canadian entities is the Canadian dollar. For those entities, sales are primarily denominated in U.S. dollars, but the costs are paid principally in Canadian dollars. Canadian entities have significant U.S. dollar denominated intercompany loans and U.S. entities, with the U.S. dollar as functional currency, have Brazilian real denominated loans. During periods of local or global economic crises, local currencies may be devalued significantly against the U.S. dollar. During times of a strengthening dollar, our net earnings can be reduced due to transaction currency losses arising from these exposures of U.S. dollar denominated liabilities held in the Brazilian and Canadian entities and Brazilian real denominated assets held in U.S. entities. To reduce economic risk and volatility on expected cash flows that are denominated in the Canadian dollar and Brazilian real, we use financial instruments that may include forward contracts, options or collars when unable to naturally offset the exposures.
Item 1B. Unresolved Staff Comments.
None.
Item 1C. Cybersecurity.
Risk Management and Strategy
As a global company, we utilize and rely upon information technology systems in many aspects of our business, including internal and external communications and the management of our accounting, financial, production and supply chain functions. As we become more dependent on information technologies to conduct our operations, and as the number and sophistication of cyberattacks increase, the risks associated with cybersecurity increase. Failure to effectively anticipate, prevent, detect, and recover from the increasing number and sophistication of cyberattacks could have a material adverse effect on our results of operations or financial condition.
To our knowledge, we have not experienced any material cybersecurity incidents of our technology systems.
Mosaic’s cybersecurity program is comprised of people, processes, and technology that are designed to adequately protect the confidentiality, integrity, and availability of information technology systems and data. Mosaic has strategically integrated cybersecurity risk management into our broader risk management framework to promote a company-wide culture of cybersecurity risk awareness. This integration ensures that cybersecurity considerations are an integral part of our decision-making processes at every level. We have a Governance Risk and Compliance team which is a dedicated team within the cybersecurity department that focuses on identifying and mitigating cybersecurity and compliance risk. The team works closely with the Information Technology department to continuously evaluate and address cybersecurity risks in alignment with our business objectives and operational needs. Our Enterprise Risk Management committee, which is comprised of members from our executive leadership team, reviews and evaluates key risks identified through cybersecurity risk management processes. Mosaic develops and continues to refine mitigation plans that adhere to industry best practices.
Regularly, Mosaic engages external vendors to provide independent insight to overall cybersecurity program effectiveness and to assist with evaluating response preparedness. As part of our third-party risk oversight, we regularly review the vendor's ratings and conduct assessments and interviews with their personnel. The results are then reported to leaders in the Information Technology department.
Governance
Board of Director Oversight
The Board of Directors oversees Mosaic’s Enterprise Risk Management program, and the Audit Committee is tasked with oversight of risk from cybersecurity threats. The Board receives an annual cybersecurity update while the Audit Committee receives reports from the Chief Information Security Officer (“CISO”) and Chief Information Officer ("CIO") regularly. The reports to the Audit Committee include updates on key performance indicators and key risk indicators, including short-term, intermediate-term and emerging risks. The Audit Committee then briefs the Board on these matters. Ad hoc updates occur as needed.
Management’s Role in Managing Risk
The Information Technology organization is led by the CIO who is responsible for cybersecurity and risk management, with oversight by the Audit Committee. The cybersecurity program is overseen by the Mosaic’s CISO and supporting cybersecurity leadership, who lead teams to protect and preserve the confidentiality, integrity and continued availability of all information owned by, or in the care of, Mosaic.The CISO, along with the leadership team, possess many years of relevant Information Technology, cybersecurity, and risk management experience in the manufacturing, electric, defense, financial, and retail sectors. Educational backgrounds include advanced degrees and certifications, such as Certified Information Systems Security Professional. During the course of leadership team’s careers, they have built and sustained programs protecting other Fortune 500 companies, critical national infrastructure, and military defense systems.
The CIO and CISO regularly update the Board and/or the Audit Committee on cybersecurity matters and the effectiveness of the cybersecurity program. The Board and Audit Committee also engage directly with senior leaders from the Information Technology department.
Item 2. Properties.
SUMMARY OVERVIEW OF MINING
As used in this Form 10-K, the terms “mineral resource,” “measured mineral resource,” “indicated mineral resource,” “inferred mineral resource,” “mineral reserve,” “proven mineral reserve” and “probable mineral reserve” are defined and used in accordance with S-K 1300. All determinates of mineral resources and mineral reserves have been prepared by qualified persons. Under S-K 1300, mineral resources may not be classified as “mineral reserves” unless the determination has been made by a qualified person that the mineral resources can be the basis of an economically viable project. Mineral resources are not mineral reserves and do not meet the threshold for mineral reserve modifying factors, such as estimated economic viability, that would allow for conversion to mineral reserves. There is no certainty that any part of the mineral resources estimated will be converted into mineral reserves.
Except for that portion of mineral resources classified as mineral reserves, mineral resources have not demonstrated economic value. Inferred mineral resources are estimates based on limited geological evidence and sampling and have too high of a degree of uncertainty to apply relevant technical and economic factors likely to influence the prospects of economic extraction in a manner useful for evaluation of economic viability. Estimates of inferred mineral resources may not be converted to a mineral reserve. It cannot be assumed that all or any part of an inferred mineral resource will be upgraded to a higher category. A significant amount of exploration must be completed to determine whether an inferred mineral resource may be upgraded to a higher category. Therefore, you are cautioned not to assume that all or any part of an inferred mineral resource exists, that it can be the basis of an economically viable project, or that it will be upgraded to a higher category.
Properties
The subsections below describe the property locations, overviews and mineral resource and mineral reserve estimates. Our material properties, as determined pursuant to S-K 1300, are Florida Phosphates, Esterhazy, Belle Plaine and Tapira. Further information about these properties can be found in the technical report summaries (“TRSs” or “TRS”) filed as exhibits to this Form 10-K.
Except as otherwise stated, the scientific and technical information relating to Florida contained in this Form 10-K is derived from the 2022 S-K 1300 report for Florida titled “Florida Phosphate Mining Technical Report Summary” effective December 31, 2022 prepared by employees of Mosaic. Except as otherwise stated, the scientific and technical information relating to Belle Plaine and Esterhazy in this Form 10-K is derived from the 2021 S-K 1300 reports titled “Belle Plaine Potash Facility Technical Report Summary” and “Esterhazy Potash Facility Technical Report Summary” effective December 31, 2022 prepared by employees of Mosaic.
Except as otherwise stated, the scientific and technical information relating to Tapira contained in this Form 10-K is derived from the 2023 S-K 1300 report for Tapira titled “SEC S-K 1300 Technical Report Summary Mosaic Fertilizantes: Complexo Mineracao de Tapira” effective December 31, 2023 prepared by qualified persons who are employees of WSP USA Inc., which is not affiliated with Mosaic.
Property Locations
Figure 2.1 and Figure 2.2 show the locations of each Resource and Reserve property.
Figure 2.1: North America Resource and Reserve Location Map
Figure 2.2: South America Resource and Reserve Location Map
Property Overview
Annual Production
Table 2.1 shows the production tonnage and grade for all phosphate properties for 2023, 2022 and 2021.
|
|
|
|
|
|
|
|
|
|
|
|
|
|
|
|
|
|
|
|
|
|
|
|
|
|
|
|
|
|
|
|
|
|
|
|
|
|
|
|
|
|
|
|
| Table 2.1 Summary of Production - Phosphate Properties |
|
|
|
|
|
| (in millions of tonnes) |
|
December 31, |
|
| Mine Property |
Annual Operational Capacity (tonnes)(a)(b) |
2023 |
|
|
2022 |
|
2021 |
|
| Production (tonnes) |
%P2O5(c) |
|
|
Production (tonnes) |
%P2O5(c) |
|
Production (tonnes) |
%P2O5(c) |
|
|
|
|
|
|
|
|
|
|
|
|
|
Phosphate (Grade: P2O5)(c) |
|
|
|
|
|
|
|
|
|
|
|
| Florida |
14.0 |
9.1 |
27.8 |
|
|
9.6 |
27.6 |
|
11.1 |
28.0 |
|
| Total United States |
14.0 |
9.1 |
27.8 |
|
|
9.6 |
27.6 |
|
11.1 |
28.0 |
|
Miski Mayo (d) |
4.8 |
4.7 |
29.7 |
|
|
4.2 |
29.7 |
|
4.2 |
29.8 |
|
| Total Peru |
4.8 |
4.7 |
29.7 |
|
|
4.2 |
29.7 |
|
4.2 |
29.8 |
|
| Araxá / Patrocinio |
1.1 |
0.9 |
34.7 |
|
|
0.9 |
34.5 |
|
0.8 |
34.9 |
|
| Cajati |
0.5 |
0.3 |
33.7 |
|
|
0.3 |
34.3 |
|
0.3 |
34.1 |
|
| Catalão |
1.0 |
1.0 |
34.8 |
|
|
1.1 |
34.8 |
|
1.1 |
34.9 |
|
| Tapira |
2.0 |
1.7 |
35.2 |
|
|
1.9 |
35.1 |
|
1.8 |
35.1 |
|
| Total Brazil |
4.6 |
3.9 |
34.9 |
|
|
4.2 |
34.8 |
|
4.0 |
34.9 |
|
| Total Phosphate |
23.4 |
17.7 |
29.9 |
|
|
18.0 |
29.8 |
|
19.3 |
29.8 |
|
______________________________
(a)Annual operational capacity is the expected average long-term annual capacity for finished goods considering constraints represented by the grade, quality and quantity of the reserves being mined as well as equipment performance and other operational factors.
(b)Actual production varies from annual operational capacity shown in the above table due to factors that include, among others, the level of demand for our products, the quality of the reserves, the nature of the geologic formations we are mining at any particular time, maintenance and turnaround time, mechanical failure, weather conditions, and other operating conditions.
(c)The percent of P2O5 represents a measure of the phosphate content in phosphate rock or a phosphate ore body. A higher percentage corresponds to a higher percentage of phosphate content in phosphate rock or a phosphate ore body.
(d)We have a 75% economic interest in the Miski Mayo Mine and consolidate its results. Miski Mayo's annual operating capacity and production tonnes are presented at 100% economic interest. These amounts are presented in wet tonnes based on average moisture levels of 3.0% to 5.0%. These quantities are the production of the drying plant.
Table 2.2 shows the production tonnage and grade for the potash properties for 2023, 2022 and 2021.
|
|
|
|
|
|
|
|
|
|
|
|
|
|
|
|
|
|
|
|
|
|
|
|
|
|
|
|
|
|
|
|
|
|
|
|
|
|
|
| Table 2.2 Summary of Production - Potash Properties |
|
|
|
|
|
|
|
| (in millions of tonnes) |
|
|
|
December 31, |
| Facility |
Annualized Proven Peaking Capacity (tonnes)(a)(b) |
|
Annual Operational Capacity (tonnes) (b)(c)(d) |
|
2023 |
|
2022 |
|
2021 |
|
|
Ore Mined (tonnes) |
Grade % K2O(e) |
|
Ore Mined (tonnes) |
Grade % K2O(e) |
|
Ore Mined (tonnes) |
Grade % K2O(e) |
Belle Plaine – MOP(f) |
3.9 |
|
3.0 |
|
10.2 |
19.3 |
|
11.3 |
19.3 |
|
11.0 |
19.3 |
Esterhazy – MOP(i) |
6.3 |
|
6.3 |
|
14.1 |
23.4 |
|
13.7 |
24.5 |
|
13.3 |
23.9 |
Colonsay – MOP(g) |
2.6 |
|
1.5 |
|
1.8 |
25.6 |
|
2.6 |
26.4 |
|
1.0 |
26.6 |
| Total Canada |
12.8 |
|
10.8 |
|
26.1 |
21.9 |
|
27.6 |
22.5 |
|
25.3 |
22.0 |
Carlsbad – K-Mag®(h) |
0.9 |
|
0.7 |
|
2.3 |
6.7 |
|
3.0 |
6.2 |
|
3.1 |
6.3 |
| Total United States |
0.9 |
|
0.7 |
|
2.3 |
6.7 |
|
3.0 |
6.2 |
|
3.1 |
6.3 |
| Taquari – MOP |
0.7 |
|
0.5 |
|
1.8 |
14.7 |
|
1.5 |
14.3 |
|
1.8 |
15.1 |
| Total Brazil |
0.7 |
|
0.5 |
|
1.8 |
14.7 |
|
1.5 |
14.3 |
|
1.8 |
15.1 |
| Total Potash |
14.4 |
|
12.0 |
|
30.2 |
20.3 |
|
32.1 |
20.6 |
|
30.2 |
20.0 |
______________________________
(a)Represents full capacity based on 350 operating days per annum.
(b)Capacity is based on finished goods capacity, not ore mined. The annualized proven peaking capacity shown above is the capacity currently used to determine our share of Canpotex sales. Canpotex members’ respective shares of Canpotex sales are based upon the members’ respective proven peaking capacities for producing potash. When a Canpotex member expands its production capacity, the new capacity is added to that member’s proven peaking capacity based on a proving run at the maximum production level. Alternatively, after January 2017, Canpotex members may elect to rely on an independent engineering firm and approved protocols to calculate their proven peaking capacity. The annual operational capacity reported in the table above can exceed the annualized proven peaking capacity until the proving run has been completed.
(c)Annual operational capacity is the expected average long-term annual capacity considering constraints represented by the grade, quality and quantity of the reserves being mined as well as equipment performance and other operational factors.
(d)Actual production varies from annual operational capacity shown in the above table due to factors that include, among others, the level of demand for our products, the quality of the reserves, the nature of the geologic formations we are mining at any particular time, maintenance and turnaround time, mechanical failure, weather conditions, and other operating conditions, as well as the effect of recent initiatives intended to improve operational excellence.
(e)Grade % K2O is a traditional reference to the percentage (by weight) of potassium oxide contained in the ore. A higher percentage corresponds to a higher percentage of potassium oxide in the ore.
(f)Equivalent to tonnes hoisted to surface at an underground shaft mine. Ore mined for Belle Plaine is calculated (KCl concentrate mined by solution divided by the estimated global grade of the deposit). The calculation is based on actual KCl tonnes mined for January 1, 2023 through December 31, 2023).
(g)We have the ability to reach an annual operating capacity of 2.1 million tonnes over time at Colonsay by increasing our staffing levels and investment in mine development activities.
(h)K-Mag® is a specialty product that we produce at our Carlsbad facility.
(i)Following completion of our Esterhazy K3 expansion project, a third-party audit assessed our Esterhazy Facility's annual nameplate capacity at 7.8 million tonnes. We are currently working with Canpotex through established procedures to determine our adjusted Canpotex entitlement percentage based on our Esterhazy Facility's audited productive capacity.
Overview
Overviews for Phosphates, Potash and Mosaic Fertilizantes are shown in Table 2.3, Table 2.4, and Table 2.5 below. All properties are operated by Mosaic. All properties listed below are production stage, except Araxá/Patrocínio. Araxá/Patrocínio is an operating mine but is considered an exploration stage mine because Mosaic is extracting minerals from this mine without having determined there are mineral reserves under S-K 1300.
Information concerning our material properties is located in this Item 2 under the headings “Florida Phosphates,” “Esterhazy,” “Belle Plaine” and “Tapira”.
Table 2.3: Phosphates Overview
|
|
|
|
|
|
|
|
|
| Florida Phosphates |
| See Florida Phosphates Individual Property Disclosure below. |
Peru - Compañía Minera Miski Mayo S.R.L. (“Miski Mayo”) |
| Location |
|
Sechura Province in the Piura Region, Peru |
| Type and amount of ownership interests |
|
75% owned by Compañía Minera Miski Mayo S.R.L., a wholly-owned indirect subsidiary of Mosaic. |
| Titles, mineral rights, leases or options and acreage |
|
Miski Mayo is the holder of 20 non-metallics mining concessions (76,000 hectares). |
| Key permit conditions |
|
Permit conditions are dictated by operating licenses, which are maintained and renewed on a regular basis. As of December 31, 2023, all environmental licenses were either still valid or were being renewed pursuant to applications with the Peruvian Environmental Agency within the legal deadlines.
In general, environmental commitments are being met; however, there are environmental requirements and commitments related to the expansion of Miski Mayo Line 3 of the Second Amendment of the EIA (2015) that have to be verified and implemented.
Miski Mayo’s environmental controls are related to monitoring the quality of wastewater, surface water, groundwater and air, as well as waste management. Additional environmental controls are in place for air emissions, air quality and noise.
Tailings storage facilities and other impoundment’s stability are monitored through specified routine internal and third party inspections.
|
| Mine types and mineralization styles |
|
Miski Mayo is a surface mine. The phosphate deposits of Peru are located within the shallow north-trending Sechura Basin, in the Piura region, hosting successive inter-layered marine sediments of phosphate. We extract phosphate ore from Miski Mayo using excavators. The ore is then transported by truck for beneficiation in a plant that we own. The beneficiated concentrate is then shipped to North America for use in our own production or sold to third parties. |
| Processing plants and other facilities |
|
Beneficiation plant |
Table 2.4: North America Potash Overview
|
|
|
|
|
|
|
|
|
Belle Plaine Potash Facility (“Belle Plaine Facility”) |
| See Belle Plaine Individual Property Disclosure below. |
Esterhazy Potash Facility (“Esterhazy Facility”) |
| See Esterhazy Individual Property Disclosure below. |
Colonsay Potash Facility (“Colonsay Facility”) |
| Location |
|
Saskatchewan, Canada |
| Type and amount of ownership interests |
|
100% owned by Mosaic Potash Colonsay ULC, a wholly-owned, indirect subsidiary of Mosaic. |
|
|
|
|
|
|
|
|
|
| Titles, mineral rights, leases or options and acreage |
|
We lease approximately 118,378 acres of mineral rights for the Colonsay Facility from the Province of Saskatchewan (the “Crown”) under Subsurface Mineral Lease KL 108. The lease term is for a period of 21 years, with renewals at our option for additional 21-year lease periods.
In addition, we own or lease approximately 14,451 acres of mineral rights within the Colonsay area. All mineral properties owned or leased by Mosaic are for the “subsurface mineral” commodity as defined in The Subsurface Mineral Tenure Regulations (Saskatchewan).
We own approximately 5,972 acres of surface rights in the Colonsay area. All infrastructure including the processing plant and tailings management areas ( “TMAs” or “TMA”) are located on our owned land.
|
| Key permit conditions |
|
A water rights license issued by the Saskatchewan Water Security Agency is in place and expires in 2032. The license is associated with the allocation of surface water rights for the site. An Approval to Operate Pollutant Control Facilities, issued by the Saskatchewan Ministry of Environment, is also in place and expires in July 2028. It is expected to be renewed at or before expiration.
There are no other significant encumbrances, including permitting requirements (existing or anticipated in the future) associated with the Colonsay Facility. Except for the royalties, we do not anticipate any future significant encumbrances based on current known regulations and existing permitting processes. There are no outstanding violations and fines. |
| Mine types and mineralization styles |
|
The intracratonic Elk Point Basin is a major sedimentary geological feature in western Canada and the northwest U.S. It contains one of the world’s largest stratabound potash resources that represents almost 25% of the global potash production. The Prairie Evaporite hosts rich deposits of evaporite minerals including NaCl, KCl and locally, carnallite that occur in three potash deposits: the Esterhazy, Belle Plaine and Patience Lake members.
The Colonsay deposit includes two potash-bearing members within its local stratigraphy; the Patience Lake Member and the Belle Plaine Member. Mining at Colonsay is conducted within the upper portion of the Patience Lake Member using a room and pillar mining method.
The Colonsay Facility uses an underground room and pillar mining method to extract potash. After being transported along a network of conveyor systems to the shaft, it is hoisted to the surface for onsite processing.
|
| Processing plants and other facilities |
|
Mill facility, beneficiation plant |
Carlsbad Potash Facility (“Carlsbad Facility”) |
| Location |
|
New Mexico, U.S. |
| Type and amount of ownership interests |
|
100% owned by Mosaic Potash Carlsbad Inc., a wholly-owned, indirect subsidiary of Mosaic. |
| Titles, mineral rights, leases or options and acreage |
|
The property consists of 89% federally owned and 11% state owned land, and 40 acres of privately owned mineral rights that Mosaic leases. We lease approximately 64,267 acres of mineral rights from the U.S. Department of Interior Bureau of Land Management (the “BLM”). These lease terms are for a period of 20 years and are reviewed and renewed at their end of term.
Surface rights are subject to separate ownership and title from subsurface mineral rights.
We own 8,370 acres of surface rights. All infrastructure, including the processing plant, TMA, cluster sites, and pipeline rights of way, are located on Mosaic-owned land.
|
|
|
|
|
|
|
|
|
|
| Key permit conditions |
|
Primary environmental resource areas identified include groundwater quality and shorebird habitat. Environmental monitoring for effluents, air and surface/groundwater is in place.
Currently, 11 permits or approvals are active for the property. We are in compliance with all such permits or approvals. One of the 11, groundwater discharge permit (DP-1399) issued by the New Mexico Environmental Department (“NMED”), is currently being renewed. The discharge permit governs operation of the TMA. A tailings management and inspection plan is in place and active. The permit includes closure and post-closure requirements and financial assurance requirements.
A mining and reclamation plan has been developed and approved by the BLM. This plan includes standards for operation and closure of the mine that comply with federal and state of New Mexico environmental regulations. Current and final mine closure plans and reclamation cost estimates are completed and the closure plans have been approved by NMED and the BLM.
There are no significant environmental permitting encumbrances (existing or anticipated in the future) associated with the Carlsbad Facility. We do not anticipate any future encumbrances based on current known regulations and existing permitting processes. There are no outstanding violations and fines.
|
| Mine types and mineralization styles |
|
The Carlsbad potash district is located within the northern New Mexico portion of the Delaware Basin. The Delaware Basin is the western subdivision of the greater Permian Basin, one of the deepest intracratonic basins in North America.
Potash mineralization at Carlsbad occurs in the Ochoan Epoch (Upper Permian Age) Salado Formation. The Salado Formation, up to a maximum of 2,200 feet (671 m) ft. thick, is an evaporite sequence dominated by 650 to 1,300 feet (198 to 396 m) of halite and muddy halite. It hosts 12 ore zones, 11 in the middle or McNutt Member and the 12th in the Upper Member. The area underlain by the 12 ore zones is about 1,900 sq. miles (4,920 sq. km). The 400 foot (122 m) thick McNutt Member is at a depth of 300 to 1,500 feet (91 to 457 m) below the surface.
The Carlsbad Facility utilizes an underground room-and-pillar mining method.
Pillars are cut in a manner that creates a panel; panel sizes can be changed based on grade, ground conditions and lease or oil and gas boundaries. The mine currently has five mine panels that consist of nine to 11 rooms. Drum-style continuous miners are utilized for mining. As the continuous miner advances, ore is fed off a boom located at the back of the miner into battery-powered ore haulage units. These units transport the ore through the open mine workings and dump it onto an extensive belt system that conveys the ore to the surface for milling.
|
| Processing plants and other facilities |
|
Langbeinite (K-Mag®) refinery and a granulation plant |
Table 2.5: Mosaic Fertilizantes Overview
|
|
|
|
|
|
|
|
|
Complexo Mineroquímic de Araxá (“Araxá”) / Complexo de Mineração de Patrocínio (“Patrocínio”) |
| Location |
|
Near Araxá / Patrocínio, Minas Gerais, Brazil |
| Type and amount of ownership interests |
|
100% owned by Mosaic Fertilizantes P&K S.A., a wholly-owned indirect subsidiary of Mosaic. |
| Titles, mineral rights, leases or options and acreage |
|
Mining rights in Brazil are governed by the Mining Code, Decree 227, dated February 27, 1967, and further regulation enacted by Agência Nacional de Mineração (the “ANM”). All subsoil situated within Brazilian territory is deemed state property, with the mining activities subject to specific permits granted by the ANM. |
|
|
|
|
|
|
|
|
|
| Key permit conditions |
|
Mosaic currently holds a total of four mining permits within the Araxá area (2,769 hectares) and two mining permits and two exploration permits within the Patrocínio area (3,480 hectares). Permit conditions are dictated by operating licenses, which are maintained and renewed on a regular basis. As of December 31, 2023, all environmental licenses were valid or were being renewed pursuant to applications filed with the Brazilian Environmental Agency.
There are action plans in progress to comply with the environmental conditions of the permits that are not met yet within the applicable regulations. Araxá and Patrocínio’s environmental controls are related to monitoring the quality of wastewater, surface water, groundwater and air, as well as waste management. Additional environmental controls are in place for air emissions, air quality and noise.
Tailings storage facilities and other impoundment’s stability are monitored through a continuous monitoring program, as well as routine inspections.
|
| Mine types and mineralization styles |
|
The Araxá and Patrocínio phosphate deposits are part of a series of Late-Cretaceous, carbonatite-bearing alkaline ultramafic plutonic complexes belong to the Alto Paranaiba Igneous Province.
The tropical weather regime prevailing in the region and the inward drainage patterns developed from the weather-resistant quartzite margins of the dome structures resulted in the development of an extremely thick soil cover in most of the complexes. The extreme weathering was responsible for the residual concentration of apatite.
The phosphate ore is extracted through surface mining by limited drilling and blasting, loaded into trucks and transported to the beneficiation plants. Patrocinio does not have its own beneficiation plant, so the ore is transported by rail to Araxá for processing.
|
| Processing plants and other facilities |
|
Two beneficiation plants at Araxá |
Complexo Mineroquímico de Cajati (“Cajati”) |
| Location |
|
Near Cajati, São Paulo, Brazil |
| Type and amount of ownership interests |
|
100% owned by Mosaic Fertilizantes P&K S.A., a wholly-owned indirect subsidiary of Mosaic. |
| Titles, mineral rights, leases or options and acreage |
|
Mining rights in Brazil are governed by the Mining Code, Decree 227, dated February 27, 1967, and further regulation enacted by the ANM. All subsoil situated within Brazilian territory is deemed state property, with the mining activities subject to specific permits granted by the ANM.
|
| Key permit conditions |
|
Mosaic currently holds a total of nine mining permits within the Cajati area (5,078 hectares). Permit conditions are dictated by operating licenses, which are maintained and renewed on a regular basis. As of December 31, 2023, all environmental licenses were still valid or were being renewed pursuant to applications filed with the Brazilian Environmental Agency.
There are action plans in progress to comply with the environmental conditions of the permits that are not met yet within the environmental permits. Cajati’s environmental controls are related to monitoring the quality of wastewater, surface and groundwater and air, as well as waste management. Additional environmental controls are in place for air emissions, air quality and noise.
Tailings storage facilities and other impoundment’s stability are strictly monitored through a continuous monitoring program as well as routine inspections. |
| Mine types and mineralization styles |
|
The primary alkaline intrusive complex of interest for Cajati is the Jacupiranga Ultramafic-Carbonatitic Mesozoic Complex. The economically exploitable portion of the Jacupiranga Alkaline Complex is focused on phosphate mineralization within the carbonatite domain of the complex.
The phosphate ore is extracted through surface mining by drilling and blasting, loaded into trucks and transported to the beneficiation plant onsite at Cajati.
|
|
|
|
|
|
|
|
|
|
| Processing plants and other facilities |
|
Beneficiation plant |
Complexo Mineração de Catalão (“CMC”) |
| Location |
|
Near Catalão, Minas Gerais (and Goias), Brazil |
| Type and amount of ownership interests |
|
100% owned by Mosaic Fertilizantes P&K S.A., a wholly-owned indirect subsidiary of Mosaic. |
| Titles, mineral rights, leases or options and acreage |
|
Mining rights in Brazil are governed by the Mining Code, Decree 227, dated February 27, 1967, and further regulation enacted by the ANM. All subsoil situated within Brazilian territory is deemed state property, with the mining activities subject to specific permits granted by the ANM.
|
| Key permit conditions |
|
Mosaic currently holds a total of eight permits within the CMC area (2,131 hectares). Permit conditions are dictated by operating licenses, which are maintained and renewed on a regular basis. As of December 31, 2023, all environmental licenses were either valid or were being renewed pursuant to applications filed with the Brazilian Environmental Agency.
There are action plans in progress to comply with the environmental conditions that are not met yet within the environmental permits. CMC’s environmental controls are related to monitoring the quality of wastewater, surface and groundwater and air, as well as waste management. Additional environmental controls are in place for air emissions, air quality and noise.
Tailings storage facilities and other impoundment’s stability are monitored through a continuous monitoring program as well as routine inspections.
|
| Mine types and mineralization styles |
|
The CMC phosphate deposit is part of a series of Late-Cretaceous, carbonatite-bearing alkaline ultramafic plutonic complexes belong to the Alto Paranaiba Igneous Province.
The tropical weather regime prevailing in the region and the inward drainage patterns developed from the weather-resistant quartzite margins of the dome structures resulted in the development of an extremely thick soil cover in most of the complexes. The extreme weathering process was responsible for the residual concentration of apatite.
The phosphate ore is extracted through surface mining by limited drilling and blasting, loaded into trucks and transported to the beneficiation plant onsite at CMC.
|
| Processing plants and other facilities |
|
Beneficiation plant |
|
|
|
| Complexo Mineração de Tapira (“Tapira”) |
| See the Tapira Individual Property Disclosure below. |
Complexo Mineroquímico de Taquari-Vassouras (“Taquari”) |
| Location |
|
Near Rosario de Catete, Sergipe, Brazil |
| Type and amount of ownership interests |
|
100% owned by Mosaic Potássio Mineração Ltda, a wholly-owned indirect subsidiary of Mosaic. |
| Titles, mineral rights, leases or options and acreage |
|
Mining rights in Brazil are governed by the Mining Code, Decree 227, dated February 27, 1967, and further regulation enacted by the ANM. All subsoil situated within Brazilian territory is deemed state property, with the mining activities subject to specific permits granted by the ANM. |
|
|
|
|
|
|
|
|
|
| Key permit conditions |
|
Mosaic currently holds one mining permit within the Taquari area (92,498 hectares). Permit conditions are dictated by operating licenses, which are maintained and renewed on a regular basis. As of December 31, 2023, all environmental licenses were either valid or being renewed pursuant to applications filed with the Brazilian Environmental Agency within the legal deadlines. Licenses are managed through national and state databases.
There are action plans in progress to comply with the environmental conditions that are not met yet within the environmental permits. Taquari’s environmental controls are related to monitoring the quality of wastewater, surface water, groundwater and air, as well as waste management. Additional environmental controls are in place for air emissions, air quality and noise.
The brine pipeline and other impoundment’s stability are monitored through a monitoring program as well as routine inspections.
|
| Mine types and mineralization styles |
|
The deposit is in the Taquari-Vassouras sub-basin and is a bedded evaporite where sylvinite is mined in an underground room and pillar mine at depths of 1,640 to 2,207 feet (500 to700m) below surface using continuous miners. The beneficiation process operation begins at the run-of-mine stockpile. The material is conveyed to the processing circuit where it is divided into seven major units: crushing, concentration, dissolution, drying, compaction, storage and shipping. |
| Processing plants and other facilities |
|
Beneficiation plant |
Mineral Resource and Mineral Reserve Estimates
Table 2.6 shows the Mineral Resource tonnage and grade for all properties as of December 31, 2023.
Table 2.6 Summary of Mineral Resources as of December 31, 2023(a)
|
|
|
|
|
|
|
|
|
|
|
|
|
|
|
|
|
|
|
|
|
|
|
|
|
|
|
|
| (in millions of tonnes) |
|
|
|
|
|
|
|
| Commodity/Geography/Mine Property Name |
|
Measured Mineral
Resources |
Indicated Mineral Resources |
Measured + Indicated Mineral Resources |
Inferred Mineral
Resources |
|
tonnes |
Grade |
tonnes |
Grade |
tonnes |
Grade |
tonnes |
Grade |
Phosphate (Grade: P2O5 )(b) |
|
|
|
|
|
|
|
|
|
| United States |
|
|
|
|
|
|
|
|
|
Florida(c) |
|
102.0 |
|
29.9 |
|
415.0 |
|
30.1 |
|
517.0 |
|
30.0 |
|
83.0 |
|
30 |
|
| Peru |
|
|
|
|
|
|
|
|
|
Miski Mayo(d) |
|
151.7 |
|
15.7 |
|
139.0 |
|
16.3 |
|
290.7 |
|
16.5 |
|
27.7 |
|
16 |
|
| Brazil |
|
|
|
|
|
|
|
|
|
Araxá/Patrocínio(e)(f) |
|
214.4 |
|
13.0 |
|
305.2 |
|
13.7 |
|
519.6 |
|
13.4 |
|
7.0 |
|
15 |
|
Cajati(e)(g) |
|
25.4 |
|
5.2 |
|
15.0 |
|
5.2 |
|
40.4 |
|
5.2 |
|
4.4 |
|
5 |
|
Catalão(e)(h) |
|
59.5 |
|
9.9 |
|
102.8 |
|
10.6 |
|
162.3 |
|
10.3 |
|
17.9 |
|
9 |
|
Tapira(e)(i) |
|
22.7 |
|
8.7 |
|
55.3 |
|
8.6 |
|
78.0 |
|
8.6 |
|
181.2 |
|
9 |
|
| Total Phosphate |
|
575.7 |
|
16.0 |
|
1,032.3 |
|
19.9 |
|
1,608.0 |
|
17.7 |
|
321.2 |
|
15 |
|
|
|
|
|
|
|
|
|
|
|
Potash (Grade: K2O)(j) |
|
|
|
|
|
|
|
|
|
| Canada |
|
|
|
|
|
|
|
|
|
Belle Plaine(k) |
|
— |
|
— |
|
— |
|
— |
|
— |
|
— |
|
4,647.0 |
|
19 |
|
Esterhazy(l) |
|
255.0 |
|
23.3 |
|
2,092.0 |
|
22.8 |
|
2,347.0 |
|
22.9 |
|
|
|
Colonsay(l) |
|
— |
|
— |
|
— |
|
— |
|
— |
|
— |
|
977.0 |
|
29 |
|
| United States |
|
|
|
|
|
|
|
|
|
Carlsbad(m) |
|
— |
|
— |
|
— |
|
— |
|
— |
|
— |
|
39.0 |
|
6 |
|
| Brazil |
|
|
|
|
|
|
|
|
|
Taquari(n) |
|
— |
|
— |
|
6.8 |
|
23.6 |
|
6.8 |
|
23.6 |
|
58.0 |
|
23 |
|
| Total Potash |
|
255.0 |
|
23.3 |
|
2,098.8 |
|
22.8 |
|
2,353.8 |
|
22.8 |
|
5,721.0 |
|
21 |
|
______________________________
(a)Mineral resources are reported exclusive of mineral reserves, and except as otherwise noted, are stated in-situ. Mineral resources are not mineral reserves and do not meet the threshold for mineral reserve modifying factors, such as estimated economic viability, that would allow for conversion to mineral reserves. There is no certainty that any part of the mineral resources estimated will be converted into mineral reserves.
(b)The percentage of P2O5 represents a measure of the phosphate content in phosphate rock or a phosphate ore body. A higher percentage corresponds to a higher percentage of phosphate content in phosphate rock or a phosphate ore body. Brazilian grades, except for Cajati, are P2O5ap, which represents the P2O5 associated with apatite and was calculated by the evaluation of the CaO / P2O5 ratio. Where CaO / P2O5 ratio was greater than or equal to 1.34, P2O5ap was equal to the total of P2O5; where the CaO / P2O5 ratio was less than 1.35, P2O5ap was equal to the CaO / 1.35 ratio.
(c)Mineral resource tonnages and grade are reported as a beneficiation plant product (phosphate rock) tonnage and P2O5 grade. The cut-offs used to estimate mineral resources include, minimum beneficiation plant concentrate BPL (27.45% P2O5), minimum pebble BPL (18.30% P2O5, except 22.88% P2O5 for DeSoto and Pioneer), maximum pebble magnesium oxide concentration and a maximum clay content cut-off for a logged matrix layer and the composite matrix volume. A Life of Mine (“LOM”) commodity price of US$118/tonne of phosphate rock was used for 2024 to 2036 to assess prospects for economic extraction but is not used for cut-off purposes.
(d)Mineral resources are presented on the basis of our 75% interest. Cut-off grade of > 8% P2O5 was applied for mineral resources. A breakeven pit shell was developed with costs, grade requirements and a sales price of US $97.69/tonne of phosphate concentrate (2022 price evaluation) to develop the mineral resource pit shell.
(e)Measured, indicated and inferred blocks were included in mineral resource estimates if they were inside mining concessions and exploration permits with a final report approved by the ANM, but exclusive of physical structures. For example, depending on the site, a physical structure may consist of a beneficiation plant, crusher or waste pile.
(f)Araxá Oxidized Cut-off grade: Mass Recovery (rend_t) > 0, P2O5 ≥ 4.0, Fe2O3 ≥ 4.0, SiO2 ≥ 0.05, BaO ≤ 18.0. Araxá Micaceous Cut-off grade: Cut-off grade for Micaceous: Mass Recovery (rend_t) > 0, P2O5 ≥ 3.0, Fe2O3 ≥ 6.0, SiO2 ≥ 1.0, BaO ≤ 13.0. For Araxá, a revenue factor of 1.0 with sales price in Brazilian Reais ($R) of R$1,953 per tonne of phosphate concentrate (2023 price evaluation) was used to develop mineral resource pit shell. Patrocínio BEB-OXI Cut-off grade: P2O5 ≥ 2.5, Fe2O3 ≤ 62.0. Patrocínio CBN-OXI Cut-off grade: P2O5 ≥ 3.2, SiO2 ≥ 0.1. Patrocínio BEB-MIC Cut-off grade: P2O5 ≥ 3.0, SiO2 ≥ 0.8. Patrocínio FET Cut-off grade: P2O5 > 0.0. Patrocínio RSI Cut-off grade: P2O5 ≥ 2.9. For Patrocínio, a revenue factor of 1.0 with a sales price of R$1,869.84 per tonne of phosphate concentrate (2023 LOM price evaluation) was used to develop mineral resource pit shell.
(g)Cut-off grade of > 3% P2O5 was applied for mineral resources. A revenue factor of 1.0 with sales price of R$2,963.40 per tonne of phosphate concentrate (2023 LOM price evaluation) was used to develop the mineral resource pit shell.
(h)Cut-off grade of P2O5ap ≥ 5.0% and 0.8 ≤ RCP ≤ 1.6 and MgO < 12% was applied to mineral resources. A revenue factor of 1.0 with a constant sales price of R$1,918.75 per tonne of phosphate concentrate (2023 LOM price evaluation) was used to develop mineral resource pit shell.
(i)Cut-off grade of P2O5ap ≥ 5.0% and 0.9 ≤ RCP ≤ 3.0 was applied to mineral resources. A revenue factor of 1.0 with a sales price of R$1,939.57 per tonne of phosphate concentrate (2023 LOM price evaluation) was used to develop the mineral resource pit shell.
(j)%K2O refers to the total %K2O of the samples.
(k)No cut-off grade is used to estimate mineral resources as the solution mining method used at the Belle Plaine Facility is not selective. At no point in the cavern development and mining process can a decision be made to mine or not mine the potash mineralization that is in contact with the mining solution. The mining solution dissolves the potash, regardless of its grade, to make a concentrate that is pumped to surface from the mining caverns for processing. A KCl commodity price of US $325/tonne was used for 2024 to 2084 to assess prospects for economic extraction for the mineral resources but is not used for cut-off purposes. A US$/CAD$ exchange rate of 1.32 was used to assess prospects for economic extraction for the mineral resources but was not used for cut-off purposes.
(l)No cut-off grade or value based on commodity price is used to estimate mineral resources as the mining method used at Colonsay or Esterhazy is not grade selective. The potash mineralization is mined on one level by continuous miners following the well-defined and continuous beds of mineralization with relatively consistent grades. The following KCl commodity prices were used to assess prospects for economic extraction for the mineral resources but are not used for cut-off purposes: US $320/tonne for Esterhazy for 2024 to 2054 and US $327/tonne for 2024 to 2116 for Colonsay. A US$/CAD$ exchange rate of 1.32 was used to assess prospects for economic extraction for the mineral resources but was not used for cut-off purposes.
(m)A 4% K2O cut-off grade with less than 2% kieserite is used to estimate mineral resources. This is consistent with the definition of mineable potash established by the U.S. Geological Survey. A US $293/tonne price was used for 2024 to 2064 to assess economic viability for the mineral resources, but was not used for cut-off purposes.
(n)Mineral resources for Taquari are reported as of December 31, 2022 and have not been adjusted for depletion incurred in 2023. Cut-off grade of > 20% KCl, a minimum sylvinite thickness of 1.8 m, and a minimum sylvinite percentage per block of 50% was applied for mineral resources.
Table 2.7 shows the Mineral Reserve tonnage and grade for all properties as of December 31, 2023.
Table 2.7: Summary of Mineral Reserves as of December 31, 2023(a)
|
|
|
|
|
|
|
|
|
|
|
|
|
|
|
|
|
|
|
|
|
| (in millions of tonnes) |
|
|
|
|
|
| Commodity/Geography/Mine Property Name |
Proven Mineral Reserves |
Probable Mineral Reserves |
Total Mineral Reserves |
| tonnes |
Grade |
tonnes |
Grade |
tonnes |
Grade |
Phosphate (Grade: P2O5)(b) |
|
|
|
|
|
|
| United States |
|
|
|
|
|
|
Florida(c) |
47.0 |
27.8 |
65.0 |
26.8 |
112.0 |
27.2 |
| Peru |
|
|
|
|
|
|
Miski Mayo(d) |
130.2 |
16.1 |
72.1 |
15.0 |
202.3 |
15.7 |
| Brazil |
|
|
|
|
|
|
Cajati(e) |
38.1 |
5.4 |
21.0 |
5.4 |
59.1 |
5.4 |
Catalão(f) |
62.3 |
10.5 |
8.9 |
10.1 |
71.2 |
10.4 |
Tapira(g) |
131.7 |
9.1 |
311.9 |
8.9 |
443.6 |
9.0 |
| Total Phosphate |
409.3 |
13.2 |
478.9 |
12.4 |
888.2 |
12.8 |
|
|
|
|
|
|
|
Potash (Grade: K2O) |
|
|
|
|
|
|
| Canada |
|
|
|
|
|
|
Belle Plaine(h) |
264.0 |
19.3 |
388.0 |
19.3 |
652.0 |
19.3 |
Esterhazy(i) |
113.0 |
23.0 |
402.0 |
20.7 |
515.0 |
21.2 |
Colonsay(i) |
101.0 |
25.2 |
163.0 |
27.2 |
264.0 |
26.5 |
| United States |
|
|
|
|
|
|
Carlsbad(j) |
170.3 |
6.5 |
0.0 |
0.0 |
170.3 |
6.5 |
| Brazil |
|
|
|
|
|
|
Taquari(k) |
0.0 |
0.0 |
26.9 |
14.7 |
26.9 |
14.7 |
| Total Potash |
648.3 |
17.7 |
979.9 |
|
21.1 |
1,628.2 |
|
19.7 |
______________________________
(a)A mineral reserve is the economically mineable part of a measured or indicated mineral resource, which includes diluting materials and allowances for losses that may occur when the material is mined or extracted. Reserves are measured as Run of Mine (“ROM”) unless otherwise noted.
(b)Brazil grades except for Cajati are P2O5ap, which represents the P2O5 associated with apatite and was calculated by the evaluation of the CaO / P2O5 ratio. Where CaO / P2O5 ratio was greater than or equal to 1.34, P2O5ap was equal to the total of P2O5; where the CaO / P2O5 ratio was less than 1.35, P2O5ap was equal to the CaO / 1.35 ratio.
(c)Mineral reserve tonnages and grade are reported as a beneficiation plant product (phosphate rock) tonnage and P2O5 grade. A LOM commodity price of US$118/tonne of phosphate rock was used to assess prospects for economic extraction but is not used for cut-off purposes. Cut-off based on productivity factors per site have been applied to estimate mineral reserves. Recoverable Finished Product tonnes vs. Matrix Volume Mined ranges from 9.4 to 9.9%. Recoverable Finished Product tonnes vs. Total Volume Mined is 2.2%.
(d)Mineral reserves are presented on the basis of our 75% interest. The reference point for cut-off grade and pit optimization analysis is tonnes of concentrate at a price of US$97.69/tonne concentrate (2022 LOM price evaluation). We applied a cut-off grade of > 8% P2O5 mineral reserves. Additionally, we used a phosphate concentrate grade limitation of a minimum P2O5 concentrate grade of 29.5% in the LOM plan.
(e)The reference point for cut-off grade and pit optimization analysis is tonnes of concentrate at a price of R$2,963.40/tonne concentrate (2023 price evaluation). Cut-off grade of > 3% P2O5 and < 11% SiO2 was applied to mineral reserves. Mineral reserves were proven to be economic based on an internal transfer price of R$1,061/tonne of phosphate rock (2023 LOM price evaluation) that was derived in the discounted cash flow and compared to the gross margin available.
(f)The reference point for cut-off grade and pit optimization analysis is tonnes of concentrate at a price of R$1,918.75/tonne concentrate (2023 price evaluation). Cut-off grade of P2O5ap ≥ 5.0% and 0.8 ≤ RCP ≤ 1.6 and MgO < 12% was applied to mineral reserves. Mineral reserves were proven to be economic based on internal transfer price of R$649/tonne of phosphate rock (2023 LOM price evaluation) that was derived in the discounted cash flow and compared to the gross margin available.
(g)The reference point for cut-off grade and pit optimization analysis is tonnes of concentrate at a price of R$1,939.57/tonne concentrate (2023 price evaluation). Cut-off grade of P2O5ap ≥ 5.0% and 0.9 ≤ RCP ≤ 3.0 was applied to mineral reserves. Mineral reserves were proven to be economic based on internal transfer price of R$543/tonne of phosphate rock (2023 LOM price evaluation) that was derived in the discounted cash flow and compared to the gross margin available.
(h)No cut-off grade is used to estimate mineral reserves as the solution mining method used at the Belle Plaine Facility is not selective. At no point in the cavern development and mining process can a decision be made to mine or not mine the potash mineralization that is in contact with the mining solution. The mining solution dissolves the potash, regardless of its grade, to make a concentrate that is pumped to surface from the mining cavities for processing. Mine designs based on a solution mining method and design criteria are used to constrain mineral reserves within mineable shapes. The following KCl commodity prices were used to assess economic viability for the mineral reserves, but were not used for cut-off purposes, 2023-$334/tonne, 2024-$200/tonne, 2025-$222/tonne, 2026-$292/tonne, 2027-$320/tonne and for the LOM $331/tonne. A US$/CAD$ exchange rate of 1.32 was used to assess economic viability for the mineral reserves but was not used for cut-off purposes.
(i)The following KCl commodity prices were used to assess economic viability for the mineral reserves: US $320/tonne for Esterhazy, US $325/tonne for Belle Plaine, and US $327/tonne for Colonsay. A US$/CAD$ exchange rate of 1.32 was used to economic viability for the Esterhazy and Belle Plaine mineral reserves.
(j)A 4% K2O cut-off grade with less than 2% kieserite is used to estimate mineral reserves. This is consistent with the definition of mineable potash established by the U.S. Geological Survey. A US $293/tonne price was used to assess economic viability for the mineral resources but was not used for cut-off purposes.
(k)Mineral Reserves for Taquari are effective as of December 31, 2022 and have not been adjusted for depletion incurred in 2023. A tonnage reduction of 20% has been applied to the Probable mineral reserves to account for geological uncertainty. A KCl grade downgrade of -10% was applied to the Probable mineral reserves in order to adjust in-situ grades to ROM grades. A mean density of 2.10 g/cc was applied to all mineral reserve volumes to convert to tonnages. Cut-off grade of ≥ 20% KCl and a minimum sylvinite thickness of 1.8m was applied for mineral reserves. The reference point for the discounted cash flow utilized K2O commodity prices (US$) of $418/tonne for 2022, $369/tonne for 2023, $353/tonne for 2024, $324/tonne for 2025, $330/tonne for 2026 and $359 for the remaining LOM. Mineral reserves were proven to be economic based on a positive discounted cash flow.
FLORIDA PHOSPHATES
Our three phosphate production stage mining facilities (South Fort Meade, Four Corners and Wingate) and three exploration properties (DeSoto, Pioneer and South Pasture) in Florida consist of over 210,000 acres of property in central Florida (Table 2.8 and Figure 2.3). We idled the mining and beneficiation activities at South Pasture. The facilities and properties are in DeSoto, Hardee, Hillsborough, Manatee and Polk counties. Even though we continue to add real property to one or more of these locations, most of the property currently being mined or planned for future mining have been in industry ownership for over 50 years. The mining facilities and exploration properties are owned by or have controlling interest granted to Mosaic Fertilizer LLC, South Ft. Meade Land Management or South Ft. Meade Land Partnership, L.P. (“SFMLP”), each a subsidiary of Mosaic.
We either own or have a controlling interest in the mineral rights to the current and future facilities. Mineral and surface rights are joined at the Four Corners, Wingate, Pioneer and South Pasture properties. Portions of the DeSoto property and South Fort Meade facility have the surface and mineral interests severed.
The net book value for our Florida phosphate mining facilities and exploration properties is $1.9 billion as of December 31, 2023.
Table 2.9 lists the land status and acreages for the facilities and properties.
Table 2.8: Property Locations
|
|
|
|
|
|
|
|
|
|
|
| Property |
|
Location |
|
|
| South Fort Meade Facility |
|
Straddles the county line road beginning 1.3 miles (2.1 km) east of the City of Bowling Green and continuing another five miles (8 km). Located at 27.667195 N, 81.761349 W. |
|
|
| Four Corners Facility |
|
Located in southeast Hillsborough County, northeast Manatee County and southwest Polk County. Located at 27.646144 N, 82.087305 W. |
|
|
| Wingate Facility |
|
Most of the property associated with this mine is west of Duette Road and north of State Road 64. There is a portion of this property that exists on the east side of Duette Road that begins approximately three miles (2 km) north of State Road 64. Located at 27.504452 N, 82.132221 W. |
|
|
|
|
|
|
|
| DeSoto Property |
|
This exploration property is bisected by State Road 70 and State Road 72 running east and west and the county line running north and south. A portion of the DeSoto property is owned fee simple and the mining interests on the remaining portion is secured by mineral rights. Located at 27.263018 N, 82.035208 W. |
|
|
| Pioneer Property |
|
This exploration property is bisected by County Road 663 running north and south. Several local roads (Murphy, Bridges, Bennett and Post Plant) cross this parcel. Located at 27.439391 N, 81.940020 W. |
|
|
| South Pasture Property |
|
The property is situated along a 10 mile stretch of State Road 64 and a seven mile stretch along Country Road 663. All parcels are bisected by County Road 663, State Road 62, State Road 64 and several local roads. The mining and beneficiation activities at this location have been idled. Located at 27.585787 N, 81.942888 W. |
|
|
Figure 2.3: Location Plan
The table below includes only land holdings associated with our mining properties.
Table 2.9: Property Status and Acreages
|
|
|
|
|
|
|
|
|
|
|
|
|
|
|
|
|
|
|
|
|
|
|
|
|
|
|
|
|
|
|
|
|
|
|
|
|
|
|
Status (Acres) |
|
|
|
Florida Phosphate Property Status and Acreages
|
|
|
|
|
|
|
|
|
|
Fee Simple |
|
Mining Agreement |
|
Mineral Rights (b) |
|
Lease |
|
Total |
|
|
|
|
|
|
|
|
| South Fort Meade Facility |
15,970 |
|
|
25,528 |
|
(a) |
92 |
|
|
711 |
|
|
42,301 |
|
|
|
|
|
|
|
|
|
| Four Corners Facility |
55,647 |
|
|
— |
|
|
— |
|
|
— |
|
|
55,647 |
|
|
|
|
|
|
|
|
|
| Wingate Facility |
8,761 |
|
|
— |
|
|
— |
|
|
— |
|
|
8,761 |
|
|
|
|
|
|
|
|
|
| DeSoto Property |
24,113 |
|
|
8 |
|
|
18,943 |
|
|
— |
|
|
43,064 |
|
|
|
|
|
|
|
|
|
| Pioneer Property |
26,017 |
|
|
— |
|
|
— |
|
|
— |
|
|
26,017 |
|
|
|
|
|
|
|
|
|
| South Pasture Property |
38,928 |
|
|
— |
|
|
— |
|
|
— |
|
|
38,928 |
|
|
|
|
|
|
|
|
|
| Total |
169,436 |
|
|
25,536 |
|
|
19,035 |
|
|
711 |
|
|
214,718 |
|
|
|
|
|
|
|
|
|
______________________________
(a) The mining agreement relates to the SFMLP which is 100% controlled by Mosaic or its subsidiaries.
(b) All acres include surface rights with the exception of the DeSoto mineral rights.
Governmental permits and approvals for mining are obtained from federal, state and county authorities, including the Environmental Resource Permit (“ERP”) issued by FDEP and permits required by Section 404 of the federal Clean Water Act. In connection with these permits, we are required to develop a reclamation plan with respect to these areas. The ERP is associated with a FDEP-approved reclamation plan that requires “acre for acre and type for type” reclamation to reclaim mined areas. Mitigation may also be required by ERP conditions which may also require conservation easements to provide permanent protection.
The integrated water use permit (“IWUP”) issued by the Southwest Florida Water Management District (“SWFWMD”) in 2012 authorizes the withdrawal of groundwater from underground aquifers through permitted wells to provide potable and production-water supplies in support of mining and other operations. The IWUP addresses all of our active mining operations. A separate water use permit (“WUP”) was issued by SWFWMD for the South Pasture property in 2017. The IWUP and the South Pasture WUP also regulate mine dewatering to avoid adverse impacts to wetlands and offsite properties. Both the IWUP and the WUP are 20 year permits expiring in 2032 and 2037, respectively.
Pre-mining development follows the issuance of regulatory permits. This involves ditch and berm construction for stormwater control, groundwater draw down mitigation where applicable, land clearing, installation of infrastructure and pre-mining dewatering (only for dragline mining).
There are no significant environmental permitting encumbrances, existing or anticipated, associated with the mining facilities and exploration properties. We do not anticipate any future encumbrances based on current known regulations and existing permitting processes. There are no material outstanding violations and fines.
Existing Infrastructure
The three mining facilities are in rural central Florida located southeast of Tampa in Hardee, Hillsborough, Manatee and Polk counties. The sites are located in agricultural zones with associated population centers and easy access to multiple transportation hubs in central Florida. The three exploration properties are located south of the mining facilities. Each will utilize the same water, electrical, railway, and road networks as the active mines.
The mining facilities at South Fort Meade, Four Corners, Wingate and South Pasture commenced operations between 1981 and 1995, as noted below under “History and Exploration”. The phosphate mines have the infrastructure to meet our current production plans and long-range production goals. The current infrastructure includes major roads and highway access, railway support from CSX Transportation and electricity supplied by Duke Energy, TECO, PRECO, Florida Power and Mosaic cogeneration in associated distribution areas. Water supply is from Mosaic-owned deep wells and recycle sources. Current clay and tailings management areas footprints are expected to meet present demands, with additional capacity planned to meet the maximum volume and deposition rates from the 2023 LOM plan. An integrated operations center remotely controls certain functions at our Florida phosphate mines.
Additional infrastructure may be added to increase production reliability or flexibility. The assets currently in place are maintained through a workflow process that focuses on proactive inspections and preventative maintenance, while trying to minimize reactive maintenance. Except for South Pasture, which is currently idled, minimal infrastructure is currently in place at the other exploration properties.
We expect the sites to continue to operate effectively during the LOM while continuing to maintain the built infrastructure and renewing the long-term agreements in place for the site’s water, electricity, and logistics needs.
We focus on reliability-centered maintenance with the goal of extending the life of the majority of assets to align with the LOM plan. We expect that some infrastructure will need to be replaced as it reaches end of life and has been factored into the relevant capital cost requirements.
Phosphate mining in central Florida is a mature industry. A network of suppliers, machine shops, fabricators, and specialty contractors exist to support mining, and post-mining, land reclamation activities. Many large component vendors have branch offices in either Lakeland or Tampa, Florida. Engineering, design, and technical services are readily available in Bartow, Lakeland and Tampa, Florida.
Mining Method
Our mining operations in central Florida extract phosphate using surface mining techniques. The active mines utilize either electric walking draglines or dredges to remove overburden and mine phosphate ore (matrix). Matrix is hydraulically transported via centrifugal pumping systems to the beneficiation plant.
Pre-mining development follows the issuance of regulatory permits. This involves ditch and berm construction for stormwater control, groundwater draw down mitigation where applicable, land clearing, installation of infrastructure and pre-mining dewatering (only for dragline mining).
Development of the mine plan is based on several factors, including geological data, equipment, property boundaries, geotechnical considerations, clay impoundment, reclamation schedule, production (volume and quality) demands, permits (local, state and federal) and third-party agreements, such as agreements with local community groups, neighboring properties or NGO’s which do not materially impair the mine plan. Production is monitored through dragline/dredge monitoring systems, mass-flow instrumentation on slurry pumping systems and pit surveys. In addition to draglines and dredges, heavy mobile equipment is used to support mining activities. While each mine is staffed with Mosaic personnel to handle production and maintenance, contractors are used on an as-needed basis.
Processing Recovery Method
Phosphate matrix mined at the three mining facilities is processed through onsite beneficiation plants. The principal production components of the beneficiation plants consist of a washer, sizing system and flotation plant.
Matrix at each mine is slurried for transport to the beneficiation plant. After receiving matrix, washers separate minerals into four separate material groups. These are debris, pebbles, clay, and under-sized flotation feed. The pebble is one of the final products and the under-sized flotation feed material contains recoverable phosphate rock. The washers separate >1.0 mm phosphate product and the <1.0 mm slurry of liberated clay, sand and phosphate particles. The clay is removed with hydrocyclones and pumped to clay settling areas while the >0.1 mm sand and phosphate move on to the sizing section.
The >0.1 mm sand and phosphate is separated into different size fractions using hydrosizers. An upward flow of water is injected into the hydrosizer that forces the fine particles to rise and overflow the sizer, while the coarse particles gently fall and flow out the sizer’s underflow. The segregated fine and coarse particles are then sent to the flotation plant so the phosphate can be separated from the sand.
The two-step flotation process, rougher flotation and cleaning flotation, is next utilized to separate phosphate from the sand. In the rougher flotation process, the phosphate mineral is recovered using flotation machines by adding fatty acid, oil, soda ash, and sodium silicate. To increase the recovered rougher phosphate grade, a second cleaning flotation process is used to remove the residual sand using amine.
History and Exploration
Table 2.10 lists the important historical dates and events relevant to the mining facilities and exploration properties:
Table 2.10: History
|
|
|
|
|
|
|
|
|
| Date |
|
Event/Activity |
| 1881 |
|
Pebble phosphate discovered along the Peace River south of Fort Meade by Captain J. Francis LeBaron, chief engineer of a detachment of the Engineering Corps, United States Army. |
| 1888 |
|
Phosphate rock first commercially mined along the Peace River. |
| 1977 |
|
Farmland Industries purchased the Pioneer (eastern portion a.k.a. Hickory Creek) property. |
| 1981 |
|
Beker Phosphate Company opened Wingate. |
| 1983 |
|
Four Corners construction was completed. The operation was an equal partnership between IMC and W.R. Grace Corporation. |
| 1985 |
|
Wingate was closed after Beker Phosphate Company filed for bankruptcy. |
| 1985 |
|
Four Corners started production. |
| 1986 |
|
IMC purchased Brewster Phosphates and closed the Lonesome Mine which would later be consolidated into Four Corners. |
| 1986 |
|
Four Corners is idled due to market conditions. |
| 1986 |
|
The DeSoto (also known as Pine Level) property is sold by AMAX Chemical Company to Consolidated Minerals, Incorporated. |
| 1988 |
|
IMC gained 100% control of Four Corners. |
| 1989 |
|
IMC restarted Four Corners. |
| 1990 |
|
Wingate is acquired by Nu-Gulf. |
| 1992 |
|
Wingate is reopened after a joint venture by Nu-Gulf and Royster Industries but closed later that year. |
| 1993 |
|
IMC-Agrico is created by a joint venture between IMC and Agrico Chemical Company (a subsidiary of Freeport McMoRan). |
| 1995 |
|
CF Industries opened and started production at South Pasture. |
| 1995 |
|
Mobil Chemical Corporation opened and started production at South Fort Meade. |
| 1996 |
|
Cargill Fertilizer (later Cargill Crop Nutrition) acquired South Fort Meade. |
| 1996 |
|
DeSoto (a.k.a. Pine Level) and Ona (includes western portion of the Pioneer property) properties are sold by CMI to IMC-Agrico. |
| 1997 |
|
IMC acquired Freeport McMoRan’s share of IMC-Agrico. |
| 1998 |
|
Wingate is reopened. |
| 1999 |
|
Wingate is closed. |
| 2002 |
|
Cargill Crop Nutrition acquired the Pioneer property (eastern portion a.k.a. Hickory Creek) from Farmland-Hydro. |
| 2004 |
|
Cargill Crop Nutrition acquired and reopened the Wingate Facility. |
| 2004 |
|
Mosaic created out of a merger between IMC and Cargill Crop Nutrition. |
| 2005 |
|
Wingate is shutdown. |
| 2006 |
|
The Fort Green site is closed permanently, and the property is consolidated into Four Corners and Wingate. |
| 2008 |
|
Wingate is reopened. |
| 2014 |
|
Mosaic acquired CF Industries’ phosphate business in Florida, which included the South Pasture property. |
| 2018 |
|
South Pasture Facility is idled. |
| 2018 |
|
Ona (western portion) property is consolidated into Four Corners. |
| 2020 |
|
South Fort Meade acquired the Eastern Reserves Phase I. |
| 2022 |
|
South Fort Meade acquired the Eastern Reserves Phase II. |
Geology and Mineralization
The phosphate deposits of Florida are sedimentary in origin and part of a phosphate-bearing province that extends from southern Florida north along the Atlantic coast into southern Virginia. Sedimentary phosphate deposits consist of rock in which the phosphate mineral(s) occur in grains, pellets, nodules, and as phosphate replacement of calcium in the remains of animal skeletal material and excrement.
Florida has phosphate rock distributed along the entire peninsula with varying lateral extents and abundance. There are five phosphate districts recognized in Florida identified as Northern, Northeast, Hardrock, Southeast and Central. The phosphates of Florida occur in sedimentary rocks and are of secondary origin, having been redeposited either by mechanical or chemical action. During deposition, most of the carbonate platform was drowned, and deposition was widespread. The intensity of reworking by marine processes allows some deposits to remain relatively near their origins and contribute to massive deposits while others were transported and winnowed into deposits of nodules, grains and pellets.
All our phosphate deposits are located in the central Florida Phosphate District. The general description of the phosphatic deposits in central Florida consist of two geological facies. The phosphate bearing units are within the Bone Valley Member of the Peace River Formation and the Undifferentiated Member of the Peace River Formation within the South Florida Extension region of the Central District. The deposit characteristics transition from north east to the south west. The major phosphate bearing units in the north east consist of a productive Bone Valley Member with limited production in the Undifferentiated Member. The phosphate bearing units in the south west exhibit limited production in the Bone Valley Member and a productive Undifferentiated Member of the Peace River Formation.
The phosphate stratigraphy consists of 5 to 50 feet (1.5 to 15.2 m) thick, white to brown poorly graded quartz sand with varying abundance of reworked phosphate grains as waste overburden. The economic zone is 13 to 50 feet (4.0 to 15.2 m) thick, with a grade ranging from 27 to 35% P2O5. It consists of tan-gray to gray quartz sands, dark gray to dark gray-blue-green clays and silts with phosphate nodules and pellets present with phosphate grains and clasts predominate. There can be interbedded waste zones of 0 to 15 feet (0.0 to 4.6 m) thick comprised of beds of cream to green barren sandy clay, clays or dense dolomitic clays. The basal units are dark gray to black clays to phosphatic limestone rubble to beds of phosphatic limestone.
Mineral Resource and Mineral Reserve Assumptions and Modifying Factors
The key mineral resource and mineral reserve assumptions and modifying factors are listed in Table 2.11.
Table 2.11: Key Assumptions and Modifying Factors:
|
|
|
|
|
|
|
|
|
|
|
|
|
|
|
| Parameter |
|
Value |
|
TRS Section |
| Supporting Information |
|
Regional geologic studies, 56,411 drill holes and greater than 40 years of mining history. |
|
Section 7 |
| Average total thickness of the phosphate mineralization |
|
13 to 50 feet (4 to 15 m) |
|
Section 6 |
Minimum Concentrate %P2O5 |
|
0.2745 |
|
Section 11 |
Minimum Pebble %P2O5 |
|
18.3 to 22.9% |
|
Section 11 |
Maximum pebble magnesium oxide (“MgO”) cut-off volume |
|
0.025 |
|
Section 11 |
| Maximum Clay Content |
|
40 to 50% |
|
Section 11 |
| Maximum Dragline Mining depth |
|
85 feet (26 m) |
|
Section 11 |
| Maximum dredge mining depth |
|
109 feet (33 m) |
|
Section 11 |
| Production Days per Year |
|
365 days |
|
Section 11 |
| Mining Method |
|
Dredge and dragline mining |
|
Section 13 |
| Production Rate |
|
Approximately 9 to 13 million tonnes per year (2023-2033). |
|
Section 13 |
| Mineral Resource Cut-offs |
|
The cut-offs used to estimate mineral resources by site include, the minimum beneficiation plant concentrate BPL (%P2O5), minimum pebble BPL (%P2O5), maximum pebble magnesium oxide concentration and a maximum clay content cut-off for a logged matrix layer and the composite matrix volume.
|
|
Section 11 |
| Mineral Reserve Cut-off |
|
Cut-off based on productivity factors per site have been applied to estimate mineral reserves. |
|
Section 12 |
| Mining Dilution |
|
15.5 to 21.5% minimum pebble volume dilution and 10.3 to 16.0% minimum concentrate volume dilution. |
|
Section 11 |
| Mineral Resource Impurity Recovery |
|
100% |
|
Section 11 |
| Mineral Reserve Pebble Impurity Recovery |
|
93 to 98% Fe2O3, 97 to 115% aluminum oxide (“Al2O3”), 87 to 100% CaO, 110 to 120% MgO |
|
Section 12 |
| Mineral Reserve Concentrate Impurity Recovery |
|
92 to 96% Fe2O3, 88 to 105% Al2O3, 87 to 100% CaO, 95 to 102% MgO |
|
Section 12 |
| Processing Method |
|
Beneficiation plants at the facilities consisting of washer, sizing and flotation processes. |
|
Section 14 |
| Mineral Resource Beneficiation Plant Recovery |
|
100% |
|
Section 11 |
| Mineral Reserves Beneficiation Plant Recovery |
|
Pebble: 87.8 to 97.2%, Concentrate: 68.5 to 79.5% |
|
Section 12 |
| Deleterious Elements and Impact |
|
Major elements include MgO, pyrite (FeS2) and Al2O3 affecting flotation and filtering processes. |
|
Section 10, 11,12 |
| Environmental Requirements, Permits etc. |
|
No significant environmental permitting encumbrances. |
|
Section 17 |
| Geotechnical Factors (if any) |
|
No concerns. |
|
Section 13 |
| Hydrological or hydrogeological factors (if any) |
|
Water inflow onto mining areas can impact recovery and dilution. |
|
Section 13 |
| Commodity Price |
|
$103/tonne of phosphate rock for 2021 mineral resources and $118/tonne for mineral reserves. |
|
Section 16 |
Mineral Resource Estimates
Mosaic’s phosphate mineral resources are reported as a beneficiation plant product (phosphate rock) tonnage and P2O5 grade, including a total primary impurities ratio (“MER”).
The geological information used to estimate the phosphate mineral resources for the mining facilities and exploration properties is based on drilling and sampling. The mineral resource estimates are completed using a proprietary software that applies specific grade, physical and impurity limits to the raw drill data of the property. These factors are used to select material that contains sufficient grade, limited impurities and is physically extractable to be included in the mineral resource estimate. The confidence and classification of the mineral resources is estimated based on the drill density of the evaluated area.
Mineral resources that are not mineral reserves have not demonstrated economic viability utilizing the criteria and assumptions required.
The methodology for estimating mineral resources consists of interpreting the available geological data to create composites of lithological units that meet the specified criteria. These composites are then mapped to determine the mineral resource boundary. The boundary is then trimmed to account for permit and mine boundary limitations. The composite data is also used to create a geologic model composed of volume, density, grade, and impurity grids created using inverse distance weighted as the interpolation method. Elevation grids are created using triangulation based on LiDAR (Light Detection and Ranging) or survey data assigned to each drill hole. A utility macro is used to adjust elevations to account for holes with no matrix that meets the mine requirements. The data from each grid is then volumetrically combined using product volumes for the specific mineral resource shape and mineral resource classification creating a block of uniform constituents. Estimation of mineralization tonnage, grade and impurities is done by applying the volume weight percent of pebble, feed, and clay for the given mineral resource shape.
Additional details regarding the estimation methodology are listed in Section 11 of the 2022 Florida Phosphate Mining TRS filed as an Exhibit to this Form 10-K.
Table 2.12 lists the total mineral resource estimates. Mineral resources are reported exclusive of the mineral reserves.
Table 2.12: Mineral Resources at the End of the Fiscal Year Ended December 31, 2023 Based on a LOM Plan Phosphate Rock Price of $103 per tonne(a)(b)(c)(d)(f)
|
|
|
|
|
|
|
|
|
|
|
|
|
|
|
|
|
|
|
|
|
|
|
|
|
|
|
|
|
|
|
| (tonnes in millions) |
|
|
|
|
|
|
|
|
|
|
| Category |
|
Tonnes(e) |
|
Grade %P2O5(e) |
|
Cut-off Grade |
|
Metallurgical Recovery % |
|
|
| Measured |
|
102.0 |
|
30.0 |
|
n/a |
|
100 |
% |
|
|
| Indicated |
|
415.0 |
|
30.1 |
|
n/a |
|
100 |
% |
|
|
| Measured + Indicated |
|
517.0 |
|
30.1 |
|
n/a |
|
100 |
% |
|
|
| Inferred |
|
83.0 |
|
30.0 |
|
n/a |
|
100 |
% |
|
|
______________________________
(a)Mineral resources are not mineral reserves and do not meet the threshold for mineral reserve modifying factors, such as estimated economic viability, that would allow for conversion to mineral reserves. There is no certainty that any part of the mineral resources estimated will be converted into mineral reserves.
(b)Mineral resources are reported as mineralization (matrix) tonnage, grade and impurities after beneficiation.
(c)Mineral resources assume dragline mining at all sites except Wingate mine where dredging is assumed.
(d)Mineral resources amenable to a dragline mining method are contained within a conceptual mine pit design using the same technical parameters as used for mineral reserves.
(e)The cut-offs used to estimate mineral resources include: minimum beneficiation plant concentrate BPL (27.45%P2O5), minimum pebble BPL (18.30%P2O5, except 22.88%P2O5 for DeSoto and Pioneer), maximum pebble magnesium oxide concentration and a maximum clay content cut-off for a logged matrix layer, and the composite matrix volume.
(f)A LOM commodity price of $103 per tonne of phosphate rock was used to assess prospects for economic extraction but is not used for cut-off purposes.
The mineral resource estimated tonnage and grades did not change from 2022 to 2023.
Mineral Reserve Estimates
Mosaic’s estimated mineral reserves are located at the South Fort Meade, Four Corners and Wingate mine facilities and are reported as a beneficiation plant product (phosphate rock) tonnage and P2O5 grade including a total MER. Mineral reserves have demonstrated economic viability utilizing the criteria and assumptions required at each phosphate facility and meet all the mining criteria required including, but not limited to mining, processing, metallurgical, infrastructure, economic, marketing, legal, environmental, social, and governmental factors.
The methodology for estimating mineral reserves consists of interpreting the available geological data to create composites of lithological units that meet the specified reserve criteria. A utility macro is used to apply reserve plant volume recoveries, adjust insoluble limits to the geologic model and to adjust elevations grids to account for holes with no matrix that meets the mine requirements. Dragline or dredge pit design work and scheduling are applied to the geologic model by the mine planner. Tonnes, grades and product quality are estimated by applying the mining shapes to the geological model. The data from each grid is then volumetrically combined using product volumes for the specific mine pit shape creating a block of uniform constituents. The recoverable tonnes of pebble and feed for the entire mine pit are calculated based on the area of the mine pit. The beneficiation plant grade recoveries are then applied to the recoverable feed tonnes to estimate the mineral reserves and recoverable concentrate tonnes.
Additional details regarding the estimation methodology are listed in Section 12 of the 2022 Florida Phosphate Mining TRS filed as an Exhibit to this Form 10-K.
The mineral reserve estimates are listed in Table 2.13.
Table 2.13: Mineral Reserves at the End of the Fiscal Year Ended December 31, 2023 Based on a LOM Plan Phosphate Rock Price of $118 per tonne(a)(b)(c)(d)(e)
|
|
|
|
|
|
|
|
|
|
|
|
|
|
|
|
|
|
|
|
|
| (tonnes in millions) |
|
|
|
|
|
|
| Category |
|
Tonnes |
|
Grade
%P2O5
|
|
Metallurgical Recovery % |
| Proven |
|
47 |
|
27.8 |
|
Pebble: 84.9 to 100%, Concentrate: 67.7 to 76.0% |
| Probable |
|
65 |
|
26.8 |
|
Pebble: 84.9 to 100%, Concentrate: 67.7 to 100% |
| Proven + Probable |
|
112 |
|
27.2 |
|
Pebble: 84.9 to 100%, Concentrate: 67.7 to 76.0% |
___________________________
(a)South Fort Meade and Four Corners mineral reserves are mined by a dragline mining method. Wingate mineral reserves are mined by dredge mining.
(b)Cut-off based on productivity factors per site have been applied to estimate mineral reserves. Recoverable finished product tonnes vs. matrix volume mined ranges from 9.4-9.9%. Recoverable finished product tonnes vs. total volume mined is 2.2%,
(c)Mine designs are used to constrain measured and indicated mineral resources within mineable pit shapes.
(d)Only after a positive economic test and inclusion in the LOM plan are the mineral reserve estimates considered and disclosed as mineral reserves.
(e)A commodity price of $118 per tonne of phosphate rock was used to assess the economic viability of the mineral reserves in the LOM.
Mineral Resources and Mineral Reserves Comparison
As of December 31, 2023, we had mineral reserves of 112 million tonnes compared to 126 million in the prior year, resulting in a decrease of 11% for proven reserves. Changes in mineral reserve tonnage from the prior year are the result of mining depletion, re-evaluations and mineral reserve acquisitions.
BELLE PLAINE
The Belle Plaine Facility is in the rural municipality of Pense (No. 160) in the province of Saskatchewan, Canada. It is located north of the TransCanada Highway (Hwy. 1) approximately 32 miles (51 km) west of Regina (Figure 2.4). It is the oldest and largest potash solution mine in the world. Coordinates for the Belle Plaine Facility are +50° 25’ 39.57, -105° 11’ 53.87” +50° 25’ 39.57,” -105° 11’ 53.87”.
We lease 53,133 acres of mineral rights from the Crown under Subsurface Mineral Lease KL 106-R. Table 2.14 lists additional information regarding the lease. Table 2.15 outlines the lease acreage designated by township and section. The lease term is for a period of 21 years from July 2012, with renewals at the Company’s option for additional 21-year periods.
In addition, we own 16,523 acres of mineral rights within the Belle Plaine area as shown in Table 2.16 below. All mineral titles owned or leased by us include “subsurface minerals,” which under The Subsurface Mineral Tenure Regulations, 2015 (Saskatchewan) means “all-natural mineral salts of boron, calcium, lithium, magnesium, potassium, sodium, bromine, chlorine, fluorine, iodine, nitrogen, phosphorus and sulfur, and their compounds, occurring more than 197.0 feet (60.0 m) below the surface of the land”. Other commodities (e.g., petroleum and natural gas, coal, etc.) may be included within mineral rights we lease or own but are not specifically sought after when acquired.
Within the total acreage leased from the Crown or owned by us are parcels of land where we own or lease less than a 100% share of the mineral rights. 100% control by lease or ownership is required for mineral extraction. Acreages currently not mineable for this reason are listed in Table 2.17 below.
There are no significant environmental permitting encumbrances, existing or anticipated in the future, associated with the Belle Plaine Facility. We do not anticipate any future encumbrances based on current known regulations and existing permitting processes. There are no outstanding fines or material violations.
The net book value for Belle Plaine is $0.9 billion as of December 31, 2023.
Figure 2.4: Location Plan
Table 2.14: Mineral Lease
|
|
|
|
|
|
|
|
|
|
|
|
|
|
|
|
|
|
|
|
|
| Crown Lease Number |
|
Type |
|
Area (Ha) |
E |
Expiration Date |
| KL 106-R |
|
Subsurface Mineral Lease |
|
21,501 |
|
|
July 1, 2033 |
Table 2.15: Sections and Acreages Owned by the Crown
|
|
|
|
|
|
|
|
|
|
|
|
|
|
|
| Township/Range |
|
Sections of Mineral Rights Owned by Crown* |
|
Area of Mineral Rights Owned by Crown (acres) |
| 18/21 |
|
2/100 |
|
12 |
| 19/21 |
|
4-13/16 |
|
3,087 |
| 17/22 |
|
4-14/16 |
|
3,118 |
| 18/22 |
|
9-10/16 |
|
6,166 |
| 19/22 |
|
9-6/16 |
|
5,991 |
| 17/23 |
|
9-11/16 |
|
6,201 |
| 18/23 |
|
14-13/16 |
|
9,475 |
| 17/24 |
|
7-1/16 |
|
4,500 |
| 18/24 |
|
18-7/16 |
|
11,813 |
| 18/25 |
|
4-5/16 |
|
2,768 |
| Total |
|
83-2/100 |
|
53,131 |
*Full sections range from 640 acres to 644 acres; total acreage shown above is based on 640 acres per section where actual survey acreage is not available.
Table 2.16: Sections and Acreages of Mosaic Owned Mineral Rights
|
|
|
|
|
|
|
|
|
|
|
|
|
|
|
|
|
|
|
|
|
| Township/Range |
|
Sections of Mineral Rights Owned by Mosaic* |
|
Area of Mineral Rights Owned by Mosaic (acres) |
|
Area of Full Quarter Sections Owned by Mosaic (acres) |
| 17/23 |
|
11-2/16 |
|
7,121 |
|
6,069 |
| 18/23 |
|
7-1/16 |
|
4,831 |
|
4,057 |
| 17/24 |
|
7-11/16 |
|
4,922 |
|
3,526 |
| 18/24 |
|
5-6/16 |
|
3,441 |
|
2,871 |
| Total |
|
31-4/16 |
|
20,315 |
|
16,523 |
*Full sections range from 640 acres to 644 acres; total acreage shown above is based on 640 acres per section where actual survey acreage is not available.
Table 2.17: Partial Mineral Rights Area
|
|
|
|
|
|
|
|
|
|
|
|
|
|
|
| Township/Range |
|
Sections of Crown Mineral Rights Leased by Mosaic, Currently Not Mineable* |
|
Crown Mineral Rights Leased by Mosaic, Currently Not Mineable (acres) |
| 18/22 |
|
1-2/100 |
|
652 |
| 19/22 |
|
1-7/100 |
|
682 |
| 18/23 |
|
38/100 |
|
241 |
| 17/24 |
|
39/100 |
|
250 |
| 18/24 |
|
97/100 |
|
624 |
| Total |
|
3-83/100 |
|
2,449 |
*Full sections range from 640 acres to 644 acres; total acreage shown above is based on 640 acres per section where actual survey acreage is not available.
Existing Infrastructure
The Belle Plaine Facility consists of a mining area and a processing plant. Based on the current mine life, the mineral reserves support mining for 61 years. The processing plant consists of a refinery and cooling pond. The Belle Plaine Facility has the infrastructure in place to meet the current production goals and LOM plan.
The current infrastructure includes major road and highway access, railway support from Canadian National Railway (“CNR”) and Canadian Pacific Railway (“CPR”), SaskPower-supplied electricity, Trans Gas-supplied natural gas and potable and non-potable water supplied from a local fresh water source. The current Tailings Management Area (“TMA”) footprint is designed to support the volume and deposition rates indicated in the 2023 LOM plan.
The main source of water (non-potable) required for production is provided by SaskWater from Buffalo Pound Lake, an 18 mile (29 km) long, 0.6 mile (1 km) wide lake with an average depth of 10 ft. (3 m), located northwest of the mine (Figure 15-1). Buffalo Pound Lake also supplies potable water for the cities of Regina, Moose Jaw and surrounding regions. Water levels are controlled by the SaskWater Security Agency and managed through the Lake Diefenbaker Dam. SaskWater operates a dedicated pumping station located on the south shore of Buffalo Pound Lake near the eastern edge of the lake with capacity of approximately 13,000 US gallons per minute. There are three on duty pumps and a fourth on standby to ensure steady supply. Belle Plaine typically runs two pumps to meet the current water needs with the other pumps providing peaking capacity for future mining. Potable water is supplied for the site from the Buffalo Pound Water Treatment facility that is operated by SaskWater. Belle Plaine also has a tie-in to the potable water line that feeds the City of Regina.
SaskPower provides a portion of the power required to run the Belle Plaine Facility. This power comes in off their main grid that could be fed from any number of power plants, along the highline running north and south along Kalum Road. A total of 138 kV comes into the Belle Plaine substation through overhead lines where it is then stepped down to 13.8 kV using two transformers (28 MVA and 33.3 MVA) to their substation where there is also a 138 kV grounding transformer and a 138 kV gas insulated switchgear lineup. The Belle Plaine Facility generates power from the site powerhouse from two turbine generators. Typically, the total required Belle Plaine power requirement is 90% in-house generated power with the remaining being 10% fed from SaskPower. Belle Plaine does not have the option to send power back to the SaskPower grid.
From the on-site substation, 13.8 kV transformer secondary wires are fed to 13.8 kV switchgear lineup in the Powerhouse to MCC rooms throughout the plant area and mine area. Belle Plaine uses overhead and buried cables throughout the mine area and cable trays in the refinery for the 13.8 kV wires. Belle Plaine owns a 138 kV air disconnect that is tied into SaskPower.
SaskEnergy supplies natural gas to the Belle Plaine Facility. The gas flows from the main lines into a local regulator station situated just north of the administration building and powerhouse. This station takes the high-pressure feed from the main lines and cuts it down through on-site filtration and also does some pre-heating to provide low pressure gas directly to the facility.
There are a variety of local or site roads on or to the Belle Plaine property. These are typically gravel roads. Roads around the processing plant are paved.
CNR and CPR are available to the Belle Plaine Facility to move final product to port. There is a tri party joint operating agreement among Mosaic, CPR and CNR which governs the joint operation and interaction of all parties for freight services at the Mosaic Belle Plaine Facility.
The Belle Plaine Facility is located between the cities of Moose Jaw and Regina, Saskatchewan. Moose Jaw has a population of approximately 34,000 people and is located 17 miles (28 km) west of the Belle Plaine Potash Facility.
The Belle Plaine Facility workforce primarily lives in Regina and Moose Jaw. Belle Plaine Facility personnel are typically trained through a variety of trades programs offered at the Saskatchewan Polytechnic campuses, the University of Regina or the University of Saskatchewan.
The province of Saskatchewan offers a large variety of suppliers for the potash mine operators. The potash industry in Saskatchewan is very mature which makes it easier to attract vendors to support the needs of the various mine sites throughout the province.
Saskatoon and Regina both have large industrial sectors with a variety of machine shops and industrial support services. Some specialty services are provided from the Alberta oil and gas industry.
Supplies are sourced locally, regionally and internationally based on availability or commercial considerations. Lead times and on-hand inventory are balanced to meet the needs of the site.
Mining Method
The Belle Plaine Facility accesses the potash mineral reserves remotely by solution mining the ore. Paired wells are directionally drilled, cased, and cemented to the base of the potash beds and are then connected underground using proprietary potash mining techniques. Solution mining can target extraction of the potash (“KCl”) beds. Current mining practices allow for all three potash beds in the Prairie Evaporite formation to be recovered. Water, or a weaker brine, is injected into the cavern to return a salt saturated and potash rich brine. This fluid is pumped through pipelines from the mining area and sent to the refinery complex as raw feed for further processing. The total life cycle of each cavern is approximately 25 years. Once the potash recovery is exhausted, each cavern is plugged and decommissioned in accordance with local government regulations.
The current production capacity of the Belle Plaine Facility is 3.2 million finished KCl tons/year (2.9 million finished tonnes/year).
Capability is scheduled to ramp up to support a finished tonnage projection of 3.3 million tons (3.0 million tonnes) per year and will do so until drilling is completed in the year 2066 at which point there will be a ramp down in production until 2084.
The 2023 Belle Plaine LOM plan based on mineral reserves has a total mine life of 61 years, ending in 2084.
Processing Recovery Method
The Belle Plaine Facility processing plant receives KCl-NaCl rich brine, known as raw feed, from the mine and achieves KCl recovery through the refinery and cooling pond areas. Well established solubility curves of H2O-NaCl-KCl systems are utilized to monitor the selective dropout of products in the process.
The refinery subjects the raw feed brine from the mining area to changing temperatures and pressures that selectively precipitates the NaCl and then the KCl out of solution in different stages of the process. Selective drop out of NaCl is achieved through two parallel lines of evaporators that heat the brine with steam that is generated on-site through natural gas fired boilers. The heating of the raw feed brine results in water liberation, causing NaCl to concentrate in the brine and then precipitate out of solution. After the brine is conditioned in the evaporator circuit, it is pumped to the thickener area for clarification and then pumped into a crystallizer circuit for KCl recovery. The crystallizer circuit subjects the process brine to a vacuum that allows further boiling, creating a cooling effect on the brine. As the brine cools, the KCl is forced to precipitate out of solution. The solid KCl is withdrawn from the crystallizer vessel as a slurry and pumped to the dewatering and drying area. The brine that overflows the crystallizer circuit, which still contains some dissolved KCl and NaCl, is fed to the cooling pond area for further KCl recovery.
The cooling pond area consists of multiple ponds that are fed with brine from the refinery and with raw feed brine from the mining area. The ponds facilitate atmospheric cooling, which allows KCl to preferentially precipitate out of the brine and then settle to the bottom of the ponds. The cooling pond area contains several KCl dredges that are comprised of a cutter wheel that fluidizes the deposited KCl from the bottom of a cooling pond and a slurry pump that moves the KCl slurry toward the dewatering and drying areas.
The dewatering and drying area removes the bulk of the brine in the slurry through process equipment and then conveys the KCl product into natural gas fired industrial dryers. The dried KCl product is then fed into the sizing area or compaction area for compacting, crushing, and screening processes to achieve product size specifications. Finished product is then conveyed to the on-site storage area, where it is held until being reclaimed, rescreened and shipped off-site, primarily through rail.
Site production is expected to increase to a stabilized 3.0 million tonnes per year until the year 2066, at which time the site will stop drilling new cavities and ramp down production to 2084. The site’s ability to produce at a sustained 3.0 million tonnes per year in future years is backed by a Canpotex proving run in 2016/2017, in which the Belle Plaine Facility achieved a production nameplate of 12,179 tons/day. Total site processing recovery will average approximately 79% throughout the remaining life of the mine and is dependent on sustained drilling activities. Future projections are modeled with mass and energy balance software to predict the future production and recovery capabilities.
History and Exploration
The Belle Plaine Facility started production in 1964, after a period of significant research into solution mining, potash recovery and processing plant construction. Table 2.18 summarizes the important historical dates and events for the Belle Plaine Facility.
Table 2.18: History
|
|
|
|
|
|
|
|
|
| Date |
|
Event/Activity |
| 1928 |
|
Discovery of evaporites in the sedimentary sequence in Saskatchewan. |
| 1956 to 1966 |
|
Pittsburgh Plate Glass completed significant research and development over a decade and published several research papers concerning solution mining and potash recovery. |
| 1960 |
|
A pilot solution mining project located at the current site was constructed, convincing Pittsburgh Plate Glass to develop the first commercial potash solution mining operation in the world based on the pilot plant results. The first exploration well drilled at the Belle Plaine property was Standard Chemical Stony Beach #1 in August 1960. Fourteen additional exploration wells were drilled from August 1960 to June 1968. |
| 1963 |
|
Kalium Chemicals, Ltd, a joint subsidiary of Pittsburgh Plate Glass and Armour and Co. started construction of the original processing plant for a capacity of 0.544 million tonnes annually. The main plant construction consisted of the North and South evaporators (all 8), crystallizers #1 to #4, #1 and #2 compactor systems, #1 to #5 beehive warehouses, loadout building and the office and maintenance buildings. |
| 1964 |
|
Mine and processing plant construction completed and production commences. The first rail car of potash was produced and shipped in August. |
| 1968 |
|
Capacity expansion to 0.9 million tonnes per year. Main assets added included three more crystallizers (#5, #6 and #7), a third cooling tower, a sixth beehive warehouse and a barn style warehouse #7, a fluid bed dryer and filter table and a third boiler. |
| 1980 to 1984 |
|
Two capacity expansions, first to 1.1 million tonnes and the second to 1.5 million tonnes per year. The major assets added included bucket elevators for each product, the fine fluid bed dryer, #4 compactor, reheat system barometric, additional galleries and conveyors to the warehouse (1A), cooling ponds, scrubbers and the Cold Leach Area. |
| 1989 |
|
Belle Plaine Facility sold to Sullivan & Proops (Vigoro). |
| 1990s |
|
Capacity expansion to 2.0 million tonnes per year. Assets added included the K-Life System, #4 Turbo Generator, dual conveyors, conversion of the compaction system and additional compactors installed. |
| 1995 |
|
IMC purchased Belle Plaine. |
| 1998 |
|
The first 2D seismic survey at the Belle Plaine mine site was completed. A total of 160 line km was completed covering an area of approximately 5.4 sq. miles (14 sq. km). |
| 2000 |
|
The first 3D seismic survey at the Belle Plaine Facility was completed, providing critical geological information about the geology of the potash members. This has become a critical tool used to provide confidence in the interpretation of the potash mineralization. |
| 2001 |
|
The 2001 Belle Plaine Facility 3D seismic survey was completed. The survey covered approximately 5 sq. miles (13 sq. km) and was adjacent to and merged with the 2000 survey. This survey program utilized 35 miles (56 km) of source lines and 45 miles (72 km) of receiver lines. |
| 2004 |
|
Mosaic created out of a merger between IMC and Cargill Crop Nutrition. |
| 2005 |
|
The 2005 Belle Plaine Facility 3D seismic survey was completed. The survey covered approximately 4 sq. miles (11 sq. km) and was adjacent to and merged with previous 3D surveys. This survey program utilized 29 miles (47 km) of source lines and 34 miles (55 km) of receiver lines. |
| 2008 |
|
The 2008 3D seismic survey covered approximately 28 sq. miles (72 sq. km) and was adjacent to and merged with previous 3D surveys. This survey program utilized 239 miles (385 km) of source lines and 235 miles (378 km) of receiver lines. |
| 2008 to 2012 |
|
Capacity was expanded to 2.86 million tonnes per year. Assets added the injection wells 3 and 4, reclaim brine system, #4 boiler, process water building, cold leach motor control center room, #5 compaction system, #8 warehouse building, #2 reclaim, reclaim losses system, pond return slurry tank and centrifuge upgrades, rotary dryer #3, #2 loadout system, 37 miles (60 km) of new mine field pipelines, a drilling rig, new substation and replacement of the #4 crystallizer. |
|
|
|
|
|
|
|
|
|
| 2010 |
|
The Pense 3D seismic survey was completed that covered approximately 15 sq. miles (40 sq. km) and was adjacent to and merged with the previous 3D surveys. This survey program consisted of 136 miles (219 km) of source lines and 129 miles (208 km) of receiver lines. |
| 2014 |
|
Plant upgrades included the adding and commissioning of Compaction #6. |
| 2016/2017 |
|
The site’s ability to produce at a sustained 3.0 million tonnes per year in future years was validated through a “proving run” completed in 2016 when the Belle Plaine Facility achieved a proven peak capacity of 3.9 million tonnes per year. |
| 2019 |
|
Plant upgrades were completed, consisting of adding the east thickener and advanced dewatering techniques. |
| 2020 |
|
Two production wells were cored in 2020 to support the grade interpretation and calibration of the gamma geophysical logging system. The recent calibration check has been evaluated by a third party potash consultant to ensure applicability of the method regarding sample quality grade estimation. |
Geology and Mineralization
The intracratonic Elk Point Basin is a major sedimentary geological feature in western Canada and the northwest U.S. It contains one of the world’s largest stratabound potash resources. The nature of this type of deposition is largely continuous with predictable depths and thickness. It is mined at several locations, including Mosaic's Esterhazy Facility.
Potash at the Belle Plaine Facility occurs conformably within Middle Devonian-age sedimentary rocks ranging in thicknesses from approximately 100 to 131 feet (30.0 to 40.0 m) at a depth of approximately 5,345 to 5,740 feet (1,630 to 1,750 m).
The Prairie Evaporite Formation, host to the potash mineralization, is divided into a basal lower salt and an overlying unnamed unit containing three potash-bearing units and one unit containing thin marker beds. In ascending order, the potash horizons in the upper unit are the Esterhazy Member, White Bear Marker Beds, Belle Plaine Member, and Patience Lake Member. Mineralogically, these members consist of sylvite and halite with minor amounts of carnallite (KCl, MgCl2, 6H2O).
The Esterhazy, Belle Plaine, and Patience Lake members underly the Belle Plaine property. Also present are the White Bear Formation marker beds which occur between the Belle Plaine and Esterhazy members but are of insufficient thickness to be minable.
The following is a summary of the key stratigraphic units for the Belle Plaine Facility area:
•Patience Lake Member: The uppermost member of the Prairie Evaporite Formation with potash production potential. Between the top of the Prairie Evaporite and the top of the Patience Lake Member is a 0 to 45 feet (0.0 to 14.0 m) thick unit of halite with clay bands called the Salt Back. The sylvite-rich horizons within the Patience Lake Member are mined using conventional underground mining techniques along a trend from Vanscoy to Lanigan in the Saskatoon area and by solution mining techniques at Belle Plaine.
•Belle Plaine Member: The Belle Plaine Member underlies the Patience Lake Member and is separated from it by a zone of low grade sylvinite. The Belle Plaine Member is mined using solution mining techniques at the Belle Plaine Facility.
•White Bear Formation: The White Bear Formation consists of marker beds that are a distinctive unit of thin interbedded clay, halite, and sylvinite horizons that are not minable due to insufficient thicknesses of only 4.0 to 5.0 feet (1.2 to 1.5 m).
•Esterhazy Member: The Esterhazy Member is separated from the Belle Plaine Member by the White Bear Formation marker beds, a sequence of clay seams, low-grade sylvinite, and halite. The Esterhazy Member is mined using conventional underground techniques at the Esterhazy Facility in southeastern Saskatchewan, and by solution mining techniques at the Belle Plaine Facility.
The mineable potash mineralization at Belle Plaine occurs in the three major potash bearing members, all of which are included in the solution mining. The potash mined at Belle Plaine is a mixture of halite and sylvite and in some parts of the Mining Area, small amounts of carnallite. There are several clay-rich zones that are not recovered in the solution mining process which recovers a concentrate portion of the minerals rather than the entire bed.
When considering the sequence of mining at the Belle Plaine Facility, the following terminology is applied to the beds. This describes the geology in a way that best summarizes the grades that are available for solution mining.
•The Upper Mining Zone consists of beds 38 to 31 of the Patience Lake Member and beds 23 to 21 of the Belle Plaine Member. The Upper Mining Zone is about 90 feet (27.4 m) thick.
•The Salt Stringer is a thin bed of salt located between Beds 31 and 23 in the Upper Mining Zone. The Salt Stringer is approximately 10 feet (3.0 m) thick.
•The Interzonal Salt is a thick bed of salt located between the Lower and Upper Mining Zones.
•The Marker Bed is a small, very rich potash bed located midway through the Interzonal Salt.
•The Lower Mining Zone consists of beds 13, 12 and 11 of the Esterhazy Member. The Lower Mining Zone is approximately 20 feet (6.1 m) thick.
Potash mineralization contains sylvinite: a mixture of the iron oxide-stained halite, sylvite and local carnallite. When present interstitially or as massive pods, carnallite can deteriorate rapidly or be preferentially dissolved. The color of the potash can vary from light orange to deep red rimmed crystals. The mineralization can be locally bedded or massive. The halite and sylvite crystals can range from small to more typically coarse to large which can be attributed to the conditions during deposition as there has been no alteration.
Mineral Resource and Mineral Reserve Assumption and Modifying Factors
The key mineral resource and mineral reserve assumptions and modifying factors are listed in Table 2.19.
Table 2.19: Key Assumptions and Modifying Factors
|
|
|
|
|
|
|
|
|
|
|
|
|
|
|
| Parameter |
|
Value |
|
TRS Section |
| Supporting Information |
|
Regional geologic studies, 700 production wells, seismic surveys and greater than 55 years of mining history from approximately 350 caverns. |
|
Section 7, 11 |
| Average composited total thickness of the potash mineralization amenable to solution mining |
|
102.2 feet (31.1 m) |
|
Section 11 |
| Tonnage Factor |
|
17.2 cu ft./tonne (2,054 kilograms per cubic meter). |
|
Section 11 |
| Average KCl grade from all drilling |
|
30.6% (19.3% K2O) |
|
Section 11 |
| Operating Days per Year |
|
365 days |
|
Section 13 |
| Mining Method |
|
Solution mining from surface installations. |
|
Section 13 |
| Production Rate |
|
3.0 million tonnes per year. |
|
Section 13 |
| Cut-off |
|
No cut-off grade or value based on commodity price is used to estimate mineral resources. This is because the solution mining method used at Belle Plaine mining is not grade selective. |
|
Section 11, 12 |
| Mining Recovery |
|
21.5% |
|
Section 13 |
| External Dilution |
|
None |
|
Section 12 |
| Processing Method |
|
KCl recovered from brine solution. |
|
Section 14 |
| Processing Recovery |
|
79 to 90% |
|
Section 14 |
| Deleterious Elements and Impact |
|
Trace NaCl and MgCl2 |
|
Section 10 |
| Environmental Requirements – Permits, etc. |
|
No significant environmental permitting encumbrances. |
|
Section 17 |
| Geotechnical Factors (if any) |
|
No concerns. |
|
Section 13 |
| Hydrological or Hydrogeological Factors (if any) |
|
No concerns. |
|
Section 13 |
| Commodity Prices |
|
KCl commodity prices of US$325 for mineral reserves. |
|
Section 17 |
| Exchange Rate (US$/C$) |
|
1.32 |
|
Section 17 |
Mineral Resource Estimates
The Belle Plaine Facility mineral resources are reported as in-situ mineralization and are exclusive of mineral reserves. The mineral resources occur in the Esterhazy, Belle Plaine and Patience Lake members. Mineral resources that are not mineral reserves have demonstrated economic viability utilizing the criteria and assumptions required at the Belle Plaine Facility.
Mineral resources that are not mineral reserves have demonstrated economic viability utilizing the criteria and assumptions required at Esterhazy.
The methodology for estimating mineral resources consists of interpreting the available geological data in plan view using AutoCAD 2020 software. The plan is updated to include the current mineral rights status, seismic survey interpretations, the limits of the current mining footprint, known areas (geological anomalies, town sites and other surface infrastructure) that make the mineral resource inaccessible and the planned cluster sites.
Additional details regarding the estimation methodology is listed in Section 11 of the 2021 Belle Plaine Facility TRS.
The mineral resource estimates for the Belle Plaine Facility are listed in Table 2.20.
Table 2.20: Mineral Resources as of December 31, 2023 Based on LOM Plan KCI Price of $325 per tonne(a)(b)(c)(d)(e)(g)(h)
|
|
|
|
|
|
|
|
|
|
|
|
|
|
|
|
|
|
|
|
|
|
|
|
|
|
|
|
|
|
|
|
|
| (tonnes in millions) |
|
|
|
|
|
|
|
|
|
|
| Category |
|
Tonnes |
|
Grade
%K2O
|
|
Grade
%KCl |
|
Cut-off
Grade(f)
|
|
Metallurgical
Recovery |
| Inferred |
|
4,647 |
|
|
19 |
|
31 |
|
n/a |
|
79 to 90% |
___________________________
(a)The mineral resources are reported as in-situ mineralization.
(b)Mineral resources are reported exclusive of those mineral resources that have been converted to mineral reserves.
(c)Mineral resources are not mineral reserves and do not meet the threshold for mineral reserve modifying factors, such as estimated economic viability, that would allow for conversion to mineral reserves. There is no certainty that any part of the mineral resources estimated will be converted into mineral reserves.
(d)Mineral resources assume solution mining.
(e)Mineral resources amenable to a solution mining method are contained within a conceptual cluster and cavern design using the same technical parameters as used for mineral reserves.
(f)No cut-off grade is used to estimate mineral resources. This is because the solution mining method used at the Belle Plaine Facility is not selective. At no point in the cavern development and mining process can a decision be made to mine or not mine the potash mineralization that is in contact with the mining solution. There is no control on what potash grade the mining solution dissolves to make a concentrate that is pumped to surface from the mining caverns for processing.
(g)Tonnages are in US Customary and metric units and are rounded to the nearest million tonnes.
(h)Rounding as required by reporting guidelines may result in apparent summation differences.
There were no changes in the mineral resource estimates from 2022 to 2023.
Mineral Reserve Estimates
The Belle Plaine Facility mineral reserves are reported as in-situ mineralization accounting for all applicable modifying factors. Mineral reserves meet all the mining criteria required at the Belle Plaine Facility including, but not limited to mining, processing, metallurgical, infrastructure, economic, marketing, legal, environmental, social, and governmental factors.
The methodology for estimating mineral reserves consists of solution mining design work and scheduling and the application of mining recovery and unplanned dilution. Additional details regarding the estimation methodology are listed in Section 12 of the 2021 Belle Plaine Facility TRS.
The mineral reserve estimates for the Belle Plaine Facility are listed in Table 2.21.
Table 2.21: Mineral Reserves at the End of the Fiscal Year Ended December 31, 2023 Based on a LOM Plan KCl Price of $325 per tonne(a)(b)(c)(d)(e)(f)
|
|
|
|
|
|
|
|
|
|
|
|
|
|
|
|
|
|
|
|
|
|
|
|
|
|
|
| (tonnes in millions) |
|
|
|
|
|
|
|
|
| Category |
|
KCl Tonnes |
|
Grade
%KCl |
|
Grade
%K2O
|
|
Metallurgical
Recovery % |
| Proven |
|
264 |
|
|
30.6 |
|
19.3 |
|
79 to 90% |
| Probable |
|
388 |
|
|
30.6 |
|
19.3 |
|
79 to 90% |
| Proven + Probable |
|
652 |
|
|
30.6 |
|
19.3 |
|
79 to 90% |
___________________________
(a)Mineral reserves are based on measured and indicated mineral resources only.
(b)All mineral reserves are mined by a solution mining method.
(c)No cut-off grade is used to estimate mineral reserves. This is because the solution mining method used at the Belle Plaine Facility is not selective. At no point in the cavern development and mining process can a decision be made to mine or not mine the potash mineralization that is in contact with the mining solution. There is no control on what potash grade the mining solution dissolves to make a concentrate that is pumped to surface from the mining cavities for processing.
(d)Only after a positive economic test and inclusion in the LOM plan is the mineral reserve estimate included as a mineral reserve.
(e)Tonnages are in US Customary and metric units and are rounded to the nearest million tonnes. The grades are rounded to one decimal place.
(f)A commodity price of US$325/tonne of KCl and a U.S.$/CAD$ exchange rate of 1.32 were used to assess the economic viability of the mineral reserves in the LOM.
Mineral Resources and Mineral Reserves Comparison
As of December 31, 2023, our estimated mineral reserves were 652 million tonnes compared to 663 million as of the prior year-end, resulting in a change of <2% related to our proven reserves. The year-over-year change is due to mining depletion.
ESTERHAZY
The Esterhazy Facility is approximately 10 miles (16 km) to the east of the town of Esterhazy in Saskatchewan, Canada, 56 miles (90 km) southeast of the city of Yorkton and 137 miles (220 km) east of the city of Regina (Figure 2.5). The K1 mill site is located nine miles (14 km) northeast of Esterhazy. The K2 mill site is located 12 miles (19 km) east of Esterhazy. The K3 mine site is located four miles east (six km) of Esterhazy and the K4 mineral resources are located 18 miles northeast of Esterhazy. The geographic coordinates for K1 are latitude 50.726463 N and longitude -101.933506 W. The K2 coordinates are latitude 50.6574 N and longitude -101.8422 W and the K3 coordinates are latitude 50.64623 N and longitude -101.99346 W.
Mosaic, through Mosaic Potash Esterhazy Limited Partnership, a wholly-owned indirect subsidiary of Mosaic, leases 197,920 acres of mineral rights from the Crown under Subsurface Mineral Leases KL 105, KL 126, and KLSA 003. Table 2.22 lists additional information regarding the three Crown leases. Table 2.23 outlines the total acreage of the Crown leases designated by township and range. The lease terms are 21 years, with renewals at our option for successive 21-year periods.
We also own or lease 206,228 acres of freehold mineral rights within the Esterhazy area as shown in Table 2.24 below. All mineral titles owned or leased by Mosaic include the “subsurface mineral” which under The Subsurface Mineral Tenure Regulations (Saskatchewan) means all natural mineral salts of boron, calcium, lithium, magnesium, potassium, sodium, bromine, chlorine, fluorine, iodine, nitrogen, phosphorus and sulfur, and their compounds, occurring more than 60m below the surface of the land. Other commodities (e.g., petroleum and natural gas, coal, etc.) that are not specifically sought after when acquired may be on mineral titles that Mosaic leases or owns.
Within the total acreage leased from the Crown or owned/leased by us are parcels of land where we own or lease less than a 100% share of the mineral rights. To mine these properties, we would need to acquire 100% control either by lease or ownership. Acres currently not mineable for this reason are listed in Table 2.25 below.
There are no significant environmental permitting encumbrances (existing or anticipated in the future) associated with the Esterhazy Facility. Except for royalties, we do not anticipate any future encumbrances based on current known regulations and existing permitting processes. There are no outstanding fines or material violations.
The net book value for Esterhazy is $3.5 billion as of December 31, 2023.
Figure 2.5: Location Plan
Table 2.22: Mineral Lease
|
|
|
|
|
|
|
|
|
|
|
|
|
|
|
|
|
|
|
|
|
| Crown Lease Number |
|
Type |
|
Area (Hectares) |
|
Expiration Date |
| KL 105 |
|
Subsurface Mineral Lease |
|
26,125 |
|
|
November 2, 2044 |
| KL 126 |
|
Subsurface Mineral Lease |
|
28,473 |
|
|
October 25, 2026 |
| KLSA 003 |
|
Subsurface Mineral Lease |
|
25,498 |
|
|
November 18, 2030 |
Table 2.23: Sections and Acreages Owned by the Crown
|
|
|
|
|
|
|
|
|
|
|
|
|
|
|
| Township/Range |
|
Sections of Mineral Rights Owned by Crown* |
|
Area of Mineral Rights Owned by Crown (acres) |
| 19/30 |
|
19-2/16 |
|
12,221 |
| 20/30 |
|
18-1/16 |
|
11,542 |
| 21/30 |
|
18-6/16 |
|
11,753 |
| 22/30 |
|
2-1/16 |
|
1,331 |
| 19/31 |
|
18-1/16 |
|
11,561 |
| 20/31 |
|
19-3/16 |
|
12,265 |
| 21/31 |
|
13-7/16 |
|
8,613 |
| 22/31 |
|
15-15/16 |
|
10,238 |
| 18/32 |
|
5-7/16 |
|
3,471 |
| 19/32 |
|
18-15/16 |
|
12,116 |
| 20/32 |
|
14-11/16 |
|
9,388 |
| 21/32 |
|
17-2/16 |
|
10,970 |
| 22/32 |
|
4-6/16 |
|
2,799 |
| 18/33 |
|
5-12/16 |
|
3,662 |
| 19/33 |
|
10-11/16 |
|
6,850 |
| 20/33 |
|
11-7/16 |
|
7,326 |
| 21/33 |
|
8-5/16 |
|
5,313 |
| 22/33 |
|
1-6/16 |
|
878 |
| 18/1 |
|
15-9/16 |
|
9,969 |
| 19/1 |
|
15-14/16 |
|
10,158 |
| 20/1 |
|
16-7/16 |
|
10,533 |
| 21/1 |
|
14-6/16 |
|
9,207 |
| 22/1 |
|
4-3/16 |
|
2,668 |
| 19A/1 |
|
2-12/16 |
|
1,762 |
| 18/2 |
|
6-1/16 |
|
3,865 |
| 19/2 |
|
4-13/16 |
|
3,083 |
| 19A/2 |
|
1-12/16 |
|
1,130 |
| Total |
|
309-4/16 |
|
194,672 |
*Full sections range from 640 acres to 644 acres; total acreage shown above is based on 640 acres per section where actual survey acreage is not available.
Table 2.24: Sections and Acreages of Mosaic-Owned Mineral Rights
|
|
|
|
|
|
|
|
|
|
|
|
|
|
|
| Township/Range |
|
Sections of Mineral Rights Owned/ Leased by Mosaic* |
|
Area of Mineral Rights Owned/Leased by Mosaic (acres) |
| 19/30 |
|
17-14/16 |
|
11,420 |
| 20/30 |
|
19-7/16 |
|
12,430 |
| 21/30 |
|
18-8/16 |
|
11,822 |
| 19/31 |
|
16-13/16 |
|
10,760 |
| 20/31 |
|
17-13/16 |
|
11,389 |
| 21/31 |
|
23-6/16 |
|
14,954 |
| 22/31 |
|
4-7/16 |
|
2,846 |
| 18/32 |
|
4-15/16 |
|
3,168 |
| 19/32 |
|
18-8/16 |
|
11,843 |
| 20/32 |
|
22-12/16 |
|
14,553 |
| 21/32 |
|
19-12/16 |
|
12,624 |
| 22/32 |
|
4-8/16 |
|
2,868 |
| 18/33 |
|
5-14/16 |
|
3,764 |
| 19/33 |
|
10-6/16 |
|
6,631 |
| 20/33 |
|
9-8/16 |
|
6,087 |
| 21/33 |
|
12-10/16 |
|
8,075 |
| 22/33 |
|
2-3/16 |
|
1,390 |
| 18/1 |
|
2-8/16 |
|
1,583 |
| 19/1 |
|
18-14/16 |
|
12,084 |
| 19A/1 |
|
4-15/16 |
|
3,177 |
| 20/1 |
|
20-8/16 |
|
13,134 |
| 21/1 |
|
21-7/16 |
|
13,707 |
| 22/1 |
|
9-15/16 |
|
6,343 |
| 18/2 |
|
2-9/16 |
|
1,631 |
| 19/2 |
|
10-4/16 |
|
6,579 |
| 19A/2 |
|
2-2/16 |
|
1,365 |
| Total |
|
30-2/16 |
|
206,227 |
*Full sections range from 640 acres to 644 acres; total acreage shown above is based on 640 acres per section where actual survey acreage is not available.
Table 2.25: Partial Mineral Rights Area
|
|
|
|
|
|
|
|
|
|
|
|
|
|
|
| Township/Range |
|
Crown Mineral Rights Leased by Mosaic, Currently Not Mineable (acres)* |
|
Mineral Rights Owned/Leased by Mosaic, Currently Not Mineable (acres)* |
| 21/30 |
|
321 |
|
— |
| 20/31 |
|
80 |
|
— |
| 21/31 |
|
80 |
|
— |
| 22/31 |
|
80 |
|
514 |
| 21/32 |
|
321 |
|
— |
| 21/33 |
|
— |
|
74 |
| 18/1 |
|
150 |
|
— |
| 19/1 |
|
1209 |
|
138 |
| 19A/1 |
|
322 |
|
— |
| 20/1 |
|
221 |
|
— |
| 21/1 |
|
80 |
|
159 |
| 18/2 |
|
160 |
|
— |
| 19/2 |
|
161 |
|
— |
| 19A/2 |
|
61 |
|
— |
| Total |
|
3246 |
|
885 |
*Less than 100% share of a mineral rights parcel.
Existing Infrastructure
The Esterhazy Facility consists of an underground mine and two processing plants that started production in 1962. The mine has an additional expected life, based on mineral reserves of 33 years, to 2054. The Esterhazy Facility has the infrastructure in place to meet the current production goals and LOM plan. The current infrastructure includes: major road and highway access; railway support from CNR and CPR; SaskPower supplied electricity; TransGas and SaskEnergy supplied natural gas; and potable and non-potable water supplied from local fresh water sources. The long-term TMA development plan is being revised to support production at the levels indicated in the LOM plan.
Process and potable water for the K1 mill is provided by three 200 ft (61 m) deep wells drilled into the upper Dundurn aquifer. The K2 mill water supply comes from the Cutarm Creek dam reservoir that is owned and operated by Mosaic. Located 1.5 miles (2.4 km) northeast of the K2 site, the dam forms a reservoir approximately 5.25 miles (8.5 km) long and 650 feet (200 m) wide. K3 mine water is supplied from K2 via a 7.4 mile (11.8 km) long pipeline.
The power to operate the Esterhazy Facility is supplied by the provincial utility, SaskPower. The K1 mill is serviced by a 72 kV line with approximately 36 MVA capacity. The K2 mill has two services at 72 kV and 138 kV respectively, with a combined capacity of 125 MVA. The K3 mine is serviced by a 230 kV line from SaskPower with 140 MVA capacity. Two transformers step down the voltage, each rated at 70 MVA.
TransGas provides an uninterrupted supply of natural gas to the Esterhazy Facility. SaskEnergy also supplies natural gas to a few outlying areas at K2. Esterhazy has regulator stations for the natural gas at each of the sites, with a low-pressure distribution piping network.
The K1 and K2 sites are serviced by the CNR main line, and by spur lines to the CPR. The surrounding area is developed for agriculture with a road network, villages and towns.
Regina International Airport is 140 miles (225 km) by highway west of the Esterhazy mine sites, while Yorkton municipal airport is 55 miles (90 km) to the northwest. The Town of Esterhazy maintains a paved 3,000 feet (914 m) long airstrip, located 8 miles (13 km) southwest of the K1 mill.
The Esterhazy Facility’s workforce lives throughout the area, generally within 62 miles (100 km) of the mine sites. This includes the Russell and Binscarth areas of western Manitoba. Education and healthcare facilities are in Esterhazy, Russell, Melville, and Yorkton.
The province of Saskatchewan offers a large variety of suppliers for the potash mine operators. The potash industry in Saskatchewan is very mature, making it easier to attract vendors to support the needs of the various mine sites throughout the province.
Saskatoon and Regina have large industrial sectors with a variety of machine shops and industrial support services. Some specialty services are provided from the Alberta oil and gas industry.
Supplies are sourced locally, regionally and internationally based on availability or commercial considerations. Lead times and on-hand inventory are balanced to meet the needs of the site.
Mining Method
At Esterhazy, potash is extracted by underground mining using the room-and-pillar method. The average planned extraction quality of the potash ore is 28.4%. Pillars are left in place between mining rooms to support the overlying tock to prevent a failure of the upper rock formations preventing an inflow of brine from any overlying water bearing zones.
The 2023 LOM plan for the Esterhazy Facility includes the K3 mineral reserves and the K4 mineral resources. It is based on an average production rate of 17.5 million tonnes per year based on 365 production days per year.
The K3 mineral reserves production is expected to be at full production in 2024 and is expected to ramp down starting in 2051, with mining anticipated to be completed in 2054.
The K4 mining resources are currently scheduled to start mining in 2051 and is expected to ramp up to full production in 2055 and ending in 2090.
Processing Recovery Method
The Esterhazy Facility’s processing plant consists of two separate mill facilities, designated as K1 and K2. Each mill processes the raw ore feed stock received from the underground mining operations through crushing, separation, screening and compaction unit operations to produce on-grade, saleable product. The plants utilize online grade analyzers to monitor the process as well as routine samples that are analyzed by the onsite lab. The milling can be broken down into two main functions: the wet end separates potash and salt, while the dry end sizes potash for sale.
The wet end of the mill begins with raw ore sizing and crushing to prepare it for the separation processes. In heavy media, the larger size fraction is separated into potash and salt through dense media separation that is driven by differences of buoyancy in salt and potash. Flotation receives the smaller size fraction and has specific reagents added that allow the potash crystals to float while the salt is rejected as tailings material. At K2 there is also a crystallizer circuit that produces potash using solubility, temperature, and pressure differences. Dewatering and drying is the final stage in the wet end, where potash is sent through centrifuges and industrial driers to remove all moisture.
Once the product is dried, it is sent to a screen to separate the right sized material from the over and undersize material for all the different product grades. Oversized material is sent through a crushing circuit to break it down to right sized material. The undersize material is upgraded through compaction to a larger product.
Esterhazy plans to ramp up milling rates once the K3 mine is up to full capacity and then stabilize at a total milling rate to the end of mine life. The differences in final product tonnes will be based on supplied raw ore grade as it varies throughout the mine workings. The site’s ability to produce at the increasing rates being forecasted in the LOM plan are supported by a proving run in 2013, when the Esterhazy plants achieved an annual production nameplate of 5.7 million tonnes overall.
History and Exploration
The Esterhazy Facility K1 started production in 1962 and K2 started production in 1967. Table 2.26 lists the important historical dates and events for Esterhazy.
Table 2.26: History
|
|
|
|
|
|
|
|
|
| Date |
|
Event/Activity |
| 1928 |
|
Discovery of evaporites in the sedimentary sequence in Saskatchewan. |
| 1955 |
|
International Minerals and Chemicals (IMC, Canada) Ltd. acquired >500,000 acre lease in Esterhazy area and started drilling. |
| 1957 to 1962 |
|
IMC Corporation begins shaft sinking at K1. The first official K1 mine production started September at a capacity of 0.9 million tonnes per year. |
| 1965 |
|
K2 TMA Phase I expansion. |
| 1966 |
|
The K1 mine capacity was expanded to 1.5 million tonnes per year. |
| 1967 |
|
The K2 shaft sinking was completed to a capacity of 2.4 million tonnes per year. The first potash production from K2 was in April/May. |
| 1968 |
|
The K2 TMA Phase II expansion was completed. |
| 1974 |
|
K2 mill expansion, heavy media circuit. |
| 1981 |
|
The K2 TMA Phase III expansion was completed. |
| 1985 |
|
Inflow 10B was detected December 29, 1985 in the D400 entry at a point 3.5 miles (5.6 km) southwest of the K2 shaft. Initial inflow was estimated to be 1,000 gpm. Information obtained using seismic surveys allowed for targeted drilling and placement of calcium chloride and various grouts to reduce the inflow to manageable levels. The pumping capacity was increased through a series of stages to bring online a total of 22 pumps, to a maximum capacity of 4,000 gpm. As a result of these efforts, K1 and K2 sites continued normal mining operations. |
| 1987 |
|
Mineral Resource Location Study – Vibroseis Study was completed. |
| 1989 |
|
12 exploration drill holes to delineate the K1 and K2 mining area were completed. |
| 1991 to 1998 |
|
Seismic surveys in the Gerald, Gerald West and Cutarm areas. |
| 1997 |
|
IMC Kalium merged with IMC Global and Freeport-McMorRan. |
| 1999 |
|
Company renamed to IMC Potash. |
| 2000-03 |
|
Seismic surveys: 2D and 3D (K1 and K2). |
| 2004 |
|
Renamed Mosaic because of Merger between IMC Global and Cargill Crop Nutrition. IMC Global and Cargill Crop Nutrition merged to form Mosaic Esterhazy ULC. |
| 2005 |
|
3D seismic surveys completed at K1 (7.5 sq. miles, 19.5 sq. km) and K2 (4.0 sq. miles, 10.3 sq. km). |
| 2006-09 |
|
Various seismic surveys completed. Hoist expansion at K2. Processing plant capacity increased to 4.8 million tonnes per year. K2 TMA expansion completed. Exploration drilling of 10 holes including two shaft pilot holes completed as part of the K3 expansion project. |
| 2010 |
|
Completion of the crushing expansion at K1. |
| 2011 |
|
3D seismic surveys at K1 North (19.7 sq. miles, 51.4 sq. km) and Perrin Lake (14.4 sq. miles, 37.3 sq. km). |
| 2012 |
|
K3 South shaft pre-sink was completed. Esterhazy exits Tolling agreement with PCS. A number of 3D seismic surveys were completed including Saskman, K1 NW, K1 SWD Field. Seven brine injection wells were drilled at Farfield. |
| 2013 |
|
K3 South Shaft sunk to the potash level. 3D seismic survey at Panel 11Q (9.2 sq. km) completed. Completion of mill expansion at K2 for an additional 0.7 million tonnes per year. |
| 2014 |
|
3D seismic survey at Panel 11Q 3C (3.6 sq. miles, 9.3 sq. km) completed. |
| 2015 |
|
3D seismic surveys at Gerald (4.7 sq. miles, 12.1 sq. km) and K3 (89.7 sq. miles, 232.4 sq. km) completed. |
| 2016 |
|
Nine exploration drill holes completed. |
| 2017 |
|
The K3 north shaft sinking was completed and the first K3 ore from the South shaft was skipped to surface and trucked to the K1 mill. |
|
|
|
|
|
|
|
|
|
| 2018 |
|
The K3 to K2 overland conveyor construction was completed. The K3 North shaft steel and Keope hoist rope up were completed. The K3 North shaft first ore skipped in December 18 and trucked to the K2 mill.
The first K2 ore was conveyed on the overland conveyor to the K2 mill in December. |
| 2019 |
|
Commissioned the K3 Koepe production and Blair service hoists. Four drum miners cutting K3 shaft pillar development started. Two four rotor miner assembly completed. The K3 South shaft sinking was completed in November. |
| 2020 |
|
Completion of the South shaft bottom steel, added a third four-rotor miner, installed the Mainline conveyor, added a fourth rotor miner cutting and completed the K3 South Headframe concrete slip. K3 shaft pillar development was completed in December. The K3 fifth four-rotor miner started cutting in October. The first ore from K3 conveyed to K1. |
| 2021 |
|
The sixth K3 four-rotor miner started cutting in January and the seventh four rotor-miner started cutting in May. The K1 and K2 mines were closed 8 months ahead of schedule in response to brine inflow conditions. |
| 2022 |
|
K1 and K2 shaft decommissioning completed. |
Geology and Mineralization
The intracratonic Elk Point Basin is a major sedimentary geological feature in western Canada and the northwest U.S. It contains one of the world’s largest stratabound potash resources. The nature of this type of deposition is largely continuous with predictable depths and thickness. It is mined at several locations, including the Esterhazy Facility.
Potash at the Esterhazy Facility area occurs conformably within Middle Devonian-age sedimentary rocks and is found in total thicknesses ranging from approximately 100 to 131 feet (30 to 40 m) at a depth of approximately 5,345 to 5,740 feet (1,630 to 1,750 m).
The Prairie Evaporite Formation, host to the potash mineralization, is divided into a basal “lower salt” and an overlying unnamed unit containing three potash-bearing units and one unit containing thin marker beds. In ascending order, the potash horizons in the upper unit are the Esterhazy Member, White Bear Marker Beds, Belle Plaine Member, and Patience Lake Member. Mineralogically, these members consist of sylvite and halite, with minor amounts of carnallite (KCl, MgCl2, 6H2O).
In the Esterhazy area, the Esterhazy, White Bear and Belle Plaine members are present, and the Patience Lake member is absent. The following is a summary of the key stratigraphic units for the Esterhazy Facility area:
•Belle Plaine Member: The Belle Plaine Member underlies Second Red Bed and makes up part of the salt back that is critical to isolating the mining horizon from the formations above. The Belle Plaine Member is mined using solution mining techniques at the Belle Plaine Facility and is not mined at the Esterhazy Facility.
•White Bear Member: The White Bear Member consists of marker beds that are a distinctive unit of thin interbedded clay, halite, and sylvinite horizons that are not minable due to insufficient thickness of only 4.0 to 5.0 feet (1.2 to 1.5 m).
•Esterhazy Member: The Esterhazy Member is separated from the Belle Plaine Member by the White Bear Member marker beds, a sequence of clay seams, low-grade sylvinite, and halite. The Esterhazy Member is mined using conventional underground techniques at the Esterhazy Facility in southeastern Saskatchewan, and by solution mining techniques at the Belle Plaine Facility.
The sylvinite intervals within the Prairie Evaporite Formation consist of a mass of interlocked sylvite crystals that range from pink to translucent and may be rimmed by greenish-grey clay or bright red iron insoluble material, with minor halite randomly disseminated throughout the mineralized zones. Local large one inch (2.5 cm) cubic translucent to cloudy halite crystals may be present within the sylvite groundmass, and overall, the sylvinite ranges from a dusky brownish red color (lower grade, 23% to 27% K2O with an increase in the amount of insoluble material) to a bright, almost translucent pinkish orange color (high grade, 30%+ K2O). Carnallite is also present locally in the Prairie Evaporite Formation as a mineral fraction of the depositional sequence. The intervening barren salt beds consist of brownish red, vitreous to translucent halite with minor sylvite and carnallite and increased insoluble materials content.
Mineral Resource and Mineral Reserve Assumptions and Modifying Factors
The key mineral resource and mineral reserve assumptions and modifying factors are listed in Table 2.27.
Table 2.27: Key Assumptions and Modifying Factors
|
|
|
|
|
|
|
|
|
|
|
|
|
|
|
| Parameter |
|
Value |
|
TRS Section |
| Supporting Information |
|
Regional geologic studies, 59 exploration holes, seismic surveys, in-mine channel samples and 50 years of mining history at K1 and K2. |
|
Section 7 |
| Average total thickness of the potash mineralization |
|
8.55 feet (2.6 m)., based on the ratio of 8.5 feet (2.6 m). production panel mining height and 9.0 feet (2.7 m) development mining heights. |
|
Section 11 |
| Density |
|
129.878 lbs./cu ft. (2,080.446 kg/cu m) |
|
Section 11 |
| In-mine channel samples grade |
|
25.9% K2O |
|
Section 11 |
| Operating Days per Year |
|
365 days |
|
Section 13 |
| Mining Method |
|
Underground room and pillar mining. |
|
Section 13 |
| Production Rate |
|
17.527 million tonnes per year. |
|
Section 13 |
| Cut-off |
|
No cut-off grade or value based on commodity price is used to estimate mineral resources. This is because the mining method used at Esterhazy is not grade selective. Potash mineralization is mined on one level by continuous miners following the well-defined and continuous beds of mineralization with relatively consistent grades. |
|
Section 11 |
| Mining Recovery |
|
28.4% |
|
Section 12, 13 |
| External Dilution |
|
0% |
|
Section 12, 13 |
| Processing Method |
|
Two mill facilities that crush, float, screen and compact KCl. |
|
Section 14 |
| Processing Recovery |
|
85 to 88% (86.1% average) |
|
Section 14 |
| Deleterious Elements and Impact |
|
Increased amounts of NaCl can significantly impact production volumes. |
|
Section 10 |
| Environmental Requirements, Permits, etc. |
|
No significant environmental permitting encumbrances. |
|
Section 17 |
| Geotechnical Factors (if any) |
|
No concerns/issues. |
|
Section 13 |
| Hydrological or Hydrogeological Factors (if any) |
|
Undersaturated brines from adjacent aquifers. |
|
Section 13 |
| Commodity Prices |
|
$219/tonne for the economic evaluation of the 2021 mineral resources and $320/tonne for the mineral reserves. |
|
Section 16 |
| Exchange Rate (US$/CAD$) |
|
1.31 for the 2021 mineral resources and 1.32 for the mineral reserves. |
|
Section 16 |
Mineral Resource Estimates
The Esterhazy Facility’s mineral resources are reported as in-situ mineralization and are exclusive of mineral reserves. The mineral resources occur in the Esterhazy, White Bear and Belle Plaine members. The mineralization is assumed to be laterally continuous and consistent, based on publicly available regional geological information and Mosaic's knowledge of the local geology and area.
Mineral resources that are not mineral reserves have not demonstrated economic viability utilizing the criteria and assumptions required at Esterhazy.
The methodology for estimating mineral resources consists of interpreting the available geological data in plan view using AutoCAD 2020 software. The plan is updated to include the current mineral rights status, seismic survey interpretations, the limits of the current mining footprint, known areas (geological anomalies, town sites and other surface infrastructure) that make the mineral resource inaccessible, property boundary pillars, pillars around exploration holes and infrastructure, “no mining” areas in the uncontrolled mineral rights locations and a pillar between the K1 and K2 mining area and the adjacent K4 mineral resource areas.
Additional details regarding the estimation methodology are listed in Section 11 of the 2021 Esterhazy Facility TRS filed as an Exhibit to the 2021 Form 10-K.
The mineral resource estimates for the Esterhazy Facility are listed in Table 2.28.
Table 2.28: Mineral Resources at the End of the Fiscal Year Ended December 31, 2023 Based on a LOM Plan KCl Price of $219 per tonne(a)(b)(c)(d)(e)(g)(h)(i)(j)
|
|
|
|
|
|
|
|
|
|
|
|
|
|
|
|
|
|
|
|
|
|
|
| (tonnes in millions) |
|
|
|
|
|
|
|
|
| Category |
|
Tonnes |
|
Grade
%K2O(f)
|
|
|
|
Metallurgical
Recovery |
| Measured |
|
255.0 |
|
|
23.3 |
|
|
|
86.1 |
| Indicated |
|
2,092.0 |
|
|
22.8 |
|
|
|
86.1 |
| Measured + Indicated |
|
2,347.0 |
|
|
22.9 |
|
|
|
86.1 |
___________________________
(a)The mineral resources are reported as in-situ mineralization and are exclusive of mineral reserves.
(b)Mineral resources have an effective date of December 31, 2023. Mineral resources are reported exclusive of those mineral resources that have been converted to mineral reserves. Unlike mineral reserves, mineral resources do not have demonstrated economic viability, but they do demonstrate reasonable prospects for economic extraction.
(c)Mineral resources are not mineral reserves and do not meet the threshold for mineral reserve modifying factors, such as estimated economic viability, that would allow for conversion to mineral reserves. There is no certainty that any part of the mineral resources estimated will be converted into mineral reserves.
(d)Mineral resources assume an underground room and pillar mining method.
(e)Mineral resources amenable to underground mining method are accessed via shaft and scheduled for extraction based on a conceptual room and pillar design using the same technical parameters as for mineral reserves.
(f)No cut-off grade or value based on commodity price is used to estimate mineral resources. This is because the mining method used at Esterhazy is not grade selective. The potash mineralization is mined on one level by continuous miners following the well-defined and continuous beds of mineralization with relatively consistent grades (Section 11.2).
(g)Tonnages are in US Customary and metric units and are rounded to the nearest million tonnes.
(h)Rounding as required by reporting guidelines may result in apparent summation differences.
(i)%K2O refers to the total %K2O of the sample.
(j)The percent carnallite refers to the mineral associated with potash ore at Esterhazy (KCl.MgCl3.6H2O). It is considered an impurity.
Mineral Reserve Estimates
The Esterhazy Facility’s mineral reserves are reported as in-situ mineralization, accounting for all applicable modifying factors. Mineral reserves meet all the mining criteria required at Esterhazy including, but not limited to mining, processing, metallurgical, infrastructure, economic, marketing, legal, environmental, social and governmental factors.
The methodology for estimating mineral reserves consists of post pillar mine design work and scheduling and the application of mining recovery and unplanned dilution. Additional details regarding the estimation methodology are listed in Section 12 of the 2021 Esterhazy Facility TRS filed as an Exhibit to the 2021 Form 10-K.
The mineral reserve estimates for the Esterhazy Facility are listed in Table 2.29.
Table 2.29: Mineral Reserves at the End of the Fiscal Year Ended December 31, 2023 Based on a LOM Plan KCl Price of $320 per tonne(a)(b)(d)(e)
|
|
|
|
|
|
|
|
|
|
|
|
|
|
|
|
|
|
|
|
|
| (tonnes in millions) |
|
|
|
|
|
|
| Category |
|
Tonnes |
|
Grade
%K2O(c)
|
|
Metallurgical
Recovery % |
| Proven |
|
113.0 |
|
|
23.00 |
|
85.3 |
| Probable |
|
402.0 |
|
|
20.74 |
|
85.3 |
| Proven + Probable |
|
515.0 |
|
|
21.24 |
|
85.3 |
___________________________
(a)Mineral reserves have an effective date of December 31, 2023.
(b)Underground mining standards and design criteria are used to constrain measured and indicated mineral resources within mineable shapes. Only after a positive economic test and inclusion in the LOM plan is the mineral reserve estimate included as mineral reserves.
(c)Tonnages are in US Customary and metric units and are rounded to the nearest million tonnes.
(d)Rounding as required by reporting guidelines may result in apparent summation differences.
(e)%K2O refers to the total %K2O of the samples.
(f)The percent carnallite refers to the mineral associated with potash ore at Esterhazy (KCl.MgCl3.6H2O). It is considered an impurity.
(g)A KCI commodity price of $320 was used to assess economic viability for the mineral reserve for the 2023 LOM plan.
(h)We used a US$/CAD$ exchange rate of 1.32 to assess economic viability for the mineral reserves but was not used for cut-off purposes.
Mineral Resources and Mineral Reserves Comparison
Our mineral reserves decreased overall by 5.2% from 2022 to 2023. Proven reserves increase by 3% while probable reserves decreased 7%. The year over year changes are due to mining depletion, changes in mineral reserve category and increased sterilization of mineral reserves due to unmineable buffer areas.
TAPIRA
Tapira is located in the western portion of the state of Minas Gerais, in the southeast of Brazil, to the north of the town of Tapira, and approximately 22 miles (35 km) south-southeast of the city of Araxá (Figure 2.6). The mine is 261 miles (420 km) by road to the Minas Gerais state capital of Belo Horizonte, via the BR-262 highway to Araxá and then the BR 146 highway to Tapira. The property extends from approximately UTM 7,805,000 N to 7,799,500 N, and from 304,000 E to 310,000 E (Corrego Alegre 1961, UTM Zone 23 South), and is centered approximately at 19º52’S/46º51’W. The Tapira complex consists of a mine and a phosphate beneficiation plant. The plant produces phosphate conventional and ultrafine concentrate, which is sent by pipeline (conventional) and truck (ultrafine) to local Mosaic chemical plants for finished product production.
Figure 2.6: Project Location Plan
Infrastructure
Tapira is located in a highly developed region known as Alto Parnaíba. This region is known for its excellent, modern infrastructure with high standards of living compared with other regions in Brazil. The local infrastructure available to Tapira is excellent, as it is situated within a well-established mining area, 22 miles (35 km) from the well-developed city of Araxá and within 16 miles (25 km) of two other mining operations.
The supply of electricity occurs via a 13.8 kiloVolt (“kV”) transmission line that is operated by CEMIG and Vale Energia Concessionaires. Tapira has a total receipt of 40 megawatts (“MW”) and an annual power usage around 305 gigawatts (“GW”). The main substation receives 13.8 kV in three oil-type transformers which is transferred to secondary substations. From the secondary substations, power is distributed to the end-use areas at 110 volts (“V”), 220 V, 280 V, 440 V, or 4,160 V.
Water intake comes from the Ribeirão do Inferno and artesian wells, as well as recovered water from the tailings dams. Additionally, there are four artesian wells at Tapira. The industrial reuse system used to recover water from the dams includes 10 pumps (four operating and six on stand-by) and 36-inch (91 cm) pipes covering varying distances to the different dam areas. The distance from BR1 dam is approximately six miles (nine km) with a rated capacity of 4,400 cubic meters per hour (“m3/hr”). The distance from BL1 dam is approximately two miles (three km) with a rated capacity of 10,400 m3/hr. The distance from BR dam is approximately 2.5 miles (four km) with a rated capacity of 4,900 m3/hr.
There is currently no rail or airport access at Tapira. The closest rail and airport access is in the city of Araxá.
Infrastructure includes a phosphate beneficiation plant with associated support infrastructure, including tailings storage facilities, maintenance facilities, warehouses, and various administrative and other support facilities. The mine infrastructure includes overburden storage and other material storage facilities, surface water management features and maintenance, warehouses, and other typical support infrastructure.
Tapira includes an impoundment stability monitoring system that covers all the operating impoundments at Tapira.
Network connectivity is in place at the mine buildings and a telephone system provides coverage throughout the mine unit. A radio system provides the ability to dispatch and control the mining equipment and transport trucks as well as communicate with the control room in the beneficiation plant.
Mineral and Surface Rights
Mining rights in Brazil are governed by the Mining Code, Decree 227, dated February 27, 1967, and further regulation enacted by the ANM. This governmental agency, which controls the mining activities throughout Brazil, was recently created as a replacement of the former National Department of Mineral Production (“DNPM”). All sub-soil situated within Brazilian territory is deemed state property, with the mining activities subject to specific permits granted by the ANM.
We currently hold a total of nine mining permits within the Tapira area (3,853 hectares (“ha”)). The Tapira mineral assets are part of a Consortium named Consórcio Vale Fosfértil Tapira created by Decree number 98.962 (February 16, 1990), process number 930.785/1988 (4,355.76 ha) granted to Vale S.A. (previously Vale do Rio Doce S.A.) and Vale Fertilizantes Fosfatados S.A. – Fosfértil.
The Tapira Mining Consortium and all mining permits have transferred from Vale S.A to Mosaic Fertilizantes P&K Ltda.
Tapira has an overall surface rights area of 8,008 ha distributed in 18 different property registrations. The surface area within the ultimate pit is currently mostly controlled by Mosaic. There is a small area near a local village that is not within the current property rights. The relocation of the village and State Highway MG-146 will be necessary to fully realize the LOM tonnages. The area surrounding the village and State Highway MG-146 is currently included in the currently controlled mining permits; and is therefore, not seen as a significant encumbrance to Tapira.
The capacity requirements are not currently in place for all tailings disposal for total LOM capacity requirements. However, Tapira has an ongoing permitting and development plan to support the mining operations that will continue through the LOM requirements.
Present Condition of the Property
The Tapira mine has been in operation since 1978 and is a production stage property.
All required fixed and permanent infrastructure of power, pipelines and primary roadways, and project access are established. Drainage, water controls, and mine access roads and ramps are established for current operations and will be expanded and continued as the pit progresses through its planned life of operations.
The ore at Tapira is recovered using open-pit conventional truck and shovel mining methods, due to the proximity of the ore to the surface and the physical characteristics of the deposit. The ore is transported via truck to a homogenization pile where it is later fed to the beneficiation plant via conveyors. The beneficiation plant produces phosphate conventional and ultrafine concentrate which is sent by pipeline (conventional) and truck (ultrafine) to local Mosaic chemical plants for finished product production.
The mining equipment at Tapira is leased and therefore not owned by us. The beneficiation plant has been in operation since Tapira started 44 years ago. The tailings dams, water dams and sedimentation ponds have been active at Tapira since mining started 44 years ago as well. Currently the BR1 dam is being raised to its final design height to accommodate the LOM plan.
The total book value for Tapira is R$1.7 billion (US$351 million with exchange rate of 1 US dollar = 4.8413 Brazilian Real) as of December 31, 2023.
Exploration activities are ongoing for in-fill drilling for phosphate production to complete the current LOM. Additional areas of exploration and research include better understanding the non-weathered material and titanium ore for future mining prospects.
History of Previous Operations
Tapira has been in operation since 1978 and has produced more than 70 million tonnes (“Mt”) of phosphate concentrate. Since 1978, Titanium Dioxide (TiO2) bearing material, mainly in the form of anatase, has been stockpiled, with more than 200,000 tonnes awaiting the implementation of an economical beneficiation method.
The geological structure of the alkaline complex of Tapira was first recognized in 1953, through magnetometric and radiometric investigations carried out by the Brazil-Germany Project. There was an agreement between the two countries to carry out regional geophysical aero-survey programs, performed by the Geological Survey of Brazil in the 1950s, 1960s, and 1970s.
In 1968, three major private groups – Pedro Maciel, Companhia Meridional de Mineração, and Companhia Brasileira de Metalurgia e Mineração – had exploration research requests granted by DNPM. In early1971, Vale (previously known as Companhia Vale do Rio Doce) joined Pedro Maciel to create the company Titan International S.A., which changed its name to Rio Doce Titânio in later years. Vale acquired the rights of Pedro Maciel at the end of 1971, with the mining rights incorporated into the company Mineração Rio Paranaíba. At the time, a series of intensive and detailed systematic works were undertaken, and important occurrences of phosphate, titanium, niobium, rare earths, and vermiculite were identified.
Extensive exploration works were undertaken between 1971 and 1973, with particular focus on the occurrences of titanium. From 1973 to 1977, the exploration priorities changed to occurrences of phosphate, with the aim of replacing the massive imports of fertilizers in the agricultural sector that was then undergoing a period of expansion in Brazil. In 1977, the Fosfértil (Fertilizantes Fosfatados S.A.) company was created under the administration of Petrofértil (a subsidiary of Petrobras, the Brazilian state oil company). In 1992, Fosfértil was privatized, and a pool of investors held the company shares.
In 2010, Vale S.A. acquired complete control of Fósfertil and after created a new company, Vale Fertilizantes S.A., which included other fertilizer assets. At the start of 2018, Mosaic Fertilizantes P&K S.A. acquired the assets of Vale Fertilizantes including the Tapira mineral deposit.
Mineral Resources and Mineral Reserves
The regional and local geology, mineral resources, and mineral reserves are detailed in the sub-sections below.
Regional and Local Geology
The Tapira phosphate deposit is part of a series of Late-Cretaceous, carbonatite-bearing alkaline ultramafic plutonic complexes belong to the Alto Paranaiba Igneous Province. The Tapira igneous rocks intrude the phyllites, schists, and quartzites of the Late-Proterozoic Brasília mobile belt. The Tapira igneous complex is roughly elliptical, 35 square kilometers (“km2”) in area and consists predominantly of alkaline pyroxenite rocks with subordinate carbonatite, serpentinite (dunite), glimmerite, syenite, and ultramafic potassic dikes.
The tropical weathering regime prevailing in the region and the inward drainage patterns developed from the weathering-resistant quartzite margins of the dome structures resulted in the development of an extremely thick soil cover in most of the complexes. The extreme weathering process was responsible for the residual concentration of apatite. The main geological types identified in the deposit are a combination of the igneous protoliths (bebedourites, phoscorites, and carbonatites) and the products of the weathering process.
Mineral Resources
The mineral resources at Tapira were estimated based on the long-standing exploration drilling and sampling completed at Tapira since 1967. The drilling results were loaded into the geological database, verified, and vetted for errors, and then used in the geological model to create the lithology and weathering surfaces. The geological model was used in creating the block model, where geological domains based on the lithology and weathering surfaces were utilized to interpret grade, density, and mass recovery in a geologically appropriate manner. Exploratory Data Analysis and geostatistical analysis were completed on the raw and composite data sets to help define interpolation parameters and mineral resource classifications. The mineral resources were restricted based on an optimized pit limit that took into account cut-off grade, price, mining costs, infrastructure limitations, and mineral licenses. The mineral resources are exclusive of mineral reserves and include approximately 69.7 Mt of measured and indicated mineral resources with a P2O5ap grade of 8.7%. There are an additional 180.8 Mt of inferred mineral resources with a P2O5ap grade of 9.2% (Table 2.30).
Table 2.30: Mineral Resources at the End of the Fiscal Year Ended 2023 Based on R$ 1,939.57/tonne of Phosphate Concentrate(a)(b)(c)(d)
|
|
|
|
|
|
|
|
|
|
|
|
|
|
|
|
|
|
|
|
|
| (tonnes in millions) |
|
|
|
|
|
|
| Category |
|
Tonnes |
|
Grade (%P2O5ap) |
|
Metallurgical Recovery (%P2O5ap) |
| Measured |
|
16.5 |
|
8.6 |
|
42.4 |
| Indicated |
|
53.2 |
|
8.7 |
|
44.0 |
| Measured + Indicated |
|
69.7 |
|
8.7 |
|
43.6 |
| Inferred |
|
180.8 |
|
9.2 |
|
58.6 |
___________________________
(a)Additional details are described in the TRS filed as an Exhibit to this Form 10-K.
(b)Mineral resources are reported exclusive of mineral reserves. Mineral resources are not mineral reserves and do not meet the threshold for mineral reserve modifying factors, such as estimated economic viability, that would allow for conversion to mineral reserves. There is no certainty that any part of the mineral resources estimated will be converted into mineral reserves.
(c)Grades are P2O5ap, which represents the P2O5 associated with apatite and was calculated by the evaluation of the CaO / P2O5 ratio. Where CaO / P2O5 ratio was greater than or equal to 1.34, P2O5ap was equal to the total of P2O5; where the CaO / P2O5 ratio was less than 1.35, P2O5ap was equal to the CaO / 1.35 ratio.
(d)Mineral resource tonnages and grade are stated in-situ and exclusive of mineral reserves. Cut-off grade of P2O5ap ≥ 5.0% and 0.9 ≤ Ratio of CaO to P2O5 (RCP) ≤ 3.0 was applied to mineral resources. Measured, indicated and inferred blocks were included in mineral resource estimates if they were inside mining concessions and exploration permits with a final report approved by ANM, but exclusive of physical structures such as the crusher and waste piles. A revenue factor of 1.0 with sales price of R$1,939.57 per tonne of phosphate concentrate (2023 price evaluation) was used to develop the mineral resource pit shell.
Mineral Reserves
A mineral reserve estimate has been prepared for Tapira. Mineral reserves are limited by the Tapira property boundary, and the ultimate pit designed for the LOM plan, which was limited with an economic optimized pit analysis.
The mineral reserve estimate includes mining modifying adjustments for mining ore recovery, mining dilution, and ore concentration recovery factors. The mineral reserve estimate is limited to a cut-off grade of 5.0% P2O5ap, as well as certain geometallurgical beneficiation criteria, including:
a.Diluted ratio of CaO to P2O5 (RCP) between 0.9 and 3.0
b.Within one of the four mineralized domains characterized by lithology and alteration
The beneficiation plant generates conventional (coarse) and ultrafine concentrates from the Tapira ore. The mass recovery of coarse concentrate is forecast based on the results of laboratory flotation tests performed on drill core samples. The mass recovery of coarse concentrate is predicted based on a mass recovery regression equation as a function of the ROM Fe2O3, CaO and P2O5 chemical compositions.
The metallurgical recovery is calculated from the mass recovery, the concentrate % P2O5, and the ROM % P2O5 according to the following equation:
Metallurgical recovery = 100 x Mass recovery x Concentrate % P2O5 / ROM % P2O5
The annual production estimates were used to determine annual estimates of capital and operating costs. All cost estimates were in Brazilian real 2023 R$ terms. Total capital costs included R$4.5 billion of sustaining capital and opportunity costs. Annual operating costs were based predominantly on historical consumption factors and unit costs. They included costs for ongoing, final reclamation, and closure. Annual total cost of rock production varied from R$320 per concentrate tonne to R$480 per concentrate tonne, with an average total cost of production for a tonne of phosphate rock concentrate at R$402.
For the purpose of reporting for our total financial statistics, the discounted cash flow was converted from Reals to U.S. dollars at an exchange rate of R$4.86 = US$1.00.
Because Tapira is a captive operation supplying rock to other Mosaic-owned chemical plants, there is no transparent mined phosphate rock commodities price market in Brazil. Mineral reserves for Tapira were estimated based on an internal transfer price. This internal transfer price was set as a constant number of US$111.76 per tonne (R$543.17 per tonne).
The Tapira mineral reserve, as of December 31, 2023, is estimated to be 443.6 Mt ROM (dry), with a dry grade of 9.0% P2O5ap delivered to the concentrator plant and 67.7 Mt (dry) concentrated phosphate tonnes at 34.7% P2O5 post-concentration process plant. This includes (Table 2.31):
a.131.7 Mt of Proven Mineral Reserve at a 9.5% P2O5ap dry grade, resulting in 19.7 Mt of concentrate with a 34.6% P2O5 post beneficiation plant; and
b.311.9 Mt of Probable Mineral Reserve with a 8.9% P2O5ap dry grade, resulting in 48.0 Mt of concentrate at 34.7% P2O5.
Table 2.31 Mineral Reserves at the End of the Fiscal Year Ended 2023 Based on R$1,939.57/tonne of Phosphate Concentrate(a)(b)(c)(d)(e)
|
|
|
|
|
|
|
|
|
|
|
|
|
|
|
|
|
|
|
|
|
| (tonnes in millions) |
|
|
|
|
|
|
| Category |
|
Tonnes (Dry) |
|
Grade
(%P2O5ap Dry)
|
|
Metallurgical Recovery (%P2O5) |
| Proven |
|
131.7 |
|
9.1 |
|
55.6 |
| Probable |
|
311.9 |
|
8.9 |
|
58.8 |
| Proven + Probable |
|
443.6 |
|
9.0 |
|
57.8 |
___________________________
(a)Additional details are described in the TRS filed as an Exhibit to this Form 10-K.
(b)Mineral reserves are within measured and indicated mineral resource limits.
(c)Only after a positive economic test and inclusion in the LOM plan is the mineral reserve estimate included as a mineral reserve.
(d)Grades are P2O5ap, which represents the P2O5 associated with apatite and was calculated by the evaluation of the CaO / P2O5 ratio. Where CaO / P2O5 ratio was greater than or equal to 1.34, P2O5ap was equal to the total of P2O5; where the CaO / P2O5 ratio was less than 1.35, P2O5ap was equal to the CaO / 1.35 ratio.
(e)Mineral reserve tonnages and grade are stated as ROM tonnages. The mineral reserves are constrained by a pit design that honors site specific geotechnical designs by pit sector. The mine plan considers constraints required for surface and groundwater management, appropriate extraction methodology, labor and equipment requirements, beneficiation plant mass and metallurgical recoveries, and are dependent upon all permits and environmental licenses in place and continued approved status. The reference point for cut-off grade and pit optimization analysis is tonnes of concentrate at a price of R$1,939.57/tonne concentrate (2023 price evaluation). Cut-off grade of P2O5ap ≥ 5.0% and 0.9 ≤ RCP ≤ 3.0 was applied to mineral reserves. Mineral reserves were proven to be economic based on internal transfer price that was derived in the discounted cash flow and compared to the gross margin available.
Mineral Resources and Mineral Reserves Comparison
The comparison of the Mineral Resources as of December 31, 2022 and December 31, 2023 can be found in Table 2.32. The Measured and Indicated Mineral Resources have decreased by 46%, while the Inferred Resources have increased by 60% since December 31, 2022.
Table 2.32: Mineral Resources Comparison
|
|
|
|
|
|
|
|
|
|
|
|
|
|
|
|
|
|
|
|
|
|
|
|
|
|
|
|
|
|
|
|
|
| (tonnes in millions) |
|
December 31, 2023 |
|
December 31, 2022 |
|
Percent Difference |
| Category |
|
Tonnes |
|
Grade (%P2O5ap) |
|
Tonnes |
|
Grade (%P2O5ap) |
|
|
| Measured |
|
16.5 |
|
8.6 |
|
62.8 |
|
8.0 |
|
|
| Indicated |
|
53.2 |
|
8.7 |
|
67.0 |
|
7.8 |
|
|
| Measured + Indicated |
|
69.7 |
|
8.7 |
|
129.8 |
|
7.9 |
|
-46 |
% |
| Inferred |
|
180.8 |
|
9.2 |
|
112.8 |
|
8.6 |
|
60 |
% |
The comparison of the Mineral Reserves as of December 31, 2022 and December 31, 2023 can be found in Table 2.33. The Mineral Reserves have decreased in tonnage by 3% from the December 31, 2022 estimate due to mining depletion as well as an updated mine plan and economic analysis. This change is not considered a material change.
Table 2.33: Mineral Reserves Comparison
|
|
|
|
|
|
|
|
|
|
|
|
|
|
|
|
|
|
|
|
|
|
|
|
|
|
|
|
|
|
|
|
|
| (tonnes in millions) |
|
December 31, 2023 |
|
December 31, 2022 |
|
Percent Difference |
| Category |
|
Tonnes |
|
Grade (%P2O5ap) |
|
Tonnes |
|
Grade (%P2O5ap) |
|
|
| Proven |
|
131.7 |
|
9.1 |
|
182.7 |
|
9.4 |
|
|
| Probable |
|
311.9 |
|
8.9 |
|
274.6 |
|
9.1 |
|
|
| Proven+Probable |
|
443.6 |
|
9.0 |
|
457.3 |
|
9.2 |
|
-3 |
% |
REGULATION S-K 1300 INTERNAL CONTROLS DISCLOSURE
Qualified persons, including third parties and Mosaic employees, are responsible for estimating mineral resources and reserves. Mosaic has a Global Review Team, consisting of a broad spectrum of internal personnel outside the operating organization whose primary responsibilities include review of the mineral resources and reserves estimation reporting for compliance with SEC rules and regulations. The Global Review Team includes members from Mosaic’s accounting, finance, business units and legal departments. Reports prepared by qualified persons and third parties are reviewed at various levels of the Global Review Team before they are ultimately reviewed and approved by our senior leadership team. In future years, Mosaic expects to modify and streamline our S-K 1300 processes and internal controls.
Item 3. Legal Proceedings.
We have included information about legal and environmental proceedings in Note 23 of our Notes to Consolidated Financial Statements. That information is incorporated herein by reference.
We are also subject to the following legal and environmental proceedings in addition to those described in Note 23 of our Consolidated Financial Statements included in this Form 10-K:
Countervailing Duty Orders. In April 2021, the U.S. Department of Commerce (“DOC”) issued countervailing duty (“CVD”) orders on imports of phosphate fertilizers from Morocco and Russia, in response to petitions filed by Mosaic. The purpose of the petitions was to remedy the injury to the U.S. phosphate fertilizer industry caused by imports that benefit from unfair foreign subsidies, and thereby restore fair competition. CVD orders normally stay in place for at least five years, with possible extensions. Moroccan and Russian producers have initiated actions at the U.S. Court of International Trade (“CIT”) seeking to overturn the orders. Mosaic has also made claims contesting certain aspects of DOC’s final determinations that, we believe, failed to capture the full extent of Moroccan and Russian subsidies. These litigation challenges remain underway. Most recently, in July and September 2023, the CIT issued three remand rulings – one addressing DOC’s determination in the CVD investigation of phosphate fertilizers from Russia, one addressing DOC’s determination in the CVD investigation of phosphate fertilizers from Morocco, and one addressing the U.S. International Trade Commission’s determination in antidumping and countervailing duty investigations of phosphate fertilizers from Russia and Morocco – instructing the agencies to reconsider certain aspects of the rulings that were the basis for issuing the CVD orders.
When a CVD order is in place, DOC normally conducts annual administrative reviews, which establish a final CVD assessment rate for past imports during a defined period, and a CVD cash deposit rate for future imports. In November 2023, DOC announced the final results of the first administrative reviews for the CVD orders on phosphate fertilizers for Russia and Morocco, covering the period November 30, 2020 to December 31, 2021. DOC calculated new subsidy rates of 2.12% for Moroccan producer OCP and 28.50% for Russian producer PhosAgro. These determinations are subject to appeal to the CIT. DOC is also conducting administrative reviews covering the period January 1, 2022 to December 31, 2022. The applicable final CVD assessment rates and cash deposit rates for imports of phosphate fertilizer from Morocco and Russia could change as a result of these various proceedings and potential associated appeals, whether in federal courts or at the World Trade Organization.
The South Pasture Mine – Hardee County Enforcement Action. On January 8, 2020, Hardee County issued a Notice of Violation (“NOV”) for Mosaic’s delay in meeting the required reclamation schedule for two designated reclamation units within the South Pasture Mine. The delay resulted from idling the South Pasture beneficiation plant in 2018; because the plant was idled, no sand was available for reclamation activities.
Acting on Mosaic’s “Application for Waiver and Reclamation Schedule Extension,” in May 2020, the Hardee County Board of County Commissioners approved: (1) a waiver of the applicable reclamation deadlines of the South Pasture Development Order and Land Development Code; (2) an alternative reclamation schedule; and (3) a settlement agreement that resolved the NOV. Mosaic timely paid the civil penalty required by the settlement agreement and continues to implement the approved alternative reclamation schedule, as required. Monitoring programs are in place to ensure continued compliance with the Waiver and settlement agreement.
Cruz Litigation. On August 27, 2020, a putative class action complaint was filed in the Circuit Court of the Thirteenth Judicial Circuit in Hillsborough County, Florida against our wholly-owned subsidiary, Mosaic Global Operations Inc., and two unrelated co-defendants. The complaint alleges claims related to elevated levels of radiation at two manufactured housing communities located on reclaimed mining land in Mulberry, Polk County, Florida, allegedly due to phosphate mining and reclamation activities occurring decades ago. Plaintiffs seek monetary damages, including punitive damages, injunctive relief requiring remediation of their properties, and a medical monitoring program funded by the defendants. On October 14, 2021, the court substantially granted a motion to dismiss we filed late in 2020, with leave for the plaintiffs to amend their complaint.
On November 3, 2021, plaintiffs filed an amended complaint and in response, Mosaic filed a motion to dismiss that complaint with prejudice on November 15, 2021. On December 23, 2021, plaintiffs opposed that motion and Mosaic replied to that opposition on January 26, 2022. On April 6, 2022, the court heard argument on the motions to dismiss filed by Mosaic and each other co-defendant. In late March 2023, the court denied Mosaic's motions to dismiss, and discovery now is underway.
We intend to continue to vigorously defend this matter.
Faustina Plant Risk Management Plan. On September 14, 2022, EPA Region 6 issued a Notice of Potential Violation and Opportunity to Confer (“NOPVOC”) regarding compliance of our Faustina Plant with Section 112(r) of the Federal Clean Air Act and 40 C.F.R. Part 68, commonly known as the Risk Management Plan Rule (“RMP Rule”). The NOPVOC relates to a compliance evaluation inspection conducted by the EPA at the Faustina Plant from February 22-25, 2022 and alleges violations of the RMP Rule. We conferred with the EPA regarding the allegations in the NOPVOC on November 30, 2022. We negotiated a Consent Agreement and Final Order (“CAFO”) with the agency that was filed on January 30, 2024. The CAFO requires a penalty payment of $217,085 and the completion of two supplemental environmental projects: (1) installation of ammonia monitors and monitoring at the plant for a period of two years and (2) donation of two generators to the St. James Parish Department of Emergency Preparedness.
Item 4. Mine Safety Disclosures.
Information concerning mine safety violations or other regulatory matters required by Section 1503(a) of the Dodd-Frank Wall Street Reform and Consumer Protection Act and Item 104 of Regulation S-K is included in Exhibit 95 to this report.
PART II.
Item 5. Market for Registrant’s Common Equity, Related Stockholder Matters and Issuer Purchases of Equity Securities.
We have included information about the market price of, dividends on and the number of holders of our common stock under “Quarterly Results (Unaudited)” in the financial information that is incorporated by reference in this Form 10-K in Part II, Item 8. “Financial Statements and Supplementary Data”.
The principal stock exchange on which our common stock is traded is The New York Stock Exchange under the symbol “MOS”.
The following provides information related to equity compensation plans:
|
|
|
|
|
|
|
|
|
|
|
|
|
|
|
|
|
|
|
|
|
| Plan category |
|
Number of shares to be
issued upon exercise of
outstanding options,
warrants and rights (a)
|
|
Weighted-average
exercise price of
outstanding options,
warrants and rights (b)
|
|
Number of shares remaining
available for future issuance
under equity compensation plans
(excluding shares reflected
in first column) |
| Equity compensation plans approved by stockholders |
|
3,766,769 |
|
|
$ |
34.46 |
|
|
17,924,996 |
|
| Equity compensation plans not approved by stockholders |
|
— |
|
|
— |
|
|
— |
|
| Total |
|
3,766,769 |
|
|
$ |
34.46 |
|
|
17,924,996 |
|
______________________________
(a)Includes grants of 596,216 stock options, 1,485,573 time-based restricted stock units and 1,684,980 total stockholder return (“TSR”) performance units settled in stock. The total does not include cash-settled TSR performance units. For purposes of the table above, the number of shares to be issued under a performance unit award reflects the maximum number of shares of our common stock that may be issued pursuant to such performance award. The actual number of shares to be issued under a TSR performance unit award will depend on the change in the market price of our common stock over a three-year vesting period, with no shares issued if the market price of a share of our common stock at the vesting date plus dividends thereon is less than 50% of its market price on the date of grant and the maximum number issued only if the market price of a share of our common stock at the vesting date plus dividends thereon is at least twice its market price on the date of grant.
(b)Includes weighted average exercise price of stock options only.
Pursuant to our equity compensation plans, we have granted and may in the future grant employee stock options to purchase shares of common stock of Mosaic for which the purchase price may be paid by means of delivery to us by the optionee of shares of common stock of Mosaic that are already owned by the optionee (at a value equal to market value on the date of the option exercise). During the period covered by this report, no options to purchase shares of common stock of Mosaic were exercised for which the purchase price was so paid.
The following table sets forth information with respects to shares of our Common Stock that we purchased under the repurchase programs during the quarter ended December 31, 2023:
|
|
|
|
|
|
|
|
|
|
|
|
|
|
|
|
|
|
|
|
|
|
|
|
|
|
|
| Period |
|
Total number of shares purchased |
|
Average price paid per share |
|
Total number of shares purchased as part of a publicly announced program |
|
Maximum approximate dollar value of shares that may yet be purchased under the program(a) |
| Common Stock |
|
|
|
|
|
|
|
|
| October 1, 2023- October 31, 2023 |
|
1,416,915 |
|
|
$ |
35.29 |
|
|
1,416,915 |
|
|
$ |
1,267,818,328 |
|
| November 1, 2023- November 30, 2023 |
|
1,444,352 |
|
|
34.62 |
|
|
1,444,352 |
|
|
1,217,818,369 |
|
| December 1, 2023- December 31, 2023 |
|
1,378,073 |
|
|
36.28 |
|
|
1,378,073 |
|
|
1,167,818,473 |
|
| Total |
|
4,239,340 |
|
|
$ |
35.38 |
|
|
4,239,340 |
|
|
$ |
1,167,818,473 |
|
(a) At the end of the month shown.
Item 6. Reserved.
Item 7. Management’s Discussion and Analysis of Financial Condition and Results of Operations.
The Management’s Discussion and Analysis of Financial Condition and Results of Operations listed in the Financial Table of Contents included in this report is incorporated herein by reference.
Item 7A. Quantitative and Qualitative Disclosures about Market Risk.
We have included a discussion about market risks under “Market Risk” in the Management’s Analysis that is included in this report in Part II, Item 7. “Management’s Discussion and Analysis of Financial Condition and Results of Operations”. This information is incorporated herein by reference.
Item 8. Financial Statements and Supplementary Data.
Our Consolidated Financial Statements, the Notes to Consolidated Financial Statements, the report of our Independent Registered Public Accounting Firm, and the information under “Quarterly Results” listed in the Financial Table of Contents included in this report are incorporated herein by reference. All other schedules for which provision is made in the applicable accounting regulation of the SEC are not required under the related instructions or are inapplicable, and therefore, have been omitted.
Item 9. Changes in and Disagreements with Accountants on Accounting and Financial Disclosures.
None.
Item 9A. Controls and Procedures.
(a)Disclosure Controls and Procedures
We maintain disclosure controls and procedures designed to ensure that information required to be disclosed in our filings under the Exchange Act is (i) recorded, processed, summarized and reported within the time periods specified in the SEC’s rules and forms, and (ii) accumulated and communicated to management, including our principal executive officer and our principal financial officer, to allow timely decisions regarding required disclosures. Our management, with the participation of our principal executive officer and our principal financial officer, has evaluated the effectiveness of our disclosure controls and procedures as of the end of the period covered by this Form 10-K. Our principal executive officer and our principal financial officer have concluded, based on such evaluations, that our disclosure controls and procedures were effective for the purpose for which they were designed as of the end of such period.
(b)Management’s Report on Internal Control Over Financial Reporting
We have included management’s report on internal control over financial reporting under “Management’s Report on Internal Control Over Financial Reporting” listed in the Financial Table of Contents included in this Form 10-K.
We have included our registered public accounting firm’s attestation report on our internal controls over financial reporting under “Report of Independent Registered Public Accounting Firm” listed in the Financial Table of Contents included in this Form 10-K.
This information is incorporated herein by reference.
(c)Changes in Internal Control Over Financial Reporting
Our management, with the participation of our principal executive officer and our principal financial officer, has evaluated any change in internal control over financial reporting that occurred during the quarter ended December 31, 2023 in accordance with the requirements of Rule 13a-15(d) promulgated by the SEC under the Exchange Act. There were no changes in internal control over financial reporting identified in connection with management’s evaluation that occurred during the quarter ended December 31, 2023 that have materially affected, or are reasonably likely to materially affect, our internal control over financial reporting.
Item 9B. Other Information.
During the quarter ended December 31, 2023, none of our directors or officers informed us of the adoption or termination of a “Rule 10b5-1 trading arrangement” or “non-Rule 10b5-1 trading arrangement” as those terms are defined in Item 408(a) of Regulation S-K.
PART III.
Item 10. Directors, Executive Officers and Corporate Governance.
The information contained under the headings “Proposal No. 1–Election of Directors,” “Corporate Governance–Committees of the Board of Directors,” “ Beneficial Ownership of Securities,” and“Delinquent Section 16 Reports” included in our definitive proxy statement for our 2024 annual meeting of stockholders and the information contained under “Information About our Executive Officers” in Part I, Item 1. “Business,” in this report is incorporated herein by reference.
We have a Code of Business Conduct and Ethics within the meaning of Item 406 of Regulation S-K adopted by the SEC under the Exchange Act that applies to our principal executive officer, principal financial officer and principal accounting officer. Our Code of Business Conduct and Ethics is available on Mosaic’s website (www.mosaicco.com) and we intend to satisfy the disclosure requirement under Item 5.05 of Form 8-K regarding any amendment to, or waiver from, a provision of our code of ethics by posting such information on our website. The information contained on Mosaic’s website is not being incorporated herein.
Item 11. Executive Compensation.
The information under the headings “Director Compensation” and “Executive Compensation” included in our definitive proxy statement for our 2024 annual meeting of stockholders is incorporated herein by reference.
Item 12. Security Ownership of Certain Beneficial Owners and Management and Related Stockholder Matters.
The information under the headings “Beneficial Ownership of Securities” and “Certain Relationships and Related Transactions” included in our definitive proxy statement for our 2024 annual meeting of stockholders is incorporated herein by reference. The table containing information related to equity compensation plans set forth in Part II, “Item 5. Market for Registrant’s Common Equity, Related Stockholder Matters and Issuer Purchases of Equity Securities” of this report is also incorporated herein by reference.
Item 13. Certain Relationships and Related Transactions, and Director Independence.
The information under the headings “Corporate Governance–Board Independence,” “Corporate Governance–Committees of the Board of Directors,” “Corporate Governance–Other Policies Relating to the Board of Directors–Policy and Procedures Regarding Transactions with Related Persons,” and “Certain Relationships and Related Transactions” included in our definitive proxy statement for our 2024 annual meeting of stockholders is incorporated herein by reference.
Item 14. Principal Accounting Fees and Services.
Our independent registered public accounting firm is KPMG LLP, Tampa, FL, Auditor Firm ID: 185.
The information included under “Audit Committee Report and Payment of Fees to Independent Registered Public Accounting Firm–Fees Paid to Independent Registered Public Accounting Firm” and “Audit Committee Report and Payment of Fees to Independent Registered Public Accounting Firm–Pre-approval of Independent Registered Public Accounting Firm Services” is included in our definitive proxy statement for our 2024 annual meeting of stockholders is incorporated herein by reference.
PART IV.
Item 15. Exhibits and Financial Statement Schedules.
|
|
|
|
|
|
|
|
|
|
|
|
|
|
|
|
|
|
|
|
|
| (a) |
(1) |
Consolidated Financial Statements filed as part of this report are listed in the Financial Table of Contents included in this report and incorporated by reference in this report in Part II, Item 8, “Financial Statements and Supplementary Data”. |
|
(2) |
All schedules for which provision is made in the applicable accounting regulations of the SEC are listed in this report in Part II, Item 8, “Financial Statements and Supplementary Data”. |
|
(3) |
Reference is made to the Exhibit Index in (b) below. |
| (b) |
Exhibits |
|
|
|
|
| Exhibit No. |
|
Description |
|
Incorporated Herein by
Reference to |
|
Filed with
Electronic
Submission |
| 2.i. |
|
Agreement and Plan of Merger and Contribution, dated as of January 26, 2004, by and among IMC Global Inc. (now known as Mosaic Global Holdings Inc.), Global Nutrition Solutions, Inc. (now known as The Mosaic Company (“Mosaic”), as successor by merger to MOS Holdings Inc. (“MOS Holdings”)), GNS Acquisition Corp., Cargill, Incorporated (“Cargill”) and Cargill Fertilizer, Inc., as amended by Amendment No. 1 to Agreement and Plan of Merger and Contribution, dated as of June 15, 2004, and as further amended by Amendment No. 2 to Agreement and Plan of Merger and Contribution, dated as of October 18, 2004 (1)
|
|
Exhibit 2.1 to Mosaic’s Current Report on Form 8-K dated October 22, 2004, and filed on October 28, 2004(2) |
|
|
|
|
|
|
|
|
|
| 3.i. |
|
|
|
Exhibit 3.i to Mosaic’s Current Report on Form 8-K dated May 19, 2016 and filed on May 23, 2016(2) |
|
|
|
|
|
|
|
|
|
| 3.ii. |
|
|
|
Exhibit 3.1 to Mosaic’s Current Report on Form 8-K dated December 15, 2023 and filed on December 20, 2023(2) |
|
|
|
|
|
|
|
|
|
| 4.i |
|
|
|
Exhibit 4.i to Mosaic’s Current Report on Form 8-K dated August 23, 2021 and filed on August 23, 2021(2) |
|
|
|
|
|
|
|
|
|
| 4.ii |
|
|
|
Exhibit 10.1 to Mosaic’s Current Report on Form 8-K dated May 10, 2023, and filed on May 10, 2023 |
|
|
|
|
|
|
|
|
|
| 4.iii |
|
Registrant hereby agrees to furnish to the Commission, upon request, all other instruments defining the rights of holders of each issue of long-term debt of the Registrant and its consolidated subsidiaries
|
|
Exhibit 4.1 to Mosaic’s Current Report on Form 8-K dated October 24, 2011 and filed on October 24, 2011(2) |
|
|
|
|
|
|
|
|
|
| 4.iv |
|
|
|
Exhibit 4.iii to Mosaic’s Annual Report on Form 10-K for the fiscal year ended December 31, 2019
|
|
|
|
|
|
|
|
|
|
|
|
|
|
|
|
|
|
|
|
|
|
|
|
|
|
|
|
|
|
|
| 10.ii.a |
|
|
|
Exhibit 10.1 to Mosaic’s Current Report on Form 8-K dated October 24, 2017 and filed on October 30, 2017
|
|
|
|
|
|
|
|
|
|
| 10.ii.b |
|
|
|
Exhibit 10.2 to Mosaic’s Current Report on Form 8-K dated October 24, 2017 and filed on October 30, 2017
|
|
|
|
|
|
|
|
|
|
10.iii.a.(3) |
|
|
|
Appendix A to Mosaic’s Proxy Statement dated August 25, 2009(2) |
|
|
|
|
|
|
|
|
|
10.iii.a.1(3) |
|
|
|
Exhibit 10.iii.u. to Mosaic’s Annual Report on Form 10-K for the Fiscal Year ended May 31, 2011(2) |
|
|
|
|
|
|
|
|
|
10.iii.a.2(3) |
|
|
|
Exhibit 10.iii.b. to Mosaic’s Quarterly Report on Form 10-Q for the Quarterly Period ended August 31, 2011(2) |
|
|
|
|
|
|
|
|
|
10.iii.b(3) |
|
|
|
|
|
X |
|
|
|
|
|
|
|
10.iii.c.1(3) |
|
|
|
|
|
X |
|
|
|
|
|
|
|
10.iii.c.2(3) |
|
|
|
Exhibit 10.1 to Mosaic’s Current Report on Form 8-K dated March 5, 2015 and filed on March 11, 2015(2) |
|
|
|
|
|
|
|
|
|
10.iii.c.3(3) |
|
|
|
Exhibit 10.iii.c.4 to Mosaic’s Quarterly Report on Form 10-Q for the Quarterly Period ended March 31, 2017(2) |
|
|
|
|
|
|
|
|
|
10.iii.d.1(3) |
|
|
|
Exhibit 10.iii.d to Mosaic’s Quarterly Report on Form 10-Q for the Quarterly Period ended March 31, 2023 |
|
|
|
|
|
|
|
|
|
| 10.iii.d.2 |
|
|
|
Exhibit 10.iii.d.2. to Mosaic’s Quarterly Report on Form 10-Q of Mosaic for the Quarterly Period ended March 31, 2023(2) |
|
|
|
|
|
|
|
|
|
|
|
|
|
|
|
|
|
|
|
|
|
|
|
10.iii.d.3(3) |
|
|
|
Exhibit 10.1 to Mosaic’s Current Report on Form 8-K dated October 31, 2019 and filed on November 4, 2019 |
|
|
|
|
|
|
|
|
|
|
|
|
|
|
|
|
|
|
|
|
|
|
|
|
|
|
|
|
|
|
10.iii.d.4(3) |
|
|
|
Exhibit 10.iii.d to Mosaic’s Quarterly Report on Form 10-Q for the Quarterly Period ended March 31, 2022 |
|
|
|
|
|
|
|
|
|
10.iii.e.1(3) |
|
|
|
Exhibit 10.iii.b. to Mosaic’s Quarterly Report on Form 10-Q for the Quarterly Period ended August 31, 2012(2) |
|
|
|
|
|
|
|
|
|
10.iii.e.2(3) |
|
|
|
Exhibit 10.iii.x. to Mosaic’s Annual Report on Form 10-K of Mosaic for the fiscal year ended May 31, 2013(2) |
|
|
|
|
|
|
|
|
|
10.iii.f.(3) |
|
|
|
Exhibit 10.iii. to Mosaic’s Current Report on Form 8-K dated October 8, 2008, and filed on October 14, 2008(2) |
|
|
|
|
|
|
|
|
|
10.iii.g.(3) |
|
Board of Directors compensatory plans, as described under the caption "Director Compensation" in The Mosaic Company definitive proxy statement to be filed with the Securities and Exchange Commission (in connection with the 2024 Annual Meeting of Stockholders). |
|
|
|
|
|
|
|
|
|
|
|
10.iii.h.(3) |
|
|
|
The material under “Compensation Discussion and Analysis—Other Executive Compensation Arrangements, Policies and Practices—Perquisites” in Mosaic’s Proxy Statement dated April 12, 2023 |
|
|
|
|
|
|
|
|
|
10.iii.i.(3) |
|
|
|
Appendix B to Mosaic’s Proxy Statement dated April 2, 2014(2) |
|
|
|
|
|
|
|
|
|
10.iii.j.(3) |
|
|
|
Exhibit 10.iii.j to Mosaic’s Annual Report on Form 10-K for the fiscal year ended December 31, 2019 |
|
|
|
|
|
|
|
|
|
10.iii.k.1(3) |
|
|
|
Exhibit 10.iii.a. to Mosaic’s Quarterly Report on Form 10-Q for the Quarterly Period ended March 31, 2015(2) |
|
|
|
|
|
|
|
|
|
10.iii.k.2(3) |
|
|
|
Exhibit 10.iii.a. to Mosaic’s Quarterly Report on Form 10-Q for the Quarterly Period ended March 31, 2016(2) |
|
|
|
|
|
|
|
|
|
10.iii.k3(3) |
|
|
|
Exhibit 10.iii.kk to Mosaic’s Quarterly Report on Form 10-Q for the Quarterly Period Ended June 30, 2016(2) |
|
|
|
|
|
|
|
|
|
10.iii.k.4(3) |
|
|
|
Exhibit 10.iii.a to Mosaic’s Quarterly Report on Form 10-Q for the Quarterly Period ended March 31, 2020 |
|
|
|
|
|
|
|
|
|
|
|
|
|
|
|
|
|
|
|
|
|
|
|
10.iii.k.5(3) |
|
|
|
Exhibit 10.iii.b to Mosaic’s Quarterly Report on Form 10-Q for the Quarterly Period ended March 31, 2020 |
|
|
|
|
|
|
|
|
|
10.iii.k.6(3) |
|
|
|
Exhibit 10.iii.c to Mosaic’s Quarterly Report on Form 10-Q for the Quarterly Period ended March 31, 2020 |
|
|
|
|
|
|
|
|
|
10.iii.k.7(3) |
|
|
|
Exhibit 10.iii.k.1 to Mosaic's Quarterly Report on Form 10-Q for the Quarterly Period Ended March 31, 2023 |
|
|
|
|
|
|
|
|
|
10.iii.k.8(3) |
|
|
|
Exhibit 10.iii.k.2 to Mosaic's Quarterly Report on Form 10-Q for the Quarterly Period Ended March 31, 2023 |
|
|
|
|
|
|
|
|
|
10.iii.k.9(3) |
|
|
|
Exhibit 10.iii.k.3 to Mosaic's Quarterly Report on Form 10-Q for the Quarterly Period Ended March 31, 2023 |
|
|
|
|
|
|
|
|
|
10.iii.k.10(3) |
|
|
|
Exhibit 10.iii.k to Mosaic’s quarterly report on Form 10-Q for the Quarterly Period Ended June 30, 2022 |
|
|
|
|
|
|
|
|
|
10.iii.l.1(3) |
|
|
|
Appendix B to Mosaic’s Proxy Statement dated April 12, 2023 |
|
|
|
|
|
|
|
|
|
10.iii.l.2(3) |
|
|
|
Exhibit 10.iii.i to Mosaic's Quarterly Report on Form 10-!Q for the Quarterly Period Ended September 30, 2023 |
|
|
|
|
|
|
|
|
|
10.iii.l.3(3) |
|
|
|
Exhibit 10.1 to Mosaic's Current Report on Form 8-K dated December 15, 2023 and filed on December 20, 2023 |
|
|
|
|
|
|
|
|
|
| 10.iv.a |
|
|
|
Exhibit 10.1. to Mosaic’s Current Report on Form 8-K dated September 30, 2015 and filed on October 6, 2015(2) |
|
|
|
|
|
|
|
|
|
| 10.iv.b |
|
|
|
Exhibit 10.v.i to Mosaic’s Quarterly Report on Form 10-Q for the Quarterly Period Ended June 30, 2016(2)
|
|
|
|
|
|
|
|
|
|
| 10.iv.c |
|
|
|
Exhibit 10.2. to Mosaic’s Current Report on Form 8-K dated September 30, 2015 and filed on October 6, 2015(2) |
|
|
|
|
|
|
|
|
|
|
|
|
|
|
|
|
|
|
|
|
|
|
|
|
|
|
|
|
|
|
| 10.iv.d |
|
|
|
Exhibit 10.v.ii to Mosaic’s Quarterly Report on Form 10-Q for the Quarterly Period Ended June 30, 2016(2) |
|
|
|
|
|
|
|
|
|
| 21 |
|
|
|
|
|
X |
|
|
|
|
|
|
|
| 23.1 |
|
|
|
|
|
X |
|
|
|
|
|
|
|
| 23.2 |
|
|
|
Exhibit 23.2 to Mosaic’s Annual Report on Form 10-K for the fiscal year ended December 31, 2022 |
|
|
|
|
|
|
|
|
|
| 23.3 |
|
|
|
|
|
X |
|
|
|
|
|
|
|
| 23.4 |
|
|
|
Exhibit 23.3 to Mosaic’s Annual Report on Form 10-K for the fiscal year ended December 31, 2021 |
|
|
|
|
|
|
|
|
|
| 23.5 |
|
|
|
Exhibit 23.4 to Mosaic’s Annual Report on Form 10-K for the fiscal year ended December 31, 2021 |
|
|
|
|
|
|
|
|
|
| 24 |
|
|
|
|
|
X |
|
|
|
|
|
|
|
| 31.1 |
|
|
|
|
|
X |
|
|
|
|
|
|
|
| 31.2 |
|
|
|
|
|
X |
|
|
|
|
|
|
|
| 32.1 |
|
|
|
|
|
X |
|
|
|
|
|
|
|
| 32.2 |
|
|
|
|
|
X |
|
|
|
|
|
|
|
| 95 |
|
|
|
|
|
X |
|
|
|
|
|
|
|
| 96.1 |
|
|
|
Exhibit 96.1 to Mosaic’s Annual Report on Form 10-K for the fiscal year ended December 31, 2022 |
|
|
|
|
|
|
|
|
|
| 96.2 |
|
|
|
Exhibit 96.2 to Mosaic’s Annual Report on Form 10-K for the fiscal year ended December 31, 2021 |
|
|
|
|
|
|
|
|
|
| 96.3 |
|
|
|
Exhibit 96.3 to Mosaic’s Annual Report on Form 10-K for the fiscal year ended December 31, 2021 |
|
|
|
|
|
|
|
|
|
| 96.4 |
|
|
|
|
|
X |
| 97.1 |
|
|
|
|
|
X |
|
|
|
|
|
|
|
|
|
|
|
|
|
|
|
|
|
|
|
|
|
|
|
|
|
|
|
|
| 101.INS |
|
Inline XBRL Instance Document (the instance document does not appear in the Interactive Data File because its XBRL tags are embedded within the Inline XBRL document) |
|
|
|
X |
|
|
|
|
|
|
|
| 101.SCH |
|
Inline XBRL Taxonomy Extension Schema Document |
|
|
|
X |
|
|
|
|
|
|
|
| 101.CAL |
|
Inline XBRL Taxonomy Extension Calculation Linkbase Document |
|
|
|
X |
| 101.LAB |
|
Inline XBRL Taxonomy Extension Label Linkbase Document |
|
|
|
X |
|
|
|
|
|
|
|
| 101.PRE |
|
Inline XBRL Taxonomy Extension Presentation Linkbase Document |
|
|
|
X |
|
|
|
|
|
|
|
| 101.DEF |
|
Inline XBRL Taxonomy Extension Definition Linkbase Document |
|
|
|
X |
|
|
|
|
|
|
|
| 104 |
|
Cover Page Interactive Data File (formatted as Inline XBRL and contained in Exhibit 101) |
|
|
|
X |
|
|
|
|
|
|
|
| (c) |
Summarized financial information of 50% or less owned persons is included in Note 9 of Notes to Consolidated Financial Statements. Financial statements and schedules are omitted as none of such persons are significant under the tests specified in Regulation S-X under Article 3.09 of general instructions to the financial statements. |
*********************************************
|
|
|
|
|
|
| (1) |
Mosaic agrees to furnish supplementally to the SEC a copy of any omitted schedules and exhibits to the extent required by rules of the Commission upon request. |
| (2) |
SEC File No. 001-32327. |
| (3) |
Denotes management contract or compensatory plan. |
| (4) |
Confidential information has been omitted from this Exhibit and filed separately with the SEC pursuant to a confidential treatment request under Rule 24b-2 of the Exchange Act. |
Item 16. Annual Report on Form 10-K Summary.
None.
*********************************************
SIGNATURES
Pursuant to the requirements of Section 13 or 15(d) of the Securities Exchange Act of 1934, the registrant has duly caused this report to be signed on its behalf by the undersigned, thereunto duly authorized.
|
|
|
| THE MOSAIC COMPANY |
| (Registrant) |
|
| /s/ Bruce M. Bodine |
| Bruce M. Bodine |
| Chief Executive Officer and President |
Date: February 22, 2024
Pursuant to the requirements of the Securities Exchange Act of 1934, this report has been signed below by the following persons on behalf of the registrant and in the capacities and on the dates indicated:
|
|
|
|
|
|
|
|
|
|
|
|
|
|
|
| Name |
|
Title |
|
Date |
|
|
|
|
|
| /s/ Bruce M. Bodine |
|
Chief Executive Officer and President and Director (principal executive officer) |
|
February 22, 2024 |
| Bruce M. Bodine |
|
|
|
|
|
|
|
|
| /s/ Clint C. Freeland |
|
Executive Vice President and Chief Financial Officer (principal financial officer) |
|
February 22, 2024 |
| Clint C. Freeland |
|
|
|
|
|
|
|
|
| /s/ Russell A. Flugel |
|
Vice President—Controller and Chief Accounting Officer (principal accounting officer) |
|
February 22, 2024 |
| Russell A. Flugel |
|
|
|
|
|
|
|
|
| * |
|
Chairman of the Board of Directors |
|
February 22, 2024 |
| Gregory L. Ebel |
|
|
|
|
|
|
|
|
|
| * |
|
Director |
|
February 22, 2024 |
| Cheryl K. Beebe |
|
|
|
|
|
|
|
|
|
| * |
|
Director |
|
February 22, 2024 |
| Timothy S. Gitzel |
|
|
|
|
|
|
|
|
|
| * |
|
Director |
|
February 22, 2024 |
| Emery N. Koenig |
|
|
|
|
|
|
|
|
|
| * |
|
Director |
|
February 22, 2024 |
| Jody L. Kuzenko |
|
|
|
|
|
|
|
|
|
| * |
|
Director |
|
February 22, 2024 |
| David T. Seaton |
|
|
|
|
|
|
|
|
|
| * |
|
Director |
|
February 22, 2024 |
| Steven M. Seibert |
|
|
|
|
|
|
|
|
|
| * |
|
Director |
|
February 22, 2024 |
| João Roberto Gonçalves Teixeira |
|
|
|
|
|
|
|
|
|
| * |
|
Director |
|
February 22, 2024 |
| Gretchen H. Watkins |
|
|
|
|
|
|
|
|
|
| * |
|
Director |
|
February 22, 2024 |
| Kelvin R. Westbrook |
|
|
|
|
|
|
|
|
|
|
|
|
|
|
|
|
|
|
| *By: |
|
/s/ Philip E. Bauer |
|
|
|
|
|
Philip E. Bauer
Attorney-in-Fact |
Financial Table of Contents
Management’s Discussion and Analysis of Financial Condition and Results of Operations
Introduction
The Mosaic Company (before or after the Cargill Transaction, as defined below, “Mosaic,” and with its consolidated subsidiaries, “we,” “us,” “our” or the “Company”) is the parent company of the business that was formed through the business combination (“Combination”) of IMC Global Inc. and the Cargill Crop Nutrition fertilizer businesses of Cargill, Incorporated and its subsidiaries (collectively, “Cargill”) on October 22, 2004. In May 2011, Cargill divested its approximately 64% equity interest in us in a split-off to its stockholders and a debt exchange with certain Cargill debt holders.
We produce and market concentrated phosphate and potash crop nutrients. We conduct our business through wholly- and majority-owned subsidiaries as well as businesses in which we own less than a majority or a non-controlling interest, including consolidated variable interest entities and investments accounted for by the equity method.
We are organized into the following business segments:
•Our Phosphates business segment owns and operates mines and production facilities in Florida, which produce concentrated phosphate crop nutrients and phosphate-based animal feed ingredients, and processing plants in Louisiana, which produce concentrated phosphate crop nutrients for sale domestically and internationally. We have a 75% economic interest in the Miski Mayo Phosphate Mine (“Miski Mayo Mine”) in Peru. These results are consolidated in the Phosphates segment. The Phosphates segment also includes our 25% interest in the Ma’aden Wa’ad Al Shamal Phosphate Company (“MWSPC”), a joint venture to develop, own and operate integrated phosphate production facilities in the Kingdom of Saudi Arabia. We market approximately 25% of the MWSPC phosphate production. We recognize our equity in the net earnings or losses relating to MWSPC on a one-quarter reporting lag in our Consolidated Statements of Earnings.
•Our Potash business segment owns and operates potash mines and production facilities in Canada and the U.S. which produce potash-based crop nutrients, animal feed ingredients and industrial products. Potash sales include domestic and international sales. We are a member of Canpotex, Limited (“Canpotex”), an export association of Canadian potash producers through which we sell our Canadian potash outside the U.S. and Canada.
•Our Mosaic Fertilizantes business segment includes five phosphate rock mines, four phosphate chemical plants and a potash mine in Brazil. The segment also includes our distribution business in South America, which consists of sales offices, crop nutrient blending and bagging facilities, port terminals and warehouses in Brazil and Paraguay. We also have a majority interest in Fospar S.A., which owns and operates a single superphosphate granulation plant and a deep-water port and throughput warehouse terminal facility in Brazil.
Intersegment eliminations, unrealized mark-to-market gains/losses on derivatives, debt expenses, corporate functional costs and the results of the China and India distribution businesses are included within Corporate, Eliminations and Other. See Note 25 of the Consolidated Financial Statements in this Form 10-K for segment results.
Key Factors that can Affect Results of Operations and Financial Condition
Our primary products, phosphate and potash crop nutrients, are, to a large extent, global commodities that are also available from a number of domestic and international competitors, and are sold by negotiated contracts or by reference to published market prices. The markets for our products are highly competitive, and the most important competitive factor for our products is delivered price. Business and economic conditions and governmental policies affecting the agricultural industry and customer sentiment are the most significant factors affecting worldwide demand for crop nutrients. The profitability of our businesses is heavily influenced by worldwide supply and demand for our products, which affects our sales prices and volumes. Our costs per tonne to produce our products are also heavily influenced by fixed costs associated with owning and operating our major facilities, significant raw material costs in our Phosphates and Mosaic Fertilizantes businesses, and fluctuations in currency exchange rates.
Our products are generally sold based on the market prices prevailing at the time the sales contract is signed or through contracts which are priced at the time of shipment. Additionally, in certain circumstances the final price of our products is determined after shipment based on the current market at the time the price is agreed to with the customer. Forward sales programs at fixed prices increase the lag between prevailing market prices and our average realized selling prices.
The mix and parameters of these sales programs vary over time based on our marketing strategy, which considers factors that include, among others, optimizing our production and operating efficiency within warehouse limitations, as well as customer requirements. The use of forward sales programs and the level of customer prepayments may vary from period to period due to changing supply and demand environments, seasonality, and market sentiments.
World prices for the key raw material inputs for concentrated phosphate products, including ammonia, sulfur and phosphate rock, have an effect on industry-wide phosphate prices and production costs. The primary feedstock for producing ammonia is natural gas. The product price for ammonia is generally highly dependent on the supply and demand balance for ammonia. In North America, we purchase approximately one-third of our ammonia from various suppliers in the spot market, with the remaining two-thirds either purchased through a long-term ammonia supply agreement (the “CF Ammonia Supply Agreement”) with an affiliate of CF Industries, Inc. (“CF”) or produced internally at our Faustina, Louisiana location. The CF Ammonia Supply Agreement provides for U.S. natural gas-based pricing that is intended to lessen pricing volatility. If the price of natural gas rises or the market price for ammonia falls outside of the range anticipated at execution of this agreement, we may not realize a cost benefit from the natural gas-based pricing over the term of the agreement, or the cost of our ammonia under the agreement could be at a competitive disadvantage. During 2023, the contract provided an advantage over pricing in the spot market. At times, we have paid more or less for ammonia under the agreement than in the spot market. On October 14, 2022, we received notice from CF to exercise the bilateral, contractual right to end the ammonia supply agreement in its current form, effective January 1, 2025. In Brazil, we purchase all our ammonia from a single supplier.
Sulfur is a global commodity that is primarily produced as a by-product of oil refining. The market price is based primarily on the supply and demand balance for sulfur. We believe our current and future investments in sulfur transformation and transportation assets will enhance our competitive advantage.
We produce and procure most of our phosphate rock requirements through either wholly or partly owned mines. In addition to producing phosphate rock, Mosaic Fertilizantes purchases phosphate, potash and nitrogen products which are either used to produce blended crop nutrients (“Blends”) or for resale.
Our per tonne selling prices for potash are affected by shifts in the product mix, geography and customer mix. Our Potash business is significantly affected by Canadian resource taxes and royalties that we pay to the Province of Saskatchewan in order for us to mine and sell our potash products. In addition, cost of goods sold is affected by a number of factors, including: fluctuations in the Canadian dollar; the level of periodic inflationary pressures on resources in western Canada, where we produce most of our potash; and natural gas costs for operating our potash solution mine at Belle Plaine, Saskatchewan. In the past, we have also incurred operating costs to manage salt saturated brine inflows at our Esterhazy, Saskatchewan K1 and K2 mine shafts, which we closed in June 2021, due to an acceleration of brine inflows. We have now transitioned mining to the K3 mine shaft, which has replaced production from the K1 and K2 shafts.
Our results of operations are also affected by changes in currency exchange rates due to our international footprint. The most significant currency impacts are generally from the Canadian dollar and the Brazilian real.
A discussion of these and other factors that affected our results of operations and financial condition for the periods covered by this Management’s Discussion and Analysis of Financial Condition and Results of Operations is set forth in further detail below. This Management’s Discussion and Analysis of Financial Condition and Results of Operations should also be read in conjunction with the narrative description of our business in Item 1, and the risk factors described in Item 1A, of Part I of this Annual Report on Form 10-K (“Form 10-K”), and our Consolidated Financial Statements, accompanying notes and other information listed in the accompanying Financial Table of Contents.
This section of this Form 10-K discusses 2023 and 2022 items and year-to-year comparisons between 2023 and 2022. Discussions of 2021 items and year-to-year comparisons between 2022 and 2021 that are not included in this Form 10-K can be found in “Management’s Discussion and Analysis of Financial Condition and Results of Operations” in Part II, Item 7 of the Company’s Form 10-K for the year ended December 31, 2022 and are incorporated by reference herein.
Throughout the discussion below, we measure units of production, sales and raw materials in metric tonnes which are the equivalent of 2,205 pounds, unless we specifically state that we mean short or long ton(s), which are the equivalent of 2,000 pounds and 2,240 pounds, respectively. In addition, we measure natural gas, a raw material used in the production of our products, in MM BTU, which stands for one million British Thermal Units (“BTU”). One BTU is equivalent to 1.06 Joules. Management uses the following metrics to monitor segment performance: production volume, sales volume, average finished product selling price and average cost per unit consumed.
In the following table, there are certain percentages that are not considered to be meaningful and are represented by “NM”.
Results of Operations
The following table shows the results of operations for the years ended December 31, 2023, 2022, and 2021:
|
|
|
|
|
|
|
|
|
|
|
|
|
|
|
|
|
|
|
|
|
|
|
|
|
|
|
|
|
|
|
|
|
|
|
|
|
|
|
|
|
|
| |
Years Ended December 31, |
|
2023-2022 |
|
2022-2021 |
| (in millions, except per share data) |
2023 |
|
2022 |
|
2021 |
|
Change |
|
Percent |
|
Change |
|
Percent |
| Net sales |
$ |
13,696.1 |
|
|
$ |
19,125.2 |
|
|
$ |
12,357.4 |
|
|
$ |
(5,429.1) |
|
|
(28) |
% |
|
$ |
6,767.8 |
|
|
55 |
% |
| Cost of goods sold |
11,485.5 |
|
|
13,369.4 |
|
|
9,157.1 |
|
|
(1,883.9) |
|
|
(14) |
% |
|
4,212.3 |
|
|
46 |
% |
| Gross margin |
2,210.6 |
|
|
5,755.8 |
|
|
3,200.3 |
|
|
(3,545.2) |
|
|
(62) |
% |
|
2,555.5 |
|
|
80 |
% |
| Gross margin percentage |
16.1 |
% |
|
30.1 |
% |
|
25.9 |
% |
|
(14.0) |
% |
|
|
|
4.2 |
% |
|
|
| Selling, general and administrative expenses |
500.5 |
|
|
498.0 |
|
|
430.5 |
|
|
2.5 |
|
|
1 |
% |
|
67.5 |
|
|
16 |
% |
|
|
|
|
|
|
|
|
|
|
|
|
|
|
| Impairment, restructuring and other expenses |
— |
|
|
— |
|
|
158.1 |
|
|
— |
|
|
NM |
|
(158.1) |
|
|
(100) |
% |
| Other operating expenses |
372.0 |
|
|
472.5 |
|
|
143.2 |
|
|
(100.5) |
|
|
(21) |
% |
|
329.3 |
|
|
NM |
| Operating earnings |
1,338.1 |
|
|
4,785.3 |
|
|
2,468.5 |
|
|
(3,447.2) |
|
|
(72) |
% |
|
2,316.8 |
|
|
94 |
|
|
|
|
|
|
|
|
|
|
|
|
|
|
|
| Interest expense, net |
(129.4) |
|
|
(137.8) |
|
|
(169.1) |
|
|
8.4 |
|
|
(6) |
% |
|
31.3 |
|
|
(19) |
% |
| Foreign currency transaction gain (loss) |
194.0 |
|
|
97.5 |
|
|
(78.5) |
|
|
96.5 |
|
|
99 |
% |
|
176.0 |
|
|
NM |
| Other (expense) income |
(76.8) |
|
|
(102.5) |
|
|
3.9 |
|
|
25.7 |
|
|
(25) |
% |
|
(106.4) |
|
|
NM |
| Earnings from consolidated companies before income taxes |
1,325.9 |
|
|
4,642.5 |
|
|
2,224.8 |
|
|
(3,316.6) |
|
|
(71) |
% |
|
2,417.7 |
|
|
109 |
|
| Provision for income taxes |
177.0 |
|
|
1,224.3 |
|
|
597.7 |
|
|
(1,047.3) |
|
|
(86) |
% |
|
626.6 |
|
|
105 |
|
| Earnings from consolidated companies |
1,148.9 |
|
|
3,418.2 |
|
|
1,627.1 |
|
|
(2,269.3) |
|
|
(66) |
% |
|
1,791.1 |
|
|
110 |
% |
| Equity in net earnings of nonconsolidated companies |
60.3 |
|
|
196.0 |
|
|
7.8 |
|
|
(135.7) |
|
|
(69) |
% |
|
188.2 |
|
|
NM |
| Net earnings including noncontrolling interests |
1,209.2 |
|
|
3,614.2 |
|
|
1,634.9 |
|
|
(2,405.0) |
|
|
(67) |
% |
|
1,979.3 |
|
|
121 |
% |
| Less: Net earnings attributable to noncontrolling interests |
44.3 |
|
|
31.4 |
|
|
4.3 |
|
|
12.9 |
|
|
41 |
% |
|
27.1 |
|
|
NM |
| Net earnings attributable to Mosaic |
$ |
1,164.9 |
|
|
$ |
3,582.8 |
|
|
$ |
1,630.6 |
|
|
$ |
(2,417.9) |
|
|
(67) |
% |
|
$ |
1,952.2 |
|
|
120 |
% |
| Diluted net earnings per share attributable to Mosaic |
$ |
3.50 |
|
|
$ |
10.06 |
|
|
$ |
4.27 |
|
|
$ |
(6.56) |
|
|
(65) |
% |
|
$ |
5.79 |
|
|
136 |
% |
| Diluted weighted average number of shares outstanding |
333.2 |
|
|
356.0 |
|
|
381.6 |
|
|
|
|
|
|
|
|
|
Overview of the Years ended December 31, 2023 and 2022
Net earnings attributable to Mosaic for the year ended December 31, 2023 were $1.2 billion, or $3.50 per diluted share, compared to $3.6 billion, or $10.06 per diluted share for 2022.
Significant factors that affected our results of operations and financial condition in 2023 and 2022 are listed below. These factors are discussed in more detail in the following sections of this Management’s Discussion and Analysis of Financial Condition and Results of Operations.
Year ended December 31, 2023
For the year ended December 31, 2023, operating results in all of our segments were impacted by lower average sales prices compared to the prior year. Global markets softened compared to the prior year, with a rebound in supply combined with buyers delaying purchases in the first half of the year, in anticipation of lower prices. Buyer deferral reversed in the later part of the current year, and we saw seasonal price strength in many markets.
In the Phosphates segment, operating results for 2023 were driven by lower average selling prices, partially offset by lower raw material costs and higher sales volumes compared to the prior year. Selling prices decreased due to the factors described above and were partially offset by lower raw material costs, primarily sulfur and ammonia, due to global supply and demand. Finished product sales volumes were favorable versus the prior year, driven by buyers deferring purchases in the prior year period in anticipation of lower sales prices.
In the Potash segment, 2023 operating results were unfavorably impacted by lower average selling prices of potash compared to the prior year period, driven by the factors discussed above. This was partially offset by higher sales volumes, driven by the factor discussed above. Current year operating results were also unfavorably impacted by higher idle plant and maintenance turnaround costs, due to the temporary idling of our Colonsay, Saskatchewan mine in the first half of the year, due to market conditions, and the length of turnarounds, compared to the prior year.
In the Mosaic Fertilizantes segment, 2023 results were unfavorably impacted by a decrease in average selling prices compared to the prior year period, driven by the factors discussed above. Sales volumes of finished goods, including performance products, were higher in the current year period, compared to the same period in the prior year, due to an increased customer base as a result of our growth strategy to expand our presence in Brazil. Results were also favorably impacted by a decrease in product costs for our distribution business, and lower sulfur and ammonia costs in our production business.
Other highlights in 2023 include:
•In January 2023, we completed the sale of the Streamsong Resort® (the “Resort”) and the approximately 7,000 acres on which it sits for net proceeds of $158 million. The Resort is a destination resort and conference center, which we developed in an area of previously mined land as part of our long-term business strategy to maximize the value and utility of our extensive land holdings in Florida. In addition to a hotel and conference center, the Resort includes multiple golf courses, a clubhouse and ancillary facilities. The sale resulted in a gain of $57 million.
•In the first quarter of 2023, we purchased the other 50% interest of equity of Gulf Sulphur Services (“GSS”), which gives us full ownership and secures control of our sulfur supply chain in the Gulf of Mexico.
•In February 2023, pursuant to existing stock repurchase authorizations, we entered into an accelerated share repurchase agreement (the “2023 ASR Agreement”) with a third-party financial institution to repurchase $300 million of our Common Stock. In 2023, we repurchased 16,879,059 shares of Common Stock in the open market for approximately $748 million. This includes 5,624,574 shares that we purchased under the 2023 ASR Agreement.
•In the first quarter of 2023, our Board of Directors approved a special dividend of $0.25 per share to be distributed in March to our stockholders of record as of March 15, 2023. In the fourth quarter of 2023, our Board of Directors approved a regular dividend increase to $0.84 per share annually from $0.80, beginning with the dividend declared in December 2023.
•In May 2023, we entered into a 10-year senior unsecured term loan facility pursuant to which we can draw up to $700 million. The term loan matures on May 18, 2033. We may voluntarily prepay the outstanding principal without premium or penalty. As of December 31, 2023, $500 million has been drawn under this facility.
•In 2023, we paid the outstanding balance of $900 million on our 4.25% senior notes, due November 15, 2023, without premium or penalty. On December 4, 2023, we issued new 5.375% senior notes consisting of $400 million aggregate principal, amount due 2028.
•In 2021, the U.S. Department of Commerce (“DOC”) issued countervailing duty (“CVD”) orders on imports of phosphate fertilizers from Morocco and Russia, in response to petitions filed by Mosaic. The orders were based on DOC's determination that the imports were unfairly subsidized and the U.S. International Trade Commission's (“ITC”) determination that the imports materially injure the U.S. fertilizer industry. The purpose of the CVD orders was to remedy the injury and thereby restore fair competition. CVD orders normally stay in place for at least five years, with possible extensions.
Moroccan and Russian producers have initiated actions at the U.S. Court of International Trade (“CIT”) seeking to overturn the orders. Mosaic has also made claims contesting certain aspects of DOC’s final determinations that, we believe, failed to capture the full extent of Moroccan and Russian subsidies. These litigation challenges remain underway. Most recently, in January 2024, DOC and the ITC issued revised determinations on remand from the CIT, upholding their original determinations that Moroccan phosphate fertilizer is unfairly subsidized, and that Moroccan and Russian imports materially injure the U.S. industry, respectively. The CIT is now reviewing these remand determinations. Also in January 2024, the CIT issued a ruling affirming DOC's original determinations that Russian phosphate fertilizer is unfairly subsidized.
When a CVD order is in place, DOC normally conducts annual administrative reviews, which establish a final CVD assessment rate for past imports during a defined period, and a CVD cash deposit rate for future imports. In November 2023, DOC announced the final results of the first administrative reviews for the CVD orders on phosphate fertilizers for Russia and Morocco, covering the period November 30, 2020 to December 31, 2021. DOC calculated new subsidy rates of 2.12% for Moroccan producer OCP and 28.50% for Russian producer PhosAgro. Mosaic, foreign producers, and a U.S. importer have appealed these decisions to the CIT. DOC is also conducting administrative reviews covering the period January 1, 2022 to December 31, 2022. The applicable final CVD assessment rates and cash deposit rates for imports of phosphate fertilizer from Morocco and Russia could change as a result of these various proceedings and potential associated appeals, whether in federal courts or at the World Trade Organization.
Year ended December 31, 2022:
Operating results for the year ended December 31, 2022 in all of our segments increased, mainly from higher average sales prices compared to the prior year period. Average selling prices rose throughout 2021 and into the first half of 2022, driven by tightness in global supply and demand. The Russian invasion of Ukraine in February 2022 created instability in global commodities markets. The invasion, together with the continuation of reduced potash exports by Belarus, significantly reduced the physical supply of fertilizer and agricultural commodities produced in those geographies. This contributed to rising fertilizer prices globally. In addition, Chinese export restrictions on phosphates also impacted the global supply of fertilizer and contributed to tightening in the worldwide fertilizer market.
In the Phosphates segment, operating results for 2022 were driven by higher average selling prices partially offset by higher raw material costs and lower sales volumes compared to the prior year. Selling prices increased due to the factors described above and were partially offset by higher raw material costs, primarily sulfur and ammonia, due to global supply and demand. Finished product sales volumes were unfavorable versus the prior year, due to adverse weather conditions in North America, which contributed to a condensed spring season, the deferral of customers purchases in North America, and delayed shipments caused by impacts from Hurricane Ian which occurred at the end of the third quarter in 2022.
In the Potash segment, 2022 operating results were favorably impacted by higher average selling prices compared to the prior year period, driven by the factors discussed above. This was partially offset by lower sales volumes, due to customers deferring purchases to future periods.
In the Mosaic Fertilizantes segment, 2022 results were favorably impacted by higher average selling prices compared to the prior year period, driven by the factors discussed above, partially offset by higher raw material and production costs and lower sales volumes compared to the prior year. Productions costs increased due to inflation and higher raw materials costs, which increased due to higher global prices for sulfur and ammonia. Sales volumes were lower in 2022 compared to the prior year, mainly due to unfavorable farmer economics.
Phosphates Net Sales and Gross Margin
The following table summarizes the Phosphates segment’s net sales, gross margin, sales volume, selling prices and raw material prices:
|
|
|
|
|
|
|
|
|
|
|
|
|
|
|
|
|
|
|
|
|
|
|
|
|
|
|
|
|
|
|
|
|
|
|
|
|
|
|
|
|
|
|
Years Ended December 31, |
|
2023-2022 |
|
2022-2021 |
(in millions, except price per tonne or unit) |
2023 |
|
2022 |
|
2021 |
|
Change |
|
Percent |
|
Change |
|
Percent |
| Net sales: |
|
|
|
|
|
|
|
|
|
|
|
|
|
North America |
$ |
3,749.8 |
|
|
$ |
4,211.2 |
|
|
$ |
3,251.4 |
|
|
$ |
(461.4) |
|
|
(11) |
% |
|
$ |
959.8 |
|
|
30 |
% |
International |
974.5 |
|
|
1,973.0 |
|
|
1,671.5 |
|
|
(998.5) |
|
|
(51) |
% |
|
301.5 |
|
|
18 |
% |
Total |
4,724.3 |
|
|
6,184.2 |
|
|
4,922.9 |
|
|
(1,459.9) |
|
|
(24) |
% |
|
1,261.3 |
|
|
26 |
% |
| Cost of goods sold |
4,022.2 |
|
|
4,425.2 |
|
|
3,617.5 |
|
|
(403.0) |
|
|
(9) |
% |
|
807.7 |
|
|
22 |
% |
| Gross margin |
$ |
702.1 |
|
|
$ |
1,759.0 |
|
|
$ |
1,305.4 |
|
|
$ |
(1,056.9) |
|
|
(60) |
% |
|
$ |
453.6 |
|
|
35 |
|
| Gross margin as a percentage of net sales |
14.9 |
% |
|
28.4 |
% |
|
26.5 |
% |
|
|
|
|
|
|
|
|
Sales volumes(a) (in thousands of metric tonnes) |
|
|
|
|
|
|
|
|
|
|
|
|
|
DAP/MAP |
3,625 |
|
|
3,399 |
|
|
3,904 |
|
|
226 |
|
|
7 |
% |
|
(505) |
|
|
(13) |
% |
Performance and Other(b) |
3,366 |
|
|
3,159 |
|
|
3,789 |
|
|
207 |
|
|
7 |
% |
|
(630) |
|
|
(17) |
% |
| Total finished product tonnes |
6,991 |
|
|
6,558 |
|
|
7,693 |
|
|
433 |
|
|
7 |
% |
|
(1,135) |
|
|
(15) |
% |
Rock(c) |
1,622 |
|
|
1,719 |
|
|
1,772 |
|
|
(97) |
|
|
(6) |
% |
|
(53) |
|
|
(3) |
% |
Total Phosphates Segment Tonnes(a) |
8,613 |
|
|
8,277 |
|
|
9,465 |
|
|
336 |
|
|
4 |
% |
|
(1,188) |
|
|
(13) |
% |
| Realized prices ($/tonne) |
|
|
|
|
|
|
|
|
|
|
|
|
|
Average finished product selling price (destination)(d) |
$ |
646 |
|
|
$ |
913 |
|
|
$ |
618 |
|
|
$ |
(267) |
|
|
(29) |
% |
|
$ |
295 |
|
|
48 |
% |
| DAP selling price (fob mine) |
$ |
573 |
|
|
$ |
804 |
|
|
$ |
564 |
|
|
$ |
(231) |
|
|
(29) |
% |
|
$ |
240 |
|
|
43 |
% |
| Average cost per unit consumed in cost of goods sold: |
|
|
|
|
|
|
|
|
|
|
|
|
|
Ammonia (metric tonne) |
$ |
426 |
|
|
$ |
603 |
|
|
$ |
396 |
|
|
$ |
(177) |
|
|
(29) |
% |
|
$ |
207 |
|
|
52 |
% |
Sulfur (long ton) |
$ |
181 |
|
|
$ |
368 |
|
|
$ |
181 |
|
|
$ |
(187) |
|
|
(51) |
% |
|
$ |
187 |
|
|
103 |
% |
Blended rock (metric tonne) |
$ |
75 |
|
|
$ |
70 |
|
|
$ |
60 |
|
|
$ |
5 |
|
|
7 |
% |
|
$ |
10 |
|
|
17 |
% |
| Production volume (in thousands of metric tonnes) - North America |
6,568 |
|
|
6,647 |
|
|
7,331 |
|
|
(79) |
|
|
(1) |
% |
|
(684) |
|
|
(9) |
% |
(a) Includes intersegment sales volumes.
(b) Includes sales volumes of MicroEssentials® and animal feed ingredients.
(c) Sales volumes of rock are presented on a wet tonne basis based on average moisture levels of 3.5% to 4.5% as it exits the drying process and is prepared for shipping.
(d) Excludes sales revenue and tonnes associated with rock sales.
Year Ended December 31, 2023 compared to Year Ended December 31, 2022
The Phosphates segment’s net sales were $4.7 billion for the year ended December 31, 2023, compared to $6.2 billion for the same period a year ago. The decrease in net sales was primarily due to lower average finished goods selling prices, which resulted in a decrease in net sales of approximately $1.7 billion. This was partially offset by higher sales volumes of finished product, which favorably impacted net sales by approximately $350 million. Net sales were also unfavorably impacted by approximately $110 million due to lower raw materials sales driven by lower sales prices and volumes of sulfur and ammonia.
Our average finished product selling price decreased 29%, to $646 per tonne for the year ended December 31, 2023, compared to $913 per tonne for the same period a year ago, due to the factors discussed in the Overview.
The Phosphates segment’s sales volumes of finished products increased to 7.0 million tonnes for the year ended December 31, 2023, compared to 6.6 million tonnes in 2022, due to the factors discussed in the Overview.
Gross margin for the Phosphates segment decreased to $702.1 million in the current year compared with $1.8 billion for the prior year. The decrease was primarily driven by significantly lower finished product selling prices, which unfavorably impacted gross margin by approximately $1.7 billion compared to the prior year. Gross margin was also negatively impacted by approximately $200 million, due to increased conversion costs, and $100 million due to increased rock costs, as discussed below.
These decreases were partially offset by lower raw material costs of sulfur and ammonia as discussed below, which impacted gross margin by approximately $590 million and by increased sales volumes of approximately $200 million. Gross margin was also favorably impacted by approximately $110 million of lower costs related to the timing of idle plant and turnaround costs in the current year period.
Our average consumed price for ammonia in our North American operations decreased to $426 per tonne in 2023 from $603 a year ago. The average consumed price for sulfur for our North American operations decreased to $181 per long ton for the year ended December 31, 2023, from $368 in the prior-year period. The purchase price of these raw materials is driven by global supply and demand. The consumed ammonia and sulfur prices also include transportation, transformation, and storage costs.
The average consumed cost of purchased and produced rock increased to $75 per tonne in the current year, from $70 a year ago. For the year ended December 31, 2023, our North American phosphate rock production decreased to 9.1 million tonnes from 9.6 million tonnes in the prior year, due to geology of rock and operational challenges.
The Phosphates segment’s production of crop nutrient dry concentrates and animal feed ingredients were similar to the prior year at approximately 6.6 million tonnes. For the year ended December 31, 2023, our operating rate for processed phosphate production decreased to 65%, compared to 67% in the same period of the prior year.
Potash Net Sales and Gross Margin
The following table summarizes the Potash segment’s net sales, gross margin, sales volume and selling price:
|
|
|
|
|
|
|
|
|
|
|
|
|
|
|
|
|
|
|
|
|
|
|
|
|
|
|
|
|
|
|
|
|
|
|
|
|
|
|
|
|
|
|
Years Ended December 31, |
|
2023-2022 |
|
2022-2021 |
(in millions, except price per tonne or unit) |
2023 |
|
2022 |
|
2021 |
|
Change |
|
Percent |
|
Change |
|
Percent |
| Net sales: |
|
|
|
|
|
|
|
|
|
|
|
|
|
North America |
$ |
1,899.9 |
|
|
$ |
2,122.3 |
|
|
$ |
1,456.8 |
|
|
$ |
(222.4) |
|
|
(10) |
% |
|
$ |
665.5 |
|
|
46 |
% |
International |
1,333.7 |
|
|
3,086.2 |
|
|
1,170.0 |
|
|
(1,752.5) |
|
|
(57) |
% |
|
1,916.2 |
|
|
164 |
% |
| Total |
3,233.6 |
|
|
5,208.5 |
|
|
2,626.8 |
|
|
(1,974.9) |
|
|
(38) |
% |
|
2,581.7 |
|
|
98 |
% |
| Cost of goods sold |
2,018.6 |
|
|
2,365.5 |
|
|
1,569.3 |
|
|
(346.9) |
|
|
(15) |
% |
|
796.2 |
|
|
51 |
% |
| Gross margin |
$ |
1,215.0 |
|
|
$ |
2,843.0 |
|
|
$ |
1,057.5 |
|
|
$ |
(1,628.0) |
|
|
(57) |
% |
|
$ |
1,785.5 |
|
|
169 |
% |
| Gross margin as a percentage of net sales |
37.6 |
% |
|
54.6 |
% |
|
40.3 |
% |
|
|
|
|
|
|
|
|
|
|
|
|
|
|
|
|
|
|
|
|
|
|
|
|
|
|
|
|
|
|
|
|
|
|
|
|
|
|
|
|
|
|
|
|
|
|
|
|
|
|
Sales volume(a) (in thousands of metric tonnes) |
|
|
|
|
|
|
|
|
|
|
|
|
|
MOP |
7,969 |
|
|
7,236 |
|
|
7,277 |
|
|
733 |
|
|
10 |
% |
|
(41) |
|
|
(1) |
% |
Performance and Other(b) |
901 |
|
|
865 |
|
|
909 |
|
|
36 |
|
|
4 |
% |
|
(44) |
|
|
(5) |
% |
| Total Potash Segment Tonnes |
8,870 |
|
|
8,101 |
|
|
8,186 |
|
|
769 |
|
|
9 |
% |
|
(85) |
|
|
(1) |
% |
| Realized prices ($/tonne) |
|
|
|
|
|
|
|
|
|
|
|
|
|
| Average finished product selling price (destination) |
$ |
365 |
|
|
$ |
643 |
|
|
$ |
321 |
|
|
$ |
(278) |
|
|
(43) |
% |
|
$ |
322 |
|
|
100 |
% |
| MOP selling price (fob mine) |
$ |
308 |
|
|
$ |
632 |
|
|
$ |
285 |
|
|
$ |
(324) |
|
|
(51) |
% |
|
$ |
347 |
|
|
122 |
% |
| Production volume (in thousands of metric tonnes) |
8,246 |
|
|
9,053 |
|
|
8,204 |
|
|
(807) |
|
|
(9) |
% |
|
849 |
|
|
10 |
% |
(a) Includes intersegment sales volumes.
(b) Includes sales volumes of K-Mag®, Aspire® and animal feed ingredients.
Year Ended December 31, 2023 compared to Year Ended December 31, 2022
The Potash segment’s net sales decreased to $3.2 billion for the year ended December 31, 2023, compared to $5.2 billion in the prior year. The decrease in net sales was driven by an unfavorable impact from lower selling prices of approximately $2.5 billion, partially offset by favorable sales volumes of approximately $550 million.
Our average finished product selling price was $365 per tonne for the year ended December 31, 2023, a decrease of $278 per tonne compared with the prior year period, due to the factors discussed in the Overview.
The Potash segment’s sales volumes increased to 8.9 million tonnes for the year ended December 31, 2023, compared to 8.1 million tonnes in the same period a year ago, due to the factors discussed in the Overview.
Gross margin for the Potash segment decreased to $1.2 billion in the current year, from $2.8 billion in the prior year period. The decrease in gross margin in the current year period is primarily due to lower selling prices, which unfavorably impacted gross margin by approximately $2.5 billion. This was partially offset by a reduction in Canadian resource taxes and royalties of $580 million, as discussed below, and by an increase of approximately $380 million, due to higher sales volumes compared to the prior year. Higher idle and turnaround costs of approximately $40 million, largely due to the idling of our Colonsay, Saskatchewan mine during the first half of the current year, also negatively impacted gross margin in the current year.
We had expense of $403.4 million from Canadian resource taxes for the year ended December 31, 2023, compared to $927.9 million in the prior year. Royalty expense also decreased to $53.6 million for the year ended December 31, 2023, from $112.6 million in the prior year. The fluctuations in Canadian resource taxes and royalties are due to lower average selling prices and margins in the current year, compared to the prior year.
For the year ended December 31, 2023, potash production decreased to 8.2 million tonnes, compared to 9.1 million tonnes in the prior year period, resulting in an operating rate of 73% for 2023, compared to 81% for 2022. Lower production in the current year was largely driven by increased idle time compared to the prior year period, due to the Colonsay mine being idle during the first half of the year as mentioned above and planned downtime at our Esterhazy mine.
Mosaic Fertilizantes Net Sales and Gross Margin
The following table summarizes the Mosaic Fertilizantes segment’s net sales, gross margin, sales volume and selling price.
|
|
|
|
|
|
|
|
|
|
|
|
|
|
|
|
|
|
|
|
|
|
|
|
|
|
|
|
|
|
|
|
|
|
|
|
|
|
|
|
|
|
|
Years Ended December 31, |
|
2023-2022 |
|
2022-2021 |
(in millions, except price per tonne or unit) |
2023 |
|
2022 |
|
2021 |
|
Change |
|
Percent |
|
Change |
|
Percent |
| Net Sales |
$ |
5,684.7 |
|
|
$ |
8,287.2 |
|
|
$ |
5,088.5 |
|
|
$ |
(2,602.5) |
|
|
(31) |
% |
|
$ |
3,198.7 |
|
|
63 |
% |
| Cost of goods sold |
5,473.1 |
|
|
7,241.6 |
|
|
4,245.8 |
|
|
(1,768.5) |
|
|
(24) |
% |
|
2,995.8 |
|
|
71 |
% |
| Gross margin |
$ |
211.6 |
|
|
$ |
1,045.6 |
|
|
$ |
842.7 |
|
|
$ |
(834.0) |
|
|
(80) |
% |
|
$ |
202.9 |
|
|
24 |
% |
| Gross margin as a percent of net sales |
3.7 |
% |
|
12.6 |
% |
|
16.6 |
% |
|
|
|
|
|
|
|
|
| Sales volume (in thousands of metric tonnes) |
|
|
|
|
|
|
|
|
|
|
Phosphate produced in Brazil |
2,235 |
|
|
2,368 |
|
|
2,543 |
|
|
(133) |
|
|
(6) |
% |
|
(175) |
|
|
(7) |
% |
Potash produced in Brazil |
195 |
|
|
165 |
|
|
240 |
|
|
30 |
|
|
18 |
% |
|
(75) |
|
|
(31) |
% |
Purchased nutrients |
7,253 |
|
|
6,905 |
|
|
7,319 |
|
|
348 |
|
|
5 |
% |
|
(414) |
|
|
(6) |
% |
| Total Mosaic Fertilizantes Segment Tonnes |
9,683 |
|
|
9,438 |
|
|
10,102 |
|
|
245 |
|
|
3 |
% |
|
(664) |
|
|
(7) |
% |
| Realized prices ($/tonne) |
|
|
|
|
|
|
|
|
|
|
|
|
|
Average finished product selling price (destination) |
$ |
587 |
|
|
$ |
878 |
|
|
$ |
504 |
|
|
$ |
(291) |
|
|
(33) |
% |
|
$ |
374 |
|
|
74 |
% |
| Brazil MAP price (delivered price to third party) |
$ |
597 |
|
|
$ |
868 |
|
|
$ |
597 |
|
|
$ |
(271) |
|
|
(31) |
% |
|
$ |
271 |
|
|
45 |
% |
Purchases (’000 tonnes) |
|
|
|
|
|
|
|
|
|
|
|
|
|
DAP/MAP from Mosaic |
341 |
|
|
272 |
|
|
311 |
|
|
69 |
|
|
25 |
% |
|
(39) |
|
|
(13) |
% |
MicroEssentials® from Mosaic |
1,019 |
|
|
1,271 |
|
|
1,226 |
|
|
(252) |
|
|
(20) |
% |
|
45 |
|
|
4 |
% |
Potash from Mosaic/Canpotex |
2,067 |
|
|
2,276 |
|
|
2,510 |
|
|
(209) |
|
|
(9) |
% |
|
(234) |
|
|
(9) |
% |
| Average cost per unit consumed in cost of goods sold: |
|
|
|
|
|
|
|
|
|
|
|
|
|
| Ammonia (metric tonne) |
$ |
807 |
|
|
$ |
1,301 |
|
|
$ |
580 |
|
|
$ |
(494) |
|
|
(38) |
% |
|
$ |
721 |
|
|
124 |
% |
| Sulfur (long ton) |
$ |
232 |
|
|
$ |
391 |
|
|
$ |
194 |
|
|
$ |
(159) |
|
|
(41) |
% |
|
$ |
197 |
|
|
102 |
% |
| Blended rock (metric tonne) |
$ |
122 |
|
|
$ |
105 |
|
|
$ |
80 |
|
|
$ |
17 |
|
|
16 |
% |
|
$ |
25 |
|
|
31 |
% |
| Production volume (in thousands of metric tonnes) |
3,457 |
|
|
3,598 |
|
|
3,725 |
|
|
(141) |
|
|
(4) |
% |
|
(127) |
|
|
(3) |
% |
Year Ended December 31, 2023 compared to Year Ended December 31, 2022
The Mosaic Fertilizantes segment’s net sales were $5.7 billion for the year ended December 31, 2023, compared to $8.3 billion for 2022. In the current period, net sales were unfavorably impacted by approximately $2.5 billion due to lower finished product selling prices, partially offset by the impact of higher finished goods sales volumes of approximately $200 million. Net sales were also unfavorably impacted by decreased revenues from other products, primarily acids, of approximately $300 million, due to lower selling prices.
The overall average finished product selling price decreased $291 per tonne, to $587 per tonne for 2023, due to the decrease in global prices referenced in the Overview.
The Mosaic Fertilizantes segment’s sales volume increased to 9.7 million tonnes for the year ended December 31, 2023, compared to 9.4 million tonnes for the prior year period, due to the factors discussed in the Overview.
Gross margin for the Mosaic Fertilizantes segment decreased to $211.6 million for the year ended December 31, 2023, from $1.0 billion in the prior year. In the current year, gross margin was unfavorably impacted by approximately $2.5 billion due to lower average selling prices. This impact was partially offset by approximately $1.7 billion related to lower product costs, primarily reductions in material purchases by our distribution business and lower raw materials costs in the current year compared to the prior year. Lower idle and turnaround costs also favorably impacted gross margin by approximately $20 million.
Foreign currency had an unfavorable impact of approximately $50 million on gross margin in the current year compared to the prior year.
The average consumed price for ammonia for our Brazilian operations was $807 per tonne for the year ended December 31, 2023, compared to $1,301 per ton in the prior year. The average consumed sulfur price for our Brazilian operations was $232 per long tonne for the year ended December 31, 2023, compared to $391 in the prior year. The purchase prices of these raw materials are driven by global supply and demand, and include transportation, transformation, and storage costs.
The Mosaic Fertilizantes segment’s production of crop nutrient dry concentrates and animal feed ingredients decreased 4% to 3.5 million tonnes for the year ended December 31, 2023, compared to 3.6 million tonnes in the prior year. For the year ended December 31, 2023, our phosphate operating rate was 77%, compared to 85% in the prior year.
Our Brazilian phosphate rock production decreased to 3.9 million tonnes for the year ended December 31, 2023 compared to 4.2 million for the prior year period due to unplanned maintenance downtime.
Corporate, Eliminations and Other
In addition to our three operating segments, we assign certain costs to Corporate, Eliminations and Other, which is presented separately in Note 25 of our Notes to Consolidated Financial Statements. The Corporate, Eliminations and Other category includes intersegment eliminations, including profit on intersegment sales, unrealized mark-to-market gains and losses on derivatives, debt expenses, corporate functional costs and the results of the China and India distribution businesses.
Gross margin for Corporate, Eliminations and Other was a gain of $81.9 million for the year ended December 31, 2023, compared to a gain of $108.2 million in the same period a year ago. Gross margin was favorably impacted by higher elimination of profit on intersegment sales in the current year period of approximately $116 million, compared to the prior year period of approximately $19 million. Gross margin was also favorably impacted by a net unrealized gain on derivatives of approximately $29 million in the current year period, compared to a net unrealized loss of approximately $21 million in the prior year period. Distribution operations in India and China had revenues and gross margin of $898.9 million and $(16.8) million, respectively, for the year ended December 31, 2023, compared to revenues and gross margin of $1.1 billion and $130.9 million, respectively, for the year ended December 31, 2022. The decreases were primarily due to decreased selling prices in the current year compared to the prior year period. This was partially offset by lower product costs in the current year due to softer global market conditions in the current year. Sales volumes of finished products were 1.9 million tonnes and 1.6 million tonnes for the years ended December 31, 2023 and 2022, respectively.
Other Income Statement Items
|
|
|
|
|
|
|
|
|
|
|
|
|
|
|
|
|
|
|
|
|
|
|
|
|
|
|
|
|
|
|
|
|
|
|
|
|
|
|
|
|
|
| |
Years Ended December 31, |
|
2023-2022 |
|
2022-2021 |
| (in millions) |
2023 |
|
2022 |
|
2021 |
|
Change |
|
Percent |
|
Change |
|
Percent |
| Selling, general and administrative expenses |
$ |
500.5 |
|
|
$ |
498.0 |
|
|
$ |
430.5 |
|
|
$ |
2.5 |
|
|
1 |
% |
|
$ |
67.5 |
|
|
16 |
% |
| Impairment, restructuring and other expenses |
— |
|
|
— |
|
|
158.1 |
|
|
— |
|
|
NM |
|
(158.1) |
|
|
(100) |
% |
| Other operating expenses |
372.0 |
|
|
472.5 |
|
|
143.2 |
|
|
(100.5) |
|
|
(21) |
% |
|
329.3 |
|
|
NM |
| Interest (expense) |
(189.0) |
|
|
(168.8) |
|
|
(194.3) |
|
|
(20.2) |
|
|
12 |
% |
|
25.5 |
|
|
(13) |
% |
| Interest income |
59.6 |
|
|
31.0 |
|
|
25.2 |
|
|
28.6 |
|
|
92 |
% |
|
5.8 |
|
|
23 |
% |
| Interest expense, net |
(129.4) |
|
|
(137.8) |
|
|
(169.1) |
|
|
8.4 |
|
|
(6) |
% |
|
31.3 |
|
|
(19) |
% |
| Foreign currency transaction gain (loss) |
194.0 |
|
|
97.5 |
|
|
(78.5) |
|
|
96.5 |
|
|
99 |
% |
|
176.0 |
|
|
NM |
| Other (expense) income |
(76.8) |
|
|
(102.5) |
|
|
3.9 |
|
|
25.7 |
|
|
(25) |
% |
|
(106.4) |
|
|
NM |
| Provision for income taxes |
177.0 |
|
|
1,224.3 |
|
|
597.7 |
|
|
(1,047.3) |
|
|
(86) |
% |
|
626.6 |
|
|
105 |
|
| Equity in net earnings of nonconsolidated companies |
60.3 |
|
|
196.0 |
|
|
7.8 |
|
|
(135.7) |
|
|
(69) |
% |
|
188.2 |
|
|
NM |
Selling, General and Administrative Expenses
Selling, general and administrative expenses were $500.5 million for the year ended December 31, 2023, compared to $498.0 million for the same period a year ago. The increase was primarily due to approximately $18 million of higher consulting and professional services costs related to executing on our strategic initiatives.
This was largely offset by approximately $16 million due to lower incentive compensation and other employee-related costs in the current year compared to the prior year.
Other Operating Expenses
Other operating expenses were $372.0 million for the year ended December 31, 2023, compared to $472.5 million for the prior year period. Other operating expenses typically relate to five major categories: (1) AROs, (2) environmental and legal reserves, (3) idle facility costs, (4) insurance reimbursements, and (5) gain/loss on sale or disposal of fixed assets. The current year includes approximately $185 million related to upward revisions in estimated closure costs for our AROs at our closed facilities, compared to approximately $157 million in the prior year, and approximately $110 million related to increases in environmental reserves, compared to approximately $173 million in the prior year. The current year period included $45 million related to costs of maintaining closed and indefinitely idled facilities compared to approximately $41 million in the prior year. These costs were primarily related to our Phosphate segment. Current year expenses were partially offset by a gain on the sale of the Resort of approximately $57 million.
Interest Expense, Net
Net interest expense decreased to $129.4 million for the year ended December 31, 2023, compared to $137.8 million in 2022. The change from the prior year is driven by higher interest income, primarily due to interest received in the current year period of $10 million on tax credit refunds from our Brazilian subsidiaries.
Foreign Currency Transaction Gain (Loss)
In 2023, we recorded a foreign currency transaction gain of $194.0 million, compared to a gain of $97.5 million in 2022. The gain was the result of the effect of the weakening of the U.S. dollar relative to the Brazilian real on intercompany loans and U.S. dollar-denominated payables held by our Brazilian subsidiaries and the impact of the U.S. dollar relative to the Canadian dollar on intercompany loans.
Other (Expense) Income
For the year ended December 31, 2023, we had other expense of $76.8 million compared to income of $102.5 million in the prior year. The change from the prior year is primarily due to lower realized losses on the marketable securities held in the RCRA Trusts of approximately $19 million in the current year compared to $46 million in the prior year. The current year expense also includes approximately $42 million related to the settlement loss on the termination of a pension plan as further described in Note 18 of our Notes to Consolidated Financial Statements.
Equity in Net Earnings of Nonconsolidated Companies
For the year ended December 31, 2023, we had a gain from equity of nonconsolidated companies of $60.3 million, net of tax, compared to a gain of $196.0 million, net of tax, for the prior year. These results were primarily related to the operations of MWSPC, which was unfavorably impacted by lower selling prices for its products in the current year compared to the prior year.
Provision for Income Taxes
|
|
|
|
|
|
|
|
|
|
|
|
|
|
|
|
|
Effective
Tax Rate |
|
Provision for
Income Taxes |
| Year Ended December 31, 2023 |
|
13.3 |
% |
|
$ |
177.0 |
|
| Year Ended December 31, 2022 |
|
26.4 |
% |
|
1,224.3 |
|
| Year Ended December 31, 2021 |
|
26.9 |
% |
|
597.7 |
|
For all years, our income tax is impacted by the mix of earnings across jurisdictions in which we operate, by a benefit associated with depletion and by the impact of certain entities being taxed in both their foreign jurisdiction and the U.S., including foreign tax credits for various taxes incurred.
For the year ended December 31, 2023, tax expense specific to the period included a net benefit of $43.4 million. The net benefit relates to the following: $38.1 million related to true-up of estimates primarily related to our U.S. tax return, $24.4 million related to changes to valuation allowances in Brazil, and $11.6 million related to an increase in a U.S. deferred tax asset.
The tax benefits are partially offset by a net tax cost of $29.3 million related to income tax expense on undistributed earnings, and $1.4 million of other miscellaneous costs.
In 2021 the Organization for Economic Co-operation and Development (the “OECD”) issued the Inclusive Framework on Base Erosion Profit Shifting. The framework introduced a two-pillar tax system that would be effective on January 1, 2024. Many countries have adopted or intend to adopt these rules in alignment with the effective date. The framework introduced a 15 percent global minimum tax commonly referred to as Pillar Two for certain multinational companies. The Company is subject to Pillar Two and legislation has been enacted or substantively enacted in certain jurisdictions the Company operates in as of December 31, 2023. This legislation will be effective for the Company’s beginning on January 1, 2024. The Company is in the process of evaluating the impact on its consolidated financial statements.
Critical Accounting Estimates
We prepare our Consolidated Financial Statements in conformity with accounting principles generally accepted in the United States of America which requires us to make various judgments, estimates and assumptions that could have a significant impact on our reported results and disclosures. We base these estimates on historical experience and other assumptions we believe to be reasonable at the time we prepare our financial statements. Changes in these estimates could have a material effect on our Consolidated Financial Statements.
Our significant accounting policies can be found in Note 2 of our Notes to Consolidated Financial Statements. We believe the following accounting policies include a higher degree of judgment and complexity in their application and are most critical to aid in fully understanding and evaluating our reported financial condition and results of operations.
Recoverability of Goodwill
Goodwill is the excess of the purchase price consideration over the estimated fair value of net assets of acquired businesses. The carrying value of goodwill in our reporting units is tested annually as of October 31 for possible impairment. We typically use an income approach valuation model, representing present value of future cash flows, to determine the fair value of a reporting unit. Growth rates for sales and profits are determined using inputs from our annual strategic and long range planning process. The rates used to discount projected future cash flows reflect a weighted average cost of capital based on the Company’s industry, capital structure and risk premiums, including those reflected in the current market capitalization. When preparing these estimates, management considers each reporting unit’s historical results, current operating trends, and specific plans in place. These estimates are impacted by various factors, including inflation, the general health of the economy and market competition. In addition, events and circumstances that might be indicators of possible impairment are assessed during other interim periods. As of October 31, 2023, the date of our annual impairment testing, the Company concluded that the fair values of the reporting units which include goodwill, Potash, Mosaic Fertilizantes and Corporate, Eliminations and Other, were in substantial excess of their respective carrying values and the goodwill for those units was not impaired. Subsequent to our annual evaluation, on December 28, 2023, Brazil enacted a tax law change that eliminates the VAT preference starting in 2024. While we are currently assessing the full impact of this change, our Mosaic Fertilizantes reporting unit would have an estimated fair value that is not in significant excess of its carrying value. We continue to believe that our long-term financial goals will be achieved and as a result, we concluded that the goodwill assigned to this reporting unit was not impaired, but could be at risk of future impairment. As of December 31, 2023, we had $99.6 million of goodwill in our Mosaic Fertilizantes reporting unit.
See Note 10 of our Notes to Consolidated Financial Statements for additional information regarding the goodwill impairment analysis, including the methodologies and assumptions used in estimating the fair values of our reporting units. As of December 31, 2023, we had $1.1 billion of goodwill.
Environmental Liabilities and Asset Retirement Obligations
We record accrued liabilities for various environmental and reclamation matters including the demolition of former operating facilities, and AROs.
Contingent environmental liabilities are described in Note 23 of our Notes to Consolidated Financial Statements. Accruals for environmental matters are based primarily on third-party estimates for the cost of remediation at previously operated sites and estimates of legal costs for ongoing environmental litigation. We regularly assess the likelihood of material adverse judgments or outcomes, the effects of potential indemnification, as well as potential ranges or probability of losses. We determine the amount of accruals required, if any, for contingencies after carefully analyzing each individual matter.
Estimating the ultimate settlement of environmental matters requires us to develop complex and interrelated assumptions based on experience with similar matters, our history, precedents, evidence, and facts specific to each matter. Actual costs incurred in future periods may vary from the estimates, given the inherent uncertainties in evaluating environmental exposures. As of December 31, 2023 and 2022, we had accrued $203.2 million and $185.5 million, respectively, for environmental matters.
As indicated in Note 14 of our Notes to Consolidated Financial Statements, we recognize AROs in the period in which we have an existing legal obligation, and the amount of the liability can be reasonably estimated. We utilize internal engineering experts as well as third-party consultants to assist in determining the costs of retiring certain of our long-term operating assets. Assumptions and estimates reflect our historical experience and our best judgments regarding future expenditures. The assumed costs are inflated based on an estimated inflation factor and discounted based on a credit-adjusted risk-free rate. For active facilities, fluctuations in the estimated costs (including those resulting from a change in environmental regulations), inflation rates and discount rates can have a significant impact on the corresponding assets and liabilities recorded in the Consolidated Balance Sheets. However, changes in the assumptions for our active facilities would not have a significant impact on the Consolidated Statements of Earnings in the year they are identified. For closed facilities, fluctuations in the estimated costs, inflation, and discount rates have an impact on the Consolidated Statements of Earnings in the year they are identified as there is no asset related to these items. Phosphate land reclamation activities in North America generally occur concurrently with mining operations; as such, we accrue and expense reclamation costs as we mine. In addition, we regularly perform post-mining evaluations to ensure we have established a sufficient liability to meet permitting requirements. As of December 31, 2023 and 2022, $2.2 billion and $1.9 billion, respectively, was accrued for AROs (including both current and noncurrent amounts) in North and South America. In August 2016, Mosaic deposited $630 million into two trust funds as financial assurance to support certain estimated future AROs. See Note 14 of our Notes to Consolidated Financial Statements for additional information regarding the Environmental Protection Agency (“EPA”) RCRA Initiative.
Income Taxes
We make estimates for income taxes in three major areas: valuation allowances, uncertain tax positions, and U.S. deferred income taxes on our non-U.S. subsidiaries’ undistributed earnings.
A valuation allowance is provided for deferred tax assets for which it is more likely than not that the related tax benefits will not be realized. Significant judgment is required in evaluating the need for and magnitude of appropriate valuation allowances. The realization of the Company’s deferred tax assets, specifically, the evaluation of net operating loss carryforwards and foreign tax credit carryforwards, is dependent on generating certain types of future taxable income, using both historical and projected future operating results, the source of future income, the reversal of existing taxable temporary differences, taxable income in prior carry-back years (if permitted) and the availability of tax planning strategies. As of December 31, 2023 and 2022, we had a valuation allowance of $1.4 billion and $0.9 billion, respectively. Changes in tax laws, assumptions with respect to future taxable income, tax planning strategies, resolution of matters under tax audit and foreign currency exchange rates could result in adjustment to these allowances.
Due to Mosaic’s global operations, we assess uncertainties and judgments in the application of complex tax regulations in a multitude of jurisdictions. Future changes in judgment related to the expected ultimate resolution of uncertain tax positions will affect earnings in the quarter of such change. While it is often difficult to predict the final outcome or the timing of resolution of any particular uncertain tax position, our liabilities for income taxes reflect what we believe to be the more likely than not outcome. We adjust these liabilities, as well as the related interest, in light of changing facts and circumstances, including negotiations with taxing authorities in various jurisdictions, outcomes of tax litigation, and resolution of disputes arising from tax audits in the normal course of business. Settlement of any particular position may require the use of cash. Based upon an analysis of tax positions taken on prior year returns and expected positions to be taken on the current year return, management has identified gross uncertain income tax positions of $25.8 million as of December 31, 2023.
Any dividends from controlled foreign corporations are tax-free from a U.S. income tax perspective. Additionally, there will not be any foreign tax credits associated with foreign, non-branch, dividends. Therefore, there are no material federal U.S. implications of future repatriations on non-U.S. subsidiaries’ undistributed earnings. However, since there are no U.S. foreign tax credits associated with foreign dividends, any foreign withholding tax associated with a future repatriation will need to be accrued if the earnings are not permanently reinvested.
We have included a further discussion of income taxes in Note 13 of our Notes to Consolidated Financial Statements.
Liquidity and Capital Resources
We define liquidity as the ability to generate or access adequate amounts of cash to meet current cash needs. We remain committed to a disciplined capital allocation strategy and assess our liquidity in terms of our ability to fund working capital requirements, fund sustaining and opportunistic capital projects, pursue strategic opportunities and make capital management decisions, which include making payments on and issuing indebtedness and making distributions to our stockholders, either in the form of share repurchases or dividends. Our liquidity is subject to general economic, financial, competitive and other factors that are beyond our control.
We have a target liquidity buffer of up to $3.0 billion, including cash and available credit facilities. We expect our liquidity to fluctuate from time to time, especially in the first quarter of each year, to manage through the seasonality of our business. We also target debt leverage ratios that are consistent with investment grade credit metrics. Our capital allocation priorities include maintaining our target investment grade metrics and financial strength, sustaining our assets, including ensuring the safety and reliability of our assets, investing to grow our business, either through organic growth or taking advantage of strategic opportunities, and returning excess cash to stockholders, including paying our dividend. During 2023, we returned capital to our stockholders through share repurchases of $756.0 million and by paying dividends of $351.6 million. Our Board of Directors also approved an increase to our annual dividend to $0.84 per share, beginning with the dividend declared on December 15, 2023.
As of December 31, 2023, we had cash and cash equivalents of $348.8 million, marketable securities held in trusts to fund future obligations of $683.6 million, long-term debt including current maturities of $3.4 billion, short-term debt of $399.7 million and stockholders’ equity of $12.4 billion. In addition, we had $399.9 million of commercial arrangements for certain customer purchases in Brazil through structured payable arrangements, as discussed in Note 11 of our Notes to Consolidated Financial Statements.
All of our cash and cash equivalents are diversified in highly rated investment vehicles. Our cash and cash equivalents are held either in the U.S. or held by non-U.S. subsidiaries and are not subject to significant foreign currency exposures, as the majority are held in investments denominated in U.S. dollars as of December 31, 2023. These funds may create foreign currency transaction gains or losses, however, depending on the functional currency of the entity holding the cash. In addition, there are no significant restrictions that would preclude us from bringing funds held by non-U.S. subsidiaries back to the U.S., aside from withholding taxes.
Sources and Uses of Cash
As of December 31, 2023, we had cash and cash equivalents and restricted cash of $348.8 million. Funds generated by operating activities, available cash and cash equivalents and our revolving credit facility continue to be our most significant sources of liquidity. We believe funds generated from the expected results of operations and available cash, cash equivalents and borrowings, either under our revolving credit facility or through long-term borrowings, will be sufficient to finance our operations, including our expansion plans, existing strategic initiatives and expected dividend payments for the foreseeable future. We expect our capital expenditures to be approximately $1.2 billion in 2024. There can be no assurance, however, that we will continue to generate cash flows at or above current levels. At December 31, 2023, we had $2.49 billion available under our $2.5 billion revolving credit facility. See Note 11 of our Notes to Consolidated Financial Statements for additional information relating to our financing arrangements, which is hereby incorporated by reference.
We have certain contractual obligations that require us to make cash payments on a scheduled basis. These include, among other things, long-term debt payments, interest payments, operating leases, unconditional purchase obligations and funding requirements of pension and postretirement obligations. Our long-term debt has maturities ranging from one year to 19 years. Unconditional purchase obligations are our largest contractual cash obligations. These include obligations for contracts to purchase raw materials such as sulfur, ammonia, phosphate rock and natural gas, obligations to purchase raw materials for our international distribution activities, and maintenance and services. Other large cash obligations are our AROs and other environmental obligations, primarily related to our Phosphates and Mosaic Fertilizantes segments. We expect to fund our AROs and other environmental obligations, purchase obligations, long-term debt and capital expenditures with a combination of operating cash flows, cash and cash equivalents and borrowings.
The following is a summary of our material contractual cash obligations as of December 31, 2023:
|
|
|
|
|
|
|
|
|
|
|
|
|
|
|
|
|
|
|
|
|
|
|
|
|
|
|
|
|
|
|
|
|
| |
|
|
|
Payments by Calendar Year |
| (in millions) |
|
Total |
|
Less than 1
year |
|
1 - 3
years |
|
3 - 5
years |
|
More than 5
years |
Long-term debt(a) |
|
$ |
3,361.7 |
|
|
$ |
130.1 |
|
|
$ |
74.5 |
|
|
$ |
1,264.8 |
|
|
$ |
1,892.3 |
|
Estimated interest payments on long-term debt(b) |
|
1,735.6 |
|
|
173.4 |
|
|
336.8 |
|
|
284.5 |
|
|
940.9 |
|
| Operating leases |
|
233.4 |
|
|
65.5 |
|
|
78.4 |
|
|
42.6 |
|
|
46.9 |
|
Purchase commitments(c) |
|
4,091.8 |
|
|
3,002.9 |
|
|
908.4 |
|
|
125.8 |
|
|
54.7 |
|
Pension and postretirement liabilities(d) |
|
109.5 |
|
|
4.4 |
|
|
17.3 |
|
|
21.3 |
|
|
66.5 |
|
| Total contractual cash obligations |
|
$ |
9,532.0 |
|
|
$ |
3,376.3 |
|
|
$ |
1,415.4 |
|
|
$ |
1,739.0 |
|
|
$ |
3,001.3 |
|
______________________________
(a)Long-term debt primarily consists of unsecured notes, finance leases, unsecured debentures and secured notes.
(b)Based on interest rates and debt balances as of December 31, 2023.
(c)Based on prevailing market prices as of December 31, 2023. For additional information related to our purchase commitments, see Note 22 of our Notes to Consolidated Financial Statements.
(d)The 2024 pension plan payments are based on minimum funding requirements. For years thereafter, pension plan payments are based on expected benefits paid. The postretirement plan payments are based on projected benefit payments. The above amounts include our North America and Brazil plans.
See Off-Balance Sheet Arrangements and Obligations below for more information on other environmental obligations.
Summary of Cash Flows
The following table represents a comparison of the net cash provided by operating activities, net cash used in investing activities and net cash used in financing activities for calendar years 2023, 2022 and 2021:
|
|
|
|
|
|
|
|
|
|
|
|
|
|
|
|
|
|
|
|
|
|
|
|
|
|
|
|
|
|
|
|
|
|
|
|
|
|
|
|
|
|
|
|
|
|
|
Years Ended December 31, |
|
|
|
|
|
|
|
|
| (in millions) |
|
|
2023-2022 |
|
2022-2021 |
| Cash Flow |
|
2023 |
|
2022 |
|
2021 |
|
Change |
|
Percent |
|
Change |
|
Percent |
| Net cash provided by operating activities |
|
$ |
2,407.2 |
|
|
$ |
3,935.8 |
|
|
$ |
2,187.0 |
|
|
$ |
(1,528.6) |
|
|
(39) |
% |
|
$ |
1,748.8 |
|
|
80 |
% |
| Net cash used in investing activities |
|
(1,317.2) |
|
|
(1,259.6) |
|
|
(1,322.3) |
|
|
(57.6) |
|
|
(5) |
% |
|
62.7 |
|
|
5 |
% |
| Net cash used in financing activities |
|
(1,480.5) |
|
|
(2,678.7) |
|
|
(682.1) |
|
|
1,198.2 |
|
|
45 |
% |
|
(1,996.6) |
|
|
(293) |
% |
Operating Activities
In 2023, net cash flow from operating activities provided us with a significant source of liquidity. For the year ended December 31, 2023, net cash provided by operating activities was $2.4 billion, compared to $3.9 billion in the prior year. Our results of operations, after non-cash adjustments to net earnings, contributed $2.0 billion to cash flows from operating activities during 2023, compared to $4.9 billion during 2022. During 2023, we had a favorable change in assets and liabilities of $401.7 million, compared to an unfavorable change of $992.5 million during 2022.
The change in assets and liabilities for the year ended December 31, 2023, was primarily driven by favorable changes in accounts receivable of $526.3 million and inventories of $1.1 billion, partially offset by unfavorable impacts from changes in accounts payable and accrued liabilities of $1.1 billion and other current and noncurrent assets of $239.2 million. The change in accounts receivable was driven primarily by lower selling prices at the end of the current year compared to the prior year. The change in inventories was driven primarily by a decrease in raw material prices and a decrease in inventory volumes, across our segments. These changes were partially offset by a decrease in accounts payable and accrued liabilities which was primarily driven by a decrease in customer prepayments in Brazil and a decrease in raw material purchase prices. The increase in current and noncurrent assets was primarily due to an increase in taxes receivable and cloud computing costs in the current year.
Investing Activities
Net cash used in investing activities for the year ended December 31, 2023, was comparable to the same period a year ago at $1.3 billion, primarily driven by capital expenditures of $1.4 billion in 2023. During 2023, we also completed the sale of the Resort for net proceeds of $158.4 million and purchased the other 50% equity of GSS for $41.0 million. GSS is now wholly-owned by Mosaic.
Financing Activities
Net cash used in financing activities was $1.5 billion for the year ended December 31, 2023, compared to $2.7 billion in the prior year. In 2023, we made repurchases of our common stock of $756.0 million and paid dividends of $393.1 million. We also made net payments on our long-term debt of $95.3 million and had net payments on structured accounts payable of $384.7 million. In 2023, we also received net proceeds from short-term borrowings of $175.1 million.
Debt Instruments, Guarantees and Related Covenants
See Note 11 and Note 16 of our Notes to Consolidated Financial Statements for additional information relating to our financing arrangements and fair value measurements, which is hereby incorporated by reference.
Financial Assurance Requirements
In addition to various operational and environmental regulations primarily related to our Phosphates segment, we incur liabilities for reclamation activities under which we are subject to financial assurance requirements. In various jurisdictions in which we operate, particularly Florida and Louisiana, we are required to pass a financial strength test or provide credit support, typically in the form of cash deposits, surety bonds or letters of credit. See Other Commercial Commitments under Off-Balance Sheet Arrangements and Obligations and Note 22 of our Notes to Consolidated Financial Statements for additional information about these requirements, which is hereby incorporated by reference.
Off-Balance Sheet Arrangements and Obligations
Off-Balance Sheet Arrangements
In accordance with the definition under rules of the Securities and Exchange Commission (“SEC”), the following qualify as off-balance sheet arrangements:
•certain obligations under guarantee contracts that have “any of the characteristics identified in Financial Accounting Standards Board (“FASB”) Accounting Standards Codification (“ASC”) paragraph ASC 460-10-15-4 (Guarantees Topic)”;
•a retained or contingent interest in assets transferred to an unconsolidated entity or similar arrangement that serves as credit, liquidity or market risk support to that entity for such assets;
•any obligation, including a contingent obligation, under a contract that would be accounted for as derivative instruments except that it is both indexed to the registrant’s own stock and classified as equity; and
•any obligation, arising out of a variable interest in an unconsolidated entity that is held by, and material to, the registrant, where such entity provides financing, liquidity, market risk or credit risk support to the registrant, or engages in leasing, hedging or research and development services with the registrant.
Information regarding guarantees that meet the above requirements is included in Note 17 of our Notes to Consolidated Financial Statements and is hereby incorporated by reference. We do not have any contingent interest in assets transferred, derivative instruments, or variable interest entities that qualify as off-balance sheet arrangements under SEC rules.
Other Commercial Commitments
The following is a summary of our other commercial commitments as of December 31, 2023:
|
|
|
|
|
|
|
|
|
|
|
|
|
|
|
|
|
|
|
|
|
|
|
|
|
|
|
|
|
|
|
|
|
| |
|
|
|
Commitment Expiration by Calendar Year |
| (in millions) |
|
Total |
|
Less than 1
year |
|
1 - 3
years |
|
3 - 5
years |
|
More than 5
years |
| Letters of credit |
|
$ |
63.1 |
|
|
$ |
63.1 |
|
|
$ |
— |
|
|
$ |
— |
|
|
$ |
— |
|
| Surety bonds |
|
765.9 |
|
|
765.6 |
|
|
— |
|
|
0.3 |
|
|
— |
|
| Total |
|
$ |
829.0 |
|
|
$ |
828.7 |
|
|
$ |
— |
|
|
$ |
0.3 |
|
|
$ |
— |
|
The surety bonds and letters of credit generally expire within one year or less but a substantial portion of these instruments provide financial assurance for continuing obligations and, therefore, in most cases, must be renewed on an annual basis. We issue letters of credit through our revolving credit facility and bilateral agreements. As of December 31, 2023, we had $10.5 million of outstanding letters of credit through our credit facility and $52.6 million outstanding through bilateral agreements. We primarily incur liabilities for reclamation activities in our Florida operations and for phosphogypsum management system (“Gypstack” or “Gypstacks”) closure in our Florida and Louisiana operations where, for permitting purposes, we must either pass a test of financial strength or provide credit support, typically in the form of cash deposits, surety bonds or letters of credit. As of December 31, 2023, we had $409.3 million in surety bonds and a $50 million letter of credit included in the total amount above. These bonds and letters of credit are outstanding for reclamation obligations, primarily related to mining in Florida. We also have a surety bond of $303.1 million with the EPA which was delivered as a substitute for the financial assurance provided through a trust (the “Plant City Trust”). The surety bonds generally require us to obtain a discharge of the bonds or to post additional collateral (typically in the form of cash or letters of credit) at the request of the issuer of the bonds.
We are subject to financial assurance requirements related to the closure and post-closure care of our Gypstacks in Florida and Louisiana. These requirements include Florida and Louisiana state financial assurance regulations, and financial assurance requirements under the terms of consent decrees that we have entered into with respect to our facilities in Florida and Louisiana. These include a consent decree (the “Plant City Consent Decree”) with EPA and the Florida Department of Environmental Protection (“FDEP”) relating to the Plant City, Florida Phosphate Concentrates facility (the “Plant City Facility”) we acquired as part of an acquisition (the “CF Phosphate Assets Acquisition”) and two separate consent decrees (collectively, the “2015 Consent Decrees”) with federal and state regulators that include financial assurance requirements for the closure and post-closure care of substantially all of our Gypstacks in Florida and Louisiana, other than those acquired as part of the CF Phosphate Assets Acquisition, which are discussed separately below.
See Note 14 of our Notes to Consolidated Financial Statements for additional information relating to our financial assurance obligations, including the Plant City Consent Decree and the 2015 Consent Decrees, which information is incorporated by reference.
Currently, state financial assurance requirements in Florida and Louisiana for the closure and post-closure care of Gypstacks are, in general terms, based upon the same assumptions and associated estimated values as the AROs recognized for financial reporting purposes. For financial reporting purposes, we recognize the AROs based on the estimated future closure and post-closure costs of Gypstacks, the undiscounted value of our North America Gypstacks is approximately $2.9 billion. The value of the AROs for closure and post-closure care of our North America Gypstacks, discounted to the present value, based on a credit-adjusted, risk-free rate, is reflected on our Consolidated Balance Sheets in the amount of approximately $1.2 billion as of December 31, 2023. Compliance with the financial assurance requirements in Florida and Louisiana is generally based on the undiscounted Gypstack closure estimates.
We satisfy substantially all of our Florida, Louisiana and federal financial assurance requirements through compliance with the financial assurance requirements under the 2015 Consent Decrees, by providing third-party credit support in the form of surety bonds (including under the Plant City Consent Decree), and a financial test mechanism supported by a corporate guarantee (“Bonnie Financial Test”) related to a closed Florida phosphate concentrates facility in Bartow, Florida (the “Bonnie Facility”) as discussed below. We comply with our remaining state financial assurance requirements because our financial strength permits us to meet applicable financial strength tests. There have been times in the past that we have not met the applicable financial strength tests and there can be no assurance that we will be able to meet the applicable financial strength tests in the future. In the event we do not meet either financial strength test, we could be required to seek an alternate financial strength test acceptable to state regulatory authorities or provide credit support, which may include surety bonds, letters of credit and cash escrows or trust funds. Cash escrows or trust funds would be classified as restricted cash on our Consolidated Balance Sheets.
Assuming we maintain our current levels of liquidity and capital resources, we do not expect that these Florida and Louisiana requirements will have a material effect on our results of operations, liquidity or capital resources.
As part of the CF Phosphate Assets Acquisition, we assumed certain AROs related to the estimated costs (“Gypstack Closure Costs”) at both the Plant City Facility and the Bonnie Facility. Associated with these assets are two related financial assurance arrangements for which we became responsible and that provided sources of funds for the estimated Gypstack Closure Costs for these facilities, pursuant to federal or state law, which the government can draw against in the event we cannot perform such closure activities. One was initially the Plant City Trust established to meet the requirements under a consent decree with EPA and the FDEP with respect to U.S. Resource Conservation and Recovery Act (“RCRA”) compliance at Plant City that also satisfied Florida financial assurance requirements at that site. Beginning in September 2016, as a substitute for the financial assurance provided through the Plant City Trust, we have provided financial assurance for Plant City in the form of a surety bond delivered to EPA (the “Plant City Bond”). The amount of the Plant City Bond is $303.1 million at December 31, 2022, which reflects our closure cost estimates at that date. The other was also a trust fund (the “Bonnie Facility Trust”) established to meet the requirements under Florida financial assurance regulations that apply to the Bonnie Facility. On July 27, 2018, we received $21.0 million from the Bonnie Facility Trust by substituting the trust fund for the Bonnie Financial Test supported by a corporate guarantee as allowed by state regulations. Both financial assurance funding obligations require estimates of future expenditures that could be impacted by refinements in scope, technological developments, new information, cost inflation, changes in regulations, discount rates and the timing of activities. Under our current approach to satisfying applicable requirements, additional financial assurance would be required in the future if increases in cost estimates exceed the face amount of the Plant City Bond or the amount supported by the Bonnie Financial Test.
Other Long-Term Obligations
The following is a summary of our other long-term obligations, including Gypstacks and land reclamation, as of December 31, 2023:
|
|
|
|
|
|
|
|
|
|
|
|
|
|
|
|
|
|
|
|
|
|
|
|
|
|
|
|
|
|
|
|
|
| |
|
|
|
Payments by Calendar Year |
| (in millions) |
|
Total |
|
Less than 1
year |
|
1 - 3
years |
|
3 - 5
years |
|
More than 5
years |
ARO(a) |
|
$ |
4,445.3 |
|
|
$ |
391.1 |
|
|
$ |
406.1 |
|
|
$ |
238.7 |
|
|
$ |
3,409.4 |
|
______________________________
(a)Represents the undiscounted estimated cash outflows required to settle the AROs. For the Potash segment, this excludes the subsequent years of tailings area management for activities such as dissolution and reclamation of land, which are estimated to require an additional 160 to 375 years until completion. The corresponding present value of all future expenditures is $2.2 billion as of December 31, 2023 and is reflected in our accrued liabilities and other noncurrent liabilities in our Consolidated Balance Sheets.
Most of our export sales of potash crop nutrients are marketed through a North American export association, Canpotex, which funds its operations in part through third-party financing facilities. As a member, Mosaic or our subsidiaries are subject to certain conditions and exceptions and contractually obligated to reimburse Canpotex for their pro rata share of any operating expenses or other liabilities incurred. The reimbursements are made through reductions to members’ cash receipts from Canpotex.
Commitments are set forth in Note 22 of our Notes to Consolidated Financial Statements and are hereby incorporated by reference.
Income Tax Obligations
Gross uncertain tax positions as of December 31, 2023 of $25.8 million are not included in the other long-term obligations table presented above because the timing of the settlement of unrecognized tax benefits cannot be reasonably determined. For further discussion, refer to Note 13 of our Notes to Consolidated Financial Statements.
Market Risk
We are exposed to the impact of fluctuations in the relative value of currencies, fluctuations in interest rates, fluctuations in the purchase prices of natural gas, nitrogen, ammonia and sulfur consumed in operations, and changes in freight costs, as well as changes in the market value of our financial instruments. We periodically enter into derivatives in order to mitigate our interest rate risks, foreign currency risks and the effects of changing commodity prices and freight prices, but not for speculative purposes.
Unrealized mark-to-market gains and losses on derivatives are recorded in Corporate, Eliminations and Other. Once realized, they are recorded in the related business segment.
Foreign Currency Exchange Rates
Due to the global nature of our operations, we are exposed to currency exchange rate changes, which may cause fluctuations in our earnings and cash flows. Our primary foreign currency exposures are the Canadian dollar and Brazilian real. To reduce economic risk and volatility on expected cash flows that are denominated in the Canadian dollar and Brazilian real, we use financial instruments that may include forward contracts, zero-cost collars and/or futures.
The functional currency of several of our Canadian entities is the Canadian dollar. For those entities, sales are primarily denominated in U.S. dollars, but the costs are paid principally in Canadian dollars. We generally enter into derivative instruments for a portion of the currency risk exposure on anticipated cash inflows and outflows, including outflows for capital expenditures denominated in Canadian dollars. Mosaic hedges cash flows on a declining basis, up to 18 months for the Canadian dollar. A stronger Canadian dollar generally reduces these entities’ operating earnings. A weaker Canadian dollar has the opposite effect. Depending on the underlying exposure, such derivatives can create additional earnings volatility because we do not apply hedge accounting. Gains or losses on these derivative contracts, both for open contracts at quarter-end (unrealized) and settled contracts (realized), are recorded in either cost of goods sold or foreign currency transaction gain (loss).
The functional currency for our Brazilian subsidiaries is the Brazilian real. We finance our Brazilian inventory purchases with U.S. dollar-denominated liabilities. We hedge a portion of cash flows on a declining basis, up to 12 months for the Brazilian real. A stronger Brazilian real relative to the U.S. dollar has the impact of reducing these liabilities on a functional currency basis. When this occurs, an associated foreign currency transaction gain is recorded as non-operating income. A weaker Brazilian real generally has the opposite effect. We also enter into derivative instruments for a portion of our currency risk exposure on anticipated Brazilian real cash flows and record an associated gain or loss in either cost of goods sold or foreign currency transaction gain (loss) line in the Consolidated Statements of Earnings. A stronger Brazilian real generally reduces our Brazilian subsidiaries operating earnings. A weaker Brazilian real has the opposite effect.
As discussed above, we have Canadian dollar, Brazilian real, and other foreign currency exchange contracts. As of December 31, 2023 and 2022, the fair value of our major foreign currency exchange contracts was an asset of $28.4 million and a liability of $27.3 million, respectively. We recorded an unrealized gain of $53.6 million in cost of goods sold and recorded an unrealized gain of $2.6 million in foreign currency transaction gain (loss) in the Consolidated Statements of Earnings for 2023.
The table below provides information about Mosaic’s significant foreign exchange derivatives.
|
|
|
|
|
|
|
|
|
|
|
|
|
|
|
|
|
|
|
|
|
|
|
|
|
|
|
|
|
|
|
|
|
|
|
|
|
|
|
|
|
|
|
|
|
|
|
|
|
|
|
| |
|
As of December 31, 2023 |
|
As of December 31, 2022 |
|
|
Expected
Maturity Date
Years ending
December 31, |
|
Fair
Value |
|
Expected
Maturity Date
Years ending
December 31, |
|
Fair
Value |
| (in millions) |
|
2024 |
|
2025 |
|
2026 |
|
|
2023 |
|
2024 |
|
2025 |
|
| Foreign Currency Exchange Forwards |
|
|
|
|
|
|
|
|
|
|
|
|
|
|
|
|
| Canadian Dollar |
|
|
|
|
|
|
|
$ |
15.5 |
|
|
|
|
|
|
|
|
$ |
(32.5) |
|
| Notional (million US$) - short Canadian dollars |
|
$ |
297.3 |
|
|
$ |
— |
|
|
$ |
— |
|
|
|
|
$ |
177.7 |
|
|
$ |
— |
|
|
$ |
— |
|
|
|
| Weighted Average Rate - Canadian dollar to U.S. dollar |
|
1.3387 |
|
|
— |
|
|
— |
|
|
|
|
1.3086 |
|
|
— |
|
|
— |
|
|
|
| Notional (million US$) - long Canadian dollars |
|
$ |
1,068.5 |
|
|
$ |
120.5 |
|
|
$ |
— |
|
|
|
|
$ |
1,405.1 |
|
|
$ |
121.1 |
|
|
$ |
— |
|
|
|
| Weighted Average Rate - Canadian dollar to U.S. dollar |
|
1.3430 |
|
|
1.3445 |
|
|
— |
|
|
|
|
1.3157 |
|
|
1.3382 |
|
|
— |
|
|
|
|
|
|
|
|
|
|
|
|
|
|
|
|
|
|
|
|
|
|
|
|
|
|
|
|
|
|
|
|
|
|
|
|
|
|
|
|
|
|
|
|
|
|
|
|
|
|
|
|
|
|
|
|
|
|
|
|
|
|
|
|
|
|
|
|
|
|
|
|
|
|
|
|
|
|
|
|
|
|
|
|
|
|
|
|
| Foreign Currency Exchange Non-Deliverable Forwards |
|
|
|
|
|
|
|
|
|
|
|
|
|
|
|
|
| Brazilian Real |
|
|
|
|
|
|
|
$ |
14.6 |
|
|
|
|
|
|
|
|
$ |
— |
|
|
|
|
|
|
|
|
|
|
|
|
|
|
|
|
|
|
|
|
|
|
|
|
|
|
|
|
|
|
|
|
|
|
|
| Notional (million US$) - long Brazilian real |
|
$ |
741.7 |
|
|
$ |
— |
|
|
$ |
— |
|
|
|
|
$ |
— |
|
|
$ |
— |
|
|
$ |
— |
|
|
|
| Weighted Average Rate - Brazilian real to U.S. dollar |
|
5.0023 |
|
|
— |
|
|
— |
|
|
|
|
— |
|
|
— |
|
|
— |
|
|
|
| Indian Rupee |
|
|
|
|
|
|
|
$ |
(0.3) |
|
|
|
|
|
|
|
|
$ |
2.9 |
|
| Notional (million US$) - short Indian rupee |
|
$ |
80.0 |
|
|
$ |
— |
|
|
$ |
— |
|
|
|
|
$ |
308.7 |
|
|
$ |
— |
|
|
$ |
— |
|
|
|
| Weighted Average Rate - Indian rupee to U.S. dollar |
|
83.7458 |
|
|
— |
|
|
— |
|
|
|
|
82.3814 |
|
|
— |
|
|
— |
|
|
|
| Notional (million US$) - long Indian rupee |
|
— |
|
|
— |
|
|
— |
|
|
|
|
$ |
40.2 |
|
|
$ |
— |
|
|
$ |
— |
|
|
|
| Weighted Average Rate - Indian rupee to U.S. dollar |
|
— |
|
|
— |
|
|
— |
|
|
|
|
81.9971 |
|
|
— |
|
|
— |
|
|
|
| China Renminbi |
|
|
|
|
|
|
|
$ |
(1.4) |
|
|
|
|
|
|
|
|
$ |
2.3 |
|
| Notional (million US$) - short China renminbi |
|
$ |
110.7 |
|
|
$ |
— |
|
|
$ |
— |
|
|
|
|
$ |
208.4 |
|
|
$ |
— |
|
|
$ |
— |
|
|
|
| Weighted Average Rate - China renminbi to U.S. dollar |
|
7.1336 |
|
|
— |
|
|
— |
|
|
|
|
6.8094 |
|
|
— |
|
|
— |
|
|
|
| Total Fair Value |
|
|
|
|
|
|
|
$ |
28.4 |
|
|
|
|
|
|
|
|
$ |
(27.3) |
|
Commodities
We use forward purchase contracts, swaps and occasionally three-way collars to reduce the risk related to significant price changes in our inputs and product prices. In addition, the natural gas-based pricing under the CF Ammonia Supply Agreement is intended to lessen ammonia pricing volatility.
All gains and losses on commodities contracts are recorded in cost of goods sold in the Consolidated Statements of Earnings.
As of December 31, 2023 and 2022, the fair value of our major commodities contracts was ($10.3) million and $18.7 million, respectively. We recorded an unrealized loss of $26.3 million in cost of goods sold on the Consolidated Statements of Earnings for 2023.
Our primary commodities exposure relates to price changes in natural gas.
The table below provides information about Mosaic’s natural gas derivatives which are used to manage the risk related to significant price changes in natural gas.
|
|
|
|
|
|
|
|
|
|
|
|
|
|
|
|
|
|
|
|
|
|
|
|
|
|
|
|
|
|
|
|
|
|
|
|
|
|
|
|
|
|
|
|
|
|
|
|
|
|
|
|
|
|
|
| |
|
As of December 31, 2023 |
|
As of December 31, 2022 |
|
|
Expected Maturity Date
Years ending
December 31, |
|
Fair Value |
|
Expected Maturity Date
Years ending
December 31, |
|
|
|
Fair Value |
| (in millions) |
|
2024 |
|
2025 |
|
2026 |
|
|
|
|
2023 |
|
2024 |
|
2025 |
|
|
|
| Natural Gas Swaps |
|
|
|
|
|
|
|
|
|
$ |
(10.3) |
|
|
|
|
|
|
|
|
|
|
$ |
18.7 |
|
| Notional (million MMBTU) - long |
|
15.1 |
|
|
2.0 |
|
|
— |
|
|
|
|
|
|
9.4 |
|
|
4.8 |
|
|
— |
|
|
|
|
|
| Weighted Average Rate (US$/MM BTU) |
|
$ |
2.75 |
|
|
$ |
3.30 |
|
|
$ |
— |
|
|
|
|
|
|
$ |
2.48 |
|
|
$ |
2.70 |
|
|
$ |
— |
|
|
|
|
|
| Total Fair Value |
|
|
|
|
|
|
|
|
|
$ |
(10.3) |
|
|
|
|
|
|
|
|
|
|
$ |
18.7 |
|
Interest Rates
From time to time, we enter into interest rate swap agreements to hedge our exposure to changes in future interest rates related to anticipated debt issuances. At December 31, 2023 and 2022, we had no interest rate swap agreements in effect.
Summary
Overall, there have been no material changes in our primary market risk exposures since the prior year. In 2024, we do not expect any material changes in our primary risk exposures. Additional information about market risk associated with our investments held in the RCRA Trusts is provided in Note 12 of our Notes to Consolidated Financial Statements. For additional information related to derivatives, see Notes 15 and 16 of our Notes to Consolidated Financial Statements.
Environmental, Health, Safety and Security Matters
We are subject to complex and evolving international, federal, state, provincial and local environmental, health, safety and security (“EHS”) policies that govern the production, distribution and use of crop nutrients and animal feed ingredients. These EHS standards regulate or propose to regulate: (i) conduct of mining, production and supply chain operations, including employee safety and facility security procedures; (ii) management or remediation of potential impacts to air, soil and water quality from our operations; (iii) disposal of waste materials; (iv) beneficial use of co-products and residuals; (v) reclamation of lands after mining; (vi) management and handling of raw materials; (vii) product content; and (viii) use of products by both us and our customers.
We have a comprehensive EHS management program that seeks to achieve sustainable, predictable and verifiable EHS performance. Key elements of our EHS program include: (i) identifying and managing EHS risk; (ii) complying with legal requirements; (iii) improving our EHS procedures and protocols; (iv) educating employees regarding EHS obligations; (v) retaining and developing professional qualified EHS staff; (vi) evaluating facility conditions; (vii) evaluating and enhancing safe workplace behaviors; (viii) performing audits; (ix) formulating EHS action plans; and (x) assuring accountability of all managers and other employees for EHS performance. Our business units are responsible for implementing day-to-day elements of our EHS program, assisted by integrated EHS professionals. We conduct audits to verify that each facility has identified risks, achieved regulatory compliance, improved EHS performance, and incorporated EHS management systems into day-to-day business functions.
New or proposed regulatory programs or policies can present significant challenges in ascertaining future compliance obligations, implementing compliance plans, and estimating future costs until implementing regulations have been finalized and definitive regulatory interpretations have been adopted. New or proposed regulatory standards may require modifications to our facilities or to operating procedures and these modifications may involve significant capital costs or increases in operating costs. For example, in March 2022, the SEC issued proposed rules on climate change disclosure requirements that, if adopted as proposed, will require disclosure of extensive detailed climate-related information. The Company is monitoring the SEC’s proposed rules and recently enacted standards in the European Union and California on climate change disclosure and is taking necessary steps to plan for the anticipated or adopted disclosure requirements.
We have expended, and anticipate that we will continue to expend, substantial financial and managerial resources to comply with EHS standards and to continue to improve our environmental stewardship.
In 2024, excluding capital expenditures arising out of the consent decrees referred to under “EPA RCRA Initiative” in Note 14 of our Notes to Consolidated Financial Statements, we expect environmental capital expenditures to total approximately $360 million, primarily related to: (i) modification or construction of waste management infrastructure and water treatment systems; (ii) construction and modification projects associated with Gypstacks and clay settling ponds at our Phosphates facilities and tailings management areas for our Potash mining and processing facilities; (iii) upgrading or new construction of air pollution control equipment at some of the concentrates plants; and (iv) capital projects associated with remediation of contamination at current or former operations. Additional expenditures for land reclamation, Gypstack closure and water treatment activities are expected to total approximately $340 million in 2024. In 2025, we estimate environmental capital expenditures will be approximately $360 million and expenditures for land reclamation activities, Gypstack closure and water treatment activities are expected to be approximately $240 million. We spent approximately $470 million for the years ended December 31, 2023 and 2022, respectively, for environmental capital expenditures, land reclamation activities, Gypstack closure and water treatment activities. No assurance can be given that greater-than-anticipated EHS capital expenditures or land reclamation, Gypstack closure or water treatment expenditures will not be required in 2024 or in the future.
Operating Requirements and Impacts
Permitting. We hold numerous environmental, mining and other permits and approvals authorizing operations at our facilities. Our ability to continue operations at a facility could be materially affected by a government agency decision to deny or delay issuing a new or renewed permit or approval, to revoke or substantially modify an existing permit or approval or to substantially change conditions applicable to a permit modification, or by legal actions that successfully challenge our permits.
Expanding our operations or extending operations into new areas is also predicated upon securing the necessary environmental or other permits or approvals. We have been engaged in, and over the next several years will be continuing, efforts to obtain permits in support of our planned Florida operations at certain of our properties. For years, we have successfully permitted properties and anticipate that we will be able to permit these properties as well.
A denial of our permits, the issuance of permits with cost-prohibitive conditions, substantial delays in issuing key permits, legal actions that prevent us from relying on permits or revocation of permits can prevent or delay our mining at the affected properties and thereby materially affect our business, results of operations, liquidity or financial condition.
In addition, in the U.S., local community involvement has become an increasingly important factor in the permitting process for companies like ours, and various counties and other parties, particularly in Florida, have in the past filed and continue to file lawsuits or administrative appeals challenging the issuance of some of the permits we require. These actions can significantly delay permit issuance. Additional information regarding certain potential or pending permit challenges is provided in Note 23 to our Consolidated Financial Statements and is incorporated herein by reference.
Federal Initiatives to Define “Waters of the United States.” The Clean Water Act (“CWA”) authorizes federal jurisdiction over “navigable waters,” defined in the Act as “waters of the United States” and often abbreviated as “WOTUS.” As it relates to Mosaic’s operations and facilities, the scope of the term WOTUS dictates legal requirements for our national pollutant discharge elimination system wastewater discharge permits and for impacts to surface waters and wetlands associated with our phosphate mining operations. A broad definition of WOTUS, and thus the scope of federal jurisdiction, increases the time required to identify wetlands and waterways subject to federal regulatory and permitting requirements, and the amount and type of mitigation required to compensate for impacts to jurisdictional WOTUS caused by our mining operations.
On May 25, 2023, the U.S. Supreme Court issued its opinion in Sackett v EPA, which significantly limits water features that can be considered WOTUS and therefore subject to CWA Section 404 jurisdiction. The Sackett decision is binding nationwide as to the determination of which wetlands and waters are subject to the CWA.
The Sackett decision invalidated the January 18, 2023, definition of WOTUS promulgated by EPA which had expanded federal jurisdiction. In response to Sackett, on August 29, 2023, EPA issued a final rule intended to conform its definition of WOTUS to the Sackett decision; the conforming rule became effective on September 8, 2023.
As a result of ongoing litigation, the January 2023 WOTUS rule, as “conformed” by the September 2023 rule, is being implemented only in 23 states, the District of Columbia, and the U.S. Territories. In the other 27 states, WOTUS is being interpreted consistent with the pre-2015 regulatory regime and the Supreme Court's Sackett decision.
Water Quality Regulations for Nutrient Discharges. New nutrient regulatory initiatives could have a material effect on either us or our customers. For example, the Gulf Coast Ecosystem Restoration Task Force, established by executive order of the U.S. President and comprised of five gulf states and eleven federal agencies, has delivered a final strategy for long-term ecosystem restoration for the gulf coast. The strategy calls for, among other matters, reduction of the flow of excess nutrients into the Gulf of Mexico through state nutrient reduction frameworks, new nutrient reduction approaches and reduction of agricultural and urban sources of excess nutrients. Implementation of the strategy will require legislative or regulatory action at the state level. We cannot predict what the requirements of any such legislative or regulatory action could be or whether or how it would affect us or our customers.
Reclamation Obligations. During phosphate mining, we remove overburden in order to retrieve phosphate rock reserves. Once we have finished mining in an area, we use the overburden and sand tailings produced by the beneficiation process to reclaim the area in accordance with approved reclamation plans and applicable laws. We have incurred and will continue to incur significant costs to fulfill our reclamation obligations.
Management of Residual Materials and Closure of Management Areas. Mining and processing of potash and phosphate generate residual materials that must be managed both during the operation of the facility and upon and after facility closure. Potash tailings, consisting primarily of salt and clay, are stored in surface disposal sites. Phosphate clay residuals from mining are deposited in clay storage areas (“CSAs”). Processing of phosphate rock with sulfuric acid generates phosphogypsum that currently is stored in Gypstacks.
During the life of the tailings management areas, CSAs and Gypstacks, we have incurred and will continue to incur significant costs to manage our potash and phosphate residual materials in accordance with environmental laws and regulations and with permit requirements. Additional legal and permit requirements will take effect when these facilities are closed. Our AROs are further discussed in Note 14 of our Notes to Consolidated Financial Statements.
New Wales Water Loss Incident. In August 2016, a sinkhole developed under one of the two cells of the Phase II Gypstack at our New Wales facility in Polk County, Florida, resulting in process water from the stack draining into the sinkhole. The incident was reported to the FDEP and the EPA. In connection with the incident, our subsidiary, Mosaic Fertilizer, LLC (“Mosaic Fertilizer”), entered into a consent order (the “Order”) with the FDEP in October 2016 pursuant to the Order, Mosaic Fertilizer agreed to, among other things, implement an approved repair plan to close the sinkhole; perform additional water monitoring and if necessary, assessment and rehabilitation activities in the event of identified offsite impacts; provide financial assurance; and evaluate the risk of potential future sinkhole formation at our active Florida Gypstack operations.
Financial Assurance. Separate from our accounting treatment for reclamation and closure liabilities, some jurisdictions in which we operate require us either to pass a test of financial strength or provide credit support, typically cash deposits, surety bonds, financial guarantees or letters of credit, to address phosphate mining reclamation liabilities and closure liabilities for clay settling areas and Gypstacks. See “Other Commercial Commitments” under “Off-Balance Sheet Arrangements and Obligations” above for additional information about these requirements. We also have obligations under certain consent decrees and a separate financial assurance arrangement relating to our facilities in Florida and Louisiana. Two consent decrees that became effective in 2016 resolved claims under RCRA and state hazardous waste laws relating to our management of certain waste materials onsite at certain fertilizer manufacturing facilities in Florida and Louisiana. Under these consent decrees, in 2016, we deposited $630 million in cash into two trust funds to provide additional financial assurance for the estimated costs of closure and post-closure care of our phosphogypsum management systems. In addition, in 2017, we issued a letter of credit in the amount of $50 million to further support our financial assurance obligation under the Florida 2015 Consent Decree. While our actual Gypstack Closure Costs are generally expected to be paid by us in the normal course of our Phosphates business over a period that may not end until three decades or more after a Gypstack has been closed, the funds on deposit in the RCRA Trusts can be drawn by the applicable governmental authority in the event we cannot perform our closure and long-term care obligations. If and when our estimated Gypstack Closure Costs with respect to the facilities associated with a RCRA Trust are sufficiently lower than the amount on deposit in that RCRA Trust, we have the right to request that the excess funds be released to us. The same is true for the RCRA Trust balance remaining after the completion of our obligations, which will be performed over a period that may not end until three decades or more after a Gypstack has been closed. See the discussion under “EPA RCRA Initiative” in Note 14 of our Notes to Consolidated Financial Statements for additional information about these matters.
We established and, in 2021, fully funded a trust valued at $25 million (Canadian dollars) in satisfaction of financial assurance requirements for closure of our Saskatchewan Potash facilities. Trust performance is subject to review by the Province of Saskatchewan every five years during its existence.
In 2020, we executed and thereafter have maintained a surety bond in the amount of approximately $82 million to establish financial assurance for closure of our Carlsbad, New Mexico potash facility with the U.S. Department of the Interior, Bureau of Land Management and the New Mexico Environment Department.
Examination of Working Places in Metal and Nonmetal Mines. In order to comply with U.S. Mine Safety and Health Administration requirements to examine working places in metal and nonmetal mines, we have adjusted our daily mine workplace examination procedures and added additional requirements for the documentation of adverse conditions when they are identified during the daily examinations.
Climate Change
We are committed to finding ways to meet the challenges of crop nutrient and animal feed ingredient production and distribution in the context of the need to reduce greenhouse gas emissions. While focused on helping the world grow the food it needs, we have proven our commitment to using our resources more efficiently and have implemented innovative energy recovery technologies that result in our generation of much of the energy we need, particularly in our U.S. Phosphates operations, from high efficiency heat recovery systems that result in lower greenhouse gas emissions. In 2021, we announced our goal to achieve net-zero greenhouse gas emissions in Florida by 2030 and companywide by 2040.
Climate Change Regulation. Various governmental initiatives to limit greenhouse gas emissions are under way or under consideration around the world. These initiatives could restrict our operating activities, require us to make changes in our operating activities that would increase our operating costs, reduce our efficiency or limit our output, require us to make capital improvements to our facilities, increase our energy, raw material and transportation costs or limit their availability, or otherwise adversely affect our results of operations, liquidity or capital resources, and these effects could be material to us.
The direct greenhouse gas emissions from our operations result primarily from:
•Combustion of natural gas to produce steam and dry potash products at our Belle Plaine, Saskatchewan potash solution mine. To a lesser extent, at our potash shaft mines, natural gas is used as a fuel to heat fresh air supplied to the shaft mines and for drying potash products.
•The use of natural gas as a feedstock in the production of ammonia at our Faustina, Louisiana facility.
•Process reactions from naturally occurring carbonates in phosphate rock.
•Operation of transport trucks, mining and construction equipment, and other machinery powered by internal combustion engines utilizing fossil fuels.
In addition, the production of energy and raw materials that we purchase from unrelated parties for use in our business and energy used in the transportation of our products and raw materials are sources of greenhouse gas emissions.
Governmental greenhouse gas emission initiatives include, among others, the December 2015 agreement (the “Paris Agreement”) which was the outcome of the 21st session of the Conference of the Parties under the United Nations Framework Convention on Climate Change. The Paris Agreement, which was signed by nearly 200 nations, including the U.S. and Canada, entered into force in late 2016 and sets out a goal of limiting the average rise in temperatures for this century to below 2 degrees Celsius. Each signatory is expected to develop its own plan (referred to as a Nationally Determined Contribution, or “NDC”) for reaching that goal.
In 2015, the U.S. had submitted a NDC aiming to achieve, by 2025, an economy-wide target of reducing greenhouse gas emissions by 26-28% below its 2005 level. The NDC also aims to use best efforts to reduce emissions by 28%. The U.S. target covers all greenhouse gases that were a part of the 2014 Inventory of Greenhouse Gas Emissions and Sinks. While the future of the U.S.’s involvement in the Paris Agreement and the status of this NDC are unclear, various legislative or regulatory initiatives relating to greenhouse gases have been adopted or considered by the U.S. Congress, the EPA or various states and those initiatives already adopted may be used to implement a U.S. NDC. Additionally, more stringent laws and regulations may be enacted to accomplish the goals set out in the NDC.
Brazil ratified the Paris Agreement in September 2016, committing to a NDC that includes an economy-wide target of 1.3 GtCO2e by 2025 and 1.2 GtCO2e by 2030. In 2020, Brazil submitted a new NDC, which reaffirms the country’s commitment to reducing total net greenhouse gas emissions by 37% in 2025 and by 43% in 2030. The NDC further commits to achieving climate neutrality in 2060. Since 2009, Brazil has a National Policy on Climate Change. This policy is implemented by two instruments: the National Plan on Climate Change and the National Climate Change Fund.
Additionally, Brazil has sector-specific policies, such as the National Plan for Low Carbon Emission in Agriculture. As part of its commitments in the Paris Agreement, Brazil enforced a Biofuels National Policy (“RenovaBio”) program in 2020, which sets a carbon credit mechanism based on emission reductions from the use of biofuels. RenovaBio aims to increase biofuels rate in the country’s energy matrix and reached 97% of its target on the first year. Under RenovaBio, fossil fuel distributors are required to compensate for the carbon emissions through the acquisition of CBIOS (decarbonization certificates), issued by biofuel producers (e.g., ethanol plants). Since 2020, the Brazilian Congress became active in proposing other climate-related legislation and could approve new instruments to combat climate change in this current legislature. We will continue to monitor developments relating to the anticipated legislation, as well as the potential future effect on our operating activities, energy, raw material and transportation costs, results of operations, liquidity or capital resources.
Canada’s intended NDC aims to achieve, by 2030, an economy-wide target of reducing greenhouse gas emissions by 40-45% below 2005 levels. In late 2016, the Canadian federal government announced plans for a comprehensive tax on carbon emissions, under which provinces opting out of the tax would have the option of adopting a cap-and-trade system. In the plans, the federal government also committed to implementing a federal carbon pricing backstop system that will apply in any province or territory that does not have a carbon pricing system in place by 2018. As of January 1, 2023, a carbon tax of $65 per tonne now applies in Canada for any emitter not covered under the federal backstop program or approved provincial program. A revised plan was submitted by Saskatchewan to the federal government in 2022, which was subsequently approved in its entirety in November 2022. Our Saskatchewan Potash facilities are subject to the Saskatchewan climate change plan regarding emissions at our facilities; however, indirect costs from the carbon tax associated with electricity, natural gas consumption, and transportation are currently passed through to Mosaic. As implementation of the Paris Agreement proceeds, more stringent laws and regulations may be enacted to accomplish the goals set out in Canada’s NDC. We will also continue to monitor developments relating to the anticipated legislation, as well as the potential future effect on our operating activities, energy, raw material and transportation costs, results of operations, liquidity or capital resources.
It is possible that future legislation or regulation addressing climate change, including in response to the Paris Agreement or any new international agreements, could adversely affect our operating activities, energy, raw material and transportation costs, results of operations, liquidity or capital resources, and these effects could be material or adversely impact our competitive advantage. In addition, to the extent climate change restrictions imposed in countries where our competitors operate, such as China, India, former Soviet Union countries or Morocco, are less stringent than in the U.S., Brazil or Canada, our competitors could gain cost or other competitive advantages over us.
Operating Impacts Due to Climate Change. The prospective impact of climate change on our operations and those of our customers and farmers remains uncertain. Scientists have hypothesized that the impacts of climate change could include changes in rainfall patterns, water shortages, changing sea levels, changing storm patterns and intensities, and changing temperature levels and that these changes could be severe. These impacts could vary by geographic location. Severe climate change could impact our costs and operating activities, the location and cost of global grain and oilseed production, and the supply and demand for grains and oilseeds. At the present time, we cannot predict the prospective impact of climate change on our results of operations, liquidity or capital resources, or whether any such effects could be material to us.
Remedial Activities
Comprehensive Environmental Response, Compensation and Liability Act (“CERCLA”) (aka Superfund) and state analogues impose liability, without regard to fault or to the legality of a party’s conduct, on certain categories of persons, including those who have disposed of “hazardous substances” at a location. Under Superfund, or its various state analogues, one party may be responsible for the entire site, regardless of fault or the locality of its disposal activity. We have contingent environmental remedial liabilities that arise principally from three sources which are further discussed below: (i) facilities currently or formerly owned by our subsidiaries or their predecessors; (ii) facilities adjacent to currently or formerly owned facilities; and (iii) third-party Superfund or state equivalent sites where we are alleged to have disposed of hazardous materials. Taking into consideration established accruals for environmental remedial matters of approximately $203.2 million as of December 31, 2023, expenditures for these known conditions currently are not expected, individually or in the aggregate, to have a material effect on our business or financial condition. However, material expenditures could be required in the future to remediate the contamination at known sites or at other current or former sites.
Remediation at Our Facilities. Many of our formerly owned or current facilities have been in operation for decades. The historical use and handling of regulated chemical substances, crop and animal nutrients and additives as well as by-product or process tailings at these facilities by us and predecessor operators have resulted in soil, surface water and groundwater impacts.
At many of these facilities, spills or other releases of regulated substances have occurred previously and potentially could occur in the future, possibly requiring us to undertake or fund cleanup efforts under Superfund or otherwise. In some instances, we have agreed, pursuant to consent orders or agreements with the appropriate governmental agencies, to undertake certain investigations, which currently are in progress, to determine whether remedial action may be required to address site impacts. At other locations, we have entered into consent orders or agreements with appropriate governmental agencies to perform required remedial activities that will address identified site conditions. Taking into account established accruals, future expenditures for these known conditions currently are not expected, individually or in the aggregate, to have a material adverse effect on our business or financial condition. However, material expenditures by us could be required in the future to remediate the environmental impacts at these or at other current or former sites.
Remediation at Third-Party Facilities. Various third parties have alleged that our historical operations have impacted neighboring offsite areas or nearby third-party facilities. In some instances, we have agreed, pursuant to orders from or agreements with appropriate governmental agencies or agreements with private parties, to undertake or fund investigations, some of which currently are in progress, to determine whether remedial action, under Superfund or otherwise, may be required to address offsite impacts. Our remedial liability at these sites, either alone or in the aggregate, taking into account established accruals, currently is not expected to have a material adverse effect on our business or financial condition. As more information is obtained regarding these sites, this expectation could change.
Liability for Offsite Disposal Locations. Currently, we are involved or concluding involvement for offsite disposal at several Superfund or equivalent state sites. Moreover, we previously have entered into settlements to resolve liability with regard to Superfund or equivalent state sites. In some cases, such settlements have included “reopeners,” which could result in additional liability at such sites in the event of newly discovered contamination or other circumstances. Our remedial liability at such disposal sites, either alone or in the aggregate, currently is not expected to have a material adverse effect on our business or financial condition. As more information is obtained regarding these sites and the potentially responsible parties involved, this expectation could change.
Product Requirements and Impacts
International, federal, state and provincial standards require us to register many of our products before these products can be sold. The standards also impose labeling requirements on these products and require us to manufacture the products to formulations set forth on the labels. We believe that, when handled and used as intended, based on the available data, crop nutrient materials do not pose harm to human health or the environment and that any additional standards or regulatory requirements relating to product requirements and impacts will not have a material adverse effect on our business or financial condition.
Environmental Justice
The U.S. federal and some state governments increasingly are adopting standards or policies requiring environmental justice reviews in some permitting actions. In general, they require governmental agencies to evaluate projects for disproportionate impacts to disadvantaged or already burdened communities. If such conditions are found, they might result in a permit denial, or restrictive or cost prohibitive conditions imposed on our operations and may impair our business and operations and could have a material adverse effect on our business, financial condition or results of operations.
Sustainability
We are committed to making informed choices that improve our corporate governance, financial strength, operational efficiency, environmental stewardship, community engagement and resource management. Through these efforts, we intend to sustain our business and experience lasting success.
We have included, or incorporate by reference, throughout this Form 10-K discussions of various matters relating to our sustainability, in its broadest sense, that we believe may be material to our investors. These matters include, but are not limited to, discussions about: corporate governance, including the leadership and respective roles of our Board of Directors and its committees, and management; recent and prospective developments in our business; product development; risk, enterprise risk management and risk oversight; the regulatory and permitting environment for our business and ongoing regulatory and permitting initiatives; executive compensation practices; employee and contractor safety; human capital matters and other EHS matters, including climate change, water management, energy and other operational efficiency initiatives, reclamation and AROs.
Other matters relating to sustainability are included in our sustainability reports that are available on our website at www.mosaicco.com/ourresponsibility. Our sustainability reports are not incorporated by reference in this Form 10-K.
Additional Information
For additional information about phosphate mine permitting in Florida, our environmental liabilities, the environmental proceedings in which we are involved, our AROs related to environmental matters, and our related accounting policies, see Environmental Liabilities and AROs under Critical Accounting Estimates above and Notes 2, 14, and 23 of our Notes to Consolidated Financial Statements.
Contingencies
Information regarding contingencies in Note 23 of our Notes to Consolidated Financial Statements is incorporated herein by reference.
Related Parties
Information regarding related party transactions is set forth in Note 24 of our Notes to Consolidated Financial Statements and is incorporated herein by reference.
Recently Issued Accounting Guidance
Recently issued accounting guidance is set forth in Note 3 of our Notes to Consolidated Financial Statements and is incorporated herein by reference.
Cautionary Statement Regarding Forward Looking Information
All statements, other than statements of historical fact, appearing in this report constitute “forward-looking statements” within the meaning of the Private Securities Litigation Reform Act of 1995. These forward looking statements include, among other things, statements about our expectations, beliefs, intentions or strategies for the future, including statements about proposed or pending future transactions or strategic plans, statements concerning our future operations, financial condition and prospects, statements regarding our expectations for capital expenditures, statements concerning our level of indebtedness and other information, and any statements of assumptions regarding any of the foregoing. In particular, forward-looking statements may include words such as “anticipate,” “believe,” “could,” “estimate,” “expect,” “intend,” “may,” “potential,” “predict,” “project” or “should”. These statements involve certain risks and uncertainties that may cause actual results to differ materially from expectations as of the date of this filing.
Factors that could cause reported results to differ materially from those expressed or implied by the forward-looking statements include, but are not limited to, the following:
•business and economic conditions and governmental policies affecting the agricultural industry where we or our customers operate, including price and demand volatility resulting from periodic imbalances of supply and demand;
•because of political and economic instability, civil unrest or changes in government policies in Brazil, Saudi Arabia, Peru or other countries in which we do business, our operations could be disrupted as higher costs of doing business could result, including those associated with implementation of new freight tables and new mining legislation;
•a potential drop in oil demand, which could lead to a significant decline in production, and its impact on the availability and price of sulfur, a key raw material input for our Phosphates and Mosaic Fertilizantes segment operations;
•changes in farmers’ application rates for crop nutrients;
•changes in the operation of world phosphate or potash markets, including consolidation in the crop nutrient industry, particularly if we do not participate in the consolidation;
•the expansion or contraction of production capacity or selling efforts by competitors or new entrants in the industries in which we operate, including the effects of actions by members of Canpotex to prove the production capacity of potash expansion projects, through proving runs or otherwise;
•the effect of future product innovations or development of new technologies on demand for our products;
•seasonality in our business that results in the need to carry significant amounts of inventory and seasonal peaks in working capital requirements, which may result in excess inventory or product shortages;
•changes in the costs, or constraints on supplies, of raw materials or energy used in manufacturing our products, or in the costs or availability of transportation for our products;
•economic and market conditions including supply chain challenges and increased costs and delays caused by transportation and labor shortages;
•declines in our selling prices or significant increases in costs that can require us to write down our inventories to the lower of cost or market, or require us to impair goodwill or other long-lived assets, or establish a valuation allowance against deferred tax assets;
•the lag in realizing the benefit of falling market prices for the raw materials we use to produce our products that can occur while we consume raw materials that we purchased or committed to purchase in the past at higher prices;
•disruptions of our operations at any of our key production, distribution, transportation or terminaling facilities, including those of Canpotex or any joint venture in which we participate;
•shortages or other unavailability of trucks, railcars, tugs, barges and ships for carrying our products and raw materials;
•the effects of and change in trade, monetary, environmental, tax and fiscal policies, laws and regulations;
•foreign exchange rates and fluctuations in those rates;
•tax regulations, currency exchange controls and other restrictions that may affect our ability to optimize the use of our liquidity;
•adverse weather and climate conditions affecting our operations, including the impact of potential hurricanes, excessive heat, cold, snow, rainfall or drought;
•difficulties or delays in receiving, challenges to, increased costs of obtaining or satisfying conditions of, or revocation or withdrawal of required governmental and regulatory approvals, including permitting activities;
•changes in the environmental and other governmental regulation that applies to our operations, including federal legislation or regulatory action expanding the types and extent of water resources regulated under federal law and the possibility of further federal or state legislation or regulatory action affecting or related to greenhouse gas emissions, including carbon taxes or other measures that may be implemented in Canada or other jurisdictions in which we operate, or of restrictions or liabilities related to elevated levels of naturally-occurring radiation that arise from disturbing the ground in the course of mining activities or possible efforts to reduce the flow of nutrients into the Gulf of Mexico, the Mississippi River basin or elsewhere;
•the potential costs and effects of implementation of federal or state water quality standards for the discharge of nitrogen and/or phosphorus into Florida waterways;
•the financial resources of our competitors, including state-owned and government-subsidized entities in other countries;
•the possibility of defaults by our customers on trade credit that we extend to them or on indebtedness that they incur to purchase our products and that we guarantee;
•any significant reduction in customers’ liquidity or access to credit that they need to purchase our products;
•the effectiveness of the processes we put in place to manage our significant strategic priorities, including our investment in MWSPC, and to successfully integrate and grow acquired businesses;
•actual costs of various items differing from management’s current estimates, including, among others, asset retirement, environmental remediation, reclamation or other environmental obligations, or the costs of MWSPC or its existing or future funding;
•the costs and effects of legal and administrative proceedings and regulatory matters affecting us, including environmental, tax or administrative proceedings, complaints that our operations are adversely impacting nearby farms, businesses, other property uses or properties, settlements thereof and actions taken by courts with respect to approvals of settlements, costs related to defending and resolving global audit, appeal or court activity and other further developments in legal proceedings and regulatory matters;
•the success of our efforts to attract and retain highly qualified and motivated employees;
•strikes, labor stoppages or slowdowns by our work force or increased costs resulting from unsuccessful labor contract negotiations, and the potential costs and effects of compliance with new regulations affecting our workforce, which increasingly focus on wages and hours, healthcare, retirement and other employee benefits;
•brine inflows at our potash mines;
•accidents or other incidents involving our properties or operations, including potential fires, explosions, seismic events, sinkholes, unsuccessful tailings management, ineffective mine safety procedures, or releases of hazardous or volatile chemicals;
•terrorism, armed conflict or other malicious intentional acts, including cybersecurity risks such as attempts to gain unauthorized access to, or disable, our information technology systems, or our costs of addressing malicious intentional acts;
•actions by the holders of controlling equity interests in businesses in which we hold a noncontrolling interest;
•changes in our relationship with the other member of Canpotex or any joint venture in which we participate or their or our exit from participation in Canpotex or any such export association or joint venture, and other changes in our commercial arrangements with unrelated third parties;
•difficulties in realizing benefits under our long-term natural gas based pricing ammonia supply agreement with CF, including the risks that the cost savings initially anticipated from the agreement may not be fully realized over the term of the agreement or that the price of natural gas or the market price for ammonia during the agreement’s term are at levels at which the agreement’s natural gas based pricing is disadvantageous to us, compared with purchases in the spot market; and
•other risk factors reported from time to time in our SEC reports.
Material uncertainties and other factors known to us are discussed in Item 1A, “Risk Factors,” of our Form 10-K for the year ended December 31, 2023 and incorporated by reference herein as if fully stated herein.
We base our forward-looking statements on information currently available to us, and we undertake no obligation to update or revise any of these statements, whether as a result of changes in underlying factors, new information, future events or other developments.
Report of Independent Registered Public Accounting Firm
To the Stockholders and Board of Directors
The Mosaic Company:
Opinion on the Consolidated Financial Statements
We have audited the accompanying consolidated balance sheets of The Mosaic Company and subsidiaries (the Company) as of December 31, 2023 and 2022, the related consolidated statements of earnings, comprehensive income, equity, and cash flows for each of the years in the three-year period ended December 31, 2023, and the related notes (collectively, the consolidated financial statements). In our opinion, the consolidated financial statements present fairly, in all material respects, the financial position of the Company as of December 31, 2023 and 2022, and the results of its operations and its cash flows for each of the years in the three-year period ended December 31, 2023, in conformity with U.S. generally accepted accounting principles.
We also have audited, in accordance with the standards of the Public Company Accounting Oversight Board (United States) (PCAOB), the Company’s internal control over financial reporting as of December 31, 2023, based on criteria established in Internal Control – Integrated Framework (2013) issued by the Committee of Sponsoring Organizations of the Treadway Commission, and our report dated February 22, 2024 expressed an unqualified opinion on the effectiveness of the Company’s internal control over financial reporting.
Basis for Opinion
These consolidated financial statements are the responsibility of the Company’s management. Our responsibility is to express an opinion on these consolidated financial statements based on our audits. We are a public accounting firm registered with the PCAOB and are required to be independent with respect to the Company in accordance with the U.S. federal securities laws and the applicable rules and regulations of the Securities and Exchange Commission and the PCAOB.
We conducted our audits in accordance with the standards of the PCAOB. Those standards require that we plan and perform the audit to obtain reasonable assurance about whether the consolidated financial statements are free of material misstatement, whether due to error or fraud. Our audits included performing procedures to assess the risks of material misstatement of the consolidated financial statements, whether due to error or fraud, and performing procedures that respond to those risks. Such procedures included examining, on a test basis, evidence regarding the amounts and disclosures in the consolidated financial statements. Our audits also included evaluating the accounting principles used and significant estimates made by management, as well as evaluating the overall presentation of the consolidated financial statements. We believe that our audits provide a reasonable basis for our opinion.
Critical Audit Matters
The critical audit matter communicated below is a matter arising from the current period audit of the consolidated financial statements that was communicated or required to be communicated to the audit committee and that: (1) relate to accounts or disclosures that are material to the consolidated financial statements and (2) involved our especially challenging, subjective, or complex judgments. The communication of a critical audit matter does not alter in any way our opinion on the consolidated financial statements, taken as a whole, and we are not, by communicating the critical audit matter below, providing a separate opinion on the critical audit matter or on the accounts or disclosures to which it relates.
Evaluation of asset retirement obligations for water treatment costs
As discussed in Note 14 to the consolidated financial statements, the Company has recorded asset retirement obligations (AROs) of $2,213.4 million as of December 31, 2023. The ARO includes the planned treatment of contaminated water (“water treatment costs”) and other asset retirement activities at the Company’s Florida and Louisiana facilities.
We identified the evaluation of asset retirement obligations for water treatment costs as a critical audit matter. Specialized skills and knowledge were required to evaluate the Company’s selection of planned water treatment activities to satisfy their legal obligation. In addition, there was a high degree of subjective auditor judgment due to the sensitivity of the AROs to minor changes to significant assumptions, such as the volume of contaminated water and the forecasted level of contamination used to estimate the water treatment costs per thousand gallons (“unit costs”).
The following are the primary procedures performed to address this critical audit matter. We evaluated the design and tested the operating effectiveness of certain internal controls related to the Company’s ARO process.
This included controls related to the knowledge, skill, and ability of third-party specialists and their relationship to the Company, determination of necessary activities required to treat contaminated water, and the development of the significant assumptions utilized in the process. We compared water treatment unit cost estimates to actual spending and water quality measurements. We evaluated the Company’s ability to accurately estimate water treatment costs by comparing the Company’s prior year estimates to the actual water treatment costs incurred. We performed sensitivity analyses over the volume of contaminated water and the unit costs assumptions to assess their impact on the water treatment costs estimate. Due to the specialized skills and knowledge used by the Company to select water treatment activities, we involved an environmental engineering professional with specialized skills and knowledge. This professional assisted in assessing the professional qualifications of the Company’s environmental engineers and engineering firm, including the knowledge, skill, and ability of the engineers, and the relationship of the engineers and engineering firm to the Company. In addition, the environmental engineering professional evaluated the Company’s planned asset retirement activities by analyzing the Company’s specialist’s reports. This professional evaluated significant engineering assumptions listed above and compared the planned activities per the specialist’s reports to other information obtained during the audit, such as:
- permits obtained which specify the Company’s legal obligations
- reports to state regulators on the level of contamination in water balances.
We evaluated the Company’s changes in assumptions for the volume of contaminated water and the forecasted level of contamination by comparing them to actual results from the prior year, as well as assessing operational changes that could impact estimated water volumes, contamination levels, or necessary treatment activities.
/s/ KPMG LLP
We have served as the Company’s auditor since 2004.
Tampa, Florida
February 22, 2024
Report of Independent Registered Public Accounting Firm
To the Stockholders and Board of Directors
The Mosaic Company:
Opinion on Internal Control Over Financial Reporting
We have audited The Mosaic Company and subsidiaries' (the Company) internal control over financial reporting as of December 31, 2023, based on criteria established in Internal Control – Integrated Framework (2013) issued by the Committee of Sponsoring Organizations of the Treadway Commission. In our opinion, the Company maintained, in all material respects, effective internal control over financial reporting as of December 31, 2023, based on criteria established in Internal Control – Integrated Framework (2013) issued by the Committee of Sponsoring Organizations of the Treadway Commission.
We also have audited, in accordance with the standards of the Public Company Accounting Oversight Board (United States) (PCAOB), the consolidated balance sheets of the Company as of December 31, 2023 and 2022, the related consolidated statements of earnings, comprehensive income, equity, and cash flows for each of the years in the three-year period ended December 31, 2023, and the related notes (collectively, the consolidated financial statements), and our report dated February 22, 2024 expressed an unqualified opinion on those consolidated financial statements.
Basis for Opinion
The Company’s management is responsible for maintaining effective internal control over financial reporting and for its assessment of the effectiveness of internal control over financial reporting, included in the accompanying Management's Report on Internal Control Over Financial Reporting. Our responsibility is to express an opinion on the Company’s internal control over financial reporting based on our audit. We are a public accounting firm registered with the PCAOB and are required to be independent with respect to the Company in accordance with the U.S. federal securities laws and the applicable rules and regulations of the Securities and Exchange Commission and the PCAOB.
We conducted our audit in accordance with the standards of the PCAOB. Those standards require that we plan and perform the audit to obtain reasonable assurance about whether effective internal control over financial reporting was maintained in all material respects. Our audit of internal control over financial reporting included obtaining an understanding of internal control over financial reporting, assessing the risk that a material weakness exists, and testing and evaluating the design and operating effectiveness of internal control based on the assessed risk. Our audit also included performing such other procedures as we considered necessary in the circumstances. We believe that our audit provides a reasonable basis for our opinion.
Definition and Limitations of Internal Control Over Financial Reporting
A company’s internal control over financial reporting is a process designed to provide reasonable assurance regarding the reliability of financial reporting and the preparation of financial statements for external purposes in accordance with generally accepted accounting principles. A company’s internal control over financial reporting includes those policies and procedures that (1) pertain to the maintenance of records that, in reasonable detail, accurately and fairly reflect the transactions and dispositions of the assets of the company; (2) provide reasonable assurance that transactions are recorded as necessary to permit preparation of financial statements in accordance with generally accepted accounting principles, and that receipts and expenditures of the company are being made only in accordance with authorizations of management and directors of the company; and (3) provide reasonable assurance regarding prevention or timely detection of unauthorized acquisition, use, or disposition of the company’s assets that could have a material effect on the financial statements.
Because of its inherent limitations, internal control over financial reporting may not prevent or detect misstatements. Also, projections of any evaluation of effectiveness to future periods are subject to the risk that controls may become inadequate because of changes in conditions, or that the degree of compliance with the policies or procedures may deteriorate.
/s/ KPMG LLP
Tampa, Florida
February 22, 2024
Consolidated Statements of Earnings
In millions, except per share amounts
|
|
|
|
|
|
|
|
|
|
|
|
|
|
|
|
|
|
| |
Years Ended December 31, |
| |
2023 |
|
2022 |
|
2021 |
| Net sales |
$ |
13,696.1 |
|
|
$ |
19,125.2 |
|
|
$ |
12,357.4 |
|
| Cost of goods sold |
11,485.5 |
|
|
13,369.4 |
|
|
9,157.1 |
|
| Gross margin |
2,210.6 |
|
|
5,755.8 |
|
|
3,200.3 |
|
| Selling, general and administrative expenses |
500.5 |
|
|
498.0 |
|
|
430.5 |
|
|
|
|
|
|
|
|
|
|
|
|
|
| Impairment, restructuring and other expenses |
— |
|
|
— |
|
|
158.1 |
|
| Other operating expenses |
372.0 |
|
|
472.5 |
|
|
143.2 |
|
| Operating earnings |
1,338.1 |
|
|
4,785.3 |
|
|
2,468.5 |
|
|
|
|
|
|
|
| Interest expense, net |
(129.4) |
|
|
(137.8) |
|
|
(169.1) |
|
| Foreign currency transaction gain (loss) |
194.0 |
|
|
97.5 |
|
|
(78.5) |
|
| Other (expense) income |
(76.8) |
|
|
(102.5) |
|
|
3.9 |
|
| Earnings from consolidated companies before income taxes |
1,325.9 |
|
|
4,642.5 |
|
|
2,224.8 |
|
| Provision for income taxes |
177.0 |
|
|
1,224.3 |
|
|
597.7 |
|
| Earnings from consolidated companies |
1,148.9 |
|
|
3,418.2 |
|
|
1,627.1 |
|
| Equity in net earnings of nonconsolidated companies |
60.3 |
|
|
196.0 |
|
|
7.8 |
|
| Net earnings including noncontrolling interests |
1,209.2 |
|
|
3,614.2 |
|
|
1,634.9 |
|
| Less: Net earnings attributable to noncontrolling interests |
44.3 |
|
|
31.4 |
|
|
4.3 |
|
| Net earnings attributable to Mosaic |
$ |
1,164.9 |
|
|
$ |
3,582.8 |
|
|
$ |
1,630.6 |
|
| Basic net earnings per share attributable to Mosaic |
$ |
3.52 |
|
|
$ |
10.17 |
|
|
$ |
4.31 |
|
| Basic weighted average number of shares outstanding |
331.3 |
|
|
352.4 |
|
|
378.1 |
|
| Diluted net earnings per share attributable to Mosaic |
$ |
3.50 |
|
|
$ |
10.06 |
|
|
$ |
4.27 |
|
| Diluted weighted average number of shares outstanding |
333.2 |
|
|
356.0 |
|
|
381.6 |
|
See Accompanying Notes to Consolidated Financial Statements
Consolidated Statements of Comprehensive Income
In millions
|
|
|
|
|
|
|
|
|
|
|
|
|
|
|
|
|
|
| |
Years Ended December 31, |
| |
2023 |
|
2022 |
|
2021 |
| Net earnings including noncontrolling interest |
$ |
1,209.2 |
|
|
$ |
3,614.2 |
|
|
$ |
1,634.9 |
|
| Other comprehensive income (loss), net of tax |
|
|
|
|
|
| Foreign currency translation gain (loss) |
154.1 |
|
|
(255.0) |
|
|
(108.2) |
|
| Net actuarial gain and prior service cost |
20.1 |
|
|
19.7 |
|
|
36.9 |
|
| Realized gain on interest rate swap |
1.4 |
|
|
1.5 |
|
|
1.5 |
|
| Net gain (loss) on marketable securities held in trust fund |
23.7 |
|
|
(24.8) |
|
|
(17.6) |
|
| Other comprehensive income (loss) |
199.3 |
|
|
(258.6) |
|
|
(87.4) |
|
| Comprehensive income |
1,408.5 |
|
|
3,355.6 |
|
|
1,547.5 |
|
| Less: Comprehensive income attributable to noncontrolling interest |
46.3 |
|
|
33.2 |
|
|
2.5 |
|
| Comprehensive income attributable to Mosaic |
$ |
1,362.2 |
|
|
$ |
3,322.4 |
|
|
$ |
1,545.0 |
|
See Accompanying Notes to Consolidated Financial Statements
Consolidated Balance Sheets
In millions, except per share amounts
|
|
|
|
|
|
|
|
|
|
|
|
| |
December 31, |
| |
2023 |
|
2022 |
| Assets |
|
|
|
| Current assets: |
|
|
|
| Cash and cash equivalents |
$ |
348.8 |
|
|
$ |
735.4 |
|
| Receivables, net |
1,269.2 |
|
|
1,699.9 |
|
| Inventories |
2,523.2 |
|
|
3,543.1 |
|
| Other current assets |
603.8 |
|
|
578.2 |
|
| Total current assets |
4,745.0 |
|
|
6,556.6 |
|
| Property, plant and equipment, net |
13,585.4 |
|
|
12,678.7 |
|
| Investments in nonconsolidated companies |
909.0 |
|
|
885.9 |
|
| Goodwill |
1,138.6 |
|
|
1,116.3 |
|
| Deferred income taxes |
1,079.2 |
|
|
752.3 |
|
| Other assets |
1,575.6 |
|
|
1,396.2 |
|
| Total assets |
$ |
23,032.8 |
|
|
$ |
23,386.0 |
|
| Liabilities and Equity |
|
|
|
| Current liabilities: |
|
|
|
| Short-term debt |
$ |
399.7 |
|
|
$ |
224.9 |
|
| Current maturities of long-term debt |
130.1 |
|
|
985.3 |
|
| Structured accounts payable arrangements |
399.9 |
|
|
751.2 |
|
| Accounts payable |
1,166.9 |
|
|
1,292.5 |
|
| Accrued liabilities |
1,777.1 |
|
|
2,279.9 |
|
| Total current liabilities |
3,873.7 |
|
|
5,533.8 |
|
| Long-term debt, less current maturities |
3,231.6 |
|
|
2,411.9 |
|
| Deferred income taxes |
1,065.5 |
|
|
1,010.1 |
|
| Other noncurrent liabilities |
2,429.2 |
|
|
2,236.0 |
|
| Equity: |
|
|
|
Preferred stock, $0.01 par value, 15,000,000 shares authorized, none issued and outstanding as of December 31, 2023 and 2022 |
— |
|
|
— |
|
Common stock, $0.01 par value, 1,000,000,000 shares authorized, 393,875,241 shares issued and 324,103,141 shares outstanding as of December 31, 2023, 391,964,464 shares issued and 339,071,423 shares outstanding as of December 31, 2022 |
3.2 |
|
|
3.4 |
|
| Capital in excess of par value |
— |
|
|
— |
|
| Retained earnings |
14,241.9 |
|
|
14,203.4 |
|
| Accumulated other comprehensive loss |
(1,954.9) |
|
|
(2,152.2) |
|
| Total Mosaic stockholders’ equity |
12,290.2 |
|
|
12,054.6 |
|
| Non-controlling interests |
142.6 |
|
|
139.6 |
|
| Total equity |
12,432.8 |
|
|
12,194.2 |
|
| Total liabilities and equity |
$ |
23,032.8 |
|
|
$ |
23,386.0 |
|
See Accompanying Notes to Consolidated Financial Statements
Consolidated Statements of Cash Flows
In millions, except per share amounts
|
|
|
|
|
|
|
|
|
|
|
|
|
|
|
|
|
|
| |
Years Ended December 31, |
| |
2023 |
|
2022 |
|
2021 |
| Cash Flows from Operating Activities |
|
|
|
|
|
| Net earnings including noncontrolling interests |
$ |
1,209.2 |
|
|
$ |
3,614.2 |
|
|
$ |
1,634.9 |
|
| Adjustments to reconcile net earnings including noncontrolling interests to net cash provided by operating activities: |
|
|
|
|
|
| Depreciation, depletion and amortization |
960.6 |
|
|
933.9 |
|
|
812.9 |
|
|
|
|
|
|
|
| Deferred and other income taxes |
(261.2) |
|
|
344.4 |
|
|
98.8 |
|
| Equity in net (earnings) of nonconsolidated companies, net of dividends |
(31.8) |
|
|
(191.5) |
|
|
(2.1) |
|
| Accretion expense for asset retirement obligations |
96.1 |
|
|
81.6 |
|
|
71.9 |
|
| Accretion expense for leases |
23.1 |
|
|
15.9 |
|
|
13.4 |
|
| Share-based compensation expense |
33.0 |
|
|
27.9 |
|
|
29.5 |
|
|
|
|
|
|
|
| Unrealized (gain) loss on derivatives |
(29.0) |
|
|
4.3 |
|
|
7.2 |
|
| Foreign currency adjustments |
(94.0) |
|
|
(67.9) |
|
|
(2.6) |
|
|
|
|
|
|
|
| Mine closure costs |
— |
|
|
— |
|
|
158.1 |
|
| Loss on sale of securities |
19.4 |
|
|
46.6 |
|
|
— |
|
| Write down of inventory to net realizable value |
56.7 |
|
|
38.0 |
|
|
— |
|
| Pension settlement loss |
42.4 |
|
|
41.9 |
|
|
— |
|
| Gain on sale of business |
(56.5) |
|
|
— |
|
|
— |
|
| Other |
37.5 |
|
|
39.0 |
|
|
(5.3) |
|
| Changes in assets and liabilities: |
|
|
|
|
|
| Receivables, net |
526.3 |
|
|
(215.2) |
|
|
(683.6) |
|
| Inventories, net |
1,061.4 |
|
|
(749.6) |
|
|
(1,067.9) |
|
| Other current assets and noncurrent assets |
(239.2) |
|
|
(247.4) |
|
|
(18.0) |
|
| Accounts payable and accrued liabilities |
(1,055.1) |
|
|
219.8 |
|
|
995.1 |
|
| Other noncurrent liabilities |
108.3 |
|
|
(0.1) |
|
|
144.7 |
|
| Net cash provided by operating activities |
2,407.2 |
|
|
3,935.8 |
|
|
2,187.0 |
|
| Cash Flows from Investing Activities |
|
|
|
|
|
| Capital expenditures |
(1,402.4) |
|
|
(1,247.3) |
|
|
(1,288.6) |
|
| Purchases of available-for-sale securities - restricted |
(1,240.8) |
|
|
(762.5) |
|
|
(433.6) |
|
| Proceeds from sale of available-for-sale securities - restricted |
1,209.1 |
|
|
743.0 |
|
|
410.1 |
|
| Proceeds from sale of business |
158.4 |
|
|
— |
|
|
— |
|
| Acquisition of business |
(41.0) |
|
|
— |
|
|
— |
|
| Other |
(0.5) |
|
|
7.2 |
|
|
(10.2) |
|
| Net cash used in investing activities |
(1,317.2) |
|
|
(1,259.6) |
|
|
(1,322.3) |
|
| Cash Flows from Financing Activities |
|
|
|
|
|
| Payments of short-term debt |
(9,832.0) |
|
|
(1,761.2) |
|
|
(726.6) |
|
| Proceeds from issuance of short-term debt |
10,007.1 |
|
|
1,980.5 |
|
|
726.6 |
|
| Payments from inventory financing arrangement |
(601.4) |
|
|
(1,651.5) |
|
|
— |
|
| Proceeds from inventory financing arrangement |
601.4 |
|
|
1,348.8 |
|
|
302.7 |
|
| Payments of structured accounts payable arrangements |
(1,432.9) |
|
|
(1,476.6) |
|
|
(1,028.4) |
|
| Proceeds from structured accounts payable arrangements |
1,048.2 |
|
|
1,460.5 |
|
|
1,122.7 |
|
| Collections of transferred receivables |
1,468.6 |
|
|
2,352.1 |
|
|
445.0 |
|
| Payments of transferred receivables |
(1,468.6) |
|
|
(2,433.2) |
|
|
(363.9) |
|
| Payments of long-term debt |
(995.3) |
|
|
(610.3) |
|
|
(608.3) |
|
| Proceeds from issuance of long-term debt |
900.0 |
|
|
— |
|
|
— |
|
|
|
|
|
|
|
| Repurchases of stock |
(756.0) |
|
|
(1,665.2) |
|
|
(410.9) |
|
| Cash dividends paid |
(351.6) |
|
|
(197.7) |
|
|
(103.7) |
|
| Dividends paid to non-controlling interest |
(41.5) |
|
|
(38.0) |
|
|
(31.3) |
|
| Other |
(26.5) |
|
|
13.1 |
|
|
(6.0) |
|
| Net cash used in financing activities |
(1,480.5) |
|
|
(2,678.7) |
|
|
(682.1) |
|
| Effect of exchange rate changes on cash |
(2.8) |
|
|
(29.7) |
|
|
9.3 |
|
| Net change in cash, cash equivalents and restricted cash |
(393.3) |
|
|
(32.2) |
|
|
191.9 |
|
| Cash, cash equivalents and restricted cash—beginning of year |
754.1 |
|
|
786.3 |
|
|
594.4 |
|
| Cash, cash equivalents and restricted cash—end of year |
$ |
360.8 |
|
|
$ |
754.1 |
|
|
$ |
786.3 |
|
See Accompanying Notes to Consolidated Financial Statements
Consolidated Statements of Cash Flows (Continued)
In millions, except per share amounts
|
|
|
|
|
|
|
|
|
|
|
|
|
|
|
|
|
|
|
Years Ended December 31, |
|
2023 |
|
2022 |
|
2021 |
| Reconciliation of cash, cash equivalents and restricted cash reported within the consolidated balance sheets to the consolidated statements of cash flows: |
|
|
|
|
|
| Cash and cash equivalents |
$ |
348.8 |
|
|
$ |
735.4 |
|
|
$ |
769.5 |
|
| Restricted cash in other current assets |
8.6 |
|
|
8.2 |
|
|
8.3 |
|
| Restricted cash in other assets |
3.4 |
|
|
10.5 |
|
|
8.5 |
|
| Total cash, cash equivalents and restricted cash shown in the statement of cash flows |
$ |
360.8 |
|
|
$ |
754.1 |
|
|
$ |
786.3 |
|
See Accompanying Notes to Consolidated Financial Statements
Consolidated Statements of Equity
In millions, except per share data
|
|
|
|
|
|
|
|
|
|
|
|
|
|
|
|
|
|
|
|
|
|
|
|
|
|
|
|
|
|
|
|
|
|
|
|
|
|
|
|
|
|
| |
|
|
Dollars |
| |
Shares |
|
Mosaic Stockholders |
|
|
|
|
|
Common
Stock |
|
Common
Stock |
|
Capital in
Excess
of Par Value |
|
Retained
Earnings |
|
Accumulated
Other
Comprehensive
Loss |
|
Non-
Controlling
Interests |
|
Total
Equity |
| Balance as of December 31, 2020 |
379.1 |
|
|
$ |
3.8 |
|
|
$ |
872.8 |
|
|
$ |
10,511.0 |
|
|
$ |
(1,806.2) |
|
|
$ |
173.8 |
|
|
$ |
9,755.2 |
|
| Total comprehensive income (loss) |
— |
|
|
— |
|
|
— |
|
|
1,630.6 |
|
|
(85.6) |
|
|
2.5 |
|
|
1,547.5 |
|
| Vesting of restricted stock units |
0.8 |
|
|
— |
|
|
(11.3) |
|
|
— |
|
|
— |
|
|
— |
|
|
(11.3) |
|
| Stock based compensation |
— |
|
|
— |
|
|
26.4 |
|
|
— |
|
|
— |
|
|
— |
|
|
26.4 |
|
| Stock option exercises |
— |
|
|
— |
|
|
3.2 |
|
|
— |
|
|
— |
|
|
— |
|
|
3.2 |
|
| Repurchases of stock |
(11.2) |
|
|
(0.1) |
|
|
(410.8) |
|
|
— |
|
|
— |
|
|
— |
|
|
(410.9) |
|
Dividends ($0.30 per share) |
— |
|
|
— |
|
|
— |
|
|
(127.4) |
|
|
— |
|
|
— |
|
|
(127.4) |
|
| Dividends for noncontrolling interests |
— |
|
|
— |
|
|
— |
|
|
— |
|
|
— |
|
|
(31.3) |
|
|
(31.3) |
|
| Purchase of noncontrolling interests |
— |
|
|
— |
|
|
(2.3) |
|
|
— |
|
|
— |
|
|
(0.6) |
|
|
(2.9) |
|
| Balance as of December 31, 2021 |
368.7 |
|
|
3.7 |
|
|
478.0 |
|
|
12,014.2 |
|
|
(1,891.8) |
|
|
144.4 |
|
|
10,748.5 |
|
| Total comprehensive income (loss) |
— |
|
|
— |
|
|
— |
|
|
3,582.8 |
|
|
(260.4) |
|
|
33.2 |
|
|
3,355.6 |
|
| Vesting of restricted stock units |
1.2 |
|
|
— |
|
|
(19.2) |
|
|
— |
|
|
— |
|
|
— |
|
|
(19.2) |
|
| Stock based compensation |
— |
|
|
— |
|
|
31.5 |
|
|
— |
|
|
— |
|
|
— |
|
|
31.5 |
|
| Stock option exercises |
— |
|
|
— |
|
|
16.0 |
|
|
— |
|
|
— |
|
|
— |
|
|
16.0 |
|
| Repurchases of stock |
(30.8) |
|
|
(0.3) |
|
|
(506.3) |
|
|
(1,166.6) |
|
|
— |
|
|
— |
|
|
(1,673.2) |
|
Dividends ($0.60 per share) |
— |
|
|
— |
|
|
— |
|
|
(227.0) |
|
|
— |
|
|
— |
|
|
(227.0) |
|
| Dividends for noncontrolling interests |
— |
|
|
— |
|
|
— |
|
|
— |
|
|
— |
|
|
(38.0) |
|
|
(38.0) |
|
|
|
|
|
|
|
|
|
|
|
|
|
|
|
| Balance as of December 31, 2022 |
339.1 |
|
|
3.4 |
|
|
— |
|
|
14,203.4 |
|
|
(2,152.2) |
|
|
139.6 |
|
|
12,194.2 |
|
| Total comprehensive income |
— |
|
|
— |
|
|
— |
|
|
1,164.9 |
|
|
197.3 |
|
|
46.3 |
|
|
1,408.5 |
|
| Vesting of restricted stock units |
1.9 |
|
|
— |
|
|
(0.8) |
|
|
(53.4) |
|
|
— |
|
|
— |
|
|
(54.2) |
|
|
|
|
|
|
|
|
|
|
|
|
|
|
|
| Stock based compensation |
— |
|
|
— |
|
|
33.0 |
|
|
— |
|
|
— |
|
|
— |
|
|
33.0 |
|
Share repurchases, including tax of $6.4 million |
(16.9) |
|
|
(0.2) |
|
|
(32.2) |
|
|
(722.0) |
|
|
— |
|
|
— |
|
|
(754.4) |
|
Dividends ($0.85 per share) |
— |
|
|
— |
|
|
— |
|
|
(351.0) |
|
|
— |
|
|
— |
|
|
(351.0) |
|
|
|
|
|
|
|
|
|
|
|
|
|
|
|
| Equity to noncontrolling interests |
— |
|
|
— |
|
|
— |
|
|
— |
|
|
— |
|
|
(43.3) |
|
|
(43.3) |
|
| Balance as of December 31, 2023 |
324.1 |
|
|
$ |
3.2 |
|
|
$ |
— |
|
|
$ |
14,241.9 |
|
|
$ |
(1,954.9) |
|
|
$ |
142.6 |
|
|
$ |
12,432.8 |
|
See Accompanying Notes to Consolidated Financial Statements
Notes to Consolidated Financial Statements
Tables in millions, except per share amounts
1. ORGANIZATION AND NATURE OF BUSINESS
The Mosaic Company (“Mosaic,” and, with its consolidated subsidiaries, “we,” “us,” “our,” or the “Company”) produces and markets concentrated phosphate and potash crop nutrients. We conduct our business through wholly- and majority-owned subsidiaries and businesses in which we own less than a majority or a noncontrolling interest, including consolidated variable interest entities and investments accounted for by the equity method.
We are organized into the following business segments:
•Our Phosphates business segment owns and operates mines and production facilities in Florida which produce concentrated phosphate crop nutrients and phosphate-based animal feed ingredients, and processing plants in Louisiana which produce concentrated phosphate crop nutrients. We have a 75% economic interest in the Miski Mayo Phosphate Mine in Peru. These results are consolidated in the Phosphates segment. The Phosphates segment also includes our 25% interest in the Ma’aden Wa’ad Al Shamal Phosphate Company (the “MWSPC”), a joint venture to develop, own and operate integrated phosphate production facilities in the Kingdom of Saudi Arabia. We market approximately 25% of the MWSPC phosphate production. We recognize our equity in the net earnings or losses relating to MWSPC on a one-quarter lag in our Consolidated Statements of Earnings.
•Our Potash business segment owns and operates potash mines and production facilities in Canada and the U.S. which produce potash-based crop nutrients, animal feed ingredients and industrial products. Potash sales include domestic and international sales. We are a member of Canpotex, Limited (“Canpotex”), an export association of Canadian potash producers through which we sell our Canadian potash outside the U.S. and Canada.
•Our Mosaic Fertilizantes business segment includes five Brazilian phosphate rock mines, four phosphate chemical plants and a potash mine in Brazil. The segment also includes our distribution business in South America, which consists of sales offices, crop nutrient blending and bagging facilities, port terminals and warehouses in Brazil and Paraguay. We also have a majority interest in Fospar S.A., which owns and operates a single superphosphate granulation plant and a deep-water port and throughput warehouse terminal facility in Brazil.
Intersegment eliminations, unrealized mark-to-market gains/losses on derivatives, debt expenses, and the results of the China and India distribution businesses are included within Corporate, Eliminations and Other.
2. SUMMARY OF SIGNIFICANT ACCOUNTING POLICIES
Statement Presentation and Basis of Consolidation
The accompanying Consolidated Financial Statements have been prepared in accordance with accounting principles generally accepted in the United States of America (“U.S. GAAP”). Throughout the Notes to Consolidated Financial Statements, amounts in tables are in millions of dollars except for per share data and as otherwise designated.
The accompanying Consolidated Financial Statements include the accounts of Mosaic and its majority-owned subsidiaries. Certain investments in companies in which we do not have control but have the ability to exercise significant influence are accounted for by the equity method.
Accounting Estimates
Preparation of the Consolidated Financial Statements in conformity with GAAP requires management to make estimates and assumptions that affect the reported amounts of assets and liabilities and disclosure of contingent assets and liabilities at the date of the financial statements and the reported amounts of net sales and expenses during the reporting periods. The most significant estimates made by management relate to the recoverability of non-current assets including goodwill, the useful lives and net realizable values of long-lived assets, environmental and reclamation liabilities, including asset retirement obligations (“ARO”), and income tax-related accounts, including the valuation allowance against deferred income tax assets. Actual results could differ from these estimates.
Revenue Recognition
We generate revenues primarily by producing and marketing phosphate and potash crop nutrients. Revenue is recognized when control of the product is transferred to the customer, which is generally upon transfer of title to the customer based on the contractual terms of each arrangement. Title is typically transferred to the customer upon shipment of the product. In certain circumstances, which are referred to as final price deferred arrangements, we ship product prior to the establishment of a valid sales contract. In such cases, we retain control of the product and do not recognize revenue until a sales contract has been agreed to with the customer.
Revenue is measured as the amount of consideration we expect to receive in exchange for the transfer of our goods. Our products are generally sold based on market prices prevailing at the time the sales contract is signed or through contracts which are priced at the time of shipment, except for the final priced deferred arrangements discussed above. Sales incentives are volumetric based annual programs and recorded as a reduction of revenue at the time of sale. We estimate the variable consideration related to our sales incentive programs based on the sales terms with customers and historical experience. Historically, sales incentives have represented 1% or less of total revenue and there have not been significant adjustments to such estimates in the financial statements.
We sell Canadian-sourced potash outside Canada and the U.S. exclusively through Canpotex distribution. Canpotex sells potash to buyers in export markets pursuant to term and spot contracts at agreed upon prices. For sales through this channel, our revenue is recognized at the amount received from Canpotex representing proceeds from their sale of potash, less net costs of Canpotex. Sales are recognized when control is transferred to Canpotex, typically upon shipment of the product to Canpotex, and adjusted at the end of each reporting period based upon the updated estimated pricing or final pricing from Canpotex. Prior to final pricing, revenue is recognized only to the extent that it is probable a significant reversal of revenue will not occur. The constraint is estimated each period based on historical experience, market trends and industry data. The estimated constraint is not material to the Company's financial statements.
Due to our membership in Canpotex, we eliminate the intra-entity profit with Canpotex at the end of each reporting period and present that profit elimination by reversing revenue and cost of goods sold for the inventory remaining at Canpotex. For more information regarding our relationship with Canpotex and accounting considerations, see Note 9 of our Notes to Consolidated Financial Statements. For information regarding sales by product type and by geographic area, see Note 25 of our Notes to Consolidated Financial Statements.
The timing of recognition of revenue related to our performance obligations may be different than the timing of collection of cash related to those performance obligations. Specifically, we collect prepayments from certain customers in Brazil. In addition, cash collection from Canpotex may occur prior to delivery of product to the end customer. We generally satisfy our contractual liabilities within one quarter of incurring the liability.
Other key revenue recognition accounting policies include:
•Shipping and handling costs are included as a component of cost of goods sold.
•We generally expense sales commissions when incurred because the amortization period would have been one year or less. These costs are recorded within sales and marketing expenses.
•We have elected to recognize the cost for freight and shipping as an expense in cost of sales, when control over the product has passed to the customer.
Non-Income Taxes
We pay Canadian resource taxes consisting of the Potash Production Tax and resource surcharge. The Potash Production Tax is a Saskatchewan provincial tax on potash production and consists of a base payment and a profits tax. In addition to the Canadian resource taxes, royalties are payable to the mineral owners with respect to potash reserves or production of potash. These resource taxes and royalties are recorded in our cost of goods sold. Our Canadian resource tax and royalty expenses were $457.0 million, $1.0 billion and $301.5 million during 2023, 2022 and 2021, respectively.
We have approximately $136.5 million of assets recorded as of December 31, 2023 related to PIS and Cofins, which is a Brazilian federal value-added tax. This amount was mostly earned in 2008 through 2022; we believe that it will be realized through offsetting income tax payments or other federal taxes or receiving cash refunds. As of December 31, 2022 we had approximately $105.0 million of assets recorded for these matters. Should the Brazilian government determine that these are not valid credits upon audit, this could impact our results in such period. We have recorded the PIS and Cofins credits at amounts which we believe are probable of collection.
Information regarding PIS and Cofins taxes already audited is included in Note 23 of our Notes to Consolidated Financial Statements.
Foreign Currency Translation
The Company’s reporting currency is the U.S. dollar; however, for operations located in Canada and Brazil, the functional currency is the local currency. Assets and liabilities of these foreign operations are translated to U.S. dollars at exchange rates in effect at the balance sheet date, while income statement accounts and cash flows are translated to U.S. dollars at the 2average exchange rates for the period. For these operations, translation gains and losses are recorded as a component of accumulated other comprehensive income in equity until the foreign entity is sold or liquidated. Transaction gains and losses result from transactions that are denominated in a currency other than the functional currency of the operation, primarily accounts receivable and intercompany loans in our Canadian entities denominated in U.S. dollars, intercompany loans receivable in our U.S. entities denominated in Brazilian real, and accounts payable in Brazil denominated in U.S. dollars. These foreign currency transaction gains and losses are presented separately in the Consolidated Statement of Earnings.
Cash and Cash Equivalents
Cash and cash equivalents include short-term, highly liquid investments with original maturities of 90 days or less and other highly liquid investments that are payable on demand such as money market accounts, certain certificates of deposit and repurchase agreements. The carrying amount of such cash equivalents approximates their fair value due to the short-term and highly liquid nature of these instruments.
Concentration of Credit Risk
In the U.S., we sell our products to manufacturers, distributors and retailers, primarily in the Midwest and Southeast. Internationally, our potash products are sold primarily through Canpotex, an export association. A concentration of credit risk arises from our sales and accounts receivable associated with the international sales of potash product through Canpotex. We consider our concentration risk related to the Canpotex receivable to be mitigated by their credit policy, which requires the underlying receivables to be substantially insured or secured by letters of credit. As of December 31, 2023 and 2022, there were $193.1 million and $244.4 million, respectively, of trade accounts receivable due from Canpotex. During 2023, 2022 and 2021, sales to Canpotex were $1.3 billion, $3.0 billion and $1.1 billion, respectively.
Inventories
Inventories of raw materials, work-in-process products, finished goods and operating materials and supplies are stated at the lower of cost or net realizable value. Costs for substantially all inventories are determined using the weighted average cost basis. To determine the cost of inventory, we allocate fixed expense to the costs of production based on the normal capacity, which refers to a range of production levels and is considered the production expected to be achieved over a number of periods or seasons under normal circumstances, taking into account the loss of capacity resulting from planned maintenance. Fixed overhead costs allocated to each unit of production should not increase due to abnormally low production. Those excess costs are recognized as a current period expense. When a production facility is completely shut down temporarily, it is considered “idle”, and all related expenses are charged to cost of goods sold.
Net realizable value of our inventory is defined as forecasted selling prices less reasonably predictable selling costs. Significant management judgment is involved in estimating forecasted selling prices including various demand and supply variables. Examples of demand variables include grain and oilseed prices, stock-to-use ratios and changes in inventories in the crop nutrients distribution channels. Examples of supply variables include forecasted prices of raw materials, such as phosphate rock, sulfur, ammonia and natural gas, estimated operating rates and industry crop nutrient inventory levels. Results could differ materially if actual selling prices differ materially from forecasted selling prices. Charges for lower of cost or market are recognized in our Consolidated Statements of Earnings in the period when there is evidence of a decline of market value below cost.
Property, Plant and Equipment and Recoverability of Long-Lived Assets
Property, plant and equipment are stated at cost. Costs of significant assets include capitalized interest incurred during the construction and development period. Repairs and maintenance, including planned major maintenance and plant turnaround costs, are expensed when incurred.
Currently, we do not have any material exploration or development stage mining projects. When we transition to new mining areas within our current properties, we incur minimal pre-mining costs related to the permitting process and land preparation activities, such as water management control and construction of roads and access points. These costs are capitalized as part of our mineral properties and rights. Mineral properties and rights at our operations include mineral reserves and mineral resources. Mineral resources have not yet been scheduled in formal mine plans and therefore are not subject to depletion. Depletion expenses for mining operations, including mineral reserves, are generally determined using the units-of-production method based on estimates of proven and probable reserves. Depreciation is computed principally using the straight-line method and units-of-production method over the following useful lives: machinery and equipment: three to 25 years; and buildings and leasehold improvements: three to 40 years.
We estimate initial useful lives based on experience and current technology. These estimates may be extended through sustaining capital programs. Factors affecting the fair value of our assets or periods of expected use may also affect the estimated useful lives of our assets and these factors can change. Therefore, we periodically review the estimated remaining lives of our facilities and other significant assets and adjust our depreciation rates prospectively where appropriate.
Long-lived assets, including fixed assets and right-of-use assets, are reviewed for impairment whenever events or changes in circumstances indicate that the carrying amount may not be recoverable. An impairment assessment involves management judgment and estimates of factors such as industry and market conditions, the economic life of the asset, sales volume and prices, inflation, raw materials costs, cost of capital, tax rates and capital spending. The carrying amount of a long-lived asset group is not recoverable if it exceeds the sum of the undiscounted cash flows expected to result from the use and eventual disposition of the asset group. If it is determined that an impairment loss has occurred, the loss is measured as the amount by which the carrying amount of the long-lived asset group exceeds its fair value.
Leases
Right of use (“ROU”) assets represent our right to use an underlying asset for the lease term. Lease liabilities represent our obligation to make lease payments arising from the lease. Operating lease ROU assets and liabilities are recognized at the commencement date of the lease, based on the present value of lease payments over the lease term. As most of our leases do not provide an implicit rate, we use our incremental borrowing rate based on the information available at the commencement date in determining the present value of lease payments. The Company’s incremental borrowing rate for a lease is the rate of interest it would have to pay on a collateralized basis to borrow an amount equal to the lease payments under similar terms. For both operating and finance leases, the initial ROU asset equals the lease liability, plus initial direct costs, less lease incentives received. Our lease agreements may include options to extend or terminate the lease, which are included in the lease term at the commencement date when it is reasonably certain that we will exercise that option. In general, we do not consider optional periods included in our lease agreements as reasonably certain of exercise at inception.
At inception, we determine whether an arrangement is a lease and the appropriate lease classification. Operating leases with terms greater than twelve months are included as operating lease ROU assets within other assets and the associated lease liabilities within accrued liabilities and other noncurrent liabilities on our consolidated balance sheets. Finance leases with terms greater than twelve months are included as finance ROU assets within property and equipment and the associated finance lease liabilities within current maturities of long-term debt and long-term debt on our consolidated balance sheets.
Leases with terms of less than twelve months, referred to as short-term leases, do not create a ROU asset or lease liability on the balance sheet.
We have lease agreements with lease and non-lease components, which are generally accounted for separately. For full-service railcar leases, we account for the lease and non-lease components as a single lease component. Additionally, for certain equipment leases, we apply assumptions using a portfolio approach, given the generally consistent terms of the agreements. Lease payments based on usage (for example, per-mile or per-hour charges), referred to as variable lease costs, are recorded separately from the determination of the ROU asset and lease liability.
Contingencies
Accruals for environmental remediation efforts are recorded when costs are probable and can be reasonably estimated. In determining these accruals, we use the most current information available, including similar past experiences, available technology, consultant evaluations, regulations in effect, the timing of remediation and cost-sharing arrangements. Adjustments to accruals, recorded as needed in our Consolidated Statement of Earnings each quarter, are made to reflect changes in and current status of these factors.
We are involved from time to time in claims and legal actions incidental to our operations, both as plaintiff and defendant. We have established what we currently believe to be adequate accruals for pending legal matters. These accruals are established as part of an ongoing worldwide assessment of claims and legal actions that takes into consideration such items as advice of legal counsel, individual developments in court proceedings, changes in the law, changes in business focus, changes in the litigation environment, changes in opponent strategy and tactics, new developments as a result of ongoing discovery and our experience in defending and settling similar claims. The litigation accruals at any time reflect updated assessments of the then-existing claims and legal actions. The final outcome or potential settlement of litigation matters could differ materially from the accruals which we have established. Legal costs are expensed as incurred.
Pension and Other Postretirement Benefits
Mosaic offers a number of benefit plans that provide pension and other benefits to qualified employees. These plans include defined benefit pension plans, supplemental pension plans, defined contribution plans and other postretirement benefit plans.
We accrue the funded status of our plans, which is representative of our obligations under employee benefit plans and the related costs, net of plan assets measured at fair value. The cost of pensions and other retirement benefits earned by employees is generally determined with the assistance of an actuary using the projected benefit method prorated on service and management’s best estimate of expected plan investment performance, salary escalation, retirement ages of employees and expected healthcare costs.
Additional Accounting Policies
To facilitate a better understanding of our consolidated financial statements we have disclosed the following significant accounting policies (with the exception of those identified above) throughout the following notes, with the related financial disclosures by major caption:
|
|
|
|
|
|
|
|
|
|
|
|
|
|
|
| Note |
|
Topic |
|
Page |
| 9 |
|
|
|
|
| 10 |
|
|
|
|
| 11 |
|
|
|
|
| 12 |
|
|
|
|
| 13 |
|
|
|
|
| 14 |
|
|
|
|
| 15 |
|
|
|
|
| 16 |
|
|
|
|
3. RECENTLY ISSUED ACCOUNTING GUIDANCE
In September 2022, the Financial Accounting Standards Board (“FASB”) issued guidance which requires that a buyer in a supplier financing program make annual disclosures about the program’s key terms, the balance sheet presentation of related amounts, the confirmed amount outstanding at the end of the period and associated rollforward information. We adopted this standard as of January 1, 2023, except for the amendment on rollforward information, which is effective for fiscal years beginning after December 15, 2023 (our fiscal 2024). We have historically presented supplier financing programs separately on the face of the balance sheet as structured accounts payable arrangements and disclosed key terms of such programs. As such, adoption of this standard did not impact our balance sheet presentation or footnote disclosures.
In November 2023, the FASB issued guidance to improve reportable segment disclosure requirements, primarily through additional disclosures about significant segment expenses. The standard is effective for fiscal years beginning after December 15, 2023 (our fiscal 2024), and interim periods within fiscal years beginning after December 15, 2024 (our fiscal 2025), with early adoption permitted. The amendments would be applied retrospectively to all prior periods presented in the financial statements. We are currently evaluating the disclosure requirements related to the new standard.
In December 2023, the FASB issued guidance to provide more disaggregation of income tax disclosures on the reconciliations of the income tax rate and income taxes paid. We are required to adopt the guidance in the first quarter of fiscal 2025, although early adoption is permitted. We are currently evaluating the disclosure requirements related to the new standard.
4. LEASES
Leasing Activity
We have operating and finance leases for heavy mobile equipment, railcars, fleet vehicles, field and plant equipment, river and cross-gulf vessels, corporate offices, land, and computer equipment. Our leases have remaining lease terms of one year to 39 years, some of which include options to extend the lease for up to 20 years and some of which include options to terminate the lease within one year.
Supplemental balance sheet information related to leases as of December 31, 2023 and December 31, 2022 is as follows:
|
|
|
|
|
|
|
|
|
|
|
|
|
|
|
|
|
|
|
|
|
|
|
December 31, |
|
|
| Type of Lease Asset or Liability |
|
2023 |
|
2022 |
|
Balance Sheet Classification |
|
|
(in millions) |
|
|
| Operating Leases |
|
|
|
|
|
|
| Right-of-use assets |
|
$ |
229.8 |
|
|
$ |
182.5 |
|
|
Other assets |
| Lease liabilities: |
|
|
|
|
|
|
| Short-term |
|
65.3 |
|
|
50.7 |
|
|
Accrued liabilities |
| Long-term |
|
168.1 |
|
|
135.2 |
|
|
Other noncurrent liabilities |
| Total |
|
$ |
233.4 |
|
|
$ |
185.9 |
|
|
|
| Finance Leases |
|
|
|
|
|
|
| Right-of-use assets: |
|
|
|
|
|
|
| Gross assets |
|
$ |
459.7 |
|
|
$ |
484.2 |
|
|
|
| Less: accumulated depreciation |
|
171.3 |
|
|
166.1 |
|
|
|
| Net assets |
|
$ |
288.4 |
|
|
$ |
318.1 |
|
|
Property, plant and equipment, net |
| Lease liabilities: |
|
|
|
|
|
|
| Short-term |
|
$ |
112.7 |
|
|
$ |
71.4 |
|
|
Current maturities of long-term debt |
| Long-term |
|
67.3 |
|
|
122.9 |
|
|
Long-term debt, less current maturities |
| Total |
|
$ |
180.0 |
|
|
$ |
194.3 |
|
|
|
Lease expense is generally included within cost of goods sold and selling, general and administrative expenses, except for interest on lease liabilities, which is recorded within net interest. The components of lease expense were as follows:
|
|
|
|
|
|
|
|
|
|
|
|
|
|
|
|
|
|
|
|
|
|
|
|
|
December 31, |
|
|
| (in millions) |
|
2023 |
|
2022 |
|
2021 |
|
|
| Operating lease cost |
|
$ |
86.9 |
|
|
$ |
86.6 |
|
|
$ |
78.8 |
|
|
|
| Finance lease cost: |
|
|
|
|
|
|
|
|
| Amortization of right-of-use assets |
|
45.8 |
|
|
45.9 |
|
|
40.6 |
|
|
|
| Interest on lease liabilities |
|
7.1 |
|
|
5.3 |
|
|
6.3 |
|
|
|
| Short-term lease cost |
|
0.1 |
|
|
0.8 |
|
|
3.1 |
|
|
|
| Variable lease cost |
|
19.8 |
|
|
19.3 |
|
|
19.2 |
|
|
|
| Total lease cost |
|
$ |
159.7 |
|
|
$ |
157.9 |
|
|
$ |
148.0 |
|
|
|
Rental expense for 2023, 2022 and 2021 was $252.1 million, $237.2 million and $211.8 million, respectively.
Supplemental cash flow information related to leases was as follows:
|
|
|
|
|
|
|
|
|
|
|
|
|
|
|
|
|
|
|
|
|
|
|
December 31, |
| (In millions) |
|
2023 |
|
2022 |
|
2021 |
| Cash paid for amounts included in the measurement of lease liabilities: |
|
|
|
|
|
|
| Operating cash flows from operating leases |
|
$ |
89.2 |
|
|
$ |
88.1 |
|
|
$ |
78.8 |
|
| Operating cash flows from finance leases |
|
7.1 |
|
|
5.3 |
|
|
6.3 |
|
| Financing cash flows from finance leases |
|
78.8 |
|
|
46.5 |
|
|
142.5 |
|
| |
|
|
|
|
|
|
| Right-of-use assets obtained in exchange for lease obligations: |
|
|
|
|
|
|
| Operating leases |
|
$ |
54.5 |
|
|
$ |
56.7 |
|
|
$ |
18.4 |
|
| Finance leases |
|
35.8 |
|
|
27.2 |
|
|
8.9 |
|
Other information related to leases was as follows:
|
|
|
|
|
|
|
|
|
|
|
December 31, 2023 |
| Weighted Average Remaining Lease Term |
|
|
| Operating leases |
|
6.4 years |
| Finance leases |
|
2.4 years |
|
|
|
| Weighted Average Discount Rate |
|
|
| Operating leases |
|
7.3 |
% |
| Finance leases |
|
4.2 |
% |
Future lease payments under non-cancellable leases recorded as of December 31, 2023, were as follows:
|
|
|
|
|
|
|
|
|
|
|
|
|
|
|
|
|
Operating Leases |
|
Finance Leases |
| (in millions) |
|
|
|
|
| 2024 |
|
$ |
79.8 |
|
|
$ |
119.2 |
|
| 2025 |
|
57.0 |
|
|
34.9 |
|
| 2026 |
|
38.6 |
|
|
16.9 |
|
| 2027 |
|
28.2 |
|
|
11.7 |
|
| 2028 |
|
23.2 |
|
|
6.0 |
|
| Thereafter |
|
63.5 |
|
|
5.8 |
|
| Total future lease payments |
|
$ |
290.3 |
|
|
$ |
194.5 |
|
| Less imputed interest |
|
(56.9) |
|
|
(14.5) |
|
| Total |
|
$ |
233.4 |
|
|
$ |
180.0 |
|
5. OTHER FINANCIAL STATEMENT DATA
The following provides additional information concerning selected balance sheet accounts:
|
|
|
|
|
|
|
|
|
|
|
|
| |
December 31, |
| (in millions) |
2023 |
|
2022 |
| Receivables |
|
|
|
| Trade - External |
$ |
940.9 |
|
|
$ |
1,242.8 |
|
| Trade - Affiliate |
194.6 |
|
|
249.6 |
|
| Non-trade |
134.4 |
|
|
208.4 |
|
|
1,269.9 |
|
|
1,700.8 |
|
| Less allowance for doubtful accounts |
0.7 |
|
|
0.9 |
|
|
$ |
1,269.2 |
|
|
$ |
1,699.9 |
|
| Inventories |
|
|
|
| Raw materials |
$ |
135.8 |
|
|
$ |
177.2 |
|
| Work in process |
964.8 |
|
|
844.8 |
|
| Finished goods |
1,178.0 |
|
|
2,158.3 |
|
Final price deferred (a) |
61.5 |
|
|
184.2 |
|
| Operating materials and supplies |
183.1 |
|
|
178.6 |
|
|
$ |
2,523.2 |
|
|
$ |
3,543.1 |
|
| Other current assets |
|
|
|
|
|
|
|
| Income and other taxes receivable |
$ |
269.3 |
|
|
$ |
189.4 |
|
| Prepaid expenses |
284.3 |
|
|
237.4 |
|
| Assets held for sale |
— |
|
|
101.9 |
|
| Other |
50.2 |
|
|
49.5 |
|
|
$ |
603.8 |
|
|
$ |
578.2 |
|
| Other assets |
|
|
|
| Restricted cash |
$ |
3.4 |
|
|
$ |
10.5 |
|
| MRO inventory |
166.3 |
|
|
141.9 |
|
| Marketable securities held in trust - restricted |
708.6 |
|
|
666.0 |
|
| Operating lease right-of-use assets |
229.8 |
|
|
182.5 |
|
| Indemnification asset |
20.9 |
|
|
23.7 |
|
| Long-term receivable |
21.8 |
|
|
26.9 |
|
Cloud computing cost (b) |
138.9 |
|
|
32.9 |
|
| Other |
285.9 |
|
|
311.8 |
|
|
$ |
1,575.6 |
|
|
$ |
1,396.2 |
|
|
|
|
|
|
|
|
|
|
|
|
|
| |
December 31, |
| (in millions) |
2023 |
|
2022 |
| Accrued liabilities |
|
|
|
| Accrued dividends |
$ |
72.3 |
|
|
$ |
72.9 |
|
| Payroll and employee benefits |
182.6 |
|
|
237.0 |
|
| Asset retirement obligations |
377.4 |
|
|
212.3 |
|
| Customer prepayments |
261.8 |
|
|
743.9 |
|
| Accrued income and other taxes |
190.0 |
|
|
208.3 |
|
| Operating lease obligation |
65.3 |
|
|
50.7 |
|
|
|
|
|
| Other |
627.7 |
|
|
754.8 |
|
|
$ |
1,777.1 |
|
|
$ |
2,279.9 |
|
| Other noncurrent liabilities |
|
|
|
| Asset retirement obligations |
$ |
1,836.0 |
|
|
$ |
1,693.3 |
|
| Operating lease obligation |
168.1 |
|
|
135.2 |
|
| Accrued pension and postretirement benefits |
119.7 |
|
|
103.3 |
|
| Unrecognized tax benefits |
30.5 |
|
|
32.5 |
|
| Other |
274.9 |
|
|
271.7 |
|
|
$ |
2,429.2 |
|
|
$ |
2,236.0 |
|
______________________________
(a)Final price deferred is product that has shipped to customers, but we retain control and do not recognize revenue until a sales contract has been agreed to with the customer.
(b)Implementation costs eligible for capitalization related to cloud computing arrangements that are a service contract are recorded within Prepaid expenses and Other assets in the Consolidated Balance Sheets and amortized over the reasonably certain term of the associated hosting arrangement. Capitalized implementation costs expensed were not material in 2023.
Interest expense, net was comprised of the following in 2023, 2022 and 2021:
|
|
|
|
|
|
|
|
|
|
|
|
|
|
|
|
|
|
| |
Years Ended December 31, |
| (in millions) |
2023 |
|
2022 |
|
2021 |
| Interest income |
$ |
59.6 |
|
|
$ |
31.0 |
|
|
$ |
25.2 |
|
| Less interest expense |
189.0 |
|
|
168.8 |
|
|
194.3 |
|
| Interest expense, net |
$ |
(129.4) |
|
|
$ |
(137.8) |
|
|
$ |
(169.1) |
|
6. PROPERTY, PLANT AND EQUIPMENT
Property, plant and equipment consist of the following:
|
|
|
|
|
|
|
|
|
|
|
|
| |
December 31, |
| (in millions) |
2023 |
|
2022 |
| Land |
$ |
373.0 |
|
|
$ |
345.6 |
|
| Mineral properties and rights |
6,477.5 |
|
|
6,018.2 |
|
| Buildings and leasehold improvements |
3,881.6 |
|
|
3,522.6 |
|
| Machinery and equipment |
11,407.6 |
|
|
10,606.8 |
|
| Construction in-progress |
1,359.8 |
|
|
1,130.4 |
|
|
23,499.5 |
|
|
21,623.6 |
|
| Less: accumulated depreciation and depletion |
9,914.1 |
|
|
8,944.9 |
|
|
$ |
13,585.4 |
|
|
$ |
12,678.7 |
|
Depreciation and depletion expense was $958.9 million, $932.1 million, and $811.8 million for 2023, 2022 and 2021, respectively. Interest capitalized on major construction projects was $35.2 million, $26.8 million, and $30.1 million for 2023, 2022 and 2021, respectively.
7. EARNINGS PER SHARE
The numerator for basic and diluted earnings per share (“EPS”) is net earnings attributable to Mosaic. The denominator for basic EPS is the weighted average number of shares outstanding during the period. The denominator for diluted EPS also includes the weighted average number of additional common shares that would have been outstanding if the dilutive potential common shares had been issued, unless the shares are anti-dilutive.
The following is a reconciliation of the numerator and denominator for the basic and diluted EPS computations:
|
|
|
|
|
|
|
|
|
|
|
|
|
|
|
|
|
|
| |
Years Ended December 31, |
| (in millions) |
2023 |
|
2022 |
|
2021 |
| Net earnings attributable to Mosaic |
$ |
1,164.9 |
|
|
$ |
3,582.8 |
|
|
$ |
1,630.6 |
|
| Basic weighted average number of shares outstanding attributable to common stockholders |
331.3 |
|
|
352.4 |
|
|
378.1 |
|
| Dilutive impact of share-based awards |
1.9 |
|
|
3.6 |
|
|
3.5 |
|
| Diluted weighted average number of shares outstanding |
333.2 |
|
|
356.0 |
|
|
381.6 |
|
| Basic net earnings per share |
$ |
3.52 |
|
|
$ |
10.17 |
|
|
$ |
4.31 |
|
| Diluted net earnings per share |
$ |
3.50 |
|
|
$ |
10.06 |
|
|
$ |
4.27 |
|
A total of 0.5 million shares for 2023, 0.1 million shares for 2022 and 0.5 million shares for 2021 of common stock subject to issuance related to share-based awards have been excluded from the calculation of diluted EPS because the effect would have been anti-dilutive.
8. CASH FLOW INFORMATION
Supplemental disclosures of cash paid for interest and income taxes and non-cash investing and financing information is as follows:
|
|
|
|
|
|
|
|
|
|
|
|
|
|
|
|
|
|
|
Years Ended December 31, |
| (in millions) |
2023 |
|
2022 |
|
2021 |
| Cash paid during the period for: |
|
|
|
|
|
| Interest |
$ |
204.7 |
|
|
$ |
196.4 |
|
|
$ |
220.0 |
|
| Less amount capitalized |
35.2 |
|
|
26.8 |
|
|
30.1 |
|
| Cash interest, net |
$ |
169.5 |
|
|
$ |
169.6 |
|
|
$ |
189.9 |
|
| Income taxes |
$ |
385.6 |
|
|
$ |
1,114.5 |
|
|
$ |
208.6 |
|
Acquiring or constructing property, plant and equipment by incurring a liability does not result in a cash outflow for us until the liability is paid. In the period the liability is incurred, the change in operating accounts payable on the Consolidated Statements of Cash Flows is adjusted by such amount. In the period the liability is paid, the amount is reflected as a cash outflow from investing activities. The applicable net change in operating accounts payable that was classified to investing activities on the Consolidated Statements of Cash Flows was $(19.5) million, $(65.2) million, and $18.6 million for 2023, 2022 and 2021, respectively.
We accrued $72.3 million related to the dividends declared in 2023 that will be paid in 2024. At December 31, 2022 and 2021, we had accrued dividends of $72.9 million and $43.6 million which were paid in 2023 and 2022, respectively.
Included in proceeds from issuance of short-term debt and payments of short-term debt were $9.6 billion and ($9.5) billion related to our commercial paper arrangement.
We had non-cash investing and financing transactions related to right-of-use assets obtained in exchange for lease obligations assets under finance leases in 2023 of $35.8 million. Non-cash investing and financing transactions related to assets acquired under capital leases were $27.2 million and $8.9 million for 2022 and 2021, respectively. In addition, in 2023, we purchased equipment of $43 million through the exchange of right of use assets.
Depreciation, depletion and amortization includes $958.9 million, $932.1 million and $811.8 million related to depreciation and depletion of property, plant and equipment, and $1.7 million, $1.8 million and $1.1 million related to the amortization of intangible assets for 2023, 2022 and 2021, respectively.
9. INVESTMENTS IN NON-CONSOLIDATED COMPANIES
We have investments in various international and domestic entities and ventures. The equity method of accounting is applied to such investments when the ownership structure prevents us from exercising a controlling influence over operating and financial policies of the businesses but still allow us to have significant influence. Under this method, our equity in the net earnings or losses of the investments is reflected as equity in net earnings of non-consolidated companies on our Consolidated Statements of Earnings. The effects of material intercompany transactions with these equity method investments are eliminated, including the gross profit on sales to and purchases from our equity-method investments which is deferred until the time of sale to the final third-party customer. The cash flow presentation of dividends received from equity method investees is determined by evaluation of the facts, circumstances and nature of the distribution.
A summary of our equity-method investments, which were in operation as of December 31, 2023, is as follows:
|
|
|
|
|
|
|
|
|
| Entity |
|
Economic Interest |
| River Bend Ag, LLC |
|
50.0 |
% |
| IFC S.A. |
|
45.0 |
% |
| MWSPC |
|
25.0 |
% |
| Canpotex |
|
36.2 |
% |
The summarized financial information shown below includes all non-consolidated companies carried on the equity method.
|
|
|
|
|
|
|
|
|
|
|
|
|
|
|
|
|
|
|
Years Ended December 31, |
| (in millions) |
2023 |
|
2022 |
|
2021 |
| Net sales |
$ |
7,055.1 |
|
|
$ |
11,852.8 |
|
|
$ |
4,758.2 |
|
| Net earnings |
317.9 |
|
|
956.9 |
|
|
70.1 |
|
| Mosaic’s share of equity in net earnings |
60.3 |
|
|
196.0 |
|
|
7.8 |
|
| Total assets |
9,900.6 |
|
|
11,707.8 |
|
|
10,685.6 |
|
| Total liabilities |
7,014.1 |
|
|
8,973.7 |
|
|
8,864.7 |
|
| Mosaic’s share of equity in net assets |
725.9 |
|
|
693.2 |
|
|
466.9 |
|
MWSPC owns and operates a mine and two chemical complexes that produce phosphate fertilizers and other downstream phosphate products in the Kingdom of Saudi Arabia. As of December 31, 2023, our cash investment was $770.0 million. We have not made any capital contributions since 2017 and do not expect future contributions to be needed. We market approximately 25% of the phosphate production of this joint venture. As of December 31, 2023, MWSPC represented 77% of the total assets and 68% of the total liabilities in the table above. In 2023, 2022 and 2021 our share of equity in net earnings was $57.6 million, $194.5 million, and $5.0 million, respectively. The difference between our share of equity in net assets as shown in the above table and the investment in non-consolidated companies as shown on the Consolidated Balance Sheets is mainly due to the July 1, 2016, equity contribution of $120 million we made to MWSPC, representing the remaining liability for our portion of mineral rights value transferred to MWSPC from Saudi Arabian Mining Company.
Canpotex is a Saskatchewan export association used by two Canadian potash producers to market, sell and distribute Canadian potash products outside of Canada and the U.S. to unrelated third -arty customers at market prices. It operates as a break-even entity and therefore has insignificant equity earnings or loss. We have concluded that the sales to Canpotex are not at arm’s-length, due to the unique pricing and payment structure and financial obligations of the stockholders. Therefore, the full profit on sales to Canpotex is eliminated until Canpotex no longer has control of the related inventory and has sold it to an unrelated third-party customer. We eliminate the intra-entity profit with Canpotex at the end of each reporting period and present that profit elimination by reversing revenue and cost of goods sold for the inventory remaining at Canpotex.
10. GOODWILL
Goodwill is carried at cost, not amortized, and represents the excess of the purchase price and related costs over the fair value assigned to the net identifiable assets of a business acquired. We test goodwill for impairment on a quantitative basis at the reporting unit level on an annual basis or upon the occurrence of events that may indicate possible impairment. Impairment is measured as the excess carrying value over the fair value of goodwill.
The changes in the carrying amount of goodwill, by reporting unit, as of December 31, 2023 and 2022, are as follows:
|
|
|
|
|
|
|
|
|
|
|
|
|
|
|
|
|
|
|
|
|
|
|
|
|
|
| (in millions) |
|
|
Potash |
|
Mosaic Fertilizantes |
|
Corporate, Eliminations and Other |
|
Total |
| Balance as of December 31, 2021 |
|
|
$ |
1,064.2 |
|
|
$ |
95.9 |
|
|
$ |
12.1 |
|
|
$ |
1,172.2 |
|
| Foreign currency translation |
|
|
(57.6) |
|
|
1.7 |
|
|
— |
|
|
(55.9) |
|
|
|
|
|
|
|
|
|
|
|
| Balance as of December 31, 2022 |
|
|
$ |
1,006.6 |
|
|
$ |
97.6 |
|
|
$ |
12.1 |
|
|
$ |
1,116.3 |
|
| Foreign currency translation |
|
|
20.3 |
|
|
2.0 |
|
|
— |
|
|
22.3 |
|
|
|
|
|
|
|
|
|
|
|
| Balance as of December 31, 2023 |
|
|
$ |
1,026.9 |
|
|
$ |
99.6 |
|
|
$ |
12.1 |
|
|
$ |
1,138.6 |
|
As of October 31, 2023, we performed our annual quantitative assessment. In performing our assessment, we estimated the fair value of each of our reporting units using the income approach, also known as the discounted cash flow (“DCF”) method. The income approach utilized the present value of cash flows to estimate fair value. The future cash flows for our reporting units were projected based on our estimates, at that time, for revenue, operating income and other factors (such as working capital and capital expenditures for each reporting unit). To determine if the fair value of each of our reporting units with goodwill exceeded its carrying value, we assumed sales volume growth rates based on our long-term expectations, our internal selling prices and projected raw material prices for years one through five, which were anchored in projections from CRU International Limited (“CRU”), an independent third party data source. Selling prices and raw material prices for years six and beyond were based on anticipated market growth and long-term CRU outlooks. The discount rates used in our DCF method were based on a weighted-average cost of capital (“WACC”), determined from relevant market comparisons. A terminal value growth rate of 2% was applied to all years thereafter for the projected period and reflected our estimate of stable growth. We then calculated a present value of the respective cash flows for each reporting unit to arrive at an estimate of fair value under the income approach. Finally, we compared our estimates of fair values for our reporting units, to our October 31, 2023 total public market capitalization, based on our common stock price at that date.
In making this assessment, we considered, among other things, expectations of projected net sales and cash flows, assumptions impacting the WACC, changes in our stock price and changes in the carrying values of our reporting units with goodwill. We also considered overall business conditions.
The Potash, Mosaic Fertilizantes and Corporate, Eliminations and Other reporting units were evaluated and not considered at risk of goodwill impairment at October 31, 2023. Our Phosphate reporting unit has no carries no goodwill. Subsequent to our annual evaluation, on December 28, 2023, Brazil enacted a tax law change that eliminates the VAT preference starting in 2024. While we are currently assessing the full impact of this change, our Mosaic Fertilizantes reporting unit would have an estimated fair value that is not in significant excess of its carrying value. We continue to believe that our long-term financial goals will be achieved and as a result, we concluded that the goodwill assigned to this reporting unit was not impaired, but could be at risk of future impairment.
As of December 31, 2023, $46.2 million of goodwill was tax deductible.
11. FINANCING ARRANGEMENTS
Mosaic Credit Facility
On August 19, 2021, we entered into a committed, unsecured, five-year revolving credit facility of up to $2.5 billion (the “Mosaic Credit Facility”), with a maturity date of August 19, 2026, which is intended to serve as our primary senior unsecured bank credit facility. The Mosaic Credit Facility has cross-default provisions that, in general, provide that a failure to pay principal or interest under, or any other amount payable under, any indebtedness with an outstanding principal amount of $100 million or more, or breach or default under such indebtedness that permits the holders thereof to accelerate the maturity thereof, will result in a cross-default.
The Mosaic Credit Facility requires Mosaic to maintain certain financial ratios, including a ratio of Consolidated Indebtedness, which has been redefined to exclude unrestricted cash and cash equivalents, to Consolidated Capitalization Ratio (as defined) of no greater than 0.65 to 1.0, as well as a minimum Interest Coverage Ratio (as defined) of not less than 3.0 to 1.0. We were in compliance with these ratios as of December 31, 2023.
The Mosaic Credit Facility also contains other events of default and covenants that limit various matters. These provisions include limitations on indebtedness, liens, investments and acquisitions (other than capital expenditures), certain mergers, certain sales of assets and other matters customary for credit facilities of this nature.
As of December 31, 2023 and 2022, we had outstanding letters of credit that utilized a portion of the amount available for revolving loans under the Mosaic Credit Facility of $10.5 million and $10.9 million, respectively. The net available borrowings for revolving loans under the Mosaic Credit Facility were approximately $2.49 billion as of December 31, 2023 and December 31, 2022, respectively. As of December 31, 2023 and 2022, unused commitment fees accrued at an average rate of 0.15%, generating expenses of $3.8 million in each period. In 2021, unused commitment fees accrued at 0.40% under our prior credit facility, which was in place through August 19, 2021, and at 0.15% thereafter, generating expense of $7.0 million.
Short-Term Debt
Short-term debt consists of the revolving credit facility under the Mosaic Credit Facility, under which there were no borrowings as of December 31, 2023, working capital financing arrangements and various other short-term borrowings related to our international operations in India, China and Brazil. These other short-term borrowings outstanding were $399.7 million and $224.9 million as of December 31, 2023 and 2022, respectively.
We have an inventory financing arrangement whereby we can sell up to $625 million of certain inventory for cash and subsequently repurchase the inventory at an agreed upon price and time in the future, not to exceed 180 days. Under the terms of the agreement, we may borrow up to 90% of the value of the inventory. It is later repurchased by Mosaic at the original sale price plus interest and any transaction costs. As of December 31, 2023 and 2022, there was no outstanding balance under this arrangement. Any outstanding amount would be classified as short-term debt on the Consolidated Balance Sheets.
We have Receivable Purchasing Agreements (“RPAs”), with banks whereby, from time-to-time, we sell certain receivables. The net face value of the purchased receivables may not exceed $600 million at any point in time. The purchase price of the receivable sold under the RPA is the face value of the receivable less an agreed upon discount. The receivables sold under the RPAs are accounted for as true sales. Upon sale, these receivables are removed from the Consolidated Balance Sheets. Cash received is presented as cash provided by operating activities in the Consolidated Statements of Cash Flows.
The Company sold approximately $1.3 billion and $2.5 billion as of December 31, 2023 and 2022, respectively, of accounts receivable under these arrangements. Discounts on sold receivables were not material for any period presented. Following the sale to the banks, we continue to service the collection of the receivables on behalf of the banks without further consideration. As of December 31, 2023 and 2022, there was no amount outstanding to be remitted to the bank. Any outstanding amount would be classified in accrued liabilities on the Condensed Consolidated Balance Sheets. Cash collected and remitted is presented as cash used in financing activities in the Condensed Consolidated Statements of Cash Flows.
We have a commercial paper program which allows us to issue unsecured commercial paper notes with maturities that vary, but do not exceed 397 days from the date of issue, up to a maximum aggregate face or principal amount outstanding at any time of $2.5 billion. We plan to use the revolving credit facility as a liquidity backstop for borrowings under the commercial paper program. As of December 31, 2023, we had $399.5 million outstanding under this program, with a weighted average interest rate of 5.62% and a remaining average term of nine days. As of December 31, 2022, we had $224.8 million outstanding under this program, with a weighted average interest rate of 4.66% and a remaining average term of 10 days.
We had additional outstanding bilateral letters of credit of $52.6 million as of December 31, 2023, which includes $50.0 million as required by the 2015 Consent Decrees as described further in Note 14 of our Consolidated Financial Statements.
Long-Term Debt, including Current Maturities
On November 13, 2017, we issued senior notes consisting of $550 million aggregate principal amount of 3.250% senior notes due 2022 and $700 million aggregate principal amount of 4.050% senior notes due 2027 (“Senior Notes of 2017”). In 2022, we paid the outstanding balance of $550 million on our 3.250% senior notes, due November 15, 2022, without premium or penalty.
In May 2023, we entered into a 10-year senior unsecured term loan facility pursuant to which we can draw up to $700 million. The term loan matures on May 18, 2033. We may voluntarily prepay the outstanding principal without premium or penalty. As of December 31, 2023, $500 million has been drawn under this facility. Interest rates for the term loan are variable and are based on the Secured Overnight Financing Rate (“SOFR”) plus credit spread adjustments.
On, December 4, 2023, we issued new senior notes consisting of $400 million aggregate principal amount of 5.375% due 2028 (the “Senior Notes of 2023”). We have the following additional senior notes outstanding: $500 million aggregate principal amount of 5.45% senior notes due 2033 and $600 million aggregate principal amount of 5.625% senior notes due 2043 (collectively, the “Senior Notes of 2013”); and $300 million aggregate principal amount of 4.875% senior notes due 2041 (collectively, the “Senior Notes of 2011”). In 2023, we paid the outstanding balance of $900 million on our 4.25% senior notes, due November 15, 2023, without premium or penalty.
The Senior Notes of 2011, the Senior Notes of 2013, the Senior Notes of 2017, and the Senior Notes of 2023 are Mosaic’s senior unsecured obligations and rank equally in right of payment with Mosaic’s existing and future senior unsecured indebtedness. The indenture governing these notes contains restrictive covenants limiting debt secured by liens, sale and leaseback transactions and mergers, consolidations and sales of substantially all assets, as well as other events of default.
A debenture issued by Mosaic Global Holdings, Inc., one of our consolidated subsidiaries, due in 2028 (the “2028 Debenture”), is outstanding as of December 31, 2023, with a balance of $147.1 million. The indenture governing the 2028 Debenture also contains restrictive covenants limiting debt secured by liens, sale and leaseback transactions and mergers, consolidations and sales of substantially all assets, as well as events of default. The obligations under the 2028 Debenture are guaranteed by the Company and several of its subsidiaries.
Long-term debt primarily consists of unsecured notes, finance leases, unsecured debentures and secured notes. Long-term debt as of December 31, 2023 and 2022, respectively, consisted of the following:
|
|
|
|
|
|
|
|
|
|
|
|
|
|
|
|
|
|
|
|
|
|
|
|
|
|
|
|
|
|
|
|
|
|
|
|
|
|
|
|
|
|
|
|
|
|
|
|
|
|
|
|
|
|
|
|
|
|
|
|
|
|
|
|
|
|
|
|
|
|
|
|
|
|
|
|
|
2023 |
|
2022 |
| (in millions) |
|
Stated Interest Rate |
|
Effective Interest Rate |
|
Maturity Date |
|
Stated Value |
|
Combination Fair
Market
Value Adjustment |
|
Discount on Notes Issuance |
|
Carrying Value |
|
Stated Value |
|
Combination Fair
Market
Value Adjustment |
|
Discount on Notes Issuance |
|
Carrying Value |
| Unsecured notes |
|
4.05% -
5.63%
|
|
5.49% |
|
2027-
2043 |
|
$ |
2,500.0 |
|
|
$ |
— |
|
|
$ |
(5.8) |
|
|
$ |
2,494.2 |
|
|
$ |
3,000.0 |
|
|
$ |
— |
|
|
$ |
(6.1) |
|
|
$ |
2,993.9 |
|
| Unsecured debentures |
|
7.30% |
|
7.19% |
|
2028 |
|
147.1 |
|
|
0.4 |
|
|
— |
|
|
147.5 |
|
|
147.1 |
|
|
0.6 |
|
|
— |
|
|
147.7 |
|
| Term Loan |
|
30 Day SOFR |
|
7.08% |
|
2033 |
|
500.0 |
|
|
— |
|
|
— |
|
|
500.0 |
|
|
— |
|
|
— |
|
|
— |
|
|
— |
|
| Finance leases |
|
0.77% -
19.72%
|
|
4.16% |
|
2024-
2032 |
|
180.0 |
|
|
— |
|
|
— |
|
|
180.0 |
|
|
194.3 |
|
|
— |
|
|
— |
|
|
194.3 |
|
Other(a) |
|
6.53% -
8.00%
|
|
6.43% |
|
2024-
2026 |
|
35.0 |
|
|
5.0 |
|
|
— |
|
|
40.0 |
|
|
54.2 |
|
|
7.1 |
|
|
— |
|
|
61.3 |
|
Total long-term debt |
|
|
|
3,362.1 |
|
|
5.4 |
|
|
(5.8) |
|
|
3,361.7 |
|
|
3,395.6 |
|
|
7.7 |
|
|
(6.1) |
|
|
3,397.2 |
|
Less current portion |
|
|
|
129.2 |
|
|
1.3 |
|
|
(0.4) |
|
|
130.1 |
|
|
983.9 |
|
|
2.0 |
|
|
(0.6) |
|
|
985.3 |
|
Total long-term debt, less current maturities |
|
|
|
$ |
3,232.9 |
|
|
$ |
4.1 |
|
|
$ |
(5.4) |
|
|
$ |
3,231.6 |
|
|
$ |
2,411.7 |
|
|
$ |
5.7 |
|
|
$ |
(5.5) |
|
|
$ |
2,411.9 |
|
______________________________
(a) Includes deferred financing fees related to our long-term debt.
Scheduled maturities of long-term debt are as follows for the periods ending December 31:
|
|
|
|
|
|
| (in millions) |
|
| 2024 |
$ |
130.1 |
|
| 2025 |
45.7 |
|
| 2026 |
28.8 |
|
| 2027 |
710.5 |
|
| 2028 |
554.3 |
|
| Thereafter |
1,892.3 |
|
| Total |
$ |
3,361.7 |
|
Structured Accounts Payable Arrangements
In Brazil, we finance some of our potash-based fertilizer, sulfur, ammonia and other raw material product purchases through third-party contractual arrangements. These arrangements provide that the third-party intermediary advance the amount of the scheduled payment to the vendor, less an appropriate discount, at a scheduled payment date and Mosaic makes payment to the third-party intermediary at dates ranging from 98 to 182 days from date of shipment. At December 31, 2023 and 2022, these structured accounts payable arrangements were $399.9 million and $751.2 million, respectively.
12. MARKETABLE SECURITIES HELD IN TRUSTS
In August 2016, Mosaic deposited $630 million into two trust funds (together, the “RCRA Trusts”) created to provide additional financial assurance in the form of cash for the estimated costs (“Gypstack Closure Costs”) of closure and long-term care of our Florida and Louisiana phosphogypsum management systems (“Gypstacks”), as described further in Note 14 of our Notes to Consolidated Financial Statements. Our actual Gypstack Closure Costs are generally expected to be paid by us in the normal course of our Phosphates business; however, funds held in each of the RCRA Trusts can be drawn by the applicable governmental authority in the event we cannot perform our closure and long-term care obligations. When our estimated Gypstack Closure Costs with respect to the facilities associated with a RCRA Trust are sufficiently lower than the amount on deposit in that RCRA Trust, we have the right to request that the excess funds be released to us. The same is true for the RCRA Trust balance remaining after the completion of our obligations, which will be performed over a period that may not end until three decades or more after a Gypstack has been closed. The investments held by the RCRA Trusts are managed by independent investment managers with discretion to buy, sell, and invest pursuant to the objectives and standards set forth in the related trust agreements. Amounts reserved to be held or held in the RCRA Trusts (including losses or reinvested earnings) are included in other assets on our Consolidated Balance Sheets.
The RCRA Trusts hold investments, which are restricted from our general use, in marketable debt securities classified as available-for-sale and are carried at fair value. As a result, unrealized gains and losses are included in other comprehensive income until realized, unless it is determined that the entire unamortized cost basis of the investment is not expected to be recovered. A credit loss would then be recognized in operations for the amount of the expected credit loss. As of December 31, 2023, we expect to recover our amortized cost on all available-for-sale securities and have not established an allowance for credit loss.
We review the fair value hierarchy classification on a quarterly basis. Changes in the ability to observe valuation inputs may result in a reclassification of levels for certain securities within the fair value hierarchy. We determine the fair market values of our available-for-sale securities and certain other assets based on the fair value hierarchy described below:
Level 1: Values based on unadjusted quoted prices in active markets that are accessible at the measurement date for identical assets or liabilities.
Level 2: Values based on quoted prices for similar instruments in active markets, quoted prices for identical or similar instruments in markets that are not active, or model-based valuation techniques for which all significant assumptions are observable in the market.
Level 3: Values generated from model-based techniques that use significant assumptions not observable in the market. These unobservable assumptions reflect our own estimates of assumptions that market participants would use in pricing the asset or liability.
Valuation techniques include use of option pricing models, discounted cash flow models and similar techniques.
The estimated fair value of the investments in the RCRA Trusts as of December 31, 2023 and December 31, 2022 are as follows:
|
|
|
|
|
|
|
|
|
|
|
|
|
|
|
|
|
|
|
|
|
|
|
|
|
December 31, 2023 |
| (in millions) |
Amortized
Cost |
|
Gross
Unrealized
Gains |
|
Gross
Unrealized
Losses |
|
Fair
Value |
| Level 1 |
|
|
|
|
|
|
|
| Cash and cash equivalents |
$ |
1.0 |
|
|
$ |
— |
|
|
$ |
— |
|
|
$ |
1.0 |
|
| Level 2 |
|
|
|
|
|
|
|
| Corporate debt securities |
204.6 |
|
|
1.9 |
|
|
(8.4) |
|
|
198.1 |
|
| Municipal bonds |
206.9 |
|
|
1.9 |
|
|
(4.1) |
|
|
204.7 |
|
| U.S. government bonds |
268.6 |
|
|
11.5 |
|
|
(0.3) |
|
|
279.8 |
|
|
|
|
|
|
|
|
|
| Total |
$ |
681.1 |
|
|
$ |
15.3 |
|
|
$ |
(12.8) |
|
|
$ |
683.6 |
|
|
|
|
|
|
|
|
|
|
December 31, 2022 |
| (in millions) |
Amortized
Cost |
|
Gross
Unrealized
Gains |
|
Gross
Unrealized
Losses |
|
Fair
Value |
| Level 1 |
|
|
|
|
|
|
|
| Cash and cash equivalents |
$ |
7.7 |
|
|
$ |
— |
|
|
$ |
— |
|
|
$ |
7.7 |
|
| Level 2 |
|
|
|
|
|
|
|
| Corporate debt securities |
203.8 |
|
|
0.1 |
|
|
(17.1) |
|
|
186.8 |
|
| Municipal bonds |
197.0 |
|
|
0.4 |
|
|
(8.0) |
|
|
189.4 |
|
| U.S. government bonds |
269.6 |
|
|
— |
|
|
(3.6) |
|
|
266.0 |
|
| Other holdings |
0.2 |
|
|
— |
|
|
— |
|
|
0.2 |
|
| Total |
$ |
678.3 |
|
|
$ |
0.5 |
|
|
$ |
(28.7) |
|
|
$ |
650.1 |
|
The following tables show gross unrealized losses and fair values of the RCRA Trusts’ available-for-sale securities that have been in a continuous unrealized loss position for which an allowance for credit losses has not been recorded as of December 31, 2023 and December 31, 2022.
|
|
|
|
|
|
|
|
|
|
|
|
|
|
|
|
|
|
|
|
|
|
|
|
|
December 31, 2023 |
|
December 31, 2022 |
Securities that have been in a continuous loss position for less than 12 months (in millions): |
Fair
Value |
|
Gross
Unrealized
Losses |
|
Fair
Value |
|
Gross
Unrealized
Losses |
| Corporate debt securities |
$ |
5.4 |
|
|
$ |
(0.1) |
|
|
$ |
105.6 |
|
|
$ |
(6.5) |
|
| Municipal bonds |
42.3 |
|
|
(0.2) |
|
|
104.7 |
|
|
(2.9) |
|
| U.S. government bonds |
26.4 |
|
|
(0.3) |
|
|
264.9 |
|
|
(3.5) |
|
| Total |
$ |
74.1 |
|
|
$ |
(0.6) |
|
|
$ |
475.2 |
|
|
$ |
(12.9) |
|
|
|
|
|
|
|
|
|
|
December 31, 2023 |
|
December 31, 2022 |
Securities that have been in a continuous loss position for more than 12 months (in millions): |
Fair
Value |
|
Gross
Unrealized
Losses |
|
Fair
Value |
|
Gross
Unrealized
Losses |
| Corporate debt securities |
$ |
121.5 |
|
|
$ |
(8.3) |
|
|
$ |
72.8 |
|
|
$ |
(10.6) |
|
| Municipal bonds |
84.1 |
|
|
(3.9) |
|
|
61.9 |
|
|
(5.1) |
|
| U.S. government bonds |
— |
|
|
— |
|
|
0.8 |
|
|
(0.1) |
|
| Total |
$ |
205.6 |
|
|
$ |
(12.2) |
|
|
$ |
135.5 |
|
|
$ |
(15.8) |
|
The following table summarizes the balance by contractual maturity of the available-for-sale debt securities invested by the RCRA Trusts as of December 31, 2023. Actual maturities may differ from contractual maturities because the issuers of the securities may have the right to prepay obligations before the underlying contracts mature.
|
|
|
|
|
|
| (in millions) |
December 31, 2023 |
| Due in one year or less |
$ |
18.6 |
|
| Due after one year through five years |
243.4 |
|
| Due after five years through ten years |
378.7 |
|
| Due after ten years |
41.9 |
|
| Total debt securities |
$ |
682.6 |
|
For the year ended December 31, 2023, realized gains and (losses) were $9.5 million and $(28.9) million, respectively. For the year ended December 31, 2022, realized gains and (losses) were $0.3 million and $(46.9) million, respectively and for the year ended December 31, 2021, realized gains and (losses) were $5.8 million and $(3.4) million, respectively.
13. INCOME TAXES
In preparing our Consolidated Financial Statements, we utilize the asset and liability approach in accounting for income taxes. We recognize income taxes in each of the jurisdictions in which we have a presence. For each jurisdiction, we estimate the actual amount of income taxes currently payable or receivable, as well as deferred income tax assets and liabilities attributable to temporary differences between the financial statement carrying amounts of existing assets and liabilities and their respective tax bases. Deferred income tax assets and liabilities are measured using enacted tax rates expected to apply to taxable income in the years in which these temporary differences are expected to be recovered or settled. The effect on deferred tax assets and liabilities of a change in tax rates is recognized in income in the period that includes the enactment date.
The provision for income taxes for 2023, 2022 and 2021 consisted of the following:
|
|
|
|
|
|
|
|
|
|
|
|
|
|
|
|
|
|
| |
Years Ended December 31, |
| (in millions) |
2023 |
|
2022 |
|
2021 |
| Current: |
|
|
|
|
|
| Federal |
$ |
86.4 |
|
|
$ |
62.7 |
|
|
$ |
(12.7) |
|
| State |
1.5 |
|
|
51.9 |
|
|
5.6 |
|
| Non-U.S. |
357.4 |
|
|
770.4 |
|
|
386.9 |
|
| Total current |
445.3 |
|
|
885.0 |
|
|
379.8 |
|
| Noncurrent: |
|
|
|
|
|
| Federal |
$ |
0.3 |
|
|
$ |
0.2 |
|
|
$ |
— |
|
| State |
— |
|
|
— |
|
|
— |
|
| Non-U.S. |
(3.0) |
|
|
(0.7) |
|
|
110.0 |
|
| Total noncurrent |
(2.7) |
|
|
(0.5) |
|
|
110.0 |
|
| Deferred: |
|
|
|
|
|
| Federal |
$ |
(35.4) |
|
|
$ |
215.4 |
|
|
$ |
141.9 |
|
| State |
(4.2) |
|
|
31.0 |
|
|
21.4 |
|
| Non-U.S. |
(226.0) |
|
|
93.4 |
|
|
(55.4) |
|
| Total deferred |
(265.6) |
|
|
339.8 |
|
|
107.9 |
|
| Provision for income taxes |
$ |
177.0 |
|
|
$ |
1,224.3 |
|
|
$ |
597.7 |
|
The components of earnings from consolidated companies before income taxes, and the effects of significant adjustments to tax computed at the federal statutory rate, were as follows:
|
|
|
|
|
|
|
|
|
|
|
|
|
|
|
|
|
|
| |
Years Ended December 31, |
| (in millions) |
2023 |
|
2022 |
|
2021 |
| U.S. earnings (loss) |
$ |
121.6 |
|
|
$ |
1,587.8 |
|
|
$ |
900.1 |
|
| Non-U.S. earnings |
1,204.3 |
|
|
3,054.7 |
|
|
1,324.7 |
|
| Earnings (loss) from consolidated companies before income taxes |
$ |
1,325.9 |
|
|
$ |
4,642.5 |
|
|
$ |
2,224.8 |
|
| Computed tax at the U.S. federal statutory rate |
21.0 |
% |
|
21.0 |
% |
|
21.0 |
% |
| State and local income taxes, net of federal income tax benefit |
0.4 |
% |
|
1.1 |
% |
|
1.2 |
% |
| Percentage depletion in excess of basis |
(4.9) |
% |
|
(1.8) |
% |
|
(1.1) |
% |
| Impact of non-U.S. earnings |
8.7 |
% |
|
5.8 |
% |
|
6.3 |
% |
| Change in valuation allowance |
(1.7) |
% |
|
— |
% |
|
(0.3) |
% |
| Non-U.S. incentives |
(11.5) |
% |
|
(2.6) |
% |
|
(5.7) |
% |
| Withholding tax |
6.3 |
% |
|
1.6 |
% |
|
3.3 |
% |
| U.S. general basket foreign tax credits |
(4.0) |
% |
|
— |
% |
|
— |
% |
| Tax legislation change impacts |
(1.6) |
% |
|
— |
% |
|
— |
% |
| Undistributed earnings |
2.2 |
% |
|
— |
% |
|
— |
% |
| Other items (none in excess of 5% of computed tax) |
(1.6) |
% |
|
1.3 |
% |
|
2.2 |
% |
| Effective tax rate |
13.3 |
% |
|
26.4 |
% |
|
26.9 |
% |
2023 Effective Tax Rate
In the year ended December 31, 2023, there were two items impacting the effective tax rate: 1) items attributable to ordinary business operations during the year, and 2) other items specific to the period.
The tax impact of our ordinary business operations is affected by the mix of earnings across jurisdictions in which we operate, by a benefit associated with depletion, by a benefit associated with non-U.S. incentives, changes in valuation allowances, and by the impact of certain entities being taxed in both their foreign jurisdiction and the U.S., including foreign tax credits for various taxes incurred.
Tax expense specific to the period included a net benefit of $43.4 million. The net benefit relates to the following: $38.1 million related to true-up of estimates primarily related to our U.S. tax return, $24.4 million related to changes to valuation allowances in Brazil, and $11.6 million related to an increase in a U.S. deferred tax asset. The tax benefits are partially offset by a net tax cost of $29.3 million related to income tax expense on undistributed earnings, and $1.4 million of other miscellaneous costs.
2022 Effective Tax Rate
In the year ended December 31, 2022, there were two items impacting the effective tax rate: 1) items attributable to ordinary business operations during the year, and 2) other items specific to the period.
The tax impact of our ordinary business operations is affected by the mix of earnings across jurisdictions in which we operate, by a benefit associated with depletion, by a benefit associated with non-U.S. incentives, changes in valuation allowances, and by the impact of certain entities being taxed in both their foreign jurisdiction and the U.S., including foreign tax credits for various taxes incurred.
Tax expense specific to the period included a net expense of $26.2 million. The net expense relates to the following: $29.0 million related to true-up of estimates primarily related to our U.S. tax return, $4.8 million related to changes to valuation allowances in Brazil, $4.0 million related to interest of effectively settled unrecognized tax benefits and $1.2 million of other miscellaneous costs. The tax expenses are partially offset by a net tax benefit related to $12.8 million of RSUs vested in CY22 above grant price.
2021 Effective Tax Rate
In the year ended December 31, 2021, there were two items impacting the effective tax rate: 1) items attributable to ordinary business operations during the year, and 2) other items specific to the period, including the Esterhazy mine closure costs.
The tax impact of our ordinary business operations is affected by the mix of earnings across jurisdictions in which we operate, by a benefit associated with depletion, by a benefit associated with non-U.S. incentives, changes in valuation allowances, and by the impact of certain entities being taxed in both their foreign jurisdiction and the U.S., including foreign tax credits for various taxes incurred.
Tax expense specific to the period included a net benefit of $0.6 million. The net expense relates to the following: $23.9 million related to true-up of estimates primarily related to our U.S. tax return and $20.4 million related to an increase in non-U.S. reserves. The tax expenses are partially offset by net tax benefits related to $43.7 million of Esterhazy mine closure costs and $1.2 million related to a benefit for withholding taxes related to undistributed earnings and other miscellaneous tax expenses.
Deferred Tax Liabilities and Assets
Significant components of our deferred tax liabilities and assets were as follows as of December 31:
|
|
|
|
|
|
|
|
|
|
|
|
| |
December 31, |
| (in millions) |
2023 |
|
2022 |
| Deferred tax liabilities: |
|
|
|
| Depreciation and amortization |
$ |
490.2 |
|
|
$ |
430.5 |
|
| Depletion |
623.6 |
|
|
613.5 |
|
| Partnership tax basis differences |
69.7 |
|
|
59.3 |
|
| Undistributed earnings of non-U.S. subsidiaries |
29.3 |
|
|
— |
|
| Other liabilities |
97.0 |
|
|
37.6 |
|
| Total deferred tax liabilities |
$ |
1,309.8 |
|
|
$ |
1,140.9 |
|
| Deferred tax assets: |
|
|
|
|
|
|
|
| Capital loss carryforwards |
14.9 |
|
|
3.6 |
|
| Foreign tax credit carryforwards |
1,266.2 |
|
|
736.7 |
|
| Net operating loss carryforwards |
514.4 |
|
|
255.8 |
|
| Pension plans and other benefits |
17.8 |
|
|
14.3 |
|
| Asset retirement obligations |
452.1 |
|
|
369.4 |
|
| Disallowed interest expense under §163(j) |
11.5 |
|
|
— |
|
| Other assets |
468.6 |
|
|
413.2 |
|
| Subtotal |
2,745.5 |
|
|
1,793.0 |
|
| Valuation allowance |
1,421.9 |
|
|
909.9 |
|
| Net deferred tax assets |
1,323.6 |
|
|
883.1 |
|
| Net deferred tax assets/(liabilities) |
$ |
13.8 |
|
|
$ |
(257.8) |
|
We have certain non-U.S. entities that are taxed in both their local jurisdiction and the U.S. As a result, we have deferred tax balances for both jurisdictions. As of December 31, 2023 and 2022, these non-U.S. deferred taxes are offset by approximately $220.5 million and $202.2 million, respectively, of anticipated foreign tax credits included within our depreciation and depletion components of deferred tax liabilities above. We have recorded a valuation allowance against the anticipated foreign tax credits of $220.5 million and $202.2 million for December 31, 2023 and 2022, respectively.
Tax Carryforwards
As of December 31, 2023, we had estimated carryforwards for tax purposes as follows: net operating losses of $1.8 billion, capital losses of $63.6 million, foreign tax credits of $1.3 billion and $4.4 million of non-U.S. business credits. These carryforward benefits may be subject to limitations imposed by the Internal Revenue Code, and in certain cases, provisions of foreign law. Approximately $1.3 billion of our net operating loss carryforwards relate to Brazil and can be carried forward indefinitely but are limited to 30 percent of taxable income each year.
The majority of the remaining net operating loss carryforwards relate to U.S. federal and certain U.S. states and can be carried forward indefinitely. Of the $1.3 billion of foreign tax credits, approximately $219.2 million have an expiration date of 2026, approximately $19.6 million have an expiration date of 2029, approximately $14.7 million have an expiration date of 2030 and approximately $14.8 million have an expiration date of 2033. The realization of our foreign tax credit carryforwards is dependent on market conditions, tax law changes, and other business outcomes including our ability to generate certain types of taxable income in the future. Due to current business operations and future forecasts, the Company has determined that no valuation allowance is required on its general basket foreign tax credits. As a result of changes in U.S. tax law due to the Tax Cuts and Jobs Act, the Company recorded valuation allowances against its branch basket foreign tax credits of $986.1 million as of December 31, 2023.
As of December 31, 2023, we have not recognized a deferred tax liability for un-remitted earnings of approximately $4.3 billion from certain foreign operations because we believe our subsidiaries have invested the undistributed earnings indefinitely, or the earnings will be remitted in a tax-neutral transaction. It is not practicable for us to determine the amount of unrecognized deferred tax liability on these reinvested earnings. As part of the accounting for the Tax Cuts and Jobs Act, we recorded local country withholding taxes related to certain entities from which we began repatriating undistributed earnings and will continue to record local country withholding taxes, including foreign exchange impacts, on all future earnings.
Valuation Allowance
In assessing the need for a valuation allowance, we consider whether it is more likely than not that some portion or all of the deferred tax assets will not be realized. We evaluate our ability to realize the tax benefits associated with deferred tax assets by analyzing the relative impact of all the available positive and negative evidence regarding our forecasted taxable income using both historical and projected future operating results, the reversal of existing taxable temporary differences, taxable income in prior carry-back years (if permitted) and the availability of tax planning strategies. The ultimate realization of deferred tax assets is dependent upon the generation of certain types of future taxable income during the periods in which those temporary differences become deductible. In making this assessment, we consider the scheduled reversal of deferred tax liabilities, our ability to carry back the deferred tax asset, projected future taxable income, and tax planning strategies. A valuation allowance will be recorded in each jurisdiction in which a deferred income tax asset is recorded when it is more likely than not that the deferred income tax asset will not be realized. Changes in deferred tax asset valuation allowances typically impact income tax expense.
For the year ended December 31, 2023, the valuation allowance increased by $512.0 million, of which a $531.0 million increase related to changes in the valuation allowance to U.S. branch foreign tax credits, and a $0.2 million increase related to changes in valuation allowances in other foreign jurisdictions. These increases to the valuation allowance were partially offset by a decrease of $12.7 million related to changes in valuation allowances and currency translation in Brazil, and $6.5 million changes in valuation allowances in other foreign jurisdictions.
For the year ended December 31, 2022, the valuation allowance increased by $135.2 million, of which a $83.6 million increase related to changes in the valuation allowance to U.S. branch foreign tax credits, a $13.2 million increase related to changes in valuation allowances and currency translation in Brazil, and $46.8 million changes in valuation allowances in other foreign jurisdictions. These increases to the valuation allowance were partially offset by a decrease of $1.5 million to net operating losses for certain U.S. states, and $7.0 million changes in valuation allowances in other foreign jurisdictions.
For the year ended December 31, 2021, the valuation allowance increased by $91.7 million, of which a $111.2 million increase related to changes in the valuation allowance to U.S. branch foreign tax credits. These increases to the valuation allowance were partially offset by a decrease of $13.9 million related to changes in valuation allowances and currency translation in Brazil, $2.4 million decrease to net operating losses for certain U.S. states, and $3.4 million changes in valuation allowances in other foreign jurisdictions.
Changes to our income tax valuation allowance were as follows:
|
|
|
|
|
|
|
|
|
|
|
|
|
|
|
|
|
|
|
Years Ended December 31, |
| (in millions) |
2023 |
|
2022 |
|
2021 |
| Income tax valuation allowance, related to deferred income taxes |
|
|
|
|
|
| Balance at beginning of period |
$ |
909.9 |
|
|
$ |
774.7 |
|
|
$ |
683.0 |
|
| Charges or (reductions) to costs and expenses |
512.0 |
|
|
135.2 |
|
|
91.7 |
|
| Balance at end of period |
$ |
1,421.9 |
|
|
$ |
909.9 |
|
|
$ |
774.7 |
|
Uncertain Tax Positions
Accounting for uncertain income tax positions is determined by prescribing a minimum probability threshold that a tax position must meet before a financial statement benefit is recognized. This minimum threshold is that a tax position is more likely than not to be sustained upon examination by the applicable taxing authority, including resolution of any related appeals or litigation processes, based on the technical merits of the position. The tax benefit to be recognized is measured as the largest amount of benefit that is greater than a fifty percent likelihood of being realized upon ultimate settlement.
As of December 31, 2023, we had $25.8 million of gross uncertain tax positions. If recognized, the benefit to our effective tax rate in future periods would be approximately $22.6 million of that amount. During 2023, we recorded net increases in our uncertain tax positions of $0.5 million related to certain U.S. and non-U.S. tax matters, of which $3.0 million impacted the effective tax rate. This increase was offset by items not included in gross uncertain tax positions.
Based upon the information available as of December 31, 2023, it is reasonably possible that the amount of unrecognized tax benefits will change in the next twelve months; however, the change cannot reasonably be estimated.
A summary of gross unrecognized tax benefit activity is as follows:
|
|
|
|
|
|
|
|
|
|
|
|
|
|
|
|
|
|
| |
Years Ended December 31, |
| (in millions) |
2023 |
|
2022 |
|
2021 |
| Gross unrecognized tax benefits, beginning of period |
$ |
25.2 |
|
|
$ |
124.6 |
|
|
$ |
36.9 |
|
| Gross increases: |
|
|
|
|
|
| Prior period tax positions |
0.9 |
|
|
0.7 |
|
|
84.7 |
|
| Current period tax positions |
3.0 |
|
|
3.0 |
|
|
3.0 |
|
| Gross decreases: |
|
|
|
|
|
| Prior period tax positions |
(3.8) |
|
|
(99.7) |
|
|
— |
|
| Currency translation |
0.5 |
|
|
(3.4) |
|
|
— |
|
| Gross unrecognized tax benefits, end of period |
$ |
25.8 |
|
|
$ |
25.2 |
|
|
$ |
124.6 |
|
We recognize interest and penalties related to unrecognized tax benefits as a component of our income tax expense. Interest and penalties accrued in our Consolidated Balance Sheets as of December 31, 2023 and 2022 were $6.4 million and $5.0 million, respectively, and are included in other noncurrent liabilities in the Consolidated Balance Sheets.
Open Tax Periods
We operate in multiple tax jurisdictions, both within the U.S. and outside the U.S., and face audits from various tax authorities regarding transfer pricing, deductibility of certain expenses, and intercompany transactions, as well as other matters. With few exceptions, we are no longer subject to examination for tax years prior to 2017.
Mosaic is continually under audit by various tax authorities in the normal course of business. Such tax authorities may raise issues contrary to positions taken by the Company. If such positions are ultimately not sustained by the Company, this could result in material assessments to the Company. The costs related to defending, if needed, such positions on appeal or in court may be material. The Company believes that any issues considered are properly accounted for.
We are currently under audit by the Internal Revenue Service for the tax years ended December 31, 2018 and December 31, 2020. Based on the information available, we do not anticipate significant changes to our unrecognized tax benefits as a result of these examinations other than the amounts discussed above.
We are currently under audit by the Canada Revenue Agency for the tax year ended December 31, 2020. Based on the information available, we do not anticipate significant changes to our unrecognized tax benefits as a result of these examinations other than the amounts discussed above
14. ASSET RETIREMENT OBLIGATIONS
We recognize our estimated ARO’s in the period in which we have an existing legal obligation associated with the retirement of a tangible long-lived asset and the amount of the liability can be reasonably estimated. The ARO is recognized at fair value when the liability is incurred with a corresponding increase in the carrying amount of the related long lived asset. We depreciate the tangible asset over its estimated useful life. The liability is adjusted in subsequent periods through accretion expense which represents the increase in the present value of the liability due to the passage of time. Such depreciation and accretion expenses are included in cost of goods sold for operating facilities and other operating expense for indefinitely closed facilities.
Our legal obligations related to asset retirement require us to: (i) reclaim lands disturbed by mining as a condition to receive permits to mine phosphate ore reserves; (ii) treat low pH process water in Gypstacks to neutralize acidity; (iii) close and monitor Gypstacks at our Florida and Louisiana facilities at the end of their useful lives; (iv) remediate certain other conditional obligations; (v) remove all surface structures and equipment, plug and abandon mine shafts, contour and revegetate, as necessary, and monitor for five years after closing our Carlsbad, New Mexico facility; (vi) decommission facilities, manage tailings and execute site reclamation at our Saskatchewan potash mines at the end of their useful lives; (vii) decommission mines in Brazil and Peru; and (viii) decommission plant sites and closed Gypstacks in Brazil. The estimated liability for these legal obligations is based on the estimated cost to satisfy the above obligations which is discounted using a credit-adjusted risk-free rate.
A reconciliation of our AROs is as follows:
|
|
|
|
|
|
|
|
|
|
|
|
| |
Years Ended December 31, |
| (in millions) |
2023 |
|
2022 |
| AROs, beginning of period |
$ |
1,905.6 |
|
|
$ |
1,749.3 |
|
|
|
|
|
| Liabilities incurred |
22.9 |
|
|
14.9 |
|
| Liabilities settled |
(198.5) |
|
|
(205.6) |
|
| Accretion expense |
96.1 |
|
|
81.6 |
|
| Revisions in estimated cash flows |
365.1 |
|
|
264.5 |
|
| Foreign currency translation |
22.2 |
|
|
0.9 |
|
| AROs, end of period |
2,213.4 |
|
|
1,905.6 |
|
| Less current portion |
377.4 |
|
|
212.3 |
|
| Non-current portion of AROs |
$ |
1,836.0 |
|
|
$ |
1,693.3 |
|
North America Gypstack Closure Costs
A majority of our ARO relates to Gypstack Closure Costs in Florida and Louisiana. For financial reporting purposes, we recognize our estimated Gypstack Closure Costs at their present value. This present value determined for financial reporting purposes is reflected on our Consolidated Balance Sheets in accrued liabilities and other noncurrent liabilities. As of December 31, 2023 and 2022, the present value of our North American Gypstack Closure Costs ARO reflected in our Consolidated Balance Sheet was approximately $1.2 billion and $1.0 billion, respectively.
As discussed below, we have arrangements to provide financial assurance for the estimated Gypstack Closure Costs associated with our facilities in Florida and Louisiana.
EPA RCRA Initiative. On September 30, 2015, we and our subsidiary, Mosaic Fertilizer, LLC (“Mosaic Fertilizer”), reached agreements with the U.S. Environmental Protection Agency (“EPA”), the U.S. Department of Justice (“DOJ”), the Florida Department of Environmental Protection (“FDEP”) and the Louisiana Department of Environmental Quality on the terms of two consent decrees (collectively, the “2015 Consent Decrees”) to resolve claims relating to our management of certain waste materials onsite at our Riverview, New Wales, Green Bay, South Pierce and Bartow fertilizer manufacturing facilities in Florida and our Faustina and Uncle Sam facilities in Louisiana.
This followed a 2003 announcement by the EPA Office of Enforcement and Compliance Assurance that it would be targeting facilities in mineral processing industries, including phosphoric acid producers, for a thorough review under the U.S. Resource Conservation and Recovery Act (“RCRA”) and related state laws. As discussed below, a separate consent decree was previously entered into with the EPA and the FDEP with respect to RCRA compliance at the Plant City Facility that we acquired as part of our acquisition of the Florida phosphate assets and assumption of certain related liabilities of CF Industries, Inc. (“CF”).
The remaining monetary obligations under the 2015 Consent Decrees include a provision of additional financial assurance for the estimated Gypstack Closure Costs for Gypstacks at the covered facilities. The RCRA Trusts are discussed in Note 12 to our Consolidated Financial Statements. In addition, we have agreed to guarantee the difference between the amounts held in each RCRA Trust (including any earnings) and the estimated closure and long-term care costs.
As of December 31, 2023, the undiscounted amount of our Gypstack Closure Costs ARO associated with the facilities covered by the 2015 Consent Decrees, determined using the assumptions used for financial reporting purposes, was approximately $2.2 billion, and the present value of our Gypstack Closure Costs ARO reflected in our Consolidated Balance Sheet for those facilities was approximately $819.9 million.
Plant City and Bonnie Facilities. As part of the CF Phosphate Assets Acquisition, we assumed certain AROs related to Gypstack Closure Costs at both the Plant City Facility and a closed Florida phosphate concentrates facility in Bartow, Florida (the “Bonnie Facility”) that we acquired. Associated with these assets are two related financial assurance arrangements for which we became responsible and that provided sources of funds for the estimated Gypstack Closure Costs for these facilities. Pursuant to federal or state laws, the applicable government entities are permitted to draw against such amounts in the event we cannot perform such closure activities. One of the financial assurance arrangements was initially a trust (the “Plant City Trust”) established to meet the requirements under a consent decree with the EPA and the FDEP with respect to RCRA compliance at the Plant City Facility. The Plant City Trust also satisfied Florida financial assurance requirements at that site. Beginning in September 2016, as a substitute for the financial assurance provided through the Plant City Trust, we have provided financial assurance for the Plant City Facility in the form of a surety bond (the “Plant City Bond”). The amount of the Plant City Bond is $303.1 million, which reflects our closure cost estimates as of December 31, 2023. The other financial assurance arrangement was also a trust fund (the “Bonnie Facility Trust”) established to meet the requirements under Florida financial assurance regulations that apply to the Bonnie Facility. In July 2018, we received $21.0 million from the Bonnie Facility Trust by substituting for the trust fund a financial test mechanism (“Bonnie Financial Test”) supported by a corporate guarantee as allowed by state regulations. Both financial assurance funding obligations require estimates of future expenditures that could be impacted by refinements in scope, technological developments, new information, cost inflation, changes in regulations, discount rates and the timing of activities. Under our current approach to satisfying applicable requirements, additional financial assurance would be required in the future if increases in cost estimates exceed the face amount of the Plant City Bond or the amount supported by the Bonnie Financial Test.
As of December 31, 2023 and 2022, the aggregate amounts of AROs associated with the combined Plant City Facility and Bonnie Facility Gypstack Closure Costs included in our consolidated balance sheet were $361.8 million and $327.5 million, respectively. The aggregate amount represented by the Plant City Bond exceeds the present value of the aggregate amount of ARO associated with that facility. This is because the amount of financial assurance we are required to provide represents the aggregate undiscounted estimated amount to be paid by us in the normal course of our Phosphates business over a period that may not end until three decades or more after the Gypstack has been closed, whereas the ARO included in our Consolidated Balance Sheet reflects the discounted present value of those estimated amounts.
15. DERIVATIVE INSTRUMENTS AND HEDGING ACTIVITIES
We periodically enter into derivatives to mitigate our exposure to foreign currency risks, interest rate movements and the effects of changing commodity prices. We record all derivatives on the Consolidated Balance Sheets at fair value. The fair value of these instruments is determined by using quoted market prices, third-party comparables, or internal estimates. We net our derivative asset and liability positions when we have a master netting arrangement in place. Changes in the fair value of the foreign currency, commodity and freight derivatives are immediately recognized in earnings. As of December 31, 2023 and 2022, the gross asset position of our derivative instruments was $36.4 million and $38.8 million, respectively, and the gross liability position of our liability instruments was $17.2 million and $50.1 million, respectively.
We do not apply hedge accounting treatments to our foreign currency exchange contracts, commodities contracts, or freight contracts. Unrealized gains and (losses) on foreign currency exchange contracts used to hedge cash flows related to the production of our products are included in cost of goods sold in the Consolidated Statements of Earnings. Unrealized gains and (losses) on commodities contracts and certain forward freight agreements are also recorded in cost of goods sold in the Consolidated Statements of Earnings. Unrealized gains or (losses) on foreign currency exchange contracts used to hedge cash flows that are not related to the production of our products are included in the foreign currency transaction gain/(loss) caption in the Consolidated Statements of Earnings.
From time to time, we enter into fixed-to-floating interest rate contracts. We apply fair value hedge accounting treatment to these contracts. Under these arrangements, we agree to exchange, at specified intervals, the difference between fixed and floating interest amounts calculated by reference to an agreed-upon notional principal amount. The mark-to-market of these fair value hedges is recorded as gains or (losses) in interest expense. We had no fixed-to-floating interest rate swap agreements in effect as of December 31, 2023 and 2022.
The following is the total absolute notional volume associated with our outstanding derivative instruments:
|
|
|
|
|
|
|
|
|
|
|
|
|
|
|
|
|
|
|
|
|
|
|
|
|
|
|
| (in millions of Units) |
|
|
|
|
|
|
|
|
| Instrument |
|
Derivative Category |
|
Unit of Measure |
|
December 31,
2023 |
|
December 31,
2022 |
| Foreign currency derivatives |
|
Foreign Currency |
|
U.S. Dollars |
|
2,418.7 |
|
|
2,361.1 |
|
|
|
|
|
|
|
|
|
|
| Natural gas derivatives |
|
Commodity |
|
MM BTU |
|
17.1 |
|
|
14.2 |
|
Credit-Risk-Related Contingent Features
Certain of our derivative instruments contain provisions that are governed by International Swap and Derivatives Association agreements with the counterparties. These agreements contain provisions that allow us to settle for the net amount between payments and receipts, and also state that if our debt were to be rated below investment grade, certain counterparties to the derivative instruments could request full collateralization on derivative instruments in net liability positions. The aggregate fair value of all derivative instruments with credit-risk-related contingent features that were in a liability position as of December 31, 2023 and 2022 was $15.6 million and $34.8 million, respectively. We have no cash collateral posted in association with these contracts. If the credit-risk-related contingent features underlying these agreements were triggered on December 31, 2023, we would have been required to post an additional $8.7 million of collateral assets, which are either cash or U.S. Treasury instruments, to the counterparties.
Counterparty Credit Risk
We enter into foreign exchange, certain commodity and interest rate derivatives, primarily with a diversified group of highly rated counterparties. We continually monitor our positions and the credit ratings of the counterparties involved and limit the amount of credit exposure to any one party. While we may be exposed to potential losses due to the credit risk of non-performance by these counterparties, material losses are not anticipated. We closely monitor the credit risk associated with our counterparties and customers and to date have not experienced material losses.
16. FAIR VALUE MEASUREMENTS
Following is a summary of the valuation techniques for assets and liabilities recorded in our Consolidated Balance Sheets at fair value on a recurring basis:
Foreign Currency Derivatives–The foreign currency derivative instruments that we currently use are forward contracts and zero-cost collars, which typically expire within 18 months. Most of the valuations are adjusted by a forward yield curve or interest rates. In such cases, these derivative contracts are classified within Level 2. Some valuations are based on exchange-quoted prices, which are classified as Level 1. Changes in the fair market values of these contracts are recognized in the Consolidated Financial Statements as a component of cost of goods sold in our Corporate, Eliminations and Other segment or foreign currency transaction gain (loss). As of December 31, 2023 and 2022, the gross asset position of our foreign currency derivative instruments was $36.4 million and $20.7 million, respectively, and the gross liability position of our foreign currency derivative instruments was $8.0 million and $49.2 million, respectively.
Commodity Derivatives–The commodity contracts primarily relate to natural gas. The commodity derivative instruments that we currently use are forward purchase contracts, swaps and three-way collars. The natural gas contracts settle using NYMEX futures or AECO price indexes, which represent fair value at any given time.
The contracts’ maturities and settlements are scheduled for future months and settlements are scheduled to coincide with anticipated gas purchases during those future periods. Quoted market prices from NYMEX and AECO are used to determine the fair value of these instruments. These market prices are adjusted by a forward yield curve and are classified within Level 2. Changes in the fair market values of these contracts are recognized in the Consolidated Financial Statements as a component of cost of goods sold in our Corporate, Eliminations and Other segment. As of December 31, 2023 and 2022, the gross asset position of our commodity derivative instruments was zero and $18.1 million, respectively, and the gross liability position of our commodity derivative instruments was $9.2 million and $0.9 million, respectively.
Interest Rate Derivatives–We manage interest expense through interest rate contracts to convert a portion of our fixed-rate debt into floating-rate debt. From time to time, we also enter into interest rate swap agreements to hedge our exposure to changes in future interest rates related to anticipated debt issuances. Valuations are based on external pricing sources and are classified as Level 2. Changes in the fair market values of these contracts are recognized in the Consolidated Financial Statements as a component of interest expense. We did not hold any interest rate derivative positions as of December 31, 2023 or 2022.
Financial Instruments
The carrying amounts and estimated fair values of our financial instruments are as follows:
|
|
|
|
|
|
|
|
|
|
|
|
|
|
|
|
|
|
|
|
|
|
|
|
| |
December 31, |
| |
2023 |
|
2022 |
| |
Carrying |
|
Fair |
|
Carrying |
|
Fair |
| (in millions) |
Amount |
|
Value |
|
Amount |
|
Value |
| Cash and cash equivalents |
$ |
348.8 |
|
|
$ |
348.8 |
|
|
$ |
735.4 |
|
|
$ |
735.4 |
|
| Accounts receivable |
1,269.2 |
|
|
1,269.2 |
|
|
1,699.9 |
|
|
1,699.9 |
|
| Accounts payable |
1,166.9 |
|
|
1,166.9 |
|
|
1,292.5 |
|
|
1,292.5 |
|
| Structured accounts payable arrangements |
399.9 |
|
|
399.9 |
|
|
751.2 |
|
|
751.2 |
|
| Short-term debt |
399.7 |
|
|
399.7 |
|
|
224.9 |
|
|
224.9 |
|
| Long-term debt, including current portion |
3,361.7 |
|
|
3,364.1 |
|
|
3,397.2 |
|
|
3,276.5 |
|
For cash and cash equivalents, accounts receivable, net, accounts payable, structured accounts payable arrangements and short-term debt, the carrying amount approximates fair value because of the short-term maturity of those instruments. Included in long-term debt is floating rate debt of $500 million. Our floating rate debt is non-public and bears a variable SOFR based rate and consists of our borrowings under our term loan facility. The fair value of our floating rate debt approximates the carrying value and is estimated based on market-based inputs including interest rates and credit spreads, which results in a Level 2 classification. The fair value of fixed rate long-term debt, including the current portion, is estimated using quoted market prices for the publicly registered notes and debentures, classified as Level 1 and Level 2, respectively, within the fair value hierarchy, depending on the market liquidity of the debt. For information regarding the fair value of our marketable securities held in trusts, see Note 12 of our Notes to Consolidated Financial Statements.
17. GUARANTEES AND INDEMNITIES
We enter into various contracts that include indemnification and guarantee provisions as a routine part of our business activities. Examples of these contracts include asset purchase and sale agreements, surety bonds, financial assurances to regulatory agencies in connection with reclamation and closure obligations, commodity sale and purchase agreements, and other types of contractual agreements with vendors and other third parties. These agreements indemnify counterparties for matters such as reclamation and closure obligations, tax liabilities, environmental liabilities, litigation and other matters, as well as breaches by Mosaic of representations, warranties and covenants set forth in these agreements. In many cases, we are essentially guaranteeing our own performance, in which case the guarantees do not fall within the scope of the accounting and disclosures requirements under U.S. GAAP. Our maximum potential exposure under our indemnification arrangements can range from a specified dollar amount to an unlimited amount, depending on the nature of the transaction. Many of the guarantees and indemnities we issue to third parties do not limit the amount or duration of our obligations to perform under them. For these guarantees and indemnities, we may not be able to estimate what our liability would be until a claim is made for payment or performance due to the contingent nature of these arrangements.
Based on our current understanding of the relevant facts, we do not believe that we will be required to make any material payments under these indemnity provisions.
18. PENSION PLANS AND OTHER BENEFITS
We sponsor pension and postretirement benefits through a variety of plans, including defined benefit plans, defined contribution plans and postretirement benefit plans in North America and certain of our international locations. We reserve the right to amend, modify or terminate the Mosaic sponsored plans at any time, subject to provisions of the Employee Retirement Income Security Act of 1974 (“ERISA”), prior agreements and our collective bargaining agreements.
Defined Benefit
During fiscal 2022, we terminated the defined benefit pension plan in the U.S, which was frozen at the time of termination. In connection with the plan termination, we settled all future obligations under the terminated plan through a combination of lump-sum payments to eligible participants who elected to receive them through a lump-sum window, and the transfer of any remaining benefit obligations under the terminated plans to a third-party insurance company under a group annuity contract. As a result of these actions, we recognized a non-cash pre-tax pension settlement charge of $41.9 million in our 2022 Consolidated Statements of Earnings (Loss) in Other (expense) income. Upon completion of the remaining obligations related to the terminated plan, the remaining over-funded plan assets of $18.6 million as of December 31, 2023 will be utilized to fund obligations associated with other qualified retirement plans.
We sponsor various defined benefit pension plans in Canada. Benefits are based on different combinations of years of service and compensation levels, depending on the plan. Generally, contributions to Canadian plans are made in accordance with the Pension Benefits Act instituted by the province of Saskatchewan. Certain employees in Canada, whose pension benefits exceed Canada Revenue Agency limitations, are covered by supplementary non-qualified, unfunded pension plans. During fiscal 2023, we terminated certain defined pension plans in Canada by transferring remaining benefit obligations for participants to a third-party insurance company under a group annuity contract. As a result of these actions, we recognized a non-cash pre-tax settlement charge of $42.4 million in our 2023 Consolidated Statements of Earnings (Loss) in Other (expense) income.
We sponsor various defined benefit pension plans in Brazil, and we acquired multi-employer pension plans for certain of our Brazil associates. All our pension plans are governed by the Brazilian pension plans regulatory agency, National Superintendence of Supplementary Pensions. Our Brazil plans are not individually significant to the Company’s consolidated financial statements after factoring in the multi-employer pension plan indemnification that we acquired through an acquisition. We made contributions to these plans, net of indemnification, of $0.1 million and $0.2 million for the years ended December 31, 2023 and 2022, respectively.
Accounting for Pension Plans
The year-end status of the North American pension plans was as follows (the 2023 presentation excludes the terminated U.S. defined benefit plans, which had an ending benefit obligation of $0.0 million and $5.2 million as of December 31, 2023 and 2022, respectively, and ending plan assets of $18.6 million and $16.6 million as of December 31, 2023 and 2022, respectively):
|
|
|
|
|
|
|
|
|
|
|
|
| |
Pension Plans |
| |
Years Ended December 31, |
| (in millions) |
2023 |
|
2022 |
| Change in projected benefit obligation: |
|
|
|
| Benefit obligation at beginning of period |
$ |
294.3 |
|
|
$ |
739.6 |
|
| Service cost |
2.8 |
|
|
4.2 |
|
| Interest cost |
11.1 |
|
|
16.8 |
|
| Actuarial (gain) loss |
3.3 |
|
|
(158.8) |
|
| Currency fluctuations |
2.0 |
|
|
(19.0) |
|
| Benefits paid and transfers |
(190.4) |
|
|
(322.2) |
|
| Plan amendments |
5.8 |
|
|
— |
|
| Liability (gain)/loss due to curtailment/settlement |
(9.3) |
|
|
38.9 |
|
| Projected benefit obligation at end of period |
$ |
119.6 |
|
|
$ |
299.5 |
|
| Change in plan assets: |
|
|
|
| Fair value at beginning of period |
$ |
329.0 |
|
|
$ |
807.0 |
|
| Currency fluctuations |
2.9 |
|
|
(21.3) |
|
| Actual return |
11.4 |
|
|
(124.9) |
|
| Company contribution |
4.2 |
|
|
7.0 |
|
| Benefits paid and transfers |
(190.4) |
|
|
(322.2) |
|
| Fair value at end of period |
$ |
157.1 |
|
|
$ |
345.6 |
|
| Funded status of the plans as of the end of period |
$ |
37.5 |
|
|
$ |
46.1 |
|
| Amounts recognized in the consolidated balance sheets: |
|
|
|
| Noncurrent assets |
$ |
43.8 |
|
|
$ |
52.9 |
|
| Current liabilities |
(0.5) |
|
|
(0.5) |
|
| Noncurrent liabilities |
(5.8) |
|
|
(6.3) |
|
| Amounts recognized in accumulated other comprehensive (income) loss |
|
|
|
| Prior service cost |
$ |
15.1 |
|
|
$ |
10.9 |
|
| Actuarial loss |
20.0 |
|
|
67.2 |
|
The accumulated benefit obligation for the defined benefit pension plans was $119.6 million and $299.1 million as of December 31, 2023 and 2022, respectively. In 2024, we expect the related plans to pay benefit payments of approximately $3.9 million and to contribute cash of at least $0.8 million to the pension plans to meet minimum funding requirements.
Plan Assets and Investment Strategies
The Company’s overall investment strategy is to obtain sufficient return and provide adequate liquidity to meet the benefit obligations of our pension plans. The primary investment objective is to secure the promised pension benefits through capital preservation and appreciation to better manage the asset/liability gap and interest rate risk. A secondary investment objective is to most effectively manage investment volatility to reduce the variability of the Company’s required contributions. A significant amount of the assets are invested in funds that are managed by Mosaic’s investment advisor and reviewed by Mosaic management. Plan assets are primarily valued based on external pricing sources and are classified as Level 2. We do not have significant concentrations of credit risk or industry sectors within the plan assets. Fair value measurements of plan assets was $157.1 million at December 31, 2023 and was invested approximately 75% in fixed income securities, 20% in equity securities, and 5% in cash.
Defined Contribution Plans
Eligible salaried and non-union hourly employees in the U.S. participate in a defined contribution investment plan which permits employees to defer a portion of their compensation through payroll deductions and provides matching contributions. We match 100% of the first 3% of the participant’s contributed pay plus 50% of the next 3% of the participant’s contributed pay, subject to Internal Revenue Service limits. Participant contributions, matching contributions and the related earnings immediately vest. Mosaic also provides an annual non-elective employer contribution feature for eligible salaried and non-union hourly employees based on the employee’s age and eligible pay. Participants are generally vested in the non-elective employer contributions after three years of service. In addition, a discretionary feature of the plan allows the Company to make additional contributions to employees. Certain union employees participate in a defined contribution retirement plan based on collective bargaining agreements.
Canadian salaried and non-union hourly employees participate in an employer funded plan with employer contributions similar to the U.S. plan. The plan provides a profit sharing component which is paid each year. We also sponsor one mandatory union plan in Canada. Benefits in these plans vest after two years of consecutive service.
The expense attributable to defined contribution plans in the U.S. and Canada was $61.7 million, $55.7 million and $55.8 million for 2023, 2022 and 2021, respectively.
Postretirement Medical Benefit Plans
We provide certain health care benefit plans for certain retired employees (“Retiree Health Plans”) which may be either contributory or non-contributory and contain certain other cost-sharing features such as deductibles and coinsurance.
The North American Retiree Health Plans are unfunded and the projected benefit obligation was $22.8 million and $22.6 million as of December 31, 2023 and 2022, respectively. This liability should continue to decrease due to our limited exposure. The related income statement effects of the Retiree Health Plans are not material to the Company. We anticipate contributing cash of at least $2.2 million in 2024 to the postretirement medical benefit plans to fund anticipated benefit payments.
The year-end status of the Brazil postretirement medical benefit plans with a discount rate of 10.40% and 10.30% on each of December 31, 2023 and 2022, respectively was as follows:
|
|
|
|
|
|
|
|
|
|
|
|
|
Postretirement Medical Benefits |
|
Years Ended December 31, |
| (in millions) |
2023 |
|
2022 |
Change in accumulated postretirement benefit obligation (“APBO”): |
|
|
|
| APBO at beginning of year |
$ |
59.1 |
|
|
$ |
58.0 |
|
| Service cost |
0.1 |
|
|
0.1 |
|
| Interest cost |
6.2 |
|
|
5.8 |
|
| Actuarial (gain) loss |
4.8 |
|
|
(7.6) |
|
| Currency fluctuations |
5.4 |
|
|
3.8 |
|
| Benefits paid |
(1.2) |
|
|
(1.0) |
|
|
|
|
|
|
|
|
|
| APBO at end of year |
$ |
74.4 |
|
|
$ |
59.1 |
|
| Change in plan assets: |
|
|
|
|
|
|
|
|
|
|
|
|
|
|
|
| Company contribution |
$ |
1.2 |
|
|
$ |
1.0 |
|
| Benefits paid |
(1.2) |
|
|
(1.0) |
|
|
|
|
|
| Unfunded status of the plans as of the end of the year |
$ |
(74.4) |
|
|
$ |
(59.1) |
|
| Amounts recognized in the consolidated balance sheets: |
|
|
|
|
|
|
|
| Current liabilities |
$ |
(1.1) |
|
|
$ |
(1.2) |
|
| Noncurrent liabilities |
(73.3) |
|
|
(57.9) |
|
| Amounts recognized in accumulated other comprehensive income |
|
|
|
| Prior service credit |
$ |
(13.2) |
|
|
$ |
(14.1) |
|
| Actuarial loss |
$ |
11.9 |
|
|
$ |
6.6 |
|
19. ACCUMULATED OTHER COMPREHENSIVE INCOME (LOSS) (“AOCI”)
The following table sets forth the changes in AOCI by component during the years ended December 31, 2023, 2022 and 2021:
|
|
|
|
|
|
|
|
|
|
|
|
|
|
|
|
|
|
|
|
|
|
|
|
|
|
|
|
|
|
| (in millions) |
Foreign Currency Translation Gain (Loss) |
|
Net Actuarial Gain and Prior Service Cost |
|
Amortization of Gain on Interest Rate Swap |
|
Net Gain (Loss) on Marketable Securities Held in Trust |
|
Total |
| Balance at December 31, 2020 |
$ |
(1,719.1) |
|
|
$ |
(109.7) |
|
|
$ |
3.7 |
|
|
$ |
18.9 |
|
|
(1,806.2) |
|
| Other comprehensive income (loss) |
(117.0) |
|
|
56.5 |
|
|
2.0 |
|
|
(22.7) |
|
|
(81.2) |
|
| Tax (expense) or benefit |
8.8 |
|
|
(19.6) |
|
|
(0.5) |
|
|
5.1 |
|
|
(6.2) |
|
| Other comprehensive income (loss), net of tax |
(108.2) |
|
|
36.9 |
|
|
1.5 |
|
|
(17.6) |
|
|
(87.4) |
|
| Addback: loss attributable to noncontrolling interest |
1.8 |
|
|
— |
|
|
— |
|
|
— |
|
|
1.8 |
|
| Balance at December 31, 2021 |
$ |
(1,825.5) |
|
|
$ |
(72.8) |
|
|
$ |
5.2 |
|
|
$ |
1.3 |
|
|
$ |
(1,891.8) |
|
| Other comprehensive income (loss) |
(261.1) |
|
|
28.6 |
|
|
2.0 |
|
|
(32.4) |
|
|
(262.9) |
|
| Tax (expense) or benefit |
6.1 |
|
|
(8.9) |
|
|
(0.5) |
|
|
7.6 |
|
|
4.3 |
|
| Other comprehensive income (loss), net of tax |
(255.0) |
|
|
19.7 |
|
|
1.5 |
|
|
(24.8) |
|
|
(258.6) |
|
| Less: gain attributable to noncontrolling interest |
(1.8) |
|
|
— |
|
|
— |
|
|
— |
|
|
(1.8) |
|
| Balance at December 31, 2022 |
$ |
(2,082.3) |
|
|
$ |
(53.1) |
|
|
$ |
6.7 |
|
|
$ |
(23.5) |
|
|
$ |
(2,152.2) |
|
| Other comprehensive income (loss) |
152.0 |
|
|
31.1 |
|
|
1.8 |
|
|
30.6 |
|
|
215.5 |
|
| Tax (expense) or benefit |
2.1 |
|
|
(11.0) |
|
|
(0.4) |
|
|
(6.9) |
|
|
(16.2) |
|
| Other comprehensive income (loss), net of tax |
154.1 |
|
|
20.1 |
|
|
1.4 |
|
|
23.7 |
|
|
199.3 |
|
| Less: gain attributable to noncontrolling interest |
(2.0) |
|
|
— |
|
|
— |
|
|
— |
|
|
(2.0) |
|
| Balance at December 31, 2023 |
$ |
(1,930.2) |
|
|
$ |
(33.0) |
|
|
$ |
8.1 |
|
|
$ |
0.2 |
|
|
$ |
(1,954.9) |
|
20. SHARE REPURCHASES
In 2022, our Board of Directors approved two share repurchase programs (the “2022 Repurchase Programs”) for a total of $3.0 billion. Our repurchase programs allow the Company to repurchase shares of our Common Stock through open market purchases, accelerated share repurchase arrangements, privately negotiated transactions or otherwise and have no set expiration date.
On February 24, 2023, pursuant to existing stock repurchase authorizations, we entered into an accelerated share repurchase agreement (the “2023 ASR Agreement”) with a third-party financial institution to repurchase $300 million of our Common Stock. At inception, we paid the financial institution $300 million and took initial delivery of 4,659,290 shares of our Common Stock, representing an estimated 80% of the total shares expected to be delivered under the 2023 ASR Agreement. In March 2023, the transaction was completed and we received an additional 965,284 shares of Common Stock. In total, 5,624,574 shares were delivered under the 2023 ASR Agreement, at an average purchase price of $53.34 per share.
During the year ended December 31, 2023, under the 2022 Repurchase Programs, we repurchased 16,879,059 shares of Common Stock in the open market for approximately $748.0 million. This includes the 5,624,574 shares purchased under the 2023 ASR Agreement.
On February 24, 2022, pursuant to existing stock repurchase authorizations, we entered into an accelerated share repurchase (the “2022 ASR Agreement”) agreement with a third-party financial institution to repurchase $400 million of our Common Stock. At inception, we paid the financial institution $400 million and took initial delivery of 7,056,229 shares of our Common Stock. Under the terms of the 2022 ASR Agreement, upon settlement, we would either receive additional shares from the financial institution or be required to deliver additional shares or cash to the financial institution. In the second quarter of 2022, the 2022 ASR Agreement was completed and we paid the financial institution an additional $54.2 million. When combining the initial $400 million paid at the inception of the 2022 ASR Agreement and the cash settlement of $54.2 million at the termination of the 2022 ASR Agreement, we repurchased 7,056,229 shares at an average repurchase price of $64.37 per share.
During the year ended December 31, 2022, under the 2022 Repurchase Programs, we repurchased 30,810,173 shares of Common Stock in the open market for approximately $1.7 billion. This includes the 7,056,229 shares purchased under the 2022 ASR Agreement.
The extent to which we repurchase our shares and the timing of any such repurchases depend on a number of factors, including market and business conditions, the price of our shares, our ability to access capital resources, our liquidity and corporate, regulatory and other considerations.
21. SHARE-BASED PAYMENTS
The Mosaic Company 2023 Stock and Incentive Plan (the “2023 Stock and Incentive Plan”) was approved by our stockholders and became effective on May 25, 2023. It permits up to 18 million shares of common stock to be issued under share-based awards granted under this plan. The 2023 Stock and Incentive Plan provides for grants of stock options, restricted stock, restricted stock units, performance units and a variety of other share-based and non-share-based awards. Our employees, officers, directors, consultants, agents, advisors and independent contractors, as well as other designated individuals, are eligible to participate in the 2023 Stock and Incentive Plan.
The Mosaic Company 2014 Stock and Incentive Plan (the “2014 Stock and Incentive Plan”) was approved by our stockholders and became effective on May 15, 2014. It permits up to 25 million shares of common stock to be issued under share-based awards granted under this plan. The 2014 Stock and Incentive Plan provides for grants of stock options, restricted stock, restricted stock units, performance units and a variety of other share-based and non-share-based awards. Our employees, officers, directors, consultants, agents, advisors and independent contractors, as well as other designated individuals, are eligible to participate in the 2014 Stock and Incentive Plan.
The Mosaic Company 2004 Omnibus Stock and Incentive Plan (the “Omnibus Plan”), which was approved by our stockholders and became effective in 2004 and subsequently amended, provided for the grant of shares and share options to employees for up to 25 million shares of common stock. While awards may no longer be made under the Omnibus Plan, it will remain in effect with respect to the awards that had been granted thereunder prior to its termination.
Mosaic settles stock option exercises, restricted stock units and certain performance units and performance shares with newly issued common shares. The Compensation Committee of the Board of Directors administers the 2014 Stock and Incentive Plan and the Omnibus Plan subject to their respective provisions and applicable law.
Stock Options
Stock options are granted with an exercise price equal to the market price of our stock at the date of grant and have a ten-year contractual term. The fair value of each option award is estimated on the date of the grant using the Black-Scholes option valuation model. Stock options generally vest in equal annual installments in the first three years following the date of grant (graded vesting). Stock options are expensed on a straight-line basis over the required service period, based on the estimated fair value of the award on the date of grant, net of estimated forfeitures.
Valuation Assumptions
Assumptions used to calculate the fair value of stock options awarded in 2017 are noted in the following table. There were no stock options granted or issued in 2023, 2022 or 2021. Expected volatility is based on the simple average of implied and historical volatility using the daily closing prices of the Company’s stock for a period equal to the expected term of the option. The risk-free interest rate is based on the U.S. Treasury rate at the time of the grant for instruments of comparable life.
|
|
|
|
|
|
| |
Year Ended December 31, 2017 |
| Weighted average assumptions used in option valuations: |
|
| Expected volatility |
35.35 |
% |
| Expected dividend yield |
1.97 |
% |
| Expected term (in years) |
7 |
| Risk-free interest rate |
2.34 |
% |
A summary of the status of our stock options as of December 31, 2023, and activity during 2023, is as follows:
|
|
|
|
|
|
|
|
|
|
|
|
|
|
|
|
|
|
|
|
|
|
|
|
|
Shares
(in millions) |
|
Weighted
Average
Exercise
Price |
|
Weighted Average Remaining Contractual Term (Years) |
|
Aggregate
Intrinsic
Value |
| Outstanding as of December 31, 2022 |
0.6 |
|
|
$ |
36.12 |
|
|
|
|
|
| Granted |
— |
|
|
— |
|
|
|
|
|
| Exercised |
— |
|
|
$ |
— |
|
|
|
|
|
| Cancelled or forfeited |
— |
|
|
$ |
— |
|
|
|
|
|
| Outstanding as of December 31, 2023 |
0.6 |
|
|
$ |
34.46 |
|
|
2.11 |
|
$ |
2.8 |
|
| Exercisable as of December 31, 2023 |
0.6 |
|
|
$ |
34.46 |
|
|
2.11 |
|
$ |
2.8 |
|
The outstanding and exercisable options as of December 31, 2023 includes 534,126 options issued from the 2014 Stock and Incentive Plan and 62,090 options issued from the Omnibus Plan.
Restricted Stock Units
Restricted stock units are issued to various employees, officers and directors at a value equal to the market price of our stock at the date of grant. The fair value of restricted stock units is equal to the market price of our stock at the date of grant. Restricted stock units generally cliff vest after three years of continuous service and are expensed on a straight-line basis over the required service period, based on the estimated grant date fair value, net of estimated forfeitures.
A summary of the status of our restricted stock units as of December 31, 2023, and activity during 2023, is as follows:
|
|
|
|
|
|
|
|
|
|
|
|
|
Shares
(in millions) |
|
Weighted Average
Grant Date Fair
Value Per Share |
| Restricted stock units as of December 31, 2022 |
2.2 |
|
|
$ |
27.68 |
|
| Granted |
0.5 |
|
|
49.02 |
|
| Issued and cancelled or forfeited |
(1.2) |
|
|
$ |
17.73 |
|
| Restricted stock units as of December 31, 2023 |
1.5 |
|
|
$ |
42.70 |
|
Performance Units
During the years ended December 31, 2023, 2022 and 2021, 1,206,263, 540,915 and 717,952 total stockholder return (“TSR”) performance units were granted, respectively. Final performance units are awarded based on the increase or decrease, subject to certain limitations, in Mosaic’s share price from the grant date to the third anniversary of the award, plus dividends (a measure of total stockholder return or TSR). The beginning and ending stock prices are based on a 30 trading-day average stock price. Holders of the awards must be employed at the end of the performance period in order for any units to vest, except in the event of death, disability or retirement at or after age 60, certain changes in control or the exercise of Committee or Board discretion as provided in the related award agreements.
The fair value of each TSR performance unit is determined using a Monte Carlo simulation. This valuation methodology utilizes assumptions consistent with those of our other share-based awards and a range of ending stock prices; however, the expected term of the awards is three years, which impacts the assumptions used to calculate the fair value of performance units as shown in the table below. 354,500, 195,755 and 262,308 of the TSR performance awards issued in 2023, 2022 and 2021, respectively, are to be settled in cash, and are therefore accounted for as a liability with changes in value recorded through earnings during the service period. The remaining TSR performance units issued in 2023, 2022 and 2021 are considered equity-classified fixed awards measured at grant-date fair value and not subsequently re-measured. All of the TSR performance units cliff vest after three years of continuous service and are expensed on a straight-line basis over the required service period, based on the estimated grant date fair value of the award net of estimated forfeitures.
A summary of the assumptions used to estimate the fair value of TSR performance units is as follows:
|
|
|
|
|
|
|
|
|
|
|
|
|
|
|
|
|
|
|
Years Ended December 31, |
|
2023 |
|
2022 |
|
2021 |
| Performance units granted |
1,206,283 |
|
|
540,915 |
|
|
717,952 |
|
| Average fair value of performance units on grant date |
$ |
50.56 |
|
|
$ |
55.08 |
|
|
$ |
27.91 |
|
| Weighted average assumptions used in performance unit valuations: |
|
|
|
|
|
| Expected volatility |
48.33 |
% |
|
54.77 |
% |
|
58.26 |
% |
| Expected dividend yield |
1.52 |
% |
|
0.81 |
% |
|
0.68 |
% |
| Expected term (in years) |
3 |
|
3 |
|
3 |
| Risk-free interest rate |
4.52 |
% |
|
1.68 |
% |
|
0.32 |
% |
A summary of our performance unit activity during 2023 is as follows:
|
|
|
|
|
|
|
|
|
|
|
|
|
Shares
(in millions) |
|
Weighted Average
Grant Date Fair
Value Per Share |
| Outstanding as of December 31, 2022 |
2.6 |
|
|
$ |
21.89 |
|
| Granted |
1.2 |
|
|
50.56 |
|
| Issued and cancelled or forfeited |
(2.5) |
|
|
$ |
13.30 |
|
| Outstanding as of December 31, 2023 |
1.3 |
|
|
$ |
39.86 |
|
The outstanding performance units as of December 31, 2023 and 2022 include 500,393 and 791,624 cash-settled performance units, respectively.
Share-Based Compensation Expense
We recorded share-based compensation expense of $37.8 million, $61.1 million and $63.5 million for 2023, 2022 and 2021, respectively. The tax benefit related to share exercises and lapses in the year was $9.0 million, $7.5 million and $6.5 million for 2023, 2022 and 2021, respectively.
As of December 31, 2023, there was $17.0 million of total unrecognized compensation cost related to options, restricted stock units and performance units and shares granted under the 2014 Stock and Incentive Plan and the Omnibus Plan. The unrecognized compensation cost is expected to be recognized over a weighted-average period of one year. No options vested in 2023, 2022 and 2021.
We received $16.0 million from exercises of share-based payment arrangements for 2022. There was no cash received from exercises of share-based payment arrangements for 2023 and 2021. We incurred a tax benefit for tax deductions from options of $7.9 million, $13.4 million and $14.0 million in 2023, 2022 and 2021, respectively.
22. COMMITMENTS
We lease certain plants, warehouses, terminals, office facilities, railcars and various types of equipment under operating leases, some of which include rent payment escalation clauses, with lease terms ranging from one to 43 years. In addition to minimum lease payments, some of our office facility leases require payment of our proportionate share of real estate taxes and building operating expenses. Our future obligations under these leases are included in Note 4 of our Notes to Consolidated Financial Statements.
We also have purchase obligations to purchase goods and services, primarily for raw materials used in products sold to customers. In 2013, we entered into an ammonia supply agreement with CF that commenced in 2017, under which Mosaic agreed to purchase approximately 545,000 to 725,000 tonnes of ammonia per year at a price tied to the prevailing price of U.S. natural gas. On October 14, 2022, we received notice from CF to exercise the bilateral, contractual right to end the ammonia supply agreement in its current form, effective January 1, 2025.
We have long-term agreements for the purchase of sulfur, which is used in the production of phosphoric acid, and natural gas, which is a significant raw material used primarily in the solution mining process in our Potash segment as well as in our phosphate concentrates plants.
A schedule of future minimum long-term purchase commitments, based on expected market prices as of December 31, 2023 is as follows:
|
|
|
|
|
|
| (in millions) |
Purchase
Commitments |
| 2024 |
$ |
3,002.9 |
|
| 2025 |
618.9 |
|
| 2026 |
289.5 |
|
| 2027 |
84.4 |
|
| 2028 |
41.4 |
|
| Subsequent years |
54.7 |
|
|
$ |
4,091.8 |
|
Purchases made under long-term commitments were $3.0 billion in 2023, $4.6 billion in 2022, and $3.1 billion in 2021.
Most of our export sales of potash crop nutrients are marketed through a North American export association, Canpotex, which may fund its operations in part through third-party financing facilities. As a member, Mosaic or our subsidiaries are contractually obligated to reimburse Canpotex for their pro rata share of any operating expenses or other liabilities incurred. The reimbursements are made through reductions to members’ cash receipts from Canpotex.
We incur liabilities for reclamation activities and Gypstack closures in our Florida and Louisiana operations where, in order to obtain necessary permits, we must either pass a test of financial strength or provide credit support, typically in the form of cash deposits, surety bonds or letters of credit. The surety bonds generally expire within one year or less but a substantial portion of these instruments provide financial assurance for continuing obligations and, therefore, in most cases, must be renewed on an annual basis. As of December 31, 2023, we had $765.9 million in surety bonds outstanding, of which $409.3 million is for reclamation obligations, primarily related to mining in Florida. In addition, included in the total amount is $303.1 million, reflecting our updated closure cost estimates, delivered to the EPA as a substitute for the financial assurance provided through the Plant City Trust. The remaining balance in surety bonds outstanding of $53.5 million is for other matters.
23. CONTINGENCIES
We have described below the material judicial and administrative proceedings to which we are subject.
Environmental Matters
We have contingent environmental liabilities that arise principally from three sources: (i) facilities currently or formerly owned by our subsidiaries or their predecessors; (ii) facilities adjacent to currently or formerly owned facilities; and (iii) third-party Superfund or state equivalent sites. At facilities currently or formerly owned by our subsidiaries or their predecessors, the historical use and handling of regulated chemical substances, crop and animal nutrients and additives and by-product or process tailings have resulted in soil, surface water and/or groundwater contamination. Spills or other releases of regulated substances, subsidence from mining operations and other incidents arising out of operations, including accidents, have occurred previously at these facilities, and potentially could occur in the future, possibly requiring us to undertake or fund cleanup or result in monetary damage awards, fines, penalties, other liabilities, injunctions or other court or administrative rulings. In some instances, pursuant to consent orders or agreements with governmental agencies, we are undertaking certain remedial actions or investigations to determine whether remedial action may be required to address contamination. At other locations, we have entered into consent orders or agreements with appropriate governmental agencies to perform required remedial activities that will address identified site conditions. Taking into consideration established accruals of approximately $203.2 million and $185.5 million, as of December 31, 2023 and 2022, respectively, expenditures for these known conditions currently are not expected, individually or in the aggregate, to have a material effect on our business or financial condition. However, material expenditures could be required in the future to remediate the contamination at known sites or at other current or former sites or as a result of other environmental, health and safety matters. Below is a discussion of certain environmental matters.
New Wales Phase II East Stack. In April 2022, we confirmed the presence of a cavity in and liner tear beneath the southern part of the active phosphogypsum stack at the Company’s New Wales facility in Florida which resulted in process water draining beneath the stack. The circumstances were reported to the FDEP and the EPA. Phase I of the repairs, consisting of stabilizing the cavity by depositing low pressure grout into it began in July 2022 and now is complete. Phase II will then inject high pressure grout beneath the stack to restore the geological confining layer beneath it. That work began in early in 2023 and is expected to conclude in the first quarter of 2024.
As of December 31, 2023, we have a reserve of $32.3 million for the estimated repairs. We are unable to estimate at this time potential future additional financial impacts or a range of loss, if any, due to the ongoing evaluation.
New Wales Phase II West Stack. In October 2023, we observed a series of seismic acoustic emissions and changes to piezometric water levels in a part of the Phase II West phosphogypsum stack at the New Wales, FL facility. These observations may be an indication of a breach in the stack liner system and were reported to the FDEP and EPA. We are developing and then will execute an investigation plan to evaluate conditions in the stack. The area of the stack is not in use for either process water storage or additional gypsum placement. It lies within a zone of capture of a recovery groundwater well, which is operating as intended. No offsite impacts are known or expected.
As of December 31, 2023, we have a reserve of $59.4 million for estimated repairs. We are unable to estimate at this time potential future additional financial impacts or a range of loss, if any, due to the ongoing evaluation.
EPA RCRA Initiative. We have certain financial assurance and other obligations under consent decrees and a separate financial assurance arrangement relating to our facilities in Florida and Louisiana. These obligations are discussed in Note 14 of our Notes to Consolidated Financial Statements.
Other Environmental Matters. Superfund and equivalent state statutes impose liability without regard to fault or to the legality of a party’s conduct on certain categories of persons who are considered to have contributed to the release of “hazardous substances” into the environment. Under Superfund, or its various state analogues, one party may, under certain circumstances, be required to bear more than its proportionate share of cleanup costs at a site where it has liability if payments cannot be obtained from other responsible parties. Currently, certain of our subsidiaries are involved or concluding involvement at several Superfund or equivalent state sites. Our remedial liability from these sites, alone or in the aggregate, currently is not expected to have a material effect on our business or financial condition. As more information is obtained regarding these sites and the potentially responsible parties involved, this expectation could change.
We believe that, pursuant to several indemnification agreements, our subsidiaries are entitled to at least partial, and in many instances complete, indemnification for the costs that may be expended by us or our subsidiaries to remedy environmental issues at certain facilities. These agreements address issues that resulted from activities occurring prior to our acquisition of facilities or businesses from parties including, but not limited to: ARCO (BP); Beatrice Fund for Environmental Liabilities; Conoco; Conserv; Estech, Inc.; Kaiser Aluminum & Chemical Corporation; Kerr-McGee Inc.; PPG Industries, Inc.; The Williams Companies; CF; and certain other private parties. Our subsidiaries have already received and anticipate receiving amounts pursuant to the indemnification agreements for certain of their expenses incurred to date as well as future anticipated expenditures. We record potential indemnifications as an offset to the established accruals when they are realizable or realized. The failure of an indemnitor to fulfill its obligations could result in future costs that could be material.
Louisiana Parishes Coastal Zone Cases
Several Louisiana parishes and the City of New Orleans have filed lawsuits against hundreds of oil and gas companies seeking regulatory, restoration and compensatory damages in connection with historical oil, gas and sulfur mining and transportation operations in the coastal zone of Louisiana. Mosaic is the corporate successor to certain companies which performed these types of operations in the coastal zone of Louisiana. Mosaic has been named in two of the lawsuits filed to date. In addition, in several other cases, historical oil, gas and sulfur operations which may have been related to Mosaic’s corporate predecessors have been identified in the complaints. Based upon information known to date, Mosaic has contractual indemnification rights against third parties for any loss or liability arising out of these claims pursuant to indemnification agreements entered into by Mosaic’s corporate predecessor(s) with third parties. There may also be insurance contracts which may respond to some or all of the claims. However, the financial ability of the third-party indemnitors, the extent of potential insurance coverage and the extent of potential liability from these claims is currently unknown.
As of October 2022, a memorandum of understanding has been executed by the State of Louisiana and the plaintiff parishes that filed claims against Mosaic and its corporate predecessors on one hand, and Mosaic Global Holdings, Inc. and its third-party indemnitors on the other hand which, when fully implemented, will release and dismiss Mosaic and its corporate predecessors from the coastal zone cases.
Funding obligations in the memorandum of understanding are expected to be undertaken by third-party indemnitors and/or insurers.
Brazil Legal Contingencies
Our Brazilian subsidiaries are engaged in a number of judicial and administrative proceedings regarding labor, environmental, mining and civil claims that allege aggregate damages and/or fines of approximately $738.2 million. We estimate that our probable aggregate loss with respect to these claims is approximately $80.6 million, which is included in our accrued liabilities in our Consolidated Balance Sheets at December 31, 2023. Approximately $529.3 million of the maximum potential loss above, relates to labor claims of which approximately $67.0 million is included in accrued liabilities in our Consolidated Balance Sheets at December 31, 2023.
Based on Brazil legislation and the current status of similar labor cases involving unrelated companies, we believe we have recorded adequate loss contingency reserves sufficient to cover our estimate of probable losses. If the status of similar cases involving unrelated companies were to adversely change in the future, our maximum exposure could increase and additional accruals could be required.
Brazil Tax Contingencies
Our Brazilian subsidiaries are engaged in a number of judicial and administrative proceedings relating to various non-income tax matters. We estimate that our maximum potential liability with respect to these matters is approximately $608.9 million, of which $168.7 million is subject to an indemnification agreement entered into with Vale S.A in connection with an acquisition.
Approximately $383.0 million of the maximum potential liability relates to a Brazilian federal value added tax, PIS and COFINS, and tax credit cases, while the majority of the remaining amount relates to various other non-income tax cases. The maximum potential liability can increase with new audits. Based on Brazil legislation and the current status of similar tax cases involving unrelated taxpayers, we believe we have recorded adequate loss contingency reserves sufficient to cover our estimate of probable losses, which are immaterial. If the status of similar tax cases involving unrelated taxpayer changes in the future, additional accruals could be required.
Other Claims
We also have certain other contingent liabilities with respect to judicial, administrative and arbitration proceedings and claims of third parties, including tax matters, arising in the ordinary course of business. We do not believe that any of these contingent liabilities will have a material adverse impact on our business or financial condition, results of operations, and cash flows.
24. RELATED PARTY TRANSACTIONS
We enter into transactions and agreements with certain of our non-consolidated companies and other related parties from time to time. As of December 31, 2023 and 2022, the net amount due to our non-consolidated companies totaled $0.8 million and $56.8 million, respectively.
The Consolidated Statements of Earnings included the following transactions with our non-consolidated companies:
|
|
|
|
|
|
|
|
|
|
|
|
|
|
|
|
|
|
|
|
|
| |
|
Years Ended December 31, |
| (in millions) |
|
2023 |
|
2022 |
|
2021 |
| Transactions with non-consolidated companies included in net sales |
|
$ |
1,321.0 |
|
|
$ |
3,015.3 |
|
|
$ |
1,120.9 |
|
| Transactions with non-consolidated companies included in cost of goods sold |
|
$ |
1,465.2 |
|
|
$ |
3,245.2 |
|
|
$ |
1,483.8 |
|
As part of the MWSPC joint venture, we market approximately 25% of the MWSPC production, for which approximately $17.5 million, $23.1 million and $12.2 million is included in revenue for the years ended December 31, 2023, 2022 and 2021, respectively.
25. BUSINESS SEGMENTS
The reportable segments are determined by management based upon factors such as products and services, production processes, technologies, market dynamics, and for which segment financial information is available for our chief operating decision maker.
For a description of our business segments see Note 1 of our Notes to Consolidated Financial Statements. We evaluate performance based on the operating earnings of the respective business segments, which includes certain allocations of corporate selling, general and administrative expenses. The segment results may not represent the actual results that would be expected if they were independent, stand-alone businesses. Intersegment eliminations, including profit on intersegment sales, mark-to-market gains/losses on derivatives, debt expenses, and the results of the China and India distribution business are included within Corporate, Eliminations and Other. Certain selling, general and administrative costs that are not controllable by the business segments are included within Corporate, Eliminations and Other.
Segment information for the years 2023, 2022 and 2021 is as follows:
|
|
|
|
|
|
|
|
|
|
|
|
|
|
|
|
|
|
|
|
|
|
|
|
|
|
|
|
|
|
|
|
|
| (in millions) |
|
Phosphates |
|
Potash |
|
Mosaic Fertilizantes |
|
Corporate,
Eliminations
and Other (a)
|
|
Total |
| Year Ended December 31, 2023 |
|
|
|
|
|
|
|
|
|
|
| Net sales to external customers |
|
$ |
3,894.5 |
|
|
$ |
3,203.1 |
|
|
$ |
5,684.7 |
|
|
$ |
913.8 |
|
|
$ |
13,696.1 |
|
| Intersegment net sales |
|
829.8 |
|
|
30.5 |
|
|
— |
|
|
(860.3) |
|
|
— |
|
| Net sales |
|
4,724.3 |
|
|
3,233.6 |
|
|
5,684.7 |
|
|
53.5 |
|
|
13,696.1 |
|
| Gross margin |
|
702.1 |
|
|
1,215.0 |
|
|
211.6 |
|
|
81.9 |
|
|
2,210.6 |
|
| Canadian resource taxes |
|
— |
|
|
403.4 |
|
|
— |
|
|
— |
|
|
403.4 |
|
| Gross margin (excluding Canadian resource taxes) |
|
702.1 |
|
|
1,618.4 |
|
|
211.6 |
|
|
81.9 |
|
|
2,614.0 |
|
|
|
|
|
|
|
|
|
|
|
|
| Operating earnings |
|
375.7 |
|
|
1,151.5 |
|
|
74.5 |
|
|
(263.6) |
|
|
1,338.1 |
|
| Capital expenditures |
|
625.9 |
|
|
357.4 |
|
|
336.3 |
|
|
82.8 |
|
|
1,402.4 |
|
| Depreciation, depletion and amortization expense |
|
485.7 |
|
|
299.0 |
|
|
165.5 |
|
|
10.4 |
|
|
960.6 |
|
| Equity in net earnings of nonconsolidated companies |
|
56.4 |
|
|
— |
|
|
— |
|
|
3.9 |
|
|
60.3 |
|
| Year Ended December 31, 2022 |
|
|
|
|
|
|
|
|
|
|
| Net sales to external customers |
|
$ |
4,546.4 |
|
|
$ |
5,122.8 |
|
|
$ |
8,287.2 |
|
|
$ |
1,168.8 |
|
|
$ |
19,125.2 |
|
| Intersegment net sales |
|
1,637.8 |
|
|
85.7 |
|
|
— |
|
|
(1,723.5) |
|
|
— |
|
| Net sales |
|
6,184.2 |
|
|
5,208.5 |
|
|
8,287.2 |
|
|
(554.7) |
|
|
19,125.2 |
|
| Gross margin |
|
1,759.0 |
|
|
2,843.0 |
|
|
1,045.6 |
|
|
108.2 |
|
|
5,755.8 |
|
| Canadian resource taxes |
|
— |
|
|
927.9 |
|
|
— |
|
|
— |
|
|
927.9 |
|
| Gross margin (excluding Canadian resource taxes) |
|
1,759.0 |
|
|
3,770.9 |
|
|
1,045.6 |
|
|
108.2 |
|
|
6,683.7 |
|
|
|
|
|
|
|
|
|
|
|
|
| Operating earnings |
|
1,347.2 |
|
|
2,767.7 |
|
|
910.4 |
|
|
(240.0) |
|
|
4,785.3 |
|
| Capital expenditures |
|
631.8 |
|
|
281.6 |
|
|
306.4 |
|
|
27.5 |
|
|
1,247.3 |
|
| Depreciation, depletion and amortization expense |
|
485.1 |
|
|
307.3 |
|
|
125.5 |
|
|
16.0 |
|
|
933.9 |
|
| Equity in net earnings of nonconsolidated companies |
|
192.4 |
|
|
— |
|
|
— |
|
|
3.6 |
|
|
196.0 |
|
| Year Ended December 31, 2021 |
|
|
|
|
|
|
|
|
|
|
| Net sales to external customers |
|
$ |
3,889.7 |
|
|
$ |
2,587.9 |
|
|
$ |
5,088.5 |
|
|
$ |
791.3 |
|
|
$ |
12,357.4 |
|
| Intersegment net sales |
|
1,033.2 |
|
|
38.9 |
|
|
— |
|
|
(1,072.1) |
|
|
— |
|
| Net sales |
|
4,922.9 |
|
|
2,626.8 |
|
|
5,088.5 |
|
|
(280.8) |
|
|
12,357.4 |
|
| Gross margin |
|
1,305.4 |
|
|
1,057.5 |
|
|
842.7 |
|
|
(5.3) |
|
|
3,200.3 |
|
| Canadian resource taxes |
|
— |
|
|
259.5 |
|
|
— |
|
|
— |
|
|
259.5 |
|
| Gross margin (excluding Canadian resource taxes) |
|
1,305.4 |
|
|
1,317.0 |
|
|
842.7 |
|
|
(5.3) |
|
|
3,459.8 |
|
| Impairment, restructuring and other expenses |
|
— |
|
|
158.1 |
|
|
— |
|
|
— |
|
|
158.1 |
|
| Operating earnings |
|
1,179.8 |
|
|
836.6 |
|
|
745.9 |
|
|
(293.8) |
|
|
2,468.5 |
|
| Capital expenditures |
|
649.9 |
|
|
410.1 |
|
|
216.1 |
|
|
12.5 |
|
|
1,288.6 |
|
| Depreciation, depletion and amortization expense |
|
428.7 |
|
|
267.8 |
|
|
101.2 |
|
|
15.2 |
|
|
812.9 |
|
| Equity in net earnings of nonconsolidated companies |
|
5.4 |
|
|
— |
|
|
— |
|
|
2.4 |
|
|
7.8 |
|
| Total assets as of December 31, 2023 |
|
$ |
10,295.9 |
|
|
$ |
8,971.9 |
|
|
$ |
5,256.3 |
|
|
$ |
(1,491.3) |
|
|
$ |
23,032.8 |
|
| Total assets as of December 31, 2022 |
|
9,570.5 |
|
|
9,582.2 |
|
|
5,562.7 |
|
|
(1,329.4) |
|
|
23,386.0 |
|
| Total assets as of December 31, 2021 |
|
8,776.4 |
|
|
8,312.8 |
|
|
4,908.2 |
|
|
39.0 |
|
|
22,036.4 |
|
______________________________
(a)The “Corporate, Eliminations and Other” category includes the results of our ancillary distribution operations in India and China. For the years ended December 31, 2023, 2022 and 2021, distribution operations in India and China had revenues of $898.9 million, $1.1 billion, and $730.1 million, respectively, and gross margins of $(16.8) million, $130.9 million, and $141.6 million, respectively.
Financial information relating to our operations by geographic area is as follows:
|
|
|
|
|
|
|
|
|
|
|
|
|
|
|
|
|
|
|
Years Ended December 31, |
| (in millions) |
2023 |
|
2022 |
|
2021 |
Net sales(a): |
|
|
|
|
|
| Brazil |
$ |
5,480.9 |
|
|
$ |
8,045.5 |
|
|
$ |
5,002.2 |
|
Canpotex(b) |
1,275.7 |
|
|
2,961.6 |
|
|
1,089.6 |
|
| China |
556.1 |
|
|
648.2 |
|
|
396.0 |
|
| Canada |
411.6 |
|
|
966.0 |
|
|
794.9 |
|
| India |
350.8 |
|
|
512.5 |
|
|
340.3 |
|
| Paraguay |
222.8 |
|
|
227.1 |
|
|
113.8 |
|
| Japan |
157.7 |
|
|
162.0 |
|
|
112.4 |
|
| Mexico |
125.5 |
|
|
165.5 |
|
|
93.6 |
|
| Colombia |
103.2 |
|
|
125.9 |
|
|
135.1 |
|
| Peru |
77.5 |
|
|
70.2 |
|
|
40.0 |
|
| Argentina |
75.2 |
|
|
224.6 |
|
|
101.3 |
|
| Australia |
69.0 |
|
|
101.6 |
|
|
64.8 |
|
| Honduras |
30.0 |
|
|
31.2 |
|
|
22.3 |
|
| Dominican Republic |
16.7 |
|
|
34.1 |
|
|
29.8 |
|
| Thailand |
8.4 |
|
|
6.3 |
|
|
18.1 |
|
| Other |
55.9 |
|
|
100.8 |
|
|
73.9 |
|
| Total international countries |
9,017.0 |
|
|
14,383.1 |
|
|
8,428.1 |
|
| United States |
4,679.1 |
|
|
4,742.1 |
|
|
3,929.3 |
|
| Consolidated |
$ |
13,696.1 |
|
|
$ |
19,125.2 |
|
|
$ |
12,357.4 |
|
______________________________
(a)Revenues are attributed to countries based on location of customer.
(b)Canpotex sales to the ultimate third-party customers are approximately: 35% to customers based in Brazil, 12% to customers based in China, 9% to customers based in Bangladesh, 7% to customers based in India, and 37% to customers based in the rest of the world.
|
|
|
|
|
|
|
|
|
|
|
|
|
|
|
|
|
December 31, |
| (in millions) |
|
2023 |
|
2022 |
| Long-lived assets: |
|
|
|
|
| Canada |
|
$ |
4,876.1 |
|
|
$ |
4,716.2 |
|
| Brazil |
|
2,467.8 |
|
|
2,153.5 |
|
| Other |
|
1,521.3 |
|
|
1,432.5 |
|
| Total international countries |
|
8,865.2 |
|
|
8,302.2 |
|
| United States |
|
7,204.8 |
|
|
6,658.6 |
|
| Consolidated |
|
$ |
16,070.0 |
|
|
$ |
14,960.8 |
|
Excluded from the table above as of December 31, 2023 and 2022, are goodwill of $1,138.6 million and $1,116.3 million and deferred income tax assets of $1,079.2 million and $752.3 million, respectively.
Net sales by product type for the years 2023, 2022 and 2021 are as follows:
|
|
|
|
|
|
|
|
|
|
|
|
|
|
|
|
|
|
|
Years Ended December 31, |
| (in millions) |
2023 |
|
2022 |
|
2021 |
| Sales by product type: |
|
|
|
|
|
| Phosphate Crop Nutrients |
$ |
3,277.5 |
|
|
$ |
4,465.0 |
|
|
$ |
3,552.7 |
|
| Potash Crop Nutrients |
4,107.7 |
|
|
6,484.1 |
|
|
3,367.9 |
|
| Crop Nutrient Blends |
2,107.4 |
|
|
2,970.0 |
|
|
1,800.0 |
|
Performance Products(a) |
2,453.3 |
|
|
3,025.8 |
|
|
1,973.6 |
|
| Phosphate Rock |
125.9 |
|
|
125.9 |
|
|
75.5 |
|
Other(b) |
1,624.3 |
|
|
2,054.4 |
|
|
1,587.7 |
|
|
$ |
13,696.1 |
|
|
$ |
19,125.2 |
|
|
$ |
12,357.4 |
|
______________________________
(a)Includes sales of MicroEssentials®, K-Mag® and Aspire®.
(b)Includes sales of industrial potash, feed products, nitrogen and other products.
26. MINE CLOSURE COSTS
Due to increased brine inflows, on June 4, 2021, the Company made the decision to accelerate the timing of the shutdown of our K1 and K2 mine shafts at our Esterhazy, Saskatchewan potash mine. Closing the K1 and K2 shafts are key pieces of the transition to the K3 shaft, but the timeline for the closure was accelerated by approximately nine months. In 2021, we had pre-tax costs of $158.1 million related to the permanent closure of these facilities. These costs consisted of $109.9 million related to the write-off of fixed assets, $37.1 million related to AROs, and $11.1 million related to inventory and other reserves.
Management’s Report on Internal Control Over Financial Reporting
The Company’s management is responsible for establishing and maintaining effective internal control over financial reporting, as defined in Rule 13a-15(f) under the Securities Exchange Act of 1934. The Company’s internal control system is a process designed to provide reasonable assurance to our management, Board of Directors and stockholders regarding the reliability of financial reporting and the preparation and fair presentation of our consolidated financial statements for external reporting purposes in accordance with U.S. generally accepted accounting principles (“U.S. GAAP”), and includes those policies and procedures that:
•Pertain to the maintenance of records that, in reasonable detail, accurately and fairly reflect the transactions and dispositions of our assets;
•Provide reasonable assurance that transactions are recorded as necessary to permit preparation of financial statements in conformity with U.S. GAAP, and that receipts and expenditures are being made only in accordance with authorizations from our management and Board of Directors; and
•Provide reasonable assurance regarding prevention or timely detection of unauthorized acquisition, use or disposition of our assets that could have a material effect on the financial statements.
Because of its inherent limitations, internal control over financial reporting may not prevent or detect misstatements. Also, projections of any evaluation of effectiveness to future periods are subject to the risk that controls may become inadequate because of changes in conditions, or that the degree of compliance with the policies or procedures may deteriorate.
Management assessed the effectiveness of the Company’s internal control over financial reporting as of December 31, 2023. In assessing the effectiveness of our internal control over financial reporting as of December 31, 2023 management used the control criteria framework of the Committee of Sponsoring Organizations (COSO) of the Treadway Commission published in its report entitled Internal Control—Integrated Framework (2013). Based on their evaluation, management concluded that the Company’s internal control over financial reporting was effective as of December 31, 2023. KPMG LLP, the independent registered public accounting firm that audited the financial statements included in this Form 10-K, has issued an auditors' report on the Company’s internal control over financial reporting as of December 31, 2023.
EX-10.IIIB
2
exhibit10iiib20231231.htm
EX-10.IIIB
Document
Exhibit 10.iii.b
DESCRIPTION OF MOSAIC MANAGEMENT INCENTIVE PROGRAM
Pursuant to the Management Incentive Plan (“MIP”) of The Mosaic Company (the “Company”), key managers of the Company and its subsidiaries, including executive officers, are eligible for annual cash incentive compensation based upon the level of attainment of business performance goals that are pre-established by the Board of Directors of the Company, upon the recommendation of the Compensation and Human Resources Committee.
The incentive measures and their respective weightings for executive officers for 2023 are described below:
•Incentive Adjusted Operating Earnings: this measure is based on the profitability of the business. It creates messaging around revenue growth, margin expansion, and control over overhead costs. This measure has a weighting of 25% for executive officers.
•Incentive Free Cash Flow: this measure is based on consolidated net cash provided by operating activities before specified items and has a 20% weighting for executive officers.
•Cost Control: this measure is based on controllable production costs per tonne of the Company’s Phosphates, Potash and Mosaic Fertilizantes business segments along with corporate selling, general, and administrative (SG&A) expenses. This measure has a 10% weighting for executive officers, as defined in the program.
•Performance Product Sales: this measure is based on the metric tonnes of performance products for which the Company recognizes revenue, on a consolidated basis. This measure has a weighting of 10% for executive officers.
•ESG Scorecard Progress: this measure is based our achievement on select portions of our 14 sustainability goals. The metric is divided equally between the sustainability measure and Environmental, Health and Safety (EHS) progress. This measure has a weighting of 15% for executive officers.
▪Sustainability: this measure spans broad Environmental, Social and Governance areas (including Diversity and Inclusion initiatives) and will measure our progress to achieve long-term goals and has a weighting of 50% of the ESG Scorecard for executive officers.
▪Environmental, Health, and Safety (EHS): this measure drives continuous EHS improvement and has a weighting of 50% of the ESG Scorecard for executive officers.
•Strategic Goals: this measure focuses on achieving key milestones of our six global strategic priorities. Each executive officer has two to three specific individual goals which link directly to our six global strategic priorities. These goals are intended to be leading indicators of future financial and operational success of the company. This measure has a weighting of 20% for executive officers.
Threshold, target and maximum payout levels are set by the Compensation and Human Resources Committee based upon the extent to which the specified performance goals are attained.
EX-10.IIIC1
3
exhibit10iiic1_20231231.htm
EX-10.IIIC1
Document
MOSAIC
NONQUALIFIED DEFERRED COMPENSATION PLAN
(2024 Restatement)
TABLE OF CONTENTS
Page
ARTICLE 1. DEFINITIONS, GENDER AND NUMBER.....................................................2
1.1. Definitions
1.2. Gender and Number
ARTICLE 2. PARTICIPATION.............................................................................................9
2.1. Who May Participate
2.2. Time and Conditions of Participation
2.3. Notification
2.4. Termination and Suspension of Participation
2.5. Missing Persons
2.6. Relationship to Other Plans
ARTICLE 3. ESTABLISHMENT OF AND ENTRIES TO ACCOUNTS............................10
3.1. Elective Deferrals
3.2. Restoration Contributions
3.3. Optional Contributions
3.4. Crediting Rate
3.5. Vesting of Accounts
ARTICLE 4. DISTRIBUTION OF ACCOUNTS..................................................................16
4.1. Distribution of Elective Deferral Accounts and Restoration
Contribution Accounts
4.2. Distribution of Optional Contribution Account
4.3. Exception to Payment Terms
4.4. Distributions on Plan Termination
ARTICLE 5. FUNDING........................................................................................................21
5.1. Source of Benefits
5.2. No Claim on Specific Assets
ARTICLE 6. ADMINISTRATION AND FINANCES.........................................................22
6.1. Administration
6.2. Powers of Committee
6.3. Actions of the Committee
6.4. Delegation
6.5. Reports and Records
6.6. Valuation of Accounts and Account Statements
6.7. Committee Member Participating in Plan
ARTICLE 7. AMENDMENTS AND TERMINATION....................................................24
7.1. Amendments
7.2. Termination
ARTICLE 8. CLAIM PROCEDURES...............................................................................25
8.1. Determinations
8.2. Claim and Review Procedures
8.3. Rules and Regulations
8.4. Deadline to File Claim
8.5. Exhaustion of Administrative Remedies
8.6. Deadline to File Legal Action
8.7. Knowledge of Fact by Participant Imputed to Beneficiary and Others
ARTICLE 9. MISCELLANEOUS....................................................................................30
9.1. No Guarantee of Employment or Retention to Perform Services
9.2. Release
9.3. Notices
9.4. Nonalienation
9.5. Withholding
9.6. Captions
9.7. Binding Agreement
9.8. Invalidity of Certain Provisions
9.9. No Other Agreements
9.10. Incapacity
9.11. Counterparts
9.12. Participating Affiliates
9.13. Sole Source of Benefits
9.14. Electronic Media
9.15. ERISA Status
9.16. Internal Revenue Code Status
9.17. Choice of Law
9.18. Choice of Venue
MOSAIC
NONQUALIFIED DEFERRED COMPENSATION PLAN
(2024 Restatement)
The Mosaic Company (the “Company”) initially established this Mosaic Nonqualified Deferred Compensation Plan (the “Plan”), effective January 1, 2006, for the benefit of certain specified executive and highly compensated employees and non-employee directors of the Company. The Plan shall apply to Compensation deferred on or after the Plan’s effective date. Since the original effective date of the Plan, the Plan has been amended by four (4) amendments. The Plan is being amended and restated to consolidate all amendments into a single restatement effective January 1, 2024.
In the case of Participants who are employees, the Plan is intended to be an unfunded plan maintained primarily for the purpose of providing deferred compensation for a select group of management or highly compensated employees, as described in Sections 201(2), 301(a)(3) and 401(a)(1) of the Employee Retirement Income Security Act of 1974 (“ERISA”). The Plan is subject to section 409A of the Code. Each provision shall be interpreted and administered accordingly. Notwithstanding the foregoing, neither the Company nor any of its officers, directors, agents or affiliates shall be obligated, directly or indirectly, to any Participant or any other person for any taxes, penalties, interest or like amounts that may be imposed on the Participant or other person on account of any amounts under this Plan or on account of any failure to comply with the Code.
The obligation of the Company to make payments under the Plan constitutes an unsecured (but legally enforceable) promise of the Company to make such payments and no person, including any Participant or Beneficiary, shall have any lien, prior claim or other security interest in any property of the Company as a result of the Plan.
ARTICLE 1
DEFINITIONS, GENDER AND NUMBER
1.1. Definitions. Whenever used in the Plan, the following words and phrases shall have the meanings set forth below unless the context plainly requires a different meaning, and when a defined meaning is intended, the term is capitalized.
(a) “Account” means the device used to measure and determine the amount of benefits payable to a Participant or Beneficiary under the Plan. A separate Account shall be established on behalf of a Participant for:
(i) Each Deferral Election Agreement entered into by the Participant pursuant to Section 3.1, termed an “Elective Deferral Account;” and
(ii) The Restoration Contributions, if any, made on the Participant’s behalf pursuant to Section 3.2, termed the “Restoration Contribution Account; and
(iii) The Optional Contributions, if any, made on the Participant’s behalf pursuant to Section 3.3, termed the “Optional Contribution Account.”
The term Account shall mean all of a Participant’s accounts under the Plan (the Elective Deferral Account, the Restoration Contribution Account and the Optional Contribution Account) unless the use of the term indicates that the provision applies to only specific account(s).
(b) “Administratively Reasonable Period of Time” means a payment under the Plan will be made as soon as administratively practicable on or after a specified date and no later than (i) within the same calendar year as such specified date, or, if later, (ii) by the fifteenth (15th) day of the third (3rd) calendar month following such specified date.
(c) “Affiliate” means any corporation which is a member of a controlled group of corporations (as defined in Section 414(b) of the Code) which includes the Company and any trade or business (whether or not incorporated) which is under common control (as defined in Section 414(c) of the Code) with the Company.
(d) “Base Compensation,” of a Participant for a Plan Year, means the Participant’s Compensation for the Plan Year excluding Incentive Compensation. In the case of an individual who is a participant in a plan sponsored by the Company which is described in Section 401(k), 125 or 132(f) of the Code, the term Base Compensation shall include any amount which would be included in the definition of Base Compensation but for the individual’s election to reduce his or her Base Compensation and have the amount of the reduction contributed to or used to purchase benefits under such plan.
(e) “Beneficiary” or “Beneficiaries” means the persons or trusts designated by a Participant in writing pursuant to Section 4.4(c) of the Plan as being entitled to receive any benefit payable under the Plan by reason of the death of a Participant, or, in the absence of such designation, the Participant’s estate.
(f) “Board” means the Board of Directors of the Company, as constituted at the relevant time.
(g) “Change in Control” means, for purposes of the Plan, a Change in Control as defined in the following paragraphs. Except as provided in the immediately preceding sentence, a Change in Control shall occur when:
(i) a majority of the directors of the Company shall be persons other than persons (1) for whose election proxies shall have been solicited by the Board of Directors of the Company, or (2) who are then serving as directors appointed by the Board of Directors to fill vacancies on the Board of Directors caused by death or resignation (but not by removal) or to fill newly-created directorships,
(ii) 50% or more of the voting power of the outstanding Voting Stock of the Company is acquired or beneficially owned by any person, entity or group (within the meaning of Section 13d(3) or 14(d)(2) of the Exchange Act) other than (1) an entity in connection with a Business Combination in which clauses (x) and (y) of subparagraph (iii) apply or (2) a licensed broker/dealer or licensed underwriter who purchases shares of Voting Stock pursuant to an underwritten public offering solely for the purpose of resale to the public,
(iii) the consummation of a merger or consolidation of the Company with or into another entity, a sale or other disposition (in one transaction or a series of transactions) of all or substantially all of the Company’s assets or a similar business combination (each, a “Business Combination”), in each case unless, immediately following such Business Combination, (x) all or substantially all of the beneficial owners of the Company’s Voting Stock immediately prior to such Business Combination beneficially own, directly or indirectly, more than 50% of the voting power of the then outstanding shares of voting stock (or comparable voting equity interests) of the surviving or acquiring entity resulting from such Business Combination (including such beneficial ownership of an entity that, as a result of such transaction, owns the Company or all or substantially all of the Company’s assets either directly or through one of more subsidiaries), in substantially the same proportions (as compared to the other beneficial owners of the Company’s Voting Stock immediately prior to such Business Combination) as their beneficial ownership of the Company’s Voting Stock immediately prior to such Business Combination, and (y) no person, entity or group beneficially owns, directly or indirectly, 50% or more of the voting power of the outstanding voting stock (or comparable equity interests) of the surviving or acquiring entity (other than a direct or indirect parent entity of the surviving or acquiring entity, that, after giving effect to the Business Combination, beneficially owns, directly or indirectly, 100% of the outstanding voting stock (or comparable equity interests) of the surviving or acquiring entity), or
(iv) approval by the shareholders of a definitive agreement or plan to liquidate or dissolve the Company.
(h) “Code” means the Internal Revenue Code of 1986, including applicable regulations for the specified section of the Code. Any reference in this Plan Statement to a section of the Code, including the applicable regulation, shall be considered also to mean and refer to any subsequent amendment or replacement of that section or regulation.
(i) “Committee” means the Compensation and Human Resources Committee of the Board of Directors (the “Compensation Committee”), except with respect to actions and determinations involving Directors, Committee shall mean the Corporate Governance and Nominating Committee of the Board of Directors (the “Governance Committee”).
(j) “Company” means The Mosaic Company.
(k) “Compensation,” of a Participant for any Plan Year, has the same meaning as in the Mosaic Company 401(k) Plan, but without regard to any Code limits placed on compensation for purposes of determining contributions and benefit accruals under qualified retirement plans, and increased by the Participant’s Elective Deferrals for such year. Notwithstanding the preceding sentence, in the case of a Director, “Compensation” shall mean the Director’s annual retainer, meeting fees, and any other amounts payable to the Director by the Company for services performed as a Director, excluding any amounts distributable under the Plan or amounts not paid in cash.
(l) “Deferral Election Agreement” means an agreement by a Participant to defer (i) a portion of the Participant’s Base Compensation, or (ii) a portion of a Participant’s Incentive Compensation. A Participant must enter into separate Deferral Election Agreements with respect to Base Compensation and Incentive Compensation.
(m) “Director” means a member of the Company’s Board of Directors who is not an employee of the Company.
(n) “Distribution Election” means a Participant’s election with respect to the distribution of an Elective Deferral Account (as made in a Participant’s Deferral Election Agreement), as provided for in Section 3.1, or with respect to the distribution of a Restoration Contribution Account, as provided for in Section 3.2.
(o) “Disabled” or “Disability” means a condition in which either: (i) the Participant is unable to engage in any substantial gainful activity by reason of any medically determinable physical or mental impairment that can be expected to result in death or can be expected to last for a continuous period of not less than twelve months, or (ii) the Participant is, by reason of any medically determinable physical or mental impairment that can be expected to result in death or can be expected to last for a continuous period of not less than twelve months, receiving replacement benefits for a period of not less than three months under an accident and health plan covering employees of the Employer and its Affiliates.
(p) “Elective Deferral” means a contribution to the Plan made by a Participant pursuant to a Deferral Election Agreement which the Participant enters into with the Company. Elective Deferrals shall be made according to the terms of the Plan set forth in Section 3.1.
(q) “Eligible Employee” means (i) an executive (an employee whose position at the Company is Vice President or higher), (ii) a management-level employee selected by the Senior Vice President of Human Resources or such person acting in that role (“SVP of Human Resources”), or (iii) a Director. The employees the Company has selected for participation are members of a select group of management or highly compensated employees (as that expression is used in ERISA).
(r) “Enrollment Period” means the period for an upcoming Plan Year designated by the Company during which Participants may enter into a Deferral Election Agreement with respect to Base Compensation and Incentive Compensation. The Enrollment Period does not need to be the same period of time for Base Compensation and Incentive Compensation.
(i) With respect to deferral of Base Compensation, the Enrollment Period ends as of the last day of the calendar year before the calendar year in which the services giving rise to the Compensation to be deferred are performed (or such earlier date as set by the Company).
(ii) With respect to deferral of Incentive Compensation, the Enrollment Period ends as of (1) if the Incentive Compensation is performance-based compensation (as defined under section 409A of the Code), the last day of the month that is six months before the end of the fiscal year during which the Incentive Compensation is earned (or such earlier date as set by the Company), and (2) if the Incentive Compensation is not performance-based compensation (as defined under section 409A of the Code), the last day of Company’s taxable year (which is its fiscal year) immediately preceding the Company’s taxable year in which the services giving rise to the Compensation to be deferred are performed (or such earlier date as set by the Company).
(s) “ERISA” means the Employee Retirement Income Security Act of 1974, including applicable regulations for the specified section of ERISA. Any reference in this Plan Statement to a section of ERISA, including the applicable regulation, shall be considered also to mean and refer to any subsequent amendment or replacement of that section or regulation.
(t) “401(k) Plan” means the Mosaic Investment Plan, as may be amended or restated from time to time.
(u) “Incentive Compensation” means, unless otherwise designated by the Compensation Committee, the Mosaic Management Incentive Plan, as may be amended or restated from time to time. The Compensation Committee may designate other plans and compensation in addition to the Mosaic Management Incentive Plan as incentive compensation.
(v) “Optional Contribution” means a contribution to the Plan made by the Company pursuant to Section 3.3.
(w) “Participant” means an Eligible Employee who has satisfied the requirements of Article 2 and commenced participation in the Plan.
(x) “Performance-Based Compensation,” of a Participant for a period means Incentive Compensation of the Participant for such period where the amount of, or entitlement to, the Incentive Compensation is contingent on the satisfaction of pre-established organizational or individual performance criteria relating to a performance period of at least 12 consecutive months in which the Participant performs services. Organizational or individual performance criteria are considered pre-established if established in writing by not later than 90 days after the commencement period of service to which the criteria relates, provided that the outcome is substantially uncertain at the time the criteria are established. Performance-based compensation may include payment based on performance criteria that are not approved by the Board or the Committee or by the stockholders of the Company.
(y) “Plan” means the “Mosaic Nonqualified Deferred Compensation Plan.” The Plan is set forth in a document initially effective as of January 1, 2006, amended and restated effective as of January 1, 2024, and subsequent amendments to that plan document.
(z) “Plan Year” means January 1 through December 31.
(aa) “Qualified CIC Termination” means the termination of a Participant who (i) has a current Senior Management Severance and Change in Control Agreement (the “Senior Management Agreement”) with the Employer at the time of termination, and (ii) is involuntarily terminated (including termination for good reason) for reasons other than Cause within six (6) months prior to or within twenty-four (24) months following a Change in Control. A Participant terminated for Cause shall not have a Qualified CIC Termination. For purposes of this definition, “Cause” means a good faith determination by the Employer of an act or omission by a Participant amounting to: (i) a material breach of any of the Participant’s obligations to the Employer under the terms of the Senior Management Agreement, (ii) the gross neglect or willful failure or refusal of the Participant to perform the duties of the Participant’s position or such other duties reasonably assigned to the Participant by the Employer, (iii) any act of personal dishonesty taken by the Participant and intended to result in substantial personal enrichment of the Participant at the expense of the Employer, (iv) any willful or intentional act that could reasonably be expected to injure the reputation, business, or business relationships of the Employer or the Participant’s reputation or business relationships, (v) perpetration of an intentional and knowing fraud against or affecting the Employer or any customer, supplier, client, agent, or employee thereof, (vi) conviction (including conviction on a nolo contendere, no contest, or similar plea) of a felony or any crime involving fraud, dishonesty, or moral turpitude, or (vii) material breach of the Code of Business Conduct and Ethics.
(bb) “Qualified Domestic Relations Order” has the same meaning as in Section 414(p) of the Code.
(cc) “Restoration Contribution” means a contribution to the Plan made by the Company pursuant to Section 3.2.
(dd) “Retires” and “Retirement” means (i) with respect to an employee, the employee’s Separation from Service on or after the last day of the calendar month in which the employee attains age 55 and has completed at least five years of service, and (ii) with respect to a Director, the Director’s Separation from Service for any reason.
(ee) “Separation from Service” means a separation from service for the purposes of section 409A of the Code.
(ff) “Trust” means the grantor trust arrangement, if any, between the Company and the Trustee that holds, administers and manages any assets that the Company may set aside from time to time to provide for its benefit obligations under the Plan. Any such trust shall be based in the United States.
(gg) “Trustee” means the entity appointed by the Company to serve as Trustee under the Trust, or any successor thereof.
(hh) “Unforeseeable Emergency” means an unforeseeable emergency for the purposes of section 409A of the Code.
1.2. Gender and Number. Except as otherwise indicated by context, masculine terminology used herein also includes the feminine and neuter, and terms used in the singular may also include the plural.
ARTICLE 2
PARTICIPATION
2.1. Who May Participate. Participation in the Plan is limited to Eligible Employees. If the SVP of Human Resources determines an employee is no longer an Eligible Employee, the employee shall cease participating in the Plan at the end of the Plan Year.
2.2. Time and Conditions of Participation. An Eligible Employee shall become a Participant only upon his or her compliance with such terms and conditions as the Company may from time to time establish for the implementation of the Plan, including but not limited to, any condition the Committee may deem necessary or appropriate for the Company to meet its obligations under the Plan. An Eligible Employee will not become a Participant unless the Eligible Employee receives written notice of his or her participation from the Company.
2.3. Notification. The Committee shall notify each employee, in writing, whom the Company has determined in its discretion to be an Eligible Employee and explain the rights, privileges and duties of a Participant in the Plan. The Committee shall provide each Eligible Employee with a Deferral Election Agreement so that the Eligible Employee may notify the Committee of his or her intent to make Elective Deferrals under the Plan.
2.4. Termination and Suspension of Participation. Once an individual has become a Participant in the Plan, participation shall continue until the first to occur of: (a) payment in full of all benefits to which the Participant or his or her Beneficiary is entitled under the Plan; or (b) the occurrence of the event specified in Section 2.5 which results in loss of benefits.
2.5. Missing Persons. Each Participant and Beneficiary entitled to receive benefits under the Plan shall be obligated to keep the Company informed of his or her current address until all Plan benefits that are due to be paid to the Participant or Beneficiary have been paid to him or her. If the Company is unable to locate the Participant and the Company has not received notice that the Participant has died, the Participant’s Account under the Plan will be forfeited as of the date that is five years after the date the payment was due. If the payment was to be made in installments, all unpaid installments shall be forfeited as of the date that is five years after the date the first installment payment was due. If the Company locates the Participant or receives notice of the Participant’s death after the forfeiture of the Participant’s Account, the Participant’s Account will not be reinstated and the Plan will owe no amount to the Participant or the Participant’s Beneficiaries. If payment is delayed because the Participant is missing or the Company does not receive timely notice of the Participant’s death, neither the Company nor any of its officers, directors, agents or affiliates shall be obligated, directly or indirectly, to any Participant or any other person for any taxes, penalties, interest or like amounts that may be imposed on the Participant or other person on account of any amounts paid under this Plan or on account of any failure to comply with the Code.
2.6. Relationship to Other Plans. Participation in the Plan shall not preclude participation of the Participant in any other fringe benefit program or plan sponsored by an Affiliate for which such Participant would otherwise be eligible.
ARTICLE 3
ABLISHMENT OF AND ENTRIES TO ACCOUNTS
3.1. Elective Deferrals. Elective deferrals shall be credited to a Participant’s Elective Deferral Account.
(a) Amount of Deferrals. Subject to the following rules and any rules adopted by the SVP of Human Resources, a Participant may make elective deferrals through a reduction in Compensation equal to but not less than five percent (5%) nor more than eighty percent (80%) for an employee and nor more than one hundred percent (100%) for a Director (in whole percentages) by entering into a Deferral Election Agreement. The Committee, in the case of Directors, or the SVP of Human Resources, in the case of all other Participants, may, from time to time, change the minimum and maximum allowable elective deferrals, although such changes shall not take effect until the following Plan Year. The Deferral Election Agreement shall remain in effect for the remainder of the Plan Year (unless terminated upon a Participant’s death or Separation from Service).
(b) Separate Elections. As provided in the definition of Deferral Election Agreement, the Participant who wishes to defer Base Compensation and Incentive Compensation must enter into separate elections with respect to each type of compensation.
(c) Initial Elections. When an employee or Director is first eligible to participate in the Plan, if the Eligible Employee has not previously participated in the same type of plan (for purposes of section 409A of the Code) at the Company, then the Eligible Employee may enter into a Deferral Election Agreement within 30 days after the Eligible Employee first becomes eligible. The Deferral Election Agreement must be completed and received by the Human Resources Department on or before the 30-day period has elapsed. The Plan shall not accept Deferral Election Agreements received after the 30-day period has elapsed. If the Eligible Employee fails to complete a Deferral Election Agreement by such time, the Eligible Employee may enter into a Deferral Election Agreement during a subsequent Enrollment Period. For initial elections made within 30 days after the Eligible Employee first becomes eligible, the Participant’s Deferral Election Agreement will be effective as of the first payroll date following the date the Human Resources Department receives the Deferral Election Agreement.
(d) Annual Elections. After the initial election, if the Eligible Employee or the Participant desires to make elective deferrals, the Eligible Employee or Participant must enter into a Deferral Election Agreement during an Enrollment Period. With respect to Base Compensation, the Participant’s Deferral Election Agreement will be effective for Compensation paid on and after January 1 following the date of the Participant’s election. With respect to Incentive Compensation, the Participant’s Deferral Election Agreement will be effective for Compensation paid on and after the last date on which a Participant may make an election.
(e) Separation from Service. The Deferral Election Agreement of a Participant shall continue with respect to Compensation paid to a Participant after the date of the Participant’s Separation from Service.
(f) Unforeseeable Emergency. The Deferral Election Agreement of a Participant shall be terminated automatically upon the SVP of Human Resources’ determination a Participant has had an Unforeseeable Emergency (after the Participant has requested the SVP of Human Resources to make such a determination). If the SVP of Human Resources denies a participant’s request, the Participant may appeal to the Committee and, if approved by the Committee, the Deferral Election Agreement of a Participant shall be terminated automatically upon the Committee’s approval.
(g) Distribution Election. At the time a Participant enters into a Deferral Election Agreement, the Participant shall elect the time and form of distribution of the Elective Deferral Account corresponding to the Deferral Election Agreement. This distribution election shall be subject to the terms of Article 4 of the Plan.
3.2. Restoration Contributions. Restoration contributions shall be credited to a Participant’s Elective Deferral Account. Participants in the Plan may receive one or more of five (5) restorative contributions.
(a) Matching Contribution Restoration. To be eligible for the matching contribution restoration, the Participant must either (i) be actively employed by the Company or its Affiliates on the last day of the Plan Year, or (ii) have terminated employment during the Plan Year on account of the Participant’s death, Disability, Retirement, or Qualified CIC Termination. In addition, the Participant must make makes Elective Deferrals to the Plan. If eligible, the Company shall credit to the Participant’s Restoration Contribution Account under this Plan a matching contribution restoration amount.
The Participant’s deferred compensation percentage shall be determined as follows: The total dollar amount of the Participant’s Elective Deferrals (both from Base Compensation and Incentive Compensation) to the Plan divided by the amount of the Participant’s Compensation above the limit under section 401(a)(17) of the Code. The matching contribution restoration amount shall be equal to (i) one hundred percent (100%) on the first three percent (3%) of the Participant’s Compensation above the limit under section 401(a)(17) of the Code, and (ii) fifty percent (50%) on the next three percent (3%), the fourth through sixth percentages, of the Participant’s Compensation above the limit under section 401(a)(17) of the Code.
(b) Non-Elective Employer Contribution Restoration. To be eligible for the non-elective employer contribution restoration, the Participant must either (i) be actively employed the Company or its Affiliates on the last day of the Plan Year, or (ii) have terminated employment during the Plan Year on account of the Participant’s death, Disability, Retirement, or Qualified CIC Termination. If eligible, the Company shall credit to the Participant’s Restoration Contribution Account under this Plan a non-elective contribution restoration amount. The non-elective employer contribution restoration amount shall be based on a Participant’s age and shall be as follows:
|
|
|
|
|
|
| Age (in years as of December 31 of Plan Year) |
Non-Elective Contribution
Restoration Percentage |
| less than 30 |
6% (which represents the 3% base plus the 3% excess above the Social Security wage base) of the Participant’s Compensation in excess of the limit under section 401(a)(17) of the Code |
| 30-39 |
7% (which represents the 4% base plus the 3% excess above the Social Security wage base) of the Participant’s Compensation in excess of the limit under section 401(a)(17) of the Code |
| 40-49 |
8% (which represents the 5% base plus the 3% excess above the Social Security wage base) of the Participant’s Compensation in excess of the limit under section 401(a)(17) of the Code |
| 50-59 |
10% (which represents the 7% base plus the 3% excess above the Social Security wage base) of the Participant’s Compensation in excess of the limit under section 401(a)(17) of the Code |
| 60 or more |
12% (which represents the 9% base plus the 3% excess above the Social Security wage base) of the Participant’s Compensation in excess of the limit under section 401(a)(17) of the Code |
(c) Discretionary Employer Contribution Restoration. To be eligible for the discretionary employer contribution restoration, the Participant must either (i) be actively employed by the Company or its Affiliates on the last day of the fiscal year following a 401(k) Plan Year, or (ii) have terminated employment during the fiscal year prior to the last day of the fiscal year on account of the Participant’s death, Disability, Retirement, or Qualified CIC Termination. If eligible, the Company shall credit to the Participant’s Restoration Contribution Account under this Plan a discretionary employer contribution restoration amount, if the Company makes a discretionary employer contribution to the 401(k) Plan. The discretionary employer contribution restoration amount shall be the amount equal to the discretionary employer contribution under the 401(k) Plan multiplied by the Participant’s Compensation above the limit under section 401(a)(17) of the Code.
(d) Excess Contribution Restoration. To be eligible for the excess contribution restoration, the Participant must either (i) be actively employed the Company or its Affiliates on the last day of the Plan Year, or (ii) have terminated employment during the Plan Year on account of the Participant’s death, Disability, Retirement, or Qualified CIC Termination. If eligible, the Company shall credit to the participant’s Restoration Contribution Account under this Plan an excess contribution restoration amount. The excess contribution restoration amount shall be equal to the amount of employer contributions (excluding employee elective contributions) that could not be contributed to a Participant’s account in the 401(k) Plan based on the limits under section 415 of the Code.
(e) Qualifying CIC Termination Contribution Restoration. To be eligible for the qualifying CIC termination contribution restoration, the Participant must have terminated employment during the Plan Year on account of the Participant’s Qualified CIC Termination. The qualifying CIC termination contribution restoration is meant to replace amounts not received by a Participant under the 401(k) Plan due to a Qualifying CIC Termination. If eligible, the Company shall credit to the Participant’s Restoration Contribution Account under this Plan a qualifying CIC termination contribution restoration amount. The qualifying CIC termination contribution restoration amount shall be equal to (i) the non-elective contribution provided for under Section 5.1(b) on the Participant’s Compensation earned through the Participant’s last day of active employment (up to the limit under section 401(a)(17) of the Code) that the Participant would have received under the 401(k) Plan if the 401(k) Plan did not have a last-day rule requirement for such a contribution, and (ii) the discretionary contribution provided for under Section 5.1(c) on the Participant’s Compensation earned through the Participant’s last day of active employment (up to the limit under section 401(a)(17) of the Code) that the Participant would have received under the 401(k) Plan if the 401(k) Plan did not have a last-day rule requirement for such a contribution.
(f) Limitation on Contributions. No contribution shall be made to this Plan for a Participant after the September 30 of the year following the year in which a Participant has a Separation from Service. This rule shall apply even if the Company determines it made an error in calculating the amount of contribution due to a Participant. In addition, a Participant who has a Separation from Service shall not be eligible for any contributions under this Plan after the September 30 of the year following the year in which a Participant has a Separation from Service.
(g) Distribution Elections. A Participant may make a distribution election with respect to the Participant’s Restoration Contribution Account for each year provided the election is made before the start of that year and meets the other election requirements set by the Company and section 409A of the Code. This distribution election shall be subject to the terms of Article 4 of the Plan.
3.3. Optional Contributions. The Employer may make an additional contribution (an Optional Contribution) for a Plan Year to all or a select group of Participants as designated by the Committee (and noted on a schedule approved and maintained by the Employer). The amount of this Optional Contribution shall be in such amounts as approved and designated by the Committee for each of the Participants on a schedule maintained by the Employer.
3.4. Crediting Rate. The Committee shall designate the manner in which a Participant’s Accounts are to be credited with gains and losses as described in this Section, which may be amended from time to time in the Committee’s discretion. If the Committee designates specific investment funds to serve as an index for crediting gains and losses to a Participant’s Accounts: (a) the Participant shall be entitled to designate which such fund or funds shall be used to measure gains and losses on his or her Accounts, and to change such designation in accordance with rules established by the Committee (in which case, such change shall be effective prospectively); (b) the Participant’s Accounts will be credited with gains and losses as if invested in such fund or funds in accordance with the Participant’s designation and the rules established by the Committee; and (c) the Committee may, in its sole discretion, eliminate any investment fund or funds previously designated by it, substitute a new investment fund or funds therefore, or add investment fund or funds, at any time. If the Committee makes any such investment funds available for this purpose, the Company shall have no obligation to actually invest any amounts in any such investment funds. If the Participant does not designate an investment fund to be used to credit gains and losses to the participant’s Account, the Participant’s Account shall be credited with the gains and losses experienced by the default investment under the 401(k) Plan.
A Participant’s Account will be credited with gains and losses as if invested in one or more of the investments funds selected by the Committee and communicated to the Participant from time to time, in the proportions designated by the Participant on an investment election form submitted to the Committee by the Participant. The investment election form shall be submitted to the Committee in the form and manner specified by the Committee, which may be electronically pursuant to Section 9.14. Until and unless changed by the Committee, Participants shall be permitted to change investment elections, generally, on a daily basis.
3.5. Vesting of Accounts. Subject to forfeiture under Section 2.5, a Participant’s Accounts shall always be one hundred percent (100%) vested.
ARTICLE 4
DISTRIBUTION OF ACCOUNTS
4.1. Distribution of Elective Deferral and Restoration Contribution Accounts. Except as provided under Section 4.4, distribution to a Participant who Retires of an Elective Deferral Account and/or a Restoration Contribution Account shall be made at the time and in the form specified by the Participant in his or her Deferral Election corresponding to the Elective Deferral Account or Restoration Contribution Account according to the following rules.
(a) Time of Distribution. A Participant shall be entitled to make separate elections with respect to their Elective Deferral Account and their Restoration Contribution Account. For each of the two Accounts, a Participant shall be entitled to elect whether distribution shall begin at: (i) a specified future date; or (ii) the Participant’s Separation from Service. If the Participant elects to have distribution commence at a specified future date, the distribution commencement date must be specified in his or her Distribution Election in which case distribution will commence to the Participant as soon as Administratively Reasonable following January 1st of the year in which the specified date falls. If the Participant elects to have distribution commence as of Separation from Service, distribution will commence on the date that is six (6) months after the Participant’s Separation from Service or as soon as Administratively Reasonable following that date. If the Participant does not specify the distribution commencement date of an Account, the Participant will be deemed to have elected to have distribution as of the date of the Participant’s Separation from Service and the rule in the preceding sentence shall apply.
(b) Form of Distribution of Elective Deferral and Restoration Contribution Accounts. A Participant shall be entitled to make separate elections with respect to their Elective Deferral Account and their Restoration Contribution Account. For each of the two Accounts, a Participant shall be entitled to elect whether distribution of the Account shall be made in: (i) a lump sum; or (ii) annual installments over a period of two to ten years. If the Participant does not specify the form of distribution of an Account, the Participant will be deemed to have elected to have the Account distributed in a lump sum.
(c) Determination of Amount of Installment Payment. If a Participant elects to have distribution of either an Elective Deferral Account or a Restoration Contribution Account made in the form of installments pursuant to Section 4.1(b)(ii), the amount of each installment payment shall be determined by multiplying the Account by a fraction, the denominator of which in the first year of payment equals the number of years over which benefits are to be paid, and the numerator of which is one. The amounts of the payments for each succeeding year shall be determined by multiplying the balance in the Account as of the applicable anniversary of the payment commencement date by a fraction, the denominator of which equals the number of remaining years over which the Account is to be paid, and the numerator of which is one. The Account will be credited with gains and losses pursuant to Section 3.4 during the payout period.
(d) Subsequent Distribution. If the Participant has elected to make and Elective Deferrals are made to the Participant’s Elective Deferral Account after the date of the initial distribution, such additional Elective Deferrals shall be distributed in the year following the year in which the Participant has a Separation from Service, but not sooner than the date which is six (6) months from the Participant’s Separation from Service. If the Participant is entitled to and the Company makes any additional Restoration Contributions to the Participant’s Restoration Contribution Account after the date of the initial distribution, such additional Restoration Contributions shall be distributed in the year following the year in which the Participant has a Separation from Service, but not sooner than the date which is six (6) months from the Participant’s Separation from Service.
(e) Election to Delay Distribution. Subject to Section 4.4, the Participant may elect to delay the time of distribution or change the form of distribution with respect to any Plan Year’s deferral election of Base Compensation or Incentive Compensation within his or her Elective Deferral Account, and also with respect to the entirety of the Participant’s Restoration Contributions, by submitting an election to the Human Resources Department in accordance with the following criteria:
(i) Such election must be submitted to and accepted by the Human Resources Department (in the Company’s sole discretion) at least twelve (12) months prior to the date a distribution to the Participant with respect to such original deferral election would otherwise have commenced; and
(ii) The commencement of distribution with respect to such deferral is delayed at least five (5) years from the date the distribution would otherwise have been paid; and
(iii) The election shall have no effect until at least twelve (12) months after the date on which the election is made (and for clarity, no attempted delay will be effective if distribution of such Plan Year’s deferral election of Base Compensation or Incentive Compensation, as applicable, would have commenced under the original deferral election within twelve (12) months of the election to delay payment); and
(iv) The election may change the form of payment to a lump sum or any installment payment form permitted by the Company in its sole discretion, provided that the commencement of payment is delayed at least five (5) years from the original time of distribution with respect to such Plan Year’s deferral of Base Compensation or Incentive Compensation, as applicable; and
(v) Notwithstanding the foregoing, the Committee shall interpret all provisions relating to changing the distribution election under this Section 4.1(e) in a manner that is consistent with Section 409A of the Code and Treasury regulations and other guidance issued thereunder. Accordingly, if the Company determines that an election is inconsistent with Section 409A of the Code and other applicable tax law, the election shall not be effective.
4.2. Distribution of Optional Contribution Account. Distribution to a Participant of the Participant’s Optional Contribution Account shall be made in a lump sum on the date that is six (6) months after the Participant’s Separation from Service or as soon as Administratively Reasonable following that date. If the Participant is entitled to and the Company makes any additional Optional Contributions to the Participant’s Optional Contribution Account after the date of the initial distribution, such additional Optional Contributions shall be distributed in the year following the year in which the Participant has a Separation from Service, but not sooner than the date which is six (6) months from the Participant’s Separation from Service.
4.3. Exception to Payment Terms. Notwithstanding the Participant’s Distribution Election or anything in this Article 4 to the contrary, the following rules apply to the time and form of payment:
(a) Separation from Service Prior to Retirement (for Reasons Other Than Death or Disability). If a Participant has a Separation from Service prior to Retirement for reasons other than death or Disability, notwithstanding Section 4.1(a) or a Participant’s Distribution Election, the Participant’s Elective Deferral Account and Restoration Contribution Account will be distributed to the Participant in a lump sum on the date that is six (6) months after the Participant’s Separation from Service or as soon as Administratively Reasonable following that date.
(b) Disability. If a Participant becomes Disabled prior to Separation from Service, notwithstanding Section 4.1(a) or a Participant’s Distribution Election to the contrary, the Participant’s Elective Deferral Account and Restoration Contribution Account shall be distributed to the Participant in a lump sum as soon as Administratively Reasonable after the date the Committee determines the participant is Disabled.
(c) Death. If a Participant dies prior to the full distribution of the Separation from Service, then notwithstanding Section 4.1(a) or a Participant’s election to the contrary the Participant’s Elective Deferral Account and Restoration Contribution Account shall be distributed to the Participant’s Beneficiary in a lump sum on the date that is ninety (90) days after the date of the Participant’s death or as soon as Administratively Reasonable following that date.
Each Participant may from time to time designate one or more persons (who may be any one or more members of such person’s family or other persons, administrators, trusts, foundations or other entities) as s Beneficiary under the Plan. Such designation shall be made on a form prescribed by the Human Resources Department. Each Participant may at any time and from time to time change any previous Beneficiary designation, without notice to or consent of any previously designated Beneficiary, by amending his or her previous designation on a form prescribed by the Human Resources Department. If the Beneficiary does not survive the Participant (or is otherwise unavailable to receive payment) or if no Beneficiary is validly designated, then the amounts payable under the Plan shall be paid to the Participant’s estate. If more than one person is the Beneficiary of a deceased Participant, each such person shall receive a pro rata share of any death benefit payable unless otherwise designated on the applicable Beneficiary designation form. If a Beneficiary who is receiving benefits dies, all benefits that were payable to such Beneficiary shall then be payable to the estate of that Beneficiary.
(d) Account Balances. If the aggregate balance of all the Participant’s accounts in all similar plans maintained by the Company (as defined under section 409A of the Code) at the time of the Participant’s Separation from Service is less than the limit under section 402(g) of the Code, then the Participant’s Account will be distributed in a lump sum on the date that is 30 days after the Participant’s Separation from Service or as soon as Administratively Reasonable following that date.
(e) Delay in Distributions.
(i) The Company shall delay the distribution of any amount otherwise required to be distributed under the Plan if, and to the extent that, the Company reasonably anticipates that the making of the distribution would violate Federal securities laws or other applicable law. In such event, the distribution will be made at the earliest date on which the Company reasonably anticipates that the making of the distribution will not cause such a violation.
(f) Acceleration of Distributions. All or a portion of a Participant’s Accounts may be distributed at an earlier time and in a different form than specified in this Article 4:
(i) As may be necessary to fulfill a Qualified Domestic Relations Order or a certificate of divestiture (as defined in Code Section 1043(b)(2)).
(ii) Upon an Unforeseeable Emergency as defined under section 409A of the Code.
(iii) Due to a failure of the Plan to satisfy Section 409A with respect to the Participant, but only to the extent an amount is required to be included in the Participant’s income as a result of such failure.
4.4. Distributions on Plan Termination. Notwithstanding anything in this Article 4 to the contrary, if the Plan is terminated, distributions shall be made in accordance with Section 7.2.
ARTICLE 5
FUNDING
5.1. Source of Benefits. All benefits under the Plan shall be paid when due by the Company out of its assets or from the Trust (if the Company establishes a Trust). Any amounts set aside by the Company for payment of benefits under the Plan are the property of the Company, except, and to the extent, provided in the Trust.
5.2. No Claim on Specific Assets. No Participant shall be deemed to have, by virtue of being a Participant in the Plan, any claim on any specific assets of the Company such that the Participant would be subject to income taxation on his or her benefits under the Plan prior to distribution and the rights of Participants and Beneficiaries to benefits to which they are otherwise entitled under the Plan shall be those of an unsecured general creditor of the Company.
ARTICLE 6
ADMINISTRATION AND FINANCES
6.1. Administration. The Plan shall be administered by the Committee. The Company shall bear all administrative costs of the Plan other than those specifically charged to a Participant or Beneficiary.
6.2. Powers of Committee. In addition to the other powers granted under the Plan, the Committee shall have all powers necessary to administer the Plan, including, without limitation, powers:
(a) to interpret the provisions of the Plan;
(b) to establish and revise the method of accounting for the Plan and to maintain the Accounts; and
(c) to establish rules for the administration of the Plan and to prescribe any forms required to administer the Plan.
The Committee delegates the day-to-day administration of the Plan to the SVP of Human Resources. In addition, the Committee may delegate any of its powers (other than the power to amend or terminate the Plan) to the Global Benefits Committee or to the Chief Administrative Officer, the Vice President of Total Rewards and Human Resources or such person performing a similar role.
6.3. Actions of the Committee. The Committee (including any person or entity to whom the Committee has delegated duties, responsibilities or authority, to the extent of such delegation) has total and complete discretionary authority to determine conclusively for all parties all questions arising in the administration of the Plan, to interpret and construe the terms of the Plan, and to determine all questions of eligibility and status of employees, Participants and Beneficiaries under the Plan and their respective interests. Subject to the claims procedures of Article 8, all determinations, interpretations, rules and decisions of the Committee (including those made or established by any person or entity to whom the Committee has delegated duties, responsibilities or authority, if made or established pursuant to such delegation) are conclusive and binding upon all persons having or claiming to have any interest or right under the Plan.
6.4. Delegation. The Committee, or any officer or other employee of the Company designated by the Committee, shall have the power to delegate specific duties and responsibilities to officers or other employees of the Company or other individuals or entities. Any delegation may be rescinded by the Committee at any time. Each person or entity to whom a duty or responsibility has been delegated shall be responsible for the exercise of such duty or responsibility and shall not be responsible for any act or failure to act of any other person or entity.
6.5. Reports and Records. The Committee, and those to whom the Committee has delegated duties under the Plan, shall keep records of all their proceedings and actions and shall maintain books of account, records, and other data as shall be necessary for the proper administration of the Plan and for compliance with applicable law.
6.6. Valuation of Accounts and Account Statements. As of each valuation date, the Committee shall adjust the previous Account balances of each Participant for Elective Deferrals, Restoration Contributions, forfeitures, distributions, and investment gains and losses. A “valuation date,” for these purposes, is the last day of each calendar quarter, and such other dates as the Committee may designate from time to time in its discretion. The Committee shall provide each Participant with a statement of his or her Account balances at least annually.
6.7. Committee Member Participating in Plan. If a member of the Committee is a Participant, such Committee member shall not be a part of, and shall not participate in any way, in any determination or decision with respect to the manner or timing of benefit distributions to him or her individually or the permissibility of withdrawals by him or her individually.
ARTICLE 7
AMENDMENTS AND TERMINATION
7.1. Amendments. The Company, by written action of the Board may amend the Plan, in whole or in part, at any time and from time to time. The Compensation Committee may amend the Plan, without approval or authorization of the Board, provided that any such amendment: (a) does not materially increase the cost of the Plan; or (b) is required in order to comply with the law, in which case the Compensation Committee shall amend the Plan in such manner as the Compensation Committee deems necessary or desirable to comply with the law. To the extent an amendment approved by the Compensation Committee affects Directors, the amendment must also be approved by the Governance Committee. No amendment may be effective to eliminate or reduce any Account balance (other than as may result from a change in Plan investments pursuant to Section 3.4), determined as of the date of such amendment, of any Participant or of any Beneficiary then eligible for benefits without such Participant’s or Beneficiary’s consent. Any Plan amendment shall be filed with the Plan documents.
7.2. Termination. The Company, by action of the Compensation Committee and Governance Committee, may at any time terminate the Plan, and reduce, suspend or discontinue future contributions to the Plan. The termination of the Plan shall not reduce any Account balance (other than as may result from a change in Plan investments pursuant to Section 3.4), determined as of the date of such amendment, of any Participant or of any Beneficiary without such Participant’s or Beneficiary’s consent. If the Plan is terminated, the Company shall terminate the Plan in accordance with the provisions permitting plan termination under section 409A of the Code.
Notwithstanding anything in the Plan to the contrary, if a Change in Control occurs, the Board, as constituted immediately prior to the Change in Control may, in its discretion, elect to terminate the Plan with respect to Participants for whom the Change in Control has occurred and distribute benefits to such Participants in a lump sum, in which case all such lump sum distributions shall be made no later than 12 months following the Change in Control.
ARTICLE 8
CLAIM PROCEDURES
8.1. Determinations. The benefits under the Plan will be paid only if the Committee decides in its discretion that the applicant is entitled to them. The Committee has discretionary authority to grant or deny benefits under the Plan. The Committee shall have the sole discretion, authority and responsibility to interpret and construe this Plan and all relevant documents and information, and to determine all factual and legal questions under the Plan, including but not limited to the entitlement of all persons to benefits and the amounts of their benefits. The Committee shall make such determinations as may be required from time to time in the administration of the Plan. This discretionary authority shall include all matters arising under the Plan. An application for a distribution shall be considered as a claim.
8.2. Claim and Review Procedures. Until modified by the Committee, the claim and review procedures set forth in this section shall be the mandatory claims and review procedure for the resolution of disputes and disposition of claims filed under the Plan to be reviewed by the Committee.
(a) Initial Claim. An individual may, subject to any applicable deadline, file with the SVP of Human Resources a written claim for benefits under the Plan in a form and manner prescribed by the SVP of Human Resources.
(i) If the claim is denied in whole or in part, the SVP of Human Resources shall notify the claimant of the adverse benefit determination within ninety (90) days after receipt of the claim.
(ii) The ninety (90) day period for making the claim determination may be extended for ninety (90) days if the SVP of Human Resources determines that special circumstances require an extension of time for determination of the claim, provided that the SVP of Human Resources notifies the claimant, prior to the expiration of the initial ninety (90) day period, of the special circumstances requiring an extension and the date by which a claim determination is expected to be made.
(b) Notice of Initial Adverse Determination. A notice of an adverse determination shall set forth in a manner calculated to be understood by the claimant:
(i) the specific reasons for the adverse determination;
(ii) references to the specific provisions of this Plan (or other applicable Plan document) on which the adverse determination is based;
(iii) a description of any additional material or information necessary to perfect the claim and an explanation of why such material or information is necessary; and
(iv) a description of the claims review procedure, including the time limits applicable to such procedure, and, if the Participant is an employee, a statement of the claimant’s right to bring a civil action under section 502(a) of ERISA following an adverse determination on review.
(c) Request for Review. Within sixty (60) days after receipt of an initial adverse benefit determination notice, the claimant may file with the SVP of Human Resources a written request for a review of the adverse determination and may, in connection therewith submit written comments, documents, records and other information relating to the claim benefits. Any request for review of the initial adverse determination not filed within sixty (60) days after receipt of the initial adverse determination notice shall be untimely. The SVP of Human Resources shall provide the request for review to the Committee.
(d) Claim on Review. If the claim, upon review, is denied in whole or in part, the Committee shall notify the claimant of the adverse benefit determination within sixty (60) days after receipt of such a request for review.
(i) The sixty (60) day period for deciding the claim on review may be extended for sixty (60) days if the Committee determines that special circumstances require an extension of time for determination of the claim, provided that the Committee notifies the claimant, prior to the expiration of the initial sixty (60) day period, of the special circumstances requiring an extension and the date by which a claim determination is expected to be made.
(ii) In the event that the time period is extended due to a claimant’s failure to submit information necessary to decide a claim on review, the claimant shall have sixty (60) days within which to provide the necessary information and the period for making the claim determination on review shall be tolled from the date on which the notification of the extension is sent to the claimant until the date on which the claimant responds to the request for additional information or, if earlier, the expiration of sixty (60) days.
(iii) The Committee’s review of a denied claim shall take into account all comments, documents, records, and other information submitted by the claimant relating to the claim, without regard to whether such information was submitted or considered in the initial benefit determination.
(e) Notice of Adverse Determination for Claim on Review. A notice of an adverse determination for a claim on review shall set forth in a manner calculated to be understood by the claimant:
(i) the specific reasons for the denial;
(ii) references to the specific provisions of this Plan Statement (or other applicable Plan document) on which the adverse determination is based;
(iii) a statement that the claimant is entitled to receive, upon request and free of charge, reasonable access to, and copies of, all documents, records, and other information relevant to the claimant’s claim for benefits;
(iv) a statement describing any voluntary appeal procedures offered by the Plan and the claimant’s right to obtain information about such procedures; and
(v) if the Participant is an employee, a statement of the claimant’s right to bring an action under section 502(a) of ERISA.
8.3. Rules and Regulations.
(a) Adoption of Rules. Any rule not in conflict or at variance with the provisions hereof may be adopted by the SVP of Human Resources or the Committee.
(b) Specific Rules.
(i) No inquiry or question shall be deemed to be a claim or a request for a review of a denied claim unless made in accordance with the established claim procedures. The Committee may require that any claim for benefits and any request for a review of a denied claim be filed on forms to be furnished by the Committee upon request.
(ii) All decisions on claims shall be made by the Committee, unless delegated by either as provided for in the Plan, in which case references in this section shall be treated as references to the delegate of the Committee.
(iii) Claimants may be represented by a lawyer or other representative at their own expense, but the Committee reserves the right to require the claimant to furnish written authorization and establish reasonable procedures for determining whether an individual has been authorized to act on behalf of a claimant. A claimant’s representative shall be entitled to copies of all notices given to the claimant.
(iv) The decision on a claim and on a request for a review of a denied claim may be provided to the claimant in electronic form instead of in writing.
(v) In connection with the review of a denied claim, the claimant or the claimant’s representative shall be provided, upon request and free of charge, reasonable access to, and copies of, all documents, records, and other information relevant to the claimant’s claim for benefits.
(vi) The time period within which a benefit determination will be made shall begin to run at the time a claim or request for review is filed in accordance with the claims procedures, without regard to whether all the information necessary to make a benefit determination accompanies the filing.
(vii) The claims and review procedures shall be administered with appropriate safeguards so that benefit claim determinations are made in accordance with governing plan documents and, where appropriate, the plan provisions have been applied consistently with respect to similarly situated claimants.
(viii) For the purpose of this section, a document, record, or other information shall be considered “relevant” if such document, record, or other information: (i) was relied upon in making the benefit determination; (ii) was submitted, considered, or generated in the course of making the benefit determination, without regard to whether such document, record, or other information was relied upon in making the benefit determination; (iii) demonstrates compliance with the administration processes and safeguards designed to ensure that the benefit claim determination was made in accordance with governing plan documents and that, where appropriate, the Plan provisions have been applied consistently with respect to similarly situated claimants; and (iv) constitutes a statement of policy or guidance with respect to the Plan concerning the denied treatment option or benefit for the claimant’s diagnosis, without regard to whether such advice or statement was relied upon in making the benefit determination.
(ix) The Committee may, in its discretion, rely on any applicable statute of limitation or deadline as a basis for denial of any claim.
8.4. Deadline to File Claim. To be considered timely under the Plan’s claim and review procedure, a claim must be filed with the SVP of Human Resources within one (1) year after the claimant knew or reasonably should have known of the principal facts upon which the claim is based. If or to the extent that the claim relates to a failure to effect a Participant’s or Beneficiary’s investment directions or a Participant’s election regarding contributions, a claim must be filed with the SVP of Human Resources within thirty (30) days after the claimant knew or reasonably should have known of the principal facts upon which the claim is based.
8.5. Exhaustion of Administrative Remedies. Notwithstanding any provision in this Plan, the exhaustion of the claim and review procedure is mandatory for resolving every claim and dispute arising under the Plan. As to such claims and disputes: (i) no legal action to recover Plan benefits or to enforce or clarify rights under the Plan under any provision of law, whether or not statutory, may be commenced until the claims and review procedure set forth herein have been exhausted in the entirety; and (ii) in any such legal action all explicit and all implicit determinations by the Committee (including, but not limited to, determinations as to whether the initial request for benefits or request for review was timely filed) shall be afforded the maximum deference permitted by law.
8.6. Deadline to File Legal Action. No legal action to recover Plan benefits or to enforce or clarify rights under the Plan under any provision of law, whether or not statutory, may be brought by any claimant on any matter pertaining to the Plan unless the legal action is commenced in the proper forum before the earlier of: (i) thirty (30) months after the date the claimant knew or reasonably should have known of the principal facts on which the claim is based, or (ii) six (6) months after the date the claimant has exhausted the claim and review procedure. If or to the extent that the claim relates to a failure to effect a Participant’s investment directions or a Participant’s election regarding contributions, the thirty (30) month period shall be nineteen (19) months.
8.7. Knowledge of Fact by Participant Imputed to Beneficiary and Others. Knowledge of all facts that a Participant knew or reasonably should have known shall be imputed to every claimant who is or claims to be a Beneficiary of the Participant or otherwise claims to derive an entitlement by reference to the Participant for the purpose of applying the previously specified periods.
ARTICLE 9
MISCELLANEOUS
9.1. No Guarantee of Employment or Retention to Perform Services. Neither the adoption and maintenance of the Plan nor the execution by the Company of a Deferral Election Agreement with any Participant shall be deemed to be a contract of employment or for the performance of services between the Company and any Participant. Nothing contained herein shall give any Participant the right to be retained in the employ of the Company or to perform services for the Company, or to interfere with the right of the Company to discharge any Participant at any time, nor shall it give the Company the right to require any Participant to remain in its employ or to perform services for it or to interfere with the Participant’s right to terminate his or her employment or performance of services at any time.
9.2. Release. Any payment of benefits to or for the benefit of a Participant or a Participant’s Beneficiaries that is made in good faith by the Company in accordance with the Company’s interpretation of its obligations hereunder, shall be in full satisfaction of all claims against the Company for benefits under the Plan to the extent of such payment.
9.3. Notices. Any notice permitted or required under the Plan shall be in writing and shall be hand-delivered or sent, postage prepaid, by first class mail, or by certified or registered mail with return receipt requested, to the Committee, if to the Company, or to the address last shown on the records of the Company, if to a Participant or Beneficiary. If a form or document must be filed with or received by the Company, the Committee, the SVP of Human Resources, the Human Resources Department or other entity (the “appropriate entity”), it must be actually received by the appropriate entity to be effective. The determination of whether or when a form or document has been received by the appropriate entity shall be made by the Committee on the basis of what documents are acknowledged by the appropriate entity to be in its actual possession without regard to the “mailbox rule” or similar rule of evidence. The absence of a document in the appropriate entity’s records and files shall be conclusive and binding proof that the document was not received by the appropriate entity.
9.4. Nonalienation. No benefit payable at any time under the Plan will be subject in any manner to alienation, sale, transfer, assignment, pledge, levy, attachment, or encumbrance of any kind, except with respect to a domestic relations order that the Committee determines to be a Qualified Domestic Relations Order.
9.5. Withholding. The Company may withhold from any payment of benefits or other compensation payable to a Participant or Beneficiary, or the Committee may direct the Trustee to withhold from any payment of benefits to a Participant or Beneficiary, such amounts as the Committee determines are reasonably necessary to pay any taxes or other amounts required to be withheld under applicable law.
9.6. Captions. Article and section headings and captions are provided for purposes of reference and convenience only and shall not be relied upon in any way to construe, define, modify, limit, or extend the scope of any provision of the Plan.
9.7. Binding Agreement. This Plan shall be binding on the parties hereto, their heirs, executors, administrators, and successors in interest.
9.8. Invalidity of Certain Provisions. If any provision of the Plan is held invalid or unenforceable, such invalidity or unenforceability shall not affect any other provision of the Plan and the Plan shall be construed and enforced as if such provision had not been included. The Plan is subject to section 409A of the Code. Each provision shall be interpreted and administered accordingly. If any provision of the Plan does not conform to the requirements of Section 409A, such that the inclusion of the provision would result in loss of the Plan’s intended tax deferral, the Plan shall be construed and enforced as if such provision had not been included.
9.9. No Other Agreements. The terms and conditions set forth herein, together with the Deferral Election Agreements entered into between the Company and Participants, constitute the entire understanding of the Company and the Participants with respect to the matters addressed herein.
9.10. Incapacity. In the event that any Participant is unable to care for his or her affairs because of illness or accident, any payment due may be paid to the Participant’s spouse, parent, brother, sister or other person deemed by the Committee to have incurred expenses for the care of such Participant, unless a duly qualified guardian or other legal representative has been appointed.
9.11. Counterparts. This Plan may be executed in any number of counterparts, each of which when duly executed by the Company shall be deemed to be an original, but all of which shall together constitute but one instrument, which may be evidenced by any counterpart.
9.12. Participating Affiliates. Any Affiliate of the Company may adopt the Plan with the permission of the Company and according to such rules as may be established from time to time by the Company in its discretion, and thereby become a “Participating Affiliate” in the Plan.
9.13. Sole Source of Benefits. Neither the Company nor any of its officers nor any member of its Board of Directors nor any member of the Committee in any way guarantee Participant Accounts against loss or depreciation, nor do they guarantee the payment of any benefit or amount which may become due and payable hereunder to any Participant, Beneficiary, or other person. Each Participant, Beneficiary, or other person entitled at any time to payments hereunder shall look solely to the assets of the Employer for such payments. If an Account shall have been distributed to a former Participant, Beneficiary, or any other person entitled to the receipt thereof, such former Participant, Beneficiary, or other person, as the case may be, shall have no further right or interest in the other assets.
9.14. Electronic Media. Notwithstanding anything in the Plan to the contrary, but subject to the requirements of ERISA, the Code, or other applicable law, any action or communication otherwise required to be taken or made in writing by a Participant or Beneficiary or by the Company or Committee shall be effective if accomplished by another method or methods required or made available by the Company or Committee, or their agent, with respect to that action or communication, including e-mail, telephone response systems, intranet systems, or the Internet.
9.15. ERISA Status. The Plan is maintained with the understanding that the Plan is an unfunded plan maintained primarily for the purpose of providing deferred compensation for a select group of management or highly compensated employees as provided in sections 201(2), 301(3) and 401(a)(1) of ERISA, and section 2520.104-23 of the regulations under ERISA. Each provision shall be interpreted and administered accordingly.
9.16. Internal Revenue Code Status. The Plan is maintained as a nonqualified deferred compensation arrangement under section 409A of the Code. Notwithstanding the foregoing, neither the Employer nor any of its officers, directors, agents or affiliates shall be obligated, directly or indirectly, to any Participant or any other person for any taxes, penalties, interest or like amounts that may be imposed on the Participant or other person on account of any amounts under this Plan or on account of any failure to comply with the Code.
9.17. Choice of Law. This instrument has been executed and delivered in the State of Florida and, except to the extent that federal law is controlling, shall be construed and enforced in accordance with the laws of the State of Florida (except that the state law will be applied without regard to any choice of law provisions).
9.18. Choice of Venue. Any claim or action brought with respect to this Plan shall be brought in the Federal courts of the State of Florida.
Dated: _____________________, 2023 THE MOSAIC COMPANY
By
Its
EX-21
4
exhibit21_20231231.htm
EX-21
Document
Exhibit 21
Subsidiary Information for The Mosaic Company
Certain subsidiaries of the Mosaic Company are listed below. Unnamed subsidiaries, considered in the aggregate as a single subsidiary, would not constitute a “significant subsidiary” as defined in Regulation S-X promulgated by the Securities and Exchange Commission.
|
|
|
|
|
|
|
|
|
| Subsidiary Name |
|
Jurisdiction of Incorporation |
| Mosaic Global Holdings Inc. |
|
Delaware |
| The Vigoro Corporation |
|
Delaware |
| Mosaic USA Holdings Inc. |
|
Delaware |
| Mosaic Fertilizer, LLC |
|
Delaware |
| Mosaic Potash Esterhazy Limited Partnership |
|
Saskatchewan |
| Mosaic Fertilizantes Netherlands C.V. |
|
Netherlands |
| Mosaic Crop Nutrition, LLC |
|
Delaware |
| Mosaic Esterhazy Holdings ULC |
|
Alberta |
| Mosaic Potash B.V. |
|
Netherlands |
| Mosaic Global Operations Inc. |
|
Delaware |
| Mosaic Global Sales, LLC |
|
Delaware |
| Mosaic Canada ULC |
|
Nova Scotia |
| Mosaic Fertilizantes P&K Ltda |
|
Brazil |
| Mosaic Netherlands Holding Company |
|
Delaware |
| Mosaic Fertilizantes do Brasil Ltda |
|
Brazil |
| Mosaic Canada Crop Nutrition, LP |
|
Manitoba |
| Phosphate Acquisition Partners L.P. |
|
Delaware |
| PRP-GP LLC |
|
Delaware |
| MOS Insurance Company |
|
Delaware |
| Mosaic Potash Carlsbad Inc |
|
Delaware |
| Mosaic Potash Colonsay ULC |
|
Nova Scotia |
| Tampa Port Services, LLC |
|
Delaware |
| Compañia Minera Miski Mayo S.R.L. |
|
Peru |
| Mosaic Phosphates B.V. |
|
Netherlands |
| Bayovar Holdings |
|
Luxembourg |
| Mosaic Brazil Fertilizantes B.V. |
|
Netherlands |
| MVM Resources International B.V. |
|
Netherlands |
| South Ft. Meade Land Management, Inc. |
|
Delaware |
| Mosaic Fertilizantes Limited |
|
Bahamas |
| Mosaic India Private Limited |
|
India |
EX-23.1
5
exhibit231_20231231.htm
EX-23.1
Document
Exhibit 23
Consent of Independent Registered Public Accounting Firm
We consent to the incorporation by reference in the registration statements (No. 333-175087, 333-177251, 333-216133, and 333-260777) on Form S-3 and registration statements (No. 333-120501, 333-120503, 333-120878, 333-142268, 333-198332, and 333-272271) on Form S-8 of our reports dated February 22, 2024, with respect to the consolidated financial statements of The Mosaic Company and the effectiveness of internal control over financial reporting.
/s/ KPMG LLP
Tampa, Florida
February 22, 2024
EX-23.3
6
exhibit233-tapiraconsent.htm
EX-23.3
exhibit233-tapiraconsent

Jerry DeWolfe, P.Geo. WSP Canada Inc. 237 4th Ave. SW Calgary, Alberta T2P 4K3 Canada CONSENT OF QUALIFIED PERSON I, Jerry DeWolfe, state that I am responsible for preparing or supervising the preparation of part(s) of the technical report summary titled ‘SEC S-K 1300 Technical Report Summary, Mosaic Fertilizantes: Complexo Mineração de Tapira’ with an effective date of December 31, 2023, as signed and certified by me (the “Technical Report Summary”). Furthermore, I state that: a. I consent to the public filing of the Technical Report Summary by The Mosaic Company; b. the document that the Technical Report Summary supports is the annual report on Form 10-K for the year ended December 31, 2023 (the “Document”); c. I consent to the use of my name, or any quotation from or summarization in the Document of the parts of the Technical Report Summary for which I am responsible, to the filing of the Technical Report Summary as an exhibit to the Document, and to the incorporation of such information into the following registration statements: Nos. 333-260777, 333-175087, 333-177251, and 333-216133 on Form S-3 and registration statements Nos. 333-120501, 333-120503, 333-120878, 333-142268, and 333-198332 and 333-272271 on Form S-8; d. I confirm that I have read the Document, and that the Document fairly and accurately reflects, in the form and context in which it appears, the information in the Technical Report Summary or in the part(s) thereof for which I am responsible. Dated at Calgary, Alberta, Canada this 20th day of February, 2024. Jerry DeWolfe, P.Geo. APEGA Member 101287

Terry L. Kremmel, P.E. WSP USA Inc. 701 Emerson Road, Suite 250, Creve Coeur, Missouri USA 63141 CONSENT OF QUALIFIED PERSON I, Terry L. Kremmel, state that I am responsible for preparing or supervising the preparation of part(s) of the technical report summary titled ‘SEC S-K 1300 Technical Report Summary, Mosaic Fertilizantes: Complexo Mineração de Tapira’ with an effective date of December 31, 2023, as signed and certified by me (the “Technical Report Summary”). Furthermore, I state that: a. I consent to the public filing of the Technical Report Summary by The Mosaic Company; b. the document that the Technical Report Summary supports is the annual report on Form 10-K for the year ended December 31, 2023 (the “Document”); c. I consent to the use of my name, or any quotation from or summarization in the Document of the parts of the Technical Report Summary for which I am responsible, to the filing of the Technical Report Summary as an exhibit to the Document, and to the incorporation of such information into the following registration statements: Nos. 333-260777, 333-175087, 333-177251, and 333- 216133 on Form S-3 and registration statements Nos. 333-120501, 333-120503, 333-120878, 333-142268, and 333-198332 and 333-272271 on Form S-8; d. I confirm that I have read the Document, and that the Document fairly and accurately reflects, in the form and context in which it appears, the information in the Technical Report Summary or in the part(s) thereof for which I am responsible. Dated at Columbia, Illinois this 20th day of February, 2024. Terry L. Kremmel, P.E. MO and NC SME Registered Member 179176
EX-24
7
exhibit24_20231231.htm
EX-24
Document
Exhibit 24
POWER OF ATTORNEY
The undersigned, being a Director and/or Officer of The Mosaic Company, a Delaware corporation (the "Company"), hereby constitutes and appoints Bruce M. Bodine, Clint C. Freeland and Philip E. Bauer his/her true and lawful attorneys and agents, each with full power and authority (acting alone and without the others) to execute and deliver in the name and on behalf of the undersigned as such Director and/or Officer, the Annual Report of the Company on Form 10-K for the calendar year ended December 31, 2023 (the "Annual Report") under the Securities Exchange Act of 1934, as amended, and to execute and deliver any and all amendments to the Annual Report for filing with the Securities and Exchange Commission; and in connection with the foregoing, to do any and all acts and things and execute any and all instruments which such attorneys and agents may deem necessary or advisable to enable the Company to comply with the securities laws of the United States and of any state or other political subdivision thereof. The undersigned hereby grants unto such attorney and agents, and each of them, full power of substitution and revocation in the premises and hereby ratifies and confirms all that such attorneys and agents may do or cause to be done by virtue of these presents.
|
|
|
|
|
|
|
|
|
|
|
|
|
|
|
| /s/ Cheryl K. Beebe |
|
|
/s/ David T. Seaton |
|
| Cheryl K. Beebe |
February 20, 2024 |
|
David T. Seaton |
February 18, 2024 |
|
|
|
|
|
| /s/ Gregory L. Ebel |
|
|
/s/ Steven M. Seibert |
|
| Gregory L. Ebel |
February 21, 2024 |
|
Steven M. Seibert |
February 21, 2024 |
|
|
|
|
|
| /s/ Timothy S. Gitzel |
|
|
/s/ João Roberto Gonçalves Teixeira |
|
| Timothy S. Gitzel |
February 17, 2024 |
|
João Roberto Gonçalves Teixeira |
February 20, 2024 |
|
|
|
|
|
| /s/ Emery N. Koenig |
|
|
/s/ Gretchen H. Watkins |
| Emery N. Koenig |
February 17, 2024 |
|
Gretchen H. Watkins |
February 18, 2024 |
|
|
|
|
|
| /s/ Jody L. Kuzenko |
|
|
/s/ Kelvin R. Westbrook |
|
| Jody L. Kuzenko |
February 21, 2024 |
|
Kelvin R. Westbrook |
February 18, 2024 |
EX-31.1
8
exhibit311_20231231.htm
EX-31.1
Document
Exhibit 31.1
Certification Required by Rule 13a-14(a)
I, Bruce M. Bodine, certify that:
|
|
|
|
|
|
| 1. |
I have reviewed this annual report on Form 10-K of The Mosaic Company; |
|
|
|
|
|
|
| 2. |
Based on my knowledge, this report does not contain any untrue statement of a material fact or omit to state a material fact necessary to make the statements made, in light of the circumstances under which such statements were made, not misleading with respect to the period covered by this report; |
|
|
|
|
|
|
| 3. |
Based on my knowledge, the financial statements, and other financial information included in this report, fairly present in all material respects the financial condition, results of operations and cash flows of the registrant as of, and for, the periods presented in this report; |
|
|
|
|
|
|
| 4. |
The registrant’s other certifying officer(s) and I are responsible for establishing and maintaining disclosure controls and procedures (as defined in Exchange Act Rules 13a-15(e) and 15d-15(e)) and internal control over financial reporting (as defined in Exchange Act Rules 13a-15(f) and 15d-15(f)) for the registrant and have: |
|
|
|
|
|
|
|
|
|
| |
a) |
Designed such disclosure controls and procedures, or caused such disclosure controls and procedures to be designed under our supervision, to ensure that material information relating to the registrant, including its consolidated subsidiaries, is made known to us by others within those entities, particularly during the period in which this report is being prepared; |
|
|
|
|
|
|
|
|
|
| |
b) |
Designed such internal control over financial reporting, or caused such internal control over financial reporting to be designed under our supervision, to provide reasonable assurance regarding the reliability of financial reporting and the preparation of financial statements for external purposes in accordance with generally accepted accounting principles; |
|
|
|
|
|
|
|
|
|
| |
c) |
Evaluated the effectiveness of the registrant’s disclosure controls and procedures and presented in this report our conclusions about the effectiveness of the disclosure controls and procedures, as of the end of the period covered by this report based on such evaluation; and |
|
|
|
|
|
|
|
|
|
| |
d) |
Disclosed in this report any change in the registrant’s internal control over financial reporting that occurred during the registrant’s most recent fiscal quarter (the registrant’s fourth fiscal quarter in the case of an annual report) that has materially affected, or is reasonably likely to materially affect, the registrant’s internal control over financial reporting; and |
|
|
|
|
|
|
| 5. |
The registrant’s other certifying officer(s) and I have disclosed, based on our most recent evaluation of internal control over financial reporting, to the registrant’s auditors and the audit committee of the registrant’s board of directors (or persons performing the equivalent function): |
|
|
|
|
|
|
|
|
|
| |
a) |
All significant deficiencies and material weaknesses in the design or operation of internal control over financial reporting which are reasonably likely to adversely affect the registrant’s ability to record, process, summarize and report financial information; and |
|
|
|
|
|
|
|
|
|
| |
b) |
Any fraud, whether or not material, that involves management or other employees who have a significant role in the registrant’s internal control over financial reporting. |
|
|
|
Date: February 22, 2024 |
|
| /s/ Bruce M. Bodine |
| Bruce M. Bodine |
| Chief Executive Officer and President |
| The Mosaic Company |
EX-31.2
9
exhibit312_20231231.htm
EX-31.2
Document
Exhibit 31.2
Certification Required by Rule 13a-14(a)
I, Clint C. Freeland, certify that:
|
|
|
|
|
|
| 1. |
I have reviewed this annual report on Form 10-K of The Mosaic Company; |
|
|
|
|
|
|
| 2. |
Based on my knowledge, this report does not contain any untrue statement of a material fact or omit to state a material fact necessary to make the statements made, in light of the circumstances under which such statements were made, not misleading with respect to the period covered by this report; |
|
|
|
|
|
|
| 3. |
Based on my knowledge, the financial statements, and other financial information included in this report, fairly present in all material respects the financial condition, results of operations and cash flows of the registrant as of, and for, the periods presented in this report; |
|
|
|
|
|
|
| 4. |
The registrant’s other certifying officer(s) and I are responsible for establishing and maintaining disclosure controls and procedures (as defined in Exchange Act Rules 13a-15(e) and 15d-15(e)) and internal control over financial reporting (as defined in Exchange Act Rules 13a-15(f) and 15d-15(f)) for the registrant and have: |
|
|
|
|
|
|
|
|
|
| |
a) |
Designed such disclosure controls and procedures, or caused such disclosure controls and procedures to be designed under our supervision, to ensure that material information relating to the registrant, including its consolidated subsidiaries, is made known to us by others within those entities, particularly during the period in which this report is being prepared; |
|
|
|
|
|
|
|
|
|
| |
b) |
Designed such internal control over financial reporting, or caused such internal control over financial reporting to be designed under our supervision, to provide reasonable assurance regarding the reliability of financial reporting and the preparation of financial statements for external purposes in accordance with generally accepted accounting principles; |
|
|
|
|
|
|
|
|
|
| |
c) |
Evaluated the effectiveness of the registrant’s disclosure controls and procedures and presented in this report our conclusions about the effectiveness of the disclosure controls and procedures, as of the end of the period covered by this report based on such evaluation; and |
|
|
|
|
|
|
|
|
|
| |
d) |
Disclosed in this report any change in the registrant’s internal control over financial reporting that occurred during the registrant’s most recent fiscal quarter (the registrant’s fourth fiscal quarter in the case of an annual report) that has materially affected, or is reasonably likely to materially affect, the registrant’s internal control over financial reporting; and |
|
|
|
|
|
|
| 5. |
The registrant’s other certifying officer(s) and I have disclosed, based on our most recent evaluation of internal control over financial reporting, to the registrant’s auditors and the audit committee of the registrant’s board of directors (or persons performing the equivalent function): |
|
|
|
|
|
|
|
|
|
| |
a) |
All significant deficiencies and material weaknesses in the design or operation of internal control over financial reporting which are reasonably likely to adversely affect the registrant’s ability to record, process, summarize and report financial information; and |
|
|
|
|
|
|
|
|
|
| |
b) |
Any fraud, whether or not material, that involves management or other employees who have a significant role in the registrant’s internal control over financial reporting. |
|
|
|
Date: February 22, 2024 |
|
| /s/ Clint C. Freeland |
| Clint C. Freeland |
| Senior Vice President and Chief Financial Officer |
| The Mosaic Company |
EX-32.1
10
exhibit321_20231231.htm
EX-32.1
Document
Exhibit 32.1
Certification of Chief Executive Officer Required by Rule 13a-14(b)
and Section 1350 of Chapter 63 of Title 18 of the United States Code
I, Bruce M. Bodine, the Chief Executive Officer and President of The Mosaic Company, certify that (i) the Annual Report on Form 10-K for the year ended December 31, 2023 of The Mosaic Company fully complies with the requirements of Section 13(a) or 15(d) of the Securities Exchange Act of 1934 and (ii) the information contained in such report fairly presents, in all material respects, the financial condition and results of operations of The Mosaic Company.
|
|
|
| February 22, 2024 |
|
| /s/ Bruce M. Bodine |
| Bruce M. Bodine |
| Chief Executive Officer and President |
| The Mosaic Company |
EX-32.2
11
exhibit322_20231231.htm
EX-32.2
Document
Exhibit 32.2
Certification of Chief Financial Officer Required by Rule 13a-14(b)
and Section 1350 of Chapter 63 of Title 18 of the United States Code
I, Clint C. Freeland, the Senior Vice President and Chief Financial Officer of The Mosaic Company, certify that (i) the Annual Report on Form 10-K for the year ended December 31, 2023 of The Mosaic Company fully complies with the requirements of Section 13(a) or 15(d) of the Securities Exchange Act of 1934 and (ii) the information contained in such report fairly presents, in all material respects, the financial condition and results of operations of The Mosaic Company.
|
|
|
|
| February 22, 2024 |
|
| /s/ Clint C. Freeland |
| Clint C. Freeland |
| Senior Vice President and Chief Financial Officer |
| The Mosaic Company |
EX-95
12
exhibit9520231231.htm
EX-95
Document
Exhibit 95
MINE SAFETY DISCLOSURES
The following table shows, for each of our U.S. mines that is subject to the Federal Mine Safety and Health Act of 1977 (“MSHA”), the information required by Section 1503(a) of the Dodd-Frank Wall Street Reform and Consumer Protection Act and Item 104 of Regulation S-K. Section references are to sections of MSHA.
|
|
|
|
|
|
|
|
|
|
|
|
|
|
|
|
|
|
|
|
|
|
|
|
|
|
|
|
|
|
|
|
|
|
|
|
|
|
|
|
|
|
|
|
|
|
|
|
|
|
|
|
|
|
|
|
|
|
|
|
|
Potash Mine |
|
Florida Phosphate Rock Mines |
Year Ended December 31, 2023 |
|
Carlsbad,
New Mexico
|
|
Four Corners |
|
South Fort Meade |
|
Wingate |
|
South Pasture |
|
Section 104 citations for violations of mandatory health or safety standards that could significantly and substantially contribute to the cause and effect of a mine safety or health hazard (#) |
|
30 |
|
15 |
|
4 |
|
4 |
|
0 |
|
|
Section 104(b) orders (#) |
|
0 |
|
0 |
|
0 |
|
0 |
|
0 |
|
|
Section 104(d) citations and orders (#) |
|
0 |
|
0 |
|
0 |
|
0 |
|
0 |
|
|
Section 110(b)(2) violations (#) |
|
0 |
|
0 |
|
0 |
|
0 |
|
0 |
|
|
Section 107(a) orders (#) |
|
0 |
|
0 |
|
0 |
|
0 |
|
0 |
|
|
Proposed assessments under MSHA (whole dollars) |
|
$373,189 |
|
$31,815 |
|
$5,442 |
|
$5,103 |
|
$203 |
|
|
Mining-related fatalities (#) |
|
0 |
|
0 |
|
0 |
|
0 |
|
0 |
|
|
Section 104(e) notice |
|
No |
|
No |
|
No |
|
No |
|
No |
|
Notice of the potential for a pattern of violations under Section 104(e) |
|
No |
|
No |
|
No |
|
No |
|
No |
|
Legal actions before the Federal Mine Safety and Health Review Commission (“FMSHRC”) initiated (#) |
|
2 |
|
2 |
|
0 |
|
0 |
|
0 |
|
|
Legal actions before the FMSHRC resolved (#) |
|
2 |
|
2 |
|
0 |
|
0 |
|
0 |
|
|
Legal actions pending before the FMSHRC, end of period: |
|
|
|
|
|
|
|
|
|
|
|
|
Contests of citations and orders referenced in Subpart B of 29 CFR Part 2700 (#) |
|
1 |
|
0 |
|
0 |
|
0 |
|
0 |
|
|
|
Contests of proposed penalties referenced in Subpart C of 29 CFR Part 2700 (#) |
|
0 |
|
0 |
|
0 |
|
0 |
|
0 |
|
|
|
Complaints for compensation referenced in Subpart D of 29 CFR Part 2700 (#) |
|
0 |
|
0 |
|
0 |
|
0 |
|
0 |
|
|
|
Complaints of discharge, discrimination or interference referenced in Subpart E of 29 CFR Part 2700 (#) |
|
0 |
|
0 |
|
0 |
|
0 |
|
0 |
|
|
|
Applications for temporary relief referenced in Subpart F of 29 CFR Part 2700 (#) |
|
0 |
|
0 |
|
0 |
|
0 |
|
0 |
|
|
|
Appeals of judges’ decisions or orders referenced in Subpart H of 29 CFR Part 2700 (#) |
|
0 |
|
0 |
|
0 |
|
0 |
|
0 |
|
|
|
Total pending legal actions (#) |
|
1 |
|
0 |
|
0 |
|
0 |
|
0 |
|
EX-96.4
13
a2023tapirask1300trs.htm
EX-96.4
a2023tapirask1300trs

REPORT SEC S-K 1300 Technical Report Summary Mosaic Fertilizantes: Complexo Mineração de Tapira Submitted to: The Mosaic Company 101 East Kennedy Blvd Suite 2500 Tampa, Florida 33602 Submitted by: WSP USA Inc. 701 Emerson Road, Suite 250, Creve Coeur, Missouri 63141 +1 314-984-8800 31406539.009-001-TRS-Rev0 Effective Date: December 31, 2023 Report Date: February 20, 2024

Report Date: February 20, 2024 31406539.009-001-TRS-Rev0 Effective Date: December 31, 2023 Complexo Mineração de Tapira ii Table of Contents 1.0 EXECUTIVE SUMMARY ............................................................................................................................. 1-1 1.1 Property Description and Ownership ................................................................................................ 1-1 1.2 Geology and Mineralization ............................................................................................................... 1-1 1.3 Status of Exploration ......................................................................................................................... 1-1 1.4 Development and Operations ........................................................................................................... 1-2 1.5 Mineral Resource Estimate ............................................................................................................... 1-2 1.6 Mineral Reserve Estimate ................................................................................................................. 1-3 1.7 Capital and Operating Costs ............................................................................................................. 1-4 1.8 Economic Analysis ............................................................................................................................ 1-4 1.9 Permitting Requirements ................................................................................................................... 1-4 1.10 Qualified Person’s Conclusions and Recommendations .................................................................. 1-5 2.0 INTRODUCTION .......................................................................................................................................... 2-1 2.1 Registrant Information ....................................................................................................................... 2-1 2.2 Terms of Reference and Purpose ..................................................................................................... 2-1 2.3 Sources of Information ...................................................................................................................... 2-4 2.4 Personal Inspection Summary .......................................................................................................... 2-4 2.5 Previously Filed Technical Report Summary Reports ...................................................................... 2-5 3.0 PROPERTY DESCRIPTION ........................................................................................................................ 3-1 3.1 Property Location .............................................................................................................................. 3-1 3.2 Mineral Rights ................................................................................................................................... 3-1 3.3 Description of Property Rights .......................................................................................................... 3-3 3.4 Royalty Payments ............................................................................................................................. 3-3 3.5 Significant Encumbrances to the Property ........................................................................................ 3-3 3.6 Other Significant Factors and Risks Affecting Access ...................................................................... 3-3 4.0 ACCESSIBILITY, CLIMATE, LOCAL RESOURCES, INFRASTRUCTURE, AND PHYSIOGRAPHY ...... 4-1 4.1 Topography and Land Description .................................................................................................... 4-1

Report Date: February 20, 2024 31406539.009-001-TRS-Rev0 Effective Date: December 31, 2023 Complexo Mineração de Tapira iii 4.2 Access to the Property ...................................................................................................................... 4-1 4.3 Climate Description ........................................................................................................................... 4-1 4.4 Availability of Required Infrastructure ............................................................................................... 4-1 5.0 HISTORY ...................................................................................................................................................... 5-1 6.0 GEOLOGICAL SETTING, MINERALIZATION, AND DEPOSIT ................................................................. 6-1 6.1 Regional Geology .............................................................................................................................. 6-1 6.2 Local and Property Geology .............................................................................................................. 6-1 6.3 Mineralization .................................................................................................................................... 6-4 7.0 EXPLORATION ............................................................................................................................................ 7-1 7.1 Exploration Work ............................................................................................................................... 7-1 7.2 Geological Exploration Drilling .......................................................................................................... 7-1 7.3 Hydrological Sampling and Hydrogeological Drilling ........................................................................ 7-5 7.4 Geotechnical Drilling ....................................................................................................................... 7-12 8.0 SAMPLE PREPARATION, ANALYSES, AND SECURITY ........................................................................ 8-1 8.1 Site Sample Preparation Methods and Security ............................................................................... 8-1 8.2 Laboratory Sample Preparation Methods and Analytical Procedures .............................................. 8-3 8.3 Quality Control and Quality Assurance Programs ............................................................................ 8-4 8.4 Qualified Person’s Opinion ................................................................................................................ 8-6 9.0 DATA VERIFICATION ................................................................................................................................. 9-1 9.1 Site Visit Data Verification ................................................................................................................. 9-1 9.2 Mineral Resources ............................................................................................................................ 9-4 9.3 Mine Plan, Cost Model, and Mineral Reserves Review .................................................................... 9-5 10.0 MINERAL BENEFICIATION AND METALLURGICAL TESTING ............................................................ 10-1 10.1 Metallurgical Testing and Analytical Procedures ............................................................................ 10-1 10.2 Representativeness of Metallurgical Testing .................................................................................. 10-2 10.3 Laboratory Used for Metallurgical Testing ...................................................................................... 10-2 10.4 Recovery Estimates ........................................................................................................................ 10-2 10.5 Qualified Person’s Opinion .............................................................................................................. 10-5

Report Date: February 20, 2024 31406539.009-001-TRS-Rev0 Effective Date: December 31, 2023 Complexo Mineração de Tapira iv 11.0 MINERAL RESOURCE ESTIMATES ........................................................................................................ 11-1 11.1 Key Assumptions, Parameters, and Methods ................................................................................. 11-1 11.2 Mineral Resource Estimate ........................................................................................................... 11-18 11.3 Basis for Establishing the Prospects of Economic Extraction for Mineral Resources .................. 11-20 11.4 Mineral Resource Classification .................................................................................................... 11-23 11.5 Mineral Resource Uncertainty Discussion .................................................................................... 11-26 11.6 Assumptions for Multiple Commodity Resource Estimate ............................................................ 11-28 11.7 Qualified Person’s Opinion on Factors that are Likely to Influence the Prospect of Economic Extraction ...................................................................................................................................... 11-28 12.0 MINERAL RESERVE ESTIMATES ........................................................................................................... 12-1 12.1 Key Assumptions, Parameters, and Methods ................................................................................. 12-1 12.2 Modifying Factors ............................................................................................................................ 12-3 12.3 Mineral Reserve Classification ...................................................................................................... 12-17 12.4 Mineral Reserve Estimate ............................................................................................................. 12-17 12.5 Qualified Person’s Opinion on Risk Factors that could Materially Affect the Mineral Reserve Estimates ....................................................................................................................................... 12-18 13.0 MINING METHODS .................................................................................................................................... 13-1 13.1 Production Tasks ............................................................................................................................ 13-1 13.2 Parameters Relative to the Mine Design and Plans ....................................................................... 13-2 13.3 Mine Design Factors ....................................................................................................................... 13-5 13.4 Stripping and Backfilling Requirements ........................................................................................ 13-12 13.5 Mining Fleet, Machinery, and Personnel Requirements ............................................................... 13-13 14.0 BENEFICIATION AND RECOVERY METHODS ...................................................................................... 14-1 14.1 Beneficiation Plant .......................................................................................................................... 14-1 14.2 Beneficiation Plant Throughput and Design, Equipment Characteristics, and Specifications ........ 14-6 14.3 Projected Requirements for Energy, Water, Process Materials, and Personnel ............................ 14-9 15.0 INFRASTRUCTURE .................................................................................................................................. 15-1 16.0 MARKET STUDIES .................................................................................................................................... 16-1 16.1 Markets ............................................................................................................................................ 16-1

Report Date: February 20, 2024 31406539.009-001-TRS-Rev0 Effective Date: December 31, 2023 Complexo Mineração de Tapira v 16.1 Commodity Price Forecasts ............................................................................................................ 16-2 16.2 Contracts ......................................................................................................................................... 16-3 17.0 ENVIRONMENTAL STUDIES, PERMITTING, AND PLANS, NEGOTIATIONS, OR AGREEMENTS WITH LOCAL INDIVIDUALS OR GROUPS .............................................................................................. 17-1 17.1 Environmental Studies .................................................................................................................... 17-1 17.2 Requirements and Plans for Waste and Tailings Disposal, Site Monitoring, and Water Management during Operations and After Mine Closure ............................................................... 17-3 17.3 Permitting Requirements ............................................................................................................... 17-11 17.4 Plans, Negotiations, or Agreements with Local Individuals, or Groups ........................................ 17-13 17.5 Descriptions of any Commitments to Ensure Local Procurement and Hiring ............................... 17-14 17.6 Mine Closure Plans ....................................................................................................................... 17-14 17.7 Qualified Person’s Opinion on the Adequacy of Current Plans to Address Any Issues Related to Environmental Compliance, Permitting, and Local Individuals, or Groups ............................... 17-16 18.0 CAPITAL AND OPERATING COSTS ....................................................................................................... 18-1 18.1 Risks Associated with Estimation Methods ..................................................................................... 18-2 19.0 ECONOMIC ANALYSIS ............................................................................................................................ 19-1 19.1 Principal Assumptions ..................................................................................................................... 19-1 19.2 Cashflow Forecast .......................................................................................................................... 19-1 19.3 Sensitivity Analysis .......................................................................................................................... 19-6 20.0 ADJACENT PROPERTIES ........................................................................................................................ 20-1 21.0 OTHER RELEVANT DATA AND INFORMATION .................................................................................... 21-1 22.0 INTERPRETATION AND CONCLUSIONS ............................................................................................... 22-1 22.1 Mineral Resources .......................................................................................................................... 22-1 22.2 Mineral Reserves ............................................................................................................................ 22-3 23.0 RECOMMENDATIONS .............................................................................................................................. 23-1 23.1 Mineral Resources .......................................................................................................................... 23-1 23.2 Mineral Reserves ............................................................................................................................ 23-1 24.0 REFERENCES ........................................................................................................................................... 24-1 25.0 RELIANCE ON INFORMATION PROVIDED BY THE REGISTRANT ..................................................... 25-1

Report Date: February 20, 2024 31406539.009-001-TRS-Rev0 Effective Date: December 31, 2023 Complexo Mineração de Tapira vi TABLES Table 2.1: Abbreviations and Acronyms ................................................................................................................ 2-2 Table 3.1: List of Mining Permits for CMT ............................................................................................................. 3-1 Table 5.1: Historical Production for CMT (Last 10 Years) ..................................................................................... 5-1 Table 7.1: Summary of Exploration Core Drilling Campaigns ............................................................................... 7-2 Table 7.2: Hydraulic Conductivity and Storage Values Obtained from the Calibration for the Years 2008, 2012, 2014, 2016, and 2021 .................................................................................................................. 7-9 Table 7.3: Calibrated Values of Hydraulic Conductivity, Effective Porosity, and Recharge Rates of Each Hydrogeological Unit Represented in the 2022 Model ......................................................................... 7-10 Table 7.4: Compilation of Data from the Geotechnical Analysis Campaigns at CMT ......................................... 7-14 Table 7.5: Material Geotechnical Properties ....................................................................................................... 7-14 Table 8.1: Mean Density Values by Weathering and Lithology Unit ..................................................................... 8-4 Table 8.2: Specifications of Certified Reference Materials used by Mosaic for Tapira ......................................... 8-6 Table 9.1: CMT Site Visit Drill Hole Collar Coordinates Verification ..................................................................... 9-2 Table 10.1: Main Lithotypes ................................................................................................................................ 10-2 Table 10.2: Linear Regression Equations used to Predict Mass Recovery (ISAB horizon) ................................ 10-3 Table 10.3: Linear Regression Equations used to Predict Mass Recovery (RSI horizon) .................................. 10-3 Table 10.4: Annual Concentrate Quality .............................................................................................................. 10-4 Table 11.1: Summary of Drill Holes Used for the Models ................................................................................... 11-1 Table 11.2: Diamond Core Drill Hole Campaigns by Year and Use in Mineral Resource Evaluation Activities ............................................................................................................................................... 11-2 Table 11.3: CMT Raw Data Statistics for the Main Geological Domains including all Core Drilling Data (1967-2022) .......................................................................................................................................... 11-4 Table 11.4: Variogram Model Parameters - Resource Domains ....................................................................... 11-10 Table 11.5: Block Model Dimensions ................................................................................................................ 11-12 Table 11.6: Block Model Variables .................................................................................................................... 11-12 Table 11.7:Block Model Estimation Domains .................................................................................................... 11-13 Table 11.8: Dry Density OK Parameters for Resource Domain Estimation ...................................................... 11-14 Table 11.9: Variables Estimated by Ordinary Kriging ........................................................................................ 11-15 Table 11.10: P2O5 OK Parameters for Resource Domain Estimation ............................................................... 11-16 Table 11.11: Linear Regression Equations used to Predict Mass Recovery in the Resource Block Model (ISAB horizon) .................................................................................................................................... 11-17 Table 11.12: Linear Regression Equations used to Predict Mass Recovery in the Resource Block Model (RSI horizon) ...................................................................................................................................... 11-17

Report Date: February 20, 2024 31406539.009-001-TRS-Rev0 Effective Date: December 31, 2023 Complexo Mineração de Tapira vii Table 11.13: Exclusive In-Situ Mineral Resource Estimate as of December 30, 2023 ..................................... 11-19 Table 11.14: Difference in Exclusive Mineral Resource Estimates from 2021 to 2023 .................................... 11-20 Table 11.15: Mineral Resource Optimization Pit Limit Parameters ................................................................... 11-21 Table 11.16: CMT Mineral Resource Classification .......................................................................................... 11-24 Table 11.17: Mineral Resources Uncertainty .................................................................................................... 11-27 Table 12.1: Block Model Estimation Domains ..................................................................................................... 12-2 Table 12.2: Linear Regression Equations used to Predict Mass Recovery (ISAB horizon) ................................ 12-7 Table 12.3: Linear Regression Equations used to Predict Mass Recovery (RSI horizon) .................................. 12-7 Table 12.4: Mining Concessions Used as a Mineral Reserves Estimate Constraint .......................................... 12-8 Table 12.5: COG Calculations ........................................................................................................................... 12-10 Table 12.6: Reserve between Operational COG and Breakeven COG ............................................................ 12-10 Table 12.7: Tapira Pit Optimization Mining Concessions and Their Impact on Pit Optimization ...................... 12-12 Table 12.8: Tapira Economic Inputs .................................................................................................................. 12-12 Table 12.9: CMT - Summary of ROM and Concentrate Mineral Reserves at December 31, 2023 Based on a Fixed Net-Back Price of Concentrate ................................................................................................. 12-18 Table 13.1: Geotechnical Parameters used in the Stability Analysis .................................................................. 13-3 Table 13.2: Proposed Geometric Parameters for Tapira Pit Design ................................................................... 13-3 Table 13.3: Recommended Design Parameters for Tapira Final Pit ................................................................... 13-4 Table 13.4: Mining Quantities by Phase through 2057 ....................................................................................... 13-6 Table 13.5: Tapira LOM Plan Production Statistics ............................................................................................. 13-8 Table 13.6: OSF Design Specifications ............................................................................................................. 13-12 Table 13.7: LOM Plan Average Waste Haul Distances (km) ............................................................................ 13-13 Table 14.1: Plant Availability and Throughput ..................................................................................................... 14-9 Table 14.2: Tapira Consumptive Use 2018 through 2022 ................................................................................. 14-10 Table 16.1: CRU CFR MAP Pricing ..................................................................................................................... 16-2 Table 17.1: Tailings Dry Density .......................................................................................................................... 17-6 Table 17.2: Current and Designed Characteristics of Tailings Dams ................................................................. 17-7 Table 17.3: Tailings Volume to be Stored in TSF ................................................................................................ 17-8 Table 17.4: Stockpiled Tailings and Magnetite .................................................................................................... 17-9 Table 17.5: Environmental Authorizations for Tapira ........................................................................................ 17-12 Table 18.1: Total LOM Capital, Operating, and Other Costs (R$ Millions) ......................................................... 18-1 Table 19.1: Cashflow (real 2023 R$ terms) ......................................................................................................... 19-2

Report Date: February 20, 2024 31406539.009-001-TRS-Rev0 Effective Date: December 31, 2023 Complexo Mineração de Tapira viii Table 19.2: Cashflow (real 2023 USD$ terms) .................................................................................................... 19-4 Table 19.3: Sensitivity Analysis (Millions of Reais) ............................................................................................. 19-7 Table 19.4: Sensitivity Analysis (Millions of US Dollars) ..................................................................................... 19-7 FIGURES Figure 3.1: Project Location Map ........................................................................................................................... 3-2 Figure 6.1: Regional Geology Map ........................................................................................................................ 6-2 Figure 6.2: Local Geology Map ............................................................................................................................. 6-3 Figure 6.3: Vertical Cross Section - Weathering and Lithology Models ................................................................ 6-6 Figure 7.1: Exploration Drill Hole Location Map .................................................................................................... 7-4 Figure 7.2: Hydrogeological Drill Hole Location Map ............................................................................................ 7-7 Figure 7.3: Potentiometric Map of the Interior of the Dome (top) and Map of Directions of Ground Water Flow (bottom) ......................................................................................................................................... 7-8 Figure 7.4: Geotechnical Drill Hole Locations ..................................................................................................... 7-15 Figure 8.1: Current Mosaic Sampling and Assay Flowsheet ................................................................................. 8-3 Figure 9.1: QP Drill Hole Collar Verification .......................................................................................................... 9-3 Figure 11.1: Lithology Model ............................................................................................................................... 11-5 Figure 11.2: Weathering Model ........................................................................................................................... 11-6 Figure 11.3: Histogram of Raw Sample Length for Resource Domains ............................................................. 11-7 Figure 11.4: Histogram of Composite Sample Length for Resource Domains ................................................... 11-8 Figure 11.5: P2O5 Variograms by Domain ......................................................................................................... 11-11 Figure 11.6: Contact Analysis for P2O5 for the Four Main Resource Domains ................................................. 11-14 Figure 11.7: Mineral Resource Pit Outline ......................................................................................................... 11-22 Figure 11.8: CMT Mineral Resource Classification Map ................................................................................... 11-25 Figure 12.1: Ore Block Surrounded by Waste Blocks ......................................................................................... 12-5 Figure 12.2: Dilution of the Blocks Located on the Edge of the Mine/Waste Interface Due to the Influence of the Face Angle ..................................................................................................................................... 12-5 Figure 12.3: Trigonometry to Calculate the Mass of the Upper and Lower Prisms............................................. 12-6 Figure 12.4: Tapira Grade-Tonnage Curve ....................................................................................................... 12-11 Figure 12.5: Summary of Tapira Nested Pit Analysis ........................................................................................ 12-14 Figure 12.6: CMT Ultimate Pit Design and Extents ........................................................................................... 12-16 Figure 13.1: Tapira Typical Mining Configuration ................................................................................................ 13-2

Report Date: February 20, 2024 31406539.009-001-TRS-Rev0 Effective Date: December 31, 2023 Complexo Mineração de Tapira ix Figure 13.2: Mining Phases ................................................................................................................................. 13-7 Figure 13.3: Annual Ore Plant Feed and Grade with Mass Recovery ................................................................ 13-9 Figure 13.4: Annual Concentrate Production .................................................................................................... 13-10 Figure 13.5: LOM Plan Annual Production (ROM) ............................................................................................ 13-11 Figure 13.6: Annual Excavator Fleet Size ......................................................................................................... 13-15 Figure 13.7: Annual Haul Truck Fleet Size ........................................................................................................ 13-16 Figure 13.8: Tapira Workforce Life-of-Mine Plan .............................................................................................. 13-17 Figure 14.1: Fine Crushing Circuit Block Flow Diagram ...................................................................................... 14-1 Figure 14.2: Granular Ore Milling and Flotation Block Flow Diagram ................................................................. 14-2 Figure 14.3: Friable Ore Milling and Flotation Block Flow Diagram .................................................................... 14-3 Figure 14.4: Conventional Concentrate Preparation Circuit ................................................................................ 14-4 Figure 14.5: Microfines Separation Circuit .......................................................................................................... 14-5 Figure 15.1: Infrastructure Layout ....................................................................................................................... 15-4

Report Date: February 20, 2024 31406539.009-001-TRS-Rev0 Effective Date: December 31, 2023 Complexo Mineração de Tapira 1-1 1.0 EXECUTIVE SUMMARY 1.1 Property Description and Ownership Complexo Mineração de Tapira (CMT) is located in the western portion of the state of Minas Gerais, in the southeast of Brazil to the north of the town of Tapira and approximately 35 kilometers (km) south-southeast of the city of Araxá. The mine is located 420 km by road from the Minas Gerais state capital of Belo Horizonte, via the BR-262 highway to Araxá and then the BR-146 highway to Tapira. CMT complex consists of a mine and a phosphate beneficiation plant. The beneficiation plant produces phosphate conventional and ultrafine concentrate which is sent by pipeline (conventional) and truck (ultrafine) to a local Mosaic chemical plant for finished product production. The Tapira mining complex has been in operation since 1978 and has produced more than 70 Million tonnes (Mt) of phosphate concentrate. The current capacity of the beneficiation plant is 2 Million tonnes per year (Mtpy). CMT is owned by Mosaic Fertilizantes P&K S.A. (Mosaic Fertilizantes), which is a subsidiary of The Mosaic Company, who acquired the asset from Vale S.A. (Vale) in January 2018. Mosaic currently holds a total of eight Mining Concessions and one Mining Concession Application that encompass CMT. 1.2 Geology and Mineralization The Tapira phosphate deposit is part of a series of Late-Cretaceous, carbonatite-bearing alkaline ultramafic plutonic complexes belong to the Alto Paranaiba Igneous Province. The Tapira igneous rocks intrude the phyllites, schists, and quartzites of the Late-Proterozoic Brasília mobile belt. The Tapira igneous complex is roughly elliptical, 35 square kilometers (km2) in area and consists predominantly of alkaline pyroxenite rocks with subordinate carbonatite, serpentinite (dunite), glimmerite, syenite, and ultramafic potassic dikes. The tropical weathering regime prevailing in the region and the inward drainage patterns developed from the weathering-resistant quartzite margins of the dome structures resulted in the development of an extremely thick soil cover in most of the complexes. The extreme weathering process was responsible for the residual concentration of apatite. The main geological types identified in the deposit are a combination of the igneous protoliths (bebedourites, phoscorites, and carbonatites) and the products of the weathering process. 1.3 Status of Exploration The geological structure of the alkaline complex of Tapira was first recognized in 1953, through magnetometric and radiometric investigations carried out by the Brazil-Germany Project. Extensive exploration works were undertaken between 1971 and 1973, with particular focus on the occurrences of titanium. From 1973 to 1977, the exploration priorities changed to occurrences of phosphate, with the aim of replacing the massive imports of fertilizers in the agricultural sector which was then undergoing a period of expansion in Brazil. Exploration drilling started in 1967 and has continued in 2023. Including the 2022 drilling program that Mosaic completed, a total of 2,192 core drill holes as well as and 11,103 percussive drill holes were completed at CMT..

Report Date: February 20, 2024 31406539.009-001-TRS-Rev0 Effective Date: December 31, 2023 Complexo Mineração de Tapira 1-2 1.4 Development and Operations The Tapira mine has been in operation since 1978. All required fixed and permanent infrastructure of power, pipelines and primary roadways, and mine access are established. Drainage, water controls, and mine access roads and ramps are established for current operations and will be expanded and continued as the pit progresses through its planned life of operations. The ore at Tapira is recovered using open-pit conventional truck and shovel mining methods, due to the proximity of the ore to the surface and the physical characteristics of the deposit. Since this is a well-established operation, the deposit, mining, beneficiation, and environmental aspects of the mine are very well understood. The knowledge for CMT is based on the collective experience of personnel from Mosaic site operations and technical disciplines gained during years of phosphate mining and ore beneficiation. This knowledge is supported by years of production data and observations from CMT. A Life-of-Mine (LOM) plan and pit design are established for 2024 to 2057. LOM plan pit design is based on current geotechnical and hydrology designs, and extraction limits, which are dictated by mining recovery and dilution factors, Cut-off Grade (COG) estimation, and economic pit optimization analysis. Pit design includes detailed design factors for wall slopes, berm widths, pit bottom, and access ramp grades and widths. The LOM plan includes annual forecasts of waste removal and transportation and ore extraction. Waste is placed in one of 6 designated and designed Overburden Storage Facilities (OSFs). Two of the OSFs are designated for higher grade titanium overburden. Ore is transported to a single concentrator plant destination. The mine plan life is approximately 34 years, as of December 31, 2023, with Run-of-Mine (ROM) ore tonnages delivered to the beneficiation plant ranging from 12.6 to 18.9 Mtpy on a wet basis, resulting in the production of approximately 2.0 Mtpy of concentrated phosphate. The mining equipment fleet planned includes a range of 3 to 11 hydraulic excavators, 27 to 52 end-dump haul trucks, and mine support equipment to support the mine plan production requirements. Hourly workforce will range from 355 to 493 workers supported by approximately 40 operational and technical staff. 1.5 Mineral Resource Estimate This sub-section contains forward-looking information related to Mineral Resource estimates for the Mine. The material factors that could cause actual results to differ materially from the conclusions, estimates, designs, forecasts or projections in the forward-looking information include any significant differences from one or more of the material factors or assumptions that were set forth in this sub-section including geological and grade interpretations and controls and assumptions and forecasts associated with establishing the prospects for economic extraction. The Mineral Resources were estimated based on the long-standing exploration drilling and sampling completed at CMT since 19676. The drilling results were loaded into the geological database, verified, and vetted for errors, and then used in the geological model to create the lithology and weathering surfaces. The geological model was used in creating the block model, where geological domains based on the lithology and weathering surfaces were utilized to interpret grade, density, and mass recovery in a geologically appropriate manner. Exploratory Data Analysis (EDA) and geostatistical analysis were completed on the raw and composite data sets to help define

Report Date: February 20, 2024 31406539.009-001-TRS-Rev0 Effective Date: December 31, 2023 Complexo Mineração de Tapira 1-3 interpolation parameters and Mineral Resource classifications. The Mineral Resources were restricted based on an optimized pit limit that considered COG, price, mining costs, infrastructure limitations, and mineral licenses. The Mineral Resources are exclusive of Mineral Reserves and include approximately 78.0 Mt of Measured and Indicated Mineral Resources with a P2O5ap grade of 8.6%. There is an additional 181.2 Mt of Inferred Mineral Resources with a P2O5ap grade of 9.2%. 1.6 Mineral Reserve Estimate This sub-section contains forward-looking information related to Mineral Reserve estimates for the Mine. The material factors that could cause actual results to differ materially from the conclusions, estimates, designs, forecasts or projections in the forward-looking information include any significant differences from one or more of the material factors or assumptions that were set forth in this sub-section including Mineral Resource model tonnes and grade, modifying factors including mining and recovery factors, production rate and schedule, mining equipment productivity, commodity market and prices and projected operating and capital costs. A Mineral Reserve estimate has been prepared for CMT. Reserves are limited by the CMT property boundary, and the ultimate pit designed for the LOM plan, which was limited with an economic optimized pit analysis. The reserve estimate includes mining modifying adjustments for mining ore recovery, mining dilution, and ore concentration recovery factors. The reserve estimate is limited to a COG of 5.0% P2O5ap, as well as certain geometallurgical beneficiation criteria, including: Diluted CaO to P2O5 ratio between 0.9 and 3.0 Within one of four mineralized domains characterized by lithology and alteration The beneficiation plant generates conventional (coarse) and ultrafine concentrates from the CMT ore. The mass recovery of coarse concentrate is forecast based on the results of laboratory flotation tests performed on drill core samples. The mass recovery of coarse concentrate is predicted based on a mass recovery regression equation as a function of the ROM Fe2O3, CaO and P2O5 chemical compositions. The mass recovery is calculated from a series of linear regression formula, updated frequently, as a function of ROM chemical composition and the P2O5 grade of the ROM. Regression formulas are developed by metallurgical domain types and closely adhere to the testing results and prediction results. See Section 10.4.1 for detailed mass recovery linear regression formula. The CMT Mineral Reserve, as of December 31, 2023, is estimated at 443.6 Mt ROM (dry) with a diluted grade of 9.3% P2O5 and a diluted grade of 9.0% P2O5ap delivered to the concentrator plant and 67.7 Mt (dry) concentrated phosphate tonnes at 35.0% P2O5 post concentration process plant. This includes: 131.7 Mt of Proven Reserve at a 9.1% P2O5ap grade (diluted), resulting in 19.7 Mt of concentrate with a 35.0% P2O5 post beneficiation plant. 311.9 Mt of Probable Reserve with an 8.9% P2O5ap grade (diluted), resulting in 48.0 Mt of concentrate at 35.0% P2O5.

Report Date: February 20, 2024 31406539.009-001-TRS-Rev0 Effective Date: December 31, 2023 Complexo Mineração de Tapira 1-4 1.7 Capital and Operating Costs This section contains forward-looking information related to capital and operating cost estimates for the Mine. The material factors that could cause actual results to differ materially from the conclusions, estimates, designs, forecasts, or projections in the forward-looking information include any significant differences from one or more of the material factors or assumptions that were set forth in this section including prevailing economic conditions continue such that unit costs are as estimated in constant (or real) dollar terms, projected labor and equipment productivity levels and that contingency is sufficient to account for changes in material factors or assumptions. The annual production estimates were used to determine annual estimates of capital and operating costs. All cost estimates were in real 2023 Brazilian Reais (R$) terms. Total capital costs included R$4.5 B of sustaining capital and opportunity costs. Annual operating costs were based predominantly on historical consumption factors and unit costs. They included costs for ongoing reclamation, final reclamation, and mine closure. Annual total cost of rock production varied from R$320 per tonne to R$480 per tonne, with an average total cost of production for a tonne of phosphate rock concentrate at R$403. 1.8 Economic Analysis This section contains forward-looking information related to economic analysis for the Mine. The material factors that could cause actual results to differ materially from the conclusions, estimates, designs, forecasts, or projections in the forward-looking information include any significant differences from one or more of the material factors or assumptions that were set forth in this sub-section including estimated capital and operating costs, project schedule and approvals timing, availability of funding, projected commodities markets, and prices. For reporting for Mosaic’s total financial statistics, the Discounted Cashflow (DCF) was converted from Reais to United States Dollars (US$) at an exchange rate of R$4.86 = U$1.00. For the economic analysis, a DCF model was developed. Because Tapira is a captive operation supplying rock to other Mosaic-owned plants, there is no transparent mined phosphate rock commodities price market in Brazil. Mineral reserves for Tapira were estimated based on an internal transfer price. This internal transfer price was set as a constant number of $112.62 per tonne (R$547.34 per tonne). The QP considers the accuracy of cost estimates to be well within a Prefeasibility Study (PFS) standard and sufficient for the economic analysis supporting the Mineral Reserve estimate for CMT. 1.9 Permitting Requirements This section contains forward-looking information related to economic analysis for the Mine. The material factors that could cause actual results to differ materially from the conclusions, estimates, designs, forecasts, or projections in the forward-looking information include any significant differences from one or more of the material factors or assumptions that were set forth in this sub-section including estimated capital and operating costs, project schedule and approvals timing, availability of funding, projected commodities markets, and prices. All mining permits have transferred from Vale S.A to Mosaic Fertilizantes. In addition, there is a mining research request in progress associated with CMT. All environmental licenses were valid at the time this report was prepared or had a renewal application filed in the Environmental Agency within the legal deadline. According to Mosaic, there are action plans in progress to comply with the environmental conditions that are not met yet within the environmental licenses. CMT’s environmental

Report Date: February 20, 2024 31406539.009-001-TRS-Rev0 Effective Date: December 31, 2023 Complexo Mineração de Tapira 1-5 controls are related to monitoring the quality of wastewater, surface and groundwater and air, as well as waste management. Additional environmental controls are in place for air emissions, air quality, and noise. A hydrotechnical study concluded in 2019 for Mosaic (POTAMOS, 2019) presented as a general diagnosis of water use that the CMT mining operation does not present a potential risk related to water supply. However, this study presented recommendations for improvements related to water management. Although water supply is not considered a risk for the CMT operation, the impacts of the existing water management practices on the surrounding areas can be considered a water supply risk to communities around the mine area. The Mine site has an Emergency Action Program for Mining Dams. Plans for expansion of tailings dams will be required to support the LOM and reserves. Additional permits will be required and may involve a study on different technological alternatives for tailings disposal. CMT’s Closure Plan was updated in 2020/2021 and includes: Closure plan based on the then current configuration of CMT (end of 2020), and Site closure plan based on the mine final configuration. In the Conceptual Closure Plan (2021), the closure cost for current configuration (Volume 1) was estimated at R$ 310.7 M, (current value - base 2020). The closure cost estimate was subsequently updated in 2021 based on updated unit costs, with a total of R$ 565.3 M in (end of 2021). 1.10 Qualified Person’s Conclusions and Recommendations In the Qualified Person’s (QP) opinion, the geological data, sampling, modeling, and estimate are carried out in a manner that both represents the data well and mitigates the likelihood of material misrepresentations for the statements of Mineral Resources. Recommendations for the Mineral Resources are focused on improving local variability for short range planning purposes that could be completed by site teams to provide improvements to short-term recovery and grade control. They are not seen as having an impact on the prospect of economic extraction. In the QP’s opinion, the operational and mine planning data, process recovery testing and modeling, LOM Plan, and estimation are carried out in a manner that both represents the data and operational experience and methodology well and mitigates the likelihood of material misrepresentations for the statements of Mineral Reserves.

Report Date: February 20, 2024 31406539.009-001-TRS-Rev0 Effective Date: December 31, 2023 Complexo Mineração de Tapira 2-1 2.0 INTRODUCTION 2.1 Registrant Information This Technical Report Summary (TRS) for the CMT mine site, located near the city of Tapira, Minas Gerais State in central Brazil was prepared by WSP USA Inc. (WSP) and The Mosaic Company (Mosaic). CMT is owned by Mosaic Fertilizantes, which is a subsidiary of The Mosaic Company, who acquired the asset from Vale S.A (Vale) in January 2018. CMT complex consists of a mine and a phosphate concentration plant. The beneficiation plant produces phosphate conventional and ultrafine concentrate which is sent by pipeline (conventional) and truck (ultrafine) to a local Mosaic chemical plant for finished product production. 2.2 Terms of Reference and Purpose The terms of reference for this TRS include: The date of this TRS Report is February 14, 2024, while the effective date of the resource and reserve estimate is December 31, 2023. It is the Qualified Person’s opinion that there are no known material changes impacting resources and reserves between December 31, 2023, and February 14, 2024. United States English spelling Metric units of measure Grades are presented in weight percent (wt. %) Coordinate system is presented in metric units using Corrego Alegre 1961, UTM Zone 23 South Constant US Dollars and Brazilian Reais as of August 2023 The purpose of this TRS is to report Mineral Resources and Mineral Reserves for CMT Key acronyms and abbreviations for this TRS include those items included in Table 2.1.

Report Date: February 20, 2024 31406539.009-001-TRS-Rev0 Effective Date: December 31, 2023 Complexo Mineração de Tapira 2-2 Table 2.1: Abbreviations and Acronyms Abbreviate/Acronym Definition °C degrees Celsius 3D three-dimensional ABNT Brazilian Association of Technical Standards Al2O3 Aluminum oxide amsl above mean sea level ANM Agência Nacional de Mineração, Brazilian National Mining Agency ARO Asset Retirement Obligation B billion BaO Barium oxide CaO Calcium oxide CAPEX Capital Expenditure CAT Caterpillar CFEM Financial Compensation for the Exploitation of Mineral Resources cm/s centimeters per second CMT Complexo Mineração de Tapira COG Cut-off Grade COGS Cost of Goods Sold CRM Certified Reference Material CVFT Consórcio Vale Fosfértil Tapira DCF Discounted Cashflow DNPM National Department of Mineral Production EDA Exploratory Data Analysis EL. elevation ESIA or EIA Environmental and Social Impact Assessment Fe2O3 Iron oxide FIR Regular Inspection Sheet FOS Factor of Safety GEOSOL SGS GEOSOL – Geologia e Sondagens GISTM Global Industry Standard on Tailings Management Golder Golder Associates Inc. Golder Golder Associates USA Inc. ha hectare K hydraulic conductivity K2O Potassium oxide km kilometer km2 square kilometer LIMS Low Intensity Magnetic Separation LOI loss on ignition LOM Life-of-Mine LOMP Life-of-Mine Plan LP Preliminary License - Licença Previa m meter M Million m/d meters per day m/s meter per second M2/d cubic meters per day m³/h cubic meters per hour

Report Date: February 20, 2024 31406539.009-001-TRS-Rev0 Effective Date: December 31, 2023 Complexo Mineração de Tapira 2-3 Abbreviate/Acronym Definition MgO Magnesium oxide mm millimeter mm3 cubic millimeter MnO Manganese oxide Mosaic The Mosaic Company Mosaic Fertilizantes Mosaic Fertilizantes P&K S.A. MR Mass Recovery Mt Million tonnes Mt million tonnes (Metric) Mtpy Million tonnes per year Na2O Sodium oxide NN Nearest Neighbor NPV Net Present Value OK Ordinary Kriging OMS Operating, Maintenance, and Surveillance OPEX Operating Expenditure OSF Overburden Storage Facility PDR Waste Deposition Piles (Pilhas de Disposição de Rejeito) PFS Prefeasibility Study PIAP Alto Paranaiba Igneous Province PSB Dam Safety Plan QA/QC Quality Assurance/Quality Control QP Qualified Person R$ Brazilian Reals R&D Research and Development RISR Regular Safety Inspection Report ROM Run-of-Mine RSA Fresh Rock RSI Semi-weathered Rock S Sulfur SG&A Selling, General, and Administrative SiO2 Silicon dioxide S-K 1300 United States Security and Exchange Commission’s regulation Subpart S-K 1300 SPT Standard Penetration Test SSP Single Superphosphate t tonne TiO2 Titanium dioxide TRS Technical Report Summary TSF Tailings Storage Facility US$ United States Dollars V volts Vale Vale S.A. Vale Fertilizantes Vale Fertilizantes S.A. WHIMS Wet High Intensity Magnetic Separators WST Water Services and Technologies wt.% weight percent μm micrometer

Report Date: February 20, 2024 31406539.009-001-TRS-Rev0 Effective Date: December 31, 2023 Complexo Mineração de Tapira 2-4 2.3 Sources of Information The compilation and estimation of Mineral Resources and Mineral Reserves used public and private data sources. The supply of the private data sources from Mosaic included a drill hole database, geological model, internal documentation, laboratory certificates, pit optimizations, mine plans and other mine planning files. A detailed list of cited reports is noted in Section 24.0 of this TRS. 2.4 Personal Inspection Summary WSP QPs traveled to site on November 8 and 9, 2021. The areas visited by the WSP QPs are noted in the below sub-sections. Prior to the site visit, the WSP QPs participated in multiple conference calls and meetings to discuss the Mineral Resources and Mineral Reserves at CMT. 2.4.1 Jerry DeWolfe The QP, as defined in S-K 1300, responsible for the preparation of the Mineral Resources for the Mine is Mr. Jerry DeWolfe, P. Geo., Senior Geological Consultant at WSP. Mr. DeWolfe visited CMT from November 8 to 9, 2021. During the site visit, Mr. DeWolfe reviewed the regional and deposit geology with senior personnel from the CMT geology and mining teams. Mr. DeWolfe visited the CMT core shed to review the deposit geology, core logging, sampling, analytical Quality Assurance and Quality Control (QA/QC), and core/sample chain of custody and archiving processes. Mr. DeWolfe also visited the CMT onsite sample preparation facilities and observed the sample preparation process. Mr. DeWolfe visited the operating mine and surrounding area and observed active long-term (exploration), short- term (pre-production) and grade control (production) drilling, logging, and sampling process. This visit included verification of drill hole locations for drill holes that were used in the modeling process as discussed in Section 9.0 of this TRS. During the site visit, Mr. DeWolfe interviewed site personnel regarding drilling, logging, sampling, and chain of custody procedures to evaluate the appropriateness of the data to be used to develop a geological model and to estimate the Mineral Resources for the Mine. Mr. DeWolfe also held discussions with the CMT Short Range Geology and Mine Planning team to better understand how the short and intermediate grade control sampling, modeling and estimation procedures and results for the mine and stockpiles were prepared in support of the mine planning and operations teams. 2.4.2 Terry Kremmel The QP, as defined in S-K 1300, responsible for the preparation of this Mineral Reserve estimates provided in this TRS is Mr. Terry Kremmel, PE, Vice President Mining Engineering at WSP. Mr. Kremmel visited CMT from November 8 to 9, 2021. During the site visit, Mr. Kremmel reviewed the general geology of the Resources with the Resource QP, including inspecting drill core samples at the Tapira Core Shed. Mr. Kremmel visited and observed the Primary and Secondary Crushing/Sizing operations and ROM ore stockpile including the Stacker/Reclaimer Blending System. Mr. Kremmel also visited the Tapira onsite laboratory facilities and observed procedures for sample preparation as well as the Physical laboratory and Chemical Assay laboratory. Mr. Kremmel visited the beneficiation plant and

Report Date: February 20, 2024 31406539.009-001-TRS-Rev0 Effective Date: December 31, 2023 Complexo Mineração de Tapira 2-5 observed the primary stages of ore beneficiation, including milling, sizing/classification, fines separation and flotation stages. Mr. Kremmel visited and inspected the operating mine and observed conditions of the haul roads and ramps, highwall conditions, operational benches, equipment, overburden and ore extraction, loading and haulage, pit and surface drainage, OSFs, beneficiation Tailings Storage Facilities (TSFs) and associated impoundment dams, impoundment stability monitoring systems, surface water (stormwater) drainage systems, and site support infrastructure (workshops and maintenance facilities, warehouses, explosive magazines, site access fuel storage and power supply). Mr. Kremmel also held discussions with Short Range Mine Planning team to better understand how the short and intermediate mine plans were developed and interrelations between planning and operations teams. 2.5 Previously Filed Technical Report Summary Reports This is the second TRS filed for the CMT mine site. The first TRS was dated February 17, 2022, with an effective Mineral Resource and Mineral Reserve estimation date of December 31, 2021.

Report Date: February 20, 2024 31406539.009-001-TRS-Rev0 Effective Date: December 31, 2023 Complexo Mineração de Tapira 3-1 3.0 PROPERTY DESCRIPTION 3.1 Property Location CMT is located in the western portion of the state of Minas Gerais, in the southeast of Brazil (Figure 3.1) to the north of the town of Tapira and approximately 35 km south-southeast of the city of Araxá. The mine is 420 km by road to the Minas Gerais state capital of Belo Horizonte, via the BR-262 highway to Araxá and then the MGC 146 highway to Tapira. The Property extends from approximately UTM 7,805,000 N to 7,799,500 N, and from 304,000 E to 310,000 E (Corrego Alegre 1961, UTM Zone 23 South), and is centered approximately at 19º52'S/46º51'W. Elevations at the Property range from 1,100 meters (m) to 1,350 m above mean sea level (amsl). The total surface area for the CMT is 10,143 hectares (ha). 3.2 Mineral Rights 3.2.1 Name and Number of Mineral Rights The CMT mineral assets are part of a Consortium named “Consórcio Vale Fosfértil Tapira” (CVFT) created by Decree number 98.962 (February 16, 1990), process number 930.785/1988 (4,355.76 ha) granted to Vale (previously Vale do Rio Doce S.A.) and Vale Fertilizantes Fosfatados S.A. – Fosfértil, the rights were then purchased by Mosiac. The consortium includes the mining permits listed in Table 3.1. The mining permits are generally managed through the consortium, but there are instances where the individual permits are referenced. CMT operates via the Tapira Mining Consortium, created by the decree nº98.962 on February 16, 1990, using the mining right Agência Nacional de Mineração, Brazilian National Mining Agency (ANM) 930.785/1988. Table 3.1: List of Mining Permits for CMT 3.2.2 Description on Acquisition of Mineral Rights Mining rights in Brazil are governed by the Mining Code, Decree 227, dated February 27, 1967, and further regulation enacted by ANM. This governmental agency, which controls the mining activities throughout Brazil, was recently created as a replacement of the former National Department of Mineral Production (DNPM). All sub-soil situated within Brazilian territory is deemed state property, with the mining activities subject to specific permits granted by the ANM. Mining Permits Granted to Area (ha) 810.330/1968 Mosaic Fertilizantes P&K Ltda 483.12 810.331/1968 Mosaic Fertilizantes P&K Ltda 500.13 812.362/1968 Mosaic Fertilizantes P&K Ltda 464.04 821.674/1969 Mosaic Fertilizantes P&K Ltda 20.01 816.066/1970 Mosaic Fertilizantes P&K Ltda 47.83 827.081/1972 Mosaic Fertilizantes P&K Ltda 339.39 803.387/1974 Mosaic Fertilizantes P&K Ltda 947.34 831.405/1997 Mosaic Fertilizantes P&K Ltda 1,040.31 833.476/2012 Mosaic Fertilizantes P&K Ltda 10.48 Total 3,852.65

[ [ A Beneficiation Plant 812362/1968 831405/1997 810331/1968 803387/1974 827081/1972 810330/1968 830408/2011 830200/2009 BL-1 BD-2 BL-3 BA-3 BD-5 BR 300000 300000 305000 305000 310000 310000 315000 315000 77 95 00 0 77 95 00 0 78 00 00 0 78 00 00 0 78 05 00 0 78 05 00 0 78 10 00 0 78 10 00 0 CLIENT THE MOSAIC COMPANY LEGEND Tapira Phosphate Property Igneous Complex Boundary Tapira Tailings Dam Town Boundary Road [ City Tapira Search Permit 830200/2009 830408/2011 Tapira Mining Concession 803387/1974 810330/1968 810331/1968 812362/1968 816066/1970 821674/1969 827081/1972 831405/1997 833476/2012 PROJECT SEC S-K 1300 TECHNICAL REPORT SUMMARY MOSAIC FERTILIZANTES: COMPLEXO MINERACAO DE TAPIRA TITLE PROJECT LOCATION MAP 31406539.009 2.6 2024-01-19 JS JS JDW #### 1 i n 0 PATH: C:\Users\gld_jsimper\WSP O365\202313515Mosaic2023 - 05_Technical Work\06_GIS\Tapira_GIS\MapFiles\3.1_Project_Location_Map.mxd PRINTED ON: 2024-01-19 AT: 1:59:41 PM Chile Ecuador Peru Bolivia Brazil Colombia Venezuela Guyana Paraguay Argentina Uruguay French Guyana KEY MAP IF TH IS M EA SU RE ME NT D OE S NO T M AT CH W HA T I S SH OW N, TH E SH EE T H AS B EE N MO DI FIE D FR OM : A NS I A CONSULTANT PROJECT NO. CONTROL REV. FIGURE YYYY-MM-DD DESIGNED PREPARED REVIEWED APPROVED REFERENCE(S) 1. COORDINATE SYSTEM: CORREGO ALEGRE 1961 UTM ZONE 23S 0 2,000 4,000 6,000 Meters1:100,000 [ [ [ [ [ [ [ [ [ Minas Gera is Goiás Ca t al ão Araxá Catalão Ibiá Patrocínio Perdizes Sacramento Uberaba Uberlândia Tapira MAP AREA MAP AREA

Report Date: February 20, 2024 31406539.009-001-TRS-Rev0 Effective Date: December 31, 2023 Complexo Mineração de Tapira 3-3 3.3 Description of Property Rights CMT has an overall surface rights area of 8,008 ha distributed in 18 different property registrations. The surface area within the ultimate pit is currently mostly controlled by Mosaic. There is a small area near the Bom Jardim Settlement that is not within the current property rights. This area can be seen in Figure 3.1, to the southwest of the red Property Limit line. The relocation of the Bom Jardim Settlement will be necessary to fully realize the LOM tonnages, see Section 3.6. 3.4 Royalty Payments Mosaic pays the Brazilian mining royalties (Compensação Financeira pela Exploração de Recursos Minerais - CFEM) in an amount of 2% of the net sales revenue with respect to the extraction of ore. There are no royalty payments to property owners. 3.5 Significant Encumbrances to the Property There are no known significant encumbrances to CMT at the time of this report. 3.6 Other Significant Factors and Risks Affecting Access The relocation of state highway MG-146 includes re-locating the Fazenda Nova Bom Jardim Settlement (local village), which is located to the west of the Mosaic currently controlled surface area. Risks include social risk during settlement relocation negotiations and an economic risk since Mosaic has not yet acquired the surface rights. This area is included in the currently controlled mining permits and is therefore, not seen as a significant encumbrance to CMT. Mosaic has started planning for the relocation of this highway prior to 2036, beginning with conceptual studies evaluating the alternative locations and potential capital expense. The capacity requirements are not currently in place for all tailings disposal for total LOM capacity requirements. However, CMT has an ongoing permitting and development plan to support the mining operations that will continue through the LOM requirements.

Report Date: February 20, 2024 31406539.009-001-TRS-Rev0 Effective Date: December 31, 2023 Complexo Mineração de Tapira 4-1 4.0 ACCESSIBILITY, CLIMATE, LOCAL RESOURCES, INFRASTRUCTURE, AND PHYSIOGRAPHY 4.1 Topography and Land Description The CMT area is marked by gently undulating relief modified by the elevation of the Tapira dome, which forms a plateau with a dome structure with principal axes of 7.4 km by 6 km and elevations around 1,300 m amsl. The preservation of the lateritic plateau is due to the existence of a quartzite ring that surrounds the igneous bodies. The Tapira region is drained by the water bodies of the Prata Basin, more precisely by tributaries that flow from the Paraná River. The regional drainage pattern is dendritic, with slight tendency towards greater drainage in the SW/NE direction. Locally, however, considering the intrusion, the drainage pattern has an annular radial shape, emphasizing the dome shape of the area. The area west of Minas Gerais is composed of a particular type of savanna known as the cerrado. Remnants of riparian forest are found near spring areas. 4.2 Access to the Property The CMT property is located 3 km north of the town of Tapira and approximately 35 km south-southeast of the city of Araxá, in the southeast of Brazil in Minas Gerais State. The town of Tapira can be accessed by road from Belo Horizonte via the BR-262 and MGC-146 state highways travelling west-northwest for approximately 420 km. The MGC-146 highway is a well-maintained, asphalt road with a speed limit of 80 kilometers per hour (km/hr) and a weight limit of 45.0 tonnes. The maximum height allowed is 4.40 m due to a power line running above the access road. There is currently no rail or airport access at Tapira. The closest rail and airport access is in the city of Araxá. 4.3 Climate Description The local climate is temperate, and the annual rainfall varies between 1,300 millimeters (mm) and 1,800 mm. The maximum monthly rainfall of approximately 300 mm occurs in December and January. Temperatures vary from a summer maximum of 28 degrees Celsius (°C) in February to a winter minimum of 12°C in July. The climate does not have a significant impact on mining operations, and mining normally take place all year, with minor effects during the rainy season. 4.4 Availability of Required Infrastructure CMT is located in a highly developed region known as Alto Parnaíba. This region is known for its excellent, modern infrastructure with high standards of living compared with other regions in Brazil. The local infrastructure available to the CMT is excellent, as it is situated within a well-established mining area, 35 km from the well- developed city of Araxá and within 25 km of two other mining operations. The supply of electricity to CMT occurs via a 138 kiloVolt (kV) transmission line that is operated by CEMIG. CMT has a total receipt of 38 megawatts (MW) and an annual power usage around 300 GW. The main substation receives 138 kV in 3 oil-type transformers which is transferred to secondary substations. From the secondary substations, power is distributed to the end-use areas at 127 volts (V), 220 V, 280 V, 440 V, or 4,160 V.

Report Date: February 20, 2024 31406539.009-001-TRS-Rev0 Effective Date: December 31, 2023 Complexo Mineração de Tapira 4-2 Water intake comes from the Ribeirão do Inferno and artesian wells, as well as recovered water from the taillings dams. Additionally, there are 4 artesian wells at the Tapira plant. The industrial reuse system used to recover water from the dams includes 4 pumps (BL01) and 2 pumps (BR) and 36” pipes covering varying distances to the different dam areas. The distance from BRI dam is approximately 9 km with a rated capacity of 4,400 cubic meters per hour (m3/hr). The distance from BL1 dam is approximately 3 km with a rated capacity of 8,000 m3/hr. The distance from BR dam is approximately 2 km with a rated capacity of 4,750 m3/hr. Mine buildings in the CMT complex are connected to a corporate local area network (LAN) through an MPLS link and an internet connection. The unit has a telephone system with coverage in all locations of the Mining Unit. The unit’s radio system includes a base station and control rooms from which all mining equipment and transport trucks are dispatched and controlled and a control room for the beneficiation plant. It is used for better quality and more efficient communication, with signal repeaters covering all operations of the complex. Three stations provide cover for the operations in the whole site. Additionaly, all vehicles in the mine area are equipped with radios and the personnel of the operational areas have portable radios.

Report Date: February 20, 2024 31406539.009-001-TRS-Rev0 Effective Date: December 31, 2023 Complexo Mineração de Tapira 5-1 5.0 HISTORY CMT has been in operation since 1978 and has produced more than 70 Mt of phosphate concentrate. Since 1978, Titanium Dioxide (TiO2) bearing material, mainly in the form of anatase, has been stockpiled, with more than 200,000 tonnes awaiting the implementation of an economical beneficiation method. The geological structure of the alkaline complex of Tapira was first recognized in 1953, through magnetometric and radiometric investigations carried out by the Brazil-Germany Project. There was an agreement between the two countries to carry out regional geophysical aero-survey programs, performed by the Geological Survey of Brazil in the 1950s, 1960s, and 1970s. In 1968, three major private groups – Pedro Maciel, Companhia Meridional de Mineração (CMM), and Companhia Brasileira de Metalurgia e Mineração (CBMM) – had exploration research requests granted by DNPM. In the beginning of 1971, Vale (previously known as Companhia Vale do Rio Doce) joined Pedro Maciel to create the company Titan International S.A., which changed its name to Rio Doce Titânio in later years. Vale acquired the rights of Pedro Maciel at the end of 1971, with the mining rights incorporated into the company Mineração Rio Paranaíba (VALEP). At the time, a series of intensive and detailed systematic works were undertaken, and important occurrences of phosphate, titanium, niobium, rare earths, and vermiculite were identified. Extensive exploration works were undertaken between 1971 and 1973, with particular focus on the occurrences of titanium. From 1973 to 1977, the exploration priorities changed to occurrences of phosphate, with the aim of replacing the massive imports of fertilizers in the agricultural sector which was then undergoing a period of expansion in Brazil. In 1977, the Fosfértil (Fertilizantes Fosfatados S.A.) company as created under the administration of Petrofértil (a subsidiary of Petrobras, the Brazilian state oil company). In 1992, Fosfértil was privatized, and a pool of investors held the company shares. In 2010, Vale acquired complete control of Fósfertil and after created a new company, Vale Fertilizantes S.A. which included other fertilizer assets. At the start of 2018, Mosaic Fertilizantes acquired the assets of Vale Fertilizers, including the Tapira mineral deposit. Details on the various historical through to recent exploration campaigns in the CMT area are presented in Section 7.0. Table 5.1 shows the historical production of CMT from 2014 to 2023. Table 5.1: Historical Production for CMT (Last 10 Years) Tapira Complex Units 2014 2015 2016 2017 2018 2019 2020 2021 2022 2023 Ore Mined Mt (wet) 17.3 15.7 16.1 17.2 14.5 10.3 16.1 15.5 14.7 15.4 P2O5 Feed Content % 8.3 8.5 8.6 8.5 8.4 8.7 8.9 8.5 8.9 9.3 Titanium Mt (wet) 0.0 0.0 0.0 0.0 6.8 9.6 4.7 7.2 4.4 4.5 Waste Mt (wet) 32.9 17.2 37.2 41.8 27.0 27.2 31.8 38.4 45.1 31.5 Total Waste Mt (wet) 32.9 17.2 37.2 41.8 33.9 36.8 36.6 45.6 49.4 36.0 Average Haul Distance - Ore km 2.62 2.94 3.54 3.38 2.28 2.5 2.6 2.2 2.5 4.0 Average Haul Distance - Waste km 2.67 3.14 3.19 3.06 2.52 2.9 2.6 2.3 2.5 2.6 Average Haul Distance - Total km 2.7 3.0 3.3 3.2 2.4 2.8 2.6 2.3 2.4 3.0 Stripping Ratio t/t 1.9 1.1 2.3 2.4 2.3 3.6 2.3 2.9 3.4 2.3 Total Movement Mt (wet) 50.1 32.9 53.2 59.0 48.4 47.0 52.6 61.1 64.1 51.3

Report Date: February 20, 2024 31406539.009-001-TRS-Rev0 Effective Date: December 31, 2023 Complexo Mineração de Tapira 6-1 6.0 GEOLOGICAL SETTING, MINERALIZATION, AND DEPOSIT 6.1 Regional Geology The Tapira phosphate deposit is part of a series of Late-Cretaceous, carbonatite-bearing alkaline ultramafic plutonic complexes belonging to the Alto Paranaiba Igneous Province. The Tapira igneous rocks intrude the phyllites, schists, and quartzites of the Late-Proterozoic Brasília mobile belt. During the Late Cretaceous, the western portion of Minas Gerais State and the adjacent portion of southern Goiás State were the site of the emplacement of many mafic to ultramafic, ultrapotassic alkaline rocks, collectively known as the Alto Paranaiba Igneous Province (PIAP). This intense magmatic activity was represented by various types of intrusive (dikes, pipes, vents, diatremes, plutonic complexes) and extrusive (lavas and pyroclastics) bodies. The igneous rock types that occur in the PIAP include kimberlites, olivine-lamprolites, and kamafugites, in addition to large intrusive complexes composed of ultramafic plutonic rocks (mainly dunites and alkali- pyroxenites), phlogopite-picrite dikes and carbonatites. The ultrapotassic magmatism in the PIAP mainly occurred along the Alto Paranaiba Arch, a NW-SE trending structure which separates the Paraná and Sanfranciscana basins. Carbonatite complexes occur in several of the alkaline igneous provinces surrounding the Paraná Basin. The regional geology is illustrated in Figure 6.1. 6.2 Local and Property Geology The Tapira igneous complex is roughly elliptical, 35 square kilometers (km2) in area and consists predominantly of alkaline pyroxenite rocks with subordinate carbonatite, serpentinite (dunite), glimmerite, syenite, and ultramafic potassic dikes. Locally, the pyroxenites are divided into: 1. Bebedourites: a local name for a variety of biotite pyroxenite composed essentially of aegirine-augite, and biotite with perovskite and opaques. 2. Phoscorites: plutonic ultramafic rocks, containing magnetite, apatite, and one of the silicates, forsterite, diopside, or phlogopite. Phoscorites almost always occur in close association with carbonatites. The tropical weathering regime prevailing in the region and the inward drainage patterns developed from the weathering-resistant quartzite margins of the dome structures resulted in the development of an extremely thick soil cover in most of the complexes. Surface outcrops are very rare and the best samples for geochemical studies are restricted to drill cores. This deposit is thought to be an igneous intrusion where the lithologies are intermixed and subject to heavy weathering. For that reason, a geological stratigraphic column does not adequately reflect the vertical and lateral domaining of the intrusive rock types and the overprinting weathering horizons. WSP instead has provided a local geological map in Figure 6.2, and cross section, Figure 6.3 , which, in the opinion of the QP, appropriately depicts the geological setting of the deposit.

(((((( ((( ( ( ( (((((((( (( ( ( ( ( ( ( ( [ Tapira IbiáAraxá IbiáTapira Araxá Tapira 295000 295000 300000 300000 305000 305000 310000 310000 315000 315000 320000 320000 325000 325000 77 85 00 0 77 85 00 0 77 90 00 0 77 90 00 0 77 95 00 0 77 95 00 0 78 00 00 0 78 00 00 0 78 05 00 0 78 05 00 0 78 10 00 0 78 10 00 0 78 15 00 0 78 15 00 0 78 20 00 0 78 20 00 0 CLIENT THE MOSAIC COMPANY LEGEND Tapira Phosphate Property Municipal Boundary Road [ City ( Geological Faults Structural Lineament Igneous Complex Boundary Geological Units Canastra Group Canastra Group (Morro do Ouro Member) Araxá Group (Schist Facies) Tapira Alkali Intrusive Suite Canastra (Paracatú Formation) Ibiá Group (Rio Verde Formation) PROJECT SEC S-K 1300 TECHNICAL REPORT SUMMARY MOSAIC FERTILIZANTES: COMPLEXO MINERACAO DE TAPIRA TITLE REGIONAL GEOLOGY MAP 31406539.009 6.1 2024-01-10 JS JS JDW #### 1 in 0 PATH: C:\Users\gld_jsimper\WSP O365\202313515Mosaic2023 - 05_Technical Work\06_GIS\Tapira_GIS\MapFiles\6.1_Regional_Geology_Map.mxd PRINTED ON: 2024-01-10 AT: 12:58:11 PM Chile or Peru Bolivia Brazil Colombia Venezuela Guyana Paraguay Argentina French Guyana KEY MAP IF T H IS M E AS U R EM EN T D O ES N O T M AT C H W H AT IS S H O W N , T H E SH EE T H AS B E EN M O D IF IE D F R O M : A N SI A CONSULTANT PROJECT NO. CONTROL REV. FIGURE YYYY-MM-DD DESIGNED PREPARED REVIEWED APPROVED REFERENCE(S) 1. COORDINATE SYSTEM: CORREGO ALEGRE 1961 UTM ZONE 23S 0 5,000 10,000 Meters1:200,000 [ [ [ [ [ [ [ [ [ Min as Ge ra is Go iás Ca t al ão Araxá Catalão Ibiá Patrocínio Perdizes Sacramento Uberaba Uberlândia Tapira MAP AREA MAP AREA

[ 305000 305000 310000 310000 78 00 00 0 78 00 00 0 CLIENT THE MOSAIC COMPANY LEGEND Tapira Phosphate Property Igneous Complex Boundary Road [ City Mining Requirement Mining Concession Lithology Bebedourito I Bebedourito II Carbonatito Sienito PROJECT SEC S-K 1300 TECHNICAL REPORT SUMMARY MOSAIC FERTILIZANTES: COMPLEXO MINERACAO DE TAPIRA TITLE LOCAL GEOLOGY MAP 31406539.009 6.2 2024-01-10 JS JS JDW #### 1 in 0 PATH: C:\Users\gld_jsimper\WSP O365\202313515Mosaic2023 - 05_Technical Work\06_GIS\Tapira_GIS\MapFiles\6.2_Local_Geology_Map.mxd PRINTED ON: 2024-01-10 AT: 1:08:09 PM Chile or Peru Bolivia Brazil Colombia Venezuela Guyana Paraguay Argentina French Guyana KEY MAP IF T H IS M E AS U R EM EN T D O ES N O T M AT C H W H AT IS S H O W N , T H E SH EE T H AS B E EN M O D IF IE D F R O M : A N SI A CONSULTANT PROJECT NO. CONTROL REV. FIGURE YYYY-MM-DD DESIGNED PREPARED REVIEWED APPROVED REFERENCE(S) 1. COORDINATE SYSTEM: CORREGO ALEGRE 1961 UTM ZONE 23S 0 1,500 3,000 Meters1:50,000 [ [ [ [ [ [ [ [ [ Min as Ge ra is Go iás Ca t al ão Araxá Catalão Ibiá Patrocínio Perdizes Sacramento Uberaba Uberlândia Tapira MAP AREA MAP AREA

Report Date: February 20, 2024 31406539.009-001-TRS-Rev0 Effective Date: December 31, 2023 Complexo Mineração de Tapira 6-4 6.3 Mineralization The Tapira phosphate deposit was formed by the supergenic alteration of bebedourites, phoscorites, and carbonatites rich in apatite. The extreme weathering process was responsible for the residual concentration of apatite. The weathering processes are typically related to the partial hydrolysis of silicate rocks and the dissolution of carbonates, with a general loss of calcium (Ca), magnesium (Mg), potassium (K), and silica (Si), and the accumulation of aluminum (Al), iron (Fe), and titanium (Ti), from the base to the top. The main geological types identified in the deposit are a combination of the igneous protoliths (bebedourites, phoscorites, and carbonatites) and the products of the weathering process. According to the level of weathering, the products are: Aloterite: The top layer consisting of intense reddish autochthonous soils. Top isalterite (saprolite): Profile with an average depth of 25 m with clayish-sandy material that can be yellow to reddish. Homogenization of mineral phases does not allow the rock structures to be identified. Bottom isalterite (saprolite): Profile with an average depth of 25 m, resulting from the advanced weathering of the altered rock horizon. Some primary rock structures can still be observed, but the overall appearance is that of homogenous altered soil. This is the mainly phosphate mineralized horizon. Semi-weathered rock: Weathered horizon in which the rock structure is mostly preserved. Fresh rock: Mainly bebedourites and phoscorites intruded by carbonatite veins. The combination of the weathering types with the rock types resulted in the following mining typologies: ALO (aloterite): a residual autochthonous reddish soil derived from the intensive weathering process of the ultramafic alkaline rocks, with high grades of Al and Fe, and a complete absence of Ca and Mg. ISAT (top isalterites): Saprolites derived from the alkali-peridotites (bebedourites and phoscorites.) With the evolution of the weathering process, at the top of the profile the apatite begins to be destroyed and the formation of minerals of the Crandalite group (aluminum and iron phosphates, of no economic interest) appeared. The Perovskite alteration gives rise to Anatase (TiO2) in high concentrations and defines the Titanium Horizon. These are located at the top of the isalterite profile and a more intensively altered product of weathering. Primary rock structures are rarely seen and the levels of CaO and P2O5 are much lower than the lower ISAB-BEB. The amount of TiO2 (anatase and ilmenite) is remarkably high and this layer has been stockpiled and has the potential for titanium production in the future. ISAB-BEB (bottom isalterite/bebedourite): Saprolites formed by intense weathering of bebedourites, leaching of Ca and Mg with a residual concentration of P, Ti, Al, Fe, and the generation of a phosphate ore horizon with a high concentration of apatite and low grade of perovskite located below the ISAT layer, as well as being rich in phosphate (apatite). Contact with the upper layer is clearly marked by the sharp reduction in CaO levels. It represents (with ISAB-FCR) the main phosphorous mineralized units. ISAB-FCR (bottom isalterite/phoscorite): Saprolites located on the same level as the ISAB-BEB layer and formed by the intense weathering of phoscorite dikes and carbonatites intruding in bebedourites. The phosphorous grade is a little higher than in the ISAB-BEB.

Report Date: February 20, 2024 31406539.009-001-TRS-Rev0 Effective Date: December 31, 2023 Complexo Mineração de Tapira 6-5 RSI-BEB (semi-weathered rock/bebedourite): Semi-weathered layer formed by moderate alteration of the bebedourites. Many primary structures and the mineralogy of the bebedourites are still preserved. CaO grades are higher than ISAB-BEB and the P2O5 grades are normally lower. RSI-FCR (semi-weathered rock/phoscorite): Semi-weathered layer formed by the non-intense alteration of the phoscorites mixed with bebedourites. Many primary structures and mineralogy are still preserved. These rocks are rich in apatite but the total phosphorous grades are lower than in the ISAB-FCR. RSA-BEB: Fresh rock, the original bebedourites (a variety of alkali-peridotites) rock with an anomalous grade of perovskite (CaTiO3) and apatite (Ca5(PO4)3(OH, F, Cl)), normally green due to the high presence of pyroxenites. RSA-FCR: Fresh rock, the original phoscorite mixed with bebedourites (a variety of alkali peridoties) rock with an anomalous grade of perovskite (CaTiO3) and apatite (Ca5(PO4)3(OH, F, Cl)), normally green due to the high presence of pyroxenites. Figure 6.3 shows a typical vertical section of the Tapira phosphate deposit showing weathering (upper section) and lithology (lower section) domains.

Report Date: February 20, 2024 31406539.009-001-TRS-Rev0 Effective Date: December 31, 2023 Complexo Mineração de Tapira 6-6 Figure 6.3: Vertical Cross Section - Weathering and Lithology Models

Report Date: February 20, 2024 31406539.009-001-TRS-Rev0 Effective Date: December 31, 2023 Complexo Mineração de Tapira 7-1 7.0 EXPLORATION 7.1 Exploration Work The Tapira alkaline dome was discovered by the geologists of the Brazilian government during studies carried out in 1953-1954. Geophysical programs were developed in 1953 by the Geological Service of Brazil and consisted of aeromagnetic and aeroradiometric surveys. Between 1966 and 1969, the National Department of Mineral Production (DNPM, now ANM) performed a detailed mapping of the regional dome structures and started the first drilling program. This exploration work was the first regional information about the regional mineral potential for phosphate, niobium, and titanium. Afterwards, many drilling campaigns were conducted by the Brazilian government and private companies. Detailed petrological, geochemical, and isotropic studies were carried out by Brod in 1999, describing the Tapira complex as a plutonic series, consisting of wehrlites, pyroxenites (bebedourites) and syenite, and a carbonatite series, composed of calcitic, calcitic-dolomitic, and dolomitic types. Based on mineral chemistry data, Brod has suggested that part of the wehrlite could be cumulates formed from a phoscoritic magma. 7.1.1 Topographic Survey Between 2008 and 2011, Vale executed geological mapping containing the main lithological units of the Tapira mine, on a scale of 1:1,000. In 2013, Vale contracted a laser topographic survey covering an area of approximately 98 km2. The work was performed by the Geoid Laser Mapping Company and resulted in orthophotographs and digital models on a scale of 1:5,000. 7.2 Geological Exploration Drilling Drilling campaigns at the CMT were carried out under the supervision of the following companies: DNPM – Departamento Nacional de Produção Mineral (1966 – 1969) DOCEGEO – Companhia vale do Rio Doce (now Vale S.A.) (1971 – 1978) CMM – Companhia Meridioonal de Mineração (1974 – 1977) MVL – Mineração Vargem da Lapa (1987) VALEP – (1978 – 1982) Fosfértil (1982 – 2009) Vale S.A. / Vale Fertilizantes S.A. (2010 – 2017) Mosaic Fertilizantes P&K S.A. (2018 – current) A total of 2,192 core drill holes were executed from 1967 to 2022 and 11,103 percussive drill holes have been completed at CMT by Vale/Mosaic since 2014. Table 7.1 summarizes the core drilling campaigns performed at the Tapira phosphate mine. All the data were taken from the Mosaic database and the existing physical records of the Tapira mine.

Report Date: February 20, 2024 31406539.009-001-TRS-Rev0 Effective Date: December 31, 2023 Complexo Mineração de Tapira 7-2 Figure 7.1 shows a map with the drilling locations for CMT. Table 7.1: Summary of Exploration Core Drilling Campaigns The initial DNPM drilling grid was 800 m x 800 m. The DOCEGEO campaign reduced it to 200 m x 200 m in some areas and to 400 m x 400 m in others. The CMM campaign repeated the grid of 800 m x 800 m and later moved to 400 m x 400 m, with drill holes reaching the fresh rock. The purpose of the VALEP campaigns was to carry out infill drilling over the pre-existing grid. The Fosfértil and Vale campaigns were designed mainly in a 50 m x 50 m infill drilling grid. Fosfértil utilized NX (54 mm core diameter) and NW (57.2 mm core diameter) drill core sizes from 1998 to 2005 and HQ (63.5 mm core diameter) and HW (76 mm core diameter) drill core sizes from 2005 to 2006. Vale used HQ and HQ2 (67.2 mm core diameter) drill core sizes for all its drilling campaigns from 2010 to 2019, and Mosaic continued to use the same drill core size. Although 754 drill holes have depths of over 120 m, only 150 drill holes were surveyed. The sampling procedures between the drilling contractors were not uniform: DNPM campaign: sampled every 2 m. DOCEGEO campaign: sampled every meter. CMM campaign: the drill holes were initially sampled every 1 m and posteriorly every 2 m. Year Owner Company Executor Company No. of Holes Total Length (m) 1967-1969 DNPM Geosol 45 3,439 1973-1978 DOCEGEO Geosol / T. Janer 171 12,100 1974-1978 CMM Geosol 104 5,329 1978-1982 VALEP Geosol 101 6,567 1987 MVL Geosol 8 903 1983-1997 Fosfértil T. Janer / Fosfértil 129 11,808 1998-2001 Fosfértil Hidropoços 115 13,647 2002-2006 Fosfértil Hidropoços / Hidrigel 286 32,050 2007 Fosfértil Hidrigel 24 2,773 2010 Vale Fertilizantes Hidrigel 19 1,747 2011-2012 Vale Fertilizantes Geosol 121 15,086 2013-2016 Vale Fertilizantes Rede 422 52,566 2017 Vale Fertilizantes Geosol 79 8,035 2018 Mosaic Geosol 71 7,576 2019 Mosaic Geosol 81 9,726 2020 Mosaic Geosol 115 8,775 2021 Mosaic Geosol 207 20,203 2022 Mosaic Geosol 94 8,991 2,192 221,321Total

Report Date: February 20, 2024 31406539.009-001-TRS-Rev0 Effective Date: December 31, 2023 Complexo Mineração de Tapira 7-3 VALEP campaign: sampling was performed at irregular lengths, with a mean of 6 m. MVL: the drill holes were sampled every 2 m. Fosfértil campaigns: sampling was performed at irregular lengths, with a mean of 5 m. Vale campaigns: drill holes executed from 2010 to May 2012 were sampled with a standard length of 5 m, whereas the drill holes performed from the second semester of 2012 to 2017 used a standard sampling length of 3 m. Mosaic campaigns: samples are carried out with a standard length of 5 m, though can vary by up to 50% of the sample support size in the extremities of the lithological contacts and/or the weathering horizon. 7.2.1 Qualified Person’s Statement on Exploration Drilling The QP has reviewed the available exploration data and procedures. The data are well documented via original digital and hard copy records and were collected using industry standard practices in place at the time. All data has been organized into a current and secure spatial relational database. The data has undergone thorough internal and third-party data verification reviews, as described in Section 9.0 of this TRS. The QP is not aware of any drilling, sampling, or recovery factors that could materially affect the accuracy and reliability of the results of the historical or recent exploration drilling.

[ 305000 305000 310000 310000 77 95 00 0 77 95 00 0 78 00 00 0 78 00 00 0 78 05 00 0 78 05 00 0 CLIENT THE MOSAIC COMPANY LEGEND Tapira Phosphate Property Igneous Complex Boundary Road [ City Mining Requirement Mining Concession Drill Holes DNPM – Departamento Nacional de Produção Mineral (1966 – 1969) DOCEGEO – Companhia vale do Rio Doce (now Vale S.A.) (1971 – 1978) CMM – Companhia Meridioonal de Mineração (1974 – 1977) MVL – Mineração Vargem da Lapa (1987) VALEP – (1978 – 1982) Fosfértil (1982 – 2009) Vale S.A. / Vale Fertilizantes S.A. (2010 – 2017) Mosaic Fertilizantes P&K S.A. (2018 – current) PROJECT SEC S-K 1300 TECHNICAL REPORT SUMMARY MOSAIC FERTILIZANTES: COMPLEXO MINERACAO DE TAPIRA TITLE EXPLORATION DRILL HOLE LOCATION MAP 31406539.009 7.1 2024-01-10 JS JS JDW #### 1 in 0 PATH: C:\Users\gld_jsimper\WSP O365\202313515Mosaic2023 - 05_Technical Work\06_GIS\Tapira_GIS\MapFiles\7.1_Expl_Drill_Hole_Map_ANSIA.mxd PRINTED ON: 2024-01-10 AT: 1:10:28 PM Chile or Peru Bolivia Brazil Colombia Venezuela Guyana Paraguay Argentina French Guyana KEY MAP IF T H IS M E AS U R EM EN T D O ES N O T M AT C H W H AT IS S H O W N , T H E SH EE T H AS B E EN M O D IF IE D F R O M : A N SI A CONSULTANT PROJECT NO. CONTROL REV. FIGURE YYYY-MM-DD DESIGNED PREPARED REVIEWED APPROVED REFERENCE(S) 1. COORDINATE SYSTEM: CORREGO ALEGRE 1961 UTM ZONE 23S 0 1,500 3,000 Meters1:60,000 [ [ [ [ [ [ [ [ [ Min as Ge ra is Go iás Ca t al ão Araxá Catalão Ibiá Patrocínio Perdizes Sacramento Uberaba Uberlândia Tapira MAP AREA MAP AREA

Report Date: February 20, 2024 31406539.009-001-TRS-Rev0 Effective Date: December 31, 2023 Complexo Mineração de Tapira 7-5 7.3 Hydrological Sampling and Hydrogeological Drilling 7.3.1 Hydrological Sampling Córrego da Mata is the main watercourse present in the CMT region, its tributaries are Córrego de Cachoeira, Córrego Pilões, and Córrego Canjarana. Other watercourses in the area are Córrego Canoas, Capão Escuro and Pailozinho. There are spillways that monitor these main watercourses. All points have a seasonal regime, with flows that follow rainfall, which are higher in rainy periods and lower in dry seasons. The flows observed in the dry period are termed the base flow of the watercourse, as they are almost entirely composed of underground flow. Mosaic monitors surface water quality at CMT in 24 locations, with a frequency ranging from monthly to biannual monitoring. The hydrogeological sampling does not undergo any QA/QC program with its testing. 7.3.2 Hydrogeological Sampling and Drilling The presence of underground water in the CMT occurs through two types of aquifers: 1. Granular aquifers: associated with the weathering horizon in the interior of the dome, the aloterite, isalterite, and semi-weathered rock horizons. The behavior of these aquifers is that of a porous medium. 2. Fissural aquifers: associated with compact rocks, due to the presence of discontinuities both in the ultramafic-alkaline carbonatitic rock (the mineralization source rock) and in the schist and quartzite host rocks of the Precambrian period of the Canastra Group. The groundwater flow pattern within the complex is generally to the south toward the outlet of the Córrego da Mata Basin. Flow inversions sometimes occur in the northern portion (with natural flow in the northeast direction toward the BR-01 tailings dam) and in the north sector of the pit where the natural flow towards the Córrego da Mata is reversed in the direction of the Córrego Paiolzinho due to the mining operations. In the region of Front 2/Bigorna, the current water level is between 1,220 and 1,135 amsl and is influenced by the mining operations and pumping of wells. In the northeast region of the pit (Fronts 4, 5, and 6) the water level is predominantly between 1,280 and 1,220 m amsl and is influenced by the lowering of water level from the mining advance (without pumping). In the region of the dams, the underground water level and consequently its flow is influenced by the formation of lakes along drainage channels. Around the BL-01 dam, the water level is between 1,280 and 1,160 meters where the underground flow is northwest towards the Retiro Stream. The groundwater flow in the region around the BR-01 tailings dam converges into the lake. Tubular wells were installed around the pit for lowering the water level, and daily static and dynamic readings of the water level are collected for inclusion into the hydrogeological model. Mosaic monitors groundwater quality at CMT in 12 locations with a frequency ranging from quarterly to annually. The hydrogeological sampling does not undergo any QA/QC program with its testing. The hydrogeological drill hole and sampling map is shown in Figure 7.2. Figure 7.3 shows the ground water flow in the region of the dome where the Tapira mining complex is located. The groundwater mainly flows to the south, towards the outlet of the Córrego da Mata Basin. Locally, the water flows toward the northern region, principally in a north easterly direction toward the BR-01 tailings dam and the pit.

Report Date: February 20, 2024 31406539.009-001-TRS-Rev0 Effective Date: December 31, 2023 Complexo Mineração de Tapira 7-6 Another type of monitoring is the water level in the complex which aims to measure variation over time and is performed by the reading of piezometers and water level indicators. A total of 8 piezometers and 82 water level indicators were installed around the pit. Conceptual hydrogeological models consist of the study of the hydraulic parameters of the aquifers in the region, which delineate the mining complex and include hydraulic conductivity (horizontal and vertical), transmissivity, and storage. This data was provided by the MDGEO in 2008, 2012, 2014, 2016, and 2021, and by Water Services and Technologies (WST) in 2022. To obtain the hydrodynamic parameters, in 2001 the Água Consultores company carried out permeability tests – infiltration of the variable load in the clay and turf coverings and alluvial deposits. In accordance with the Brazilian Association of Technical Standards (ABNT) the tests carried out complied with NBR-12545. In these tests, the mean hydraulic conductivity values obtained were around 0.05 meters per day (m/day; 10-5 centimeters per second [cm/s]) in the valley bottoms and 0.20 m/day (10-4 cm/s) at higher elevations (over 1,300 m amsl). The transmissivity and storage values of the aquifers were obtained through the pumping tests carried out in the observation wells in compliance with regulation NBR-15495, entitled “Monitoring Wells in Granular Aquifers.” The result showed transmissivity values of between 60 and 70 cubic meters per day (m²/day) in the Bigorna region, due to the upper aquifers located in the weathering horizon.

305000 305000 310000 310000 78 00 00 0 78 00 00 0 CLIENT THE MOSAIC COMPANY LEGEND Tapira Phosphate Property Igneous Complex Boundary Road [ City <all other values> Monitoring Points Complementary Flow Deep Horizontal Drain Lowering Well Piezometer Spillway Water Level Indicator Potentiometric Surface Hydrography PROJECT SEC S-K 1300 TECHNICAL REPORT SUMMARY MOSAIC FERTILIZANTES: COMPLEXO MINERACAO DE TAPIRA TITLE HYDROGEOLOGICAL DRILL HOLE LOCATION MAP 31406539.009 7.2 2024-01-10 JS JS JDW #### 1 in 0 PATH: C:\Users\gld_jsimper\WSP O365\202313515Mosaic2023 - 05_Technical Work\06_GIS\Tapira_GIS\MapFiles\7.2_Hydro_Drill_Hole_Map_ANSIA.mxd PRINTED ON: 2024-01-10 AT: 1:08:48 PM Chile or Peru Bolivia Brazil Colombia Venezuela Guyana Paraguay Argentina French Guyana KEY MAP IF T H IS M E AS U R EM EN T D O ES N O T M AT C H W H AT IS S H O W N , T H E SH EE T H AS B E EN M O D IF IE D F R O M : A N SI A CONSULTANT PROJECT NO. CONTROL REV. FIGURE YYYY-MM-DD DESIGNED PREPARED REVIEWED APPROVED REFERENCE(S) 1. COORDINATE SYSTEM: CORREGO ALEGRE 1961 UTM ZONE 23S 0 1,000 2,000 Meters1:45,000 [ [ [ [ [ [ [ [ [ Min as Ge ra is Go iás Ca t al ão Araxá Catalão Ibiá Patrocínio Perdizes Sacramento Uberaba Uberlândia Tapira MAP AREA MAP AREA

Report Date: February 20, 2024 31406539.009-001-TRS-Rev0 Effective Date: December 31, 2023 Complexo Mineração de Tapira 7-8 Figure 7.3: Potentiometric Map of the Interior of the Dome (top) and Map of Directions of Ground Water Flow (bottom)

Report Date: February 20, 2024 31406539.009-001-TRS-Rev0 Effective Date: December 31, 2023 Complexo Mineração de Tapira 7-9 The horizontal and vertical hydraulic conductivity values (Kh and Kv) and the storage values for the confined and free aquifers (Ss and Sy) were obtained from the calibration of the numerical model developed by MDGEO, in 2008, 2012 to 2014, 2016, and 2021, and by WST in 2022. The compilation of these results is summarized Table 7.2 and Table 7.3. Table 7.2: Hydraulic Conductivity and Storage Values Obtained from the Calibration for the Years 2008, 2012, 2014, 2016, and 2021 Year Lithology Kh (Kx and Kv) (m/day) Kv (Kz) (m/day) Ss (1/m) Sy (-) Compact phosphate 0.01 0.005 0.0005 0.005 Friable phosphate + semi- compact (ore P2O5) 0.4 0.04 0.007 0.11 Titanium (Ti ore) 0.75 0.075 0.008 0.13 Clayey overlying layers (red, yellow and peat) 0.15 0.015 0.002 0.002 Kaolinite (constrained occurrence) 0.15 0.015 0.002 0.002 Fresh Rock 0.008 0.008 0.00001 0.001 Fractured Rock 0.3 0.2 0.0003 0.03 Isalterite 0.5 0.33 0.0011 0.11 Isalterite (magnetite pockets) 1.5 0.75 0.0022 0.22 Aloterite 0.2 0.1 0.0004 0.04 Fresh Rock 0.008 0.008 0.00001 0.001 Fractured Rock 0.05 0.025 0.0002 0.02 Isalterite (undivided) 0.3 0.1 0.0008 0.08 Aloterite 0.1 0.05 0.0003 0.03 Isalterite (magnetite-titanium) 1.8 0.9 0.003 0.3 Isalterite - Silexite 0.5 0.33 0.00001 0.001 Isalterite - Fenite 0.15 0.1 0.0008 0.08 Isalterite - Fenite 1.4 1 0.0012 0.12 Isalterite - Carbonatite 1.2 0.8 0.0011 0.11 Fresh Rock 0.008 0.008 0.00001 0.008 Fractured Rock 0.05 0.025 0.0003 0.04 Aloterite 0.1 0.05 0.0003 0.03 Isalterite (magnetite-titanium) 1.8 0.9 0.0022 0.17 Isalterite - Fenite 0.15 0.1 0.0001 0.001 Isalterite – Bebedourite+Phoscorite 1.4 1 0.0011 0.11 Isalterite - Carbonatite 1.2 0.8 0.0012 0.012 Isalterite – Bebedourite 0.1 0.05 0.0025 0.025 Isatelrite - Sienito 0.12 0.08 0.001 0.05 Xisto – Fresh Rock 0.008 0.008 0.000001 0.00001 Xisto – Altered Rock 0.8 0.8 0.0003 0.03 2008 2012 to 2014 2016 2021

Report Date: February 20, 2024 31406539.009-001-TRS-Rev0 Effective Date: December 31, 2023 Complexo Mineração de Tapira 7-10 Table 7.3: Calibrated Values of Hydraulic Conductivity, Effective Porosity, and Recharge Rates of Each Hydrogeological Unit Represented in the 2022 Model Note: Kxx, Kyy, Kzz = Hydraulic Conductivity; Sy = Effective Porosity 7.3.3 Hydrogeological Modeling The numerical modeling of the groundwater flow of CMT was developed in Visual Modflow software, version 2011, based on the mathematical method of finite differences. The methodology used consisted of the integration of the increment of the modeled area and the revision of the geological model, recalibration in a transient discharge state, simulation of the advance of the mining, and assessment of the alterations in water availability. The assembly and calibration stages of the model seek to numerically represent the conceptual hydrogeological model. They mainly involve the definition of the physical limits of the model, the definition and allocation of the contour conditions, the distribution of the geology and respective hydrodynamic properties, and the representation of the tubular wells and the other drainage structures of the cave, as well as the hydrogeological monitoring. The description of the numeric model is produced using data to simulate the natural conditions of the subsurface environment of the modeled area. It begins with the limits of the model and the grid, with an area of around 223 km² and a depth of 420 m. The groundwater flow is represented by a steady state and a transient state. The numeric elements inserted into the model are the contour conditions and determine the relationships between the hydraulic loads and the ground water flow of the area. These physical/hydrogeological elements consider inactive Hydrogeological Unit Subdivision Kxx / Kyy / Kzz (m/s) Sy Recharge Rate Aloterite - 5.04E-07 0.03 18% Phoscorite 9.00E-07 Carbonatite 2.91E-06 Undifferentiated Alkalies 5.20E-07 Layer 1 1.00E-05 0.1 0% Layers 2 to 18 1.00E-07 0.01 - Layer 1 1.00E-05 0.1 0% Layer 2 1.00E-06 0.05 - Layer 3 1.00E-07 0.05 - Layer 4 to 18 3.00E-08 0.001 - Soil 8.30E-06 0.1 25% Semi-weathered Rock 1.00E-07 0.01 - Fresh Rock 7.00E-08 0.005 - Soil 1.00E-05 0.17 25% Semi-weathered Rock 1.00E-06 0.12 - Fresh Rock 1.00E-07 0.05 - Soil 8.00E-07 0.03 13% Semi-weathered Rock 1.00E-07 0.02 - Fresh Rock 5.00E-08 0.01 - Geological Fault – Damage Zone - 1.00E-05 0.001 - 0.10 18% - 25% DAM BL-01 & BR-01 - 8.00E-07 0.03 0 25% Semi-weathered Rock Fresh Rock Fenite Quartzite Xisto Isalterite 0.1

Report Date: February 20, 2024 31406539.009-001-TRS-Rev0 Effective Date: December 31, 2023 Complexo Mineração de Tapira 7-11 cells (null flow); recharge, a mean multi-year rainfall in the Tapira region over an 11-year period of 1,591 millimeters per year (mm/year), of which 20% was attributed to precipitation and 80% to evapotranspiration and surface runoff; specified potential and drainage. The modeled area is approximately 162 km², covering the entire Alkaline Complex of Tapira (Domo) and the Córrego da Mata basin, as well as other sub-basins around the complex. The model covers a rectangular area 13,300 m long by 12,200 m wide and 400 m deep. The main grid has 100 x 100 m cells, and for added detail the Bigorna region, the grid was refined to 20 x 20 m cells. The vertical axis (Z) was divided into a series of 20 intervals of 20 m from 1,330 to 930 m amsl, totaling 400 m in depth. The description of the hydrogeological units in the model was essentially based on the lithostructural (physical) characteristics of each mapped unit. Hydraulic conductivity (K), storage (Ss and Sy) and porosities (Peffetiva, Ptotal) values were assigned. The model was based on the description of the hydrogeological units using, in an intrinsic manner, the litho-structural characteristics of each unit mapped, while the assembly and the calibration also considered the water level, piezometer and vertical draining indicators. The balance zones calculated the water balance in pre-determined cells and correspond to the volume of water that flows into and out of said cell. These zones were attributed to the cells located along the streams in the interior of the boundaries, which receive the outflow of the drains, and for which there exists monitoring data, through spillways or measurement apparatuses. Drain-type conditions were applied to streams and drainage structures in the pit. This property was assigned to cells along the tracing of all streams within the modeled boundary. The drains applied in the previous work, under the mine pit, simulating the pit drainage channels, were kept in the present model. Steady and transient state calibrations were performed. For the calibration of the model in steady state, May 2007 was considered as a reference before the continued operation of the first tubular well. A transient calibration was performed to adjust the storage values of the hydrogeological units. This was carried out from June 2007 to July 2020 with a division of 53 stress periods. The water levels calculated by the model show a good approximation with the water levels monitored by the instruments. The normalized mean square error - normalized root mean square, used as a calibration parameter for all instruments, presented a value of 6.0%. The multi-year average of precipitation in the Tapira region for the last 32 years is 1,628 mm/year. Considering recharge as the percentage of precipitation that infiltrates the land and feeds aquifers, a rate of 20% of precipitation (326 mm/year) was initially assigned, corresponding to a base value adopted for recharge in crystalline terrains under humid climate (Bertachini, 1987). In this case, the remaining 80% (1,303 mm/year) correspond mainly to evapotranspiration and runoff. The recharge percentages that provided the best water level calibration in the modeled area were 25% (407 mm) of the total precipitation in natural ground, 37% (602 mm) in mine pit and 13% (212 mm) in area outside the Dome. Constant head condition was applied to the active cells of Dams BL (elevation 1,215 m amsl) and BR (elevation 1,195 m amsl), to the northwest and northeast of the model, respectively.

Report Date: February 20, 2024 31406539.009-001-TRS-Rev0 Effective Date: December 31, 2023 Complexo Mineração de Tapira 7-12 The hydraulic conductivity varies between 8x10E-3 and 1.8 m/d, for the healthy rock and Titanio zone. For the transient case, the values of storage coefficients from 1x10e-05 to 2.5x10e-03 were estimated. Considering the instruments and the available water level database and the results obtained in the model, it can be said that a good calibration of the groundwater level was achieved in the model, especially in the instruments in the Bigorna region. From the hydrogeological, recalibrated numeric model, the MDGEO company finalized a study that carried out simulations of the advance of the mining and the lowering of the water level until the year 2032 in the area delimited by the CMT. Additional monitoring includes measurement of the flow rates of the streams to monitor surface discharges and possible impacts caused by the project on the water availability of the region. This monitoring is performed through spillways and micro-pulleys, with a total of 26 spillways, Parshall and Sump channels, which aim to monitor the flow produced inside the mine. 7.3.4 Qualified Person’s Opinion It is the QP’s opinion that monitoring methodologies applied to surface water, groundwater, and the drilling and pumping test activities to obtain hydraulic parameters are appropriate and have been completed by qualified companies inside the normative, which allows for the data’s appropriate use in the hydrogeological model. Furthermore, the hydrogeological model complies with good calibration practices and has an adequate representation. With respect to the hydrochemical samples, these were taken and reported according to the authority’s requirements. All these activities are appropriate for establishing a Mineral Reserves estimate as summarized in this TRS. The QP is not aware of any hydrological and hydrogeological drilling, sampling, testing, and modeling factors that could materially affect the accuracy and reliability of the results of the hydrological and hydrogeological studies. 7.4 Geotechnical Drilling Several geotechnical investigation campaigns have been conducted at CMT since 1999. The geotechnical campaigns have been executed following the guidelines included in the standards developed by the Brazilian Association of Technical Standards (or ABNT), particularly: NBR 8044 “Geotechnical Project – Procedures”: establishes the procedures to be observed in geotechnical studies and projects; and NBR 13029 “Development and Presentation of Plans for the Disposal of Waste Rock Heaps”: establishes the minimum requirements for the development and presentation of the plan of the heaps to be used for the disposal of waste rock in order to comply with safety, operational, economic, and decommissioning conditions. The geotechnical investigation campaigns executed to date include site investigation and laboratory testing. The site investigation includes: Standard penetration test (SPT) Test pits with collection of non-deformed samples

Report Date: February 20, 2024 31406539.009-001-TRS-Rev0 Effective Date: December 31, 2023 Complexo Mineração de Tapira 7-13 Exploratory drilling and collection of non-deformed samples and field analyses, for the determination of density by the sand bottle or drive-cylinder method. These actions follow the recommended procedures set out in Directives ABNT/NBR-6484, NBR-9604, NBR-9820, NBR-7185 (sand bottle test), and NBR-9813 (drive-cylinder test). The geotechnical testing does not undergo any QA/QC program with its testing. There are water level indicators and piezometers installed on the slopes as well as surface benchmarks on the benches of the mine, in accordance with directive ABNT/NBR-13895 (Figure 7.2). A series of laboratory testing campaigns have been executed to characterize the type and strength of the materials found at CMT. The laboratory testing programs included: Atterberg limits (NBR-6459 and NBR-7180) Soil samples - Preparation for compaction and characterization tests (NBR-6457) Soil - Grain size analysis (NBR-7181) Specific mass of the solids (NBR-6508) Soil - Compaction test (NBR-7182) Los Angeles abrasion test (NBR - NM51) Soil - Determination of the coefficient of permeability from granular soils at constant head (NBR-13292) Determination of void ratio (NBR-12004 and 12051) In 2019, WALM prepared a report summarizing the geotechnical investigation campaigns carried out by Mosaic Fertilizantes at CMT between 1995 and 2019. An additional geotechnical investigation campaign was conducted in 2021 and the studies were updated accordingly. A summary of the geotechnical investigation campaigns can be seen in Table 7.4.

Report Date: February 20, 2024 31406539.009-001-TRS-Rev0 Effective Date: December 31, 2023 Complexo Mineração de Tapira 7-14 Table 7.4: Compilation of Data from the Geotechnical Analysis Campaigns at CMT Strength parameters of the different materials found at CMT were determined based on the results of the laboratory tests. The properties of the different units are presented in Table 7.5. The locations of the geotechnical drill holes are illustrated in Figure 7.4. A summary of the geotechnical studies at CMT is presented in document, WBH122-17-MOSC075-RTE-0001. Table 7.5: Material Geotechnical Properties 7.4.1 Qualified Person’s Opinion The QP has reviewed the available geotechnical data and procedures. The data are well documented via original digital and hard copy records and were collected using industry standard practices in place at the time. The data has undergone thorough internal and third-party data verification reviews, as described in Section 9.0 of this TRS. The QP is not aware of any geotechnical drilling, sampling, or recovery factors that could materially affect the accuracy and reliability of the results of the historical or recent geotechnical drilling. Year Drill holes Laboratory tests Material 1999 - Triaxial CIU Kaolinized Soil 2005- 2006 10 test wells Triaxial CIU and saturated CIU Yellow clay, Titanium and friable phosphate 2008 50 test wells (20 samples) Specific weight of grains Natural specific weight Triaxial CIU and Saturated CIU Yellow clay, Titanium and friable phosphate 2013 15 drill holes (13 samples) Triaxial CIU and saturated CIU Isalterite, friable phosphate, Titanium, Syenite, Yellow Clay and Isalterite/Kaolin 2015 12 test wells Triaxial CIU and saturated CIU Syenite, Friable Phosphate, Titanium and Clays 2021 14 test wells Triaxial CIU and saturated CIU Isalterite, friable phosphate, Titanium, Syenite, Yellow Clay and Isalterite/Kaolin c’ (kPa) ϕ' (°) c’ (kPa) ϕ' (°) Waste Dump / PDE 19 - 10 32 - - Cover Aloterite 18 20 50 29 42 32 Titanium Isalterite Topo 20 21 40 30 30 33 Bebedourite / Phoscrete Friable Phosphate (Bottom Isalterite) 22 22 23 29 21 32 Bebedourite / Phoscrete Semi-compact Phosphate (Semi-weathered Rock) 24 22 100 35 50 35 Bebedourite / Phoscrete Compact Phosphate (Fresh Rock) 24 24 200 35 100 35 Syenite/ Kaolinized Soils 22 22 37 31 35 29 Fenite 17 - 31 25 - - Weathering Triaxial CIU nat Triaxial CIU sat Material γ wet (kN/m³) γ sat (kN/m³)

!. !. !. !. !.!.!. !. !.!. !. !. !. !. !. !. !.!. !. !. !.!. !. !. !. !. !. !. !.!. !. !. !. !.!. !.!. !. !. !. !. !.!.!. !. !. !. !. !. !. BL-1 BL-1 BR PI-AA-01 PI-AA-06 PI-TI-02 PI-TI-07 PI-FF-03PI-FF-04 PI-FF-05 PI-FF-08 PI-FF-09 PI-FF-10 P-101 (AA) P-102 (AA) P-103 (Ti) P-104 (Ti) P-105 (FF) P-106 (FF) P-107 (Ti) P-108 (FF) P-109 (Ti) P-110A (FF) P-111 (FF) P-112A (AAc) P-113 (AAc) P-114 (AAc) P-115 (Ti)P-116 (FF) P-117 (AAc) P-118 (Ti) P-119 (Ti) P-120 (AA) P-121 (FF) P-122 (FF) P-123 (AA) P-124 (AA)P-125 (Ti) P-126 (Ti)P-127 (FF) P-128 (FF) AI-Big-01 AI-Big-02 AI-Big-05 AI-Big-06 AI-Big-07 AI-Big-08AI-Big-09 AI-Big-10 AI-Big-11 AI-Big-12 AI-Big-13 AI-Big-14AI-Big-15 305000 305000 306000 306000 307000 307000 308000 308000 309000 309000 78 00 00 0 78 00 00 0 78 01 00 0 78 01 00 0 78 02 00 0 78 02 00 0 78 03 00 0 78 03 00 0 78 04 00 0 78 04 00 0 CLIENT THE MOSAIC COMPANY LEGEND Tapira Phosphate Property Igneous Complex Boundary Tapira Tailings Dam !. Geotechnical Drill Hole PROJECT SEC S-K 1300 TECHNICAL REPORT SUMMARY MOSAIC FERTILIZANTES: COMPLEXO MINERACAO DE TAPIRA TITLE GEOTECHNICAL DRILL HOLE LOCATION MAP 31406539.009 7.4 2024-01-10 JS JS JDW #### 1 in 0 PATH: C:\Users\gld_jsimper\WSP O365\202313515Mosaic2023 - 05_Technical Work\06_GIS\Tapira_GIS\MapFiles\7.4_Geotech_Drill_Hole_Map_ANSIA.mxd PRINTED ON: 2024-01-10 AT: 1:20:17 PM Chile or Peru Bolivia Brazil Colombia Venezuela Guyana Paraguay Argentina French Guyana KEY MAP IF T H IS M E AS U R EM EN T D O ES N O T M AT C H W H AT IS S H O W N , T H E SH EE T H AS B E EN M O D IF IE D F R O M : A N SI A CONSULTANT PROJECT NO. CONTROL REV. FIGURE YYYY-MM-DD DESIGNED PREPARED REVIEWED APPROVED REFERENCE(S) 1. COORDINATE SYSTEM: CORREGO ALEGRE 1961 UTM ZONE 23S 0 500 1,000 Meters1:25,000 [ [ [ [ [ [ [ [ [ Min as Ge ra is Go iás Ca t al ão Araxá Catalão Ibiá Patrocínio Perdizes Sacramento Uberaba Uberlândia Tapira MAP AREA MAP AREA

Report Date: February 20, 2024 31406539.009-001-TRS-Rev0 Effective Date: December 31, 2023 Complexo Mineração de Tapira 8-1 8.0 SAMPLE PREPARATION, ANALYSES, AND SECURITY 8.1 Site Sample Preparation Methods and Security Sample preparation and analysis for two time periods, 1988-2009 and 2010-Present, are detailed in the subsections below. 8.1.1 Drilling Campaigns from 1983 to 2009 (Fosfértil) From 1988 to 2009, samples were collected by Fosfértil staff and contractors. Drilling logs were prepared by geologists in relation to the geological and geotechnical characteristics and uploaded in the Datamine Studio software. A sampling plan was executed using intervals with a length of 5.0 m, considering the geological and weathering contacts. The minimum accepted sample length was 0.5 m, and the maximum was 7.0 m. Half-core samples were taken with a special sampling spoon for friable materials or cut using a diamond saw for compact materials. Samples were stored in large plastic bags, weighed, and tagged. The mean weight of each sample was 9.5 kg. One-half of the sample was sent to the Fosfértil analytical laboratory, the other was archived in a core storage facility on site. Sampling and tagging were carried out by SRJ Geologia e Serviços Ltda (a local contractor) at the mine preparation facility and were assayed at the Fosfértil laboratory. The preparation protocol consisted of drying and crushing to 100%-½", Jones-splitting of 250 gram (g) to 300 g aliquots, and pulverization to 100%-150 microns (μm; 100 mesh). Pulp rejects were returned and are currently stored at the Tapira storage facility. Sample preparation was conducted by Fosfértil geology personnel at the lab. The mine laboratory has been used to assay the exploration samples since 1998. From 2002 onwards, pulverized samples were assayed by pressed pellet x- ray fluorescence (XRF) for total P2O5, CaO, SiO2, MgO, Al2O3, Fe2O3, and TiO2 grades. Assay results were reported on signed, printed certificates, and digital certificates in Word format, including Excel tables, were submitted to the geologists via e-mail. 8.1.2 Drilling Campaigns from 2010 to Present (Vale and Mosaic) After the acquisition of CMT by Vale in 2010 and then Mosaic in 2018, the procedures for sampling and assaying did not change significantly. The main guidelines for sampling and assaying were: 2010 to May 2012: Intervals with a length of 5.0 m broken by geology and weathering. The collected samples had a minimum length of 2.5 m and a maximum of 7.5 m. Geological units shorter than 2.5 m were incorporated into a larger sample. May 2012 to 2017: Intervals with a length of 3.0 m broken by geology and weathering. The collected samples should have a minimum length of 1.5 m and a maximum of 4.5 m. Since 2018: The protocol used prior to 2012 was adopted again. The collected samples should have a minimum length of 2.5 m and a maximum of 7.5 m. Geological units shorter than 2.5 m were incorporated into a bigger sample. The sample intervals were marked on the core boxes with sequential numbering. After 2012: Intervals with less than 60% core recovery were not sampled and are marked with the code NS in the database.

Report Date: February 20, 2024 31406539.009-001-TRS-Rev0 Effective Date: December 31, 2023 Complexo Mineração de Tapira 8-2 All sample information was logged directly into DHLogger_GDMS system by the geologist. Half-core samples were taken with a special sampling spoon for friable materials or cut using a diamond saw for compact materials. Samples were stored in large plastic bags, weighed, and tagged. Logging was performed by Mosaic (previously Vale) geologists and sampling and tagging were prepared by the contractors. After sampling the remaining material was kept in the box and stored in the core shed. Sample submission forms were prepared for dispatch to the physical and chemical analysis laboratories. Analyses were performed in internal laboratories between 2010 and 2011. In 2012 the analyses were performed by SGS Laboratory, located in Vespasiano, in the state of Minas Gerais, Brazil. From 2013 to 2022, all long-term samples were analysed by ALS Laboratory, located in Lima, Peru, with the short-term samples analysed internally. Up until the middle of 2020, all samples were prepared at the internal CMT laboratory; however, from mid-2020 all long-term samples were sent to ALS in Lima for preparation and analysis. Short-term samples continue to be analysed internally. The analytical laboratories hold the following certifications: SGS Laboratory, Vespasiano city, Brazil: ISO 9001, ISO 14001, Brazil Certificate of Accreditation (Environmental Laboratory), Regional Chemical Council (2nd Region Minas Gerais) Company Certificate. ALS Laboratory, Lima Peru: ISO 17025 - Standards Council of Canada Certificate of Accreditation. Chemical analyses were performed for the following major elements: P2O5, CaO, MgO, Al2O3, Fe2O3, SiO2, BaO, K2O, MnO, Na2O, TiO2, and Loss on Ignition (LOI). Other minor elements were also analyzed. SGS used the ICP method while the CMT internal laboratory and ALS used the XRF method for the major elements. All samples analyzed in 2012 by SGS were discarded and re-assayed by ALS using the XRF method in 2013. Figure 8.1 shows the current sampling and testing procedures in use at Mosaic.

Report Date: February 20, 2024 31406539.009-001-TRS-Rev0 Effective Date: December 31, 2023 Complexo Mineração de Tapira 8-3 Figure 8.1: Current Mosaic Sampling and Assay Flowsheet 8.2 Laboratory Sample Preparation Methods and Analytical Procedures 8.2.1 Density The density measurements used for Mineral Resource evaluation were performed by Vale after 2010, and Mosaic after 2018. Density data collected prior to 2010 was removed from the database and not used due the lack of details of the methods and procedures used. A total of 13,404 density determinations were carried out using the following methods. Table 8.1 summarizes the mean dry density values by weathering and lithology unit. 8.2.1.1 Archimedes Principle Hydrostatic Balance (drill hole samples) The drill core samples were weighed before packaging in thin plastic (natural weight) and weighted again after being sealed (natural weight plus packaging). The samples were placed in a container filled with water and the weight of the sample in water was measured with the aid of a bespoke tool that is attached to the hydrostatic scale. After weighing the samples in water, the samples were unpackaged and dried for 24 hours. After drying, they were weighed again to obtain the dry weight. Density was then calculated as follows: 𝐷𝑒𝑛𝑠𝑖𝑡𝑦 𝑊𝑊 𝑃 𝑊 𝑃 𝑊 𝑃 𝑊 Where: W = Weight P = Packaging Nat = Natural (Air) Wat = Water

Report Date: February 20, 2024 31406539.009-001-TRS-Rev0 Effective Date: December 31, 2023 Complexo Mineração de Tapira 8-4 8.2.1.2 Excavation with Sand Fill (in-situ samples) The basic principle of the sand replacement method was to measure the in-situ volume of the hole from which the material was excavated, based on the weight of the sand of known density that fills the hole. The in-situ density of the material was given by the weight of the excavated material divided by the in-situ volume. 8.2.1.3 Core Cutter (in-situ samples) The core cutter method was used to determine the field density. A core of known volume was dug into the surface and then weighed, first empty and secondly with the material collected. Density was calculated by dividing mass by volume. The number of measurements and the average density values for each weathering and lithological domain used in the resource model are shown in Table 8.1. Table 8.1: Mean Density Values by Weathering and Lithology Unit Notes: SF = Excavation with Sand Fill, CC = Core Cutter, AM = Archimedes Method 8.3 Quality Control and Quality Assurance Programs Vale initialized the analytical QA/QC program in the Tapira phosphate mineral deposit in 2010. The program includes the generation of reference materials certified with their own matrixes, or in other words, each unit has its own Certified Reference Material (CRM), leading to greater adherence of the results. From 2012 on, a specialist team was created to guarantee the effective control of these processes. 8.3.1 Historical Analytical Quality Control at CMT Considering the absence of analytical quality control programs before 2010, in 2011 Vale carried out a core borehole re-sampling of previous drilling campaigns to verify the information quality of the database. This re- sampling was conducted under the supervision of AMEC Minproc (AMEC). Weathering Lithology No. of Samples Method Mean Dry Density (g/cm³) ALO - 996 SF, CC and AM 1.62 ISAT - 1,332 SF, CC and AM 1.68 FCR/CBN 2,098 SF, CC and AM 1.88 BEB 1,220 SF, CC and AM 1.80 SIE 185 SF, CC and AM 1.88 FCR/CBN 2,893 SF, CC and AM 2.45 BEB 1,605 SF, CC and AM 2.55 SIE 153 AM and SF 2.41 FCR/CBN 1,362 AM 2.91 BEB 860 AM 3.02 SIE 127 AM 2.68 FEN 16 AM 2.19 ENC 44 AM 1.90 12,891 ISAB RSI RSA - Total

Report Date: February 20, 2024 31406539.009-001-TRS-Rev0 Effective Date: December 31, 2023 Complexo Mineração de Tapira 8-5 Vale collected crushed samples from core boreholes drilled from 1981 to 2007. The re-sampling was performed by the Vale technical team and the sample physical preparation was conducted by the Tapira internal laboratory. The samples were analyzed in the SGS Geosol laboratory in Vespasiano, Brazil. A further 20% of all samples were also analyzed at the ALS laboratory in Lima, Peru and 10% of all samples were also analyzed in the CMT internal laboratory. In general, the analytical accuracy and precision in relation to the elements analyzed were considered within acceptable limits. No significant contamination was found for the elements analyzed during preparation and analysis. 8.3.2 Analytical Quality Control (2010 to Present) Vale and then Mosaic relied partly on the internal analytical QC measures implemented by the SGS, ALS and CMT internal laboratories. In addition, they implemented external analytical control measures consisting of inserting CRM samples, blank material, and coarse and pulverized duplicate assays in all sample batches submitted for assaying. Control samples are inserted at a minimum rate of 15% per batch. Pulverized and coarse duplicates were analyzed by the CMT internal laboratory (January 2010 to July 2012), the SGS Geosol laboratory in Vespasiano, Brazil (Oct 2012 to February 2013) and the ALS Minerals laboratory in Lima, Peru (October 2013 to present). The blank material is a not a certified commercial product and was not specifically prepared for Mosaic. Ten chemical analyses for each purchased blank were prepared by Mosaic for validation. From October 2011, three different CRMs were created from Tapira samples and certified for Al2O3, BaO, CaO, Fe2O3, MgO, P2O5, SiO2, and TiO2 grades. Besides those certificates, CRMs created from Araxá phosphate mineral deposit have also been used in CMT analytical QA/QC programs since November 2013. All the CMT CRM standards were recertified by Iluka Resources Ltd (Iluka) in October 2015. In 2018/2019 the CRMs were recertified by KYMI Ltda. (KYMI) of Belo Horizonte, Brazil. KYMI performed statistical calculations and subsequent evaluations to redefine the acceptance limits. P2O5 grades of the reference material range from 4.94% to 12.11%. Table 8.2: shows the specifications of the CRMs used by Mosaic in the Tapira phosphate mineral deposit. In addition, since May 2016 pulverized samples originally assayed at ALS have been sent to SGS for umpire laboratory testing. The controls of the chemical laboratory generally consist of the monitoring of CRMs, using the same principles to validate the results in terms of accuracy proposed by international methods of chemical analysis. The equation used in these guidelines for the evaluation of the results of the analysis of the standards or CRM is: 𝑉 𝑉 3 𝑠𝑡𝑑.𝐸𝑟𝑟𝑜𝑟 𝑎

Report Date: February 20, 2024 31406539.009-001-TRS-Rev0 Effective Date: December 31, 2023 Complexo Mineração de Tapira 8-6 Where: Vc = Certified value Vm = Value obtained from the analysis of the CRM 3 = Parameter of quality assurance of the action Std.Error = Standard error in the certified material statistics α =Sampling process error of primary laboratory Table 8.2: Specifications of Certified Reference Materials used by Mosaic for Tapira To control the precision, duplicates were used. Each type of duplicate controls a separate stage of the process. Field duplicates control the accuracy of the measurement process, from the sampling stage to sample preparation and analysis. Crushed duplicates, meanwhile, allow for the monitoring of sample preparation, while pulverized samples can be used to monitor only the analytical process. There are two types of control of pulverized samples, namely, reproducibility and repeatability. For the control of reproducibility, a certain quantity of pulverized samples is duplicated and sent to the secondary laboratory. The differences found in these pairs are a measure of analytical reproducibility, allowing for the fact that laboratories do not strictly follow the same analytical routines. The control of repeatability, meanwhile, is not strictly necessary in geological testing, as the conditions of the laboratory vary between the batches received (analysts, reagents, equipment, calibration curves and other elements may change). What is controlled in such cases is the precision of the laboratory, defined in ISO 5725-3 as an intermediate measure of precision. For QA and precision verification, crushed and pulverized duplicates were used. These are referred to in the company's internal terminology as CDP and PDS, respectively. All the samples are currently validated as being within the acceptable limits and liberation parameters of their pre-defined batches, established in accordance with the internal procedures set out in the requirements listed above. 8.4 Qualified Person’s Opinion The QP has reviewed the available sampling preparation, analytical and sample security (chain of custody) procedures, and validations applied to the CMT data after 1984, as well as the quality control program implemented since 2010. The data and methods are well documented via original digital and hard copy records and were collected using industry standard practices in place at the time. All data has been organized into a current and secure spatial relational database. The data has undergone thorough internal and third-party data verification reviews, as described in Section 9.0 of this TRS. The QP is not aware of any sampling, analytical, or sample security factors that could materially affect the accuracy and reliability of the results of the historical or recent exploration drilling. The QP considers that the sampling and analytical data collected after 1984 are of sufficient quality to support Mineral Resource evaluation. CRM Certified Value (P2O5%) Standard Deviation Lab Deviation Source CMA03-10 4.936 0.0324 0.1126 KYMI Ltda CMT01-19 12.105 0.0599 0.1194 KYMI Ltda CMT02-19 11.385 0.0479 0.1440 KYMI Ltda CMT03-19 8.369 0.0383 0.1090 KYMI Ltda

Report Date: February 20, 2024 31406539.009-001-TRS-Rev0 Effective Date: December 31, 2023 Complexo Mineração de Tapira 9-1 9.0 DATA VERIFICATION 9.1 Site Visit Data Verification As part of the data and methodology verification process, the WSP QPs performed a personal inspection site visit at CMT during November 8 and 9, 2021. The site visit was completed in fulfilment of the requirement that the Mineral Resource or Mineral Reserves QP(s) perform a current site visit to the Mine in support of preparation of any S-K 1300 Mineral Resource and/or Mineral Reserve statements, or TRS. The purpose of the site visit was to allow the QPs to observe key aspects of the Mine site and operations including deposit geology, current and previous exploration programs, mining operations, mineral beneficiation operations and site infrastructure. Key members of the CMT geology and mining operations teams and senior management teams were engaged with the WSP QPs throughout the site visit to allow for in depth discussion and verification of current and historical methods and results and to discuss any concerns and recommendations. Activities performed by the QPs during the site visit included the following: General overview of the deposit geology, exploration, and mining operations history with the CMT mining operations and senior management teams. Observed several active drill rigs completing exploration core drilling as part of the annual CMT long-term (exploration) drilling program. The drill site review included a review of the drill hole location and final surveying methods, drilling methods, core recovery, and boxing methodology and drill core chain of custody. Performed collar location checks on seven exploration drill holes that were included in the current geological model (see further discussion below). Visited the CMT core shed and reviewed drill core from two long-term core drill holes. This review included a discussion on core handling and security, drill core logging, sample identification and selection, field (blind) analytical QA/QC sample insertion, drill core storage and sample reject (coarse and pulp) storage. Reviewed geological data collection, data management, interpretation, geology and grade modeling and Mineral Resource estimation procedures with the CMT geology team. Observed several active drill rigs completing grade control and blast hole drilling as part of the current mining operations grade control and drill and blast processes. The grade control process review included observation of the manual quartering and sample selection process used to select the grade control and metallurgical samples for analysis at the onsite laboratory. Visited the onsite sample preparation, chemical laboratory, and metallurgical laboratory to review grade control and metallurgical sample receiving, sample preparation, analysis, QA/QC procedures and sample and reject storage procedures for the CMT short-term sampling. Visited the ore handling system including primary and secondary crushing, belt conveying and homogenization stockpile with stacker/reclaimer system. Visited the mining operation and observed current conditions for the haul roads, pit ramps and access, pit wall stability, mining equipment, mine operations, blasting procedures, pit, and surface water management and OSFs and operations.

Report Date: February 20, 2024 31406539.009-001-TRS-Rev0 Effective Date: December 31, 2023 Complexo Mineração de Tapira 9-2 Visited the process tailings storage facilities, observed conditions and operations, and discussed planned expansions of the impoundments with the site team. Visited the CMT process plant operations, including the milling operations (rod-and-ball mills, and low intensity magnetic separation), hydrocyclone (fines separation and classification), and the coarse, fine, and ultrafine flotation process (rougher and fine bed flotation and fine columnar flotation), as well as product storage facilities. Visited the various support infrastructure facilities used to support the operation, including the power station, product loadout, workshops and warehouses, service facilities and explosives storage facilities. Met with the permitting and environmental team to discuss any environmental/permitting issues and status of planned permitting activities. Met with the site short-term planning team to discuss current resource update methodologies for updating the resource model, and methods for updating current short-range mine plans. It should be noted that both historical and current long-term (exploration) samples at CMT were submitted to offsite, third-party commercial laboratories for analyses; the third-party laboratories were not visited as part of the QP site visit. As presented in the bullets above, the QP visited collar locations for seven exploration drill holes that were included in the current geological model database; one additional drill hole that was completed after the modeling database was finalized was also visited. Given the current pit limits, many of the CMT exploration drill holes used to develop the geological model now fall within the current pit limits; as a result, drill holes available for verification purposes during the site visit were limited to the resource area outside of the current mining operations limits. Figure 9.1 presents the locations of the drill holes verified during the site visit. The drill hole collar locations were typically marked by a cement slab with a short section of PVC pipe sticking up from the slab serving as a monument for the drill collar. The drill hole collar monuments had a metal drill hole identification tag recording the drill hole name, completion date, total depth, azimuth, dip, and collar coordinates. The drill hole collar positions were verified by the QP using a handheld non-differential GPS. Table 9.1 presents a summary of the drill hole collar coordinates recorded during the site visit along with the comparison against the drill hole collar coordinates recorded in the geological database. In general, the drill hole collar positions were found to be within the allowable tolerances given the relative precision of the original drill hole collar survey and the handheld GPS coordinates collected by the QP during the site visit. Table 9.1: CMT Site Visit Drill Hole Collar Coordinates Verification Easting (m) Northing (m) Elevation (m) Easting (m) Northing (m) Elevation (m) Easting (m) Northing (m) Elevation (m) CMT MTP DH 413 308,990 7,801,384 1,337 308,988 7,801,381 1,331 -1 -4 -6 CMT MTP DH 435 309,255 7,800,944 1,327 309,221 7,800,974 1,325 -34 30 -2 No collar found CMT MTP DH 348 310,121 7,801,309 1,336 310,119 7,801,308 1,330 -3 -1 -6 CMT MTP DH 405 309,486 7,801,968 1,305 309,487 7,801,965 1,303 1 -3 -2 CMT MTP DH 0439 308,841 7,800,811 1,272 308,844 7,800,810 1,269 3 -1 -3 CMT MTP DH 0438 308,863 7,800,611 1,278 308,864 7,800,609 1,276 1 -1 -2 CMT MTP DH 0510 308,416 7,800,206 1,321 308,416 7,800,204 1,321 0 -2 0 -5 3 -3 Notes Average DHID GPS CMT Database Difference

[ [ [ [ [ [ [ [ [ [ [ [ [ [ [ [ [ [ [ [ [ [ [ [ [ [ [ [ [ [ [ [ [ [ [[ [ [ [ [ [ [ [ [ [ [ [ [ [ [ [ [ [ [ [ [ [ [ [ [ [ [ [ [ [ [ [ [ [ [[ [ [ [ [ [ [ [ [ [ [ [ [ [ [ [ [ [ [ [ [ [ [ [ [ [ [ [ [ [ [[ [ [ [ [ [ [ [ [ [ [ [ [ [ [ [ [ [ [ [ [ [ [ [ [ [ [ [ [ [[[ [ [ [ [ [ [ [[ [ [ [ [ [ [ [ [ [ [ [ [ [ [ [ [ [ [ [ [ [ [ [ [ [ [ [ [ [ [ [ [ [ [ [ [ [ [ [ [ [ [ [ [ [ [ [ [ [ [ [ [ [ [ [ [ [ [ [ [[[ [ [ [ [[ [ [ [ [ [ [ [ [ [ [ [ [ [ [ [ [ [ [ [ [ [[ [ [ [ [ [ [ [ [ [ [ [ [ [ [ [ [ [ [ [ [ [ [ [ [ [ [ [ [ [ [ [ [ [ [ [ [ [ [ [ [ [ [ [ [ [ [ [ [ [ [[ [ [ [[[[[ [ [ [ [ [ [ [[[[[[ [[ [[ [ [ [[ [ [ [ [ [ [[ [ [ [ [ [ [ [ [ [ [ [ [ [ [ [ [ [ [ [ [ [ [[ [ [ [[[ [ [[ [ [[ [ [ [ [ [[ [ [ [ [[ [ [[ [ [[[[[ [ [ [[[[ [ [ [[ [[[ [ [ [[ [ [ [[[[[ [ [ [ [ [ [[[[[ [ [ [ [[[[ [ [ [[ [[ [ [ [ [ [ [[[ [[[[ [[[ [[[ [ [[ [ [[ [[ [ [ [ [ [[ [ [ [ [[[ [ [ [ [[ [ [[[[ [[[ [[[[ [ [ [ [ [ [ [ [ [ [ [ [ [[ [ [ [ [ [[ [ [ [ [[ [ [ [ [[[[ [ [ [ [ [ [ [ [[[[ [[ [ [[ [ [ [[ [ [ [ [[ [ [ [ [ [ [ [ [ [ [ [ [[ [ [ [ [ [ [ [ [[ [[[ [ [ [ [ [ [ [ [ [[ [ [ [ [ [ [ [ [ [ [ [ [ [ [ [ [ [ [ [ [ [ [ [ [ [ [ [ [ [ [ [ [[ [ [ [ [ [ [ [ [ [ [[[[ [ [ [ [ [ [ [[ [ [[ [[ [ [ [ [ [[ [ [ [ [ [ [ [ [ [ [ [ [ [ [ [ [ [ [ [ [ [ [ [ [ [ [ [ [ [ [ [ [ [ [ [ [ [ [ [ [ [ [ [ [ [ [ [ [ [ [ [ [ [ [ [ [ [ [ [ [ [ [ [ [ [ [ [ [ [ [ [ [ [ [ [ [ [ [ [ [ [ [ [ [ [ [ [ [ [ [ [ [ [ [ [ [ [ [ [ [ [ [ [ [ [ [ [ [ [ [ [ [ [ [ [ [ [ [ [ [ [ [ [ [ [ [ [ [ [ [ [ [ [ [ [ [ [ [ [ [[ [ [ [ [ [ [ [ [ [ [ [ [ [ [ [ [ [ [ [ [ [ [ [[ [ [ [ [ [ [ [ [ [ [ [ [ [ [ [ [ [ [ [ [ [ [ [ [ [ [ [ [ [ [[ [ [[ [ [ [ [ [[ [ [ [ [ [ [[ [ [ [ [ [ [ [ [ [ [ [ [ [ [ [[ [ [ [ [ [ [ [ [ [ [ [ [ [ [ [ [ [ [[ [ [ [[ [ [ [ [ [ [[ [[ [[ [ [ [ [ [ [[[[ [ [ [ [ [ [[[[[ [ [ [ [ [[[[[ [ [ [ [ [ [[ [ [[ [ [[ [ [ [ [ [ [[ [[ [ [ [ [[ [ [ [ [[ [[ [ [ [ [ [ [ [ [ [ [[[ [[ [ [ [ [ [[[ [[ [ [ [ [ [ [ [ [ [[ [[[[ [ [[ [ [ [ [ [ [ [ [ [[ [ [ [ [ [ [ [ [ [ [ [ [ [ [ [ [ [ [ [ [[ [ [ [ [[ [ [ [ [[ [ [ [ [ [ [ [ [ [ [[ [ [ [ [ [ [ [ [[ [ [ [ [ [ [ [ [ [ [ [ [ [ [ [ [ [ [ [ [ [ [ [ [ [ [ [ [ [ [ [ [ [ [ [ [ [ [ [ [ [ [ [ [ [ [ [ [ [ [ [ [ [ [ [ [ [ [ [ [[ [ [ [[ [ [ [ [ [ [ [ [[ [ [ [ [ [ [ [ [ [ [ [ [ [ [ [ [ [ [ [ [ [ [ [ [ [ [ [ [ [ [ [[ [ [ [ [ [ [ [ [ [ [ [ [ [ [[[ [ [ [ [ [ [[ [ [ [ [ [ [ [ [ [ [[ [ [ [ [ [ [ [ [ [ [ [ [ [ [ [[ [ [ [ [ [ [ [ [ [ [ [ [ [ [ [ [ [ [ [ [ [ [ [ [ [ [ [ [ [ [ [ [ [ [ [ [ [ [ [ [ [ [ [ [ [ [ [ [ [ [ [ [ [ [ [ [ [ [ [ [ [ [ [[ [ [ [ [ [ [ [ [ [ [ [ [ [ [ [ [ [ [ [ [ [ [ [ [ [ [ [ [ [ [ [ [ [ [ [[ [ [ [ [ [ [ [ [ [ [ [ [ [ [ [ [ [ [ [ [ [ [ [ [ [ [ [[ [ [ [ [ [ [ [ [ [ [ [ [ [ [ [ [ [[ [ [ [ [[ [ [ [ [ [ [ [ [ [ [ [ [ [ [ [ [ [ [ [ [ [ [ [ [ [ [ [ [ [ [ [ [ [ [ [ [ [ [ [ [ [ [ [ [ [ [ [ [ [ [ [ [ [ [ [ [ [ [ [ [ [ [ [ [ [ [ [ [ [ [ [ [ [ [ [ [ [ [ [ [ [ [ [ [ [ [ [ [ [ [ [ [ [ [ [ [ [ [ [ [ [ [ [ [ [ [ [ [ [ [ [[ [ [ [ [ [ [ [ [ [ [ [ [ [[[ [ [ [[ [ [ [[ [[ [ [ [ [ [ [ [ [[ [ [ [ [ [ [ [ [ [ [ [ [ [ [ [ [ [ [ [ [ [ [ [ [ [ [ [ [ [ [ [ [ [ [ [ [ [ [ [ [ [ [ [ [ [ [ [ [ [ [ [ [ [ [ [ [ [ [ [ [ [ [ [ [ [ [ [ [ [ [ [ [ [ [ [ [ [ [[ [ [ [ [ [ [ [ [ [ [ [ [ [ [ [ [ [ [ [ [ [ [ [ [ [ [ [ [ [[ [ [ [ [ [ [ [ [ [ [ [ [ [ [ [ [ [ [[ [ [ [ [ [ [ [ [ [ [ [ [ [ [ [ [ [ [ [ [ [ [ [ [ [ [ [ [ [ [ [ [ [ [ [ [ [ [ [ [ [ [ [ [ [ [ [ [ [ [ [ [ [[ [ [ [ [ [ [ [ [ [ [ [ [ [ [ [ [ [ [[ [ [ [ [ [ [ [ [ [ [ [ [ [ [ [ [ [ [ [ [ [ [ [[ [ [ [ [[ [ [ [ [ [ [ [ [ [ [ [ [ [ [ [ [ [ [ [ [ [ [ [ [ [ [[ [ [ [ [ [ [ [[[ [ [ [ [ [[ [ [[ [[ [ [ [ [ [ [ [ [ [ [ [ [ [ [ [ [ [ [ [ [ [ [ [ [ [ [ [ [ [ [ [ [ [ [ [ [ [ [ [ [ [ [ [ [ [ [ [ [ [ [ [ [ [ [ [ [ [ [[ [ [[ [[ [ [ [ [ [ [ [ [ [ [[ [ [[ [ [ [ [ [ [ [ [ [ [ [ [ [ [ [ [ [ [ [ [ [ [ [ [ [ [ [ [ [ [ [ [ [ [ [[ [ [ [ [ [ [ [ [ [ [ [[ [ [ [ [ [ [ [[ [ [ [ [ [ [[ [ [ [ [ [ [ [ [ [ [ [ [ [ [ [ [ [ [ [ [ [ [ [ [ [ [ [ [ [ [ [ [ [ [ [ [ [ [ [ [ [ [ [ [ [ [ [ [ [ [ [ [ [ [ [ [ [ [ [ [ [ [ [ [ [ [ [ [ [ [ [ [ [ [ [ [[ [ [ [ [ [ [ [ [ [ [ [[ [ [[ [ [ [ [ [ [[ [ [ [ [ [ [ [ [ [ [ [ [ [ [ [ [ [ [ [ [ [[ [[ [ [ [ [ [ [ [ [ [ [ [ [ [ [ [[ [ [ [ [ [ [ [ [ [ [ [ [ [ [ [ [ [ [ [ [ [ [ [ [ [ [ [ [ [ [ [ [ [ [ [ [ [ [ [ [ [ [ [ [ [ [ [ [ [ [ [ [ [ [ [ [ [ [ [ [ [ [ [ [ [ [ [ [ [ [ [ [ [ [ [ [ [ [ [ [ [ [ [ [ [ [ [ [ [ [ [ [ [ [ [ [ [ [ [ [ [ [ [ [ [ [ [ [ [ [ [ [ [ [ [ [ [ [ [ [ [ [ [ [ [ [ [ [[ [ [ [ [ [ [ [ [ [ [ [ [ [ [ [ [ [ [ [ [ [ [ [ [ [ [ [ [ [ [ [ [ [ [ [ [ [ [ [ [ [ [ [ [ [ [ [ [ [ [ [ [ [ [ [ [ CMT MTP DH 413 CMT MTP DH 435 CMT MTP DH 348 CMT MTP DH 405 CMT MTP DH 0439 CMT MTP DH 0438 CMT MTP DH 0510 305000 305000 310000 310000 77 95 00 0 77 95 00 0 78 00 00 0 78 00 00 0 78 05 00 0 78 05 00 0 CLIENT THE MOSAIC COMPANY LEGEND Tapira Phosphate Property Igneous Complex Boundary Road [ City Mining Requirement Mining Concession [ Drill Hole [ Visited Drill Hole PROJECT SEC S-K 1300 TECHNICAL REPORT SUMMARY MOSAIC FERTILIZANTES: COMPLEXO MINERACAO DE TAPIRA TITLE QP DRILL HOLE COLLAR VERIFICATION 31406539.009 9.1 2024-01-10 JS JS JDW #### 1 in 0 PATH: C:\Users\gld_jsimper\WSP O365\202313515Mosaic2023 - 05_Technical Work\06_GIS\Tapira_GIS\MapFiles\9.1_QP_Drill_Hole_Verification_Map_ANSIA.mxd PRINTED ON: 2024-01-10 AT: 1:14:46 PM Chile or Peru Bolivia Brazil Colombia Venezuela Guyana Paraguay Argentina French Guyana KEY MAP IF T H IS M E AS U R EM EN T D O ES N O T M AT C H W H AT IS S H O W N , T H E SH EE T H AS B E EN M O D IF IE D F R O M : A N SI A CONSULTANT PROJECT NO. CONTROL REV. FIGURE YYYY-MM-DD DESIGNED PREPARED REVIEWED APPROVED REFERENCE(S) 1. COORDINATE SYSTEM: CORREGO ALEGRE 1961 UTM ZONE 23S 0 1,500 3,000 Meters1:60,000 [ [ [ [ [ [ [ [ [ Min as Ge ra is Go iás Ca t al ão Araxá Catalão Ibiá Patrocínio Perdizes Sacramento Uberaba Uberlândia Tapira MAP AREA MAP AREA

Report Date: February 20, 2024 31406539.009-001-TRS-Rev0 Effective Date: December 31, 2023 Complexo Mineração de Tapira 9-4 9.2 Mineral Resources WSP reviewed the following items, as discussed in the sub-sections below, as part of its geological data, modeling, and Mineral Resource estimation verification. 9.2.1 Assay Certificates The modeling database includes a total of 61,434 assay samples with P2O5 values. Signed PDF assay certificates for 37,950 of those samples were provided for review, including 7,511 new samples since 2019. WSP reviewed the provided post-2019 assay certificates from both ALS and the internal laboratory and found only 7 assays that had different values in the database than those in the assay certificates. Of the 61,434 samples in the assay database, 17,971 were included in the four resource domains with P2O5 values. Assay certificates were provided for 13,826 of these samples (76%) and of the assay certificates reviewed only 3 samples had different values in the database than in the assay certificates. 9.2.2 Quality Assurance and Quality Control Programs WSP reviewed Mosaic’s documentation relating to the QA/QC programs that were completed in the post-mortem phase as well as the current exploration phases. This review included an evaluation of the amount of CRM standards, duplicates, and blanks that were incorporated into the sampling plans as well as an evaluation of the CRM composition and suitability for use relative to the style and grade range of the mineralization. 9.2.3 Block Model WSP reviewed in detail the modeling inputs, procedures, parameters, and results for the lithological, weathering and grade modeling. The interpolation of the grade parameters was justified with WSP’s independent analysis and comparison of additional modeling techniques. The results of the comparison showed that the grade interpolation on a global scale did not materially change with different interpolation techniques. 9.2.4 Variography WSP reviewed in detail the assumptions and data that went into the P2O5 variogram analysis. This was completed by re-creating the variograms using the data provided and analyzing the variograms to determine if the same results could be read from the graphs. Overall, WSP did not find material errors in the assumptions or interpretation of the variograms. 9.2.5 Mineral Resource Constraints and Assumptions WSP reviewed the constraints and assumptions that were made in establishing the Mineral Resource pit shell. The Mineral Resource pit shell was also validated visually based on cross section review of the pit shell and the block model coded for resource definition criteria for domain and COGs. 9.2.6 Limitations on Data Verification The WSP QP was not directly involved in the exploration drilling and sampling programs that formed the basis for collecting the data used in the geological modeling and Mineral Resource estimates for CMT. As a result, the WSP QP was not able to observe the drilling, sampling, or sample preparation while in progress; and therefore, WSP has had to rely on forensic review of the exploration program data, documentation, and standard database validation checks to ensure the resultant geological database is representative and reliable for use in geological modeling and Mineral Resource and Reserve estimation.

Report Date: February 20, 2024 31406539.009-001-TRS-Rev0 Effective Date: December 31, 2023 Complexo Mineração de Tapira 9-5 The WSP QP is not aware of any other limitations on or failure to conduct appropriate data verification. 9.2.7 Statement on Adequacy of Data The WSP QP responsible for the estimation of CMT Mineral Resources has verified the data used in the preparation of the geological model and resultant Mineral Resource estimate, including collar survey, downhole geological data and observations, sampling, analytical, and other test data underlying the information or opinions contained in the written disclosure presented in this TRS. The Mineral Resource QP, by way of the data verification process described in this Section, has used only that data, which were deemed by the QP to have been generated with proper industry standard procedures, were accurately transcribed from the original source and were suitable to be used for the purpose of preparing geological models and Mineral Resource estimates. Data that could not be verified to this standard were reviewed for information purposes only but were not used in the development of the geological models, or Mineral Resource estimates, presented in this TRS. 9.3 Mine Plan, Cost Model, and Mineral Reserves Review WSP reviewed the following items, as discussed in the sub-sections below, as part of its mine planning, cost model, and Mineral Reserves data verification. 9.3.1 Geotechnical WSP reviewed the 2021 geotechnical report summarizing the stability analysis of the Final Pit. Stability analyses were performed in multiple locations in the final pit, resulting in segregation of the mining area into seven geotechnical zones and 4 geotechnical sectors with varying face angles and berm widths. The resulting mine design meets the standards dictated by Mosaic to have a minimum safety factor of 1.3. 9.3.2 Mining Methods The proximity of the mineralized ore to the surface results in the use of surface mining methods to extract the material. The shape of the mineralized zone further defined the surface mining design as an open-pit mine using excavators and trucks as the primary mining equipment. The drill-and-blast work was contracted to Enaex Britante with both ANFO and emulsion used as blasting agents to fracture the rock to a manageable size. The rock was then hauled to the beneficiation plant (ore), or to the ex-pit storage facilities (waste). 9.3.3 Cut-off Grade and Modifying Factors WSP reviewed the calculations used to establish the COG of 5.3% P2O5 referred to in Section 12.2.5. These calculations summarize the amount of apatite concentrate produced per wet tonne of ore, at about a 1.73 (60.6% / 35.0%) multiple of the assayed P2O5 grade. Therefore, the mass recovery of an assayed 5.3% P2O5 grade becomes 9.2%, which computes to about 79.6 kilograms of concentrate for 867.1 kilograms of dry ore. At this COG, the block is amenable to beneficiation, but further block valuation calculations determine whether the block will have a positive cashflow. CMT has historically used a 5.0% COG. CMT applies modifying factors to the ore blocks by examining lithological and weathering boundaries, the portion of a block which will come into contact with a neighboring waste block and what the grade of that neighboring waste block is. The CMT mine does not apply any additional mining recovery factors to the ore extraction, assuming their equipment is selective enough to be able to mine to the boundary of the ore and the waste as defined by the interpolated rock unit triangulations.

Report Date: February 20, 2024 31406539.009-001-TRS-Rev0 Effective Date: December 31, 2023 Complexo Mineração de Tapira 9-6 9.3.4 Pit Optimization WSP reviewed the pit optimization inputs and assumptions provided by Mosaic by conducting an independent pit optimization exercise using the same input values, beginning topography, and permit boundaries. The pit optimization is based on a script used to place a value on the blocks after looking at the mining and beneficiation costs. WSP concluded that the ultimate pit shell and waste/ore quantities provided by Mosaic were reasonable given the pit optimization inputs and that this ultimate pit shell provides a positive economic value. 9.3.5 Mine Design The ultimate pit shell selected from the pit optimization exercise was refined to yield the final pit shell by integrating operational design characteristics, including ramp locations and grades, OSF locations, mining width and height, and other practical mining considerations, given pit geometry. The mine is divided into 4 different fronts: Bigorna, Frente 2, Frente 5 and Frente 6. Access ramps are designed with a maximum slope of 8%. Benches are designed to have a 12-m to 15-m width and a 10-m height, with varying face angles depending upon the mine area, the lithology, and weathering. 9.3.6 Production Schedule Production sequencing was carried out using the Deswik interactive scheduler which allows the user to visually plan multiple ongoing mining faces simultaneously. Ore blocks were selected using the “digline” functionality in Deswik, while waste blocks were placed into the nearest OSF with available capacity. WSP reviewed the phase delineations and quantities provided by Mosaic and verified that the mining sequence was reasonable and will support the planned production for the LOM Plan. 9.3.7 Labor and Equipment WSP reviewed the productivity calculations used for equipment fleet size estimations, including equipment capacity, availability and utilization percentages, equipment operating hours, and haul distances. The truck fleet is adequately sized for the requirements of the mine and matches well with the selected excavators. The operational plan of CMT includes the use of four teams on 12-hour shifts, operating 24 hours per day, 365 days per year, with a staff of approximately 470 hourly employees. To calculate the required personnel, the annual count of loading/transportation equipment is multiplied by the number of teams (4), and the equipment availability and then increased by a factor 10% to account for the 75th percentile of availability and 13.3% for absenteeism. 9.3.8 Limitations on Data Verification The WSP QP is not aware of any other limitations on or failure to conduct appropriate data verification. 9.3.9 Statement on Adequacy of Data The WSP QP responsible for Mine Planning and Mineral Reserve estimates has verified the data used in the preparation of the mine design and resultant Mineral Reserve estimate, including geotechnical design criteria, COG calculations, mine modifying factors, production schedule, labor and equipment estimates, and other test data underlying the information, or opinions, contained in the written disclosure presented in this TRS.

Report Date: February 20, 2024 31406539.009-001-TRS-Rev0 Effective Date: December 31, 2023 Complexo Mineração de Tapira 9-7 The QP has used only that data which was deemed by the QP to have been generated with proper industry standard procedures, was accurately transcribed from the original source and was suitable to be used for the purpose of preparing the mine design and Mineral Reserve estimates. Data that could not be verified to this standard was reviewed for information purposes only but was not used in the development of the mine design, or Mineral Reserve estimates, presented in this TRS.

Report Date: February 20, 2024 31406539.009-001-TRS-Rev0 Effective Date: December 31, 2023 Complexo Mineração de Tapira 10-1 10.0 MINERAL BENEFICIATION AND METALLURGICAL TESTING 10.1 Metallurgical Testing and Analytical Procedures 10.1.1 Test Work and Program History The Tapira beneficiation plant has been operating since 1978 and during that time the ownership has changed three times. Vale acquired the Tapira operations in 2010 and in early 2018 Mosaic Fertilizantes acquired Vale Fertilizers assets, including the Tapira operations. The test programs performed for the original owner more than 45 years ago to develop process design criteria are not available to Mosaic. 10.1.2 Historical Test Work Results The results of the historical tests that were used in the development of the beneficiation plant are not available to Mosaic. Mosaic has eleven standard procedures covering core drilling, core logging, core sampling, preparation of samples for chemical analysis and for characterization testing. Currently, drill core samples are used for density determinations (whole cores) and for chemically analysis (prepared cores). Also, samples of cuttings from percussion drills are tested. The samples containing at least 4% P2O5 are considered potential ore and are subjected to routine characterization tests consisting of milling to a P80 of 208 μm, low intensity magnetic separation to reject magnetite, and size classification to reject <37 μm fines. The >37 μm (400 mesh) fraction is attritioned at 60% solids and pH 8.6 for 10 minutes and then fines separated at 37 um. The <37 μm fraction is rejected, while the >37 μm fraction is subjected to three or more flotation tests to examine the grade recovery relationship at different reagent dosages. The magnetic reject, the -37 μm rejects, the flotation tailings, and the flotation concentrate are dried, weighed, and chemically analyzed. The results of geometallurgical testing, including reagent dosages are made available to the mine planning team. The laboratory process does not investigate ultra-fine flotation. Ultra-fine concentrate is predicted as a percentage of conventional concentrate. Additional characterization tests, as listed below, are performed on core samples selected by the mine planning team. Chemical composition of the run-of-mine: Chemical analysis of the global sample including P2O5, CaO, Al2O3, Fe2O3, SiO2, TiO2, MgO, BaO, Nb2O5, S, CO2, and LOI. Size by size chemical composition of the crushed sample (<3 mm) and of the ground sample (<0.208 mm). The wet screened size fractions are analyzed for the same elements as the global sample. Flotation tests with different typologies and different grades for process optimization. The core samples subjected to routine characterization tests provide geometallurgical data for long-term planning. The samples from percussion drilling subjected to routine characterization tests provide data for short-term planning. Selected samples, representing four main lithotypes as identified in Table 10.1, are examined. Domains 6 and 7, which have a higher ratio of CaO:P2O5, are more problematic than Domains 3 and 4.

Report Date: February 20, 2024 31406539.009-001-TRS-Rev0 Effective Date: December 31, 2023 Complexo Mineração de Tapira 10-2 Table 10.1: Main Lithotypes 10.2 Representativeness of Metallurgical Testing The short-term data base, established from testing 9,239 samples from percussion drilling, indicated that the average ROM grade was 8.87% P2O5 and that the average mass and metallurgical recoveries were 13.18% and 51.38% respectively. The long-term database, established from 4,632 drill core samples, indicated that the average ROM grade was 9.07% P2O5 and that the average mass and metallurgical recoveries were 12.61% and 48.27%, respectively. The number of samples is large enough to represent the four main ore domains. 10.3 Laboratory Used for Metallurgical Testing The geometallurgical testing and chemical analyses of the geometallurgical samples are performed by the Tapira internal laboratory. Certified laboratories (ALS in Lima, Peru and SGS in Vespasiano – MG) are also used. The SGS lab analyzes the drill core samples and is also used as a check laboratory. All samples analyzed in 2012 by SGS were discarded and re- assayed in 2013 by ALS using XRF method. Paired data from the Tapira Internal Laboratory, SGS and ALS were validated by Mosaic staff through bias charts, quantile-quantile, and relative precision plots for the following elements: P2O5, CaO, MgO, Fe2O3, SiO2 and Al2O3. The data examined showed that the assay results can be reproduced by SGS and ALS from coarse and pulp duplicates with high confidence. The Tapira Internal Laboratory also presented results with high confidence. In addition, for the three laboratories, all duplicate pairs have a correlation coefficient of at least 0.99. The analytical laboratories hold the following certifications: SGS Laboratory, Vespasiano city, Brazil: ISO 9001, ISO 14001, Brazil Certificate of Accreditation (Environmental Laboratory), Regional Chemical Council (2nd Region Minas Gerais) Company Certificate ALS Laboratory, Lima Peru: ISO 17025: Standards Council of Canada Certificate of Accreditation 10.4 Recovery Estimates 10.4.1 Mass Recovery This sub-section contains forward-looking information related to mass recovery for the Mine. The material factors that could cause actual results to differ materially from the conclusions, estimates, designs, forecasts or projections in the forward-looking information include any significant differences from one or more of the material factors or assumptions that were set forth in this sub-section including actual plant feed characteristics that are different from the historical operations or from samples tested to date, and, equipment and operational performance that yield different results from the historical operations and historical and current test work results. Domain Lithotype 3 Isalterite/BEB 4 Isalterite/BEB-FCR 6 Semi-weathered/BEB 7 Semi-weathered/BEB-FCR

Report Date: February 20, 2024 31406539.009-001-TRS-Rev0 Effective Date: December 31, 2023 Complexo Mineração de Tapira 10-3 The density and chemical analyses of ore samples were used for kriging the grades of blocks of ore. The interpolated mean values of P2O5, CaO, and Fe2O3 were used for each for the weathering domains. Mass recovery, an important parameter impacting the operating cost, is determined by the following relationship: Mass Recovery = 100 x concentrate mass / ROM mass The geometallurgical test data are evaluated periodically to establish an equation for predicting mass recovery as a function of ROM chemical composition. The bench test database was subdivided into the deciles of metallurgical recovery and individualized as a homogenous domain, treating isalterite and semi-weathered horizons separately. For each metallurgical recovery domain, a linear regression was developed (Table 10.2. for ISAB and Table 10.3 for RSI), capable of predicting Mass Recovery according to the P2O5 grade of the ROM, with close adherence between the test results and the predicted results. The current equation for predicting the mass recovery of conventional phosphate concentrate from Tapira ore is presented below. Section 11.1.9 of this Report provides more information on the block model interpolation of the mass recovery regression equation. Table 10.2: Linear Regression Equations used to Predict Mass Recovery (ISAB horizon) Table 10.3: Linear Regression Equations used to Predict Mass Recovery (RSI horizon) Indicator Linear Regression R2 ID_100 Mass Recovery = -3.90595 + 1.29102 * P2O5 0.67 ID_200 Mass Recovery = -3.23931 + 1.40167 * P2O5 0.76 ID_300 Mass Recovery = -2.01713 + 1.41655 * P2O5 0.79 ID_400 Mass Recovery = -2.45084 + 1.60326 * P2O5 0.84 ID_500 Mass Recovery = -1.19864+ 1.60015* P2O5 0.87 ID_600 Mass Recovery = -0.675597 + 1.6648 * P2O5 0.88 ID_700 Mass Recovery = -0.36394 + 1.75184 * P2O5 0.94 ID_800 Mass Recovery = 1.830943 * P2O5 0.99 ID_900 Mass Recovery = 1.928374 * P2O5 0.99 ID_1000 Mass Recovery = 2.022531 * P2O5 0.99 Indicator Linear Regression R2 ID_100 Mass Recovery = 0.541734 * P2O5 0.93 ID_200 Mass Recovery = 0.814935 * P2O5 0.96 ID_300 Mass Recovery = -0.984993 + 1.172184 * P2O5 0.71 ID_400 Mass Recovery = -0.78843 + 1.319323 * P2O5 0.79 ID_500 Mass Recovery = -0.506689 + 1.419933* P2O5 0.87 ID_600 Mass Recovery = -1.23431 + 1.69144 * P2O5 0.92 ID_700 Mass Recovery = -0.509149 + 1.712097 * P2O5 0.94 ID_800 Mass Recovery = -0.76669 + 1.88907 * P2O5 0.96 ID_900 Mass Recovery = 1.913369 * P2O5 0.99 ID_1000 Mass Recovery = 0.96556 + 1.95716 * P2O5 0.98

Report Date: February 20, 2024 31406539.009-001-TRS-Rev0 Effective Date: December 31, 2023 Complexo Mineração de Tapira 10-4 The predicted mass recovery is for conventional concentrate because the laboratory testing does not include preparation and flotation of the ultrafine flotation feed. The ultrafine concentrate is typically about 8% of the total concentrate. From 2016 through 2022, the actual mass recovery of total concentrate (conventional plus ultrafine concentrates) averaged 14.58%. The QP is not aware of any other beneficiation factors or deleterious elements, than those discussed previously, that could have a significant effect on potential economic extraction. 10.4.2 Metallurgical Recovery This sub-section contains forward-looking information related to metallurgical recovery for the Mine. The material factors that could cause actual results to differ materially from the conclusions, estimates, designs, forecasts or projections in the forward-looking information include any significant differences from one or more of the material factors or assumptions that were set forth in this sub-section including actual plant feed characteristics that are different from the historical operations or from samples tested to date, , equipment and operational performance that yield different results from the historical operations and historical and current test work results. The metallurgical recovery is calculated from the mass recovery, the concentrate % P2O5, and the ROM % P2O5 according to the following equation: Metallurgical recovery = 100 x Mass recovery x Concentrate % P2O5 / ROM % P2O5 From 2016 through 2022, the actual metallurgical recovery based on total concentrate tonnes and %P2O5 averaged 58.5% and had an annual maximum of 62.2%. 10.4.3 Concentrate Quality The monthly concentrate quality during 2018 through 2022 are summarized in Table 10.4. The minimum and maximum values for each year are monthly averages. The coarse concentrate typically contains slightly higher %P2O5 and slightly lower %Fe2O3 than the fine concentrate. The total (combined coarse and fine) concentrate consistently averages more than 35% P2O5 and less than 2.8% Fe2O3. Table 10.4: Annual Concentrate Quality For forecasting purposes Mosaic assumes that both the conventional and ultrafine concentrates will contain 35% P2O5 by weight. As shown by Table 10.4, this assumption is slightly conservative. Min Avg Max Min Avg Max Min Avg Max Min Avg Max Min Avg Max P2O5% 35.15 35.49 36.36 35.11 35.3 35.59 35.1 35.32 35.57 35.03 35.15 35.43 35.04 35.27 35.55 Fe2O3% 1.84 2.2 2.42 1.86 2.31 2.81 2.29 2.58 2.73 2.04 2.28 2.74 1.94 2.48 2.66 Al2O3% 0.24 0.36 0.44 0.34 0.36 0.47 0.28 0.37 0.48 0.29 0.35 0.47 0.15 0.4 0.51 MgO% 0.27 0.35 0.47 0.18 0.35 0.52 - 0.41 0.64 0.42 0.55 0.74 0.35 0.48 0.62 CaO% 48.96 49.51 50.37 47.91 49.02 50.17 47.43 48.28 48.93 47.71 48.95 49.73 50.36 49.03 48.16 P2O5% 35.17 35.41 35.68 34.73 35.11 35.67 34.06 34.86 35.26 34.64 35.05 35.32 34.64 35.09 35.46 Fe2O3% 1.65 2.28 3.09 1.51 2.43 3.68 2.11 2.73 3.62 1.79 2.34 3.44 1.9 2.47 2.89 P2O5% 35.18 35.49 36.3 35.14 35.28 35.55 35.02 35.28 35.53 35.03 35.14 35.39 35.07 35.26 35.52 Fe2O3% 1.83 2.21 2.48 1.83 2.32 2.89 2.31 2.59 2.79 2.07 2.3 2.79 1.94 2.48 2.67 Fine² Total³ Coarse¹ 2018 2019 2020 2021 2022

Report Date: February 20, 2024 31406539.009-001-TRS-Rev0 Effective Date: December 31, 2023 Complexo Mineração de Tapira 10-5 Mass recoveries are forecast by a regression equation developed from geometallurgical test data and ore chemical analyses. Typically, mining activity causes the ore grade to be diluted and Mosaic takes dilution into account before applying the predictive equation. The forecast metallurgical recovery is calculated from the forecasts of mass recovery and concentrate % P2O5 and the diluted ROM %P2O5. 10.5 Qualified Person’s Opinion It is the QP’s opinion that the metallurgical and analytical testing and historical data is adequate for the estimation of mass and metallurgical recovery estimation factors and estimation of Mineral Reserves.

Report Date: February 20, 2024 31406539.009-001-TRS-Rev0 Effective Date: December 31, 2023 Complexo Mineração de Tapira 11-1 11.0 MINERAL RESOURCE ESTIMATES 11.1 Key Assumptions, Parameters, and Methods 11.1.1 Geological Database The CMT database contains 2,278 diamond core drill holes and 13,843 percussive drill holes. Not all drill holes had lithology and assay information. All validated data were used to prepare the three-dimensional (3D) geological model of the deposit, but only the diamond core drill holes performed after the year of 1989 with linear core recovery >60% were used to perform the Mineral Resource grade estimations. The core drill holes from 1967-1980 did not include any QA/QC; and therefore, are not used in the Mineral Resource grade estimations. Core drilling from 1981-2007 are supported by a “post-mortem” QA/QC data validation process and core drill holes from 2010 onward are supported by a full QA/QC program. Core drilling from 1981-1983 was excluded from the Mineral Resource grade estimations due to poor survey and core recovery records. Table 11.1 and Table 11.2 summarize the drill hole data used. Table 11.1: Summary of Drill Holes Used for the Models Model Drill Hole Type Year Drill Hole Count Total Length (m) Assayed Samples DDH 1967-2022 2,266 223,697 61,434 Percussive 2016-2022 12,401 122,360 14,542 14,667 346,057 75,976 Resource Grade Estimation DDH 1989-2022 1,556 168,933 43,975 Geological Total

Report Date: February 20, 2024 31406539.009-001-TRS-Rev0 Effective Date: December 31, 2023 Complexo Mineração de Tapira 11-2 Table 11.2: Diamond Core Drill Hole Campaigns by Year and Use in Mineral Resource Evaluation Activities 11.1.2 Core Recovery The mean recovery of the drill core samples for the four resource domains was 93.58% (see discussion of domains below). For compositing, only samples with more than 60% recovery were used. Samples with a recovery rate below 60% and above 100% were excluded before the compositing process, along with samples with a final chemical balance of over 102%. The number of samples with core sample recovery below 60% represents 1.20% of the total sample population while the number of samples with core sample recovery greater than 100% represents less than 0.01% of the total sample population. While such samples exhibit only small differences in their mean grade values, they were excluded from the Mineral Resource estimation and categorization processes. 11.1.3 Domain Classification The geological interpretation for CMT considered the lithologies and the weathering, accordingly. The rocks and the products of the weathering characteristics are described in Section 6.3. Two models were built for the Tapira mineral deposit: a weathering model and a lithological model. A combination of both models was used to define the domains used for Mineral Resource estimation. Year Number of Drill Holes Length (m) Year Number of Drill Holes Length (m) Year Number of Drill Holes Length (m) 1967 24 2,302 1989 9 938 2010 20 1,880 1968 36 2,161 1990 9 953 2011 14 1,521 1969 16 1,350 1991 2 208 2012 107 13,566 1972 1 83 1992 4 437 2013 106 13,616 1973 1 27 1993 4 490 2014 157 19,464 1974 80 4,502 1994 7 911 2015 107 14,028 1975 120 9,782 1995 4 460 2016 56 6,018 1976 88 4,031 1996 7 762 2017 80 8,082 1977 22 981 1997 5 595 2018 61 7,576 1979 30 1,726 1998 16 1,707 2019 83 9,785 1980 38 1,856 1999 25 2,670 2020 115 8,776 1981 20 1,671 2000 29 3,465 2021 205 20,048 1982 19 1,729 2001 46 5,934 2022 94 8,991 1983 14 822 2002 51 5,930 Total 1,205 133,349 1984 28 2,085 2003 32 3,652 1985 18 1,512 2004 67 7,170 1986 13 1,140 2005 86 9,952 1987 20 2,318 2006 42 4,296 1988 16 1,753 2007 24 2,773 Total 604 41,831 Total 469 53,304 Geological Interpretation + Resource Estimation - QA/QC program Geological Interpretation + Resource Estimation - No QA/QC but post- mortem validation Geological Interpretation Only - No QA/QC validation

Report Date: February 20, 2024 31406539.009-001-TRS-Rev0 Effective Date: December 31, 2023 Complexo Mineração de Tapira 11-3 The weathering model consisted of the following rock types: Aloterite (ALO) Top Isalterite (ISAT) Bottom Isalterite (ISAB) Semi-weathered Rock (RSI) Fresh Rock (RSA) The geological model consisted of the following rock types: Soil (COB) Phoscorite + Bebedourite (FCR) Bebedourite (BEB) Carbonatite (CBN) Syenite (SIE) Fenite (FEN) High Titanium Zone (ZTI) Enclosing Rocks (ENC) The database included codes for 11 different logged geological domains, which represent a combination of lithologies and weathering horizons. Only four have significant phosphorous grades and are included in the Mineral Resource statement: Domain 3: ISAB-BEB (Bottom Isalterite Bebedourite) Domain 4: ISAB-FCR (Bottom Isalterite-Phoscorite) Domain 6: RSI-BEB (Semi-weathered Bebedourite) Domain 7: RSI-FCR (Semi-weathered Phoscorite) Correlation coefficients were completed to help define the domains. Except for the strong correlation of P2O5 and CaO in the isalterites, the linear correlations between variables in the mineralized domains tend to be moderate to weak. In general, Fe2O3 shows moderate negative correlations with CaO, MgO, and SiO2. Table 11.3 summarizes the key grade parameter statistics of the four main geological domains for all the core drilling campaigns. In general, the most weathered types (ISAB-FCR and ISAB-BEB) were richer in P2O5, Al2O3, and Fe2O3 and poorer in CaO, SiO2, and MgO, evidencing the lateritic supergenic process. Compared with the BEB types, the FCR types were slightly higher in P2O5 and CaO, though the differences were not clearly marked.

Report Date: February 20, 2024 31406539.009-001-TRS-Rev0 Effective Date: December 31, 2023 Complexo Mineração de Tapira 11-4 Table 11.3: CMT Raw Data Statistics for the Main Geological Domains including all Core Drilling Data (1967-2022) 11.1.4 Geological Modeling Seequent Leapfrog Geo™ (Leapfrog) software was used to construct the solids for both the lithological and weathering models. The topography that was used to constrain the model included an unmined topographic surface as well as the CMT mined topography surface as of March 10, 2023. The unmined topography surface was sourced from a low- resolution historical survey and a laser aerial survey. The low-resolution survey was only used in areas where un- mined surfaces were not available due to mining activities at the time of the laser aerial survey. Figure 11.1 and Figure 11.2 illustrate the lithology and weathering models. Domain Variable No. Samples Minimum Maximum Mean Std. Dev. Variance Var. Coeff. Q1 Median Q3 P2O5 7,407 0.18 33.00 8.36 3.16 9.96 0.38 6.21 8.18 10.15 CaO 7,245 0.14 48.00 11.84 4.73 22.34 0.40 8.80 11.75 14.61 MgO 5,474 0.10 22.48 4.63 2.90 8.39 0.63 2.50 4.26 6.17 Fe2O3 5,688 4.31 62.24 25.74 7.83 61.25 0.30 20.74 24.87 29.91 SiO2 2,765 1.48 63.45 24.09 8.60 74.00 0.36 18.70 24.30 29.10 Al2O3 2,765 0.01 28.60 4.79 2.36 5.56 0.49 3.39 4.49 5.66 P2O5 7,999 0.35 34.81 10.46 3.93 15.44 0.38 7.85 10.10 12.63 CaO 7,889 0.03 45.30 14.38 5.53 30.60 0.38 10.85 14.17 17.60 MgO 7,234 0.07 18.23 3.94 3.02 9.12 0.77 1.41 3.40 5.68 Fe2O3 7,290 6.10 74.93 27.74 8.51 72.43 0.31 22.25 26.51 31.96 SiO2 6,251 0.33 73.70 21.14 8.52 72.54 0.40 15.41 21.52 26.70 Al2O3 6,251 0.01 30.90 4.33 2.26 5.13 0.52 2.92 4.09 5.37 P2O5 5,567 0.19 23.59 5.02 2.31 5.34 0.46 3.65 4.77 6.10 CaO 5,386 0.55 51.00 17.39 5.96 35.51 0.34 12.95 17.98 21.85 MgO 4,324 0.16 26.39 8.30 2.48 6.16 0.30 6.80 8.31 9.71 Fe2O3 4,388 1.26 68.18 17.19 5.29 27.98 0.31 14.06 16.35 19.41 SiO2 2,549 2.41 66.70 29.54 6.98 48.75 0.24 25.60 30.63 33.88 Al2O3 2,549 0.01 14.15 2.55 1.36 1.85 0.53 1.66 2.35 3.18 P2O5 5,690 0.10 35.90 5.75 2.65 7.02 0.46 4.14 5.46 6.88 CaO 5,632 0.35 55.10 19.91 5.86 34.30 0.29 16.69 20.00 22.80 MgO 5,134 0.08 22.17 9.99 3.11 9.64 0.31 8.14 9.99 12.00 Fe2O3 5,157 1.00 55.01 18.02 5.87 34.48 0.33 14.70 16.88 19.93 SiO2 4,679 1.05 65.20 25.95 7.35 54.06 0.28 21.50 26.40 30.98 Al2O3 4,679 0.01 15.23 2.26 1.34 1.80 0.59 1.44 2.11 2.81 ISAB-FCR (ED4) ISAB-BEB (ED3) RSI-FCR (ED7) RSI-BEB (ED6)

Report Date: February 20, 2024 31406539.009-001-TRS-Rev0 Effective Date: December 31, 2023 Complexo Mineração de Tapira 11-5 Figure 11.1: Lithology Model

Report Date: February 20, 2024 31406539.009-001-TRS-Rev0 Effective Date: December 31, 2023 Complexo Mineração de Tapira 11-6 Figure 11.2: Weathering Model

Report Date: February 20, 2024 31406539.009-001-TRS-Rev0 Effective Date: December 31, 2023 Complexo Mineração de Tapira 11-7 11.1.5 Assay Compositing The CMT database contained samples that were collected at irregular length intervals according to the changes in the visual and physical properties of the drill core. Since 2018, and during the Fosfértil campaigns, sampling was performed on 5 m intervals. During the period from 2012 to 2017 (Vale Fertilizantes Campaigns) sampling was performed on 3 m intervals. In all cases, the geological contacts and weathered profile were used to limit the sample intervals (samples honored geological and weathering boundaries). Figure 11.3 shows the distribution of raw sample lengths for the four mineralized horizons. The large counts of 3 m and 5 m lengths represent the procedures adopted by Mosaic and the previous asset owners. Figure 11.3: Histogram of Raw Sample Length for Resource Domains The procedure used to prepare the composite database was: 1. Samples from the same mineralized horizon were grouped in 5 meters length composite, to respect data and the minimum mining unit. 2. Composites shorter than 2.5 m were removed from the final composite dataset. 3. Samples with a core recovery rate below 60% and above 100% were excluded before the compositing process, along with samples with a final chemical balance of over 102%.

Report Date: February 20, 2024 31406539.009-001-TRS-Rev0 Effective Date: December 31, 2023 Complexo Mineração de Tapira 11-8 Figure 11.4 shows the distribution of the sample lengths after compositing. The composite lengths intervals that were less than 2.5 m were removed to mitigate the problem of statistical support during block grade estimation. Additionally, the samples without QA/QC validation were removed before the compositing process. Figure 11.4: Histogram of Composite Sample Length for Resource Domains Histograms were used to evaluate the grade distributions after the compositing process and showed that there was no significant difference between the two sizes of composites (3 m and 5 m). Future modeling efforts should include a simplified, uniform compositing basis. This will likely have changes to local estimates but will likely not have material changes to the global estimate. The number of samples excluded during the compositing process was approximately 9% of the total sample count, being lower in the isalterite horizon at 7% and approximately 9% in the semi-weathered rock horizon. 11.1.6 Evaluation of Outliers An outlier is a data measurement that differs significantly from other observations, whether due to variability in the measurement or experimental error. Outliers sometimes distort the results of an estimation by altering the means of the population. An evaluation of outliers for P2O5, SiO2, and Fe2O3 grades for the mineralized domains was performed as part of the data evaluation and modeling process. The anomalous grades were treated separately during the estimation process.

Report Date: February 20, 2024 31406539.009-001-TRS-Rev0 Effective Date: December 31, 2023 Complexo Mineração de Tapira 11-9 Outliers were defined as the 98-99th percentile of the data range depending on the domain. During the grade estimation, outliers were limited spatially to only influence the model by one block. No capping or top-cutting was applied. 11.1.7 Variography Variography is used to model the continuity of spatial phenomena such as the distribution of grades in a mineralized body. At CMT, variography was used to establish the principal directions and ranges of anisotropy for the various grade parameters, by domain, in support of grade modeling and Mineral Resource estimation. ISATIS.neo™ (Isatis) software was used for the preparation of experimental variograms and variogram models. A summary of the variogram parameters for each grade variable within the four resource domains is shown in Table 11.4. The model variograms for P2O5 are shown in Figure 11.5.

Report Date: February 20, 2024 31406539.009-001-TRS-Rev0 Effective Date: December 31, 2023 Complexo Mineração de Tapira 11-10 Table 11.4: Variogram Model Parameters - Resource Domains Major Semi Minor 1 Spherical 3.77 116 72 21 2 Spherical 2.39 818 1,199 64 1 Spherical 7.46 141 132 77 2 Spherical 7.32 1,695 2,833 21 1 Spherical 2.63 88 85 26 2 Spherical 2.79 2,577 1,906 33 1 Spherical 40.05 85 80 31 2 Spherical 24.40 920 791 15 1 Spherical 1.48 79 116 45 2 Spherical 2.70 1,103 1,644 34 1 Spherical 28.08 89 111 22 2 Spherical 16.79 1,670 1,180 36 1 Spherical 0.02 54 80 21 2 Spherical 0.01 298 500 38 1 Spherical 5.63 80 116 20 2 Spherical 3.82 750 588 107 1 Spherical 11.66 66 118 74 2 Spherical 9.45 1,644 950 17 1 Spherical 5.45 63 67 25 2 Spherical 2.38 423 626 51 1 Spherical 28.64 82 69 50 2 Spherical 24.16 1,010 838 20 1 Spherical 2.14 96 76 53 2 Spherical 1.62 896 923 16 1 Spherical 36.10 73 122 22 2 Spherical 20.21 904 587 102 1 Spherical 0.02 60 82 33 2 Spherical 0.02 1,695 1,976 42 1 Spherical 1.52 80 172 21 2 Spherical 1.59 1,538 1,796 66 1 Spherical 14.32 66 78 47 2 Spherical 6.91 1,644 2,184 16 1 Spherical 1.82 88 57 24 2 Spherical 2.23 2,171 1,874 40 1 Spherical 21.53 141 69 66 2 Spherical 12.00 2,674 3,981 26 1 Spherical 0.59 88 87 38 2 Spherical 0.99 1,432 1,678 32 1 Spherical 8.53 51 65 24 2 Spherical 9.48 1,155 881 39 1 Spherical 0.05 54 53 18 2 Spherical 0.06 98 147 30 1 Spherical 3.01 31 105 21 2 Spherical 1.63 956 759 55 1 Spherical 10.48 77 78 52 2 Spherical 9.09 469 592 27 1 Spherical 2.91 77 57 30 2 Spherical 4.79 1,341 1,005 127 1 Spherical 13.78 122 69 158 2 Spherical 24.94 1,712 1,094 43 1 Spherical 0.35 88 87 93 2 Spherical 0.74 939 983 67 1 Spherical 12.61 51 59 24 2 Spherical 11.77 223 192 154 1 Spherical 0.04 83 78 24 2 Spherical 0.04 866 498 71 Fe2O3 ED 3 - I SA B/ BE B Domain Variable Rotation 70 0 0 0.030Density (Dry) 110 0 Density (Dry) 170 0 0 0.03 1.16 CaO 60 0 0 2.93 Density (Dry) 50 0 0 0.05 ED 7 - R SI /F CR Fe2O3 50 0 0 0 0 0.95 Fe2O3 160 0 0 4.59 SiO2 150 0 0 5.31 Al2O3 Variogram Model Azimuth Plunge Dip Nugget Effect Structure No. Type Total Sill Range (m) P2O5 Al2O3 160 0 0 0.36 140 0 0 0.00 SiO2 150 0 0 2.08 MgO 0.19 SiO2 150 0 0 9.12 140 0 0 5.54 P2O5 130 0 0 2.42 CaO 130 0 0 3.73 MgO 40 0 0 CaO 50 0 0 0.59 MgO 70 0 Al2O3 160 0 0 0.36 Fe2O3 160 0 0 5.54 P2O5 60 0 0 0.46 Al2O3 160 0 0 0.55 0 0.36 SiO2 100 0 0 3.41 ED 4 - I SA B/ FC R Density (Dry) 30 0 0 0.04 ED 6 - R SI /B EB 150 0 0 0.19 3.07 P2O5 150 0 0 0.75 CaO 150 0 0 4.35 MgO 70

Report Date: February 20, 2024 31406539.009-001-TRS-Rev0 Effective Date: December 31, 2023 Complexo Mineração de Tapira 11-11 Figure 11.5: P2O5 Variograms by Domain 11.1.8 Block Model Parameters, Density, and Grade Estimation This sub-section contains forward-looking information related to density and grade for the Mine. The material factors that could cause actual results to differ materially from the conclusions, estimates, designs, forecasts or projections in the forward-looking information include any significant differences from one or more of the material factors or assumptions that were set forth in this sub-section including actual in-situ characteristics that are different from the samples collected and tested to date, equipment and operational performance that yield different results from current test work results. 11.1.8.1 Block Model Parameters The Isatis software package was used to create a grid of regular blocks of 25m x 25m x 5m. The dimensions of the block model are presented in Table 11.5 and the variables of the block model are presented in Table 11.6.

Report Date: February 20, 2024 31406539.009-001-TRS-Rev0 Effective Date: December 31, 2023 Complexo Mineração de Tapira 11-12 Table 11.5: Block Model Dimensions Table 11.6: Block Model Variables Two key calculated field equations used in the block modeling were RCP and P2O5ap; these calculated fields were defined as follows: 1. RCP was the ratio between the CaO and P2O5 of the block. 2. P2O5ap was the P2O5 associated with apatite and calculated by the evaluation of the CaO / P2O5 ratio. If the CaO / P2O5 ratio was greater than or equal to 1.34, P2O5ap was equal to the total of P2O5; if the CaO / P2O5 ratio was less than 1.35, P2O5ap was equal to the CaO / 1.35 ratio. Hard boundaries were used for the grade estimation of the four main domains defined in the geological interpretation: ISAB-BEB (Domain 3); ISAB-FCR (Domain 4); RSI-BEB (Domain 6); and RSI-FCR (Domain 7). Table 11.7 shows the domains flagged in the block model. Those highlighted in grey are the phosphorous rich domains that are included in the Mineral Resource statement. Dimension Block Size (m) Origin (m) Offset (m) Number of Blocks X 25 304,700 6,500 260 Y 25 7,795,800 8,250 330 Z 5 850 650 130 Variable Description Variable Description al2o3 Aluminum oxide p2o5 Phosphate oxide bao Barium oxide p2o5ap Content of apatitic phosphate cao Calcium p2o5cf P2o5 grade in the phosphate rock class Resource classification rcp Ratio cao / p2o5 comp Compacity rend_cv Mass recovery conventional concentrate (coarse circuit) dens_bs Dry density rend_t Total mass recovery dens_bu Wet density rend_uf Mass recovery ultra thin concentrate (fine circuit) domain Alphanumeric weathering + lithology rlama Mud recovery drymass Total mass dry base rmag Magnetite recovery fe2o3 Iron oxide rmet_cv Metallurgical recovery conventional circuit fe2o3cf Fe2o3 grade in the phosphate rock rock Total mass of block id_domain Numeric weathering + lithology runder Flotation recovery id_intem Numeric weathering sio2 Silica oxide id_lito Numeric lithology tio2 Titanium oxide intem Alphanumeric weathered topo Variable used to create model survey reference lito Alphanumeric lithology type Mineral resource with cut off mgo Magnesium oxide umi_bs Moisture dry base mine Flag used to reference survey umi_bu Moisture wet base nb2o5 Niobium oxide

Report Date: February 20, 2024 31406539.009-001-TRS-Rev0 Effective Date: December 31, 2023 Complexo Mineração de Tapira 11-13 Table 11.7:Block Model Estimation Domains Grade contact analysis was undertaken between the defined weathering horizons of the same rock types, and it was found that the P2O5 grade means exhibit a sharp disruption close to the geological contact (as shown in Figure 11.6). This justifies the use of the geological domains as hard boundaries for mineral resource estimation, even though the contact is not hard for all elements. Estimation Domain Description ED1 ALO/COB ED2 ISAT/ZTI ED3 ISAB/BEB ED4 ISAB/FCR ED5 ISAB/SIE ED6 RSI/BEB ED7 RSI/FCR ED8 RSI/SIE ED9 RSA/BEB ED10 RSA/FCR ED11 RSA/SIE

Report Date: February 20, 2024 31406539.009-001-TRS-Rev0 Effective Date: December 31, 2023 Complexo Mineração de Tapira 11-14 Figure 11.6: Contact Analysis for P2O5 for the Four Main Resource Domains The volumes of the solids of the geological model were compared to the volumes of the blocks and no significant differences were found. 11.1.8.2 Density Dry density for the Mineral Resource domains was interpolated into the block model using Ordinary Kriging (OK) in Isatis. Mean dry density values were applied to the waste rock domains. Kriging was carried out with two estimation passes with progressively relaxed search ellipsoids and data requirements (see Table 11.8). In all cases, the ellipsoid orientations are based on the variogram model. The search neighborhood sizes for the first and second estimation passes did not exceed the full variogram ranges of the Dens_bs (dry density). For the blocks that were not estimated in the second OK estimation pass, the Nearest Neighbor (NN) interpolated value was adopted. Domains 3 and 4 were analyzed through variography independently and domains 6 and 7 were analyzed through variography together, though estimated separately. Table 11.8: Dry Density OK Parameters for Resource Domain Estimation 11.1.8.3 Estimation of Grades Grade was interpolated into the block model in Isatis using OK. The grade variables are listed in Table 11.9. Min No. Samples Opt No. Samples per Octant No. Sectors Azimuth Plunge Dip Major Semi Minor 1 8 3 8 170 0 0 250 150 20 2 6 2 8 170 0 0 500 350 40 3 2 1 8 170 0 0 1,350 900 100 4 2 1 8 170 0 0 4,500 4,500 450 1 8 3 8 110 0 0 250 150 20 2 6 2 8 110 0 0 500 350 40 3 2 1 8 110 0 0 1,350 900 100 4 2 1 8 110 0 0 4,500 4,500 450 1 8 3 8 30 0 0 250 150 20 2 6 2 8 30 0 0 500 350 40 3 2 1 8 30 0 0 1,350 900 100 4 2 1 8 30 0 0 4,500 4,500 450 1 8 3 8 130 0 0 250 150 20 2 6 2 8 130 0 0 500 350 40 3 2 1 8 130 0 0 1,350 900 100 4 2 1 8 130 0 0 4,500 4,500 450 RSI-FCR (ED7) Domain Pass No. of Samples Search Orientation Search Ranges (m) RSI-BEB (ED6) ISAB-FCR (ED4) ISAB-BEB (ED3)

Report Date: February 20, 2024 31406539.009-001-TRS-Rev0 Effective Date: December 31, 2023 Complexo Mineração de Tapira 11-15 Table 11.9: Variables Estimated by Ordinary Kriging For all the elements, four estimation passes were used with progressively relaxed search ellipsoids and data requirements (Table 11.10). In all cases, the ellipsoid orientations were based on the appropriate variogram model. The same ranges were used for all variables and are based on the P2O5 variogram. The search neighborhood sizes for the first and second estimation passes did not exceed the full variogram ranges of the P2O5. The third and final estimation run was approximately twice the variogram ranges of the P2O5. The blocks near samples with anomalous values were analyzed to verify spatial distribution, and to ensure they fell within the main resource domains ED3, ED4, ED6 and ED7. A capping strategy was not used in the estimation for these anomalous values as they were spatially constrained and determined not to have a significant influence on the surrounding blocks. Variable Description P2O5 Phosphate Oxide Al2O3 Aluminium Oxide BaO Barium Oxide CaO Calcium Oxide Fe2O3 Iron Oxide K2O Potassium Oxide LOI Loss on Ignition MgO Magnesium Oxide MnO Manganese Oxide Na2O Sodium Oxide SiO2 Silica Oxide TiO2 Titanium Oxide

Report Date: February 20, 2024 31406539.009-001-TRS-Rev0 Effective Date: December 31, 2023 Complexo Mineração de Tapira 11-16 Table 11.10: P2O5 OK Parameters for Resource Domain Estimation 11.1.9 Mass and Metallurgical Recovery This sub-section contains forward-looking information related to mass and metallurgical recovery for the Mine. The material factors that could cause actual results to differ materially from the conclusions, estimates, designs, forecasts or projections in the forward-looking information include any significant differences from one or more of the material factors or assumptions that were set forth in this sub-section including actual plant feed characteristics that are different from the historical operations or from samples tested to date, equipment and operational performance that yield different results from the historical operations and historical and current test work results. The Mass Recovery (MR) variable represents the quantity of concentrate recovered by the concentration plant. It is an extremely important variable used to define the production and cost of a mineral block. Mass Recovery was estimated using linear regression equations, using the P2O5 ROM grade as a regressor, combined with the estimate of metallurgical recovery indicators using the indicator kriging method. The bench test database was subdivided into the deciles of metallurgical recovery and was modeled as a homogeneous indicator using the numeric model algorithm in Leapfrog. For each metallurgical recovery indicator, a linear regression was developed (Table 11.11 and Table 11.12), capable of predicting Mass Recovery according to the P2O5 grade of the ROM, with close adherence between the test result and the predicted result. The results of bench tests are not at the same concentrated grades basis, which causes issues with correlation. Mosaic recalculated the MR to a concentrated grade 35.5%, which standardized the data in order to create the linear regressions. Min No. Samples Opt No. Samples per Octant No. Sectors Azimuth Plunge Dip Major Semi Minor 1 8 3 8 70 0 0 250 150 20 2 6 2 8 70 0 0 500 350 40 3 2 1 8 70 0 0 1,350 900 100 4 2 1 8 70 0 0 3,500 3,500 300 1 8 3 8 130 0 0 250 150 20 2 6 2 8 130 0 0 500 350 40 3 2 1 8 130 0 0 1,350 900 100 4 2 1 8 130 0 0 3,500 3,500 300 1 8 3 8 60 0 0 250 150 20 2 6 2 8 60 0 0 500 350 40 3 2 1 8 60 0 0 1,350 900 100 4 2 1 8 60 0 0 3,500 3,500 300 1 8 3 8 150 0 0 250 150 20 2 6 2 8 150 0 0 500 350 40 3 2 1 8 150 0 0 1,350 900 100 4 2 1 8 150 0 0 3,500 3,500 300 Pass No. of Samples Search Orientation Search Ranges (m) RSI-FCR (ED7) RSI-BEB (ED6) ISAB-FCR (ED4) ISAB-BEB (ED3) Domain

Report Date: February 20, 2024 31406539.009-001-TRS-Rev0 Effective Date: December 31, 2023 Complexo Mineração de Tapira 11-17 Table 11.11: Linear Regression Equations used to Predict Mass Recovery in the Resource Block Model (ISAB horizon) Table 11.12: Linear Regression Equations used to Predict Mass Recovery in the Resource Block Model (RSI horizon) The regressions were validated using scatter plot graphs, which indicated that the predicted values of MR are close to the real values of MR obtained in the bench tests. The result of the MR estimate using the specific linear regressions for each kriging indicator was validated with drift analysis graphs, comparing the result of the estimate with the results of the database of the bench tests of the samples from the drill holes. The metallurgical recovery of the isalterite blocks was calculated in the resource model using Equation 1. Indicator Linear Regression R2 ID_100 Mass Recovery = -3.90595 + 1.29102 * P2O5 0.67 ID_200 Mass Recovery = -3.23931 + 1.40167 * P2O5 0.76 ID_300 Mass Recovery = -2.01713 + 1.41655 * P2O5 0.79 ID_400 Mass Recovery = -2.45084 + 1.60326 * P2O5 0.84 ID_500 Mass Recovery = -1.19864+ 1.60015* P2O5 0.87 ID_600 Mass Recovery = -0.675597 + 1.6648 * P2O5 0.88 ID_700 Mass Recovery = -0.36394 + 1.75184 * P2O5 0.94 ID_800 Mass Recovery = 1.830943 * P2O5 0.99 ID_900 Mass Recovery = 1.928374 * P2O5 0.99 ID_1000 Mass Recovery = 2.022531 * P2O5 0.99 Indicator Linear Regression R2 ID_100 Mass Recovery = 0.541734 * P2O5 0.93 ID_200 Mass Recovery = 0.814935 * P2O5 0.96 ID_300 Mass Recovery = -0.984993 + 1.172184 * P2O5 0.71 ID_400 Mass Recovery = -0.78843 + 1.319323 * P2O5 0.79 ID_500 Mass Recovery = -0.506689 + 1.419933* P2O5 0.87 ID_600 Mass Recovery = -1.23431 + 1.69144 * P2O5 0.92 ID_700 Mass Recovery = -0.509149 + 1.712097 * P2O5 0.94 ID_800 Mass Recovery = -0.76669 + 1.88907 * P2O5 0.96 ID_900 Mass Recovery = 1.913369 * P2O5 0.99 ID_1000 Mass Recovery = 0.96556 + 1.95716 * P2O5 0.98

Report Date: February 20, 2024 31406539.009-001-TRS-Rev0 Effective Date: December 31, 2023 Complexo Mineração de Tapira 11-18 Equation 1: 𝑀𝑒𝑡𝑎𝑙𝑙𝑢𝑟𝑔𝑖𝑐𝑎𝑙 𝑅𝑒𝑐𝑜𝑣𝑒𝑟𝑦 𝑀𝑎𝑠𝑠 𝑅𝑒𝑐𝑜𝑣𝑒𝑟𝑦 ∗ 𝑃2𝑂5𝑃2𝑂5 Several geometallurgical tests were carried out by the mine staff using samples collected from the percussive and core drilling. To validate the regression equation a reconciliation study was conducted. This consisted of comparing the local declustered mean value for Mass Recovery from the technological tests, with the RM value predicted by the regression equation. A NN approach was used for the declustering of data. 11.1.10 Model Validation The validation of the grade estimation was performed using the following approaches: Verification of global statistical comparison: Estimated grades of P2O5, CaO, MgO, SiO2, Al2O3, Fe2O3, and density were validated against the declustered and non-declustered composite grades, for the four resource domains. Drift analysis using the NN estimate for declustering of composites: Swath plots were produced for the P2O5, CaO, SiO2, Al2O3, Fe2O3, and density grades for each domain, comparing the kriged block model grades with NN declustered composite grades. In general, the kriging grades matched the nearest neighbor values, and no significant bias was identified. Sensitivity Analysis changing the neighborhood estimation parameters and treatment of outliers: Sensitivity analysis was carried out with variations in both the search range and the number of composites used in the first and second pass of the estimate. Reconciliation: Annual reconciliations between the long-term resource model and the beneficiation plant reports were carried out from 2017 to 2022. In general, the reconciliation demonstrates that the Tapira Mineral Resource model exhibits strong adherence in the estimation of grades, metallurgy, and mass. 11.2 Mineral Resource Estimate This sub-section contains forward-looking information related to Mineral Resource estimates for the Mine. The material factors that could cause actual results to differ materially from the conclusions, estimates, designs, forecasts or projections in the forward-looking information include any significant differences from one or more of the material factors or assumptions that were set forth in this sub-section including geological and grade interpretations and controls and assumptions and forecasts associated with establishing the prospects for economic extraction. For estimating the Mineral Resources for CMT, the following definition as set forth in the S-K 1300 Definition Standards adopted December 26, 2018, was applied.

Report Date: February 20, 2024 31406539.009-001-TRS-Rev0 Effective Date: December 31, 2023 Complexo Mineração de Tapira 11-19 Under S-K 1300, a Mineral Resource is defined as: “…is a concentration or occurrence of material of economic interest in or on the Earth’s crust in such form, grade or quality, and quantity that there are reasonable prospects for economic extraction. A mineral resource is a reasonable estimate of mineralization, taking into account relevant factors such as cutoff grade, likely mining dimensions, location or continuity, that, with the assumed and justifiable technical and economic conditions, is likely to, in whole or in part, become economically extractable. It is not merely an inventory of all mineralization drilled or sampled.” Based on the geological model, grade model, parameters for establishing prospects for economic extraction, and the Mineral Resource classification discussed in this Section, the CMT in-situ Mineral Resources are summarized in Table 11.13. The Mineral Resources are exclusive of Mineral Reserves and include approximately 78.0 Mt of Measured and Indicated Mineral Resources with a P2O5ap grade of 8.6%. There are an additional 181.2 Mt of Inferred Mineral Resources with a P2O5ap grade of 9.2%. Table 11.13: Exclusive In-Situ Mineral Resource Estimate as of December 30, 2023 Notes: 1. Reference topography of December 30, 2023 2. COG of P2O5ap ≥ 5.0% and 0.9 ≤ RCP ≤ 3.0 3. Mineral Resource tonnages are exclusive of Mineral Reserve tonnages Table 11.14 summarizes the differences between the 2021 and 2023 Mineral Resource estimates. Measured and Indicated Mineral Resources have decreased overall by 51.8 Mt since 2021, due largely to depletion from mining, as well as downgrading of Measured to Indicated Mineral Resources in the Cafezal and East areas using a more conservative estimation methodology. The Inferred Mineral Resource has increased by 68.4 Mt due to additional drilling data acquired since 2019, as well as revised classification in the south region. The total Mineral Resource estimate has increased overall by 16.6 Mt since the 2021 TRS. Geological Domain Category In Situ Tonnage, Dry Basis In Situ P2O5 In Situ P2O5 ap Total Concentrate Mass Recovery Total Concentrate Metallurgical Recovery (Mt) (wt. %) (wt. %) (%) (% P2O5) ISAB 19.4 9.3 8.9 13.1 48.4 RSI 3.3 7.1 7.1 10.2 49.4 Measured 22.7 9.0 8.7 12.7 48.6 ISAB 45.1 9.5 9.0 12.8 47.3 RSI 10.2 6.9 6.9 11.6 56.3 Indicated 55.3 9.0 8.6 12.5 48.9 ISAB 64.5 9.4 9.0 12.9 47.6 RSI 13.6 6.9 6.9 11.3 54.6 Measured + Indicated 78.0 9.0 8.6 12.6 48.8 ISAB 155.3 9.8 9.6 17.5 63.8 RSI 25.9 6.9 6.9 11.7 58.7 Inferred 181.2 9.4 9.2 16.7 63.0 Measured Indicated Measured + Indicated Inferred

Report Date: February 20, 2024 31406539.009-001-TRS-Rev0 Effective Date: December 31, 2023 Complexo Mineração de Tapira 11-20 Table 11.14: Difference in Exclusive Mineral Resource Estimates from 2021 to 2023 A detailed discussion on selection of the of COGs is presented in Section 12.2.5 of this TRS. 11.3 Basis for Establishing the Prospects of Economic Extraction for Mineral Resources This sub-section contains forward-looking information related to establishing the prospects of economic extraction for Mineral Resources for the M ine. The material factors that could cause actual results to differ materially from the conclusions, estimates, designs, forecasts, or projections in the forward-looking information include any significant differences from one or more of the material factors or assumptions that were set forth in this sub- section including COG assumptions, costing forecasts and product pricing forecasts. The requirement of “reasonable prospects for economic extraction” generally implies that quantity and grade estimates meet certain economic limits, and that Mineral Resources are reported at an appropriate cut-off level, considering extraction scenarios and beneficiation recoveries.” To determine the quantities of material that offer “reasonable prospects for economical extraction” in an open pit, the Datamine Net Present Value (NPV) Scheduler® software package was used to evaluate the profitability of each resource block based on its value. The following restrictions were used for the generation of the Mineral Resource pit: Measured, Indicated, and Inferred blocks inside mining concessions and exploration permits with a final report approved by ANM, but excluding physical structures such as crusher and waste piles. Revenue factor of 1.0 with sales price of R$1,939.57 per tonne of phosphatic concentrate. P2O5ap ≥ 5% and 0.9 ≤ RCP ≤ 3. Where: RCP is the ratio of CaO to P2O5. P2O5ap is the P2O5 associated with apatite and is calculated by assessing the CaO/ P2O5 ratio. If the CaO/ P2O5 ratio is greater than or equal to 1.35, P2O5ap will be equal to total P2O5; if the CaO/ P2O5 ratio is less than 1.35, P2O5ap is equal to CaO/1.35 ratio. The cost parameters are summarized in Table 11.15 and the Mineral Resource pit shell is shown in Figure 11.7. In Situ Tonnage, Dry Basis In Situ P2O5 Total Concentrate Mass Recovery Total Concentrate Metallurgical Recovery (Mt) (wt. %) (%) (% P2O5) Measured -40.1 0.6 1.2 -4.1 Indicated -11.7 1.0 2.6 -4.3 Measured + Indicated -51.8 0.8 2.0 -4.2 Inferred 68.4 0.7 2.6 10.6 Total Resource 16.6 0.9 3.2 6.0 Classification

Report Date: February 20, 2024 31406539.009-001-TRS-Rev0 Effective Date: December 31, 2023 Complexo Mineração de Tapira 11-21 Table 11.15: Mineral Resource Optimization Pit Limit Parameters Parameters Unit Value DMT Fixed to Ore R$/tmov 3.37 DMT Variable to Ore R$/tmov/km 1.7 DMT Fixed to Waste R$/tmov 5.64 DMT Variable to Waste R$/tmov/km 1.9 Fixed R$/t RoM 7.63 Variable R$/t RoM 14.22 P2O5 % 35.0% Process (Chemical Plant) R$/tconc 969.95 SG&A R$/tconc 22.66 R&D R$/tconc 31.35 Sustaining R$/tconc 167.75 Beneficiation Cost Concentrate Grade Sales Cost Mining Cost

[ 305000 305000 310000 310000 77 95 00 0 77 95 00 0 78 00 00 0 78 00 00 0 78 05 00 0 78 05 00 0 CLIENT THE MOSAIC COMPANY LEGEND Tapira Phosphate Property Igneous Complex Boundary Road [ City Mining Requirement Mining Concession Mineral Resource Pit Outline PROJECT SEC S-K 1300 TECHNICAL REPORT SUMMARY MOSAIC FERTILIZANTES: COMPLEXO MINERACAO DE TAPIRA TITLE MINERAL RESOURCE PIT OUTLINE 31406539.009 11.7 2024-01-10 JS JS JDW #### 1 in 0 PATH: C:\Users\gld_jsimper\WSP O365\202313515Mosaic2023 - 05_Technical Work\06_GIS\Tapira_GIS\MapFiles\11.7_MR_Pit_Shell_Map_ANSIA.mxd PRINTED ON: 2024-01-10 AT: 2:02:18 PM Chile or Peru Bolivia Brazil Colombia Venezuela Guyana Paraguay Argentina French Guyana KEY MAP IF T H IS M E AS U R EM EN T D O ES N O T M AT C H W H AT IS S H O W N , T H E SH EE T H AS B E EN M O D IF IE D F R O M : A N SI A CONSULTANT PROJECT NO. CONTROL REV. FIGURE YYYY-MM-DD DESIGNED PREPARED REVIEWED APPROVED REFERENCE(S) 1. COORDINATE SYSTEM: CORREGO ALEGRE 1961 UTM ZONE 23S 0 1,500 3,000 Meters1:60,000 [ [ [ [ [ [ [ [ [ Min as Ge ra is Go iás Ca t al ão Araxá Catalão Ibiá Patrocínio Perdizes Sacramento Uberaba Uberlândia Tapira MAP AREA MAP AREA

Report Date: February 20, 2024 31406539.009-001-TRS-Rev0 Effective Date: December 31, 2023 Complexo Mineração de Tapira 11-23 The results of the Mineral Resource pit optimization were used only for the purpose of testing “reasonable prospects for economic extraction” and do not represent an attempt to estimate Mineral Reserves. Mineral Reserves can only be estimated after the application of all modifying factors. 11.4 Mineral Resource Classification This sub-section contains forward-looking information related to Mineral Resource classification for the Mine. The material factors that could cause actual results to differ materially from the conclusions, estimates, designs, forecasts, or projections in the forward-looking information include any significant differences from one or more of the material factors or assumptions that were set forth in this sub-section including geological and grade continuity analysis and assumptions. According to the S-K 1300 regulations, to reflect geological confidence, Mineral Resources are subdivided into the following categories based on increased geological confidence: Inferred, Indicated, and Measured, which are defined under S-K 1300 as: “Inferred Mineral Resource is that part of a mineral resource for which quantity and grade or quality are estimated on the basis of limited geological evidence and sampling. The level of geological uncertainty associated with an inferred mineral resource is too high to apply relevant technical and economic factors likely to influence the prospects of economic extraction in a manner useful for evaluation of economic viability. Because an inferred mineral resource has the lowest level of geological confidence of all mineral resources, which prevents the application of the modifying factors in a manner useful for evaluation of economic viability, an inferred mineral resource may not be considered when assessing the economic viability of a mining project, and may not be converted to a mineral reserve.” “Indicated Mineral Resource is that part of a mineral resource for which quantity and grade or quality are estimated on the basis of adequate geological evidence and sampling. The level of geological certainty associated with an indicated mineral resource is sufficient to allow a qualified person to apply modifying factors in sufficient detail to support mine planning and evaluation of the economic viability of the deposit. Because an indicated mineral resource has a lower level of confidence than the level of confidence of a measured mineral resource, an indicated mineral resource may only be converted to a probable mineral reserve.” “Measured Mineral Resource is that part of a mineral resource for which quantity and grade or quality are estimated on the basis of conclusive geological evidence and sampling. The level of geological certainty associated with a measured mineral resource is sufficient to allow a qualified person to apply modifying factors, as defined in this section, in sufficient detail to support detailed mine planning and final evaluation of the economic viability of the deposit. Because a measured mineral resource has a higher level of confidence than the level of confidence of either an indicated mineral resource or an inferred mineral resource, a measured mineral resource may be converted to a proven mineral reserve or to a probable mineral reserve.”

Report Date: February 20, 2024 31406539.009-001-TRS-Rev0 Effective Date: December 31, 2023 Complexo Mineração de Tapira 11-24 The Mineral Resource classification process was defined through the relationship between the variogram range and 95% of data variance (D95) considering the analysis of the P2O5 variable for the ISAB-BEB domain. The Mineral Resource classification also considers the quality of the data that were used. As a result, to complete the Mineral Resource classification, only drill holes covered by the post-mortem QA/QC program (1990 to 2007) and drill holes that were submitted to a formal QA/QC program (starting in 2010) were utilized. To classify the Mineral Resources the following steps were used: Measured Resources: D95/2 into the first search ellipsoid with a minimum of eight samples and at least five samples from drill holes after 2010. Indicated Resources: blocks estimated in the first search ellipsoid with a minimum of 8 samples and less than 5 samples from drill holes after 2010, or blocks estimated in the second search ellipsoid within a range less than D90 and with a minimum of 6 samples. Inferred Resources: blocks estimated in the third search ellipsoid with a minimum of 4 samples and a maximum range equal to twice the total range (1,380 m). Table 11.16 summarizes the parameters used in the Mineral Resource classification. Figure 11.8 illustrates the Mineral Resource Classification. Table 11.16: CMT Mineral Resource Classification A post-processing procedure was performed to reduce the number of isolated blocks of one Mineral Resource classification inside another predominate classification. This procedure re-flagged the blocks with a rolling average and constructed solids around them. The final Mineral Resource classification reflects the most accurate vision of the geological continuity and confidence of the existing information. Min Max Max Samples per Oct No. of Octants Major Semi Minor Measured 8 24 3 8 100 100 15 Indicated 6 16 2 8 690 560 35 Inferred 4 16 2 8 1,380 1,120 70 No. Samples Category Search Ranges (m)

[ [ [ [ [ [ [ [ [ [ [ [ [ [ [ [ [ [ [ [ [ [ [ [ [ [ [ [ [ [ [ [ [ [ [[ [ [ [ [ [ [ [ [ [ [ [ [ [ [ [ [ [ [ [ [ [ [ [ [ [ [ [ [ [ [ [ [ [ [[ [ [ [ [ [ [ [ [ [ [ [ [ [ [ [ [ [ [ [ [ [ [ [ [ [ [ [ [ [ [[ [ [ [ [ [ [ [ [ [ [ [ [ [ [ [ [ [ [ [ [ [ [ [ [ [ [ [ [ [[[ [ [ [ [ [ [ [[ [ [ [ [ [ [ [ [ [ [ [ [ [ [ [ [ [ [ [ [ [ [ [ [ [ [ [ [ [ [ [ [ [ [ [ [ [ [ [ [ [ [ [ [ [ [ [ [ [ [ [ [ [ [ [ [ [ [ [ [[[ [ [ [ [[ [ [ [ [ [ [ [ [ [ [ [ [ [ [ [ [ [ [ [ [ [[ [ [ [ [ [ [ [ [ [ [ [ [ [ [ [ [ [ [ [ [ [ [ [ [ [ [ [ [ [ [ [ [ [ [ [ [ [ [ [ [ [ [ [ [ [ [ [ [ [ [[ [ [ [[[[[ [ [ [ [ [ [ [[[[[[ [[ [[ [ [ [[ [ [ [ [ [ [[ [ [ [ [ [ [ [ [ [ [ [ [ [ [ [ [ [ [ [ [ [ [[ [ [ [[[ [ [[ [ [[ [ [ [ [ [[ [ [ [ [[ [ [[ [ [[[[[ [ [ [[[[ [ [ [[ [[[ [ [ [[ [ [ [[[[[ [ [ [ [ [ [[[[[ [ [ [ [[[[ [ [ [[ [[ [ [ [ [ [ [[[ [[[[ [[[ [[[ [ [[ [ [[ [[ [ [ [ [ [[ [ [ [ [[[ [ [ [ [[ [ [[[[ [[[ [[[[ [ [ [ [ [ [ [ [ [ [ [ [ [[ [ [ [ [ [[ [ [ [ [[ [ [ [ [[[[ [ [ [ [ [ [ [ [[[[ [[ [ [[ [ [ [[ [ [ [ [[ [ [ [ [ [ [ [ [ [ [ [ [[ [ [ [ [ [ [ [ [[ [[[ [ [ [ [ [ [ [ [ [[ [ [ [ [ [ [ [ [ [ [ [ [ [ [ [ [ [ [ [ [ [ [ [ [ [ [ [ [ [ [ [ [[ [ [ [ [ [ [ [ [ [ [[[[ [ [ [ [ [ [ [[ [ [[ [[ [ [ [ [ [[ [ [ [ [ [ [ [ [ [ [ [ [ [ [ [ [ [ [ [ [ [ [ [ [ [ [ [ [ [ [ [ [ [ [ [ [ [ [ [ [ [ [ [ [ [ [ [ [ [ [ [ [ [ [ [ [ [ [ [ [ [ [ [ [ [ [ [ [ [ [ [ [ [ [ [ [ [ [ [ [ [ [ [ [ [ [ [ [ [ [ [ [ [ [ [ [ [ [ [ [ [ [ [ [ [ [ [ [ [ [ [ [ [ [ [ [ [ [ [ [ [ [ [ [ [ [ [ [ [ [ [ [ [ [ [ [ [ [ [ [[ [ [ [ [ [ [ [ [ [ [ [ [ [ [ [ [ [ [ [ [ [ [ [[ [ [ [ [ [ [ [ [ [ [ [ [ [ [ [ [ [ [ [ [ [ [ [ [ [ [ [ [ [ [[ [ [[ [ [ [ [ [[ [ [ [ [ [ [[ [ [ [ [ [ [ [ [ [ [ [ [ [ [ [[ [ [ [ [ [ [ [ [ [ [ [ [ [ [ [ [ [ [[ [ [ [[ [ [ [ [ [ [[ [[ [[ [ [ [ [ [ [[[[ [ [ [ [ [ [[[[[ [ [ [ [ [[[[[ [ [ [ [ [ [[ [ [[ [ [[ [ [ [ [ [ [[ [[ [ [ [ [[ [ [ [ [[ [[ [ [ [ [ [ [ [ [ [ [[[ [[ [ [ [ [ [[[ [[ [ [ [ [ [ [ [ [ [[ [[[[ [ [[ [ [ [ [ [ [ [ [ [[ [ [ [ [ [ [ [ [ [ [ [ [ [ [ [ [ [ [ [ [[ [ [ [ [[ [ [ [ [[ [ [ [ [ [ [ [ [ [ [[ [ [ [ [ [ [ [ [[ [ [ [ [ [ [ [ [ [ [ [ [ [ [ [ [ [ [ [ [ [ [ [ [ [ [ [ [ [ [ [ [ [ [ [ [ [ [ [ [ [ [ [ [ [ [ [ [ [ [ [ [ [ [ [ [ [ [ [ [[ [ [ [[ [ [ [ [ [ [ [ [[ [ [ [ [ [ [ [ [ [ [ [ [ [ [ [ [ [ [ [ [ [ [ [ [ [ [ [ [ [ [ [[ [ [ [ [ [ [ [ [ [ [ [ [ [ [[[ [ [ [ [ [ [[ [ [ [ [ [ [ [ [ [ [[ [ [ [ [ [ [ [ [ [ [ [ [ [ [ [[ [ [ [ [ [ [ [ [ [ [ [ [ [ [ [ [ [ [ [ [ [ [ [ [ [ [ [ [ [ [ [ [ [ [ [ [ [ [ [ [ [ [ [ [ [ [ [ [ [ [ [ [ [ [ [ [ [ [ [ [ [ [ [[ [ [ [ [ [ [ [ [ [ [ [ [ [ [ [ [ [ [ [ [ [ [ [ [ [ [ [ [ [ [ [ [ [ [ [[ [ [ [ [ [ [ [ [ [ [ [ [ [ [ [ [ [ [ [ [ [ [ [ [ [ [ [[ [ [ [ [ [ [ [ [ [ [ [ [ [ [ [ [ [[ [ [ [ [[ [ [ [ [ [ [ [ [ [ [ [ [ [ [ [ [ [ [ [ [ [ [ [ [ [ [ [ [ [ [ [ [ [ [ [ [ [ [ [ [ [ [ [ [ [ [ [ [ [ [ [ [ [ [ [ [ [ [ [ [ [ [ [ [ [ [ [ [ [ [ [ [ [ [ [ [ [ [ [ [ [ [ [ [ [ [ [ [ [ [ [ [ [ [ [ [ [ [ [ [ [ [ [ [ [ [ [ [ [ [ [[ [ [ [ [ [ [ [ [ [ [ [ [ [[[ [ [ [[ [ [ [[ [[ [ [ [ [ [ [ [ [[ [ [ [ [ [ [ [ [ [ [ [ [ [ [ [ [ [ [ [ [ [ [ [ [ [ [ [ [ [ [ [ [ [ [ [ [ [ [ [ [ [ [ [ [ [ [ [ [ [ [ [ [ [ [ [ [ [ [ [ [ [ [ [ [ [ [ [ [ [ [ [ [ [ [ [ [ [ [[ [ [ [ [ [ [ [ [ [ [ [ [ [ [ [ [ [ [ [ [ [ [ [ [ [ [ [ [ [[ [ [ [ [ [ [ [ [ [ [ [ [ [ [ [ [ [ [[ [ [ [ [ [ [ [ [ [ [ [ [ [ [ [ [ [ [ [ [ [ [ [ [ [ [ [ [ [ [ [ [ [ [ [ [ [ [ [ [ [ [ [ [ [ [ [ [ [ [ [ [ [[ [ [ [ [ [ [ [ [ [ [ [ [ [ [ [ [ [ [[ [ [ [ [ [ [ [ [ [ [ [ [ [ [ [ [ [ [ [ [ [ [ [[ [ [ [ [[ [ [ [ [ [ [ [ [ [ [ [ [ [ [ [ [ [ [ [ [ [ [ [ [ [ [[ [ [ [ [ [ [ [[[ [ [ [ [ [[ [ [[ [[ [ [ [ [ [ [ [ [ [ [ [ [ [ [ [ [ [ [ [ [ [ [ [ [ [ [ [ [ [ [ [ [ [ [ [ [ [ [ [ [ [ [ [ [ [ [ [ [ [ [ [ [ [ [ [ [ [ [[ [ [[ [[ [ [ [ [ [ [ [ [ [ [[ [ [[ [ [ [ [ [ [ [ [ [ [ [ [ [ [ [ [ [ [ [ [ [ [ [ [ [ [ [ [ [ [ [ [ [ [ [[ [ [ [ [ [ [ [ [ [ [ [[ [ [ [ [ [ [ [[ [ [ [ [ [ [[ [ [ [ [ [ [ [ [ [ [ [ [ [ [ [ [ [ [ [ [ [ [ [ [ [ [ [ [ [ [ [ [ [ [ [ [ [ [ [ [ [ [ [ [ [ [ [ [ [ [ [ [ [ [ [ [ [ [ [ [ [ [ [ [ [ [ [ [ [ [ [ [ [ [ [ [[ [ [ [ [ [ [ [ [ [ [ [[ [ [[ [ [ [ [ [ [[ [ [ [ [ [ [ [ [ [ [ [ [ [ [ [ [ [ [ [ [ [[ [[ [ [ [ [ [ [ [ [ [ [ [ [ [ [ [[ [ [ [ [ [ [ [ [ [ [ [ [ [ [ [ [ [ [ [ [ [ [ [ [ [ [ [ [ [ [ [ [ [ [ [ [ [ [ [ [ [ [ [ [ [ [ [ [ [ [ [ [ [ [ [ [ [ [ [ [ [ [ [ [ [ [ [ [ [ [ [ [ [ [ [ [ [ [ [ [ [ [ [ [ [ [ [ [ [ [ [ [ [ [ [ [ [ [ [ [ [ [ [ [ [ [ [ [ [ [ [ [ [ [ [ [ [ [ [ [ [ [ [ [ [ [ [ [[ [ [ [ [ [ [ [ [ [ [ [ [ [ [ [ [ [ [ [ [ [ [ [ [ [ [ [ [ [ [ [ [ [ [ [ [ [ [ [ [ [ [ [ [ [ [ [ [ [ [ [ [ [ [ [ 305000 305000 310000 310000 77 95 00 0 77 95 00 0 78 00 00 0 78 00 00 0 78 05 00 0 78 05 00 0 CLIENT THE MOSAIC COMPANY LEGEND Tapira Phosphate Property Igneous Complex Boundary Road [ City [ Drill Hole Measured Resource Indicated Resource Inferred Resource Mineral Potential PROJECT SEC S-K 1300 TECHNICAL REPORT SUMMARY MOSAIC FERTILIZANTES: COMPLEXO MINERACAO DE TAPIRA TITLE CMT MINERAL RESOURCE CLASSIFICATION MAP 31406539.009 11.8 2024-01-10 JS JS JDW #### 1 in 0 PATH: C:\Users\gld_jsimper\WSP O365\202313515Mosaic2023 - 05_Technical Work\06_GIS\Tapira_GIS\MapFiles\11.6_CMT_Res_Class_Map_ANSIA.mxd PRINTED ON: 2024-01-10 AT: 2:00:56 PM Chile or Peru Bolivia Brazil Colombia Venezuela Guyana Paraguay Argentina French Guyana KEY MAP IF T H IS M E AS U R EM EN T D O ES N O T M AT C H W H AT IS S H O W N , T H E SH EE T H AS B E EN M O D IF IE D F R O M : A N SI A CONSULTANT PROJECT NO. CONTROL REV. FIGURE YYYY-MM-DD DESIGNED PREPARED REVIEWED APPROVED REFERENCE(S) 1. COORDINATE SYSTEM: CORREGO ALEGRE 1961 UTM ZONE 23S 0 1,500 3,000 Meters1:60,000 [ [ [ [ [ [ [ [ [ Min as Ge ra is Go iás Ca t al ão Araxá Catalão Ibiá Patrocínio Perdizes Sacramento Uberaba Uberlândia Tapira MAP AREA MAP AREA

Report Date: February 20, 2024 31406539.009-001-TRS-Rev0 Effective Date: December 31, 2023 Complexo Mineração de Tapira 11-26 11.5 Mineral Resource Uncertainty Discussion The sources of uncertainty for the Mineral Resources evaluation include the following topics, along with their location in this report: Sampling or drilling methods – Section 7.2 and 8.0 Data processing and handling – Section 11.0 Geologic modeling – Section 11.1.4 Block modeling – Section 11.1.8 Tonnage estimation – Section 11.2 The sampling and drilling methods present a low source of uncertainty based on the current standards that are in place with Mosaic and those that have been in place for the recent exploration history. The items that help reduce uncertainty with the sampling and drilling methods include the fact that drill holes were cored with HQ2 size core. The core was then measured and logged and sampled with guidance from the CMT geological team. A specification of 60% linear core recovery was used to limit samples that were used in the modeling process. The core was then sent to accredited laboratories where QA/QC programs were implemented and were actively monitored for laboratory performance. Once the assay results were received from the laboratories, the data was input into the geological database along with the collar, drill hole information, lithology records and weathering records. The lithology and weathering records from the core logging was validated based on the assay results by the CMT geological team to adhere with known trends for the various domains. The data handling was secure in the geological database and this process also demonstrated a low level of uncertainty for the Mineral Resource estimate. The validated database was loaded into the geological modeling software, where surfaces for lithology and weathering were modeled and validated based on drill holes, geological trends, and operational experience. The current geological model appears to define the Measured and Indicated Mineral Resource areas of the pit well. Uncertainty for these areas can be classified as low for a global estimate; however, there will likely be minor local variability when the area is mined and compared back to the model. This is common as the geological model is just that, a model that is used to estimate tonnages. The model for the measured and indicated portions of the deposit is appropriate to use for conversion to Mineral Reserves. Areas of the geological model in the Inferred Mineral Resource portion of the deposit will require future drilling and exploration to better define and understand the lithological variation before they can be upgraded to Measured or Indicated Mineral Resources. The level of uncertainty for the lithological model is moderate for the Inferred Mineral Resource areas due to the type of geological deposit that is being modeled. The weathering model is simpler since weathering originates from the surface and generally follows the topography. For this reason, the uncertainty of the weathering profiles are low-moderate for the Inferred Mineral Resource areas. As with the Measured and Indicated Mineral Resource areas, the global uncertainty is lower than the local uncertainty due to the ability to average over the areas when estimating globally. The geological model was then imported into the block model where the lithology and weathering surfaces were utilized to domain the deposit into geological domains to support the grade estimation. This step was completed

Report Date: February 20, 2024 31406539.009-001-TRS-Rev0 Effective Date: December 31, 2023 Complexo Mineração de Tapira 11-27 with care and diligence by the CMT geologists who are very well versed in the geological environment of CMT and, therefore, the uncertainty is low. The drill hole data was then composited, and a geostatistical analysis was completed to better understand the variability of the grades by domain. There were appropriate data counts and understanding of the geostatistical processes for this analysis to be completed by the CMT geologists. However, this type of analysis is only a tool to help predict the grades through block modeling. With more drilling and data in the geostatistical analysis, the geostatistical results could change if an area of the deposit has significantly different variability in grade. Based on the understanding of the current deposit, this is unlikely, but could occur in the inferred areas where drill spacing is greater. The geostatistical results were used to interpret grades and densities into the block model. The results were verified by CMT geologists through global statistics, drift analysis, and reconciliations. Like the geological modeling, uncertainty for areas classified as Measured and Indicated Mineral Resources are low globally, but low- moderate for local variability. For Inferred Mineral Resources, the uncertainty is higher based on a larger drill spacing and is low-moderate for global variability and moderate for local variability. The block model for the measured and indicated portions of the deposit is appropriate to use for conversion to Mineral Reserves. The Mineral Resource tonnages were limited with the use of an optimized pit shell where reasonable prices and COGs were used. Additionally, areas with significant infrastructure such as the primary crusher and conveyor were excluded from the estimate. The estimate was completed by utilizing the block model with the resource categorization and the resource pit limit. Areas of uncertainty for the resource estimate include: A substantial change in price that would affect the resource pit shell limit. Changes in grade based on additional drilling that would influence the amount of tonnages that would be excluded with the COG. In summary, given all the considerations in this Section and report, the uncertainty in the tonnage estimate for the Measured Mineral Resources, is low, Indicated Mineral Resources estimates is low to moderate, and Inferred Mineral Resources is moderate, as shown in Table 11.17. Table 11.17: Mineral Resources Uncertainty Uncertainty Item Measured Uncertainty Indicated Uncertainty Inferred Uncertainty Sampling and Drilling Methods Low Low Low Data Processing and Handling Low Low Low Geological Modeling – Globally/Locally Low/Low Low/Low-Moderate Low-Moderate/Moderate Geologic Domaining Low Low Low Geostatistical Analysis Low Low Moderate Block Modeling – Globally/Locally Low/Low Low/Low-Moderate Low-Moderate/Moderate Tonnage Estimate Low Low-Moderate Moderate

Report Date: February 20, 2024 31406539.009-001-TRS-Rev0 Effective Date: December 31, 2023 Complexo Mineração de Tapira 11-28 11.6 Assumptions for Multiple Commodity Resource Estimate This does not apply to the Mineral Resource estimate for CMT. 11.7 Qualified Person’s Opinion on Factors that are Likely to Influence the Prospect of Economic Extraction As CMT is an operation with more than 40 years of operational experience and data, it is the QP’s opinion that the relevant technical and economic factors necessary to support economic extraction of the Mineral Resource have been appropriately accounted for at CMT. The QP is not aware of any issues that require further work that are likely to influence the prospect of economic extraction for the Mineral Resources stated in this TRS. Recommendations that are detailed in Section 23.1 are related to improving local variability for short range planning purposes that could be completed by site teams to provide improvements to short-term recovery and grade control. They are not seen as having an impact on the prospect of economic extraction.

Report Date: February 20, 2024 31406539.009-001-TRS-Rev0 Effective Date: December 31, 2023 Complexo Mineração de Tapira 12-1 12.0 MINERAL RESERVE ESTIMATES 12.1 Key Assumptions, Parameters, and Methods This sub-section contains forward-looking information related to the key assumptions, parameters, and methods for the Mineral Reserve estimates for the Mine. The material factors that could cause actual results to differ materially from the conclusions, estimates, designs, forecasts, or projections in the forward-looking information include any significant differences from one or more of the material factors or assumptions that were set forth in this sub-section including Mineral Resource model tonnes and grade and mine design parameters. 12.1.1 Geologic Resource Model The geological model previously described in Section 11.0 and used to estimate Mineral Resources was the basis for the estimate of Mineral Reserves. The geological model is based on core drilling from 1983 to 2022. A Mineral Resource pit was developed to define and limit the estimation of mineral resources to the “reasonable prospects for economic extraction.” The Tapira geological model is a sub-blocked model detailing lithological and weathering contacts. As such, two models were built for the Tapira mineral deposit: 1. Lithological model composed of 8 identified rock types. 2. Weathering model composed of 5 identified rock units. A combination of both models was used to define geologic domains for Mineral Resource estimation. The geological domains were used as grade estimation zones in the resource model. Table 12.1 summarizes the modeled domains and highlighted resource domains in the isalterite and semi-weathered rock zones. Four of the geological domains contain significant phosphorous content and were included in the Mineral Resource Statement: 1. ISAB-FCR: Bottom Isalterite/Phoscorite 2. ISAB-BEB: Bottom Isalterite/Bebedourite 3. RSI-FCR: Semi-weathered Rock/Phoscorite 4. RSI-BEB: Semi-weathered Rock/Bebedourite

Report Date: February 20, 2024 31406539.009-001-TRS-Rev0 Effective Date: December 31, 2023 Complexo Mineração de Tapira 12-2 Table 12.1: Block Model Estimation Domains Each block within the resource block model was normalized to 25 m by 25 m by 5 m in the XYZ dimensions. Each block within the resource block model contained over 200 variables describing the block contents for lithological and weathering codes, metallurgical grades, density, moisture, mass and metallurgical recovery, concentrate grades, volumes, and in-situ and recovered tonnages. 12.1.2 Mine Design Criteria The general mine design criteria used to estimate mineral reserves are listed below: 1. Surface, open-pit mining approach 2. Haul road design width of 15 m 3. Berm width of 12 m or 15 m and bench height of 10 m 4. Typical ramp width of 27 m 5. Maximum ramp grade 8% 6. Effective wall angles by geotechnical design sector are summarized in Section 13.2.1. Rock_Type Type ID_LITO Estimation Domain ALO-COB Waste 5 1 ISAT-ZTI Titanium 6 2 ISAB-BEB Ore 1 3 ISAB-FCR Ore 2 ISAB-CBN Ore 3 ISAB-SIE Waste 4 5 ISAB-FEN Waste 98 - ISAB-ENC Waste 99 - RSI-BEB Ore 1 6 RSI-FCR Ore 2 RSI-CBN Ore 3 RSI-SIE Waste 4 8 RSI-FEN Waste 98 - RSI-ENC Waste 99 - RSA-BEB Waste 1 9 RSA-FCR Waste 2 RSA-CBN Waste 3 RSA-SIE Waste 4 11 RSA-FEN Waste 98 - RSA-ENC Waste 99 - 7 4 10

Report Date: February 20, 2024 31406539.009-001-TRS-Rev0 Effective Date: December 31, 2023 Complexo Mineração de Tapira 12-3 Mosaic currently holds a total of 9 mining permits within the Tapira Complex, with easement areas in place for the purposes of tailings disposal, electrical transmission lines, and ore beneficiation infrastructure. The MG-146 highway is currently located within the final pit extents; funds have been included in the projected capital costs to acquire the necessary property and relocate the road. The potential mining area was limited to the currently permitted area, with appropriate offsets applied. After applying all boundaries and appropriate offsets, the ultimate mining pit designs were constructed based on this boundary using the following pit parameters: COG of 5.0% P2O5 ap (diluted) – Described further in Section 12.2.5 RCP (ratio between CaO and P2O5 in a block) between 0.9 and 3.0 Within one of the four mineralized domains shown in Table 12.1 (highlighted domains) Loss and dilution based on parameters of neighboring blocks, as described in Section 12.2.1. General mine design criteria listed above. Geotechnical parameters, as described in Section 13.2.1. Process recovery methodology and factors described in Section 10.4. Using these designs and the parameters mentioned above, an ultimate mining pit design was developed, the potential reserves were calculated and limited within the pit design, and an economic analysis was performed (see Section 19.0). The point of reference of the Mineral Reserves estimate is: ROM ore delivered to the process plant. The Concentrate Reserve Estimate is the reserve produced and recovered in the beneficiation plant (post beneficiation). All reserves are as of December 31, 2023. 12.2 Modifying Factors This sub-section contains forward-looking information related to the modifying factors for the Mineral Reserve estimates for the Mine. The material factors that could cause actual results to differ materially from the conclusions, estimates, designs, forecasts or projections in the forward-looking information include any significant differences from one or more of the material factors or assumptions that were set forth in this sub-section including modifying factors including dilution and mining and recovery factors, beneficiation assumptions, property limits, commodity price, cut off grades, pit optimization assumptions and the ultimate pit design. Modifying factors are applied to mineralized material within the measured and indicated resource classifications to establish the economic viability of Mineral Reserves. A summary of modifying factors applied to the CMT mine Mineral Reserve estimate is provided below.

Report Date: February 20, 2024 31406539.009-001-TRS-Rev0 Effective Date: December 31, 2023 Complexo Mineração de Tapira 12-4 12.2.1 Dilution, Loss, and Mine Recovery Dilution in mining can be defined as the addition of waste material to the ore during the mining process and can be due to a lack of selectivity, or in some cases, inadequate operational configuration. The process considers the neighborhood relationship between an ore block with the adjacent blocks, weighting the grades by a predetermined distance, and by the density of the blocks. The dilution effects result in a reduction of the in-situ P2O5 grade for the mining model as well as a reduction in mass recovery. The factors that cause dilution are diverse and include: Nature of ore contacts and boundaries Pit boundary zones Block size and position Sample density Geological complexity Selectivity of mining and equipment size Mining method and type of crushing Dilution can be internal (caused by intrinsic deposit factors) or external (caused by operational factors). Dilution cannot be fully eliminated as it is impossible to have the exact accuracy of the mining limits; however, it can be estimated and considered, thus minimizing the differences between the mine plan and the actual operations. A script was developed by the Mosaic Long-Term Mine Planning team to calculate the diluted grades of the ore blocks based upon the information found in the block model, specifically the contacts between and grades of the ore and waste blocks and the geotechnical design parameters. Dilution is calculated only for the ore blocks that have at least one adjacent waste block using a contact dilution approach, which occurs through contact of the ore and waste layers, as well as operational dilution which occurs through both ore/waste contact and the face angle of the benches. Contact dilution occurs in the regions between the ore and waste zones. The portion of the ore mined in this contact region will be diluted by the waste, since it is impossible to completely segment these two layers during mining. This difficulty in segmenting the ore and waste also occurs with operational dilution, because it is not possible to mine block by block due to the size of the mining equipment and the mining geometry that must be followed. Figure 12.1 shows an example of an ore block surrounded by five blocks of waste. In three of the five blocks, dashed lines represent the part of the contact blocks that will be extracted together with the ore during mining. The dilution is calculated by the equation:

Report Date: February 20, 2024 31406539.009-001-TRS-Rev0 Effective Date: December 31, 2023 Complexo Mineração de Tapira 12-5 Figure 12.1: Ore Block Surrounded by Waste Blocks The pit design requires additional geotechnical considerations such as the overall angle, the face angle, and the berm size. With this information, it is possible to calculate the masses of the triangular prisms formed by the influence of the face angle as shown in Figure 12.2 and Figure 12.3. These two prisms are located exactly in the transition zone between ore and waste blocks and indicate the amount of waste to be added to the ore mined (upper prism) and amount of ore lost or unmined indicated by the lower prism. In these two cases, calculations are obtained by: Figure 12.2: Dilution of the Blocks Located on the Edge of the Mine/Waste Interface Due to the Influence of the Face Angle

Report Date: February 20, 2024 31406539.009-001-TRS-Rev0 Effective Date: December 31, 2023 Complexo Mineração de Tapira 12-6 Figure 12.3: Trigonometry to Calculate the Mass of the Upper and Lower Prisms To calculate the diluted grade, the mass of the triangular prism designated as diluted will be added to the block mass, and the mass of the triangular prism designated as loss will be subtracted from it. The equations below present the steps to calculate the loss, dilution, final mass of the block, and diluted grade given the influence of the face angle: Mining Loss = Mass of Lower Block * Grade of Ore Block Mining Dilution = Mass of Upper Block * Grade of Contact Block Final Mass of Block = Mass of Ore Block + Mass of Upper Block – Mass of Lower Block Diluted Grade = (Mass of Ore Block * Grade of Ore Block) - Mining Loss + Mining Dilution Final Mass of Block Geological dilution is based on mineralized contacts, modeled weathering, and lithology. In the case of Tapira, the ISAB-FCR, ISAB-BEB, RSI-FCR, and RSI-BEB were considered ore for the purposes of dilution estimation. The contaminant grade comes from the neighboring waste blocks, and the ore grade is weighted by the percentage of waste in the ore block. The Tapira Mine does not apply any additional mining recovery factors to the ore extraction, assuming their equipment is selective enough to be able to mine the boundary of the ore and waste as defined by the interpolated rock unit triangulations. The portion of overburden outside the geological modeling envelope is incorporated into the waste. For simplicity, densities and moistures were not weighted, so there is no change in the original ore mass, only in the ore grade. An evaluation was carried out and it was determined that this difference is immaterial.

Report Date: February 20, 2024 31406539.009-001-TRS-Rev0 Effective Date: December 31, 2023 Complexo Mineração de Tapira 12-7 12.2.2 Beneficiation Mass recovery, an important parameter impacting the operating cost, is determined by the following relationship: Mass Recovery = 100 x concentrate mass / ROM mass The geometallurgical test data are evaluated periodically to establish an equation for predicting mass recovery as a function of ROM chemical composition. The bench test database was subdivided into the deciles of metallurgical recovery and individualized as a homogenous domain, treating isalterite and semi-weathered horizons separately. For each metallurgical recovery domain, a linear regression was developed (Table 12.2 for ISAB and Table 12.3 for RSI), capable of predicting Mass Recovery according to the P2O5 grade of the ROM, with close adherence between the test results and the predicted results. The current equation for predicting the mass recovery of conventional phosphate concentrate from Tapira ore is presented below. Table 12.2: Linear Regression Equations used to Predict Mass Recovery (ISAB horizon) Table 12.3: Linear Regression Equations used to Predict Mass Recovery (RSI horizon) The predicted mass recovery is for conventional concentrate because the laboratory testing does not include preparation and flotation of the ultrafine flotation feed. The ultrafine concentrate is typically about 8% of the total concentrate. Indicator Linear Regression R2 ID_100 Mass Recovery = -3.90595 + 1.29102 * P2O5 0.67 ID_200 Mass Recovery = -3.23931 + 1.40167 * P2O5 0.76 ID_300 Mass Recovery = -2.01713 + 1.41655 * P2O5 0.79 ID_400 Mass Recovery = -2.45084 + 1.60326 * P2O5 0.84 ID_500 Mass Recovery = -1.19864+ 1.60015* P2O5 0.87 ID_600 Mass Recovery = -0.675597 + 1.6648 * P2O5 0.88 ID_700 Mass Recovery = -0.36394 + 1.75184 * P2O5 0.94 ID_800 Mass Recovery = 1.830943 * P2O5 0.99 ID_900 Mass Recovery = 1.928374 * P2O5 0.99 ID_1000 Mass Recovery = 2.022531 * P2O5 0.99 Indicator Linear Regression R2 ID_100 Mass Recovery = 0.541734 * P2O5 0.93 ID_200 Mass Recovery = 0.814935 * P2O5 0.96 ID_300 Mass Recovery = -0.984993 + 1.172184 * P2O5 0.71 ID_400 Mass Recovery = -0.78843 + 1.319323 * P2O5 0.79 ID_500 Mass Recovery = -0.506689 + 1.419933* P2O5 0.87 ID_600 Mass Recovery = -1.23431 + 1.69144 * P2O5 0.92 ID_700 Mass Recovery = -0.509149 + 1.712097 * P2O5 0.94 ID_800 Mass Recovery = -0.76669 + 1.88907 * P2O5 0.96 ID_900 Mass Recovery = 1.913369 * P2O5 0.99 ID_1000 Mass Recovery = 0.96556 + 1.95716 * P2O5 0.98

Report Date: February 20, 2024 31406539.009-001-TRS-Rev0 Effective Date: December 31, 2023 Complexo Mineração de Tapira 12-8 The metallurgical recovery is calculated from the mass recovery, the concentrate % P2O5, and the ROM % P2O5 according to the following equation: Metallurgical recovery = 100 x Mass recovery x Concentrate % P2O5 / ROM % P2O5 12.2.3 Property Limits The December 31, 2023, Mineral Reserve estimate for Tapira has been constrained by an ultimate pit design developed from a nested pit optimization exercise and bound by Mosaic’s mining concessions shown in Table 12.4. Additional information on the pit optimization process used to define the economic limits of the ultimate pit design is provided in Section 12.2.6. Table 12.4: Mining Concessions Used as a Mineral Reserves Estimate Constraint 12.2.4 Commodity Price Used The commodity price of R$ 1,939.57 that was used for the COG assessment, pit optimization, and Mineral Reserve estimate is based on a composite value of all Fertilizantes product sales and was provided by Mosaic for WSP to rely upon. The time frame of the price is December 31, 2023. 12.2.5 Cut-off Grade Estimate Per the definitions in S-K 1300, “For the purposes of establishing ‘prospects of economic extraction’, the COG is the grade that distinguishes material deemed to have no economic value from material deemed to have economic value.” In simpler terms, the COG is the grade at which revenue generated by a block is equal to its total cost resulting in a net value of zero. For material to be processed as ore at the CMT beneficiation facilities, not only must the material generate enough revenue to cover costs to be treated as ore, but it must also meet certain geometallurgical beneficiation criteria, including: Diluted P2O5ap grade greater than 5.0% Diluted RCP greater than or equal to 0.9 and less than 3.0 Within one of the four mineralized domains shown in Table 12.1 Mining Permits Granted to Area (ha) 810.330/1968 Mosaic Fertilizantes P&K Ltda 483.12 810.331/1968 Mosaic Fertilizantes P&K Ltda 500.13 812.362/1968 Mosaic Fertilizantes P&K Ltda 464.04 821.674/1969 Mosaic Fertilizantes P&K Ltda 20.01 816.066/1970 Mosaic Fertilizantes P&K Ltda 47.83 827.081/1972 Mosaic Fertilizantes P&K Ltda 339.39 803.387/1974 Mosaic Fertilizantes P&K Ltda 947.34 831.405/1997 Mosaic Fertilizantes P&K Ltda 1,040.31 833.476/2012 Mosaic Fertilizantes P&K Ltda 10.48 Total 3,852.65

Report Date: February 20, 2024 31406539.009-001-TRS-Rev0 Effective Date: December 31, 2023 Complexo Mineração de Tapira 12-9 Mosaic has used a break-even COG approach, as shown below, to define the minimum grade that must be met for an ore block to generate enough revenue to cover the total cost of mining ore and any increment of waste that must be mined to recover the ore (i.e., strip ratio). The mass recovery of ore material which defines the amount of concentrate recovered from a tonne of plant feed is a function of ROM P2O5, Fe2O3, and CaO grade on a dry basis. For vertically integrated companies such as Mosaic, the product sold is not the concentrate generated by the beneficiation plant, but one of numerous performance, phosphate, feed, and industrial products generated by a chemical plant, each of which has different specifications and prices. The calculation of a concentrate “selling price”, therefore, requires that the value added by the additional treatment that the phosphate concentrate undergoes at the chemical plant be “net-backed” to the mines. Net-back pricing is a complicated process that requires a complete understanding of the business and markets. The Mineral Reserves QP has, therefore, relied on Mosaic’s calculation of net-back pricing in the determination of COG. Using an anticipated net-back price of concentrate, the historical costs of mining, beneficiation, and selling, and the historical metallurgical recovery of P2O5 at CMT, a break-even ROM COG 5.3% P2O5ap was estimated to delineate ore from waste (Table 12.5). This COG was assumed at a constant value of R$ 1,939.57 per tonne of concentrate for 2023 and beyond and does not consider fluctuations in pricing. As previously noted, the break-even COG calculated by Mosaic includes not only the cost to mine ore, but the cost to mine an increment of waste required to access ore. The marginal COG is used to determine the minimum grade at which the block can be processed and still be profitable. Unlike the breakeven COG, the marginal COG does not include the cost of mining the block, only the processing and downstream costs. The marginal COG is used in situations where a block with a grade lower than the breakeven COG must be mined in order to access underlying higher grade material. In this case, since the block must be removed anyway, then it is necessary to evaluate if it is more cost-efficient to treat the block as waste or to process the block as ore by comparing the grade of the block to the marginal COG.

Report Date: February 20, 2024 31406539.009-001-TRS-Rev0 Effective Date: December 31, 2023 Complexo Mineração de Tapira 12-10 Table 12.5: COG Calculations Notes: 1. Total cost includes cost of mining waste and ore. 2. As required to result in a block value of zero. 3. Mass Recovery = ROM P2O5 x Metallurgical Recovery / P2O5 Concentrate. 4. Concentrate = Mass Recovery x ROM Ore (dry basis). The calculations in Table 12.5 summarize the amount of apatite concentrate produced per wet tonne of ore. The grade tonnage curve shown in Figure 12.4 highlights about 490 Mt of ore within the block model that are at or above a 5.3% P2O5ap breakeven COG. While 5.3% is the breakeven COG, Mosaic continues to use a standard operational 5% P2O5ap COG to remain consistent with existing mine planning and reserve estimation. The quantity of reserves between the 5.0% and 5.3% P2O5 grade is estimated to be 5.1 Mt as shown in Table 12.6. This is approximately 1.1% of the total reserves for Tapira. The QP therefore believes that it is reasonable to continue using a 5.0% operational COG since only 1.1% of the total reserves are between 5.0% and 5.3% P2O5 and all of the reserves are above the marginal COG. Table 12.6: Reserve between Operational COG and Breakeven COG Item Breakeven COG Marginal COG Tonnes wet (t) 1 1 Tonnes dry (t) 0.87 0.87 Grade 5.30% 2.12% P2O5 grade ROM2 4.6% 1.8% Metallurgical Recovery (%) 60.6% 60.6% P2O5 Concentrate Grade (%) 35.0% 35.0% P2O5 content conc. (t) 0.03 0.01 Mass recovery (%)3 9.2% 3.7% Concentrate (t)4 0.08 0.03 Total Cost1 154.5 61.8 Selling Price 1,939.6 1,939.6 Profit R$/t 0.0 0.0 Reserve Tonnes Cutoff 5.3% P2O5 Cutoff 5% P2O5 Difference Variance Proven 145,987,479 147,241,066 1,253,587 0.85% isa 117,833,904 118,433,737 599,833 0.51% rsi 28,153,575 28,807,329 653,754 2.27% Probable 308,687,330 312,580,976 3,893,646 1.25% isa 245,340,298 246,016,176 675,878 0.27% rsi 63,347,032 66,564,800 3,217,768 4.83% Total 454,674,809 459,822,042 5,147,233 1.12% isa 363,174,202 364,449,913 1,275,711 0.35% rsi 91,500,607 95,372,129 3,871,522 4.06%

Report Date: February 20, 2024 31406539.009-001-TRS-Rev0 Effective Date: December 31, 2023 Complexo Mineração de Tapira 12-11 Figure 12.4: Tapira Grade-Tonnage Curve 12.2.6 Pit Optimization Methodology and Ultimate Pit Selection The Tapira operation utilizes standard pit optimization methodology in Datamine NPV Scheduler to determine the extent of economically mineable reserves. The value of individual blocks is calculated in Datamine Studio OP using a script which assigns costs and, in the case of ore blocks, revenue. The script, which is based on a set of profit function parameters, assigns fixed and variable costs for the following: 1) Ore Mining 2) Waste Mining 3) Ore beneficiation The script assigns value to the ore blocks based on the average revenue generated from a tonne of beneficiated phosphate rock. The value per tonne is calculated as revenue from the sale of fertilizer products minus the costs downstream of the beneficiation plant, i.e., the chemical plant costs to produce the saleable products. The pit optimization is based on the script used to place a value on the blocks. The average transportation distance is estimated block by block in Datamine Studio OP using a script to assign fixed and variable distance definitions. The tool calculates the centroid distance of each block within a given area to its position within the overburden storage facility. Distance calculations account for the gradient of ramps and are prorated by a factor of 1.285, depending upon the assigned waste location to account for curves.

Report Date: February 20, 2024 31406539.009-001-TRS-Rev0 Effective Date: December 31, 2023 Complexo Mineração de Tapira 12-12 The total area available to be mined is 4,379 ha. As shown in Table 12.7, multiple mining concessions were used to constrain the pit optimization so that mining would not occur outside these limits. Additionally, two areas known as the East and West property and the INCRA Settlement were applied “obstacle limits” such that a minimum Net Present Value (NPV) must be achieved to mine in these areas. Table 12.7: Tapira Pit Optimization Mining Concessions and Their Impact on Pit Optimization A nested pit analysis was performed in NPV scheduler using the economic inputs shown in Table 12.8. A series of profit factors were applied to the selling price at R$1,939.57 per tonne of concentrate to determine the highest and lowest value ore within the deposit. A summary of the resultant pit tonnages, best case NPV, and worst case NPV at profit factors ranging from 1% to 100% of the base ore block value is provided as Figure 12.5. Based on this nested pit analysis, Mosaic chose the pit with a profit factor of 46% (i.e., Pit 46) as the basis of the ultimate pit design described in Section 12.2.7. Table 12.8: Tapira Economic Inputs Mining Concession Comments Mosaic Property Limits Not used to constrain optimization ANM 803.387/1974 Used to constrain pit optimization ANM 810.330/1968 Used to constrain pit optimization ANM 810.331/1968 Used to constrain pit optimization ANM 812.362/1968 Used to constrain pit optimization ANM 816.066/1970 Used to constrain pit optimization ANM 821.674/1969 Used to constrain pit optimization ANM 827.081/1972 Used to constrain pit optimization ANM 831.405/1997 Used to constrain pit optimization ANM 833.476/2012 Used to constrain pit optimization East and West Property Obstacle limit NPV > R$35M INCRA Settlement Obstacle limit NPV > R$180M Description Units Basis 2023 Cycle1 2023 Cycle - Updated Mining Cost Waste Fixed R$/t wet 5.64 15.94 Variable R$/t-km wet 1.90 1.72 Ore Fixed R$/t wet 3.37 3.31 Variable R$/t-km wet 1.70 1.80 Processing Cost R$/t wet 21.85 18.13 Selling Costs Cost of Chemical Plant R$/t Concentrate dry 969.94 840.05 SG&A R$/t Concentrate dry 22.66 22.44 R&D R$/t Concentrate dry 31.35 31.04 Sustaining R$/t Concentrate dry 167.75 172.45 Turn Around & Idle R$/t Concentrate dry 61.74 61.62 Total R$/t Concentrate dry 1,253.45 1,127.60 Selling Price R$/t Concentrate dry 1,939.57 1,925.74 Notes: 1. 2023 Cycle costs were used in the Pit Optimization exercise, but the updated costs reflect the most current cost estimates at the time of this report.

Report Date: February 20, 2024 31406539.009-001-TRS-Rev0 Effective Date: December 31, 2023 Complexo Mineração de Tapira 12-13 Figure 12.5: Summary of Tapira Nested Pit Analysis

Report Date: February 20, 2024 31406539.009-001-TRS-Rev0 Effective Date: December 31, 2023 Complexo Mineração de Tapira 12-14 12.2.7 Ultimate Pit Design The ultimate pit design that forms the basis of the CMT Mineral Reserve estimate was based on Pit 46 selected from the nested pit analysis described in Section 12.2.6. The ultimate pit design considers geotechnical and hydrological factors that are described in Section 13.2. A map showing the design and extents of the ultimate pit is provided as Figure 12.6.

BL-1 BR 830408/2011 830408/2011 830200/2009 833476/2012 812362/1968 831405/1997 810331/1968 803387/1974 827081/1972 810330/1968 816066/1970 821674/1969 306,000 306,000 309,000 309,000 312,000 312,000 7, 79 7, 00 0 7, 79 7, 00 0 7, 80 0, 00 0 7, 80 0, 00 0 7, 80 3, 00 0 7, 80 3, 00 0 1 in 0 PATH: C:\Users\USJD700685\OneDrive - WSP O365\Tapira\GIS\MapFiles\Tapira_Ultimate_Pit_8.5x11.mxd PRINTED ON: 2023-11-06 AT: 10:16:03 AM Chile Ecuador Peru Bolivia Brazil nama Colombia Venezuela Paraguay Argentina French Guyana IF T H IS M E A S U R E M E N T D O E S N O T M AT C H W H AT IS S H O W N , T H E S H E E T H A S B E E N M O D IF IE D F R O M : A N S I A CLIENT THE MOSAIC COMPANY PROJECT MOSAIC 2023 SK1300 REPORTING TITLE TAPIRA ULTIMATE PIT 31406539.009 - - 2023-11-06 JD JD TK - CONSULTANT PROJECT NO. CONTROL REV. YYYY-MM-DD DESIGNED PREPARED REVIEWED APPROVED REFERENCE(S) 1. WGS 1984 UTM ZONE 23S 0 400 800 1,200 1,600 Meters 12. FIGURE Inset Area LEGEND Tapira Phosphate Property Settlement Boundary Ultimate Pit Mining Concession Mining Requirement Search Permit Tailings Dam Quartzite Ring Ultimate Pit Design Highway MG-146 River/Stream [ [ [ [ [ [ [ [ [ Min as Ge ra is Go iás C a ta l ã o Araxá Catalão Ibiá Patrocínio Perdizes Sacramento Uberaba Uberlândia Tapira Map Area

Report Date: February 20, 2024 31406539.009-001-TRS-Rev0 Effective Date: December 31, 2023 Complexo Mineração de Tapira 12-16 12.3 Mineral Reserve Classification This sub-section contains forward-looking information related to the Mineral Reserve classification for the Mine. The material factors that could cause actual results to differ materially from the conclusions, estimates, designs, forecasts or projections in the forward-looking information include any significant differences from one or more of the material factors or assumptions that were set forth in this sub-section including Mineral Resource model tonnes, grade, and classification. For estimating the Mineral Reserves for Tapira, the following definition as set forth in the S-K 1300 Definition Standards adopted December 26, 2018, was applied. Under S-K 1300, a Mineral Reserve is defined as: “… an estimate of tonnage and grade or quality of indicated and measured mineral resources that, in the opinion of the qualified person, can be the basis of an economically viable project. More specifically, it is the economically mineable part of a measured or indicated mineral resource, which includes diluting materials and allowances for losses that may occur when the material is mined or extracted.” Mineral Reserves are subdivided into classes of Probable Mineral Reserves and Proven Mineral Reserves, which correspond to Indicated and Measured Mineral Resources, respectively, with the level of confidence reducing with each class. Mineral Reserves are always reported as the economically mineable portion of a Measured and/or Indicated Mineral Resource, and take into consideration the mining, beneficiation, metallurgical, economic, marketing, legal, environmental, infrastructure, social, and governmental factors (the “Modifying Factors”) that may be applicable to the deposit. 12.4 Mineral Reserve Estimate This sub-section contains forward-looking information related to Mineral Reserve estimates for the Mine. The material factors that could cause actual results to differ materially from the conclusions, estimates, designs, forecasts or projections in the forward-looking information include any significant differences from one or more of the material factors or assumptions that were set forth in this sub-section including Mineral Resource model tonnes and grade, modifying factors including mining and recovery factors, production rate and schedule, mining equipment productivity, commodity market and prices and projected operating and capital costs. Based on the mining boundaries and modifying factors discussed above, the beneficiation plant recovery methods and factors discussed in Section 13.0, and the Economic Assessment, discussed in Section 19.0, CMT contains the economically minable Mineral Reserves listed in Table 12.6. The Mineral Reserves include approximately 443.6 Mt of ROM ore with a P2O5ap grade of 9.0%, that is expected to yield 67.7 Mt of Concentrate with a P2O5ap grade of 34.7%. The point of reference for Mineral Reserves is as delivered to the beneficiation plant as of December 31, 2023.

Report Date: February 20, 2024 31406539.009-001-TRS-Rev0 Effective Date: December 31, 2023 Complexo Mineração de Tapira 12-17 Table 12.9: CMT - Summary of ROM and Concentrate Mineral Reserves at December 31, 2023 Based on a Fixed Net-Back Price of Concentrate Notes: The reference point for COG and pit optimization analysis is tonnes of concentrate at a price of R$1,939.57/tonne concentrate (2022 price evaluation). COG of P2O5ap ≥ 5.0% and 0.9 ≤ RCP ≤ 3.0 was applied to Mineral Reserves. Mineral Reserves are stated ROM as of December 31, 2023. 12.5 Qualified Person’s Opinion on Risk Factors that could Materially Affect the Mineral Reserve Estimates The Tapira mine has been in operation for over 40 years. Since this is a well-established operation, the deposit, mining, beneficiation, and environmental aspects of the Mine are very well understood. The knowledge for CMT is based on the collective experience of personnel from Mosaic site operations and technical disciplines gained during years of phosphate mining and ore beneficiation. This knowledge is supported by years of production data and observations from CMT. The primary risks, that could materially affect the Mineral Reserve estimate, would include: A long-term, global material decrease in fertilizer product prices for sales that are not protected under long- term sales agreements Inflation rates with corresponding changes in capital and operating costs Production rates Exchange rates Tax rates Changing environmental regulations, and Change in political climate Classification ROM Tonnage, dry basis (Mt) P2O5ap_d Grade (%) ROM P2O5_d Grade (%) Concentrate Tonnage, dry basis (Mt) Total Concentrate P2O5 Grade (%) Total Concentrate Mass Recovery (%) Total Concentrate Metallurgical Recovery (%) Proven 131.7 9.1 9.5 19.7 34.6 15.0 55.6 Probable 311.9 8.9 9.3 48.0 34.7 15.4 58.8 Grand Total 443.6 9.0 9.3 67.7 34.7 15.3 57.8

Report Date: February 20, 2024 31406539.009-001-TRS-Rev0 Effective Date: December 31, 2023 Complexo Mineração de Tapira 13-1 13.0 MINING METHODS 13.1 Production Tasks The Tapira mine has been in operation for over 40 years. Since this is an established operation, the deposit, mining, beneficiation, and environmental aspects of the Mine are very well understood. The geological knowledge for CMT is based on the collective experience of personnel from Mosaic site operations geology, mining, metallurgy, and other technical disciplines gained during years of phosphate mining in Brazil and within the PIAP. This knowledge is supported by years of production data and observations from CMT and other Mosaic surface mining operations in Brazil. The ore at Tapira is recovered using open-pit conventional truck and shovel mining methods due to the proximity of the ore to the surface and the physical characteristics of the deposit. Mining operations progress in a four-step process, which includes clear and grub, drilling and blasting, overburden removal, and ore production. In the development phase, drainage and water control are established, and then the required infrastructure consisting of power, pipelines, and roadways is established. 13.1.1 Clear and Grub Surface areas to be disturbed during the mining process are progressively cleared of vegetation using track dozers, as necessary. 13.1.2 Drilling and Blasting Blasting at Tapira is conducted by Enaex Britante. The main explosive in use is emulsion and the blast design includes 4.5 to 5-inch diameter holes, in a 10-meter bench with a blasting grid ranging from 2.1 m x 2.5 m up to 3.8 m by 4.4 m. Typical powder factors range from 200 g/t up to around 330 g/t.st. 13.1.3 Overburden Removal and Storage Waste is hauled to one of the 6 ex-pit overburden storage facilities, serving different areas and types of waste from the mine. Waste containing notably higher grades of titanium is hauled to one of the three titanium stockpiles. Overburden material is loaded by a Hitachi EX1200 or Hitachi EX2500 bucket-class hydraulic mining excavator loading Caterpillar (CAT) 777 90-tonne haul trucks or Komatsu 730E 180-tonne haul trucks. Dozers assist the loading fleet with general clean-up and material removal, as necessary. Overburden material is hauled to one of the ex-pit OSFs and dozers are used to push overburden down the sides of the OSFs on an as-needed basis. Total waste haulage routes using mine access ramps will vary over the life of the operation but generally range from about 2.5 km to 7.9 km. 13.1.4 Ore Production Primary ore loading operations use bucket-class hydraulic mining excavators loading CAT 777 end-dump haul trucks of 90-t capacity. The excavators are supplemented by dozers. Ore material is hauled up the active mining face and ex-pit to the beneficiation plant. Total ore haulage routes using mine access ramps will vary over the life of the operation but range from about 3.4 km to 8.0 km. Ore material is unloaded at a stockpile at the beneficiation plant where is it further handled by beneficiation plant front-end loaders. After it is dropped at the beneficiation plant, the ore material is crushed, sized, and stockpiled for further beneficiation.

Report Date: February 20, 2024 31406539.009-001-TRS-Rev0 Effective Date: December 31, 2023 Complexo Mineração de Tapira 13-2 Figure 13.1 demonstrates a typical open-pit operation utilizing excavators in backhoe configuration and haul trucks to remove both ore and overburden. The general sizing and depth of the mine at most stages of the operation requires multiple working benches on the advancing faces. This will allow consistent mine development with a continued pushback and assist with continuous ore deliveries to the beneficiation plant. Figure 13.1: Tapira Typical Mining Configuration 13.2 Parameters Relative to the Mine Design and Plans This sub-section contains forward-looking information related to mine design for the Mine. The material factors that could cause actual results to differ materially from the conclusions, estimates, designs, forecasts or projections in the forward-looking information include any significant differences from one or more of the material factors or assumptions that were set forth in this sub-section including geotechnical and hydrogeological. 13.2.1 Geotechnical The geotechnical units at Tapira are defined by the lithology and weathering models. The geotechnical units found at Tapira are predominantly friable, without control of discontinuities or anisotropy in the mechanical behavior of these materials. The stability of the final pit slopes was analyzed in 2D using limit equilibrium methods and considered a rotational mode of failure, which is appropriate for the characteristics of the materials found in Tapira. The resistance parameters used in the stability analysis are summarized in Table 13.1.

Report Date: February 20, 2024 31406539.009-001-TRS-Rev0 Effective Date: December 31, 2023 Complexo Mineração de Tapira 13-3 Table 13.1: Geotechnical Parameters used in the Stability Analysis Notes: ƴ nat – Natural Density ƴ sat – Saturated Density CIU – Consolidated Isotropic Undrained c’ – cohesion φ – friction angle The results of the stability analysis indicate that at an inter-ramp and global scale the slopes are stable, with factors of safety exceeding the acceptance criteria. At a local scale, benches in saturated condition are unstable and dewatering will be required to locally lowering the phreatic surface by 5 m to obtain a Factor of Safety (FOS) greater than 1.3 at a bench scale. The design parameters for the Tapira pit are shown in Table 13.2. Table 13.2: Proposed Geometric Parameters for Tapira Pit Design The Tapira geotechnical model is divided into 7 different zones, with the possibility of further subdivision into 4 geotechnical sectors. The divisions are based upon the unique combination of lithology and weathering in each area, with recommended design parameters as shown in Table 13.3. ƴ nat ƴ sat (kN/m3) (kN/m3) c' (kPa) φ' (°) c' (kPa) φ' (°) Waste Dump / PDE 19 - 10 32 - - Cover Aloterite 18 20 50 29 42 32 Titanium Isalterite Topo 20 21 40 30 30 33 Bebedourite / Phoscrete Friable Phosphate (bottom isalterite) 22 22 23 29 21 32 Bebedourite / Phoscrete Semi-compact Phosphate (Semi- weathered Rock) 24 22 100 35 50 35 Bebedourite / Phoscrete Compact Phosphate (Fresh Rock) 24 24 200 35 100 35 Syenite / Kaolinized Soils 22 22 37 31 35 29 Fenite 17 - 31 25 - - Triaxial CIU SatLithology Weathering Triaxial CIU Nat Typologies and Lithologies Face Angle Berm Width Berm Height Cover 59° 12 m 10 m Titanium 40 - 45° 15 m 10 m Friable Phosphate 30 - 45° 15 m 10 m Semi-Compact Phosphate 55° 15 m 10 m Compact Phosphate 55° 15 m 10 m Fenite 45° 15 m 10 m Syenite 35° 15 m 10 m Carbonatite 35° 15 m 10 m

Report Date: February 20, 2024 31406539.009-001-TRS-Rev0 Effective Date: December 31, 2023 Complexo Mineração de Tapira 13-4 Table 13.3: Recommended Design Parameters for Tapira Final Pit 13.2.2 Hydrogeological Hydrological and Hydrogeological drilling, sampling, and characterizations are described in Section 7.3 of this TRS. The groundwater flow pattern within the complex is generally to the south toward the outlet of the Córrego da Mata Basin. Flow inversions sometimes occur in the northern portion (with natural flow in the Northeast direction toward the BR-01 tailings dam) and in the north sector of the pit where the natural flow towards the Córrego da Mata is reversed in the direction of the Córrego Paiolzinho due to the mining operations. In the region of Front 2/Bigorna, the current water level is between 1,220 and 1,130 meters influenced by the mining operations and pumping of wells. In the northeast region of the pit (Fronts 4, 5, and 6) the water level is predominantly between 1,280 and 1,310 meters influenced by the lowering of water level from the mining advance (without pumping). In the region of the dams, the underground water level and consequently its flow is influenced by the formation of lakes along drainage channels. Around the BL-01 dam the water level is between 1,280 and 1,160 meters where the underground flow is northwest towards the Retiro Stream. The groundwater flow in the region around the BR-01 tailings dam converges into the lake. The mine’s dewatering system consists of 11 deep tubular wells, with water levels monitored daily. Additionally, there are 27 spillways with flow rate monitoring, 10 of which lie within the Alkaline Complex. Historical flow information used in the model development and calibration indicates that the volumes pumped by the wells are predominantly located in a range of orders of magnitude from 20 to 150 m³ by month throughout the monitoring period from May 2010 to July 2022. Future mining plans will require an increase in the dewatering rates. Monthly dewatering flows in the simulated future mining plans were around 500 m3/hr for the dry months and over 1,000 m3/hr for the rainy months. The projected dewatering flow rates must be produced by dewatering wells, sump pumping, and surface drainage. For a large portion of the mining area, dewatering should occur predominantly by gravity. Water above elevation 1,220 is drained by gravity while below this level, the water drains to a sump and requires pumping for removal. Surface water runoff from the yards and service locations is collected by open-air drainage systems (channels). Mining Area Sector Weathering Lithology Bench Height (m) Face Angle (α) Berm (m) Slope Angle (b) Model Field>>> gt_sector id_intem id_lito gt_face gt_berm gt_slope ZONE I 100 Aloterite 10 59 12 29 0 1200 Top Isalterite - General 3 1200 Top Isalterite - Green Sector 4 1200 Top Isalterite - Red Sector 0 2200 Base Isalterite - General 1 2200 Base Isalterite - Blue Sector 0 Host Rock and Fenite 1 1200 Top Isalterite - Blue Sector 2 1200 Top Isalterite - Orange Sector 2 2200 Base Isalterite - Orange Sector 3 2200 Base Isalterite - Green Sector 4 2200 Base Isalterite - Red Sector 6 Sienite Lithology 5 Carbonitite 300 Semi-Weathered Rock (RSI) 400 Fresh Rock (RSA) ZONE VII 41 Dumps 10 27 15 16 22 ZONE III 10 40 15 20 17 ZONE V 10 35 15 19 Description ZONE IV 10 30 15 ZONE II 10 45 15 ZONE VI 10 55 15 24

Report Date: February 20, 2024 31406539.009-001-TRS-Rev0 Effective Date: December 31, 2023 Complexo Mineração de Tapira 13-5 Storm contact water collected from the overburden storage facility collector channels as well as other mine contact water is drained to the BL1 impoundment. Water discharges from the BL1 impoundment to the BA3 impoundment for water solids settlement and clarification and then discharged to the BRI impoundment. The BR impoundment receives the beneficiation plant fines tailings and provides make-up water back to the beneficiation plant while collecting and storing the fines. Overflow water discharges to the BD5 impoundment for solids settling and water clarification. Mine dewatering and mine sediment collection pond water is discharged to the BD2 collector impoundment and then also discharged to BD5 for clarification. Clarified water is discharged to the BRI impoundment. All water discharged off the property is through the BRI overflow into the nearby river. 13.3 Mine Design Factors This sub-section contains forward-looking information related to mine design and production plans for the Mine. The material factors that could cause actual results to differ materially from the conclusions, estimates, designs, forecasts or projections in the forward-looking information include any significant differences from one or more of the material factors or assumptions that were set forth in this sub-section including mining strategy and production rates, expected mine life and mining unit dimensions. Mine planning at CMT follows the typical standards for open-pit mining. The processes involved include: 1. Application of dilution and recovery factors 2. Development of a value for each of the blocks in the model 3. Estimation of COG 4. Perform pit optimization and select optimal pit shell to be used for the basis of the ultimate pit design 5. Run NPV scheduler to provide guidance on phase designs and mine development 6. Ultimate pit design 7. Development of phase designs 8. Development of mine planning targets and constraints, and 9. Preparing Deswik based LOM plan The unconstrained theoretical ultimate pit shell derived from the pit optimization process was modified to incorporate more detailed design specifications to transform the pit shell into a functional open-pit mine. The resulting pit design was referred to as the Operational Pit. The operational pit was also limited by the following constraints: 1. Mining restrictions, including legal and environmental impacts 2. Overall slope angle, and 3. Operational design characteristics, including ramp locations and grades, OSF locations, mining width and height, and other practical mining considerations, given pit geometry.

Report Date: February 20, 2024 31406539.009-001-TRS-Rev0 Effective Date: December 31, 2023 Complexo Mineração de Tapira 13-6 The design road width of 15 m is approximately 2.5 times the width of the largest truck, the CAT 777. This allows for two-way traffic with an adequate separation distance along main haulage routes. Access ramps are designed with a maximum slope of 8%. Benches are designed to have a 12 m to 15 m width and a 10-m height, with varying face angles depending upon the mine area, the lithology, and weathering as noted in Table 13.3. Given the ultimate pit limits, annual waste and ore tonnages were generated for the CMT mine plan periods with corresponding mining production sequences. The mine design was split into 28 phases. Figure 13.2 shows where the phases are located within the ultimate pit boundaries and Table 13.4 shows the corresponding tonnages produced by each phase over the LOM. Table 13.4: Mining Quantities by Phase through 2057 Ore Titanium Waste MTonnes - Wet MTonnes - Wet MTonnes - Wet Phase 01 4.58 0.00 2.45 Phase 02 0.33 1.49 8.14 Phase 03 3.89 1.76 7.99 Phase 04 4.19 2.58 12.95 Phase 05 2.67 0.44 1.27 Phase 06 5.34 0.60 12.46 Phase 07 3.01 0.00 0.30 Phase 08 0.00 0.20 1.03 Phase 09 1.62 2.32 12.03 Phase 10 1.06 0.01 0.10 Phase 11 0.19 0.00 0.20 Phase 12 4.87 5.30 3.09 Phase 14 8.58 1.55 21.87 Phase 14-1 5.39 0.51 6.01 Phase 14-2 9.47 0.41 38.83 Phase 15 25.22 14.96 48.13 Phase 16 23.08 3.53 16.35 Phase 17 31.40 5.52 42.14 Phase 18 6.09 4.22 7.46 Phase 19 15.03 15.36 6.95 Phase 21 21.41 10.43 13.17 Phase 22 8.08 0.00 7.83 Phase 23 24.07 1.22 23.53 Phase 24 60.39 1.44 51.66 Phase 25 47.33 22.78 42.71 Phase 26 44.99 23.15 26.45 Phase 27 28.46 8.32 10.68 Phase 28 114.30 8.01 94.77 505.04 136.11 520.55 Phase Name Total

Report Date: February 20, 2024 31406539.009-001-TRS-Rev0 Effective Date: December 31, 2023 Complexo Mineração de Tapira 13-7 Figure 13.2: Mining Phases 13.3.1 Mining Strategy and Production Rate Annual concentrate production at Tapira is scheduled to be approximately 2.0 Mtpy with a corresponding ore production of approximately 13.5 Mtpy (dry basis). The annual waste tonnage generally decreases over the mine life with about 37 Mt of waste in 2024-2029 down to around 23 Mt of waste from 2030-2044. Annual waste tonnages decrease further to less than 6 Mt in 2050-2054. The annual LOM plan production summary statistics are shown on Table 13.5: Tapira LOM Plan Production Statistics . Annual plant feed, mass recovery, and plant feed grade are shown in Figure 13.3, annual concentrate production is shown in Figure 13.4, and annual waste and ore quantities are shown in Figure 13.5.

Report Date: February 20, 2024 31406539.009-001-TRS-Rev0 Effective Date: December 31, 2023 Complexo Mineração de Tapira 13-8 Table 13.5: Tapira LOM Plan Production Statistics Notes: Values for 2030-2054 were provided in 5-year increments. The mass totals in this figure distribute the 5-year totals evenly over each year. The average qualities and mass recovery for the 5-year increment were applied over each year of the 5-year period. Values for 2055- 2057 were provided as a 3-year increment. The mass totals in this figure distribute the 3-year totals evenly over each year. The average qualities and mass recovery for the 3-year increment were applied over each year of the 3-year period. Description Unit Total 2024 2025 2026 2027 2028 2029 2030 2031 2032 2033 2034 2035 Plant Feed Total Mt (wet) 794.07 15.61 16.00 15.91 15.80 16.14 15.42 16.10 16.10 16.10 16.10 16.10 15.68 Plant Feed Total Mt (dry) 444.32 12.94 13.26 13.19 13.10 13.38 12.79 13.35 13.35 13.35 13.35 13.35 13.00 Concentrate Mt (dry) 69.45 1.93 1.98 2.06 2.12 2.16 2.16 1.90 1.90 1.90 1.90 1.90 2.07 Mass Recovery % 15.63 14.93 14.91 15.60 16.21 16.11 16.91 14.20 14.20 14.20 14.20 14.20 15.89 CaO % 15.19 16.93 14.18 11.07 12.42 13.92 12.62 13.74 13.74 13.74 13.74 13.74 15.13 Fe2O3 % 25.44 26.64 27.66 29.00 30.96 27.78 30.65 27.26 27.26 27.26 27.26 27.26 26.05 MgO % 5.48 5.83 5.04 3.62 2.78 3.82 2.93 4.17 4.17 4.17 4.17 4.17 4.17 P2O5ap % 8.97 9.30 8.94 8.78 8.72 8.82 9.03 8.62 8.62 8.62 8.62 8.62 9.65 RCP % 1.69 1.82 1.59 1.26 1.42 1.58 1.40 1.59 1.59 1.59 1.59 1.59 1.57 Waste Mined Mt (wet) 666.17 39.17 36.64 39.00 37.00 38.30 37.00 22.00 22.00 22.00 22.00 22.00 21.88 Titanium Mt (wet) 137.81 2.92 6.95 7.88 16.20 11.23 15.06 9.47 9.47 9.47 9.47 9.47 1.68 Waste Mt (wet) 677.91 36.24 29.69 31.12 20.80 27.07 21.94 12.53 12.53 12.53 12.53 12.53 20.20 Stripping Ratio t/t 1.25 2.34 2.19 2.37 2.21 2.41 2.33 2.33 2.33 2.33 2.33 2.33 1.31 Total Movement Mt (wet) 1,201.14 55.93 53.40 55.76 53.76 54.26 52.86 39.49 39.49 39.49 39.49 39.49 38.64 Description Unit Total 2036 2037 2038 2039 2040 2041 2042 2043 2044 2045 2046 Plant Feed Total Mt (wet) 794.07 15.68 15.68 15.68 15.68 15.52 15.52 15.52 15.52 15.52 16.05 16.05 Plant Feed Total Mt (dry) 444.32 13.00 13.00 13.00 13.00 12.87 12.87 12.87 12.87 12.87 13.31 13.31 Concentrate Mt (dry) 69.45 2.07 2.07 2.07 2.07 2.16 2.16 2.16 2.16 2.16 1.92 1.92 Mass Recovery % 15.63 15.89 15.89 15.89 15.89 16.80 16.80 16.80 16.80 16.80 14.50 14.50 CaO % 15.19 15.13 15.13 15.13 15.13 13.65 13.65 13.65 13.65 13.65 17.15 17.15 Fe2O3 % 25.44 26.05 26.05 26.05 26.05 25.40 25.40 25.40 25.40 25.40 23.71 23.71 MgO % 5.48 4.17 4.17 4.17 4.17 5.17 5.17 5.17 5.17 5.17 7.62 7.62 P2O5ap % 8.97 9.65 9.65 9.65 9.65 8.37 8.37 8.37 8.37 8.37 9.12 9.12 RCP % 1.69 1.57 1.57 1.57 1.63 1.69 1.63 1.63 1.63 1.63 1.88 1.88 Waste Mined Mt (wet) 666.17 21.88 21.88 21.88 21.88 22.63 22.63 22.63 22.63 22.63 14.78 14.78 Titanium Mt (wet) 137.81 1.68 1.68 1.68 1.68 2.69 2.69 2.69 2.69 2.69 1.48 1.48 Waste Mt (wet) 677.91 20.20 20.20 20.20 20.20 49.85 49.85 49.85 49.85 49.85 13.30 13.30 Stripping Ratio t/t 1.25 1.31 1.31 1.31 1.31 1.00 1.00 1.00 1.00 1.00 0.48 0.48 Total Movement Mt (wet) 1,201.14 38.64 38.64 38.64 38.64 37.44 37.44 37.44 37.44 37.44 30.83 30.83 Description Unit Total 2047 2048 2049 2050 2051 2052 2053 2054 2055 2056 2057 Plant Feed Total Mt (wet) 794.07 16.05 16.05 16.05 15.64 15.64 15.64 15.64 15.64 15.36 15.36 15.36 Plant Feed Total Mt (dry) 444.32 13.31 13.31 13.31 12.97 12.97 12.97 12.97 12.97 12.73 12.73 12.73 Concentrate Mt (dry) 69.45 1.92 1.92 1.92 2.15 2.15 2.15 2.15 2.15 2.01 2.01 2.01 Mass Recovery % 15.63 14.50 14.50 14.50 16.60 16.60 16.60 16.60 16.60 15.80 15.80 15.80 CaO % 15.19 17.15 17.15 17.15 17.24 17.24 17.24 17.24 17.24 17.93 17.93 17.93 Fe2O3 % 25.44 23.71 23.71 23.71 22.89 22.89 22.89 22.89 22.89 19.73 19.73 19.73 MgO % 5.48 7.62 7.62 7.62 7.52 7.52 7.52 7.52 7.52 7.39 7.39 7.39 P2O5ap % 8.97 9.12 9.12 9.12 9.23 9.23 9.23 9.23 9.23 8.77 8.77 8.77 RCP % 1.69 1.88 1.88 1.88 1.87 1.87 1.87 1.87 1.87 2.04 2.04 2.04 Waste Mined Mt (wet) 666.17 14.78 14.78 14.78 6.22 6.22 6.22 6.22 6.22 0.50 0.50 0.50 Titanium Mt (wet) 137.81 1.48 1.48 1.48 0.19 0.19 0.19 0.19 0.19 0.00 0.00 0.00 Waste Mt (wet) 677.91 13.30 13.30 13.30 6.03 6.03 6.03 6.03 6.03 0.50 0.50 0.50 Stripping Ratio t/t 1.25 0.48 0.48 0.48 0.26 0.26 0.26 0.26 0.26 0.04 0.04 0.04 Total Movement Mt (wet) 1,201.14 30.83 30.83 30.83 21.03 21.03 21.03 21.03 21.03 12.67 12.67 12.67

Report Date: February 20, 2024 31406539.009-001-TRS-Rev0 Effective Date: December 31, 2023 Complexo Mineração de Tapira 13-9 Notes: Values for 2030-2054 were provided in 5-year increments. The plant feed totals in this figure distribute the 5-year totals evenly over each year. The average mass recovery for the 5-year increment was applied over each year of the 5-year period. Values for 2055-2057 were provided as a 3-year increment. The plant feed totals in this figure distribute the 3-year totals evenly over each year. The average mass recovery for the 3-year increment was applied over each year of the 3-year period. Figure 13.3: Annual Ore Plant Feed and Grade with Mass Recovery 15 .6 16 .0 15 .9 15 .8 16 .1 15 .4 16 .1 16 .1 16 .1 16 .1 16 .1 15 .7 15 .7 15 .7 15 .7 15 .7 15 .5 14.9 14.9 15.6 16.2 16.1 16.9 14.2 14.2 14.2 14.2 14.2 15.9 15.9 15.9 15.9 15.9 16.8 0 2 4 6 8 10 12 14 16 18 0 2 4 6 8 10 12 14 16 18 20 24 20 25 20 26 20 27 20 28 20 29 20 30 20 31 20 32 20 33 20 34 20 35 20 36 20 37 20 38 20 39 20 40 G ra de /R ec ov er y (% ) Pl an t F ee d (M t), w et b as is Plant Feed Total (tonne, wet basis) Mass Recovery (%) 15 .5 15 .5 15 .5 15 .5 16 .0 16 .0 16 .0 16 .0 16 .0 15 .6 15 .6 15 .6 15 .6 15 .6 15 .4 15 .4 15 .4 16.8 16.8 16.8 16.8 14.5 14.5 14.5 14.5 14.5 16.6 16.6 16.6 16.6 16.6 15.8 15.8 15.8 0 2 4 6 8 10 12 14 16 18 0 2 4 6 8 10 12 14 16 18 20 41 20 42 20 43 20 44 20 45 20 46 20 47 20 48 20 49 20 50 20 51 20 52 20 53 20 54 20 55 20 56 20 57 G ra de /R ec ov er y (% ) Pl an t F ee d (M t), w et b as is Plant Feed Total (tonne, wet basis) Mass Recovery (%)

Report Date: February 20, 2024 31406539.009-001-TRS-Rev0 Effective Date: December 31, 2023 Complexo Mineração de Tapira 13-10 Figure 13.4: Annual Concentrate Production 1. 79 1. 83 1. 90 1. 96 1. 99 2. 00 1. 75 1. 75 1. 75 1. 75 1. 75 1. 91 1. 91 1. 91 1. 91 1. 91 2. 00 0. 14 0. 15 0. 15 0. 16 0. 16 0. 16 0. 14 0. 14 0. 14 0. 14 0. 14 0. 15 0. 15 0. 15 0. 15 0. 15 0. 16 0.0 0.5 1.0 1.5 2.0 2.5 20 24 20 25 20 26 20 27 20 28 20 29 20 30 20 31 20 32 20 33 20 34 20 35 20 36 20 37 20 38 20 39 20 40 C on ce nt ra te P ro du ct io n (M t, dr y ba si s) Conventional Concentrate Ultrafine Concentrate 2. 00 2. 00 2. 00 2. 00 1. 78 1. 78 1. 78 1. 78 1. 78 1. 99 1. 99 1. 99 1. 99 1. 99 1. 86 1. 86 1. 86 0. 16 0. 16 0. 16 0. 16 0. 14 0. 14 0. 14 0. 14 0. 14 0. 16 0. 16 0. 16 0. 16 0. 16 0. 15 0. 15 0. 15 0.0 0.5 1.0 1.5 2.0 2.5 20 41 20 42 20 43 20 44 20 45 20 46 20 47 20 48 20 49 20 50 20 51 20 52 20 53 20 54 20 55 20 56 20 57 C on ce nt ra te P ro du ct io n (M t, dr y ba si s) Conventional Concentrate Ultrafine Concentrate

Report Date: February 20, 2024 31406539.009-001-TRS-Rev0 Effective Date: December 31, 2023 Complexo Mineração de Tapira 13-11 Figure 13.5: LOM Plan Annual Production (ROM) 15 .6 16 .0 15 .9 15 .8 16 .1 15 .4 16 .1 16 .1 16 .1 16 .1 16 .1 15 .7 15 .7 15 .7 15 .7 15 .7 15 .5 39 .2 36 .6 39 .0 37 .0 38 .3 37 .0 22 .0 22 .0 22 .0 22 .0 22 .0 21 .9 21 .9 21 .9 21 .9 21 .9 22 .6 0.00 5.00 10.00 15.00 20.00 25.00 30.00 35.00 40.00 45.00 20 24 20 25 20 26 20 27 20 28 20 29 20 30 20 31 20 32 20 33 20 34 20 35 20 36 20 37 20 38 20 39 20 40 Q ua nt ity M in ed (M to nn es - w et ) Plant Feed Total Waste Mined 15 .5 15 .5 15 .5 15 .5 16 .0 16 .0 16 .0 16 .0 16 .0 15 .6 15 .6 15 .6 15 .6 15 .6 15 .4 15 .4 15 .4 22 .6 22 .6 22 .6 22 .6 14 .8 14 .8 14 .8 14 .8 14 .8 6. 2 6. 2 6. 2 6. 2 6. 2 0. 5 0. 5 0. 5 0.00 5.00 10.00 15.00 20.00 25.00 30.00 35.00 40.00 45.00 20 41 20 42 20 43 20 44 20 45 20 46 20 47 20 48 20 49 20 50 20 51 20 52 20 53 20 54 20 55 20 56 20 57 Q ua nt ity M in ed (M to nn es - w et ) Plant Feed Total Waste Mined

Report Date: February 20, 2024 31406539.009-001-TRS-Rev0 Effective Date: December 31, 2023 Complexo Mineração de Tapira 13-12 13.3.2 Expected Mine Life Current Tapira Mine life is approximately 34 years, ending in 2057, with an average ROM ore production rate of 13.1 Mtpy (dry) resulting in annual concentrate production of about 2.0 Mtpy. 13.3.3 Mining Unit Dimensions The operational pit will have benches that are 12-15 m wide by 10 m high to match the digging profiles of the selected excavators. Split benches are also incorporated into the mine design at a height of 5 m, and decoupling berms are incorporated into the mine design for geotechnical stability, as needed. The face angles and overall slope angles vary by geotechnical sector and are laid out in Table 13.3. Haul roads will have a minimum width of 15 m and a maximum ramp grade of 8%. 13.4 Stripping and Backfilling Requirements Phosphate ore at the Tapira Mine is hauled to the primary crusher while titanium ore is hauled to a stockpile for storage and possible future beneficiation. Waste is hauled to one of six ex-pit OSFs. As the mine progresses, the main haul roads are planned to be moved over time to stay near the edge of the ultimate pit. The design specifications of each OSF are listed in Table 13.6Table 13.6: OSF Design Specifications . Table 13.6: OSF Design Specifications Capacity Bench Height Berm Width Mm³ m m E04 1 9.08 10 10 1V : 2H 1 30.18 10 10 1V : 2H 2 58.11 10 10 1V : 2H 1 4.85 10 10 1V : 2H 2 11.55 10 10 1V : 2H 1 3.14 10 10 1V : 2H 2 11.95 10 10 1V : 2H 3 37.04 10 10 1V : 2H 4 67.90 10 10 1V : 2H 5 59.26 10 10 1V : 2H 1 11.72 10 10 1V : 2H 2 15.90 10 10 1V : 2H 3 28.48 10 10 1V : 2H 1 7.93 10 10 1V : 2H 2 44.65 10 10 1V : 2H 1 9.83 10 10 1V : 2H 2 20.46 10 10 1V : 2H T06 1 89.93 10 10 1V : 2H PXT 1 1.02 10 10 1V : 2H Phase Slope Face Angle E06 E07 E08 E09 T04 T05 Waste Dump

Report Date: February 20, 2024 31406539.009-001-TRS-Rev0 Effective Date: December 31, 2023 Complexo Mineração de Tapira 13-13 Average annual one-way haulage distances for the LOM Plan are estimated in Deswik using the Landfill and Haulage Simulator (LHS) module for the defined waste and ore haulage routes and considering the operations schedules of the OSFs. A summary of average one-way haulage distances for the waste and titanium for the LOM Plan is provided in Table 13.7. Table 13.7: LOM Plan Average Waste Haul Distances (km) 13.5 Mining Fleet, Machinery, and Personnel Requirements This sub-section contains forward-looking information related to equipment selection for the Mine. The material factors that could cause actual results to differ materially from the conclusions, estimates, designs, forecasts, or projections in the forward-looking information include any significant differences from one or more of the material factors or assumptions that were set forth in this sub-section including labor and equipment availability and productivity. The mine uses a combination of equipment for material extraction and transportation. The production equipment is leased. Currently, the largest haul truck on site has a capacity of approximately 196 tonnes and is used for waste haulage. Fleet sizing is estimated based on historical performance. Historical loading times and delays by equipment fleets are tracked and used to estimate loading productivity. The maximum hourly truck productivity is calculated by dividing the truck capacity by the cycle time. The capacity is then multiplied by the utilization factor and the availability factor and is then derated by a factor of 5% to 10% to account for non-productive engine hours Deposit 2024 2025 2026 2027 2028 2029 2030-2034 PDE E06 2.0 2.4 2.2 - - - 4.0 PDE E07 2.0 2.3 3.7 - - 4.3 - PDE E08 3.2 2.7 4.6 - 2.1 2.2 6.3 PDE E09 - - 2.7 4.0 3.8 3.8 3.6 Waste Average 2.9 2.5 3.6 4.0 3.8 4.1 5.2 T04 5.3 7.2 5.7 - 5.2 - 8.1 T05 5.2 3.6 4.0 3.0 4.6 4.6 4.5 T06 - - - - - 2.0 3.4 Titanium Average 5.3 4.6 4.6 3.0 4.6 4.0 5.2 Deposit 2035-2039 2040-2044 2045-2049 2050-2054 2055-2057 LOM Avg PDE E06 4.1 7.1 7.9 - - PDE E07 - - - - - PDE E08 4.6 6.1 - 4.1 5.8 PDE E09 6.7 - - - - Waste Average 5.1 6.4 7.9 4.1 5.8 T04 8.9 7.3 6.2 7.3 - T05 4.7 - - - - T06 3.3 3.3 3.3 - - Titanium Average 4.9 7.2 6.0 7.3 - 5.0 4.8

Report Date: February 20, 2024 31406539.009-001-TRS-Rev0 Effective Date: December 31, 2023 Complexo Mineração de Tapira 13-14 to get an effective hourly productivity per unit. The total material movement required is divided by the effective hourly productivity to yield the minimum required fleet size. The availability for the leased mining equipment is required to be at least 85%, and utilization ranges from 56% to 65%. Excavator productivity estimates include dividing the associated truck capacity by the truck loading and maneuvering time and incorporate an over- capacity factor and idle time. The current fleet consists of approximately 49 trucks and will increase to a maximum of 52 in 2029. The fleet size remains around 50 trucks until 2045 when it decreases to 39 trucks and then down to roughly 30 trucks in the latter years of the mine plan. The excavator fleet size is generally between 5 and 12 excavators, with 3-4 excavators assigned to ore and a variable amount of excavators used for mining titanium and waste removal depending on the material movement requirements. Annual fleet sizes for excavators and haul trucks are shown in Figure 13.6 and Figure 13.7, respectively. For the support equipment, the fleet size is maintained throughout the LOM with the support equipment specified below: CAT 416E – Backhoe Loader CAT 420E – Backhoe Loader CAT 140K – Motor Grader CAT 320 - Excavator CAT 950H – Wheel Loader CAT 966H – Wheel Loader CAT D6 – Dozer, and Volvo EC700 – Excavator The operational plan of the Tapira Mine includes the use of 4 teams on 12-hour shifts, operating 24 hours per day, 365 days per year with a staff of approximately 240 hourly employees. To calculate the required personnel, the annual count of loading/transportation equipment is multiplied by the number of teams (4), and the equipment availability, and then increased by 13.3% to account for absenteeism. The annual estimate of the required workforce size is shown in Figure 13.8. The operational management structure includes a General Manager that is over the whole complex and is assisted by the Mine Manager, Plant Manager, Maintenance Manager, ADM Supervisor, TO Leader, Site Secretary, and Performance Analyst. The Mine Manager oversees mining operations including the Production and infrastructure supervisors, mining technicians and engineers, and any interns on site. Production supervisors on each shift are responsible for mining technicians and the Level I, Level II, and Level III equipment operators on each shift. The Beneficiation Plant Manager oversees beneficiation plant production supervisors for each shift, as well as a development/control supervisor and a beneficiation plant mining engineer.

Report Date: February 20, 2024 31406539.009-001-TRS-Rev0 Effective Date: December 31, 2023 Complexo Mineração de Tapira 13-15 Figure 13.6: Annual Excavator Fleet Size 4 4 4 4 4 4 4 4 4 4 4 4 4 4 4 4 3 2 2 1 1 1 1 1 1 4 4 4 3 4 3 2 2 2 2 2 2 2 2 2 2 3 1 2 2 4 3 4 3 3 3 3 3 1 1 1 1 1 1 0 2 4 6 8 10 12 14 2024 2025 2026 2027 2028 2029 2030 2031 2032 2033 2034 2035 2036 2037 2038 2039 2040 Nu m be r o f E xc av at or s Ore - EX 1200 Waste - EX 1200 Waste - EX 2500 Titanium - EX 1200 3 3 3 3 3 3 3 3 3 3 3 3 3 3 2 2 2 1 1 1 1 1 1 1 3 3 3 3 2 2 2 2 2 1 1 1 1 1 1 1 1 1 1 1 1 1 1 1 1 1 1 1 0 1 2 3 4 5 6 7 8 9 2041 2042 2043 2044 2045 2046 2047 2048 2049 2050 2051 2052 2053 2054 2055 2056 2057 Nu m be r o f E xc av at or s Ore - EX 1200 Waste - EX 1200 Waste - EX 2500 Titanium - EX 1200

Report Date: February 20, 2024 31406539.009-001-TRS-Rev0 Effective Date: December 31, 2023 Complexo Mineração de Tapira 13-16 Figure 13.7: Annual Haul Truck Fleet Size 25 25 24 22 19 24 24 24 24 24 24 31 31 31 31 31 27 8 6 6 8 8 8 8 8 7 12 12 12 12 12 12 9 9 9 9 9 9 9 9 9 9 12 4 10 10 14 14 16 13 13 13 13 13 2 2 2 2 2 5 0 10 20 30 40 50 60 2024 2025 2026 2027 2028 2029 2030 2031 2032 2033 2034 2035 2036 2037 2038 2039 2040 N um be r o f T ru ck s Ore - CAT 777 Waste - CAT 777 Waste - KM 730E Titanium - CAT 777 27 27 27 27 24 24 24 24 24 22 22 22 22 22 24 24 24 7 7 7 7 3 3 3 12 12 12 12 12 12 12 12 12 6 6 6 6 6 5 5 5 5 3 3 3 3 3 2 2 2 2 2 0 10 20 30 40 50 60 2041 2042 2043 2044 2045 2046 2047 2048 2049 2050 2051 2052 2053 2054 2055 2056 2057 N um be r o f T ru ck s Ore - CAT 777 Waste - CAT 777 Waste - KM 730E Titanium - CAT 777

Report Date: February 20, 2024 31406539.009-001-TRS-Rev0 Effective Date: December 31, 2023 Complexo Mineração de Tapira 13-17 Figure 13.8: Tapira Workforce Life-of-Mine Plan 45 45 49 45 45 45 37 37 37 37 37 33 33 33 33 33 231 231 231 231 231 231 231 231 231 231 231 231 231 231 231 231 40 40 40 40 40 40 40 40 40 40 40 40 40 40 40 40 192 192 213 196 209 213 188 188 188 188 188 204 204 204 204 209 0 100 200 300 400 500 600 20 24 20 25 20 26 20 27 20 28 20 29 20 30 20 31 20 32 20 33 20 34 20 35 20 36 20 37 20 38 20 40 Loading Support Administrative Haulage 33 33 33 33 25 25 25 25 25 21 21 21 21 21 13 13 13 231 231 231 231 231 231 231 231 231 231 231 231 231 231 231 231 231 40 40 40 40 40 40 40 40 40 40 40 40 40 40 40 40 40 209 209 209 209 160 160 160 160 160 123 123 123 123 123 111 111 111 0 100 200 300 400 500 600 20 41 20 42 20 43 20 44 20 45 20 46 20 47 20 48 20 49 20 50 20 51 20 52 20 53 20 54 20 55 20 56 20 57 Loading Support Administrative Haulage

Report Date: February 20, 2024 31406539.009-001-TRS-Rev0 Effective Date: December 31, 2023 Complexo Mineração de Tapira 14-1 14.0 BENEFICIATION AND RECOVERY METHODS 14.1 Beneficiation Plant 14.1.1 Crushing and Blending Coarse crushing reduces the ROM ore to pass 4 inches and places the crushed ore on one of two blending storage piles. Mine haul trucks unload the ROM ore into the primary gyratory crusher. The primary discharge is conveyed to the secondary toothed roll crusher. The secondary discharge is conveyed to a stacker that places the ore on one of two longitudinal blending piles. The piles are nominally 700 m long and 13 m high. Fine crushing reclaims ore from the blending piles and reduces the particle size to granular ore (19/7 mm) and friable ore (<7 mm) by screening and a 3rd and 4th stage of crushing using cone crushers. The granular ore is conveyed to the granular milling and flotation circuit. The friable ore is slurried with water and pumped to the friable ore milling and flotation circuit. A block flow diagram of the fine crushing circuit is presented in Figure 14.1. Figure 14.1: Fine Crushing Circuit Block Flow Diagram 14.1.2 Granular Ore Milling and Flotation This circuit comprises an open circuit rod mill, a closed-circuit ball mill, Low Intensity Magnetic Separation (LIMS), three stages of fines separation, two sets of parallel conditioning tanks, and four stages of flotation using mechanical flotation cells.

Report Date: February 20, 2024 31406539.009-001-TRS-Rev0 Effective Date: December 31, 2023 Complexo Mineração de Tapira 14-2 The rod mill reduces the particle size to about 80% <1200 μm, which is fine enough to liberate phosphate from magnetite (Fe3O4). The LIMS removes magnetite from the rod mill discharge. The LIMS nonmagnetic product is fed to the closed-circuit ball mill and the overflow from the classification cyclone is about 80% passing 270 μm, which is fine enough to liberate the phosphate from the gangue minerals. Before the flotation reagents are added, the ground feed is fines separated, attrition scrubbed, and fines separated again. The fines separation cyclone overflows are classified by smaller diameter cyclones to recover additional flotation feed from the rejected granular fines. The coarser and finer feed fractions are separately conditioned with flotation reagents and then combined for rougher flotation. The rougher tailing is treated by scavenger flotation to recover additional phosphate. The scavenger tailing is rejected, and the scavenger concentrate is recycled to rougher flotation. The rougher concentrate is upgraded by the 1st cleaner flotation cells and the 1st cleaner tailings are recycled to rougher flotation. The 1st cleaner concentrate is upgraded to final granular concentrate by the 2nd cleaner flotation cells. The tailings from the 2nd cleaner flotation are also recycled to rougher flotation. The four stages of flotation produce two final products – scavenger tailings and granular component of conventional concentrate. Figure 14.2 illustrates the granular milling and flotation circuit. Figure 14.2: Granular Ore Milling and Flotation Block Flow Diagram 14.1.3 Friable Ore Milling and Flotation This circuit comprises closed-circuit ball mills, two-stage LIMS, several stages of fines separation, coarse and fine feed conditioning tanks, and four stages of flotation using mechanical flotation cells for coarse feed and a column cell and mechanical cell scavenger for fine feed. The friable ore is pre-classified by a cyclone. The cyclone overflow is fines separated to recover fine phosphate and reject natural fines (<40 μm). The pre-classification cyclone underflow feeds the ball mills, which grind the ore to about 80% passing 470 μm. Magnetite is rejected from the ball mill discharge by a rougher and scavenger

Report Date: February 20, 2024 31406539.009-001-TRS-Rev0 Effective Date: December 31, 2023 Complexo Mineração de Tapira 14-3 stage of LIMS. The magnetic product is rejected, and the nonmagnetic product is pumped to the closed-circuit classification cyclone. The cyclone overflow is about 80% passing 210 μm. The classification cyclone overflow is fines separated, attrition scrubbed, and fines separated again to recover coarse flotation feed. The fines separation cyclone overflows are combined, and fines separated a third time to recover fine phosphate, which is attrition scrubbed and fines separated a fourth time. The overflows from the 3rd and 4th fines separation cyclones are rejected as friable fines. The fine feed is conditioned with flotation reagents and then floated in a column cell. The column cell tailings are refloated (scavenged) in mechanical cells. The scavenger cell tailings are the fine tailing. The concentrates (froth products) from the column cell and scavenger machine are combined and pumped to the coarse feed rougher mechanical flotation cells. The coarse feed is conditioned with flotation reagents and then floated in rougher mechanical flotation cells. The rougher tailings are scavenged in mechanical flotation cells and the scavenger tailings are the coarse circuit tailings. The scavenger concentrate is recycled to rougher flotation. The rougher concentrate is densified by cyclones. The dilute cyclone overflow is treated by cleaner flotation in mechanical cells. The cleaner concentrate is combined with the cyclone underflow and treated by the final cleaner flotation cells. The final cleaner tailings are recycled to the rougher concentrate cyclone and the final cleaner concentrate is the friable circuit concentrate. The coarse and fine flotation circuits (six circuits combined) produce three final products to include fine tailings, coarse tailings, and the friable component of conventional concentrate Friable ore milling and flotation are illustrated in Figure 14.3. Figure 14.3: Friable Ore Milling and Flotation Block Flow Diagram

Report Date: February 20, 2024 31406539.009-001-TRS-Rev0 Effective Date: December 31, 2023 Complexo Mineração de Tapira 14-4 14.1.4 Granular and Friable (Conventional) Concentrate Preparation This circuit removes paramagnetic minerals from the granular and friable flotation concentrates and then grinds the final concentrate to a particles size suitable for slurry pipeline transport to the Uberaba Chemical Complex. The granular and friable concentrates are combined and treated by Wet High Intensity Magnetic Separators (WHIMS) that reject paramagnetic minerals. The nonmagnetic product is ground by two closed-circuit ball mills. The ground slurry (cyclone overflows) is dewatered to about 60% solids by a combination of cyclones and thickeners and pumped into agitated storage tanks. The conventional concentrate preparation circuit is illustrated in Figure 14.4. Figure 14.4: Conventional Concentrate Preparation Circuit 14.1.5 Microfines Separation This circuit recovers ultrafine phosphate from the granular and friable fines. The granular and friable fines are subjected to several stages of fines separation in 2-inch diameter cyclones to recover feed for the ultrafine flotation circuit. This circuit, shown in Figure 14.5, and the subsequent ultrafine flotation circuit allow the metallurgical recovery to be increased by about 5%.

Report Date: February 20, 2024 31406539.009-001-TRS-Rev0 Effective Date: December 31, 2023 Complexo Mineração de Tapira 14-5 Figure 14.5: Microfines Separation Circuit 14.1.6 Ultrafine Flotation This circuit upgrades the ultrafine feed to ultrafine concentrate. The ultrafine feed is conditioned with flotation reagents and then subjected to rougher and cleaner flotation in two column cells. The froth product from the cleaner column cell is the ultrafine concentrate. The cleaner column tailings are recycled to the rougher column cell. The rougher column tailings are scavenged by mechanical flotation cells. The scavenger flotation tailings are the ultrafine tailings, and the scavenger cell concentrate is recycled to the rougher column cell. The three stages of flotation yield two final products to include ultrafine tailings and ultrafine concentrate. The ultrafine concentrate is dewatered by a belt filter and placed on a storage pile. 14.1.7 Product Storage and Transportation The nonmagnetic product from the WHIMS is reground by two parallel ball mills operating in closed circuit with 15- inch diameter cyclones to produce material suitable for transport by a slurry pipeline (about 94% passing 150 μm). The ground coarse concentrate is dewatered to about 60% solids by cyclones and a thickener. The solids in the cyclone overflow are recovered by the thickener and combined with the cyclone underflow and are placed into one of four agitated storage tanks. The concentrate slurry is withdrawn from the agitated storage tanks by centrifugal pumps that can recirculate the slurry or feed the pumping station. The pumping station has parallel piston pumps that develop sufficient pressure to force the slurry through a 124-km pipeline to the Uberaba Chemical Complex. The fine concentrate filter cake is reclaimed from storage piles by a frontend loader and placed in highway haul trucks that transport the fine concentrate to Mosaic’s Uberaba Chemical Complex.

Report Date: February 20, 2024 31406539.009-001-TRS-Rev0 Effective Date: December 31, 2023 Complexo Mineração de Tapira 14-6 14.2 Beneficiation Plant Throughput and Design, Equipment Characteristics, and Specifications This sub-section contains forward-looking information related to the beneficiation plant throughput and design, equipment characteristics, and specifications for the Mine. The material factors that could cause actual results to differ materially from the conclusions, estimates, designs, forecasts or projections in the forward-looking information include any significant differences from one or more of the material factors or assumptions that were set forth in this sub-section including actual plant feed characteristics that are different from the historical operations or from samples tested to date, equipment and operational performance that yield different results from the historical operations, historical and current test work results, and beneficiation recovery factors. The major process equipment and some material handling equipment are described in the following ten equipment lists. Coarse crushing: Plate feeders – 2 Vibrating grizzly screens – 2 Primary crusher – 1 Secondary Crusher – 2 Stacker – 1 Ore receiving silos – 6 Belt conveyors – 10 Fine crushing: Bucket wheel reclaimer – 2 Belt conveyors – 13 Single deck vibrating screen -2 Double deck vibrating screen – 7 Tertiary cone crusher – 1 Quaternary cone crusher – 1 Quaternary impact crusher – 1 Milling and Magnetic Separation: Belt conveyors – 5 Rod mills – 2 Ball Mills – 5 Friable pre-classification feed pumps - 4 Friable pre-classification distributors – 4 Friable pre-classification cyclones – 32 (4 x 8) Friable classification feed pumps – 4 Friable classification distributors – 4 Friable classification cyclones – 20 (4 x 5) Friable 2 pre-classification feed pumps - 4 Friable 2 pre-classification distributors – 4 Friable 2 pre-classification cyclones – 20 (4 x 5) Granular classification feed pump – 1

Report Date: February 20, 2024 31406539.009-001-TRS-Rev0 Effective Date: December 31, 2023 Complexo Mineração de Tapira 14-7 Granular classification cyclones – 5 Granular rougher LIMS - 4 Friable rougher LIMS – 12 Friable cleaner LIMS – 4 Fines separation, Attrition, and Conditioning: 1st Friable fines separation feed pump – 2 1st Friable fines separation feed distributor – 2 1st Friable fines separation cyclones – 12 (2 x 6) 2nd Friable fines separation feed pump – 2 2nd Friable fines separation feed distributor – 4 2nd Friable fines separation cyclones – 24 (4 x 6) 3rd Friable fines separation feed pump – 2 3rd Friable fines separation feed distributor – 2 3rd Friable fines separation cyclones – 8 (2 x 4) 4th Friable fines separation feed pump – 2 4th Friable fines separation feed distributor – 6 4th Friable fines separation cyclones – 72 (6 x 12) 6th Friable fines separation feed pump – 1 6th Friable fines separation feed distributor – 4 6th Friable fines separation cyclones – 48 (4 x 12) 1st Granular fines separation feed pump – 1 1st Granular fines separation feed distributor – 1 1st Granular fines separation cyclones – 5 (1 x 5) 2nd Granular fines separation feed pump – 1 2nd Granular fines separation feed distributor – 1 2nd Granular fines separation cyclones – 9 (1 x 9) 3rd Friable fines separation feed pump – 1 3rd Friable fines separation feed distributor – 1 3rd Friable fines separation cyclones – 2 (1 x 2) 3rd Friable standby fines separation feed pump – 1 3rd Friable standby fines separation feed distributor – 1 3rd Friable standby fines separation cyclones – 6 (1 x 6) Friable attrition cells – 12 (4 x 3) Granular attrition cells – 4 (2 x 2) Friable attrition cells - 4 Granular fine feed conditioners - 2 Granular coarse feed conditioners - 2 Friable fine feed conditioners - 2 Friable coarse feed conditioners – 3 Flotation: Friable coarse feed 4-way rotary distributors – 2 Friable coarse rougher flotation cells - 32 (4 x 8) Friable coarse scavenger flotation cells - 32 (4 x 8) Friable coarse cleaner flotation cells - 15 (3 x 5) Friable coarse recleaner flotation cells - 12 (3 x 4)

Report Date: February 20, 2024 31406539.009-001-TRS-Rev0 Effective Date: December 31, 2023 Complexo Mineração de Tapira 14-8 Friable fine rougher column cells – 2 Friable fine scavenger flotation cells – 8 (1 x 8) Granular coarse rougher flotation cells - 8 (1 x 8) Granular coarse scavenger flotation cells - 16 (2 x 8) Granular coarse cleaner flotation cells - 4 (1 x 4) Granular coarse recleaner flotation cells - 3 (1 x 3) Granular fine rougher column cell – 1 Friable coarse rougher 26-inch cyclones Ultrafine Circuit: Trash screen – 1 1st stage cyclones – 896 2nd stage cyclones – 336 3rd stage cyclones – 112 Ultrafine feed conditioning tanks – 2 Ultrafine rougher flotation column – 1 Ultrafine cleaner flotation column – 1 Ultrafine scavenger flotation cells – 4 Ultrafine concentrate thickener – 1 Ultrafine drum filter – 1 Belt conveyors – 3 Reagents: Starch dosing feeders – 3 Starch dilution tanks – 2 Starch causticizing tanks – 2 Ultrafine soap holding tanks - 4 Ultrafine saponification tanks – 4 Ultrafine starch dilution tank – 1 Ultrafine starch causticizing tank – 1 Ultrafine starch holding tank – 1 Caustic soda dilution tank – 2 Synthetic collector preparation tank – 1 Starch pneumatic feeders – 4 Vegetable oil collector storage tank – 2 Hidrocol storage tank – 1 Caustic soda storage tanks – 2 Synthetic collector storage tanks – 2 WHIMS: Wet high intensity magnetic separators – 6 Regrinding: Conventional concentrate regrind ball mills – 2 Classification cyclones – 4 Concentrate Thickening: Conventional concentrate thickener – 2

Report Date: February 20, 2024 31406539.009-001-TRS-Rev0 Effective Date: December 31, 2023 Complexo Mineração de Tapira 14-9 Concentrate dewatering cyclones – 4 Concentrate storage tanks – 4 Concentrate piston pumps – 4 Minimum, average, and maximum annual data for 2017 through 2022 are presented in Table 14.1. Table 14.1: Plant Availability and Throughput The six-year averages in the above table are pulled down by the below par performance during 2019. The five- year averages indicate annual ROM tonnages of 15.5 Mt (wet) and 12.92 Mt (dry). Similarly, the four-year average for annual operating operation was 8,283 hours. The production plan through 2057 averages 8,262 operating hours annually, which should be possible if there are no marketing constraints or major unexpected operating problems. Similarly, the planned maximum annual ore throughput is 16.1 Mt (wet) and 13.4 Mt (dry), which should be possible also. The forecast mass recoveries range from 14.2% to 16.9% and average 15.7%, which seems optimistic compared to the last six years; however, the average ROM %P2O5 over the next 37 years exceeds the average ROM %P2O5 (8.5%) during the last five years. The variation in ROM %P2O5 explains about 58% of the variation in mass recovery. 14.3 Projected Requirements for Energy, Water, Process Materials, and Personnel This sub-section contains forward-looking information related to the projected requirements for energy, water, process materials and personnel for the Mine. The material factors that could cause actual results to differ materially from the conclusions, estimates, designs, forecasts, or projections in the forward-looking information include any significant differences from one or more of the material factors or assumptions that were set forth in this sub-section including actual plant requirements that yield different results from the historical operations. The consumption of flotation reagents, grinding media, electric power, and water per tonne of concentrate are summarized in Table 14.2. Item Units Minimum Average Maximum ROM, wet basis Mtpy, wet 11.15 14.76 15.7 ROM, dry basis Mtpy, dry 9.16 12.3 13.27 Operating hours/yr. hr/yr 6,111 7,921 8,351 Conventional concentrate Mtpy 1.19 1.64 1.78 Ultrafine concentrate Mtpy 0.11 0.14 0.16 Total concentrate Mtpy 1.3 1.78 1.94

Report Date: February 20, 2024 31406539.009-001-TRS-Rev0 Effective Date: December 31, 2023 Complexo Mineração de Tapira 14-10 Table 14.2: Tapira Consumptive Use 2018 through 2022 Notes: 1. Per tonne of total concentrate 2. Vegetable and synthetic collectors combined 3. Rods and balls 4. Makeup water 14.3.1 Water Water is supplied to the administrative and production sectors of the mine site by the Ribeirão do Inferno and artesian wells, as well as from the taillings dams. The industrial reuse system used to recover water from the dams includes 10 pumps (4 operating and 6 on stand-by) and 36” pipes covering varying distances to the different dam areas. The rated capacity of the pipes is 4,400 m3/hr from the BR1 dam, 10,400 m3/hr from the BL1 dam, and 4,900 m3/hr from the BR dam. The tailings from the Tapira plant are disposed of in the BR dam (coarse tailings) and the BL1 dam (fine talings/sludge). Approximately 10.9 million m3/yr are deposited in the dams and are subjected to natural sedimentation. 14.3.2 Electricity The Tapira Plant is powered by CEMIG and Vale Energia Concessionaires, with a total receipt of 40 MW. Annually, the beneficiation plant uses around 305 GW and the contract between Mosaic and the power suppliers establishes the minimum required off-take along with a 3% charge for line losses. 14.3.3 Reagents Four flotation reagents are used at Tapira: a pH modifier (caustic soda), a depressant (corn starch), and two fatty acid type collectors (vegetable & synthetic). The flotation feed pulps are first conditioned with pH modifier and depressant. Next the flotation feed pulps are conditioned with the collectors. The collectors adsorb on the surfaces of the apatite particles and make the apatite particles hydrophobic. 14.3.3.1 Caustic Soda Caustic soda (NaOH) is received as a 50% strength solution by tanker truck. The 50% solution is pumped into a storage tank and then transferred as needed to use tanks where it is diluted to a 10% solution with water. The 10% solution is used to: Adjust the pH of the flotation feed slurry in the conditioning tanks To causticize the corn starch To saponify the vegetable collector Item Units 1 2018 2019 2020 2021 2022 Collectors 2 kg/t 3.05 3.23 3.21 2.43 2.87 Corn Starch kg/t 2.13 2.57 2.54 2.58 2.06 Caustic Soda kg/t 1.31 1.64 1.67 1.46 1.34 Grinding Media 3 kg/t 1.08 1.04 1.07 1.14 1.21 Diesel Oil L/t 0.17 0.37 0.28 0.48 0.40 Electricity kWh/t 157.49 172.45 156.68 156.60 161.30 Water 4 m3/t 5.76 8.76 6.27 6.72 7.33

Report Date: February 20, 2024 31406539.009-001-TRS-Rev0 Effective Date: December 31, 2023 Complexo Mineração de Tapira 14-11 14.3.3.2 Corn Starch Corn starch is received as a powder by tanker truck and pneumatically transferred into a storage silo. Batches of powder are agitated with water and the 10% solution of caustic soda to obtain a 3% solution of causticized starch. The 3% solution is used to precondition the flotation feed slurry to depress gangue minerals during flotation. 14.3.3.3 Vegetable Collector The fatty (carboxylic) acid is received by tanker truck and pumped into a storage tank. Batches of fatty acid are agitated with water and the 10% solution of caustic soda to prepare a 5% solution of saponified collector. The 5% solution is used to condition the flotation feed slurry and render the surface of the apatite particles hydrophobic. 14.3.3.4 Synthetic Collector The synthetic collector is also received by tanker truck and pumped into a dedicated storage tank. Batches of synthetic collector are agitated with water to prepare a 30% solution. The 30% solution is used to augment the collection of apatite. 14.3.4 Personnel Beneficiation plant operations are overseen by a plant manager, with a Production Officer, Development and Control Supervisor, and Mining Engineer beneath him. Each shift has a production supervisor and Mineral Operators classified as Level 1, Level 2, Level 3 with each shift having 22-23 operators.

Report Date: February 20, 2024 31406539.009-001-TRS-Rev0 Effective Date: December 31, 2023 Complexo Mineração de Tapira 15-1 15.0 INFRASTRUCTURE This section contains forward-looking information related to locations and designs of facilities comprising infrastructure for the Mine. The material factors that could cause actual results to differ materially from the conclusions, estimates, designs, forecasts, or projections in the forward-looking information include any significant differences from one or more of the material factors or assumptions that were set forth in this sub-section including Project development plan and schedule, available routes and facilities sites with the characteristics described, facilities design criteria, access, and approvals timing. The CMT property is located 3 km north of the town of Tapira and approximately 35 km south-southeast of the city of Araxá, in the southeast of Brazil in Minas Gerais State. The town of Tapira can be accessed by road from Belo Horizonte via the BR-262 and MGC-146 state highways travelling west-northwest for over 420 km. Figure 15.1 includes an overview map of the infrastructure at CTV. The CMT property has 5 access points: 1. Main Entrance with 4 gates and 4 turnstiles 2. Temporary Access for the Construction of the BL1 dam 3. Abutment of the BL1 dam 4. Access to the BD5 dam 5. Access to the former coffee plantation/mine area. The first four access points are off the MGC-146 highway from Tapira, while the last access road is primarily used by people from other communities. The tailings from Tapira’s beneficiation plant are disposed of in the BR (coarse tailings) and BL1 (fine tailings/sludge) dams at a rate of approximately 10.9 million m3 per year. Overburden is stored in one of six separate ex-pit overburden storage facilities (OSFs), and the material high in Titanium is placed in one of two titanium storage facilities for possible future beneficiation. There are 14 administrative buildings in the Tapira complex including laboratories, offices, restaurants, and changing rooms. There is one warehouse at Tapira which consists of a shed and a patio for storage. The Tapira Plant has a central maintenance workshop with an area of 6,626 m2 and auxiliary workshops with 428.04 m2 of area. The Tapira beneficiation plant is powered by the CEMIG Concessionaires, with a total receipt of 40 MW. The main substation receives 13.8 kV in 3 oil-type transformers which transfer 13.8 kV to secondary substation. From the secondary substations, power is distributed to the end-use areas at 110 V, 220 V, 380 V, 440 V, or 4,160 V. There is approximately 1 km of distribution line mounted on metallic structures from the concessionaires to the beneficiation plant. There are also overhead lines from the main substation to serve remote areas of the beneficiation plant, such as the primary crusher, mining face, dams, secondary crusher, and pump houses. There are two fuel stations at Tapira, one in the plant area with a capacity of 30 m3 and one in the mine area with a capacity of 270 m3. The 270 m3 fueling station at the Mine has 6 - 15 m3 tanks, 3 – 20 m3 tanks, and 4 – 30 m3 tanks. There is a spilled oil collection system, as well as a water and oil separator box connected to the drainage

Report Date: February 20, 2024 31406539.009-001-TRS-Rev0 Effective Date: December 31, 2023 Complexo Mineração de Tapira 15-2 network. The fuel storage tanks have containment basins/dikes which can contain any leakage or spills resulting from damage to the tanks. There is also infrastructure in place to allow for transfer of material out of the tanks if necessary. Tapira’s water intake comes from the Ribeirão do Inferno and artesian wells, as well as recovered water from the tailings dams. There are 4 artesian wells at the Tapira plant: the Mine well, the well at the Outpatient Facility, the well at the Caixa Central, and the well at the water treatment station. The water collection system consists of a tower located in the center of the BR1 dam. The water exits the tower through a pipe that feeds the system’s pumps. There are currently 4 pumps with a nominal capacity of 1,000 m3/hr, two of which are on stand-by while the other two operate. The catchment is located 8 km from the CMT and pumped to CMT through a 32-inch pipe. In addition to the BR1 collection system, CMT has an industrial water reuse system that has two withdrawals, one at the sludge dam (BL01) and one at the tailings dam (BR). The BL01 collection system consists of 4 pumps with an average flow rate of 2,600 m3/hr and is located 3 km from the plant. From this catchment system, the water is pumped to CMT through 36” pipes. The BR collection system consists of 2 pumps with an average flow rate of 2,450 m3/hr and is located 2 km from the plant. The water from this catchment system is pumped to CMT through 36” pipes. Tapira’s fire protection includes a mobile fire-fighting system, fire extinguishers, signaling boards, and fire hydrants. There are enough fire extinguishers located around the beneficiation plant that are inspected monthly and hydrostatically tested every five years. There is one 80 m3 water reservoir in the mine and a 54 m3 reservoir in the administrative area to be used for firefighting. The hose shelters contain all the equipment in working condition and undergo frequent inspections. The runoff from the surface disturbance is collected by open-pit drainage systems without measurements and/or sampling of runoff. The primary customers of CMT are Mosaic’s Uberaba Chemical Complex, and the Araxá Chemical Plant, with an annual production of approximately 2,000,000 tonnes of material. CMT has a shipping capacity of 6,000 tpd of conventional phosphate concentrate and 1,000 tpd of ultrafine phosphate concentrate. Ultrafine phosphate concentrate is stored in open yards and is manually loaded into trailers and the filling time of each truck is approximately 15 minutes. The CMT beneficiation plant has a total storage capacity of about 47,800 tonnes, which corresponds to 7 days of typical production. There are three explosives magazines on site: One with explosives, one with the accessories (boosters, and fuses), and an emulsion tank. The explosives depots are located on firm, dry, flood-free ground with a clearing of at least 20 m around the buildings and fencing installed to control access. The CMT Processing Plant produces two products that can be shipped to the Uberaba Chemical Complex and Araxá Chemical Plant (primary customers of that): Conventional Concentrate and Ultrafine Concentrate. Before being shipped, the conventional concentrate is stored in 4 pulp tanks or in a pond and this total storage capacity for conventional concentrate is 46,000 tonnes and 10,000 tonnes for ultra-fine concentrate. The pipeline where the conventional concentrate is pumped to the Uberaba unit is 123 km long with 9.625-inch pipes. The pumping system consists of 4 positive displacement pumps, each capable of pumping 125 m³/h. Of the 4 pumps available, 2 are used for pumping the pulp and the other 2 remain on stand-by. The pulp that is dispatched is prepared in the 4 concentrate tanks, which are adapted to the specifications of the product that is dispatched in batches of ore.

Report Date: February 20, 2024 31406539.009-001-TRS-Rev0 Effective Date: December 31, 2023 Complexo Mineração de Tapira 15-3 The daily dispatch capacity for conventional concentrate is 6,000 t/day, so if all the storage capacity is used (46,000t), the time needed to consume this stock will be approximately 8 days. The ultra-fine concentrate is shipped to the Uberaba and Araxá units by road. An average process time of 1 day is considered for shipping this concentrate, both to Araxá (which is 45 km away from CMT) and to Uberaba (which is 170 km away from CMT). This estimate considers an average speed of 80 km/h for the trucks. The daily shipping capacity for ultra-fine concentrate is 1,000 t/day, so if all the storage capacity is used (10,000 t), the time needed to consume this stock will be approximately 10 days. There is no receipt of raw material at the Tapira Mineral Complex.

A [ Tapira BL-1 BD-2 BL-3 BA-3 BD-5 BR Beneficiation Plant 303,000 303,000 306,000 306,000 309,000 309,000 7, 79 7, 00 0 7, 79 7, 00 0 7, 80 0, 00 0 7, 80 0, 00 0 7, 80 3, 00 0 7, 80 3, 00 0 7, 80 6, 00 0 7, 80 6, 00 0 1 in 0 IF T H IS M E A S U R E M E N T D O E S N O T M AT C H W H AT IS S H O W N , T H E S H E E T H A S B E E N M O D IF IE D F R O M : A N S I A CLIENT THE MOSAIC COMPANY PROJECT MOSAIC 2023 SK1300 REPORTING TITLE INFRASTRUCTURE MAP 31406539.009 - - 2024-01-04 JD JD TK - CONSULTANT PROJECT NO. CONTROL REV. YYYY-MM-DD DESIGNED PREPARED REVIEWED APPROVED REFERENCE(S) 1. WGS 1984 UTM ZONE 23S 0 1,000 2,000 3,000 Meters 12.7 FIGURE LEGEND Tapira Phosphate Property Ultimate Pit Contours (20 m) Settlement Boundary Ultimate Pit Mining Concession Mining Requirement Search Permit Tailings Dam Quartzite Ring Highway MG-146 River/Stream [ [ [ [ [ [ [ [ [ Min as Ge ra is Go iás C a ta l ã o Araxá Catalão Ibiá Patrocínio Perdizes Sacramento Uberaba Uberlândia Tapira Map Area Substation Main Gate Beneficiation Plant Homogenization Yard Recrusher Beneficiation Plant Inset Map Primary Crusher Secondary Crusher Fuel Station

Report Date: February 20, 2024 31406539.009-001-TRS-Rev0 Effective Date: December 31, 2023 Complexo Mineração de Tapira 16-1 16.0 MARKET STUDIES This section contains forward-looking information related to commodity demand and prices for the Mine. The material factors that could cause actual results to differ materially from the conclusions, estimates, designs, forecasts or projections in the forward-looking information include any significant differences from one or more of the material factors or assumptions that were set forth in this section including prevailing economic conditions, commodity demand and prices are as forecasted over the LOM period. 16.1 Markets Phosphorus is one of the three primary crop nutrients required for plant growth and is not substitutable. Phosphate rock0F0F 1 is the raw material feedstock utilized to produce virtually all phosphate fertilizers worldwide, as well as being the phosphate feedstock for animal feed ingredients and industrial and food products. Production of phosphate end-products is most commonly achieved by reacting the phosphate rock with sulphuric acid to produce intermediate phosphoric acid, which is then used as the precursor for nearly all high-analysis granular phosphate fertilizers (e.g., ammonium phosphates) as well as most animal feed and industrial/food phosphates. A less common process route involves reacting phosphate rock with sulphuric acid to produce single superphosphate, a low-analysis phosphate fertilizer. The global market for phosphate rock is estimated to be approximately 214 million metric tonnes in 2024 and has grown at a compound annual rate of around 1.8% over the past two decades, though has slowed modestly in the past several years (CRU Phosphate Rock Database, 2023). Going forward, global phosphate rock demand is expected to continue to grow, with Mosaic and independent analysts typically projecting a growth rate of 1-2% per annum. This growth ensures sufficient market demand for continued production at Mosaic’s Brazil phosphate rock mines 1F1F 2. In fact, such demand growth will necessitate some combination of new mining capacity globally or higher operating rates at existing mines to meet the growing demand. Global phosphate rock trade has been rangebound at around 30 Mt for the past two decades. Mosaic’s Brazil phosphate rock mines produce circa 4 Mt of phosphate rock concentrate per annum which is further processed into finished products at Mosaic’s downstream phosphate production facilities in the country – i.e., phosphoric acid intermediate product – then phosphate fertilizers and animal feed phosphates – or Single Superphosphate (SSP). The open-pit mining and beneficiation practices at the Brazil mines results in a phosphate rock product with a grade of ~76% BPL (~35% P2O5) and is amendable as feedstock for phosphoric acid or SSP. The circa 2 Mt of phosphate rock produced at the Tapira mine annually (grading >35% P2O5) is utilized as feedstock for the Uberaba downstream phosphates plant. 1 Phosphate rock is the term utilized to describe phosphate ore that has been mined and/or beneficiated to produce a material that is suitable for further processing into downstream products such as fertilizer. 2 Mosaic currently operates four phosphate rock mines in Brazil – Catalão, Tapira, Araxá/Patrocínio and Cajati.

Report Date: February 20, 2024 31406539.009-001-TRS-Rev0 Effective Date: December 31, 2023 Complexo Mineração de Tapira 16-2 16.2 Commodity Price Forecasts The commodity price forecasts utilized in the analysis are derived from an independent third party, CRU, which is a reputable supplier of market forecasts across a range of commodities including phosphate rock. CRU’s market studies cover the entire supply chain, focusing on supply, demand, trade and prices by country and product. However, there is no quoted benchmark for phosphate rock in Brazil, as the rock produced is almost exclusively consumed by captive downstream operations. As such, an internal transfer price forecast was constructed by deducting mining and beneficiation costs as well as chemical plant related costs. To do so, CRU’s benchmark forecast for downstream products – into which Mosaic’s Brazil phosphate rock is processed – were utilized. The phosphate fertilizer price forecast from CRU utilized in this report is MAP CFR Brazil, from CRU’s Phosphate Fertilizer Market Outlook dated November 2023. This price was then adjusted for freight based on Mosaic’s freight standards to derive a FOB plant netback, then a weighted adjustment is applied to reflect the historical pricing differential for the various phosphate end-products other than MAP that are produced with Tapira phosphate rock, to arrive at an average annual fertilizer price for the years 2024-2028. Table 16.1 shows the average CRU CFR MAP price forecast price for the years 2024-2028 averaged $512 (R$2,490) per metric tonne. Table 16.1: CRU CFR MAP Pricing Note: An exchange rate of R$4.86 = US$1.00 was applied Source: CRU’s Phosphate Fertilizer Market Outlook dated November 2023 The pricing of the non-MAP products produced with the Tapira phosphate rock – e.g., SSP, TSP, and DCP – tend to track closely to the price of MAP over time, and the typical pricing differential was then applied to the forecast. The CRU CFR MAP price forecast was used to predict the Tapira product combination and was an average revenue of R$2,033 per metric tonne, which was used for all years of the LOM plan. The Tapira revenue price differs from the price used in the Mineral Resource and Mineral Reserve pit optimization price of R$1,939.57 since it is based on an updated analysis of product pricing from 2023. The Mineral Resource and Mineral Reserve pit optimization price was applicable at the time that the pit optimization analysis was completed (2022). This forecast finished product price was utilized as the basis to then calculate a gross margin available to fund the upstream mining and processing of phosphate rock. The gross margin available for Tapira was calculated as R$694 per metric tonne. Under this approach, the internal transfer phosphate rock price cannot exceed the gross margin available. The DCF in Section 19.0 was calculated using an internal transfer phosphate rock price to show a Net Present Value of zero. The internal transfer price per tonne in the DCF is R$547 which is less than the gross margin available. This analysis demonstrates that the margin available for phosphate rock exceeds the total costs of phosphate rock production. Refer to the economic section of the report for further detail on this methodology. Item 2024 2025 2026 2027 2028 2029-2057 Average 2024-2028 Average 2024-2057 MAP CFR Brazil (US$) 540 518 518 493 493 490 512 509 MAP CFR Brazil (R$) 2,624 2,517 2,517 2,396 2,396 2,380 2,490 2,472

Report Date: February 20, 2024 31406539.009-001-TRS-Rev0 Effective Date: December 31, 2023 Complexo Mineração de Tapira 16-3 The exchange rate utilized in the analysis was derived internally utilizing a consensus view of forecasts from several third parties and is based on an August 2023 analysis. A forecast of 4.86 Real per US Dollar was utilized for the forecast period. Based on the current fluctuation in the Brazilian Real, this forecast is considered conservative and appropriate for this TRS report. 16.3 Contracts Effectively all phosphate rock produced at Mosaic’s Brazil mines is consumed at Mosaic’s downstream facilities.

Report Date: February 20, 2024 31406539.009-001-TRS-Rev0 Effective Date: December 31, 2023 Complexo Mineração de Tapira 17-1 17.0 ENVIRONMENTAL STUDIES, PERMITTING, AND PLANS, NEGOTIATIONS, OR AGREEMENTS WITH LOCAL INDIVIDUALS OR GROUPS 17.1 Environmental Studies The main activities carried out at CMT include apatite mining and beneficiation. CMT includes one mine, six waste rock piles, three titanium piles, three sediment retention dikes, one water dam, a crushing plant, a beneficiation plant, three tailings storage facilities (BR, BL-1, and magnetite dike) and an ore pipeline, that connects CMT to the Uberaba Chemical Complex. 17.1.1 Environmental and Social Impact Assessment An Environmental and Social Impact Assessment (ESIA, EIA in the Portuguese acronym) was prepared by in 2016 (MULTIGEO, 2016) for CMT. The Area of Direct Influence (AID in the Portuguese acronym) considered in the ESIA for the biotic and physical environments was defined by the head of the drainage basin of the Potreiro, Paiolzinho, Boa Vista, Areia, and da Mata streams, as well as the rest of its hydrographic basin, which encompasses the structures of CMT. The AID for the socioeconomic component defined in this ESIA comprised the municipalities of Tapira and Araxá, both in Minas Gerais state. 17.1.2 Biodiversity Regarding the floristic diversity of the region where CMT is located, a floristic survey carried out as part of the ESIA for tailings dam BL-1 (MULTIGEO, 2017b) identified 243 botanical species, belonging to 69 families of which Fabaceae was the most representative. Among the species recorded, four stand out for falling into categories of vulnerable or endangered at the national or state level, namely: Araucaria angustifolia (Araucári), Euterpe edulis (Juçara), Ocotea odorífera (Canela- sassafrás) and Cedrela fissilis (Acaiacá). In addition, one species of peki (Caryocar Brasiliense) and two species of ipe (Handroanthus ochraceus and Handroanthus serratifolius) are declared as of common interest, permanent preservation and immune to cutting in the state of Minas Gerais by State Law No. 9,743/1988. At CMT an area of 4,290 ha (60.6% of the total CMT area: 7,080 ha) has some type of vegetation cover. This amount includes approximately 331 ha of eucalyptus reforestation (corresponding to 4.7% of the CMT area) and 1,307 ha of native vegetation (corresponding to 18.4% of the CMT area). Approximately 2,794 ha (39.5%%) correspond to areas occupied by infrastructure dedicated to mining and mineral beneficiation (GOLDER, 2021). A fauna survey carried out as part of the ESIA for tailings dam BL-1 (MULTIGEO, 2017b) presented conclusions that include: Birdlife: The study indicated the occurrence of 121 species in the region where CMT is located. These species are distributed in 42 families. Three species fall into some category of extinction threat in Brazil and/or Minas Gerais, according to the MMA (2014b) and COPAM (2010), namely: Taoniscus nanus (inhambu-carapé), Crax fasciolata (curassow) and Jabiru mycteria (tuiuiú). Mammalian fauna: The study identified 42 species of mammals belonging to 16 families. Five species fall into some category of extinction threat in Brazil or Minas Gerais, according to the MMA (2014b) and COPAM

Report Date: February 20, 2024 31406539.009-001-TRS-Rev0 Effective Date: December 31, 2023 Complexo Mineração de Tapira 17-2 (2010): Mymercophaga tridactyla (giant anteater), Chrysocyon brachyurus (Guara wolf), Puma yagouarondia (Moorish cat), Puma concolor (Puma), Pecari tajacu (Cateto / Caititu). Herpetofauna: The study identified 16 species of amphibians distributed in 5 families and 3 species of reptiles distributed in 3 families. No endemic or endangered species were observed. Ichthyofauna: The study identified 17 species belonging to 9 families. The order Characiformes was the most abundant in the region, with 46.8% of the individuals captured in the survey. One of the species identified in the survey (Brycon nattereri - Pirapitinga) is considered threatened at the federal and state level. 17.1.3 Archaeological and Speleological Studies In a survey that was part of the ESIA, an archaeological site named “Valter Dentista” was identified at CMT. It was detailed in the Preliminary Report of Archeology and in the Archaeological Management Program, both presented to Instituto do Patrimônio Histórico e Artístico Nacional, IPHAN (The National Historic and Artistic Heritage Institute) to comply with a requirement of the process of renewing the environmental operation permit. In response, IPHAN issued a consent regarding the management proposal, indicating compensatory actions such as the possibility of transferring archaeological collections to an Archaeological Museum in the municipality and the creation of a Foundation, responsible for the administration of the museum. The compensatory action refers to the publication of a book and that was completed within the deadline indicated in the consent issued by IPHAN. On June 13, 2022, IPHAN issued a document indicating that two of the compensatory actions would be converted to financial compensation, totalizing R$ 320,000. The ESIA for raising the tailings dam BL-1 (MULTIGEO, 2017b) included a speleological survey that concluded that there are no caves at CMT. One of the reasons for that is the presence of a weathering layer about 160 m thick with a soil that is predominantly clayey, making the development of caves impossible (MULTIGEO, 2017b). 17.1.4 Socio-Economic Study According to Multigeo (2016) the area of indirect influence of CMT for the socioeconomic context consisted of the municipalities of Tapira and Araxá. In December 2023 CMT had a total of 782 direct employees and approximately 715 contractors. Approximately 80% of the direct employees live in Araxá and 15% in Tapira, in the state of Minas Gerais (GOLDER, 2021). In 2010 the Gini index, that measures concentration of wealth in a scale of 0 (complete equality) to 1 (complete inequality) was 0.48 in Araxá and 0.54 in Tapira, below the average in Minas Gerai state (0.56) and Brazil (0.60). In 2010 the HDI (Human Development Index) was 0.772 in Araxá and 0.712 in Tapira (both considered high), above (Araxá) and below (Tapira) the average in Minas Gerais state (0.731) and Brazil (0.727), both classified as high. According to Golder (2021) no references were found about the existence of Quilombolas (communities with slave descendants) or indigenous population in the region where CMT is in the official database consulted: Palmares Foundation (for Quilombolas) and FUNAI (for indigenous population). The closest Quilombola community identified was located approximately 76 km north of CMT.

Report Date: February 20, 2024 31406539.009-001-TRS-Rev0 Effective Date: December 31, 2023 Complexo Mineração de Tapira 17-3 17.1.5 Baseline Water Quality and Water Quantity Study Multigeo (2011) carried out a confirmatory investigation at CMT in seven areas previously classified as potentially containing exceedances, with a total of 35 boreholes drilled for sampling surface and subsurface soil. The results indicated the following parameters with concentrations above soil quality standards: barium (11 boreholes), cobalt (1 borehole at a workshop) and nickel (1 borehole at a subcontractor area). The study indicated that barium occurred uniformly in all areas studied, as result of the lithology of the region, and the concentrations above soil quality standards were not resulting from the CMT operation. Multigeo (2017a) carried out a confirmatory investigation at CMT in four areas corresponding to fuel stations, with a total of 10 boreholes drilled for sampling soil and analysis of BTEX, PAH e TPH. No concentrations above soil quality standards were identified in this investigation. Ramboll (2018) prepared a conceptual site model indicating 25 areas of interest (AOI) related to soil and groundwater quality based on previous investigation works (as above) and characteristics of the areas / operations. No further confirmatory investigations were conducted at these areas. Mosaic is planning to carry out an additional investigation in these areas in 2022, which consist of a voluntary action (i.e., not demanded by the environmental regulator). Golder (2021) reviewed groundwater quality monitoring results from 2016 to 2019, corresponding to 12 locations at CMT that are monitored with a frequency ranging from quarterly to annual. In general, the results indicated compliance with groundwater quality standards, with exception of few barium results, that presented concentrations above the soil quality standard. As indicated above, the barium results may be related to the local geology. Mosaic monitors surface water quality in 24 locations with a frequency ranging from monthly to biannually. According to Mosaic (2020), in a compilation of data from 2016 to 2020, some sporadic values above regulatory water quality standards were observed in some monitoring locations, including: pH, dissolved oxygen, coliforms, BOD, turbidity, aluminum, dissolved iron, manganese, phosphorus, nitrate, total phenols. 17.2 Requirements and Plans for Waste and Tailings Disposal, Site Monitoring, and Water Management during Operations and After Mine Closure This sub-section contains forward-looking information related to waste and tailings disposal, site monitoring and water management for the Mine. The material factors that could cause actual results to differ materially from the conclusions, estimates, designs, forecasts or projections in the forward-looking information include any significant differences from one or more of the material factors or assumptions that were set forth in this sub-section including waste disposal volumes increase from historical values and predicted values, that regulatory framework is unchanged during the Study period, and no unforeseen environmental, social or community events disrupt timely approvals. CMT’s environmental controls are related to monitoring the quality of wastewater, surface and groundwater and air, as well as waste management.

Report Date: February 20, 2024 31406539.009-001-TRS-Rev0 Effective Date: December 31, 2023 Complexo Mineração de Tapira 17-4 17.2.1 Effluents Wastewater from site operations is discharged into the tailings dams. Sewage and oily effluents are treated in specific systems before being discharged into the tailings dams. Mosaic monitors wastewater quality at CMT in the following locations: Oil/water separators / oily water treatment plants: 9 locations. Sanitary sewage (septic tanks): 16 locations. Outlet of tailing dams and dikes: 7 locations. Monitoring results from January 2020 to October 2023 were available for review (file: Gerenciador de Monitoramentos Ambientais-CMT 2020 a 2023.xlsm) for 7 locations corresponding to wastewater discharge from tailings dams and 9 locations corresponding to the discharge of an oil/water separator. Results from 2021 to 2023 indicated in general compliance with the applicable wastewater discharge standards. A notable exception was the concentration of total suspended solids in the effluent from BD2, that exceed the standard in most of the monthly monitoring results available, including 7 values 50 times or higher than the standard (100 mg/L). 17.2.2 Waste Management Mosaic has a Solid Waste Management Plan at CMT that defines procedures for collection, temporary storage, and final destination of wastes. Structures for temporary storage of wastes at CMT include a deposit (warehouse) for hazardous wastes including cover, masonry walls, concrete floor and drainage system directed to a sump. (MOSAIC, 2020). The Reserve Audit carried out in 2014 considered the need to develop a more detailed waste (overburden) management plan, because the waste management plan did not indicate a clear direction for waste capacity after 2030. A waste rock Master Plan was updated in December 2023 to address waste capacity for the remainder of the mine life. 17.2.3 Air Quality Mosaic monitors emissions from equipment at CMT. In case of concentrations above the air quality standard, the equipment is sent for maintenance, and it is authorized to restart operation only after complying with standard. Mosaic monitors air quality (Total Suspended Particulate – TSP) in five locations around the Site with biannual frequency since May 2022. Results from May 2022 to May 2023 available for review were in compliance with the national air quality standard for TSP. 17.2.4 Surface and Groundwater Quality Mosaic monitors surface water quality at CMT in 24 locations with a frequency ranging from weekly to annual. Regarding the content of phosphorus in surface waters around CMT, a background study supports the establishment of a concentration of 0.344 mg/L as the maximum permissible concentration for phosphorus in surface waters. Monitoring results from January 2020 to October 2023 were available for review (file: Gerenciador de Monitoramentos Ambientais-CMT 2020 a 2023.xlsm) and indicated general compliance with the applicable surface water quality standards.

Report Date: February 20, 2024 31406539.009-001-TRS-Rev0 Effective Date: December 31, 2023 Complexo Mineração de Tapira 17-5 Mosaic monitors groundwater quality at CMT in 34 locations with a frequency ranging from weekly to annually. These locations include piezometers, groundwater abstraction wells and wells used for lowering the water table in the mine. Monitoring results from January 2020 to October 2023 were available for review (file: Gerenciador de Monitoramentos Ambientais-CMT 2020 a 2023.xlsm) and indicated general compliance with the applicable groundwater quality standards. 17.2.5 Tailings Management and Monitoring CMT has two tailings dams, three dams for sediment containment and water clarification, and one water dam: Dam BA3: The BA-3 Dam was built in 1980 to contain any solids that may be spilled by the BL-1 dam or the contribution basin, controlling its reservoir and preventing the emission of suspended solids into the Potreiro stream, located downstream. Dam BD2: It was built in 1979 by Fosfértil, former owner of the Tapira Mining Complex, using local soil compacted by traffic, with the purpose of containing solids carried by the beneficiation plant's discharges. Dam BD5: It is a structure designed to contain the solids carried from the beneficiation plant and mine area as well as the solids that may not eventually be contained in the BR dam area, located upstream of this structure. It was built in 1987, with the raisings in 1995, 1999, and 2012. Dam BR: It was built in 1980 and it is located at the head of the Boa Vista stream and upstream from the BD5 dam. The BR Dam was designed for tailings containment. The reservoir occupies a considerable portion of the basin's drainage area, being sectioned in half by the tailings thrown at its left abutment. Currently, the crest elevation is 1,200 m and there are four additional raises planned (El. 1,210 m, El. 1,220 m, El. 1,230 m, and El. 1,235 m). Dam BL-1: According to document No. BL1 43-70-2020 April 1977, the initial project of the BL1 Dam was prepared by the companies Paulo Abib Eng. and WA Waler & Associates, in 1977, with the purpose of storing of the phosphate plant's tailings, owned by the company Mineração Vale do Paranaíba SA. According to this document, an initial dike was designed, in compacted soil, and with a crest at El. 1,160 m. A rockfill dike was also built, located about 237 m downstream of the initial dike, with a crest at an elevation of 1,145 m. It was bult in 1977, with raisings concluded in 2008, 2015, 2019, and a reinforcement and rising concluded in 2021.Currently, the crest elevation is 1,225 m. Dam BRI: It was built in a single stage in 1978, with the purpose of storing and capturing water for use in the Phosphate ore beneficiation process. 17.2.5.1 Corporate Policy and Guidelines All documentation regarding the tailings dams is included in the Dam Safety Plan (PSB) of each structure on the SGPSB - Management System for Dam Safety Plan platform. The existing documentation is consistent with the requirements of Brazilian dam safety legislation: Law 12,334 of September 20, 2010, and Resolution 95, dated February 7, 2022, established by National Mining Agency (ANM in the Portuguese acronym). 17.2.5.2 Tailings Characterization The latest Tailings Master Plan report was developed by Walm in 2022 (WA02821013-1-GT-RTE-0002). Since then, various studies for tailings disposal were carried out in term of disposal plan for BL1 and BR dam with the

Report Date: February 20, 2024 31406539.009-001-TRS-Rev0 Effective Date: December 31, 2023 Complexo Mineração de Tapira 17-6 combination of stacking the coarse tailings from cyclones operations forming the Waste Deposition Piles (PDRs). Next year after those studies concluded, the tailings master plan will be updated. From Tapira unit we have three types of tailings generated which include ultrafines, coarse tailings and magnetite. Table 17.1 considers the parameters of dry density for the types of tailings produced. Table 17.1: Tailings Dry Density 17.2.5.3 Operations and Monitoring for Compliance The Operating, Maintenance, and Surveillance (OMS) Manual for the Tapira Structures was updated in 2023. The geotechnical monitoring of Tapira’s tailings dams includes field inspections and measurements of the installed instrumentation equipment. Field visual inspections are performed every two weeks by traversing the structures looking for anomalies that may impact the dam integrity and its associated structures, while the readings of the instruments follow a specific frequency for each type of instrument installed. Both activities are executed by the Mosaic technical team, as requested in the current Brazilian legislation. The data obtained during field inspections are recorded on a Regular Inspection Sheet (FIR) every two weeks, which is inserted in the SIGBAR/SIGDEP Monitoring Plan. A monthly assessment is done by Geoconsultoria (owner of the SIGBAR/SIGDEP Monitoring System) with the issuance of a technical report containing the readings performed and the instruments interpretation. All documentation generated by the information obtained through routine and regular inspections is inserted in the Dam Safety Plan (PSB) of each dam, located on the platform SGPSB - Management System for Dam Safety Plan. The Tapira site includes a dedicated monitoring room from which all Fertilizantes site impoundments are monitored via remote sensing devices and cameras. 17.2.5.4 Engineer of Record and Inspection Report Reviews The latest regular safety inspection reports available for the second semester of 2023 for the structures BA3 (MO- 23004-GT-RT-0025), BD2 (MO-23004-GT-RT-0023), BD5(MO-23004-GT-RT-0024), BR (MO-23004-GT-RT- 0020), BL-1(MO-23004-GT-RT-0021), and BRI (MO-23004-GT-RT-0022) identified no issues that directly interfere with the stability of the structures. The Dam Regular Safety Inspection Report (RISR) is carried out with biannual frequency and a Periodic Security Review must occur every 3 years for structures classified with high potential damage associated (BR, BL1, BD5, BR1, and BD2) and 5 years for structures classified with medium potential damage associated (BA3 Dam). 17.2.5.5 Compliance Monitoring and Report Documentation The monitoring and control system for geotechnical parameters consists of monitoring the behavior of the structure in comparison to the expected behavior using data on pore pressures in the foundation and embankment, the reservoir’s water level, the drained flow, the movement and settlement of the foundation and embankment. Parameter Ultrafines Coarse Tailings Magnetite Hydraulic Disposal (t/m3) 1.10 1.50 - Compaction (t/m3) - 1.80 2.90

Report Date: February 20, 2024 31406539.009-001-TRS-Rev0 Effective Date: December 31, 2023 Complexo Mineração de Tapira 17-7 For this purpose, in the currently operating structures, monitoring instruments were installed, using the SIGBAR management system, which is divided into modules, each covering an aspect related to the safety of dams. For all the structures there are documents that indicate levels to represent a normal, attention, alert, or emergency situation for the installed instrumentation control. These documents were issued in 2016 for the structures BR, BL1, BRI, BD2, BD5, respectively, FF44CR05, 04, 06, 02, 03, and in 2004 for structure BA3 (FF42CR01). The readings periodicity of the instruments was established in the operating manuals of the structures, all prepared by Mosaic itself between 2017 and 2019. The minimum frequency of readings of survey monuments is monthly, water level indicators, piezometers and flow meters are every two weeks, although it can be weekly in rainy seasons. The reservoir water level is read weekly. The pluviometry was not reported. All documentation regarding the tailings dams is included in the Dam Safety Plan (PSB) of each structure on the SGPSB - Management System for Dam Safety Plan platform. 17.2.5.6 Design Capacity The characteristics of the tailings dams used in the Tapira LOMP are summarized in Table 17.2. Table 17.2: Current and Designed Characteristics of Tailings Dams Notes: 1. Considering the last raise 2. Latest Dam Safety Review 3. Consider the currently volume avaiable 4. Global Industry Standard on Tailings Management (GISTM) Classification A tailings disposal plan was prepared for Tapira by Walm in 2022 (WA02821013-1-GT-RTE-0002), which considered the generation of tailings during the LOMP, detailed in Table 17.3 and Table 17.4. Design¹ Current Design Capacity³ Start End BL1 1,225 1,225 210² 15 98 1977 2026 Very High BR 1,235 1,200 230 185.3 61 1980 2057 Very High PDR 2A 1,235 NA 10 10 60 2034 2038 Significant PDR 2B 1,225 NA 56 56 90 2038 2054 NA PDR 2C 1,280 NA 19 19 110 2054 2057 NA PDM 2 1,228 NA 36 36 56 2027 2057 NA Classification (4) Reservoir Volume [Mm³] Current Height [m] Tailings Dam Crest Elevation [m] Operation

Report Date: February 20, 2024 31406539.009-001-TRS-Rev0 Effective Date: December 31, 2023 Complexo Mineração de Tapira 17-8 Table 17.3: Tailings Volume to be Stored in TSF Period Slurry + Ultrafine Tailings (Mm3) Coarse Tailings (Mm3) Period Slurry + Ultrafine Tailings (Mm3) Coarse Tailings (Mm3) 2024 4.54 3.31 2041 4.45 3.34 2025 4.52 3.38 2042 4.44 3.33 2026 4.42 3.38 2043 4.20 3.15 2027 4.51 3.31 2044 4.31 3.23 2028 4.50 3.35 2045 4.46 3.35 2029 4.42 3.13 2046 4.32 3.24 2030 4.46 3.08 2047 4.52 3.39 2031 4.18 3.07 2048 4.46 3.35 2032 4.10 3.21 2049 4.15 3.11 2033 4.10 3.16 2050 4.29 3.22 2034 4.28 3.24 2051 4.30 3.23 2035 4.21 3.26 2052 4.45 3.34 2036 4.31 3.23 2053 4.49 3.37 2037 4.48 3.36 2054 4.40 3.30 2038 4.46 3.34 2055 4.51 3.38 2039 4.49 3.37 2056 4.97 2.98 2040 4.49 3.37 2057 4.38 3.23

Report Date: February 20, 2024 31406539.009-001-TRS-Rev0 Effective Date: December 31, 2023 Complexo Mineração de Tapira 17-9 Table 17.4: Stockpiled Tailings and Magnetite The tailings disposal strategy in the document can be summarized as follows: Coarse tailings: 2022-Aug/2023: Launch in “Dam BL1” (El. 1,225.00m) (existing structure); Sep/2023-Sep/2024: Mechanized launch in the base area of the “PDR Teste”, located on the left abutment arm of the “BR Dam” (El. 1,200.00m) (existing structure); Sep/2024-Oct/2025: Launching upstream of the “BR Dam” reservoir (El. 1,200.00m) (existing structure); Oct/2025-Dec/2025: Disposal in “PDR-I” (structure to be built); Jan/2026-Mar/2027: Launching from the crest to create a beach for the raising of the “BR Dam” (El. 1,210.00m) (existing structure, to be raised – preliminary environmental license already issued); Mar/2027-Aug/2030: Disposal in “PDR-I” (structure to be built); Aug/2030-Jan/2035: Disposal in PDR-II” (structure to be built); Jan/2035-Nov/2036: Launching from the crest to create a beach for the raising of the “BR Dam” (El. 1,230.00m) (existing structure, to be raised); Nov/2036-Dec/2057: Disposal in PDR-II (structure to be built). Period Coarse Tailings (Mm3) Magnetite (Mm3) Period Coarse Tailings (Mm3) Magnetite (Mm3) 2024 2.76 0.42 2041 2.78 0.42 2025 2.82 0.43 2042 2.77 0.42 2026 2.81 0.43 2043 2.63 0.40 2027 2.76 0.42 2044 2.69 0.41 2028 2.79 0.42 2045 2.79 0.42 2029 2.61 0.40 2046 2.70 0.41 2030 2.56 0.39 2047 2.82 0.43 2031 2.56 0.39 2048 2.79 0.42 2032 2.67 0.41 2049 2.59 0.39 2033 2.63 0.40 2050 2.68 0.41 2034 2.70 0.41 2051 2.69 0.41 2035 2.72 0.41 2052 2.78 0.42 2036 2.69 0.41 2053 2.81 0.43 2037 2.80 0.43 2054 2.75 0.42 2038 2.79 0.42 2055 2.82 0.43 2039 2.81 0.43 2056 2.48 0.38 2040 2.81 0.43 2057 2.74 0.42

Report Date: February 20, 2024 31406539.009-001-TRS-Rev0 Effective Date: December 31, 2023 Complexo Mineração de Tapira 17-10 Mud + Ultrafines: 2022-Mar/2027: Launch in “Dam BL1” (El. 1,225.00m) (existing structure); Mar/2027-2057: Launch at “BR Dam” (El. 1,210.00m and El. 1,230.00m) (existing structure, to be raised); Magnetite: Jan/2024-Dec/2025: Construction material for the raising mass of the “BR Dam” (El. 1,210.00 m) (structure to be built); Mar/2030-Dec/2034: Construction material for the raising mass of the “BR Dam” (El. 1,220.00 m and El. 1,230.00 m) (structure to be built); Jan/2035-Dec/2057: Fixed monthly sales rate (material will be sold); Jan/2035-Dec/2057: Disposal in “PDM-2” (structure to be built). 17.2.6 Water Management A hydrotechnical study concluded in 2019 for Mosaic (POTAMOS, 2019) presented as a general diagnosis of water use that CMT does not present a potential risk related to water supply. However, this study presented recommendations for improvements related to water management, such as the need to rectify the water use permits of the dams by changing the minimum flow rate, developing and implementing a water resources management system, conducting studies to assess the impact of mining operations on watercourses adjacent to the mine area, defining correct replacement flows; and improvements related to the monitoring system such as the daily reading of the residual flow in all dams as a necessary measure to meet the demands of the Water Management Agency (IGAM) that has intensified the inspection due to the critical period of hydrological recession in recent years in the State of Minas Gerais. The study also highlights the need to update the water balance of the industrial unit annually due to the frequent changes in the hydrological regime and the review of studies on water supply and availability in the basins in which CMT is located. The recommendations relating to piping facilities and flow meters are in progress to be implemented at CMT through Capital Expenditure (Capex) improvements over the next few years. Although water supply is not considered a risk for the CMT operation, the impacts of the existing water management practices on the surrounding areas can be considered a risk. Communities around the mine area have limited access to water resources and that access is directly influenced by CMT’s operations CMT has a flow replacement system in three streams. Issues related to water use tend to become more relevant in a context of changes in the hydrological regime due to climate change and greater control by the agencies responsible for the management of water resources. Near the CMT area there is a rural settlement called “Assentamento Fazenda Nova Bom Jardim” (Fazenda Nova Bom Jardim Settlement), an agrarian reform project of the Instituto Nacional de Colonização e Reforma Agrária - INCRA (National Institute of Colonization and Agrarian Reform). The settlement, adjacent to the CMT mine area, has 10 (ten) settled families that collect water from springs and local streams. Due to changes in water availability

Report Date: February 20, 2024 31406539.009-001-TRS-Rev0 Effective Date: December 31, 2023 Complexo Mineração de Tapira 17-11 caused by lowering the water table within the mine pit, CMT provides the replacement of flows in Canoas, Cachoeira and Bálsamo streams. 17.3 Permitting Requirements This sub-section contains forward-looking information related to permitting requirements for the Mine. The material factors that could cause actual results to differ materially from the conclusions, estimates, designs, forecasts or projections in the forward-looking information include any significant differences from one or more of the material factors or assumptions that were set forth in this sub-section including regulatory framework is unchanged for Study period and no unforeseen environmental, social or community events disrupt timely approvals. The current Brazilian legislation generally includes the following steps in the environmental permitting process: Preliminary License (Licença Previa – LP): authorizes the permitting process based on the assessment of the environmental feasibility of an activity. In the case of mining operations usually requires the presentation of an ESIA. Installation License (Licença de Instalação – LI): authorizes the installation of the structures that will be used for the activity. Operation License (Licença de Operação - LO: authorizes the operation of the activity. Table 17.5 presents environmental licenses and other material permits for CMT. All environmental permits were valid at the time this report was prepared or had its renewal application filed in the Environmental Agency within the legal deadline; according to the Brazilian legislation, in the latter case the permits are still valid until a final decision of the Environmental Agency is provided.

Report Date: February 20, 2024 31406539.009-001-TRS-Rev0 Effective Date: December 31, 2023 Complexo Mineração de Tapira 17-12 Table 17.5: Environmental Authorizations for Tapira Authorization(a) Number Description Issued on Validity Preliminary, Installation and Operation License 4683/2020 Deposits T2 and T4 October 30, 2020 October 30, 2030 Preliminary, Installation and Operation License 076/2021 Deposit E6 July 30, 2021 July 30, 2031 Preliminary, Installation and Operation License 083/2021 First expansion of the deposit T4 August 27, 2021 August 27, 2031 Preliminary License 091/2021 Raising tailings dam BR to 1210 m October 26, 2021 October 26, 2026 Operation License 194/2010 (135/2020) Operation of the Site, including exploitation of phosphate ore, ultrafine unit, tailings dam and ore pipeline. November 12, 2010 November 12, 2016(c) Operation License 028/2012 Operation of the Site - increase February 10, 2012 February 10, 2018(d) Operation License 072/2015 Fuel stations at the mine and near the central office December 13, 2013 December 13, 2019(e) Operation License 118/2011 Operation of expansion of waste rock pile E1 August 12, 2011 August 12, 2015(f ) Operation License 055/2018 Tailings dam BL-1 up to the elevation 1220 m. May 10, 2018 May 10, 2028 Corrective Operation License 097/2017 Raising tailings dam BL-1 from 1215.0 m to 1217.5 m August 11, 2017 August 11, 2027 Simplified Environmental License 182/2018 Expansion of the fuel station at the mine October 3, 2018 October 3, 2028 Operation License 5079/2022 Operation of tailings dam BL-1 up to the elevation 1225 m. January 28, 2022 January 28, 2032 Water grant 1906074/2019 Groundwater abstraction at the mine area: 7 m³/h; 18 h/day, 365 days/year. August 31, 2019 August 31, 2024 Water grant 1904333/2019 Groundwater abstraction near the water treatment plant 6.6 m³/h; 10 h/day; 365 days/year. June 14, 2019 June 14, 2024 Water grant 1905254/2019 Groundwater abstraction near the water tank (tower): 11.82 m³/h; 18 h/day, 365 days/year. July 30, 2019 July 30, 2024 Water grant 01376/2009 Water dam with abstraction – Ribeirão do Inferno: 917 L/s (3301 m³/h); 24 h/day; 12 months/year. Maximum monthly volumes allowed: 245,609 m³ in January, Marco, May, July, August, October and December, 221,840 m³ in February and 237,686 in April, June, September and November. BR. Requires to maintain residual flow of 70% of Q7,10.(b) December 12, 2013 June 6, 2014(g) Water grant 01375/2010 Tailings dam BR. Requires to maintain residual flow of 70% of Q7,10. December 12, 2013 May 19, 2015(h) Water grant 03380/2017 Tailings dam BL-1. Requires to maintain residual flow of 100% of Q7,10. October 10, 2017 December 11, 2023 Water grant 01376/2010 Sediment retention dike DB5. Requires to maintain residual flow of 70% of Q7,10. December 12, 2013 May 19, 2015(i)

Report Date: February 20, 2024 31406539.009-001-TRS-Rev0 Effective Date: December 31, 2023 Complexo Mineração de Tapira 17-13 Table 17.5 (cont.) Notes: (a) Licenses, autorizations and water grants issued by SEMAD (Secretaria de Estado de Meio Ambiente e Desenvolvimento Sustentável – Minas Gerais State Environment Regulator). (b) Q7,10: average flow rate of seven days and ten years of recurrence (c) Renewal request was filed on April 28, 2014, within the deadline required in the license. (d) Renewal request was filed on April 28, 2014, within the deadline required in the license. (e) Renewal request was filed on August 12, 2019, within the deadline required in the license. (f) Renewal request was filed on April 28, 2014, within the deadline required in the license. (g) Renewal request was filed on April 16, 2014, within the deadline required in the license. (h) Renewal request was filed on October 28, 2014, within the deadline required in the license. (i) Renewal request was filed on October 28, 2014, within the deadline required in the license. (j) Renewal request was filed on February 9, 2018, within the deadline required in the license. (k) Renewal request was filed on February 5, 2018, within the deadline required in the license. 17.4 Plans, Negotiations, or Agreements with Local Individuals, or Groups This sub-section contains forward-looking information related to plans, negotiations or agreements with local individuals or groups for the Mine. The material factors that could cause actual results to differ materially from the conclusions, estimates, designs, forecasts or projections in the forward-looking information include any significant differences from one or more of the material factors or assumptions that were set forth in this sub-section including that regulatory framework is unchanged for Study period; no unforeseen environmental, social or community events disrupt timely approvals. The Mosaic Institute is the social pillar of Mosaic Fertilizantes whose objectives are to promote mutual, sustainable development in the surrounding communities based on regional reality, operational activity, social indices, propensities, and the needs and wants of the inhabitants. The Institute's activities are based on four platforms: Water, Food, Education, and Local Development. The programs developed by the Mosaic Institute at CMT include (GOLDER, 2021): Authorization(a) Number Description Issued on Validity Water grant 1904383/2019 Channeling tributary to Boa Vista stream. June 19, 2019 June 19, 2024 Water grant 1904693/2019 Water dam in the Protreiro stream with no abstraction July 18, 2019 July 18, 2024 Water grant 1906017/2019 Groundwater abstraction near the medical clinic: 1.2 m³/h; 18 h/day, 365 days/year. October 26, 2019 October 26, 2029 Water grant 2105716/2022 Lowering water table at the mine August 27, 2022 August 27, 2031 Water grant 1907484/2021 Channeling E6 August 8, 2021 August 8, 2031 Water grant 39591/2019 Dike at E6 deposit March 6, 2020 March 6, 2030 Certification on insignificant water use 275078/2021 Dike at the mine – T4 deposit July 23, 2021 July 23, 2024 LO 046/2021 APU-119890/2021 138/2017 APU-1972601/2013 138/2017 APU-1168053/2017 Authorization for environmental intervention LO 283/2022 Removal of vegetation for mie expansion until 2027 and deposit T6 July 7, 2022 July 7, 2028 Authorization for environmental intervention Removal of vegetation for expansion of the mine: fronts 2, 4 and 4 November 14, 2017 February 10, 2018(k) Authorization for environmental intervention Removal of vegetation for expansion of the mine: fronts 4 and 5 May 14, 2021 May 14, 2023 Authorization for environmental intervention Removal of vegetation for drilling works February 20, 2012 February 10, 2018(j)

Report Date: February 20, 2024 31406539.009-001-TRS-Rev0 Effective Date: December 31, 2023 Complexo Mineração de Tapira 17-14 Food: The actions aim, among others, to promote training in healthy eating, food safety and combating waste. Food donations, implementation of school gardens, lectures and training on topics related to healthy eating, food safety, combating waste, as well as other mobilization and social engagement actions are carried out. In 2019 the program involved 290 direct beneficiaries in Tapira and 1,160 indirect beneficiaries. Water: The Water Notice is a project that launches social competition notices for the selection of projects that seek to value and encourage water resource management practices, and preservation actions capable of ensuring the availability of water for present and future generations. In 2020, the second edition of the project was launched, which included twelve initiatives spread across several cities where Mosaic operates. The projects included are developed by civil society organizations and higher education and research institutions; each project will receive up to R$45,000 during the implementation of the proposal. Education: The School Project is developed through the Public Management program, through the elaboration of a socioeconomic diagnosis and proposition of actions together with local public managers. Among the actions carried out in Tapira, the program involved the elaboration of actions that have an impact on education, with the mapping of potential sites and receiving educational institutions. Through the mobilization and articulation with local leaders and public authorities, a solution laboratory is proposed. In Tapira, the program carried out actions on two fronts, involving 20 municipal employees. The “Mosaic Educa” Program has as its main objective the strengthening of basic education through the improvement and reorganization of structures, concomitant with the training of educational managers and students, in school management and in encouraging reading. The program already has actions in the municipalities of Paranaguá, Catalão, Uberaba and Candeias. With four schools involved, the Mosaic Educa Program has 4,800 benefited students, in addition to 350 trained professionals, who benefit around 200 schools. Indirectly, 2,200 families are served through the program to strengthen basic education. In Tapira, it will be implemented after the completion of the construction works for the Municipal Children's Education Center in the municipality. 17.5 Descriptions of any Commitments to Ensure Local Procurement and Hiring In addition to the Mosaic Institute initiatives, the Environmental Education and Citizenship Program (PEAC in the Portuguese acronym) includes a series of actions to meet the local residents’ needs and works to promote educational actions with a focus on environmental education for both internal and external audiences. It also plays a role in publicizing environmental legislation and being responsible for creating opportunities for discussions on the local realities of related topics. 17.6 Mine Closure Plans This sub-section contains forward-looking information related to mine closure for the Mine. The material factors that could cause actual results to differ materially from the conclusions, estimates, designs, forecasts or projections in the forward-looking information include any significant differences from one or more of the material factors or assumptions that were set forth in this sub-section including prevailing economic conditions continue such that unit costs are as estimated in constant (or real) dollar terms, projected labor and equipment productivity levels are

Report Date: February 20, 2024 31406539.009-001-TRS-Rev0 Effective Date: December 31, 2023 Complexo Mineração de Tapira 17-15 appropriate at time of closure and estimated infrastructure and mining facilities are appropriate at the time of closure. CMT’s Closure Plan was updated in 2020/2021 (GOLDER, 2021) and it was split into two volumes, as follows: 1. Volume I: Closure plan based on the current configuration of CMT (end of 2020). 2. Volume II: Supplementary information related to CMT closure based on its final configuration (2060). Based on a qualitative analysis of post-closure land use alternatives, rehabilitation / revegetation with native species was selected as CMT. The closure actions included: Open pits: erosion control, surface drainage, revegetation. Waste rock piles: erosion control, surface drainage, and revegetation. Waste rock piles E1, E2, T1, and T2 were considered as already closed and no addition actions were proposed for the closure of these structures. Sediment retention dikes: BA3: Removal of the dike and sediments, grading, surface drainage and revegetation. BD2: Grading, surface drainage and revegetation. BD5: Water removal, lowering the crest of the dike, filling up the reservoir with material from the embankment, grading, surface drainage, revegetation. Industrial and administrative areas: dismantling and demolition, surface grading, surface drainage and revegetation. Storage yards: Demolition of concrete floor (where exists), grading and revegetation. Ponds: Grading and revegetation. Tailings storage facilities: Tailings dam BL1: Water removal, grading the reservoir surface, replacement of the concrete spillway by a rock filled spillway, surface drainage, revegetation. Tailings dam BR: Water removal, lowering the crest of the embankment, filling up the reservoir with material from the embankment, grading, replacement of the concrete spillway by a rock filled spillway, surface drainage, revegetation. Lake 3 on the reservoir will be maintained and the water level will be controlled by surface drainage system to be implemented. Magnetite pile: Grading, surface drainage, cover with soil and overburden, revegetation.

Report Date: February 20, 2024 31406539.009-001-TRS-Rev0 Effective Date: December 31, 2023 Complexo Mineração de Tapira 17-16 Water dam: Dismantling and removal of equipment and structures, water removal, removal of the dike, geomorphic adjustment of the reservoir to restore the former river channel, revegetation. Ore pipeline: Removal of all aerial pipeline and its support structures (underground pipeline would not be removed), revegetation of areas with exposed soil after removal of the pipeline. The LOM closure cost was estimated in the Conceptual Closure Plan (2021) based on 2020 unit prices, and then updated in October 2021, based on the review of some unit prices. The updated LOM closure cost in 2021 was R$ 565.3 M. Adjusting this value based on the accumulated inflation3 in Brazil from October 2021 to December 2023 (15.23%) and work planned for 2021-2023 results in a LOM closure cost of R$ 390.4 M. 17.7 Qualified Person’s Opinion on the Adequacy of Current Plans to Address Any Issues Related to Environmental Compliance, Permitting, and Local Individuals, or Groups It is the WSP QP’s opinion that the current Mosaic’s actions and plans are appropriate to address the identified issues related to environmental compliance, permitting, relationship with local individuals or groups, and tailings management. 3 INCC index was used, corresponding to inflation of civil construction prices.

Report Date: February 20, 2024 31406539.009-001-TRS-Rev0 Effective Date: December 31, 2023 Complexo Mineração de Tapira 18-1 18.0 CAPITAL AND OPERATING COSTS This section contains forward-looking information related to capital and operating cost estimates for the Mine. The material factors that could cause actual results to differ materially from the conclusions, estimates, designs, forecasts or projections in the forward-looking information include any significant differences from one or more of the material factors or assumptions that were set forth in this section including prevailing economic conditions continue such that unit costs are as estimated in constant (or real) dollar terms, projected labor and equipment productivity levels and that contingency is sufficient to account for changes in material factors or assumptions. Capital costs includes sustaining and expansion costs and were estimated using available current costs, historical averages, engineering studies and budgetary allocations. Therefore, the capital expenditures have been estimated to a PFS level and its attendant accuracy and contingency levels. Operating costs included compensation for haulage effort as haulage distance varied throughout the mine life. Fixed and variable costs were developed for the following cost centers: Mining Beneficiation The operating cost approach allows for the application of well-known historical consumption rates for consumables along with the ability to use current quotes or estimates for the unit costs for consumables, which results in the ability to project operating cost to a PFS level for the cost centers noted above. Primary mine equipment was leased; and therefore, their costs are included in the mine operating cost estimate. The LOM operating cost estimates for the Tapira operation are summarized in Table 18.1 which includes costs for Sales, General and Administrative (SG&A) and expenses related to Costs of Goods Sold (COGS). Table 18.1: Total LOM Capital, Operating, and Other Costs (R$ Millions) Note: Costs are rounded to the nearest million R$. Rounding as required by the reporting guidelines may result in apparent summation differences. Other Operating Costs includes legal expenses, Instituto Mosaic (community relations), health insurance for retirees, legal contingency, and others. Other costs, include SG&A fixed cost, and other COGS (Facilities Idling, Research and Development [R&D], turnaround, inventory, etc.). Description LOM Total (R$ M) Capital $4,461 Operating $25,743 Mining $15,306 Processing $10,437 Other Operating Costs $243 Other Costs (SG&A and CoGs) $1,010 Total $31,457

Report Date: February 20, 2024 31406539.009-001-TRS-Rev0 Effective Date: December 31, 2023 Complexo Mineração de Tapira 18-2 18.1 Risks Associated with Estimation Methods It should be noted that at the time that the capital costs were prepared when Brazil was experiencing high inflation rates and is, therefore, considered a risk to the capital cost estimates. Beneficiation plant improvement capital will be subject to engineering uncertainty. The capital estimates are done to a PFS level, which is sufficient to support Mineral Reserve estimation. Beneficiation sustaining capital would be replacement of major components and is expected to have minimal risk as the equipment being replaced is well known for cost, productivity, and application and is based on Mosaic historical purchase prices.

Report Date: February 20, 2024 31406539.009-001-TRS-Rev0 Effective Date: December 31, 2023 Complexo Mineração de Tapira 19-1 19.0 ECONOMIC ANALYSIS This section contains forward-looking information related to economic analysis for the Mine. The material factors that could cause actual results to differ materially from the conclusions, estimates, designs, forecasts or projections in the forward-looking information include any significant differences from one or more of the material factors or assumptions that were set forth in this sub-section including estimated capital and operating costs, project schedule and approvals timing, availability of funding, projected commodities markets and prices. 19.1 Principal Assumptions Sales price: The price and value of phosphate rock produced by Tapira was developed based on a comparison of available gross margin compared to the cost of phosphate rock production at CMT. See Section 16.0 for additional information on pricing methodology. Production: The total phosphate ore production schedule for Tapira is based on supplying about 64.2 M tonnes of conventional concentrate, and 5.2 M tonnes of Ultrafine concentrate over the LOM. FX Rate: WSP converted the DCF from Brazilian Reais to US Dollars, at an exchange rate of R$4.86 = US$1.00. Inflation: No inflation was applied to costs or revenues. Diesel Prices: The prices range from R$4.00/L to R$4.41/L for S-500, and R$4.06/L to R$4.49/L for S-10. Discount Rate: A discount rate of 13.69% was used to account for cost of capital and project risk. 19.2 Cashflow Forecast The cashflow for production from the Tapira Mine is shown in Table 19.1 in R$. Table 19.2 represents the cashflow in US$. An exchange rate of R$4.86 = US$1.00 was applied.

Report Date: February 20, 2024 31406539.009-001-TRS-Rev0 Effective Date: December 31, 2023 Complexo Mineração de Tapira 19-2 Table 19.1: Cashflow (real 2023 R$ terms) 2024 2025 2026 2027 2028 2029 2030 2031 2032 2033 2034 2035 Sales Price (R$ / Tonne) 547.34 547.34 547.34 547.34 547.34 547.34 547.34 547.34 547.34 547.34 547.34 547.34 Production (000's Tonnes) 1,933 1,978 2,057 2,124 2,156 2,162 1,895 1,895 1,895 1,895 1,895 2,066 FX Rate (BRL to USD) 4.86 4.86 4.86 4.86 4.86 4.86 4.86 4.86 4.86 4.86 4.86 4.86 Diesel Price: S-500 (R$/L) 5.41 5.19 5.13 5.26 5.39 5.53 5.67 5.67 5.67 5.67 5.67 5.67 Diesel Price: S-10 (R$/L) 5.49 5.27 5.22 5.34 5.48 5.62 5.76 5.76 5.76 5.76 5.76 5.76 Concentrate 1,058,033 1,082,750 1,125,958 1,162,318 1,179,914 1,183,432 1,037,286 1,037,286 1,037,286 1,037,286 1,037,286 1,130,704 Other Revenue Sales Revenue (Tapira Mine) 1,058,033 1,082,750 1,125,958 1,162,318 1,179,914 1,183,432 1,037,286 1,037,286 1,037,286 1,037,286 1,037,286 1,130,704 Mining 564,478 538,776 564,805 541,192 556,202 554,043 478,167 478,167 478,167 478,167 478,167 485,130 Processing 298,167 301,626 307,939 313,401 315,935 316,558 295,480 295,480 295,480 295,480 295,480 309,106 Other Operating Costs 7,146 7,146 7,146 7,146 7,146 7,146 7,146 7,146 7,146 7,146 7,146 7,146 Resource Taxes, Royalties and Other Government Levies or Interests 17,958 17,495 18,168 17,790 18,155 18,123 16,105 16,105 16,105 16,105 16,105 16,534 Cash Costs of Production (Excluding Taxes) 869,791 847,548 879,890 861,739 879,284 877,747 780,793 780,793 780,793 780,793 780,793 801,382 Allocated Costs Other Costs 29,717 29,717 29,717 29,717 29,717 29,717 29,717 29,717 29,717 29,717 29,717 29,717 Income Taxes Income Tax 30,013 39,806 40,095 51,900 49,485 50,092 37,887 37,124 36,295 35,446 33,578 49,767 Closure Reclamation and Closure 116 88 1 - 3,325 6,182 8,789 39,594 12,192 662 - - Capital Expenditures Capital Expenditures 328,181 263,900 274,917 226,127 274,980 76,017 88,222 82,380 86,238 84,861 179,318 153,748 Working Capital Net Change in Working Capital (5,388) (2,755) 1,857 (2,687) 1,166 (239) (5,117) - - - - (606) Cash Flow Annual Net Cash Flow (212,354) (113,049) (118,687) (22,268) (76,198) 125,791 80,891 51,574 75,946 89,702 (2,225) 80,162 Tapira 00 0' s R$ Revenue Costs of Production Assumptions 2036 2037 2038 2039 2040 2041 2042 2043 2044 2045 2046 2047 Sales Price (R$ / Tonne) 547.34 547.34 547.34 547.34 547.34 547.34 547.34 547.34 547.34 547.34 547.34 547.34 Production (000's Tonnes) 2,066 2,066 2,066 2,066 2,162 2,162 2,162 2,162 2,162 1,923 1,923 1,923 FX Rate (BRL to USD) 4.86 4.86 4.86 4.86 4.86 4.86 4.86 4.86 4.86 4.86 4.86 4.86 Diesel Price: S-500 (R$/L) 5.67 5.67 5.67 5.67 5.67 5.67 5.67 5.67 5.67 5.67 5.67 5.67 Diesel Price: S-10 (R$/L) 5.76 5.76 5.76 5.76 5.76 5.76 5.76 5.76 5.76 5.76 5.76 5.76 Concentrate 1,130,704 1,130,704 1,130,704 1,130,704 1,183,432 1,183,432 1,183,432 1,183,432 1,183,432 1,052,767 1,052,767 1,052,767 Other Revenue Sales Revenue (Tapira Mine) 1,130,704 1,130,704 1,130,704 1,130,704 1,183,432 1,183,432 1,183,432 1,183,432 1,183,432 1,052,767 1,052,767 1,052,767 Mining 485,130 485,130 485,130 485,130 483,077 483,092 483,092 483,092 483,077 430,188 430,188 430,188 Processing 309,106 309,106 309,106 309,106 316,455 316,455 316,455 316,455 316,455 297,445 297,445 297,445 Other Operating Costs 7,146 7,146 7,146 7,146 7,146 7,146 7,146 7,146 7,146 7,146 7,146 7,146 Resource Taxes, Royalties and Other Government Levies or Interests 16,534 16,534 16,534 16,534 16,644 16,644 16,644 16,644 16,644 15,147 15,147 15,147 Cash Costs of Production (Excluding Taxes) 801,382 801,382 801,382 801,382 806,679 806,694 806,694 806,694 806,679 734,780 734,780 734,780 Allocated Costs Other Costs 29,717 29,717 29,717 29,717 29,717 29,717 29,717 29,717 29,717 29,717 29,717 29,717 Income Taxes Income Tax 48,811 46,939 45,628 44,281 54,543 53,018 51,379 49,630 46,495 30,555 28,431 26,146 Closure Reclamation and Closure - - - - - - - - - - - - Capital Expenditures Capital Expenditures 84,143 157,263 104,876 102,326 103,176 103,493 104,844 104,986 175,778 101,813 101,964 100,506 Working Capital Net Change in Working Capital - - - - (935) 1 - - (1) (3,190) - - Cash Flow Annual Net Cash Flow 150,117 78,869 132,567 136,464 173,608 173,865 174,153 175,761 108,121 143,946 142,729 146,471 Tapira 00 0' s R$ Revenue Costs of Production Assumptions

Report Date: February 20, 2024 31406539.009-001-TRS-Rev0 Effective Date: December 31, 2023 Complexo Mineração de Tapira 19-3 Table 19.1 (cont.) Note: Costs are rounded to the nearest thousand R$. Rounding as required by the reporting guidelines may result in apparent summation differences. 2048 2049 2050 2051 2052 2053 2054 2055 2056 2057 Total/ Average Sales Price (R$ / Tonne) 547.34 547.34 547.34 547.34 547.34 547.34 547.34 547.34 547.34 547.34 543.17 Production (000's Tonnes) 1,923 1,923 2,154 2,154 2,154 2,154 2,154 2,014 2,014 2,014 69,453 FX Rate (BRL to USD) 4.86 4.86 4.86 4.86 4.86 4.86 4.86 4.86 4.86 4.86 4.86 Diesel Price: S-500 (R$/L) 5.67 5.67 5.67 5.67 5.67 5.67 5.67 5.67 5.67 5.67 5.61 Diesel Price: S-10 (R$/L) 5.76 5.76 5.76 5.76 5.76 5.76 5.76 5.76 5.76 5.76 5.70 Concentrate 1,052,767 1,052,767 1,178,754 1,178,754 1,178,754 1,178,754 1,178,754 1,102,422 1,102,422 1,102,422 37,724,770 Other Revenue Sales Revenue (Tapira Mine) 1,052,767 1,052,767 1,178,754 1,178,754 1,178,754 1,178,754 1,178,754 1,102,422 1,102,422 1,102,422 37,724,770 Mining 430,188 430,188 351,994 351,994 351,994 351,994 351,994 281,159 281,159 281,159 15,305,798 Processing 297,445 297,445 315,765 315,765 315,765 315,765 315,765 303,912 303,912 303,912 10,436,622 Other Operating Costs 7,146 7,146 7,146 7,146 7,146 7,146 7,146 7,146 7,146 7,146 242,964 Resource Taxes, Royalties and Other Government Levies or Interests 15,147 15,147 13,901 13,901 13,901 13,901 13,901 12,180 12,180 12,180 535,885 Cash Costs of Production (Excluding Taxes) 734,780 734,780 674,904 674,904 674,904 674,904 674,904 592,218 592,218 592,218 25,985,384 Allocated Costs Other Costs 29,717 29,717 29,717 29,717 29,717 29,717 29,717 29,717 29,717 29,717 1,010,378 Income Taxes Income Tax 23,482 20,531 63,664 60,023 55,873 50,834 44,402 38,182 25,210 232 1,162,316 Closure Reclamation and Closure - - - - - - - 161 11,343 307,900 338,773 Capital Expenditures Capital Expenditures 106,593 106,224 106,256 101,950 99,607 100,767 102,922 101,222 103,770 99,915 (4,493,279) Working Capital Net Change in Working Capital - - (9,029) - - - - (5,675) - - (32,501) Cash Flow Annual Net Cash Flow 143,049 146,368 299,340 298,258 304,752 308,630 312,908 334,419 327,985 60,261 4,231,255 Tapira 00 0' s R$ Revenue Costs of Production Assumptions

Report Date: February 20, 2024 31406539.009-001-TRS-Rev0 Effective Date: December 31, 2023 Complexo Mineração de Tapira 19-4 Table 19.2: Cashflow (real 2023 USD$ terms) 2024 2025 2026 2027 2028 2029 2030 2031 2032 2033 2034 2035 Sales Price (USD / Tonne) 112.62 112.62 112.62 112.62 112.62 112.62 112.62 112.62 112.62 112.62 112.62 112.62 Production (000's Tonnes) 1,933 1,978 2,057 2,124 2,156 2,162 1,895 1,895 1,895 1,895 1,895 2,066 FX Rate (BRL to USD) 4.86 4.86 4.86 4.86 4.86 4.86 4.86 4.86 4.86 4.86 4.86 4.86 Diesel Price: S-500 (USD/gal) 4.21 4.04 4.00 4.09 4.20 4.31 4.41 4.41 4.41 4.41 4.41 4.41 Diesel Price: S-10 (USD/gal) 4.28 4.11 4.06 4.16 4.27 4.37 4.49 4.49 4.49 4.49 4.49 4.49 Concentrate 217,702 222,788 231,679 239,160 242,781 243,504 213,433 213,433 213,433 213,433 213,433 232,655 Other Revenue Sales Revenue (Tapira Mine) 217,702 222,788 231,679 239,160 242,781 243,504 213,433 213,433 213,433 213,433 213,433 232,655 Mining 116,148 110,859 116,215 111,356 114,445 114,001 98,388 98,388 98,388 98,388 98,388 99,821 Processing 61,351 62,063 63,362 64,486 65,007 65,135 60,798 60,798 60,798 60,798 60,798 63,602 Other Operating Costs 1,470 1,470 1,470 1,470 1,470 1,470 1,470 1,470 1,470 1,470 1,470 1,470 Resource Taxes, Royalties and Other Government Levies or Interests 3,695 3,600 3,738 3,661 3,736 3,729 3,314 3,314 3,314 3,314 3,314 3,402 Cash Costs of Production (Excluding Taxes) 178,969 174,393 181,047 177,313 180,923 180,606 160,657 160,657 160,657 160,657 160,657 164,893 Allocated Costs Other Costs 6,115 6,115 6,115 6,115 6,115 6,115 6,115 6,115 6,115 6,115 6,115 6,115 Income Taxes Income Tax 6,175 8,190 8,250 10,679 10,182 10,307 7,796 7,639 7,468 7,293 6,909 10,240 Closure Reclamation and Closure 24 18 0 - 684 1,272 1,808 8,147 2,509 136 - - Capital Expenditures Capital Expenditures 67,527 54,300 56,567 46,528 56,580 15,641 18,153 16,951 17,745 17,461 36,897 31,635 Working Capital Net Change in Working Capital (1,109) (567) 382 (553) 240 (49) (1,053) - - - - (125) Cash Flow Annual Net Cash Flow (43,694) (23,261) (24,421) (4,582) (15,679) 25,883 16,644 10,612 15,627 18,457 (458) 16,494 Tapira 00 0' s US D Revenue Costs of Production Assumptions 2036 2037 2038 2039 2040 2041 2042 2043 2044 2045 2046 2047 Sales Price (USD / Tonne) 112.62 112.62 112.62 112.62 112.62 112.62 112.62 112.62 112.62 112.62 112.62 112.62 Production (000's Tonnes) 2,066 2,066 2,066 2,066 2,162 2,162 2,162 2,162 2,162 1,923 1,923 1,923 FX Rate (BRL to USD) 4.86 4.86 4.86 4.86 4.86 4.86 4.86 4.86 4.86 4.86 4.86 4.86 Diesel Price: S-500 (USD/gal) 4.41 4.41 4.41 4.41 4.41 4.41 4.41 4.41 4.41 4.41 4.41 4.41 Diesel Price: S-10 (USD/gal) 4.49 4.49 4.49 4.49 4.49 4.49 4.49 4.49 4.49 4.49 4.49 4.49 Concentrate 232,655 232,655 232,655 232,655 243,504 243,504 243,504 243,504 243,504 216,619 216,619 216,619 Other Revenue Sales Revenue (Tapira Mine) 232,655 232,655 232,655 232,655 243,504 243,504 243,504 243,504 243,504 216,619 216,619 216,619 Mining 99,821 99,821 99,821 99,821 99,399 99,402 99,402 99,402 99,399 88,516 88,516 88,516 Processing 63,602 63,602 63,602 63,602 65,114 65,114 65,114 65,114 65,114 61,203 61,203 61,203 Other Operating Costs 1,470 1,470 1,470 1,470 1,470 1,470 1,470 1,470 1,470 1,470 1,470 1,470 Resource Taxes, Royalties and Other Government Levies or Interests 3,402 3,402 3,402 3,402 3,425 3,425 3,425 3,425 3,425 3,117 3,117 3,117 Cash Costs of Production (Excluding Taxes) 164,893 164,893 164,893 164,893 165,983 165,986 165,986 165,986 165,983 151,189 151,189 151,189 Allocated Costs Other Costs 6,115 6,115 6,115 6,115 6,115 6,115 6,115 6,115 6,115 6,115 6,115 6,115 Income Taxes Income Tax 10,043 9,658 9,388 9,111 11,223 10,909 10,572 10,212 9,567 6,287 5,850 5,380 Closure Reclamation and Closure - - - - - - - - - - - - Capital Expenditures Capital Expenditures 17,313 32,359 21,579 21,055 21,230 21,295 21,573 21,602 36,168 20,949 20,980 20,680 Working Capital Net Change in Working Capital - - - - (192) 0 - - (0) (656) - - Cash Flow Annual Net Cash Flow 30,888 16,228 27,277 28,079 35,722 35,775 35,834 36,165 22,247 29,619 29,368 30,138 Tapira 00 0' s US D Revenue Costs of Production Assumptions

Report Date: February 20, 2024 31406539.009-001-TRS-Rev0 Effective Date: December 31, 2023 Complexo Mineração de Tapira 19-5 Table 19.2 (cont.) Note: Costs are rounded to the nearest thousand US$. Rounding as required by the reporting guidelines may result in apparent summation differences. 2048 2049 2050 2051 2052 2053 2054 2055 2056 2057 Total/ Average Sales Price (USD / Tonne) 112.62 112.62 112.62 112.62 112.62 112.62 112.62 112.62 112.62 112.62 112.62 Production (000's Tonnes) 1,923 1,923 2,154 2,154 2,154 2,154 2,154 2,014 2,014 2,014 69,453 FX Rate (BRL to USD) 4.86 4.86 4.86 4.86 4.86 4.86 4.86 4.86 4.86 4.86 4.86 Diesel Price: S-500 (USD/gal) 4.41 4.41 4.41 4.41 4.41 4.41 4.41 4.41 4.41 4.41 4.37 Diesel Price: S-10 (USD/gal) 4.49 4.49 4.49 4.49 4.49 4.49 4.49 4.49 4.49 4.49 4.44 Concentrate 216,619 216,619 242,542 242,542 242,542 242,542 242,542 226,836 226,836 226,836 7,821,889 Other Revenue Sales Revenue (Tapira Mine) 216,619 216,619 242,542 242,542 242,542 242,542 242,542 226,836 226,836 226,836 7,821,889 Mining 88,516 88,516 72,427 72,427 72,427 72,427 72,427 57,852 57,852 57,852 3,149,341 Processing 61,203 61,203 64,972 64,972 64,972 64,972 64,972 62,533 62,533 62,533 2,147,453 Other Operating Costs 1,470 1,470 1,470 1,470 1,470 1,470 1,470 1,470 1,470 1,470 49,993 Resource Taxes, Royalties and Other Government Levies or Interests 3,117 3,117 2,860 2,860 2,860 2,860 2,860 2,506 2,506 2,506 110,264 Cash Costs of Production (Excluding Taxes) 151,189 151,189 138,869 138,869 138,869 138,869 138,869 121,855 121,855 121,855 5,346,787 Allocated Costs Other Costs 6,115 6,115 6,115 6,115 6,115 6,115 6,115 6,115 6,115 6,115 207,897 Income Taxes Income Tax 4,832 4,224 13,100 12,350 11,496 10,460 9,136 7,856 5,187 48 288,020 Closure Reclamation and Closure - - - - - - - 33 2,334 63,354 80,320 Capital Expenditures Capital Expenditures 21,933 21,857 21,863 20,977 20,495 20,734 21,177 20,827 21,352 20,559 (924,543) Working Capital Net Change in Working Capital - - (1,858) - - - - (1,168) - - (6,708) Cash Flow Annual Net Cash Flow 29,434 30,117 61,593 61,370 62,706 63,504 64,384 68,810 67,487 12,399 870,766 Tapira 00 0' s US D Revenue Costs of Production Assumptions

Report Date: February 20, 2024 31406539.009-001-TRS-Rev0 Effective Date: December 31, 2023 Complexo Mineração de Tapira 19-6 As shown in Table 19.1 and Table 19.2, the following parameters were calculated or generated: Sales Revenue: The total sales revenue of $7.82 B (R$38.01 B) only includes the concentrate sales. Other revenues do not apply for the Tapira mine. The LOM Internal Transfer Price of $112.60/t (547.21) is calculated by setting the NPV to zero at the targeted discount rate of 13.69%. Mining and Beneficiation Cost: The total mining and beneficiation cost were $3.1 B (R$15.3 B) and $2.1 B (R$10.4 B) respectively. See Section 18.0 for more details. Other Operating Costs: The total other operating costs of $50.0 M (R$243.0 M) is a LOM sum of a fixed annual cost of $1.47 M (R$7.1 M), which includes legal expenses, Instituto Mosaic (community relations), health insurance for retirees, legal contingency, and others. Royalties and other government Levies or Interests: For the Tapira property, there are no royalties for mining operations on site. CFEM (2%) is calculated based on the costs of rock production. Cash Costs of Production: The total cash cost of production, excluding taxes, is $5.7 B (R$27.9 B). Other costs: The other costs include a total cost of $87.2 M (R$423.9 M) for SG&A, which is an annual fixed cost of $2.57 M (R$12.5 M), and a total cost of $120.7 M (R$586.4 M) for Other COGs (Facilities Idling, R&D, turnaround, inventory, etc.), which is an annual fixed cost of $3.6 M (R$17.3 M). Taxes: The tax rate for the DCF was set at 25%. Reclamation and Closure: The Closure costs continued until 2068. For simplicity, the cashflow is presented through the final year of mining with the Closure costs beyond the final year of mining accumulated, discounted (at the 13.69% discount rate) and included in the Closure cost estimate in year 2057. The total discounted LOM cost of Closure cost accretions is $80.3 M (R$390.4 M). Capital Expenditures: The total capital expenditures include sustaining and opportunity capital and is $924.5 M (R$4.5 B). See Section 18.0 for more details. Net Change in Working Capital: The working capital is calculated by using total annual days, accounts receivable, accounts payable, and inventory. It is assumed that the remaining working capital is recovered in the final year which makes the sum of all calculated working capital equal to zero. Cashflow: The cashflow is calculated by subtracting all operating, taxes, capital costs, and closure cost accretion from the total revenue. Net Present Value: The NPV was set to zero, by setting the Internal Transfer Price to a constant value of $112.60 (R$547.21). 19.3 Sensitivity Analysis The sensitivity analysis was carried out by independently varying the price, operating cost, and capital cost. The results of the sensitivity analysis are shown in Table 19.3 and Table 19.4.

Report Date: February 20, 2024 31406539.009-001-TRS-Rev0 Effective Date: December 31, 2023 Complexo Mineração de Tapira 19-7 Table 19.3: Sensitivity Analysis (Millions of Reais) Note: Costs are rounded to the nearest million R$. Rounding as required by the reporting guidelines may result in apparent summation differences. Table 19.4: Sensitivity Analysis (Millions of US Dollars) Note: Costs are rounded to the nearest million US$. Rounding as required by the reporting guidelines may result in apparent summation differences. Because the Mosaic phosphate mines are captive suppliers of phosphate concentrate to Mosaic Chemical Plant(s), market demand risk is negligible. Market price risk is dependent on the ability of Mosaic to pay the mining, beneficiation, and transport costs of the run-of-mine phosphate ore over the study period. Mosaic’s ability to cover the mining and beneficiation costs is dependent upon sales of fertilizer products produced from the Chemical Plant(s) and the Gross Margin Available (Total Revenue - Chemical Plant Operating Costs). Phosphate ore is economical if the price of concentrate is lower than the Gross Margin Available. Item -20% -10% 0% 10% 20% Price (1,302) (602) - 601 1,202 Operating Cost 920 460 - (460) (945) Capital 270 135 - (135) (270) Item -20% -10% 0% 10% 20% Price (268) (124) - 124 247 Operating Cost 189 95 - (95) (194) Capital 56 28 - (28) (56)

Report Date: February 20, 2024 31406539.009-001-TRS-Rev0 Effective Date: December 31, 2023 Complexo Mineração de Tapira 20-1 20.0 ADJACENT PROPERTIES There is no information used in this TRS that has been sourced from adjacent properties. The phosphate mineralization for this deposit is limited to the igneous complex, which is fully enclosed within the CMT mining permits. Due to this, material changes to the Mineral Resource and Mineral Reserve estimates are not likely if adjacent property information is included in future estimates. Adjacent property mining occurs within the region, however within different igneous complexes.

Report Date: February 20, 2024 31406539.009-001-TRS-Rev0 Effective Date: December 31, 2023 Complexo Mineração de Tapira 21-1 21.0 OTHER RELEVANT DATA AND INFORMATION It is the opinion of the QPs that all material information has been stated in the above sections of this TRS.

Report Date: February 20, 2024 31406539.009-001-TRS-Rev0 Effective Date: December 31, 2023 Complexo Mineração de Tapira 22-1 22.0 INTERPRETATION AND CONCLUSIONS This section contains forward-looking information related to Mineral Resources and the LOM plan for the Mine. The material factors that could cause actual results to differ materially from the conclusions, estimates, designs, forecasts or projections in the forward-looking information include any significant differences from one or more of the material factors or assumptions that were forth in this sub-section including geological and grade interpretations and controls and assumptions and forecasts associated with establishing the prospects for economic extraction, grade continuity analysis and assumptions, Mineral Resource model tonnes and grade and mine design parameters, actual plant feed characteristics that are different from the historical operations or from samples tested to date, equipment and operational performance that yield different results from the historical operations and historical and current test work results, mining strategy and production rates, expected mine life and mining unit dimensions, prevailing economic conditions, commodity demand and prices are as forecast over the LOM period, waste disposal volumes increase from historical values and predicted values, that regulatory framework is unchanged during the Study period, and no unforeseen environmental, social or community events disrupt timely approvals, regulatory framework is unchanged for Study period and no unforeseen environmental, social or community events disrupt timely approvals, and estimated capital and operating costs, project schedule and approvals timing, availability of funding, projected commodities markets and prices. Based on current project status, the QP’s are not recommending additional work at this time. However, the following recommendations have been identified to further enhance internal processes and planning. 22.1 Mineral Resources The following is a summary of the key interpretations and conclusions relating to geology and Mineral Resource estimation: The CMT geology team has a clear understanding of the interaction of lithology and weather as it related to controlling the phosphate mineralization of interest. The geological and deposit related knowledge has been appropriately used to develop and guide the exploration, modeling and estimation processes used by the CMT geology team. Exploration data collection methods and results were well documented for both historical and recent exploration campaigns. The exploration data collection methods followed industry standard practices that were in place at the time of the various exploration campaigns. CMT has conducted appropriate internal and external third-party data verification and data validation work on both historical and recent exploration data to ensure the geological database is reliable, representative, and free of material errors or omissions. Data that did not meet the standards for reliability were removed entirely from the modeling database or were used in a limited capacity (i.e., lithology modeling, but not grade interpolation). The resultant validated geological database is considered reliable, representative and it is the QPs view that it is fit for purpose in developing a geological model and for the preparation of Mineral Resource estimates as well as for use in other modifying factors studies, including mine design and scheduling and Mineral Reserve estimation.

Report Date: February 20, 2024 31406539.009-001-TRS-Rev0 Effective Date: December 31, 2023 Complexo Mineração de Tapira 22-2 The geological interpretation and modeling methodology is appropriate for the style of mineralization and data available for CMT. The modeling methodology followed current industry standard practices. Modeling of the lithology and weathering domains and interpolation of the grade parameters was guided by sound geological interpretation and detailed geological, statistical, and geostatistical analysis and interpretation of the validated geological data. The mature nature of the operation and a solid understanding of the confidence of continuity of the geological domains of interest has supported the establishment of Reasonable Prospects for Economic Extraction for the CMT phosphate Mineral Resources reported in this TRS. The classification of Mineral Resources into confidence classes Measured, Indicated, and Inferred considered spatial variability of geological domains (both lithology and weathering) and grade parameters as well as geological confidence and uncertainty in the various methods and results used to develop the estimate, spanning exploration through estimation. The impact of geological uncertainty and risk has been evaluated across various key stages of the data collection, modeling and estimation process. A high-level summary of the assessment of geological uncertainty is as follows: Measured Mineral Resources are considered to have a low degree of geological uncertainty across all elements evaluated. Indicated Mineral Resources are also considered to have a low degree of geological uncertainty across most items, except for local scale variability in geological and grade modeling, where broader spatial distribution and confidence of continuity (relative to Measured category) may result in low-moderate uncertainty in these elements. This is not seen as a risk to the global estimate of Mineral Resources for CMT but could have local short range impact on future mining operations if not addressed via infill/production drilling and so forth. Inferred Mineral Resources are considered to have a mix of low to moderate degree of geological uncertainty across all elements evaluated. As with the low-moderate risks identified in the Indicated Mineral Resource category above, the risks in the Inferred Mineral Resource category are primarily relating to spatial distribution of data and confidence of continuity, and again are seen as potential impacts on local rather than global estimates. Geological uncertainty in the Inferred Mineral Resource category can likely be reduced via future infill and production drilling. As CMT is an operation with almost 45 years of operational experience and data, the QP does not see any issues that require further work relating to relevant technical and economic factors that are likely to influence the prospect of economic extraction. Geological and Mineral Resource recommendations for CMT relate to improving confidence/understanding of the local variability for short range planning purposes that could be completed by site teams to provide improvements to short-term recovery and grade control. These are not seen as having an impact on the prospect of economic extraction. The QP for the Mineral Resource estimates does not believe that there are significant risks or uncertainties associated with the Mineral Resource estimate, as discussed in Section 11.5 and Section 11.7.

Report Date: February 20, 2024 31406539.009-001-TRS-Rev0 Effective Date: December 31, 2023 Complexo Mineração de Tapira 22-3 22.2 Mineral Reserves The following is a summary of the key interpretations and conclusions relating to the mine plan components and Mineral Reserve estimation: The Tapira mine is a well-established operation. The deposit, mining, beneficiation, and environmental aspects of the Mine are very well understood. The operational and technical knowledge has been appropriately used in the development of the LOM Plan and Mineral Reserve estimation. Years of historical operational data and observations have been well documented. The Mineral Reserve estimate summarized in Section 12.4 is based on a PFS level LOM plan, employing proven industry and practical methods of mining applicable to the type of ore deposit, demonstrated to be economic through a companion OPEX/CAPEX costing estimate. The Mineral Reserve estimate has been prepared to comply with all disclosure standards for Mineral Reserves under S-K 1300 reporting requirements, including: Consideration of the economically mineable part of Measured and Indicated Mineral Resource estimates Proper application of modifying factors to the Mineral Resources, including: − Estimation/modeling of allowances for mining loss and inclusion of mining diluting materials − Pit optimization − COG estimation − Process mass and metallurgical recovery estimates based on industry standardized testing Consideration of: − Mining and beneficiation practices and requirements − Metallurgical factors − Infrastructure requirements − Economic and marketing factors − Legal, government, environmental, and social obligations Classification of the estimated Mineral Reserves as Proven and Probable Mining of phosphate ore at CMT relies on typical open-pit type of unit operations to remove, transport and store overburden and other non-ore bearing material, and extraction and transportation of ore to the beneficiation plant. The CMT operation has equipment for open-pit mining of the appropriate fleet size and capacity, and labor staffing to support the LOM production plan. Process recovery relies upon standardized metallurgical and analytical testing. The metallurgical and analytical testing and historical data is adequate for the estimation of mass and metallurgical recovery estimation factors and estimation of Mineral Reserves.

Report Date: February 20, 2024 31406539.009-001-TRS-Rev0 Effective Date: December 31, 2023 Complexo Mineração de Tapira 22-4 Process mass recovery estimations are based on linear regression equations based on laboratory flotation testing and have historically provided a good estimation of predictive values of phosphate recovery. The Tapira beneficiation process is similar to other processes treating Brazilian igneous phosphate ores. The capacity of the beneficiation plant is sufficient to support the LOM production plan. Sufficient infrastructure is in-place to support the Tapira mining and beneficiation operations with planned expansion as necessary to support the LOM Plan, including: Project rail and road access OSFs Process TSFs Water and pipelines Power supply and local electric distribution lines Mine and beneficiation maintenance and support facilities Critical environmental studies have been completed, including a 2016 ESIA. Critical community issues which have been identified include potential impacts on impoundment dam failures. All requirements for environmental monitoring for effluents, air quality and surface/groundwater quality are in place. A waste management plan is in place. Currently, 30 environmental permits in place. Mine closure plans and cost estimates are completed, representing current land disturbance conditions and anticipated land disturbance conditions at the end of the LOM. The primary risks, that could materially affect the Mineral Reserve estimate, would include: A long-term, global material decrease in fertilizer product prices for sales that are not protected under long- term sales agreements Inflation rates with corresponding changes in capital and operating costs Production rates Exchange rates Tax rates Changing environmental regulations Change in political climate The relocation of state highway MG-146 includes re-locating the Fazenda Nova Bom Jardim Settlement, which is located to the west of the Mosaic currently controlled surface area. Risks include social risk during negotiations and an economic risk since Mosaic has not yet acquired the surface rights. This area is included in the currently controlled mining permits; and is therefore, not seen as a significant encumbrance to CMT.

Report Date: February 20, 2024 31406539.009-001-TRS-Rev0 Effective Date: December 31, 2023 Complexo Mineração de Tapira 22-5 The capacity requirements are not currently in place for all tailings disposal for total LOM capacity requirements. However, CMT has an ongoing permitting and development plan to support the mining operations that will continue through the LOM requirements.

Report Date: February 20, 2024 31406539.009-001-TRS-Rev0 Effective Date: December 31, 2023 Complexo Mineração de Tapira 23-1 23.0 RECOMMENDATIONS 23.1 Mineral Resources The recommendations listed below are focused on improving local variability for short-range planning purposes that could be completed by site teams to provide improvements to short-term recovery and grade control. They are not seen as having an impact on the prospect of economic extraction. Further investigation on the impacts of alternative grade interpolation methods such as surface normal, dynamic anisotropy, and so forth. Consider further interpretive controls on the leapfrog lithological domain modeling to improve geological reasonableness of the domain modeling. Future modeling efforts should include a simplified, uniform compositing basis. This will likely have changes to local estimates, but will likely not have material changes to the global estimate. 23.2 Mineral Reserves The recommendations listed below are focused on supporting the LOM Plan requirements and to ensure maximum recovery of stated reserves. These recommendations will have an economic impact on economic extraction: Continue design and permitting efforts to ensure the re-route of the MG-146. Continue and complete negotiations (technical, financial and social aspects) to successfully relocate Fazenda Nova Bom Jardim Settlement. Continue with design and permitting efforts required to expand tailings facility capacity as necessary to support the long-term extraction of reserves.

Report Date: February 20, 2024 31406539.009-001-TRS-Rev0 Effective Date: December 31, 2023 Complexo Mineração de Tapira 24-1 24.0 REFERENCES CRU International Ltd., Phosphate Rock Database, November 2023. CRU International Ltd., Phosphate Fertilizer Market Outlook, November 2023. GOLDER, 2021. Plano Conceitual de Fechamento do Complexo de Mineração de Tapira. MOSAIC, 2020. Resultados Automonitoramento – 2020 – Atendimento a Condicionante nº 5 da Licença de Operação nº 028/2012 Substituído pelo Nº 138/2017. (file: Relatório Automonitoramento 2019.pdf) MULTIGEO, 2017a. Investigação Ambiental da Qualidade do Solo nos Quatro Postos de Abastecimento de Combustíveis. MULTIGEO, 2017b. Estudo de Impacto Ambiental. Alteamento da Barragem BL-1. MULTIGEO, 2016. Estudo de Impacto Ambiental - Complexo de Mineração de Tapira. MULTIGEO, 2011. Investigação Confirmatória de Passivo Ambiental em Áreas Industriais. PÓTAMOS, 2019. Diagnóstico do uso da água nas unidades industriais Araxá – Tapira, Tapira – Cajati. (file: CAJ - CAJATI - POTMOS0001-1-TC-APT-0004.pdf) RAMBOLL, 2018. Conceptual Site Model - Areas Of Interest.

Report Date: February 20, 2024 31406539.009-001-TRS-Rev0 Effective Date: December 31, 2023 Complexo Mineração de Tapira 25-1 25.0 RELIANCE ON INFORMATION PROVIDED BY THE REGISTRANT The Qualified Persons for Mineral Resources and Mineral Reserves have relied upon the registrant to supply information that was used in the following Sections: Description of mineral and property rights Section 11.3 – Resource pit shell costs and pricing for Mineral Resources Section 12.2.4 and 12.2.5 – COG costs and pricing for Mineral Reserves Section 12.2.6 – Pit Optimization costs and pricing for Mineral Reserves Section 16.0 – Market Studies Section 19.0 – Economic Analysis For the information relating to mineral and property rights in this TRS, WSP relied on Mosaic’s permitting and environmental team. WSP has not researched property or mineral rights for CMT as we consider it to be reasonable to rely on Mosaic’s permitting and environmental team who is responsible for maintaining this information. WSP has also relied on Mosaic’s finance team for details regarding applicable taxes, royalties, exchange rates, product pricing, and market studies as noted in the COG and pit optimization for Mineral Resources and Mineral Reserves, Market Studies, and the Economic Analysis. It is WSP’s opinion that it is reasonable to rely on Mosaic for this information as Mosaic has been operating CMT since 2018.

wsp.com
EX-97.1
14
exhibit971_20231231.htm
EX-97.1
Document
THE MOSAIC COMPANY
INCENTIVE COMPENSATION RECOVERY POLICY
1.Introduction.
The Board of Directors of the Mosaic Company (the “Company”) believes that it is in the best interests of the Company and its stockholders to create and maintain a culture that emphasizes integrity and accountability and that reinforces the Company's compensation philosophy. The Board has therefore adopted this policy, which provides for the recovery of erroneously awarded incentive compensation in the event that the Company is required to prepare an accounting restatement due to material noncompliance of the Company with any financial reporting requirements under the federal securities laws (the “Policy”). This Policy is designed to comply with Section 10D of the Securities Exchange Act of 1934, as amended (the “Exchange Act”), related rules and the listing standards of the New York Stock Exchange (the “NYSE”) or any other securities exchange on which the Company’s shares are listed in the future.
2.Administration.
This Policy shall be administered by the Board or, if so designated by the Board, the Compensation and Human Resources Committee (the “Committee”), in which case, all references herein to the Board shall be deemed references to the Committee. Any determinations made by the Board shall be final and binding on all affected individuals.
3.Covered Executives.1
Unless and until the Board determines otherwise, for purposes of this Policy, the term “Covered Executive” means a current or former employee who is or was identified by the Company as the Company’s president, principal financial officer, principal accounting officer (or if there is no such accounting officer, the controller), any vice-president of the Company in charge of a principal business unit, division, or function (such as sales, administration, or finance), any other officer who performs a policy-making function, or any other person who performs similar policy-making functions for the Company. Executive officers of the Company’s subsidiaries are deemed “Covered Executives” if they perform such policy-making functions for the Company. “Policy-making function” is not intended to include policy-making functions that are not significant. “Covered Executives” will include, at minimum, the executive officers identified by the Company pursuant to Item 401(b) of Regulation S-K of the Exchange Act.
This Policy covers Incentive Compensation received by a person after beginning service as a Covered Executive and who served as a Covered Executive at any time during the performance period for that Incentive Compensation.
4.Recovery: Accounting Restatement.
In the event the Company is required to prepare an accounting restatement of its financial statements filed with the Securities and Exchange Commission (the “SEC”) due to the Company’s material noncompliance with any financial reporting requirements under the federal securities laws (including any required accounting restatement to correct an error in previously issued financial statements that is material to the previously issued financial statements, or that
1 “Covered Executive” is based on the definition of “officer” under Rule 16a-1(f) of the Exchange Act as presented in the listings standards.
would result in a material misstatement if the error were corrected in the current period or left uncorrected in the current period) (an “Accounting Restatement”), the Company will recover reasonably promptly any excess Incentive Compensation received by any Covered Executive during the three completed fiscal years immediately preceding the date on which the Company is required to prepare an Accounting Restatement, including transition periods resulting from a change in the Company’s fiscal year as provided in Rule 10D-1 of the Exchange Act (the “Recovery Period”). Incentive Compensation is deemed “received” in the Company’s fiscal period during which the financial reporting measure specified in the Incentive Compensation award is attained, even if the payment or grant of the Incentive Compensation occurs after the end of that Recovery Period. The determination of the time when the Company is “required” to prepare an Accounting Restatement shall be made in accordance with applicable SEC and national securities exchange rules and regulations.
(a) Definition of Incentive Compensation.
For purposes of this Policy, “Incentive Compensation” means any compensation that is granted, earned, or vested based wholly or in part upon the attainment of a “financial reporting measure” (as defined in paragraph (b) below), including, for example, bonuses or awards under the Company’s short and long-term incentive plans, grants and awards under the Company’s equity incentive plans, and contributions of such bonuses or awards to the Company’s deferred compensation plans or other employee benefit plans that are not tax-qualified plans. For avoidance of doubt, Incentive Compensation that is deferred (either mandatorily or voluntarily) under the Company’s non-qualified deferred compensation plans, as well as any matching amounts and earnings thereon, are subject to this Policy. Incentive Compensation does not include awards which are granted, earned or vested without regard to attainment of financial reporting measures, such as time-vesting awards, discretionary awards and awards based wholly on subjective standards, strategic measures or operational measures.
(b) Financial Reporting Measures.
Financial reporting measures are those that are determined and presented in accordance with the accounting principles used in preparing the Company’s financial statements (including non-GAAP financial measures) and any measures derived wholly or in part from such financial measures. For the avoidance of doubt, financial reporting measures include stock price and total shareholder return. A measure need not be presented within the financial statements or included in a filing with the SEC to constitute a financial reporting measure for purposes of this Policy.
(c) Excess Incentive Compensation: Amount Subject to Recovery.
The amount(s) to be recovered from the Covered Executive will be the amount(s) by which the Covered Executive’s Incentive Compensation for the relevant period(s) exceeded the amount(s) that the Covered Executive otherwise would have received had such Incentive Compensation been determined based on the restated amounts contained in the Accounting Restatement. All amounts shall be computed without regard to taxes paid.
For Incentive Compensation based on financial reporting measures such as stock price or total shareholder return, where the amount of excess compensation is not subject to mathematical recalculation directly from the information in an Accounting Restatement, the Board will calculate the amount to be reimbursed based on a reasonable estimate of the effect of the Accounting Restatement on such financial reporting measure upon which the Incentive Compensation was received.
The Company will maintain documentation of that reasonable estimate and will provide such documentation to the applicable national securities exchange.
(d) Method of Recovery.
The Board will determine, in its sole discretion, the method(s) for recovering reasonably promptly excess Incentive Compensation hereunder. Such methods may include, without limitation:
(i) requiring reimbursement of Incentive Compensation previously paid;
(ii) forfeiting any Incentive Compensation contribution made under the Company’s deferred compensation plans;
(iii) offsetting the recovered amount from any compensation or Incentive Compensation that the Covered Executive may earn or be awarded in the future;
(iv) some combination of the foregoing; or
(v) taking any other remedial and recovery action permitted by law, as determined by the Board.
5.No Indemnification or Advance.
Subject to applicable law, the Company shall not indemnify, including by paying or reimbursing for premiums for any insurance policy covering any potential losses, any Covered Executives against the loss of any erroneously awarded Incentive Compensation, nor shall the Company advance any costs or expenses to any Covered Executives in connection with any action to recover excess Incentive Compensation.
6.Interpretation.
The Board is authorized to interpret and construe this Policy and to make all determinations necessary, appropriate or advisable for the administration of this Policy. It is intended that this Policy be interpreted in a manner that is consistent with the requirements of Section 10D of the Exchange Act and any applicable rules or standards adopted by the SEC or any national securities exchange on which the Company's securities are listed.
7.Effective Date.
The effective date of this Policy is October 2, 2023 (the “Effective Date”). This Policy applies to Incentive Compensation received by Covered Executives on or after the Effective Date that results from attainment of a financial reporting measure based on or derived from financial information for any fiscal period ending on or after the Effective Date. Incentive Compensation received by Covered Executives prior to the Effective Date remains subject to the Company’s prior recovery policies. In addition, this Policy is intended to be and will be incorporated as an essential term and condition of any Incentive Compensation agreement, plan or program that the Company establishes or maintains on or after the Effective Date.
8.Amendment and Termination.
The Board may amend this Policy from time to time in its discretion, and shall amend this Policy as it deems necessary to reflect changes in regulations adopted by the SEC under Section 10D of the Exchange Act and to comply with any rules or listing standards adopted by the NYSE or any other securities exchange on which the Company’s shares are listed in the future.
9.Other Recovery Rights.
The Board intends that this Policy will be applied to the fullest extent of the law. The Board may require that any employment agreement or similar agreement relating to Incentive Compensation entered into on or after the Effective Date shall, as a condition to the grant of any benefit thereunder, require a Covered Executive to agree to abide by the terms of this Policy. Any right of recovery under this Policy is in addition to, and not in lieu of, any (i) other remedies or rights of compensation recovery that may be available to the Company pursuant to the terms of any similar policy in any employment agreement, or similar agreement relating to Incentive Compensation, unless any such agreement expressly prohibits such right of recovery, and (ii) any other legal remedies available to the Company. The provisions of this Policy are in addition to (and not in lieu of) any rights to repayment the Company may have under Section 304 of the Sarbanes-Oxley Act of 2002 and other applicable laws.
10.Impracticability.
The Company shall recover any excess Incentive Compensation in accordance with this Policy, except to the extent that certain conditions are met and the Board has determined that such recovery would be impracticable, all in accordance with Rule 10D-1 of the Exchange Act and the listing standards of the NYSE or any other securities exchange on which the Company’s shares are listed in the future.
11.Successors.
This Policy shall be binding upon and enforceable against all Covered Executives and their beneficiaries, heirs, executors, administrators or other legal representatives.