| Maryland | 001-37399 | 30-0870244 | ||||||
|
(State or Other Jurisdiction
of Incorporation)
|
(Commission File Number) |
(IRS Employer
Identification No.)
|
||||||
120 Passaic Avenue Fairfield, New Jersey |
07004 |
|||||||
(Address of Principal Executive Offices) |
(Zip Code) | |||||||
| Title of each class | Trading Symbol(s) | Name of each exchange on which registered | ||||||||||||
| Common Stock, $0.01 par value | KRNY | The NASDAQ Stock Market LLC | ||||||||||||
| Exhibit Number | Description | |||||||
| 99.1 | ||||||||
| 99.2 | ||||||||
| 104 | Cover Page Interactive Data File (embedded within the Inline XBRL document). | |||||||
KEARNY FINANCIAL CORP. |
||||||||
Date: July 25, 2024 |
By: | /s/ Keith Suchodolski | ||||||
| Keith Suchodolski | ||||||||
| Senior Executive Vice President and Chief Operating Officer | ||||||||
| Linked-Quarter Comparative Financial Analysis | ||
| (Dollars and Shares in Thousands, Except Per Share Data) |
June 30, 2024 |
March 31, 2024 |
Variance or Change |
Variance or Change Pct. |
||||||||||
| Assets | ||||||||||||||
| Cash and cash equivalents | $ | 63,864 | $ | 71,027 | $ | (7,163) | -10.1 | % | ||||||
| Securities available for sale | 1,072,833 | 1,098,655 | (25,822) | -2.4 | % | |||||||||
| Securities held to maturity | 135,742 | 139,643 | (3,901) | -2.8 | % | |||||||||
| Loans held-for-sale | 6,036 | 4,117 | 1,919 | 46.6 | % | |||||||||
| Loans receivable | 5,732,787 | 5,758,336 | (25,549) | -0.4 | % | |||||||||
| Less: allowance for credit losses on loans | (44,939) | (44,930) | 9 | — | % | |||||||||
| Net loans receivable | 5,687,848 | 5,713,406 | (25,558) | -0.4 | % | |||||||||
| Premises and equipment | 44,940 | 45,053 | (113) | -0.3 | % | |||||||||
| Federal Home Loan Bank stock | 80,300 | 81,347 | (1,047) | -1.3 | % | |||||||||
| Accrued interest receivable | 29,521 | 31,065 | (1,544) | -5.0 | % | |||||||||
| Goodwill | 113,525 | 210,895 | (97,370) | -46.2 | % | |||||||||
| Core deposit intangible | 1,931 | 2,057 | (126) | -6.1 | % | |||||||||
| Bank owned life insurance | 297,874 | 296,493 | 1,381 | 0.5 | % | |||||||||
| Deferred income taxes, net | 50,339 | 47,225 | 3,114 | 6.6 | % | |||||||||
| Other assets | 98,708 | 100,989 | (2,281) | -2.3 | % | |||||||||
| Total assets | $ | 7,683,461 | $ | 7,841,972 | $ | (158,511) | -2.0 | % | ||||||
| Liabilities | ||||||||||||||
| Deposits: | ||||||||||||||
| Non-interest-bearing | $ | 598,366 | $ | 586,089 | $ | 12,277 | 2.1 | % | ||||||
| Interest-bearing | 4,559,757 | 4,622,961 | (63,204) | -1.4 | % | |||||||||
| Total deposits | 5,158,123 | 5,209,050 | (50,927) | -1.0 | % | |||||||||
| Borrowings | 1,709,789 | 1,722,178 | (12,389) | -0.7 | % | |||||||||
| Advance payments by borrowers for taxes | 17,409 | 17,387 | 22 | 0.1 | % | |||||||||
| Other liabilities | 44,569 | 44,279 | 290 | 0.7 | % | |||||||||
| Total liabilities | 6,929,890 | 6,992,894 | (63,004) | -0.9 | % | |||||||||
| Stockholders' Equity | ||||||||||||||
| Common stock | 644 | 644 | — | — | % | |||||||||
| Paid-in capital | 493,680 | 493,187 | 493 | 0.1 | % | |||||||||
| Retained earnings | 343,326 | 440,308 | (96,982) | -22.0 | % | |||||||||
| Unearned ESOP shares | (20,916) | (21,402) | 486 | 2.3 | % | |||||||||
| Accumulated other comprehensive loss | (63,163) | (63,659) | 496 | 0.8 | % | |||||||||
| Total stockholders' equity | 753,571 | 849,078 | (95,507) | -11.2 | % | |||||||||
| Total liabilities and stockholders' equity | $ | 7,683,461 | $ | 7,841,972 | $ | (158,511) | -2.0 | % | ||||||
| Consolidated capital ratios | ||||||||||||||
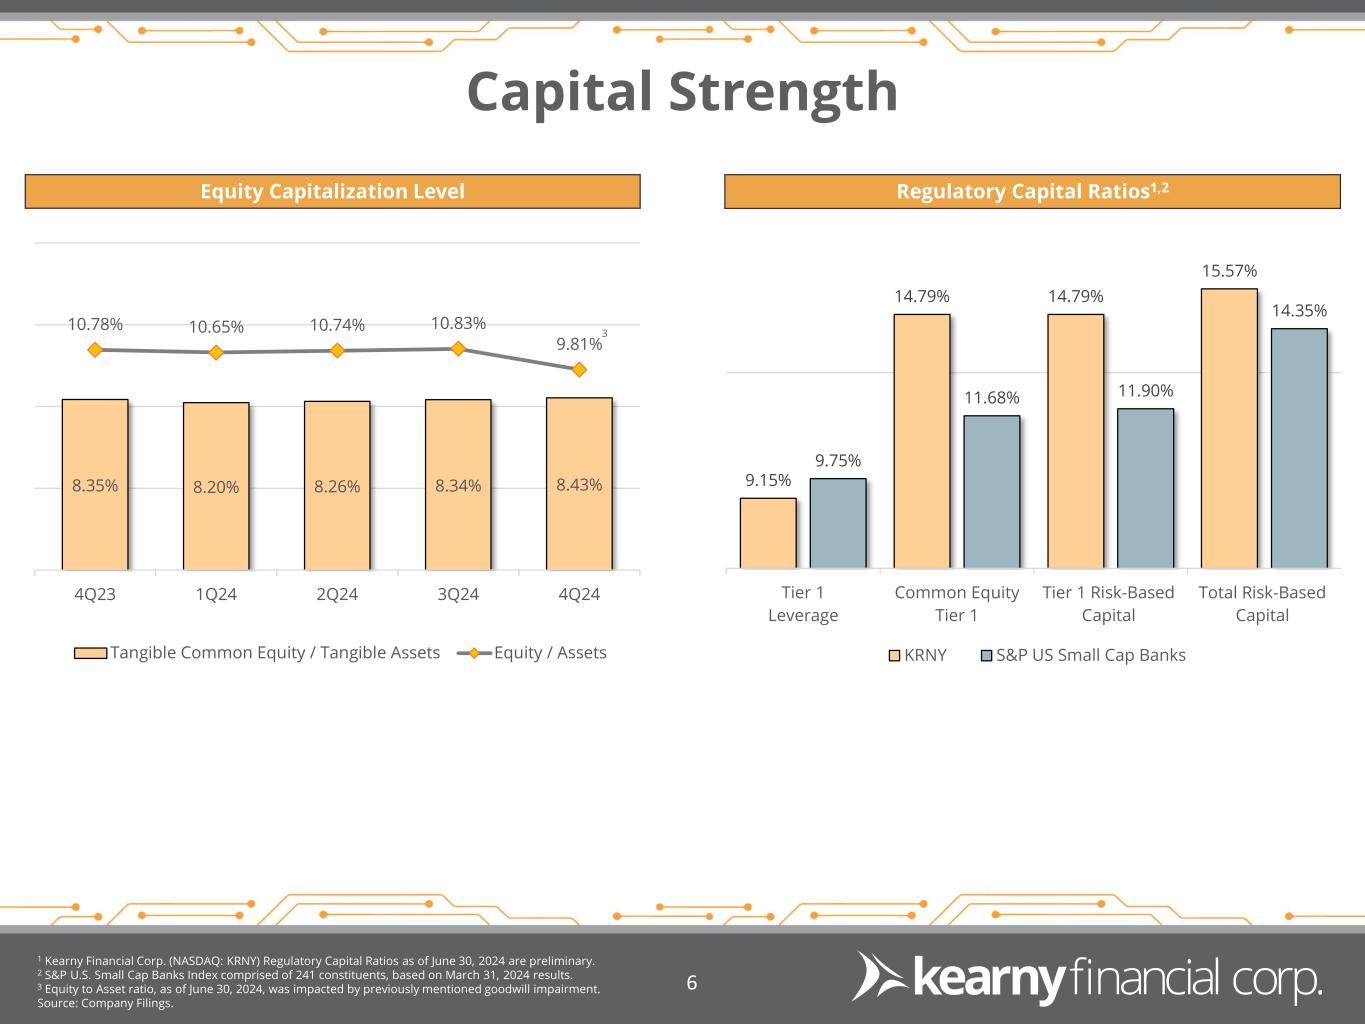
| Equity to assets | 9.81 | % | 10.83 | % | -1.02 | % | ||||||||
Tangible equity to tangible assets (1) |
8.43 | % | 8.34 | % | 0.09 | % | ||||||||
| Share data | ||||||||||||||
| Outstanding shares | 64,434 | 64,437 | (3) | — | % | |||||||||
| Book value per share | $ | 11.70 | $ | 13.18 | $ | (1.48) | -11.2 | % | ||||||
Tangible book value per share (2) |
$ | 9.90 | $ | 9.87 | $ | 0.03 | 0.3 | % | ||||||
| (Dollars and Shares in Thousands, Except Per Share Data) |
Three Months Ended | Variance or Change |
Variance or Change Pct. |
|||||||||||
| June 30, 2024 |
March 31, 2024 |
|||||||||||||
| Interest income | ||||||||||||||
| Loans | $ | 65,819 | $ | 64,035 | $ | 1,784 | 2.8 | % | ||||||
| Taxable investment securities | 14,802 | 15,490 | (688) | -4.4 | % | |||||||||
| Tax-exempt investment securities | 80 | 85 | (5) | -5.9 | % | |||||||||
| Other interest-earning assets | 2,289 | 2,475 | (186) | -7.5 | % | |||||||||
| Total interest income | 82,990 | 82,085 | 905 | 1.1 | % | |||||||||
| Interest expense | ||||||||||||||
| Deposits | 32,187 | 32,320 | (133) | -0.4 | % | |||||||||
| Borrowings | 17,527 | 15,446 | 2,081 | 13.5 | % | |||||||||
| Total interest expense | 49,714 | 47,766 | 1,948 | 4.1 | % | |||||||||
| Net interest income | 33,276 | 34,319 | (1,043) | -3.0 | % | |||||||||
| Provision for credit losses | 3,527 | 349 | 3,178 | 910.6 | % | |||||||||
| Net interest income after provision for credit losses | 29,749 | 33,970 | (4,221) | -12.4 | % | |||||||||
| Non-interest income | ||||||||||||||
| Fees and service charges | 580 | 657 | (77) | -11.7 | % | |||||||||
| Gain (loss) on sale of loans | 111 | (712) | 823 | -115.6 | % | |||||||||
| Income from bank owned life insurance | 3,209 | 3,039 | 170 | 5.6 | % | |||||||||
| Electronic banking fees and charges | 1,130 | 464 | 666 | 143.5 | % | |||||||||
| Other income | 776 | 755 | 21 | 2.8 | % | |||||||||
| Total non-interest income | 5,806 | 4,203 | 1,603 | -38.1 | % | |||||||||
| Non-interest expense | ||||||||||||||
| Salaries and employee benefits | 17,266 | 16,911 | 355 | 2.1 | % | |||||||||
| Net occupancy expense of premises | 2,738 | 2,863 | (125) | -4.4 | % | |||||||||
| Equipment and systems | 3,785 | 3,823 | (38) | -1.0 | % | |||||||||
| Advertising and marketing | 480 | 387 | 93 | 24.0 | % | |||||||||
| Federal deposit insurance premium | 1,532 | 1,429 | 103 | 7.2 | % | |||||||||
| Directors' compensation | 360 | 360 | — | — | % | |||||||||
| Goodwill impairment | 97,370 | — | 97,370 | — | % | |||||||||
| Other expense | 3,020 | 3,286 | (266) | -8.1 | % | |||||||||
| Total non-interest expense | 126,551 | 29,059 | 97,492 | 335.5 | % | |||||||||
| (Loss) income before income taxes | (90,996) | 9,114 | (100,110) | 1098.4 | % | |||||||||
| Income taxes | (917) | 1,717 | (2,634) | -153.4 | % | |||||||||
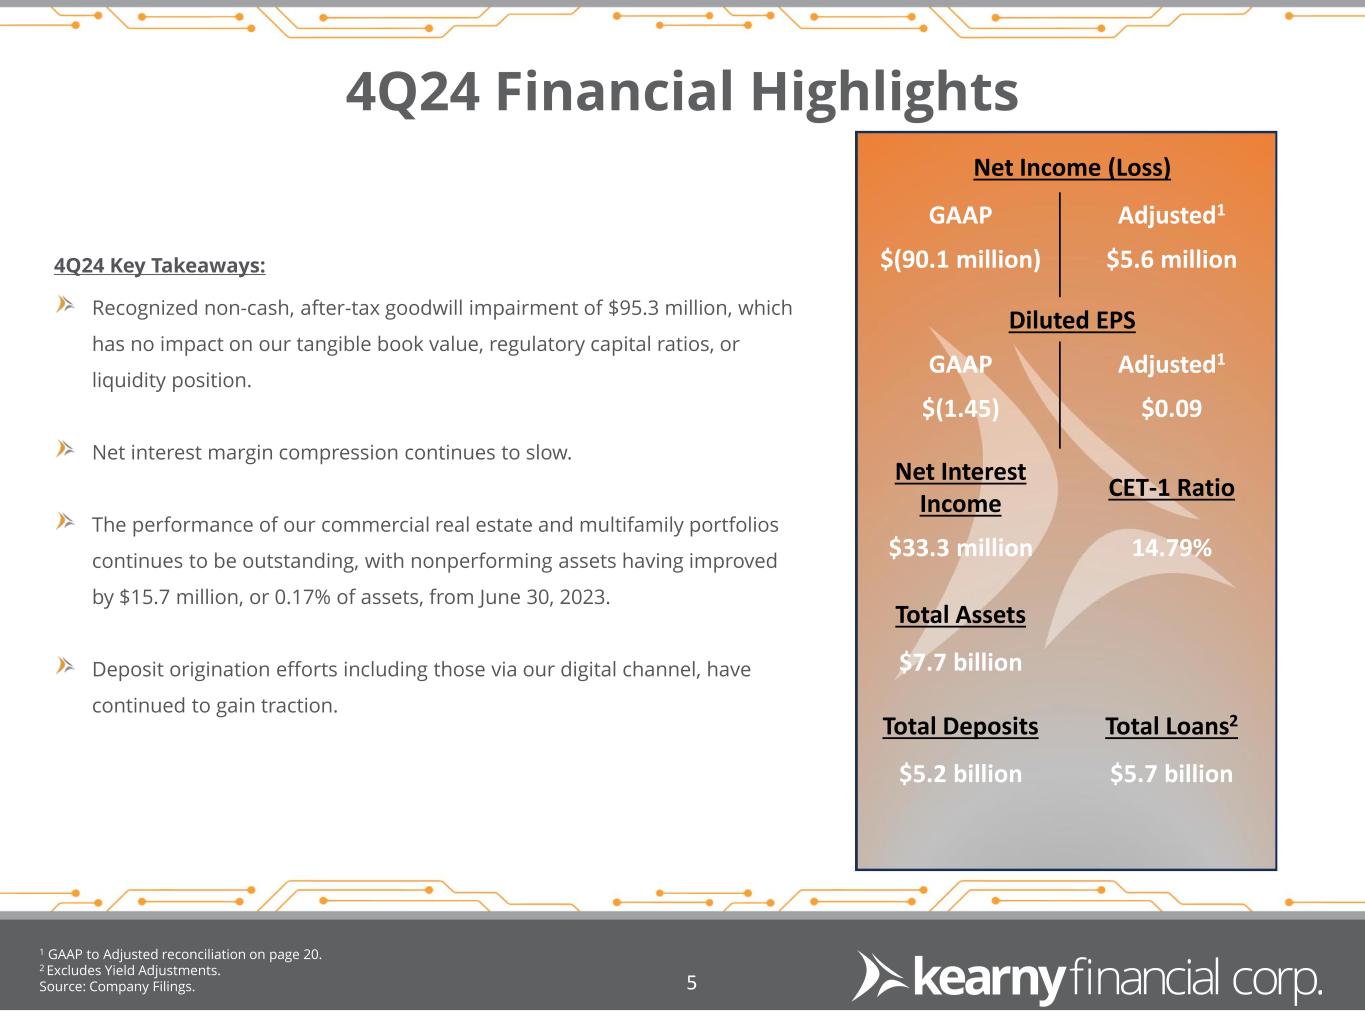
| Net (loss) income | $ | (90,079) | $ | 7,397 | $ | (97,476) | 1317.8 | % | ||||||
| Net (loss) income per common share (EPS) | ||||||||||||||
| Basic | $ | (1.45) | $ | 0.12 | $ | (1.57) | ||||||||
| Diluted | $ | (1.45) | $ | 0.12 | $ | (1.57) | ||||||||
| Dividends declared | ||||||||||||||
| Cash dividends declared per common share | $ | 0.11 | $ | 0.11 | $ | — | ||||||||
| Cash dividends declared | $ | 6,903 | $ | 6,844 | $ | 59 | ||||||||
| Dividend payout ratio | -7.7 | % | 92.5 | % | -100.2 | % | ||||||||
| Weighted average number of common shares outstanding | ||||||||||||||
| Basic | 62,254 | 62,205 | 49 | |||||||||||
| Diluted | 62,254 | 62,211 | 43 | |||||||||||
| (Dollars in Thousands) | Three Months Ended | Variance or Change |
Variance or Change Pct. |
|||||||||||
| June 30, 2024 |
March 31, 2024 |
|||||||||||||
| Assets | ||||||||||||||
| Interest-earning assets: | ||||||||||||||
| Loans receivable, including loans held for sale | $ | 5,743,008 | $ | 5,752,477 | $ | (9,469) | -0.2 | % | ||||||
| Taxable investment securities | 1,343,541 | 1,382,064 | (38,523) | -2.8 | % | |||||||||
| Tax-exempt investment securities | 13,737 | 14,614 | (877) | -6.0 | % | |||||||||
| Other interest-earning assets | 128,257 | 125,155 | 3,102 | 2.5 | % | |||||||||
| Total interest-earning assets | 7,228,543 | 7,274,310 | (45,767) | -0.6 | % | |||||||||
| Non-interest-earning assets | 466,537 | 577,411 | (110,874) | -19.2 | % | |||||||||
| Total assets | $ | 7,695,080 | $ | 7,851,721 | $ | (156,641) | -2.0 | % | ||||||
| Liabilities and Stockholders' Equity | ||||||||||||||
| Interest-bearing liabilities: | ||||||||||||||
| Deposits: | ||||||||||||||
| Interest-bearing demand | $ | 2,310,521 | $ | 2,378,831 | $ | (68,310) | -2.9 | % | ||||||
| Savings | 631,622 | 635,226 | (3,604) | -0.6 | % | |||||||||
| Certificates of deposit | 1,613,798 | 1,705,513 | (91,715) | -5.4 | % | |||||||||
| Total interest-bearing deposits | 4,555,941 | 4,719,570 | (163,629) | -3.5 | % | |||||||||
| Borrowings: | ||||||||||||||
| Federal Home Loan Bank advances | 1,507,192 | 1,428,801 | 78,391 | 5.5 | % | |||||||||
| Other borrowings | 228,461 | 210,989 | 17,472 | 8.3 | % | |||||||||
| Total borrowings | 1,735,653 | 1,639,790 | 95,863 | 5.8 | % | |||||||||
| Total interest-bearing liabilities | 6,291,594 | 6,359,360 | (67,766) | -1.1 | % | |||||||||
| Non-interest-bearing liabilities: | ||||||||||||||
| Non-interest-bearing deposits | 589,438 | 581,870 | 7,568 | 1.3 | % | |||||||||
| Other non-interest-bearing liabilities | 62,978 | 65,709 | (2,731) | -4.2 | % | |||||||||
| Total non-interest-bearing liabilities | 652,416 | 647,579 | 4,837 | 0.7 | % | |||||||||
| Total liabilities | 6,944,010 | 7,006,939 | (62,929) | -0.9 | % | |||||||||
| Stockholders' equity | 751,070 | 844,782 | (93,712) | -11.1 | % | |||||||||
| Total liabilities and stockholders' equity | $ | 7,695,080 | $ | 7,851,721 | $ | (156,641) | -2.0 | % | ||||||
| Average interest-earning assets to average interest-bearing liabilities | 114.89 | % | 114.39 | % | 0.50 | % | 0.4 | % | ||||||
| Three Months Ended | Variance or Change |
||||||||||
| June 30, 2024 |
March 31, 2024 |
||||||||||
| Average yield on interest-earning assets: | |||||||||||
| Loans receivable, including loans held for sale | 4.58 | % | 4.45 | % | 0.13 | % | |||||
| Taxable investment securities | 4.41 | % | 4.48 | % | -0.07 | % | |||||
Tax-exempt investment securities (1) |
2.32 | % | 2.32 | % | — | % | |||||
| Other interest-earning assets | 7.14 | % | 7.91 | % | -0.77 | % | |||||
| Total interest-earning assets | 4.59 | % | 4.51 | % | 0.08 | % | |||||
| Average cost of interest-bearing liabilities: | |||||||||||
| Deposits: | |||||||||||
| Interest-bearing demand | 3.06 | % | 3.08 | % | -0.02 | % | |||||
| Savings | 0.63 | % | 0.46 | % | 0.17 | % | |||||
| Certificates of deposit | 3.35 | % | 3.11 | % | 0.24 | % | |||||
| Total interest-bearing deposits | 2.83 | % | 2.74 | % | 0.09 | % | |||||
| Borrowings: | |||||||||||
| Federal Home Loan Bank advances | 3.86 | % | 3.55 | % | 0.31 | % | |||||
| Other borrowings | 5.24 | % | 5.22 | % | 0.02 | % | |||||
| Total borrowings | 4.04 | % | 3.77 | % | 0.27 | % | |||||
| Total interest-bearing liabilities | 3.16 | % | 3.00 | % | 0.16 | % | |||||
Interest rate spread (2) |
1.43 | % | 1.51 | % | -0.08 | % | |||||
Net interest margin (3) |
1.84 | % | 1.89 | % | -0.05 | % | |||||
| Non-interest income to average assets (annualized) | 0.30 | % | 0.21 | % | 0.09 | % | |||||
| Non-interest expense to average assets (annualized) | 6.58 | % | 1.48 | % | 5.10 | % | |||||
Efficiency ratio (4) |
323.81 | % | 75.43 | % | 248.38 | % | |||||
| Return on average assets (annualized) | -4.68 | % | 0.38 | % | -5.06 | % | |||||
| Return on average equity (annualized) | -47.97 | % | 3.50 | % | -51.47 | % | |||||
Return on average tangible equity (annualized) (5) |
-56.69 | % | 4.68 | % | -61.37 | % | |||||
| Year-to-Year Comparative Financial Analysis | ||
| (Dollars and Shares in Thousands, Except Per Share Data) |
June 30, 2024 |
June 30, 2023 |
Variance or Change |
Variance or Change Pct. |
||||||||||
| (Unaudited) | (Audited) | |||||||||||||
| Assets | ||||||||||||||
| Cash and cash equivalents | $ | 63,864 | $ | 70,515 | $ | (6,651) | -9.4 | % | ||||||
| Securities available for sale | 1,072,833 | 1,227,729 | (154,896) | -12.6 | % | |||||||||
| Securities held to maturity | 135,742 | 146,465 | (10,723) | -7.3 | % | |||||||||
| Loans held-for-sale | 6,036 | 9,591 | (3,555) | -37.1 | % | |||||||||
| Loans receivable | 5,732,787 | 5,829,421 | (96,634) | -1.7 | % | |||||||||
| Less: allowance for credit losses on loans | (44,939) | (48,734) | (3,795) | -7.8 | % | |||||||||
| Net loans receivable | 5,687,848 | 5,780,687 | (92,839) | -1.6 | % | |||||||||
| Premises and equipment | 44,940 | 48,309 | (3,369) | -7.0 | % | |||||||||
| Federal Home Loan Bank of New York stock | 80,300 | 71,734 | 8,566 | 11.9 | % | |||||||||
| Accrued interest receivable | 29,521 | 28,133 | 1,388 | 4.9 | % | |||||||||
| Goodwill | 113,525 | 210,895 | (97,370) | -46.2 | % | |||||||||
| Core deposit intangible | 1,931 | 2,457 | (526) | -21.4 | % | |||||||||
| Bank owned life insurance | 297,874 | 292,825 | 5,049 | 1.7 | % | |||||||||
| Deferred income tax assets, net | 50,339 | 51,973 | (1,634) | -3.1 | % | |||||||||
| Other real estate owned | — | 12,956 | (12,956) | -100.0 | % | |||||||||
| Other assets | 98,708 | 110,546 | (11,838) | -10.7 | % | |||||||||
| Total assets | $ | 7,683,461 | $ | 8,064,815 | $ | (381,354) | -4.7 | % | ||||||
| Liabilities | ||||||||||||||
| Deposits: | ||||||||||||||
| Non-interest-bearing | $ | 598,366 | $ | 609,999 | $ | (11,633) | -1.9 | % | ||||||
| Interest-bearing | 4,559,757 | 5,019,184 | (459,427) | -9.2 | % | |||||||||
| Total deposits | 5,158,123 | 5,629,183 | (471,060) | -8.4 | % | |||||||||
| Borrowings | 1,709,789 | 1,506,812 | 202,977 | 13.5 | % | |||||||||
| Advance payments by borrowers for taxes | 17,409 | 18,338 | (929) | (5.1) | % | |||||||||
| Other liabilities | 44,569 | 41,198 | 3,371 | 8.2 | % | |||||||||
| Total liabilities | 6,929,890 | 7,195,531 | (265,641) | (3.7) | % | |||||||||
| Stockholders' Equity | ||||||||||||||
| Common stock | 644 | 659 | (15) | -2.3 | % | |||||||||
| Paid-in capital | 493,680 | 503,332 | (9,652) | -1.9 | % | |||||||||
| Retained earnings | 343,326 | 457,611 | (114,285) | -25.0 | % | |||||||||
| Unearned ESOP shares | (20,916) | (22,862) | 1,946 | -8.5 | % | |||||||||
| Accumulated other comprehensive loss | (63,163) | (69,456) | 6,293 | -9.1 | % | |||||||||
| Total stockholders' equity | 753,571 | 869,284 | (115,713) | -13.3 | % | |||||||||
| Total liabilities and stockholders' equity | $ | 7,683,461 | $ | 8,064,815 | $ | (381,354) | -4.7 | % | ||||||
| Consolidated capital ratios | ||||||||||||||
| Equity to assets | 9.81 | % | 10.78 | % | -0.97 | % | ||||||||
Tangible equity to tangible assets (1) |
8.43 | % | 8.35 | % | 0.08 | % | ||||||||
| Share data | ||||||||||||||
| Outstanding shares | 64,434 | 65,864 | (1,430) | -2.2 | % | |||||||||
| Book value per share | $ | 11.70 | $ | 13.20 | $ | (1.50) | -11.4 | % | ||||||
Tangible book value per share (2) |
$ | 9.90 | $ | 9.96 | $ | (0.06) | -0.6 | % | ||||||
| Year Ended | ||||||||||||||
| (Dollars and Shares in Thousands, Except Per Share Data) |
June 30, 2024 |
June 30, 2023 |
Variance or Change |
Variance or Change Pct. |
||||||||||
| (Unaudited) | (Audited) | |||||||||||||
| Interest income | ||||||||||||||
| Loans | $ | 256,007 | $ | 233,147 | $ | 22,860 | 9.8 | % | ||||||
| Taxable investment securities | 63,313 | 54,855 | 8,458 | 15.4 | % | |||||||||
| Tax-exempt investment securities | 336 | 694 | (358) | -51.6 | % | |||||||||
| Other interest-earning assets | 9,212 | 5,028 | 4,184 | 83.2 | % | |||||||||
| Total interest income | 328,868 | 293,724 | 35,144 | 12.0 | % | |||||||||
| Interest expense | ||||||||||||||
| Deposits | 122,414 | 78,163 | 44,251 | 56.6 | % | |||||||||
| Borrowings | 63,860 | 39,696 | 24,164 | 60.9 | % | |||||||||
| Total interest expense | 186,274 | 117,859 | 68,415 | 58.0 | % | |||||||||
| Net interest income | 142,594 | 175,865 | (33,271) | -18.9 | % | |||||||||
| Provision for credit losses | 6,226 | 2,486 | 3,740 | 150.4 | % | |||||||||
| Net interest income after provision for credit losses | 136,368 | 173,379 | (37,011) | -21.3 | % | |||||||||
| Non-interest income | ||||||||||||||
| Fees and service charges | 2,609 | 3,106 | (497) | -16.0 | % | |||||||||
| Loss on sale and call of securities | (18,135) | (15,227) | (2,908) | 19.1 | % | |||||||||
| Loss on sale of loans | (282) | (1,645) | 1,363 | -82.9 | % | |||||||||
| Loss on sale of real estate owned | (974) | (139) | (835) | 600.7 | % | |||||||||
| Income from bank owned life insurance | 9,076 | 8,645 | 431 | 5.0 | % | |||||||||
| Electronic banking fees and charges | 2,357 | 1,759 | 598 | 34.0 | % | |||||||||
| Other income | 3,356 | 6,252 | (2,896) | -46.3 | % | |||||||||
| Total non-interest income | (1,993) | 2,751 | (4,744) | -172.4 | % | |||||||||
| Non-interest expense | ||||||||||||||
| Salaries and employee benefits | 69,220 | 75,589 | (6,369) | -8.4 | % | |||||||||
| Net occupancy expense of premises | 11,033 | 12,036 | (1,003) | -8.3 | % | |||||||||
| Equipment and systems | 15,223 | 14,577 | 646 | 4.4 | % | |||||||||
| Advertising and marketing | 1,396 | 2,122 | (726) | -34.2 | % | |||||||||
| Federal deposit insurance premium | 5,980 | 5,133 | 847 | 16.5 | % | |||||||||
| Directors' compensation | 1,506 | 1,364 | 142 | 10.4 | % | |||||||||
| Goodwill impairment | 97,370 | — | 97,370 | — | % | |||||||||
| Other expense | 13,423 | 12,930 | 493 | 3.8 | % | |||||||||
| Total non-interest expense | 215,151 | 123,751 | 91,400 | 73.9 | % | |||||||||
| (Loss) income before income taxes | (80,776) | 52,379 | (133,155) | -254.2 | % | |||||||||
| Income taxes | 5,891 | 11,568 | (5,677) | -49.1 | % | |||||||||
| Net (loss) income | $ | (86,667) | $ | 40,811 | $ | (127,478) | -312.4 | % | ||||||
| Net (loss) income per common share (EPS) | ||||||||||||||
| Basic | $ | (1.39) | $ | 0.63 | $ | (2.02) | ||||||||
| Diluted | $ | (1.39) | $ | 0.63 | $ | (2.02) | ||||||||
| Dividends declared | ||||||||||||||
| Cash dividends declared per common share | $ | 0.44 | $ | 0.44 | $ | — | ||||||||
| Cash dividends declared | $ | 27,618 | $ | 28,651 | $ | (1,033) | ||||||||
| Dividend payout ratio | (31.9) | % | 70.2 | % | (102.1) | % | ||||||||
| Weighted average number of common shares outstanding | ||||||||||||||
| Basic | 62,444 | 64,804 | (2,360) | |||||||||||
| Diluted | 62,444 | 64,804 | (2,360) | |||||||||||
| Year Ended | ||||||||||||||
| (Dollars in Thousands) | June 30, 2024 |
June 30, 2023 |
Variance or Change |
Variance or Change Pct. |
||||||||||
| Assets | ||||||||||||||
| Interest-earning assets: | ||||||||||||||
| Loans receivable, including loans held for sale | $ | 5,752,496 | $ | 5,827,123 | $ | (74,627) | -1.3 | % | ||||||
| Taxable investment securities | 1,438,200 | 1,532,961 | (94,761) | -6.2 | % | |||||||||
| Tax-exempt investment securities | 14,718 | 30,332 | (15,614) | -51.5 | % | |||||||||
| Other interest-earning assets | 131,019 | 115,390 | 15,629 | 13.5 | % | |||||||||
| Total interest-earning assets | 7,336,433 | 7,505,806 | (169,373) | -2.3 | % | |||||||||
| Non-interest-earning assets | 541,859 | 563,131 | (21,272) | -3.8 | % | |||||||||
| Total assets | $ | 7,878,292 | $ | 8,068,937 | $ | (190,645) | -2.4 | % | ||||||
| Liabilities and Stockholders' Equity | ||||||||||||||
| Interest-bearing liabilities: | ||||||||||||||
| Deposits: | ||||||||||||||
| Interest-bearing demand | $ | 2,308,893 | $ | 2,349,802 | $ | (40,909) | -1.7 | % | ||||||
| Savings | 662,981 | 896,651 | (233,670) | -26.1 | % | |||||||||
| Certificates of deposit | 1,778,682 | 2,083,864 | (305,182) | -14.6 | % | |||||||||
| Total interest-bearing deposits | 4,750,556 | 5,330,317 | (579,761) | -10.9 | % | |||||||||
| Borrowings: | ||||||||||||||
| Federal Home Loan Bank Advances | 1,458,941 | 1,101,658 | 357,283 | 32.4 | % | |||||||||
| Other borrowings | 184,768 | 57,468 | 127,300 | 221.5 | % | |||||||||
| Total borrowings | 1,643,709 | 1,159,126 | 484,583 | 41.8 | % | |||||||||
| Total interest-bearing liabilities | 6,394,265 | 6,489,443 | (95,178) | -1.5 | % | |||||||||
| Non-interest-bearing liabilities: | ||||||||||||||
| Non-interest-bearing deposits | 595,266 | 644,543 | (49,277) | -7.6 | % | |||||||||
| Other non-interest-bearing liabilities | 64,444 | 59,593 | 4,851 | 8.1 | % | |||||||||
| Total non-interest-bearing liabilities | 659,710 | 704,136 | (44,426) | -6.3 | % | |||||||||
| Total liabilities | 7,053,975 | 7,193,579 | (139,604) | -1.9 | % | |||||||||
| Stockholders' equity | 824,317 | 875,358 | (51,041) | -5.8 | % | |||||||||
| Total liabilities and stockholders' equity | $ | 7,878,292 | $ | 8,068,937 | $ | (190,645) | -2.4 | % | ||||||
| Average interest-earning assets to average interest-bearing liabilities | 114.73 | % | 115.66 | % | (0.93) | % | -0.8 | % | ||||||
| Year Ended | |||||||||||
| June 30, 2024 |
June 30, 2023 |
Variance or Change |
|||||||||
| Average yield on interest-earning assets: | |||||||||||
| Loans receivable, including loans held for sale | 4.45 | % | 4.00 | % | 0.45 | % | |||||
| Taxable investment securities | 4.40 | % | 3.58 | % | 0.82 | % | |||||
Tax-exempt investment securities (1) |
2.28 | % | 2.29 | % | -0.01 | % | |||||
| Other interest-earning assets | 7.03 | % | 4.36 | % | 2.67 | % | |||||
| Total interest-earning assets | 4.48 | % | 3.91 | % | 0.57 | % | |||||
| Average cost of interest-bearing liabilities: | |||||||||||
| Deposits: | |||||||||||
| Interest-bearing demand | 2.91 | % | 1.73 | % | 1.18 | % | |||||
| Savings | 0.50 | % | 0.37 | % | 0.13 | % | |||||
| Certificates of deposit | 2.92 | % | 1.64 | % | 1.28 | % | |||||
| Total interest-bearing deposits | 2.58 | % | 1.47 | % | 1.11 | % | |||||
| Borrowings: | |||||||||||
| Federal Home Loan Bank Advances | 3.70 | % | 3.43 | % | 0.27 | % | |||||
| Other borrowings | 5.36 | % | 3.41 | % | 1.95 | % | |||||
| Total borrowings | 3.89 | % | 3.42 | % | 0.47 | % | |||||
| Total interest-bearing liabilities | 2.91 | % | 1.82 | % | 1.09 | % | |||||
Interest rate spread (2) |
1.57 | % | 2.09 | % | -0.52 | % | |||||
Net interest margin (3) |
1.94 | % | 2.34 | % | -0.40 | % | |||||
| Non-interest income to average assets | (0.03) | % | 0.03 | % | -0.06 | % | |||||
| Non-interest expense to average assets | 2.73 | % | 1.53 | % | 1.20 | % | |||||
Efficiency ratio (4) |
153.02 | % | 69.28 | % | 83.74 | % | |||||
| Return on average assets | (1.10) | % | 0.51 | % | -1.61 | % | |||||
| Return on average equity | (10.51) | % | 4.66 | % | -15.17 | % | |||||
Return on average tangible equity (5) |
(13.64) | % | 6.17 | % | -19.81 | % | |||||
| Five-Quarter Financial Trend Analysis | ||
| (Dollars and Shares in Thousands, Except Per Share Data) |
June 30, 2024 |
March 31, 2024 |
December 31, 2023 |
September 30, 2023 |
June 30, 2023 |
||||||||||||
| (Unaudited) | (Unaudited) | (Unaudited) | (Unaudited) | (Audited) | |||||||||||||
| Assets | |||||||||||||||||
| Cash and cash equivalents | $ | 63,864 | $ | 71,027 | $ | 73,860 | $ | 57,219 | $ | 70,515 | |||||||
| Securities available for sale | 1,072,833 | 1,098,655 | 1,144,175 | 1,215,633 | 1,227,729 | ||||||||||||
| Securities held to maturity | 135,742 | 139,643 | 141,959 | 143,730 | 146,465 | ||||||||||||
| Loans held-for-sale | 6,036 | 4,117 | 14,030 | 3,934 | 9,591 | ||||||||||||
| Loans receivable | 5,732,787 | 5,758,336 | 5,745,629 | 5,736,049 | 5,829,421 | ||||||||||||
| Less: allowance for credit losses on loans | (44,939) | (44,930) | (44,867) | (46,872) | (48,734) | ||||||||||||
| Net loans receivable | 5,687,848 | 5,713,406 | 5,700,762 | 5,689,177 | 5,780,687 | ||||||||||||
| Premises and equipment | 44,940 | 45,053 | 45,928 | 46,868 | 48,309 | ||||||||||||
| Federal Home Loan Bank stock | 80,300 | 81,347 | 83,372 | 81,509 | 71,734 | ||||||||||||
| Accrued interest receivable | 29,521 | 31,065 | 30,258 | 29,766 | 28,133 | ||||||||||||
| Goodwill | 113,525 | 210,895 | 210,895 | 210,895 | 210,895 | ||||||||||||
| Core deposit intangible | 1,931 | 2,057 | 2,189 | 2,323 | 2,457 | ||||||||||||
| Bank owned life insurance | 297,874 | 296,493 | 256,064 | 294,491 | 292,825 | ||||||||||||
| Deferred income taxes, net | 50,339 | 47,225 | 46,116 | 56,500 | 51,973 | ||||||||||||
| Other real estate owned | — | — | 11,982 | 12,956 | 12,956 | ||||||||||||
| Other assets | 98,708 | 100,989 | 136,242 | 129,865 | 110,546 | ||||||||||||
| Total assets | $ | 7,683,461 | $ | 7,841,972 | $ | 7,897,832 | $ | 7,974,866 | $ | 8,064,815 | |||||||
| Liabilities | |||||||||||||||||
| Deposits: | |||||||||||||||||
| Non-interest-bearing | $ | 598,366 | $ | 586,089 | $ | 584,130 | $ | 595,141 | $ | 609,999 | |||||||
| Interest-bearing | 4,559,757 | 4,622,961 | 4,735,500 | 4,839,027 | 5,019,184 | ||||||||||||
| Total deposits | 5,158,123 | 5,209,050 | 5,319,630 | 5,434,168 | 5,629,183 | ||||||||||||
| Borrowings | 1,709,789 | 1,722,178 | 1,667,055 | 1,626,933 | 1,506,812 | ||||||||||||
| Advance payments by borrowers for taxes | 17,409 | 17,387 | 16,742 | 16,907 | 18,338 | ||||||||||||
| Other liabilities | 44,569 | 44,279 | 46,427 | 47,324 | 41,198 | ||||||||||||
| Total liabilities | 6,929,890 | 6,992,894 | 7,049,854 | 7,125,332 | 7,195,531 | ||||||||||||
| Stockholders' Equity | |||||||||||||||||
| Common stock | 644 | 644 | 645 | 652 | 659 | ||||||||||||
| Paid-in capital | 493,680 | 493,187 | 493,297 | 497,269 | 503,332 | ||||||||||||
| Retained earnings | 343,326 | 440,308 | 439,755 | 460,464 | 457,611 | ||||||||||||
| Unearned ESOP shares | (20,916) | (21,402) | (21,889) | (22,375) | (22,862) | ||||||||||||
| Accumulated other comprehensive loss | (63,163) | (63,659) | (63,830) | (86,476) | (69,456) | ||||||||||||
| Total stockholders' equity | 753,571 | 849,078 | 847,978 | 849,534 | 869,284 | ||||||||||||
| Total liabilities and stockholders' equity | $ | 7,683,461 | $ | 7,841,972 | $ | 7,897,832 | $ | 7,974,866 | $ | 8,064,815 | |||||||
| Consolidated capital ratios | |||||||||||||||||
| Equity to assets | 9.81 | % | 10.83 | % | 10.74 | % | 10.65 | % | 10.78 | % | |||||||
Tangible equity to tangible assets (1) |
8.43 | % | 8.34 | % | 8.26 | % | 8.20 | % | 8.35 | % | |||||||
| Share data | |||||||||||||||||
| Outstanding shares | 64,434 | 64,437 | 64,445 | 65,132 | 65,864 | ||||||||||||
| Book value per share | $ | 11.70 | $ | 13.18 | $ | 13.16 | $ | 13.04 | $ | 13.20 | |||||||
Tangible book value per share (2) |
$ | 9.90 | $ | 9.87 | $ | 9.85 | $ | 9.77 | $ | 9.96 | |||||||
| (Dollars in Thousands) | June 30, 2024 |
March 31, 2024 |
December 31, 2023 |
September 30, 2023 |
June 30, 2023 |
||||||||||||
| Loan portfolio composition: | |||||||||||||||||
| Commercial loans: | |||||||||||||||||
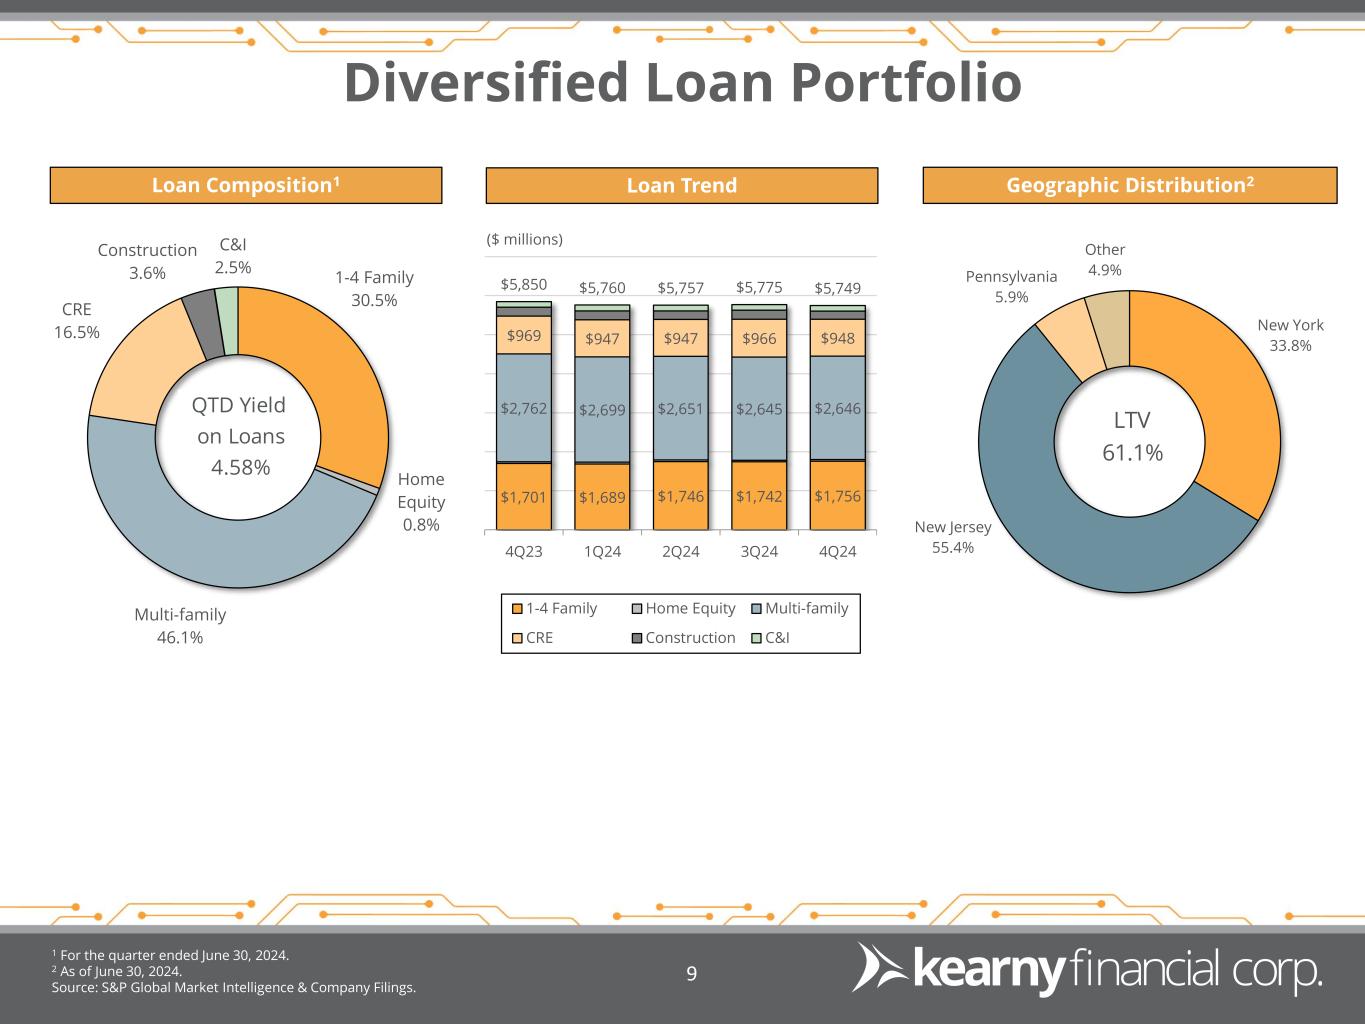
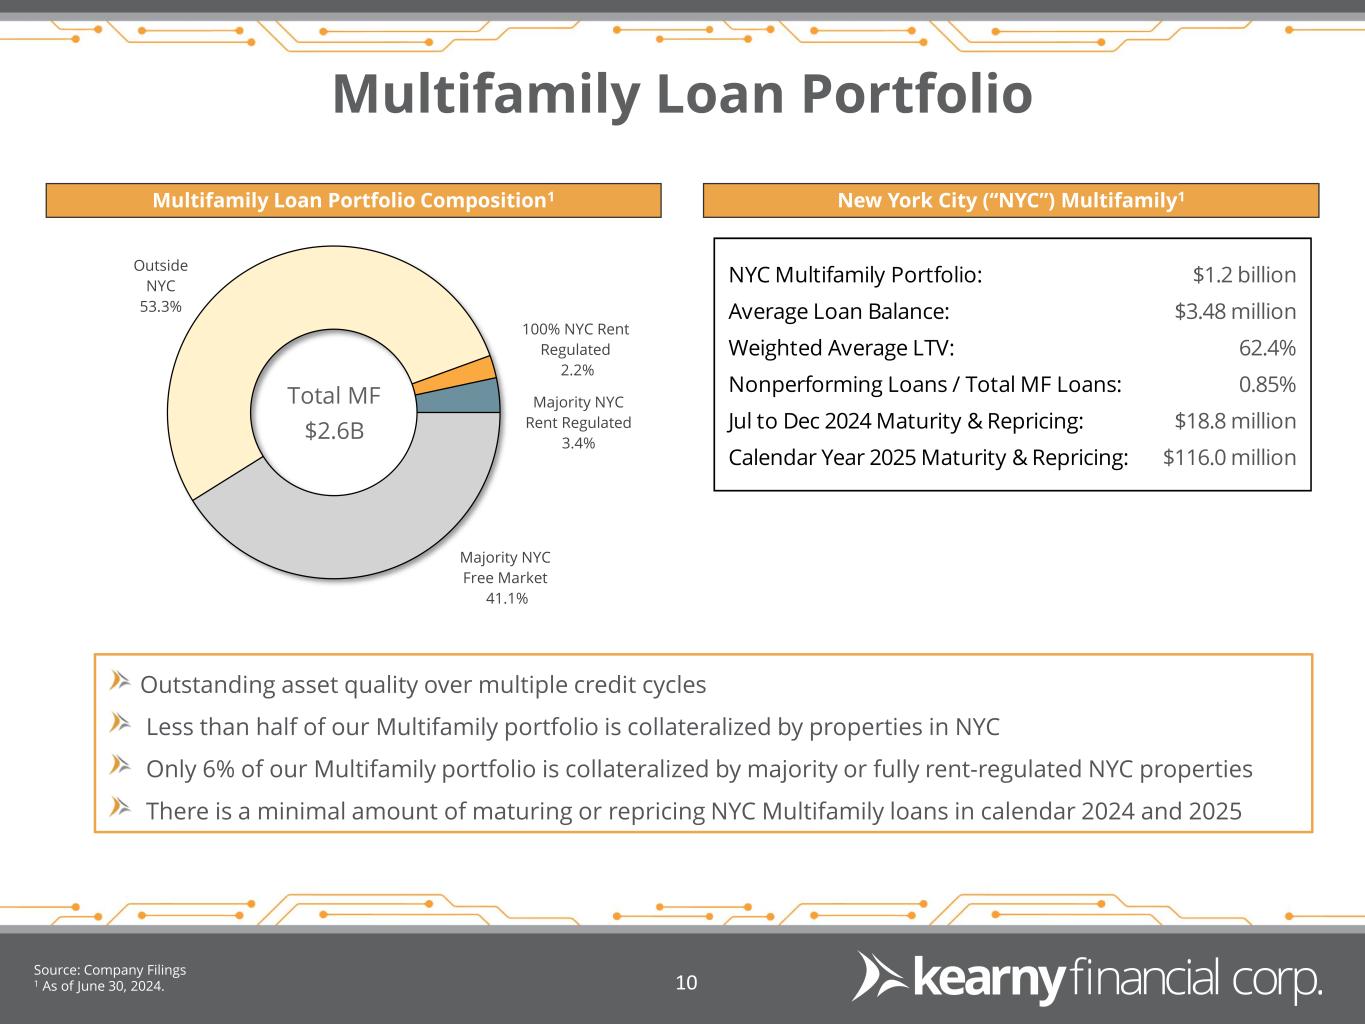
| Multi-family mortgage | $ | 2,645,851 | $ | 2,645,195 | $ | 2,651,274 | $ | 2,699,151 | $ | 2,761,775 | |||||||
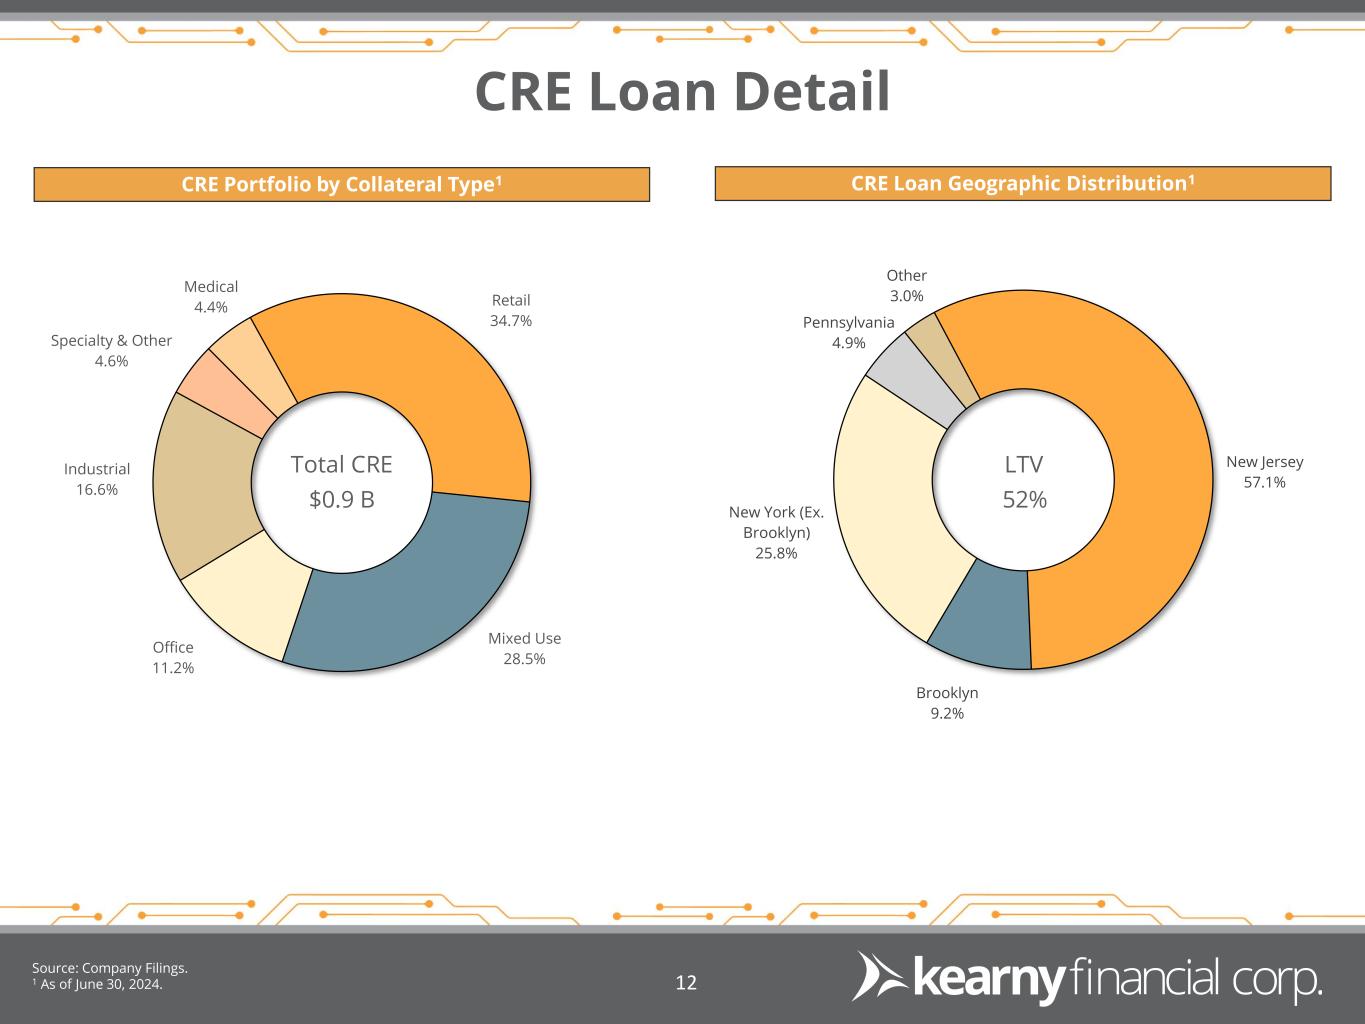
| Nonresidential mortgage | 948,075 | 965,539 | 947,287 | 946,801 | 968,574 | ||||||||||||
| Commercial business | 142,747 | 147,326 | 144,134 | 149,229 | 146,861 | ||||||||||||
| Construction | 209,237 | 229,457 | 221,933 | 230,703 | 226,609 | ||||||||||||
| Total commercial loans | 3,945,910 | 3,987,517 | 3,964,628 | 4,025,884 | 4,103,819 | ||||||||||||
| One- to four-family residential mortgage | 1,756,051 | 1,741,644 | 1,746,065 | 1,689,051 | 1,700,559 | ||||||||||||
| Consumer loans: | |||||||||||||||||
| Home equity loans | 44,104 | 42,731 | 43,517 | 42,896 | 43,549 | ||||||||||||
| Other consumer | 2,685 | 3,198 | 2,728 | 2,644 | 2,549 | ||||||||||||
| Total consumer loans | 46,789 | 45,929 | 46,245 | 45,540 | 46,098 | ||||||||||||
| Total loans, excluding yield adjustments | 5,748,750 | 5,775,090 | 5,756,938 | 5,760,475 | 5,850,476 | ||||||||||||
| Unaccreted yield adjustments | (15,963) | (16,754) | (11,309) | (24,426) | (21,055) | ||||||||||||
| Loans receivable, net of yield adjustments | 5,732,787 | 5,758,336 | 5,745,629 | 5,736,049 | 5,829,421 | ||||||||||||
| Less: allowance for credit losses on loans | (44,939) | (44,930) | (44,867) | (46,872) | (48,734) | ||||||||||||
| Net loans receivable | $ | 5,687,848 | $ | 5,713,406 | $ | 5,700,762 | $ | 5,689,177 | $ | 5,780,687 | |||||||
| Asset quality: | |||||||||||||||||
| Nonperforming assets: | |||||||||||||||||
| Accruing loans - 90 days and over past due | $ | — | $ | — | $ | — | $ | — | $ | — | |||||||
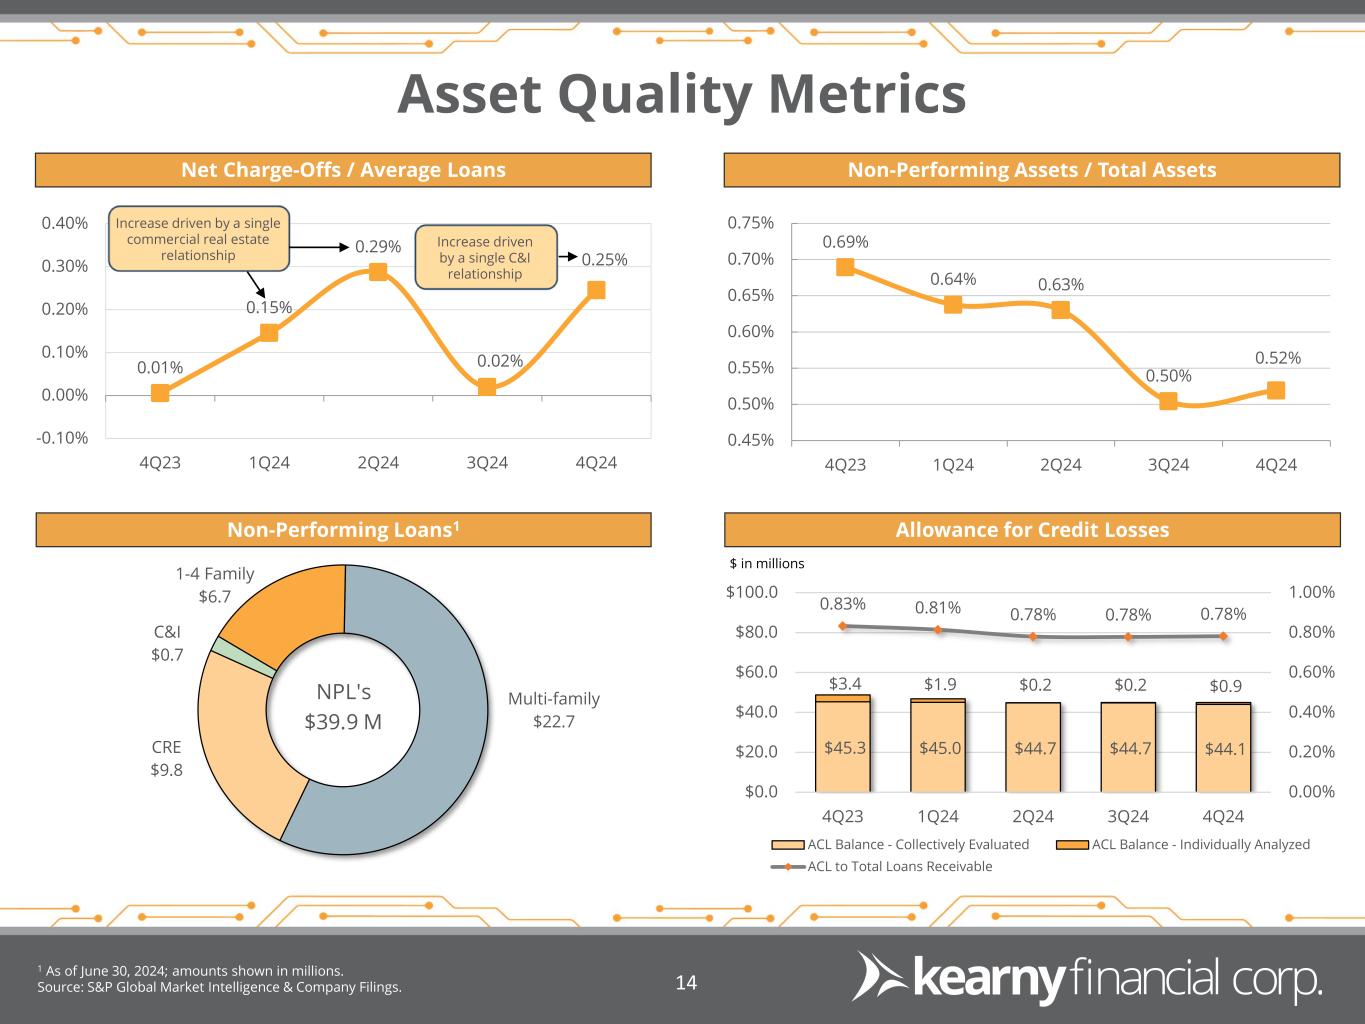
| Nonaccrual loans | 39,882 | 39,546 | 28,089 | 37,912 | 42,627 | ||||||||||||
| Total nonperforming loans | 39,882 | 39,546 | 28,089 | 37,912 | 42,627 | ||||||||||||
| Nonaccrual loans held-for-sale | — | — | 9,700 | — | — | ||||||||||||
| Other real estate owned | — | — | 11,982 | 12,956 | 12,956 | ||||||||||||
| Total nonperforming assets | $ | 39,882 | $ | 39,546 | $ | 49,771 | $ | 50,868 | $ | 55,583 | |||||||
| Nonperforming loans (% total loans) | 0.70 | % | 0.69 | % | 0.49 | % | 0.66 | % | 0.73 | % | |||||||
| Nonperforming assets (% total assets) | 0.52 | % | 0.50 | % | 0.63 | % | 0.64 | % | 0.69 | % | |||||||
| Classified loans | $ | 118,700 | $ | 115,772 | $ | 94,676 | $ | 98,616 | $ | 93,526 | |||||||
| Allowance for credit losses on loans (ACL): | |||||||||||||||||
| ACL to total loans | 0.78 | % | 0.78 | % | 0.78 | % | 0.81 | % | 0.83 | % | |||||||
| ACL to nonperforming loans | 112.68 | % | 113.61 | % | 159.73 | % | 123.63 | % | 114.33 | % | |||||||
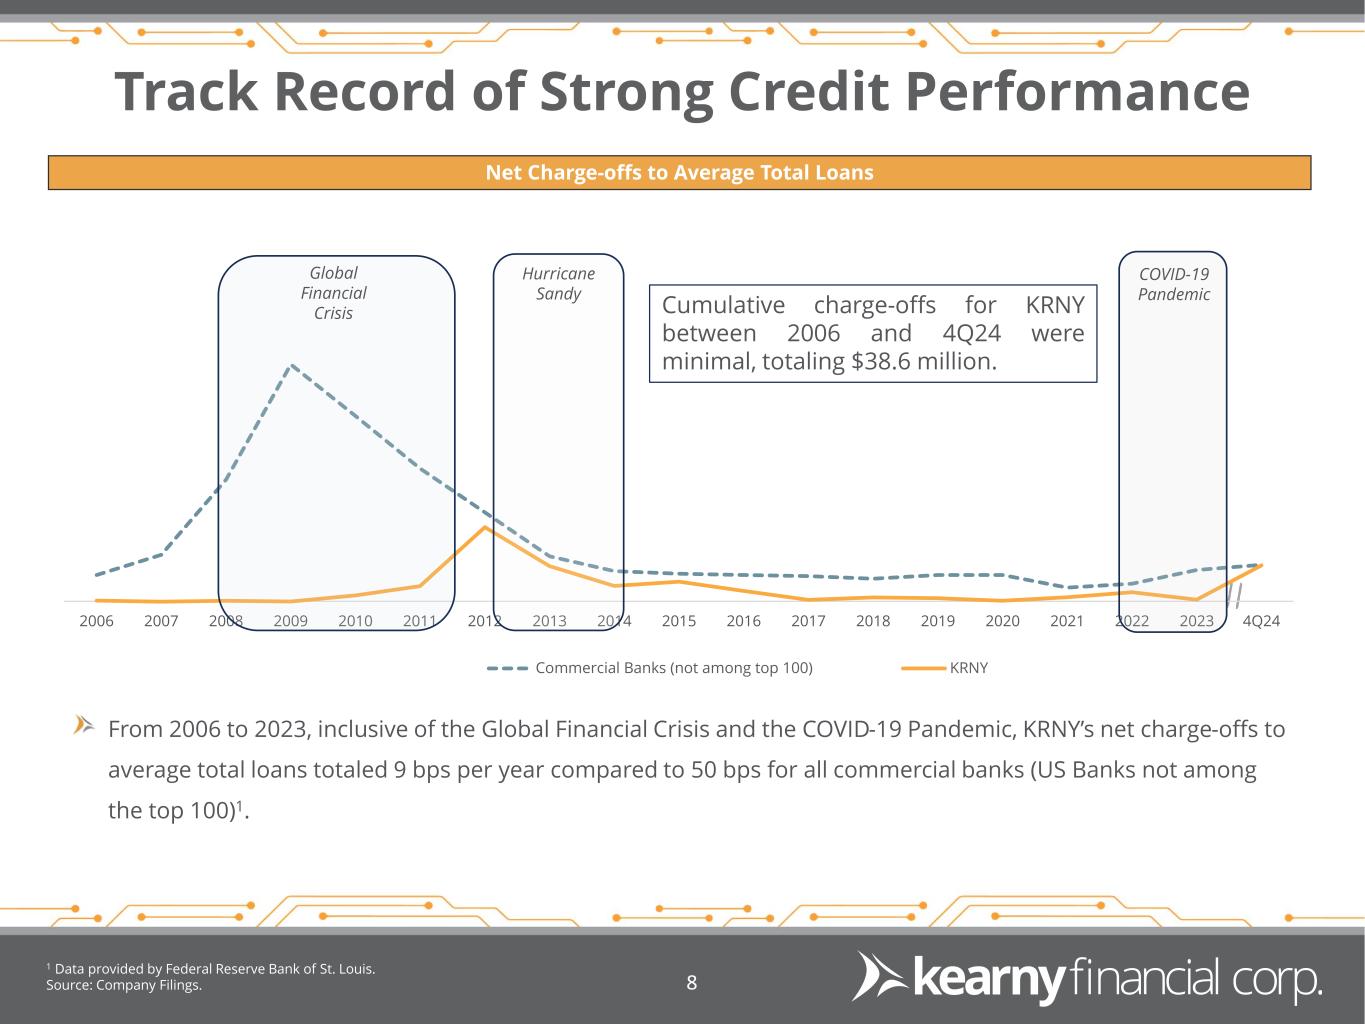
| Net charge-offs | $ | 3,518 | $ | 286 | $ | 4,110 | $ | 2,107 | $ | 82 | |||||||
| Average net charge-off rate (annualized) | 0.25 | % | 0.02 | % | 0.29 | % | 0.15 | % | 0.01 | % | |||||||
| (Dollars in Thousands) | June 30, 2024 |
March 31, 2024 |
December 31, 2023 |
September 30, 2023 |
June 30, 2023 |
||||||||||||
| Funding composition: | |||||||||||||||||
| Deposits: | |||||||||||||||||
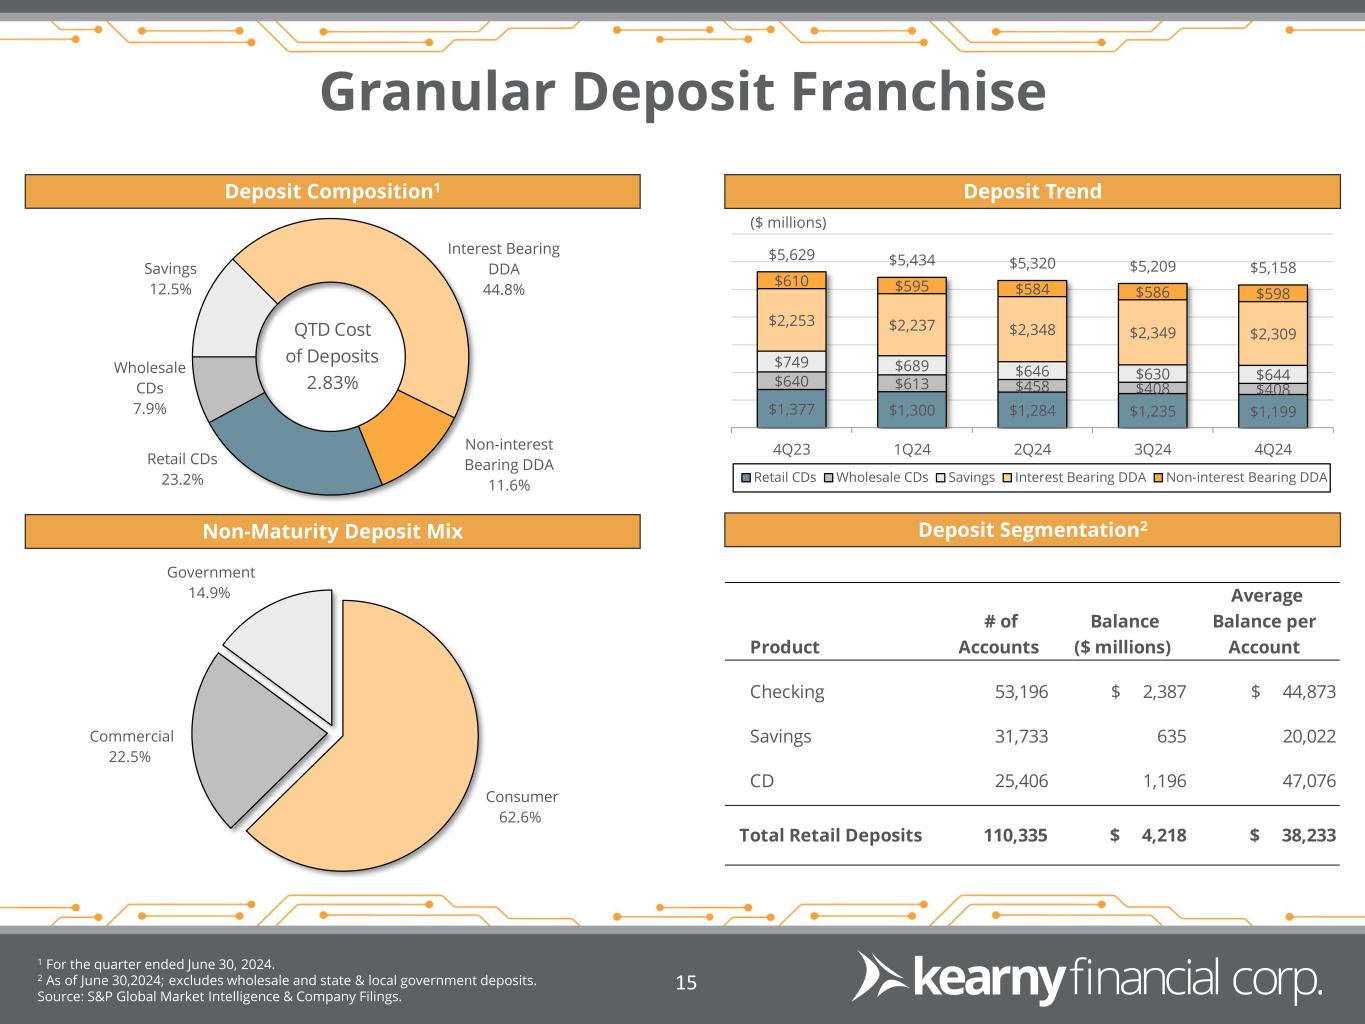
| Non-interest-bearing deposits | $ | 598,367 | $ | 586,089 | $ | 584,130 | $ | 595,141 | $ | 609,999 | |||||||
| Interest-bearing demand | 2,308,915 | 2,349,032 | 2,347,262 | 2,236,573 | 2,252,912 | ||||||||||||
| Savings | 643,481 | 630,456 | 646,182 | 689,163 | 748,721 | ||||||||||||
| Certificates of deposit (retail) | 1,199,127 | 1,235,261 | 1,283,676 | 1,300,382 | 1,377,028 | ||||||||||||
| Certificates of deposit (brokered and listing service) | 408,234 | 408,212 | 458,380 | 612,909 | 640,523 | ||||||||||||
| Interest-bearing deposits | 4,559,757 | 4,622,961 | 4,735,500 | 4,839,027 | 5,019,184 | ||||||||||||
| Total deposits | 5,158,124 | 5,209,050 | 5,319,630 | 5,434,168 | 5,629,183 | ||||||||||||
| Borrowings: | |||||||||||||||||
| Federal Home Loan Bank advances | 1,534,789 | 1,457,178 | 1,432,055 | 1,456,933 | 1,281,812 | ||||||||||||
| Overnight borrowings | 175,000 | 265,000 | 235,000 | 170,000 | 225,000 | ||||||||||||
| Total borrowings | 1,709,789 | 1,722,178 | 1,667,055 | 1,626,933 | 1,506,812 | ||||||||||||
| Total funding | $ | 6,867,913 | $ | 6,931,228 | $ | 6,986,685 | $ | 7,061,101 | $ | 7,135,995 | |||||||
| Loans as a % of deposits | 110.4 | % | 109.8 | % | 107.4 | % | 104.8 | % | 102.9 | % | |||||||
| Deposits as a % of total funding | 75.1 | % | 75.2 | % | 76.1 | % | 77.0 | % | 78.9 | % | |||||||
| Borrowings as a % of total funding | 24.9 | % | 24.8 | % | 23.9 | % | 23.0 | % | 21.1 | % | |||||||
| Uninsured deposits: | |||||||||||||||||
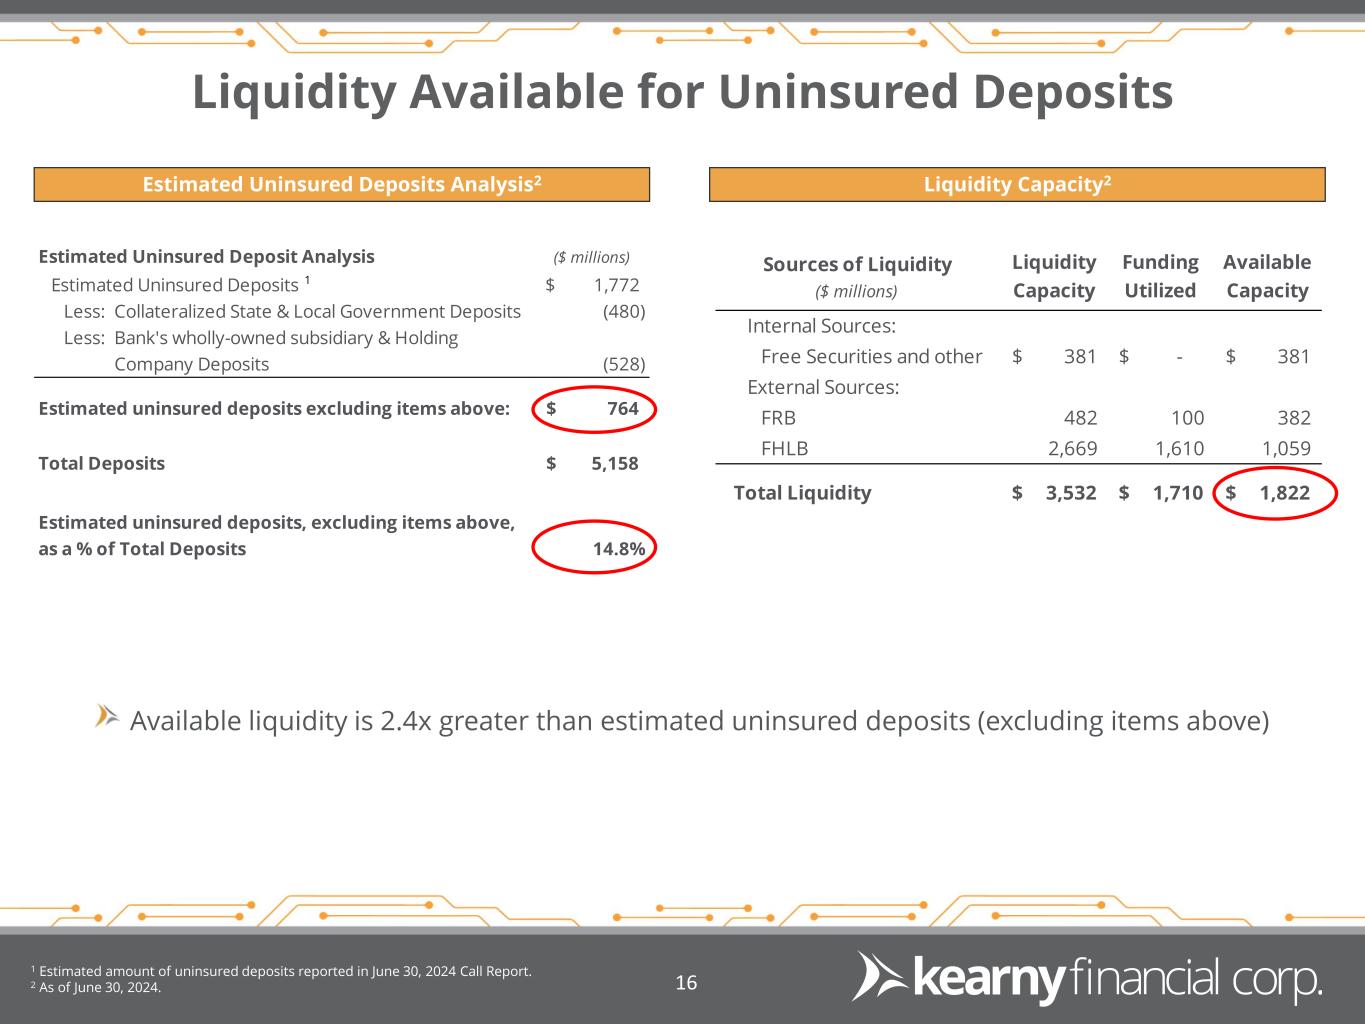
Uninsured deposits (reported) (1) |
$ | 1,772,623 | $ | 1,760,740 | $ | 1,813,122 | $ | 1,734,288 | $ | 1,771,416 | |||||||
Uninsured deposits (adjusted) (2) |
$ | 764,447 | $ | 718,026 | $ | 694,510 | $ | 683,265 | $ | 710,377 | |||||||
| Three Months Ended | |||||||||||||||||
| (Dollars and Shares in Thousands, Except Per Share Data) |
June 30, 2024 |
March 31, 2024 |
December 31, 2023 |
September 30, 2023 |
June 30, 2023 |
||||||||||||
| Interest income | |||||||||||||||||
| Loans | $ | 65,819 | $ | 64,035 | $ | 63,384 | $ | 62,769 | $ | 62,044 | |||||||
| Taxable investment securities | 14,802 | 15,490 | 16,756 | 16,265 | 15,736 | ||||||||||||
| Tax-exempt investment securities | 80 | 85 | 84 | 87 | 91 | ||||||||||||
| Other interest-earning assets | 2,289 | 2,475 | 2,401 | 2,047 | 1,821 | ||||||||||||
| Total interest income | 82,990 | 82,085 | 82,625 | 81,168 | 79,692 | ||||||||||||
| Interest expense | |||||||||||||||||
| Deposits | 32,187 | 32,320 | 30,340 | 27,567 | 26,226 | ||||||||||||
| Borrowings | 17,527 | 15,446 | 16,446 | 14,441 | 13,286 | ||||||||||||
| Total interest expense | 49,714 | 47,766 | 46,786 | 42,008 | 39,512 | ||||||||||||
| Net interest income | 33,276 | 34,319 | 35,839 | 39,160 | 40,180 | ||||||||||||
| Provision for (reversal of) credit losses | 3,527 | 349 | 2,105 | 245 | (306) | ||||||||||||
| Net interest income after provision for (reversal of) credit losses | 29,749 | 33,970 | 33,734 | 38,915 | 40,486 | ||||||||||||
| Non-interest income | |||||||||||||||||
| Fees and service charges | 580 | 657 | 624 | 748 | 699 | ||||||||||||
| Loss on sale and call of securities | — | — | (18,135) | — | — | ||||||||||||
| Gain (loss) on sale of loans | 111 | (712) | 104 | 215 | 199 | ||||||||||||
| Loss on sale of other real estate owned | — | — | (974) | — | (139) | ||||||||||||
| Income from bank owned life insurance | 3,209 | 3,039 | 1,162 | 1,666 | 1,605 | ||||||||||||
| Electronic banking fees and charges | 1,130 | 464 | 396 | 367 | 399 | ||||||||||||
| Other income | 776 | 755 | 811 | 1,014 | 903 | ||||||||||||
| Total non-interest income | 5,806 | 4,203 | (16,012) | 4,010 | 3,666 | ||||||||||||
| Non-interest expense | |||||||||||||||||
| Salaries and employee benefits | 17,266 | 16,911 | 17,282 | 17,761 | 17,315 | ||||||||||||
| Net occupancy expense of premises | 2,738 | 2,863 | 2,674 | 2,758 | 2,862 | ||||||||||||
| Equipment and systems | 3,785 | 3,823 | 3,814 | 3,801 | 3,511 | ||||||||||||
| Advertising and marketing | 480 | 387 | 301 | 228 | 231 | ||||||||||||
| Federal deposit insurance premium | 1,532 | 1,429 | 1,495 | 1,524 | 1,455 | ||||||||||||
| Directors' compensation | 360 | 360 | 393 | 393 | 345 | ||||||||||||
| Goodwill impairment | 97,370 | — | — | — | — | ||||||||||||
| Other expense | 3,020 | 3,286 | 3,808 | 3,309 | 3,042 | ||||||||||||
| Total non-interest expense | 126,551 | 29,059 | 29,767 | 29,774 | 28,761 | ||||||||||||
| (Loss) income before income taxes | (90,996) | 9,114 | (12,045) | 13,151 | 15,391 | ||||||||||||
| Income taxes | (917) | 1,717 | 1,782 | 3,309 | 3,378 | ||||||||||||
| Net (loss) income | $ | (90,079) | $ | 7,397 | $ | (13,827) | $ | 9,842 | $ | 12,013 | |||||||
| Net (loss) income per common share (EPS) | |||||||||||||||||
| Basic | $ | (1.45) | $ | 0.12 | $ | (0.22) | $ | 0.16 | $ | 0.19 | |||||||
| Diluted | $ | (1.45) | $ | 0.12 | $ | (0.22) | $ | 0.16 | $ | 0.19 | |||||||
| Dividends declared | |||||||||||||||||
| Cash dividends declared per common share | $ | 0.11 | $ | 0.11 | $ | 0.11 | $ | 0.11 | $ | 0.11 | |||||||
| Cash dividends declared | $ | 6,903 | $ | 6,844 | $ | 6,882 | $ | 6,989 | $ | 7,007 | |||||||
| Dividend payout ratio | -7.7 | % | 92.5 | % | -49.8 | % | 71.0 | % | 58.3 | % | |||||||
| Weighted average number of common shares outstanding | |||||||||||||||||
| Basic | 62,254 | 62,205 | 62,299 | 63,014 | 63,667 | ||||||||||||
| Diluted | 62,254 | 62,211 | 62,299 | 63,061 | 63,667 | ||||||||||||
| Three Months Ended | |||||||||||||||||
| (Dollars in Thousands) | June 30, 2024 |
March 31, 2024 |
December 31, 2023 |
September 30, 2023 |
June 30, 2023 |
||||||||||||
| Assets | |||||||||||||||||
| Interest-earning assets: | |||||||||||||||||
| Loans receivable, including loans held-for-sale | $ | 5,743,008 | $ | 5,752,477 | $ | 5,726,321 | $ | 5,788,074 | $ | 5,932,541 | |||||||
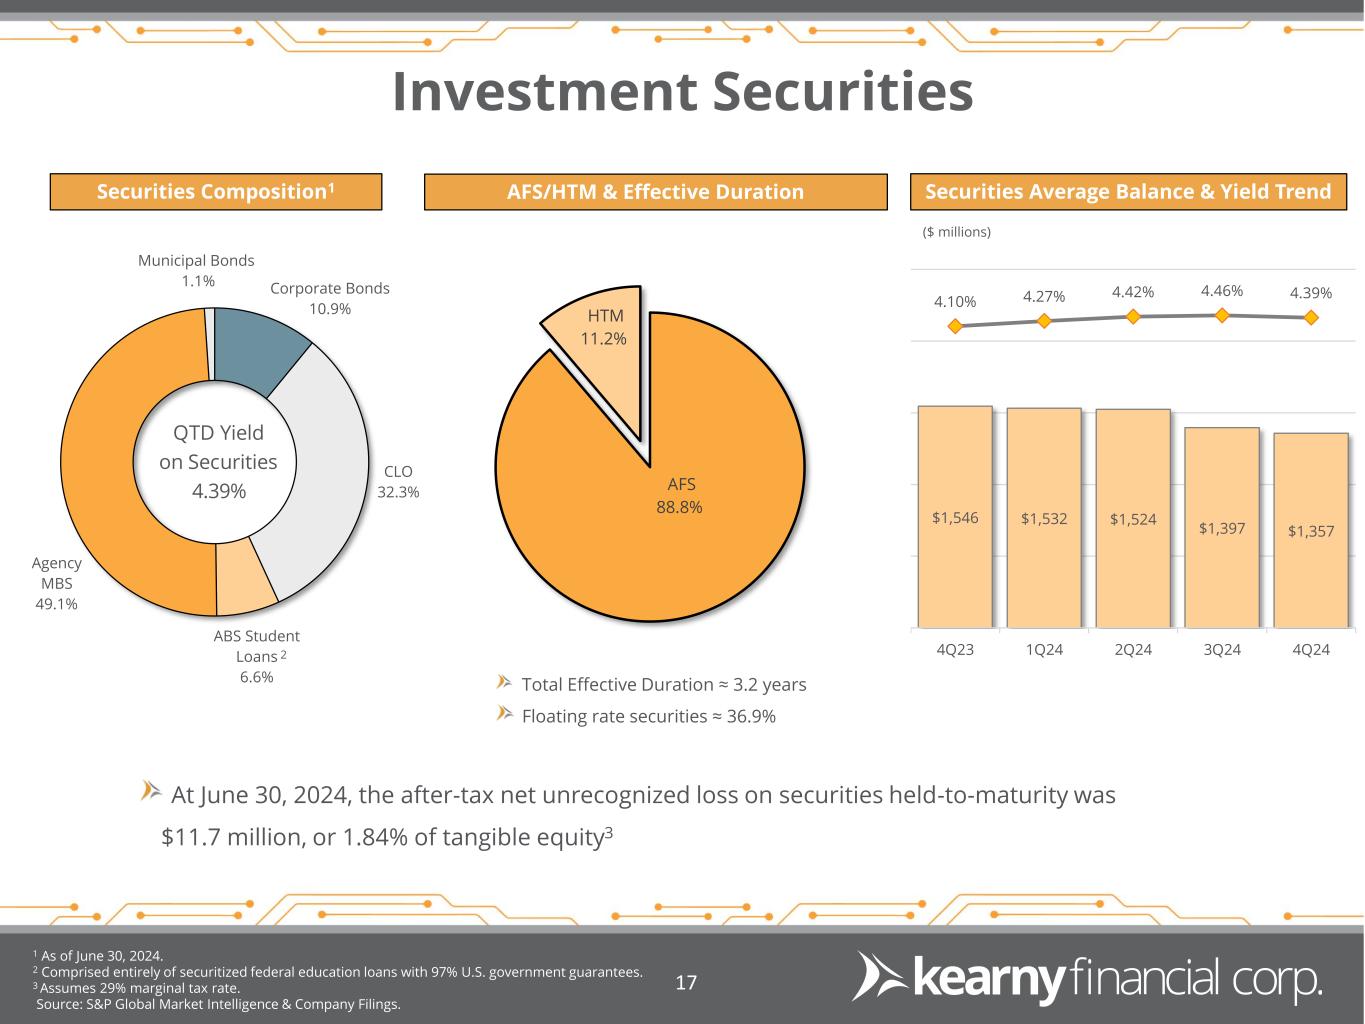
| Taxable investment securities | 1,343,541 | 1,382,064 | 1,509,165 | 1,516,393 | 1,529,582 | ||||||||||||
| Tax-exempt investment securities | 13,737 | 14,614 | 15,025 | 15,483 | 16,346 | ||||||||||||
| Other interest-earning assets | 128,257 | 125,155 | 139,740 | 130,829 | 128,158 | ||||||||||||
| Total interest-earning assets | 7,228,543 | 7,274,310 | 7,390,251 | 7,450,779 | 7,606,627 | ||||||||||||
| Non-interest-earning assets | 466,537 | 577,411 | 554,335 | 568,723 | 556,962 | ||||||||||||
| Total assets | $ | 7,695,080 | $ | 7,851,721 | $ | 7,944,586 | $ | 8,019,502 | $ | 8,163,589 | |||||||
| Liabilities and Stockholders' Equity | |||||||||||||||||
| Interest-bearing liabilities: | |||||||||||||||||
| Deposits: | |||||||||||||||||
| Interest-bearing demand | $ | 2,310,521 | $ | 2,378,831 | $ | 2,301,169 | $ | 2,245,831 | $ | 2,321,120 | |||||||
| Savings | 631,622 | 635,226 | 664,926 | 719,508 | 774,854 | ||||||||||||
| Certificates of deposit | 1,613,798 | 1,705,513 | 1,824,316 | 1,968,512 | 2,057,818 | ||||||||||||
| Total interest-bearing deposits | 4,555,941 | 4,719,570 | 4,790,411 | 4,933,851 | 5,153,792 | ||||||||||||
| Borrowings: | |||||||||||||||||
| Federal Home Loan Bank advances | 1,507,192 | 1,428,801 | 1,513,497 | 1,386,473 | 1,374,316 | ||||||||||||
| Other borrowings | 228,461 | 210,989 | 142,283 | 158,098 | 100,055 | ||||||||||||
| Total borrowings | 1,735,653 | 1,639,790 | 1,655,780 | 1,544,571 | 1,474,371 | ||||||||||||
| Total interest-bearing liabilities | 6,291,594 | 6,359,360 | 6,446,191 | 6,478,422 | 6,628,163 | ||||||||||||
| Non-interest-bearing liabilities: | |||||||||||||||||
| Non-interest-bearing deposits | 589,438 | 581,870 | 597,294 | 612,251 | 608,765 | ||||||||||||
| Other non-interest-bearing liabilities | 62,978 | 65,709 | 62,387 | 66,701 | 64,970 | ||||||||||||
| Total non-interest-bearing liabilities | 652,416 | 647,579 | 659,681 | 678,952 | 673,735 | ||||||||||||
| Total liabilities | 6,944,010 | 7,006,939 | 7,105,872 | 7,157,374 | 7,301,898 | ||||||||||||
| Stockholders' equity | 751,070 | 844,782 | 838,714 | 862,128 | 861,691 | ||||||||||||
| Total liabilities and stockholders' equity | $ | 7,695,080 | $ | 7,851,721 | $ | 7,944,586 | $ | 8,019,502 | $ | 8,163,589 | |||||||
| Average interest-earning assets to average interest-bearing liabilities
|
114.89 | % | 114.39 | % | 114.65 | % | 115.01 | % | 114.76 | % | |||||||
| Three Months Ended | |||||||||||||||||
| June 30, 2024 |
March 31, 2024 |
December 31, 2023 |
September 30, 2023 |
June 30, 2023 |
|||||||||||||
| Average yield on interest-earning assets: | |||||||||||||||||
| Loans receivable, including loans held-for-sale | 4.58 | % | 4.45 | % | 4.43 | % | 4.34 | % | 4.18 | % | |||||||
| Taxable investment securities | 4.41 | % | 4.48 | % | 4.44 | % | 4.29 | % | 4.12 | % | |||||||
Tax-exempt investment securities (1) |
2.32 | % | 2.32 | % | 2.25 | % | 2.25 | % | 2.23 | % | |||||||
| Other interest-earning assets | 7.14 | % | 7.91 | % | 6.87 | % | 6.26 | % | 5.68 | % | |||||||
| Total interest-earning assets | 4.59 | % | 4.51 | % | 4.47 | % | 4.36 | % | 4.19 | % | |||||||
| Average cost of interest-bearing liabilities: | |||||||||||||||||
| Deposits: | |||||||||||||||||
| Interest-bearing demand | 3.06 | % | 3.08 | % | 2.91 | % | 2.58 | % | 2.38 | % | |||||||
| Savings | 0.63 | % | 0.46 | % | 0.44 | % | 0.47 | % | 0.48 | % | |||||||
| Certificates of deposit | 3.35 | % | 3.11 | % | 2.82 | % | 2.49 | % | 2.24 | % | |||||||
| Total interest-bearing deposits | 2.83 | % | 2.74 | % | 2.53 | % | 2.23 | % | 2.04 | % | |||||||
| Borrowings: | |||||||||||||||||
| Federal Home Loan Bank advances | 3.86 | % | 3.55 | % | 3.82 | % | 3.54 | % | 3.51 | % | |||||||
| Other borrowings | 5.24 | % | 5.22 | % | 5.65 | % | 5.46 | % | 4.89 | % | |||||||
| Total borrowings | 4.04 | % | 3.77 | % | 3.97 | % | 3.74 | % | 3.60 | % | |||||||
| Total interest-bearing liabilities | 3.16 | % | 3.00 | % | 2.90 | % | 2.59 | % | 2.38 | % | |||||||
Interest rate spread (2) |
1.43 | % | 1.51 | % | 1.57 | % | 1.77 | % | 1.81 | % | |||||||
Net interest margin (3) |
1.84 | % | 1.89 | % | 1.94 | % | 2.10 | % | 2.11 | % | |||||||
| Non-interest income to average assets (annualized) | 0.30 | % | 0.21 | % | -0.81 | % | 0.20 | % | 0.18 | % | |||||||
| Non-interest expense to average assets (annualized) | 6.58 | % | 1.48 | % | 1.50 | % | 1.49 | % | 1.41 | % | |||||||
Efficiency ratio (4) |
323.81 | % | 75.43 | % | 150.13 | % | 68.97 | % | 65.60 | % | |||||||
| Return on average assets (annualized) | -4.68 | % | 0.38 | % | -0.70 | % | 0.49 | % | 0.59 | % | |||||||
| Return on average equity (annualized) | -47.97 | % | 3.50 | % | -6.59 | % | 4.57 | % | 5.58 | % | |||||||
Return on average tangible equity (annualized) (5) |
-56.69 | % | 4.68 | % | -8.84 | % | 6.07 | % | 7.41 | % | |||||||
| Three Months Ended | |||||||||||||||||
| (Dollars and Shares in Thousands, Except Per Share Data) |
June 30, 2024 |
March 31, 2024 |
December 31, 2023 |
September 30, 2023 |
June 30, 2023 |
||||||||||||
| Adjusted net income: | |||||||||||||||||
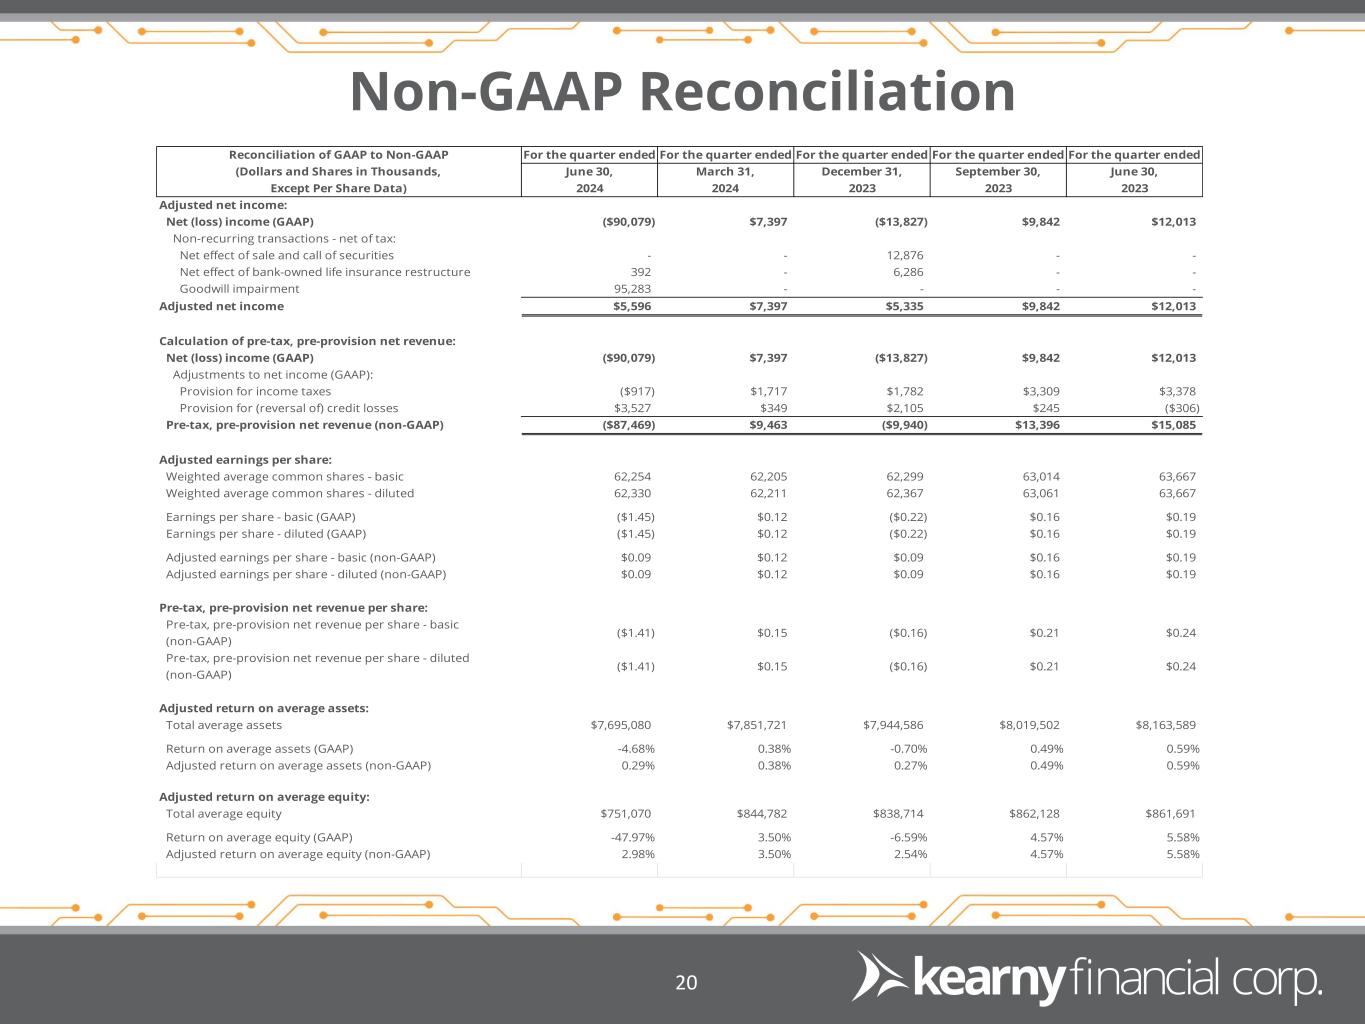
| Net (loss) income (GAAP) | $ | (90,079) | $ | 7,397 | $ | (13,827) | $ | 9,842 | $ | 12,013 | |||||||
| Non-recurring transactions - net of tax: | |||||||||||||||||
| Net effect of sale and call of securities | — | — | 12,876 | — | — | ||||||||||||
| Net effect of bank-owned life insurance restructure | 392 | — | 6,286 | — | — | ||||||||||||
| Goodwill impairment | 95,283 | — | — | — | — | ||||||||||||
| Adjusted net income | $ | 5,596 | $ | 7,397 | $ | 5,335 | $ | 9,842 | $ | 12,013 | |||||||
| Calculation of pre-tax, pre-provision net revenue: | |||||||||||||||||
| Net (loss) income (GAAP) | $ | (90,079) | $ | 7,397 | $ | (13,827) | $ | 9,842 | $ | 12,013 | |||||||
| Adjustments to net income (GAAP): | |||||||||||||||||
| Provision for income taxes | (917) | 1,717 | 1,782 | 3,309 | 3,378 | ||||||||||||
| Provision for (reversal of) credit losses | 3,527 | 349 | 2,105 | 245 | (306) | ||||||||||||
| Pre-tax, pre-provision net revenue (non-GAAP) | $ | (87,469) | $ | 9,463 | $ | (9,940) | $ | 13,396 | $ | 15,085 | |||||||
| Adjusted earnings per share: | |||||||||||||||||
| Weighted average common shares - basic | 62,254 | 62,205 | 62,299 | 63,014 | 63,667 | ||||||||||||
| Weighted average common shares - diluted | 62,330 | 62,211 | 62,367 | 63,061 | 63,667 | ||||||||||||
| Earnings per share - basic (GAAP) | $ | (1.45) | $ | 0.12 | $ | (0.22) | $ | 0.16 | $ | 0.19 | |||||||
| Earnings per share - diluted (GAAP) | $ | (1.45) | $ | 0.12 | $ | (0.22) | $ | 0.16 | $ | 0.19 | |||||||
| Adjusted earnings per share - basic (non-GAAP) | $ | 0.09 | $ | 0.12 | $ | 0.09 | $ | 0.16 | $ | 0.19 | |||||||
| Adjusted earnings per share - diluted (non-GAAP) | $ | 0.09 | $ | 0.12 | $ | 0.09 | $ | 0.16 | $ | 0.19 | |||||||
| Pre-tax, pre-provision net revenue per share: | |||||||||||||||||
| Pre-tax, pre-provision net revenue per share - basic (non-GAAP)
|
$ | (1.41) | $ | 0.15 | $ | (0.16) | $ | 0.21 | $ | 0.24 | |||||||
| Pre-tax, pre-provision net revenue per share - diluted (non-GAAP)
|
$ | (1.41) | $ | 0.15 | $ | (0.16) | $ | 0.21 | $ | 0.24 | |||||||
| Adjusted return on average assets: | |||||||||||||||||
| Total average assets | $ | 7,695,080 | $ | 7,851,721 | $ | 7,944,586 | $ | 8,019,502 | $ | 8,163,589 | |||||||
| Return on average assets (GAAP) | -4.68 | % | 0.38 | % | -0.70 | % | 0.49 | % | 0.59 | % | |||||||
| Adjusted return on average assets (non-GAAP) | 0.29 | % | 0.38 | % | 0.27 | % | 0.49 | % | 0.59 | % | |||||||
| Adjusted return on average equity: | |||||||||||||||||
| Total average equity | $ | 751,070 | $ | 844,782 | $ | 838,714 | $ | 862,128 | $ | 861,691 | |||||||
| Return on average equity (GAAP) | -47.97 | % | 3.50 | % | -6.59 | % | 4.57 | % | 5.58 | % | |||||||
| Adjusted return on average equity (non-GAAP) | 2.98 | % | 3.50 | % | 2.54 | % | 4.57 | % | 5.58 | % | |||||||
| Three Months Ended | |||||||||||||||||
| (Dollars and Shares in Thousands, Except Per Share Data) |
June 30, 2024 |
March 31, 2024 |
December 31, 2023 |
September 30, 2023 |
June 30, 2023 |
||||||||||||
| Adjusted return on average tangible equity: | |||||||||||||||||
| Total average equity | $ | 751,070 | $ | 844,782 | $ | 838,714 | $ | 862,128 | $ | 861,691 | |||||||
| Less: average goodwill | (113,525) | (210,895) | (210,895) | (210,895) | (210,895) | ||||||||||||
| Less: average other intangible assets | (2,006) | (2,138) | (2,277) | (2,411) | (2,544) | ||||||||||||
| Total average tangible equity | $ | 635,539 | $ | 631,749 | $ | 625,542 | $ | 648,822 | $ | 648,252 | |||||||
| Return on average tangible equity (non-GAAP) | -56.69 | % | 4.68 | % | -8.84 | % | 6.07 | % | 7.41 | % | |||||||
| Adjusted return on average tangible equity (non-GAAP) | 3.52 | % | 4.68 | % | 3.41 | % | 6.07 | % | 7.41 | % | |||||||
| Adjusted non-interest expense ratio: | |||||||||||||||||
| Non-interest expense (GAAP) | $ | 126,551 | $ | 29,059 | $ | 29,767 | $ | 29,774 | $ | 28,761 | |||||||
| Non-recurring transactions: | |||||||||||||||||
| Goodwill impairment | (97,370) | — | — | — | — | ||||||||||||
| Non-interest expense (non-GAAP) | $ | 29,181 | $ | 29,059 | $ | 29,767 | $ | 29,774 | $ | 28,761 | |||||||
| Non-interest expense ratio (GAAP) | 6.58 | % | 1.48 | % | 1.50 | % | 1.49 | % | 1.41 | % | |||||||
| Adjusted non-interest expense ratio (non-GAAP) | 1.52 | % | 1.48 | % | 1.50 | % | 1.49 | % | 1.41 | % | |||||||
| Adjusted efficiency ratio: | |||||||||||||||||
| Non-interest expense (non-GAAP) | $ | 29,181 | $ | 29,059 | $ | 29,767 | $ | 29,774 | $ | 28,761 | |||||||
| Net interest income (GAAP) | $ | 33,276 | $ | 34,319 | $ | 35,839 | $ | 39,160 | $ | 40,180 | |||||||
| Total non-interest income (GAAP) | 5,806 | 4,203 | (16,012) | 4,010 | 3,666 | ||||||||||||
| Non-recurring transactions: | |||||||||||||||||
| Net effect of sale and call of securities | — | — | 18,135 | — | — | ||||||||||||
| Net effect of bank-owned life insurance restructure | 392 | — | 573 | — | — | ||||||||||||
| Total revenue (non-GAAP) | $ | 39,474 | $ | 38,522 | $ | 38,535 | $ | 43,170 | $ | 43,846 | |||||||
| Efficiency ratio (GAAP) | 323.81 | % | 75.43 | % | 150.13 | % | 68.97 | % | 65.60 | % | |||||||
| Adjusted efficiency ratio (non-GAAP) | 73.92 | % | 75.43 | % | 77.25 | % | 68.97 | % | 65.60 | % | |||||||
| Year Ended | |||||||||||
| (Dollars and Shares in Thousands, Except Per Share Data) |
June 30, 2024 |
June 30, 2023 |
|||||||||
| Adjusted net income: | |||||||||||
| Net (loss) income (GAAP) | $ | (86,667) | $ | 40,811 | |||||||
| Non-recurring transactions - net of tax: | |||||||||||
| Branch consolidation expenses and impairment charges | — | 568 | |||||||||
| Net effect of sale and call of securities | 12,876 | 10,811 | |||||||||
| Net effect of sale of other assets | — | (2,081) | |||||||||
| Severance expense from workforce realignment | — | 538 | |||||||||
| Net effect of bank-owned life insurance contract restructure | 6,678 | — | |||||||||
| Goodwill impairment | 95,283 | — | — | ||||||||
| Adjusted net income | $ | 28,170 | $ | 50,647 | |||||||
| Calculation of pre-tax, pre-provision net revenue: | |||||||||||
| Net (loss) income (GAAP) | (86,667) | 40,811 | |||||||||
| Adjustments to net income (GAAP): | |||||||||||
| Provision for income taxes | $ | 5,891 | $ | 11,568 | |||||||
| Provision for (reversal of) credit losses | 6,226 | 2,486 | |||||||||
| Pre-tax, pre-provision net revenue (non-GAAP) | (74,550) | 54,865 | |||||||||
| Adjusted earnings per share: | |||||||||||
| Weighted average common shares - basic | 62,444 | 64,804 | |||||||||
| Weighted average common shares - diluted | 62,444 | 64,804 | |||||||||
| Earnings per share - basic (GAAP) | $ | (1.39) | $ | 0.63 | |||||||
| Earnings per share - diluted (GAAP) | $ | (1.39) | $ | 0.63 | |||||||
| Adjusted earnings per share - basic (non-GAAP) | $ | 0.45 | $ | 0.78 | |||||||
| Adjusted earnings per share - diluted (non-GAAP) | $ | 0.45 | $ | 0.78 | |||||||
| Pre-tax, pre-provision net revenue per share: | |||||||||||
| Pre-tax, pre-provision net revenue per share - basic (non-GAAP) | $ | (1.19) | $ | 0.85 | |||||||
| Pre-tax, pre-provision net revenue per share - diluted (non-GAAP) | $ | (1.19) | $ | 0.85 | |||||||
| Adjusted return on average assets: | |||||||||||
| Total average assets | $ | 7,878,292 | $ | 8,068,937 | |||||||
| Return on average assets (GAAP) | -1.10 | % | 0.51 | % | |||||||
| Adjusted return on average assets (non-GAAP) | 0.36 | % | 0.63 | % | |||||||
| Adjusted return on average equity: | |||||||||||
| Total average equity | $ | 824,317 | $ | 875,358 | |||||||
| Return on average equity (GAAP) | -10.51 | % | 4.66 | % | |||||||
| Adjusted return on average equity (non-GAAP) | 3.42 | % | 5.79 | % | |||||||
| Adjusted return on average tangible equity: | |||||||||||
| Total average equity | $ | 824,317 | $ | 875,358 | |||||||
| Less: average goodwill | (186,685) | (210,895) | |||||||||
| Less: average other intangible assets | (2,209) | (2,757) | |||||||||
| Total average tangible equity | $ | 635,423 | $ | 661,706 | |||||||
| Return on average tangible equity (non-GAAP) | -13.64 | % | 6.17 | % | |||||||
| Adjusted return on average tangible equity (non-GAAP) | 4.43 | % | 7.65 | % | |||||||
| Year Ended | |||||||||||
| (Dollars in Thousands) | June 30, 2024 |
June 30, 2023 |
|||||||||
| Adjusted non-interest expense ratio: | |||||||||||
| Non-interest expense (GAAP) | $ | 215,151 | $ | 123,751 | |||||||
| Non-routine transactions: | |||||||||||
| Branch consolidation expenses and impairment charges | — | (800) | |||||||||
| Severance expense from workforce realignment | — | (757) | |||||||||
| Goodwill impairment | (97,370) | — | |||||||||
| Non-interest expense (non-GAAP) | $ | 117,781 | $ | 122,194 | |||||||
| Non-interest expense ratio (GAAP) | 2.73 | % | 1.53 | % | |||||||
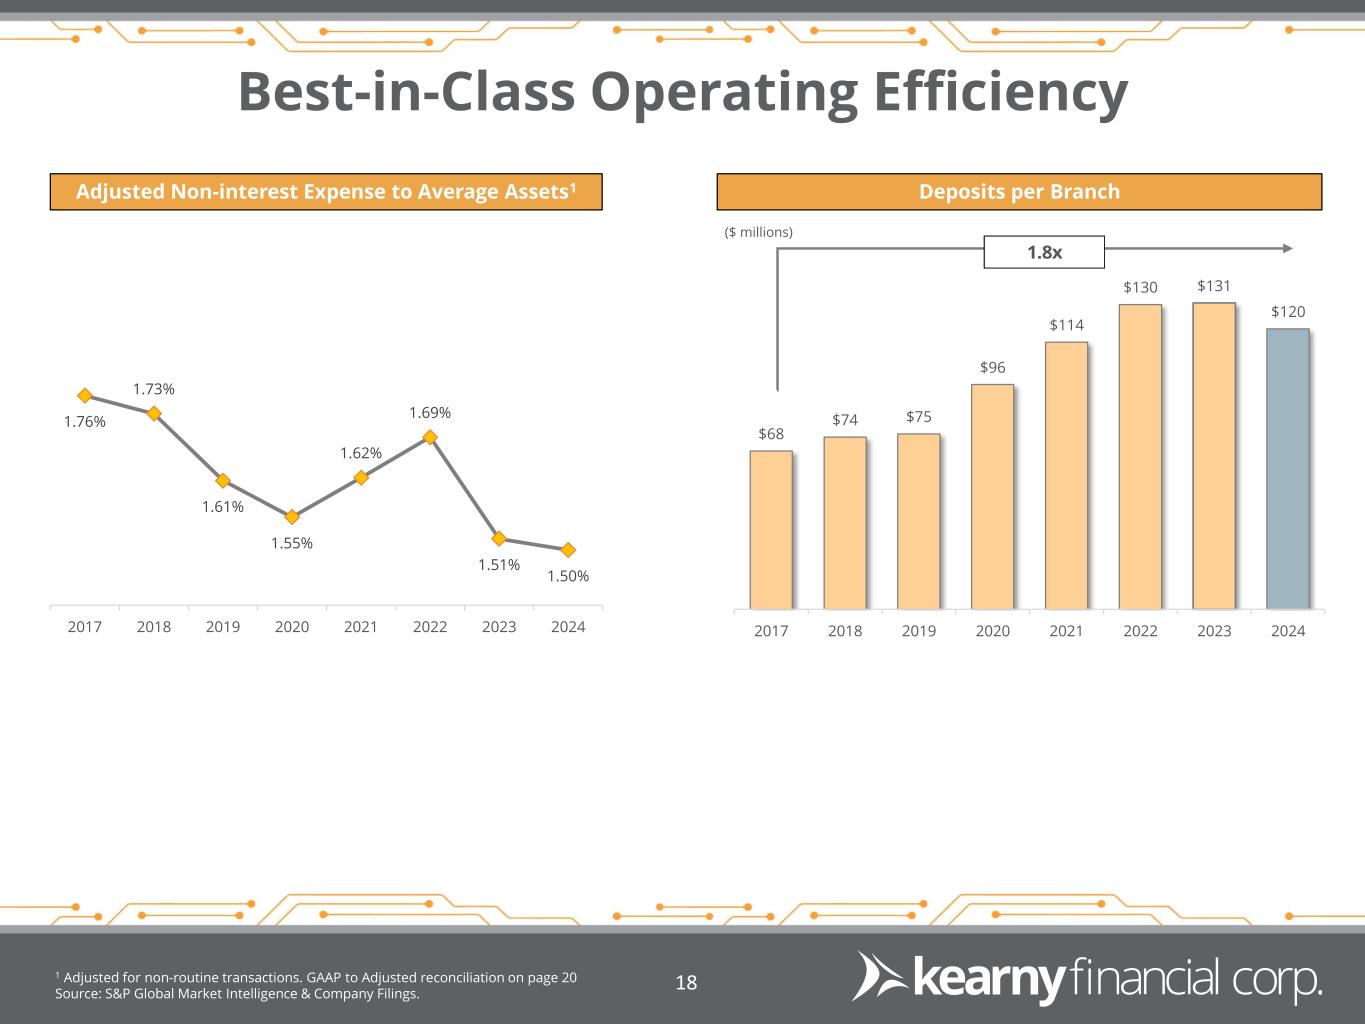
| Adjusted non-interest expense ratio (non-GAAP) | 1.50 | % | 1.51 | % | |||||||
| Adjusted efficiency ratio: | |||||||||||
| Non-interest expense (non-GAAP) | $ | 117,781 | $ | 122,194 | |||||||
| Net interest income (GAAP) | $ | 142,594 | $ | 175,865 | |||||||
| Total non-interest income (GAAP) | (1,993) | 2,751 | |||||||||
| Non-routine transactions: | |||||||||||
| Net effect of sale and call of securities | 18,135 | 15,227 | |||||||||
| Net effect of sale of other assets | — | (2,931) | |||||||||
| Net effect of bank-owned life insurance contract restructure | 965 | — | |||||||||
| Total revenue (non-GAAP) | $ | 159,701 | $ | 190,912 | |||||||
| Efficiency ratio (GAAP) | 153.02 | % | 69.28 | % | |||||||
| Adjusted efficiency ratio (non-GAAP) | 73.75 | % | 64.01 | % | |||||||

