| CURRENT REPORT | ||
| PURSUANT TO SECTION 13 OR 15(d) OF THE | ||
| SECURITIES EXCHANGE ACT OF 1934 | ||
| Maryland | (Urban Edge Properties) | 001-36523 | (Urban Edge Properties) | 47-6311266 | ||||||||||||||||
| Delaware | (Urban Edge Properties LP) | 333-212951-01 | (Urban Edge Properties LP) | 36-4791544 | ||||||||||||||||
| (State or other jurisdiction of incorporation or organization) | (Commission File Number) | (I.R.S. Employer Identification Number) | ||||||||||||||||||
12 East 49th Street |
||||||||||||||
| New York | NY | 10017 | ||||||||||||
| (Address of Principal Executive offices) (Zip Code) | ||||||||||||||
| Registrant’s telephone number including area code: | (212) | 956-2556 | ||||||
Former name or former address, if changed since last report: N/A | ||||||||
| ☐ | Written communications pursuant to Rule 425 under the Securities Act (17 CFR 230.425) | ||||
| ☐ | Soliciting material pursuant to Rule 14a-12 under the Exchange Act (17 CFR 240.14a-12) | ||||
| ☐ | Pre-commencement communications pursuant to Rule 14d-2(b) under the Exchange Act (17 CFR 240.14d-2(b)) | ||||
| ☐ | Pre-commencement communications pursuant to Rule 13e-4(c) under the Exchange Act (17 CFR 240.13e-4(c)) | ||||
| Title of class of registered securities | Trading symbol | Name of exchange on which registered | ||||||
| Common shares of beneficial interest, par value $0.01 per share | UE | The New York Stock Exchange | ||||||
| Title of class of registered securities | Trading symbol | Name of exchange on which registered | ||||||
| None | N/A | N/A | ||||||
| 104 | Cover Page Interactive Data File (the cover page tags are embedded within the Inline XBRL document) | |||||||
| URBAN EDGE PROPERTIES | ||||||||
| (Registrant) | ||||||||
Date: February 12, 2025 |
By: | /s/ Mark Langer | ||||||
Mark Langer, Executive Vice President and Chief Financial Officer |
||||||||
| URBAN EDGE PROPERTIES LP | ||||||||
| By: Urban Edge Properties, General Partner | ||||||||
Date: February 12, 2025 |
By: | /s/ Mark Langer | ||||||
Mark Langer, Executive Vice President and Chief Financial Officer |
||||||||
 |
Exhibit 99.1 | |||||||
| Urban Edge Properties | For additional information: | |||||||
12 East 49th Street |
Mark Langer, EVP and | |||||||
| New York, NY 10017 | Chief Financial Officer | |||||||
| 212-956-0082 | ||||||||
| FOR IMMEDIATE RELEASE: | ||||||||
| Urban Edge Properties Reports Fourth Quarter and Full Year 2024 Results | ||||||||
| -- Provides 2025 Earnings Outlook -- | ||||||||
| -- Board Raises Quarterly Cash Dividend by 12% -- | ||||||||
| (in thousands, except per share amounts) | 4Q24 | 4Q23 | FY 2024 | FY 2023 | ||||||||||||||||
| Net income attributable to common shareholders | $ | 30,121 | $ | 221,235 | $ | 72,563 | $ | 248,497 | ||||||||||||
| Net income per diluted share | 0.24 | 1.88 | 0.60 | 2.11 | ||||||||||||||||
| Funds from Operations ("FFO") | 45,350 | 45,676 | 186,732 | 184,438 | ||||||||||||||||
| FFO per diluted share | 0.35 | 0.37 | 1.48 | 1.51 | ||||||||||||||||
| FFO as Adjusted | 44,061 | 37,916 | 169,720 | 153,050 | ||||||||||||||||
| FFO as Adjusted per diluted share | 0.34 | 0.31 | 1.35 | 1.25 | ||||||||||||||||
| 4Q24 | FY 2024 | |||||||||||||
| Same-property NOI growth | 6.6 | % | 4.3 | % | ||||||||||
| Same-property NOI growth, including properties in redevelopment | 7.4 | % | 5.1 | % | ||||||||||
| Guidance 2025E | Per Diluted Share(1) |
||||||||||||||||||||||
| (in thousands, except per share amounts) | Low | High | Low | High | |||||||||||||||||||
| Net income | $ | 41,200 | $ | 47,700 | $ | 0.32 | $ | 0.37 | |||||||||||||||
| Less net (income) loss attributable to noncontrolling interests in: | |||||||||||||||||||||||
| Operating partnership | (2,200) | (2,600) | (0.02) | (0.02) | |||||||||||||||||||
| Consolidated subsidiaries | 1,000 | 1,000 | 0.01 | 0.01 | |||||||||||||||||||
| Net income attributable to common shareholders | 40,000 | 46,100 | 0.31 | 0.35 | |||||||||||||||||||
| Adjustments: | |||||||||||||||||||||||
| Rental property depreciation and amortization | 135,100 | 135,100 | 1.04 | 1.04 | |||||||||||||||||||
| Limited partnership interests in operating partnership | 2,200 | 2,600 | 0.02 | 0.02 | |||||||||||||||||||
| FFO Applicable to diluted common shareholders | $ | 177,300 | $ | 183,800 | $ | 1.36 | $ | 1.41 | |||||||||||||||
| Adjustments to FFO: | |||||||||||||||||||||||
| Transaction, severance, litigation and other expenses | 1,000 | 1,000 | 0.01 | 0.01 | |||||||||||||||||||
| FFO as Adjusted applicable to diluted common shareholders | $ | 178,300 | $ | 184,800 | $ | 1.37 | $ | 1.42 | |||||||||||||||
Per Diluted Share(1) |
|||||||||||
| Low | High | ||||||||||
| 2024 FFO applicable to diluted common shareholders | $ | 1.48 | $ | 1.48 | |||||||
2024 Items impacting FFO comparability(2) |
(0.14) | (0.14) | |||||||||
| 2025 Items impacting FFO comparability | (0.01) | (0.01) | |||||||||
| Same-property NOI growth, including redevelopment | 0.06 | 0.07 | |||||||||
| Acquisitions net of dispositions NOI growth | 0.01 | 0.01 | |||||||||
| Interest and debt expense | (0.02) | — | |||||||||
| Recurring general and administrative | (0.01) | 0.01 | |||||||||
| Straight-line rent and non-cash items | (0.01) | — | |||||||||
| Lease termination and other income | (0.01) | (0.01) | |||||||||
| 2025 FFO applicable to diluted common shareholders | $ | 1.36 | $ | 1.41 | |||||||
| December 31, | December 31, | ||||||||||
| 2024 | 2023 | ||||||||||
| ASSETS | |||||||||||
| Real estate, at cost: | |||||||||||
| Land | $ | 660,198 | $ | 635,905 | |||||||
| Buildings and improvements | 2,791,728 | 2,678,076 | |||||||||
| Construction in progress | 289,057 | 262,275 | |||||||||
| Furniture, fixtures and equipment | 11,296 | 9,923 | |||||||||
| Total | 3,752,279 | 3,586,179 | |||||||||
| Accumulated depreciation and amortization | (886,886) | (819,243) | |||||||||
| Real estate, net | 2,865,393 | 2,766,936 | |||||||||
| Operating lease right-of-use assets | 65,491 | 56,988 | |||||||||
| Cash and cash equivalents | 41,373 | 101,123 | |||||||||
| Restricted cash | 49,267 | 73,125 | |||||||||
| Tenant and other receivables | 20,672 | 14,712 | |||||||||
| Receivables arising from the straight-lining of rents | 61,164 | 60,775 | |||||||||
Identified intangible assets, net of accumulated amortization of $65,027 and $51,399, respectively |
109,827 | 113,897 | |||||||||
Deferred leasing costs, net of accumulated amortization of $22,488 and $21,428, respectively |
27,799 | 27,698 | |||||||||
| Prepaid expenses and other assets | 70,554 | 64,555 | |||||||||
| Total assets | $ | 3,311,540 | $ | 3,279,809 | |||||||
| LIABILITIES AND EQUITY | |||||||||||
| Liabilities: | |||||||||||
| Mortgages payable, net | $ | 1,569,753 | $ | 1,578,110 | |||||||
| Unsecured credit facility | 50,000 | 153,000 | |||||||||
| Operating lease liabilities | 62,585 | 53,863 | |||||||||
| Accounts payable, accrued expenses and other liabilities | 89,982 | 102,997 | |||||||||
Identified intangible liabilities, net of accumulated amortization of $50,275 and $46,610, respectively |
177,496 | 170,411 | |||||||||
| Total liabilities | 1,949,816 | 2,058,381 | |||||||||
| Commitments and contingencies | |||||||||||
| Shareholders’ equity: | |||||||||||
Common shares: $0.01 par value; 500,000,000 shares authorized and 125,450,684 and 117,652,656 shares issued and outstanding, respectively |
1,253 | 1,175 | |||||||||
| Additional paid-in capital | 1,149,981 | 1,011,942 | |||||||||
| Accumulated other comprehensive income | 177 | 460 | |||||||||
| Accumulated earnings | 126,670 | 137,113 | |||||||||
| Noncontrolling interests: | |||||||||||
| Operating partnership | 65,069 | 55,355 | |||||||||
| Consolidated subsidiaries | 18,574 | 15,383 | |||||||||
| Total equity | 1,361,724 | 1,221,428 | |||||||||
| Total liabilities and equity | $ | 3,311,540 | $ | 3,279,809 | |||||||
| Quarter Ended December 31, | Year Ended December 31, | ||||||||||||||||||||||
| 2024 | 2023 | 2024 | 2023 | ||||||||||||||||||||
| REVENUE | |||||||||||||||||||||||
| Rental revenue | $ | 116,298 | $ | 106,253 | $ | 444,465 | $ | 406,112 | |||||||||||||||
| Other income | 69 | 10,329 | 501 | 10,810 | |||||||||||||||||||
| Total revenue | 116,367 | 116,582 | 444,966 | 416,922 | |||||||||||||||||||
| EXPENSES | |||||||||||||||||||||||
| Depreciation and amortization | 37,483 | 31,460 | 150,389 | 108,979 | |||||||||||||||||||
| Real estate taxes | 16,509 | 16,909 | 68,651 | 64,889 | |||||||||||||||||||
| Property operating | 21,588 | 18,811 | 78,776 | 68,563 | |||||||||||||||||||
| General and administrative | 9,645 | 9,167 | 37,474 | 37,070 | |||||||||||||||||||
| Real estate impairment loss | — | — | — | 34,055 | |||||||||||||||||||
| Lease expense | 3,493 | 3,164 | 13,169 | 12,634 | |||||||||||||||||||
| Total expenses | 88,718 | 79,511 | 348,459 | 326,190 | |||||||||||||||||||
| Gain on sale of real estate | 23,469 | 217,352 | 38,818 | 217,708 | |||||||||||||||||||
| Interest income | 639 | 1,397 | 2,667 | 3,037 | |||||||||||||||||||
| Interest and debt expense | (19,583) | (22,515) | (81,587) | (74,945) | |||||||||||||||||||
| (Loss) gain on extinguishment of debt | (4) | (1,396) | 21,423 | 41,144 | |||||||||||||||||||
| Income before income taxes | 32,170 | 231,909 | 77,828 | 277,676 | |||||||||||||||||||
| Income tax (expense) benefit | (664) | 10 | (2,386) | (17,800) | |||||||||||||||||||
| Net income | 31,506 | 231,919 | 75,442 | 259,876 | |||||||||||||||||||
| Less net (income) loss attributable to noncontrolling interests in: | |||||||||||||||||||||||
| Operating partnership | (1,571) | (10,688) | (3,978) | (11,899) | |||||||||||||||||||
| Consolidated subsidiaries | 186 | 4 | 1,099 | 520 | |||||||||||||||||||
| Net income attributable to common shareholders | $ | 30,121 | $ | 221,235 | $ | 72,563 | $ | 248,497 | |||||||||||||||
| Earnings per common share - Basic: | $ | 0.24 | $ | 1.88 | $ | 0.60 | $ | 2.11 | |||||||||||||||
| Earnings per common share - Diluted: | $ | 0.24 | $ | 1.88 | $ | 0.60 | $ | 2.11 | |||||||||||||||
| Weighted average shares outstanding - Basic | 124,945 | 117,548 | 121,324 | 117,506 | |||||||||||||||||||
| Weighted average shares outstanding - Diluted | 129,701 | 117,641 | 121,432 | 117,597 | |||||||||||||||||||
| Quarter Ended December 31, |
Year Ended December 31, |
||||||||||||||||||||||
| (in thousands, except per share amounts) | 2024 | 2023 | 2024 | 2023 | |||||||||||||||||||
| Net income | $ | 31,506 | $ | 231,919 | $ | 75,442 | $ | 259,876 | |||||||||||||||
| Less net (income) loss attributable to noncontrolling interests in: | |||||||||||||||||||||||
| Operating partnership | (1,571) | (10,688) | (3,978) | (11,899) | |||||||||||||||||||
| Consolidated subsidiaries | 186 | 4 | 1,099 | 520 | |||||||||||||||||||
| Net income attributable to common shareholders | 30,121 | 221,235 | 72,563 | 248,497 | |||||||||||||||||||
| Adjustments: | |||||||||||||||||||||||
| Rental property depreciation and amortization | 37,127 | 31,105 | 149,009 | 107,695 | |||||||||||||||||||
| Limited partnership interests in operating partnership | 1,571 | 10,688 | 3,978 | 11,899 | |||||||||||||||||||
| Gain on sale of real estate | (23,469) | (217,352) | (38,818) | (217,708) | |||||||||||||||||||
Real estate impairment loss(2) |
— | — | — | 34,055 | |||||||||||||||||||
| FFO Applicable to diluted common shareholders | 45,350 | 45,676 | 186,732 | 184,438 | |||||||||||||||||||
FFO per diluted common share(1) |
0.35 | 0.37 | 1.48 | 1.51 | |||||||||||||||||||
| Adjustments to FFO: | |||||||||||||||||||||||
| Transaction, severance and litigation expenses | 248 | 315 | 1,402 | 2,039 | |||||||||||||||||||
Loss (gain) on extinguishment of debt(3) |
4 | 1,396 | (21,423) | (41,144) | |||||||||||||||||||
| Tax impact of Shops at Caguas debt refinancing | — | — | — | 16,302 | |||||||||||||||||||
Impact of property in foreclosure(4) |
— | 1,139 | 2,276 | 3,060 | |||||||||||||||||||
Termination fees and non-cash adjustments(5) |
(1,541) | (603) | 848 | (847) | |||||||||||||||||||
| Income tax refund related to prior periods | — | — | — | (684) | |||||||||||||||||||
| Tenant bankruptcy settlement income | — | (7) | (115) | (114) | |||||||||||||||||||
| Litigation settlement income | — | (10,000) | — | (10,000) | |||||||||||||||||||
| FFO as Adjusted applicable to diluted common shareholders | $ | 44,061 | $ | 37,916 | $ | 169,720 | $ | 153,050 | |||||||||||||||
FFO as Adjusted per diluted common share(1) |
$ | 0.34 | $ | 0.31 | $ | 1.35 | $ | 1.25 | |||||||||||||||
Weighted Average diluted common shares(1) |
129,701 | 122,063 | 126,095 | 122,064 | |||||||||||||||||||
| Quarter Ended December 31, |
Year Ended December 31, |
||||||||||||||||||||||
| (Amounts in thousands) | 2024 | 2023 | 2024 | 2023 | |||||||||||||||||||
| Net income | $ | 31,506 | $ | 231,919 | $ | 75,442 | $ | 259,876 | |||||||||||||||
| Depreciation and amortization | 37,483 | 31,460 | 150,389 | 108,979 | |||||||||||||||||||
| Interest and debt expense | 19,583 | 22,515 | 81,587 | 74,945 | |||||||||||||||||||
| General and administrative expense | 9,645 | 9,167 | 37,474 | 37,070 | |||||||||||||||||||
| Loss (gain) on extinguishment of debt | 4 | 1,396 | (21,423) | (41,144) | |||||||||||||||||||
| Real estate impairment loss | — | — | — | 34,055 | |||||||||||||||||||
| Income tax expense (benefit) | 664 | (10) | 2,386 | 17,800 | |||||||||||||||||||
| Interest income | (639) | (1,397) | (2,667) | (3,037) | |||||||||||||||||||
| Non-cash revenue and expenses | (4,825) | (3,837) | (11,999) | (11,610) | |||||||||||||||||||
| Other expense (income) | 424 | (9,775) | 897 | (9,097) | |||||||||||||||||||
| Gain on sale of real estate | (23,469) | (217,352) | (38,818) | (217,708) | |||||||||||||||||||
| NOI | 70,376 | 64,086 | 273,268 | 250,129 | |||||||||||||||||||
| Adjustments: | |||||||||||||||||||||||
| Sunrise Mall net operating loss | 52 | 501 | 1,733 | 2,427 | |||||||||||||||||||
| Tenant bankruptcy settlement income and lease termination income | (160) | (183) | (1,762) | (1,428) | |||||||||||||||||||
Non-same property NOI and other(1) |
(14,891) | (12,445) | (56,403) | (43,287) | |||||||||||||||||||
| Same-property NOI | $ | 55,377 | $ | 51,959 | $ | 216,836 | $ | 207,841 | |||||||||||||||
| NOI related to properties being redeveloped | 5,681 | 4,902 | 22,668 | 20,017 | |||||||||||||||||||
| Same-property NOI including properties in redevelopment | $ | 61,058 | $ | 56,861 | $ | 239,504 | $ | 227,858 | |||||||||||||||
| Quarter Ended December 31, |
Year Ended December 31, |
||||||||||||||||||||||
| (Amounts in thousands) | 2024 | 2023 | 2024 | 2023 | |||||||||||||||||||
| Net income | $ | 31,506 | $ | 231,919 | $ | 75,442 | $ | 259,876 | |||||||||||||||
| Depreciation and amortization | 37,483 | 31,460 | 150,389 | 108,979 | |||||||||||||||||||
| Interest and debt expense | 19,583 | 22,515 | 81,587 | 74,945 | |||||||||||||||||||
| Income tax expense (benefit) | 664 | (10) | 2,386 | 17,800 | |||||||||||||||||||
| Gain on sale of real estate | (23,469) | (217,352) | (38,818) | (217,708) | |||||||||||||||||||
| Real estate impairment loss | — | — | — | 34,055 | |||||||||||||||||||
| EBITDAre | 65,767 | 68,532 | 270,986 | 277,947 | |||||||||||||||||||
| Adjustments for Adjusted EBITDAre: | |||||||||||||||||||||||
| Transaction, severance and litigation expenses | 248 | 315 | 1,402 | 2,039 | |||||||||||||||||||
| Loss (gain) on extinguishment of debt | 4 | 1,396 | (21,423) | (41,144) | |||||||||||||||||||
| Tenant bankruptcy settlement income | — | (7) | (115) | (114) | |||||||||||||||||||
Impact of property in foreclosure(1) |
— | (325) | (561) | (641) | |||||||||||||||||||
Termination fees and non-cash adjustments(2) |
(1,541) | (770) | 1,295 | (1,014) | |||||||||||||||||||
| Litigation settlement income | — | (10,000) | — | (10,000) | |||||||||||||||||||
| Adjusted EBITDAre | $ | 64,478 | $ | 59,141 | $ | 251,584 | $ | 227,073 | |||||||||||||||

| SUPPLEMENTAL DISCLOSURE | ||
| PACKAGE | ||
| December 31, 2024 | ||
| Urban Edge Properties | ||
12 East 49th Street, New York, NY 10017 | ||
| NY Office: 212-956-0082 | ||
| www.uedge.com | ||
| URBAN EDGE PROPERTIES | |||||
| SUPPLEMENTAL DISCLOSURE | |||||
| December 31, 2024 | |||||
| (unaudited) | |||||
| TABLE OF CONTENTS | |||||
| Page | |||||
| Press Release | |||||
Fourth Quarter 2024 Earnings Press Release |
1 | ||||
| Overview | |||||
| Summary Financial Results and Ratios | 12 | ||||
| Consolidated Financial Statements | |||||
| Consolidated Balance Sheets | 13 | ||||
| Consolidated Statements of Income | 14 | ||||
| Non-GAAP Financial Measures and Supplemental Data | |||||
| Supplemental Schedule of Net Operating Income | 15 | ||||
| Earnings Before Interest, Taxes, Depreciation and Amortization for Real Estate (EBITDAre) | 16 | ||||
| Funds from Operations | 17 | ||||
| Market Capitalization, Debt Ratios and Liquidity | 18 | ||||
| Additional Disclosures | 19 | ||||
| Leasing Data | |||||
| Tenant Concentration - Top Twenty-Five Tenants | 20 | ||||
| Leasing Activity | 21 | ||||
| Leases Executed But Not Yet Rent Commenced | 22 | ||||
| Retail Portfolio Lease Expiration Schedules | 23 | ||||
| Property Data | |||||
| Property Status Report | 25 | ||||
| Property Acquisitions and Dispositions | 28 | ||||
| Development, Redevelopment and Anchor Repositioning Projects | 29 | ||||
| Debt Schedules | |||||
| Debt Summary | 31 | ||||
| Mortgage Debt Summary | 32 | ||||
| Debt Maturity Schedule | 33 | ||||
 |
||||||||
| Urban Edge Properties | For additional information: | |||||||
12 East 49th Street |
Mark Langer, EVP and | |||||||
| New York, NY 10017 | Chief Financial Officer | |||||||
| 212-956-0082 | ||||||||
| FOR IMMEDIATE RELEASE: | ||||||||
| Urban Edge Properties Reports Fourth Quarter and Full Year 2024 Results | ||||||||
| -- Provides 2025 Earnings Outlook -- | ||||||||
| -- Board Raises Quarterly Cash Dividend by 12% -- | ||||||||
| (in thousands, except per share amounts) | 4Q24 | 4Q23 | FY 2024 | FY 2023 | ||||||||||||||||
| Net income attributable to common shareholders | $ | 30,121 | $ | 221,235 | $ | 72,563 | $ | 248,497 | ||||||||||||
| Net income per diluted share | 0.24 | 1.88 | 0.60 | 2.11 | ||||||||||||||||
| Funds from Operations ("FFO") | 45,350 | 45,676 | 186,732 | 184,438 | ||||||||||||||||
| FFO per diluted share | 0.35 | 0.37 | 1.48 | 1.51 | ||||||||||||||||
| FFO as Adjusted | 44,061 | 37,916 | 169,720 | 153,050 | ||||||||||||||||
| FFO as Adjusted per diluted share | 0.34 | 0.31 | 1.35 | 1.25 | ||||||||||||||||
| 4Q24 | FY 2024 | |||||||||||||
| Same-property NOI growth | 6.6 | % | 4.3 | % | ||||||||||
| Same-property NOI growth, including properties in redevelopment | 7.4 | % | 5.1 | % | ||||||||||
| Guidance 2025E | Per Diluted Share(1) |
||||||||||||||||||||||
| (in thousands, except per share amounts) | Low | High | Low | High | |||||||||||||||||||
| Net income | $ | 41,200 | $ | 47,700 | $ | 0.32 | $ | 0.37 | |||||||||||||||
| Less net (income) loss attributable to noncontrolling interests in: | |||||||||||||||||||||||
| Operating partnership | (2,200) | (2,600) | (0.02) | (0.02) | |||||||||||||||||||
| Consolidated subsidiaries | 1,000 | 1,000 | 0.01 | 0.01 | |||||||||||||||||||
| Net income attributable to common shareholders | 40,000 | 46,100 | 0.31 | 0.35 | |||||||||||||||||||
| Adjustments: | |||||||||||||||||||||||
| Rental property depreciation and amortization | 135,100 | 135,100 | 1.04 | 1.04 | |||||||||||||||||||
| Limited partnership interests in operating partnership | 2,200 | 2,600 | 0.02 | 0.02 | |||||||||||||||||||
| FFO Applicable to diluted common shareholders | $ | 177,300 | $ | 183,800 | $ | 1.36 | $ | 1.41 | |||||||||||||||
| Adjustments to FFO: | |||||||||||||||||||||||
| Transaction, severance, litigation and other expenses | 1,000 | 1,000 | 0.01 | 0.01 | |||||||||||||||||||
| FFO as Adjusted applicable to diluted common shareholders | $ | 178,300 | $ | 184,800 | $ | 1.37 | $ | 1.42 | |||||||||||||||
Per Diluted Share(1) |
|||||||||||
| Low | High | ||||||||||
| 2024 FFO applicable to diluted common shareholders | $ | 1.48 | $ | 1.48 | |||||||
2024 Items impacting FFO comparability(2) |
(0.14) | (0.14) | |||||||||
| 2025 Items impacting FFO comparability | (0.01) | (0.01) | |||||||||
| Same-property NOI growth, including redevelopment | 0.06 | 0.07 | |||||||||
| Acquisitions net of dispositions NOI growth | 0.01 | 0.01 | |||||||||
| Interest and debt expense | (0.02) | — | |||||||||
| Recurring general and administrative | (0.01) | 0.01 | |||||||||
| Straight-line rent and non-cash items | (0.01) | — | |||||||||
| Lease termination and other income | (0.01) | (0.01) | |||||||||
| 2025 FFO applicable to diluted common shareholders | $ | 1.36 | $ | 1.41 | |||||||
| Quarter Ended December 31, |
Year Ended December 31, |
||||||||||||||||||||||
| (in thousands, except per share amounts) | 2024 | 2023 | 2024 | 2023 | |||||||||||||||||||
| Net income | $ | 31,506 | $ | 231,919 | $ | 75,442 | $ | 259,876 | |||||||||||||||
| Less net (income) loss attributable to noncontrolling interests in: | |||||||||||||||||||||||
| Operating partnership | (1,571) | (10,688) | (3,978) | (11,899) | |||||||||||||||||||
| Consolidated subsidiaries | 186 | 4 | 1,099 | 520 | |||||||||||||||||||
| Net income attributable to common shareholders | 30,121 | 221,235 | 72,563 | 248,497 | |||||||||||||||||||
| Adjustments: | |||||||||||||||||||||||
| Rental property depreciation and amortization | 37,127 | 31,105 | 149,009 | 107,695 | |||||||||||||||||||
| Limited partnership interests in operating partnership | 1,571 | 10,688 | 3,978 | 11,899 | |||||||||||||||||||
| Gain on sale of real estate | (23,469) | (217,352) | (38,818) | (217,708) | |||||||||||||||||||
Real estate impairment loss(2) |
— | — | — | 34,055 | |||||||||||||||||||
| FFO Applicable to diluted common shareholders | 45,350 | 45,676 | 186,732 | 184,438 | |||||||||||||||||||
FFO per diluted common share(1) |
0.35 | 0.37 | 1.48 | 1.51 | |||||||||||||||||||
| Adjustments to FFO: | |||||||||||||||||||||||
| Transaction, severance and litigation expenses | 248 | 315 | 1,402 | 2,039 | |||||||||||||||||||
Loss (gain) on extinguishment of debt(3) |
4 | 1,396 | (21,423) | (41,144) | |||||||||||||||||||
| Tax impact of Shops at Caguas debt refinancing | — | — | — | 16,302 | |||||||||||||||||||
Impact of property in foreclosure(4) |
— | 1,139 | 2,276 | 3,060 | |||||||||||||||||||
Termination fees and non-cash adjustments(5) |
(1,541) | (603) | 848 | (847) | |||||||||||||||||||
| Income tax refund related to prior periods | — | — | — | (684) | |||||||||||||||||||
| Tenant bankruptcy settlement income | — | (7) | (115) | (114) | |||||||||||||||||||
| Litigation settlement income | — | (10,000) | — | (10,000) | |||||||||||||||||||
| FFO as Adjusted applicable to diluted common shareholders | $ | 44,061 | $ | 37,916 | $ | 169,720 | $ | 153,050 | |||||||||||||||
FFO as Adjusted per diluted common share(1) |
$ | 0.34 | $ | 0.31 | $ | 1.35 | $ | 1.25 | |||||||||||||||
Weighted Average diluted common shares(1) |
129,701 | 122,063 | 126,095 | 122,064 | |||||||||||||||||||
| Quarter Ended December 31, |
Year Ended December 31, |
||||||||||||||||||||||
| (Amounts in thousands) | 2024 | 2023 | 2024 | 2023 | |||||||||||||||||||
| Net income | $ | 31,506 | $ | 231,919 | $ | 75,442 | $ | 259,876 | |||||||||||||||
| Depreciation and amortization | 37,483 | 31,460 | 150,389 | 108,979 | |||||||||||||||||||
| Interest and debt expense | 19,583 | 22,515 | 81,587 | 74,945 | |||||||||||||||||||
| General and administrative expense | 9,645 | 9,167 | 37,474 | 37,070 | |||||||||||||||||||
| Loss (gain) on extinguishment of debt | 4 | 1,396 | (21,423) | (41,144) | |||||||||||||||||||
| Real estate impairment loss | — | — | — | 34,055 | |||||||||||||||||||
| Income tax expense (benefit) | 664 | (10) | 2,386 | 17,800 | |||||||||||||||||||
| Interest income | (639) | (1,397) | (2,667) | (3,037) | |||||||||||||||||||
| Non-cash revenue and expenses | (4,825) | (3,837) | (11,999) | (11,610) | |||||||||||||||||||
| Other expense (income) | 424 | (9,775) | 897 | (9,097) | |||||||||||||||||||
| Gain on sale of real estate | (23,469) | (217,352) | (38,818) | (217,708) | |||||||||||||||||||
| NOI | 70,376 | 64,086 | 273,268 | 250,129 | |||||||||||||||||||
| Adjustments: | |||||||||||||||||||||||
| Sunrise Mall net operating loss | 52 | 501 | 1,733 | 2,427 | |||||||||||||||||||
| Tenant bankruptcy settlement income and lease termination income | (160) | (183) | (1,762) | (1,428) | |||||||||||||||||||
Non-same property NOI and other(1) |
(14,891) | (12,445) | (56,403) | (43,287) | |||||||||||||||||||
| Same-property NOI | $ | 55,377 | $ | 51,959 | $ | 216,836 | $ | 207,841 | |||||||||||||||
| NOI related to properties being redeveloped | 5,681 | 4,902 | 22,668 | 20,017 | |||||||||||||||||||
| Same-property NOI including properties in redevelopment | $ | 61,058 | $ | 56,861 | $ | 239,504 | $ | 227,858 | |||||||||||||||
| Quarter Ended December 31, |
Year Ended December 31, |
||||||||||||||||||||||
| (Amounts in thousands) | 2024 | 2023 | 2024 | 2023 | |||||||||||||||||||
| Net income | $ | 31,506 | $ | 231,919 | $ | 75,442 | $ | 259,876 | |||||||||||||||
| Depreciation and amortization | 37,483 | 31,460 | 150,389 | 108,979 | |||||||||||||||||||
| Interest and debt expense | 19,583 | 22,515 | 81,587 | 74,945 | |||||||||||||||||||
| Income tax expense (benefit) | 664 | (10) | 2,386 | 17,800 | |||||||||||||||||||
| Gain on sale of real estate | (23,469) | (217,352) | (38,818) | (217,708) | |||||||||||||||||||
| Real estate impairment loss | — | — | — | 34,055 | |||||||||||||||||||
| EBITDAre | 65,767 | 68,532 | 270,986 | 277,947 | |||||||||||||||||||
| Adjustments for Adjusted EBITDAre: | |||||||||||||||||||||||
| Transaction, severance and litigation expenses | 248 | 315 | 1,402 | 2,039 | |||||||||||||||||||
| Loss (gain) on extinguishment of debt | 4 | 1,396 | (21,423) | (41,144) | |||||||||||||||||||
| Tenant bankruptcy settlement income | — | (7) | (115) | (114) | |||||||||||||||||||
Impact of property in foreclosure(1) |
— | (325) | (561) | (641) | |||||||||||||||||||
Termination fees and non-cash adjustments(2) |
(1,541) | (770) | 1,295 | (1,014) | |||||||||||||||||||
| Litigation settlement income | — | (10,000) | — | (10,000) | |||||||||||||||||||
| Adjusted EBITDAre | $ | 64,478 | $ | 59,141 | $ | 251,584 | $ | 227,073 | |||||||||||||||
| URBAN EDGE PROPERTIES | |||||||||||
| ADDITIONAL DISCLOSURES | |||||||||||
| As of December 31, 2024 | |||||||||||
| URBAN EDGE PROPERTIES | ||||||||
| SUMMARY FINANCIAL RESULTS AND RATIOS | ||||||||
For the quarter and year ended December 31, 2024 |
||||||||
| (in thousands, except per share, sf, rent psf and financial ratio data) | ||||||||
| Quarter ended | Year ended | |||||||||||||
| Summary Financial Results | December 31, 2024 | December 31, 2024 | ||||||||||||
| Total revenue | $ | 116,367 | $ | 444,966 | ||||||||||
| General & administrative expenses (G&A) | $ | 9,645 | $ | 37,474 | ||||||||||
Recurring G&A(1) |
$ | 9,397 | $ | 36,072 | ||||||||||
| Net income attributable to common shareholders | $ | 30,121 | $ | 72,563 | ||||||||||
| Earnings per diluted share | $ | 0.24 | $ | 0.60 | ||||||||||
Adjusted EBITDAre(2) |
$ | 64,478 | $ | 251,584 | ||||||||||
| Funds from operations (FFO) | $ | 45,350 | $ | 186,732 | ||||||||||
| FFO per diluted common share | $ | 0.35 | $ | 1.48 | ||||||||||
| FFO as Adjusted | $ | 44,061 | $ | 169,720 | ||||||||||
| FFO as Adjusted per diluted common share | $ | 0.34 | $ | 1.35 | ||||||||||
| Total dividends paid per share | $ | 0.17 | $ | 0.68 | ||||||||||
| Stock closing price low-high range (NYSE) | $20.94 to $23.60 | $15.93 to $23.60 | ||||||||||||
Weighted average diluted shares used in EPS computations(3) |
129,701 | 121,432 | ||||||||||||
Weighted average diluted common shares used in FFO computations(3) |
129,701 | 126,095 | ||||||||||||
| Summary Property, Operating and Financial Data | ||||||||||||||
| # of Total properties / # of Retail properties | 75 / 74 | |||||||||||||
Gross leasable area (GLA) sf - retail portfolio(4)(5) |
16,064,000 | |||||||||||||
Weighted average annual rent psf - retail portfolio(4)(5) |
$ | 20.79 | ||||||||||||
Consolidated portfolio leased occupancy at end of period(6) |
91.7 | % | ||||||||||||
Consolidated retail portfolio leased occupancy at end of period(5) |
96.8 | % | ||||||||||||
Same-property portfolio leased occupancy at end of period(7) |
96.6 | % | ||||||||||||
Same-property physical occupancy at end of period(7)(8) |
94.3 | % | ||||||||||||
Same-property NOI growth(7) |
6.6 | % | 4.3 | % | ||||||||||
| Same-property NOI growth, including redevelopment properties | 7.4 | % | 5.1 | % | ||||||||||
NOI margin(9) |
63.8 | % | 64.3 | % | ||||||||||
Same-property expense recovery ratio(10) |
83.7 | % | 83.5 | % | ||||||||||
Same-property, including redevelopment, expense recovery ratio(10) |
81.5 | % | 81.8 | % | ||||||||||
New, renewal and option rent spread - cash basis(11) |
20.8 | % | 12.5 | % | ||||||||||
New, renewal and option rent spread - GAAP basis(11) |
26.7 | % | 18.2 | % | ||||||||||
Net debt to total market capitalization(12) |
34.5 | % | 34.5 | % | ||||||||||
Net debt to Adjusted EBITDAre(12) |
6.0 | x | 6.1 | x | ||||||||||
Adjusted EBITDAre to interest expense(2) |
3.5 | x | 3.3 | x | ||||||||||
Adjusted EBITDAre to fixed charges(2) |
2.9 | x | 2.7 | x | ||||||||||
| URBAN EDGE PROPERTIES | ||||||||
| CONSOLIDATED BALANCE SHEETS | ||||||||
As of December 31, 2024 and 2023 |
||||||||
| (in thousands, except share and per share amounts) | ||||||||
| December 31, | December 31, | ||||||||||
| 2024 | 2023 | ||||||||||
| ASSETS | |||||||||||
| Real estate, at cost: | |||||||||||
| Land | $ | 660,198 | $ | 635,905 | |||||||
| Buildings and improvements | 2,791,728 | 2,678,076 | |||||||||
| Construction in progress | 289,057 | 262,275 | |||||||||
| Furniture, fixtures and equipment | 11,296 | 9,923 | |||||||||
| Total | 3,752,279 | 3,586,179 | |||||||||
| Accumulated depreciation and amortization | (886,886) | (819,243) | |||||||||
| Real estate, net | 2,865,393 | 2,766,936 | |||||||||
| Operating lease right-of-use assets | 65,491 | 56,988 | |||||||||
| Cash and cash equivalents | 41,373 | 101,123 | |||||||||
| Restricted cash | 49,267 | 73,125 | |||||||||
| Tenant and other receivables | 20,672 | 14,712 | |||||||||
| Receivables arising from the straight-lining of rents | 61,164 | 60,775 | |||||||||
Identified intangible assets, net of accumulated amortization of $65,027 and $51,399, respectively |
109,827 | 113,897 | |||||||||
Deferred leasing costs, net of accumulated amortization of $22,488 and $21,428, respectively |
27,799 | 27,698 | |||||||||
| Prepaid expenses and other assets | 70,554 | 64,555 | |||||||||
| Total assets | $ | 3,311,540 | $ | 3,279,809 | |||||||
| LIABILITIES AND EQUITY | |||||||||||
| Liabilities: | |||||||||||
| Mortgages payable, net | $ | 1,569,753 | $ | 1,578,110 | |||||||
| Unsecured credit facility | 50,000 | 153,000 | |||||||||
| Operating lease liabilities | 62,585 | 53,863 | |||||||||
| Accounts payable, accrued expenses and other liabilities | 89,982 | 102,997 | |||||||||
Identified intangible liabilities, net of accumulated amortization of $50,275 and $46,610, respectively |
177,496 | 170,411 | |||||||||
| Total liabilities | 1,949,816 | 2,058,381 | |||||||||
| Commitments and contingencies | |||||||||||
| Shareholders’ equity: | |||||||||||
Common shares: $0.01 par value; 500,000,000 shares authorized and 125,450,684 and 117,652,656 shares issued and outstanding, respectively |
1,253 | 1,175 | |||||||||
| Additional paid-in capital | 1,149,981 | 1,011,942 | |||||||||
| Accumulated other comprehensive income | 177 | 460 | |||||||||
| Accumulated earnings | 126,670 | 137,113 | |||||||||
| Noncontrolling interests: | |||||||||||
| Operating partnership | 65,069 | 55,355 | |||||||||
| Consolidated subsidiaries | 18,574 | 15,383 | |||||||||
| Total equity | 1,361,724 | 1,221,428 | |||||||||
| Total liabilities and equity | $ | 3,311,540 | $ | 3,279,809 | |||||||
| URBAN EDGE PROPERTIES | ||||||||
| CONSOLIDATED STATEMENTS OF INCOME | ||||||||
For the quarters and years ended December 31, 2024 and 2023 |
||||||||
| (in thousands, except per share amounts) | ||||||||
| Quarter Ended December 31, | Year Ended December 31, | ||||||||||||||||||||||
| 2024 | 2023 | 2024 | 2023 | ||||||||||||||||||||
| REVENUE | |||||||||||||||||||||||
| Rental revenue | $ | 116,298 | $ | 106,253 | $ | 444,465 | $ | 406,112 | |||||||||||||||
| Other income | 69 | 10,329 | 501 | 10,810 | |||||||||||||||||||
| Total revenue | 116,367 | 116,582 | 444,966 | 416,922 | |||||||||||||||||||
| EXPENSES | |||||||||||||||||||||||
| Depreciation and amortization | 37,483 | 31,460 | 150,389 | 108,979 | |||||||||||||||||||
| Real estate taxes | 16,509 | 16,909 | 68,651 | 64,889 | |||||||||||||||||||
| Property operating | 21,588 | 18,811 | 78,776 | 68,563 | |||||||||||||||||||
| General and administrative | 9,645 | 9,167 | 37,474 | 37,070 | |||||||||||||||||||
| Real estate impairment loss | — | — | — | 34,055 | |||||||||||||||||||
| Lease expense | 3,493 | 3,164 | 13,169 | 12,634 | |||||||||||||||||||
| Total expenses | 88,718 | 79,511 | 348,459 | 326,190 | |||||||||||||||||||
| Gain on sale of real estate | 23,469 | 217,352 | 38,818 | 217,708 | |||||||||||||||||||
| Interest income | 639 | 1,397 | 2,667 | 3,037 | |||||||||||||||||||
| Interest and debt expense | (19,583) | (22,515) | (81,587) | (74,945) | |||||||||||||||||||
| (Loss) gain on extinguishment of debt | (4) | (1,396) | 21,423 | 41,144 | |||||||||||||||||||
| Income before income taxes | 32,170 | 231,909 | 77,828 | 277,676 | |||||||||||||||||||
| Income tax (expense) benefit | (664) | 10 | (2,386) | (17,800) | |||||||||||||||||||
| Net income | 31,506 | 231,919 | 75,442 | 259,876 | |||||||||||||||||||
| Less net (income) loss attributable to noncontrolling interests in: | |||||||||||||||||||||||
| Operating partnership | (1,571) | (10,688) | (3,978) | (11,899) | |||||||||||||||||||
| Consolidated subsidiaries | 186 | 4 | 1,099 | 520 | |||||||||||||||||||
| Net income attributable to common shareholders | $ | 30,121 | $ | 221,235 | $ | 72,563 | $ | 248,497 | |||||||||||||||
| Earnings per common share - Basic: | $ | 0.24 | $ | 1.88 | $ | 0.60 | $ | 2.11 | |||||||||||||||
| Earnings per common share - Diluted: | $ | 0.24 | $ | 1.88 | $ | 0.60 | $ | 2.11 | |||||||||||||||
| Weighted average shares outstanding - Basic | 124,945 | 117,548 | 121,324 | 117,506 | |||||||||||||||||||
| Weighted average shares outstanding - Diluted | 129,701 | 117,641 | 121,432 | 117,597 | |||||||||||||||||||
| URBAN EDGE PROPERTIES | ||||||||
| SUPPLEMENTAL SCHEDULE OF NET OPERATING INCOME | ||||||||
For the quarters and years ended December 31, 2024 and 2023 |
||||||||
| (in thousands) | ||||||||
| Quarter Ended December 31, |
Percent Change | Year Ended December 31, |
Percent Change | ||||||||||||||||||||||||||||||||
| 2024 | 2023 | 2024 | 2023 | ||||||||||||||||||||||||||||||||
Composition of NOI(1) |
|||||||||||||||||||||||||||||||||||
| Property rentals | $ | 80,793 | $ | 76,054 | $315,018 | $ | 293,018 | ||||||||||||||||||||||||||||
| Tenant expense reimbursements | 31,170 | 26,928 | 118,654 | 104,321 | |||||||||||||||||||||||||||||||
| Rental revenue deemed uncollectible | (521) | (317) | (1,151) | (2,370) | |||||||||||||||||||||||||||||||
| Total property revenue | 111,442 | 102,665 | 8.5% | 432,521 | 394,969 | 9.5% | |||||||||||||||||||||||||||||
| Real estate taxes | (16,509) | (16,908) | (68,650) | (64,887) | |||||||||||||||||||||||||||||||
| Property operating | (21,953) | (19,296) | (80,586) | (70,477) | |||||||||||||||||||||||||||||||
| Lease expense | (2,604) | (2,375) | (10,017) | (9,476) | |||||||||||||||||||||||||||||||
| Total property operating expenses | (41,066) | (38,579) | 6.4% | (159,253) | (144,840) | 10.0% | |||||||||||||||||||||||||||||
NOI(1) |
$ | 70,376 | $ | 64,086 | 9.8% | $ | 273,268 | $ | 250,129 | 9.3% | |||||||||||||||||||||||||
| NOI margin (NOI / Total property revenue) | 63.2 | % | 62.4 | % | 63.2 | % | 63.3 | % | |||||||||||||||||||||||||||
Same-property NOI(1)(2) |
|||||||||||||||||||||||||||||||||||
| Property rentals | $ | 63,059 | $ | 59,950 | $ | 245,956 | $ | 237,153 | |||||||||||||||||||||||||||
| Tenant expense reimbursements | 24,878 | 22,125 | 95,592 | 88,495 | |||||||||||||||||||||||||||||||
| Rental revenue deemed uncollectible | (699) | (161) | (1,110) | (1,098) | |||||||||||||||||||||||||||||||
| Total property revenue | 87,238 | 81,914 | 340,438 | 324,550 | |||||||||||||||||||||||||||||||
| Real estate taxes | (13,258) | (12,927) | (53,770) | (52,243) | |||||||||||||||||||||||||||||||
| Property operating | (16,381) | (14,419) | (60,408) | (54,084) | |||||||||||||||||||||||||||||||
| Lease expense | (2,222) | (2,609) | (9,424) | (10,382) | |||||||||||||||||||||||||||||||
| Total property operating expenses | (31,861) | (29,955) | (123,602) | (116,709) | |||||||||||||||||||||||||||||||
Same-property NOI(1)(2) |
$ | 55,377 | $ | 51,959 | 6.6% | $ | 216,836 | $ | 207,841 | 4.3% | |||||||||||||||||||||||||
NOI related to properties being redeveloped(2) |
5,681 | 4,902 | 22,668 | 20,017 | |||||||||||||||||||||||||||||||
Same-property NOI including properties in redevelopment(1) |
$ | 61,058 | $ | 56,861 | 7.4% | $ | 239,504 | $ | 227,858 | 5.1% | |||||||||||||||||||||||||
| Same-property physical occupancy | 94.3 | % | 92.5 | % | 94.3 | % | 92.5 | % | |||||||||||||||||||||||||||
| Same-property leased occupancy | 96.6 | % | 95.8 | % | 96.6 | % | 95.8 | % | |||||||||||||||||||||||||||
| Number of properties included in same-property analysis | 65 | 65 | |||||||||||||||||||||||||||||||||
| URBAN EDGE PROPERTIES | ||||||||
| EARNINGS BEFORE INTEREST, TAXES, DEPRECIATION and AMORTIZATION for REAL ESTATE (EBITDAre) | ||||||||
For the quarters and years ended December 31, 2024 and 2023 |
||||||||
| (in thousands) | ||||||||
| Quarter Ended December 31, |
Year Ended December 31, |
||||||||||||||||||||||
| 2024 | 2023 | 2024 | 2023 | ||||||||||||||||||||
| Net income | $ | 31,506 | $ | 231,919 | $ | 75,442 | $ | 259,876 | |||||||||||||||
| Depreciation and amortization | 37,483 | 31,460 | 150,389 | 108,979 | |||||||||||||||||||
| Interest expense | 18,448 | 21,469 | 77,265 | 70,820 | |||||||||||||||||||
| Amortization of deferred financing costs | 1,135 | 1,046 | 4,322 | 4,125 | |||||||||||||||||||
| Income tax expense (benefit) | 664 | (10) | 2,386 | 17,800 | |||||||||||||||||||
| Gain on sale of real estate | (23,469) | (217,352) | (38,818) | (217,708) | |||||||||||||||||||
| Real estate impairment loss | — | — | — | 34,055 | |||||||||||||||||||
| EBITDAre | 65,767 | 68,532 | 270,986 | 277,947 | |||||||||||||||||||
| Adjustments for Adjusted EBITDAre: | |||||||||||||||||||||||
| Transaction, severance and litigation expenses | 248 | 315 | 1,402 | 2,039 | |||||||||||||||||||
| Loss (gain) on extinguishment of debt | 4 | 1,396 | (21,423) | (41,144) | |||||||||||||||||||
| Tenant bankruptcy settlement income | — | (7) | (115) | (114) | |||||||||||||||||||
Impact of property in foreclosure(1) |
— | (325) | (561) | (641) | |||||||||||||||||||
Termination fees and non-cash adjustments(2) |
(1,541) | (770) | 1,295 | (1,014) | |||||||||||||||||||
| Litigation settlement income | — | (10,000) | — | (10,000) | |||||||||||||||||||
| Adjusted EBITDAre | $ | 64,478 | $ | 59,141 | $ | 251,584 | $ | 227,073 | |||||||||||||||
| Interest expense | $ | 18,448 | $ | 21,469 | $ | 77,265 | $ | 70,820 | |||||||||||||||
| Adjusted EBITDAre to interest expense | 3.5 | x | 2.8 | x | 3.3 | x | 3.2 | x | |||||||||||||||
| Fixed charges | |||||||||||||||||||||||
| Interest expense | $ | 18,448 | $ | 21,469 | $ | 77,265 | $ | 70,820 | |||||||||||||||
| Scheduled principal amortization | 3,838 | 4,250 | 14,528 | 19,724 | |||||||||||||||||||
| Total fixed charges | $ | 22,286 | $ | 25,719 | $ | 91,793 | $ | 90,544 | |||||||||||||||
| Adjusted EBITDAre to fixed charges | 2.9 | x | 2.3 | x | 2.7 | x | 2.5 | x | |||||||||||||||
| URBAN EDGE PROPERTIES | ||||||||
| FUNDS FROM OPERATIONS | ||||||||
For the quarter and year ended December 31, 2024 |
||||||||
| (in thousands, except per share amounts) | ||||||||
|
Quarter Ended
December 31, 2024
|
Year Ended
December 31, 2024
|
||||||||||||||||||||||
| (in thousands) | (per share)(1) |
(in thousands) | (per share)(1) |
||||||||||||||||||||
| Net income | $ | 31,506 | $ | 0.24 | $ | 75,442 | $ | 0.60 | |||||||||||||||
| Less net (income) loss attributable to noncontrolling interests in: | |||||||||||||||||||||||
| Operating partnership | (1,571) | (0.01) | (3,978) | (0.03) | |||||||||||||||||||
| Consolidated subsidiaries | 186 | — | 1,099 | 0.01 | |||||||||||||||||||
| Net income attributable to common shareholders | 30,121 | 0.23 | 72,563 | 0.58 | |||||||||||||||||||
| Adjustments: | |||||||||||||||||||||||
| Rental property depreciation and amortization | 37,127 | 0.29 | 149,009 | 1.18 | |||||||||||||||||||
Limited partnership interests in operating partnership(2) |
1,571 | 0.01 | 3,978 | 0.03 | |||||||||||||||||||
| Gain on sale of real estate | (23,469) | (0.18) | (38,818) | (0.31) | |||||||||||||||||||
| FFO applicable to diluted common shareholders | 45,350 | 0.35 | 186,732 | 1.48 | |||||||||||||||||||
| Adjustments to FFO: | |||||||||||||||||||||||
| Transaction, severance and litigation expenses | 248 | — | 1,402 | 0.01 | |||||||||||||||||||
Loss (gain) on extinguishment of debt(3) |
4 | — | (21,423) | (0.17) | |||||||||||||||||||
Impact of property in foreclosure(4) |
— | — | 2,276 | 0.02 | |||||||||||||||||||
Non-cash adjustments(5) |
(1,541) | (0.01) | 848 | 0.01 | |||||||||||||||||||
| Tenant bankruptcy settlement income | — | — | (115) | — | |||||||||||||||||||
| FFO as Adjusted applicable to diluted common shareholders | $ | 44,061 | $ | 0.34 | $ | 169,720 | $ | 1.35 | |||||||||||||||
| Weighted average diluted shares used to calculate EPS | 129,701 | 121,432 | |||||||||||||||||||||
| Assumed conversion of OP and LTIP Units to common shares | — | 4,663 | |||||||||||||||||||||
| Weighted average diluted common shares - FFO | 129,701 | 126,095 | |||||||||||||||||||||
| URBAN EDGE PROPERTIES | ||||||||
| MARKET CAPITALIZATION, DEBT RATIOS AND LIQUIDITY | ||||||||
| As of December 31, 2024 | ||||||||
| (in thousands, except share amounts and market price) | ||||||||
| December 31, 2024 | |||||
| Closing market price of common shares | $ | 21.50 | |||
| Basic common shares | 125,450,684 | ||||
| OP and LTIP units | 6,386,837 | ||||
| Diluted common shares | 131,837,521 | ||||
| Equity market capitalization | $ | 2,834,507 | |||
Total consolidated debt(1) |
$ | 1,633,820 | |||
| Cash and cash equivalents including restricted cash | (90,640) | ||||
| Net debt | $ | 1,543,180 | |||
Net Debt to annualized Adjusted EBITDAre(2) |
6.0 | x | |||
Total consolidated debt(1) |
$ | 1,633,820 | |||
| Equity market capitalization | 2,834,507 | ||||
| Total market capitalization | $ | 4,468,327 | |||
| Net debt to total market capitalization at applicable market price | 34.5 | % | |||
| Cash and cash equivalents including restricted cash | $ | 90,640 | |||
Available under unsecured credit facility(3) |
717,865 | ||||
| Total liquidity | $ | 808,505 | |||
| URBAN EDGE PROPERTIES | ||||||||
| ADDITIONAL DISCLOSURES | ||||||||
| (in thousands) | ||||||||
| Quarter Ended December 31, | Year Ended December 31, | |||||||||||||||||||||||||
| Rental revenue: | 2024 | 2023 | 2024 | 2023 | ||||||||||||||||||||||
| Property rentals | $ | 85,699 | $ | 79,945 | $ | 327,123 | $ | 304,772 | ||||||||||||||||||
| Tenant expense reimbursements | 31,120 | 26,625 | 118,493 | 103,709 | ||||||||||||||||||||||
| Rental revenue deemed uncollectible | (521) | (317) | (1,151) | (2,369) | ||||||||||||||||||||||
| Total rental revenue | $ | 116,298 | $ | 106,253 | $ | 444,465 | $ | 406,112 | ||||||||||||||||||
| Quarter Ended December 31, | Year Ended December 31, | |||||||||||||||||||||||||
| Composition of Property Rentals: | 2024 | 2023 | 2024 | 2023 | ||||||||||||||||||||||
| Minimum rent | $ | 79,351 | $ | 74,595 | $ | 309,652 | $ | 287,952 | ||||||||||||||||||
Non-cash revenues(1) |
4,906 | 3,898 | 12,221 | 11,868 | ||||||||||||||||||||||
| Percentage rent | 1,282 | 1,275 | 3,604 | 3,638 | ||||||||||||||||||||||
Lease termination income(1) |
160 | 177 | 1,646 | 1,314 | ||||||||||||||||||||||
| Total property rentals | $ | 85,699 | $ | 79,945 | $ | 327,123 | $ | 304,772 | ||||||||||||||||||
Quarter Ended December 31, |
Year Ended December 31, |
|||||||||||||||||||||||||
| Certain Non-Cash Items: | 2024 | 2023 | 2024 | 2023 | ||||||||||||||||||||||
Straight-line rents(2) |
$ | 163 | $ | 901 | $ | 2,552 | $ | 3,687 | ||||||||||||||||||
Amortization of below-market lease intangibles, net(2) |
4,743 | 2,997 | 9,669 | 8,181 | ||||||||||||||||||||||
Lease expense GAAP adjustments(3) |
(81) | (60) | (223) | (258) | ||||||||||||||||||||||
Amortization of deferred financing costs(4) |
(1,135) | (1,046) | (4,322) | (4,125) | ||||||||||||||||||||||
Capitalized interest(4) |
2,853 | 2,830 | 10,553 | 11,209 | ||||||||||||||||||||||
Share-based compensation expense(5) |
(2,852) | (1,788) | (10,431) | (7,811) | ||||||||||||||||||||||
Capital Expenditures:(6) |
||||||||||||||||||||||||||
| Development and redevelopment costs | $ | 33,566 | $ | 19,537 | $ | 78,230 | $ | 83,397 | ||||||||||||||||||
| Maintenance capital expenditures | 9,811 | 10,257 | 26,650 | 27,487 | ||||||||||||||||||||||
| Leasing commissions | 1,090 | 1,432 | 5,074 | 4,741 | ||||||||||||||||||||||
| Tenant improvements and allowances | 1,075 | 1,376 | 5,222 | 4,840 | ||||||||||||||||||||||
| Total capital expenditures | $ | 45,542 | $ | 32,602 | $ | 115,176 | $ | 120,465 | ||||||||||||||||||
| Tenant and Other Receivables: | As of December 31, 2024 | |||||||
| Tenant and other receivables billed | $ | 26,325 | ||||||
| Revenue deemed uncollectible | (5,653) | |||||||
| Tenant and other receivables deemed collectible | $ | 20,672 | ||||||
| URBAN EDGE PROPERTIES | ||||||||
| TENANT CONCENTRATION - TOP TWENTY-FIVE TENANTS | ||||||||
| As of December 31, 2024 | ||||||||
| Tenant | Number of stores | Square feet | % of total square feet | Annualized base rent ("ABR") | % of total ABR | Weighted average ABR per square foot | Average remaining term of ABR(1) |
||||||||||||||||
The TJX Companies(2) |
28 | 873,159 | 5.0% | $ | 18,373,109 | 5.6% | $ | 21.04 | 4.1 | ||||||||||||||
| Walmart | 6 | 872,522 | 5.0% | 9,989,075 | 3.1% | 11.45 | 8.1 | ||||||||||||||||
| Kohl's | 9 | 855,561 | 4.9% | 9,648,520 | 3.0% | 11.28 | 5.6 | ||||||||||||||||
| Best Buy | 9 | 409,641 | 2.4% | 9,533,005 | 2.9% | 23.27 | 5.3 | ||||||||||||||||
| Lowe's Companies | 6 | 976,415 | 5.6% | 8,946,256 | 2.7% | 9.16 | 4.9 | ||||||||||||||||
| The Home Depot | 5 | 538,742 | 3.1% | 8,925,418 | 2.7% | 16.57 | 11.5 | ||||||||||||||||
| Burlington | 9 | 468,606 | 2.7% | 8,548,539 | 2.6% | 18.24 | 4.9 | ||||||||||||||||
| PetSmart | 12 | 278,451 | 1.6% | 7,418,818 | 2.3% | 26.64 | 4.1 | ||||||||||||||||
| ShopRite | 5 | 361,053 | 2.1% | 6,826,508 | 2.1% | 18.91 | 10.0 | ||||||||||||||||
| BJ's Wholesale Club | 4 | 454,297 | 2.6% | 6,182,571 | 1.9% | 13.61 | 5.3 | ||||||||||||||||
| LA Fitness | 7 | 337,334 | 2.0% | 5,784,897 | 1.8% | 17.15 | 5.5 | ||||||||||||||||
The Gap(3) |
14 | 208,937 | 1.2% | 5,717,296 | 1.8% | 27.36 | 4.3 | ||||||||||||||||
Dick's Sporting Goods(4) |
7 | 278,683 | 1.6% | 5,666,353 | 1.7% | 20.33 | 2.2 | ||||||||||||||||
| Target Corporation | 4 | 476,146 | 2.8% | 5,565,180 | 1.7% | 11.69 | 7.9 | ||||||||||||||||
Amazon(5) |
3 | 145,279 | 0.8% | 5,036,444 | 1.5% | 34.67 | 6.1 | ||||||||||||||||
Ahold Delhaize (Stop & Shop) |
3 | 212,216 | 1.2% | 3,952,820 | 1.2% | 18.63 | 5.9 | ||||||||||||||||
| Bob's Discount Furniture | 5 | 202,172 | 1.2% | 3,860,671 | 1.2% | 19.10 | 4.8 | ||||||||||||||||
| Nordstrom | 3 | 106,720 | 0.6% | 3,476,434 | 1.1% | 32.58 | 6.9 | ||||||||||||||||
| AMC | 1 | 85,000 | 0.5% | 3,267,502 | 1.0% | 38.44 | 5.0 | ||||||||||||||||
| Ulta | 8 | 83,679 | 0.5% | 3,070,549 | 0.9% | 36.69 | 4.2 | ||||||||||||||||
| 24 Hour Fitness | 1 | 53,750 | 0.3% | 2,700,000 | 0.8% | 50.23 | 7.0 | ||||||||||||||||
| Five Below | 10 | 93,578 | 0.5% | 2,674,129 | 0.8% | 28.58 | 5.2 | ||||||||||||||||
| Staples | 6 | 128,355 | 0.7% | 2,637,951 | 0.8% | 20.55 | 1.9 | ||||||||||||||||
| DSW | 6 | 117,766 | 0.7% | 2,590,693 | 0.8% | 22.00 | 5.1 | ||||||||||||||||
| Anthropologie | 1 | 31,450 | 0.2% | 2,531,725 | 0.8% | 80.50 | 3.8 | ||||||||||||||||
| Total/Weighted Average | 172 | 8,649,512 | 49.8% | $ | 152,924,463 | 46.8% | $ | 17.68 | 5.7 | ||||||||||||||
| URBAN EDGE PROPERTIES | ||||||||
| LEASING ACTIVITY | ||||||||
For the quarter and year ended December 31, 2024 |
||||||||
|
Quarter Ended
December 31, 2024
|
Year Ended December 31, 2024 |
Year Ended December 31, 2023 |
|||||||||||||||||||||||||||||||||
GAAP(2) |
Cash(1) |
GAAP(2) |
Cash(1) |
GAAP(2) |
Cash(1) |
||||||||||||||||||||||||||||||
| New leases | |||||||||||||||||||||||||||||||||||
| Number of new leases executed | 16 | 16 | 79 | 79 | 64 | 64 | |||||||||||||||||||||||||||||
| Total square feet | 123,429 | 123,429 | 485,153 | 485,153 | 486,201 | 486,201 | |||||||||||||||||||||||||||||
| Number of same space leases | 13 | 13 | 55 | 55 | 49 | 49 | |||||||||||||||||||||||||||||
| Same space square feet | 117,036 | 117,036 | 334,972 | 334,972 | 418,322 | 418,322 | |||||||||||||||||||||||||||||
| Prior rent per square foot | $ | 17.51 | $ | 18.66 | $ | 21.28 | $ | 22.23 | $ | 21.32 | $ | 22.43 | |||||||||||||||||||||||
| New rent per square foot | $ | 29.12 | $ | 26.95 | $ | 31.34 | $ | 27.95 | $ | 29.64 | $ | 27.86 | |||||||||||||||||||||||
| Same space weighted average lease term (years) | 10.6 | 10.6 | 12.3 | 12.3 | 9.7 | 9.7 | |||||||||||||||||||||||||||||
| Same space TIs per square foot | N/A | $ | 42.37 | N/A | $ | 30.27 | N/A | $ | 26.12 | ||||||||||||||||||||||||||
| Rent spread | 66.3 | % | 44.4 | % | 47.3 | % | 25.7 | % | 39.0 | % | 24.2 | % | |||||||||||||||||||||||
| Renewals & Options | |||||||||||||||||||||||||||||||||||
| Number of leases executed | 13 | 13 | 86 | 86 | 110 | 110 | |||||||||||||||||||||||||||||
| Total square feet | 278,757 | 278,757 | 1,910,688 | 1,910,688 | 1,519,738 | 1,519,738 | |||||||||||||||||||||||||||||
| Number of same space leases | 13 | 13 | 84 | 84 | 110 | 110 | |||||||||||||||||||||||||||||
| Same space square feet | 278,757 | 278,757 | 1,682,610 | 1,682,610 | 1,519,738 | 1,519,738 | |||||||||||||||||||||||||||||
| Prior rent per square foot | $ | 21.19 | $ | 21.19 | $ | 17.90 | $ | 17.94 | $ | 22.10 | $ | 22.10 | |||||||||||||||||||||||
| New rent per square foot | $ | 23.94 | $ | 23.75 | $ | 19.92 | $ | 19.60 | $ | 24.35 | $ | 23.95 | |||||||||||||||||||||||
| Same space weighted average lease term (years) | 5.1 | 5.1 | 5.6 | 5.6 | 5.8 | 5.8 | |||||||||||||||||||||||||||||
| Same space TIs per square foot | N/A | $ | — | N/A | $ | 0.10 | N/A | $ | 3.07 | ||||||||||||||||||||||||||
| Rent spread | 13.0 | % | 12.1 | % | 11.3 | % | 9.3 | % | 10.2 | % | 8.4 | % | |||||||||||||||||||||||
| Total New Leases and Renewals & Options | |||||||||||||||||||||||||||||||||||
| Number of leases executed | 29 | 29 | 165 | 165 | 174 | 174 | |||||||||||||||||||||||||||||
| Total square feet | 402,186 | 402,186 | 2,395,841 | 2,395,841 | 2,005,939 | 2,005,939 | |||||||||||||||||||||||||||||
| Number of same space leases | 26 | 26 | 139 | 139 | 159 | 159 | |||||||||||||||||||||||||||||
| Same space square feet | 395,793 | 395,793 | 2,017,582 | 2,017,582 | 1,938,060 | 1,938,060 | |||||||||||||||||||||||||||||
| Prior rent per square foot | $ | 20.10 | $ | 20.44 | $ | 18.46 | $ | 18.65 | $ | 21.93 | $ | 22.17 | |||||||||||||||||||||||
| New rent per square foot | $ | 25.47 | $ | 24.69 | $ | 21.82 | $ | 20.98 | $ | 25.49 | $ | 24.80 | |||||||||||||||||||||||
| Same space weighted average lease term (years) | 6.7 | 6.7 | 6.7 | 6.7 | 6.6 | 6.6 | |||||||||||||||||||||||||||||
| Same space TIs per square foot | N/A | $ | 12.53 | N/A | $ | 5.11 | N/A | $ | 8.05 | ||||||||||||||||||||||||||
| Rent spread | 26.7 | % | 20.8 | % | 18.2 | % | 12.5 | % | 16.2 | % | 11.9 | % | |||||||||||||||||||||||
| URBAN EDGE PROPERTIES | ||||||||
| LEASES EXECUTED BUT NOT YET RENT COMMENCED | ||||||||
| As of December 31, 2024 | ||||||||
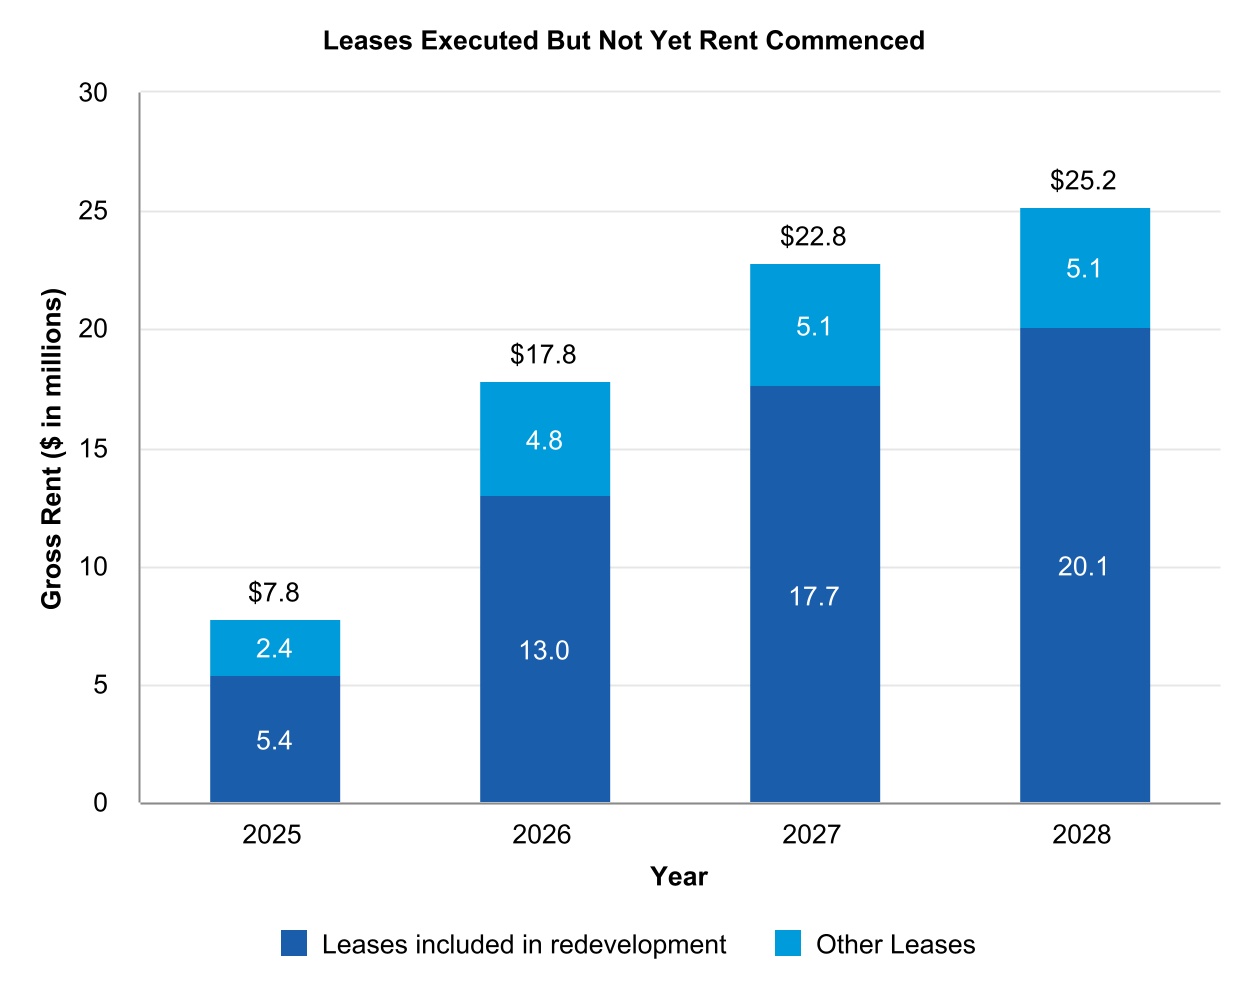
| (in thousands) | 2025 | 2026 | 2027 | 2028 | |||||||||||||||||||
| Same-property | $ | 6,100 | $ | 13,100 | $ | 14,100 | $ | 14,100 | |||||||||||||||
| (in thousands) | Annualized Gross Rent | ||||
| Leases executed but not yet rent commenced as of September 30, 2024 | $ | 23,800 | |||
Less: Leases commenced during the fourth quarter |
(2,100) | ||||
Plus: Leases executed during the fourth quarter |
3,500 | ||||
Leases executed but not yet rent commenced as of December 31, 2024 |
$ | 25,200 | |||
| URBAN EDGE PROPERTIES | ||||||||
| RETAIL PORTFOLIO LEASE EXPIRATION SCHEDULE | ||||||||
| As of December 31, 2024 | ||||||||
| ANCHOR TENANTS (SF>=10,000) | SHOP TENANTS (SF<10,000) | TOTAL TENANTS | ||||||||||||||||||||||||||||||||||||
Year(1) |
# of leases | Square Feet | % of Total SF | Weighted Avg ABR PSF(2) |
# of leases | Square Feet | % of Total SF | Weighted Avg ABR PSF(2) |
# of leases | Square Feet | % of Total SF | Weighted Avg ABR PSF(2) |
||||||||||||||||||||||||||
| M-T-M | 2 | 86,000 | 0.6% | $ | 6.99 | 36 | 99,000 | 3.5% | $ | 26.25 | 38 | 185,000 | 1.2% | $ | 17.30 | |||||||||||||||||||||||
| 2025 | 11 | 371,000 | 2.8% | 16.60 | 65 | 178,000 | 6.3% | 39.16 | 76 | 549,000 | 3.4% | 23.92 | ||||||||||||||||||||||||||
| 2026 | 23 | 744,000 | 5.6% | 20.48 | 102 | 311,000 | 11.0% | 40.17 | 125 | 1,055,000 | 6.6% | 26.29 | ||||||||||||||||||||||||||
| 2027 | 29 | 1,035,000 | 7.8% | 13.11 | 112 | 339,000 | 12.0% | 37.15 | 141 | 1,374,000 | 8.6% | 19.04 | ||||||||||||||||||||||||||
| 2028 | 28 | 945,000 | 7.1% | 20.69 | 80 | 275,000 | 9.7% | 42.31 | 108 | 1,220,000 | 7.6% | 25.57 | ||||||||||||||||||||||||||
| 2029 | 61 | 2,507,000 | 18.9% | 21.24 | 99 | 333,000 | 11.8% | 43.31 | 160 | 2,840,000 | 17.7% | 23.83 | ||||||||||||||||||||||||||
| 2030 | 41 | 2,178,000 | 16.5% | 12.05 | 50 | 194,000 | 6.9% | 42.48 | 91 | 2,372,000 | 14.8% | 14.54 | ||||||||||||||||||||||||||
| 2031 | 20 | 1,267,000 | 9.6% | 13.88 | 37 | 136,000 | 4.8% | 34.23 | 57 | 1,403,000 | 8.7% | 15.85 | ||||||||||||||||||||||||||
| 2032 | 11 | 331,000 | 2.5% | 16.89 | 48 | 161,000 | 5.7% | 35.02 | 59 | 492,000 | 3.1% | 22.82 | ||||||||||||||||||||||||||
| 2033 | 22 | 722,000 | 5.5% | 18.78 | 39 | 137,000 | 4.8% | 39.19 | 61 | 859,000 | 5.3% | 22.03 | ||||||||||||||||||||||||||
| 2034 | 21 | 857,000 | 6.5% | 18.74 | 46 | 165,000 | 5.8% | 38.32 | 67 | 1,022,000 | 6.4% | 21.90 | ||||||||||||||||||||||||||
| 2035 | 14 | 696,000 | 5.3% | 18.63 | 34 | 135,000 | 4.8% | 35.16 | 48 | 831,000 | 5.2% | 21.31 | ||||||||||||||||||||||||||
| Thereafter | 23 | 1,240,000 | 9.3% | 18.60 | 25 | 107,000 | 3.8% | 38.37 | 48 | 1,347,000 | 8.2% | 20.17 | ||||||||||||||||||||||||||
| Subtotal/Average | 306 | 12,979,000 | 98.0% | $ | 17.22 | 773 | 2,570,000 | 90.9% | $ | 38.82 | 1,079 | 15,549,000 | 96.8% | $ | 20.79 | |||||||||||||||||||||||
| Vacant | 12 | 259,000 | 2.0% | N/A | 101 | 256,000 | 9.1% | N/A | 113 | 515,000 | 3.2% | N/A | ||||||||||||||||||||||||||
| Total/Average | 318 | 13,238,000 | 100.0% | N/A | 874 | 2,826,000 | 100.0% | N/A | 1,192 | 16,064,000 | 100.0% | N/A | ||||||||||||||||||||||||||
| URBAN EDGE PROPERTIES | ||||||||
| RETAIL PORTFOLIO LEASE EXPIRATION SCHEDULE ASSUMING EXERCISE OF ALL OPTIONS | ||||||||
| As of December 31, 2024 | ||||||||
| ANCHOR TENANTS (SF>=10,000) | SHOP TENANTS (SF<10,000) | TOTAL TENANTS | ||||||||||||||||||||||||||||||||||||
Year(1) |
# of leases | Square Feet | % of Total SF | Weighted Avg ABR PSF(2) |
# of leases | Square Feet | % of Total SF | Weighted Avg ABR PSF(2) |
# of leases | Square Feet | % of Total SF | Weighted Avg ABR PSF(2) |
||||||||||||||||||||||||||
| M-T-M | 2 | 86,000 | 0.6% | $ | 6.99 | 36 | 99,000 | 3.5% | $ | 26.25 | 38 | 185,000 | 1.2% | $ | 17.30 | |||||||||||||||||||||||
| 2025 | 9 | 234,000 | 1.8% | 19.55 | 45 | 116,000 | 4.1% | 43.37 | 54 | 350,000 | 2.2% | 27.44 | ||||||||||||||||||||||||||
| 2026 | 6 | 110,000 | 0.8% | 23.82 | 63 | 159,000 | 5.6% | 46.85 | 69 | 269,000 | 1.7% | 37.43 | ||||||||||||||||||||||||||
| 2027 | 3 | 34,000 | 0.3% | 19.58 | 61 | 125,000 | 4.4% | 42.92 | 64 | 159,000 | 1.0% | 37.93 | ||||||||||||||||||||||||||
| 2028 | 4 | 212,000 | 1.6% | 19.67 | 44 | 131,000 | 4.6% | 42.47 | 48 | 343,000 | 2.1% | 28.38 | ||||||||||||||||||||||||||
| 2029 | 15 | 423,000 | 3.2% | 19.38 | 49 | 144,000 | 5.1% | 45.97 | 64 | 567,000 | 3.5% | 26.13 | ||||||||||||||||||||||||||
| 2030 | 9 | 236,000 | 1.8% | 20.91 | 32 | 109,000 | 3.9% | 42.43 | 41 | 345,000 | 2.1% | 27.71 | ||||||||||||||||||||||||||
| 2031 | 8 | 251,000 | 1.9% | 22.63 | 35 | 106,000 | 3.8% | 41.20 | 43 | 357,000 | 2.2% | 28.15 | ||||||||||||||||||||||||||
| 2032 | 7 | 264,000 | 2.0% | 18.96 | 37 | 120,000 | 4.2% | 38.66 | 44 | 384,000 | 2.4% | 25.12 | ||||||||||||||||||||||||||
| 2033 | 16 | 455,000 | 3.4% | 29.76 | 27 | 88,000 | 3.1% | 55.95 | 43 | 543,000 | 3.4% | 34.01 | ||||||||||||||||||||||||||
| 2034 | 19 | 578,000 | 4.4% | 22.54 | 46 | 169,000 | 6.0% | 43.41 | 65 | 747,000 | 4.7% | 27.26 | ||||||||||||||||||||||||||
| 2035 | 11 | 258,000 | 1.9% | 20.76 | 26 | 98,000 | 3.5% | 44.86 | 37 | 356,000 | 2.2% | 27.39 | ||||||||||||||||||||||||||
| Thereafter | 197 | 9,838,000 | 74.3% | 23.38 | 272 | 1,106,000 | 39.1% | 49.07 | 469 | 10,944,000 | 68.1% | 25.98 | ||||||||||||||||||||||||||
| Subtotal/Average | 306 | 12,979,000 | 98.0% | $ | 22.99 | 773 | 2,570,000 | 90.9% | $ | 45.58 | 1,079 | 15,549,000 | 96.8% | $ | 26.73 | |||||||||||||||||||||||
| Vacant | 12 | 259,000 | 2.0% | N/A | 101 | 256,000 | 9.1% | N/A | 113 | 515,000 | 3.2% | N/A | ||||||||||||||||||||||||||
| Total/Average | 318 | 13,238,000 | 100.0% | N/A | 874 | 2,826,000 | 100.0% | N/A | 1,192 | 16,064,000 | 100.0% | N/A | ||||||||||||||||||||||||||
| URBAN EDGE PROPERTIES | ||||||||
| PROPERTY STATUS REPORT | ||||||||
| As of December 31, 2024 | ||||||||
| (dollars in thousands, except per sf amounts) | ||||||||
| Property | Total Square Feet (1) |
Percent Leased(1) |
Weighted Average ABR PSF(2) |
Mortgage Debt(6) |
Major Tenants | ||||||||||||
| RETAIL PORTFOLIO: | |||||||||||||||||
| California: | |||||||||||||||||
Walnut Creek (Mt. Diablo)(4) |
7,000 | 100.0% | $69.90 | — | Sweetgreen | ||||||||||||
| Walnut Creek (Olympic) | 31,000 | 100.0% | 80.50 | — | Anthropologie | ||||||||||||
| Connecticut: | |||||||||||||||||
| Newington Commons | 189,000 | 90.0% | 9.50 | $15,719 | Walmart, Staples | ||||||||||||
| Maryland: | |||||||||||||||||
| Goucher Commons | 155,000 | 92.5% | 26.61 | — | Sprouts, HomeGoods, Five Below, Ulta, Kirkland's, DSW, Golf Galaxy | ||||||||||||
| Rockville Town Center | 98,000 | 100.0% | 16.41 | — | Regal Entertainment Group | ||||||||||||
The Village at Waugh Chapel(5) |
382,000 | 97.9% | 24.09 | $55,071 | Safeway, LA Fitness, Marshalls, Home Goods, T.J. Maxx | ||||||||||||
Wheaton (leased through 2060)(3) |
66,000 | 100.0% | 18.35 | — | Best Buy | ||||||||||||
| Woodmore Towne Centre | 712,000 | 98.8% | 18.44 | $117,200 | Costco, Wegmans, At Home, Best Buy, LA Fitness, Nordstrom Rack | ||||||||||||
| Massachusetts: | |||||||||||||||||
Cambridge (leased through 2033)(3) |
48,000 | 100.0% | 28.32 | — | PetSmart, Central Rock Gym | ||||||||||||
Gateway Center(5) |
640,000 | 100.0% | 9.72 | — | Costco, Target, Home Depot, Total Wine | ||||||||||||
Shoppers World(5) |
752,000 | 99.8% | 22.50 | — | T.J. Maxx, Marshalls, Home Sense, Sierra Trading, Public Lands, Golf Galaxy, Nordstrom Rack, Hobby Lobby, AMC, Kohl's, Best Buy | ||||||||||||
| The Shops at Riverwood | 79,000 | 100.0% | 25.80 | $20,958 | Price Rite, Planet Fitness, Goodwill | ||||||||||||
| Wonderland Marketplace | 140,000 | 100.0% | 14.22 | — | Big Lots, Planet Fitness, Marshalls, Get Air | ||||||||||||
| Missouri: | |||||||||||||||||
| Manchester Plaza | 131,000 | 100.0% | 12.09 | $12,500 | Pan-Asia Market, Academy Sports, Bob's Discount Furniture | ||||||||||||
| New Hampshire: | |||||||||||||||||
Salem (leased through 2102)(3) |
39,000 | 100.0% | 10.61 | — | Fun City | ||||||||||||
| New Jersey: | |||||||||||||||||
Bergen Town Center - East(8) |
253,000 | 92.1% | 22.56 | — | Lowe's, Best Buy, REI | ||||||||||||
| Bergen Town Center - West | 1,018,000 | 95.5% | 33.58 | $290,000 | Target, Whole Foods Market, Burlington, Marshalls, Nordstrom Rack, Saks Off 5th, HomeGoods, H&M, Bloomingdale's Outlet, Nike Factory Store, Old Navy, Kohl's, World Market (lease not commenced) | ||||||||||||
| Briarcliff Commons | 180,000 | 100.0% | 25.03 | $30,000 | Uncle Giuseppe's, Kohl's | ||||||||||||
| Brick Commons | 277,000 | 100.0% | 22.06 | $50,000 | ShopRite, Kohl's, Marshalls, Old Navy | ||||||||||||
| Brunswick Commons | 427,000 | 100.0% | 16.17 | $63,000 | Lowe's, Kohl's, Dick's Sporting Goods, P.C. Richard & Son, T.J. Maxx, LA Fitness | ||||||||||||
Carlstadt Commons (leased through 2050)(3) |
78,000 | 98.3% | 21.69 | — | Food Bazaar | ||||||||||||
| Garfield Commons | 298,000 | 100.0% | 16.38 | $38,886 | Walmart, Burlington, Marshalls, PetSmart, Ulta | ||||||||||||
| Greenbrook Commons | 170,000 | 98.3% | 20.00 | $31,000 | BJ's Wholesale Club, Aldi | ||||||||||||
| Hackensack Commons | 275,000 | 100.0% | 26.29 | $66,400 | The Home Depot, 99 Ranch, Staples, Petco | ||||||||||||
| Hanover Commons | 343,000 | 100.0% | 23.30 | $60,155 | The Home Depot, Dick's Sporting Goods, Saks Off Fifth, Marshalls | ||||||||||||
Heritage Square(5) |
87,000 | 100.0% | 31.19 | — | HomeSense, Sierra Trading Post, Ulta | ||||||||||||
| Hudson Commons | 236,000 | 100.0% | 14.33 | — | Lowe's, P.C. Richard & Son | ||||||||||||
| URBAN EDGE PROPERTIES | ||||||||
| PROPERTY STATUS REPORT | ||||||||
| As of December 31, 2024 | ||||||||
| (dollars in thousands, except per sf amounts) | ||||||||
| Property | Total Square Feet (1) |
Percent Leased(1) |
Weighted Average ABR PSF(2) |
Mortgage Debt(6) |
Major Tenants | ||||||||||||
| Hudson Mall | 381,000 | 73.5% | 17.57 | — | Marshalls, Big Lots, Retro Fitness, Staples, Old Navy | ||||||||||||
| Kearny Commons | 123,000 | 100.0% | 25.33 | — | LA Fitness, Marshalls, Ulta | ||||||||||||
| Kennedy Commons | 62,000 | 100.0% | 15.67 | — | Food Bazaar | ||||||||||||
| Lodi Commons | 43,000 | 100.0% | 20.94 | — | Dollar Tree | ||||||||||||
Ledgewood Commons(5) |
447,000 | 99.3% | 15.30 | $50,000 | Walmart, Ashley Furniture, At Home, Barnes & Noble, Burlington, DSW, Marshalls, Old Navy, Ulta | ||||||||||||
| Manalapan Commons | 200,000 | 93.7% | 23.44 | — | Best Buy, Raymour & Flanigan, PetSmart, Avalon Flooring, Atlantic Health (lease not commenced), Nordstrom Rack (lease not commenced) | ||||||||||||
| Marlton Commons | 214,000 | 100.0% | 17.50 | $36,024 | ShopRite, Kohl's, PetSmart | ||||||||||||
| Millburn | 104,000 | 89.5% | 29.93 | $21,525 | Trader Joe's, CVS, PetSmart | ||||||||||||
| Montclair | 18,000 | 100.0% | 32.00 | $7,250 | Whole Foods Market | ||||||||||||
Paramus (leased through 2033)(3) |
63,000 | 100.0% | 49.97 | — | 24 Hour Fitness | ||||||||||||
| Plaza at Cherry Hill | 417,000 | 80.7% | 13.86 | — | Aldi, Total Wine, LA Fitness, Raymour & Flanigan, Guitar Center | ||||||||||||
| Plaza at Woodbridge | 293,000 | 96.7% | 21.54 | $50,905 | Best Buy, Raymour & Flanigan, Lincoln Tech, UFC Gym, national grocer (lease not commenced) | ||||||||||||
| Rockaway River Commons | 189,000 | 96.8% | 15.40 | $26,215 | ShopRite, T.J. Maxx | ||||||||||||
Rutherford Commons (leased through 2099)(3) |
196,000 | 100.0% | 13.98 | $23,000 | Lowe's | ||||||||||||
Stelton Commons (leased through 2039)(3) |
56,000 | 100.0% | 21.99 | — | Staples, Party City | ||||||||||||
| Tonnelle Commons | 410,000 | 100.0% | 23.29 | $95,286 | BJ's Wholesale Club, Walmart, PetSmart | ||||||||||||
| Totowa Commons | 272,000 | 100.0% | 21.49 | $50,800 | The Home Depot, Staples, Tesla (lease not commenced), Lidl (lease not commenced), Boot Barn (lease not commenced) | ||||||||||||
| Town Brook Commons | 231,000 | 98.7% | 14.45 | $29,610 | Stop & Shop, Kohl's | ||||||||||||
| West Branch Commons | 279,000 | 98.7% | 16.74 | — | Lowe's, Burlington | ||||||||||||
| West End Commons | 241,000 | 100.0% | 11.89 | $23,717 | Costco, The Tile Shop, La-Z-Boy, Petco, Da Vita Dialysis | ||||||||||||
| Woodbridge Commons | 225,000 | 100.0% | 14.04 | $22,100 | Walmart, Dollar Tree, Advance Auto Parts | ||||||||||||
| New York: | |||||||||||||||||
| Amherst Commons | 311,000 | 98.1% | 11.35 | — | BJ's Wholesale Club, Burlington, LA Fitness, Bob's Discount Furniture, Ross (lease not commenced) | ||||||||||||
Bruckner Commons(5) |
335,000 | 82.0% | 43.76 | — | ShopRite, Burlington, BJ's Wholesale Club (lease not commenced) | ||||||||||||
Shops at Bruckner(5) |
113,000 | 100.0% | 39.72 | $37,350 | Aldi, Marshalls, Five Below, Old Navy | ||||||||||||
| Burnside Commons | 100,000 | 91.4% | 17.90 | — | Bingo Wholesale | ||||||||||||
| Cross Bay Commons | 44,000 | 95.8% | 41.62 | — | Northwell Health | ||||||||||||
Dewitt (leased through 2041)(3) |
46,000 | 100.0% | 19.36 | — | Best Buy | ||||||||||||
| Forest Commons | 165,000 | 89.5% | 26.49 | — | Western Beef, Planet Fitness, Advance Auto Parts, NYC Public School | ||||||||||||
| Gun Hill Commons | 81,000 | 100.0% | 38.79 | — | Aldi, Planet Fitness | ||||||||||||
Henrietta Commons (leased through 2056)(3) |
165,000 | 97.9% | 4.71 | — | Kohl's | ||||||||||||
| Huntington Commons | 208,000 | 98.0% | 22.19 | $43,704 | ShopRite, Marshalls, Old Navy, Petco, Burlington | ||||||||||||
| URBAN EDGE PROPERTIES | ||||||||
| PROPERTY STATUS REPORT | ||||||||
| As of December 31, 2024 | ||||||||
| (dollars in thousands, except per sf amounts) | ||||||||
| Property | Total Square Feet (1) |
Percent Leased(1) |
Weighted Average ABR PSF(2) |
Mortgage Debt(6) |
Major Tenants | ||||||||||||
| Kingswood Crossing | 107,000 | 84.4% | 47.58 | — | Target, Marshalls, Maimonides Medical, Visiting Nurse Services | ||||||||||||
Meadowbrook Commons (leased through 2040)(3) |
44,000 | 100.0% | 22.31 | — | Bob's Discount Furniture | ||||||||||||
| Mount Kisco Commons | 189,000 | 100.0% | 18.08 | $10,390 | Target, Stop & Shop | ||||||||||||
New Hyde Park (leased through 2029)(3) |
101,000 | 100.0% | 23.41 | — | Stop & Shop | ||||||||||||
| Yonkers Gateway |
448,000 | 95.5% | 20.55 | $50,000 | Burlington, Marshalls, HomeSense, Best Buy, DSW, PetSmart, Alamo Drafthouse Cinema, Wren Kitchens | ||||||||||||
| Pennsylvania: | |||||||||||||||||
Broomall Commons(5) |
170,000 | 100.0% | 15.43 | — | Amazon Fresh, Planet Fitness, PetSmart, Nemours Children's Hospital, Picklr (lease not commenced) | ||||||||||||
| Lincoln Plaza | 228,000 | 100.0% | 5.35 | — | Lowe's, Community Aid, Mattress Firm | ||||||||||||
| MacDade Commons | 102,000 | 100.0% | 13.00 | — | Walmart | ||||||||||||
| Marten Commons | 185,000 | 100.0% | 15.23 | — | Kohl's, Ross Dress for Less, Staples, Petco | ||||||||||||
Springfield (leased through 2025)(3) |
41,000 | 100.0% | 25.29 | — | PetSmart | ||||||||||||
| Wilkes-Barre Commons | 184,000 | 100.0% | 13.34 | — | Bob's Discount Furniture, Ross Dress for Less, Marshalls, Petco, Wren Kitchen | ||||||||||||
Wyomissing (leased through 2065)(3) |
76,000 | 100.0% | 14.83 | — | LA Fitness, PetSmart | ||||||||||||
| South Carolina: | |||||||||||||||||
Charleston (leased through 2063)(3) |
45,000 | 100.0% | 15.96 | — | Best Buy | ||||||||||||
| Virginia: | |||||||||||||||||
Norfolk (leased through 2069)(3) |
114,000 | 100.0% | 7.79 | — | BJ's Wholesale Club | ||||||||||||
| Puerto Rico: | |||||||||||||||||
| Shops at Caguas | 356,000 | 96.6% | 33.46 | $81,504 | Sector Sixty6, Forever 21, Old Navy | ||||||||||||
The Outlets at Montehiedra(5) |
531,000 | 97.1% | 24.21 | $73,551 | The Home Depot, Marshalls, Caribbean Cinemas, Old Navy, Ralph's Food Warehouse, T.J. Maxx, Burlington (lease not commenced) | ||||||||||||
| Total Retail Portfolio | 16,064,000 | 96.8% | $20.79 | $1,583,820 | |||||||||||||
Sunrise Mall(4)(5)(7) |
1,228,000 | 25.6% | 7.35 | — | Macy's, Dick's Sporting Goods | ||||||||||||
| Total Urban Edge Properties | 17,292,000 | 91.7% | $20.52 | $1,583,820 | |||||||||||||
| URBAN EDGE PROPERTIES | ||||||||
| PROPERTY ACQUISITIONS AND DISPOSITIONS | ||||||||
For the year ended December 31, 2024 |
||||||||
| (dollars in thousands) | ||||||||
2024 Property Acquisitions: |
||||||||||||||||||||
| Date Acquired | Property Name | City | State | GLA | Price | |||||||||||||||
| 2/8/2024 | Heritage Square | Watchung | NJ | 87,000 | $ | 34,000 | ||||||||||||||
| 4/5/2024 | Ledgewood Commons | Roxbury Township | NJ | 448,000 | 83,250 | |||||||||||||||
| 10/29/2024 | The Village at Waugh Chapel | Gambrills | MD | 382,000 | 125,600 | |||||||||||||||
2024 Property Dispositions: |
||||||||||||||||||||
| Date Disposed | Property Name | City | State | GLA | Price | |||||||||||||||
| 3/14/2024 | Hazlet | Hazlet | NJ | 95,000 | $ | 8,700 | ||||||||||||||
| 4/26/2024 | Lodi | Lodi | NJ | 127,000 | 29,200 | |||||||||||||||
| 10/29/2024 | Union (Vauxhall) | Union | NJ | 232,000 | 71,000 | |||||||||||||||
| URBAN EDGE PROPERTIES | ||||||||
| DEVELOPMENT, REDEVELOPMENT AND ANCHOR REPOSITIONING PROJECTS | ||||||||
| As of December 31, 2024 | ||||||||
| (in thousands, except square footage data) | ||||||||
| Active Projects | Estimated Gross Cost(1) |
Incurred as of 12/31/24 | Target Stabilization(2) |
Description and Status | |||||||||||||
Bruckner Commons (Phase A)(5) |
$ | 51,300 | $ | 21,200 | 2Q27 | Retenanting a portion of the former Kmart box with BJ's Wholesale Club | |||||||||||
Bruckner Commons (Phase B)(5) |
18,400 | 1,700 | 4Q26 | Redeveloping Toys "R" Us box with 20,000 sf of retail and restaurant pads | |||||||||||||
The Outlets at Montehiedra (Phase C)(5) |
12,600 | 10,000 | 1Q25 | Demising and retenanting former Kmart box with Ralph's Food Warehouse and Urology Hub | |||||||||||||
Hudson Mall(3) |
9,700 | 7,000 | 2Q26 | Retenanting former Toys "R" Us box | |||||||||||||
Manalapan Commons (Phase B)(3) |
7,500 | 2,800 | 3Q25 | Backfilling vacant Bed Bath & Beyond with 25,000± sf national apparel retailer and remaining 12,000± sf | |||||||||||||
The Outlets at Montehiedra (Phase E)(5) |
7,400 | 4,600 | 2Q25 | Backfilling Tiendas Capri with 33,000 sf Burlington | |||||||||||||
Marlton Commons(3) |
7,300 | 5,700 | 2Q25 | Redeveloping Friendly's with new 11,000± sf multi-tenant pad (First Watch, Cava, and Mattress Firm executed) | |||||||||||||
Totowa Commons (Phase A)(3) |
5,700 | 1,500 | 4Q25 | Backfilling former Bed Bath & Beyond box with Tesla | |||||||||||||
Brick Commons(3) |
5,300 | 4,800 | 2Q25 | Replacing Santander Bank with two quick service restaurants (Shake Shack and First Watch executed) | |||||||||||||
Walnut Creek(3) |
3,500 | 2,600 | 3Q25 | Retenanting former Z Gallerie with Sweetgreen (open) and Ronbow | |||||||||||||
Bergen Town Center (Phase E)(3) |
3,400 | 1,600 | 4Q25 | Backfilling vacant Midas space with First Watch | |||||||||||||
Amherst Commons(3) |
3,100 | 2,800 | 1Q25 | Backfilling vacant anchor with Ross and Bob's Discount Furniture | |||||||||||||
Totowa Commons (Phase B)(3) |
3,100 | 600 | 1Q26 | Retenanting vacant Marshalls with 27,000 sf Lidl and 18,000 sf Boot Barn | |||||||||||||
Bergen Town Center (Phase D)(3) |
2,700 | 700 | 1Q25 | Backfilling former Neiman Marcus with World Market | |||||||||||||
Yonkers Gateway Center (Phase B)(3) |
2,600 | 2,000 | 3Q25 | Relocating Red Wing Shoes, adding Dave's Hot Chicken into vacant shop space and expanding Best Buy in former Red Wing Shoes | |||||||||||||
Plaza at Woodbridge (Phase A)(3) |
2,400 | 100 | 1Q26 | Retenanting 17,000± sf of former Bed Bath & Beyond with national grocer | |||||||||||||
The Outlets at Montehiedra (Phase B)(5) |
2,200 | 200 | 1Q26 | Developing new 6,000± sf pad for Texas Roadhouse | |||||||||||||
Huntington Commons (Phase D)(3) |
2,200 | 2,000 | 2Q25 | Retenanting former bank pad with Starbucks and Yoga Six | |||||||||||||
Broomall Commons(5) |
1,800 | — | 1Q26 | Backfilling vacant anchor with Picklr | |||||||||||||
Bergen Town Center (Phase C)(3) |
1,700 | 300 | 3Q25 | Backfilling vacant restaurant space with Ani Ramen and retenanting former Qdoba with Bluestone Lane (open) | |||||||||||||
Woodmore Towne Centre (Phase A)(3) |
1,700 | 500 | 3Q26 | New pad for free standing Bank of America | |||||||||||||
Manalapan Commons (Phase A)(3) |
1,600 | 300 | 2Q25 | Backfilling vacant A.C. Moore space with 18,000 sf Atlantic Health | |||||||||||||
| Ledgewood Commons | 1,500 | — | 3Q26 | Developing new restaurant pad for Tommy's Tavern + Tap | |||||||||||||
Newington Commons(3) |
1,400 | — | 1Q26 | Backfilling former Staples with Bob's Discount Furniture | |||||||||||||
Plaza at Cherry Hill (Phase C)(3) |
1,400 | 100 | 1Q26 | Backfilling vacant space with 10,000 sf Big Blue Swim | |||||||||||||
Plaza at Woodbridge (Phase B)(3) |
1,100 | — | 4Q27 | Expanding existing ExtraSpace self-storage by 13,000± sf in vacant space | |||||||||||||
| Total | $ | 162,600 | (4) |
$ | 73,100 | ||||||||||||
| URBAN EDGE PROPERTIES | ||||||||
| DEVELOPMENT, REDEVELOPMENT AND ANCHOR REPOSITIONING PROJECTS | ||||||||
| As of December 31, 2024 | ||||||||
| (in thousands, except square footage data) | ||||||||
| Completed Projects | Estimated Gross Cost(1) |
Incurred as of 12/31/24 | Stabilization(2) |
Description and status | |||||||||||||
The Outlets at Montehiedra (Phase D)(6) |
$ | 4,800 | $ | 4,500 | 4Q24 | Retenanted 24,000 sf of vacant Kmart box with T.J. Maxx | |||||||||||
Burnside Commons(3) |
6,900 | 6,900 | 3Q24 | Retenanted anchor vacancy with Bingo Wholesale | |||||||||||||
Kingswood Crossing (Phase A)(3) |
3,100 | 3,100 | 3Q24 | Backfilled 21,000 sf vacancy with Visiting Nurse Service of NY | |||||||||||||
Huntington Commons (Phase B)(3) |
13,300 | 12,500 | 2Q24 | Backfilled the relocated Marshalls box with Burlington, as well as additional center repositioning and renovations | |||||||||||||
Yonkers Gateway Center (Phase A)(3) |
1,600 | 1,600 | 1Q24 | Retenanted end cap space with Wren Kitchens | |||||||||||||
| Total | $ | 29,700 | (4) |
$ | 28,600 | ||||||||||||
Future Redevelopment(5) |
Location | Opportunity | ||||||
Bergen Town Center(3) |
Paramus, NJ | Improvements to common areas and enhancements to merchandising mix | ||||||
Brunswick Commons(3) |
East Brunswick, NJ | Develop new pad | ||||||
Hudson Mall(3) |
Jersey City, NJ | Reposition mall with retail and amenity upgrades and consideration of alternate uses | ||||||
The Plaza at Cherry Hill(3) |
Cherry Hill, NJ | Renovate exterior of center and common areas and upgrade tenancy | ||||||
| Sunrise Mall | Massapequa, NY | Redevelop mall including consideration of alternate uses | ||||||
| URBAN EDGE PROPERTIES | ||||||||
| DEBT SUMMARY | ||||||||
As of December 31, 2024 and 2023 |
||||||||
| (in thousands) | ||||||||
| December 31, 2024 | December 31, 2023 | ||||||||||
| Secured fixed rate debt | $ | 1,532,915 | $ | 1,462,766 | |||||||
| Secured variable rate debt | 50,905 | 127,969 | |||||||||
| Unsecured variable rate debt | 50,000 | 153,000 | |||||||||
| Total debt | $ | 1,633,820 | $ | 1,743,735 | |||||||
| % Secured fixed rate debt | 93.8 | % | 83.9 | % | |||||||
| % Secured variable rate debt | 3.1 | % | 7.3 | % | |||||||
| % Unsecured variable rate debt | 3.1 | % | 8.8 | % | |||||||
| Total | 100 | % | 100 | % | |||||||
| Secured mortgage debt | $ | 1,583,820 | $ | 1,590,735 | |||||||
Unsecured debt(1) |
50,000 | 153,000 | |||||||||
| Total debt | $ | 1,633,820 | $ | 1,743,735 | |||||||
| % Secured mortgage debt | 96.9 | % | 91.2 | % | |||||||
| % Unsecured mortgage debt | 3.1 | % | 8.8 | % | |||||||
| Total | 100 | % | 100 | % | |||||||
| Weighted average remaining maturity on secured mortgage debt | 4.7 years | 5.0 years | |||||||||
| Weighted average remaining maturity on unsecured debt | 3.1 years | 4.1 years | |||||||||
| Total market capitalization (see page 18) | $ | 4,468,327 | |||||||||
| % Secured mortgage debt | 35.4 | % | |||||||||
| % Unsecured debt | 1.1 | % | |||||||||
| Total debt : Total market capitalization | 36.5 | % | |||||||||
Weighted average interest rate on secured mortgage debt(2) |
5.04 | % | 5.01 | % | |||||||
Weighted average interest rate on unsecured debt(2) |
5.47 | % | 6.56 | % | |||||||
| Total debt | 5.05 | % | 5.14 | % | |||||||
| URBAN EDGE PROPERTIES | ||||||||
| MORTGAGE DEBT SUMMARY | ||||||||
As of December 31, 2024 and 2023 |
||||||||
| (dollars in thousands) | ||||||||
| Property | Maturity Date | Rate | December 31, 2024 | December 31, 2023 | Percent of Mortgage Debt at December 31, 2024 |
||||||||||||
Hudson Commons(1) |
11/15/24 | — | % | $ | — | $ | 26,930 | — | % | ||||||||
Gun Hill Commons(1) |
12/1/24 | — | % | — | 23,696 | — | % | ||||||||||
| West End Commons | 12/10/25 | 3.99 | % | 23,717 | 24,196 | 1.5 | % | ||||||||||
| Town Brook Commons | 12/1/26 | 3.78 | % | 29,610 | 30,229 | 1.9 | % | ||||||||||
| Rockaway River Commons | 12/1/26 | 3.78 | % | 26,215 | 26,763 | 1.7 | % | ||||||||||
| Hanover Commons | 12/10/26 | 4.03 | % | 60,155 | 61,324 | 3.8 | % | ||||||||||
| Tonnelle Commons | 4/1/27 | 4.18 | % | 95,286 | 97,115 | 6.0 | % | ||||||||||
| Manchester Plaza | 6/1/27 | 4.32 | % | 12,500 | 12,500 | 0.8 | % | ||||||||||
| Millburn Gateway Center | 6/1/27 | 3.97 | % | 21,525 | 22,015 | 1.4 | % | ||||||||||
Plaza at Woodbridge(2) |
6/8/27 | 5.26 | % | 50,905 | 52,278 | 3.2 | % | ||||||||||
| Totowa Commons | 12/1/27 | 4.33 | % | 50,800 | 50,800 | 3.2 | % | ||||||||||
| Woodbridge Commons | 12/1/27 | 4.36 | % | 22,100 | 22,100 | 1.4 | % | ||||||||||
| Brunswick Commons | 12/6/27 | 4.38 | % | 63,000 | 63,000 | 4.0 | % | ||||||||||
| Rutherford Commons | 1/6/28 | 4.49 | % | 23,000 | 23,000 | 1.5 | % | ||||||||||
Kingswood Center(3) |
2/6/28 | — | % | — | 69,054 | — | % | ||||||||||
| Hackensack Commons | 3/1/28 | 4.36 | % | 66,400 | 66,400 | 4.2 | % | ||||||||||
| Marlton Commons | 12/1/28 | 3.86 | % | 36,024 | 36,725 | 2.3 | % | ||||||||||
Union (Vauxhall)(4) |
12/10/28 | — | % | — | 45,202 | — | % | ||||||||||
Yonkers Gateway Center(5) |
4/10/29 | 6.30 | % | 50,000 | 23,148 | 3.2 | % | ||||||||||
| Ledgewood Commons | 5/5/29 | 6.03 | % | 50,000 | — | 3.2 | % | ||||||||||
| The Shops at Riverwood | 6/24/29 | 4.25 | % | 20,958 | 21,326 | 1.3 | % | ||||||||||
| Shops at Bruckner | 7/1/29 | 6.00 | % | 37,350 | 37,817 | 2.4 | % | ||||||||||
Greenbrook Commons(6) |
9/1/29 | 6.03 | % | 31,000 | 25,065 | 2.0 | % | ||||||||||
| Huntington Commons | 12/5/29 | 6.29 | % | 43,704 | 43,704 | 2.8 | % | ||||||||||
| Bergen Town Center | 4/10/30 | 6.30 | % | 290,000 | 290,000 | 18.1 | % | ||||||||||
| The Outlets at Montehiedra | 6/1/30 | 5.00 | % | 73,551 | 75,590 | 4.6 | % | ||||||||||
Montclair(7) |
8/15/30 | 3.15 | % | 7,250 | 7,250 | 0.5 | % | ||||||||||
| Garfield Commons | 12/1/30 | 4.14 | % | 38,886 | 39,607 | 2.5 | % | ||||||||||
The Village at Waugh Chapel(8) |
12/1/31 | 3.76 | % | 55,071 | — | 3.5 | % | ||||||||||
Brick Commons(9) |
12/10/31 | 5.20 | % | 50,000 | 47,683 | 3.2 | % | ||||||||||
| Woodmore Towne Centre | 1/6/32 | 3.39 | % | 117,200 | 117,200 | 7.4 | % | ||||||||||
| Newington Commons | 7/1/33 | 6.00 | % | 15,719 | 15,920 | 1.0 | % | ||||||||||
| Shops at Caguas | 8/1/33 | 6.60 | % | 81,504 | 82,000 | 5.1 | % | ||||||||||
| Briarcliff Commons | 10/1/34 | 5.47 | % | 30,000 | — | 1.9 | % | ||||||||||
Mount Kisco Commons(10) |
11/15/34 | 6.40 | % | 10,390 | 11,098 | 0.7 | % | ||||||||||
| Total mortgage debt | 5.04 | % | $ | 1,583,820 | $ | 1,590,735 | 100 | % | |||||||||
| Unamortized debt issuance costs | (14,067) | (12,625) | |||||||||||||||
| Total mortgage debt, net | $ | 1,569,753 | $ | 1,578,110 | |||||||||||||
| URBAN EDGE PROPERTIES | ||||||||
| DEBT MATURITY SCHEDULE | ||||||||
As of December 31, 2024 |
||||||||
| (dollars in thousands) | ||||||||
| Year | Amortization | Balloon Payments | Revolving Credit Facilities(1) |
Premium/(Discount) Amortization | Total | Weighted Average Interest rate at maturity | Percent of Debt Maturing | ||||||||||||||||
| 2025 | $ | 13,886 | $ | 23,261 | $ | — | $ | (774) | $ | 36,373 | 4.3% | 2.2 | % | ||||||||||
| 2026 | 14,505 | 111,228 | — | (774) | 124,959 | 4.0% | 7.6 | % | |||||||||||||||
| 2027 | 10,629 | 306,781 | — | (774) | 316,636 | 4.5% | 19.4 | % | |||||||||||||||
| 2028 | 9,559 | 122,402 | 50,000 | (773) | 181,188 | 4.7% | 11.1 | % | |||||||||||||||
| 2029 | 8,163 | 224,990 | — | (773) | 232,380 | 6.0% | 14.2 | % | |||||||||||||||
| 2030 | 5,566 | 391,042 | — | (773) | 395,835 | 5.9% | 24.2 | % | |||||||||||||||
| 2031 | 3,741 | 110,000 | — | (713) | 113,028 | 4.5% | 6.9 | % | |||||||||||||||
| 2032 | 3,986 | 117,200 | — | (60) | 121,126 | 3.5% | 7.4 | % | |||||||||||||||
| 2033 | 2,986 | 78,094 | — | (60) | 81,020 | 6.5% | 5.0 | % | |||||||||||||||
| Thereafter | 1,333 | 30,000 | — | (58) | 31,275 | 5.5% | 1.9 | % | |||||||||||||||
| Total | $ | 74,354 | $ | 1,514,998 | $ | 50,000 | $ | (5,532) | $ | 1,633,820 | 5.1% | 100 | % | ||||||||||
| Unamortized debt issuance costs | (14,067) | ||||||||||||||||||||||
| Total outstanding debt, net | $ | 1,619,753 | |||||||||||||||||||||