
| Indiana | 001-36454 | 35-2047713 | ||||||||||||
| (State or other jurisdiction of | (Commission File | (IRS Employer Identification No.) | ||||||||||||
| incorporation) | Number) | |||||||||||||
1205 Kimball Boulevard, Jasper, Indiana |
47546 | |||||||
| (Address of principal executive offices) | (Zip Code) | |||||||
| Not Applicable | ||
| (Former name or former address, if changed since last report) | ||
| Securities registered pursuant to Section 12(b) of the Act: | ||||||||
| Title of each Class | Trading Symbol | Name of each exchange on which registered | ||||||
| Common Stock, no par value | KE | The Nasdaq Stock Market LLC | ||||||
| Exhibit | ||||||||
| Number | Description | |||||||
| 99.1 | ||||||||
| 104 | Cover Page Interactive Data File (formatted in Inline XBRL) | |||||||
| KIMBALL ELECTRONICS, INC. | |||||
| By: | /s/ Jana T. Croom | ||||
| JANA T. CROOM Chief Financial Officer |
|||||
 |
KIMBALL ELECTRONICS REPORTS Q1 RESULTS;
COMPANY REITERATES GUIDANCE FOR FISCAL 2026
|
||||
|
“I’m pleased with the results for the first quarter and start to the new fiscal year. Sales were in line with expectations, driven by strength in the medical vertical, margins improved year-over-year, cash from operations was positive for the seventh consecutive quarter, and debt at the end of Q1 was the lowest level in over three years. We have ample liquidity to navigate the current operating environment, and plenty of dry powder to opportunistically invest in growth.
I continue to be impressed with our team’s progress in positioning the Company for the future. Our solid footing as an EMS provider and our capabilities as a medical CMO are unique in the industry and we look to expand upon them through organic, and possibly inorganic, channels. We remain confident this powerful combination will result in a return to profitable topline growth next year, and we are reiterating our guidance for fiscal 2026.”
Richard D. Phillips
Chief Executive Officer
|
First Quarter 2026 Highlights
•Revenue of $365.6 million, with strong year-over-year sales growth in the medical end-market vertical
•Operating income of $14.5 million, or 4.0% of net sales, adjusted OI of 4.8%, up 140 bps year-over-year
•Net income of $10.1 million, or $0.40 per diluted share, adjusted EPS of $0.49, more than double Q1 fiscal 2025
•Cash from operations of $8.1 million, the seventh consecutive quarter of positive cash generation
•Debt of $138.0 million, down $9.5 million in the quarter, and borrowing capacity of $294.3 million
•Cash Conversion Days of 83, the lowest level in 3 years
•Invested $1.5 million to repurchase 49,000 shares of common stock
|
|||||||||||||||||||
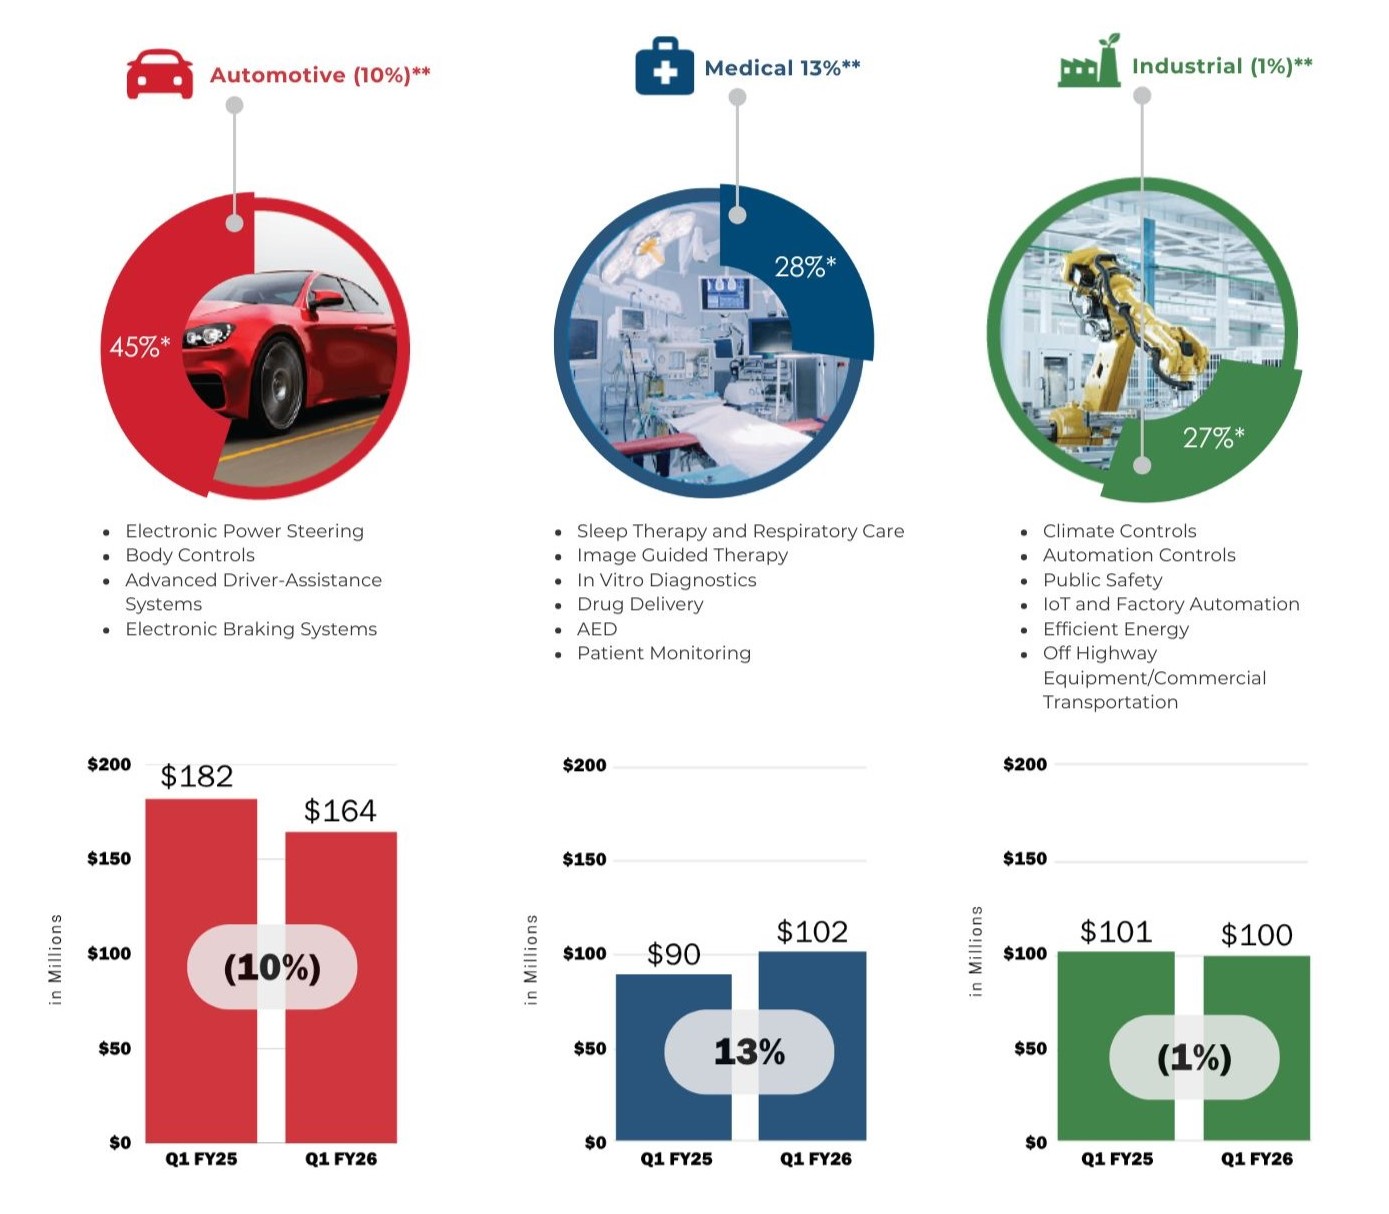
Net Sales By Vertical Market For The First Quarter Of Fiscal 2026 | ||||||||
Sales in the medical vertical market increased 13% compared to the first quarter of fiscal 2025, while sales in automotive decreased 10% and industrial, excluding Automation, Test and Measurement, decreased 1%. | ||||||||
 | ||||||||
|
*Percentage of net sales.
**Percentage changes compared to Q1 of fiscal 2025.
AT&M excluded from all amounts, percentages, and periods.
| ||||||||
 |
Conference Call / Webcast |
||||
|
Thursday, November 6, 2025
Live Webcast:
investors.kimballelectronics.com/events-and-presentations/events
For those unable to participate in the live webcast, the call will be archived at investors.kimballelectronics.com.
| |||||
Forward-Looking Statements | ||
Non-GAAP Financial Measures | ||
| About Kimball Electronics, Inc. | ||
|
Contact:
Andrew D. Regrut
Treasurer and Investor Relations Officer
812.827.4151
Investor.Relations@kimballelectronics.com
|
|||||||
Three Months Ended |
|||||||||||
| September 30, | |||||||||||
| (Amounts in Thousands, except EPS) | 2025 | 2024 | |||||||||
| Net Sales | $ | 365,603 | $ | 374,256 | |||||||
Operating Income |
$ | 14,454 | $ | 9,115 | |||||||
Adjusted Operating Income (non-GAAP) |
$ | 17,534 | $ | 12,590 | |||||||
| Operating Income % | 4.0 | % | 2.4 | % | |||||||
| Adjusted Operating Income (non-GAAP) % | 4.8 | % | 3.4 | % | |||||||
| Net Income | $ | 10,086 | $ | 3,154 | |||||||
Adjusted Net Income (non-GAAP) |
$ | 12,250 | $ | 5,527 | |||||||
Diluted EPS |
$ | 0.40 | $ | 0.12 | |||||||
Adjusted Diluted EPS (non-GAAP) |
$ | 0.49 | $ | 0.22 | |||||||
Three Months Ended |
|||||||||||||||||||||||||||||
| September 30, | |||||||||||||||||||||||||||||
| (Amounts in Millions) | 2025 |
* | 2024 (2) |
* | Percent Change |
||||||||||||||||||||||||
Automotive |
$ | 164.4 | 45 | % | $ | 181.8 | 49 | % | (10) | % | |||||||||||||||||||
Medical |
101.6 | 28 | % | 89.8 | 24 | % | 13 | % | |||||||||||||||||||||
Industrial excluding AT&M (1) |
99.6 | 27 | % | 100.6 | 26 | % | (1) | % | |||||||||||||||||||||
Net Sales excluding AT&M (1) |
$ | 365.6 | 100 | % | $ | 372.2 | 99 | % | (2) | % | |||||||||||||||||||
AT&M (1) |
— | — | % | 2.1 | 1 | % | (100) | % | |||||||||||||||||||||
| Total Net Sales | $ | 365.6 | 100 | % | $ | 374.3 | 100 | % | (2) | % | |||||||||||||||||||
*As a percent of Total Net Sales |
|||||||||||||||||||||||||||||
(1)Sales from our Automation, Test, and Measurement business (AT&M), which was divested effective July 31, 2024, were previously included in the industrial vertical | |||||||||||||||||||||||||||||
(2)Beginning in the first quarter of fiscal year 2026, sales to customers related to commercial transportation, previously included in the automotive vertical, are now reflected in the industrial vertical; prior periods have been recast to conform to current period presentation | |||||||||||||||||||||||||||||
–Automotive includes electronic power steering, body controls, advanced driver-assistance systems, and electronic braking systems | |||||||||||||||||||||||||||||
–Medical includes sleep therapy and respiratory care, image guided therapy, in vitro diagnostics, drug delivery, AED, and patient monitoring | |||||||||||||||||||||||||||||
–Industrial includes climate controls, automation controls, public safety, IoT and factory automation, efficient energy, off highway equipment, and commercial transportation | |||||||||||||||||||||||||||||
| Condensed Consolidated Statements of Income | |||||||||||||||||||||||
| (Unaudited) | Three Months Ended | ||||||||||||||||||||||
| (Amounts in Thousands, except Per Share Data) | September 30, 2025 | September 30, 2024 | |||||||||||||||||||||
| Net Sales | $ | 365,603 | 100.0 | % | $ | 374,256 | 100.0 | % | |||||||||||||||
| Cost of Sales | 336,767 | 92.1 | % | 350,656 | 93.7 | % | |||||||||||||||||
| Gross Profit | 28,836 | 7.9 | % | 23,600 | 6.3 | % | |||||||||||||||||
| Selling and Administrative Expenses | 13,090 | 3.5 | % | 13,427 | 3.6 | % | |||||||||||||||||
| Restructuring Expense | 1,416 | 0.4 | % | 2,322 | 0.6 | % | |||||||||||||||||
| Gain on Disposal | (124) | — | % | (1,264) | (0.3) | % | |||||||||||||||||
Operating Income |
14,454 | 4.0 | % | 9,115 | 2.4 | % | |||||||||||||||||
| Interest Income | 139 | — | % | 222 | 0.1 | % | |||||||||||||||||
| Interest Expense | (2,353) | (0.6) | % | (4,792) | (1.3) | % | |||||||||||||||||
| Non-Operating Income (Expense), net | (1,241) | (0.4) | % | (1,661) | (0.4) | % | |||||||||||||||||
| Other Income (Expense), net | (3,455) | (1.0) | % | (6,231) | (1.6) | % | |||||||||||||||||
| Income Before Taxes on Income | 10,999 | 3.0 | % | 2,884 | 0.8 | % | |||||||||||||||||
| Provision (Benefit) for Income Taxes | 913 | 0.2 | % | (270) | — | % | |||||||||||||||||
Net Income |
$ | 10,086 | 2.8 | % | $ | 3,154 | 0.8 | % | |||||||||||||||
| Earnings Per Share of Common Stock: | |||||||||||||||||||||||
| Basic | $ | 0.41 | $ | 0.13 | |||||||||||||||||||
| Diluted | $ | 0.40 | $ | 0.12 | |||||||||||||||||||
| Average Number of Shares Outstanding: | |||||||||||||||||||||||
| Basic | 24,600 | 24,979 | |||||||||||||||||||||
| Diluted | 24,909 | 25,235 | |||||||||||||||||||||
| Condensed Consolidated Statements of Cash Flows | Three Months Ended | ||||||||||
| (Unaudited) | September 30, | ||||||||||
| (Amounts in Thousands) | 2025 | 2024 | |||||||||
| Net Cash Flow provided by Operating Activities | $ | 8,065 | $ | 45,474 | |||||||
Net Cash Flow (used for) provided by Investing Activities |
(6,202) | 5,226 | |||||||||
Net Cash Flow used for Financing Activities |
(13,966) | (52,954) | |||||||||
| Effect of Exchange Rate Change on Cash, Cash Equivalents, and Restricted Cash | 116 | 1,830 | |||||||||
Net Decrease in Cash, Cash Equivalents, and Restricted Cash |
(11,987) | (424) | |||||||||
| Cash, Cash Equivalents, and Restricted Cash at Beginning of Period | 89,467 | 78,779 | |||||||||
| Cash, Cash Equivalents, and Restricted Cash at End of Period | $ | 77,480 | $ | 78,355 | |||||||
| (Unaudited) | |||||||||||
| Condensed Consolidated Balance Sheets | September 30, 2025 |
June 30, 2025 |
|||||||||
| (Amounts in Thousands) | |||||||||||
| ASSETS | |||||||||||
| Cash and cash equivalents | $ | 75,696 | $ | 88,781 | |||||||
| Receivables, net | 226,012 | 222,623 | |||||||||
| Contract assets | 75,199 | 71,812 | |||||||||
| Inventories | 272,725 | 273,500 | |||||||||
| Prepaid expenses and other current assets | 34,341 | 36,027 | |||||||||
| Assets held for sale | 6,579 | 6,861 | |||||||||
| Property and Equipment, net | 273,937 | 264,804 | |||||||||
| Goodwill | 6,191 | 6,191 | |||||||||
| Other Intangible Assets, net | 2,305 | 2,427 | |||||||||
Other Assets, net |
104,931 | 104,286 | |||||||||
| Total Assets | $ | 1,077,916 | $ | 1,077,312 | |||||||
LIABILITIES AND SHARE OWNERS’ EQUITY |
|||||||||||
| Current portion of long-term debt | $ | 6,600 | $ | 17,400 | |||||||
| Accounts payable | 234,567 | 218,805 | |||||||||
| Advances from customers | 27,058 | 35,867 | |||||||||
| Accrued expenses | 43,795 | 46,489 | |||||||||
| Long-term debt, less current portion | 130,925 | 129,650 | |||||||||
| Other long-term liabilities | 57,832 | 59,217 | |||||||||
| Share Owners’ Equity | 577,139 | 569,884 | |||||||||
| Total Liabilities and Share Owners’ Equity | $ | 1,077,916 | $ | 1,077,312 | |||||||
| Other Financial Metrics | |||||||||||||||||
| (Unaudited) | |||||||||||||||||
| (Amounts in Millions, except CCD) | |||||||||||||||||
| At or For the | |||||||||||||||||
| Three Months Ended | |||||||||||||||||
| September 30, | June 30, | September 30, | |||||||||||||||
| 2025 | 2025 | 2024 | |||||||||||||||
| Depreciation and Amortization | $ | 9.1 | $ | 9.6 | $ | 9.2 | |||||||||||
Cash Conversion Days (CCD) (1) |
83 | 85 | 108 | ||||||||||||||
Open Orders (2) |
$ | 593 | $ | 642 | $ | 594 | |||||||||||
Select Financial Results of Automation, Test and Measurement |
|||||||||||
| (Unaudited) | |||||||||||
(Amounts in Millions) |
|||||||||||
| Three Months Ended | |||||||||||
| September 30, | |||||||||||
| 2025 | 2024 | ||||||||||
| Net Sales | $ | — | $ | 2.1 | |||||||
Operating Income (Loss) (1) |
$ | — | $ | 0.8 | |||||||
| Reconciliation of Non-GAAP Financial Measures | |||||||||||
| (Unaudited, Amounts in Thousands, except Per Share Data) | |||||||||||
| Three Months Ended | |||||||||||
| September 30, | |||||||||||
| 2025 | 2024 | ||||||||||
| Net Sales Growth (vs. same period in prior year) | (2) | % | (15) | % | |||||||
| Foreign Currency Exchange Impact | 1 | % | — | % | |||||||
| Constant Currency Growth | (3) | % | (15) | % | |||||||
| Selling and Administrative Expenses, as reported | $ | 13,090 | $ | 13,427 | |||||||
| Stock Compensation Expense | (1,563) | (2,072) | |||||||||
| SERP | (225) | (345) | |||||||||
| Adjusted Selling and Administrative Expenses | $ | 11,302 | $ | 11,010 | |||||||
Operating Income, as reported |
$ | 14,454 | $ | 9,115 | |||||||
| Stock Compensation Expense | 1,563 | 2,072 | |||||||||
| SERP | 225 | 345 | |||||||||
| Restructuring Expense | 1,416 | 2,322 | |||||||||
| Asset Impairment (Gain on Disposal) | (124) | (1,264) | |||||||||
| Adjusted Operating Income | $ | 17,534 | $ | 12,590 | |||||||
Net Income, as reported |
$ | 10,086 | $ | 3,154 | |||||||
| Stock Compensation Expense, After-Tax | 1,185 | 1,571 | |||||||||
| Restructuring Expense, After-Tax | 1,073 | 1,761 | |||||||||
| Asset Impairment (Gain on Disposal), After-Tax | (94) | (959) | |||||||||
| Adjusted Net Income | $ | 12,250 | $ | 5,527 | |||||||
| Diluted Earnings per Share, as reported | $ | 0.40 | $ | 0.12 | |||||||
| Stock Compensation Expense | 0.05 | 0.06 | |||||||||
| Restructuring Expense | 0.04 | 0.07 | |||||||||
| Asset Impairment (Gain on Disposal) | — | (0.03) | |||||||||
| Adjusted Diluted Earnings per Share | $ | 0.49 | $ | 0.22 | |||||||
| Twelve Months Ended | |||||||||||
| September 30, | |||||||||||
| 2025 | 2024 | ||||||||||
| Operating Income | $ | 50,874 | $ | 38,902 | |||||||
| Goodwill Impairment | — | 5,820 | |||||||||
| SERP | 494 | 1,202 | |||||||||
| Restructuring Expense | 10,084 | 4,708 | |||||||||
| Asset Impairment (Gain on Disposal) | (1,251) | 15,776 | |||||||||
| Legal Settlements (Recovery) | — | (892) | |||||||||
| Stock Compensation Expense | 6,010 | 7,564 | |||||||||
| Adjusted Operating Income (non-GAAP) | $ | 66,211 | $ | 73,080 | |||||||
| Tax Effect | 23,511 | 16,285 | |||||||||
| After-tax Adjusted Operating Income | $ | 42,700 | $ | 56,795 | |||||||
Average Invested Capital (1) |
$ | 669,471 | $ | 773,016 | |||||||
| ROIC | 6.4 | % | 7.3 | % | |||||||