
| Indiana | 001-36454 | 35-2047713 | ||||||||||||
| (State or other jurisdiction of | (Commission File | (IRS Employer Identification No.) | ||||||||||||
| incorporation) | Number) | |||||||||||||
1205 Kimball Boulevard, Jasper, Indiana |
47546 | |||||||
| (Address of principal executive offices) | (Zip Code) | |||||||
| Not Applicable | ||
| (Former name or former address, if changed since last report) | ||
| Securities registered pursuant to Section 12(b) of the Act: | ||||||||
| Title of each Class | Trading Symbol | Name of each exchange on which registered | ||||||
| Common Stock, no par value | KE | The Nasdaq Stock Market LLC | ||||||
| Exhibit | ||||||||
| Number | Description | |||||||
| 99.1 | ||||||||
| 104 | Cover Page Interactive Data File (formatted in Inline XBRL) | |||||||
| KIMBALL ELECTRONICS, INC. | |||||
| By: | /s/ Jana T. Croom | ||||
| JANA T. CROOM Chief Financial Officer |
|||||
 |
KIMBALL ELECTRONICS REPORTS Q2 RESULTS, COMPANY UPDATES OUTLOOK FOR FISCAL YEAR 2025 |
||||
|
“The results for the second quarter were in line with expectations as we continue to navigate a sustained period of declining customer demand, while focusing on what is controllable. For the fourth consecutive quarter, cash flow generated from operating activities was positive, inventory levels were reduced, and debt was paid down, with borrowings nearly 40% lower than a year ago. Our improved balance sheet provides ample liquidity to weather our current challenges, along with the necessary dry powder to opportunistically and meaningfully invest in growing the business.
The Company is being strategically repositioned for a return to growth with a restructuring plan that includes the divestiture of the non-core assets from the AT&M business, improved facility utilization with the planned closing of our plant in Tampa, and increased focus on the medical CMO. Our efforts in all three vertical markets have been sharpened to target attractive new spaces that align with our capabilities. While we remain optimistic for the future, we acknowledge that the necessary changes won’t happen overnight. As a result, we have revised our expectations for the full fiscal year as we anticipate more time will be needed to stabilize the business and return to our historical growth pattern.”
Richard D. Phillips
Chief Executive Officer
|
Second Quarter Fiscal 2025 Highlights
•Net sales totaled $357.4 million
•Operating income of $8.2 million, or 2.3% of net sales, adjusted operating income of 3.7%
•Inventory ended the quarter at $306 million, a reduction of $29 million from Q1, and down $182 million, or 37%, from peak levels
•Cash generated by operating activities of $29.5 million, the fourth consecutive quarter of positive cash flow
•Borrowings on credit facilities of $205 million, a $41 million decrease from the first quarter, and down $90 million, or 30%, from the beginning of the fiscal year
•Enhanced capital structure by amending the credit facility with the addition of a 5-year, $100 million Term Loan A, which provides additional liquidity to grow the business
•Cash and cash equivalents of $53.9 million and borrowing capacity available of $226.4 million
•Capital expenditures of $6.5 million
•Invested $3.0 million to repurchase 160,000 shares of common stock
|
|||||||||||||||||||
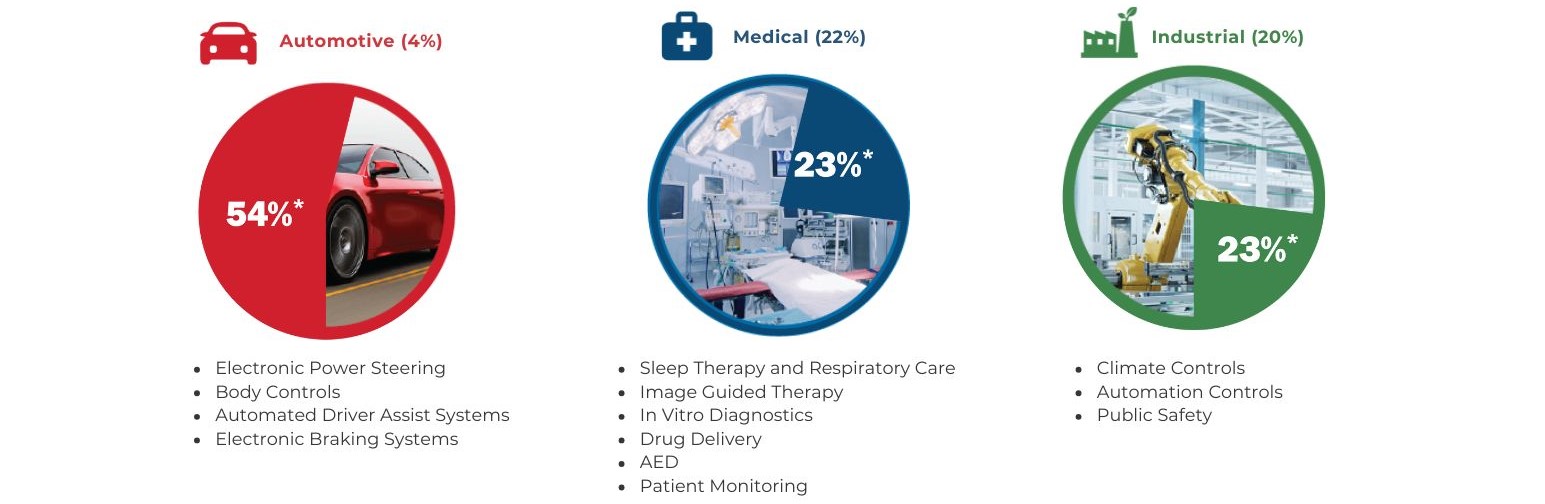
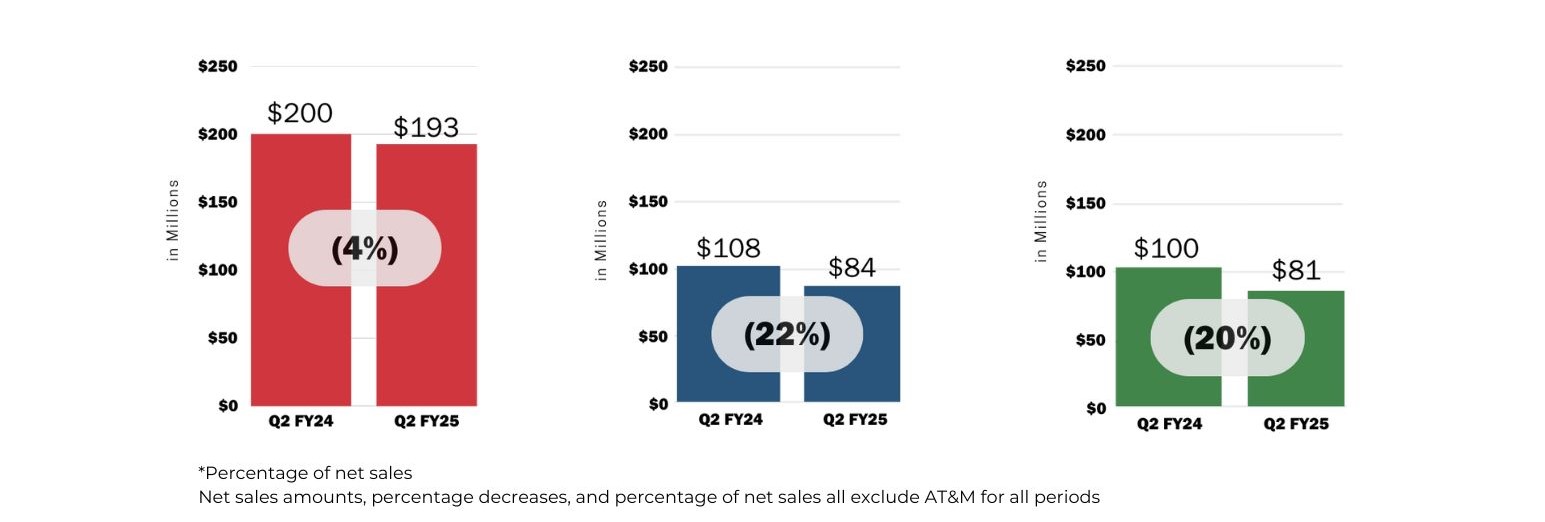
Net Sales by Vertical Market for Q2 Fiscal 2025: | ||||||||
Sales in the automotive, medical, and industrial vertical markets declined 4%, 22%, and 20%, respectively. | ||||||||
 | ||||||||
 | ||||||||
| FISCAL YEAR 2025 GUIDANCE | |||||
 |
•Net sales in the range of $1.40 - $1.44 billion, compared to the previous guidance of $1.44 - $1.54 billion
•Adjusted operating income of 3.4% - 3.6% of net sales, compared to the previous guidance of 4.0% - 4.5% of net sales(a)
•The estimate for capital expenditures remains unchanged at $40 - $50 million
|
||||
(a) Fiscal year 2025 guidance reflects a change in our adjusted operating income calculation beginning in fiscal year 2025, which excludes stock compensation expense. This change better aligns our presentation with others in our industry. A reconciliation of GAAP and non-GAAP financial measures is included below. | |||||
Forward-Looking Statements | ||
| Non-GAAP Financial Measures | ||
| About Kimball Electronics, Inc. | ||
| Conference Call / Webcast | |||||
| Date: | February 5, 2025 | ||||
| Time: | 10:00 AM Eastern Time | ||||
| Live Webcast: | investors.kimballelectronics.com/events-and-presentations/events | ||||
| Dial-In #: | 877-407-8293 (or 201-689-8349) | ||||
For those unable to participate in the live webcast, the call will be archived at investors.kimballelectronics.com. | |||||
|
Contact:
Andrew D. Regrut
Treasurer and Investor Relations Officer
812.827.4151
Investor.Relations@kimballelectronics.com
|
|||||||
| Three Months Ended | Six Months Ended | ||||||||||||||||||||||
| December 31, | December 31, | ||||||||||||||||||||||
| (Amounts in Thousands, except EPS) | 2024 | 2023 | 2024 | 2023 | |||||||||||||||||||
| Net Sales | $ | 357,392 | $ | 421,235 | $ | 731,648 | $ | 859,316 | |||||||||||||||
Operating Income |
$ | 8,230 | $ | 16,610 | $ | 17,345 | $ | 36,100 | |||||||||||||||
Adjusted Operating Income (non-GAAP) (1) |
$ | 13,333 | $ | 19,063 | $ | 25,923 | $ | 40,069 | |||||||||||||||
| Operating Income % | 2.3 | % | 3.9 | % | 2.4 | % | 4.2 | % | |||||||||||||||
| Adjusted Operating Income (non-GAAP) % | 3.7 | % | 4.5 | % | 3.5 | % | 4.7 | % | |||||||||||||||
| Net Income | $ | 3,432 | $ | 8,290 | $ | 6,586 | $ | 19,044 | |||||||||||||||
Adjusted Net Income (non-GAAP) (1) |
$ | 7,354 | $ | 9,783 | $ | 12,881 | $ | 21,821 | |||||||||||||||
Diluted EPS |
$ | 0.14 | $ | 0.33 | $ | 0.26 | $ | 0.75 | |||||||||||||||
Adjusted Diluted EPS (non-GAAP) (1) |
$ | 0.29 | $ | 0.39 | $ | 0.51 | $ | 0.86 | |||||||||||||||
| Three Months Ended | Six Months Ended | ||||||||||||||||||||||||||||||||||||||||||||||||||||||||||
| December 31, | December 31, | ||||||||||||||||||||||||||||||||||||||||||||||||||||||||||
| (Amounts in Millions) | 2024 | * | 2023 | * | Percent Change |
2024 | * | 2023 | * | Percent Change | |||||||||||||||||||||||||||||||||||||||||||||||||
Automotive |
$ | 192.8 | 54 | % | $ | 200.2 | 47 | % | (4) | % | $ | 381.1 | 52 | % | $ | 412.7 | 48 | % | (8) | % | |||||||||||||||||||||||||||||||||||||||
Medical |
84.0 | 23 | % | 108.1 | 26 | % | (22) | % | 173.8 | 24 | % | 210.5 | 25 | % | (17) | % | |||||||||||||||||||||||||||||||||||||||||||
Industrial excluding AT&M (1) |
80.6 | 23 | % | 100.4 | 24 | % | (20) | % | 174.6 | 24 | % | 213.3 | 24 | % | (18) | % | |||||||||||||||||||||||||||||||||||||||||||
Net Sales excluding AT&M (1) |
$ | 357.4 | 100 | % | $ | 408.7 | 97 | % | (13) | % | $ | 729.5 | 100 | % | $ | 836.5 | 97 | % | (13) | % | |||||||||||||||||||||||||||||||||||||||
AT&M (1) |
— | — | % | 12.5 | 3 | % | (100) | % | 2.1 | — | % | 22.8 | 3 | % | (91) | % | |||||||||||||||||||||||||||||||||||||||||||
| Total Net Sales | $ | 357.4 | 100 | % | $ | 421.2 | 100 | % | (15) | % | $ | 731.6 | 100 | % | $ | 859.3 | 100 | % | (15) | % | |||||||||||||||||||||||||||||||||||||||
*As a percent of Total Net Sales |
|||||||||||||||||||||||||||||||||||||||||||||||||||||||||||
| (1) Sales from our Automation, Test, and Measurement business (AT&M), which was divested effective July 31, 2024, were previously included in the Industrial vertical | |||||||||||||||||||||||||||||||||||||||||||||||||||||||||||
–Automotive includes electronic power steering, body controls, automated driver assist systems, and electronic braking systems | |||||||||||||||||||||||||||||||||||||||||||||||||||||||||||
–Medical includes sleep therapy and respiratory care, image guided therapy, in vitro diagnostics, drug delivery, AED, and patient monitoring | |||||||||||||||||||||||||||||||||||||||||||||||||||||||||||
–Industrial includes climate controls, automation controls, and public safety | |||||||||||||||||||||||||||||||||||||||||||||||||||||||||||
| Condensed Consolidated Statements of Income | |||||||||||||||||||||||
| (Unaudited) | Three Months Ended | ||||||||||||||||||||||
| (Amounts in Thousands, except Per Share Data) | December 31, 2024 | December 31, 2023 | |||||||||||||||||||||
| Net Sales | $ | 357,392 | 100.0 | % | $ | 421,235 | 100.0 | % | |||||||||||||||
| Cost of Sales | 333,965 | 93.4 | % | 386,802 | 91.8 | % | |||||||||||||||||
| Gross Profit | 23,427 | 6.6 | % | 34,433 | 8.2 | % | |||||||||||||||||
| Selling and Administrative Expenses | 10,526 | 3.0 | % | 17,823 | 4.3 | % | |||||||||||||||||
| Restructuring Expense | 4,671 | 1.3 | % | — | — | % | |||||||||||||||||
Operating Income |
8,230 | 2.3 | % | 16,610 | 3.9 | % | |||||||||||||||||
| Interest Income | 253 | 0.1 | % | 101 | — | % | |||||||||||||||||
| Interest Expense | (4,241) | (1.2) | % | (6,137) | (1.5) | % | |||||||||||||||||
| Non-Operating Income (Expense), net | (768) | (0.2) | % | 702 | 0.3 | % | |||||||||||||||||
| Other Income (Expense), net | (4,756) | (1.3) | % | (5,334) | (1.2) | % | |||||||||||||||||
| Income Before Taxes on Income | 3,474 | 1.0 | % | 11,276 | 2.7 | % | |||||||||||||||||
| Provision for Income Taxes | 42 | — | % | 2,986 | 0.7 | % | |||||||||||||||||
Net Income |
$ | 3,432 | 1.0 | % | $ | 8,290 | 2.0 | % | |||||||||||||||
| Earnings Per Share of Common Stock: | |||||||||||||||||||||||
| Basic | $ | 0.14 | $ | 0.33 | |||||||||||||||||||
| Diluted | $ | 0.14 | $ | 0.33 | |||||||||||||||||||
| Average Number of Shares Outstanding: | |||||||||||||||||||||||
| Basic | 24,870 | 25,094 | |||||||||||||||||||||
| Diluted | 24,968 | 25,211 | |||||||||||||||||||||
| (Unaudited) | Six Months Ended | ||||||||||||||||||||||
| (Amounts in Thousands, except Per Share Data) | December 31, 2024 | December 31, 2023 | |||||||||||||||||||||
| Net Sales | $ | 731,648 | 100.0 | % | $ | 859,316 | 100.0 | % | |||||||||||||||
| Cost of Sales | 684,621 | 93.6 | % | 789,341 | 91.9 | % | |||||||||||||||||
| Gross Profit | 47,027 | 6.4 | % | 69,975 | 8.1 | % | |||||||||||||||||
| Selling and Administrative Expenses | 23,953 | 3.2 | % | 33,875 | 3.9 | % | |||||||||||||||||
| Restructuring Expense | 6,993 | 1.0 | % | — | — | % | |||||||||||||||||
| Gain on Disposal | (1,264) | (0.2) | % | — | — | % | |||||||||||||||||
| Operating Income | 17,345 | 2.4 | % | 36,100 | 4.2 | % | |||||||||||||||||
| Interest Income | 475 | 0.1 | % | 400 | — | % | |||||||||||||||||
| Interest Expense | (9,033) | (1.2) | % | (11,584) | (1.3) | % | |||||||||||||||||
| Non-Operating Income (Expense), net | (2,429) | (0.4) | % | (429) | (0.1) | % | |||||||||||||||||
| Other Income (Expense), net | (10,987) | (1.5) | % | (11,613) | (1.4) | % | |||||||||||||||||
| Income Before Taxes on Income | 6,358 | 0.9 | % | 24,487 | 2.8 | % | |||||||||||||||||
Provision (Benefit) for Income Taxes |
(228) | 0.0 | % | 5,443 | 0.6 | % | |||||||||||||||||
| Net Income | $ | 6,586 | 0.9 | % | $ | 19,044 | 2.2 | % | |||||||||||||||
| Earnings Per Share of Common Stock: | |||||||||||||||||||||||
| Basic | $ | 0.26 | $ | 0.76 | |||||||||||||||||||
| Diluted | $ | 0.26 | $ | 0.75 | |||||||||||||||||||
| Average Number of Shares Outstanding: | |||||||||||||||||||||||
| Basic | 24,924 | 25,067 | |||||||||||||||||||||
| Diluted | 25,098 | 25,240 | |||||||||||||||||||||
| Condensed Consolidated Statements of Cash Flows | Six Months Ended | ||||||||||
| (Unaudited) | December 31, | ||||||||||
| (Amounts in Thousands) | 2024 | 2023 | |||||||||
| Net Cash Flow provided by (used for) Operating Activities | $ | 74,932 | $ | (17,922) | |||||||
| Net Cash Flow used for Investing Activities | (1,214) | (24,365) | |||||||||
| Net Cash Flow (used for) provided by Financing Activities | (97,255) | 38,859 | |||||||||
| Effect of Exchange Rate Change on Cash, Cash Equivalents, and Restricted Cash | (722) | 368 | |||||||||
| Net Decrease in Cash, Cash Equivalents, and Restricted Cash | (24,259) | (3,060) | |||||||||
| Cash, Cash Equivalents, and Restricted Cash at Beginning of Period | 78,779 | 43,864 | |||||||||
| Cash, Cash Equivalents, and Restricted Cash at End of Period | $ | 54,520 | $ | 40,804 | |||||||
| (Unaudited) | |||||||||||
| Condensed Consolidated Balance Sheets | December 31, 2024 |
June 30, 2024 |
|||||||||
| (Amounts in Thousands) | |||||||||||
| ASSETS | |||||||||||
| Cash and cash equivalents | $ | 53,865 | $ | 77,965 | |||||||
| Receivables, net | 235,166 | 282,336 | |||||||||
| Contract assets | 81,957 | 76,320 | |||||||||
| Inventories | 306,242 | 338,116 | |||||||||
| Prepaid expenses and other current assets | 31,550 | 44,682 | |||||||||
| Assets held for sale | — | 27,587 | |||||||||
| Property and Equipment, net | 271,251 | 269,659 | |||||||||
| Goodwill | 6,191 | 6,191 | |||||||||
| Other Intangible Assets, net | 2,716 | 2,994 | |||||||||
Other Assets, net |
85,498 | 82,069 | |||||||||
| Total Assets | $ | 1,074,436 | $ | 1,207,919 | |||||||
LIABILITIES AND SHARE OWNERS’ EQUITY |
|||||||||||
| Current portion of long-term debt | $ | 24,900 | $ | 59,837 | |||||||
| Accounts payable | 204,690 | 213,551 | |||||||||
| Advances from customers | 39,340 | 30,151 | |||||||||
| Accrued expenses | 42,291 | 63,189 | |||||||||
| Liabilities held for sale | — | 8,594 | |||||||||
| Long-term debt, less current portion | 179,601 | 235,000 | |||||||||
| Long-term income taxes payable | — | 3,255 | |||||||||
| Other long-term liabilities | 46,138 | 53,881 | |||||||||
| Share Owners’ Equity | 537,476 | 540,461 | |||||||||
| Total Liabilities and Share Owners’ Equity | $ | 1,074,436 | $ | 1,207,919 | |||||||
| Other Financial Metrics | |||||||||||||||||
| (Unaudited) | |||||||||||||||||
| (Amounts in Millions, except CCD) | |||||||||||||||||
| At or For the | |||||||||||||||||
| Three Months Ended | |||||||||||||||||
| December 31, | September 30, | December 31, | |||||||||||||||
| 2024 | 2024 | 2023 | |||||||||||||||
| Depreciation and Amortization | $ | 9.1 | $ | 9.2 | $ | 9.1 | |||||||||||
Cash Conversion Days (CCD) (1) |
107 | 108 | 117 | ||||||||||||||
Open Orders (2) |
$ | 564 | $ | 594 | $ | 836 | |||||||||||
Select Financial Results of Automation, Test and Measurement |
|||||||||||||||||||||||
| (Unaudited) | |||||||||||||||||||||||
(Amounts in Millions) |
|||||||||||||||||||||||
| Three Months Ended | Six Months Ended | ||||||||||||||||||||||
| December 31, | December 31, | ||||||||||||||||||||||
| 2024 | 2023 | 2024 | 2023 | ||||||||||||||||||||
| Net Sales | $ | — | $ | 12.5 | $ | 2.1 | $ | 22.8 | |||||||||||||||
Operating Income (Loss) (1) |
$ | — | $ | 1.4 | $ | 0.8 | $ | 1.2 | |||||||||||||||
| Reconciliation of Non-GAAP Financial Measures | |||||||||||||||||||||||
| (Unaudited, Amounts in Thousands, except Per Share Data) | |||||||||||||||||||||||
| Three Months Ended | Six Months Ended | ||||||||||||||||||||||
| December 31, | December 31, | ||||||||||||||||||||||
| 2024 | 2023 | 2024 | 2023 | ||||||||||||||||||||
| Net Sales Growth (vs. same period in prior year) | (15) | % | (4) | % | (15) | % | 2 | % | |||||||||||||||
| Foreign Currency Exchange Impact | — | % | 1 | % | — | % | 1 | % | |||||||||||||||
| Constant Currency Growth | (15) | % | (5) | % | (15) | % | 1 | % | |||||||||||||||
| Selling and Administrative Expenses, as reported | $ | 10,526 | $ | 17,823 | $ | 23,953 | $ | 33,875 | |||||||||||||||
| Stock Compensation Expense | (501) | (1,969) | (2,573) | (3,662) | |||||||||||||||||||
| SERP | 69 | (484) | (276) | (307) | |||||||||||||||||||
| Adjusted Selling and Administrative Expenses | $ | 10,094 | $ | 15,370 | $ | 21,104 | $ | 29,906 | |||||||||||||||
Operating Income, as reported |
$ | 8,230 | $ | 16,610 | $ | 17,345 | $ | 36,100 | |||||||||||||||
| Stock Compensation Expense | 501 | 1,969 | 2,573 | 3,662 | |||||||||||||||||||
| SERP | (69) | 484 | 276 | 307 | |||||||||||||||||||
| Restructuring Expense | 4,671 | — | 6,993 | — | |||||||||||||||||||
| Gain on Disposal | — | — | (1,264) | — | |||||||||||||||||||
| Adjusted Operating Income | $ | 13,333 | $ | 19,063 | $ | 25,923 | $ | 40,069 | |||||||||||||||
Net Income, as reported |
$ | 3,432 | $ | 8,290 | $ | 6,586 | $ | 19,044 | |||||||||||||||
| Stock Compensation Expense, After-Tax | 380 | 1,493 | 1,951 | 2,777 | |||||||||||||||||||
| Restructuring Expense, After-Tax | 3,542 | — | 5,303 | — | |||||||||||||||||||
| Gain on Disposal, After-Tax | — | — | (959) | — | |||||||||||||||||||
| Adjusted Net Income | $ | 7,354 | $ | 9,783 | $ | 12,881 | $ | 21,821 | |||||||||||||||
| Diluted Earnings per Share, as reported | $ | 0.14 | $ | 0.33 | $ | 0.26 | $ | 0.75 | |||||||||||||||
| Stock Compensation Expense | 0.01 | 0.06 | 0.07 | 0.11 | |||||||||||||||||||
| Restructuring Expense | 0.14 | — | 0.21 | — | |||||||||||||||||||
| Gain on Disposal | — | — | (0.03) | — | |||||||||||||||||||
| Adjusted Diluted Earnings per Share | $ | 0.29 | $ | 0.39 | $ | 0.51 | $ | 0.86 | |||||||||||||||
| Twelve Months Ended | |||||||||||||||||||||||
| December 31, | |||||||||||||||||||||||
| 2024 | 2023 | ||||||||||||||||||||||
| Operating Income | $ | 30,522 | $ | 92,769 | |||||||||||||||||||
| Goodwill Impairment | 5,820 | — | |||||||||||||||||||||
| Stock Compensation Expense | 6,096 | 7,219 | |||||||||||||||||||||
| SERP | 649 | 903 | |||||||||||||||||||||
| Legal Recovery | (892) | (212) | |||||||||||||||||||||
| Restructuring Expense | 9,379 | — | |||||||||||||||||||||
| Asset Impairment and Gain on Disposal | 15,776 | — | |||||||||||||||||||||
| Adjusted Operating Income (non-GAAP) | $ | 67,350 | $ | 100,679 | |||||||||||||||||||
| Tax Effect | 17,019 | 24,954 | |||||||||||||||||||||
| After-tax Adjusted Operating Income | $ | 50,331 | $ | 75,725 | |||||||||||||||||||
Average Invested Capital (1) |
$ | 756,966 | $ | 770,051 | |||||||||||||||||||
| ROIC | 6.6 | % | 9.8 | % | |||||||||||||||||||