o |
REGISTRATION STATEMENT PURSUANT TO SECTIONS 12(b) OR 12(g) OF THE SECURITIES EXCHANGE ACT OF 1934 |
x |
ANNUAL REPORT PURSUANT TO SECTION 13 OR 15(d) OF THE SECURITIES EXCHANGE ACT OF 1934 |
o |
TRANSITION REPORT PURSUANT TO SECTION 13 OR 15(d) OF THE SECURITIES EXCHANGE ACT OF 1934 |
o |
SHELL COMPANY REPORT PURSUANT TO SECTION 13 OR 15(d) OF THE SECURITIES EXCHANGE ACT OF 1934 |
The Netherlands | |
(Jurisdiction of Incorporation or Organization) | |
Title of Each Class |
Trading Symbol(s) |
Name of Each Exchange on which Registered |
||
Common Shares, par value €0.01 |
STLA |
New York Stock Exchange |
Large accelerated filer |
þ |
Accelerated filer o |
Non-accelerated filer o |
||
Emerging growth company |
o |
Page |
||
BOARD OF DIRECTORS |
Chairman
John Elkann
|
Vice Chairman
Robert Peugeot(3)
|
Chief Executive Officer
Carlos Tavares
|
Directors
Henri de Castries(1),(2),(3)
Fiona Clare Cicconi(1),(2),(3)
Nicolas Dufourcq(1)
Ann Frances Godbehere(2)
Wan Ling Martello(2),(3)
Benoît Ribadeau-Dumas(1),(3)
Jacques de Saint-Exupéry
Kevin Scott(1)
|
INDEPENDENT AUDITOR
Ernst & Young Accountants LLP (AFM annual report filing)(4)
EY S.p.A (SEC Form 20-F filing)(4)
|
For the year ended December 31, 2021 |
||||||||||
Pro Forma adjustments |
||||||||||
(€ million, except per share amounts) |
Stellantis |
January 1 - 16,
2021 results of
FCA
|
Purchase Price
Allocation
|
Other
adjustments
|
Stellantis Pro
Forma
Consolidated
Income
Statement
|
|||||
Note 1 |
Note 2 |
Note 3 |
Note 4 |
|||||||
Net revenues |
€149,419 |
€2,704 |
€2 |
€(6) |
€152,119 |
|||||
Cost of revenues |
119,943 |
2,322 |
(52) |
(6) |
122,207 |
|||||
Selling, general and other costs |
9,130 |
192 |
(2) |
— |
9,320 |
|||||
Research and development costs |
4,487 |
113 |
(40) |
— |
4,560 |
|||||
Gains/(Losses) on disposal of investments |
(35) |
— |
— |
— |
(35) |
|||||
Restructuring costs |
698 |
— |
— |
— |
698 |
|||||
Share of the profit of equity method investees(1) |
737 |
3 |
— |
— |
740 |
|||||
Operating income/(loss) |
15,863 |
80 |
96 |
— |
16,039 |
|||||
Net financial expenses |
734 |
29 |
(17) |
— |
746 |
|||||
Profit/(loss) before taxes |
15,129 |
51 |
113 |
— |
15,293 |
|||||
Tax expense |
1,911 |
21 |
7 |
— |
1,939 |
|||||
Net profit/(loss) from continuing operations |
13,218 |
30 |
106 |
— |
13,354 |
|||||
Profit/(loss) from discontinued operations, net of tax |
990 |
— |
— |
— |
990 |
|||||
Net profit/(loss) |
€14,208 |
€30 |
€106 |
€— |
€14,344 |
|||||
Net profit/(loss) attributable to: |
||||||||||
Owners of the parent |
€14,200 |
€30 |
€106 |
€— |
€14,336 |
|||||
Non-controlling interests |
€8 |
€— |
€— |
€— |
€8 |
|||||
Net profit/(loss) from continuing operations |
||||||||||
Owners of the parent |
€13,210 |
€30 |
€106 |
€— |
€13,346 |
|||||
Non-controlling interests |
€8 |
€— |
€— |
€— |
€8 |
|||||
Earnings per share: |
||||||||||
Basic earnings per share |
€4.64 |
€4.69 |
||||||||
Diluted earnings per share |
€4.51 |
€4.55 |
||||||||
Earnings per share from continuing operations: |
||||||||||
Basic earnings per share |
€4.32 |
€4.36 |
||||||||
Diluted earnings per share |
€4.19 |
€4.23 |
||||||||
January 1-16, 2021 |
||||||||||
(€ million) |
Intangible
assets
|
Property,
plant and
equipment
|
Financial
liabilities
|
Other |
Total |
|||||
(A) |
(B) |
(C) |
(D) |
|||||||
Net revenues |
€— |
€— |
€— |
€2 |
€2 |
|||||
Cost of revenues |
— |
45 |
— |
7 |
52 |
|||||
Selling, general and other costs |
— |
2 |
— |
— |
2 |
|||||
Research and development costs |
40 |
— |
— |
— |
40 |
|||||
Net financial expenses/(income) |
— |
— |
21 |
(4) |
17 |
|||||
Tax expenses |
(4) |
— |
(3) |
— |
(7) |
|||||
Net profit |
€36 |
€47 |
€18 |
€5 |
€106 |
|||||
Year ended December 31, 2021 |
||||
(€ million except otherwise noted) |
Stellantis |
Continuing
operations
|
Discontinued
operations
|
|
Net profit attributable to owners of the parent, as adjusted |
€14,200 |
€13,210 |
€990 |
|
Add: FCA Net profit attributable to owners of the parent, January 1 -
16, 2021
|
30 |
30 |
— |
|
Add: Pro forma adjustments |
106 |
106 |
— |
|
Pro Forma Net profit attributable to owners of the parent (A) |
€14,336 |
€13,346 |
€990 |
|
Weighted average number of shares outstanding for basic earnings
per share (thousand), January 17 - December 31, 2021 (B)
|
3,059,284 |
3,059,284 |
3,059,284 |
|
Pro Forma Basic earnings per share (€ per share) (A/B) |
€4.69 |
€4.36 |
€0.32 |
|
Year ended December 31, 2021 |
||||
(€ million except otherwise noted) |
Stellantis |
Continuing
operations
|
Discontinued
operations
|
|
Net profit attributable to owners of the parent, as adjusted |
€14,200 |
€13,210 |
€990 |
|
Add: FCA Net profit attributable to owners of the parent, January 1 -
16, 2021
|
30 |
30 |
— |
|
Add: Pro forma adjustments |
106 |
106 |
— |
|
Pro Forma Net profit attributable to owners of the parent (A) |
€14,336 |
€13,346 |
€990 |
|
Weighted average number of shares outstanding (thousand),
January 17 - December 31, 2021
|
3,059,284 |
3,059,284 |
3,059,284 |
|
Number of shares deployable for share-based compensation,
January 17 - December 31, 2021 (thousand)
|
23,651 |
23,651 |
23,651 |
|
Equity warrants delivered to GM (thousand) |
68,497 |
68,497 |
68,497 |
|
Pro Forma Weighted average number of shares outstanding for
diluted earnings per share (thousand) (B)
|
3,151,432 |
3,151,432 |
3,151,432 |
|
Pro Forma Diluted earnings per share (€ per share) (A/B) |
€4.55 |
€4.23 |
€0.31 |
|
Stellantis Shareholders |
Number of Issued
Common Shares(1)
|
Percentage of
Issued Common
Shares
|
||
Exor |
449,410,092 |
14.20 |
||
EPF(2) |
224,228,121 |
7.08 |
||
BPI(3) |
192,703,907 |
6.09 |
||
BlackRock Inc.(4) |
111,977,749 |
3.54 |


At December 31, |
|||||
2023 |
2022 |
2021 |
|||
North America |
81,341 |
88,835 |
91,289 |
||
Enlarged Europe |
135,211 |
142,681 |
150,807 |
||
Middle East & Africa |
6,101 |
5,311 |
5,983 |
||
South America |
28,928 |
28,968 |
29,352 |
||
China and India & Asia Pacific |
6,694 |
6,572 |
4,164 |
||
Total |
258,275 |
272,367 |
281,595 |
||
Years ended December 31, |
||||||
2023 |
2022 |
2021 |
||||
(millions of units) |
||||||
North America |
1.8 |
1.8 |
2.0 |
|||
Enlarged Europe |
2.7 |
2.6 |
3.1 |
|||
Middle East & Africa |
0.6 |
0.4 |
0.4 |
|||
South America |
0.9 |
0.8 |
0.8 |
|||
China and India & Asia Pacific |
0.2 |
0.2 |
0.2 |
|||
Total Regions |
6.2 |
5.8 |
6.6 |
|||
Maserati |
0.03 |
0.02 |
0.02 |
|||
Total Worldwide |
6.2 |
5.8 |
6.6 |
|||
Years ended December 31, |
||||||||||||
2023(1) |
2022(1) |
2021(1) |
||||||||||
North America |
Sales |
Market Share |
Sales |
Market Share |
Sales |
Market Share |
||||||
Thousands of units (except percentages) |
||||||||||||
U.S. |
1,527 |
9.6% |
1,547 |
10.9% |
1,777 |
11.5% |
||||||
Canada |
158 |
9.5% |
169 |
11.4% |
161 |
9.9% |
||||||
Mexico |
97 |
6.8% |
74 |
6.6% |
66 |
6.3% |
||||||
Total |
1,782 |
9.4% |
1,791 |
10.7% |
2,005 |
11.1% |
||||||
Years ended December 31, |
||||||
U.S. |
2023 |
2022 |
2021 |
|||
Automaker |
Percentage of industry |
|||||
GM |
16.3% |
16.1% |
14.4% |
|||
Toyota |
14.2% |
14.9% |
15.2% |
|||
Ford |
12.6% |
13.2% |
12.4% |
|||
Hyundai/Kia |
10.4% |
10.4% |
9.7% |
|||
Stellantis(1) |
9.6% |
10.9% |
11.5% |
|||
Honda |
8.2% |
7.0% |
9.5% |
|||
Nissan |
5.7% |
5.2% |
6.4% |
|||
Other |
23.1% |
22.3% |
21.0% |
|||
Total |
100% |
100% |
100% |
|||
Years ended December 31, |
||||||||||||
2023 |
2022 |
2021 |
||||||||||
Enlarged Europe |
Sales |
Market Share |
Sales |
Market Share |
Sales |
Market Share |
||||||
Thousands of units (except percentages) |
||||||||||||
France |
634 |
29.4% |
620 |
33.1% |
749 |
35.8% |
||||||
Italy |
591 |
33.6% |
535 |
36.4% |
637 |
39.0% |
||||||
Germany |
389 |
12.5% |
371 |
12.9% |
417 |
14.4% |
||||||
UK |
313 |
13.9% |
268 |
14.1% |
315 |
15.7% |
||||||
Spain |
221 |
20.2% |
213 |
22.9% |
257 |
25.4% |
||||||
Other |
550 |
14.2% |
543 |
13,1% |
676 |
16.6% |
||||||
Europe(1) |
2,698 |
18.3% |
2,550 |
19.7% |
3,051 |
22.1% |
||||||
Other Europe(2) |
19 |
1.3% |
22 |
1.9% |
47 |
2.1% |
||||||
Total |
2,717 |
16.8% |
2,572 |
18.3% |
3,098 |
19.3% |
||||||
Years ended December 31, |
||||||
Europe 30(1) Passenger Cars |
2023 |
2022 |
2021 |
|||
Automaker |
Percentage of industry |
|||||
Volkswagen |
24.0% |
23.0% |
22.9% |
|||
Stellantis(2) |
18.3% |
19.7% |
22.1% |
|||
Renault |
10.5% |
10.1% |
10.2% |
|||
Hyundai/Kia |
7.5% |
8.2% |
7.4% |
|||
Toyota |
6.7% |
6.8% |
6.1% |
|||
Mercedes-Benz |
6.2% |
6.5% |
6.3% |
|||
BMW |
6.2% |
6.3% |
6.2% |
|||
Ford |
5.9% |
6.5% |
6.5% |
|||
Other |
14.7% |
12.8% |
12.2% |
|||
Total |
100% |
100% |
100% |
|||
Years ended December 31, |
||||||||||||
2023 |
2022 |
2021 |
||||||||||
Middle East & Africa |
Sales |
Market Share |
Sales |
Market Share |
Sales |
Market Share |
||||||
Thousands of units (except percentages) |
||||||||||||
Turkey |
419 |
34.0% |
250 |
31.9% |
219 |
29.7% |
||||||
Algeria |
56 |
86.5% |
14 |
53.5% |
11 |
31.4% |
||||||
Morocco |
33 |
20.7% |
34 |
20.8% |
37 |
21.1% |
||||||
Gulf(1) |
33 |
2.4% |
26 |
2.3% |
33 |
3.2% |
||||||
Overseas France(2) |
21 |
28.8% |
24 |
33.8% |
23 |
31.6% |
||||||
Israel Zone(3) |
21 |
7.4% |
22 |
8.0% |
24 |
7.8% |
||||||
Egypt |
8 |
11.3% |
17 |
16.3% |
42 |
22.9% |
||||||
Other(4) |
23 |
2.6% |
28 |
2.9% |
22 |
2.3% |
||||||
Total |
614 |
14.8% |
415 |
11.9% |
411 |
11.8% |
||||||
Years ended December 31, |
||||||
G6(1) Middle East & Africa |
2023 |
2022 |
2021 |
|||
Automaker |
Percentage of industry |
|||||
Toyota |
18.0% |
20.3% |
18.9% |
|||
Stellantis(2) |
16.9% |
14.8% |
15.1% |
|||
Hyundai/Kia |
13.3% |
13.9% |
14.1% |
|||
Renault |
8.6% |
9.3% |
9.2% |
|||
Volkswagen |
7.7% |
6.8% |
8.1% |
|||
Ford |
5.2% |
4.7% |
4.5% |
|||
BMW |
1.1% |
1.1% |
1.1% |
|||
Mercedes-Benz |
1.4% |
1.4% |
1.3% |
|||
Other |
27.8% |
27.7% |
27.6% |
|||
Total |
100% |
100% |
100% |
|||
Years ended December 31, |
||||||||||||
2023(1) |
2022(1) |
2021(1) |
||||||||||
South America |
Sales |
Market Share |
Sales |
Market Share |
Sales |
Market Share |
||||||
Thousands of units (except percentages) |
||||||||||||
Brazil |
687 |
31.4% |
647 |
32.9% |
636 |
32.0% |
||||||
Argentina |
120 |
28.2% |
117 |
30.7% |
103 |
29.1% |
||||||
Other South America |
72 |
6.4% |
80 |
6.2% |
73 |
6.1% |
||||||
Total |
879 |
23.5% |
844 |
23.2% |
812 |
22.9% |
||||||
Brazil |
Years ended December 31, |
|||||
2023(1) |
2022(1) |
2021(1) |
||||
Automaker |
Percentage of industry |
|||||
Stellantis(2) |
31.4% |
32.9% |
32.0% |
|||
Volkswagen |
16.4% |
14.3% |
15.9% |
|||
GM |
15.0% |
14.8% |
12.2% |
|||
Ford |
1.3% |
1.1% |
2.0% |
|||
Other |
35.9% |
37.0% |
37.9% |
|||
Total |
100% |
100% |
100% |
|||
Years ended December 31, |
||||||||||||
2023(1)(5) |
2022(1)(5) |
2021(1)(5) |
||||||||||
China and India &
Asia Pacific
|
Sales |
Market Share |
Sales |
Market Share |
Sales |
Market Share |
||||||
Thousands of units (except percentages) |
||||||||||||
China(2)* |
69 |
0.3% |
94 |
0.4% |
124 |
0.6% |
||||||
Japan |
33 |
0.8% |
34 |
1.0% |
45 |
1.2% |
||||||
India(3) |
17 |
0.4% |
20 |
0.5% |
13 |
0.4% |
||||||
Australia |
18 |
1.5% |
17 |
1.7% |
18 |
1.8% |
||||||
Asean & General
Distributors(“AGD”)(4)
|
11 |
0.3% |
20 |
0.6% |
14 |
0.5% |
||||||
South Korea |
7 |
0.4% |
9 |
0.6% |
13 |
0.9% |
||||||
New Zealand |
3 |
1.8% |
3 |
2.1% |
4 |
2.8% |
||||||
China and India & Asia
Pacific major Markets
|
159 |
0.4% |
198 |
0.6% |
231 |
0.7% |
||||||
Total |
159 |
0.4% |
198 |
0.5% |
231 |
0.6% |
||||||
2023 Sales |
As a
percentage of
2023 sales
|
2022 Sales |
As a
percentage of
2022 sales
|
2021 Sales |
As a
percentage of
2021 sales
|
|||||||
U.S./Mexico |
7,907 |
29.6% |
6,945 |
29.7% |
7,765 |
32.0% |
||||||
Europe top 4(1) |
6,035 |
22.6% |
5,442 |
23.3% |
3,434 |
14.1% |
||||||
China |
4,367 |
16.4% |
4,680 |
20.0% |
7,357 |
30.3% |
||||||
Japan |
1,729 |
6.5% |
1,238 |
5.3% |
1,080 |
4.5% |
||||||
Other countries |
6,651 |
24.9% |
5,099 |
21.8% |
4,633 |
19.1% |
||||||
Total |
26,689 |
100.0% |
23,404 |
100.0% |
24,269 |
100.0% |
Years ended December 31, |
||||
(thousands of units) |
2023 |
2022 |
||
North America |
1,903 |
1,861 |
||
Enlarged Europe |
2,814 |
2,626 |
||
Middle East & Africa |
443 |
283 |
||
South America |
879 |
859 |
||
China and India & Asia Pacific |
102 |
127 |
||
Maserati |
27 |
26 |
||
Total Consolidated shipments |
6,168 |
5,782 |
||
Joint venture shipments |
225 |
221 |
||
Total Combined shipments |
6,393 |
6,003 |
||
Pro Forma |
||||||||
Years ended December 31, |
Year ended
December 31,
|
|||||||
2023 |
2022 |
2021 |
(€ million) |
2021 |
||||
€189,544 |
€179,592 |
€149,419 |
Net revenues |
€152,119 |
||||
151,400 |
144,327 |
119,943 |
Cost of revenues |
122,207 |
||||
9,541 |
8,981 |
9,130 |
Selling, general and other costs |
9,320 |
||||
5,619 |
5,200 |
4,487 |
Research and development costs |
4,560 |
||||
20 |
72 |
(35) |
Gains/(losses) on disposal of investments |
(35) |
||||
1,119 |
1,144 |
698 |
Restructuring costs |
698 |
||||
491 |
264 |
737 |
Share of the profit of equity method investees |
740 |
||||
22,376 |
20,276 |
15,863 |
Operating income/(loss) |
16,039 |
||||
(42) |
768 |
734 |
Net financial expenses/(income) |
746 |
||||
22,418 |
19,508 |
15,129 |
Profit/(loss) before taxes |
15,293 |
||||
3,793 |
2,729 |
1,911 |
Tax expense/(benefit) |
1,939 |
||||
18,625 |
16,779 |
13,218 |
Net profit/(loss) from continuing operations |
13,354 |
||||
— |
— |
990 |
Profit/(loss) from discontinued operations, net of tax |
990 |
||||
€18,625 |
€16,779 |
€14,208 |
Net profit/(loss) |
€14,344 |
||||
Net profit/(loss) attributable to: |
||||||||
€18,596 |
€16,799 |
€14,200 |
Owners of the parent |
€14,336 |
||||
€29 |
€(20) |
€8 |
Non-controlling interests |
€8 |
||||
Net profit/(loss) from continuing operations attributable to: |
||||||||
€18,596 |
€16,799 |
€13,210 |
Owners of the parent |
€13,346 |
||||
€29 |
€(20) |
€8 |
Non-controlling interests |
€8 |
||||
Net profit/(loss) from discontinued operations attributable to: |
||||||||
€— |
€— |
€990 |
Owners of the parent |
€990 |
||||
€— |
€— |
€— |
Non-controlling interests |
€— |
||||
Pro Forma |
||||||||||||||
Years ended December 31, |
Increase/(Decrease) |
Year ended
December
31,
|
Increase/
(Decrease)
|
|||||||||||
2023 |
2022 |
2021 |
2023 vs. 2022 |
2022 vs. 2021 |
(€ million) |
2021 |
2022 vs. Pro
Forma 2021
|
|||||||
€189,544 |
€179,592 |
€149,419 |
5.5% |
20.2% |
Net revenues |
€152,119 |
18.1% |
|||||||
Pro Forma |
||||||||||||||
Years ended December 31, |
Increase/(Decrease) |
Year ended
December 31,
|
Increase/
(Decrease)
|
|||||||||||
2023 |
2022 |
2021 |
2023 vs. 2022 |
2022 vs. 2021 |
(€ million) |
2021 |
2022 vs. Pro
Forma 2021
|
|||||||
€151,400 |
€144,327 |
€119,943 |
4.9% |
20.3% |
Cost of revenues |
€122,207 |
18.1% |
|||||||
79.9% |
80.4% |
80.3% |
Cost of revenues as % of Net
revenues
|
80.3% |
||||||||||
Pro Forma |
||||||||||||||
Years ended December 31, |
Increase/(Decrease) |
Year ended
December 31,
|
Increase/
(Decrease)
|
|||||||||||
2023 |
2022 |
2021 |
2023 vs. 2022 |
2022 vs. 2021 |
(€ million) |
2021 |
2022 vs. Pro
Forma 2021
|
|||||||
€9,541 |
€8,981 |
€9,130 |
6.2% |
(1.6)% |
Selling, general and other costs |
€9,320 |
(3.6)% |
|||||||
5.0% |
5.0% |
6.1% |
Selling, general and other costs
as % of Net revenues
|
6.1% |
||||||||||
Pro Forma |
||||||||||||||
Years ended December 31, |
Increase/(Decrease) |
Year ended
December 31,
|
Increase/
(Decrease)
|
|||||||||||
2023 |
2022 |
2021 |
2023 vs. 2022 |
2022 vs. 2021 |
(€ million) |
2021 |
2022 vs. Pro
Forma 2021
|
|||||||
€3,300 |
€3,233 |
€2,761 |
2.1% |
17.1% |
Research and development
expenditures expensed
|
€2,818 |
14.7% |
|||||||
2,193 |
1,889 |
1,575 |
16.1% |
19.9% |
Amortization of capitalized
development expenditures
|
1,591 |
18.7% |
|||||||
126 |
78 |
151 |
61.5% |
(48.3)% |
Impairment and write-off of
capitalized development
expenditures
|
151 |
(48.3)% |
|||||||
€5,619 |
€5,200 |
€4,487 |
8.1% |
15.9% |
Total Research and
development costs
|
€4,560 |
14.0% |
|||||||
Pro Forma |
||||||||
Years ended December 31, |
Year ended
December
31,
|
|||||||
2023 |
2022 |
2021 |
(€ million) |
2021 |
||||
1.7% |
1.8% |
1.8% |
Research and development expenditures expensed as % of Net revenues |
1.9% |
||||
1.2% |
1.1% |
1.1% |
Amortization of capitalized development expenditures as % of Net revenues |
1.0% |
||||
0.1% |
—% |
0.1% |
Impairment and write-off of capitalized development expenditures as % of
Net revenues
|
0.1% |
||||
3.0% |
2.9% |
3.0% |
Total Research and development costs as % of Net revenues |
3.0% |
||||
Pro Forma |
||||||||||||||
Years ended December 31, |
Increase/(Decrease) |
Year ended
December 31,
|
Increase/
(Decrease)
|
|||||||||||
2023 |
2022 |
2021 |
2023 vs.
2022
|
2022 vs. 2021 |
(€ million) |
2021 |
2022 vs. Pro
Forma 2021
|
|||||||
€4,184 |
€3,487 |
€2,976 |
20.0% |
17.2% |
Capitalized development
expenditures(1)
|
€3,055 |
14.1% |
|||||||
3,300 |
3,233 |
€2,761 |
2.1% |
17.1% |
Research and development
expenditures expensed
|
2,818 |
14.7% |
|||||||
€7,484 |
€6,720 |
€5,737 |
11.4% |
17.1% |
Total Research and
development expenditures
|
€5,873 |
14.4% |
|||||||
55.9% |
51.9% |
51.9% |
Capitalized development
expenditures as % of Total
Research and development
expenditures
|
52.0% |
||||||||||
3.9% |
3.7% |
3.8% |
Total Research and
development expenditures as
% of Net revenues
|
3.9% |
||||||||||
Pro Forma |
||||||||||||||
Years ended December 31, |
Increase/(Decrease) |
Year ended
December 31,
|
Increase/
(Decrease)
|
|||||||||||
2023 |
2022 |
2021 |
2023 vs. 2022 |
2022 vs. 2021 |
(€ million) |
2021 |
2022 vs. Pro
Forma 2021
|
|||||||
€1,119 |
€1,144 |
€698 |
(2.2)% |
63.9% |
Restructuring costs |
€698 |
63.9% |
|||||||
Years ended December 31, |
Increase/(Decrease) |
Year ended
December 31,
|
Increase/
(Decrease)
|
|||||||||||
2023 |
2022 |
2021 |
2023 vs. 2022 |
2022 vs. 2021 |
(€ million) |
2021 |
2022 vs. Pro
Forma 2021
|
|||||||
€491 |
€264 |
€737 |
86.0% |
(64.2)% |
Share of the profit/(loss) of
equity method investees
|
€740 |
(64.3)% |
|||||||
Pro Forma |
||||||||||||||
Years ended December 31, |
Increase/(Decrease) |
Year ended
December 31,
|
Increase/
(Decrease)
|
|||||||||||
2023 |
2022 |
2021 |
2023 vs. 2022 |
2022 vs. 2021 |
(€ million) |
2021 |
2022 vs. Pro
Forma 2021
|
|||||||
€(42) |
€768 |
734 |
(105.5)% |
4.6% |
Net financial expenses/
(income)
|
€746 |
2.9% |
|||||||
Pro Forma |
||||||||||||||
Years ended December 31, |
Increase/(Decrease) |
Year ended
December 31,
|
Increase/
(Decrease)
|
|||||||||||
2023 |
2022 |
2021 |
2023 vs. 2022 |
2022 vs. 2021 |
(€ million) |
2021 |
2022 vs. Pro
Forma 2021
|
|||||||
€3,793 |
€2,729 |
€1,911 |
39.0% |
42.8% |
Tax expense/(benefit) |
€1,939 |
40.7% |
|||||||
16.9% |
14.0% |
12.6% |
+290 bps |
+140 bps |
Effective tax rate |
13.3% |
+70 bps |
|||||||
Pro Forma |
||||||||||||||
Years ended December 31, |
Increase/(Decrease) |
Year ended
December 31,
|
Increase/
(Decrease)
|
|||||||||||
2023 |
2022 |
2021 |
2023 vs. 2022 |
2022 vs. 2021 |
(€ million) |
2021 |
2022 vs. Pro
Forma 2021
|
|||||||
€18,625 |
€16,779 |
€13,218 |
11.0% |
26.9% |
Net profit/(loss) from
continuing operations
|
€13,354 |
25.6% |
|||||||
Pro Forma |
||||||||||||||
Years ended December 31, |
Increase/(Decrease) |
Year ended
December 31,
|
Increase/
(Decrease)
|
|||||||||||
2023 |
2022 |
2021 |
2023 vs. 2022 |
2022 vs. 2021 |
(€ million) |
2021 |
2022 vs. Pro
Forma 2021
|
|||||||
€— |
€— |
€990 |
—% |
(100.0)% |
Profit/(loss) from discontinued
operations, net of tax
|
€990 |
(100.0)% |
|||||||
Pro Forma |
||||||||||||||
Years ended December 31, |
Increase/(Decrease) |
Year ended
December 31,
|
Increase/
(Decrease)
|
|||||||||||
2023 |
2022 |
2021 |
2023 vs. 2022 |
2022 vs. 2021 |
(€ million) |
2021 |
2022 vs. Pro
Forma 2021
|
|||||||
€24,343 |
€24,017 |
€18,564 |
1.4% |
29.4% |
Adjusted operating income |
€18,751 |
28.1% |
|||||||
12.8% |
13.4% |
12.4% |
-60 bps |
+100 bps |
Adjusted operating income
margin (%)
|
12.3% |
+110 bps |
|||||||
Year ended December 31, 2022 |
||||||
(€ million) |
As reported |
Share of profit/
(loss) of equity
method investees
|
As adjusted |
|||
Adjusted operating income |
€23,323 |
€694 |
€24,017 |
|||
Adjusted operating income margin (%) |
13.0% |
+40 bps |
13.4% |
|||
Year ended December 31, 2021 |
||||||
(€ million) |
As reported |
Share of profit/
(loss) of equity
method investees
|
As adjusted |
|||
Adjusted operating income |
€17,827 |
€737 |
€18,564 |
|||
Adjusted operating income margin (%) |
11.9% |
+50 bps |
12.4% |
|||
Year ended December 31, 2021 |
||||||
(€ million) |
As reported |
Share of profit/
(loss) of equity
method investees
|
As adjusted |
|||
Pro Forma Adjusted operating income |
€18,011 |
€740 |
€18,751 |
|||
Pro Forma Adjusted operating income margin (%) |
11.8% |
+50 bps |
12.3% |
|||
Year ended December 31, |
||
(€ million) |
2023 |
|
Net profit/(loss) from continuing operations |
€18,625 |
|
Tax expense/(benefit) |
3,793 |
|
Net financial expenses/(income) |
(42) |
|
Operating income/(loss) |
22,376 |
|
Adjustments: |
||
Restructuring and other costs, net of reversals |
1,161 |
|
Collective bargaining agreements costs |
428 |
|
Argentina currency devaluation |
302 |
|
Impairment expense and supplier obligations |
201 |
|
Reorganization of financial services |
76 |
|
Takata recall campaign |
(10) |
|
Patents litigation |
(61) |
|
Gains on disposal of equity investments and other assets |
(201) |
|
Other |
71 |
|
Total adjustments |
1,967 |
|
Adjusted operating income |
€24,343 |
Year ended December 31, |
||
(€ million) |
2022 |
|
Net profit/(loss) from continuing operations |
€16,779 |
|
Tax expense/(benefit) |
2,729 |
|
Net financial expenses/(income) |
768 |
|
Operating income/(loss) |
20,276 |
|
Adjustments: |
||
Restructuring and other costs, net of reversals |
1,144 |
|
Takata recall campaign |
951 |
|
CAFE penalty rate |
660 |
|
Change in estimate of non-contractual warranties |
314 |
|
Impairment of GAC-Stellantis JV |
297 |
|
Impairment expense and supplier obligations |
237 |
|
Patents litigation |
134 |
|
Write down of FCA Bank investment |
133 |
|
Other |
(129) |
|
Total adjustments |
3,741 |
|
Adjusted operating income |
€24,017 |
Year ended December 31, |
||
(€ million) |
2021 |
|
Net profit/(loss) from continuing operations |
€13,218 |
|
Tax expense/(benefit) |
1,911 |
|
Net financial expenses/(income) |
734 |
|
Operating income/(loss) |
15,863 |
|
Add: FCA operating income, January 1 - 16, 2021 |
80 |
|
Add: Pro Forma adjustments |
96 |
|
Pro Forma Operating income/(loss) |
16,039 |
|
Adjustments: |
||
Restructuring and other costs, net of reversals |
873 |
|
Change in estimate of non-contractual warranties |
732 |
|
Reversal of inventory fair value adjustment in purchase accounting |
522 |
|
Impairment expense and supplier obligations |
309 |
|
Brazilian indirect tax - reversal of liability/recognition of credits |
(253) |
|
Other |
529 |
|
Total adjustments January 1 - December 31, 2021 |
2,712 |
|
Pro Forma Adjusted operating income |
€18,751 |
Year ended December 31, |
||
(€ million) |
2021 |
|
Net profit/(loss) from continuing operations |
€13,218 |
|
Tax expense/(benefit) |
1,911 |
|
Net financial expenses/(income) |
734 |
|
Operating income/(loss) |
15,863 |
|
Adjustments: |
||
Restructuring and other costs, net of reversals |
873 |
|
Change in estimate of non-contractual warranties |
732 |
|
Reversal of inventory fair value adjustment in purchase accounting |
522 |
|
Impairment expense and supplier obligations |
309 |
|
Brazilian indirect tax - reversal of liability/recognition of credits |
(253) |
|
Other |
529 |
|
Total adjustments January 1 - December 31, 2021 |
2,712 |
|
Less: Adjustments January 1- 16, 2021 |
11 |
|
Adjusted operating income |
€18,564 |
Pro Forma |
||||||||||
Years ended December 31, |
Increase/(Decrease) |
Increase/(Decrease) |
||||||||
(€ per share) |
2023 |
2022 |
2021 |
2023 vs. 2022 |
2022 vs.
Pro Forma 2021
|
|||||
Adjusted diluted EPS |
€6.42 |
€5.99 |
€4.46 |
7.2% |
34.3% |
|||||
Years ended December 31, |
||||
(€ million except otherwise noted) |
2023 |
2022 |
||
Net profit attributable to owners of the parent |
18,596 |
16,799 |
||
Weighted average number of shares outstanding (000) |
3,107,725 |
3,140,089 |
||
Number of shares deployable for share-based compensation (000) |
24,733 |
23,870 |
||
Weighted average number of shares outstanding for diluted earnings per share (000) |
3,132,458 |
3,163,959 |
||
Diluted earnings per share (A) (€/share) |
5.94 |
5.31 |
||
Adjustments, per above |
1,967 |
3,741 |
||
Tax impact on adjustments |
(452) |
(733) |
||
Unusual items related to income taxes |
— |
(851) |
||
Total adjustments, net of taxes |
1,515 |
2,157 |
||
Impact of adjustments above, net of taxes, on Diluted earnings per share from continuing
operations (B) (€/share)
|
0.48 |
0.68 |
||
Adjusted Diluted earnings per share (€/share) (A+B) |
6.42 |
5.99 |
||
(€ million except otherwise noted) |
Year ended
December 31, 2021
|
|
Net profit from continuing operations attributable to owners of the parent |
13,210 |
|
Add: FCA Net profit from continuing operations attributable to owners of the parent, January 1 - 16, 2021 |
30 |
|
Add: Pro forma adjustments, net of taxes |
106 |
|
Pro Forma Net profit from continuing operations attributable to owners of the parent (A) |
13,346 |
|
Weighted average number of shares outstanding, January 17 - December 31, 2021 (000) |
3,059,284 |
|
Number of shares deployable for share-based compensation, January 17 - December 31, 2021 (000) |
23,651 |
|
Equity warrants delivered to General Motors (000) |
68,497 |
|
Weighted average number of shares outstanding for diluted earnings per share (“EPS”), January 17 -
December 31, 2021 (000) (B)
|
3,151,432 |
|
Pro Forma diluted EPS from continuing operations (€/share) (A/B=C) |
4.23 |
|
Adjustments, per above |
2,712 |
|
Tax impact on adjustments |
(475) |
|
Unusual items related to income taxes |
(1,516) |
|
Total adjustments, net of taxes |
721 |
|
Impact of adjustments above, net of taxes, on Pro Forma Diluted earnings per share from continuing
operations (D) (€/share)
|
0.23 |
|
Pro Forma Adjusted diluted earnings per share (€/share) (C+D) |
4.46 |
(€ million, except shipments
which are in thousands of units)
|
Net revenues |
Adjusted operating income |
Consolidated Shipments |
|||||||||||||||
Years ended December 31, |
||||||||||||||||||
2023 |
2022 |
2021 |
2023 |
2022 |
2021 |
2023 |
2022 |
2021 |
||||||||||
North America |
€86,500 |
€85,475 |
€67,715 |
€13,298 |
€13,987 |
€11,089 |
1,903 |
1,861 |
1,764 |
|||||||||
Enlarged Europe |
66,598 |
63,311 |
58,728 |
6,519 |
6,218 |
5,373 |
2,814 |
2,626 |
2,847 |
|||||||||
Middle East & Africa |
10,560 |
6,453 |
5,165 |
2,503 |
1,188 |
672 |
443 |
283 |
272 |
|||||||||
South America |
16,058 |
15,620 |
10,496 |
2,369 |
2,048 |
873 |
879 |
859 |
811 |
|||||||||
China and India & Asia Pacific |
3,528 |
4,505 |
3,927 |
502 |
641 |
437 |
102 |
127 |
118 |
|||||||||
Maserati |
2,335 |
2,320 |
2,003 |
141 |
201 |
116 |
27 |
26 |
— |
|||||||||
Other activities |
5,211 |
3,169 |
2,768 |
(322) |
179 |
(27) |
— |
— |
— |
|||||||||
Unallocated items &
eliminations(1)
|
(1,246) |
(1,261) |
(1,383) |
(667) |
(445) |
31 |
— |
— |
— |
|||||||||
Total |
€189,544 |
€179,592 |
€149,419 |
€24,343 |
€24,017 |
€18,564 |
6,168 |
5,782 |
5,836 |
|||||||||
Pro Forma |
||||||
(€ million, except shipments which are in thousands of units) |
Net revenues |
Adjusted
operating income
|
Consolidated
Shipments
|
|||
Year ended December 31, 2021 |
||||||
North America |
€69,736 |
€11,342 |
1,820 |
|||
Enlarged Europe |
59,060 |
5,324 |
2,860 |
|||
Middle East & Africa |
5,201 |
663 |
273 |
|||
South America |
10,681 |
882 |
830 |
|||
China and India & Asia Pacific |
3,980 |
428 |
120 |
|||
Maserati |
2,021 |
103 |
24 |
|||
Other activities |
2,728 |
(22) |
— |
|||
Unallocated items & eliminations(1) |
(1,288) |
31 |
— |
|||
Total |
€152,119 |
€18,751 |
5,927 |
|||
Pro
Forma
|
||||||||||||||
Years ended December 31, |
Increase/(Decrease) |
Year ended
December
31,
|
Increase/
(Decrease)
|
|||||||||||
2023 |
2022 |
2021 |
2023 vs. 2022 |
2022 vs. 2021 |
2021 |
2022 vs Pro
Forma 2021
|
||||||||
1,903 |
1,861 |
1,764 |
2.3% |
5.5% |
Shipments (thousands of units) |
1,820 |
2.3% |
|||||||
€86,500 |
€85,475 |
67,715 |
1.2% |
26.2% |
Net revenues (€ million) |
€69,736 |
22.6% |
|||||||
€13,298 |
€13,987 |
€11,089 |
(4.9)% |
26.1% |
Adjusted operating income (€
million)
|
€11,342 |
23.3% |
|||||||
15.4% |
16.4% |
16.4% |
-100 bps |
— bps |
Adjusted operating income
margin (%)
|
16.3% |
+10 bps |
|||||||
Year ended December 31, 2022 |
||||||
(€ million) |
As reported |
Share of profit/
(loss) of equity
method investees
|
As adjusted |
|||
Adjusted operating income |
13,989 |
(2) |
13,987 |
|||
Adjusted operating income margin (%) |
16.4% |
— bps |
16.4% |
|||
Year ended December 31, 2021 |
||||||
(€ million) |
As reported |
Share of profit/
(loss) of equity
method investees
|
As adjusted |
|||
Adjusted operating income |
11,103 |
(14) |
11,089 |
|||
Adjusted operating income margin (%) |
16.4% |
— bps |
16.4% |
|||
Year ended December 31, 2021 |
||||||
(€ million) |
As reported |
Share of profit/
(loss) of equity
method investees
|
As adjusted |
|||
Pro Forma Adjusted operating income |
11,356 |
(14) |
11,342 |
|||
Pro Forma Adjusted operating income margin (%) |
16.3% |
— bps |
16.3% |
|||
Pro
Forma
|
||||||||||||||
Years ended December 31, |
Increase/(Decrease) |
Year ended
December
31,
|
Increase/
(Decrease)
|
|||||||||||
2023 |
2022 |
2021 |
2023 vs. 2022 |
2022 vs. 2021 |
2021 |
2022 vs Pro
Forma 2021
|
||||||||
2,814 |
2,626 |
2,847 |
7.2% |
(7.8)% |
Shipments (thousands of units) |
2,860 |
(8.2)% |
|||||||
€66,598 |
€63,311 |
€58,728 |
5.2% |
7.8% |
Net revenues (€ million) |
€59,060 |
7.2% |
|||||||
€6,519 |
€6,218 |
€5,373 |
4.8% |
15.7% |
Adjusted operating income (€
million)
|
€5,324 |
16.8% |
|||||||
9.8% |
9.8% |
9.1% |
— bps |
+70 bps |
Adjusted operating income
margin (%)
|
9.0% |
+80 bps |
|||||||
Year ended December 31, 2022 |
||||||
(€ million) |
As reported |
Share of profit/
(loss) of equity
method investees
|
As adjusted |
|||
Adjusted operating income |
6,293 |
(75) |
6,218 |
|||
Adjusted operating income margin (%) |
9.9% |
-10 bps |
9.8% |
|||
Year ended December 31, 2021 |
||||||
(€ million) |
As reported |
Share of profit/
(loss) of equity
method investees
|
As adjusted |
|||
Adjusted operating income |
5,419 |
(46) |
5,373 |
|||
Adjusted operating income margin (%) |
9.2% |
-10 bps |
9.1% |
|||
Year ended December 31, 2021 |
||||||
(€ million) |
As reported |
Share of profit/
(loss) of equity
method investees
|
As adjusted |
|||
Pro Forma Adjusted operating income |
5,370 |
(46) |
5,324 |
|||
Pro Forma Adjusted operating income margin (%) |
9.1% |
-10 bps |
9.0% |
|||
Pro
Forma
|
||||||||||||||
Years ended December 31, |
Increase/
(Decrease)
|
Increase/
(Decrease)
|
Year ended
December
31,
|
Increase/
(Decrease)
|
||||||||||
2023 |
2022 |
2021 |
2023 vs.
2022
|
2022 vs.
2021
|
2021 |
2022 vs Pro
Forma 2021
|
||||||||
616 |
426 |
387 |
44.6% |
10.1% |
Combined shipments
(thousands of units)
|
389 |
9.5% |
|||||||
443 |
283 |
272 |
56.5% |
4.0% |
Consolidated shipments
(thousands of units)
|
273 |
3.7% |
|||||||
€10,560 |
€6,453 |
€5,165 |
63.6% |
24.9% |
Net revenues (€ million) |
€5,201 |
24.1% |
|||||||
€2,503 |
€1,188 |
€672 |
110.7% |
76.8% |
Adjusted operating income (€
million)
|
€663 |
79.2% |
|||||||
23.7% |
18.4% |
13.0% |
+530 bps |
+540 bps |
Adjusted operating income
margin (%)
|
12.7% |
+570 bps |
|||||||
Year ended December 31, 2022 |
||||||
(€ million) |
As reported |
Share of profit/
(loss) of equity
method investees
|
As adjusted |
|||
Adjusted operating income |
1,078 |
110 |
1,188 |
|||
Adjusted operating income margin (%) |
16.7% |
+170 bps |
18.4% |
|||
Year ended December 31, 2021 |
||||||
(€ million) |
As reported |
Share of profit/
(loss) of equity
method investees
|
As adjusted |
|||
Adjusted operating income |
554 |
118 |
672 |
|||
Adjusted operating income margin (%) |
10.7% |
+230 bps |
13.0% |
|||
Year ended December 31, 2021 |
||||||
(€ million) |
As reported |
Share of profit/
(loss) of equity
method investees
|
As adjusted |
|||
Pro Forma Adjusted operating income |
545 |
118 |
663 |
|||
Pro Forma Adjusted operating income margin (%) |
10.5% |
+220 bps |
12.7% |
|||
Pro
Forma
|
||||||||||||||
Years ended December 31, |
Increase/(Decrease) |
Year ended
December
31,
|
Increase/
(Decrease)
|
|||||||||||
2023 |
2022 |
2021 |
2023 vs. 2022 |
2022 vs. 2021 |
2021 |
2022 vs Pro
Forma 2021
|
||||||||
879 |
859 |
811 |
2.3% |
5.9% |
Shipments (thousands of units) |
830 |
3.5% |
|||||||
€16,058 |
€15,620 |
10,496 |
2.8% |
48.8% |
Net revenues (€ million) |
€10,681 |
46.2% |
|||||||
€2,369 |
€2,048 |
€873 |
15.7% |
134.6% |
Adjusted operating income (€
million)
|
€882 |
132.2% |
|||||||
14.8% |
13.1% |
8.3% |
+170 bps |
+480 bps |
Adjusted operating income
margin (%)
|
8.3% |
+480 bps |
|||||||
Pro
Forma
|
||||||||||||||
Years ended December 31, |
Increase/(Decrease) |
Year ended
December
31,
|
Increase/
(Decrease)
|
|||||||||||
2023 |
2022 |
2021 |
2023 vs.
2022
|
2022 vs.
2021
|
2021 |
2022 vs Pro
Forma 2021
|
||||||||
154 |
205 |
216 |
(24.9)% |
(5.1)% |
Combined shipments
(thousands of units)
|
219 |
(6.4)% |
|||||||
102 |
127 |
118 |
(19.7)% |
7.6% |
Consolidated shipments
(thousands of units)
|
120 |
5.8% |
|||||||
€3,528 |
€4,505 |
€3,927 |
(21.7)% |
14.7% |
Net revenues (€ million) |
€3,980 |
13.2% |
|||||||
€502 |
€641 |
€437 |
(21.7)% |
46.7% |
Adjusted operating income (€
million)
|
€428 |
49.8% |
|||||||
14.2% |
14.2% |
11.1% |
0 bps |
+310 bps |
Adjusted operating income
margin (%)
|
10.8% |
+340 bps |
|||||||
Year ended December 31, 2022 |
||||||
(€ million) |
As reported |
Share of profit/
(loss) of equity
method investees
|
As adjusted |
|||
Adjusted operating income |
654 |
(13) |
641 |
|||
Adjusted operating income margin (%) |
14.5% |
-30 bps |
14.2% |
|||
Year ended December 31, 2021 |
||||||
(€ million) |
As reported |
Share of profit/
(loss) of equity
method investees
|
As adjusted |
|||
Adjusted operating income |
444 |
(7) |
437 |
|||
Adjusted operating income margin (%) |
11.3% |
-20 bps |
11.1% |
|||
Year ended December 31, 2021 |
||||||
(€ million) |
As reported |
Share of profit/
(loss) of equity
method investees
|
As adjusted |
|||
Pro Forma Adjusted operating income |
442 |
(14) |
428 |
|||
Pro Forma Adjusted operating income margin (%) |
11.1% |
-30 bps |
10.8% |
|||
Pro
Forma
|
||||||||||||||
Years ended December 31, |
Increase/(Decrease) |
Year ended
December
31,
|
Increase/
(Decrease)
|
|||||||||||
2023 |
2022 |
2021 |
2023 vs. 2022 |
2022 vs. 2021 |
2021 |
2022 vs Pro
Forma 2021
|
||||||||
26.6 |
25.9 |
24.0 |
2.7% |
7.9% |
Shipments (thousands of units) |
24.2 |
7.0% |
|||||||
€2,335 |
€2,320 |
€2,003 |
0.6% |
15.8% |
Net revenues (€ million) |
€2,021 |
14.8% |
|||||||
€141 |
€201 |
€116 |
(29.9)% |
73.3% |
Adjusted operating income (€
million)
|
€103 |
95.1% |
|||||||
6.0% |
8.7% |
5.8% |
-270 bps |
+290 bps |
Adjusted operating income margin
(%)
|
5.1% |
+360 bps |
|||||||
At December 31, |
||||
(€ million) |
2023 |
2022 |
||
Cash, cash equivalents and financial securities(1) |
€49,758 |
€49,960 |
||
Undrawn committed credit lines |
12,621 |
12,680 |
||
Cash, cash equivalents and financial securities - included with Assets held for sale |
231 |
65 |
||
Total Available liquidity(2) |
€62,610 |
€62,705 |
||
of which: Available liquidity of the Industrial Activities |
€61,056 |
€61,316 |
||
Years ended December 31, |
||||||
(€ million) |
2023 |
2022 |
2021 |
|||
Cash flows from operating activities - continuing operations |
€22,485 |
€19,959 |
€18,646 |
|||
Cash flows from (used in) investing activities - continuing operations(2) |
(15,047) |
(10,531) |
11,789 |
|||
Cash flows (used in) investing activities - discontinued operations(1) |
— |
— |
(3,115) |
|||
Cash flows from (used in) financing activities - continuing operations |
(9,200) |
(13,167) |
(1,366) |
|||
Effect of changes in exchange rates |
(836) |
608 |
764 |
|||
(Increase)/decrease in cash and cash equivalents included in asset held for sale |
(166) |
(65) |
18 |
|||
Increase/(decrease) in cash and cash equivalents |
(2,764) |
(3,196) |
26,736 |
|||
Net cash and cash equivalents at beginning of the period |
46,433 |
49,629 |
22,893 |
|||
NET CASH AND CASH EQUIVALENTS AT END OF PERIOD |
€43,669 |
€46,433 |
€49,629 |
|||
Years ended December 31, |
||||
(€ million) |
2023 |
2022 |
||
Cash flows from/(used in) operating activities |
€22,485 |
€19,959 |
||
Less: Cash flows from operating activities - discontinued operations |
— |
— |
||
Cash flows from operating activities - continuing operations |
22,485 |
19,959 |
||
Less: Operating activities not attributable to industrial activities |
(753) |
211 |
||
Less: Capital expenditures and capitalized research and development expenditures and change
in amounts payable on property, plant and equipment and intangible assets for industrial
activities
|
9,031 |
8,938 |
||
Add: Proceeds from disposal of assets and other changes in investing activities |
2,152 |
500 |
||
Less: Net proceeds related to the reorganization of financial services in Europe(1) |
1,532 |
— |
||
Less: Contributions of equity to joint ventures and minor acquisitions of consolidated
subsidiaries and equity method and other investments
|
2,767 |
769 |
||
Add: Defined benefit pension contribution, net of tax |
798 |
278 |
||
Industrial free cash flows |
12,858 |
10,819 |
||
At December 31, 2023 |
At December 31, 2022 |
|||||||||||
(€ million) |
Company |
Industrial
activities
|
Financial
services
|
Company |
Industrial
activities
|
Financial
services
|
||||||
Third parties debt (Principal) |
(28,792) |
(22,018) |
(6,774) |
(26,335) |
(23,508) |
(2,827) |
||||||
Capital market(1) |
(18,637) |
(17,555) |
(1,082) |
(19,088) |
(18,488) |
(600) |
||||||
Bank debt |
(2,847) |
(1,990) |
(857) |
(2,937) |
(2,264) |
(673) |
||||||
Other debt(2) |
(5,150) |
(334) |
(4,816) |
(2,051) |
(517) |
(1,534) |
||||||
Lease liabilities |
(2,158) |
(2,139) |
(19) |
(2,259) |
(2,239) |
(20) |
||||||
Accrued interest and other adjustments(3) |
(671) |
(658) |
(13) |
(818) |
(793) |
(25) |
||||||
Debt with third parties (excluding held for sale) |
(29,463) |
(22,676) |
(6,787) |
(27,153) |
(24,301) |
(2,852) |
||||||
Debt classified as held for sale |
(122) |
(122) |
— |
(11) |
(11) |
— |
||||||
Debt with third parties including held for sale |
(29,585) |
(22,798) |
(6,787) |
(27,164) |
(24,312) |
(2,852) |
||||||
Intercompany, net(4) |
— |
3,064 |
(3,064) |
— |
918 |
(918) |
||||||
Current financial receivables from jointly-controlled
financial services companies(5)
|
767 |
647 |
120 |
321 |
321 |
— |
||||||
Debt, net of intercompany, and current financial
receivables from jointly-controlled financial service
companies
|
(28,818) |
(19,087) |
(9,731) |
(26,843) |
(23,073) |
(3,770) |
||||||
Derivative financial assets/(liabilities), net and collateral
deposits(6)
|
20 |
49 |
(29) |
52 |
52 |
— |
||||||
Financial securities(7) |
6,089 |
5,875 |
214 |
3,527 |
3,326 |
201 |
||||||
Cash and cash equivalents |
43,669 |
42,419 |
1,250 |
46,433 |
45,335 |
1,098 |
||||||
Cash and cash equivalents classified as held for sale |
231 |
231 |
— |
65 |
65 |
— |
||||||
Net financial position |
21,191 |
29,487 |
(8,296) |
23,234 |
25,705 |
(2,471) |
||||||
Risk category |
Category description |
Risk appetite |
Strategic |
Risk that may arise from the pursuit of Stellantis’ business
plan, from strategic changes in the business environment, and/
or from adverse strategic business decisions.
|
We are prepared to take risks in a responsible way
that takes our stakeholders’ interests into account
and is consistent with our business plan.
|
Operational |
Risk relating to internal processes, people and systems or
external events (including legal and reputational risks).
|
We look to mitigate operational risks to the
maximum extent based on cost/benefit
considerations.
|
Financial |
Risk relating to uncertainty of return and the potential for
financial loss due to financial performance.
|
We seek capital market and other transactions to
strengthen our financial position while allowing us
to finance our operations on a consolidated global
basis.
|
Compliance |
Risk of non-compliance with relevant regulations and laws,
internal policies and procedures.
|
We hold ourselves, as well as our employees,
responsible for acting with honesty, integrity and
respect, including complying with our Code of
Conduct, applicable laws and regulations
everywhere we do business.
|
Risk
Category
|
Risk |
Risk Description |
Control / Mitigating Actions |
Strategic |
Transition to
Electrification
|
Main risk factors for transition to
electrification include: the evolving nature
of the regulatory environment, the higher
production costs (and corresponding) prices
of EV vehicles that could reduce our
competitive advantage and result in lower
customer appetite and lower profit margin
or in a sharp decrease of the automotive
market share in western countries, the
aggressive competition of new players in
the EV market that are developing with
lower production cost and advanced
technological solutions, and the dependence
of EV (market) acceptance on government
incentives.
|
Cost-reduction strategies to make electric
vehicle’s price more affordable, including
taking a stake in Chinese EV maker Leapmotor
that will give Stellantis further access to
innovative technologies and to an extended
offer.
Execution of battery/EDM roadmap to deliver
performance at the right level.
Secured access to key components and raw
material by entering into long-term agreements
or partnerships.
Strategic partnerships to gain access to the latest
innovations.
|
Operational |
Supply Chain |
Stellantis’ ability to manage critical
supplies to prevent production interruptions,
and the ability to manage limited
availability and increased costs of
commodities, energy and transportation.
|
Actions to mitigate risks related to potential
unavailability of raw materials and critical
components in the time required by production
planning include:
•assessment of the end-to-end value
chain of supplies to identify possible
critical resources;
•monitoring of global, political,
environmental and economic events, to
anticipate or identify those that could
lead to supply chain disruption and
implement timely mitigating actions;
•developing technical solutions to
reduce dependence on critical raw
materials;
•monitoring the suppliers’ risk to
mitigate disruption due to any kind of
failure; and
•strategic partnerships.
|
Risk
Category
|
Risk |
Risk Description |
Control / Mitigating Actions |
Compliance |
Compliance |
The increasing complexity of compliance
requirements in different fields (e.g.,
corporate liability, market regulations,
export controls, anti-bribery, emissions and
vehicle safety, data privacy, human rights,
etc.) puts the organization at risk of non-
compliance, that could result in potential
fines, increased costs, and reputational
damages.
|
Company governance and regular oversight by
senior management to monitor compliance with
laws and regulatory requirements and to
promote consistency in approach and process
across Stellantis operations.
Stellantis Code of Conduct clearly and
affirmatively requires employees to report
issues of non-compliance.
“Stellantis Integrity Helpline” program
encourages employees, contractors, suppliers
and dealers to report any issues that may
concern vehicle safety, emissions or regulatory
compliance.
|
Financial |
Macro-
Economic
Factors
|
The exposure to adverse financial
conditions such as persistent inflation also
impacting labor cost, high interest rates, as
well as repeated increases and volatility in
foreign exchange, raw material and energy
prices, could impact Stellantis’ plans and
profitability and its financial ability to offset
the effects of a major crisis. This risk is
increased by geopolitical instabilities,
continued protectionism and unavailability
of natural resources and energy.
|
Risk is mitigated through:
•natural and financial hedging
strategies;
•material substitution and circular
economy strategy;
•optimization in technical solutions to
minimize the use of critical resources
or find substitutions; and
•constant monitoring of raw material
market dynamics and of raw materials
price trend.
|
Operational |
Social
Uprising
|
The extreme polarization and fragmentation
of society in countries where Stellantis
operates, exacerbated by geopolitical
instability, financial inequality and
disparate support of social networks, makes
it more likely that unrest, violence or
terrorist acts will occur in these countries
that could impact on continuity and
performance of Stellantis’ operations.
|
Implementation of Stellantis business continuity
policy and definition of business continuity and
resumption plan at plant level to strengthen
resilience in the event of acts that could
endanger Stellantis’ employees and operations.
|
Strategic |
Carbon and
Resources
Neutrality
|
Risk of not achieving carbon neutrality
target due to the cost of plants, real estate
and supply chain potential transformation,
considering the carbon footprint reduction
target of the entire value chain.
|
As part of the Dare Forward 2030 strategic plan,
Stellantis committed to becoming the industry
champion in climate change mitigation,
reaching 50 percent of carbon footprint
reduction by 2030 compared to 2021 levels (for
real estate scope, target to be reached by 2025)
and carbon net zero emissions by 2038 with
single-digit percentage compensation of the
remaining emissions. Appropriate governance is
in place to monitor the implementation of
various projects aimed at reducing our carbon
footprint.
|
Operational |
Natural &
Industrial
Hazard
|
Global warming increases the likelihood of
major climate events impacting production
or distribution such as flash floods,
tornadoes, hailstorms, heat waves or even
water shortages.
|
The analysis of specific climate risks for
Stellantis and critical suppliers’ sites allows an
effective implementation and continuous
monitoring of the prevention process and of the
business continuity and resumption plan at site
level to reduce impact and reinforce resilience.
|
Name |
Year of Birth |
Position |
Nationality |
Term(1) |
Independent |
|||||||
John Elkann |
M |
1976 |
Chairman and Executive
Director
|
Italian |
5 years |
No |
||||||
Carlos Tavares |
M |
1958 |
Chief Executive Officer and
Executive Director
|
Portuguese |
5 years |
No |
||||||
Robert Peugeot |
M |
1950 |
Vice Chairman and Non-
Executive Director
|
French |
5 years |
No |
||||||
Henri de Castries |
M |
1954 |
Senior Independent Director
and Non-Executive Director
|
French |
5 years |
Yes |
||||||
Benoît Ribadeau-Dumas |
M |
1972 |
Non-Executive Director |
French |
4 years |
No |
||||||
Fiona Clare Cicconi |
F |
1966 |
Non-Executive Director |
British – Italian |
4 years |
Yes |
||||||
Jacques de Saint-Exupéry |
M |
1957 |
Non-Executive Director |
French |
4 years |
No |
||||||
Nicolas Dufourcq |
M |
1963 |
Non-Executive Director |
French |
4 years |
Yes |
||||||
Ann Frances Godbehere |
F |
1955 |
Non-Executive Director |
Canadian – British |
4 years |
Yes |
||||||
Wan Ling Martello |
F |
1958 |
Non-Executive Director |
U.S. |
4 years |
Yes |
||||||
Kevin Scott |
M |
1972 |
Non-Executive Director |
U.S. |
4 years |
Yes |
Directors Owning Stellantis Common Shares |
Shares |
Percent of
Class
|
||
John Elkann |
1,047,609 |
—% |
||
Carlos Tavares |
1,192,501 |
—% |
||
Robert Peugeot |
15,000 |
—% |
||
Henri de Castries |
21,000 |
—% |
||
Fiona Clare Cicconi |
11,662 |
—% |
||
Benoît Ribadeau-Dumas |
— |
—% |
||
Jacques de Saint-Exupéry |
1,000 |
—% |
||
Nicolas Dufourcq |
— |
—% |
||
Ann Frances Godbehere |
9,650 |
—% |
||
Wan Ling Martello |
— |
—% |
||
Kevin Scott |
— |
—% |
Year of Birth |
Name |
Nationality |
||||
1976 |
J. Elkann |
M |
Italian |
|||
1958 |
C. Tavares |
M |
Portuguese |
|||
1950 |
R. Peugeot |
M |
French |
|||
1954 |
H. De Castries |
M |
French |
|||
1975 |
A. Agnelli(1) |
M |
Italian |
|||
1972 |
B. Ribadeau-Dumas(2) |
M |
French |
|||
1966 |
F. C. Cicconi |
F |
British – Italian |
|||
1957 |
J. De Saint-Exupery |
M |
French |
|||
1963 |
N. Dufourcq |
M |
French |
|||
1955 |
A. F. Godbehere |
F |
Canadian - British |
|||
1958 |
W. L. Martello |
F |
U.S. |
|||
1972 |
K. Scott |
M |
U.S. |
Name |
Meeting Board of
Directors
|
Audit Committee |
ESG Committee |
Remuneration
Committee
|
John Elkann |
6/6 |
|||
Carlos Tavares |
6/6 |
|||
Robert Peugeot |
6/6 |
3/3 |
||
Henri de Castries |
6/6 |
10/10 |
3/3 |
3/3 |
Andrea Agnelli |
1/1 |
1/1 |
1/1 |
|
Benoît Ribadeau-Dumas |
5/5 |
1/1 |
2/2 |
|
Fiona Clare Cicconi |
5/6 |
3/3 |
3/3 |
|
Jacques de Saint-Exupery |
6/6 |
|||
Nicolas Dufourcq |
6/6 |
3/3 |
||
Ann Frances Godbehere |
6/6 |
10/10 |
||
Wan Ling Martello |
5/6 |
8/10 |
3/3 |
|
Kevin Scott |
5/6 |
3/3 |
Executive Compensation changes made in 2023 |
•The LTI plan consists of 100% Performance Share Units (“PSUs” for the Executive Directors) beginning with the
2023 grant, as amended to the Remuneration Policy and approved by Shareholders at the 2023 AGM held on April
13, 2023.
|
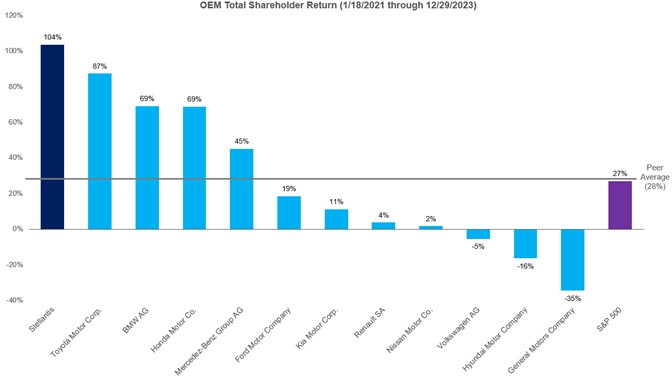
•The Total Shareholder Return (“TSR”) metric, beginning with the 2023 LTI grant, does not allow for any vesting/
payout for below-median performance.
|
•We improved our message as to how our global footprint is reflected in benchmarking our executive compensation
with our peer group and how our incentives reflect the Company’s bold strategy to transform itself to a sustainable
mobility tech company – emphasizing the electrification and software of its vehicles, followed with its ambitious
DARE FORWARD 2030 plan for carbon net zero in 2038 with single-digit percentage compensation of the
remaining emissions.
|
•We enhanced the transparency of the Remuneration Report with more detail of setting our incentive performance
targets and performance achievement, in particular that of the CEO Transformation Award’s milestones/goals and
how it is aligned with the Company’s long-term strategy and shareholders’ interests.
|
2021 |
2022 |
2023 |
Total |
||||
Performance Incentives & Profit Sharing (in million €) |
€1,995 |
€2,047 |
€1,855 |
€5,897 |
|||
Employee Stock Purchase Plan - rollout in 2023 (in million €) |
— |
— |
€36 |
€36 |
|||
Dividends to Shareholders (in million €) |
€3,300 |
€4,200 |
€4,700(1) |
€12,200 |
Principles of Executive Remuneration | |
Alignment with Stellantis Strategy |
Compensation is strongly linked to the achievement of the Company’s disclosed
performance targets.
|
Pay for Performance |
Must reinforce our performance-driven culture and principles of meritocracy.
Majority of pay is linked directly to Company performance through both short
and long-term variable pay.
|
Competitiveness |
Compensation will be competitive against the comparable global market and set in
a manner to attract, retain and motivate expert leaders and highly qualified
executives. Considering competitiveness across both the European and U.S. talent
market is essential given our global footprint.
|
Creating Long-term Shareholder
Value
|
Performance targets triggering any variable compensation payment should align
with the interests of shareholders and other stakeholders.
|
Compliance |
Compensation policies and practices are designed to comply with applicable laws
and corporate governance requirements.
|
Risk Prudence |
The compensation structure and design should avoid incentives that encourage
unnecessary or excessive risks that could threaten the Company’s value.
|
Remuneration Element |
Key Feature |
Alignment to Strategy and
Shareholder Interests
|
Base Salary |
Market-based fixed cash compensation
set competitively to large global
automobile manufacturers with the peer
group.
|
Set at a level to attract, motivate and
retain the best talents in global and/or
regional markets.
|
Short Term Incentive Plan -
Stellantis Annual Incentive Plan
(“SAIP”)
|
Paid annually in cash; the CEO’s target
opportunity is 200% of base salary and
maximum opportunity is 400% of base
salary. Board Chair is not eligible.
|
Incentivize delivery of performance
against our pre-established and
challenging annual strategic and
financial goals.
|
LTI Plan |
100% Performance Share Units
(PSUs): Conditional rights on ordinary
shares, with amounts earned subject to
Company performance and a three-year
vesting schedule.
|
Incentivize delivery of financial
performance and creation of long-term
sustainable value; demonstrates long-
term alignment with shareholder
interests. PSUs are 100% at-risk and
contingent upon Stellantis’
performance - no amounts are
guaranteed.
|
Share Ownership and Retention
Guidelines
|
Executive Directors:
Six (6) x Annual Base Salary
Required to retain one hundred percent
(100%) of net, after-tax shares of
Common stock issued upon vesting and
settlement of any equity awards granted
until the fifth (5th) anniversary of the
grant date of such award.
Shares owned outright and any
unvested Restricted Stock Units
(RSUs) are counted for purposes of
satisfying the guideline. Unvested
PSUs are not considered.
|
Establishes long-term alignment with
shareholders; promotes focus on
management of company risks.
|
Retirement Benefits |
Defined contribution retirement
savings plan that is available to the
CEO and all employees in the country
of employment. The Chairman
participates in a retiree health care
benefit plan.
|
Provides appropriate retirement savings
designed to be competitive in the
relevant market.
|
Other Benefits & Allowances |
Executive Directors may receive usual
and customary fringe benefits such as
severance, company vehicles, security,
medical insurance, tax preparation,
financial consulting and tax
equalization.
|
Recognizes competitive practices. |
CEO Transformation Incentive
(One-time, long-term award)
|
One-time cash incentive with payout
upon the achievement of innovative
milestones/goals during a five-year
period (2021-2025).
|
Designed to achieve results within an
aggressive timeline toward carbon
neutrality in mobility and technology.
|
CEO Shareholder Return Incentive
(One-time, long-term award)
|
One-time equity incentive with payout
only if share price appreciates at least
80% for sixty consecutive days during
a five-year period (2021-2025).
50% of any payout is subject to an
additional 2-year holding period.
|
Directly aligned with Shareholder
return on investment (absolute TSR).
|
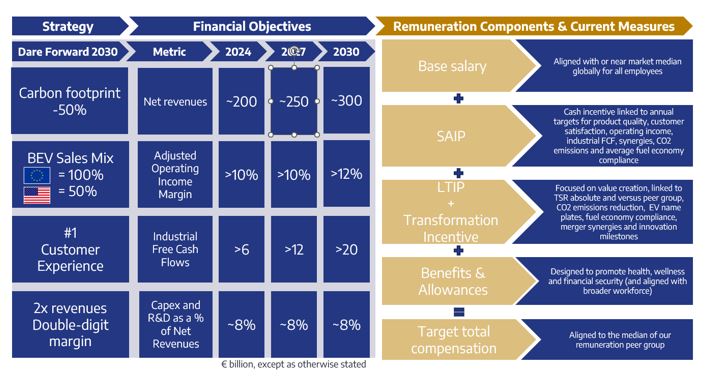
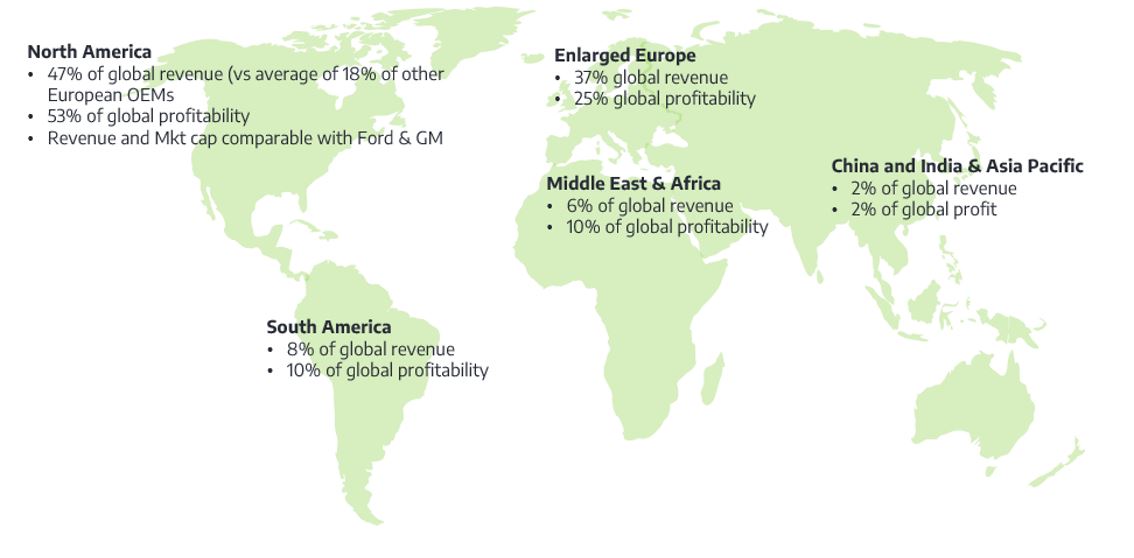
U.S. Companies |
European Companies |
||
•Boeing |
•General Dynamics |
•Airbus |
•Renault |
•Caterpillar |
•General Electric |
•ArcelorMittal |
•Siemens |
•Chevron |
•General Motors |
•BASF |
•ThyssenKrupp |
•Deere |
•Honeywell |
•BMW |
•Total |
•Exxon Mobil |
•Lockheed Martin |
•Continental |
•Volkswagen |
•Ford |
•Raytheon Technologies |
•Mercedes-Benz
(formerly Daimler)
|
•Volvo |
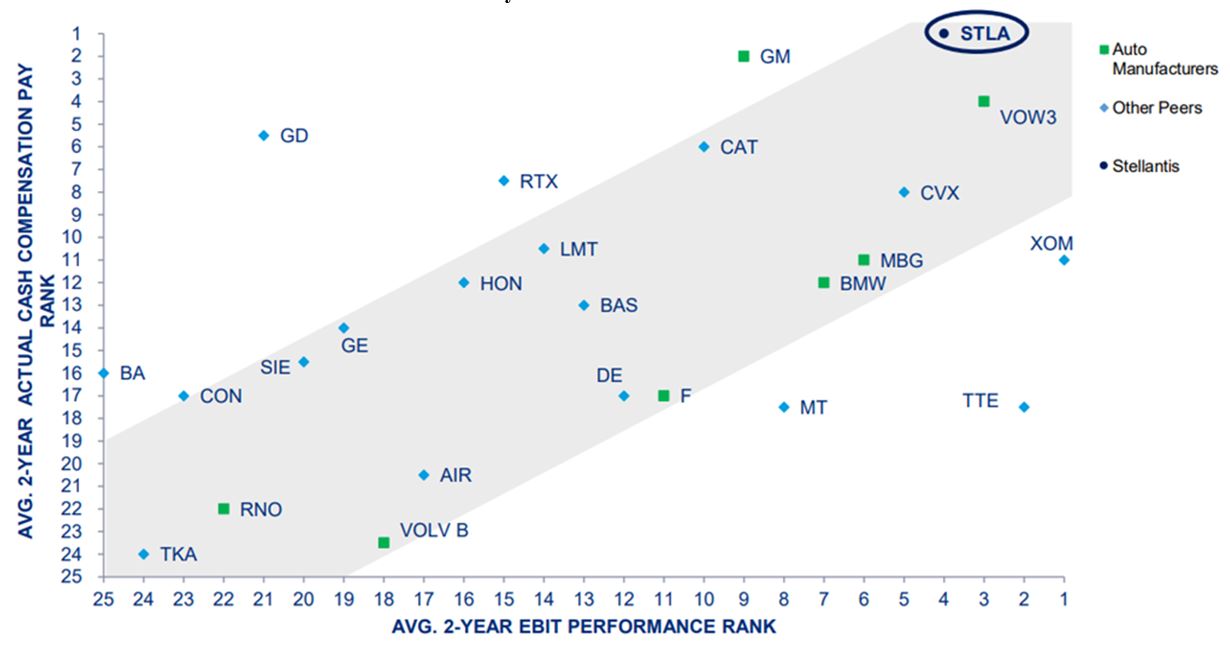

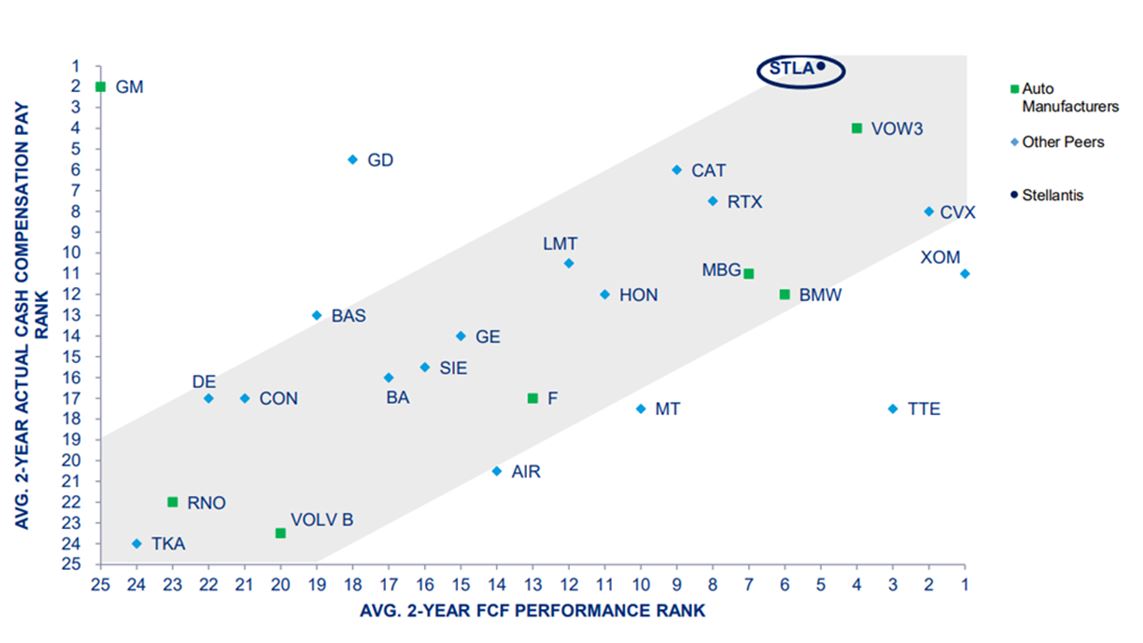

What we do: |
What we do not do: |
|||
•Pay for performance by structuring a significant
percentage of target compensation in the form of
variable, at risk compensation within Stellantis
|
•We do not offer remuneration which encourages
our Executive Directors and non-Executive
Directors to take any unnecessary or excessive
risks or to act in their own interests
|
|||
•Predetermined stretch performance goals for
incentive pay programs
|
•We do not reward for performance below threshold |
|||
•We align goals and values organization-wide
through incentive pay and rigorous performance
management
|
•We do not have excessive pay programs |
|||
•Incorporate ESG goals into our short-term and
long-term incentive plans
|
•We do not allow hedging, pledging or short-selling
of our securities
|
|||
•Market comparison of Executive Director and non-
Executive Director remuneration against relevant
peers
|
•We do not pay out guaranteed bonuses |
|||
•Conduct a rigorous and detailed analysis of CEO
pay and Company performance against our peers
|
•We have no excessive perquisites |
|||
•We consider pay ratios within the Company in
establishing Executive Directors’ pay
|
||||
•Use of an independent compensation consultant
reporting directly to the Remuneration Committee
|
||||
•We have robust stock ownership and share retention
guidelines
|
||||
•We have clawback policies incorporated into our
incentive plans
|
||||
•“Double-trigger” vesting of equity awards upon a
change of control
|
||||
Year |
Base Pay |
Annual Bonus |
Transformation
Incentive
|
Vested LTI |
Pension
Contribution
|
Total |
||||||
2023 |
€2,000,000 |
€5,786,800 |
€10,000,000 |
€3,738,229 |
€1,946,700 |
€23,471,729 |
||||||
2022 |
€2,000,000 |
€7,480,000 |
€— |
€3,073,489 |
€2,370,000 |
€14,923,489 |
Fixed Remuneration |
Variable Remuneration |
|||||||||||||
Directors of
Stellantis
|
Office
Held
|
Year |
Base
salary/
Fees
|
Fringe benefits |
Short-term
incentive
|
Long-term
incentive
|
Post
Retirement
Benefits
Expense
|
Other
Compensation
|
Total
Remuneration
|
Proportion of
Fixed
Remuneration
|
Proportion of
Variable
Remuneration
|
|||
ELKANN,
John Philipp
|
Chairman |
2023 |
€924,404 |
€684,230 |
(1) |
€3,214,886 |
(2) |
€4,823,520 |
33% |
67% |
||||
2022 |
951,519 |
1,124,290 |
3,774,242 |
5,850,051 |
35% |
65% |
||||||||
TAVARES,
Carlos
|
CEO |
2023 |
2,000,000 |
634,697 |
(1) |
€5,786,800 |
26,125,828 |
(3) |
€1,946,700 |
36,494,025 |
7% |
93% |
||
2022 |
2,000,000 |
14,345 |
7,480,000 |
11,594,661 |
2,370,000 |
23,459,006 |
9% |
91% |
||||||
PEUGEOT,
Robert
|
Vice
Chairman
|
2023 |
205,000 |
11,927 |
(4) |
216,927 |
100% |
—% |
||||||
2022 |
205,000 |
14,595 |
219,595 |
100% |
—% |
|||||||||
AGNELLI,
Andrea(5)
|
Director |
2023 |
60,000 |
2,644 |
(4) |
62,644 |
100% |
—% |
||||||
2022 |
210,000 |
13,022 |
223,022 |
100% |
—% |
|||||||||
CASTRIES,
Henri de
|
Director |
2023 |
275,000 |
11,924 |
(4) |
286,924 |
100% |
—% |
||||||
2022 |
275,000 |
15,010 |
290,010 |
100% |
—% |
|||||||||
CICCONI,
Fiona Clare
|
Director |
2023 |
215,632 |
18,846 |
(4) |
234,478 |
100% |
—% |
||||||
2022 |
210,000 |
17,611 |
227,611 |
100% |
—% |
|||||||||
DUFOURCQ,
Nicolas(6)
|
Director |
2023 |
- |
- |
- |
|||||||||
2022 |
- |
- |
- |
|||||||||||
GODBEHERE,
Ann Frances
|
Director |
2023 |
225,000 |
510 |
(4) |
225,510 |
100% |
—% |
||||||
2022 |
225,000 |
3,106 |
228,106 |
100% |
—% |
|||||||||
MARTELLO,
Wan Ling
|
Director |
2023 |
220,000 |
25,960 |
(4) |
245,960 |
100% |
—% |
||||||
2022 |
220,000 |
14,440 |
234,440 |
100% |
—% |
|||||||||
RIBADEAU-
DUMAS,
Benoit(7)
|
Director |
2023 |
— |
— |
— |
—% |
—% |
|||||||
SAINT-
EXUPERY,
Jacques
|
Director |
2023 |
200,000 |
— |
(4) |
200,000 |
100% |
—% |
||||||
2022 |
200,000 |
1,853 |
201,853 |
100% |
—% |
|||||||||
SCOTT, Kevin |
Director |
2023 |
205,000 |
25,960 |
(4) |
230,960 |
100% |
—% |
||||||
2022 |
205,000 |
13,702 |
218,702 |
100% |
—% |
|||||||||
4,530,036 |
1,416,698 |
5,786,800 |
29,340,714 |
1,946,700 |
— |
43,020,948 |
||||||||
Executive Director |
2023 Annual Base Salary |
John Elkann, Chairman |
$1,000,000 |
Carlos Tavares, Chief Executive Officer |
€2,000,000 |
Executive Director |
2023 Annual Incentive Target Opportunity
(as a % of base pay)
|
||
Threshold |
Target |
Maximum |
|
John Elkann, Board Chair |
Not Eligible |
Not Eligible |
Not Eligible |
Carlos Tavares, Chief Executive Officer |
50% |
200% |
400% |
Measure |
Weighting |
How performance is calculated |
Adjusted Operating Income (AOI) |
25% |
SAIP financial targets are based on the annual budget developed
in-line with the long-term Dare Forward 2030 strategic plan.
|
Industrial Free Cash Flow |
25% |
|
Synergies (less implementation costs) |
20% |
|
ESG Metric:
LEV Market Share EU & Mix U.S.
|
15% |
ESG metric reflecting an increasing volume of electrified mobility |
Quality |
15% |
Measured by product quality rates and service quality customer
satisfaction. Goals set at beginning of the performance year which
reflect improvement from prior year.
|
Metric |
2022 Targets |
2022 Actual
Performance
|
2023 Targets |
AOI |
Threshold: 9.0%
Target: 10.0%
Maximum: 12.1%
|
13.0% |
Threshold: 10.0%
Target: 12.5%
Maximum: 14.0%
|
Industrial Free Cash Flow |
Threshold: €2.5bn
Target: €3.5b
Maximum: €8.1bn
|
€10.8bn |
Threshold: €6.0bn
Target: €7.0b
Maximum: €10.0bn
|
Synergies (less
implementation costs)
|
Threshold: €3.6bn
Target: €4.5b
Maximum: €5.0bn
|
€7.1bn |
Threshold: €7.1bn
Target: €7.5b
Maximum: €8.1bn
|
LEV
•Market Share (EU)
•Mix (U.S.
|
N/A
New Metric
|
N/A
New Metric
|
Refer to below table for target and
performance ranges
|
Quality
•Failure Rate
•Customer Satisfaction
|
Not Disclosed |
Not Disclosed |
•Threshold performance generally set at
prior year’s 2022 actual performance
results
•Failure Rate target set at a stretch
22.5% improvement from 2022 actual
performance results
|
SAIP Performance Metric |
Weight |
Threshold |
Target |
Maximum |
Actual |
SAIP Result |
Adjusted Operating Income |
25% |
10.0% |
12.5% |
14.0% |
12.84% |
122.7% |
Industrial Free Cash Flow |
25% |
€6.0bn |
€7.0bn |
€10.0bn |
€12.9bn |
200% |
Synergies |
20% |
€7.1bn |
€7.5bn |
€8.1bn |
€8.4bn |
200% |
Low Emissions Vehicles |
||||||
Market Share - EU |
7.5% |
Parity - 4.1 |
Parity |
Parity + 1.5 |
Parity - 4.0 |
51.2% |
Mix - U.S. |
7.5% |
6.6% |
13.3% |
14.5% |
13.5% |
116.7% |
Quality – 3 metrics |
||||||
Failure Rate 3MIS kppm |
8% |
ND* |
ND* |
ND* |
ND* |
93% |
Customer Satisfaction – NPS NV |
3.5% |
ND* |
ND* |
ND* |
ND* |
50% |
Customer Satisfaction – NPS AFS |
3.5% |
ND* |
ND* |
ND* |
ND* |
63% |
Total Payout Percentage: |
144.67% |
|||||
Base
Salary
|
Annual Cash Bonus Range |
Actual 2023
SAIP Payout
|
||||
Below
Threshold
|
Threshold |
Target |
Maximum |
|||
Carlos Tavares |
€2,000,000 |
€ 0 |
€2,000,000 |
€4,000,000 |
€8,000,000 |
€5,786,800 |
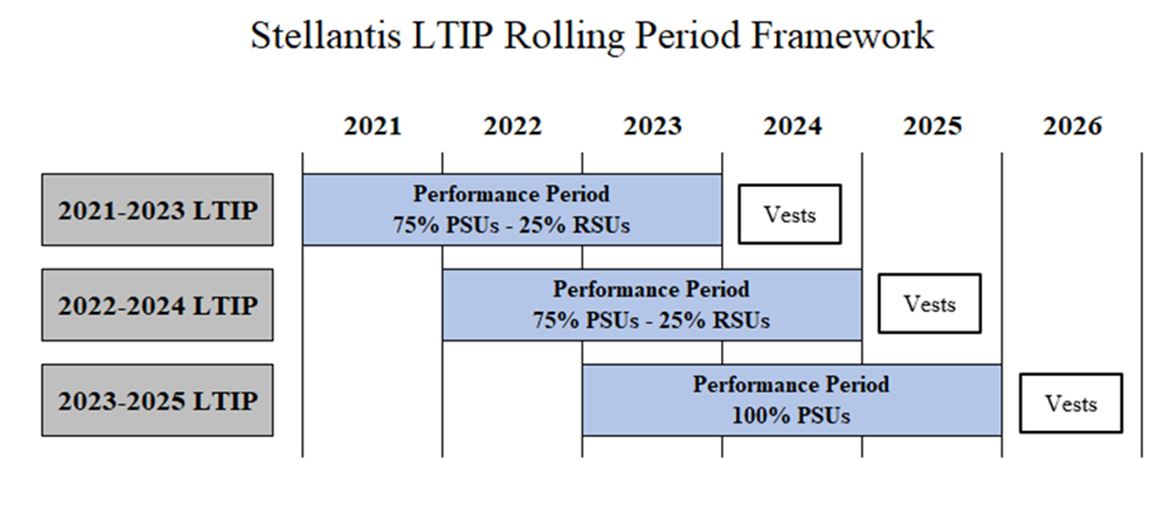
Executive Director |
2023 Long-Term Incentive Opportunity |
|
Target Opportunity |
Maximum Opportunity |
|
John Elkann, Board Chair |
300% of base salary |
390% of base salary |
Carlos Tavares, Chief Executive Officer |
600% of base salary |
780% of base salary |
2021-2023 & 2022-2024 LTI PSU Metrics | ||
Measure |
Weighting |
How performance is calculated |
Relative Total Shareholder Return |
40% |
Relative TSR performance as compared to peer group of
companies. over a 3-year period
|
Synergies (less implementation costs) |
40% |
Cumulative cash synergies net of implementation costs
realized over the three-year period. Maximum payout for
this metric is 100%.
|
The CO2 emissions reduction metric (weighted at 20% of the LTI) has two components equally weighted: | ||
CAFE Compliance |
10% |
Must be compliant in each year of the 3-year period with
the Europe Corporate Average Fuel Economy (CAFE).
Failure to comply in any one year will result in no payout
for this metric.
|
Electrification of Vehicle Nameplates |
10% |
Projected number of EV nameplates at the end of a 3-year
period. Maximum payout for this metric is 100%.
|
2023-2025 LTI PSU Metrics | ||
Measure |
Weighting |
How performance is calculated |
Relative Total Shareholder Return |
30% |
Relative TSR performance as compared to peer group of
companies. over a 3-year period; no payout below median
performance.
|
Adjusted operating income (3-yr period) |
40% |
Cumulative cash synergies net of implementation costs
realized over the three-year period. Maximum payout for
this metric is 100%.
|
Electrification of Vehicle Nameplates |
30% |
Projected number of EV nameplates at the end of a 3-year
period. Maximum payout for this metric is 100%.
|
2021-2023 LTI & 2022-2024 LTI
TSR Payout Scale
|
2023-2025 LTI
TSR Payout Scale
|
|||
Stellantis Rank |
Payout % of Target |
Stellantis Rank |
Payout % of Target |
|
1st |
200% |
1st |
200% |
|
2nd |
175% |
2nd |
180% |
|
3rd |
150% |
3rd |
160% |
|
4th |
125% |
4th |
140% |
|
5th |
100% |
5th |
120% |
|
6th |
75% |
6th |
100% |
|
7th |
50% |
7th |
—% |
|
8th |
25% |
8th |
—% |
|
9th |
—% |
9th |
—% |
|
10th |
—% |
10th |
—% |
|
11th |
—% |
11th |
—% |
|
12th |
—% |
12th |
—% |
|
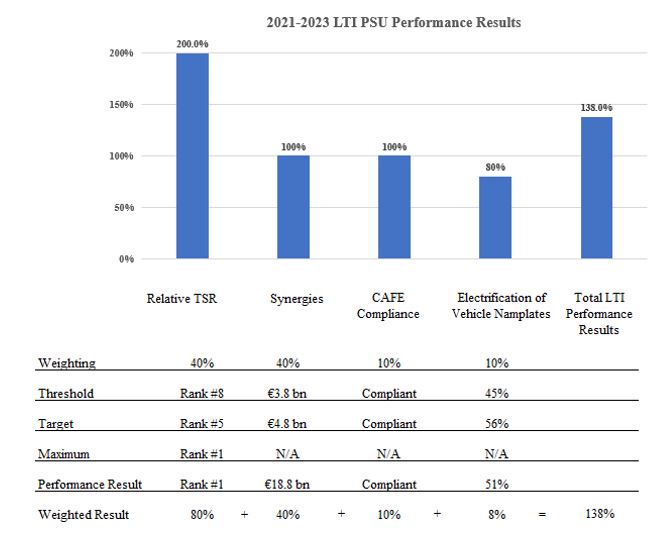
Executive Director |
2021-2023 Long-Term Incentive PSUs Awarded |
|
PSUs awarded in 2021 |
PSUs to be distributed in May 2024
(based on 138% performance)
|
|
John Elkann, Board Chair |
127,900 |
176,502 |
Carlos Tavares, Chief Executive Officer |
612,700 |
845,526 |
Beginning in 2021, Stellantis launched its bold strategy to transform itself to a
sustainable mobility tech company – emphasizing the electrification and software of its
vehicles, followed with its ambitious DARE FORWARD 2030 plan for carbon net zero
in 2038 with single-digit percentage compensation of the remaining emissions.
Given the challenges that the automotive industry is facing with the
transformation in global mobility, technology and the electrification of vehicles, and in
recognition of Mr. Tavares’ essential role in leading Stellantis through the merger, on
June 30, 2021, as provided under the terms of the Remuneration Policy, the
Remuneration Committee recommended, and the Board approved, a one-time
transformation incentive for the CEO. The design of the incentive, through the
Remuneration Committee’s comprehensive and thoughtful consideration, reflects direct
alignment between the Company’s direction of delivering value to shareholders through
the critical merger and integration period while successfully positioning the Company as
a global leader in the innovation of electrification of mobility in the industry. It was for
this reason that the one-time incentive was defined and awarded in 2021 (after the
creation of Stellantis from the merger) - to lock-in long-term goals over a critical five-
year performance period.
|
€ 30 billion
in Company
investment of
electrification and
technology
To be a leader in
the industry
Maximum payout (meeting
all seven milestones) of the
Transformation Incentive is 0.167% of
the investment
|
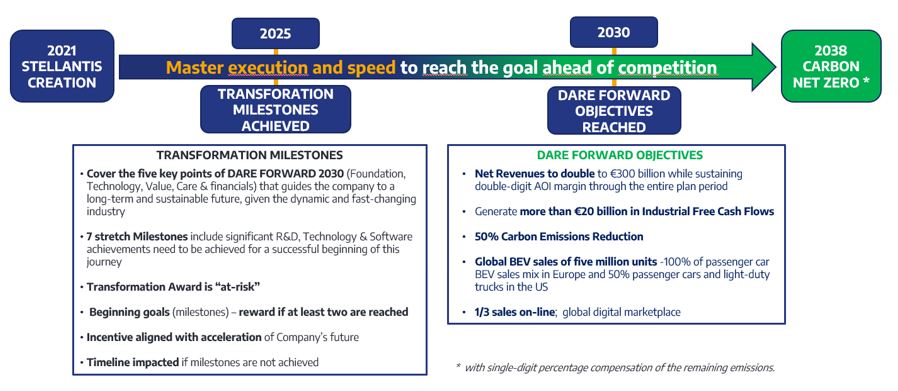
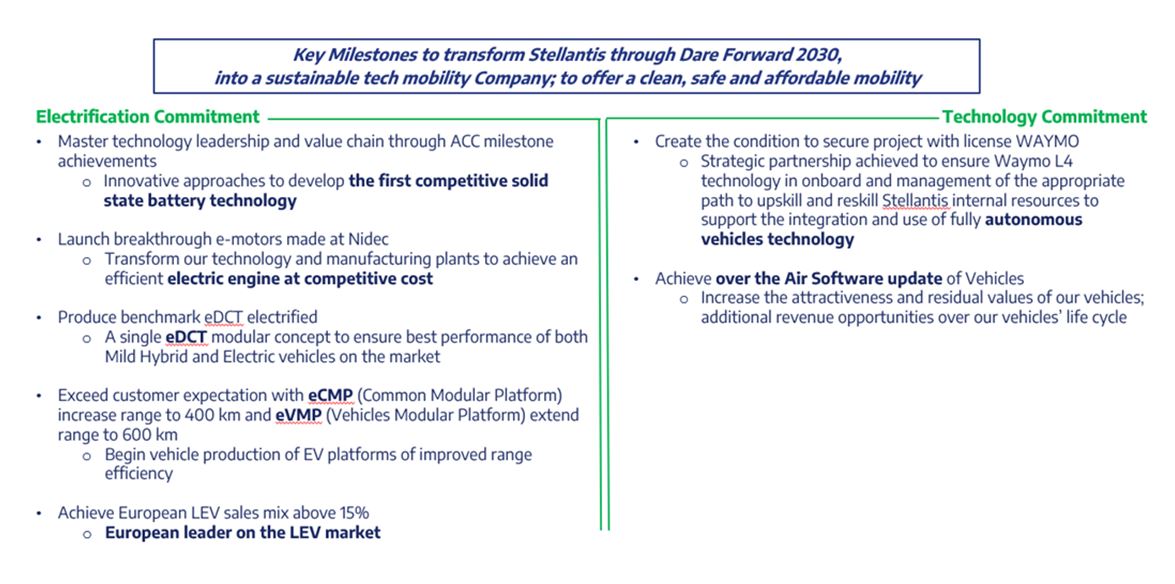
1. |
Milestone Validation |
•Company’s Human Resources and the business owner responsible for the milestone
confirms that the milestone was achieved.
•Minutes/documentation necessary to support achievement, subject to internal audit
verification.
|
2. |
Milestone Assessment |
•Detailed information about milestone achievement provided to Remuneration
Committee for review and assessment.
|
3. |
Committee Validation |
•Committee makes determination that milestone was successfully achieved (vesting of
the award).
|
4. |
Incentive Payout |
•Incentive is settled in cash no later than sixty days from vesting event.
•CEO must remain in continuous employment throughout the achievement of each
milestone.
|
Innovative Milestone Achieved
during the 5-year Performance Period
|
Cash Award (percentage of Target Value) |
0-1 |
0% |
2 |
20% |
3 |
40% |
4 |
80% |
5 |
120% |
6 |
160% |
7 |
200% |
Milestone Achieved |
Significance to Long-Term Strategy |
Stellantis Sustainability and Future |
European LEV sales mix at 15%
(achieved in 2022)
|
•In 2020, the European LEV sales
mix was 6.7%
•Industry is transforming away
from carbon-emitting internal
combustion engines
|
•Beginning of the journey to
become a global leader in
electrification and mobility
•Drive Stellantis in the LEV (BEV/
PHEV) competition to be a top
player in industry
|
First start of production of e-motors
made at Nidec PSA E-motors (NPE)
(achieved in 2023)
|
•Starting from ground up –
modification of plants to produce
new technology and retraining of
employees
•Cornerstone for e-components
vertical integration
•Provides highest efficiency at
competitive costs
•Over €93M of industrial
investments to date
|
•Stellantis Trémery plant first
facility to produce electric motors
•Aims to drive electrification
growth while also meeting the
needs of other automakers
|
First start of production of eDCT
electrified
(achieved in 2023)
|
•Starting from ground up –
modification of plants to produce
new technology and retraining of
employees
•Cornerstone for e-components
vertical integration
•Provides broader availability of
affordable electrified powertrains
on global market
•Over €57M of industrial
investments to date
|
•Stellantis Metz site ramping up
production of 600,000 electrified
dual-clutch gearboxes per year
•Supply mild Hybrid Electric
Vehicles and PHEV
•Solution will gradually be
extended to all brand models in
Europe to reduce CO2 emissions
|
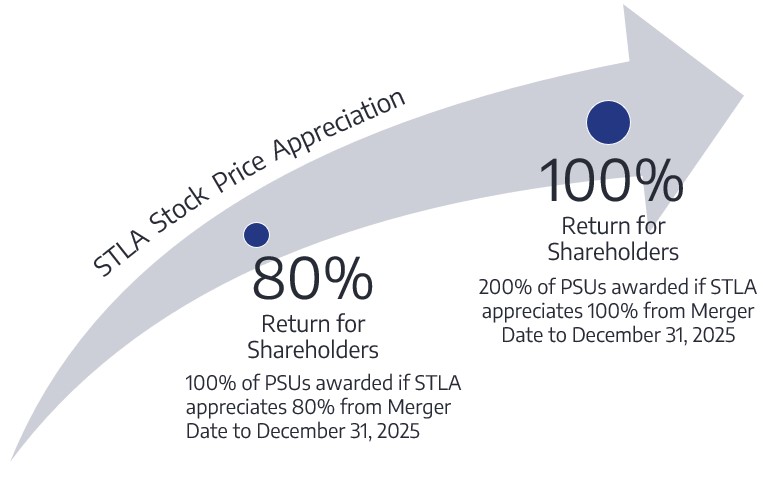
Name of
Director,
Position
|
Specification
of Plan
|
Performance
Period
|
Grant Date |
Number of
Units
Granted
|
Fair Value
at
Grant Date(3)
|
Vesting
Date
|
End of Holding
Period(4)
|
Opening
Balance -
January 01,
2023
|
Shares
Granted
|
Shares
Vested(5)
|
Closing
Balance
|
Long Term
Incentive
Expense
|
ELKANN,
John Phillip,
Chairman
|
2020 LTI
RSU(1)
|
2020-2022 |
May 1, 2020 |
382,560 |
€ 2,968,739 |
May 1, 2023 |
May 1, 2025 |
477,106 |
— |
477,106 |
— |
€ 610,449 |
2021 LTI
RSU
|
2021-2023 |
April 15, 2021 |
42,580 |
€ 622,904 |
April 15, 2024 |
May 1, 2026 |
42,580 |
— |
— |
42,580 |
€ 220,415 |
|
2021 LTI
PSU
|
2021-2023 |
April 15, 2021 |
127,900 |
€ 1,871,053 |
April 15, 2024 |
May 1, 2026 |
127,900 |
— |
— |
127,900 |
€ 787,133 |
|
2022 LTI
RSU
|
2022-2024 |
May 15, 2022 |
54,950 |
€ 580,959 |
May 15, 2025 |
May 15, 2027 |
54,950 |
— |
— |
54,950 |
€ 222,885 |
|
2022 LTI
PSU
|
2022-2024 |
May 15, 2022 |
164,840 |
€ 1,686,462 |
May 15, 2025 |
May 15, 2027 |
164,840 |
— |
— |
164,840 |
€ 745,374 |
|
2023 LTI
PSU
|
2023 - 2025 |
May 1, 2023 |
169,773 |
€ 2,138,008 |
May 1, 2026 |
May 1, 2028 |
— |
169,773 |
— |
169,773 |
€ 628,629 |
|
TAVARES,
Carlos CEO
|
2019 LTI
RSU
|
2019- 2021 |
May 20, 2019 |
130,000 |
€ 2,299,440 |
May 23, 2022
May 23, 2023
|
102,780 |
— |
102,780 |
— |
€ 58,706 |
|
2020 LTI
RSU
|
2020-2022 |
May 11, 2020 |
80,000 |
€ 826,880 |
May 11, 2023 |
144,638 |
— |
144,638 |
— |
€ 132,926 |
||
2021 LTI
RSU
|
2021-2023 |
April 15, 2021 |
204,180 |
€ 2,956,526 |
May 15, 2024 |
May 15, 2026 |
204,180 |
— |
— |
204,180 |
€ 1,056,936 |
|
2021 LTI
PSU
|
2021-2023 |
April 15, 2021 |
612,700 |
€ 9,484,596 |
May 15, 2024 |
May 15, 2026 |
612,700 |
— |
— |
612,700 |
€ 3,770,732 |
|
2021 CEO
PSU(2)
|
2021-2026 |
June 28, 2021 |
1,000,000 |
€ 19,560,000 |
January 17,
2026
|
January 17,
2028
|
1,000,000 |
— |
— |
1,000,000 |
€ 4,293,090 |
|
2021 LTI
RSU(6)
|
2021-2023 |
October 1,
2021
|
10,190 |
€ 143,068 |
October 1,
2024
|
May 1, 2026 |
10,190 |
— |
— |
10,190 |
€ 51,158 |
|
2022 LTI
RSU
|
2022-2024 |
May 15, 2022 |
232,220 |
€ 2,584,366 |
May 15, 2025 |
May 15, 2027 |
232,220 |
— |
— |
232,220 |
€ 922,086 |
|
2022 LTI
PSU
|
2022-2024 |
May 15, 2022 |
696,650 |
€ 7,502,483 |
May 15, 2025 |
May 15, 2027 |
696,650 |
— |
— |
696,650 |
€ 3,083,791 |
|
2023 LTI
PSU
|
2023 - 2025 |
May 1, 2023 |
744,417 |
€ 9,374,692 |
May 1, 2026 |
May 1, 2028 |
— |
744,417 |
— |
744,417 |
€ 2,756,403 |
Non-executive Director Remuneration | |
Annual cash retainer: |
€ 200,000 |
Additional retainer for Senior Independent Director: |
€ 50,000 |
Additional retainer for Audit Committee Chair: |
€ 25,000 |
Additional retainer for Audit Committee membership: |
€ 10,000 |
Additional retainer for other Committee Chairs: |
€ 10,000 |
Additional retainer for other Committee membership: |
€ 5,000 |
Employees excluding Executive Directors |
2023 |
2022 |
2021 |
2020(1) |
2019(1) |
5 years
average
|
||||||
Personnel cost (€ billion) |
19.1 |
18.2 |
17.1 |
10.3 |
11.4 |
15.2 |
||||||
Average number of employees |
271,292 |
282,926 |
292,432 |
191,703 |
198,770 |
247,425 |
||||||
Average employee compensation (€) |
70,404 |
64,328 |
58,475 |
53,729 |
57,353 |
60,858 |
2023 |
2022 |
2021(1) |
2020(2) |
2019(2) |
5 years
average
|
|||||||
CEO compensation (€) |
36,494,025 |
23,459,006 |
17,453,507 |
11,729,558 |
13,280,913 |
20,479,802 |
||||||
Average employee compensation (€) |
70,404 |
64,328 |
58,475 |
53,729 |
57,353 |
60,858 |
||||||
CEO Pay Ratio |
518* |
365 |
298 |
218 |
232 |
337 |
Company Performance |
2023 |
2022 |
2021 |
2020(1) |
2019(1) |
|||||||||||||||
Net revenues (€ million) |
€ |
189,544 |
€ |
179,592 |
€ |
149,419 |
€ |
86,676 |
€ |
108,187 |
||||||||||
Net profit/(loss) from continuing operations (€ million) |
18,625 |
16,779 |
13,218 |
24 |
2,700 |
|||||||||||||||
Diluted earnings/(loss) per share from continuing
operations (€)
|
€ |
5.94 |
€ |
5.31 |
€ |
4.19 |
€ |
0.02 |
€ |
1.71 |
||||||||||
Director |
Position |
2023 |
2022 |
2021 |
2020(1) |
2019(1) |
||||||
ELKANN,
John Philipp
|
Chairman |
€ 4,823,519 |
€ 5,850,051 |
€ 7,884,085 |
€ 2,391,177 |
€ 3,849,946 |
||||||
TAVARES,
Carlos
|
CEO |
36,494,025 |
23,459,006 |
19,153,507 |
||||||||
PEUGEOT,
Robert
|
Director |
216,927 |
219,595 |
203,782 |
||||||||
AGNELLI,
Andrea
|
Director |
62,644 |
223,022 |
226,135 |
45,888 |
180,157 |
||||||
CASTRIES,
Henri de
|
Director |
286,294 |
290,010 |
273,725 |
||||||||
CICCONI, Fiona
Clare
|
Director |
234,478 |
227,611 |
208,061 |
||||||||
DUFOURCQ,
Nicolas
|
Director |
- |
- |
- |
||||||||
GODBEHERE,
Ann Frances
|
Director |
225,510 |
228,106 |
228,458 |
||||||||
MARTELLO,
Wan Ling
|
Director |
245,960 |
234,440 |
221,546 |
||||||||
RIBADEAU-
DUMAS, Benoit
|
Director |
- |
||||||||||
SAINT-
EXUPERY,
Jacques
|
Director |
200,000 |
201,853 |
198,436 |
||||||||
SCOTT,
Kevin
|
Director |
230,960 |
218,702 |
203,498 |
||||||||
MARCHIONNE,
Sergio
|
Former CEO |
26,080,867 |
||||||||||
MANLEY,
Michael
|
Former CEO |
51,184,773(2) |
305,876 |
11,728,558 |
13,280,913 |
|||||||
PALMER,
Richard
|
Former CFO |
345,686(3) |
14,766,580 |
4,471,542 |
4,035,288 |
|||||||
ABBOTT, John |
Former Director |
8,456 |
43,775 |
178,655 |
||||||||
BRANDOLINI
D'ABBA,
Tiberto
|
Former Director |
9,169 |
44,691 |
180,968 |
||||||||
EARLE,
Glenn
|
Former Director |
8,387 |
71,635 |
215,649 |
||||||||
MARS,
Valerie
|
Former Director |
11,872 |
60,903 |
208,529 |
||||||||
SIMMONS,
Ruth J.
|
Former Director |
- |
- |
99,835 |
||||||||
THOMPSON,
Ronald L.
|
Former Director |
14,611 |
58,231 |
220,524 |
||||||||
VOLPI,
Michelango A.
|
Former Director |
12,198 |
52,369 |
189,409 |
||||||||
WHEATCROFT,
Patience
|
Former Director |
8,723 |
59,690 |
204,284 |
||||||||
ZEGNA,
Emenegildo
|
Former Director |
24,479 |
68,037 |
205,626 |
Average employee compensation |
2023 |
2022 |
2021 |
2020(1) |
2019(1) |
||||||||||||||||
Average employee compensation |
€ |
70,404 |
€ |
64,328 |
€ |
58,475 |
€ |
53,729 |
€ |
57,353 |
|||||||||||
Page |
||
Report of Independent Registered Public Accounting Firm EY S.p.A. (PCAOB ID: 1521) |
||
Provision for North America product warranty and recall campaigns | |
Description
of the
Matter
|
At December 31, 2023, the provision for product warranty and recall campaigns amounted to €8,984 million with the most
significant amounts related to the North America region. The Company establishes a provision for product warranty
obligations, including the estimated cost of service and recall actions in the North America region, at the time the vehicle is
sold. The estimated future costs of these actions, which are recorded in cost of revenues in the consolidated income
statement, are principally based on assumptions regarding the lifetime warranty costs of each vehicle line and each model
year of that vehicle line, as well as claims and past experience for the vehicles. The disclosures on warranty provision are
included in notes 2 and 21 to the consolidated financial statements.
Auditing management’s provision for product warranty and recall campaign was complex in consideration of the judgment
required to develop assumptions around future costs to be incurred for warranty provision. The complexity in evaluating
management’s estimate related to the North America region’s warranty and campaign provision is driven by numerous
uncertainties, including the nature and frequency of warranty claims and the estimated average costs of such claims. Due to
the significance, the uncertainty, and potential volatility of these estimated future costs and other factors, changes in
assumptions used could materially affect the result of the Company’s consolidated financial statements and is therefore
considered a critical audit matter.
|
How We
Addressed
the Matter
in Our
Audit
|
The procedures designed to address the matter in our audit included, among others, obtaining an understanding, evaluating
the design of and testing the operating effectiveness of controls over the Company’s warranty and recall campaign process,
including controls over management’s review of the aforementioned significant assumptions.
We involved actuarial specialists to assist us in evaluating and testing the Company's methodology and the assumptions
developed by management in determining the warranty and recall campaign provision. With the assistance of the actuarial
specialists, we performed sensitivity analyses and independently calculated a range of probable outcomes for the North
America product warranty and recall campaigns provision. We compared current year developments against expectations.
We performed other audit procedures to evaluate the data applied in the model including, among others, (i) tested warranty
payments made in the year, (ii) obtained external third-party confirmations in respect of the completeness and accuracy of
current year claims for warranty and recall and (iii) tested estimated costs associated with approved recall campaigns. We
evaluated the adequacy of the related disclosures in the consolidated financial statements, including the disclosures of
related significant judgements made by management.
|
Recoverability of non-current assets with definite useful lives with reference to Enlarged Europe | |
Description
of the
Matter
|
At December 31, 2023, the non-current assets with definite useful lives amounted to €58,312 million. Non-current assets
with definite useful lives include property, plant and equipment (€37,687 million) and intangible assets (€20,625 million),
that include assets historically recorded by Peugeot-Citroen-DS (PCD) in Enlarged Europe. Intangible assets with definite
useful lives mainly consist of capitalized development expenditures. The Company reviews the carrying amount of non-
current assets with definite useful lives when events or circumstances indicate that an asset may be impaired and, if
required, the carrying amount of the asset is reduced to its recoverable amount, which is the higher of fair value less costs of
disposal and its value in use. The recoverable amount is determined at the cash generating unit (CGU) level. The disclosures
on non-current assets with definite useful lives are included in notes 2, 10 and 11 of the consolidated financial statements.
Auditing management’s assessment of the recoverability of non-current assets with definite useful lives with reference to
Enlarged Europe for PCD was complex and highly judgmental due to the significance, uncertainties and potential volatility
involved in the forecast volumes and margins, which may be affected by regulatory changes as well as changes in the
expected costs of implementing electrification. Changes in the assumptions used could potentially materially affect the
recoverability of such non-current assets with definite useful lives. Therefore, this matter is considered to be a critical audit
matter.
|
How We
Addressed
the Matter
in Our
Audit
|
The procedures designed to address the matter in our audit included, among others, obtaining an understanding, evaluating
the design and testing the operating effectiveness of controls over the Company’s non-current assets with definite useful
lives impairment assessment process, including controls over management’s review of the significant assumptions described
above.
To test the determination of the recoverable amount of the CGUs, we involved valuation specialists to assist in evaluating
the methodology used by the Company, including the impairment test model developed and the discount rates (Weighted
Average Cost of Capital) applied. With the assistance of our valuation specialists, we performed independent calculations
and sensitivity analyses over key assumptions for each CGU. We evaluated the key assumptions applied in determining the
recoverable amount and evaluated the CGUs identified and tested the allocation of assets to the carrying value of each
CGU. We assessed the cash flow forecasts for each CGU by comparing volumes with those forecasted per automotive
industry market research reports and comparing forecasted revenue and margins with actuals of other vehicles from the
same brand and/or segment. We evaluated the consistency of the volumes mix derived from the impairment test with the
Company’s long-term strategy on climate change risks and the electrification transition and the impact thereof on the cash
flows used in determining the cash flows of the CGUs. We evaluated the historical accuracy of the Company's forecasts by
comparing to actual results. We evaluated the adequacy of the related disclosures in the consolidated financial statements,
including the disclosures of related significant judgements made by management.
|
Years ended December 31, |
|||||||
Note |
2023 |
2022(1) |
2021(1) |
||||
Net revenues |
4 |
€189,544 |
€179,592 |
€149,419 |
|||
Cost of revenues |
151,400 |
144,327 |
119,943 |
||||
Selling, general and other costs |
9,541 |
8,981 |
9,130 |
||||
Research and development costs |
5 |
5,619 |
5,200 |
4,487 |
|||
Gains/(losses) on disposal of investments |
20 |
72 |
(35) |
||||
Restructuring costs |
1,119 |
1,144 |
698 |
||||
Share of the profit/(loss) of equity method investees |
12 |
491 |
264 |
737 |
|||
Operating income/(loss) |
22,376 |
20,276 |
15,863 |
||||
Net financial expenses/(income) |
6 |
(42) |
768 |
734 |
|||
Profit/(loss) before taxes |
22,418 |
19,508 |
15,129 |
||||
Tax expense/(benefit) |
7 |
3,793 |
2,729 |
1,911 |
|||
Net profit/(loss) from continuing operations |
18,625 |
16,779 |
13,218 |
||||
Profit/(loss) from discontinued operations, net of tax |
3 |
— |
— |
990 |
|||
Net profit/(loss) |
€18,625 |
€16,779 |
€14,208 |
||||
Net profit/(loss) attributable to: |
|||||||
Owners of the parent |
€18,596 |
€16,799 |
€14,200 |
||||
Non-controlling interests |
29 |
(20) |
8 |
||||
€18,625 |
€16,779 |
€14,208 |
|||||
Net profit/(loss) from continuing operations attributable to: |
|||||||
Owners of the parent |
€18,596 |
€16,799 |
€13,210 |
||||
Non-controlling interests |
29 |
(20) |
8 |
||||
€18,625 |
€16,779 |
€13,218 |
|||||
Earnings per share: |
28 |
||||||
Basic earnings per share |
€5.98 |
€5.35 |
€4.64 |
||||
Diluted earnings per share |
€5.94 |
€5.31 |
€4.51 |
||||
Earnings per share for Net profit from continuing operations: |
28 |
||||||
Basic earnings per share |
€5.98 |
€5.35 |
€4.32 |
||||
Diluted earnings per share |
€5.94 |
€5.31 |
€4.19 |
||||
Years ended December 31, |
|||||||
Note |
2023 |
2022 |
2021 |
||||
Consolidated profit/(loss) for the period |
€18,625 |
€16,779 |
€14,208 |
||||
Fair value remeasurement to cash flow hedges |
(910) |
(482) |
149 |
||||
of which, reclassified to the income statement |
532 |
(353) |
(98) |
||||
of which, recognized in equity during the period |
(1,442) |
(129) |
247 |
||||
Gains and losses from remeasurement of financial assets |
57 |
3 |
6 |
||||
of which, recognized in equity during the period |
57 |
3 |
6 |
||||
Exchange differences on translating foreign operations |
(1,927) |
2,013 |
2,005 |
||||
Income tax benefit/(expense) |
245 |
89 |
(54) |
||||
Share of Other comprehensive income/(loss) for equity method investees |
(221) |
(7) |
(47) |
||||
Amounts to be potentially reclassified to profit or loss |
27 |
(2,756) |
1,616 |
2,059 |
|||
Actuarial gains and losses on defined benefit pension obligations |
(228) |
1,753 |
2,488 |
||||
Share of Other comprehensive income/(loss) for equity method investees |
2 |
(5) |
8 |
||||
Income tax (expense)/benefit |
41 |
(379) |
(729) |
||||
Amounts not to be reclassified to profit or loss |
27 |
(185) |
1,369 |
1,767 |
|||
TOTAL CONSOLIDATED COMPREHENSIVE INCOME/(LOSS)
FOR THE PERIOD
|
€15,684 |
€19,764 |
€18,034 |
||||
of which, attributable to equity holders of the parent |
€15,658 |
€19,781 |
€18,020 |
||||
of which, attributable to non-controlling interests |
€26 |
€(17) |
€14 |
||||
At December 31, |
|||||
Note |
2023 |
2022 |
|||
Assets |
|||||
Goodwill and intangible assets with indefinite useful lives |
9 |
€30,994 |
€31,738 |
||
Other intangible assets |
10 |
20,625 |
19,006 |
||
Property, plant and equipment |
11 |
37,687 |
36,205 |
||
Equity method investments |
12 |
8,070 |
4,834 |
||
Non-current financial assets |
13 |
3,269 |
710 |
||
Other non-current assets and prepaid expenses |
16 |
7,694 |
6,723 |
||
Deferred tax assets |
7 |
2,152 |
2,052 |
||
Tax receivables |
16 |
117 |
112 |
||
Total Non-current assets |
110,608 |
101,380 |
|||
Inventories |
14 |
21,414 |
17,360 |
||
Assets sold with a buy-back commitment |
1,328 |
1,594 |
|||
Trade receivables |
16 |
6,426 |
4,928 |
||
Tax receivables |
16 |
802 |
543 |
||
Other current assets and prepaid expenses |
16 |
10,288 |
7,549 |
||
Current financial assets |
13 |
6,830 |
4,323 |
||
Cash and cash equivalents |
18 |
43,669 |
46,433 |
||
Assets held for sale |
3 |
763 |
2,046 |
||
Total Current assets |
91,520 |
84,776 |
|||
Total Assets |
€202,128 |
€186,156 |
|||
Equity and liabilities |
|||||
Equity |
27 |
||||
Equity attributable to owners of the parent |
81,693 |
71,999 |
|||
Non-controlling interests |
427 |
383 |
|||
Total Equity |
82,120 |
72,382 |
|||
Liabilities |
|||||
Long-term debt |
22 |
20,001 |
19,469 |
||
Other non-current financial liabilities |
17 |
21 |
— |
||
Other non-current liabilities |
23 |
8,065 |
8,129 |
||
Non-current provisions |
21 |
7,744 |
8,460 |
||
Employee benefits liabilities |
20 |
4,911 |
5,891 |
||
Tax liabilities |
542 |
668 |
|||
Deferred tax liabilities |
7 |
4,784 |
4,332 |
||
Total Non-current liabilities |
46,068 |
46,949 |
|||
Short-term debt and current portion of long-term debt |
22 |
9,462 |
7,684 |
||
Current provisions |
21 |
13,724 |
11,311 |
||
Employee benefit liabilities |
20 |
562 |
545 |
||
Trade payables |
33,008 |
31,726 |
|||
Tax liabilities |
1,264 |
900 |
|||
Other liabilities |
23 |
15,570 |
14,528 |
||
Other current financial liabilities |
17 |
18 |
18 |
||
Liabilities held for sale |
3 |
332 |
113 |
||
Total Current liabilities |
73,940 |
66,825 |
|||
Total Equity and liabilities |
€202,128 |
€186,156 |
|||
Years ended December 31, |
|||||||
Note |
2023 |
2022 |
2021 |
||||
Consolidated profit from continuing operations |
€18,625 |
€16,779 |
€13,218 |
||||
Adjustments for non-cash items: |
30 |
||||||
depreciation and amortization |
7,549 |
6,797 |
5,871 |
||||
(gains)/losses on disposals |
(195) |
(192) |
(121) |
||||
change in deferred taxes |
701 |
(711) |
(654) |
||||
other non-cash items |
720 |
391 |
99 |
||||
Change in provisions |
2,460 |
1,906 |
(1,152) |
||||
Result of equity method investments net of dividends received |
30 |
(156) |
(47) |
(185) |
|||
Change in carrying amount of leased vehicles |
(1,747) |
(483) |
358 |
||||
Changes in working capital |
15 |
(5,472) |
(4,481) |
1,212 |
|||
Net cash from operating activities |
22,485 |
19,959 |
18,646 |
||||
Proceeds from disposal of shares in consolidated companies and of investments in
non-consolidated companies
|
1,457 |
235 |
161 |
||||
Acquisitions of consolidated subsidiaries and equity method and other investments |
(3,885) |
(666) |
(726) |
||||
Cash and cash equivalents of FCA at the merger |
— |
— |
22,514 |
||||
Proceeds from disposals of property, plant and equipment and intangible assets |
533 |
545 |
295 |
||||
Investments in property, plant and equipment and intangible assets |
(10,193) |
(8,615) |
(8,687) |
||||
Change in amounts payable on property, plant and equipment and intangible assets |
1,068 |
(399) |
(1,426) |
||||
Net change in receivables from financing activities |
(3,834) |
(1,413) |
(306) |
||||
Other changes |
(193) |
(218) |
(36) |
||||
Net cash from/(used in) investing activities - discontinued operations |
— |
— |
(3,115) |
||||
Net cash from/(used in) investing activities |
(15,047) |
(10,531) |
8,674 |
||||
Distributions paid: |
|||||||
to Stellantis shareholders |
(4,208) |
(3,353) |
(4,204) |
||||
to non-controlling shareholders of subsidiaries |
— |
(1) |
— |
||||
Proceeds from issuance of shares |
92 |
40 |
243 |
||||
(Purchases)/sales of treasury shares |
(2,434) |
(923) |
— |
||||
Changes in short-term debt and other financial assets and liabilities |
328 |
(400) |
(846) |
||||
Changes in long-term debt |
(214) |
(6,480) |
4,106 |
||||
Change in securities |
(2,754) |
(2,069) |
(610) |
||||
Other changes |
(10) |
19 |
(55) |
||||
Net cash from/(used in) financing activities |
(9,200) |
(13,167) |
(1,366) |
||||
Effect of changes in exchange rates |
(836) |
608 |
764 |
||||
(Increase)/decrease in cash and cash equivalents included in asset held for sale |
(166) |
(65) |
18 |
||||
Increase/(decrease) in cash and cash equivalents |
(2,764) |
(3,196) |
26,736 |
||||
Net cash and cash equivalents at beginning of the period |
46,433 |
49,629 |
22,893 |
||||
Net cash and cash equivalents at end of the period |
18 |
€43,669 |
€46,433 |
€49,629 |
|||
Attributable to the Owners of the parent |
||||||||||||||||||||||
Share
capital(1)
|
Treasury
shares
|
Retained
earnings
and other
reserves(1)
|
Cash flow
hedge
reserve
|
Remeasure
ment of the
fair value of
financial
assets
|
Actuarial
gains and
losses on
pension
obligations
plans
|
Effect of
change in
exchange
rates
|
Cumulative
share of
OCI of
equity
method
investees
|
Equity -
Attributa
ble to
Owners
of the
parent
|
Non-
controlling
interests
|
Total Equity |
||||||||||||
At January 1, 2021 |
€20 |
€— |
€22,141 |
€74 |
€— |
€271 |
€(1,162) |
€(51) |
€21,293 |
€2,580 |
€23,873 |
|||||||||||
Other comprehensive
income
|
— |
— |
— |
95 |
6 |
1,759 |
2,000 |
(40) |
3,820 |
6 |
3,826 |
|||||||||||
Net profit |
— |
— |
14,200 |
— |
— |
— |
— |
— |
14,200 |
8 |
14,208 |
|||||||||||
Total Other
comprehensive
income
|
— |
— |
14,200 |
95 |
6 |
1,759 |
2,000 |
(40) |
18,020 |
14 |
18,034 |
|||||||||||
FCA - PSA merger |
11 |
— |
19,826 |
— |
— |
— |
— |
— |
19,837 |
59 |
19,896 |
|||||||||||
Faurecia loss of control
and distribution
|
— |
— |
(2,883) |
— |
— |
— |
118 |
— |
(2,765) |
(2,457) |
(5,222) |
|||||||||||
Distributions |
— |
— |
(1,000) |
— |
— |
— |
— |
— |
(1,000) |
— |
(1,000) |
|||||||||||
Share-based
compensation
|
— |
— |
221 |
— |
— |
— |
— |
— |
221 |
— |
221 |
|||||||||||
Other changes(2) |
— |
— |
271 |
30 |
— |
— |
— |
— |
301 |
204 |
505 |
|||||||||||
At December 31, 2021 |
31 |
— |
52,776 |
199 |
6 |
2,030 |
956 |
(91) |
55,907 |
400 |
56,307 |
|||||||||||
Other comprehensive
income
|
— |
— |
— |
(393) |
3 |
1,374 |
2,010 |
(12) |
2,982 |
3 |
2,985 |
|||||||||||
Net profit |
— |
— |
16,799 |
— |
— |
— |
— |
— |
16,799 |
(20) |
16,779 |
|||||||||||
Total Other
comprehensive
income
|
— |
— |
16,799 |
(393) |
3 |
1,374 |
2,010 |
(12) |
19,781 |
(17) |
19,764 |
|||||||||||
Capital increase |
1 |
— |
39 |
— |
— |
— |
— |
— |
40 |
— |
40 |
|||||||||||
(Purchases) sales of
treasury shares(1)
|
— |
(923) |
— |
— |
— |
— |
— |
— |
(923) |
— |
(923) |
|||||||||||
Distributions |
— |
— |
(3,353) |
— |
— |
— |
— |
— |
(3,353) |
(1) |
(3,354) |
|||||||||||
Share-based
compensation
|
— |
— |
163 |
— |
— |
— |
— |
— |
163 |
— |
163 |
|||||||||||
Other changes(2) |
— |
— |
359 |
25 |
— |
— |
— |
— |
384 |
1 |
385 |
|||||||||||
At December 31, 2022 |
32 |
(923) |
66,783 |
(169) |
9 |
3,404 |
2,966 |
(103) |
71,999 |
383 |
72,382 |
|||||||||||
Other comprehensive
income
|
— |
— |
— |
(665) |
57 |
(187) |
(1,924) |
(219) |
(2,938) |
(3) |
(2,941) |
|||||||||||
Net profit |
— |
— |
18,596 |
— |
— |
— |
— |
— |
18,596 |
29 |
18,625 |
|||||||||||
Total Other
comprehensive
income
|
— |
— |
18,596 |
(665) |
57 |
(187) |
(1,924) |
(219) |
15,658 |
26 |
15,684 |
|||||||||||
Capital increase |
— |
— |
— |
— |
— |
— |
— |
— |
— |
— |
— |
|||||||||||
(Purchases) sales of
treasury shares(1)
|
— |
(2,434) |
— |
— |
— |
— |
— |
— |
(2,434) |
— |
(2,434) |
|||||||||||
Cancellation of treasury
shares(1)
|
(1) |
923 |
(923) |
— |
— |
— |
— |
— |
(1) |
— |
(1) |
|||||||||||
Distributions |
— |
— |
(4,208) |
— |
— |
— |
— |
— |
(4,208) |
— |
(4,208) |
|||||||||||
Share-based
compensation
|
— |
— |
295 |
— |
— |
— |
— |
— |
295 |
— |
295 |
|||||||||||
Other changes(2) |
— |
— |
383 |
1 |
— |
— |
— |
— |
384 |
18 |
402 |
|||||||||||
At December 31, 2023 |
€31 |
€(2,434) |
€80,926 |
€(833) |
€66 |
€3,217 |
€1,042 |
€(322) |
€81,693 |
€427 |
€82,120 |
|||||||||||
1. |
Principal activities |
2. |
Basis of preparation |
2023 |
2022 |
2021 |
|||||||||
Average |
At December 31 |
Average |
At December 31 |
Average |
At December 31 |
||||||
U.S. Dollar (USD) |
1.081 |
1.105 |
1.054 |
1.067 |
1.183 |
1.133 |
|||||
Argentine Peso (ARS)(1) |
n.a. |
893.404 |
n.a. |
188.915 |
n.a. |
116.360 |
|||||
Brazilian Real (BRL) |
5.401 |
5.350 |
5.441 |
5.568 |
6.377 |
6.320 |
|||||
Canadian Dollar (CAD) |
1.460 |
1.464 |
1.370 |
1.444 |
1.483 |
1.439 |
|||||
Swiss Franc (CHF) |
0.972 |
0.926 |
1.005 |
0.985 |
1.082 |
1.033 |
|||||
Chinese Renminbi (CNY) |
7.657 |
7.851 |
7.079 |
7.358 |
7.633 |
7.195 |
|||||
Turkish Lira (TRY)(2) |
n.a. |
32.603 |
n.a. |
19.953 |
n.a. |
15.100 |
|||||
Pound Sterling (GBP) |
0.870 |
0.869 |
0.853 |
0.887 |
0.860 |
0.840 |
|||||
Mexican Peso (MXN) |
19.193 |
18.723 |
21.203 |
20.856 |
23.989 |
23.144 |
|||||
Polish Zloty (PLN) |
4.544 |
4.348 |
4.686 |
4.690 |
4.566 |
4.599 |
|||||
Japanese Yen (JPY) |
151.854 |
156.330 |
137.931 |
140.660 |
129.848 |
130.380 |
|||||
Years |
|
Buildings |
33 - 40 |
Plant, machinery and equipment |
2 - 25 |
Other assets |
2 - 34 |
Financial asset cash flow business model |
Initial measurement(1) |
Measurement category(3) |
Solely to collect the contractual cash flows (Held to
Collect)
|
Fair Value including transaction costs |
Amortized Cost(2) |
Collect both the contractual cash flows and generate
cash flows arising from the sale of assets (Held to
Collect and Sell)
|
Fair Value including transaction costs |
Fair value through other comprehensive
income (“FVOCI”)
|
Generate cash flows primarily from the sale of
assets (Held to Sell)
|
Fair Value |
FVPL |
Financial asset |
IFRS 9 impairment model |
Trade receivables |
Simplified approach |
Receivables from financing activities |
General approach |
Other receivables |
General approach |
Stage |
Description |
Time period for
measurement of ECL
|
Stage 1 |
A financial instrument that is not credit-impaired on initial recognition |
12-month ECL |
Stage 2 |
A financial instrument with a significant increase in credit risk since initial
recognition
|
Lifetime ECL |
Stage 3 |
A financial instrument that is credit-impaired or has defaulted |
Lifetime ECL |
Effect on
pension
benefit
obligation
increase/
(decrease) in
Net liability
|
Germany and
France
|
UK |
US and Canada |
Other |
|||||
(€ million) |
|||||||||
25 basis point decrease in discount rate |
584 |
100 |
44 |
434 |
6 |
||||
25 basis point increase in discount rate |
(559) |
(95) |
(42) |
(416) |
(6) |
||||
Effect on health
care, life insurance and OPEB
obligation
|
|
(€ million) |
|
25 basis point decrease in discount rate |
68 |
25 basis point increase in discount rate |
(66) |
100 basis point decrease in health care cost trend rate |
(16) |
100 basis point increase in health care cost trend rate |
17 |
3. |
Scope of consolidation |
Name |
Country |
Percentage
Interest Held
|
||
North America |
||||
FCA US LLC |
USA |
100.00 |
||
FCA Canada Inc. |
Canada |
100.00 |
||
Stellantis Mexico, S.A. de C.V. |
Mexico |
100.00 |
||
South America |
||||
FCA Fiat Chrysler Automoveis Brasil Ltda. |
Brazil |
100.00 |
||
FCA Automobiles Argentina S.A. |
Argentina |
100.00 |
||
Peugeot Citroën Argentina S.A. |
Argentina |
99.96 |
||
Enlarged Europe |
||||
Stellantis Europe S.p.A. |
Italy |
100.00 |
||
Automobiles Peugeot |
France |
100.00 |
||
Automobiles Citroën |
France |
100.00 |
||
Opel Automobile GmbH |
Germany |
100.00 |
||
Groupe PSA Italia S.p.A. |
Italy |
100.00 |
||
Stellantis & You France S.A.S. |
France |
100.00 |
||
Stellantis Auto S.A.S. |
France |
100.00 |
||
FCA Germany GmbH |
Germany |
100.00 |
||
Stellantis España, S.L. |
Spain |
99.99 |
||
Vauxhall Motors Limited |
United Kingdom |
100.00 |
||
FCA France S.A.S. |
France |
100.00 |
||
Peugeot Motor Company PLC |
United Kingdom |
100.00 |
||
Stellantis & You UK Limited |
United Kingdom |
100.00 |
||
Peugeot Deutschland GmbH |
Germany |
100.00 |
||
Stellantis & You Italia S.p.A. |
Italy |
100.00 |
||
Stellantis Nederland B.V. |
Netherlands |
100.00 |
||
Citroën Deutschland GmbH |
Germany |
100.00 |
||
Citroën UK Ltd |
United Kingdom |
100.00 |
||
FCA Poland S.p.z.o.o. |
Poland |
100.00 |
Middle East & Africa |
||||
Stellantis Middle East FZE |
United Arab Emirates |
100.00 |
||
Stellantis Otomotiv Pazarlama Anonim Sirketi |
Turkey |
100.00 |
||
China and India & Asia Pacific |
||||
Stellantis Japan Ltd. |
Japan |
100.00 |
||
Fiat India Automobiles Private Limited |
India |
50.00 |
||
Maserati |
||||
Maserati S.p.A. |
Italy |
100.00 |
||
Maserati (China) Cars Trading Co., Ltd. |
People's Rep.of China |
100.00 |
||
Maserati North America Inc. |
USA |
100.00 |
||
Financial Services |
||||
Stellantis Financial Services Europe S.A. |
France |
100.00 |
||
Stellantis Automotive Finance Co. Ltd. |
People's Rep.of China |
100.00 |
||
Stellantis Financial Services US Corp. |
USA |
100.00 |
||
Banco Stellantis S.A. |
Brazil |
100.00 |
||
Fidis S.p.A. |
Italy |
100.00 |
||
Holdings & Other Companies |
||||
FCA North America Holdings LLC |
USA |
100.00 |
||
GIE PSA Trésorerie |
France |
100.00 |
||
Fiat Chrysler Finance North America, Inc. |
USA |
100.00 |
||
FCA US Insurance Company |
USA |
100.00 |
||
Fiat Chrysler Finance S.p.A. |
Italy |
100.00 |
||
Stellantis International S.A. |
Switzerland |
100.00 |
(€ million) |
At December 22, 2022 |
|
Goodwill |
€172 |
|
Other intangible assets |
87 |
|
Other assets |
13 |
|
Total assets |
€272 |
|
Total equity |
€239 |
|
Long-term debt and Short term debt and current portion of long-term debt |
21 |
|
Other liabilities |
12 |
|
Total equity and liabilities |
€272 |
Number of shares
issued and outstanding
as of January 16, 2021
|
Exchange
ratio
|
Adjusted number of shares
on completion (i.e. Stellantis
shares)
|
Exchange
ratio
|
Deemed number of shares
for consideration
transferred calculation
|
||||||||||
(a) |
(b) |
(c) = (a)*(b) |
(d) |
(e) = (c)/(d) |
||||||||||
PSA |
887,038,000 |
(1) |
1.742 |
1,545,220,196 |
49.53% |
1.742 |
887,038,000 |
49.53% |
||||||
FCA |
1,574,714,499 |
(2) |
1 |
1,574,714,499 |
50.47% |
1.742 |
903,969,288 |
50.47% |
||||||
Total |
3,119,934,695 |
1,791,007,288 |
||||||||||||
Number of shares of PSA deemed to be issued to FCA shareholders under reverse
acquisition accounting
|
Number of shares |
903,969,288 |
||
Market price of PSA shares as of January 15, 2021 |
€ |
€21.85 |
||
Fair value of common shares deemed to be issued to FCA shareholders as of
January 15, 2021
|
€ million |
19,752 |
||
Additional consideration for share-based compensation |
€ million |
85 |
||
Consideration transferred |
€ million |
€19,837 |
(€ million) |
At the acquisition date
(January 17, 2021)
|
|
Consideration transferred |
19,837 |
|
Add: minority interests |
59 |
|
Less: fair value of FCA’s Net assets acquired |
8,390 |
|
Goodwill |
11,506 |
(€ million) |
At the acquisition date
(January 17, 2021)
|
|
Assets |
||
Intangible assets with indefinite useful lives |
€12,797 |
|
Other intangible assets |
8,256 |
|
Property, plant and equipment |
20,667 |
|
Equity method investments |
2,637 |
|
Non-current financial assets |
320 |
|
Other non-current assets |
3,833 |
|
Total Non-current assets |
48,510 |
|
Inventories |
9,333 |
|
Assets sold with a buy-back commitment |
812 |
|
Trade receivables |
1,970 |
|
Other current assets and prepaid expenses |
4,408 |
|
Current financial assets |
502 |
|
Cash and cash equivalents |
22,514 |
|
Total Current assets |
39,539 |
|
Total Assets |
€88,049 |
|
Liabilities |
||
Long-term debt |
€18,362 |
|
Other non-current financial liabilities |
269 |
|
Other non-current liabilities |
5,386 |
|
Non-current provisions |
5,452 |
|
Employee benefits liabilities |
8,181 |
|
Total Non-current liabilities |
37,650 |
|
Short-term debt and current portion of long-term debt |
4,052 |
|
Current provisions |
7,540 |
|
Employee benefits liabilities |
595 |
|
Trade payables |
20,302 |
|
Other current financial liabilities |
159 |
|
Other current liabilities |
9,361 |
|
Total Current liabilities |
42,009 |
|
Total Liabilities |
79,659 |
|
Net assets acquired |
€8,390 |
4. |
Net revenues |
Years ended December 31, |
|||||
2023 |
2022 |
2021 |
|||
(€ million) |
|||||
Revenues from: |
|||||
Shipments of vehicles and sales of other goods |
€183,230 |
€173,718 |
€144,559 |
||
Other services provided |
4,018 |
3,786 |
3,112 |
||
Construction contract revenues |
709 |
779 |
602 |
||
Lease installments from assets sold with a buy-back commitment |
896 |
849 |
994 |
||
Interest income of financial services activities |
691 |
460 |
152 |
||
Total Net revenues |
€189,544 |
€179,592 |
€149,419 |
||
Years ended December 31, |
|||||
2023 |
2022 |
2021 |
|||
(€ million) |
|||||
Net revenues in: |
|||||
North America(1) |
€88,466 |
€87,283 |
€68,885 |
||
France |
18,079 |
16,365 |
15,421 |
||
Brazil |
13,742 |
11,363 |
7,607 |
||
Italy |
11,790 |
10,840 |
10,065 |
||
Germany |
10,467 |
9,046 |
7,891 |
||
United Kingdom |
8,380 |
7,348 |
6,106 |
||
Turkey |
6,187 |
3,110 |
2,294 |
||
Spain |
5,147 |
5,307 |
4,428 |
||
Belgium |
2,533 |
2,552 |
2,214 |
||
Netherlands |
1,577 |
1,376 |
1,192 |
||
Argentina |
1,524 |
2,735 |
1,961 |
||
Japan |
1,377 |
1,152 |
1,174 |
||
Portugal |
1,335 |
1,138 |
917 |
||
Poland |
1,204 |
1,230 |
1,273 |
||
China |
1,141 |
1,811 |
2,013 |
||
Algeria |
1,079 |
277 |
192 |
||
Switzerland |
930 |
763 |
1,160 |
||
Austria |
812 |
801 |
1,085 |
||
Other countries |
13,774 |
15,095 |
13,541 |
||
Total Net revenues |
€189,544 |
€179,592 |
€149,419 |
||
2023 |
North
America
|
Enlarged
Europe
|
Middle
East &
Africa
|
South
America
|
China
and India
& Asia
Pacific
|
Maserati |
Other
activities
|
Total |
||||||||
(€ million) |
||||||||||||||||
Revenues from: |
||||||||||||||||
Shipments of vehicles and sales of other
goods
|
€85,238 |
€63,961 |
€10,487 |
€15,638 |
€3,463 |
€2,276 |
€2,167 |
€183,230 |
||||||||
Other services provided |
1,260 |
1,587 |
73 |
510 |
63 |
59 |
466 |
4,018 |
||||||||
Construction contract revenues |
— |
— |
— |
— |
— |
— |
709 |
709 |
||||||||
Revenues from goods and services |
86,498 |
65,548 |
10,560 |
16,148 |
3,526 |
2,335 |
3,342 |
187,957 |
||||||||
Lease installments from assets sold with a
buy-back commitment
|
— |
896 |
— |
— |
— |
— |
— |
896 |
||||||||
Interest income from financial services
activities
|
— |
— |
— |
— |
— |
— |
691 |
691 |
||||||||
Total Net revenues |
€86,498 |
€66,444 |
€10,560 |
€16,148 |
€3,526 |
€2,335 |
€4,033 |
€189,544 |
||||||||
2022 |
North
America
|
Enlarged
Europe
|
Middle
East &
Africa
|
South
America
|
China
and India
& Asia
Pacific
|
Maserati |
Other
activities
|
Total |
||||||||
(€ million) |
||||||||||||||||
Revenues from: |
||||||||||||||||
Shipments of vehicles and sales of other
goods
|
€84,239 |
€60,769 |
€6,399 |
€15,178 |
€4,455 |
€2,271 |
€407 |
€173,718 |
||||||||
Other services provided |
1,234 |
1,609 |
54 |
462 |
45 |
51 |
331 |
3,786 |
||||||||
Construction contract revenues |
— |
— |
— |
— |
— |
— |
779 |
779 |
||||||||
Revenues from goods and services |
85,473 |
62,378 |
6,453 |
15,640 |
4,500 |
2,322 |
1,517 |
178,283 |
||||||||
Lease installments from assets sold with a buy-
back commitment
|
1 |
848 |
— |
— |
— |
— |
— |
849 |
||||||||
Interest income from financial services
activities
|
— |
— |
— |
— |
— |
— |
460 |
460 |
||||||||
Total Net revenues |
€85,474 |
€63,226 |
€6,453 |
€15,640 |
€4,500 |
€2,322 |
€1,977 |
€179,592 |
||||||||
2021 |
North
America
|
Enlarged
Europe
|
Middle
East &
Africa
|
South
America
|
China
and India
& Asia
Pacific
|
Maserati |
Other
activities
|
Total |
||||||||
(€ million) |
||||||||||||||||
Revenues from: |
||||||||||||||||
Shipments of vehicles and sales of other
goods
|
€66,618 |
€56,315 |
€5,088 |
€10,191 |
€3,868 |
€1,962 |
€517 |
€144,559 |
||||||||
Other services provided |
1,072 |
1,309 |
77 |
283 |
56 |
40 |
275 |
3,112 |
||||||||
Construction contract revenues |
— |
— |
— |
— |
— |
— |
602 |
602 |
||||||||
Revenues from goods and services |
67,690 |
57,624 |
5,165 |
10,474 |
3,924 |
2,002 |
1,394 |
148,273 |
||||||||
Lease installments from assets sold with a
buy-back commitment
|
16 |
978 |
— |
— |
— |
— |
— |
994 |
||||||||
Interest income from financial services
activities
|
— |
— |
— |
— |
— |
— |
152 |
152 |
||||||||
Total Net revenues |
€67,706 |
€58,602 |
€5,165 |
€10,474 |
€3,924 |
€2,002 |
€1,546 |
€149,419 |
||||||||
5. |
Research and development costs |
Years ended December 31, |
|||||
2023 |
2022 |
2021 |
|||
(€ million) |
|||||
Research and development expenditures expensed |
€3,300 |
€3,233 |
€2,761 |
||
Amortization of capitalized development expenditures |
2,193 |
1,889 |
1,575 |
||
Impairment and write-off of capitalized development expenditures |
126 |
78 |
151 |
||
Total Research and development costs |
€5,619 |
€5,200 |
€4,487 |
||
6. |
Net financial expenses/(income) |
Years ended December 31, |
|||||
2023 |
2022 |
2021 |
|||
(€ million) |
|||||
Interest income and other financial income |
€2,678 |
€1,066 |
€188 |
||
Financial expenses: |
|||||
Interest expense and other financial expenses: |
1,064 |
959 |
545 |
||
Interest expense on notes |
386 |
281 |
182 |
||
Interest expense on borrowings from bank |
59 |
105 |
77 |
||
Other interest cost and financial expenses |
619 |
573 |
286 |
||
Interest on lease liabilities |
63 |
63 |
56 |
||
Write-down of financial assets |
128 |
14 |
10 |
||
Net interest expense/(income) on employee benefits provisions |
203 |
163 |
169 |
||
Total Financial expenses |
1,458 |
1,199 |
780 |
||
Net expenses from derivative financial instruments and exchange rate differences |
1,178 |
635 |
142 |
||
Total Financial expenses and Net expenses from derivative financial
instruments and exchange rate differences
|
2,636 |
1,834 |
922 |
||
Net Financial expenses/(income) |
€(42) |
€768 |
€734 |
||
7. |
Tax expense/(benefit) |
Years ended December 31, |
|||||
2023 |
2022 |
2021 |
|||
(€ million) |
|||||
Current tax expense |
€3,405 |
€3,565 |
€2,294 |
||
Deferred tax expense/(benefit) |
559 |
(840) |
(342) |
||
Tax expense/(benefit) relating to prior periods(1) |
(171) |
4 |
(41) |
||
Total Tax expense/(benefit) |
€3,793 |
€2,729 |
€1,911 |
||
Years ended December 31, |
|||||
2023 |
2022 |
2021 |
|||
(€ million) |
|||||
Profit/(loss) before tax |
€22,418 |
€19,508 |
€15,129 |
||
Income tax rate |
25.8% |
25.8% |
25.0% |
||
Theoretical income taxes |
€5,784 |
€5,033 |
€3,782 |
||
Tax effect on: |
|||||
Differences between foreign tax rates and the theoretical applicable tax rate and
tax holidays
|
(407) |
(495) |
178 |
||
Recognition and utilization of previously unrecognized deferred tax assets |
(740) |
(1,153) |
(1,954) |
||
Deferred tax assets not recognized and write-downs |
— |
47 |
598 |
||
Permanent differences |
(470) |
(406) |
(656) |
||
Tax credits |
(299) |
(221) |
(85) |
||
Tax rate changes |
— |
— |
53 |
||
Withholding tax |
44 |
21 |
63 |
||
Other differences |
(119) |
(97) |
(68) |
||
Total Tax expense |
€3,793 |
€2,729 |
€1,911 |
||
Effective tax rate |
16.9% |
14.0% |
12.6% |
||
At December 31, |
|||
2023 |
2022 |
||
(€ million) |
|||
Deferred tax assets(1) |
€2,152 |
€2,052 |
|
Deferred tax liabilities(1) |
(4,784) |
(4,332) |
|
Total Net deferred tax assets/(liabilities) |
€(2,632) |
€(2,280) |
|
At January 1,
2023
|
Recognized in
Consolidated
Income
Statement
|
Recognized in
Equity
|
Transferred to
Assets/
(Liabilities)
Held for Sale
|
Translation
differences and
Other
|
At December
31, 2023
|
||||||
(€ million) |
|||||||||||
Deferred tax liabilities arising on: |
|||||||||||
Accelerated depreciation |
€(2,775) |
€(315) |
€— |
€— |
€(12) |
€(3,102) |
|||||
Capitalized development assets |
(4,296) |
332 |
— |
— |
43 |
(3,921) |
|||||
Other Intangible assets and
Intangible assets with indefinite
useful lives
|
(3,964) |
(12) |
— |
— |
107 |
(3,869) |
|||||
Right-of-use assets |
(331) |
29 |
— |
— |
26 |
(276) |
|||||
Provision for employee benefits |
(1,086) |
(4) |
(23) |
— |
35 |
(1,078) |
|||||
Other |
(1,488) |
48 |
235 |
(26) |
186 |
(1,045) |
|||||
Total deferred tax liabilities |
€(13,941) |
€78 |
€212 |
€(26) |
€385 |
€(13,291) |
|||||
Deferred tax assets arising on: |
|||||||||||
Provisions |
4,852 |
(304) |
(37) |
— |
(43) |
4,468 |
|||||
Provision for employee benefits |
2,183 |
(208) |
6 |
— |
(28) |
1,953 |
|||||
Lease liabilities |
373 |
(8) |
2 |
— |
(31) |
336 |
|||||
Impairment of tangible and
intangible assets
|
1,269 |
(376) |
(1) |
— |
(15) |
877 |
|||||
Inventories |
375 |
62 |
5 |
— |
2 |
444 |
|||||
Allowances for doubtful
accounts
|
58 |
10 |
(1) |
— |
(8) |
59 |
|||||
Provision for buy back |
169 |
1 |
— |
— |
(17) |
153 |
|||||
Other |
2,589 |
(156) |
172 |
— |
377 |
2,982 |
|||||
Total deferred tax assets |
€11,868 |
€(979) |
€146 |
€— |
€237 |
€11,272 |
|||||
Unrecognized deferred tax assets
on temporary differences1
|
(3,183) |
311 |
11 |
— |
(516) |
(3,377) |
|||||
Deferred tax assets arising on tax
loss carry-forwards
|
9,506 |
(402) |
— |
— |
(35) |
9,069 |
|||||
Unrecognized deferred tax assets
on tax loss carry-forwards
|
(6,531) |
260 |
— |
— |
(34) |
(6,305) |
|||||
Total Net deferred tax assets/
(liabilities)
|
€(2,280) |
€(732) |
€369 |
€(26) |
€37 |
€(2,632) |
|||||
At January 1,
2022
|
Recognized in
Consolidated
Income
Statement
|
Recognized in
Equity
|
Transferred
to Assets/
(Liabilities)
Held for Sale
|
Translation
differences
and Other
|
At December
31, 2022
|
||||||
(€ million) |
|||||||||||
Deferred tax liabilities arising on: |
|||||||||||
Accelerated depreciation |
€(2,662) |
€19 |
€— |
€— |
€(133) |
€(2,775) |
|||||
Capitalized development assets |
(4,313) |
116 |
— |
— |
(99) |
(4,296) |
|||||
Other Intangible assets and
Intangible assets with indefinite
useful lives
|
(3,733) |
(44) |
— |
— |
(187) |
(3,964) |
|||||
Right-of-use assets |
(397) |
82 |
— |
— |
(16) |
(331) |
|||||
Provision for employee benefits |
(591) |
— |
(477) |
— |
(18) |
(1,086) |
|||||
Other |
(1,398) |
(219) |
162 |
— |
(33) |
(1,488) |
|||||
Total deferred tax liabilities |
€(13,094) |
€(46) |
€(315) |
€— |
€(486) |
€(13,941) |
|||||
Deferred tax assets arising on: |
|||||||||||
Provisions |
4,510 |
211 |
1 |
(10) |
140 |
4,852 |
|||||
Provision for employee benefits |
2,325 |
(342) |
12 |
— |
188 |
2,183 |
|||||
Lease liabilities |
413 |
(60) |
— |
— |
20 |
373 |
|||||
Impairment of tangible and
intangible assets
|
1,590 |
(319) |
— |
— |
(2) |
1,269 |
|||||
Inventories |
250 |
129 |
— |
(2) |
(2) |
375 |
|||||
Provision for buy-back |
131 |
42 |
— |
— |
(4) |
169 |
|||||
Allowances for doubtful
accounts
|
115 |
(66) |
— |
(1) |
10 |
58 |
|||||
Other |
2,635 |
(178) |
25 |
— |
107 |
2,589 |
|||||
Total deferred tax assets |
€11,969 |
€(583) |
€38 |
€(13) |
€457 |
€11,868 |
|||||
Unrecognized deferred tax assets
on temporary differences
|
(3,462) |
466 |
(26) |
9 |
(170) |
(3,183) |
|||||
Deferred tax assets arising on tax
loss carry-forwards
|
8,803 |
469 |
— |
2 |
232 |
9,506 |
|||||
Unrecognized deferred tax assets
on tax loss carry-forwards
|
(6,663) |
373 |
— |
(3) |
(238) |
(6,531) |
|||||
Total Net deferred tax assets /
(liabilities)
|
€(2,447) |
€680 |
€(303) |
€(5) |
€(205) |
€(2,280) |
|||||
Tax loss carry-forward
(after application of the
current tax rate)
|
Recognized deferred tax
assets on tax loss carry-
forward
|
Unrecognized deferred tax
assets on tax loss carry-
forwards (after application
of the current tax rate)
|
||||
At December 31, 2023 |
||||||
(€ million) |
||||||
Tax Groups: |
||||||
France |
€1,663 |
€(1,645) |
€18 |
|||
Germany |
120 |
(120) |
— |
|||
Spain |
561 |
(63) |
498 |
|||
Italy |
3,499 |
(605) |
2,894 |
|||
Other Jurisdictions: |
||||||
Brazil |
2,411 |
— |
2,411 |
|||
Others |
815 |
(331) |
484 |
|||
Total |
€9,069 |
€(2,764) |
€6,305 |
|||
Tax loss carry-forward
(after application of the
current tax rate)
|
Recognized deferred tax
assets on tax loss carry-
forward
|
Unrecognized deferred tax
assets on tax loss carry-
forwards (after application
of the current tax rate)
|
||||
At December 31, 2022 |
||||||
(€ million) |
||||||
Tax Groups: |
||||||
France |
€2,066 |
€(2,050) |
€16 |
|||
Germany |
249 |
(249) |
— |
|||
Spain |
597 |
(53) |
544 |
|||
Italy |
3,640 |
(486) |
3,154 |
|||
Other Jurisdictions: |
||||||
Brazil |
2,252 |
— |
2,252 |
|||
Others |
702 |
(136) |
566 |
|||
Total |
€9,506 |
€(2,975) |
€6,531 |
|||
8. |
Other information by nature |
Years ended December 31, |
||||||
2023 |
2022 |
2021 |
||||
(€ million) |
||||||
Depreciation of right-of-use assets |
€607 |
€555 |
€529 |
|||
Interest expense on lease liabilities |
63 |
63 |
56 |
|||
Variable lease payments not included in the
measurement of lease liabilities
|
3 |
5 |
5 |
|||
Income from sub-leasing right-of-use assets |
(109) |
(108) |
(95) |
|||
Expenses relating to short-term leases and to leases
of low-value assets
|
111 |
107 |
137 |
|||
Gains arising from sale and leaseback transactions |
(155) |
(119) |
(22) |
|||
Total expense recognized in Net profit from
continuing operations
|
€520 |
€503 |
€610 |
|||
9. |
Goodwill and intangible assets with indefinite useful lives |
Goodwill |
||||||||||||
Gross amount |
Accumulated
impairment
losses
|
Total
Goodwill
|
Brands |
Other |
Total
Goodwill and
intangible
assets with
indefinite
useful lives
|
|||||||
(€ million) |
||||||||||||
At January 1, 2022 |
€14,415 |
€(40) |
€14,375 |
€15,527 |
€19 |
€29,921 |
||||||
Additions |
356 |
— |
356 |
— |
— |
356 |
||||||
Disposal |
(21) |
— |
(21) |
— |
— |
(21) |
||||||
Translation differences and
Other
|
795 |
2 |
797 |
685 |
— |
1,482 |
||||||
At December 31, 2022 |
15,545 |
(38) |
15,507 |
16,212 |
19 |
31,738 |
||||||
Additions(1) |
66 |
— |
66 |
— |
5 |
71 |
||||||
Disposals |
(12) |
— |
(12) |
— |
— |
(12) |
||||||
Translation differences and
Other
|
(388) |
— |
(388) |
(416) |
1 |
(803) |
||||||
At December 31, 2023 |
€15,211 |
€(38) |
€15,173 |
€15,796 |
€25 |
€30,994 |
||||||
At December 31, 2023 |
At December 31, 2022 |
|||||||
(€ million) |
Goodwill |
Brands |
Goodwill |
Brands |
||||
North America |
€10,412 |
€11,795 |
€10,790 |
€12,220 |
||||
Enlarged Europe |
1,899 |
2,876 |
2,092 |
3,021 |
||||
Middle East & Africa |
— |
— |
— |
— |
||||
South America |
1,550 |
— |
1,461 |
— |
||||
China and India & Asia Pacific |
170 |
— |
185 |
— |
||||
Maserati |
514 |
972 |
514 |
971 |
||||
Other activities |
628 |
153 |
465 |
— |
||||
Total |
€15,173 |
€15,796 |
€15,507 |
€16,212 |
||||
10. |
Other intangible assets |
Capitalized
development
expenditures
|
Patents,
concessions
and licenses
|
Other
intangible
assets
|
Total |
||||
(€ million) |
|||||||
Gross carrying amount at January 1, 2022 |
€28,965 |
€802 |
€3,814 |
€33,581 |
|||
Additions |
3,589 |
88 |
535 |
4,212 |
|||
Divestitures |
(54) |
(6) |
(225) |
(285) |
|||
Change in scope of consolidation |
— |
31 |
11 |
42 |
|||
Translation differences and other changes |
481 |
1 |
164 |
646 |
|||
At December 31, 2022 |
32,981 |
916 |
4,299 |
38,196 |
|||
Additions |
4,352 |
98 |
270 |
4,720 |
|||
Divestitures |
(49) |
(13) |
(334) |
(396) |
|||
Change in scope of consolidation |
5 |
6 |
29 |
40 |
|||
Translation differences and other changes |
(503) |
— |
(26) |
(529) |
|||
At December 31, 2023 |
36,786 |
1,007 |
4,238 |
42,031 |
|||
Accumulated amortization and impairment losses at
January 1, 2022
|
15,320 |
459 |
1,167 |
16,946 |
|||
Amortization |
1,893 |
95 |
166 |
2,154 |
|||
Impairment losses and asset write-offs(1) |
67 |
— |
6 |
73 |
|||
Divestitures |
(57) |
(3) |
(10) |
(70) |
|||
Change in scope of consolidation |
— |
(1) |
1 |
— |
|||
Translation differences and other changes |
54 |
1 |
32 |
87 |
|||
At December 31, 2022 |
17,277 |
551 |
1,362 |
19,190 |
|||
Amortization |
2,193 |
92 |
200 |
2,485 |
|||
Impairment losses and asset write-offs |
122 |
— |
— |
122 |
|||
Divestitures |
(38) |
(11) |
(3) |
(52) |
|||
Change in scope of consolidation |
5 |
5 |
17 |
27 |
|||
Translation differences and other changes |
(348) |
(3) |
(15) |
(366) |
|||
At December 31, 2023 |
19,211 |
634 |
1,561 |
21,406 |
|||
Carrying amount at December 31, 2022 |
€15,704 |
€365 |
€2,937 |
€19,006 |
|||
Carrying amount at December 31, 2023 |
€17,575 |
€373 |
€2,677 |
€20,625 |
|||
11. |
Property, plant and equipment |
Land |
Buildings |
Plant, machinery
and equipment
|
Other
assets(1)
|
Advances and
tangible assets
in progress
|
Total |
||||||
(€ million) |
|||||||||||
Gross carrying amount at January 1, 2022 |
€1,651 |
€10,232 |
€45,548 |
€6,074 |
€3,944 |
€67,449 |
|||||
Additions |
— |
322 |
3,133 |
367 |
1,017 |
4,839 |
|||||
Divestitures and disposals |
(39) |
(491) |
(1,018) |
(280) |
(67) |
(1,895) |
|||||
Change in the scope of consolidation |
7 |
(6) |
(10) |
60 |
1 |
52 |
|||||
Translation differences |
43 |
242 |
862 |
19 |
188 |
1,354 |
|||||
Transfer to Assets held for sale |
(104) |
(168) |
(158) |
(7) |
(18) |
(455) |
|||||
Other changes |
(9) |
129 |
1,334 |
423 |
(1,402) |
475 |
|||||
At December 31, 2022 |
1,549 |
10,260 |
49,691 |
6,656 |
3,663 |
71,819 |
|||||
Additions |
30 |
368 |
1,693 |
2,123 |
3,481 |
7,695 |
|||||
Divestitures and disposals |
(65) |
(505) |
(1,496) |
(292) |
— |
(2,358) |
|||||
Change in the scope of consolidation |
(6) |
25 |
66 |
(5) |
13 |
93 |
|||||
Translation differences |
(16) |
(120) |
(521) |
(67) |
(75) |
(799) |
|||||
Transfer to Assets held for sale |
(40) |
(36) |
(5) |
— |
— |
(81) |
|||||
Other changes |
(4) |
123 |
1,299 |
30 |
(1,540) |
(92) |
|||||
At December 31, 2023 |
1,448 |
10,115 |
50,727 |
8,445 |
5,542 |
76,277 |
|||||
Accumulated depreciation and impairment
losses at January 1, 2022
|
17 |
4,169 |
26,520 |
1,231 |
24 |
31,961 |
|||||
Depreciation |
3 |
583 |
3,633 |
434 |
— |
4,653 |
|||||
Divestitures and disposal |
(1) |
(250) |
(1,012) |
(154) |
— |
(1,417) |
|||||
Impairment losses and asset write-offs |
9 |
37 |
— |
— |
— |
46 |
|||||
Change in the scope of consolidation |
2 |
(2) |
15 |
24 |
— |
39 |
|||||
Translation differences |
— |
26 |
150 |
(3) |
3 |
176 |
|||||
Transfer to Assets held for sale |
— |
(84) |
(112) |
(4) |
— |
(200) |
|||||
Other changes |
2 |
11 |
158 |
185 |
— |
356 |
|||||
At December 31, 2022 |
32 |
4,490 |
29,352 |
1,713 |
27 |
35,614 |
|||||
Depreciation |
4 |
543 |
3,989 |
601 |
— |
5,137 |
|||||
Divestitures and disposals |
(6) |
(397) |
(1,418) |
(214) |
— |
(2,035) |
|||||
Impairment losses and asset write-offs |
4 |
(5) |
58 |
1 |
— |
58 |
|||||
Change in the scope of consolidation |
1 |
— |
35 |
— |
— |
36 |
|||||
Translation differences |
(1) |
(30) |
(252) |
(28) |
(1) |
(312) |
|||||
Transfer to Assets held for sale |
— |
(4) |
(5) |
— |
— |
(9) |
|||||
Other changes |
(2) |
46 |
49 |
9 |
(1) |
101 |
|||||
At December 31, 2023 |
32 |
4,643 |
31,808 |
2,082 |
25 |
38,590 |
|||||
Carrying amount at December 31, 2022 |
€1,517 |
€5,770 |
€20,339 |
€4,943 |
€3,636 |
€36,205 |
|||||
Carrying amount at December 31, 2023 |
€1,416 |
€5,472 |
€18,919 |
€6,363 |
€5,517 |
€37,687 |
|||||
Land |
Buildings |
Plant,
machinery and
equipment
|
Other assets |
Total |
||||||
(€ million) |
||||||||||
Balance at January 1, 2022 |
€22 |
€1,734 |
€349 |
€221 |
€2,326 |
|||||
Depreciation |
(3) |
(269) |
(126) |
(157) |
(555) |
|||||
Additions |
— |
124 |
46 |
208 |
378 |
|||||
Divestitures |
(2) |
(196) |
(7) |
(7) |
(212) |
|||||
Change in the scope of consolidation |
4 |
(11) |
(3) |
— |
(10) |
|||||
Translation differences |
1 |
59 |
11 |
9 |
80 |
|||||
Other |
1 |
(40) |
(5) |
(2) |
(46) |
|||||
Balance at December 31, 2022 |
23 |
1,401 |
265 |
272 |
1,961 |
|||||
Depreciation |
(4) |
(248) |
(114) |
(241) |
(607) |
|||||
Additions |
17 |
200 |
12 |
269 |
498 |
|||||
Divestitures |
(4) |
(52) |
(6) |
(4) |
(66) |
|||||
Change in the scope of consolidation |
— |
15 |
— |
— |
15 |
|||||
Translation differences |
— |
(24) |
(2) |
(8) |
(34) |
|||||
Other |
1 |
17 |
(2) |
1 |
17 |
|||||
Balance at December 31, 2023 |
€33 |
€1,309 |
€153 |
€289 |
€1,784 |
|||||
12. |
Investments accounted for using the equity method |
At December 31, |
|||
2023 |
2022 |
||
(€ million) |
|||
Joint ventures |
€6,013 |
€4,561 |
|
Associates |
2,006 |
195 |
|
Other |
51 |
78 |
|
Total Investments accounted for using the equity method |
€8,070 |
€4,834 |
|
Ownership percentage |
Investment balance |
|||||||
At December 31, |
At December 31, |
|||||||
2023 |
2022 |
2023 |
2022 |
|||||
Ownership percentage |
(€ million) |
|||||||
Finance companies in partnership with SCF |
50.0% |
50.0% |
€1,977 |
€2,092 |
||||
Finance companies in partnership with BNPP PF |
50.0% |
50.0% |
1,096 |
718 |
||||
Tofas-Turk Otomobil Fabrikasi A.S. |
37.9% |
37.9% |
1,037 |
932 |
||||
StarPlus Energy LLC |
49.0% |
49.0% |
558 |
141 |
||||
NextStar Energy Inc(1) |
49.0% |
—% |
397 |
— |
||||
Leasys SAS |
50.0% |
50.0% |
339 |
323 |
||||
Symbio(1) |
33.3% |
—% |
230 |
— |
||||
Automotive Cells Company SE (“ACC”) |
33.3% |
33.3% |
155 |
177 |
||||
Others |
224 |
178 |
||||||
Total joint ventures |
€6,013 |
€4,561 |
||||||
Zhejiang Leapmotor Technology Co., Ltd.(1) |
21.3% |
—% |
1,409 |
— |
||||
Archer Aviation Inc(1) |
10.1% |
—% |
112 |
— |
||||
Punch Powertrain PSA E-Transmission N.V. |
56.0% |
39.0% |
172 |
117 |
||||
Nordex S.A. |
50.0% |
—% |
142 |
— |
||||
360 Energy S.A.(1) |
49.5% |
—% |
105 |
— |
||||
Others |
66 |
78 |
||||||
Total associates |
€2,006 |
€195 |
||||||
Total joint ventures and associates |
€8,019 |
€4,756 |
||||||
At December 31, |
|||
2023 |
2022 |
||
(€ million) |
|||
Financial assets |
€34,499 |
€33,616 |
|
Of which: Cash and cash equivalents |
3,452 |
2,527 |
|
Other assets |
1,583 |
1,600 |
|
Financial liabilities |
29,382 |
28,558 |
|
Other liabilities |
2,746 |
2,474 |
|
Total Equity |
3,954 |
4,184 |
|
Carrying amount of interest |
|||
Company’s share of net assets |
1,977 |
2,092 |
|
Carrying amount of interest |
€1,977 |
€2,092 |
|
Years ended December 31, |
|||||
2023 |
2022 |
2021 |
|||
(€ million) |
|||||
Interest and similar income |
€3,303 |
€2,592 |
€2,300 |
||
Interest and similar expenses |
(2,084) |
(1,258) |
(997) |
||
Income tax expense |
(239) |
(219) |
(210) |
||
Profit from continuing operations |
628 |
690 |
673 |
||
Net profit |
628 |
690 |
673 |
||
Net profit attributable to owners of the parent (A) |
314 |
345 |
336 |
||
Other comprehensive income/(loss) attributable to owners of the parent (B) |
3 |
(8) |
15 |
||
Total Comprehensive income attributable to owners of the parent (A+B) |
€317 |
€337 |
€351 |
||
Company’s share of net profit |
€314 |
€345 |
€336 |
||
Years ended December 31, |
|||||
2023 |
2022 |
2021 |
|||
(€ million) |
|||||
Joint Ventures |
€547 |
€286 |
€737 |
||
Associates |
(50) |
13 |
22 |
||
Other |
(6) |
(35) |
(22) |
||
Total Share of the profit/(loss) of equity method investees |
€491 |
€264 |
€737 |
||
Years ended December 31, |
|||||
2023 |
2022 |
2021 |
|||
(€ million) |
|||||
Joint ventures: |
|||||
Profit/(loss) from continuing operations |
€233 |
€(152) |
€168 |
||
Net profit/(loss) |
233 |
(152) |
168 |
||
Other comprehensive loss |
(265) |
(47) |
(72) |
||
Total Other comprehensive (loss)/income |
€(32) |
€(199) |
€96 |
||
Associates: |
|||||
Income/(loss) from continuing operations |
€(50) |
€13 |
€22 |
||
Net income/(loss) |
(50) |
13 |
22 |
||
Other comprehensive income |
(11) |
— |
13 |
||
Total Other comprehensive income |
€(61) |
€13 |
€35 |
||
13. |
Financial assets |
At December 31, |
|||||||||||||
2023 |
2022 |
||||||||||||
Note |
Current |
Non-
current
|
Total |
Current |
Non-
current
|
Total |
|||||||
(€ million) |
|||||||||||||
Derivative financial assets |
17 |
€17 |
€23 |
€40 |
€13 |
€21 |
€34 |
||||||
Financial securities measured at fair value through
other comprehensive income
|
24 |
59 |
356 |
415 |
96 |
62 |
158 |
||||||
Financial securities measured at fair value through
profit or loss
|
24 |
1,013 |
911 |
1,924 |
573 |
367 |
940 |
||||||
Financial securities measured at amortized cost |
3,667 |
1,764 |
5,431 |
3,171 |
52 |
3,223 |
|||||||
Financial receivables |
2,023 |
158 |
2,181 |
469 |
158 |
627 |
|||||||
Collateral deposits(1) |
24 |
51 |
57 |
108 |
1 |
50 |
51 |
||||||
Total financial assets |
€6,830 |
€3,269 |
€10,099 |
€4,323 |
€710 |
€5,033 |
|||||||
14. |
Inventories |
At December 31, |
|||
2023 |
2022 |
||
(€ million) |
|||
Finished goods and goods for resale |
€12,064 |
€8,304 |
|
Work-in-progress, raw materials and manufacturing supplies |
9,136 |
8,781 |
|
Amount due from customers for contract work |
214 |
275 |
|
Total Inventories |
€21,414 |
€17,360 |
|
At December 31, |
|||
2023 |
2022 |
||
(€ million) |
|||
Aggregate amount of costs incurred and recognized profits (less recognized losses) to date |
€766 |
€826 |
|
Less: Progress billings |
659 |
662 |
|
Construction contracts, net asset/(liability) |
€107 |
€164 |
|
Construction contract assets |
214 |
275 |
|
Less: Construction contract liabilities (Note 23) |
107 |
111 |
|
Construction contracts, net asset/(liability) |
€107 |
€164 |
|
At January 1,
2023
|
Advances
received from
customers
|
Amounts
recognized within
revenue
|
At December 31,
2023
|
|||||
(€ million) |
||||||||
Construction contracts, net asset/(liability) |
€164 |
€(766) |
€709 |
€107 |
||||
15. |
Working capital |
Years ended December 31, |
|||||
2023 |
2022 |
2021 |
|||
(€ million) |
|||||
(Increase)/decrease in inventories |
€(4,388) |
€(5,606) |
€2,201 |
||
(Increase)/decrease in trade receivables |
(2,249) |
(1,986) |
246 |
||
Increase/(decrease) in trade payables |
1,058 |
4,165 |
(1,273) |
||
Other changes |
107 |
(1,054) |
38 |
||
Total change in working capital |
€(5,472) |
€(4,481) |
€1,212 |
||
16. |
Trade receivables, other assets, prepaid expenses and tax receivables |
At December 31 |
|||||||||||
2023 |
2022 |
||||||||||
Current |
Non-current |
Total |
Current |
Non-current |
Total |
||||||
(€ million) |
|||||||||||
Receivables from financing activities |
€4,487 |
€4,507 |
€8,994 |
€2,153 |
€2,553 |
€4,706 |
|||||
Other receivables |
4,311 |
1,628 |
5,939 |
3,506 |
1,730 |
5,236 |
|||||
Defined benefit plan assets (Note 20) |
24 |
886 |
910 |
— |
1,844 |
1,844 |
|||||
Derivative operating assets |
157 |
51 |
208 |
587 |
286 |
873 |
|||||
Prepaid expenses and other |
1,309 |
622 |
1,931 |
1,303 |
310 |
1,613 |
|||||
Total other assets and prepaid expenses |
€10,288 |
€7,694 |
€17,982 |
€7,549 |
€6,723 |
€14,272 |
|||||
At December 31, |
|||||||||||||||||||
2023 |
2022 |
||||||||||||||||||
Total
due within
one year
(current)
|
Due
between
one and
five years
|
Due
beyond
five years
|
Total due
after one
year
(non-
current)
|
Total |
Total
due within
one year
(current)
|
Due
between
one and
five years
|
Due
beyond
five years
|
Total due
after one
year
(non-
current)
|
Total |
||||||||||
(€ million) |
|||||||||||||||||||
Receivables from
financing activities
|
€4,487 |
€3,273 |
€1,234 |
€4,507 |
€8,994 |
€2,153 |
€1,918 |
€635 |
€2,553 |
€4,706 |
|||||||||
Other receivables |
4,311 |
1,498 |
130 |
1,628 |
5,939 |
3,506 |
1,614 |
116 |
1,730 |
5,236 |
|||||||||
Derivative operating
assets
|
157 |
51 |
— |
51 |
208 |
587 |
286 |
— |
286 |
873 |
|||||||||
Total |
€8,955 |
€4,822 |
€1,364 |
€6,186 |
€15,141 |
€6,246 |
€3,818 |
€751 |
€4,569 |
€10,815 |
|||||||||
Tax receivables |
€802 |
€84 |
€33 |
€117 |
€919 |
€543 |
€79 |
€33 |
€112 |
€655 |
|||||||||
At January 1,
2023
|
Provision |
Use and
other changes
|
Transferred to
Assets held for
sale
|
At December
31, 2023
|
|||||
(€ million) |
|||||||||
ECL allowance - Trade receivables |
€562 |
€219 |
€(230) |
€— |
€551 |
||||
At December 31, |
||||||||||||
2023 |
2022 |
|||||||||||
Current and
less than 90
days past
due
|
90 days or
more past
due
|
Total |
Current and
less than 90
days past
due
|
90 days or
more past
due
|
Total |
|||||||
(€ million) |
||||||||||||
Gross amount |
€5,964 |
€964 |
€6,928 |
€4,820 |
€669 |
€5,489 |
||||||
ECL allowance |
(88) |
(463) |
(551) |
(178) |
(384) |
(562) |
||||||
Carrying amount |
€5,876 |
€501 |
€6,377 |
€4,642 |
€285 |
€4,927 |
||||||
At December 31, |
|||
2023 |
2022 |
||
(€ million) |
|||
Dealer financing |
€2,305 |
€1,644 |
|
Retail financing |
5,505 |
2,475 |
|
Finance leases |
133 |
7 |
|
Other |
1,051 |
580 |
|
Total Receivables from financing activities |
€8,994 |
€4,706 |
|
At January 1,
2023
|
Provision |
Use and
other changes
|
Transferred to
Assets held for
sale
|
At December
31, 2023
|
|||||
(€ million) |
|||||||||
ECL allowance - Receivables from financing
activities
|
€172 |
€185 |
€(162) |
€— |
€195 |
||||
At December 31, |
||||||||||||||||
2023 |
2022 |
|||||||||||||||
Stage 1 |
Stage 2 |
Stage 3 |
Total |
Stage 1 |
Stage 2 |
Stage 3 |
Total |
|||||||||
(€ million) |
||||||||||||||||
Gross amount |
€8,841 |
€117 |
€114 |
€9,072 |
€4,492 |
€69 |
€58 |
€4,619 |
||||||||
ECL allowance |
(149) |
(23) |
(23) |
(195) |
(138) |
(22) |
(12) |
(172) |
||||||||
Carrying amount |
€8,692 |
€94 |
€91 |
€8,877 |
€4,354 |
€47 |
€46 |
€4,447 |
||||||||
At December 31, |
|||||||||||
2023 |
2022 |
||||||||||
Trade
receivables
|
Receivables
from
financing
activities
|
Total |
Trade
receivables
|
Receivables
from
financing
activities
|
Total |
||||||
(€ million) |
|||||||||||
Carrying amount of assets transferred and not
derecognized
|
€58 |
€9 |
€67 |
€119 |
€9 |
€128 |
|||||
Carrying amount of the related liabilities (Note 22) |
€58 |
€9 |
€67 |
€119 |
€9 |
€128 |
|||||
17. |
Derivative financial and operating assets and liabilities |
At December 31, |
|||||||
2023 |
2022 |
||||||
Positive fair
value
|
Negative fair
value
|
Positive fair
value
|
Negative fair
value
|
||||
(€ million) |
|||||||
Fair value hedges: |
|||||||
Interest rate risk - interest rate swaps |
€26 |
€(1) |
€— |
€— |
|||
Interest rate and currency risk - combined interest rate and
currency swaps
|
— |
— |
— |
— |
|||
Currency risk - forward contracts, currency swaps and
currency options
|
— |
— |
25 |
(22) |
|||
Commodity price risk – commodity swaps and commodity
options
|
— |
— |
— |
— |
|||
Total Fair value hedges |
26 |
(1) |
25 |
(22) |
|||
Cash flow hedges: |
|||||||
Interest rate risk - interest rate swaps |
— |
(28) |
19 |
— |
|||
Currency risks - forward contracts, currency swaps and
currency options
|
111 |
(331) |
423 |
(266) |
|||
Commodity price risk – commodity swaps and commodity
options
|
36 |
(681) |
406 |
(637) |
|||
Total Cash flow hedges |
147 |
(1,040) |
848 |
(903) |
|||
Net investment hedges: |
|||||||
Currency risks - forward contracts, currency swaps and
currency options
|
— |
— |
— |
— |
|||
Total Net investment hedges |
— |
— |
— |
— |
|||
Derivatives for trading |
75 |
(43) |
34 |
(25) |
|||
Total Fair value of derivative financial assets/(liabilities) |
€248 |
€(1,084) |
€907 |
€(950) |
|||
Financial derivative assets/(liabilities) - current |
€17 |
€(18) |
€13 |
€(18) |
|||
Financial derivative assets/(liabilities) - non-current |
€23 |
€(21) |
€21 |
€— |
|||
Derivative operating assets/(liabilities) - current |
€157 |
€(746) |
€587 |
€(708) |
|||
Derivative operating assets/(liabilities) - non-current |
€51 |
€(299) |
€286 |
€(224) |
|||
At December 31, |
|||||||||||||||
2023 |
2022 |
||||||||||||||
Due within
one year
|
Due
between
one and
five
years
|
Due
beyond
five
years
|
Total |
Due within
one year
|
Due
between
one and
five
years
|
Due
beyond
five
years
|
Total |
||||||||
(€ million) |
|||||||||||||||
Currency risk management |
€21,424 |
€6,263 |
€— |
€27,687 |
€22,142 |
€5,831 |
€— |
€27,973 |
|||||||
Interest rate risk management |
42 |
6,680 |
— |
6,722 |
220 |
830 |
— |
1,050 |
|||||||
Interest rate and currency risk
management
|
37 |
28 |
— |
65 |
14 |
101 |
— |
115 |
|||||||
Commodity price risk
management
|
2,809 |
2,196 |
— |
5,005 |
3,291 |
3,252 |
— |
6,543 |
|||||||
Total Notional amount |
€24,312 |
€15,167 |
€— |
€39,479 |
€25,667 |
€10,014 |
€— |
€35,681 |
|||||||
Years ended December 31, |
|||||
2023 |
2022 |
2021 |
|||
(€ million) |
|||||
Currency and interest rate risk |
|||||
Change in ineffective portion |
€(1) |
€(34) |
€(16) |
||
Interest rate risk |
|||||
Change in ineffective portion |
— |
— |
— |
||
Net gains/(losses) |
€(1) |
€(34) |
€(16) |
||
Years ended December 31, |
|||||
2023 |
2022 |
2021 |
|||
(€ million) |
|||||
Currency risk |
|||||
(Increase)/decrease in Cost of revenues |
€(101) |
€(111) |
€(82) |
||
Net financial income/(expenses) |
— |
— |
(86) |
||
Result from investments |
7 |
(10) |
20 |
||
Interest rate risk |
|||||
(Increase)/decrease in Cost of revenues |
— |
— |
— |
||
Result from investments |
44 |
(59) |
(6) |
||
Net financial income/(expenses) |
— |
— |
2 |
||
Commodity price risk |
|||||
(Increase)/decrease in Cost of revenues |
(435) |
464 |
18 |
||
Ineffectiveness and discontinued hedges |
4 |
(6) |
2 |
||
Tax expense |
77 |
(99) |
5 |
||
Total recognized in the Consolidated Income Statement |
€(404) |
€179 |
€(127) |
||
18. |
Cash and cash equivalents |
At December 31, |
|||
2023 |
2022 |
||
(€ million) |
|||
Cash at banks |
€8,981 |
€9,836 |
|
Money market securities measured at FVTPL |
17,691 |
20,870 |
|
Other cash equivalents |
16,997 |
15,727 |
|
Total Cash and cash equivalents |
€43,669 |
€46,433 |
|
19. |
Share-based compensation |
2023 |
|||||||||||
PSU TSR |
Weighted
average fair
value at the
grant date
(€)
|
PSU Synergies |
Weighted
average fair
value at the
grant date
(€)
|
PSU
Compliance
|
Weighted
average fair
value at the
grant date
(€)
|
||||||
Outstanding shares unvested at
January 1
|
6,352,440 |
€13.09 |
6,352,440 |
€12.61 |
1,588,222 |
€12.61 |
|||||
Granted |
2,903,808 |
12.02 |
56,890 |
16.14 |
14,225 |
14.05 |
|||||
Vested |
— |
— |
— |
— |
— |
— |
|||||
Canceled |
— |
— |
— |
— |
— |
— |
|||||
Forfeited |
(676,719) |
12.43 |
(439,100) |
12.43 |
(347,390) |
12.59 |
|||||
Outstanding shares unvested at
December 31
|
8,579,529 |
€12.79 |
5,970,230 |
€12.64 |
1,255,057 |
€12.76 |
|||||
2023 |
|||||||||||
PSU
Electrification
|
Weighted
average fair
value at the
grant date
(€)
|
PSU AOI |
Weighted
average fair
value at the
grant date
(€)
|
PRSU |
Weighted
average fair
value at the
grant date
(€)
|
||||||
Outstanding shares unvested at
January 1
|
1,587,998 |
€12.61 |
— |
€— |
— |
€— |
|||||
Granted |
2,861,143 |
12.83 |
3,795,870 |
12.88 |
417,386 |
15.82 |
|||||
Vested |
— |
— |
— |
— |
— |
— |
|||||
Canceled |
— |
— |
— |
— |
— |
— |
|||||
Forfeited |
(109,760) |
12.43 |
(316,827) |
12.83 |
|||||||
Outstanding shares unvested at
December 31
|
4,339,381 |
€12.64 |
3,479,043 |
€12.83 |
417,386 |
€15.82 |
|||||
2022 |
|||||||||||||||
PSU TSR |
Weighted
average fair
value at the
grant date
(€)
|
PSU
Synergies
|
Weighted
average fair
value at the
grant date
(€)
|
PSU
Compliance
|
Weighted
average fair
value at the
grant date
(€)
|
PSU
Electrification
|
Weighted
average fair
value at the
grant date
(€)
|
||||||||
Outstanding
shares unvested
at January 1
|
2,757,605 |
€17.07 |
2,757,605 |
€14.55 |
689,516 |
€14.55 |
689,285 |
€14.55 |
|||||||
Granted |
3,803,956 |
10.38 |
3,803,956 |
11.29 |
950,992 |
11.29 |
950,986 |
11.29 |
|||||||
Vested |
— |
— |
— |
— |
— |
— |
— |
— |
|||||||
Canceled |
— |
— |
— |
— |
— |
— |
— |
— |
|||||||
Forfeited |
(209,121) |
16.50 |
(209,121) |
14.27 |
(52,286) |
14.27 |
(52,273) |
14.27 |
|||||||
Outstanding
shares unvested
at December 31
|
6,352,440 |
€13.09 |
6,352,440 |
€12.61 |
1,588,222 |
€12.61 |
1,587,998 |
€12.61 |
|||||||
2021 |
|||||||||||||||
PSU TSR |
Weighted
average fair
value at the
grant date
(€)
|
PSU
Synergies
|
Weighted
average fair
value at the
grant date
(€)
|
PSU
Compliance
|
Weighted
average fair
value at the
grant date
(€)
|
PSU
Electrification
|
Weighted
average fair
value at the
grant date
(€)
|
||||||||
Outstanding
shares unvested
at January 1
|
— |
€— |
— |
€— |
— |
€— |
— |
€— |
|||||||
Granted |
2,934,454 |
17.07 |
2,934,454 |
14.55 |
733,729 |
14.55 |
733,498 |
14.55 |
|||||||
Vested |
— |
— |
— |
— |
— |
— |
— |
— |
|||||||
Canceled |
— |
— |
— |
— |
— |
— |
— |
— |
|||||||
Forfeited |
(176,849) |
17.07 |
(176,849) |
14.55 |
(44,213) |
14.55 |
(44,213) |
14.55 |
|||||||
Outstanding
shares unvested
at December 31
|
2,757,605 |
€17.07 |
2,757,605 |
€14.55 |
689,516 |
€14.55 |
689,285 |
€14.55 |
|||||||
2023 |
2022 |
2021 |
||||
Key assumptions |
PSU TSR Awards Range |
|||||
Grant date stock price |
€15.37 - €15.64 |
€12.51 - €13.33 |
€16.98 - €17.68 |
|||
Expected volatility |
34% |
42% |
41% |
|||
Risk-free rate |
2.94% |
0.4% |
0.69% |
|||
2023 |
2022 |
2021 |
|||||||||
RSUs |
Weighted
average fair
value at the
grant date
(€)
|
RSUs |
Weighted
average fair
value at the
grant date
(€)
|
RSUs |
Weighted
average fair
value at the
grant date
(€)
|
||||||
Outstanding shares unvested at
January 1
|
8,824,943 |
€12.77 |
4,316,256 |
€14.62 |
— |
€— |
|||||
Granted |
3,419,898 |
12.41 |
5,186,760 |
11.45 |
4,499,970 |
14.62 |
|||||
Vested |
(365,601) |
15.26 |
(310,968) |
16.11 |
— |
— |
|||||
Canceled |
— |
— |
— |
— |
— |
||||||
Forfeited |
(816,533) |
12.51 |
(367,105) |
14.02 |
(183,714) |
14.62 |
|||||
Outstanding shares unvested at
December 31
|
11,062,707 |
€12.67 |
8,824,943 |
€12.77 |
4,316,256 |
€14.62 |
|||||
2023 |
2022 |
2021 |
|||||||||
Replacement
Stellantis
RSU awards
|
Weighted
average fair
value at the
grant date
(€)
|
Replacement
Stellantis
RSU awards
|
Weighted
average fair
value at the
grant date
(€)
|
Replacement
Stellantis
RSU awards
|
Weighted
average fair
value at the
grant date
(€)
|
||||||
Outstanding shares unvested at
January 1
|
9,722,133 |
€9.95 |
17,520,829 |
€11.08 |
— |
€— |
|||||
Anti-dilution adjustment |
— |
— |
— |
— |
2,181,936 |
11.09 |
|||||
Granted |
— |
— |
— |
— |
24,321,968 |
11.14 |
|||||
Vested |
(9,597,921) |
9.95 |
(6,923,401) |
10.19 |
(8,438,777) |
11.30 |
|||||
Canceled |
— |
— |
— |
— |
— |
— |
|||||
Forfeited |
(124,212) |
— |
(875,295) |
10.05 |
(544,298) |
10.32 |
|||||
Outstanding shares unvested at
December 31
|
— |
€9.95 |
9,722,133 |
€9.95 |
17,520,829 |
€11.08 |
|||||
2023 |
2022 |
2021 |
||||||||||
Replacement
Stellantis RSU
awards
|
Weighted
average fair
value at the
grant date
(€)
|
Replacement
Stellantis RSU
awards
|
Weighted
average fair
value at the
grant date
(€)
|
Replacement
Stellantis RSU
awards
|
Weighted
average fair
value at the
grant date
(€)
|
|||||||
Outstanding shares unvested at
January 1
|
6,422,078 |
€6.71 |
11,573,960 |
€7.9 |
8,576,981 |
€15.3 |
||||||
Anti-dilution adjustment |
— |
— |
— |
— |
7,278,029 |
— |
||||||
Granted |
— |
— |
— |
— |
— |
— |
||||||
Vested |
(6,422,078) |
6.71 |
(4,187,770) |
8.78 |
(4,245,183) |
9.15 |
||||||
Canceled |
— |
— |
— |
— |
— |
— |
||||||
Forfeited |
— |
— |
(964,112) |
7.76 |
(35,867) |
8.99 |
||||||
Outstanding shares unvested at
December 31
|
— |
€— |
6,422,078 |
€6.71 |
11,573,960 |
€7.9 |
||||||
2021 Anti-
dilution
adjustment
|
||
RSU Awards: |
||
Number of awards - as adjusted |
3,179,903 |
20. |
Employee benefits liabilities |
At December 31, |
||||||||||||
2023 |
2022 |
|||||||||||
Current |
Non-
current
|
Total |
Current |
Non-
current
|
Total |
|||||||
(€ million) |
||||||||||||
Pension benefits |
€45 |
€1,913 |
€1,958 |
€43 |
€2,783 |
€2,826 |
||||||
Health care and life insurance plans |
120 |
1,577 |
1,697 |
126 |
1,596 |
1,722 |
||||||
Other post-employment benefits |
58 |
735 |
793 |
56 |
771 |
827 |
||||||
Other provisions for employees |
339 |
686 |
1,025 |
320 |
741 |
1,061 |
||||||
Total Employee benefits liabilities |
€562 |
€4,911 |
€5,473 |
€545 |
€5,891 |
€6,436 |
||||||
At December 31, |
||||
2023 |
2022 |
|||
(€ million) |
||||
Present value of defined benefit obligations: |
||||
Pension benefits |
€23,468 |
€23,652 |
||
Health care and life insurance plans |
1,697 |
1,722 |
||
Other post-employment benefits |
767 |
805 |
||
Total present value of defined benefit obligations (a) |
25,932 |
26,179 |
||
Fair value of plan assets (b) |
22,642 |
22,676 |
||
Asset ceiling (c) |
248 |
28 |
||
Total net defined benefit plans (a - b + c) |
3,538 |
3,531 |
||
of which: |
||||
Net defined benefit liability (d) |
4,448 |
5,375 |
||
Defined benefit plan asset (Note 16) |
(910) |
(1,844) |
||
Other provisions for employees (e) |
1,025 |
1,061 |
||
Total Employee benefits liabilities (d + e) |
€5,473 |
€6,436 |
||
Expected benefit
payments
|
||
(€ million) |
||
2024 |
€1,771 |
|
2025 |
€1,784 |
|
2026 |
€1,780 |
|
2027 |
€1,791 |
|
2028 |
€1,753 |
|
2029-2033 |
€8,523 |
2023 |
2022 |
|||||||||||||||||||
US and
Canada
|
UK |
France
and
Germany
|
Other |
Total |
US and
Canada
|
UK |
France
and
Germany
|
Other |
Total |
|||||||||||
(€ million) |
||||||||||||||||||||
Projected benefit obligation |
||||||||||||||||||||
At beginning of period:
Present value
|
€(19,201) |
€(1,545) |
€(2,671) |
€(235) |
€(23,652) |
€(24,197) |
€(2,480) |
€(3,141) |
€(413) |
€(30,231) |
||||||||||
Effect of changes in scope of
consolidation and other
|
(1) |
1 |
(1) |
— |
(1) |
22 |
1 |
(283) |
34 |
(226) |
||||||||||
Service cost |
(99) |
— |
(32) |
(9) |
(140) |
(160) |
— |
(57) |
(11) |
(228) |
||||||||||
Interest cost |
(980) |
(69) |
(94) |
(17) |
(1,160) |
(729) |
(44) |
(46) |
(9) |
(828) |
||||||||||
Benefit payments for the year |
1,537 |
83 |
117 |
39 |
1,776 |
1,564 |
97 |
105 |
24 |
1,790 |
||||||||||
Participant contributions |
(1) |
— |
— |
— |
(1) |
(1) |
— |
— |
— |
(1) |
||||||||||
Actuarial gains and (losses) |
(165) |
108 |
(128) |
(4) |
(189) |
5,568 |
756 |
750 |
149 |
7,223 |
||||||||||
Demographic assumptions
and experience
|
10 |
(19) |
(17) |
(13) |
(39) |
58 |
(71) |
(219) |
(23) |
(255) |
||||||||||
Financial assumptions |
(175) |
127 |
(111) |
9 |
(150) |
5,510 |
827 |
969 |
172 |
7,478 |
||||||||||
Effect of changes in exchange
rates
|
610 |
(32) |
— |
(13) |
565 |
(1,265) |
128 |
— |
(12) |
(1,149) |
||||||||||
Past service cost |
(396) |
(2) |
— |
— |
(398) |
(3) |
(3) |
— |
2 |
(4) |
||||||||||
Effect of curtailments and
settlements/Other
|
(268) |
— |
— |
— |
(268) |
— |
— |
1 |
1 |
2 |
||||||||||
At period-end: Present value |
€(18,964) |
€(1,456) |
€(2,809) |
€(239) |
€(23,468) |
€(19,201) |
€(1,545) |
€(2,671) |
€(235) |
€(23,652) |
||||||||||
Plan Assets |
||||||||||||||||||||
At beginning of period: Fair
value
|
€17,959 |
€1,989 |
€2,547 |
€181 |
€22,676 |
€21,856 |
€3,148 |
€3,238 |
€233 |
€28,475 |
||||||||||
Effect of changes in scope of
consolidation and other
|
— |
— |
— |
— |
— |
(29) |
— |
264 |
(26) |
209 |
||||||||||
Expected return on assets |
920 |
90 |
90 |
8 |
1,108 |
660 |
56 |
47 |
2 |
765 |
||||||||||
Participant contributions |
1 |
— |
— |
— |
1 |
1 |
— |
— |
— |
1 |
||||||||||
Administrative Expenses |
(84) |
(3) |
— |
— |
(87) |
(82) |
(1) |
— |
(1) |
(84) |
||||||||||
Actuarial gains and (losses) |
560 |
(255) |
(124) |
(7) |
174 |
(4,267) |
(978) |
(909) |
(20) |
(6,174) |
||||||||||
Effect of changes in exchange
rates
|
(554) |
41 |
— |
1 |
(512) |
1,067 |
(165) |
— |
2 |
904 |
||||||||||
Employer contributions |
993 |
21 |
6 |
— |
1,020 |
309 |
26 |
8 |
2 |
345 |
||||||||||
Benefit payments for the year |
(1,533) |
(83) |
(111) |
(11) |
(1,738) |
(1,556) |
(97) |
(101) |
(11) |
(1,765) |
||||||||||
At period-end: Fair value |
€18,262 |
€1,800 |
€2,408 |
€172 |
€22,642 |
€17,959 |
€1,989 |
€2,547 |
€181 |
€22,676 |
||||||||||
2023 |
2022 |
|||||||||||||||||||
US and
Canada
|
UK |
France
and
Germany
|
Other |
Total |
US and
Canada
|
UK |
France
and
Germany
|
Other |
Total |
|||||||||||
(€ million) |
||||||||||||||||||||
Present value of
projected benefit
obligation
|
€(18,964) |
€(1,456) |
€(2,809) |
€(239) |
€(23,468) |
€(19,201) |
€(1,545) |
€(2,671) |
€(235) |
€(23,652) |
||||||||||
Fair value of plan assets |
18,262 |
1,800 |
2,408 |
172 |
22,642 |
17,959 |
1,989 |
2,547 |
181 |
22,676 |
||||||||||
Net (liability) asset
recognized in the balance
sheet before minimum
funding requirement
(IFRIC 14)
|
(702) |
344 |
(401) |
(67) |
(826) |
(1,242) |
444 |
(124) |
(54) |
(976) |
||||||||||
Minimum funding
requirement liability
(IFRIC 14)
|
(248) |
— |
— |
— |
(248) |
(28) |
— |
— |
— |
(28) |
||||||||||
Net (liability) asset
recognized in the balance
sheet
|
(950) |
344 |
(401) |
(67) |
(1,074) |
(1,270) |
444 |
(124) |
(54) |
(1,004) |
||||||||||
Of which, liability |
(1,444) |
(22) |
(432) |
(60) |
(1,958) |
(2,528) |
(38) |
(192) |
(68) |
(2,826) |
||||||||||
Of which, asset |
494 |
366 |
31 |
(7) |
884 |
1,258 |
482 |
68 |
14 |
1,822 |
||||||||||
Years ended December 31, |
||||||
2023 |
2022 |
2021 |
||||
(€ million) |
||||||
Current service cost |
€140 |
€228 |
€238 |
|||
Interest expense |
1,160 |
828 |
678 |
|||
Interest income |
(1,108) |
(765) |
(588) |
|||
Other administration costs |
87 |
83 |
73 |
|||
Past service costs/(credits) and (gains)/losses arising from settlements/curtailments |
666 |
3 |
(184) |
|||
Items relating to discontinued operations |
— |
— |
— |
|||
Total recognized in the Consolidated Income Statement |
€945 |
€377 |
€217 |
|||
At December 31, |
||||||||
2023 |
2022 |
|||||||
Amount |
of which have a
quoted market
price in an active
market
|
Amount |
of which have a
quoted market
price in an active
market
|
|||||
(€ million) |
||||||||
Cash and cash equivalents |
€1,943 |
€1,742 |
€961 |
€850 |
||||
U.S. equity securities |
671 |
669 |
908 |
906 |
||||
Non-U.S. equity securities |
516 |
516 |
641 |
641 |
||||
Equity commingled funds |
1,118 |
688 |
1,445 |
399 |
||||
Equity instruments |
2,305 |
1,873 |
2,994 |
1,946 |
||||
Government securities |
2,837 |
1,476 |
2,262 |
986 |
||||
Corporate bonds (including convertible and high yield bonds) |
4,414 |
217 |
4,333 |
14 |
||||
Other fixed income |
4,178 |
— |
4,950 |
37 |
||||
Fixed income securities |
11,429 |
1,693 |
11,545 |
1,037 |
||||
Private equity funds |
2,956 |
— |
2,965 |
— |
||||
Diversified Commingled funds |
47 |
— |
125 |
34 |
||||
Real estate funds |
1,288 |
— |
1,343 |
4 |
||||
Hedge funds |
2,308 |
— |
2,634 |
— |
||||
Investment funds |
6,599 |
— |
7,067 |
38 |
||||
Insurance contracts and other |
366 |
22 |
109 |
73 |
||||
Total fair value of plan assets |
€22,642 |
€5,330 |
€22,676 |
€3,944 |
||||
At December 31, |
||||||||||||||||||||
2023 |
2022 |
|||||||||||||||||||
U.S. |
Canada |
UK |
France |
Germany |
U.S. |
Canada |
UK |
France |
Germany |
|||||||||||
Discount rate |
5.43% |
4.64% |
5.29% |
4.46% |
3.99% |
5.40% |
5.27% |
4.52% |
4.01% |
3.56% |
||||||||||
Future salary
increase rate
|
—% |
3.50% |
2.70% |
2.77% |
2.80% |
—% |
3.50% |
2.55% |
2.68% |
2.80% |
||||||||||
Expected benefit
payments
|
||
(€ million) |
||
2024 |
€120 |
|
2025 |
€119 |
|
2026 |
€119 |
|
2027 |
€119 |
|
2028 |
€119 |
|
2029-2033 |
€591 |
2023 |
2022 |
|||
(€ million) |
||||
Present value of obligations at January 1 |
€1,722 |
€2,258 |
||
Included in the Consolidated Income Statement |
143 |
92 |
||
Included in Other comprehensive income: |
||||
Actuarial (gains)/losses from: |
||||
- Demographic and other assumptions |
(25) |
(45) |
||
- Financial assumptions |
40 |
(565) |
||
Effect of movements in exchange rates |
(53) |
118 |
||
Other: |
||||
Benefits paid |
(130) |
(136) |
||
December 31 |
€1,697 |
€1,722 |
||
Years ended December 31, |
||||||
2023 |
2022 |
2021 |
||||
(€ million) |
||||||
Current service cost |
€11 |
€21 |
€21 |
|||
Interest expense |
89 |
70 |
60 |
|||
Past service costs/(credits) and losses/(gains) arising from settlements |
43 |
1 |
— |
|||
Total recognized in the Consolidated Income Statement |
€143 |
€92 |
€81 |
|||
At December 31, |
|||||||
2023 |
2022 |
||||||
U.S. |
Canada |
U.S. |
Canada |
||||
Discount rate |
5.51% |
4.64% |
5.54% |
5.27% |
|||
Salary growth |
2.50% |
2.00% |
1.50% |
1.25% |
|||
Weighted average ultimate healthcare cost trend rate |
3.95% |
4.00% |
4.00% |
4.00% |
|||
2023 |
2022 |
|||
(€ million) |
||||
Present value of obligations at January 1 |
€805 |
€1,125 |
||
Included in the Consolidated Income Statement |
60 |
(34) |
||
Included in Other comprehensive income: |
||||
Actuarial (gains)/losses from: |
||||
- Demographic and other assumptions |
(27) |
49 |
||
- Financial assumptions |
(29) |
(279) |
||
Effect of movements in exchange rates |
(4) |
1 |
||
Other: |
||||
Benefits paid |
(47) |
(56) |
||
Other changes |
9 |
(1) |
||
Present value of obligations at December 31 |
€767 |
€805 |
||
Years ended December 31, |
||||||
2023 |
2022 |
2021 |
||||
(€ million) |
||||||
Current service cost |
€31 |
€38 |
€95 |
|||
Interest expense |
34 |
12 |
10 |
|||
Past service costs/(credits) and losses/(gains) arising from settlements |
(5) |
(84) |
(82) |
|||
Total recognized in the Consolidated Income Statement |
€60 |
€(34) |
€23 |
|||
21. |
Provisions |
At December 31, |
||||||||||||
2023 |
2022 |
|||||||||||
Current |
Non-
current
|
Total |
Current |
Non-
current
|
Total |
|||||||
(€ million) |
||||||||||||
Product warranty and recall campaigns |
€3,574 |
€5,410 |
€8,984 |
€3,501 |
€5,764 |
€9,265 |
||||||
Sales incentives |
6,031 |
— |
6,031 |
3,395 |
— |
3,395 |
||||||
Restructuring |
958 |
342 |
1,300 |
853 |
687 |
1,540 |
||||||
Legal proceedings and disputes |
343 |
747 |
1,090 |
405 |
793 |
1,198 |
||||||
Commercial risks |
2,301 |
422 |
2,723 |
2,444 |
228 |
2,672 |
||||||
Other risks |
517 |
823 |
1,340 |
713 |
988 |
1,701 |
||||||
Total Provisions |
€13,724 |
€7,744 |
€21,468 |
€11,311 |
€8,460 |
€19,771 |
||||||
At January
1, 2023
|
Additional
provisions
|
Settlements |
Unused
amounts
|
Translation
differences
|
Transfer to
Liabilities
held for
sale
|
Change in
scope
|
Other |
At
December
31, 2023
|
||||||||||
(€ million) |
||||||||||||||||||
Product warranty and
recall campaigns
|
€9,265 |
€5,064 |
€(5,066) |
€(114) |
€(210) |
€(63) |
€— |
€108 |
€8,984 |
|||||||||
Sales incentives |
3,395 |
10,378 |
(7,552) |
(69) |
(103) |
— |
— |
(18) |
6,031 |
|||||||||
Restructuring costs |
1,540 |
1,147 |
(1,058) |
(344) |
(4) |
— |
(1) |
20 |
1,300 |
|||||||||
Legal proceedings and
disputes
|
1,198 |
192 |
(266) |
(69) |
7 |
— |
(1) |
29 |
1,090 |
|||||||||
Commercial risks |
2,672 |
912 |
(731) |
(39) |
(87) |
— |
— |
(4) |
2,723 |
|||||||||
Other risks |
1,701 |
429 |
(411) |
(316) |
(17) |
— |
(7) |
(39) |
1,340 |
|||||||||
Total Provisions |
€19,771 |
€18,122 |
€(15,084) |
€(951) |
€(414) |
€(63) |
€(9) |
€96 |
€21,468 |
|||||||||
22. |
Debt |
At December 31, |
||||||||||||||||||||
2023 |
2022 |
|||||||||||||||||||
Due
within
one year
(current)
|
Due
between
one and
five years
|
Due
beyond
five years
|
Total
(non-
current)
|
Total
Debt
|
Due
within
one year
(current)
|
Due
between
one and
five years
|
Due
beyond
five
years
|
Total
(non-
current)
|
Total
Debt
|
|||||||||||
(€ million) |
||||||||||||||||||||
Notes |
€2,277 |
€7,133 |
€8,805 |
€15,938 |
€18,215 |
€3,692 |
€7,662 |
€7,911 |
€15,573 |
€19,265 |
||||||||||
Borrowings from
banks
|
1,512 |
1,297 |
27 |
1,324 |
2,836 |
1,389 |
1,416 |
145 |
1,561 |
2,950 |
||||||||||
Asset-backed
financing
|
3,638 |
1,014 |
126 |
1,140 |
4,778 |
1,009 |
558 |
88 |
646 |
1,655 |
||||||||||
Lease liabilities |
718 |
728 |
712 |
1,440 |
2,158 |
634 |
896 |
729 |
1,625 |
2,259 |
||||||||||
Other debt |
1,317 |
150 |
9 |
159 |
1,476 |
960 |
63 |
1 |
64 |
1,024 |
||||||||||
Total Debt |
€9,462 |
€10,322 |
€9,679 |
€20,001 |
€29,463 |
€7,684 |
€10,595 |
€8,874 |
€19,469 |
€27,153 |
||||||||||
At December 31, |
||||||||||||
(€ million) |
Currency |
Face value of
outstanding
notes
(million)
|
Coupon
%
|
Maturity |
2023 |
2022 |
||||||
Stellantis (Peugeot S.A. issuances): |
||||||||||||
STELLANTIS N.V. (Peugeot S.A.) 2016 |
EUR |
500 |
2.375 |
Q2/2023 |
— |
508 |
||||||
STELLANTIS N.V. (Peugeot S.A.) 2017 |
EUR |
600 |
2.000 |
Q1/2024 |
609 |
608 |
||||||
STELLANTIS N.V. (Peugeot S.A.) 2017 |
EUR |
100 |
2.000 |
Q1/2024 |
102 |
102 |
||||||
STELLANTIS N.V. (Peugeot S.A.) 2018 |
EUR |
650 |
2.000 |
Q1/2025 |
659 |
658 |
||||||
STELLANTIS N.V. (Peugeot S.A.) 2019 |
EUR |
600 |
1.125 |
Q3/2029 |
596 |
594 |
||||||
STELLANTIS N.V. (Peugeot S.A.) 2020 |
EUR |
1,000 |
2.750 |
Q2/2026 |
1,014 |
1,011 |
||||||
STELLANTIS N.V. (Peugeot S.A.)
Schuldschein 2019
|
EUR |
100 |
1.050 |
Q4/2023 |
— |
101 |
||||||
STELLANTIS N.V. (Peugeot S.A.)
Schuldschein 2019
|
EUR |
60 |
1.600 |
Q2/2026 |
61 |
61 |
||||||
STELLANTIS N.V. (Peugeot S.A.)
Schuldschein 2019
|
EUR |
50 |
1.810 |
Q2/2027 |
50 |
50 |
||||||
STELLANTIS N.V. (Peugeot S.A.)
Schuldschein 2019
|
EUR |
70 |
Euribor
6M +
1.050
|
Q4/2023 |
— |
71 |
||||||
STELLANTIS N.V. (Peugeot S.A.)
Schuldschein 2019
|
EUR |
204 |
Euribor
6M +
1.400
|
Q2/2026 |
207 |
204 |
||||||
Medium Term Note Programme(1): |
||||||||||||
STELLANTIS N.V. (FCA N.V.) 2016 |
EUR |
1,250 |
3.750 |
Q1/2024 |
1,296 |
1,340 |
||||||
STELLANTIS N.V. (FCA N.V.) 2020 |
EUR |
1,250 |
3.375 |
Q3/2023 |
— |
1,289 |
||||||
STELLANTIS N.V. (FCA N.V.) 2020 |
EUR |
1,250 |
3.875 |
Q1/2026 |
1,381 |
1,420 |
||||||
STELLANTIS N.V. (FCA N.V.) 2020 |
EUR |
1,000 |
4.500 |
Q3/2028 |
1,200 |
1,219 |
||||||
STELLANTIS N.V. 2021 |
EUR |
1,250 |
0.625 |
Q1/2027 |
1,256 |
1,254 |
||||||
STELLANTIS N.V. 2021 |
EUR |
1,250 |
0.750 |
Q1/2029 |
1,254 |
1,250 |
||||||
STELLANTIS N.V. 2021 |
EUR |
1,250 |
1.250 |
Q2/2033 |
1,241 |
1,240 |
||||||
STELLANTIS N.V. 2022 |
EUR |
1,000 |
2.750 |
Q2/2032 |
1,016 |
1,016 |
||||||
STELLANTIS N.V. 2023 - Green Bond |
EUR |
1,250 |
4.375 |
Q1/2030 |
1,285 |
— |
||||||
STELLANTIS N.V. 2023 |
EUR |
1,250 |
4.250 |
Q2/2031 |
1,266 |
— |
||||||
Other Notes: |
||||||||||||
STELLANTIS N.V. (FCA N.V.) 2015 |
U.S.$ |
1,500 |
5.250 |
Q2/2023 |
— |
1,437 |
||||||
STELLANTIS FINANCE US 2021 |
U.S $ |
1,000 |
1.711 |
Q1/2027 |
909 |
942 |
||||||
STELLANTIS FINANCE US 2021 |
U.S $ |
1,000 |
2.691 |
Q3/2031 |
909 |
941 |
||||||
STELLANTIS FINANCE US 2022 |
U.S. $ |
550 |
5.625 |
Q1/2028 |
512 |
520 |
||||||
STELLANTIS FINANCE US 2022 |
U.S. $ |
700 |
6.375 |
Q3/2032 |
643 |
665 |
||||||
GIE PSA Trésorerie 2003 |
EUR |
600 |
6.000 |
Q3/2033 |
749 |
764 |
||||||
Total Notes |
€18,215 |
€19,265 |
||||||||||
At December 31, |
||||||||||
(€ million) |
Currency |
Interest rate % |
Maturity(1) |
2023 |
2022 |
|||||
Warehouse Credit
Facilities:
|
||||||||||
SFS Funding I |
USD |
CP/SOFR+spread |
Q3/2024 |
3,189 |
627 |
|||||
SFS Funding II |
USD |
CP/SOFR+spread |
Q3/2024 |
109 |
10 |
|||||
FIARC |
USD |
SOFR+spread |
Q2/2025 |
29 |
101 |
|||||
Term Notes: |
||||||||||
Term Notes 2017-2020 |
USD |
2.80%-7.07% |
Q2/2027 |
36 |
114 |
|||||
Term Notes 2021-1 |
USD |
0.89%-5.37% |
Q2/2028 |
45 |
75 |
|||||
Term Notes 2021-2 |
USD |
0.48%-3.14% |
Q4/2028 |
98 |
158 |
|||||
Term Notes 2022-1 |
USD |
2.03%-5.41% |
Q2/2029 |
125 |
201 |
|||||
Term Notes 2022-2 |
USD |
6.26%-8.71% |
Q4/2029 |
151 |
241 |
|||||
Term Notes 2023-1 |
USD |
5.89%-7.74% |
Q1/2031 |
929 |
— |
|||||
Total |
€4,711 |
€1,527 |
||||||||
At December 31, |
||||
2023 |
2022 |
|||
(€ million) |
||||
Long-term debt (non-current) |
€1,440 |
€1,625 |
||
Short-term debt and current portion of long-term debt (current) |
€718 |
€634 |
||
At December 31, 2023 |
||
(€ million) |
||
Due within one year |
€818 |
|
Due between one and five years |
824 |
|
Due beyond five years |
795 |
|
Total undiscounted lease liabilities |
€2,437 |
23. |
Other liabilities |
At December 31, |
||||||||||||
2023 |
2022 |
|||||||||||
Current |
Non-
current
|
Total |
Current |
Non-
current
|
Total |
|||||||
(€ million) |
||||||||||||
Payables for buy-back agreements |
€1,877 |
€4,645 |
€6,522 |
€1,968 |
€4,931 |
€6,899 |
||||||
Accrued expenses and deferred income |
4,778 |
751 |
5,529 |
3,620 |
149 |
3,769 |
||||||
Indirect tax payables |
1,426 |
15 |
1,441 |
1,563 |
23 |
1,586 |
||||||
Payables to personnel |
2,658 |
4 |
2,662 |
2,700 |
6 |
2,706 |
||||||
Social security payables |
567 |
15 |
582 |
633 |
14 |
647 |
||||||
Construction contract liabilities
(Note 14)
|
107 |
— |
107 |
111 |
— |
111 |
||||||
Service contract liability |
808 |
2,160 |
2,968 |
948 |
2,255 |
3,203 |
||||||
Derivatives operating liability |
746 |
299 |
1,045 |
708 |
224 |
932 |
||||||
Other |
2,603 |
176 |
2,779 |
2,277 |
527 |
2,804 |
||||||
Total Other liabilities |
€15,570 |
€8,065 |
€23,635 |
€14,528 |
€8,129 |
€22,657 |
||||||
At December 31, |
||||||||||||||||||||
2023 |
2022 |
|||||||||||||||||||
Total
due within
one year
(Current)
|
Due
between
one and
five
years
|
Due
beyond
five
years
|
Total due
after one
year
(Non-
Current)
|
Total |
Total
due within
one year
(Current)
|
Due
between
one and
five
years
|
Due
beyond
five
years
|
Total due
after one
year
(Non-
Current)
|
Total |
|||||||||||
(€ million) |
||||||||||||||||||||
Other liabilities (excluding
Accrued expenses, deferred
income and service contract
liability)
|
€9,984 |
€5,124 |
€30 |
€5,154 |
€15,138 |
€9,960 |
€2,449 |
€3,276 |
€5,725 |
€15,685 |
||||||||||
At January 1,
2023
|
Advances
received from
customers
|
Amounts
recognized
within revenue
|
Transfers to
Assets/
(Liabilities)
held for sale
|
Other Changes |
At December
31, 2023
|
|||||||
(€ million) |
||||||||||||
Service contract liability |
€3,203 |
€1,198 |
€(1,272) |
€— |
€(161) |
€2,968 |
||||||
24. |
Fair value measurement |
At December 31, |
|||||||||||||||||
2023 |
2022 |
||||||||||||||||
Note |
Level 1 |
Level 2 |
Level 3 |
Total |
Level 1 |
Level 2 |
Level 3 |
Total |
|||||||||
(€ million) |
|||||||||||||||||
Financial securities and equity
instruments measured at FVOCI
|
13 |
€110 |
€23 |
€282 |
€415 |
€99 |
€19 |
€40 |
€158 |
||||||||
Financial securities and equity
instruments measured at FVPL
|
13 |
1,041 |
— |
883 |
1,924 |
726 |
— |
214 |
940 |
||||||||
Derivative financial assets |
17 |
— |
40 |
— |
40 |
2 |
30 |
2 |
34 |
||||||||
Derivative operating assets |
17 |
— |
208 |
— |
208 |
— |
873 |
— |
873 |
||||||||
Collateral deposits |
13 |
108 |
— |
— |
108 |
51 |
— |
— |
51 |
||||||||
Receivables from financing
activities
|
16 |
— |
— |
117 |
117 |
— |
— |
259 |
259 |
||||||||
Trade receivables |
16 |
— |
49 |
— |
49 |
— |
1 |
— |
1 |
||||||||
Other receivables |
16 |
— |
— |
76 |
76 |
— |
— |
89 |
89 |
||||||||
Money market securities |
18 |
17,691 |
— |
— |
17,691 |
20,869 |
— |
1 |
20,870 |
||||||||
Total Assets |
€18,950 |
€320 |
€1,358 |
€20,628 |
€21,747 |
€923 |
€605 |
€23,275 |
|||||||||
Derivative financial liabilities |
17 |
— |
39 |
— |
39 |
— |
18 |
— |
18 |
||||||||
Derivative operating liabilities |
17 |
— |
1,005 |
40 |
1,045 |
— |
883 |
49 |
932 |
||||||||
Total Liabilities |
€— |
€1,044 |
€40 |
€1,084 |
€— |
€901 |
€49 |
€950 |
|||||||||
Receivables
from
financing
activities
|
Financial
securities
|
Derivative
financial
assets/
(liabilities)
|
Collateral
deposits
|
Money
market
securities
|
Other
receivables
|
|||||||
(€ million) |
||||||||||||
At January 1, 2023 |
€259 |
€254 |
€(48) |
€— |
€1 |
€89 |
||||||
Change in scope of consolidation |
(28) |
|||||||||||
Gains/(Losses) recognized in
Consolidated Income Statement
|
— |
1 |
— |
— |
— |
(13) |
||||||
Losses recognized in Other
comprehensive income/(loss)
|
— |
(151) |
8 |
— |
— |
— |
||||||
Issues/Settlements |
(142) |
— |
— |
— |
— |
— |
||||||
Purchases/Sales |
— |
1,089 |
— |
— |
— |
— |
||||||
Transfers to Assets/(Liabilities) held for
sale
|
— |
— |
— |
— |
— |
— |
||||||
Transfers from Level 3 |
— |
— |
— |
— |
(1) |
— |
||||||
At December 31, 2023 |
€117 |
€1,165 |
€(40) |
€— |
€— |
€76 |
||||||
Receivables
from
financing
activities
|
Financial
securities
|
Derivative
financial
assets/
(liabilities)
|
Collateral
deposits
|
Money
market
securities
|
Other
receivables
|
|||||||
(€ million) |
||||||||||||
At January 1, 2022 |
€252 |
€142 |
€(11) |
€15 |
€12 |
€134 |
||||||
Gains recognized in Other
comprehensive income/(loss)
|
— |
5 |
4 |
— |
— |
20 |
||||||
Losses recognized in Consolidated
Income Statement
|
— |
— |
(41) |
— |
— |
— |
||||||
Issues/Settlements |
7 |
— |
— |
— |
— |
— |
||||||
Purchases/Sales |
— |
58 |
— |
— |
(11) |
— |
||||||
Transfers to Assets/(Liabilities) held for
sale
|
— |
— |
— |
— |
— |
— |
||||||
Transfers from Level 3 |
— |
49 |
— |
(15) |
— |
(65) |
||||||
At December 31, 2022 |
€259 |
€254 |
€(48) |
€— |
€1 |
€89 |
||||||
At December 31, |
|||||||||
2023 |
2022 |
||||||||
Note |
Carrying
amount
|
Fair
Value
|
Carrying
amount
|
Fair
Value
|
|||||
(€ million) |
|||||||||
Dealer financing |
€2,188 |
€2,184 |
€1,370 |
€1,365 |
|||||
Retail financing |
5,505 |
5,364 |
2,475 |
2,301 |
|||||
Finance lease |
133 |
133 |
7 |
7 |
|||||
Other receivables from financing activities |
1,051 |
1,063 |
595 |
564 |
|||||
Total Receivables from financing activities(1) |
16 |
€8,877 |
€8,744 |
€4,447 |
€4,237 |
||||
Asset-backed financing |
€4,778 |
€4,772 |
€1,655 |
€1,629 |
|||||
Notes |
18,215 |
17,391 |
19,265 |
17,321 |
|||||
Borrowings from banks & Other debt |
4,312 |
4,274 |
3,974 |
3,901 |
|||||
Total Debt, excluding Lease liabilities |
22 |
€27,305 |
€26,437 |
€24,894 |
€22,851 |
||||
25. |
Related party transactions |
Years ended December 31, |
||||||||||||||||||||||||
2023 |
2022 |
2021 |
||||||||||||||||||||||
Net
Revenues
|
Cost of
revenues
|
Selling,
general
and
other
costs, net
|
Net
Financial
expenses/
(income)
|
Net
Revenues
|
Cost of
revenues
|
Selling,
general
and
other
costs, net
|
Net
Financial
expenses/
(income)
|
Net
Revenues
|
Cost of
revenues
|
Selling,
general
and
other
costs, net
|
Net
Financial
expenses
|
|||||||||||||
(€ million) |
||||||||||||||||||||||||
Tofas |
€1,339 |
€779 |
€27 |
€— |
€1,129 |
€1,699 |
€24 |
€— |
€831 |
€1,220 |
€14 |
€— |
||||||||||||
FCA Bank |
— |
— |
— |
— |
2,007 |
33 |
30 |
21 |
1,666 |
19 |
(1) |
39 |
||||||||||||
Leasys |
960 |
12 |
6 |
— |
— |
— |
— |
— |
— |
— |
— |
— |
||||||||||||
GAC-Stellantis JV |
— |
— |
— |
— |
24 |
— |
— |
(2) |
45 |
— |
— |
(3) |
||||||||||||
Dongfeng Peugeot
Citroën Automobiles
|
72 |
177 |
— |
(3) |
140 |
604 |
— |
(7) |
150 |
122 |
— |
— |
||||||||||||
Finance companies in
partnership with SCF
and BNPP PF(1)
|
8,973 |
471 |
(7) |
14 |
7,773 |
623 |
1 |
(2) |
7,251 |
647 |
57 |
— |
||||||||||||
Other |
4 |
1 |
(1) |
(2) |
3 |
— |
12 |
(4) |
4 |
2 |
8 |
— |
||||||||||||
Total joint
arrangements
|
11,348 |
1,440 |
25 |
9 |
11,076 |
2,959 |
67 |
6 |
9,947 |
2,010 |
78 |
36 |
||||||||||||
GEFCO |
— |
— |
— |
— |
— |
— |
— |
— |
25 |
2,048 |
— |
— |
||||||||||||
Other |
23 |
196 |
2 |
(1) |
65 |
183 |
16 |
— |
66 |
144 |
16 |
(2) |
||||||||||||
Total associates |
23 |
196 |
2 |
(1) |
65 |
183 |
16 |
— |
91 |
2,192 |
16 |
(2) |
||||||||||||
CNHI |
28 |
— |
(3) |
— |
50 |
— |
— |
— |
332 |
169 |
1 |
— |
||||||||||||
Iveco |
218 |
19 |
(5) |
— |
233 |
26 |
(1) |
— |
— |
— |
— |
— |
||||||||||||
Ferrari N.V. |
16 |
51 |
(1) |
— |
22 |
83 |
— |
— |
27 |
115 |
— |
— |
||||||||||||
Directors and Key
Management
|
— |
— |
87 |
— |
— |
— |
75 |
— |
— |
— |
73 |
— |
||||||||||||
Other |
1 |
— |
43 |
— |
1 |
1 |
48 |
— |
179 |
5 |
49 |
— |
||||||||||||
Total CNHI, Ferrari,
Directors and other
|
263 |
70 |
121 |
— |
306 |
110 |
122 |
— |
538 |
289 |
123 |
— |
||||||||||||
Total unconsolidated
subsidiaries
|
95 |
24 |
— |
— |
17 |
50 |
5 |
(1) |
261 |
11 |
5 |
(4) |
||||||||||||
Total transactions
with related parties
|
€11,729 |
€1,730 |
€148 |
€8 |
€11,464 |
€3,302 |
€210 |
€5 |
€10,837 |
€4,502 |
€222 |
€30 |
||||||||||||
Total for the
Company
|
€189,544 |
€151,400 |
€9,541 |
€(42) |
€179,592 |
€144,327 |
€8,981 |
€768 |
€149,419 |
€119,943 |
€9,130 |
€734 |
||||||||||||
At December 31, |
||||||||||||||||
2023 |
2022 |
|||||||||||||||
Trade and
other
receivables
|
Trade
payables and
other liabilities
|
Asset-
backed
financing
|
Debt(1) |
Trade
and other
receivables
|
Trade
payables and
other liabilities
|
Asset-
backed
financing
|
Debt (1) |
|||||||||
(€ million) |
||||||||||||||||
Tofas |
€164 |
€180 |
€— |
€— |
€214 |
€423 |
€— |
€— |
||||||||
FCA Bank |
— |
— |
— |
— |
272 |
122 |
2 |
113 |
||||||||
Leasys |
147 |
104 |
— |
38 |
— |
— |
— |
— |
||||||||
GAC-Stellantis JV |
— |
14 |
— |
— |
— |
14 |
— |
— |
||||||||
Dongfeng Peugeot Citroën
Automobiles
|
128 |
44 |
— |
— |
114 |
64 |
— |
— |
||||||||
Finance companies in partnership
with SCF and BNPP PF(2)
|
943 |
400 |
38 |
22 |
919 |
258 |
55 |
16 |
||||||||
Other |
77 |
11 |
— |
— |
14 |
16 |
— |
— |
||||||||
Total joint arrangements |
1,459 |
753 |
38 |
60 |
1,533 |
897 |
57 |
129 |
||||||||
Other |
237 |
34 |
— |
— |
102 |
27 |
— |
— |
||||||||
Total associates |
237 |
34 |
— |
— |
102 |
27 |
— |
— |
||||||||
CNHI |
11 |
1 |
— |
— |
19 |
1 |
— |
— |
||||||||
Iveco |
42 |
40 |
— |
— |
34 |
17 |
— |
— |
||||||||
Ferrari N.V. |
8 |
19 |
— |
— |
11 |
17 |
— |
— |
||||||||
Other |
1 |
25 |
— |
— |
1 |
39 |
— |
— |
||||||||
Total CNHI, Ferrari N.V. and
other
|
62 |
85 |
— |
— |
65 |
74 |
— |
— |
||||||||
Total unconsolidated
subsidiaries
|
188 |
26 |
— |
7 |
95 |
91 |
— |
8 |
||||||||
Total originating from related
parties
|
€1,946 |
€898 |
€38 |
€67 |
€1,795 |
€1,089 |
€57 |
€137 |
||||||||
Total for the Company |
€21,359 |
€56,643 |
€4,778 |
€24,685 |
€14,870 |
€54,383 |
€1,655 |
€25,498 |
||||||||
26. |
Guarantees granted, commitments and contingent liabilities |
(€ million) |
||
2024 |
€2,130 |
|
2025 |
€1,893 |
|
2026 |
€2,909 |
|
2027 |
€2,961 |
|
2028 |
€3,206 |
|
2029 and thereafter |
€2,374 |
27. |
Equity |
Common Shares |
Special Voting
Shares A
|
Special Voting
Shares B
|
Total |
|||||
Balance at January 1, 2023 |
3,144,246,685 |
178,692 |
— |
3,144,425,377 |
||||
Issuance of special voting shares |
— |
1,000 |
208,622 |
209,622 |
||||
Purchase of treasury shares |
(142,090,297) |
(110,410) |
(208,622) |
(142,409,329) |
||||
Shares issued for long-term incentive plans and
employee share purchase plan
|
20,942,651 |
— |
— |
20,942,651 |
||||
Balance at December 31, 2023 |
3,023,099,039 |
69,282 |
— |
3,023,168,321 |
Dates right subscribed |
From November 13 to November 30, 2023 |
Employee subscription price |
€14.52 |
Years ended December 31, |
||||||||||||||||||
2023 |
2022 |
2021 |
||||||||||||||||
Pre-tax
balance
|
Tax
income/
(expense)
|
Net
balance
|
Pre-tax
balance
|
Tax
income/
(expense)
|
Net
balance
|
Pre-tax
balance
|
Tax
income/
(expense)
|
Net
balance
|
||||||||||
(€ million) |
||||||||||||||||||
Fair value remeasurement of
cash flow hedges
|
(910) |
245 |
(665) |
(482) |
89 |
(393) |
149 |
(54) |
95 |
|||||||||
Gains and losses from
remeasurement of
financial assets
|
€57 |
€— |
€57 |
€3 |
€— |
€3 |
€6 |
€— |
€6 |
|||||||||
Actuarial gains and losses on
defined benefit
pension obligations
|
€(228) |
€41 |
€(187) |
€1,753 |
€(379) |
€1,374 |
€2,488 |
€(729) |
€1,759 |
|||||||||
Exchange differences on
translating foreign
operations
|
(1,927) |
— |
(1,927) |
2,013 |
— |
2,013 |
2,005 |
— |
2,005 |
|||||||||
Share of Other comprehensive
income/(loss) for equity method
investees
|
(219) |
— |
(219) |
(12) |
— |
(12) |
(39) |
— |
(39) |
|||||||||
Items relating to discontinued
operations
|
— |
— |
— |
— |
— |
— |
— |
— |
— |
|||||||||
Total Other comprehensive
income/(loss)
|
€(3,227) |
€286 |
€(2,941) |
€3,275 |
€(290) |
€2,985 |
€4,609 |
€(783) |
€3,826 |
|||||||||
28. |
Earnings per share |
Years ended December 31, |
|||||||
2023 |
2022 |
2021 |
|||||
Net profit attributable to owners of the parent |
million |
€18,596 |
€16,799 |
€14,200 |
|||
Weighted average number of shares outstanding |
thousand |
3,107,725 |
3,140,089 |
3,059,284 |
|||
Basic earnings per share |
€ |
€5.98 |
€5.35 |
€4.64 |
|||
Years ended December 31, |
|||||||
2023 |
2022 |
2021 |
|||||
Net profit from continuing operations attributable to owners of the
parent
|
million |
€18,596 |
€16,799 |
€13,210 |
|||
Weighted average number of shares outstanding |
thousand |
3,107,725 |
3,140,089 |
3,059,284 |
|||
Basic earnings per share from continuing operations |
€ |
€5.98 |
€5.35 |
€4.32 |
|||
Years ended December 31, |
|||||||
2023 |
2022 |
2021 |
|||||
Net profit from discontinued operations attributable to owners of the
parent
|
million |
€— |
€— |
€990 |
|||
Weighted average number of shares outstanding |
thousand |
3,107,725 |
3,140,089 |
3,059,284 |
|||
Basic earnings per share from discontinued operations |
€ |
€— |
€— |
€0.32 |
|||
Years ended December 31, |
|||||||
2023 |
2022 |
2021 |
|||||
Net profit attributable to owners of the parent |
million |
€18,596 |
€16,799 |
€14,200 |
|||
Weighted average number of shares outstanding |
thousand |
3,107,725 |
3,140,089 |
3,059,284 |
|||
Number of shares deployable for share-based compensation |
thousand |
24,733 |
23,870 |
23,651 |
|||
Equity warrants delivered to GM |
thousand |
— |
— |
68,497 |
|||
Weighted average number of shares outstanding for diluted earnings
per share
|
thousand |
3,132,458 |
3,163,959 |
3,151,432 |
|||
Diluted earnings per share |
€ |
€5.94 |
€5.31 |
€4.51 |
|||
Years ended December 31, |
|||||||
2023 |
2022 |
2021 |
|||||
Net profit from continuing operations attributable to owners of the
parent
|
million |
€18,596 |
€16,799 |
€13,210 |
|||
Weighted average number of shares outstanding |
3,107,725 |
3,140,089 |
3,059,284 |
||||
Number of shares deployable for share-based compensation |
thousand |
24,733 |
23,870 |
23,651 |
|||
Equity warrants delivered to GM |
thousand |
— |
— |
68,497 |
|||
Weighted average number of shares outstanding for diluted earnings
per share
|
thousand |
3,132,458 |
3,163,959 |
3,151,432 |
|||
Diluted earnings per share from continuing operations |
€ |
€5.94 |
€5.31 |
€4.19 |
|||
Years ended December 31, |
|||||||
2023 |
2022 |
2021 |
|||||
Net profit from discontinued operations attributable to owners of the
parent
|
million |
€— |
€— |
€990 |
|||
Weighted average number of shares outstanding |
3,107,725 |
3,140,089 |
3,059,284 |
||||
Number of shares deployable for share-based compensation |
thousand |
24,733 |
23,870 |
23,651 |
|||
Equity warrants delivered to GM |
thousand |
— |
— |
68,497 |
|||
Weighted average number of shares outstanding for diluted earnings
per share
|
thousand |
3,132,458 |
3,163,959 |
3,151,432 |
|||
Diluted earnings per share from discontinued operations |
€ |
€— |
€— |
€0.31 |
|||
29. |
Segment reporting |
2023 |
North
America
|
Enlarged
Europe
|
Middle
East &
Africa
|
South
America
|
China and
India &
Asia Pacific
|
Maserati |
Other
activities
|
Unallocated
items &
eliminations
|
Stellantis |
|||||||||
(€ million) |
||||||||||||||||||
Net revenues from external
customers
|
€86,498 |
€66,444 |
€10,560 |
€16,148 |
€3,526 |
€2,335 |
€4,207 |
€(174) |
€189,544 |
|||||||||
Net revenues from
transactions with other
segments
|
2 |
154 |
— |
(90) |
2 |
— |
1,004 |
(1,072) |
— |
|||||||||
Net revenues |
86,500 |
66,598 |
10,560 |
16,058 |
3,528 |
2,335 |
5,211 |
(1,246) |
189,544 |
|||||||||
Net profit/(loss) from
continuing operations
|
€18,625 |
|||||||||||||||||
Tax expense/(benefit) |
€3,793 |
|||||||||||||||||
Net financial expenses/
(income)
|
€(42) |
|||||||||||||||||
Operating income/(loss)(1) |
€22,376 |
|||||||||||||||||
Adjustments: |
||||||||||||||||||
Restructuring and other
costs, net of reversals(2)
|
€650 |
€475 |
€— |
€14 |
€1 |
€1 |
€20 |
€— |
€1,161 |
|||||||||
Collective agreements
related costs(3)
|
€428 |
€— |
€— |
€— |
€— |
€— |
€— |
€— |
€428 |
|||||||||
Argentina currency
devaluation(4)
|
€— |
€— |
€— |
€302 |
€— |
€— |
€— |
€— |
€302 |
|||||||||
Impairment expense and
supplier obligations(5)
|
€— |
€47 |
€— |
€— |
€154 |
€— |
€— |
€— |
€201 |
|||||||||
Reorganization of financial
services(6)
|
€— |
€— |
€— |
€— |
€— |
€— |
€76 |
€— |
€76 |
|||||||||
Takata recall campaign |
€— |
€(44) |
€30 |
€— |
€4 |
€— |
€— |
€— |
€(10) |
|||||||||
Patents litigation(7) |
€(20) |
€(40) |
€— |
€(1) |
€— |
€— |
€— |
€— |
€(61) |
|||||||||
Gains on disposal of equity
investments and other
assets(8)
|
€(65) |
€(40) |
€— |
€— |
€(57) |
€— |
€(39) |
€— |
€(201) |
|||||||||
Other |
€40 |
€99 |
€1 |
€(43) |
€(18) |
€— |
€(15) |
€7 |
€71 |
|||||||||
Total adjustments |
€1,033 |
€497 |
€31 |
€272 |
€84 |
€1 |
€42 |
€7 |
€1,967 |
|||||||||
Adjusted operating income |
€13,298 |
€6,519 |
€2,503 |
€2,369 |
€502 |
€141 |
€(322) |
€(667) |
€24,343 |
|||||||||
Share of profit/(loss) of
equity method investees,
excluding adjustments(1)
|
€(6) |
€(139) |
€192 |
€16 |
€18 |
€— |
€410 |
€— |
€491 |
|||||||||
2022 |
North
America
|
Enlarged
Europe
|
Middle
East &
Africa
|
South
America
|
China and
India &
Asia Pacific
|
Maserati |
Other
activities
|
Unallocated
items &
eliminations
|
Stellantis |
|||||||||
(€ million) |
||||||||||||||||||
Net revenues from external
customers
|
€85,474 |
€63,226 |
€6,453 |
€15,640 |
€4,500 |
€2,322 |
€1,953 |
€24 |
€179,592 |
|||||||||
Net revenues from
transactions with other
segments
|
1 |
85 |
— |
(20) |
5 |
(2) |
1,216 |
(1,285) |
— |
|||||||||
Net revenues |
85,475 |
63,311 |
6,453 |
15,620 |
4,505 |
2,320 |
3,169 |
(1,261) |
179,592 |
|||||||||
Net profit/(loss) from
continuing operations
|
€16,779 |
|||||||||||||||||
Tax expense/(benefit) |
€2,729 |
|||||||||||||||||
Net financial expenses/
(income)
|
€768 |
|||||||||||||||||
Operating income/(loss)(1) |
€20,276 |
|||||||||||||||||
Adjustments: |
||||||||||||||||||
Restructuring costs and
other costs, net of
reversals(2)
|
€56 |
€1,020 |
€— |
€36 |
€— |
€2 |
€30 |
€— |
€1,144 |
|||||||||
Takata recall campaign(3) |
€382 |
€545 |
€22 |
€2 |
€— |
€— |
€— |
€— |
€951 |
|||||||||
CAFE penalty rate(4) |
€660 |
€— |
€— |
€— |
€— |
€— |
€— |
€— |
€660 |
|||||||||
Change in estimate of non-
contractual warranties(5)
|
€— |
€294 |
€14 |
€3 |
€3 |
€— |
€— |
€— |
€314 |
|||||||||
Impairment of GAC-
Stellantis JV(6)
|
€— |
€— |
€— |
€— |
€297 |
€— |
€— |
€— |
€297 |
|||||||||
Impairment expense and
supplier obligations(7)
|
€99 |
€92 |
€— |
€45 |
€— |
€— |
€— |
€1 |
€237 |
|||||||||
Patents litigation(8) |
€93 |
€40 |
€— |
€1 |
€— |
€— |
€— |
€— |
€134 |
|||||||||
Write down of FCA Bank
investment(9)
|
€— |
€— |
€— |
€— |
€— |
€— |
€133 |
€— |
€133 |
|||||||||
Other(10) |
€(24) |
€(232) |
€(1) |
€62 |
€36 |
€— |
€27 |
€3 |
€(129) |
|||||||||
Total adjustments |
€1,266 |
€1,759 |
€35 |
€149 |
€336 |
€2 |
€190 |
€4 |
€3,741 |
|||||||||
Adjusted operating income |
€13,987 |
€6,218 |
€1,188 |
€2,048 |
€641 |
€201 |
€179 |
€(445) |
€24,017 |
|||||||||
Share of profit/(loss) of
equity method investees,
excluding adjustments(1)
|
€(2) |
€(75) |
€110 |
€— |
€(310) |
€— |
€541 |
€— |
€264 |
|||||||||
Adjusted operating income,
as reported
|
€13,989 |
€6,293 |
€1,078 |
€2,048 |
€654 |
€201 |
€(495) |
€(445) |
€23,323 |
|||||||||
Add: Share of profit/(loss)
of equity method investees
|
(2) |
(75) |
110 |
— |
(310) |
— |
541 |
— |
€264 |
|||||||||
Adjustments: |
||||||||||||||||||
Impairment of GAC-
Stellantis JV(6)
|
— |
— |
— |
— |
297 |
— |
— |
— |
€297 |
|||||||||
Write down of FCA Bank
investment(9)
|
— |
— |
— |
— |
— |
— |
133 |
— |
€133 |
|||||||||
Adjusted operating
income, as adjusted(1)
|
€13,987 |
€6,218 |
€1,188 |
€2,048 |
€641 |
€201 |
€179 |
€(445) |
€24,017 |
|||||||||
2021 |
North
America
|
Enlarged
Europe
|
Middle
East &
Africa
|
South
America
|
China and
India &
Asia Pacific
|
Maserati |
Other
activities
|
Unallocated
items &
eliminations
|
Stellantis |
|||||||||
(€ million) |
||||||||||||||||||
Net revenues(1) |
€67,715 |
€58,728 |
€5,165 |
€10,496 |
€3,927 |
€2,003 |
€2,768 |
€(1,383) |
€149,419 |
|||||||||
Net revenues from transactions
with other segments
|
(9) |
(126) |
— |
(22) |
(3) |
(1) |
(1,222) |
1,383 |
— |
|||||||||
Net revenues from external
customers(1)
|
67,706 |
58,602 |
5,165 |
10,474 |
3,924 |
2,002 |
1,546 |
— |
149,419 |
|||||||||
Add: FCA Net revenues from
external customers January 1 -
January 16, 2021(2)
|
2,015 |
335 |
36 |
189 |
51 |
18 |
60 |
— |
2,704 |
|||||||||
Add: Pro forma adjustments(3) |
3 |
(7) |
— |
— |
— |
— |
— |
— |
(4) |
|||||||||
Pro Forma Net revenues from
external customers, January 1
- December 31, 2021
|
69,724 |
58,930 |
5,201 |
10,663 |
3,975 |
2,020 |
1,606 |
— |
152,119 |
|||||||||
Net revenues from transactions
with other segments
|
12 |
130 |
— |
18 |
5 |
1 |
1,122 |
(1,288) |
— |
|||||||||
Pro Forma Net revenues(4) |
€69,736 |
€59,060 |
€5,201 |
€10,681 |
€3,980 |
€2,021 |
€2,728 |
€(1,288) |
€152,119 |
|||||||||
Net profit/(loss) from
continuing operations
|
€13,218 |
|||||||||||||||||
Tax expense/(benefit) |
€1,911 |
|||||||||||||||||
Net financial expenses/(income) |
€734 |
|||||||||||||||||
Operating income/(loss)(5) |
€15,863 |
|||||||||||||||||
Add: FCA operating income,
January 1 - 16, 2021
|
€80 |
|||||||||||||||||
Add: Pro forma adjustments |
€96 |
|||||||||||||||||
Pro Forma Operating income/
(loss)(5)
|
€16,039 |
|||||||||||||||||
Adjustments: |
||||||||||||||||||
Restructuring costs and other
costs, net of reversals(6)
|
€(4) |
€781 |
€2 |
€54 |
€— |
€1 |
€39 |
€— |
€873 |
|||||||||
Change in estimate of non-
contractual warranties(7)
|
€2 |
€581 |
€57 |
€68 |
€13 |
€11 |
€— |
€— |
€732 |
|||||||||
Reversal of inventory fair
value adjustment in purchase
accounting(8)
|
€401 |
€89 |
€— |
€13 |
€19 |
€— |
€— |
€— |
€522 |
|||||||||
Impairment expense and
supplier obligations(9)
|
€58 |
€233 |
€6 |
€6 |
€— |
€6 |
€— |
€— |
€309 |
|||||||||
Brazilian indirect tax -
reversal of liability/
recognition of credits(10)
|
€— |
€— |
€— |
€(253) |
€— |
€— |
€— |
€— |
€(253) |
|||||||||
Other(11) |
€228 |
€(17) |
€(6) |
€41 |
€7 |
€2 |
€140 |
€134 |
€529 |
|||||||||
Total adjustments Jan 1 - Dec
31, 2021
|
€685 |
€1,667 |
€59 |
€(71) |
€39 |
€20 |
€179 |
€134 |
€2,712 |
|||||||||
Pro Forma Adjusted
operating income
|
€11,342 |
€5,324 |
€663 |
€882 |
€428 |
€103 |
€(22) |
€31 |
€18,751 |
|||||||||
Share of profit of equity method
investees(5)
|
€(14) |
€(46) |
€118 |
€— |
€(7) |
€— |
€686 |
€— |
€737 |
|||||||||
Pro Forma Adjusted operating
income, as reported
|
€11,356 |
€5,370 |
€545 |
€882 |
€442 |
€103 |
€(718) |
€31 |
€18,011 |
|||||||||
Add: Share of profit/(loss) of
equity method investees
|
(14) |
(46) |
118 |
— |
(7) |
— |
686 |
— |
€737 |
|||||||||
Adjustments: |
||||||||||||||||||
Add: FCA Share of profit/(loss)
of equity method investees,
January 1 - 16, 2021
|
— |
— |
— |
— |
(7) |
— |
10 |
— |
€3 |
|||||||||
Pro Forma Adjusted operating
income, as adjusted(5)
|
€11,342 |
€5,324 |
€663 |
€882 |
€428 |
€103 |
€(22) |
€31 |
€18,751 |
|||||||||
2021 |
North
America
|
Enlarged
Europe
|
Middle
East &
Africa
|
South
America
|
China and
India &
Asia Pacific
|
Maserati |
Other
activities
|
Unallocated
items &
eliminations
|
Stellantis |
|||||||||
(€ million) |
||||||||||||||||||
Net profit/(loss) from
continuing operations
|
€13,218 |
|||||||||||||||||
Tax expense/(benefit) |
€1,911 |
|||||||||||||||||
Net financial expenses/
(income)
|
€734 |
|||||||||||||||||
Operating income/(loss)(1) |
€15,863 |
|||||||||||||||||
Adjustments: |
||||||||||||||||||
Restructuring costs and other
costs, net of reversals(2)
|
€(4) |
€781 |
€2 |
€54 |
€— |
€1 |
€39 |
€— |
€873 |
|||||||||
Change in estimates of non-
contractual warranties(3)
|
€2 |
€581 |
€57 |
€68 |
€13 |
€11 |
€— |
€— |
€732 |
|||||||||
Reversal of inventory fair
value adjustment in purchase
accounting(4)
|
€401 |
€89 |
€— |
€13 |
€19 |
€— |
€— |
€— |
€522 |
|||||||||
Impairment expense and
supplier obligations(5)
|
€58 |
€233 |
€6 |
€6 |
€— |
€6 |
€— |
€— |
€309 |
|||||||||
Brazilian indirect tax -
reversal of liability/
recognition of credits(6)
|
€— |
€— |
€— |
€(253) |
€— |
€— |
€— |
€— |
€(253) |
|||||||||
Other(7) |
€228 |
€(17) |
€(6) |
€41 |
€7 |
€2 |
€140 |
€134 |
€529 |
|||||||||
Total adjustments Jan 1 - Dec
31, 2021
|
€685 |
€1,667 |
€59 |
€(71) |
€39 |
€20 |
€179 |
€134 |
€2,712 |
|||||||||
Less: Adjustments Jan 1-16,
2021(8)
|
€— |
€— |
€— |
€— |
€— |
€— |
€— |
€— |
€11 |
|||||||||
Adjusted operating income |
€11,089 |
€5,373 |
€672 |
€873 |
€437 |
€116 |
€(27) |
€31 |
€18,564 |
|||||||||
Adjusted operating income, as
reported
|
€11,103 |
€5,419 |
€554 |
€873 |
€444 |
€116 |
€(713) |
€31 |
€17,827 |
|||||||||
Add: Share of profit/(loss) of
equity method investees
|
(14) |
(46) |
118 |
— |
(7) |
— |
686 |
— |
€737 |
|||||||||
Adjusted operating income, as
adjusted(1)
|
€11,089 |
€5,373 |
€672 |
€873 |
€437 |
€116 |
€(27) |
€31 |
€18,564 |
|||||||||
At December 31, |
||||
2023 |
2022 |
|||
(€ million) |
||||
North America(1) |
€52,029 |
€50,410 |
||
France |
17,893 |
16,031 |
||
Italy |
8,810 |
8,646 |
||
Germany |
4,884 |
5,334 |
||
Brazil |
3,811 |
3,556 |
||
Spain |
1,876 |
2,030 |
||
United Kingdom |
1,194 |
1,278 |
||
Poland |
1,038 |
812 |
||
Slovakia |
460 |
377 |
||
Serbia |
161 |
105 |
||
Other countries |
5,817 |
3,536 |
||
Total Non-current assets (other than financial instruments, deferred tax assets and post-
employment benefits assets)
|
97,973 |
92,115 |
||
30. |
Explanatory notes to the Consolidated Statement of Cash Flows |
Years ended December 31, |
||||
2023 |
2022 |
|||
(€ million) |
||||
Total Debt at January 1 |
€27,153 |
€33,581 |
||
Add: Derivative (assets)/liabilities and collateral at January 1 |
(67) |
(1,205) |
||
Add: Securities and financial receivables at January 1 |
(4,176) |
(839) |
||
Total Liabilities from financing activities at January 1 |
€22,910 |
€31,537 |
||
Cash flows |
(2,640) |
(8,949) |
||
Foreign exchange effects |
(250) |
397 |
||
Fair value changes |
468 |
(110) |
||
Changes in scope of consolidation |
955 |
389 |
||
Transfer to (Assets)/Liabilities held for sale |
(122) |
— |
||
Other changes |
(1,324) |
(354) |
||
Total Liabilities from financing activities at December 31 |
€19,997 |
€22,910 |
||
Less: Derivative (assets)/liabilities and collateral at December 31 |
(109) |
(67) |
||
Less: Securities and financial receivables at December 31 |
(9,357) |
(4,176) |
||
Total Debt at December 31 |
€29,463 |
€27,153 |
||
31. |
Qualitative and quantitative information on financial risks |
32. |
Subsequent events |
Payments due by period |
||||||||||
(€ million) |
Total |
Less than 1
year
|
1-3 years |
3-5 years |
More than
5 years
|
|||||
Long-term debt(1) |
€26,099 |
€8,987 |
€4,511 |
€3,750 |
€8,851 |
|||||
Interest on Long-term debt(2) |
3,109 |
669 |
908 |
667 |
865 |
|||||
Lease liabilities(3) |
2,437 |
818 |
500 |
324 |
795 |
|||||
Short-term leases and Low-value assets obligations(4) |
88 |
75 |
12 |
1 |
— |
|||||
Unconditional minimum purchase obligations(5) |
15,473 |
2,130 |
4,802 |
6,167 |
2,374 |
|||||
Purchase obligations(6) |
9,721 |
5,792 |
2,901 |
1,024 |
4 |
|||||
Pension contribution requirements(7) |
84 |
84 |
— |
— |
— |
|||||
Total |
€57,011 |
€18,555 |
€13,634 |
€11,933 |
€12,889 |
|||||
Country |
Location |
|
North America |
||
U.S. |
Warren, Michigan |
|
U.S. |
Sterling Heights, Michigan |
|
U.S. |
Belvidere, Illinois |
|
U.S. |
Toledo, Ohio (Toledo North) |
|
U.S. |
Detroit, Michigan (Detroit Assembly Complex - Jefferson) |
|
U.S. |
Detroit, Michigan (Detroit Assembly Complex - Mack) |
|
U.S. |
Toledo, Ohio (Toledo South) |
|
Mexico |
Toluca, Estado de México |
|
Mexico |
Saltillo, Coahuila (Saltillo Truck) |
|
Mexico |
Saltillo, Coahuila (Saltillo Van) |
|
Canada |
Windsor, Ontario |
|
Canada |
Brampton, Ontario |
|
South America |
||
Brazil |
Betim |
|
Brazil |
Goiana |
|
Brazil |
Porto Real |
|
Argentina |
Buenos Aires |
|
Argentina |
Cordoba |
|
Enlarged Europe |
||
France |
Hordain |
|
France |
Mulhouse |
|
France |
Poissy |
|
France |
Rennes |
|
France |
Sochaux |
|
Germany |
Eisenach |
|
Germany |
Russelsheim |
|
Italy |
Turin (Mirafiori) |
|
Italy |
Cassino |
|
Italy |
Pomigliano |
|
Italy |
Melfi |
|
Italy |
Val Di Sangro |
|
Poland |
Gliwice |
|
Poland |
Tychy |
|
Slovakia |
Trnava |
|
Serbia |
Kragujevac |
|
Spain |
Madrid |
|
Spain |
Vigo |
|
Spain |
Zaragoza |
|
UK |
Ellesmere Port |
|
UK |
Luton |
Years Ended December 31, |
||||
(€ million) |
2023 |
2022 |
||
Audit fees |
€40.8 |
€39.1 |
||
Audit-related fees |
0.4 |
0.2 |
||
Tax fees(1) |
0.6 |
— |
||
Total |
€41.8 |
€39.3 |
||
Period |
Total Number of Shares
Purchased
|
Average Price Paid per
Share (€)(1)
|
Total Number of Shares
Purchased as Part of
Publicly Announced Plans
or Programs
|
Maximum Number of
Shares that May Yet Be
Purchased under the Plans
or Programs
|
||||
Jan 1 to Jan 31, 2023 |
— |
— |
— |
— |
||||
Feb 1 to Feb 28, 2023 |
— |
— |
— |
— |
||||
March 1 to March 31, 2023 |
1,353,740 |
16.21 |
1,353,740 |
243,002,537 |
||||
April 1 to April 30, 2023 |
3,549,884 |
16.15 |
3,549,884 |
317,795,539 |
||||
May 1 to May 31, 2023 |
28,346,188 |
14.84 |
28,346,188 |
289,449,351 |
||||
June 1 to June 30, 2023 |
11,276,800 |
15.40 |
11,276,800 |
278,172,551 |
||||
July 1 to July 31, 2023 |
7,700,621 |
16.45 |
7,700,621 |
270,471,930 |
||||
Aug 1 to Aug 31, 2023 |
9,550,000 |
17.13 |
9,550,000 |
260,921,930 |
||||
Sept 1 to Sept 30, 2023 |
13,907,561 |
17.67 |
13,907,561 |
247,014,369 |
||||
Oct 1 to Oct 31, 2023 |
15,897,068 |
17.60 |
15,897,068 |
231,117,301 |
||||
Nov 1 to Nov 30, 2023 |
50,000,000 |
18.68 |
50,000,000 |
181,117,301 |
||||
Dec 1 to Dec 31, 2023 |
508,435 |
21.00 |
508,435 |
180,608,866 |
||||
Total |
142,090,297 |
17.13 |
142,090,297 |
180,608,866 |
Exhibit
Number
|
Description of Documents |
Certain long-term debt instruments, none of which relates to indebtedness that exceeds 10% of the consolidated assets of
Stellantis N.V., have not been filed as exhibits to this Form 20-F. Stellantis N.V. agrees to furnish the Securities and
Exchange Commission, upon its request, a copy of any instrument defining the rights of holders of long-term debt of
Stellantis N.V. and its consolidated subsidiaries.
|
|
101.SCH |
XBRL Taxonomy Extension Schema Document |
101.CAL |
XBRL Taxonomy Extension Calculation Linkbase Document |
101.DEF |
XBRL Taxonomy Extension Definition Linkbase Document |
101.LAB |
XBRL Taxonomy Extension Label Linkbase Document |
101.PRE |
XBRL Taxonomy Extension Presentation Linkbase Document |
Item |
Section |
Cross Reference |
Page |
Part I | |||
Item 1. |
Identity of Directors, Senior Management and Advisers |
Not applicable |
|
Item 2. |
Offer Statistics and Expected Timetable |
Not applicable |
|
Item 3. |
Key Information |
||
B. Capitalization and Indebtedness |
Not applicable |
||
C. Reasons for the Offer and Use of Proceeds |
Not applicable |
||
D. Risk Factors |
|||
Item 4. |
Information on the Company |
||
A. History and Development of the Company |
|||
B. Business Overview |
|||
to the Consolidated Financial Statements
|
|||
C. Organization Structure |
Consolidated Financial Statements
|
||
D. Property, Plant and Equipment |
|||
Item 4A. |
Unresolved Staff Comments |
None |
|
Item 5. |
Operating and Financial Review |
||
A. Operating Results |
|||
B. Liquidity and Capital Resources |
|||
Note 22 (Debt) to the Consolidated
Financial Statements
|
|||
the Consolidated Financial Statements
|
|||
C. Research and Development, Patents and Licenses, etc. |
|||
D. Trend Information |
|||
E. Critical Accounting Estimates |
|||
G. Safe Harbor |
|||
F. Non-GAAP financial measures |
|||
Item |
Section |
Cross Reference |
Page |
Item 6. |
Directors, Senior Management and Employees |
||
A. Directors and Senior Management |
|||
B. Compensation |
Remuneration Report |
||
the Consolidated Financial Statements
|
|||
C. Board Practices |
|||
D. Employees |
|||
E. Share Ownership |
|||
F. Disclosure of a Registrant's Actions to Recover Erroneously
Awarded Compensation
|
Disclosure of a Registrant's Actions to
Recover Erroneously Awarded
Compensation
|
||
Item 7. |
Major Shareholders and Related Party Transactions |
||
A. Major Shareholders |
|||
B. Related Party Transactions |
the Consolidated Financial Statements
|
||
C. Interests of Experts and Counsel |
Not applicable |
||
Item 8. |
Financial Information |
||
A. Consolidated Statements and Other Financial Information |
|||
to the Consolidated Financial Statements
|
|||
B. Significant Changes |
|||
Item 9. |
The Offer and Listing |
||
A. Offer and Listing Details |
|||
B. Plan of Distribution |
Not applicable |
||
C. Markets |
|||
D. Selling Shareholders |
Not applicable |
||
E. Dilution |
Not applicable |
||
F. Expenses of the Issue |
Not applicable |
||
Item 10. |
Additional Information |
||
A. Share Capital |
Not applicable |
||
B. Memorandum and Articles of Association |
|||
C. Material Contracts |
|||
D. Exchange Controls |
|||
E. Taxation |
|||
F. Dividends and Paying Agents |
Not applicable |
||
G. Statements of Experts |
Not applicable |
||
H. Documents on Display |
|||
I. Subsidiary Information |
Not applicable |
||
J. Annual report to security holders |
Not applicable |
Item |
Section |
Cross Reference |
Page |
Item 11. |
Quantitative and Qualitative Disclosures |
Consolidated Financial Statements
|
|
Item 12. |
Description of Securities Other than Equity Securities |
||
A. Debt Securities |
Not applicable |
||
B. Warrants and Rights |
Not applicable |
||
C. Other Securities |
Not applicable |
||
D. American Depositary Shares |
None |
||
Part II | |||
Item 13. |
Defaults, Dividend Arrearages and Delinquencies |
None |
|
Item 14. |
Material Modifications to the Rights of Security Holders and
Use of Proceeds
|
None |
|
Item 15. |
Controls and Procedures |
||
Item 16A. |
Audit Committee Financial Expert |
||
Item 16B. |
Code of Ethics |
||
Item 16C. |
Principal Accountant Fees and Services |
||
Item 16D. |
Exemptions from the Listing Standards for Audit Committees |
None |
|
Item 16E. |
Purchases of Equity Securities by the Issuer and Affiliated
Purchasers
|
Note 27 (Equity) to the Consolidated
Financial Statements
|
|
Item 16F. |
Change in the Registrant's Certifying Accountant |
Change in the Registrant's Certifying
Accountant
|
|
Item 16G. |
Corporate Governance |
||
Item 16H. |
Mine Safety Disclosure |
None |
|
Item 16I. |
Disclosure Regarding Foreign Jurisdictions that Prevent
Inspections
|
None |
|
Item 16J. |
Insider trading policies |
Not applicable |
|
Item 16K. |
Cybersecurity |
||
Part III | |||
Item 17. |
Financial Statements |
||
Item 18. |
Financial Statements |
||
Item 19. |
Exhibits |
||
STELLANTIS N.V. |
|||
(Registrant) |
|||
By: |
/s/ Natalie Knight |
||
Name: Natalie Knight |
|||
Title: Chief Financial Officer |
|||
Date: |
February 22, 2024 |
||
| Name | Country | Percentage Interest Held |
||||||||||||
North America |
||||||||||||||
| FCA US LLC | USA | 100.00 | ||||||||||||
| FCA Canada Inc. | Canada | 100.00 | ||||||||||||
| Stellantis Mexico, S.A. de C.V. | Mexico | 100.00 | ||||||||||||
South America |
||||||||||||||
| FCA Fiat Chrysler Automoveis Brasil Ltda. | Brazil | 100.00 | ||||||||||||
| FCA Automobiles Argentina S.A. | Argentina | 100.00 | ||||||||||||
| Peugeot Citroën Argentina S.A. | Argentina | 99.96 | ||||||||||||
Enlarged Europe |
||||||||||||||
| Stellantis Europe S.p.A. | Italy | 100.00 | ||||||||||||
| Automobiles Peugeot | France | 100.00 | ||||||||||||
| Automobiles Citroën | France | 100.00 | ||||||||||||
| Opel Automobile GmbH | Germany | 100.00 | ||||||||||||
| Groupe PSA Italia S.p.A. | Italy | 100.00 | ||||||||||||
| Stellantis & You France S.A.S. | France | 100.00 | ||||||||||||
| Stellantis Auto S.A.S. | France | 100.00 | ||||||||||||
| FCA Germany GmbH | Germany | 100.00 | ||||||||||||
| Stellantis España, S.L. | Spain | 99.99 | ||||||||||||
| Vauxhall Motors Limited | United Kingdom | 100.00 | ||||||||||||
| FCA France S.A.S. | France | 100.00 | ||||||||||||
| Peugeot Motor Company PLC | United Kingdom | 100.00 | ||||||||||||
| Stellantis & You UK Limited | United Kingdom | 100.00 | ||||||||||||
| Peugeot Deutschland GmbH | Germany | 100.00 | ||||||||||||
| Stellantis & You Italia S.p.A. | Italy | 100.00 | ||||||||||||
| Stellantis Nederland B.V. | Netherlands | 100.00 | ||||||||||||
| Citroën Deutschland GmbH | Germany | 100.00 | ||||||||||||
| Citroën UK Ltd | United Kingdom | 100.00 | ||||||||||||
| FCA Poland S.p.z.o.o. | Poland | 100.00 | ||||||||||||
| Middle East & Africa | ||||||||||||||
| Stellantis Middle East FZE | United Arab Emirates | 100.00 | ||||||||||||
| Stellantis Otomotiv Pazarlama Anonim Sirketi | Turkey | 100.00 | ||||||||||||
| China and India & Asia Pacific | ||||||||||||||
| Stellantis Japan Ltd. | Japan | 100.00 | ||||||||||||
| Fiat India Automobiles Private Limited | India | 50.00 | ||||||||||||
Maserati |
||||||||||||||
Maserati S.p.A. |
Italy | 100.00 | ||||||||||||
Maserati (China) Cars Trading Co., Ltd. |
People's Rep.of China | 100.00 | ||||||||||||
Maserati North America, Inc. |
USA | 100.00 | ||||||||||||
| Financial Services | ||||||||||||||
| Stellantis Financial Services Europe S.A. | France | 100.00 | ||||||||||||
| Stellantis Automotive Finance Co. Ltd. | People's Rep.of China | 100.00 | ||||||||||||
| Stellantis Financial Services US Corp. | USA | 100.00 | ||||||||||||
| Banco Stellantis S.A. | Brazil | 100.00 | ||||||||||||
| Fidis S.p.A. | Italy | 100.00 | ||||||||||||
| Holdings & Other Companies | ||||||||||||||
| FCA North America Holdings LLC | USA | 100.00 | ||||||||||||
| GIE PSA Trésorerie | France | 100.00 | ||||||||||||
| Fiat Chrysler Finance North America, Inc. | USA | 100.00 | ||||||||||||
| FCA US Insurance Company | USA | 100.00 | ||||||||||||
| Fiat Chrysler Finance S.p.A. | Italy | 100.00 | ||||||||||||
| Stellantis International S.A. | Switzerland | 100.00 | ||||||||||||
| Date: | February 22, 2024 | /s/ Carlos Tavares | ||||||
| Carlos Tavares | ||||||||
| Chief Executive Officer and Director | ||||||||
| Date: | February 22, 2024 | /s/ Natalie Knight | ||||||
Natalie Knight |
||||||||
| Chief Financial Officer | ||||||||
| Date: | February 22, 2024 | /s/ Carlos Tavares | ||||||
| Carlos Tavares | ||||||||
| Chief Executive Officer and Director | ||||||||
| Date: | February 22, 2024 | /s/ Natalie Knight | ||||||
| Natalie Knight | ||||||||
| Chief Financial Officer | ||||||||