| Delaware | 001-36102 | 90-1002689 | ||||||
| (State or Other Jurisdiction of Incorporation) | (Commission File Number) | (I.R.S. Employer Identification No.) | ||||||
| ☐ | Written communications pursuant to Rule 425 under the Securities Act (17 CFR 230.425) | ||||
| ☐ | Soliciting material pursuant to Rule 14a-12 under the Exchange Act (17 CFR 240.14a-12) | ||||
| ☐ | Pre-commencement communications pursuant to Rule 14d-2(b) under the Exchange Act (17 CFR 240.14d-2(b)) | ||||
| ☐ | Pre-commencement communications pursuant to Rule 13e-4(c) under the Exchange Act (17 CFR 240.13e-4(c)) | ||||
| Title of each class | Trading Symbol | Name of each exchange on which registered | ||||||||||||
| Common Stock, $0.01 par value per share | KN | New York Stock Exchange | ||||||||||||
| Item 2.02 Results of Operations and Financial Condition. | |||||
On October 24, 2024, Knowles Corporation (the "Company") issued a press release announcing its results of operations for the quarter ended September 30, 2024 and posted on its website at http://investor.knowles.com presentation slides which summarize certain of its results of operations for the quarter ended September 30, 2024. Knowles Corporation's quarterly financial conference call and webcast will be held on October 24, 2024. A copy of the press release is being furnished as Exhibit 99.1 hereto and a copy of the presentation slides is being furnished as Exhibit 99.2 hereto. | |||||
The information furnished with the Current Report on Form 8-K and the related exhibits included in Item 9.01 shall not be deemed to be "filed" for purposes of the Securities Exchange Act of 1934, as amended, nor shall it be deemed incorporated by reference in any filing under the Securities Act of 1933, as amended, except as expressly set forth by specific reference in such filing. | |||||
| Forward Looking Statements | |||||
This Current Report on Form 8-K contains forward-looking statements within the meaning of the safe harbor provisions of the United States Private Securities Litigation Reform Act of 1995, such as statements relating to the expected impact of the Company's restructuring program, including estimates of timing and amounts of restructuring charges. The words “believe,” “expect,” “anticipate,” “project,” “estimate,” “budget,” “continue,” “could,” “intend,” “may,” “plan,” “potential,” “predict,” “seek,” “should,” “will,” “would,” “objective,” “forecast,” “goal,” “guidance,” “outlook,” “effort,” “target,” and similar expressions, among others, generally identify forward-looking statements, which speak only as of the date the statements were made. The statements in this Current Report on Form 8-K are based on currently available information and the current expectations, forecasts, and assumptions of Knowles’ management concerning risks and uncertainties that could cause actual outcomes or results to differ materially from those outcomes or results that are projected, anticipated, or implied in these statements, including risks relating to the timing and execution of the restructuring program; estimates and assumptions related to settlement of supplier obligations, the cost of severance benefits, non-cash fixed asset write-offs, and other associated costs; and other risks, relevant factors, and uncertainties identified in our Annual Report on Form 10-K for the fiscal year ended December 31, 2023, subsequent Reports on Forms 10-Q and 8-K and our other filings we make with the U.S. Securities and Exchange Commission. The Company disclaims any intention or obligation to update or revise any forward-looking statements, whether as a result of new information, future events or otherwise, except as required by law. | |||||
| Item 9.01 Financial Statements and Exhibits. | ||||||||
| (d) Exhibits. | ||||||||
| The following exhibits are furnished as part of this report: | ||||||||
| Exhibit Number | Description |
|||||||
| 104 | Cover Page Interactive Data File (embedded within the Inline XBRL document) | |||||||
| KNOWLES CORPORATION | |||||
Date: October 24, 2024 |
By: /s/ Robert J. Perna | ||||
| Robert J. Perna | |||||
| Senior Vice President, General Counsel & Secretary | |||||

|
Financial Contact:
Sarah Cook
Knowles Investor Relations
Email: investorrelations@knowles.com
| |||||
| Q3-24 | Q2-24 | Q3-23 | |||||||||
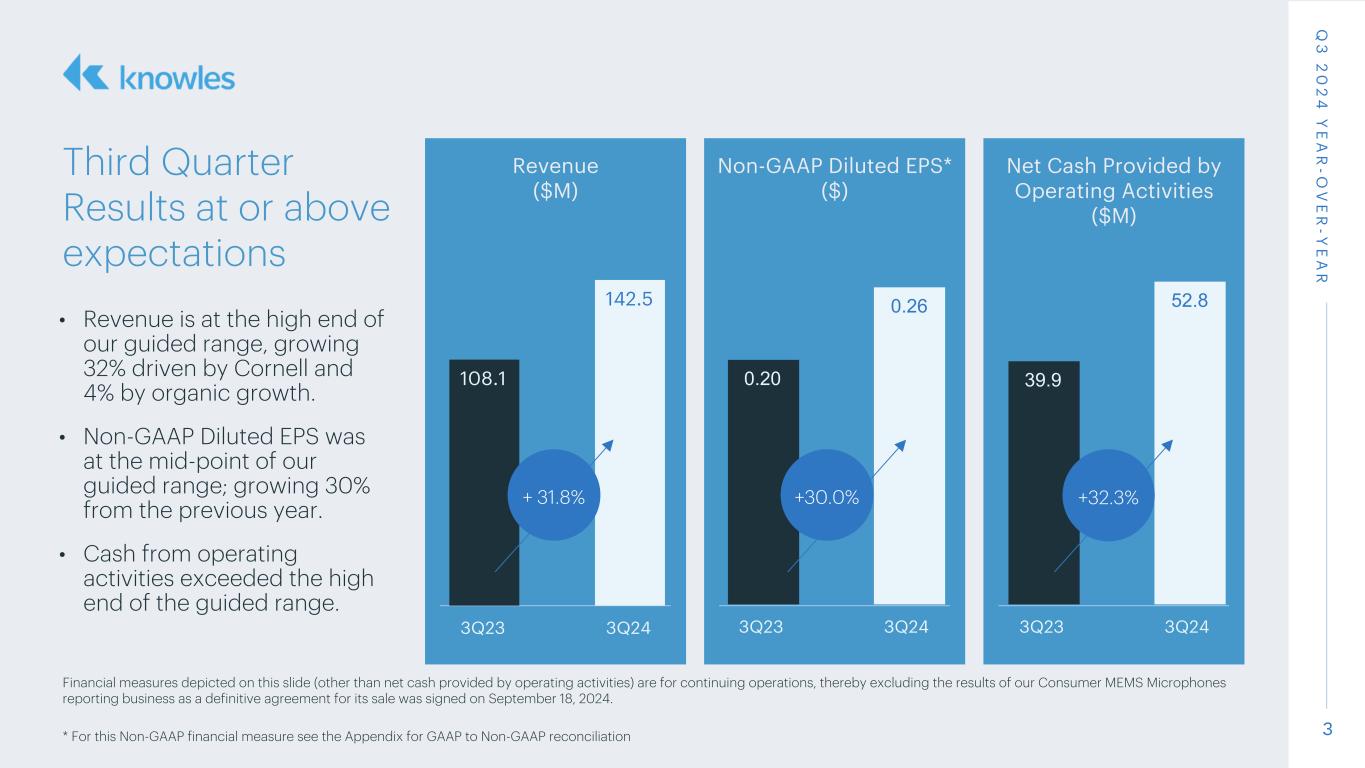
| Revenues | $142.5 | $135.2 | $108.1 | ||||||||
| Gross profit | $62.9 | $57.8 | $50.4 | ||||||||
| (as a % of revenues) | 44.1% | 42.8% | 46.6% | ||||||||
| Non-GAAP gross profit | $64.8 | $59.8 | $50.9 | ||||||||
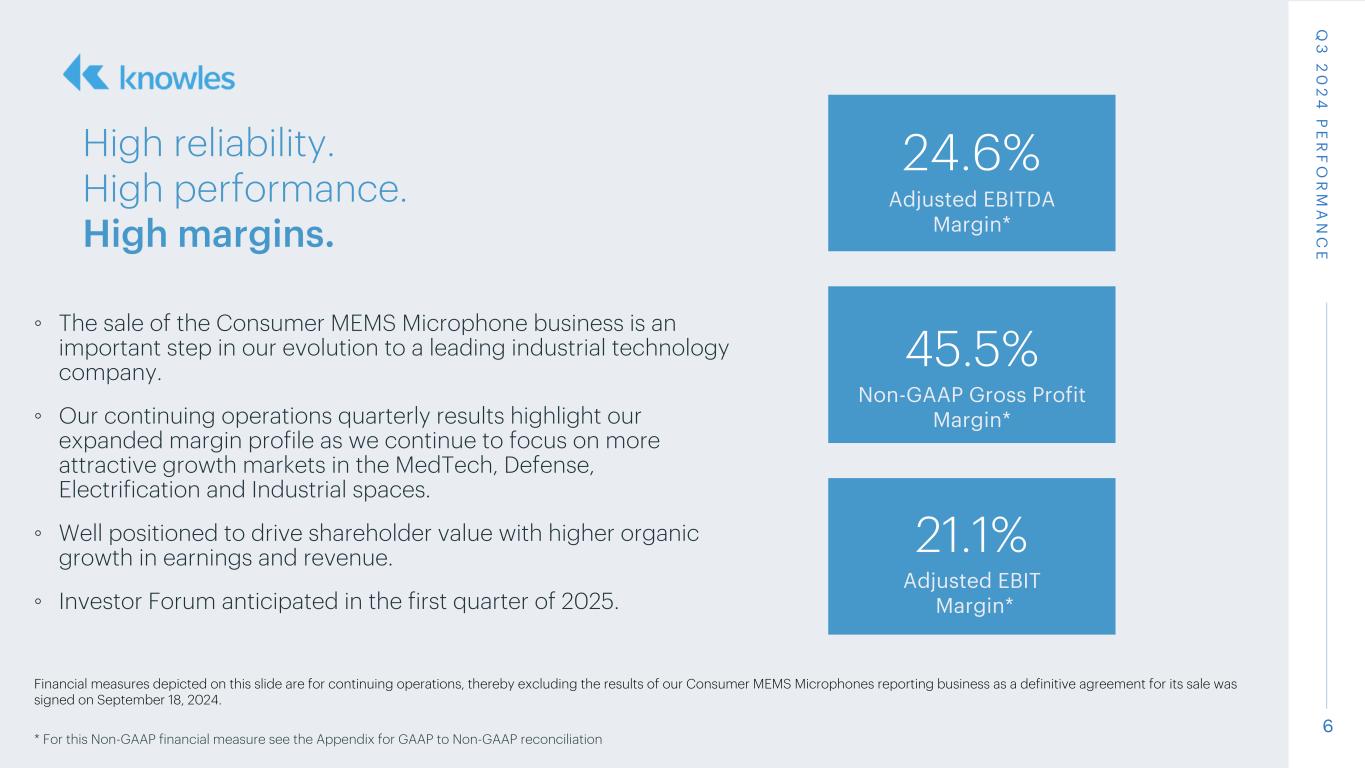
| (as a % of revenues) | 45.5% | 44.2% | 47.1% | ||||||||
| Diluted earnings per share** | $0.10 | $0.05 | $0.17 | ||||||||
| Non-GAAP diluted earnings per share | $0.26 | $0.20 | $0.20 | ||||||||
| Net cash provided by operating activities | $52.8 | $24.9 | $39.9 | ||||||||
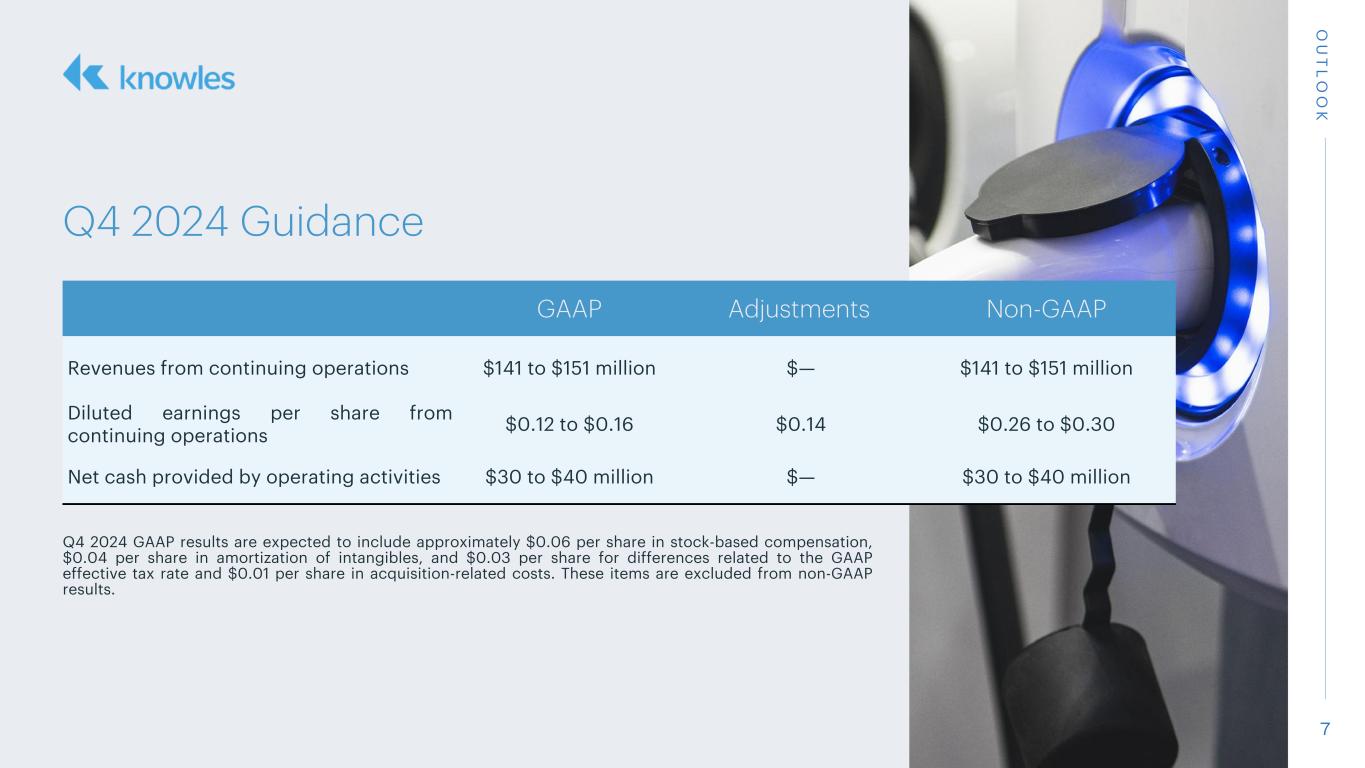
| GAAP | Adjustments | Non-GAAP | |||||||||
| Revenues from continuing operations | $141 to $151 million | — | $141 to $151 million | ||||||||
| Diluted earnings per share from continuing operations | $0.12 to $0.16 | $0.14 | $0.26 to $0.30 | ||||||||
| Net cash provided by operating activities | $30 to $40 million | — | $30 to $40 million | ||||||||
| Quarter Ended | |||||||||||||||||
| September 30, 2024 |
June 30, 2024 |
September 30, 2023 |
|||||||||||||||
| Revenues | $ | 142.5 | $ | 135.2 | $ | 108.1 | |||||||||||
| Cost of goods sold | 79.5 | 77.1 | 57.5 | ||||||||||||||
| Restructuring charges - cost of goods sold | 0.1 | 0.3 | 0.2 | ||||||||||||||
| Gross profit | 62.9 | 57.8 | 50.4 | ||||||||||||||
| Research and development expenses | 10.2 | 9.6 | 8.1 | ||||||||||||||
| Selling and administrative expenses | 33.9 | 35.6 | 29.4 | ||||||||||||||
| Restructuring charges | 0.1 | (0.1) | 1.5 | ||||||||||||||
| Operating expenses | 44.2 | 45.1 | 39.0 | ||||||||||||||
| Operating earnings | 18.7 | 12.7 | 11.4 | ||||||||||||||
| Interest expense, net | 3.9 | 4.6 | 0.6 | ||||||||||||||
| Other expense (income), net | 2.6 | 0.3 | (0.5) | ||||||||||||||
| Earnings before income taxes and discontinued operations | 12.2 | 7.8 | 11.3 | ||||||||||||||
| Provision for (benefit from) income taxes | 3.0 | 3.0 | (3.9) | ||||||||||||||
| Earnings from continuing operations | 9.2 | 4.8 | 15.2 | ||||||||||||||
| (Loss) earnings from discontinued operations, net | (8.7) | (264.1) | 1.4 | ||||||||||||||
| Net earnings (loss) | $ | 0.5 | $ | (259.3) | $ | 16.6 | |||||||||||
| Earnings per share from continuing operations: | |||||||||||||||||
| Basic | $ | 0.10 | $ | 0.05 | $ | 0.17 | |||||||||||
| Diluted | $ | 0.10 | $ | 0.05 | $ | 0.17 | |||||||||||
| (Loss) earnings per share from discontinued operations: | |||||||||||||||||
| Basic | $ | (0.09) | $ | (2.95) | $ | 0.01 | |||||||||||
| Diluted | $ | (0.09) | $ | (2.93) | $ | 0.01 | |||||||||||
| Net earnings (loss) per share: | |||||||||||||||||
| Basic | $ | 0.01 | $ | (2.90) | $ | 0.18 | |||||||||||
| Diluted | $ | 0.01 | $ | (2.88) | $ | 0.18 | |||||||||||
| Weighted-average common shares outstanding: | |||||||||||||||||
| Basic | 88.7 | 89.4 | 90.8 | ||||||||||||||
| Diluted | 89.7 | 89.9 | 91.4 | ||||||||||||||
| Nine Months Ended | |||||||||||
| September 30, 2024 |
September 30, 2023 |
||||||||||
| Revenues | $ | 411.0 | $ | 317.6 | |||||||
| Cost of goods sold | 235.7 | 172.2 | |||||||||
| Restructuring charges - cost of goods sold | 1.4 | 0.2 | |||||||||
| Gross profit | 173.9 | 145.2 | |||||||||
| Research and development expenses | 29.2 | 24.0 | |||||||||
| Selling and administrative expenses | 106.8 | 87.3 | |||||||||
| Restructuring charges | 1.5 | 1.8 | |||||||||
| Operating expenses | 137.5 | 113.1 | |||||||||
| Operating earnings | 36.4 | 32.1 | |||||||||
| Interest expense, net | 12.9 | 2.2 | |||||||||
| Other expense, net | 2.5 | 0.5 | |||||||||
| Earnings before income taxes and discontinued operations | 21.0 | 29.4 | |||||||||
| Provision for (benefit from) income taxes | 8.0 | (9.6) | |||||||||
| Earnings from continuing operations | 13.0 | 39.0 | |||||||||
| Loss from discontinued operations, net | (269.3) | (14.0) | |||||||||
| Net (loss) earnings | $ | (256.3) | $ | 25.0 | |||||||
| Earnings per share from continuing operations: | |||||||||||
| Basic | $ | 0.15 | $ | 0.43 | |||||||
| Diluted | $ | 0.14 | $ | 0.42 | |||||||
| Loss per share from discontinued operations: | |||||||||||
| Basic | $ | (3.02) | $ | (0.16) | |||||||
| Diluted | $ | (2.98) | $ | (0.15) | |||||||
| Net (loss) earnings per share: | |||||||||||
| Basic | $ | (2.87) | $ | 0.27 | |||||||
| Diluted | $ | (2.84) | $ | 0.27 | |||||||
| Weighted-average common shares outstanding: | |||||||||||
| Basic | 89.2 | 91.2 | |||||||||
| Diluted | 90.2 | 91.9 | |||||||||
| Quarter Ended | Nine Months Ended | ||||||||||||||||||||||||||||
| September 30, 2024 |
June 30, 2024 |
September 30, 2023 |
September 30, 2024 |
September 30, 2023 |
|||||||||||||||||||||||||
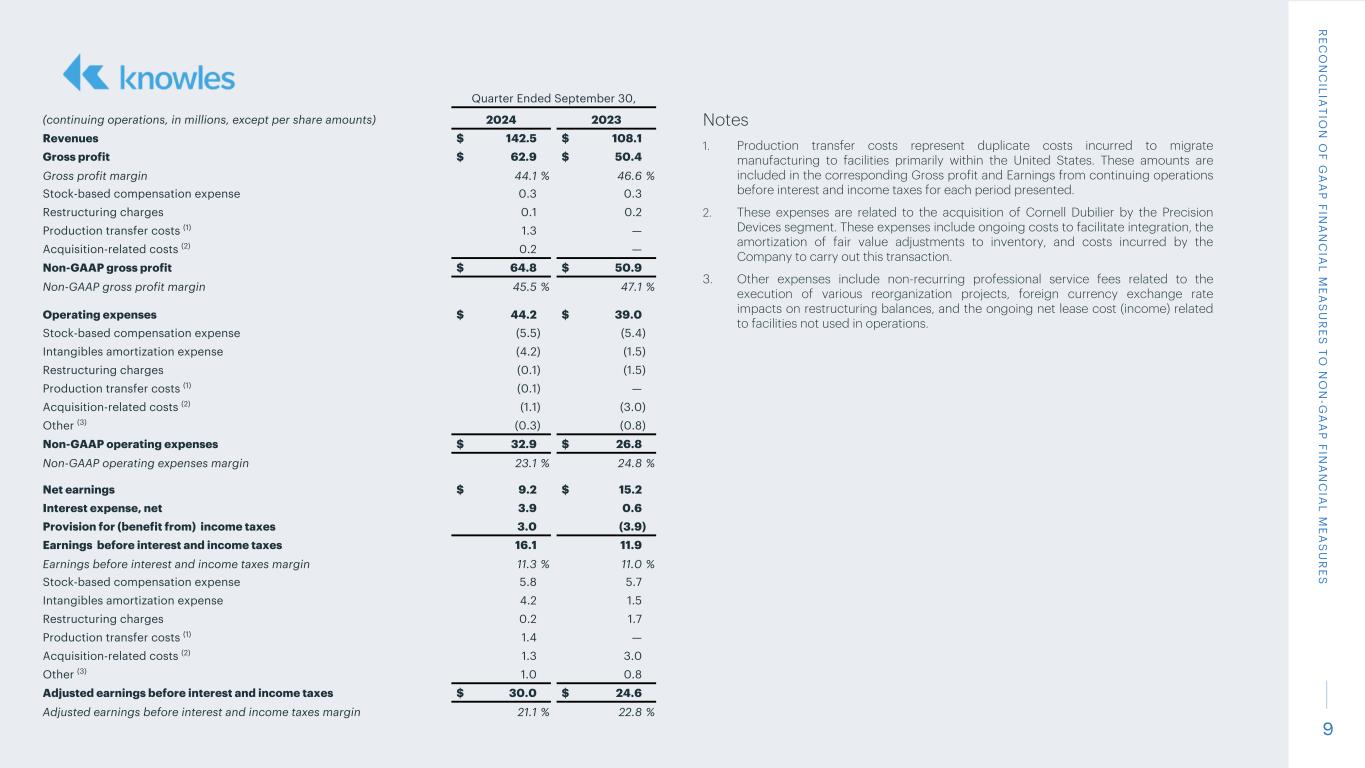
| Gross profit | $ | 62.9 | $ | 57.8 | $ | 50.4 | $ | 173.9 | $ | 145.2 | |||||||||||||||||||
| Gross profit as % of revenues | 44.1 | % | 42.8 | % | 46.6 | % | 42.3 | % | 45.7 | % | |||||||||||||||||||
| Stock-based compensation expense | 0.3 | 0.4 | 0.3 | 1.1 | 1.3 | ||||||||||||||||||||||||
| Restructuring charges | 0.1 | 0.3 | 0.2 | 1.4 | 0.2 | ||||||||||||||||||||||||
Production transfer costs (2) |
1.3 | 0.7 | — | 2.8 | — | ||||||||||||||||||||||||
Acquisition-related costs (3) |
0.2 | 0.6 | — | 2.2 | — | ||||||||||||||||||||||||
Other (4) |
— | — | — | 1.1 | — | ||||||||||||||||||||||||
| Non-GAAP gross profit | $ | 64.8 | $ | 59.8 | $ | 50.9 | $ | 182.5 | $ | 146.7 | |||||||||||||||||||
| Non-GAAP gross profit as % of revenues | 45.5 | % | 44.2 | % | 47.1 | % | 44.4 | % | 46.2 | % | |||||||||||||||||||
| Research and development expenses | $ | 10.2 | $ | 9.6 | $ | 8.1 | $ | 29.2 | $ | 24.0 | |||||||||||||||||||
| Stock-based compensation expense | (0.6) | (0.5) | (0.5) | (1.6) | (1.5) | ||||||||||||||||||||||||
| Intangibles amortization expense | (0.6) | (0.6) | (0.1) | (1.8) | (0.3) | ||||||||||||||||||||||||
Acquisition-related costs (3) |
(0.1) | (0.1) | — | (0.5) | — | ||||||||||||||||||||||||
| Non-GAAP research and development expenses | $ | 8.9 | $ | 8.4 | $ | 7.5 | $ | 25.3 | $ | 22.2 | |||||||||||||||||||
| Selling and administrative expenses | $ | 33.9 | $ | 35.6 | $ | 29.4 | $ | 106.8 | $ | 87.3 | |||||||||||||||||||
| Stock-based compensation expense | (4.9) | (5.0) | (4.9) | (14.1) | (14.2) | ||||||||||||||||||||||||
| Intangibles amortization expense | (3.6) | (3.6) | (1.4) | (11.0) | (4.0) | ||||||||||||||||||||||||
Production transfer costs (2) |
(0.1) | (0.1) | — | (0.2) | — | ||||||||||||||||||||||||
Acquisition-related costs (3) |
(1.0) | (1.3) | (3.0) | (4.8) | (3.0) | ||||||||||||||||||||||||
Other (4) |
(0.3) | (0.1) | (0.8) | (0.5) | (1.6) | ||||||||||||||||||||||||
| Non-GAAP selling and administrative expenses | $ | 24.0 | $ | 25.5 | $ | 19.3 | $ | 76.2 | $ | 64.5 | |||||||||||||||||||
| Operating expenses | $ | 44.2 | $ | 45.1 | $ | 39.0 | $ | 137.5 | $ | 113.1 | |||||||||||||||||||
| Stock-based compensation expense | (5.5) | (5.5) | (5.4) | (15.7) | (15.7) | ||||||||||||||||||||||||
| Intangibles amortization expense | (4.2) | (4.2) | (1.5) | (12.8) | (4.3) | ||||||||||||||||||||||||
| Restructuring charges | (0.1) | 0.1 | (1.5) | (1.5) | (1.8) | ||||||||||||||||||||||||
Production transfer costs (2) |
(0.1) | (0.1) | — | (0.2) | — | ||||||||||||||||||||||||
Acquisition-related costs (3) |
(1.1) | (1.4) | (3.0) | (5.3) | (3.0) | ||||||||||||||||||||||||
Other (4) |
(0.3) | (0.1) | (0.8) | (0.5) | (1.6) | ||||||||||||||||||||||||
| Non-GAAP operating expenses | $ | 32.9 | $ | 33.9 | $ | 26.8 | $ | 101.5 | $ | 86.7 | |||||||||||||||||||
| Net earnings from continuing operations | $ | 9.2 | $ | 4.8 | $ | 15.2 | $ | 13.0 | $ | 39.0 | |||||||||||||||||||
| Interest expense, net | 3.9 | 4.6 | 0.6 | 12.9 | 2.2 | ||||||||||||||||||||||||
| Provision for (benefit from) income taxes | 3.0 | 3.0 | (3.9) | 8.0 | (9.6) | ||||||||||||||||||||||||
| Earnings from continuing operations before interest and income taxes | 16.1 | 12.4 | 11.9 | 33.9 | 31.6 | ||||||||||||||||||||||||
Earnings from continuing operations before interest and income taxes as % of revenues |
11.3 | % | 9.2 | % | 11.0 | % | 8.2 | % | 9.9 | % | |||||||||||||||||||
| Stock-based compensation expense | 5.8 | 5.9 | 5.7 | 16.8 | 17.0 | ||||||||||||||||||||||||
| Intangibles amortization expense | 4.2 | 4.2 | 1.5 | 12.8 | 4.3 | ||||||||||||||||||||||||
| Restructuring charges | 0.2 | 0.2 | 1.7 | 2.9 | 2.0 | ||||||||||||||||||||||||
Production transfer costs (2) |
1.4 | 0.8 | — | 3.0 | — | ||||||||||||||||||||||||
Acquisition-related costs (3) |
1.3 | 2.0 | 3.0 | 7.5 | 3.0 | ||||||||||||||||||||||||
Other (4) |
1.0 | (0.3) | 0.8 | 1.6 | 1.6 | ||||||||||||||||||||||||
| Adjusted earnings from continuing operations before interest and income taxes | $ | 30.0 | $ | 25.2 | $ | 24.6 | $ | 78.5 | $ | 59.5 | |||||||||||||||||||
Adjusted earnings from continuing operations before interest and income taxes as % of revenues |
21.1 | % | 18.6 | % | 22.8 | % | 19.1 | % | 18.7 | % | |||||||||||||||||||
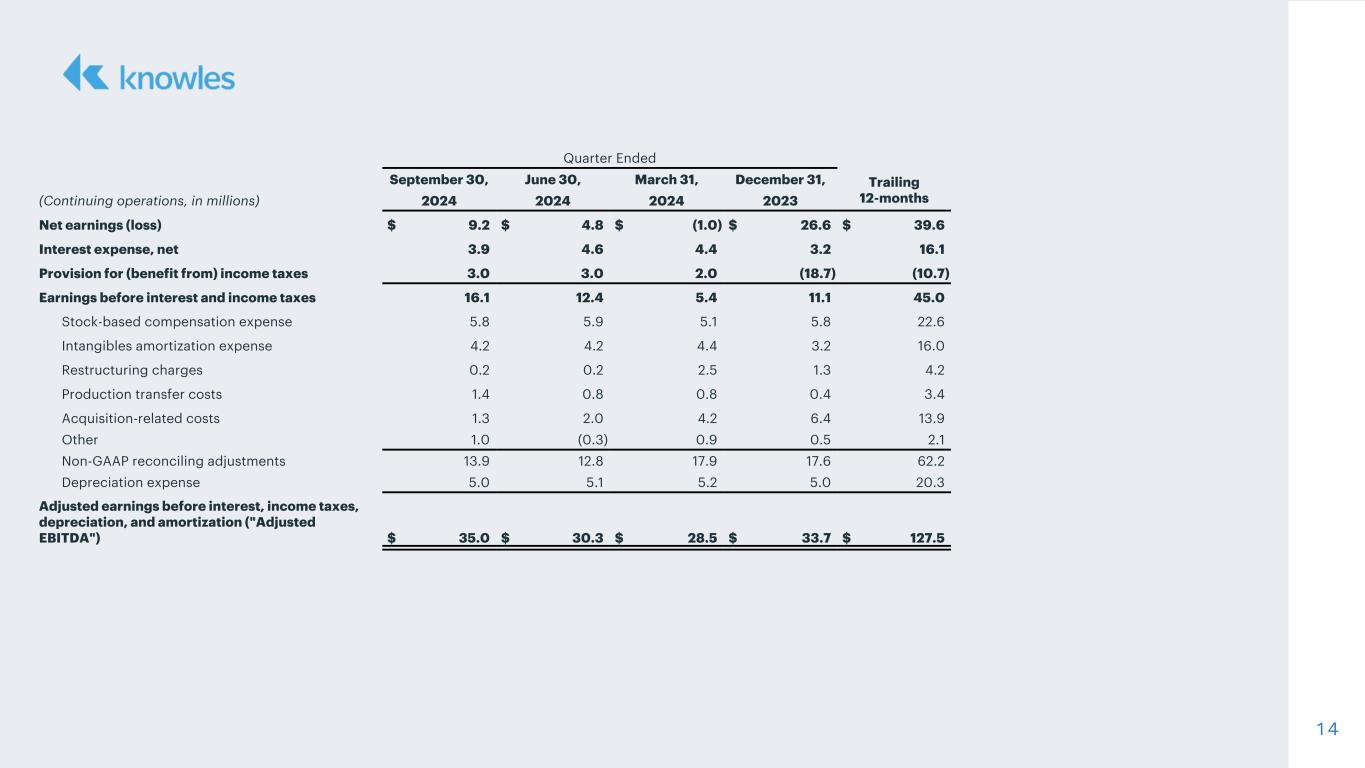
| Net earnings from continuing operations | $ | 9.2 | $ | 4.8 | $ | 15.2 | $ | 13.0 | $ | 39.0 | |||||||||||||||||||
| Interest expense, net | 3.9 | 4.6 | 0.6 | 12.9 | 2.2 | ||||||||||||||||||||||||
| Provision for (benefit from) income taxes | 3.0 | 3.0 | (3.9) | 8.0 | (9.6) | ||||||||||||||||||||||||
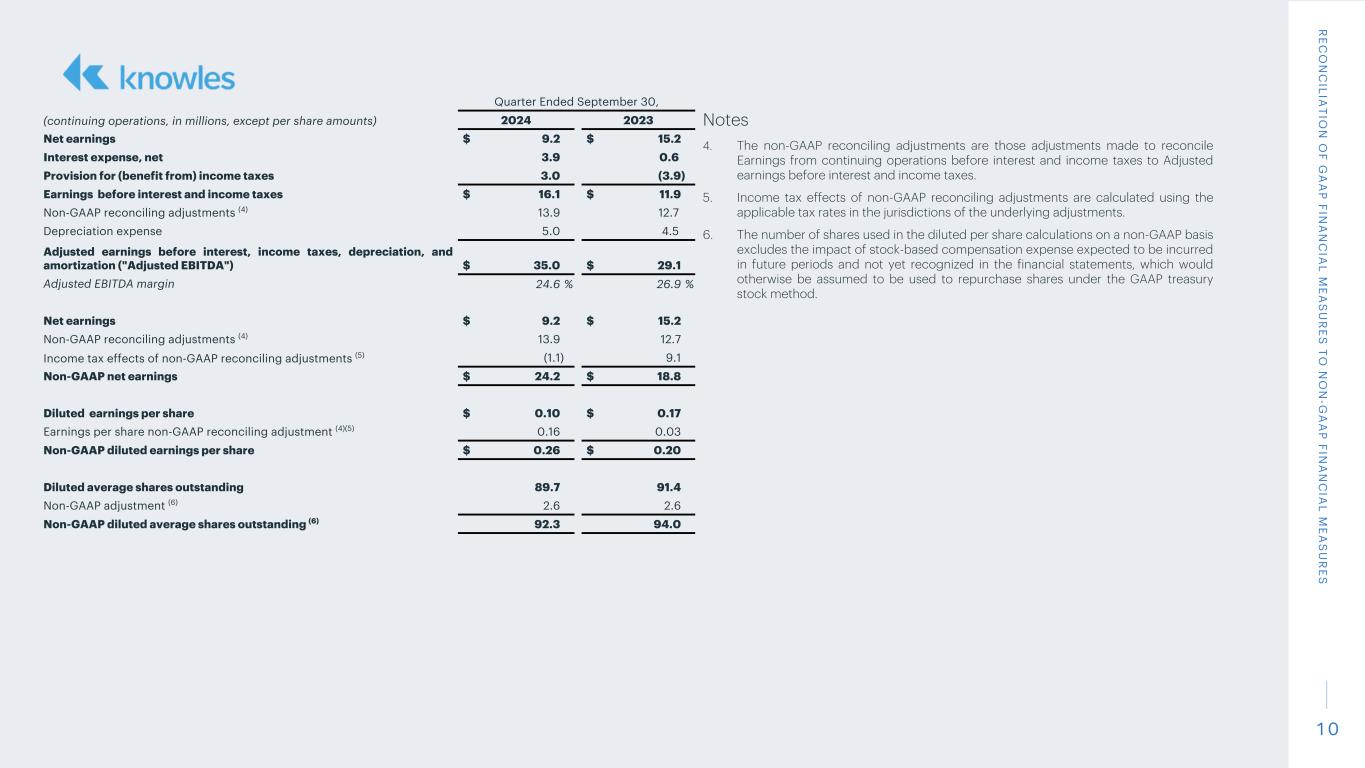
| Earnings from continuing operations before interest and income taxes | 16.1 | 12.4 | 11.9 | 33.9 | 31.6 | ||||||||||||||||||||||||
Non-GAAP reconciling adjustments (6) |
13.9 | 12.8 | 12.7 | 44.6 | 27.9 | ||||||||||||||||||||||||
| Depreciation expense | 5.0 | 5.1 | 4.5 | 15.3 | 13.7 | ||||||||||||||||||||||||
| Adjusted earnings from continuing operations before interest, income taxes, depreciation, and amortization ("Adjusted EBITDA") | $ | 35.0 | $ | 30.3 | $ | 29.1 | $ | 93.8 | $ | 73.2 | |||||||||||||||||||
Adjusted EBITDA as a % of revenues |
24.6 | % | 22.4 | % | 26.9 | % | 22.8 | % | 23.0 | % | |||||||||||||||||||
| Quarter Ended | Nine Months Ended | ||||||||||||||||||||||||||||
| September 30, 2024 |
June 30, 2024 |
September 30, 2023 |
September 30, 2024 |
September 30, 2023 |
|||||||||||||||||||||||||
| Provision for (benefit from) income taxes | $ | 3.0 | $ | 3.0 | $ | (3.9) | $ | 8.0 | $ | (9.6) | |||||||||||||||||||
Income tax effects of non-GAAP reconciling adjustments (5) |
(1.1) | (0.8) | 9.1 | (2.0) | 22.8 | ||||||||||||||||||||||||
| Non-GAAP provision for income taxes | $ | 1.9 | $ | 2.2 | $ | 5.2 | $ | 6.0 | $ | 13.2 | |||||||||||||||||||
| Net earnings from continuing operations | $ | 9.2 | $ | 4.8 | $ | 15.2 | $ | 13.0 | $ | 39.0 | |||||||||||||||||||
Non-GAAP reconciling adjustments (6) |
13.9 | 12.8 | 12.7 | 44.6 | 27.9 | ||||||||||||||||||||||||
Income tax effects of non-GAAP reconciling adjustments (5) |
(1.1) | (0.8) | 9.1 | (2.0) | 22.8 | ||||||||||||||||||||||||
| Non-GAAP net earnings | $ | 24.2 | $ | 18.4 | $ | 18.8 | $ | 59.6 | $ | 44.1 | |||||||||||||||||||
| Diluted earnings per share from continuing operations | $ | 0.10 | $ | 0.05 | $ | 0.17 | $ | 0.14 | $ | 0.42 | |||||||||||||||||||
Earnings per share non-GAAP reconciling adjustment (5)(6) |
0.16 | 0.15 | 0.03 | 0.50 | 0.05 | ||||||||||||||||||||||||
| Non-GAAP diluted earnings per share | $ | 0.26 | $ | 0.20 | $ | 0.20 | $ | 0.64 | $ | 0.47 | |||||||||||||||||||
| Diluted average shares outstanding | 89.7 | 89.9 | 91.4 | 90.2 | 91.9 | ||||||||||||||||||||||||
Non-GAAP adjustment (7) |
2.6 | 3.3 | 2.6 | 2.6 | 2.5 | ||||||||||||||||||||||||
Non-GAAP diluted average shares outstanding (7) |
92.3 | 93.2 | 94.0 | 92.8 | 94.4 | ||||||||||||||||||||||||
| September 30, 2024 | December 31, 2023 | ||||||||||
| Current assets: | |||||||||||
| Cash and cash equivalents | $ | 92.6 | $ | 87.3 | |||||||
Receivables, net of allowances of $0.1 and $0.2 |
105.7 | 90.7 | |||||||||
| Inventories | 124.9 | 127.0 | |||||||||
| Prepaid and other current assets | 9.8 | 6.9 | |||||||||
| Current assets of discontinued operations | 103.0 | 116.9 | |||||||||
| Total current assets | 436.0 | 428.8 | |||||||||
| Property, plant, and equipment, net | 134.4 | 141.9 | |||||||||
| Goodwill | 270.4 | 270.5 | |||||||||
| Intangible assets, net | 162.3 | 175.6 | |||||||||
| Operating lease right-of-use assets | 7.8 | 10.2 | |||||||||
| Other assets and deferred charges | 115.6 | 113.7 | |||||||||
| Non-current assets of discontinued operations | 44.8 | 322.1 | |||||||||
| Total assets | $ | 1,171.3 | $ | 1,462.8 | |||||||
| Current liabilities: | |||||||||||
| Current maturities of long-term debt | $ | 49.5 | $ | 47.1 | |||||||
| Accounts payable | 34.2 | 27.0 | |||||||||
| Accrued compensation and employee benefits | 27.0 | 23.2 | |||||||||
| Operating lease liabilities | 2.3 | 3.1 | |||||||||
| Other accrued expenses | 18.5 | 20.9 | |||||||||
| Federal and other taxes on income | 16.4 | 2.8 | |||||||||
| Current liabilities of discontinued operations | 38.0 | 40.5 | |||||||||
| Total current liabilities | 185.9 | 164.6 | |||||||||
| Long-term debt | 175.5 | 224.1 | |||||||||
| Deferred income taxes | 0.8 | 0.7 | |||||||||
| Long-term operating lease liabilities | 5.5 | 6.1 | |||||||||
| Other liabilities | 24.0 | 29.3 | |||||||||
| Non-current liabilities of discontinued operations | 2.2 | 3.9 | |||||||||
| Commitments and contingencies | |||||||||||
| Stockholders' equity: | |||||||||||
Preferred stock - $0.01 par value; 10,000,000 shares authorized; none issued |
— | — | |||||||||
Common stock - $0.01 par value; 400,000,000 shares authorized; 98,271,587 and 88,380,502 shares issued and outstanding at September 30, 2024, respectively, and 97,297,703 and 89,092,871 shares issued and outstanding at December 31, 2023, respectively |
1.0 | 1.0 | |||||||||
Treasury stock - at cost; 9,891,085 and 8,204,832 shares at September 30, 2024 and December 31, 2023, respectively |
(180.8) | (151.2) | |||||||||
| Additional paid-in capital | 1,707.0 | 1,689.9 | |||||||||
| Accumulated deficit | (632.1) | (375.8) | |||||||||
| Accumulated other comprehensive loss | (117.7) | (129.8) | |||||||||
| Total stockholders' equity | 777.4 | 1,034.1 | |||||||||
| Total liabilities and stockholders' equity | $ | 1,171.3 | $ | 1,462.8 | |||||||
| Nine Months Ended September 30, | |||||||||||
| 2024 | 2023 | ||||||||||
| Operating Activities | |||||||||||
| Net (loss) earnings | $ | (256.3) | $ | 25.0 | |||||||
| Adjustments to reconcile net (loss) earnings to cash from operating activities: | |||||||||||
| Goodwill impairment | 262.5 | — | |||||||||
| Depreciation and amortization | 40.7 | 33.8 | |||||||||
| Stock-based compensation | 21.4 | 21.8 | |||||||||
| Non-cash interest expense and amortization of debt issuance costs | 6.4 | 0.6 | |||||||||
| Impairment of disposal group | 2.3 | — | |||||||||
| Deferred income taxes | 0.7 | 1.6 | |||||||||
| Non-cash restructuring charges | 0.3 | (1.8) | |||||||||
| Gain on sale of fixed assets | (1.1) | (10.0) | |||||||||
| Gain on sale of asset | (7.2) | — | |||||||||
| Other, net | 7.4 | (2.4) | |||||||||
| Changes in assets and liabilities (excluding effects of foreign exchange): | |||||||||||
| Receivables, net | (8.4) | 15.5 | |||||||||
| Inventories | 11.2 | (19.0) | |||||||||
| Prepaid and other current assets | (0.3) | (0.8) | |||||||||
| Accounts payable | 5.8 | 11.3 | |||||||||
| Accrued compensation and employee benefits | 3.5 | 0.3 | |||||||||
| Other accrued expenses | (3.1) | (2.7) | |||||||||
| Accrued taxes | 15.3 | (2.3) | |||||||||
| Other non-current assets and non-current liabilities | (6.1) | (8.6) | |||||||||
| Net cash provided by operating activities | 95.0 | 62.3 | |||||||||
| Investing Activities | |||||||||||
| Proceeds from the sale of asset | 7.2 | — | |||||||||
| Proceeds from the sale of property, plant, and equipment | — | 12.4 | |||||||||
| Capital expenditures | (10.3) | (11.8) | |||||||||
| Acquisition of asset | — | (0.3) | |||||||||
| Purchase of investments | (0.5) | (0.4) | |||||||||
| Proceeds from the sale of investments | 0.5 | 0.4 | |||||||||
| Net cash (used in) provided by investing activities | (3.1) | 0.3 | |||||||||
| Financing Activities | |||||||||||
| Payments under revolving credit facility | (130.0) | — | |||||||||
| Borrowings under revolving credit facility | 78.0 | — | |||||||||
| Repurchase of common stock | (29.5) | (27.5) | |||||||||
| Tax on restricted and performance stock unit vesting and stock option exercises | (6.4) | (6.2) | |||||||||
| Payments of debt issuance costs | — | (1.9) | |||||||||
| Payments of finance lease obligations | (1.4) | (1.3) | |||||||||
| Proceeds from exercise of stock options | 2.1 | 1.6 | |||||||||
| Net cash used in financing activities | (87.2) | (35.3) | |||||||||
| Effect of exchange rate changes on cash and cash equivalents | 0.6 | (0.4) | |||||||||
| Net increase in cash and cash equivalents | 5.3 | 26.9 | |||||||||
| Cash and cash equivalents at beginning of period | 87.3 | 48.2 | |||||||||
| Cash and cash equivalents at end of period | $ | 92.6 | $ | 75.1 | |||||||
| Quarter Ended | Nine Months Ended | ||||||||||||||||||||||||||||
| September 30, 2024 | June 30, 2024 | September 30, 2023 | September 30, 2024 | September 30, 2023 | |||||||||||||||||||||||||
| Net cash provided by operating activities | $ | 52.8 | $ | 24.9 | $ | 39.9 | $ | 95.0 | $ | 62.3 | |||||||||||||||||||
| Less: amounts attributable to discontinued operations | (22.3) | 1.3 | (21.9) | (22.1) | (21.6) | ||||||||||||||||||||||||
| Non-GAAP net cash attributable to continuing operations | 30.5 | 26.2 | 18.0 | 72.9 | 40.7 | ||||||||||||||||||||||||
| Capital expenditures | (3.7) | (3.2) | (3.9) | (10.3) | (11.8) | ||||||||||||||||||||||||
| Less: amounts attributable to discontinued operations | 0.2 | 0.2 | 0.8 | 0.9 | 3.8 | ||||||||||||||||||||||||
| Non-GAAP capital expenditures attributable to continuing operations | (3.5) | (3.0) | (3.1) | (9.4) | (8.0) | ||||||||||||||||||||||||
| Non-GAAP net cash attributable to continuing operations | 30.5 | 26.2 | 18.0 | 72.9 | 40.7 | ||||||||||||||||||||||||
| Non-GAAP capital expenditures attributable to continuing operations | (3.5) | (3.0) | (3.1) | (9.4) | (8.0) | ||||||||||||||||||||||||
| Adjusted free cash flow | $ | 27.0 | $ | 23.2 | $ | 14.9 | $ | 63.5 | $ | 32.7 | |||||||||||||||||||
| Adjusted free cash flow as a % of revenues | 18.9 | % | 17.2 | % | 13.8 | % | 15.5 | % | 10.3 | % | |||||||||||||||||||

