
December 5, 2023 S e n ti n e lO n e Q 3 F Y 20 24 Q3 FY2024 Letter to Shareholders
Q3 FY2024 LETTER TO SHAREHOLDERS 2SENTINELONE Table of Contents To Our Shareholders 3 Technology Highlights 7 Go-To-Market Highlights 10 Q3 FY2024 Financials 12 Guidance 15 Closing 16 Financial Statements 22
Q3 FY2024 LETTER TO SHAREHOLDERS 3SENTINELONE 01 To Our Shareholders Our third-quarter results demonstrate solid execution in delivering high growth with substantial margin improvement. Macroeconomic headwinds persist, yet we exceeded our expectations across all key met- rics, driven by our leading AI-based security and partner-centric go-to-market approach. Once again, we are raising our top-line and bottom-line expectations for the fiscal year 2024. Revenue grew 42% year-over-year (y/y) to $164 million and annualized recurring revenue (ARR) grew 43% y/y to $664 million, fueled by a combination of new customer growth and existing customer expansion. Net new ARR of $52 million exceeded our typical third-quarter seasonality and accelerated to 11% year- over-year growth1. Our performance signifies strong demand for SentinelOne’s endpoint security as well as adjacent solutions like Cloud, Data, and Identity. Our progress toward profitability remains a bright spot, as demonstrated by significant margin improve- ments. Our GAAP and non-GAAP gross margin expanded by 9 and 8 percentage points y/y, respectively. Our non-GAAP gross margin of 79% reached a new record, now at the high end of our long-term target range of 75-80%, or higher. This progress reflects the benefits of our increasing scale, platform unit economics, and solid pricing power. Similarly, our GAAP and non-GAAP operating margin expanded by 41 and 32 percentage points y/y, respectively. Q3 marked our 9th consecutive quarter of more than 25 percentage points of non-GAAP operating margin y/y improvement—this is tremendous progress. And, we’re raising our fiscal year 2024 non-GAAP operating margin expectation to (20)%, compared to our prior guidance of (25)%. These results show the scalability of our business model and the potential for operating leverage. With $1.1 billion of cash and equivalents as of quarter-end and a rapidly improving margin profile, we will continue to balance growth and investments. Our competitive position remains strong as we continue to win a significant majority of competitive eval- uations against both next-gen and legacy vendors. We are succeeding in the endpoint market as well as in adjacent markets like Cloud and Data. Our total customer base now exceeds 11,500. Importantly this number is understated as it does not include the customers served by our MSSP (Managed Security Service Provider) partners. We’re seeing strong momentum with businesses of all sizes, especially large enterprises, and MSSP partners. Our ARR per customer grew approximately 15% y/y, reflecting broader platform adoption and success with large enterprises. From a macroeconomic perspective, the global economy remains volatile, further typified by recent ge- opolitical tensions. Yet the threat landscape remains unrelenting. In the age of AI and modern cyberwar- fare, the velocity and complexity of attacks are rising. A slew of recent high-profile attacks showcase the enormous consequences of breaches—costing hundreds of millions of dollars, lost business, and dis- ruption. Events like these are constant reminders of why cybersecurity remains the top priority for Chief Information Officers (CIOs) around the world. 1 Compared to adjusted Q3 FY23 net new ARR of $49 million.
Q3 FY2024 LETTER TO SHAREHOLDERS 4SENTINELONE The most unnerving part of these attacks is that they continue to circumvent so-called large platform vendors. Siloed data architectures or disjointed platforms do not yield better security outcomes. Selecting a bigger vendor does not mean better security. In contrast, we introduced a novel approach that yields real-time, superior protection—fully autonomous cybersecurity and unified enterprise data in one place. Our unified data and security platform architecture helps enterprises to consolidate spending, point products, and consoles, resulting in better value and user experience. In Q3, Singularity Cloud and Singularity Data were our fastest-growing solutions. Combined, they rep- resented over 20% of quarterly bookings and grew triple digits y/y. Our differentiated cloud workload protection solution continues to drive sizeable new customer wins and rapid customer expansion. We’ve also seen a notable uptick in demand for our Singularity Data Lake solution. We believe superior per- formance, scalability, and cost of ownership make our fully integrated data capabilities an attractive alternative to enterprises looking to modernize away from legacy Security Information and Event Man- agement (SIEM) solutions. We are proud to partner with many leading MSSPs across the world. We continue to make important progress in solidifying our leadership position and strengthening our partnerships across the MSSP eco- system. We have established deeper relationships and long-term growth commitments to our platform with leading MSSPs like Pax8 and N-able, in a way that provides us visibility into mutual growth and suc- cess. MSSPs represent the fastest-growing channel category in the security market driven by structural demand for managed services. We believe SentinelOne is the platform of choice for MSSPs to build and scale their managed security services. We recently hosted our inaugural customer and partner conference, OneCon, and showcased our com- mitment to key areas of innovation and investment: Endpoint, Cloud, Data, and AI. In endpoint security, we achieved a 4th consecutive year of leadership in the MITRE Engenuity ATT&CK® Evaluations. The ability to alert on a potential attack indicator is only the tip of the iceberg. The real dif- ferentiation is in achieving 100% detection and protection with zero delays and configuration changes— where SentinelOne outperforms its peers. This is the difference between a simulation and the real world. Attackers don’t offer extra time or a chance to make configuration changes. Our Singularity Platform is built to be real-time, AI-driven, and autonomous. We are also expanding our Cloud Security offerings. We’re already leading in cloud workload protection and cloud data security. In the coming year, Singularity Cloud will become a full-featured CNAPP with agent-based and agentless capabilities. Finally, SentinelOne is the only vendor to ingest and cross-correlate data across an entire enterprise in a unified platform. This architecture combined with our Purple AI leadership puts us in a strong position to deliver enterprise-wide security and disrupt the legacy data analytics market. We have begun to deliver Purple AI to select customers, once again solidifying SentinelOne as a leader in AI-based security. We expect Purple AI to be generally available in Q1 of fiscal year 2025. It will be fully integrated throughout the Singularity Platform to enhance investigations, simplify threat hunting, make recommendations, and automate actions. Beyond technological demands, there is a growing need to assess, quantify, and articulate cybersecurity risks—helping enterprises understand who’s targeting them and the strength of their holistic security
Q3 FY2024 LETTER TO SHAREHOLDERS 5SENTINELONE posture. We’ve launched PinnacleOne, a strategic advisory practice to help some of the largest corpora- tions in the world and governments build world-class cybersecurity programs. We are providing access to top experts, including Chris Krebs and Alex Stamos, who can help enterprises think bigger and broader than the siloed approaches of today. Our holistic approach to risk management has the ability to empower organizations to adapt and move forward with confidence across all products and environments. Q3 FY2024 Highlights (All metrics are compared to the third quarter of fiscal year 2023, unless otherwise noted; FY2023 metrics reflect the one-time ARR adjustment announced in the first quarter of fiscal year 2024) • Revenue in the quarter grew 42% to $164 million, compared to $115 million. ARR grew 43% to $664 million, compared to $463 million. • Total customers exceeded 11,500 at quarter end. Customers with an ARR of $100,000 or more grew 33% to 1,060. Dollar-based NRR exceeded 115%. • GAAP gross margin was 73%, 9 percentage points higher compared to 64%. Non-GAAP gross margin was 79%, 8 percentage points higher compared to 71%. • GAAP operating margin was (50)%, 41 percentage points higher compared to (90)%. Non-GAAP operating margin was (11)%, 32 percentage points higher compared to (43)%. • Operating cash flow margin was (14)%, compared to (52)%. Free cash flow margin was (16)%, 40 percentage points higher compared to (56)%. • Cash, cash equivalents, and investments were $1.1 billion as of October 31, 2023.
Q3 FY2024 LETTER TO SHAREHOLDERS 6SENTINELONE SentinelLabs operates as an open venue for threat researchers, committed to sharing the latest threat intelligence with a growing community of cyber defenders. By providing novel findings from the world of malware, exploits, advanced persistent threats (APTs), and cybercrime, the SentinelLabs team helps global enterprises and government bodies stay ahead of their adversaries. We work to cut through the noise of partial information, offering tools, context, and insights to achieve our collective mission of a safer digital life for all. Research Highlights We combined our technical expertise with Reuters' investigative journalism to provide a nuanced view of the Hack-For-Hire landscape, focusing particularly on the Appin Security Group (Appin). This collaboration represents a significant effort to bring to light the intricate operations of a key player in cyber espionage. • Diverse Range of Hack-for-Hire Services: The landscape of hack-for-hire enterprises has undergone a transformation, diversifying the array of services available to both private enterprises and govern- ment entities. • In-depth Analysis of Appin's Operations: We provide a detailed dissection of Appin's methodologies, particularly their techniques in malware creation, exploit development, and network infrastructure. • Global Impact and Victimology: Our findings expose Appin's extensive global reach, with operations impacting countries including Norway, Pakistan, China, and India, affecting both government officials and private businesses. Discovered by SentinelOne, in collaboration with QGroup, the 'Sandman' APT targets telecom sectors with unique LuaDream malware, marking a significant development in understanding global cyber threats. • Sandman has been primarily targeting telecommunication providers in the Middle East, Western Europe, and the South Asian subcontinent. The activities are characterized by strategic lateral movements and minimal engagements, likely intended to minimize the risk of detection. • Sandman deployed a novel modular backdoor utilizing the LuaJIT platform, a relatively rare occurrence in the threat landscape. We refer to this malware as LuaDream. The implementation of LuaDream indicates a well-executed, maintained, and actively developed project of a considerable scale. • LuaDream does not appear to be related to any known threat actors. While the development style is historically associated with a specific type of advanced threat actor, inconsistencies between the high- end development of the malware and poor segmentation practices lead us toward the possibility of a private contractor or mercenary group similar to Metador.
Q3 FY2024 LETTER TO SHAREHOLDERS 7SENTINELONE 02 Technology Highlights The Singularity Platform offers superior protection and ease of use. In the latest Gartner Peer Insights, SentinelOne received an overall score of 4.8 out of 5 across the board for its customer experience and product capabilities, where 96% of respondents recommend SentinelOne’s security platform. CRN recognized SentinelOne as a winner in “CRN’s 2023 Products of the Year Awards” for Endpoint and Cloud Security. Singularity is the first AI security platform to provide enterprise-wide visibility and protection, bringing all enterprise data together in a unified Data Lake to eliminate risk and protect the future. We’re further ad- vancing our capabilities, ensuring that we consistently deliver superior enterprise value and drive better business outcomes agnostic of attack surface. Our innovation roadmap is focused on four key pillars of innovation: Endpoint, Cloud, Data, and AI. Let’s review our innovation lead on each of these individually. Maintaining Endpoint Security Leadership For the fourth straight year, the Singularity Platform demonstrated industry-leading detection and protec- tion capabilities in MITRE’s ATT&CK Evaluation, scoring: • 100% Protection—blocked 13 out of 13 protection steps • 100% Detection—detected 18 of 18 detection steps • 100% Real-time—zero delayed detections • 100% Realistic—zero configuration changes Our approach to this year’s MITRE Evaluation reflects our philosophy on protection—speed and auton- omous operation are critical. Complex attacks can move from initial access to credential compromise, lateral movement, data encryption, and extortion in a matter of minutes or even seconds. MITRE provides vendors with an opportunity to re-test any step and make configuration changes. However, there are no second chances in the real world: an adversary will not let you bolster your security during an attack. Unlike most participants in this test, you will see no delayed modifiers in SentinelOne’s results. We also contextualize and organize attacks into a handful of alerts, while some larger vendors take a kitchen-sink approach with thousands of alerts. Speed and realistic performance matter. Singularity protection is au- tonomous, effective, and designed for the real world.
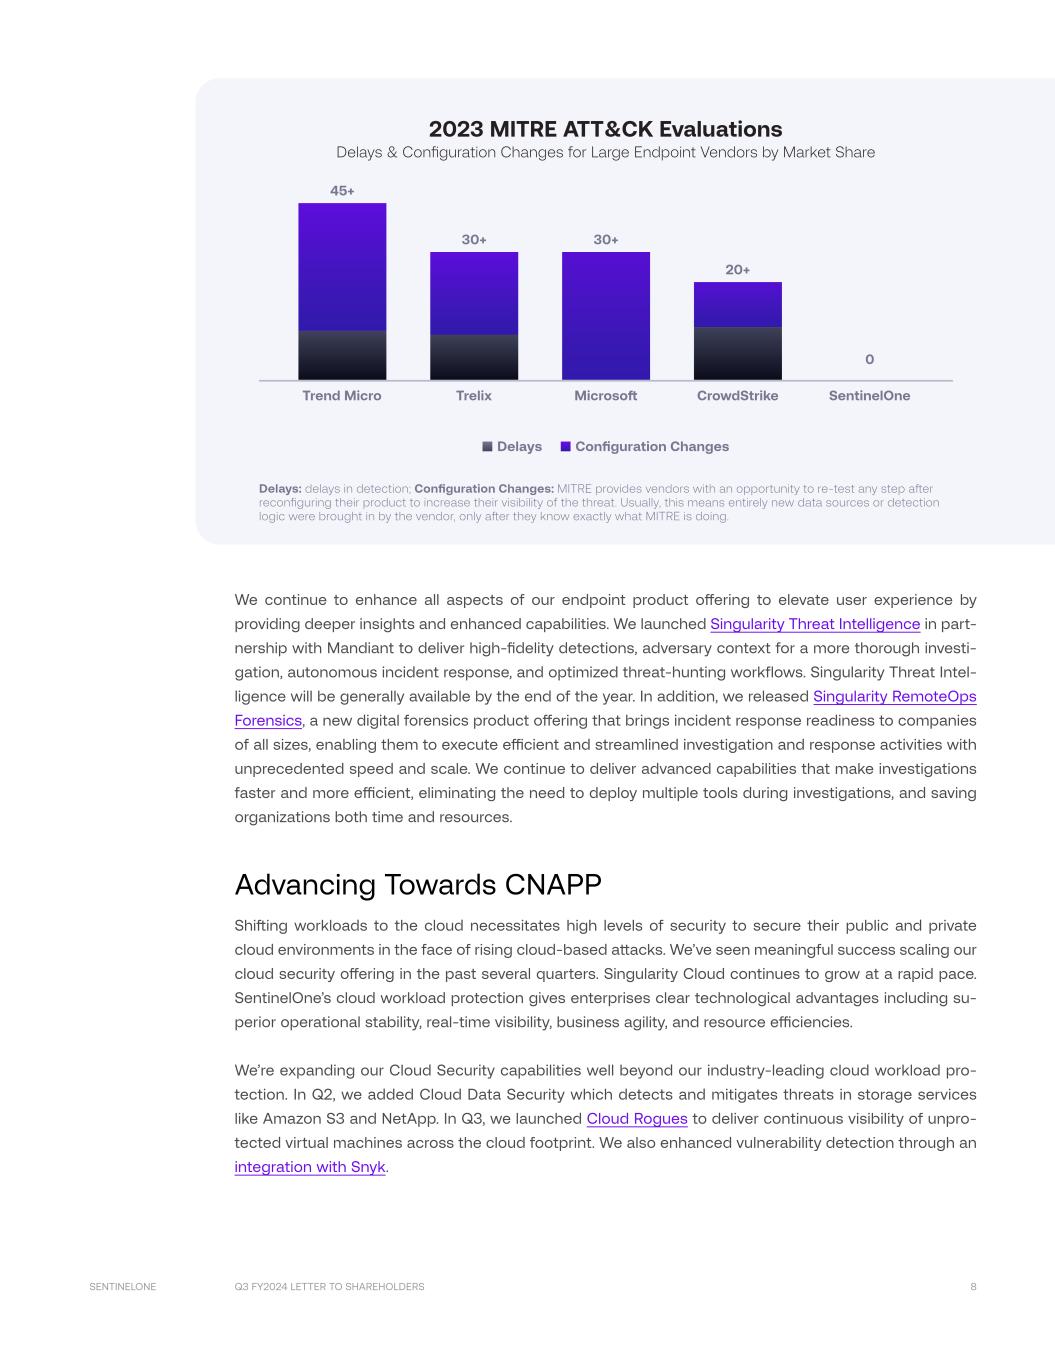
Q3 FY2024 LETTER TO SHAREHOLDERS 8SENTINELONE 45+ CrowdStrikeMicroso SentinelOne 0 20+ 30+ Trend Micro Trelix 30+ 2023 MITRE ATT&CK Evaluations Delays & Configuration Changes for Large Endpoint Vendors by Market Share Delays Configuration Changes Delays: delays in detection; Configuration Changes: MITRE provides vendors with an opportunity to re-test any step aer reconfiguring their product to increase their visibility of the threat. Usually, this means entirely new data sources or detection logic were brought in by the vendor, only aer they know exactly what MITRE is doing. We continue to enhance all aspects of our endpoint product offering to elevate user experience by providing deeper insights and enhanced capabilities. We launched Singularity Threat Intelligence in part- nership with Mandiant to deliver high-fidelity detections, adversary context for a more thorough investi- gation, autonomous incident response, and optimized threat-hunting workflows. Singularity Threat Intel- ligence will be generally available by the end of the year. In addition, we released Singularity RemoteOps Forensics, a new digital forensics product offering that brings incident response readiness to companies of all sizes, enabling them to execute efficient and streamlined investigation and response activities with unprecedented speed and scale. We continue to deliver advanced capabilities that make investigations faster and more efficient, eliminating the need to deploy multiple tools during investigations, and saving organizations both time and resources. Advancing Towards CNAPP Shifting workloads to the cloud necessitates high levels of security to secure their public and private cloud environments in the face of rising cloud-based attacks. We’ve seen meaningful success scaling our cloud security offering in the past several quarters. Singularity Cloud continues to grow at a rapid pace. SentinelOne’s cloud workload protection gives enterprises clear technological advantages including su- perior operational stability, real-time visibility, business agility, and resource efficiencies. We’re expanding our Cloud Security capabilities well beyond our industry-leading cloud workload pro- tection. In Q2, we added Cloud Data Security which detects and mitigates threats in storage services like Amazon S3 and NetApp. In Q3, we launched Cloud Rogues to deliver continuous visibility of unpro- tected virtual machines across the cloud footprint. We also enhanced vulnerability detection through an integration with Snyk.
Q3 FY2024 LETTER TO SHAREHOLDERS 9SENTINELONE We are excited to announce that over the next 12 months, we plan to offer a complete Cloud-Native Application Protection Platform (CNAPP) to safeguard public and private cloud infrastructure with agent- based and agentless capabilities and data security services. Unified Singularity Data Lake and Analytics Our unified approach to security data lake and autonomous protection is gaining strong traction. We’re now securing multi-million dollar data deals on a standalone basis as well as expansions in conjunction with endpoint and cloud security. We are just scratching the surface of a massive security data market opportunity that is ripe for disruption. Singularity Data Lake enables organizations to centralize and transform data for cost-effective, high- performance security and log analytics—bringing SIEM, Extended Detection Response (XDR), and Log Analytics solutions together as one. Every SentinelOne customer gets access to our fully integrated Singularity Data Lake. Agnostic to source or vendor, Singularity Data Lake can ingest, correlate, and integrate all types of enterprise data at a significant scale—a single pane of glass and platform. This is a critical capability for a security platform to deliver the benefits of cost, performance, and scale demanded by enterprises today and into the future. The combination of Singularity Data Lake and Purple AI delivers an exceptionally easy-to-use platform, helping organizations transition from legacy SIEM solutions and unlock the benefits of comprehensive data and security. Purple AI makes analysis and actionability across all of this data faster and easier than ever before, reducing days or hours of work into minutes. AI: Pioneering the Application of AI to Cybersecurity Bad actors are increasingly using AI-based tactics to infiltrate networks, creating unprecedented cyber- security challenges. Last month, SentinelLabs identified a new Python-based info stealer and hack tool called ‘Predator AI’ that is designed to target cloud services by implementing a ChatGPT-driven class. These types of AI-based threats pose serious challenges. We have begun to deliver Purple AI to select customers with full general availability coming in Q1 of fiscal year 2025. While many of our competitors are still working to prepare controlled demos and issue illustrative pricing, we have made security AI a product reality. We’ve worked to seamlessly integrate Purple AI across the entire Singularity Platform. Purple AI is designed to help security teams go beyond chatbots. Security analysts can use natural language processing for threat hunting and investigations, get suggested queries and hunting quick starts, generate contextual summaries, automate investigative processes, take recommended response actions, and much more. Purple AI is designed to accelerate SecOps, unify workflows, automate processes, and unlock efficiencies across security operation centers. In short, our AI innovations have the capacity to supercharge the security analyst and tilt the scales in favor of the enterprise.
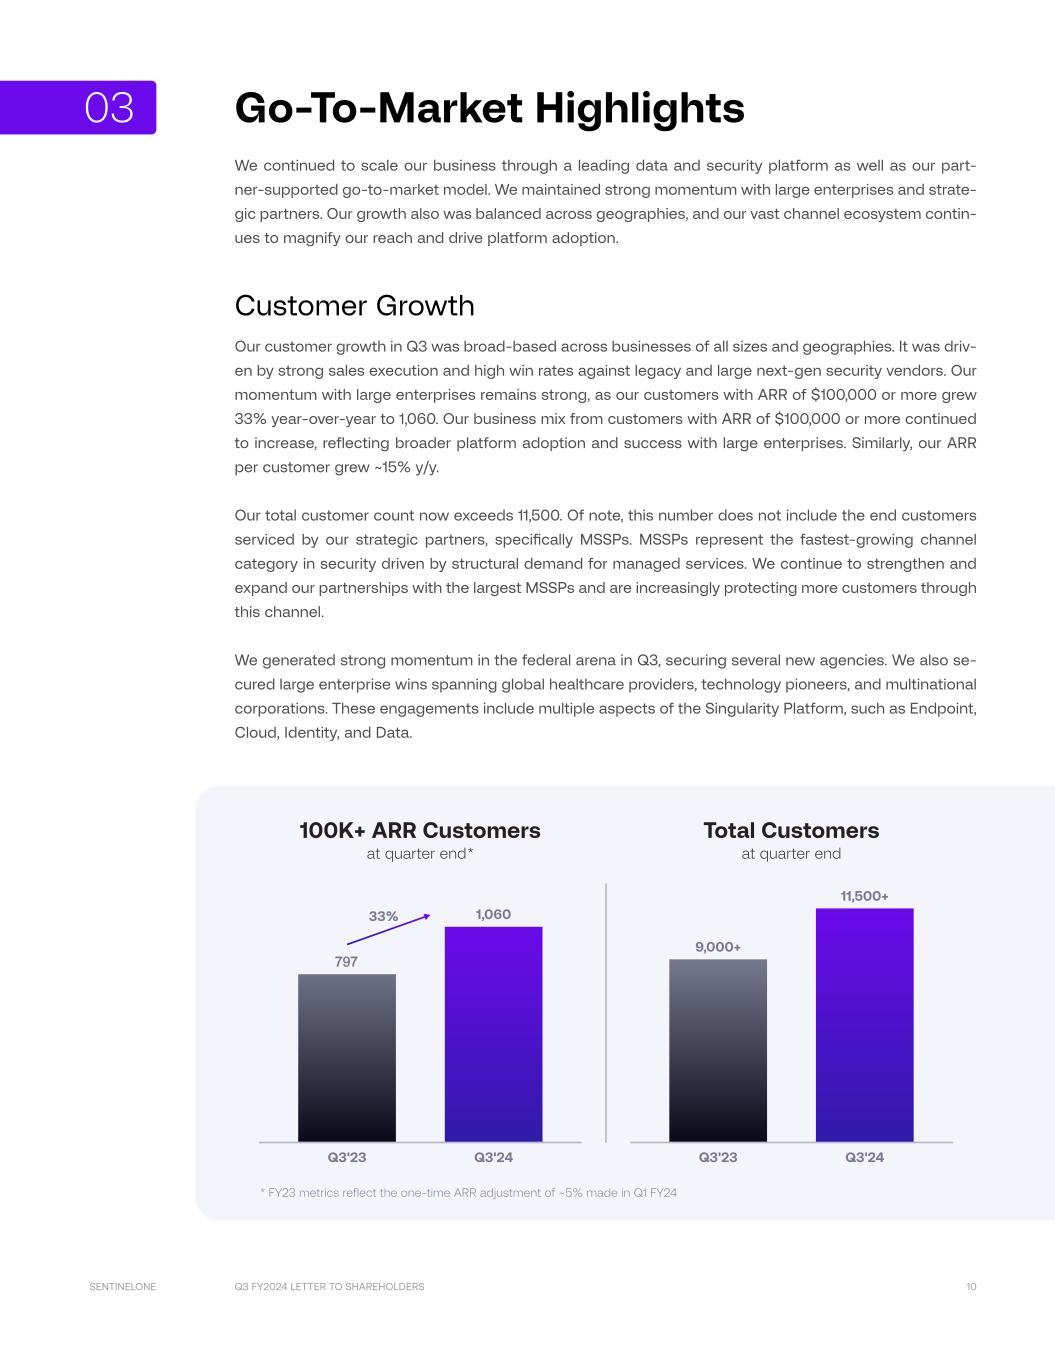
Q3 FY2024 LETTER TO SHAREHOLDERS 10SENTINELONE Go-To-Market Highlights We continued to scale our business through a leading data and security platform as well as our part- ner-supported go-to-market model. We maintained strong momentum with large enterprises and strate- gic partners. Our growth also was balanced across geographies, and our vast channel ecosystem contin- ues to magnify our reach and drive platform adoption. Customer Growth Our customer growth in Q3 was broad-based across businesses of all sizes and geographies. It was driv- en by strong sales execution and high win rates against legacy and large next-gen security vendors. Our momentum with large enterprises remains strong, as our customers with ARR of $100,000 or more grew 33% year-over-year to 1,060. Our business mix from customers with ARR of $100,000 or more continued to increase, reflecting broader platform adoption and success with large enterprises. Similarly, our ARR per customer grew ~15% y/y. Our total customer count now exceeds 11,500. Of note, this number does not include the end customers serviced by our strategic partners, specifically MSSPs. MSSPs represent the fastest-growing channel category in security driven by structural demand for managed services. We continue to strengthen and expand our partnerships with the largest MSSPs and are increasingly protecting more customers through this channel. We generated strong momentum in the federal arena in Q3, securing several new agencies. We also se- cured large enterprise wins spanning global healthcare providers, technology pioneers, and multinational corporations. These engagements include multiple aspects of the Singularity Platform, such as Endpoint, Cloud, Identity, and Data. 797 Q3'23 100K+ ARR Customers at quarter end* Total Customers at quarter end 33% 9,000+ Q3'23 1,060 Q3'24 11,500+ Q3'24 * FY23 metrics reflect the one-time ARR adjustment of ~5% made in Q1 FY24 03
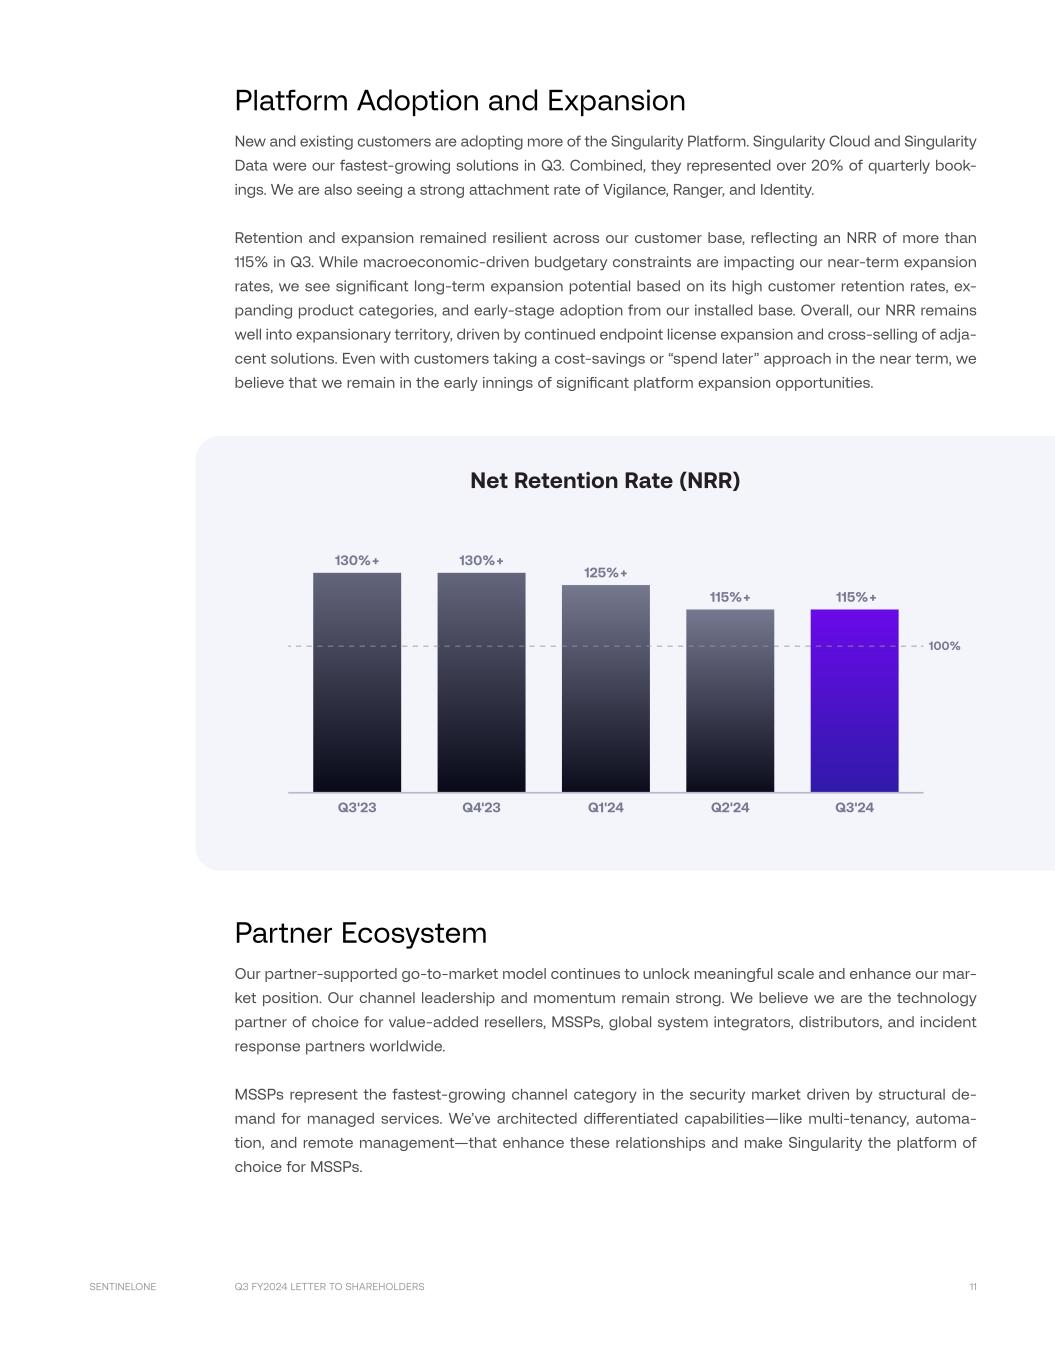
Q3 FY2024 LETTER TO SHAREHOLDERS 11SENTINELONE Platform Adoption and Expansion New and existing customers are adopting more of the Singularity Platform. Singularity Cloud and Singularity Data were our fastest-growing solutions in Q3. Combined, they represented over 20% of quarterly book- ings. We are also seeing a strong attachment rate of Vigilance, Ranger, and Identity. Retention and expansion remained resilient across our customer base, reflecting an NRR of more than 115% in Q3. While macroeconomic-driven budgetary constraints are impacting our near-term expansion rates, we see significant long-term expansion potential based on its high customer retention rates, ex- panding product categories, and early-stage adoption from our installed base. Overall, our NRR remains well into expansionary territory, driven by continued endpoint license expansion and cross-selling of adja- cent solutions. Even with customers taking a cost-savings or “spend later” approach in the near term, we believe that we remain in the early innings of significant platform expansion opportunities. 130%+130%+ 100% Q3'23 Q4'23 Q1'24 Q2'24 Net Retention Rate (NRR) 115%+ 125%+ Q3'24 115%+ Partner Ecosystem Our partner-supported go-to-market model continues to unlock meaningful scale and enhance our mar- ket position. Our channel leadership and momentum remain strong. We believe we are the technology partner of choice for value-added resellers, MSSPs, global system integrators, distributors, and incident response partners worldwide. MSSPs represent the fastest-growing channel category in the security market driven by structural de- mand for managed services. We’ve architected differentiated capabilities—like multi-tenancy, automa- tion, and remote management—that enhance these relationships and make Singularity the platform of choice for MSSPs.
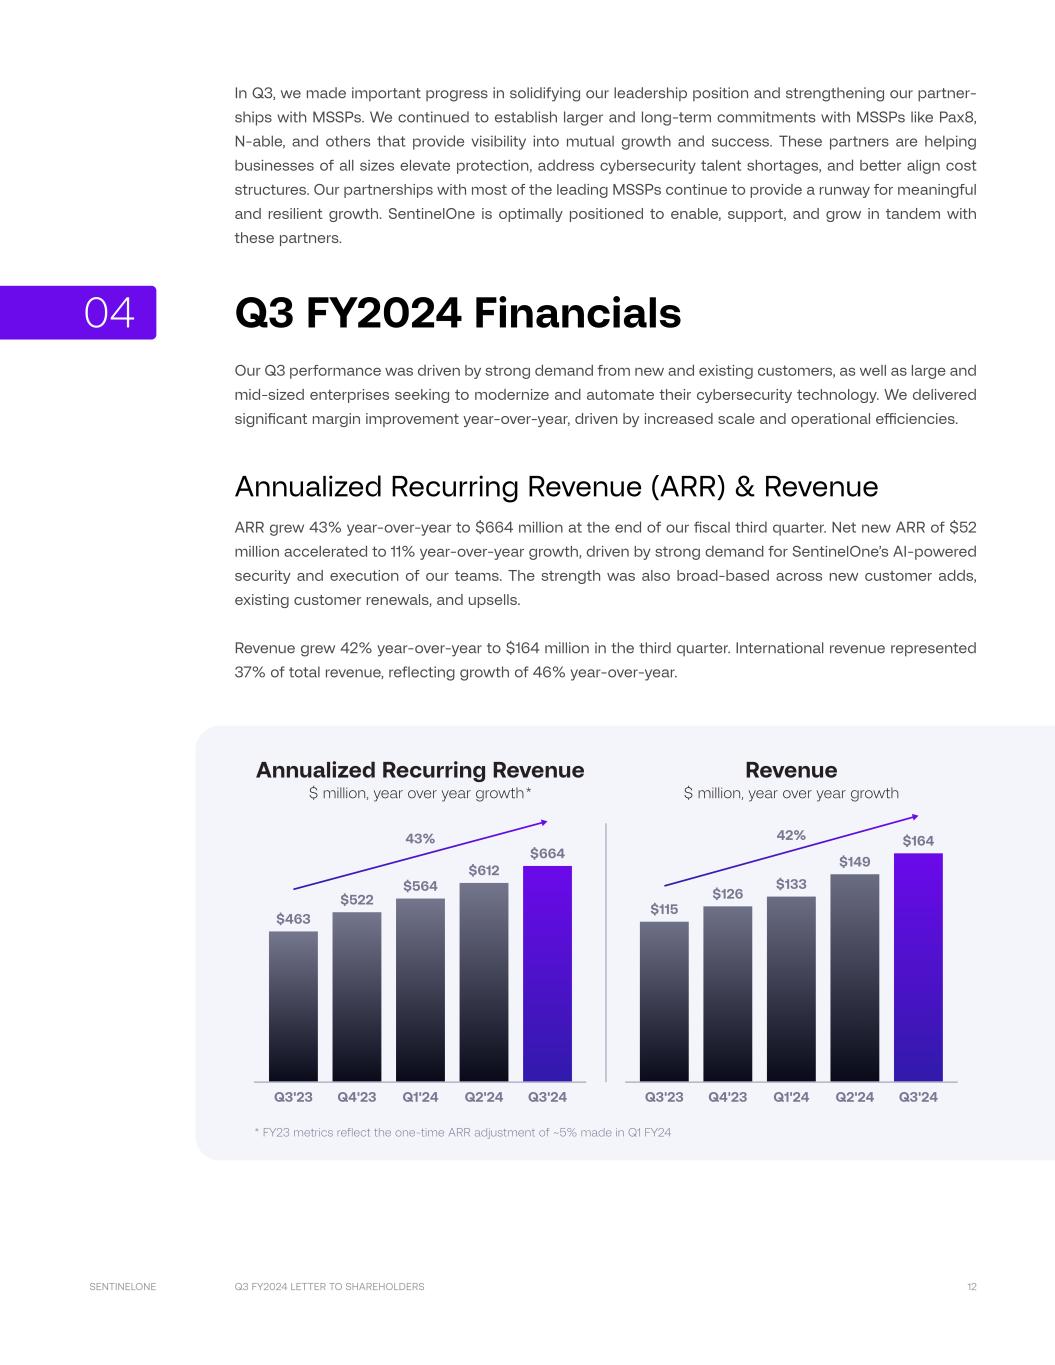
Q3 FY2024 LETTER TO SHAREHOLDERS 12SENTINELONE In Q3, we made important progress in solidifying our leadership position and strengthening our partner- ships with MSSPs. We continued to establish larger and long-term commitments with MSSPs like Pax8, N-able, and others that provide visibility into mutual growth and success. These partners are helping businesses of all sizes elevate protection, address cybersecurity talent shortages, and better align cost structures. Our partnerships with most of the leading MSSPs continue to provide a runway for meaningful and resilient growth. SentinelOne is optimally positioned to enable, support, and grow in tandem with these partners. Q3 FY2024 Financials Our Q3 performance was driven by strong demand from new and existing customers, as well as large and mid-sized enterprises seeking to modernize and automate their cybersecurity technology. We delivered significant margin improvement year-over-year, driven by increased scale and operational efficiencies. Annualized Recurring Revenue (ARR) & Revenue ARR grew 43% year-over-year to $664 million at the end of our fiscal third quarter. Net new ARR of $52 million accelerated to 11% year-over-year growth, driven by strong demand for SentinelOne’s AI-powered security and execution of our teams. The strength was also broad-based across new customer adds, existing customer renewals, and upsells. Revenue grew 42% year-over-year to $164 million in the third quarter. International revenue represented 37% of total revenue, reflecting growth of 46% year-over-year. $463 $115 Q3'23 Q1'24Q4'23 Q3'23 Q1'24Q4'23 $522 $564 $612 $126 Q2'24 Q2'24 43% 42% Annualized Recurring Revenue $ million, year over year growth* Revenue $ million, year over year growth $133 $149 $664 Q3'24 Q3'24 $164 * FY23 metrics reflect the one-time ARR adjustment of ~5% made in Q1 FY24 04
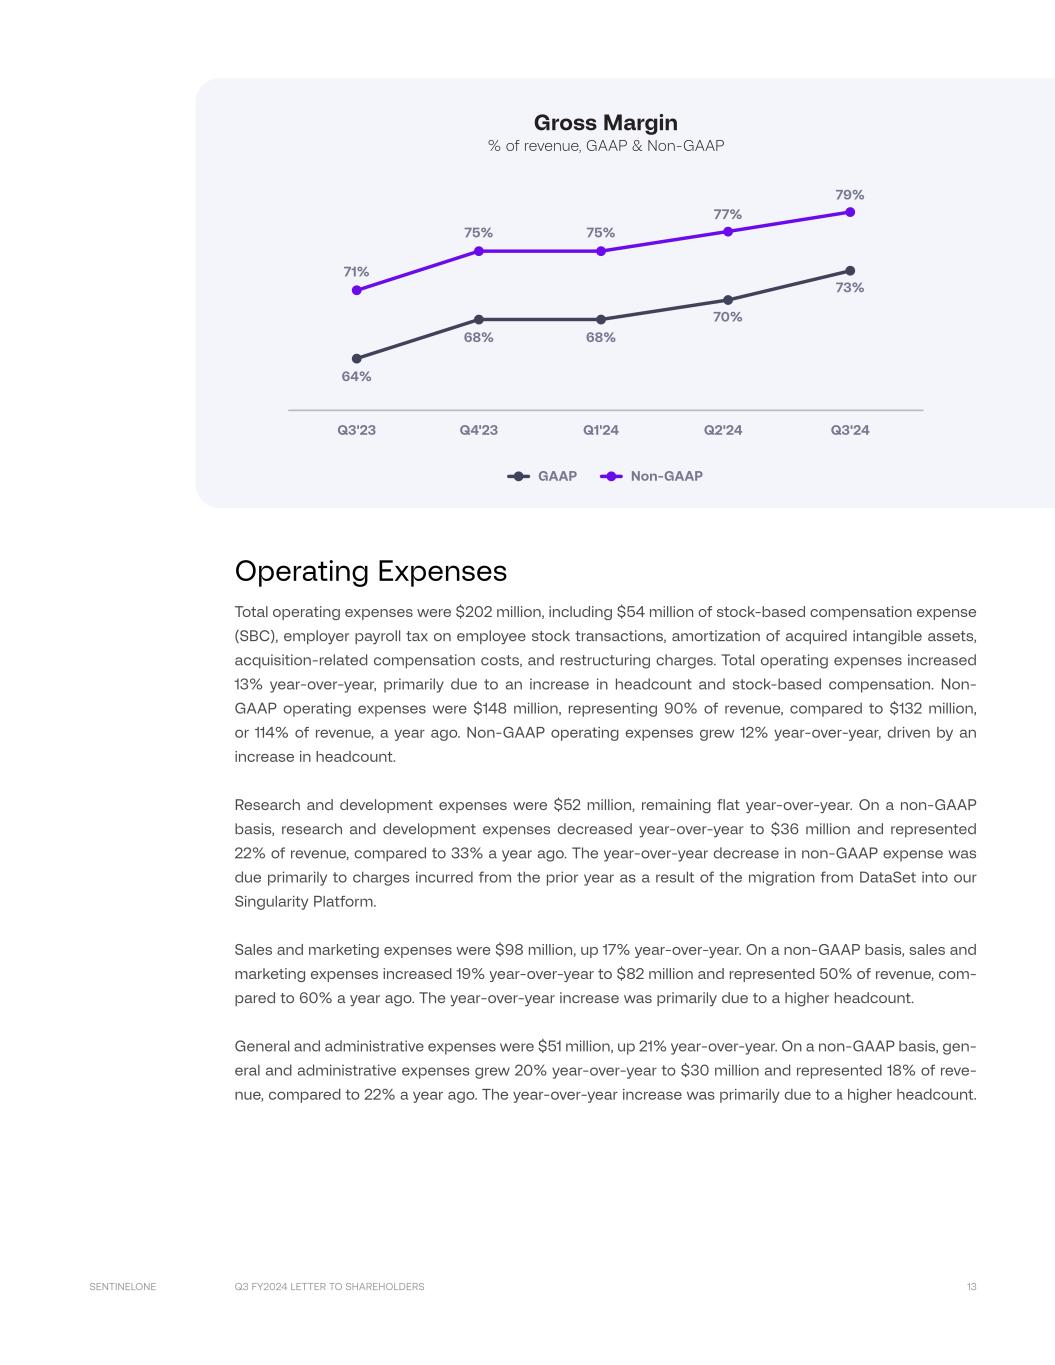
Q3 FY2024 LETTER TO SHAREHOLDERS 13SENTINELONE Gross Profit & Margin Gross profit was $120 million, or 73% of revenue, compared to 64% of revenue a year ago. Non-GAAP gross profit was $130 million, or 79% of revenue, compared to 71% of revenue a year ago. This year-over- year increase was driven primarily by increasing scale, data efficiencies, and customers’ growing platform adoption. GAAP Non-GAAP Q3'23 Q4'23 Q1'24 64% 71% Q2'24 68% 68% 75% 75% 70% 77% Gross Margin of revenue, GAAP & Non-GAAP Q3'24 73% 79% Operating Expenses Total operating expenses were $202 million, including $54 million of stock-based compensation expense (SBC), employer payroll tax on employee stock transactions, amortization of acquired intangible assets, acquisition-related compensation costs, and restructuring charges. Total operating expenses increased 13% year-over-year, primarily due to an increase in headcount and stock-based compensation. Non- GAAP operating expenses were $148 million, representing 90% of revenue, compared to $132 million, or 114% of revenue, a year ago. Non-GAAP operating expenses grew 12% year-over-year, driven by an increase in headcount. Research and development expenses were $52 million, remaining flat year-over-year. On a non-GAAP basis, research and development expenses decreased year-over-year to $36 million and represented 22% of revenue, compared to 33% a year ago. The year-over-year decrease in non-GAAP expense was due primarily to charges incurred from the prior year as a result of the migration from DataSet into our Singularity Platform. Sales and marketing expenses were $98 million, up 17% year-over-year. On a non-GAAP basis, sales and marketing expenses increased 19% year-over-year to $82 million and represented 50% of revenue, com- pared to 60% a year ago. The year-over-year increase was primarily due to a higher headcount. General and administrative expenses were $51 million, up 21% year-over-year. On a non-GAAP basis, gen- eral and administrative expenses grew 20% year-over-year to $30 million and represented 18% of reve- nue, compared to 22% a year ago. The year-over-year increase was primarily due to a higher headcount.
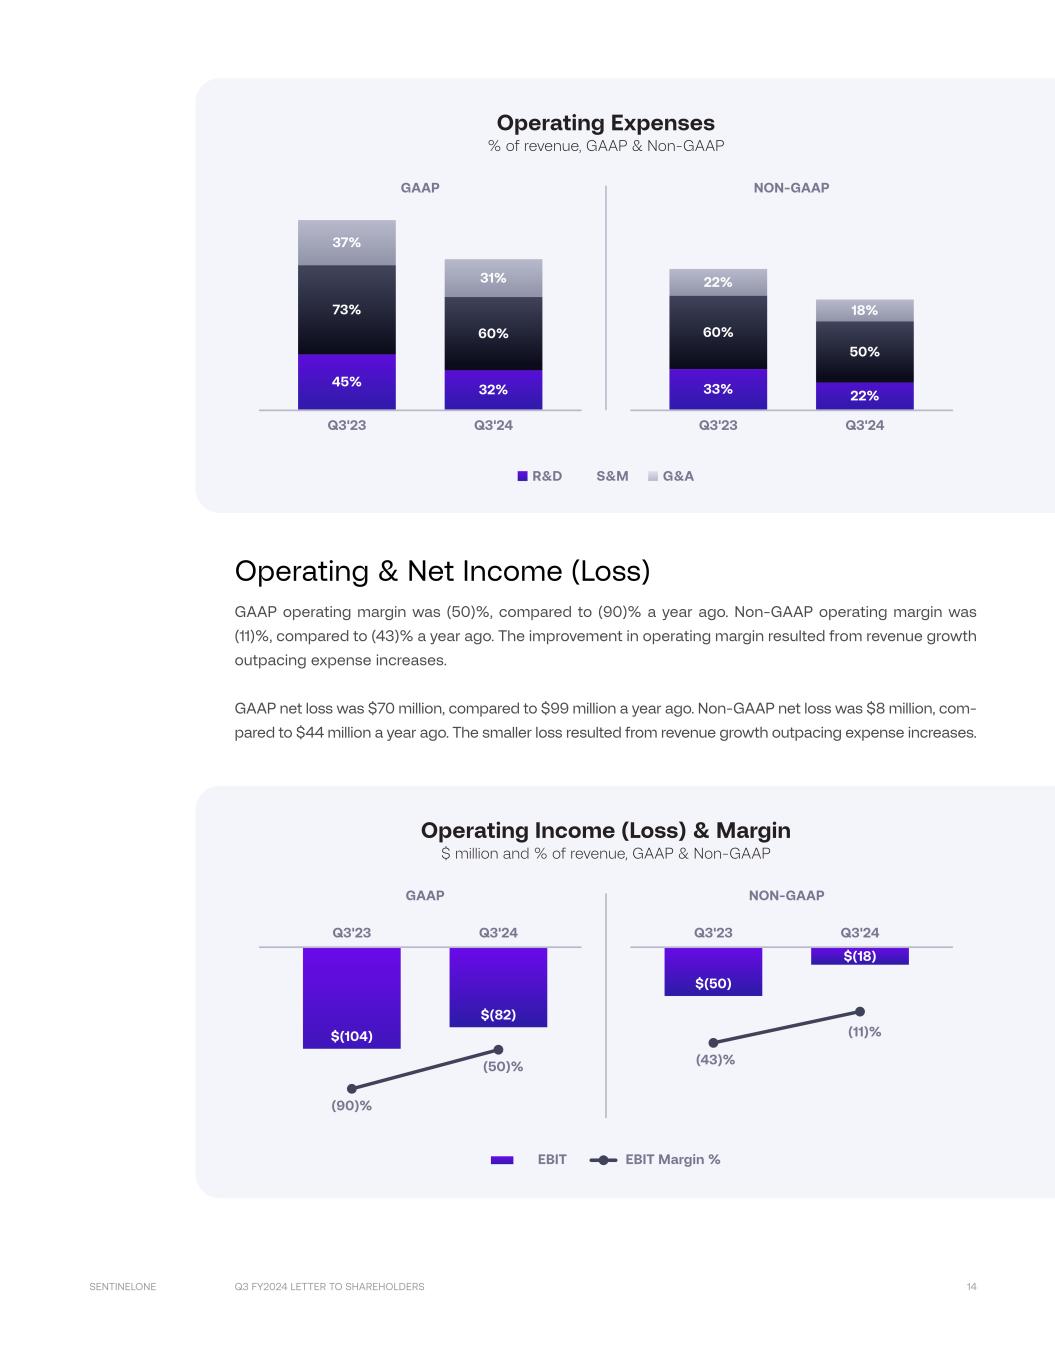
Q3 FY2024 LETTER TO SHAREHOLDERS 14SENTINELONE GAAP NON-GAAP Q3'23 Q3'24 33% 22% 60% 50% 22% 18% Q3'23 Q3'24 45% 32% 73% 60% 37% 31% R&D S&M G&A Operating Expenses % of revenue, GAAP & Non-GAAP Operating & Net Income (Loss) GAAP operating margin was (50)%, compared to (90)% a year ago. Non-GAAP operating margin was (11)%, compared to (43)% a year ago. The improvement in operating margin resulted from revenue growth outpacing expense increases. GAAP net loss was $70 million, compared to $99 million a year ago. Non-GAAP net loss was $8 million, com- pared to $44 million a year ago. The smaller loss resulted from revenue growth outpacing expense increases. $(104) $(82) Q3'23 Q3'24 EBIT EBIT Margin % $(50) $(18) Q3'23 Q3'24 GAAP NON-GAAP (43)% (11)% (50)% (90)% Operating Income (Loss) & Margin $ million and % of revenue, GAAP & Non-GAAP
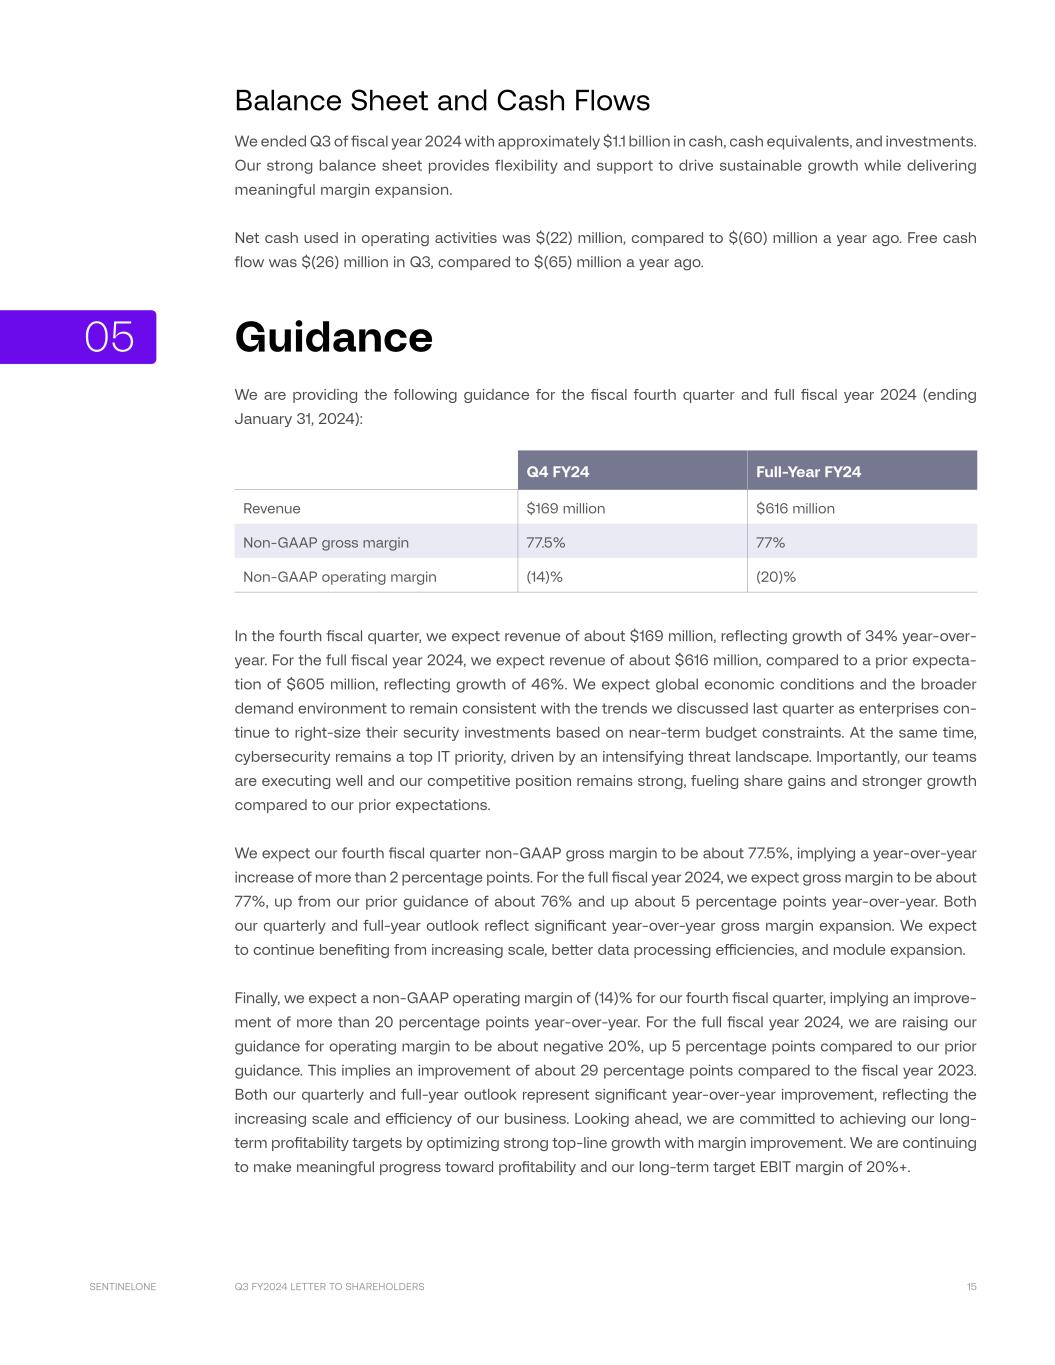
Q3 FY2024 LETTER TO SHAREHOLDERS 15SENTINELONE Balance Sheet and Cash Flows We ended Q3 of fiscal year 2024 with approximately $1.1 billion in cash, cash equivalents, and investments. Our strong balance sheet provides flexibility and support to drive sustainable growth while delivering meaningful margin expansion. Net cash used in operating activities was $(22) million, compared to $(60) million a year ago. Free cash flow was $(26) million in Q3, compared to $(65) million a year ago. Guidance We are providing the following guidance for the fiscal fourth quarter and full fiscal year 2024 (ending January 31, 2024): Q4 FY24 Full-Year FY24 Revenue $169 million $616 million Non-GAAP gross margin 77.5% 77% Non-GAAP operating margin (14)% (20)% In the fourth fiscal quarter, we expect revenue of about $169 million, reflecting growth of 34% year-over- year. For the full fiscal year 2024, we expect revenue of about $616 million, compared to a prior expecta- tion of $605 million, reflecting growth of 46%. We expect global economic conditions and the broader demand environment to remain consistent with the trends we discussed last quarter as enterprises con- tinue to right-size their security investments based on near-term budget constraints. At the same time, cybersecurity remains a top IT priority, driven by an intensifying threat landscape. Importantly, our teams are executing well and our competitive position remains strong, fueling share gains and stronger growth compared to our prior expectations. We expect our fourth fiscal quarter non-GAAP gross margin to be about 77.5%, implying a year-over-year increase of more than 2 percentage points. For the full fiscal year 2024, we expect gross margin to be about 77%, up from our prior guidance of about 76% and up about 5 percentage points year-over-year. Both our quarterly and full-year outlook reflect significant year-over-year gross margin expansion. We expect to continue benefiting from increasing scale, better data processing efficiencies, and module expansion. Finally, we expect a non-GAAP operating margin of (14)% for our fourth fiscal quarter, implying an improve- ment of more than 20 percentage points year-over-year. For the full fiscal year 2024, we are raising our guidance for operating margin to be about negative 20%, up 5 percentage points compared to our prior guidance. This implies an improvement of about 29 percentage points compared to the fiscal year 2023. Both our quarterly and full-year outlook represent significant year-over-year improvement, reflecting the increasing scale and efficiency of our business. Looking ahead, we are committed to achieving our long- term profitability targets by optimizing strong top-line growth with margin improvement. We are continuing to make meaningful progress toward profitability and our long-term target EBIT margin of 20%+. 05

Q3 FY2024 LETTER TO SHAREHOLDERS 16SENTINELONE The above statements are based on current targets as of the date of this letter, and we undertake no obli- gation to update them after such date. These statements are forward-looking, and actual results may differ materially due to many factors. Refer to the Forward-Looking Statements below for information on the factors that could cause our actions and results to differ materially from these forward-looking statements. Guidance for non-GAAP financial measures excludes stock-based compensation expense, employer payroll tax on employee stock transactions, amortization expense of acquired intangible assets, acqui- sition-related compensation costs, restructuring charges, and gain on strategic investments. We have not provided the most directly comparable GAAP measures on a forward-looking basis because certain items are out of our control or cannot be reasonably predicted. Accordingly, a reconciliation for non- GAAP gross margin and non-GAAP operating margin is not available without unreasonable effort. How- ever, it is important to note that material changes to reconciling items could have a significant effect on future GAAP results. We have provided a reconciliation of other GAAP to non-GAAP metrics in tables at the end of this letter. Closing We will host a conference call at 2:00 p.m. Pacific Time / 5:00 p.m. Eastern Time today to discuss details of our fiscal third quarter results. A live webcast and replay will be available on SentinelOne’s Investor Re- lations website at investors.sentinelone.com. Thank you for taking the time to read our shareholder letter. We look forward to your questions on our call this afternoon. Sincerely, Tomer Weingarten Dave Bernhardt CEO and Co-founder CFO 06
Q3 FY2024 LETTER TO SHAREHOLDERS 17SENTINELONE Forward-Looking Statements This letter and the live webcast, which will be held at 2:00 p.m. Pacific Time / 5:00 p.m. Eastern Time on December 5, 2023, contain “forward-looking statements” within the meaning of Section 27A of the Se- curities Act of 1933, as amended, and Section 21E of the Securities Exchange Act of 1934, as amended, which statements involve risks and uncertainties, including but not limited to statements regarding our future growth, execution, competitive position, and future financial and operating performance, including our financial outlook for the fourth quarter of fiscal year 2024 and our full fiscal year 2024, including non- GAAP gross profit and non-GAAP operating margin; progress towards our longer-term profitability tar- gets; and general market trends. The words “believe,” “may,” “will,” “potentially,” “estimate,” “continue,” “an- ticipate,” “intend,” “could,” “would,” “project,” “target,” “plan,” “expect,” or the negative of these terms and similar expressions are intended to identify forward-looking statements. However, not all forward-looking statements contain these identifying words. There are a significant number of factors that could cause our actual results to differ materially from state- ments made in this letter and live webcast, including but not limited to our limited operating history; our history of losses; intense competition in the market we compete in; fluctuations in our operating results; actual or perceived network or security incidents against us; our ability to successfully integrate any ac- quisitions and strategic investments; actual or perceived defects, errors or vulnerabilities in our platform; risks associated with managing our rapid growth; general market, political, economic, and business con- ditions, including those related to declining global macroeconomic conditions, government shutdowns, rising interest rates, supply chain disruptions and inflation, labor shortages, recent banking sector issues, uncertainty with respect to the federal budget, and geopoitical uncertainty, including the effects of the conflicts in Israel and Ukraine and the judicial reform in Israel; our ability to attract new and retain existing customers, or renew and expand our relationships with them; the ability of our platform to effectively in- teroperate within our customers’ IT infrastructure; disruptions or other business interruptions that affect the availability of our platform including cybersecurity incidents; the failure to timely develop and achieve market acceptance of new products and subscriptions as well as existing products, subscriptions and support offerings; rapidly evolving technological developments in the market for security products and subscription and support offerings; length of sales cycles; and risks of securities class action litigation. Additional risks and uncertainties that could affect our financial results are included under the captions “Risk Factors” and “Management’s Discussion and Analysis of Financial Condition and Results of Opera- tions” set forth in our filings and reports with the Securities and Exchange Commission (SEC), including our most recently filed Annual Report on Form 10-K, dated March 29, 2023, subsequent Quarterly Reports on Form 10-Q, and other filings and reports that we may file from time to time with the SEC, copies of which are available on our website at investors.sentinelone.com and on the SEC’s website at www.sec.gov. You should not rely on these forward-looking statements, as actual outcomes and results may differ materially from those contemplated by these forward-looking statements as a result of such risks and uncertainties. All forward-looking statements in this letter and the live webcast are based on information and estimates available to us at the time of this letter and the live webcast, respectively, and were based on current expectations, estimates, forecasts, and projections as well as the beliefs and assumptions of management. We do not assume any obligation to update the forward-looking statements provided to reflect events that occur or circumstances that exist after the date of this letter and live webcast or to reflect new information or the occurrence of unexpected events, except as required by law. We may not actually achieve the plans, intentions, or expectations disclosed in our forward-looking statements, and you should not place undue reliance on our forward-looking statements.
Q3 FY2024 LETTER TO SHAREHOLDERS 18SENTINELONE Non-GAAP Financial Measures In addition to our results determined in accordance with GAAP, we believe the following non-GAAP meas- ures are useful in evaluating our operating performance. We use the following non-GAAP financial infor- mation to evaluate our ongoing operations and for internal planning and forecasting purposes. We believe that non-GAAP financial information, when taken collectively, with the financial information presented in accordance with GAAP, may be helpful to investors because it provides consistency and comparability with past financial performance. However, non-GAAP financial information is presented for supplemental informational purposes only, has limitations as an analytical tool, and should not be considered in isolation or as a substitute for financial information presented in accordance with GAAP. Other companies, including companies in our industry, may calculate similarly titled non-GAAP measures differently or may use other measures to evaluate their performance, all of which could reduce the use- fulness of our non-GAAP financial measures as tools for comparison. In addition, the utility of free cash flow as a measure of our liquidity is limited as it does not represent the total increase or decrease in our cash balance for a given period. Reconciliations between non-GAAP financial measures to the most directly comparable financial meas- ure stated in accordance with GAAP are contained at the end of the earnings press release following the accompanying financial data. Investors are encouraged to review the related GAAP financial measures and the reconciliation of these non-GAAP financial measures to their most directly comparable GAAP financial measures and not rely on any single financial measure to evaluate our business. Non-GAAP Gross Profit and Non-GAAP Gross Margin We define non-GAAP gross profit and non-GAAP gross margin as GAAP gross profit and GAAP gross margin, respectively, excluding stock-based compensation expense, employer payroll tax on employee stock transactions, amortization of acquired intangible assets, acquisition-related compensation, and restructuring charges. We believe non-GAAP gross profit and non-GAAP gross margin provide our man- agement and investors consistency and comparability with our past financial performance and facilitate period-to-period comparisons of operations, as these measures eliminate the effects of certain variables unrelated to our overall operating performance. Non-GAAP Loss from Operations and Non-GAAP Operating Margin We define non-GAAP loss from operations and non-GAAP operating margin as GAAP loss from opera- tions and GAAP operating margin, respectively, excluding stock-based compensation expense, employer payroll tax on employee stock transactions, amortization of acquired intangible assets, acquisition-relat- ed compensation, and restructuring charges. We believe non-GAAP loss from operations and non-GAAP operating margin provide our management and investors consistency and comparability with our past financial performance and facilitate period-to-period comparisons of operations, as these metrics gen- erally eliminate the effects of certain variables unrelated to our overall operating performance. Non-GAAP Net Loss and Non-GAAP Net Loss per Share, Basic and Diluted We define non-GAAP net loss as GAAP net loss excluding stock-based compensation expense, employ- er payroll tax on employee stock transactions, amortization of acquired intangible assets, restructuring
Q3 FY2024 LETTER TO SHAREHOLDERS 19SENTINELONE charges, gains (losses) on strategic investments, and the tax benefit associated with the partial reversal of a valuation of our deferred tax assets for the second quarter of fiscal year 2023. We define non-GAAP net loss per share, basic and diluted, as non-GAAP net loss divided by the weighted-average common shares outstanding. Since we have reported net losses for all periods presented, we have excluded all potentially dilutive securities from the calculation of net loss per share as their effect is anti-dilutive and accordingly, basic and diluted net loss per share is the same for all periods presented. We believe that excluding these items from non-GAAP net loss and non-GAAP net loss per share, diluted, provides management and investors with greater visibility into the underlying performance of our core business operating results. Free Cash Flow Free cash flow is a non-GAAP financial measure that we define as net cash provided by (used in) operating activities less cash used for purchases of property and equipment and capitalized internal-use software. We believe that free cash flow is a useful indicator of liquidity that provides information to management and investors, even if negative, as it provides useful information about the amount of cash generated (or consumed) by our operating activities that is available (or not available) to be used for other strategic ini- tiatives. For example, if free cash flow is negative, we may need to access cash reserves or other sources of capital to invest in strategic initiatives. While we believe that free cash flow is useful in evaluating our business, free cash flow is a non-GAAP financial measure that has limitations as an analytical tool, and free cash flow should not be considered as an alternative to, or substitute for, net cash provided by (used in) operating activities in accordance with GAAP. The utility of free cash flow as a measure of our liquidity is limited as it does not represent the total increase or decrease in our cash balance for any given period and does not reflect our future contractual commitments. In addition, other companies, including compa- nies in our industry, may calculate free cash flow differently or not at all, which reduces the usefulness of free cash flow as a tool for comparison. Expenses Excluded from Non-GAAP Measures Stock-based compensation expense Stock-based compensation expense is a non-cash expense that varies in amount from period to period and is dependent on market forces that are often beyond our control. As a result, management excludes this item from our internal operating forecasts and models. Management believes that non-GAAP meas- ures adjusted for stock-based compensation expense provide investors with a basis to measure our core performance against the performance of other companies without the variability created by stock-based compensation as a result of the variety of equity awards used by other companies and the varying meth- odologies and assumptions used. Employer payroll tax on employee stock transactions Employer payroll tax expense related to employee stock transactions are tied to the vesting or exercise of underlying equity awards and the price of our common stock at the time of vesting, which varies in amount from period to period and is dependent on market forces that are often beyond our control. As a result, management excludes this item from our internal operating forecasts and models. Management believes that non-GAAP measures adjusted for employer payroll taxes on employee stock transactions provide investors with a basis to measure our core performance against the performance of other com- panies without the variability created by employer payroll taxes on employee stock transactions as a result of the stock price at the time of employee exercise.
Q3 FY2024 LETTER TO SHAREHOLDERS 20SENTINELONE Amortization of acquired intangible assets Amortization of acquired intangible asset expense are tied to the intangible assets that were acquired in conjunction with acquisitions, which results in non-cash expenses that may not otherwise have been incurred. Management believes excluding the expense associated with intangible assets from non-GAAP measures allows for a more accurate assessment of our ongoing operations and provides investors with a better comparison of period-over-period operating results. Acquisition-related compensation costs Acquisition-related compensation costs include cash-based compensation expense resulting from the employment retention of certain employees established in accordance with the terms of the acquisition of Attivo Networks, Inc. in May 2022 (the Attivo acquisition). Acquisition-related cash-based compensa- tion costs have been excluded as they were specifically negotiated as part of the Attivo acquisition in order to retain such employees and relate to cash compensation that was made either in lieu of stock- based compensation or where the grant of stock-based compensation awards was not practicable. In most cases, these acquisition-related compensation costs are not factored into management's evalua- tion of potential acquisitions or our performance after completion of acquisitions, because they are not related to our core operating performance. In addition, the frequency and amount of such charges can vary significantly based on the size and timing of acquisitions and the maturities of the businesses being acquired. Excluding acquisition-related compensation costs from non-GAAP measures provides inves- tors with a basis to compare our results against those of other companies without the variability caused by purchase accounting. Restructuring charges Restructuring charges primarily relate to severance payments, employee benefits, stock based com- pensation, and inventory write-offs. These restructuring charges are excluded from non-GAAP financial measures because they are the result of discrete events that are not considered core-operating activities. We believe that it is appropriate to exclude restructuring charges from non-GAAP financial measures because it enables the comparison of period-over-period operating results from continuing operations. Gains and losses on strategic investments Gains and losses on strategic investments relate to the subsequent changes in fair value of our strategic investments. These gains and losses are excluded from non-GAAP financial measures because they are the result of discrete events that are not considered core-operating activities. We believe that it is appropriate to exclude gains and losses from strategic investments from non-GAAP financial measures because it enables the comparison of period-over-period net income (loss). Income tax provision (benefit) We believe that excluding the tax benefit associated with the partial reversal of the valuation allowance against our deferred tax assets for the second quarter of fiscal year 2023 provides our senior manage- ment as well as other users of our financial statements with a valuable perspective on the performance and health of the business. This partial reversal relates to realization of our deferred tax assets used to offset deferred tax liabilities recorded in the Attivo acquisition. This one-time benefit is not indicative of current or future operations and expenses.
Q3 FY2024 LETTER TO SHAREHOLDERS 21SENTINELONE Key Business Metrics We monitor the following key metrics to help us evaluate our business, identify trends affecting our busi- ness, formulate business plans and make strategic decisions. Annualized Recurring Revenue (ARR) We believe that ARR is a key operating metric to measure our business because it is driven by our ability to acquire new subscription and capacity customers and to maintain and expand our relationship with existing customers. ARR represents the annualized revenue run rate of our subscription and capacity contracts at the end of a reporting period, assuming contracts are renewed on their existing terms for customers that are under contracts with us. ARR is not a forecast of future revenue, which can be impact- ed by contract start and end dates and renewal rates. In the first quarter of fiscal year 2024, we adjusted our historical ARR. The adjustment to ARR did not impact historical total bookings or revenue.Further information relating to this adjustment can be found in “Item 2. Management’s Discussion and Analysis of Financial Condition and Results of Operations, Key Business Metrics” in our Quarterly Report on Form 10-Q filed with the SEC on June 1, 2023. Customers with ARR of $100,000 or More We believe that our ability to increase the number of customers with ARR of $100,000 or more is an indicator of our market penetration and strategic demand for our platform. We define a customer as an entity that has an active subscription for access to our platform. We count Managed Service Providers (MSPs), MSSPs, Managed Detection & Response firms (MDRs), and Original Equipment Manufacturers (OEMs), who may purchase our products on behalf of multiple companies, as a single customer. We do not count our reseller or distributor channel partners as customers. Based on the adjustments to ARR described above, cus- tomers with ARR of $100,000 or more for the prior periods in fiscal year 2023 presented above have been adjusted based on the same percentage adjustment rate identified in the first quarter of fiscal year 2024. Dollar-Based Net Retention Rate (NRR) We believe that our ability to retain and expand the revenue generated from our existing customers is an indicator of the long-term value of our customer relationships and our potential future business oppor- tunities. Dollar-based net retention rate measures the percentage change in our ARR derived from our customer base at a point in time. To calculate these metrics, we first determine Prior Period ARR, which is ARR from the population of our customers as of 12 months prior to the end of a particular reporting peri- od. We calculate Net Retention ARR as the total ARR at the end of a particular reporting period from the set of customers that is used to determine Prior Period ARR. Net Retention ARR includes any expansion and is net of contraction and attrition associated with that set of customers. NRR is the quotient obtained by dividing Net Retention ARR by Prior Period ARR. Definitions Customers: We define a customer as an entity that has an active subscription for access to our platform. We count MSPs, MSSPs, MDRs, and OEMs, who may purchase our product on behalf of multiple com- panies, as a single customer. We do not count our reseller or distributor channel partners as customers.
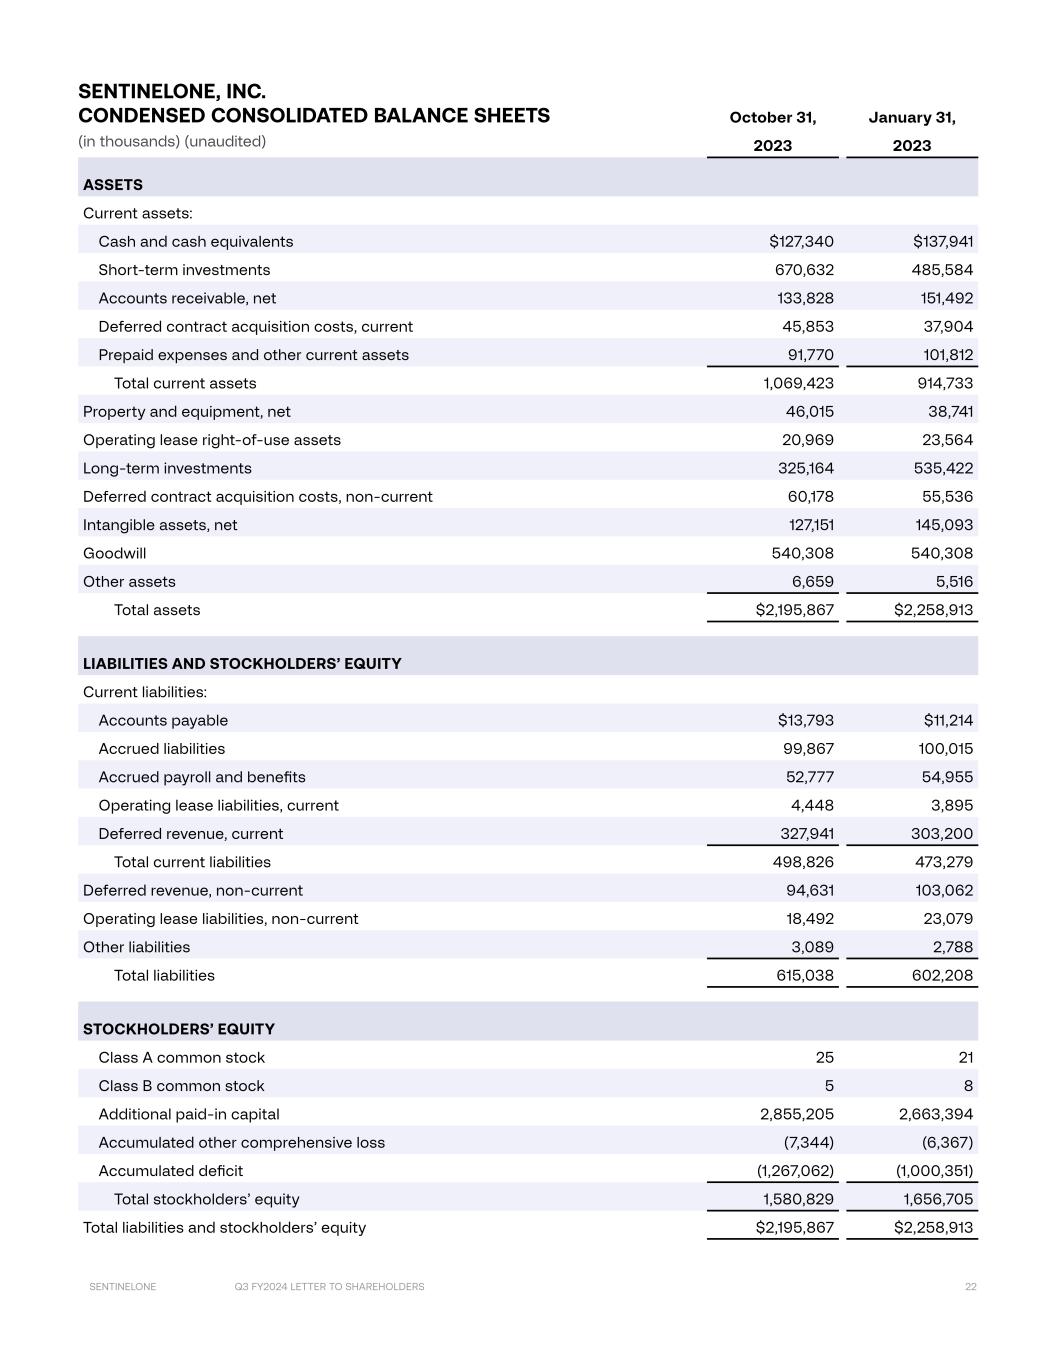
Q3 FY2024 LETTER TO SHAREHOLDERS 22SENTINELONE Financial Statements October 31, January 31, 2023 2023 ASSETS Current assets: Cash and cash equivalents $127,340 $137,941 Short-term investments 670,632 485,584 Accounts receivable, net 133,828 151,492 Deferred contract acquisition costs, current 45,853 37,904 Prepaid expenses and other current assets 91,770 101,812 Total current assets 1,069,423 914,733 Property and equipment, net 46,015 38,741 Operating lease right-of-use assets 20,969 23,564 Long-term investments 325,164 535,422 Deferred contract acquisition costs, non-current 60,178 55,536 Intangible assets, net 127,151 145,093 Goodwill 540,308 540,308 Other assets 6,659 5,516 Total assets $2,195,867 $2,258,913 LIABILITIES AND STOCKHOLDERS’ EQUITY Current liabilities: Accounts payable $13,793 $11,214 Accrued liabilities 99,867 100,015 Accrued payroll and benefits 52,777 54,955 Operating lease liabilities, current 4,448 3,895 Deferred revenue, current 327,941 303,200 Total current liabilities 498,826 473,279 Deferred revenue, non-current 94,631 103,062 Operating lease liabilities, non-current 18,492 23,079 Other liabilities 3,089 2,788 Total liabilities 615,038 602,208 STOCKHOLDERS’ EQUITY Class A common stock 25 21 Class B common stock 5 8 Additional paid-in capital 2,855,205 2,663,394 Accumulated other comprehensive loss (7,344) (6,367) Accumulated deficit (1,267,062) (1,000,351) Total stockholders’ equity 1,580,829 1,656,705 Total liabilities and stockholders’ equity $2,195,867 $2,258,913 SENTINELONE, INC. CONDENSED CONSOLIDATED BALANCE SHEETS (in thousands) (unaudited)

Q3 FY2024 LETTER TO SHAREHOLDERS 23SENTINELONE Three Months Ended Oct. 31, Nine Months Ended Oct. 31, 2023 2022 2023 2022 Revenue $164,165 $115,323 $446,979 $296,083 Cost of revenue(1) 43,765 41,006 131,015 104,406 Gross profit 120,400 74,317 315,964 191,677 OPERATING EXPENSES Research and development(1) 52,306 52,234 161,730 153,104 Sales and marketing(1) 98,249 83,953 295,682 223,594 General and administrative(1) 51,239 42,188 151,425 117,525 Restructuring(1) 74 — 4,329 — Total operating expenses 201,868 178,375 613,166 494,223 Loss from operations (81,468) (104,058) (297,202) (302,546) Interest income 11,877 7,193 33,901 11,502 Interest expense (1) (613) (1,213) (1,225) Other expense, net 605 (781) 1,655 (645) Loss before income taxes (68,987) (98,259) (262,859) (292,914) Provision (benefit) for income taxes 1,317 599 3,852 (7,916) Net loss $(70,304) $(98,858) $(266,711) $(284,998) Net loss per share attributable to Class A and Class B common stockholders, basic and diluted $(0.24) $(0.35) $(0.91) $(1.03) Weighted-average shares used in computing net loss per share attributable to Class A and Class B common stockholders, basic and diluted 296,650,848 280,635,022 292,755,742 275,867,765 (1) INCLUDES STOCK-BASED COMPENSATION EXPENSE AS FOLLOWS Cost of revenue $4,329 $2,835 $12,570 $7,082 Research and development 15,634 13,996 45,876 37,954 Sales and marketing 14,085 12,166 40,362 28,977 General and administrative 20,865 16,690 65,560 44,305 Restructuring — — (1,060) — Total stock-based compensation expense $54,913 $45,687 $163,308 $118,318 SENTINELONE, INC. CONDENSED CONSOLIDATED STATEMENTS OF OPERATIONS (in thousands, except share and per share data) (unaudited)

Q3 FY2024 LETTER TO SHAREHOLDERS 24SENTINELONE Nine Months Ended Oct. 31, 2023 2022 CASH FLOW FROM OPERATING ACTIVITIES: Net loss $(266,711) $(284,998) Adjustments to reconcile net loss to net cash used in operating activities: Depreciation and amortization 28,549 20,097 Amortization of deferred contract acquisition costs 34,699 25,871 Non-cash operating lease costs 3,010 2,547 Stock-based compensation expense 163,308 118,318 Loss on investments, accretion of discounts, and amortization of premiums on investments, net (16,289) (5,620) Net gain on strategic investments (2,706) — Other 637 (446) Changes in operating assets and liabilities, net of effects of acquisition Accounts receivable 18,846 (12,699) Prepaid expenses and other assets 10,075 (11,072) Deferred contract acquisition costs (47,289) (38,163) Accounts payable 1,935 (1,377) Accrued liabilities (220) 261 Accrued payroll and benefits (1,998) (18,786) Operating lease liabilities (4,650) (4,296) Deferred revenue 16,311 40,609 Other liabilities 301 (1,464) Net cash used in operating activities (62,192) (171,218) CASH FLOW FROM INVESTING ACTIVITIES: Purchases of property and equipment (1,117) (4,827) Purchases of intangible assets (3,436) (247) Capitalization of internal-use software (9,687) (10,279) Purchases of investments (462,539) (1,728,162) Sales and maturities of investments 504,340 778,555 Cash paid for acquisition, net of cash and restricted cash acquired — (281,032) Net cash provided by (used in) investing activities 27,561 (1,245,992) CASH FLOW FROM FINANCING ACTIVITIES: Payments of deferred offering costs — (186) Proceeds from exercise of stock options 17,366 11,282 Proceeds from issuance of common stock under the employee stock purchase plan 6,416 8,682 Net cash provided by financing activities 23,782 19,778 NET CHANGE IN CASH, CASH EQUIVALENTS, AND RESTRICTED CASH (10,849) (1,397,432) CASH, CASH EQUIVALENTS, AND RESTRICTED CASH–BEGINNING OF PERIOD 202,406 1,672,051 CASH, CASH EQUIVALENTS, AND RESTRICTED CASH–END OF PERIOD $191,557 $274,619 SENTINELONE, INC. CONDENSED CONSOLIDATED STATEMENTS OF CASH FLOWS (in thousands) (unaudited)
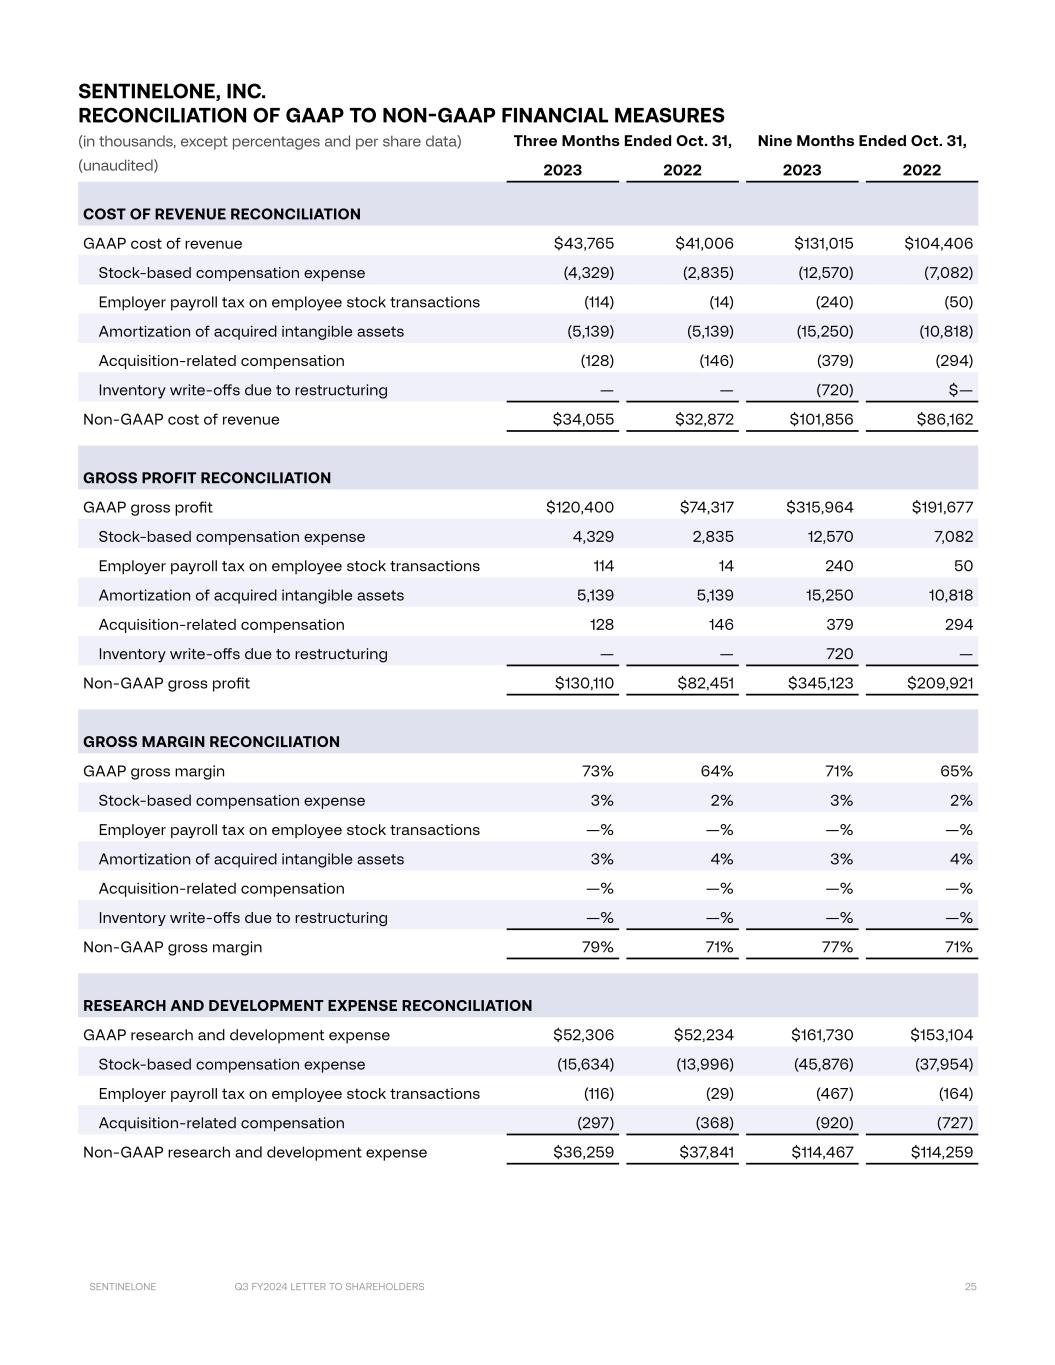
Q3 FY2024 LETTER TO SHAREHOLDERS 25SENTINELONE Three Months Ended Oct. 31, Nine Months Ended Oct. 31, 2023 2022 2023 2022 COST OF REVENUE RECONCILIATION GAAP cost of revenue $43,765 $41,006 $131,015 $104,406 Stock-based compensation expense (4,329) (2,835) (12,570) (7,082) Employer payroll tax on employee stock transactions (114) (14) (240) (50) Amortization of acquired intangible assets (5,139) (5,139) (15,250) (10,818) Acquisition-related compensation (128) (146) (379) (294) Inventory write-offs due to restructuring — — (720) $— Non-GAAP cost of revenue $34,055 $32,872 $101,856 $86,162 GROSS PROFIT RECONCILIATION GAAP gross profit $120,400 $74,317 $315,964 $191,677 Stock-based compensation expense 4,329 2,835 12,570 7,082 Employer payroll tax on employee stock transactions 114 14 240 50 Amortization of acquired intangible assets 5,139 5,139 15,250 10,818 Acquisition-related compensation 128 146 379 294 Inventory write-offs due to restructuring — — 720 — Non-GAAP gross profit $130,110 $82,451 $345,123 $209,921 GROSS MARGIN RECONCILIATION GAAP gross margin 73% 64% 71% 65% Stock-based compensation expense 3% 2% 3% 2% Employer payroll tax on employee stock transactions —% —% —% —% Amortization of acquired intangible assets 3% 4% 3% 4% Acquisition-related compensation —% —% —% —% Inventory write-offs due to restructuring —% —% —% —% Non-GAAP gross margin 79% 71% 77% 71% RESEARCH AND DEVELOPMENT EXPENSE RECONCILIATION GAAP research and development expense $52,306 $52,234 $161,730 $153,104 Stock-based compensation expense (15,634) (13,996) (45,876) (37,954) Employer payroll tax on employee stock transactions (116) (29) (467) (164) Acquisition-related compensation (297) (368) (920) (727) Non-GAAP research and development expense $36,259 $37,841 $114,467 $114,259 SENTINELONE, INC. RECONCILIATION OF GAAP TO NON-GAAP FINANCIAL MEASURES (in thousands, except percentages and per share data) (unaudited)

Q3 FY2024 LETTER TO SHAREHOLDERS 26SENTINELONE Three Months Ended Oct. 31, Nine Months Ended Oct. 31, 2023 2022 2023 2022 SALES AND MARKETING EXPENSE RECONCILIATION GAAP sales and marketing expense $98,249 $83,953 $295,682 $223,594 Stock-based compensation expense (14,085) (12,166) (40,362) (28,977) Employer payroll tax on employee stock transactions (177) (99) (751) (378) Amortization of acquired intangible assets (1,955) (2,144) (5,816) (4,470) Acquisition-related compensation (125) (539) (538) (1,074) Non-GAAP sales and marketing expense $81,907 $69,005 $248,215 $188,695 GENERAL AND ADMINISTRATIVE EXPENSE RECONCILIATION GAAP general and administrative expense $51,239 $42,188 $151,425 $117,525 Stock-based compensation expense (20,865) (16,690) (65,560) (44,305) Employer payroll tax on employee stock transactions (242) 56 (668) (393) Amortization of acquired intangible assets — (19) (2) (56) Acquisition-related compensation (2) (343) (383) (679) Non-GAAP general and administrative expense $30,130 $25,192 $84,812 $72,092 RESTRUCTURING EXPENSE RECONCILIATION GAAP restructuring expense $74 $— $4,329 $— Severance and employee benefits (74) — (5,389) — Stock-based compensation expense — — 1,060 — Non-GAAP restructuring expense $— $— $— $— OPERATING LOSS RECONCILIATION GAAP operating loss $(81,468) $(104,058) $(297,202) $(302,546) Stock-based compensation expense 54,913 45,687 163,308 118,318 Employer payroll tax on employee stock transactions 649 86 2,126 985 Amortization of acquired intangible assets 7,094 7,302 21,068 15,344 Acquisition-related compensation 552 1,396 2,220 2,774 Inventory write-offs due to restructuring — — 720 — Severance and employee benefits 74 — 5,389 — Non-GAAP operating loss* $(18,186) $(49,587) $(102,371) $(165,125) SENTINELONE, INC. RECONCILIATION OF GAAP TO NON-GAAP FINANCIAL MEASURES (in thousands, except percentages and per share data) (unaudited)
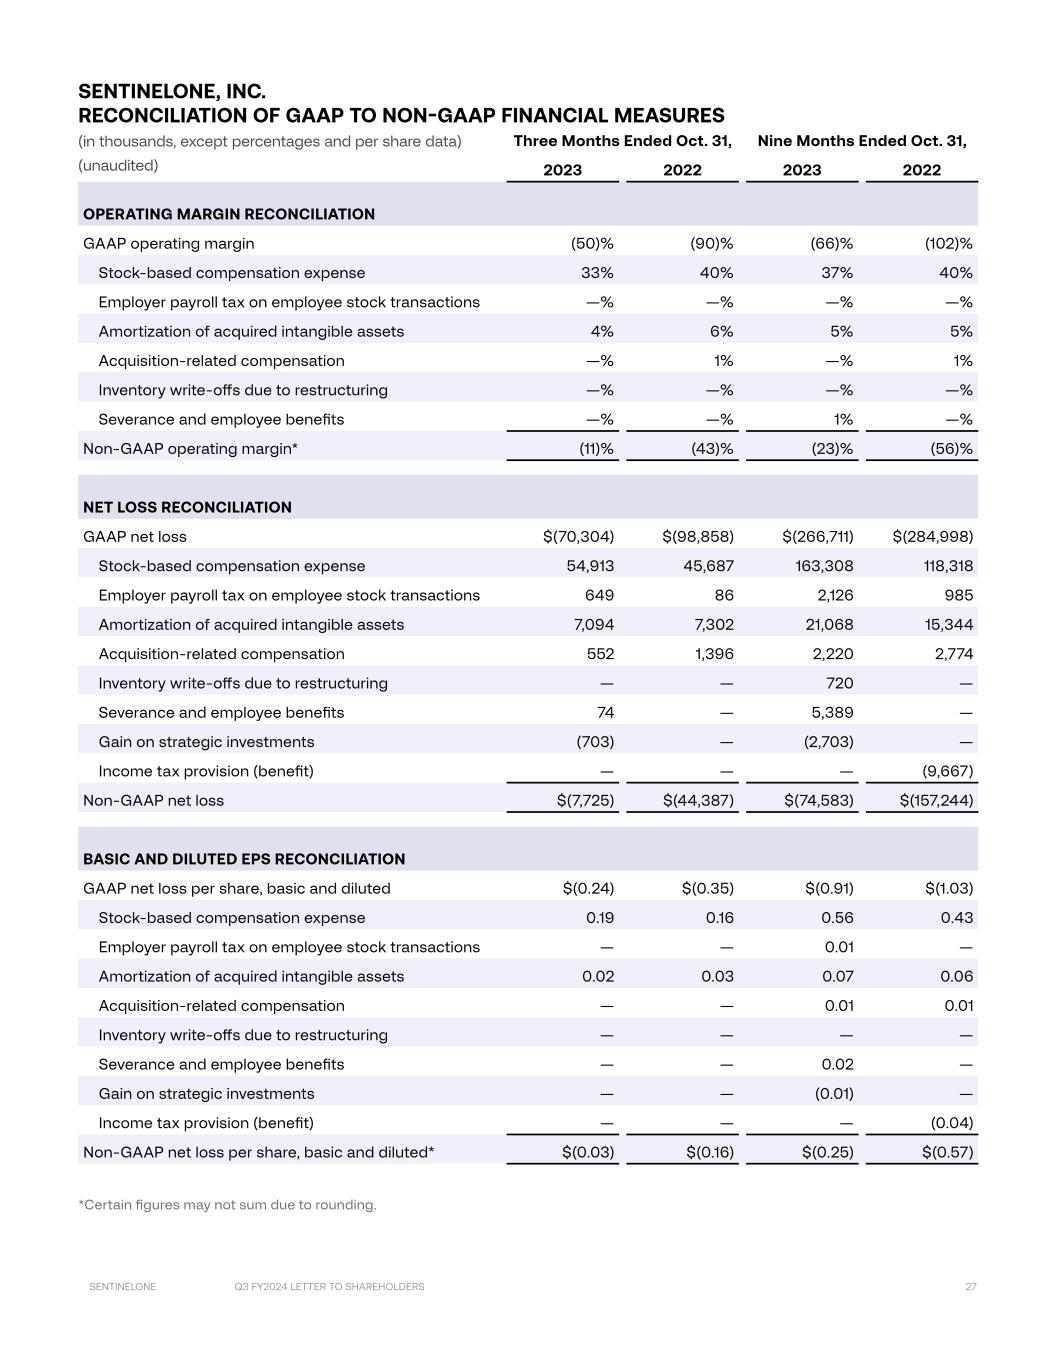
Q3 FY2024 LETTER TO SHAREHOLDERS 27SENTINELONE Three Months Ended Oct. 31, Nine Months Ended Oct. 31, 2023 2022 2023 2022 OPERATING MARGIN RECONCILIATION GAAP operating margin (50)% (90)% (66)% (102)% Stock-based compensation expense 33% 40% 37% 40% Employer payroll tax on employee stock transactions —% —% —% —% Amortization of acquired intangible assets 4% 6% 5% 5% Acquisition-related compensation —% 1% —% 1% Inventory write-offs due to restructuring —% —% —% —% Severance and employee benefits —% —% 1% —% Non-GAAP operating margin* (11)% (43)% (23)% (56)% NET LOSS RECONCILIATION GAAP net loss $(70,304) $(98,858) $(266,711) $(284,998) Stock-based compensation expense 54,913 45,687 163,308 118,318 Employer payroll tax on employee stock transactions 649 86 2,126 985 Amortization of acquired intangible assets 7,094 7,302 21,068 15,344 Acquisition-related compensation 552 1,396 2,220 2,774 Inventory write-offs due to restructuring — — 720 — Severance and employee benefits 74 — 5,389 — Gain on strategic investments (703) — (2,703) — Income tax provision (benefit) — — — (9,667) Non-GAAP net loss $(7,725) $(44,387) $(74,583) $(157,244) BASIC AND DILUTED EPS RECONCILIATION GAAP net loss per share, basic and diluted $(0.24) $(0.35) $(0.91) $(1.03) Stock-based compensation expense 0.19 0.16 0.56 0.43 Employer payroll tax on employee stock transactions — — 0.01 — Amortization of acquired intangible assets 0.02 0.03 0.07 0.06 Acquisition-related compensation — — 0.01 0.01 Inventory write-offs due to restructuring — — — — Severance and employee benefits — — 0.02 — Gain on strategic investments — — (0.01) — Income tax provision (benefit) — — — (0.04) Non-GAAP net loss per share, basic and diluted* $(0.03) $(0.16) $(0.25) $(0.57) *Certain figures may not sum due to rounding. SENTINELONE, INC. RECONCILIATION OF GAAP TO NON-GAAP FINANCIAL MEASURES (in thousands, except percentages and per share data) (unaudited)
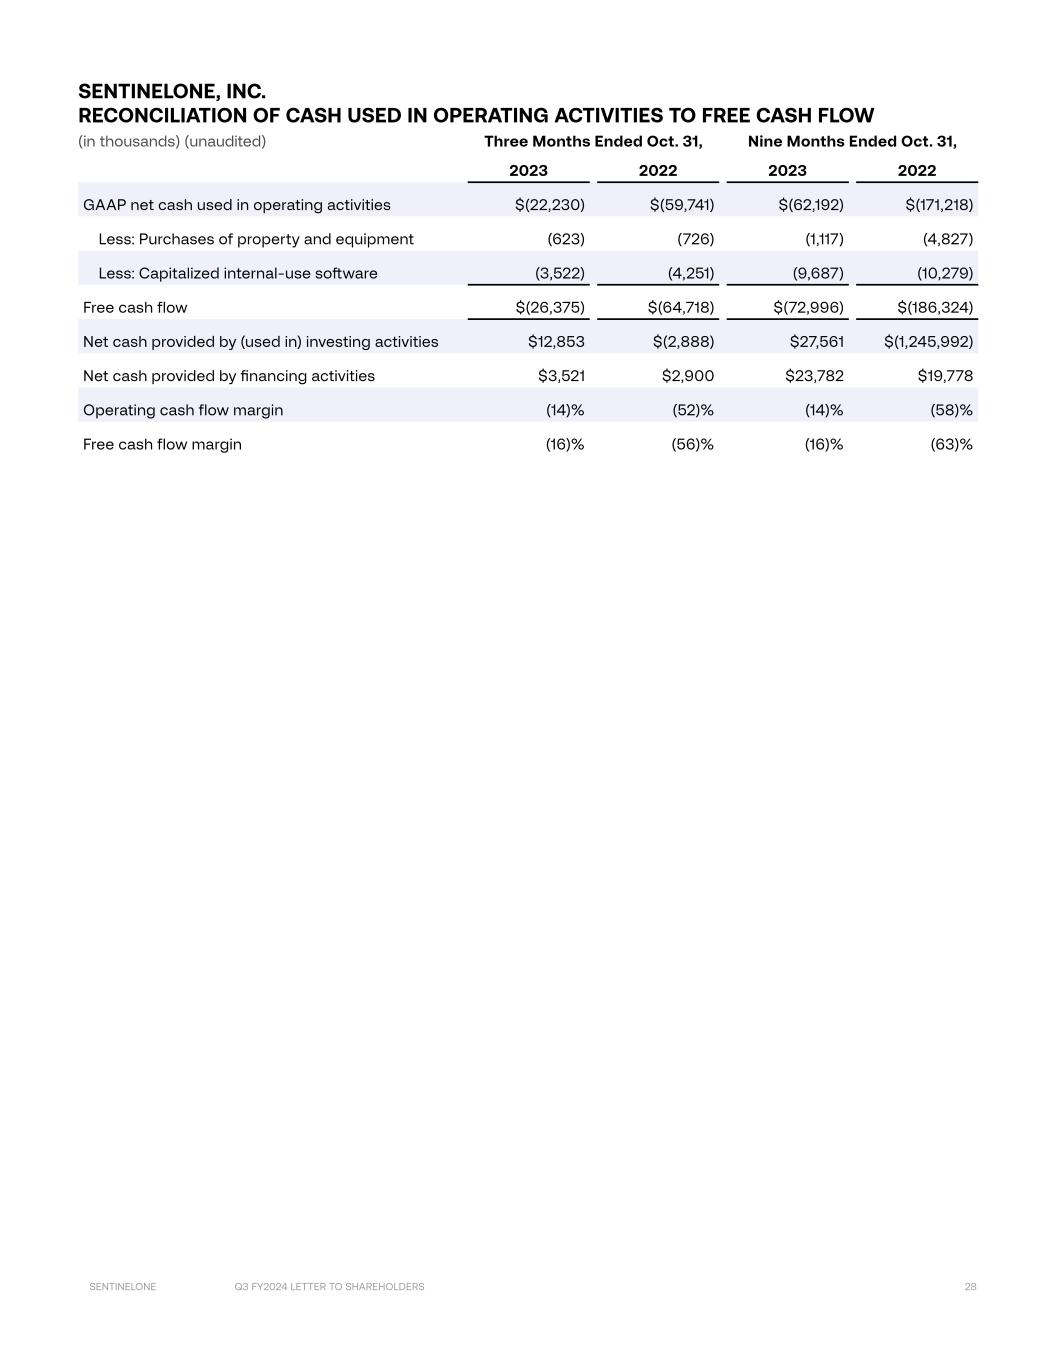
Q3 FY2024 LETTER TO SHAREHOLDERS 28SENTINELONE Three Months Ended Oct. 31, Nine Months Ended Oct. 31, 2023 2022 2023 2022 GAAP net cash used in operating activities $(22,230) $(59,741) $(62,192) $(171,218) Less: Purchases of property and equipment (623) (726) (1,117) (4,827) Less: Capitalized internal-use software (3,522) (4,251) (9,687) (10,279) Free cash flow $(26,375) $(64,718) $(72,996) $(186,324) Net cash provided by (used in) investing activities $12,853 $(2,888) $27,561 $(1,245,992) Net cash provided by financing activities $3,521 $2,900 $23,782 $19,778 Operating cash flow margin (14)% (52)% (14)% (58)% Free cash flow margin (16)% (56)% (16)% (63)% SENTINELONE, INC. RECONCILIATION OF CASH USED IN OPERATING ACTIVITIES TO FREE CASH FLOW (in thousands) (unaudited)

sentinelone.com © SentinelOne 2023
