00015755152024FYFALSEhttp://www.sprouts.com/20241229#IncomeExpenseStoreClosureAndOtherCostsNethttp://www.sprouts.com/20241229#IncomeExpenseStoreClosureAndOtherCostsNethttp://www.sprouts.com/20241229#IncomeExpenseStoreClosureAndOtherCostsNetP1Yhttp://fasb.org/us-gaap/2024#PropertyPlantAndEquipmentAndFinanceLeaseRightOfUseAssetAfterAccumulatedDepreciationAndAmortizationhttp://fasb.org/us-gaap/2024#PropertyPlantAndEquipmentAndFinanceLeaseRightOfUseAssetAfterAccumulatedDepreciationAndAmortizationhttp://www.sprouts.com/20241229#LongTermDebtAndFinanceLeaseLiabilitiesNoncurrenthttp://www.sprouts.com/20241229#LongTermDebtAndFinanceLeaseLiabilitiesNoncurrenthttp://fasb.org/us-gaap/2024#InterestIncomeExpenseNonoperatingNethttp://fasb.org/us-gaap/2024#InterestIncomeExpenseNonoperatingNethttp://fasb.org/us-gaap/2024#InterestIncomeExpenseNonoperatingNetiso4217:USDxbrli:sharesiso4217:USDxbrli:sharessfm:storesfm:statesfm:segmentxbrli:puresfm:derivative00015755152024-01-012024-12-2900015755152024-06-2800015755152025-02-1800015755152024-12-2900015755152023-12-3100015755152023-01-022023-12-3100015755152022-01-032023-01-010001575515us-gaap:CommonStockMember2022-01-020001575515us-gaap:AdditionalPaidInCapitalMember2022-01-020001575515us-gaap:RetainedEarningsMember2022-01-020001575515us-gaap:AccumulatedOtherComprehensiveIncomeMember2022-01-0200015755152022-01-020001575515us-gaap:RetainedEarningsMember2022-01-032023-01-010001575515us-gaap:AccumulatedOtherComprehensiveIncomeMember2022-01-032023-01-010001575515us-gaap:CommonStockMember2022-01-032023-01-010001575515us-gaap:AdditionalPaidInCapitalMember2022-01-032023-01-010001575515us-gaap:CommonStockMember2023-01-010001575515us-gaap:AdditionalPaidInCapitalMember2023-01-010001575515us-gaap:RetainedEarningsMember2023-01-010001575515us-gaap:AccumulatedOtherComprehensiveIncomeMember2023-01-0100015755152023-01-010001575515us-gaap:RetainedEarningsMember2023-01-022023-12-310001575515us-gaap:AccumulatedOtherComprehensiveIncomeMember2023-01-022023-12-310001575515us-gaap:CommonStockMember2023-01-022023-12-310001575515us-gaap:AdditionalPaidInCapitalMember2023-01-022023-12-310001575515us-gaap:CommonStockMember2023-12-310001575515us-gaap:AdditionalPaidInCapitalMember2023-12-310001575515us-gaap:RetainedEarningsMember2023-12-310001575515us-gaap:AccumulatedOtherComprehensiveIncomeMember2023-12-310001575515us-gaap:RetainedEarningsMember2024-01-012024-12-290001575515us-gaap:CommonStockMember2024-01-012024-12-290001575515us-gaap:AdditionalPaidInCapitalMember2024-01-012024-12-290001575515us-gaap:CommonStockMember2024-12-290001575515us-gaap:AdditionalPaidInCapitalMember2024-12-290001575515us-gaap:RetainedEarningsMember2024-12-290001575515us-gaap:AccumulatedOtherComprehensiveIncomeMember2024-12-290001575515us-gaap:ProductConcentrationRiskMembersfm:PerishablesMemberus-gaap:RevenueFromContractWithCustomerMember2024-01-012024-12-290001575515us-gaap:ProductConcentrationRiskMembersfm:PerishablesMemberus-gaap:RevenueFromContractWithCustomerMember2023-01-022023-12-310001575515us-gaap:ProductConcentrationRiskMembersfm:PerishablesMemberus-gaap:RevenueFromContractWithCustomerMember2022-01-032023-01-010001575515us-gaap:ProductConcentrationRiskMembersfm:NonPerishablesMemberus-gaap:RevenueFromContractWithCustomerMember2024-01-012024-12-290001575515us-gaap:ProductConcentrationRiskMembersfm:NonPerishablesMemberus-gaap:RevenueFromContractWithCustomerMember2023-01-022023-12-310001575515us-gaap:ProductConcentrationRiskMembersfm:NonPerishablesMemberus-gaap:RevenueFromContractWithCustomerMember2022-01-032023-01-010001575515us-gaap:PrepaidExpensesAndOtherCurrentAssetsMember2023-12-310001575515us-gaap:PrepaidExpensesAndOtherCurrentAssetsMember2024-12-290001575515us-gaap:InventoryValuationReserveMember2023-12-310001575515us-gaap:InventoryValuationReserveMember2024-12-290001575515srt:MinimumMembersfm:ComputerHardwareAndSoftwareMember2024-12-290001575515srt:MaximumMembersfm:ComputerHardwareAndSoftwareMember2024-12-290001575515srt:MinimumMemberus-gaap:FurnitureAndFixturesMember2024-12-290001575515srt:MaximumMemberus-gaap:FurnitureAndFixturesMember2024-12-290001575515us-gaap:LeaseholdImprovementsMember2024-12-290001575515us-gaap:BuildingMember2024-12-290001575515sfm:UnderperformingStoresMember2023-01-022023-12-310001575515us-gaap:OperatingSegmentsMember2023-01-022023-12-310001575515srt:MinimumMember2024-12-290001575515srt:MaximumMember2024-12-290001575515us-gaap:SupplierConcentrationRiskMemberus-gaap:OperatingSegmentsMemberus-gaap:CostOfGoodsTotalMember2024-01-012024-12-290001575515us-gaap:SupplierConcentrationRiskMemberus-gaap:OperatingSegmentsMemberus-gaap:CostOfGoodsTotalMember2023-01-022023-12-310001575515us-gaap:SupplierConcentrationRiskMemberus-gaap:OperatingSegmentsMemberus-gaap:CostOfGoodsTotalMember2022-01-032023-01-010001575515us-gaap:SellingGeneralAndAdministrativeExpensesMember2024-01-012024-12-290001575515us-gaap:SellingGeneralAndAdministrativeExpensesMember2023-01-022023-12-310001575515us-gaap:SellingGeneralAndAdministrativeExpensesMember2022-01-032023-01-010001575515sfm:IncomeExpenseStoreClosureAndOtherCostsNetMember2024-01-012024-12-290001575515sfm:IncomeExpenseStoreClosureAndOtherCostsNetMember2023-01-022023-12-310001575515sfm:IncomeExpenseStoreClosureAndOtherCostsNetMember2022-01-032023-01-010001575515us-gaap:TradeNamesMember2023-01-010001575515us-gaap:TradeNamesMember2023-01-022023-12-310001575515us-gaap:TradeNamesMember2023-12-310001575515sfm:IndefiniteLivedReacquiredRightsMember2023-01-010001575515sfm:IndefiniteLivedReacquiredRightsMember2023-01-022023-12-310001575515sfm:IndefiniteLivedReacquiredRightsMember2023-12-310001575515us-gaap:LicensingAgreementsMember2023-01-010001575515us-gaap:LicensingAgreementsMember2023-01-022023-12-310001575515us-gaap:LicensingAgreementsMember2023-12-310001575515us-gaap:TradeNamesMember2024-01-012024-12-290001575515us-gaap:TradeNamesMember2024-12-290001575515sfm:IndefiniteLivedReacquiredRightsMember2024-01-012024-12-290001575515sfm:IndefiniteLivedReacquiredRightsMember2024-12-290001575515us-gaap:LicensingAgreementsMember2024-01-012024-12-290001575515us-gaap:LicensingAgreementsMember2024-12-290001575515us-gaap:SeniorLienMemberus-gaap:LineOfCreditMemberus-gaap:SecuredDebtMember2024-12-290001575515us-gaap:SeniorLienMemberus-gaap:LineOfCreditMemberus-gaap:SecuredDebtMember2023-12-310001575515us-gaap:SeniorLienMemberus-gaap:LineOfCreditMemberus-gaap:SecuredDebtMembersfm:AmendedAndRestatedCreditAgreementMember2022-03-250001575515us-gaap:SeniorLienMembersfm:FormerRevolvingCreditFacilityMemberus-gaap:SecuredDebtMember2018-03-270001575515us-gaap:SeniorLienMemberus-gaap:LineOfCreditMemberus-gaap:SecuredDebtMember2022-03-252022-03-250001575515us-gaap:SeniorLienMemberus-gaap:SecuredDebtMembersfm:AmendedAndRestatedCreditAgreementMember2022-03-250001575515us-gaap:SeniorLienMembersfm:SwinglineLoanSubfacilityMemberus-gaap:SecuredDebtMembersfm:AmendedAndRestatedCreditAgreementMember2022-03-250001575515us-gaap:SeniorLienMemberus-gaap:SecuredDebtMembersfm:AmendedAndRestatedCreditAgreementMember2024-12-290001575515us-gaap:SeniorLienMembersfm:VariableRateComponentOneMemberus-gaap:SecuredDebtMembersfm:AmendedAndRestatedCreditAgreementMember2022-03-252022-03-250001575515us-gaap:SeniorLienMemberus-gaap:SecuredDebtMemberus-gaap:SecuredOvernightFinancingRateSofrMembersfm:AmendedAndRestatedCreditAgreementMember2022-03-252022-03-250001575515us-gaap:SeniorLienMembersfm:VariableRateComponentOneMemberus-gaap:SecuredDebtMembersfm:TermSecuredOvernightFinancingRateSOFRAndSOFRAdjustmentMembersfm:AmendedAndRestatedCreditAgreementMember2022-03-252022-03-250001575515us-gaap:SeniorLienMembersfm:VariableRateComponentTwoMemberus-gaap:SecuredDebtMembersfm:AmendedAndRestatedCreditAgreementMember2022-03-252022-03-250001575515us-gaap:SeniorLienMembersfm:VariableRateComponentTwoMemberus-gaap:SecuredDebtMemberus-gaap:BaseRateMembersfm:AmendedAndRestatedCreditAgreementMember2022-03-252022-03-250001575515us-gaap:SeniorLienMemberus-gaap:SecuredDebtMembersfm:AmendedAndRestatedCreditAgreementMember2022-03-252022-03-250001575515us-gaap:SeniorLienMemberus-gaap:SecuredDebtMembersrt:MinimumMembersfm:AmendedAndRestatedCreditAgreementMember2022-03-252022-03-250001575515us-gaap:SeniorLienMemberus-gaap:SecuredDebtMembersrt:MaximumMembersfm:AmendedAndRestatedCreditAgreementMember2022-03-252022-03-250001575515us-gaap:SecuredDebtMemberus-gaap:SecuredOvernightFinancingRateSofrMembersfm:AmendedAndRestatedCreditAgreementMember2024-01-012024-12-290001575515us-gaap:SeniorLienMemberus-gaap:SecuredDebtMembersfm:TermSecuredOvernightFinancingRateSOFRAndSOFRAdjustmentMembersfm:AmendedAndRestatedCreditAgreementMember2024-01-012024-12-290001575515sfm:AmendedAndRestatedCreditAgreementMember2024-01-012024-12-290001575515sfm:AmendedAndRestatedCreditAgreementMember2024-12-290001575515sfm:AmendedAndRestatedCreditAgreementMember2023-01-022023-12-310001575515sfm:AmendedAndRestatedCreditAgreementMember2023-12-310001575515sfm:AmendedAndRestatedCreditAgreementMember2022-03-252022-03-250001575515sfm:InsuranceMember2024-12-290001575515sfm:InsuranceMember2023-12-310001575515sfm:AwardsGrantedUnderTheTwoThousandTwentyTwoIncentivePlanMember2024-12-290001575515sfm:May222024ShareRepurchaseProgramMember2024-05-220001575515sfm:MarchTwoTwoThousandTwentyTwoShareRepurchaseProgramMember2022-03-020001575515sfm:MarchTwoTwoThousandTwentyTwoShareRepurchaseProgramMember2024-05-220001575515sfm:MarchTwoTwoThousandTwentyTwoShareRepurchaseProgramMember2024-12-290001575515sfm:MarchTwoTwoThousandTwentyTwoShareRepurchaseProgramMember2024-01-012024-12-290001575515sfm:May222024ShareRepurchaseProgramMember2024-12-290001575515sfm:May222024ShareRepurchaseProgramMember2024-01-012024-12-290001575515us-gaap:SubsequentEventMember2024-12-302025-02-180001575515us-gaap:RestrictedStockUnitsRSUMember2024-01-012024-12-290001575515us-gaap:RestrictedStockUnitsRSUMember2023-01-022023-12-310001575515us-gaap:RestrictedStockUnitsRSUMember2022-01-032023-01-010001575515us-gaap:PerformanceSharesMember2024-01-012024-12-290001575515us-gaap:PerformanceSharesMember2023-01-022023-12-310001575515us-gaap:PerformanceSharesMember2022-01-032023-01-010001575515us-gaap:PerformanceSharesMember2024-01-012024-12-290001575515us-gaap:EmployeeStockOptionMember2023-01-022023-12-310001575515us-gaap:PerformanceSharesMember2023-01-022023-12-310001575515us-gaap:EmployeeStockOptionMember2022-01-032023-01-010001575515us-gaap:PerformanceSharesMember2022-01-032023-01-010001575515us-gaap:InterestRateSwapMember2023-12-310001575515us-gaap:InterestRateSwapMember2024-12-290001575515us-gaap:ForwardContractsMember2017-12-310001575515us-gaap:CashFlowHedgingMemberus-gaap:ForwardContractsMember2017-12-310001575515us-gaap:CashFlowHedgingMemberus-gaap:ForwardContractsMember2017-12-012017-12-310001575515us-gaap:AccumulatedGainLossNetCashFlowHedgeParentMember2022-01-020001575515us-gaap:AccumulatedGainLossNetCashFlowHedgeParentMember2022-01-032023-01-010001575515us-gaap:AccumulatedGainLossNetCashFlowHedgeParentMember2023-01-010001575515us-gaap:FairValueMeasurementsRecurringMember2024-12-290001575515us-gaap:FairValueInputsLevel1Memberus-gaap:FairValueMeasurementsRecurringMember2023-12-310001575515us-gaap:FairValueInputsLevel2Memberus-gaap:FairValueMeasurementsRecurringMember2023-12-310001575515us-gaap:FairValueInputsLevel3Memberus-gaap:FairValueMeasurementsRecurringMember2023-12-310001575515us-gaap:FairValueMeasurementsRecurringMember2023-12-310001575515sfm:HealthyGroceryStoresSegmentMember2024-01-012024-12-290001575515sfm:HealthyGroceryStoresSegmentMember2023-01-022023-12-310001575515sfm:HealthyGroceryStoresSegmentMember2022-01-032023-01-010001575515sfm:PerishablesMember2024-01-012024-12-290001575515sfm:PerishablesMember2023-01-022023-12-310001575515sfm:PerishablesMember2022-01-032023-01-010001575515sfm:NonPerishablesMember2024-01-012024-12-290001575515sfm:NonPerishablesMember2023-01-022023-12-310001575515sfm:NonPerishablesMember2022-01-032023-01-010001575515us-gaap:ProductConcentrationRiskMemberus-gaap:RevenueFromContractWithCustomerMember2024-01-012024-12-290001575515us-gaap:ProductConcentrationRiskMemberus-gaap:RevenueFromContractWithCustomerMember2023-01-022023-12-310001575515us-gaap:ProductConcentrationRiskMemberus-gaap:RevenueFromContractWithCustomerMember2022-01-032023-01-010001575515sfm:AwardsGrantedUnderTheTwoThousandTwentyTwoIncentivePlanMemberus-gaap:RestrictedStockUnitsRSUMembersfm:March192024Member2024-01-012024-12-290001575515sfm:AwardsGrantedUnderTheTwoThousandTwentyTwoIncentivePlanMemberus-gaap:PerformanceSharesMembersfm:March192024Member2024-01-012024-12-290001575515sfm:AwardsGrantedUnderTheTwoThousandTwentyTwoIncentivePlanMemberus-gaap:EmployeeStockOptionMembersfm:March192024Member2024-01-012024-12-290001575515sfm:AwardsGrantedUnderTheTwoThousandTwentyTwoIncentivePlanMemberus-gaap:RestrictedStockUnitsRSUMembersfm:June42024Member2024-01-012024-12-290001575515sfm:AwardsGrantedUnderTheTwoThousandTwentyTwoIncentivePlanMemberus-gaap:PerformanceSharesMembersfm:June42024Member2024-01-012024-12-290001575515sfm:AwardsGrantedUnderTheTwoThousandTwentyTwoIncentivePlanMemberus-gaap:EmployeeStockOptionMembersfm:June42024Member2024-01-012024-12-290001575515sfm:AwardsGrantedUnderTheTwoThousandTwentyTwoIncentivePlanMemberus-gaap:RestrictedStockUnitsRSUMembersfm:September42024Member2024-01-012024-12-290001575515sfm:AwardsGrantedUnderTheTwoThousandTwentyTwoIncentivePlanMemberus-gaap:PerformanceSharesMembersfm:September42024Member2024-01-012024-12-290001575515sfm:AwardsGrantedUnderTheTwoThousandTwentyTwoIncentivePlanMemberus-gaap:EmployeeStockOptionMembersfm:September42024Member2024-01-012024-12-290001575515us-gaap:RestrictedStockUnitsRSUMembersfm:AwardsGrantedUnderTheTwoThousandTwentyTwoIncentivePlanMember2024-01-012024-12-290001575515us-gaap:PerformanceSharesMembersfm:AwardsGrantedUnderTheTwoThousandTwentyTwoIncentivePlanMember2024-01-012024-12-290001575515us-gaap:EmployeeStockOptionMembersfm:AwardsGrantedUnderTheTwoThousandTwentyTwoIncentivePlanMember2024-01-012024-12-290001575515sfm:AwardsGrantedUnderTheTwoThousandTwentyTwoIncentivePlanMemberus-gaap:RestrictedStockUnitsRSUMembersfm:MarchFourteenTwoThousandTwentyThreeMember2023-01-022023-12-310001575515sfm:AwardsGrantedUnderTheTwoThousandTwentyTwoIncentivePlanMemberus-gaap:PerformanceSharesMembersfm:MarchFourteenTwoThousandTwentyThreeMember2023-01-022023-12-310001575515sfm:AwardsGrantedUnderTheTwoThousandTwentyTwoIncentivePlanMemberus-gaap:EmployeeStockOptionMembersfm:MarchFourteenTwoThousandTwentyThreeMember2023-01-022023-12-310001575515sfm:AwardsGrantedUnderTheTwoThousandTwentyTwoIncentivePlanMemberus-gaap:RestrictedStockUnitsRSUMembersfm:MayOneTwoThousandTwentyThreeMember2023-01-022023-12-310001575515sfm:AwardsGrantedUnderTheTwoThousandTwentyTwoIncentivePlanMemberus-gaap:PerformanceSharesMembersfm:MayOneTwoThousandTwentyThreeMember2023-01-022023-12-310001575515sfm:AwardsGrantedUnderTheTwoThousandTwentyTwoIncentivePlanMemberus-gaap:EmployeeStockOptionMembersfm:MayOneTwoThousandTwentyThreeMember2023-01-022023-12-310001575515sfm:AwardsGrantedUnderTheTwoThousandTwentyTwoIncentivePlanMemberus-gaap:RestrictedStockUnitsRSUMembersfm:JuneSevenTwoThousandTwentyThreeMember2023-01-022023-12-310001575515sfm:AwardsGrantedUnderTheTwoThousandTwentyTwoIncentivePlanMemberus-gaap:PerformanceSharesMembersfm:JuneSevenTwoThousandTwentyThreeMember2023-01-022023-12-310001575515sfm:AwardsGrantedUnderTheTwoThousandTwentyTwoIncentivePlanMemberus-gaap:EmployeeStockOptionMembersfm:JuneSevenTwoThousandTwentyThreeMember2023-01-022023-12-310001575515sfm:AwardsGrantedUnderTheTwoThousandTwentyTwoIncentivePlanMemberus-gaap:RestrictedStockUnitsRSUMembersfm:SeptemberFiveTwoThousandTwentyThreeMember2023-01-022023-12-310001575515sfm:AwardsGrantedUnderTheTwoThousandTwentyTwoIncentivePlanMemberus-gaap:PerformanceSharesMembersfm:SeptemberFiveTwoThousandTwentyThreeMember2023-01-022023-12-310001575515sfm:AwardsGrantedUnderTheTwoThousandTwentyTwoIncentivePlanMemberus-gaap:EmployeeStockOptionMembersfm:SeptemberFiveTwoThousandTwentyThreeMember2023-01-022023-12-310001575515sfm:AwardsGrantedUnderTheTwoThousandTwentyTwoIncentivePlanMemberus-gaap:RestrictedStockUnitsRSUMembersfm:SeptemberElevenTwoThousandTwentyThreeMember2023-01-022023-12-310001575515sfm:AwardsGrantedUnderTheTwoThousandTwentyTwoIncentivePlanMemberus-gaap:PerformanceSharesMembersfm:SeptemberElevenTwoThousandTwentyThreeMember2023-01-022023-12-310001575515sfm:AwardsGrantedUnderTheTwoThousandTwentyTwoIncentivePlanMemberus-gaap:EmployeeStockOptionMembersfm:SeptemberElevenTwoThousandTwentyThreeMember2023-01-022023-12-310001575515sfm:AwardsGrantedUnderTheTwoThousandTwentyTwoIncentivePlanMemberus-gaap:RestrictedStockUnitsRSUMembersfm:OctoberThirtyTwoThousandTwentyThreeMember2023-01-022023-12-310001575515sfm:AwardsGrantedUnderTheTwoThousandTwentyTwoIncentivePlanMemberus-gaap:PerformanceSharesMembersfm:OctoberThirtyTwoThousandTwentyThreeMember2023-01-022023-12-310001575515sfm:AwardsGrantedUnderTheTwoThousandTwentyTwoIncentivePlanMemberus-gaap:EmployeeStockOptionMembersfm:OctoberThirtyTwoThousandTwentyThreeMember2023-01-022023-12-310001575515us-gaap:RestrictedStockUnitsRSUMembersfm:AwardsGrantedUnderTheTwoThousandTwentyTwoIncentivePlanMember2023-01-022023-12-310001575515us-gaap:PerformanceSharesMembersfm:AwardsGrantedUnderTheTwoThousandTwentyTwoIncentivePlanMember2023-01-022023-12-310001575515us-gaap:EmployeeStockOptionMembersfm:AwardsGrantedUnderTheTwoThousandTwentyTwoIncentivePlanMember2023-01-022023-12-310001575515sfm:AwardsGrantedUnderTheTwoThousandTwentyTwoIncentivePlanMemberus-gaap:RestrictedStockUnitsRSUMemberus-gaap:ShareBasedCompensationAwardTrancheOneMember2024-01-012024-12-290001575515sfm:AwardsGrantedUnderTheTwoThousandTwentyTwoIncentivePlanMemberus-gaap:RestrictedStockUnitsRSUMemberus-gaap:ShareBasedCompensationAwardTrancheTwoMember2024-01-012024-12-290001575515sfm:AwardsGrantedUnderTheTwoThousandTwentyTwoIncentivePlanMemberus-gaap:RestrictedStockUnitsRSUMembersrt:DirectorMember2024-01-012024-12-290001575515sfm:AwardsGrantedUnderTheTwoThousandTwentyTwoIncentivePlanMember2024-01-012024-12-290001575515us-gaap:EmployeeStockOptionMember2024-01-012024-12-290001575515us-gaap:EmployeeStockOptionMember2023-01-022023-12-310001575515us-gaap:EmployeeStockOptionMember2022-01-032023-01-010001575515us-gaap:EmployeeStockOptionMember2024-12-290001575515us-gaap:EmployeeStockOptionMember2023-12-310001575515us-gaap:EmployeeStockOptionMember2023-01-010001575515us-gaap:RestrictedStockUnitsRSUMember2023-12-310001575515us-gaap:RestrictedStockUnitsRSUMember2024-12-290001575515us-gaap:PerformanceSharesMembersrt:MinimumMembersfm:TwoThousandTwentyMember2019-12-302021-01-030001575515us-gaap:PerformanceSharesMembersrt:MaximumMembersfm:TwoThousandTwentyMember2019-12-302021-01-030001575515us-gaap:PerformanceSharesMembersfm:TwoThousandTwentyMember2023-01-022023-12-310001575515us-gaap:PerformanceSharesMembersfm:TwoThousandTwentyMember2024-12-290001575515us-gaap:PerformanceSharesMembersrt:MinimumMembersfm:TwoThousandTwentyOneMember2021-01-042022-01-020001575515us-gaap:PerformanceSharesMembersrt:MaximumMembersfm:TwoThousandTwentyOneMember2021-01-042022-01-020001575515us-gaap:PerformanceSharesMembersfm:TwoThousandTwentyOneMember2024-03-012024-03-310001575515us-gaap:PerformanceSharesMembersfm:TwoThousandTwentyOneMember2024-12-290001575515us-gaap:PerformanceSharesMembersrt:MinimumMembersfm:TwoThousandTwentyTwoMember2022-01-032023-01-010001575515us-gaap:PerformanceSharesMembersrt:MaximumMembersfm:TwoThousandTwentyTwoMember2022-01-032023-01-010001575515us-gaap:PerformanceSharesMemberus-gaap:SubsequentEventMembersfm:TwoThousandTwentyTwoMember2024-12-302025-02-200001575515us-gaap:PerformanceSharesMembersrt:MinimumMembersfm:TwoThousandTwentyThreeMember2023-01-022023-12-310001575515us-gaap:PerformanceSharesMembersrt:MaximumMembersfm:TwoThousandTwentyThreeMember2023-01-022023-12-310001575515us-gaap:PerformanceSharesMembersrt:MinimumMembersfm:TwoThousandTwentyFourMember2024-01-012024-12-290001575515us-gaap:PerformanceSharesMembersrt:MaximumMembersfm:TwoThousandTwentyFourMember2024-01-012024-12-290001575515us-gaap:PerformanceSharesMembersfm:TwoThousandTwentyOneMember2024-01-012024-12-290001575515us-gaap:PerformanceSharesMember2024-12-290001575515us-gaap:PerformanceSharesMember2023-12-310001575515us-gaap:PerformanceSharesMember2023-01-0100015755152023-02-012023-02-280001575515sfm:RonaldCohnIncMember2023-03-200001575515sfm:RonaldCohnIncMemberus-gaap:CommonStockMember2023-03-202023-03-200001575515sfm:RonaldCohnIncMember2023-03-202023-03-200001575515sfm:RonaldCohnIncMember2023-03-2000015755152024-09-302024-12-29
UNITED STATES
SECURITIES AND EXCHANGE COMMISSION
Washington, D.C. 20549
FORM 10-K
|
|
|
|
|
|
| x |
ANNUAL REPORT PURSUANT TO SECTION 13 OR 15(d) OF THE SECURITIES EXCHANGE ACT OF 1934 |
For the fiscal year ended December 29, 2024
OR
|
|
|
|
|
|
| o |
TRANSITION REPORT PURSUANT TO SECTION 13 OR 15(d) OF THE SECURITIES EXCHANGE ACT OF 1934 |
For the transition period from to
Commission File Number: 001-36029
Sprouts Farmers Market, Inc.
(Exact name of registrant as specified in its charter)
|
|
|
|
|
|
| Delaware |
32-0331600 |
|
(State or other jurisdiction of
incorporation or organization)
|
(I.R.S. Employer
Identification No.)
|
5455 East High Street, Suite 111
Phoenix, Arizona 85054
(Address of principal executive offices and zip code)
(480) 814-8016
(Registrant’s telephone number, including area code)
Securities registered pursuant to Section 12(b) of the Act:
|
|
|
|
|
|
|
|
|
|
|
|
|
|
|
| Title of Each Class |
|
Trading Symbol(s) |
|
Name of Each Exchange on Which Registered |
| Common Stock, $0.001 par value |
|
SFM |
|
Nasdaq Global Select Market |
Securities registered pursuant to Section 12(g) of the Act:
None
Indicate by check mark if the registrant is a well-known seasoned issuer, as defined in Rule 405 of the Securities Act. Yes x No o
Indicate by check mark if the registrant is not required to file reports pursuant to Section 13 or Section 15(d) of the Act. Yes o No x
Indicate by check mark whether the registrant (1) has filed all reports required to be filed by Section 13 or 15(d) of the Securities Exchange Act of 1934 during the preceding 12 months (or for such shorter period that the registrant was required to file such reports), and (2) has been subject to such filing requirements for the past 90 days. Yes x No o
Indicate by check mark whether the registrant has submitted electronically every Interactive Data File required to be submitted pursuant to Rule 405 of Regulation S-T (§ 232.405 of this chapter) during the preceding 12 months (or for such shorter period that the registrant was required to submit such files). Yes x No o
Indicate by check mark whether the registrant is a large accelerated filer, an accelerated filer, a non-accelerated filer, a smaller reporting company, or an emerging growth company. See the definitions of “large accelerated filer,” “accelerated filer,” “smaller reporting company,” and “emerging growth company” in Rule 12b-2 of the Exchange Act.
|
|
|
|
|
|
|
|
|
|
|
|
| Large accelerated filer |
x |
Accelerated filer |
o |
| |
|
|
|
| Non-accelerated filer |
o |
Smaller reporting company |
o |
| |
|
|
|
|
|
Emerging growth company |
o |
If an emerging growth company, indicate by check mark if the registrant has elected not to use the extended transition period for complying with any new or revised financial accounting standards provided pursuant to Section 13(a) of the Exchange Act. o
Indicate by check mark whether the registrant has filed a report on and attestation to its management’s assessment of the effectiveness of its internal control over financial reporting under Section 404(b) of the Sarbanes-Oxley Act (15 U.S.C. 7262(b)) by the registered public accounting firm that prepared or issued its audit report. x
If securities are registered pursuant to Section 12(b) of the Act, indicate by check mark whether the financial statements of the registrant included in the filing reflect the correction of an error to previously issued financial statements. o
Indicate by check mark whether any of those error corrections are restatements that required a recovery analysis of incentive-based compensation received by any of the registrant’s executive officers during the relevant recovery period pursuant to §240.10D-1(b). o
Indicate by check mark whether the registrant is a shell company (as defined in Rule 12b-2 of the Exchange Act). Yes o No x
As of June 28, 2024, the last business day of the registrant’s most recently completed second fiscal quarter, the aggregate market value of the registrant’s voting common stock held by non-affiliates of the registrant was $8,343,509,097, based on the last reported sale price of such stock as reported on The Nasdaq Global Select Market on such date.
As of February 18, 2025, there were 98,585,382 outstanding shares of the registrant’s common stock, $0.001 par value per share.
_________________________________
DOCUMENTS INCORPORATED BY REFERENCE
Portions of the registrant’s definitive Proxy Statement for its 2025 Annual Meeting of Stockholders are incorporated by reference in Part III of this Annual Report on Form 10-K where indicated. Such Proxy Statement will be filed with the Securities and Exchange Commission within 120 days of the registrant’s fiscal year ended December 29, 2024.
TABLE OF CONTENTS
As used in this Annual Report on Form 10-K, unless the context otherwise requires, references to the “Company,” “Sprouts,” “we,” “us” and “our” refer to Sprouts Farmers Market, Inc., a Delaware corporation, and, where appropriate, its subsidiaries. The inclusion of our website addresses in this Annual Report on Form 10-K does not include or incorporate by reference the information on or accessible through our websites herein.
SPECIAL NOTE REGARDING FORWARD-LOOKING STATEMENTS
This Annual Report on Form 10-K contains “forward-looking statements” that involve substantial risks and uncertainties. The statements contained in this Annual Report on Form 10-K that are not purely historical are forward-looking statements within the meaning of Section 27A of the Securities Act of 1933, as amended (referred to as the “Securities Act”), and Section 21E of the Securities Exchange Act of 1934, as amended (referred to as the “Exchange Act”), including, but not limited to, statements regarding our growth strategy, expectations, beliefs, intentions, future operations, future financial position, future revenue, projected expenses, and plans and objectives of management. In some cases, you can identify forward-looking statements by terms such as “anticipate,” “believe,” “estimate,” “expect,” “intend,” “may,” “might,” “plan,” “project,” “will,” “would,” “should,” “could,” “can,” “predict,” “potential,” “continue,” “objective,” or the negative of these terms, and similar expressions intended to identify forward-looking statements. However, not all forward-looking statements contain these identifying words. These forward-looking statements reflect our current views about future events and involve known risks, uncertainties, and other factors that may cause our actual results, levels of activity, performance, or achievement to be materially different from those expressed or implied by the forward-looking statements. Factors that could cause or contribute to such differences include, but are not limited to, those discussed in the section titled “Risk Factors” included in this Annual Report on Form 10-K. Furthermore, such forward-looking statements speak only as of the date of this report. Except as required by law, we undertake no obligation to update any forward-looking statements to reflect events or circumstances after the date of such statements.
PART I
Item 1. Business
Sprouts Farmers Market offers a unique specialty grocery experience featuring an open layout with fresh produce at the heart of the store. Sprouts inspires wellness naturally with a carefully curated assortment of better-for-you products paired with purpose-driven people. We continue to bring the latest in wholesome, innovative products made with lifestyle-friendly ingredients such as organic, plant-based and gluten-free. From our founding in 2002, we have grown rapidly, significantly increasing our sales, store count and profitability. Headquartered in Phoenix with 440 stores in 24 states as of December 29, 2024, we are one of the largest and fastest growing specialty retailers of fresh, natural and organic food in the United States.
Our Growth Strategy
We continue to execute on our long-term growth strategy that we believe is transforming our company and driving profitable growth, focusing on the following areas:
•Win with Target Customers. We are focusing attention on our target customers, identified through research as ‘health enthusiasts’ and ‘selective shoppers’, where there is ample opportunity to gain share within these customer segments. We believe our business can continue to grow by leveraging existing strengths in a unique assortment of better-for-you, quality products and by providing a full omnichannel offering through delivery or pickup via our website or the Sprouts app.
•Market Expansion. We are delivering unique smaller stores with expectations of stronger returns, while maintaining the approachable, fresh-focused farmer’s market heritage Sprouts is known for. From 2021 through 2024, we have opened 75 new stores and remodeled one store featuring our updated format. Our geographic store expansion and new store placement will intersect where our target customers live, in markets with growth potential and supply chain support, which we believe will provide a long runway of approximately 10% annual unit growth.
•Create an Advantaged Supply Chain. We believe our network of distribution centers can drive efficiencies across the chain and support growth plans. To further deliver on our fresh commitment and reputation, as well as to increase our local offerings and improve financial results, we aspire to ultimately position fresh distribution centers within a 250-mile radius of stores. Following the opening of two fresh distribution centers in fiscal 2021 and the relocation of our Southern California distribution center, closure of our Georgia distribution center and partnership with a third-party fresh distribution center in the Northeast in fiscal 2023, we are better leveraging our existing distribution center capacity, and approximately 80% of our stores were within 250 miles of a distribution center as of December 29, 2024.
•Customer Engagement and Personalization. We believe we are elevating our national brand recognition and positioning by telling our unique brand story rooted in product innovation and differentiation. We are increasing our use of data analytics and insights. We believe this data-driven intelligence will increase customer engagement through personalization efforts with digital and social connections to drive additional sales growth and loyalty.
•Inspire and Engage Our Talent to Create a Best Place to Work. Subsequent to the initial launch of our long-term growth strategy, we have added the focus area of inspiring and engaging our talent through our culture, acquisition and development and total rewards program to attract and retain the talent we believe we need to execute on our strategic goals and transform our company into a premier place to work.
•Invest in Technology for Growth. We continue to make investments in technology in support of our strategy, with a focus on enhancing efficiency, scalability, and customer experience. While we are showing positive outcomes on our strategic investments in inventory management and customer personalization, we believe that ongoing investments in our technology foundation will allow us to streamline operations and improve decision making to execute on our strategy.
•Deliver on Key Financial Metrics. We are measuring and reporting on the success of this strategy against a number of long-term financial and operational targets. Since the implementation of our strategy beginning in 2020, we have significantly improved our margin structure above our 2019 baseline.
Our Stores and Operations
We believe our stores represent a blend of farmers markets, natural foods stores, and smaller specialty markets, distinguishing us from other food retailers, while also providing a broad offering of innovative and differentiated products with lifestyle friendly ingredients for our customers.
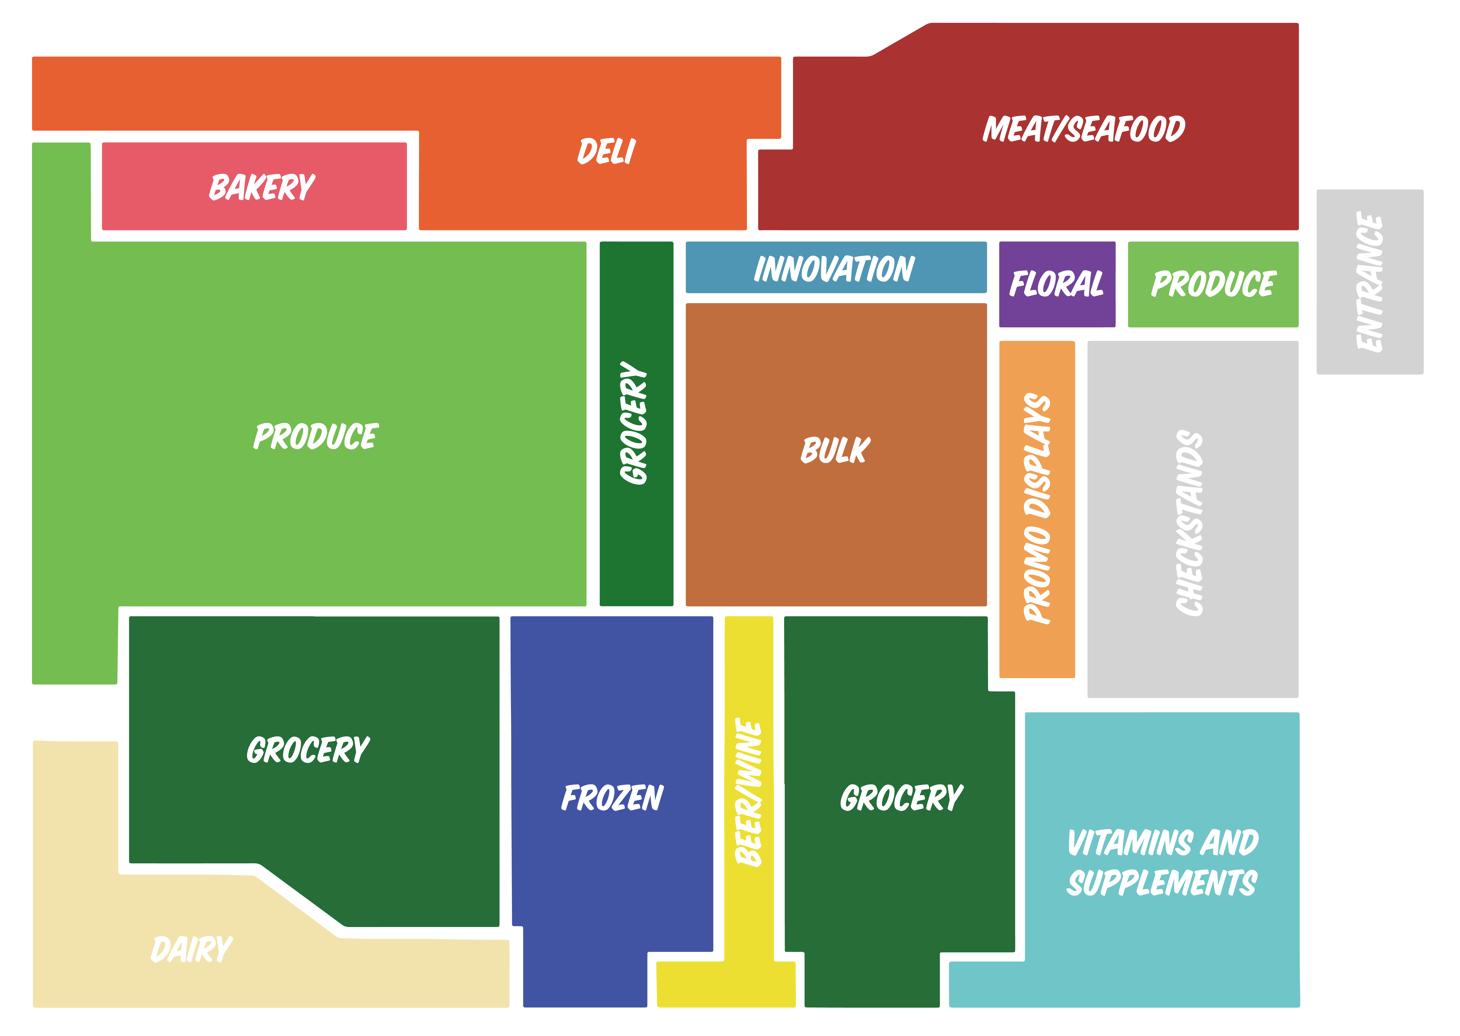
•Store Design and Experience. Our stores are organized in a “flipped” conventional food retail store model, positioning our produce at the center of the store surrounded by a specialty grocery offering. Produce remains the heart of our stores, as we typically dedicate approximately 20% of a store’s selling square footage to produce, which we believe is significantly higher than many of our peers. The stores are designed with open layouts and low displays, intended to provide an easy-to-shop environment that invokes a farmers’ market experience and allows our customers to view the entire store. Our small box format allows for quick in-and-out service, and our curated assortment of innovative, responsibly and locally sourced items offer treasure hunt shopping experiences. The below diagram shows a sample layout of our updated smaller format stores:
•Customer Engagement. We are committed to providing, and believe we have, best-in-class customer engagement, which builds trust with our customers and differentiates the Sprouts shopping experience from that of many of our competitors. We design our stores to maximize personal connections with our purpose-driven team members, as we believe this interaction provides an opportunity to educate customers and provides a valued, differentiated customer service model, which enhances customer loyalty and increases visits and purchases over time. In addition, we continue to expand mobile and digital opportunities to further engage with our customers and provide a full omnichannel offering as many customers use both in-store and online for their grocery needs.
•Store Size. Currently, our stores average approximately 28,000 square feet, which we believe is smaller than many of our peers’ average stores. Under our long-term growth strategy, our updated format stores feature a smaller box size, generally between 21,000 and 25,000 square feet, that stay true to our fresh-focused, farmers market heritage but are generally less expensive to build, reduce non-selling space, reduce occupancy and operating costs and leverage the strengths of our older, highly productive stores. Our stores are located in a variety of mid-sized and larger shopping centers, lifestyle centers and in certain cases, independent single-unit, stand-alone developments. The size of our stores and our real estate strategy provide us flexibility in site selection.
•Team Members. Our stores are typically staffed with 75 to 100 full and part-time team members. We strive to create a strong and unified company culture, rooted in our purpose, with a dedication to developing team members throughout the entire organization. We take pride in caring for and assisting our store teams through our store support office and regional teams. We have prioritized making investments in training development that we believe enhances our team members’ knowledge, particularly with respect to our expanded and evolving product offerings, so our team members can continue to engage and assist our customers. We also support leadership and career opportunities for our team members at Sprouts. We believe our team members contribute to our consistently high service standards and this helps us successfully open and operate our stores.
Our Product Offering
We are a specialty natural and organic food retailer offering a unique shopping experience for our customers. To offer the right assortment of healthy alternatives and good-for-you options, we curate our product mix to attribute-driven and differentiated fresh, natural and organic foods and healthier options throughout all of our departments, with innovative products that feature lifestyle friendly ingredients.
Fresh, Natural and Organic Foods
We focus our product offerings on fresh, natural and organic foods. Foods are generally considered “fresh” if they are minimally processed or in their raw state not subject to any type of preservation or freezing. Natural foods can be broadly defined as foods that are minimally processed and are free of synthetic preservatives, artificial sweeteners, colors, flavors and other additives, growth hormones, antibiotics, hydrogenated oils, stabilizers and emulsifiers. Essentially, natural foods are largely or completely free of non-naturally occurring chemicals and are as near to their whole, natural state as possible. Organic foods refer to the food itself as well as the method by which it is produced. In general, organic operations must demonstrate that they are protecting natural resources, conserving biodiversity, and using only approved substances and must be certified by a USDA-accredited certifying agency. Further, retailers that handle, store or sell organic products must implement measures to protect their organic character.
Product Categories
We categorize the varieties of products we sell as perishable and non-perishable. Perishable product categories include produce, meat and meat alternatives, seafood, deli, bakery, floral and dairy and dairy alternatives. Non-perishable product categories include grocery, vitamins and supplements, bulk items, frozen foods, beer and wine, and natural health and body care. The following is a breakdown of our perishable and non-perishable sales mix:
|
|
|
|
|
|
|
|
|
|
|
|
|
|
|
|
|
|
|
2024 |
|
2023 |
|
2022 |
| Perishables |
57.3 |
% |
|
57.3 |
% |
|
58.0 |
% |
| Non-Perishables |
42.7 |
% |
|
42.7 |
% |
|
42.0 |
% |
Departments
While we focus on providing an abundant and affordable offering of natural and organic produce, our stores also include the following departments: packaged groceries, meat and meat alternatives, seafood, deli, vitamins and supplements, dairy and dairy alternatives, bulk items, baked goods, frozen foods, natural health and body care, and beer and wine. Our departments reflect our unique selling proposition featuring intentional curation of responsibly and locally sourced products. We believe each of our departments provides high-quality, differentiated and value-oriented offerings for our customers which we continuously refine with our customers' preferences in mind.
Sprouts Brand
We continue to expand the breadth of our Sprouts branded products with a dedicated product development team focused on continuing this growth. We sell a broad assortment of products that are differentiated, attribute focused and fun to explore, offer incredible taste, quality, value and experience, and are only available at Sprouts. Our program to update and redesign all Sprouts branded products is over 90% complete, and we expect to complete the refresh and redesign of our Vitamins and Supplements in 2025. We have experienced and expect to continue to see positive impact in terms of sales and recognition from our new food and beverage design. The Sprouts Brand program accounted for just over 23% of our revenue in fiscal 2024. We believe our Sprouts Brand products build and enhance the overall Sprouts brand and allow us to distinguish ourselves from our competitors, promoting customer loyalty and creating a destination shopping experience for products only available at our stores.
Product Innovation
We believe Sprouts is on the forefront of food innovation and has paved the way for natural food trends for over two decades. Since our founding, Sprouts has carried a wide selection of innovative natural and organic brands that resonate with our target customers and inspire healthy living for everyone. We have nurtured and grown many startup brands that now serve as category leaders. As we continue to grow, we aspire to become the most innovative health and wellness specialty food retailer in the country by seeking out and growing our relationships with niche vendors to bring their unique, quality products to the millions of shoppers who visit our stores every week. Led by our dedicated foraging team, we embrace product innovation, and we believe our stores serve as an incubator for growth across the natural foods industry, highlighting new and differentiated items in our innovation center merchandising displays.
In 2024, we launched approximately 7,100 new products. We feature thousands of responsibly sourced products with certifications and attributes that are desired by our target customer base, including organic, paleo, keto, plant-based, non-GMO, fair trade, gluten-free, vegan, grass-fed, raw and humane certified. We will continue to offer a treasure hunt experience for our customers by sourcing new, innovative and differentiated offerings into every department of our stores.
Sourcing and Distribution
We manage the buying of, and set the standards for, the products we sell, and we source our products from hundreds of vendors and suppliers, both domestically and internationally. We are committed to sourcing products in a manner that respects people, our communities and the environment, and we seek to partner with suppliers and service providers that share this commitment, as included in our Supplier Code of Conduct, which details our expectations regarding workplace standards and supplier best practices, and our Commitment to Human Rights, which details our commitment to respecting human rights in our operations and supply chain.
We work closely with our supply chain partners to improve animal welfare standards, responsible seafood sourcing, support for organic and regenerative agriculture and the ethical treatment of people. For an overview of our product sourcing policies and programs, please visit: https://www.sprouts.com/about/sustainability/.
We believe, based on our industry experience, that our strong relationships in the produce business provide us a competitive advantage and enable us to offer high-quality produce at prices we believe are generally below those of conventional food retailers and even further below high-end natural and organic food retailers. Our centralized buyers are supported by dedicated regional procurement teams that provide us flexibility to procure produce on local, regional and national levels. Our regional produce buying teams allow us to form meaningful relationships with farmers to build a path to growing with them as we grow, and our flexibility allows us to react to produce markets quickly in order to help us bring new and innovative varietals to our customers at favorable pricing. These products become treasure hunt items found at our stores.
Given the importance of produce to our stores, we source, warehouse and self-distribute nearly all produce. This ensures our produce meets our high-quality standards. We have department and product specifications that ensure a consistently high level of quality and freshness across our produce offering. These specifications are measured at both entry and exit points to our facilities. We manage every aspect of quality control in our produce distribution centers.
As a pillar of our long-term growth strategy, we expect to create an advantaged supply chain and aspire to locate our distribution centers within 250 miles of the majority of our stores. We currently have six produce distribution centers, with two located in California and one located in each of Arizona, Texas, Colorado and Florida. In 2023, we entered into a partnership with a third-party produce distributor in Pennsylvania to supply fresh produce to our Mid-Atlantic stores. As of December 29, 2024, approximately 80% of our stores were within 250 miles of a distribution center. The proximity of our distribution centers to our stores has allowed us to deliver on our fresh commitment to our customers, by sourcing more products from local farmers and improving efficiencies in our distribution process.
We believe our scale, together with this decentralized purchasing structure and flexibility generates cost savings, which we frequently pass on to our customers. Distributors and farmers recognize the volume of goods we sell through our stores and our flexible purchasing and supply chain model allows us to opportunistically acquire produce at great value which we will frequently pass along to our customers.
For all non-produce products, we use third-party distributors and vendors to distribute products directly to our stores following specifications and ingredient and quality control standards that are set by us.
KeHE Distributors, LLC (“KeHE”), is our primary supplier of dry grocery and frozen food products, accounting for approximately 50%, 47% and 45% of our total purchases in fiscal 2024, 2023 and 2022, respectively. Another 3% of our total purchases in each of fiscal 2024, 2023 and 2022 were made through our secondary supplier, United Natural Foods, Inc. (“UNFI”). Our primary meat and seafood distributor accounted for approximately 14% of our total purchases in each of fiscal 2024 and 2023 and 13% of our total purchases in fiscal 2022. As a step to improve our fresh supply chain, we are currently in the process of transitioning from our primary meat and seafood distributor. We expect to initially transition to an intermediary third-party distributor and ultimately to a self-distribution model under which we will deal directly with our suppliers. As with complex transitions of this magnitude, there are associated short-term risks, including in particular, potential product supply disruptions resulting in lost sales at our stores and transition-related expenses that exceed our expectations. See “Risk Factors—Disruption of significant supplier relationships could negatively affect our business.”
Our Pricing, Marketing and Advertising
Pricing
As a farmers market style store, we emphasize competitive prices throughout the entire store, as we are able to pass along the benefits of our scale and purchasing power to our customers, particularly in certain categories such as produce. We position our prices with everyday value for our customers within our margin structure, with regular promotions that drive traffic and trial. Our Sprouts Brand products offer entry-level price points in certain categories, but also focus on attributes, innovation, treasure hunt experience, wellness or health benefits and quality.
Marketing and Advertising
As part of our long-term growth strategy to refine our brand and marketing approach, we continue to grow our current marketing strategy to drive more profitable growth and create more meaningful connections with our customers. Our digital-first marketing strategy is focused on connecting with our most important, higher value target customers via precision geographic targeting, data-driven media and focusing on personal relevance to tap into our target audience’s needs and affinities.
We are telling our unique and differentiated story through both traditional channels and digital media, including online video, streaming audio and outdoor media. Leveraging digital communications targeted to specific geographic areas provides us with greater flexibility to utilize different media channels based on market composition. This allows us to respond to local competitive activity and to better connect with customers in both our established and emerging markets. Connecting with our customers via owned CRM channels like email and text messages continues to be a significant priority. We focus our efforts on personalizing content that is relevant to our customers. We experienced an 8.6% increase in email subscribers in 2024 compared to 2023. During 2024, we garnered 17 million weekly digital flyer views, demonstrating that our leverage of digital media to reach customers and share what is new and unique at Sprouts resonates with the habits of today’s shoppers.
We have developed and maintain the Sprouts app on which we include digital coupons and in-store scan features, and our website, www.sprouts.com, on which we display our weekly sales flyers and highlight our unique and differentiated product offerings. Our website and app also feature online ordering for delivery and pickup. We offer home deliveries from our stores through delivery service providers, including Instacart, DoorDash and Uber Eats, in all of our markets nationwide. In 2024, we also piloted our Sprouts Rewards loyalty program in select markets. We will continue to explore mobile and digital opportunities to further connect with our customers and leverage data for better customer insights.
Sprouts continues to educate and reach shoppers through social partnerships, special content and sponsorships. Among our 2024 highlights:
•We continued our long-term commitment to and investment in collegiate women’s athletics through partnerships with the Big 12 and SEC conferences. In conjunction these partnerships as well as individual agreements with Arizona State University, University of Southern California and University of Texas, we expanded our NIL portfolio and partnered with over 150 female collegiate athletes.
•Sprouts also became the title partner of the ESPN Sprouts Farmers Market Collegiate Quad which features schools from top 25 collegiate gymnastics programs, All-Americans, and current and future Olympians. In 2024, this Collegiate Quad became the most watched NCAA gymnastics meet in ESPN history.
•Sprouts continued its back-of-jersey sponsorship with the Angel City Football Club in 2024, leading to almost 65 million impressions across multiple platforms. As a portion of this partnership, funds are allocated to support local causes that provide fresh food access and further children’s nutrition education throughout Los Angeles. In 2024, Sprouts and Angel City held 9 garden work days and contributed over 1,400 collective service hours into the local Los Angeles community.
Our Customers
We have employed deep research to understand our target customer, what occasions drive purchases, what they buy and where they buy it. Our research yielded a better understanding that our target customer is comprised of two specific groups: health enthusiasts and selective shoppers (whom we formerly referred to as experience seekers), and we are focusing on these groups in our long-term growth strategy.
Our target customer over-indexes on lifestyle choices and seeks better-for-you grocery options and innovative, quality products to support their healthy lifestyle. We believe they are engaged and connected to what they eat – how it makes them feel, where it comes from and the role it can play in their lives. Our target customer covers a wide range of incomes and age demographics – from Baby Boomers to Generation Z – and seek a variety of healthy and organic options in addition to a great store experience. We believe we only serve a small portion of these target customers at present and have an opportunity to gain a larger proportion of their market share of food-at-home purchases by targeting and identifying those innovative, attribute-driven, quality products and providing the in-store experience and support in living a healthy lifestyle that they are seeking.
Sustainability Impact
Central to our identity is our purpose rooted in care, community, and sustainability: “To Help People Live and Eat Better." From our team culture to our curated customer experience and the way we uplift our communities, we aspire to make a meaningful impact. We work collaboratively with our supply chain partners, community organizations, and industry experts to understand our material impacts and prioritize our efforts to maximize our positive influence on the people and communities that we serve.
Our sustainability initiatives emphasize responsible sourcing, food waste diversion, and carbon emissions reduction. In 2024, these efforts delivered measurable progress:
•30% of total sales from organic products;
•Sales of plant-based products, a less carbon-intensive option, grew by 27% from 2023;
•18% of total sales were from fresh produce;
•Advanced regenerative and local agriculture through intentional supplier partnerships; and
•Rescued over 35 million pounds of food, providing the equivalent of over 29 million meals to local food banks.
Based on our sustainability impacts, we received a rating of AAA in the 2024 MSCI ESG Ratings assessment. The AAA rating represents the highest rating on the scale and signifies a company leading its industry in managing the most significant risks and opportunities. For more information on our efforts and reporting, including our most recent Impact reports, please visit: sprouts.com/about/sustainability/. The information contained on or accessible through our website and in our impact reports is not incorporated by reference into this Annual Report on Form 10-K.
The Sprouts Healthy Communities Foundation
In 2015, we formed the Sprouts Healthy Communities Foundation (referred to as our “Foundation”), a registered 501(c)(3) organization focused on advancing nutrition education, fresh food access and improved health outcomes for children and adults in the communities where Sprouts operates. Since its inception, our Foundation has awarded more than $35 million in donations to nonprofits and schools with programs that bring its mission to life.
Our Foundation's 2024 highlights included:
•Invested over $4 million in hyper-local grants to 578 nonprofit organizations and schools focused on school garden education, and health and wellness programs for children and adults;
•Awarded $10 million in high-impact capacity grants to empower nonprofit organizations to expand their program operations;
•Contributed $1 million to the Florida Disaster Relief Fund to aid in relief and recovery efforts following Hurricane Milton; and
•Hosted the second national Growing School Gardens Summit, uniting over 450 educators and organizations responsible for educating an estimated 5 million students nationwide.
For more information on our Foundation, please visit: sprouts.com/about/sprouts-foundation/.
Human Capital Management
At Sprouts, we help people live and eat better. By living our purpose, we improve the health of the communities we serve. Our impact goes beyond healthy and delicious food. We help people live better holistically, represented by all the different ways that we care for each other, our customers, our communities, and for the planet. Our culture is rooted in our values of “Care”, “Own it”, and “Love Being Different”. Customer engagement is critical to our culture and growth plans, and we place great importance on recruiting candidates and retaining team members that have a love of food, pride themselves on service excellence, and share our purpose driven culture. We build on our targeted recruitment efforts with robust training on customer engagement and product knowledge to ensure there is friendly, knowledgeable staff in every store. As of December 29, 2024, we had approximately 35,000 team members. None of our team members are subject to collective bargaining agreements. We consider our relations with our team members to be good, and we have never experienced a strike or significant work stoppage.
2024 Highlights. We are proud of the following achievements during the year:
•We solidified our purpose statement and rolled it out across the organization. We engaged in activities connecting each team member’s role to our purpose statement.
•We continue to cascade our three core values to intentionally shape our culture and act as a lens to guide the decisions we make. We reinforced the critical behaviors and actions to create a sense of inclusion and belonging.
•We engaged in leadership development sessions across the organization, including a focus on coaching and feedback to develop and grow our team members.
•As one of the fastest growing specialty retailers of fresh, natural and organic food in the country, we created approximately 3,300 new jobs in 2024 through new store openings.
•Additionally, we promoted over 6,100 team members and filled 54% of store manager positions with internal candidates.
•Team members saved approximately $23.4 million through store discounts.
•We awarded 50 scholarships to team members and dependents in 2024. Since the scholarship program’s inception, we have awarded more than $1.9 million in scholarships.
Total Rewards. Because we are a people powered business, we are proud to continuously invest in our workforce by offering competitive salaries and wages, which we regularly assess against the current business environment and labor market. We proactively make changes to our total rewards programs to attract the talent that will support our growth strategy and will elevate the customer experience. Furthermore, we offer comprehensive, relevant and market competitive benefits to all eligible team members:
•We offer a variety of medical benefit plans to allow team members the ability to choose the best plan for them and their families.
•We offer well-being services and support dedicated to the mental, physical, emotional and financial well-being of our team members.
•We have a quarterly bonus plan for which all store team members are eligible.
•All team members over 18 can enroll in our 401(k) plan on the first of the month following three months of service, and we offer a contribution matching program.
•We offer a paid sick time policy for all team members and offer generous leave programs.
•All hourly team members are eligible for semi-annual reviews and merit increases.
•We have enhanced our benefits to support mental well-being and counseling services for all team members.
•We offer team members the opportunity to participate in the Western Association of Food Chains’ Retail Management Certificate Program that provides the core skills and knowledge to move into a management role in the retail industry. During 2024, 39 Sprouts team members enrolled in this program.
•We participated in the McKinsey Connected Leaders Academy, for the fourth year, engaging high performing leaders in programs designed to develop diverse leaders at Sprouts. We had 70 participants in 2024, which included leaders participating in Hispanic, Black & Asian Executive level and Manager level programs.
•We offer The Henry Boney Memorial Scholarship, which is designed to offer team members or their dependents a $2,000 scholarship to achieve their college dreams.
•We also embarked on mentor circles offered as a program created and executed by our Inspiring Women at Sprouts team member resource group.
•We offer internal and external coaching to develop our leaders.
•All Sprouts team members can save at our stores, with a 15% Work Perk Discount. This year we offered a 30% discount to all team members over the course of fourteen days aligned with our holiday celebrations. We also offered team members an additional three days with a 25% discount.
•We provided special bonuses to team members in honor of winning Progressive Grocers Retailer of the Year.
Education, Training and Safety. We believe Sprouts is an attractive place to work with significant growth opportunities for our approximately 35,000 team members. To grow the next generation of leaders at Sprouts, we have developed a Leadership Training Model to on-board store managers new to Sprouts. In 2024, we had 81 Leadership graduates totaling more than 33,200 hours in training. We graduated 20 leaders from our college fast-track program which trains college graduates for assistant store management roles. In addition, our Assistant Store Manager training program to accelerate internal promotions supported 39 team members. These development programs support our store growth and workforce plan. In 2024, we rolled out bite-sized training through our new learning management system. This enables daily learning through mobile devices. Our store team members completed over 1,046,000 hours of in-store training in 2024.
We are committed to maintaining a safe environment for our team members and customers. Our stores implement various programs to reduce and eliminate hazards, resulting in a safer workplace and improved shopping experience. In 2024, our stores reported a 10% reduction in worker compensation claim frequency rate and a 9% reduction in general liability claim frequency rate over the prior year.
Team Member Resource Groups. We pride ourselves on supporting an inclusive, respectful, and caring culture throughout our organization. We have five team member resource groups that provide input on our recruiting efforts and insight into team member sentiment and culture survey data to better inform our business and people planning efforts. These groups consist of "Inspiring Women at Sprouts" our women's resource group, “Sabor” our Hispanic and Latin resource group, “Soul” our Black/African American resource group, “Rainbow Alliance” our LBGTQIA+ resource group and “Honored to Serve” our veteran’s resource group. These team member resource groups support our values of “care” and “love being different”.
Growing Our Business
As part of our long-term growth plan, we plan to expand our store base with approximately 10% annual unit growth. Our geographic store expansion and new store placement will intersect where our target customers live, in markets with growth potential and supply chain support, providing a long runway for us to achieve our growth target.
We intend to continue to focus our growth on areas where we have a large concentration of stores, such as California and Texas, while building out our newer markets, such as Florida and the Mid-Atlantic region, to achieve a larger concentration of stores. We have opened 33, 30 and 16 new stores in fiscal 2024, 2023 and 2022, respectively. We expect to continue to expand our store base with at least 35 store openings planned for fiscal 2025, all of which will be in our updated format. See “Item 2. Properties” for additional information with respect to our store closures in 2023.
The below diagram shows our store footprint, by state, as of December 29, 2024.
New Store Development
We have an extensive analytics-based process for new store site selection, which includes in-depth analysis of area demographics, competition, growth potential, traffic patterns, grocery spend and other key criteria. We have a dedicated real estate team as well as a real estate committee that includes certain of our executive officers. Multiple members of this committee often conduct an on-site inspection prior to approving any new location.
We have been successful across a variety of urban, suburban and rural locations in diverse geographies, from coast to coast, which we believe supports the portability of the Sprouts brand and store model into a wide range of markets. As we implement our long-term growth strategy, our stores will continue to deliver a unique and friendly shopping experience that stays true to our farmers market heritage by featuring a smaller box size than our recent vintages, generally between 21,000 and 25,000 square feet. By reducing our store square footage, our newer stores generally have a lower cost to build and decreased occupancy and operating costs, while reducing non-selling space that results in generally flat sales compared to our larger stores.
We expect these cost reductions will allow us to deliver higher returns than our larger stores and continue to accelerate our growth.
See “Item 2. Properties” for additional information with respect to our store locations.
Seasonality
Our business is subject to modest seasonality. Our average weekly sales per store fluctuate throughout the year and are typically highest in the first half of the fiscal year and lowest during the fourth quarter.
Our Competition and Industry
We operate within the competitive and highly fragmented grocery store industry which encompasses a wide array of food retailers, including large national and regional conventional chain supermarkets, warehouse clubs, small grocery and convenience stores, independent grocers, and natural and organic, specialty, mass, discount and other food retail and online formats. Based on our industry experience, we believe our new stores capture market share from conventional supermarkets and specialty concepts in the supermarket segment.
Grocery customers are attracted to unique product offerings, formats and differentiated shopping experiences. Based on our industry experience, we also believe consumers are increasingly focused on health and wellness and are actively seeking healthy foods in order to improve eating habits. This overall demand for healthy products is driven by many factors, including increased awareness about the benefits of eating healthy, a greater focus on preventative health measures using food as medicine, and the rising costs of health care. We believe customers are attracted to retailers with comprehensive health and wellness product offerings. As a result, food retailers are offering an increased assortment of fresh, natural and organic foods as well as vitamins and supplements to meet this demand.
Our competitors within the overall grocery industry primarily include other specialty food retailers such as Whole Foods, Trader Joe’s, and smaller local or regional operators, conventional supermarkets such as Kroger, Albertsons, Safeway, H-E-B and Publix, as well as mass or discount retailers such as Target and Walmart, warehouse membership clubs, online retailers such as Amazon, specialty stores, restaurants, home delivery and meal solution companies, and any other outlets offering food and similar products as those found in our stores. We believe Sprouts offers consumers a compelling value and differentiated products relative to our competitors and will continue to benefit from increasing consumer focus on health, wellness and value, as well as their emphasis on an enhanced shopping experience featuring a broad selection of attribute-driven products along with exceptional customer engagement.
Insurance and Risk Management
We use a combination of insurance and self-insurance to manage potential liabilities related to workers’ compensation, general liability, product liability, cybersecurity, directors' and officers' liability, team member healthcare benefits, and other casualty and property risks. Various factors, including changes in legal trends and interpretations, inflation rate fluctuations, changes in claims settlement practices, changes in applicable laws affecting benefit levels, insolvency of insurance carriers, risk transfer management, and fluctuations in discount rates, could impact the ultimate settlements of claims and the overall cost of our insurance program. As such, there is no guarantee that our insurance coverage will fully mitigate all potential risks or claims. We continuously evaluate our insurance program to ensure that our coverage levels are appropriate considering evolving risks, claims experience, and the regulatory environment. We also assess the financial strength of our insurance carriers to minimize the risk of insolvency and ensure stability in our coverage.
Trademarks and Other Intellectual Property
We believe that our intellectual property has substantial value and has contributed to the success of our business. In particular, our trademarks, including our registered SPROUTS FARMERS MARKET® and SPROUTS® trademarks, are valuable assets that we believe reinforce our customers’ favorable perception of our stores.
In addition to our trademarks, we believe that our trade dress, which includes the human-scale design, arrangement, color scheme and other physical characteristics of our stores and product displays, is a large part of the farmers market atmosphere we create in our stores and enables customers to distinguish our stores and products from those of our competitors.
From time to time, third parties have used names similar to ours, have applied to register trademarks similar to ours and, we believe, have infringed or misappropriated our intellectual property rights. Third parties have also, from time to time, opposed our trademarks and challenged our intellectual property rights. We respond to these actions on a case-by-case basis. The outcomes of these actions have included both negotiated out-of-court settlements as well as litigation.
Information Technology Systems
We have made significant investments in IT infrastructure and business systems to enhance efficiency, scalability, and customer experience to support our long-term growth and operational resilience. These investments include enterprise data management, labor and shrink optimization, store replenishment, demand forecasting, and in-store technologies, all aimed at streamlining operations and improving decision-making.
Our IT initiatives focus on maintaining high in-stock availability, optimizing demand forecasting, automating supply chain processes, enhancing the customer experience, and increasing workforce productivity. These enhancements drive greater operational efficiency, cost control, and business agility. To further strengthen our capabilities, we continue to integrate emerging technologies such as artificial intelligence, machine learning, and cloud computing to advance automation, generate real-time insights, and improve scalability.
We operate on an integrated IT platform that provides the agility and scalability necessary to support business growth and evolving market demands. This platform ensures operational consistency across our business, enabling seamless adaptation to changing conditions while positioning us for future expansion.
To mitigate risks such as cybersecurity threats, system disruptions, and data breaches, we have implemented a multi-layered security strategy, including advanced threat detection, continuous monitoring, third-party security audits, employee cybersecurity training, and robust disaster recovery and incident response protocols. Our cybersecurity program aligns with industry standards such as the NIST Cybersecurity Framework (CSF), while our data protection practices comply with privacy regulations, including the California Privacy Rights Act (CPRA). For payment security, we adhere to the Payment Card Industry Data Security Standard (PCI DSS) to ensure the protection of cardholder data and transaction integrity.
Regulatory Compliance
Our stores and online retail operations are subject to various local, state and federal laws, regulations and administrative practices affecting our business. We must comply with provisions regulating health, sanitation and food safety standards, food labeling, equal employment, minimum wages, data privacy, environmental protection, licensing for the manufacture, preparation and sale of food and, in many stores, licensing for beer and wine or other alcoholic beverages, and cannabidiol (“CBD”) products. Our operations, including the manufacturing, processing, formulating, packaging, labeling and advertising of products by us and our vendors are subject to regulation by various state and federal agencies, including the Food and Drug Administration (“FDA”), the Federal Trade Commission (“FTC”), the U.S. Department of Agriculture (“USDA”), the Consumer Product Safety Commission (“CPSC”) and the Environmental Protection Agency (“EPA”).
Food. The FDA has comprehensive authority to regulate the manufacture, labeling, distribution, sale, marketing and safety of food and food ingredients for humans and pets (other than meat, poultry, catfish and certain egg products), as well as dietary supplements under the Federal Food, Drug, and Cosmetic Act (“FDCA”). Similarly, the USDA’s Food Safety Inspection Service (“FSIS”) is the public health agency responsible for ensuring that the nation’s commercial supply of meat, poultry, catfish and certain egg products is safe, wholesome and correctly labeled and packaged under the Federal Meat Inspection Act and the Poultry Products Inspection Act.
Congress amended the FDCA through passage of the Food Safety Modernization Act (“FSMA”), which greatly expanded FDA’s regulatory oversight over all actors in the food product supply chain. FDA regulations mandate participation in USDA's Hazard Analysis and Critical Control Points (“HACCP”) program or FDA's Hazard Analysis and Risk-Based Prevention Controls (“HARPC”) program, as applicable, which require that risk-based preventive controls be observed by the majority of food producers. This authority applies to all domestic food facilities and, by way of imported food supplier verification requirements, to all foreign facilities that supply food products.
The FDA and FSIS also exercise broad jurisdiction over the labeling and promotion of food and meat products. Labeling is a broad concept that, under certain circumstances, extends even to product-related claims and representations made on a company’s website, in-store or similar printed or graphic medium. All foods, including dietary supplements, must bear labeling that provides consumers with essential information with respect to standards of identity, net quantity, nutrition facts labeling, ingredient statement, and allergen disclosures. The agencies also regulate the use of structure/function claims, health claims and nutrient content claims for food and dietary supplement products. Additional in-store labeling requirements, such as disclosure of calories and other nutrient information for frequently sold items are now in effect. In addition, various nutrition initiatives that will impact many actors in our supply chain, such as the elimination of certain partially hydrogenated oils and brominated vegetable oil went into effect in 2023.
USDA’s Agricultural Marketing Service (“AMS”) oversees compliance with the National Organic Standards Program and related labeling activity. In addition, AMS has responsibility for newly enacted requirements surrounding the disclosure of the presence of bioengineered ingredients in food.
AMS also enforces the Perishable Agricultural Commodities Act ("PACA") which imposes fair business practices on parties engaged in the sale of perishable fruits, vegetables and some nuts. Entities that buy and sell perishable commodities require a PACA license and disputes about sales of produce are subject to rules and regulations under PACA.
Dietary Supplements. The FDA has comprehensive authority to regulate the safety of dietary supplements, dietary ingredients, labeling and current good manufacturing practices. Congress amended the FDCA in 1994 through passage of the Dietary Supplement Health and Education Act (“DSHEA”), which greatly expanded FDA’s regulatory authority over dietary supplements. Through DSHEA, dietary supplements became a separately defined FDA-regulated product that is also subject to the general food regulations. Dietary supplements are allowed to carry structure/function claims which relate to support of healthy functioning. However, no statement on a dietary supplement may expressly or implicitly represent that it will diagnose, cure, mitigate, treat or prevent a disease.
Cosmetics. The FDA has comprehensive authority to regulate cosmetics under the FDCA and the Fair Packaging and Labeling Act (“FPLA”). No cosmetic product labeling or marketing may advertise any therapeutic use, such as treating or preventing disease, or claim to affect the structure or function of the body. The Modernization of Cosmetics Regulation Act of 2022 ("MoCRA") created a comprehensive regulatory framework that imposes new FDA registration and listing requirements, adverse event reporting obligations, labeling rules, enforcement authority, and good manufacturing practices ("GMP") requirements, among other regulatory obligations, on cosmetic manufacturers, packers or distributors of cosmetic products whose name appears on the label of the product.
Homeopathic Products. The FDA has the authority to regulate homeopathic products. Under the FDCA, homeopathic products are subject to the same requirements related to approval, adulteration and misbranding as other drug products. There are no FDA-approved products labeled as homeopathic. Any product labeled as homeopathic is being marketed in the U.S. without FDA evaluation for safety or effectiveness.
CBD Products. The 2018 Farm Bill legalized the production of hemp and products made from hemp, hemp derivatives including CBD oil and extracts, and established that these products are no longer controlled substances, as long as the cannabis plant and products derived from the plant contain no more than 0.3% THC. Under the FDCA, it is unlawful to introduce into interstate commerce a food to which has been added a substance that is an active ingredient in an approved drug product or a substance for which substantial clinical investigations have been instituted, and the existence of such investigations has been made public. FDA has approved one drug product containing CBD as an active ingredient. Consequently, because CBD has been approved as a drug active ingredient, FDA’s current legal position is that CBD cannot be legally contained in a dietary supplement or food product.
This restriction only applies to dietary supplements and foods. To date, FDA has limited its enforcement actions to those ingestible, topical, and cosmetic CBD products that make therapeutic or drug claims. However, regardless of enforcement priorities, FDA has the authority to remove from the market any CBD product if it is adulterated, its labeling is false or misleading, it is otherwise misbranded, or if it violates any other FDCA or FDA requirement or regulation. This enforcement authority extends to states that have legalized and regulated the distribution of ingestible CBD products.
Food, Cosmetics, Homeopathic and CBD Products, and Dietary Supplement Advertising. The FTC exercises jurisdiction over the advertising of foods, cosmetics, homeopathic and CBD products, and dietary supplements. The FTC has the power to institute monetary sanctions and the imposition of consent decrees and penalties that can severely limit a company’s business practices. In recent years, the FTC has instituted numerous enforcement actions against companies for failure to have adequate substantiation for claims made in advertising or for the use of false or misleading advertising claims.
Compliance. As is common in our industry, we rely on our suppliers and contract manufacturers to ensure that the products they manufacture and sell to us comply with all applicable regulatory and legislative requirements. In general, we seek certifications of compliance, representations and warranties, indemnification and/or insurance from our suppliers and contract manufacturers. However, even with adequate insurance and indemnification, any claims of non-compliance could significantly damage our reputation and consumer confidence in products we sell. In addition, the failure of such products to comply with applicable regulatory and legislative requirements could prevent us from marketing the products or require us to recall or remove such products from our stores. In order to comply with applicable statutes and regulations, our suppliers and contract manufacturers have from time to time reformulated, eliminated or relabeled certain of their products and we have revised certain provisions of our sales and marketing program.
Corporate Offices
Our principal executive offices are located at 5455 East High Street, Suite 111, Phoenix, Arizona 85054. Our website address is www.sprouts.com. The information on or accessible through our website is not incorporated by reference into this Annual Report on Form 10-K or in any other report or document we file with the Securities and Exchange Commission (“SEC”).
Available Information
Our Annual Report on Form 10-K, Quarterly Reports on Form 10-Q, Current Reports on Form 8-K, and all amendments to those reports, and the Proxy Statement for our Annual Meeting of Stockholders are made available, free of charge, on our investor relations website at http://investors.sprouts.com/, as soon as reasonably practicable after such reports have been filed with or furnished to the SEC. We also use our website as a tool to disclose important information about our company and comply with our disclosure obligations under Regulation Fair Disclosure. Our corporate governance documents, code of ethics and Board committee charters and policies are also posted on http://investors.sprouts.com/.
Item 1A. Risk Factors
Certain factors may have a material adverse effect on our business, financial condition and results of operations. You should carefully consider the risks and uncertainties described below, together with all of the other information in this Annual Report on Form 10-K, including our consolidated financial statements and related notes. Any of the following risks could materially and adversely affect our business, results of operations, cash flows, financial condition, or prospects and cause the value of our common stock to decline.
Market and Other External Risks
General economic conditions that impact consumer spending or result in competitive responses could adversely affect our business.
The retail food business is sensitive to changes in general economic conditions. Inflation, recessionary economic cycles, increases in interest rates, higher prices for commodities, raw materials, fuel and other energy, high levels of unemployment and consumer debt, depressed home values, high tax rates, tariffs and other macroeconomic factors that affect consumer spending and confidence or buying habits may materially adversely affect the demand for and prices of products we sell in our stores. As a result, consumers may be more cautious and could reduce their spending in our stores or shift their spending to lower-priced competition, such as warehouse membership clubs, dollar stores, online retailers or extreme value formats, which could have a material and adverse effect on our operating results and financial condition.
In addition, prolonged inflation or deflation can impact our business. Food inflation, when combined with reduced consumer spending, could also reduce sales, gross profit margins and comparable store sales. As a result, our operating results and financial condition could be materially adversely affected. Food deflation across multiple categories, particularly in produce and proteins, could also reduce sales growth and earnings if our competitors react by lowering their retail pricing and expanding their promotional activities, which can lead to retail deflation higher than cost deflation that could reduce our sales, gross profit margins and comparable store sales.
Our failure to compete successfully in our competitive industry may adversely affect our revenues and profitability.
We operate in the competitive retail food industry. Our competitors include specialty grocers, conventional supermarkets, natural food stores, mass or discount retailers, warehouse membership clubs, online retailers and specialty stores, as well as restaurants and home delivery and home meal solution providers. These businesses compete with us for products, customers and locations. We compete on a combination of factors, primarily differentiated product selection, quality, convenience, shopping experience, customer engagement, store format, location, price and delivery options. Our failure to offer products or services that appeal to our customers’ preferences or to effectively market these products or services could lead to a decrease in our sales. To the extent that our competitors offer lower prices or similar products, our ability to maintain profit margins and sales levels may be negatively impacted. In addition, some competitors are aggressively expanding their number of stores or their product offerings, increasing the space allocated to fresh, natural and organic foods, and enhancing options of engaging with and delivering their products to customers. Some of these competitors may have greater financial or marketing resources than we do and may be able to devote greater resources to sourcing, promoting and selling their products. As competition in certain areas or platforms intensifies or competitors open stores or expand delivery options within close proximity to our stores, our results of operations and cash flows may be negatively impacted through a loss of sales, decrease in customer traffic and market share, reduction in margin from competitive price changes or greater operating costs.
We rely heavily on sales of fresh produce and quality fresh, natural and organic products, and product supply disruptions may have an adverse effect on our profitability and operating results.
We have a significant focus on perishable products, including fresh produce and natural and organic products. Sales of produce accounted for approximately 18% and 19% of our net sales in fiscal 2024 and 2023, respectively. We have generally not experienced significant difficulty to date in maintaining the supply of our produce and fresh, natural and organic products that meet our quality standards. However, there is no assurance that these products will be available to meet our needs in the future. The availability of such products at competitive prices depends on many factors beyond our control, including the number and size of farms that grow natural or organic crops or raise livestock that meet our quality, welfare and production standards, tariffs and import regulations or restrictions on foreign-sourced products, stability of the global supply chain and the ability of our vendors to maintain required attributes or organic, non-genetically modified or other applicable third-party certifications for such products.
Produce is also vulnerable to adverse weather conditions and natural disasters, such as floods, droughts, storms, frosts, wildfires, earthquakes, hurricanes, pestilences and other extreme or abnormal environmental conditions, including the potential effects of climate change, any of which can lower crop yields and reduce crop size and quality. This could reduce the available supply of, or increase the price of, fresh produce, which may adversely impact sales of our fresh produce and our other products that rely on produce as a key ingredient.
In addition, we and our suppliers compete with other food retailers in the procurement of fresh, natural and organic products, and other specialty, attribute-driven products which are often less available than conventional products. If our competitors significantly increase these types of product offerings due to increases in consumer demand or otherwise, we and our suppliers may not be able to obtain a sufficient supply of such products on favorable terms, or at all, and our sales may decrease, which could have a material adverse effect on our business, financial condition, results of operations and cash flows. We could also suffer significant inventory losses in the event of disruption of our supply chain network or extended power outages or other damaging events in our stores or distribution centers. If we are unable to maintain inventory levels suitable for our business needs, it would materially adversely affect our financial condition, results of operations and cash flows.
The current geographic concentration of our stores creates an exposure to local or regional downturns or catastrophic occurrences and the impact of climate change.
As of December 29, 2024, we operated 149 stores in California, making California our largest market representing 34% of our total stores in fiscal 2024. We also have store concentration in Texas, Arizona, Florida and Colorado, operating 54, 47, 47 and 33 stores in those states, respectively, and representing 12%, 11%, 11% and 8% of our total stores in fiscal 2024, respectively. As we execute our long-term growth strategy, we may become even more concentrated in these markets, as well as other identified expansion markets. In addition, we source a large portion of our produce from California, ranging from approximately 40% to approximately 70% depending on the time of year. As a result, our business is currently more susceptible to regional conditions than the operations of more geographically diversified competitors, and we are vulnerable to economic downturns and natural disasters in those regions. Any unforeseen events or circumstances that negatively affect these areas in which we have stores or from which we obtain products could materially adversely affect our revenues and profitability. These factors include, among other things, changes in demographics, population and employee bases; regulation; wage increases; changes in economic conditions; floods, prolonged droughts, diminished water resources, windstorms such as tornados, cyclones, hurricanes and tropical storms, winter storms or other severe weather conditions, which may be caused or exacerbated by climate change; and other catastrophic occurrences, such as pandemics, earthquakes or wildfires. Such conditions may result in reduced customer traffic and spending in our stores, physical damage to our stores, full or partial loss of power in our stores, loss of inventory, closure of one or more of our stores, inadequate work force in our markets, temporary disruption in the supply of products whether from self or third-party distribution, delays in the delivery of goods to our stores and a reduction in the availability of products in our stores. Any of these factors, particularly in areas with significant geographic concentration of our stores or produce growers on which we rely, may disrupt our business and materially adversely affect our financial condition, results of operations and cash flows.
Fluctuations in product and commodity availability and prices, including from the impact of tariffs, may impact profitability.
The availability of many products we sell, including produce, or products with ingredients such as wheat, corn, oils, milk, sugar, cocoa, nuts and other key commodities, may be impacted by weather events and catastrophic occurrences. These products and commodities are also subject to significant price fluctuations and may be impacted by economic factors such as tariffs and inflation. For example, on February 1, 2025, the U.S. government announced a 25% tariff on product imports from certain countries, including Mexico and Canada, and 10% tariffs on product imports from certain countries, including China. Although certain of these tariffs were subsequently paused, any increase in prices of such products or key ingredients as a result of tariffs or otherwise may cause our vendors to seek price increases from us. Price decreases may result in our competitors reducing retail prices on products or items containing such ingredients. If we are unable to mitigate these fluctuations by passing the effects through to our customers, which will largely depend upon competitive market conditions, our profitability may be impacted either through increased costs to us or lower prices and loss of customers due to competitive conditions, which may impact gross margins, or through reduced revenue as a result of a decline in the number and average size of customer transactions.
Supply chain disruptions may delay our store growth plans.
Disruptions to the global supply chain due to events beyond our control, such as tariffs, pandemics or wars, may cause us to experience shortages or increased costs of necessary products or equipment resulting in delays in or greater expenses for our future new store openings.
Widespread health epidemics or other incidents beyond our control could materially impact our business.
Our business could be severely impacted by widespread regional, national or global health epidemics or other incidents beyond our control such as terrorism, riots, acts of violence and other crimes. Such events may cause customers to avoid public gathering places such as our stores or otherwise change their shopping behaviors. Additionally, these occurrences could adversely impact our business by disrupting production and delivery of products to our stores and by impacting our ability to appropriately staff our stores.
Increasing energy costs, unless offset by more efficient usage or other operational responses, may impact our profitability.
We utilize natural gas, water, sewer and electricity in our stores and our transportation providers use gasoline and diesel in trucks that deliver products to our stores. We have been adversely impacted by the increased costs of energy and may be further adversely impacted if costs continue to increase. We may also be required to pay certain adjustments or other amounts pursuant to our supply and delivery contracts in connection with increases in fuel prices. Increases in energy costs, whether driven by increased demand, decreased or disrupted supply, increased environmental regulations or an anticipation of any such events or otherwise, will increase the costs of operating our stores and distribution centers. Our shipping costs also may increase if fuel and freight prices increase. We may not be able to recover these rising costs through increased prices charged to our customers, and any increased prices may exacerbate the risk of customers choosing lower-cost alternatives. In addition, if we are unsuccessful in attempts to protect against these increases in energy costs through long-term energy contracts, improved energy procurement, improved efficiency and other operational improvements, the overall costs of operating our stores will increase, which would impact our profitability, financial condition, results of operations and cash flows.
We may require additional capital to fund the expansion of our business, and our inability to obtain such capital could harm our business.
To support our growth strategy, we must have sufficient capital to continue to make significant investments in our new and existing stores and advertising. If cash flows from operations are not sufficient, we may need additional equity or debt financing to provide the funds required to expand our business. If such financing is not available on satisfactory terms or at all, we may be unable to expand our business or to develop new business at the rate desired. Debt financing increases expenses, may contain covenants that restrict the operation of our business, and must be repaid regardless of operating results. Equity financing, or debt financing that is convertible into equity, could result in additional dilution to our existing stockholders. Our inability to obtain adequate capital resources to fund our business and growth strategy may require us to delay, scale back or eliminate some or all of our operations or the expansion of our business, which may have a material adverse effect on our business, operating results, financial condition or prospects.
Business and Operating Risks
Our ability to execute on our long-term growth strategy largely depends on new store openings, and our failure to successfully open new stores could negatively impact our business.
Our continued growth depends, in large part, on our ability to open new stores and to operate those stores successfully. Successful implementation of our long-term growth strategy depends upon a number of factors, including our ability to effectively achieve a level of cash flow or obtain necessary financing to support our expansion; find suitable sites for new store locations; manage supply chain constraints to obtain necessary equipment; negotiate and execute leases on acceptable terms; secure and manage the inventory necessary for the launch and operation of our new stores; hire, train and retain skilled team members; promote and market new stores; successfully execute and gain customer acceptance of our store format; and address competitive merchandising, distribution, operational and other challenges encountered in connection with expansion into new geographic areas and markets.
Although we plan to expand our store base primarily through new store openings, we may grow through strategic acquisitions. Our ability to grow through strategic acquisitions will depend upon our ability to identify suitable targets and negotiate acceptable terms and conditions for their acquisition, as well as our ability to obtain financing for such acquisitions, integrate the acquired stores into our existing store base and retain the customers of such stores. If we are ineffective in performing these activities, then our efforts to open and operate new stores may be unsuccessful or unprofitable, and we may be unable to execute our growth strategy.
In fiscal 2024, we opened 33 new stores. In fiscal 2023, we opened 30 new stores and acquired two stores. We currently expect to achieve approximately 10% annual unit growth and to open at least 35 new stores in 2025, including penetration of new markets with a greater concentration of new stores. However, we may not achieve this expected level of new store growth due to inability to find suitable sites, supply chain disruptions or otherwise. We may not have the level of cash flow or financing necessary to support our growth strategy. Additionally, our proposed expansion will place increased demands on our operational, managerial and administrative resources. These increased demands could cause us to operate our existing business less effectively, which in turn could cause deterioration in the financial performance of our existing stores. Further, new store openings in markets where we have existing stores may result in reduced sales volumes at our existing stores in those markets. If we experience a decline in performance, we may slow or discontinue store openings, or we may decide to close stores that we are unable to operate in a profitable manner. If we fail to successfully implement our growth strategy, including by opening new stores, our financial condition, results of operations and cash flows may be adversely affected.
Real or perceived concerns that products we sell could cause unexpected illness, side effects, injury or death could result in their discontinuance or expose us to lawsuits, either of which could result in unexpected costs and damage to our reputation.
There is increasing public awareness regarding and governmental scrutiny of food safety. Unexpected illness, side effects, injury, or death caused by products we prepare and/or sell, in particular our Sprouts Brand products, or involving vendors that provide us with products or services that are consumed by our customers could expose us to severe damage to our reputation, product liability or negligence lawsuits or government enforcement actions. Any claims brought against us may exceed our existing or future insurance policy coverage or limits. Any judgment against us that is in excess of our policy limits would have to be paid from our cash reserves, which would reduce our capital resources. Further, we may not have sufficient capital resources to pay a judgment, in which case our creditors could levy against our assets. Such illnesses, side effects, injuries or deaths could also result in the discontinuance of sales of these products or our relationship with such vendors or prevent us from achieving market acceptance of the affected products.
As a fresh, natural and organic retailer, we believe that many customers choose to shop our stores because of their interest in health, nutrition and food safety. As a result, we believe that our customers hold us to a high food safety and quality standard, in particular for our Sprouts Brand products. Therefore, real or perceived quality or food safety concerns, whether or not ultimately based on fact, and whether or not involving products prepared and/or sold at our stores or vendors that supply us with products or provide us with services, would cause negative publicity and lost confidence regarding our company, brand, or products, which could in turn harm our reputation and net sales, and could have a material adverse effect on our business, results of operations, cash flows or financial condition.
Any significant interruption in the operations of our distribution centers or supply chain network could disrupt our ability to deliver our produce and other products in a timely manner.
We self-distribute our produce through six distribution centers located in Arizona, Texas, northern California, southern California, Colorado and Florida. We also have entered into a partnership with a third-party produce distributor in Pennsylvania to supply fresh produce to our Mid-Atlantic stores. As we further expand our geographic footprint or self-distribute additional product categories, we may require additional distribution centers or expansion of our existing distribution centers. Any unanticipated or unusual expenses or significant interruption or failure in the operation of our distribution center infrastructure, such as disruptions due to fire, severe weather or other catastrophic events, cyberattacks, network or power outages, labor shortages or disagreements, shipping or infrastructure problems, food safety concerns, integration of new distribution centers or product categories into our supply chain network, inability of our new distribution centers to perform as expected or contractual disputes with third-party service providers could result in increased expenses and adversely impact our ability to distribute produce and other products to our stores.
Such interruptions could result in lost sales and a loss of customer loyalty to our brand, as well as increased costs from third-party service providers. While we maintain business interruption and property insurance, if the operation of our distribution centers or transportation network were interrupted for any reason, causing delays in shipment of product to our stores, our insurance may not be sufficient to cover losses we experience, which could have a material adverse effect on our business, financial condition, results of operations and cash flows.
In addition, unexpected delays in deliveries from vendors that ship directly to our stores or increases in distribution and transportation costs (including through increased labor or fuel costs) could have a material adverse effect on our financial condition, results of operations and cash flows. Labor shortages, work stoppages or wage increases in the transportation or other industries, long-term disruptions to the national and international transportation infrastructure, reduction in capacity and industry-specific regulations such as hours-of-service rules that lead to delays or interruptions of deliveries or increased costs could negatively affect our business.
Disruption of significant supplier relationships could negatively affect our business.
KeHE is our primary supplier of dry grocery and frozen food products, accounting for approximately 50% and 47% of our total purchases in fiscal 2024 and 2023, respectively. Our current primary contractual relationship with KeHE continues through July 18, 2025 and provides that KeHE will be our primary supplier for all of our stores. Our primary distributor of meat and seafood products accounted for approximately 14% of our total purchases in each of fiscal 2024 and 2023. Due to this concentration of purchases from a small number of third-party suppliers, the cancellation or interruption of our distribution arrangements or the disruption, delay or inability of our suppliers to timely deliver product to our stores in quantities or within service parameters that meet our requirements may materially and adversely affect our operating results while we establish alternative supply chain channels due to lost sales, as well as increased costs from alternative distribution arrangements. In addition, we are currently in the process of transitioning from our primary meat and seafood distributor. We expect to initially transition to an intermediary third-party distributor and ultimately to a self-distribution model under which we will deal directly with our suppliers. As with complex transitions of this magnitude, there are associated short-term risks, including in particular, potential product supply disruptions resulting in lost sales at our stores and transition-related expenses that exceed our expectations. Another 3% of our total purchases in both fiscal 2024 and 2023 were made through our secondary supplier of dry grocery and frozen food products, UNFI. We expect to extend our current contractual relationship with UNFI through December 31, 2025. There is no assurance UNFI or other distributors will be able to fulfill our needs on favorable terms or at all. If KeHE, UNFI or any of our other distributors or suppliers fail to fulfill their financial or contractual obligations or the products they distribute fail to comply with food safety, labeling or other laws and regulations, or face allegations of non-compliance, their operations may be disrupted and we could incur substantial related costs. Further, the food distribution and manufacturing industries are dynamic. Consolidation or dissolution of distributors or the manufacturers that supply them could reduce our supply options and detrimentally impact the terms under which we purchase products. We may not be able to find replacement suppliers on commercially reasonable terms, which would have a material adverse effect on our financial condition, results of operations and cash flows.
Disruptions to, security breaches or non-compliance involving, our information technology systems could harm our ability to run our business and expose us to potential liability and loss of revenues.
We rely extensively on information technology systems for point-of-sale processing in our stores, supply chain, financial reporting, human resources, store operations, ecommerce and various other processes and transactions. Our information technology systems are subject to damage or interruption from power outages, computer and telecommunications failures, computer viruses, security breaches, including tampering with hardware and breaches of our transaction processing or other systems that could result in the compromise of confidential customer or team member data, ransomware attacks, catastrophic events, and usage errors by our team members. Phishing attacks have emerged as particularly pervasive, including as a means for ransomware attacks, which have increased both in frequency and breadth. Point-of-sale hardware in our stores has also been targeted by individuals attempting to install skimmer devices or conduct other tampering to illicitly obtain payment card information. In response to these wide-ranging cybersecurity and data privacy risks, we have implemented numerous security protocols in order to strengthen security, and we maintain a customary cyber insurance policy, but there can be no assurance breaches will not occur in the future, be detected in a timely manner or be covered by our insurance policy. Significant expenditures could be required to remedy future cybersecurity problems and protect against future breaches.
Additionally, compliance with current and future applicable federal and state privacy, cybersecurity and related laws, including for example the California Privacy Act of 2018 (“CCPA”) and the California Privacy Rights Act (“CPRA”), can be costly and time-consuming, and we could be subject to enforcement actions or penalties for non-compliance. These costs could have a material adverse effect on our business, and our efforts may not meaningfully limit the success of future attempts to breach our information technology systems.
Our information technology systems may also fail to perform as we anticipate, and we may encounter difficulties or significant expenses in implementing new systems, adapting these systems to changing technologies or legal requirements or expanding them to meet the future needs and growth of our business. If our systems are improperly implemented, breached, damaged, cease to function properly, do not function as anticipated or are perceived to have failed, we may have to make significant investments to fix or replace them; suffer interruptions in our operations; experience data loss; incur liability to our customers, team members and others; face costly litigation, enforcement actions and penalties; and our brand and reputation with our customers may be harmed. Various third parties, such as our service providers and suppliers, including our most significant suppliers, and payment processors and their suppliers (i.e., our fourth parties), also rely heavily on information technology systems, and any failure of these systems for any reason (e.g., cybersecurity attack, software glitch, human or system error or omission), could also cause loss of sales, transactional or other data, compromise of customer or team member data and significant interruptions to our business. Any security breach or other material interruption in the information technology systems we rely on, particularly those required for point-of-sale payment processing in our stores, may have a material adverse effect on our business, operating results and financial condition.
In addition, many of our store support team members work remotely. Our failure to provide appropriate technological resources and maintain adequate safeguards around our remote work environment could result in loss of productivity and usage errors by our team members or the loss or compromise of confidential customer, team member or company data. In addition, the remote work environment may increase certain risks to our business, including phishing and other cybersecurity attacks.
If we are unable to successfully identify market trends and react to changing consumer preferences in a timely manner, our sales may decrease.
We believe our success depends, in substantial part, on our ability to:
•anticipate, identify and react to fresh, natural and organic grocery and dietary supplement trends and changing consumer preferences and demographics in a timely manner;
•translate market trends into appropriate, innovative product and service offerings in our stores before our competitors and effectively market these trends to our target customers; and
•develop and maintain vendor and service provider relationships that provide us access to the newest on-trend merchandise and customer engagement options on reasonable terms.
Consumer preferences often change rapidly and without warning, moving from one trend to another among many product or retail concepts. Our performance is impacted by trends regarding healthy lifestyles, product attributes, dietary preferences, convenient options, fresh, natural and organic products, meal solutions, ingredient transparency and sustainability, and vitamins and supplements, as well as new and evolving methods of engaging with and delivering our products to our customers. Consumer preferences towards vitamins, supplements or fresh, natural and organic food products might shift as a result of, among other things, economic conditions, food safety perceptions, scientific research or findings regarding the benefits or efficacy of such products, national media attention and the cost, attributes or sustainability of these products. A change in consumer preferences away from our offerings would have a material adverse effect on our business. Additionally, negative publicity over the safety, efficacy or benefits of any such items, in particular our Sprouts Brand products, may adversely affect demand for our products, and could result in lower customer traffic, sales, results of operations and cash flows.
If we are unable to anticipate and satisfy consumer preferences with respect to product offerings and customer engagement options, our sales may decrease, which could have a material adverse effect on our business, financial condition, results of operations and cash flows.
Our newly opened stores may negatively impact our financial results in the short-term, and may not achieve sales and operating levels consistent with our more mature stores on a timely basis or at all.
We have actively pursued new store growth as part of our long-term strategy and plan to continue doing so in the future. Our new store openings may not be as successful or reach the sales and profitability levels of our existing stores. New store openings may negatively impact our financial results in the short-term due to the effect of store opening costs and lower sales and contribution to overall profitability during the initial period following opening. New stores typically build their sales volume and their customer base over time and, as a result, generally have lower margins and higher operating expenses, as a percentage of net sales, than our more mature stores. New stores may not achieve sustained sales and operating levels consistent with our more mature store base on a timely basis or at all. This may result in store closures or otherwise have an adverse effect on our financial condition and operating results. Further, we have experienced in the past, and expect to experience in the future, some sales volume transfer from our existing stores to our new stores as some of our existing customers switch to new, closer locations. If our new stores are less profitable than our existing stores, or if we experience sales volume transfer from our existing stores, our financial condition and operating results may be adversely affected.
On many of our projects, we have received landlord contributions for leasehold improvements and other build-out costs. We cannot guarantee that we will be able to continue to receive landlord contributions at the same levels or at all. Any reductions of landlord contributions could have an adverse impact on our new store cash-on-cash returns and our operating results.
We may be unable to maintain or increase comparable store sales, which could negatively impact our business and stock price.
We may not be able to achieve or improve the levels of comparable store sales that we have experienced in the past. Our comparable store sales growth could be lower than our historical average for many reasons, including general economic conditions, competition, cycling prior year performance and the other matters discussed in these Risk Factors. These factors may cause our comparable store sales results to be materially lower than in recent periods, which could harm our business and result in a decline in the price of our common stock.
We may be unable to maintain or improve our operating margins, which could adversely affect our financial condition and ability to grow.
If we are unable to successfully manage the potential difficulties associated with store growth, we may not be able to capture the efficiencies of scale that we expect from expansion. If we are not able to capture efficiencies of scale related to our smaller store format, improve our systems, sustain cost discipline, optimize promotional activity and maintain appropriate store labor levels and disciplined product selection, our customer traffic and operating margins may stagnate or decline. In addition, competition and pricing pressures from competitors and our inability to timely pass on product cost increases due to inflation or otherwise to our customers through retail price increases may also adversely impact our operating margins. Both our inability to capture the efficiencies from scale and competition could have a material adverse effect on our business, financial condition, results of operations and cash flows and adversely affect the price of our common stock.
If we fail to maintain our reputation and the value of our brand, our sales may decline.
We believe our continued success depends on our ability to maintain and grow the value of the Sprouts brand. Maintaining, promoting and positioning our brand and reputation will depend largely on the success of our marketing and merchandising efforts and our ability to provide a consistent, high-quality customer experience. Brand value is based in large part on perceptions of subjective qualities, and even isolated incidents involving our company, our team members, suppliers, agents, marketing partners, third-party service providers or the products we sell can erode trust and confidence, particularly if they involve our Sprouts Brand products, or result in adverse publicity, governmental investigations or litigation. Our brand could be adversely affected if we fail to manage these risks, or if our public image or reputation were to be tarnished by negative publicity.
If we are unable to protect against inventory shrink, our results of operations and financial condition could be adversely affected.
Our business depends on our ability to effectively manage our inventory. We have historically experienced loss of inventory (also called shrink) due to damage, theft, spoilage, inventory management and other causes.
Sustained elevated levels of inventory shrink could adversely affect our results of operations and financial condition. To protect against the possibility of rising inventory shrink, we have taken, and may continue to take, certain operational and strategic actions that could adversely affect our results of operations. In addition, sustained high rates of inventory shrink at certain stores could impact the profitability of those stores and result in the impairment of long-lived assets.
The loss of key management could negatively affect our business.
We are dependent upon a number of key management and other team members. If we were to lose the services of a key member of our management team or a significant number of key team members within a short period of time, this could have a material adverse effect on our operations as we may not be able to find suitable individuals to replace them on a timely basis, if at all. In addition, any such departure could be viewed in a negative light by investors and analysts, which may cause our stock price to decline. We do not maintain key person insurance on any team member.
If we are unable to attract, train and retain team members, we may not be able to grow or successfully operate our business.
The food retail industry is labor intensive. Our continued success and ability to grow through new store openings is dependent upon our ability to attract, develop and retain qualified team members in our stores and at our store support offices who understand and appreciate our culture and are able to represent our brand effectively and establish credibility with our business partners and customers. We face intense competition for qualified team members, many of whom are subject to offers from competing employers. Due to a tight labor market, availability of talent and other factors, we have experienced, and could continue to experience, a shortage of labor for store positions. Our ability to meet our labor needs, while controlling wage and labor-related costs, is subject to numerous external factors, including the availability of a sufficient number of qualified persons in the work force in the markets in which we are located, unemployment levels within those markets, unionization of the available work force, prevailing wage rates, changing demographics, health and other insurance costs and changes in employment legislation. In the event of increasing wage rates, if we fail to increase our wages competitively, the quality of our workforce could decline, causing our customer engagement to suffer, while increasing our wages could cause our earnings to decrease. If we are unable to hire, train and retain team members capable of meeting our business needs and expectations, our business and brand image may be impaired. Any failure to meet our staffing needs or any material increase in turnover rates of our team members or team member wages may adversely affect our business, results of operations, cash flows or financial condition.
Union attempts to organize our team members could negatively affect our business.
None of our team members are currently subject to a collective bargaining agreement. As we continue to grow and enter different regions, unions may attempt to organize all or part of our team member base at certain stores or within certain regions. Responding to such organization attempts may distract management and team members and may have a negative financial impact on individual stores, or on our business as a whole.
Higher wage and benefit costs could adversely affect our business.
Changes in federal and state minimum wage laws and other laws relating to employee compensation and benefits could cause us to incur additional wage and benefit costs, as well as increased contractual costs associated with our service providers. Increased labor costs brought about by changes in minimum wage laws, other regulations or prevailing market conditions would increase our expenses and have an adverse impact on our profitability.
Our lease obligations could adversely affect our financial performance and may require us to continue paying rent for store locations that we no longer operate.
We are subject to risks associated with our current and future store, distribution center and administrative office real estate leases. Our high level of fixed lease obligations will require us to use a portion of cash generated by our operations to satisfy these obligations and could adversely impact our ability to obtain future financing, if required, to support our growth or other operational investments. We will require substantial cash flows from operations to make our payments under our operating leases, all of which provide for periodic increases in rent. If we are not able to make the required payments under the leases, the lenders or owners of the relevant stores, distribution centers or administrative offices may, among other things, repossess those assets, which could adversely affect our ability to conduct our operations.
In addition, our failure to make payments under our operating leases could trigger defaults under other leases or under agreements governing our indebtedness, which could cause the counterparties under those agreements to accelerate the obligations due thereunder.
Further, we generally cannot cancel our leases, so if we decide to close or relocate a location, we may nonetheless be committed to perform our obligations under the applicable lease, including paying the base rent for the remaining lease term. In addition, as our leases expire, we may fail to negotiate renewals, either on commercially acceptable terms or any terms at all, which could materially adversely affect our business, results of operations, cash flows or financial condition.
Claims under our insurance plans may differ from our estimates, which could materially impact our results of operations.
We use a combination of insurance and self-insurance plans to provide for potential liabilities, including for workers’ compensation, general liability (including, in connection with legal proceedings described under “—Legal proceedings could materially impact our business, financial condition, results of operations and cash flows” below), property insurance, director and officers’ liability insurance, automobile liability insurance, environmental liability insurance, and team member health-care benefits. Liabilities associated with the risks that are retained by us are estimated, in part, by considering historical claims experience, demographic factors, severity factors and other actuarial assumptions. Our results could be materially impacted by claims and other expenses related to such plans if future occurrences and claims differ from these assumptions and historical trends.
We may be unable to generate sufficient cash flow to satisfy our debt service obligations, which could adversely impact our business.
As of December 29, 2024, the Company had no long-term debt outstanding debt under our credit agreement (referred to as the “Credit Agreement”). We may incur indebtedness in the future, including borrowings under our Credit Agreement. Any indebtedness we may incur, or any hedging arrangements related to such indebtedness could require us to divert funds identified for other purposes for debt service and impair our liquidity position. If we cannot generate sufficient cash flow from operations to service our debt, we may need to refinance our debt, dispose of assets or issue equity to obtain necessary funds. We do not know whether we will be able to take any of such actions on a timely basis, on terms satisfactory to us or at all.
Covenants in our Credit Agreement restrict our operational flexibility.
Our Credit Agreement contains usual and customary restrictive covenants relating to our management and the operation of our business, including incurring additional indebtedness; making certain investments; merging, dissolving, liquidating, consolidating, or disposing of all or substantially all of our assets; paying dividends, making distributions, or redeeming capital stock; entering into transactions with our affiliates; and granting liens on our assets.
Our Credit Agreement also requires us to maintain a specified total net leverage ratio and minimum interest coverage ratio at the end of any fiscal quarter at any time the facility is drawn. Our ability to meet these ratios, if applicable, could be affected by events beyond our control. Failure to comply with any of the covenants under our Credit Agreement could result in a default under the facility, which could cause our lenders to accelerate the timing of payments and exercise their lien on substantially all of our assets, which would have a material adverse effect on our business, operating results, and financial condition.
Financial Reporting, Legal and Other Regulatory Risks
Legal proceedings could materially impact our business, financial condition, results of operations and cash flows.
Our operations, which are characterized by a high volume of customer traffic and data collection for transactions involving a wide variety of product selections, carry a higher exposure to consumer litigation risk when compared to the operations of companies operating in some other industries. Consequently, we may be a party to individual personal injury, product liability, intellectual property, data security and privacy, accessibility and other legal actions in the ordinary course of our business, including litigation arising from food-related illness or product labeling. In addition, our team members may, from time to time, bring lawsuits against us regarding injury, hostile work environment, discrimination, wage and hour disputes, sexual harassment, or other employment issues.
In recent years, there has been an increase in the number of discrimination and harassment claims across the United States generally. Additionally, we could be exposed to industry-wide or class-action claims arising from products we carry or industry-specific business or employment practices. The outcome of litigation, particularly class action lawsuits, is difficult to assess or quantify. Plaintiffs in these types of lawsuits may seek recovery of very large or indeterminate amounts, and the magnitude of the potential loss relating to such lawsuits may remain unknown for substantial periods of time. While we maintain insurance against many types of claims, insurance coverage may not be adequate, and the cost to defend against future litigation may be significant. There may also be adverse publicity associated with litigation that may decrease consumer confidence in or perceptions of our business and impact our ability to hire and retain team members, regardless of whether the allegations are valid or whether we are ultimately found liable. As a result, litigation may materially adversely affect our business, financial condition, results of operations and cash flows.
We, as well as our vendors, are subject to numerous laws and regulations and our compliance with these laws and regulations may increase our costs, limit or eliminate our ability to sell certain products, raise regulatory enforcement risks, or otherwise adversely affect our business, reputation, results of operations, cash flows and financial condition.
Enforcement. Both FDA and USDA have broad authority to enforce their applicable statutes and regulations relating to the safety, labeling, manufacturing, distribution and promotion of foods, cosmetics, homeopathic and CBD products, and dietary supplements, including powers to issue a public warning letter to a company, publicize information about adulterated or misbranded products, institute an administrative detention of products, request or order a recall from the market, impose import restrictions and request the Department of Justice to initiate a seizure action, an injunction action or a criminal prosecution. Enforcement actions may also lead to follow-on consumer class action litigation.
Dietary Supplement, CBD and Homeopathic Product Risks. Our sales of dietary supplements are regulated by FDA. However, other public and private actors are increasingly targeting dietary supplement retailers and manufacturers for selling products that fail to adhere to requirements under the FDCA, as amended by DSHEA. While the FDCA provides FDA with the authority to remove products from the market that are adulterated or misbranded, state actors, and the Plaintiffs’ Bar have been targeting retailers and manufacturers of dietary supplements for failing to adhere to current good manufacturing practices and for false or misleading product statements. As a retailer of certain topical or ingestible CBD products, the FDA also has the authority to remove from the market any CBD product if it is adulterated, its labeling is false or misleading, it is otherwise misbranded, or if it violates any other FDCA or FDA requirement or regulation. This enforcement authority extends to states that have legalized and regulated the distribution of CBD products. States in which we operate have also imposed restrictions or permitting requirements for the sale of various CBD products. The FDCA also provides FDA with the authority to remove homeopathic products from the market that are adulterated or misbranded or contain improper or excessive amounts of active ingredients. Further, companies have also been targets for litigation on the basis of marketing homeopathic and CBD products with misbranding, misleading claims or quality issues.
Advertising and Product Claims Risks. In connection with the marketing and advertisement of products we sell, we could be the target of claims relating to false or deceptive advertising, including under the oversight of the FTC and pursuant to the FTC Act and consumer protection statutes of some states. Furthermore, in recent years, the FDA has been aggressive in enforcing its regulations with respect to nutrient content claims (e.g., “low fat,” “good source of,” “calorie free,” etc.), unauthorized “health claims” (claims that characterize the relationship between a food or food ingredient and a disease or health condition), and other claims that impermissibly suggest therapeutic benefits for certain foods or food components. Regulatory enforcement actions could interrupt the marketing and sales of products in our stores, including our private label products, severely damage our brand reputation and public image, increase the cost of products in our stores, result in product recalls or costly litigation, and impede our ability to deliver merchandise in sufficient quantities or quality to our stores, which could result in a material adverse effect on our business, financial condition, results of operations and cash flows.
Our reputation could also suffer from real or perceived issues involving the labeling or marketing of products we sell as “natural.” Although the FDA and the USDA have each issued statements regarding the appropriate use of the word “natural,” there is no single, U.S. government-regulated definition of the term “natural” for use in the food industry. The resulting uncertainty has led to consumer confusion, distrust and legal challenges. Plaintiffs have commenced legal actions against a number of food companies and retailers that market “natural” or similarly labeled products, asserting false, misleading and deceptive advertising and labeling claims, including claims related to genetically modified ingredients.
Should we become subject to similar claims, consumers may avoid purchasing products from us or seek alternatives, even if the basis for the claim is unfounded. Adverse publicity about these matters may discourage consumers from buying our products. The cost of defending against any such claims could be significant. Any loss of confidence on the part of consumers in the truthfulness of our labeling or ingredient claims would be difficult and costly to overcome and may significantly reduce our brand value. Any of these events could adversely affect our reputation and brand and decrease our sales, which would have a material adverse effect on our business, financial condition, results of operations and cash flows.
Organic and GMO Claims. We are also subject to the USDA’s Organic Rule, which facilitates interstate commerce and the marketing of organically produced food, and provides assurance to our customers that such products meet consistent, uniform standards. Compliance with the USDA’s Organic Rule also places a significant burden on some of our suppliers, which may cause a disruption in some of our product offerings. Additionally, the USDA has promulgated regulations that require disclosure of whether food offered for sale contains bioengineered (GMO) ingredients or detectable genetic material that has been modified through certain lab techniques and cannot be created through conventional breeding or found in nature. Implementation began in January 2022. Mandatory compliance will begin on July 21, 2025.
Food and FSMA Implementation Costs. While the FDA has authorized certain per and polyfluoroalkyl substances ("PFAS") for use in specific food contact applications, a growing number of states have passed legislation or issued policies restricting food contact articles with intentionally added PFAS, such as certain single-use food packaging and foodware items. For example, a California law that became effective in 2023 bans intentionally added PFAS in fiber-based food packaging, mandates online chemical disclosures, and limits claims about PFAS-free and other hazard groups. As more states impose similar restrictions, it is possible that additional states in which we operate will also implement bans on PFAS.
FSMA directed an historic shift at FDA from the agency reacting to and solving problems in the food supply chain to preventing contamination of food before it occurs. FSMA accomplished this goal by overhauling FDA’s current food safety program to require all actors in the food supply chain to expand their safety programs and record keeping processes. FSMA’s continued implementation, such as the rule on Additional Traceability Records for Certain Foods, and FDA’s own development in understanding effective ways to enforce FSMA provisions could delay the supply of certain products, result in certain products being unavailable to us for sale, see an increase in price of certain products, and/or increase the expenditure of company resources to ensure compliance (e.g., technology, consultants, employees, etc.).
Cosmetics. As a retailer of private label cosmetic products, we are subject to new registration and listing requirements, adverse event reporting obligations, labeling rules, enforcement authority, and GMP requirements under MoCRA. Our failure to comply with these requirements could result in enforcement actions, such as recalls, administrative detentions, or injunctions that may disrupt the promotion and sale of these products, significantly harm our brand’s reputation and image, and subject us to product recalls or follow-on consumer class action litigation.
Ecommerce Platform and Third-Party Risks. Our online order ecommerce platform is subject to the same laws and regulations as our retail operations. Product statements made on our website must be in accordance with labeling requirements. As is common in our industry, we rely on our suppliers and contract manufacturers to ensure that the products they manufacture and sell to us comply with all applicable regulatory and legal requirements. In general, we seek representations and warranties, indemnification and/or insurance from our suppliers and contract manufacturers. However, even with adequate insurance and indemnification, any claims of non-compliance could significantly damage our reputation and consumer confidence in products we sell. In addition, the failure of such products to comply with applicable regulatory and legislative requirements could prevent us from marketing the products or require us to recall or remove such products from our stores. In order to comply with applicable statutes and regulations, our suppliers and contract manufacturers have from time to time reformulated, eliminated or relabeled certain of their products and we have revised certain provisions of our sales and marketing program.
Future changes in legal and regulatory requirements may introduce new risks into our operations which we are not able to currently anticipate. For example, changes taking place in the United States associated with a new federal administration, as well as changes in legal standards, may introduce uncertainties with respect to our current and future operations. It is possible that new laws, regulations or executive orders may be enacted or enforced differently than they were before, which may expose us to additional uncertainty and require the expenditure of additional resources to ensure that we are able to comply.
Such actions could also adversely restrict our business and operations. There could also be changes in FDA’s regulatory and enforcement agenda and resources for such actions. Further, legal and regulatory changes may impact how we may market and sell our products in the future, for example, by changing food and dietary supplement label requirements. At this time, it is too early to predict the exact nature of any changes that may take place or whether and how they may impact our business and results of operations.
We are also subject to laws and regulations more generally applicable to retailers. Compliance with or changes to such laws and regulations may increase our costs, limit or eliminate our ability to sell certain products or otherwise adversely affect our business, reputation, results of operations, financial condition or cash flows.
We are subject to laws and regulations more generally applicable to retailers, including those related to labor and employment, taxation, zoning and land use, environmental protection, workplace safety, public health, community right-to-know, data privacy, waste diversion and hazardous waste disposal, packaging labels and content, consumer protection and alcoholic beverage sales, as well as other voluntary safety protocols. Our stores are subject to unscheduled inspections on a regular basis, which, if violations are found, could result in the assessment of fines, suspension of one or more needed licenses and, in the case of repeated “critical” violations, closure of the store until a re-inspection demonstrates that we have remediated the problem. Further, our new store openings could be delayed or prevented, or our existing stores could be impacted by difficulties or failures in our ability to obtain or maintain required permits, approvals or licenses. In addition, we are subject to environmental laws pursuant to which we could be held responsible for all of the costs or liabilities relating to any contamination at our or our predecessors’ past or present facilities and at third-party waste disposal sites, regardless of our knowledge of, or responsibility for, such contamination, and such costs may exceed our environmental liability insurance coverage.
As is common in our industry, we rely on our suppliers and contract manufacturers to ensure that the products they manufacture and sell to us comply with all applicable regulatory and legislative requirements. In general, we seek representations and warranties, indemnification and/or insurance from our suppliers and contract manufacturers. However, even with adequate insurance and indemnification, any claims of non-compliance could significantly damage our reputation and consumer confidence in our products. In order to comply with applicable statutes and regulations, our suppliers and contract manufacturers have from time to time reformulated, eliminated or relabeled certain of their products and we have revised certain provisions of our sales and marketing program.
We cannot predict the nature of future laws, regulations, interpretations or applications, or determine what effect either additional government regulations or executive or administrative orders, when and if promulgated, or disparate federal, state and local regulatory schemes would have on our business in the future. They could, however, increase our costs; result in our unintended misinterpretation or noncompliance; expose us to litigation, enforcement actions and fines; require the reformulation of certain products or alternative sourcing from domestic suppliers or otherwise to meet new standards, regulations or trade restrictions; require the recall or discontinuance of certain products not able to be reformulated or alternatively sourced in compliance with new regulations or restrictions; impose additional recordkeeping; expand documentation of the properties of certain products; necessitate expanded or different labeling and/or scientific substantiation; or require us to discontinue certain operations. Any or all of such requirements could have a material adverse effect on our business, financial condition, results of operations and cash flows.
We may be unable to adequately protect our intellectual property rights, which could harm our business.
We rely on a combination of trademark, trade secret, copyright and domain name law and internal procedures and nondisclosure agreements to protect our intellectual property. In particular, we believe our trademarks, including SPROUTS FARMERS MARKET® and SPROUTS®, and our domain names, including sprouts.com, are valuable assets. However, there can be no assurance that our intellectual property rights will be sufficient to distinguish our products and services from those of our competitors and to provide us with a competitive advantage. From time to time, third parties may use names and logos similar to ours, may apply to register trademarks or domain names similar to ours, and may infringe or otherwise violate our intellectual property rights. There can be no assurance that our intellectual property rights can be successfully asserted against such third parties or will not be invalidated, circumvented or challenged. Asserting or defending our intellectual property rights could be time consuming and costly and could distract management’s attention and resources.
If we are unable to prevent our competitors from using names, logos and domain names similar to ours, consumer confusion could result, the perception of our brand and products could be negatively affected, and our sales and profitability could suffer as a result.
We may also be subject to claims that our intellectual property, activities or the products we sell infringe, misappropriate or otherwise violate the intellectual property rights of others. Any such claims can be time consuming and costly to defend and may distract management’s attention and resources, even if the claims are without merit. Such claims may also require us to enter into costly settlement or license agreements (which could, for example, prevent us from using our trademarks in certain geographies or in connection with certain products and services), pay costly damage awards, and face a temporary or permanent injunction prohibiting us from marketing or providing the affected products and services, any of which could have a material adverse effect on our business.
Changes in accounting standards may materially impact reporting of our financial condition and results of operations.
Accounting principles generally accepted in the United States and related accounting pronouncements, implementation guidelines, and interpretations for many aspects of our business, such as accounting for leases, inventories, goodwill and intangible assets, store closures, insurance, income taxes, share-based compensation and accounting for mergers and acquisitions and other special items, are complex and involve subjective judgments. Changes in these rules or their interpretation may necessitate changes to our financial statement presentation and significantly change or add significant volatility to our reported earnings without a comparable underlying change in cash flow from operations. As a result, changes in accounting standards may materially impact our reported financial condition and results of operations.
If we are unable to maintain effective internal control over financial reporting in the future, we may fail to prevent or detect material misstatements in our financial statements, in which case investors may lose confidence in the accuracy and completeness of our financial reports and the market price of our common stock may decline.
As a public company, we are required to maintain internal control over financial reporting. If we are unable to maintain effective internal control over financial reporting, if we identify any material weaknesses therein, if we are unsuccessful in our efforts to remediate any such material weakness, if our management is unable to report that our internal control over financial reporting is effective, or if our independent registered public accounting firm is unable to express an opinion as to the effectiveness of our internal control over financial reporting, investors may lose confidence in the accuracy and completeness of our financial reports and the market price of our common stock could be negatively affected. In addition, we could become subject to investigations by the Nasdaq Stock Market, the SEC, or other regulatory authorities, which could require additional financial and management resources.
If our goodwill or other intangible assets become impaired, we may be required to record a significant charge to earnings.
We have a significant amount of goodwill and other intangible assets. As of December 29, 2024, we had goodwill and intangible assets of approximately $381.8 million and $208.1 million, respectively, which represented approximately 10.5% and 5.7% of our total assets as of such date, respectively. Goodwill is reviewed for impairment on an annual basis in the fourth fiscal quarter or whenever events occur or circumstances change that would more likely than not reduce the fair value of our reporting unit below its carrying amount. Fair value is determined based on the discounted cash flows and the market value of our single reporting unit. If the fair value of the reporting unit is less than its carrying value, an immediate charge to earnings would be recorded for the amount by which the reporting unit's carrying amount exceeds its fair value, not to exceed the carrying amount of the goodwill, which would adversely affect our operating results.
Our nutrition-oriented educational activities may be impacted by government regulation or our inability to secure adequate liability insurance.
We provide nutrition-oriented information to our customers, and these activities may be subject to state and federal regulation and oversight by professional organizations. In the past, the FDA has expressed concerns regarding summarized health and nutrition-related information that it (i) does not, in the FDA’s view, accurately present such information, (ii) diverts a consumer’s attention and focus from FDA-required nutrition labeling and information or (iii) impermissibly promotes drug-type disease-related benefits. If our team members or third parties we engage to provide this information do not act in accordance with regulatory requirements, we may become subject to penalties or litigation that could have a material adverse effect on our business.
Our business and reputation may be adversely impacted by evolving environmental, social and governance matters.
Increasingly, investors, customers, government agencies, non-governmental organizations, team members, communities and other stakeholders are focusing on environmental, social and governance ("ESG") matters and related disclosures. Many of these stakeholders evaluate and measure the performance of companies based on a variety of ESG metrics. As a fresh, natural and organic specialty retailer, we believe that many stakeholders hold us to higher standards with respect to ESG matters. As a result, we disclose certain ESG-related metrics, initiatives and goals in our SEC filings and other public disclosures. Execution against these ESG initiatives may be costly, and we may be unable to achieve our goals due to factors outside of our control. If our ESG-related reporting is incomplete or inaccurate or fails to comply with regulatory requirements, or if we fail to achieve significant progress with respect to our ESG goals on a timely basis, or at all, our business, financial performance, growth and reputation with our investors, customers and other stakeholders could be adversely affected. In addition, there also exists certain “anti-ESG” sentiment among some individuals and government institutions, and we may also face scrutiny and reputational harm from these parties regarding our ESG initiatives or goals.
Common Stock Ownership Risks
Our stock price may be volatile, and you may not be able to resell your shares at or above the price you paid for them or at all.
There is no guarantee that our common stock will appreciate in value or even maintain the price at which our stockholders have purchased their shares. The trading price of our common stock may be volatile and subject to wide price fluctuations in response to various factors, many of which are beyond our control. Furthermore, the stock markets have experienced extreme price and volume fluctuations that have affected and continue to affect the market prices of equity securities of many companies. These fluctuations often have been unrelated or disproportionate to the operating performance of those companies. These and other factors may cause the market price and demand for our common stock to fluctuate substantially, which may limit or prevent investors from readily selling their shares of common stock and may otherwise negatively affect the price or liquidity of our common stock. In addition, in the past, when the market price of a stock has been volatile, holders of that stock have sometimes instituted securities class action litigation against the company that issued the stock. If any of our stockholders were to bring a lawsuit against us, we could incur substantial costs defending the lawsuit or paying for settlements or damages. Such a lawsuit could also divert the time and attention of our management.
Anti-takeover provisions could impair a takeover attempt and adversely affect existing stockholders.
Certain provisions of our certificate of incorporation and bylaws and applicable provisions of Delaware law may have the effect of rendering more difficult, delaying, or preventing an acquisition of our company, even when this would be in the best interest of our stockholders. These include, without limitation, the following provisions:
•a classified board of directors (referred to as the “Board”) whose members serve staggered three-year terms;
•“blank check” preferred stock, which could be issued by the board without stockholder approval and may contain voting, liquidation, dividend, and other rights superior to our common stock;
•inability of our stockholders to call special meetings of stockholders, which may delay the ability of our stockholders to force consideration of a proposal or the ability of holders controlling a majority of our capital stock to take action, including the removal of directors; and
•required advance notice of stockholder proposals for business to be conducted at meetings of our stockholders and for nominations of candidates for election to the board.
Any provision of our certificate of incorporation or bylaws or Delaware law that has the effect of delaying or deterring a change in control could limit the opportunity for our stockholders to receive a premium for their shares of our common stock, and could also affect the price that some investors are willing to pay for our common stock.
If securities or industry analysts cease publishing research or reports about us, our business, or our market, or if they adversely change their recommendations regarding our stock, our stock price and trading volume could decline.
The trading market for our common stock is influenced by the research and reports that industry or securities analysts may publish about us, our business, our market or our competitors. If we do not maintain adequate research coverage, or if any of the analysts who may cover us downgrade our stock or publish inaccurate or unfavorable research about our business or provide relatively more favorable recommendations about our competitors, our stock price could decline. If any analyst who may cover us were to cease coverage of our company or fail to regularly publish reports on us, we could lose visibility in the financial markets, which in turn could cause our stock price or trading volume to decline.
Since we do not expect to pay any cash dividends in the near future, investors may be forced to sell their stock in order to obtain a return on their investment.
Although we regularly evaluate our capital structure and opportunities to create value for our investors, we do not anticipate declaring or paying in the near future any cash dividends on our capital stock. Instead, we plan to retain any earnings to finance our operations and growth plans. In addition, our Credit Agreement contains covenants that we must satisfy in order to pay cash dividends. Accordingly, investors must rely on sales of their common stock after price appreciation, which may never occur, as the only way to realize any return on their investment. As a result, investors seeking cash dividends should not purchase our common stock.
Our business could be impacted as a result of actions by activist stockholders or others.
We may be subject, from time to time, to legal and business challenges in the operation of our company due to actions instituted by activist shareholders or others. Responding to such actions, which may include private engagement, publicity campaigns, proxy contests, efforts to force transactions not supported by our board, and litigation, could be costly and time-consuming, may not align with our strategic plan and could divert the time and attention of our board and management from our business. Perceived uncertainties as to our future direction as a result of stockholder activism may lead to the perception of a change in the direction of the business or other instability and may affect our stock price, relationships with vendors, customers, prospective and current team members and others.
Item 1B. Unresolved Staff Comments
None.
Item 1C. Cybersecurity
Cybersecurity is of critical importance to our success. We are susceptible to significant and persistent cybersecurity threats, including data breaches, ransomware, and phishing attacks. These threats, which are constantly evolving, include attempts by malicious actors to breach our security and compromise our information technology systems, as well as those of our vendors and suppliers. A cybersecurity incident impacting us or any third party could disrupt operations, damage our reputation, and result in costly litigation and/or government enforcement action. We are committed to maintaining robust cybersecurity and data protection practices and continuously evaluate cybersecurity threats, considering their immediate and long-term effects on our business strategy, operations, and financial condition.
Under the oversight of our Board of Directors, and the Board’s risk committee, our management has established comprehensive processes identifying, assessing, and managing material risks from cybersecurity threats. These processes are integrated into our enterprise risk management program and include proactive measures such as advanced threat monitoring, penetration testing, multi-factor authentication, and team member training. We also align our practices with recognized standards such as the NIST Cybersecurity Framework. Our detailed incident response plan outlines steps for detection, assessment, notification, and recovery, including escalation to management, the Risk Committee, and the Board when appropriate.
The risk committee of our Board, chaired by a director with extensive cybersecurity expertise, receives quarterly updates from management on cybersecurity risks and incidents, including those with moderate or higher impacts.
Management updates the full board regularly to ensure alignment on mitigation strategies. Our Chief Technology Officer, with more than 35 years of IT experience, leads our cybersecurity efforts, supported by a dedicated team of certified specialists and external consultants.
Our third-party vendors and service providers are integral to our operations but pose unique cybersecurity challenges due to their access to data and our reliance on them for critical operations, including supply chain management. To address these risks, we maintain a third-party vendor risk management program that includes pre-onboarding due diligence, regular audits, and ongoing compliance evaluations. Additionally, we assess critical vendors’ supply chain security practices to reduce risks from subcontractors.
As of the date of this report, no cybersecurity incidents have had a material adverse effect on our business, financial condition, or results of operations. However, we recognize that no system is immune to breaches. While we maintain cyber insurance coverage for specific risks, such as ransomware attacks and business interruption, the costs of certain incidents could exceed policy limits. We continue to invest in advanced technologies, such as AI-driven threat detection, to strengthen our defenses against evolving threats.
See Item 1A. “Risk Factors – Disruptions to, security breaches or non-compliance involving our information technology systems could harm our ability to run our business and expose us to potential liability and loss of revenues” for additional discussion of cybersecurity risks that may materially impact us.
Item 2. Properties
We seek to select sites for our store locations in markets with growth potential where our target customers and supply chain capabilities intersect. As of December 29, 2024, we had 440 stores located in 24 states, as shown in the chart below:
|
|
|
|
|
|
|
|
|
|
|
|
|
|
|
| State |
Number of Stores |
|
State |
Number of Stores |
| Alabama |
3 |
|
New Jersey |
3 |
| Arizona |
47 |
|
New Mexico |
10 |
| California |
149 |
|
North Carolina |
6 |
| Colorado |
33 |
|
Oklahoma |
11 |
| Delaware |
2 |
|
Pennsylvania |
5 |
| Florida |
47 |
|
South Carolina |
2 |
| Georgia |
17 |
|
Tennessee |
8 |
| Kansas |
4 |
|
Texas |
54 |
| Louisiana |
1 |
|
Utah |
5 |
| Maryland |
7 |
|
Virginia |
3 |
| Missouri |
3 |
|
Washington |
3 |
| Nevada |
16 |
|
Wyoming |
1 |
In fiscal 2024, we opened 33 new stores. In fiscal 2023, we opened 30 new stores and acquired two stores.
We lease all of our stores from unaffiliated third parties. A typical store lease is for an initial 10 to 15 year term with three or four renewal options of five years each. We expect that we will be able to renegotiate these leases or relocate these stores as necessary. In addition to new store openings, we remodel or relocate stores periodically in order to improve performance. See “Business – New Store Development” for additional information with respect to our store site selection process.
As of December 29, 2024, we utilized six distribution centers. Information about such facilities, as well as our current corporate office in Phoenix, Arizona, is set forth in the table below:
|
|
|
|
|
|
|
|
|
|
|
|
| Facility |
State |
|
Square Footage* |
| Corporate Office |
Arizona |
|
96,000 |
| Distribution Center |
Arizona |
|
129,000 |
| Distribution Center |
California |
|
337,000 |
| Distribution Center |
California |
|
108,000 |
| Distribution Center |
Colorado |
|
134,000 |
| Distribution Center |
Florida |
|
134,000 |
| Distribution Center |
Texas |
|
234,000 |
________________________________________________
*Rounded to the nearest 1,000 square feet
We lease our corporate office and our distribution centers in Arizona, Southern California, Colorado, Florida and Texas from unaffiliated third parties; our Northern California distribution center is leased by a third-party logistics provider. We expect to expand our distribution center network to support our growth. See “Business – Sourcing and Distribution” for additional information with respect to our distribution centers.
We believe our portfolio of long-term leases is a valuable asset supporting our retail operations, but we do not believe that any individual store property or distribution center lease is material to our financial condition or results of operations.
In fiscal 2023 as part of our real estate portfolio review, we closed 11 stores. These stores, on average, were approximately 30% larger than our current prototype format and were underperforming financially. See Note 26, “Store Closures” to our consolidated financial statements contained in Item 8 of this Annual Report on Form 10-K for additional information regarding these store closures.
Item 3. Legal Proceedings
From time to time we are a party to legal proceedings, including matters involving personnel and employment issues, product liability, personal injury, intellectual property and other proceedings arising in the ordinary course of business, which have not resulted in any material losses to date. Although our management does not expect that the outcome in these proceedings will have a material adverse effect on our financial condition or results of operations, litigation is inherently unpredictable. Therefore, we could incur judgments or enter into settlements of claims that could materially impact our results.
See Note 18, “Commitments and Contingencies” to our consolidated financial statements contained in Item 8 of this Annual Report on Form 10-K for information regarding certain legal proceedings in which we are involved.
Item 4. Mine Safety Disclosures Item 5.
Not applicable.
PART II
Market for Registrant’s Common Equity, Related Stockholder Matters and Issuer Purchases of Equity Securities
Market Information
Our common stock began trading on the Nasdaq Global Select Market under the symbol “SFM” on August 1, 2013. The number of stockholders of record of our common stock as of February 18, 2025 was 23. This number excludes stockholders whose stock is held in nominee or street name by brokers.
Dividend Policy
Although we regularly evaluate our capital structure and opportunities to create value for our stockholders, since we became a publicly traded company on August 1, 2013, we have not declared or paid, and do not anticipate declaring or paying in the near future, any cash dividends on our capital stock. Any future determination as to the declaration and payment of dividends, if any, will be at the discretion of our board of directors and will depend on then existing conditions, including our operating results, financial condition, contractual restrictions, capital requirements, business prospects, and other factors our board of directors may deem relevant. Our Credit Agreement contains covenants that we must satisfy in order to pay cash dividends.
Issuer Purchases of Equity Securities
The following table provides information about our share repurchase activity during the thirteen weeks ended December 29, 2024.
|
|
|
|
|
|
|
|
|
|
|
|
|
|
|
|
|
|
|
|
|
|
|
|
|
|
|
Period (1) |
|
Total number
of shares
purchased |
|
Average
price paid
per share (2)
|
|
Total number
of shares
purchased as
part of publicly
announced plans
or programs |
|
Approximate
dollar value
of shares that
may yet be
purchased under
the plans or
programs (3)
|
| September 30, 2024 - October 27, 2024 |
|
45,647 |
|
$ |
112.26 |
|
|
45,647 |
|
$ |
553,773,000 |
|
| October 28, 2024 - November 24, 2024 |
|
210,321 |
|
$ |
140.45 |
|
|
210,321 |
|
$ |
524,192,000 |
|
| November 25, 2024 - December 29, 2024 |
|
534,012 |
|
$ |
137.77 |
|
|
534,012 |
|
$ |
450,623,000 |
|
| Total |
|
789,980 |
|
|
|
789,980 |
|
|
(1)Periodic information is presented by reference to our fiscal periods during the fourth quarter of fiscal year 2024.
(2)Average price paid per share includes costs associated with the purchases, but excludes the excise tax on share repurchases imposed as part of the Inflation Reduction Act of 2022.
(3)On May 22, 2024, our board of directors authorized a new $600 million share repurchase program of our common stock. The shares may be purchased on a discretionary basis from time to time through May 22, 2027, subject to general business and market conditions and other investment opportunities, through open market purchases, privately negotiated transactions, or other means, including through Rule 10b5-1 trading plans.
Performance Graph
The graph set forth below compares the cumulative total stockholder return on our common stock between December 29, 2019 and December 29, 2024, with the cumulative total return of (i) the Nasdaq Composite Index and (ii) the S&P Food Retail Index, over the same period.
The comparison assumes that $100.00 was invested in our common stock, the Nasdaq Composite Index and the S&P Food Retail Index, and assumes reinvestment of dividends, if any. The graph assumes the initial value of our common stock on December 27, 2019 (the last trading day prior to the beginning of fiscal 2020) was the closing sale price on that day of $19.51 per share. The performance shown on the graph below is based on historical results and is not intended to suggest future performance.
COMPARISON OF 5 YEAR CUMULATIVE TOTAL RETURN*
Among Sprouts Farmers Market Inc., the NASDAQ Composite Index
and the S&P 500 Food Retail Index
|
|
|
|
|
|
|
|
|
|
*$100 invested on 12/29/19 in stock or index, including reinvestment of dividends.
Indexes calculated on month-end basis. |
|
|
|
|
|
Copyright© 2025 Standard & Poor's, a division of S&P Global. All rights reserved. |
|
This performance graph shall not be deemed “soliciting material” or to be “filed” with the SEC for purposes of Section 18 of the Exchange Act or otherwise subject to the liabilities under that section, and shall not be deemed to be incorporated by reference into any filing of Sprouts Farmers Market, Inc. under the Securities Act or the Exchange Act.
Item 6. [Reserved]
Item 7. Management’s Discussion and Analysis of Financial Condition and Results of Operations
You should read the following discussion and analysis of our financial condition and results of operations together with the consolidated financial statements and related notes that are included elsewhere in this Annual Report on Form 10-K as well as "Part II—Item 7. Management's Discussion and Analysis of Financial Condition and Results of Operations" included in our Annual Report on Form 10-K for the fiscal year ended December 31, 2023 filed with the SEC on February 22, 2024, which provides comparisons of fiscal 2023 and fiscal 2022. This discussion contains forward-looking statements based upon current expectations that involve risks and uncertainties. Our actual results may differ materially from those anticipated in these forward-looking statements as a result of various factors, including those set forth under “Risk Factors” or in other parts of this Annual Report on Form 10-K. Please also see the section entitled “Special Note Regarding Forward-Looking Statements.”
Business Overview
Sprouts Farmers Market offers a unique specialty grocery experience featuring an open layout with fresh produce at the heart of the store. Sprouts inspires wellness naturally with a carefully curated assortment of better-for-you products paired with purpose-driven people. We continue to bring the latest in wholesome, innovative products made with lifestyle-friendly ingredients such as organic, plant-based and gluten-free. From our founding in 2002, we have grown rapidly, significantly increasing our sales, store count and profitability. Headquartered in Phoenix with 440 stores in 24 states as of December 29, 2024, we are one of the largest and fastest growing specialty retailers of fresh, natural and organic food in the United States.
Outlook
We continue to execute on our long-term growth strategy that we believe is transforming our company and driving profitable growth, focusing on the following areas:
•Win with Target Customers. We are focusing attention on our target customers, identified through research as ‘health enthusiasts’ and ‘selective shoppers’, where there is ample opportunity to gain share within these customer segments. We believe our business can continue to grow by leveraging existing strengths in a unique assortment of better-for-you, quality products and by providing a full omnichannel offering through delivery or pickup via our website or the Sprouts app.
•Market Expansion. We are delivering unique smaller stores with expectations of stronger returns, while maintaining the approachable, fresh-focused farmer’s market heritage Sprouts is known for. From 2021 through 2024, we have opened 75 new stores and remodeled one store featuring our updated format. Our geographic store expansion and new store placement will intersect where our target customers live, in markets with growth potential and supply chain support, which we believe will provide a long runway of approximately 10% annual unit growth.
•Create an Advantaged Supply Chain. We believe our network of distribution centers can drive efficiencies across the chain and support growth plans. To further deliver on our fresh commitment and reputation, as well as to increase our local offerings and improve financial results, we aspire to ultimately position fresh distribution centers within a 250-mile radius of stores. Following the opening of two fresh distribution centers in fiscal 2021 and the relocation of our Southern California distribution center, closure of our Georgia distribution center and partnership with a third-party fresh distribution center in the Northeast in fiscal 2023, we are better leveraging our existing distribution center capacity, and approximately 80% of our stores were within 250 miles of a distribution center as of December 29, 2024.
•Customer Engagement and Personalization. We believe we are elevating our national brand recognition and positioning by telling our unique brand story rooted in product innovation and differentiation. We are increasing our use of data analytics and insights. We believe this data-driven intelligence will increase customer engagement through personalization efforts with digital and social connections to drive additional sales growth and loyalty.
•Inspire and Engage Our Talent to Create a Best Place to Work. Subsequent to the initial launch of our long-term growth strategy, we have added the focus area of inspiring and engaging our talent through our culture, acquisition and development and total rewards program to attract and retain the talent we believe we need to execute on our strategic goals and transform our company into a premier place to work.
•Invest in Technology for Growth. We continue to make investments in technology in support of our strategy, with a focus on enhancing efficiency, scalability, and customer experience. While we are showing positive outcomes on our strategic investments in inventory management and customer personalization, we believe that ongoing investments in our technology foundation will allow us to streamline operations and improve decision making to execute on our strategy.
•Deliver on Key Financial Metrics. We are measuring and reporting on the success of this strategy against a number of long-term financial and operational targets. Since the implementation of our strategy beginning in 2020, we have significantly improved our margin structure above our 2019 baseline.
As a step to improve our fresh supply chain, we are currently in the process of transitioning from our primary meat and seafood distributor that accounted for approximately 14% of our total purchases in each of fiscal 2024 and 2023. We expect to initially transition to an intermediary third-party distributor and ultimately to a self-distribution model under which we will deal directly with our suppliers. As with complex transitions of this magnitude, there are associated short-term risks, including in particular, potential product supply disruptions resulting in lost sales at our stores and transition-related expenses that exceed our expectations. See “Business—Sourcing and Distribution” and “Risk Factors—Disruption of significant supplier relationships could negatively affect our business.”
Components of Operating Results
We report our results of operations on a 52- or 53-week fiscal year ending on the Sunday closest to December 31, with each fiscal quarter generally divided into three periods consisting of two four-week periods and one five-week period. Fiscal 2024, fiscal 2023 and fiscal 2022 were 52-week years ending on December 29, 2024, December 31, 2023 and January 1, 2023, respectively.
Net Sales
We recognize sales revenue at the point of sale, with discounts provided to customers reflected as a reduction in sales revenue. Proceeds from sales of gift cards are recorded as a liability at the time of sale and recognized as sales when they are redeemed by the customer. See Note 3, “Significant Accounting Policies” to our consolidated financial statements contained in Item 8 of this Annual Report on Form 10-K for additional information on revenue recognition related to gift cards. We do not include sales taxes in net sales.
We monitor our comparable store sales growth to evaluate and identify trends in our sales performance. Our practice is to include sales from a store in comparable store sales beginning on the first day of the 61st week following a store’s opening or date of acquisition and to exclude sales from a closed store from comparable store sales on the day of closure. This practice may differ from the methods that other retailers use to calculate similar measures.
Historically, our net sales have increased as a result of new store openings and comparable store sales growth. Additional factors that influence comparable store sales growth and other sales trends include:
•general economic conditions and trends, including levels of disposable income and consumer confidence;
•our competition, including competitive store openings in the vicinity of our stores and competitor pricing and merchandising strategies;
•consumer preferences and buying trends;
•our ability to identify market trends, and to source and provide product offerings that promote customer traffic and growth in average ticket;
•the number of customer transactions and average ticket;
•the prices of our products, including the effects of factors beyond our control, such as inflation, deflation and tariffs;
•opening new stores in the vicinity of our existing stores; and
•advertising, in-store merchandising and other marketing activities.
Cost of sales and gross profit
Cost of sales includes the cost of inventory sold during the period, including direct costs of purchased merchandise (net of discounts and allowances), distribution and supply chain costs, and depreciation and amortization expense for distribution centers and supply chain-related assets. Merchandise incentives received from vendors, which are reflected in the carrying value of inventory when earned or as progress is made toward earning the rebate or allowance, and are reflected as a component of cost of sales as the inventory is sold. Inflation and deflation in the prices of food and other products we sell may periodically affect our gross profit and gross margin. Tariffs, such as those recently proposed by the U.S. government on goods imported from Mexico, Canada, China and certain other countries, may result in cost increases on products such as produce that we import from impacted countries, as well as products containing ingredients imported from these countries. While we are still evaluating the potential impact of these tariffs, the short-term impact of tariffs, inflation, and deflation is largely dependent on whether or not we pass the effects through to our customers, which will largely depend upon competitive market conditions.
Our cost of sales and gross profit are correlated to sales volumes. As sales increase, gross margin is affected by the relative mix of products sold, pricing and promotional strategies, inventory shrinkage and leverage of fixed costs of sales.
Selling, general and administrative expenses
Selling, general and administrative expenses primarily consist of salaries, wages and benefits costs, share-based compensation, store occupancy costs (including rent, property taxes, utilities, common area maintenance and insurance), advertising costs, buying costs, pre-opening and other administrative costs.
Depreciation and Amortization
Depreciation and amortization (exclusive of depreciation included in cost of sales) primarily consists of depreciation and amortization for buildings, store leasehold improvements, and equipment.
Store closure and other costs, net
Store closure and other costs, net primarily reflects impairment charges of long-lived assets and costs incurred related to store closures, including severance and any exit costs associated with closing a store, in addition to occupancy costs associated with closed store locations. One-time disaster recovery costs are also included here.
Results of Operations for Fiscal 2024, 2023 and 2022
The following tables set forth our results of operations and other operating data for the periods presented. The period-to-period comparison of financial results is not necessarily indicative of financial results to be achieved in future periods. Each of fiscal 2024, 2023 and 2022 consisted of 52 weeks.
|
|
|
|
|
|
|
|
|
|
|
|
|
|
|
|
|
|
| |
Fiscal 2024 |
|
Fiscal 2023 |
|
Fiscal 2022 |
|
|
|
|
|
|
| |
(in thousands, except per share data) |
| Consolidated Statement of Income Data: |
|
|
|
|
|
| Net sales |
$ |
7,719,290 |
|
|
$ |
6,837,384 |
|
|
$ |
6,404,223 |
|
| Cost of sales |
4,777,799 |
|
|
4,315,543 |
|
|
4,055,659 |
|
| Gross profit |
2,941,491 |
|
|
2,521,841 |
|
|
2,348,564 |
|
| Selling, general and administrative expenses |
2,291,350 |
|
|
2,000,437 |
|
|
1,855,649 |
|
| Depreciation and amortization (exclusive of depreciation included in cost of sales) |
132,748 |
|
|
131,893 |
|
|
123,530 |
|
| Store closure and other costs, net |
12,896 |
|
|
39,280 |
|
|
11,025 |
|
| Income from operations |
504,497 |
|
|
350,231 |
|
|
358,360 |
|
| Interest (income) expense, net |
(2,201) |
|
|
6,491 |
|
|
9,047 |
|
| Income before income taxes |
506,698 |
|
|
343,740 |
|
|
349,313 |
|
| Income tax provision |
126,097 |
|
|
84,884 |
|
|
88,149 |
|
| Net income |
$ |
380,601 |
|
|
$ |
258,856 |
|
|
$ |
261,164 |
|
|
|
|
|
|
|
| Weighted average shares outstanding - basic |
100,363 |
|
102,479 |
|
108,232 |
| Dilutive effect of equity-based awards |
1,016 |
|
911 |
|
907 |
| Weighted average shares and equivalent shares outstanding - diluted |
101,379 |
|
103,390 |
|
109,139 |
| Diluted net income per share |
$ |
3.75 |
|
|
$ |
2.50 |
|
|
$ |
2.39 |
|
|
|
|
|
|
|
|
|
|
|
|
|
|
|
|
|
|
|
|
Fiscal 2024 |
|
Fiscal 2023 |
|
Fiscal 2022 |
| Other Operating Data: |
|
|
|
|
|
| Comparable store sales growth |
7.6 |
% |
|
3.4 |
% |
|
2.2 |
% |
| Stores at beginning of period |
407 |
|
386 |
|
374 |
Opened (1) |
33 |
|
30 |
|
16 |
| Closed |
— |
|
(11) |
|
(4) |
| Acquired |
— |
|
2 |
|
— |
| Stores at end of period |
440 |
|
407 |
|
386 |
Total square feet at the end of the period(2) |
12,123,032 |
|
11,322,798 |
|
10,894,396 |
| Average square feet per store at the end of the period |
27,552 |
|
27,820 |
|
28,224 |
(1)Stores opened is exclusive of two store relocations during fiscal 2024.
(2)Total square feet at the end of the period includes the square footage for all stores that were open as of the end of the fiscal year presented and excludes any vacant or subleased space.
Comparison of Fiscal 2024 to 2023
Net sales
|
|
|
|
|
|
|
|
|
|
|
|
|
|
|
|
|
|
|
|
|
|
|
|
|
Fiscal 2024 |
|
Fiscal 2023 |
|
Change |
|
% Change |
|
|
|
|
|
|
|
|
|
(dollars in thousands) |
| Net sales |
$ |
7,719,290 |
|
|
$ |
6,837,384 |
|
|
$ |
881,906 |
|
|
13 |
% |
| Comparable store sales growth |
7.6 |
% |
|
3.4 |
% |
|
|
|
|
Net sales during 2024 totaled $7.7 billion, increasing 13%, over the prior fiscal year. The sales increase was driven by a 7.6% increase in comparable store sales, in part due to an increase in basket value due to retail price inflation, in addition to sales from new stores opening since the prior year, partially offset by a slight reduction in the number of items per basket and the impact of store closures. See "Impact of Inflation and Deflation." Comparable store sales contributed approximately 94% of total sales in 2024 and 95% of total sales in 2023.
Cost of sales and gross profit
|
|
|
|
|
|
|
|
|
|
|
|
|
|
|
|
|
|
|
|
|
|
|
|
|
Fiscal 2024 |
|
Fiscal 2023 |
|
Change |
|
% Change |
|
|
|
|
|
|
|
|
|
(dollars in thousands) |
| Net sales |
$ |
7,719,290 |
|
|
$ |
6,837,384 |
|
|
$ |
881,906 |
|
|
13 |
% |
| Cost of sales |
4,777,799 |
|
|
4,315,543 |
|
|
462,256 |
|
|
11 |
% |
| Gross profit |
2,941,491 |
|
|
2,521,841 |
|
|
419,650 |
|
|
17 |
% |
| Gross margin |
38.1 |
% |
|
36.9 |
% |
|
1.2 |
% |
|
|
Gross profit increased during 2024 compared to 2023 by $419.7 million to $2.9 billion driven by increased sales volume for the reasons discussed above. Gross margin increased by 1.2% to 38.1% compared to 36.9%. The increase was a result of favorable shrink, continued promotional optimization, and positive results from our selling, general and administrative expense investments we have made over the past few years.
Selling, general and administrative expenses
|
|
|
|
|
|
|
|
|
|
|
|
|
|
|
|
|
|
|
|
|
|
|
|
|
Fiscal 2024 |
|
Fiscal 2023 |
|
Change |
|
% Change |
|
|
|
|
|
|
|
|
|
(dollars in thousands) |
| Selling, general and administrative expenses |
$ |
2,291,350 |
|
|
$ |
2,000,437 |
|
|
$ |
290,913 |
|
|
15 |
% |
| Percentage of net sales |
29.7 |
% |
|
29.3 |
% |
|
0.4 |
% |
|
|
Selling, general and administrative expenses increased $290.9 million, or 15%, compared to 2023 due to the net increase in new stores opened since the prior year and higher payroll and incentive compensation costs. In addition, we experienced the effects of higher credit card and ecommerce fees resulting from an increase in sales compared to the prior year.
Depreciation and amortization
|
|
|
|
|
|
|
|
|
|
|
|
|
|
|
|
|
|
|
|
|
|
|
|
|
Fiscal 2024 |
|
Fiscal 2023 |
|
Change |
|
% Change |
|
|
|
|
|
|
|
|
|
(dollars in thousands) |
| Depreciation and amortization |
$ |
132,748 |
|
|
$ |
131,893 |
|
|
$ |
855 |
|
|
1 |
% |
| Percentage of net sales |
1.7 |
% |
|
1.9 |
% |
|
(0.2) |
|
|
|
Depreciation and amortization expense (exclusive of depreciation included in cost of sales) was $132.7 million in 2024, compared to $131.9 million in 2023. Depreciation and amortization expense (exclusive of depreciation included in cost of sales) primarily consists of depreciation and amortization for buildings, store leasehold improvements, and equipment for new stores as well as remodel initiatives in older stores. Depreciation and amortization in 2023 was inclusive of $5.9 million in accelerated depreciation in connection with the closing of certain underperforming stores during 2023. See Note 26, “Store Closures” to our consolidated financial statements contained in Item 8 of this Annual Report on Form 10-K.
Store closure and other costs, net
|
|
|
|
|
|
|
|
|
|
|
|
|
|
|
|
|
|
|
|
|
|
|
|
|
Fiscal 2024 |
|
Fiscal 2023 |
|
Change |
|
% Change |
|
|
|
|
|
|
|
|
|
(dollars in thousands) |
| Store closure and other costs, net |
$ |
12,896 |
|
|
$ |
39,280 |
|
|
$ |
(26,384) |
|
|
(67) |
% |
| Percentage of net sales |
0.2 |
% |
|
0.6 |
% |
|
(0.4) |
% |
|
|
Store closure and other costs, net decreased by $26.4 million to $12.9 million in 2024 compared to $39.3 million in 2023. Store closure and other costs, net in 2024 was primarily related to ongoing occupancy costs incurred in connection with our closed store locations. Store closure and other costs, net in 2023 primarily consisted of $30.5 million of impairment losses related to the write-down of leasehold improvements and right-of-use assets, of which $27.8 million was incurred in association with the decision to close 11 underperforming stores. See Note 26, "Store Closures" to our consolidated financial statements contained in Item 8 of this Annual Report on Form 10-K.
Interest (income) expense, net
|
|
|
|
|
|
|
|
|
|
|
|
|
|
|
|
|
|
|
|
|
|
|
|
|
Fiscal 2024 |
|
Fiscal 2023 |
|
Change |
|
% Change |
|
|
|
|
|
|
|
|
|
(dollars in thousands) |
| Long-term debt |
$ |
4,259 |
|
|
$ |
11,815 |
|
|
$ |
(7,556) |
|
|
(64) |
% |
| Finance leases |
747 |
|
|
816 |
|
|
(69) |
|
|
(8) |
% |
| Deferred financing costs |
772 |
|
|
772 |
|
|
— |
|
|
— |
% |
| Interest income and other |
(7,979) |
|
|
(6,912) |
|
|
(1,067) |
|
|
15 |
% |
| Total interest expense, net |
$ |
(2,201) |
|
|
$ |
6,491 |
|
|
$ |
(8,692) |
|
|
(134) |
% |
The decrease in interest (income) expense, net was primarily due to higher interest income earned as a result of higher interest rates and lower credit facility fees due to lower average debt outstanding. See Note 13, “Long-Term Debt and Finance Lease Liabilities” to our consolidated financial statements contained in Item 8 of this Annual Report on Form 10-K.
Income tax provision
|
|
|
|
|
|
|
|
|
|
|
|
|
|
|
|
|
|
|
|
|
|
|
|
|
Fiscal 2024 |
|
Fiscal 2023 |
|
Change |
|
% Change |
|
|
|
|
|
|
|
|
|
(dollars in thousands) |
| Income tax provision |
$ |
126,097 |
|
|
$ |
84,884 |
|
|
$ |
41,213 |
|
|
49 |
% |
| Effective income tax rate |
24.9 |
% |
|
24.7 |
% |
|
0.2 |
% |
|
|
Income tax provision increased by $41.2 million to $126.1 million for 2024 from $84.9 million for 2023, and the effective income tax rate increased to 24.9% in 2024 from 24.7% in 2023 primarily due to a reduction in federal credits and reduced impact of other permanent items due to higher pre-tax income, offset by a reduction in state taxes due to a state valuation allowance recorded in the prior year.
Net income
|
|
|
|
|
|
|
|
|
|
|
|
|
|
|
|
|
|
|
|
|
|
|
|
|
Fiscal 2024 |
|
Fiscal 2023 |
|
Change |
|
% Change |
|
|
|
|
|
|
|
|
|
(dollars in thousands) |
| Net income |
$ |
380,601 |
|
|
$ |
258,856 |
|
|
$ |
121,745 |
|
|
47 |
% |
| Percentage of net sales |
4.9 |
% |
|
3.8 |
% |
|
1.1 |
% |
|
|
Net income increased $121.7 million primarily due to higher gross profit and lower store closure and other costs, partially offset by higher selling, general and administrative expenses for the reasons discussed above.
Diluted earnings per share
|
|
|
|
|
|
|
|
|
|
|
|
|
|
|
|
|
|
|
|
|
|
|
|
|
Fiscal 2024 |
|
Fiscal 2023 |
|
Change |
|
% Change |
|
|
|
|
|
|
|
|
|
(shares in thousands) |
| Diluted earnings per share |
$ |
3.75 |
|
|
$ |
2.50 |
|
|
$ |
1.25 |
|
|
50 |
% |
| Diluted weighted average shares outstanding |
101,379 |
|
103,390 |
|
(2,011) |
|
|
The increase in diluted earnings per share of $1.25 was driven by higher net income as well as fewer diluted shares outstanding compared to the prior year, due to our repurchase of approximately 2.7 million shares for a total cost of $240.6 million, including excise tax of 1%, under our share repurchase program.
Return on Invested Capital
In addition to reporting financial results in accordance with generally accepted accounting principles, or GAAP, we provide information regarding Return on Invested Capital (referred to as “ROIC”) as additional information about our operating results. ROIC is a non-GAAP financial measure and should not be reviewed in isolation or considered as a substitute for our financial results as reported in accordance with GAAP. ROIC is an important measure used by management to evaluate our investment returns on capital and provides a meaningful measure of the effectiveness of our capital allocation over time.
We define ROIC as net operating profit after tax (referred to as “NOPAT”), including the effect of capitalized operating leases, divided by average invested capital. Operating lease interest represents the add-back to operating income driven by the hypothetical interest expense we would incur if the property under our operating leases were owned or accounted for as a finance lease. The assumed ownership and associated interest expense are calculated using the discount rate for each lease as recorded as a component of rent expense within selling, general and administrative expenses. Invested capital reflects a trailing four-quarter average.
As numerous methods exist for calculating ROIC, our method may differ from methods used by other companies to calculate their ROIC. It is important to understand the methods and the differences in those methods used by other companies to calculate their ROIC before comparing our ROIC to that of other companies.
Our calculation of ROIC for the fiscal years indicated was as follows:
|
|
|
|
|
|
|
|
|
|
|
|
|
|
|
|
|
|
|
2024 |
|
2023 |
|
2022 |
|
|
|
|
|
|
|
(dollars in thousands) |
Net income (1) |
$ |
380,601 |
|
|
$ |
258,856 |
|
|
$ |
261,164 |
|
Special items, net of tax (2), (3) |
— |
|
|
34,272 |
|
|
— |
|
Interest expense, net of tax (3) |
(1,654) |
|
|
4,882 |
|
|
6,764 |
|
| Net operating profit after-tax (NOPAT) |
$ |
378,947 |
|
|
$ |
298,010 |
|
|
$ |
267,928 |
|
|
|
|
|
|
|
Total rent expense, net of tax (3) |
189,896 |
|
|
175,592 |
|
|
154,626 |
|
Estimated depreciation on operating leases, net of tax (3) |
(105,570) |
|
|
(98,535) |
|
|
(87,775) |
|
Estimated interest on operating leases, net of tax (3), (4) |
84,326 |
|
|
77,057 |
|
|
66,851 |
|
| NOPAT, including effect of operating leases |
$ |
463,273 |
|
|
$ |
375,067 |
|
|
$ |
334,779 |
|
|
|
|
|
|
|
| Average working capital |
184,691 |
|
|
227,375 |
|
|
271,604 |
|
| Average property and equipment |
838,166 |
|
|
749,611 |
|
|
704,786 |
|
| Average other assets |
602,959 |
|
|
595,776 |
|
|
568,609 |
|
| Average other liabilities |
(102,539) |
|
|
(97,870) |
|
|
(96,583) |
|
| Average invested capital |
$ |
1,523,277 |
|
|
$ |
1,474,892 |
|
|
$ |
1,448,416 |
|
|
|
|
|
|
|
Average operating leases (5) |
1,603,777 |
|
|
1,423,077 |
|
|
1,259,362 |
|
| Average invested capital, including operating leases |
$ |
3,127,054 |
|
|
$ |
2,897,969 |
|
|
$ |
2,707,778 |
|
|
|
|
|
|
|
| ROIC, including operating leases |
14.8 |
% |
|
12.9 |
% |
|
12.4 |
% |
___________________________________________
(1)Net income amounts represent total net income for the past four trailing quarters.
(2)Special items related to store closure, supply chain transition costs related to our new and recently expanded distribution centers and acquisition related charges net of tax.
(3)Net of tax amounts are calculated using the normalized effective tax rate for the periods presented.
(4)2024, 2023 and 2022 estimated interest on operating leases is calculated by multiplying operating leases by the 7.0%, 7.2% and 7.1% discount rate, respectively, for each lease recorded as rent expense within direct store expense.
(5)2024, 2023 and 2022 average operating leases represents the average net present value of outstanding lease obligations over the trailing four quarters.
Liquidity and Capital Resources
The following table sets forth the major sources and uses of cash for each of the periods set forth below, as well as our cash, cash equivalents and restricted cash at the end of each period (in thousands):
|
|
|
|
|
|
|
|
|
|
|
|
|
|
|
|
|
|
|
Fiscal 2024 |
|
Fiscal 2023 |
|
Fiscal 2022 |
| Cash, cash equivalents and restricted cash at end of period |
$ |
267,213 |
|
|
$ |
203,870 |
|
|
$ |
295,192 |
|
| Cash from operating activities |
$ |
645,214 |
|
|
$ |
465,068 |
|
|
$ |
371,329 |
|
| Cash used in investing activities |
$ |
(230,375) |
|
|
$ |
(238,342) |
|
|
$ |
(124,010) |
|
| Cash used in financing activities |
$ |
(351,496) |
|
|
$ |
(318,048) |
|
|
$ |
(199,131) |
|
We have generally financed our operations principally through cash generated from operations and borrowings under our credit facilities. Our primary uses of cash are for purchases of inventory, operating expenses, capital expenditures primarily for opening new stores, remodels and maintenance, repurchases of our common stock and debt service. Our principal contractual obligations and commitments consist of obligations under our Credit Agreement, interest on our Credit Agreement, operating and finance leases, purchase commitments and self-insurance liabilities. Our operating and finance leases for the rental of land, buildings, and for rental of facilities and equipment expire or become subject to renewal clauses at various dates through 2048. We believe that our existing cash, cash equivalents and restricted cash, and cash anticipated to be generated from operations will be sufficient to meet our anticipated cash needs for at least the next 12 months. Our future capital requirements will depend on many factors, including new store openings, remodel and maintenance capital expenditures at existing stores, store initiatives and other corporate capital expenditures and activities. Our cash, cash equivalents and restricted cash position benefits from the fact that we generally collect cash from sales to customers the same day or, in the case of credit or debit card transactions, within days from the related sale.
Operating Activities
Cash flows from operating activities increased $180.1 million to $645.2 million in 2024 compared to $465.1 million in 2023. The increase in cash flows from operating activities was primarily a result of higher net income adjusted for non-cash items of $130.3 million and favorable changes in working capital of $80.9 million, partially offset by higher payments on our operating lease liabilities of $29.7 million due to growth.
Cash flows provided by operating activities from changes in working capital were $112.3 million in 2024, compared to $31.4 million in 2023. This $80.9 million increase in cash flow from changes in working capital was primarily attributable to the following factors, each of which had a positive impact on working capital: (i) a $26.8 million change in accounts receivable driven by the timing of collections as well as a $43.3 million change in accounts payable and accrued liabilities, primarily due to timing differences of payments for goods and services (ii) a $9.7 million change in prepaid expenses and other current assets primarily due to timing differences of tax payments; and (iii) a $10.4 million change in accrued salaries and benefits due to increased incentive compensation accruals in the current year. These increases were partially offset by a a $9.3 million change in inventories primarily due to inflationary cost increases in the prior year.
Investing Activities
Cash flows used in investing activities consist primarily of capital expenditures in new stores, including leasehold improvements and store equipment, capital expenditures to maintain the appearance of our stores, sales enhancing initiatives and other corporate investments as well as cash outlays for acquisitions. Cash flows used in investing activities were $230.4 million and $238.3 million for 2024 and 2023, respectively. The increase in purchases of property and equipment was primarily due to more stores under construction in 2024 as compared to 2023 and heavier investment in upgraded equipment to support our initiatives.
Cash flows used in investing activities in 2023 also included our acquisition of Ronald Cohn, Inc. See Note 27, "Business Combination" to our consolidated financial statements contained in Item 8 of this Annual Report on Form 10-K.
We expect capital expenditures to be in the range of $230 - $250 million in 2025, net of estimated landlord tenant improvement allowances, primarily to fund investments in new stores, remodels, maintenance capital expenditures and corporate capital expenditures. We expect to fund our capital expenditures with cash on hand and cash generated from operating activities. We do not have any material contractual commitments for future capital expenditures as of December 29, 2024.
Financing Activities
Cash flows used in financing activities were $351.5 million for 2024 compared to $318.0 million for 2023. During 2024, cash flows used in financing activities primarily consisted of approximately $228.5 million for share repurchases and $125.0 million in payments on our Credit Agreement, $1.8 million for payments of excise tax on share repurchases partially offset by $4.9 million in proceeds from the exercise of stock options. During 2023, cash flows used in financing activities primarily consisted of approximately $203.5 million for share repurchases and $125.0 million in payments on our Credit Agreement, partially offset by $11.5 million in proceeds from the exercise of stock options.
Long-term Debt and Credit Facilities
The Company had no long-term debt outstanding as of December 29, 2024. Long-term debt outstanding as of December 31, 2023 was $125.0 million.
See Note 13, “Long-Term Debt and Finance Lease Liabilities” to our consolidated financial statements contained in Item 8 of this Annual Report on Form 10-K for a description of our Credit Agreement.
Share Repurchase Program
Our board of directors from time to time authorizes share repurchase programs for our common stock. The following table outlines the share repurchase programs authorized by our board, and the related repurchase activity and available authorization as of December 29, 2024:
|
|
|
|
|
|
|
|
|
|
|
|
|
|
|
|
|
|
|
|
|
|
|
|
|
|
|
| Effective date |
|
Expiration date |
|
Amount
authorized |
|
Cost of
repurchases |
|
Authorization
available |
| March 2, 2022 |
|
December 31, 2024 |
|
$ |
600,000 |
|
|
$ |
480,715 |
|
|
$ |
— |
|
| May 22, 2024 |
|
May 22, 2027 |
|
$ |
600,000 |
|
|
$ |
149,377 |
|
|
$ |
450,623 |
|
The shares under our current repurchase program may be purchased on a discretionary basis from time to time through the applicable expiration date, subject to general business and market conditions and other investment opportunities, through open market purchases, privately negotiated transactions, or other means, including through Rule 10b5-1 trading plans. Our board’s authorization of the share repurchase program does not obligate us to acquire any particular amount of common stock, and the repurchase program may be commenced, suspended, or discontinued at any time.
Share repurchase activity under our repurchase programs for the periods indicated was as follows (total cost in thousands):
|
|
|
|
|
|
|
|
|
|
|
|
|
Year Ended |
|
December 29, 2024 |
|
December 31, 2023 |
| Number of common shares acquired |
2,656,058 |
|
5,864,246 |
| Average price per common share acquired |
$ |
90.57 |
|
|
$ |
35.00 |
|
| Total cost of common shares acquired |
$ |
240,562 |
|
|
$ |
205,262 |
|
Shares purchased under our repurchase programs were subsequently retired and the excess of the repurchase price over par value was charged to retained earnings. The cost of common shares repurchased included the 1% excise tax imposed as part of the Inflation Reduction Act of 2022.
Subsequent to December 29, 2024 and through February 18, 2025, the Company repurchased an additional 0.7 million shares of common stock for $93.7 million, excluding excise tax.
Factors Affecting Liquidity
We can currently borrow under our Credit Agreement, up to an initial aggregate commitment of $700.0 million, which may be increased from time to time pursuant to an expansion feature set forth in the Credit Agreement. We have previously utilized borrowings under our Credit Agreement to fund our share repurchase program as described above. The interest rate we pay on our borrowings increases as our net leverage ratio increases and may increase or decrease based upon the achievement of certain diversity and sustainability-linked metric thresholds.
The Credit Agreement contains financial, affirmative and negative covenants. The negative covenants include, among other things, limitations on our ability to:
•incur additional indebtedness;
•grant additional liens;
•enter into sale-leaseback transactions;
•make loans or investments;
•merge, consolidate or enter into acquisitions;
•pay dividends or distributions;
•enter into transactions with affiliates;
•enter into new lines of business;
•modify the terms of debt or other material agreements; and
•change our fiscal year.
Each of these covenants is subject to customary and other agreed-upon exceptions.
In addition, the Credit Agreement requires that we and our subsidiaries maintain a maximum total net leverage ratio not to exceed 3.75 to 1.00, which ratio may be increased from time to time in connection with certain permitted acquisitions pursuant to conditions as set forth in the Credit Agreement, and a minimum interest coverage ratio not to be less than 3.00 to 1.00. Each of these covenants is tested on the last day of each fiscal quarter, starting with the fiscal quarter ended March 31, 2024.
We were in compliance with all applicable covenants under the Credit Agreement as of December 29, 2024.
Our Credit Agreement is defined and more fully described in Note 13, “Long-Term Debt and Finance Lease Liabilities” to our consolidated financial statements contained in Item 8 of this Annual Report on Form 10-K.
Contractual Obligations
Our principal contractual obligations and commitments consist of obligations under our Credit Agreement, interest on our Credit Agreement, operating and finance leases, purchase commitments and self-insurance liabilities. See Note 7, "Leases," Note 13, “Long-Term Debt and Finance Lease Liabilities,” Note 15, "Self-Insurance Programs" and Note 18, "Commitments and Contingencies" to our consolidated financial statements contained in Item 8 of this Annual Report on Form 10-K for more information on the nature and timing of these obligations.
The future amount and timing of interest payments are expected to vary with the outstanding amounts and then prevailing contractual interest rates. Interest and fee payments through the March 25, 2027 maturity date of our Credit Agreement based on the outstanding amounts as of December 29, 2024 and interest rates in effect at the time of this filing, are estimated to be approximately $1.9 million. These payments are estimated to be approximately $0.8 million in 2025 and approximately $1.1 million thereafter.
Real estate obligations, consisting of legally binding minimum lease payments for leases executed but not yet commenced, were $756.9 million as of December 29, 2024, including $9.7 million in 2025 and $747.2 million thereafter through 2044.
Our purchase commitments under noncancelable service and supply contracts that are enforceable and legally binding totaled $37.5 million as of December 29, 2024, including $19.6 million in 2025 and $17.9 million thereafter through 2029. Obligations under contracts that we can cancel without a significant penalty are not included in purchase commitments.
We periodically make other commitments and become subject to other contractual obligations that we believe to be routine in nature and incidental to the operation of the business. Management believes that such routine commitments and contractual obligations do not have a material impact on our business, financial condition or results of operations.
Impact of Inflation and Deflation
Inflation and deflation in the prices of food and other products we sell may periodically affect our sales, gross profit and gross margin. Food inflation, when combined with reduced consumer spending, could also reduce sales, gross profit margins and comparable store sales. Inflationary pressures on compensation, utilities, commodities, equipment and supplies may also impact our profitability. Food deflation across multiple categories, particularly in produce, could reduce sales growth and earnings if our competitors react by lowering their retail pricing and expanding their promotional activities, which can lead to retail deflation higher than cost deflation that could reduce our sales, gross profit margins and comparable store sales. The short-term impact of inflation and deflation is largely dependent on whether or not the effects are passed through to our customers, which is subject to competitive market conditions.
Food inflation and deflation is affected by a variety of factors and our determination of whether to pass on the effects of inflation or deflation to our customers is made in conjunction with our overall pricing and marketing strategies, as well as our competitors’ responses. Although we may experience periodic effects on sales, gross profit, gross margins and cash flows as a result of changing prices, we do not expect the effect of inflation or deflation to have a material impact on our ability to execute our long-term business strategy.
Critical Accounting Estimates
Our discussion and analysis of our financial condition and results of operations are based upon our financial statements, which have been prepared in accordance with GAAP. These principles require us to make estimates and judgments that affect the reported amounts of assets, liabilities, sales and expenses, cash flow and related disclosure of contingent assets and liabilities. We base our estimates on historical experience and on various other assumptions that we believe to be reasonable under the circumstances. Actual results may differ from these estimates. To the extent that there are material differences between these estimates and our actual results, our future financial statements will be affected.
We believe that of our significant accounting policies, which are described in Note 3, “Significant Accounting Policies” to the consolidated financial statements contained in Item 8 of this Annual Report on Form 10-K, the following accounting policies involve the most difficult, complex or subjective judgments: inventories, lease assumptions, self-insurance reserves, goodwill and intangible assets, impairment of long-lived assets, and income taxes. Accordingly, we believe these are the most critical to fully understand and evaluate our financial condition and results of operations.
Inventories
We value our inventory at the lower of cost or net realizable value. The significant estimate used in inventory valuation is the estimate of inventory shrinkage.
Shrink expense is accrued as a percentage of sales based on historical shrink trends. We perform physical inventories regularly, and our shrink accrual represents the loss estimate since the last physical inventory date through the reporting date. Actual physical inventory losses could vary significantly from our estimates due to changes in market conditions and other internal or external factors.
We believe that all inventories are saleable and no allowances or reserves for obsolescence were recorded as of December 29, 2024 and December 31, 2023.
Lease Assumptions
The most significant estimates used by management in accounting for leases and the impact of those estimates are as follows:
Expected lease term—Our expected lease term includes both contractual lease periods and option periods that are determined to be reasonably certain. The expected lease term is used in determining whether the lease is accounted for as an operating lease or a finance lease. An increase in the expected lease term will increase the probability that a lease will be considered a finance lease and will generally result in higher interest and depreciation expense for a leased property recorded on our balance sheets.
Incremental borrowing rate—The incremental borrowing rate is primarily used in determining whether the lease is accounted for as an operating lease or a finance lease. An increase in the incremental borrowing rate decreases the net present value of the minimum lease payments and reduces the probability that a lease will be considered a finance lease. For finance leases, the incremental borrowing rate is also used in allocating our rental payments between interest expense and a reduction of the outstanding obligation.
Fair market value of the leased asset—The fair market value of leased retail property is generally estimated based on comparable market data provided by third-party sources and evaluated using the experience of our development staff. Fair market value is used in determining whether the lease is accounted for as an operating lease or a finance lease.
Self-Insurance Reserves
We are self-insured for costs related to workers’ compensation, general liability and employee health benefits up to certain self-insured retentions and stop-loss limits. As of December 29, 2024, the consolidated self-insurance reserve balance was $53.2 million, of which a majority of the balance related to workers' compensation and general liability reserves. Liabilities for self-insurance reserves are estimated based on independent actuarial estimates, which are based on historical information and assumptions about future events.
We utilize various techniques, including analysis of historical trends and actuarial valuation methods, to estimate the cost to settle reported claims and claims incurred but not yet reported as of the balance sheet date. The actuarial valuation methods consider loss development factors, which include the development time frame and expected claim reporting and settlement patterns, and expected loss costs, which include the expected frequency and severity of claim activity. We believe our assumptions are reasonable, but the estimated reserves for these liabilities could be affected materially by future events or claims experiences that differ from historical trends and assumptions.
Goodwill and Intangible Assets
Goodwill represents the cost of acquired businesses in excess of the fair value of assets and liabilities acquired. Our indefinite-lived intangible assets consist of trade names related to “Sprouts Farmers Market,” liquor licenses and reacquired rights recognized in connection with the acquisition of Ronald Cohn, Inc. in fiscal 2023. See Note 27, “Business Combination” to our consolidated financial statements contained in Item 8 of this Annual Report on Form 10-K for additional information regarding this acquisition.
Goodwill and indefinite-lived intangible assets are evaluated for impairment on an annual basis during the fourth fiscal quarter, or more frequently if events or changes in circumstances indicate that the asset might be impaired. Our impairment evaluation of goodwill consists of a qualitative assessment to determine if it is more likely than not that the fair value of the reporting unit is less than its carrying amount. If this qualitative assessment indicates it is more likely than not that the estimated fair value of the reporting unit exceeds its carrying value, no further analysis is required, and goodwill is not impaired. Our qualitative assessment considers factors including changes in the competitive market, budget-to-actual performance, trends in market capitalization for us and our peers, turnover in key management personnel and overall changes in the macroeconomic environment.
Our impairment evaluation for our indefinite-lived intangible assets consists of a qualitative assessment, similar to that for goodwill. If the qualitative assessment indicates it is more likely than not that the estimated fair value of an indefinite-lived intangible asset exceeds its carrying value, no further analysis is required, and the asset is not impaired.
If our qualitative assessments indicate that it is more likely than not that the estimated fair value is less than carrying value, we compare the estimated fair value of the reporting unit or asset to its carrying amount with an impairment loss recognized for the amount, if any, by which carrying value exceeds estimated fair value. There are significant judgments and estimates in determining the estimated fair value of the reporting unit or asset; it is therefore possible that materially different amounts could be recorded if we used different assumptions or if the underlying circumstances were to change.
As of December 29, 2024, our consolidated goodwill balance was $381.8 million, and our consolidated indefinite-lived intangible assets balance was $208.1 million. No impairment of goodwill or indefinite-lived intangible assets was recorded during fiscal 2024, 2023 and 2022 because our qualitative assessments indicated that it was more likely than not that the estimated fair values of the reporting unit and the indefinite-lived intangible assets exceeded their carrying value.
Impairment of Long-Lived Assets
Long-lived assets are reviewed for impairment whenever events or changes in circumstances indicate that the carrying amounts may not be recoverable. This evaluation is performed at the lowest level of identifiable cash flows independent of other assets. An impairment loss would be recognized when estimated undiscounted future cash flows from the operation and/or disposition of the assets are less than their carrying amount. Measurement of an impairment loss would be based on the excess of the carrying amount of the asset group over its fair value. Fair value is measured using discounted cash flows or independent opinions of value, as appropriate. Our estimates of cash flows used to assess impairment involve significant judgment and are based upon assumptions on variables such as sales growth rate, gross margin, payroll and other controllable expenses. Application of alternative assumptions and definitions could produce significantly different results.
We recorded an impairment loss of $0.4 million, $30.5 million and $8.1 million in fiscal 2024, 2023 and 2022, respectively. See Note 3, “Significant Accounting Policies,” Note 6, “Property and Equipment" and Note 26, "Store Closures" to our consolidated financial statements contained in Item 8 of this Annual Report on Form 10-K.
Income Taxes
Income taxes are accounted for under the asset and liability method. Deferred tax assets and liabilities are recognized for the future tax consequences attributable to differences between the financial statement carrying amounts of existing assets and liabilities and their respective tax bases and operating loss and tax credit carryforwards. Deferred tax assets and liabilities are measured using enacted tax rates expected to apply to taxable income in the years in which those temporary differences are expected to be recovered or settled. The effect on deferred tax assets and liabilities of a change in tax rates is recognized in income in the period that includes the enactment date. We recognize the effect of income tax positions only if those positions are more likely than not of being sustained. Recognized income tax positions are measured at the largest amount that is greater than 50% likely of being realized. Changes in recognition or measurement are reflected in the period in which the change in judgment occurs. We record interest and penalties related to unrecognized tax benefits as part of income tax expense.
During the ordinary course of business, there are many transactions and calculations for which the ultimate tax settlement is uncertain. Under applicable accounting guidance, we are required to evaluate the realizability of our deferred tax assets. The realization of our deferred tax assets is dependent on future earnings. Applicable accounting guidance requires that a valuation allowance be recognized when, based on available evidence, it is more likely than not that all or a portion of deferred tax assets will not be realized due to the inability to generate sufficient taxable income in future periods. In circumstances where there is significant negative evidence, establishment of a valuation allowance must be considered. A pattern of sustained profitability is considered significant positive evidence when evaluating a decision to reverse a valuation allowance. Further, in those cases where a pattern of sustained profitability exists, projected future taxable income may also represent positive evidence, to the extent that such projections are determined to be reliable given the current economic environment. Accordingly, our assessment of our valuation allowances requires considerable judgment and could have a significant negative or positive impact on our current and future earnings.
Item 7A. Quantitative and Qualitative Disclosures about Market Risk
Interest Rate Sensitivity
As described in Note 13, “Long-Term Debt and Finance Lease Liabilities” to our accompanying consolidated financial statements contained in Item 8 of this Annual Report on Form 10-K, we have a Credit Agreement that bears interest at a rate based in part on SOFR. Accordingly, we could be exposed to fluctuations in interest rates. As of December 29, 2024, we had no outstanding borrowings under our Credit Agreement.
Item 8. Financial Statements and Supplementary Data
INDEX TO FINANCIAL STATEMENTS
|
|
|
|
|
|
| Consolidated Financial Statements for |
|
| Sprouts Farmers Market, Inc. and Subsidiaries: |
|
|
|
|
|
|
|
|
|
|
|
|
|
|
|
REPORT OF INDEPENDENT REGISTERED PUBLIC ACCOUNTING FIRM
To the Board of Directors and Stockholders of Sprouts Farmers Market, Inc.
Opinions on the Financial Statements and Internal Control over Financial Reporting
We have audited the accompanying consolidated balance sheets of Sprouts Farmers Market, Inc. and its subsidiaries (the "Company") as of December 29, 2024 and December 31, 2023, and the related consolidated statements of income, of comprehensive income, of stockholders’ equity and of cash flows for each of the three years in the period ended December 29, 2024, including the related notes (collectively referred to as the "consolidated financial statements"). We also have audited the Company's internal control over financial reporting as of December 29, 2024, based on criteria established in Internal Control - Integrated Framework (2013) issued by the Committee of Sponsoring Organizations of the Treadway Commission (COSO).
In our opinion, the consolidated financial statements referred to above present fairly, in all material respects, the financial position of the Company as of December 29, 2024 and December 31, 2023, and the results of its operations and its cash flows for each of the three years in the period ended December 29, 2024 in conformity with accounting principles generally accepted in the United States of America. Also in our opinion, the Company maintained, in all material respects, effective internal control over financial reporting as of December 29, 2024, based on criteria established in Internal Control - Integrated Framework (2013) issued by the COSO.
Basis for Opinions
The Company's management is responsible for these consolidated financial statements, for maintaining effective internal control over financial reporting, and for its assessment of the effectiveness of internal control over financial reporting, included in Management’s Annual Report on Internal Control over Financial Reporting appearing under Item 9A. Our responsibility is to express opinions on the Company’s consolidated financial statements and on the Company's internal control over financial reporting based on our audits. We are a public accounting firm registered with the Public Company Accounting Oversight Board (United States) (PCAOB) and are required to be independent with respect to the Company in accordance with the U.S. federal securities laws and the applicable rules and regulations of the Securities and Exchange Commission and the PCAOB.
We conducted our audits in accordance with the standards of the PCAOB. Those standards require that we plan and perform the audits to obtain reasonable assurance about whether the consolidated financial statements are free of material misstatement, whether due to error or fraud, and whether effective internal control over financial reporting was maintained in all material respects.
Our audits of the consolidated financial statements included performing procedures to assess the risks of material misstatement of the consolidated financial statements, whether due to error or fraud, and performing procedures that respond to those risks. Such procedures included examining, on a test basis, evidence regarding the amounts and disclosures in the consolidated financial statements. Our audits also included evaluating the accounting principles used and significant estimates made by management, as well as evaluating the overall presentation of the consolidated financial statements. Our audit of internal control over financial reporting included obtaining an understanding of internal control over financial reporting, assessing the risk that a material weakness exists, and testing and evaluating the design and operating effectiveness of internal control based on the assessed risk. Our audits also included performing such other procedures as we considered necessary in the circumstances. We believe that our audits provide a reasonable basis for our opinions.
Definition and Limitations of Internal Control over Financial Reporting
A company’s internal control over financial reporting is a process designed to provide reasonable assurance regarding the reliability of financial reporting and the preparation of financial statements for external purposes in accordance with generally accepted accounting principles. A company’s internal control over financial reporting includes those policies and procedures that (i) pertain to the maintenance of records that, in reasonable detail, accurately and fairly reflect the transactions and dispositions of the assets of the company; (ii) provide reasonable assurance that transactions are recorded as necessary to permit preparation of financial statements in accordance with generally accepted accounting principles, and that receipts and expenditures of the company are being made only in accordance with authorizations of management and directors of the company; and (iii) provide reasonable assurance regarding prevention or timely detection of unauthorized acquisition, use, or disposition of the company’s assets that could have a material effect on the financial statements.
Because of its inherent limitations, internal control over financial reporting may not prevent or detect misstatements. Also, projections of any evaluation of effectiveness to future periods are subject to the risk that controls may become inadequate because of changes in conditions, or that the degree of compliance with the policies or procedures may deteriorate.
Critical Audit Matters
The critical audit matter communicated below is a matter arising from the current period audit of the consolidated financial statements that was communicated or required to be communicated to the audit committee and that (i) relates to accounts or disclosures that are material to the consolidated financial statements and (ii) involved our especially challenging, subjective, or complex judgments. The communication of critical audit matters does not alter in any way our opinion on the consolidated financial statements, taken as a whole, and we are not, by communicating the critical audit matter below, providing a separate opinion on the critical audit matter or on the accounts or disclosures to which it relates.
Valuation of General Liability and Workers’ Compensation Self-Insurance Reserves
As described in Notes 3 and 15 to the consolidated financial statements, the Company is self-insured for costs related to workers’ compensation, general liability and employee health benefits up to certain stop-loss limits. As of December 29, 2024, the Company’s recorded amounts for general liability, workers’ compensation and team member health benefit liabilities was $53.2 million, of which a significant portion is related to the general liability and workers’ compensation self-insurance reserves. Management estimates the self-insurance reserves based on independent actuarial estimates, which are based on historical information and assumptions about future events. Management utilizes various techniques, including analysis of historical trends and actuarial valuation methods, to estimate the cost to settle reported claims and claims incurred but not yet reported as of the balance sheet date. When estimating the self-insurance reserves, several factors are considered by management, including (i) loss development factors, which include the development time frame and expected claim reporting and settlement patterns, and (ii) expected loss costs, which include the expected frequency and severity of claim activity.
The principal considerations for our determination that performing procedures relating to the valuation of the general liability and workers’ compensation self-insurance reserves is a critical audit matter are (i) the significant judgment by management when developing the estimates of the general liability and workers’ compensation self-insurance reserves; (ii) the high degree of auditor judgment, subjectivity and effort in performing procedures and evaluating management’s significant assumptions related to the loss development factors and expected loss costs; and (iii) the audit effort involved the use of professionals with specialized skill and knowledge.
Addressing the matter involved performing procedures and evaluating audit evidence in connection with forming our overall opinion on the consolidated financial statements. These procedures included testing the effectiveness of controls relating to management’s valuation of the general liability and workers’ compensation self-insurance reserves, including controls over the significant assumptions. These procedures also included, among others (i) reading management’s general liability and workers’ compensation self-insurance program agreements and (ii) testing the completeness and accuracy of the underlying historical claims data used in management’s estimates. Professionals with specialized skill and knowledge were used to assist in testing management’s process for estimating the valuation of the general liability and workers’ compensation self-insurance reserves, including (i) evaluating the appropriateness of the actuarial valuation methods used by management and (ii) evaluating the reasonableness of significant assumptions used by management related to loss development factors and expected loss costs by considering (a) current and past claim and settlement activity and (b) whether the assumptions were consistent with evidence obtained in other areas of the audit.
/s/ PricewaterhouseCoopers LLP
Phoenix, Arizona
February 20, 2025
We have served as the Company’s auditor since 2011.
SPROUTS FARMERS MARKET, INC. AND SUBSIDIARIES
CONSOLIDATED BALANCE SHEETS
(IN THOUSANDS, EXCEPT SHARE AND PER SHARE AMOUNTS)
|
|
|
|
|
|
|
|
|
|
|
|
|
December 29, 2024 |
|
December 31, 2023 |
| ASSETS |
|
|
|
| Current assets: |
|
|
|
| Cash and cash equivalents |
$ |
265,159 |
|
|
$ |
201,794 |
|
| Accounts receivable, net |
30,901 |
|
|
30,313 |
|
| Inventories |
343,329 |
|
|
323,198 |
|
| Prepaid expenses and other current assets |
36,131 |
|
|
48,467 |
|
| Total current assets |
675,520 |
|
|
603,772 |
|
| Property and equipment, net of accumulated depreciation |
895,189 |
|
|
798,707 |
|
| Operating lease assets, net |
1,466,903 |
|
|
1,322,854 |
|
| Intangible assets |
208,094 |
|
|
208,060 |
|
| Goodwill |
381,750 |
|
|
381,741 |
|
| Other assets |
13,243 |
|
|
12,294 |
|
| Total assets |
$ |
3,640,699 |
|
|
$ |
3,327,428 |
|
| LIABILITIES AND STOCKHOLDERS’ EQUITY |
|
|
|
| Current liabilities: |
|
|
|
| Accounts payable |
$ |
213,414 |
|
|
$ |
179,927 |
|
| Accrued liabilities |
216,842 |
|
|
164,887 |
|
| Accrued salaries and benefits |
97,991 |
|
|
74,752 |
|
| Current portion of operating lease liabilities |
150,400 |
|
|
126,271 |
|
| Current portion of finance lease liabilities |
1,321 |
|
|
1,032 |
|
| Total current liabilities |
679,968 |
|
|
546,869 |
|
| Long-term operating lease liabilities |
1,520,272 |
|
|
1,399,676 |
|
| Long-term debt and finance lease liabilities |
7,248 |
|
|
133,685 |
|
| Other long-term liabilities |
38,259 |
|
|
36,270 |
|
| Deferred income tax liability |
73,059 |
|
|
62,381 |
|
| Total liabilities |
2,318,806 |
|
|
2,178,881 |
|
| Commitments and contingencies (Note 18) |
|
|
|
| Stockholders’ equity: |
|
|
|
Undesignated preferred stock; $0.001 par value; 10,000,000 shares authorized, no shares issued and outstanding |
— |
|
|
— |
|
Common stock, $0.001 par value; 200,000,000 shares authorized, 99,255,036 shares issued and outstanding, December 29, 2024; 101,211,984 shares issued and outstanding, December 31, 2023 |
99 |
|
|
101 |
|
| Additional paid-in capital |
808,140 |
|
|
774,834 |
|
| Retained earnings |
513,654 |
|
|
373,612 |
|
| Total stockholders’ equity |
1,321,893 |
|
|
1,148,547 |
|
| Total liabilities and stockholders’ equity |
$ |
3,640,699 |
|
|
$ |
3,327,428 |
|
The accompanying notes are an integral part of these consolidated financial statements.
SPROUTS FARMERS MARKET, INC. AND SUBSIDIARIES
CONSOLIDATED STATEMENTS OF INCOME
(IN THOUSANDS, EXCEPT PER SHARE AMOUNTS)
|
|
|
|
|
|
|
|
|
|
|
|
|
|
|
|
|
|
|
Year Ended |
|
December 29, 2024 |
|
December 31, 2023 |
|
January 1, 2023 |
| Net sales |
$ |
7,719,290 |
|
|
$ |
6,837,384 |
|
|
$ |
6,404,223 |
|
| Cost of sales |
4,777,799 |
|
|
4,315,543 |
|
|
4,055,659 |
|
| Gross profit |
2,941,491 |
|
|
2,521,841 |
|
|
2,348,564 |
|
| Selling, general and administrative expenses |
2,291,350 |
|
|
2,000,437 |
|
|
1,855,649 |
|
| Depreciation and amortization (exclusive of depreciation included in cost of sales) |
132,748 |
|
|
131,893 |
|
|
123,530 |
|
| Store closure and other costs, net |
12,896 |
|
|
39,280 |
|
|
11,025 |
|
| Income from operations |
504,497 |
|
|
350,231 |
|
|
358,360 |
|
| Interest (income) expense, net |
(2,201) |
|
|
6,491 |
|
|
9,047 |
|
| Income before income taxes |
506,698 |
|
|
343,740 |
|
|
349,313 |
|
| Income tax provision |
126,097 |
|
|
84,884 |
|
|
88,149 |
|
| Net income |
380,601 |
|
|
$ |
258,856 |
|
|
$ |
261,164 |
|
| Net income per share: |
|
|
|
|
|
| Basic |
$ |
3.79 |
|
|
$ |
2.53 |
|
|
$ |
2.41 |
|
| Diluted |
$ |
3.75 |
|
|
$ |
2.50 |
|
|
$ |
2.39 |
|
| Weighted average shares outstanding: |
|
|
|
|
|
| Basic |
100,363 |
|
102,479 |
|
108,232 |
| Diluted |
101,379 |
|
103,390 |
|
109,139 |
The accompanying notes are an integral part of these consolidated financial statements.
SPROUTS FARMERS MARKET, INC. AND SUBSIDIARIES
CONSOLIDATED STATEMENTS OF COMPREHENSIVE INCOME
(IN THOUSANDS)
|
|
|
|
|
|
|
|
|
|
|
|
|
|
|
|
|
|
|
Year Ended |
|
December 29, 2024 |
|
December 31, 2023 |
|
January 1, 2023 |
| Net income |
$ |
380,601 |
|
|
$ |
258,856 |
|
|
$ |
261,164 |
|
|
|
|
|
|
|
| Other comprehensive income, net of tax |
|
|
|
|
|
Unrealized gains on cash flow hedging activities, net of income tax of $1,819 in fiscal 2022 |
— |
|
|
— |
|
|
5,259 |
|
Reclassification of net losses on cash flow hedges to net income, net of income tax of ($520) in fiscal 2022 |
— |
|
|
— |
|
|
(1,501) |
|
| Total other comprehensive income |
— |
|
|
— |
|
|
3,758 |
|
|
|
|
|
|
|
| Comprehensive income |
$ |
380,601 |
|
|
$ |
258,856 |
|
|
$ |
264,922 |
|
The accompanying notes are an integral part of these consolidated financial statements.
SPROUTS FARMERS MARKET, INC. AND SUBSIDIARIES
CONSOLIDATED STATEMENTS OF STOCKHOLDERS’ EQUITY
(IN THOUSANDS, EXCEPT SHARE AMOUNTS)
|
|
|
|
|
|
|
|
|
|
|
|
|
|
|
|
|
|
|
|
|
|
|
|
|
|
|
|
|
|
|
|
|
|
|
|
|
Shares |
|
Common
Stock |
|
Additional
Paid-in
Capital |
|
Retained
Earnings |
|
Accumulated
Other
Comprehensive
Income
(Loss) |
|
Total
Stockholders’
Equity |
|
|
|
|
|
|
|
|
|
|
|
|
|
|
|
|
|
|
|
|
|
|
|
|
|
|
|
|
|
|
|
|
|
|
|
|
|
|
|
|
|
|
|
|
|
|
|
|
|
|
|
|
|
|
|
|
|
|
|
|
|
|
|
|
|
|
|
|
|
|
|
|
| Balances at January 2, 2022 |
111,114,374 |
|
111 |
|
|
704,701 |
|
|
258,822 |
|
|
(3,758) |
|
|
959,876 |
|
| Net income |
— |
|
— |
|
|
— |
|
|
261,164 |
|
|
— |
|
|
261,164 |
|
| Other comprehensive income |
— |
|
— |
|
|
— |
|
|
— |
|
|
3,758 |
|
|
3,758 |
|
| Issuance of shares under stock plans |
855,464 |
|
— |
|
|
5,041 |
|
|
— |
|
|
— |
|
|
5,041 |
|
| Repurchase and retirement of common stock |
(6,897,082) |
|
(6) |
|
|
— |
|
|
(199,974) |
|
|
— |
|
|
(199,980) |
|
| Share-based compensation |
— |
|
— |
|
|
16,603 |
|
|
— |
|
|
— |
|
|
16,603 |
|
| Balances at January 1, 2023 |
105,072,756 |
|
105 |
|
|
726,345 |
|
|
320,012 |
|
|
— |
|
|
1,046,462 |
|
| Net income |
— |
|
— |
|
|
— |
|
|
258,856 |
|
|
— |
|
|
258,856 |
|
| Issuance of shares under stock plans |
1,449,116 |
|
1 |
|
|
11,453 |
|
|
— |
|
|
— |
|
|
11,454 |
|
| Repurchase and retirement of common stock, including excise tax |
(5,864,246) |
|
(6) |
|
|
— |
|
|
(205,256) |
|
|
— |
|
|
(205,262) |
|
| Share-based compensation |
— |
|
— |
|
|
18,898 |
|
|
— |
|
|
— |
|
|
18,898 |
|
| Issuance of shares for acquisition |
554,358 |
|
1 |
|
|
18,138 |
|
|
— |
|
|
— |
|
|
18,139 |
|
| Balances at December 31, 2023 |
101,211,984 |
|
101 |
|
|
774,834 |
|
|
373,612 |
|
|
— |
|
|
1,148,547 |
|
| Net income |
— |
|
— |
|
|
— |
|
|
380,601 |
|
|
— |
|
|
380,601 |
|
| Issuance of shares under stock plans |
699,110 |
|
1 |
|
|
4,889 |
|
|
— |
|
|
— |
|
|
4,890 |
|
| Repurchase and retirement of common stock, including excise tax |
(2,656,058) |
|
(3) |
|
|
— |
|
|
(240,559) |
|
|
— |
|
|
(240,562) |
|
| Share-based compensation |
— |
|
— |
|
|
28,417 |
|
|
— |
|
|
— |
|
|
28,417 |
|
|
|
|
|
|
|
|
|
|
|
|
|
| Balances at December 29, 2024 |
99,255,036 |
|
$ |
99 |
|
|
$ |
808,140 |
|
|
$ |
513,654 |
|
|
$ |
— |
|
|
$ |
1,321,893 |
|
|
|
|
|
|
|
|
|
|
|
|
|
The accompanying notes are an integral part of these consolidated financial statements.
SPROUTS FARMERS MARKET, INC. AND SUBSIDIARIES
CONSOLIDATED STATEMENTS OF CASH FLOWS
(IN THOUSANDS)
|
|
|
|
|
|
|
|
|
|
|
|
|
|
|
|
|
|
| |
Year Ended |
| |
December 29, 2024 |
|
December 31, 2023 |
|
January 1, 2023 |
| Operating activities |
|
|
|
|
|
| Net income |
$ |
380,601 |
|
|
$ |
258,856 |
|
|
$ |
261,164 |
|
| Adjustments to reconcile net income to net cash provided by operating activities: |
|
|
|
|
|
| Depreciation and amortization expense |
140,164 |
|
|
137,811 |
|
|
127,067 |
|
| Operating lease asset amortization |
133,923 |
|
|
127,208 |
|
|
117,315 |
|
| Impairment of assets |
406 |
|
|
30,549 |
|
|
8,066 |
|
| Share-based compensation |
28,417 |
|
|
18,898 |
|
|
16,603 |
|
| Deferred income taxes |
10,691 |
|
|
(4,915) |
|
|
3,228 |
|
| Other non-cash items |
5,610 |
|
|
1,086 |
|
|
672 |
|
| Changes in operating assets and liabilities, net of effects from acquisition: |
|
|
|
|
|
| Accounts receivable |
30,007 |
|
|
3,173 |
|
|
13,381 |
|
| Inventories |
(20,131) |
|
|
(10,857) |
|
|
(45,158) |
|
| Prepaid expenses and other current assets |
11,903 |
|
|
2,210 |
|
|
(18,467) |
|
| Other assets |
(45) |
|
|
3,482 |
|
|
2,039 |
|
| Accounts payable |
27,986 |
|
|
12,215 |
|
|
13,362 |
|
| Accrued liabilities |
39,305 |
|
|
11,746 |
|
|
5,416 |
|
| Accrued salaries and benefits |
23,240 |
|
|
12,880 |
|
|
2,831 |
|
| Operating lease liabilities |
(168,538) |
|
|
(138,795) |
|
|
(132,889) |
|
| Other long-term liabilities |
1,675 |
|
|
(479) |
|
|
(3,301) |
|
| Cash flows from operating activities |
645,214 |
|
|
465,068 |
|
|
371,329 |
|
| Investing activities |
|
|
|
|
|
| Purchases of property and equipment |
(230,375) |
|
|
(225,310) |
|
|
(124,010) |
|
| Payments for acquisition, net of cash acquired |
— |
|
|
(13,032) |
|
|
— |
|
| Cash flows used in investing activities |
(230,375) |
|
|
(238,342) |
|
|
(124,010) |
|
| Financing activities |
|
|
|
|
|
| Proceeds from revolving credit facilities |
— |
|
|
— |
|
|
62,500 |
|
| Payments on revolving credit facilities |
(125,000) |
|
|
(125,000) |
|
|
(62,500) |
|
| Payments on finance lease liabilities |
(1,148) |
|
|
(1,006) |
|
|
(819) |
|
| Payments of deferred financing costs |
— |
|
|
— |
|
|
(3,373) |
|
| Repurchase of common stock |
(228,472) |
|
|
(203,496) |
|
|
(199,980) |
|
| Payments of excise tax on repurchases of common stock |
(1,766) |
|
|
— |
|
|
— |
|
| Proceeds from exercise of stock options |
4,890 |
|
|
11,454 |
|
|
5,041 |
|
| Cash flows used in financing activities |
(351,496) |
|
|
(318,048) |
|
|
(199,131) |
|
| Increase/(Decrease) in cash, cash equivalents, and restricted cash |
63,343 |
|
|
(91,322) |
|
|
48,188 |
|
| Cash, cash equivalents, and restricted cash at beginning of the period |
203,870 |
|
|
295,192 |
|
|
247,004 |
|
| Cash, cash equivalents, and restricted cash at the end of the period |
$ |
267,213 |
|
|
$ |
203,870 |
|
|
$ |
295,192 |
|
|
|
|
|
|
|
| Supplemental disclosure of cash flow information |
|
|
|
|
|
| Cash paid for interest |
$ |
5,008 |
|
|
$ |
12,561 |
|
|
$ |
11,132 |
|
| Cash paid for income taxes |
102,226 |
|
|
96,633 |
|
|
93,419 |
|
|
|
|
|
|
|
| Supplemental disclosure of non-cash activities |
|
|
|
|
|
| Property and equipment in accounts payable and accrued liabilities |
$ |
36,682 |
|
|
$ |
29,592 |
|
|
$ |
36,177 |
|
| Issuance of shares for acquisition |
— |
|
|
18,139 |
|
|
— |
|
| Excise tax accrued on repurchase of common stock |
2,091 |
|
|
1,766 |
|
|
— |
|
| Leased assets obtained in exchange for new operating lease liabilities, net of lease terminations |
278,230 |
|
|
364,997 |
|
|
157,269 |
|
| Leased assets obtained in exchange for new finance lease liabilities |
— |
|
|
809 |
|
|
— |
|
The accompanying notes are an integral part of these consolidated financial statements.
SPROUTS FARMERS MARKET, INC. AND SUBSIDIARIES
NOTES TO CONSOLIDATED FINANCIAL STATEMENTS
1. Organization and Description of Business
Sprouts Farmers Market, Inc., a Delaware corporation, through its subsidiaries, offers a unique specialty grocery experience featuring an open layout with fresh produce at the heart of the store. The Company continues to bring the latest in wholesome, innovative products made with lifestyle-friendly ingredients such as organic, plant-based and gluten-free. As of December 29, 2024, the Company operated 440 stores in 24 states. For convenience, the “Company” is used to refer collectively to Sprouts Farmers Market, Inc. and, unless the context requires otherwise, its subsidiaries. The Company’s store operations are conducted by its subsidiaries.
2. Basis of Presentation
The consolidated financial statements include the accounts of the Company and its wholly owned subsidiaries in accordance with accounting principles generally accepted in the United States of America (“GAAP”). All material intercompany accounts and transactions have been eliminated in consolidation.
The Company has one operating segment, and therefore, one reportable segment: healthy grocery stores.
The Company categorizes the varieties of products it sells as perishable and non-perishable. Perishable product categories include produce, meat and meat alternatives, seafood, deli, bakery, floral and dairy and dairy alternatives. Non-perishable product categories include grocery, vitamins and supplements, bulk items, frozen foods, beer and wine, and natural health and body care.
The following is a breakdown of the Company’s perishable and non-perishable sales mix:
|
|
|
|
|
|
|
|
|
|
|
|
|
|
|
|
|
|
|
2024 |
|
2023 |
|
2022 |
| Perishables |
57.3 |
% |
|
57.3 |
% |
|
58.0 |
% |
| Non-Perishables |
42.7 |
% |
|
42.7 |
% |
|
42.0 |
% |
All dollar amounts are in thousands, unless otherwise indicated.
3. Significant Accounting Policies
Fiscal Years
The Company reports its results of operations on a 52- or 53-week fiscal calendar ending on the Sunday closest to December 31. Fiscal year 2024 ended on December 29, 2024 and included 52 weeks. Fiscal year 2023 ended on December 31, 2023 and included 52 weeks. Fiscal year 2022 ended on January 1, 2023 and included 52 weeks. Fiscal years 2024, 2023 and 2022 are referred to as 2024, 2023 and 2022, respectively.
Significant Accounting Estimates
The preparation of financial statements in conformity with GAAP requires management to make estimates and assumptions. Such estimates and assumptions affect the reported amounts of assets and liabilities and the disclosure of contingent assets and liabilities at the date of the financial statements and the reported amounts of revenues and expenses during the reporting period. The Company’s critical accounting estimates include inventories, lease assumptions, self-insurance reserves, goodwill and intangible assets, impairment of long-lived assets, and income taxes. Actual results could differ from those estimates.
Cash and Cash Equivalents
The Company considers all highly liquid instruments with an original maturity of three months or less to be cash equivalents. The Company’s cash and cash equivalents are maintained at financial institutions in the United States of America. Deposits in transit include sales through the end of the period, the majority of which were paid with credit and debit cards and settle within a few days of the sales transactions. The amounts due from banks for these transactions at each reporting date were as follows:
|
|
|
|
|
|
|
|
|
|
|
|
| |
As Of |
| |
December 29, 2024 |
|
December 31, 2023 |
| Due from banks for debit and credit card transactions |
$ |
80,409 |
|
|
$ |
85,116 |
|
Restricted Cash
Restricted cash relates to the Company’s defined benefit plan forfeitures and the Company’s healthcare, general liability and workers’ compensation plan benefits of approximately $2.1 million as of December 29, 2024 and December 31, 2023, and is included in prepaid expenses and other current assets in the accompanying consolidated balance sheets.
Accounts Receivable
Accounts receivable primarily represents billings to vendors for scan, advertising and other rebates, receivables from ecommerce sales, billings to landlords for tenant allowances, manufacturer coupons and other miscellaneous receivables. Accounts receivable also includes receivables from the Company’s insurance carrier for payments expected to be made in excess of self-insured retentions. The Company provides an allowance for doubtful accounts when a specific account is determined to be uncollectible.
Inventories
Inventories consist of merchandise purchased for resale, which are stated at the lower of cost or net realizable value. The cost method is used for distribution center and store perishable department inventories by assigning costs to each of these items based on a first-in, first-out (FIFO) basis (net of vendor discounts).
The Company’s non-perishable inventory is valued at the lower of cost or net realizable value using weighted averaging, the use of which approximates the FIFO method.
Inventories are reduced for estimated losses related to shrinkage. The Company believes that all inventories are saleable and no allowances or reserves for obsolescence were recorded as of December 29, 2024 and December 31, 2023.
Property and Equipment
Property and equipment are stated at cost, net of accumulated depreciation and amortization. Expenditures for major additions and improvements to facilities as well as significant component replacements are capitalized. All other maintenance and repairs are charged to expense as incurred. When property is retired or otherwise disposed of, the related cost and accumulated depreciation are removed from the accounts and any resulting gain or loss is reflected in the consolidated statements of income. Depreciation expense, which includes the amortization of assets recorded as finance leases, is computed using the straight-line method over the estimated useful lives of the individual assets. Terms of leases used in the determination of estimated useful lives may include renewal options if the exercise of the renewal option is determined to be reasonably certain.
The following table includes the estimated useful lives of certain of the Company’s asset classes:
|
|
|
|
|
|
| Computer hardware and software |
3 to 5 years |
| Furniture, fixtures and equipment |
3 to 20 years |
| Leasehold improvements |
up to 15 years |
| Buildings |
40 years |
Store development costs, which include costs associated with the selection and procurement of real estate sites, are also included in property and equipment. These costs are included in leasehold improvements and are amortized over the remaining lease term of the successful sites with which they are associated.
Self-Insurance Reserves
The Company uses a combination of insurance and self-insurance programs to provide for costs associated with general liability, workers’ compensation and team member health benefits. Liabilities for self-insurance reserves are estimated based on independent actuarial estimates, which are based on historical information and assumptions about future events. The Company utilizes various techniques, including analysis of historical trends and actuarial valuation methods, to estimate the cost to settle reported claims and claims incurred but not yet reported as of the balance sheet date. The actuarial valuation methods consider loss development factors, which include the development time frame and expected claim reporting and settlement patterns, and expected loss costs, which include the expected frequency and severity of claim activity. Amounts expected to be recovered from insurance companies are included in the liability, with a corresponding amount recorded in accounts receivable.
Goodwill and Intangible Assets
Goodwill represents the cost of acquired businesses in excess of the fair value of assets and liabilities acquired. The Company’s indefinite-lived intangible assets consist of trade names related to “Sprouts Farmers Market,” liquor licenses and reacquired rights recognized in connection with the acquisition of Ronald Cohn, Inc. in 2023. See Note 27, “Business Combination” for more information on this acquisition.
Goodwill and indefinite-lived intangible assets are evaluated for impairment on an annual basis during the fourth fiscal quarter, or more frequently if events or changes in circumstances indicate that the asset might be impaired. The Company’s impairment evaluation of goodwill consists of a qualitative assessment to determine if it is more likely than not that the fair value of the reporting unit is less than its carrying amount. The Company’s qualitative assessment considered factors including changes in the competitive market, budget-to-actual performance, trends in market capitalization for the Company and its peers, turnover in key management personnel and overall changes in the macroeconomic environment. If this qualitative assessment indicates it is more likely than not that the estimated fair value of the reporting unit exceeds its carrying value, no further analysis is required, and goodwill is not impaired. Otherwise, the Company compares the estimated fair value of the reporting unit to its carrying amount with an impairment loss recognized for the amount, if any, by which carrying value exceeds estimated fair value.
The impairment evaluation for the Company’s indefinite-lived intangible assets consists of a qualitative assessment, similar to that for goodwill. If the qualitative assessment indicates it is more likely than not that the estimated fair value exceeds its carrying value, no further analysis is required, and the asset is not impaired. Otherwise, the Company compares the estimated fair value of the asset to its carrying amount with an impairment loss recognized for the amount, if any, by which carrying value exceeds estimated fair value.
The Company has determined its business consists of a single reporting unit. The Company has had no goodwill impairment charges for the past three fiscal years. See Note 8, “Intangible Assets” and Note 9, “Goodwill” for further discussion.
Impairment of Long-Lived Assets
The Company assesses its long-lived assets, including property and equipment and right-of-use assets, for potential impairment whenever events or changes in circumstances indicate that the carrying amount of an asset group may not be recoverable.
These events primarily include current period losses combined with a history of losses or a projection of continuing losses, a significant decrease in the market value of an asset or a decision to close or relocate a store. The Company groups and evaluates long-lived assets for impairment at the individual store level, which is the lowest level at which independent identifiable cash flows are available. Recoverability of assets to be held and used is measured by a comparison of the carrying amount of the asset group to the future undiscounted cash flows expected to be generated by that asset group. The Company’s impairment analysis contains management assumptions about key variables including sales growth rate, gross margin, payroll and other controllable expenses.
If impairment is indicated, a loss is recognized for any excess of the carrying value over the estimated fair value of the asset group. The fair value of the asset group is estimated based on the discounted future cash flows using a discount rate commensurate with the related risk or comparable market values, if available. The Company recorded an impairment loss of $0.4 million and $8.1 million in 2024 and 2022, respectively, as part of the normal course of business primarily related to the write-down of right-of-use assets and leasehold improvements. The Company recorded an impairment loss of $30.5 million in 2023 of which $27.8 million was in connection with the decision to close certain underperforming stores (see Note 26, "Store Closures") and $2.7 million was in the normal course of business primarily related to the write-down of right-of-use assets and leasehold improvements. These charges are recorded as a component of Store closure and other costs, net in the accompanying consolidated statements of income.
Deferred Financing Costs
The Company capitalizes certain fees and costs incurred in connection with the issuance of debt. Deferred financing costs are amortized to interest expense over the term of the debt using the effective interest method. For the Credit Agreement and Former Credit Facility (as defined in Note 13, “Long-Term Debt and Finance Lease Liabilities”), deferred financing costs are amortized on a straight-line basis over the term of the facility. Upon prepayment, redemption or conversion of debt, the Company accelerates the recognition of an appropriate amount of financing costs as loss on extinguishment of debt. The current and noncurrent portions of deferred financing costs are included in prepaid expenses and other current assets and other assets, respectively, in the accompanying consolidated balance sheets.
Leases
The Company leases its stores, distribution centers, and administrative offices. The Company determines if an arrangement is a lease at inception. Operating leases are included in operating lease assets, current portion of operating lease liabilities and noncurrent portion of operating lease liabilities in the accompanying consolidated balance sheets. Finance leases are included in property, plant, equipment, net, current portion of finance lease liabilities, and long-term debt and finance lease liabilities in the accompanying consolidated balance sheets. Operating lease payments are charged on a straight-line basis to rent expense, a component of selling, general and administrative expenses, over the lease term and finance lease payments are charged to interest expense and depreciation and amortization expense using a debt model over the lease term.
The Company’s lease assets represent a right to use an underlying asset for the lease term and lease liabilities represent the Company’s obligation to make lease payments arising from the lease. Lease assets and liabilities and the related rent expense are recognized at the lease commencement date (date on which the Company gains access to the property) based on the estimated present value of lease payments over the lease term, net of landlord allowances expected to be received. The Company accounts for the lease and non-lease components as a single lease component for all current classes of leases.
Most of the Company’s lease agreements include variable payments related to pass-through costs for common area maintenance ("CAM"), property taxes, and insurance. Additionally, some of the Company’s lease agreements include rental payments based on a percentage of retail sales over contractual levels. These variable payments are not included in the measurement of the lease liability or asset and are expensed as incurred.
As most of the Company’s lease agreements do not provide an implicit rate, the Company uses an estimated incremental borrowing rate, which is derived from third-party information available at the lease commencement date, in determining the present value of lease payments.
The rate used is for a secured borrowing of a similar term as the lease.
Most leases include one or more options to renew, with renewal terms that can extend the lease term from one to twenty years or more. The exercise of lease renewal options is at the Company’s sole discretion. The lease term includes the initial contractual term as well as any options to extend the lease when it is reasonably certain that the Company will exercise that option. Leases with a term of 12 months or less (“short-term leases”) are not recorded on the balance sheet. The Company does not currently have any material short-term leases. Additionally, the Company’s lease agreements do not contain any residual value guarantees or material restrictive covenants.
The Company subleases certain real estate to third parties, which have all been classified as operating leases. The Company recognizes sublease income on a straight-line basis.
Fair Value Measurements
The Company records its financial assets and liabilities in accordance with the framework for measuring fair value in accordance with ASC 820. This framework establishes a three-level fair value hierarchy that prioritizes the inputs used to measure fair value:
Level 1: Quoted prices for identical instruments in active markets.
Level 2: Quoted prices for similar instruments in active markets; quoted prices for identical or similar instruments in markets that are not active; and model-derived valuations in which all significant inputs and significant value drivers are observable in active markets.
Level 3: Valuations derived from valuation techniques in which one or more significant inputs or significant value drivers are unobservable.
Fair value measurements of nonfinancial assets and nonfinancial liabilities are primarily used in the impairment analysis of goodwill, intangible assets, and long-lived assets. Impairment losses related to store-level assets are calculated using significant unobservable inputs including the present value of future cash flows expected to be generated using a risk-adjusted market based weighted-average cost of capital, comparable store sales growth assumptions, and third party property appraisal data. Therefore, these inputs are classified as a level 3 measurement in the fair value hierarchy.
Derivative Financial Instruments
The Company records derivatives at fair value. The designation of a derivative instrument as a hedge and its ability to meet the hedge accounting criteria determine how the Company reflects the change in fair value of the derivative instrument in its financial statements. A derivative qualifies for hedge accounting if, at inception, the derivative is expected to be highly effective in offsetting the underlying hedged cash flows, and the Company fulfills the hedge documentation standards at the time it enters into the derivative contract. The Company designates its hedge based on the exposure it is hedging. For qualifying cash flow hedges, the Company records changes in fair value in other comprehensive income (“OCI”). The Company releases the derivative’s gain or loss from OCI to match the timing of the underlying hedged item’s effect on earnings.
The Company reviews the effectiveness of its hedging instruments quarterly. The Company recognizes changes in the fair value for derivatives not designated as hedges or those not qualifying for hedge accounting in current period earnings. The Company discontinues hedge accounting for any hedge that is no longer evaluated to be highly effective.
The Company does not enter into derivative financial instruments for trading or speculative purposes, and it monitors the financial stability and credit standing of its counterparties in these transactions. The Company had no active derivative financial instruments as of December 29, 2024 or December 31, 2023.
Share-Based Compensation
The Company measures share-based compensation cost at the grant date based on the fair value of the award and recognizes share-based compensation cost as expense over the vesting period. As share-based compensation expense recognized in the consolidated statements of income is based on awards ultimately expected to vest, the amount of expense has been reduced for actual forfeitures as they occur.
The Company uses the Black-Scholes option-pricing model to determine the grant date fair value for each option grant. See Note 25, “Share-Based Compensation” for a discussion of assumptions used in the calculation of fair values. Application of alternative assumptions could produce different estimates of the fair value of share-based compensation and, consequently, the related amounts recognized in the accompanying consolidated statements of income. The grant date fair value of restricted stock units (“RSUs”) and performance share awards (“PSAs”) is based on the closing price per share of the Company’s common stock on the grant date. The Company recognizes compensation expense for time-based awards on a straight-line basis and for performance-based awards on the graded-vesting method over the vesting period of the awards.
Revenue Recognition
The Company’s performance obligations are satisfied upon the transfer of goods to the customer, which occurs at the point of sale, and payment from customers is also due at the time of sale. Proceeds from the sale of gift cards are recorded as a liability at the time of sale and recognized as sales when they are redeemed by the customer and the performance obligation is satisfied by the Company. The Company’s gift cards do not expire. Based on historical redemption rates, a small and relatively stable percentage of gift cards will never be redeemed, referred to as "breakage." Estimated breakage revenue is recognized over time in proportion to actual gift card redemptions and was not material in any period presented. A summary of the activity and balances in the gift card liability, net is as follows:
|
|
|
|
|
|
|
|
|
|
|
|
|
|
|
|
|
|
|
Year Ended |
|
December 29, 2024 |
|
December 31, 2023 |
|
January 1, 2023 |
| Beginning Balance |
$ |
10,566 |
|
|
$ |
10,906 |
|
|
$ |
12,586 |
|
Gift cards issued during the period but not redeemed(1) |
4,727 |
|
|
4,271 |
|
|
4,291 |
|
| Revenue recognized from beginning liability |
(4,222) |
|
|
(4,611) |
|
|
(5,971) |
|
| Ending Balance |
$ |
11,071 |
|
|
$ |
10,566 |
|
|
$ |
10,906 |
|
(1)net of estimated breakage
The nature of goods the Company transfers to customers at the point of sale are inventories, consisting of merchandise purchased for resale.
The Company does not have any material contract assets or receivables from contracts with customers, any revenue recognized in the current period from performance obligations satisfied in previous periods, any contract performance obligations, or any material costs to obtain or fulfill a contract as of December 29, 2024.
Cost of Sales
Cost of sales includes the cost of inventory sold during the period, including the direct costs of purchased merchandise (net of discounts and allowances), distribution and supply chain costs, and depreciation and amortization for distribution centers and supply chain related assets. The Company recognizes vendor allowances and merchandise volume related rebate allowances as a reduction of inventories during the period when earned and reflects the allowances as a component of cost of sales as the inventory is sold.
The Company’s largest supplier accounted for approximately 50%, 47% and 45% of total purchases during 2024, 2023 and 2022, respectively.
Selling, General and Administrative Expenses
Selling, general and administrative expenses primarily consist of salaries, wages and benefits costs, share-based compensation, occupancy costs (including rent, property taxes, utilities, CAM and insurance), advertising costs, buying costs, pre-opening and other administrative costs.
The Company charges certain vendors to place advertisements in the Company’s in-store guide and circulars under a cooperative advertising program. The Company records rebates received from vendors in connection with cooperative advertising programs as a reduction to advertising costs when the allowance represents a reimbursement of a specific incremental and identifiable cost.
Advertising costs are expensed as incurred. Advertising expense, net of rebates, was $46.8 million, $45.8 million and $49.2 million for 2024, 2023 and 2022, respectively.
Depreciation and amortization
Depreciation and amortization expense (exclusive of depreciation included in cost of sales) primarily consists of depreciation and amortization for buildings, store leasehold improvements, and equipment.
Income Taxes
Income taxes are accounted for under the asset and liability method. Deferred tax assets and liabilities are recognized for the future tax consequences attributable to differences between the financial statement carrying amounts of existing assets and liabilities and their respective tax basis and operating loss and tax credit carryforwards. Deferred tax assets and liabilities are measured using enacted tax rates expected to apply to taxable income in the years in which those temporary differences are expected to be recovered or settled. The effect on deferred tax assets and liabilities of a change in tax rates is recognized in income in the period that includes the enactment date. The Company’s deferred tax assets are subject to periodic recoverability assessments. Valuation allowances are established, when necessary, to reduce deferred tax assets to the amount that more likely than not will be realized. Realization of the deferred tax assets is principally dependent upon achievement of projected future taxable income offset by deferred tax liabilities. Changes in recognition or measurement are reflected in the period in which the judgment occurs.
The Company files income tax returns for federal purposes and in many states. The Company’s tax filings remain subject to examination by applicable tax authorities for a certain length of time, generally three years, following the tax year to which those filings relate.
The Company recognizes the effect of uncertain income tax positions only if those positions are more likely than not of being sustained. Recognized income tax positions are measured at the largest amount that is greater than 50% likely of being realized. Changes in recognition or measurement are reflected in the period in which the change in judgment occurs. The Company records interest and penalties related to unrecognized tax benefits as part of income tax expense.
Share Repurchases
The Company has elected to retire shares repurchased to date. Shares retired become part of the pool of authorized but unissued shares. The Company has elected to record the purchase price of the retired shares in excess of par value directly as a reduction of retained earnings. The cost of common shares repurchased includes a 1% excise tax imposed as part of the Inflation Reduction Act of 2022.
Net Income per Share
Basic net income per share is calculated by dividing net income by the weighted average number of shares outstanding during the fiscal period.
Diluted net income per share is based on the weighted average number of shares outstanding, plus, where applicable, shares that would have been outstanding related to dilutive options, PSAs and RSUs.
Comprehensive Income
Comprehensive income consists of net income and the unrealized gains or losses on derivative instruments that qualify for and have been designated as cash flow hedges, for all periods presented.
Recently Adopted Accounting Pronouncements
Segment Reporting – Improvements to Reportable Segment Disclosures
In November 2023, the FASB issued ASU no. 2023-07, “Segment Reporting (Topic 280) Improvements to Reportable Segment Disclosures." The amendments in this update increased required disclosures about a public entity's reportable segments, primarily through enhanced disclosures about significant segment expenses that are regularly provided to the Company’s chief operating decision maker (“CODM”). In addition, ASU 2023-07 requires the Company to disclose the title and position of its CODM. The Company adopted this standard effective December 29, 2024 and accordingly updated its segment disclosures (see Note 24, “Segments”) but there was no impact on the Company’s results of operations, cash flows and financial condition.
Recently Issued Accounting Pronouncements Not Yet Adopted
Income Taxes – Improvements to Income Tax Disclosures
In December 2023, the FASB issued ASU no. 2023-09, “Income Taxes (Topic 740) Improvements to Income Tax Disclosures." The amendments in this update enhance a public entity's annual income tax disclosures primarily related to the rate reconciliation and income taxes paid information. The guidance will be effective for the Company for its fiscal year 2025. Early adoption is permitted, and the guidance should be applied prospectively, with an option to apply it retrospectively. The Company expects this update to impact its income tax disclosures but does not anticipate that this update will impact its results of operations, cash flows or financial condition.
Disaggregation of Income Statement Expenses
In November 2024, the FASB issues ASU no. 2024-03, "Income Statement-Reporting Comprehensive Income-Expense Disaggregation Disclosures (Subtopic 220-40): Disaggregation of Income Statement Expenses". The standard requires public entities to disclose additional disaggregation of expense in the notes to the financial statements for interim and annual reporting periods. The guidance is effective for the Company for its fiscal year 2027. Early adoption is permitted, and the guidance should be applied prospectively, with an option to apply it retrospectively. The Company is currently evaluating the potential impact of this ASU on its consolidated financial statements and disclosures.
No other new accounting pronouncements issued or effective during 2024 had, or are expected to have, a material impact on the Company’s consolidated financial statements.
4. Accounts Receivable
A summary of accounts receivable is as follows:
|
|
|
|
|
|
|
|
|
|
|
|
|
As Of |
|
December 29, 2024 |
|
December 31, 2023 |
| Landlords |
$ |
5,577 |
|
|
$ |
5,451 |
|
| Vendors |
3,814 |
|
|
3,168 |
|
| Insurance |
2,913 |
|
|
2,884 |
|
| Ecommerce |
9,993 |
|
|
7,682 |
|
| Other |
8,604 |
|
|
11,128 |
|
| Total |
$ |
30,901 |
|
|
$ |
30,313 |
|
The Company recorded allowances for certain vendor receivables of $1.3 million at December 29, 2024 and December 31, 2023.
5. Prepaid Expenses and Other Current Assets
A summary of prepaid expenses and other current assets is as follows:
|
|
|
|
|
|
|
|
|
|
|
|
|
As Of |
|
December 29, 2024 |
|
December 31, 2023 |
| Prepaid expenses |
$ |
24,469 |
|
|
$ |
22,062 |
|
| Restricted cash |
2,054 |
|
|
2,076 |
|
| Income tax receivable |
8,839 |
|
|
23,559 |
|
| Other current assets |
769 |
|
|
770 |
|
| Total |
$ |
36,131 |
|
|
$ |
48,467 |
|
6. Property and Equipment
A summary of property and equipment, net is as follows:
|
|
|
|
|
|
|
|
|
|
|
|
|
As Of |
|
December 29, 2024 |
|
December 31, 2023 |
| Land and finance lease assets |
$ |
16,859 |
|
|
$ |
16,562 |
|
| Furniture, fixtures and equipment |
1,129,303 |
|
|
1,002,824 |
|
| Leasehold improvements |
831,020 |
|
|
715,489 |
|
| Construction in progress |
79,994 |
|
|
92,066 |
|
| Total property and equipment |
2,057,176 |
|
|
1,826,941 |
|
| Accumulated depreciation and amortization |
(1,161,987) |
|
|
(1,028,234) |
|
| Property and equipment, net |
$ |
895,189 |
|
|
$ |
798,707 |
|
Depreciation expense was $139.2 million, $136.6 million and $125.7 million for 2024, 2023 and 2022, respectively. Depreciation expense is primarily reflected in Depreciation and amortization on the consolidated statements of income.
Impairment expense was $0.4 million, $30.5 million and $8.1 million for 2024, 2023 and 2022, respectively. Impairment expense is reflected in Store closure and other costs, net on the consolidated statements of income.
7. Leases
Lease cost includes both the fixed and variable expenses recorded for leases. The components of lease cost are as follows:
|
|
|
|
|
|
|
|
|
|
|
|
|
|
|
|
|
|
|
|
|
|
|
|
|
|
|
Year Ended |
|
Classification |
|
December 29, 2024 |
|
December 31, 2023 |
|
January 1, 2023 |
| Operating lease cost: |
|
|
|
|
|
|
|
| Open locations |
Selling, general and administrative expenses (1) |
|
$ |
247,312 |
|
|
$ |
232,745 |
|
|
$ |
204,559 |
|
| Closed locations |
Store closure and other costs, net |
|
$ |
7,122 |
|
|
$ |
4,029 |
|
|
$ |
796 |
|
| Finance lease cost: |
|
|
|
|
|
|
|
| Amortization of Property and Equipment |
Depreciation and amortization |
|
1,128 |
|
|
1,062 |
|
|
966 |
|
| Interest on lease liabilities |
Interest expense |
|
747 |
|
|
816 |
|
|
852 |
|
| Variable lease cost: |
|
|
|
|
|
|
|
| Open locations |
Selling, general and administrative expenses (1) |
|
75,646 |
|
|
70,197 |
|
|
65,979 |
|
| Closed locations |
Store closure and other costs, net |
|
2,138 |
|
|
2,302 |
|
|
504 |
|
| Sublease income: |
|
|
|
|
|
|
|
| Open locations |
Selling, general and administrative expenses |
|
(831) |
|
|
(832) |
|
|
(833) |
|
| Closed locations |
Store closure and other costs, net |
|
$ |
(71) |
|
|
$ |
— |
|
|
$ |
— |
|
| Total net lease cost |
|
|
$ |
333,191 |
|
|
$ |
310,319 |
|
|
$ |
272,823 |
|
(1)Supply chain-related amounts of $20.3 million, $18.2 million and $12.4 million were included in cost of sales for 2024, 2023 and 2022, respectively.
Supplemental balance sheet information related to leases is as follows:
|
|
|
|
|
|
|
|
|
|
|
|
|
|
|
|
|
|
|
|
|
As Of |
|
Classification |
|
December 29, 2024 |
|
December 31, 2023 |
| Assets |
|
|
|
|
|
| Operating |
Operating lease assets |
|
$ |
1,466,903 |
|
|
$ |
1,322,854 |
|
| Finance |
Property and equipment, net |
|
6,161 |
|
|
7,127 |
|
| Total lease assets |
|
|
$ |
1,473,064 |
|
|
$ |
1,329,981 |
|
| Liabilities |
|
|
|
|
|
| Current: |
|
|
|
|
|
| Operating |
Current portion of operating lease liabilities |
|
$ |
150,400 |
|
|
$ |
126,271 |
|
| Finance |
Current portion of finance lease liabilities |
|
1,321 |
|
|
1,032 |
|
| Noncurrent: |
|
|
|
|
|
| Operating |
Long-term operating lease liabilities |
|
1,520,272 |
|
|
1,399,676 |
|
| Finance |
Long-term debt and finance lease liabilities |
|
7,248 |
|
|
8,685 |
|
| Total lease liabilities |
|
|
$ |
1,679,241 |
|
|
$ |
1,535,664 |
|
|
|
|
|
|
|
|
|
|
|
|
|
|
|
|
|
|
|
|
2024 |
|
2023 |
|
2022 |
| Weighted average remaining lease term (years): |
|
|
|
|
|
| Operating leases |
10.1 |
|
10.0 |
|
9.4 |
| Finance leases |
5.8 |
|
6.7 |
|
7.8 |
| Weighted average discount rate: |
|
|
|
|
|
| Operating leases |
7.0 |
% |
|
7.2 |
% |
|
7.1 |
% |
| Finance leases |
8.4 |
% |
|
8.3 |
% |
|
8.4 |
% |
Supplemental cash flow and other information related to leases is as follows:
|
|
|
|
|
|
|
|
|
|
|
|
|
|
|
|
|
|
|
Year Ended |
|
December 29, 2024 |
|
December 31, 2023 |
|
January 1, 2023 |
| Cash paid for amounts included in measurement of lease liabilities: |
|
|
|
|
|
| Operating cash flows for operating leases |
$ |
249,862 |
|
|
$ |
228,411 |
|
|
$ |
207,516 |
|
| Operating cash flows for finance leases |
747 |
|
|
816 |
|
|
852 |
|
|
|
|
|
|
|
| Lease assets obtained in exchange for lease liabilities: |
|
|
|
|
|
| Finance leases |
$ |
— |
|
|
$ |
809 |
|
|
$ |
— |
|
| Operating leases |
278,230 |
|
|
364,997 |
|
|
157,269 |
|
A summary of maturities of lease liabilities is as follows:
|
|
|
|
|
|
|
|
|
|
|
|
|
|
|
|
|
|
|
Operating Leases(1), (2) |
|
Finance Leases |
|
Total |
| 2025 |
$ |
250,665 |
|
|
$ |
1,991 |
|
|
$ |
252,656 |
|
| 2026 |
261,921 |
|
|
1,945 |
|
|
263,866 |
|
| 2027 |
247,453 |
|
|
2,032 |
|
|
249,485 |
|
| 2028 |
216,527 |
|
|
1,766 |
|
|
218,293 |
|
| 2029 |
221,926 |
|
|
1,281 |
|
|
223,207 |
|
| Thereafter |
1,176,921 |
|
|
1,960 |
|
|
1,178,881 |
|
| Total lease payments |
2,375,413 |
|
|
10,975 |
|
|
2,386,388 |
|
| Less: Imputed interest |
(704,741) |
|
|
(2,406) |
|
|
(707,147) |
|
| Total lease liabilities |
1,670,672 |
|
|
8,569 |
|
|
1,679,241 |
|
| Less: Current portion |
(150,400) |
|
|
(1,321) |
|
|
(151,721) |
|
| Long-term lease liabilities |
$ |
1,520,272 |
|
|
$ |
7,248 |
|
|
$ |
1,527,520 |
|
(1)Operating lease payments include $77.2 million related to periods covered by options to extend lease terms that are reasonably certain of being exercised and exclude $756.9 million of legally binding minimum lease payments for leases executed but not yet commenced.
(2)These amounts include rental income related to subtenant agreements under which we will receive $1.0 million in 2025, $1.0 million in 2026, $0.9 million in 2027, $0.4 million in 2028, $0.3 million in 2029 and $0.1 million thereafter.
8. Intangible Assets
A summary of the activity and balances in intangible assets is as follows:
|
|
|
|
|
|
|
|
|
|
|
|
|
|
|
|
|
|
|
Balance at January 1, 2023 |
|
Additions/Adjustments |
|
Balance at December 31, 2023 |
| Indefinite-lived trade names |
$ |
182,937 |
|
|
$ |
— |
|
|
$ |
182,937 |
|
| Indefinite-lived reacquired rights |
— |
|
|
23,100 |
|
|
23,100 |
|
| Indefinite-lived liquor licenses |
2,023 |
|
|
— |
|
|
2,023 |
|
| Total intangible assets |
$ |
184,960 |
|
|
$ |
23,100 |
|
|
$ |
208,060 |
|
|
|
|
|
|
|
|
|
|
|
|
|
|
|
|
|
|
|
| |
Balance at December 31, 2023 |
|
Additions/Adjustments |
|
Balance at December 29, 2024 |
| Indefinite-lived trade names |
$ |
182,937 |
|
|
$ |
— |
|
|
$ |
182,937 |
|
| Indefinite-lived reacquired rights |
23,100 |
|
|
— |
|
|
23,100 |
|
| Indefinite-lived liquor licenses |
2,023 |
|
|
34 |
|
|
2,057 |
|
| Total intangible assets |
$ |
208,060 |
|
|
$ |
34 |
|
|
$ |
208,094 |
|
There was no amortization expense in 2024, 2023 and 2022.
9. Goodwill
The Company’s goodwill balance was $381.8 million and $381.7 million as of December 29, 2024 and December 31, 2023, respectively. As of December 29, 2024 and December 31, 2023, the Company had no accumulated goodwill impairment losses. The goodwill was related to the acquisitions of Henry’s Farmers Market and Sunflower Farmers Market in 2011 and 2012, respectively, and the acquisition of Ronald Cohn, Inc. in 2023. For further details, see Note 27, "Business Combination."
10. Other Assets
As of December 29, 2024 and December 31, 2023, other assets of $13.2 million and $12.3 million, respectively, primarily consisted of deferred software as a service, capitalized durable supplies, self insurance receivables associated with general liability and workers’ compensation, utilities deposits, deferred financing costs, and miscellaneous other assets.
11. Accrued Liabilities
A summary of accrued liabilities is as follows:
|
|
|
|
|
|
|
|
|
|
|
|
|
As Of |
|
December 29, 2024 |
|
December 31, 2023 |
| Self-insurance reserves |
$ |
28,927 |
|
|
$ |
25,012 |
|
| Accrued occupancy related (CAM, property taxes, etc.) |
25,971 |
|
|
23,935 |
|
| Gift cards, net of breakage |
11,071 |
|
|
10,566 |
|
| Accrued sales, use and excise tax |
16,550 |
|
|
14,296 |
|
| Other accrued liabilities |
134,323 |
|
|
91,078 |
|
| Total |
$ |
216,842 |
|
|
$ |
164,887 |
|
12. Accrued Salaries and Benefits
A summary of accrued salaries and benefits is as follows:
|
|
|
|
|
|
|
|
|
|
|
|
|
As Of |
|
December 29, 2024 |
|
December 31, 2023 |
| Bonuses |
$ |
52,454 |
|
|
$ |
33,890 |
|
| Payroll |
23,205 |
|
|
20,652 |
|
| Vacation |
20,061 |
|
|
18,050 |
|
| Severance and other |
2,271 |
|
|
2,160 |
|
| Total |
$ |
97,991 |
|
|
$ |
74,752 |
|
13. Long-Term Debt and Finance Lease Liabilities
A summary of long-term debt and finance lease liabilities is as follows:
|
|
|
|
|
|
|
|
|
|
|
|
|
|
|
|
|
|
|
|
|
|
|
|
|
|
|
|
|
|
|
|
|
As Of |
| Facility |
|
Maturity |
|
Interest Rate |
|
December 29, 2024 |
|
December 31, 2023 |
| Senior secured debt |
|
|
|
|
|
|
|
|
$700.0 million Credit Agreement |
|
March 25, 2027 |
|
Variable |
|
$ |
— |
|
|
$ |
125,000 |
|
| Finance lease liabilities |
|
Various |
|
n/a |
|
7,248 |
|
|
8,685 |
|
| Long-term debt and finance lease liabilities |
|
|
|
|
|
$ |
7,248 |
|
|
$ |
133,685 |
|
Credit Agreement
The Company’s subsidiary, Sprouts Farmers Markets Holdings, LLC (“Intermediate Holdings”), is the borrower under a credit agreement entered into on March 25, 2022 (the “Credit Agreement”). The Credit Agreement provides for a revolving credit facility (the "Revolving Credit Facility") with an initial aggregate commitment of $700.0 million. Amounts outstanding under the Credit Agreement may be increased from time to time in accordance with an expansion feature set forth in the Credit Agreement.
The Company capitalized debt issuance costs of $3.4 million related to the Credit Agreement, which, combined with the remaining $0.5 million debt issuance costs in respect of that certain amended and restated credit agreement entered into on March 27, 2018, by and among the Company, Intermediate Holdings, certain lenders party thereto and JPMorgan Chase Bank, N.A., as administrative agent and collateral agent (the “Former Credit Facility”), which remained outstanding as of the time of Intermediate Holdings’ entry into the Credit Agreement, are being amortized on a straight-line basis to interest expense over the five-year term of the Credit Agreement.
The Credit Agreement provides for a $70.0 million letter of credit sub-facility (the "Letter of Credit Sub-Facility") and a $50.0 million swingline facility. Letters of credit issued under the Credit Agreement reduce the capacity of Intermediate Holdings to borrow under the Revolving Credit Facility. Letters of credit totaling $19.6 million have been issued as of December 29, 2024 under the Letter of Credit Sub-Facility, primarily to support the Company’s insurance programs.
Guarantees
Obligations under the Credit Agreement are guaranteed by the Company and substantially all of its existing and future wholly-owned material domestic subsidiaries, and are secured by first-priority security interests in substantially all of the assets of the Company, Intermediate Holdings, and the subsidiary guarantors, including, without limitation, a pledge by the Company of its equity interest in Intermediate Holdings.
Interest and Fees
Loans under the Credit Agreement will initially bear interest, at the Company's option, either at the Term SOFR (with a floor of 0.00%) plus a 0.10% SOFR adjustment and 1.00% per annum or base rate (with a floor of 0.00%) plus 0.00% per annum. The interest rate margins are subject to upward adjustments pursuant to a pricing grid based on the Company’s total net leverage ratio as set forth in the Credit Agreement and to upward or downward adjustments of up to 0.05% based upon the achievement of certain diversity and sustainability-linked metric thresholds, as set forth in the Credit Agreement.
Under the terms of the Credit Agreement, the Company is obligated to pay a commitment fee on the available unused amount of the commitments, which commitment fee ranges between 0.10% to 0.225% per annum, pursuant to a pricing grid based on the Company’s total net leverage ratio. The commitment fees are subject to upward or downward adjustments of up to 0.01% based upon the achievement of certain diversity and sustainability-linked metric thresholds, as set forth in the Credit Agreement.
As of December 29, 2024, loans outstanding under the Credit Agreement bore interest at Term SOFR (as defined in the Credit Agreement) plus a 0.10% SOFR adjustment and 0.95% per annum.
As of December 29, 2024, outstanding letters of credit issued under the Credit Agreement were subject to a participation fee of 0.95% per annum and an issuance fee of 0.125% per annum.
Payments and Borrowings
The Credit Agreement is scheduled to mature, and the commitments thereunder will terminate on March 25, 2027, subject to extensions as set forth therein.
The Company may prepay loans and permanently reduce commitments under the Credit Agreement at any time in agreed-upon minimum principal amounts, without premium or penalty (except SOFR breakage costs, if applicable).
In connection with the execution of the Credit Agreement, the Company's obligations under the Former Credit Facility were prepaid and terminated.
During 2024, the Company made no additional borrowings and made principal payments of $125.0 million, resulting in no outstanding debt under the Credit Agreement of as of December 29, 2024. During 2023, the Company made no additional borrowings and principal payments of $125.0 million, resulting in total outstanding debt under the Credit Agreement of $125.0 million as of December 31, 2023.
Covenants
The Credit Agreement contains financial, affirmative and negative covenants. The negative covenants include, among other things, limitations on the Company’s ability to:
•incur additional indebtedness;
•grant additional liens;
•enter into sale-leaseback transactions;
•make loans or investments;
•merge, consolidate or enter into acquisitions;
•pay dividends or distributions;
•enter into transactions with affiliates;
•enter into new lines of business;
•modify the terms of debt or other material agreements; and
•change its fiscal year.
Each of these covenants is subject to customary and other agreed-upon exceptions.
In addition, the Credit Agreement requires that the Company and its subsidiaries maintain a maximum total net leverage ratio not to exceed 3.75 to 1.00, which ratio may be increased from time to time in connection with certain permitted acquisitions pursuant to conditions as set forth in the Credit Agreement, and a minimum interest coverage ratio not to be less than 3.00 to 1.00.
Each of these covenants is tested on the last day of each fiscal quarter.
The Company was in compliance with all applicable covenants under the Credit Agreement as of December 29, 2024.
14. Other Long-Term Liabilities
A summary of other long-term liabilities is as follows:
|
|
|
|
|
|
|
|
|
|
|
|
|
As Of |
|
December 29, 2024 |
|
December 31, 2023 |
| Long-term portion of self-insurance reserves |
$ |
24,301 |
|
|
$ |
22,826 |
|
| Other |
13,958 |
|
|
13,444 |
|
| Total |
$ |
38,259 |
|
|
$ |
36,270 |
|
15. Self-Insurance Programs
The Company is self-insured for costs related to workers’ compensation, general liability and employee health benefits up to certain self-insured retentions and stop-loss limits. The Company establishes reserves for the ultimate obligation of reported and incurred but not reported (“IBNR”) claims. IBNR claims are estimated using various techniques, including analysis of historical trends and actuarial valuation methods.
The Company purchases coverage from third-party insurers for exposures in excess of certain stop-loss limits and recorded receivables of $2.1 million and $1.3 million from its insurance carriers for payments expected to be made in excess of self-insured retentions at December 29, 2024 and December 31, 2023, respectively. The Company recorded amounts for general liability, workers' compensation and team member health benefit liabilities of $53.2 million and $47.8 million at December 29, 2024 and December 31, 2023, respectively.
The following table summarizes the changes in the Company's self-insurance reserves through December 29, 2024:
|
|
|
|
|
|
|
|
|
|
|
|
|
|
|
|
|
|
|
Year Ended |
|
December 29, 2024 |
|
December 31, 2023 |
|
January 1, 2023 |
| Beginning Balance |
$ |
47,838 |
|
|
$ |
47,612 |
|
|
$ |
50,529 |
|
| Expenses, net of actuarial adjustments |
106,093 |
|
|
85,148 |
|
|
76,720 |
|
| Claim Payments |
(100,703) |
|
|
(84,922) |
|
|
(79,637) |
|
| Ending Balance |
53,228 |
|
|
47,838 |
|
|
47,612 |
|
| Less: Current portion |
(28,927) |
|
|
(25,012) |
|
|
(23,954) |
|
| Long-term portion |
$ |
24,301 |
|
|
$ |
22,826 |
|
|
$ |
23,658 |
|
The current portion of the self-insurance reserves is included in "Accrued Liabilities" and the long-term portion is included in "Other Long-Term Liabilities" in the accompanying consolidated balance sheets.
16. Defined Contribution Plan
The Company maintains the Sprouts Farmers Market, Inc. Employee 401(k) Savings Plan (the “Plan”), which is a defined contribution plan covering all eligible team members. Under the provisions of the Plan, participants may direct the Company to defer a portion of their compensation to the Plan, subject to the Internal Revenue Code limitations.
The Company provides for an employer matching contribution equal to 50% of each dollar contributed by the participants up to 6% of their eligible compensation.
The following table outlines the total expense recorded for the matching under the Plan, which is reflected in Selling, general and administrative expenses on the consolidated statements of income:
|
|
|
|
|
|
|
|
|
|
|
|
|
|
|
| Year Ended |
| December 29, 2024 |
|
December 31, 2023 |
|
January 1, 2023 |
| $ |
9,570 |
|
|
$ |
8,496 |
|
|
$ |
7,820 |
|
17. Income Taxes
Income Tax Provision
The income tax provision consists of the following:
|
|
|
|
|
|
|
|
|
|
|
|
|
|
|
|
|
|
|
Year Ended |
|
December 29, 2024 |
|
December 31, 2023 |
|
January 1, 2023 |
| U.S. Federal—current |
$ |
87,601 |
|
|
$ |
67,898 |
|
|
$ |
66,398 |
|
| U.S. Federal—deferred |
8,501 |
|
|
(5,927) |
|
|
1,028 |
|
| U.S. Federal—total |
96,102 |
|
|
61,971 |
|
|
67,426 |
|
| State—current |
27,805 |
|
|
21,902 |
|
|
19,823 |
|
| State—deferred |
2,190 |
|
|
1,011 |
|
|
900 |
|
| State—total |
29,995 |
|
|
22,913 |
|
|
20,723 |
|
| Total provision |
$ |
126,097 |
|
|
$ |
84,884 |
|
|
$ |
88,149 |
|
Tax Rate Reconciliation
Income tax provision differed from the amounts computed by applying the U.S. federal income tax rate to pre-tax income as a result of the following:
|
|
|
|
|
|
|
|
|
|
|
|
|
|
|
|
|
|
|
Year Ended |
|
December 29, 2024 |
|
December 31, 2023 |
|
January 1, 2023 |
| Federal statutory rate |
21.0 |
% |
|
21.0 |
% |
|
21.0 |
% |
| Increase (decrease) in income taxes resulting from: |
|
|
|
|
|
| State income taxes, net of federal benefit |
4.8 |
|
5.4 |
|
4.7 |
| Enhanced charitable contribution impact |
(0.9) |
|
(1.0) |
|
(0.9) |
| Non-deductible Executive Compensation |
1.4 |
|
1.4 |
|
0.9 |
| Benefit of federal tax credit |
(0.3) |
|
(0.7) |
|
(0.5) |
| Excess tax benefits from share based payments |
(1.1) |
|
(1.2) |
|
(0.4) |
| Other, net |
— |
|
(0.2) |
|
0.4 |
| Effective income tax rate |
24.9 |
% |
|
24.7 |
% |
|
25.2 |
% |
The effective income tax rate increased to 24.9% in 2024 from 24.7% in 2023 primarily due to a reduction in federal credits and reduced impact of other permanent items due to higher pre-tax income, offset by a reduction in state taxes due to a state valuation allowance recorded in the prior year. The effective income tax rate decreased to 24.7% in 2023 from 25.2% in 2022 primarily due to excess tax benefits related to the exercise or vesting of share-based awards partially offset by an increase in nondeductible executive compensation.
Excess tax benefits or detriments associated with share-based payment awards are recognized as income tax benefits or expense in the income statement. The tax effects of exercised or vested awards are treated as discrete items in the reporting period in which they occur.
The income tax benefit resulting from share-based awards was $7.0 million, $5.0 million and $1.7 million for 2024, 2023 and 2022, respectively, and is reflected as a reduction to the 2024, 2023 and 2022 income tax provision.
Deferred Taxes
Significant components of the Company’s deferred tax assets and deferred tax liabilities are as follows:
|
|
|
|
|
|
|
|
|
|
|
|
|
As Of |
|
December 29, 2024 |
|
December 31, 2023 |
| Deferred tax assets |
|
|
|
| Employee benefits |
$ |
22,163 |
|
|
$ |
18,329 |
|
| Tax credits |
— |
|
|
105 |
|
| Operating leases |
429,362 |
|
|
392,168 |
|
| Other lease related |
5,946 |
|
|
6,137 |
|
| Other accrued liabilities |
5,411 |
|
|
4,320 |
|
| Charitable contribution carryforward |
4,522 |
|
|
3,343 |
|
| Inventories and other |
2,881 |
|
|
2,905 |
|
| Total gross deferred tax assets |
470,285 |
|
|
427,307 |
|
| Less: Valuation Allowance |
(4,522) |
|
|
(3,343) |
|
| Total deferred tax assets, net of valuation allowance |
465,763 |
|
|
423,964 |
|
| Deferred tax liabilities |
|
|
|
| Depreciation and amortization |
(89,974) |
|
|
(80,765) |
|
| Intangible assets |
(70,978) |
|
|
(64,668) |
|
| Operating leases |
(376,994) |
|
|
(339,973) |
|
| Asset retirement obligations |
(876) |
|
|
(939) |
|
| Total gross deferred tax liabilities |
(538,822) |
|
|
(486,345) |
|
| Net deferred tax liability |
$ |
(73,059) |
|
|
$ |
(62,381) |
|
A valuation allowance is established for deferred tax assets if it is more likely than not that these items will either expire before the Company is able to realize their benefits, or that the realization of future deductions is uncertain.
Management performs an assessment over future taxable income to analyze whether it is more likely than not that some portion or all of the deferred tax assets will not be realized. The ultimate realization of deferred tax assets is dependent upon the generation of future taxable income during the periods in which those temporary differences become deductible.
The valuation allowance was $4.5 million and $3.3 million as of December 29, 2024 and December 31, 2023, respectively, related to contribution carryforwards that management does not believe will ultimately be realized.
The Company has evaluated all available positive and negative evidence and believes it is probable that all other the deferred tax assets will be realized and has not recorded any other valuation allowance against the Company’s deferred tax assets as of December 29, 2024 and December 31, 2023.
The Company applies the authoritative accounting guidance under ASC 740 for the recognition, measurement, classification and disclosure of uncertain tax positions taken or expected to be taken in a tax return.
A reconciliation of the beginning and ending amounts of unrecognized tax benefits is as follows:
|
|
|
|
|
|
|
|
|
|
|
|
|
|
|
|
|
|
|
As Of |
|
December 29, 2024 |
|
December 31, 2023 |
|
January 1, 2023 |
| Beginning balance |
$ |
477 |
|
|
$ |
1,119 |
|
|
$ |
1,770 |
|
| Additions based on tax positions related to the current year |
— |
|
|
58 |
|
|
43 |
|
| Additions based on tax positions related to prior years |
— |
|
|
— |
|
|
— |
|
| Reductions for settlements with taxing authorities |
— |
|
|
— |
|
|
(694) |
|
| Reduction due to lapse of applicable statute of limitations |
(245) |
|
|
(700) |
|
|
— |
|
|
|
|
|
|
|
| Ending balance |
$ |
232 |
|
|
$ |
477 |
|
|
$ |
1,119 |
|
The Company had unrecognized tax benefits (tax effected) of $0.2 million and $0.5 million as of December 29, 2024 and December 31, 2023, respectively. These would impact the effective tax rate if recognized.
The Company’s policy is to recognize accrued interest and penalties as a component of income tax expense.
The Company anticipates a decrease in the total amount of unrecognized tax benefits in the amount of $0.2 million during the next twelve months related to the passing of the applicable statute of limitations.
The Company files income tax returns with federal and state tax authorities within the United States. The general statute of limitations for income tax examinations remains open for federal tax returns for tax years 2018 through 2023 and state tax returns for the tax years 2019 through 2023 with few exceptions.
18. Commitments and Contingencies
Commitments
Real estate obligations, which include legally binding minimum lease payments for leases executed but not yet commenced, were $756.9 million as of December 29, 2024.
In addition to its lease obligations, the Company maintains certain purchase commitments with various vendors to ensure its operational needs are fulfilled. As of December 29, 2024, total future purchase commitments under noncancelable service and supply contracts were $37.5 million.
Commitments related to the Company’s business operations cover varying periods of time and are not individually significant. These commitments are expected to be fulfilled with no adverse consequences to the Company’s operations or financial conditions.
Contingencies
The Company is exposed to claims and litigation matters arising in the ordinary course of business and uses various methods to resolve these matters that are believed to best serve the interests of the Company’s stakeholders. The Company’s primary contingencies are associated with self-insurance obligations and litigation matters. Self-insurance liabilities require significant judgments, and actual claim settlements and associated expenses may differ from the Company’s current provisions for loss. See Note 15, “Self-Insurance Programs” for more information.
19. Capital Stock
Common stock
As of December 29, 2024, 99,255,036 shares of the Company’s common stock were issued and outstanding after the repurchase and retirement of 2,656,058 shares during 2024, as described below. As of December 29, 2024, 5,589,778 shares of common stock are reserved for issuance under the 2022 Incentive Plan (see Note 25, “Share-Based Compensation”).
The following table outlines the options exercised in exchange for the issuance of shares of common stock during 2024, 2023 and 2022:
|
|
|
|
|
|
|
|
|
|
|
|
|
|
|
|
|
|
|
Year Ended |
|
December 29, 2024 |
|
December 31, 2023 |
|
January 1, 2023 |
| Options exercised |
210,312 |
|
637,387 |
|
218,509 |
| Other share issuances under stock plans |
488,798 |
|
811,729 |
|
636,955 |
Share Repurchases
On May 22, 2024, the Company's board of directors authorized a new $600 million share repurchase program for its common stock. The new authorization replaced the Company's then-existing share repurchase authorization of $600 million that was due to expire on December 31, 2024, of which $119.3 million remained available upon its replacement, and under which no further shares may be repurchased. The following table outlines the common stock share repurchase programs authorized by the Company’s board of directors and the related repurchase activity and available authorization as of December 29, 2024:
|
|
|
|
|
|
|
|
|
|
|
|
|
|
|
|
|
|
|
|
|
|
|
|
|
|
|
| Effective date |
|
Expiration date |
|
Amount
authorized |
|
Cost of
repurchases |
|
Authorization
available |
| March 2, 2022 |
|
December 31, 2024 |
|
$ |
600,000 |
|
|
$ |
480,715 |
|
|
$ |
— |
|
| May 22, 2024 |
|
May 22, 2027 |
|
$ |
600,000 |
|
|
$ |
149,377 |
|
|
$ |
450,623 |
|
The shares under the Company’s repurchase programs may be purchased on a discretionary basis from time to time through the applicable expiration date, subject to general business and market conditions and other investment opportunities, through open market purchases, privately negotiated transactions, or other means, including through Rule 10b5-1 trading plans. The board’s authorization of the share repurchase programs does not obligate the Company to acquire any particular amount of common stock, and the repurchase programs may be commenced, suspended, or discontinued at any time.
Share repurchase activity under the Company’s repurchase programs for the periods indicated was as follows (total cost in thousands):
|
|
|
|
|
|
|
|
|
|
|
|
|
Year Ended |
|
December 29, 2024 |
|
December 31, 2023 |
| Number of common shares acquired |
2,656,058 |
|
5,864,246 |
| Average price per common share acquired |
$ |
90.57 |
|
|
$ |
35.00 |
|
| Total cost of common shares acquired |
$ |
240,562 |
|
|
$ |
205,262 |
|
Shares purchased under the Company’s repurchase programs were subsequently retired and the excess of the repurchase price over par value was charged to retained earnings. The cost of common shares repurchased included the 1% excise tax imposed as part of the Inflation Reduction Act of 2022.
Subsequent to December 29, 2024 and through February 18, 2025, the Company repurchased an additional 0.7 million shares of common stock for $93.7 million, excluding excise tax.
Preferred Stock
The Company’s board of directors is authorized, subject to limitations prescribed by Delaware law, to issue up to 10,000,000 shares of the Company’s preferred stock in one or more series, to establish from time to time the number of shares to be included in each series, to fix the designation, powers, preferences, and rights of the shares of each series and any of its qualifications, limitations, or restrictions, in each case without further action by the Company’s stockholders. The Company’s board of directors can also increase or decrease the number of shares of any series of preferred stock, but not below the number of shares of that series then outstanding. The Company’s board of directors may authorize the issuance of preferred stock with voting or conversion rights that could adversely affect the voting power or other rights of the holders of the common stock. The issuance of preferred stock, while providing flexibility in connection with possible acquisitions and other corporate purposes, could, among other things, have the effect of delaying, deferring, or preventing a change in control of the Company and might adversely affect the market price of the Company’s common stock and the voting and other rights of the holders of the Company’s common stock. The Company has no current plan to issue any shares of preferred stock.
20. Net Income per Share
The computation of basic net income per share is based on the number of weighted average shares outstanding during the period. The computation of diluted net income per share includes the dilutive effect of share equivalents consisting of incremental shares deemed outstanding from the assumed exercise of options and unvested RSUs. PSAs are included in the computation of diluted net income per share only to the extent that the underlying performance conditions are satisfied prior to the end of the reporting period or would be satisfied if the end of the reporting period were the end of the related performance period, and if the effect would be dilutive.
A reconciliation of the numerators and denominators of the basic and diluted net income per share calculations is as follows (in thousands, except per share amounts):
|
|
|
|
|
|
|
|
|
|
|
|
|
|
|
|
|
|
|
Year Ended |
|
December 29, 2024 |
|
December 31, 2023 |
|
January 1, 2023 |
| Basic net income per share: |
|
|
|
|
|
| Net income |
$ |
380,601 |
|
|
$ |
258,856 |
|
|
$ |
261,164 |
|
| Weighted average shares outstanding - basic |
100,363 |
|
102,479 |
|
108,232 |
| Basic net income per share |
$ |
3.79 |
|
|
$ |
2.53 |
|
|
$ |
2.41 |
|
| Diluted net income per share: |
|
|
|
|
|
| Net income |
$ |
380,601 |
|
|
$ |
258,856 |
|
|
$ |
261,164 |
|
| Weighted average shares outstanding - basic |
100,363 |
|
102,479 |
|
108,232 |
| Dilutive effect of share-based awards: |
|
|
|
|
|
| Assumed exercise of options to purchase shares |
497 |
|
343 |
|
337 |
| RSUs |
474 |
|
524 |
|
394 |
| PSAs |
45 |
|
44 |
|
176 |
| Weighted average shares and equivalent shares outstanding - diluted |
101,379 |
|
103,390 |
|
109,139 |
| Diluted net income per share |
$ |
3.75 |
|
|
$ |
2.50 |
|
|
$ |
2.39 |
|
For the year ended December 29, 2024, the Company had 0.2 million PSAs outstanding which were excluded from the computation of diluted net income per share as those awards would have been antidilutive or were performance awards with performance conditions not yet deemed met. For the year ended December 31, 2023 the Company had 0.2 million options and 0.4 million PSAs outstanding which were excluded from the computation of diluted net income per share as those awards would have been antidilutive or were performance awards with performance conditions not yet deemed met. For the year ended January 1, 2023, the Company had 0.2 million options and 0.3 million PSAs outstanding which were excluded from the computation of diluted net income per share as those awards would have been antidilutive or were performance awards with performance conditions not yet deemed met.
21. Derivative Financial Instruments
The Company did not have any outstanding interest rate swap agreements as of December 29, 2024 and December 31, 2023.
In December 2017, the Company entered into an interest rate swap agreement to manage its cash flow associated with variable interest rates. This forward contract was designated and qualified as a cash flow hedge, and its change in fair value was recorded as a component of other comprehensive income and reclassified into earnings in the same period or periods in which the forecasted transaction occurred. The forward contract consisted of five cash flow hedges with a notional dollar amount of $250.0 million, and each had a length of one year and matured annually from 2018 to 2022.
The gain or loss on these derivative instruments was recognized in other comprehensive income, net of tax, with the portion related to current period interest payments reclassified to Interest expense, net on the consolidated statements of income. The following table summarizes these losses classified on the consolidated statements of income:
|
|
|
|
|
|
|
|
|
|
|
|
|
|
|
|
|
|
|
Year Ended |
|
December 29, 2024 |
|
December 31, 2023 |
|
January 1, 2023 |
| Consolidated Statements of Income Classification |
|
|
|
|
|
| Interest expense, net |
$ |
— |
|
|
$ |
— |
|
|
$ |
2,021 |
|
22. Comprehensive Income
The Company did not have any changes in accumulated other comprehensive income for the years ended December 29, 2024, or December 31, 2023. The following table presents the changes in accumulated other comprehensive income (loss) for the year ended January 1, 2023:
|
|
|
|
|
|
|
Cash Flow
Hedges |
| Balance at January 2, 2022 |
$ |
(3,758) |
|
| Other comprehensive income, net of tax |
|
Unrealized gains on cash flow hedging activities, net of income tax of $1,819 |
5,259 |
|
Reclassification of net losses on cash flow hedges to net income, net of income tax of ($520) |
(1,501) |
|
| Total other comprehensive income |
3,758 |
|
| Balance at January 1, 2023 |
$ |
— |
|
Amounts reclassified from accumulated other comprehensive income (loss) to net income were included within Interest expense, net on the consolidated statements of income.
23. Fair Value Measurements
The Company records its financial assets and liabilities in accordance with the framework for measuring fair value in accordance with GAAP. This framework establishes a fair value hierarchy that prioritizes the inputs used to measure fair value:
Level 1: Quoted prices for identical instruments in active markets.
Level 2: Quoted prices for similar instruments in active markets; quoted prices for identical or similar instruments in markets that are not active; and model-derived valuations in which all significant inputs and significant value drivers are observable in active markets.
Level 3: Valuations derived from valuation techniques in which one or more significant inputs or significant value drivers are unobservable.
Fair value measurements of nonfinancial assets and nonfinancial liabilities are primarily used in the impairment analysis of goodwill, intangible assets, and long-lived assets.
The Company did not have any financial liabilities measured at fair value on a recurring basis as of December 29, 2024. The following table presents the Company’s fair value hierarchy for the Company’s financial assets and liabilities measured at fair value on a recurring basis as of December 31, 2023:
|
|
|
|
|
|
|
|
|
|
|
|
|
|
|
|
|
|
|
|
|
|
|
|
|
|
|
| December 31, 2023 |
|
Level 1 |
|
Level 2 |
|
Level 3 |
|
Total |
| Long-term debt |
|
$ |
— |
|
|
$ |
125,000 |
|
|
$ |
— |
|
|
$ |
125,000 |
|
| Total financial liabilities |
|
$ |
— |
|
|
$ |
125,000 |
|
|
$ |
— |
|
|
$ |
125,000 |
|
The determination of fair values of certain tangible and intangible assets for purposes of the Company’s goodwill or long-lived asset impairment evaluation as described above is based upon Level 3 inputs. When necessary, the Company uses third party market data and market participant assumptions to derive the fair value of its asset groupings, which primarily include right-of-use lease assets and property and equipment. For further details, see Note 3, “Significant Accounting Policies – Impairment of Long-lived Assets”.
Cash, cash equivalents, and restricted cash, accounts receivable, prepaid expenses and other current assets, accounts payable, accrued liabilities, and accrued salaries and benefits approximate fair value because of the short maturity of those instruments. Based on comparable open market transactions, the fair value of the long-term debt approximated carrying value as of December 31, 2023.
24. Segments
The Company has one operating segment, and therefore, one reportable segment: healthy grocery stores. The Company derives all its revenues from the sale of products at its various store locations across the United States. The accounting policies of the segment are the same as described in the summary of significant accounting policies. The Company’s chief operating decision maker (“CODM”) is the chief executive officer. The CODM assesses performance and allocates resources based on consolidated net income. The measure of segment assets is reported on the balance sheet as total consolidated assets.
In accordance with ASC 280, the following table represents the significant expense and key metrics reviewed by the CODM:
|
|
|
|
|
|
|
|
|
|
|
|
|
|
|
|
|
|
|
Year Ended |
|
December 29, 2024 |
|
December 31, 2023 |
|
January 1, 2023 |
| Net Sales |
$ |
7,719,290 |
|
|
$ |
6,837,384 |
|
|
$ |
6,404,223 |
|
| Less: |
|
|
|
|
|
| Cost of sales |
4,777,799 |
|
|
4,315,543 |
|
|
4,055,659 |
|
| Direct store expenses |
1,958,392 |
|
|
1,723,726 |
|
|
1,608,611 |
|
Other segment items (1) |
478,602 |
|
|
447,884 |
|
|
381,593 |
|
| Interest expense, net |
(2,201) |
|
|
6,491 |
|
|
9,047 |
|
| Income tax provision |
126,097 |
|
|
84,884 |
|
|
88,149 |
|
| Net income |
$ |
380,601 |
|
|
$ |
258,856 |
|
|
$ |
261,164 |
|
(1) Other segment items include non-store selling, general, and administrative expenses, depreciation and amortization, store closure costs, and other overhead expenses.
The Company categorizes the varieties of products it sells as perishable and non-perishable. Perishable product categories include produce, meat and meat alternatives, seafood, deli, bakery, floral and dairy and dairy alternatives. Non-perishable product categories include grocery, vitamins and supplements, bulk items, frozen foods, beer and wine, and natural health and body care.
In accordance with ASC 606, the following table represents a disaggregation of revenue for 2024, 2023 and 2022:
|
|
|
|
|
|
|
|
|
|
|
|
|
|
|
|
|
|
|
|
|
|
|
|
|
|
|
|
|
|
|
|
|
|
|
|
|
Year Ended |
|
December 29, 2024 |
|
December 31, 2023 |
|
January 1, 2023 |
| Perishables |
$ |
4,424,762 |
|
|
57.3 |
% |
|
$ |
3,915,971 |
|
|
57.3 |
% |
|
$ |
3,717,642 |
|
|
58.0 |
% |
| Non-Perishables |
3,294,528 |
|
|
42.7 |
% |
|
2,921,413 |
|
|
42.7 |
% |
|
2,686,581 |
|
|
42.0 |
% |
| Net sales |
$ |
7,719,290 |
|
|
100.0 |
% |
|
$ |
6,837,384 |
|
|
100.0 |
% |
|
$ |
6,404,223 |
|
|
100.0 |
% |
25. Share-Based Compensation
2022 Incentive Plan
In March 2022, the Company’s board of directors adopted the Sprouts Farmers Market, Inc. 2022 Omnibus Incentive Compensation Plan (the “2022 Incentive Plan”), which became effective May 25, 2022, upon approval by the Company’s stockholders. The 2022 Incentive Plan provides team members of the Company, certain consultants and advisors who perform services for the Company, and non-employee members of the Company's board of directors with the opportunity to receive grants of equity awards, including stock options, RSUs, PSAs, and other stock-based awards. The 2022 Incentive Plan replaced the 2013 Incentive Plan (as described below).
Awards Granted under the 2022 Incentive Plan
The Company granted the following awards during 2024 and 2023 under the 2022 Incentive Plan:
|
|
|
|
|
|
|
|
|
|
|
|
|
|
|
|
|
|
|
|
|
| Grant Date |
|
RSUs |
|
PSAs |
|
Options |
| March 19, 2024 |
|
272,855 |
|
103,584 |
|
135,783 |
| June 4, 2024 |
|
1,538 |
|
— |
|
— |
| September 4, 2024 |
|
15,024 |
|
— |
|
— |
| Total |
|
289,417 |
|
103,584 |
|
135,783 |
| Weighted-average grant date fair value |
|
$ |
63.14 |
|
|
$ |
61.15 |
|
|
$ |
23.50 |
|
| Weighted-average exercise price |
|
— |
|
|
— |
|
|
$ |
61.15 |
|
|
|
|
|
|
|
|
|
|
|
|
|
|
|
|
|
|
|
|
|
|
| Grant Date |
|
RSUs |
|
PSAs |
|
Options |
| March 14, 2023 |
|
491,729 |
|
172,059 |
|
221,085 |
| May 1, 2023 |
|
2,931 |
|
— |
|
— |
| June 7, 2023 |
|
1,271 |
|
— |
|
— |
| September 5, 2023 |
|
6,408 |
|
— |
|
— |
| September 11, 2023 |
|
10,204 |
|
— |
|
— |
| October 30, 2023 |
|
1,512 |
|
— |
|
— |
| Total |
|
514,055 |
|
172,059 |
|
221,085 |
| Weighted-average grant date fair value |
|
$ |
33.21 |
|
|
$ |
32.95 |
|
|
$ |
12.63 |
|
| Weighted-average exercise price |
|
— |
|
|
— |
|
|
$ |
32.95 |
|
The aggregate number of shares of common stock that may be issued to team members and directors under the 2022 Incentive Plan may not exceed 6,600,000, subject to the following adjustments. If any awards granted under the 2022 Incentive Plan, terminate, expire, or are cancelled, forfeited, exchanged, or surrendered without having been exercised, vested or paid in shares, the shares will again be available for purposes of the 2022 Incentive Plan. In addition, the number of shares subject to outstanding awards under the Sprouts Farmers Market, Inc. 2013 Incentive Plan (the “2013 Incentive Plan”) that terminate, expire, are paid in cash, or are cancelled, forfeited, exchanged, or surrendered without having been exercised, vested, or paid in shares under the 2013 Incentive Plan after the effective date of the 2022 Incentive Plan will be available for issuance under the 2022 Incentive Plan.
As of December 29, 2024, there were 1,064,137 stock awards outstanding and 5,589,778 shares remaining available for issuance under the 2022 Incentive Plan.
2013 Incentive Plan
Prior to the adoption of the 2022 Incentive Plan, the 2013 Incentive Plan served as the umbrella plan for the Company’s share-based and cash-based incentive compensation programs for its directors, officers and other team members. Upon stockholder approval of the 2022 Incentive Plan on May 25, 2022, no further awards will be granted under the 2013 Incentive Plan, but awards outstanding under the 2013 Incentive Plan will remain outstanding in accordance with their terms and the terms of the 2013 Incentive Plan.
The RSUs generally vest either one-third each year for three years or one-half each year for two years for team members. RSUs granted to independent members of the Company’s board of directors cliff vest in one year. The options expire seven years from grant date. The PSAs are described below.
Stock Options
Outstanding options only become immediately vested in the event of a change in control (as defined in the applicable team member award agreement) if the grants are not continued or assumed by the acquirer on a substantially equivalent basis. If the options and awards continue or are assumed on a substantially equivalent basis, but employment is terminated by the Company or an acquirer without cause or by the team member for good reason (as such terms are defined in the applicable team member award agreement) within 24 months following the change in control, such options or awards will become immediately vested upon such termination. Under all other scenarios, the awards continue to vest per the schedule outlined in the applicable award agreement.
Shares issued for option exercises are newly issued shares.
The estimated weighted average fair values of options granted during 2024, 2023 and 2022 were $23.50, $12.63 and $10.58, respectively, and were calculated using the following assumptions in the table below:
|
|
|
|
|
|
|
|
|
|
|
|
|
|
|
|
|
|
|
2024 |
|
2023 |
|
2022 |
| Dividend yield |
0.00 |
% |
|
0.00 |
% |
|
0.00 |
% |
| Expected volatility |
38.41 |
% |
|
39.48 |
% |
|
36.59 |
% |
| Risk free interest rate |
4.31 |
% |
|
3.78 |
% |
|
2.12 |
% |
| Expected term, in years |
4.50 |
|
4.50 |
|
4.50 |
The grant date weighted average fair value of the 0.3 million options issued but not vested as of December 29, 2024 was $16.90. The grant date weighted average fair value of the 0.4 million options issued but not vested as of December 31, 2023 was $10.84. The grant date weighted average fair value of the 1.0 million options issued but not vested as of January 1, 2023 was $6.66.
The following table summarizes grant date weighted average fair value of options granted and options forfeited:
|
|
|
|
|
|
|
|
|
|
|
|
|
|
|
|
|
|
|
Year Ended |
|
December 29, 2024 |
|
December 31, 2023 |
|
January 1, 2023 |
| Grant date weighted average fair value of options granted |
$ |
23.50 |
|
|
$ |
12.63 |
|
|
$ |
10.58 |
|
| Grant date weighted average fair value of options forfeited |
$ |
11.87 |
|
|
$ |
10.98 |
|
|
$ |
8.66 |
|
Expected volatility for option grants and modifications are calculated based upon the Company’s historical volatility data over a time frame consistent with the expected life of the awards. The expected term is estimated based on the expected period that the options are anticipated to be outstanding after initial grant until exercise or expiration based upon various factors including the contractual terms of the awards and vesting schedules.
The expected risk-free rate is based on the U.S. Treasury yield curve rates in effect at the time of the grant using the term most consistent with the expected life of the award. Dividend yield was estimated at zero as the Company does not anticipate making regular future distributions to stockholders. The total intrinsic value of options exercised was $12.2 million for each of fiscal 2024 and 2023 and $1.8 million for fiscal 2022.
The following table summarizes option activity during 2024:
|
|
|
|
|
|
|
|
|
|
|
|
|
|
|
|
|
|
|
|
|
|
|
|
|
Number of
Options |
|
Weighted
Average
Exercise
Price |
|
Weighted
Average
Remaining
Contractual
Life (In Years) |
|
Aggregate
Intrinsic
Value |
| Outstanding at December 31, 2023 |
854,375 |
|
$ |
25.70 |
|
|
|
|
|
| Granted |
135,783 |
|
61.15 |
|
|
|
|
|
| Forfeited |
(16,060) |
|
32.41 |
|
|
|
|
|
| Exercised |
(210,312) |
|
23.25 |
|
|
|
|
$ |
12,219 |
|
| Outstanding at December 29, 2024 |
763,786 |
|
32.54 |
|
|
4.17 |
|
$ |
72,378 |
|
| Exercisable—December 29, 2024 |
446,479 |
|
23.86 |
|
|
3.26 |
|
$ |
46,186 |
|
| Vested/Expected to vest—December 29, 2024 |
763,786 |
|
$ |
32.54 |
|
|
4.17 |
|
$ |
72,378 |
|
RSUs
Outstanding RSUs only become immediately vested in the event of a change in control (as defined in the applicable team member award agreement) if the awards are not continued or assumed by the acquirer on a substantially equivalent basis. If the awards continue or are assumed on a substantially equivalent basis, but employment is terminated by the Company or an acquirer without cause or by the team member for good reason (as such terms are defined in the applicable team member award agreement) within 24 months following the change in control, such awards will become immediately vested upon such termination. Under all other scenarios, the awards continue to vest per the schedule outlined in the applicable award agreement.
Shares issued for RSU vesting are newly issued shares.
The fair value for restricted stock units is calculated based on the closing stock price on the date of grant. The total grant date fair value of RSUs vested during 2024, 2023 and 2022 was $15.2 million, $13.3 million and $9.2 million, respectively.
The following table summarizes the weighted average grant date fair value of RSUs awarded during 2024, 2023 and 2022:
|
|
|
|
|
|
|
|
|
|
|
|
|
|
|
|
|
|
|
Year Ended |
|
December 29, 2024 |
|
December 31, 2023 |
|
January 1, 2023 |
| RSUs awarded |
$ |
63.14 |
|
|
$ |
33.21 |
|
|
$ |
31.01 |
|
The following table summarizes RSU activity during 2024:
|
|
|
|
|
|
|
|
|
|
|
|
|
Number of
RSUs |
|
Weighted
Average
Grant Date
Fair Value |
| Outstanding at December 31, 2023 |
868,196 |
|
$ |
31.79 |
|
| Awarded |
289,417 |
|
63.14 |
|
| Vested |
(488,798) |
|
31.11 |
|
| Forfeited |
(58,400) |
|
40.76 |
|
| Outstanding at December 29, 2024 |
610,415 |
|
$ |
46.33 |
|
PSAs
PSAs granted in 2020 were subject to the Company achieving certain earnings before taxes (“EBT”) performance targets for the 2022 fiscal year. The criteria was based on a range of performance targets in which grantees may earn 0% to 200% of the base number of awards granted. The performance conditions with respect to fiscal year 2022 EBT were deemed to have been met, and the PSAs vested at the maximum pay out level on the third anniversary of the grant date (March 2023). During the year ended December 31, 2023, 268,699 of the 2020 PSAs vested. There were no outstanding 2020 PSAs as of December 29, 2024.
PSAs granted in 2021 are subject to the Company achieving certain EBIT performance targets for the 2023 fiscal year. The criteria is based on a range of performance targets in which grantees may earn 0% to 200% of the base number of awards granted. The performance conditions with respect to 2023 EBIT were deemed not to have been met. Accordingly, no performance shares vested on the third anniversary of the grant date (March 2024). There were no outstanding 2021 PSAs as of December 29, 2024.
PSAs granted in 2022 are subject to the Company achieving certain EBIT performance targets for the 2024 fiscal year. The criteria is based on a range of performance targets in which grantees may earn 0% to 200% of the base number of awards granted. Subsequent to December 29, 2024, the performance conditions with respect to 2024 EBIT were deemed to have been met, and PSAs will vest at 150% payout level on the third anniversary of the grant date (March 2025).
PSAs granted in 2023 are subject to the Company achieving certain EBIT performance targets for the 2025 fiscal year. The criteria is based on a range of performance targets in which grantees may earn 0% to 200% of the base number of awards granted. If performance conditions are met, the applicable number of performance shares will vest on the third anniversary of the grant date (March 2026).
PSAs granted in 2024 are subject to the Company achieving certain EBIT performance targets for the 2026 fiscal year. The criteria is based on a range of performance targets in which grantees may earn 0% to 200% of the base number of awards granted. If performance conditions are met, the applicable number of performance shares will vest on the third anniversary of the grant date (March 2027).
The PSAs only become immediately vested in the event of a change in control (as defined in the applicable team member award agreement) if the awards are not continued or assumed by the acquirer on a substantially equivalent basis. If the awards continue or are assumed on a substantially equivalent basis, but employment is terminated by the Company or an acquirer without cause or by the team member for good reason (as such terms are defined in the applicable team member award agreement) within 24 months following the change in control, such awards will become immediately vested upon such termination. Under all other scenarios, the awards continue to vest per the schedule outlined in the applicable team member award agreement.
Shares issued for PSA vesting are newly issued shares.
The fair value for PSAs is calculated based on the closing stock price on the date of grant.
The total grant date fair value of PSAs granted during 2024 was $6.3 million. No PSAs vested during 2024. The total grant date fair value of performance shares forfeited and not earned during 2024 was $4.2 million. The total grant date fair value of the 0.4 million PSAs issued but not released as of December 29, 2024 was $14.9 million.
The total grant date fair value of PSAs granted during 2023 was $5.7 million. The total grant date fair value of PSAs vested during 2023 was $4.5 million. The total grant date fair value of performance shares forfeited or not earned during 2023 was $1.1 million. The total grant date fair value of the 0.4 million PSAs issued but not released as of December 31, 2023 was $12.9 million.
The total grant date fair value of PSAs granted during 2022 was $5.1 million. The total grant date fair value of PSAs vested during 2022 was $4.1 million. The total grant date fair value of performance shares forfeited or not earned during 2022 was $0.8 million. The total grant date fair value of the 0.5 million PSAs issued but not released as of January 1, 2023 was $11.1 million.
The following table summarizes PSA activity during 2024:
|
|
|
|
|
|
|
|
|
|
|
|
|
Number of
PSAs |
|
Weighted
Average
Grant Date
Fair Value |
| Outstanding at December 31, 2023 |
436,510 |
|
$ |
29.66 |
|
| Awarded |
103,584 |
|
61.15 |
|
| Vested |
— |
|
— |
|
| Forfeited |
(24,242) |
|
25.53 |
|
| PSAs earned |
— |
|
— |
|
| PSAs not earned |
(145,574) |
|
24.42 |
|
| Outstanding at December 29, 2024 |
370,278 |
|
$ |
40.37 |
|
Share-Based Compensation Expense
The Company presents share-based compensation expense in Selling, general and administrative expenses on the Company’s consolidated statements of income. The amount recognized was as follows:
|
|
|
|
|
|
|
|
|
|
|
|
|
|
|
|
|
|
|
Year Ended |
|
December 29, 2024 |
|
December 31, 2023 |
|
January 1, 2023 |
| Share-based compensation expense |
$ |
28,417 |
|
|
$ |
18,898 |
|
|
$ |
16,603 |
|
| Income tax benefit |
(3,647) |
|
|
(3,007) |
|
|
(2,495) |
|
| Net share-based compensation expense |
$ |
24,770 |
|
|
$ |
15,891 |
|
|
$ |
14,108 |
|
As of December 29, 2024, total unrecognized compensation expense and remaining weighted average recognition period related to outstanding share-based awards were as follows:
|
|
|
|
|
|
|
|
|
|
|
|
|
Unrecognized
compensation
expense |
|
Remaining
weighted
average
recognition
period |
| Options |
$ |
3,424 |
|
|
1.5 |
| RSUs |
17,302 |
|
|
1.4 |
| PSAs |
13,568 |
|
|
1.2 |
| Total unrecognized compensation expense at December 29, 2024 |
$ |
34,294 |
|
|
|
During 2024, 2023 and 2022, the Company received $4.9 million, $11.5 million and $5.0 million in cash proceeds from the exercise of options, respectively.
The Company recorded tax benefits of $7.0 million, $5.0 million and $1.7 million during 2024, 2023 and 2022, respectively, resulting from share-based awards.
26. Store Closures
In February 2023, the Company's board of directors approved the closing of 11 stores, all of which were closed during 2023. These stores, on average, were approximately 30% larger than the Company's current prototype format and were underperforming financially. The closure of these stores resulted in a charge of $27.8 million in 2023 related to the impairment of leasehold improvements and right-of-use assets and was reflected in Store closure and other costs, net on the consolidated statements of income. The impairment charge represented the excess of the carrying value over the estimated fair value of each store's asset group. Accelerated depreciation on the closed stores' assets during 2023 was $5.9 million, and was reflected in Depreciation and amortization on the consolidated statements of income. Severance expense during 2023 was immaterial.
No stores were closed during 2024 and all lease costs associated with our closed locations, for which a lease remains in effect, are included within Store closure and other costs, net. See Note 7, "Leases", for amounts incurred during 2024.
27. Business Combination
On March 20, 2023, the Company completed its acquisition of Ronald Cohn, Inc., a corporation that owned two stores located in California operating under the ‘Sprouts Farmers Market’ name pursuant to a legacy trademark license arrangement. The aggregate consideration paid in the transaction consisted of 0.6 million of the Company’s common shares valued at $18.1 million using the closing price of the Company's common stock on March 20, 2023 and cash consideration of $13.0 million.
The Company accounted for this transaction as a business combination in accordance with the acquisition method of accounting, which requires that the purchase price be allocated to the assets and liabilities acquired based on their estimated fair values as of the acquisition date. Acquisition-related costs were immaterial and were expensed as incurred. The financial results of the acquired stores have been included in the Company’s consolidated financial statements from the date of acquisition. The acquired stores' results of operations were not material to the Company's consolidated results.
The net purchase price was allocated to the net tangible assets of ($4.9) million and a reacquired right intangible asset of $23.1 million based on their fair values on the acquisition date. The remaining unallocated net purchase price of $12.9 million was recorded as goodwill. Goodwill represents the future economic benefits to the Company from the acquisition, which include the Company's ability to fully control the Sprouts Farmers Market brand by termination of the legacy trademark license agreement and allowing further expansion opportunities in Southern California. The goodwill is not expected to be deductible for tax purposes. The final allocation of the purchase price consideration to the assets acquired and liabilities assumed has been completed and included an immaterial amount of measurement period adjustments.
Item 9. Changes In and Disagreements with Accountants on Accounting and Financial Disclosure
None.
Item 9A. Controls and Procedures
Evaluation of Disclosure Controls and Procedures
We maintain a system of disclosure controls and procedures (as defined in Rules 13a-15(e) and 15d-15(e) under the Exchange Act) designed to ensure that the information required to be disclosed by us in the reports that we file or submit under the Exchange Act, is recorded, processed, summarized and reported within the time periods specified in the rules and forms of the SEC, and is accumulated and communicated to our management, including our Chief Executive Officer (our principal executive officer) and our Chief Financial Officer (our principal financial officer), as appropriate, to allow timely decisions regarding required disclosure.
Our management, with the participation of our Chief Executive Officer and Chief Financial Officer, has evaluated the effectiveness of our disclosure controls and procedures under the Exchange Act as of December 29, 2024, the end of the period covered by this Annual Report on Form 10-K. Based upon that evaluation, our Chief Executive Officer and Chief Financial Officer concluded that, as of December 29, 2024, our disclosure controls and procedures were effective.
Management’s Annual Report on Internal Control Over Financial Reporting
Our management is responsible for establishing and maintaining adequate internal control over financial reporting as defined in Rules 13a-15(f) and 15d-15(f) under the Exchange Act. Our internal control over financial reporting is designed to provide reasonable assurance regarding the reliability of financial reporting and the preparation of financial statements for external purposes in accordance with generally accepted accounting principles.
Because of its inherent limitations, internal control over financial reporting may not prevent or detect misstatements. Also, projections of any evaluation of effectiveness to future periods are subject to the risk that controls may become inadequate because of changes in conditions, or that the degree of compliance with the policies or procedures may deteriorate.
Under the supervision and with the participation of our management, including our Chief Executive Officer and Chief Financial Officer, we assessed the effectiveness of our internal control over financial reporting as of December 29, 2024, using the criteria set forth by the Committee of Sponsoring Organizations of the Treadway Commission (COSO) in Internal Control—Integrated Framework (2013 Framework). Based on this assessment, our management has concluded that our internal control over financial reporting was effective as of December 29, 2024.
PricewaterhouseCoopers LLP, our independent registered public accounting firm, assessed the effectiveness of our internal control over financial reporting as of December 29, 2024, as stated in the firm’s report which is included with the consolidated financial statements in Item 8 of this Annual Report on Form 10-K.
Changes in Internal Control Over Financial Reporting
There were no changes in our internal control over financial reporting that occurred during the quarterly period ended December 29, 2024 that have materially affected, or are reasonably likely to materially affect, our internal control over financial reporting.
Item 9B. Other Information
During the fourth quarter of 2024, none of our directors or executive officers adopted or terminated a Rule 10b5-1 Trading Plan, or a “non-Rule 10b5-1 trading arrangement” (as defined in Item 408(c) of Regulation S-K).
Item 9C. Disclosure Regarding Foreign Jurisdictions that Prevent Inspection Item 10.
Not Applicable.
PART III
Directors, Executive Officers and Corporate Governance
The information required by this item will be contained in our definitive Proxy Statement to be filed with the SEC in connection with our 2025 Annual Meeting of Stockholders (referred to as the “Proxy Statement”), which is expected to be filed not later than 120 days after the end of our fiscal year ended December 29, 2024, and is incorporated herein by reference.
We have adopted a Code of Ethics – Principal Executive Officer and Senior Financial Officers (referred to as the “Code”) that applies to our principal executive officer, principal financial officer and principal accounting officer and controller. The Code is publicly available on our website at https://investors.sprouts.com/esg/governance-documents/.
We will provide disclosure of future updates, amendments or waivers from the Code by posting them to our investor relations website located at investors.sprouts.com. The information contained on or accessible through our website is not incorporated by reference into this Annual Report on Form 10-K.
Item 11. Executive Compensation
The information required by this Item will be set forth in the Proxy Statement and is incorporated herein by reference.
Item 12. Security Ownership of Certain Beneficial Owners and Management and Related Stockholder Matters
The information required by this Item will be set forth in the Proxy Statement and is incorporated herein by reference.
Item 13. Certain Relationships and Related Transactions, and Director Independence
The information required by this Item will be set forth in the Proxy Statement and is incorporated herein by reference.
Item 14. Principal Accountant Fees and Services
The information required by this Item will be set forth in the Proxy Statement and is incorporated herein by reference.
PART IV
Item 15. Exhibits and Financial Statement Schedules
(a)Documents filed as part of this report:
1.Financial Statements: The information concerning our financial statements and Report of Independent Registered Public Accounting Firm required by this Item is incorporated by reference herein to the section of this Annual Report on Form 10-K in Item 8, titled “Financial Statements and Supplementary Data.”
2.Financial Statement Schedules: No schedules are required.
3.Exhibits: See Item 15(b) below.
(b)Exhibits:
|
|
|
|
|
|
|
Exhibit
Number
|
Description |
|
|
| 2.1 |
|
|
|
| 3.1 |
|
|
|
| 3.2 |
|
|
|
| 4.1 |
|
|
|
| 10.1* |
|
|
|
| 10.1.1* |
|
|
|
| 10.1.2(a)* |
|
|
|
| 10.1.2(b)* |
|
|
|
| 10.1.2(c)* |
|
|
|
| 10.1.2(d)* |
|
|
|
| 10.1.3(a)* |
|
|
|
| 10.1.3(b)* |
|
|
|
| 10.1.3(c)* |
|
|
|
| 10.1.3(d)* |
|
|
|
| 10.1.3(e)* |
|
|
|
| 10.1.3(f)* |
|
|
|
| 10.1.4* |
|
|
|
| 10.2† |
|
|
|
| 10.3* |
|
|
|
|
|
|
|
|
|
| 10.4 |
Credit Agreement, dated as of March 25, 2022, among Sprouts Farmers Market, Inc., Sprouts Farmers Markets Holdings, LLC, the lenders named therein, Bank of America, N.A., as administrative agent, issuing bank and swingline lender, JPMorgan Chase Bank, N.A., as sustainability structuring agent, BMO Capital Markets Corp., JPMorgan Chase Bank, N.A. and Wells Fargo Securities, LLC as syndication agents, Truist Bank and PNC Bank, N.A. as documentation agents, and BofA Securities, Inc., BMO Capital Markets Corp., JPMorgan Chase Bank, N.A. and Wells Fargo Securities, LLC as joint bookrunners and joint lead arrangers (16) |
|
|
| 10.5* |
|
|
|
| 10.6* |
|
|
|
| 10.7† |
|
|
|
| 10.8* |
|
|
|
| 10.9* |
|
|
|
| 10.9.1(a)* |
|
|
|
| 10.9.1(b)* |
|
|
|
| 10.9.2* |
|
|
|
| 10.9.3* |
|
|
|
| 10.9.4* |
|
|
|
| 10.9.5* |
|
|
|
| 10.10* |
|
|
|
| 10.11* |
|
|
|
| 19 |
|
|
|
| 21.1 |
|
|
|
| 23.1 |
|
|
|
| 31.1 |
|
|
|
| 31.2 |
|
|
|
| 32.1 |
|
|
|
| 32.2 |
|
|
|
|
|
|
|
|
|
| 97.1 |
|
|
|
| 101.INS |
Inline XBRL Instance Document |
|
|
| 101.SCH |
Inline XBRL Taxonomy Extension Schema with Embedded Linkbase Documents |
|
|
| 104 |
Cover Page Interactive Data File (embedded within the Inline XBRL document) |
† Portions of this exhibit (indicated by asterisks) have been omitted pursuant to a request for confidential treatment previously submitted separately to the SEC.
*Management contract or compensatory plan or arrangement.
(1)Filed as an exhibit to Amendment No. 4 to the Registrant’s Registration Statement on Form S-1 (File No. 333-188493) filed with the SEC on July 29, 2013, and incorporated herein by reference.
(2)Filed as an exhibit to the Registrant’s Annual Report on Form 10-K filed with the SEC on March 2, 2023, and incorporated herein by reference.
(3)Filed as an exhibit to the Registrant’s Current Report on Form 8-K filed with the SEC on May 5, 2015, and incorporated herein by reference.
(4)Filed as an exhibit to the Registrant’s Quarterly Report on Form 10-Q filed with the SEC on May 7, 2015, and incorporated herein by reference.
(5)Filed as an exhibit to the Registrant’s Quarterly Report on Form 10-Q filed with the SEC on August 1, 2019, and incorporated herein by reference.
(6)Filed as an exhibit to the Registrant’s Current Report on Form 8-K filed with the SEC on September 22, 2021, and incorporated herein by reference.
(7)Filed as an exhibit to the Registrant’s Current Report on Form 8-K filed with the SEC on February 24, 2022, and incorporated herein by reference
(8)Filed as an exhibit to the Registrant’s Quarterly Report on Form 10-Q filed with the SEC on May 3, 2018, and incorporated herein by reference.
(9)Filed as an exhibit to the Registrant’s Quarterly Report on Form 10-Q filed with the SEC on May 2, 2019, and incorporated herein by reference.
(10)Filed as an exhibit to the Registrant’s Quarterly Report on Form 10-Q filed with the SEC on May 5, 2020, and incorporated herein by reference.
(11)Filed as an exhibit to the Registrant’s Quarterly Report on Form 10-Q filed with the SEC on May 6, 2021, and incorporated herein by reference.
(12)Filed as an exhibit to the Registrant’s Quarterly Report on Form 10-Q filed with the SEC on May 4, 2022, and incorporated herein by reference.
(13)Filed as an exhibit to the Registrant’s Current Report on Form 8-K filed with the SEC on May 27, 2022, and incorporated herein by reference.
(14)Filed as an exhibit to the Registrant’s Quarterly Report on Form 10-Q/A filed with the SEC on April 1, 2019, and incorporated herein by reference.
(15)Filed as an exhibit to the Registrant’s Registration Statement on Form S-1 (File No. 333-188493) filed with the SEC on May 9, 2013, and incorporated herein by reference.
(16)Filed as an exhibit to the Registrant’s Current Report on Form 8-K filed with the SEC on March 25, 2022, and incorporated herein by reference.
(17)Filed as an exhibit to the Registrant’s Quarterly Report on Form 10-Q filed with the SEC on August 6, 2015, and incorporated herein by reference.
(18)Filed as an exhibit to the Registrant’s Current Report on Form 8-K filed with the SEC on February 28, 2020, and incorporated herein by reference.
(19)Filed as an exhibit to the Registrant’s Quarterly Report on Form 10-Q filed with the SEC on August 4, 2016, and incorporated herein by reference.
(20)Filed as an exhibit to the Registrant’s Quarterly Report on Form 10-Q filed with the SEC on May 1, 2023, and incorporated herein by reference.
(21)Filed as an exhibit to the Registrant’s Quarterly Report on Form 10-Q filed with the SEC on May 1, 2024, and incorporated herein by reference.
(22)Filed as an exhibit to the Registrant’s Current Report on Form 8-K filed with the SEC on October 31, 2023, and incorporated herein by reference.
(23)Filed as an exhibit to the Registrant’s Annual Report on Form 10-K filed with the SEC on February 22, 2024, and incorporated herein by reference.
Item 16. Form 10-K Summary Pursuant to the requirements of Section 13 or 15(d) of the Securities Exchange Act of 1934, the registrant has duly caused this report to be signed on its behalf by the undersigned, thereunto duly authorized.
None.
SIGNATURES
|
|
|
|
|
|
|
|
|
|
SPROUTS FARMERS MARKET, INC. |
|
|
|
Date: February 20, 2025 |
By: |
/s/ Curtis Valentine |
|
Name: |
Curtis Valentine |
|
Title: |
Chief Financial Officer |
Pursuant to the requirements of the Securities Exchange Act of 1934, this report has been signed below by the following persons on behalf of the registrant and in the capacities and on the dates indicated.
|
|
|
|
|
|
|
|
|
|
|
|
|
|
|
| Signature |
|
Title |
|
Date |
|
|
|
|
|
| /s/ Jack L. Sinclair |
|
Director and Chief Executive Officer
(Principal Executive Officer)
|
|
February 20, 2025 |
|
|
|
|
| Jack L. Sinclair |
|
|
|
|
|
|
|
|
|
| /s/ Curtis Valentine |
|
Chief Financial Officer
(Principal Financial Officer)
|
|
February 20, 2025 |
|
|
|
|
| Curtis Valentine |
|
|
|
|
|
|
|
|
|
| /s/ Stacy W. Hilgendorf |
|
Vice President, Controller
(Principal Accounting Officer)
|
|
February 20, 2025 |
|
|
|
|
| Stacy W. Hilgendorf |
|
|
|
|
|
|
|
|
|
| /s/ Joseph Fortunato |
|
Chairman of the Board |
|
February 20, 2025 |
|
|
|
|
|
| Joseph Fortunato |
|
|
|
|
|
|
|
|
|
| /s/ Joel D. Anderson |
|
Director |
|
February 20, 2025 |
|
|
|
|
|
| Joel D. Anderson |
|
|
|
|
|
|
|
|
|
| /s/ Hari K. Avula |
|
Director |
|
February 20, 2025 |
|
|
|
|
|
| Hari K. Avula |
|
|
|
|
|
|
|
|
|
| /s/ Kristen E. Blum |
|
Director |
|
February 20, 2025 |
|
|
|
|
|
| Kristen E. Blum |
|
|
|
|
|
|
|
|
|
| /s/ Terri Funk Graham |
|
Director |
|
February 20, 2025 |
|
|
|
|
|
| Terri Funk Graham |
|
|
|
|
|
|
|
|
|
| /s/ Joseph D. O’Leary |
|
Director |
|
February 20, 2025 |
|
|
|
|
|
| Joseph D. O’Leary |
|
|
|
|
|
|
|
|
|
| /s/ Douglas G. Rauch |
|
Director |
|
February 20, 2025 |
|
|
|
|
|
| Douglas G. Rauch |
|
|
|
|
EX-19
2
sfm-20241229xex19.htm
EX-19
Document
Exhibit 19
SPROUTS FARMERS MARKET, INC.
POLICY STATEMENT ON INSIDE INFORMATION AND INSIDER TRADING FOR OFFICERS, DIRECTORS
AND TEAM MEMBERS
(as amended through January 2025)
In the course of your employment with Sprouts Farmers Market, Inc. or its subsidiaries (collectively, “Sprouts” or the “Company”), you are likely to use or have access to information about Sprouts that is not generally available to the public. Because of your relationship with Sprouts, you have certain responsibilities under the federal securities laws and the rules of the Securities and Exchange Commission (the “SEC”) with respect to inside information. The purpose of this Policy Statement is to outline Sprouts’ policies regarding the protection of material, non-public information and trading and tipping, as well as the expected standards of conduct of Sprouts’ directors, officers and team members with respect to these highly sensitive matters. This Policy Statement explains your obligations under the law and Sprouts’ policies. You should read this Policy Statement carefully and comply with it at all times. Please note that this Policy Statement is addressed principally to insider trading and does not purport to address all requirements or restrictions under the securities laws applicable to ownership of or trading in securities of a public company by its officers, directors or team members.
I.SUMMARY OF POLICY STATEMENT
To avoid the appearance of impropriety, all rules set forth in this Policy Statement will apply not only to you, but also to all members of your family who reside in the same household and to all entities, such as trusts, that you or such family members control.
Sprouts’ policy regarding securities trading can be summarized by four important rules:
1.You may not trade in securities of Sprouts (or any other entity with a relationship with Sprouts, such as a vendor, supplier, possible acquisition target, or competitor of Sprouts) at any time that you possess material, non-public (what is described below as “inside”) information about Sprouts (or about such other entity).
2.You may not trade in securities of Sprouts during any “blackout period” – which is any period of time during which Sprouts has imposed a trading freeze on its securities for all or a designated group of team members due to a significant unannounced matter.
3.If you are a member of the Board of Directors, an officer, or a restricted team member (as defined below) of Sprouts, you may not trade in securities of Sprouts other than during the period beginning 24 hours after the public release of Sprouts’ quarterly and annual earnings results and ending two weeks before the end of Sprouts’ quarter (the “Trading Window”). If you are subject to the SEC’s Section 16 reporting requirements (due to your position as a member of the Board of Directors or as an executive officer of Sprouts) or believe that you may possess material, non-public information about Sprouts, you may only trade in securities of Sprouts during a trading window after you have obtained prior approval from Sprouts’ Chief Legal Officer (or his or her designee) for such transaction. (Sprouts’ Chief Legal Officer must obtain approval from the Chief Executive Officer or Chief Financial Officer for his or her own trades.) Sprouts may from time to time as circumstances warrant designate additional restricted team members to whom this pre-clearance requirement will also apply. A “restricted team member” is any team member designated as such by the Chief Legal Officer from time to time because such team member may have access to material, non-public financial or other information about Sprouts (or any other entity with a relationship with Sprouts).
4.You may not convey to any other person (“tip”) inside information regarding Sprouts (or any other entity with a relationship with Sprouts).
The foregoing rules are only a summary. You must comply with all of the policies set forth below, which represents Sprouts’ complete Policy Statement on inside information and insider trading.
II.INSIDE INFORMATION
A.What is Inside Information?
“Inside” information is material information (as described below) about Sprouts that is not available to the public. Information generally becomes available to the public when it has been disclosed by Sprouts in a press release or other widely available public statement, such as a filing with the SEC, post on the Company’s investor relations website or broadcast. Information provided only to team members or a select group of third parties is not considered publicly available. In general, information is considered to have been made available to the public 24 hours after the formal release of the information. In other words, there is a presumption that the public needs 24 hours to receive and absorb such information.
Information is only considered publicly available if it is broadly disseminated by Sprouts through authorized channels, including by spokespersons permitted to communicate with the public on Sprouts’ behalf in accordance with Company policies. Unauthorized disclosure of inside information is strictly prohibited by Company policy.
B.What is Material Information?
As a general rule, information about Sprouts is material if it could reasonably be expected to affect someone’s decision to buy, hold, or sell Sprouts’ securities. For example, information generally is considered to be “material” if its disclosure to the public would be reasonably likely to affect (1) an investor’s decision to buy or sell the securities of the company to which the information relates, or (2) the market price of that company’s securities. While it is not possible to identify in advance all information that will be deemed to be material, some examples of such information would include the following: earnings results; significant financial data; a potential sale of a company; major mergers, acquisitions or dispositions; news of major market expansions or possible store closures; executive personnel changes; unusual gains or losses in major operations; dividends; significant litigation, governmental investigations or other legal or regulatory developments; change in arrangements with key vendors; major marketing changes; significant product defects, recalls or returns; change to or termination of relationship with the company’s auditors or notice that the company may no longer rely on an audit report; and significant cybersecurity incidents.
It can sometimes be difficult to know whether information would be considered “material.” The determination of whether information is material is almost always clearer after the fact, when the effect of that information on the market can be quantified. Although you may have information about Sprouts that you do not consider to be material, federal regulators and others may conclude (with the benefit of hindsight) that such information was material. Therefore, trading in Sprouts securities when you possess non-public information about Sprouts can be risky.
For this reason, we have implemented the trading rules described above. For the most part, individuals should not be making their own determinations as to whether or not they possess material inside information. A decision will be made and implemented Company-wide with respect to all the relevant impacted individuals.
C.How are the Insider Trading Prohibitions Enforced?
The seriousness of insider trading is reflected in the penalties that may be imposed. Individuals who violate the insider trading laws may be subject to significant criminal and civil penalties. In addition, the SEC may impose liability on Sprouts itself for failing to properly prevent the individual’s violation. Needless to say, any of these outcomes would result in significant embarrassment for the individual involved, as well as for Sprouts.
Criminal prosecution and the imposition of fines and/or imprisonment is commonplace.
Any director, officer or team member who violates the prohibitions against insider trading or knows of such violation by any other persons must report the violation promptly to Sprouts’ Chief Legal Officer. Upon learning of any such violations, Sprouts will determine the appropriate course of action. Insider trading could also be grounds for dismissal.
For all of these reasons, both you and Sprouts have a significant interest in ensuring that insider trading is scrupulously avoided.
D.How Should Material Information be Safeguarded?
Before material information relating to Sprouts or its business has been disclosed to the general public, it must be kept in strict confidence. Such information should be discussed only with persons who are employed by or represent Sprouts who have a “need to know” and should be confined to as small a group as possible. The utmost care and circumspection must be exercised at all times. Therefore, conversations in public places, such as elevators, restaurants, and airplanes, as well as conversations on mobile phones, should be limited to matters that do not involve information of a sensitive or confidential nature. Confidential information should not be discussed with friends and family. Even disclosure of seemingly harmless information can expose the insider and his or her friends and family, as well as Sprouts, to civil and criminal penalties. Friends and family may not fully understand the consequences of disclosing or using material, non-public information. In addition, you should not transmit confidential information through any electronic system that is not secure.
On occasion, it may be necessary for legitimate business reasons to disclose material, non-public information to persons outside the Company. Such persons might include advisors engaged by the Company such as attorneys or accountants, commercial bankers, investment bankers, or other companies seeking to engage in a joint venture, merger, or common investment or other joint goal with Sprouts. In such circumstances, the information should not be conveyed until an express understanding has been reached, such as by entry into a non-disclosure agreement, that such information is not to be used for trading purposes and may not be further disclosed other than for legitimate business reasons.
III.STATEMENT OF POLICY
1.For purposes of this Policy Statement, all references to “you” shall mean you, as well as any family members that reside in the same household as you, as well as any corporations, partnerships, limited liability companies, trusts or other entities under your control. Except as otherwise provided, the following policies apply to all of Sprouts’ officers, directors and team members (including, but not limited to, “restricted team members.”)
2.You may not buy, sell, gift or transfer the securities of Sprouts (or any other company that may have a relationship with Sprouts such as a supplier, possible acquisition target, or competitor) when you are in possession of material, non-public information concerning Sprouts (or such other company) or during a blackout period. The insider trading rules apply both to securities purchases (to make a profit based on good news) and securities sales (to avoid a loss based on bad news) regardless of how or from whom the material, non-public information has been obtained. A “blackout period” means a trading freeze imposed by Sprouts with respect to trading in its securities. These blackout periods will be imposed during times when Sprouts is most likely to have material, non-public information available. These blackout periods may vary in length and occur in periods in which the trading window would otherwise be open, as circumstances warrant.
3.If you are an officer, director or restricted team member, you may trade in securities of Sprouts only during the trading window. If you are subject to the SEC’s Section 16 reporting requirements (due to your position as a member of the Board of Directors or as an executive officer of Sprouts) or believe that you may possess material, non-public information about Sprouts, you may only trade in
securities of Sprouts during a trading window after you have obtained prior approval from Sprouts’ Chief Legal Officer (or his or her designee) for such transaction.
a)“Restricted team member” means any team member designated as such by the Chief Legal Officer from time to time because such team members have access to material, non-public financial or other information about Sprouts.
b)“Trading window” means the period beginning 24 hours after the public release of Sprouts’ quarterly and annual earnings and ending two weeks before the end of Sprouts’ quarter.
Sprouts may find it necessary, from time to time, to require compliance with this preclearance process by certain restricted team members other than and in addition to the directors and executive officers subject to the SEC’s Section 16 reporting requirements. If this pre-clearance requirement applies to you, you will be so notified by the Chief Legal Officer.
Approval of any proposed trade by the Chief Legal Officer does not constitute legal, business or financial advice. You are responsible for ensuring your own compliance with federal and state securities laws and for your own investment decisions. Failure to comply with applicable securities laws or this Policy Statement may result in severe legal penalties or discipline by Sprouts. Even if you receive approval from the Chief Legal Officer to execute a trade, you may make such trades only so long as you are not trading in violation of this Policy Statement.
4.You may not convey (or “tip”) material, non-public information to any other person by providing them with material, non-public information regarding Sprouts or assisting them in any way. The concept of unlawful tipping includes passing on such information to friends, family members or acquaintances under circumstances that suggest that you were trying to help them make a profit or avoid a loss. You may, of course, provide such information to other Sprouts team members or representatives on a “need to know” basis in the course of performing your job with Sprouts.
5.Trades made in accordance with Rule 10b5-1 arrangements are exempt from the foregoing restrictions; provided, however, such Rule 10b5-1 arrangements may only be entered into during an open trading window and if you are not otherwise in possession of material non-public information about Sprouts.
6.The foregoing restrictions apply to trading in call or put options involving Sprouts securities, or other derivative securities, as well as “short sales” of Sprouts securities, purchasing Sprouts securities on margin (paying less than 100% of the purchase price before full ownership of the securities) and short-term trading in Sprouts securities (holding securities for less than six months). Because of the complexity of reporting puts, calls, derivatives, and shorts as well as the difficulty of ensuring that these types of transactions are managed in accordance with applicable securities laws and this Policy Statement, you may not engage in these types of transactions involving Sprouts’ securities without the prior approval of the Chief Legal Officer. Note that certain hedging and pledging transactions are prohibited by Section IV below.
7.You must observe the foregoing policies and procedures at all times. Your failure to do so will be grounds for disciplinary action, up to and including dismissal.
8.You must promptly report to the Chief Legal Officer any trading in Sprouts’ securities by Sprouts personnel or disclosure of material, non-public information by Sprouts personnel that you have reason to believe may violate this Policy Statement or the securities laws of the United States.
9.The foregoing restrictions are in addition to any additional obligations applicable to you under other Sprouts policies, including policies relating to the confidentiality of information and preservation of trade secrets or other intellectual property or proprietary information.
IV.POLICIES RELATING TO HEDGING AND PLEDGING OF COMPANY SECURITIES
1.Hedging Transactions. Certain forms of hedging or monetization transactions, such as zero-cost collars, forward sale contracts and equity swaps allow a person to lock in much of the value of his or her stock holdings, often in exchange for all or part of the potential upside appreciation of the stock. These transactions allow the person to continue to own the covered securities, but without the full risks and rewards of ownership. When this occurs, the person may no longer have the same objectives as Sprouts’ other stockholders. For this reason, officers, directors and team members are prohibited from engaging in hedging or monetization transactions involving Sprouts’ securities. If you have any question as to whether a potential transaction is covered by the foregoing prohibition, please consult with the Chief Legal Officer in advance.
2.Margin Accounts and Pledges. Officers, directors and team members may not hold Sprouts’ securities in a margin account or pledge Sprouts’ securities as collateral for a loan. Generally, all Sprouts’ securities that are held in a brokerage account should be held in a cash account. If you hold Sprouts’ securities in a margin account or pledge Sprouts’ securities as collateral for a loan, those securities may be sold without your consent or knowledge – even if the brokerage account has other assets – by the broker if such person fails to meet a margin call or by the lender if such person defaults on the loan. Such sale may occur at a time when you are aware of material, non-public information or not otherwise permitted to trade in Sprouts’ securities.
3.Exceptions. If you desire to enter into a hedging or pledging arrangement prohibited by this Section IV, you must submit a request for approval to the Chief Legal Officer at least two weeks prior to the proposed execution of documents evidencing the proposed transaction and your request must include a justification for the proposed arrangement. Approval may be denied, delayed or conditioned in the discretion of the Chief Legal Officer.
V.CERTIFICATION
You must sign, date, and return the attached Certification stating that you received Sprouts’ Policy Statement regarding insider trading and the preservation of the confidentiality of material, non-public information and related procedures, and you agree to comply with it. Please note that you are bound by the Policy Statement whether or not you sign the Certification.
CERTIFICATION
I hereby certify that I:
a.have read and understand the Policy Statement on Inside Information and Insider Trading For Officers, Directors and Team Members and related procedures, a copy of which was distributed with this Certificate;
b.have complied with the foregoing policy and procedures;
c.will continue to comply with the policy and procedures set forth in the Policy Statement; and
d.if I am subject to the SEC’s Section 16 reporting requirements (due to my position as a member of the Board of Directors or as an executive officer of Sprouts) or believe that I may possess material, non-public information about Sprouts, will request prior approval of all proposed sales, transfers or acquisitions of securities of Sprouts.
Signature: _____________________________________
Name: ________________________________________
Title: _________________________________________
Date: _________________________________________
EX-21.1
3
sfm-20241229xex211.htm
EX-21.1
Document
Exhibit 21.1
Subsidiaries of Sprouts Farmers Market, Inc.
|
|
|
|
|
|
|
|
|
|
|
|
|
|
|
|
|
|
|
|
|
|
|
Jurisdiction of |
|
Control by |
Subsidiary |
|
Organization |
|
Registrant |
|
Subsidiary |
Sprouts Farmers Markets Holdings, LLC |
|
Delaware |
|
100 |
% |
|
|
Sunflower Farmers Markets, LLC |
|
Delaware |
|
|
|
100 |
% |
SFM, LLC |
|
Delaware |
|
|
|
100 |
% |
SFM Logistics, LLC |
|
Arizona |
|
|
|
100 |
% |
SFM Manager, LLC |
|
Texas |
|
|
|
100 |
% |
SF Market Texas, LLC |
|
Delaware |
|
|
|
100 |
% |
Henry’s Holdings LLC |
|
Delaware |
|
|
|
100 |
% |
Sprouts Farmers Market Texas, LP |
|
Texas |
|
|
|
100 |
% |
SH Markets, Inc. |
|
Texas |
|
|
|
100 |
% |
SFM Beverages, Inc. |
|
Texas |
|
|
|
100 |
% |
Ronald Cohn, Inc. |
|
California |
|
|
|
100 |
% |
| Greenfield Insurance, LLC |
|
Arizona |
|
|
|
100 |
% |
EX-23.1
4
sfm-20241229xex231.htm
EX-23.1
Document
Exhibit 23.1
CONSENT OF INDEPENDENT REGISTERED PUBLIC ACCOUNTING FIRM
We hereby consent to the incorporation by reference in the Registration Statements on Form S-8 (Nos. 333-265459 and 333-190920) of Sprouts Farmers Market, Inc. of our report dated February 20, 2025, relating to the financial statements and the effectiveness of internal control over financial reporting, which appears in this Form 10-K.
/s/ PricewaterhouseCoopers LLP
Phoenix, Arizona
February 20, 2025
EX-31.1
5
sfm-20241229xex311.htm
EX-31.1
Document
Exhibit 31.1
CERTIFICATION OF CHIEF EXECUTIVE OFFICER PURSUANT TO SECTION 302 OF
THE SARBANES-OXLEY ACT OF 2002
I, Jack L. Sinclair, certify that:
1.I have reviewed this Annual Report on Form 10-K of Sprouts Farmers Market, Inc.;
2.Based on my knowledge, this report does not contain any untrue statement of a material fact or omit to state a material fact necessary to make the statements made, in light of the circumstances under which such statements were made, not misleading with respect to the period covered by this report;
3.Based on my knowledge, the financial statements, and other financial information included in this report, fairly present in all material respects the financial condition, results of operations and cash flows of the registrant as of, and for, the periods presented in this report;
4.The registrant’s other certifying officer(s) and I are responsible for establishing and maintaining disclosure controls and procedures (as defined in Exchange Act Rules 13a-15(e) and 15d-15(e)) and internal control over financial reporting (as defined in Exchange Act Rules 13a-15(f) and 15d-15(f)) for the registrant and have:
a)Designed such disclosure controls and procedures, or caused such disclosure controls and procedures to be designed under our supervision, to ensure that material information relating to the registrant, including its consolidated subsidiaries, is made known to us by others within those entities, particularly during the period in which this report is being prepared;
b)Designed such internal control over financial reporting, or caused such internal control over financial reporting to be designed under our supervision, to provide reasonable assurance regarding the reliability of financial reporting and the preparation of financial statements for external purposes in accordance with generally accepted accounting principles;
c)Evaluated the effectiveness of the registrant’s disclosure controls and procedures and presented in this report our conclusions about the effectiveness of the disclosure controls and procedures, as of the end of the period covered by this report based on such evaluation; and
d)Disclosed in this report any change in the registrant’s internal control over financial reporting that occurred during the registrant’s most recent fiscal quarter (the registrant’s fourth fiscal quarter in the case of an annual report) that has materially affected, or is reasonably likely to materially affect, the registrant’s internal control over financial reporting; and
5.The registrant’s other certifying officer(s) and I have disclosed, based on our most recent evaluation of internal control over financial reporting, to the registrant’s auditors and the audit committee of the registrant’s board of directors (or persons performing the equivalent functions):
a)All significant deficiencies and material weaknesses in the design or operation of internal control over financial reporting which are reasonably likely to adversely affect the registrant’s ability to record, process, summarize and report financial information; and
b)Any fraud, whether or not material, that involves management or other employees who have a significant role in the registrant’s internal control over financial reporting.
|
|
|
|
|
|
Date: February 20, 2025 |
/s/ Jack L. Sinclair |
|
Jack L. Sinclair |
|
Chief Executive Officer |
|
(Principal Executive Officer) |
EX-31.2
6
sfm-20241229xex312.htm
EX-31.2
Document
Exhibit 31.2
CERTIFICATION OF CHIEF FINANCIAL OFFICER PURSUANT TO SECTION 302 OF
THE SARBANES-OXLEY ACT OF 2002
I, Curtis Valentine, certify that:
1. I have reviewed this Annual Report on Form 10-K of Sprouts Farmers Market, Inc.;
2. Based on my knowledge, this report does not contain any untrue statement of a material fact or omit to state a material fact necessary to make the statements made, in light of the circumstances under which such statements were made, not misleading with respect to the period covered by this report;
3. Based on my knowledge, the financial statements, and other financial information included in this report, fairly present in all material respects the financial condition, results of operations and cash flows of the registrant as of, and for, the periods presented in this report;
4. The registrant’s other certifying officer(s) and I are responsible for establishing and maintaining disclosure controls and procedures (as defined in Exchange Act Rules 13a-15(e) and 15d-15(e)) and internal control over financial reporting (as defined in Exchange Act Rules 13a-15(f) and 15d-15(f)) for the registrant and have:
a) Designed such disclosure controls and procedures, or caused such disclosure controls and procedures to be designed under our supervision, to ensure that material information relating to the registrant, including its consolidated subsidiaries, is made known to us by others within those entities, particularly during the period in which this report is being prepared;
b) Designed such internal control over financial reporting, or caused such internal control over financial reporting to be designed under our supervision, to provide reasonable assurance regarding the reliability of financial reporting and the preparation of financial statements for external purposes in accordance with generally accepted accounting principles;
c) Evaluated the effectiveness of the registrant’s disclosure controls and procedures and presented in this report our conclusions about the effectiveness of the disclosure controls and procedures, as of the end of the period covered by this report based on such evaluation; and
d) Disclosed in this report any change in the registrant’s internal control over financial reporting that occurred during the registrant’s most recent fiscal quarter (the registrant’s fourth fiscal quarter in the case of an annual report) that has materially affected, or is reasonably likely to materially affect, the registrant’s internal control over financial reporting; and
5. The registrant’s other certifying officer(s) and I have disclosed, based on our most recent evaluation of internal control over financial reporting, to the registrant’s auditors and the audit committee of the registrant’s board of directors (or persons performing the equivalent functions):
a) All significant deficiencies and material weaknesses in the design or operation of internal control over financial reporting which are reasonably likely to adversely affect the registrant’s ability to record, process, summarize and report financial information; and
b) Any fraud, whether or not material, that involves management or other employees who have a significant role in the registrant’s internal control over financial reporting.
|
|
|
|
|
|
Date: February 20, 2025 |
/s/ Curtis Valentine |
|
Curtis Valentine |
|
Chief Financial Officer |
|
(Principal Financial Officer) |
EX-32.1
7
sfm-20241229xex321.htm
EX-32.1
Document
Exhibit 32.1
CERTIFICATION OF CHIEF EXECUTIVE OFFICER PURSUANT TO
18 U.S.C. SECTION 1350
AS ADOPTED PURSUANT TO SECTION 906
OF THE SARBANES-OXLEY ACT OF 2002
In connection with the Annual Report of Sprouts Farmers Market, Inc., (the “Company”) on Form 10-K for the fiscal year ended December 29, 2024 as filed with the Securities and Exchange Commission on the date hereof (the “Report”), I, Jack L. Sinclair, Chief Executive Officer of the Company, certify, based on my knowledge, pursuant to 18 U.S.C. Section 1350, as adopted pursuant to Section 906 of the Sarbanes-Oxley Act of 2002, that:
(1)The Report fully complies with the requirements of Section 13(a) or 15(d) of the Securities Exchange Act of 1934, as amended (15 U.S.C. 78m(a) or 78o(d)); and
(2)The information contained in the Report fairly presents, in all material respects, the financial condition and results of operations of the Company.
|
|
|
|
|
|
Date: February 20, 2025 |
/s/ Jack L. Sinclair |
|
Jack L. Sinclair |
|
Chief Executive Officer |
|
(Principal Executive Officer) |
This certification accompanies the Report to which it relates, is not deemed filed with the Securities and Exchange Commission and is not to be incorporated by reference into any filing of the Company under the Securities Act of 1933, as amended, or the Securities Exchange Act of 1934, as amended (whether made before or after the date of the Report), irrespective of any general incorporation language contained in such filing.
EX-32.2
8
sfm-20241229xex322.htm
EX-32.2
Document
Exhibit 32.2
CERTIFICATION OF CHIEF FINANCIAL OFFICER PURSUANT TO
18 U.S.C. SECTION 1350
AS ADOPTED PURSUANT TO SECTION 906
OF THE SARBANES-OXLEY ACT OF 2002
In connection with the Annual Report of Sprouts Farmers Market, Inc., (the “Company”) on Form 10-K for the fiscal year ended December 29, 2024 as filed with the Securities and Exchange Commission on the date hereof (the “Report”), I, Curtis Valentine, Chief Financial Officer of the Company, certify, based on my knowledge, pursuant to 18 U.S.C. Section 1350, as adopted pursuant to Section 906 of the Sarbanes-Oxley Act of 2002, that:
(1)The Report fully complies with the requirements of Section 13(a) or 15(d) of the Securities Exchange Act of 1934, as amended (15 U.S.C. 78m(a) or 78o(d)); and
(2)The information contained in the Report fairly presents, in all material respects, the financial condition and results of operations of the Company.
|
|
|
|
|
|
Date: February 20, 2025 |
/s/ Curtis Valentine |
|
Curtis Valentine |
|
Chief Financial Officer |
|
(Principal Financial Officer) |
This certification accompanies the Report to which it relates, is not deemed filed with the Securities and Exchange Commission and is not to be incorporated by reference into any filing of the Company under the Securities Act of 1933, as amended, or the Securities Exchange Act of 1934, as amended (whether made before or after the date of the Report), irrespective of any general incorporation language contained in such filing.