4th Quarter 2023 Earnings Update
Company Presentation | March 2024 2 Forward Looking Statements and Non-GAAP Measures In keeping with the SEC's "Safe Harbor" guidelines, certain statements made during this presentation could be considered forward-looking and subject to certain risks and uncertainties that could cause results to differ materially from those projected. When we use the words "will likely result," "may," "anticipate," "estimate," "should," "expect," "believe," "intend," or similar expressions, we intend to identify forward-looking statements. Such forward-looking statements include, but are not limited to, our business and investment strategy, our understanding of our competition, current market trends and opportunities, projected operating results, and projected capital expenditures. These forward-looking statements are subject to known and unknown risks and uncertainties, which could cause actual results to differ materially from those anticipated including, without limitation: the Risk Factors discussed in our Annual Report on Form 10-K for the year ended December 31, 2022; rising interest rates and inflation; macroeconomic conditions, such as a prolonged period of weak economic growth and volatility in the capital and financial markets; uncertainty in the business sector and market volatility due to the recent failures of Silicon Valley Bank, New York Signature Bank and First Republic Bank; general and economic business conditions affecting the lodging and travel industry; our ability to repay, refinance or restructure our debt and the debt of certain of our subsidiaries; anticipated or expected purchases or sales of assets; our projected operating results; completion of any pending transactions; risks associated with our ability to effectuate our dividend policy, including factors such as operating results and the economic outlook influencing our board’s decision whether to pay further dividends at levels previously disclosed or to use available cash to pay dividends; general volatility of the capital markets and the market price of our common stock; changes in our business or investment strategy; availability, terms and deployment of capital; availability of qualified personnel; changes in our industry and the market in which we operate, interest rates or the general economy, the degree and nature of our competition, legislative and regulatory changes, including changes to the Internal Revenue Code of 1986, as amended (the “Code”), and related rules, regulations and interpretations governing the taxation of REITs; and limitations imposed on our business and our ability to satisfy complex rules in order for us to qualify as a REIT for federal income tax purposes. These and other risk factors are more fully discussed in the company's filings with the Securities and Exchange Commission. EBITDA is defined as net income (loss) before interest expense and amortization of loan costs, depreciation and amortization, income taxes, equity in (earnings) loss of unconsolidated entity and after the Company’s portion of EBITDA of OpenKey. In addition, we excluded impairment on real estate, (gain) loss on insurance settlement and disposition of assets and Company’s portion of EBITDA of OpenKey from EBITDA to calculate EBITDA for real estate, or EBITDAre, as defined by NAREIT. EBITDA yield is defined as trailing twelve month EBITDA divided by the purchase price or debt amount. A capitalization rate is determined by dividing the property's net operating income by the purchase price. Net operating income is the property's Hotel EBITDA minus a capital expense reserve of either 4% or 5% of gross revenues. Hotel EBITDA flow-through is the change in Hotel EBITDA divided by the change in total revenues. EBITDA, FFO, AFFO, CAD and other terms are non-GAAP measures, reconciliations of which have been provided in prior earnings releases and filings with the SEC or in the appendix to this presentation. The calculation of implied equity value is derived from an estimated blended capitalization rate (“Cap Rate”) for the entire portfolio using the capitalization rate method. The estimated Cap Rate is based on recent Cap Rates of publically traded peers involving a similar blend of asset types found in the portfolio, which is then applied to Net Operating Income (“NOI”) of the company’s assets to calculate a Total Enterprise Value (“TEV”) of the company. From the TEV, we deduct debt and preferred equity and then add back working capital to derive an equity value. The capitalization rate method is one of several valuation methods for estimating asset value and implied equity value. Among the limitations of using the capitalization rate method for determining an implied equity value are that it does not take into account the potential change or variability in future cash flows, potential significant future capital expenditures, the intended hold period of the asset, or a change in the future risk profile of an asset. This presentation is for informational purposes only and is not an offer to sell, or a solicitation of an offer to buy or sell, any securities of Braemar Hotels & Resorts Inc. or any of its respective affiliates, and may not be relied upon in connection with the purchase or sale of any such security. Prior to investing in Braemar, potential investors should carefully review Braemar’s periodic filings with the Securities and Exchange Commission, including, but not limited to, Braemar’s most current Form 10-K, Form 10-Q and Form 8-K’s, including the risk factors included therein.

Company Presentation | March 2024 3 Experienced Management Team 28 years of hospitality experience 8 years with the Company 15 years with Morgan Stanley Cornell School of Hotel Administration BS University of Pennsylvania MBA 23 years of hospitality experience 20 years with the Company 3 years with ClubCorp CFA charter holder Southern Methodist University BBA 14 years of hospitality experience 9 years with the Company Prior experience with the Central Intelligence Agency and Northrop Grumman University of Texas BA University of Maryland MBA RICHARD J. STOCKTON Chief Executive Officer & President DERIC S. EUBANKS, CFA Chief Financial Officer CHRISTOPHER C. NIXON Executive Vice President & Head of Asset Management

Company Presentation | March 2024 4 $78 $206 2013 2023 +165% $233 $745 2013 2023 +219% 8 16 2013 2023 +8 $962 $2,227 2013 2023 +131% Total Assets(2) Hotel EBITDA(2)(3) (1) As of 12/31/23 (2) In millions (3) 2023 TTM Hotel Rev and TTM Hotel EBITDA figures are comparable Number of Hotels % of Total Hotel Rev (2)(3) Company Fact Sheet Since inception in 2013, we have significantly increased Gross Asset Value and EBITDA for our iconic and irreplaceable portfolio NYSE: BHR $184.7M EQUITY MARKET CAP(1) $1.8B ENTERPRISE VALUE(1) HIGHEST RevPAR LODGING REIT 1. Ritz-Carlton Sarasota 11% 2. Ritz-Carlton Reserve Dorado Beach 11% 3. Ritz-Carlton St. Thomas 10% 4. Four Seasons Scottsdale 9% 5. Capital Hilton 8% Top-5 Properties (2023 Total Revenue)(1)
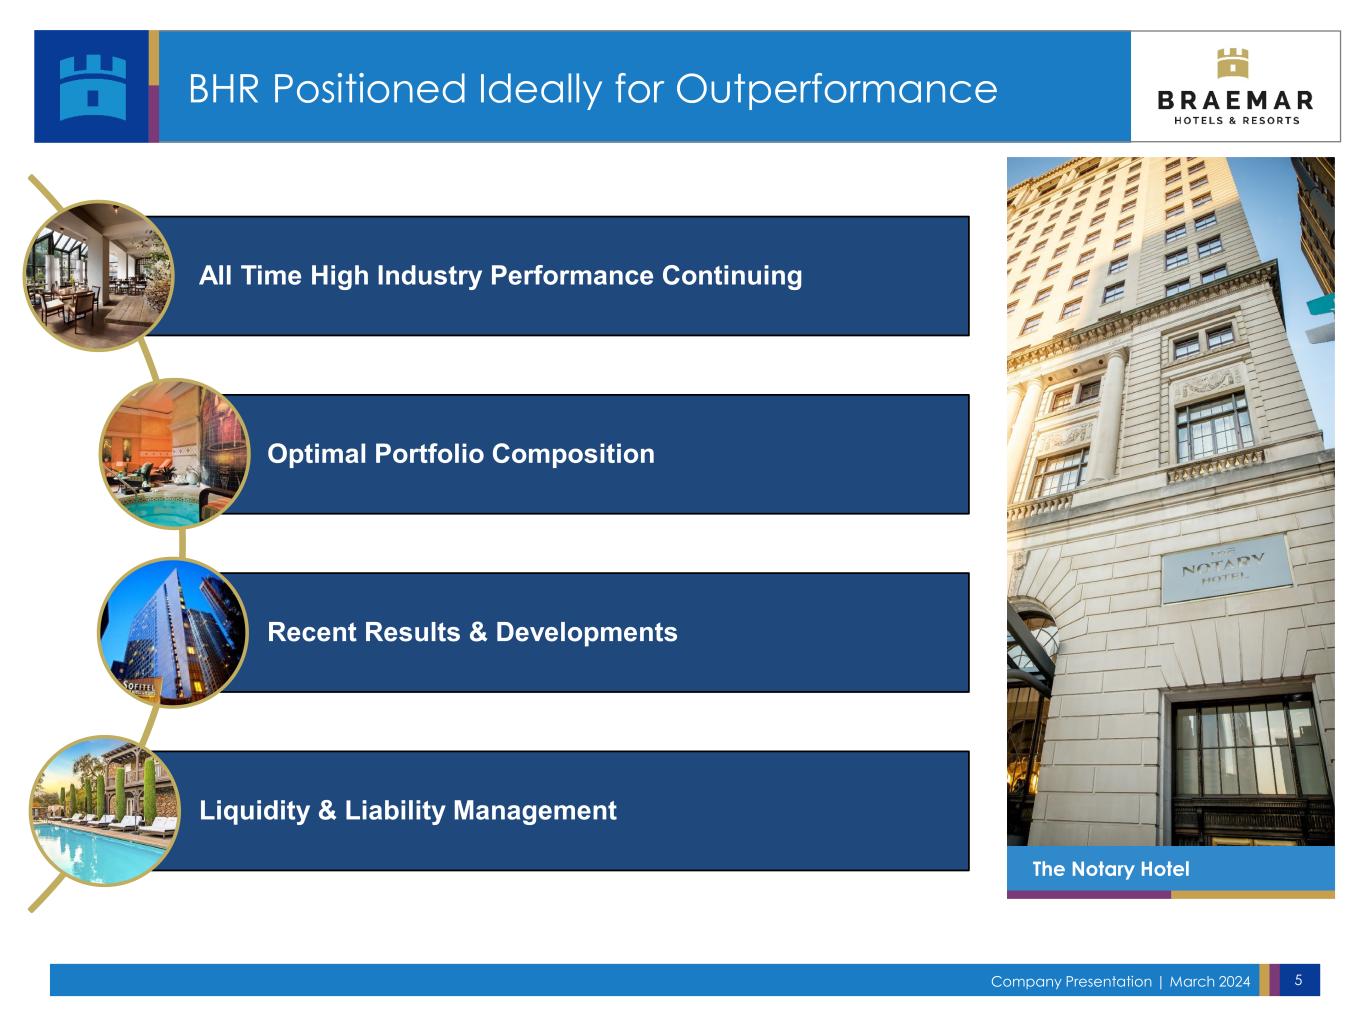
Company Presentation | March 2024 5 BHR Positioned Ideally for Outperformance All Time High Industry Performance Continuing Optimal Portfolio Composition Recent Results & Developments Liquidity & Liability Management The Notary Hotel

All Time High Industry Performance Continuing Ritz-Carlton Reserve Dorado Beach
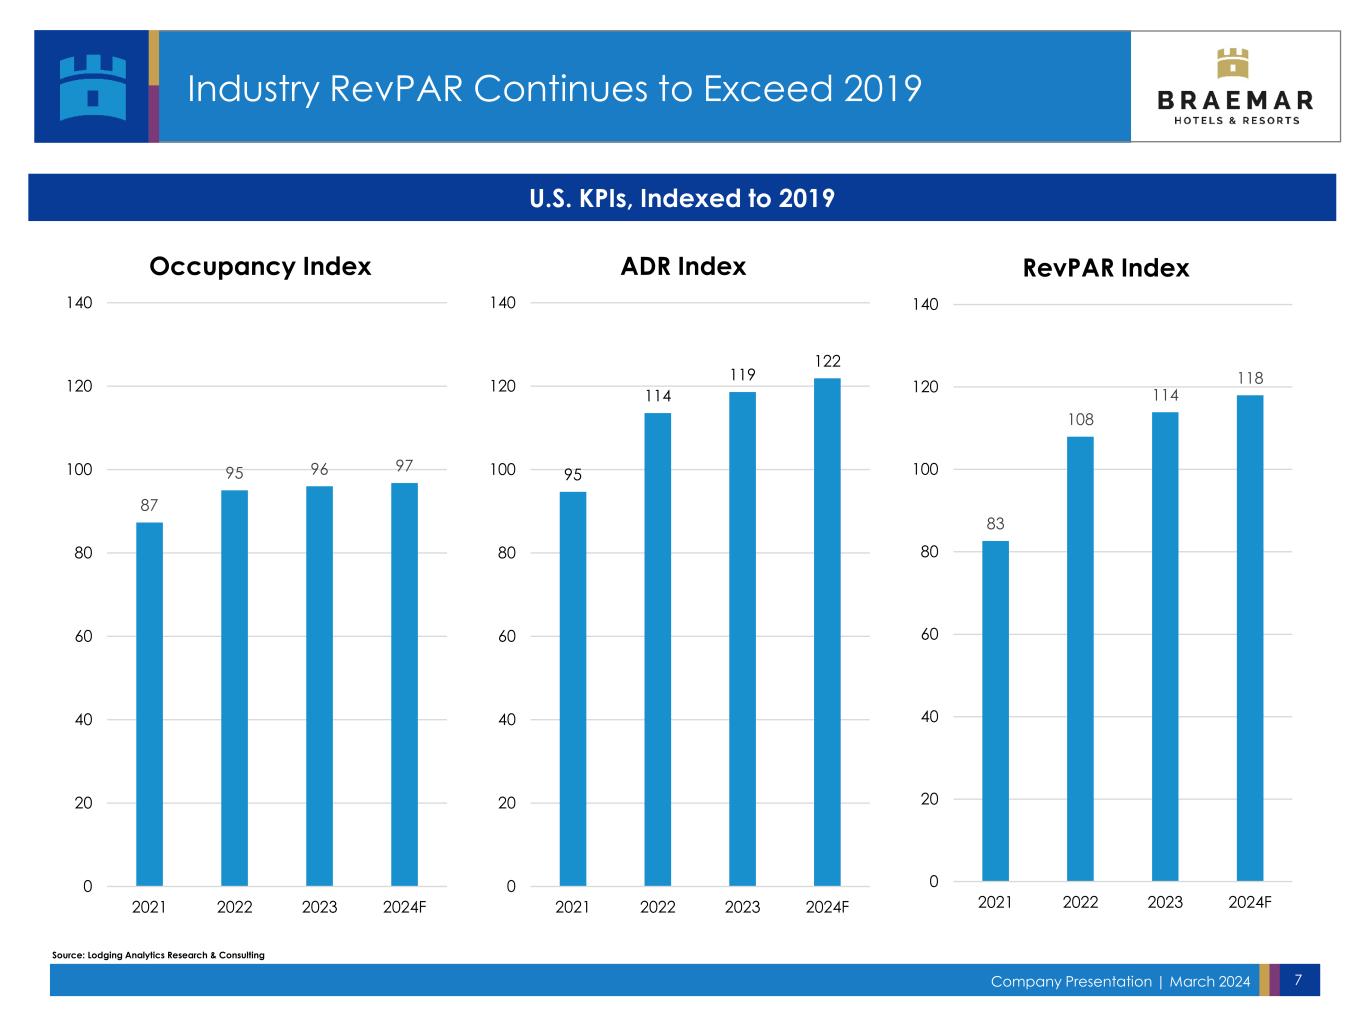
Company Presentation | March 2024 7 87 95 96 97 0 20 40 60 80 100 120 140 2021 2022 2023 2024F Occupancy Index Industry RevPAR Continues to Exceed 2019 Source: Lodging Analytics Research & Consulting U.S. KPIs, Indexed to 2019 95 114 119 122 0 20 40 60 80 100 120 140 2021 2022 2023 2024F ADR Index 83 108 114 118 0 20 40 60 80 100 120 140 2021 2022 2023 2024F RevPAR Index

Company Presentation | March 2024 8 $0 $40 $80 $120 $160 Q4 '19 Q4 '20 Q4 '21 Q4 '22 Q4 '23 Real ADR Continues to Rise Real ADR Nominal ADR 0% 10% 20% 30% 40% 50% 60% Q4 '19 Q4 '20 Q4 '21 Q4 '22 Q4 '23 Occupancy Down Slightly Real Industry ADR and RevPAR Nearing Full Recovery Source: STR $128 53% $127 54% $0 $15 $30 $45 $60 $75 $90 Q4 '19 Q4 '20 Q4 '21 Q4 '22 Q4 '23 Real RevPAR Stabilizing Real RevPAR Nominal RevPAR $69 $67 Hilton Torrey Pines Marriott Seattle Waterfront
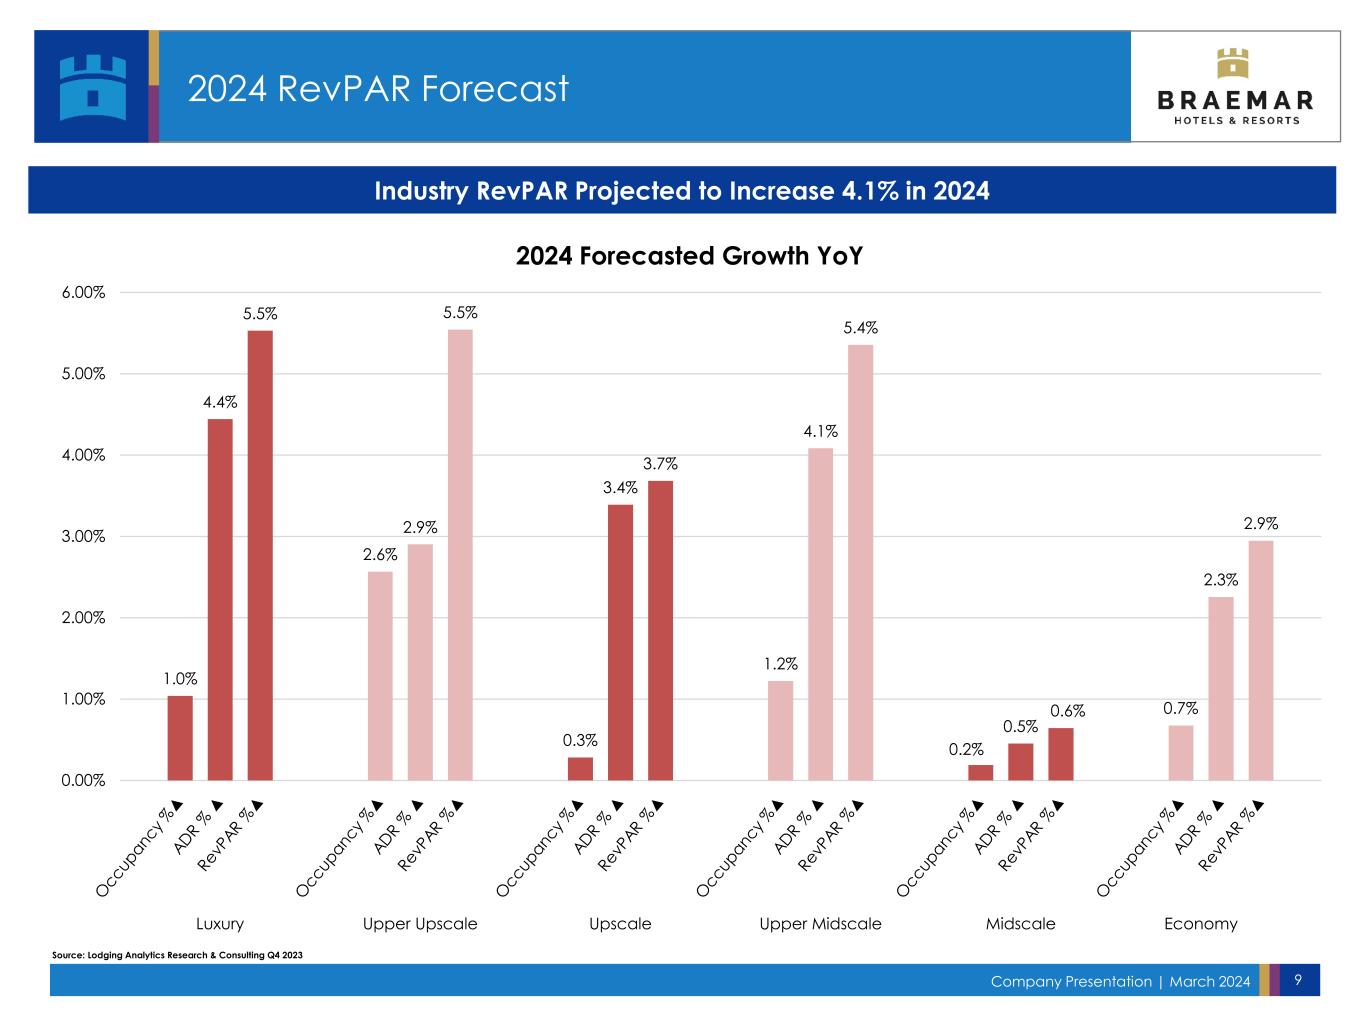
Company Presentation | March 2024 9 2024 RevPAR Forecast Source: Lodging Analytics Research & Consulting Q4 2023 1.0% 4.4% 5.5% 2.6% 2.9% 5.5% 0.3% 3.4% 3.7% 1.2% 4.1% 5.4% 0.2% 0.5% 0.6% 0.7% 2.3% 2.9% 0.00% 1.00% 2.00% 3.00% 4.00% 5.00% 6.00% Luxury Upper Upscale Upscale Upper Midscale Midscale Economy 2024 Forecasted Growth YoY Industry RevPAR Projected to Increase 4.1% in 2024

Optimal Portfolio Composition Taking Advantage of Strategic Asset Class Bardessono Hotel and Spa

Company Presentation | March 2024 11 $4,915 $6,067 $6,082 $12,273 $15,011 $17,289 $20,924 $21,863 $22,381 $22,628 Hotel Yountville Bardessono Ritz-Carlton Lake Tahoe Park Hyatt Beaver Creek Pier House Hilton Torrey Pines Ritz-Carlton Reserve Dorado Beach Four Seasons Scottsdale Ritz-Carlton Sarasota Ritz-Carlton St. Thomas $987 $8,183 $9,276 $10,317 $12,816 $15,427 Cameo Beverly Hills Sofitel Chicago Magnificent Mile The Clancy The Notary Hotel Marriott Seattle Waterfront Capital Hilton High Quality Assets with High Barriers to Entry (1) By Number of Hotels (2) In thousands Properties Resort Hotel Q4 2023 YTD EBITDA(2) Urban Key (1) Resort: 62% Urban: 38%
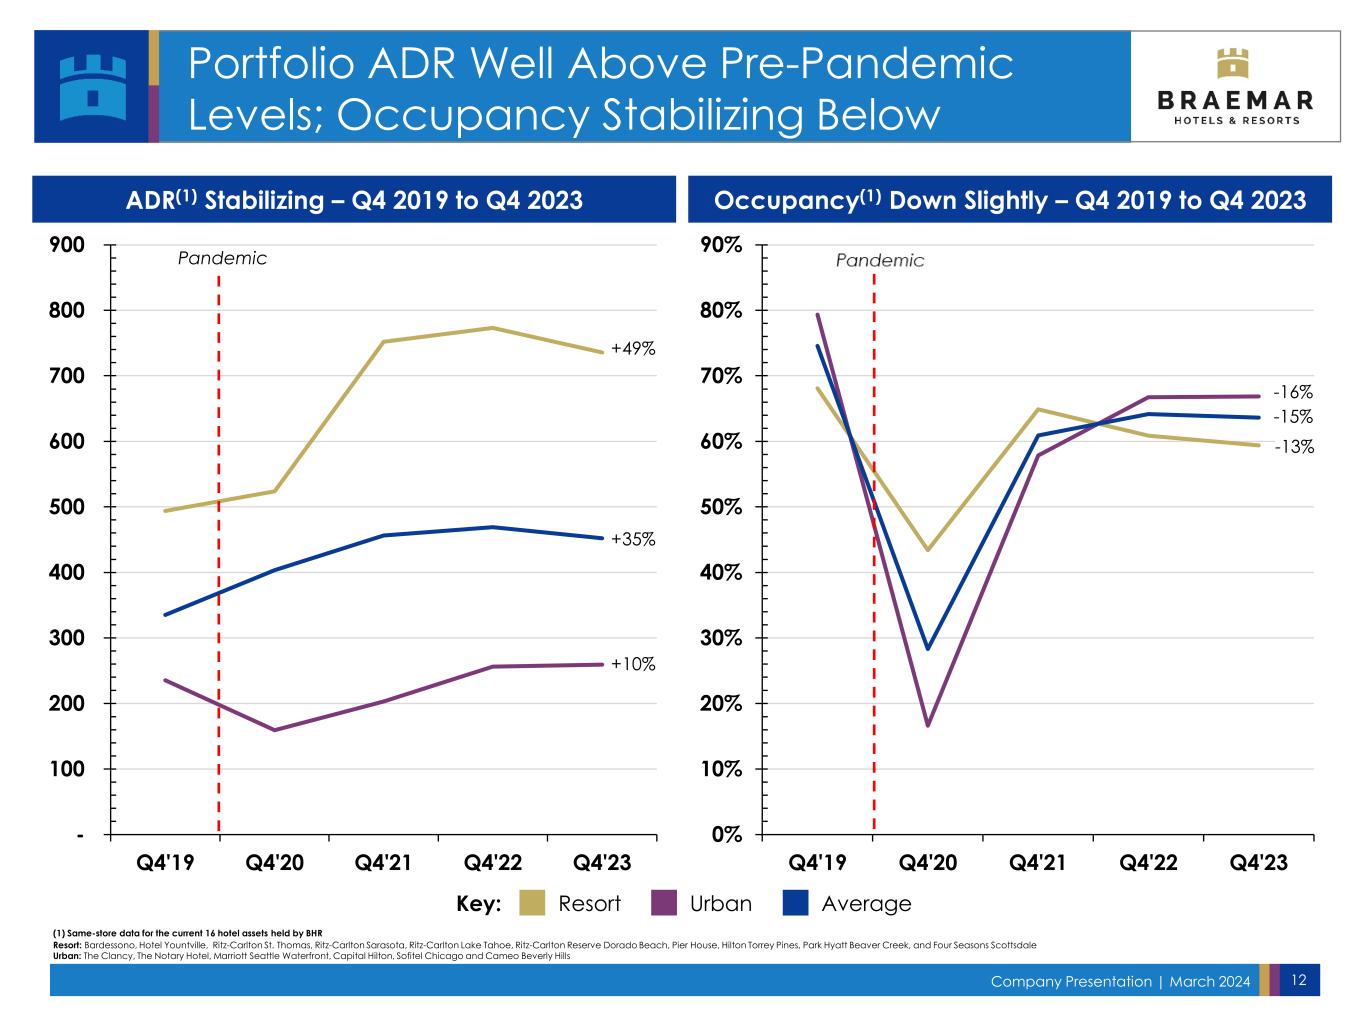
Company Presentation | March 2024 12 Portfolio ADR Well Above Pre-Pandemic Levels; Occupancy Stabilizing Below ADR(1) Stabilizing – Q4 2019 to Q4 2023 Occupancy(1) Down Slightly – Q4 2019 to Q4 2023 (1) Same-store data for the current 16 hotel assets held by BHR Resort: Bardessono, Hotel Yountville, Ritz-Carlton St. Thomas, Ritz-Carlton Sarasota, Ritz-Carlton Lake Tahoe, Ritz-Carlton Reserve Dorado Beach, Pier House, Hilton Torrey Pines, Park Hyatt Beaver Creek, and Four Seasons Scottsdale Urban: The Clancy, The Notary Hotel, Marriott Seattle Waterfront, Capital Hilton, Sofitel Chicago and Cameo Beverly Hills - 100 200 300 400 500 600 700 800 900 Q4'19 Q4'20 Q4'21 Q4'22 Q4'23 Pandemic 0% 10% 20% 30% 40% 50% 60% 70% 80% 90% Q4'19 Q4'20 Q4'21 Q4'22 Q4'23 -15% -13% -16% Key: Resort Urban Average +49% +35% +10%
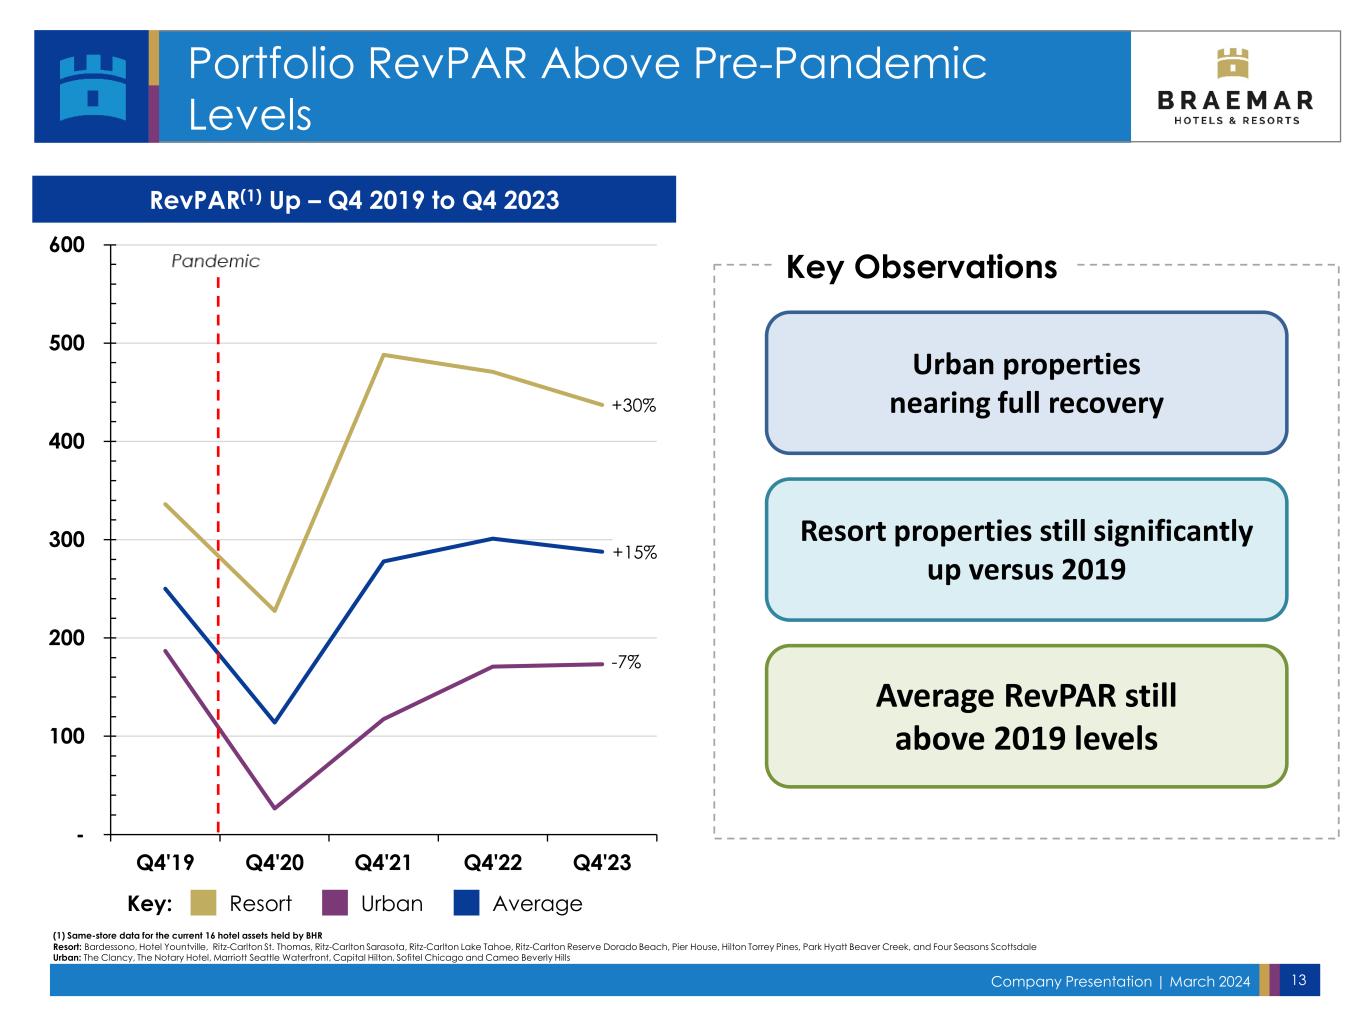
Company Presentation | March 2024 13 RevPAR(1) Up – Q4 2019 to Q4 2023 Key: Resort Urban Average Key Observations Urban properties nearing full recovery Resort properties still significantly up versus 2019 Average RevPAR still above 2019 levels (1) Same-store data for the current 16 hotel assets held by BHR - 100 200 300 400 500 600 Q4'19 Q4'20 Q4'21 Q4'22 Q4'23 Portfolio RevPAR Above Pre-Pandemic Levels Resort: Bardessono, Hotel Yountville, Ritz-Carlton St. Thomas, Ritz-Carlton Sarasota, Ritz-Carlton Lake Tahoe, Ritz-Carlton Reserve Dorado Beach, Pier House, Hilton Torrey Pines, Park Hyatt Beaver Creek, and Four Seasons Scottsdale Urban: The Clancy, The Notary Hotel, Marriott Seattle Waterfront, Capital Hilton, Sofitel Chicago and Cameo Beverly Hills +30% +15% -7%
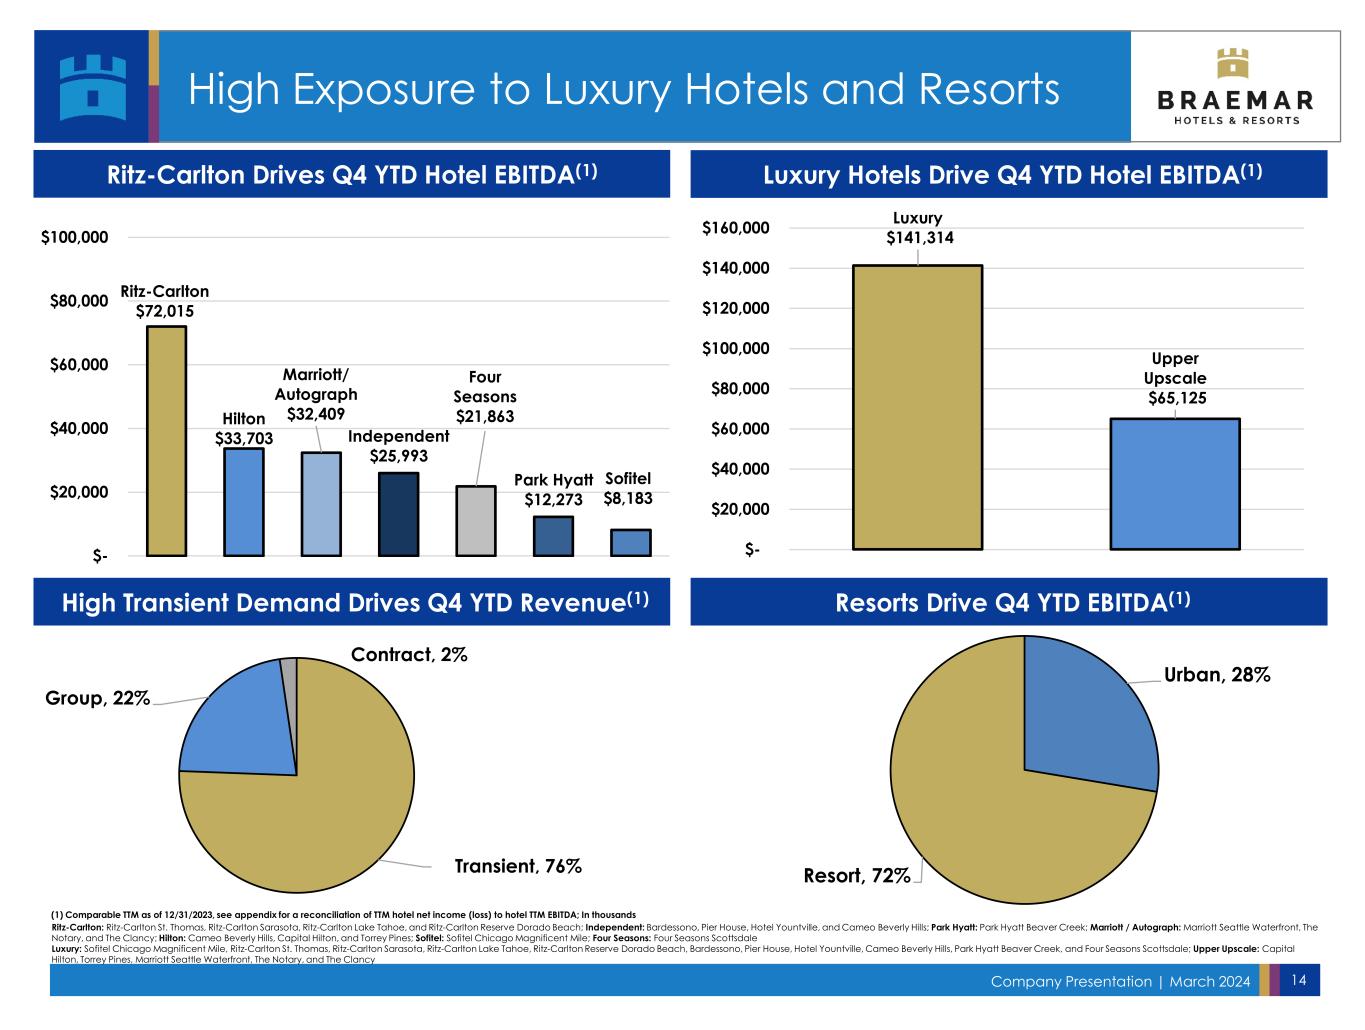
Company Presentation | March 2024 14 Ritz-Carlton $72,015 Hilton $33,703 Marriott/ Autograph $32,409 Independent $25,993 Four Seasons $21,863 Park Hyatt $12,273 Sofitel $8,183 $- $20,000 $40,000 $60,000 $80,000 $100,000 Luxury $141,314 Upper Upscale $65,125 $- $20,000 $40,000 $60,000 $80,000 $100,000 $120,000 $140,000 $160,000 Urban, 28% Resort, 72% Ritz-Carlton Drives Q4 YTD Hotel EBITDA(1) Luxury Hotels Drive Q4 YTD Hotel EBITDA(1) (1) Comparable TTM as of 12/31/2023, see appendix for a reconciliation of TTM hotel net income (loss) to hotel TTM EBITDA; In thousands High Transient Demand Drives Q4 YTD Revenue(1) Resorts Drive Q4 YTD EBITDA(1) High Exposure to Luxury Hotels and Resorts Ritz-Carlton: Ritz-Carlton St. Thomas, Ritz-Carlton Sarasota, Ritz-Carlton Lake Tahoe, and Ritz-Carlton Reserve Dorado Beach; Independent: Bardessono, Pier House, Hotel Yountville, and Cameo Beverly Hills; Park Hyatt: Park Hyatt Beaver Creek; Marriott / Autograph: Marriott Seattle Waterfront, The Notary, and The Clancy; Hilton: Cameo Beverly Hills, Capital Hilton, and Torrey Pines; Sofitel: Sofitel Chicago Magnificent Mile; Four Seasons: Four Seasons Scottsdale Luxury: Sofitel Chicago Magnificent Mile, Ritz-Carlton St. Thomas, Ritz-Carlton Sarasota, Ritz-Carlton Lake Tahoe, Ritz-Carlton Reserve Dorado Beach, Bardessono, Pier House, Hotel Yountville, Cameo Beverly Hills, Park Hyatt Beaver Creek, and Four Seasons Scottsdale; Upper Upscale: Capital Hilton, Torrey Pines, Marriott Seattle Waterfront, The Notary, and The Clancy Transient, 76% Group, 22% Contract, 2%

Recent Results & Developments Solid Q4 Results Signal Potential For Steady Recovery Ritz-Carlton St. Thomas

Company Presentation | March 2024 16 Pier House Resort & Spa (1) In thousands (2) Please refer to slides 28-39 for a reconciliation to the most directly comparable non-GAAP financial metric Q4 EBITDA Results Supported By Strong Resort Contribution

Company Presentation | March 2024 17 Comparable Hotel Operating Results(1) 2023 Q4 2022 Q4 % Variance 2023 ADR $452 $469 (4%) Occupancy 64% 64% 0%(2) RevPAR $288 $301 (4%) Total Hotel Revenue(3) $179,216 $185,917 (4%) Hotel EBITDA(3) $45,116 $50,832 (11%) Hotel EBITDA Margin 25% 27% (2%)(2) (1) Includes all hotels (2) Percentage metrics are shown in points moved (3) In thousands (4) As reported in Earnings Releases: 2019 as reported on 2/25/2021; 2020 as reported on 2/24/2022; 2021 and 2022 as reported on 2/22/2023; TTM Q4’23 as reported on 2/29/24 COMPARABLE HOTEL EBITDA(1)(4)COMPARABLE REVPAR(1)(4) A Slight Reduction in ADRs on Tough Comps Shapes Q4 Results $233 $101 $238 $312 $307 $- $50 $100 $150 $200 $250 $300 $350 2019 2020 2021 2022 2023 $143 $14 $142 $222 $206 $- $50 $100 $150 $200 $250 2019 2020 2021 2022 2023 (In m illi on s)
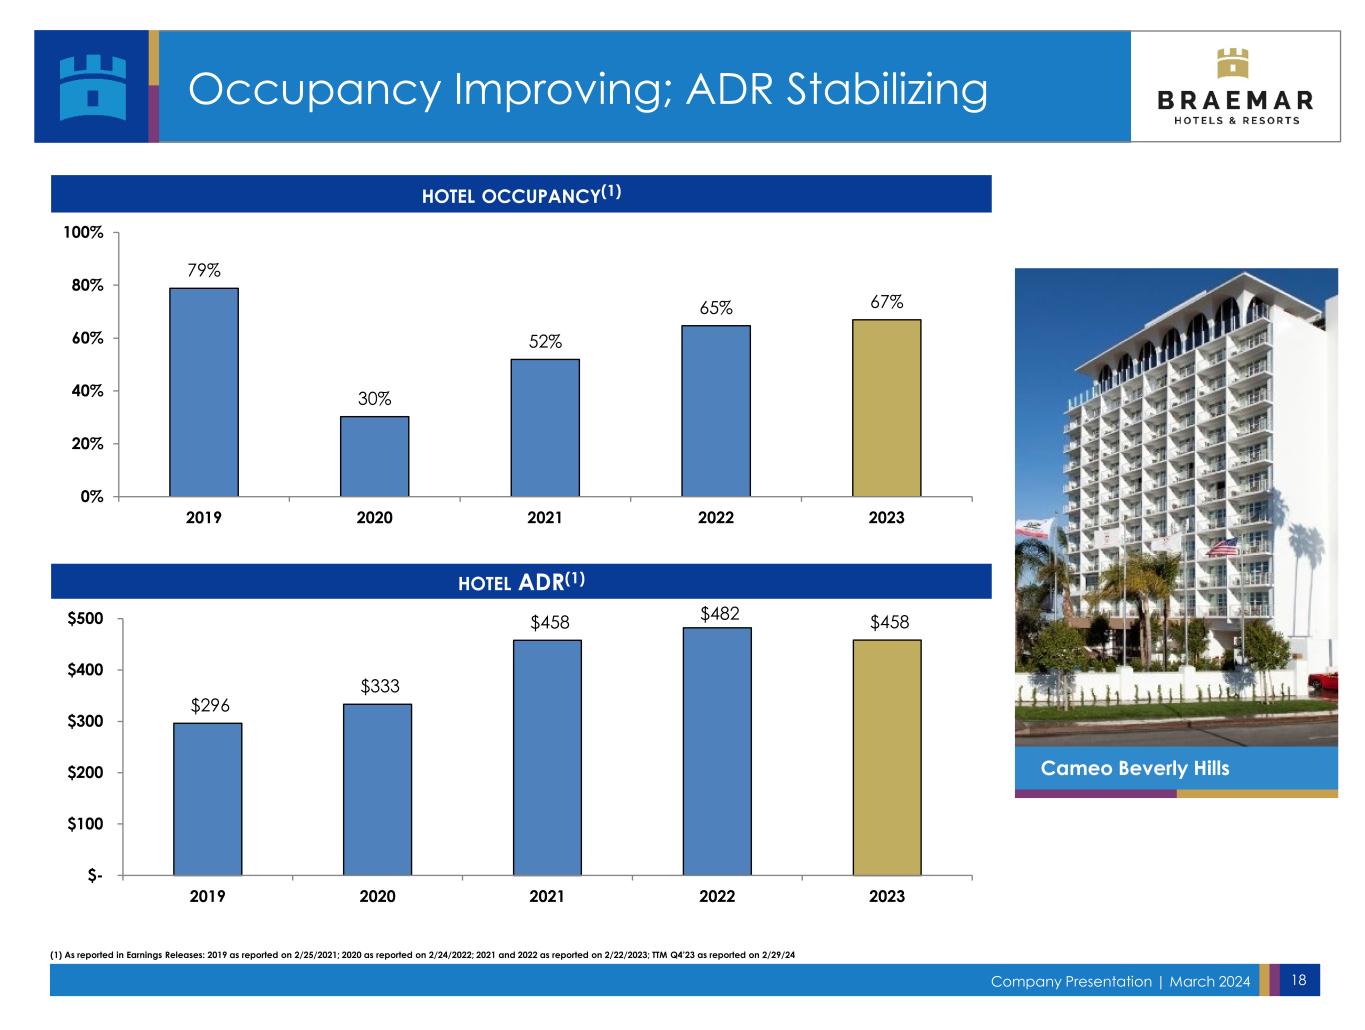
Company Presentation | March 2024 18 (1) As reported in Earnings Releases: 2019 as reported on 2/25/2021; 2020 as reported on 2/24/2022; 2021 and 2022 as reported on 2/22/2023; TTM Q4’23 as reported on 2/29/24 HOTEL ADR(1) HOTEL OCCUPANCY(1) Occupancy Improving; ADR Stabilizing Cameo Beverly Hills $296 $333 $458 $482 $458 $- $100 $200 $300 $400 $500 2019 2020 2021 2022 2023 79% 30% 52% 65% 67% 0% 20% 40% 60% 80% 100% 2019 2020 2021 2022 2023
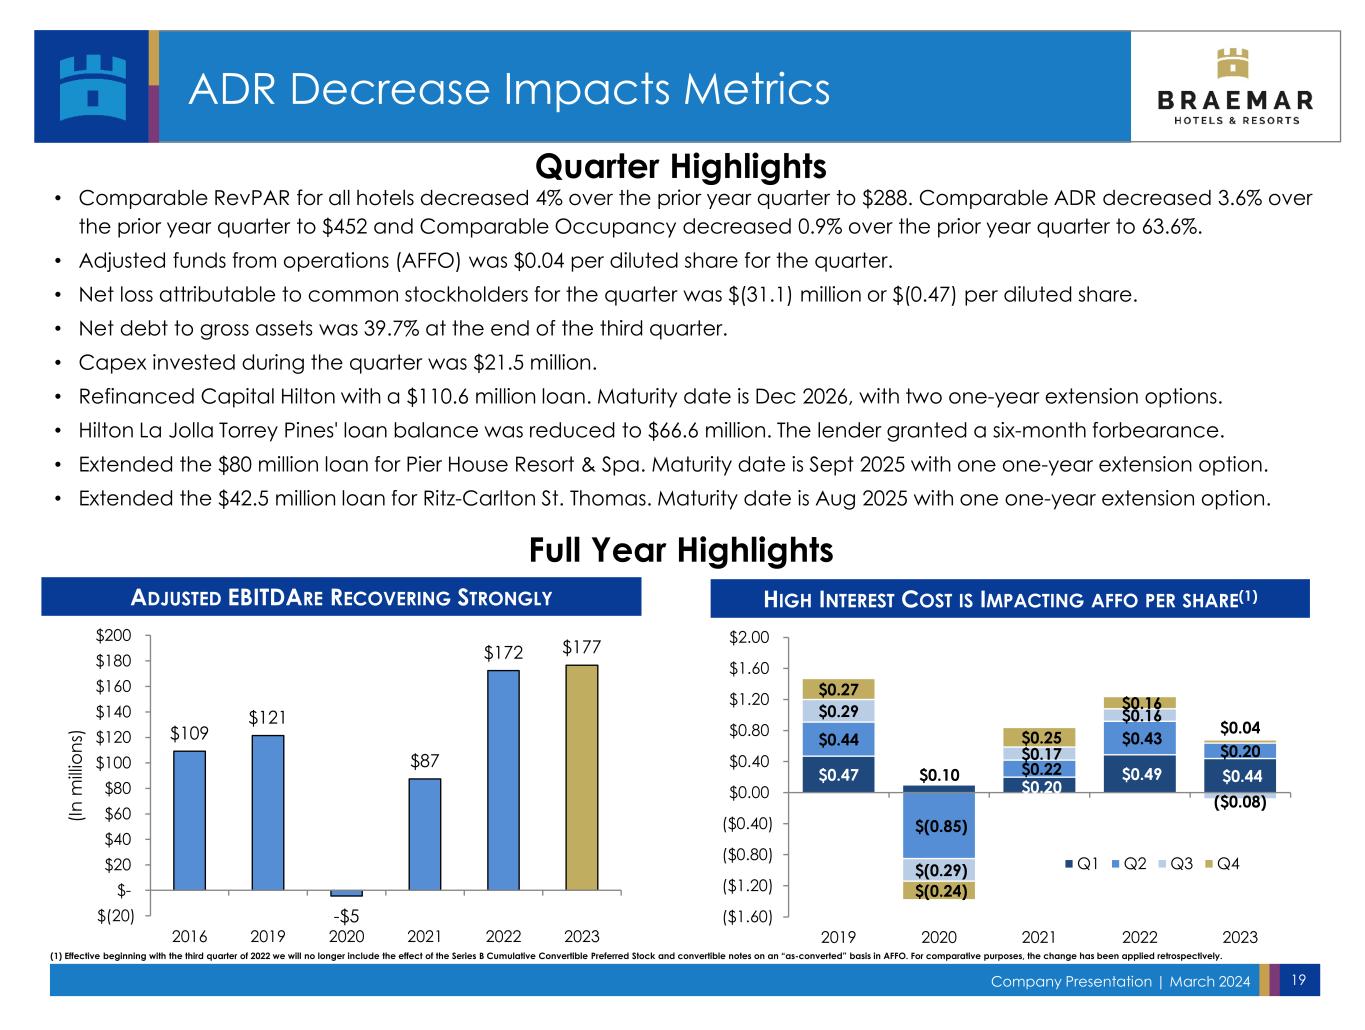
Company Presentation | March 2024 19 HIGH INTEREST COST IS IMPACTING AFFO PER SHARE(1)ADJUSTED EBITDARE RECOVERING STRONGLY Quarter Highlights Full Year Highlights ADR Decrease Impacts Metrics (1) Effective beginning with the third quarter of 2022 we will no longer include the effect of the Series B Cumulative Convertible Preferred Stock and convertible notes on an “as-converted” basis in AFFO. For comparative purposes, the change has been applied retrospectively. $0.47 $0.10 $0.20 $0.49 $0.44 $0.44 $(0.85) $0.22 $0.43 $0.20 $0.29 $(0.29) $0.17 $0.16 ($0.08) $0.27 $(0.24) $0.25 $0.16 $0.04 ($1.60) ($1.20) ($0.80) ($0.40) $0.00 $0.40 $0.80 $1.20 $1.60 $2.00 2019 2020 2021 2022 2023 Q1 Q2 Q3 Q4 $109 $121 -$5 $87 $172 $177 $(20) $- $20 $40 $60 $80 $100 $120 $140 $160 $180 $200 2016 2019 2020 2021 2022 2023 (In m illi on s) • Comparable RevPAR for all hotels decreased 4% over the prior year quarter to $288. Comparable ADR decreased 3.6% over the prior year quarter to $452 and Comparable Occupancy decreased 0.9% over the prior year quarter to 63.6%. • Adjusted funds from operations (AFFO) was $0.04 per diluted share for the quarter. • Net loss attributable to common stockholders for the quarter was $(31.1) million or $(0.47) per diluted share. • Net debt to gross assets was 39.7% at the end of the third quarter. • Capex invested during the quarter was $21.5 million. • Refinanced Capital Hilton with a $110.6 million loan. Maturity date is Dec 2026, with two one-year extension options. • Hilton La Jolla Torrey Pines' loan balance was reduced to $66.6 million. The lender granted a six-month forbearance. • Extended the $80 million loan for Pier House Resort & Spa. Maturity date is Sept 2025 with one one-year extension option. • Extended the $42.5 million loan for Ritz-Carlton St. Thomas. Maturity date is Aug 2025 with one one-year extension option.

Company Presentation | March 2024 20 Top Q4 2023 Capital Expenditures Capital Hilton Ritz-Carlton Lake Tahoe Guestroom Renovation Total Project Cost $12.8M Q4 ‘23 Spend $1.6M • Renovated guestrooms and suites Spa Renovation Total Project Cost $7.7M Q4 ‘23 Spend $2.5M • Renovated the salon and the treatment and healing water rooms of the spa (85% complete) Guestroom Renovation & Key Additions Total Project Cost $37.1M Q4 ‘23 Spend $3.7M • Renovated guestrooms and suites Ritz-Carlton Sarasota Washington, D.C. Truckee, CA Sarasota, FL $21.5M Spent in Q4 2023; $77.1M Spent in 2023

Company Presentation | March 2024 21 Major 2024 Planned Capital Expenditures Capital Hilton Ritz-Carlton Lake Tahoe Ritz-Carlton SarasotaRitz-Carlton St. Thomas Bardessono Hotel Cameo Beverly Hills $90M - $100M Range in Capital Expenditures Planned in 2024 • Public space renovation • Spa renovation (85% complete) • LXR conversion (PIP) (0% complete) • Guestroom renovation (40% complete) & converting fitness center into a parlor (0% complete) • Guestroom renovation & key additions (90% complete) • Restaurant renovation (0% complete)

Liquidity & Liability Management Maintain Liquidity, Manage Maturities and Interest Cost Ritz-Carlton Sarasota

Company Presentation | March 2024 23 Liability Management Strategy Pro Forma Maturity Schedule (2)(3) (1) As of 12/31/23 (2) The $136 million loan secured by the Four Seasons Scottsdale excludes amortizing payments (3) Maturity schedule reflects the loan refinances subsequent to December 31, 2023. Ritz-Carlton, St. Thomas $85.6MCASH & CASH EQUIVALENTS $80.9MRESTRICTED CASH TOTAL CASH $184.2M $17.7MDUE FROM 3RD PARTY MANAGERS Liquidity Position (1) $66.6 $30.0 $293.2 $262.2 $270.5 $242.6 4.3% 13.2% 11.8% 12.2% 10.9% 0% 5% 10% 15% $0.0 $100.0 $200.0 $300.0 $400.0 2024 2025 2026 2027 2028 (% o f G ro ss A ss et s) (in m ill io ns ) Hilton Torrey Pines Cameo Beverly Hills % of Gross Assets

Company Presentation | March 2024 24 BHR Positioned Ideally for Outperformance All Time High Industry Performance Continuing Optimal Portfolio Composition Recent Results & Developments Liquidity & Liability Management Four Seasons Scottsdale
Appendix Ritz-Carlton Lake Tahoe

Company Presentation | March 2024 26 Indebtedness
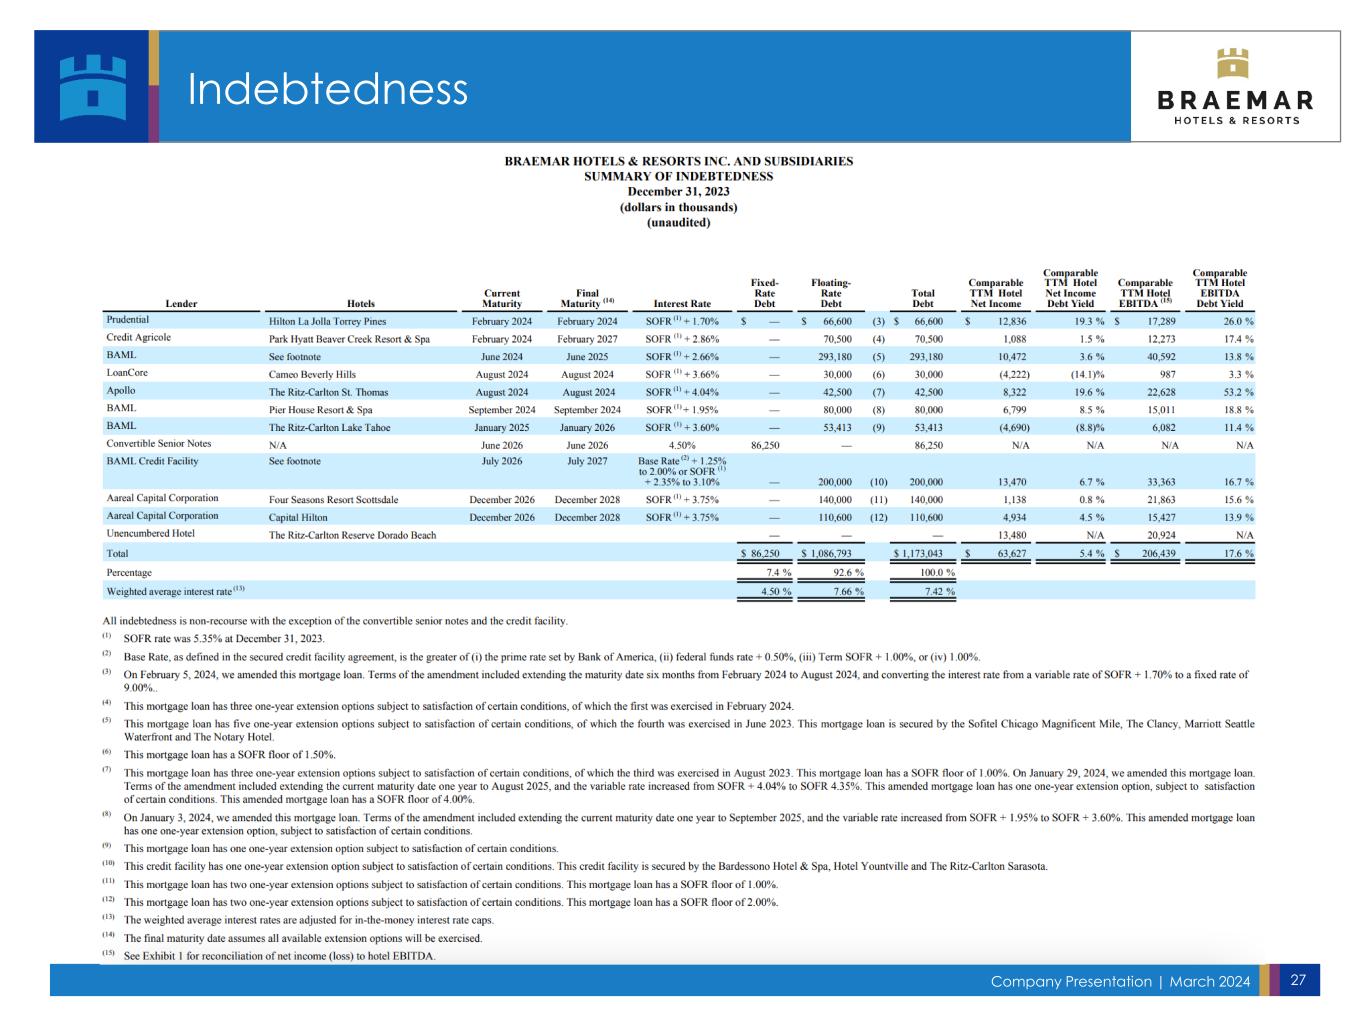
Company Presentation | March 2024 27 Indebtedness
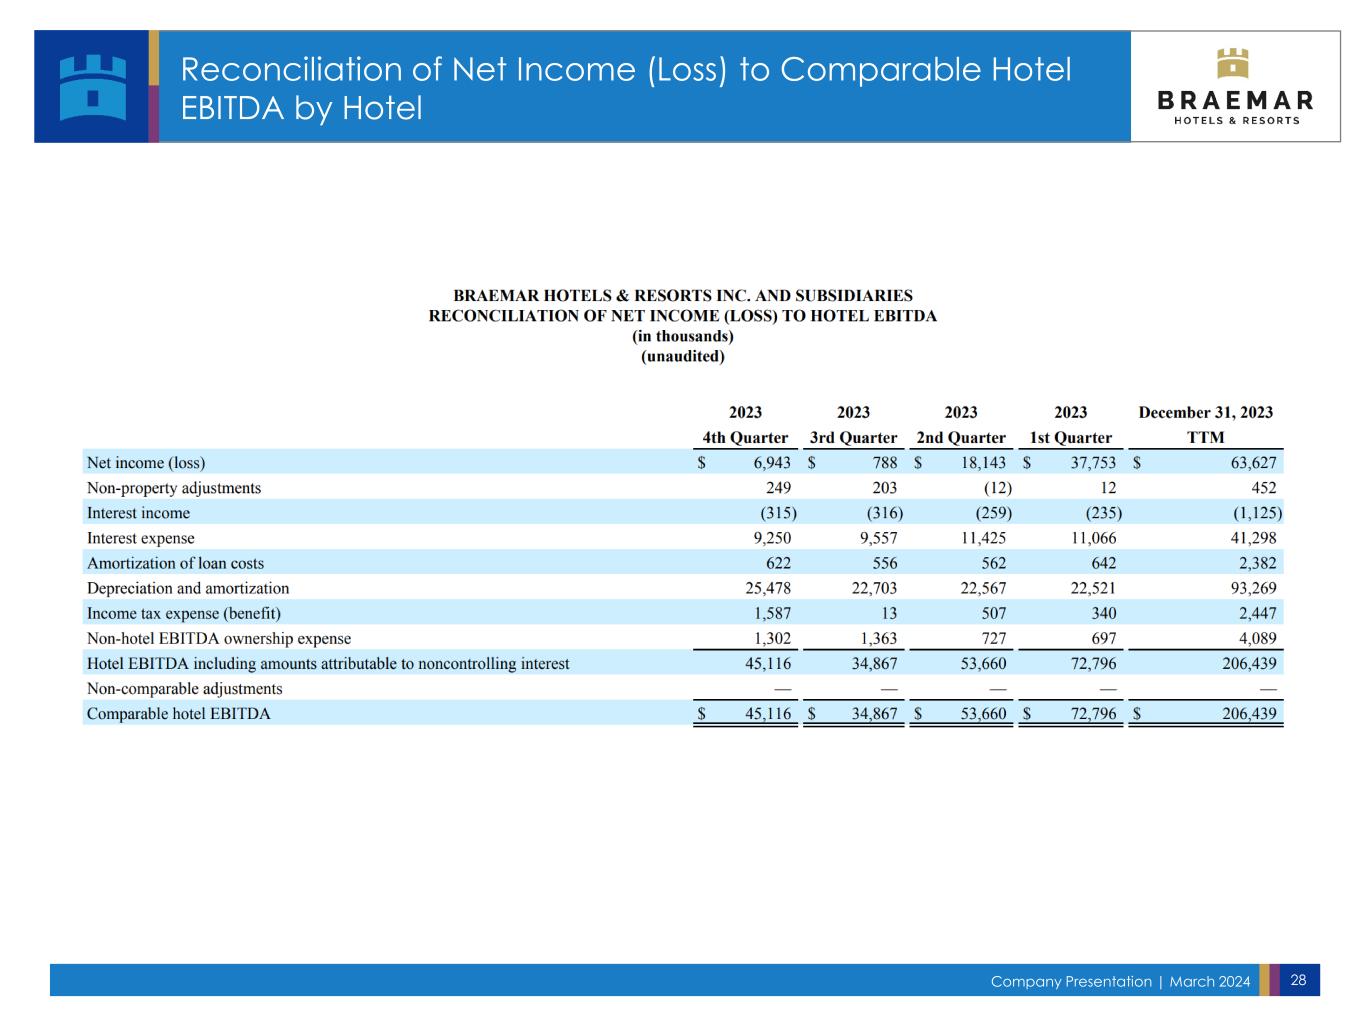
Company Presentation | March 2024 28 Reconciliation of Net Income (Loss) to Comparable Hotel EBITDA by Hotel
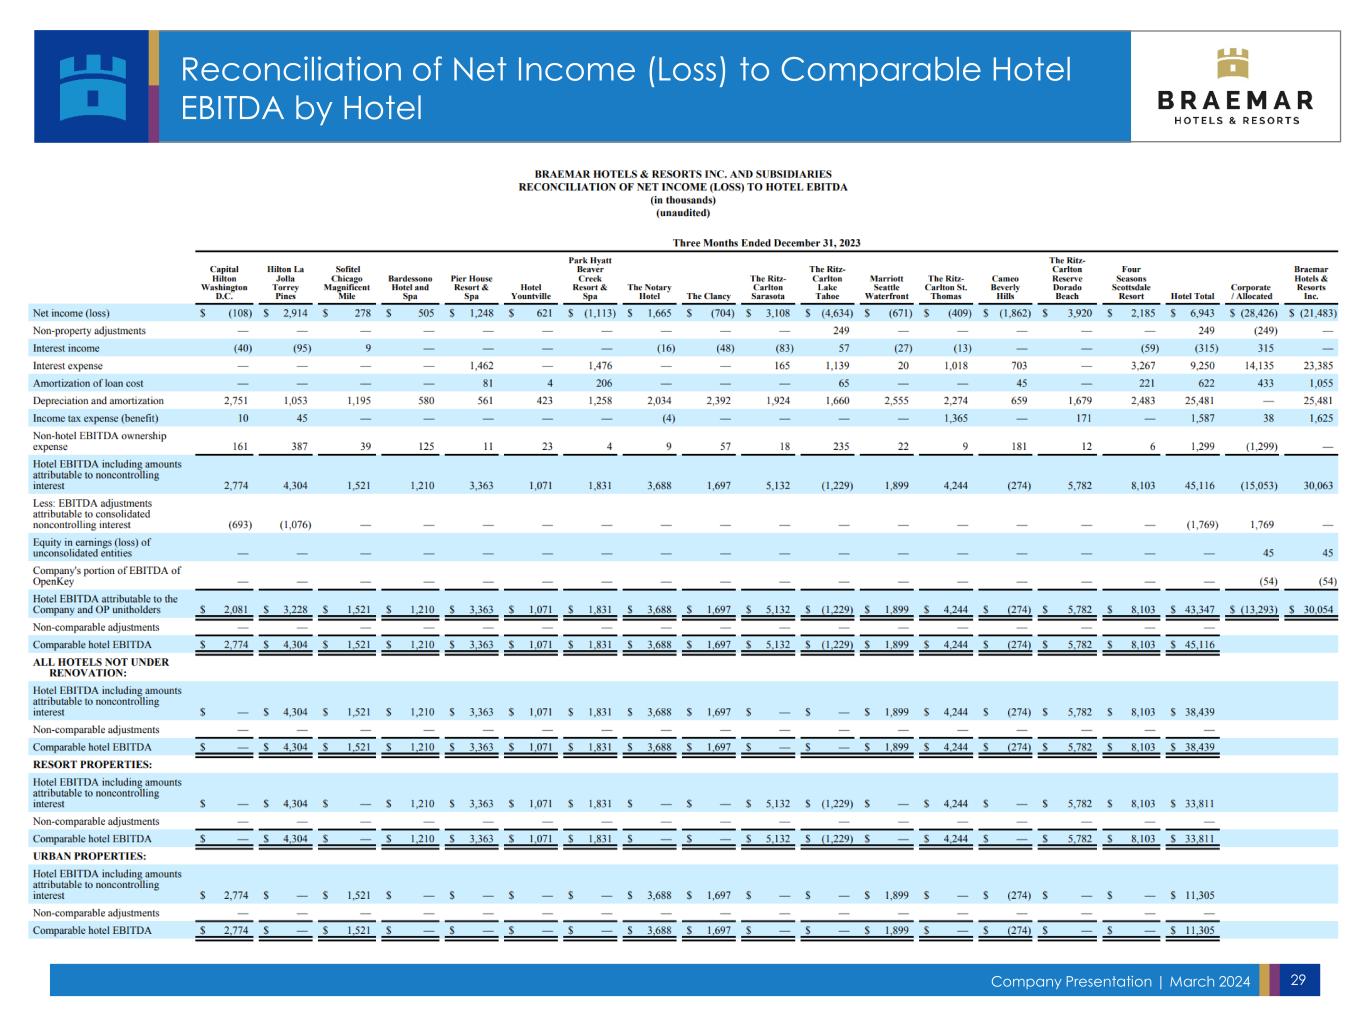
Company Presentation | March 2024 29 Reconciliation of Net Income (Loss) to Comparable Hotel EBITDA by Hotel
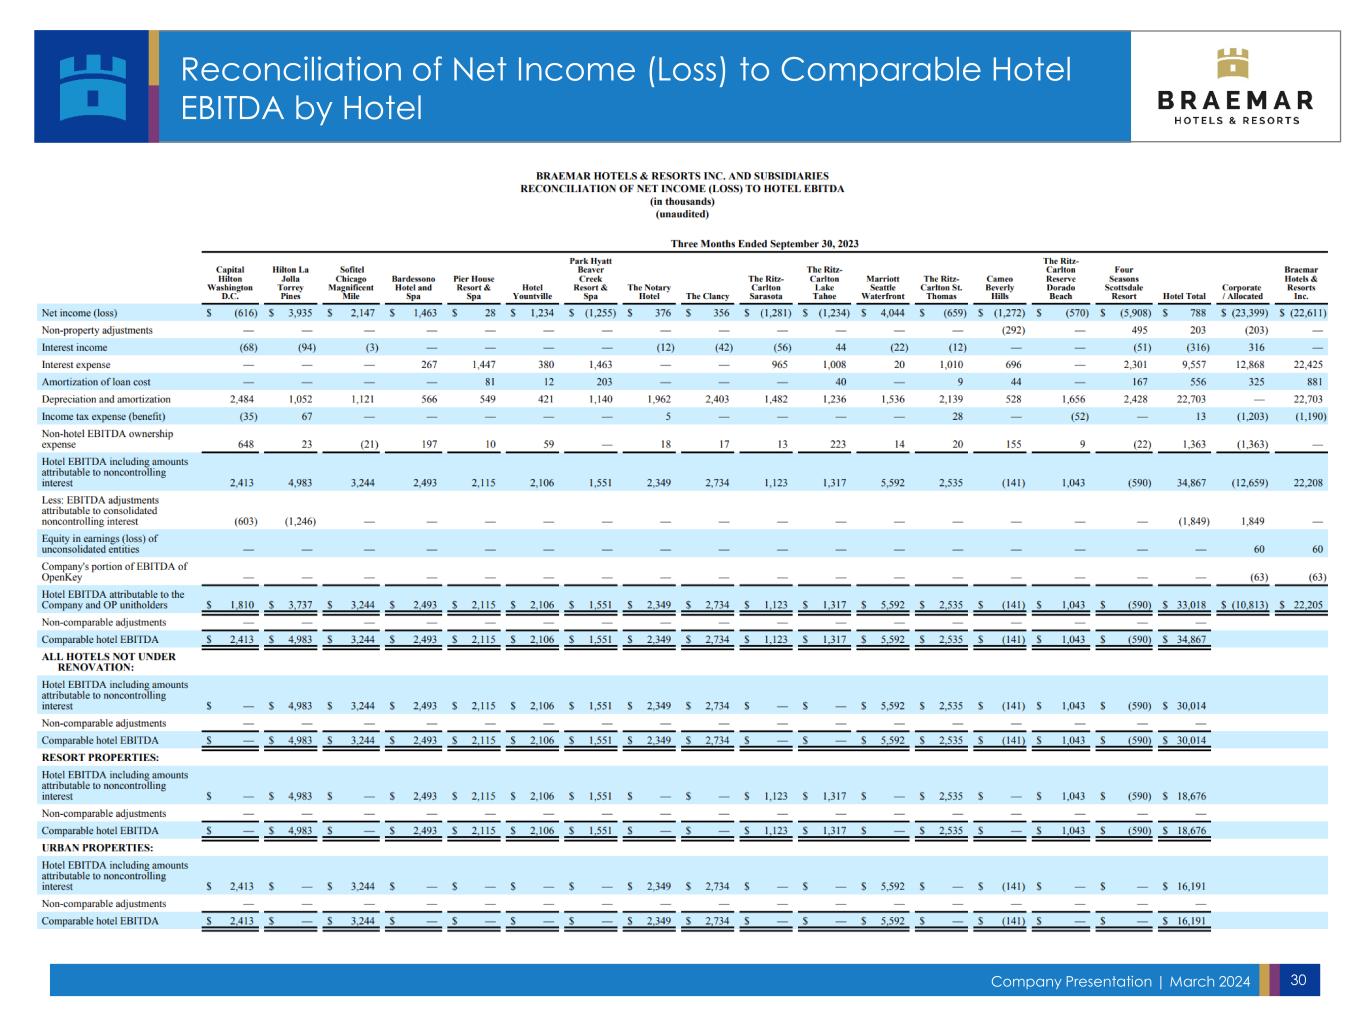
Company Presentation | March 2024 30 Reconciliation of Net Income (Loss) to Comparable Hotel EBITDA by Hotel

Company Presentation | March 2024 31 Reconciliation of Net Income (Loss) to Comparable Hotel EBITDA by Hotel
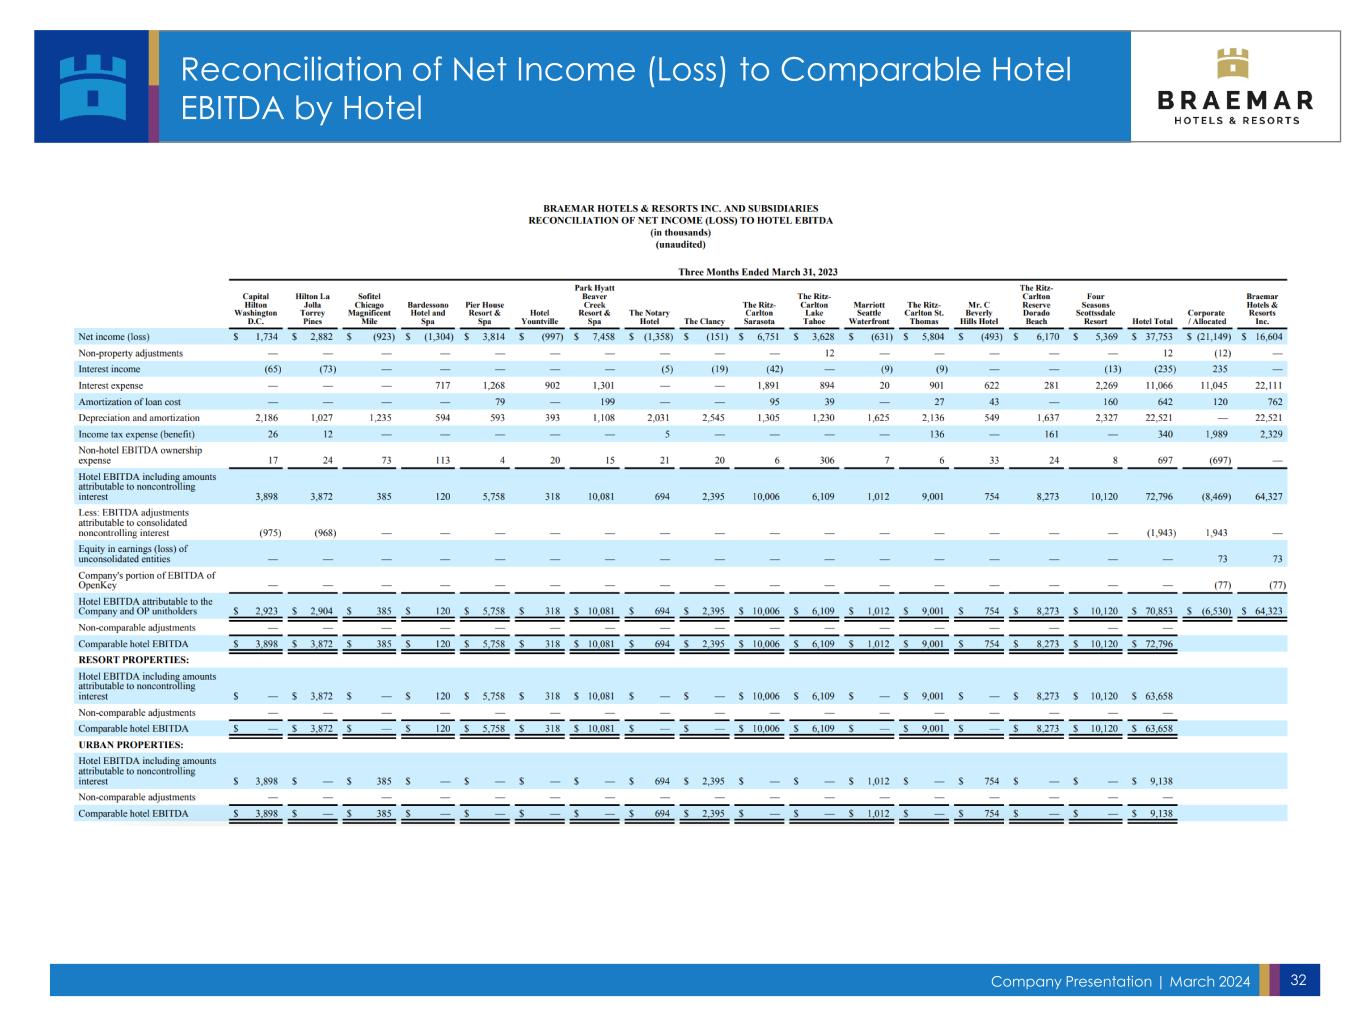
Company Presentation | March 2024 32 Reconciliation of Net Income (Loss) to Comparable Hotel EBITDA by Hotel
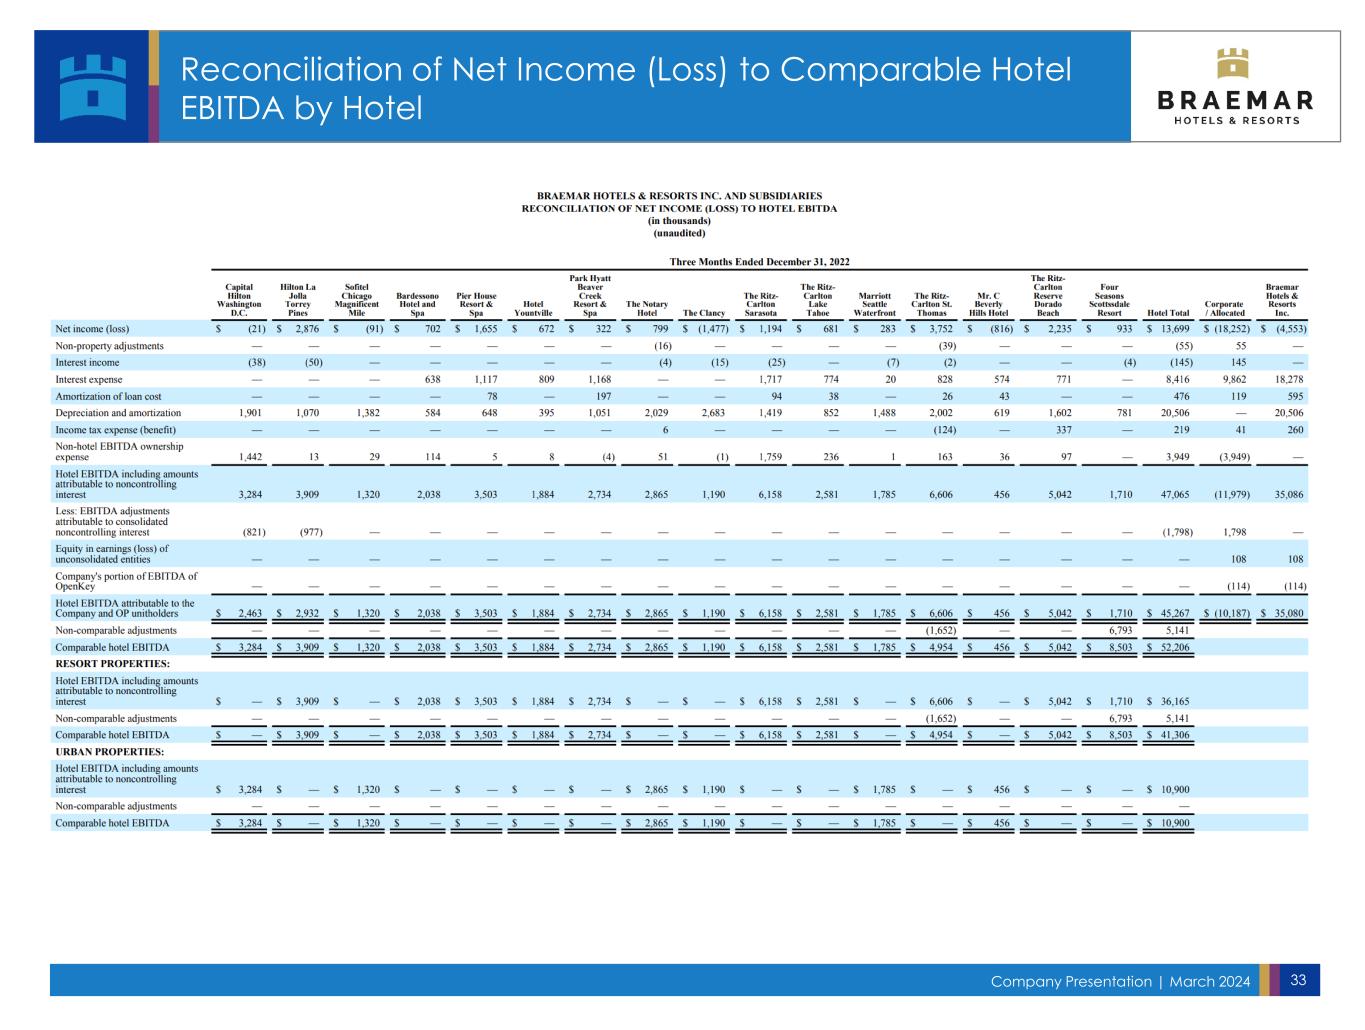
Company Presentation | March 2024 33 Reconciliation of Net Income (Loss) to Comparable Hotel EBITDA by Hotel

Company Presentation | March 2024 34 Reconciliation of Net Income (Loss) to Comparable Hotel EBITDA

Company Presentation | March 2024 35 Reconciliation of Net Income (Loss) to Comparable Hotel EBITDA
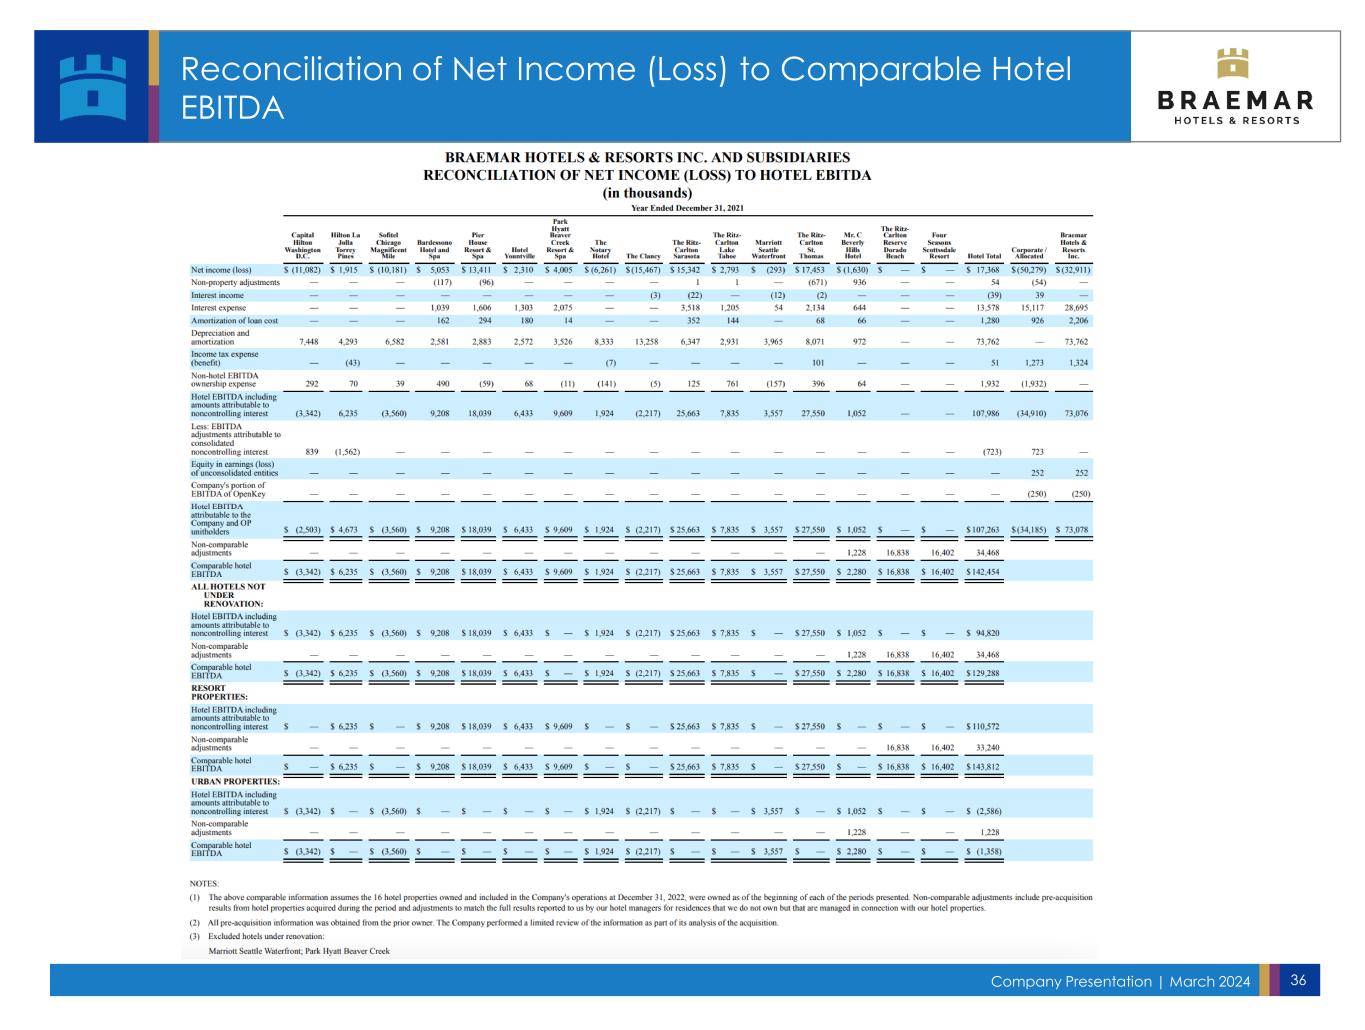
Company Presentation | March 2024 36 Reconciliation of Net Income (Loss) to Comparable Hotel EBITDA

Company Presentation | March 2024 37 Reconciliation of Net Income (Loss) to Comparable Hotel EBITDA

Company Presentation | March 2024 38 Reconciliation of Net Income (Loss) to Comparable Hotel EBITDA Note: As reported, used in Comparable Hotel EBITDA Slide 17
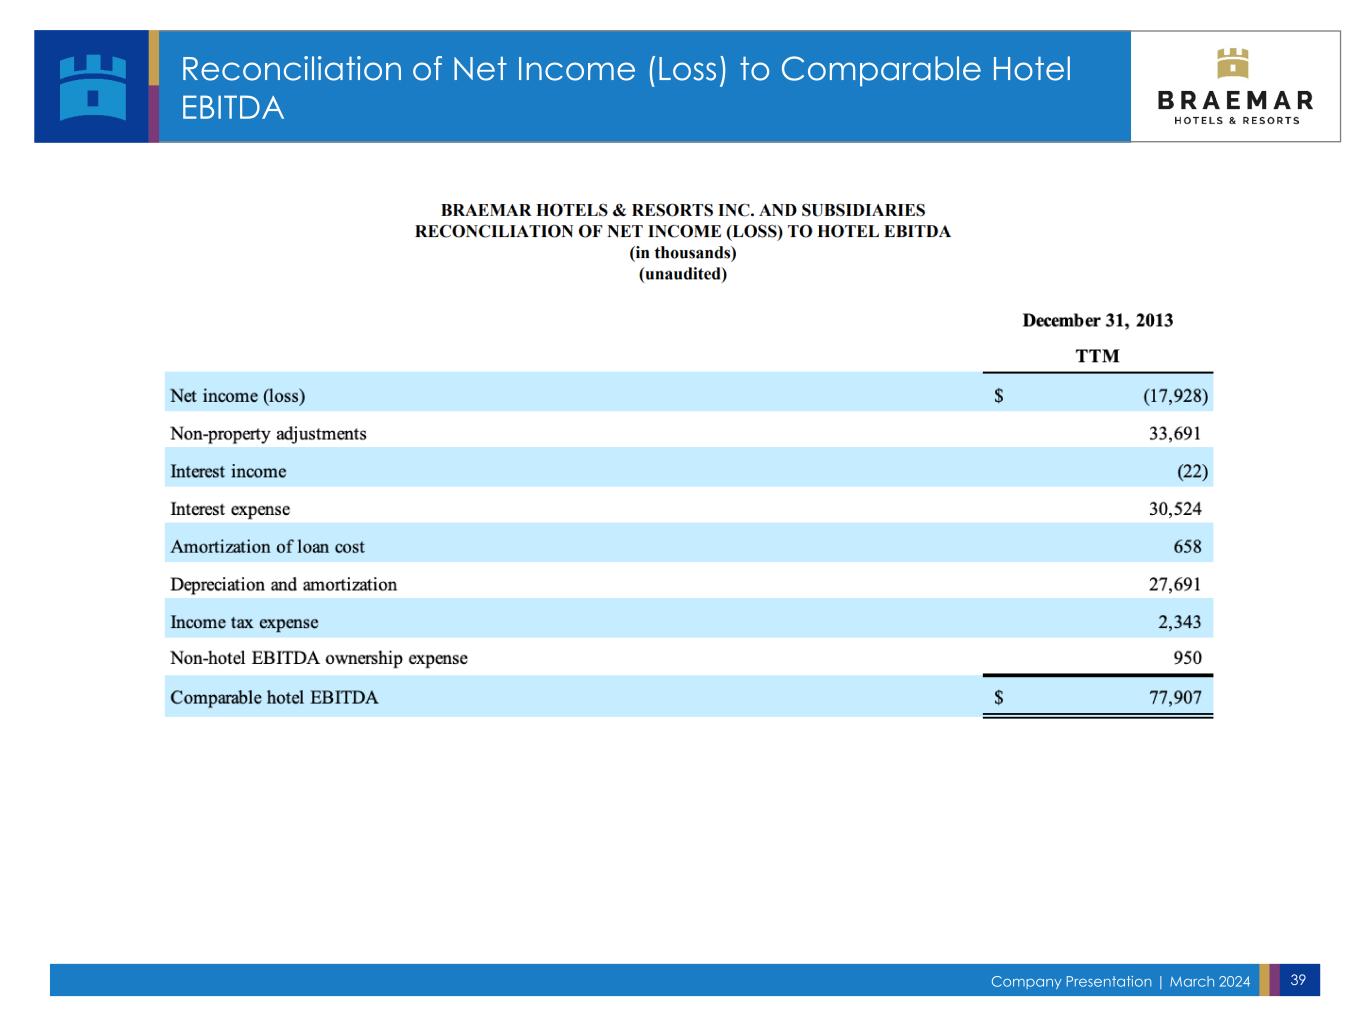
Company Presentation | March 2024 39 Reconciliation of Net Income (Loss) to Comparable Hotel EBITDA
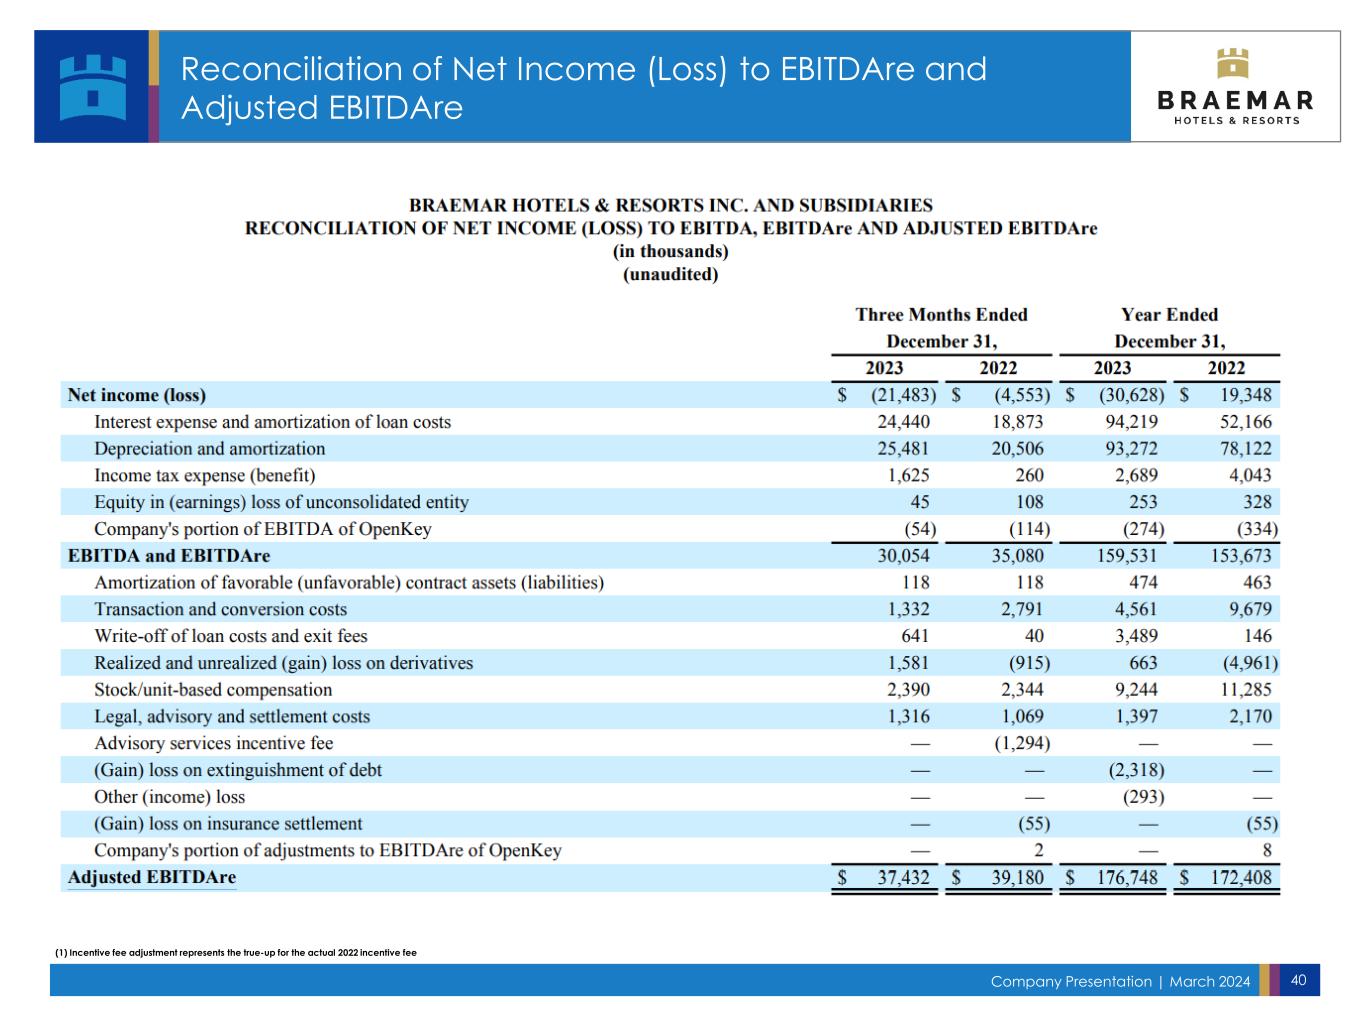
Company Presentation | March 2024 40 Reconciliation of Net Income (Loss) to EBITDAre and Adjusted EBITDAre (1) Incentive fee adjustment represents the true-up for the actual 2022 incentive fee

Company Presentation | March 2024 41 Reconciliation of Net Income (Loss) to EBITDAre and Adjusted EBITDAre
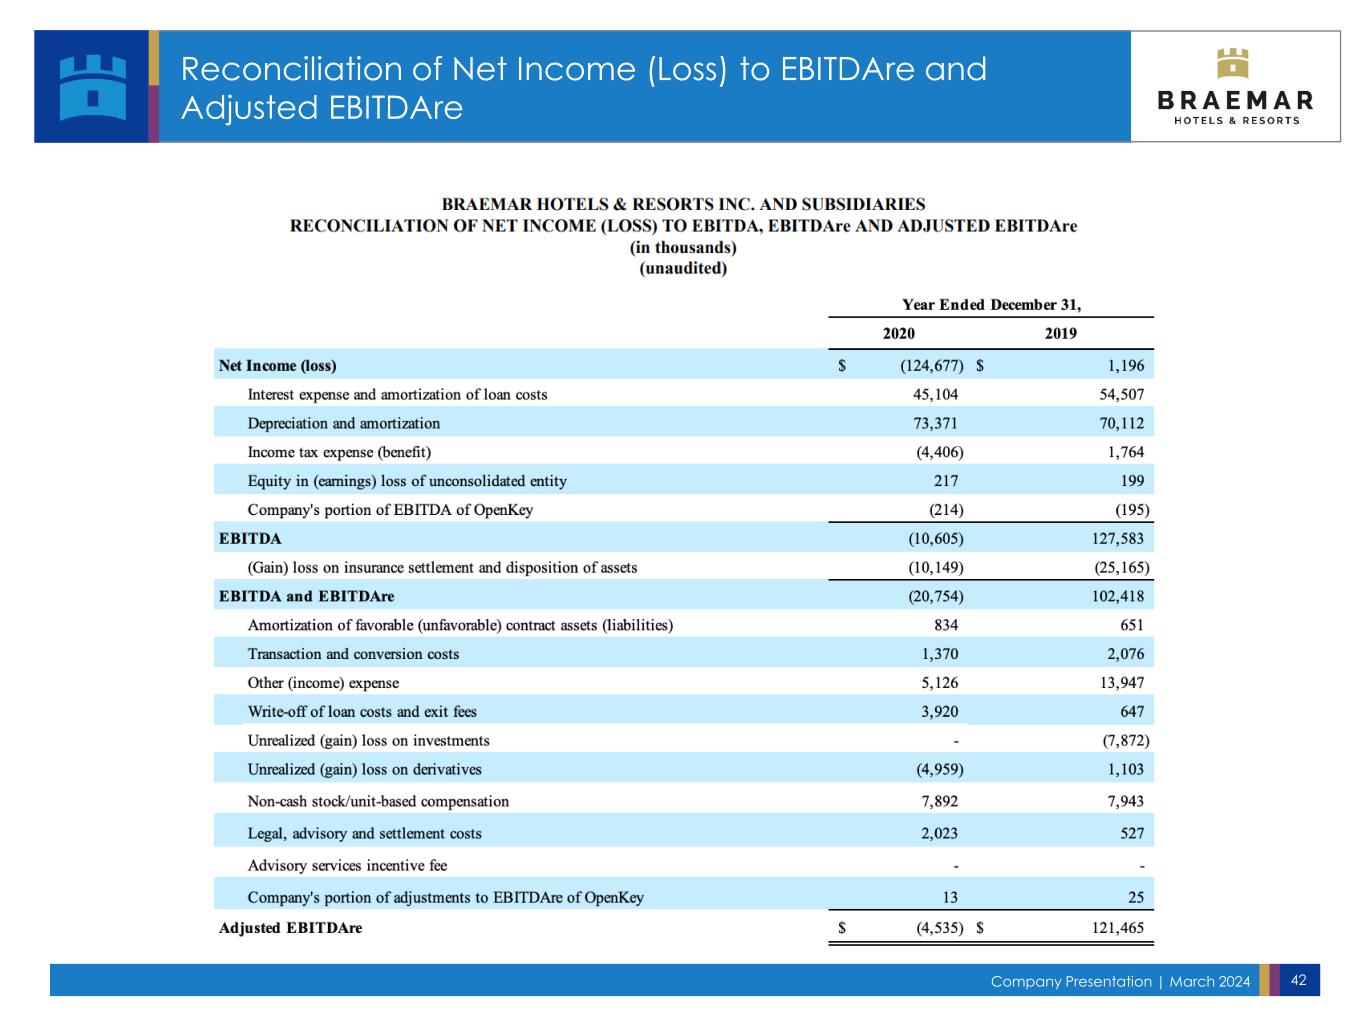
Company Presentation | March 2024 42 Reconciliation of Net Income (Loss) to EBITDAre and Adjusted EBITDAre
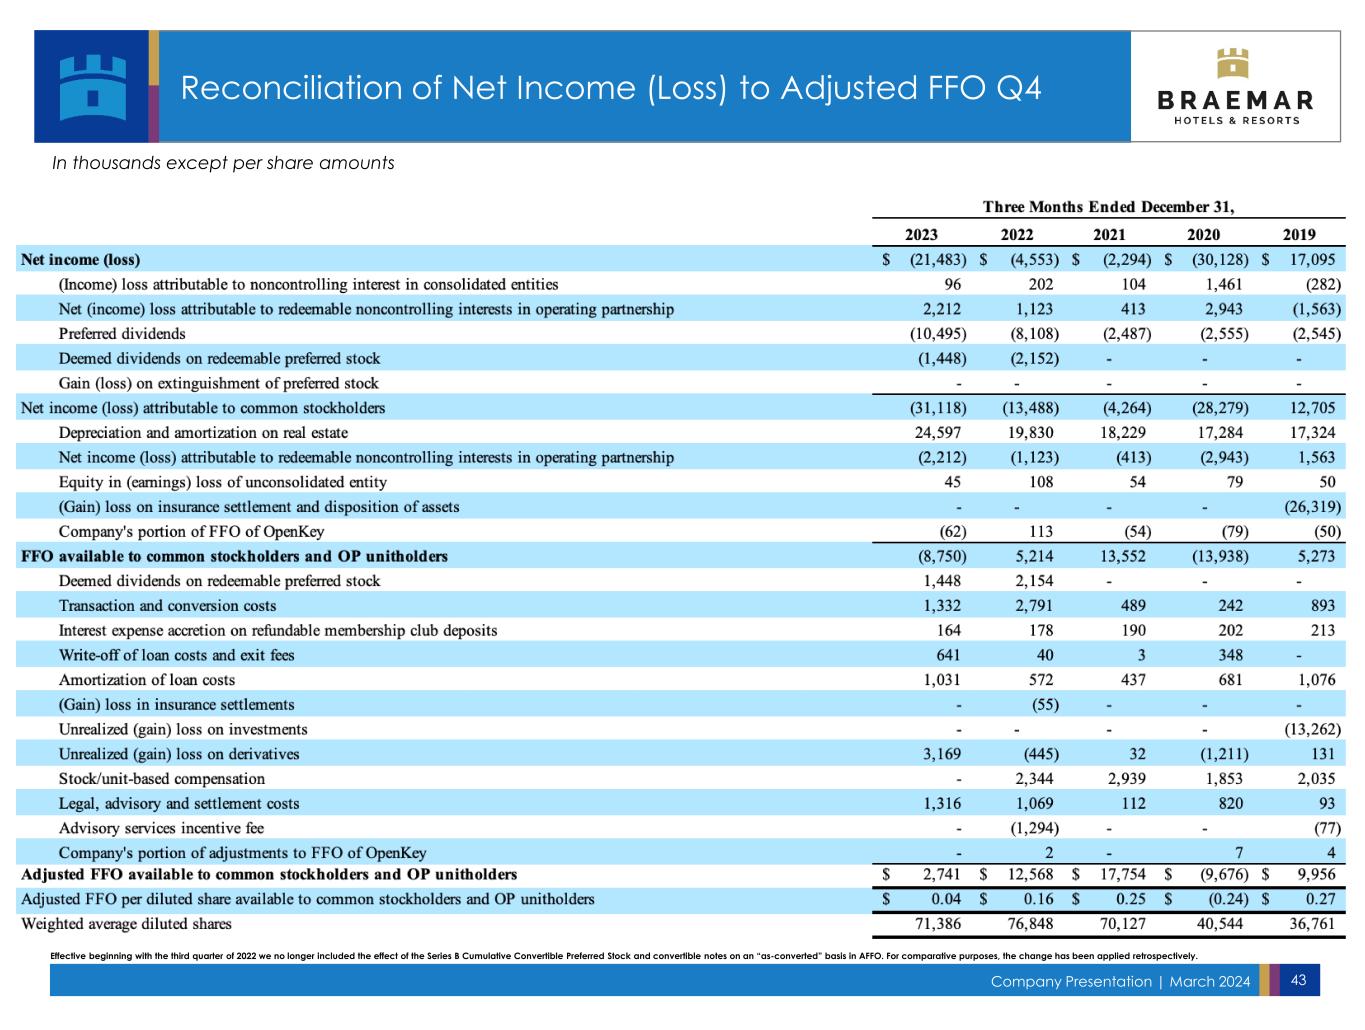
Company Presentation | March 2024 43 Reconciliation of Net Income (Loss) to Adjusted FFO Q4 In thousands except per share amounts Effective beginning with the third quarter of 2022 we no longer included the effect of the Series B Cumulative Convertible Preferred Stock and convertible notes on an “as-converted” basis in AFFO. For comparative purposes, the change has been applied retrospectively.
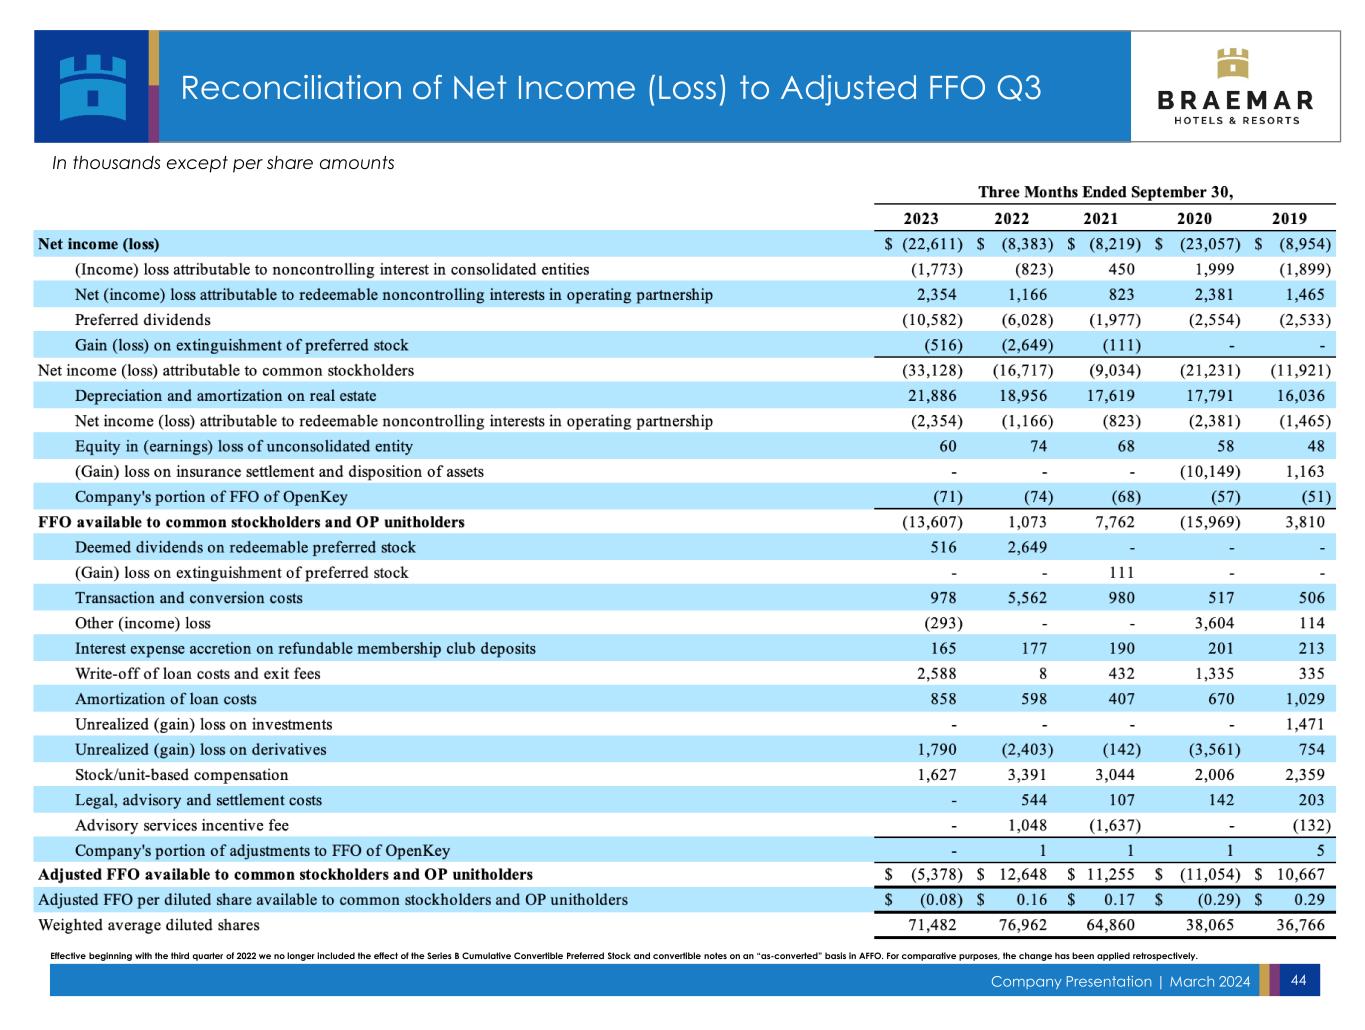
Company Presentation | March 2024 44 Reconciliation of Net Income (Loss) to Adjusted FFO Q3 In thousands except per share amounts Effective beginning with the third quarter of 2022 we no longer included the effect of the Series B Cumulative Convertible Preferred Stock and convertible notes on an “as-converted” basis in AFFO. For comparative purposes, the change has been applied retrospectively.
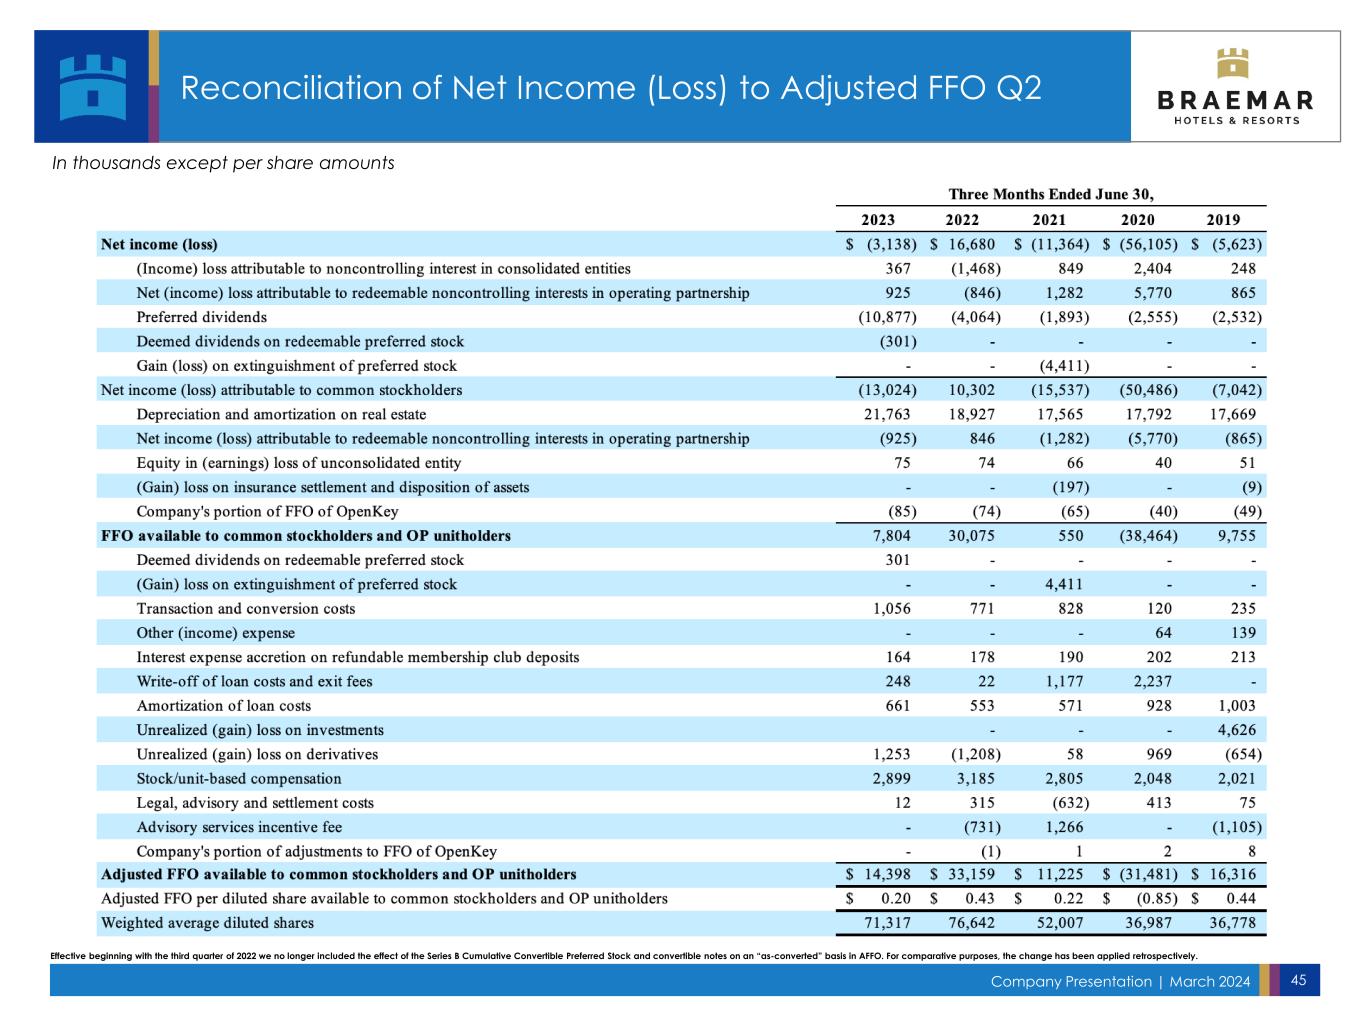
Company Presentation | March 2024 45 Reconciliation of Net Income (Loss) to Adjusted FFO Q2 In thousands except per share amounts Effective beginning with the third quarter of 2022 we no longer included the effect of the Series B Cumulative Convertible Preferred Stock and convertible notes on an “as-converted” basis in AFFO. For comparative purposes, the change has been applied retrospectively.

Company Presentation | March 2024 46 Reconciliation of Net Income (Loss) to Adjusted FFO Q1 In thousands except per share amounts Effective beginning with the third quarter of 2022 we no longer included the effect of the Series B Cumulative Convertible Preferred Stock and convertible notes on an “as-converted” basis in AFFO. For comparative purposes, the change has been applied retrospectively.


