| Maryland | 001-36008 | 46-2024407 | ||||||||||||
| (State or other jurisdiction of incorporation) |
(Commission File Number) | (IRS Employer Identification No.) | ||||||||||||
| 11620 Wilshire Boulevard, Suite 1000 | ||||||||
| Los Angeles | ||||||||
| California | 90025 | |||||||
| (Address of principal executive offices) | (Zip Code) | |||||||
| ☐ | Written communications pursuant to Rule 425 under the Securities Act (17 CFR 230.425) | ||||
| ☐ | Soliciting material pursuant to Rule 14a-12 under the Exchange Act (17 CFR 240.14a-12) |
||||
| ☐ | Pre-commencement communications pursuant to Rule 14d-2(b) under the Exchange Act (17 CFR 240.14d-2(b)) |
||||
| ☐ | Pre-commencement communications pursuant to Rule 13e-4(c) under the Exchange Act (17 CFR 240.13e-4(c)) |
||||
| Title of each class | Trading symbols | Name of each exchange on which registered | ||||||||||||
| Common Stock, $0.01 par value | REXR | New York Stock Exchange | ||||||||||||
| 5.875% Series B Cumulative Redeemable Preferred Stock | REXR-PB | New York Stock Exchange | ||||||||||||
| 5.625% Series C Cumulative Redeemable Preferred Stock | REXR-PC | New York Stock Exchange | ||||||||||||
| Exhibit Number |
Description | |||||||
| 99.1 | ||||||||
| 99.2 | ||||||||
| 104 | Cover Page Interactive Data File (embedded within the Inline XBRL document) | |||||||
| Rexford Industrial Realty, Inc. | |||||
| October 15, 2025 |
/s/ Michael S. Frankel
|
||||
| Michael S. Frankel Co-Chief Executive Officer (Principal Executive Officer) |
|||||
| Rexford Industrial Realty, Inc. | |||||
| October 15, 2025 |
/s/ Howard Schwimmer
|
||||
| Howard Schwimmer Co-Chief Executive Officer (Principal Executive Officer) |
|||||

Q3 2025 Leasing Activity |
||||||||||||||||||||||||||
Releasing Spreads(1)(2) |
||||||||||||||||||||||||||
# of Leases Executed |
SF of
Leasing
|
Net Effective |
Cash |
|||||||||||||||||||||||
New Leases |
69 | 2,361,131 | 25.6% | 10.9% | ||||||||||||||||||||||
Renewal Leases |
54 | 904,014 | 26.5% | 9.9% | ||||||||||||||||||||||
Total Leases |
123 | 3,265,145 | 26.1% | 10.3% | ||||||||||||||||||||||
2025 Outlook (1) |
Q3 2025 Updated Guidance |
Q2 2025 Guidance |
||||||||||||
| Net Income Attributable to Common Stockholders per diluted share | $1.44 - $1.46 | $1.38 - $1.42 | ||||||||||||
| Company share of Core FFO per diluted share | $2.39 - $2.41 | $2.37 - $2.41 | ||||||||||||
Same Property Portfolio NOI Growth — Net Effective |
0.75% - 1.25% | 0.75% - 1.25% | ||||||||||||
Same Property Portfolio NOI Growth — Cash |
3.75% - 4.25% | 2.25% - 2.75% | ||||||||||||
Average Same Property Portfolio Occupancy (Full Year) (2) |
+/- 96.0% | 95.5% - 96.0% | ||||||||||||
General and Administrative Expenses (3) |
+/- $82M | +/- $82M | ||||||||||||
| Net Interest Expense | +/- $105M | +/- $107M | ||||||||||||
2025 Estimate |
|||||||||||
| Low | High | ||||||||||
| Net income attributable to common stockholders | $ | 1.44 | $ | 1.46 | |||||||
| Company share of depreciation and amortization | 1.28 | 1.28 | |||||||||
Company share of gains on sale of real estate |
(0.36) | (0.36) | |||||||||
| Company share of FFO | $ | 2.36 | $ | 2.38 | |||||||
Add: Core FFO adjustments(1) |
0.03 | 0.03 | |||||||||
| Company share of Core FFO | $ | 2.39 | $ | 2.41 | |||||||
| September 30, 2025 | December 31, 2024 | ||||||||||
| (unaudited) | |||||||||||
| ASSETS | |||||||||||
| Land | $ | 7,774,737 | $ | 7,822,290 | |||||||
| Buildings and improvements | 4,607,202 | 4,611,987 | |||||||||
| Tenant improvements | 194,405 | 188,217 | |||||||||
| Furniture, fixtures, and equipment | 132 | 132 | |||||||||
| Construction in progress | 475,072 | 333,690 | |||||||||
| Total real estate held for investment | 13,051,548 | 12,956,316 | |||||||||
| Accumulated depreciation | (1,119,746) | (977,133) | |||||||||
| Investments in real estate, net | 11,931,802 | 11,979,183 | |||||||||
| Cash and cash equivalents | 248,956 | 55,971 | |||||||||
| Restricted cash | 65,464 | — | |||||||||
Loan receivable, net |
123,589 | 123,244 | |||||||||
| Rents and other receivables, net | 15,727 | 15,772 | |||||||||
| Deferred rent receivable, net | 181,439 | 161,693 | |||||||||
| Deferred leasing costs, net | 82,227 | 67,827 | |||||||||
Deferred loan costs, net |
7,391 | 1,999 | |||||||||
| Acquired lease intangible assets, net | 154,931 | 201,467 | |||||||||
Acquired indefinite-lived intangible asset |
5,156 | 5,156 | |||||||||
Interest rate swap assets |
2,804 | 8,942 | |||||||||
| Other assets | 31,522 | 26,964 | |||||||||
| Total Assets | $ | 12,851,008 | $ | 12,648,218 | |||||||
| LIABILITIES & EQUITY | |||||||||||
| Liabilities | |||||||||||
| Notes payable | $ | 3,249,733 | $ | 3,345,962 | |||||||
| Interest rate swap liability | 1,626 | — | |||||||||
| Accounts payable, accrued expenses and other liabilities | 153,558 | 149,707 | |||||||||
| Dividends and distributions payable | 103,913 | 97,823 | |||||||||
| Acquired lease intangible liabilities, net | 122,870 | 147,473 | |||||||||
| Tenant security deposits | 91,835 | 90,698 | |||||||||
Tenant prepaid rents |
85,114 | 90,576 | |||||||||
| Total Liabilities | 3,808,649 | 3,922,239 | |||||||||
| Equity | |||||||||||
| Rexford Industrial Realty, Inc. stockholders’ equity | |||||||||||
Preferred stock, $0.01 par value per share, 10,050,000 shares authorized: |
|||||||||||
5.875% series B cumulative redeemable preferred stock, 3,000,000 shares outstanding at September 30, 2025 and December 31, 2024 ($75,000 liquidation preference) |
72,443 | 72,443 | |||||||||
5.625% series C cumulative redeemable preferred stock, 3,450,000 shares outstanding at September 30, 2025 and December 31, 2024 ($86,250 liquidation preference) |
83,233 | 83,233 | |||||||||
Common Stock,$ 0.01 par value per share, 489,950,000 authorized and 232,810,406 and 225,285,011 shares outstanding at September 30, 2025 and December 31, 2024, respectively |
2,328 | 2,253 | |||||||||
| Additional paid in capital | 8,993,439 | 8,601,276 | |||||||||
| Cumulative distributions in excess of earnings | (474,813) | (441,881) | |||||||||
| Accumulated other comprehensive loss | (515) | 6,746 | |||||||||
| Total stockholders’ equity | 8,676,115 | 8,324,070 | |||||||||
| Noncontrolling interests | 366,244 | 401,909 | |||||||||
| Total Equity | 9,042,359 | 8,725,979 | |||||||||
| Total Liabilities and Equity | $ | 12,851,008 | $ | 12,648,218 | |||||||
| Three Months Ended September 30, | Nine Months Ended September 30, | ||||||||||||||||||||||
| 2025 | 2024 | 2025 | 2024 | ||||||||||||||||||||
| REVENUES | |||||||||||||||||||||||
| Rental income | $ | 246,757 | $ | 238,396 | $ | 737,146 | $ | 682,359 | |||||||||||||||
| Management and leasing services | 118 | 156 | 392 | 444 | |||||||||||||||||||
| Interest income | 6,367 | 3,291 | 17,498 | 10,709 | |||||||||||||||||||
| TOTAL REVENUES | 253,242 | 241,843 | 755,036 | 693,512 | |||||||||||||||||||
| OPERATING EXPENSES | |||||||||||||||||||||||
| Property expenses | 57,879 | 54,867 | 168,438 | 154,254 | |||||||||||||||||||
| General and administrative | 20,037 | 20,926 | 59,657 | 60,213 | |||||||||||||||||||
| Depreciation and amortization | 81,172 | 69,241 | 239,100 | 203,415 | |||||||||||||||||||
| TOTAL OPERATING EXPENSES | 159,088 | 145,034 | 467,195 | 417,882 | |||||||||||||||||||
| OTHER EXPENSES | |||||||||||||||||||||||
| Other expenses | 4,218 | 492 | 6,701 | 2,204 | |||||||||||||||||||
| Interest expense | 25,463 | 27,340 | 79,452 | 70,423 | |||||||||||||||||||
| TOTAL EXPENSES | 188,769 | 172,866 | 553,348 | 490,509 | |||||||||||||||||||
Debt extinguishment and modification expenses |
— | — | (291) | — | |||||||||||||||||||
| Gains on sale of real estate | 28,583 | 1,745 | 86,101 | 18,013 | |||||||||||||||||||
| NET INCOME | 93,056 | 70,722 | 287,498 | 221,016 | |||||||||||||||||||
| Less: net income attributable to noncontrolling interests | (3,137) | (2,952) | (10,046) | (9,399) | |||||||||||||||||||
| NET INCOME ATTRIBUTABLE TO REXFORD INDUSTRIAL REALTY, INC. | 89,919 | 67,770 | 277,452 | 211,617 | |||||||||||||||||||
| Less: preferred stock dividends | (2,314) | (2,314) | (6,943) | (6,943) | |||||||||||||||||||
| Less: earnings attributable to participating securities | (519) | (395) | (1,650) | (1,222) | |||||||||||||||||||
| NET INCOME ATTRIBUTABLE TO COMMON STOCKHOLDERS | $ | 87,086 | $ | 65,061 | $ | 268,859 | $ | 203,452 | |||||||||||||||
Net income attributable to common stockholders per share – basic |
$ | 0.37 | $ | 0.30 | $ | 1.16 | $ | 0.94 | |||||||||||||||
Net income attributable to common stockholders per share – diluted |
$ | 0.37 | $ | 0.30 | $ | 1.16 | $ | 0.94 | |||||||||||||||
| Weighted-average shares of common stock outstanding – basic | 234,587 | 218,760 | 232,720 | 216,857 | |||||||||||||||||||
| Weighted-average shares of common stock outstanding – diluted | 234,587 | 219,133 | 232,720 | 216,994 | |||||||||||||||||||
Same Property Portfolio Occupancy | |||||||||||||||||
| September 30, | |||||||||||||||||
| 2025 | 2024 | Change (basis points) | |||||||||||||||
Quarterly Weighted Average Occupancy:(1) |
|||||||||||||||||
| Los Angeles County | 96.7% | 97.5% | (80) bps | ||||||||||||||
| Orange County | 98.7% | 99.3% | (60) bps | ||||||||||||||
| Riverside / San Bernardino County | 95.4% | 97.2% | (180) bps | ||||||||||||||
| San Diego County | 98.3% | 95.8% | 250 bps | ||||||||||||||
| Ventura County | 94.3% | 92.3% | 200 bps | ||||||||||||||
| Same Property Portfolio Weighted Average Occupancy | 96.5% | 97.2% | (70) bps | ||||||||||||||
| Ending Occupancy: | 96.8% | 96.9% | (10) bps | ||||||||||||||
Same Property Portfolio NOI and Cash NOI |
|||||||||||||||||||||||||||||||||||||||||||||||
| Three Months Ended September 30, | Nine Months Ended September 30, | ||||||||||||||||||||||||||||||||||||||||||||||
| 2025 | 2024 | $ Change | % Change | 2025 | 2024 | $ Change | % Change | ||||||||||||||||||||||||||||||||||||||||
| Rental income | $ | 194,202 | $ | 190,107 | $ | 4,095 | 2.2 | % | $ | 573,711 | $ | 563,695 | $ | 10,016 | 1.8 | % | |||||||||||||||||||||||||||||||
| Property expenses | 43,998 | 42,668 | 1,330 | 3.1 | % | 127,326 | 122,980 | 4,346 | 3.5 | % | |||||||||||||||||||||||||||||||||||||
| Same Property Portfolio NOI | $ | 150,204 | $ | 147,439 | $ | 2,765 | 1.9 | % | $ | 446,385 | $ | 440,715 | $ | 5,670 | 1.3 | % | |||||||||||||||||||||||||||||||
| Straight line rental revenue adjustment | (3,776) | (7,763) | 3,987 | (51.4) | % | (11,709) | (22,502) | 10,793 | (48.0) | % | |||||||||||||||||||||||||||||||||||||
| Above/(below) market lease revenue adjustments | (5,081) | (5,727) | 646 | (11.3) | % | (15,082) | (18,198) | 3,116 | (17.1) | % | |||||||||||||||||||||||||||||||||||||
| Same Property Portfolio Cash NOI | $ | 141,347 | $ | 133,949 | $ | 7,398 | 5.5 | % | $ | 419,594 | $ | 400,015 | $ | 19,579 | 4.9 | % | |||||||||||||||||||||||||||||||
| Three Months Ended September 30, | Nine Months Ended September 30, | ||||||||||||||||||||||
| 2025 | 2024 | 2025 | 2024 | ||||||||||||||||||||
| Net income | $ | 93,056 | $ | 70,722 | $ | 287,498 | $ | 221,016 | |||||||||||||||
| General and administrative | 20,037 | 20,926 | 59,657 | 60,213 | |||||||||||||||||||
| Depreciation and amortization | 81,172 | 69,241 | 239,100 | 203,415 | |||||||||||||||||||
| Other expenses | 4,218 | 492 | 6,701 | 2,204 | |||||||||||||||||||
| Interest expense | 25,463 | 27,340 | 79,452 | 70,423 | |||||||||||||||||||
Debt extinguishment and modification expenses |
— | — | 291 | — | |||||||||||||||||||
| Management and leasing services | (118) | (156) | (392) | (444) | |||||||||||||||||||
| Interest income | (6,367) | (3,291) | (17,498) | (10,709) | |||||||||||||||||||
| Gains on sale of real estate | (28,583) | (1,745) | (86,101) | (18,013) | |||||||||||||||||||
| Net operating income (NOI) | $ | 188,878 | $ | 183,529 | $ | 568,708 | $ | 528,105 | |||||||||||||||
| Straight line rental revenue adjustment | (8,164) | (11,441) | (20,599) | (28,376) | |||||||||||||||||||
Above/(below) market lease revenue adjustments |
(5,254) | (6,635) | (20,228) | (21,494) | |||||||||||||||||||
| Cash NOI | $ | 175,460 | $ | 165,453 | $ | 527,881 | $ | 478,235 | |||||||||||||||
| NOI | $ | 188,878 | $ | 183,529 | $ | 568,708 | $ | 528,105 | |||||||||||||||
| Non-Same Property Portfolio rental income | (52,555) | (48,289) | (163,435) | (118,664) | |||||||||||||||||||
| Non-Same Property Portfolio property expenses | 13,881 | 12,199 | 41,112 | 31,274 | |||||||||||||||||||
| Same Property Portfolio NOI | $ | 150,204 | $ | 147,439 | $ | 446,385 | $ | 440,715 | |||||||||||||||
| Straight line rental revenue adjustment | (3,776) | (7,763) | (11,709) | (22,502) | |||||||||||||||||||
| Above/(below) market lease revenue adjustments | (5,081) | (5,727) | (15,082) | (18,198) | |||||||||||||||||||
| Same Property Portfolio Cash NOI | $ | 141,347 | $ | 133,949 | $ | 419,594 | $ | 400,015 | |||||||||||||||
| Three Months Ended September 30, | Nine Months Ended September 30, | ||||||||||||||||||||||
| 2025 | 2024 | 2025 | 2024 | ||||||||||||||||||||
| Net income | $ | 93,056 | $ | 70,722 | $ | 287,498 | $ | 221,016 | |||||||||||||||
| Adjustments: | |||||||||||||||||||||||
| Depreciation and amortization | 81,172 | 69,241 | 239,100 | 203,415 | |||||||||||||||||||
| Gains on sale of real estate | (28,583) | (1,745) | (86,101) | (18,013) | |||||||||||||||||||
| Funds From Operations (FFO) | $ | 145,645 | $ | 138,218 | $ | 440,497 | $ | 406,418 | |||||||||||||||
| Less: preferred stock dividends | (2,314) | (2,314) | (6,943) | (6,943) | |||||||||||||||||||
Less: FFO attributable to noncontrolling interests(1) |
(4,906) | (5,389) | (15,262) | (15,987) | |||||||||||||||||||
Less: FFO attributable to participating securities(2) |
(713) | (566) | (2,191) | (1,718) | |||||||||||||||||||
| Company share of FFO | $ | 137,712 | $ | 129,949 | $ | 416,101 | $ | 381,770 | |||||||||||||||
| Company Share of FFO per common share – basic | $ | 0.59 | $ | 0.59 | $ | 1.79 | $ | 1.76 | |||||||||||||||
| Company Share of FFO per common share – diluted | $ | 0.59 | $ | 0.59 | $ | 1.79 | $ | 1.76 | |||||||||||||||
| FFO | $ | 145,645 | $ | 138,218 | $ | 440,497 | $ | 406,418 | |||||||||||||||
| Adjustments: | |||||||||||||||||||||||
| Acquisition expenses | 161 | 6 | 263 | 114 | |||||||||||||||||||
Debt extinguishment and modification expenses |
— | — | 291 | — | |||||||||||||||||||
| Amortization of loss on termination of interest rate swaps | — | 59 | — | 177 | |||||||||||||||||||
| Non-capitalizable demolition costs | — | — | 365 | 1,127 | |||||||||||||||||||
Severance costs(3)(4) |
2,728 | — | 4,410 | — | |||||||||||||||||||
Other nonrecurring expenses(4) |
1,259 | — | 1,259 | — | |||||||||||||||||||
| Core FFO | $ | 149,793 | $ | 138,283 | $ | 447,085 | $ | 407,836 | |||||||||||||||
| Less: preferred stock dividends | (2,314) | (2,314) | (6,943) | (6,943) | |||||||||||||||||||
Less: Core FFO attributable to noncontrolling interest(1) |
(5,045) | (5,391) | (15,485) | (16,035) | |||||||||||||||||||
Less: Core FFO attributable to participating securities(2) |
(734) | (567) | (2,225) | (1,725) | |||||||||||||||||||
| Company share of Core FFO | $ | 141,700 | $ | 130,011 | $ | 422,432 | $ | 383,133 | |||||||||||||||
| Company share of Core FFO per common share – basic | $ | 0.60 | $ | 0.59 | $ | 1.82 | $ | 1.77 | |||||||||||||||
| Company share of Core FFO per common share – diluted | $ | 0.60 | $ | 0.59 | $ | 1.82 | $ | 1.77 | |||||||||||||||
| Weighted-average shares of common stock outstanding – basic | 234,587 | 218,760 | 232,720 | 216,857 | |||||||||||||||||||
| Weighted-average shares of common stock outstanding – diluted | 234,587 | 219,133 | 232,720 | 216,994 | |||||||||||||||||||
| Three Months Ended September 30, 2025 | |||||
| Net income | $ | 93,056 | |||
| Interest expense | 25,463 | ||||
| Depreciation and amortization | 81,172 | ||||
| Gains on sale of real estate | (28,583) | ||||
EBITDAre |
$ | 171,108 | |||
| Stock-based compensation amortization | 10,485 | ||||
| Acquisition expenses | 161 | ||||
Other nonrecurring expenses |
1,259 | ||||
Pro forma effect of dispositions(1) |
(389) | ||||
Adjusted EBITDAre |
$ | 182,624 | |||
Table of Contents. |
||||||||
| Section | Page | ||||
| Corporate Data: | |||||
| Consolidated Financial Results: | |||||
| Portfolio Data: | |||||
|
Third Quarter 2025
Supplemental Financial Reporting Package
|
Page 2
|

|
||||||
Investor Company Summary. |
||||||||
| Executive Management Team | ||||||||
| Howard Schwimmer | Co-Chief Executive Officer, Director | |||||||
| Michael S. Frankel | Co-Chief Executive Officer, Director | |||||||
| Laura Clark | Chief Operating Officer | |||||||
| Michael Fitzmaurice | Chief Financial Officer | |||||||
David E. Lanzer |
General Counsel and Corporate Secretary | |||||||
| Board of Directors | ||||||||
| Tyler H. Rose | Chairman |
|||||||
| Howard Schwimmer | Co-Chief Executive Officer, Director | |||||||
| Michael S. Frankel | Co-Chief Executive Officer, Director | |||||||
| Robert L. Antin | Director | |||||||
| Diana J. Ingram | Director | |||||||
| Angela L. Kleiman | Director | |||||||
| Debra L. Morris | Director | |||||||
| Investor Relations Information | ||||||||
Mikayla Lynch | ||||||||
Director, Investor Relations and Capital Markets |
||||||||
mlynch@rexfordindustrial.com | ||||||||
| Equity Research Coverage | ||||||||||||||||||||||||||||||||
| BofA Securities | Samir Khanal |
(646) 855-1497 |
Green Street Advisors | Vince Tibone | (949) 640-8780 | |||||||||||||||||||||||||||
| Barclays | Brendan Lynch | (212) 526-9428 | J.P. Morgan Securities | Michael Mueller | (212) 622-6689 | |||||||||||||||||||||||||||
| BMO Capital Markets | John Kim | (212) 885-4115 | Jefferies LLC | Jonathan Petersen | (212) 284-1705 | |||||||||||||||||||||||||||
| BNP Paribas Exane | Nate Crossett | (646) 342-1588 | Mizuho Securities USA | Vikram Malhotra | (212) 282-3827 | |||||||||||||||||||||||||||
Cantor Fitzgerald |
Richard Anderson |
(929) 441-6927 |
Robert W. Baird & Co. | Nicholas Thillman | (414) 298-5053 | |||||||||||||||||||||||||||
| Citigroup Investment Research | Craig Mailman | (212) 816-4471 | Scotiabank | Greg McGinniss | (212) 225-6906 | |||||||||||||||||||||||||||
| Colliers Securities | Barry Oxford | (203) 961-6573 | Truist Securities | Anthony Hau | (212) 303-4176 | |||||||||||||||||||||||||||
Deutsche Bank |
Omotayo Okusanya | (212) 250-9284 |
Wells Fargo Securities | Blaine Heck | (443) 263-6529 | |||||||||||||||||||||||||||
Evercore ISI |
Steve Sakwa | (212) 446-9462 | Wolfe Research | Andrew Rosivach | (646) 582-9250 | |||||||||||||||||||||||||||
|
Third Quarter 2025
Supplemental Financial Reporting Package
|
Page 3
|
|
||||||
Company Overview. |
||||||||
| For the Quarter Ended September 30, 2025 | ||||||||
|
Third Quarter 2025
Supplemental Financial Reporting Package
|
Page 4
|
|
||||||
Highlights - Consolidated Financial Results. |
||||||||
| Quarterly Results | (in millions) | |||||||
|
Third Quarter 2025
Supplemental Financial Reporting Package
|
Page 5
|
|
||||||
Financial and Portfolio Highlights and Capitalization Data.(1) |
||||||||
| (in thousands except share and per share data and portfolio statistics) | ||||||||
| Three Months Ended | |||||||||||||||||||||||||||||
| September 30, 2025 | June 30, 2025 | March 31, 2025 | December 31, 2024 | September 30, 2024 | |||||||||||||||||||||||||
| Financial Results: | |||||||||||||||||||||||||||||
| Total rental income | $ | 246,757 | $ | 241,568 | $ | 248,821 | $ | 239,737 | $ | 238,396 | |||||||||||||||||||
| Net income | $ | 93,056 | $ | 120,394 | $ | 74,048 | $ | 64,910 | $ | 70,722 | |||||||||||||||||||
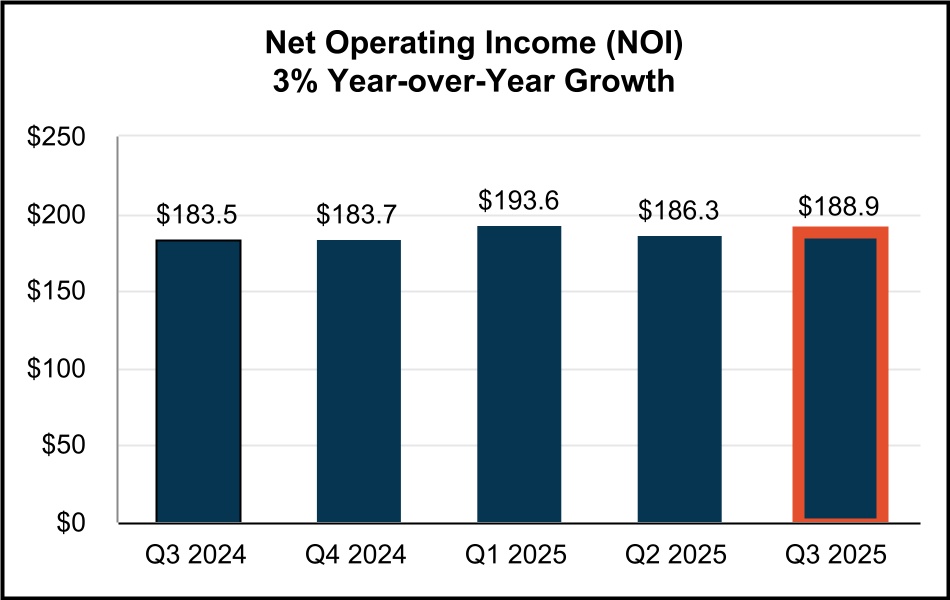
| Net Operating Income (NOI) | $ | 188,878 | $ | 186,270 | $ | 193,560 | $ | 183,731 | $ | 183,529 | |||||||||||||||||||
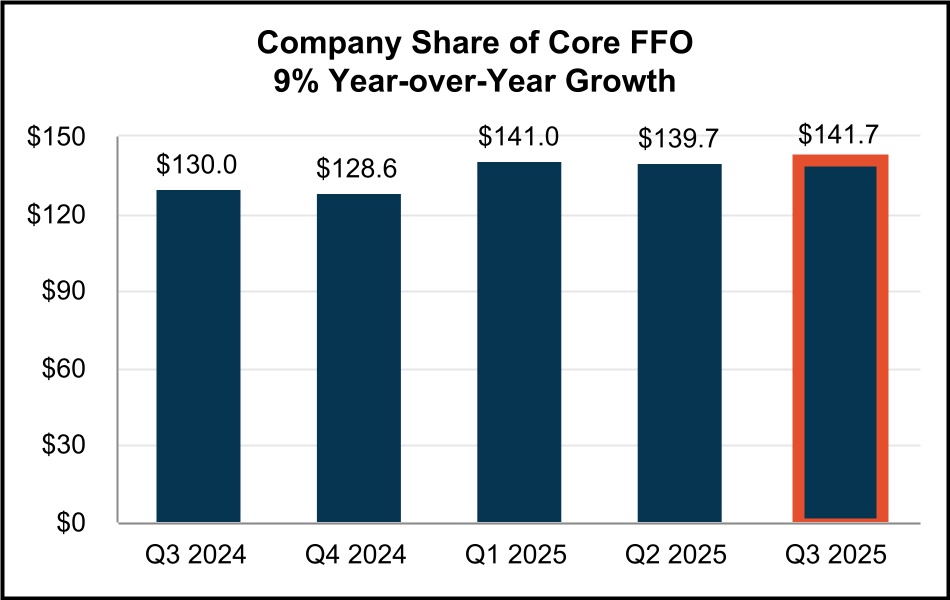
| Company share of Core FFO | $ | 141,700 | $ | 139,709 | $ | 141,023 | $ | 128,562 | $ | 130,011 | |||||||||||||||||||
| Company share of Core FFO per common share - diluted | $ | 0.60 | $ | 0.59 | $ | 0.62 | $ | 0.58 | $ | 0.59 | |||||||||||||||||||
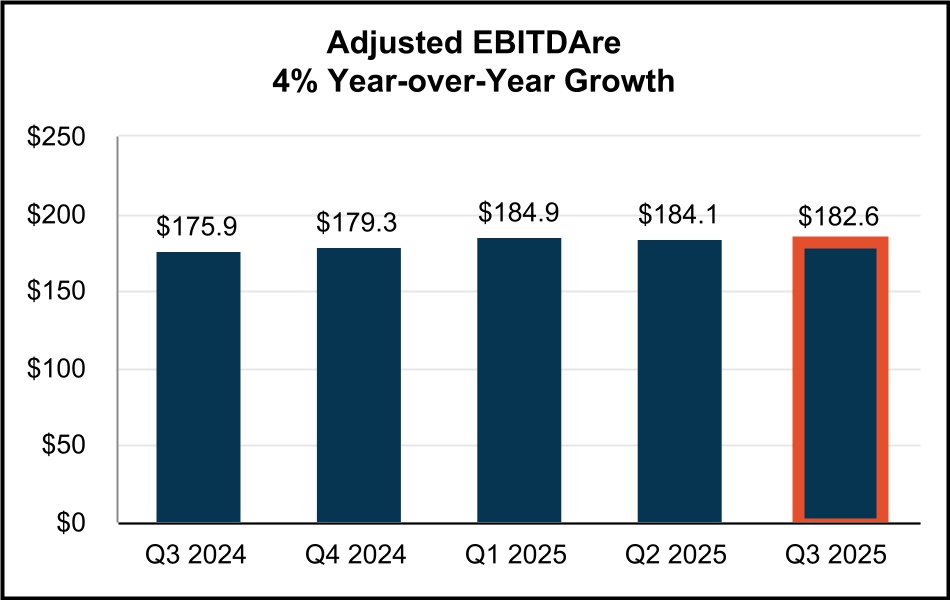
Adjusted EBITDAre |
$ | 182,624 | $ | 184,111 | $ | 184,859 | $ | 179,347 | $ | 175,929 | |||||||||||||||||||
| Dividend declared per common share | $ | 0.4300 | $ | 0.4300 | $ | 0.4300 | $ | 0.4175 | $ | 0.4175 | |||||||||||||||||||
| Portfolio Statistics: | |||||||||||||||||||||||||||||
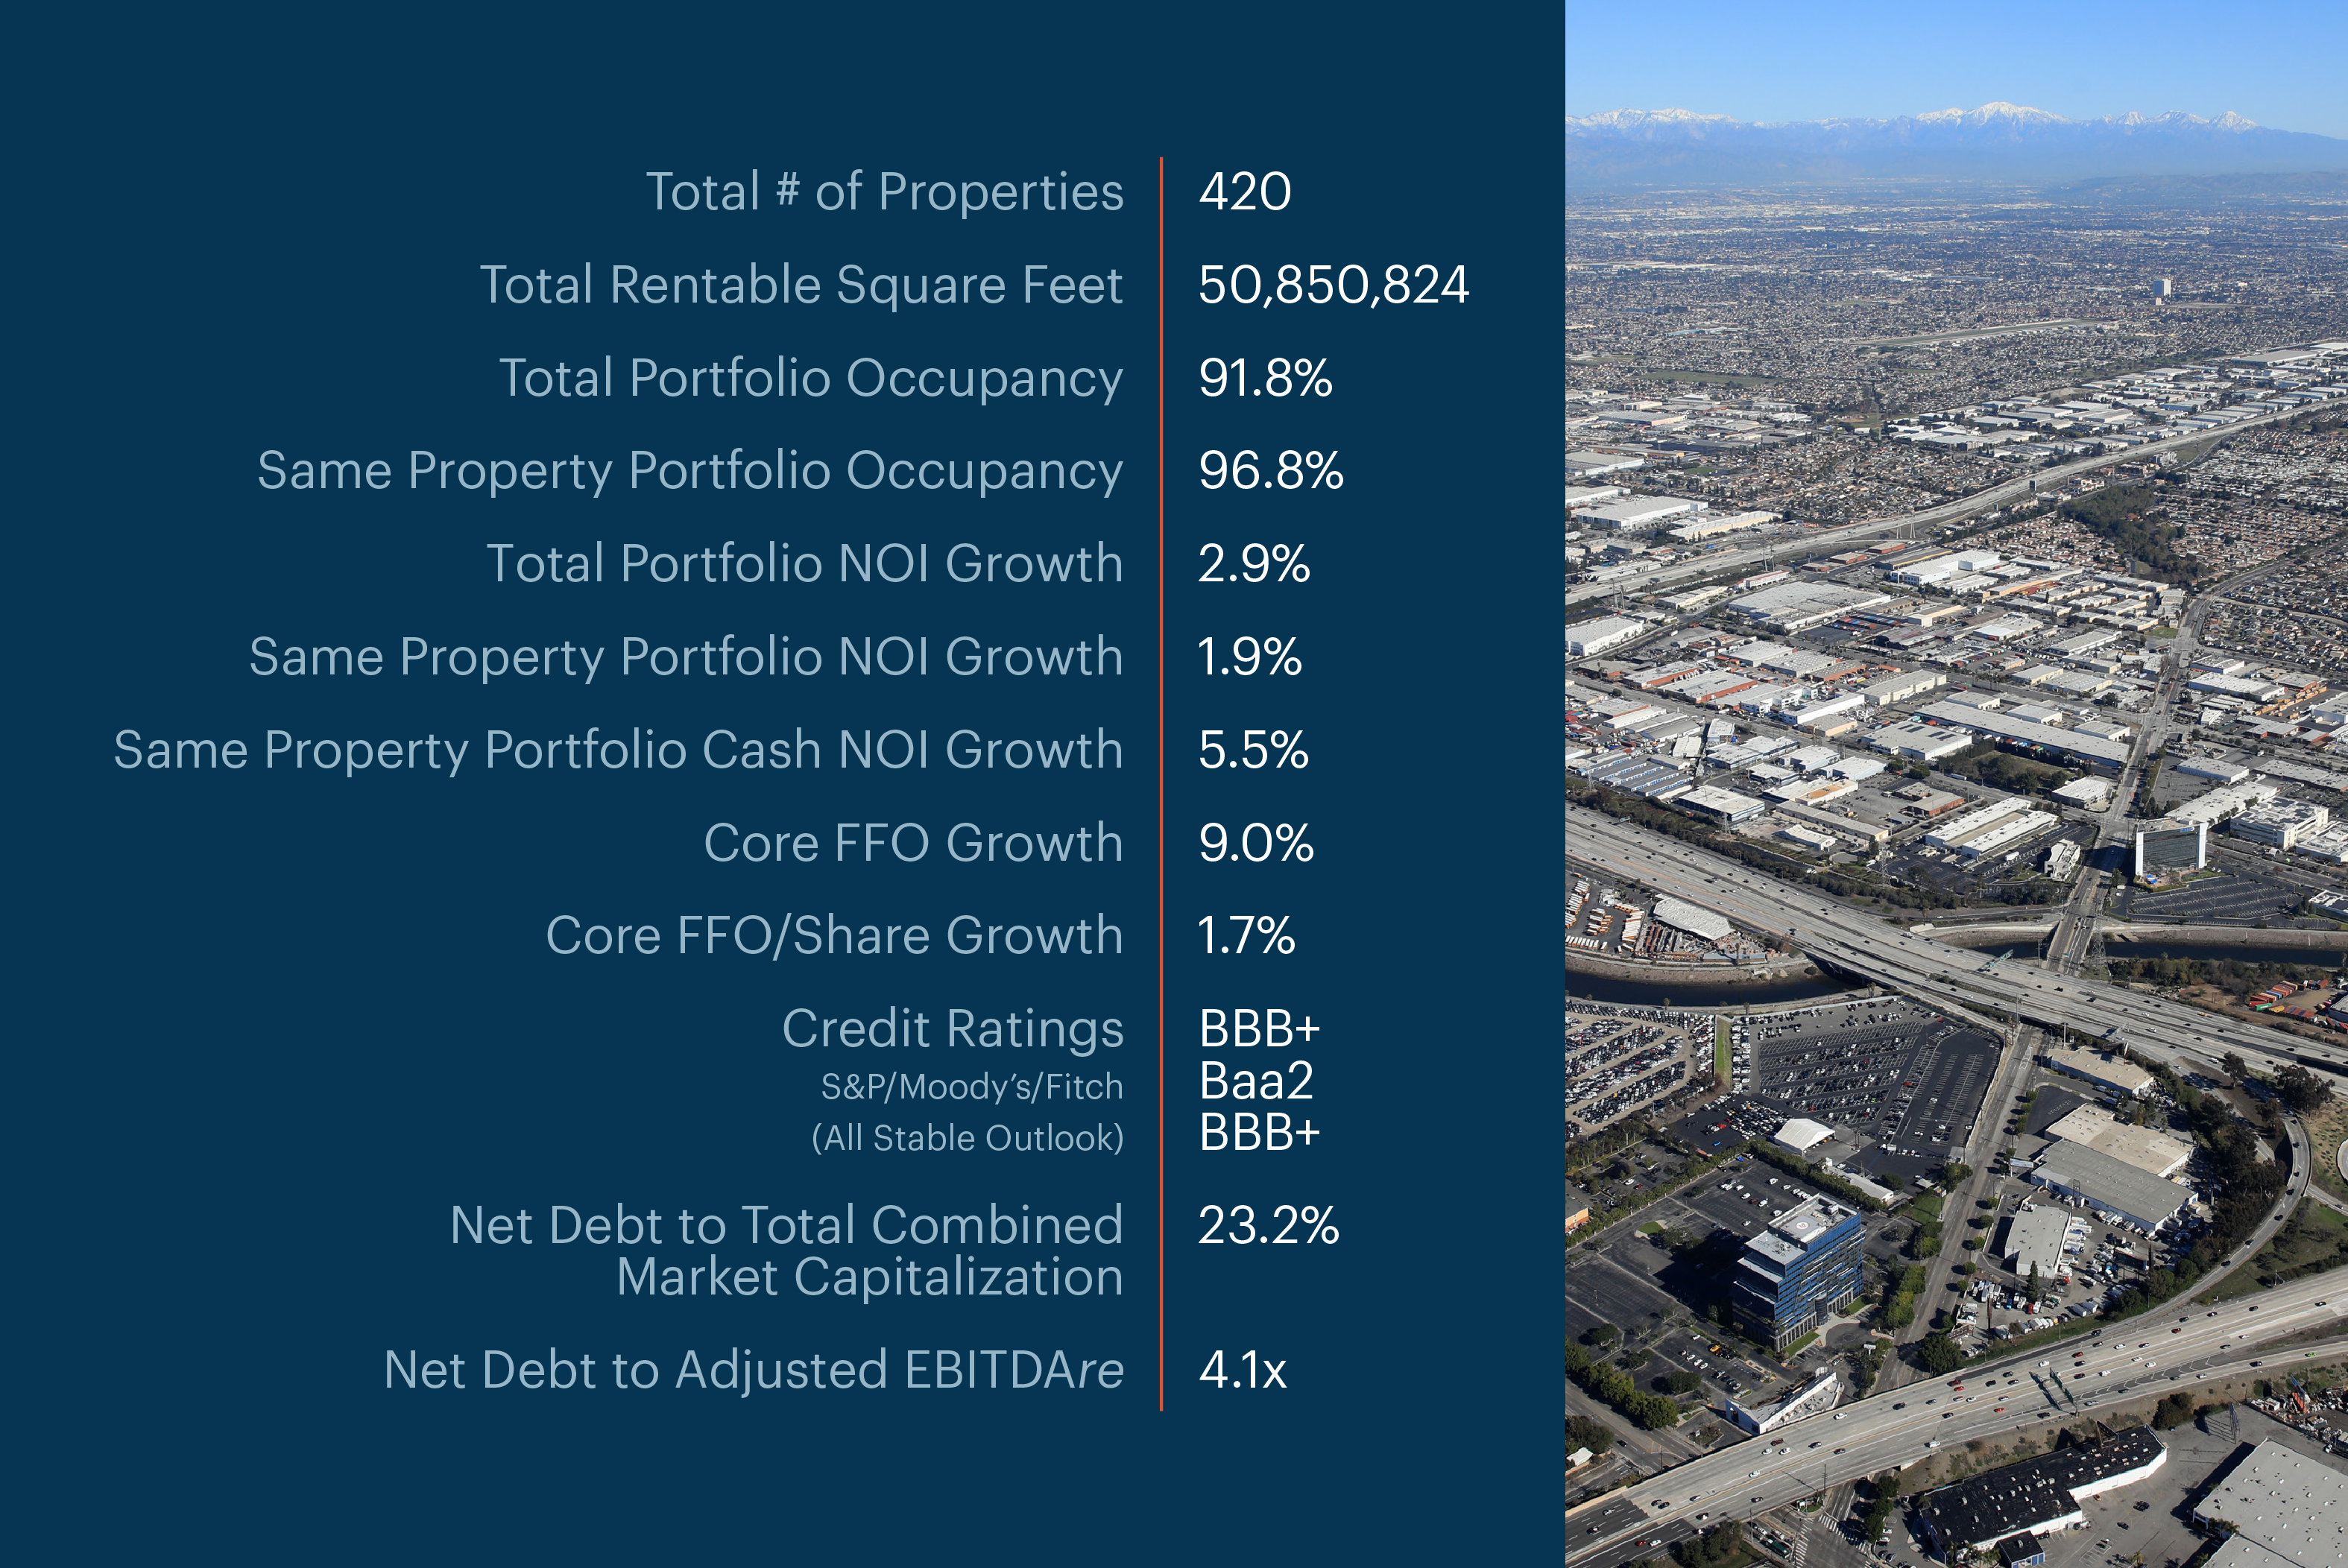
| Portfolio rentable square feet (“RSF”) | 50,850,824 | 51,021,897 | 50,952,137 | 50,788,225 | 50,067,981 | ||||||||||||||||||||||||
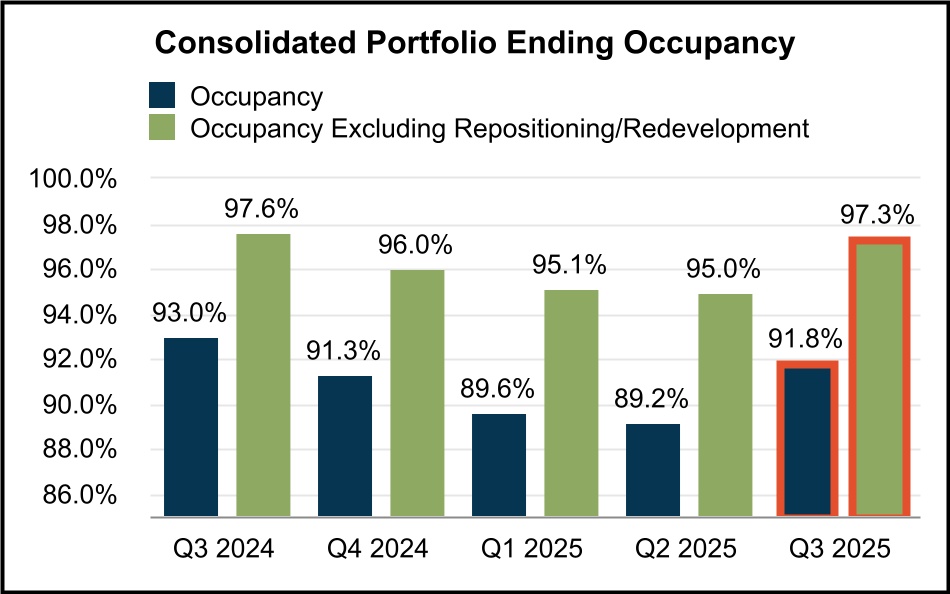
| Ending occupancy | 91.8% | 89.2% | 89.6% | 91.3% | 93.0% | ||||||||||||||||||||||||
Ending occupancy excluding repositioning/redevelopment(2) |
97.3% | 95.0% | 95.1% | 96.0% | 97.6% | ||||||||||||||||||||||||
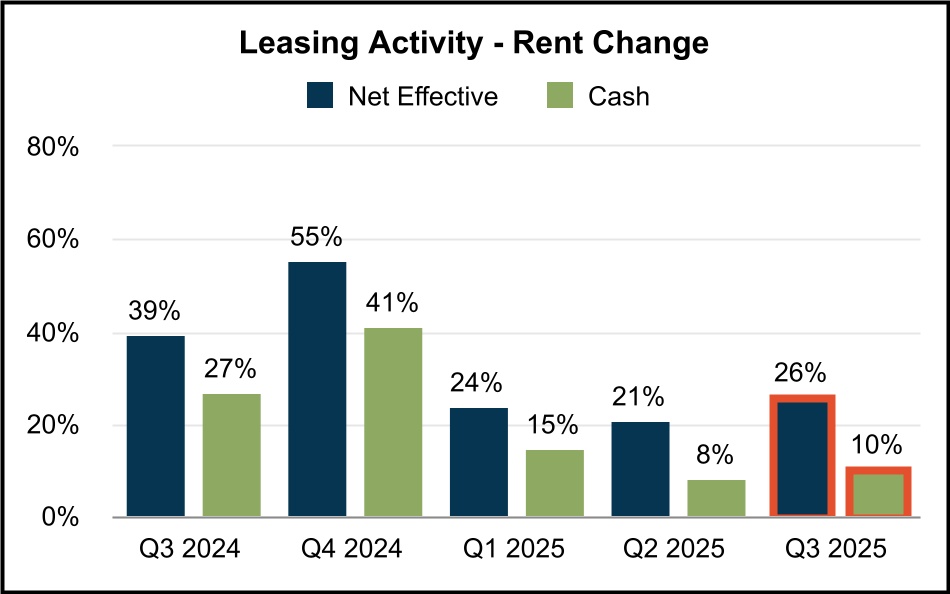
| Net Effective Rent Change | 26.1% | 20.9% | 23.8% | 55.4% | 39.2% | ||||||||||||||||||||||||
| Cash Rent Change | 10.3% | 8.1% | 14.7% | 41.0% | 26.7% | ||||||||||||||||||||||||
| Same Property Portfolio Performance: | |||||||||||||||||||||||||||||
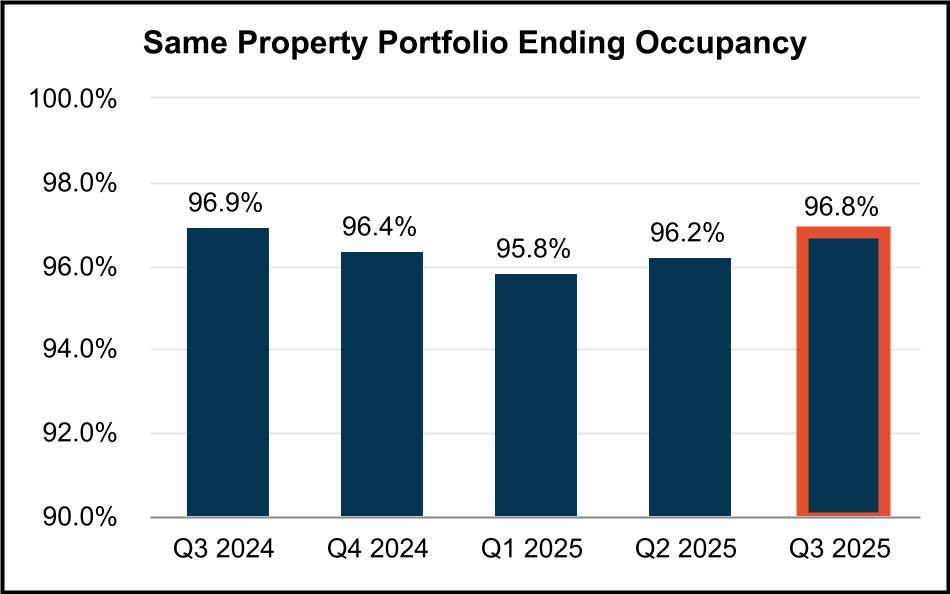
Same Property Portfolio ending occupancy(3)(4) |
96.8% | 96.2% | 95.8% | 96.4% | 96.9% | ||||||||||||||||||||||||
Same Property Portfolio NOI growth(4)(5) |
1.9% | 1.2% | 0.8% | ||||||||||||||||||||||||||
Same Property Portfolio Cash NOI growth(4)(5) |
5.5% | 4.0% | 5.2% | ||||||||||||||||||||||||||
| Capitalization: | |||||||||||||||||||||||||||||
Total shares and units issued and outstanding at period end(6) |
240,452,878 | 244,334,274 | 244,310,773 | 233,295,793 | 227,278,210 | ||||||||||||||||||||||||
| Series B and C Preferred Stock and Series 1, 2 and 3 CPOP Units | $ | 173,250 | $ | 173,250 | $ | 173,250 | $ | 213,956 | $ | 213,956 | |||||||||||||||||||
| Total equity market capitalization | $ | 10,058,268 | $ | 8,864,220 | $ | 9,738,017 | $ | 9,233,171 | $ | 11,648,323 | |||||||||||||||||||
| Total consolidated debt | $ | 3,278,896 | $ | 3,379,141 | $ | 3,379,383 | $ | 3,379,622 | $ | 3,386,273 | |||||||||||||||||||
| Total combined market capitalization (net debt plus equity) | $ | 13,088,208 | $ | 11,812,244 | $ | 12,612,821 | $ | 12,556,822 | $ | 14,972,760 | |||||||||||||||||||
| Ratios: | |||||||||||||||||||||||||||||
| Net debt to total combined market capitalization | 23.2% | 25.0% | 22.8% | 26.5% | 22.2% | ||||||||||||||||||||||||
Net debt to Adjusted EBITDAre (quarterly results annualized) |
4.1x | 4.0x | 3.9x | 4.6x | 4.7x | ||||||||||||||||||||||||
|
Third Quarter 2025
Supplemental Financial Reporting Package
|
Page 6
|
|
||||||
Guidance. |
||||||||
| As of September 30, 2025 | ||||||||
| METRIC | Q3-2025 UPDATED GUIDANCE |
Q2-2025 GUIDANCE |
YTD RESULTS AS OF SEPTEMBER 30, 2025 | |||||||||||||||||
Net Income Attributable to Common Stockholders per diluted share (1)(2) |
$1.44 - $1.46 | $1.38 - $1.42 | $1.16 | |||||||||||||||||
Company share of Core FFO per diluted share (1)(2) |
$2.39 - $2.41 | $2.37 - $2.41 | $1.82 | |||||||||||||||||
Same Property Portfolio NOI Growth - Net Effective (3) |
0.75% - 1.25% | 0.75% - 1.25% | 1.3% | |||||||||||||||||
Same Property Portfolio NOI Growth - Cash (3) |
3.75% - 4.25% | 2.25% - 2.75% | 4.9% | |||||||||||||||||
Average Same Property Portfolio Occupancy (Full Year) (3)(4) |
+/- 96.0% | 95.5% - 96.0% | 96.2% | |||||||||||||||||
Net General and Administrative Expenses (5) |
+/- $82M | +/- $82M | $59.7M | |||||||||||||||||
| Net Interest Expense | +/- $105M | +/- $107M | $79.5M | |||||||||||||||||
|
Third Quarter 2025
Supplemental Financial Reporting Package
|
Page 7
|
|
||||||
Guidance (Continued). |
||||||||
| As of September 30, 2025 | ||||||||
| Earnings Components | Range ($ per share) |
Notes | ||||||||||||||||||
Q2 2025 Core FFO Per Diluted Share Guidance |
$2.37 | $2.41 | ||||||||||||||||||
| Same Property Portfolio NOI Growth | — | — | SP Net Effective NOI Growth guidance unchanged at 0.75% - 1.25% |
|||||||||||||||||
Repositioning/Redevelopment NOI |
— | (0.01) | Projected rent commencement timing extended |
|||||||||||||||||
Net General & Administrative Expenses (2) |
— | — | Guidance unchanged at +/- $82M |
|||||||||||||||||
| Net Interest Expense | 0.01 | — | Guidance updated to +/- $105M |
|||||||||||||||||
| Decrease in Share Count | 0.01 | 0.01 |
$150M of share repurchases in 3Q at a weighted average share
price of $38.62
|
|||||||||||||||||
Current 2025 Core FFO Per Diluted Share Guidance |
$2.39 | $2.41 | ||||||||||||||||||
| Core FFO Per Diluted Share Annual Growth | 2% | 3% | ||||||||||||||||||
|
Third Quarter 2025
Supplemental Financial Reporting Package
|
Page 8
|
|
||||||
Consolidated Balance Sheets. |
||||||||
| (unaudited and in thousands) | ||||||||
| September 30, 2025 | June 30, 2025 | March 31, 2025 | December 31, 2024 | September 30, 2024 | |||||||||||||||||||||||||
| ASSETS | |||||||||||||||||||||||||||||
| Land | $ | 7,774,737 | $ | 7,787,021 | $ | 7,797,744 | $ | 7,822,290 | $ | 7,703,232 | |||||||||||||||||||
| Buildings and improvements | 4,607,202 | 4,594,494 | 4,573,881 | 4,611,987 | 4,416,032 | ||||||||||||||||||||||||
| Tenant improvements | 194,405 | 186,429 | 181,632 | 188,217 | 181,785 | ||||||||||||||||||||||||
| Furniture, fixtures, and equipment | 132 | 132 | 132 | 132 | 132 | ||||||||||||||||||||||||
| Construction in progress | 475,072 | 431,807 | 386,719 | 333,690 | 370,431 | ||||||||||||||||||||||||
| Total real estate held for investment | 13,051,548 | 12,999,883 | 12,940,108 | 12,956,316 | 12,671,612 | ||||||||||||||||||||||||
| Accumulated depreciation | (1,119,746) | (1,070,684) | (1,021,151) | (977,133) | (925,373) | ||||||||||||||||||||||||
| Investments in real estate, net | 11,931,802 | 11,929,199 | 11,918,957 | 11,979,183 | 11,746,239 | ||||||||||||||||||||||||
| Cash and cash equivalents | 248,956 | 431,117 | 504,579 | 55,971 | 61,836 | ||||||||||||||||||||||||
| Restricted cash | 65,464 | 130,071 | 50,105 | — | — | ||||||||||||||||||||||||
| Loan receivable, net | 123,589 | 123,474 | 123,359 | 123,244 | 123,129 | ||||||||||||||||||||||||
| Rents and other receivables, net | 15,727 | 12,861 | 17,622 | 15,772 | 17,315 | ||||||||||||||||||||||||
| Deferred rent receivable, net | 181,439 | 173,691 | 166,893 | 161,693 | 151,637 | ||||||||||||||||||||||||
| Deferred leasing costs, net | 82,227 | 71,482 | 70,404 | 67,827 | 69,152 | ||||||||||||||||||||||||
| Deferred loan costs, net | 7,391 | 7,892 | 1,642 | 1,999 | 2,356 | ||||||||||||||||||||||||
Acquired lease intangible assets, net(1) |
154,931 | 169,036 | 182,444 | 201,467 | 205,510 | ||||||||||||||||||||||||
Acquired indefinite-lived intangible asset |
5,156 | 5,156 | 5,156 | 5,156 | 5,156 | ||||||||||||||||||||||||
Interest rate swap assets |
2,804 | 3,586 | 5,580 | 8,942 | 3,880 | ||||||||||||||||||||||||
| Other assets | 31,522 | 15,765 | 20,730 | 26,964 | 34,092 | ||||||||||||||||||||||||
| Assets associated with real estate held for sale, net | — | 6,282 | 18,386 | — | — | ||||||||||||||||||||||||
| Total Assets | $ | 12,851,008 | $ | 13,079,612 | $ | 13,085,857 | $ | 12,648,218 | $ | 12,420,302 | |||||||||||||||||||
| LIABILITIES & EQUITY | |||||||||||||||||||||||||||||
| Liabilities | |||||||||||||||||||||||||||||
| Notes payable | $ | 3,249,733 | $ | 3,347,575 | $ | 3,348,060 | $ | 3,345,962 | $ | 3,350,190 | |||||||||||||||||||
| Interest rate swap liability | 1,626 | 667 | — | — | 295 | ||||||||||||||||||||||||
| Accounts payable, accrued expenses and other liabilities | 153,558 | 124,814 | 141,999 | 149,707 | 169,084 | ||||||||||||||||||||||||
| Dividends and distributions payable | 103,913 | 105,594 | 105,285 | 97,823 | 95,288 | ||||||||||||||||||||||||
Acquired lease intangible liabilities, net(2) |
122,870 | 129,683 | 136,661 | 147,473 | 155,328 | ||||||||||||||||||||||||
| Tenant security deposits | 91,835 | 90,757 | 90,050 | 90,698 | 91,983 | ||||||||||||||||||||||||
Tenant prepaid rents |
85,114 | 85,494 | 88,822 | 90,576 | 93,218 | ||||||||||||||||||||||||
| Liabilities associated with real estate held for sale | — | 4 | 234 | — | — | ||||||||||||||||||||||||
| Total Liabilities | 3,808,649 | 3,884,588 | 3,911,111 | 3,922,239 | 3,955,386 | ||||||||||||||||||||||||
| Equity | |||||||||||||||||||||||||||||
| Series B preferred stock, net ($75,000 liquidation preference) | 72,443 | 72,443 | 72,443 | 72,443 | 72,443 | ||||||||||||||||||||||||
| Series C preferred stock, net ($86,250 liquidation preference) | 83,233 | 83,233 | 83,233 | 83,233 | 83,233 | ||||||||||||||||||||||||
| Preferred stock | 155,676 | 155,676 | 155,676 | 155,676 | 155,676 | ||||||||||||||||||||||||
| Common stock | 2,328 | 2,367 | 2,362 | 2,253 | 2,195 | ||||||||||||||||||||||||
| Additional paid in capital | 8,993,439 | 9,140,264 | 9,116,069 | 8,601,276 | 8,318,979 | ||||||||||||||||||||||||
| Cumulative distributions in excess of earnings | (474,813) | (462,309) | (474,550) | (441,881) | (407,695) | ||||||||||||||||||||||||
| Accumulated other comprehensive income (loss) | (515) | 1,092 | 3,582 | 6,746 | 1,474 | ||||||||||||||||||||||||
| Total stockholders’ equity | 8,676,115 | 8,837,090 | 8,803,139 | 8,324,070 | 8,070,629 | ||||||||||||||||||||||||
| Noncontrolling interests | 366,244 | 357,934 | 371,607 | 401,909 | 394,287 | ||||||||||||||||||||||||
| Total Equity | 9,042,359 | 9,195,024 | 9,174,746 | 8,725,979 | 8,464,916 | ||||||||||||||||||||||||
| Total Liabilities and Equity | $ | 12,851,008 | $ | 13,079,612 | $ | 13,085,857 | $ | 12,648,218 | $ | 12,420,302 | |||||||||||||||||||
|
Third Quarter 2025
Supplemental Financial Reporting Package
|
Page 9
|
|
||||||
Consolidated Statements of Operations. |
||||||||
| Quarterly Results | (unaudited and in thousands, except share and per share data) | |||||||
| Three Months Ended | |||||||||||||||||||||||||||||
| Sep 30, 2025 | Jun 30, 2025 | Mar 31, 2025 | Dec 31, 2024 | Sep 30, 2024 | |||||||||||||||||||||||||
| Revenues | |||||||||||||||||||||||||||||
Rental income(1) |
$ | 246,757 | $ | 241,568 | $ | 248,821 | $ | 239,737 | $ | 238,396 | |||||||||||||||||||
| Management and leasing services | 118 | 132 | 142 | 167 | 156 | ||||||||||||||||||||||||
| Interest income | 6,367 | 7,807 | 3,324 | 2,991 | 3,291 | ||||||||||||||||||||||||
| Total Revenues | 253,242 | 249,507 | 252,287 | 242,895 | 241,843 | ||||||||||||||||||||||||
| Operating Expenses | |||||||||||||||||||||||||||||
| Property expenses | 57,879 | 55,298 | 55,261 | 56,006 | 54,867 | ||||||||||||||||||||||||
| General and administrative | 20,037 | 19,752 | 19,868 | 21,940 | 20,926 | ||||||||||||||||||||||||
| Depreciation and amortization | 81,172 | 71,188 | 86,740 | 71,832 | 69,241 | ||||||||||||||||||||||||
| Total Operating Expenses | 159,088 | 146,238 | 161,869 | 149,778 | 145,034 | ||||||||||||||||||||||||
| Other Expenses | |||||||||||||||||||||||||||||
| Other expenses | 4,218 | 244 | 2,239 | 34 | 492 | ||||||||||||||||||||||||
| Interest expense | 25,463 | 26,701 | 27,288 | 28,173 | 27,340 | ||||||||||||||||||||||||
| Total Expenses | 188,769 | 173,183 | 191,396 | 177,985 | 172,866 | ||||||||||||||||||||||||
| Debt extinguishment and modification expenses | — | (291) | — | — | — | ||||||||||||||||||||||||
| Gains on sale of real estate | 28,583 | 44,361 | 13,157 | — | 1,745 | ||||||||||||||||||||||||
| Net Income | 93,056 | 120,394 | 74,048 | 64,910 | 70,722 | ||||||||||||||||||||||||
| Less: net income attributable to noncontrolling interests | (3,137) | (4,060) | (2,849) | (2,725) | (2,952) | ||||||||||||||||||||||||
| Net income attributable to Rexford Industrial Realty, Inc. | 89,919 | 116,334 | 71,199 | 62,185 | 67,770 | ||||||||||||||||||||||||
| Less: preferred stock dividends | (2,314) | (2,315) | (2,314) | (2,315) | (2,314) | ||||||||||||||||||||||||
| Less: earnings allocated to participating securities | (519) | (592) | (539) | (457) | (395) | ||||||||||||||||||||||||
| Net income attributable to common stockholders | $ | 87,086 | $ | 113,427 | $ | 68,346 | $ | 59,413 | $ | 65,061 | |||||||||||||||||||
| Earnings per Common Share | |||||||||||||||||||||||||||||
| Net income attributable to common stockholders per share - basic | $ | 0.37 | $ | 0.48 | $ | 0.30 | $ | 0.27 | $ | 0.30 | |||||||||||||||||||
| Net income attributable to common stockholders per share - diluted | $ | 0.37 | $ | 0.48 | $ | 0.30 | $ | 0.27 | $ | 0.30 | |||||||||||||||||||
| Weighted average shares outstanding - basic | 234,586,980 | 236,098,831 | 227,395,984 | 222,516,006 | 218,759,979 | ||||||||||||||||||||||||
| Weighted average shares outstanding - diluted | 234,586,980 | 236,098,831 | 227,395,984 | 222,856,120 | 219,133,037 | ||||||||||||||||||||||||
|
Third Quarter 2025
Supplemental Financial Reporting Package
|
Page 10
|
|
||||||
Consolidated Statements of Operations. |
||||||||
| Quarterly Results (continued) | (unaudited and in thousands, except share and per share data) | |||||||
| Three Months Ended September 30, | Nine Months Ended September 30, | ||||||||||||||||||||||
| 2025 | 2024 | 2025 | 2024 | ||||||||||||||||||||
| Revenues | |||||||||||||||||||||||
| Rental income | $ | 246,757 | $ | 238,396 | $ | 737,146 | $ | 682,359 | |||||||||||||||
| Management and leasing services | 118 | 156 | 392 | 444 | |||||||||||||||||||
| Interest income | 6,367 | 3,291 | 17,498 | 10,709 | |||||||||||||||||||
| Total Revenues | 253,242 | 241,843 | 755,036 | 693,512 | |||||||||||||||||||
| Operating Expenses | |||||||||||||||||||||||
| Property expenses | 57,879 | 54,867 | 168,438 | 154,254 | |||||||||||||||||||
| General and administrative | 20,037 | 20,926 | 59,657 | 60,213 | |||||||||||||||||||
| Depreciation and amortization | 81,172 | 69,241 | 239,100 | 203,415 | |||||||||||||||||||
| Total Operating Expenses | 159,088 | 145,034 | 467,195 | 417,882 | |||||||||||||||||||
| Other Expenses | |||||||||||||||||||||||
| Other expenses | 4,218 | 492 | 6,701 | 2,204 | |||||||||||||||||||
| Interest expense | 25,463 | 27,340 | 79,452 | 70,423 | |||||||||||||||||||
| Total Expenses | 188,769 | 172,866 | 553,348 | 490,509 | |||||||||||||||||||
Debt extinguishment and modification expenses |
— | — | (291) | — | |||||||||||||||||||
| Gains on sale of real estate | 28,583 | 1,745 | 86,101 | 18,013 | |||||||||||||||||||
| Net Income | 93,056 | 70,722 | 287,498 | 221,016 | |||||||||||||||||||
| Less: net income attributable to noncontrolling interests | (3,137) | (2,952) | (10,046) | (9,399) | |||||||||||||||||||
| Net income attributable to Rexford Industrial Realty, Inc. | 89,919 | 67,770 | 277,452 | 211,617 | |||||||||||||||||||
| Less: preferred stock dividends | (2,314) | (2,314) | (6,943) | (6,943) | |||||||||||||||||||
| Less: earnings allocated to participating securities | (519) | (395) | (1,650) | (1,222) | |||||||||||||||||||
| Net income attributable to common stockholders | $ | 87,086 | $ | 65,061 | $ | 268,859 | $ | 203,452 | |||||||||||||||
| Net income attributable to common stockholders per share – basic | $ | 0.37 | $ | 0.30 | $ | 1.16 | $ | 0.94 | |||||||||||||||
| Net income attributable to common stockholders per share – diluted | $ | 0.37 | $ | 0.30 | $ | 1.16 | $ | 0.94 | |||||||||||||||
| Weighted-average shares of common stock outstanding – basic | 234,586,980 | 218,759,979 | 232,720,272 | 216,857,153 | |||||||||||||||||||
| Weighted-average shares of common stock outstanding – diluted | 234,586,980 | 219,133,037 | 232,720,272 | 216,993,590 | |||||||||||||||||||
|
Third Quarter 2025
Supplemental Financial Reporting Package
|
Page 11
|
|
||||||
Non-GAAP FFO and Core FFO Reconciliations.(1) |
||||||||
| (unaudited and in thousands, except share and per share data) | ||||||||
| Three Months Ended | |||||||||||||||||||||||||||||
| September 30, 2025 | June 30, 2025 | March 31, 2025 | December 31, 2024 | September 30, 2024 | |||||||||||||||||||||||||
| Net Income | $ | 93,056 | $ | 120,394 | $ | 74,048 | $ | 64,910 | $ | 70,722 | |||||||||||||||||||
| Adjustments: | |||||||||||||||||||||||||||||
| Depreciation and amortization | 81,172 | 71,188 | 86,740 | 71,832 | 69,241 | ||||||||||||||||||||||||
| Gains on sale of real estate | (28,583) | (44,361) | (13,157) | — | (1,745) | ||||||||||||||||||||||||
NAREIT Defined Funds From Operations (FFO) |
145,645 | 147,221 | 147,631 | 136,742 | 138,218 | ||||||||||||||||||||||||
| Less: preferred stock dividends | (2,314) | (2,315) | (2,314) | (2,315) | (2,314) | ||||||||||||||||||||||||
Less: FFO attributable to noncontrolling interests(2) |
(4,906) | (4,962) | (5,394) | (5,283) | (5,389) | ||||||||||||||||||||||||
Less: FFO attributable to participating securities(3) |
(713) | (728) | (750) | (624) | (566) | ||||||||||||||||||||||||
| Company share of FFO | $ | 137,712 | $ | 139,216 | $ | 139,173 | $ | 128,520 | $ | 129,949 | |||||||||||||||||||
| Company share of FFO per common share‐basic | $ | 0.59 | $ | 0.59 | $ | 0.61 | $ | 0.58 | $ | 0.59 | |||||||||||||||||||
| Company share of FFO per common share‐diluted | $ | 0.59 | $ | 0.59 | $ | 0.61 | $ | 0.58 | $ | 0.59 | |||||||||||||||||||
| FFO | $ | 145,645 | $ | 147,221 | $ | 147,631 | $ | 136,742 | $ | 138,218 | |||||||||||||||||||
| Adjustments: | |||||||||||||||||||||||||||||
Acquisition expenses(4) |
161 | 23 | 79 | 9 | 6 | ||||||||||||||||||||||||
| Debt extinguishment and modification expenses | — | 291 | — | — | — | ||||||||||||||||||||||||
| Amortization of loss on termination of interest rate swaps | — | — | — | 34 | 59 | ||||||||||||||||||||||||
Non-capitalizable demolition costs(4) |
— | — | 365 | — | — | ||||||||||||||||||||||||
Severance costs(4)(5) |
2,728 | 199 | 1,483 | — | — | ||||||||||||||||||||||||
Other nonrecurring expenses(4) |
1,259 | — | — | — | — | ||||||||||||||||||||||||
| Core FFO | 149,793 | 147,734 | 149,558 | 136,785 | 138,283 | ||||||||||||||||||||||||
| Less: preferred stock dividends | (2,314) | (2,315) | (2,314) | (2,315) | (2,314) | ||||||||||||||||||||||||
Less: Core FFO attributable to noncontrolling interests(2) |
(5,045) | (4,979) | (5,461) | (5,284) | (5,391) | ||||||||||||||||||||||||
Less: Core FFO attributable to participating securities(3) |
(734) | (731) | (760) | (624) | (567) | ||||||||||||||||||||||||
| Company share of Core FFO | $ | 141,700 | $ | 139,709 | $ | 141,023 | $ | 128,562 | $ | 130,011 | |||||||||||||||||||
| Company share of Core FFO per common share‐basic | $ | 0.60 | $ | 0.59 | $ | 0.62 | $ | 0.58 | $ | 0.59 | |||||||||||||||||||
| Company share of Core FFO per common share‐diluted | $ | 0.60 | $ | 0.59 | $ | 0.62 | $ | 0.58 | $ | 0.59 | |||||||||||||||||||
| Weighted-average shares outstanding-basic | 234,586,980 | 236,098,831 | 227,395,984 | 222,516,006 | 218,759,979 | ||||||||||||||||||||||||
Weighted-average shares outstanding-diluted(6) |
234,586,980 | 236,098,831 | 227,395,984 | 222,856,120 | 219,133,037 | ||||||||||||||||||||||||
|
Third Quarter 2025
Supplemental Financial Reporting Package
|
Page 12
|
|
||||||
Non-GAAP FFO and Core FFO Reconciliations.(1) |
||||||||
| (unaudited and in thousands, except share and per share data) | ||||||||
| Three Months Ended September 30, | Nine Months Ended September 30, | |||||||||||||||||||||||||
| 2025 | 2024 | 2025 | 2024 | |||||||||||||||||||||||
| Net Income | $ | 93,056 | $ | 70,722 | $ | 287,498 | $ | 221,016 | ||||||||||||||||||
| Adjustments: | ||||||||||||||||||||||||||
| Depreciation and amortization | 81,172 | 69,241 | 239,100 | 203,415 | ||||||||||||||||||||||
| Gains on sale of real estate | (28,583) | (1,745) | (86,101) | (18,013) | ||||||||||||||||||||||
| Funds From Operations (FFO) | 145,645 | 138,218 | 440,497 | 406,418 | ||||||||||||||||||||||
| Less: preferred stock dividends | (2,314) | (2,314) | (6,943) | (6,943) | ||||||||||||||||||||||
| Less: FFO attributable to noncontrolling interests | (4,906) | (5,389) | (15,262) | (15,987) | ||||||||||||||||||||||
| Less: FFO attributable to participating securities | (713) | (566) | (2,191) | (1,718) | ||||||||||||||||||||||
| Company share of FFO | $ | 137,712 | $ | 129,949 | $ | 416,101 | $ | 381,770 | ||||||||||||||||||
| Company share of FFO per common share‐basic | $ | 0.59 | $ | 0.59 | $ | 1.79 | $ | 1.76 | ||||||||||||||||||
| Company share of FFO per common share‐diluted | $ | 0.59 | $ | 0.59 | $ | 1.79 | $ | 1.76 | ||||||||||||||||||
| FFO | $ | 145,645 | $ | 138,218 | $ | 440,497 | $ | 406,418 | ||||||||||||||||||
| Adjustments: | ||||||||||||||||||||||||||
Acquisition expenses(2) |
161 | 6 | 263 | 114 | ||||||||||||||||||||||
| Debt extinguishment and modification expenses | — | — | 291 | — | ||||||||||||||||||||||
| Amortization of loss on termination of interest rate swaps | — | 59 | — | 177 | ||||||||||||||||||||||
Non-capitalizable demolition costs(2) |
— | — | 365 | 1,127 | ||||||||||||||||||||||
Severance costs(2)(3) |
2,728 | — | 4,410 | — | ||||||||||||||||||||||
Other nonrecurring expenses(2) |
1,259 | — | 1,259 | — | ||||||||||||||||||||||
| Core FFO | 149,793 | 138,283 | 447,085 | 407,836 | ||||||||||||||||||||||
| Less: preferred stock dividends | (2,314) | (2,314) | (6,943) | (6,943) | ||||||||||||||||||||||
| Less: Core FFO attributable to noncontrolling interests | (5,045) | (5,391) | (15,485) | (16,035) | ||||||||||||||||||||||
| Less: Core FFO attributable to participating securities | (734) | (567) | (2,225) | (1,725) | ||||||||||||||||||||||
| Company share of Core FFO | $ | 141,700 | $ | 130,011 | $ | 422,432 | $ | 383,133 | ||||||||||||||||||
| Company share of Core FFO per common share‐basic | $ | 0.60 | $ | 0.59 | $ | 1.82 | $ | 1.77 | ||||||||||||||||||
| Company share of Core FFO per common share‐diluted | $ | 0.60 | $ | 0.59 | $ | 1.82 | $ | 1.77 | ||||||||||||||||||
| Weighted-average shares outstanding-basic | 234,586,980 | 218,759,979 | 232,720,272 | 216,857,153 | ||||||||||||||||||||||
| Weighted-average shares outstanding-diluted | 234,586,980 | 219,133,037 | 232,720,272 | 216,993,590 | ||||||||||||||||||||||
|
Third Quarter 2025
Supplemental Financial Reporting Package
|
Page 13
|
|
||||||
Non-GAAP AFFO Reconciliation.(1) |
||||||||
| (unaudited and in thousands, except share and per share data) | ||||||||
| Three Months Ended | |||||||||||||||||||||||||||||
| September 30, 2025 |
June 30, 2025 |
March 31, 2025 |
December 31, 2024 |
September 30, 2024 |
|||||||||||||||||||||||||
Funds From Operations(2) |
$ | 145,645 | $ | 147,221 | $ | 147,631 | $ | 136,742 | $ | 138,218 | |||||||||||||||||||
| Adjustments: | |||||||||||||||||||||||||||||
| Amortization of deferred financing costs | 1,340 | 1,255 | 1,134 | 1,246 | 1,252 | ||||||||||||||||||||||||
| Non-cash stock compensation | 10,485 | 10,091 | 9,699 | 11,539 | 9,918 | ||||||||||||||||||||||||
| Debt extinguishment and modification expenses | — | 291 | — | — | — | ||||||||||||||||||||||||
| Amortization related to termination/settlement of interest rate derivatives | 78 | 76 | 77 | 112 | 136 | ||||||||||||||||||||||||
| Note payable (discount) premium amortization, net | 1,597 | 1,579 | 1,560 | 1,534 | 1,511 | ||||||||||||||||||||||||
| Non-capitalizable demolition costs | — | — | 365 | — | — | ||||||||||||||||||||||||
| Severance costs | 2,728 | 199 | 1,483 | — | — | ||||||||||||||||||||||||
| Other nonrecurring expenses | 1,259 | — | — | — | — | ||||||||||||||||||||||||
| Deduct: | |||||||||||||||||||||||||||||
| Preferred stock dividends | (2,314) | (2,315) | (2,314) | (2,315) | (2,314) | ||||||||||||||||||||||||
Straight line rental revenue adjustment(3) |
(8,164) | (6,918) | (5,517) | (10,057) | (11,441) | ||||||||||||||||||||||||
| Above/(below) market lease revenue adjustments | (5,254) | (5,788) | (9,186) | (6,159) | (6,635) | ||||||||||||||||||||||||
Capitalized payments(4) |
(15,756) | (14,368) | (13,321) | (12,102) | (13,900) | ||||||||||||||||||||||||
| Accretion of net loan origination fees | (115) | (115) | (115) | (115) | (115) | ||||||||||||||||||||||||
Recurring capital expenditures(5) |
(3,563) | (5,887) | (1,311) | (7,882) | (5,254) | ||||||||||||||||||||||||
2nd generation tenant improvements(6) |
(460) | (663) | (162) | (296) | (18) | ||||||||||||||||||||||||
2nd generation leasing commissions(7) |
(8,007) | (4,162) | (4,879) | (3,520) | (2,660) | ||||||||||||||||||||||||
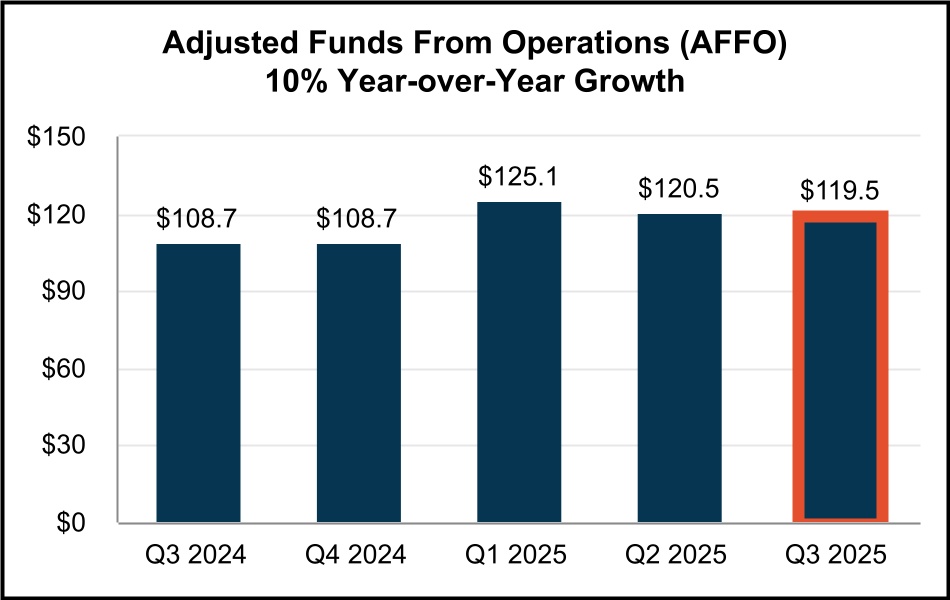
| Adjusted Funds From Operations (AFFO) | $ | 119,499 | $ | 120,496 | $ | 125,144 | $ | 108,727 | $ | 108,698 | |||||||||||||||||||
|
Third Quarter 2025
Supplemental Financial Reporting Package
|
Page 14
|
|
||||||
Statement of Operations Reconciliations - NOI, Cash NOI, EBITDAre and Adjusted EBITDAre.(1) | ||||||||
| (unaudited and in thousands) | ||||||||
| NOI and Cash NOI | |||||||||||||||||||||||||||||
| Three Months Ended | |||||||||||||||||||||||||||||
| Sep 30, 2025 | Jun 30, 2025 | Mar 31, 2025 | Dec 31, 2024 | Sep 30, 2024 | |||||||||||||||||||||||||
Rental income(2)(3)(4) |
$ | 246,757 | $ | 241,568 | $ | 248,821 | $ | 239,737 | $ | 238,396 | |||||||||||||||||||
| Less: Property expenses | 57,879 | 55,298 | 55,261 | 56,006 | 54,867 | ||||||||||||||||||||||||
| Net Operating Income (NOI) | $ | 188,878 | $ | 186,270 | $ | 193,560 | $ | 183,731 | $ | 183,529 | |||||||||||||||||||
Above/(below) market lease revenue adjustments |
(5,254) | (5,788) | (9,186) | (6,159) | (6,635) | ||||||||||||||||||||||||
| Straight line rental revenue adjustment | (8,164) | (6,918) | (5,517) | (10,057) | (11,441) | ||||||||||||||||||||||||
| Cash NOI | $ | 175,460 | $ | 173,564 | $ | 178,857 | $ | 167,515 | $ | 165,453 | |||||||||||||||||||
EBITDAre and Adjusted EBITDAre |
|||||||||||||||||||||||||||||
| Three Months Ended | |||||||||||||||||||||||||||||
| Sep 30, 2025 | Jun 30, 2025 | Mar 31, 2025 | Dec 31, 2024 | Sep 30, 2024 | |||||||||||||||||||||||||
| Net income | $ | 93,056 | $ | 120,394 | $ | 74,048 | $ | 64,910 | $ | 70,722 | |||||||||||||||||||
| Interest expense | 25,463 | 26,701 | 27,288 | 28,173 | 27,340 | ||||||||||||||||||||||||
| Depreciation and amortization | 81,172 | 71,188 | 86,740 | 71,832 | 69,241 | ||||||||||||||||||||||||
| Gains on sale of real estate | (28,583) | (44,361) | (13,157) | — | (1,745) | ||||||||||||||||||||||||
EBITDAre |
$ | 171,108 | $ | 173,922 | $ | 174,919 | $ | 164,915 | $ | 165,558 | |||||||||||||||||||
| Stock-based compensation amortization | 10,485 | 10,091 | 9,699 | 11,539 | 9,918 | ||||||||||||||||||||||||
| Debt extinguishment and modification expenses | — | 291 | — | — | — | ||||||||||||||||||||||||
| Acquisition expenses | 161 | 23 | 79 | 9 | 6 | ||||||||||||||||||||||||
Other nonrecurring expenses |
1,259 | — | — | — | — | ||||||||||||||||||||||||
Pro forma effect of acquisitions(5) |
— | — | — | 2,884 | 426 | ||||||||||||||||||||||||
Pro forma effect of dispositions(6) |
(389) | (216) | 162 | — | 21 | ||||||||||||||||||||||||
Adjusted EBITDAre |
$ | 182,624 | $ | 184,111 | $ | 184,859 | $ | 179,347 | $ | 175,929 | |||||||||||||||||||
|
Third Quarter 2025
Supplemental Financial Reporting Package
|
Page 15
|
|
||||||
Same Property Portfolio Performance.(1) |
||||||||
| (unaudited and dollars in thousands) | ||||||||
| Same Property Portfolio: | ||||||||||||||||||||||||||||||||||||||||||||||||||
| Number of properties | 288 | |||||||||||||||||||||||||||||||||||||||||||||||||
| Square Feet | 37,916,326 | |||||||||||||||||||||||||||||||||||||||||||||||||
| Same Property Portfolio NOI and Cash NOI: | ||||||||||||||||||||||||||||||||||||||||||||||||||
| Three Months Ended September 30, | Nine Months Ended September 30, | |||||||||||||||||||||||||||||||||||||||||||||||||
| 2025 | 2024 | $ Change | % Change | 2025 | 2024 | $ Change | % Change | |||||||||||||||||||||||||||||||||||||||||||
Rental income(2)(3)(4) |
$ | 194,202 | $ | 190,107 | $ | 4,095 | 2.2% | $ | 573,711 | $ | 563,695 | $ | 10,016 | 1.8% | ||||||||||||||||||||||||||||||||||||
| Property expenses | 43,998 | 42,668 | 1,330 | 3.1% | 127,326 | 122,980 | 4,346 | 3.5% | ||||||||||||||||||||||||||||||||||||||||||
| Same Property Portfolio NOI | $ | 150,204 | $ | 147,439 | $ | 2,765 | 1.9% | (4) |
$ | 446,385 | $ | 440,715 | $ | 5,670 | 1.3% | (4) |
||||||||||||||||||||||||||||||||||
Straight-line rental revenue adjustment |
(3,776) | (7,763) | 3,987 | (51.4)% | (11,709) | (22,502) | 10,793 | (48.0)% | ||||||||||||||||||||||||||||||||||||||||||
Above/(below) market lease revenue adjustments |
(5,081) | (5,727) | 646 | (11.3)% | (15,082) | (18,198) | 3,116 | (17.1)% | ||||||||||||||||||||||||||||||||||||||||||
| Same Property Portfolio Cash NOI | $ | 141,347 | $ | 133,949 | $ | 7,398 | 5.5% | (4) |
$ | 419,594 | $ | 400,015 | $ | 19,579 | 4.9% | (4) |
||||||||||||||||||||||||||||||||||
| Same Property Portfolio Occupancy: | |||||||||||||||||||||||||||||
| Three Months Ended September 30, | |||||||||||||||||||||||||||||
| 2025 | 2024 | Year-over-Year Change (basis points) |
Three Months Ended June 30, 2025(5) |
Sequential Change (basis points) |
|||||||||||||||||||||||||
Quarterly Weighted Average Occupancy:(5) |
|||||||||||||||||||||||||||||
| Los Angeles County | 96.7% | 97.5% | (80) bps | 95.6% | 110 bps | ||||||||||||||||||||||||
| Orange County | 98.7% | 99.3% | (60) bps | 99.0% | (30) bps | ||||||||||||||||||||||||
| Riverside / San Bernardino County | 95.4% | 97.2% | (180) bps | 96.6% | (120) bps | ||||||||||||||||||||||||
| San Diego County | 98.3% | 95.8% | 250 bps | 98.0% | 30 bps | ||||||||||||||||||||||||
| Ventura County | 94.3% | 92.3% | 200 bps | 91.4% | 290 bps | ||||||||||||||||||||||||
| Quarterly Weighted Average Occupancy | 96.5% | 97.2% | (70) bps | 96.0% | 50 bps | ||||||||||||||||||||||||
| Ending Occupancy: | 96.8% | 96.9% | (10) bps | 96.2% | 60 bps | ||||||||||||||||||||||||
|
Third Quarter 2025
Supplemental Financial Reporting Package
|
Page 16
|
|
||||||
Capitalization Summary. |
||||||||
| (unaudited and in thousands, except share and per share data) | ||||||||
| Capitalization as of September 30, 2025 | ||||||||

| Description | September 30, 2025 | June 30, 2025 | March 31, 2025 | December 31, 2024 | September 30, 2024 | ||||||||||||||||||||||||
Common shares outstanding(1) |
232,297,172 | 236,151,829 | 235,610,472 | 224,868,888 | 219,102,342 | ||||||||||||||||||||||||
Operating partnership units outstanding(2) |
8,155,706 | 8,182,445 | 8,700,301 | 8,426,905 | 8,175,868 | ||||||||||||||||||||||||
| Total shares and units outstanding at period end | 240,452,878 | 244,334,274 | 244,310,773 | 233,295,793 | 227,278,210 | ||||||||||||||||||||||||
| Share price at end of quarter | $ | 41.11 | $ | 35.57 | $ | 39.15 | $ | 38.66 | $ | 50.31 | |||||||||||||||||||
| Common Stock and Operating Partnership Units - Capitalization | $ | 9,885,018 | $ | 8,690,970 | $ | 9,564,767 | $ | 9,019,215 | $ | 11,434,367 | |||||||||||||||||||
Series B and C Cumulative Redeemable Preferred Stock(3) |
$ | 161,250 | $ | 161,250 | $ | 161,250 | $ | 161,250 | $ | 161,250 | |||||||||||||||||||
4.00% Series 2 Cumulative Redeemable Convertible Preferred Units(4) |
— | — | — | 40,706 | 40,706 | ||||||||||||||||||||||||
3.00% Series 3 Cumulative Redeemable Convertible Preferred Units(4) |
12,000 | 12,000 | 12,000 | 12,000 | 12,000 | ||||||||||||||||||||||||
| Preferred Equity | $ | 173,250 | $ | 173,250 | $ | 173,250 | $ | 213,956 | $ | 213,956 | |||||||||||||||||||
| Total Equity Market Capitalization | $ | 10,058,268 | $ | 8,864,220 | $ | 9,738,017 | $ | 9,233,171 | $ | 11,648,323 | |||||||||||||||||||
| Total Debt | $ | 3,278,896 | $ | 3,379,141 | $ | 3,379,383 | $ | 3,379,622 | $ | 3,386,273 | |||||||||||||||||||
| Less: Cash and cash equivalents | (248,956) | (431,117) | (504,579) | (55,971) | (61,836) | ||||||||||||||||||||||||
| Net Debt | $ | 3,029,940 | $ | 2,948,024 | $ | 2,874,804 | $ | 3,323,651 | $ | 3,324,437 | |||||||||||||||||||
| Total Combined Market Capitalization (Net Debt plus Equity) | $ | 13,088,208 | $ | 11,812,244 | $ | 12,612,821 | $ | 12,556,822 | $ | 14,972,760 | |||||||||||||||||||
| Net debt to total combined market capitalization | 23.2 | % | 25.0 | % | 22.8 | % | 26.5 | % | 22.2 | % | |||||||||||||||||||
Net debt to Adjusted EBITDAre (quarterly results annualized)(5) |
4.1x | 4.0x | 3.9x | 4.6x | 4.7x | ||||||||||||||||||||||||
Net debt & preferred equity to Adjusted EBITDAre (quarterly results annualized)(5) |
4.4x | 4.2x | 4.1x | 4.9x | 5.0x | ||||||||||||||||||||||||
|
Third Quarter 2025
Supplemental Financial Reporting Package
|
Page 17
|
|
||||||
Debt Summary. |
||||||||
| (unaudited and dollars in thousands) | ||||||||
| Debt Detail: | ||||||||||||||||||||||||||
| As of September 30, 2025 | ||||||||||||||||||||||||||
| Debt Description | Maturity Date | Stated Interest Rate |
Effective
Interest Rate(1)
|
Principal
Balance(2)
|
||||||||||||||||||||||
| Unsecured Debt: | ||||||||||||||||||||||||||
$1.25 Billion Revolving Credit Facility(3) |
5/30/2029(4) |
SOFR+0.725%(5) |
4.965% | $ | — | |||||||||||||||||||||
$575M Exchangeable 2027 Senior Notes(6) |
3/15/2027 | 4.375% | 4.375% | 575,000 | ||||||||||||||||||||||
| $300M Term Loan Facility | 5/26/2027 | SOFR+0.80%(5) |
3.717%(7) |
300,000 | ||||||||||||||||||||||
| $125M Senior Notes | 7/13/2027 | 3.930% | 3.930% | 125,000 | ||||||||||||||||||||||
| $300M Senior Notes | 6/15/2028 | 5.000% | 5.000% | 300,000 | ||||||||||||||||||||||
$575M Exchangeable 2029 Senior Notes(6) |
3/15/2029 | 4.125% | 4.125% | 575,000 | ||||||||||||||||||||||
| $25M Series 2019A Senior Notes | 7/16/2029 | 3.880% | 3.880% | 25,000 | ||||||||||||||||||||||
| $400M Senior Notes | 12/1/2030 | 2.125% | 2.125% | 400,000 | ||||||||||||||||||||||
| $400M Term Loan Facility | 5/30/2030 | SOFR+0.80%(5) |
4.214%(8) |
400,000 | ||||||||||||||||||||||
| $400M Senior Notes - Green Bond | 9/1/2031 | 2.150% | 2.150% | 400,000 | ||||||||||||||||||||||
| $75M Series 2019B Senior Notes | 7/16/2034 | 4.030% | 4.030% | 75,000 | ||||||||||||||||||||||
| Secured Debt: | ||||||||||||||||||||||||||
| $60M Term Loan Facility | 10/27/2026(9) |
SOFR+1.250%(9) |
5.060%(10) |
60,000 | ||||||||||||||||||||||
| 701-751 Kingshill Place | 1/5/2026 | 3.900% | 3.900% | 6,749 | ||||||||||||||||||||||
| 13943-13955 Balboa Boulevard | 7/1/2027 | 3.930% | 3.930% | 13,915 | ||||||||||||||||||||||
| 2205 126th Street | 12/1/2027 | 3.910% | 3.910% | 5,200 | ||||||||||||||||||||||
| 2410-2420 Santa Fe Avenue | 1/1/2028 | 3.700% | 3.700% | 10,300 | ||||||||||||||||||||||
| 11832-11954 La Cienega Boulevard | 7/1/2028 | 4.260% | 4.260% | 3,710 | ||||||||||||||||||||||
| 1100-1170 Gilbert Street (Gilbert/La Palma) | 3/1/2031 | 5.125% | 5.125% | 1,378 | ||||||||||||||||||||||
| 7817 Woodley Avenue | 8/1/2039 | 4.140% | 4.140% | 2,644 | ||||||||||||||||||||||
| Total Debt | 3.741% | $ | 3,278,896 | |||||||||||||||||||||||
Debt Composition: |
||||||||||||||||||||||||||||||||
| Category | Weighted Average Term Remaining (yrs) |
Stated Interest Rate | Effective Interest Rate | Balance | % of Total | |||||||||||||||||||||||||||
| Fixed | 3.5 | 3.741% (See Table Above) |
3.741% | $ | 3,278,896 | 100% | ||||||||||||||||||||||||||
| Variable | — | — | —% | $ | — | 0% | ||||||||||||||||||||||||||
| Secured | 1.7 | 4.590% | $ | 103,896 | 3% | |||||||||||||||||||||||||||
| Unsecured | 3.6 | 3.713% | $ | 3,175,000 | 97% | |||||||||||||||||||||||||||
|
Third Quarter 2025
Supplemental Financial Reporting Package
|
Page 18
|
|
||||||
Debt Summary (Continued). |
||||||||
| (unaudited and dollars in thousands) | ||||||||
Debt Maturity Schedule(11): |
||||||||||||||||||||||||||||||||
| Year | Secured |
Unsecured | Total | % Total | Effective Interest Rate(1) |
|||||||||||||||||||||||||||
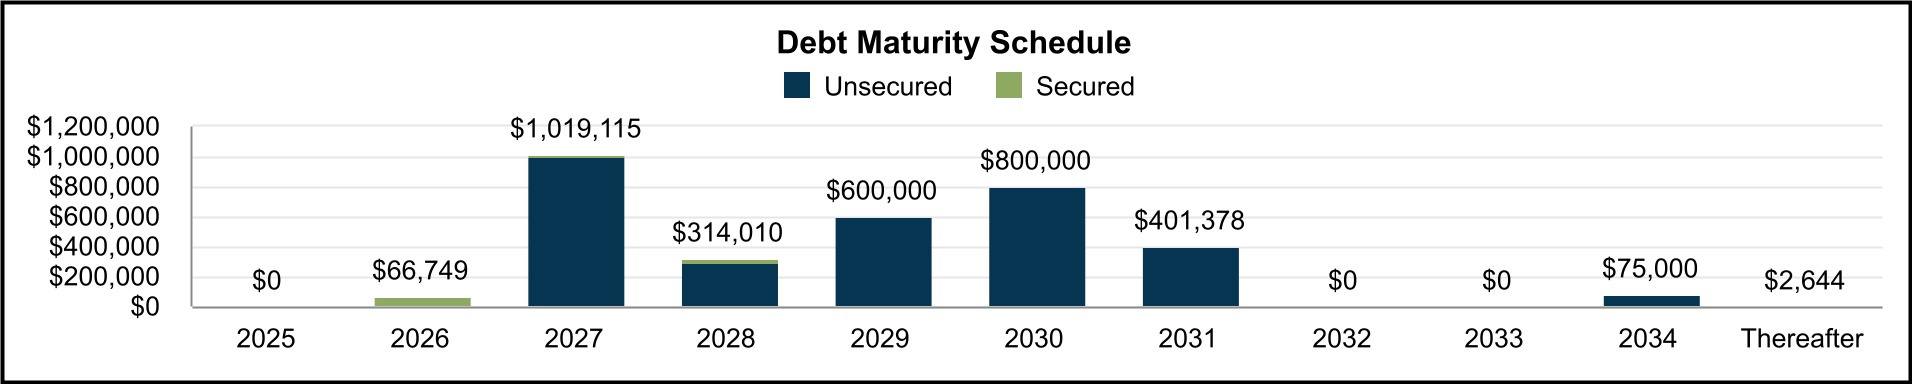
| 2025 | $ | — | $ | — | $ | — | — | % | — | % | ||||||||||||||||||||||
| 2026 | 66,749 | — | 66,749 | 2 | % | 4.943 | % | |||||||||||||||||||||||||
| 2027 | 19,115 | 1,000,000 | 1,019,115 | 32 | % | 4.118 | % | |||||||||||||||||||||||||
| 2028 | 14,010 | 300,000 | 314,010 | 10 | % | 4.949 | % | |||||||||||||||||||||||||
| 2029 | — | 600,000 | 600,000 | 18 | % | 4.115 | % | |||||||||||||||||||||||||
| 2030 | — | 800,000 | 800,000 | 24 | % | 3.169 | % | |||||||||||||||||||||||||
| 2031 | 1,378 | 400,000 | 401,378 | 12 | % | 2.160 | % | |||||||||||||||||||||||||
| 2032 | — | — | — | — | % | — | % | |||||||||||||||||||||||||
| 2033 | — | — | — | — | % | — | % | |||||||||||||||||||||||||
| 2034 | — | 75,000 | 75,000 | 2 | % | 4.030 | % | |||||||||||||||||||||||||
| Thereafter | 2,644 | — | 2,644 | — | % | 4.140 | % | |||||||||||||||||||||||||
| Total | $ | 103,896 | $ | 3,175,000 | $ | 3,278,896 | 100 | % | 3.741 | % | ||||||||||||||||||||||
|
Third Quarter 2025
Supplemental Financial Reporting Package
|
Page 19
|
|
||||||
Operations. |
||||||||
| Quarterly Results | ||||||||
|
Third Quarter 2025
Supplemental Financial Reporting Package
|
Page 20
|
|
||||||
Portfolio Overview. |
||||||||
| At September 30, 2025 | (unaudited results) | |||||||
| Consolidated Portfolio: | ||||||||
| Rentable Square Feet | Ending Occupancy % | In-Place ABR(3) |
|||||||||||||||||||||||||||||||||||||||||||||||||||||||||||||||
| Market | # of Properties |
Same Property Portfolio |
Non-Same Property Portfolio |
Total Portfolio |
Same Property Portfolio |
Non-Same Property Portfolio |
Total
Portfolio(1)
|
Total Portfolio
Excluding
Repo/Redev(2)
|
Total (in 000’s) |
Per Square Foot |
|||||||||||||||||||||||||||||||||||||||||||||||||||||||
| Central LA | 20 | 2,778,544 | 451,803 | 3,230,347 | 96.6 | % | 82.5 | % | 94.7 | % | 97.6 | % | $ | 40,783 | $13.34 | ||||||||||||||||||||||||||||||||||||||||||||||||||
| Greater San Fernando Valley | 74 | 5,485,235 | 1,655,320 | 7,140,555 | 96.6 | % | 69.2 | % | 90.3 | % | 98.0 | % | 112,382 | $17.44 | |||||||||||||||||||||||||||||||||||||||||||||||||||
| Mid-Counties | 39 | 2,984,698 | 1,669,792 | 4,654,490 | 98.9 | % | 76.8 | % | 90.9 | % | 99.2 | % | 71,322 | $16.85 | |||||||||||||||||||||||||||||||||||||||||||||||||||
| San Gabriel Valley | 46 | 3,407,578 | 2,502,784 | 5,910,362 | 92.0 | % | 88.7 | % | 90.6 | % | 94.4 | % | 71,045 | $13.27 | |||||||||||||||||||||||||||||||||||||||||||||||||||
| South Bay | 81 | 6,303,325 | 1,657,301 | 7,960,626 | 98.8 | % | 57.3 | % | 90.2 | % | 99.2 | % | 167,796 | $23.38 | |||||||||||||||||||||||||||||||||||||||||||||||||||
| Los Angeles County | 260 | 20,959,380 | 7,937,000 | 28,896,380 | 96.8 | % | 75.2 | % | 90.9 | % | 97.7 | % | 463,328 | $17.64 | |||||||||||||||||||||||||||||||||||||||||||||||||||
| North Orange County | 25 | 1,094,646 | 1,580,440 | 2,675,086 | 97.1 | % | 85.0 | % | 89.9 | % | 98.7 | % | 46,389 | $19.28 | |||||||||||||||||||||||||||||||||||||||||||||||||||
| OC Airport | 10 | 1,099,985 | 106,604 | 1,206,589 | 99.2 | % | 100.0 | % | 99.3 | % | 99.3 | % | 23,559 | $19.67 | |||||||||||||||||||||||||||||||||||||||||||||||||||
| South Orange County | 9 | 346,463 | 183,098 | 529,561 | 100.0 | % | 88.9 | % | 96.2 | % | 100.0 | % | 8,843 | $17.36 | |||||||||||||||||||||||||||||||||||||||||||||||||||
| West Orange County | 10 | 852,079 | 436,759 | 1,288,838 | 100.0 | % | 86.3 | % | 95.4 | % | 100.0 | % | 20,634 | $16.79 | |||||||||||||||||||||||||||||||||||||||||||||||||||
| Orange County | 54 | 3,393,173 | 2,306,901 | 5,700,074 | 98.8 | % | 86.2 | % | 93.7 | % | 99.3 | % | 99,425 | $18.61 | |||||||||||||||||||||||||||||||||||||||||||||||||||
| Inland Empire East | 1 | 33,258 | — | 33,258 | 100.0 | % | — | % | 100.0 | % | 100.0 | % | 660 | $19.86 | |||||||||||||||||||||||||||||||||||||||||||||||||||
| Inland Empire West | 53 | 8,490,725 | 1,051,523 | 9,542,248 | 96.0 | % | 80.9 | % | 94.4 | % | 96.5 | % | 137,671 | $15.29 | |||||||||||||||||||||||||||||||||||||||||||||||||||
| Riverside / San Bernardino County | 54 | 8,523,983 | 1,051,523 | 9,575,506 | 96.1 | % | 80.9 | % | 94.4 | % | 96.5 | % | 138,331 | $15.30 | |||||||||||||||||||||||||||||||||||||||||||||||||||
| Central San Diego | 21 | 1,349,009 | 779,311 | 2,128,320 | 98.2 | % | 67.7 | % | 87.0 | % | 94.9 | % | 39,196 | $21.17 | |||||||||||||||||||||||||||||||||||||||||||||||||||
| North County San Diego | 13 | 1,179,355 | 143,663 | 1,323,018 | 98.1 | % | 100.0 | % | 98.3 | % | 99.1 | % | 19,642 | $15.10 | |||||||||||||||||||||||||||||||||||||||||||||||||||
| San Diego County | 34 | 2,528,364 | 922,974 | 3,451,338 | 98.1 | % | 72.7 | % | 91.3 | % | 96.6 | % | 58,838 | $18.66 | |||||||||||||||||||||||||||||||||||||||||||||||||||
| Ventura | 18 | 2,511,426 | 716,100 | 3,227,526 | 95.6 | % | 69.3 | % | 89.8 | % | 93.6 | % | 40,150 | $13.86 | |||||||||||||||||||||||||||||||||||||||||||||||||||
| Ventura County | 18 | 2,511,426 | 716,100 | 3,227,526 | 95.6 | % | 69.3 | % | 89.8 | % | 93.6 | % | 40,150 | $13.86 | |||||||||||||||||||||||||||||||||||||||||||||||||||
| CONSOLIDATED TOTAL / WTD AVG | 420 | 37,916,326 | 12,934,498 | 50,850,824 | 96.8 | % | 77.1 | % | 91.8 | % | 97.3 | % | $ | 800,072 | $17.13 | (4) |
|||||||||||||||||||||||||||||||||||||||||||||||||
|
Third Quarter 2025
Supplemental Financial Reporting Package
|
Page 21
|
|
||||||
Executed Leasing Statistics and Trends. |
||||||||
| (unaudited results) | ||||||||
| Executed Leasing Activity and Weighted Average New / Renewal Leasing Spreads: | ||||||||
| Three Months Ended | ||||||||||||||||||||||||||||||||
| Sep 30, 2025 | Jun 30, 2025 | Mar 31, 2025 | Dec 31, 2024 | Sep 30, 2024 | ||||||||||||||||||||||||||||
| Leasing Spreads: | ||||||||||||||||||||||||||||||||
| Net Effective Rent Change | 26.1 | % | 20.9 | % | 23.8 | % | 55.4 | % | 39.2 | % | ||||||||||||||||||||||
| Cash Rent Change | 10.3 | % | 8.1 | % | 14.7 | % | 41.0 | % | 26.7 | % | ||||||||||||||||||||||
Leasing Activity (Building SF):(1)(2) |
||||||||||||||||||||||||||||||||
| New leases | 2,361,131 | 678,727 | 882,403 | 330,334 | 994,566 | |||||||||||||||||||||||||||
| Renewal leases | 904,014 | 1,020,266 | 1,511,946 | 684,961 | 599,529 | |||||||||||||||||||||||||||
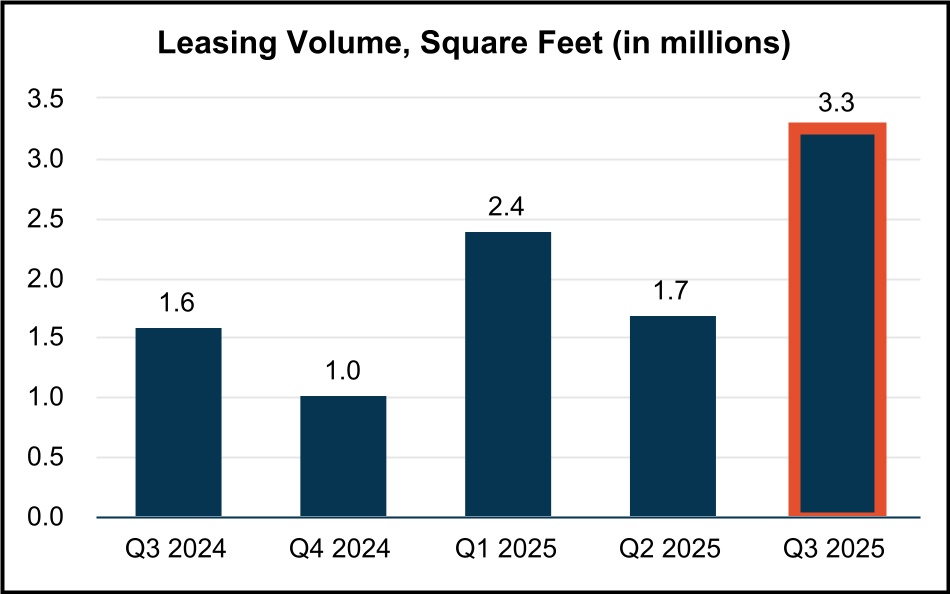
| Total leasing activity | 3,265,145 | 1,698,993 | 2,394,349 | 1,015,295 | 1,594,095 | |||||||||||||||||||||||||||
| Total expiring leases | (1,734,790) | (1,786,814) | (3,102,514) | (2,436,160) | (1,677,064) | |||||||||||||||||||||||||||
| Expiring leases - placed into repositioning/redevelopment | 418,878 | 304,776 | 833,218 | 996,035 | 476,821 | |||||||||||||||||||||||||||
Net absorption(3) |
1,949,233 | 216,955 | 125,053 | (424,830) | 393,852 | |||||||||||||||||||||||||||
Retention rate(4) |
72 | % | 69 | % | 68 | % | 51 | % | 52 | % | ||||||||||||||||||||||
Retention + Backfill rate(5) |
77 | % | 74 | % | 82 | % | 62 | % | 72 | % | ||||||||||||||||||||||
Executed Leasing Activity and Change in Annual Rental Rates and Turnover Costs for Current Quarter Leases:(6) |
||||||||||||||||||||||||||||||||||||||||||||||||||||||||||||||||||||||||||
Net Effective Rent |
Cash Rent | Turnover Costs(8) |
||||||||||||||||||||||||||||||||||||||||||||||||||||||||||||||||||||||||
| Third Quarter 2025: | # Leases Signed |
SF of Leasing |
Wtd. Avg. Lease Term (Years) |
Current Lease |
Prior Lease |
Rent Change |
Current Lease |
Prior Lease |
Rent Change |
Wtd. Avg. Abatement (Months) |
Tenant
Improvements
per SF
|
Leasing
Commissions
per SF
|
||||||||||||||||||||||||||||||||||||||||||||||||||||||||||||||
New |
69 | 2,361,131 | 5.2 | $11.11 | $8.84 | 25.6% | $11.04 | $9.95 | 10.9% | 5.1 | $1.43 | $3.57 | ||||||||||||||||||||||||||||||||||||||||||||||||||||||||||||||
| Renewal | 54 | 904,014 | 4.9 | $17.89 | $14.14 | 26.5% | $17.16 | $15.61 | 9.9% | 2.5 | $1.18 | $3.80 | ||||||||||||||||||||||||||||||||||||||||||||||||||||||||||||||
Total / Wtd. Average(7) |
123 | 3,265,145 | 5.1 | $14.20 | $11.26 | 26.1% | $13.83 | $12.53 | 10.3% | 3.9 | $1.31 | $3.67 | ||||||||||||||||||||||||||||||||||||||||||||||||||||||||||||||
|
Third Quarter 2025
Supplemental Financial Reporting Package
|
Page 22
|
|
||||||
Leasing Statistics (Continued). |
||||||||
| (unaudited results) | ||||||||
| Lease Expiration Schedule as of September 30, 2025: | ||||||||
| Year of Lease Expiration | # of Leases Expiring |
Total Rentable Square Feet |
In-Place + Uncommenced ABR (in thousands) |
In-Place + Uncommenced ABR per SF |
||||||||||||||||||||||
| Available | — | 1,281,638 | $ | — | $— | |||||||||||||||||||||
Repositioning/Redevelopment(1) |
— | 2,509,507 | — | $— | ||||||||||||||||||||||
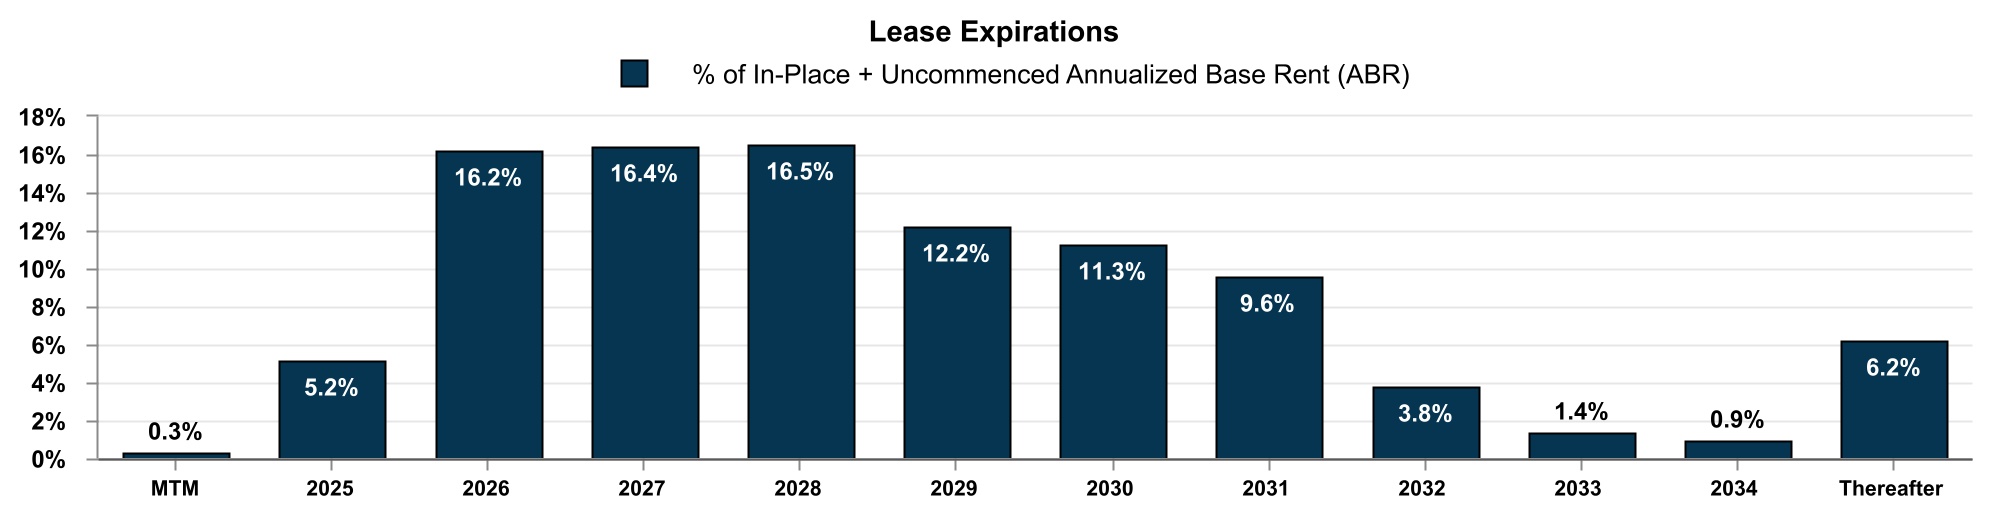
| MTM Tenants | 5 | 145,165 | 2,134 | $14.70 | ||||||||||||||||||||||
| 2025 | 98 | 2,803,697 | 41,590 | $14.83 | ||||||||||||||||||||||
| 2026 | 421 | 8,283,384 | 130,833 | $15.79 | ||||||||||||||||||||||
| 2027 | 359 | 7,531,757 | 131,974 | $17.52 | ||||||||||||||||||||||
| 2028 | 276 | 7,053,890 | 133,374 | $18.91 | ||||||||||||||||||||||
| 2029 | 179 | 5,140,354 | 98,393 | $19.14 | ||||||||||||||||||||||
| 2030 | 134 | 5,611,113 | 90,879 | $16.20 | ||||||||||||||||||||||
| 2031 | 58 | 5,596,885 | 77,737 | $13.89 | ||||||||||||||||||||||
| 2032 | 25 | 1,512,233 | 31,043 | $20.53 | ||||||||||||||||||||||
| 2033 | 14 | 643,583 | 11,354 | $17.64 | ||||||||||||||||||||||
| 2034 | 7 | 355,445 | 6,980 | $19.64 | ||||||||||||||||||||||
| Thereafter | 39 | 2,382,173 | 50,331 | $21.13 | ||||||||||||||||||||||
| Total Portfolio | 1,615 | 50,850,824 | $ | 806,622 | $17.14(2) |
|||||||||||||||||||||
|
Third Quarter 2025
Supplemental Financial Reporting Package
|
Page 23
|
|
||||||
Top Tenants and Lease Segmentation. |
||||||||
| (unaudited results) | ||||||||
Top 20 Tenants as of September 30, 2025 |
||||||||
| Tenant | Submarket | Leased Rentable SF |
In-Place + Uncommenced
ABR (in 000’s)(1)
|
% of In-Place +
Uncommenced ABR(1)
|
In-Place + Uncommenced
ABR per SF(1)
|
Lease Expiration |
||||||||||||||||||||||||||||||||
| Tireco, Inc. | Inland Empire West | 1,101,840 | $19,251 | 2.4% | $17.47 | 1/31/2027 | ||||||||||||||||||||||||||||||||
| L3 Technologies, Inc. | Multiple Submarkets(2) |
595,267 | $12,967 | 1.6% | $21.78 | 9/30/2031 | ||||||||||||||||||||||||||||||||
| Zenith Energy West Coast Terminals LLC | South Bay | —(3) |
$11,909 | 1.5% | $3.34(3) |
9/29/2041 | ||||||||||||||||||||||||||||||||
| Cubic Corporation | Central San Diego | 515,382 | $11,443 | 1.4% | $22.20 | 3/31/2038(4) |
||||||||||||||||||||||||||||||||
| IBY, LLC | San Gabriel Valley | 1,178,021 | $11,322 | 1.4% | $9.61 | 4/5/2031(5) |
||||||||||||||||||||||||||||||||
| Federal Express Corporation | Multiple Submarkets(6) |
527,861 | $10,756 | 1.3% | $20.38 | 11/30/2032(6) |
||||||||||||||||||||||||||||||||
| GXO Logistics Supply Chain, Inc. | Mid-Counties | 411,034 | $9,076 | 1.1% | $22.08 | 11/30/2028 | ||||||||||||||||||||||||||||||||
| The Hertz Corporation | South Bay | 38,680(7) |
$8,922 | 1.1% | $10.71(7) |
6/30/2026 | ||||||||||||||||||||||||||||||||
| Best Buy Stores, L.P. | Inland Empire West | 501,649 | $8,871 | 1.1% | $17.68 | 6/30/2029 | ||||||||||||||||||||||||||||||||
| Orora Packaging Solutions | Multiple Submarkets(8) |
476,065 | $7,845 | 1.0% | $16.48 | 9/30/2028(8) |
||||||||||||||||||||||||||||||||
| Top 10 Tenants | 5,345,799 | $112,362 | 13.9% | |||||||||||||||||||||||||||||||||||
| Top 11 - 20 Tenants | 3,258,530 | $51,416 | 6.4% | |||||||||||||||||||||||||||||||||||
| Total Top 20 Tenants | 8,604,329 | $163,778 | 20.3% | |||||||||||||||||||||||||||||||||||
| Lease Segmentation by Size: | |||||||||||||||||||||||||||||||||||||||||||||||||||||
| Square Feet | Number of Leases |
Leased Building/Land Rentable SF |
Building/Land Rentable SF |
Leased % |
Leased % Excl.
Repo/Redev
|
In-Place +
Uncommenced ABR
(in 000’s)(1)
|
% of In-Place +
Uncommenced
ABR(1)
|
In-Place +
Uncommenced
ABR per SF(1)
|
|||||||||||||||||||||||||||||||||||||||||||||
| Building: | |||||||||||||||||||||||||||||||||||||||||||||||||||||
| <4,999 | 572 | 1,379,949 | 1,513,827 | 91.2% | 91.4% | $ | 27,666 | 3.4% | $20.05 | ||||||||||||||||||||||||||||||||||||||||||||
| 5,000 - 9,999 | 224 | 1,598,314 | 1,739,329 | 91.9% | 94.6% | 30,781 | 3.8% | $19.26 | |||||||||||||||||||||||||||||||||||||||||||||
| 10,000 - 24,999 | 320 | 5,179,926 | 5,887,279 | 88.0% | 91.9% | 97,841 | 12.1% | $18.89 | |||||||||||||||||||||||||||||||||||||||||||||
| 25,000 - 49,999 | 178 | 6,559,888 | 7,275,629 | 90.2% | 96.0% | 115,754 | 14.4% | $17.65 | |||||||||||||||||||||||||||||||||||||||||||||
| 50,000 - 99,999 | 120 | 8,594,059 | 9,619,402 | 89.3% | 98.3% | 146,381 | 18.2% | $17.03 | |||||||||||||||||||||||||||||||||||||||||||||
| >100,000 | 126 | 23,541,544 | 24,591,497 | 95.7% | 99.3% | 339,742 | 42.1% | $14.43 | |||||||||||||||||||||||||||||||||||||||||||||
| Building Subtotal / Wtd. Avg. | 1,540 | 46,853,680 | (2) |
50,626,963 | (2) |
92.5% | (2) |
97.4% | (2) |
$ | 758,165 | 94.0% | $16.18 | ||||||||||||||||||||||||||||||||||||||||
Land/IOS(3) |
26 | 8,176,495 | (4) |
8,359,956 | (4) |
97.8% | 45,510 | 5.6% | $5.44 | (4) |
|||||||||||||||||||||||||||||||||||||||||||
Other(3) |
49 | 2,947 | 0.4% | ||||||||||||||||||||||||||||||||||||||||||||||||||
| Total | 1,615 | $ | 806,622 | 100.0% | |||||||||||||||||||||||||||||||||||||||||||||||||
|
Third Quarter 2025
Supplemental Financial Reporting Package
|
Page 24
|
|
||||||
Capital Expenditure Summary. |
||||||||
| (unaudited results, in thousands, except square feet and per square foot data) | ||||||||
| Nine months ended September 30, 2025 | ||||||||
| Year to Date | ||||||||||||||||||||||||||||||||||||||
| Q3-2025 | Q2-2025 | Q1-2025 | Total | SF(1) |
PSF | |||||||||||||||||||||||||||||||||
| Tenant Improvements: | ||||||||||||||||||||||||||||||||||||||
| New Leases – 1st Generation | $ | 328 | $ | 292 | $ | 798 | $ | 1,418 | 798,639 | $ | 1.78 | |||||||||||||||||||||||||||
| New Leases – 2nd Generation | 112 | 641 | 4 | 757 | 527,850 | $ | 1.43 | |||||||||||||||||||||||||||||||
| Renewals | 348 | 22 | 158 | 528 | 745,122 | $ | 0.71 | |||||||||||||||||||||||||||||||
| Total Tenant Improvements | $ | 788 | $ | 955 | $ | 960 | $ | 2,703 | ||||||||||||||||||||||||||||||
| Leasing Commissions & Lease Costs: | ||||||||||||||||||||||||||||||||||||||
| New Leases – 1st Generation | $ | 7,984 | $ | 1,879 | $ | 3,058 | $ | 12,921 | 2,207,324 | $ | 5.85 | |||||||||||||||||||||||||||
| New Leases – 2nd Generation | 4,844 | 1,258 | 1,886 | 7,988 | 2,108,565 | $ | 3.79 | |||||||||||||||||||||||||||||||
| Renewals | 3,163 | 2,904 | 2,993 | 9,060 | 3,981,711 | $ | 2.28 | |||||||||||||||||||||||||||||||
| Total Leasing Commissions & Lease Costs | $ | 15,991 | $ | 6,041 | $ | 7,937 | $ | 29,969 | ||||||||||||||||||||||||||||||
| Total Recurring Capex | $ | 3,563 | $ | 5,887 | $ | 1,311 | $ | 10,761 | 51,052,096 | $ | 0.21 | |||||||||||||||||||||||||||
| Recurring Capex % of NOI | 1.9 | % | 3.2 | % | 0.7 | % | 1.9 | % | ||||||||||||||||||||||||||||||
| Recurring Capex % of Rental Income | 1.4 | % | 2.4 | % | 0.5 | % | 1.5 | % | ||||||||||||||||||||||||||||||
| Nonrecurring Capex: | ||||||||||||||||||||||||||||||||||||||
Repositioning and Redevelopment in Process(2) |
$ | 55,820 | $ | 61,491 | $ | 39,455 | $ | 156,766 | ||||||||||||||||||||||||||||||
Unit Renovation(3) |
1,877 | 1,452 | 2,910 | 6,239 | ||||||||||||||||||||||||||||||||||
Other(4) |
4,612 | 2,433 | 996 | 8,041 | ||||||||||||||||||||||||||||||||||
| Total Nonrecurring Capex | $ | 62,309 | $ | 65,376 | $ | 43,361 | $ | 171,046 | 38,828,590 | $ | 4.41 | |||||||||||||||||||||||||||
Other Capitalized Costs(5) |
$ | 16,214 | $ | 14,814 | $ | 13,644 | $ | 44,672 | ||||||||||||||||||||||||||||||
|
Third Quarter 2025
Supplemental Financial Reporting Package
|
Page 25
|
|
||||||
Properties and Space Under Repositioning/Redevelopment.(1) | ||||||||
| As of September 30, 2025 | (unaudited results, $ in millions) | |||||||
| Repositioning | ||||||||||||||||||||||||||||||||||||||||||||||||||||||||||||||
|
Repo/
Lease-Up
RSF(2)
|
Repo RSF
Leased %
9/30/2025
|
Est. Constr. Period(1) |
Purch.
Price(1)
|
Proj.
Repo
Costs(1)
|
Proj.
Total
Invest.(1)
|
Proj.
Remaining
Costs
|
||||||||||||||||||||||||||||||||||||||||||||||||||||||||
Property |
County |
Submarket |
Start | Target Complet. |
||||||||||||||||||||||||||||||||||||||||||||||||||||||||||
| CURRENT REPOSITIONING: | ||||||||||||||||||||||||||||||||||||||||||||||||||||||||||||||
9455 Cabot Drive |
San Diego |
Central San Diego |
83,563 | —% | 2Q-25 | 4Q-25 | 12.2 | 8.2 | 20.4 | 2.7 | ||||||||||||||||||||||||||||||||||||||||||||||||||||
1175 Aviation Place |
Los Angeles | Greater San Fernando Valley | 93,202 | —% | 3Q-25 | 2Q-26 | 17.9 | 4.0 | 21.9 | 2.2 | ||||||||||||||||||||||||||||||||||||||||||||||||||||
14400 Figueroa Street (Figueroa & Rosecrans) |
Los Angeles | South Bay | 55,998 | —% | 2Q-25 | 3Q-26 | 61.4 | 13.1 | 74.5 | 10.6 | ||||||||||||||||||||||||||||||||||||||||||||||||||||
3935-3949 Heritage Oak Court |
Ventura | Ventura | 190,031 | 43% | 3Q-25 | 3Q-26 | 56.7 | 8.3 | 65.0 | 6.5 | ||||||||||||||||||||||||||||||||||||||||||||||||||||
Total |
422,794 | $ | 148.2 | $ | 33.6 | $ | 181.8 | $ | 22.0 | |||||||||||||||||||||||||||||||||||||||||||||||||||||
Actual Cash NOI - 3Q-2025 |
$0.4 | |||||||||||||||||||||||||||||||||||||||||||||||||||||||||||||
Estimated Annualized Stabilized Cash NOI |
$8.2 - $9.1 |
|||||||||||||||||||||||||||||||||||||||||||||||||||||||||||||
Estimated Unlevered Stabilized Yield |
4.5% - 5.0% |
|||||||||||||||||||||||||||||||||||||||||||||||||||||||||||||
|
Repo/
Lease-Up
RSF(2)
|
Repo RSF
Leased %
9/30/2025
|
Construction Period |
Purch.
Price(1)
|
Proj.
Repo
Costs(1)
|
Proj.
Total
Invest.(1)
|
Proj.
Remaining
Costs
|
||||||||||||||||||||||||||||||||||||||||||||||||||||||||
Property |
County |
Submarket |
Start | Complete |
||||||||||||||||||||||||||||||||||||||||||||||||||||||||||
| LEASE-UP REPOSITIONING: | ||||||||||||||||||||||||||||||||||||||||||||||||||||||||||||||
14434-14527 San Pedro Street |
Los Angeles |
South Bay |
58,225 | —% | 3Q-23 | 1Q-25 | $ | 49.8 | $ | 14.7 | $ | 64.5 | $ | 0.9 | ||||||||||||||||||||||||||||||||||||||||||||||||
800 Sandhill Avenue (17000 Kingsview Avenue) |
Los Angeles | South Bay |
100,121 | 100% | 1Q-24 | 1Q-25 | 14.0 | 4.5 | 18.5 | 1.0 | ||||||||||||||||||||||||||||||||||||||||||||||||||||
| 1315 Storm Parkway | Los Angeles | South Bay | 37,844 | —% | 2Q-24 | 4Q-24 | 8.5 | 3.5 | 12.0 | 0.6 | ||||||||||||||||||||||||||||||||||||||||||||||||||||
19301 Santa Fe Avenue |
Los Angeles | South Bay |
LAND | —% | 2Q-24 | 3Q-25 | 14.7 | 5.7 | 20.4 | 0.6 | ||||||||||||||||||||||||||||||||||||||||||||||||||||
8985 Crestmar Point |
San Diego | Central San Diego |
53,395 | —% | 4Q-24 | 3Q-25 | 8.1 | 5.5 | 13.6 | 0.9 | ||||||||||||||||||||||||||||||||||||||||||||||||||||
14955 Salt Lake Avenue |
Los Angeles | San Gabriel Valley | 46,453 | —% | 4Q-24 | 3Q-25 | 10.9 | 3.7 | 14.6 | 0.5 | ||||||||||||||||||||||||||||||||||||||||||||||||||||
Total |
296,038 | $ | 106.0 | $ | 37.6 | $ | 143.6 | $ | 4.5 | |||||||||||||||||||||||||||||||||||||||||||||||||||||
Actual Cash NOI - 3Q-2025 |
$0.2 | |||||||||||||||||||||||||||||||||||||||||||||||||||||||||||||
| Estimated Annualized Stabilized Cash NOI | $7.9 - $8.6 |
|||||||||||||||||||||||||||||||||||||||||||||||||||||||||||||
| Estimated Unlevered Stabilized Yield | 5.5% - 6.0% |
|||||||||||||||||||||||||||||||||||||||||||||||||||||||||||||
|
Third Quarter 2025
Supplemental Financial Reporting Package
|
Page 26
|
|
||||||
Properties and Space Under Repositioning/Redevelopment (Continued).(1) | ||||||||
| As of September 30, 2025 | (unaudited results, $ in millions) | |||||||
| Repositioning | ||||||||||||||||||||||||||||||||||||||||||||||||||||||||||||||
|
Repo/
Lease-Up
RSF(2)
|
Repo RSF
Leased %
9/30/2025
|
Construction Period |
Purch.
Price(1)
|
Proj.
Repo
Costs(1)
|
Proj.
Total
Invest.(1)
|
Proj.
Remaining
Costs
|
||||||||||||||||||||||||||||||||||||||||||||||||||||||||
Property |
County |
Submarket |
Start | Complete |
||||||||||||||||||||||||||||||||||||||||||||||||||||||||||
| STABILIZED REPOSITIONING: | ||||||||||||||||||||||||||||||||||||||||||||||||||||||||||||||
11308-11350 Penrose Street(3) |
Los Angeles | Greater San Fernando Valley | 71,547 | 100% | 1Q-23 | 1Q-24 | $ | 12.1 | $ | 5.4 | $ | 17.5 | $ | 0.1 | ||||||||||||||||||||||||||||||||||||||||||||||||
1020 Bixby Drive |
Los Angeles | San Gabriel Valley | 57,600 | 100% | 1Q-24 | 3Q-24 | 16.5 | 3.0 | 19.5 | — | ||||||||||||||||||||||||||||||||||||||||||||||||||||
Harcourt & Susana |
Los Angeles | South Bay | 34,000 | 100% | 2Q-24 | 3Q-25 | 54.4 | 10.3 | 64.7 | — | ||||||||||||||||||||||||||||||||||||||||||||||||||||
Total |
163,147 | $ | 83.0 | $ | 18.7 | $ | 101.7 | $ | 0.1 | |||||||||||||||||||||||||||||||||||||||||||||||||||||
Actual Cash NOI - 3Q-2025 |
$0.1 | |||||||||||||||||||||||||||||||||||||||||||||||||||||||||||||
Annualized Stabilized Cash NOI |
$4.2 | |||||||||||||||||||||||||||||||||||||||||||||||||||||||||||||
Achieved Unlevered Stabilized Yield |
4.1% | |||||||||||||||||||||||||||||||||||||||||||||||||||||||||||||
| OTHER REPOSITIONING: | ||||||||||||||||||||||||||||||||||||||||||||||||||||||||||||||
21 projects totaling 888,851 RSF with estimated costs < $2 million individually(4) |
$ | 28.6 | $ | 7.6 | ||||||||||||||||||||||||||||||||||||||||||||||||||||||||||
Actual Cash NOI - 3Q-2025 |
$0.4 | |||||||||||||||||||||||||||||||||||||||||||||||||||||||||||||
| Estimated Annualized Stabilized Cash NOI | $15.5 - $16.0 |
|||||||||||||||||||||||||||||||||||||||||||||||||||||||||||||
| Estimated Unlevered Stabilized Yield | 6.5% - 7.0% |
|||||||||||||||||||||||||||||||||||||||||||||||||||||||||||||
|
Third Quarter 2025
Supplemental Financial Reporting Package
|
Page 27
|
|
||||||
Properties and Space Under Repositioning/Redevelopment (Continued).(1) | ||||||||
| As of September 30, 2025 | (unaudited results, $ in millions) | |||||||
| Redevelopment | ||||||||||||||||||||||||||||||||||||||||||||||||||||||||||||||
|
Projected
RSF(5)
|
Property
Leased %
9/30/2025
|
Est. Constr. Period(1) |
Purch.
Price(1)
|
Proj.
Redev
Costs(1)
|
Proj.
Total
Invest.(1)
|
Proj.
Remaining
Costs
|
||||||||||||||||||||||||||||||||||||||||||||||||||||||||
Property |
County |
Submarket |
Start | Target Complet. |
||||||||||||||||||||||||||||||||||||||||||||||||||||||||||
| CURRENT REDEVELOPMENT: | ||||||||||||||||||||||||||||||||||||||||||||||||||||||||||||||
9615 Norwalk Boulevard |
Los Angeles |
Mid-Counties |
201,571 | —% | 3Q-21 | 4Q-25 | $ | 9.6 | $ | 50.7 | $ | 60.3 | $ | 4.0 | ||||||||||||||||||||||||||||||||||||||||||||||||
15010 Don Julian Road |
Los Angeles | San Gabriel Valley | 219,242 | —% | 1Q-23 | 4Q-25 | 22.9 | 37.8 | 60.7 | 10.0 | ||||||||||||||||||||||||||||||||||||||||||||||||||||
14940 Proctor Road |
Los Angeles | San Gabriel Valley | 159,532 | —% | 4Q-24 | 2Q-26 | 28.8 | 26.2 | 55.0 | 8.7 | ||||||||||||||||||||||||||||||||||||||||||||||||||||
| 11234 Rush Street | Los Angeles | San Gabriel Valley | 103,108 | —% | 4Q-24 | 3Q-26 | 12.6 | 21.0 | 33.6 | 10.4 | ||||||||||||||||||||||||||||||||||||||||||||||||||||
| 5235 Hunter Avenue | Orange | North Orange County |
117,772 | —% | 1Q-25 | 3Q-26 | 11.4 | 20.2 | 31.6 | 9.2 | ||||||||||||||||||||||||||||||||||||||||||||||||||||
| 3547-3555 Voyager Street | Los Angeles | South Bay | 67,371 | —% | 1Q-25 | 3Q-26 | 21.1 | 18.8 | 39.9 | 14.5 | ||||||||||||||||||||||||||||||||||||||||||||||||||||
| 7815 Van Nuys Boulevard | Los Angeles | Greater San Fernando Valley | 78,990 | —% | 2Q-25 | 2Q-27 | 25.6 | 16.0 | 41.6 | 13.4 | ||||||||||||||||||||||||||||||||||||||||||||||||||||
14005 Live Oak Avenue |
Los Angeles | San Gabriel Valley | 100,380 | —% | 3Q-25 | 2Q-27 | 25.6 | 19.7 | 45.3 | 18.8 | ||||||||||||||||||||||||||||||||||||||||||||||||||||
Total |
1,047,966 | $ | 157.6 | $ | 210.4 | $ | 368.0 | $ | 89.0 | |||||||||||||||||||||||||||||||||||||||||||||||||||||
Actual Cash NOI - 3Q-2025 |
$0.1 | |||||||||||||||||||||||||||||||||||||||||||||||||||||||||||||
| Estimated Annualized Stabilized Cash NOI | $17.5 - $19.3 |
|||||||||||||||||||||||||||||||||||||||||||||||||||||||||||||
| Estimated Unlevered Stabilized Yield | 4.75% - 5.25% |
|||||||||||||||||||||||||||||||||||||||||||||||||||||||||||||
|
RSF
|
Property
Leased %
9/30/2025
|
Construction Period |
Purch.
Price(1)
|
Proj.
Redev
Costs(1)
|
Proj.
Total
Invest.(1)
|
Proj.
Remaining
Costs
|
||||||||||||||||||||||||||||||||||||||||||||||||||||||||
Property |
County |
Submarket |
Start | Complete |
||||||||||||||||||||||||||||||||||||||||||||||||||||||||||
| LEASE-UP REDEVELOPMENT: | ||||||||||||||||||||||||||||||||||||||||||||||||||||||||||||||
| 9920-10020 Pioneer Boulevard | Los Angeles | Mid-Counties | 163,435 | 78% | 4Q-21 | 3Q-24 | $ | 23.6 | $ | 32.1 | $ | 55.7 | $ | 0.5 | ||||||||||||||||||||||||||||||||||||||||||||||||
3211-3233 Mission Oaks Boulevard(6) |
Ventura |
Ventura |
116,852 | 83% | 2Q-22 | 1Q-25 | 40.7 | 26.1 | 66.8 | 0.3 | ||||||||||||||||||||||||||||||||||||||||||||||||||||
12118 Bloomfield Avenue |
Los Angeles | Mid-Counties | 107,045 | —% | 4Q-22 | 1Q-25 | 16.7 | 20.0 | 36.7 | 0.9 | ||||||||||||||||||||||||||||||||||||||||||||||||||||
19900 Plummer Street |
Los Angeles | Greater San Fernando Valley | 79,539 | —% | 3Q-23 | 1Q-25 | 15.5 | 15.8 | 31.3 | 1.7 | ||||||||||||||||||||||||||||||||||||||||||||||||||||
12772 San Fernando Road |
Los Angeles | Greater San Fernando Valley |
143,529 | —% | 3Q-23 | 1Q-25 | 22.1 | 22.6 | 44.7 | 1.4 | ||||||||||||||||||||||||||||||||||||||||||||||||||||
Rancho Pacifica - Building 5(7) |
Los Angeles | South Bay | 76,553 | —% | 4Q-23 | 1Q-25 | 9.3 | 17.3 | 26.6 | 3.1 | ||||||||||||||||||||||||||||||||||||||||||||||||||||
1500 Raymond Avenue |
Orange | North Orange County |
136,218 | —% | 4Q-23 | 1Q-25 | 46.1 | 22.4 | 68.5 | 1.2 | ||||||||||||||||||||||||||||||||||||||||||||||||||||
4416 Azusa Canyon Road |
Los Angeles | San Gabriel Valley |
129,830 | —% | 4Q-22 | 2Q-25 | 12.3 | 21.7 | 34.0 | 2.7 | ||||||||||||||||||||||||||||||||||||||||||||||||||||
17907-18001 Figueroa Street |
Los Angeles | South Bay | 76,468 | —% | 4Q-23 | 2Q-25 | 20.2 | 18.6 | 38.8 | 0.9 | ||||||||||||||||||||||||||||||||||||||||||||||||||||
21515 Western Avenue |
Los Angeles | South Bay | 83,740 | —% | 2Q-23 | 3Q-25 | 19.1 | 19.3 | 38.4 | 1.2 | ||||||||||||||||||||||||||||||||||||||||||||||||||||
Total |
1,113,209 | $ | 225.6 | $ | 215.9 | $ | 441.5 | $ | 13.9 | |||||||||||||||||||||||||||||||||||||||||||||||||||||
Actual Cash NOI - 3Q-2025 |
$0.6 | |||||||||||||||||||||||||||||||||||||||||||||||||||||||||||||
| Estimated Annualized Stabilized Cash NOI | $23.2 - $25.4 |
|||||||||||||||||||||||||||||||||||||||||||||||||||||||||||||
| Estimated Unlevered Stabilized Yield | 5.25% - 5.75% |
|||||||||||||||||||||||||||||||||||||||||||||||||||||||||||||
|
Third Quarter 2025
Supplemental Financial Reporting Package
|
Page 28
|
|
||||||
Properties and Space Under Repositioning/Redevelopment (Continued).(1) | ||||||||
| As of September 30, 2025 | (unaudited results, $ in millions) | |||||||
Redevelopment |
||||||||||||||||||||||||||||||||||||||||||||||||||||||||||||||
|
RSF
|
Property
Leased %
9/30/2025
|
Construction Period |
Purch.
Price(1)
|
Proj.
Repo
Costs(1)
|
Proj.
Total
Invest.(1)
|
Proj.
Remaining
Costs
|
||||||||||||||||||||||||||||||||||||||||||||||||||||||||
Property |
County |
Submarket |
Start | Complete |
||||||||||||||||||||||||||||||||||||||||||||||||||||||||||
| STABILIZED REDEVELOPMENT: | ||||||||||||||||||||||||||||||||||||||||||||||||||||||||||||||
8888 Balboa Avenue |
Los Angeles | Central Los Angeles |
123,492 | 100% | 3Q-22 | 4Q-24 | $ | 19.9 | $ | 22.9 | $ | 42.8 | $ | 0.5 | ||||||||||||||||||||||||||||||||||||||||||||||||
6027 Eastern Avenue |
San Diego | Central San Diego | 94,140 | 100% | 3Q-22 | 1Q-25 | 23.4 | 21.3 | 44.7 | 0.2 | ||||||||||||||||||||||||||||||||||||||||||||||||||||
2390-2444 N. American Way |
Orange | North Orange County | 100,483 | 100% | 4Q-22 | 2Q-24 | 17.1 | 19.4 | 36.5 | 0.2 | ||||||||||||||||||||||||||||||||||||||||||||||||||||
3071 Coronado Street(8) |
Orange | North Orange County | 105,173 | 100% | 1Q-23 | 1Q-24 | 28.2 | 16.7 | 44.9 | 0.5 | ||||||||||||||||||||||||||||||||||||||||||||||||||||
Total |
423,288 | $ | 88.6 | $ | 80.3 | $ | 168.9 | $ | 1.4 | |||||||||||||||||||||||||||||||||||||||||||||||||||||
Actual Cash NOI - 3Q-2025 |
$0.1 | |||||||||||||||||||||||||||||||||||||||||||||||||||||||||||||
Annualized Stabilized Cash NOI |
$7.8 | |||||||||||||||||||||||||||||||||||||||||||||||||||||||||||||
Achieved Unlevered Stabilized Yield |
4.6% | |||||||||||||||||||||||||||||||||||||||||||||||||||||||||||||
|
Third Quarter 2025
Supplemental Financial Reporting Package
|
Page 29
|
|
||||||
Properties and Space Under Repositioning/Redevelopment (Continued).(1) | ||||||||
| As of September 30, 2025 | (unaudited results, $ in millions) | |||||||
| Near-Term Potential Future Repositioning and Redevelopment | |||||||||||||||||
| Property | County/ Submarket |
Projected
RSF(7)
|
Estimated Construction Start Period | Purchase Price | Project Description |
||||||||||||
| FUTURE REPOSITIONING: | |||||||||||||||||
| 24935 Avenue Kearny | LA/ SF Valley |
69,761 | 2025 | $5.8 | Office and warehouse improvements, including fire sprinkler upgrade to modernize 1980s vintage building acquired in 2014. |
||||||||||||
9400-9500 Santa Fe Springs Road(9) |
LA/Mid-Counties |
184,270 | 2026 | $210.0 | Functionality and quality upgrades including new office, additional power capacity and sprinkler upgrade. |
||||||||||||
10660 Mulberry Avenue |
IE-West |
50,191 | 2026 | $11.0 | Building improvements to increase functionality and quality including new office, additional power capacity and sprinkler upgrade. |
||||||||||||
Total Future Repositioning |
304,222 | ||||||||||||||||
| Aggregate Projected Costs - Future Repositioning | $15.0 - $16.0 |
||||||||||||||||
Actual Cash NOI - 3Q-2025 |
$1.0 | ||||||||||||||||
| FUTURE REDEVELOPMENT: | |||||||||||||||||
950 West 190th Street (Herbalife) |
LA/South Bay |
197,000 | 2025 | $41.5 | Industrially-zoned office building was acquired with short-term sale leaseback in place providing revenue through predevelopment period. The redeveloped property will deliver a best-in-class, high-image industrial facility with irreplicable entitlements. |
||||||||||||
| 9323 Balboa Avenue | SD/Central |
177,278 | 2025 | $27.1 | Industrially-zoned office campus acquired through a sale leaseback. Two vacated office buildings on 7.7 acres will be redeveloped into a modern industrial building. |
||||||||||||
| 3100 Fujita Street | LA/South Bay |
82,080 | 2025 | $14.2 | Redevelopment of an existing 1970s vintage, functionally-limited industrial building acquired in 2018 through a sale leaseback. |
||||||||||||
9000 Airport Blvd (Hertz) |
LA/South Bay |
418,000 | 2026 | $144.3 | 18 acres of industrially-zoned land acquired through a sale leaseback with the Hertz Corporation for planned redevelopment. Following Hertz's expiration (6/30/2026) and relocation to LAX's consolidated rent-a-car facility, the project will deliver a rare, Class-A industrial campus. |
||||||||||||
|
Third Quarter 2025
Supplemental Financial Reporting Package
|
Page 30
|
|
||||||
Properties and Space Under Repositioning/Redevelopment (Continued).(1) | ||||||||
| As of September 30, 2025 | (unaudited results, $ in millions) | |||||||
FUTURE REDEVELOPMENT CONTINUED: | |||||||||||||||||
| Property | County/ Submarket |
Projected
RSF(7)
|
Estimated Construction Start Period | Purchase Price | Project Description |
||||||||||||
| 16425 Gale Avenue | LA/SG Valley |
290,166 | 2026 | $26.3 | Redevelopment of an existing 1970s vintage industrial building acquired in 2016. The project will deliver a modern, Class A demisable cross-dock industrial building. |
||||||||||||
| 2401-2421 Glassell Street | OC/North |
298,918 | 2026 | $70.4 | Industrially-zoned office campus acquired with intent to redevelop into Class A industrial building. |
||||||||||||
| 600-708 Vermont Avenue | OC/North | 253,316 | 2026 | $57.2 | Four-building, single-tenant office campus acquired through a sale leaseback with the intent to redevelop. The redevelopment project will deliver a best-in-class, single-tenant industrial building. |
||||||||||||
| 18455 Figueroa Street | LA/South Bay |
179,284 | 2026 | $65.7 | Industrially-zoned R&D office campus acquired with intent to redevelop. The project will deliver a Class A, demisable cross-dock industrial building with irreplicable entitlements. |
||||||||||||
| 3901 Via Oro Avenue | LA/South Bay |
74,260 | 2026 | $20.6 | Industrially-zoned office building acquired with intent to redevelop. The redeveloped property will deliver a highly-functional, Class A industrial building following tenant expiration. |
||||||||||||
Total Future Redevelopment |
1,970,302 | ||||||||||||||||
| Total Future Repositioning/Redevelopment | 2,274,524 | ||||||||||||||||
| Aggregate Projected Costs - Future Redevelopment | $315.0 - $340.0 |
||||||||||||||||
Actual Cash NOI - 3Q-2025 |
$5.4 | ||||||||||||||||
|
Third Quarter 2025
Supplemental Financial Reporting Package
|
Page 31
|
|
||||||
Properties and Space Under Repositioning/Redevelopment (Continued).(1) |
|||||||||||
| As of September 30, 2025 | (unaudited results, in thousands, except square feet) | ||||||||||
| Prior and Current Year Stabilized Repositioning/Redevelopment | ||||||||||||||||||||||||||||||||||||||||||||||||||||||||
| Property (Submarket) | Rentable Square Feet | Stabilized Period | Unlevered Stabilized Yield | |||||||||||||||||||||||||||||||||||||||||||||||||||||
20851 Currier Road (SG Valley) |
59,412 | 3Q-24 | 4.7% | |||||||||||||||||||||||||||||||||||||||||||||||||||||
| 17311 Nichols Lane (West OC) | 104,182 | 3Q-24 | 8.2% | |||||||||||||||||||||||||||||||||||||||||||||||||||||
12752-12822 Monarch Street (West OC) |
163,864 | 3Q-24 | 8.6% | |||||||||||||||||||||||||||||||||||||||||||||||||||||
| 500 Dupont Avenue (Inland Empire West) | 274,885 | 4Q-24 | 5.5% | |||||||||||||||||||||||||||||||||||||||||||||||||||||
2880 Ana Street (South Bay) |
LAND |
4Q-24 | 4.3% | |||||||||||||||||||||||||||||||||||||||||||||||||||||
12907 Imperial Highway (Mid-Counties) |
101,080 | 4Q-24 | 14.3% | |||||||||||||||||||||||||||||||||||||||||||||||||||||
| 4039 Calle Platino (North County SD) | 73,807 | 1Q-25 | 8.5% | |||||||||||||||||||||||||||||||||||||||||||||||||||||
29120 Commerce Center Drive (SF Valley) |
135,258 | 1Q-25 | 8.5% | |||||||||||||||||||||||||||||||||||||||||||||||||||||
East 27th Street (Central LA) |
126,563 | 1Q-25 | 5.4% | |||||||||||||||||||||||||||||||||||||||||||||||||||||
| 122-125 N. Vinedo Avenue (SF Valley) | 48,520 | 1Q-25 | 13.5% | |||||||||||||||||||||||||||||||||||||||||||||||||||||
| 29125 Avenue Paine (SF Valley) | 176,107 | 1Q-25 | 6.8% | |||||||||||||||||||||||||||||||||||||||||||||||||||||
218 Turnbull Canyon Road (SG Valley) |
191,153 | 2Q-25 |
9.2% | |||||||||||||||||||||||||||||||||||||||||||||||||||||
1901 Via Burton (North OC) |
139,449 | 2Q-25 |
6.0% | |||||||||||||||||||||||||||||||||||||||||||||||||||||
| 11308-11350 Penrose Street (SF Valley) | 71,547 | 3Q-25 |
6.8% | |||||||||||||||||||||||||||||||||||||||||||||||||||||
| 1020 Bixby Drive (SG Valley) | 57,600 | 3Q-25 |
4.5% | |||||||||||||||||||||||||||||||||||||||||||||||||||||
| Harcourt & Susana (South Bay) | 34,000 | 3Q-25 |
3.2% | |||||||||||||||||||||||||||||||||||||||||||||||||||||
| 8888 Balboa Avenue (Central SD) | 123,492 | 3Q-25 |
6.4% | |||||||||||||||||||||||||||||||||||||||||||||||||||||
| 6027 Eastern Avenue (Central LA) | 94,140 | 3Q-25 |
2.8% | |||||||||||||||||||||||||||||||||||||||||||||||||||||
| 3071 Coronado Street (North OC) | 105,173 | 3Q-25 |
4.3% | |||||||||||||||||||||||||||||||||||||||||||||||||||||
| 2390-2444 American Way (North OC) | 100,483 | 3Q-25 |
5.0% | |||||||||||||||||||||||||||||||||||||||||||||||||||||
|
Third Quarter 2025
Supplemental Financial Reporting Package
|
Page 32
|
|
||||||
Current Year Investments and Dispositions Summary. |
||||||||||||||||||||||||||||||||
| As of September 30, 2025 | (unaudited results) | |||||||||||||||||||||||||||||||
| 2025 Current Period Dispositions Acquisitions | ||||||||||||||||||||||||||||||||
| Disposition Date |
Property Address | County | Submarket | Rentable Square Feet |
Sale Price ($ in MM) |
|||||||||||||||||||||||||||
| 3/28/2025 | 1055 Sandhill Avenue | Los Angeles | South Bay | 127,775 | $ | 52.45 | ||||||||||||||||||||||||||
| 4/3/2025 | 20 Icon | Orange | South Orange County | 102,299 | $ | 50.88 | ||||||||||||||||||||||||||
| 5/23/2025 | 2270 Camino Vida Roble | San Diego | North San Diego | 106,311 | $ | 30.70 | ||||||||||||||||||||||||||
| 7/18/2025 | 1332 & 1336 Rocky Point Drive | San Diego | North San Diego | 51,081 | $ | 14.72 | ||||||||||||||||||||||||||
| 8/6/2025 | 8542 Slauson Avenue | Los Angeles | Central | 24,679 | $ | 17.30 | ||||||||||||||||||||||||||
| 9/4/2025 | 15715 Arrow Highway | Los Angeles | San Gabriel Valley | 76,000 | $ | 21.59 | ||||||||||||||||||||||||||
Total 2025 Dispositions through September 30, 2025 |
488,145 | $ | 187.64 | |||||||||||||||||||||||||||||
|
Third Quarter 2025
Supplemental Financial Reporting Package
|
Page 33
|
|
||||||
Net Asset Value Components. |
||||||||
| As of September 30, 2025 | (unaudited and in thousands, except share data) | |||||||
| Net Operating Income | ||||||||
Pro Forma Net Operating Income (NOI)(1) |
Three Months Ended Sep 30, 2025 | |||||||
| Total operating rental income | $246,757 | |||||||
| Property operating expenses | (57,879) | |||||||
Pro forma effect of uncommenced leases(2) |
859 | |||||||
Pro forma effect of dispositions(3) |
(389) | |||||||
Pro forma NOI effect of significant properties classified as current, lease-up, and stabilized repositioning and redevelopment(4) |
16,582 | |||||||
| Pro Forma NOI | 205,930 | |||||||
Above/(below) market lease revenue adjustments |
(5,254) | |||||||
| Straight line rental revenue adjustment | (8,164) | |||||||
| Pro Forma Cash NOI | $192,512 | |||||||
| Balance Sheet Items | ||||||||
| Other assets and liabilities | September 30, 2025 | |||||||
| Cash and cash equivalents | $248,956 | |||||||
| Restricted cash | 65,464 | |||||||
| Loan receivable, net | 123,589 | |||||||
| Rents and other receivables, net | 15,727 | |||||||
| Other assets | 31,522 | |||||||
| Accounts payable, accrued expenses and other liabilities | (153,558) | |||||||
| Dividends payable | (103,913) | |||||||
| Tenant security deposits | (91,835) | |||||||
| Prepaid rents | (85,114) | |||||||
Estimated remaining cost to complete repositioning/redevelopment projects(5) |
(130,824) | |||||||
| Total other assets and liabilities | $(79,986) | |||||||
| Debt and Shares Outstanding | ||||||||
Total consolidated debt(6) |
$3,278,896 | |||||||
| Preferred stock/units - liquidation preference | $173,250 | |||||||
Common shares outstanding(7) |
232,297,172 | |||||||
Operating partnership units outstanding(8) |
8,155,706 | |||||||
| Total common shares and operating partnership units outstanding | 240,452,878 | |||||||
|
Third Quarter 2025
Supplemental Financial Reporting Package
|
Page 34
|
|
||||||
Notes and Definitions. | ||||||||
|
Third Quarter 2025
Supplemental Financial Reporting Package
|
Page 35
|
|
||||||
Notes and Definitions. | ||||||||
| September 30, 2025 | |||||||||||||||||
| Current Period Covenant | Revolver, $300M & $400M Term Loan Facilities |
Senior Notes ($125M, $25M, $75M) |
|||||||||||||||
| Maximum Leverage Ratio | less than 60% | 21.9% | 26.5% | ||||||||||||||
| Maximum Secured Leverage Ratio | less than 45% | 0.6% | N/A | ||||||||||||||
| Maximum Secured Leverage Ratio | less than 40% | N/A | 0.8% | ||||||||||||||
| Maximum Secured Recourse Debt | less than 15% | N/A | —% | ||||||||||||||
| Minimum Tangible Net Worth | $7,266,909 | N/A | $10,125 | ||||||||||||||
| Minimum Fixed Charge Coverage Ratio | at least 1.50 to 1.00 | 5.51 to 1.0 | 5.35 to 1.00 | ||||||||||||||
| Unencumbered Leverage Ratio | less than 60% | 22.9% | 28.5% | ||||||||||||||
| Unencumbered Interest Coverage Ratio | at least 1.75 to 1.00 | 6.03 to 1.00 | 6.03 to 1.00 | ||||||||||||||
| September 30, 2025 | |||||||||||
| Current Period Covenant | Senior Notes ($400M due 2030 & $400M due 2031) |
||||||||||
| Maximum Debt to Total Asset Ratio | less than 60% | 23.5% | |||||||||
| Maximum Secured Debt to Total Asset Ratio | less than 40% | 0.7% | |||||||||
| Minimum Debt Service Coverage Ratio | at least 1.50 to 1.00 | 5.12 to 1.00 | |||||||||
| Minimum Unencumbered Assets to Unsecured Debt Ratio | at least 1.50 to 1.00 | 4.30 to 1.00 | |||||||||
For the Three Months Ended |
|||||||||||||||||||||||||||||
| Sep 30, 2025 | Jun 30, 2025 | Mar 31, 2025 | Dec 31, 2024 | Sep 30, 2024 | |||||||||||||||||||||||||
EBITDAre |
$ | 171,108 | $ | 173,922 | $ | 174,919 | $ | 164,915 | $ | 165,558 | |||||||||||||||||||
Above/(below) market lease revenue adjustments |
(5,254) | (5,788) | (9,186) | (6,159) | (6,635) | ||||||||||||||||||||||||
Non-cash stock compensation |
10,485 | 10,091 | 9,699 | 11,539 | 9,918 | ||||||||||||||||||||||||
Debt extinguishment and modification expenses |
— | 291 | — | — | — | ||||||||||||||||||||||||
Straight line rental revenue adj. |
(8,164) | (6,918) | (5,517) | (10,057) | (11,441) | ||||||||||||||||||||||||
Capitalized payments |
(6,516) | (5,304) | (5,091) | (4,592) | (5,323) | ||||||||||||||||||||||||
| Accretion of net loan origination fees | (115) | (115) | (115) | (115) | (115) | ||||||||||||||||||||||||
Recurring capital expenditures |
(3,563) | (5,887) | (1,311) | (7,882) | (5,254) | ||||||||||||||||||||||||
| 2nd gen. tenant improvements | (460) | (663) | (162) | (296) | (18) | ||||||||||||||||||||||||
| 2nd gen. leasing commissions | (8,007) | (4,162) | (4,879) | (3,520) | (2,660) | ||||||||||||||||||||||||
| Cash flow for fixed charge coverage calculation | $ | 149,514 | $ | 155,467 | $ | 158,357 | $ | 143,833 | $ | 144,030 | |||||||||||||||||||
| Cash interest expense calculation detail: | |||||||||||||||||||||||||||||
| Interest expense | 25,463 | 26,701 | 27,288 | 28,173 | 27,340 | ||||||||||||||||||||||||
| Capitalized interest | 9,240 | 9,064 | 8,230 | 7,510 | 8,577 | ||||||||||||||||||||||||
| Note payable premium amort. | (1,597) | (1,579) | (1,560) | (1,534) | (1,511) | ||||||||||||||||||||||||
| Amort. of deferred financing costs | (1,340) | (1,255) | (1,134) | (1,246) | (1,252) | ||||||||||||||||||||||||
| Amort. of swap term fees & t-locks | (78) | (76) | (77) | (112) | (136) | ||||||||||||||||||||||||
| Cash interest expense | 31,688 | 32,855 | 32,747 | 32,791 | 33,018 | ||||||||||||||||||||||||
| Scheduled principal payments | 244 | 242 | 230 | 254 | 286 | ||||||||||||||||||||||||
| Preferred stock/unit dividends | 2,404 | 2,405 | 2,695 | 2,827 | 2,815 | ||||||||||||||||||||||||
| Fixed charges | $ | 34,336 | $ | 35,502 | $ | 35,672 | $ | 35,872 | $ | 36,119 | |||||||||||||||||||
| Fixed Charge Coverage Ratio | 4.4 | x | 4.4 | x | 4.4 | x | 4.0 | x | 4.0 | x | |||||||||||||||||||
|
Third Quarter 2025
Supplemental Financial Reporting Package
|
Page 36
|
|
||||||
Notes and Definitions. | ||||||||
|
Third Quarter 2025
Supplemental Financial Reporting Package
|
Page 37
|
|
||||||
Notes and Definitions. | ||||||||
| Three Months Ended | |||||||||||||||||||||||||||||
| Sep 30, 2025 | Jun 30, 2025 | Mar 31, 2025 | Dec 31, 2024 | Sep 30, 2024 | |||||||||||||||||||||||||
| Rental revenue (before collectability adjustment) | $ | 203,217 | $ | 199,839 | $ | 208,394 | $ | 199,601 | $ | 197,506 | |||||||||||||||||||
| Tenant reimbursements | 42,612 | 41,403 | 41,856 | 39,716 | 40,969 | ||||||||||||||||||||||||
| Other income | 915 | 467 | 874 | 620 | 651 | ||||||||||||||||||||||||
| Increase (reduction) in revenue due to change in collectability assessment | 13 | (141) | (2,303) | (200) | (730) | ||||||||||||||||||||||||
| Rental income | $ | 246,757 | $ | 241,568 | $ | 248,821 | $ | 239,737 | $ | 238,396 | |||||||||||||||||||
| Three Months Ended | |||||||||||||||||||||||||||||
| Sep 30, 2025 | Jun 30, 2025 | Mar 31, 2025 | Dec 31, 2024 | Sep 30, 2024 | |||||||||||||||||||||||||
| # of Properties | 288 | 289 | 292 | 293 | 293 | ||||||||||||||||||||||||
| Square Feet | 37,916,326 | 37,991,248 | 38,380,256 | 36,961,884 | 36,961,821 | ||||||||||||||||||||||||
| Ending Occupancy | 96.8 | % | 96.1 | % | 95.7 | % | 94.1 | % | 96.7 | % | |||||||||||||||||||
| SPP NOI growth | 1.9 | % | 1.1 | % | 0.7 | % | 2.2 | % | 2.6 | % | |||||||||||||||||||
| SPP Cash NOI growth | 5.5 | % | 3.9 | % | 5.0 | % | 5.3 | % | 5.3 | % | |||||||||||||||||||
| Three Months Ended September 30, | Nine Months Ended September 30, | ||||||||||||||||||||||||||||||||||||||||||||||
| 2025 | 2024 | $ Change | % Change | 2025 | 2024 | $ Change | % Change | ||||||||||||||||||||||||||||||||||||||||
| Rental revenue | $ | 160,911 | $ | 157,880 | $ | 3,031 | 1.9% | $ | 475,824 | $ | 468,154 | $ | 7,670 | 1.6% | |||||||||||||||||||||||||||||||||
| Tenant reimbursements | 32,853 | 31,663 | 1,190 | 3.8% | 96,298 | 93,790 | 2,508 | 2.7% | |||||||||||||||||||||||||||||||||||||||
| Other income | 438 | 564 | (126) | (22.3)% | 1,589 | 1,751 | (162) | (9.3)% | |||||||||||||||||||||||||||||||||||||||
| Rental income | $ | 194,202 | $ | 190,107 | $ | 4,095 | 2.2% | $ | 573,711 | $ | 563,695 | $ | 10,016 | 1.8% | |||||||||||||||||||||||||||||||||
| Three Months Ended | |||||||||||||||||||||||||||||
| Sep 30, 2025 | Jun 30, 2025 | Mar 31, 2025 | Dec 31, 2024 | Sep 30, 2024 | |||||||||||||||||||||||||
| Net Income | $ | 93,056 | $ | 120,394 | $ | 74,048 | $ | 64,910 | $ | 70,722 | |||||||||||||||||||
| General and administrative | 20,037 | 19,752 | 19,868 | 21,940 | 20,926 | ||||||||||||||||||||||||
| Depreciation & amortization | 81,172 | 71,188 | 86,740 | 71,832 | 69,241 | ||||||||||||||||||||||||
| Other expenses | 4,218 | 244 | 2,239 | 34 | 492 | ||||||||||||||||||||||||
| Interest expense | 25,463 | 26,701 | 27,288 | 28,173 | 27,340 | ||||||||||||||||||||||||
Debt extinguishment and modification expenses |
— | 291 | — | — | — | ||||||||||||||||||||||||
| Management & leasing services | (118) | (132) | (142) | (167) | (156) | ||||||||||||||||||||||||
| Interest income | (6,367) | (7,807) | (3,324) | (2,991) | (3,291) | ||||||||||||||||||||||||
| Gains on sale of real estate | (28,583) | (44,361) | (13,157) | — | (1,745) | ||||||||||||||||||||||||
| NOI | $ | 188,878 | $ | 186,270 | $ | 193,560 | $ | 183,731 | $ | 183,529 | |||||||||||||||||||
| S/L rental revenue adj. | (8,164) | (6,918) | (5,517) | (10,057) | (11,441) | ||||||||||||||||||||||||
Above/(below) market lease revenue adjustments |
(5,254) | (5,788) | (9,186) | (6,159) | (6,635) | ||||||||||||||||||||||||
| Cash NOI | $ | 175,460 | $ | 173,564 | $ | 178,857 | $ | 167,515 | $ | 165,453 | |||||||||||||||||||
|
Third Quarter 2025
Supplemental Financial Reporting Package
|
Page 38
|
|
||||||
Notes and Definitions. | ||||||||
| Three Months Ended September 30, | Nine Months Ended September 30, | ||||||||||||||||||||||
| 2025 | 2024 | 2025 | 2024 | ||||||||||||||||||||
| Net income | $ | 93,056 | $ | 70,722 | $ | 287,498 | $ | 221,016 | |||||||||||||||
| General and administrative | 20,037 | 20,926 | 59,657 | 60,213 | |||||||||||||||||||
| Depreciation and amortization | 81,172 | 69,241 | 239,100 | 203,415 | |||||||||||||||||||
| Other expenses | 4,218 | 492 | 6,701 | 2,204 | |||||||||||||||||||
| Interest expense | 25,463 | 27,340 | 79,452 | 70,423 | |||||||||||||||||||
Debt extinguishment and modification expenses |
— | — | 291 | — | |||||||||||||||||||
| Management and leasing services | (118) | (156) | (392) | (444) | |||||||||||||||||||
| Interest income | (6,367) | (3,291) | (17,498) | (10,709) | |||||||||||||||||||
| Gains on sale of real estate | (28,583) | (1,745) | (86,101) | (18,013) | |||||||||||||||||||
| NOI | $ | 188,878 | $ | 183,529 | $ | 568,708 | $ | 528,105 | |||||||||||||||
| Non-Same Property Portfolio rental income | (52,555) | (48,289) | (163,435) | (118,664) | |||||||||||||||||||
| Non-Same Property Portfolio property exp. | 13,881 | 12,199 | 41,112 | 31,274 | |||||||||||||||||||
| Same Property Portfolio NOI | $ | 150,204 | $ | 147,439 | $ | 446,385 | $ | 440,715 | |||||||||||||||
| Straight line rental revenue adjustment | (3,776) | (7,763) | (11,709) | (22,502) | |||||||||||||||||||
Above/(below) market lease revenue adjustments |
(5,081) | (5,727) | (15,082) | (18,198) | |||||||||||||||||||
| Same Property Portfolio Cash NOI | $ | 141,347 | $ | 133,949 | $ | 419,594 | $ | 400,015 | |||||||||||||||
| 2025 Estimate | |||||||||||
| Low | High | ||||||||||
| Net income attributable to common stockholders | $ | 1.44 | $ | 1.46 | |||||||
| Company share of depreciation and amortization | 1.28 | 1.28 | |||||||||
Company share of gains on sale of real estate(1) |
(0.36) | (0.36) | |||||||||
| Company share of FFO | $ | 2.36 | $ | 2.38 | |||||||
Add: Core FFO adjustments(2) |
0.03 | 0.03 | |||||||||
| Company share of Core FFO | $ | 2.39 | $ | 2.41 | |||||||
| Sep 30, 2025 | Jun 30, 2025 | Mar 31, 2025 | Dec 31, 2024 | Sep 30, 2024 | ||||||||||||||||||||||||||||
| Ending Occupancy: | ||||||||||||||||||||||||||||||||
| Los Angeles County | 90.9% | 87.9% | 88.0% | 90.2% | 93.6% | |||||||||||||||||||||||||||
| Orange County | 93.7% | 90.7% | 88.4% | 90.3% | 90.6% | |||||||||||||||||||||||||||
| Riverside / San Bernardino County | 94.4% | 93.9% | 95.9% | 96.0% | 93.9% | |||||||||||||||||||||||||||
| San Diego County | 91.3% | 86.7% | 89.6% | 89.8% | 92.3% | |||||||||||||||||||||||||||
| Ventura County | 89.8% | 87.5% | 87.7% | 91.2% | 89.8% | |||||||||||||||||||||||||||
| Total/Weighted Average | 91.8% | 89.2% | 89.6% | 91.3% | 93.0% | |||||||||||||||||||||||||||
| Total Portfolio RSF | 50,850,824 | 51,021,897 | 50,952,137 | 50,788,225 | 50,067,981 | |||||||||||||||||||||||||||
| Total/Weighted Average | ||||||||
| Occupied SF | 46,699,167 | |||||||
Uncommenced Renewal Leases - Leased SF(1) |
1,080,841 | |||||||
Uncommenced New Leases - Leased SF(1) |
360,512 | |||||||
| Leased SF | 47,059,679 | |||||||
| Percent Leased | 92.5 | % | ||||||
In-Place ABR(2) |
$ | 800,073 | ||||||
ABR Under Uncommenced Leases (in thousands)(2)(3) |
6,549 | |||||||
In-Place + Uncommenced ABR (in thousands)(2) |
$ | 806,622 | ||||||
In-Place + Uncommenced ABR per SF(2) |
$ | 17.14 | ||||||
|
Third Quarter 2025
Supplemental Financial Reporting Package
|
Page 39
|
|
||||||