| Maryland | 001-36008 | 46-2024407 | ||||||||||||
| (State or other jurisdiction of incorporation) |
(Commission File Number) | (IRS Employer Identification No.) | ||||||||||||
| 11620 Wilshire Boulevard, Suite 1000 | ||||||||
| Los Angeles | ||||||||
| California | 90025 | |||||||
| (Address of principal executive offices) | (Zip Code) | |||||||
| ☐ | Written communications pursuant to Rule 425 under the Securities Act (17 CFR 230.425) | ||||
| ☐ | Soliciting material pursuant to Rule 14a-12 under the Exchange Act (17 CFR 240.14a-12) |
||||
| ☐ | Pre-commencement communications pursuant to Rule 14d-2(b) under the Exchange Act (17 CFR 240.14d-2(b)) |
||||
| ☐ | Pre-commencement communications pursuant to Rule 13e-4(c) under the Exchange Act (17 CFR 240.13e-4(c)) |
||||
| Title of each class | Trading symbols | Name of each exchange on which registered | ||||||||||||
| Common Stock, $0.01 par value | REXR | New York Stock Exchange | ||||||||||||
| 5.875% Series B Cumulative Redeemable Preferred Stock | REXR-PB | New York Stock Exchange | ||||||||||||
| 5.625% Series C Cumulative Redeemable Preferred Stock | REXR-PC | New York Stock Exchange | ||||||||||||
| Exhibit Number |
Description | |||||||
| 99.1 | ||||||||
| 99.2 | ||||||||
| 104 | Cover Page Interactive Data File (embedded within the Inline XBRL document) | |||||||
| Rexford Industrial Realty, Inc. | |||||
| April 17, 2024 |
/s/ Michael S. Frankel
|
||||
| Michael S. Frankel Co-Chief Executive Officer (Principal Executive Officer) |
|||||
| Rexford Industrial Realty, Inc. | |||||
| April 17, 2024 |
/s/ Howard Schwimmer
|
||||
| Howard Schwimmer Co-Chief Executive Officer (Principal Executive Officer) |
|||||

Q1-2024 Leasing Activity |
||||||||||||||||||||||||||||||||||||||
Releasing Spreads |
Releasing Spreads
Excluding Tireco, Inc.
Lease Extension(1)
|
|||||||||||||||||||||||||||||||||||||
# of Leases Executed |
SF of
Leasing
|
GAAP |
Cash |
GAAP |
Cash |
|||||||||||||||||||||||||||||||||
New Leases |
50 | 830,941 | 41.3% | 31.2% | 41.3% | 31.2% | ||||||||||||||||||||||||||||||||
Renewal Leases |
64 | 2,398,076 | 14.8% | 11.3% | 56.8% | 34.4% | ||||||||||||||||||||||||||||||||
Total Leases |
114 | 3,229,017 | 17.3% | 13.2% | 53.0% | 33.6% | ||||||||||||||||||||||||||||||||
2024 Outlook (1) |
Q1 2024 Updated Guidance | Initial Guidance | ||||||||||||
| Net Income Attributable to Common Stockholders per diluted share | $1.17 - $1.20 | $1.11 - $1.14 | ||||||||||||
| Company share of Core FFO per diluted share | $2.31 - $2.34 | $2.27 - $2.30 | ||||||||||||
| Same Property Portfolio NOI Growth - GAAP | 4.25% - 5.25% | 4.0% - 5.0% | ||||||||||||
| Same Property Portfolio NOI Growth - Cash | 7.0% - 8.0% | 7.0% - 8.0% | ||||||||||||
Average Same Property Portfolio Occupancy (Full Year) (2) |
96.5% - 97.0% | 96.5% - 97.0% | ||||||||||||
General and Administrative Expenses (3) |
+/- $83.0M | +/- $83.0M | ||||||||||||
| Net Interest Expense | +/- $99.0M | $60.0M - $61.0M | ||||||||||||
| 2024 Estimate | |||||||||||
| Low | High | ||||||||||
| Net income attributable to common stockholders | $ | 1.17 | $ | 1.20 | |||||||
| Company share of depreciation and amortization | 1.17 | 1.17 | |||||||||
Company share of gains on sale of real estate(1) |
(0.03) | (0.03) | |||||||||
| Company share of Core FFO | $ | 2.31 | $ | 2.34 | |||||||
| March 31, 2024 | December 31, 2023 | ||||||||||
| (unaudited) | |||||||||||
| ASSETS | |||||||||||
| Land | $ | 7,568,720 | $ | 6,815,622 | |||||||
| Buildings and improvements | 4,260,512 | 3,933,379 | |||||||||
| Tenant improvements | 172,707 | 167,251 | |||||||||
| Furniture, fixtures, and equipment | 132 | 132 | |||||||||
| Construction in progress | 258,413 | 240,010 | |||||||||
| Total real estate held for investment | 12,260,484 | 11,156,394 | |||||||||
| Accumulated depreciation | (827,576) | (782,461) | |||||||||
| Investments in real estate, net | 11,432,908 | 10,373,933 | |||||||||
| Cash and cash equivalents | 336,960 | 33,444 | |||||||||
Loan receivable, net |
122,899 | 122,784 | |||||||||
| Rents and other receivables, net | 17,896 | 17,494 | |||||||||
| Deferred rent receivable, net | 130,694 | 123,325 | |||||||||
| Deferred leasing costs, net | 61,017 | 59,351 | |||||||||
| Deferred loan costs, net | 3,069 | 3,426 | |||||||||
| Acquired lease intangible assets, net | 223,698 | 153,670 | |||||||||
| Acquired indefinite-lived intangible | 5,156 | 5,156 | |||||||||
| Interest rate swap asset | 16,737 | 9,896 | |||||||||
| Other assets | 22,114 | 25,225 | |||||||||
| Acquisition related deposits | 7,975 | 2,125 | |||||||||
| Total Assets | $ | 12,381,123 | $ | 10,929,829 | |||||||
| LIABILITIES & EQUITY | |||||||||||
| Liabilities | |||||||||||
| Notes payable | $ | 3,349,120 | $ | 2,225,914 | |||||||
| Accounts payable, accrued expenses and other liabilities | 148,920 | 128,842 | |||||||||
| Dividends and distributions payable | 94,356 | 83,733 | |||||||||
| Acquired lease intangible liabilities, net | 171,687 | 147,561 | |||||||||
| Tenant security deposits | 91,034 | 84,872 | |||||||||
Tenant prepaid rents |
110,727 | 115,002 | |||||||||
| Total Liabilities | 3,965,844 | 2,785,924 | |||||||||
| Equity | |||||||||||
| Rexford Industrial Realty, Inc. stockholders’ equity | |||||||||||
Preferred stock, $0.01 par value per share, 10,050,000 shares authorized: |
|||||||||||
5.875% series B cumulative redeemable preferred stock, 3,000,000 shares outstanding at March 31, 2024 and December 31, 2023 ($75,000 liquidation preference) |
72,443 | 72,443 | |||||||||
5.625% series C cumulative redeemable preferred stock, 3,450,000 shares outstanding at March 31, 2024 and December 31, 2023 ($86,250 liquidation preference) |
83,233 | 83,233 | |||||||||
Common Stock,$ 0.01 par value per share, 489,950,000 authorized and 217,822,056 and 212,346,450 shares outstanding at March 31, 2024 and December 31, 2023, respectively |
2,178 | 2,123 | |||||||||
| Additional paid in capital | 8,233,127 | 7,940,781 | |||||||||
| Cumulative distributions in excess of earnings | (370,720) | (338,835) | |||||||||
| Accumulated other comprehensive loss | 13,922 | 7,172 | |||||||||
| Total stockholders’ equity | 8,034,183 | 7,766,917 | |||||||||
| Noncontrolling interests | 381,096 | 376,988 | |||||||||
| Total Equity | 8,415,279 | 8,143,905 | |||||||||
| Total Liabilities and Equity | $ | 12,381,123 | $ | 10,929,829 | |||||||
| Three Months Ended March 31, | |||||||||||
| 2024 | 2023 | ||||||||||
| REVENUES | |||||||||||
| Rental income | $ | 210,990 | $ | 185,164 | |||||||
| Management and leasing services | 132 | 190 | |||||||||
| Interest income | 2,974 | 882 | |||||||||
| TOTAL REVENUES | 214,096 | 186,236 | |||||||||
| OPERATING EXPENSES | |||||||||||
| Property expenses | 47,482 | 42,825 | |||||||||
| General and administrative | 19,980 | 18,197 | |||||||||
| Depreciation and amortization | 66,278 | 59,429 | |||||||||
| TOTAL OPERATING EXPENSES | 133,740 | 120,451 | |||||||||
| OTHER EXPENSES | |||||||||||
| Other expenses | 1,408 | 647 | |||||||||
| Interest expense | 14,671 | 13,701 | |||||||||
| TOTAL EXPENSES | 149,819 | 134,799 | |||||||||
| Gains on sale of real estate | — | 12,133 | |||||||||
| NET INCOME | 64,277 | 63,570 | |||||||||
| Less: net income attributable to noncontrolling interests | (2,906) | (3,064) | |||||||||
| NET INCOME ATTRIBUTABLE TO REXFORD INDUSTRIAL REALTY, INC. | 61,371 | 60,506 | |||||||||
| Less: preferred stock dividends | (2,314) | (2,314) | |||||||||
| Less: earnings attributable to participating securities | (418) | (320) | |||||||||
| NET INCOME ATTRIBUTABLE TO COMMON STOCKHOLDERS | $ | 58,639 | $ | 57,872 | |||||||
Net income attributable to common stockholders per share – basic |
$ | 0.27 | $ | 0.30 | |||||||
Net income attributable to common stockholders per share – diluted |
$ | 0.27 | $ | 0.30 | |||||||
| Weighted-average shares of common stock outstanding – basic | 214,402 | 195,367 | |||||||||
| Weighted-average shares of common stock outstanding – diluted | 214,438 | 195,779 | |||||||||
| Same Property Portfolio Occupancy: | |||||||||||||||||
| March 31, | |||||||||||||||||
| 2024 | 2023 | Change (basis points) | |||||||||||||||
Quarterly Weighted Average Occupancy:(1) |
|||||||||||||||||
| Los Angeles County | 96.9% | 97.5% | (60) bps | ||||||||||||||
| Orange County | 99.6% | 98.8% | 80 bps | ||||||||||||||
| Riverside / San Bernardino County | 94.8% | 93.4% | 140 bps | ||||||||||||||
| San Diego County | 98.4% | 98.9% | (50) bps | ||||||||||||||
| Ventura County | 96.4% | 99.6% | (320) bps | ||||||||||||||
| Same Property Portfolio Weighted Average Occupancy | 96.8% | 97.0% | (20) bps | ||||||||||||||
| Ending Occupancy: | 96.4% | 97.0% | (60) bps | ||||||||||||||
| Same Property Portfolio NOI and Cash NOI: | |||||||||||||||||||||||
| Three Months Ended March 31, | |||||||||||||||||||||||
| 2024 | 2023 | $ Change | % Change | ||||||||||||||||||||
| Rental income | $ | 171,557 | $ | 162,571 | $ | 8,986 | 5.5 | % | |||||||||||||||
| Property expenses | 38,928 | 36,840 | 2,088 | 5.7 | % | ||||||||||||||||||
| Same Property Portfolio NOI | $ | 132,629 | $ | 125,731 | $ | 6,898 | 5.5 | % | |||||||||||||||
| Straight line rental revenue adjustment | (4,753) | (6,924) | 2,171 | (31.4) | % | ||||||||||||||||||
| Above/(below) market lease revenue adjustments | (5,642) | (6,196) | 554 | (8.9) | % | ||||||||||||||||||
| Same Property Portfolio Cash NOI | $ | 122,234 | $ | 112,611 | $ | 9,623 | 8.5 | % | |||||||||||||||
| Three Months Ended March 31, | |||||||||||
| 2024 | 2023 | ||||||||||
| Net income | $ | 64,277 | $ | 63,570 | |||||||
| General and administrative | 19,980 | 18,197 | |||||||||
| Depreciation and amortization | 66,278 | 59,429 | |||||||||
| Other expenses | 1,408 | 647 | |||||||||
| Interest expense | 14,671 | 13,701 | |||||||||
| Management and leasing services | (132) | (190) | |||||||||
| Interest income | (2,974) | (882) | |||||||||
| Gains on sale of real estate | — | (12,133) | |||||||||
| Net operating income (NOI) | $ | 163,508 | $ | 142,339 | |||||||
| Straight line rental revenue adjustment | (7,368) | (7,628) | |||||||||
Above/(below) market lease revenue adjustments(1) |
(7,591) | (8,290) | |||||||||
| Cash NOI | $ | 148,549 | $ | 126,421 | |||||||
| NOI | $ | 163,508 | $ | 142,339 | |||||||
| Non-Same Property Portfolio rental income | (39,433) | (22,593) | |||||||||
| Non-Same Property Portfolio property expenses | 8,554 | 5,985 | |||||||||
| Same Property Portfolio NOI | $ | 132,629 | $ | 125,731 | |||||||
| Straight line rental revenue adjustment | (4,753) | (6,924) | |||||||||
| Above/(below) market lease revenue adjustments | (5,642) | (6,196) | |||||||||
| Same Property Portfolio Cash NOI | $ | 122,234 | $ | 112,611 | |||||||
| Three Months Ended March 31, | |||||||||||
| 2024 | 2023 | ||||||||||
| Net income | $ | 64,277 | $ | 63,570 | |||||||
| Adjustments: | |||||||||||
| Depreciation and amortization | 66,278 | 59,429 | |||||||||
| Gains on sale of real estate | — | (12,133) | |||||||||
| Funds From Operations (FFO) | $ | 130,555 | $ | 110,866 | |||||||
| Less: preferred stock dividends | (2,314) | (2,314) | |||||||||
Less: FFO attributable to noncontrolling interests(1) |
(5,188) | (4,833) | |||||||||
Less: FFO attributable to participating securities(2) |
(570) | (427) | |||||||||
| Company share of FFO | $ | 122,483 | $ | 103,292 | |||||||
| Company Share of FFO per common share – basic | $ | 0.57 | $ | 0.53 | |||||||
| Company Share of FFO per common share – diluted | $ | 0.57 | $ | 0.53 | |||||||
| FFO | $ | 130,555 | $ | 110,866 | |||||||
| Adjustments: | |||||||||||
| Acquisition expenses | 50 | 73 | |||||||||
| Impairment of right-of-use asset | — | 188 | |||||||||
| Amortization of loss on termination of interest rate swaps | 59 | 59 | |||||||||
| Non-capitalizable demolition costs | 998 | 340 | |||||||||
Write-offs of below-market lease intangibles related to unexercised renewal options(3) |
— | (1,318) | |||||||||
| Core FFO | $ | 131,662 | $ | 110,208 | |||||||
| Less: preferred stock dividends | (2,314) | (2,314) | |||||||||
Less: Core FFO attributable to noncontrolling interest(1) |
(5,226) | (4,809) | |||||||||
Less: Core FFO attributable to participating securities(2) |
(575) | (425) | |||||||||
| Company share of Core FFO | $ | 123,547 | $ | 102,660 | |||||||
| Company share of Core FFO per common share – basic | $ | 0.58 | $ | 0.53 | |||||||
| Company share of Core FFO per common share – diluted | $ | 0.58 | $ | 0.52 | |||||||
| Weighted-average shares of common stock outstanding – basic | 214,402 | 195,367 | |||||||||
| Weighted-average shares of common stock outstanding – diluted | 214,438 | 195,779 | |||||||||
 `
`Table of Contents. |
||||||||
| Section | Page | ||||
| Corporate Data: | |||||
| Consolidated Financial Results: | |||||
| Portfolio Data: | |||||
|
First Quarter 2024
Supplemental Financial Reporting Package
|
Page 2
|

|
||||||
Investor Company Summary. |
||||||||
| Executive Management Team | ||||||||
| Howard Schwimmer | Co-Chief Executive Officer, Director | |||||||
| Michael S. Frankel | Co-Chief Executive Officer, Director | |||||||
| Laura Clark | Chief Financial Officer | |||||||
| David Lanzer | General Counsel and Corporate Secretary | |||||||
| Board of Directors | ||||||||
| Richard Ziman | Chairman | |||||||
| Tyler H. Rose | Lead Independent Director | |||||||
| Howard Schwimmer | Co-Chief Executive Officer, Director | |||||||
| Michael S. Frankel | Co-Chief Executive Officer, Director | |||||||
| Robert L. Antin | Director | |||||||
| Diana J. Ingram | Director | |||||||
| Angela L. Kleiman | Director | |||||||
| Debra L. Morris | Director | |||||||
| Investor Relations Information | ||||||||
| investorrelations@rexfordindustrial.com | ||||||||
Equity Research Coverage |
||||||||||||||
| BofA Securities | Camille Bonnel | (646) 855-5042 | ||||||||||||
| Barclays | Brendan Lynch | (212) 526-9428 | ||||||||||||
| BMO Capital Markets | John Kim | (212) 885-4115 | ||||||||||||
| BNP Paribas Exane | Nate Crossett | (646) 342-1588 | ||||||||||||
| Citigroup Investment Research | Craig Mailman | (212) 816-4471 | ||||||||||||
Colliers Securities |
Barry Oxford |
(203) 961-6573 |
||||||||||||
| Green Street Advisors | Vince Tibone | (949) 640-8780 | ||||||||||||
| J.P. Morgan Securities | Michael Mueller | (212) 622-6689 | ||||||||||||
| Jefferies LLC | Jonathan Petersen | (212) 284-1705 | ||||||||||||
| Mizuho Securities USA | Vikram Malhotra | (212) 282-3827 | ||||||||||||
| Robert W. Baird & Co. | Nicholas Thillman | (414) 298-5053 | ||||||||||||
| Scotiabank | Greg McGinniss | (212) 225-6906 | ||||||||||||
Truist Securities |
Anthony Hau |
(212) 303-4176 |
||||||||||||
| Wells Fargo Securities | Blaine Heck | (443) 263-6529 | ||||||||||||
| Wolfe Research | Andrew Rosivach | (646) 582-9250 | ||||||||||||
|
First Quarter 2024
Supplemental Financial Reporting Package
|
Page 3
|
|
||||||
Company Overview. |
||||||||
| For the Quarter Ended March 31, 2024 | ||||||||
|
First Quarter 2024
Supplemental Financial Reporting Package
|
Page 4
|
|
||||||
Highlights - Consolidated Financial Results. |
||||||||
| Quarterly Results | (in millions) | |||||||
|
First Quarter 2024
Supplemental Financial Reporting Package
|
Page 5
|
|
||||||
Financial and Portfolio Highlights and Capitalization Data. (1) |
||||||||
| (in thousands except share and per share data and portfolio statistics) | ||||||||
| Three Months Ended | |||||||||||||||||||||||||||||
| March 31, 2024 | December 31, 2023 | September 30, 2023 | June 30, 2023 | March 31, 2023 | |||||||||||||||||||||||||
| Financial Results: | |||||||||||||||||||||||||||||
| Total rental income | $ | 210,990 | $ | 207,909 | $ | 204,212 | $ | 194,098 | $ | 185,164 | |||||||||||||||||||
| Net income | $ | 64,277 | $ | 67,321 | $ | 61,790 | $ | 56,910 | $ | 63,570 | |||||||||||||||||||
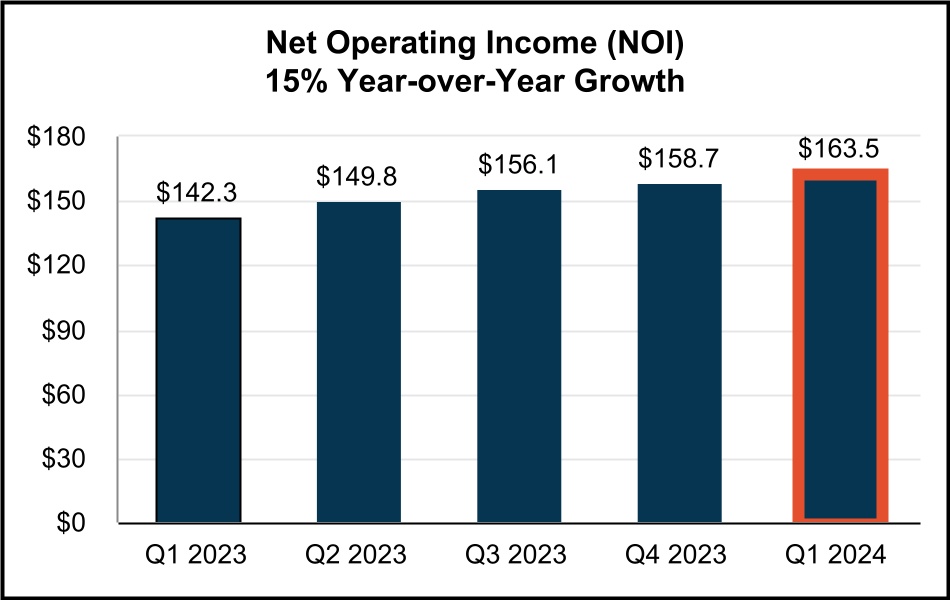
| Net Operating Income (NOI) | $ | 163,508 | $ | 158,650 | $ | 156,127 | $ | 149,788 | $ | 142,339 | |||||||||||||||||||
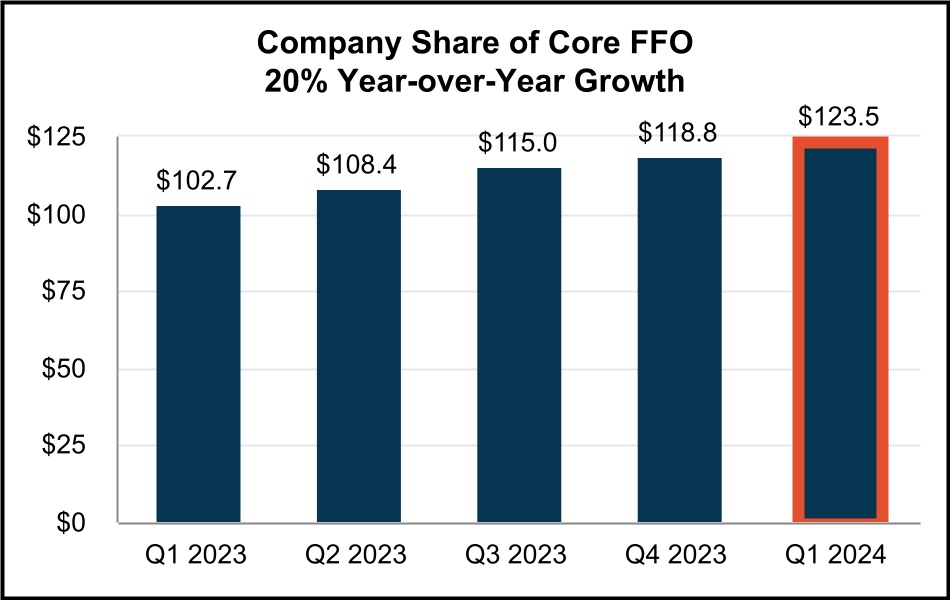
| Company share of Core FFO | $ | 123,547 | $ | 118,781 | $ | 114,969 | $ | 108,419 | $ | 102,660 | |||||||||||||||||||
| Company share of Core FFO per common share - diluted | $ | 0.58 | $ | 0.56 | $ | 0.56 | $ | 0.54 | $ | 0.52 | |||||||||||||||||||
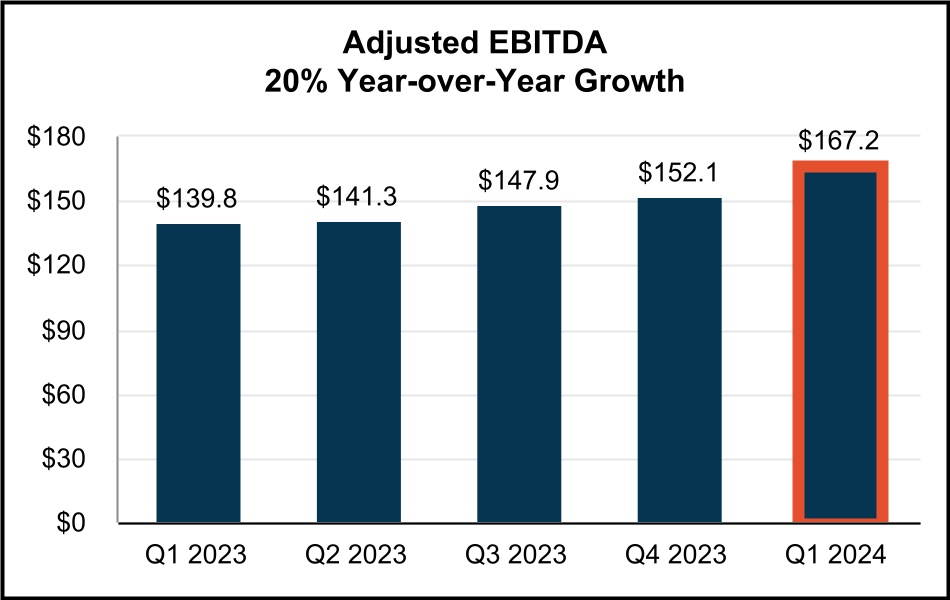
| Adjusted EBITDA | $ | 167,207 | $ | 152,126 | $ | 147,925 | $ | 141,258 | $ | 139,755 | |||||||||||||||||||
| Dividend declared per common share | $ | 0.4175 | $ | 0.380 | $ | 0.380 | $ | 0.380 | $ | 0.380 | |||||||||||||||||||
| Portfolio Statistics: | |||||||||||||||||||||||||||||
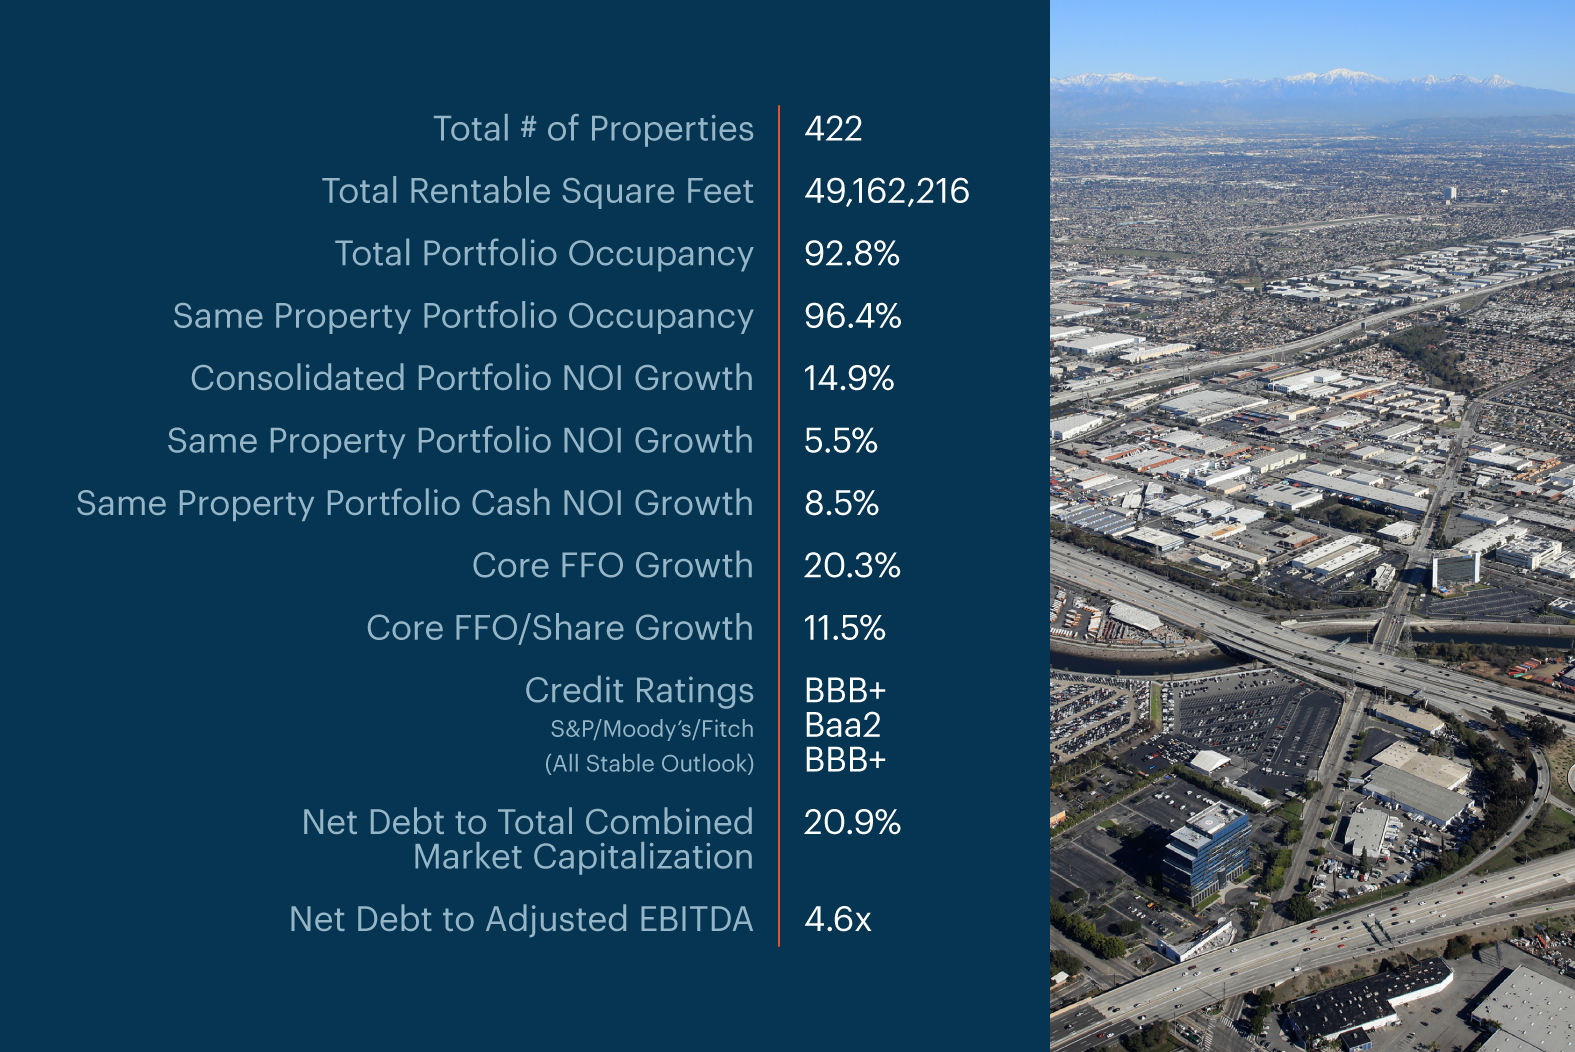
| Portfolio rentable square feet (“RSF”) | 49,162,216 | 45,860,368 | 44,998,613 | 44,167,774 | 43,954,272 | ||||||||||||||||||||||||
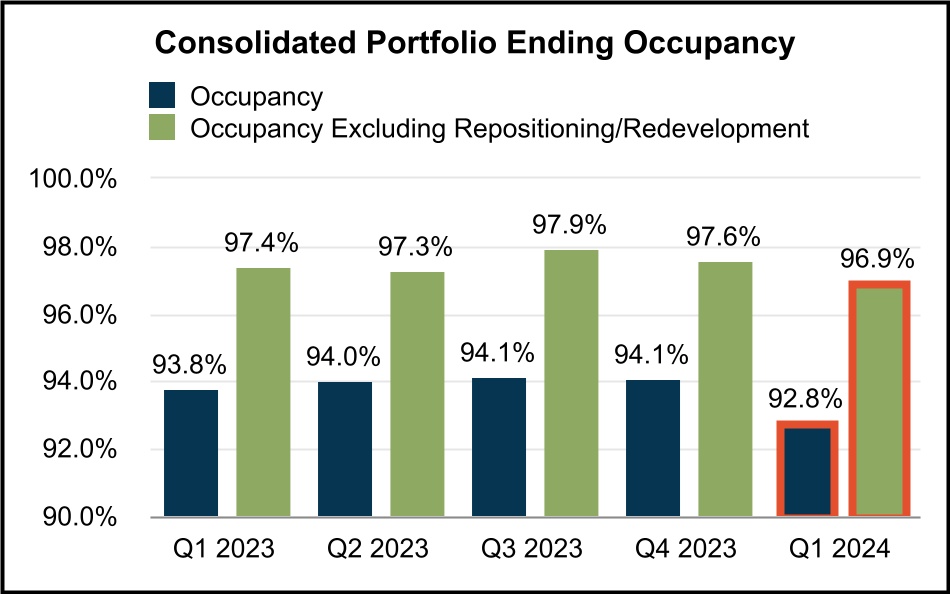
| Ending occupancy | 92.8% | 94.1% | 94.1% | 94.0% | 93.8% | ||||||||||||||||||||||||
Ending occupancy excluding repositioning/redevelopment(2) |
96.9% | 97.6% | 97.9% | 97.3% | 97.4% | ||||||||||||||||||||||||
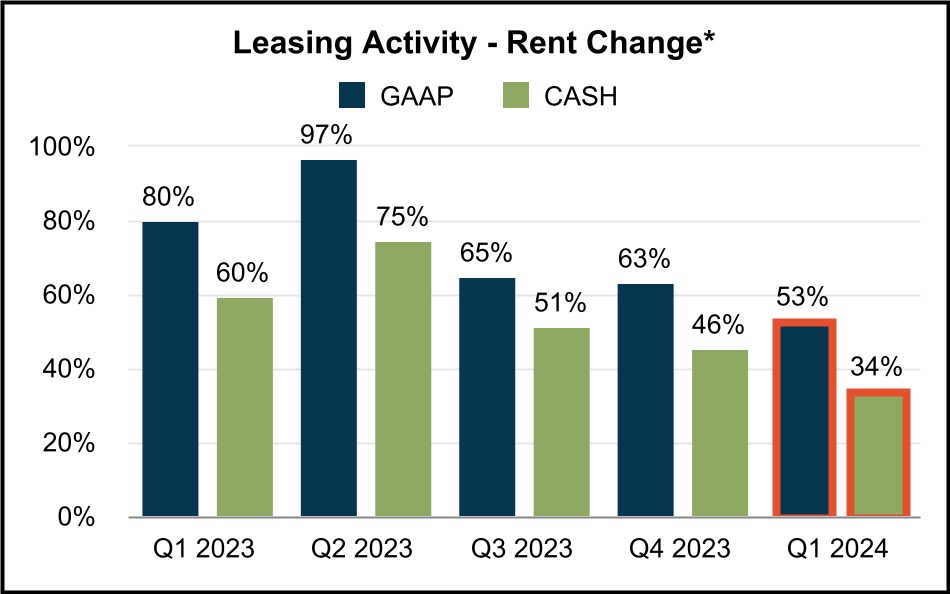
Rent Change - GAAP(3) |
53.0% | 63.1% | 64.8% | 96.8% | 80.2% | ||||||||||||||||||||||||
Rent Change - Cash(3) |
33.6% | 45.6% | 51.4% | 74.8% | 59.7% | ||||||||||||||||||||||||
| Same Property Portfolio Performance: | |||||||||||||||||||||||||||||
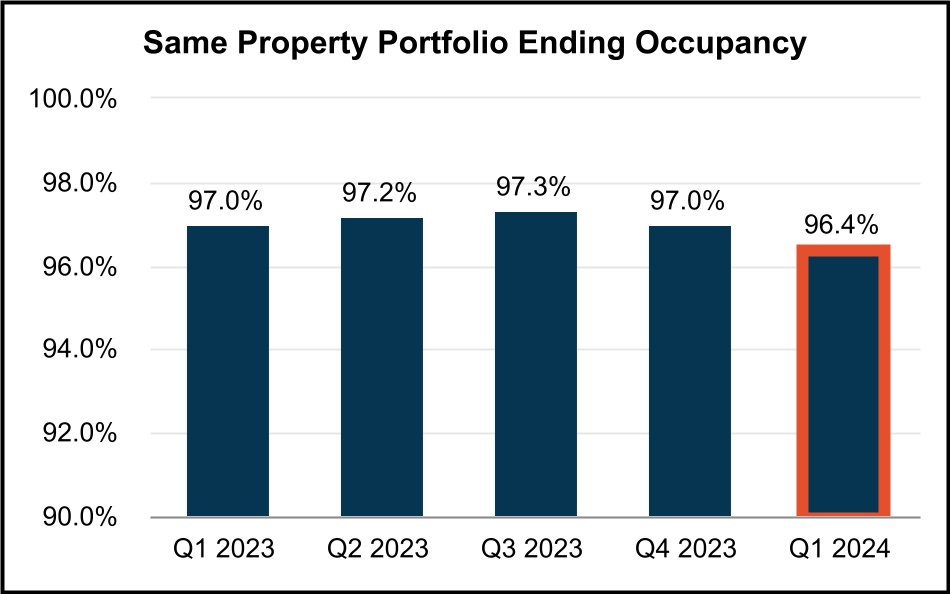
Same Property Portfolio ending occupancy(4) |
96.4% | 97.0% | 97.3% | 97.2% | 97.0% | ||||||||||||||||||||||||
Same Property Portfolio NOI growth(5) |
5.5% | ||||||||||||||||||||||||||||
Same Property Portfolio Cash NOI growth(5) |
8.5% | ||||||||||||||||||||||||||||
| Capitalization: | |||||||||||||||||||||||||||||
Total shares and units issued and outstanding at period end(6) |
224,992,152 | 219,629,857 | 213,435,271 | 208,031,757 | 208,016,268 | ||||||||||||||||||||||||
| Series B and C Preferred Stock and Series 1, 2 and 3 CPOP Units | $ | 241,031 | $ | 241,068 | $ | 241,068 | $ | 241,068 | $ | 241,068 | |||||||||||||||||||
| Total equity market capitalization | $ | 11,558,136 | $ | 12,562,303 | $ | 10,774,099 | $ | 11,104,486 | $ | 12,649,238 | |||||||||||||||||||
| Total consolidated debt | $ | 3,389,088 | $ | 2,243,025 | $ | 2,245,605 | $ | 2,245,972 | $ | 2,250,136 | |||||||||||||||||||
| Total combined market capitalization (net debt plus equity) | $ | 14,610,264 | $ | 14,771,884 | $ | 12,936,436 | $ | 13,214,176 | $ | 14,645,756 | |||||||||||||||||||
| Ratios: | |||||||||||||||||||||||||||||
| Net debt to total combined market capitalization | 20.9% | 15.0% | 16.7% | 16.0% | 13.6% | ||||||||||||||||||||||||
| Net debt to Adjusted EBITDA (quarterly results annualized) | 4.6x | 3.6x | 3.7x | 3.7x | 3.6x | ||||||||||||||||||||||||
|
First Quarter 2024
Supplemental Financial Reporting Package
|
Page 6
|
|
||||||
Guidance. |
||||||||
| As of March 31, 2024 | ||||||||
| METRIC | Q1-2024 UPDATED GUIDANCE |
INITIAL 2024 GUIDANCE |
YTD RESULTS AS OF MARCH 31, 2024 | |||||||||||||||||
Net Income Attributable to Common Stockholders per diluted share (1)(2) |
$1.17 - $1.20 | $1.11 - $1.14 | $0.27 | |||||||||||||||||
Company share of Core FFO per diluted share (1)(2) |
$2.31 - $2.34 | $2.27 - $2.30 | $0.58 | |||||||||||||||||
Same Property Portfolio NOI Growth - GAAP (3) |
4.25% - 5.25% | 4.0% - 5.0% | 5.5% | |||||||||||||||||
Same Property Portfolio NOI Growth - Cash (3) |
7.0% - 8.0% | 7.0% - 8.0% | 8.5% | |||||||||||||||||
Average Same Property Portfolio Occupancy (Full Year) (3) |
96.5% - 97.0% | 96.5% - 97.0% | 96.8% | |||||||||||||||||
General and Administrative Expenses (4) |
+/- $83.0M | +/- $83.0M | $20.0M | |||||||||||||||||
| Net Interest Expense | +/- $99.0M | $60.0M - $61.0M | $14.7M | |||||||||||||||||
|
First Quarter 2024
Supplemental Financial Reporting Package
|
Page 7
|
|
||||||
Guidance (Continued). |
||||||||
| As of March 31, 2024 | ||||||||
| Earnings Components | Range ($ per share) |
Notes | ||||||||||||||||||
2024 Core FFO Per Diluted Share Guidance (Previous) |
$2.27 | $2.30 | Initial 2024 Guidance | |||||||||||||||||
| Same Property Portfolio NOI Growth | — | — | FY 2024 SP NOI Growth (GAAP) Guidance range of 4.25% - 5.25% |
|||||||||||||||||
| 1Q Investments (Includes Closed Subsequent to Quarter End) | 0.23 | 0.23 |
Incremental 2024 NOI related to $1.0B of acquisitions closed since
prior guidance
|
|||||||||||||||||
| Net G&A Expense | — | — | FY 2024 Guidance range of +/- $83.0M |
|||||||||||||||||
| Net Interest Expense | (0.17) | (0.17) | FY 2024 Guidance range of +/- $99.0M |
|||||||||||||||||
| Other | (0.02) | (0.02) | Incremental impact of equity issuance | |||||||||||||||||
2024 Core FFO Per Diluted Share Guidance (Current) |
$2.31 | $2.34 | ||||||||||||||||||
| Core FFO Per Diluted Share Annual Growth | 5% | 7% | ||||||||||||||||||
|
First Quarter 2024
Supplemental Financial Reporting Package
|
Page 8
|
|
||||||
Consolidated Balance Sheets. |
(unaudited and in thousands) | |||||||
| March 31, 2024 | December 31, 2023 | September 30, 2023 | June 30, 2023 | March 31, 2023 | |||||||||||||||||||||||||
| ASSETS | |||||||||||||||||||||||||||||
| Land | $ | 7,568,720 | $ | 6,815,622 | $ | 6,606,022 | $ | 6,400,698 | $ | 6,334,926 | |||||||||||||||||||
| Buildings and improvements | 4,260,512 | 3,933,379 | 3,869,303 | 3,723,837 | 3,671,384 | ||||||||||||||||||||||||
| Tenant improvements | 172,707 | 167,251 | 160,108 | 155,182 | 153,019 | ||||||||||||||||||||||||
| Furniture, fixtures, and equipment | 132 | 132 | 132 | 132 | 132 | ||||||||||||||||||||||||
| Construction in progress | 258,413 | 240,010 | 188,079 | 127,416 | 102,633 | ||||||||||||||||||||||||
| Total real estate held for investment | 12,260,484 | 11,156,394 | 10,823,644 | 10,407,265 | 10,262,094 | ||||||||||||||||||||||||
| Accumulated depreciation | (827,576) | (782,461) | (739,369) | (695,129) | (652,722) | ||||||||||||||||||||||||
| Investments in real estate, net | 11,432,908 | 10,373,933 | 10,084,275 | 9,712,136 | 9,609,372 | ||||||||||||||||||||||||
| Cash and cash equivalents | 336,960 | 33,444 | 83,268 | 136,282 | 253,618 | ||||||||||||||||||||||||
| Restricted cash | — | — | — | — | 16,239 | ||||||||||||||||||||||||
| Loan receivable, net | 122,899 | 122,784 | — | — | — | ||||||||||||||||||||||||
| Rents and other receivables, net | 17,896 | 17,494 | 18,973 | 14,126 | 13,845 | ||||||||||||||||||||||||
| Deferred rent receivable, net | 130,694 | 123,325 | 114,927 | 103,192 | 94,980 | ||||||||||||||||||||||||
| Deferred leasing costs, net | 61,017 | 59,351 | 56,735 | 54,848 | 47,739 | ||||||||||||||||||||||||
| Deferred loan costs, net | 3,069 | 3,426 | 3,783 | 4,139 | 4,474 | ||||||||||||||||||||||||
Acquired lease intangible assets, net(1) |
223,698 | 153,670 | 154,036 | 147,990 | 161,339 | ||||||||||||||||||||||||
| Acquired indefinite-lived intangible | 5,156 | 5,156 | 5,156 | 5,156 | 5,156 | ||||||||||||||||||||||||
| Interest rate swap asset | 16,737 | 9,896 | 24,494 | 19,869 | 6,947 | ||||||||||||||||||||||||
| Other assets | 22,114 | 25,225 | 31,817 | 19,055 | 21,811 | ||||||||||||||||||||||||
| Acquisition related deposits | 7,975 | 2,125 | — | 8,700 | 3,625 | ||||||||||||||||||||||||
| Total Assets | $ | 12,381,123 | $ | 10,929,829 | $ | 10,577,464 | $ | 10,225,493 | $ | 10,239,145 | |||||||||||||||||||
| LIABILITIES & EQUITY | |||||||||||||||||||||||||||||
| Liabilities | |||||||||||||||||||||||||||||
| Notes payable | $ | 3,349,120 | $ | 2,225,914 | $ | 2,227,637 | $ | 2,227,154 | $ | 2,230,687 | |||||||||||||||||||
| Interest rate swap liability | — | — | — | — | 835 | ||||||||||||||||||||||||
| Accounts payable, accrued expenses and other liabilities | 148,920 | 128,842 | 155,103 | 109,881 | 110,272 | ||||||||||||||||||||||||
| Dividends and distributions payable | 94,356 | 83,733 | 81,423 | 79,370 | 79,370 | ||||||||||||||||||||||||
Acquired lease intangible liabilities, net(2) |
171,687 | 147,561 | 155,582 | 130,511 | 138,339 | ||||||||||||||||||||||||
| Tenant security deposits | 91,034 | 84,872 | 83,643 | 81,163 | 77,029 | ||||||||||||||||||||||||
Tenant prepaid rents(3) |
110,727 | 115,002 | 30,772 | 42,600 | 44,303 | ||||||||||||||||||||||||
| Total Liabilities | 3,965,844 | 2,785,924 | 2,734,160 | 2,670,679 | 2,680,835 | ||||||||||||||||||||||||
| Equity | |||||||||||||||||||||||||||||
| Series B preferred stock, net ($75,000 liquidation preference) | 72,443 | 72,443 | 72,443 | 72,443 | 72,443 | ||||||||||||||||||||||||
| Series C preferred stock, net ($86,250 liquidation preference) | 83,233 | 83,233 | 83,233 | 83,233 | 83,233 | ||||||||||||||||||||||||
| Preferred stock | 155,676 | 155,676 | 155,676 | 155,676 | 155,676 | ||||||||||||||||||||||||
| Common stock | 2,178 | 2,123 | 2,065 | 2,010 | 2,008 | ||||||||||||||||||||||||
| Additional paid in capital | 8,233,127 | 7,940,781 | 7,613,354 | 7,311,458 | 7,299,837 | ||||||||||||||||||||||||
| Cumulative distributions in excess of earnings | (370,720) | (338,835) | (320,180) | (298,367) | (273,849) | ||||||||||||||||||||||||
| Accumulated other comprehensive income (loss) | 13,922 | 7,172 | 21,142 | 16,525 | 3,117 | ||||||||||||||||||||||||
| Total stockholders’ equity | 8,034,183 | 7,766,917 | 7,472,057 | 7,187,302 | 7,186,789 | ||||||||||||||||||||||||
| Noncontrolling interests | 381,096 | 376,988 | 371,247 | 367,512 | 371,521 | ||||||||||||||||||||||||
| Total Equity | 8,415,279 | 8,143,905 | 7,843,304 | 7,554,814 | 7,558,310 | ||||||||||||||||||||||||
| Total Liabilities and Equity | $ | 12,381,123 | $ | 10,929,829 | $ | 10,577,464 | $ | 10,225,493 | $ | 10,239,145 | |||||||||||||||||||
|
First Quarter 2024
Supplemental Financial Reporting Package
|
Page 9
|
|
||||||
Consolidated Statements of Operations. |
||||||||
| Quarterly Results | (unaudited and in thousands, except share and per share data) | |||||||
| Three Months Ended | |||||||||||||||||||||||||||||
| Mar 31, 2024 | Dec 31, 2023 | Sep 30, 2023 | Jun 30, 2023 | Mar 31, 2023 | |||||||||||||||||||||||||
| Revenues | |||||||||||||||||||||||||||||
Rental income(1) |
$ | 210,990 | $ | 207,909 | $ | 204,212 | $ | 194,098 | $ | 185,164 | |||||||||||||||||||
| Management and leasing services | 132 | 163 | 158 | 171 | 190 | ||||||||||||||||||||||||
| Interest income | 2,974 | 2,353 | 1,029 | 1,497 | 882 | ||||||||||||||||||||||||
| Total Revenues | 214,096 | 210,425 | 205,399 | 195,766 | 186,236 | ||||||||||||||||||||||||
| Operating Expenses | |||||||||||||||||||||||||||||
| Property expenses | 47,482 | 49,259 | 48,085 | 44,310 | 42,825 | ||||||||||||||||||||||||
| General and administrative | 19,980 | 19,988 | 18,575 | 18,267 | 18,197 | ||||||||||||||||||||||||
| Depreciation and amortization | 66,278 | 65,839 | 60,449 | 58,793 | 59,429 | ||||||||||||||||||||||||
| Total Operating Expenses | 133,740 | 135,086 | 127,109 | 121,370 | 120,451 | ||||||||||||||||||||||||
| Other Expenses | |||||||||||||||||||||||||||||
| Other expenses | 1,408 | 316 | 551 | 306 | 647 | ||||||||||||||||||||||||
| Interest expense | 14,671 | 14,570 | 15,949 | 17,180 | 13,701 | ||||||||||||||||||||||||
| Total Expenses | 149,819 | 149,972 | 143,609 | 138,856 | 134,799 | ||||||||||||||||||||||||
| Gains on sale of real estate | — | 6,868 | — | — | 12,133 | ||||||||||||||||||||||||
| Net Income | 64,277 | 67,321 | 61,790 | 56,910 | 63,570 | ||||||||||||||||||||||||
| Less: net income attributable to noncontrolling interests | (2,906) | (2,970) | (2,824) | (2,717) | (3,064) | ||||||||||||||||||||||||
| Net income attributable to Rexford Industrial Realty, Inc. | 61,371 | 64,351 | 58,966 | 54,193 | 60,506 | ||||||||||||||||||||||||
| Less: preferred stock dividends | (2,314) | (2,315) | (2,314) | (2,315) | (2,314) | ||||||||||||||||||||||||
| Less: earnings allocated to participating securities | (418) | (357) | (314) | (318) | (320) | ||||||||||||||||||||||||
| Net income attributable to common stockholders | $ | 58,639 | $ | 61,679 | $ | 56,338 | $ | 51,560 | $ | 57,872 | |||||||||||||||||||
| Earnings per Common Share | |||||||||||||||||||||||||||||
| Net income attributable to common stockholders per share - basic | $ | 0.27 | $ | 0.29 | $ | 0.27 | $ | 0.26 | $ | 0.30 | |||||||||||||||||||
| Net income attributable to common stockholders per share - diluted | $ | 0.27 | $ | 0.29 | $ | 0.27 | $ | 0.26 | $ | 0.30 | |||||||||||||||||||
| Weighted average shares outstanding - basic | 214,401,661 | 210,089,164 | 205,279,681 | 200,610,890 | 195,366,969 | ||||||||||||||||||||||||
| Weighted average shares outstanding - diluted | 214,437,913 | 210,362,069 | 205,447,532 | 200,667,250 | 195,779,007 | ||||||||||||||||||||||||
|
First Quarter 2024
Supplemental Financial Reporting Package
|
Page 10
|
|
||||||
Consolidated Statements of Operations. |
||||||||
| Quarterly Results (continued) | (unaudited and in thousands, except share and per share data) | |||||||
| Three Months Ended March 31, | ||||||||||||||
| 2024 | 2023 | |||||||||||||
| Revenues | ||||||||||||||
| Rental income | $ | 210,990 | $ | 185,164 | ||||||||||
| Management and leasing services | 132 | 190 | ||||||||||||
| Interest income | 2,974 | 882 | ||||||||||||
| Total Revenues | 214,096 | 186,236 | ||||||||||||
| Operating Expenses | ||||||||||||||
| Property expenses | 47,482 | 42,825 | ||||||||||||
| General and administrative | 19,980 | 18,197 | ||||||||||||
| Depreciation and amortization | 66,278 | 59,429 | ||||||||||||
| Total Operating Expenses | 133,740 | 120,451 | ||||||||||||
| Other Expenses | ||||||||||||||
| Other expenses | 1,408 | 647 | ||||||||||||
| Interest expense | 14,671 | 13,701 | ||||||||||||
| Total Expenses | 149,819 | 134,799 | ||||||||||||
| Gains on sale of real estate | — | 12,133 | ||||||||||||
| Net Income | 64,277 | 63,570 | ||||||||||||
| Less: net income attributable to noncontrolling interests | (2,906) | (3,064) | ||||||||||||
| Net income attributable to Rexford Industrial Realty, Inc. | 61,371 | 60,506 | ||||||||||||
| Less: preferred stock dividends | (2,314) | (2,314) | ||||||||||||
| Less: earnings allocated to participating securities | (418) | (320) | ||||||||||||
| Net income attributable to common stockholders | $ | 58,639 | $ | 57,872 | ||||||||||
| Net income attributable to common stockholders per share – basic | $ | 0.27 | $ | 0.30 | ||||||||||
| Net income attributable to common stockholders per share – diluted | $ | 0.27 | $ | 0.30 | ||||||||||
| Weighted-average shares of common stock outstanding – basic | 214,401,661 | 195,366,969 | ||||||||||||
| Weighted-average shares of common stock outstanding – diluted | 214,437,913 | 195,779,007 | ||||||||||||
|
First Quarter 2024
Supplemental Financial Reporting Package
|
Page 11
|
|
||||||
Non-GAAP FFO and Core FFO Reconciliations. (1) |
||||||||
| (unaudited and in thousands, except share and per share data) | ||||||||
| Three Months Ended | |||||||||||||||||||||||||||||
| March 31, 2024 | December 31, 2023 | September 30, 2023 | June 30, 2023 | March 31, 2023 | |||||||||||||||||||||||||
| Net Income | $ | 64,277 | $ | 67,321 | $ | 61,790 | $ | 56,910 | $ | 63,570 | |||||||||||||||||||
| Adjustments: | |||||||||||||||||||||||||||||
| Depreciation and amortization | 66,278 | 65,839 | 60,449 | 58,793 | 59,429 | ||||||||||||||||||||||||
| Gains on sale of real estate | — | (6,868) | — | — | (12,133) | ||||||||||||||||||||||||
NAREIT Defined Funds From Operations (FFO) |
130,555 | 126,292 | 122,239 | 115,703 | 110,866 | ||||||||||||||||||||||||
| Less: preferred stock dividends | (2,314) | (2,315) | (2,314) | (2,315) | (2,314) | ||||||||||||||||||||||||
Less: FFO attributable to noncontrolling interests(2) |
(5,188) | (4,960) | (4,909) | (4,812) | (4,833) | ||||||||||||||||||||||||
Less: FFO attributable to participating securities(3) |
(570) | (504) | (461) | (451) | (427) | ||||||||||||||||||||||||
| Company share of FFO | $ | 122,483 | $ | 118,513 | $ | 114,555 | $ | 108,125 | $ | 103,292 | |||||||||||||||||||
| Company share of FFO per common share‐basic | $ | 0.57 | $ | 0.56 | $ | 0.56 | $ | 0.54 | $ | 0.53 | |||||||||||||||||||
| Company share of FFO per common share‐diluted | $ | 0.57 | $ | 0.56 | $ | 0.56 | $ | 0.54 | $ | 0.53 | |||||||||||||||||||
| FFO | $ | 130,555 | $ | 126,292 | $ | 122,239 | $ | 115,703 | $ | 110,866 | |||||||||||||||||||
| Adjustments: | |||||||||||||||||||||||||||||
| Acquisition expenses | 50 | 39 | 10 | 247 | 73 | ||||||||||||||||||||||||
Impairment of right-of-use asset(4) |
— | — | — | — | 188 | ||||||||||||||||||||||||
| Amortization of loss on termination of interest rate swaps | 59 | 59 | 59 | 59 | 59 | ||||||||||||||||||||||||
| Non-capitalizable demolition costs | 998 | 180 | 361 | — | 340 | ||||||||||||||||||||||||
Write-offs of below-market lease intangibles related to unexercised renewal options(5) |
— | — | — | — | (1,318) | ||||||||||||||||||||||||
| Core FFO | 131,662 | 126,570 | 122,669 | 116,009 | 110,208 | ||||||||||||||||||||||||
| Less: preferred stock dividends | (2,314) | (2,315) | (2,314) | (2,315) | (2,314) | ||||||||||||||||||||||||
Less: Core FFO attributable to noncontrolling interests(2) |
(5,226) | (4,969) | (4,924) | (4,823) | (4,809) | ||||||||||||||||||||||||
Less: Core FFO attributable to participating securities(3) |
(575) | (505) | (462) | (452) | (425) | ||||||||||||||||||||||||
| Company share of Core FFO | $ | 123,547 | $ | 118,781 | $ | 114,969 | $ | 108,419 | $ | 102,660 | |||||||||||||||||||
| Company share of Core FFO per common share‐basic | $ | 0.58 | $ | 0.57 | $ | 0.56 | $ | 0.54 | $ | 0.53 | |||||||||||||||||||
| Company share of Core FFO per common share‐diluted | $ | 0.58 | $ | 0.56 | $ | 0.56 | $ | 0.54 | $ | 0.52 | |||||||||||||||||||
| Weighted-average shares outstanding-basic | 214,401,661 | 210,089,164 | 205,279,681 | 200,610,890 | 195,366,969 | ||||||||||||||||||||||||
Weighted-average shares outstanding-diluted(6) |
214,437,913 | 210,362,069 | 205,447,532 | 200,667,250 | 195,779,007 | ||||||||||||||||||||||||
|
First Quarter 2024
Supplemental Financial Reporting Package
|
Page 12
|
|
||||||
Non-GAAP FFO and Core FFO Reconciliations. (1) |
||||||||
| (unaudited and in thousands, except share and per share data) | ||||||||
| Three Months Ended March 31, | ||||||||||||||
| 2024 | 2023 | |||||||||||||
| Net Income | $ | 64,277 | $ | 63,570 | ||||||||||
| Adjustments: | ||||||||||||||
| Depreciation and amortization | 66,278 | 59,429 | ||||||||||||
| Gains on sale of real estate | — | (12,133) | ||||||||||||
| Funds From Operations (FFO) | 130,555 | 110,866 | ||||||||||||
| Less: preferred stock dividends | (2,314) | (2,314) | ||||||||||||
| Less: FFO attributable to noncontrolling interests | (5,188) | (4,833) | ||||||||||||
| Less: FFO attributable to participating securities | (570) | (427) | ||||||||||||
| Company share of FFO | $ | 122,483 | $ | 103,292 | ||||||||||
| Company share of FFO per common share‐basic | $ | 0.57 | $ | 0.53 | ||||||||||
| Company share of FFO per common share‐diluted | $ | 0.57 | $ | 0.53 | ||||||||||
| FFO | $ | 130,555 | $ | 110,866 | ||||||||||
| Adjustments: | ||||||||||||||
| Acquisition expenses | 50 | 73 | ||||||||||||
| Impairment of right-of-use asset | — | 188 | ||||||||||||
| Amortization of loss on termination of interest rate swaps | 59 | 59 | ||||||||||||
| Non-capitalizable demolition costs | 998 | 340 | ||||||||||||
Write-offs of below-market lease intangibles related to unexercised renewal options(2) |
— | (1,318) | ||||||||||||
| Core FFO | 131,662 | 110,208 | ||||||||||||
| Less: preferred stock dividends | (2,314) | (2,314) | ||||||||||||
| Less: Core FFO attributable to noncontrolling interests | (5,226) | (4,809) | ||||||||||||
| Less: Core FFO attributable to participating securities | (575) | (425) | ||||||||||||
| Company share of Core FFO | $ | 123,547 | $ | 102,660 | ||||||||||
| Company share of Core FFO per common share‐basic | $ | 0.58 | $ | 0.53 | ||||||||||
| Company share of Core FFO per common share‐diluted | $ | 0.58 | $ | 0.52 | ||||||||||
| Weighted-average shares outstanding-basic | 214,401,661 | 195,366,969 | ||||||||||||
| Weighted-average shares outstanding-diluted | 214,437,913 | 195,779,007 | ||||||||||||
|
First Quarter 2024
Supplemental Financial Reporting Package
|
Page 13
|
|
||||||
Non-GAAP AFFO Reconciliation. (1) |
||||||||
| (unaudited and in thousands, except share and per share data) | ||||||||
| Three Months Ended | |||||||||||||||||||||||||||||
| March 31, 2024 |
December 31, 2023 |
September 30, 2023 |
June 30, 2023 |
March 31, 2023 |
|||||||||||||||||||||||||
Funds From Operations(2) |
$ | 130,555 | $ | 126,292 | $ | 122,239 | $ | 115,703 | $ | 110,866 | |||||||||||||||||||
| Adjustments: | |||||||||||||||||||||||||||||
| Amortization of deferred financing costs | 1,011 | 1,000 | 1,001 | 999 | 856 | ||||||||||||||||||||||||
| Non-cash stock compensation | 9,088 | 9,338 | 8,166 | 7,956 | 8,178 | ||||||||||||||||||||||||
| Impairment of right-of-use asset | — | — | — | — | 188 | ||||||||||||||||||||||||
| Amortization related to termination/settlement of interest rate derivatives | 137 | 137 | 137 | 136 | 129 | ||||||||||||||||||||||||
| Note payable (discount) premium amortization, net | 293 | 214 | 205 | 203 | 66 | ||||||||||||||||||||||||
| Non-capitalizable demolition costs | 998 | 180 | 361 | — | 340 | ||||||||||||||||||||||||
| Deduct: | |||||||||||||||||||||||||||||
| Preferred stock dividends | (2,314) | (2,315) | (2,314) | (2,315) | (2,314) | ||||||||||||||||||||||||
Straight line rental revenue adjustment(3) |
(7,368) | (8,514) | (11,792) | (8,653) | (7,628) | ||||||||||||||||||||||||
Above/(below) market lease revenue adjustments(4) |
(7,591) | (8,119) | (7,241) | (6,232) | (8,290) | ||||||||||||||||||||||||
Capitalized payments(5) |
(13,163) | (12,443) | (10,581) | (8,885) | (8,924) | ||||||||||||||||||||||||
| Accretion of net loan origination fees | (115) | (84) | — | — | — | ||||||||||||||||||||||||
Recurring capital expenditures(6) |
(2,990) | (7,047) | (10,874) | (6,683) | (2,194) | ||||||||||||||||||||||||
2nd generation tenant improvements and leasing commissions(7) |
(3,457) | (3,611) | (4,406) | (5,623) | (5,259) | ||||||||||||||||||||||||
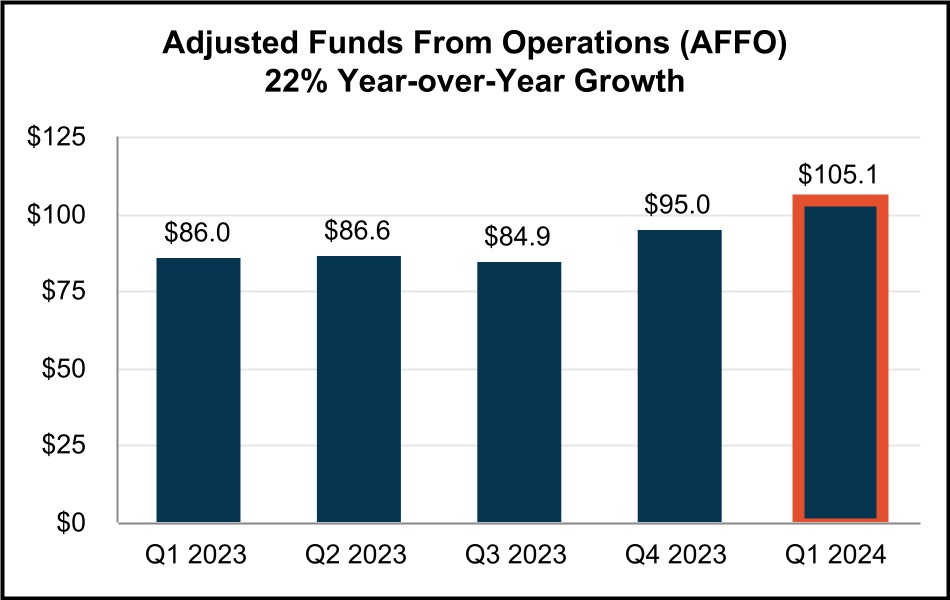
| Adjusted Funds From Operations (AFFO) | $ | 105,084 | $ | 95,028 | $ | 84,901 | $ | 86,606 | $ | 86,014 | |||||||||||||||||||
|
First Quarter 2024
Supplemental Financial Reporting Package
|
Page 14
|
|
||||||
Statement of Operations Reconciliations - NOI, Cash NOI, EBITDAre and Adjusted EBITDA. (1) | ||||||||
| (unaudited and in thousands) | ||||||||
| NOI and Cash NOI | |||||||||||||||||||||||||||||
| Three Months Ended | |||||||||||||||||||||||||||||
| Mar 31, 2024 | Dec 31, 2023 | Sep 30, 2023 | Jun 30, 2023 | Mar 31, 2023 | |||||||||||||||||||||||||
Rental income(2)(3) |
$ | 210,990 | $ | 207,909 | $ | 204,212 | $ | 194,098 | $ | 185,164 | |||||||||||||||||||
| Less: Property expenses | 47,482 | 49,259 | 48,085 | 44,310 | 42,825 | ||||||||||||||||||||||||
| Net Operating Income (NOI) | $ | 163,508 | $ | 158,650 | $ | 156,127 | $ | 149,788 | $ | 142,339 | |||||||||||||||||||
Above/(below) market lease revenue adjustments |
(7,591) | (8,119) | (7,241) | (6,232) | (8,290) | ||||||||||||||||||||||||
| Straight line rental revenue adjustment | (7,368) | (8,514) | (11,792) | (8,653) | (7,628) | ||||||||||||||||||||||||
| Cash NOI | $ | 148,549 | $ | 142,017 | $ | 137,094 | $ | 134,903 | $ | 126,421 | |||||||||||||||||||
EBITDAre and Adjusted EBITDA |
|||||||||||||||||||||||||||||
| Three Months Ended | |||||||||||||||||||||||||||||
| Mar 31, 2024 | Dec 31, 2023 | Sep 30, 2023 | Jun 30, 2023 | Mar 31, 2023 | |||||||||||||||||||||||||
| Net income | $ | 64,277 | $ | 67,321 | $ | 61,790 | $ | 56,910 | $ | 63,570 | |||||||||||||||||||
| Interest expense | 14,671 | 14,570 | 15,949 | 17,180 | 13,701 | ||||||||||||||||||||||||
| Depreciation and amortization | 66,278 | 65,839 | 60,449 | 58,793 | 59,429 | ||||||||||||||||||||||||
| Gains on sale of real estate | — | (6,868) | — | — | (12,133) | ||||||||||||||||||||||||
EBITDAre |
$ | 145,226 | $ | 140,862 | $ | 138,188 | $ | 132,883 | $ | 124,567 | |||||||||||||||||||
| Stock-based compensation amortization | 9,088 | 9,338 | 8,166 | 7,956 | 8,178 | ||||||||||||||||||||||||
| Acquisition expenses | 50 | 39 | 10 | 247 | 73 | ||||||||||||||||||||||||
| Impairment of right-of-use asset | — | — | — | — | 188 | ||||||||||||||||||||||||
Pro forma effect of acquisitions and loan issuance(4) |
12,843 | 1,976 | 1,561 | 172 | 6,927 | ||||||||||||||||||||||||
Pro forma effect of dispositions(5) |
— | (89) | — | — | (178) | ||||||||||||||||||||||||
| Adjusted EBITDA | $ | 167,207 | $ | 152,126 | $ | 147,925 | $ | 141,258 | $ | 139,755 | |||||||||||||||||||
|
First Quarter 2024
Supplemental Financial Reporting Package
|
Page 15
|
|
||||||
Same Property Portfolio Performance.(1) |
||||||||
| (unaudited and dollars in thousands) | ||||||||
| Same Property Portfolio: | ||||||||||||||||||||||||||||||||||||||||||||||||||
| Number of properties | 296 | |||||||||||||||||||||||||||||||||||||||||||||||||
| Square Feet | 37,109,867 | |||||||||||||||||||||||||||||||||||||||||||||||||
| Same Property Portfolio NOI and Cash NOI: | ||||||||||||||||||||||||||
| Three Months Ended March 31, | ||||||||||||||||||||||||||
| 2024 | 2023 | $ Change | % Change | |||||||||||||||||||||||
Rental income(2)(3)(4) |
$ | 171,557 | $ | 162,571 | $ | 8,986 | 5.5% | |||||||||||||||||||
| Property expenses | 38,928 | 36,840 | 2,088 | 5.7% | ||||||||||||||||||||||
| Same Property Portfolio NOI | $ | 132,629 | $ | 125,731 | $ | 6,898 | 5.5% | (4) |
||||||||||||||||||
Straight-line rental revenue adjustment |
(4,753) | (6,924) | 2,171 | (31.4)% | ||||||||||||||||||||||
Above/(below) market lease revenue adjustments |
(5,642) | (6,196) | 554 | (8.9)% | ||||||||||||||||||||||
| Same Property Portfolio Cash NOI | $ | 122,234 | $ | 112,611 | $ | 9,623 | 8.5% | (4) |
||||||||||||||||||
| Same Property Portfolio Occupancy: | |||||||||||||||||||||||||||||
| Three Months Ended March 31, | |||||||||||||||||||||||||||||
| 2024 | 2023 | Year-over-Year Change (basis points) |
Three Months Ended December 31, 2023 | Sequential Change (basis points) |
|||||||||||||||||||||||||
Quarterly Weighted Average Occupancy:(5) |
|||||||||||||||||||||||||||||
| Los Angeles County | 96.9% | 97.5% | (60) bps | 97.2% | (30) bps | ||||||||||||||||||||||||
| Orange County | 99.6% | 98.8% | 80 bps | 98.6% | 100 bps | ||||||||||||||||||||||||
| Riverside / San Bernardino County | 94.8% | 93.4% | 140 bps | 95.1% | (30) bps | ||||||||||||||||||||||||
| San Diego County | 98.4% | 98.9% | (50) bps | 98.5% | (10) bps | ||||||||||||||||||||||||
| Ventura County | 96.4% | 99.6% | (320) bps | 97.7% | (130) bps | ||||||||||||||||||||||||
| Quarterly Weighted Average Occupancy | 96.8% | 97.0% | (20) bps | 97.0% | (20) bps | ||||||||||||||||||||||||
| Ending Occupancy: | 96.4% | 97.0% | (60) bps | 97.0% | (60) bps | ||||||||||||||||||||||||
|
First Quarter 2024
Supplemental Financial Reporting Package
|
Page 16
|
|
||||||
Capitalization Summary. |
||||||||
| (unaudited and in thousands, except share and per share data) | ||||||||
| Capitalization as of March 31, 2024 | ||||||||

| Description | March 31, 2024 | December 31, 2023 | September 30, 2023 | June 30, 2023 | March 31, 2023 | |||||||||||||||||||||||||||
Common shares outstanding(1) |
217,382,937 | 211,998,010 | 206,134,730 | 200,680,708 | 200,418,714 | |||||||||||||||||||||||||||
Operating partnership units outstanding(2) |
7,609,215 | 7,631,847 | 7,300,541 | 7,351,049 | 7,597,554 | |||||||||||||||||||||||||||
| Total shares and units outstanding at period end | 224,992,152 | 219,629,857 | 213,435,271 | 208,031,757 | 208,016,268 | |||||||||||||||||||||||||||
| Share price at end of quarter | $ | 50.30 | $ | 56.10 | $ | 49.35 | $ | 52.22 | $ | 59.65 | ||||||||||||||||||||||
| Common Stock and Operating Partnership Units - Capitalization | $ | 11,317,105 | $ | 12,321,235 | $ | 10,533,031 | $ | 10,863,418 | $ | 12,408,170 | ||||||||||||||||||||||
Series B and C Cumulative Redeemable Preferred Stock(3) |
$ | 161,250 | $ | 161,250 | $ | 161,250 | $ | 161,250 | $ | 161,250 | ||||||||||||||||||||||
4.43937% Series 1 Cumulative Redeemable Convertible Preferred Units(4) |
27,031 | 27,031 | 27,031 | 27,031 | 27,031 | |||||||||||||||||||||||||||
4.00% Series 2 Cumulative Redeemable Convertible Preferred Units(4) |
40,750 | 40,787 | 40,787 | 40,787 | 40,787 | |||||||||||||||||||||||||||
3.00% Series 3 Cumulative Redeemable Convertible Preferred Units(4) |
12,000 | 12,000 | 12,000 | 12,000 | 12,000 | |||||||||||||||||||||||||||
| Preferred Equity | $ | 241,031 | $ | 241,068 | $ | 241,068 | $ | 241,068 | $ | 241,068 | ||||||||||||||||||||||
| Total Equity Market Capitalization | $ | 11,558,136 | $ | 12,562,303 | $ | 10,774,099 | $ | 11,104,486 | $ | 12,649,238 | ||||||||||||||||||||||
| Total Debt | $ | 3,389,088 | $ | 2,243,025 | $ | 2,245,605 | $ | 2,245,972 | $ | 2,250,136 | ||||||||||||||||||||||
| Less: Cash and cash equivalents | (336,960) | (33,444) | (83,268) | (136,282) | (253,618) | |||||||||||||||||||||||||||
| Net Debt | $ | 3,052,128 | $ | 2,209,581 | $ | 2,162,337 | $ | 2,109,690 | $ | 1,996,518 | ||||||||||||||||||||||
| Total Combined Market Capitalization (Net Debt plus Equity) | $ | 14,610,264 | $ | 14,771,884 | $ | 12,936,436 | $ | 13,214,176 | $ | 14,645,756 | ||||||||||||||||||||||
| Net debt to total combined market capitalization | 20.9 | % | 15.0 | % | 16.7 | % | 16.0 | % | 13.6 | % | ||||||||||||||||||||||
Net debt to Adjusted EBITDA (quarterly results annualized)(5) |
4.6x | 3.6x | 3.7x | 3.7x | 3.6x | |||||||||||||||||||||||||||
Net debt & preferred equity to Adjusted EBITDA (quarterly results annualized)(5) |
4.9x | 4.0x | 4.1x | 4.2x | 4.0x | |||||||||||||||||||||||||||
|
First Quarter 2024
Supplemental Financial Reporting Package
|
Page 17
|
|
||||||
Debt Summary. |
||||||||
| (unaudited and dollars in thousands) | ||||||||
| Debt Detail: | ||||||||||||||||||||||||||
| As of March 31, 2024 | ||||||||||||||||||||||||||
| Debt Description | Maturity Date | Stated Interest Rate |
Effective
Interest Rate(1)
|
Principal
Balance(2)
|
||||||||||||||||||||||
| Unsecured Debt: | ||||||||||||||||||||||||||
$1.0 Billion Revolving Credit Facility(3) |
5/26/2026(4) |
SOFR+0.685%(5) |
6.125% | $ | — | |||||||||||||||||||||
| $400M Term Loan Facility | 7/19/2024(4) |
SOFR+0.76%(5) |
4.832%(6) |
400,000 | ||||||||||||||||||||||
| $100M Senior Notes | 8/6/2025 | 4.290% | 4.290% | 100,000 | ||||||||||||||||||||||
$575M Exchangeable 2027 Senior Notes(7) |
3/15/2027 | 4.375% | 4.375% | 575,000 | ||||||||||||||||||||||
| $300M Term Loan Facility | 5/26/2027 | SOFR+0.76%(5) |
3.677%(8) |
300,000 | ||||||||||||||||||||||
| $125M Senior Notes | 7/13/2027 | 3.930% | 3.930% | 125,000 | ||||||||||||||||||||||
| $300M Senior Notes | 6/15/2028 | 5.000% | 5.000% | 300,000 | ||||||||||||||||||||||
$575M Exchangeable 2029 Senior Notes(7) |
3/15/2029 | 4.125% | 4.125% | 575,000 | ||||||||||||||||||||||
| $25M Series 2019A Senior Notes | 7/16/2029 | 3.880% | 3.880% | 25,000 | ||||||||||||||||||||||
| $400M Senior Notes | 12/1/2030 | 2.125% | 2.125% | 400,000 | ||||||||||||||||||||||
| $400M Senior Notes - Green Bond | 9/1/2031 | 2.150% | 2.150% | 400,000 | ||||||||||||||||||||||
| $75M Series 2019B Senior Notes | 7/16/2034 | 4.030% | 4.030% | 75,000 | ||||||||||||||||||||||
| Secured Debt: | ||||||||||||||||||||||||||
| 11600 Los Nietos Road | 5/1/2024 | 4.190% | 4.190% | 2,246 | ||||||||||||||||||||||
| $60M Term Loan Facility | 10/27/2024(9) |
SOFR+1.250%(9) |
5.060%(10) |
60,000 | ||||||||||||||||||||||
| 5160 Richton Street | 11/15/2024 | 3.790% | 3.790% | 3,997 | ||||||||||||||||||||||
| 22895 Eastpark Drive | 11/15/2024 | 4.330% | 4.330% | 2,520 | ||||||||||||||||||||||
| 701-751 Kingshill Place | 1/5/2026 | 3.900% | 3.900% | 6,951 | ||||||||||||||||||||||
| 13943-13955 Balboa Boulevard | 7/1/2027 | 3.930% | 3.930% | 14,502 | ||||||||||||||||||||||
| 2205 126th Street | 12/1/2027 | 3.910% | 3.910% | 5,200 | ||||||||||||||||||||||
| 2410-2420 Santa Fe Avenue | 1/1/2028 | 3.700% | 3.700% | 10,300 | ||||||||||||||||||||||
| 11832-11954 La Cienega Boulevard | 7/1/2028 | 4.260% | 4.260% | 3,832 | ||||||||||||||||||||||
| 1100-1170 Gilbert Street (Gilbert/La Palma) | 3/1/2031 | 5.125% | 5.125% | 1,692 | ||||||||||||||||||||||
| 7817 Woodley Avenue | 8/1/2039 | 4.140% | 4.140% | 2,848 | ||||||||||||||||||||||
| 3.827% | $ | 3,389,088 | ||||||||||||||||||||||||
Debt Composition(1): |
||||||||||||||||||||||||||||||||
| Category | Weighted Average Term Remaining (yrs)(11) |
Stated Interest Rate | Effective Interest Rate | Balance | % of Total | |||||||||||||||||||||||||||
| Fixed | 4.2 | 3.827% (See Table Above) |
3.827% | $ | 3,389,088 | 100% | ||||||||||||||||||||||||||
| Variable | — | — | —% | $ | — | 0% | ||||||||||||||||||||||||||
| Secured | 2.0 | 4.544% | $ | 114,088 | 3% | |||||||||||||||||||||||||||
| Unsecured | 4.3 | 3.800% | $ | 3,275,000 | 97% | |||||||||||||||||||||||||||
|
First Quarter 2024
Supplemental Financial Reporting Package
|
Page 18
|
|
||||||
Debt Summary (Continued). |
||||||||
| (unaudited and dollars in thousands) | ||||||||
Debt Maturity Schedule(12): |
||||||||||||||||||||||||||||||||
| Year | Secured(13) |
Unsecured | Total | % Total | Effective Interest Rate(1) |
|||||||||||||||||||||||||||
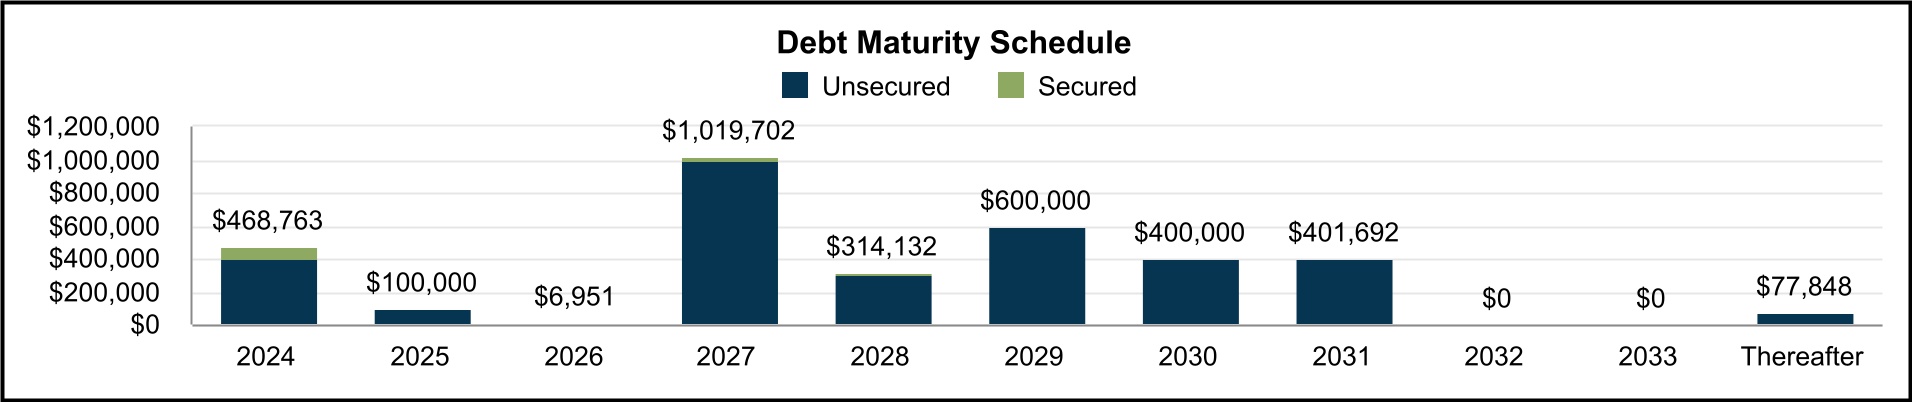
| 2024 | $ | 68,763 | $ | 400,000 | $ | 468,763 | 14 | % | 4.847 | % | ||||||||||||||||||||||
| 2025 | — | 100,000 | 100,000 | 3 | % | 4.290 | % | |||||||||||||||||||||||||
| 2026 | 6,951 | — | 6,951 | — | % | 3.900 | % | |||||||||||||||||||||||||
| 2027 | 19,702 | 1,000,000 | 1,019,702 | 30 | % | 4.106 | % | |||||||||||||||||||||||||
| 2028 | 14,132 | 300,000 | 314,132 | 9 | % | 4.948 | % | |||||||||||||||||||||||||
| 2029 | — | 600,000 | 600,000 | 18 | % | 4.115 | % | |||||||||||||||||||||||||
| 2030 | — | 400,000 | 400,000 | 12 | % | 2.125 | % | |||||||||||||||||||||||||
| 2031 | 1,692 | 400,000 | 401,692 | 12 | % | 2.163 | % | |||||||||||||||||||||||||
| 2032 | — | — | — | — | % | — | % | |||||||||||||||||||||||||
| 2033 | — | — | — | — | % | — | % | |||||||||||||||||||||||||
| Thereafter | 2,848 | 75,000 | 77,848 | 2 | % | 4.034 | % | |||||||||||||||||||||||||
| Total | $ | 114,088 | $ | 3,275,000 | $ | 3,389,088 | 100 | % | 3.827 | % | ||||||||||||||||||||||
|
First Quarter 2024
Supplemental Financial Reporting Package
|
Page 19
|
|
||||||
Operations. |
||||||||
| Quarterly Results | ||||||||
|
First Quarter 2024
Supplemental Financial Reporting Package
|
Page 20
|
|
||||||
Portfolio Overview. |
||||||||
| At March 31, 2024 | (unaudited results) | |||||||
| Consolidated Portfolio: | ||||||||
| Rentable Square Feet | Ending Occupancy % | In-Place ABR(3) |
||||||||||||||||||||||||||||||||||||||||||||||||||||||||||||
| Market | # of Properties |
Same Property Portfolio |
Non-Same Property Portfolio |
Total Portfolio |
Same Property Portfolio |
Non-Same Property Portfolio |
Total
Portfolio(1)
|
Total Portfolio
Excluding
Repositioning/
Redevelopment(2)
|
Total (in 000’s) |
Per Square Foot |
||||||||||||||||||||||||||||||||||||||||||||||||||||
| Central LA | 22 | 2,803,151 | 383,278 | 3,186,429 | 93.3 | % | 54.7 | % | 88.6 | % | 95.1 | % | $ | 34,338 | $12.16 | |||||||||||||||||||||||||||||||||||||||||||||||
| Greater San Fernando Valley | 74 | 5,638,426 | 1,343,701 | 6,982,127 | 97.7 | % | 82.8 | % | 94.8 | % | 98.8 | % | 98,302 | $14.85 | ||||||||||||||||||||||||||||||||||||||||||||||||
| Mid-Counties | 38 | 2,266,738 | 2,037,041 | 4,303,779 | 97.5 | % | 95.0 | % | 96.4 | % | 98.7 | % | 65,613 | $15.82 | ||||||||||||||||||||||||||||||||||||||||||||||||
| San Gabriel Valley | 46 | 3,908,505 | 1,995,562 | 5,904,067 | 97.3 | % | 95.5 | % | 96.7 | % | 98.0 | % | 71,486 | $12.52 | ||||||||||||||||||||||||||||||||||||||||||||||||
| South Bay | 82 | 6,260,782 | 1,241,069 | 7,501,851 | 95.8 | % | 68.3 | % | 91.3 | % | 97.5 | % | 145,391 | $21.23 | ||||||||||||||||||||||||||||||||||||||||||||||||
| Los Angeles County | 262 | 20,877,602 | 7,000,651 | 27,878,253 | 96.5 | % | 85.9 | % | 93.8 | % | 97.8 | % | 415,130 | $15.88 | ||||||||||||||||||||||||||||||||||||||||||||||||
| North Orange County | 24 | 1,404,332 | 886,436 | 2,290,768 | 100.0 | % | 76.7 | % | 91.0 | % | 100.0 | % | 33,295 | $15.98 | ||||||||||||||||||||||||||||||||||||||||||||||||
| OC Airport | 10 | 1,018,385 | 188,204 | 1,206,589 | 99.7 | % | 100.0 | % | 99.7 | % | 99.7 | % | 22,178 | $18.43 | ||||||||||||||||||||||||||||||||||||||||||||||||
| South Orange County | 10 | 448,762 | 183,098 | 631,860 | 100.0 | % | 87.3 | % | 96.3 | % | 96.3 | % | 9,793 | $16.09 | ||||||||||||||||||||||||||||||||||||||||||||||||
| West Orange County | 10 | 610,876 | 688,436 | 1,299,312 | 100.0 | % | 50.4 | % | 73.7 | % | 87.7 | % | 14,705 | $15.36 | ||||||||||||||||||||||||||||||||||||||||||||||||
| Orange County | 54 | 3,482,355 | 1,946,174 | 5,428,529 | 99.9 | % | 70.6 | % | 89.4 | % | 96.8 | % | 79,971 | $16.48 | ||||||||||||||||||||||||||||||||||||||||||||||||
| Inland Empire East | 1 | 33,258 | — | 33,258 | 100.0 | % | — | % | 100.0 | % | 100.0 | % | 635 | $19.09 | ||||||||||||||||||||||||||||||||||||||||||||||||
| Inland Empire West | 51 | 7,472,746 | 1,702,582 | 9,175,328 | 94.6 | % | 74.4 | % | 90.9 | % | 95.5 | % | 118,029 | $14.16 | ||||||||||||||||||||||||||||||||||||||||||||||||
| Riverside / San Bernardino County | 52 | 7,506,004 | 1,702,582 | 9,208,586 | 94.6 | % | 74.4 | % | 90.9 | % | 95.5 | % | 118,664 | $14.18 | ||||||||||||||||||||||||||||||||||||||||||||||||
| Central San Diego | 21 | 1,160,347 | 850,062 | 2,010,409 | 99.1 | % | 88.2 | % | 94.5 | % | 95.1 | % | 35,333 | $18.60 | ||||||||||||||||||||||||||||||||||||||||||||||||
| North County San Diego | 14 | 1,336,344 | 143,663 | 1,480,007 | 97.4 | % | 79.1 | % | 95.6 | % | 99.2 | % | 20,509 | $14.50 | ||||||||||||||||||||||||||||||||||||||||||||||||
| San Diego County | 35 | 2,496,691 | 993,725 | 3,490,416 | 98.1 | % | 86.9 | % | 94.9 | % | 96.9 | % | 55,842 | $16.85 | ||||||||||||||||||||||||||||||||||||||||||||||||
| Ventura | 19 | 2,747,215 | 409,217 | 3,156,432 | 94.6 | % | 78.8 | % | 92.6 | % | 92.8 | % | 37,042 | $12.68 | ||||||||||||||||||||||||||||||||||||||||||||||||
| Ventura County | 19 | 2,747,215 | 409,217 | 3,156,432 | 94.6 | % | 78.8 | % | 92.6 | % | 92.8 | % | 37,042 | $12.68 | ||||||||||||||||||||||||||||||||||||||||||||||||
| CONSOLIDATED TOTAL / WTD AVG | 422 | 37,109,867 | 12,052,349 | 49,162,216 | 96.4 | % | 81.6 | % | 92.8 | % | 96.9 | % | $ | 706,649 | $15.49 | |||||||||||||||||||||||||||||||||||||||||||||||
|
First Quarter 2024
Supplemental Financial Reporting Package
|
Page 21
|
|
||||||
Leasing Statistics and Trends. |
||||||||
| (unaudited results) | ||||||||
| Leasing Activity and Weighted Average New / Renewal Leasing Spreads: | ||||||||
| Three Months Ended | ||||||||||||||||||||||||||||||||
| Mar 31, 2024 | Dec 31, 2023 | Sep 30, 2023 | Jun 30, 2023 | Mar 31, 2023(1) |
||||||||||||||||||||||||||||
| Leasing Spreads: | ||||||||||||||||||||||||||||||||
GAAP Rent Change(2) |
53.0 | % | 63.1 | % | 64.8 | % | 96.8 | % | 80.2 | % | ||||||||||||||||||||||
Cash Rent Change(2) |
33.6 | % | 45.6 | % | 51.4 | % | 74.8 | % | 59.7 | % | ||||||||||||||||||||||
Leasing Activity (SF):(3) |
||||||||||||||||||||||||||||||||
| New leases | 830,941 | 727,886 | 862,420 | 961,235 | 522,288 | |||||||||||||||||||||||||||
| Renewal leases | 2,398,076 | 1,196,023 | 667,179 | 1,165,452 | 1,254,005 | |||||||||||||||||||||||||||
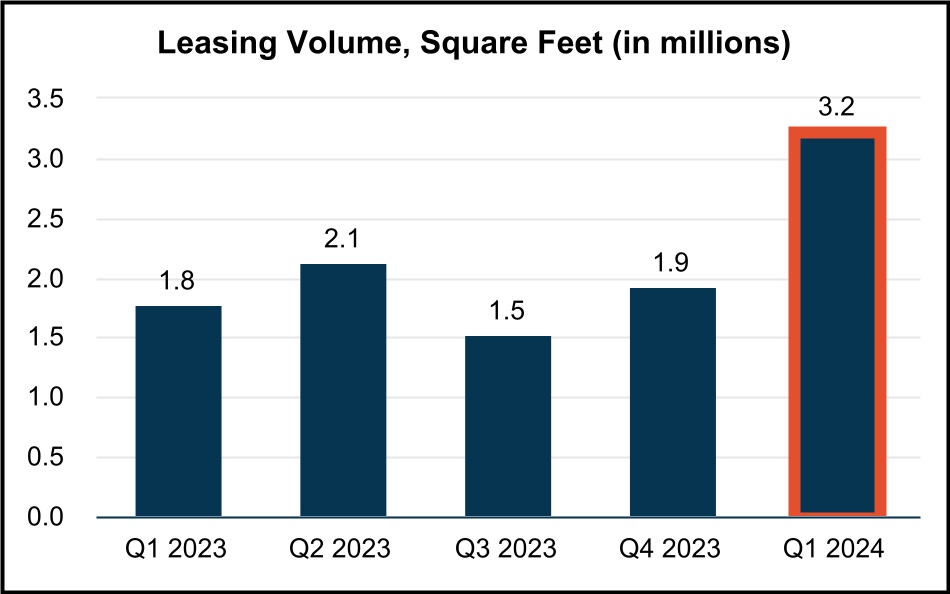
| Total leasing activity | 3,229,017 | 1,923,909 | 1,529,599 | 2,126,687 | 1,776,293 | |||||||||||||||||||||||||||
| Total expiring leases | (3,819,253) | (2,193,335) | (1,653,111) | (2,065,869) | (2,461,943) | |||||||||||||||||||||||||||
| Expiring leases - placed into repositioning/redevelopment | 732,083 | 473,701 | 557,387 | 395,180 | 720,119 | |||||||||||||||||||||||||||
Net absorption(4) |
141,847 | 204,275 | 433,875 | 455,998 | 34,469 | |||||||||||||||||||||||||||
Retention rate(5) |
82 | % | 77 | % | 62 | % | 71 | % | 83 | % | ||||||||||||||||||||||
Retention + Backfill rate(6) |
87 | % | 84 | % | 80 | % | 79 | % | 90 | % | ||||||||||||||||||||||
Leasing Activity and Change in Annual Rental Rates and Turnover Costs for Current Quarter Leases:(7) |
||||||||||||||||||||||||||||||||||||||||||||||||||||||||||||||||||||
| GAAP Rent | Cash Rent | |||||||||||||||||||||||||||||||||||||||||||||||||||||||||||||||||||
| First Quarter 2024: | # Leases Signed |
SF of Leasing |
Wtd. Avg. Lease Term (Years) |
Current Lease |
Prior Lease |
Rent Change - GAAP |
Current Lease |
Prior Lease |
Rent Change - Cash |
Wtd. Avg. Abatement (Months) |
Turnover
Costs
per SF(8)
|
|||||||||||||||||||||||||||||||||||||||||||||||||||||||||
| New | 50 | 830,941 | 4.2 | $18.02 | $12.75 | 41.3% | $17.83 | $13.59 | 31.2% | 2.1 | $7.01 | |||||||||||||||||||||||||||||||||||||||||||||||||||||||||
| Renewal | 64 | 2,398,076 | 3.1 | $17.61 | $15.34 | 14.8% | $17.71 | $15.91 | 11.3% | 1.7 | $1.53 | |||||||||||||||||||||||||||||||||||||||||||||||||||||||||
| Total / Wtd. Average | 114 | 3,229,017 | 3.4 | $17.65 | $15.05 | 17.3% | $17.72 | $15.65 | 13.2% | 1.7 | $2.14 | |||||||||||||||||||||||||||||||||||||||||||||||||||||||||
Excluding Tireco, Inc. Lease Extension:(2) | ||||||||||||||||||||||||||||||||||||||||||||||||||||||||||||||||||||
Renewal |
63 | 1,296,236 | 4.1 | $19.64 | $12.53 | 56.8% | $18.08 | $13.46 | 34.4% | 1.2 | $3.94 | |||||||||||||||||||||||||||||||||||||||||||||||||||||||||
| Total / Wtd. Average | 113 | 2,127,177 | 4.1 | $19.25 | $12.58 | 53.0% | $18.02 | $13.49 | 33.6% | 1.4 | $4.69 | |||||||||||||||||||||||||||||||||||||||||||||||||||||||||
|
First Quarter 2024
Supplemental Financial Reporting Package
|
Page 22
|
|
||||||
Leasing Statistics (Continued). |
||||||||
| (unaudited results) | ||||||||
| Lease Expiration Schedule as of March 31, 2024: | ||||||||
| Year of Lease Expiration | # of Leases Expiring |
Total Rentable Square Feet |
In-Place + Uncommenced ABR (in thousands) |
In-Place + Uncommenced ABR per SF |
||||||||||||||||||||||
| Available | — | 1,590,141 | $ | — | $— | |||||||||||||||||||||
Repositioning/Redevelopment(1) |
— | 1,351,820 | — | $— | ||||||||||||||||||||||
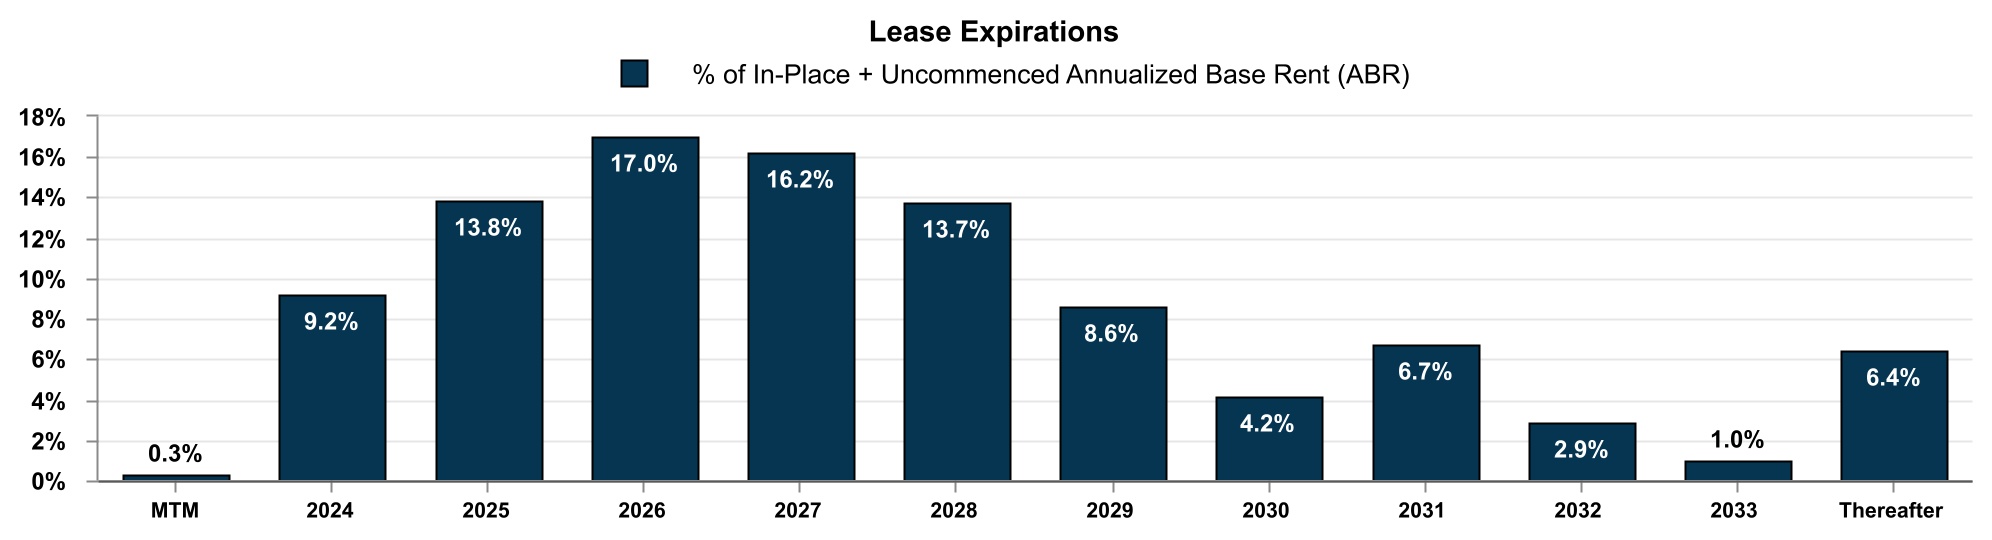
| MTM Tenants | 6 | 159,555 | 2,035 | $12.75 | ||||||||||||||||||||||
| 2024 | 305 | 4,765,435 | 66,444 | $13.94 | ||||||||||||||||||||||
| 2025 | 412 | 7,115,085 | 99,793 | $14.03 | ||||||||||||||||||||||
| 2026 | 378 | 8,741,930 | 123,134 | $14.09 | ||||||||||||||||||||||
| 2027 | 225 | 7,390,942 | 117,537 | $15.90 | ||||||||||||||||||||||
| 2028 | 150 | 5,375,271 | 99,505 | $18.51 | ||||||||||||||||||||||
| 2029 | 85 | 3,670,173 | 62,547 | $17.04 | ||||||||||||||||||||||
| 2030 | 28 | 1,978,712 | 30,438 | $15.38 | ||||||||||||||||||||||
| 2031 | 26 | 3,328,558 | 48,662 | $14.62 | ||||||||||||||||||||||
| 2032 | 16 | 973,530 | 20,782 | $21.35 | ||||||||||||||||||||||
| 2033 | 10 | 386,007 | 7,182 | $18.61 | ||||||||||||||||||||||
| Thereafter | 39 | 2,335,057 | 46,522 | $19.92 | ||||||||||||||||||||||
| Total Portfolio | 1,680 | 49,162,216 | $ | 724,581 | $15.68 | |||||||||||||||||||||
|
First Quarter 2024
Supplemental Financial Reporting Package
|
Page 23
|
|
||||||
Top Tenants and Lease Segmentation. |
||||||||
| (unaudited results) | ||||||||
Top 20 Tenants as of March 31, 2024 |
||||||||
| Tenant | Submarket | Leased Rentable SF |
In-Place + Uncommenced
ABR (in 000’s)(1)
|
% of In-Place +
Uncommenced ABR(1)
|
In-Place + Uncommenced
ABR per SF(1)
|
Lease Expiration |
||||||||||||||||||||||||||||||||
Tireco, Inc.(2) |
Inland Empire West | 1,101,840 | $19,251 | 2.7% | $17.47 | 1/31/2027 | ||||||||||||||||||||||||||||||||
| L3 Technologies, Inc. | Multiple Submarkets(3) |
595,267 | $12,555 | 1.7% | $21.09 | 9/30/2031 | ||||||||||||||||||||||||||||||||
| Zenith Energy West Coast Terminals LLC | South Bay | —(4) |
$11,446 | 1.6% | $3.28(4) |
9/29/2041 | ||||||||||||||||||||||||||||||||
| Cubic Corporation | Central San Diego | 515,382 | $10,786 | 1.5% | $20.93 | 3/31/2038(5) |
||||||||||||||||||||||||||||||||
| Federal Express Corporation | Multiple Submarkets(6) |
527,861 | $10,238 | 1.4% | $19.40 | 11/30/2032(6) |
||||||||||||||||||||||||||||||||
GXO Logistics Supply Chain, Inc. |
Mid-Counties |
411,034 | $8,385 | 1.2% | $20.40 | 11/30/2028 | ||||||||||||||||||||||||||||||||
| Best Buy Stores, L.P. | Inland Empire West | 501,649 | $8,201 | 1.1% | $16.35 | 6/30/2029 | ||||||||||||||||||||||||||||||||
| The Hertz Corporation | South Bay | 38,680(7) |
$7,932 | 1.1% | $9.90(7) |
3/31/2026 | ||||||||||||||||||||||||||||||||
| IBY, LLC | San Gabriel Valley | 993,142 | $7,059 | 1.0% | $7.11 | 4/5/2031 | ||||||||||||||||||||||||||||||||
| Michael Kors (USA) | Mid-Counties | 565,619 | $6,098 | 0.8% | $10.78 | 11/30/2026 | ||||||||||||||||||||||||||||||||
| Top 10 Tenants | 5,250,474 | $101,951 | 14.1% | |||||||||||||||||||||||||||||||||||
| Top 11 - 20 Tenants | 2,776,006 | $44,736 | 6.2% | |||||||||||||||||||||||||||||||||||
| Total Top 20 Tenants | 8,026,480 | $146,687 | 20.3% | |||||||||||||||||||||||||||||||||||
| Lease Segmentation by Size: | |||||||||||||||||||||||||||||||||||||||||||||||||||||
| Square Feet | Number of Leases |
Leased Building Rentable SF |
Building Rentable SF |
Building Leased % |
Building Leased % Excl. Repo/Redev |
In-Place +
Uncommenced ABR
(in 000’s)(1)
|
% of In-Place +
Uncommenced
ABR(1)
|
In-Place +
Uncommenced
ABR per SF(1)
|
|||||||||||||||||||||||||||||||||||||||||||||
| <4,999 | 638 | 1,548,763 | 1,711,164 | 90.5% | 92.7% | $ | 28,626 | 4.0% | $18.48 | ||||||||||||||||||||||||||||||||||||||||||||
| 5,000 - 9,999 | 233 | 1,673,774 | 1,849,154 | 90.5% | 93.5% | 30,598 | 4.2% | $18.28 | |||||||||||||||||||||||||||||||||||||||||||||
| 10,000 - 24,999 | 326 | 5,302,471 | 5,850,392 | 90.6% | 94.0% | 92,355 | 12.7% | $17.42 | |||||||||||||||||||||||||||||||||||||||||||||
| 25,000 - 49,999 | 181 | 6,589,755 | 7,293,592 | 90.3% | 96.5% | 102,871 | 14.2% | $15.61 | |||||||||||||||||||||||||||||||||||||||||||||
| 50,000 - 99,999 | 120 | 8,732,381 | 9,447,034 | 92.4% | 97.5% | 134,059 | 18.5% | $15.35 | |||||||||||||||||||||||||||||||||||||||||||||
| >100,000 | 121 | 22,179,809 | 22,762,340 | 97.4% | 100.0% | 294,514 | 40.7% | $13.28 | |||||||||||||||||||||||||||||||||||||||||||||
| Building Subtotal / Wtd. Avg. | 1,619 | 46,026,953 | (2) |
48,913,676 | (2) |
94.1% | (2) |
97.8% | $ | 683,023 | 94.3% | $14.84 | |||||||||||||||||||||||||||||||||||||||||
Land/IOS(3) |
24 | 8,146,906 | (4) |
39,447 | 5.4% | $4.84 | (4) |
||||||||||||||||||||||||||||||||||||||||||||||
Other(3) |
37 | 2,110 | 0.3% | ||||||||||||||||||||||||||||||||||||||||||||||||||
| Total | 1,680 | $ | 724,580 | 100.0% | |||||||||||||||||||||||||||||||||||||||||||||||||
|
First Quarter 2024
Supplemental Financial Reporting Package
|
Page 24
|
|
||||||
Capital Expenditure Summary. |
||||||||
| (unaudited results, in thousands, except square feet and per square foot data) | ||||||||
| Three months ended March 31, 2024 | ||||||||
| Year to Date | ||||||||||||||||||||
| Total | SF(1) |
PSF | ||||||||||||||||||
| Tenant Improvements: | ||||||||||||||||||||
| New Leases – 1st Generation | $ | 378 | 224,102 | $ | 1.69 | |||||||||||||||
| New Leases – 2nd Generation | — | — | $ | 0.00 | ||||||||||||||||
| Renewals | 226 | 238,579 | $ | 0.95 | ||||||||||||||||
| Total Tenant Improvements | $ | 604 | ||||||||||||||||||
| Leasing Commissions & Lease Costs: | ||||||||||||||||||||
| New Leases – 1st Generation | $ | 2,189 | 585,122 | $ | 3.74 | |||||||||||||||
| New Leases – 2nd Generation | 985 | 276,719 | $ | 3.56 | ||||||||||||||||
| Renewals | 2,246 | 665,746 | $ | 3.37 | ||||||||||||||||
| Total Leasing Commissions & Lease Costs | $ | 5,420 | ||||||||||||||||||
| Total Recurring Capex | $ | 2,990 | 46,208,746 | $ | 0.06 | |||||||||||||||
| Recurring Capex % of NOI | 1.8 | % | ||||||||||||||||||
| Recurring Capex % of Rental Income | 1.4 | % | ||||||||||||||||||
| Nonrecurring Capex: | ||||||||||||||||||||
Repositioning and Redevelopment in Process(2) |
$ | 55,817 | ||||||||||||||||||
Unit Renovation(3) |
1,843 | |||||||||||||||||||
Other(4) |
4,377 | |||||||||||||||||||
| Total Nonrecurring Capex | $ | 62,037 | 26,409,973 | $ | 2.35 | |||||||||||||||
Other Capitalized Costs(5) |
$ | 13,535 | ||||||||||||||||||
|
First Quarter 2024
Supplemental Financial Reporting Package
|
Page 25
|
|
||||||
Properties and Space Under Repositioning/Redevelopment.(1) | ||||||||
| As of March 31, 2024 | (unaudited results, $ in millions) | |||||||
| Repositioning | |||||||||||||||||||||||||||||||||||||||||||||||||||||||||||||||||||||||||||||
|
Total
Property
RSF(2)
|
Repo/
Lease-Up
RSF(2)
|
Total Property Leased % 3/31/2024 |
Est. Constr.
Period(1)
|
Est.
Stabilization
Period(1)(3)
|
Purch.
Price(1)
|
Proj.
Repo
Costs(1)
|
Proj.
Total
Invest.(1)
|
Cumulative
Investment
to Date(1)
|
Actual
Cash NOI
1Q-2024(1)
|
Est.
Annual
Stabilized
Cash NOI(1)
|
Est.
Unlevered
Stabilized
Yield(1)
|
||||||||||||||||||||||||||||||||||||||||||||||||||||||||||||||||||
| Property (Submarket) | Start | Target Complet. |
|||||||||||||||||||||||||||||||||||||||||||||||||||||||||||||||||||||||||||
| CURRENT REPOSITIONING: | |||||||||||||||||||||||||||||||||||||||||||||||||||||||||||||||||||||||||||||
| 2880 Ana Street (South Bay) | LAND | LAND | —% | 3Q-23 | 2Q-24 | 4Q-24 | $ | 34.9 | $ | 5.4 | $ | 40.3 | $ | 36.5 | $ | 0.0 | $ | 1.8 | 4.5% | ||||||||||||||||||||||||||||||||||||||||||||||||||||||||||
| 14434-14527 San Pedro Street (South Bay) | 58,094 | 58,094 | —% | 3Q-23 | 2Q-25 | 4Q-25 | 49.8 | 14.6 | 64.4 | 51.5 | 0.0 | 3.6 | 5.5% | ||||||||||||||||||||||||||||||||||||||||||||||||||||||||||||||||
| 29120 Commerce Center Drive (SF Valley) | 135,258 | 135,258 | 100%(4) |
3Q-23 | 4Q-25 | 3Q-26 | 27.1 | 4.1 | 31.2 | 31.2 | 0.3 | 2.5 | 7.9% | ||||||||||||||||||||||||||||||||||||||||||||||||||||||||||||||||
| 263-321 Gardena Blvd (South Bay) | 55,238 | 55,238 | —% | 4Q-23 | 3Q-24 | 1Q-25 | 16.2 | 2.9 | 19.1 | 17.5 | 0.0 | 2.1 | 11.1% | ||||||||||||||||||||||||||||||||||||||||||||||||||||||||||||||||
| 17311 Nichols Lane (OC West) | 104,182 | 104,182 | 100%(5) |
1Q-24 | 2Q-24 | 3Q-24 | 17.1 | 4.6 | 21.7 | 17.8 | 0.0 | 1.7 | 8.0% | ||||||||||||||||||||||||||||||||||||||||||||||||||||||||||||||||
East 27th Street (Central LA)(6) |
300,389 | 126,563 | 58% | 1Q-24 | 4Q-24 | 2Q-25 | 26.9 | 6.4 | 33.3 | 28.0 | (0.1) | 1.8 | 5.4% | ||||||||||||||||||||||||||||||||||||||||||||||||||||||||||||||||
| 122-125 N. Vinedo Avenue (SF Valley) | 48,381 | 48,381 | —% | 1Q-24 | 4Q-24 | 3Q-25 | 5.3 | 3.2 | 8.5 | 5.8 | 0.0 | 1.2 | 13.5% | ||||||||||||||||||||||||||||||||||||||||||||||||||||||||||||||||
| 1020 Bixby Drive (SG Valley) | 56,915 | 56,915 | —% | 1Q-24 | 4Q-24 | 3Q-25 | 16.5 | 3.4 | 19.9 | 17.2 | 0.2 | 0.9 | 4.5% | ||||||||||||||||||||||||||||||||||||||||||||||||||||||||||||||||
| 12907 Imperial Highway (Mid-Counties) | 101,080 | 101,080 | —% | 1Q-24 | 4Q-24 | 3Q-25 | 12.3 | 3.5 | 15.8 | 12.6 | 0.1 | 2.0 | 12.4% | ||||||||||||||||||||||||||||||||||||||||||||||||||||||||||||||||
17000 Kingsview Avenue (South Bay) |
100,121 | 100,121 | 77%(7) |
1Q-24 | 1Q-25 | 4Q-25 | 14.0 | 4.4 | 18.4 | 14.5 | 0.2 | 1.6 | 8.5% | ||||||||||||||||||||||||||||||||||||||||||||||||||||||||||||||||
| 29125 Avenue Paine (SF Valley) | 175,897 | 175,897 | 100%(8) |
1Q-24 | 3Q-25 | 1Q-26 | 45.3 | 5.9 | 51.2 | 47.0 | 0.3 | 3.1 | 6.1% | ||||||||||||||||||||||||||||||||||||||||||||||||||||||||||||||||
| Total/Weighted Average | 1,135,555 | 961,729 | $ | 265.4 | $ | 58.4 | $ | 323.8 | $ | 279.6 | $ | 1.0 | $ | 22.3 | 6.8% | ||||||||||||||||||||||||||||||||||||||||||||||||||||||||||||||
| LEASE-UP REPOSITIONING: | |||||||||||||||||||||||||||||||||||||||||||||||||||||||||||||||||||||||||||||
| 20851 Currier Road (SG Valley) | 59,412 | 59,412 | 100%(9) |
1Q-23 | 2Q-23 | 2Q-24 | $ | 22.0 | $ | 2.1 | $ | 24.1 | $ | 23.6 | $ | 0.0 | $ | 1.0 | 4.4% | ||||||||||||||||||||||||||||||||||||||||||||||||||||||||||
| 444 Quay Avenue (South Bay) | 26,700 | 26,700 | 100%(10) |
1Q-23 | 1Q-24 | 2Q-24 | 25.8 | 10.0 | 35.8 | 34.5 | 0.0 | 3.2 | 8.9% | ||||||||||||||||||||||||||||||||||||||||||||||||||||||||||||||||
| 500 Dupont Avenue (Inland Empire West) | 274,898 | 274,898 | —% | 1Q-23 | 1Q-24 | 3Q-24 | 58.8 | 10.5 | 69.3 | 67.4 | 0.0 | 4.0 | 5.7% | ||||||||||||||||||||||||||||||||||||||||||||||||||||||||||||||||
11308-11350 Penrose Street (SF Valley)(11) |
151,011 | 71,547 | 53% | 1Q-23 | 1Q-24 | 3Q-24 | 12.1 | 5.2 | 17.3 | 16.7 | 0.0 | 1.4 | 7.8% | ||||||||||||||||||||||||||||||||||||||||||||||||||||||||||||||||
| 4039 Calle Platino (North County SD) | 143,663 | 73,807 | 79% | 2Q-23 | 1Q-24 | 3Q-24 | 20.5 | 4.2 | 24.7 | 24.5 | 0.2 | 2.0 | 8.2% | ||||||||||||||||||||||||||||||||||||||||||||||||||||||||||||||||
| Total/Weighted Average | 655,684 | 506,364 | $ | 139.2 | $ | 32.0 | $ | 171.2 | $ | 166.7 | $ | 0.2 | $ | 11.6 | 6.8% | ||||||||||||||||||||||||||||||||||||||||||||||||||||||||||||||
| STABILIZED REPOSITIONING: | |||||||||||||||||||||||||||||||||||||||||||||||||||||||||||||||||||||||||||||
8210-8240 Haskell Avenue (SF Valley)(12) |
52,934 | 52,934 | 50% | 1Q-22 | 1Q-23 | 1Q-24 | $ | 12.5 | $ | 2.2 | $ | 14.7 | $ | 14.4 | $ | 0.0 | $ | 0.9 | 6.2% | ||||||||||||||||||||||||||||||||||||||||||||||||||||||||||
| 9755 Distribution Avenue (Central SD) | 48,011 | 24,071 | 100% | 2Q-23 | 4Q-23 | 1Q-24 | 5.5 | 1.6 | 7.1 | 7.1 | 0.1 | 0.9 | 13.4% | ||||||||||||||||||||||||||||||||||||||||||||||||||||||||||||||||
| 8902-8940 Activity Road (Central SD) | 112,876 | 13,950 | 98% | 3Q-23 | 1Q-24 | 1Q-24 | 3.3 | 1.7 | 5.0 | 5.0 | 0.0 | 0.4 | 7.0% | ||||||||||||||||||||||||||||||||||||||||||||||||||||||||||||||||
| Total/Weighted Average | 213,821 | 90,955 | $ | 21.3 | $ | 5.5 | $ | 26.8 | $ | 26.5 | $ | 0.1 | $ | 2.2 | 8.3% | ||||||||||||||||||||||||||||||||||||||||||||||||||||||||||||||
| FUTURE REPOSITIONING: | |||||||||||||||||||||||||||||||||||||||||||||||||||||||||||||||||||||||||||||
| 19301 Santa Fe Avenue (South Bay) | LAND | LAND | —% | 2Q-24 | 1Q-25 | 3Q-25 | $ | 14.7 | $ | 5.8 | $ | 20.5 | $ | 15.0 | $ | 0.1 | $ | 1.0 | 5.0% | ||||||||||||||||||||||||||||||||||||||||||||||||||||||||||
East 46th Street (Central LA) |
190,663 | 78,928 | 75% | 2Q-24 | 2Q-25 | 1Q-26 | 14.7 | 5.0 | 19.7 | 14.8 | 0.3 | 2.0 | 10.0% | ||||||||||||||||||||||||||||||||||||||||||||||||||||||||||||||||
3131 Harcourt Street (South Bay) |
34,000 | 34,000 | 56% | 3Q-24 | 3Q-25 | 2Q-26 | 54.4 | 9.9 | 64.3 | 54.9 | 0.2 | 2.6 | 4.1% | ||||||||||||||||||||||||||||||||||||||||||||||||||||||||||||||||
14400 Figueroa Street (South Bay) |
56,700 | 56,700 | —% | 3Q-24 | 4Q-25 | 3Q-26 | 61.4 | 13.1 | 74.5 | 62.1 | 0.0 | 3.0 | 4.0% | ||||||||||||||||||||||||||||||||||||||||||||||||||||||||||||||||
8985 Crestmar Point (Central SD) |
53,395 | 53,395 | 87% | 4Q-24 | 3Q-25 | 2Q-26 | 8.1 | 6.4 | 14.5 | 8.2 | 0.1 | 0.8 | 5.4% | ||||||||||||||||||||||||||||||||||||||||||||||||||||||||||||||||
| Total/Weighted Average | 334,758 | 223,023 | $ | 153.3 | $ | 40.2 | $ | 193.5 | $ | 155.0 | $ | 0.7 | $ | 9.4 | 4.9% | ||||||||||||||||||||||||||||||||||||||||||||||||||||||||||||||
| Total Repositioning (Excluding Other) | 2,339,818 | 1,782,071 | $ | 579.2 | $ | 136.1 | $ | 715.3 | $ | 627.8 | $ | 2.0 | $ | 45.5 | 6.3% | ||||||||||||||||||||||||||||||||||||||||||||||||||||||||||||||
|
First Quarter 2024
Supplemental Financial Reporting Package
|
Page 26
|
|
||||||
Properties and Space Under Repositioning/Redevelopment (Continued).(1) | ||||||||
| As of March 31, 2024 | (unaudited results, $ in millions) | |||||||
| Redevelopment | |||||||||||||||||||||||||||||||||||||||||||||||||||||||||||||||||||||||
|
Projected
RSF(13)
|
Total
Property
Leased %
3/31/2024
|
Est. Constr. Period(1) |
Est.
Stabilization
Period(1)(3)
|
Purch.
Price(1)
|
Proj.
Redev
Costs(1)
|
Proj.
Total
Invest.(1)
|
Cumulative
Investment
to Date(1)
|
Actual
Cash NOI
1Q-2024(1)
|
Est.
Annual
Stabilized
Cash NOI(1)
|
Est.
Unlevered
Stabilized
Yield(1)
|
|||||||||||||||||||||||||||||||||||||||||||||||||||||||||||||
| Property (Submarket) | Start | Target Complet. |
|||||||||||||||||||||||||||||||||||||||||||||||||||||||||||||||||||||
| CURRENT REDEVELOPMENT: | |||||||||||||||||||||||||||||||||||||||||||||||||||||||||||||||||||||||
| 1055 Sandhill Avenue (South Bay) | 127,857 | —% | 3Q-21 | 2Q-24 | 4Q-24 | $ | 12.0 | $ | 18.6 | $ | 30.6 | $ | 28.7 | $ | 0.0 | $ | 2.5 | 8.1% | |||||||||||||||||||||||||||||||||||||||||||||||||||||
| 9615 Norwalk Boulevard (Mid-Counties) | 201,571 | —% | 3Q-21 | 1Q-25 | 3Q-25 | 9.6 | 48.9 | 58.5 | 32.7 | 0.0 | 4.5 | 7.7% | |||||||||||||||||||||||||||||||||||||||||||||||||||||||||||
| 9920-10020 Pioneer Blvd (Mid-Counties) | 162,231 | —% | 4Q-21 | 2Q-24 | 4Q-24 | 23.6 | 33.4 | 57.0 | 47.7 | 0.0 | 3.3 | 5.9% | |||||||||||||||||||||||||||||||||||||||||||||||||||||||||||
| 1901 Via Burton (North OC) | 139,449 | —% | 1Q-22 | 2Q-24 | 4Q-24 | 24.5 | 21.2 | 45.7 | 39.6 | 0.0 | 3.0 | 6.5% | |||||||||||||||||||||||||||||||||||||||||||||||||||||||||||
3233 Mission Oaks Blvd. (Ventura)(14) |
117,358 | —% | 2Q-22 | 2Q-24 | 2Q-25 | 40.7 | 28.4 | 69.1 | 58.6 | 0.8 | 5.8 | 8.3% | |||||||||||||||||||||||||||||||||||||||||||||||||||||||||||
| 6027 Eastern Avenue (Central LA) | 93,498 | —% | 3Q-22 | 3Q-24 | 1Q-25 | 23.4 | 19.9 | 43.3 | 34.7 | 0.0 | 1.9 | 4.4% | |||||||||||||||||||||||||||||||||||||||||||||||||||||||||||
| 8888-8992 Balboa Avenue (Central SD) | 123,488 | —% | 3Q-22 | 3Q-24 | 2Q-25 | 19.9 | 20.9 | 40.8 | 32.6 | 0.0 | 2.5 | 6.1% | |||||||||||||||||||||||||||||||||||||||||||||||||||||||||||
| 2390-2444 American Way (North OC) | 100,483 | —% | 4Q-22 | 2Q-24 | 4Q-24 | 17.1 | 19.3 | 36.4 | 34.0 | 0.0 | 2.0 | 5.5% | |||||||||||||||||||||||||||||||||||||||||||||||||||||||||||
| 12118 Bloomfield Avenue (Mid-Counties) | 109,447 | —% | 4Q-22 | 4Q-24 | 2Q-25 | 16.7 | 20.4 | 37.1 | 23.1 | 0.0 | 2.4 | 6.6% | |||||||||||||||||||||||||||||||||||||||||||||||||||||||||||
| 4416 Azusa Canyon Road (SG Valley) | 130,063 | —% | 4Q-22 | 4Q-24 | 3Q-25 | 12.3 | 20.9 | 33.2 | 18.5 | 0.0 | 2.5 | 7.7% | |||||||||||||||||||||||||||||||||||||||||||||||||||||||||||
| 15010 Don Julian Road (SG Valley) | 219,242 | —% | 1Q-23 | 1Q-25 | 3Q-25 | 22.9 | 31.7 | 54.6 | 29.1 | 0.0 | 3.9 | 7.1% | |||||||||||||||||||||||||||||||||||||||||||||||||||||||||||
| 21515 Western Avenue (South Bay) | 84,100 | —% | 2Q-23 | 1Q-25 | 4Q-25 | 19.1 | 19.3 | 38.4 | 21.9 | 0.0 | 1.8 | 4.6% | |||||||||||||||||||||||||||||||||||||||||||||||||||||||||||
| 12772 San Fernando Road (SF Valley) | 143,421 | —% | 3Q-23 | 4Q-24 | 1Q-25 | 22.1 | 23.8 | 45.9 | 25.4 | 0.0 | 3.0 | 6.6% | |||||||||||||||||||||||||||||||||||||||||||||||||||||||||||
| 19900 Plummer Street (SF Valley) | 79,900 | —% | 3Q-23 | 4Q-24 | 2Q-25 | 15.5 | 15.8 | 31.3 | 17.7 | 0.0 | 1.6 | 5.1% | |||||||||||||||||||||||||||||||||||||||||||||||||||||||||||
| 17907-18001 Figueroa Street (South Bay) | 76,722 | —% | 4Q-23 | 4Q-24 | 3Q-25 | 20.2 | 17.7 | 37.9 | 20.2 | 0.0 | 2.5 | 6.5% | |||||||||||||||||||||||||||||||||||||||||||||||||||||||||||
Rancho Pacifica - Bldg 5 (South Bay)(15) |
76,500 | —% | 4Q-23 | 4Q-24 | 3Q-25 | 9.3 | 16.3 | 25.6 | 11.0 | 0.0 | 1.5 | 5.8% | |||||||||||||||||||||||||||||||||||||||||||||||||||||||||||
| 1500 Raymond Avenue (North OC) | 138,497 | —% | 4Q-23 | 1Q-25 | 3Q-25 | 46.1 | 25.0 | 71.1 | 49.8 | 0.0 | 3.1 | 4.4% | |||||||||||||||||||||||||||||||||||||||||||||||||||||||||||
| Total/Weighted Average | 2,123,827 | $ | 355.0 | $ | 401.5 | $ | 756.5 | $ | 525.3 | $ | 0.8 | $ | 47.8 | 6.3% | |||||||||||||||||||||||||||||||||||||||||||||||||||||||||
| LEASE-UP REDEVELOPMENT: | |||||||||||||||||||||||||||||||||||||||||||||||||||||||||||||||||||||||
12752-12822 Monarch St. (West OC)(16) |
163,864 | 17% | 1Q-22 | 2Q-23 | 2Q-24 | $ | 34.1 | $ | 18.5 | $ | 52.6 | $ | 51.2 | $ | (0.1) | $ | 4.5 | 8.5% | |||||||||||||||||||||||||||||||||||||||||||||||||||||
| 3071 Coronado Street (North OC) | 105,173 | —% | 1Q-23 | 1Q-24 | 3Q-24 | 28.2 | 16.9 | 45.1 | 45.1 | 0.0 | 2.2 | 4.8% | |||||||||||||||||||||||||||||||||||||||||||||||||||||||||||
| Total/Weighted Average | 269,037 | $ | 62.3 | $ | 35.4 | $ | 97.7 | $ | 96.3 | $ | (0.1) | $ | 6.7 | 6.8% | |||||||||||||||||||||||||||||||||||||||||||||||||||||||||
| FUTURE REDEVELOPMENT: | |||||||||||||||||||||||||||||||||||||||||||||||||||||||||||||||||||||||
| 13711 Freeway Drive (Mid-Counties) | 104,500 | 100% | 3Q-24 | 4Q-25 | 3Q-26 | $ | 34.1 | $ | 21.3 | $ | 55.4 | $ | 34.7 | $ | 0.1 | $ | 2.6 | 4.6% | |||||||||||||||||||||||||||||||||||||||||||||||||||||
| 14940 Proctor Road (SG Valley) | 165,537 | 100% | 3Q-24 | 4Q-25 | 2Q-26 | 28.8 | 25.3 | 54.1 | 29.8 | 0.5 | 2.8 | 5.1% | |||||||||||||||||||||||||||||||||||||||||||||||||||||||||||
| 7815 Van Nuys Blvd (SF Valley) | 77,000 | 56% | 4Q-24 | 4Q-25 | 2Q-26 | 25.6 | 16.2 | 41.8 | 25.8 | 0.0 | 1.9 | 4.5% | |||||||||||||||||||||||||||||||||||||||||||||||||||||||||||
| 404-430 Berry Way (North OC) | 147,000 | 16% | 2Q-25 | 3Q-26 | 1Q-27 | 23.8 | 27.5 | 51.3 | 24.1 | 0.1 | 2.9 | 5.7% | |||||||||||||||||||||||||||||||||||||||||||||||||||||||||||
| Total/Weighted Average | 494,037 | $ | 112.3 | $ | 90.3 | $ | 202.6 | $ | 114.4 | $ | 0.7 | $ | 10.2 | 5.0% | |||||||||||||||||||||||||||||||||||||||||||||||||||||||||
| Total Redevelopment | 2,886,901 | $ | 529.6 | $ | 527.2 | $ | 1,056.8 | $ | 736.0 | $ | 1.4 | $ | 64.7 | 6.1% | |||||||||||||||||||||||||||||||||||||||||||||||||||||||||
Total Repositioning / Redevelopment |
4,668,972 | $ | 1,108.8 | $ | 663.3 | $ | 1,772.1 | $ | 1,363.8 | $ | 3.4 | $ | 110.2 | 6.2% | |||||||||||||||||||||||||||||||||||||||||||||||||||||||||
OTHER REPOSITIONING: |
|||||||||||||||||||||||||||||||||||||||||||||||||||||||||||||||||||||||
13 projects totaling 476,994 RSF with estimated costs < $2 million individually(17) |
$ | 15.0 | $ | 4.8 | $ | 0.4 | $ | 15.2 | 7.0% - 8.0% | ||||||||||||||||||||||||||||||||||||||||||||||||||||||||||||||
|
First Quarter 2024
Supplemental Financial Reporting Package
|
Page 27
|
|
||||||
Properties and Space Under Repositioning/Redevelopment (Continued).(1) |
|||||||||||
| As of March 31, 2024 | (unaudited results, in thousands, except square feet) | ||||||||||
| Prior and Current Year Stabilized Repositioning/Redevelopment | ||||||||||||||||||||||||||||||||||||||||||||||||||||||||
| Property (Submarket) | Rentable Square Feet | Stabilized Period | Unlevered Stabilized Yield | |||||||||||||||||||||||||||||||||||||||||||||||||||||
| 12821 Knott Street (West OC) | 165,171 | 2Q-23 | 10.3% | |||||||||||||||||||||||||||||||||||||||||||||||||||||
| 12133 Greenstone Avenue (Mid-Counties) | LAND | 2Q-23 | 7.2% | |||||||||||||||||||||||||||||||||||||||||||||||||||||
| 14100 Vine Place (Mid-Counties) | 122,514 | 2Q-23 | 4.5% | |||||||||||||||||||||||||||||||||||||||||||||||||||||
| 15601 Avalon Boulevard (South Bay) | 86,879 | 2Q-23 | 6.5% | |||||||||||||||||||||||||||||||||||||||||||||||||||||
| 19431 Santa Fe Avenue (South Bay) | LAND | 4Q-23 | 12.9% | |||||||||||||||||||||||||||||||||||||||||||||||||||||
| 2800 Casitas Avenue (SF Valley) | 116,158 | 4Q-23 | 5.4% | |||||||||||||||||||||||||||||||||||||||||||||||||||||
| 9755 Distribution Avenue (Central SD) | 24,071 | 1Q-24 | 13.4% | |||||||||||||||||||||||||||||||||||||||||||||||||||||
| 8902-8940 Activity Road (Central SD) | 13,950 | 1Q-24 | 7.0% | |||||||||||||||||||||||||||||||||||||||||||||||||||||
|
First Quarter 2024
Supplemental Financial Reporting Package
|
Page 28
|
|
||||||
Current Year Investments and Dispositions Summary. |
||||||||||||||||||||||||||||||||||||||||||||
| As of March 31, 2024 | (unaudited results) | |||||||||||||||||||||||||||||||||||||||||||
| 2024 Current Period Acquisitions | ||||||||||||||||||||||||||||||||||||||||||||
| Investment Date |
Property Address | County | Submarket | Rentable Square Feet |
Investment Price ($ in MM) |
Occ. % at Acquisition |
Est. Unlevered Stabilized Yield |
|||||||||||||||||||||||||||||||||||||
| 1/31/2024 | 5000 & 5010 Azusa Canyon Rd | Los Angeles | San Gabriel Valley | 233,984 | $ | 84.00 | 100% | 5.4% | ||||||||||||||||||||||||||||||||||||
| 3/28/2024 | Blackstone Industrial Assets(1) |
Various | Various | 3,008,578 | 996.80 | 98% | 5.6% | |||||||||||||||||||||||||||||||||||||
Total 2024 Acquisitions through March 31, 2024 |
3,242,562 | $ | 1,080.80 | |||||||||||||||||||||||||||||||||||||||||
2024 Subsequent Period Acquisitions | ||||||||||||||||||||||||||||||||||||||||||||
| Investment Date |
Property Address | County | Submarket | Rentable Square Feet |
Acquisition
Price
($ in MM)
|
Occ. % at
Acquisition
|
Est. Unlevered Stabilized Yield |
|||||||||||||||||||||||||||||||||||||
| 4/5/2024 | 4422 Airport Drive | San Bernardino | Inland Empire West | 88,283 | $ | 26.73 | 100% | 5.5% | ||||||||||||||||||||||||||||||||||||
Total Year to Date 2024 Acquisitions |
3,330,845 | $ | 1,107.53 | |||||||||||||||||||||||||||||||||||||||||
| 2024 Subsequent Period Dispositions | ||||||||||||||||||||||||||||||||
| Disposition Date |
Property Address | County | Submarket | Rentable Square Feet |
Sale Price ($ in MM) |
|||||||||||||||||||||||||||
| 4/16/2024 | 2360-2364 East Sturgis Road |
Ventura |
Ventura |
49,641 | $ | 10.00 | ||||||||||||||||||||||||||
Total Year to Date 2024 Dispositions |
49,641 | $ | 10.00 | |||||||||||||||||||||||||||||
|
First Quarter 2024
Supplemental Financial Reporting Package
|
Page 29
|
|
||||||
Current Year Investments and Dispositions Summary (Continued). |
||||||||||||||||||||||||||||||||
| As of March 31, 2024 | (unaudited results) | |||||||||||||||||||||||||||||||
2024 Current Period Acquisitions - Blackstone Industrial Assets | ||||||||||||||||||||||||||||||||
| Investment Date |
Property Address | County | Submarket | Rentable Square Feet |
Occ. % at Acquisition |
|||||||||||||||||||||||||||
| 3/28/2024 | 11120 Sherman Way | Los Angeles | Greater San Fernando Valley | 28,094 | 100% | |||||||||||||||||||||||||||
| 3/28/2024 | 11128 Gault Street | Los Angeles | Greater San Fernando Valley | 30,488 | 100% | |||||||||||||||||||||||||||
| 3/28/2024 | 11130 Sherman Way | Los Angeles | Greater San Fernando Valley | 22,148 | 100% | |||||||||||||||||||||||||||
| 3/28/2024 | 11150 Gault Way | Los Angeles | Greater San Fernando Valley | 19,968 | 100% | |||||||||||||||||||||||||||
| 3/28/2024 | 11156 Sherman Way | Los Angeles | Greater San Fernando Valley | 25,929 | 100% | |||||||||||||||||||||||||||
| 3/28/2024 | 11166 Gault Street | Los Angeles | Greater San Fernando Valley | 20,592 | 100% | |||||||||||||||||||||||||||
| 3/28/2024 | 7100 Case Avenue | Los Angeles | Greater San Fernando Valley | 34,286 | 100% | |||||||||||||||||||||||||||
| 3/28/2024 | 7100 Fair Avenue | Los Angeles | Greater San Fernando Valley | 17,010 | 100% | |||||||||||||||||||||||||||
| 3/28/2024 | 7101 Case Avenue | Los Angeles | Greater San Fernando Valley | 17,010 | 100% | |||||||||||||||||||||||||||
| 3/28/2024 | 7101 Fair Avenue | Los Angeles | Greater San Fernando Valley | 32,741 | 100% | |||||||||||||||||||||||||||
| 3/28/2024 | 7103 Fair Avenue | Los Angeles | Greater San Fernando Valley | 17,010 | 100% | |||||||||||||||||||||||||||
| 3/28/2024 | 7118 Fair Avenue | Los Angeles | Greater San Fernando Valley | 20,273 | 100% | |||||||||||||||||||||||||||
| 3/28/2024 | 7119 Fair Avenue | Los Angeles | Greater San Fernando Valley | 20,273 | 100% | |||||||||||||||||||||||||||
| 3/28/2024 | 7121 Case Avenue | Los Angeles | Greater San Fernando Valley | 20,273 | 100% | |||||||||||||||||||||||||||
| 3/28/2024 | 7149 Fair Avenue | Los Angeles | Greater San Fernando Valley | 32,311 | 100% | |||||||||||||||||||||||||||
| 3/28/2024 | 9140 Lurline Avenue | Los Angeles | Greater San Fernando Valley | 146,516 | 100% | |||||||||||||||||||||||||||
| 3/28/2024 | 10712-10748 Bloomfield Avenue | Los Angeles | Mid-Counties | 75,960 | 100% | |||||||||||||||||||||||||||
| 3/28/2024 | 12932-12958 Midway Place | Los Angeles | Mid-Counties | 161,517 | 100% | |||||||||||||||||||||||||||
| 3/28/2024 | 14407 Alondra Blvd | Los Angeles | Mid-Counties | 221,415 | 100% | |||||||||||||||||||||||||||
| 3/28/2024 | 14647-14667 Northam Street | Los Angeles | Mid-Counties | 140,000 | 100% | |||||||||||||||||||||||||||
| 3/28/2024 | 14680-14700 Alondra Blvd | Los Angeles | Mid-Counties | 96,000 | 100% | |||||||||||||||||||||||||||
| 3/28/2024 | 14710 Northam Street | Los Angeles | Mid-Counties | 45,000 | 100% | |||||||||||||||||||||||||||
| 3/28/2024 | 14720-14750 Alondra Blvd | Los Angeles | Mid-Counties | 100,000 | 100% | |||||||||||||||||||||||||||
| 3/28/2024 | 14725 Northam Street | Los Angeles | Mid-Counties | 80,000 | 100% | |||||||||||||||||||||||||||
| 3/28/2024 | 14730-14750 Northam Street | Los Angeles | Mid-Counties | 67,468 | 100% | |||||||||||||||||||||||||||
| 3/28/2024 | 9028 Dice Road | Los Angeles | Mid-Counties | 96,000 | 100% | |||||||||||||||||||||||||||
| 3/28/2024 | 17705-17709 Valley Blvd | Los Angeles | San Gabriel Valley | 32,000 | 47% | |||||||||||||||||||||||||||
| 3/28/2024 | 17745-17749 Valley Blvd | Los Angeles | San Gabriel Valley | 40,095 | 100% | |||||||||||||||||||||||||||
| 3/28/2024 | 17755 Valley Blvd | Los Angeles | San Gabriel Valley | 30,000 | 100% | |||||||||||||||||||||||||||
| 3/28/2024 | 421 Baldwin Park Blvd | Los Angeles | San Gabriel Valley | 45,000 | 100% | |||||||||||||||||||||||||||
| 3/28/2024 | 433 Baldwin Park Blvd | Los Angeles | San Gabriel Valley | 102,654 | 100% | |||||||||||||||||||||||||||
| 3/28/2024 | 437 Baldwin Park Blvd | Los Angeles | San Gabriel Valley | 70,000 | 100% | |||||||||||||||||||||||||||
| 3/28/2024 | 620-628 Hambledon Avenue | Los Angeles | San Gabriel Valley | 40,000 | 75% | |||||||||||||||||||||||||||
| 3/28/2024 | 630-634 Hambledon Avenue | Los Angeles | San Gabriel Valley | 40,000 | 100% | |||||||||||||||||||||||||||
| 3/28/2024 | 1715 West 132nd Street | Los Angeles | South Bay | 20,168 | 100% | |||||||||||||||||||||||||||
| 3/28/2024 | 2910 Pacific Commerce Drive East | Los Angeles | South Bay | 150,000 | 100% | |||||||||||||||||||||||||||
|
First Quarter 2024
Supplemental Financial Reporting Package
|
Page 30
|
|
||||||
Current Year Investments and Dispositions Summary (Continued). |
||||||||||||||||||||||||||||||||
| As of March 31, 2024 | (unaudited results) | |||||||||||||||||||||||||||||||
2024 Current Period Acquisitions - Blackstone Industrial Assets | ||||||||||||||||||||||||||||||||
| Investment Date |
Property Address | County | Submarket | Rentable Square Feet |
Occ. % at Acquisition |
|||||||||||||||||||||||||||
| 3/28/2024 | 1212 Howell Avenue | Orange | North Orange County | 25,962 | 100% | |||||||||||||||||||||||||||
| 3/28/2024 | 1222 Howell Avenue | Orange | North Orange County | 81,325 | 100% | |||||||||||||||||||||||||||
| 3/28/2024 | 1500 Walnut Avenue | Orange | North Orange County | 121,615 | 100% | |||||||||||||||||||||||||||
| 3/28/2024 | 200 Boysenberry Lane | Orange | North Orange County | 198,275 | 100% | |||||||||||||||||||||||||||
| 3/28/2024 | 4141 Palm Street | Orange | North Orange County | 100,000 | 100% | |||||||||||||||||||||||||||
| 3/28/2024 | 1217 Saint Gertrude Place | Orange | OC Airport | 106,604 | 100% | |||||||||||||||||||||||||||
| 3/28/2024 | 20472 Crescent Bay | Orange | South Orange County | 31,020 | 59% | |||||||||||||||||||||||||||
| 3/28/2024 | 20492 Crescent Bay | Orange | South Orange County | 46,642 | 100% | |||||||||||||||||||||||||||
| 3/28/2024 | 20512 Crescent Bay | Orange | South Orange County | 29,285 | 64% | |||||||||||||||||||||||||||
| 3/28/2024 | 20532 Crescent Bay | Orange | South Orange County | 24,127 | 100% | |||||||||||||||||||||||||||
| 3/28/2024 | 25172 Arctic Ocean Drive | Orange | South Orange County | 52,024 | 100% | |||||||||||||||||||||||||||
| 3/28/2024 | 4115 Schaefer Avenue | San Bernardino | Inland Empire West | 33,500 | 100% | |||||||||||||||||||||||||||
Total 2024 Current Period Acquisitions - Blackstone Industrial Assets |
3,008,578 | |||||||||||||||||||||||||||||||
|
First Quarter 2024
Supplemental Financial Reporting Package
|
Page 31
|
|
||||||
Net Asset Value Components. |
||||||||
| As of March 31, 2024 | (unaudited and in thousands, except share data) | |||||||
| Net Operating Income | ||||||||
Pro Forma Net Operating Income (NOI)(1) |
Three Months Ended Mar 31, 2024 | |||||||
| Total operating rental income | $210,990 | |||||||
| Property operating expenses | (47,482) | |||||||
Pro forma effect of uncommenced leases(2) |
3,378 | |||||||
Pro forma effect of acquisitions(3) |
12,843 | |||||||
Pro forma NOI effect of significant properties classified as repositioning, redevelopment and lease-up(4) |
24,206 | |||||||
| Pro Forma NOI | 203,935 | |||||||
Above/(below) market lease revenue adjustments |
(7,591) | |||||||
| Straight line rental revenue adjustment | (7,368) | |||||||
| Pro Forma Cash NOI | $188,976 | |||||||
| Balance Sheet Items | ||||||||
| Other assets and liabilities | March 31, 2024 | |||||||
| Cash and cash equivalents | $336,960 | |||||||
| Loan receivable, net | 122,899 | |||||||
| Rents and other receivables, net | 17,896 | |||||||
| Other assets | 22,114 | |||||||
| Acquisition related deposits | 7,975 | |||||||
| Accounts payable, accrued expenses and other liabilities | (148,920) | |||||||
| Dividends payable | (94,356) | |||||||
| Tenant security deposits | (91,034) | |||||||
| Prepaid rents | (110,727) | |||||||
| Estimated remaining cost to complete repositioning/redevelopment projects | (405,711) | |||||||
| Total other assets and liabilities | $(342,904) | |||||||
| Debt and Shares Outstanding | ||||||||
Total consolidated debt(5) |
$3,389,088 | |||||||
| Preferred stock/units - liquidation preference | $241,031 | |||||||
Common shares outstanding(6) |
217,382,937 | |||||||
Operating partnership units outstanding(7) |
7,609,215 | |||||||
| Total common shares and operating partnership units outstanding | 224,992,152 | |||||||
|
First Quarter 2024
Supplemental Financial Reporting Package
|
Page 32
|
|
||||||
Notes and Definitions. | ||||||||
|
First Quarter 2024
Supplemental Financial Reporting Package
|
Page 33
|
|
||||||
Notes and Definitions. | ||||||||
| March 31, 2024 | |||||||||||||||||
| Current Period Covenant | Revolver, $300M, $400M & $60M Term Loan Facilities | Senior Notes ($100M, $125M, $25M, $75M) | |||||||||||||||
| Maximum Leverage Ratio | less than 60% | 23.8% | 26.4% | ||||||||||||||
| Maximum Secured Leverage Ratio | less than 45% | 0.9% | N/A | ||||||||||||||
| Maximum Secured Leverage Ratio | less than 40% | N/A | 0.9% | ||||||||||||||
| Maximum Secured Recourse Debt | less than 15% | N/A | —% | ||||||||||||||
| Minimum Tangible Net Worth | $6,638,386 | N/A | $9,185,688 | ||||||||||||||
| Minimum Fixed Charge Coverage Ratio | at least 1.50 to 1.00 | 4.59 to 1.0 | 4.59 to 1.0 | ||||||||||||||
| Unencumbered Leverage Ratio | less than 60% | 27.9% | 31.1% | ||||||||||||||
| Unencumbered Interest Coverage Ratio | at least 1.75 to 1.00 | 5.30 to 1.00 | 5.30 to 1.00 | ||||||||||||||
| March 31, 2024 | |||||||||||
| Current Period Covenant | Senior Notes ($400M due 2030 & $400M due 2031) |
||||||||||
| Maximum Debt to Total Asset Ratio | less than 60% | 25.7% | |||||||||
| Maximum Secured Debt to Total Asset Ratio | less than 40% | 0.9% | |||||||||
| Minimum Debt Service Coverage Ratio | at least 1.50 to 1.00 | 4.37 to 1.00 | |||||||||
| Minimum Unencumbered Assets to Unsecured Debt Ratio | at least 1.50 to 1.00 | 3.93 to 1.00 | |||||||||
For the Three Months Ended |
|||||||||||||||||||||||||||||
| Mar 31, 2024 | Dec 31, 2023 | Sep 30, 2023 | Jun 30, 2023 | Mar 31, 2023 | |||||||||||||||||||||||||
EBITDAre |
$ | 145,226 | $ | 140,862 | $ | 138,188 | $ | 132,883 | $ | 124,567 | |||||||||||||||||||
Above/(below) market lease revenue adjustments |
(7,591) | (8,119) | (7,241) | (6,232) | (8,290) | ||||||||||||||||||||||||
Non-cash stock compensation |
9,088 | 9,338 | 8,166 | 7,956 | 8,178 | ||||||||||||||||||||||||
| Impairment of right-of-use asset | — | — | — | — | 188 | ||||||||||||||||||||||||
Straight line rental revenue adj. |
(7,368) | (8,514) | (11,792) | (8,653) | (7,628) | ||||||||||||||||||||||||
Capitalized payments |
(5,237) | (4,892) | (4,395) | (4,001) | (3,934) | ||||||||||||||||||||||||
| Accretion of net loan origination fees | (115) | (84) | — | — | — | ||||||||||||||||||||||||
Recurring capital expenditures |
(2,990) | (7,047) | (10,874) | (6,683) | (2,194) | ||||||||||||||||||||||||
2nd gen. tenant improvements & leasing commissions |
(3,457) | (3,611) | (4,406) | (5,623) | (5,259) | ||||||||||||||||||||||||
| Cash flow for fixed charge coverage calculation | $ | 127,556 | $ | 117,933 | $ | 107,646 | $ | 109,647 | $ | 105,628 | |||||||||||||||||||
| Cash interest expense calculation detail: | |||||||||||||||||||||||||||||
| Interest expense | 14,671 | 14,570 | 15,949 | 17,180 | 13,701 | ||||||||||||||||||||||||
| Capitalized interest | 7,926 | 7,551 | 6,186 | 4,884 | 4,990 | ||||||||||||||||||||||||
| Note payable premium amort. | (293) | (214) | (205) | (203) | (66) | ||||||||||||||||||||||||
| Amort. of deferred financing costs | (1,011) | (1,000) | (1,001) | (999) | (856) | ||||||||||||||||||||||||
| Amort. of swap term fees & t-locks | (137) | (137) | (137) | (136) | (129) | ||||||||||||||||||||||||
| Cash interest expense | 21,156 | 20,770 | 20,792 | 20,726 | 17,640 | ||||||||||||||||||||||||
| Scheduled principal payments | 324 | 354 | 367 | 363 | 379 | ||||||||||||||||||||||||
| Preferred stock/unit dividends | 3,116 | 3,116 | 3,116 | 3,117 | 3,116 | ||||||||||||||||||||||||
| Fixed charges | $ | 24,596 | $ | 24,240 | $ | 24,275 | $ | 24,206 | $ | 21,135 | |||||||||||||||||||
| Fixed Charge Coverage Ratio | 5.2 | x | 4.9 | x | 4.4 | x | 4.5 | x | 5.0 | x | |||||||||||||||||||
|
First Quarter 2024
Supplemental Financial Reporting Package
|
Page 34
|
|
||||||
Notes and Definitions. | ||||||||
|
First Quarter 2024
Supplemental Financial Reporting Package
|
Page 35
|
|
||||||
Notes and Definitions. | ||||||||
| Three Months Ended | |||||||||||||||||||||||||||||
| Mar 31, 2024 | Dec 31, 2023 | Sep 30, 2023 | Jun 30, 2023 | Mar 31, 2023 | |||||||||||||||||||||||||
| Rental revenue (before collectability adjustment) | $ | 176,215 | $ | 173,866 | $ | 169,822 | $ | 161,959 | $ | 153,521 | |||||||||||||||||||
| Tenant reimbursements | 35,650 | 34,507 | 34,842 | 32,236 | 31,419 | ||||||||||||||||||||||||
| Other income | 846 | 484 | 581 | 649 | 564 | ||||||||||||||||||||||||
| Increase (reduction) in revenue due to change in collectability assessment | (1,721) | (948) | (1,033) | (746) | (340) | ||||||||||||||||||||||||
| Rental income | $ | 210,990 | $ | 207,909 | $ | 204,212 | $ | 194,098 | $ | 185,164 | |||||||||||||||||||
| Three Months Ended | |||||||||||||||||||||||||||||
| Mar 31, 2024 | Dec 31, 2023 | Sep 30, 2023 | Jun 30, 2023 | Mar 31, 2023 | |||||||||||||||||||||||||
| # of Properties | 296 | 254 | 256 | 256 | 257 | ||||||||||||||||||||||||
| Square Feet | 37,109,867 | 32,476,716 | 32,496,313 | 32,496,302 | 32,601,949 | ||||||||||||||||||||||||
| Ending Occupancy | 96.4 | % | 97.5 | % | 97.9 | % | 98.1 | % | 98.0 | % | |||||||||||||||||||
| SPP NOI growth | 5.5 | % | 8.4 | % | 8.9 | % | 8.0 | % | 7.3 | % | |||||||||||||||||||
| SPP Cash NOI growth | 8.5 | % | 9.5 | % | 9.5 | % | 10.0 | % | 10.7 | % | |||||||||||||||||||
| Three Months Ended March 31, | |||||||||||||||||||||||
| 2024 | 2023 | $ Change | % Change | ||||||||||||||||||||
| Rental revenue | $ | 141,451 | $ | 134,005 | $ | 7,446 | 5.6% | ||||||||||||||||
| Tenant reimbursements | 29,403 | 28,071 | 1,332 | 4.7% | |||||||||||||||||||
| Other income | 703 | 495 | 208 | 42.0% | |||||||||||||||||||
| Rental income | $ | 171,557 | $ | 162,571 | $ | 8,986 | 5.5% | ||||||||||||||||
| Three Months Ended | |||||||||||||||||||||||||||||
| Mar 31, 2024 | Dec 31, 2023 | Sep 30, 2023 | Jun 30, 2023 | Mar 31, 2023 | |||||||||||||||||||||||||
| Net Income | $ | 64,277 | $ | 67,321 | $ | 61,790 | $ | 56,910 | $ | 63,570 | |||||||||||||||||||
| General and administrative | 19,980 | 19,988 | 18,575 | 18,267 | 18,197 | ||||||||||||||||||||||||
| Depreciation & amortization | 66,278 | 65,839 | 60,449 | 58,793 | 59,429 | ||||||||||||||||||||||||
| Other expenses | 1,408 | 316 | 551 | 306 | 647 | ||||||||||||||||||||||||
| Interest expense | 14,671 | 14,570 | 15,949 | 17,180 | 13,701 | ||||||||||||||||||||||||
| Management & leasing services | (132) | (163) | (158) | (171) | (190) | ||||||||||||||||||||||||
| Interest income | (2,974) | (2,353) | (1,029) | (1,497) | (882) | ||||||||||||||||||||||||
| Gains on sale of real estate | — | (6,868) | — | — | (12,133) | ||||||||||||||||||||||||
| NOI | $ | 163,508 | $ | 158,650 | $ | 156,127 | $ | 149,788 | $ | 142,339 | |||||||||||||||||||
| S/L rental revenue adj. | (7,368) | (8,514) | (11,792) | (8,653) | (7,628) | ||||||||||||||||||||||||
Above/(below) market lease revenue adjustments |
(7,591) | (8,119) | (7,241) | (6,232) | (8,290) | ||||||||||||||||||||||||
| Cash NOI | $ | 148,549 | $ | 142,017 | $ | 137,094 | $ | 134,903 | $ | 126,421 | |||||||||||||||||||
|
First Quarter 2024
Supplemental Financial Reporting Package
|
Page 36
|
|
||||||
Notes and Definitions. | ||||||||
| Three Months Ended March 31, | |||||||||||
| 2024 | 2023 | ||||||||||
| Net income | $ | 64,277 | $ | 63,570 | |||||||
| General and administrative | 19,980 | 18,197 | |||||||||
| Depreciation and amortization | 66,278 | 59,429 | |||||||||
| Other expenses | 1,408 | 647 | |||||||||
| Interest expense | 14,671 | 13,701 | |||||||||
| Management and leasing services | (132) | (190) | |||||||||
| Interest income | (2,974) | (882) | |||||||||
| Gains on sale of real estate | — | (12,133) | |||||||||
| NOI | $ | 163,508 | $ | 142,339 | |||||||
| Non-Same Property Portfolio rental income | (39,433) | (22,593) | |||||||||
| Non-Same Property Portfolio property exp. | 8,554 | 5,985 | |||||||||
| Same Property Portfolio NOI | $ | 132,629 | $ | 125,731 | |||||||
| Straight line rental revenue adjustment | (4,753) | (6,924) | |||||||||
Above/(below) market lease revenue adjustments |
(5,642) | (6,196) | |||||||||
| Same Property Portfolio Cash NOI | $ | 122,234 | $ | 112,611 | |||||||
2024 Estimate |
|||||||||||
| Low | High | ||||||||||
| Net income attributable to common stockholders | $ | 1.17 | $ | 1.20 | |||||||
| Company share of depreciation and amortization | 1.17 | 1.17 | |||||||||
Company share of gains on sale of real estate(1) |
(0.03) | (0.03) | |||||||||
| Company share of Core FFO | $ | 2.31 | $ | 2.34 | |||||||
| Mar 31, 2024 | Dec 31, 2023 | Sep 30, 2023 | Jun 30, 2023 | Mar 31, 2023 | ||||||||||||||||||||||||||||
| Ending Occupancy: | ||||||||||||||||||||||||||||||||
| Los Angeles County | 93.8% | 95.4% | 94.8% | 94.9% | 94.9% | |||||||||||||||||||||||||||
| Orange County | 89.4% | 92.4% | 92.0% | 91.3% | 90.3% | |||||||||||||||||||||||||||
| Riverside / San Bernardino County | 90.9% | 90.8% | 92.9% | 91.9% | 90.5% | |||||||||||||||||||||||||||
| San Diego County | 94.9% | 93.2% | 92.2% | 92.8% | 94.7% | |||||||||||||||||||||||||||
| Ventura County | 92.6% | 96.7% | 97.7% | 98.0% | 99.7% | |||||||||||||||||||||||||||
| Total/Weighted Average | 92.8% | 94.1% | 94.1% | 94.0% | 93.8% | |||||||||||||||||||||||||||
| Total Portfolio RSF | 49,162,216 | 45,860,368 | 44,998,613 | 44,167,774 | 43,954,272 | |||||||||||||||||||||||||||
| Total/Weighted Average | ||||||||
| Occupied SF | 45,608,229 | |||||||
Uncommenced Renewal Leases - Leased SF(1) |
923,395 | |||||||
Uncommenced New Leases - Leased SF(1) |
612,026 | |||||||
| Leased SF | 46,220,255 | |||||||
| Percent Leased | 94.0 | % | ||||||
In-Place ABR(2) |
$ | 706,649 | ||||||
ABR Under Uncommenced Leases (in thousands)(2)(3) |
17,931 | |||||||
In-Place + Uncommenced ABR (in thousands)(2) |
$ | 724,580 | ||||||
In-Place + Uncommenced ABR per SF(2) |
$ | 15.68 | ||||||
|
First Quarter 2024
Supplemental Financial Reporting Package
|
Page 37
|
|
||||||