UNITED STATES
SECURITIES AND EXCHANGE COMMISSION
WASHINGTON, D.C. 20549
_________________________
FORM 8-K
CURRENT REPORT
Pursuant to Section 13 or 15(d) of the Securities Exchange Act of 1934.
Date of Report: (Date of Earliest Event Reported): August 8, 2022
PHX MINERALS INC.
(Exact name of registrant as specified in its charter)
|
DELAWARE |
001-31759 |
73-1055775 |
|
(State or other jurisdiction |
(Commission File Number) |
(I.R.S. Employer |
|
of incorporation) |
|
Identification No.) |
|
1320 South University Drive, |
|
|
|
Suite 720 |
|
|
|
Fort Worth, TX |
|
76107 |
|
(Address of principal executive offices) |
|
(Zip code) |
(405) 948-1560
(Registrant’s telephone number including area code)
Not Applicable
(Former name or former address if changed since last report)
Check the appropriate box below if the Form 8-K filing is intended to simultaneously satisfy the filing obligation of the registrant under any of the following provisions (see General Instruction A.2. below):
|
☐ |
Written communications pursuant to Rule 425 under the Securities Act (17 CFR 230.425) |
|
☐ |
Soliciting material pursuant to Rule 14a-12 under the Exchange Act (17 CFR 240.14a-12) |
|
☐ |
Pre-commencement communications pursuant to Rule 14d-2(b) under the Exchange Act (17 CFR 240.14d-2(b)) |
|
☐ |
Pre-commencement communications pursuant to Rule 13e-4(c) under the Exchange Act (17 CFR 240.13e-4(c)) |
Securities registered pursuant in Section 12(b) of the Act:
|
Title of each class |
|
Trading Symbol(s) |
|
Name of each exchange on which registered |
|
Common Stock, $0.01666 par value |
|
PHX |
|
New York Stock Exchange |
Indicate by check mark whether the registrant is an emerging growth company as defined in Rule 405 of the Securities Act of 1933 (§230.405 of this chapter) or Rule 12b-2 of the Securities Exchange Act of 1934 (§240.12b-2 of this chapter).
Emerging growth company ☐
If an emerging growth company, indicate by check mark if the registrant has elected not to use the extended transition period for complying with any new or revised financial accounting standards provided pursuant to Section 13(a) of the Exchange Act. ☐
|
Item 2.02 |
Results of Operations and Financial Condition. |
On August 8, 2022, PHX Minerals Inc. (the “Company”) issued a press release providing information regarding the Company’s third quarter 2022 financial and operating results. The press release is furnished as Exhibit 99.1 to this Current Report on Form 8-K and is incorporated by reference herein.
|
Item 7.01 |
Regulation FD Disclosure.
|
The information set forth under Item 2.02 of this Current Report on Form 8-K is hereby incorporated in this Item 7.01 by reference.
On August 8, 2022, the Company posted an updated investor presentation to its website. A copy of the presentation is furnished as Exhibit 99.2 to this Current Report on Form 8-K.
The information in Item 2.02 and Item 7.01 of this Current Report on Form 8-K, including the attached Exhibit 99.1 and 99.2, is being furnished pursuant to Item 2.02 and Item 7.01 and shall not be deemed to be “filed” for purposes of Section 18 of the Securities Exchange Act of 1934, as amended (the “Exchange Act”), or otherwise subject to the liabilities of that section, and shall not be deemed to be incorporated by reference into any of the Company’s filings under the Securities Act of 1933, as amended, or the Exchange Act, whether made before or after the date hereof and regardless of any general incorporation language in such filings, except to the extent expressly set forth by specific reference in such a filing.
|
|
Item 9.01 |
Financial Statements and Exhibits |
|
|
(d) |
Exhibits. |
|
Exhibit No. |
Title of Document |
|
|
|
|
99.1 |
|
|
99.2 |
|
104 |
|
|
Cover Page Interactive Data File (embedded within the Inline XBRL document). |
SIGNATURES
Pursuant to the requirements of the Securities Exchange Act of 1934, the registrant has duly caused this report to be signed on its behalf by the undersigned hereunto duly authorized.
PHX MINERALS INC.
|
|
|
By: |
/s/ Chad L. Stephens |
|
|
|
|
Chad L. Stephens |
|
|
|
|
Chief Executive Officer |
|
|
|
|
|
|
DATE: |
August 8, 2022 |
|
|
Exhibit 99.1

FOR IMMEDIATE RELEASE
PLEASE CONTACT:
Chad L. Stephens
405.948.1560
Website: www.phxmin.com
PHX MINERALS INC.
REPORTS THIRD FISCAL QUARTER 2022 RESULTS AND ANNOUNCES DIVIDEND PAYMENT
FORT WORTH, Texas, Aug. 8, 2022 – PHX MINERALS INC., “PHX” or the “Company” (NYSE: PHX), today reported financial and operating results for the third fiscal quarter ended June 30, 2022.
SUMMARY OF RESULTS FOR THE QUARTER ENDED JUNE 30, 2022, AND SUBSEQUENT EVENTS
|
|
• |
Net income in the third fiscal quarter of 2022 was $8.6 million, or $0.25 per share, compared to net loss of ($4.0) million, or ($0.12) per share, in the second fiscal quarter of 2022. |
|
|
• |
Adjusted EBITDA(1) of $7.2 million for the third fiscal quarter of 2022 increased from $5.8 million in the second fiscal quarter of 2022. |
|
|
• |
Royalty production volumes for the third fiscal quarter of 2022 increased 3% to 1,595 Mmcfe, and total production volumes for the third fiscal quarter of 2022 decreased 1% to 2,430 Mmcfe, compared to the second fiscal quarter of 2022. |
|
|
• |
80% of royalty production volumes and 78% of total production volumes in the third fiscal quarter of 2022 were attributable to natural gas. |
|
|
• |
96 gross (0.25 net) wells converted to PDP, including 39 gross (0.19 net) in the SCOOP and 12 gross (0.03 net) in the Haynesville, during the third fiscal quarter of 2022, compared to 108 gross (0.48 net) in the second fiscal quarter of 2022. |
|
|
• |
155 gross (0.79 net) wells in progress as of June 30, 2022, compared to 134 gross (0.60 net) as of March 31, 2022. |
|
|
• |
Total debt was $28.3 million and the debt to adjusted EBITDA (TTM) (1) ratio was 1.31x at June 30, 2022. |
|
|
• |
During the third fiscal quarter of 2022, PHX closed on acquisitions totaling 938 net royalty acres located in the SCOOP play of Oklahoma and the Haynesville play of East Texas and Louisiana for approximately $9.1 million. |
|
|
• |
Since June 30, 2022, PHX has closed on additional acquisitions of 544 net royalty acres located in the SCOOP play of Oklahoma and the Haynesville play of Louisiana for approximately $8.2 million. |
|
|
• |
PHX has entered into a PSA to divest the remainder of its non-operated working interest position in the Fayetteville Shale of Arkansas for approximately $6 million subject to customary closing adjustments. |
|
|
• |
PHX announced a $0.02 per share quarterly dividend, payable on Sept. 9, 2022, to stockholders of record on Aug. 25, 2022. |
|
|
(1) |
This is a non-GAAP measure. Refer to the Non-GAAP Reconciliation section. |
Chad L. Stephens, President and CEO, commented, “I am pleased to report another outstanding quarter of financial results including adjusted EBITDA of $7.2 million, a 22% increase over the prior sequential quarter. I would like to thank all of the PHX employees for their hard work that helped the company achieve these excellent third quarter 2022 results.
Consistent with our first and second quarter of 2022 results, we reported an increase in royalty volumes and a further decrease in working interest volumes. This is in line with our corporate strategy. We continue to allocate 100% of our capital to acquiring minerals in the core of the Haynesville in Louisiana and the SCOOP in Southern Oklahoma in high rock quality areas under well capitalized active operators, assuring us of near-term line of sight development. We are keenly focused on executing a successful acquisition strategy and expect our royalty volumes will continue to increase on an annual basis.
In our third fiscal quarter ended June 30, 2022, and including through Aug. 4th, we have closed on a total of $18.0 million in additional minerals located primarily in the Haynesville with line-of-sight development, which should continue to drive our growing royalty volumes. This brings our fiscal 2022 acquisition program to approximately $42 million. There continues to be a strong set of acquisition opportunities in front of us.
Lastly, I’d like to announce that during our third fiscal quarter we opened our new corporate headquarters in Fort Worth, Texas. This move places our senior management team at the epicenter of the mineral space. We will retain our offices in Oklahoma City where our accounting and technical staff are located and do not anticipate any disruption to the business.

– 1 –
PHX Minerals Inc.
Reports Third Fiscal Quarter 2022 Results …cont.
We are excited about having new offices in Fort Worth and believe it will better position us to execute the Company’s growth strategy of building shareholder value through the acquisition and ownership of high-quality mineral interest in our core areas.”
OPERATING HIGHLIGHTS
|
|
Third Quarter Ended |
|
|
Third Quarter Ended |
|
|
Nine Months Ended |
|
|
Nine Months Ended |
|
||||
|
|
June 30, 2022 |
|
|
June 30, 2021 |
|
|
June 30, 2022 |
|
|
June 30, 2021 |
|
||||
|
Gas Mcf Sold |
|
1,897,799 |
|
|
|
1,879,343 |
|
|
|
5,380,093 |
|
|
|
5,090,619 |
|
|
Average Sales Price per Mcfe before the |
|
|
|
|
|
|
|
|
|
|
|
|
|
|
|
|
effects of settled derivative contracts |
$ |
6.82 |
|
|
$ |
3.33 |
|
|
$ |
5.61 |
|
|
$ |
2.77 |
|
|
Average Sales Price per Mcfe after the |
|
|
|
|
|
|
|
|
|
|
|
|
|
|
|
|
effects of settled derivative contracts |
$ |
4.32 |
|
|
$ |
3.31 |
|
|
$ |
3.72 |
|
|
$ |
2.76 |
|
|
Oil Barrels Sold |
|
48,928 |
|
|
|
55,492 |
|
|
|
148,632 |
|
|
|
170,437 |
|
|
Average Sales Price per Mcfe before the |
|
|
|
|
|
|
|
|
|
|
|
|
|
|
|
|
effects of settled derivative contracts |
$ |
105.23 |
|
|
$ |
63.77 |
|
|
$ |
90.40 |
|
|
$ |
52.95 |
|
|
Average Sales Price per Mcfe after the |
|
|
|
|
|
|
|
|
|
|
|
|
|
|
|
|
effects of settled derivative contracts |
$ |
60.18 |
|
|
$ |
46.25 |
|
|
$ |
57.63 |
|
|
$ |
49.15 |
|
|
NGL Barrels Sold |
|
39,732 |
|
|
|
46,753 |
|
|
|
124,358 |
|
|
|
125,118 |
|
|
Average Sales Price per Barrel(1) |
$ |
36.76 |
|
|
$ |
23.58 |
|
|
$ |
35.52 |
|
|
$ |
20.42 |
|
|
|
|
|
|
|
|
|
|
|
|
|
|
|
|
|
|
|
Mcfe Sold |
|
2,429,760 |
|
|
|
2,492,813 |
|
|
|
7,018,036 |
|
|
|
6,863,949 |
|
|
Natural gas, oil and NGL sales before the |
|
|
|
|
|
|
|
|
|
|
|
|
|
|
|
|
effects of settled derivative contracts |
$ |
19,561,568 |
|
|
$ |
10,899,820 |
|
|
$ |
48,032,597 |
|
|
$ |
25,670,624 |
|
|
Natural gas, oil and NGL sales after the |
|
|
|
|
|
|
|
|
|
|
|
|
|
|
|
|
effects of settled derivative contracts |
$ |
12,607,397 |
|
|
$ |
9,895,130 |
|
|
$ |
32,971,756 |
|
|
$ |
24,981,817 |
|
|
|
|
|
|
|
|
|
|
|
|
|
|
|
|
|
|
|
(1) There were no NGL settled derivative contracts during the 2022 and 2021 periods. |
|
||||||||||||||
*****MORE*****
– 2 –
PHX Minerals Inc.
Reports Third Fiscal Quarter 2022 Results …cont.
Total Production for the last four quarters was as follows:
|
Quarter ended |
|
Mcf Sold |
|
|
Oil Bbls Sold |
|
|
NGL Bbls Sold |
|
|
Mcfe Sold |
|
||||
|
6/30/2022 |
|
|
1,897,799 |
|
|
|
48,928 |
|
|
|
39,732 |
|
|
|
2,429,760 |
|
|
3/31/2022 |
|
|
1,908,030 |
|
|
|
51,631 |
|
|
|
40,371 |
|
|
|
2,460,042 |
|
|
12/31/2021 |
|
|
1,574,265 |
|
|
|
48,074 |
|
|
|
44,256 |
|
|
|
2,128,248 |
|
|
9/30/2021 |
|
|
1,609,101 |
|
|
|
54,043 |
|
|
|
46,369 |
|
|
|
2,211,570 |
|
Royalty Interest Production for the last four quarters was as follows:
|
Quarter ended |
|
Mcf Sold |
|
|
Oil Bbls Sold |
|
|
NGL Bbls Sold |
|
|
Mcfe Sold |
|
||||
|
6/30/2022 |
|
|
1,283,737 |
|
|
|
32,562 |
|
|
|
19,369 |
|
|
|
1,595,323 |
|
|
3/31/2022 |
|
|
1,261,949 |
|
|
|
28,758 |
|
|
|
18,852 |
|
|
|
1,547,609 |
|
|
12/31/2021 |
|
|
949,523 |
|
|
|
25,996 |
|
|
|
19,953 |
|
|
|
1,225,220 |
|
|
9/30/2021 |
|
|
705,397 |
|
|
|
29,442 |
|
|
|
19,364 |
|
|
|
998,230 |
|
Working Interest Production for the last four quarters was as follows:
|
Quarter ended |
|
Mcf Sold |
|
|
Oil Bbls Sold |
|
|
NGL Bbls Sold |
|
|
Mcfe Sold |
|
||||
|
6/30/2022 |
|
|
614,062 |
|
|
|
16,366 |
|
|
|
20,363 |
|
|
|
834,437 |
|
|
3/31/2022 |
|
|
646,081 |
|
|
|
22,873 |
|
|
|
21,519 |
|
|
|
912,433 |
|
|
12/31/2021 |
|
|
624,742 |
|
|
|
22,078 |
|
|
|
24,303 |
|
|
|
903,028 |
|
|
9/30/2021 |
|
|
903,704 |
|
|
|
24,601 |
|
|
|
27,005 |
|
|
|
1,213,340 |
|
*****MORE*****
– 3 –
PHX Minerals Inc.
Reports Third Fiscal Quarter 2022 Results …cont.
FINANCIAL HIGHLIGHTS
|
|
|
Third Quarter Ended |
|
|
Third Quarter Ended |
|
|
Nine Months Ended |
|
|
Nine Months Ended |
|
||||
|
|
|
June 30, 2022 |
|
|
June 30, 2021 |
|
|
June 30, 2022 |
|
|
June 30, 2021 |
|
||||
|
Working Interest Sales |
|
$ |
7,088,153 |
|
|
$ |
5,486,978 |
|
|
$ |
18,959,671 |
|
|
$ |
13,245,980 |
|
|
Royalty Interest Sales |
|
$ |
12,473,415 |
|
|
$ |
5,412,842 |
|
|
$ |
29,072,926 |
|
|
$ |
12,424,644 |
|
|
Natural Gas, Oil and NGL Sales |
|
$ |
19,561,568 |
|
|
$ |
10,899,820 |
|
|
$ |
48,032,597 |
|
|
$ |
25,670,624 |
|
|
|
|
|
|
|
|
|
|
|
|
|
|
|
|
|
|
|
|
Gains (Losses) on Derivative Contracts |
|
$ |
(2,387,226 |
) |
|
$ |
(5,487,483 |
) |
|
$ |
(12,534,464 |
) |
|
$ |
(8,089,662 |
) |
|
Lease Bonuses and Rental Income |
|
$ |
209,329 |
|
|
$ |
259,152 |
|
|
$ |
450,152 |
|
|
$ |
319,139 |
|
|
Total Revenue |
|
$ |
17,383,671 |
|
|
$ |
5,671,489 |
|
|
$ |
35,948,285 |
|
|
$ |
17,900,101 |
|
|
|
|
|
|
|
|
|
|
|
|
|
|
|
|
|
|
|
|
Lease Operating Expense |
|
|
|
|
|
|
|
|
|
|
|
|
|
|
|
|
|
per Working Interest Mcfe |
|
$ |
1.08 |
|
|
$ |
0.83 |
|
|
$ |
1.16 |
|
|
$ |
0.84 |
|
|
Transportation, Gathering and Marketing |
|
|
|
|
|
|
|
|
|
|
|
|
|
|
|
|
|
per Mcfe |
|
$ |
0.59 |
|
|
$ |
0.62 |
|
|
$ |
0.59 |
|
|
$ |
0.60 |
|
|
Production Tax per Mcfe |
|
$ |
0.38 |
|
|
$ |
0.24 |
|
|
$ |
0.33 |
|
|
$ |
0.19 |
|
|
Cash G&A Expense per Mcfe (1) |
|
$ |
0.95 |
|
|
$ |
0.78 |
|
|
$ |
0.90 |
|
|
$ |
0.78 |
|
|
G&A Expense per Mcfe |
|
$ |
1.18 |
|
|
$ |
0.91 |
|
|
$ |
1.10 |
|
|
$ |
0.88 |
|
|
Interest Expense per Mcfe |
|
$ |
0.12 |
|
|
$ |
0.09 |
|
|
$ |
0.10 |
|
|
$ |
0.12 |
|
|
DD&A per Mcfe |
|
$ |
0.83 |
|
|
$ |
0.86 |
|
|
$ |
0.82 |
|
|
$ |
0.90 |
|
|
Total Expense per Mcfe |
|
$ |
3.47 |
|
|
$ |
3.15 |
|
|
$ |
3.38 |
|
|
$ |
3.14 |
|
|
|
|
|
|
|
|
|
|
|
|
|
|
|
|
|
|
|
|
Net Income (Loss) |
|
$ |
8,589,010 |
|
|
$ |
(1,356,594 |
) |
|
$ |
11,250,804 |
|
|
$ |
(2,453,037 |
) |
|
Adjusted EBITDA (2) |
|
$ |
7,194,102 |
|
|
$ |
5,008,654 |
|
|
$ |
17,429,579 |
|
|
$ |
11,506,346 |
|
|
|
|
|
|
|
|
|
|
|
|
|
|
|
|
|
|
|
|
Cash Flow from Operations |
|
$ |
8,404,654 |
|
|
$ |
5,563,226 |
|
|
$ |
24,338,974 |
|
|
$ |
10,240,333 |
|
|
CapEx |
|
$ |
72,176 |
|
|
$ |
271,661 |
|
|
$ |
351,524 |
|
|
$ |
696,759 |
|
|
CapEx - Mineral Acquisitions |
|
$ |
8,954,133 |
|
|
$ |
11,402,761 |
|
|
$ |
29,872,407 |
|
|
$ |
19,337,265 |
|
|
|
|
|
|
|
|
|
|
|
|
|
|
|
|
|
|
|
|
Borrowing Base |
|
|
|
|
|
|
|
|
|
$ |
50,000,000 |
|
|
$ |
28,500,000 |
|
|
Debt |
|
|
|
|
|
|
|
|
|
$ |
28,300,000 |
|
|
$ |
19,900,000 |
|
|
Debt to Adjusted EBITDA (TTM) (2) |
|
|
|
|
|
|
|
|
|
|
1.31 |
|
|
|
1.45 |
|
|
|
(1) |
G&A excluding restricted stock and deferred director’s expense. |
|
|
(2) |
This is a non-GAAP measure. Refer to the Non-GAAP Reconciliation section. |
*****MORE*****
– 4 –
PHX Minerals Inc.
Reports Third Fiscal Quarter 2022 Results …cont.
THIRD FISCAL QUARTER ENDED JUNE 30, 2022, RESULTS
The Company recorded third fiscal quarter 2022 net income of $8,589,010, or $0.25 per share, as compared to a net loss of ($1,356,594), or ($0.05) per share, in the third fiscal quarter 2021. The change in net income was principally the result of increased natural gas, oil and NGL sales, decreased losses associated with our hedge contracts and increased gains on asset sales, partially offset by an increase in general and administrative costs, or G&A, and income tax expense.
Natural gas, oil and NGL revenue increased $8,661,748, or 79%, for the third quarter 2022, compared to the corresponding 2021 quarter due to increases in natural gas, oil and NGL prices of 105%, 65% and 56%, respectively, and an increase in natural gas volumes of 1%, partially offset by a decrease in oil and NGL volumes of 12% and 15%, respectively.
The production increase in royalty volumes during the three months ended June 30, 2022, as compared to the three months ended June 30, 2021, resulted from new wells associated with 2021 and 2022 acquisitions in the Haynesville Shale and SCOOP plays coming online. The decrease in working interest volumes resulted from the divestiture of low-value legacy working interests in Oklahoma and the Fayetteville Shale in Arkansas, naturally declining production in high-interest wells in the Arkoma Stack and STACK plays, and legacy wells shut in in the Eagle Ford play while the operator completes new offset wells.
The Company had a net loss on derivative contracts of ($2,387,226) in the third fiscal 2022 quarter, as compared to a net loss of ($5,487,483) in the third fiscal 2021 quarter, of which ($5,670,147) is a realized loss and $3,282,921 is an unrealized gain with respect to the third fiscal 2022 quarter. Realized net loss on derivative contracts for the third fiscal 2022 quarter excludes $1,284,024 of cash paid to settle off-market derivative contracts. The change in net loss on derivative contracts was due to the Company’s settlements of natural gas and oil collars and fixed price swaps and the change in valuation caused by the difference in June 30, 2022, pricing relative to the strike price on open derivative contracts.
The 10% increase in total cost per Mcfe in the third fiscal 2022 quarter, relative to the third fiscal 2021 quarter, was primarily driven by an increase in G&A and production taxes. G&A increased $602,510, or 26%, in the third fiscal 2022 quarter, compared to the corresponding 2021 quarter due to legal expenses associated with reincorporating in the state of Delaware, increased transaction activity and restricted stock expense. Production taxes increased $328,339, or 55%, due to increase in natural gas, oil and NGL revenue, but decreased as a percent of natural gas, oil and NGL revenue in the third fiscal 2022 quarter, compared to the corresponding 2021 quarter from 5.5% to 4.7%.
NINE MONTHS ENDED JUNE 30, 2022, RESULTS
The Company recorded net income of $11,250,804, or $0.33 per share, in the fiscal nine-month period ended June 30, 2022 (the “fiscal nine-month 2022 period”), as compared to a net loss of ($2,453,037), or ($0.10) per share, in the corresponding 2021 period. The change in net income was principally the result of increased natural gas, oil and NGL sales, gains on asset sales and lease bonuses and rental income, and decreased DD&A, partially offset by an increase in losses on derivative contracts, production taxes, G&A and income tax expense.
Natural gas, oil and NGL sales increased $22,361,973, or 87%, for the fiscal nine-month 2022 period, compared to the corresponding 2021 period, due to increases in natural gas, oil and NGL prices of 103%, 71% and 74%, respectively, and an increase in natural gas volumes of 6%, partially offset by a decrease in oil and NGL volumes of 13% and 1%, respectively.
Natural gas volumes increased during the nine months ended June 30, 2022, as compared to the nine months ended June 30, 2021, primarily as a result of new wells associated with recent acquisitions in the Haynesville Shale and SCOOP plays coming online. These gas volumes were partially offset by naturally declining production in high-interest wells in the Arkoma Stack and divestitures in the Fayetteville. NGL production decreased slightly as a result of naturally declining production from liquids-rich gas wells in the STACK. The decrease in oil production was a result of naturally declining production in working interest wells and the Company’s strategy of no longer participating with working interests in new drilling in the Eagle Ford play and reduced drilling activity of royalty wells in the Bakken play, as well as naturally declining production in high-interest wells brought online in the STACK during fiscal year 2021. Oil production decreases were partially offset by new wells in the SCOOP.
The Company had a net loss on derivative contracts of ($12,534,464) in the fiscal nine-month 2022 period, as compared to a net loss of ($8,089,662) in the corresponding 2021 period, of which ($8,595,246) is a realized loss and ($3,939,218) is an unrealized loss with respect to the fiscal nine-month 2022 period. Realized net loss on derivative contracts for the fiscal nine-month 2022 period excludes $6,465,597 of cash paid to settle off-market derivative contracts. The change in net loss on derivative contracts was due to the Company’s settlements of natural gas and oil collars and fixed price swaps and the change in valuation caused by the difference in June 30, 2022, pricing relative to the strike price on open derivative contracts.
*****MORE*****
– 5 –
PHX Minerals Inc.
Reports Third Fiscal Quarter 2022 Results …cont.
The 8% increase in total cost per Mcfe in the fiscal nine-month 2022 period, relative to the corresponding 2021 period, was primarily driven by an increase in G&A and production taxes, partially offset by a decrease in DD&A. G&A increased $1,651,758, or 27%, in the fiscal nine-month 2022 period, compared to the corresponding 2021 period due to legal expenses associated with reincorporating in the state of Delaware, increased transaction activity and restricted stock expense. Production taxes increased $958,499, or 75%, due to increase in natural gas, oil and NGL revenue, but decreased as a percent of natural gas, oil and NGL revenue in the nine-month 2022 period, compared to the corresponding 2021 period from 5.1% to 4.8%. DD&A decreased $448,465, or 7%, in the fiscal nine-month 2022 period to $0.82 per Mcfe, as compared to $0.90 per Mcfe in the corresponding 2021 period. Of the DD&A decrease, $587,155 was a result of an $0.08 decrease in the DD&A rate per Mcfe, partially offset by an increase of $138,690 resulting from production increasing 2% in the fiscal nine-month 2022 period, compared to the corresponding 2021 period. The DD&A rate per Mcfe decrease was mainly due to an increase in reserves during the fiscal nine-month 2022 period, as compared to the corresponding 2021 period.
OPERATIONS UPDATE
During the third fiscal quarter of 2022, the Company converted 96 gross (0.25 net) wells to producing status, including 39 gross (0.19 net) in the SCOOP and 12 gross (0.03 net) in the Haynesville, compared to 108 gross (0.48 net) wells, including 35 gross (0.04 net) in the SCOOP and 31 gross (0.33 net) in the Haynesville, during the second fiscal quarter of 2022.
At June 30, 2022, the Company had a total of 155 gross (0.79 net) wells in progress across its mineral positions and 65 gross (0.21 net) active permitted wells, compared to 134 gross (0.60 net) wells in progress and 52 gross (0.23 net) active permitted wells at March 31, 2022. As of June 30, 2022, 25 rigs were operating on the Company’s acreage with 96 rigs operating within 2.5 miles of its acreage, compared to 18 rigs operating on the Company’s acreage with 86 rigs operating within 2.5 miles of its acreage as of March 31, 2022.
|
|
|
|
|
|
|
|
|
|
|
|
|
Bakken/ |
|
|
|
|
|
|
|
|
|
|
|
|
|
|
|
|
|
|
|
|
|
|
|
|
|
|
|
|
|
|
|
|
|
|
|
Three |
|
|
Arkoma |
|
|
|
|
|
|
|
|
|
|
|
|
|
|
|
|
|
||
|
|
|
SCOOP |
|
|
STACK |
|
|
|
|
Forks |
|
|
Stack |
|
|
Fayetteville |
|
|
Haynesville |
|
|
Other |
|
|
Total |
|
||||||||
|
As of June 30, 2022: |
|
|
|
|
|
|
|
|
|
|
|
|
|
|
|
|
|
|
|
|
|
|
|
|
|
|
|
|
|
|
|
|
|
|
|
Gross Wells in Progress on PHX Acreage |
|
|
46 |
|
|
|
20 |
|
|
|
|
|
11 |
|
|
|
9 |
|
|
|
- |
|
|
|
62 |
|
|
|
7 |
|
|
|
155 |
|
|
Net Wells in Progress on PHX Acreage |
|
|
0.17 |
|
|
|
0.09 |
|
|
|
|
|
0.05 |
|
|
|
0.01 |
|
|
|
- |
|
|
|
0.43 |
|
|
|
0.04 |
|
|
|
0.79 |
|
|
Gross Active Permits on PHX Acreage |
|
|
20 |
|
|
|
17 |
|
|
|
|
|
2 |
|
|
|
- |
|
|
|
- |
|
|
|
16 |
|
|
|
10 |
|
|
|
65 |
|
|
|
|
|
|
|
|
|
|
|
|
|
|
|
|
|
|
|
|
|
|
|
|
|
|
|
|
|
|
|
|
|
|
|
|
|
|
As of June 30, 2022: |
|
|
|
|
|
|
|
|
|
|
|
|
|
|
|
|
|
|
|
|
|
|
|
|
|
|
|
|
|
|
|
|
|
|
|
Rigs Present on PHX Acreage |
|
|
6 |
|
|
|
2 |
|
|
|
|
|
3 |
|
|
|
- |
|
|
|
- |
|
|
|
12 |
|
|
|
2 |
|
|
|
25 |
|
|
Rigs Within 2.5 Miles of PHX Acreage |
|
|
21 |
|
|
|
20 |
|
|
|
|
|
6 |
|
|
|
4 |
|
|
|
- |
|
|
|
36 |
|
|
|
9 |
|
|
|
96 |
|
Leasing Activity
During the third quarter of fiscal 2022, the Company leased 395 net mineral acres for an average bonus payment of $512 per net mineral acre and an average royalty of 22%.
*****MORE*****
– 6 –
PHX Minerals Inc.
Reports Third Fiscal Quarter 2022 Results …cont.
|
|
|
|
|
|
|
|
|
|
|
Bakken/ |
|
|
|
|
|
|
|
|
|
|
|
|
|
|
|
|
|
|
|
|
|
|
|
|
|
|
|
|
|
|
|
|
|
Three |
|
|
Arkoma |
|
|
|
|
|
|
|
|
|
|
|
|
|
|
|
|
|
||
|
|
|
SCOOP |
|
|
STACK |
|
|
Forks |
|
|
Stack |
|
|
Fayetteville |
|
|
Haynesville |
|
|
Other |
|
|
Total |
|
||||||||
|
During Three Months Ended June 30, 2022: |
|
|
|
|
|
|
|
|
|
|
|
|
|
|
|
|
|
|
|
|
|
|
|
|
|
|
|
|
|
|
|
|
|
Net Mineral Acres Leased |
|
|
15 |
|
|
|
112 |
|
|
|
- |
|
|
|
- |
|
|
|
- |
|
|
|
68 |
|
|
|
200 |
|
|
|
395 |
|
|
Average Bonus per Net Mineral Acre |
|
$ |
325 |
|
|
$ |
1,000 |
|
|
|
- |
|
|
|
- |
|
|
|
- |
|
|
$ |
500 |
|
|
$ |
355 |
|
|
$ |
512 |
|
|
Average Royalty per Net Mineral Acre |
|
23% |
|
|
23% |
|
|
|
- |
|
|
- |
|
|
|
- |
|
|
23% |
|
|
21% |
|
|
22% |
|
||||||
ACQUISITION AND DIVESTITURE UPDATE
During the third quarter of fiscal year 2022, the Company purchased 938 net royalty acres for approximately $9.1 million and sold 2,387 net mineral acres, which were outside our core focus areas and predominantly undeveloped and unleased, for approximately $0.5 million.
|
|
|
|
|
|
|
|
|
|
|
Bakken/ |
|
|
|
|
|
|
|
|
|
|
|
|
|
|
|
|
|
|
|
|
|
|
|
|
|
|
|
|
|
|
|
|
|
Three |
|
|
Arkoma |
|
|
|
|
|
|
|
|
|
|
|
|
|
|
|
|
|
||
|
|
|
SCOOP |
|
|
STACK |
|
|
Forks |
|
|
Stack |
|
|
Fayetteville |
|
|
Haynesville |
|
|
Other |
|
|
Total |
|
||||||||
|
During Three Months Ended June 30, 2022: |
|
|
|
|
|
|
|
|
|
|
|
|
|
|
|
|
|
|
|
|
|
|
|
|
|
|
|
|
|
|
|
|
|
Net Mineral Acres Purchased |
|
|
208 |
|
|
|
- |
|
|
|
- |
|
|
|
- |
|
|
|
- |
|
|
|
448 |
|
|
|
- |
|
|
|
656 |
|
|
Net Royalty Acres Purchased |
|
|
216 |
|
|
|
- |
|
|
|
- |
|
|
|
- |
|
|
|
- |
|
|
|
722 |
|
|
|
- |
|
|
|
938 |
|
|
Price per Net Royalty Acre |
|
$ |
9,394 |
|
|
|
- |
|
|
|
- |
|
|
|
- |
|
|
|
- |
|
|
$ |
9,830 |
|
|
|
- |
|
|
$ |
9,730 |
|
|
Net Mineral Acres Sold |
|
|
- |
|
|
|
- |
|
|
|
- |
|
|
|
- |
|
|
|
- |
|
|
|
- |
|
|
|
2,387 |
|
|
|
2,387 |
|
|
Net Royalty Acres Sold |
|
|
- |
|
|
|
- |
|
|
|
- |
|
|
|
- |
|
|
|
- |
|
|
|
- |
|
|
|
2,387 |
|
|
|
2,387 |
|
|
Price per Net Royalty Acre |
|
|
- |
|
|
|
- |
|
|
|
- |
|
|
|
- |
|
|
|
- |
|
|
|
- |
|
|
$ |
214 |
|
|
$ |
214 |
|
THIRD QUARTER EARNINGS CALL
PHX will host a conference call to discuss the Company’s third fiscal quarter results at 11:00 a.m. EDT tomorrow Aug. 9, 2022. Management’s discussion will be followed by a question-and-answer session with investors. To participate on the conference call, please dial 877-407-3088 (domestic) or 201-389-0927 (international). A replay of the call will be available for 14 days after the call. The number to access the replay of the conference call is 877-660-6853 and the PIN for the replay is 13731836.
*****MORE*****
– 7 –
PHX Minerals Inc.
Reports Third Fiscal Quarter 2022 Results …cont.
FINANCIAL RESULTS
Statements of Operations
|
|
Three Months Ended June 30, |
|
|
Nine Months Ended June 30, |
|
||||||||||
|
|
2022 |
|
|
2021 |
|
|
2022 |
|
|
2021 |
|
||||
|
Revenues: |
|
|
|
|
|
||||||||||
|
Natural gas, oil and NGL sales |
$ |
19,561,568 |
|
|
$ |
10,899,820 |
|
|
$ |
48,032,597 |
|
|
$ |
25,670,624 |
|
|
Lease bonuses and rental income |
|
209,329 |
|
|
|
259,152 |
|
|
|
450,152 |
|
|
|
319,139 |
|
|
Gains (losses) on derivative contracts |
|
(2,387,226 |
) |
|
|
(5,487,483 |
) |
|
|
(12,534,464 |
) |
|
|
(8,089,662 |
) |
|
|
|
17,383,671 |
|
|
|
5,671,489 |
|
|
|
35,948,285 |
|
|
|
17,900,101 |
|
|
Costs and expenses: |
|
|
|
|
|
|
|
|
|
|
|
|
|
|
|
|
Lease operating expenses |
|
900,807 |
|
|
|
1,064,989 |
|
|
|
3,086,272 |
|
|
|
3,100,052 |
|
|
Transportation, gathering and marketing |
|
1,430,136 |
|
|
|
1,538,174 |
|
|
|
4,132,258 |
|
|
|
4,138,653 |
|
|
Production taxes |
|
925,197 |
|
|
|
596,858 |
|
|
|
2,301,537 |
|
|
|
1,316,038 |
|
|
Depreciation, depletion and amortization |
|
2,022,832 |
|
|
|
2,137,707 |
|
|
|
5,727,708 |
|
|
|
6,176,173 |
|
|
Provision for impairment |
|
6,277 |
|
|
|
45,855 |
|
|
|
11,862 |
|
|
|
45,855 |
|
|
Interest expense |
|
286,345 |
|
|
|
220,439 |
|
|
|
693,276 |
|
|
|
790,202 |
|
|
General and administrative |
|
2,877,614 |
|
|
|
2,275,104 |
|
|
|
7,717,435 |
|
|
|
6,065,677 |
|
|
Losses (gains) on asset sales and other |
|
(630,547 |
) |
|
|
(35,043 |
) |
|
|
(743,867 |
) |
|
|
(177,512 |
) |
|
Total costs and expenses |
|
7,818,661 |
|
|
|
7,844,083 |
|
|
|
22,926,481 |
|
|
|
21,455,138 |
|
|
Income (loss) before provision (benefit) for income taxes |
|
9,565,010 |
|
|
|
(2,172,594 |
) |
|
|
13,021,804 |
|
|
|
(3,555,037 |
) |
|
|
|
|
|
|
|
|
|
|
|
|
|
|
|
|
|
|
Provision (benefit) for income taxes |
|
976,000 |
|
|
|
(816,000 |
) |
|
|
1,771,000 |
|
|
|
(1,102,000 |
) |
|
|
|
|
|
|
|
|
|
|
|
|
|
|
|
|
|
|
Net income (loss) |
$ |
8,589,010 |
|
|
$ |
(1,356,594 |
) |
|
$ |
11,250,804 |
|
|
$ |
(2,453,037 |
) |
|
|
|
|
|
|
|
|
|
|
|
|
|
|
|
|
|
|
|
|
|
|
|
|
|
|
|
|
|
|
|
|
|
|
|
|
|
|
|
|
|
|
|
|
|
|
|
|
|
|
|
|
Basic and diluted earnings (loss) per common share |
$ |
0.25 |
|
|
$ |
(0.05 |
) |
|
$ |
0.33 |
|
|
$ |
(0.10 |
) |
|
|
|
|
|
|
|
|
|
|
|
|
|
|
|
|
|
|
Weighted average shares outstanding: |
|
|
|
|
|
|
|
|
|
|
|
|
|
|
|
|
Basic |
|
34,652,155 |
|
|
|
28,309,258 |
|
|
|
34,009,105 |
|
|
|
24,482,639 |
|
|
Diluted |
|
34,851,214 |
|
|
|
28,309,258 |
|
|
|
34,009,105 |
|
|
|
24,482,639 |
|
|
|
|
|
|
|
|
|
|
|
|
|
|
|
|
|
|
|
Dividends per share of |
|
|
|
|
|
|
|
|
|
|
|
|
|
|
|
|
common stock paid in period |
$ |
0.02 |
|
|
$ |
0.01 |
|
|
$ |
0.045 |
|
|
$ |
0.03 |
|
|
|
|
|
|
|
|
|
|
|
|
|
|
|
|
|
|
*****MORE*****
– 8 –
PHX Minerals Inc.
Reports Third Fiscal Quarter 2022 Results …cont.
Balance Sheets
|
|
June 30, 2022 |
|
|
Sept. 30, 2021 |
|
||
|
Assets |
|
|
|
|
|
|
|
|
Current assets: |
|
|
|
|
|
|
|
|
Cash and cash equivalents |
$ |
4,489,282 |
|
|
$ |
2,438,511 |
|
|
Natural gas, oil, and NGL sales receivables (net of $0 |
|
11,780,557 |
|
|
|
6,428,982 |
|
|
allowance for uncollectable accounts) |
|
|
|
|
|
|
|
|
Refundable income taxes |
|
860,416 |
|
|
|
2,413,942 |
|
|
Other |
|
1,276,942 |
|
|
|
942,082 |
|
|
Total current assets |
|
18,407,197 |
|
|
|
12,223,517 |
|
|
|
|
|
|
|
|
|
|
|
Properties and equipment at cost, based on |
|
|
|
|
|
|
|
|
successful efforts accounting: |
|
|
|
|
|
|
|
|
Producing natural gas and oil properties |
|
265,800,998 |
|
|
|
319,984,874 |
|
|
Non-producing natural gas and oil properties |
|
50,204,756 |
|
|
|
40,466,098 |
|
|
Other |
|
972,770 |
|
|
|
794,179 |
|
|
|
|
316,978,524 |
|
|
|
361,245,151 |
|
|
Less accumulated depreciation, depletion and amortization |
|
(193,551,159 |
) |
|
|
(257,643,661 |
) |
|
Net properties and equipment |
|
123,427,365 |
|
|
|
103,601,490 |
|
|
|
|
|
|
|
|
|
|
|
Operating lease right-of-use assets |
|
770,952 |
|
|
|
607,414 |
|
|
Other, net |
|
764,068 |
|
|
|
578,593 |
|
|
Total assets |
$ |
143,369,582 |
|
|
$ |
117,011,014 |
|
|
|
|
|
|
|
|
|
|
|
Liabilities and Stockholders' Equity |
|
|
|
|
|
|
|
|
Current liabilities: |
|
|
|
|
|
|
|
|
Accounts payable |
$ |
486,034 |
|
|
$ |
772,717 |
|
|
Derivative contracts, net |
|
10,189,546 |
|
|
|
12,087,988 |
|
|
Income taxes payable |
|
- |
|
|
|
334,050 |
|
|
Current portion of operating lease liability |
|
190,604 |
|
|
|
132,287 |
|
|
Accrued liabilities and other |
|
1,489,127 |
|
|
|
1,809,337 |
|
|
Total current liabilities |
|
12,355,311 |
|
|
|
15,136,379 |
|
|
|
|
|
|
|
|
|
|
|
Long-term debt |
|
28,300,000 |
|
|
|
17,500,000 |
|
|
Deferred income taxes, net |
|
550,906 |
|
|
|
343,906 |
|
|
Asset retirement obligations |
|
2,116,246 |
|
|
|
2,836,172 |
|
|
Derivative contracts, net |
|
1,068,544 |
|
|
|
1,696,479 |
|
|
Operating lease liability, net of current portion |
|
1,015,405 |
|
|
|
789,339 |
|
|
|
|
|
|
|
|
|
|
|
Total liabilities |
|
45,406,412 |
|
|
|
38,302,275 |
|
|
|
|
|
|
|
|
|
|
|
Stockholders' equity: |
|
|
|
|
|
|
|
|
Common Stock, $0.01666 par value; 54,000,500 |
|
|
|
|
|
|
|
|
shares authorized and 35,680,970 issued at June 30, 2022; |
|
|
|
|
|
|
|
|
36,000,500 shares authorized and 32,770,433 issued at Sept. 30, 2021 |
|
594,445 |
|
|
|
545,956 |
|
|
Capital in excess of par value |
|
42,849,595 |
|
|
|
33,213,645 |
|
|
Deferred directors' compensation |
|
1,451,690 |
|
|
|
1,768,151 |
|
|
Retained earnings |
|
58,676,047 |
|
|
|
48,966,420 |
|
|
|
|
103,571,777 |
|
|
|
84,494,172 |
|
|
Less treasury stock, at cost; 377,232 shares at June 30, |
|
|
|
|
|
|
|
|
2022, and 388,545 shares at Sept. 30, 2021 |
|
(5,608,607 |
) |
|
|
(5,785,433 |
) |
|
Total stockholders' equity |
|
97,963,170 |
|
|
|
78,708,739 |
|
|
Total liabilities and stockholders' equity |
$ |
143,369,582 |
|
|
$ |
117,011,014 |
|
*****MORE*****
– 9 –
PHX Minerals Inc.
Reports Third Fiscal Quarter 2022 Results …cont.
Condensed Statements of Cash Flows
|
|
Nine Months Ended June 30, |
|
|||||
|
|
2022 |
|
|
2021 |
|
||
|
Operating Activities |
|
|
|||||
|
Net income (loss) |
$ |
11,250,804 |
|
|
$ |
(2,453,037 |
) |
|
Adjustments to reconcile net income (loss) to net cash provided |
|
|
|
|
|
|
|
|
by operating activities: |
|
|
|
|
|
|
|
|
Depreciation, depletion and amortization |
|
5,727,708 |
|
|
|
6,176,173 |
|
|
Impairment of producing properties |
|
11,862 |
|
|
|
45,855 |
|
|
Provision for deferred income taxes |
|
207,000 |
|
|
|
(1,117,000 |
) |
|
Gain from leasing fee mineral acreage |
|
(449,053 |
) |
|
|
(316,541 |
) |
|
Proceeds from leasing fee mineral acreage |
|
545,920 |
|
|
|
334,938 |
|
|
Net (gain) loss on sales of assets |
|
(865,035 |
) |
|
|
(136,596 |
) |
|
Directors' deferred compensation expense |
|
147,298 |
|
|
|
167,425 |
|
|
Total (gain) loss on derivative contracts |
|
12,534,464 |
|
|
|
8,089,662 |
|
|
Cash receipts (payments) on settled derivative contracts |
|
(1,215,245 |
) |
|
|
(688,807 |
) |
|
Restricted stock awards |
|
1,219,047 |
|
|
|
542,674 |
|
|
Other |
|
55,653 |
|
|
|
72,126 |
|
|
Cash provided (used) by changes in assets and liabilities: |
|
|
|
|
|
|
|
|
Natural gas, oil and NGL sales receivables |
|
(5,351,575 |
) |
|
|
(2,134,395 |
) |
|
Other current assets |
|
(78,262 |
) |
|
|
(89,957 |
) |
|
Accounts payable |
|
(251,059 |
) |
|
|
209,014 |
|
|
Income taxes receivable |
|
1,553,526 |
|
|
|
1,425,471 |
|
|
Other non-current assets |
|
(393,492 |
) |
|
|
87,065 |
|
|
Income taxes payable |
|
(334,050 |
) |
|
|
- |
|
|
Accrued liabilities |
|
23,463 |
|
|
|
26,263 |
|
|
Total adjustments |
|
13,088,170 |
|
|
|
12,693,370 |
|
|
Net cash provided by operating activities |
|
24,338,974 |
|
|
|
10,240,333 |
|
|
|
|
|
|
|
|
|
|
|
Investing Activities |
|
|
|
|
|
|
|
|
Capital expenditures |
|
(351,524 |
) |
|
|
(696,759 |
) |
|
Acquisition of minerals and overriding royalty interests |
|
(29,872,407 |
) |
|
|
(19,337,265 |
) |
|
Net proceeds from sales of assets |
|
7,852,389 |
|
|
|
533,371 |
|
|
Net cash provided (used) by investing activities |
|
(22,371,542 |
) |
|
|
(19,500,653 |
) |
|
|
|
|
|
|
|
|
|
|
Financing Activities |
|
|
|
|
|
|
|
|
Borrowings under credit facility |
|
14,300,000 |
|
|
|
- |
|
|
Payments of loan principal |
|
(3,500,000 |
) |
|
|
(8,850,000 |
) |
|
Net proceeds from equity issuance |
|
4,670,112 |
|
|
|
11,088,858 |
|
|
Cash receipts from (payments on) off-market derivative contracts |
|
(13,845,596 |
) |
|
|
- |
|
|
Purchases of treasury stock |
|
- |
|
|
|
(2,741 |
) |
|
Payments of dividends |
|
(1,541,177 |
) |
|
|
(757,692 |
) |
|
Net cash provided (used) by financing activities |
|
83,339 |
|
|
|
1,478,425 |
|
|
|
|
|
|
|
|
|
|
|
Increase (decrease) in cash and cash equivalents |
|
2,050,771 |
|
|
|
(7,781,895 |
) |
|
Cash and cash equivalents at beginning of period |
|
2,438,511 |
|
|
|
10,690,395 |
|
|
Cash and cash equivalents at end of period |
$ |
4,489,282 |
|
|
$ |
2,908,500 |
|
|
|
|
|
|
|
|
|
|
|
Supplemental Schedule of Noncash Investing and Financing Activities |
|
|
|
|
|
|
|
|
|
|
|
|
|
|
|
|
|
Gross additions to properties and equipment |
$ |
33,431,875 |
|
|
$ |
23,794,178 |
|
|
Value of shares used for acquisitions |
|
(3,510,001 |
) |
|
|
(3,718,000 |
) |
|
Net (increase) decrease in accounts payable for properties |
|
|
|
|
|
|
|
|
and equipment additions |
|
302,057 |
|
|
|
(42,154 |
) |
|
Capital expenditures and acquisitions |
$ |
30,223,931 |
|
|
$ |
20,034,024 |
|
*****MORE*****
– 10 –
PHX Minerals Inc.
Reports Third Fiscal Quarter 2022 Results …cont.
Derivative Contracts as of Aug. 5, 2022
|
|
|
|
|
|
|
|
|
|
|
|
|
Collar Average |
|
|
Collar Average |
|
||
|
Fiscal Period |
|
Product |
|
Volume Mcf/Bbl |
|
|
Swap Price |
|
|
Floor Price |
|
|
Ceiling Price |
|
||||
|
Remaining 2022 |
|
Natural Gas |
|
|
135,000 |
|
|
|
|
|
|
$ |
4.15 |
|
|
$ |
6.53 |
|
|
Remaining 2022 |
|
Natural Gas |
|
|
250,000 |
|
|
$ |
3.01 |
|
|
|
|
|
|
|
|
|
|
2023 |
|
Natural Gas |
|
|
890,000 |
|
|
|
|
|
|
$ |
4.49 |
|
|
$ |
8.10 |
|
|
2023 |
|
Natural Gas |
|
|
2,100,000 |
|
|
$ |
3.24 |
|
|
|
|
|
|
|
|
|
|
2024 |
|
Natural Gas |
|
|
60,000 |
|
|
|
|
|
|
$ |
3.00 |
|
|
$ |
4.70 |
|
|
2024 |
|
Natural Gas |
|
|
380,000 |
|
|
$ |
3.41 |
|
|
|
|
|
|
|
|
|
|
|
|
|
|
|
|
|
|
|
|
|
|
|
|
|
|
|
|
|
|
Remaining 2022 |
|
Crude Oil |
|
|
19,000 |
|
|
$ |
46.89 |
|
|
|
|
|
|
|
|
|
|
2023 |
|
Crude Oil |
|
|
15,000 |
|
|
|
|
|
|
$ |
75.00 |
|
|
$ |
96.00 |
|
|
2023 |
|
Crude Oil |
|
|
72,750 |
|
|
$ |
63.65 |
|
|
|
|
|
|
|
|
|
|
2024 |
|
Crude Oil |
|
|
14,250 |
|
|
$ |
74.91 |
|
|
|
|
|
|
|
|
|
Non-GAAP Reconciliation
This press release includes certain “non-GAAP financial measures” as defined under the rules and regulations of the U.S. Securities and Exchange Commission, or the SEC, including Regulation G. These non-GAAP financial measures are calculated using GAAP amounts in the Company’s financial statements. These measures, detailed below, are provided in addition to, not as an alternative for, and should be read in conjunction with, the information contained in the Company’s financial statements prepared in accordance with GAAP (including the notes thereto), included in the Company’s SEC filings and posted on its website.
Adjusted EBITDA Reconciliation
We define “adjusted EBITDA” as earnings before interest, taxes, depreciation and amortization, or EBITDA, excluding unrealized gains (losses) on derivatives and gains (losses) on asset sales and including cash receipts from (payments on) off-market derivatives and restricted stock and deferred directors’ expense. We have included a presentation of adjusted EBITDA because we recognize that certain investors consider this amount to be a useful means of measuring our ability to meet our debt service obligations and evaluating our financial performance. Adjusted EBITDA has limitations and should not be considered in isolation or as a substitute for net income, operating income, cash flow from operations or other consolidated income or cash flow data prepared in accordance with GAAP. Because not all companies use identical calculations, this presentation of adjusted EBITDA may not be comparable to a similarly titled measure of other companies.
*****MORE*****
– 11 –
PHX Minerals Inc.
Reports Third Fiscal Quarter 2022 Results …cont.
The following table provides a presentation of net income (loss) to adjusted EBITDA for the periods indicated:
|
|
Third Quarter Ended |
|
|
Third Quarter Ended |
|
|
Nine Months Ended |
|
|
Nine Months Ended |
|
|
Second Quarter Ended |
|
|||||
|
|
June 30, 2022 |
|
|
June 30, 2021 |
|
|
June 30, 2022 |
|
|
June 30, 2021 |
|
|
March 31, 2022 |
|
|||||
|
Net Income (Loss) |
$ |
8,589,010 |
|
|
$ |
(1,356,594 |
) |
|
$ |
11,250,804 |
|
|
$ |
(2,453,037 |
) |
|
$ |
(4,020,455 |
) |
|
Plus: |
|
|
|
|
|
|
|
|
|
|
|
|
|
|
|
|
|
|
|
|
Income tax expense |
|
|
|
|
|
|
|
|
|
|
|
|
|
|
|
|
|
|
|
|
(benefit) |
|
976,000 |
|
|
|
(816,000 |
) |
|
|
1,771,000 |
|
|
|
(1,102,000 |
) |
|
|
33,000 |
|
|
Interest expense |
|
286,345 |
|
|
|
220,439 |
|
|
|
693,276 |
|
|
|
790,202 |
|
|
|
230,212 |
|
|
DD&A |
|
2,022,832 |
|
|
|
2,137,707 |
|
|
|
5,727,708 |
|
|
|
6,176,173 |
|
|
|
2,121,116 |
|
|
Impairment |
|
6,277 |
|
|
|
45,855 |
|
|
|
11,862 |
|
|
|
45,855 |
|
|
|
- |
|
|
Less: |
|
|
|
|
|
|
|
|
|
|
|
|
|
|
|
|
|
|
|
|
Unrealized gains (losses) |
|
|
|
|
|
|
|
|
|
|
|
|
|
|
|
|
|
|
|
|
on derivatives |
|
3,282,921 |
|
|
|
(4,482,793 |
) |
|
|
(3,939,218 |
) |
|
|
(7,400,855 |
) |
|
|
(11,772,640 |
) |
|
Gains (losses) on asset sales |
|
693,750 |
|
|
|
31,243 |
|
|
|
865,038 |
|
|
|
61,801 |
|
|
|
2,292,215 |
|
|
Plus: |
|
|
|
|
|
|
|
|
|
|
|
|
|
|
|
|
|
|
|
|
Cash receipts from (payments on) |
|
|
|
|
|
|
|
|
|
|
|
|
|
|
|
|
|
|
|
|
off-market derivative contracts(1) |
|
(1,284,024 |
) |
|
|
- |
|
|
|
(6,465,597 |
) |
|
|
- |
|
|
|
(2,493,481 |
) |
|
Restricted stock and deferred |
|
|
|
|
|
|
|
|
|
|
|
|
|
|
|
|
|
|
|
|
director's expense |
|
574,333 |
|
|
|
325,697 |
|
|
|
1,366,346 |
|
|
|
710,099 |
|
|
|
468,598 |
|
|
Adjusted EBITDA |
$ |
7,194,102 |
|
|
$ |
5,008,654 |
|
|
$ |
17,429,579 |
|
|
$ |
11,506,346 |
|
|
$ |
5,819,415 |
|
|
|
|
|
|
|
|
|
|
|
|
|
|
|
|
|
|
|
|
|
|
|
(1) The initial receipt of $8.8 million of cash from BP Energy Company, or BP, for entering into the off-market derivative contracts had no effect on the Company’s statement of operations and was considered cash flow from financing activities. A portion of subsequent settlements with BP had no effect on the Company’s statement of operations. |
|
||||||||||||||||||
*****MORE*****
– 12 –
PHX Minerals Inc.
Reports Third Fiscal Quarter 2022 Results …cont.
Debt to Adjusted EBITDA (TTM) Reconciliation
“Debt to adjusted EBITDA (TTM)” is defined as the ratio of long-term debt to adjusted EBITDA on a trailing 12-month (TTM) basis. We have included a presentation of debt to adjusted EBITDA (TTM) because we recognize that certain investors consider such ratios to be useful means of measuring our ability to meet our debt service obligations and for evaluating our financial performance. The debt to adjusted EBITDA (TTM) ratio has limitations and should not be considered in isolation or as a substitute for net income, operating income, cash flow from operations or other consolidated income or cash flow data prepared in accordance with GAAP. Because not all companies use identical calculations, this presentation of debt to adjusted EBITDA (TTM) may not be comparable to a similarly titled measure of other companies. The following table provides a presentation of net income (loss) to adjusted EBITDA on a TTM basis and of the resulting debt to adjusted EBITDA (TTM) ratio:
|
|
TTM Ended |
|
|
TTM Ended |
|
||
|
|
June 30, 2022 |
|
|
June 30, 2021 |
|
||
|
Net Income (Loss) |
$ |
7,486,604 |
|
|
$ |
(4,287,159 |
) |
|
Plus: |
|
|
|
|
|
|
|
|
Income tax expense (benefit) |
|
2,221,949 |
|
|
|
(1,780,060 |
) |
|
Interest expense |
|
898,201 |
|
|
|
1,118,561 |
|
|
DD&A |
|
7,297,339 |
|
|
|
8,696,169 |
|
|
Impairment |
|
16,482 |
|
|
|
45,855 |
|
|
Less: |
|
|
|
|
|
|
|
|
Unrealized gains (losses) |
|
|
|
|
|
|
|
|
on derivatives |
|
(815,184 |
) |
|
|
(9,788,013 |
) |
|
Gains (losses) on asset sales |
|
1,112,581 |
|
|
|
770,911 |
|
|
Plus: |
|
|
|
|
|
|
|
|
Cash receipts from (payments on) |
|
|
|
|
|
|
|
|
off-market derivative contracts(1) |
|
2,334,403 |
|
|
|
- |
|
|
Restricted stock and deferred |
|
|
|
|
|
|
|
|
director's expense |
|
1,691,912 |
|
|
|
878,405 |
|
|
Adjusted EBITDA |
$ |
21,649,493 |
|
|
$ |
13,688,873 |
|
|
|
|
|
|
|
|
|
|
|
Debt |
$ |
28,300,000 |
|
|
$ |
19,900,000 |
|
|
Debt to Adjusted EBITDA (TTM) |
|
1.31 |
|
|
|
1.45 |
|
|
|
|
|
|
|
|
|
|
|
(1) The initial receipt of $8.8 million of cash from BP for entering into the off-market derivative contracts had no effect on the Company’s statement of operations and was considered cash flow from financing activities. A portion of subsequent settlements with BP has no effect on the Company’s statement of operations. |
|
||||||
Pretax Net Income (Loss) Excluding Non-cash Derivative Gains (Losses) Reconciliation
“Pretax net income (loss) excluding non-cash derivative gains (losses)” is defined as earnings before taxes, excluding unrealized gains (losses) on derivatives. We have included a presentation of pretax net income (loss) excluding non-cash derivative gains (losses) because we recognize that certain investors consider this amount to be a useful means of measuring our ability to meet our debt service obligations and evaluating our financial performance. Pretax net income (loss) excluding non-cash derivative gains (losses) has limitations and should not be considered in isolation or as a substitute for net income, operating income, cash flow from operations or other consolidated income or cash flow data prepared in accordance with GAAP. Because not all companies use identical calculations, this presentation of pretax net income (loss) excluding non-cash derivative gains (losses) may not be comparable to a similarly titled measure of other companies.
*****MORE*****
– 13 –
PHX Minerals Inc.
Reports Third Fiscal Quarter 2022 Results …cont.
The following table provides a presentation of net income (loss) to pretax net income (loss) excluding non-cash derivative gains (losses) for the periods indicated:
|
|
Third Quarter Ended |
|
|
Second Quarter Ended |
|
||
|
|
June 30, 2022 |
|
|
March 31, 2022 |
|
||
|
Net Income (Loss) |
$ |
8,589,010 |
|
|
$ |
(4,020,455 |
) |
|
Plus: |
|
|
|
|
|
|
|
|
Income tax expense (benefit) |
|
976,000 |
|
|
|
33,000 |
|
|
Less: |
|
|
|
|
|
|
|
|
Unrealized gains (losses) |
|
|
|
|
|
|
|
|
on derivatives |
|
3,282,921 |
|
|
|
(11,772,640 |
) |
|
Pretax Net Income (Loss) excluding |
|
|
|
|
|
|
|
|
Non-cash Derivative Gains (Losses) |
$ |
6,282,089 |
|
|
$ |
7,785,185 |
|
|
|
|
|
|
|
|
|
|
|
Weighted average shares outstanding |
|
|
|
|
|
|
|
|
Basic |
|
34,652,155 |
|
|
|
34,292,455 |
|
|
Diluted |
|
34,851,214 |
|
|
|
34,292,455 |
|
|
|
|
|
|
|
|
|
|
|
Pretax Net Income (Loss) excluding Non-cash |
|
|
|
|
|
|
|
|
Derivative Gains (Losses) per basic and diluted share |
$ |
0.18 |
|
|
$ |
0.23 |
|
|
|
|
|
|
|
|
|
|
PHX Minerals Inc. (NYSE: PHX) Fort Worth, Texas, based, PHX Minerals Inc. is a natural gas and oil mineral company with a strategy to proactively grow its mineral position in its core areas of focus. PHX owns approximately 75,000 leased mineral acres principally located in Oklahoma, Texas, Louisiana, North Dakota, and Arkansas. Additional information on PHX can be found at www.phxmin.com.
Cautionary Statement Regarding Forward-Looking Statements
This press release includes “forward-looking statements” within the meaning of Section 27A of the Securities Act of 1933, as amended, and Section 21E of the Securities Exchange Act of 1934, as amended. Words such as “anticipates,” “plans,” “estimates,” “believes,” “expects,” “intends,” “will,” “should,” “may” and similar expressions may be used to identify forward-looking statements. Forward-looking statements are not statements of historical fact and reflect PHX’s current views about future events. Forward-looking statements may include, but are not limited to, statements relating to: the Company’s ability to execute its business strategies; the volatility of realized natural gas and oil prices; the level of production on the Company’s properties; estimates of quantities of natural gas, oil and NGL reserves and their values; general economic or industry conditions; legislation or regulatory requirements; conditions of the securities markets; the Company’s ability to raise capital; changes in accounting principles, policies or guidelines; financial or political instability; acts of war or terrorism; title defects in the properties in which the Company invests; and other economic, competitive, governmental, regulatory or technical factors affecting properties, operations or prices. Although the Company believes expectations reflected in these and other forward-looking statements are reasonable, the Company can give no assurance such expectations will prove to be correct. Such forward-looking statements are subject to a number of assumptions, risks and uncertainties, many of which are beyond the control of the Company. These forward-looking statements involve certain risks and uncertainties that could cause the results to differ materially from those expected by the Company’s management. Information concerning these risks and other factors can be found in the Company’s filings with the SEC, including its Annual Reports on Form 10-K and Quarterly Reports on Form 10-Q, available on the Company’s website or the SEC’s website at www.sec.gov.
*****MORE*****
– 14 –
PHX Minerals Inc.
Reports Third Fiscal Quarter 2022 Results …cont.
Investors are cautioned that any such statements are not guarantees of future performance and that actual results or developments may differ materially from those projected in forward-looking statements. The forward-looking statements in this press release are made as of the date hereof, and the Company does not undertake any obligation to update the forward-looking statements as a result of new information, future events or otherwise.
*****END*****
– 15 –

Exhibit 99.2 PHX MINERALS Investor Presentation August 2022
Cautionary Statement Regarding Forward-Looking Statements This presentation does not constitute an offer to sell, a solicitation of an offer to buy, or a recommendation to purchase any security of PHX Minerals Inc. (“PHX” or the “Company”). No offering of securities shall be made except by means of a prospectus meeting the requirements of Section 10 of the Securities Act of 1933, as amended, or an exemption therefrom. Cautionary Statement Regarding Forward-Looking Statements This presentation includes “forward-looking statements” within the meaning of Section 27A of the Securities Act of 1933 and Section 21E of the Securities Exchange Act of 1934. All statements, other than statements of historical fact, included in this presentation that address activities, events or developments that PHX Minerals Inc. (“PHX” or the “Company”) expects, believes or anticipates will or may occur in the future are forward looking statements. The words “anticipates”, “plans”, “estimates”, “believes”, “expects”, “intends”, “will”, “should”, “may” and similar expressions may be used to identify forward-looking statements. Forward-looking statements may include, but are not limited to, statements relating to: our ability to execute our business strategies; the volatility of realized natural gas and oil prices; the level of production on our properties; estimates of quantities of natural gas, oil and NGL reserves and their values; general economic or industry conditions; legislation or regulatory requirements; conditions of the securities markets; our ability to raise capital; changes in accounting principles, policies or guidelines; financial or political instability; acts of war or terrorism; title defects in the properties in which we invest; and other economic, competitive, governmental, regulatory or technical factors affecting our properties, operations or prices. Although the Company believes the expectations reflected in these and other forward-looking statements are reasonable, the Company can give no assurance such statements will prove to be correct. Such forward-looking statements are subject to a number of assumptions, risks and uncertainties, many of which are beyond the control of the Company. These forward-looking statements involve certain risks and uncertainties that could cause the results to differ materially from those expected by the Company’s management. Information concerning these risks and other factors can be found in the Company’s filings with the Securities and Exchange Commission, including its Annual Reports on Form 10-K and Quarterly Reports on Form 10-Q, available on the Company's website or the SEC’s website at www.sec.gov. Readers are cautioned that any such statements are not guarantees of future performance and that actual results or developments may differ materially from those projected in the forward-looking statements. The forward-looking statements in this presentation are made as of the date hereof, and the Company does not undertake any obligation to update the forward-looking statements as a result of new information, future events or otherwise. Use of Non-GAAP Financial Information This presentation includes certain non-GAAP financial measures. Adjusted EBITDA and discretionary cash flow are supplemental non-GAAP measures that are used by management and external users of our financial statements, such as industry analysts, investors, lenders and rating agencies. PHX defines “adjusted EBITDA” as earnings before interest, taxes, depreciation and amortization, or EBITDA, excluding unrealized gains (losses) on derivatives and gains (losses) on asset sales and including cash receipts from (payments on) off-market derivatives and restricted stock and deferred directors’ expense. PHX defines “discretionary cash flow” as Adjusted EBITDA minus interest expense plus gain on sale. PHX references Adjusted EBITDA and discretionary cash flow in this presentation because it recognizes that certain investors consider Adjusted EBITDA and discretionary cash flow useful means of measuring our ability to meet our debt service obligations and evaluating our financial performance. Adjusted EBITDA and discretionary cash flow have limitations and should not be considered in isolation or as a substitute for net income, operating income, cash flow from operations or other consolidated income or cash flow data prepared in accordance with GAAP. Because not all companies use identical calculations, the Company’s calculations of Adjusted EBITDA or discretionary cash flow may not be comparable to similarly titled measures of other companies. Oil and Gas Reserves The SEC generally permits oil and gas companies, in filings made with the SEC, to disclose proved reserves, which are reserve estimates that geological and engineering data demonstrate with reasonable certainty to be recoverable in future years from known reservoirs under existing economic and operating conditions, and certain probable and possible reserves that meet the SEC’s definitions for such terms. The Company discloses only estimated proved reserves in its filings with the SEC. The Company’s estimated proved reserves as of September 30, 2020, referenced in this presentation were prepared by DeGolyer and MacNaughton, an independent engineering firm, and comply with definitions promulgated by the SEC. Additional information on the Company’s estimated proved reserves is contained in the Company’s filings with the SEC. PHX MINERALS 2

Investment Considerations Strategy of growth via accretive mineral acquisitions Growth underpinned by complete technical evaluation Attractive valuation relative to mineral focused peer group Highly fragmented mineral ownership Seasoned management and technical team ▪ Actively pursue high-quality positions in the highly fragmented minerals space ▪ Minimal incremental G&A required to meaningfully scale ▪ Acquisitions underpinned by technical expertise, engineering, and geology ▪ Target geologic / economic attributes that will attract development capital ▪ Attractive EBITDA and cash flow multiples ▪ Strong free cash flow yield ▪ Low leverage ▪ Ample supply of private minerals assets seeking monetization ▪ Limited capital market options for sellers seeking an exit ▪ Management and Board have extensive experience and relationships throughout the MidContinent ▪ Proven track record of creating value through technically driven analysis PHX MINERALS 3 Continued Replenishment of Drilling Inventory Gross WIP Conversions Fiscal Q3 20221 Net WIP Conversions Fiscal Q3 20221 The majority of conversions were in SCOOP (39 gross wells) and Haynesville (12 gross wells) Note: [BAR CHART] [BAR CHART] 1 WIPs includes wells that are Drilling and DUCs 2 Includes Permits, PROBs, POSS and Contingent 3 Includes wells changed to SI, TA or P&A PHX MINERALS 8

Company Overview Key Statistics Net Leased Royalty Acres1 85,025 Average Net Interest on Producing Royalty Interest Wells 0.63% 3Q22 Net Production (MMcfe/d)1 26.7 3Q22 Adjusted EBITDA ($mm)2 $7.2 Gross Royalty Wells on Production1 5,682 Gross Royalty WIPs1 155 Gross Royalty Active Permits1 65 Gross Royalty Additional Undrilled Locations3 2,496 Gross Rigs Running on PHX acreage4 25 Gross Rigs Running Within 2.5 miles of PHX acreage4 96 Royalty Interest Production Growth [BAR CHART] [BAR CHART] [BAR CHART] Reserve Summary5,6 3Q22 Production (MMcfe/d)1 Source: Company information and Enverus 1 As of 6/30/2022 2 See Slide 21 for non-GAAP reconciliation 3 PROB and POSS inventory based on CGA MY22 report proforma acquisitions and divestitures completed through 6/30/20222 4 Provided by Enverus as of 6/30/2022 5 3P Reserves per 6/30/2022 CGA MY22 report, proforma acquisitions and divestitures completed through 6/30/2022, using a 6/30/2022 effective date and 7/18/2022 STRIP price of WTI/HH 2022: $96.76/$7.44, 2023: $84.69/$5.50, 2024: $78.15/$4.68, 2025: $73.94/$4.44, 2026: $71.17/$4.30, 2027: $69.31/$4.20, 2028: $68.04/$4.24, 2029: $67.10/$4.29, 2030: $66.69/$4.39, 2031: $66.97/$4.50, 2032: $67.25/$4.63, 2033+: $67.58/$4.76. 6 PUDs in the PHX reserve report are Permits, WIPs or DUCs. Probables share all technical merits of PUDs but development timing is uncertain. PHX Probables may be PUDs in their respective operator’s reserve report. PHX MINERALS 4
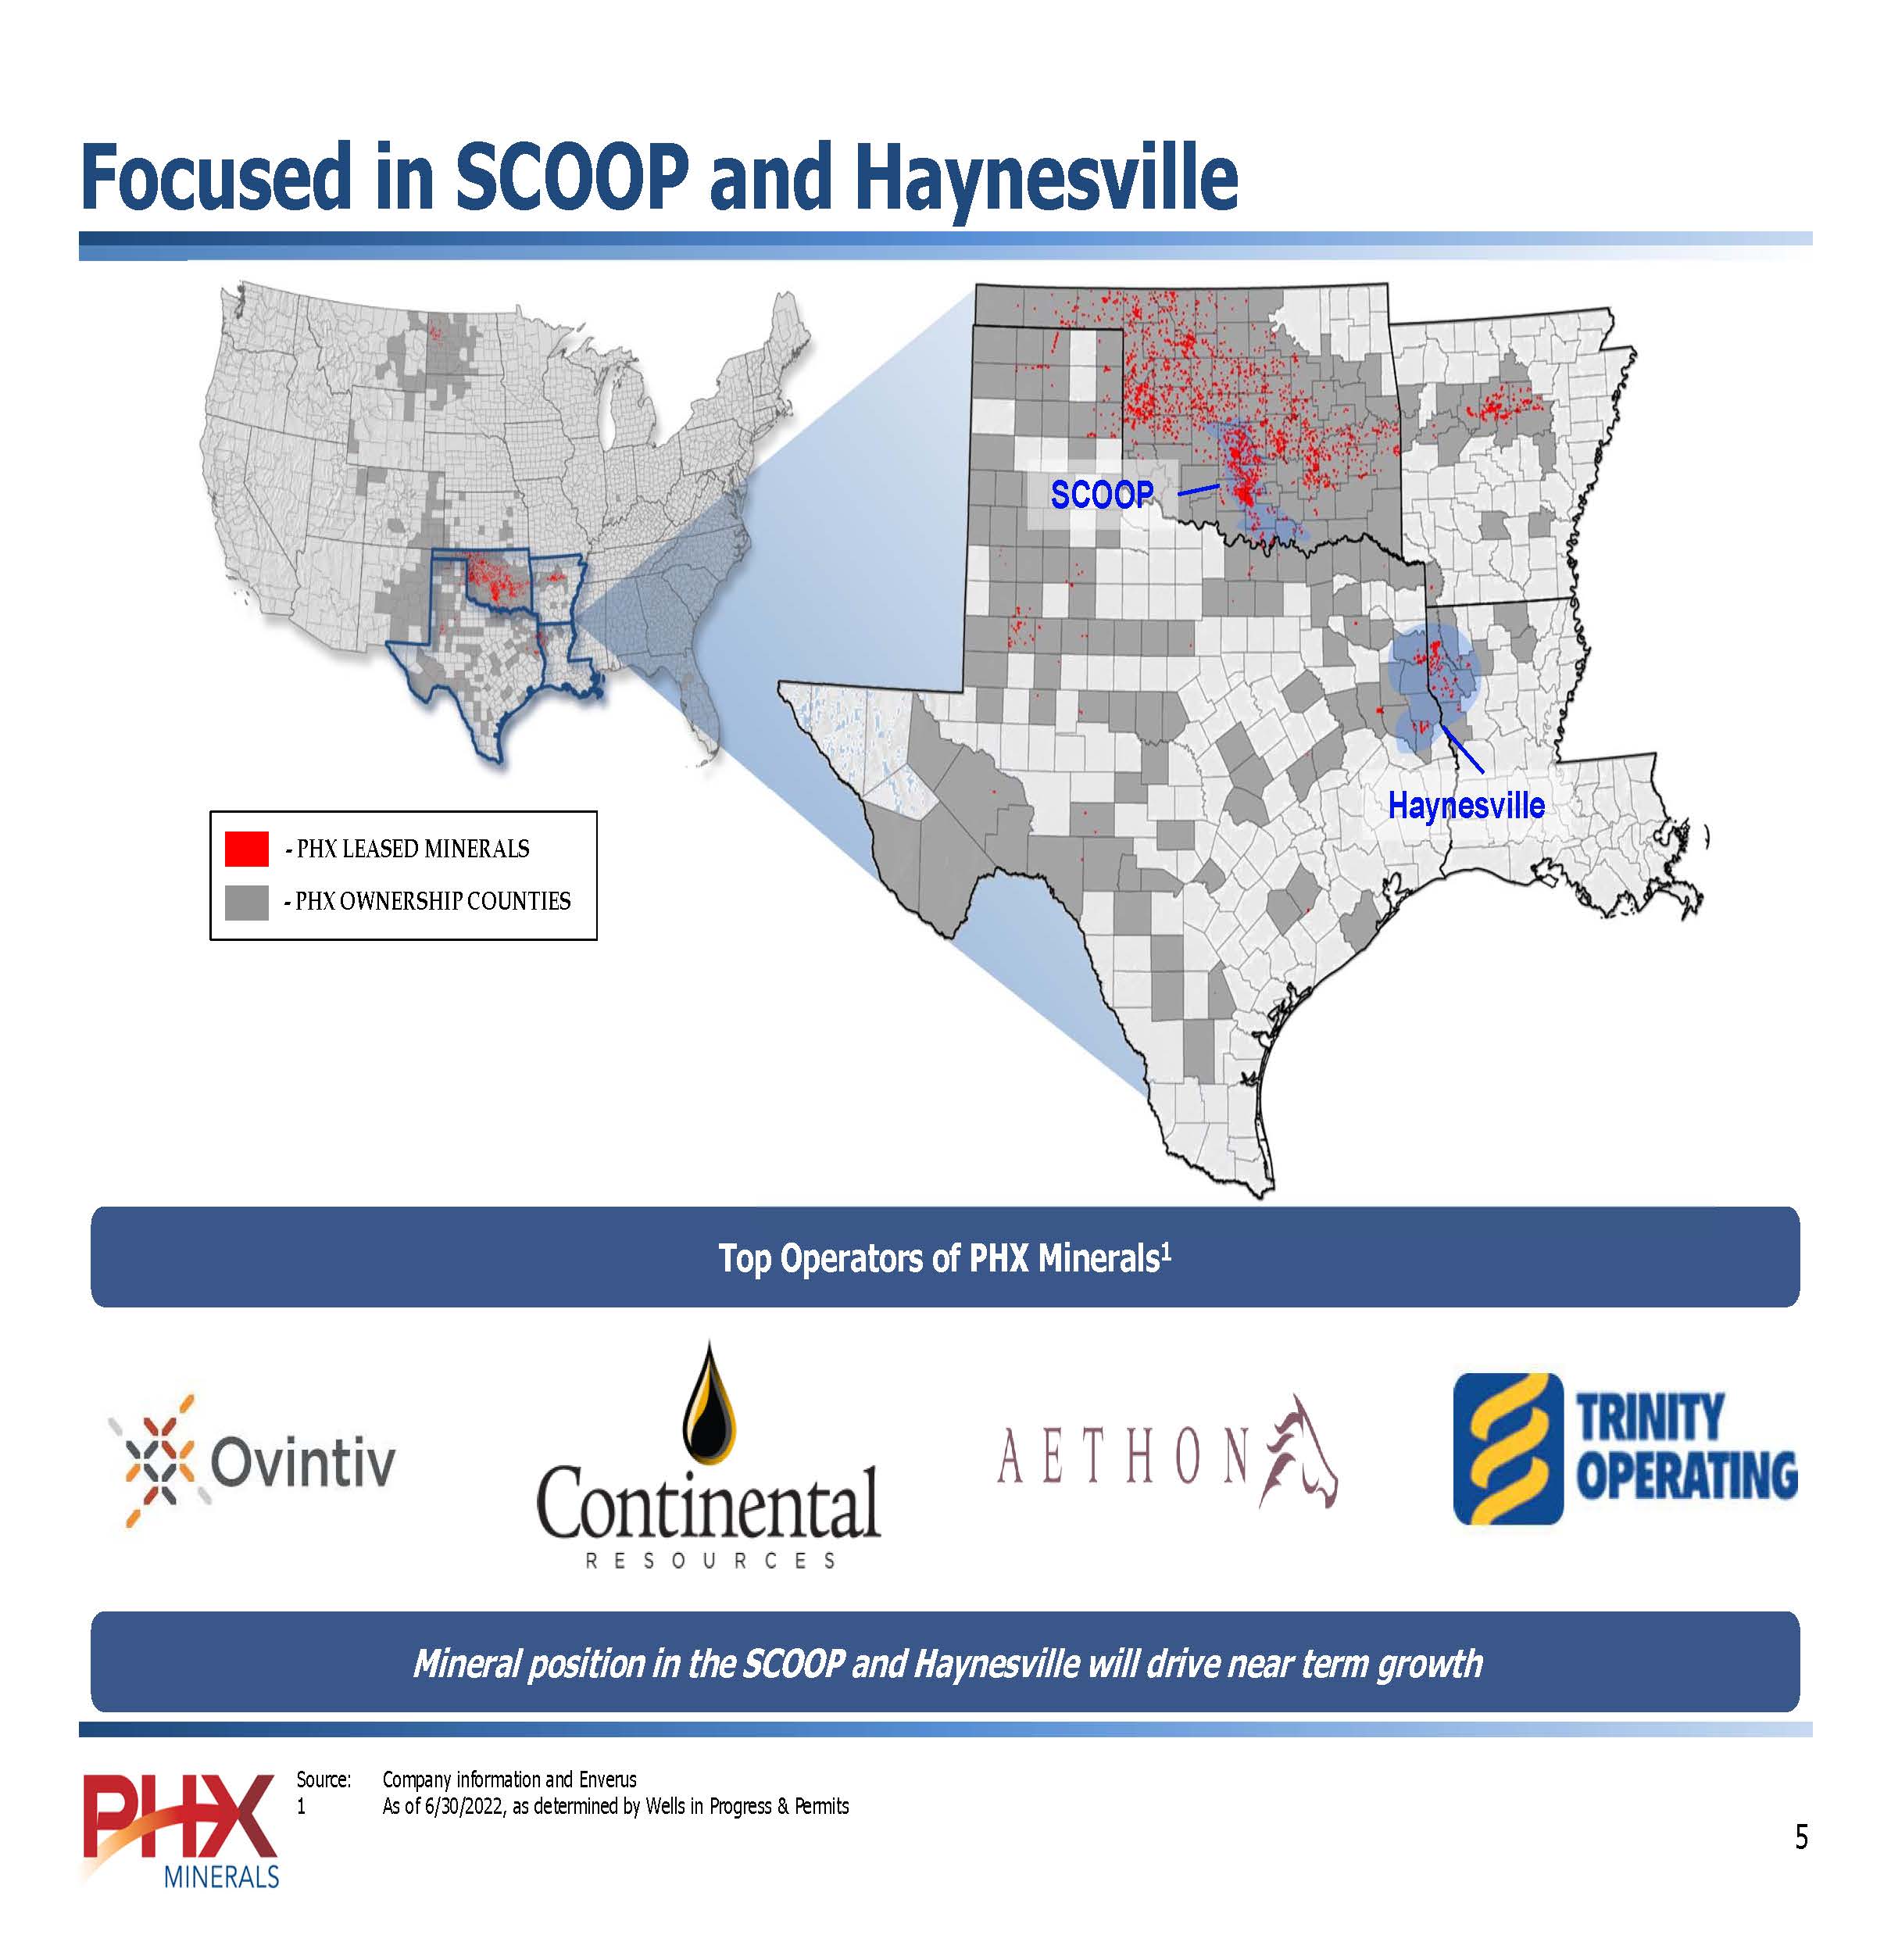
Focused in SCOOP and Haynesville - PHX LEASED MINERALS - PHX OWNERSHIP COUNTIES Top Operators of PHX Minerals1 Ovintiv Continental RESOURCES AETHON TRINITY OPERATING Mineral position in the SCOOP and Haynesville will drive near term growth Source: Company information and Enverus 1 As of 6/30/2022, as determined by Wells in Progress & Permits PHX MINERALS 5
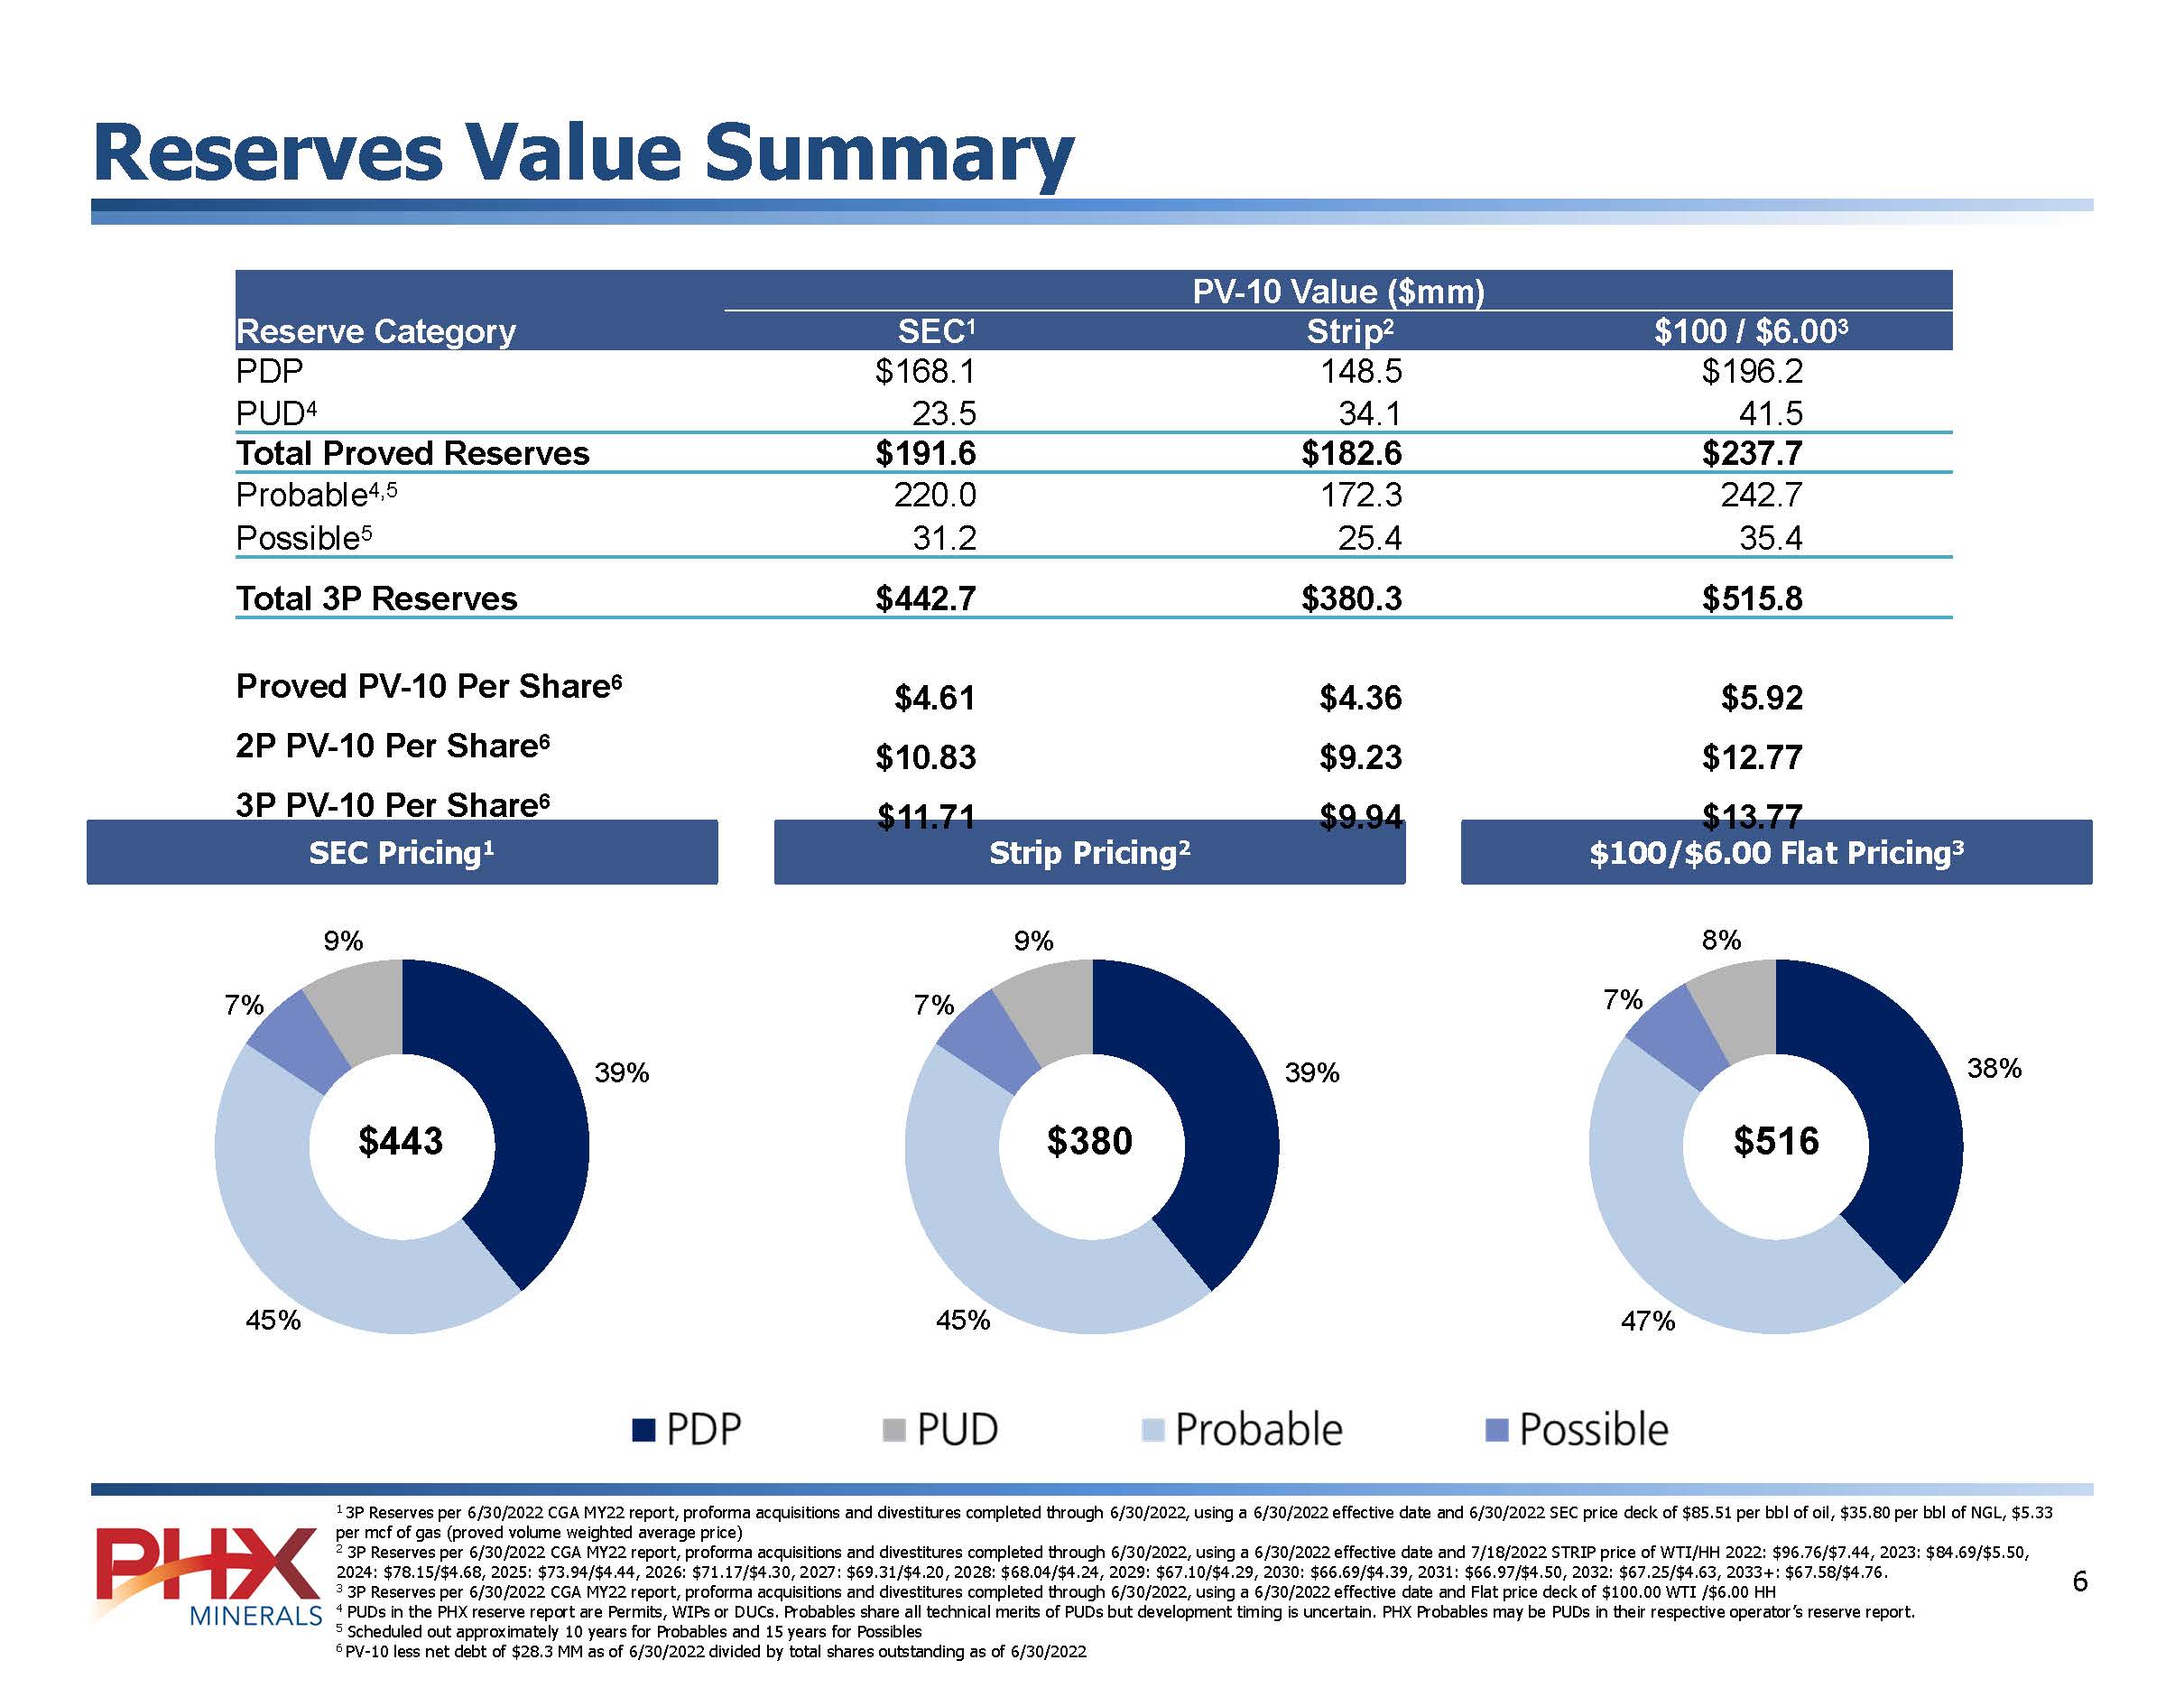
Reserves Value Summary PV-10 Value ($mm) Reserve Category SEC1 Strip2 $100 / $6.003 PDP $168.1 148.5 $196.2 PUD4 23.5 34.1 41.5 Total Proved Reserves $191.6 $182.6 $237.7 Probable4,5 220.0 172.3 242.7 Possible5 31.2 25.4 35.4 Total 3P Reserves $442.7 $380.3 $515.8 Proved PV-10 Per Share6 $4.61 $4.36 $5.92 2P PV-10 Per Share6 $10.83 $9.23 $12.77 3P PV-10 Per Share6 $11.71 $9.94 $13.77 SEC Pricing1 Strip Pricing2 $100/$6.00 Flat Pricing3 1 3P Reserves per 6/30/2022 CGA MY22 report, proforma acquisitions and divestitures completed through 6/30/2022, using a 6/30/2022 effective date and 6/30/2022 SEC price deck of $85.51 per bbl of oil, $35.80 per bbl of NGL, $5.33 per mcf of gas (proved volume weighted average price) 2 3P Reserves per 6/30/2022 CGA MY22 report, proforma acquisitions and divestitures completed through 6/30/2022, using a 6/30/2022 effective date and 7/18/2022 STRIP price of WTI/HH 2022: $96.76/$7.44, 2023: $84.69/$5.50, 2024: $78.15/$4.68, 2025: $73.94/$4.44, 2026: $71.17/$4.30, 2027: $69.31/$4.20, 2028: $68.04/$4.24, 2029: $67.10/$4.29, 2030: $66.69/$4.39, 2031: $66.97/$4.50, 2032: $67.25/$4.63, 2033+: $67.58/$4.76. 3 3P Reserves per 6/30/2022 CGA MY22 report, proforma acquisitions and divestitures completed through 6/30/2022, using a 6/30/2022 effective date and Flat price deck of $100.00 WTI /$6.00 HH 4 PUDs in the PHX reserve report are Permits, WIPs or DUCs. Probables share all technical merits of PUDs but development timing is uncertain. PHX Probables may be PUDs in their respective operator’s reserve report. 5 Scheduled out approximately 10 years for Probables and 15 years for Possibles 6 PV-10 less net debt of $28.3 MM as of 6/30/2022 divided by total shares outstanding as of 6/30/2022 PHX MINERALS 6

Royalty Interest Inventory by Basin Undeveloped Locations Gross Sub-region PDP Wells Average NRI1 Wells In Progress1 Average NRI2 Permits1 Average NRI2 PROB3 POSS Contingent SCOOP 1,008 0.40% 46 0.37% 20 0.18% 1,040 369 211 Haynesville 257 0.64% 62 0.70% 16 0.43% 361 0 0 STACK 348 0.50% 20 0.43% 17 0.29% 266 60 272 Bakken 588 0.28% 11 0.46% 2 1.09% 209 9 77 Arkoma Stack 438 0.76% 9 0.07% 0 0.00% 99 83 128 Fayetteville 882 0.47% 0 0.00% 0 0.00% 0 0 475 Other4 2,161 0.88% 7 0.55% 10 0.29% 0 0 16 Total 5,682 0.63% 155 0.51% 65 0.32% 1,975 521 1,179 Gross Undeveloped Locations [BAR CHART] [BAR CHART] Note: Inventory based on D&M prepared reserve report as of fiscal YE2021 pro forma for acquisitions and divestitures completed through 6/30/2022 1 As of 6/30/2022 2 Average net interest on Wells in Progress and Permits are internal estimates and subject to confirmation from operator 3 Probables share all technical merits of PUDs but development timing is uncertain. PHX Probables may be PUDs in their respective operator’s reserve report. 4 Other undeveloped inventory is largely comprised of Western Anadarko Assets & Permian Basin PHX MINERALS 7
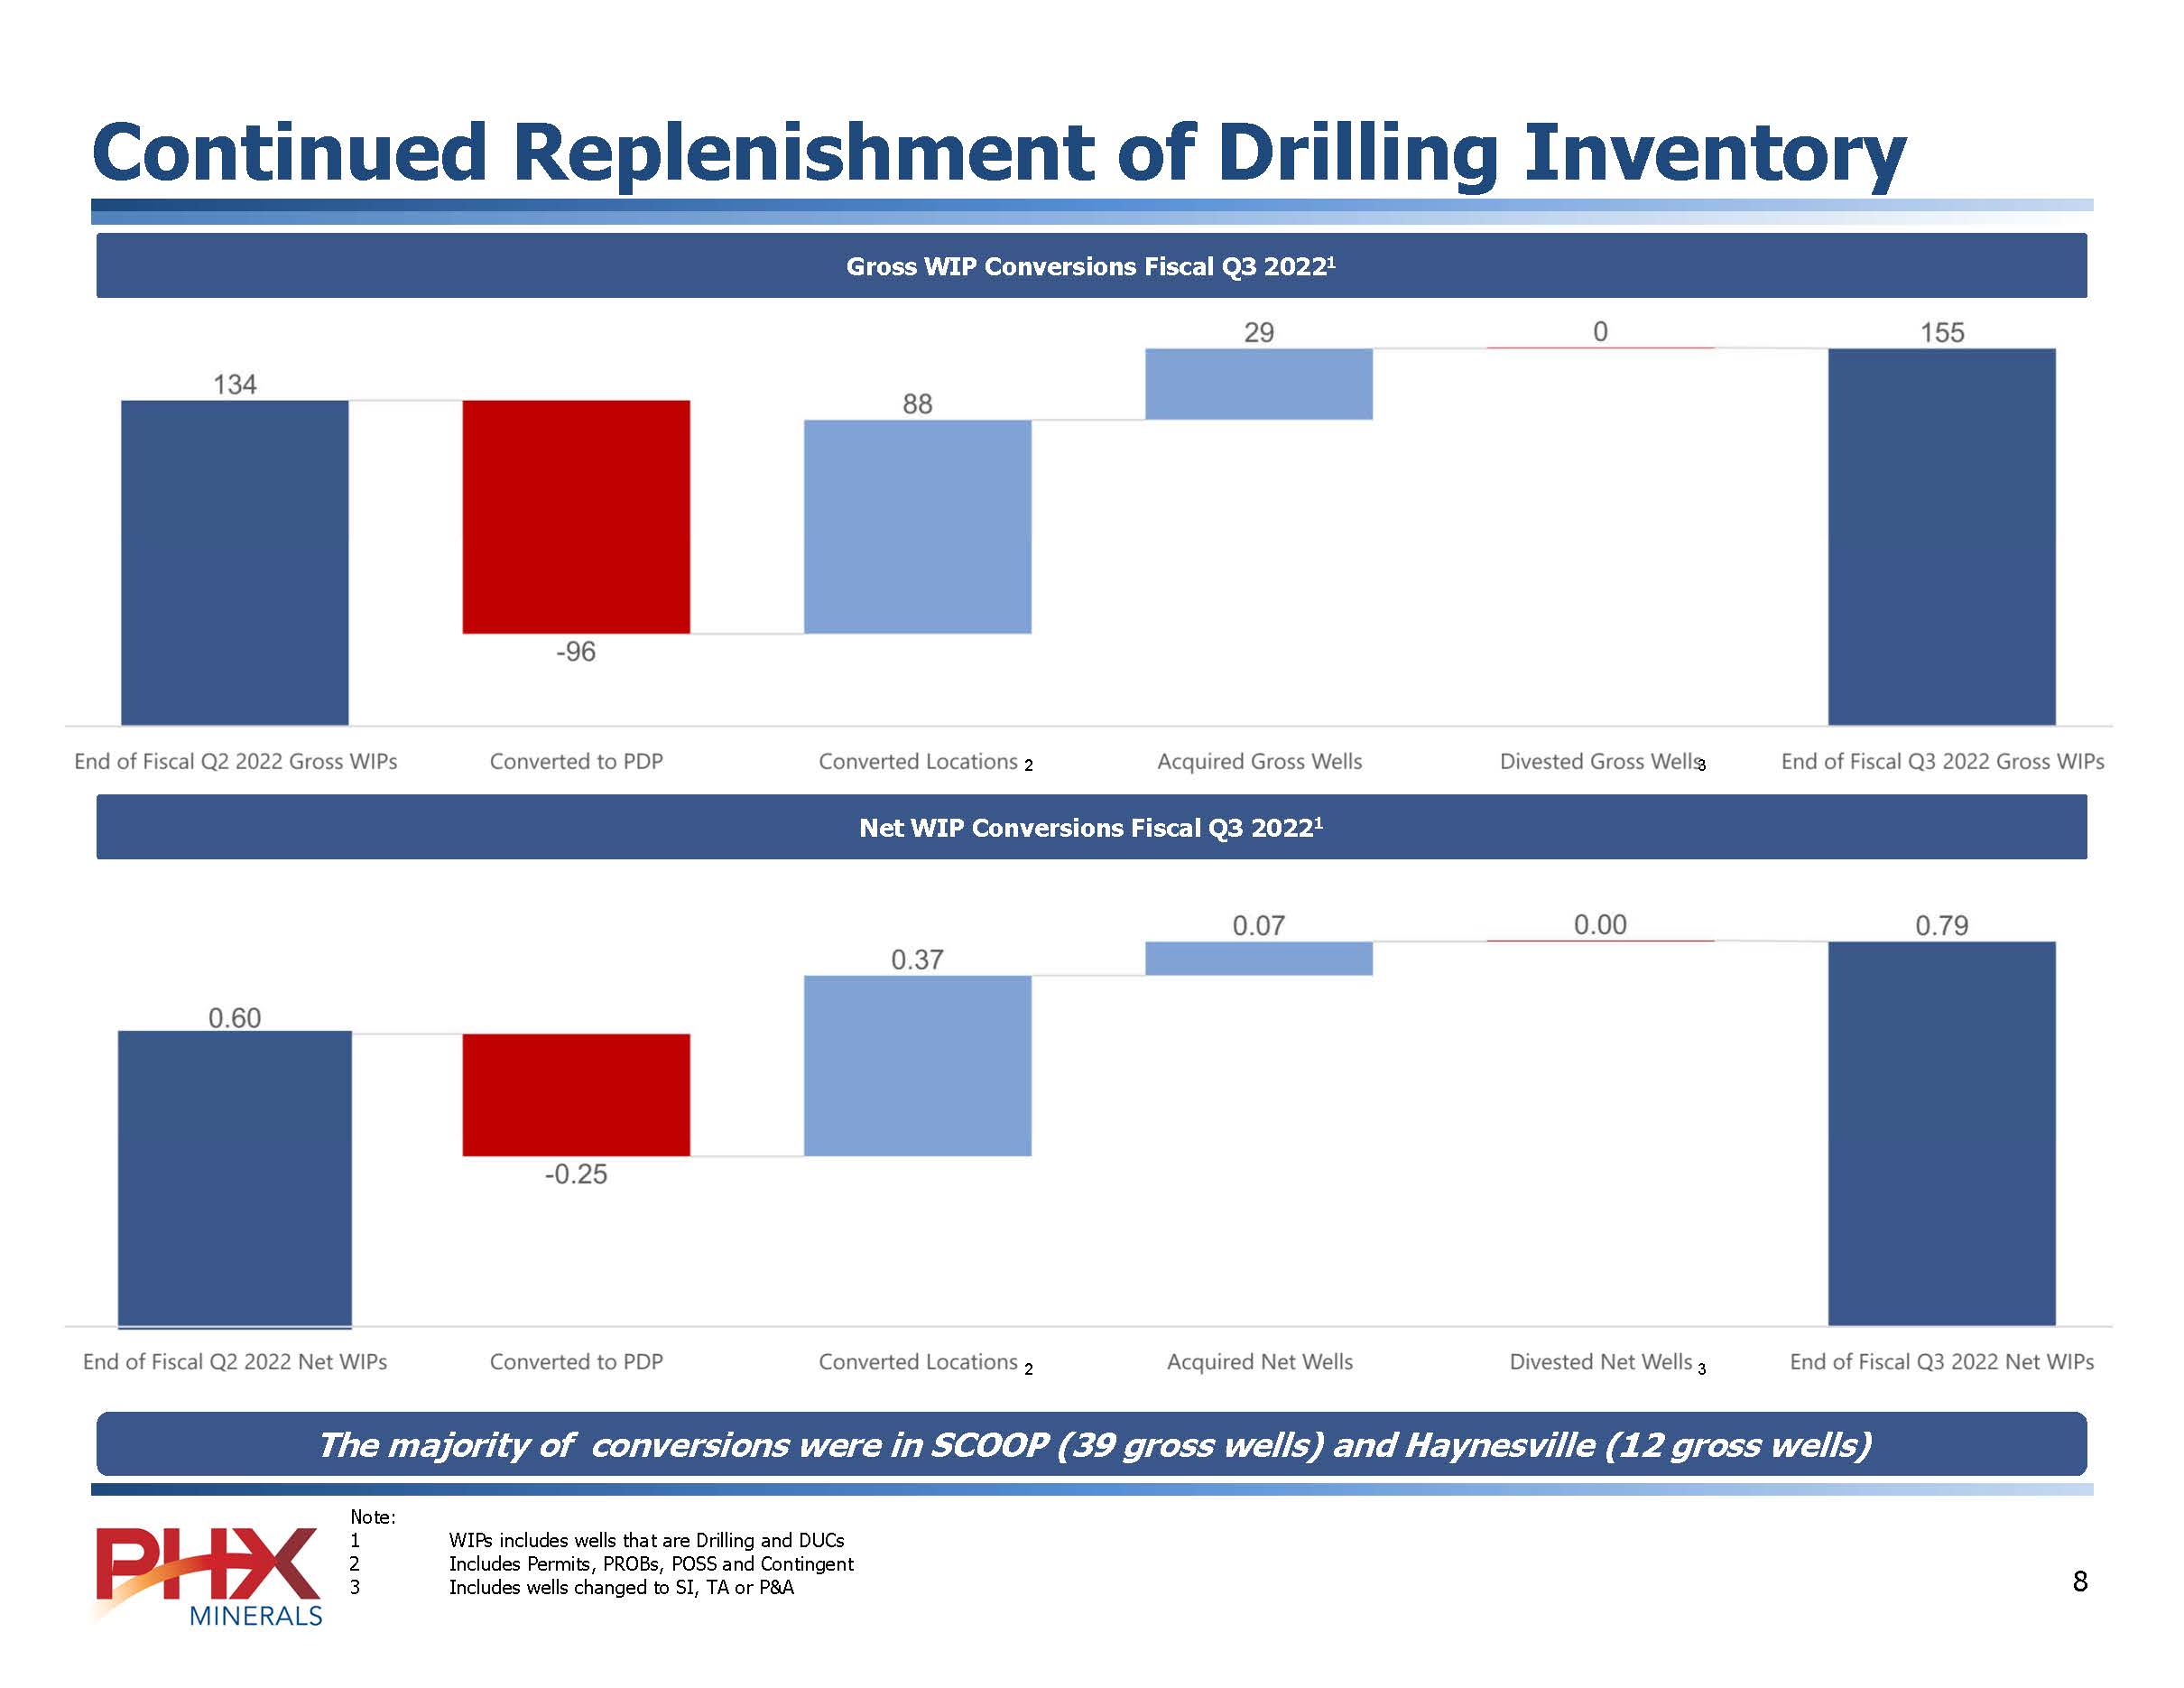

Continued Replenishment of Drilling Inventory Gross WIP Conversions Fiscal 2022 YTD1 [BAR CHART] Net WIP Conversions Fiscal 2022 YTD1 [BAR CHART] New Wells in Progress are replenishing inventory converted to Proved Developed Producing Note: 1 WIPs includes wells that are Drilling and DUCs 2 Includes Permits, PROBs, POSS and Contingent 3 Includes wells changed to SI, TA or P&A PHX MINERALS 9 Acquisition Summary Q1 2021 through Q3 2022 Acquisitions total over $63 million Acquisitions by Basin by Quarter [BAR CHART] • Focused on highest quality rock in the SCOOP and Haynesville plays • Targeting a mix of production, near term development opportunities via wells in progress and additional upside potential under high quality operators • $19.9M in acquisitions in SCOOP and $43.4M in Haynesville since Q1 of 2021 % of Net Wells by Type at end of FYE 2021 YTD ‘22 Acquisition Net Well by Type % of Net Wells by Type at end of Q3 ’22 [BAR CHART] [BAR CHART] [BAR CHART] PHX MINERALS 10
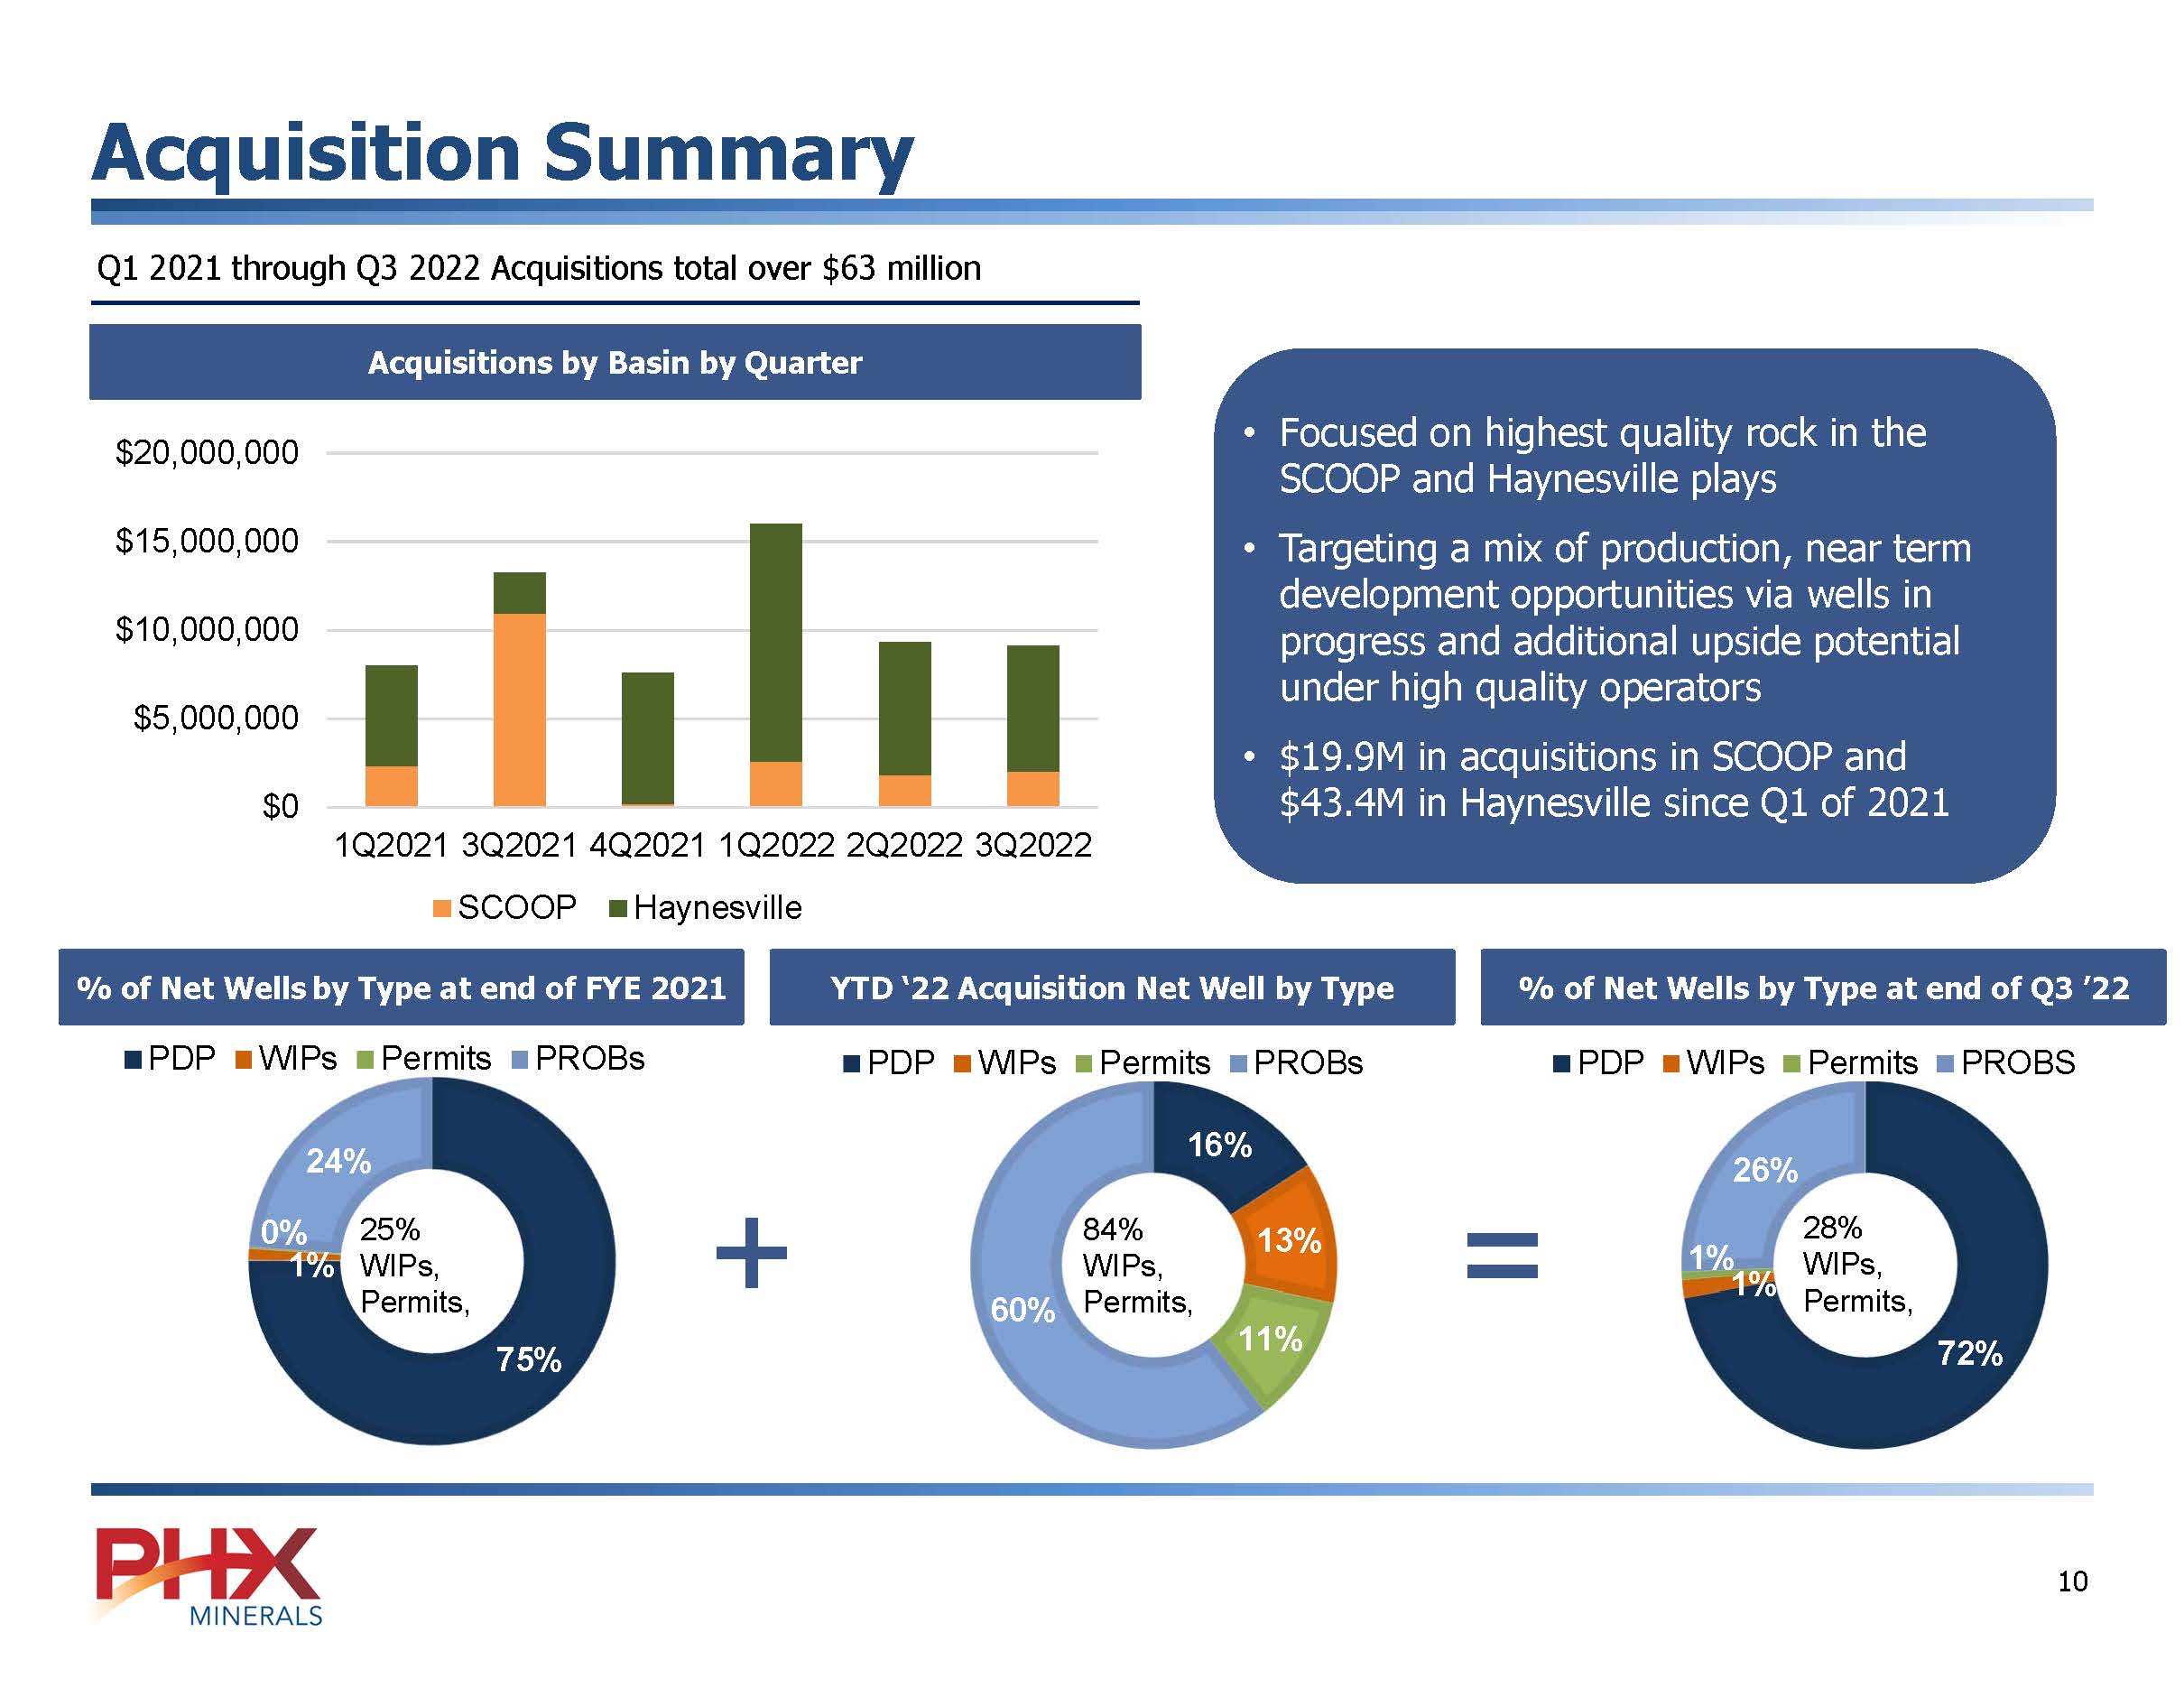
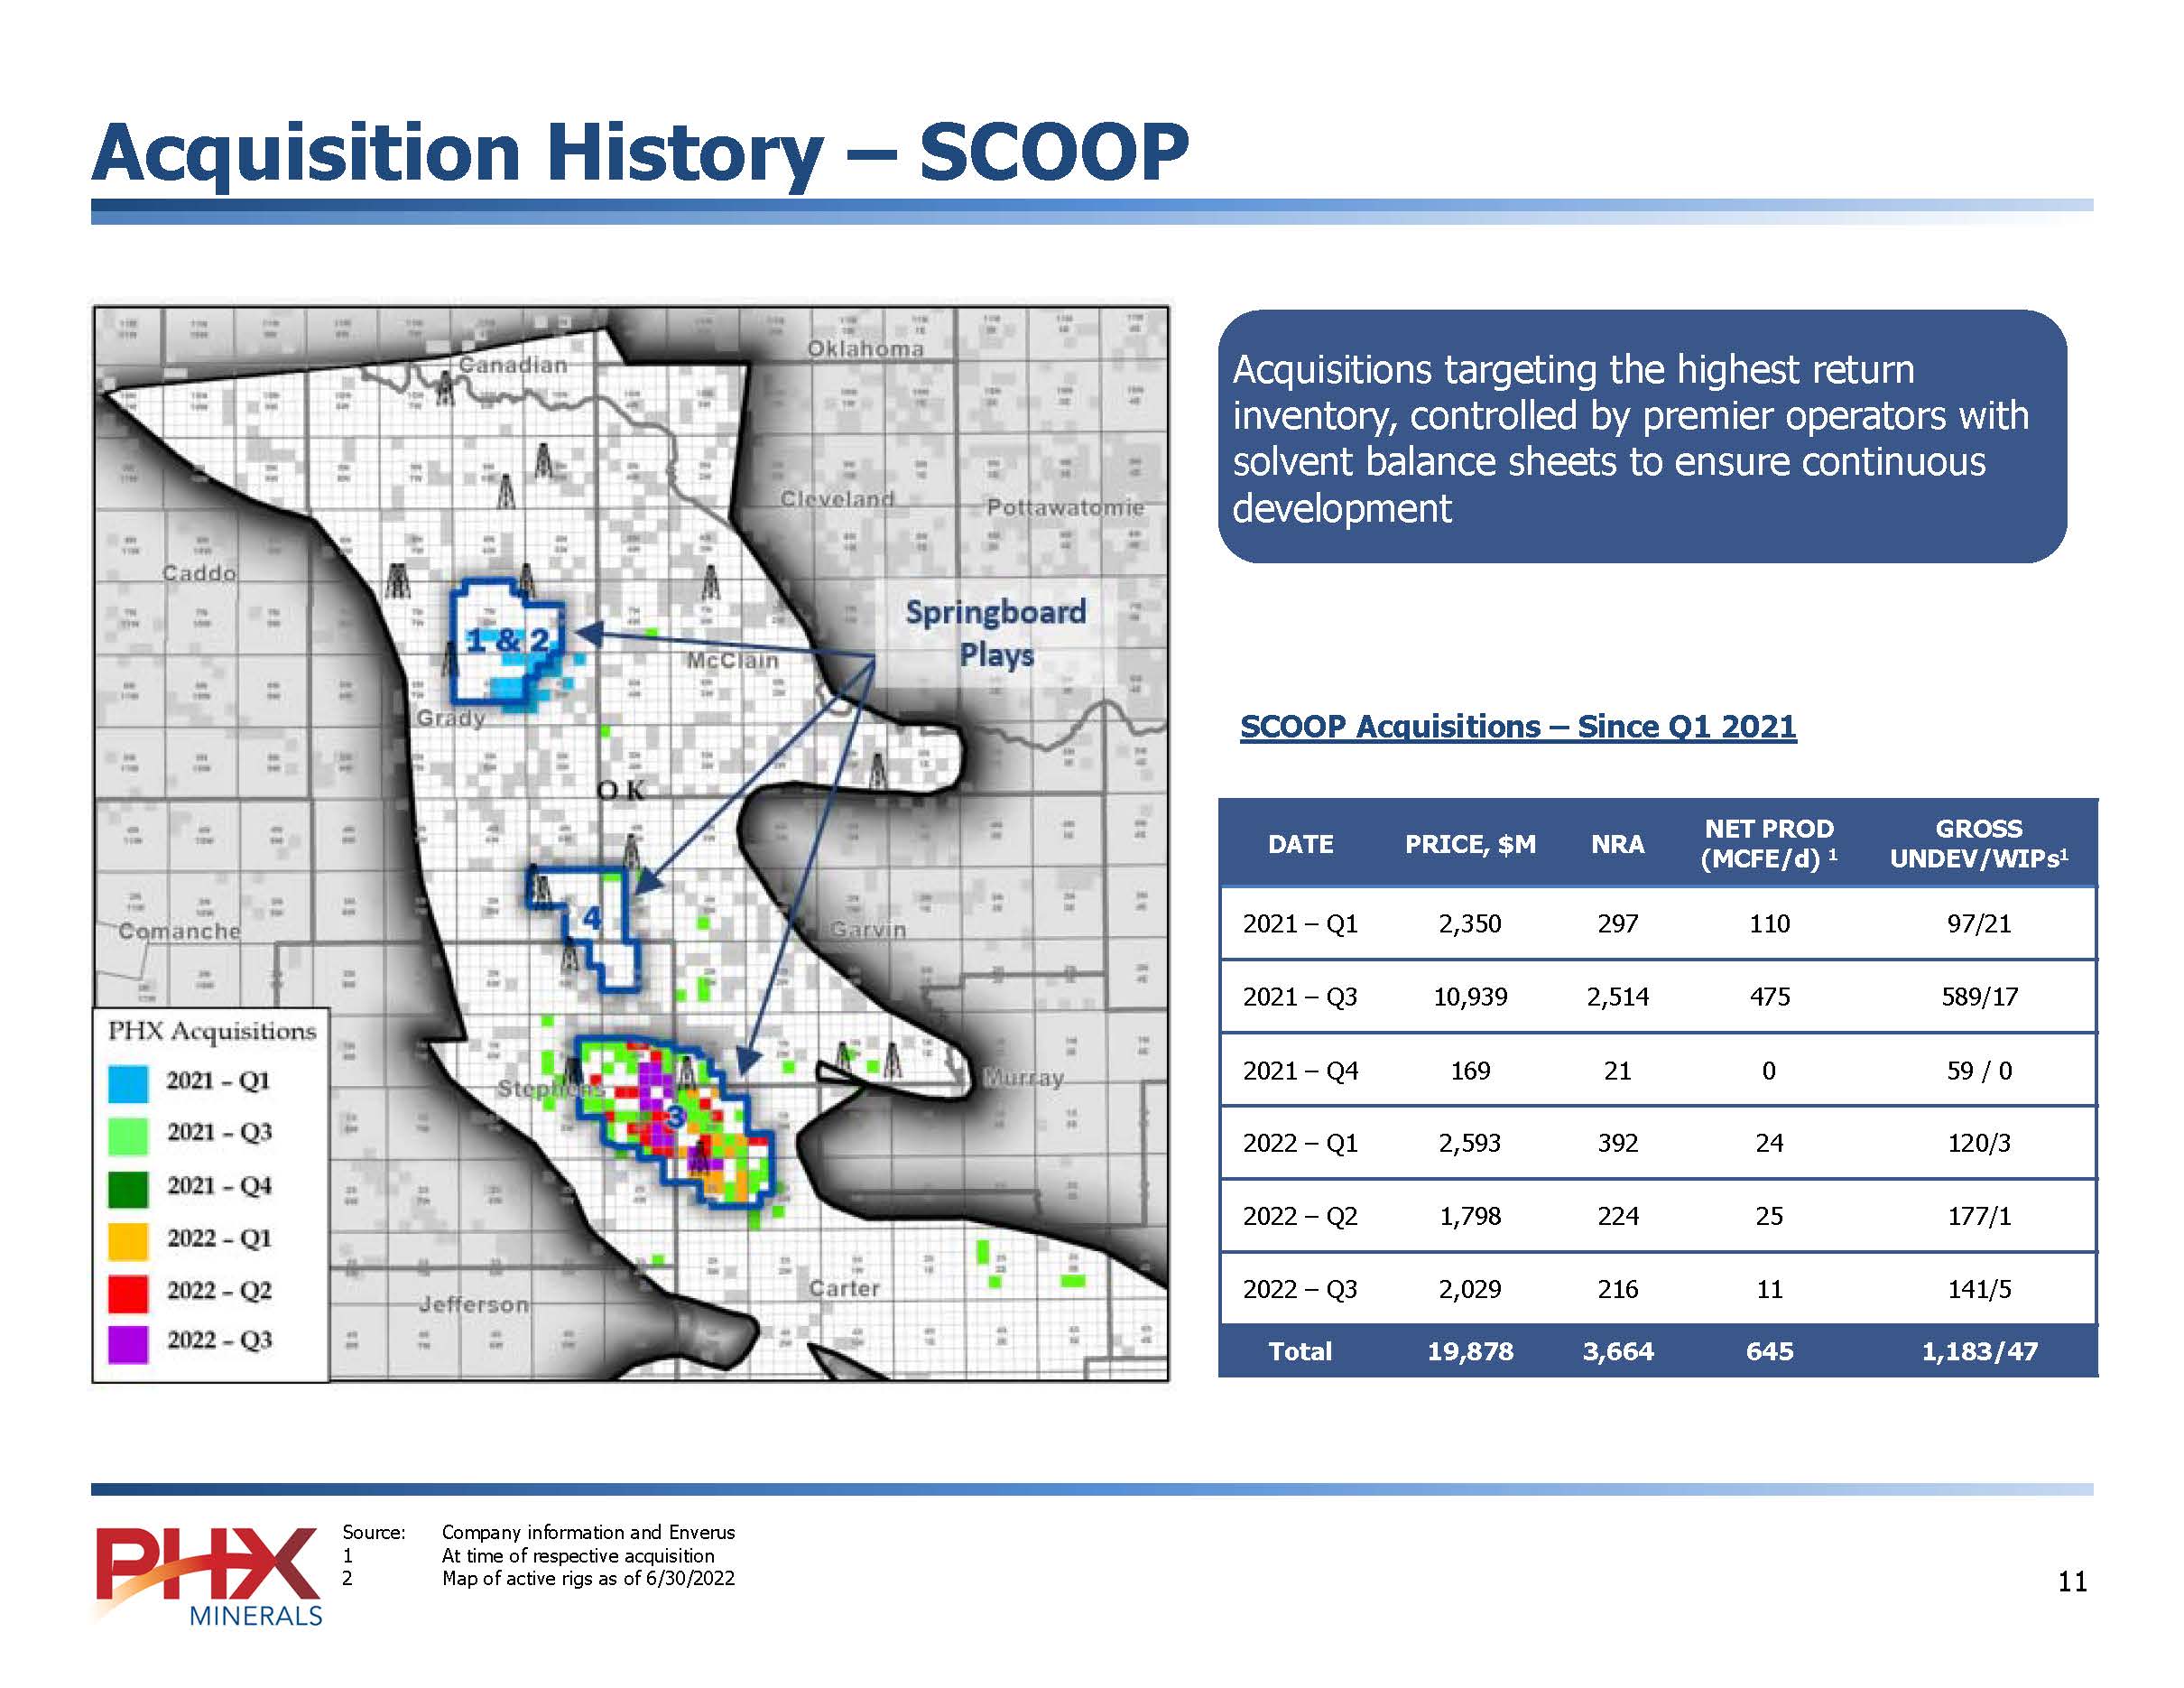
Acquisition History – SCOOP Acquisitions targeting the highest return inventory, controlled by premier operators with solvent balance sheets to ensure continuous development [BAR CHART] SCOOP Acquisitions – Since Q1 2021 Source: Company information and Enverus 1 At time of respective acquisition 2 Map of active rigs as of 6/30/2022 DATE PRICE, $M NRA NET PROD (MCFE/d) 1 GROSS UNDEV/WIPs1 2021 – Q1 2,350 297 110 97/21 2021 – Q3 10,939 2,514 475 589/17 2021 – Q4 169 21 0 59 / 0 2022 – Q1 2,593 392 24 120/3 2022 – Q2 1,798 224 25 177/1 2022 – Q3 2,029 216 11 141/5 Total 19,878 3,664 645 1,183/47 PHX MINERALS 11
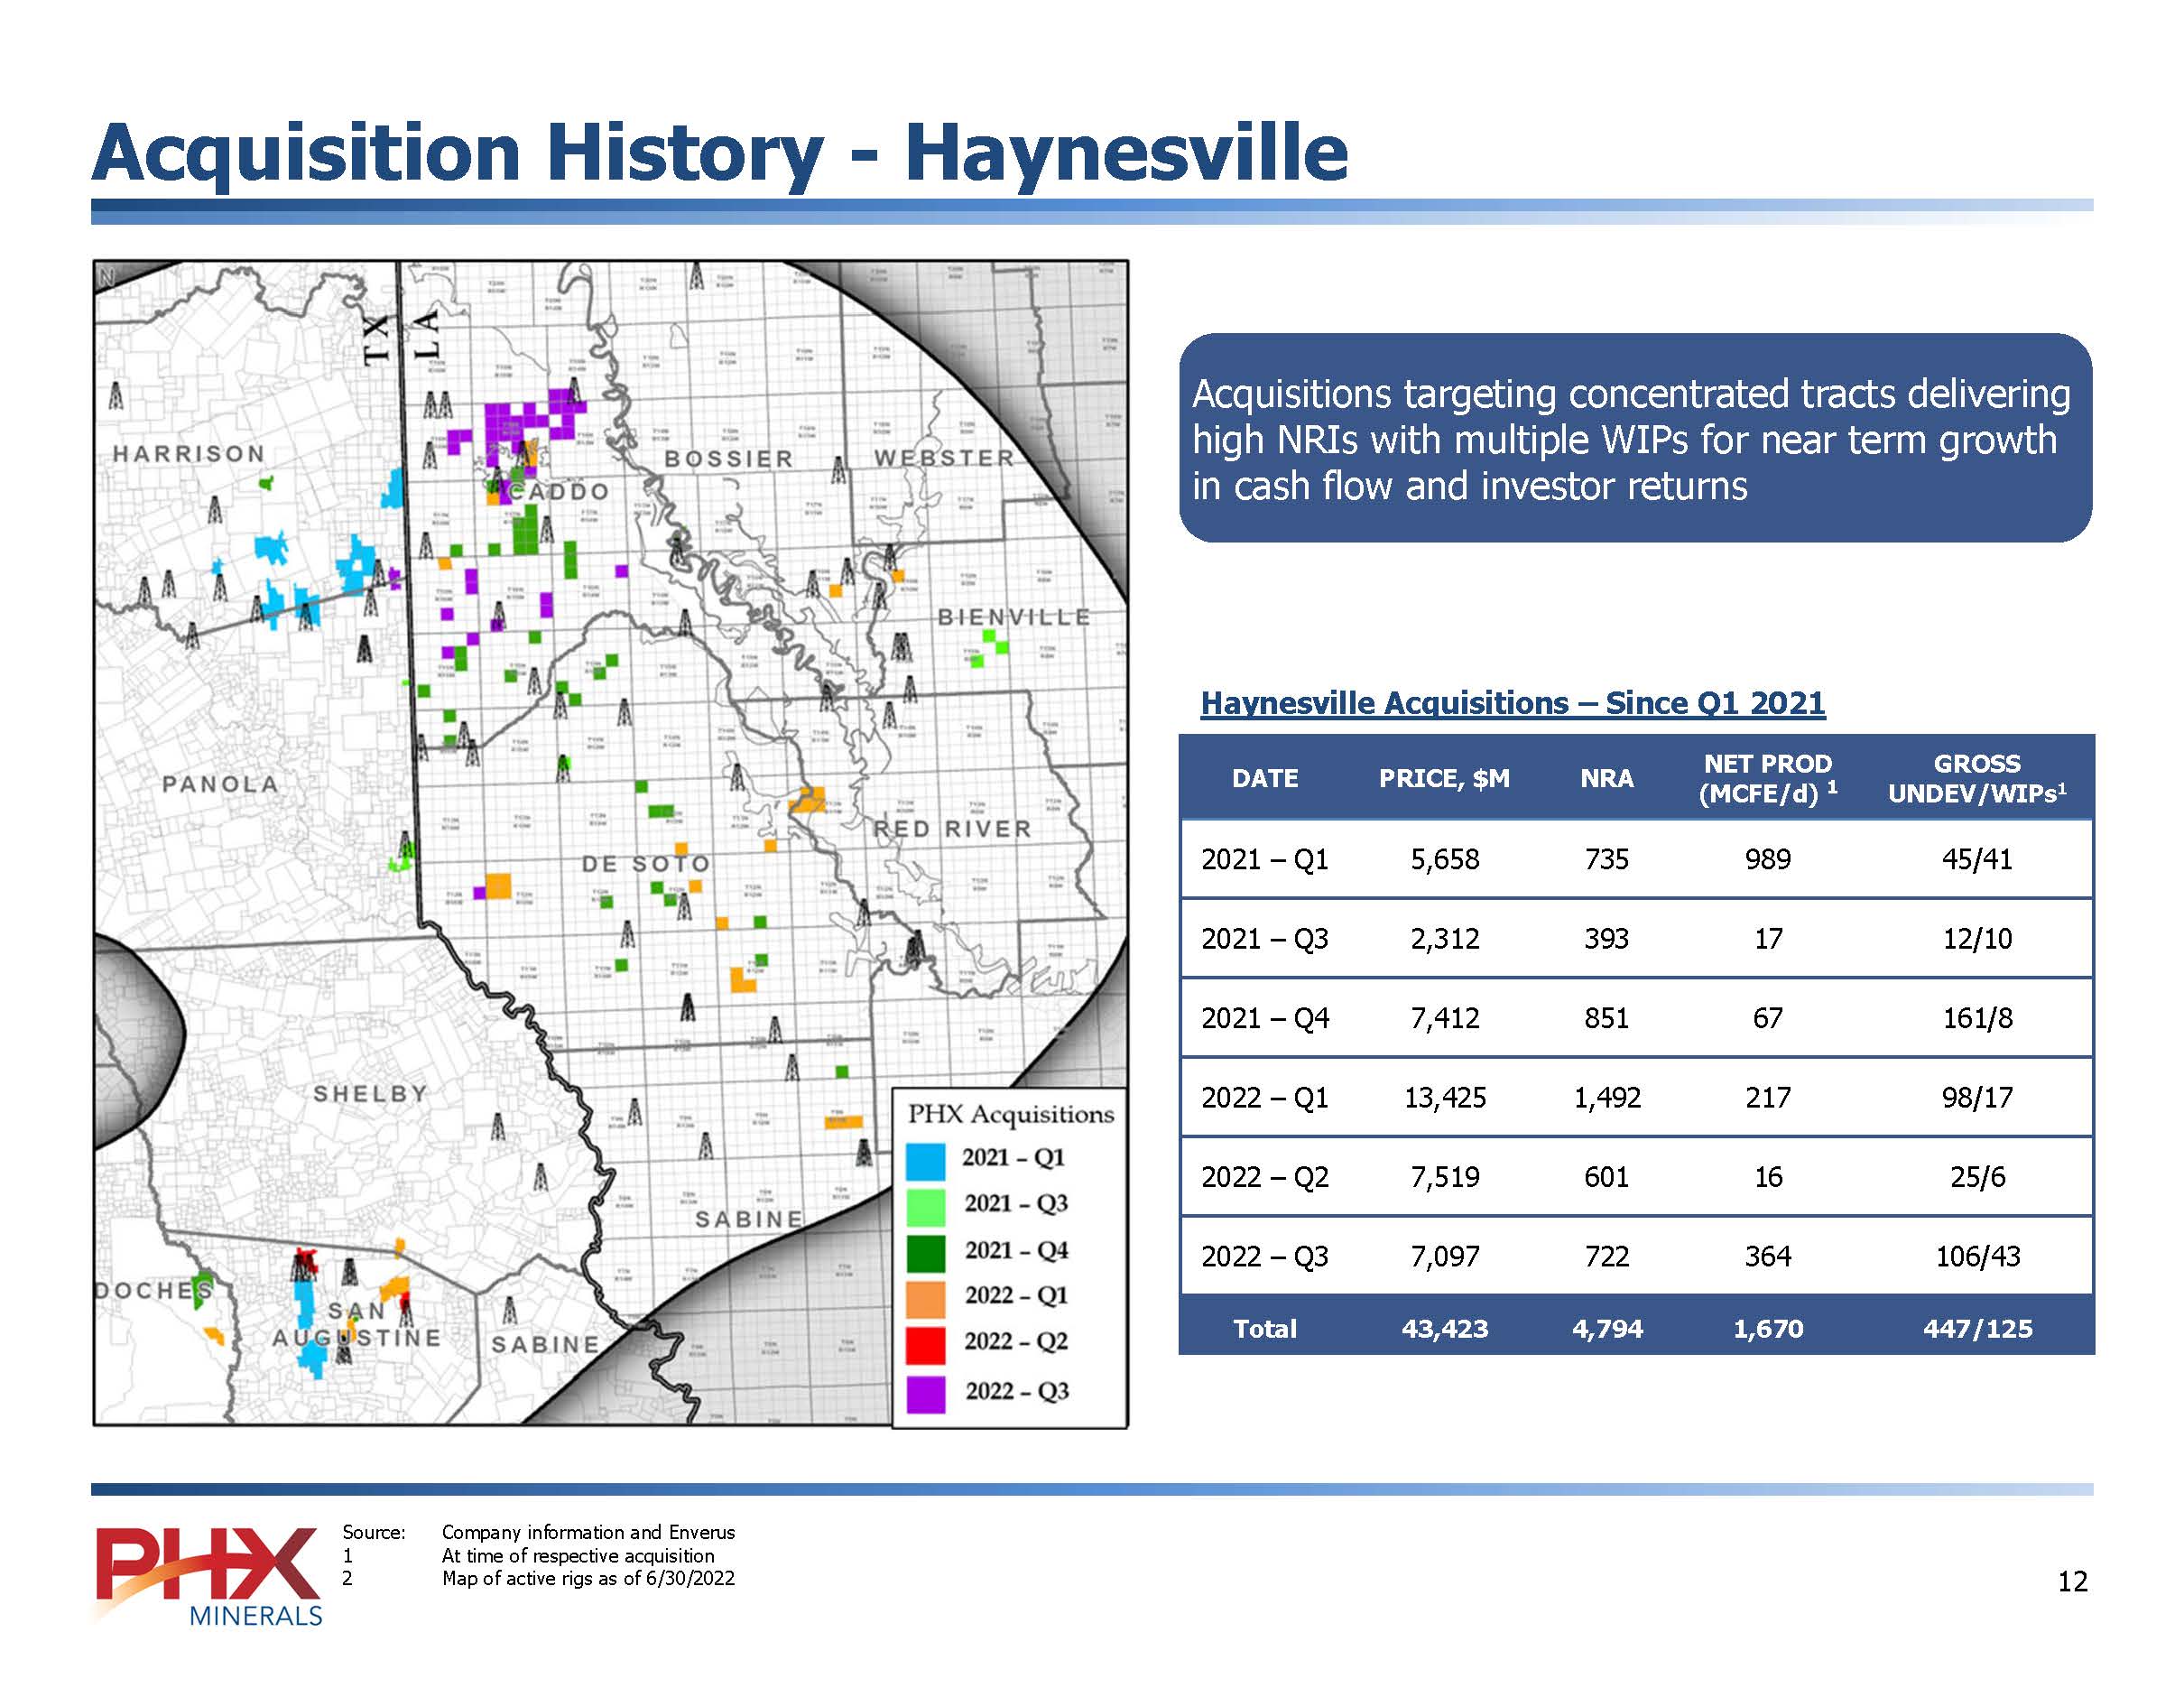
Acquisition History - Haynesville Acquisitions targeting concentrated tracts delivering high NRIs with multiple WIPs for near term growth in cash flow and investor returns Haynesville Acquisitions – Since Q1 2021 DATE PRICE, $M NRA NET PROD (MCFE/d) 1 GROSS UNDEV/WIPs1 2021 – Q1 5,658 735 989 45/41 2021 – Q3 2,312 393 17 12/10 2021 – Q4 7,412 851 67 161/8 2022 – Q1 13,425 1,492 217 98/17 2022 – Q2 7,519 601 16 25/6 2022 – Q3 7,097 722 364 106/43 Total 43,423 4,794 1,670 447/125 Source: Company information and Enverus 1 At time of respective acquisition 2 Map of active rigs as of 6/30/2022 [BAR CHART] PHX MINERALS 12
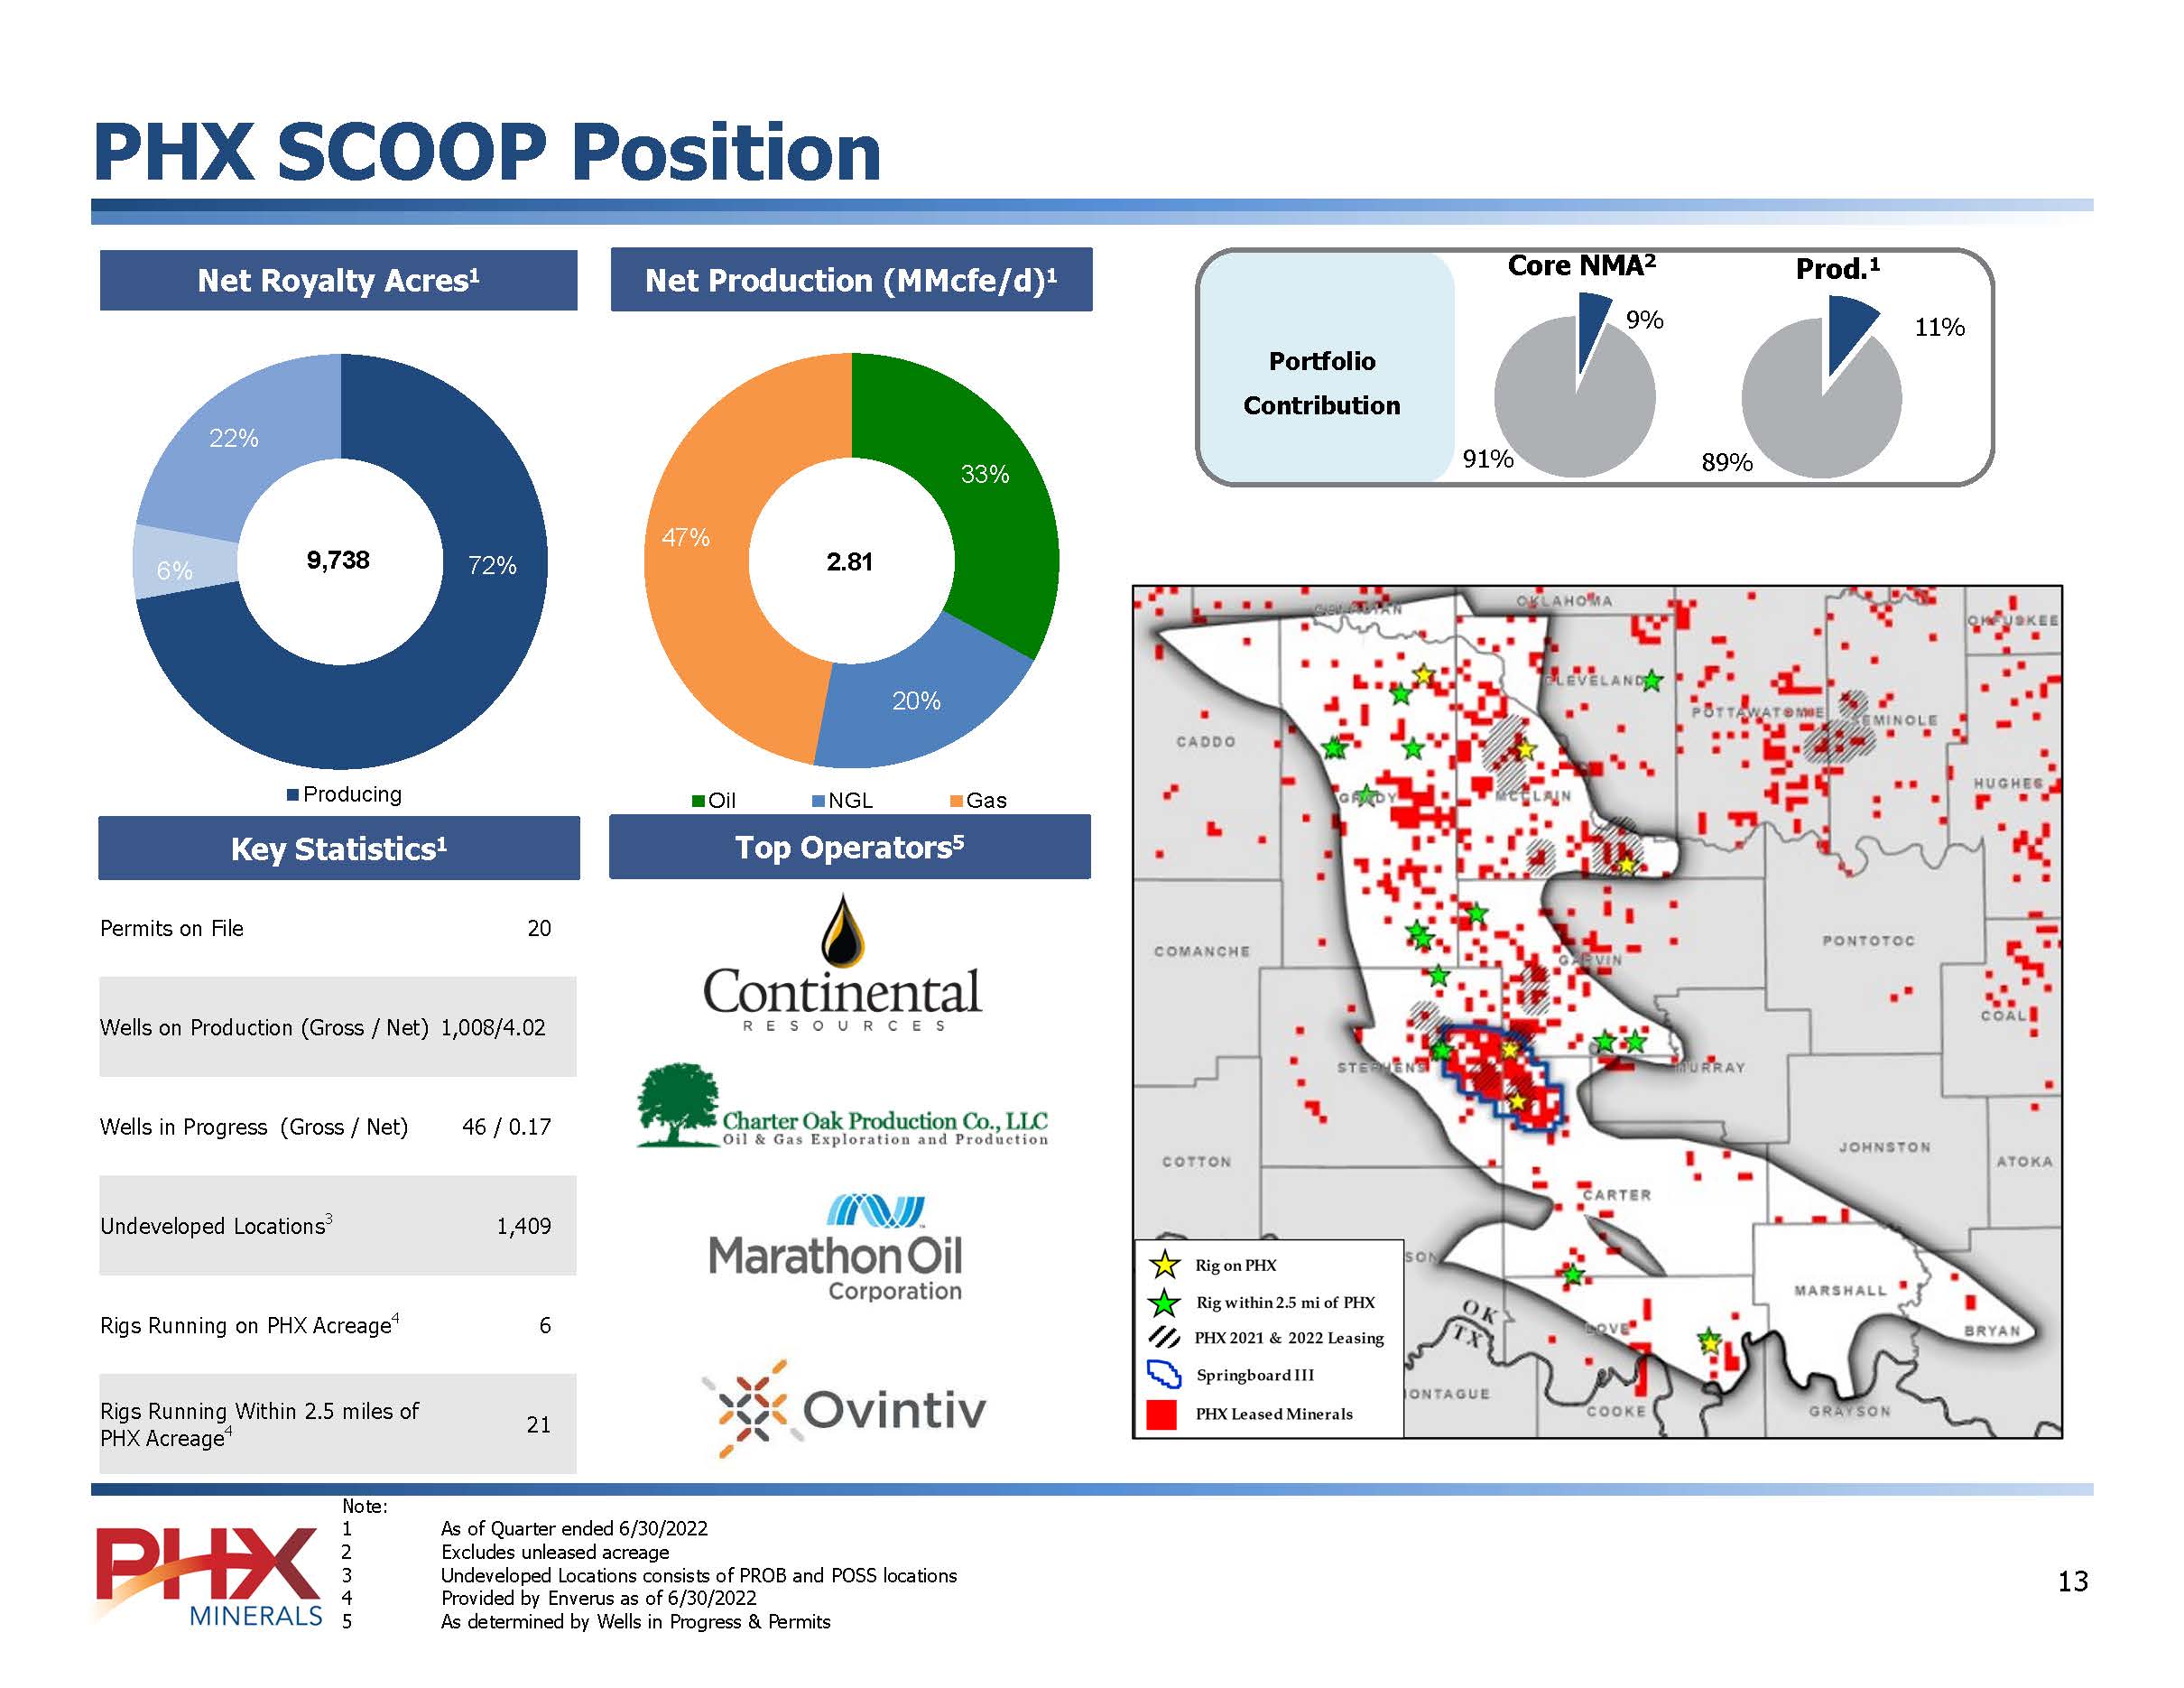
PHX SCOOP Position Net Royalty Acres1 Net Production (MMcfe/d)1 Portfolio Contribution Core NMA2 Prod.1 Key Statistics1 Top Operators5 Permits on File 20 Wells on Production (Gross / Net) 1,008/4.02 Wells in Progress (Gross / Net) 46 / 0.17 Undeveloped Locations3 1,409 Rigs Running on PHX Acreage4 6 Rigs Running Within 2.5 miles of PHX Acreage4 21 Note: 1 As of Quarter ended 6/30/2022 2 Excludes unleased acreage 3 Undeveloped Locations consists of PROB and POSS locations 4 Provided by Enverus as of 6/30/2022 5 As determined by Wells in Progress & Permits [BAR CHART] PHX MINERALS 13
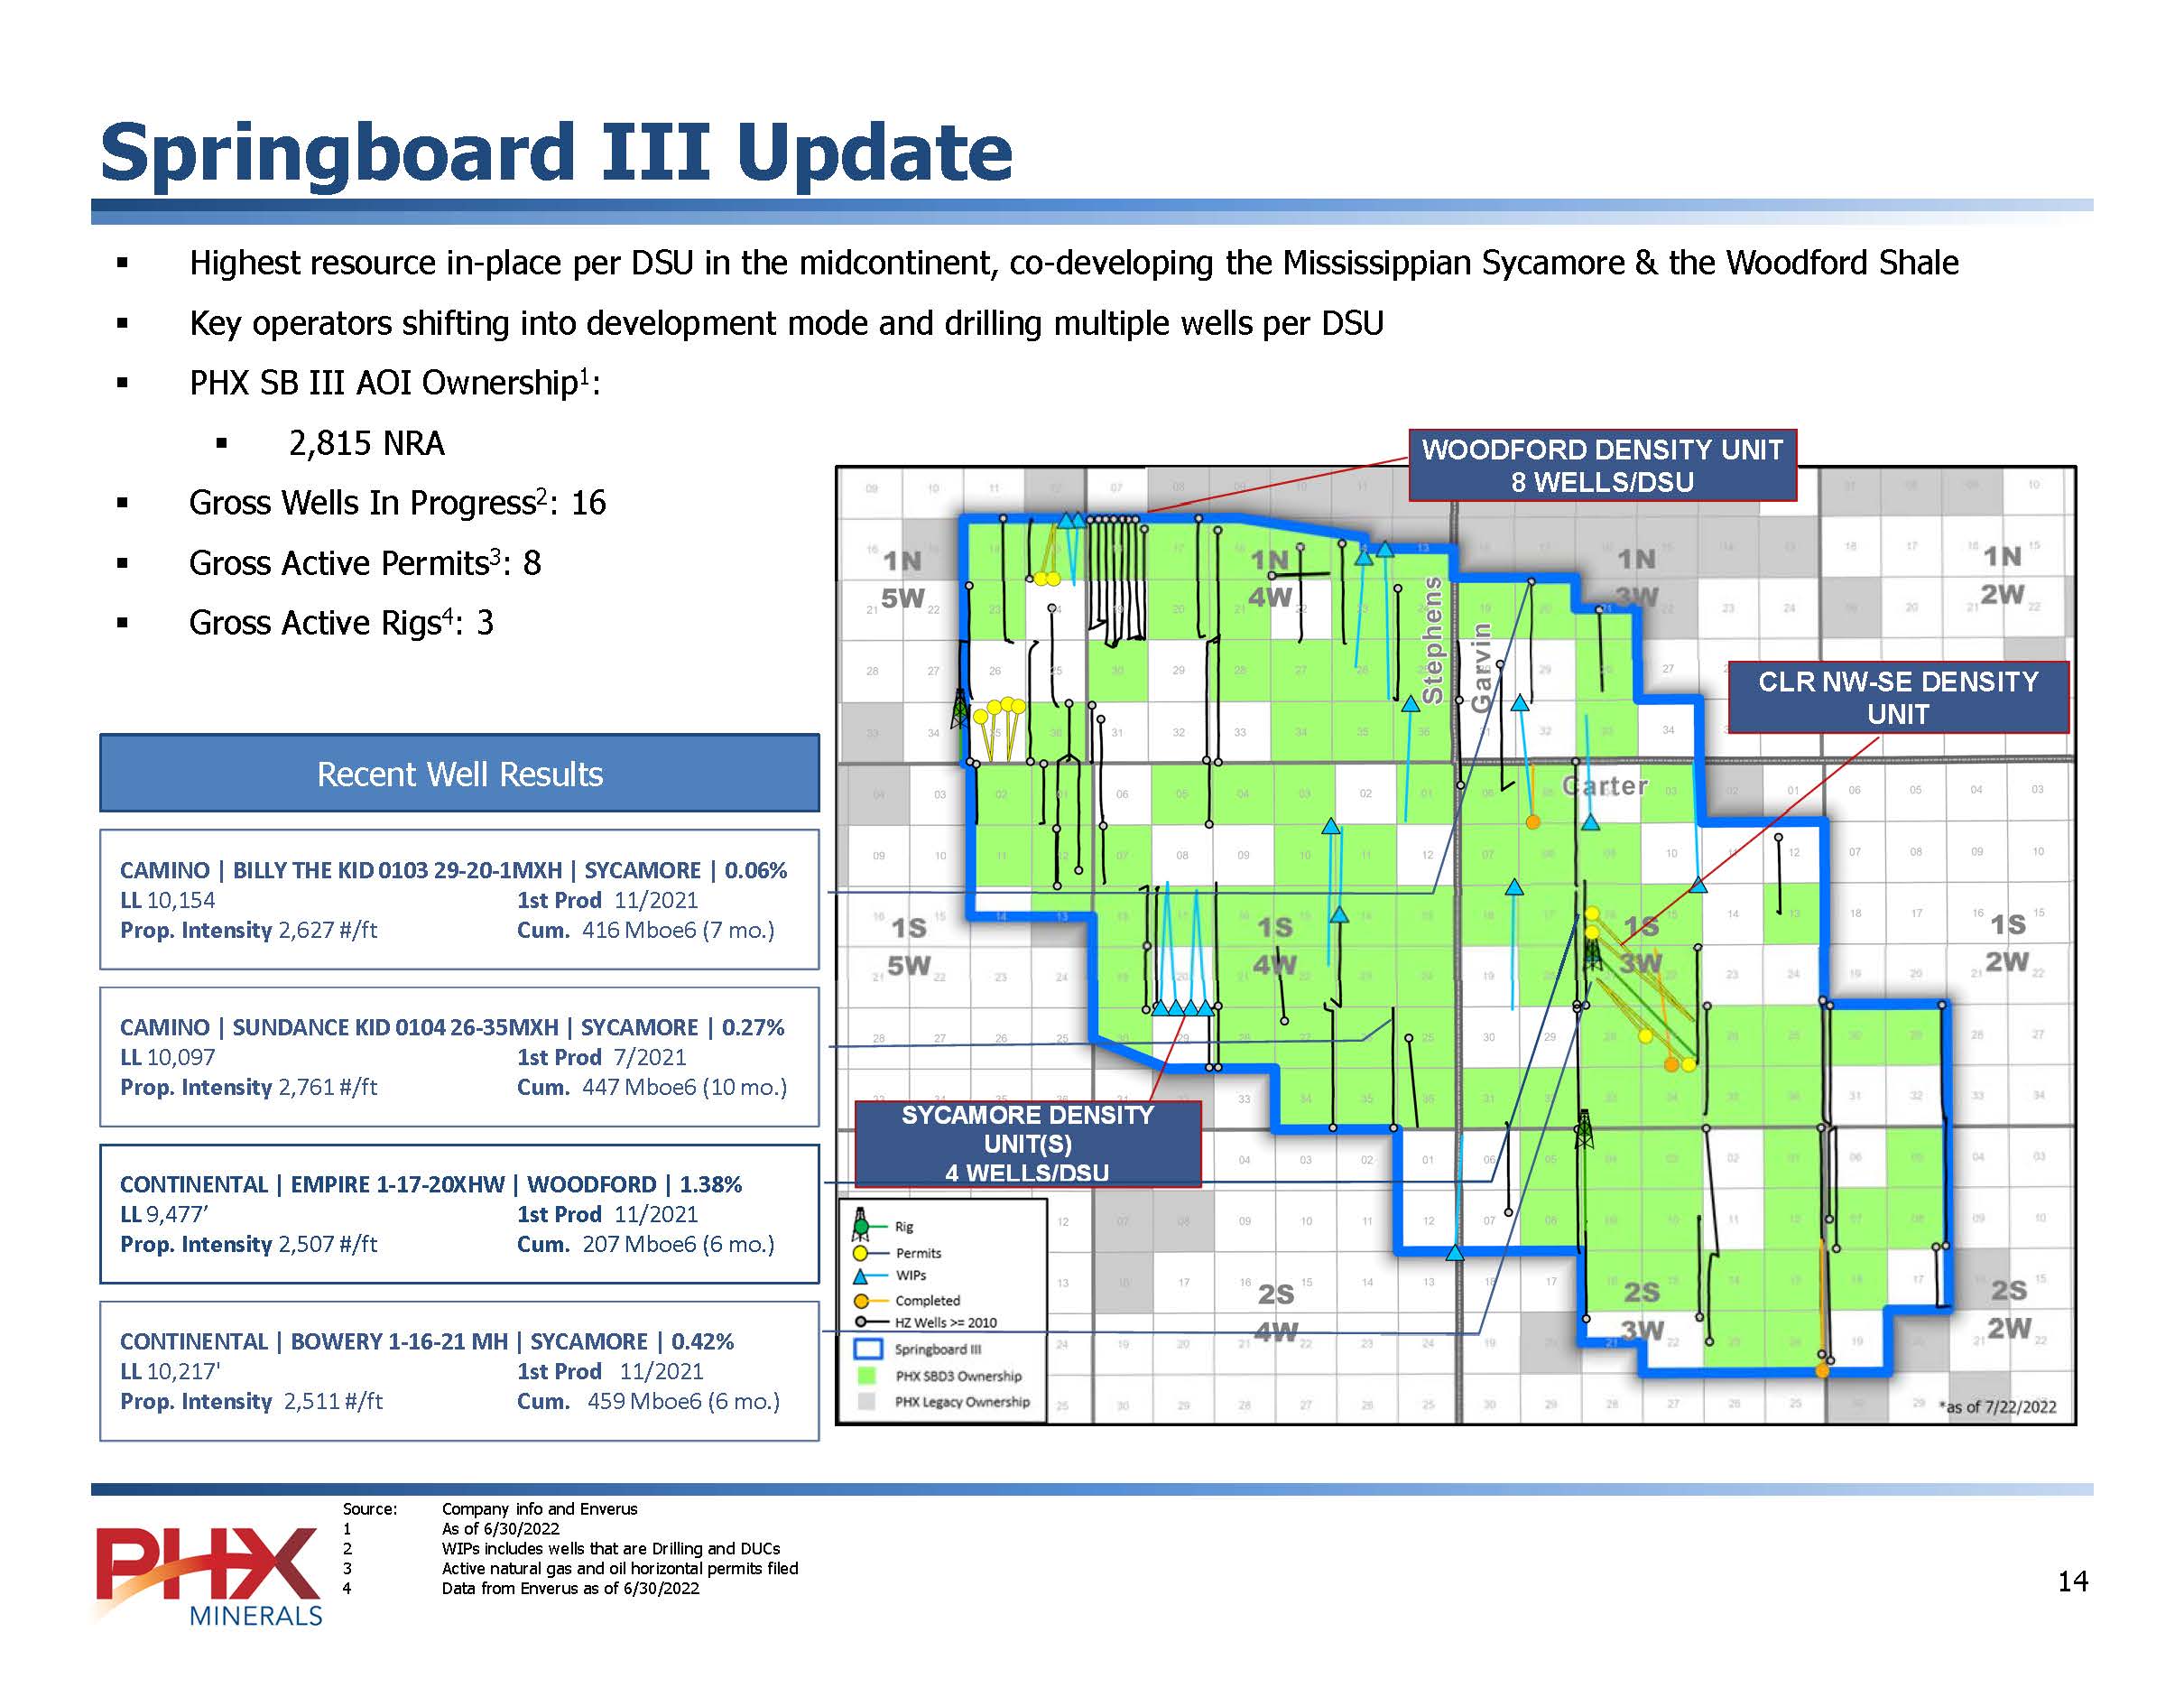
Springboard III Update ▪ Highest resource in-place per DSU in the midcontinent, co-developing the Mississippian Sycamore & the Woodford Shale ▪ Key operators shifting into development mode and drilling multiple wells per DSU ▪ PHX SB III AOI Ownership1: ▪ 2,815 NRA ▪ Gross Wells In Progress2: 16 ▪ Gross Active Permits3: 8 ▪ Gross Active Rigs4: 3 WOODFORD DENSITY UNIT 8 WELLS/DSU CLR NW-SE DENSITY UNIT SYCAMORE DENSITY UNIT(S) 4 WELLS/DSU Recent Well Results CAMINO | BILLY THE KID 0103 29-20-1MXH | SYCAMORE | 0.06% LL 10,154 1st Prod 11/2021 Prop. Intensity 2,627 #/ft Cum. 416 Mboe6 (7 mo.) CAMINO | SUNDANCE KID 0104 26-35MXH | SYCAMORE | 0.27% LL 10,097 1st Prod 7/2021 Prop. Intensity 2,761 #/ft Cum. 447 Mboe6 (10 mo.) CONTINENTAL | EMPIRE 1-17-20XHW | WOODFORD | 1.38% LL 9,477’ 1st Prod 11/2021 Prop. Intensity 2,507 #/ft Cum. 207 Mboe6 (6 mo.) CONTINENTAL | BOWERY 1-16-21 MH | SYCAMORE | 0.42% LL 10,217' 1st Prod 11/2021 Prop. Intensity 2,511 #/ft Cum.
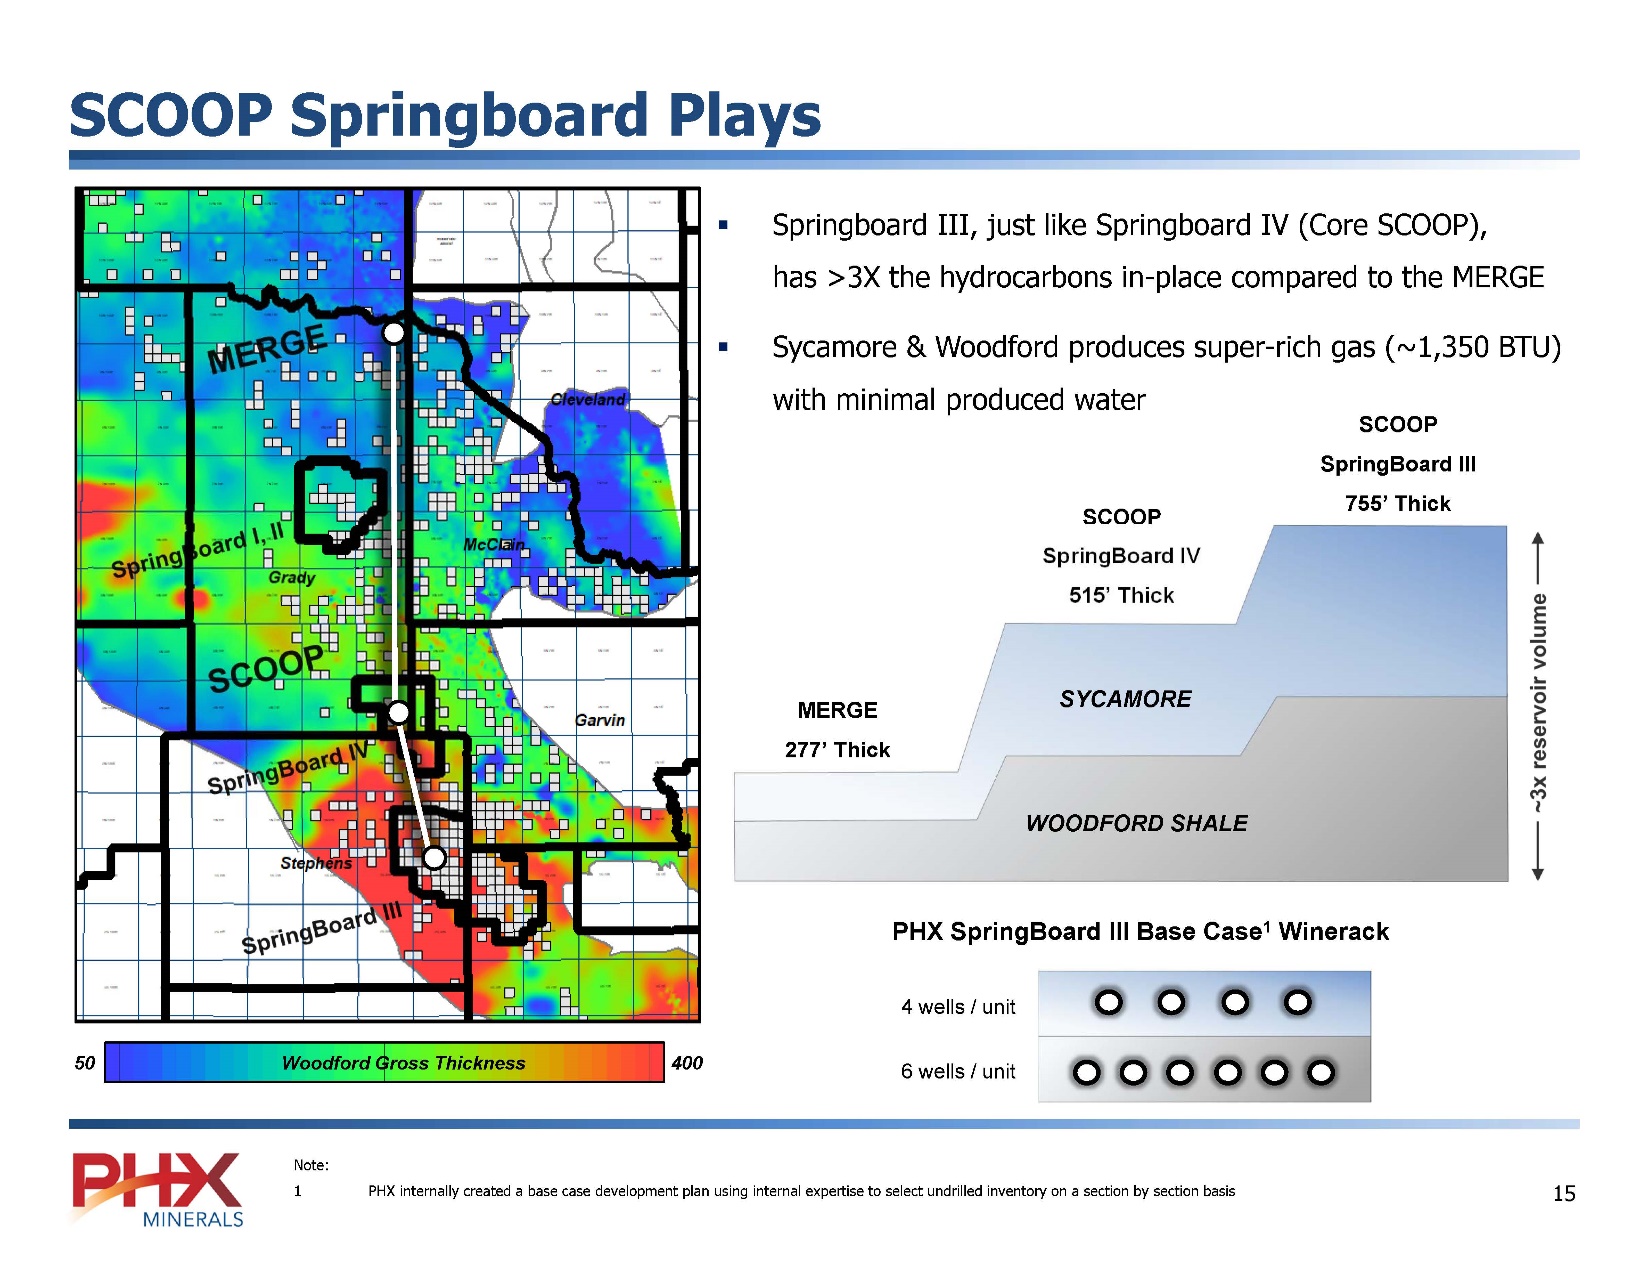
459 Mboe6 (6 mo.) Source: Company info and Enverus 1 As of 6/30/2022 2 WIPs includes wells that are Drilling and DUCs 3 Active natural gas and oil horizontal permits filed 4 Data from Enverus as of 6/30/2022 [BAR CHART] PHX MINERALS 14 SCOOP Springboard Plays ▪ Springboard III, just like Springboard IV (Core SCOOP), has >3X the hydrocarbons in-place compared to the MERGE ▪ Sycamore & Woodford produces super-rich gas (~1,350 BTU) with minimal produced water SCOOP SpringBoard IV 515’ Thick SCOOP SpringBoard III 755’ Thick MERGE 277’ Thick SYCAMORE WOODFORD SHALE PHX SpringBoard III Base Case1 Winerack 4 wells / unit 6 wells / unit 50 Woodford Gross Thickness 400 Note: 1 PHX internally created a base case development plan using internal expertise to select undrilled inventory on a section by section basis [BAR CHART] PHX MINERALS 15 PHX Haynesville Position Net Royalty Acres1 Net Production (MMcfe/d)1 Portfolio Contribution Prod.1 Core NMA2 Key Statistics1 Top Operators5 Permits on File 16 Wells on Production (Gross / Net) 257 / 1.65 Wells in Progress (Gross / Net) 62/0.43 Undeveloped Locations3 361 Rigs Running on PHX Acreage4 12 Rigs Running Within 2.5 miles of PHX Acreage4 36 [COMPANY LOGO] [COMPANY LOGO] [COMPANY LOGO] Blue Dome Operating LLC Note: 1 As of Quarter Ended 6/30/2022 2 Excludes unleased acreage 3 Undeveloped Locations consists of PROB and POSS locations 4 Provided by Enverus as of 6/30/2022 5 As determined by Wells in Progress & Permits [BAR CHART] PHX MINERALS 16
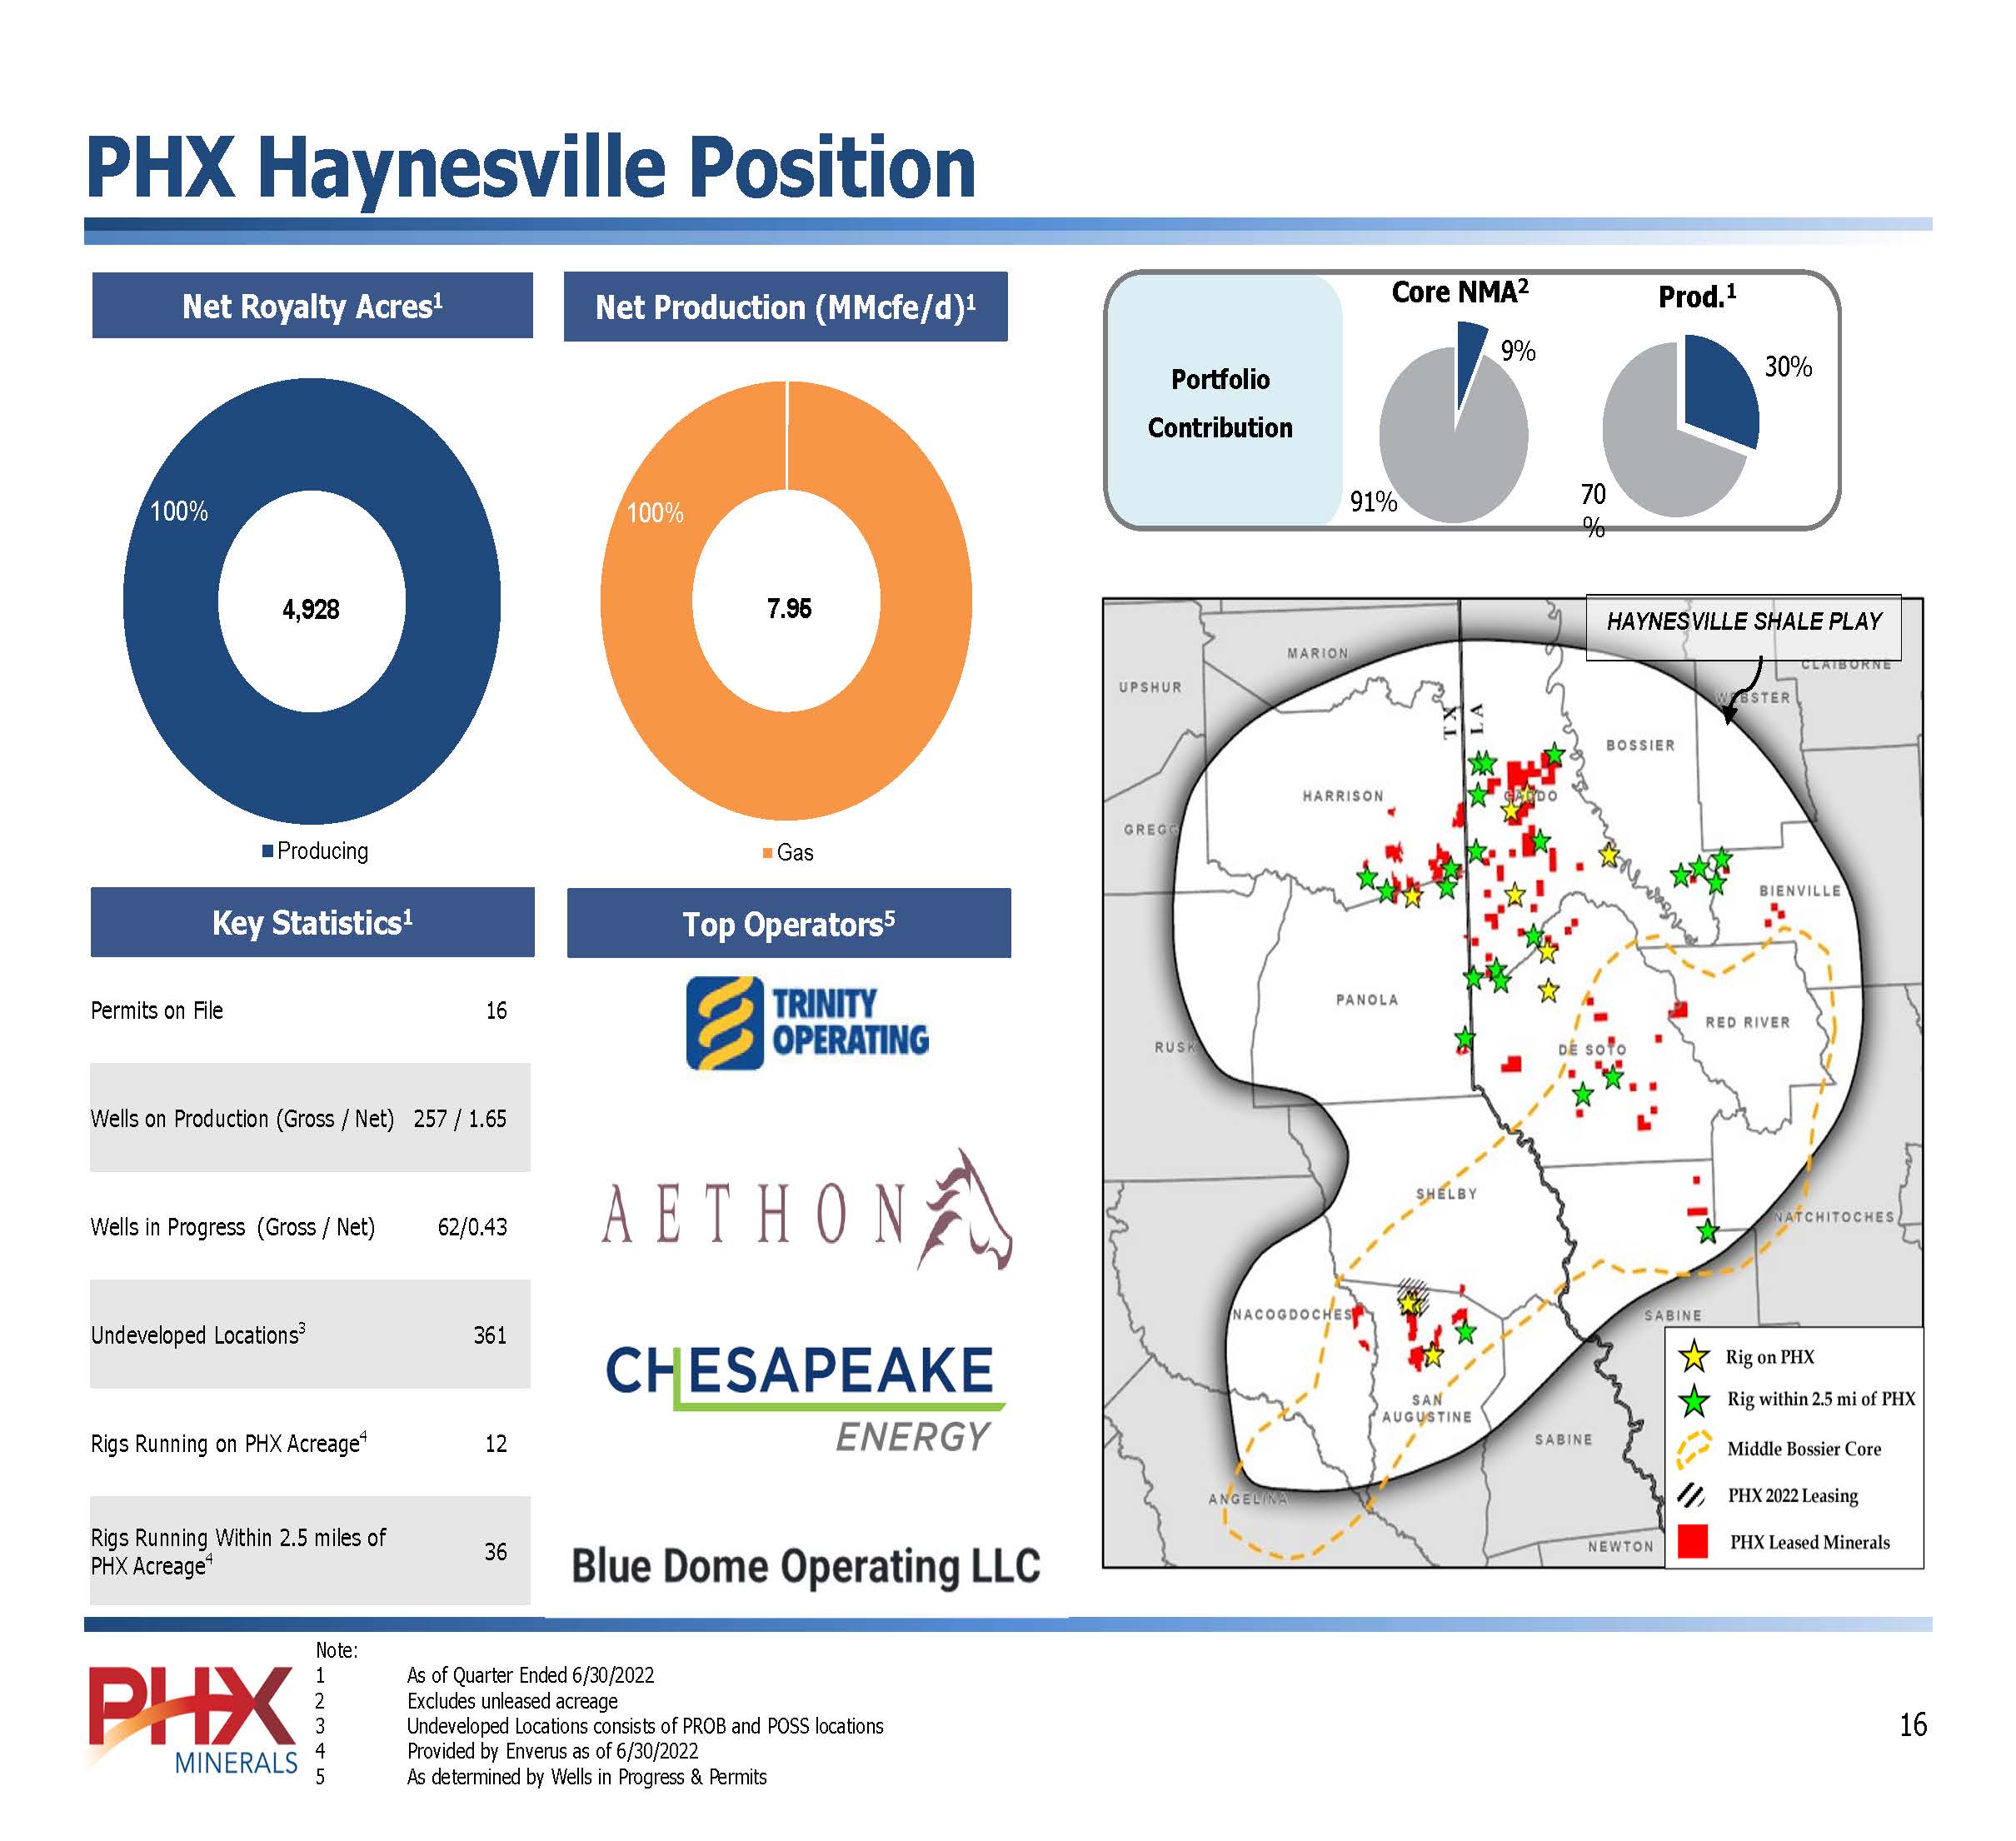
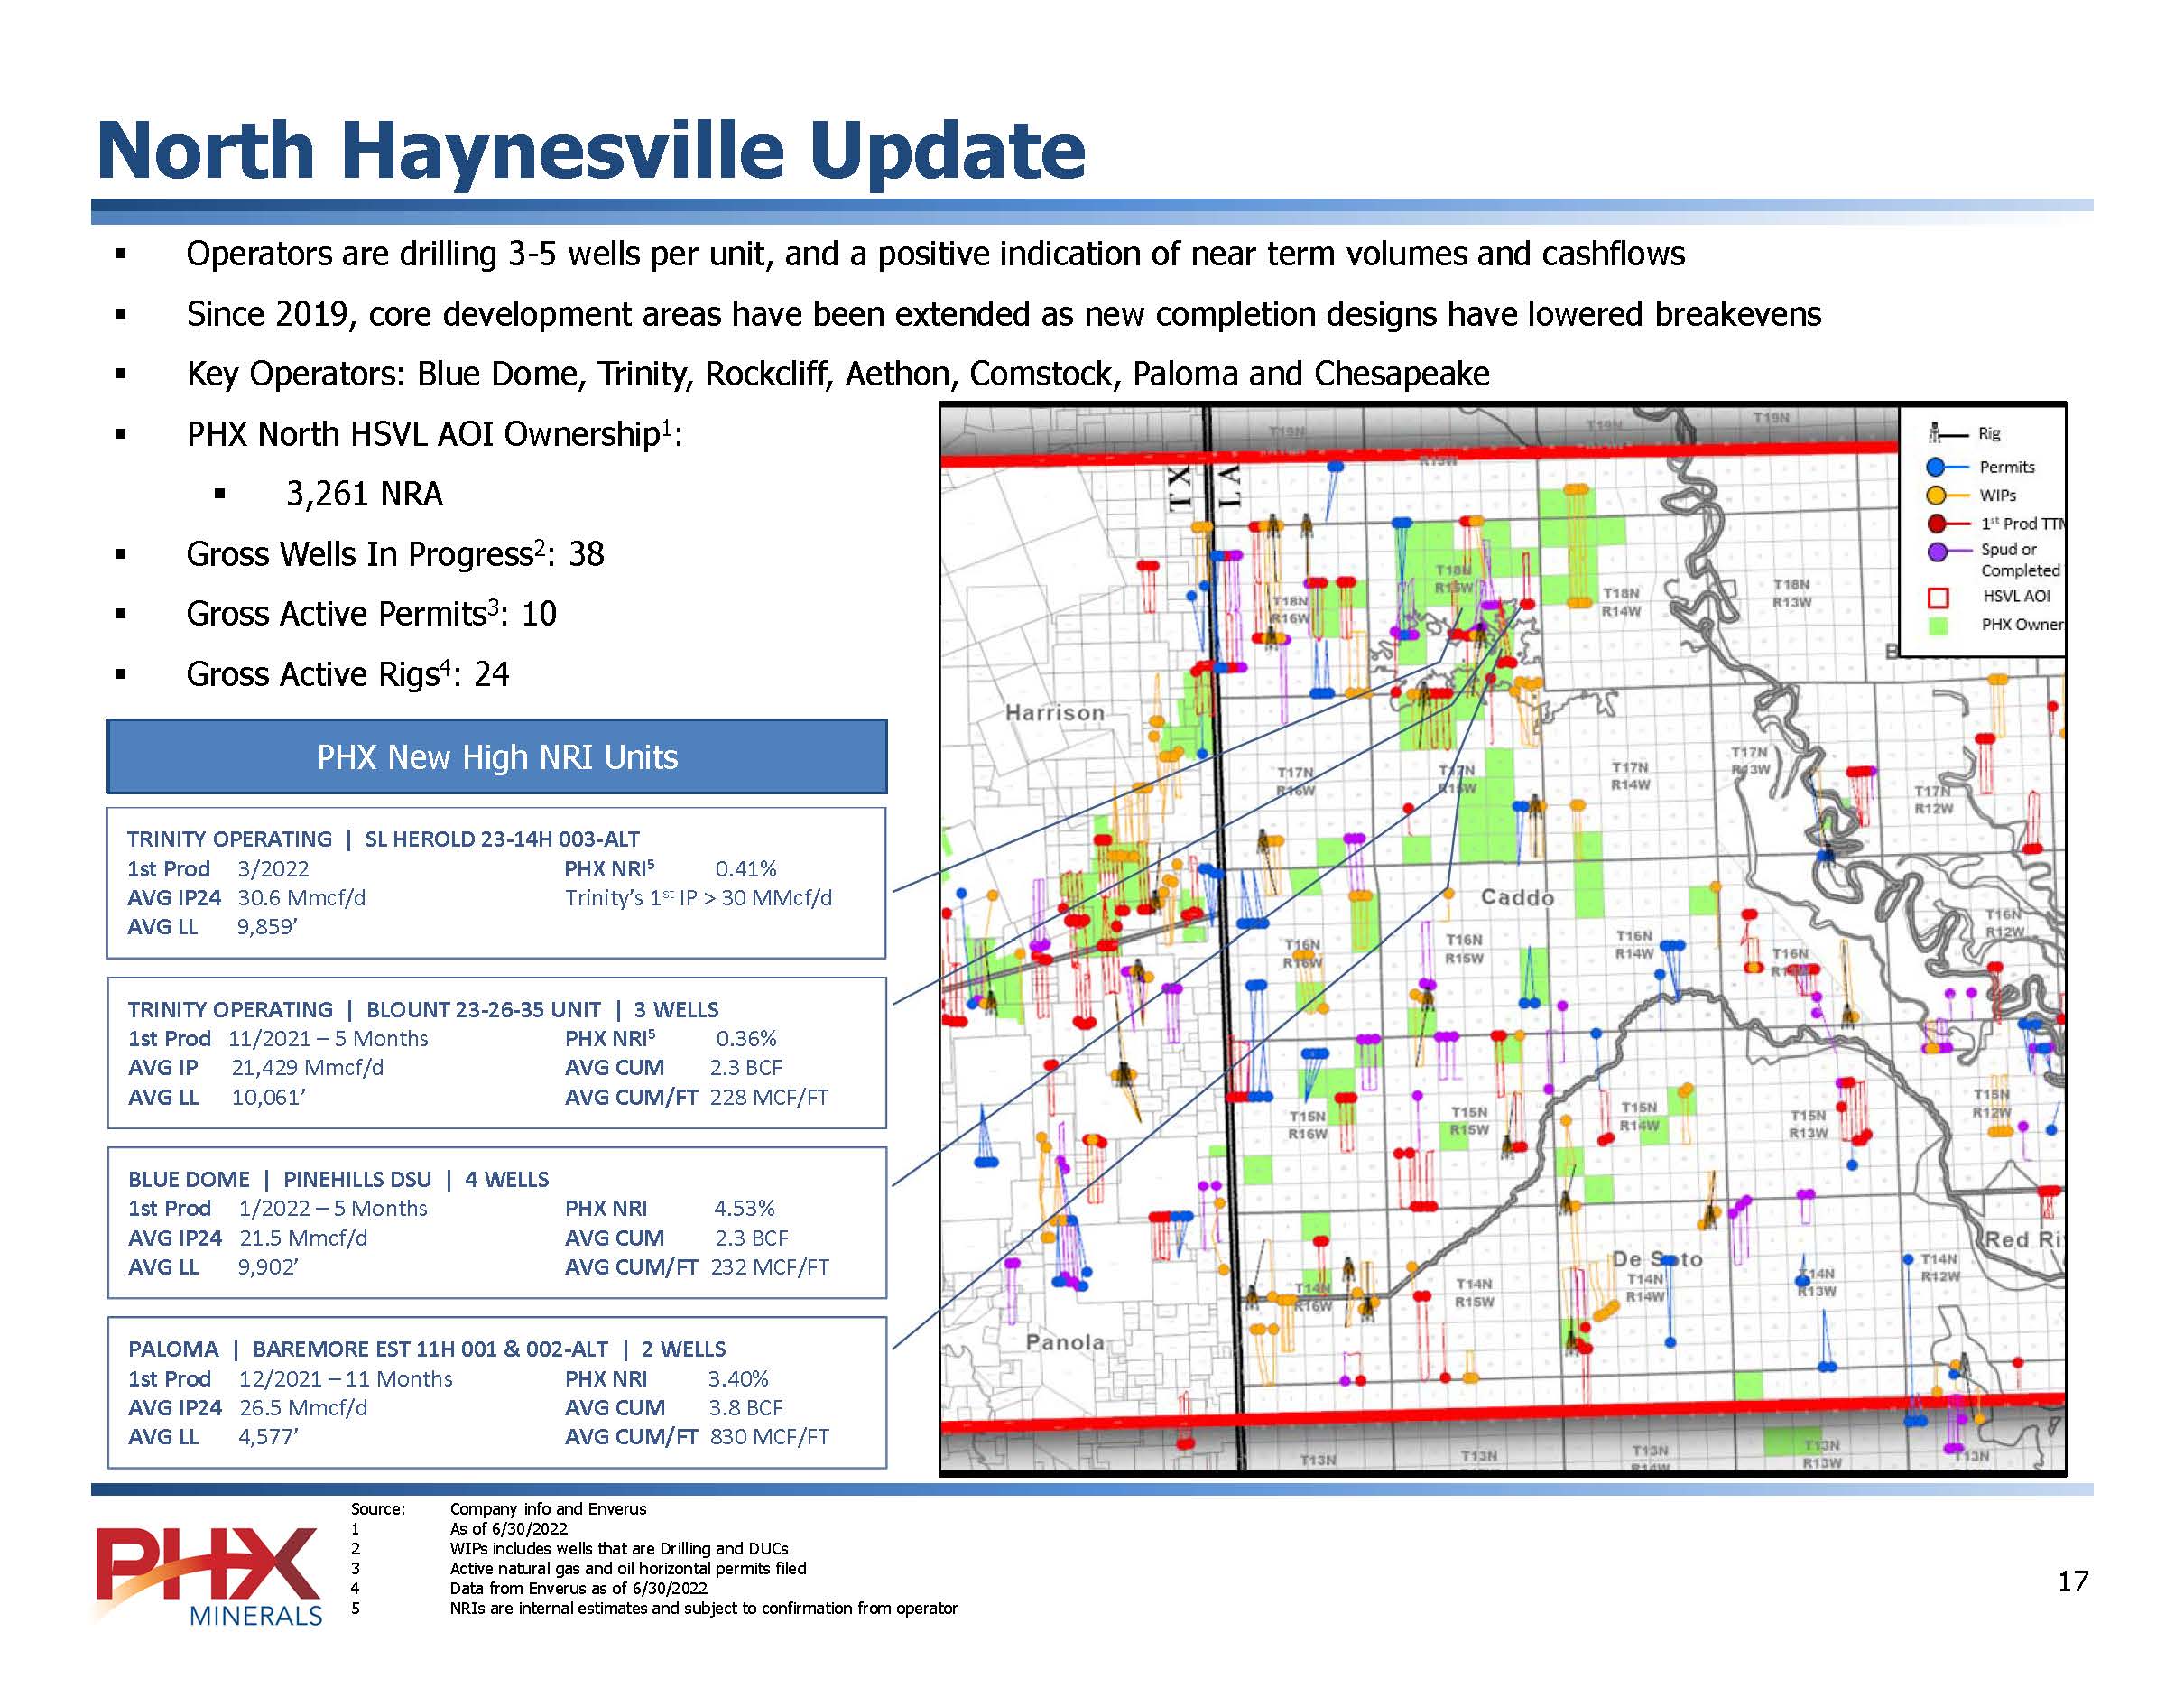
North Haynesville Update ▪ Operators are drilling 3-5 wells per unit, and a positive indication of near term volumes and cashflows ▪ Since 2019, core development areas have been extended as new completion designs have lowered breakevens ▪ Key Operators: Blue Dome, Trinity, Rockcliff, Aethon, Comstock, Paloma and Chesapeake ▪ PHX North HSVL AOI Ownership1: ▪ 3,261 NRA ▪ Gross Wells In Progress2: 38 ▪ Gross Active Permits3: 10 ▪ Gross Active Rigs4: 24 PHX New High NRI Units TRINITY OPERATING | SL HEROLD 23-14H 003-ALT 1st Prod 3/2022 PHX NRI5 0.41% AVG IP24 30.6 Mmcf/d Trinity’s 1st IP > 30 MMcf/d AVG LL 9,859’ TRINITY OPERATING | BLOUNT 23-26-35 UNIT | 3 WELLS 1st Prod 11/2021 – 5 Months PHX NRI5 0.36% AVG IP 21,429 Mmcf/d AVG CUM 2.3 BCF AVG LL 10,061’ AVG CUM/FT 228 MCF/FT BLUE DOME | PINEHILLS DSU | 4 WELLS 1st Prod 1/2022 – 5 Months PHX NRI 4.53% AVG IP24 21.5 Mmcf/d AVG CUM 2.3 BCF AVG LL 9,902’ AVG CUM/FT 232 MCF/FT PALOMA | BAREMORE EST 11H 001 & 002-ALT | 2 WELLS 1st Prod 12/2021 – 11 Months PHX NRI 3.40% AVG IP24 26.5 Mmcf/d AVG CUM 3.8 BCF AVG LL 4,577’ AVG CUM/FT 830 MCF/FT Source: Company info and Enverus 1 As of 6/30/2022 2 WIPs includes wells that are Drilling and DUCs 3 Active natural gas and oil horizontal permits filed 4 Data from Enverus as of 6/30/2022 5 NRIs are internal estimates and subject to confirmation from operator [BAR CHART] PHX MINERALS 17 Royalty Cash Flow Driving Shareholder Value Oil & Gas Sales and Realized Price [BAR CHART] Adjusted EBITDA1 [BAR CHART] Adjusted Pre-tax NI2 [BAR CHART] Return on Capital Employed3 [BAR CHART] Source: Company filings 1 Calculated as net income excluding non-cash gain/loss on derivatives, income tax expense, interest expense, DD&A, non-cash impairments, non-cash G&A, gain(losses) on asset sales and cash receipts from/payments on off-market derivatives.
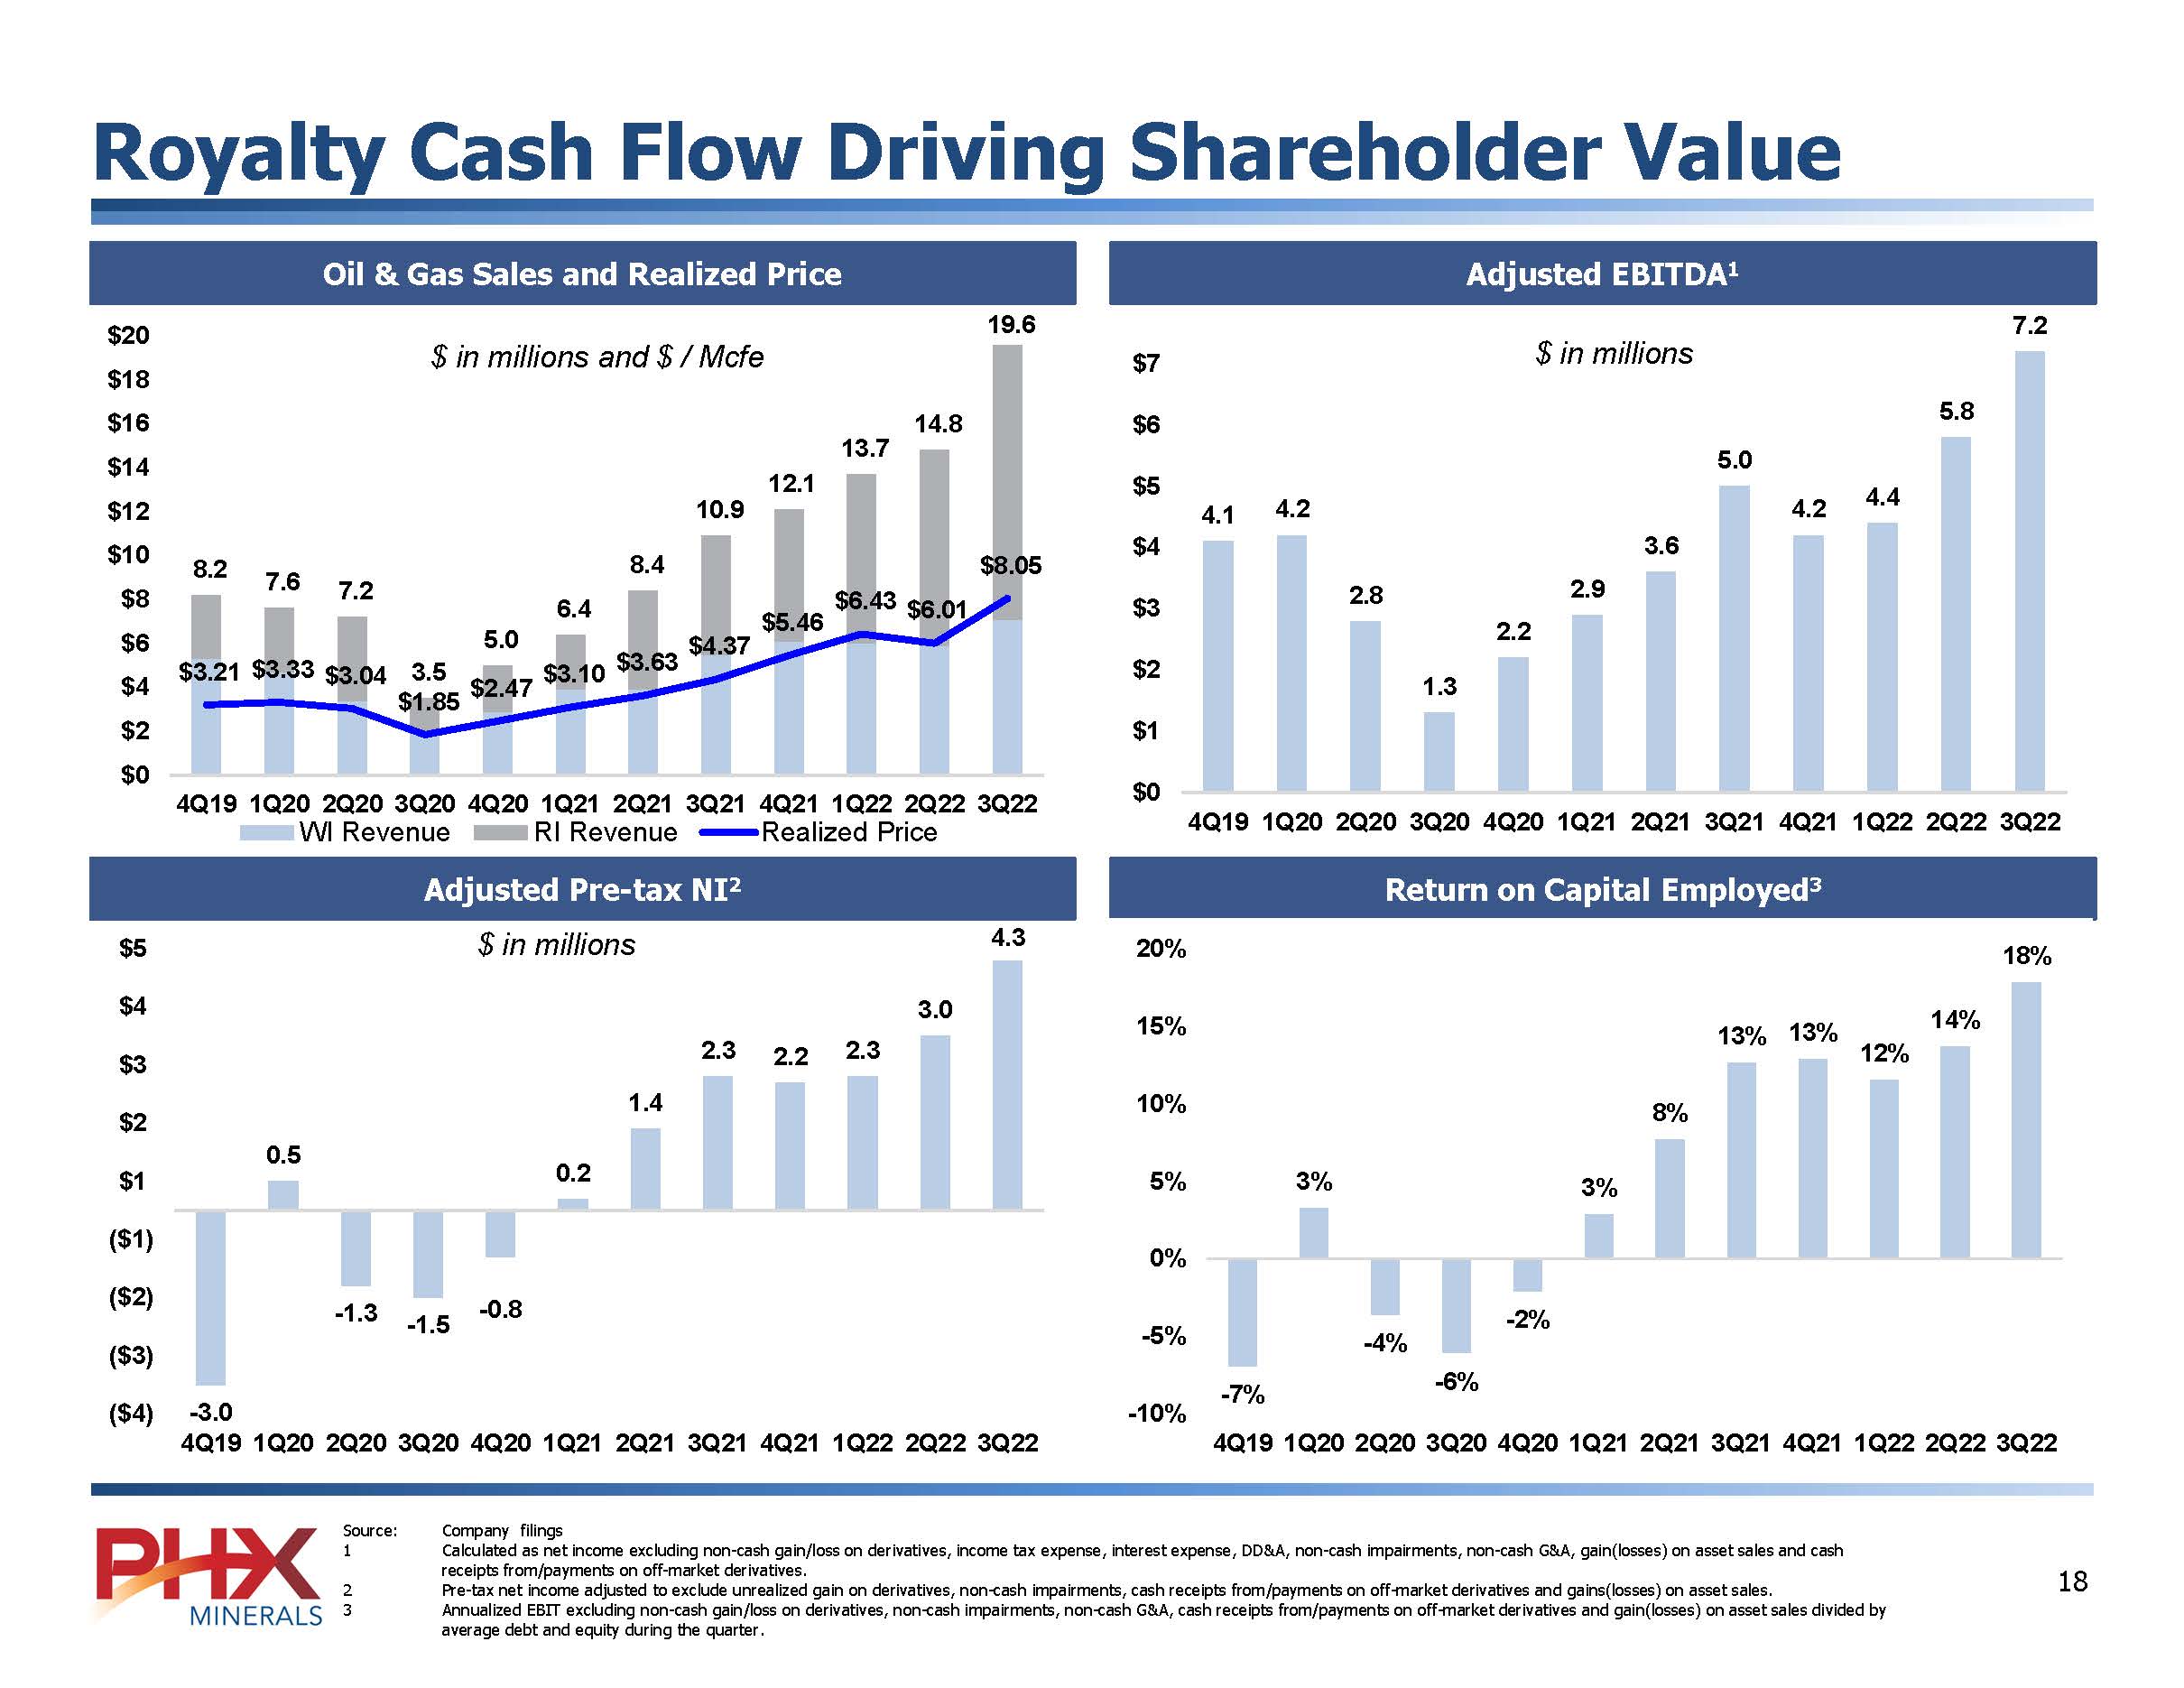
2 Pre-tax net income adjusted to exclude unrealized gain on derivatives, non-cash impairments, cash receipts from/payments on off-market derivatives and gains(losses) on asset sales. 3 Annualized EBIT excluding non-cash gain/loss on derivatives, non-cash impairments, non-cash G&A, cash receipts from/payments on off-market derivatives and gain(losses) on asset sales divided by average debt and equity during the quarter.
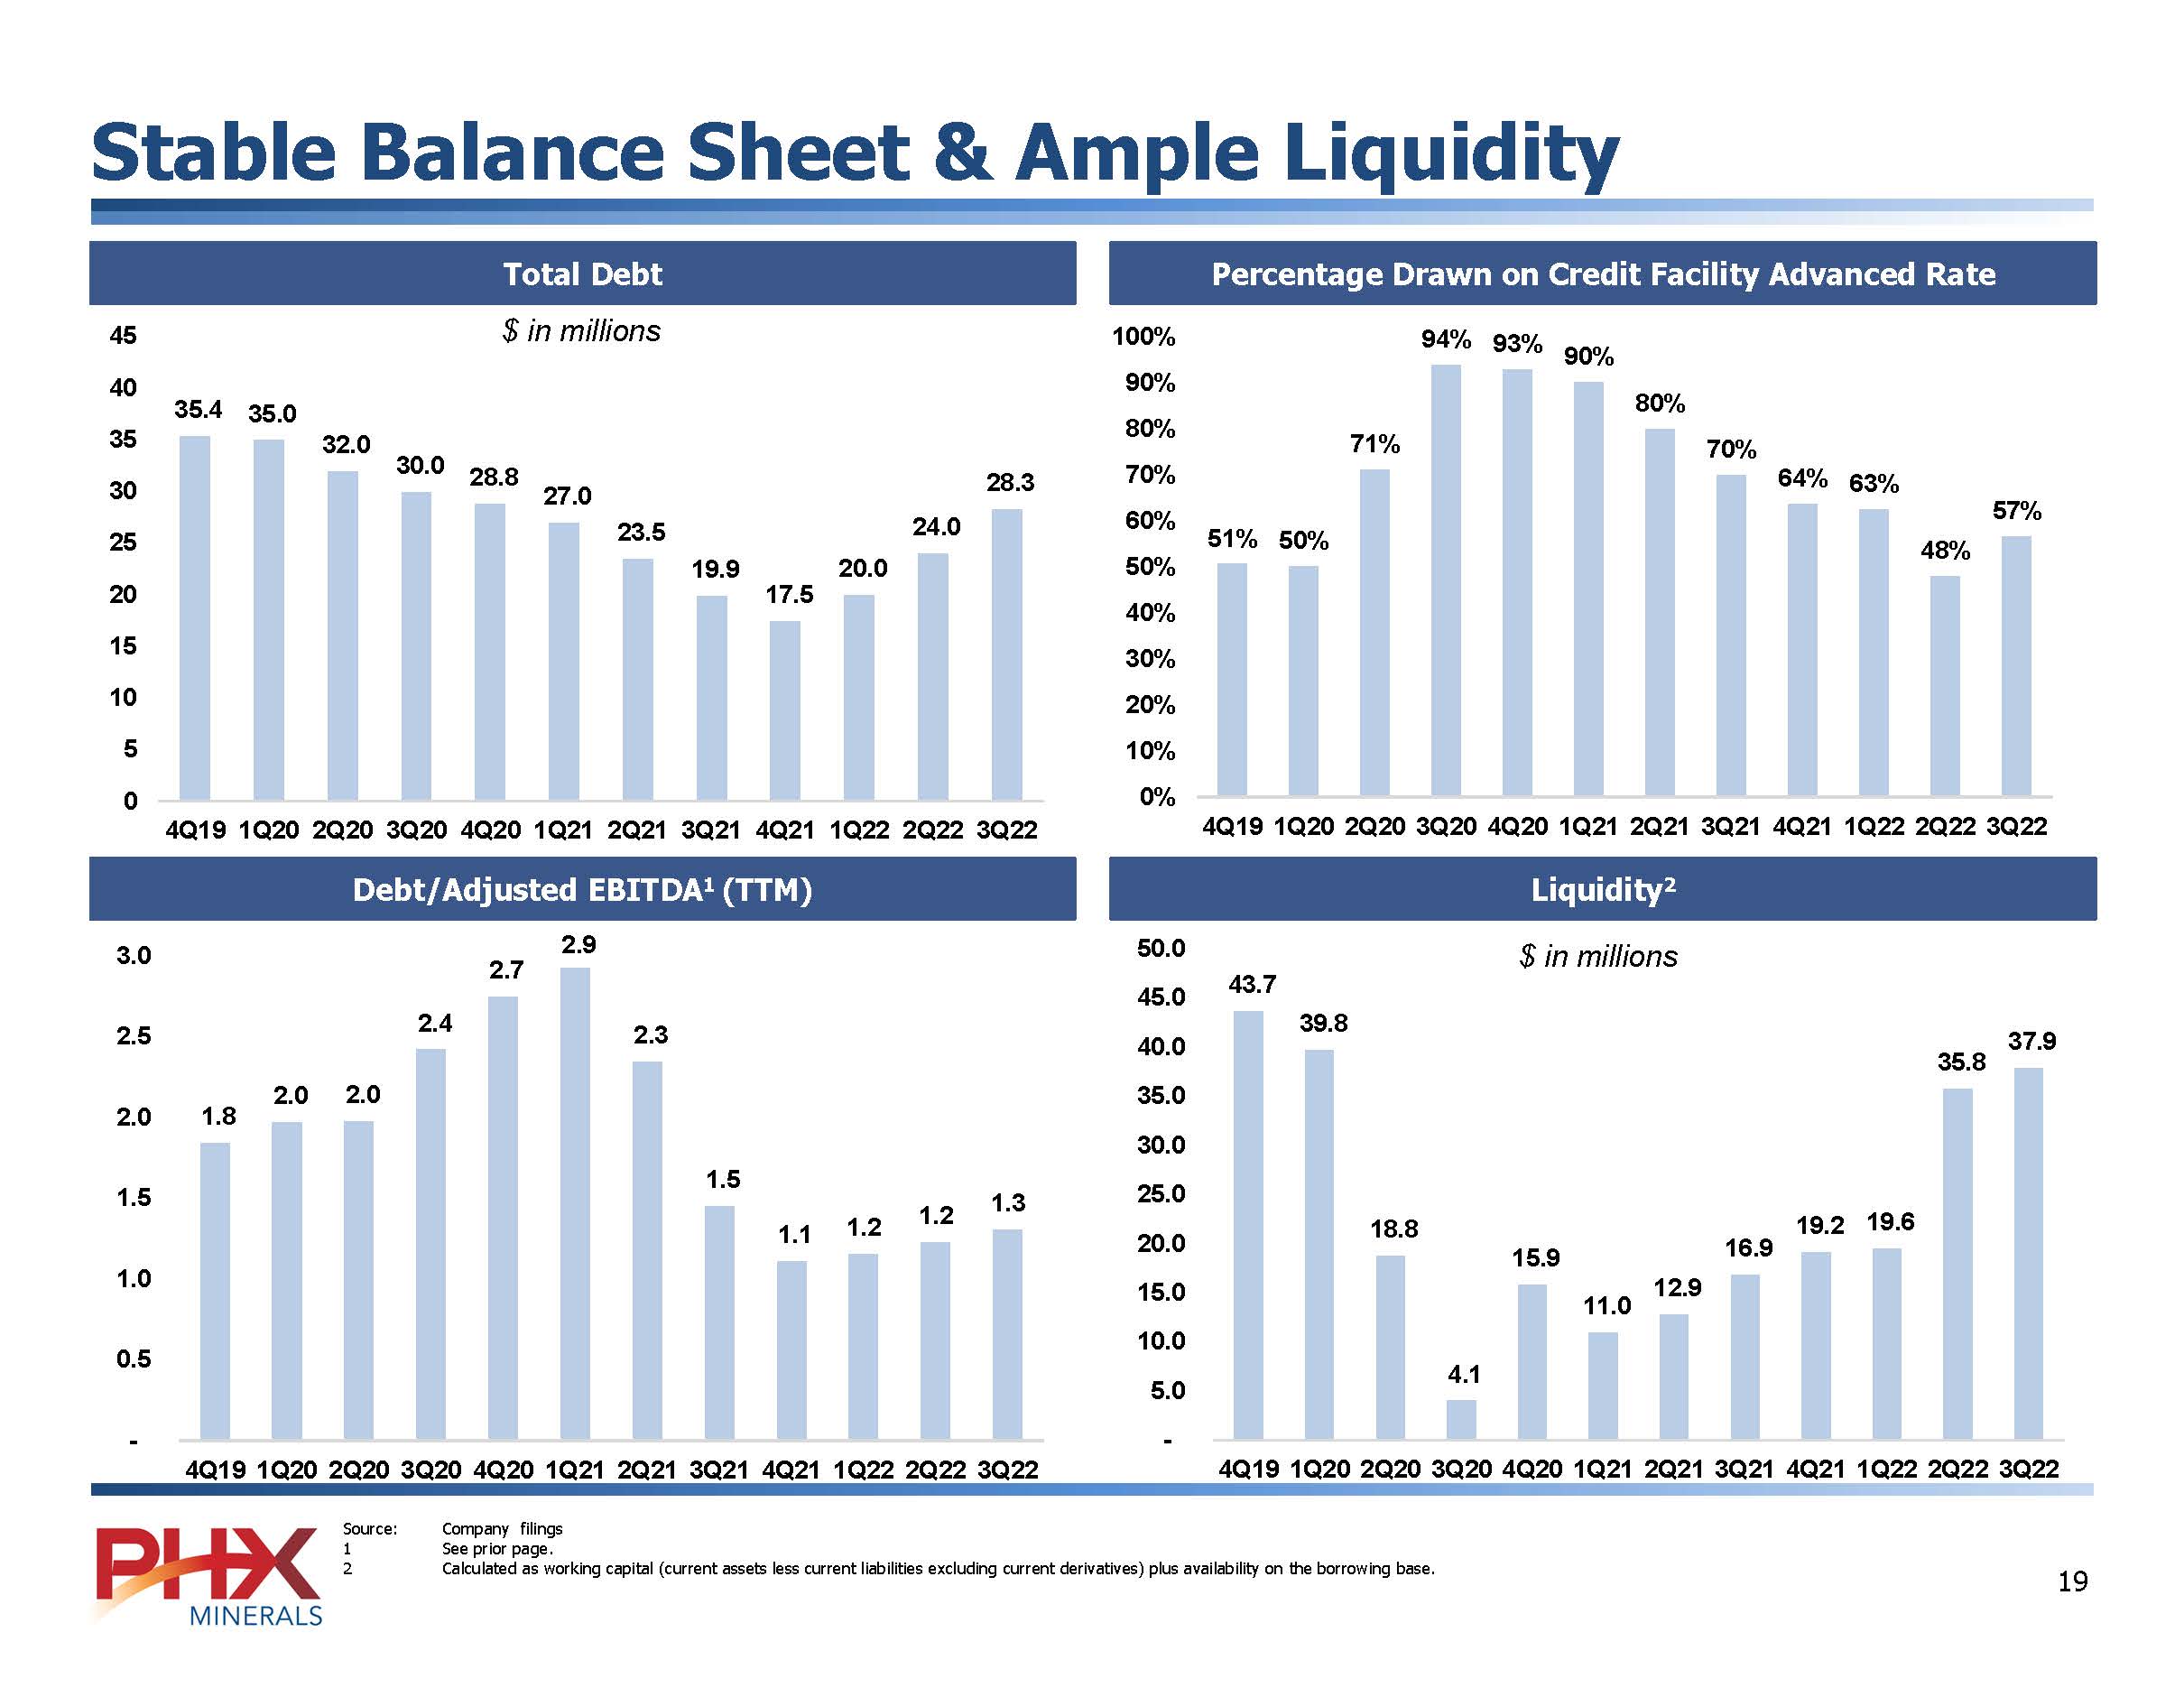
PHX MINERALS 18 Stable Balance Sheet & Ample Liquidity Total Debt [BAR CHART] Percentage Drawn on Credit Facility Advanced Rate [BAR CHART] Debt/Adjusted EBITDA1 (TTM) [BAR CHART] Liquidity2 [BAR CHART] Source: Company filings 1 See prior page. 2 Calculated as working capital (current assets less current liabilities excluding current derivatives) plus availability on the borrowing base.
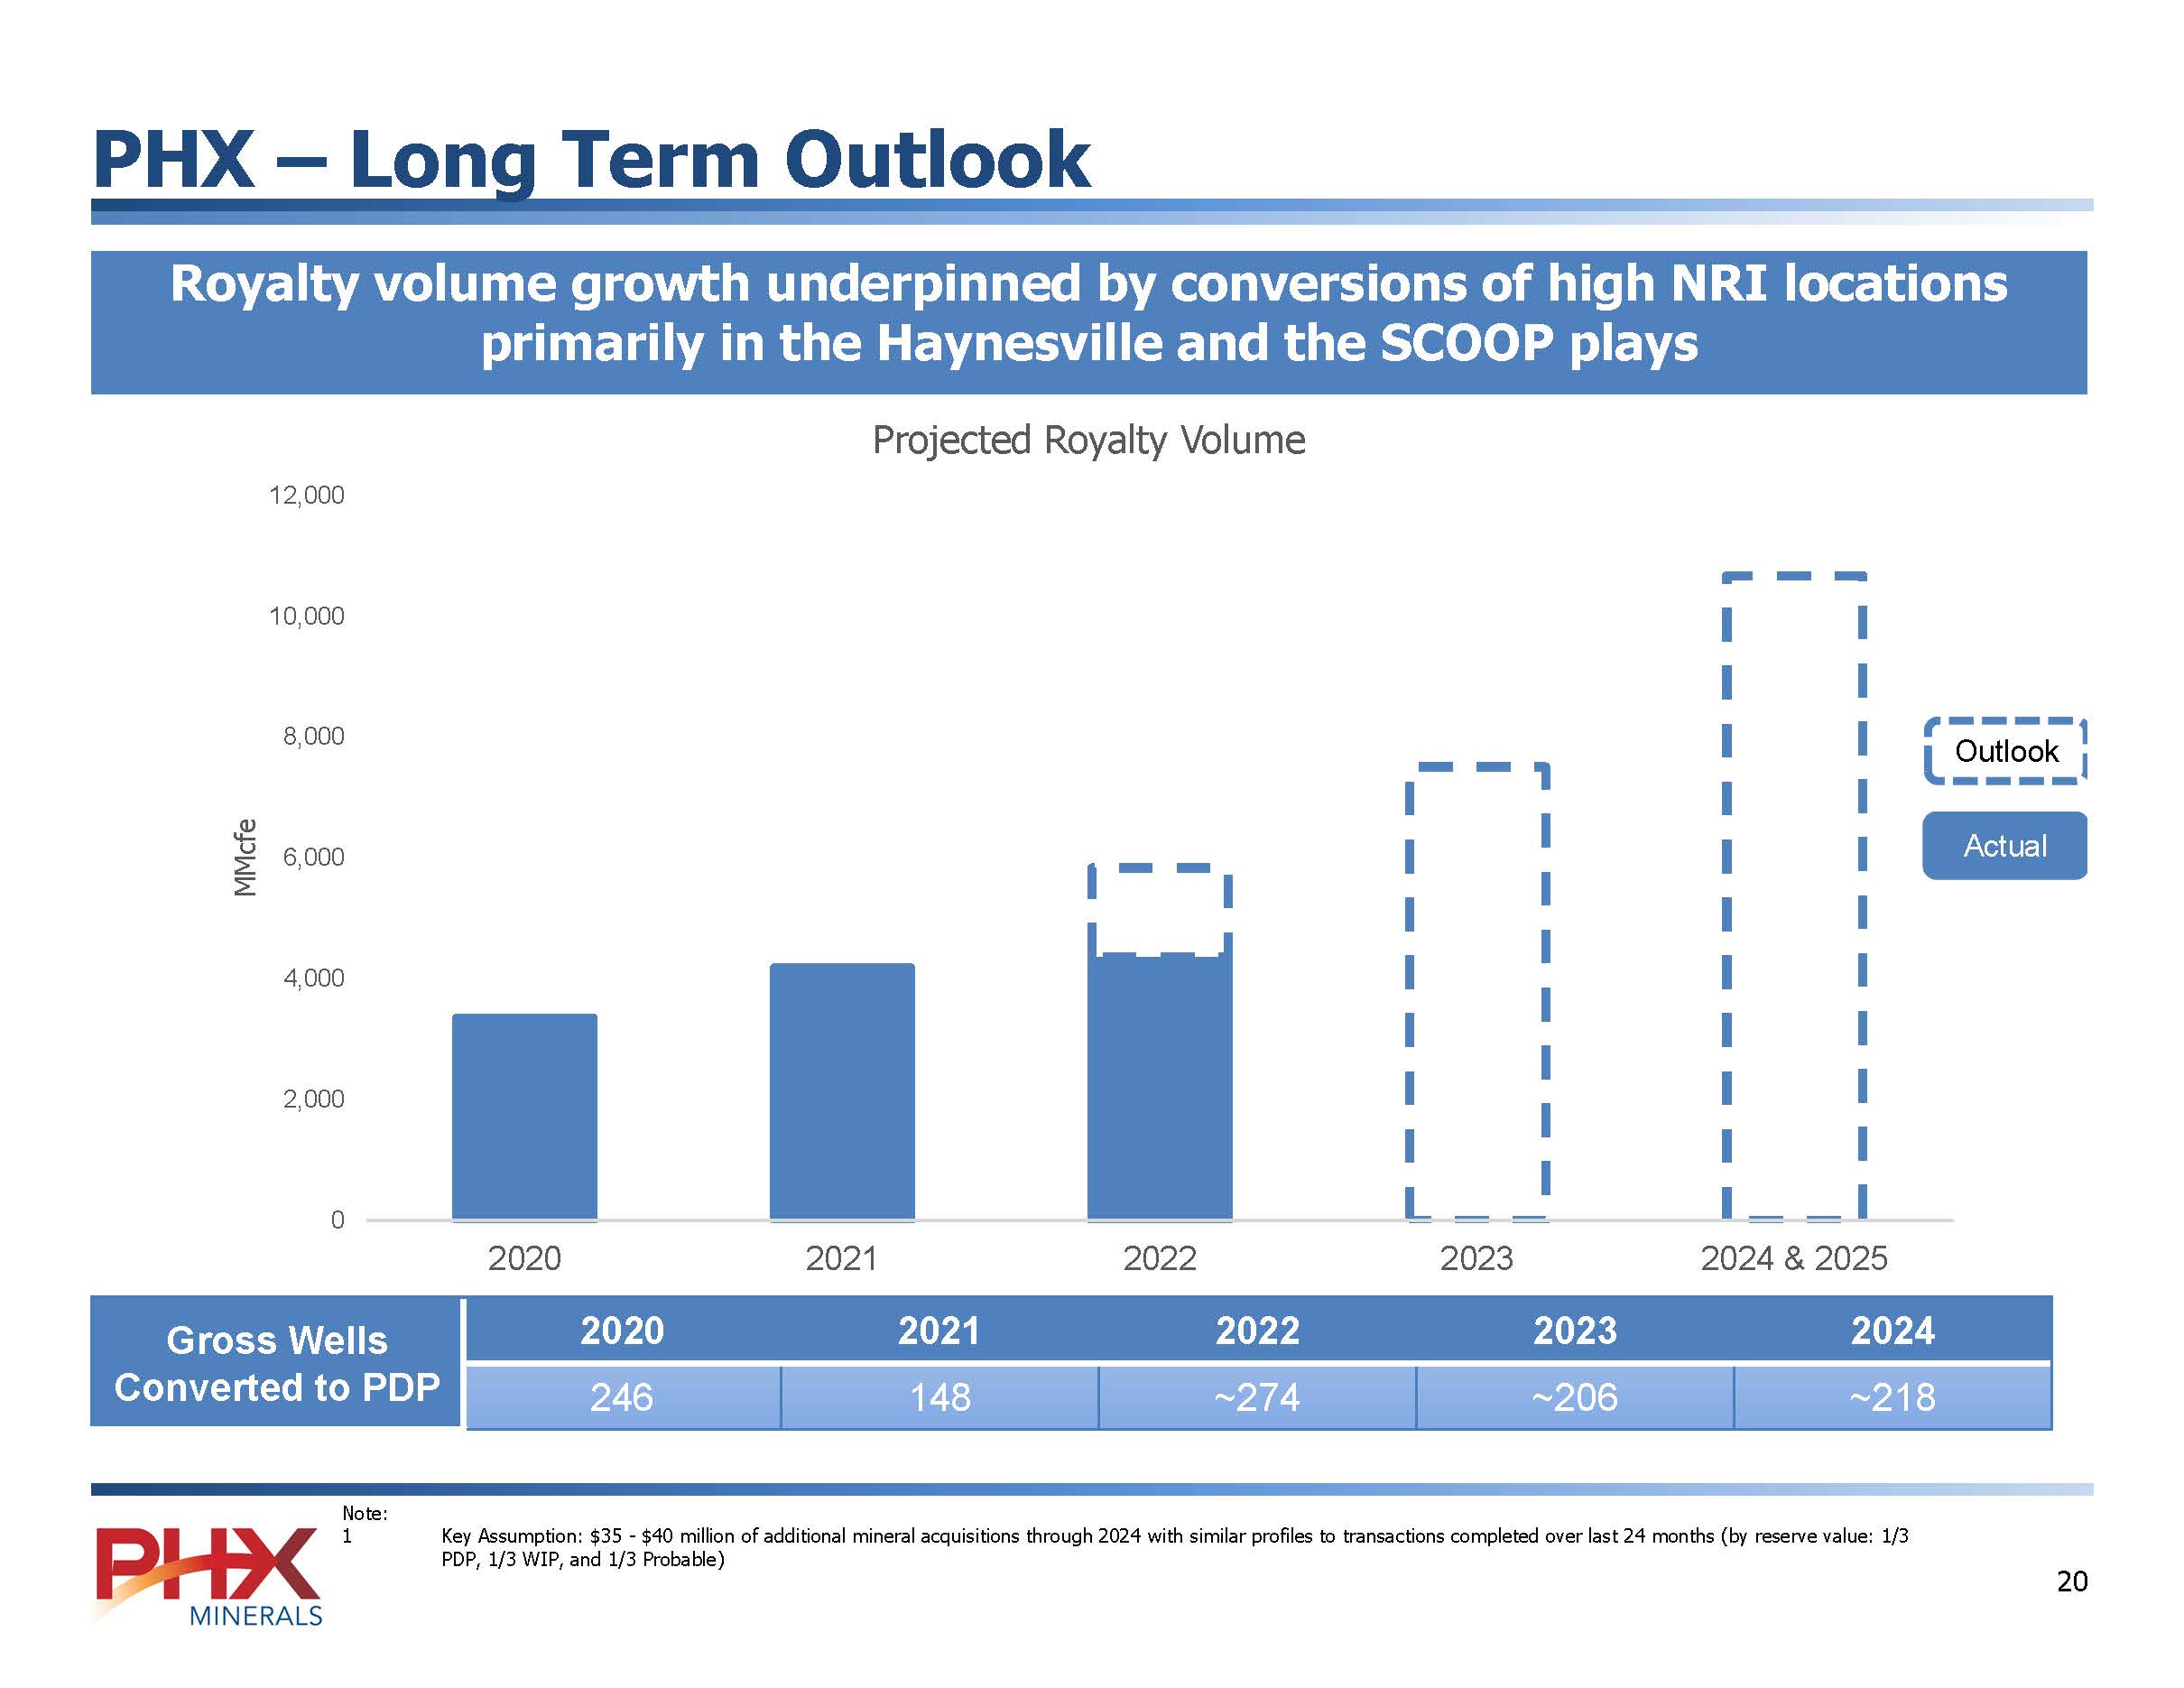
PHX – Long Term Outlook Royalty volume growth underpinned by conversions of high NRI locations primarily in the Haynesville and the SCOOP plays Projected Royalty Volume [BAR CHART] Gross Wells Converted to PDP 2020 2021 2022 2023 2024 246 148 ~274 ~206 ~218 Note: 1 Key Assumption: $35 - $40 million of additional mineral acquisitions through 2024 with similar profiles to transactions completed over last 24 months (by reserve value: 1/3 PDP, 1/3 WIP, and 1/3 Probable) PHX MINERALS 20
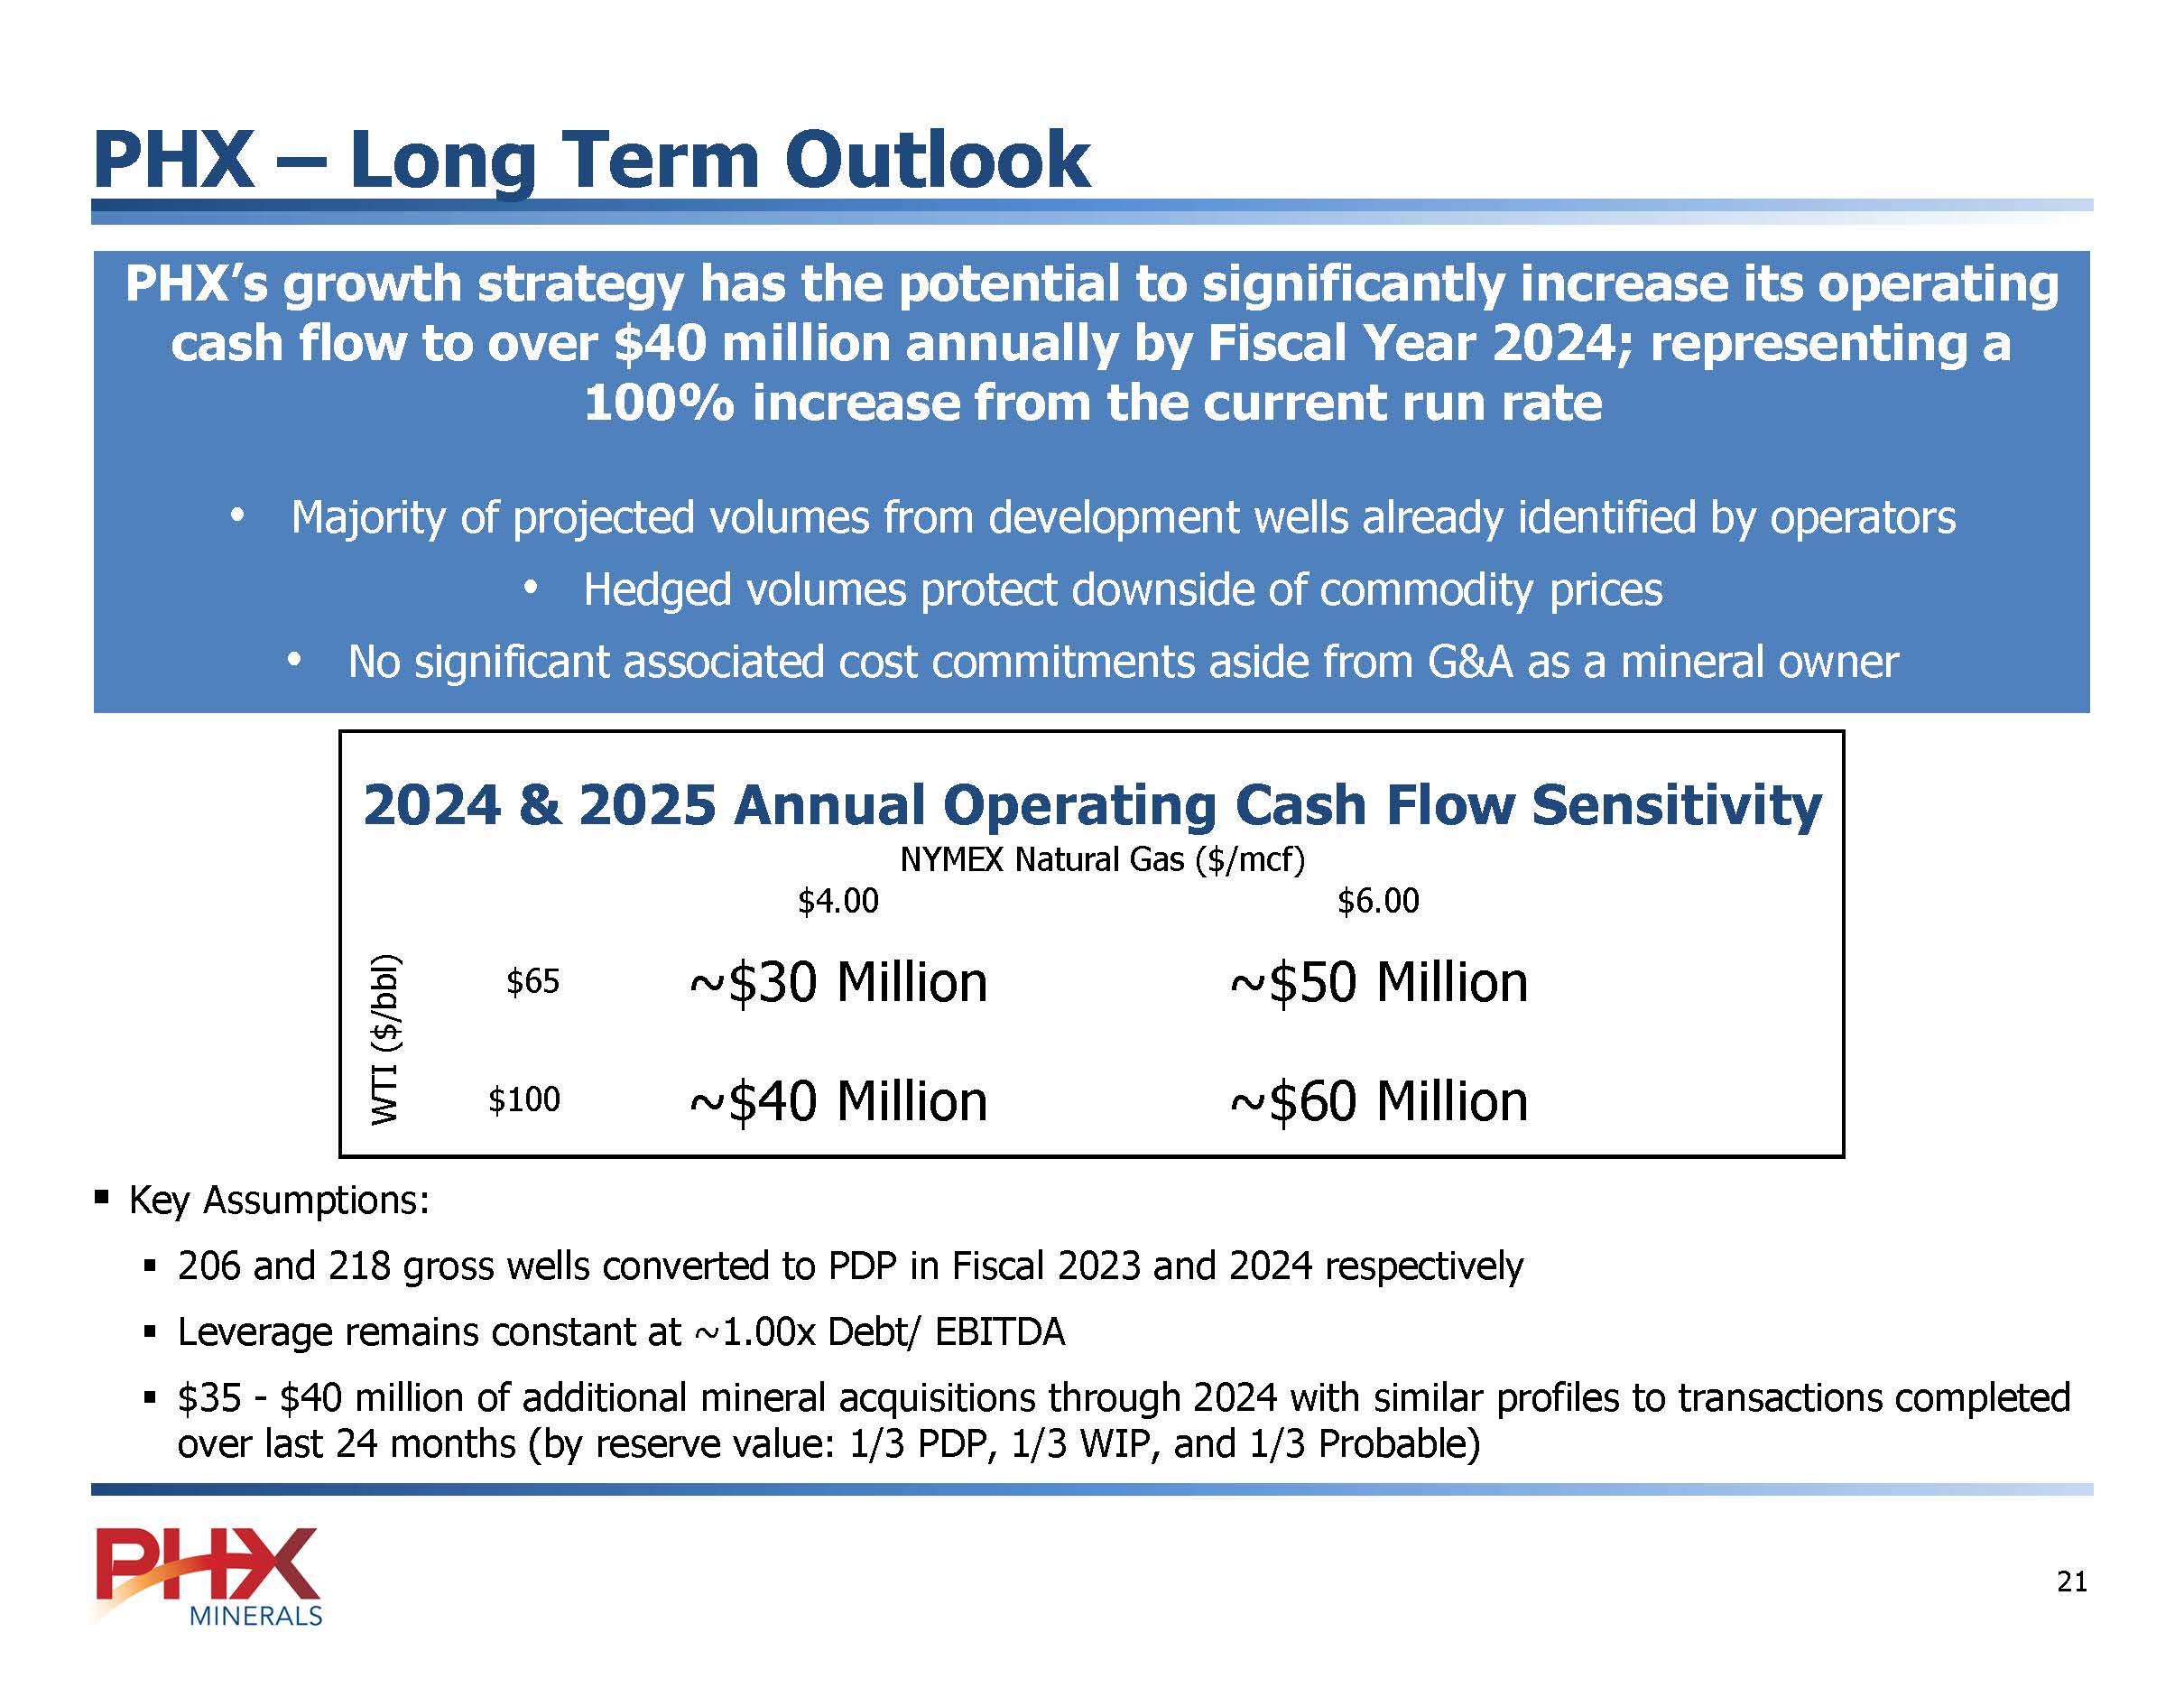
PHX MINERALS 19 PHX – Long Term Outlook PHX’s growth strategy has the potential to significantly increase its operating cash flow to over $40 million annually by Fiscal Year 2024; representing a 100% increase from the current run rate • Majority of projected volumes from development wells already identified by operators • Hedged volumes protect downside of commodity prices • No significant associated cost commitments aside from G&A as a mineral owner 2024 & 2025 Annual Operating Cash Flow Sensitivity NYMEX Natural Gas ($/mcf) $4.00 $6.00 WTI ($/bbl) ~$30 Million ~$50 Million $65 ~$40 Million ~$60 Million $100 ▪ Key Assumptions: ▪ 206 and 218 gross wells converted to PDP in Fiscal 2023 and 2024 respectively ▪ Leverage remains constant at ~1.00x Debt/ EBITDA ▪ $35 - $40 million of additional mineral acquisitions through 2024 with similar profiles to transactions completed over last 24 months (by reserve value: 1/3 PDP, 1/3 WIP, and 1/3 Probable) PHX MINERALS 21
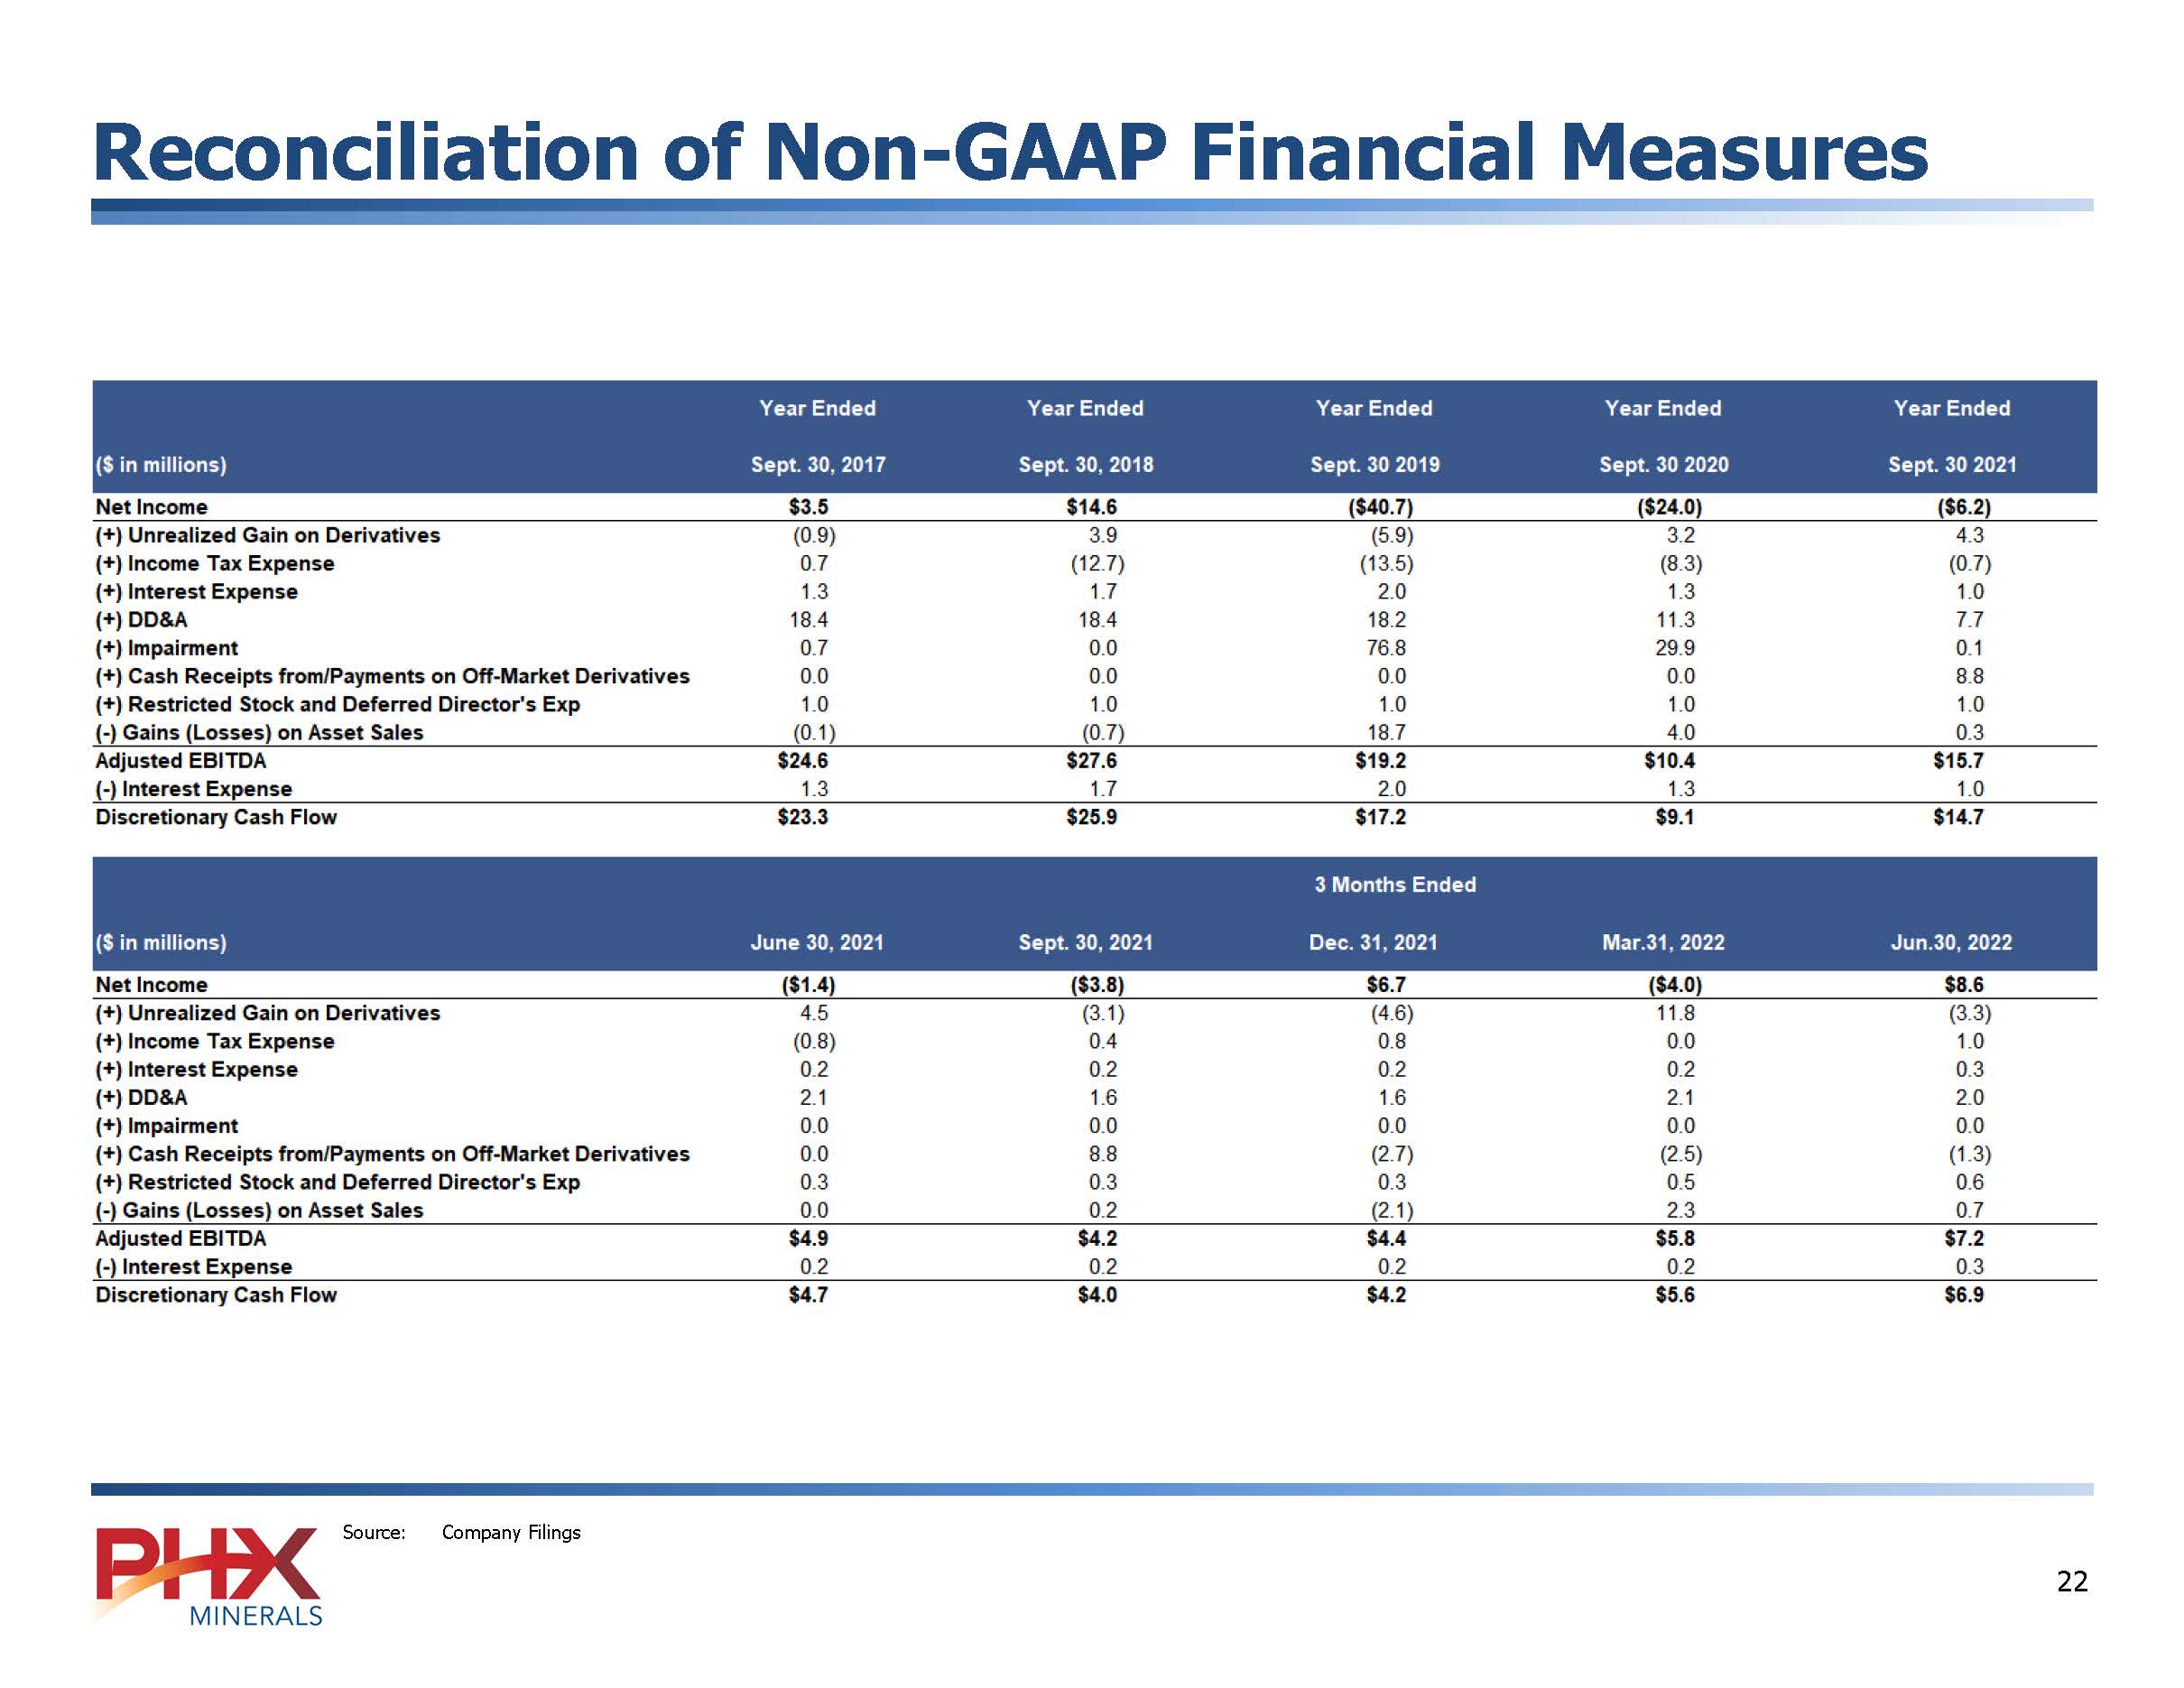
Reconciliation of Non-GAAP Financial Measures PHX Minerals Source: Company Filings 22 Reconciliation of Non-GAAP Financial Measures Year Ended Year Ended Year Ended Year Ended Year Ended ($ in millions) Sept. 30, 2017 Sept 30, 2018Sept. 30 2019 Sept. 30 2020Sept. 30 2021 Net Income $3.5 $14.6 ($40.7) ($24.0) (6.2) (+) Unrealized Gain on Derivatives(0.9) 3.9 (5.9) 3.2 4.3 (+) Income Tax Expense 0.7 (12.7) (13.5) (8.3) (0.7) (+) Interest Expense 1.3 1.7 2.0 1.3 1.0 (+) DD&A 18.4 18.4 18.2 11.3 7.7 (+) Impairment 0.7 0.0 76.8 29.9 0.1 (+) Cash Receipts from/Payments on Off Market Derivatives 0.0 0.0 0.0 0.0 8.8 (+) Restricted Stock and Deferred Director’s Exp 1.0 1.0 1.0 1.0 1.0 (-) Gains (Losses) on Asset sales (0.1) (0.7) 18.7 4.0 0.3 Adjusted EBITDA $24.6 $27.6 $19.2 $10.4 $15.7 (-) Interest Expense 1.3 1.7 2.0 1.3 1.0 Discretionary Cash Flow $23.3 $25.9 $17.2 $9.1 $14.7 3 Months Ended ($ in millions) June 30, 2021 Sept. 30, 2021Dec. 31, 2021 Mar.31, 2022 Jun.30, 2022 Net Income ($1.4) ($3.8) $6.7 ($4.0) $8.6 (+) Unrealized Gain on Derivatives 4.5 (3.1) (4.6) 11.8 (3.3) (+) Income Tax Expense (0.8) 0.4 0.8 0.0 1.0 (+) Interest Expense 0.2 0.2 0.2 0.2 0.3 (+) DD&A 2.1 1.6 1.6 2.1 2.0 (+) Impairment 0.0 0.0 0.0 0.0 0.0 (+) Cash Receipts from/Payments on Off-Market Derivatives0.0 8.8 (2.7) (2.5) (1.3) (+) Restricted Stock and Deferred Director’s Exp 0.3 0.3 0.3 0.5 0.6 (-) Gains (Losses) on Asset Sales 0.0 0.2 (2.1) 2.3 0.7 Adjusted EBITDA $4.9 $4.2 $4.4 $5.8 $7.2 (-) Interest Expense 0.2 0.2 0.2 0.2 0.3 Discretionary Cash Flow $4.7 $4.0 $4.2 $5.6 $6.9 PHX Source: Company Filings MONERALS 22
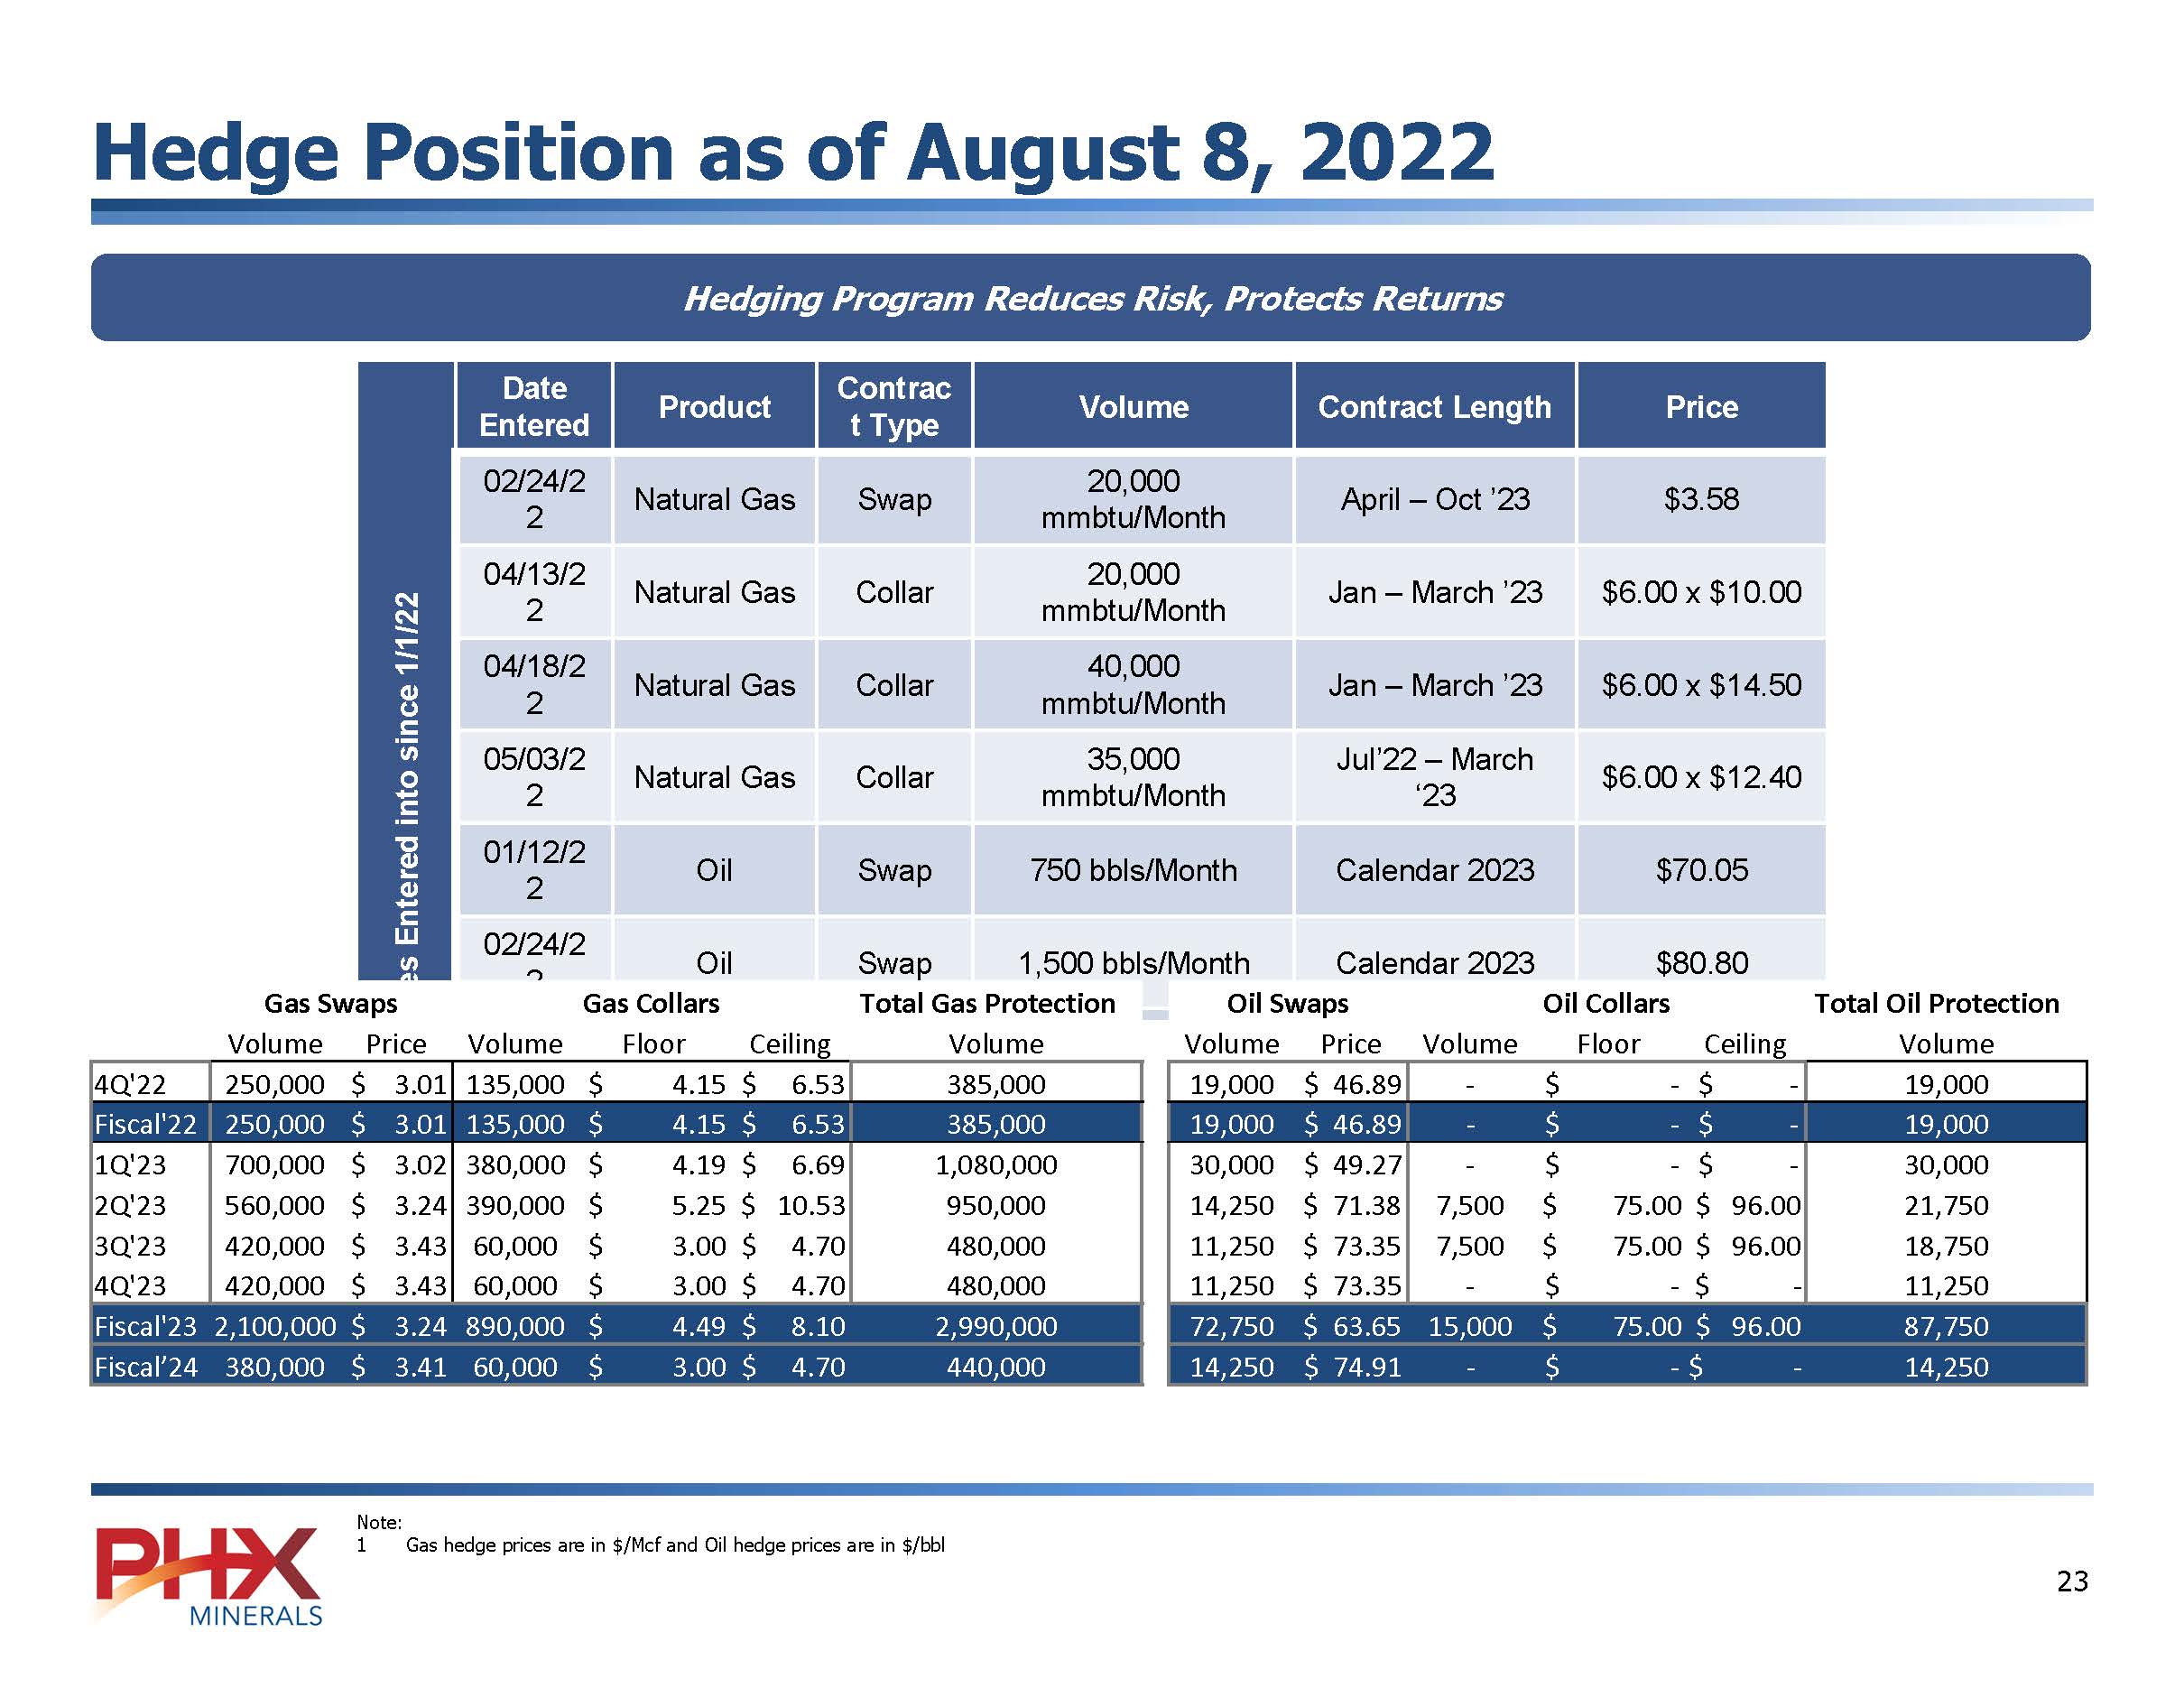
Hedge Position as of August 8, 2022 Hedging Program Reduces Risk, Protects Returns Trades Entered into since 1/1/22 Date Entered Product Contract Type Volume Contract Length Price 02/24/22 Natural Gas Swap 20,000 mmbtu/Month April – Oct ’23$3.58 04/13/22 Natural Gas Collar 20,000 mmbtu/Month Jan – March ’23$6.00 x $10.0004/18/22 Natural Gas Collar 40,000 mmbtu/Month Jan – March ’23$6.00 x $14.5005/03/22 Natural Gas Collar 35,000 mmbtu/Month Jul’22 – March ‘23$6.00 x $12.4001/12/22 OilSwap 750 bbls/Month Calendar 2023$70.05 02/24/22 OilSwap 1,500 bbls/Month Calendar 2023$80.80 03/07/22 OilSwap 1,000 bbls/Month Sep – Dec ‘22$94.49 05/03/22 OilCollar 2,500 bbls/Month Jan – June ‘23$75.00 x $96.00 08/04/22 OilSwap 1,000 bbls/Month Apr – Dec ’23$80.74 Gas Swaps Gas Collars Total Gas Protection Oil SwapsOil Collars Total Oil Protection Volume Price Volume Floor Ceiling Volume Volume Price Volume Floor Ceiling Volume 4Q'22 250,000 $ 3.01 135,000 $ 4.15 $ 6.53 385,000 19,000 $ 46.89 - $ - $ - 19,000 Fiscal'22 250,000 $ 3.01 135,000 $ 4.15 $ 6.53 385,000 19,000 $ 46.89 - $ - $ - 19,000 1Q'23 700,000 $ 3.02 380,000 $ 4.19 $ 6.69 1,080,000 30,000 $ 49.27 - $ - $ - 30,000 2Q'23 560,000 $ 3.24 390,000 $ 5.25 $ 10.53 950,000 14,250 $ 71.38 7,500 $ 75.00 $ 96.00 21,750 3Q'23 420,000 $ 3.43 60,000 $ 3.00 $ 4.70 480,000 11,250 $ 73.35 7,500 $ 75.00 $ 96.00 18,750 4Q'23 420,000 $ 3.43 60,000 $ 3.00 $ 4.70 480,000 11,250 $ 73.35 - $ - $ - 11,25 Fiscal'23 2,100,000 $ 3.24 890,000 $ 4.49 $ 8.10 2,990,000 72,750 $ 63.65 15,000 $ 75.00 $ 96.00 87,750 Fiscal’24 380,000 $ 3.41 60,000 $ 3.00 $ 4.70 440,000 14,250 $ 74.91 - $ - $ -14,250 PHX MINERALS Note: 1 Gas hedge prices are in $/Mcf and Oil hedge prices are in $/bbl 23
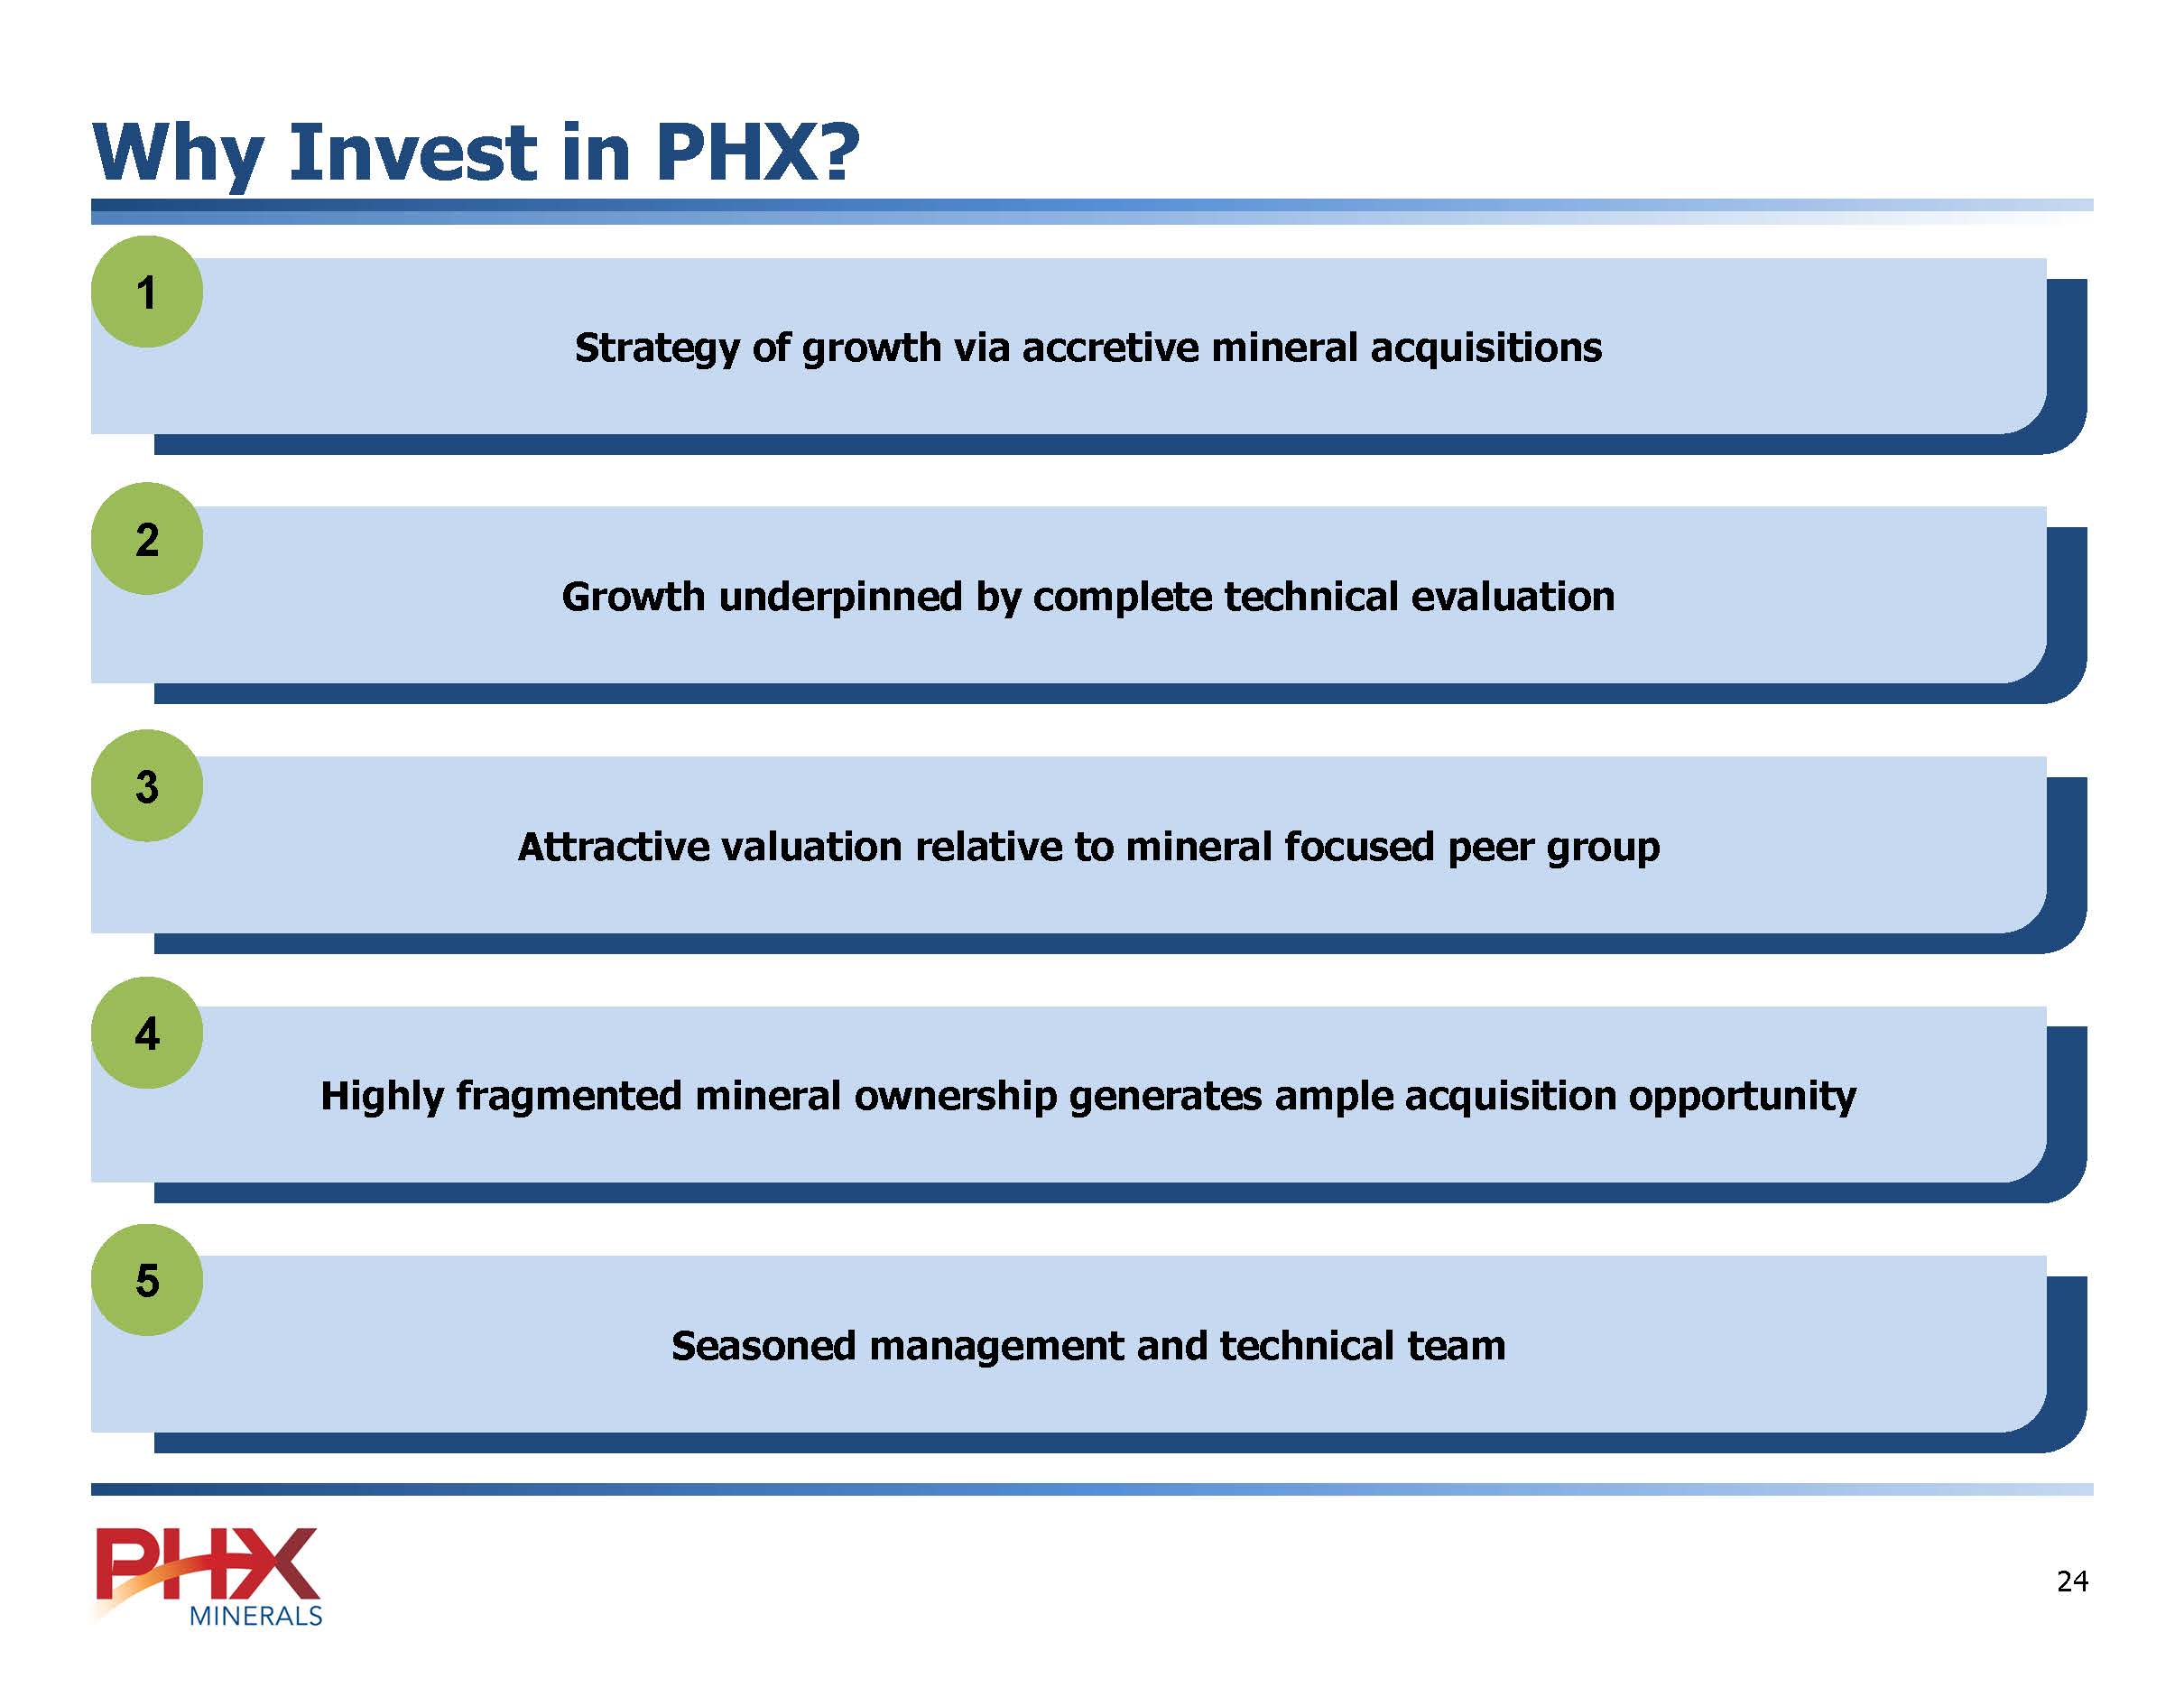
Why Invest in PHX? 1 Strategy of growth via accretive mineral acquisitions 2Growth underpinned by complete technical evaluation 3 Attractive valuation relative to mineral focused peer group 4 Highly fragmented mineral ownership generates ample acquisition opportunity 5 Seasoned management and technical team PHX MINERLS 24
PHX MINERLS Appendix 25
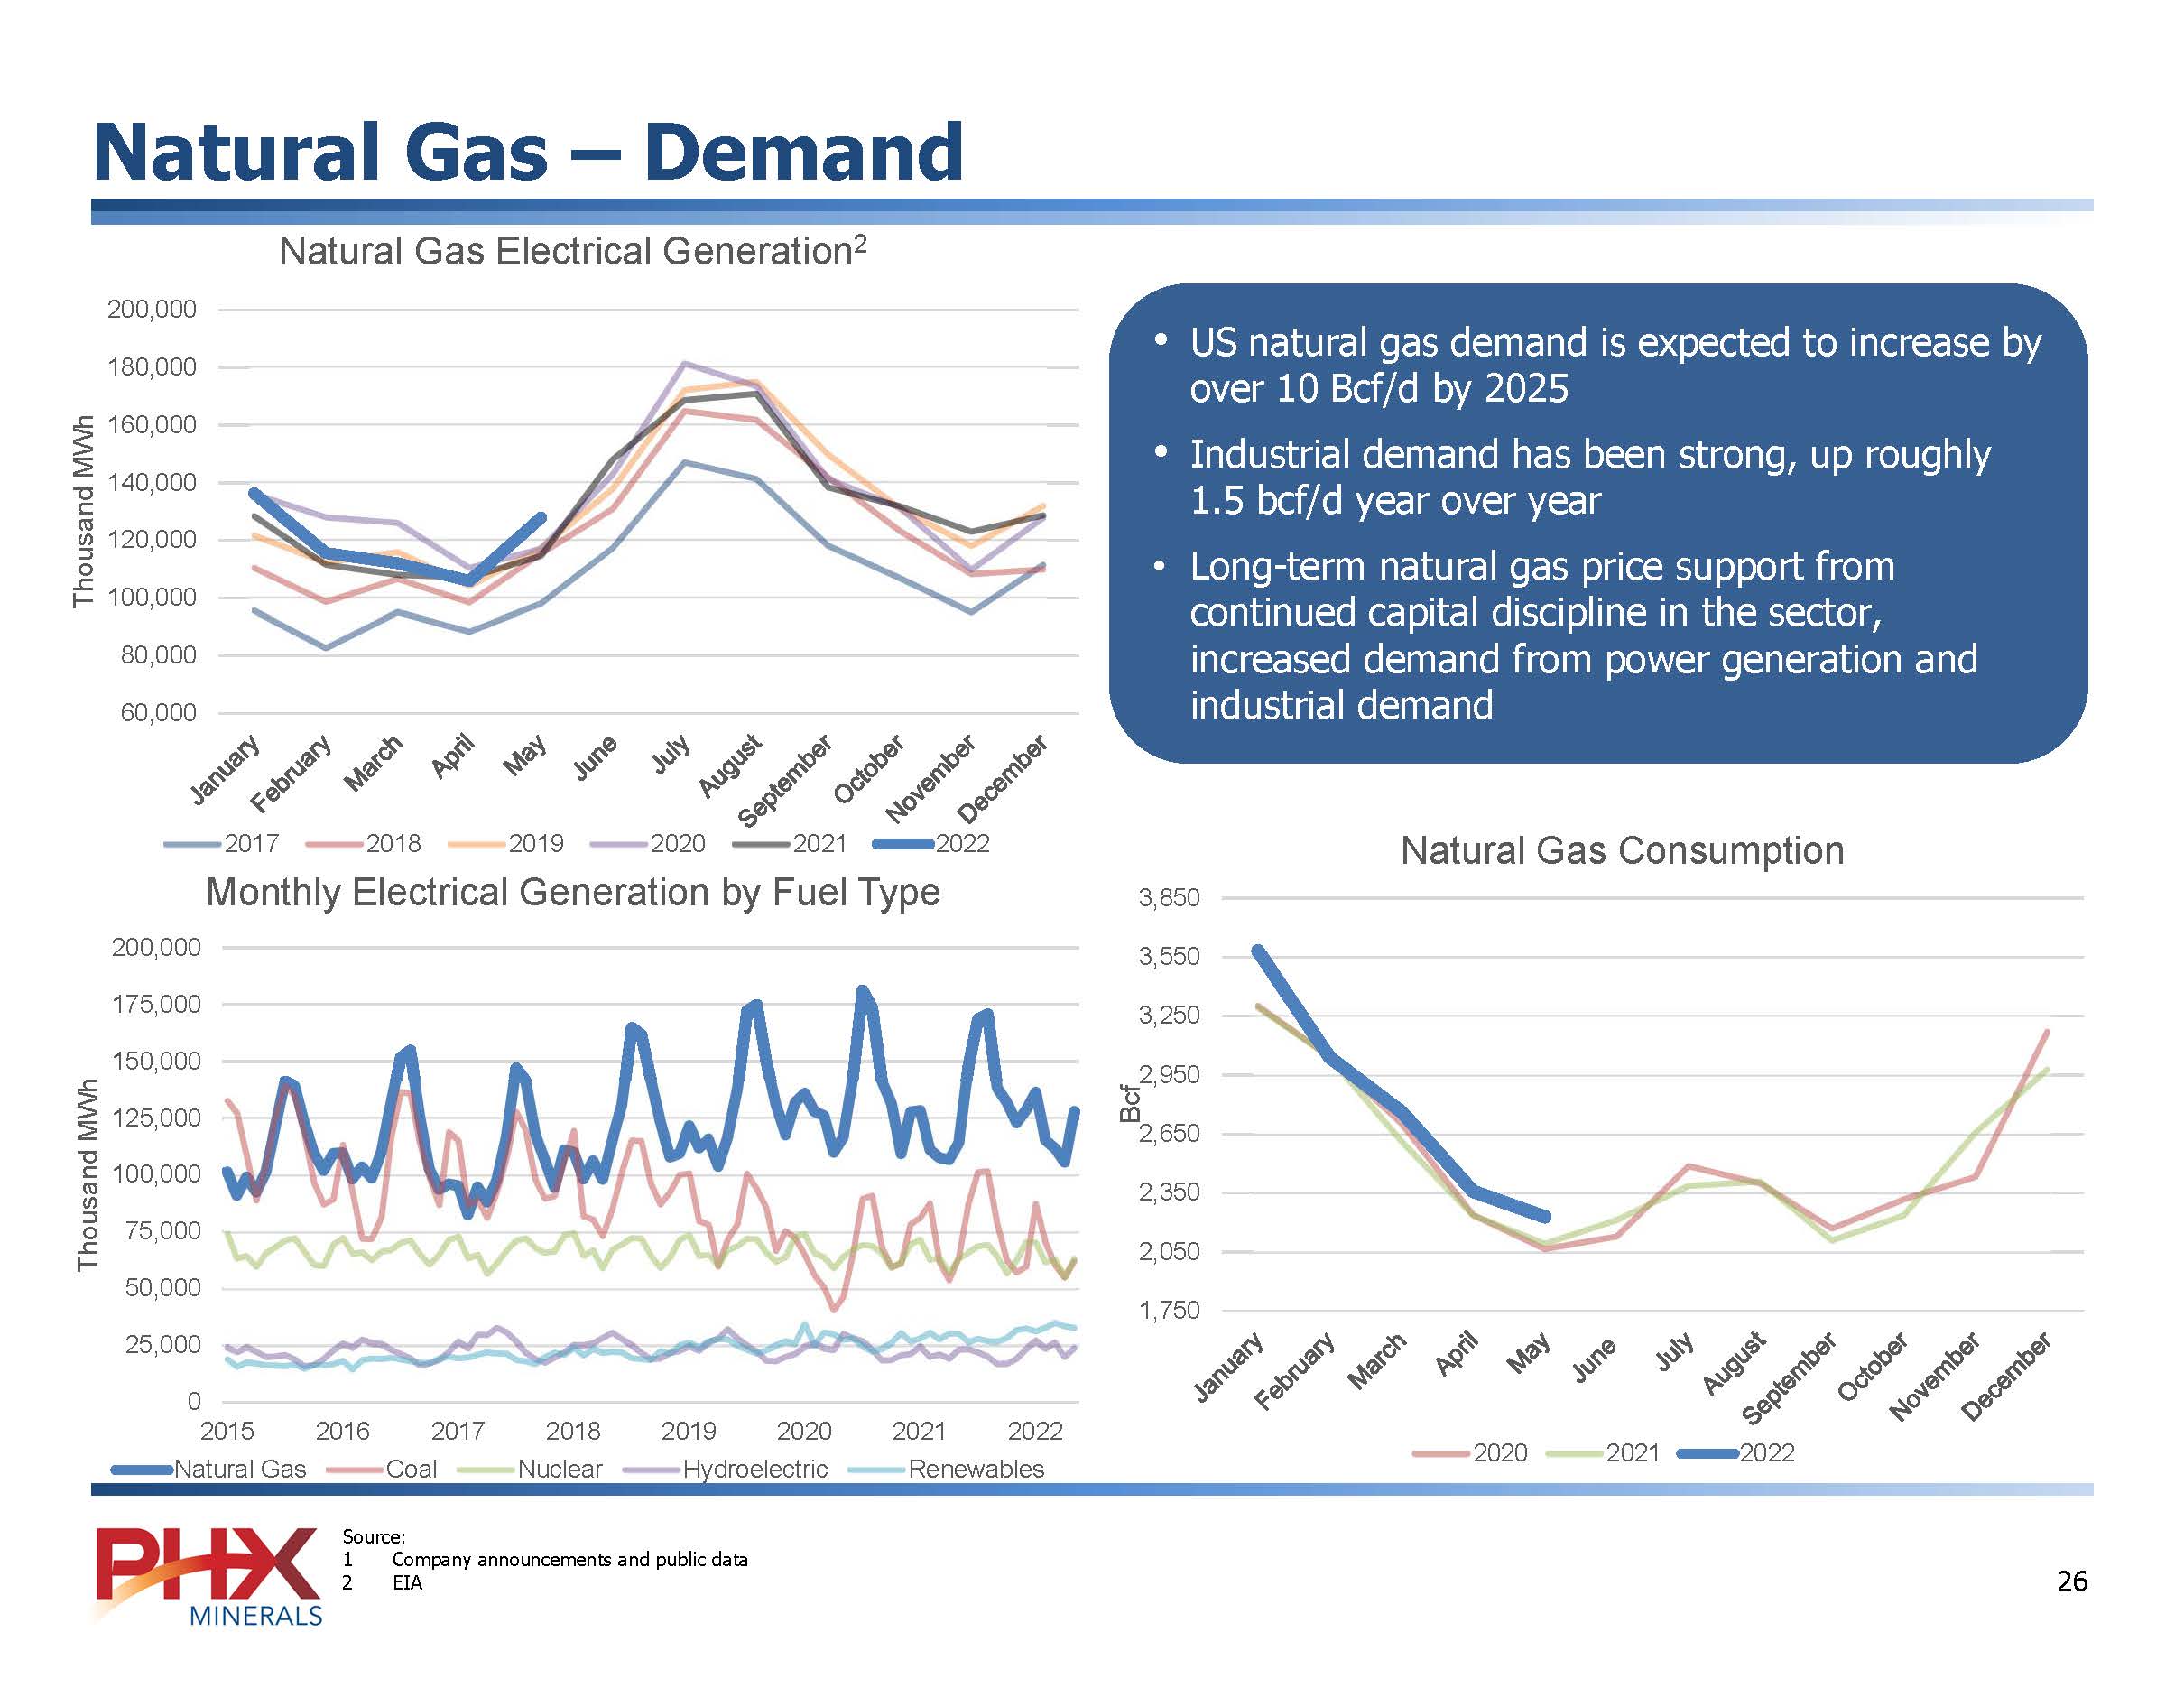
Natural Gas – Demand Natural Gas Electrical Generation2 (BAR Chart ) • US natural gas demand is expected to increase by over 10 Bcf/d by 2025 • Industrial demand has been strong, up roughly 1.5 bcf/d year over year • Long-term natural gas price support from continued capital discipline in the sector, increased demand from power generation and industrial demand PHX MINERALS Source: 1 Company announcements and public data 2 EIA 26
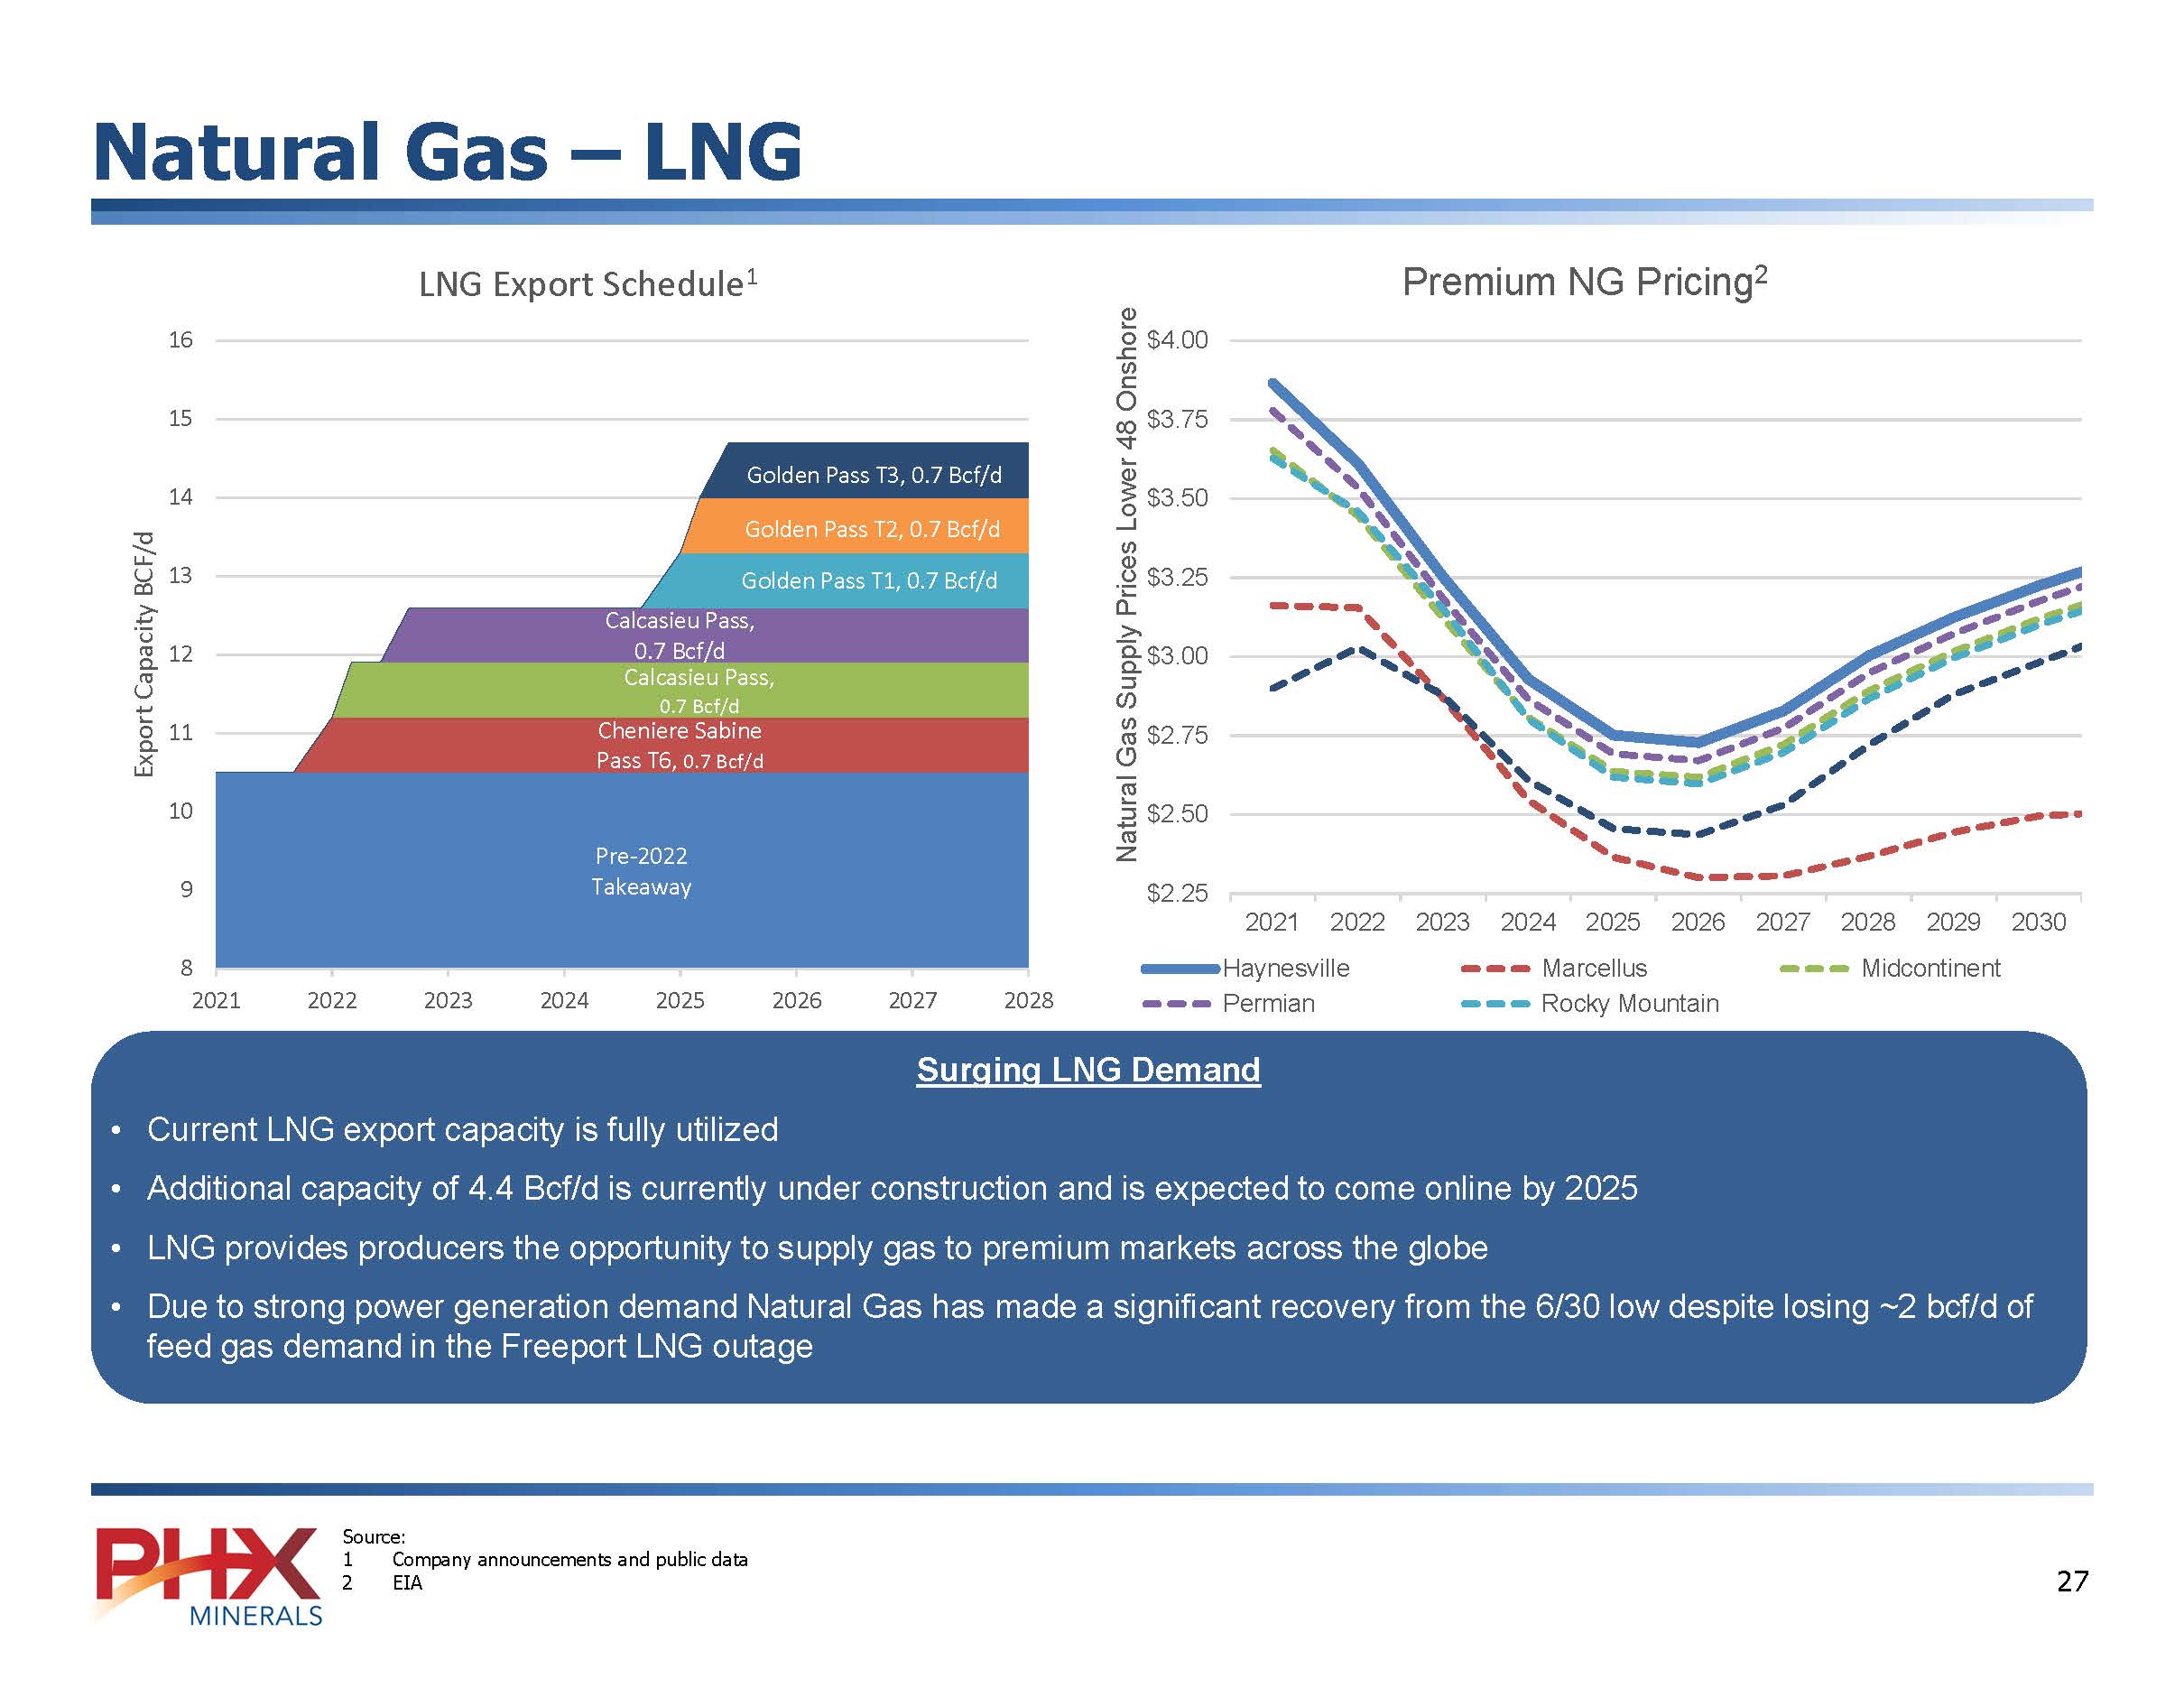
Natural Gas – LNG LNG Export Schedule1 Export Capacity BCF/d Natural Gas Supply Prices Lower 48 Onshore Premium NG Pricing2 (BAR chart) Surging LNG Demand • Current LNG export capacity is fully utilized • Additional capacity of 4.4 Bcf/d is currently under construction and is expected to come online by 2025 • LNG provides producers the opportunity to supply gas to premium markets across the globe • Due to strong power generation demand Natural Gas has made a significant recovery from the 6/30 low despite losing ~2 bcf/d of feed gas demand in the Freeport LNG outage PHX MINERALS Source: 1 Company announcements and public data 2 EIA 27
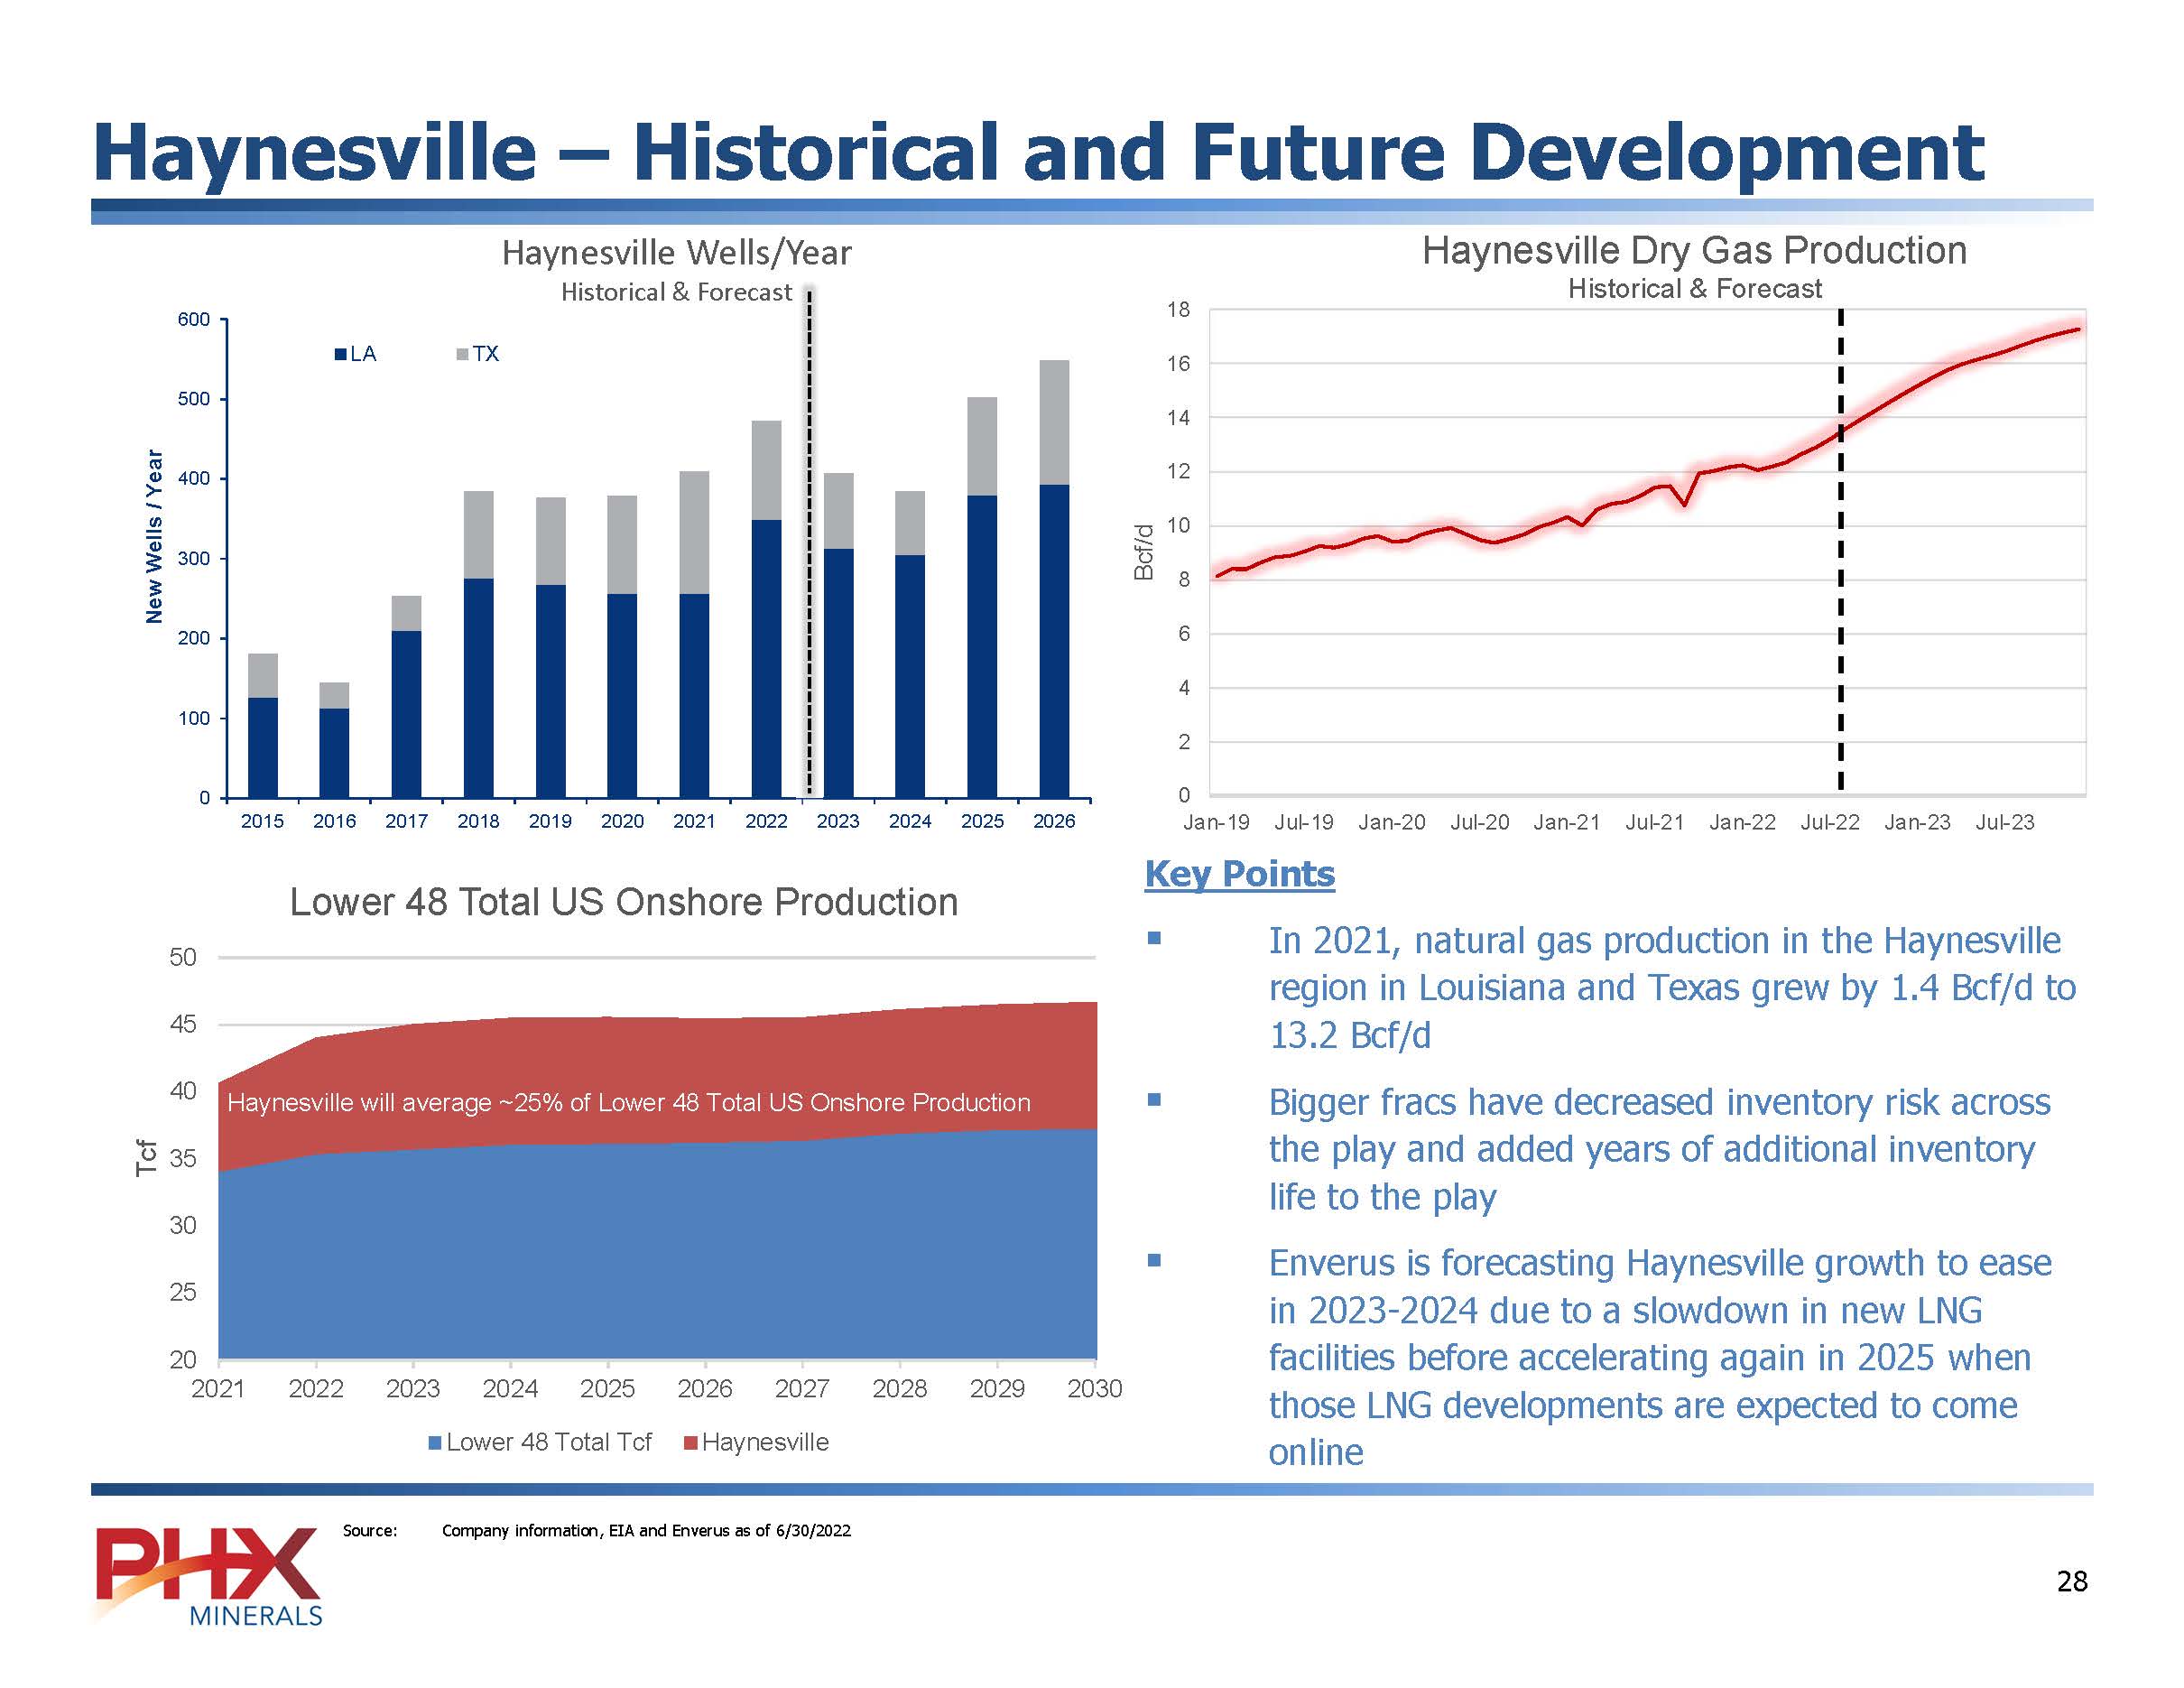
Haynesville – Historical and Future Development Lower 48 Total US Onshore Production Haynesville Dry Gas Production Haynesville Wells/Year Historical & Forecast Historical & Forecast (BAR CHART) Key Points ▪ In 2021, natural gas production in the Haynesville region in Louisiana and Texas grew by 1.4 Bcf/d to 13.2 Bcf/d ▪ Bigger fracs have decreased inventory risk across the play and added years of additional inventory life to the play ▪ Enverus is forecasting Haynesville growth to ease in 2023-2024 due to a slowdown in new LNG facilities before accelerating again in 2025 when those LNG developments are expected to come online PHX MINERALS Source: Company information, EIA and Enverus as of 6/30/2022 28
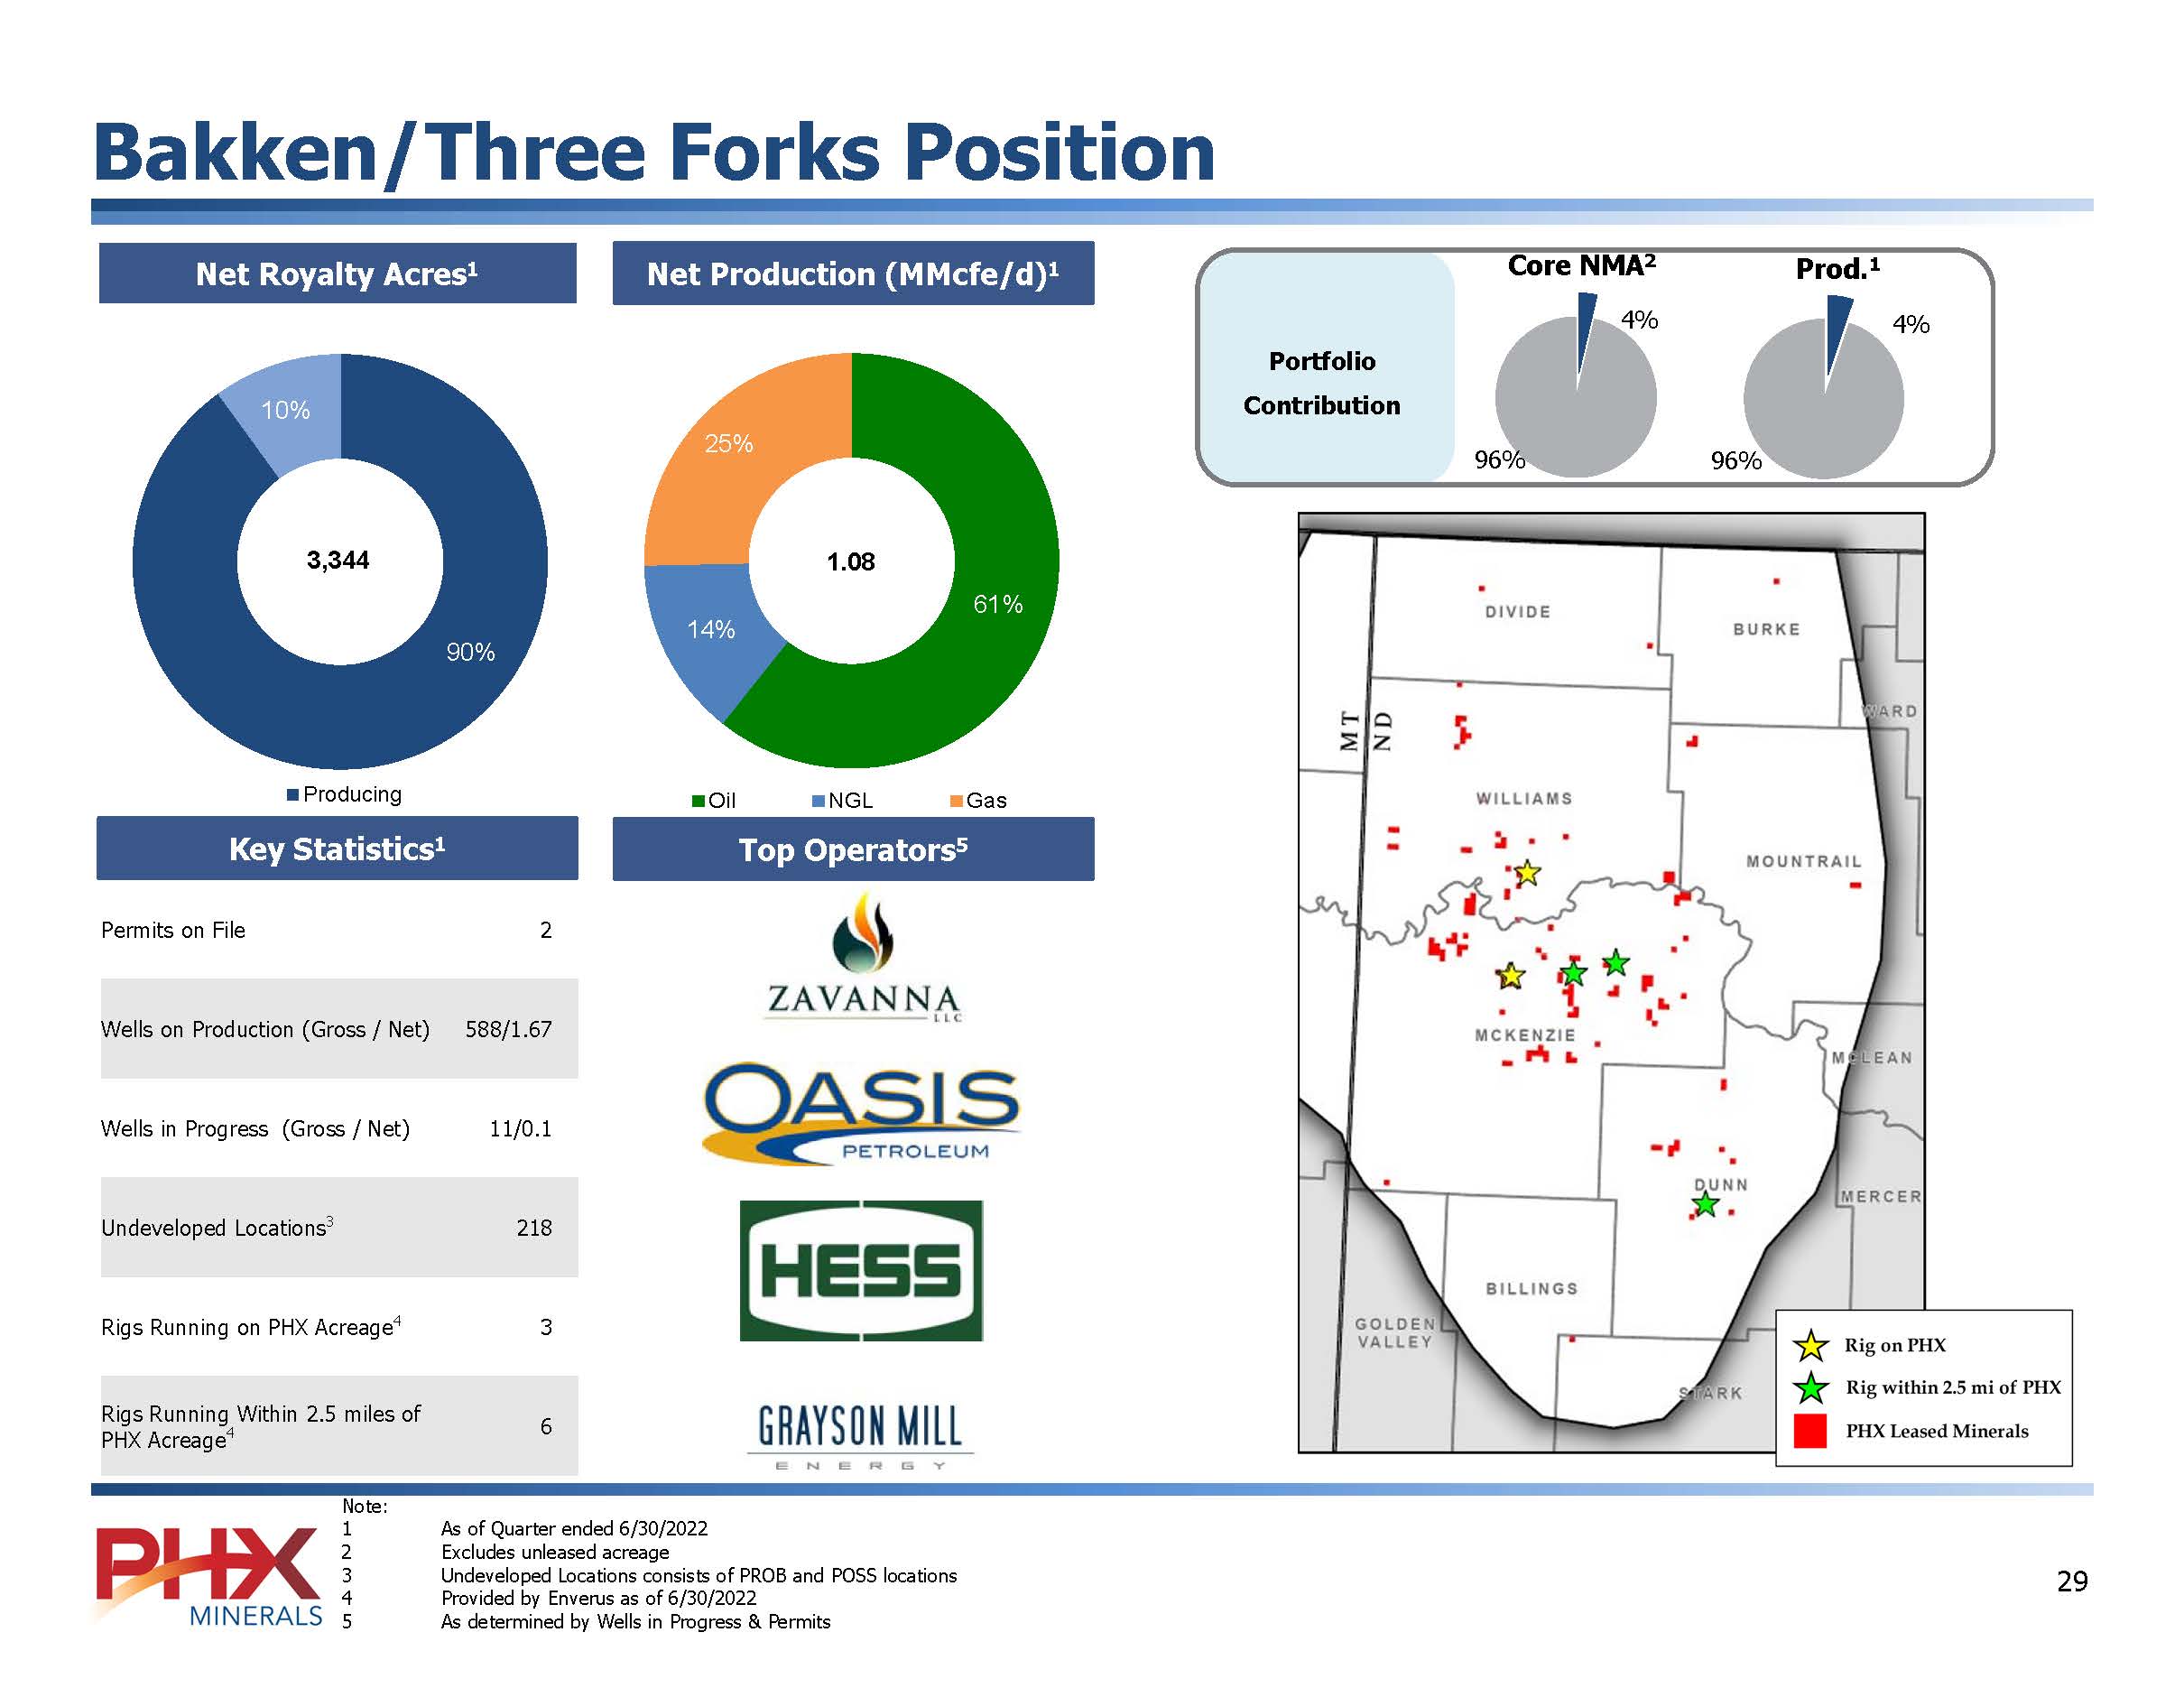
Bakken/Three Forks Position Net Royalty Acres1 Net Production (MMcfe/d)1 Core NMA2 Prod.1 Portfolio (BAR CHART) Contribution 4% 4% 96%96% Permits on File 2 Wells on Production (Gross / Net) 588/1.67 Wells in Progress (Gross / Net) 11/0.1 Undeveloped Locations3 218 Rigs Running on PHX Acreage4 3 Rigs Running Within 2.5 miles of PHX Acreage4 6 PHX MINERALS Note: 1 As of Quarter ended 6/30/2022 2 Excludes unleased acreage 3 Undeveloped Locations consists of PROB and POSS locations 4 Provided by Enverus as of 6/30/2022 5 As determined by Wells in Progress & Permits 29
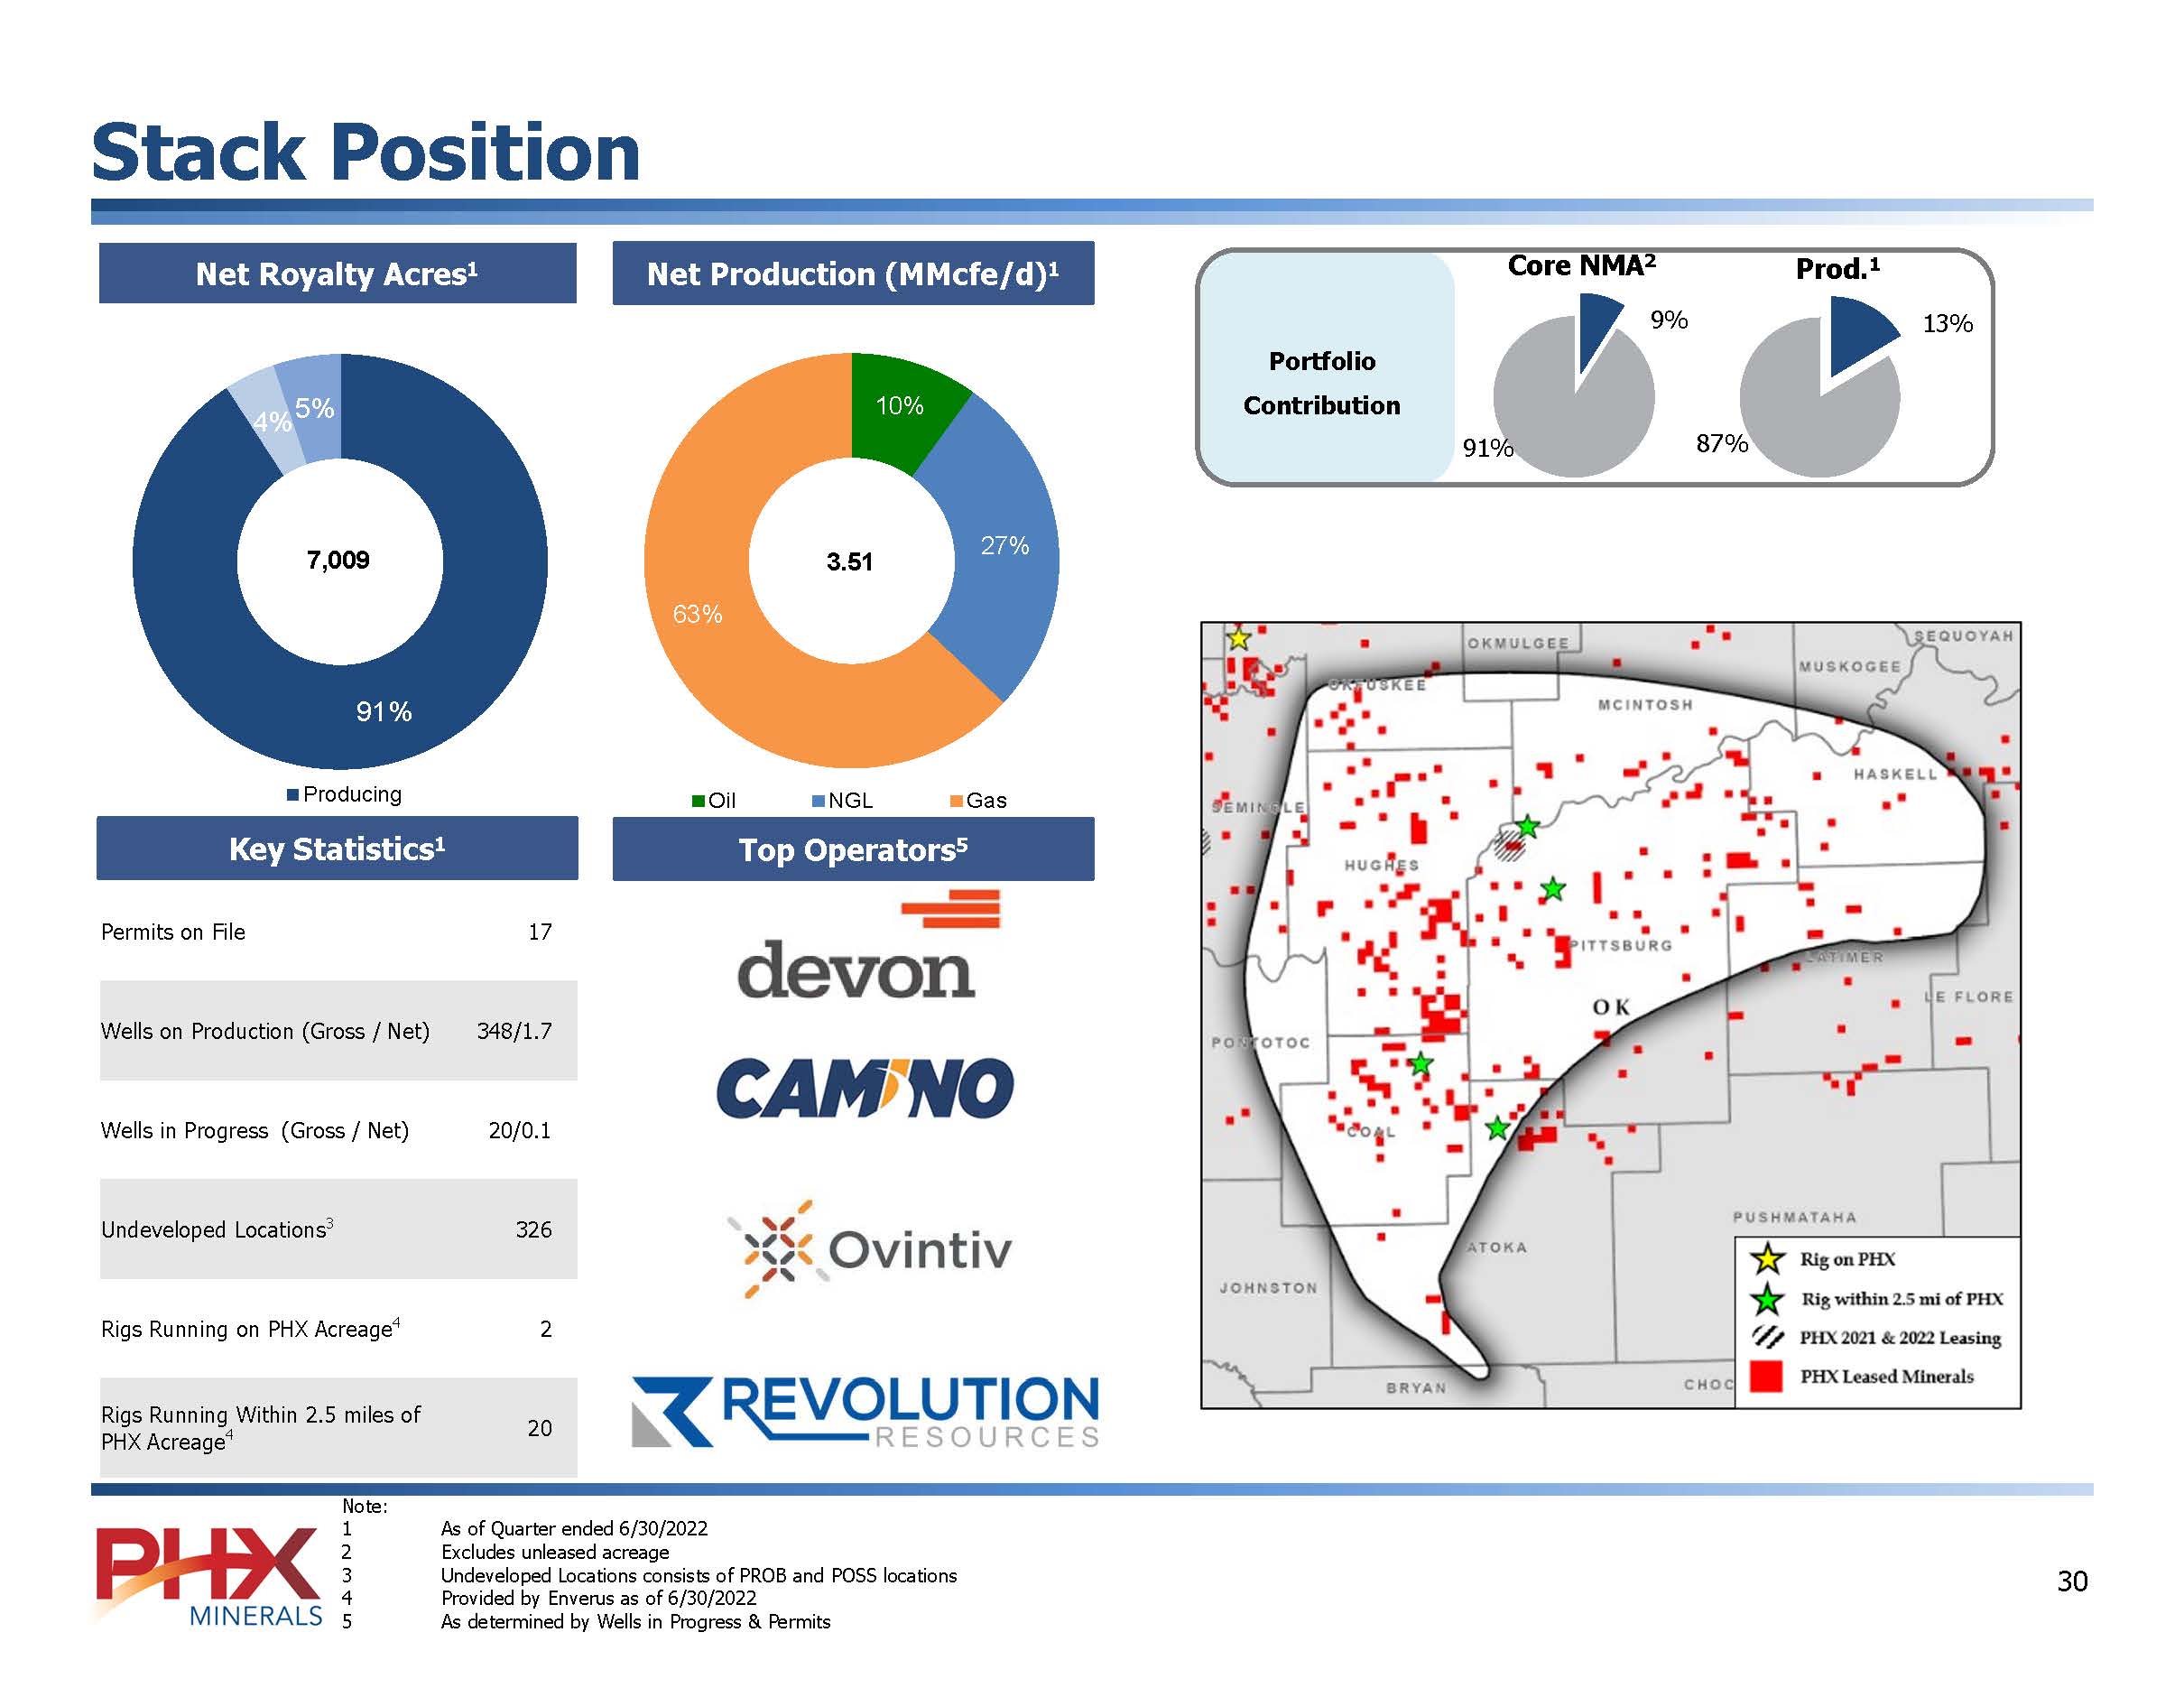
Stack Position Net Royalty Acres1 Net Production (MMcfe/d)1 Portfolio Contribution Core NMA2 Prod.1 Key Statistics1 Top Operators5 Permits on File 17 Wells on Production (Gross / Net) 348/1.7 Wells in Progress (Gross / Net) 20/0.1 Undeveloped Locations3 326 Rigs Running on PHX Acreage4 2 Rigs Running Within 2.5 miles of PHX Acreage4 20 Note: 1 As of Quarter ended 6/30/2022 2 Excludes unleased acreage 3 Undeveloped Locations consists of PROB and POSS locations 4 Provided by Enverus as of 6/30/2022 5 As determined by Wells in Progress & Permits [ BAR CHART] [ BAR CHART] Devon CAMINO Ovintiv REVOLUTION RESOURCES PHX MINERALS 30
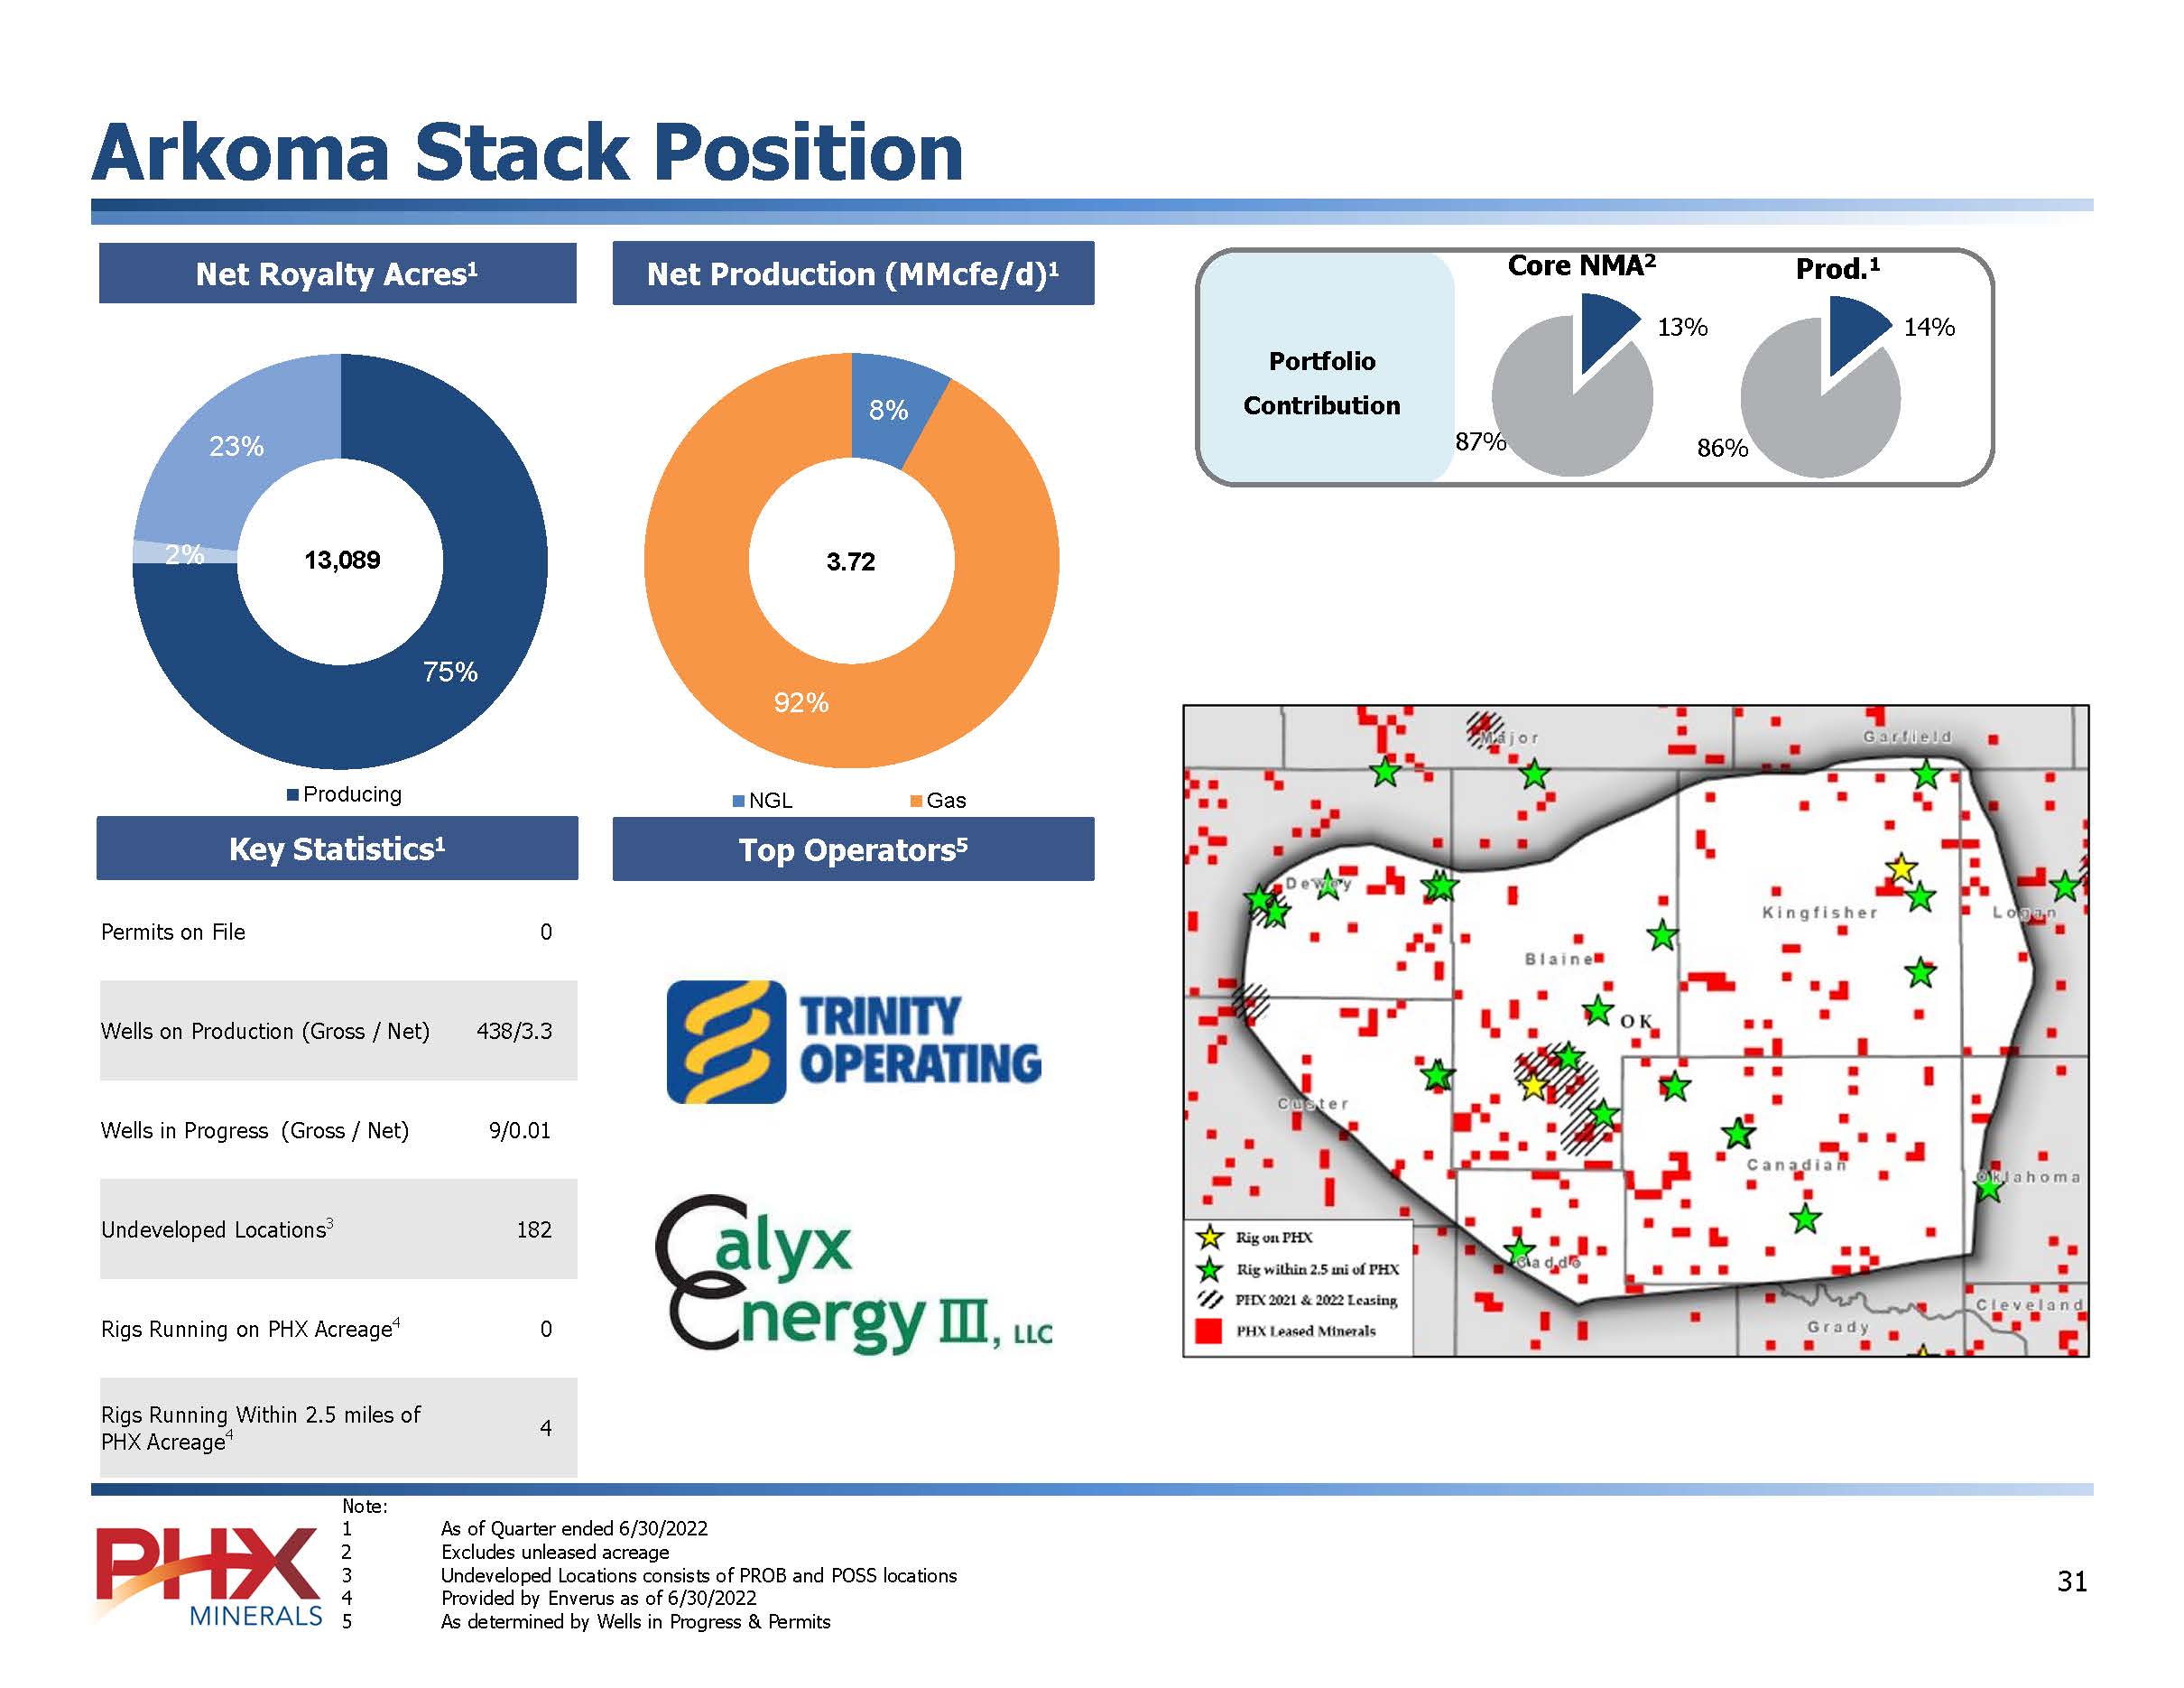
Arkoma Stack Position Net Royalty Acres1 Net Production (MMcfe/d)1 Portfolio Contribution Core NMA2 Prod.1 Key Statistics1 Top Operators5 Permits on File 0 Wells on Production (Gross / Net) 438/3.3 Wells in Progress (Gross / Net) 9/0.01 Undeveloped Locations3 182 Rigs Running on PHX Acreage4 0 Rigs Running Within 2.5 miles of PHX Acreage4 4 TRINITY OPERATING alyx nergy III, LLC Note: 1 As of Quarter ended 6/30/2022 2 Excludes unleased acreage 3 Undeveloped Locations consists of PROB and POSS locations 4 Provided by Enverus as of 6/30/2022 5 As determined by Wells in Progress & Permits [ BAR CHART] [ BAR CHART] PHX MINERALS 31
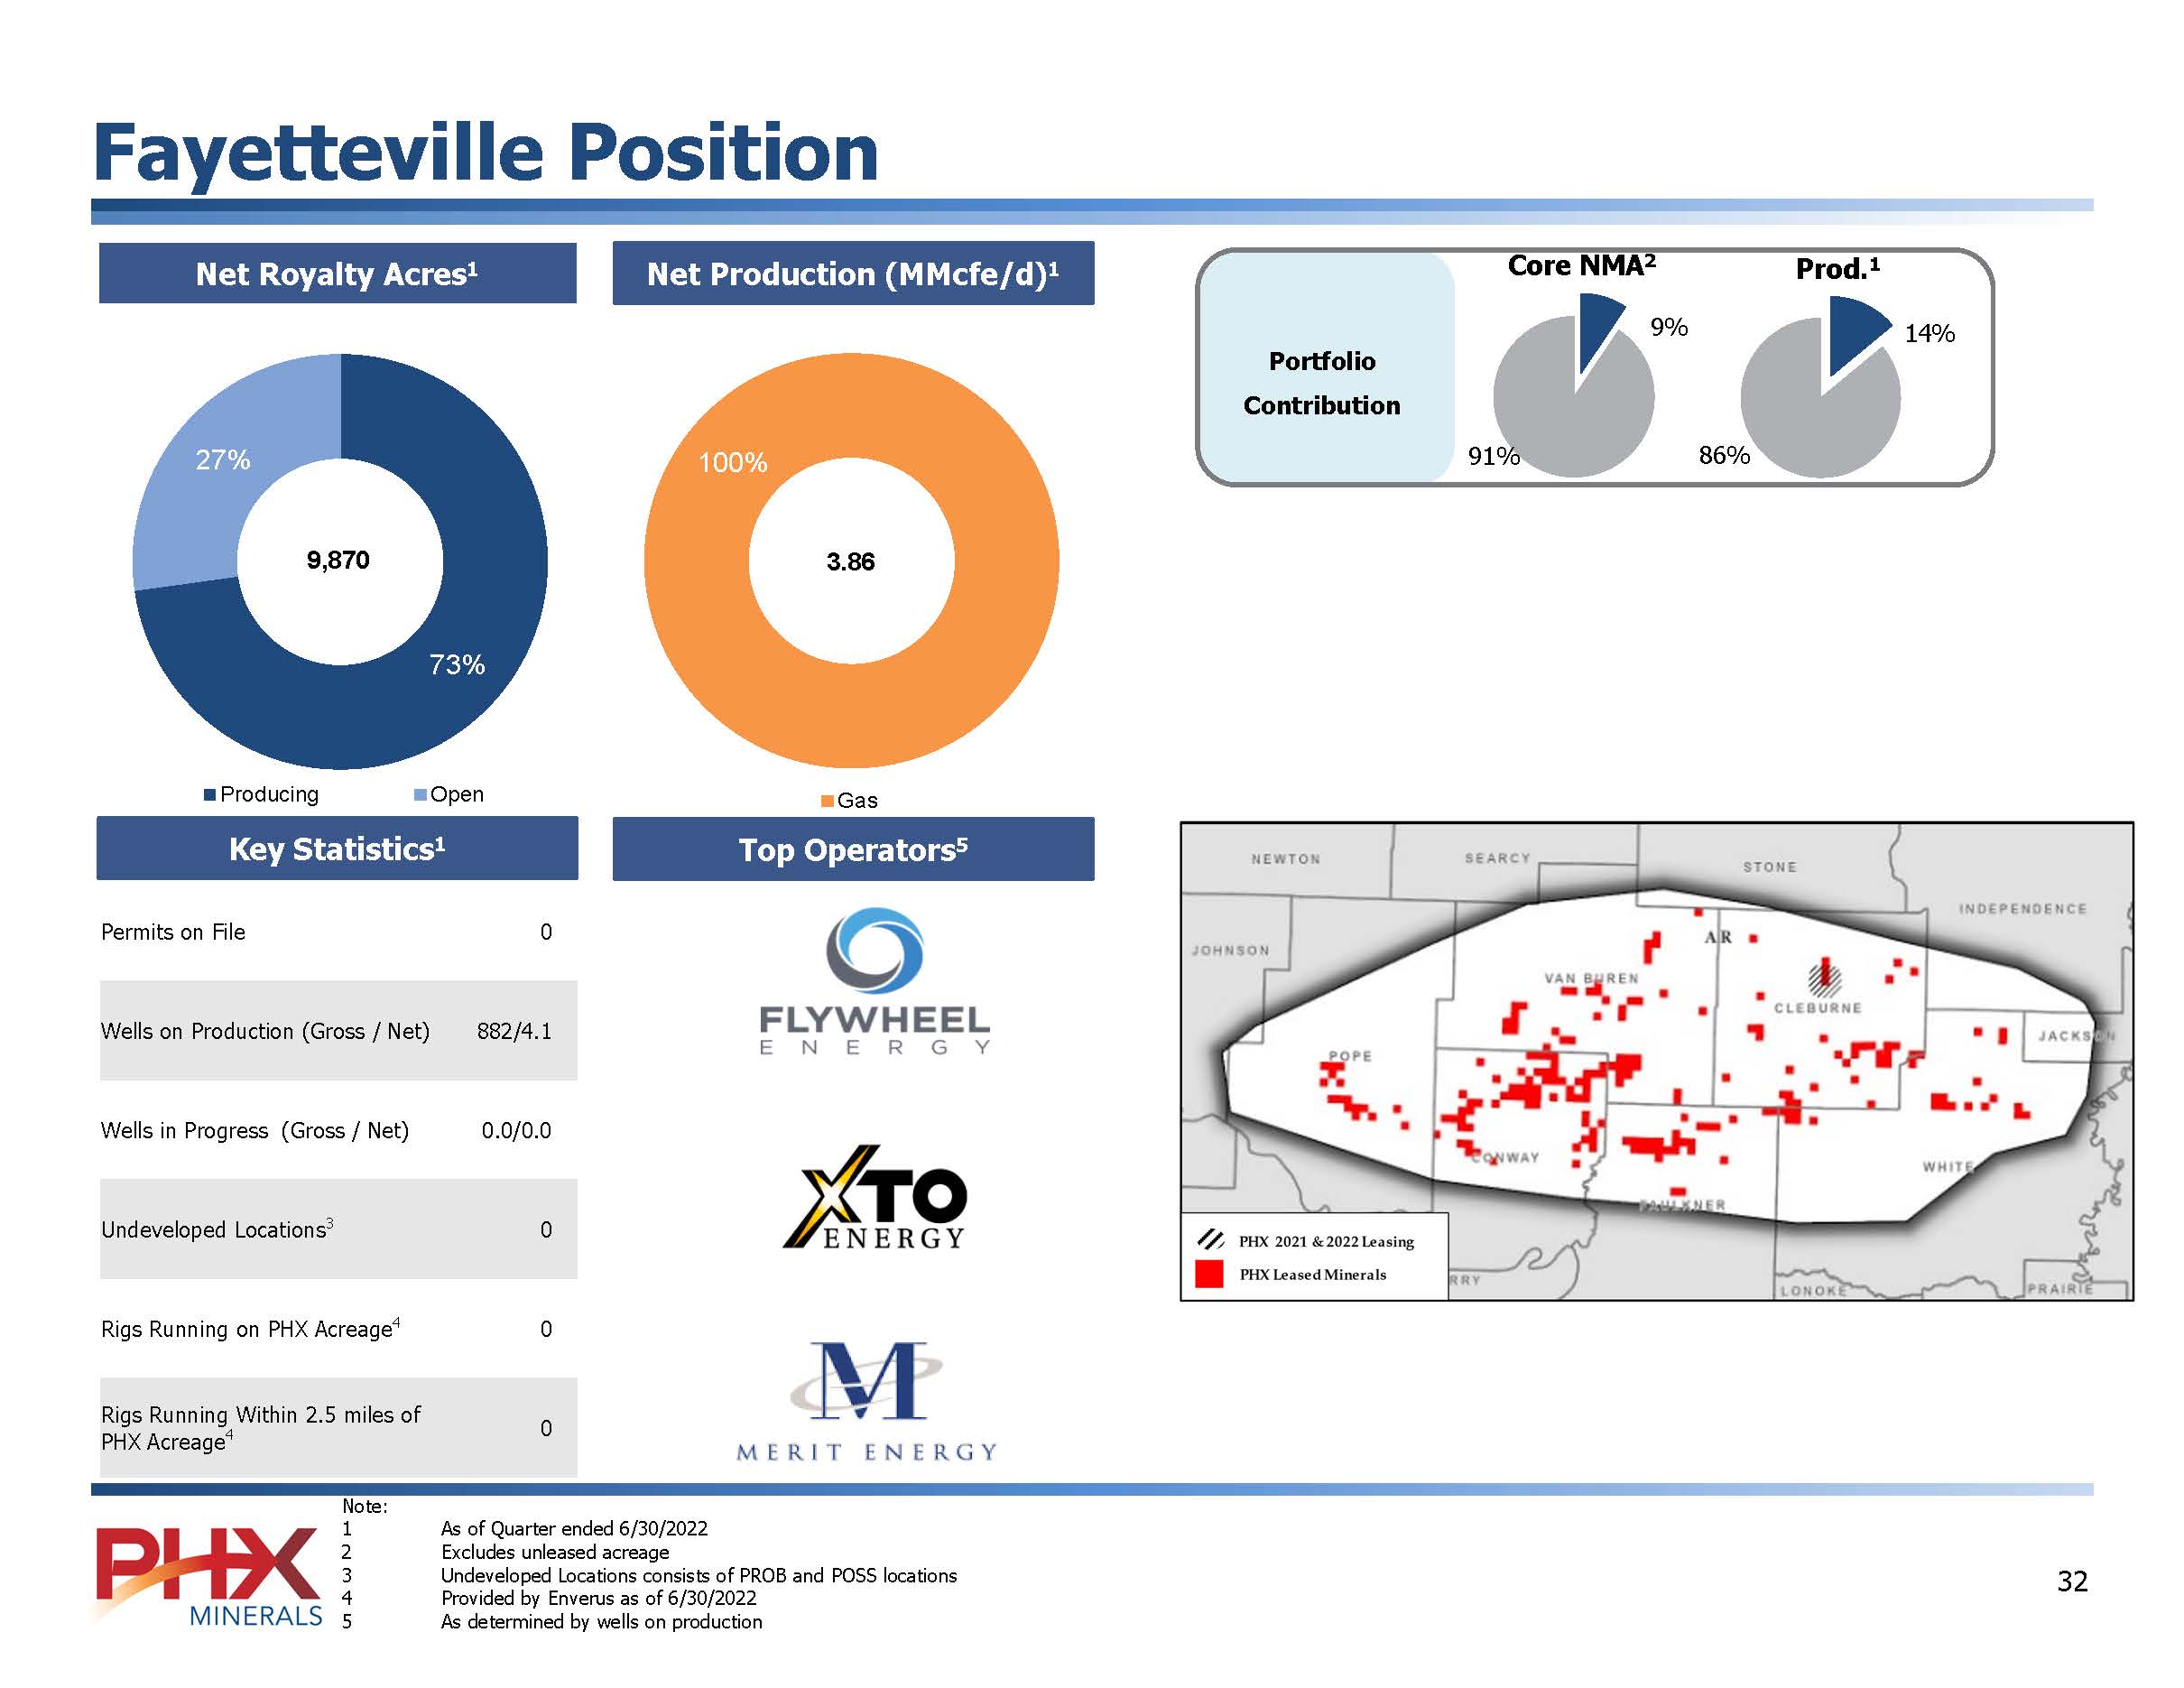
Fayetteville Position Net Royalty Acres1 Net Production (MMcfe/d)1 Key Statistics1 Top Operators5 Permits on File 0 Wells on Production (Gross / Net) 882/4.1 Wells in Progress (Gross / Net) 0.0/0.0 Undeveloped Locations3 0 Rigs Running on PHX Acreage4 0 Rigs Running Within 2.5 miles of PHX Acreage4 0 Portfolio Contribution Core NMA2 Prod.1 FLYWHEEL ENERGY XTO ENERGY M MERIT ENERGY [ BAR CHART] [ BAR CHART] PHX MINERALS 32
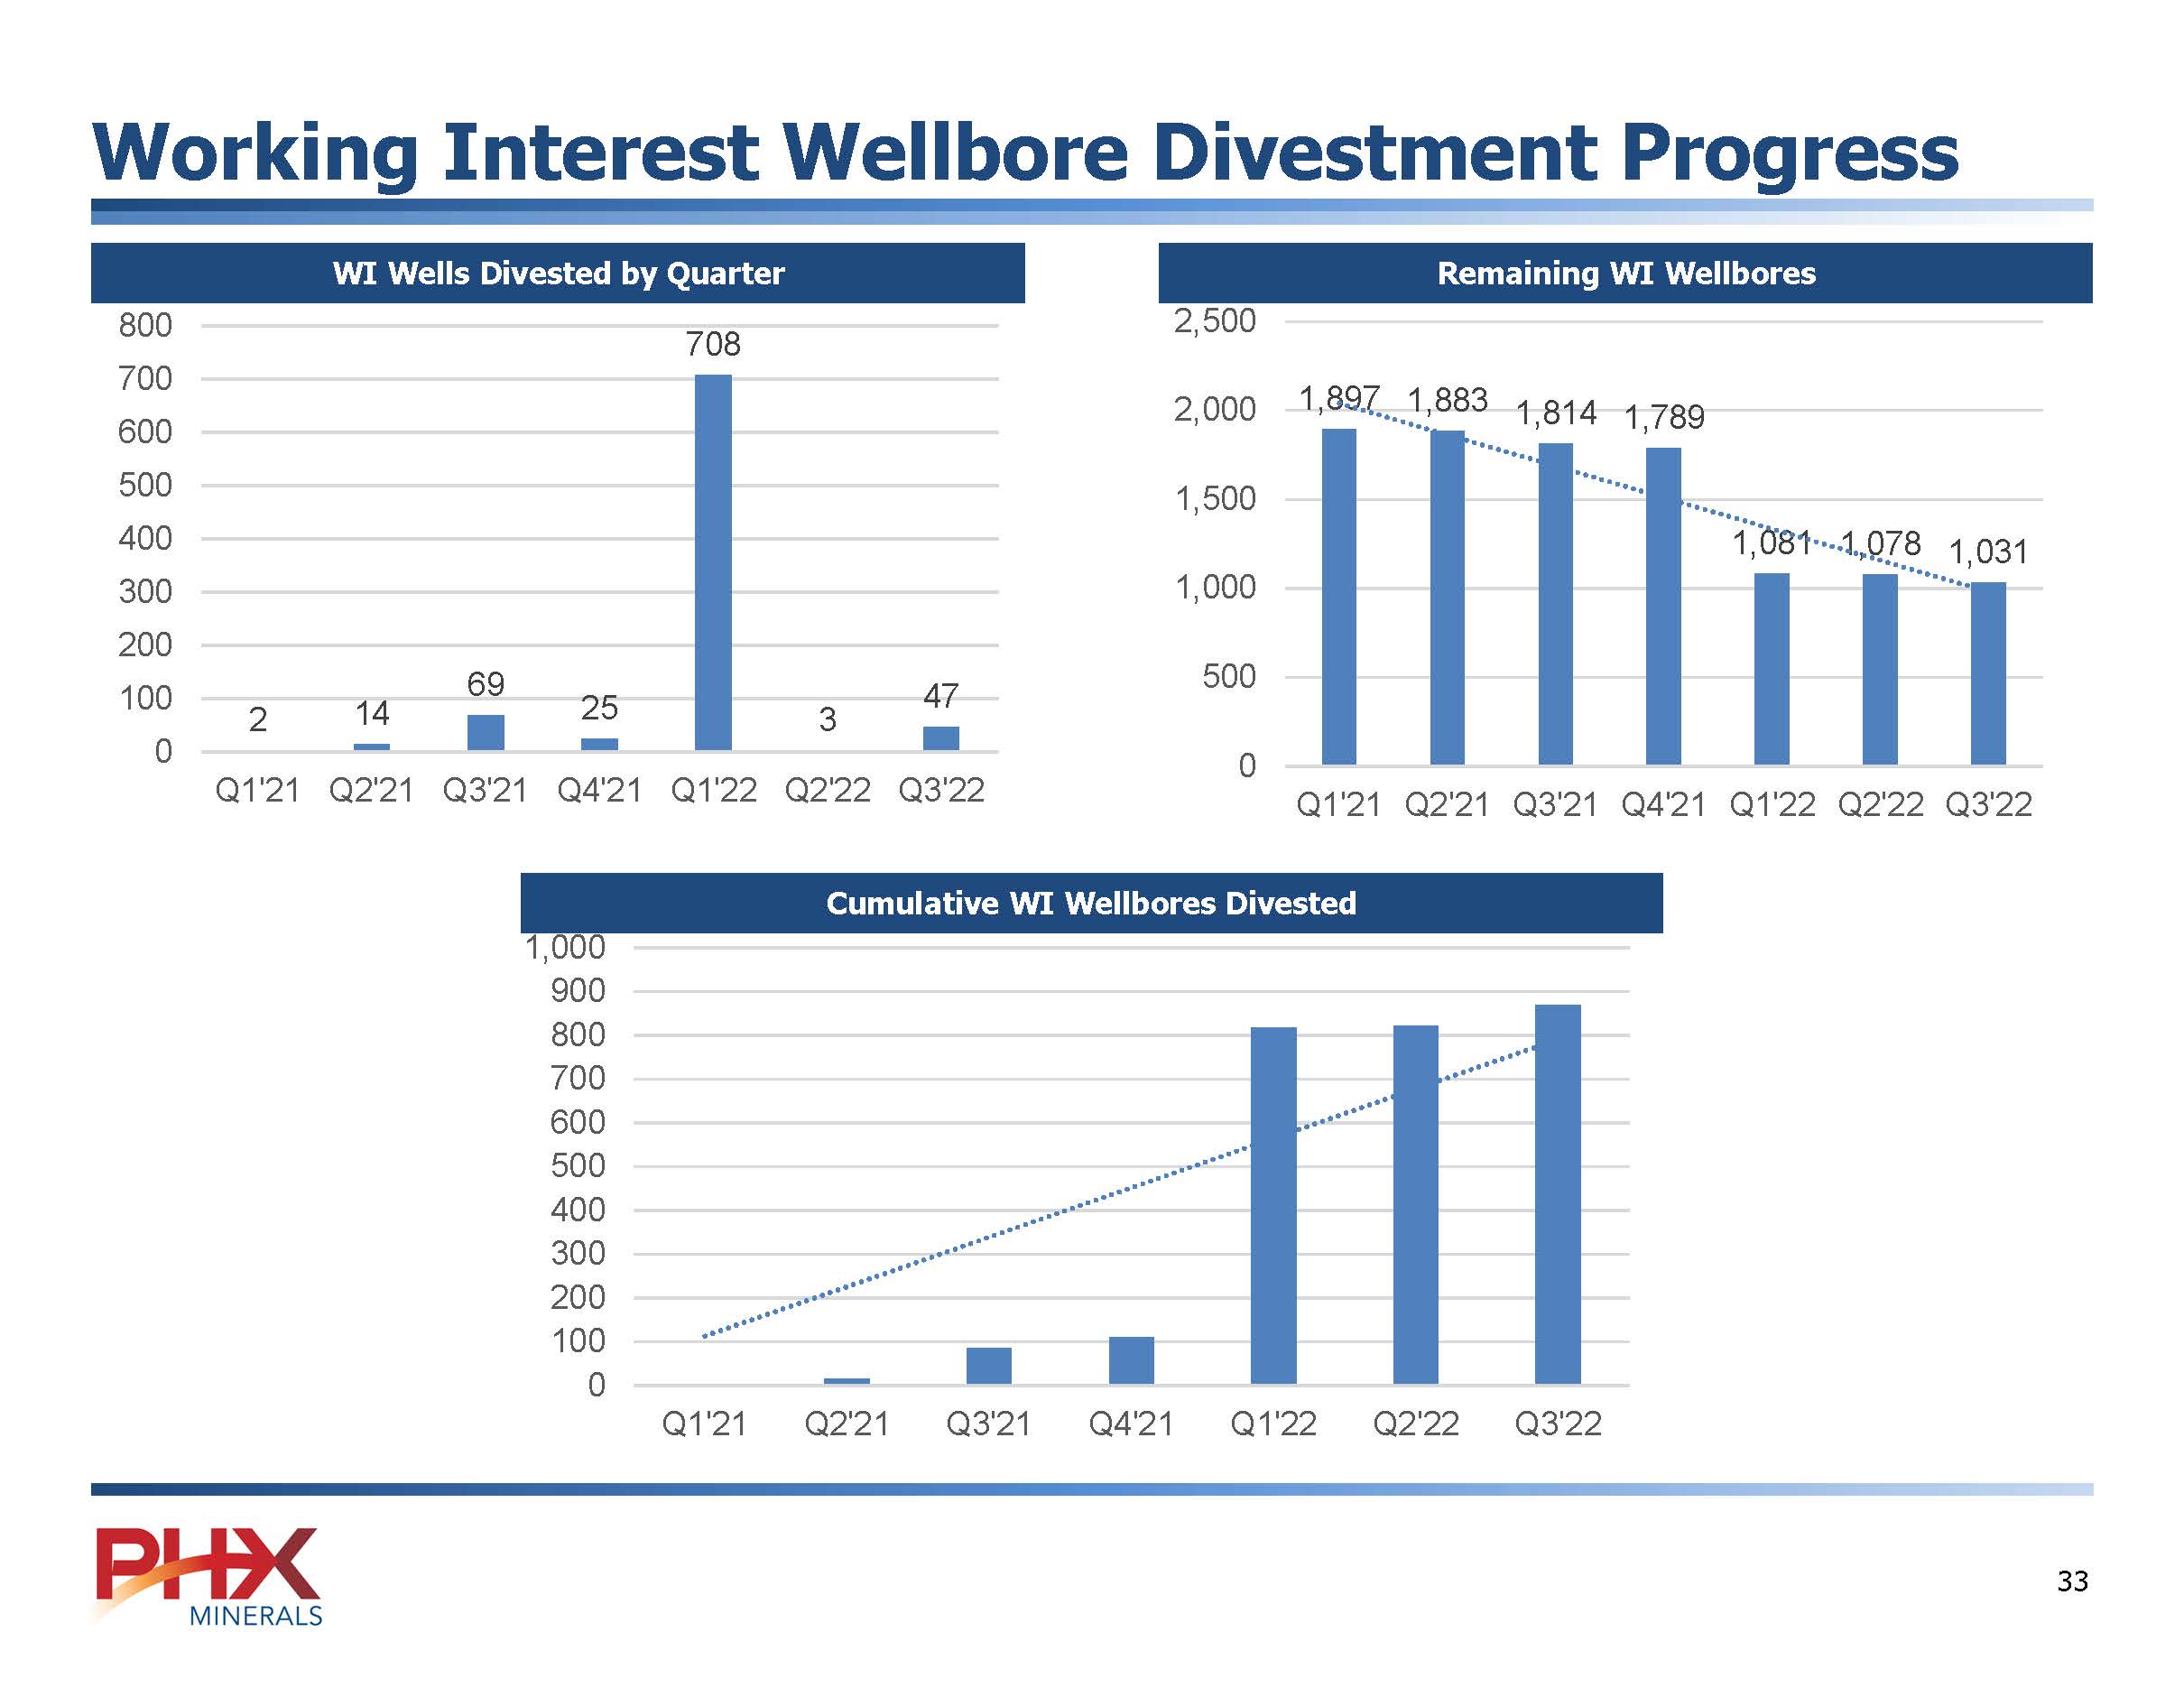
Working Interest Wellbore Divestment Progress WI Wells Divested by Quarter Remaining WI Wellbores Cumulative WI Wellbores Divested [ BAR CHART] PHX MINERALS 33
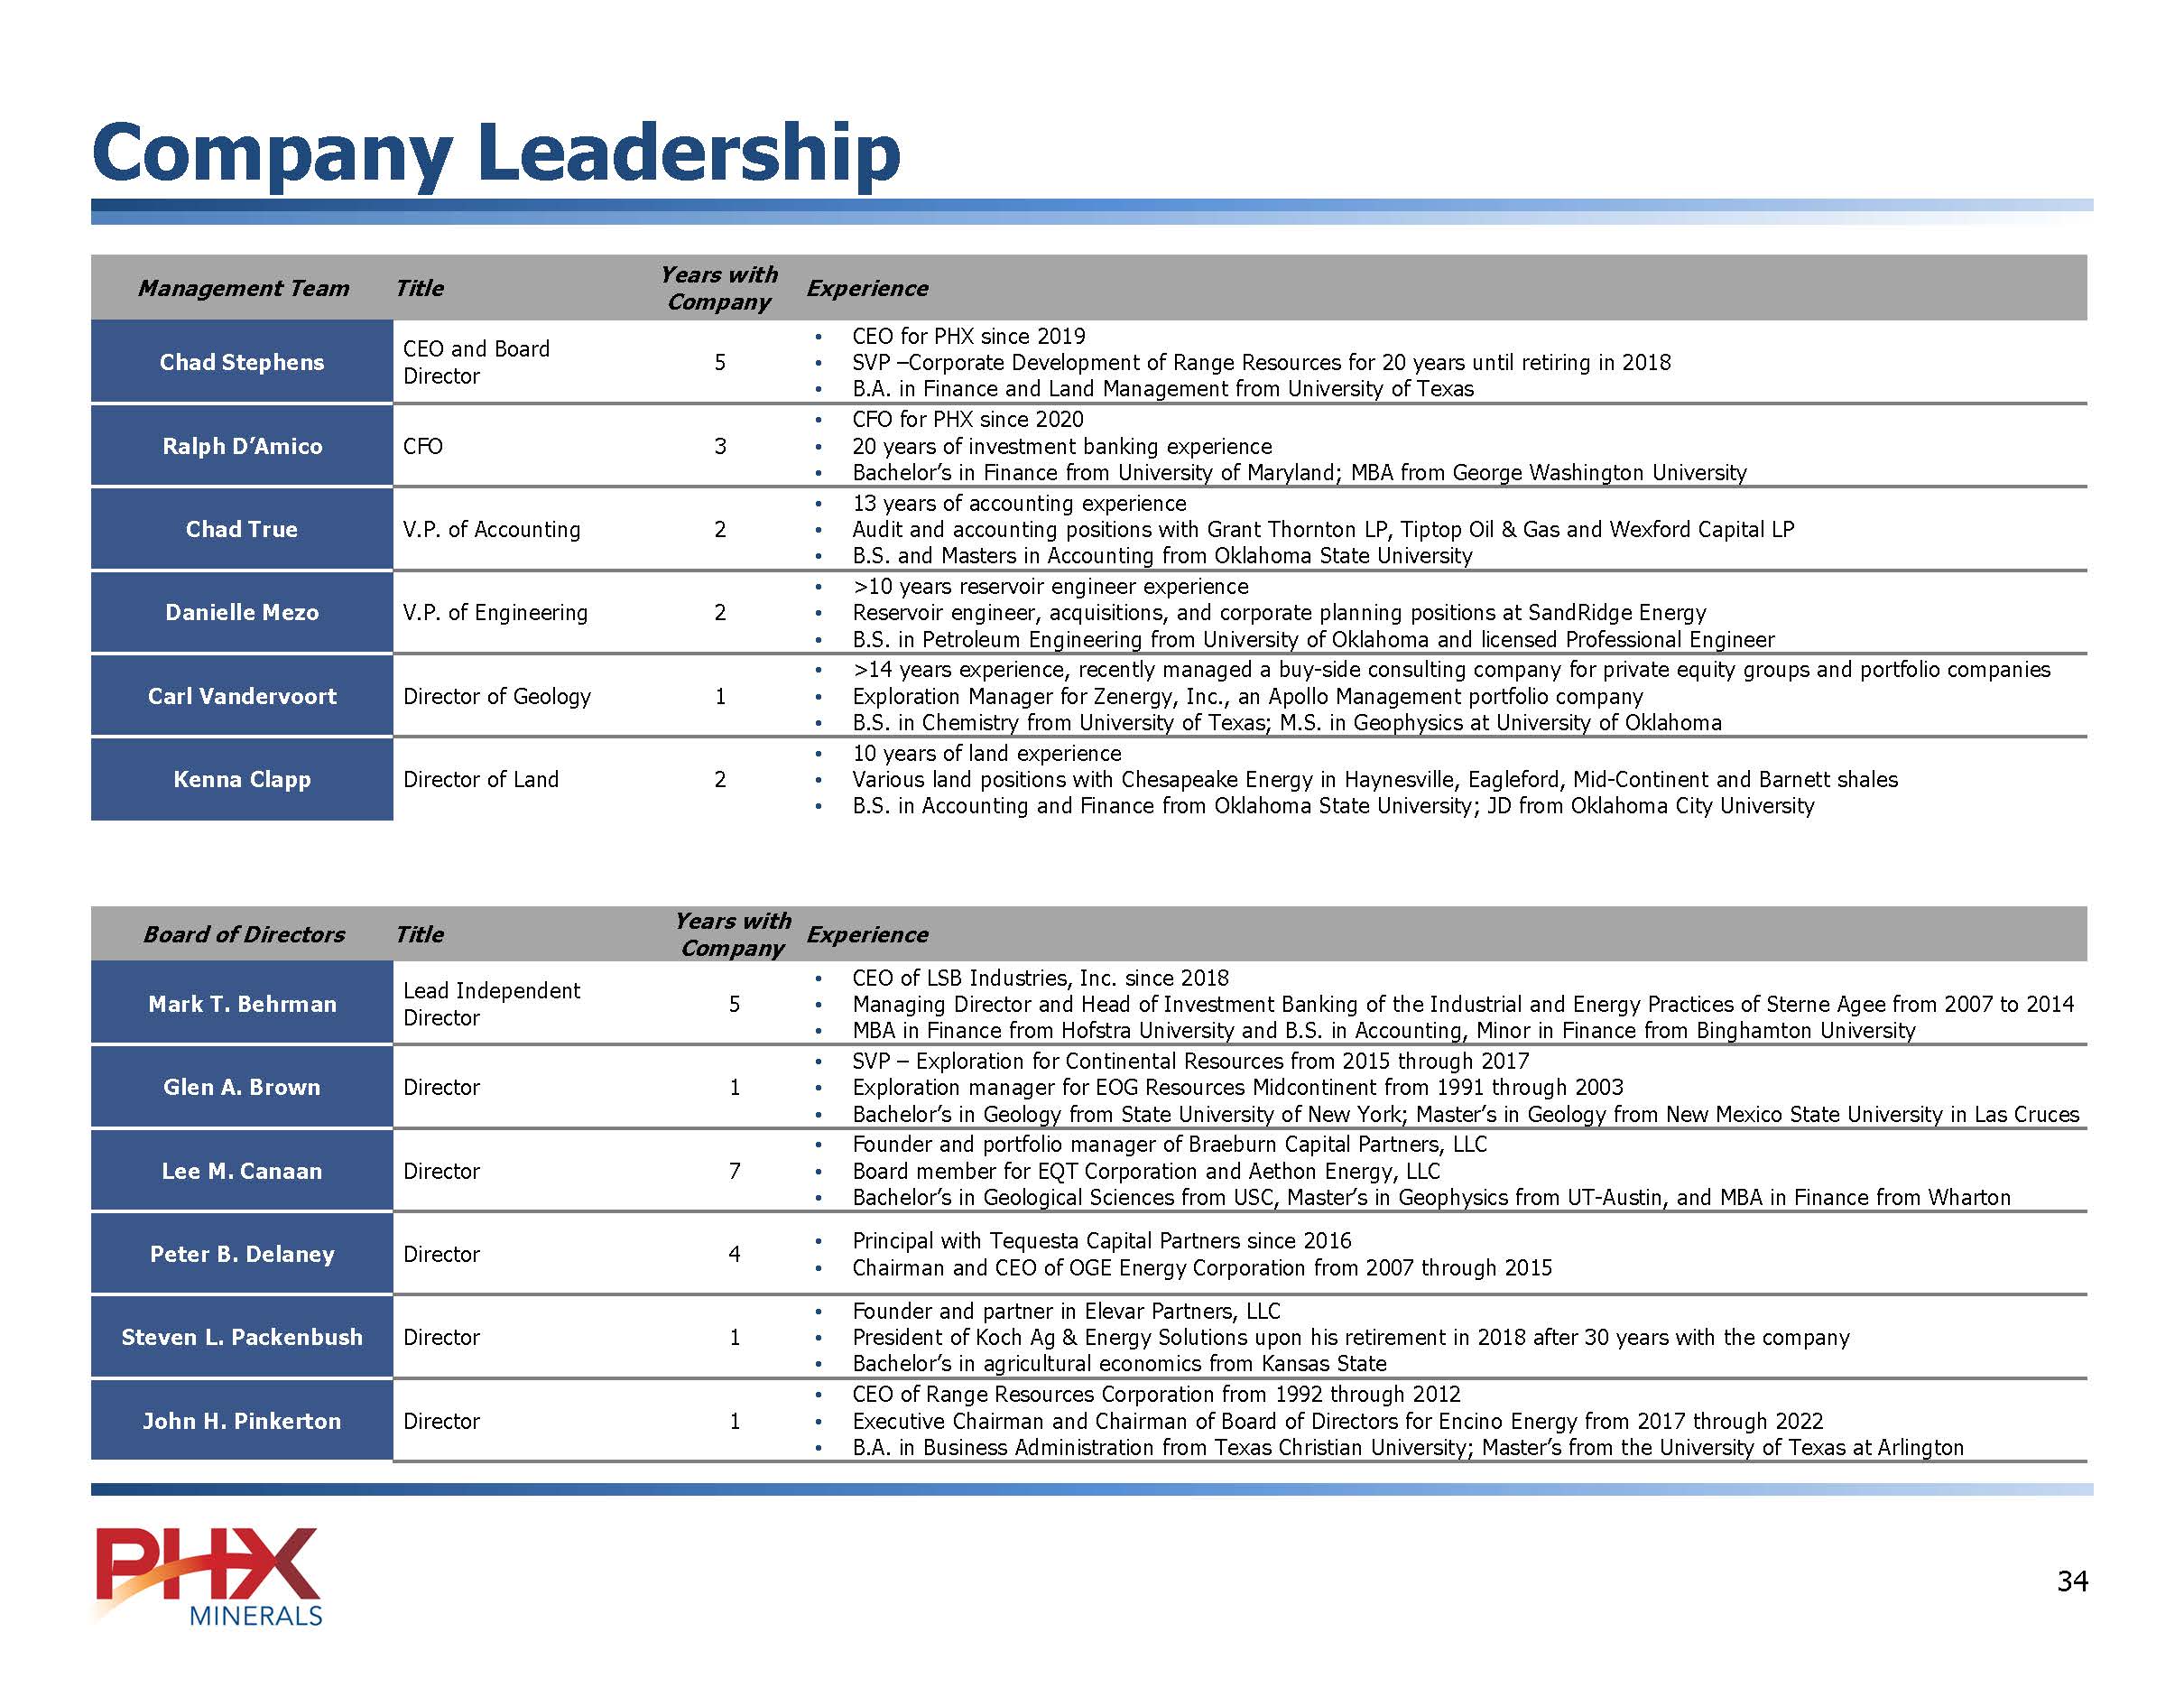
Company Leadership Management Team Title Years with Company Experience • Chad Stephens CEO and Board Director 5 CEO for PHX since 2019 • SVP –Corporate Development of Range Resources for 20 years until retiring in 2018 • B.A. in Finance and Land Management from University of Texas • Ralph D’Amico CFO 3 CFO for PHX since 2020 • 20 years of investment banking experience • Bachelor’s in Finance from University of Maryland; MBA from George Washington University • Chad True V.P. of Accounting 2 13 years of accounting experience • Audit and accounting positions with Grant Thornton LP, Tiptop Oil & Gas and Wexford Capital LP • B.S. and Masters in Accounting from Oklahoma State University • Danielle Mezo V.P. of Engineering 2 >10 years reservoir engineer experience • Reservoir engineer, acquisitions, and corporate planning positions at SandRidge Energy • B.S. in Petroleum Engineering from University of Oklahoma and licensed Professional Engineer • Carl Vandervoort Director of Geology 1 >14 years experience, recently managed a buy-side consulting company for private equity groups and portfolio companies • Exploration Manager for Zenergy, Inc., an Apollo Management portfolio company • B.S. in Chemistry from University of Texas; M.S. in Geophysics at University of Oklahoma • Kenna Clapp Director of Land 2 10 years of land experience • Various land positions with Chesapeake Energy in Haynesville, Eagleford, Mid-Continent and Barnett shales • B.S. in Accounting and Finance from Oklahoma State University; JD from Oklahoma City University Board of Directors Title Years with Company Experience • Mark T. Behrman Lead Independent Director 5 CEO of LSB Industries, Inc. since 2018 • Managing Director and Head of Investment Banking of the Industrial and Energy Practices of Sterne Agee from 2007 to 2014 • MBA in Finance from Hofstra University and B.S. in Accounting, Minor in Finance from Binghamton University • Glen A. Brown Director 1 SVP – Exploration for Continental Resources from 2015 through 2017 • Exploration manager for EOG Resources Midcontinent from 1991 through 2003 • Bachelor’s in Geology from State University of New York; Master’s in Geology from New Mexico State University in Las Cruces • Lee M. Canaan Director 7 Founder and portfolio manager of Braeburn Capital Partners, LLC • Board member for EQT Corporation and Aethon Energy, LLC • Bachelor’s in Geological Sciences from USC, Master’s in Geophysics from UT-Austin, and MBA in Finance from Wharton • Peter B. Delaney Director 4 Principal with Tequesta Capital Partners since 2016 • Chairman and CEO of OGE Energy Corporation from 2007 through 2015 • Steven L. Packenbush Director 1 Founder and partner in Elevar Partners, LLC • President of Koch Ag & Energy Solutions upon his retirement in 2018 after 30 years with the company • Bachelor’s in agricultural economics from Kansas State • John H. Pinkerton Director 1 CEO of Range Resources Corporation from 1992 through 2012 • Executive Chairman and Chairman of Board of Directors for Encino Energy from 2017 through 2022 • B.A. in Business Administration from Texas Christian University; Master’s from the University of Texas at Arlington PHX MINERALS 34