Document
Exhibit 99.1
Snap Inc. Announces Second Quarter 2024 Financial Results
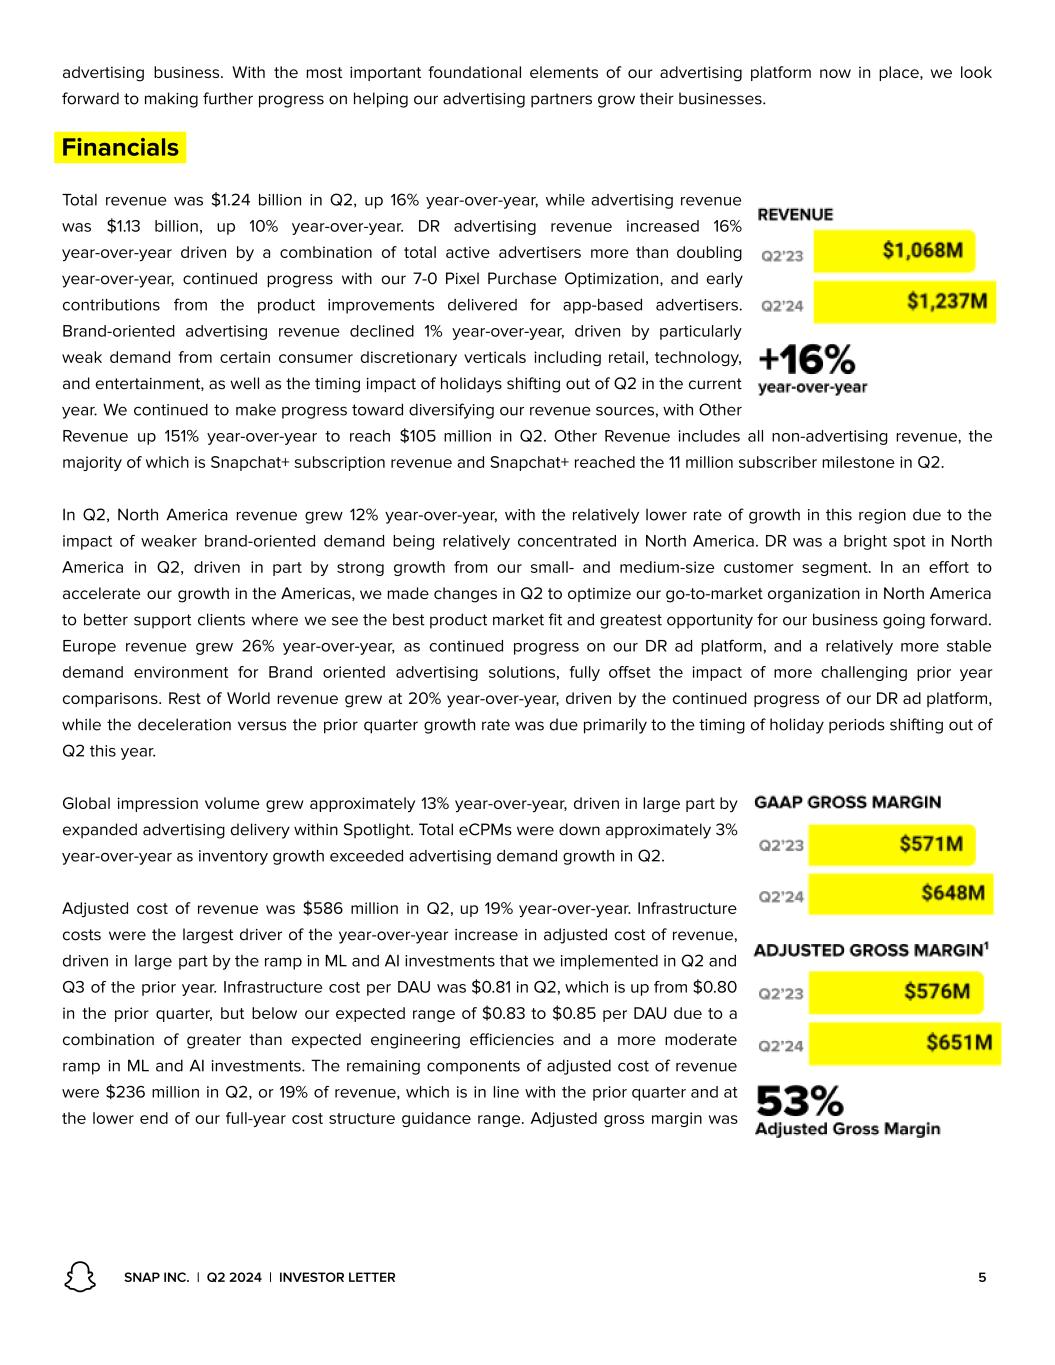
Second quarter revenue increased 16% year-over-year to $1,237 million
Daily Active Users increased 9% year-over-year to 432 million
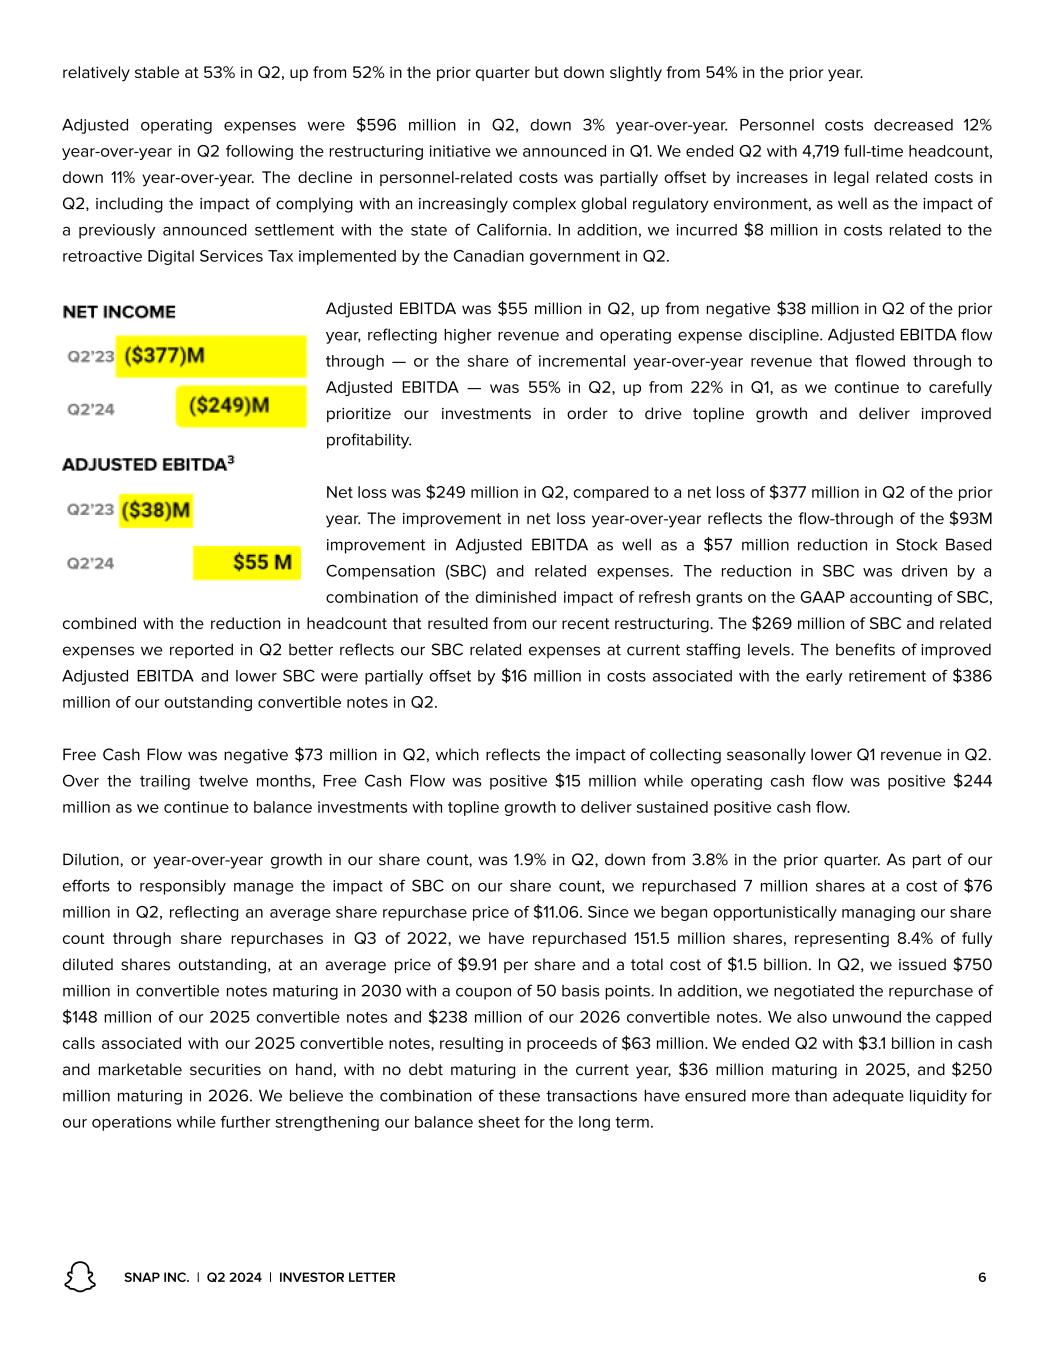
Net loss improved 34% year-over-year to $249 million
Adjusted EBITDA improved 243% year-over-year to $55 million
SANTA MONICA, Calif. – August 1, 2024 – Snap Inc. (NYSE: SNAP) today announced financial results for the quarter ended June 30, 2024.
“Our community grew to reach more than 850 million monthly active users in Q2, with more than 11 million Snapchat+ subscribers,” said Evan Spiegel, CEO. “We continued to scale our advertising platform with active advertisers more than doubling year-over-year. We are looking forward to hosting our upcoming Snap Partner Summit on September 17th, where we will announce new updates to our service.”
Q2 2024 Financial Summary
•Revenue was $1,237 million, compared to $1,068 million in the prior year, an increase of 16% year-over-year.
•Net loss was $249 million, compared to $377 million in the prior year.
•Adjusted EBITDA was $55 million, compared to $(38) million in the prior year.
•Operating cash flow was $(21) million, compared to $(82) million in the prior year.
•Free Cash Flow was $(73) million, compared to $(119) million in the prior year.
•On a trailing twelve month basis, operating cash flow was $244 million and Free Cash Flow was $15 million.
|
|
|
|
|
|
|
|
|
|
|
|
|
|
|
|
|
|
|
|
|
|
|
|
|
|
|
|
|
|
|
|
|
|
|
|
|
Three Months Ended
June 30,
|
|
Percent
Change |
|
Six Months Ended
June 30,
|
|
Percent
Change |
|
2024 |
|
2023 |
|
|
2024 |
|
2023 |
|
|
|
|
|
|
|
|
|
|
|
|
|
| (Unaudited) |
(in thousands, except per share amounts) |
|
|
| Revenue |
$ |
1,236,768 |
|
|
$ |
1,067,669 |
|
|
16 |
% |
|
$ |
2,431,541 |
|
|
$ |
2,056,277 |
|
|
18 |
% |
| Operating loss |
$ |
(253,975) |
|
|
$ |
(404,339) |
|
|
37 |
% |
|
$ |
(587,207) |
|
|
$ |
(769,603) |
|
|
24 |
% |
| Net loss |
$ |
(248,620) |
|
|
$ |
(377,308) |
|
|
34 |
% |
|
$ |
(553,710) |
|
|
$ |
(705,982) |
|
|
22 |
% |
Adjusted EBITDA (1) |
$ |
54,977 |
|
|
$ |
(38,479) |
|
|
243 |
% |
|
$ |
100,636 |
|
|
$ |
(37,666) |
|
|
367 |
% |
| Net cash provided by (used in) operating activities |
$ |
(21,377) |
|
|
$ |
(81,936) |
|
|
74 |
% |
|
$ |
66,975 |
|
|
$ |
69,166 |
|
|
(3) |
% |
Free Cash Flow (2) |
$ |
(73,439) |
|
|
$ |
(118,879) |
|
|
38 |
% |
|
$ |
(35,535) |
|
|
$ |
(15,407) |
|
|
(131) |
% |
| Diluted net loss per share attributable to common stockholders |
$ |
(0.15) |
|
|
$ |
(0.24) |
|
|
38 |
% |
|
$ |
(0.34) |
|
|
$ |
(0.44) |
|
|
23 |
% |
Non-GAAP diluted net income (loss) per share (3) |
$ |
0.02 |
|
|
$ |
(0.02) |
|
|
200 |
% |
|
$ |
0.05 |
|
|
$ |
(0.01) |
|
|
600 |
% |
(1)See page
9 for a reconciliation of net loss to Adjusted EBITDA. Total restructuring charges included in our consolidated statements of operations for the three and six months ended June 30, 2024, and excluded from Adjusted EBITDA, were $1.9 million and $72.0 million, respectively.
(2)See page
9 for a reconciliation of net cash provided by (used in) operating activities to Free Cash Flow.
(3)See page
10 for a reconciliation of diluted net loss per share to non-GAAP diluted net income (loss) per share.
Q2 2024 Summary & Key Highlights
We grew and deepened our engagement with our community:
•DAUs were 432 million in Q2 2024, an increase of 36 million, or 9% year-over-year.
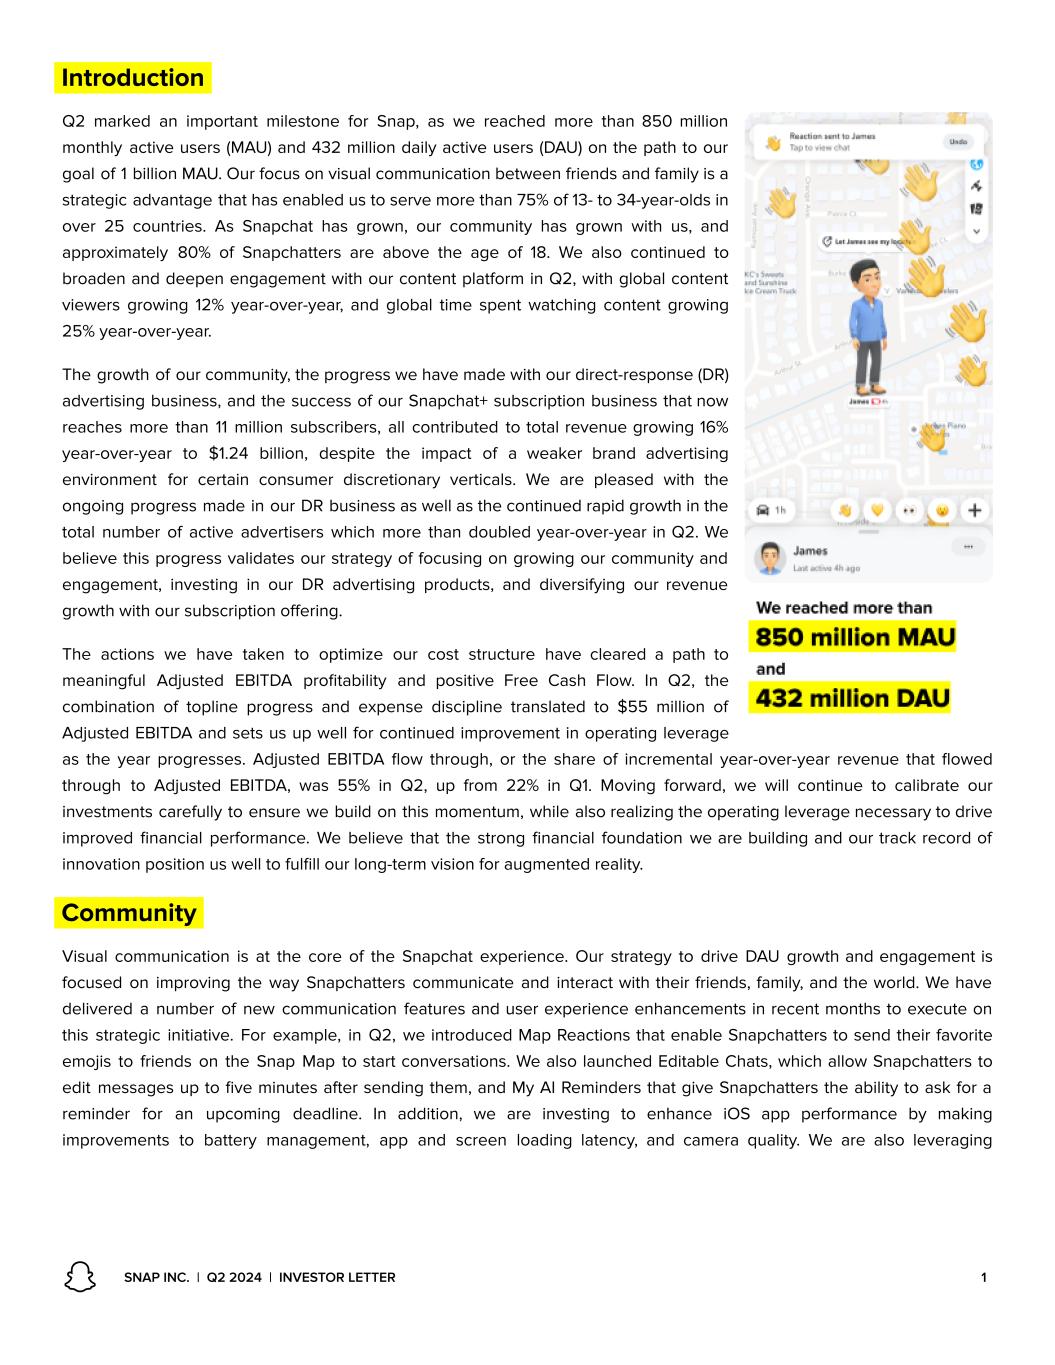
•Q2 marked an important milestone for Snap, as we reached more than 850 million monthly active users (MAU).
•We recently announced new communication features for Snapchatters to stay connected with friends and family and the world, including editable chats, Map emoji reactions, and My AI reminders.
•We renewed our longstanding sports partnerships with the NFL, NBA, and WNBA, to provide official content across Stories and Spotlight for our community.
•We announced Snap Nation, an exciting evolution of our partnership with Live Nation that gives Snapchatters access to tour and festival experiences that only Live Nation can offer.
•We partnered with Ensemble, a branded entertainment company founded by Issa Rae to help brands produce content with our 523 creator accelerator program that is focused on growing and building diverse voices.
•We selected members of our first-ever Council for Digital Well-Being, in which we’ll hear from teens on their perspectives on the states of their digital lives today and hopes for the future.
•We announced several new features to further safeguard our community from online harms, including expanded in-app warnings, enhanced friending protections, simplified location-sharing, and blocking improvements.
We are focused on accelerating and diversifying our revenue growth:
•Ongoing momentum with our direct response products and growth in small- and medium-size businesses (SMB) contributed to total active advertisers more than doubling year-over-year in Q2.
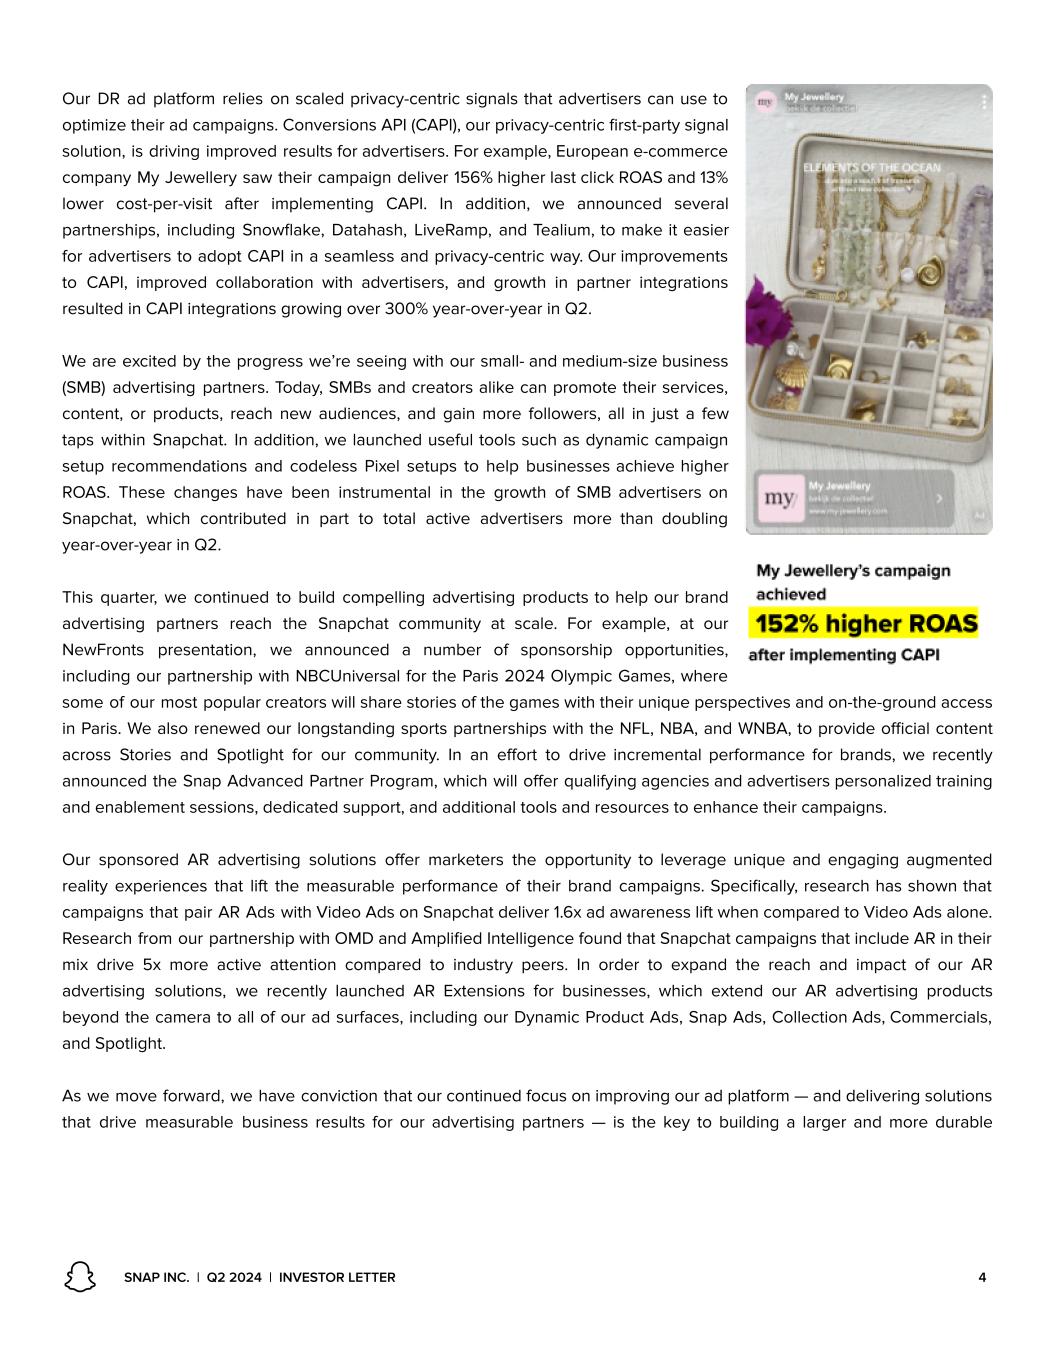
•Our improvements to Conversions API (CAPI), improved collaboration with advertisers, and growth in partner integrations resulted in CAPI integrations growing over 300% year-over-year.
•Snapchat+ reached 11 million subscribers in Q2.
•We announced AR Extensions, which enable advertisers to integrate AR Lenses and Filters directly into all Snapchat ad formats.
•We announced that brands can now leverage Generative AI technology such as our ML Face Effects to create custom sponsored AR Lenses.
•To help entertainment advertisers understand Snapchat’s impact on theatrical releases, we partnered with Samba TV, which found that exposure to campaigns on Snapchat delivered a 91% lift in ticket sales.
•We launched the Snap Advanced Partner Program, offering qualifying agencies and partners the opportunity to work closely with Snapchat to create innovative solutions that build stronger full funnel campaigns and drive results.
We invested in our augmented reality platform:
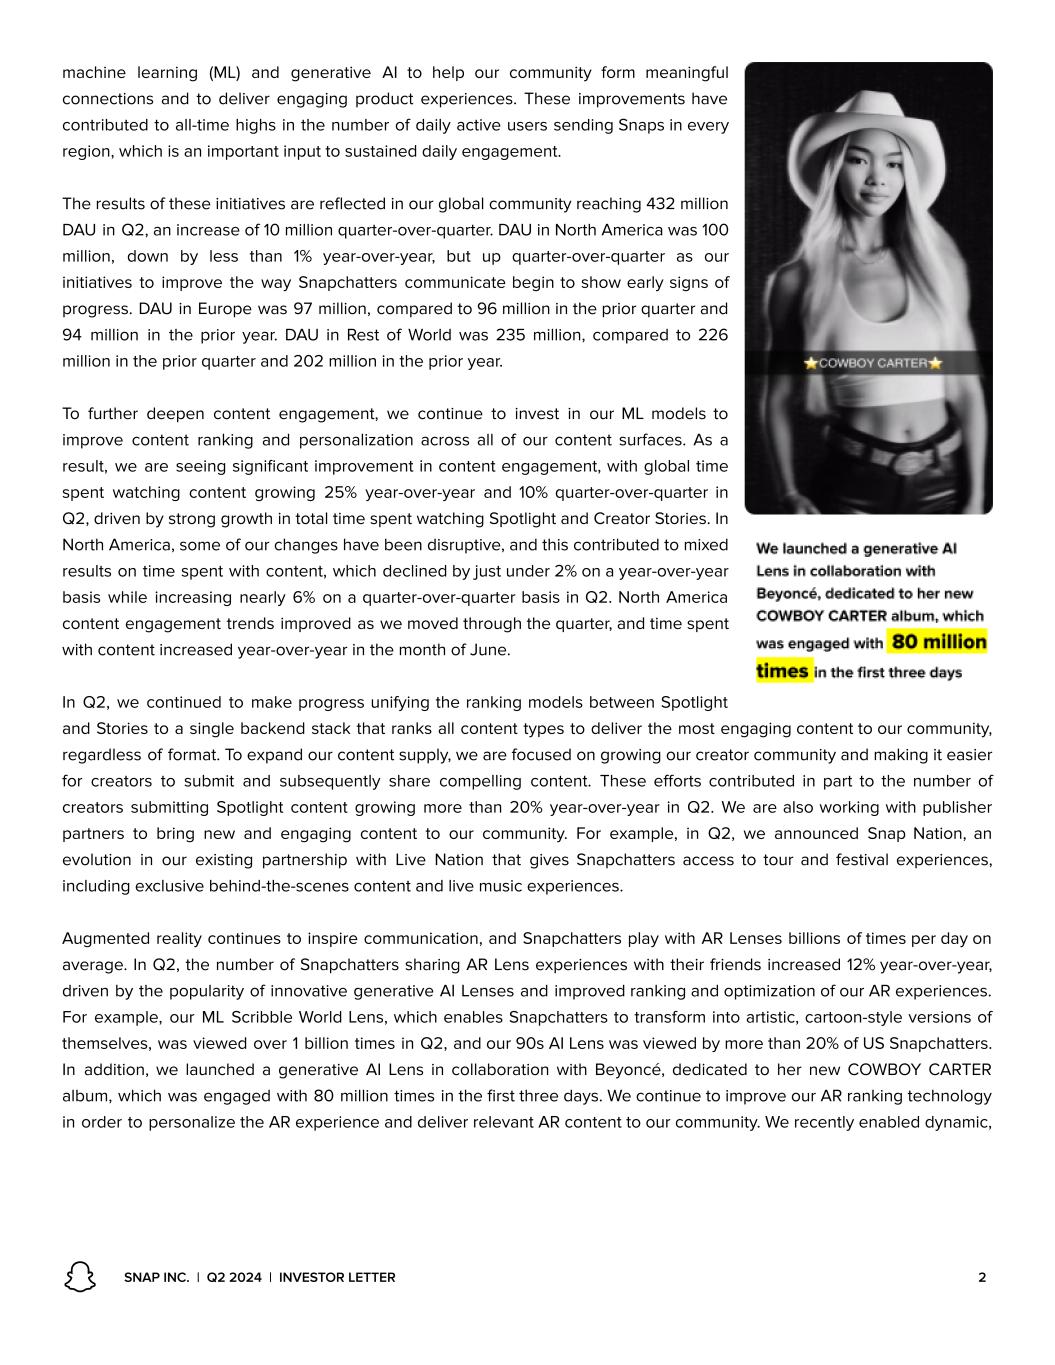
•We continue to invest in Generative AI models and automation for the creation of ML and AI Lenses, such as our Gen AI lens Scribble World which was viewed over 1 billion times and our 90’s AI lens, which was viewed by more than 20% of US Snapchaters.
•We launched Lens Studio 5.0, which features our new Gen AI Suite that makes Lens Studio easier to use by enabling creators to generate a variety of Lens-ready assets with a prompt and no coding required.
•In partnership with Live Nation and Ocesa, our AR technology enhanced for the first time Tecate Emblema, a major music festival in Mexico City, powered by CameraKit Live.
•Our partnership with OMD and Amplified Intelligence found that Snapchat campaigns that include AR in their mix drive 5x more active attention compared to industry peers.
•We partnered with Cartier on a first-of-its-kind AR experience celebrating the 100th anniversary of The Trinity Collection, allowing Snapchatters to try-on and shop the Classic Trinity Ring.
Q3 2024 Outlook
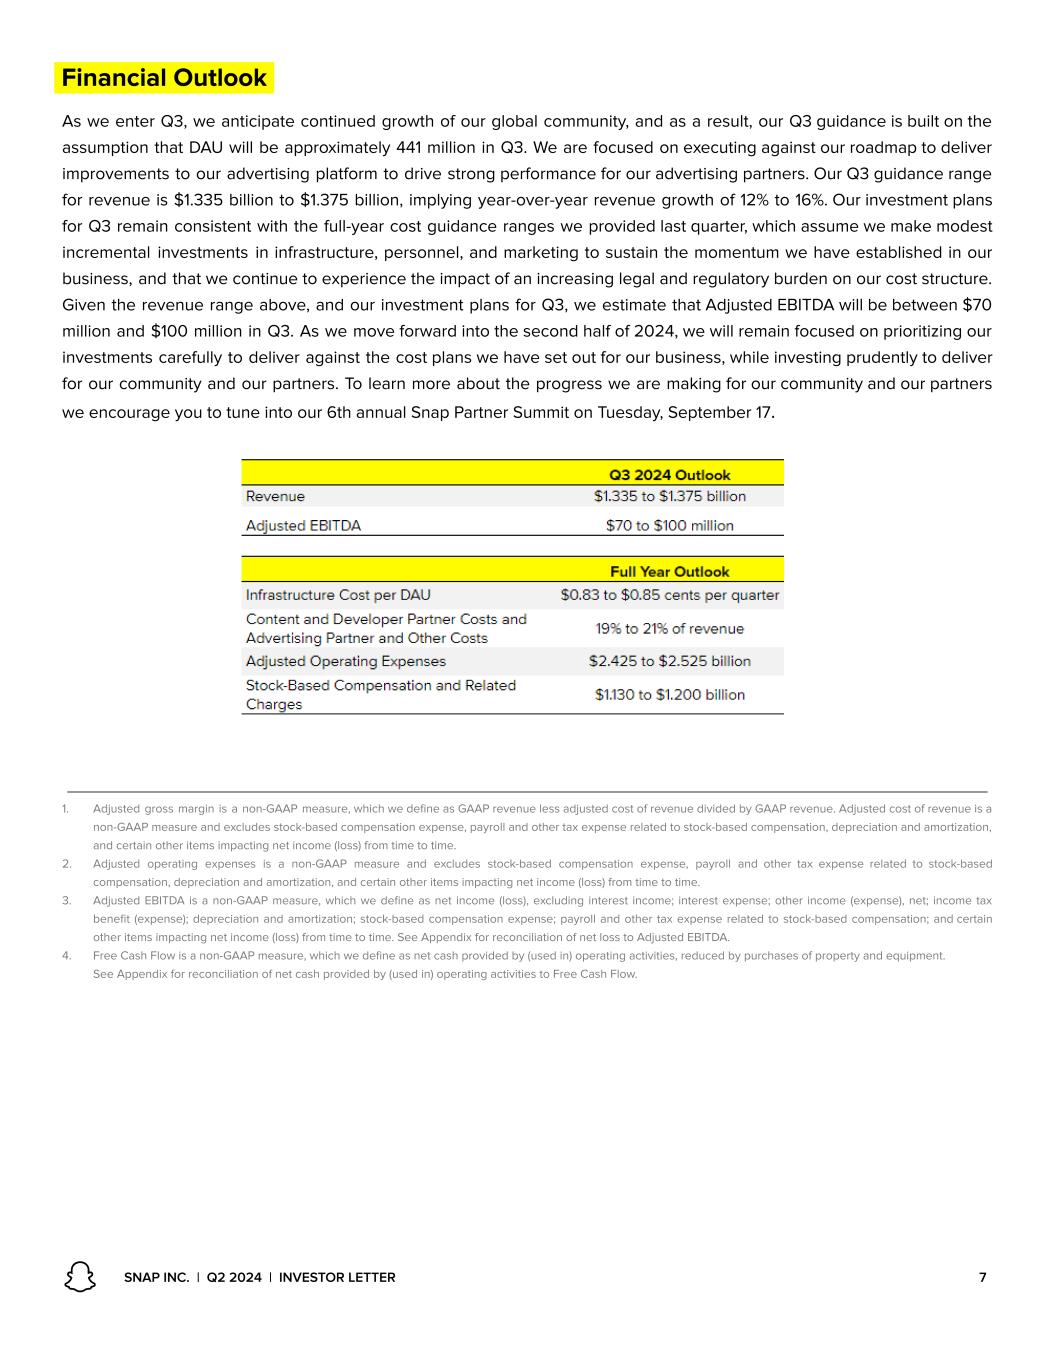
As we enter Q3, we anticipate continued growth of our global community, and as a result, our Q3 guidance is built on the assumption that DAU will be approximately 441 million in Q3. We are focused on executing against our roadmap to deliver improvements to our advertising platform to drive strong performance for our advertising partners and accelerate topline growth. Our Q3 guidance range for revenue is $1,335 million to $1,375 million, implying year-over-year revenue growth of 12% to 16%. Given the revenue range above, and our investment plans for the quarter ahead, we estimate that Adjusted EBITDA will be between $70 million and $100 million in Q3.
Conference Call Information
Snap Inc. will host a conference call to discuss the results at 2:30 p.m. Pacific / 5:30 p.m. Eastern today. The live audio webcast along with supplemental information will be accessible at investor.snap.com. A recording of the webcast will also be available following the conference call.
Snap Inc. uses its websites (including snap.com and investor.snap.com) as means of disclosing material non-public information and for complying with its disclosure obligation under Regulation FD.
Definitions
Free Cash Flow is defined as net cash provided by (used in) operating activities, reduced by purchases of property and equipment.
Common shares outstanding plus shares underlying stock-based awards includes common shares outstanding, restricted stock units, restricted stock awards, and outstanding stock options.
Adjusted EBITDA is defined as net income (loss), excluding interest income; interest expense; other income (expense), net; income tax benefit (expense); depreciation and amortization; stock-based compensation expense; payroll and other tax expense related to stock-based compensation; and certain other items impacting net income (loss) from time to time.
A Daily Active User (DAU) is defined as a registered and logged-in Snapchat user who visits Snapchat through our applications or websites at least once during a defined 24-hour period. We calculate average DAUs for a particular quarter by adding the number of DAUs on each day of that quarter and dividing that sum by the number of days in that quarter.
Average revenue per user (ARPU) is defined as quarterly revenue divided by the average DAUs.
A Monthly Active User (MAU) is defined as a registered and logged-in Snapchat user who visits Snapchat through our applications or websites at least once during the 30-day period ending on the calendar month-end. We calculate average Monthly Active Users for a particular quarter by calculating the average of the MAUs as of each calendar month-end in that quarter.
Note: For adjustments and additional information regarding the non-GAAP financial measures and other items discussed, please see “Non-GAAP Financial Measures,” “Reconciliation of GAAP to Non-GAAP Financial Measures,” and “Supplemental Financial Information and Business Metrics.”
About Snap Inc.
Snap Inc. is a technology company. We believe the camera presents the greatest opportunity to improve the way people live and communicate. We contribute to human progress by empowering people to express themselves, live in the moment, learn about the world, and have fun together. For more information, visit snap.com.
Contact
Investors and Analysts:
ir@snap.com
Press:
press@snap.com
Forward-Looking Statements
This press release contains forward-looking statements within the meaning of Section 27A of the Securities Act of 1933, as amended, or the Securities Act, and Section 21E of the Securities Exchange Act of 1934, as amended, or the Exchange Act, about us and our industry that involve substantial risks and uncertainties. All statements other than statements of historical facts contained in this press release, including statements regarding guidance, our future results of operations or financial condition, future stock repurchase programs or stock dividends, business strategy and plans, user growth and engagement, product initiatives, objectives of management for future operations, and advertiser and partner offerings, are forward-looking statements. In some cases, you can identify forward-looking statements because they contain words such as “anticipate,” “believe,” “contemplate,” “continue,” “could,” “estimate,” “expect,” “going to,” “intend,” “may,” “plan,” “potential,” “predict,” “project,” “should,” “target,” “will,” or “would” or the negative of these words or other similar terms or expressions. We caution you that the foregoing may not include all of the forward-looking statements made in this press release.
You should not rely on forward-looking statements as predictions of future events. We have based the forward-looking statements contained in this press release primarily on our current expectations and projections about future events and trends, including our financial outlook, macroeconomic uncertainty, and geo-political conflicts, that we believe may continue to affect our business, financial condition, results of operations, and prospects. These forward-looking statements are subject to risks and uncertainties related to: our financial performance; our ability to attain and sustain profitability; our ability to generate and sustain positive cash flow; our ability to attract and retain users, partners, and advertisers; competition and new market entrants; managing our growth and future expenses; compliance with new laws, regulations, and executive actions; our ability to maintain, protect, and enhance our intellectual property; our ability to succeed in existing and new market segments; our ability to attract and retain qualified team members and key personnel; our ability to repay or refinance outstanding debt, or to access additional financing; future acquisitions, divestitures, or investments; and the potential adverse impact of climate change, natural disasters, health epidemics, macroeconomic conditions, and war or other armed conflict, as well as risks, uncertainties, and other factors described in “Risk Factors” and elsewhere in our most recent periodic report filed with the U.S. Securities and Exchange Commission, or SEC, which is available on the SEC’s website at www.sec.gov. Additional information will be made available in our periodic report that will be filed with the SEC for the period covered by this press release and other filings that we make from time to time with the SEC. In addition, any forward-looking statements contained in this press release are based on assumptions that we believe to be reasonable as of this date. We undertake no obligation to update any forward-looking statements to reflect events or circumstances after the date of this press release or to reflect new information or the occurrence of unanticipated events, including future developments related to geo-political conflicts and macroeconomic conditions, except as required by law.
Non-GAAP Financial Measures
To supplement our consolidated financial statements, which are prepared and presented in accordance with GAAP, we use certain non-GAAP financial measures, as described below, to understand and evaluate our core operating performance. These non-GAAP financial measures, which may be different than similarly titled measures used by other companies, are presented to enhance investors’ overall understanding of our financial performance and should not be considered a substitute for, or superior to, the financial information prepared and presented in accordance with GAAP.
We use the non-GAAP financial measure of Free Cash Flow, which is defined as net cash provided by (used in) operating activities, reduced by purchases of property and equipment. We believe Free Cash Flow is an important liquidity measure of the cash that is available, after capital expenditures, for operational expenses and investment in our business and is a key financial indicator used by management. Additionally, we believe that Free Cash Flow is an important measure since we use third-party infrastructure partners to host our services and therefore we do not incur significant capital expenditures to support revenue generating activities. Free Cash Flow is useful to investors as a liquidity measure because it measures our ability to generate or use cash. Once our business needs and obligations are met, cash can be used to maintain a strong balance sheet and invest in future growth.
We use the non-GAAP financial measure of Adjusted EBITDA, which is defined as net income (loss), excluding interest income; interest expense; other income (expense), net; income tax benefit (expense); depreciation and amortization; stock-based compensation expense; payroll and other tax expense related to stock-based compensation; and certain other items impacting net income (loss) from time to time. We believe that Adjusted EBITDA helps identify underlying trends in our business that could otherwise be masked by the effect of the expenses that we exclude in Adjusted EBITDA.
We use the non-GAAP financial measure of non-GAAP net income (loss), which is defined as net income (loss), excluding amortization of intangible assets; stock-based compensation expense; payroll and other tax expense related to stock-based compensation; certain other items impacting net income (loss) from time to time; and related income tax adjustments. Non-GAAP net income (loss) and weighted average diluted shares are then used to calculate non-GAAP diluted net income (loss) per share. Similar to Adjusted EBITDA, we believe these measures help identify underlying trends in our business that could otherwise be masked by the effect of the expenses we exclude in the measure.
We believe that these non-GAAP financial measures provide useful information about our financial performance, enhance the overall understanding of our past performance and future prospects, and allow for greater transparency with respect to key metrics used by our management for financial and operational decision-making. We are presenting these non-GAAP measures to assist investors in seeing our financial performance through the eyes of management, and because we believe that these measures provide an additional tool for investors to use in comparing our core financial performance over multiple periods with other companies in our industry.
For a reconciliation of these non-GAAP financial measures to the most directly comparable GAAP financial measure, please see “Reconciliation of GAAP to Non-GAAP Financial Measures.”
Snap Inc., “Snapchat,” and our other registered and common law trade names, trademarks, and service marks are the property of Snap Inc. or our subsidiaries.
SNAP INC.
CONSOLIDATED STATEMENTS OF CASH FLOWS
(in thousands, unaudited)
|
|
|
|
|
|
|
|
|
|
|
|
|
|
|
|
|
|
|
|
|
|
|
|
|
Three Months Ended
June 30,
|
|
Six Months Ended
June 30,
|
|
2024 |
|
2023 |
|
2024 |
|
2023 |
| Cash flows from operating activities |
|
|
|
|
|
|
|
| Net loss |
$ |
(248,620) |
|
|
$ |
(377,308) |
|
|
$ |
(553,710) |
|
|
$ |
(705,982) |
|
| Adjustments to reconcile net loss to net cash provided by (used in) operating activities: |
|
|
|
|
|
|
|
| Depreciation and amortization |
37,930 |
|
|
39,688 |
|
|
79,643 |
|
|
74,908 |
|
| Stock-based compensation |
259,311 |
|
|
317,943 |
|
|
523,063 |
|
|
632,874 |
|
| Amortization of debt issuance costs |
2,208 |
|
|
1,839 |
|
|
3,950 |
|
|
3,675 |
|
|
|
|
|
|
|
|
|
| Losses (gains) on debt and equity securities, net |
2,662 |
|
|
(4,434) |
|
|
11,630 |
|
|
(15,267) |
|
|
|
|
|
|
|
|
|
| Other |
10,583 |
|
|
(16,307) |
|
|
(6,029) |
|
|
(26,703) |
|
| Change in operating assets and liabilities, net of effect of acquisitions: |
|
|
|
|
|
|
|
| Accounts receivable, net of allowance |
(36,916) |
|
|
(103,629) |
|
|
125,291 |
|
|
184,744 |
|
| Prepaid expenses and other current assets |
(34,526) |
|
|
(1,098) |
|
|
(48,155) |
|
|
(14,302) |
|
| Operating lease right-of-use assets |
14,929 |
|
|
17,817 |
|
|
28,504 |
|
|
35,475 |
|
| Other assets |
(955) |
|
|
(1,275) |
|
|
(6,097) |
|
|
(425) |
|
| Accounts payable |
(61,556) |
|
|
8,426 |
|
|
(95,645) |
|
|
(28,546) |
|
| Accrued expenses and other current liabilities |
45,821 |
|
|
52,981 |
|
|
27,440 |
|
|
(37,210) |
|
| Operating lease liabilities |
(13,940) |
|
|
(17,792) |
|
|
(27,870) |
|
|
(36,342) |
|
| Other liabilities |
1,692 |
|
|
1,213 |
|
|
4,960 |
|
|
2,267 |
|
| Net cash provided by (used in) operating activities |
(21,377) |
|
|
(81,936) |
|
|
66,975 |
|
|
69,166 |
|
| Cash flows from investing activities |
|
|
|
|
|
|
|
| Purchases of property and equipment |
(52,062) |
|
|
(36,943) |
|
|
(102,510) |
|
|
(84,573) |
|
| Purchases of strategic investments |
(2,000) |
|
|
(3,290) |
|
|
(2,000) |
|
|
(7,770) |
|
| Sales of strategic investments |
1,006 |
|
|
— |
|
|
1,015 |
|
|
— |
|
| Cash paid for acquisitions, net of cash acquired |
— |
|
|
(50,254) |
|
|
— |
|
|
(50,254) |
|
| Purchases of marketable securities |
(774,852) |
|
|
(631,218) |
|
|
(1,240,524) |
|
|
(1,505,271) |
|
| Sales of marketable securities |
166,557 |
|
|
85,922 |
|
|
166,557 |
|
|
91,273 |
|
| Maturities of marketable securities |
447,153 |
|
|
611,835 |
|
|
832,081 |
|
|
1,536,158 |
|
| Other |
(100) |
|
|
(2,451) |
|
|
(100) |
|
|
(124) |
|
| Net cash provided by (used in) investing activities |
(214,298) |
|
|
(26,399) |
|
|
(345,481) |
|
|
(20,561) |
|
| Cash flows from financing activities |
|
|
|
|
|
|
|
| Proceeds from issuance of convertible notes, net of issuance costs |
740,350 |
|
|
— |
|
|
740,350 |
|
|
— |
|
| Purchase of capped calls |
(68,850) |
|
|
— |
|
|
(68,850) |
|
|
— |
|
| Proceeds from termination of capped calls |
62,683 |
|
|
— |
|
|
62,683 |
|
|
— |
|
| Proceeds from the exercise of stock options |
2,425 |
|
|
382 |
|
|
2,494 |
|
|
411 |
|
| Repurchases of Class A non-voting common stock |
(75,955) |
|
|
— |
|
|
(311,069) |
|
|
— |
|
| Deferred payments for acquisitions |
(3,695) |
|
|
(242,088) |
|
|
(3,695) |
|
|
(244,116) |
|
| Repurchases of convertible notes |
(418,336) |
|
|
— |
|
|
(859,042) |
|
|
— |
|
| Other |
(1,799) |
|
|
— |
|
|
(1,799) |
|
|
— |
|
| Net cash provided by (used in) financing activities |
236,823 |
|
|
(241,706) |
|
|
(438,928) |
|
|
(243,705) |
|
| Change in cash, cash equivalents, and restricted cash |
1,148 |
|
|
(350,041) |
|
|
(717,434) |
|
|
(195,100) |
|
| Cash, cash equivalents, and restricted cash, beginning of period |
1,063,880 |
|
|
1,578,717 |
|
|
1,782,462 |
|
|
1,423,776 |
|
| Cash, cash equivalents, and restricted cash, end of period |
$ |
1,065,028 |
|
|
$ |
1,228,676 |
|
|
$ |
1,065,028 |
|
|
$ |
1,228,676 |
|
SNAP INC.
CONSOLIDATED STATEMENTS OF OPERATIONS
(in thousands, except per share amounts, unaudited)
|
|
|
|
|
|
|
|
|
|
|
|
|
|
|
|
|
|
|
|
|
|
|
|
|
Three Months Ended June 30, |
|
Six Months Ended June 30, |
|
2024 |
|
2023 |
|
2024 |
|
2023 |
| Revenue |
$ |
1,236,768 |
|
|
$ |
1,067,669 |
|
|
$ |
2,431,541 |
|
|
$ |
2,056,277 |
|
| Costs and expenses: |
|
|
|
|
|
|
|
| Cost of revenue |
588,921 |
|
|
496,874 |
|
|
1,163,670 |
|
|
936,860 |
|
| Research and development |
406,196 |
|
|
477,663 |
|
|
855,955 |
|
|
932,775 |
|
| Sales and marketing |
266,320 |
|
|
280,597 |
|
|
542,354 |
|
|
549,030 |
|
| General and administrative |
229,306 |
|
|
216,874 |
|
|
456,769 |
|
|
407,215 |
|
| Total costs and expenses |
1,490,743 |
|
|
1,472,008 |
|
|
3,018,748 |
|
|
2,825,880 |
|
| Operating loss |
(253,975) |
|
|
(404,339) |
|
|
(587,207) |
|
|
(769,603) |
|
| Interest income |
36,462 |
|
|
43,144 |
|
|
76,360 |
|
|
81,092 |
|
| Interest expense |
(5,113) |
|
|
(5,343) |
|
|
(9,856) |
|
|
(11,228) |
|
| Other income (expense), net |
(20,792) |
|
|
1,323 |
|
|
(20,873) |
|
|
12,695 |
|
| Loss before income taxes |
(243,418) |
|
|
(365,215) |
|
|
(541,576) |
|
|
(687,044) |
|
| Income tax benefit (expense) |
(5,202) |
|
|
(12,093) |
|
|
(12,134) |
|
|
(18,938) |
|
| Net loss |
$ |
(248,620) |
|
|
$ |
(377,308) |
|
|
$ |
(553,710) |
|
|
$ |
(705,982) |
|
| Net loss per share attributable to Class A, Class B, and Class C common stockholders: |
|
|
|
|
|
|
|
| Basic |
$ |
(0.15) |
|
|
$ |
(0.24) |
|
|
$ |
(0.34) |
|
|
$ |
(0.44) |
|
| Diluted |
$ |
(0.15) |
|
|
$ |
(0.24) |
|
|
$ |
(0.34) |
|
|
$ |
(0.44) |
|
| Weighted average shares used in computation of net loss per share: |
|
|
|
|
|
|
|
| Basic |
1,644,736 |
|
1,603,172 |
|
1,646,064 |
|
1,592,365 |
| Diluted |
1,644,736 |
|
1,603,172 |
|
1,646,064 |
|
1,592,365 |
SNAP INC.
CONSOLIDATED BALANCE SHEETS
(in thousands, except par value)
|
|
|
|
|
|
|
|
|
|
|
|
|
June 30,
2024 |
|
December 31,
2023 |
|
(unaudited) |
|
|
| Assets |
|
|
|
| Current assets |
|
|
|
| Cash and cash equivalents |
$ |
1,060,551 |
|
|
$ |
1,780,400 |
|
| Marketable securities |
2,020,723 |
|
|
1,763,680 |
|
| Accounts receivable, net of allowance |
1,141,849 |
|
|
1,278,176 |
|
| Prepaid expenses and other current assets |
198,074 |
|
|
153,587 |
|
| Total current assets |
4,421,197 |
|
|
4,975,843 |
|
| Property and equipment, net |
444,485 |
|
|
410,326 |
|
| Operating lease right-of-use assets |
521,101 |
|
|
516,862 |
|
| Intangible assets, net |
112,808 |
|
|
146,303 |
|
| Goodwill |
1,691,317 |
|
|
1,691,827 |
|
| Other assets |
229,131 |
|
|
226,597 |
|
| Total assets |
$ |
7,420,039 |
|
|
$ |
7,967,758 |
|
| Liabilities and Stockholders’ Equity |
|
|
|
| Current liabilities |
|
|
|
| Accounts payable |
$ |
179,586 |
|
|
$ |
278,961 |
|
| Operating lease liabilities |
21,279 |
|
|
49,321 |
|
| Accrued expenses and other current liabilities |
875,119 |
|
|
805,836 |
|
| Convertible senior notes, net |
36,170 |
|
|
— |
|
| Total current liabilities |
1,112,154 |
|
|
1,134,118 |
|
| Long-term convertible senior notes, net |
3,602,563 |
|
|
3,749,400 |
|
| Operating lease liabilities, noncurrent |
579,896 |
|
|
546,279 |
|
| Other liabilities |
58,704 |
|
|
123,849 |
|
| Total liabilities |
5,353,317 |
|
|
5,553,646 |
|
| Commitments and contingencies |
|
|
|
| Stockholders’ equity |
|
|
|
| Class A non-voting common stock, $0.00001 par value. 3,000,000 shares authorized, 1,447,952 shares issued, 1,399,665 shares outstanding at June 30, 2024, and 3,000,000 shares authorized, 1,440,541 shares issued, 1,391,341 shares outstanding at December 31, 2023. |
14 |
|
|
14 |
|
| Class B voting common stock, $0.00001 par value. 700,000 shares authorized, 22,528 shares issued and outstanding at June 30, 2024 and December 31, 2023. |
— |
|
|
— |
|
| Class C voting common stock, $0.00001 par value. 260,888 shares authorized, 231,627 shares issued and outstanding at June 30, 2024 and December 31, 2023. |
2 |
|
|
2 |
|
| Treasury stock, at cost. 48,287 and 49,200 shares of Class A non-voting common stock at June 30, 2024 and December 31, 2023, respectively. |
(470,999) |
|
|
(479,903) |
|
| Additional paid-in capital |
15,126,248 |
|
|
14,613,404 |
|
| Accumulated deficit |
(12,591,315) |
|
|
(11,726,536) |
|
| Accumulated other comprehensive income (loss) |
2,772 |
|
|
7,131 |
|
| Total stockholders’ equity |
2,066,722 |
|
|
2,414,112 |
|
| Total liabilities and stockholders’ equity |
$ |
7,420,039 |
|
|
$ |
7,967,758 |
|
SNAP INC.
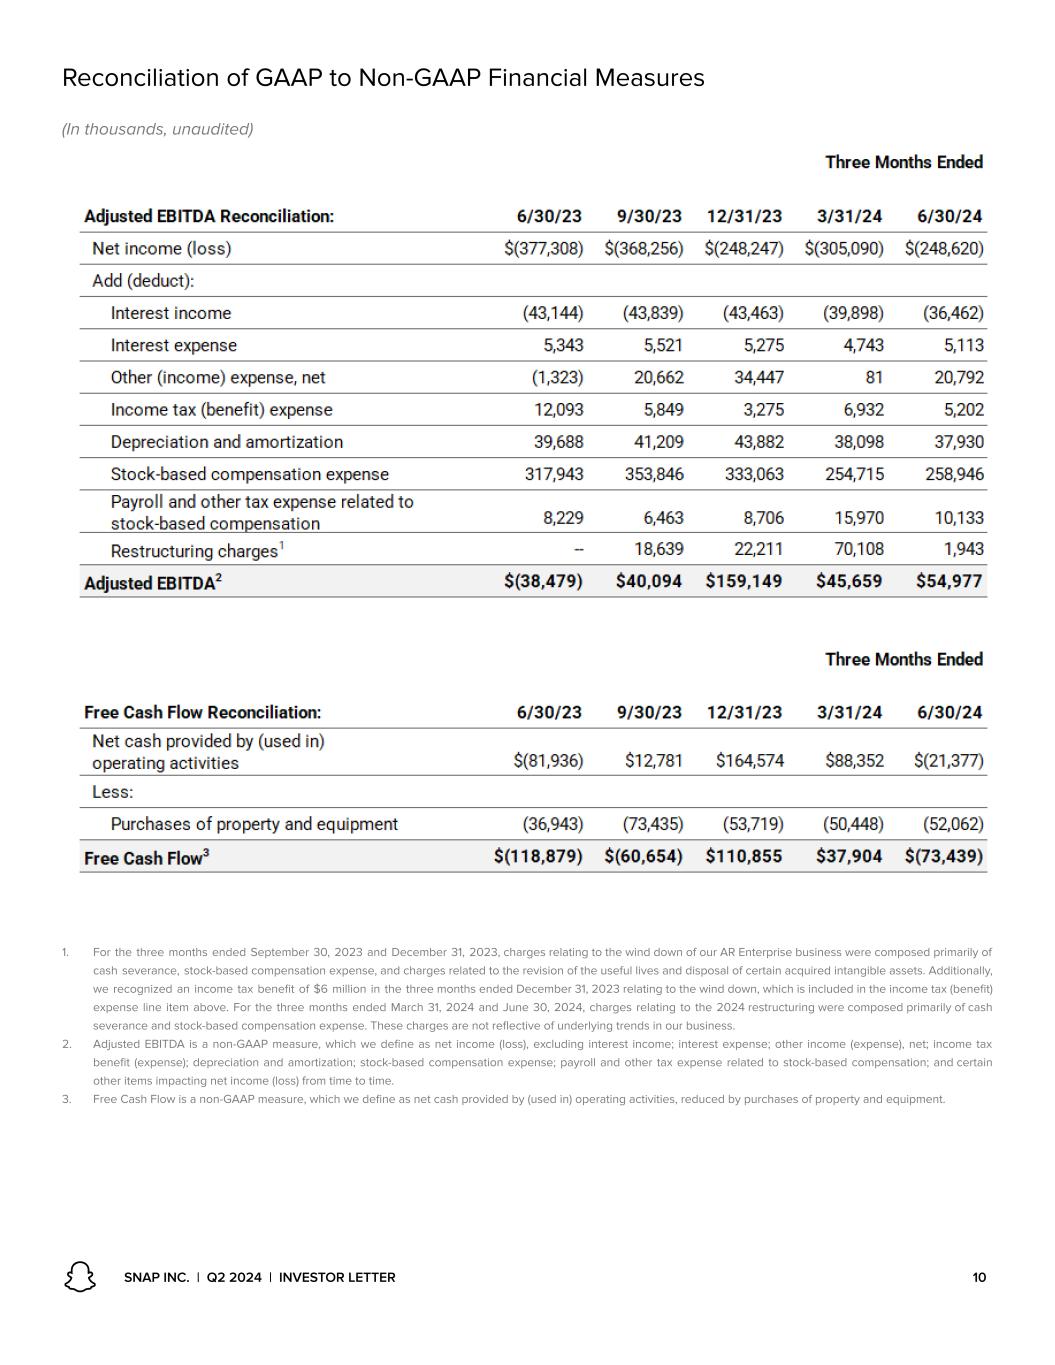
RECONCILIATION OF GAAP TO NON-GAAP FINANCIAL MEASURES
(in thousands, unaudited)
|
|
|
|
|
|
|
|
|
|
|
|
|
|
|
|
|
|
|
|
|
|
|
|
|
Three Months Ended
June 30,
|
|
Six Months Ended
June 30,
|
|
2024 |
|
2023 |
|
2024 |
|
2023 |
| Free Cash Flow reconciliation: |
|
|
|
|
|
|
|
| Net cash provided by (used in) operating activities |
$ |
(21,377) |
|
|
$ |
(81,936) |
|
|
$ |
66,975 |
|
|
$ |
69,166 |
|
| Less: |
|
|
|
|
|
|
|
| Purchases of property and equipment |
(52,062) |
|
|
(36,943) |
|
|
(102,510) |
|
|
(84,573) |
|
| Free Cash Flow |
$ |
(73,439) |
|
|
$ |
(118,879) |
|
|
$ |
(35,535) |
|
|
$ |
(15,407) |
|
|
|
|
|
|
|
|
|
|
|
|
|
|
|
|
|
|
|
|
|
|
|
|
|
|
Three Months Ended
June 30,
|
|
Six Months Ended
June 30,
|
|
2024 |
|
2023 |
|
2024 |
|
2023 |
| Adjusted EBITDA reconciliation: |
|
|
|
|
|
|
|
| Net loss |
$ |
(248,620) |
|
|
$ |
(377,308) |
|
|
$ |
(553,710) |
|
|
$ |
(705,982) |
|
| Add (deduct): |
|
|
|
|
|
|
|
| Interest income |
(36,462) |
|
|
(43,144) |
|
|
(76,360) |
|
|
(81,092) |
|
| Interest expense |
5,113 |
|
|
5,343 |
|
|
9,856 |
|
|
11,228 |
|
| Other (income) expense, net |
20,792 |
|
|
(1,323) |
|
|
20,873 |
|
|
(12,695) |
|
| Income tax (benefit) expense |
5,202 |
|
|
12,093 |
|
|
12,134 |
|
|
18,938 |
|
| Depreciation and amortization |
37,930 |
|
|
39,688 |
|
|
76,028 |
|
|
74,908 |
|
| Stock-based compensation expense |
258,946 |
|
|
317,943 |
|
|
513,661 |
|
|
632,874 |
|
| Payroll and other tax expense related to stock-based compensation |
10,133 |
|
|
8,229 |
|
|
26,103 |
|
|
24,155 |
|
Restructuring charges (1) |
1,943 |
|
|
— |
|
|
72,051 |
|
|
— |
|
| Adjusted EBITDA |
$ |
54,977 |
|
|
$ |
(38,479) |
|
|
$ |
100,636 |
|
|
$ |
(37,666) |
|
(1)Restructuring charges are primarily related to cash severance, stock-based compensation expense, and other charges associated with the 2024 restructuring. These charges are not reflective of underlying trends in our business.
Total depreciation and amortization expense by function:
|
|
|
|
|
|
|
|
|
|
|
|
|
|
|
|
|
|
|
|
|
|
|
|
|
Three Months Ended
June 30,
|
|
Six Months Ended
June 30,
|
|
2024 |
|
2023 |
|
2024 |
|
2023 |
Depreciation and amortization expense (1): |
|
|
|
|
|
|
|
| Cost of revenue |
$ |
1,872 |
|
|
$ |
3,170 |
|
|
$ |
4,022 |
|
|
$ |
6,396 |
|
| Research and development |
22,909 |
|
|
24,847 |
|
|
50,507 |
|
|
48,986 |
|
| Sales and marketing |
5,084 |
|
|
5,605 |
|
|
9,661 |
|
|
10,678 |
|
| General and administrative |
8,065 |
|
|
6,066 |
|
|
15,453 |
|
|
8,848 |
|
| Total |
$ |
37,930 |
|
|
$ |
39,688 |
|
|
$ |
79,643 |
|
|
$ |
74,908 |
|
(1)Depreciation and amortization expense for the six months ended June 30, 2024 includes restructuring charges.
SNAP INC.
RECONCILIATION OF GAAP TO NON-GAAP FINANCIAL MEASURES (continued)
(in thousands, except per share amounts, unaudited)
Total stock-based compensation expense by function:
|
|
|
|
|
|
|
|
|
|
|
|
|
|
|
|
|
|
|
|
|
|
|
|
|
Three Months Ended
June 30,
|
|
Six Months Ended
June 30,
|
|
2024 |
|
2023 |
|
2024 |
|
2023 |
Stock-based compensation expense (1): |
|
|
|
|
|
|
|
| Cost of revenue |
$ |
1,260 |
|
|
$ |
2,365 |
|
|
$ |
3,075 |
|
|
$ |
4,250 |
|
| Research and development |
171,465 |
|
|
217,565 |
|
|
345,984 |
|
|
437,415 |
|
| Sales and marketing |
52,208 |
|
|
57,597 |
|
|
106,864 |
|
|
112,536 |
|
| General and administrative |
34,378 |
|
|
40,416 |
|
|
67,140 |
|
|
78,673 |
|
| Total |
$ |
259,311 |
|
|
$ |
317,943 |
|
|
$ |
523,063 |
|
|
$ |
632,874 |
|
(1)Stock-based compensation expense for the three and six months ended June 30, 2024 includes restructuring charges.
|
|
|
|
|
|
|
|
|
|
|
|
|
|
|
|
|
|
|
|
|
|
|
|
|
Three Months Ended
June 30,
|
|
Six Months Ended
June 30,
|
|
2024 |
|
2023 |
|
2024 |
|
2023 |
| Non-GAAP net income (loss) reconciliation: |
|
|
|
|
|
|
|
| Net loss |
$ |
(248,620) |
|
|
$ |
(377,308) |
|
|
$ |
(553,710) |
|
|
$ |
(705,982) |
|
| Amortization of intangible assets |
14,950 |
|
|
18,405 |
|
|
30,393 |
|
|
36,160 |
|
| Stock-based compensation expense |
258,946 |
|
|
317,943 |
|
|
513,661 |
|
|
632,874 |
|
| Payroll and other tax expense related to stock-based compensation |
10,133 |
|
|
8,229 |
|
|
26,103 |
|
|
24,155 |
|
Restructuring charges (1) |
1,943 |
|
|
— |
|
|
72,051 |
|
|
— |
|
| Income tax adjustments |
(4,020) |
|
|
(269) |
|
|
(6,019) |
|
|
(237) |
|
| Non-GAAP net income (loss) |
$ |
33,332 |
|
|
$ |
(33,000) |
|
|
$ |
82,479 |
|
|
$ |
(13,030) |
|
|
|
|
|
|
|
|
|
| Weighted-average common shares - Diluted |
1,644,736 |
|
1,603,172 |
|
1,646,064 |
|
1,592,365 |
|
|
|
|
|
|
|
|
| Non-GAAP diluted net income (loss) per share reconciliation: |
|
|
|
|
|
|
|
| Diluted net loss per share |
$ |
(0.15) |
|
|
$ |
(0.24) |
|
|
$ |
(0.34) |
|
|
$ |
(0.44) |
|
| Non-GAAP adjustment to net loss |
0.17 |
|
|
0.22 |
|
|
0.39 |
|
|
0.43 |
|
| Non-GAAP diluted net income (loss) per share |
$ |
0.02 |
|
|
$ |
(0.02) |
|
|
$ |
0.05 |
|
|
$ |
(0.01) |
|
(1)Restructuring charges are primarily related to cash severance, stock-based compensation expense, and other charges associated with the 2024 restructuring. These charges are not reflective of underlying trends in our business.
SNAP INC.
SUPPLEMENTAL FINANCIAL INFORMATION AND BUSINESS METRICS
(dollars and shares in thousands, except per user amounts, unaudited)
|
|
|
|
|
|
|
|
|
|
|
|
|
|
|
|
|
|
|
|
|
|
|
|
|
|
|
|
|
|
|
|
|
|
|
|
|
Q1 2023 |
|
Q2 2023 |
|
Q3 2023 |
|
Q4 2023 |
|
Q1 2024 |
|
Q2 2024 |
|
|
|
|
|
|
|
|
|
|
|
|
|
(NM = Not Meaningful) |
| Cash Flows and Shares |
|
|
|
|
|
|
|
|
|
|
|
| Net cash provided by (used in) operating activities |
$ |
151,102 |
|
|
$ |
(81,936) |
|
|
$ |
12,781 |
|
|
$ |
164,574 |
|
|
$ |
88,352 |
|
|
$ |
(21,377) |
|
| Net cash provided by (used in) operating activities - YoY (year-over-year) |
19 |
% |
|
34 |
% |
|
(77) |
% |
|
31 |
% |
|
(42) |
% |
|
74 |
% |
| Net cash provided by (used in) operating activities - TTM (trailing twelve months) |
$ |
208,257 |
|
|
$ |
250,402 |
|
|
$ |
207,238 |
|
|
$ |
246,521 |
|
|
$ |
183,771 |
|
|
$ |
244,330 |
|
| Purchases of property and equipment |
$ |
(47,630) |
|
|
$ |
(36,943) |
|
|
$ |
(73,435) |
|
|
$ |
(53,719) |
|
|
$ |
(50,448) |
|
|
$ |
(52,062) |
|
| Purchases of property and equipment - YoY |
125 |
% |
|
58 |
% |
|
94 |
% |
|
14 |
% |
|
6 |
% |
|
41 |
% |
| Purchases of property and equipment - TTM |
$ |
(155,761) |
|
|
$ |
(169,334) |
|
|
$ |
(204,933) |
|
|
$ |
(211,727) |
|
|
$ |
(214,545) |
|
|
$ |
(229,664) |
|
| Free Cash Flow |
$ |
103,472 |
|
|
$ |
(118,879) |
|
|
$ |
(60,654) |
|
|
$ |
110,855 |
|
|
$ |
37,904 |
|
|
$ |
(73,439) |
|
| Free Cash Flow - YoY |
(3) |
% |
|
19 |
% |
|
(435) |
% |
|
41 |
% |
|
(63) |
% |
|
38 |
% |
| Free Cash Flow - TTM |
$ |
52,496 |
|
|
$ |
81,068 |
|
|
$ |
2,305 |
|
|
$ |
34,794 |
|
|
$ |
(30,774) |
|
|
$ |
14,666 |
|
| Common shares outstanding |
1,595,205 |
|
|
1,616,119 |
|
|
1,638,905 |
|
|
1,645,496 |
|
|
1,643,120 |
|
|
1,653,820 |
|
| Common shares outstanding - YoY |
(2) |
% |
|
(2) |
% |
|
2 |
% |
|
5 |
% |
|
3 |
% |
|
2 |
% |
| Shares underlying stock-based awards |
128,218 |
|
|
149,065 |
|
|
154,525 |
|
|
157,981 |
|
|
146,240 |
|
|
144,315 |
|
| Shares underlying stock-based awards - YoY |
71 |
% |
|
62 |
% |
|
63 |
% |
|
20 |
% |
|
14 |
% |
|
(3) |
% |
| Total common shares outstanding plus shares underlying stock-based awards |
1,723,423 |
|
|
1,765,184 |
|
|
1,793,430 |
|
|
1,803,477 |
|
|
1,789,360 |
|
|
1,798,135 |
|
| Total common shares outstanding plus shares underlying stock-based awards - YoY |
1 |
% |
|
2 |
% |
|
5 |
% |
|
6 |
% |
|
4 |
% |
|
2 |
% |
|
|
|
|
|
|
|
|
|
|
|
|
| Results of Operations |
|
|
|
|
|
|
|
|
|
|
|
| Revenue |
$ |
988,608 |
|
|
$ |
1,067,669 |
|
|
$ |
1,188,551 |
|
|
$ |
1,361,287 |
|
|
$ |
1,194,773 |
|
|
$ |
1,236,768 |
|
| Revenue - YoY |
(7) |
% |
|
(4) |
% |
|
5 |
% |
|
5 |
% |
|
21 |
% |
|
16 |
% |
| Revenue - TTM |
$ |
4,527,728 |
|
|
$ |
4,484,488 |
|
|
$ |
4,544,563 |
|
|
$ |
4,606,115 |
|
|
$ |
4,812,280 |
|
|
$ |
4,981,379 |
|
Revenue by region (1) |
|
|
|
|
|
|
|
|
|
|
|
| North America |
$ |
639,896 |
|
|
$ |
686,829 |
|
|
$ |
786,154 |
|
|
$ |
899,542 |
|
|
$ |
743,131 |
|
|
$ |
767,560 |
|
| North America - YoY |
(16) |
% |
|
(13) |
% |
|
(3) |
% |
|
2 |
% |
|
16 |
% |
|
12 |
% |
| North America - TTM |
$ |
3,117,489 |
|
|
$ |
3,018,637 |
|
|
$ |
2,993,189 |
|
|
$ |
3,012,421 |
|
|
$ |
3,115,656 |
|
|
$ |
3,196,387 |
|
| Europe |
$ |
157,760 |
|
|
$ |
182,109 |
|
|
$ |
200,272 |
|
|
$ |
238,253 |
|
|
$ |
195,844 |
|
|
$ |
229,835 |
|
| Europe - YoY |
(3) |
% |
|
7 |
% |
|
24 |
% |
|
9 |
% |
|
24 |
% |
|
26 |
% |
| Europe - TTM |
$ |
707,805 |
|
|
$ |
719,817 |
|
|
$ |
758,693 |
|
|
$ |
778,394 |
|
|
$ |
816,478 |
|
|
$ |
864,204 |
|
| Rest of World |
$ |
190,952 |
|
|
$ |
198,731 |
|
|
$ |
202,125 |
|
|
$ |
223,492 |
|
|
$ |
255,798 |
|
|
$ |
239,373 |
|
| Rest of World - YoY |
34 |
% |
|
28 |
% |
|
30 |
% |
|
11 |
% |
|
34 |
% |
|
20 |
% |
| Rest of World - TTM |
$ |
702,434 |
|
|
$ |
746,034 |
|
|
$ |
792,681 |
|
|
$ |
815,300 |
|
|
$ |
880,146 |
|
|
$ |
920,788 |
|
| Operating loss |
$ |
(365,264) |
|
|
$ |
(404,339) |
|
|
$ |
(380,063) |
|
|
$ |
(248,713) |
|
|
$ |
(333,232) |
|
|
$ |
(253,975) |
|
| Operating loss - YoY |
(35) |
% |
|
(1) |
% |
|
13 |
% |
|
14 |
% |
|
9 |
% |
|
37 |
% |
| Operating loss - Margin |
(37) |
% |
|
(38) |
% |
|
(32) |
% |
|
(18) |
% |
|
(28) |
% |
|
(21) |
% |
| Operating loss - TTM |
$ |
(1,489,043) |
|
|
$ |
(1,492,442) |
|
|
$ |
(1,437,263) |
|
|
$ |
(1,398,379) |
|
|
$ |
(1,366,347) |
|
|
$ |
(1,215,983) |
|
| Net income (loss) |
$ |
(328,674) |
|
|
$ |
(377,308) |
|
|
$ |
(368,256) |
|
|
$ |
(248,247) |
|
|
$ |
(305,090) |
|
|
$ |
(248,620) |
|
| Net income (loss) - YoY |
9 |
% |
|
11 |
% |
|
(2) |
% |
|
14 |
% |
|
7 |
% |
|
34 |
% |
| Net income (loss) - TTM |
$ |
(1,398,703) |
|
|
$ |
(1,353,944) |
|
|
$ |
(1,362,698) |
|
|
$ |
(1,322,485) |
|
|
$ |
(1,298,901) |
|
|
$ |
(1,170,213) |
|
| Adjusted EBITDA |
$ |
813 |
|
|
$ |
(38,479) |
|
|
$ |
40,094 |
|
|
$ |
159,149 |
|
|
$ |
45,659 |
|
|
$ |
54,977 |
|
| Adjusted EBITDA - YoY |
(99) |
% |
|
(635) |
% |
|
(45) |
% |
|
(32) |
% |
|
NM |
|
243 |
% |
Adjusted EBITDA - Margin (2) |
0.1 |
% |
|
(4) |
% |
|
3 |
% |
|
12 |
% |
|
4 |
% |
|
4 |
% |
| Adjusted EBITDA - TTM |
$ |
313,918 |
|
|
$ |
268,249 |
|
|
$ |
235,703 |
|
|
$ |
161,577 |
|
|
$ |
206,423 |
|
|
$ |
299,879 |
|
(1) Total revenue for geographic reporting is apportioned to each region based on our determination of the geographic location in which advertising impressions are delivered, as this approximates revenue based on user activity. This allocation is consistent with how we determine ARPU.
(2) We define Adjusted EBITDA margin as Adjusted EBITDA divided by GAAP revenue.
SNAP INC.
SUPPLEMENTAL FINANCIAL INFORMATION AND BUSINESS METRICS (continued)
(dollars and shares in thousands, except per user amounts, unaudited)
|
|
|
|
|
|
|
|
|
|
|
|
|
|
|
|
|
|
|
|
|
|
|
|
|
|
|
|
|
|
|
|
|
|
|
|
|
Q1 2023 |
|
Q2 2023 |
|
Q3 2023 |
|
Q4 2023 |
|
Q1 2024 |
|
Q2 2024 |
| Other |
|
|
|
|
|
|
|
|
|
|
|
DAU (in millions) (1) |
383 |
|
|
397 |
|
|
406 |
|
|
414 |
|
|
422 |
|
|
432 |
|
| DAU - YoY |
15 |
% |
|
14 |
% |
|
12 |
% |
|
10 |
% |
|
10 |
% |
|
9 |
% |
| DAU by region (in millions) |
|
|
|
|
|
|
|
|
|
|
|
| North America |
100 |
|
|
101 |
|
|
101 |
|
|
100 |
|
|
100 |
|
|
100 |
|
| North America - YoY |
3 |
% |
|
2 |
% |
|
1 |
% |
|
— |
% |
|
(1) |
% |
|
— |
% |
| Europe |
93 |
|
|
94 |
|
|
95 |
|
|
96 |
|
|
96 |
|
|
97 |
|
| Europe - YoY |
10 |
% |
|
9 |
% |
|
7 |
% |
|
4 |
% |
|
4 |
% |
|
3 |
% |
| Rest of World |
190 |
|
|
202 |
|
|
211 |
|
|
218 |
|
|
226 |
|
|
235 |
|
| Rest of World - YoY |
27 |
% |
|
25 |
% |
|
21 |
% |
|
19 |
% |
|
19 |
% |
|
16 |
% |
| ARPU |
$ |
2.58 |
|
|
$ |
2.69 |
|
|
$ |
2.93 |
|
|
$ |
3.29 |
|
|
$ |
2.83 |
|
|
$ |
2.86 |
|
| ARPU - YoY |
(19) |
% |
|
(16) |
% |
|
(6) |
% |
|
(5) |
% |
|
10 |
% |
|
6 |
% |
| ARPU by region |
|
|
|
|
|
|
|
|
|
|
|
| North America |
$ |
6.37 |
|
|
$ |
6.83 |
|
|
$ |
7.82 |
|
|
$ |
8.96 |
|
|
$ |
7.44 |
|
|
$ |
7.67 |
|
| North America - YoY |
(18) |
% |
|
(14) |
% |
|
(4) |
% |
|
2 |
% |
|
17 |
% |
|
12 |
% |
| Europe |
$ |
1.70 |
|
|
$ |
1.93 |
|
|
$ |
2.11 |
|
|
$ |
2.49 |
|
|
$ |
2.04 |
|
|
$ |
2.36 |
|
| Europe - YoY |
(12) |
% |
|
(2) |
% |
|
15 |
% |
|
5 |
% |
|
20 |
% |
|
22 |
% |
| Rest of World |
$ |
1.00 |
|
|
$ |
0.98 |
|
|
$ |
0.96 |
|
|
$ |
1.03 |
|
|
$ |
1.13 |
|
|
$ |
1.02 |
|
| Rest of World - YoY |
6 |
% |
|
3 |
% |
|
8 |
% |
|
(7) |
% |
|
13 |
% |
|
4 |
% |
| Employees (full-time; excludes part-time, contractors, and temporary personnel) |
5,201 |
|
5,286 |
|
5,367 |
|
5,289 |
|
4,835 |
|
4,719 |
| Employees - YoY |
(15) |
% |
|
(18) |
% |
|
(6) |
% |
|
— |
% |
|
(7) |
% |
|
(11) |
% |
|
|
|
|
|
|
|
|
|
|
|
|
| Depreciation and amortization expense |
|
|
|
|
|
|
|
|
|
|
|
| Cost of revenue |
$ |
3,226 |
|
|
$ |
3,170 |
|
|
$ |
3,184 |
|
|
$ |
3,171 |
|
|
$ |
2,150 |
|
|
$ |
1,872 |
|
| Research and development |
24,139 |
|
|
24,847 |
|
|
26,252 |
|
|
31,040 |
|
|
27,598 |
|
|
22,909 |
|
| Sales and marketing |
5,073 |
|
|
5,605 |
|
|
5,466 |
|
|
10,017 |
|
|
4,577 |
|
|
5,084 |
|
| General and administrative |
2,782 |
|
|
6,066 |
|
|
6,307 |
|
|
8,096 |
|
|
7,388 |
|
|
8,065 |
|
| Total |
$ |
35,220 |
|
|
$ |
39,688 |
|
|
$ |
41,209 |
|
|
$ |
52,324 |
|
|
$ |
41,713 |
|
|
$ |
37,930 |
|
| Depreciation and amortization expense - YoY |
(8) |
% |
|
(50) |
% |
|
14 |
% |
|
8 |
% |
|
18 |
% |
|
(4) |
% |
|
|
|
|
|
|
|
|
|
|
|
|
| Stock-based compensation expense |
|
|
|
|
|
|
|
|
|
|
|
| Cost of revenue |
$ |
1,885 |
|
|
$ |
2,365 |
|
|
$ |
2,640 |
|
|
$ |
2,665 |
|
|
$ |
1,815 |
|
|
$ |
1,260 |
|
| Research and development |
219,850 |
|
|
217,565 |
|
|
234,615 |
|
|
220,996 |
|
|
174,519 |
|
|
171,465 |
|
| Sales and marketing |
54,939 |
|
|
57,597 |
|
|
72,783 |
|
|
70,369 |
|
|
54,656 |
|
|
52,208 |
|
| General and administrative |
38,257 |
|
|
40,416 |
|
|
47,895 |
|
|
39,167 |
|
|
32,762 |
|
|
34,378 |
|
| Total |
$ |
314,931 |
|
|
$ |
317,943 |
|
|
$ |
357,933 |
|
|
$ |
333,197 |
|
|
$ |
263,752 |
|
|
$ |
259,311 |
|
| Stock-based compensation expense - YoY |
14 |
% |
|
— |
% |
|
4 |
% |
|
(26) |
% |
|
(16) |
% |
|
(18) |
% |
(1)Numbers may not foot due to rounding.
