株探米国株
日本語 英語
エドガーで原本を確認する
0001901637 False ☐ ☐ ☐ ☐ 0001901637 2026-04-23 2026-04-23
1
UNITED STATES
SECURITIES AND EXCHANGE COMMISSION
WASHINGTON,
D.C. 20549
__________________________
FORM
8-K
__________________________
CURRENT REPORT
Pursuant to Section 13 or 15(d) of the Securities Exchange Act
of 1934
Date of Report (Date of earliest event reported):
April 23, 2026
__________________________
USCB Financial Holdings, Inc.
(Exact name of Registrant as Specified in Its Charter)
__________________________
Florida
001-41196
87-4070846
(State or Other Jurisdiction
of Incorporation)
(Commission File Number)
(IRS Employer
Identification No.)
2301 N.W. 87th Avenue
,
Doral
,
Florida
33172
(Address of Principal Executive Offices)
(Zip Code)
Registrant’s Telephone
Number, Including Area Code: (
305
)
715-5200
__________________________
Check the appropriate box below if the Form 8-K filing is intended to simultaneously satisfy the filing obligation
of the registrant under
any of the following provisions:
Written communications pursuant
to Rule 425 under the Securities Act (17 CFR 230.425)
Soliciting material pursuant to Rule 14a-12 under the Exchange Act (17 CFR 240.14a
-12)
Pre-commencement communications pursuant to Rule 14d-2(b)
under the Exchange Act (17 CFR 240.14d-2(b))
Pre-commencement communications pursuant to Rule 13e-4(c) under the Exchange
Act (17 CFR 240.13e-4(c))
Securities registered pursuant to Section 12(b) of the Act:
Title of each class
Trading
Symbol(s)
Name of each exchange on which registered
Class A common stock, $1.00 par value per share
USCB
The Nasdaq Stock Market LLC
Indicate by
check mark
whether the
registrant is
an emerging
growth company
as defined
in Rule
405 of
the Securities
Act of
1933
(§ 230.405 of this chapter) or Rule 12b-2 of the Securities Exchange Act of 1934 (§ 240.12b
-2 of this chapter).
Emerging growth company
If
an
emerging
growth
company,
indicate
by
check
mark
if
the
registrant
has
elected
not
to
use
the
extended
transition
period
for
complying with any new or revised financial accounting standards provided
pursuant to Section 13(a) of the Exchange Act.
2
Item 2.02. Results of Operations and Financial Condition.
On April 23, 2026, USCB Financial Holdings, Inc. (the “Company”) issued a press release announcing
its financial results for
the quarter ended March 31, 2026.
A copy of the press release is
furnished as Exhibit 99.1 to
this Current Report on Form 8-K
(“Form
8-K”) and is incorporated herein by reference.
The information in this
Item 2.02, including
Exhibit 99.1 hereto,
is being furnished
and shall not
be deemed “filed”
for purposes
of Section 18 of the
Securities Exchange Act of
1934 (the “Exchange Act”),
or otherwise be subject to
the liability of that section,
and
shall
not
be
deemed
to
be
incorporated
by
reference
into
any
filing
under
the
Securities
Act
of
1933
(the
“Securities
Act”)
or
the
Exchange Act except as expressly set forth by specific reference in such filing to
this Form 8-K.
Item 7.01. Regulation FD Disclosure.
As previously
announced, at 11:00
a.m. ET on
April 24, 2026,
the Company will
hold an earnings
conference call to
discuss
its financial
performance
for the
quarter
ended
March 31,
2026.
A copy
of the
slides forming
the basis
of
the
presentation
is being
furnished as
Exhibit 99.2
to this
Form 8-K
and is
incorporated herein
by reference.
A copy
of the
slides has
also been
posted to
the
Company’s investor relations website,
located at investors.uscenturybank.com.
The information in this
Item 7.01, including
Exhibit 99.2 hereto,
is being furnished
and shall not
be deemed “filed”
for purposes
of Section 18 of the Exchange Act, or otherwise be subject to the liability of that section, and shall not be deemed to be incorporated by
reference into any filing under the
Securities Act or the Exchange Act
except as set forth by
specific reference in such filing to this
Form
8-K.
Item 9.01. Financial Statements and Exhibits.
(d) Exhibits.
Exhibit No.
Description
99.1
99.2
104
Cover Page Interactive Data File (embedded within the Inline XBRL document)
3
SIGNATURE
Pursuant to the requirements of the Securities Exchange Act of 1934, the registrant has duly
caused this report to be signed on
its behalf by the undersigned hereunto duly authorized.
USCB Financial Holdings, Inc.
By:
/s/ Robert Anderson
Name:
Robert Anderson
Title:
Chief Financial Officer
Date: April 23, 2026
EX-99.1 5 exhibit991.htm EX-99.1 exhibit991
exhibit991p1i0
1
Exhibit 99.1
EARNINGS RELEASE
USCB Financial Holdings, Inc. Delivers Record Quarter: $0.51 diluted EPS,
up 33% over prior year. ROAA
1.34%, ROAE 17.07%, and 22% Year‑Over‑Year
Net Income Growth.
MIAMI, FL
– April
23, 2026
– USCB
Financial Holdings,
Inc. (the
“Company”) (NASDAQ:
USCB)
, the
holding company
for
U.S.
Century
Bank
(the
“Bank”),
reported
net
income
of
$9.4
million
or
$0.51
per
fully
diluted
share
for
the
three
months
ended
March 31, 2026, compared with net income of $7.7 million or $0.38 per
fully diluted share for the same period in 2025.
“The Company delivered a record quarter driven by strong core
earnings performance and disciplined balance sheet execution.
Diluted
earnings
per
share
reached
a
record
$0.51,
while
quarterly
ROAA
increased
to
1.34%.
Net
income
increased
22%
year-over-year,
supported by 15.3% growth in net interest income, reflecting effective asset deployment and continued margin resilience. Credit quality
remained strong, underscoring the strength of the Company’s underwriting standards and risk management
framework,” said Luis de la
Aguilera, Chairman, President, and CEO.
Unless otherwise stated, all percentage comparisons in the bullet points below are calculated at or for the quarter ended March 31, 2026
compared to at or for the quarter ended March 31, 2025 and annualized
where appropriate.
Profitability
Annualized return
on average
assets for
the quarter
ended March 31,
2026 was
1.34% compared
to 1.19%
for the first
quarter of
2025.
Annualized return on average stockholders’
equity for the quarter ended March 31,
2026 was 17.07% compared to
14.15% for the
first quarter of 2025.
The efficiency ratio for the quarter ended March 31, 2026
was 52.34% compared to 52.79% for the first quarter of 2025.
Net interest margin for the quarter ended March 31, 2026 was 3.27
%
compared to 3.10% for the first quarter of 2025.
Net interest income before
provision for credit losses was $22.0
million for the quarter ended
March 31, 2026, an increase of
$2.9
million or 15.3% compared to $19.1 million for the same period in 2025.
The Company recognized
a $619 thousand income
tax benefit in the
first quarter of 2026
due to an adjustment
to the deferred
tax
asset calculation from 2025.
Balance Sheet
Total assets were $2.8 billion at March 31, 2026, representing an increase of $168.4 million or 6.3% from $2.7 billion at March 31,
2025.
Total loans held for investment were $2.2 billion at March 31, 2026, representing an increase of $204.8 million or
10.1% from $2.0
billion at March 31, 2025.
Total
deposits
were
$2.5 billion
at
March 31,
2026,
representing
an
increase
of
$184.0 million
or
8.0%
from
$2.3
billion
at
March 31, 2025.
Total
stockholders’
equity
was $223.2
million
at March 31,
2026,
representing
a decrease
of $1.8
million
or 0.8%
from $225.1
million at March 31,
2025. Total stockholders’ equity included accumulated
other comprehensive loss of
$31.3 million at
March 31,
2026 compared to
accumulated other
comprehensive loss of
$41.1 million at
March 31, 2025. The
decrease in total
stockholders’
equity was
driven primarily
by the
repurchase of
2.0 million
shares of
Class A
common
stock conducted
in September
2025
as
previously disclosed.
2
Asset Quality
The
allowance
for
credit
losses
(“ACL”)
increased
by
$1.4
million
to
$26.1
million
at
March 31,
2026
from
$24.7
million
at
March 31, 2025.
The ACL represented 1.16% of total loans at March 31, 2026 and 1.22%
of total loans at March 31, 2025.
The provision for credit
loss was $801 thousand
for the quarter ended
March 31, 2026, an increase
of $120 thousand compared
to
$681 thousand for the same period in 2025.
The ratio of non-performing loans to
total loans was 0.16% for the quarter
ended March 31, 2026 and 0.20% for the
quarter ended
March 31, 2025. Non-performing loans totaled $3.6 million at March 31,
2026 and $4.2 million at March 31, 2025.
Non-interest Income and Non-interest Expense
Non-interest income was $4.2
million for the three
months ended March 31, 2026,
an increase of
$434 thousand or 11.7% compared
to $3.7 million for the same period in 2025.
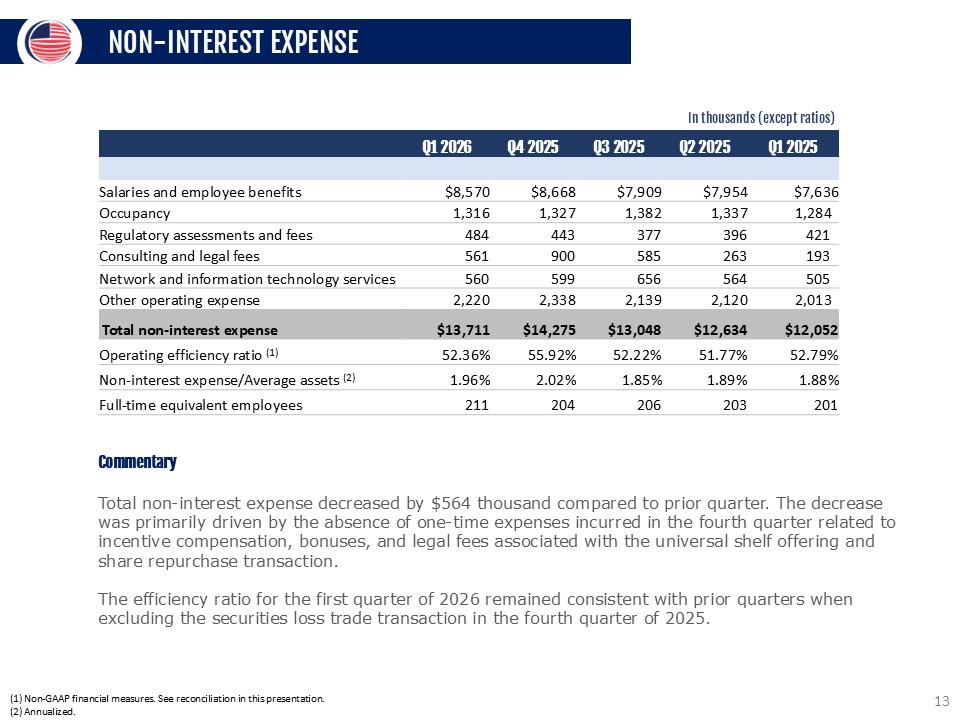
Non-interest expense was $13.7 million for the
three months ended March 31, 2026, an
increase of $1.7 million or
13.8% compared
to $12.1 million for the three months ended March 31, 2025.
Capital
On April
20, 2026,
the Company’s
Board of
Directors declared
a quarterly
cash dividend
of $0.125
per share
of the
Company’s
Class A
common stock.
The dividend
will be paid
on June 5,
2026 to
shareholders of
record at
the close
of business
on May
15,
2026.
As of March 31, 2026,
total risk-based capital ratios for the Company and the Bank were 14.09% and 13.96%, respectively, well in
excess of regulatory requirements (only applicable to the Bank currently)
.
Tangible book value per common
share (non-GAAP financial measure) was $12.23 at March 31, 2026, representing an increase of
$1.00 or 8.9% from $11.23 at March 31, 2025. At March 31, 2026,
tangible book value per common share was negatively affected
by ($1.72) per
share due to
an accumulated other
comprehensive loss of
$31.3 million mostly
due to changes
in the market
value
of the Company’s
available for sale securities. At March 31, 2025,
tangible book value per common share was negatively
affected
by ($2.05) per share due to an accumulated other comprehensive loss of $41.1
million.
Conference Call and Webcast
The Company
will host
a conference
call on
Friday,
April 24,
2026, at
11:00
a.m. Eastern Time
to discuss
the Company’s
unaudited
financial results for the quarter ended March 31,
2026. To access the conference call, dial (833) 816-1416 (U.S. toll-free) and
ask to join
the USCB Financial Holdings Call.
Additionally,
interested
parties can
listen to
a live
webcast
of the
call in
the “Investor
Relations” section
of the
Company’s
website
at www.uscentury.com
.
An archived version of the webcast will be available in the same location shortly after
the live call has ended.
About USCB Financial Holdings, Inc.
USCB Financial Holdings, Inc.
is the bank holding company for
U.S. Century Bank. Established in
2002, U.S. Century Bank is one
of
the largest
community banks
headquartered
in Miami,
and one
of the
largest community
banks in
the State
of Florida.
U.S. Century
Bank is rated 5-Stars by BauerFinancial, the nation’s leading independent
bank rating firm. U.S. Century Bank offers customers a wide
range of
financial products
and services
and supports
numerous community
organizations,
including
the Greater
Miami Chamber
of
Commerce, the South Florida Hispanic Chamber of Commerce, and ChamberSouth. For more information about us
or to find a banking
center near you, please call (305) 715-5200 or visit www.uscentury.com.
Forward-Looking Statements
This earnings release
may contain statements
that are not
historical in nature
and are intended
to be, and
are hereby identified
as, forward-
looking
statements
for
purposes
of
the
safe
harbor
provided
by
Section
21E
of
the
Securities
Exchange
Act
of
1934,
as
amended.
Forward-looking statements are
those that are
not historical facts.
The words “may,”
“will,” “anticipate,” “could,”
“should,” “would,”
“believe,” “contemplate,” “expect,” “aim,” “plan,” “estimate,” “seek,” “continue,” and “intend,”, the negative of these terms, as well as
other similar words
and expressions of
the future, are
intended to identify
forward-looking statements. These forward-looking statements
include, but are not limited
to, statements related to our
projected growth, anticipated future
financial performance, and management’s
3
long-term performance goals, as well as statements
relating to the anticipated effects on our results of
operations and financial condition
from expected or
potential developments or events,
or business and
growth strategies, including anticipated
internal growth and potential
future additional balance sheet restructuring.
These forward-looking statements involve significant risks and uncertainties that could cause our actual
results to differ materially from
those anticipated in such statements. Potential risks and uncertainties include,
but are not limited to:
the strength of the United States economy in general and the strength of the local economies in
which we conduct operations;
our ability to successfully manage interest rate risk, credit risk, liquidity risk,
and other risks inherent to our industry;
the accuracy of our financial statement
estimates and assumptions, including the
estimates used for our allowance for
credit losses
and deferred tax asset valuation allowance;
the efficiency and effectiveness of our internal
control procedures and processes;
our ability to comply with
the extensive laws and
regulations to which we are
subject, including the laws for
each jurisdiction where
we operate;
adverse changes or conditions in capital and financial markets, including
actual or potential stresses in the banking industry;
deposit attrition and the level of our uninsured deposits;
legislative
or
regulatory
changes,
including
the
enactment
of
the
One
Big
Beautiful
Bill
and
changes
in
accounting
principles,
policies, practices or guidelines, including the on-going effects of
the Current Expected Credit Losses (“CECL”) standard;
the
lack
of
a
significantly
diversified
loan
portfolio
and
our
concentration
in
the
South
Florida
market,
including
the
risks
of
geographic,
depositor,
and
industry
concentrations,
including
our
concentration
in
loans
secured
by
real
estate,
in
particular,
commercial real estate;
the effects of climate change;
the concentration of ownership of our common stock;
fluctuations in the price of our common stock;
our ability to
fund or access
the capital markets
at attractive rates
and terms and
manage our growth,
both organic
growth as well
as growth through other means, such as future acquisitions;
inflation, interest rate, unemployment rate, and market and monetary
fluctuations;
the effects of potential new or increased tariffs,
retaliatory tariffs and trade restrictions;
the impact of international hostilities and geopolitical events;
increased competition
and its effect
on the pricing
of our products
and services as
well as our
interest rate spread
and net interest
margin;
the loss of key employees;
the effectiveness
of our risk management
strategies, including operational
risks, including, but
not limited to, client,
employee, or
third-party fraud and security breaches; and
other risks described in this earnings release and other filings we make with the
Securities and Exchange Commission (“SEC”).
All forward-looking
statements are
necessarily only
estimates of
future results,
and there
can be
no assurance
that actual
results will
not differ
materially from
expectations. Therefore,
you are
cautioned not
to place
undue reliance
on any
forward-looking statements.
Further, forward-looking statements included in this
earnings release are
made only as
of the date
hereof, and we
undertake no obligation
to update or revise any forward-looking statement to reflect events
or circumstances after the date on which the statements are made
or
to reflect the occurrence of unanticipated
events, unless required to do
so under the federal securities laws.
You
should also review the
risk factors described in the reports the Company has filed or will file with the
SEC.
Non-GAAP Financial Measures
This earnings release
includes financial information determined
by methods other
than in accordance
with generally accepted
accounting
principles (“GAAP”). This financial
information includes certain
operating performance measures. Management
has included these non-
GAAP
measures
because
it
believes
these
measures
may
provide
useful
supplemental
information
for
evaluating
the
Company’s
operations and
underlying performance
trends. Further,
management uses these
measures in
managing and
evaluating the Company’s
business and intends to refer to
them in discussions about our operations
and performance. Operating performance
measures should be
viewed
in
addition
to,
and
not
as
an
alternative
to
or
substitute
for,
measures
determined
in
accordance
with
GAAP,
and
are
not
necessarily
comparable
to
non-GAAP
measures
that
may
be
presented
by
other
companies.
Reconciliations
of
these
non-GAAP
measures
to
the most
directly
comparable
GAAP measures
can be
found
in the
‘Non-GAAP
Reconciliation
Tables’
included
in the
exhibits to this earnings release.
All numbers included in this press release are unaudited unless otherwise noted.
4
Contacts:
Investor Relations
InvestorRelations@uscentury.com
Media Relations
Martha Guerra-Kattou
MGuerra@uscentury.com
5
USCB FINANCIAL HOLDINGS, INC.
CONSOLIDATED STATEMENTS
OF INCOME (UNAUDITED)
(Dollars in thousands, except per share data)
Three Months Ended March 31,
2026
2025
Interest income:
Loans, including fees
$
32,789
$
30,245
Investment securities
3,411
3,024
Interest-bearing deposits in financial institutions
832
709
Total interest income
37,032
33,978
Interest expense:
Interest-bearing checking deposits
310
338
Savings and money market deposits
8,133
9,335
Time deposits
4,700
3,918
FHLB advances
1,040
1,272
Subordinated notes
801
-
Total interest expense
14,984
14,863
Net interest income before provision for credit losses
22,048
19,115
Provision for credit losses
801
681
Net interest income after provision for credit losses
21,247
18,434
Non-interest income:
Service fees
3,100
2,331
Gain on sale of securities available for sale, net
14
-
Gain on sale of loans held for sale, net
106
525
Other non-interest income
930
860
Total non-interest income
4,150
3,716
Non-interest expense:
Salaries and employee benefits
8,570
7,636
Occupancy
1,316
1,284
Regulatory assessments and fees
484
421
Consulting and legal fees
561
193
Network and information technology services
560
505
Other operating expense
2,220
2,013
Total non-interest expense
13,711
12,052
Income before income tax expense
11,686
10,098
Income tax expense
2,335
2,440
Net income
$
9,351
$
7,658
Per share information:
Net income per common share, basic
$
0.51
$
0.38
Net income per common share, diluted
$
0.51
$
0.38
Cash dividends declared
$
0.125
$
0.10
Weighted average shares outstanding:
Common shares, basic
18,214,041
20,020,933
Common shares, diluted
18,454,006
20,319,535
6
USCB FINANCIAL HOLDINGS, INC.
SELECTED FINANCIAL DATA (UNAUDITED)
(Dollars in thousands, except per share data)
As of or For the Three Months Ended
3/31/2026
12/31/2025
9/30/2025
6/30/2025
3/31/2025
Income statement data:
Net interest income before provision for credit losses
$
22,048
$
22,207
$
21,274
$
21,034
$
19,115
Provision for credit losses
801
480
105
1,031
681
Net interest income after provision for credit losses
21,247
21,727
21,169
20,003
18,434
Service fees
3,100
2,209
2,661
2,402
2,331
Gain (loss) on sale of securities available for sale, net
14
(7,498)
(28)
-
-
Gain on sale of loans held for sale, net
106
197
128
151
525
Other non-interest income
930
914
923
817
860
Total non-interest income
4,150
(4,178)
3,684
3,370
3,716
Salaries and employee benefits
8,570
8,668
7,909
7,954
7,636
Occupancy
1,316
1,327
1,382
1,337
1,284
Regulatory assessments and fees
484
443
377
396
421
Consulting and legal fees
561
900
585
263
193
Network and information technology services
560
599
656
564
505
Other operating expense
2,220
2,338
2,139
2,120
2,013
Total non-interest expense
13,711
14,275
13,048
12,634
12,052
Net income before income tax expense
11,686
3,274
11,805
10,739
10,098
Income tax expense
2,335
1,911
2,866
2,599
2,440
Net income
$
9,351
$
1,363
$
8,939
$
8,140
$
7,658
Per share information:
Net income per common share, basic
$
0.51
$
0.08
$
0.46
$
0.41
$
0.38
Net income per common share, diluted
$
0.51
$
0.07
$
0.45
$
0.40
$
0.38
Cash dividends declared
$
0.125
$
0.10
$
0.10
$
0.10
$
0.10
Balance sheet data (at period-end):
Cash and cash equivalents
$
78,963
$
38,477
$
56,811
$
54,819
$
97,984
Securities available-for-sale
$
277,160
$
307,490
$
324,179
$
285,382
$
275,139
Securities held-to-maturity
$
149,931
$
153,941
$
156,365
$
158,740
$
161,790
Total securities
$
427,091
$
461,431
$
480,544
$
444,122
$
436,929
Loans held for investment
(1)
$
2,241,051
$
2,189,257
$
2,130,966
$
2,113,318
$
2,036,212
Allowance for credit losses
$
(26,102)
$
(25,500)
$
(24,964)
$
(24,933)
$
(24,740)
Total assets
$
2,845,735
$
2,791,540
$
2,767,945
$
2,719,474
$
2,677,382
Non-interest-bearing demand deposits
$
620,714
$
583,860
$
584,240
$
584,895
$
605,489
Interest-bearing deposits
$
1,872,866
$
1,761,220
$
1,871,374
$
1,750,766
$
1,704,080
Total deposits
$
2,493,580
$
2,345,080
$
2,455,614
$
2,335,661
$
2,309,569
FHLB advances
$
53,000
$
158,250
$
11,000
$
108,000
$
108,000
Subordinated notes
$
39,338
$
39,300
$
39,262
$
-
$
-
Total liabilities
$
2,622,489
$
2,574,357
$
2,558,850
$
2,487,891
$
2,452,294
Total stockholders' equity
$
223,246
$
217,183
$
209,095
$
231,583
$
225,088
Capital ratios:
(2)
Leverage ratio
8.61%
8.46%
8.47%
9.72%
9.61%
Common equity tier 1 capital
11.09%
10.92%
11.17%
12.52%
12.48%
Tier 1 risk-based capital
11.09%
10.92%
11.17%
12.52%
12.48%
Total risk-based capital
14.09%
13.91%
14.20%
13.73%
13.72%
(1)
Loan amounts include deferred fees/costs.
(2)
Reflects the Company's regulatory capital ratios which
are provided for informational purposes only; as a small
bank holding company, the Company is not subject
to regulatory capital requirements. The Bank's total risk-based
capital at March 31, 2026 was 13.96%.
7
USCB FINANCIAL HOLDINGS, INC.
AVERAGE BALANCES, RATIOS, AND OTHER DATA
(UNAUDITED)
(Dollars in thousands)
As of or For the Three Months Ended
3/31/2026
12/31/2025
9/30/2025
6/30/2025
3/31/2025
Average balance sheet data:
Cash and cash equivalents
$
112,107
$
82,338
$
139,389
$
71,388
$
82,610
Securities available-for-sale
$
295,065
$
332,356
$
299,892
$
281,840
$
265,154
Securities held-to-maturity
$
152,144
$
155,269
$
157,702
$
160,443
$
163,510
Total securities
$
447,209
$
487,625
$
457,594
$
442,283
$
428,664
Loans held for investment
(1)
$
2,177,734
$
2,130,898
$
2,099,043
$
2,057,445
$
1,986,856
Total assets
$
2,834,717
$
2,799,863
$
2,798,115
$
2,677,198
$
2,606,593
Interest-bearing deposits
$
1,842,283
$
1,857,218
$
1,887,545
$
1,710,568
$
1,652,147
Non-interest-bearing demand deposits
$
584,784
$
595,969
$
569,522
$
580,121
$
563,040
Total deposits
$
2,427,067
$
2,453,187
$
2,457,067
$
2,290,689
$
2,215,187
FHLB advances
$
110,045
$
51,462
$
40,065
$
116,527
$
138,944
Subordinated notes
$
39,313
$
39,287
$
26,029
$
-
$
-
Total liabilities
$
2,612,491
$
2,587,470
$
2,572,799
$
2,448,706
$
2,387,088
Total stockholders' equity
$
222,226
$
212,393
$
225,316
$
228,492
$
219,505
Performance ratios:
Return on average assets
(2)
1.34%
0.19%
1.27%
1.22%
1.19%
Return on average equity
(2)
17.07%
2.55%
15.74%
14.29%
14.15%
Net interest margin
(2)
3.27%
3.27%
3.14%
3.28%
3.10%
Non-interest income to average assets
(2)
0.59%
(0.59)%
0.52%
0.50%
0.58%
Non-interest expense to average assets
(2)
1.96%
2.02%
1.85%
1.89%
1.88%
Efficiency ratio
(3)
52.34%
79.18%
52.28%
51.77%
52.79%
Loans by type (at period end):
(4)
Residential real estate
$
346,917
$
307,692
$
316,557
$
307,020
$
301,164
Commercial real estate
$
1,259,642
$
1,244,835
$
1,226,121
$
1,206,621
$
1,150,129
Commercial and industrial
$
291,333
$
295,548
$
269,430
$
263,966
$
256,326
Correspondent banks
$
128,722
$
127,968
$
104,598
$
110,155
$
103,026
Consumer and other
$
207,794
$
207,215
$
207,939
$
218,426
$
218,711
Asset quality data:
Allowance for credit losses to total loans
1.16%
1.16%
1.17%
1.18%
1.22%
Allowance for credit losses to non-performing loans
717%
813%
1906%
1825%
595%
Total non-performing loans
(5)
$
3,640
$
3,138
$
1,310
$
1,366
$
4,156
Non-performing loans to total loans
0.16%
0.14%
0.06%
0.06%
0.20%
Non-performing assets to total assets
(5)
0.13%
0.11%
0.05%
0.05%
0.16%
Net charge-offs (recoveries of) to average loans
(2)
(0.00)%
(0.00)%
(0.00)%
0.14%
0.00%
Net charge-offs (recovery) of credit losses
$
(4)
$
(11)
$
(4)
$
702
$
2
Interest rates and yields:
(2)
Loans held for investment
6.11%
6.16%
6.21%
6.23%
6.17%
Investment securities
3.05%
3.01%
3.03%
3.06%
2.81%
Total interest-earning assets
5.49%
5.54%
5.56%
5.64%
5.51%
Deposits
(6)
2.20%
2.28%
2.53%
2.46%
2.49%
FHLB advances
3.83%
3.91%
3.73%
3.72%
3.71%
Subordinated notes
8.26%
8.09%
6.16%
-
-
Total interest-bearing liabilities
3.05%
3.14%
3.34%
3.32%
3.37%
Other information:
Full-time equivalent employees
211
204
206
203
201
(1)
Loan amounts include deferred fees/costs.
(2)
Annualized.
(3)
Efficiency ratio is defined as total non-interest expense divided
by sum of net interest income and total non-interest
income.
(4)
Loan amounts exclude deferred fees/costs.
(5)
The amounts for total non-performing loans and total non-performing
assets are the same at the dates presented since there was
no other real estate owned (OREO)
recorded at any of the dates presented.
(6) Reflects effect of non-interest-bearing deposits.
8
USCB FINANCIAL HOLDINGS, INC.
NET INTEREST MARGIN (UNAUDITED)
(Dollars in thousands)
Three Months Ended March 31,
2026
2025
Average
Balance
Interest
Yield/Rate
(1)
Average
Balance
Interest
Yield/Rate
(1)
Assets
Interest-earning assets:
Loans held for investment
(2)
$
2,177,734
$
32,789
6.11%
$
1,986,856
$
30,245
6.17%
Investment securities
(3)
454,262
3,411
3.05%
436,935
3,024
2.81%
Other interest-earning assets
105,457
832
3.20%
75,182
709
3.82%
Total interest-earning assets
2,737,453
37,032
5.49%
2,498,973
33,978
5.51%
Non-interest-earning assets
97,264
107,620
Total assets
$
2,834,717
$
2,606,593
Liabilities and stockholders' equity
Interest-bearing liabilities:
Interest-bearing checking deposits
$
52,099
310
2.41%
$
53,611
338
2.56%
Saving and money market deposits
1,256,418
8,133
2.63%
1,199,027
9,335
3.16%
Time deposits
533,766
4,700
3.57%
399,509
3,918
3.98%
Total interest-bearing deposits
1,842,283
13,143
2.89%
1,652,147
13,591
3.34%
FHLB advances
110,045
1,040
3.83%
138,944
1,272
3.71%
Subordinated notes
39,313
801
8.26%
-
-
- %
Total interest-bearing liabilities
1,991,641
14,984
3.05%
1,791,091
14,863
3.37%
Non-interest-bearing demand deposits
584,784
563,040
Other non-interest-bearing liabilities
36,066
32,957
Total liabilities
2,612,491
2,387,088
Stockholders' equity
222,226
219,505
Total liabilities and stockholders' equity
$
2,834,717
$
2,606,593
Net interest income
$
22,048
$
19,115
Net interest spread
(4)
2.44%
2.14%
Net interest margin
(5)
3.27%
3.10%
(1)
Annualized.
(2)
Average loan balances include non-accrual loans. Interest income on loans includes accretion
of deferred loan fees, net of deferred loan costs.
(3)
At fair value except for securities held to maturity. This amount includes
FHLB stock.
(4)
Net interest spread is the average yield earned on total
interest-earning assets minus the average rate paid on total interest-bearing
liabilities.
(5)
Net interest margin is the ratio of net interest income to total
interest-earning assets.
9
USCB FINANCIAL HOLDINGS, INC.
NON-GAAP FINANCIAL MEASURES (UNAUDITED)
(Dollars in thousands)
As of or For the Three Months Ended
3/31/2026
12/31/2025
9/30/2025
6/30/2025
3/31/2025
Pre-tax pre-provision ("PTPP") income:
(1)
Net income
$
9,351
$
1,363
$
8,939
$
8,140
$
7,658
Plus: Income tax expense
2,335
1,911
2,866
2,599
2,440
Plus: Provision for credit losses
801
480
105
1,031
681
PTPP income
$
12,487
$
3,754
$
11,910
$
11,770
$
10,779
PTPP return on average assets:
(1)
PTPP income
$
12,487
$
3,754
$
11,910
$
11,770
$
10,779
Average assets
$
2,834,717
$
2,799,863
$
2,798,115
$
2,677,198
$
2,606,593
PTPP return on average assets
(2)
1.79%
0.53%
1.69%
1.76%
1.68%
Operating net income:
(1)
Net income
$
9,351
$
1,363
$
8,939
$
8,140
$
7,658
Less: Net gains (losses) on sale of securities
14
(7,498)
(28)
-
-
Less: Tax effect on sale of securities
(4)
1,900
7
-
-
Plus: Tax (benefit) liability expense from prior periods
(619)
(3)
1,096
(4)
-
-
-
Operating net income
$
8,722
$
8,057
$
8,960
$
8,140
$
7,658
Operating return on average assets:
(1)
Operating net income
$
8,722
$
8,057
$
8,960
$
8,140
$
7,658
Average assets
$
2,834,717
$
2,799,863
$
2,798,115
$
2,677,198
$
2,606,593
Operating net income return on average assets
(2)
1.25%
1.14%
1.27%
1.22%
1.19%
Operating return on average equity:
(1)
Operating net income
$
8,722
$
8,057
$
8,960
$
8,140
$
7,658
Average equity
$
222,226
$
212,393
$
225,316
$
228,492
$
219,505
Operating net income return on average equity
(2)
15.92%
15.05%
15.78%
14.29%
14.15%
Operating revenue:
(1)
Net interest income
$
22,048
$
22,207
$
21,274
$
21,034
$
19,115
Non-interest income
4,150
(4,178)
3,684
3,370
3,716
Less: Net gains (losses) on sale of securities
14
(7,498)
(28)
-
-
Operating revenue
$
26,184
$
25,527
$
24,986
$
24,404
$
22,831
Operating efficiency ratio:
(1)
Total non-interest expense
$
13,711
$
14,275
$
13,048
$
12,634
$
12,052
Operating revenue
$
26,184
$
25,527
$
24,986
$
24,404
$
22,831
Operating efficiency ratio
52.36%
55.92%
52.22%
51.77%
52.79%
(1) The Company believes these non-GAAP financial measurements
are key indicators of the ongoing earnings power of the
Company.
(2)
Annualized.
(3)
The Company recognized a $619 thousand income tax
benefit in first quarter of 2026 due to an adjustment
to the deferred tax asset calculation from 2025.
(4) State tax liability expenses for 2024 and for the
first three quarters of 2025 were recognized during the fourth
quarter of 2025. The state tax expense is related to
taxes due on interest income on loans whose collateral are
located outside of the State of Florida.
10
USCB FINANCIAL HOLDINGS, INC.
NON-GAAP FINANCIAL MEASURES (UNAUDITED)
(Dollars in thousands, except per share data)
As of or For the Three Months Ended
3/31/2026
12/31/2025
9/30/2025
6/30/2025
3/31/2025
Tangible book value per common share (at period-end):
(1)(4)
Total stockholders' equity
$
223,246
$
217,183
$
209,095
$
231,583
$
225,088
Less: Intangible assets
-
-
-
-
-
Tangible stockholders' equity
$
223,246
$
217,183
$
209,095
$
231,583
$
225,088
Total shares issued and outstanding (at period-end):
Total common shares issued and outstanding
18,257,400
18,137,885
18,107,385
20,078,385
20,048,385
Tangible book value per common share
(2)
$
12.23
$
11.97
$
11.55
$
11.53
$
11.23
Operating diluted net income per common share:
(1)
Operating net income
$
8,722
$
8,057
$
8,960
$
8,140
$
7,658
Total weighted average diluted shares of common stock
18,454,006
18,348,725
19,755,820
20,295,794
20,319,535
Operating diluted net income per common share:
$
0.47
$
0.44
$
0.45
$
0.40
$
0.38
Tangible Common Equity/Tangible Assets
(1)(4)
Tangible stockholders' equity
$
223,246
$
217,183
$
209,095
$
231,583
$
225,088
Tangible total assets
(3)
$
2,845,735
$
2,791,540
$
2,767,945
$
2,719,474
$
2,677,382
Tangible Common Equity/Tangible Assets
7.84%
7.78%
7.55%
8.52%
8.41%
(1)
The Company believes these non-GAAP financial measurements
are key indicators of the ongoing earnings power of the
Company.
(2)
Excludes the dilutive effect, if any, of shares of common stock issuable upon exercise of outstanding
stock options.
(3) Since the Company has no intangible assets, tangible
stockholders’ equity and tangible total assets are the
same amounts as stockholders’ equity and total assets,
respectively, as calculated under GAAP.
(4) The decrease in total stockholders’ equity was driven primarily
by the repurchase of 2.0 million shares of Class A
common stock conducted in September 2025.
EX-99.2 7 exhibit992.htm EX-99.2 exhibit992
exhibit992p1i0
Exhibit 99.2
exhibit992p2i0
USCB FINANCIAL HOLDINGS EARNINGS PRESENTATION FIRST QUARTER 2026 NASDAQ: USCB FORWARD-LOOKING STATEMENTS This presentation may contain statements that are not historical in nature and are intended to be, and are hereby identified as, forward-looking statements for purposes of the safe harbor provided by Section 21E of the Securities Exchange Act of 1934, as amended. Forward-looking statements are those that are not historical facts. The words “may,” “will,” “anticipate,” “could,” “ should,” “would,” “believe,” “contemplate,” “expect,” “aim,” “plan,” “estimate,” “continue,” “seek,” and “intend,” the negative of these terms, as well as other similar words and expressions of the future, are intended to identify forward-looking statements. These forward-looking statements include, but are not limited to, statements related to our projected growth, anticipated future financial performance, and management’s long-term performance goals, as well as statements relating to the anticipated effects on our results of operations and financial condition from expected or potential developments or events, or business and growth strategies, including anticipated internal growth and potential future additional balance sheet restructuring. All numbers included in this presentation are unaudited unless otherwise noted. These forward-looking statements involve significant risks and uncertainties that could cause our actual results to differ materially from those anticipated in such statements. Potential risks and uncertainties include, but are not limited to: the strength of the United States economy in general and the strength of the local economies in which we conduct operations; our ability to successfully manage interest rate risk, credit risk, liquidity risk, and other risks inherent to our industry; the accuracy of our financial statement estimates and assumptions, including the estimates used for our allowance for credit losses and deferred tax asset valuation allowance; the efficiency and effectiveness
of our internal control procedures and processes; our ability to comply
with the extensive laws and regulations to which we are subject,
including the laws for each jurisdiction where we operate;
adverse changes or conditions in the capital and financial markets,
including actual or potential stresses in the banking industry;
deposit attrition and the level of our uninsured deposits; legislative
or regulatory changes and changes, including the enactment
of the One Big Beautiful Bill, in accounting principles, policies, practices
or guidelines, including the on-going effects of the implementation
of the Current Expected Credit Losses (“CECL”) standard;
the lack of a significantly diversified loan portfolio and our concentration
in the South Florida market, including the risks of geographic, depositor,
and industry concentrations, including our concentration in
loans secured by real estate, in particular, commercial real estate;
the effects of climate change; the concentration of ownership
of our common stock; fluctuations in the price of our common
stock; our ability to fund or access the capital markets at attractive
rates and terms and manage our growth, both organic growth as
well as growth through other means, such as future acquisitions;
inflation, interest rate, unemployment rate, and market and monetary
fluctuations; the effects of potential new or increased tariffs,
retaliatory tariffs and trade restrictions; the impact of international hostilities
and geopolitical events; increased competition and its effect
on the pricing of our products and services as well as our net interest rate
spread and net interest margin; the loss of key employees; the effectiveness
of our risk management strategies, including operational risks, including,
but not limited to, client, employee, or fourth-party fraud and security
breaches; and other risks described in this presentation and other filings
we make with the Securities and Exchange Commission
(“SEC”). All forward-looking statements are necessarily only estimates of future results, and there can be no assurance that actual results will not differ materially from expectations. Therefore, you are cautioned not to place undue reliance on any forward-looking statements. Further, forward-looking statements included in this presentation are made only as of the date hereof, and we undertake no obligation to update or revise any forward-looking statements to reflect events or circumstances occurring after the date on which the statements are made or to reflect the occurrence of unanticipated events, unless required to do so under the federal securities laws. You should also review the risk factors described in the reports USCB Financial Holdings, Inc. has filed or will file with the SEC. Non-GAAP Financial Measures This presentation includes financial information determined by methods other than in accordance with generally accepted accounting principles (“GAAP”). This financial information includes certain operating performance measures. Management has included these non-GAAP financial measures because it believes these measures may provide useful supplemental information for evaluating the Company’s expectations and underlying performance trends. Further, management uses these measures in managing and evaluating the Company’s business and intends to refer to them in discussions about our operations and performance. Operating performance measures should be viewed in addition to, and not as an alternative to or substitute for, measures determined in accordance with GAAP, and are not necessarily comparable to non-GAAP measures that may be presented by other companies. Reconciliations of these non-GAAP measures to the most directly comparable GAAP measures can be found in the Non-GAAP financial measures reconciliation tables included in this presentation. 2 CAPITAL/ CREDIT PROFITABILITY GROWTH On April 20, 2026, the Company’s Board of Directors declared a quarterly cash dividend of $0.125 per share on the Company’s Class A common stock.
exhibit992p3i0
The dividend will be payable on June 5, 2026, to shareholders of record as of the close of business on May 15, 2026. Total risk -based capital was $14.09%(2) as of March 31, 2026. As of March 31, 2026, non-performing loans totaled $3.6 million or 0.16% of total loans compared to $4.2 million or 0.20% as of March 31, 2025. ACL coverage ratio was 1.16% of total loans at March 31, 2026, and 1.22% at March 31, 2025. Average deposits increased by $211.9 million or 9.6% compared to the first quarter 2025. Average loans increased $190.9 million or 9.6% compared to the first quarter 2025. Tangible book value per common share(1) at March 31, 2026, increased $1.00 or 8.9% to $12.23, compared to $11.23 at March 31, 2025. TBV per share at March 31, 2026, included an AOCI impact of ($1.72) and at March 31, 2025 ($2.05). Q1 2026 HIGHLIGHTS Non-GAAP financial measure. See reconciliation in this presentation. Reflects the Company's regulatory capital ratios which are provided for informational purposes only; as a small bank holding company, the Company is not subject to regulatory capital requirements. Net income was $9.4 million or $0.51 per diluted share. Excluding a $619 thousand income tax benefit due to an adjustment to the DTA calculation of 2025, operating diluted EPS(1) was $0.47. ROAA was 1.34% for the first quarter 2026 compared to 1.19% for the first quarter 2025. Operating ROAA(1) was 1.25% compared to 1.19% for the first quarter 2025. ROAE was 17.07% for the first quarter 2026 compared to 14.15% for the first quarter 2025. Operating ROAE(1) was 15.92% compar ed to 14.19% for the first quarter 2025. 3 HISTORICAL FINANCIALS EOP for Balance Sheet amounts Loans (1) In millions $765 $2,241 2017 2018 2019 2020 2021 2022 2023 2024 2025 Q1 2026 Deposits In millions $820 $2,494 2017 2018 2019 2020 2021 2022 2023 2024 2025 Q1 2026 Total Stockholders’ Equity In millions $114 $223 2017 2018 2019 2020 2021 2022 2023 2024 2025 Q1 2026 ACL/Total Loans (2) 1.33% 1.16% 2017 2018 2019 2020 2021 2022 2023 2024 2025 Q1 2026 Net charge -offs (recoveries) In thousands ($21,872) ($4) 2017 2018 2019 2020 2021 2022 2023 2024 2025 Q1 2026 Nonperforming Assets/Total Assets 0.17% 0.13% 2017 2018 2019 2020 2021 2022 2023 2024 2025 Q1 2026
exhibit992p4i0
Net Interest Income
exhibit992p5i0
In millions $31 $84 2017 2018 2019 2020 2021 2022 2023 2024 2025 Q1 2026 Efficiency ratio 86.65% 523.40% 2017 2018 2019 2020 2021 2022 2023 2024 2025 Q1 2026 PTPP ROAA (3) 0.52% 1.79% 2017 2018 2019 2020 2021 2022 2023 2024 2025 Q1 2026 (1) Loan amounts include deferred fees/costs. (2) ACL was calculated under the CECL standard methodology for all periods beginning January 1, 2023, and the incurred loss methodology for all periods before. (3) Non-GAAP financial measure. See reconciliation in this presentation. 4 FINANCIAL RESULTS In thousands (except per share data) Balance Sheet (EOP) Income Statement Q1 2026 Q4 2025 Q1 2025 Total Securities $427,091 $461,431 $436,929 Total Loans (1) $2,241,051 $2,189,257 $2,036,212 Total Assets $2,845,735 $2,791,540 $2,677,382 Total Deposits $2,493,580 $2,345,080 $2,309,569 Total Equity (2) $223,246 $217,183 $225,088 Net Interest Income $22,048 $22,207 $19,115 Non-Interest Income $4,150 ($4,178) $3,716 Total Revenue (3) $26,198 $18,029 $22,831 Provision for Credit Losses $801 $480 $681 Non-Interest Expense $13,711 $14,275 $12,052 Income Before Income Taxes $11,686 $3,274 $10,098 Income Tax Expense $2,335 1,911 $2,440 Net Income $9,351 $1,363 $7,658 Diluted Earnings Per Share (EPS) $0.51 $0.07 $0.38 Operating Diluted Earnings Per Share (4) $0.47 $0.44 $0.38 Weighted Average Diluted Shares 18,454,006 18,348,725 20,319,535 (1) Loan amounts include deferred fees/costs. (2) Total Equity includes accumulated other comprehensive loss of $31.3 million for Q1 2026, $30.3 million for Q4 2025, and $41.1 million for Q1 2025. Total equity decreased between periods mainly due to the repurchase of 2.0 million shares of Class A common stock conducted in September 2025. (3) Equals net interest income plus non-interest income. (4) Non-GAAP financial measures. See reconciliation in this presentation. 5 KEY PERFORMANCE INDICATORS In thousands (except for TBV/share and ratios) Q1 2026 Q4 2025 Q1 2025 Total Assets (EOP) $2,845,735 $2,791,540 $2,677,382 Total Loans (EOP) (1) $2,241,051 $2,189,257 $2,036,212 Total Deposits (EOP) $2,493,580 $2,345,080 $2,309,569 Tangible Book Value/Share (2)(3)(4) $12.23 $11.97 $11.23 Operating Return On Average Assets (2)(5) 1.25% 1.14% 1.19% Operating Return On Average Equity (2)(5) 15.92% 15.05% 14.15% Net Interest Margin (5) 3.27% 3.27% 3.10% Operating Efficiency Ratio (2)(5) 52.36% 52.92% 52.79% Non-Interest Expense/Avg.
exhibit992p6i0
Assets (5) 1.96% 2.02% 1.88% Tangible Common Equity/Tangible Assets (2)(4) 7.84% 7.78% 8.41% Total Risk-Based Capital (6) 14.09% 13.91% 13.72% NCO/Avg Loans (5) 0.00% 0.00% 0.00% NPA/Assets 0.13% 0.11% 0.16% Allowance for Credit Losses/Loans 1.16% 1.16% 1.22% (1) Loan amounts include deferred fees/costs. (2) Non-GAAP financial measures. See reconciliation in this presentation. (3) AOCI effect on tangible book value per share was ($1.72) for Q1 2026, ($1.67) for Q4 2025 and ($2.05) for Q1 2025. (4) TBV/share and TCE/TA were affected by a decrease in total stockholders’ equity due to the repurchase of 2.0 million shares of Class A common stock conducted in September 2025. (5) Annualized. (6) Reflects the Company's regulatory capital ratios which are provided for informational purposes only; as a small bank holding company, the Company is not subject to regulatory capital requirements. 6 DEPOSIT PORTFOLIO Deposits AVG In millions $2,215 $2,291 $2,457 $2,453 $2,427 $563 $580 $570 $569 $585 $1,652 $1,711 $1,887 $1,857 $1,842 Q1 2025 Q2 2025 Q3 2025 Q4 2025 Q1 2026 Interest-bearing deposits Non-interest-bearing demand deposit Deposit EOP In millions $2,310 $2,336 $2,456 $2,345 $2,494 $447 $462 $520 $528 $552 $1,208 $1,248 $1,292 $1,186 $1,294 $50 $41 $60 $47 $57 $605 $585 $584 $584 $621 Q1 2025 Q2 2025 Q3 2025 Q4 2025 Q1 2026 Non-interest-bearing demand deposits Interest-bearing checking deposits Saving and money market deposits Time deposits Commentary Average deposits totaled $2.4 billion, reflecting a slight decrease from the prior quarter and an increase of $211.9 million compared to the first quarter of 2025.
exhibit992p7i0
EOP total deposits increased $148.5 million compared to the prior quarter and $184.0 million or 8.0% compared to the first quarter of 2025. Deposit cost improved to 2.20%, decreasing 8 bps quarter-over-quarter and 29 bps year-over-year. in this slide the Deposits AVG totals must be updated manually Same goes for the red bps math Deposit Cost Q1 2025 Q2 2025 Q3 2025 Q4 2025 Q1 2026 Interest-Bearing Deposit Cost 3.34% 3.29% 3.29% 3.02% 2.89% Total Deposits (1) 2.49% 2.46% 2.53% 2.28% 2.20% (1) Reflects effects of non-interest-bearing deposits. 7 LOAN PORTFOLIO Total Loans (AVG) In millions 6.17% 6.23% 6.21% 6.16% 6.11% $1,987 $2,057 $2,099 $2,131 $2,178 Q1 2025 Q2 2025 Q3 2025 Q4 2025 Q1 2026 Loans Loan Yields Total Gross Loans (EOP) (1) In millions $2,029 $2,106 $2,125 $2,183 $2,234 $219 $218 $208 $207 $208 $103 $110 $105 $128 $128 $256 $264 $269 $296 $291 $301 $307 $317 $308 $347 $1,150 $1,207 $1,226 $1,245 $1,260 Q1 2025 Q2 2025 Q3 2025 Q4 2025 Q1 2026 Commercial real estate Residential rea Commercial and industrial Correspondent banks Consumer and other Commentary Average loans increased $46.8 million or 8.91% annualized compared to prior quarter and $190.9 million or 9.6% compared to first quarter 2025.
exhibit992p8i0
exhibit992p9i0
Loan yield declined slightly to 6.11% in Q1 2026, driven by the interest rate market environment and the effects of loan repricing. (1) Excludes deferred fees/cost. 8 LOAN PRODUCTION In millions, except for ratios 6.67% 7.12% 6.43% 5.93% 5.87% $182 $119 $187 $110 $132 $113 $196 $137 $188 $136 Q1 2025 Q2 2025 Q3 2025 Q4 2025 Q1 2026 Loan Production/Line change Loan Amortization/payoffs New loans weighted average coupon Net Loan Production Trend Loan Composition Trend EOP (1) In millions, except for ratios $948 $2,234 28% 16% 63% 56% 9% 28% Jun-20 Mar-26 Residential real estate Commercial real estate Real Estate Loans Commentary Gross loan production totaled $188.0 million during the first quarter of 2026, with March closings accounting for $113.5 million or 60.4%, of total quarterly production. Additionally, $56.6 million, or 30.1% of quarterly loan closings, consisted of correspondent banking loans, which carried a new‑loan yield of 5.13%. Excluding correspondent banking loan production, the weighted‑average yield on new loans originated during the quarter was 6.20%. Embedded prepayment penalties help protect yield and earnings in the event of early loan prepayments. (1) Excludes deferred fees/cost. 9 NET INTEREST MARGIN Net Interest Income/Margin (1) In thousands (except ratios) 3.10% 3.28% 3.14% 3.27% 3.27% $19,115 $21,034 $21,274 $22,207 $22,048 Q1 2025 Q2 2025 Q3 2025 Q4 2025 Q1 2026 Net Interest Income NIM Interest-Earning Assets Mix (AVG) 3% 2% 4% 3% 4% 17% 18% 18% 18% 17% 80% 80% 78% 79% 79% Q1 2025 Q2 2025 Q3 2025 Q4 2025 Q1 2026 Total Loans Investment Securities Cash Balances & Equivalents Commentary Q1 2026 net interest income and margin were impacted by the following factors: Net interest income was slightly lower during the quarter compared to previous quarter, partially impacted by day-count.
exhibit992p10i0
Loan payoffs occurred earlier in the quarter. 60.4% of new loan production occurred in March 2026, limiting the full-quarter earning impact. Interest Rates and Yields Q1 2025 Q2 2025 Q3 2025 Q4 2025 Q1 2026 Loans 6.17% 6.23% 6.21% 6.16% 6.11% Investment securities 2.81% 3.06% 3.03% 3.01% 3.05% Interest-earning assets 5.51% 5.64% 5.56% 5.54% 5.49% Deposits (2) 2.49% 2.46% 2.53% 2.28% 2.20% Interest -bearing liabilities 3.37% 3.32% 3.34% 3.14% 3.05% (1) Annualized. (2) Reflects effects of non-interest-bearing deposits. 10 ASSET QUALITY Allowance for Credit Losses In thousands (except ratios) 1.22% 1.18% 1.17% 1.16% 1.16% $24,740 $24,933 $24,964 $25,500 $26,102 Q1 2025 Q2 2025 Q3 2025 Q4 2025 Q1 2026 Allowance for credit losses Non-performing Loans In thousands (except ratios) 0.20% 0.06% 0.06% 0.14% 0.16% $4,156 $1,366 $1,310 $3,138 $3,640 Q1 2025 Q2 2025 Q3 2025 Q4 2025 Q1 2026 Non-accrual loans Non-performing loans to total loans Commentary Allowance for credit losses increased $602 thousand compared to prior quarter and $1.4 million compared to first quarter 2025.
exhibit992p11i0
exhibit992p12i0
ACL coverage ratio was 1.16% as of March 31, 2026. Non‑performing loans increased by $0.5 million from the prior quarter to $3.6 million. The non‑performing loans‑to‑total loans ratio was 0.16% as of March 31, 2026. Classified Loans (1) to Total Loans 0.44% 0.27% 0.22% 0.29% 0.30% Q1 2025 Q2 2025 Q3 2025 Q4 2025 Q1 2026 (1) Loans classified as substandard at period end. No loans classified doubtful at any of the dates presented. 11 NON-INTEREST INCOME In thousands (except ratios) Q1 2026 Q4 2025 Q3 2025 Q2 2025 Q1 2025 Total service fees $3,100 $2,209 $2,661 $ 2,402 $2,331 Wire fees $623 $656 $647 $604 $570 Swap fees $1,554 $449 $790 $428 $93 Other $923 $1,104 $1,224 $1,370 $1,668 Gain (loss) on sale of securities available for sale $14 ($7,498) ($28) - - Gain on sale of loans held for sale $106 $197 $128 $151 $525 Other income $930 $914 $923 $817 $860 Total non-interest income $4,150 ($4,178) $3,684 $3,370 $3,716 Average total assets $2,834,717 $2,799,863 $2,798,115 $2,677,198 $2,606,593 Non-interest income/Average assets (1) 0.59% (0.59%) 0.52% 0.50% 0.58% Commentary Non-interest income increased in the first quarter of 2026, primarily driven by $1.6 million of swap fee income. Non-interest income was 15.8% of total revenue for first quarter 2026. (1) Annualized. 12 NON-INTEREST EXPENSE In thousands (except ratios) Q1 2026 Q4 2025 Q3 2025 Q2 2025 Q1 2025 Salaries and employee benefits $8,570 $8,668 $7,909 $7,954 $7,636 Occupancy 1,316 1,327 1,382 1,337 1,284 Regulatory assessments and fees 484 443 377 396 421 Consulting and legal fees 561 900 585 263 193 Network and information technology services 560 599 656 564 505 Other operating expense 2,220 2,338 2,139 2,120 2,013 Total non-interest expense $13,711 $14,275 $13,048 $12,634 $12,052 Operating efficiency ratio (1) 52.36% 55.92% 52.22% 51.77% 52.79% Non -interest expense/Average assets (2) 1.96% 2.02% 1.85% 1.89% 1.88% Full-time equivalent employees 211 204 206 203 201 Commentary Total non-interest expense decreased by $564 thousand compared to prior quarter.
exhibit992p13i0
The decrease was primarily driven by the absence of one-time expenses incurred in the fourth quarter related to incentive compensation, bonuses, and legal fees associated with the universal shelf offering and share repurchase transaction. The efficiency ratio for the first quarter of 2026 remained consistent with prior quarters when excluding the securities loss trade transaction in the fourth quarter of 2025. (1) Non-GAAP financial measures. See reconciliation in this presentation. (2) Annualized. 13 CAPITAL Capital Ratios (1) Q3 2025 Q1 2025 Well- Capitalized Leverage Ratio TCE/TA (2) Tier 1 Risk-Based Capital Total Risk-Based Capital AOCI In Millions 8.46% 7.78% 10.92% 13.91% ($30.3) 9.61% 8.41% 12.48% 13.72% ($41.1) 5.00% NA 8.00% 10.00% Q4 2025 Commentary On April 20, 2026, the Company’s Board of Directors declared a quarterly cash dividend of $0.125 per share on the Company’s Class A common stock.
exhibit992p14i0
The dividend will be payable on June 5, 2026, to shareholders of record as of the close of business on May 15, 2026. Q1 2026 EOP common stock shares outstanding: 18,257,400. AOCI was ($31.3) million or ($1.72) per share as of March 31, 2026. 8.61% 7.84% 11.09% 14.09% ($31.3) Q1 2026 (1) Reflects the Company's regulatory capital ratios which are provided for informational purposes only; as a small bank holding company, the Company is not subject to regulatory capital requirements. (2) Non-GAAP financial measures. See reconciliation in this presentation. 14 USCB FINANCIAL HOLDINGS TAKEAWAYS 1.
exhibit992p15i0
Leading franchise located in one of the most attractive banking markets in U.S. 2. Scarcity value in the Miami MSA 3. Robust capital position with regulatory ratios well in excess of “well capitalized” threshold 4. Low risk, commercially oriented loan portfolio 5. Demonstrated profitability profile since 2015 recap further improved by current management team 6. Strong asset quality – minimal charge -offs experienced since 2015 recap 7. Attractive deposit base driven by steady growth in specialized verticals 8.
exhibit992p16i0
Balanced liquidity profile with a 90% loan/deposit ratio (EOP) 15 APPENDIX - NON-GAAP RECONCILIATION In thousands (except ratios) As of or For the Three Months Ended 3/31/2026 12/31/2025 9/30/2025 6/30/2025 3/31/2025 Pre-tax pre-provision ("PTPP") income: (1) Net income s 9,351 $ 1,363 $ 8,939 s 8,140 s 7,658 Plus: Income tax expense 2,335 1,911 2,866 2,599 2,440 Plus: Provision for credit losses 801 480 105 1,031 681 PTPP income S—12,487 S 3,754 S11,910 S 11,770 S 10,779 PTPP return on average assets: (1) PTPP income 2sammr, eoig,ge s 12,487 c D oo s 7*7 s 3,754 S 2,799,863 0.53% s 11,910 S 2,798,115 1.69% s 11,770 s 2,677,198 1.76% s 10,779 s 2,606,593 1.68% Average DepositsPTPP return on average assets (2) 1.79% Operating net income: (1) Net income S 9,351 S 1,363 S 8,939 S 8,140 S 7,658 Less: Net gains (losses) on sale of securities 14 (7,498) (28) - - Less: Tax effect on sale of securities (4) 1,900 7 - - Plus: Tax (beneft) fability expense from prior periods (619)” 1,096" - - - Operating net income s 8,722 S 8,057 S 8,960 s 8,140 s 7,658 Operating return on average assets: Operating net income Average assets (1) s 8,722 $ 2,834,717 s 8,057 S 2,799,863 s 8,960 $ 2,798,115 s 8,140 s 2,677,198 s 7,658 s 2,606,593 Operating net income return on average assets (2) 1.25% 1.14% 1.27% 1.22% 1.19% Operating return on average equity: Operating net income (1) s 8,722 s 8,057 s 8,960 s 8,140 s 7,658 Average equity Operating net income return on average equity (2) S 222,226 15.92% s 212,393 15.05% s 225,316 15.78% S 228,492 14.29% S 219,505 14.15% Operating revenue: (1) Net interest income S 22,048 S 22,207 S 21,274 S 21,034 S 19,115 Non-interest income 4,150 (4,178) 3,684 3,370 3,716 Less: Net gains (losses) on sale of securities 14 (7.498) (28) - - Operating revenue s 26,184 s 25,527 s 24,986 s 24,404 s 22,831 Operating efficiency ratio: (1) Total non-interest expense s 13,711 s 14,275 s 13,048 s 12,634 s
exhibit992p17i0
12,052 Operating revenue S 26,184 $ 25,527 $ 24,986 S 24,404 S 22,831 Operating efficiency ratio 52.36% 55.92% 52.22% 51.77% 52.79% (1 ) The Company beleves these non-GAAP financial measurements are key indicators of the ongoing earnings power of the Company. 2. Annualized. 3. The Company recognized a $61 9 thousand income tax benefit in first quarter of 2026 due to an adjustment to the deferred tax asset calculation from 2025. 4. State tax fability expenses for 2024 and for the first three quarters of 2025 were recognized during the fourth quarter of 2025. The state tax expense is related to taxes due on interest income on loans whose collateral are located outside of the State of Florida. 16 APPENDIX - NON-GAAP RECONCILIATION In thousands (except ratios and share data) As of or For the Three Months Ended 3/31/2026 12/31/2025 9/30/2025 6/30/2025 3/31/2025 Tangible book value per common share (at period-end): (1)(4) Total stockholders' equity s 223,246 s 217,183 s 209,095 s 231,583 s 225,088 Less: Intangible assets - - - - - Tangible stockholders' equity s 223,246 s 217,183 s 209,095 s 231,583 s 225,088 Total shares issued and outstanding (at period-end): Total common shares issued and outstanding 18,257,400 18,137,885 18,107,385 20,078,385 20,048,385 Tangible book value per common share (2) s 12.23 $ 11.97 $ 11.55 $ 11.53 $ 11.23 Operating diluted net income per common share: (1) Operating net income s 8,722 s 8,057 s 8,960 s 8,140 s 7,658 Total weighted average diluted shares of common stock 18,454,006 18,348,725 19,755,820 20,295,794 20,319,535 Operating diluted net income per common share: s 0.47 s 0.44 s 0.45 s 0.40 s 0.38 Tangible Common Equity Tangible Assets (1)(4) Tangible stockholders' equity s 223,246 s 217,183 s 209,095 s 231,583 s 225,088 Tangible total assets (3) s 2,845,735 s 2,791,540 s 2,767,945 s 2,719,474 s 2,677,382 Tangible Common Equity/Tangible Assets 7.84% 7.78% 7.55% 8.52% 8.41% (1 ) The Company believes these non-GAAP financial measurements are key indicators of the ongoing earnings power of the Company. 2. Excludes the dilutive effect, if any, of shares of common stock issuable upon exercise of outstanding stock options. 3. Since the Company has no intangible assets, tangible stockholders equity and tangible total assets are the same amounts as stockholders equity and total assets, respectively, as calculated under GAAP. 4. The decrease in total stockholders equity was driven primarily by the repurchase of 2.0 million shares of Class A common stock conducted in September 2025. 17 APPENDIX - BUSINESS VERTICALS in this slide the % of loan comp must be updated manually Private Client Group (1) $330MM Deposits Association Banking $160MM Deposits / $126MM Loans Deposit aggregating focus/strategy.
exhibit992p18i0
Tailored products & services for professionals, professional firms, business owners, and affluent individuals and their families. PCG also provides concierge-level banking service for the legal and healthcare sectors delivering financial solutions designed specifically for these professionals. Deposit aggregating focus/strategy. Banking for Homeowner Associations and Property Managers. Offer deposit collection services and esoteric lending solutions ranging from insurance premium and large capital improvements financing. Significant lending capacity to target large credits. Yacht Lending $202MM Loans Yacht financing for larger vessels, transaction range is $750k -$7.5MM. Brokered oriented business, 3 vendor approved brokers. Member of the National Marine Lenders Association. Launched this new vertical in 2022. Balances as of March 31, 2026. Differentiated Banking Product Offerings and Services Specialty banking products, services and solutions designed for small businesses, homeowner associations, law firms, medical practices and other professional services firms, yacht lending and global banking services Correspondent Banking $257MM Deposits / $129MM Loans Comprehensive range of both domestic and international services with the latest in technology to ensure quick processing. Focus on Caribbean and Latin American countries. Correspondent banking services include letters of credit, foreign collections, wire transfers, ForEx and trade finance. SBA / Small Business Lending $60MM Loans Relationship-oriented business focused on delivering fast loan commitments to small and medium-sized enterprises. Predominately small business line of
credits and CD secured loans. Affordable SBA loan provider. Approved by the SBA to participate in the Preferred Lenders Program. (1) Effective 4th quarter 2025, the Private Client Group vertical now includes balances for the entire business unit, encompassing not only some Jurist Advantage and Health Industry sectors, but also other professional and affluent client segments. Accordingly, balances presented for PCG reflect the full scope of the business unit, rather than select sectors as previously reported. When evaluating period-over-period trends, please consider this expanded scope. 18 APPENDIX - LOAN PORTFOLIO MIX Loan Portfolio Mix (1) As of 03/31/26 CRE Loan Portfolio (non-owner occupied and owner occupied) (5) in this slide the CRE Loan Mix sum and Loan Portfolio Mix sum must be updated manually $1,260MM CRE Loan Mix $2,234MM (4) Commentary Total loan balance at quarter end was $2,234 million (4).
exhibit992p19i0
Commercial Real Estate (owner occupied and non-owner occupied) was 56.4% or $1,260 million of the total loan portfolio. CRE mix is diversified and granular. Retail non-owner occupied makes up 26% of total CRE or $326.9 million . (1) Balance in millions. Excludes deferred fees/cost. (2) LTV - Loan to value ratio. (3) DSCR - Debt service coverage ratio.
exhibit992p20i0
(4) Excludes deferred fees/cost (5) Includes loan types: office, warehouse, retail, and other 19 APPENDIX - SECURITIES PORTFOLIO Portfolio Composition CMO MBS CMBS SBA Agency Municipalities Corporate Bank Subordinated Debt 3% 28% 15% 39% 7% 5% 1% 2% Commentary Securities portfolio totaled $427.1 million; 64.9% of the portfolio is classified as AFS, while 35.1% is classified as HTM. The modified duration is 5.2 and the average life is 6.1 years. Duration has increased because we have purchased longer-duration bonds to protect the balance sheet from expected lower interest rates. We expect to receive $34.2 million from the securities portfolio for the remainder of 2026, at current rates; these cashflows will support loan growth and/or deposit volatility. 81% of the portfolio is invested in agency mortgage-backed securities, boosting liquidity. EOP for Balance Sheet amounts, in millions Securities Portfolio Key Metrics Metrics as of 03/31/2026 Securities portfolio $ 427.1 AFS as % of portfolio 64.9% HTM as % of portfolio 35.1% Qtr. weighted avg. port. yield 3.05% Average life 6.1 Modified duration 5.2 Estimated Short Term Cashflows -100 Base +100 2026 $69.5 $34.2 $48.1 2027 $62.5 $35.7 $49.8 2028 $45.3 $27.5 $41.3 2029 $35.7 $22.6 $35.1 Total Cashflow $213.1 $120.0 $174.4 Total Cashflow / Total Portfolio 44% 25% 36% 20 APPENDIX - INTEREST RATE SENSITIVITY Loan Portfolio Repricing Profile by Rate Type Hybrid ARM 4% Fixed Rate 37% Variable Rate 59% 37% 8% 55% Loan Repricing Schedule Variable/Hybrid Rate Loans 21% 54% 16% 9% 0-1yrs.
exhibit992p21i0
1-2 yrs 2-3 yrs. 3 yrs. Static NII Simulation Year 1 & 2 Net Interest Income change from base ($ in thousands and % change) Year 1 Year 2 1.9% -2.1% -100 +100 -100 +100 21 CONTACT INFORMATION LOU DE LA AGUILERA Chairman, President & CEO (305) 715-5186 laguilera@uscentury.com ROB ANDERSON EVP, Chief Financial Officer (305) 715-5393 rob.anderson@uscentury.com INVESTOR RELATIONS InvestorRelations@uscentury.com 22
exhibit992p22i0