株探米国株
英語
エドガーで原本を確認する
0001901637 False ☐ ☐ ☐ ☐ 0001901637 2025-01-24 2025-01-24


1
UNITED STATES
SECURITIES AND EXCHANGE COMMISSION
WASHINGTON,
 
D.C. 20549
__________________________
FORM
8-K
__________________________
CURRENT REPORT
Pursuant to Section 13 or 15(d) of the Securities Exchange Act
 
of 1934
Date of Report (Date of earliest event reported):
January 24, 2025
__________________________
USCB Financial Holdings, Inc.
(Exact name of Registrant as Specified in Its Charter)
 
__________________________
 
Florida
001-41196
87-4070846
(State or Other Jurisdiction
of Incorporation)
(Commission File Number)
(IRS Employer
Identification No.)
2301 N.W. 87th Avenue
,
Doral
,
Florida
33172
(Address of Principal Executive Offices)
(Zip Code)
Registrant’s Telephone
 
Number, Including Area Code: (
305
)
715-5200
 
__________________________
Check the appropriate box below if the Form 8-K filing is intended to simultaneously satisfy the filing obligation
 
of the registrant under
any of the following provisions:
 
Written communications pursuant
 
to Rule 425 under the Securities Act (17 CFR 230.425)
Soliciting material pursuant to Rule 14a-12 under the Exchange Act (17 CFR 240.14a
 
-12)
Pre-commencement communications pursuant to Rule 14d-2(b)
 
under the Exchange Act (17 CFR 240.14d-2(b))
Pre-commencement communications pursuant to Rule 13e-4(c) under the Exchange
 
Act (17 CFR 240.13e-4(c))
Securities registered pursuant to Section 12(b) of the Act:
Title of each class
Trading
Symbol(s)
Name of each exchange on which registered
Class A common stock, $1.00 par value per share
USCB
The Nasdaq Stock Market LLC
Indicate by
 
check mark
 
whether the
 
registrant is
 
an emerging
 
growth company
 
as defined
 
in Rule
 
405 of
 
the Securities
 
Act of
 
1933
(§ 230.405 of this chapter) or Rule 12b-2 of the Securities Exchange Act of 1934 (§ 240.12b
 
-2 of this chapter).
Emerging growth company
If
 
an
 
emerging
 
growth
 
company,
 
indicate
 
by
 
check
 
mark
 
if
 
the
 
registrant
 
has
 
elected
 
not
 
to
 
use
 
the
 
extended
 
transition
 
period
 
for
complying with any new or revised financial accounting standards provided
 
pursuant to Section 13(a) of the Exchange Act.
 
2
Item 7.01. Regulation FD Disclosure.
USCB Financial Holdings,
 
Inc. is filing an
 
investor presentation (the
 
“Presentation”), which will
 
be used by the
 
management
team for presentations to investors and
 
others. A copy of the Presentation
 
is attached hereto as Exhibit 99.1 and
 
incorporated herein by
reference. The Presentation is
 
also available on the
 
Company’s website
 
at investors.uscenturybank.com.
 
Information contained herein,
including Exhibit 99.1, is being furnished and shall not be deemed “filed”
 
for the purposes of Section 18 of the Securities
 
Exchange Act
of 1934,
 
as amended
 
“Exchange Act”,
 
or otherwise
 
subject to
 
the liability
 
of such
 
section, and
 
shall not
 
be deemed
 
incorporated by
reference
 
in any
 
filing
 
under the
 
Securities
 
Act
 
of
 
1933,
 
as amended
 
,
 
or the
 
Exchange
 
Act,
 
regardless
 
of any
 
general
 
incorporation
language in such filing, except as shall be expressly set forth by specific
 
reference in such a filing.
 
Item 9.01. Financial Statements and Exhibits.
(d) Exhibits.
Exhibit No.
 
Description
104
Cover Page Interactive Data File (embedded within the Inline XBRL document)


3
SIGNATURE
Pursuant to the requirements of the Securities Exchange Act of 1934, the registrant has duly
 
caused this report to be signed on
its behalf by the undersigned hereunto duly authorized.
USCB Financial Holdings, Inc.
By:
/s/ Robert Anderson
Name:
Robert Anderson
Title:
Chief Financial Officer
Date: January 24, 2025
EX-99.1 5 exhibit991.htm EX-99.1 exhibit991
exhibit991p1i0
 
Exhibit 99.1
INVESTOR PRESENTATION FOURTH QUARTER 2024 NASDAQ: USCB USCB FINANCIAL HOLDINGS U.S.
exhibit991p2i0
 
CENTURY BANK FORWARD-LOOKING STATEMENTS This presentation may contain statements that are not historical in nature and are intended to be, and are hereby identified as, forward-looking statements for purposes of the safe harbor provided by Section 21E of the Securities Exchange Act of 1934, as amended. Forward-looking statements are those that are not historical facts. The words “may,” “will,” “anticipate,” “could,” “ should,” “would,” “believe,” “contemplate,” “expect,” “aim,” “plan,” “estimate,” “continue,” “seek,” and “intend,”, the negative of these terms, as well as other similar words and expressions of the future, are intended to identify forward-looking statements. These forward -looking statements include, but are not limited to, statements related to our projected growth, anticipated future financial performance, and management’s long-term performance goals, as well as statements relating to the anticipated effects on our results of operations and financial condition from expected or potential developments or events, or business and growth strategies, including anticipated internal growth and balance sheet restructuring. These forward-looking statements involve significant risks and uncertainties that could cause our actual results to differ materially from those anticipated in such statements. Potential risks and uncertainties include, but are not limited to: the strength of the United States economy in general and the strength of the local economies in which we conduct operations; our ability to successfully manage interest rate risk, credit risk, liquidity risk, and other risks inherent to our industry; the accuracy of our financial statement estimates and assumptions, including the estimates used for our credit loss reserve and deferred tax asset valuation allowance; the efficiency and effectiveness of our internal control procedures and processes; our ability to comply with the extensive laws and regulations to
which we are subject, including the laws for each jurisdiction where
 
we operate; adverse changes or conditions in the capital and financial
 
markets, including actual or potential stresses in the banking
 
industry; deposit attrition and the level of our uninsured deposits; legislative
 
or regulatory changes and changes in accounting principles, policies,
 
practices or guidelines, including the on-going effects of the
 
implementation of the Current Expected Credit Losses (“CECL”)
 
standard; the lack of a significantly diversified loan portfolio
 
and the concentration in the South Florida market, including the risks
 
of geographic, depositor, and industry concentrations, including
 
our concentration in loans secured by real estate, in particular,
 
commercial real estate; the effects of climate change; the concentration
 
of ownership of our common stock; fluctuations in the price of our
 
common stock; our ability to fund or access the capital
 
markets at attractive rates and terms and manage our growth, both
 
organic growth as well as growth through other means, such as future
 
acquisitions; inflation, interest rate, unemployment rate, and
 
market and monetary fluctuations; impacts of international hostilities
 
and geopolitical events; increased competition and its effect
 
on the pricing of our products and services as well as our net interest rate
 
spread and net interest margin; the loss of key employees; the effectiveness
 
of our risk management strategies, including operational risks, including,
 
but not limited to, client, employee, or third-party fraud and
 
security breaches; and other risks described in this presentation and other
 
filings we make with the Securities and Exchange Commission (“SEC”).
 
All forward-looking statements are necessarily only estimates of
 
future results, and there can be no assurance that actual results will not
 
differ materially from expectations. Therefore, you are cautioned
 
not to place undue reliance on any forward-
looking statements. Further, forward-looking statements included in this presentation are made only as of the date hereof, and we undertake no obligation to update or revise any forward-looking statements to reflect events or circumstances occurring after the date on which the statements are made or to reflect the occurrence of unanticipated events, unless required to do so under the federal securities laws. You should also review the risk factors described in the reports USCB Financial Holdings, Inc. filed or will file with the SEC. Non-GAAP Financial Measures This presentation includes financial information determined by methods other than in accordance with generally accepted accounting principles (“GAAP”). This financial information includes certain operating performance measures. Management has included these non-GAAP financial measures because it believes these measures may provide useful supplemental information for evaluating the Company’s expectations and underlying performance trends. Further, management uses these measures in managing and evaluating the Company’s business and intends to refer to them in discussions about our operations and performance. Operating performance measures should be viewed in addition to, and not as an alternative to or substitute for, measures determined in accordance with GAAP, and are not necessarily comparable to non-GAAP measures that may be presented by other companies. Reconciliations of these non-GAAP measures to the most directly comparable GAAP measures can be found in the Non-GAAP financial measures reconciliation tables included in this presentation. All numbers included in this presentation are unaudited unless otherwise noted. 2 TABLE OF CONTENTS (1) Who We Are (2) Growth Strategy (3) Financial Review (4) Appendix 3
exhibit991p3i0
 
exhibit991p4i0
 
WE ARE A RELATIONSHIP-FIRST BANK Company Overview Founded in 2002, U.S. Century Bank is a state-chartered bank headquartered in South Florida. 9th largest Florida headquartered bank by deposits in Miami Dade County as of June 30, 2024. (1) Its holding company formed in 2021, USCB Financial Holdings, Inc. (NASDAQ: USCB) is included in the Russell 3000 Index. The Bank conducted its initial public offering in July 2021, raising $40.0 million in equity capital. Full-service commercial bank offering products and services tailored to meet the needs of small-to-medium sized businesses, entrepreneurs and professionals in South Florida (Miami -Dade, Broward, and Palm Beach counties) SBA preferred lender, ranked as a top SBA 7(a) community bank lender in Miami -Dade and Broward counties 5-star Bauer Financial rating ASSETS $2.6B LOANS(2) $2.0B DEPOSITS • EQUITY $2.2B H $215M NPA/ASSETS 0.10% TOTAL RBC(3) (4) 13.51% ROAA") • EPS5) 1.08% H $0.34 Commercial Banking Focused on servicing small/medium-sized businesses within branch footprint Offer relationship-focused retail deposit products to owners and operators of SMBs Ability for customers to access accounts through online and mobile banking platforms Credit products include Asset-Based Loans, Lines of Credit and Term Loans Provide Treasury Management services to clients Relationship-driven with flexible solutions tailored to each client’s need South Flrida 10 Branches For the Company as of December 31, 2024. FDIC Deposit Market Share Report as of 6/30/24. Loan amounts include deferred fees/costs. Company’s regulatory capital ratio which is provided for informational purposes; the company, as a small bank holding company, is not subject to regulatory capital requirements. Based on fourth quarter 2024. Fully Diluted EPS for the quarter ended December 31, 2024. 4 LOCATED IN A VIBRANT ECONOMY Florida is one of the largest business markets in the country According to the U.S. Small Business Administration’s October 2024 report, Florida ranks second among states with the largest SBA loan production (6,559 loans) and third in SBA lending amount ($3.5 billion) Enterprise Florida reported the state had the lowest unemployment rate amongst the top ten largest states as of November 2024. Florida continues to maintain one of the lowest unemployment rates compared to the national rate According to CNBC, Florida ranked #5 in 2024 for business, published July 2024 The tri-county area of Miami-Dade, Broward and Palm Beach is the premier market within the state of Florida According to the U.S. Small Business Administration’s latest report, Miami-Dade MSA accounts for more than 1/3 of small businesses in the state of Florida as of December 2024 A diverse and vibrant economy Miami-Dade MSA has a rapidly growing population The Miami-Dade MSA represents over 6 million residents and will reach close to 7 million by 2025 Business-friendly tax structures, no personal income tax and a reasonable cost of living attract business to Florida 22 Fortune 500 companies are in Florida, with 11 in the Miami-Dade MSA as of September 2024 Sources: U.S. Small Business Administration’s Office of Advocacy for 2024, Enterprise Florida, U.S. Bureau of Labor Statistics, Fortune Magazine, CNBC, Miami-Dade Beacon Council. 5
exhibit991p5i0
 
exhibit991p6i0
 
ATTRACTIVE DEMOGRAPHICS 2nd second state with highest population growth from April 1, 2020, to July 2023, totaling almost 1 million increase in population (1) 6th place GDP growth in the U.S., 160 bps above national average in 1st quarter of 2024 (2) Unemployment rate was 3.4% compared to the national rate of 4.1% as of December 2024 (3) The labor force was up 3% percent (+40,298) over the year in May 2024 (4) 10% projected increase of Florida per Capita Personal Income from 2023 to 2025 (5) Palm Beach County 2.9% unemployment rate below national average (6) Broward County 2.8% unemployment rate below national average (6) Miami-Dade County 2.2% unemployment rate of below national average (6) In Miami-Dade County international trade was up 29.2% in the first half 2024, trade value totaled $55 billion. (7) United States Census Bureau “QuickFacts Miami-Dade County, Florida” U.S. Bureau of Economic Analysis Q1 2024 U.S. Bureau of Labor Statistics January 2025 FloridaCommerce June Press Release 2024 Office of Economic and Demographic Research Florida U.S. Bureau of Labor Statistics Miami, FL, Area Economic Summary as of May 2024 Regulatory & Economic Resources Department. Data compares 1st half 2024 vs. 1st half 2020. 6 SEASONED MANAGEMENT Luis de la Aguilera Chairman, President & CEO Previously President & CEO of TotalBank 41+ years in banking Rob Anderson Chief Financial Officer Previously CFO of Capstar Financial Holdings 19+ years in banking Bill Turner Chief Credit Officer Previously CCO of Interamerican Bank 36+ years in banking Oscar Gomez Head of Global Banking Division Previously at Regions Bank 31+ years in banking Maricarmen Logroño Chief Risk Officer Previously at Doral Bank 21+ years in banking Nicholas Bustle Chief Lending Officer Previously at Valley Bank 36+ years in banking Andres Collazo Director of Operations & IT Systems Previously at TotalBank 34+ years in banking Martha Guerra-Kattou Director of Sales & Marketing Previously at TotalBank 31+ years in banking Seasoned Management Team with Local Banking Experience 7
exhibit991p7i0
 
exhibit991p8i0
 
ACCOMPLISHED BOARD OF DIRECTORS Luis de la Aguilera Chairman, President & CEO Previously President & CEO of TotalBank Director since 2016 Aida Levitan Board Member President the Levitan Group Director since 2013 Kirk Wycoff Board Member Managing Partner, Patriot Financial Partners, L.P. Director since 2015 Howard Feinglass Board Member Managing Partner, Priam Capital Director since 2015 Ramón Abadin Board Member Partner, Ramon A. Abadin P.A. Director since 2017 Bernardo Fernandez, Jr. Board Member CEO, Baptist Health Medical Group Director since 2017 Ramon A. Rodriguez, CPA Board Member Chairman and Chief Executive Officer Cable Insurance Director since 2022 Robert Kafafian Board Member Founder, Chairman & Chief Executive Officer The Kafafian Group, Inc. Director since 2022 Maria C.
exhibit991p9i0
 
Alonso Board Member CEO and Regional Dean of Northeastern University, Miami Campus Director since 2022 Highly Accomplished and Aligned Board with Complementary Track Records 8 OUR STRATEGY Organic Loan Growth: Take advantage of platform that we have developed post 2015 recapitalization, capitalize on fragmented Miami-Dade MSA community banking market, and continue to build market share Capitalize on inherent advantages over smaller community banks which lack our product expertise and breadth of service Due to significant consolidation, there exists a base of potential clients that desire to partner with a bank that is locally headquartered Team Lift-outs: Continue to bring in top tier talent to U.S. Century Bank, with teams attracted to culture, public currency and local decision making Overall growth success will depend upon our ability to attract, retain, develop, incentivize, and reward the human capital necessary to execute growth strategy Attractive stock-based incentive compensation to attract top tier talent Asset Purchases: Portfolio loan purchases from companies exiting non-core lines of business; opportunistic to complement organic growth initiatives Net capital can serve as dry powder to facilitate meaningfully sized portfolio acquisitions Proactively evaluating portfolio opportunities that are consistent with USCB’s credit philosophy Strategic Acquisitions: Become an active acquirer for Florida banks looking to find a partner Focused on strategic, financially attractive acquisitions which support USCB’s organic growth strategy without compromising the risk profile Numerous potential partners in Miami-Dade MSA that may seek liquidity USCB is positioned to offer stock consideration 9 DIVERSIFIED BUSINESS VERTICALS Specialty banking products, services and solutions designed for small businesses, homeowner associations, law firms, medical practices and other professional services firms, yacht lending and global banking services Differentiated Banking Product Offerings Jurist Advantage $218MM Deposits Deposit aggregating focus/strategy Tailored products & services for law offices, managing partners, associates and other staff members Commercial deposits accounts, treasury management, commercial lending, student loan refinancing, residential loans and credit card services Yacht Lending $194 Loans Yacht financing for larger vessels, transaction range is $750 -$7.5MM.
exhibit991p10i0
 
Brokered oriented business, 3 vendor approved brokers Member of the National Marine Lenders Association Launched this new vertical in 2022 Association Banking $125MM Deposits/$114MM Loans Deposit aggreg ating focus/strategy Banking for Homeowner Associations and Property Managers Offer deposit collection services and esoteric lending solutions ranging from insurance premium and large capital improvements financing Significant lending capacity to target large credits SBA / Small Business Lending $53 Loans Relationship-oriented business focused on delivering fast loan commitments to small and medium- sized enterprises Predominately small business line of credits and CD secured loans Affordable SBA loan provider Approved by the SBA to participate in the Preferred Lenders Program Medical Advantage $18 Deposits Deposit aggregating focus/strategy As a concierge-level banking service, MDAdvantage is designed to cater to the ”„>>********WY - complex banking requirements of medical professionals. Offers a broad range of products and services developed for physicians, dentists, and veterinarians Correspondent Banking $265 Deposits/$83MM Loans Comprehensive
range of both domestic and international services with the latest in technology to ensure quick processing Focus on Caribbean and Latin American countries Correspondent banking services include letters of credit, foreign collections, wire transfers, ForEx and trade finance Balances as of December 31, 2024. 10 DEPOSIT AGGREGATING VERTICALS Deposits Trend (EOP) In millions $88 $229 $312 $352 $446 $492 $626 $48 $129 $138 $154 $177 $16 $18 $10 $38 $77 $68 $97 $112 $125 $30 $62 $97 $130 $172 $164 $218 2018 2019 2020 2021 2022 2023 2024 JA/PCG HOA Corresponding Banking MD Advantage Commentary $538 million in deposit growth in these verticals compared to December 31, 2018.
exhibit991p11i0
 
Growth by vertical from 2018 to 2024: JA/PCG: $188 million. HOA: $115 million. Correspondent Banking & International Banking: $217 million. MD Advantage: $18 million. 11 Q4 2024 HIGHLIGHTS GROWTH Average deposits increased by $225.0 million or 11.8% compared to the fourth quarter 2023.
exhibit991p12i0
 
Average loans increased $260.0 million or 15.3% compared to the fourth quarter 2023. Liquidity sources as of December 31, 2024, aggregated $679 million in on-balance sheet and off-balance sheet sources. Tangible book value per common share (a non-GAAP measure) (1) on December 31, 2024, was $10.81, which included an AOCI impact of ($2.24), increased $1.00 or 10.2% from $9.81 on December 31, 2023, which included an AOCI impact of ($2.26). PROFITABILITY Net income was $6.9 million or $0.34 per diluted share, an increase of $4.2 million or 153.7% compared to the fourth quarter 2023. Net interest income before provision increased $5.0 million or 34.7% for the quarter compared to the fourth quarter 2023. Non-interest expense increased $2.1 million or 19.9% for the quarter compared to the fourth quarter 2023. Non-routine non-interest expenses accounted for $1.0 million which had an impact of ($0.04) on diluted EPS. ROAA was 1.08% in the fourth quarter 2024 compared to 0.48% for the fourth quarter 2023. ROAE was 12.73% in the fourth quarter 2024 compared to 5.88% for the fourth quarter 2023. CAPITAL/CRDIT The Company’s Board of Directors doubled the quarterly cash dividend and declared a $0.10 per share of the Company’s Class A common stock dividend on January 21, 2025. The dividend will be paid on March 5, 2025, to shareholders of record at the close of business on February 14, 2025. At December 31, 2024, nonaccrual loans totaled $2.7 million. ACL coverage ratio was 1.22% at December 31, 2024, and 1.18% at December 31, 2023. Total stockholders' equity increased by $23.4 million or 12.2% compared to December 31, 2023. (1) Non-GAAP financial measure. See reconciliation in this presentation. 12 HISTORICAL FINANCIALS EOP for Balance Sheet amounts Loans (1) In millions $735 $1,973 2016 2017 2018 2019 2020 2021 2022 2023 2024 Deposits In millions $782 $2,174 2016 2017 2018 2019 2020 2021 2022 2023 2024 Total Stockholders’ equity In millions $86 $215 2016 2017 2018 2019 2020 2021 2022 2023 2024 ACL/Total Loans (2) 1.17% 1.22% 2016 2017 2018 2019 2020 2021 2022 2023 2024 Net charge-offs ($1,019) ($26) 2016 2017 2018 2019 2020 2021 2022 2023 2024 Nonperforming Assets/Total Assets 1.58% 0.10% 2016 2017 2018 2019 2020 2021 2022 2023 2024 Net Interest Income In millions $30 $70 2016 2017 2018 2019 2020 2021 2022 2023 2024 Efficiency ratio 94.15% 55.92% 2016 2017 2018 2019 2020 2021 2022 2023 2024 PTPP ROAA (3) 0.24% 1.58% 55.92% 2016 2017 2018 2019 2020 2021 2022 2023 2024 (1) Loan amounts include deferred fees/costs.
exhibit991p13i0
 
exhibit991p14i0
 
(2) ACL was calculated under the CECL standard methodology for all periods beginning January 1, 2023, and the incurred loss methodology for all periods before. (3) Non-GAAP financial measure. See reconciliation in this presentation. 13 FINANCIAL RESULTS In thousands (except per share data) Q4 2024 Q3 2024 Q4 2023 Balance Sheet (EOP) Total Securities $424,915 $426,528 $404,303 Total Loans (1) $1,972,848 $1,931,362 $1,780,827 Total Assets $2,581,216 $2,503,954 $2,339,093 Total Deposits $2,174,004 $2,126,617 $1,937,139 Total Equity (2) $215,388 $213,916 $191,968 Income Statement Net Interest Income $19,358 $18,109 $14,376 Non-Interest Income $3,627 $3,438 $1,326 Total Revenue (3) $22,985 $21,547 $15,702 Provision for Credit Losses $1,030 $931 $1,475 Non -Interest Expense $12,854 $11,454 $10,719 Net Income $6,904 $6 ,949 $2,721 Diluted Earning Per Share (EPS) $0.34 $0.35 $0.14 Weighted Average Diluted Shares 20,183,731 19,825,211 19,573,350 (1) Loan amounts include deferred fees/costs. (2) Total Equity includes accumulated comprehensive loss of $44.5 million for Q4 2024, $38.0 million for Q3 2024, and $44.3 million for Q4 2023. (3) Equals net interest income plus non-interest income. 14 KEY PERFORMANCE INDICATORS GROWTH PROFITABILITY CAPITAL/CREDI Q4 2024 Q3 2024 Q4 2023 In thousands (except for TBV/share) Total Assets (EOP) $2,581,216 $2,503,954 $2,339,093 Total Loans (EOP) $1,972,848 $1,931,362 $1,780,827 Total Deposits (EOP) $2,174,004 $2,126,617 $1,937,139 Tangible Book Value/Share (1)(2) $10.81 $10.90 $9.81 Return On Average Assets (ROAA) (3) 1.08% 1.11% 0.48% Return On Average Equity (ROAE) (3) 12.73% 13.38% 5.88% Net Interest Margin (3) 3.16% 3.03% 2.65% Efficiency Ratio 55.92% 53.16% 68.27% Non-Interest Expense/Avg.
exhibit991p15i0
 
Assets (3) 2.01% 1.83% 1.87% Tangible Common Equity/Tangible Assets (1) 8.34% 8.54% 8.21% Total Risk-Based Capital (4) 13.51% 13.22% 12.78% NCO/Avg Loans (3) 0.00% 0.00% 0.00% NPA/Assets 0.10% 0.11% 0.02% Allowance for Credit Losses/Loans 1.22% 1.19% 1.18% (1) Non-GAAP financial measures. See reconciliation in this presentation. (2) AOCI effect on tangible book value per share was ($2.24) for Q4 2024, ($1.94) for Q3 2024 and ($2.26) for Q4 2023. (3) Annualized. (4) Reflects the Company's regulatory capital ratios which are provided for informational purposes only; as a small bank holding company, the Company is not subject to regulatory capital requirements. 15 DEPOSIT PORTFOLIO Deposits AVG In millions $1,914 $2,049 $2,083 $2,078 $2,139 $282 $323 $316 $326 $341 $1,005 $1,098 $1,101 $1,085 $1,156 $50 $53 $6 $58 $51 $577 $575 $610 $609 $591 Q4 2023 Q1 2024 Q2 2024 Q3 2024 Q4 2024 Non-interest-bearing deposits Interest-bearing checking deposits Money market and savings Time deposits Deposit Cost (1) 5.50% 5.50% 5.50% 5.00% 4.50% 2.53% 2.76% 2.64% 2.66% 2.48% Q4 2023 Q1 2024 Q2 2024 Q3 2024 Q4 2024 Deposit Cost Fed Funds Rate (upper bound) Commentary Average deposits increased $61.1 million or 11.7% annualized compared to the prior quarter and increased $225.0 million or 11.8% compared to the fourth quarter 2023.
exhibit991p16i0
 
exhibit991p17i0
 
DDA was 27.6% of total average deposits. The quarterly average cost of total deposits decreased 18 bps compared to the prior quarter and 5 bps compared to the fourth quarter 2023. (1) Reflects effect of non-interest-bearing deposits. 16 LIQUIDITY EOP for Balance Sheet amounts Total Liquidity 27% 27% 25% 28% 26% 10% 12% 10% 15% 16% Dec-23 Mar-24 Jun-24 Sep-24 Dec-24 On Balance Sheet Liquid Assets Total Liquidity Liquid Assets: On-Balance Sheet Liquidity / Total Assets Total Liquidity: Total Liquidity / Total Assets Sources of Liquidity (in millions) 12/31/2024 On Balance Sheet Liquidity Cash $6 Due from banks $67 Investment securities unpledged $340 Total on balance sheet liquidity (Liquid Assets) $413 Off Balance Sheet Liquidity FHLB excess capacity $130 Federal Reserve Discount Window $31 Fed Fund Lines $105 Total off balance sheet liquidity $266 Total Liquidity $679 Commentary We believe we are well positioned to weather the current economic environment. We have ample sources of liquidity both on and off-balance sheet. Continued growth of both deposits and loans maintained loan-to-deposit ratio around 90% for the past three quarters.
exhibit991p18i0
 
Loan-to-Deposit Ratio 91.9% 86.6% 90.9% 90.8% 90.7% Dec-23 Mar-24 Jun-24 Sep-24 Dec-24 Liquidity calculation excludes vault cash reserves 17 LOAN PORTFOLIO Total Loans (AVG) In millions $1,699 $1,782 $1,828 $1,878 $1,959 Q4 2023 Q1 2024 Q2 2024 Q3 2024 Q4 2024 Loan Yields 5.79% 6.01% 6.16% 6.32% 6.25% "46 bps Q4'23 vs Q4'24" Q4 2023 Q1 2024 Q2 2024 Q3 2024 Q4 2024 Commentary Average loans increased $80.3 million or 17.0% annualized compared to prior quarter and $260.0 million or 15.3% compared to the fourth quarter 2023. Loan yield decreased 7 bps compared to the prior quarter and increased 46 bps compared to the fourth quarter 2023. 18 LOAN PRODUCTION Net Loan Production Trend In millions 8.00% 8.16% 8.01% 7.75% 7.14% $150 $46 $131 $91 $155 $108 $157 $95 $161 $123 Q4 2023 Q1 2024 Q2 2024 Q3 2024 Q4 2024 Loan Production/Line charges Loan Amortization/payoffs New loan weighted average coupon Loan Composition Trend EOP (1) In millions $948 $1,965 28% 15% 63% 58% 9% 27% Jun-20 Dec-20 Residential real estate Commercial real estate Real Estate Loans Commercial and industrial, Correspondent banks, and Consumer and other.
exhibit991p19i0
 
exhibit991p20i0
 
(1) Excludes deferred fees/cost. Commentary $161.3 million in new loan production in the fourth quarter 2024. Weighted average coupon on new loans was 7.14% for fourth quarter 2024, 89 bps above portfolio weighted average yield. Loan composition shift from real estate loans to non-CRE loans further diversifies our loan portfolio. 19 NET INTEREST MARGIN Net Interest Income/Margin (1) In thousands (except ratios) 2.7% 2.6% 2.9% 3.0% 3.2% $14,376 $15,158 $17,311 $18,109 $19,358 Q4 2023 Q1 2024 Q2 2024 Q3 2024 Q4 2024 Net Interest Income NIM Interest-Earning Assets Mix (AVG) 2% 5% 4% 3% 2% 19% 18% 19% 18% 18% 79% 77% 77% 79% 80% Q4 2023 Q1 2024 Q2 2024 Q3 2024 Q4 2024 Total Loans Investment Securities Cash Balances & Equivalents Commentary Net interest income increased $1.2 million or 27.4% annualized compared to prior quarter and $5.0 million or 34.7% compared to the fourth quarter 2023. Net interest margin increased 13 bps compared to prior quarter and 51 bps compared to fourth quarter 2023. NIM drivers: Proactive deposit cost reduction initiatives. Interest -earning asset mix improved. (1) Annualized. 20 INTEREST RATE SENSITIVITY Loan Portfolio Repricing Profile by Rate Type Hybrid ARM 3% Fixed Rate 41% Variable Rate 56% 28% 10% 62% Prime CMT SQFR Loan Repricing Schedule Variable/Hybrid Rate Loans 24% 41% 12% 23% yrs.
exhibit991p21i0
 
1-2 yrs. 2-3 yrs. >3 yrs. Static NII Simulation Year 1 & 2 -100 -1.2% 0.6% +100 -100 -4.6% 3.3% +100 Net Interest Income change from base ($ in thousands and % change) 21 SECURITIES PORTFOLIO EOP for Balance Sheet amounts, in millions Portfolio Composition CMO MBS CMBS SBA Agency Municipalities Corporate Bank Subordinated Debt 6% 32% 21% 22% 7% 6% 4% 2% Securities Portfolio Key Metrics Metrics as of 12/31/2024 Securities Portfolio $ 424.9 AFS as % of portfolio 61% HTM as % of portfolio 39% Weighted Avg.
exhibit991p22i0
 
Portfolio Yield 2.6% Average Life 6.8 Mod Duration 5.3 Commentary Securities portfolio totaled $424.9 million; 61% of the portfolio is classified as AFS, while 39% is classified as HTM. The modified duration is 5.3 and the average life is 6.8 years. Duration has increased as the result of higher rates and lower prepayments. We expect to receive $48.5 million from the securities portfolio in 2025 at current rates; these cashflows will support loan growth or debt repayment. If rates drop 100 bps, we expect to receive $51.9 million. 75% of the portfolio is invested in mortgage-backed securities, boosting liquidity.
exhibit991p23i0
 
Estimated Short Term Cashflows -100 Base +100 2025 $51.9 $48.5 $44.9 2026 $55.3 $52.5 $49.5 2027 $43.6 $41.8 $39.5 Total $150.8 $142.8 $133.9 Securities Portfolio % 35.5% 33.6% 31.5% 22 ASSET QUALITY Allowance for Credit Losses In thousands (except ratios) 1.18% 1.18% 1.19% 1.19% 1.22% $21,084 $21,454 $2,230 $23,067 $24,070 Q4 2023 Q1 2024 Q2 2024 Q3 2024 Q4 2024 Allowance for credit losses ACL/Total loans Non-performing Loans In thousands (except ratios) 0.03% 0.03% 0.04% 0.14% 0.14% $468 $456 $758 $2,725 $2,707 Q4 2023 Q1 2024 Q2 2024 Q3 2024 Q4 2024 Non-accrual loans Non-performing loans to total loans Commentary Allowance for credit losses increased $1.0 million compared to prior quarter and $3.0 million compared to fourth quarter 2023. ACL coverage ratio was at 1.22% as of December 31, 2024. One C&I loan for $403 thousand, two consumer loans totaling $2.0 million, and one residential real estate loan for $314 thousand were classified as nonaccrual as of December 31, 2024. Classified Loans (1) to Total Loans 0.53% 0.44% 0.42% 0.36% 0.37% Q4 2023 Q1 2024 Q2 2024 Q3 2024 Q4 2024 (1) Loans classified as substandard at period end. No loans classified doubtful at any of the dates presented. 23 LOAN PORTFOLIO MIX Loan Portfolio Mix (1) Residential real estate CRE - Owner occupied CRE - Non-owner occupied Commercial and industrial Correspondent banks Consumer and other 15% 10% 48% 13% 4% 10% $1,965 MM(1) Commentary Total loan balance at quarter end was $1,965 million (1).
exhibit991p24i0
 
Commercial Real Estate (owner occupied and non-owner occupied) was 57% or $1,128 million of the total loan portfolio(1). CRE mix is diversified and granular. Retail non-owner occupied makes up 27% of total CRE or $305.0 million. CRE Loan Mix Land/Construction 3% Other 3% Retail 27% Multifamily 18% CRE - Owner Occupied 18% Office 10% Warehouse 12% Hotels 9% As of 12/31/24 Excludes deferred fees/cost Includes loan types: office, warehouse, retail, and other CRE Loan Portfolio (non-owner occupied and owner occupied) Weighted Average Loan Type Outstanding Balance (1) LTV (2) DSCR (3) Average Loan Size (1) Retail $326 56% 1.59 $3.0 Multifamily $204 56% 1.34 $1.7 Office $184 56% 1.85 $1.5 Warehouse $192 57% 1.72 $1.6 Hotel $102 56% 2.05 $5.1 Other $83 57% 1.93 $1.7 Land/Construction $38 47% NA $2.0 (1) Balance in millions. Excludes deferred fees/cost. (2) LTV - Loan to value ratio. (3) DSCR - Debt service coverage ratio. 24 NON-INTEREST INCOME In thousands (except ratios) Q4 2024 Q3 2024 Q2 2024 Q1 2024 Q4 2023 Total service fees $2,667 $2,544 $1,977 $1,651 $1,348 Wire fees $587 $563 $557 $521 $518 Swap fees $1,076 $1,285 $650 $285 $16 Other $1,004 $696 $770 $845 $814 Gain (loss) on sale of securities available for sale - - 14 - (883) Gain on sale of loans held for sale 154 109 417 67 105 Other income 806 785 803 746 756 Total non-interest income $3,627 $3,438 $3,211 $2,464 $1,326 Average total assets $2,544,592 $2,485,434 $2,479,222 $2,436,103 $2,268,811 Non -interest income/Average assets (1) 0.57% 0.55% 0.52% 0.41% 0.23% Commentary Service fees increased $1.3 million compared to the fourth quarter 2023 mainly due to loan swap fees, wire fees, and loan pre-payment penalties.
exhibit991p25i0
 
exhibit991p26i0
 
Gain on sale of SBA 7a loans represented $154 thousand for the fourth quarter 2024. Non-interest income is 15.8% of total revenue for fourth quarter 2024 and 0.57% to average assets; both metrics are higher compared to fourth quarter 2023. (1) Annualized. 25 NON-INTEREST EXPENSE In thousands (except ratios) Q4 2024 Q3 2024 Q2 2024 Q1 2024 Q4 2023 Salaries and employee benefits $7,930 $7,200 $7,353 $6,310 $6,104 Occupancy 1,337 1,341 1,266 1,314 1,262 Regulatory assessments and fees 405 452 476 433 412 Consulting and legal fees 552 161 263 592 642 Network and information technology services 494 513 479 507 552 Other operating expense 2,136 1,787 1,723 2,018 1,747 Total non-interest expense $12,854 $11,454 $11,560 $11,174 $10,719 Efficiency ratio 55.92% 53.16% 56.33% 63.41% 68.27% Non-interest expense/Average assets (1) 2.01% 1.83% 1.88% 1.84% 1.87% Full-time equivalent employees 199 198 197 199 196 Commentary – Q4 2024 Vs Q3 2024 Q4’24 Routine Increases: $362k Salaries and employee benefits increased $110 thousand due to merit increases and higher replacement cost of personnel. Consulting and legal expenses increased $218 thousand due to timing of billings throughout the year. Other operating expense increased $104 thousand mainly due to internet banking fees and item processing expenses. Occupancy, regulatory assessment and fees, and network and information technology had a net decrease of $70 thousand. Q4’24 Non-Routine Increases: $1,038k Diluted EPS Impact ($0.04) Salaries and employee benefits increased $620 thousand due to restricted stock award expense (a shorter initial vesting period; annual expense was recognized in two months). Legal expenses increased $173 thousand for various items for which we expect reimbursement in coming quarters. Other operating expense increased $174 thousand related to forced-place insurance related to borrowers. The Company expects to receive reimbursements in coming quarters. Additionally, other operating expense increase due to $71 thousand excise tax related to the Company’s stock repurchases pursuant to its previously announced
stock repurchase programs. Annualized. 26
exhibit991p27i0
 
CAPITAL Capital Ratios (1) Leverage Ratio TCE/TA (2) Tier 1 Risk-Based Capital Total Risk-Based Capital AOCI In Millions Q4 2024 9.53% 8.34% 12.28% 13.51% ($44.5) Q3 2024 9.34% 8.54% 12.01% 13.22% ($38.0) Q4 2023 9.28% 8.21% 11.62% 12.78% ($44.3) Well- Capitalized 5.00% NA 8.00% 10.00% Commentary The Company paid in December 2024 a cash dividend of $0.05 per share of the Company’s Class A common stock; the aggregate distributed dividend amount was $1.0 million. The Company doubled the size of the quarterly dividend to $0.10 per share for first quarter 2025. Q4 2024 EOP common stock shares outstanding: 19,924,632. (1) Reflects the Company's regulatory capital ratios which are provided for informational purposes only; as a small bank holding company, the Company is not subject to regulatory capital requirements. (2) Non-GAAP financial measures. See reconciliation in this presentation. 27 TAKEAWAYS Leading franchise located in one of the most attractive banking markets in Florida and the U.S. Robust organic growth Strong asset quality, with minimal charge- offs experienced since 2015 recapitalization Experienced and tested management team Strong profitability, with pathway for future enhancement identified Core funded deposit base with 28% non- interest-bearing deposits (Avg.) 28
exhibit991p28i0
 
exhibit991p29i0
 
APPENDIX – RISK MANAGEMENT Risk Management Philosophy and
 
Culture Management has instilled a culture of adherence
 
to well-developed risk management procedures. Management is responsible
 
for day-to-day risk management (identifying, evaluating, and addressing
 
potential risks that may exist at the enterprise, strategic, financial,
 
operational, compliance and reporting levels.) The risk
 
management and compliance division consist of twenty-two professionals
 
covering enterprise risk management, cybersecurity, third-party
 
risk, bank secrecy, consumer compliance, regulatory,
 
corporate, and legal affairs. The division plays an active role
 
in assessing corporate risks, compliance and collaborating with
 
management to mitigate identified risks. Heightened focus on BSA / AML
 
/ KYC compliance due to foreign exposure. Individual country
 
loan exposure limited to 0% - 70% of total capital based on individual
 
country risk. Correspondent banking services offered exclusively
 
to institutions in countries meeting U.S. Century’s robust risk
 
tolerance framework. Highly experienced compliance team with international
 
compliance experience from larger banking institutions. The
 
audit and risk committee of the board of directors consists of
 
four members responsible for complete oversight of Company’s
 
risk management, compliance, and internal controls: Ramon
 
Rodriguez (Chair), Bernardo Fernandez, Ramón Abadin and Maria
 
Alonso. Credit Philosophy Conservative credit culture that encourages
 
prudent and desirable loans over unchecked growth Underwriting
 
strength stems from deep understanding of U.S. Century’s market,
 
long-standing relationships with clients, and disciplined underwriting
 
and credit review process Focused on maintaining a well-diversified
 
and conservative loan portfolio Robust Credit Administration Underwriting
 
group supported by experienced credit officers with both credit
exhibit991p30i0
 
analysis and lending experience Effective and independent loan review Credit Committee meetings conduct in-depth loan portfolio monitoring, including concentration limits Active monitoring and reporting on existing or emerging concentrations and targeted reviews of any higher risk portfolios 29 APPENDIX – TECHNOLOGY SUPPORT 2016 • : Paperless Account Opening T • — January ‘16-April ‘16 • J s — International Letter of Credit eTran April 16—July‘16 / Reporting Database Fs EMV Debit Cards August ‘16 - October ‘16 . May ‘16 - September 16 / 2017 / v c 2rdr, Instant Issue Debit Card once October ‘16-March ‘17 - / / v ‘—Cash Management Portal August ‘16 - March ‘17 v () Eedlink Anywhere April 17 - September 17 • J 2018 A v = Network In-housing s sanuory 18 - september 18 • J / . . , Secureworks MSSP Secureworks Y .. .. Januory 18 - Moy 18 / v •u,, . OFFICE 365 " "itromon Febeu0ry<18_Sepfember'1B — J 2019 v — : — Horizon Core Conversion 1 — September ‘18 - September ‘19 • / f Zelle P2P VVVVV June 19 - November 19 s w Zelle E NCR 1 Image Deposit ATM March 19 - D€C€mb€r 19 • / 2020 1 v i Accounts Payable 1 November '19-January ‘20 s mm. Collaboration Applications " " February ‘20 - March ‘20 A v ~ M Ran 1 PPP Loan Origination System May ‘20 - June ‘20 • J X banktel 2021 y Summit PPP Loan Origination "COoA™" January ‘21 - February ‘21 J 1 1 .. .
exhibit991p31i0
 
Immutable backup solution Co Jon 21-June‘21 CECL and ALLL Application © anngo June ‘21 - December ‘21 E NCR 1 Treasury Management Platform November ‘20 - October ‘21 / nued next slide 30 APPENDIX – TECHNOLOGY SUPPORT 2022 Y M A MI Remote Account Opening -- Oaober'21-Mürch'22 y Secureworks MXDR platform Feb ‘22-July22‘ / / . r Ring Central call reporting It October ‘22 - March ‘23 • . 5 ■ — 2023 -- abrigo Loan origination system 9 June ‘22 - May 23 w edN w 1 FED Now payments January ‘23 - October ‘23 / 2024 A 9 Pidgin real time payments pidgin January ‘23 - October f23 Check fraud application • J 2025 - 2026 A s CRM system w / . Financial reporting application • . Zelle Zelle for Small Business / . ACH Positive Pay/ACH Alert / v Account analysis solution • J / . Siem Solution • / / . Commercial Account Opening / / v o • PBX (Saas) - Teams Calling up November ‘23- April ‘25 • / / . Wire fraud application • / •• Cloud (laas) for DR environment • 1 July 23 - May ‘25 / Operating PTPP income: (1) PTPP income S 10,131 S 10,093 S 8,962 S 6,448 S 4,983 Less: Net gains (losses) on sale of securities Orerating PTDD income c 10191 c 10 003 c 14 o 019 c c 449 c (883) c occ operating PTPP return on average assets Operating PTPP income (1) s 10,131 s 10,093 s 8,948 s 6,448 s 5,866 Average assets s 2,544,592 s 2,485,434 s 2,479,222 s 2,436,103 s 2,268,811 Operating PTPP return on average assets (2) 1.58% 1.62% 1.45% 1.06% 1.03% Operating return on average assets (1) Operating net income s 6,904 s 6,949 s 6,199 s 4,612 s 3,380 Average assets S 2,544,592 s 2,485,434 S 2,479,222 S 2,436,103 S 2,268,811 Operating return on average assets (2) 1.08% 1.11% 1.01% 0.76% 0.59% Operating return on average equity: (1) Operating net income s 6,904 s 6,949 s 6,199 s 4,612 s 3,380 Average equity s 215,715 s 206,641 s 197,755 s 193,092 s 183,629 Operating return on average equity (2) 12.73% 13.38% 12.61% 9.61% 7.30% Operating Revenue: (1) Net interest income s 19,358 s 18,109 s 17,311 s 15,158 s 14,376 Non-interest income 3,627 3,438 3,211
exhibit991p32i0
 
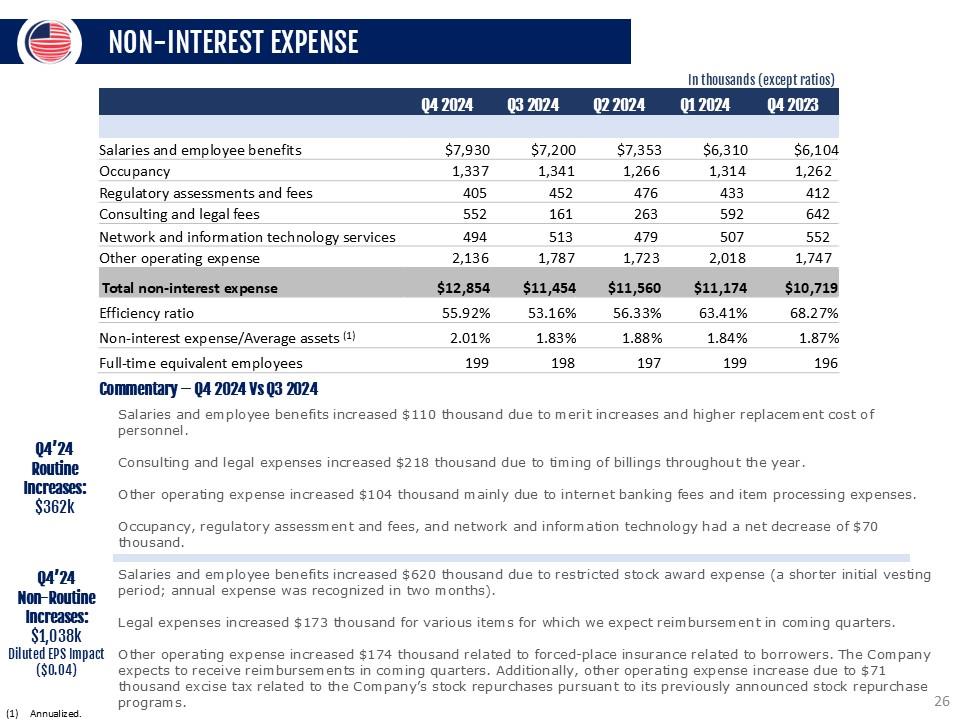
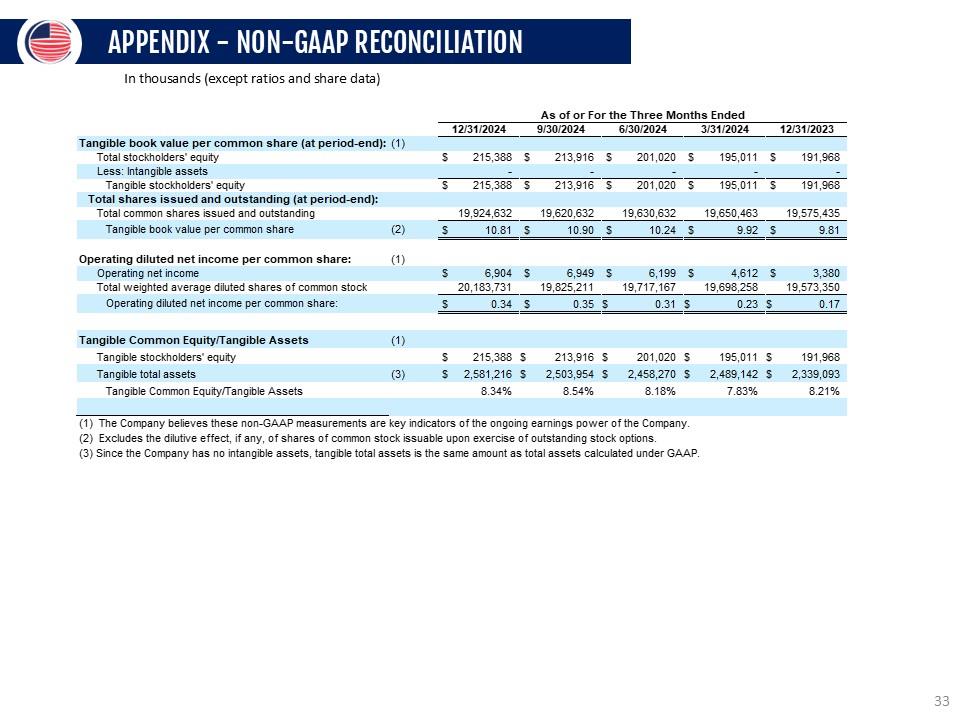
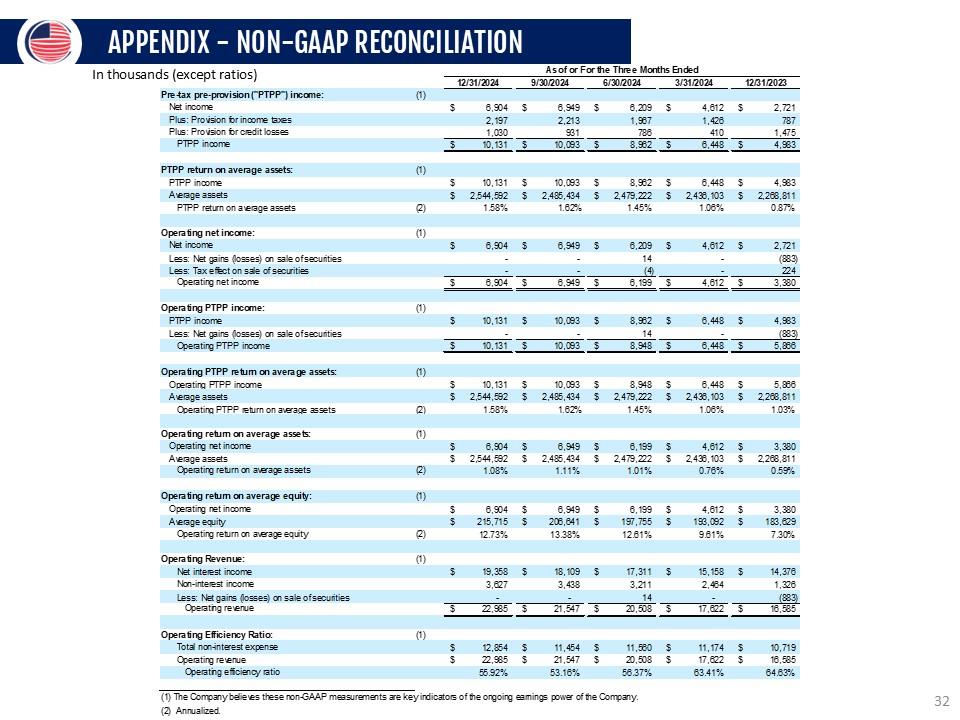
2,464 1,326 Less: Net gains (losses) on sale of securties Operating revenue c 22 08= c 21 E47 c 14 20 Eng c 17623 c (883) 16 coc — Operating Efficiency Ratio: (1) Total non-interest expense s 12,854 s 11,454 s 11,560 s 11,174 s 10,719 Operating revenue Operating efficiency ratio s 22,985 55.92% s 21,547 53.16% s 20,508 56.37% s 17,622 63.41% s 16,585 64.63% (1)The Company believes these non-GAAP measurements are key indicators of the ongoing eamings power of the Company. (2) Annualized. 31 APPENDIX - NON-GAAP RECONCILIATION In thousands (except ratios) As of or For the Three Mon ths Ended 12/31/2024 9/30/2024 6/30/2024 3/31/2024 12/31/2023 Pre-tax pre-provision ("PTPP") income: Net income Plus: Provision income taxes Plus: Provision br credit losses PTPP income PTPP return on average assets PTPP income Average assets PIPP return on average assets Operating net income: Net income Less: Net gains (losses) on sale of securities Less: Tax effect on sale of securities Operating net income Operating PTPP income: PTPP income Less: Net gains (losses) on sale of securities Operating PTPP income Operating PTPP return on average assets Operating PTPP income Average assets Operating PTPP return on average assets Operating return on average assets Operating net income Average assets Operating return on average assets > 6,904 3 6,949 > 6,209 3 4,612 3 2,‘21 2,197 2,213 1,967 1,426 787 1,030 931 786 410 1,475 LS_ 10,131 $ 10,093 $ 8,962 $ 6,448 $ 4,983 s 10,131 s 10,093 s 8,962 s 6,448 s 4,983 s 2,544,592 s 2,485,434 s 2,479,222 s 2,436,103 s 2,268,811 1.58% 1.62% 1.45% 1.06% 0.87% s 6,904 s 6,949 s 6,209 s 4,612 s 2,721 - - 14 - (883) - - (4) - 224 s 6,904 S 6,949 S 6,199 S 4,612 S 3,380 S 10,131 S 10,093 S 8,962 S 6,448 S 4,983 c 10131 c 10 003 c 14 8 048 c s 448 c (883) c 2cc • • • • s s 10,131 PcA con s c 10,093 2 JOc 494 s s 8,948 2 170 299 s s 6,448 2,436,103 1.06% s s 5,866 2,268,811 1.03% —, —44,04 1.58% • —, —0U,04 1.62% ,--4 1.45% S 6,904 S 6,949 S 6,199 S 4,612 S 3,380 s 2,544,592 s 2,485,434 S 2,479,222 s 2,436,103 S 2,268,811 1.08% 1.11% 1.01% 0.76% 0.59% 32 APPENDIX - NON-GAAP RECONCILIATION In thousands (except ratios and share data) As of or For the Three Months Ended 12/31/2024 9/30/2024 6/30/2024 3/31/2024 12/31/2023 Tangible book value per common share (at period-end): (1) Total stockholders’ equity $ 215,388 $ 213,916 $ 201,020 $ 195,011 $ 191,968 Less: Intangible assets - - - - - Tangible stockholders’ equity $ 215,388 $ 213,916 $ 201 .020 $ 195,011 $ 191,968 Total shares issued and outstanding (at period-end): Total common shares issued and outstanding 19,924,632 19,620,632 19,630,632 19,650,463 19,575,435 Tangible book value per common share (2) S 10.81 $ 10.90 $ 10.24 $ 9.92 $ 9.81 Operating diluted net incom e per com mons hare: (1) Operating net income $ 6,904 $ 6,949 $ 6,199 $ 4,612 $ 3,380 Total weighted average diluted shares of common stock 20,183,731 19,825,211 19,717,167 19,698,258 19,573,350 Operating diluted net income per common share: $ 0.34 $ 0.35 $ 0.31 $ 0.23 $ 0.17 Tangible Com m on Equity/Tangible Assets (1) Tangible stockholders’ equity $ 215,388 $ 213,916 $ 201,020 $ 195,011 $ 191,968 Tangible total assets (3) $ 2,581,216 $ 2,503,954 $ 2,458,270 $ 2,489,142 $ 2,339,093 Tangible Common Equity/Tangible Assets 8.34% 8.54% 8.18% 7.83% 8.21% 1.
exhibit991p33i0
 
The Company believes these non-GAAP measurements are key indicators of the ongoing earnings pow er of the Company. 2. Excludes the dilutive effect if any, of shares of common stock issuable upon exercise of outstanding stock options. 3. Since the Company has no intangible assets, tangible total assets is the same amount as total assets calculated under GAAP. 33 CONTACT INFORMATION LOU DE LA AGUILERA Chairman, President & CEO (305) 715-5186 laguilera@uscentury.com ROB ANDERSON EVP, Chief Financial Officer (305) 715-5393 rob.anderson@uscentury.com INVESTOR RELATIONS InvestorRelations@uscentury.com 34
exhibit991p34i0