株探米国株
日本語 英語
エドガーで原本を確認する
0001901637 False ☐ ☐ ☐ ☐ 0001901637 2024-10-31 2024-10-31


1
UNITED STATES
SECURITIES AND EXCHANGE COMMISSION
WASHINGTON,
 
D.C. 20549
__________________________
FORM
8-K
__________________________
CURRENT REPORT
Pursuant to Section 13 or 15(d) of the Securities Exchange Act
 
of 1934
Date of Report (Date of earliest event reported):
October 31, 2024
__________________________
USCB Financial Holdings, Inc.
(Exact name of Registrant as Specified in Its Charter)
 
__________________________
 
Florida
001-41196
87-4070846
(State or Other Jurisdiction
of Incorporation)
(Commission File Number)
(IRS Employer
Identification No.)
2301 N.W. 87th Avenue
,
Doral
,
Florida
33172
(Address of Principal Executive Offices)
(Zip Code)
Registrant’s Telephone
 
Number, Including Area Code: (
305
)
715-5200
 
__________________________
Check the appropriate box below if the Form 8-K filing is intended to simultaneously satisfy the filing obligation
 
of the registrant under
any of the following provisions:
 
Written communications pursuant
 
to Rule 425 under the Securities Act (17 CFR 230.425)
Soliciting material pursuant to Rule 14a-12 under the Exchange Act (17 CFR 240.14a
 
-12)
Pre-commencement communications pursuant to Rule 14d-2(b)
 
under the Exchange Act (17 CFR 240.14d-2(b))
Pre-commencement communications pursuant to Rule 13e-4(c) under the Exchange
 
Act (17 CFR 240.13e-4(c))
Securities registered pursuant to Section 12(b) of the Act:
Title of each class
Trading
Symbol(s)
Name of each exchange on which registered
Class A common stock, $1.00 par value per share
USCB
The Nasdaq Stock Market LLC
Indicate by
 
check mark
 
whether the
 
registrant is
 
an emerging
 
growth company
 
as defined
 
in Rule
 
405 of
 
the Securities
 
Act of
 
1933
(§ 230.405 of this chapter) or Rule 12b-2 of the Securities Exchange Act of 1934 (§ 240.12b
 
-2 of this chapter).
Emerging growth company
If
 
an
 
emerging
 
growth
 
company,
 
indicate
 
by
 
check
 
mark
 
if
 
the
 
registrant
 
has
 
elected
 
not
 
to
 
use
 
the
 
extended
 
transition
 
period
 
for
complying with any new or revised financial accounting standards provided
 
pursuant to Section 13(a) of the Exchange Act.
 
2
Item 2.02. Results of Operations and Financial Condition.
 
On October 31, 2024,
 
USCB Financial Holdings, Inc.
 
(the “Company”) issued a
 
press release announcing its
 
financial results
for the quarter ended
 
September 30, 2024. A copy
 
of the press release is furnished
 
as Exhibit 99.1 to
 
this Current Report on Form
 
8-K
(“Form 8-K”) and is incorporated herein by reference.
The information
 
in this Item
 
2.02, including
 
Exhibit 99.1, is
 
being furnished
 
and shall not
 
be deemed
 
“filed” for purposes
 
of
Section 18 of the
 
Securities Exchange Act
 
of 1934 (the “Exchange
 
Act”), or otherwise subject
 
to the liability of
 
that section, and
 
shall
not be deemed
 
to be incorporated
 
by reference into
 
any filing under
 
the Securities Act of
 
1933 (the “Securities
 
Act”) or the
 
Exchange
Act except as expressly set forth by specific reference in such filing to this Form 8-K.
Item 7.01. Regulation FD Disclosure.
As previously announced, at
 
11:00 a.m. ET on
 
November 1, 2024,
 
the Company will
 
hold an earnings
 
conference call to
 
discuss
its financial performance
 
for the quarter ended
 
September 30, 2024. A copy
 
of the slides forming
 
the basis of the presentation
 
is being
furnished as
 
Exhibit 99.2
 
to this
 
Form 8-K
 
and is
 
incorporated herein
 
by reference.
 
A copy
 
of the
 
slides has
 
also been
 
posted to
 
the
Company’s investor relations website,
 
located at investors.uscenturybank.com.
The information
 
in this Item
 
7.01, including
 
Exhibit 99.2, is
 
being furnished
 
and shall not
 
be deemed
 
“filed” for purposes
 
of
Section 18
 
of the
 
Exchange Act,
 
or otherwise
 
subject to
 
the
 
liability of
 
that section,
 
and
 
shall not
 
be deemed
 
to be
 
incorporated
 
by
reference into any filing under the
 
Securities Act or the Exchange Act
 
except as set forth by
 
specific reference in such filing to
 
this Form
8-K.
Item 9.01. Financial Statements and Exhibits.
(d) Exhibits.
Exhibit No.
Description
99.1
99.2
104
Cover Page Interactive Data File (embedded within the Inline XBRL document)
 
 
3
SIGNATURE
Pursuant to the requirements of the Securities Exchange Act of 1934, the registrant has duly
 
caused this report to be signed on
its behalf by the undersigned hereunto duly authorized.
USCB Financial Holdings, Inc.
By:
/s/ Robert Anderson
Name:
Robert Anderson
Title:
Chief Financial Officer
Date: October 31, 2024
EX-99.1 5 exhibit991.htm EX-99.1 exhibit991
 
 
exhibit991p1i0
1
Exhibit 99.1
EARNINGS RELEASE
USCB Financial Holdings, Inc. Reports Record Fully Diluted EPS of
 
$0.35 for Q3 2024; ROAA of 1.11% and
ROAE of 13.38%
MIAMI, FL – October 31, 2024 – USCB Financial Holdings, Inc. (the
 
“Company”) (NASDAQ: USCB)
, the holding company for
U.S.
 
Century
 
Bank
 
(the
 
“Bank”),
 
reported
 
net
 
income
 
of
 
$6.9
 
million
 
or
 
$0.35
 
per
 
fully
 
diluted
 
share
 
for
 
the
 
three
 
months
 
ended
September 30, 2024, compared with net income of $3.8 million or $0.19
 
per fully diluted share for the same period in 2023.
 
“We
 
are proud
 
to report
 
our second
 
consecutive quarter
 
of record
 
fully diluted
 
earnings per
 
share, demonstrating
 
the strength
 
of our
strategic initiatives and
 
operational performance.”
 
said Luis de la
 
Aguilera, Chairman, President,
 
and CEO. “With
 
a return on average
assets of
 
1.11%
 
and a
 
NIM of 3.03%,
 
we are
 
effectively leveraging
 
our assets
 
to drive
 
profitability.
 
Additionally,
 
our growth
 
in non-
interest
 
income
 
reflects
 
our
 
commitment
 
to
 
diversifying
 
revenue
 
streams
 
and
 
enhancing
 
shareholder
 
value.
 
We
 
remain
 
focused
 
on
delivering strong performance and sustainable growth to our stakeholders
 
.” said de la Aguilera.
 
Unless otherwise stated, all percentage
 
comparisons in the bullet points
 
below are calculated at
 
or for the quarter
 
ended September 30,
2024 compared to at or for the quarter ended September 30, 2023
 
and annualized where appropriate.
Profitability
Annualized return on average assets for the quarter
 
ended September 30, 2024 was 1.11%
 
compared to 0.67% for the third quarter
of 2023.
 
Annualized return on
 
average stockholders’ equity
 
for the quarter
 
ended September 30,
 
2024 was 13.38%
 
compared to 8.19%
 
for
the third quarter of 2023.
 
The efficiency ratio for the quarter ended September 30,
 
2024 was 53.16% compared to 64.64% for the third quarter of 2023.
 
Net interest margin for the quarter ended September 30, 2024
 
was 3.03%
 
compared to 2.60% for the third quarter of 2023.
Net interest income
 
before provision for
 
credit losses was
 
$18.1 million for
 
the quarter ended
 
September 30, 2024, an
 
increase of
$4.1 million or 29.1% compared to the third quarter of 2023.
Balance Sheet
Total
 
assets
 
were
 
$2.5
 
billion
 
at
 
September 30,
 
2024,
 
representing
 
an
 
increase
 
of
 
$259.4 million
 
or
 
11.6%
 
from
 
$2.2
 
billion
 
at
September 30, 2023.
Total
 
loans
 
were
 
$1.9
 
billion
 
at
 
September 30,
 
2024,
 
representing
 
an
 
increase
 
of
 
$254.8 million
 
or
 
15.2%
 
from
 
$1.7
 
billion
 
at
September 30, 2023.
Total
 
deposits were
 
$2.1 billion at
 
September 30, 2024,
 
representing an
 
increase of
 
$205.7 million or
 
10.7% from
 
$1.9 billion
 
at
September 30, 2023.
Total
 
stockholders’
 
equity
 
was
 
$213.9 million
 
at
 
September 30,
 
2024,
 
representing
 
an
 
increase
 
of
 
$31.0
 
million
 
or
 
17.0% from
$182.9
 
million
 
at September 30,
 
2023. Total
 
stockholders’ equity
 
included
 
accumulated comprehensive
 
loss of
 
$38.0 million
 
at
September 30, 2024 compared to accumulated comprehensive loss of $51.2
 
million at September 30, 2023.
 
Asset Quality
The allowance
 
for credit
 
losses (“ACL”)
 
increased by
 
$3.6 million
 
to $23.1
 
million at
 
September 30, 2024
 
from $19.5
 
million at
September 30, 2023.
The ACL represented 1.19% of total loans at September 30, 2024
 
and 1.16% at September 30, 2023.
2
Provision for credit
 
loss was $931 thousand
 
for the quarter
 
ended September 30, 2024,
 
an increase of
 
$278 thousand compared
 
to
the third quarter of 2023.
Non-performing
 
loans to
 
total loans
 
was 0.14%
 
at September 30,
 
2024 and
 
0.03% at
 
September 30, 2023.
 
Nonperforming loans
totaled $2.7 million at September 30, 2024 and $479 thousand at September
 
30, 2023.
Non-interest Income and Non-interest Expense
Non-interest
 
income was
 
$3.4
 
million
 
for
 
the
 
three
 
months
 
ended September 30,
 
2024,
 
an
 
increase
 
of
 
$1.3
 
million
 
or
 
59.1%
compared to $2.2 million for the same period in 2023.
 
Non-interest
 
expense
 
was
 
$11.5
 
million
 
for
 
the
 
three
 
months
 
ended
 
September 30,
 
2024,
 
an
 
increase
 
of
 
$1.0
 
million
 
or
 
9.5%
compared to $10.5 million for the same period in 2023.
 
Capital
On October
 
28, 2024,
 
the Company’s
 
Board of
 
Directors declared
 
a cash
 
dividend of
 
$0.05 per
 
share of
 
the Company’s
 
Class A
common stock. The dividend will be paid on December 5, 2024 to shareholders of record at the close of business on November 15,
2024.
As of September 30, 2024,
total risk-based capital ratios for the Company and the Bank were 13.22% and 13.14%,
 
respectively.
Tangible
 
book value
 
per common
 
share (a
 
non-GAAP measure)
 
was $10.90
 
at September 30,
 
2024, representing
 
an increase
 
of
$0.66
 
or 25.6%
 
annualized
 
from
 
$10.24
 
at June
 
30,
 
2024.
 
At September
 
30,
 
2024,
 
tangible book
 
value
 
per
 
common
 
share was
negatively affected by $1.94 due to an accumulated comprehensive loss
 
of $38.0 million. At June 30, 2024, tangible
 
book value per
common share was negatively affected by $2.28 due
 
to an accumulated comprehensive loss of $44.7 million.
 
During
 
the quarter,
 
the Company
 
repurchased
 
10,000
 
shares of
 
Class A
 
common
 
stock at
 
a weighted
 
average
 
cost per
 
share of
$12.03. The
 
aggregate purchase price
 
for these transactions
 
was approximately
 
$120 thousand,
 
including transaction
 
costs. As of
September 30, 2024, 537,980 shares remained authorized for repurchase
 
under the Company’s share repurchase programs.
 
Conference Call and Webcast
 
The Company will host a conference call
 
on Friday, November 1, 2024, at 11:00 a.m. Eastern Time to discuss the Company’s unaudited
financial results
 
for the quarter
 
ended September 30, 2024.
 
To
 
access the conference
 
call, dial (833)
 
816-1416 (U.S. toll-free)
 
and ask
to join the USCB Financial Holdings Call.
 
Additionally,
 
interested
 
parties can
 
listen to
 
a live
 
webcast
 
of the
 
call in
 
the “Investor
 
Relations” section
 
of the
 
Company’s
 
website
at www.uscentury.com
 
.
 
An archived version of the webcast will be available in the same location shortly after
 
the live call has ended.
About USCB Financial Holdings, Inc.
USCB Financial Holdings, Inc.
 
is the bank holding company for
 
U.S. Century Bank. Established in 2002,
 
U.S. Century Bank is one of
the largest
 
community banks
 
headquartered
 
in Miami,
 
and one
 
of the
 
largest community
 
banks in
 
the State
 
of Florida.
 
U.S. Century
Bank is rated 5-Stars by BauerFinancial, the nation’s leading independent
 
bank rating firm. U.S. Century Bank offers customers a wide
range of
 
financial products
 
and services
 
and supports
 
numerous community
 
organizations,
 
including
 
the Greater
 
Miami Chamber
 
of
Commerce, the South Florida Hispanic Chamber of Commerce, and ChamberSouth. For more information about us
 
or to find a banking
center near you, please call (305) 715-5200 or visit www.uscentury.com.
Forward-Looking Statements
This earnings release
 
may contain statements
 
that are not
 
historical in nature
 
and are intended
 
to be, and
 
are hereby identified
 
as, forward-
looking
 
statements
 
for
 
purposes
 
of
 
the
 
safe
 
harbor
 
provided
 
by
 
Section
 
21E
 
of
 
the
 
Securities
 
Exchange
 
Act
 
of
 
1934,
 
as
 
amended.
Forward-looking statements are
 
those that are
 
not historical facts.
 
The words “may,”
 
“will,” “anticipate,” “could,”
 
“should,” “would,”
“believe,” “contemplate,”
 
“expect,” “aim,”
 
“plan,” “estimate,”
 
“continue,” and
 
“intend,”, the negative
 
of these terms,
 
as well as
 
other
similar
 
words
 
and
 
expressions
 
of
 
the
 
future,
 
are
 
intended
 
to identify
 
forward-looking
 
statements.
 
These
 
forward-looking
 
statements
include, but are not limited
 
to, statements related to our
 
projected growth, anticipated future financial
 
performance, and management’s
long-term performance goals, as well as statements
 
relating to the anticipated effects on our results of
 
operations and financial condition
from expected or potential developments or events, or business and
 
growth strategies, including anticipated internal growth and balance
sheet restructuring.
3
These forward-looking statements involve significant risks and uncertainties that could cause our actual
 
results to differ materially from
those anticipated in such statements. Potential risks and uncertainties include,
 
but are not limited to:
the strength of the United States economy in general and the strength of the local economies in
 
which we conduct operations;
our ability to successfully manage interest rate risk, credit risk, liquidity risk,
 
and other risks inherent to our industry;
the
 
accuracy
 
of
 
our
 
financial
 
statement
 
estimates
 
and
 
assumptions,
 
including
 
the
 
estimates
 
used
 
for
 
our
 
credit
 
loss
 
reserve
 
and
deferred tax asset valuation allowance;
the efficiency and effectiveness of our internal
 
control procedures and processes;
our ability to comply with
 
the extensive laws and
 
regulations to which we are
 
subject, including the laws for
 
each jurisdiction where
we operate;
adverse changes or conditions in capital and financial markets, including
 
actual or potential stresses in the banking industry;
deposit attrition and the level of our uninsured deposits;
legislative
 
or
 
regulatory
 
changes and
 
changes
 
in
 
accounting
 
principles,
 
policies,
 
practices or
 
guidelines,
 
including
 
the on-going
effects of the implementation of the Current Expected Credit Losses (“CECL”)
 
standard;
the
 
lack
 
of
 
a
 
significantly
 
diversified
 
loan
 
portfolio
 
and
 
the
 
concentration
 
in
 
the
 
South
 
Florida
 
market,
 
including
 
the
 
risks
 
of
geographic,
 
depositor,
 
and
 
industry
 
concentrations,
 
including
 
our
 
concentration
 
in
 
loans
 
secured
 
by
 
real
 
estate,
 
in
 
particular,
commercial real estate;
the effects of climate change;
the concentration of ownership of our common stock;
fluctuations in the price of our common stock;
our ability to
 
fund or access
 
the capital markets
 
at attractive rates
 
and terms and
 
manage our growth,
 
both organic
 
growth as well
as growth through other means, such as future acquisitions;
inflation, interest rate, unemployment rate, and market
 
and monetary fluctuations;
impacts of international hostilities and geopolitical events;
increased competition
 
and its effect
 
on the pricing
 
of our products
 
and services as
 
well as our
 
interest rate spread
 
and net interest
margin;
the loss of key employees;
the effectiveness
 
of our risk management
 
strategies, including operational
 
risks, including, but
 
not limited to, client,
 
employee, or
third-party fraud and security breaches; and
other risks described in this earnings release and other filings we make with the
 
Securities and Exchange Commission (“SEC”).
All forward-looking
 
statements are
 
necessarily only
 
estimates of
 
future results,
 
and there
 
can be
 
no assurance
 
that actual
 
results will
not differ
 
materially from
 
expectations. Therefore,
 
you are
 
cautioned not
 
to place
 
undue reliance
 
on any
 
forward-looking statements.
Further, forward-looking statements included in this
 
earnings release are
 
made only as
 
of the date
 
hereof, and we
 
undertake no obligation
to update or revise any forward-looking statement to reflect events
 
or circumstances after the date on which the statements are made
 
or
to reflect the occurrence of unanticipated
 
events, unless required to do
 
so under the federal securities laws.
 
You
 
should also review the
risk factors described in the reports the Company filed or will file with the SEC.
Non-GAAP Financial Measures
This earnings release
 
includes financial information determined
 
by methods other
 
than in accordance
 
with generally accepted
 
accounting
principles (“GAAP”). This financial
 
information includes certain
 
operating performance measures. Management
 
has included these
 
non-
GAAP
 
measures
 
because
 
it
 
believes
 
these
 
measures
 
may
 
provide
 
useful
 
supplemental
 
information
 
for
 
evaluating
 
the
 
Company’s
operations and
 
underlying performance
 
trends. Further,
 
management uses these
 
measures in
 
managing and
 
evaluating the Company’s
business and intends to refer to
 
them in discussions about our operations
 
and performance. Operating performance
 
measures should be
viewed
 
in
 
addition
 
to,
 
and
 
not
 
as
 
an
 
alternative
 
to
 
or
 
substitute
 
for,
 
measures
 
determined
 
in
 
accordance
 
with
 
GAAP,
 
and
 
are
 
not
necessarily
 
comparable
 
to
 
non-GAAP
 
measures
 
that
 
may
 
be
 
presented
 
by
 
other
 
companies.
 
Reconciliations
 
of
 
these
 
non-GAAP
measures
 
to
 
the most
 
directly
 
comparable
 
GAAP measures
 
can be
 
found
 
in the
 
‘Non-GAAP
 
Reconciliation
 
Tables’
 
included
 
in the
exhibits to this earnings release.
All numbers included in this press release are unaudited unless otherwise noted.
Contacts:
Investor Relations
InvestorRelations@uscentury.com
Media Relations
Martha Guerra-Kattou
 
MGuerra@uscentury.com


4
USCB FINANCIAL HOLDINGS, INC.
CONSOLIDATED STATEMENTS
 
OF INCOME (UNAUDITED)
(Dollars in thousands, except per share data)
Three Months Ended September 30,
Nine Months Ended September 30,
2024
2023
2024
2023
Interest income:
Loans, including fees
$
29,819
$
22,523
$
84,479
$
63,081
Investment securities
2,754
2,833
8,634
7,501
Interest-bearing deposits in financial institutions
989
1,026
3,953
2,459
Total interest income
33,562
26,382
97,066
73,041
Interest expense:
Interest-bearing checking deposits
411
331
1,171
574
Savings and money market accounts
10,064
8,779
30,529
20,532
Time deposits
3,391
2,565
9,907
5,767
FHLB advances and other borrowings
1,587
685
4,881
1,976
Total interest expense
15,453
12,360
46,488
28,849
Net interest income before provision for credit losses
18,109
14,022
50,578
44,192
Provision for credit losses
931
653
2,127
892
Net interest income after provision for credit losses
17,178
13,369
48,451
43,300
Non-interest income:


Service fees
2,544
1,329
6,172
3,707
Gain (loss) on sale of securities available for sale, net
-
(955)
14
(976)
Gain on sale of loans held for sale, net
109
255
593
696
Other non-interest income
785
1,532
2,334
2,650
Total non-interest income
3,438
2,161
9,113
6,077
Non-interest expense:


Salaries and employee benefits
7,200
6,066
20,863
18,325
Occupancy
1,341
1,350
3,921
3,968
Regulatory assessments and fees
452
365
1,361
1,041
Consulting and legal fees
161
513
1,016
1,257
Network and information technology services
513
481
1,499
1,464
Other operating expense
1,787
1,686
5,528
5,034
Total non-interest expense
11,454
10,461
34,188
31,089
Net income before income tax expense
9,162
5,069
23,376
18,288
Income tax expense
2,213
1,250
5,606
4,464
Net income
$
6,949
$
3,819
$
17,770
$
13,824
Per share information:
 
Net income per common share, basic
$
0.35
$
0.20
$
0.90
$
0.70
Net income per common share, diluted
$
0.35
$
0.19
$
0.90
$
0.70
Cash dividends declared
$
0.05
$
-
$
0.15
$
-
Weighted average shares outstanding:
Common shares, basic
19,621,447
19,542,723
19,653,103
19,661,685
Common shares, diluted
19,825,211
19,611,897
19,761,242
19,729,181


5
USCB FINANCIAL HOLDINGS, INC.
SELECTED FINANCIAL DATA (UNAUDITED)
(Dollars in thousands, except per share data)
As of or For the Three Months Ended
9/30/2024
6/30/2024
3/31/2024
12/31/2023
9/30/2023
Income statement data:
Net interest income
$
18,109
$
17,311
$
15,158
$
14,376
$
14,022
Provision for credit losses
931
786
410
1,475
653
Net interest income after provision for credit losses
17,178
16,525
14,748
12,901
13,369
Service fees
2,544
1,977
1,651
1,348
1,329
Gain (loss) on sale of securities available for sale, net
-
14
-
(883)
(955)
Gain on sale of loans held for sale, net
109
417
67
105
255
Other income
785
803
746
756
1,532
Total non-interest income
3,438
3,211
2,464
1,326
2,161
Salaries and employee benefits
7,200
7,353
6,310
6,104
6,066
Occupancy
1,341
1,266
1,314
1,262
1,350
Regulatory assessments and fees
452
476
433
412
365
Consulting and legal fees
161
263
592
642
513
Network and information technology services
513
479
507
552
481
Other operating expense
1,787
1,723
2,018
1,747
1,686
Total non-interest expense
11,454
11,560
11,174
10,719
10,461
Net income before income tax expense
9,162
8,176
6,038
3,508
5,069
Income tax expense
2,213
1,967
1,426
787
1,250
Net income
$
6,949
$
6,209
$
4,612
$
2,721
$
3,819
Per share information:
Net income per common share, basic
$
0.35
$
0.32
$
0.23
$
0.14
$
0.20
Net income per common share, diluted
$
0.35
$
0.31
$
0.23
$
0.14
$
0.19
Cash dividends declared
$
0.05
$
0.05
$
0.05
$
-
$
-
Balance sheet data (at period-end):


Cash and cash equivalents
$
38,486
$
77,261
$
126,546
$
41,062
$
33,435
Securities available-for-sale
$
259,527
$
236,444
$
259,992
$
229,329
$
218,609
Securities held-to-maturity
$
167,001
$
169,606
$
173,038
$
174,974
$
197,311
Total securities
$
426,528
$
406,050
$
433,030
$
404,303
$
415,920
Loans held for investment
(1)
$
1,931,362
$
1,869,249
$
1,821,196
$
1,780,827
$
1,676,520
Allowance for credit losses
$
(23,067)
$
(22,230)
$
(21,454)
$
(21,084)
$
(19,493)
Total assets
$
2,503,954
$
2,458,270
$
2,489,142
$
2,339,093
$
2,244,602
Non-interest-bearing demand deposits
$
637,313
$
579,243
$
576,626
$
552,762
$
573,546
Interest-bearing deposits
$
1,489,304
$
1,477,459
$
1,526,168
$
1,384,377
$
1,347,376
Total deposits
$
2,126,617
$
2,056,702
$
2,102,794
$
1,937,139
$
1,920,922
FHLB advances and other borrowings
$
118,000
$
162,000
$
162,000
$
183,000
$
102,000
Total liabilities
$
2,290,038
$
2,257,250
$
2,294,131
$
2,147,125
$
2,061,718
Total stockholders' equity
$
213,916
$
201,020
$
195,011
$
191,968
$
182,884
Capital ratios:
(2)


Leverage ratio
9.34%
9.03%
8.91%
9.28%
9.26%
Common equity tier 1 capital
12.01%
11.93%
11.80%
11.62%
11.97%
Tier 1 risk-based capital
12.01%
11.93%
11.80%
11.62%
11.97%
Total risk-based capital
 
13.22%
13.12%
12.98%
12.78%
13.10%
(1)
 
Loan amounts include deferred fees/costs.
(2) Reflects the Company's regulatory capital ratios which are
 
provided for informational purposes only; as a small bank holding
 
company, the Company is not subject
to regulatory capital requirements. The Bank's total risk-based
 
capital for third quarter 2024 was 13.14%.


6
USCB FINANCIAL HOLDINGS, INC.
AVERAGE BALANCES, RATIOS,
 
AND OTHER DATA (UNAUDITED)
(Dollars in thousands)
As of or For the Three Months Ended
9/30/2024
6/30/2024
3/31/2024
12/31/2023
9/30/2023
Average balance sheet data:
Cash and cash equivalents
$
87,937
$
107,831
$
132,266
$
57,069
$
90,742
Securities available-for-sale
$
244,881
$
263,345
$
239,896
$
215,649
$
222,134
Securities held-to-maturity
$
168,632
$
171,682
$
174,142
$
181,151
$
218,694
Total securities
$
413,514
$
435,027
$
414,038
$
396,800
$
440,828
Loans held for investment
(1)
$
1,878,230
$
1,828,487
$
1,781,528
$
1,698,611
$
1,610,864
Total assets
$
2,485,434
$
2,479,222
$
2,436,103
$
2,268,811
$
2,250,258
Interest-bearing deposits
$
1,468,067
$
1,473,513
$
1,473,831
$
1,336,470
$
1,353,516
Non-interest-bearing demand deposits
$
609,456
$
610,370
$
574,760
$
577,133
$
587,917
Total deposits
$
2,077,523
$
2,083,883
$
2,048,591
$
1,913,603
$
1,941,433
FHLB advances and other borrowings
$
156,043
$
162,000
$
164,187
$
139,000
$
85,326
Total liabilities
$
2,278,793
$
2,281,467
$
2,243,011
$
2,085,182
$
2,065,357
Total stockholders' equity
$
206,641
$
197,755
$
193,092
$
183,629
$
184,901
Performance ratios:
Return on average assets
(2)
1.11%
1.01%
0.76%
0.48%
0.67%
Return on average equity
(2)
13.38%
12.63%
9.61%
5.88%
8.19%
Net interest margin
(2)
3.03%
2.94%
2.62%
2.65%
2.60%
Non-interest income to average assets
(2)
0.55%
0.52%
0.41%
0.23%
0.38%
Non-interest expense to average assets
(2)
1.83%
1.88%
1.84%
1.87%
1.84%
Efficiency ratio
(3)
53.16%
56.33%
63.41%
68.27%
64.64%
Loans by type (at period end):
(4)


Residential real estate
$
283,477
$
256,807
$
237,906
$
204,419
$
188,880
Commercial real estate
$
1,095,112
$
1,053,030
$
1,057,800
$
1,047,593
$
1,005,280
Commercial and industrial
$
246,539
$
248,525
$
228,045
$
219,757
$
212,975
Correspondent banks
$
103,815
$
112,510
$
100,182
$
114,945
$
94,640
Consumer and other
 
$
198,604
$
194,644
$
194,325
$
191,930
$
173,096
Asset quality data:


Allowance for credit losses to total loans
1.19%
1.19%
1.18%
1.18%
1.16%
Allowance for credit losses to non-performing loans
846%
2,933%
4,705%
4,505%
4,070%
Total non-performing loans
(5)
$
2,725
$
758
$
456
$
468
 
$
479
Non-performing loans to total loans
0.14%
0.04%
0.03%
0.03%
0.03%
Non-performing assets to total assets
(5)
0.11%
0.03%
0.02%
0.02%
0.02%
Net charge-offs (recoveries of) to average loans
(2)
(0.00)%
(0.00)%
(0.00)%
(0.00)%
(0.00)%
Net charge-offs (recovery) of credit losses
$
(6)
$
(2)
$
(7)
$
(3)
$
(5)
Interest rates and yields:
(2)


Loans
6.32%
6.16%
6.01%
5.79%
5.55%
Investment securities
 
2.61%
2.80%
2.69%
2.46%
2.52%
Total interest-earning assets
5.61%
5.54%
5.34%
5.16%
4.89%
Deposits
(6)
2.66%
2.64%
2.76%
2.53%
2.39%
FHLB advances and other borrowings
4.05%
4.03%
4.10%
4.04%
3.19%
Total interest-bearing liabilities
3.79%
3.76%
3.86%
3.66%
3.41%
Other information:
Full-time equivalent employees
198
197
199
196
194
(1)
 
Loan amounts include deferred fees/costs.
(2)
 
Annualized.
(3)
 
Efficiency ratio is defined as total non-interest expense divided
 
by sum of net interest income and total non-interest
 
income.
(4)
 
Loan amounts exclude deferred fees/costs.
(5)
 
The amounts for total non-performing loans and total non-performing
 
assets are the same at the dates presented since there was
 
no other real estate owned (OREO)
recorded.
(6) Reflects effect of non-interest-bearing deposits.


7
USCB FINANCIAL HOLDINGS, INC.
 
NET INTEREST MARGIN (UNAUDITED)
(Dollars in thousands)
Three Months Ended September 30,
2024
2023
Average
 
Balance
Interest
Yield/Rate
(1)
Average
 
Balance
Interest
Yield/Rate
(1)
Assets
Interest-earning assets:
Loans
(2)
$
1,878,230
$
29,819
6.32%
$
1,610,864
$
22,523
5.55%
Investment securities
(3)
419,315
2,754
2.61%
445,828
2,833
2.52%
Other interest-earning assets
80,378
989
4.89%
83,479
1,026
4.88%
Total interest-earning assets
2,377,923
33,562
5.61%
2,140,171
26,382
4.89%
Non-interest-earning assets
107,511
 
 
110,087
 
 
Total assets
$
2,485,434
$
2,250,258
Liabilities and stockholders' equity


Interest-bearing liabilities:
Interest-bearing checking deposits
$
57,925
411
2.82%
$
52,080
331
2.52%
Saving and money market deposits
1,084,562
10,064
3.69%
1,011,164
8,779
3.44%
Time deposits
325,580
3,391
4.14%
290,272
2,565
3.51%
Total interest-bearing deposits
1,468,067
13,866
3.76%
1,353,516
11,675
3.42%
FHLB advances and other borrowings
156,043
1,587
4.05%
85,326
685
3.19%
Total interest-bearing liabilities
1,624,110
15,453
3.79%
1,438,842
12,360
3.41%
Non-interest-bearing demand deposits
609,456
 
 
587,917
 
 
Other non-interest-bearing liabilities
45,227
38,598
Total liabilities
2,278,793
 
 
2,065,357
 
 
Stockholders' equity
206,641
184,901
Total liabilities and stockholders' equity
$
2,485,434
 
 
$
2,250,258
 
 
Net interest income
$
18,109
$
14,022
Net interest spread
(4)
1.82%
1.48%
Net interest margin
(5)
3.03%
2.60%
(1)
 
Annualized.
(2)
 
Average loan balances include non-accrual loans. Interest income on loans includes accretion
 
of deferred loan fees, net of deferred loan costs.
(3)
 
At fair value except for securities held to maturity. This amount includes FHLB
 
stock.
(4)
 
Net interest spread is the average yield earned on total
 
interest-earning assets minus the average rate paid on total interest-bearing
 
liabilities.
(5)
 
Net interest margin is the ratio of net interest income to total
 
interest-earning assets.


8
USCB FINANCIAL HOLDINGS, INC.
NON-GAAP FINANCIAL MEASURES (UNAUDITED)
(Dollars in thousands)
As of or For the Three Months Ended
9/30/2024
6/30/2024
3/31/2024
12/31/2023
9/30/2023
Pre-tax pre-provision ("PTPP") income:
(1)
Net income
$
6,949
$
6,209
$
4,612
$
2,721
$
3,819
Plus: Provision for income taxes
2,213
1,967
1,426
787
1,250
Plus: Provision for credit losses
931
786
410
1,475
653
PTPP income
$
10,093
$
8,962
$
6,448
$
4,983
$
5,722
PTPP return on average assets:
(1)


PTPP income
$
10,093
$
8,962
$
6,448
$
4,983
$
5,722
Average assets
$
2,485,434
$
2,479,222
$
2,436,103
$
2,268,811
$
2,250,258
PTPP return on average assets
(2)
1.62%
1.45%
1.06%
0.87%
1.01%


Operating net income:
(1)
Net income
$
6,949
$
6,209
$
4,612
$
2,721
$
3,819
Less: Net gains (losses) on sale of securities
-
14
-
(883)
(955)
Less: Tax effect on sale of securities
-
(4)
-
224
242
Operating net income
$
6,949
$
6,199
$
4,612
$
3,380
$
4,532


Operating PTPP income:
(1)
PTPP income
$
10,093
$
8,962
$
6,448
$
4,983
$
5,722
Less: Net gains (losses) on sale of securities
-
14
-
(883)
(955)
Operating PTPP income
$
10,093
$
8,948
$
6,448
$
5,866
$
6,677
Operating PTPP return on average assets:
(1)


Operating PTPP income
$
10,093
$
8,948
$
6,448
$
5,866
$
6,677
Average assets
$
2,485,434
$
2,479,222
$
2,436,103
$
2,268,811
$
2,250,258
Operating PTPP return on average assets
(2)
1.62%
1.45%
1.06%
1.03%
1.18%


Operating return on average assets:
(1)
Operating net income
$
6,949
$
6,199
$
4,612
$
3,380
$
4,532
Average assets
$
2,485,434
$
2,479,222
$
2,436,103
$
2,268,811
$
2,250,258
Operating return on average assets
(2)
1.11%
1.01%
0.76%
0.59%
0.80%
Operating return on average equity:
(1)
Operating net income
$
6,949
$
6,199
$
4,612
$
3,380
$
4,532
Average equity
$
206,641
$
197,755
$
193,092
$
183,629
$
184,901
Operating return on average equity
(2)
13.38%
12.61%
9.61%
7.30%
9.72%
Operating Revenue:
(1)
 
Net interest income
$
18,109
 
$
17,311
 
$
15,158
 
$
14,376
 
$
14,022
 
Non-interest income
 
3,438
3,211
2,464
 
1,326
 
2,161
 
Less: Net gains (losses) on sale of securities
-
14
-
(883)
(955)
 
Operating revenue
$
21,547
$
20,508
$
17,622
$
16,585
$
17,138
Operating Efficiency Ratio:
(1)
 
Total non-interest expense
$
11,454
 
$
11,560
 
$
11,174
 
$
10,719
 
$
10,461
 
Operating revenue
$
21,547
$
20,508
$
17,622
$
16,585
$
17,138
 
Operating efficiency ratio
53.16%
56.37%
63.41%
64.63%
61.04%
(1) The Company believes these non-GAAP measurements are
 
key indicators of the ongoing earnings power of the
 
Company.
(2)
 
Annualized.


9
USCB FINANCIAL HOLDINGS, INC.
NON-GAAP FINANCIAL MEASURES (UNAUDITED)
(Dollars in thousands, except per share data)
As of or For the Three Months Ended
9/30/2024
6/30/2024
3/31/2024
12/31/2023
9/30/2023
Tangible book value per common share (at period-end):
(1)
Total stockholders' equity
$
213,916
$
201,020
$
195,011
$
191,968
$
182,884
Less: Intangible assets
-
-
-
-
-
Tangible stockholders' equity
$
213,916
$
201,020
$
195,011
$
191,968
$
182,884
Total shares issued and outstanding (at period-end):
Total common shares issued and outstanding
19,620,632
19,630,632
19,650,463
19,575,435
19,542,290
Tangible book value per common share
(2)
$
10.90
$
10.24
$
9.92
$
9.81
$
9.36
Operating diluted net income per common share:
(1)
Operating net income
$
6,949
$
6,199
$
4,612
$
3,380
$
4,532
Total weighted average diluted shares of common stock
19,825,211
19,717,167
19,698,258
19,573,350
19,611,897
Operating diluted net income per common share:
$
0.35
$
0.31
 
$
 
0.23
 
$
 
0.17
 
$
 
0.23
Tangible Common Equity/Tangible Assets
(1)
 
Tangible stockholders' equity
$
213,916
$
201,020
$
195,011
$
191,968
$
182,884
 
Tangible total assets
(3)
$
2,503,954
 
$
 
2,458,270
 
$
 
2,489,142
 
$
 
2,339,093
 
$
 
2,244,602
Tangible Common Equity/Tangible Assets
8.54%
8.18%
7.83%
8.21%
8.15%
(1)
 
The Company believes these non-GAAP measurements
 
are key indicators of the ongoing earnings power
 
of the Company.
(2)
 
Excludes the dilutive effect, if any, of shares of common stock issuable upon exercise of outstanding
 
stock options.
(3) Since the Company has no intangible assets, tangible total assets is the same amount as total assets calculated under GAA EARNINGS PRESENTATION THIRD QUARTER 2024 NASDAQ: USCB USCB FINANCIAL HOLDING | U.S. CENTURY BANK
P.
EX-99.2 7 exhibit992.htm EX-99.2 exhibit992
exhibit992p1i0
 
Exhibit 99.2
exhibit992p2i0
 
FORWARD-LOOKING STATEMENTS This presentation
 
may contain statements that are not historical in nature and are
 
intended to be, and are hereby identified as, forward-looking statements
 
for purposes of the safe harbor provided by Section 21E of the
 
Securities Exchange Act of 1934, as amended.
 
Forward-looking statements are those that are not historical facts.
 
The words “may,” “will,” “anticipate,” “could,” “ should,” “would,”
 
“believe,” “contemplate,” “expect,” “aim,” “plan,” “estimate,”
 
“continue,” and “intend,”, the negative of these terms, as well as other
 
similar words and expressions of the future, are intended to identify
 
forward-looking statements. These forward-looking statements
 
include, but are not limited to, statements related to our projected
 
growth, anticipated future financial performance, and management’s
 
long-term performance goals, as well as statements relating to
 
the anticipated effects on our results of operations and financial condition
 
from expected or potential developments or events, or business and
 
growth strategies, including anticipated internal growth and balance
 
sheet restructuring. These forward-looking statements involve
 
significant risks and uncertainties that could cause our actual
 
results to differ materially from those anticipated in such statements.
 
Potential risks and uncertainties include, but are not limited to: the
 
strength of the United States economy in general and the strength
 
of the local economies in which we conduct operations; our
 
ability to successfully manage interest rate risk, credit risk,
 
liquidity risk, and other risks inherent to our industry; the accuracy
 
of our financial statement estimates
 
and assumptions, including the estimates used for our credit loss
 
reserve and deferred tax asset valuation allowance; the efficiency
 
and effectiveness of our internal control procedures and
 
processes; our ability to comply with the extensive laws and regulations
 
to which
we are subject, including the laws for each jurisdiction where we operate;
 
adverse changes or conditions in the capital and financial markets,
 
including actual or potential stresses in the banking industry;
 
deposit attrition and the level of our uninsured deposits; legislative
 
or regulatory changes and changes in accounting principles,
 
policies, practices or guidelines, including the on-going effects
 
of the implementation of the Current Expected Credit Losses (“CECL”)
 
standard; the lack of a significantly diversified loan portfolio and the concentration
 
in the South Florida market, including the risks of geographic,
 
depositor, and industry concentrations, including our concentration
 
in loans secured by real estate, in particular, commercial real
 
estate; the effects of climate change; the concentration of ownership of
 
our common stock; fluctuations in the price of our common stock;
 
our ability to fund or access the capital markets at attractive
 
rates and terms and manage our growth, both organic growth as
 
well as growth through other means, such as future acquisitions;
 
inflation, interest rate, unemployment rate, and market and monetary
 
fluctuations; impacts of international hostilities and geopolitical
 
events; increased competition and its effect on the pricing of our products
 
and services as well as our net interest rate spread and net
 
interest margin; the loss of key employees; the effectiveness
 
of our risk management strategies, including operational risks, including,
 
but not limited to, client, employee, or third-party fraud and
 
security breaches; and other risks described in this presentation and
 
other filings we make with the Securities and Exchange Commission
 
(“SEC”). All forward-looking statements are necessarily
 
only estimates of future results, and there can be no assurance that actual
 
results will not differ materially from expectations. Therefore,
 
you are cautioned not to place undue reliance on any forward-looking
statements. Further, forward-looking statements included in this presentation are made only as of the date hereof, and we undertake no obligation to update or revise any forward-looking statements to reflect events or circumstances occurring after the date on which the statements are made or to reflect the occurrence of unanticipated events, unless required to do so under the federal securities laws. You should also review the risk factors described in the reports USCB Financial Holdings, Inc. filed or will file with the SEC. Non-GAAP Financial Measures This presentation includes financial information determined by methods other than in accordance with generally accepted accounting principles (“GAAP”). This financial information includes certain operating performance measures. Management has included these non-GAAP financial measures because it believes these measures may provide useful supplemental information for evaluating the Company’s expectations and underlying performance trends. Further, management uses these measures in managing and evaluating the Company’s business and intends to refer to them in discussions about our operations and performance. Operating performance measures should be viewed in addition to, and not as an alternative to or substitute for, measures determined in accordance with GAAP, and are not necessarily comparable to non-GAAP measures that may be presented by other companies. Reconciliations of these non-GAAP measures to the most directly comparable GAAP measures can be found in the Non-GAAP financial measures reconciliation tables included in this presentation. All numbers included in this presentation are unaudited unless otherwise noted. 2 Q3 2024 HIGHLIGHTS GROWTH Average deposits increased by $136.1 million or 7.0% compared to the third quarter 2023.
exhibit992p3i0
 
Average loans increased $267.4 million or 16.6% compared to the third quarter 2023. Liquidity sources as of September 30, 2024, aggregated $695 million in on-balance sheet and off-balance sheet sources. Tangible book value per common share (a non-GAAP measure) (1) on September 30, 2024 was $10.90 includes AOCI impact of ($1.94) increased $0.66 or 25.7% annualized from $10.24 in prior quarter end which included an AOCI impact of ($2.62). PROFITABILITY Net income was $6.9 million or $0.35 per diluted share, an increase of $3.1 million or 82.0% compared to the third quarter 2023. Net interest income before provision increased $4.1 million or 29.1% for the quarter compared to the third quarter 2023. ROAA was 1.11% in the third quarter 2024 compared to 0.67% for the third quarter 2023. ROAE was 13.38% in the third quarter 2024 compared to 8.19% for the third quarter 2023. CAPITAL/CREDIT The Company’s Board of Directors declared a cash dividend of $0.05 per share of the Company’s Class A common stock on October 28, 2024. The dividend will be paid on December 5, 2024 to shareholders of record at the close of business on November 15, 2024. At September 30, 2024, four loans were classified as nonaccrual for a total of $2.7 million. ACL coverage ratio was 1.19% at September 30, 2024, and 1.16% at September 30, 2023. (1) Non-GAAP financial measure. See reconciliation in this presentation. 3 HISTORICAL FINANCIALS EOP for Balance Sheet amounts Loans (1) In millions $735 $1,931 2016 2017 2018 2019 2020 2021 2022 2023 Q1 Q2 Q3 2024 2024 2024 Deposits In millions $782 $2,127 2016 2017 2018 2019 2020 2021 2022 2023 Q1 Q2 Q3 2024 2024 2024 Total stockholders' equity In millions $86 $214 2016 2017 2018 2019 2020 2021 2022 2023 Q1 Q2 Q3 2024 2024 2024 ACL/Total Loans (2) 1.17% 1.19% 2016 2017 2018 2019 2020 2021 2022 2023 Q1 Q2 Q3 2024 2024 2024 Net charge -offs ($1,019) ($6) 2016 2017 2018 2019 2020 2021 2022 2023 Q1 Q2 Q3 2024 2024 2024 Nonperforming Assets/Total Assets 1.58% 0.11% 2016 2017 2018 2019 2020 2021 2022 2023 Q1 Q2 Q3 2024 2024 2024 Net Interest Income In millions $30 $59 2016 2017 2018 2019 2020 2021 2022 2023 Q1 Q2 Q3 2024 2024 2024 Efficiency ratio 94.15% 53.16% 2016 2017 2018 2019 2020 2021 2022 2023 Q1 Q2 Q3 2024 2024 2024 PTPP ROAA (3) 0.24% 1.62% 2016 2017 2018 2019 2020 2021 2022 2023 Q1 Q2 Q3 2024 2024 2024 (1) Loan amounts include deferred fees/costs.
exhibit992p4i0
 
exhibit992p5i0
 
(2) ACL was calculated under the CECL standard methodology for all periods after January 1st 2023, and the incurred loss methodology for all periods before. (3) Non-GAAP financial measure. See reconciliation in this presentation. 4 FINANCIAL RESULTS In thousands (except per share data) Q3 2024 Q2 2024 Q3 2023 Balance Sheet (EOP) Total Securities $426,528 $406,050 $415,920 Total Loans (1) $1,931,362 $1,869,249 $1,676,520 Total Assets $2,503,954 $2,458,270 $2,244,602 Total Deposits $2,126,617 $2,056,702 $1,920,922 Total Equity (2) $213,916 $201,020 $182,884 Income Statement Net Interest Income $18,109 $17,311 $14,022 Non-Interest Income $3,438 $3,211 $2,161 Total Revenue $21,547 $20,522 $16,183 Provision for Credit Losses $931 $786 $653 Non-Interest Expense $11,454 $11,560 $10,461 Net Income $6,949 $6,209 $3,819 Diluted Earning Per Share (EPS) $0.35 $0.31 $0.19 Weighted Average Diluted Shares 19,825,211 19,717,167 19,611,897 (1) Loan amounts include deferred fees/costs. (2) Total Equity includes accumulated comprehensive loss of $38.0 million for Q3 2024, $44.7 million for Q2 2024, and $51.2 million for Q3 2023. 5 KEY PERFORMANCE INDICATORS Q3 2024 Q2 2024 Q3 2023 In thousands (except for TBV/share) GROWTH Total Assets (EOP) $2,503,954 $2,458,270 $2,244,602 Total Loans (EOP) $1,931,362 $1,869,249 $1,676,520 Total Deposits (EOP) $2,126,617 $2,056,702 $1,920,922 Tangible Book Value/Share (1)(2) $10.90 $10.24 $9.36 PROFITABILITY Return On Average Assets (ROAA) (3) 1.11% 1.01% 0.67% Return On Average Equity (ROAE) (3) 13.38% 12.63% 8.19% Net Interest Margin (3) 3.03% 2.94% 2.60% Efficiency Ratio 53.16% 56.33% 64.64% Non -Interest Expense/Avg Assets (3) 1.83% 1.88% 1.84% CAPITAL/CREDIT Tangible Common Equity/Tangible Assets (1) 8.54% 8.18% 8.15% Total Risk-Based Capital (4) 13.22% 13.12% 13.10% NCO/Avg Loans (3) 0.00% 0.00% 0.00% NPA/Assets 0.11% 0.03% 0.02% Allowance for Credit Losses/Loans 1.19% 1.19% 1.16% (1) Non-GAAP financial measures.
exhibit992p6i0
 
See reconciliation in this presentation. (2) AOCI effect on tangible book value per share was ($1.94) for Q3 2024, ($2.28) for Q2 2024 and ($2.62) for Q3 2023. (3) Annualized. (4) Reflects the Company's regulatory capital ratios which are provided for informational purposes only; as a small bank holding company, the Company is not subject to regulatory capital requirements. 6 DEPOSIT PORTFOLIO Deposits AVG In millions $1,941 $1,914 $2,049 $2,083 $2,078 $290 $282 $323 $316 $326 $1,011 $1,005 $1,098 $1,101 $1,085 $52 $50 $53 $56 $58 $588 $577 $575 $610 $609 Q3 2023 Q4 2023 Q1 2024 Q2 2024 Q3 2024 Non-interest -bearing deposits Money market and savings Interest-bearing checking deposits Time deposits Deposit Cost 2.39% 2.53% 2.76% 2.64% 2.66% Q3 2023 Q4 2023 Q1 2024 Q2 2024 Q3 2024 Commentary Average deposits slightly decreased to $2,078 million compared to the prior quarter and increased $136.1 million or 7.0% compared to the third quarter 2023.
exhibit992p7i0
 
DDA remained at 29% of total average deposits. The quarterly average cost of deposits went up 2 bps during the third quarter of 2024 compared to the prior quarter; however, the monthly average deposit cost for September 2024 was 2.57%. The monthly decrease in deposit cost was due to the Company reducing Money Market rates in conjunction with the Fed Funds decrease during the month. 7 LOAN PORTFOLIO Total Loans (AVG) In millions 2.39% 2.53% 2.76% 2.64% 2.66% Q3 2023 Q4 2023 Q1 2024 Q2 2024 Q3 2024 Loan Yields $1,611 $1,699 $1,782 $1,828 $1,878 Q3 2023 Q4 2023 Q1 2024 Q2 2024 Q3 2024 5.55% 5.79% 6.01% 6.16% 6.32% 0.02% 0.00% 0.00% 0.00% 0.00% 5.37% 5.79% 6.01% 6.16% 6.32% + 79 Q3'23 vs Q3'24 Q3 2023 Q4 2023 Q1 2024 Q2 2024 Q3 2024 Loan coupon Lona fees Commentary Average loans increased $49.7 million or 10.8% annualized compared to prior quarter and $267.4 million or 16.6% compared to the third quarter 2023.
exhibit992p8i0
 
exhibit992p9i0
 
Loan coupon increased 16 bps compared to the prior quarter and 79 bps compared to the third quarter 2023. 8 LOAN PRODUCTION Net Loan Production Trend In millions 8.00% 8.00% 8.16% 8.01% 7.75% $135 $55 $150 $46 $131 $91 $155 $108 $157 $83 Q3 2023 Q4 2023 Q1 2024 Q2 2024 Q3 2024 Loan Production/Line changes Loan Amortization/payoffs New loans weighted average coupon Loan Composition Trend EOP (1) In millions $948 $1,928 28% 15% 63% 57% 9% 28% Jun-20 Sep-24 Residential real estate commercial real estate Real Estate Loans Commercial and industrial, correspondent banks, and Customer and other (1) Excludes deferred fees/cost. Commentary $146.0 million in new loan production in the third quarter 2024. Weighted average coupon on new loans was 7.75% for third quarter 2024, 143 bps above portfolio weighted average yield. Loan composition shift from real estate loans to non-CRE loans is steadily increasing, further diversifying our loan portfolio. 9 NET INTEREST MARGIN Net Interest Income/Margin (1) In thousands (Except ratios) 2.60% 2.65% 2.62% 2.94% 3.03% $14,022 $14,376 $15,158 $17,311 $18,109 Q3 2023 Q4 2023 Q1 2024 Q2 2024 Q3 2024 Net Interest Income NIM Interest-Earning Assets Mix (AVG) 4% 2% 5% 4% 3% 21% 19% 18% 19% 18% 75% 79% 77% 77% 79% Q3 2023 Q4 2023 Q1 2024 Q2 2024 Q3 2024 Total Loans Investment Securities Cash Balances & Equivalents Commentary Net interest income increased $798 thousand or 18.3% annualized compared to prior quarter and $4.1 million or 29.1% compared to the third quarter 2023.
exhibit992p10i0
 
Net interest margin increased 9 bps compared to prior quarter and 43 bps compared to third quarter 2023. NIM drivers: Interest earning asset mix improving at higher yields. Deposit cost remained stable. (1) Annualized. 10 INTEREST RATE SENSITIVITY Loan Portfolio Repricing Profile by Rate Type Hybrid ARM 3% Fixed Rate 44% Variable Rate 53% 23% 12% 65% Prime CMT SQFR Loan Repricing Schedule Variable/Hybrid Rate Loans 29% 38% 12% 21% yrs.
exhibit992p11i0
 
1-2 yrs. 2-3 yrs. >3 yrs.
exhibit992p12i0
 
Static NII Simulation Year 1 & 2 $4,000 $3,000 $2,000 $1,000 -100 +100 -100 +100 $0 -1.4% 0.7% -5.5% 4.1% -$1,000 -$2,000 -$3,000 -$4,000 -$5,000 Net Interest Income change from base ($ in thousands and % change) 11 ASSET QUALITY Allowance for Credit Losses In thousands (except ratios) 1.16% 1.18% 1.18% 1.19% 1.19% $19,493 $21,084 $21,454 $22,230 $23,067 Q3 2023 Q4 2023 Q1 2024 Q2 2024 Q3 2024 Allowance for credit losses ACL/Total loans Non-performing Loans In thousands (except ratios) 0.03% 0.03% 0.03% 0.04% 0.14% $479 $468 $456 $759 $2,725 Q3 2023 Q4 2023 Q1 2024 Q2 2024 Q3 2024 Non-accrual loans Non-performing loans to total loans Classified Loans (1) to Total Loans 0.27% 0.53% 0.44% 0.45% 0.36% Q3 2023 Q4 2023 Q1 2024 Q2 2024 Q3 2024 Commentary Allowance for credit losses increased $837 thousand compared to prior quarter and $3.6 million compared to third quarter 2023. ACL coverage ratio was at 1.19% as of September 30, 2024. One C&I loan for $420 thousand, one consumer loan for $1,991 thousand, and one residential real estate loan for $314 thousand were classified as nonaccrual as of September 30, 2024. (1) Loans classified as substandard at period end. No loans classified doubtful at all the dates presented. 12 LOAN PORTFOLIO MIX Loan Portfolio Mix (1) 10% 15% 10% 47% 13% 5% $1,928 MM(1) Residential real estate CRE – Owner occupied CRE – Non-owner occupied Commercial and industrial Correspondent banks Consumer and other Commentary Total loan balance at quarter end was $1,928 million (1).
exhibit992p13i0
 
Commercial Real Estate (owner occupied and non-owner occupied) was 57% or $1,095 million of the total loan portfolio(1). CRE mix is diversified and granular. Retail non-owner occupied makes up 27% of total CRE or $297.1 million. CRE Loan Mix Land/Construction 3% Other 3% Retail 27% Multifamily 18% CRE - Owner Occupied 17% Office 11% Warehouse 12% Hotels 9% $1,095MM As of 9/30/24 Excludes deferred fees/cost Includes loan types: office, warehouse, retail, and other CRE Loan Portfolio (non-owner occupied and owner occupied) Weighted Average Loan Type Outstanding Balance (1) LTV (2) DSCR (3) Average Loan Size (1) Retail $316 57% 1.53 $3.0 Multifamily $203 56% 1.33 $1.6 Office $182 56% 1.94 $1.5 Warehouse $187 57% 2.25 $1.6 Hotel $96 59% 2.23 $4.8 Other $75 57% 2.07 $1.7 Land/Construction $36 45% NA $2.1 (1) Balance in millions. Excludes deferred fees/cost. (2) LTV - Loan to value ratio. (3) DSCR - Debt service coverage ratio. 13 CRE OFFICE PORTFOLIO Owner Occupied Office by Business Type In Millions as of 9/30/2024 $19.2 30% $16.4 25% $24.8 38% $4.4 7% Medical/Dental Other Professional Other <$1MM Commentary Total office loan portfolio (owner occupied and non-owner occupied) had 120 notes with an average balance of $1.5 million, LTV of 56%, and DSCR of 1.94X at quarter end.
exhibit992p14i0
 
The largest business type in the office portfolio is multi-tenant with 46% of the portfolio. South Florida’s office sector outperforms the national average with a lower vacancy rate of 12% and with a positive net absorption for three straight years as of Q1 2024. All three major markets within South Florida were ranked in the top 10 nationally for year-over-year rent growth. (1) Non-Owner Occupied Office by Business Type $12.1 11% $83.0 71% $16.3 14% $4.9 4% Multi-Tenant Medical/Dental Other <$1MM Office Loan Portfolio Maturities and Repricing < 1 year 1 year to 3 years 3 years to 5 years 5 years to 10 years > 10 years 11% 28% 49% 12% 0% CRE Office Key Metrics As of 9/30/240 Avg. Loan Size in millions $1.5 NCOs / Average Loans 0.00% Delinquencies / Loans 0.00% Nonaccruals / Loans 0.00% Classified Loans / Loans 0.00% (1) Data points source: CBRE, a NYSE-listed and worldwide commercial real estate services & investment company with clients in 100+ countries, including over 95% of the Fortune 100. Published March 2024. 14 NON-INTEREST INCOME In thousands (except ratios) Q3 2024 Q2 2024 Q1 2024 Q4 2023 Q3 2023 Total service fees $2,544 $1,977 $1,651 $1,348 $1,329 Wire fees $563 $557 $521 $518 $502 Swap fees $1,285 $650 $285 $16 $97 Other $696 $770 $845 $814 $730 Gain (loss) on sale of securities available for sale - 14 - (883) (955) Gain on sale of loans held for sale 109 417 67 105 255 Other income 785 803 746 756 1,532 Total non-interest income $3,438 $3,211 $2,464 $1,326 $2,161 Average total assets $2,485,434 $2,479,222 $2,436,103 $2,268,811 $2,250,258 Non-interest income/Average assets (1) 0.55% 0.52% 0.41% 0.23% 0.38% Commentary Service fees increased year over year due to loan swap fees and wire fees.
exhibit992p15i0
 
exhibit992p16i0
 
Gain on sale of SBA 7a loans represent $109 thousand for the third quarter 2024. Non-interest income is 16.0% of total revenue for third quarter 2024 and 0.55% to average assets; both metrics are higher than prior quarters. (1) Annualized. 15 NON-INTEREST EXPENSE In thousands (except ratios) Q3 2024 Q2 2024 Q1 2024 Q4 2023 Q3 2023 Salaries and employee benefits $7,200 $7,353 $6,310 $6,104 $6,066 Occupancy 1,341 1,266 1,314 1,262 1,350 Regulatory assessments and fees 452 476 433 412 365 Consulting and legal fees 161 263 592 642 513 Network and information technology services 513 479 507 552 481 Other operating expense 1,787 1,723 2,018 1,747 1,686 Total non-interest expense $11,454 $11,560 $11,174 $10,719 $10,461 Efficiency ratio 53.16% 56.33% 63.41% 68.27% 64.64% Average total assets $2,485,434 $2,479,222 $2,436,103 $2,268,811 $2,250,258 Non-interest expense / Average assets (1) 1.83% 1.88% 1.84% 1.87% 1.84% Full-time equivalent employees 198 197 199 196 194 Commentary Salaries and benefits decreased $153 thousand compared to the prior quarter due to higher incentives paid in the second quarter 2024. Consulting and legal fees decreased $102 thousand compared to the prior quarter due to reimbursement of legal expenses. Non-interest expense to average assets remained under 2% for all periods. Efficiency ratio improved for the third quarter 2024 primarily due to strong growth in non-interest income and a slight decrease in non-interest expenses. (1) Annualized. 16 CAPITAL Capital Ratios Q3 2024 Q2 2024 Q3 2023 Well-Capitalized Leverage Ratio 9.34% 9.03% 9.26% 5.00% TCE/TA 8.54% 8.18% 8.15% NA Tier 1 Risk-Based Capital 12.01% 11.93% 11.97% 8.00% Total Risk - Based Capital 13.22% 13.12% 13.10% 10.00% AOCI ($38.0) ($44.7) ($51.2) In Millions Commentary The Company paid in September 2024 a cash dividend of $0.05 per share of the Company’s Class A common stock; the aggregate distributed dividend amount was $1.0 million.
exhibit992p17i0
 
During the quarter, the Company repurchased 10,000 shares of common stock at a weighted average cost per share of $12.03. 537,980 shares remained authorized for repurchase under the Company’s share repurchase programs at September 30, 2024. Q3 2024 EOP common stock shares outstanding: 19,620,632. (1) Reflects the Company's regulatory capital ratios which are provided for informational purposes only; as a small bank holding company, the Company is not subject to regulatory capital requirements. (2) Non-GAAP financial measures. See reconciliation in this presentation. 17 TAKEAWAYS Leading franchise located in one of the most attractive banking markets in Florida and the U.S. Robust organic growth Strong asset quality, with minimal charge-offs experienced since 2015 recapitalization Experienced and tested management team Strong profitability, with pathway for future enhancement identified Core funded deposit base with 30% non-interest-bearing deposits (EOP) 18
exhibit992p18i0
 
exhibit992p19i0
 
APPENDIX - NON-GAAP RECONCILIATION APPENDIX
 
- NON-GAAP RECONCILIATION In thousands (except
 
ratios) Pre-tax pre-provision ("PTPP") income: Net income
 
Plus: Provision for income taxes Plus: Provision for credit losses
 
PTPP income PTPP return on average as sets: As of or For the
 
Three Months Ended 9/30/2024 6/30/2024 3/31/2024 12/31/2023 9/30/2023
 
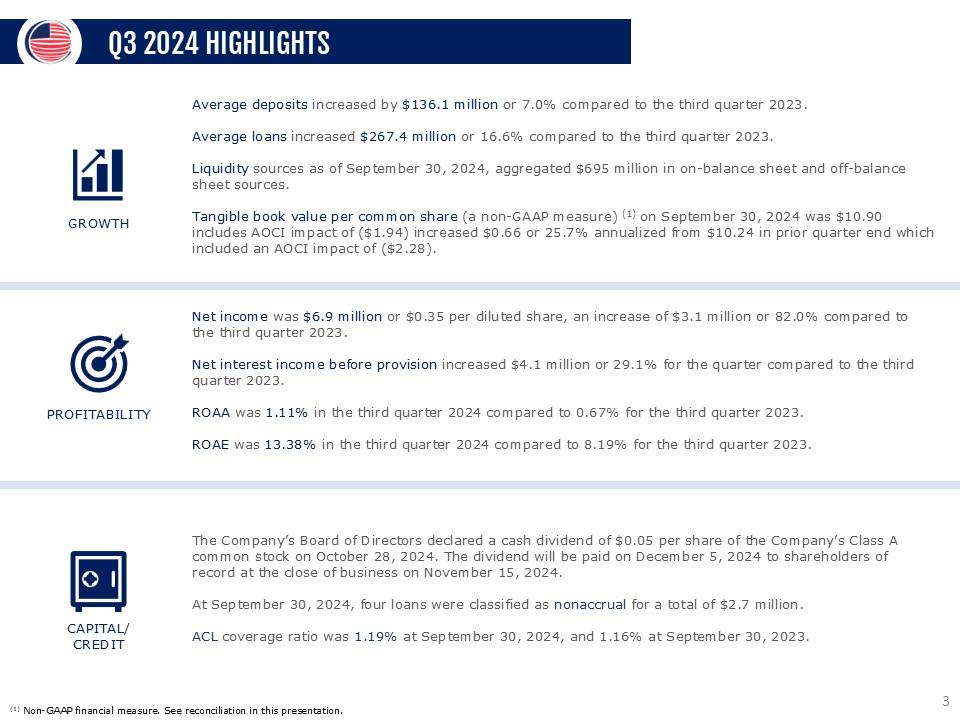
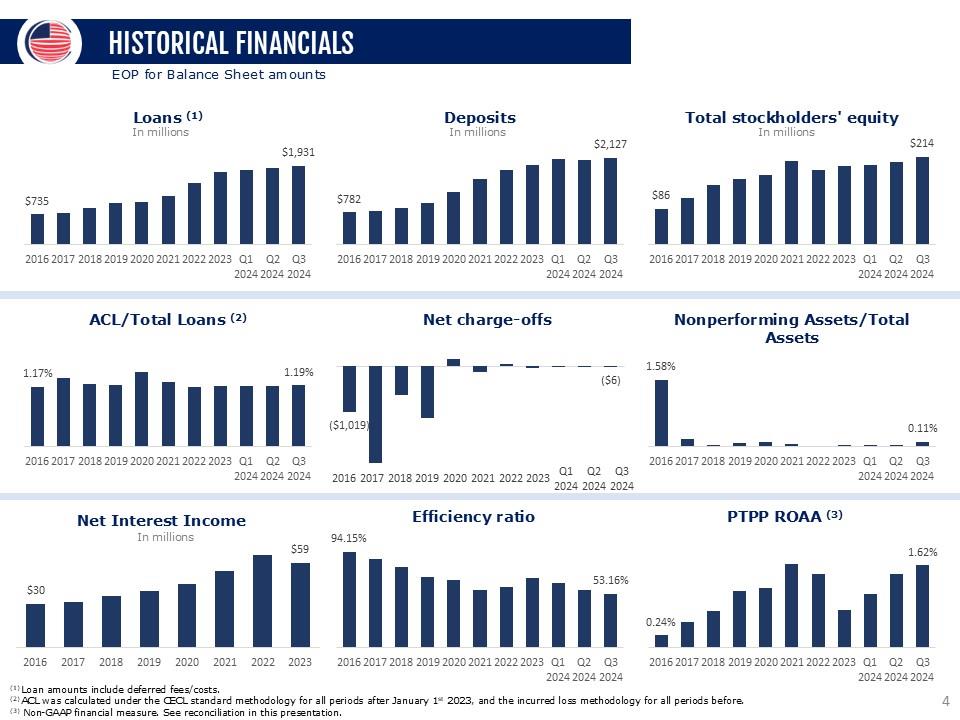
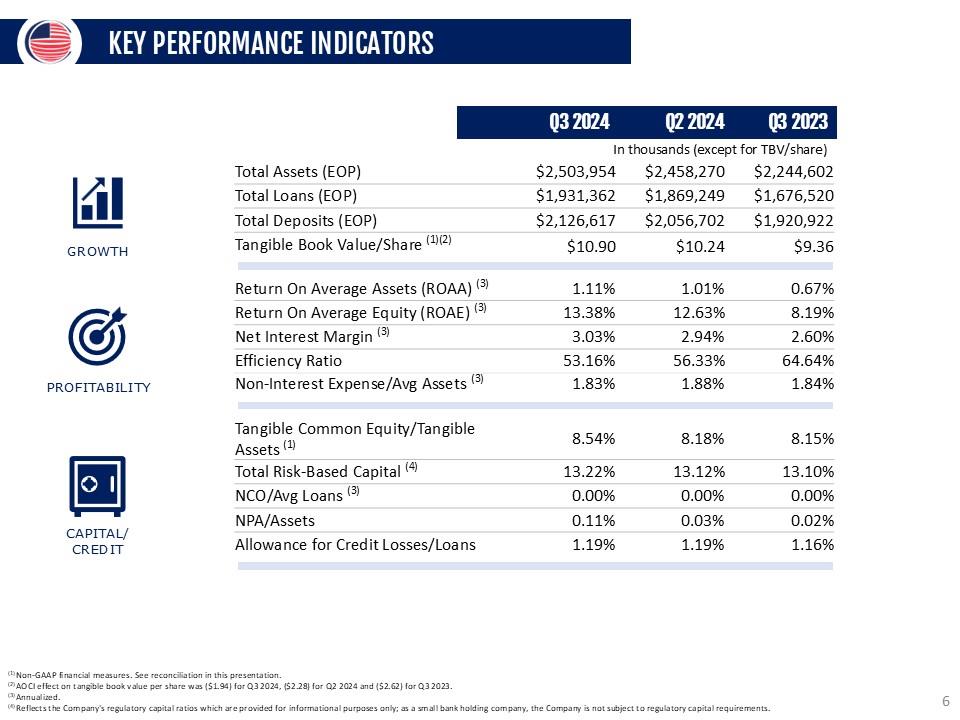
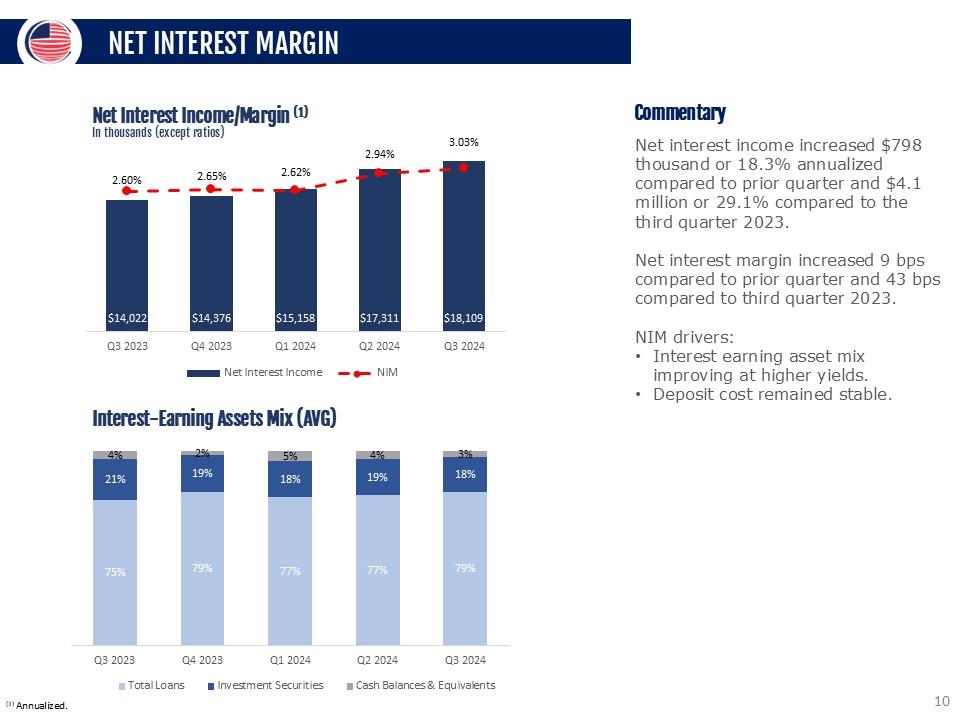
$ 6,949 $ 6,209 $ 2,213 1,987 4,812
 
$ 1,428 2,721 $ 3,819 787 1,250 931 786 410 1,475 853 10,093
 
8,982 $ 6,448 $ 4,983 $ 5,722 (1) PTPP in come Average
 
assets PTPP return on average assets $ 10,093 $ 8,962 $ 8,448
 
$ 4,983 $ 5,722 $ 2,485,434 $ 2,479,222 $ 2,438,103 $ 2,288,811
 
$ 2,250,258 (2) 1.62% 1.45% 1.08% 0.87% 1.01% Operating net
 
income: Net income Less: Net gains (losses) on sale of securities Less:
 
Tax effect on sale of securities Operating net income
 
(1) $ 6,949 $ 6,209 $ 4,812 $ 2,721 $ 3,819 14 (883) (955) (4)
 
224 242 $ 6,949 $ 6,199 $ 4,812 $ 3,380 $ 4,532 Operating PTPP income:
 
PTPP in come (1) $ 10,093 $ 8,982 $ 6,448 $ 4,983 $ 5,722 Less: Net
 
gains (losses) on sale of securities Operating PTPP in come
 
14 (883) (955) $ 10,093 $ 8,948 $ 6,448 5,886 $ 6,677 Operating
 
PTPP return on average as sets: (1) Operating PTPP income $
 
10,093 $ 8,948 Average assets $ 2,485,434 $ Operating PTPP
 
return on average assets (2) 1.62% 2,479,222 1.45% $ $ 2,438,103
 
1.08% 8,448 $ 5,886 $ 6,677 $ 2,268,811 1.03% $ 2,250,258
 
1.18% Operating return on average as sets: (1) Operating net
 
income 6,949 6,199 4,812 $ Average assets Operating return on average
 
assets (2) $ 2,485,434
 
1.11% $ 2,479,222 1.01% $ 2,438,103 $ 0.76% 3,380 2,288,811
 
0.59% 4,532 $ 2,250,258 0.80% Operating return on average
 
equity: (1) Operating net income Average equity 19 19 Operating return
 
on average equity (2) 6,949 $ 206,641 6,199 $ $ 197,755 $ 13.38%
 
12.81% 4,812 $ 193,092 $ 9.61% 3,380 $ 183,629 7.30%
exhibit992p20i0
 
$ 4,532 184,901 9.72% Operating Revenue: (1) Net interest income $ Non -interest income 18,109 $ 3,438 17,311 $ Less: Net gains (losses) on sale of securities 3,211 14 15,158 $ 2,484 14,376 5 14,022 1,326 2,161 (883) (955) Operating revenue 21,547 $ 20,508 $ 17,822 $ 16,585 $ 17,138 Operating Efficiency Ratio: Total non-interest expense Operating revenue Operating efficiency rato $ 11,454 $ 21,547 $ 53.16% 11,560 $ 20,508 $ 56.37% 11,174 $ 17,822 $ 63.41% 10,719 $ 10,461 16,585 $ 64.63% 17,138 61.04% (1) The Company believes these non-GAAP measurements are key indicators of the ongoing earnings power of the Company. 19 (2) Annualized. 19 APPENDIX - NON-GAAP RECONCILIATION In thousands (except ratios and share data) 9/30/2024 3/31/2024 As of or For the Three Months Ended 6/30/2024 12/31/2023 9/30/2023 Tangible book value per common share (at period-end): (1) Total stockholders' equity $ 213,916 $ 201,020 $ 195,011 $ 191,968 $ 182,884 Less: Intangible assets Tangible stockholders' equity Total common shares issued and outstanding $ 213,916 $ 201,020 $ 195,011 S 191,968 $ 182,884 Total shares issued and outstanding (at period-end): 19,620,632 19,630,632 19,650,463 19,575,435 19,542,290 Tangible book value per common share (2) $ 10.90 $ 10.24 $ 9.92 $ 9.81 $ 9.36 Operating diluted net income per common share: (1) Operating net income $ 6,949 $ 6,199 $ Total weighted average diluted shares of common stock 19,825,211 19,717,167 4,612 $ 19,698,258 19,573,350 Operating diluted net income per common share: $ 0.35 $ 0.31 $ 0.23 $ 3,380 $ 4,532 19,611,897 0.17 $ 0.23 Tangible Common Equity/Tangible Assets (1) Tangible stockholders' equity $ Tangible total assets (3) $ Tangible Common Equity/Tangible Assets 213,916 $ 2,503,954 $ 8.54% 201,020 $ 2,458,270 $ 8.18% 195,011 $ 2,489,142 $ 7.83% 191,968 $ 2,339,093 $ 8.21% 182,884 2,244,602 8.15% (1) The Company believes these non-GAAP measurements are key indicators of the ongoing earnings power of the Company. (2) Excludes the dilutive effect, if any, of shares of common stock issuable upon exercise of outstanding stock options. (3) Since the Company has no intangible assets, tangible total assets is the same amount as total assets calculated under GAAP. 20 CONTACT INFORMATION LOU DE LA AGUILERA Chairman, President & CEO (305) 715-5186 laguilera@uscentury.com ROB ANDERSON EVP, Chief Financial Officer (305) 715-5393 rob.anderson@uscentury.com INVESTOR RELATIONS InvestorRelations@uscentury.com 21
exhibit992p21i0