株探米国株
英語
エドガーで原本を確認する
0001901637 False ☐ ☐ ☐ ☐ 0001901637 2023-08-07 2023-08-07


1
UNITED STATES
SECURITIES AND EXCHANGE COMMISSION
WASHINGTON,
 
D.C. 20549
__________________________
FORM
8-K
__________________________
CURRENT REPORT
Pursuant to Section 13 or 15(d) of the Securities Exchange Act
 
of 1934
Date of Report (Date of earliest event reported):
August 7, 2023
__________________________
USCB Financial Holdings, Inc.
(Exact name of Registrant as Specified in Its Charter)
 
__________________________
 
Florida
001-41196
87-4070846
(State or Other Jurisdiction
of Incorporation)
(Commission File Number)
(IRS Employer
Identification No.)
2301 N.W. 87th Avenue
,
Doral
,
Florida
33172
(Address of Principal Executive Offices)
(Zip Code)
Registrant’s Telephone
 
Number, Including Area Code: (
305
)
715-5200
 
__________________________
Check the appropriate box below if the Form 8-K filing is intended to simultaneously satisfy the filing obligation
 
of the registrant under
any of the following provisions:
 
Written communications pursuant
 
to Rule 425 under the Securities Act (17 CFR 230.425)
Soliciting material pursuant to Rule 14a-12 under the Exchange Act (17 CFR 240.14a
 
-12)
Pre-commencement communications pursuant to Rule 14d-2(b)
 
under the Exchange Act (17 CFR 240.14d-2(b))
Pre-commencement communications pursuant to Rule 13e-4(c) under the Exchange
 
Act (17 CFR 240.13e-4(c))
Securities registered pursuant to Section 12(b) of the Act:
Title of each class
Trading
Symbol(s)
Name of each exchange on which registered
Class A common stock, $1.00 par value per share
USCB
The Nasdaq Stock Market LLC
Indicate by
 
check mark
 
whether the
 
registrant is
 
an emerging
 
growth company
 
as defined
 
in Rule
 
405 of
 
the Securities
 
Act of
 
1933
(§ 230.405 of this chapter) or Rule 12b-2 of the Securities Exchange Act of 1934 (§ 240.12b
 
-2 of this chapter).
Emerging growth company
If
 
an
 
emerging
 
growth
 
company,
 
indicate
 
by
 
check
 
mark
 
if
 
the
 
registrant
 
has
 
elected
 
not
 
to
 
use
 
the
 
extended
 
transition
 
period
 
for
complying with any new or revised financial accounting standards provided
 
pursuant to Section 13(a) of the Exchange Act.
 
2
Item 7.01. Regulation FD Disclosure.
USCB Financial Holdings,
 
Inc. is filing an
 
investor presentation (the
 
“Presentation”), which will
 
be used by the
 
management
team for presentations to investors and
 
others. A copy of the Presentation
 
is attached hereto as Exhibit 99.1 and
 
incorporated herein by
reference. The Presentation is
 
also available on the
 
Company’s website
 
at investors.uscenturybank.com.
 
Information contained herein,
including Exhibit 99.1, is being furnished and shall not be deemed “filed”
 
for the purposes of Section 18 of the Securities
 
Exchange Act
of 1934,
 
as amended
 
“Exchange Act”,
 
or otherwise
 
subject to
 
the liability
 
of such
 
section, and
 
shall not
 
be deemed
 
incorporated by
reference
 
in any
 
filing
 
under the
 
Securities
 
Act
 
of
 
1933,
 
as amended
 
,
 
or the
 
Exchange
 
Act,
 
regardless
 
of any
 
general
 
incorporation
language in such filing, except as shall be expressly set forth by specific
 
reference in such a filing.
 
Item 9.01. Financial Statements and Exhibits.
(d) Exhibits.
Exhibit No.
 
Description
104
Cover Page Interactive Data File (embedded within the Inline XBRL document)


3
SIGNATURE
Pursuant to the requirements of the Securities Exchange Act of 1934, the registrant has duly
 
caused this report to be signed on
its behalf by the undersigned hereunto duly authorized.
USCB Financial Holdings, Inc.
By:
/s/ Robert Anderson
Name:
Robert Anderson
Title:
Chief Financial Officer
Date: August 7, 2023
EX-99.1 2 exhibit991.htm EXHIBIT 99.1 exhibit991
exhibit991p1i0
 
Exhibit 99.1
USCB Financial Holdings Inc.
exhibit991p2i0
 
NASDAQ: USCB USCB FINANCIAL HOLDINGS Forward-Looking Statements This presentation may contain statements that are not historical in nature and are intended to be, and are hereby identified as, forward-looking statements for purposes of the safe harbor provided by Section 21E of the Securities Exchange Act of 1934, as amended. Forward-looking statements are those that are not historical facts. The words “may,” “will,” “anticipate,” “should,” “would,” “believe,” “contemplate,” “expect,” “aim,” “plan,” “estimate,” “continue,” and “intend,” as well as other similar words and expressions of the future, are intended to identify forward-looking statements. These forward-looking statements include, but are not limited to, statements related to our projected growth, anticipated future financial performance, and management’s long-term performance goals, as well as statements relating to the anticipated effects on results of operations and financial condition from expected developments or events, or business and growth strategies, including anticipated internal growth and balance sheet restructuring. These forward-looking statements involve significant risks and uncertainties that could cause our actual results to differ materially from those anticipated in such statements. Potential risks and uncertainties include, but are not limited to: • the strength of the United States economy in general and the strength of the local economies in which we conduct operati ons; • our ability to successfully manage interest rate risk, credit risk, liquidity risk, and other risks inherent to our industry; • the accuracy of our financial statement estimates and assumptions, including the estimates used for our credit loss reserve and deferred tax asset valuation allowance; • the efficiency and effectiveness of our internal control procedures and processes; • our ability to comply with the extensive laws and regulations to which we are subject, including the laws for each jurisdiction where
we operate; • adverse changes or conditions in capital and financial
 
markets, including actual or potential stresses in the banking industry;
 
• deposit attrition and the level of our uninsured deposits; • legislative
 
or regulatory changes and changes in accounting principles,
 
policies, practices or guidelines, including the on-going effects
 
of the implementation of the Current Expected Credit Losses (“CECL”)
 
standard; • the effects of our lack of a diversified loan portfolio and
 
concentration in the South Florida market, including the risks
 
of geographic, depositor, and industry concentrations, including
 
our concentration in loans secured by real estate; • effects
 
of climate change; • the concentration of ownership of our common
 
stock; • fluctuations in the price of our common stock; • our
 
ability to fund or access the capital markets at attractive rates
 
and terms and manage our growth, both organic growth as well as growth
 
through other means, such as future acquisitions; • inflation,
 
interest rate, unemployment rate, market, and monetary fluctuations;
 
• impacts of international hostilities and geopolitical events; • increased
 
competition and its effect on the pricing of our products and services
 
as well as our margin; • the effectiveness of our risk management
 
strategies, including operational risks, including, but not limited
 
to, client, employee, or third-party fraud and security breaches; and
 
• other risks described in this presentation and other filings we
 
make with the Securities and Exchange Commission (“SEC”).
 
All forward-looking statements are necessarily only estimates of
 
future results, and there can be no assurance that actual
 
results will not differ materially from expectations. Therefore, you are
 
cautioned not to place undue reliance on any forward-looking statements.
 
Further, forward-looking statements included in this presentation are
 
made only as of the date hereof, and we undertake no obligation to
 
update or
revise any forward-looking statements to reflect events or circumstances after the date on which the statements are made or to reflect the occurrence of unanticipated events, unless required to do so under the federal securities laws. You should also review the risk factors described in the reports USCB Financial Holdings, Inc. filed or will file with the SEC. Non-GAAP Financial Measures This presentation includes financial information determined by methods other than in accordance with generally accepted accounting principles (“GAAP”). This financial information includes certain operating performance measures. Management has included these non-GAAP measures because it believes these measures may provide useful supplemental information for evaluating the Company’s expectations and underlying performance trends. Further, management uses these measures in managing and evaluating the Company’s business and intends to refer to them in discussions about our operations and performance. Operating performance measures should be viewed in addition to, and not as an alternative to or substitute for, measures determined in accordance with GAAP, and are not necessarily comparable to non-GAAP measures that may be presented by other companies. Reconciliations of these non-GAAP measures to the most directly comparable GAAP measures can be found in the ‘Non-GAAP Reconciliation Tables’ included in the presentation. 2 All numbers included in this presentation are unaudited unless otherwise noted. 2 Table of Contents Who We Are Growth Strategy Financial Review Appendix 3
exhibit991p3i0
 
exhibit991p4i0
 
We are a Relationship-First, Business Bank Company Overview Founded in 2002, U.S. Century Bank is a state-chartered bank headquartered in South Florida 8th largest Florida headquartered bank by deposits in Miami Dade County as of June 30, 2022. (1) Its holding company formed in 2021, USCB Financial Holdings, Inc (NASDAQ: USCB) is included in the Russell 3000 Index The Bank issued its initial public offering in July 2021, raising $40.0 million in equity capital. Full service commercial bank offering products and services tailored to meet the needs of Small-to-Medium Sized Businesses, entrepreneurs and professionals in South Florida (Miami Dade, Broward, and Palm Beach) SBA preferred lender, ranked as a top SBA 7(a) community bank lender in Miami Dade and Broward counties 5-star Bauer Financial rating Commercial Banking Focused on servicing small/medium-sized businesses within branch footprint Offer relationship retail deposit products to owners and operators of SMBs Ability for customers to access accounts through online and mobile banking platforms Credit products include Asset Based Loans, Lines of Credit and Term Loans Provide Treasury Management services to clients Relationship-driven with flexible solutions tailored to each client’s need Assets $2.2B Loans $1.6B Deposits $1.9B Equity $184M NPA/Assets 0.02% Total RBC 13.4% ROAA (2) 0.94% EPS(3) $0.50 South florida 10 Branches For the Company as of June 30, 2023. FDIC Deposit Market Share Report as of 6/30/22. Annualized based on year-to-date results. Diluted EPS for the six months ended June 30, 2023. 4 Historical Financials EOP for Balance Sheet amounts Loans (1) In millions $735 $1,596 Deposits In millions $782 $1,921 Total Stockholders’ Equity In millions $86 $184 ACL/Total Loans 1.17% 1.18% Net Charge Offs In thousands -$1,019 $29 Nonperforming Assets/Total Assets 1.58% 0.02% Total Revenue In millions $37 $69 Efficiency Ratio 94.15% 62.25% PTPP ROAA (2) 0.24% 1.02% (1) Loan amounts include deferred fees/costs.
exhibit991p5i0
 
(2) Non-GAAP financial measure. Annualized. 5
exhibit991p6i0
 
Diversified Business Verticals SBA / Small Business Lending $40MM
 
Loans Relationship-oriented business focused on delivering fast loan
 
commitments to small and medium-sized enterprises Predominately
 
Small business line of credits and CD secured loans Affordable SBA
 
loan provider Approved by the SBA to participate in the Preferred
 
Lenders Program Differentiated Banking Product Offerings Specialty banking
 
products, services and solutions designed for small businesses,
 
homeowner associations, law firms, medical practices
 
and other professional services firms, yacht lending and global banking
 
services Correspondent Banking $180MM Deposits / $85MM Loans
 
Comprehensive range of both domestic and international services
 
with the latest in technology to ensure quick processing Focus on
 
Caribbean and Latin American countries Correspondent banking
 
services include letters of credit, foreign collections, wire transfers,
 
ForEx and trade finance Jurist Advantage $159MM Deposits Deposit
 
aggregating focus/strategy Tailored products & services
 
for law offices, managing partners, associates and other staff
 
members Commercial deposits accounts, treasury management, commercial
 
lending, student loan refinancing, residential loans and credit
 
card services Yacht Lending $163MM Loans Yacht
 
financing for larger vessels, transaction range is $750k -$7.5MM.
 
Brokered oriented business, 3 vendor approved brokers Member
 
of the National Marine Lenders Association Acquired two yacht lending
 
portfolios in 2021 and launched this new vertical in 2022 Association
 
Banking $116MM Deposits / $86MM loans Deposit aggregating focus/strategy
 
Banking for Homeowner Associations and Property Managers
 
Offer deposit collection services and esoteric lending solutions ranging
 
from insurance premium and large capital improvements financing
 
Significant lending capacity to target large credits
Balances as of June 30, 2023. 6
exhibit991p7i0
 
Located in a Vibrant Economy DORAL HEADQUARTERS Florida is one of the largest business markets in the country According to the U.S. Small Business Administration’s 2022 report, Florida ranks third among states with the largest number of small businesses (three million) Enterprise Florida reported the state had the lowest unemployment rate amongst the top ten largest states as of November 2022. Florida continues to maintain one of the lowest unemployment rates compared to the national rate According to CNBC, Florida ranked #8 in 2023 for business The tri-county area of Miami-Dade, Broward and Palm Beach is the premier market within the state of Florida According to the US Small Business Administration’s latest report, Miami-Dade MSA accounts for more than 1/3 of small businesses in the state of Florida as of December 2022 A diverse and vibrant economy Miami-Dade MSA has a rapidly growing population The Miami-Dade MSA represents over 6 million residents and will reach close to 7 million by 2025 Business-friendly tax structures, no personal income tax and a reasonable cost living attract business to Florida 23 Fortune 500 companies are in Florida, with 11 in the Miami-Dade MSA as of 2022 Sources: U.S. Small Business Administration’s Office of Advocacy for 2022, Enterprise Florida, U.S. Bureau of Labor Statistics, Fortune Magazine, Miami-Dade Beacon Council. 7 Attractive Demographics Household Income Projected Growth 2022-2027 (1) Miami leads expectations of income growth with a 5-year growth rate of 16.98%.
exhibit991p8i0
 
9 cities within the current USCB network are expected to have growth greater than the US and Florida averages Miami-Dade MSA is the premier market within the state of Florida The Miami-Dade metro area is the tenth largest MSA in the United States by total number of businesses, per the North American Industry Classification System (NAICS) database USCB network USA & Florida growth rates 11.74% 11.90% 11.97% 12.02% 12.05% 12.10% 12.35% 12.39% 12.81% 13.20% 13.24% 13.26% 13.32% 13.37% 13.46% 13.47% 13.78% 13.99% 14.04% 14.16% 15.34% 15.61% 16.98% Tampa Coral Springs Palm Bay Jackonville Hollywodd US Florida Pembroke Pines Hialeah Davie Spring Hill Tallahassee Miramar Cape Coral Pmpano Beach West Palm Beach orland Clearwater Saint Ptersburg Miami Gardens Fort Lauderdale Prt Saint Lucie Miami (1) Source: S&P Global Market Intelligence. 8 Seasoned Management Luis de la Aguilera Chairman, President & CEO Previously President & CEO of TotalBank 40+ years in banking Rob Anderson Chief Financial Officer Previously CFO of Capstar Financial Holdings 18+ years in banking Benigno Pazos Chief Credit Officer Previously CCO of TotalBank 42+ years in banking Oscar Gomez Head of Global Banking Division Previously at Regions Bank 30+ years in banking Jay Shehadeh General Counsel Previously at Shehadeh Giannamore, PLLC 9+ years in banking Nicholas Bustle Chief Lending Officer Previously at Valley Bank 35+ years in banking Andres Collazo Director of Operations & IT Systems Previously at TotalBank 33+ years in banking Martha Guerra-Kattou Director of Sales & Marketing Previously at TotalBank 30+ years in banking Seasoned Management Team with Local Banking Experience 9
exhibit991p9i0
 
exhibit991p10i0
 
Accomplished Board of Directors Luis de la Aguilera Chairman, President & CEO Previously President & CEO of TotalBank Director since 2016 Aida Levitan Board Member President the Levitan Gorup Director since 2013 Kirk Wycoff Board Member Managing Partner, Patriot Financial Partners, L.P. Director since 2015 Howard Feinglass Board Member Managing Partner, Priam Capital Director since 2015 Ramón Abadin Board Member Partner, Ramon A. Abadin P.A. Director since 2017 Bernardo Fernandez, Jr. Board Member CEO, Baptist Health Medical Group Director since 2017 Ramon A. Rodriguez, CPA Board Member Chairman and Chief Executive Officer Cable Insurance Director since 2022 Robert Kafafian Board Member Founder, Chairman & Chief Executive Officer The Kafafian Group, Inc. Director since 2022 Maria C.
exhibit991p11i0
 
Alonso Board Member CEO and Regional Dean of Northeastern University, Miami Campus Director since 2022 Highly Accomplished and Aligned Board with Complementary Track Records 10 Our Strategy Organic Loan Growth: Take advantage of platform that we have developed post recap, capitalize on fragmented Miami -Dade MSA community banking market, and continue to build market share Capitalize on inherent advantages over smaller community banks which lack our product expertise and breadth of service Due to significant consolidation, there exists a base of potential clients that desire to partner with a bank that is locally headquartered Team Lift-outs: Continue to bring in top tier talent to U.S. Century Bank, with teams attracted to culture, public currency and local decision making Overall growth success will depend upon our ability to attract, retain, develop, incentivize, and reward the human capital necessary to execute growth strategy Attractive stock-based incentive compensation to attract top tier talent Asset Purchases: Portfolio loan purchases from companies exiting non-core lines of business; opportunistic to organic growth initiatives Net capital can serve as dry powder to facilitate meaningfully sized portfolio acquisitions Proactively evaluating portfolio opportunities that are consistent with USCB’s credit philosophy Strategic Acquisitions: Become an active acquirer for Florida banks looking to find a partner Focused on strategic, financially attractive acquisitions which support USCB’s organic growth strategy without compromising the risk profile Numerous potential partners Miami-Dade MSA that may seek liquidity USCB is positioned to offer stock consideration 11 Q2 2023 Highlights GROWTH Average deposits increased by $155.8 million or 9.1% compared to the second quarter 2022.
exhibit991p12i0
 
Liquidity sources increased to $853 million in on-balance sheet and off-balance sheet sources. Insured and collateralized deposit, increased to 51% from 43% in the second quarter 2022. Average loans, excluding PPP loans, increased $290.1 million or 22.7% compared to the second quarter 2022. Tangible Book Value per Share (1) was $9.40 includes an after-tax unrealized security loss impact of $2.41. PROFITABILITY Net income was $4.2 million or $0.21 per diluted share. ROAA was 0.77% compared to 1.08% for the second quarter 2022. ROAE was 9.13% compared to 11.38% for the second quarter 2022. Efficiency ratio was 65.25% compared to 55.34% for the second quarter 2022. CAPITAL/CREDIT Credit metrics remain strong. One C&I loan classified as nonaccrual for a total of $486 thousand. ACL coverage ratio was 1.18%. Effective January 1, 2023, the Company adopted the CECL methodology for estimating credit losses. Repurchased 77,603 shares of common stock during the quarter at a weighted average price of $9.58. 172,397 common shares remain authorized for repurchase under the repurchase program. (1) Non-GAAP financial measure. 12 Financial Results In thousands (except per share data) Q2 2023 Q1 2023 Q2 2022 Balance Sheet (EOP) Total Securities $439,398 $415,837 $456,135 Total Loans (1) $1,595,959 $1,580,394 $1,372,733 Total Assets $2,225,914 $2,163,821 $2,016,086 Total Deposits $1,921,301 $1,830,462 $1,738,720 Total Equity (2) $183,685 $183,858 $180,068 Income Statement Net Interest Income $14,173 $15,997 $15,642 Non-interest Income $1,846 $2,070 $1,617 Total Revenue $16,019 $18,067 $17,259 Provision for Credit Losses $38 $201 $705 Non-interest Expense $10,452 $10,176 $9,551 Net Income $4,196 $5,809 $5,295 Diluted Earning Per Share (EPS) $0.21 $0.29 $0.26 Weighted Average Diluted Shares 19,639,682 19,940,606 20,171,261 (1) Loan amounts include deferred fees/costs.
exhibit991p13i0
 
exhibit991p14i0
 
(2) Total Equity includes after-tax unrealized security losses of $47.1 million for Q2 2023, $42.1 million for Q1 2023, and $36.9 million for Q2 2022. 13 Key Performance Indicators Q2 2023 Q1 2023 Q2 2022 CAPITAL/CREDIT PROFITABILITY GROWTH Tangible Common Equity/Tangible Assets (1) 8.25% 8.50% 8.93% Total Risk-Based Capital (2) 13.42% 13.20% 13.74% NCO/Avg Loans (3) 0.01% (0.01%) 0.00% NPA/Assets 0.02% 0.02% 0.00% Allowance Credit Losses/Loans 1.18% 1.20% 1.15% Return On Average Assets (ROAA) (3) 0.77% 1.11% 1.08% Return On Average Equity (ROAE) (3) 9.13% 12.85% 11.38% Net Interest Margin (3) 2.73% 3.22% 3.37% Efficiency Ratio 65.25% 56.32% 55.34% Total Assets (EOP) $2,225,914 $2,163,821 $2,016,086 Total Loans (EOP) $1,595,959 $1,580,394 $1,372,733 Total Deposits (EOP) $1,921,301 $1,830,462 $1,738,720 Tangible Book Value/Share (1)(4) $9.40 $9.37 $9.00 (1) Non-GAAP Financial Measures. (2) For the Company. (3) Annualized. (4) After tax unrealized security loss effect on tangible book value per share was ($2.41) for Q2 2023, ($2.14) for Q1 2023 and ($1.84) for Q2 2022. 14 Deposit Portfolio Deposits AVG In millions $1,717 $1,763 $1,804 $1,844 $1,872 $224 $217 $217 $225 $277 $781 $823 $871 $897 $940 $67 $67 $62 $58 $53 $645 $656 $654 $664 $602 Q2 2022 Q3 2022 Q4 2022 Q1 2023 Q2 2023 Non-interest-bearing deposits Money market and savings Interest-bearing checking deposits Time deposits Deposit Cost 0.25% 0.21% 1.75% 0.21% 3.25% 0.34% 4.50% 0.77% 5.00% 1.29% 5.28% 1.99% Deposit Cost Fed Funds Rate (Upper bound) Commentary Average deposits increased $28.2 million or 6.1% annualized compared to the prior quarter and $155.8 million or 9.1% compared to the second quarter 2022.
exhibit991p15i0
 
Deposit composition mix shifted towards interest bearing and ICS/CDARS products. Average DDA balances comprised 32.1% of total deposits as of June 30, 2023. Deposit beta of 36% since Q4 2021. In abundance of caution given the recent bank failures, brought in $50 million of brokered CDs at a weighted average rate of 4.98% to boost liquidity. 15 Deposit Distribution EOP for Balance Sheet amounts Deposits Composition Person 36% Business 50% Brokered Deposits 3% Public Funds 11% Commentary Our deposit base reflects our business model: a commercial bank.
exhibit991p16i0
 
The total amount of uninsured deposits adjusted by the collateralized portion of public funds is 49% for quarter end. Excluding the collateralized portion of Public Funds, the uninsured deposits are 53%. As of June 30, 2023, the deposit balance of ICS/CDARS was $114.3 million, increase of $78.6 million from first quarter 2023. Deposits by Customer Segment In thousands for balance sheet amounts r , , . Average Balance Deposit Type Total Balance % of Total (#) Accounts per Account Business $ 955,768 50% 6,979 $ 137 Personal $ 696,101 36% 12,686 $ 55 Public Funds $ 219,432 11% 31 $ 7,078 Brokered CDs $ 50,000 3% 2 $ 25,000 Grand Total $ 1,921,301 100% 19,698 $ 98 Uninsured Deposits to Total Deposits (1) 57% 59% 57% $751 $765 $750 $988 $1,032 $1,079 Q2 2022 Q3 2022 Q4 2022 56% $1,028 $951 Ql 2023 Q2 2023 Uninsured Depositors Insured Depositors Uninsured Deposits/Deposits (1) Uninsured deposits excludes collateralized Public Funds . 16 Liquidity EOP for Balance Sheet amounts Total Liquidity On Balance Sheet Liquid Assets Total Liquidity Liquid Assets: On-Balance Sheet Liquidity / Total Assets Total Liquidity: Total Liquidity / Total Assets Sources of Liquidity (in millions) 6/30/2023 On Balance Sheet Liquidity Cash $7 Due from banks $76 Investment securities unpledged $226 Total on balance sheet liquidity (Liquid Assets) $309 Off Balance Sheet Liquidity FHLB excess capacity $270 Bank Term Funding Program (B TFP) $137 Federal Reserve Discount Window $32 Fed Fund Lines $105 Total off balance sheet liquidity $544 Total Liquidity $853 Commentary We believe we are well positioned to weather the current environment.
exhibit991p17i0
 
We have ample sources of liquidity both on and off-balance sheet. Loan-to-deposits ratio negatively impacted by additional liquidity brought on balance sheet with $50 million of brokered CDs. We are enrolled in BTFP but have not drawn.
exhibit991p18i0
 
Loan-to-Deposit Ratio 29% 31% 25% 22% Jun-22 Sep-22 38% Dec-22 Mar-23 Jun-23 17 Loan Portfolio Total Loans (AVG) In millions $1,399 Q2 2022 03 2022 $1,547 $1,569 Q4 2022 Ql 2023 Q2 2023 Loans (Excl PPP) PPP Loans Loans Yields 4.35% 0.13% 4.22% 4.53% 4.86% 0.04% 0.03% 4.82% 4.50% Q2 2022 Q3 2022 Q4 2022 5.17% 0.03% 5.14% 5.33% 0.02% + 109 bps Q2'23 vs Q2'22 Q1 2023 Q2 2023 Loan Coupon Loan Fees Commentary Average loans, excluding PPP loans, increased $22.5 million or 5.8% annualized compared to prior quarter and $290.1 million or 22.7% compared to the second quarter 2022. Loan coupon increased 17 bps compared to prior quarter and 109 bps compared to the second quarter 2022. Loan fees yield decreased 11 bps compared to second quarter 2022 primarily due to a decrease of $441 thousand in PPP loan fees. 18 Loan Production Net Loan Production Trend In millions 7.20% Q2 2022 Q3 2022 Q4 2022 Q1 2023 Q2 2023 Loan Production & Line changes Loan Amortization & payoffs New loans average coupon Loan Composition Trend W In millions $948 Jun-20 $1,595 12% 62% 26% Jun-23 • Residential real estate • Commercial real estate Real Estate Loans ■ Commercial and industrial, Foreign banks, and Consumer and other i!| Excludes unearned fees and PPP Loans.
exhibit991p19i0
 
EOP. Commentary $88 million net growth for year -to-date 2023. Average coupon on new loans was 7.20% for second quarter 2023, 189 bps above portfolio average. Q2 2023 loan production for the quarter was well diversified; 46% C&I, 16% CRE; 31% consumer, 3% correspondent banks; and 3% residential. Loan production was impacted by recent bank failures. Loan composition shows diversification and growth in C&I and consumer loans. 19 Net Interest Margin Net Interest Income/Margin <w In thousands (except ratios) _ Ml 3.37% 3.47% 3.27% 3.45% 3.45% $15,642 $16,774 $16,866 Q2 2022 Q3 2022 Q4 2022 Net Interest Income NIM 3.22% 3.22% $15,997 2.73% Q1 2023 Q2 2023 NIM excluding PPP Loans Interest-Earning Assets Mix (AVG) Commentary Net interest income decreased by $1.8 million compared to the prior quarter predominately due to increase in deposit cost and a liability sensitive balance sheet.
exhibit991p20i0
 
Held more cash in wake of recent bank failures and increased liquidity with higher priced brokered CD’s ($50 million) which negatively impacted NIM. Shift in deposit mix; out of DDA and into interest bearing depos its. Majority of Q2 loan production (higher yields) was booked at the end of the quarter, the full impact on the NIM is yet to be realized. $50 million notional pay fixed rate swap executed in Q2; $100 million pay fixed rate swap executed in early Q3 to help future NIM. Q3 loan pipeline is strong, ($200 million) and loan coupons are above 7.50%. 26% 1% 69% Q2 2022 A / Q3 2022 Q4 2022 Ql 2023 Q2 2023 Total Loans (excluding PPP Loans) ■ Investment Securities • PPP Loans • Cash Balances & Equivalents (1) Annualized. 20 Interest Rate Sensitivity Loan Portfolio Repricing Profile by Rate Type Hybrid ARM 5% Series 1 Point "1-2 yr Value: 81,355,318 (8%) Fixed Rate 38% 67% ■ Prime ■ CMT LIBOR/SOFR Loan Repricing Schedule Variable/Hybrid Rate Loans 33% 8% 13% 46% ■ 0-1 yrs.
exhibit991p21i0
 
■ 1-2 yrs. ■ 2-3 yrs ■ >3 yrs.
exhibit991p22i0
 
Static NII Simulation Year 1 & 2 $6,000 Year 1 $5,000 $4,000 $3,000 $2,000 $1,000 -0.1% $0 +100 -$1,000 Year 2 6.7% 3.9% ■ Net Interest Income change from base {$ in thousands and % change) +100 Plot Area +200 21 21 Asset Quality Allowance for Credit Losses In thousands (except ratios) 1.15% 1.16% 1.16% 1.20% 1.18% $15,786 $16,604 $17,487 $18,887 $18,815 Allowance for credit losses ACL/Total loans Non-performing Loans In thousands (except ratios) 0.00% 0.00% 0.00% 0.03% 0.03% $468 $468 Non-accrual loans Non-performing loans to total loans Commentary ACL coverage ratio is at 1.18%, slightly down from prior quarter due to improvement in economic outlook. One C&I loan for $486 thousand was classified as nonaccrual at June 30, 2023. No OREO. Improved economic forecasts drove a small reduction in expected loss rates and this was partially offset by net portfolio growth during the quarter. Classified Loans (1) to Total Loans 0.08% 0.07% 0.26% 0.25% 0.21 (1) Loans classified as substandard at period end. No loans classified doubtful or loss at period end. 22 Loan Portfolio Mix Loan Portfolio Mix (1) ■ Residential real estate • CRE - Owner occupied • CRE - Non-owner occupied ■ Commercial and industrial Correspondent banks ■ Consumer and other Commentary Total Loan balance at quarter end was $1,595 million (1).
exhibit991p23i0
 
Commercial Real Estate (owner occupied and non-owner occupied) was 62% or $989.4 million of the total loan portfolio (1). CRE mix is diversified and granular. Retail non-owner occupied makes up 30% of total CRE or $297.4 million. CRE Loan Mix Land/Construction Hotels 8% Other Warehouse ► 8% $989MM Retail 30% CRE - Owner Occupied 16%121 Multifamily 18% ned fees. CRE Loan Portfolio (non-owner occupied and owner occupied) Loan Type LTV (1) DSCR(2) Average Loan Size (3) Retail 56% 1.63 $3.0 Multifamily 62% 1.41 $1.4 Office 57% 2.20 $1.5 Warehouse 58% 1.84 $1.2 Hotels 54% 1.92 $4.8 Other 57% 1.97 $1.8 Land/Construction 58% NA $3.1 (1) LTV - Loan to value ratio. (2) DSCR - Debt service coverage ratio. (3) Balance in millions. 23 CRE Office Portfolio Loan size 32$ 77 $46 25 $32 8 $41 7 $25 3 Outstanding Balance as of 6/30/2023 Number of Loans Key Metrics Avg.
exhibit991p24i0
 
Loan Size in millions NCOS/Average Loans Delinquencies / Loans Nonaccruals/ Loans Classified Loans/Loans At 6/30/2023 $ 1.5 0.00% 0.00% 0.00% 0.00% Portfolio performing with clean credit metrics Commentary Non-owner-occupied office is 8% of total loans and 70% have recourse to a guarantor. Owner occupied office is 3% of the loan portfolio and 99% have recourse to a guarantor. Total office loan portfolio (owner occupied and non-owner occupied) had 120 notes with an average balance of $1.5 million dollars, LTV of 57%, and DSCR of 2.20X at quarter end. 91% of outstanding loan balances are within the USCB primary market. Miami’s office sector outperforms the national average with a lower vacancy rate of 9.4% and availability rate of 11.8%, compared to the estimated national average of 13% and 16.5%, respectively. (1) Loan Maturity < l year 1 year to 3 years 3 years to 5 years 5 years to 10 years >10 years 5% 9% 14% 71% 1% (1) Data points source: CoStar Group, a NASDAQ company and world leader in commercial real estate information with a comprehensive database of real estate data throughout the US, Canada, UK and France. Published April 2023. 24 Non-Interest Income In thousands (except ratios) Q2 2023 Q1 2023 Q4 2022 Q3 2022 Q2 2022 Service fees $1,173 $1,205 $1,093 $934 $1,083 Gain (loss) on sale of securities available for sale - (21) (1,989) (558) (3) Gain on sale of loans held for sale 94 347 205 330 22 Other income 579 539 568 1,083 515 Total non -interest income $1,846 $2,070 ($123) $1,789 $1,617 Average total assets $2,183,542 $2,120,218 $2,051,867 $2,026,791 $1,968,381 Non-interest income / Average assets (1) 0.34% 0.40% (0.02%) 0.35% 0.33% Commentary Service fees remain substantially consistent quarter over quarter.
exhibit991p25i0
 
exhibit991p26i0
 
SBA loan sales produced $94 thousand of gains in the second quarter 2023. Fluctuation of non-interest income primarily impacted by one-time items in other income and loss on sale of securities in prior quarters. (1) Annualized. 25 Non-Interest Expense In thousands (except ratios) Q2 2023 Q1 2023 Q4 2022 Q3 2022 Q2 2022 Salaries and employee benefits $5,882 $6,377 $6,080 $6,075 $5,913 Occupancy 1,319 1,299 1,256 1,281 1,251 Regulatory assessments and fees 452 224 222 269 226 Consulting and legal fees 386 358 371 604 398 Network and information technology services 505 478 483 488 448 Other operating expense 1,908 1,440 1,602 1,415 1,315 Total non-interest expense $10,452 $10,176 $10,014 $10,132 $9,551 Efficiency ratio 65.25% 56.32% 59.81% 54.58% 55.34% Average total assets $2,183,542 $2,120,218 $2,051,867 $2,026,791 $1,968,381 Non -interest expense / Average assets (1) 1.92% 1.95% 1.94% 1.98% 1.95% Full-time equivalent employees 198 196 191 191 192 Commentary Salaries and employee benefits decreased due to lower incentive accr ual based on performance for the first half of 2023. Regulatory assessments and fees increased $228 thousand due to an increase in the FDIC deposit insurance assessment rate compared to first quarter 2023. Other operating expense increased $468 thousand due to increase in audit and tax services, internet banking fees, and special assets insurance expense. Efficiency ratio impacted by lower revenue and increase in non-interest expenses. (1) Annualized. 26 Capital Capital Ratios <« Q22023 Leverage Ratio TCE/TA M Tier 1 Risk Based Capital Total Risk Based Capital AOCI In Millions 9.32% 8.25% 12.27% 13.42% ($47.1) Capitalized 9.36% 9.43% 5.00% 8.50% 8.93% NA 12.04% 12.65% 8.00% 13.20% 13.74% 10.00% ($42.1) ($36.9) Commentary Repurchased 77,603 shares during the quarter at a weighted average price of $9.58.
exhibit991p27i0
 
172,397 common shares remain authorized for repurchase under the repurchase program. AOCI on investment securities was ($47.1) million or ($2.41) per share as of June 30, 2023. Q2 2023 EOP shares outstanding: Common Stock: 19,544,777 (1) For the Company. (2) Non-GAAP Financial Measures. 27 Takeaways Leading franchise located in one of the most attractive Robust organic growth banking markets in Florida and the U.S. Strong asset quality, with minimal charge- offs experienced since 2015 recapitalization Experienced and tested management team Strong profitability, with pathway for future enhancement identified Core funded deposit base with 32.1% Non- Interest-Bearing Deposits (AVG) 28
exhibit991p28i0
 
exhibit991p29i0
 
APPENDIX – Risk Management Risk Management Philosophy and
 
Culture Management has instilled a culture of adherence to well-developed
 
risk management procedures Management is responsible for day-to-day
 
risk management (identifying, evaluating, and addressing potential
 
risks that may exist at the enterprise, strategic, financial, operational,
 
compliance and reporting levels) Risk management division consists
 
of four individuals covering enterprise risk management, cybersecurity,
 
third-party risk, internal audit and loan reviews Compliance
 
division consists of seventeen individuals covering bank secrecy,
 
consumer compliance and investigations Both areas play an active role in assessing
 
corporate risks, compliance and collaborating with management
 
to mitigate identified risks Heightened focus on BSA / AML / KYC
 
compliance due to foreign exposure Individual country loan
 
exposure limited to 0% - 70% of total capital based on individual
 
country risk Global banking services offered exclusively to
 
institutions in countries
 
meeting U.S. Century’s robust risk tolerance framework
 
Highly experienced compliance team with international compliance experience
 
from larger banking institutions Audit Committee consist of 4 members
 
responsible for complete oversight of Company’s risk management
 
process: Ramon Rodriguez (Chair), Bernardo Fernandez, Ramón
 
Abadin and Maria Alonso Credit Philosophy Conservative credit culture
 
that encourages prudent and desirable loans over unchecked growth
 
Underwriting strength stems from deep understanding of U.S. Century’s
 
market, long-standing relationships with clients, and disciplined process
 
Focused on maintaining a well-diversified and conservative loan
 
portfolio Robust Credit Administration Underwriting group supported
 
by experienced credit officers with both credit and lending
 
experience Effective and independent loan review Credit
exhibit991p30i0
 
Committee meetings conduct in-depth loan portfolio monitoring, including concentration limits Active monitoring and reporting on existing or emerging concentrations and targeted reviews of any higher risk portfolios 29 APPENDIX – Technology Support 2016 2017 2018 2019 2020 2021 <=\ Paperless Account Opening January '16-April ‘16 ©Tran International Letter Of Credit April '16-July '16 m^Tonce - lnstant Issue Debit Card October '16 - March '17 <=\ Cash Management Portal August'16-March '17 Network In-housing January '18 - September ‘18 Secureworks Secureworks MSSP January '18 - May '18 <=\ Horizon Core Conversion September '18 - September '19 Zelle P2P June ‘19 - November '19 >: banktel Accounts Payable November '19-January 20 Collaboration Applications S „»an,-20-Mora,-20 y ,V,LINDERS Summit PPP Loan Origination 01 tRA ' January 21 - February 21 Treasury Management Platform November 20-October 21 Continued next slide Reporting Database May ‘16 - September ‘16 V- BNCootro! (7... Fedlink Anywhere vAAAAAAAAA/ April '17- September ‘17 S" Microsoft OFFICE 365 February ‘18 - September '18 i N c: j EMV Debit Cards August '16 - October '16 y NCR Image Deposit ATM March '19 - December ‘19 \_MiftATED ppp Loan Origination System May 20-June 20 y y COHE ITY Immutable backup solution Jan 21-June 21 f “ CECL and ALLL Application aDr,Q0 June 21 - December 21 30 APPENDIX – Technology Support 2022 Sw 2023 2024 - 2025 r a M ANTI Remote Account Opening October 21-March 22 y Secureworks MXDR platform Feb 22 -July 22' r <$} abrigo k Loan origination system June 22-May 23 j r FèdNÇ-w k FED Now payments January 23 - October 23 s # PBX(SaaS)-Teams Calling 4 ■ November 23- March 24 Wire fraud application k j CRM system Account analysis solution ACH Positive Pay/ACH Alert f A Ring Central call reporting October 22 - March 23 y.
exhibit991p31i0
 
exhibit991p32i0
 
y \ Pidgin real time payments Pid9in January 23 - October 23 k Cloud (laasj for DR environment July 23-December 23 Commercial Account Opening k j Financial reporting application k Siem Solution 31 APPENDIX – Yacht Lending Vertical 2023 Boat Shows Tampa Boat Show Jun 23-25, 2023 Naples Boat Show Jan 19-22, 2023 Vero Beach Boat Show Nov 18-19, 2023 Palm Beach Boat Show Mar 21-24, 2023 Ft. Lauderdale Boat Show Oct 25-29, 2023 Miami Boat Show Feb 15-19, 2023 U.S.
exhibit991p33i0
 
Century Bank Commentary Yacht financing for larger vessels, transaction range is $750k -$7.5MM Brokered oriented business, 3 vendor approved brokers Member of the National Marine Lenders Association USCB is in proximity to multiple yachting hubs and boat shows, offering easy access to a vast network of marinas and costal communities 32 APPENDIX – Non-GAAP Reconciliation In thousands (except ratios) 6/30/2023 Pre-Tax Pre-Provision ("PTPP") Income: Net income$4:196 Plus: Provision for income taxes 1:333 Plus: Provision for credit losses 3S_ PTPP income$5;567 PTPP Return on Average Assets: PTPP income$5:567 Average assets$2,183,542 PTPP return on average assets 1 1.02% Operating Net Income: Net income$4:196 Less: Net gains (losses) on sale of securities Less: Tax effect on sale of securities - Operating net income$4,196 Operating PTPP Income: PTPP income$5:567 Less: Net gains (losses) on sale of securities - Operating PTPP Income $ 5,567 Operating PTPP Return on Average Assets: Operating PTPP income S 5,567 Average assets S 2,183,542 Operating PTPP Return on average assets ‘ 1.02% As of or for the three months ended 3/31/2023 12/31/2022 9/30/2022 6/30/2022 S 5,809$4,434$5,558$5,295 1,881 1,415 1,963 1,708 201 880 910 705 S 7,891$6,729$8,431$7,708 S 7,891 S 2,120,218 1.51% S 6,729 S 2,051,867 1.3 0% S 8,431 S 2,026,791 1.65% S 7,708 S 1,968,381 1.57% S 5,809$4,434$5,558$5,295 (21) (1,9 89) (558) (3) 5 504 141 1_ S 5,825$5,919$5,975$5,297 S 7,891$6,729$8,431$7,708 ^211 (1Î989) (558) _Q1 S 7,912$8,718$8,98 9$7,711 S 7,912 S 8,718 S 8,989 S 7,711 S 2,120,218 S 2,051,867$2,026,791$1,968,381 1.51% 1.57% 1.69% 1.76% Operating PTPP Return on Average Assets: Operating PTPP income$5:567 Average assets$2,183,542 Operating PTPP Return on average assets 1 1.02% Operating Return on Average Assets: Operating net income$4:196 Average assets$2,183,542 Operating return on average assets ^ ' 0.77% Operating Return on Average Equity: Operating net income$4,196 Average equity$184,238 Operating return on average equity (1) 9.13% Operating Revenue: Net interest income$14,173 Non-interest income 1,846 Less: Net gains (losses) on sale of securities -
exhibit991p34i0
 
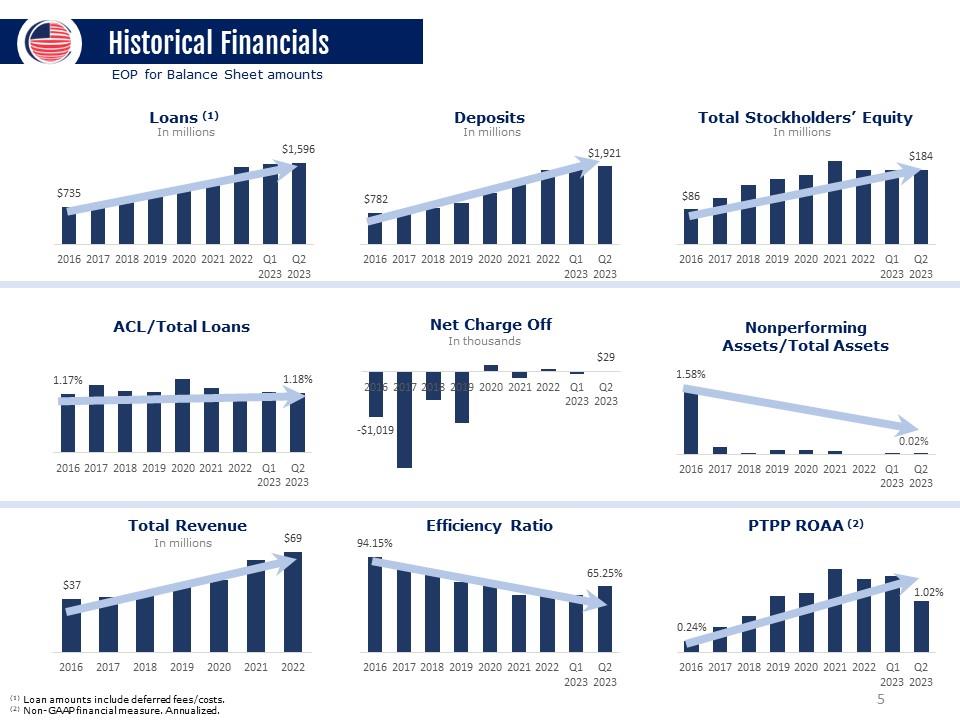
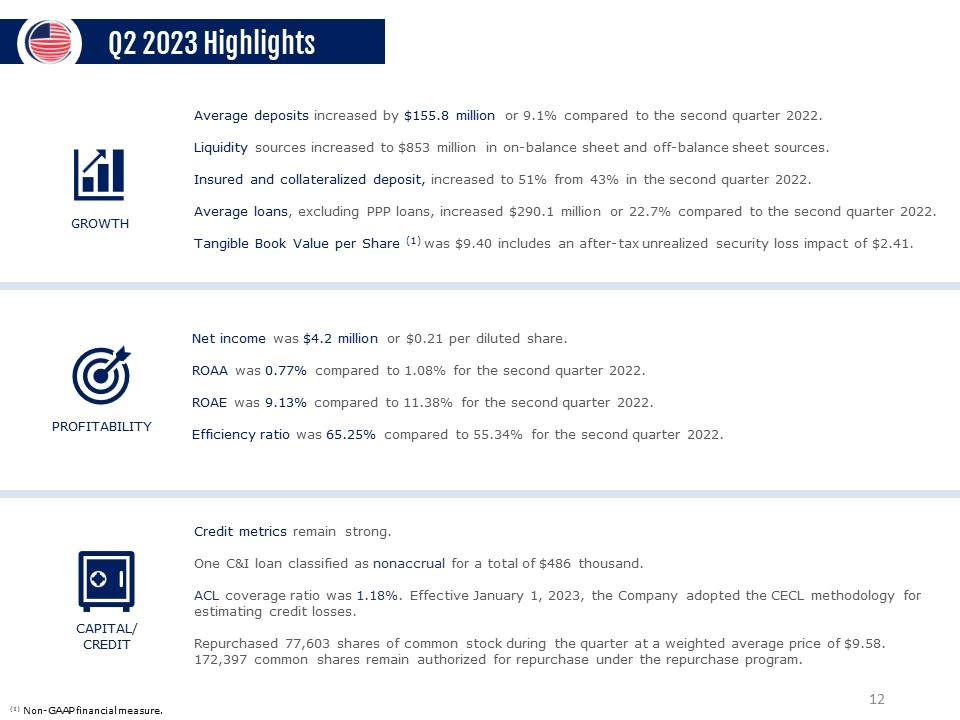
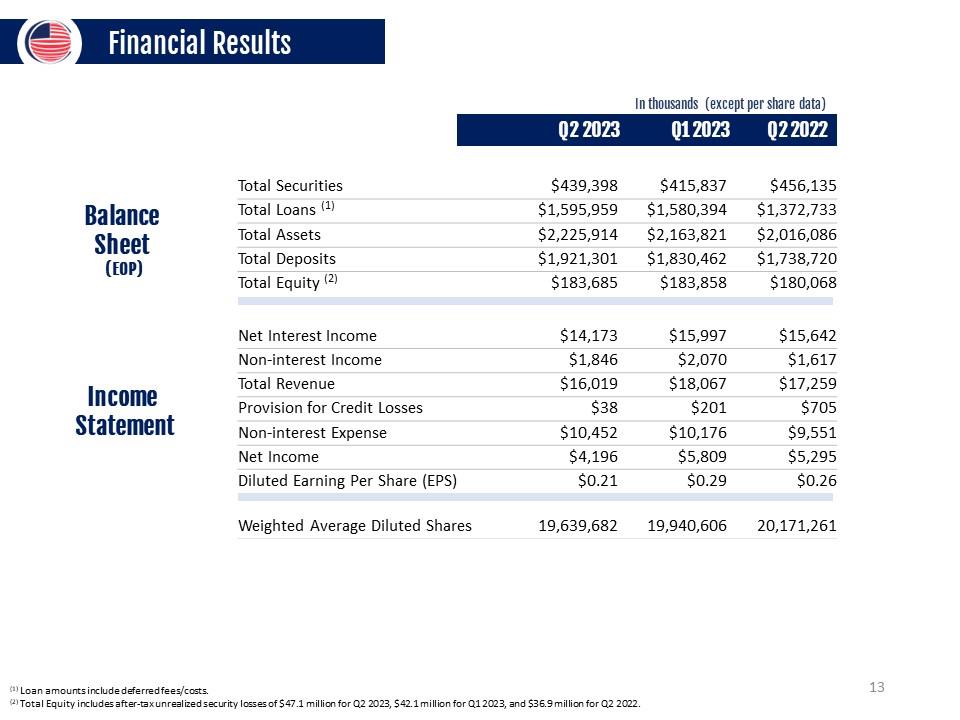
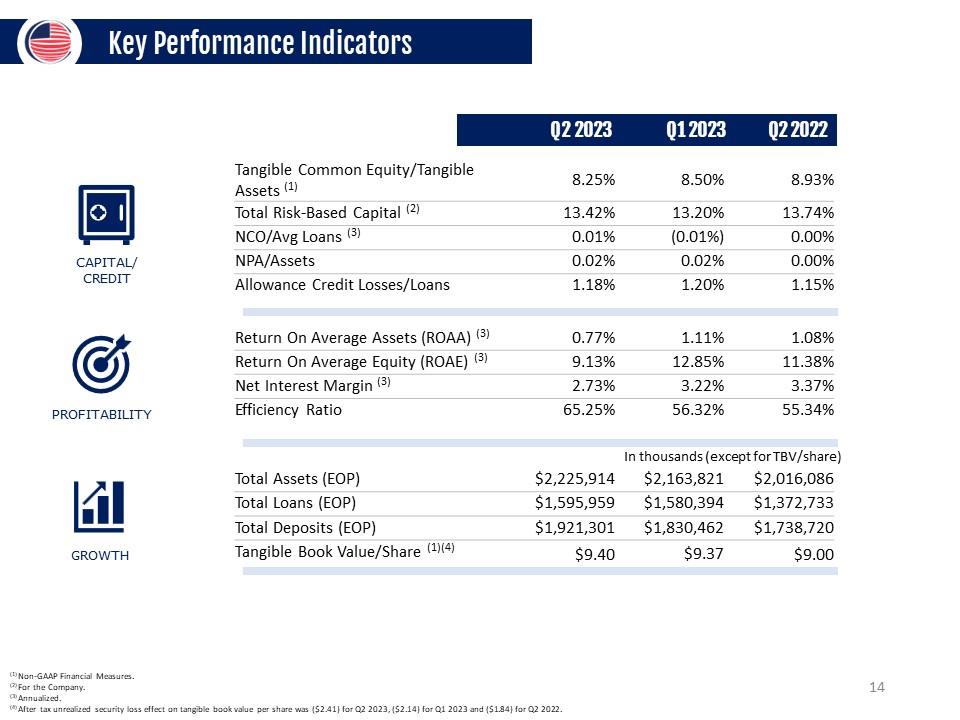
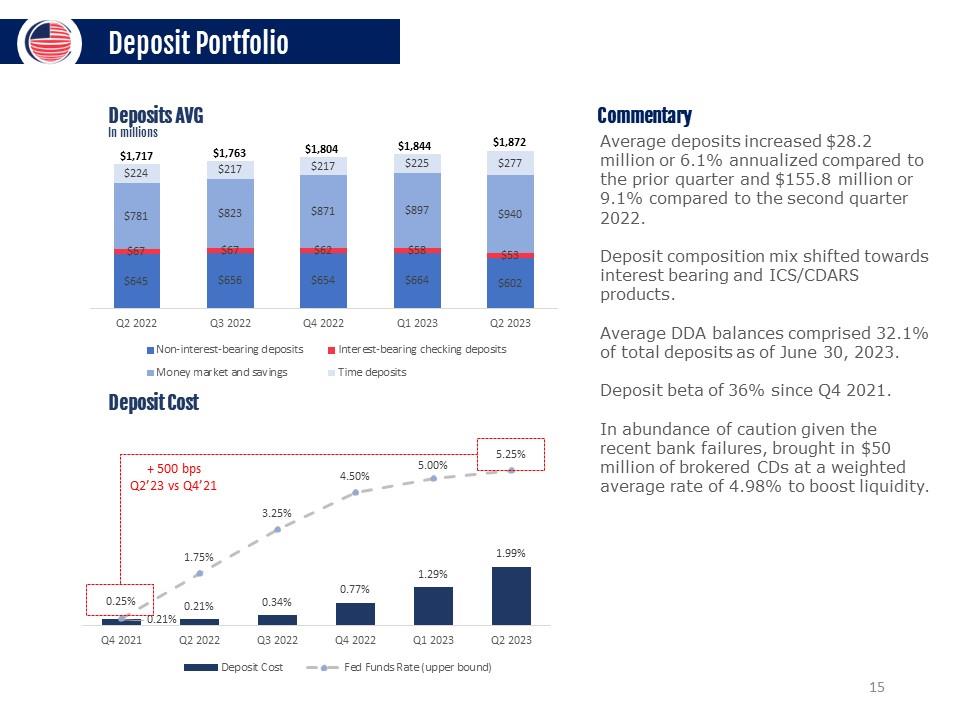
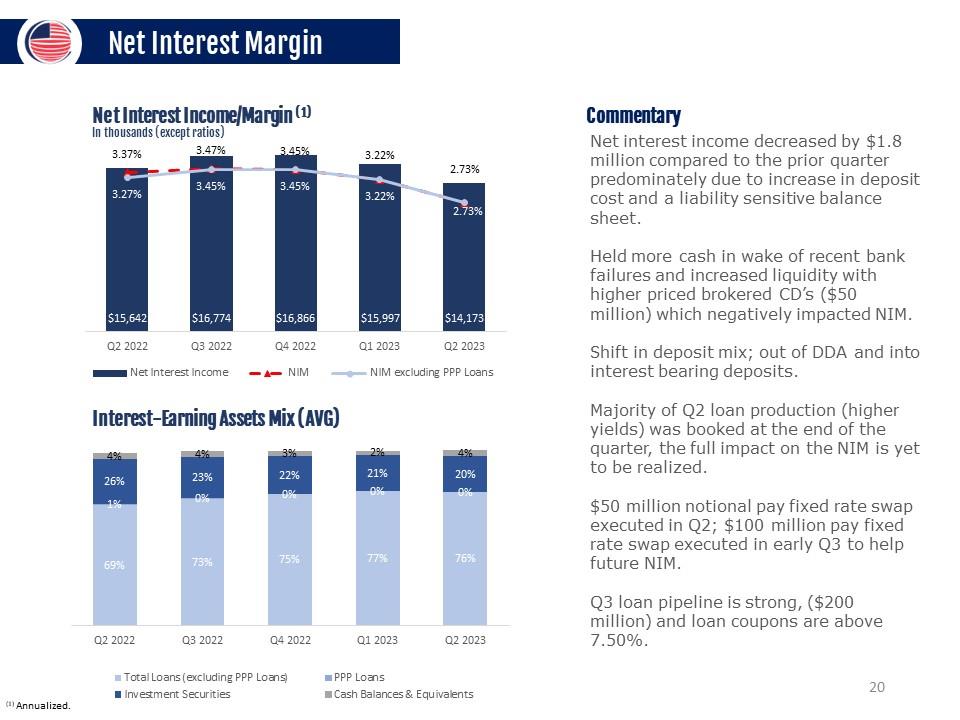
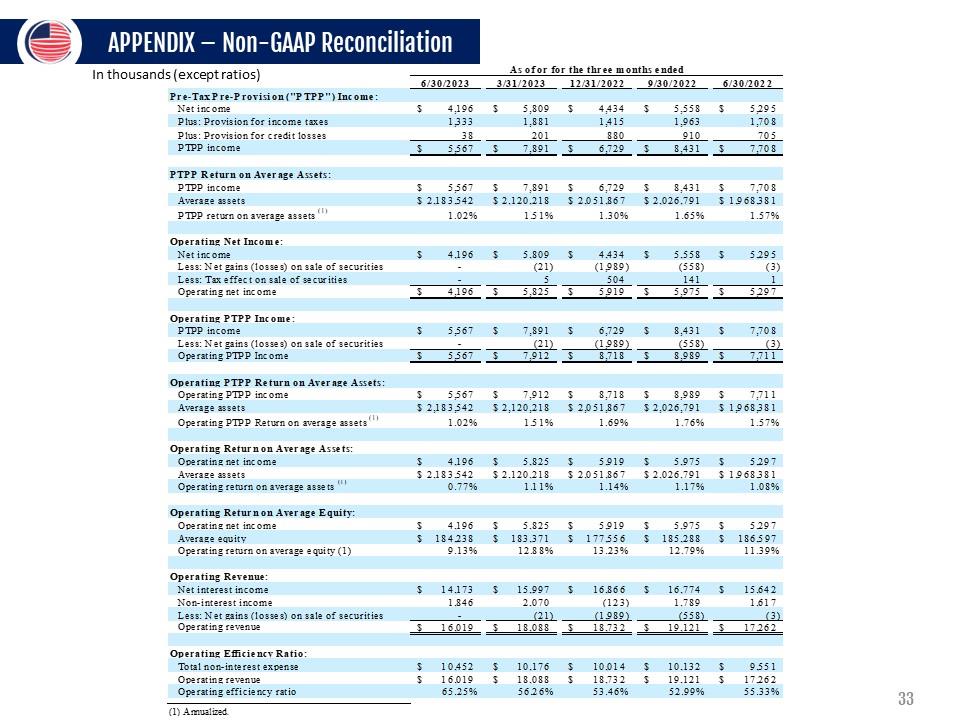
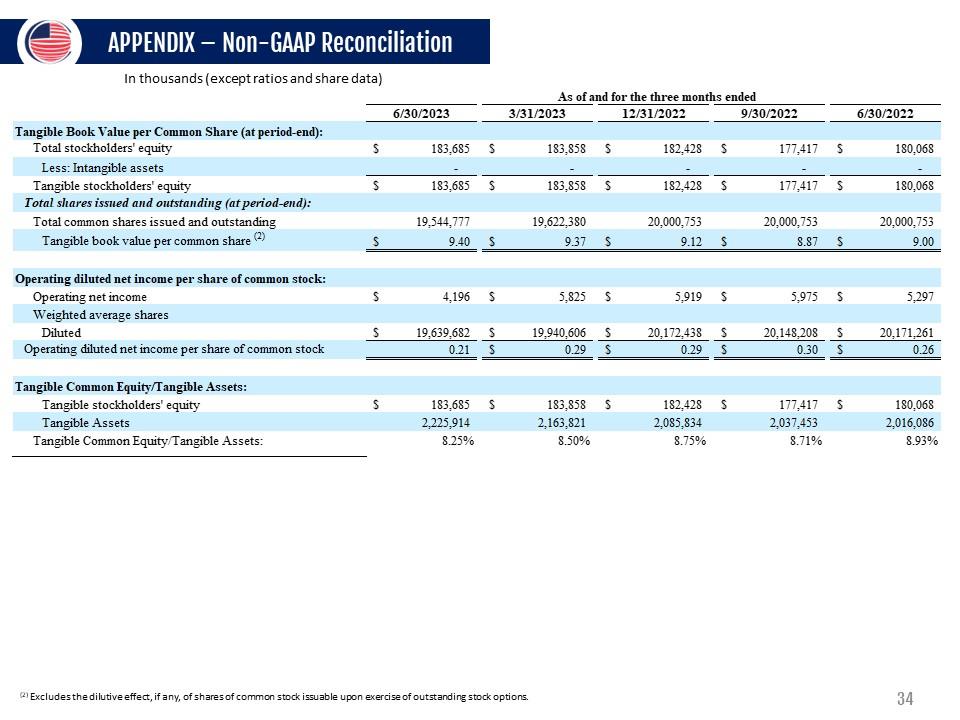
Operating revenue$16,019 Operating Efficiency Ratio: Total non -interest expense S 10,452 Operating revenue S 16,019 Operating efficiency ratio 65.25% (1) Annualized. S 7,912 S 2,120,218 1.51% S 8,718 S 2,051,867 1.69% S 8,989 S 2,026,791 1.76% S 7,711 S 1,968,381 1.57% S 5,825 S 2,120,218 1.11% S 5,919 S 2,051,867 1.14% S 5,975 S 2,026,791 1.17% S 5,297 S 1,968,381 1.08% S 5,825 S 5,919 S 5,975 S 5,297 S 183,371$177,556$185,288$186,597 12.88% 13.23% 12.79% 11.39% S 15,997$16,866$16,774$15,642 2,070 (123) 1,789 1,617 (21) (1:989) (558) (3) S 18,088$18,732$19,121$17,262 S 10,176 S 18,088 56.26% S 10,014 S 18,732 53.46% S 10,132 S 19,121 52.99% S 9,551 S 17,262 55.33% (1) Annualized. 33 APPENDIX – Non-GAAP Reconciliation In thousands (except ratios and share data) 6/30/2023 Tangible Book Value per Common Share (at period-end): Total stockholders 'equity$183:685 Less: Intangible assets - Tangible stockholders 'equity$183:685 Total shares issued and outstanding (at period-end): Total common shares issued and outstanding 19:544:777 Tangible book value per common shareS 9.40 Operating diluted net income per share of common stock: Operating net income$4:196 Weighted average shares Diluted$19;639;682 Operating diluted net income per share of common stock 0.21 Tangible Common Equity/Tangible Assets: Tangible stockholders 'equity$183:685 Tangible Assets 2:225:914 Tangible Common Equity /Tangible Assets: 8.25% As of and for the three months ended 3/31/2023 12/31/2022 9/30/2022 6/30/2022 S 183,858$181428$177,417$180:068 S 183,858$181428$177,417$180,068 19,622,380 20,000,753 20,000,753 20,000,753 S 9.37 $ 9.12$8.87 $ 9.00 S 5,825$5,919$5,975$5197 S 19,940,606 S 20,172,438 S 20,148,208 S 20,171161 S 0.29$0.29$0.30$0.26 S 183,858$182,428$177,417$180,068 2,163,821 8.50% 2,085,834 8.75% 2,037,453 8.71% 2,016,086 8.93% (2) Excludes the dilutive effect, if any, of shares of common stock issuable upon exercise of outstanding stock options. 34 CONTACT INFORMATION LOU DE LA AGUILERA Chairman, President & CEO (305) 715-5186 EH laguilera@uscentury.com ROB ANDERSON EVP, CHIEF FINANCIAL OFFICER (305) 715-5393 rob.anderson@uscentury.com INVESTOR RELATIONS InvestorRelations@uscentury.com 35
exhibit991p35i0