株探米国株
日本語 英語
エドガーで原本を確認する
0001901637 False ☐ ☐ ☐ ☐ 0001901637 2023-07-27 2023-07-27


1
UNITED STATES
SECURITIES AND EXCHANGE COMMISSION
WASHINGTON,
 
D.C. 20549
__________________________
FORM
8-K
__________________________
CURRENT REPORT
Pursuant to Section 13 or 15(d) of the Securities Exchange Act
 
of 1934
Date of Report (Date of earliest event reported):
July 27, 2023
__________________________
USCB Financial Holdings, Inc.
(Exact name of Registrant as Specified in Its Charter)
 
__________________________
 
Florida
001-41196
87-4070846
(State or Other Jurisdiction
of Incorporation)
(Commission File Number)
(IRS Employer
Identification No.)
2301 N.W. 87th Avenue
,
Doral
,
Florida
33172
(Address of Principal Executive Offices)
(Zip Code)
Registrant’s Telephone
 
Number, Including Area Code: (
305
)
715-5200
 
__________________________
Check the appropriate box below if the Form 8-K filing is intended to simultaneously satisfy the filing obligation
 
of the registrant under
any of the following provisions:
 
Written communications pursuant
 
to Rule 425 under the Securities Act (17 CFR 230.425)
Soliciting material pursuant to Rule 14a-12 under the Exchange Act (17 CFR 240.14a
 
-12)
Pre-commencement communications pursuant to Rule 14d-2(b)
 
under the Exchange Act (17 CFR 240.14d-2(b))
Pre-commencement communications pursuant to Rule 13e-4(c) under the Exchange
 
Act (17 CFR 240.13e-4(c))
Securities registered pursuant to Section 12(b) of the Act:
Title of each class
Trading
Symbol(s)
Name of each exchange on which registered
Class A common stock, $1.00 par value per share
USCB
The Nasdaq Stock Market LLC
Indicate by
 
check mark
 
whether the
 
registrant is
 
an emerging
 
growth company
 
as defined
 
in Rule
 
405 of
 
the Securities
 
Act of
 
1933
(§ 230.405 of this chapter) or Rule 12b-2 of the Securities Exchange Act of 1934 (§ 240.12b
 
-2 of this chapter).
Emerging growth company
If
 
an
 
emerging
 
growth
 
company,
 
indicate
 
by
 
check
 
mark
 
if
 
the
 
registrant
 
has
 
elected
 
not
 
to
 
use
 
the
 
extended
 
transition
 
period
 
for
complying with any new or revised financial accounting standards provided
 
pursuant to Section 13(a) of the Exchange Act.
 
2
Item 2.02. Results of Operations and Financial Condition.
 
On July 27, 2023, USCB Financial
 
Holdings, Inc. (the “Company”), issued
 
a press release announcing its financial
 
results for
the second quarter ended June 30, 2023. A copy of the
 
press release is furnished as Exhibit 99.1 to this
 
Current Report on Form 8-K and
is incorporated herein by reference.
The information
 
in this Item
 
2.02, including
 
Exhibit 99.1, is
 
being furnished
 
and shall not
 
be deemed
 
“filed” for purposes
 
of
Section 18 of the
 
Securities Exchange Act
 
of 1934 (the “Exchange
 
Act”), or otherwise subject
 
to the liability of
 
that section, and
 
shall
not be deemed
 
to be incorporated
 
by reference into
 
any filing under
 
the Securities Act of
 
1933 (the “Securities
 
Act”) or the
 
Exchange
Act.
Item 7.01. Regulation FD Disclosure.
As previously announced, at 11:00 a.m. ET on July 28, 2023, the Company will hold an earnings conference
 
call to discuss its
financial performance for the quarter ended June 30, 2023. A copy of the slides forming
 
the basis of the presentation is being furnished
as Exhibit 99.2 to this Current Report on Form 8-K and is incorporated herein by reference. A copy of the slides has
 
also been posted to
the Company’s investor relations website,
 
located at investors.uscenturybank.com.
The information
 
in this Item
 
7.01, including
 
Exhibit 99.2, is
 
being furnished
 
and shall not
 
be deemed
 
“filed” for purposes
 
of
Section 18
 
of the
 
Exchange Act,
 
or otherwise
 
subject to
 
the
 
liability of
 
that section,
 
and
 
shall not
 
be deemed
 
to be
 
incorporated
 
by
reference into any filing under the Securities Act or the Exchange Act.
Item 9.01. Financial Statements and Exhibits.
(d) Exhibits.
Exhibit No.
Description
99.1
99.2
104
Cover Page Interactive Data File (embedded within the Inline XBRL document)
EX-99.1 2 exhibit991.htm EXHIBIT 99.1 exhibit991
exhibit991p1i0
1
Exhibit 99.1
EARNINGS RELEASE
USCB Financial Holdings, Inc. Reports EPS of $0.21 for Q2 2023
MIAMI, FL – July 27, 2023 – USCB Financial Holdings, Inc. (the “Company”) (NASDAQ: USCB)
, the holding company for U.S.
Century Bank
 
(the “Bank”), reported
 
net income of
 
$4.2 million or
 
$0.21 per diluted
 
share for the
 
three months ended
 
June 30, 2023,
compared with net income of $5.3 million or $0.26 per diluted share, for the
 
same period in 2022.
 
The Company announced
 
on June 28, 2023 the
 
appointment of Luis de la
 
Aguilera to succeed Aida
 
Levitan, Ph.D. as Chairman
 
of the
Board of Directors
 
for both the
 
Company and the
 
Bank. Levitan had
 
served as chairman
 
of the Board
 
since 2017 and
 
will continue
 
to
contribute as a valued member of the Board.
 
“I am deeply grateful
 
for the privilege of
 
serving as Chairman of
 
this respected institution
 
for the past six years.
 
I extend my
 
heartfelt
thanks
 
to
 
the
 
Board
 
of
 
Directors,
 
our
 
dedicated
 
employees,
 
and
 
supportive
 
community
 
for
 
their
 
unwavering
 
commitment
 
and
collaboration,” said Aida Levitan, Ph.D., who will continue
 
as Board Director. “It is with
 
great confidence, that our Board of Directors
passes its leadership
 
as Chairman to
 
Luis de La
 
Aguilera, President and
 
CEO, along with
 
confirming Kirk
 
Wycoff,
 
Managing Partner
of Patriot Financial Partners, as Lead Independent Director.”
“As President
 
and CEO
 
of USCB
 
Financial Holdings,
 
Inc., I
 
am honored
 
to assume
 
the additional
 
responsibility of
 
Chairman of
 
the
Board.
 
Our unwavering
 
focus remains
 
on organic
 
and sustainable
 
growth,
 
ensuring
 
that USCB
 
Financial
 
Holdings
 
Inc. continues
 
to
thrive in
 
a sound
 
and prudent
 
manner.
 
We
 
are a
 
leading franchise
 
in what
 
I feel
 
is one
 
of the
 
most attractive
 
banking markets
 
in the
United States,” said de la
 
Aguilera. “On behalf of the
 
Board and the entire USCB team,
 
I thank Aida Levitan for her
 
leadership for the
past six years.”
“Like others in the industry today,
 
we are navigating a challenging operational environment with an inverted yield curve,
 
higher deposit
cost,
 
and
 
liquidity
 
concerns.
 
Despite
 
these
 
headwinds,
 
we
 
continue
 
to
 
execute
 
our
 
plans,
 
steadily
 
growing
 
both
 
loans
 
and
 
deposits,
underscoring our
 
resilience and
 
commitment to
 
serve our
 
customers and
 
community.
 
As we
 
look forward
 
to the
 
third quarter,
 
we are
encouraged by
 
increased and diversified
 
loan demand, which
 
positions us well
 
for the second
 
half of 2023,”
 
said Luis de
 
la Aguilera,
Chairman, President, and CEO.
Unless
 
otherwise
 
stated,
 
all
 
percentage
 
comparisons
 
in
 
the
 
bullet
 
points
 
below
 
are
 
calculated
 
for
 
the
 
quarter
 
ended
 
June 30,
 
2023
compared to the quarter ended June 30, 2022 and annualized where
 
appropriate.
Profitability
Annualized return on
 
average assets for the
 
quarter ended June 30,
 
2023 was 0.77%
 
compared to 1.08%
 
for the second
 
quarter of
2022.
 
Annualized
 
return on
 
average stockholders’
 
equity for
 
the quarter
 
ended June
 
30, 2023
 
was 9.13
 
%
 
compared to
 
11.38%
 
for the
second quarter of 2022.
 
The efficiency ratio for the quarter ended June 30, 2023 was 65.25%
 
compared to 55.34% for the second quarter of 2022.
 
Net interest margin for the quarter ended June 30, 2023 was 2.73
 
%
 
compared to 3.37% for the same quarter ended 2022.
Net
 
interest
 
income
 
before
 
provision
 
for
 
credit
 
losses
 
was
 
$14.2 million
 
for
 
the
 
quarter
 
ended
 
June 30,
 
2023,
 
a
 
decrease
 
of
$1.5 million or 9.4% compared to the second quarter of 2022.
Balance Sheet
Total assets were $2.2
 
billion at June 30, 2023, representing an increase of $209.8 million or
 
10.4% from June 30, 2022.
Total loans were $1.6
 
billion at June 30, 2023, representing an increase of $223.2 million or 16.3% from
 
June 30, 2022.
Total deposits were $1.
 
9
 
billion at June 30, 2023, representing an increase of $182.6 million or 10.5%
 
from June 30, 2022.
 
2
Total
 
stockholders’
 
equity was
 
$183.7 million
 
at June 30,
 
2023, representing
 
an increase
 
of $3.6
 
million or
 
2.0%
 
from June 30,
2022.
 
Total
 
stockholders’ equity includes
 
after-tax unrealized security
 
losses of $47.1 million
 
at June 30, 2023 compared
 
to after-
tax unrealized security losses of $36.9 million at June 30, 2022.
Asset Quality
Allowance for
 
credit losses
 
(“ACL”) was
 
calculated under
 
the Current
 
Expected Credit
 
Losses (“CECL”)
 
standard methodology
for the first and second quarter of 2023 and the incurred loss methodology for the
 
preceding quarters.
The ACL increased by $3.0 million to $18.8 million at June 30, 2023 from
 
$15.8 million at June 30, 2022.
The allowance for credit losses represented 1.18% of total loans at June 30, 2023
 
compared to 1.15% at
 
June 30, 2022.
Non-performing loans to total loans was 0.03% at June 30, 2023 compared
 
to 0.00% at June 30, 2022.
Non-interest Income and Non-interest Expense
Non-interest income was $1.8 million for the three months ended
 
June 30, 2023, an increase of $229 thousand or 14.2%
 
compared
to $1.6 million for the same period in 2022.
 
Non-interest expense was $10.5 million for the three months ended June 30, 2023, an increase of $901 thousand or 9.4% compared
to the same period in 2022.
 
Capital
During the quarter the Company repurchased 77,603 shares of USCB Financial Holdings Inc. at a weighted average price per
 
share
of $9.58. The
 
aggregate purchase price
 
for these transactions
 
was approximately $746.9
 
thousand, including transaction
 
costs. These
repurchases were
 
made through
 
open market pursuant
 
to the Company’s
 
publicly announced
 
repurchase program.
 
As of June
 
30,
2023, 172,397 shares remain authorized for repurchase under the program.
As of June 30, 2023,
total risk-based capital ratios for the Company and the Bank were 13.42% and
 
13.38%, respectively.
Tangible book value per
 
common share (a
 
non-GAAP measure) of
 
$9.40 was negatively
 
affected by $2.41
 
due to after
 
tax unrealized
security losses of $47.1 million at
 
June 30, 2023. At June 30, 2022, tangible book
 
value of $9.00 was negatively affected
 
by $1.84
due to $36.9 million after tax unrealized security losses.
Conference Call and Webcast
 
The Company
 
will host
 
a conference
 
call on
 
Friday,
 
July 28,
 
2023, at
 
11:00
 
a.m. Eastern Time
 
to discuss
 
the Company’s
 
unaudited
financial results for the quarter
 
ended June 30, 2023. To
 
access the conference call, dial (800)
 
715-9871 (U.S. toll-free)
 
and ask to join
the USCB Financial Holdings Call or provide conference ID 6813115
 
.
 
Additionally,
 
interested
 
parties can
 
listen to
 
a live
 
webcast
 
of the
 
call in
 
the “Investor
 
Relations” section
 
of the
 
Company’s
 
website
at www.uscentury.com
 
.
 
An archived version of the webcast will be available in the same location shortly after
 
the live call has ended.
About USCB Financial Holdings, Inc.
USCB Financial Holdings, Inc.
 
is the bank holding company for
 
U.S. Century Bank. Established in 2002,
 
U.S. Century Bank is one of
the largest
 
community banks
 
headquartered
 
in Miami,
 
and one
 
of the
 
largest community
 
banks in
 
the State
 
of Florida.
 
U.S. Century
Bank is rated 5-Stars by BauerFinancial, the nation’s leading independent
 
bank rating firm. U.S. Century Bank offers customers a wide
range of
 
financial products
 
and services
 
and supports
 
numerous community
 
organizations,
 
including
 
the Greater
 
Miami Chamber
 
of
Commerce, the South
 
Florida Hispanic Chamber
 
of Commerce, and
 
ChamberSouth. For more
 
information or to
 
find a banking
 
center
near you, please call (305) 715-5200 or visit www.uscentury.com.
Forward-Looking Statements
This earnings
 
release may contain
 
statements that are
 
not historical in
 
nature and are
 
intended to be,
 
and are hereby
 
identified as,
 
forward-
looking
 
statements
 
for
 
purposes
 
of
 
the
 
safe
 
harbor
 
provided
 
by
 
Section
 
21E
 
of
 
the
 
Securities
 
Exchange
 
Act
 
of
 
1934,
 
as
 
amended.
Forward-looking statements are those that are not historical facts. The words “may,” “will,” “anticipate,” “should,” “would,” “believe,”
“contemplate,”
 
“expect,”
 
“aim,” “plan,”
 
“estimate,” “continue,”
 
and
 
“intend,”
 
as well
 
as other
 
similar words
 
and
 
expressions
 
of the
future, are intended to
 
identify forward-looking statements. These forward-looking statements
 
include,
 
but are not limited
 
to,
 
statements
3
related to
 
our projected
 
growth, anticipated
 
future financial
 
performance, and
 
management’s
 
long-term performance
 
goals, as
 
well as
statements relating to the anticipated
 
effects on results of
 
operations and financial
 
condition from expected developments
 
or events, or
business and growth strategies, including anticipated internal growth
 
and balance sheet restructuring.
These forward-looking statements involve significant risks and uncertainties that could cause our actual
 
results to differ materially from
those anticipated in such statements. Potential risks and uncertainties include,
 
but are not limited to:
the strength of the United States economy in general and the strength of the local
 
economies in which we conduct operations;
our ability to successfully manage interest rate risk, credit risk, liquidity risk,
 
and other risks inherent to our industry;
the
 
accuracy
 
of
 
our
 
financial
 
statement
 
estimates
 
and
 
assumptions,
 
including
 
the
 
estimates
 
used
 
for
 
our
 
credit
 
loss
 
reserve
 
and
deferred tax asset valuation allowance;
the efficiency and effectiveness of our internal
 
control procedures and processes;
our ability to comply with
 
the extensive laws and
 
regulations to which we are
 
subject, including the laws for
 
each jurisdiction where
we operate;
adverse changes or conditions in capital and financial markets, including
 
actual or potential stresses in the banking industry;
deposit attrition and the level of our uninsured deposits;
legislative
 
or
 
regulatory
 
changes and
 
changes
 
in
 
accounting
 
principles,
 
policies,
 
practices or
 
guidelines,
 
including
 
the on-going
effects of the implementation of the Current Expected Credit Losses (“CECL”)
 
standard;
the effects of
 
our lack of
 
a diversified loan
 
portfolio and concentration in
 
the South Florida
 
market, including the
 
risks of geographic,
depositor, and industry concentrations, including
 
our concentration in loans secured by real estate;
effects of climate change;
the concentration of ownership of our common stock;
fluctuations in the price of our common stock;
our ability to
 
fund or access
 
the capital markets
 
at attractive rates
 
and terms and
 
manage our growth,
 
both organic
 
growth as well
as growth through other means, such as future
 
acquisitions;
inflation, interest rate, unemployment rate, market and monetary fluctuations;
impacts of international hostilities and geopolitical events;
increased competition and its effect on the pricing of our products
 
and services as well as our margin;
the effectiveness
 
of our risk management
 
strategies, including operational
 
risks, including, but
 
not limited to, client,
 
employee, or
third-party fraud and security breaches; and
other risks described in this earnings release and other filings we make with the
 
Securities and Exchange Commission (“SEC”).
All forward-looking statements are necessarily only estimates of future results, and there can be no assurance that actual results will not
differ materially from
 
expectations. Therefore, you
 
are cautioned not
 
to place undue
 
reliance on any
 
forward-looking statements. Further,
forward-looking
 
statements included
 
in this
 
earnings release
 
are made
 
only as
 
of the
 
date hereof,
 
and we
 
undertake no
 
obligation
 
to
update or revise any forward-looking statement
 
to reflect events or circumstances after the date on which the statements
 
are made or to
reflect the occurrence of unanticipated events, unless required to
 
do so under the federal securities
 
laws. You should also review the risk
factors described in the reports the Company filed or will file with the SEC.
Non-GAAP Financial Measures
This earnings
 
release includes financial
 
information determined by
 
methods other than
 
in accordance with
 
generally accepted accounting
principles (“GAAP”). This financial
 
information includes certain
 
operating performance measures. Management
 
has included these
 
non-
GAAP
 
measures
 
because
 
it
 
believes
 
these
 
measures
 
may
 
provide
 
useful
 
supplemental
 
information
 
for
 
evaluating
 
the
 
Company’s
operations and
 
underlying performance
 
trends. Further,
 
management uses these
 
measures in
 
managing and
 
evaluating the Company’s
business and intends to refer to
 
them in discussions about our operations
 
and performance. Operating performance
 
measures should be
viewed
 
in
 
addition
 
to,
 
and
 
not
 
as
 
an
 
alternative
 
to
 
or
 
substitute
 
for,
 
measures
 
determined
 
in
 
accordance
 
with
 
GAAP,
 
and
 
are
 
not
necessarily
 
comparable
 
to
 
non-GAAP
 
measures
 
that
 
may
 
be
 
presented
 
by
 
other
 
companies.
 
Reconciliations
 
of
 
these
 
non-GAAP
measures
 
to
 
the most
 
directly
 
comparable
 
GAAP measures
 
can be
 
found
 
in the
 
‘Non-GAAP
 
Reconciliation
 
Tables’
 
included
 
in the
exhibits to this earnings
 
release.
All numbers included in this press release are unaudited unless otherwise noted.
Contacts:
Investor Relations
InvestorRelations@uscentury.com
Media Relations
Martha Guerra-Kattou
 
MGuerra@uscentury.com


4
USCB FINANCIAL HOLDINGS, INC.
CONSOLIDATED STATEMENTS
 
OF INCOME (UNAUDITED)
(Dollars in thousands, except per share data)
Three Months Ended June 30,
Six Months Ended June 30,
2023
2022
2023
2022
Interest income:
Loans, including fees
$
20,847
$
14,053
$
40,558
$
27,035
Investment securities
2,382
2,510
4,668
4,839
Interest-bearing deposits in financial institutions
1,051
121
1,433
152
Total interest income
24,280
16,684
46,659
32,026
Interest expense:
Interest-bearing checking
200
17
243
33
Savings and money market accounts
6,968
615
11,753
1,166
Time deposits
2,145
271
3,202
530
FHLB advances and other borrowings
794
139
1,291
276
Total interest expense
10,107
1,042
16,489
2,005
Net interest income before provision for credit losses
14,173
15,642
30,170
30,021
Provision for credit losses
38
705
239
705
Net interest income after provision for credit losses
14,135
14,937
29,931
29,316
Non-interest income:


Service fees
1,173
1,083
2,378
1,983
Gain (loss) on sale of securities available for sale, net
-
(3)
(21)
18
Gain on sale of loans held for sale, net
94
22
441
356
Loan settlement
-
-
-
161
Other non-interest income
579
515
1,118
1,044
Total non-interest income
1,846
1,617
3,916
3,562
Non-interest expense:
Salaries and employee benefits
5,882
5,913
12,259
11,788
Occupancy
1,319
1,251
2,618
2,521
Regulatory assessments and fees
452
226
676
439
Consulting and legal fees
386
398
744
915
Network and information technology services
505
448
983
835
Other operating expense
1,908
1,315
3,348
2,665
Total non-interest expense
10,452
9,551
20,628
19,163
Net income before income tax expense
5,529
7,003
13,219
13,715
Income tax expense
1,333
1,708
3,214
3,566
Net income
4,196
5,295
10,005
10,149
Per share information:
Net income per common share, basic
$
0.21
$
0.26
$
0.51
$
0.51
Net income per common share, diluted
$
0.21
$
0.26
$
0.51
$
0.50
Weighted average shares outstanding:
Common shares, basic
19,590,359
20,000,753
19,722,152
19,997,869
Common shares, diluted
19,639,682
20,171,261
19,790,756
20,192,918


5
USCB FINANCIAL HOLDINGS, INC.
SELECTED FINANCIAL DATA (UNAUDITED)
(Dollars in thousands, except per share data)
As of or For the Three Months Ended
6/30/2023
3/31/2023
12/31/2022
9/30/2022
6/30/2022
Income statement data:
Net interest income
$
14,173
$
15,997
$
16,866
$
16,774
$
15,642
Provision for credit losses
38
201
880
910
705
Net interest income after provision for credit losses
14,135
15,796
15,986
15,864
14,937
Service fees
1,173
1,205
1,093
934
1,083
Gain (loss) on sale of securities available for sale, net
-
(21)
(1,989)
(558)
(3)
Gain on sale of loans held for sale, net
94
347
205
330
22
Other income
579
539
568
1,083
515
Total non-interest income
1,846
2,070
(123)
1,789
1,617
Salaries and employee benefits
5,882
6,377
6,080
6,075
5,913
Occupancy
1,319
1,299
1,256
1,281
1,251
Regulatory assessments and fees
452
224
222
269
226
Consulting and legal fees
386
358
371
604
398
Network and information technology services
505
478
483
488
448
Other operating expense
1,908
1,440
1,602
1,415
1,315
Total non-interest expense
10,452
10,176
10,014
10,132
9,551
Net income before income tax expense
5,529
7,690
5,849
7,521
7,003
Income tax expense
1,333
1,881
1,415
1,963
1,708
Net income
$
4,196
$
5,809
$
4,434
$
5,558
$
5,295
Per share information:
Net income per common share, basic
$
0.21
$
0.29
$
0.22
$
0.28
$
0.26
Net income per common share, diluted
$
0.21
$
0.29
$
0.22
$
0.28
$
0.26
Balance sheet data (at period-end):


Cash and cash equivalents
$
87,280
$
63,251
$
54,168
$
73,326
$
83,272
Securities available-for-sale
$
218,442
$
229,409
$
230,140
$
248,571
$
339,464
Securities held-to-maturity
$
220,956
$
186,428
$
188,699
$
178,865
$
116,671
Total securities
$
439,398
$
415,837
$
418,839
$
427,436
$
456,135
Loans held for investment
(1)
$
1,595,959
$
1,580,394
$
1,507,338
$
1,431,513
$
1,372,733
Allowance for credit losses
$
(18,815)
$
(18,887)
$
(17,487)
$
(16,604)
$
(15,786)
Total assets
$
2,225,914
$
2,163,821
$
2,085,834
$
2,037,453
$
2,016,086
Non-interest-bearing deposits
$
572,360
$
633,606
$
629,776
$
662,808
$
653,708
Interest-bearing deposits
$
1,348,941
$
1,196,856
$
1,199,505
$
1,133,834
$
1,085,012
Total deposits
$
1,921,301
$
1,830,462
$
1,829,281
$
1,796,642
$
1,738,720
FHLB advances and other borrowings
$
87,000
$
120,000
$
46,000
$
26,000
$
66,000
Total liabilities
$
2,042,229
$
1,979,963
$
1,903,406
$
1,860,036
$
1,836,018
Total stockholders' equity
$
183,685
$
183,858
$
182,428
$
177,417
$
180,068
Capital ratios:
(2)


Leverage ratio
9.32%
9.36%
9.61%
9.48%
9.43%
Common equity tier 1 capital
12.27%
12.04%
12.53%
12.56%
12.65%
Tier 1 risk-based capital
12.27%
12.04%
12.53%
12.56%
12.65%
Total risk-based capital
 
13.42%
13.20%
13.65%
13.65%
13.74%
(1)
 
Loan amounts include deferred fees/costs.
(2) Reflects the Company's regulatory capital ratios AVERAGE BALANCES, RATIOS, AND OTHER DATA (UNAUDITED)


6
USCB FINANCIAL HOLDINGS, INC.
(Dollars in thousands)
As of or For the Three Months Ended
6/30/2023
3/31/2023
12/31/2022
9/30/2022
6/30/2022
Average balance sheet data:
Cash and cash equivalents
$
94,313
$
50,822
$
61,892
$
77,887
$
80,254
Securities available-for-sale
$
224,913
$
230,336
$
242,144
$
331,206
$
370,933
Securities held-to-maturity
$
192,628
$
187,826
$
184,459
$
116,733
$
120,130
Total securities
$
417,541
$
418,162
$
426,603
$
447,939
$
491,063
Loans held for investment
(1)
$
1,569,266
$
1,547,393
$
1,456,780
$
1,398,761
$
1,296,476
Total assets
$
2,183,542
$
2,120,218
$
2,051,867
$
2,026,791
$
1,968,381
Interest-bearing deposits
$
1,270,657
$
1,179,878
$
1,150,049
$
1,107,129
$
1,071,709
Non-interest-bearing deposits
$
601,778
$
664,369
$
653,820
$
655,853
$
644,975
Total deposits
$
1,872,435
$
1,844,247
$
1,803,869
$
1,762,982
$
1,716,684
FHLB advances and other borrowings
$
93,075
$
61,600
$
37,500
$
43,935
$
36,330
Total liabilities
$
1,999,304
$
1,936,847
$
1,874,311
$
1,841,503
$
1,781,784
Total stockholders' equity
$
184,238
$
183,371
$
177,556
$
185,288
$
186,597
Performance ratios:
Return on average assets
(2)
0.77%
1.11%
0.86%
1.09%
1.08%
Return on average equity
(2)
9.13%
12.85%
9.91%
11.90%
11.38%
Net interest margin
(2)
2.73%
3.22%
3.45%
3.47%
3.37%
Non-interest income to average assets
(2)
0.34%
0.40%
(0.02)%
0.35%
0.33%
Efficiency ratio
(3)
65.25%
56.32%
59.81%
54.58%
55.34%
Loans by type (at period end):
(4)
Residential real estate
$
183,093
$
184,427
$
185,636
$
186,551
$
203,662
Commercial real estate
$
989,401
$
987,757
$
970,410
$
928,531
$
843,445
Commercial and industrial
$
169,401
$
160,947
$
126,984
$
121,145
$
131,271
Foreign banks
$
85,409
$
97,405
$
93,769
$
94,450
$
84,770
Consumer and other
 
$
167,845
$
149,410
$
130,429
$
100,845
$
109,250
Asset quality data:
 
 
Allowance for credit losses to total loans
1.18%
1.20%
1.16%
1.16%
1.15%
Allowance for credit losses to non-performing loans
3,871%
3,886%
- %
- %
- %
Total non-performing loans
(5)
$
486
$
486
$
-
$
-
 
$
-
Non-performing loans to total loans
0.03%
0.03%
- %
- %
- %
Non-performing assets to total assets
0.02%
0.02%
- %
- %
- %
Net charge-offs (recoveries of) to average loans
(2)
0.01%
(0.01)%
(0.00)%
0.03%
(0.00)%
Net charge-offs (recovery of) credit losses
$
29
$
(49)
$
(2)
$
91
$
(7)
Interest rates and yields:
(2)
Loans
5.33%
5.17%
4.86%
4.53%
4.35%
Investment securities
 
2.26%
2.20%
2.13%
1.94%
2.04%
Total interest-earning assets
4.68%
4.51%
4.21%
3.82%
3.60%
Deposits
1.99%
1.29%
0.77%
0.34%
0.21%
FHLB advances and other borrowings
3.42%
3.27%
2.27%
1.63%
1.53%
Total interest-bearing liabilities
2.97%
2.08%
1.25%
0.59%
0.38%
Other information:


Full-time equivalent employees
198
196
191
191
192
(1)
 
Loan amounts include deferred fees/costs.
(2)
 
Annualized.
(3)
 
Efficiency ratio is defined as total non-interest expense divided
 
by sum of net interest income and total non-interest
 
income.
(4)
 
Loan amounts exclude deferred fees/costs.
(5)
 
The amounts for total non-performing loans and total non-performing
 
assets are the same at the dates presented since there were
 
no impaired investments or other
real estate owned (OREO) recorded.


7
USCB FINANCIAL HOLDINGS, INC.
 
NET INTEREST MARGIN (UNAUDITED)
(Dollars in thousands)
Three Months Ended June 30,
2023
2022
Average
 
Balance
Interest
Yield/Rate
(1)
Average
 
Balance
Interest
Yield/Rate
(1)
Assets
Interest-earning assets:
Loans
(2)
$
1,569,266
$
20,847
5.33%
$
1,296,476
$
14,053
4.35%
Investment securities
(3)
422,544
2,382
2.26%
493,352
2,510
2.04%
Other interest-earnings assets
87,536
1,051
4.82%
69,503
121
0.70%
Total interest-earning assets
2,079,346
24,280
4.68%
1,859,331
16,684
3.60%
Non-interest-earning assets
104,196
 
 
109,050
 
 
Total assets
$
2,183,542
$
1,968,381
Liabilities and stockholders' equity


Interest-bearing liabilities:
Interest-bearing checking
$
53,561
200
1.50%
$
66,349
17
0.10%
Saving and money market deposits
940,095
6,968
2.97%
781,076
615
0.32%
Time deposits
277,001
2,145
3.11%
224,284
271
0.48%
Total interest-bearing deposits
1,270,657
9,313
2.94%
1,071,709
903
0.34%
FHLB advances and other borrowings
93,075
794
3.42%
36,330
139
1.53%
Total interest-bearing liabilities
1,363,732
10,107
2.97%
1,108,039
1,042
0.38%
Non-interest-bearing demand deposits
601,778
 
 
644,975
 
 
Other non-interest-bearing liabilities
33,794
28,770
Total
 
liabilities
1,999,304
 
 
1,781,784
 
 
Stockholders' equity
184,238
186,597
Total liabilities and stockholders' equity
$
2,183,542
 
 
$
1,968,381
 
 
Net interest income
$
14,173
$
15,642
Net interest spread
(4)
1.71%
3.22%
Net interest margin
(5)
2.73%
3.37%
(1)
 
Annualized.
(2)
 
Average loan balances include non-accrual loans. Interest income on loans includes accretion
 
of deferred loan fees, net of deferred loan costs.
(3)
 
At fair value except for securities held to maturity. This amount includes FHLB
 
stock.
(4)
 
Net interest spread is the average yield earned on total
 
interest-earning assets minus the average rate paid on total interest-bearing
 
liabilities.
(5)
 
Net interest margin is the ratio of net interest income to total
 
interest-earning assets.


8
USCB FINANCIAL HOLDINGS, INC.
NON-GAAP FINANCIAL MEASURES (UNAUDITED)
(Dollars in thousands)
As of or For the Three Months Ended
6/30/2023
3/31/2023
12/31/2022
9/30/2022
6/30/2022
Pre-tax pre-provision ("PTPP") income:
(1)
Net income
$
4,196
$
5,809
$
4,434
$
5,558
$
5,295
Plus: Provision for income taxes
1,333
1,881
1,415
1,963
1,708
Plus: Provision for credit losses
38
201
880
910
705
PTPP income
$
5,567
$
7,891
$
6,729
$
8,431
$
7,708
PTPP return on average assets:
(1)


PTPP income
$
5,567
$
7,891
$
6,729
$
8,431
$
7,708
Average assets
$
2,183,542
$
2,120,218
$
2,051,867
$
2,026,791
$
1,968,381
PTPP return on average assets
(2)
1.02%
1.51%
1.30%
1.65%
1.57%


Operating net income:
(1)
Net income
$
4,196
$
5,809
$
4,434
$
5,558
$
5,295
Less: Net gains (losses) on sale of securities
-
(21)
(1,989)
(558)
(3)
Less: Tax effect on sale of securities
-
5
504
141
1
Operating net income
$
4,196
$
5,825
$
5,919
$
5,975
$
5,297


Operating PTPP income:
(1)
PTPP income
$
5,567
$
7,891
$
6,729
$
8,431
$
7,708
Less: Net gains (losses) on sale of securities
-
(21)
(1,989)
(558)
(3)
Operating PTPP income
$
5,567
$
7,912
$
8,718
$
8,989
$
7,711
Operating PTPP return on average assets:
(1)


Operating PTPP income
$
5,567
$
7,912
$
8,718
$
8,989
$
7,711
Average assets
$
2,183,542
$
2,120,218
$
2,051,867
$
2,026,791
$
1,968,381
Operating PTPP return on average assets
(2)
1.02%
1.51%
1.69%
1.76%
1.57%


Operating return on average assets:
(1)
Operating net income
$
4,196
$
5,825
$
5,919
$
5,975
$
5,297
Average assets
$
2,183,542
$
2,120,218
$
2,051,867
$
2,026,791
$
1,968,381
Operating return on average assets
(2)
0.77%
1.11%
1.14%
1.17%
1.08%
Operating return on average equity:
(1)
Operating net income
$
4,196
$
5,825
$
5,919
$
5,975
$
5,297
Average equity
$
184,238
$
183,371
$
177,556
$
185,288
$
186,597
Operating return on average equity
(2)
9.13%
12.88%
13.23%
12.79%
11.39%
Operating Revenue:
(1)
 
Net interest income
$
14,173
 
$
15,997
 
$
16,866
 
$
16,774
 
$
15,642
 
Non-interest income
 
1,846
2,070
(123)
 
1,789
 
1,617
 
Less: Net gains (losses) on sale of securities
-
(21)
(1,989)
(558)
(3)
 
Operating revenue
$
16,019
$
18,088
$
18,732
$
19,121
$
17,262
Operating Efficiency Ratio:
(1)
 
Total non-interest expense
$
10,452
 
$
10,176
 
$
10,014
 
$
10,132
 
$
9,551
 
Operating revenue
$
16,019
$
18,088
$
18,732
$
19,121
$
17,262
 
Operating efficiency ratio
65.25%
56.26%
53.46%
52.99%
55.33%
(1) The Company believes these non-GAAP measurements are
 
key indicators of the ongoing earnings power of the
 
Company.
(2)
 
Annualized.


9
USCB FINANCIAL HOLDINGS, INC.
NON-GAAP FINANCIAL MEASURES (UNAUDITED)
(Dollars in thousands, except per share data)
As of or For the Three Months Ended
6/30/2023
3/31/2023
12/31/2022
9/30/2022
6/30/2022
Tangible book value per common share (at period-end):
(1)
Total stockholders' equity
$
183,685
$
183,858
$
182,428
$
177,417
$
180,068
Less: Intangible assets
-
-
-
-
-
Tangible stockholders' equity
$
183,685
$
183,858
$
182,428
$
177,417
$
180,068
Total shares issued and outstanding (at period-end):
Total common shares issued and outstanding
19,544,777
19,622,380
20,000,753
20,000,753
20,000,753
Tangible book value per common share
(2)
$
9.40
$
9.37
$
9.12
$
8.87
$
9.00
Operating diluted net income per common share:
(1)
Operating net income
$
4,196
$
5,825
$
5,919
$
5,975
$
5,297
Total weighted average diluted shares of common stock
19,639,682
19,940,606
20,172,438
20,148,208
20,171,261
Operating diluted net income per common share:
$
0.21
$
0.29
 
$
 
0.29
 
$
 
0.30
 
$
 
0.26
Tangible Common Equity/Tangible Assets
 
Tangible stockholders' equity
$
183,685
$
183,858
$
182,428
$
177,417
$
180,068
 
Tangible assets
$
2,225,914
 
$
 
2,163,821
 
$
 
2,085,834
 
$
 
2,037,453
 
$
 
2,016,086
Tangible Common Equity/Tangible Assets
8.25%
8.50%
8.75%
8.71%
8.93%
(1)
 
The Company believes these non-GAAP measurements
 
are key indicators of the ongoing earnings power
 
of the Company.
(2)
 
Excludes the dilutive effect, if any, of shares of common stock issuable upon exercise of outstanding
 
stock options.
EX-99.2 4 exhibit992.htm EXHIBIT 99.2 exhibit992
exhibit992p1i0
 
Exhibit 99.2
exhibit992p2i0
 
EARNINGS PRESENTATION SECOND QUARTER 2023 NASDAQ: USCB FORWARD-LOOKING STATEMENTS This presentation may contain statements that are not historical in nature and are intended to be, and are hereby identified as, forward-looking statements for purposes of the safe harbor provided by Section 21E of the Securities Exchange Act of 1934, as amended. Forward-looking statements are those that are not historical facts. The words “may,” “will,” “anticipate,” “should,” “would,” “believe,” “contemplate,” “expect,” “aim,” “plan,” “estimate,” “continue,” and “intend,” as well as other similar words and expressions of the future, are intended to identify forward-looking statements. These forward-looking statements include, but are not limited to, statements related to our projected growth, anticipated future financial performance, and management’s long-term performance goals, as well as statements relating to the anticipated effects on results of operations and financial condition from expected developments or events, or business and growth strategies, including anticipated internal growth and balance sheet restructuring. These forward -looking statements involve significant risks and uncertainties that could cause our actual results to differ materially from those anticipated in such statements. Potential risks and uncertainties include, but are not limited to: the strength of the United States economy in general and the strength of the local economies in which we conduct operations; our ability to successfully manage interest rate risk, credit risk, liquidity risk, and other risks inherent to our industry; the accuracy of our financial statement estimates and assumptions, including the estimates used for our credit loss reserve and deferred tax asset valuation allowance; the efficiency and effectiveness of our internal control procedures and processes; our ability to comply with the extensive laws and regulations to which we are subject, including the laws for each jurisdiction
where we operate; adverse changes or conditions in capital and financial
 
markets, including actual or potential stresses in the banking
 
industry; deposit attrition and the level of our uninsured deposits;
 
legislative or regulatory changes and changes in accounting principles,
 
policies, practices or guidelines, including the on-going effects
 
of the implementation of the Current Expected Credit Losses (“CECL”)
 
standard; the effects of our lack of a diversified loan portfolio and concentration
 
in the South Florida market, including the risks of geographic, depositor,
 
and industry concentrations, including our concentration in loans secured
 
by real estate; effects of climate change; the concentration of
 
ownership of our common stock; fluctuations in the price of our common
 
stock; our ability to fund or access the capital markets at attractive
 
rates and terms and manage our growth, both organic growth as
 
well as growth through other means, such as future acquisitions; inflation,
 
interest rate, unemployment rate, market, and monetary fluctuations;
 
impacts of international hostilities and geopolitical events; increased
 
competition and its effect on the pricing of our products and services
 
as well as our margin; the effectiveness of our risk management
 
strategies, including operational risks, including, but not limited
 
to, client, employee, or third-party fraud and security breaches;
 
and other risks described in this presentation and other filings we
 
make with the Securities and Exchange Commission (“SEC”).
 
All forward-looking statements are necessarily only estimates of
 
future results, and there can be no assurance that actual results will not
 
differ materially from expectations. Therefore, you are
 
cautioned not to place undue reliance on any forward-looking statements.
 
Further, forward-looking statements included in this presentation
 
are made only as of the date hereof, and we undertake no obligation to
 
update or revise any
forward-looking statements to reflect events or circumstances after the date on which the statements are made or to reflect the occurrence of unanticipated events, unless required to do so under the federal securities laws. You should also review the risk factors described in the reports USCB Financial Holdings, Inc. filed or will file with the SEC. Non-GAAP Financial Measures This presentation includes financial information determined by methods other than in accordance with generally accepted accounting principles (“GAAP”). This financial information includes certain operating performance measures. Management has included these non-GAAP measures because it believes these measures may provide useful supplemental information for evaluating the Company’s expectations and underlying performance trends. Further, management uses these measures in managing and evaluating the Company’s business and intends to refer to them in discussions about our operations and performance. Operating performance measures should be viewed in addition to, and not as an alternative to or substitute for, measures determined in accordance with GAAP, and are not necessarily comparable to non-GAAP measures that may be presented by other companies. Reconciliations of these non-GAAP measures to the most directly comparable GAAP measures can be found in the ‘Non-GAAP Reconciliation Tables’ included in the presentation. All numbers included in this presentation are unaudited unless otherwise noted. 2 Q2 2023 HIGLIGHTS GROWTH Average deposits increased by $155.8 million or 9.1% compared to the second quarter 2022.
exhibit992p3i0
 
Liquidity sources increased to $853 million in on-balance sheet and off-balance sheet sources. Insured and collateralized deposit, increased to 51% from 43% in the second quarter 2022. Average loans, excluding PPP loans, increased $290.1 million or 22.7% compared to the second quarter 2022. Tangible Book Value per Share (1) was $9.40 includes an after-tax unrealized security loss impact of $2.41. PROFITABILITY Net income was $4.2 million or $0.21 per diluted share. ROAA was 0.77% compared to 1.08% for the second quarter 2022. ROAE was 9.13% compared to 11.38% for the second quarter 2022. Efficiency ratio was 65.25% compared to 55.34% for the second quarter 2022. CAPITAL/ CREDIT Credit metrics remain strong. One C&I loan classified as nonaccrual for a total of $486 thousand. ACL coverage ratio was 1.18%. Effective January 1, 2023, the Company adopted the CECL methodology for estimating credit losses. Repurchased 77,603 shares of common stock during the quarter at a weighted average price of $9.58. 172,397 common shares remain authorized for repurchase under the repurchase program. (1) Non-GAAP financial measure. 3 HISTORICAL FINANCIAL EOP for Balance Sheet amounts
exhibit992p4i0
 
Loans (1)
In millions $735 $1,596 2016 2017 2018 2019 2020 2021 2022 Q1 Q2 2023 2023 Deposits In millions $782 $1,921 2016 2017 2018 2019 2020 2021 2022 Q1 Q2 2023 2023 Total Stockholder’s Equity In millions $86 $184 2016 2017 2018 2019 2020 2021 2022 Q1 Q2 2023 2023 ACL/Total Loans 1.17% 1.18% 2016 2017 2018 2019 2020 2021 2022 Q1 Q2 2023 2023 Net Charge Off In thousands -$1,019 $29 2016 2017 2018 2019 2020 2021 2022 Q1 Q2 2023 2023 Nonperforming Assets/Total Assets 1.58% 0.02% 2016 2017 2018 2019 2020 2021 2022 Q1 Q2 2023 2023 Total Revenue In millions $37 $69 2016 2017 2018 2019 2020 2021 2022 Efficiency Ratio 94.15% 65.25% 2016 2017 2018 2019 2020 2021 2022 Q1 Q2 2023 2023 PTPP ROAA (2) 0.24% 1.02% 2016 2017 2018 2019 2020 2021 2022 Q1 Q2 2023 2023 (1) Loan amounts include deferred fees/costs. (2) Non-GAAP financial measure. Annualized. 4 FINANCIAL RESULTS In thousands (except per share data) Q2 2023 Q1 2023 Q2 2022 Balance Sheet (EOP) Total Securities $439,398 $415,837 $456,135 Total Loans (1) $1,595,959 $1,580,394 $1,372,733 Total Assets $2,225,914 $2,163,821 $2,016,086 Total Deposits $1,921,301 $1,830,462 $1,738,720 Total Equity (2) $183,685 $183,858 $180,068 Income Statement Net Interest Income $14,173 $15,997 $15,642 Non-interest Income $1,846 $2,070 $1,617 Total Revenue $16,019 $18,067 $17,259 Provision for Credit Losses $38 $201 $705 Non-interest Expense $10,452 $10,176 $9,551 Net Income $4,196 $5,809 $5,295 Diluted Earning Per Share (EPS) $0.21 $0.29 $0.26 Weighted Average Diluted Shares 19,639,682 19,940,606 20,171,261 (1) Loan amounts include deferred fees/costs.
exhibit992p5i0
 
exhibit992p6i0
 
(2) Total Equity includes after-tax unrealized security losses of $47.1 million for Q2 2023, $42.1 million for Q1 2023, and $36.9 million for Q2 2022. 5 KEY PERFORMANCE INDICATORS CAPITAL/ CREDIT PROFITABILITY GROWTH Q2 2023 Q1 2023 Q2 2022 Tangible Common Equity/Tangible Assets (1) 8.25% 8.50% 8.93% Total Risk-Based Capital (2) 13.42% 13.20% 13.74% NCO/Avg Loans (3) 0.01% (0.01%) 0.00% NPA/Assets 0.02% 0.02% 0.00% Allowance Credit Losses/Loans 1.18% 1.20% 1.15% Return On Average Assets (ROAA) (3) 0.77% 1.11% 1.08% Return On Average Equity (ROAE) (3) 9.13% 12.85% 11.38% Net Interest Margin (3) 2.73% 3.22% 3.37% Efficiency Ratio 65.25% 56.32% 55.34% Total Assets (EOP) $2,225,914 $2,163,821 $2,016,086 Total Loans (EOP) $1,595,959 $1,580,394 $1,372,733 Total Deposits (EOP) $1,921,301 $1,830,462 $1,738,720 Tangible Book Value/Share (1)(4) $9.40 $9.37 $9.00 (1) Non-GAAP Financial Measures. (2) For the Company. (3) Annualized. (4) After tax unrealized security loss effect on tangible book value per share was ($2.41) for Q2 2023, ($2.14) for Q1 2023 and ($1.84) for Q2 2022. 6 DEPOSIT PORTFOLIO Deposits AVG In millions $1,717 $1,763 $1,804 $1,844 $1,872 $224 $217 $217 $225 $277 $781 $823 $871 $897 $940 $67 $67 $62 $58 $53 $645 $656 $654 $664 $602 Q2 2022 Q3 2022 Q4 2022 Q1 2023 Q2 2023 Non-interest-bearing deposits Money market and savings Interest-bearing checking deposits Time deposits Deposit Cost "+500 bps Q2'23 vs Q4'21" 0.25% 1.75% 3.25% 4.50% 5.00% 5.25% 0.21% 0.21% 0.34% 0.77% 1.29% 1.99% Q2 2022 Q3 2022 Q4 2022 Q1 2023 Q2 2023 Deposit Costs Fed Funds Rate (upper bound) Commentary Average deposits increased $28.2 million or 6.1% annualized compared to the prior quarter and $155.8 million or 9.1% compared to the second quarter 2022.
exhibit992p7i0
 
Deposit composition mix shifted towards interest bearing and ICS/CDARS products. Average DDA balances comprised 32.1% of total deposits as of June 30, 2023. Deposit beta of 36% since Q4 2021. In abundance of caution given the recent bank failures, brought in $50 million of brokered CDs at a weighted average rate of 4.98% to boost liquidity. 7 DEPOSIT DISTRIBUTION EOP for Balance Sheet amounts Deposits Composition Public Funds 11% Personal 36% Broker Deposits 3% Business 50% Commentary Our deposit base reflects our business model: a commercial bank.
exhibit992p8i0
 
The total amount of uninsured deposits adjusted by the collateralized portion of public funds is 49% for quarter end. Excluding the collateralized portion of Public Funds, the uninsured deposits are 53%. As of June 30, 2023, the deposit balance of ICS/CDARS was $114.3 million, increase of $78.6 million from first quarter 2023. Deposits by Customer Segment In thousands for balance sheet amounts Deposit Type Total Balance % of Total (#) Accounts Average Balance per Account Business $ 955,768 50% 6,979 $ 137 Personal $ 696,101 36% 12,686 s 55 PublicFunds $ 219,432 11% 31 $ 7,078 Brokered CDs $ 50,000 3% 2 $ 25,000 Grand Total $ 1,921,301 100% 19,698 $ 98 Uninsured Deposits to Total Deposits (1) In millions 57% 57% 59% 56% 49% $751 $765 $750 $802 $970 $988 $1,032 $1,079 $1,028 $951 Q2 2022 Q3 2022 Q4 2022 Q1 2023 Q2 2023 Uninsured Depositors Insured Depositors Uninsured Deposits/Deposits (1) Uninsured deposits excludes collateralized Public Funds . 8 LIQUIDITY EOP for Balance Sheet amounts Total Liquidity 29% 31% 30% 28% 38% 25% 22% 20% 19% 14% Jun-22 Sep-23 Dec-23 Mar-23 Jun-23 On Balance Sheet Liquid Assets Total Liquidity Liquid Assets: On-Balance Sheet Liquidity / Total Assets Total Liquidity: total Liquidity / Total Assets Commentary We believe we are well positioned to weather the current environment.
exhibit992p9i0
 
We have ample sources of liquidity both on and off-balance sheet. Loan-to-deposits ratio negatively impacted by additional liquidity brought on balance sheet with $50 million of brokered CDs. We are enrolled in BTFP but have not drawn. Sources of Liquidity (in millions) 6/30/2023 On Balance Sheet Liquidity Cash $7 Due from banks $76 Investment securities unpledged $226 Total on balance sheet liquidity (Liquid Assets) $309 Off Balance Sheet Liquidity FHLB excess capacity $270 Bank Term Funding Program (BTFP) $137 Federal Reserve Discount Window $32 Fed Fund Lines $105 Total off balance sheet liquidity $544 Total Liquidity $853 Loan-to-Deposit Ratio 79.0% 79.7% 82.4% 86.3% 83.1% Jun-22 Sep-23 Dec-23 Mar-23 Jun-23 9 LOAN PORTFOLIO Total Loans (AVG) In millions Loans (Excl PPP) PPP Loans Loans Yields 4.35% 4.53% 4.86% 5.17% 5.33% 0.13% 0.03% 0.04% 0.03% 0.02% +109 bps 4.22% 4.50% 4.82% 5.14% 5.31% Q2'23 vs Q2'22 Q2 2022 Q3 2022 Q4 2022 Q1 2023 Q2 2023 Loan coupon Loan fees Commentary Average loans, excluding PPP loans, increased $22.5 million or 5.8% annualized compared to prior quarter and $290.1 million or 22.7% compared to the second quarter 2022.
exhibit992p10i0
 
exhibit992p11i0
 
Loan coupon increased 17 bps compared to prior quarter and 109 bps compared to the second quarter 2022. Loan fees yield decreased 11 bps compared to second quarter 2022 primarily due to a decrease of $441 thousand in PPP loan fees. 10 LOAN PRODUCTION Net Loan Production Trend In millions 4.44% 4.85% 5.68% 6.66% 7.20% $169 $56 $130 $71 $129 $54 $94 $22 $67 $51 Q2 2022 Q3 2022 Q4 2022 Q1 2023 Q2 2023 Loan Production & Line Changes Loan Amortization & payoffs New loans average coupon Loan Composition Trend (1) In millions $948 $1,595 28% 12 % 63% 62% 9% 26% Jun-20 Jun-23 Residential real etate Commercial real estate Real Estate Loans Commercial and industrial, Foreign banks, and Consumer and other (1) Excludes unearned fees and PPP Loans. EOP. Commentary $88 million net growth for year -to-date 2023. Average coupon on new loans was 7.20% for second quarter 2023, 189 bps above portfolio average. Q2 2023 loan production for the quarter was well diversified; 46% C&I, 16% CRE; 31% consumer, 3% correspondent banks; and 3% residential. Loan production was impacted by recent bank failures. Loan composition shows diversification and growth in C&I and consumer loans. 11 NET INTEREST MARGIN Net Interest Income/Margin (1) In thousands (except ratios) 3.37% 3.47% 3.45% 3.22% 2.73% 3.27% 3.45% 3.45% 3.22% 2.73% $15,642 $16,774 $16,866 $15,997 $14,173 Q2 2022 Q3 2022 Q4 2022 Q1 2023 Q2 2023 Net Interest Income NIM NIM excluding PPP Loans Interest-Earning Assets Mix (AVG) 4% 4% 3% 2% 4% 26% 23% 22% 21% 20% 1% 0% 0% 0% 0% 69% 73% 75% 77% 76% Q2 2022 Q3 2022 Q4 2022 Q1 2023 Q2 2023 Total Loans (excluding PPP Loans) Investment Securities PPP Loans Cash Balances & Equivalents Commentary Net interest income decreased by $1.8 million compared to the prior quarter predominately due to increase in deposit cost and a liability sensitive balance sheet.
exhibit992p12i0
 
Held more cash in wake of recent bank failures and increased liquidity with higher priced brokered CD’s ($50 million) which negatively impacted NIM. Shift in deposit mix; out of DDA and into interest bearing deposits. Majority of Q2 loan production (higher yields) was booked at the end of the quarter, the full impact on the NIM is yet to be realized. $50 million notional pay fixed rate swap executed in Q2; $100 million pay fixed rate swap executed in early Q3 to help future NIM. Q3 loan pipeline is strong, ($200 million) and loan coupons are above 7.50%. (1) Annualized. 12 INTEREST RATE SENSITIVITY Loan Portfolio Repricing Profile By Rate Type Hybrid ARM 5% Fixed Rate 38% Variable Rate 57% 18% 15% 67% Prime CMT LIBOR/SOFR 46% 33% 8% 13% 46% yrs.
exhibit992p13i0
 
1-2 yrs 2-3 yrs. >3yrs. Static NII Simulation Year 1 & 2 Year 1 Year 2 -0.1% -0.6% 3.9% 6.7% +100 +200 +100 +200 Net interest income changes from base ($ in thousands and % change) 13 ASSET QUALITY Allowance for Credit Losses In thousands (except ratios) 1.15% 1.16% 1.16% 1.20% 1.18% $15,786 $16,604 $17,487 $18,887 $18,815 Q2 2022 Q3 2022 Q4 2022 Q1 2023 Q2 2023 Allowance for credit loss ACL/Total loans Commentary ACL coverage ratio is at 1.18%, slightly down from prior quarter due to improvement in economic outlook.
exhibit992p14i0
 
One C&I loan for $486 thousand was classified as nonaccrual at June 30, 2023. No OREO. Improved economic forecasts drove a small reduction in expected loss rates and this was partially offset by net portfolio growth during the quarter. Non-performing Loans In thousands (except ratios) 0.00% 0.00% 0.00% 0.03% 0.03% $486 $486 Q2 2022 Q3 2022 Q4 2022 Q1 2023 Q2 2023 Non-accrual loans Non-performing loans to total loans Classified Loans (1) to Total Loans 0.08% 0.07% 0.26% 0.25% 0.21% (1) Loans classified as substandard at period end. No loans classified doubtful or loss at period end. 14 LOAN PORTFOLIO MIX Loan Portfolio Mix (1) Residential real estate CRE - Owner occupied CRE - Non-owner occupied Commercial and industrial Correspondent banks Consumer and other 11% 11% 10% 52% 11% 50% $1,595MM Commentary Total Loan balance at quarter end was $1,595 million (1).
exhibit992p15i0
 
Commercial Real Estate (owner occupied and non-owner occupied) was 62% or $989.4 million of the total loan portfolio (1). CRE mix is diversified and granular. Retail non-owner occupied makes up 30% of total CRE or $297.4 million. CRE Loan Mix Land/Construction 5% Other 3% Retail 30% Multifamily 18% CRE - Owner Occupied 16% Office 12% Warehouse 8% Hotels 8% Land/Construction 5% CRE Loan Portfolio (non-owner occupied and owner occupied) Weighted Average Loan Type LTV»> DSCR<2> Average Loan Size (3) Retail 56% 1.63 $3.0 Multifamily 62% L41 $1.4 Office 57% 2.20 $1.5 Warehouse 58% L84 $1.2 Hotels 54% L92 $4.8 Other 57% L97 $1.8 Land/Construction 58% NA $3.1 (1) LTV - Loan to value ratio. (2) DSCR - Debt service coverage ratio. (3) Balance in millions. As of 6/30/23 Excludes unearned fees. Includes loan types: office, warehouse, gas station, retail and other. 15 CRE OFFICE PORTFOLIO Loan size 77 25 8 7 3 $32 $46 $32 $41 $25 Under $1MM "$1MM- $3MM" "$3MM- $5MM" "$5MM- $7MM" "$7MM- $10MM" Outstanding Balance as of 6/30/2023 Number of Loans Key Metrics At 6/30/2023 Avg.
exhibit992p16i0
 
Loan Size in millions $ 1.5 Portfolio NCOs/ Average Loans 0.00% performing with clean Delinquencies/Loans 0.00% credit metrics Nonaccruals/Loan s 0.00% Classified Loans/Loans 0.00% Loan Maturity < 1 year 1 year to 3 3 years to 5 5 years to 10 >10 years years years years 5% 9% 14% 71% 1% Commentary Non-owner-occupied office is 8% of total loans and 70% have recourse to a guarantor. Owner occupied office is 3% of the loan portfolio and 99% have recourse to a guarantor. Total office loan portfolio (owner occupied and non-owner occupied) had 120 notes with an average balance of $1.5 million dollars, LTV of 57%, and DSCR of 2.20X at quarter end. 91% of outstanding loan balances are within the USCB primary market. Miami’s office sector outperforms the national average with a lower vacancy rate of 9.4% and availability rate of 11.8%, compared to the estimated national average of 13% and 16.5%, respectively. (1) (1) Data points source: CoStar Group, a NASDAQ company and world leader in commercial real estate information with a comprehensive database of real estate data throughout the US, Canada, UK and France. Published April 2023. 16 NON-INTEREST INCOME In thousands (except ratios) Q2 2023 Q1 2023 Q4 2022 Q3 2022 Q2 2022 Service fees $1,173 $1,205 $1,093 $934 $1,083 Gain (loss) on sale of securities available for sale - (21) (1,989) (558) (3) Gain on sale of loans held for sale 94 347 205 330 22 Other income 579 539 568 1,083 515 Total non-interest income $1,846 $2,070 ($123) $1,789 $1,617 Average total assets $2,183,542 $2,120,218 $2,051,867 $2,026,791 $1,968,381 Non-interest income / Average assets (1) 0.34% 0.40% (0.02%) 0.35% 0.33% Commentary Service fees remain substantially consistent quarter over quarter.
exhibit992p17i0
 
exhibit992p18i0
 
SBA loan sales produced $94 thousand of gains in the second quarter 2023. Fluctuation of non-interest income primarily impacted by one-time items in other income and loss on sale of securities in prior quarters. (1) Annualized. 17 NON-INTEREST EXPENSE In thousands (except ratios) Q2 2023 Q1 2023 Q4 2022 Q3 2022 Q2 2022 Salaries and employee benefits $5,882 $6,377 $6,080 $6,075 $5,913 Occupancy 1,319 1,299 1,256 1,281 1,251 Regulatory assessments and fees 452 224 222 269 226 Consulting and legal fees 386 358 371 604 398 Network and information technology services 505 478 483 488 448 Other operating expense 1,908 1,440 1,602 1,415 1,315 Total non-interest expense $10,452 $10,176 $10,014 $10,132 $9,551 Efficiency ratio 65.25% 56.32% 59.81% 54.58% 55.34% Average total assets $2,183,542 $2,120,218 $2,051,867 $2,026,791 $1,968,381 Non-interest expense / Average assets (1) 1.92% 1.95% 1.94% 1.98% 1.95% Full-time equivalent employees 198 196 191 191 192 Commentary Salaries and employee benefits decreased due to lower incentive accrual based on performance for the first half of 2023. Regulatory assessments and fees increased $228 thousand due to an increase in the FDIC deposit insurance assessment rate compared to first quarter 2023. Other operating expense increased $468 thousand due to increase in audit and tax services, internet banking fees, and special assets insurance expense. Efficiency ratio impacted by lower revenue and increase in non-interest expenses. (1) Annualized. 18 CAPITAL Capital Ratios Q2 2023 Q1 2023 Q2 2022 Well-Capitalized Leverage Ratio 9.32% 9.36% 9.43% 5.00% TCE/TA 8.25% 8.50% 8.93% NA Tier 1 Risk Based Capital 12.27% 12.04% 12.65% 8.00% Total Risk Based Capital 13.42% 13.20% 13.74% 10.00 AOCI In Millions ($47.1) ($42.1) ($36.9) Commentary Repurchased 77,603 shares during the quarter at a weighted average price of $9.58.
exhibit992p19i0
 
172,397 common shares remain authorized for repurchase under the repurchase program. AOCI was ($47.1) million or ($2.41) per share as of June 30, 2023. Q2 2023 EOP shares outstanding: Common Stock: 19,544,777 (1) For the Company. (2) Non-GAAP Financial Measures. 19 TAKEAWAYS Leading franchise located in one of the most attractive banking markets in Florida and the U.S. Robust organic growth Strong asset quality, with minimal charge-offs experienced since 2015 recapitalization Experienced and tested management team Strong profitability, with pathway for future enhancement identified Core funded deposit base with 32.1% Non-Interest-Bearing Deposits (AVG) 20
exhibit992p20i0
 
exhibit992p21i0
 
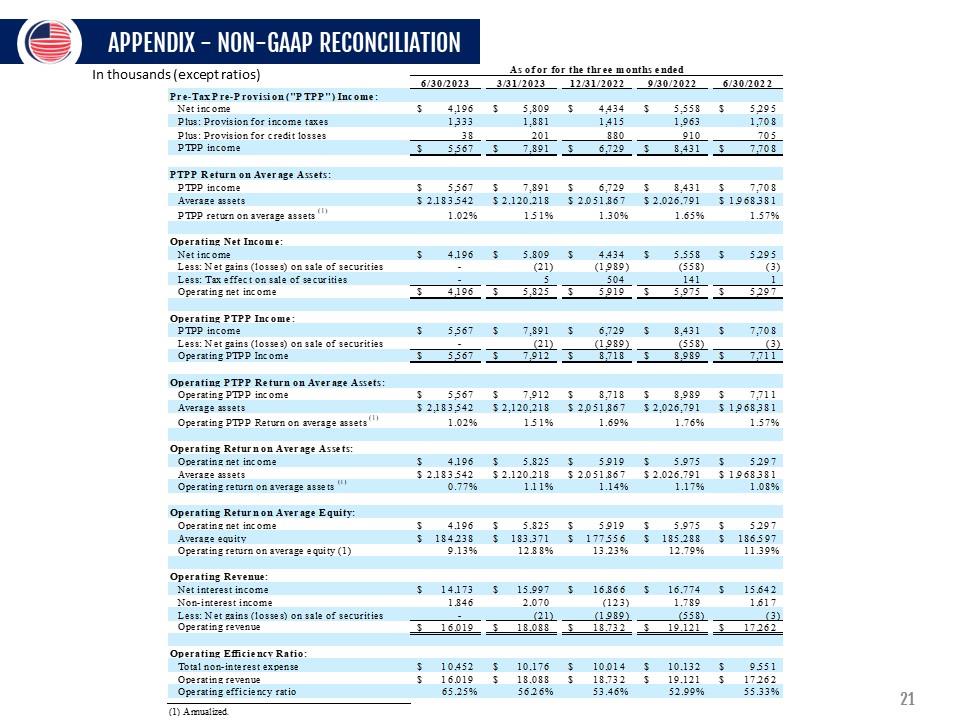
APPENDIX - NON-GAAP RECONCILIATION In thousand$(except
 
ratios) A$of or for the three month$ended 6/30/2023 3/31/2023
 
12/31/2022 9/30/2022 6/30/2022 U/JUí _u¿o Pre-Tax Pre-Provision
 
("PTPP") Income: Net income $4:196 Plus: Provision for income
 
taxe$1:333 Plus: Provision for credit losse$ 3S_ PTPP income $5.567
 
PTPP Return on Average Assets: PTPP income $5:567 Average
 
asset$$2,183,542 PTPP return on average asset$1 1.02% Operating Net
 
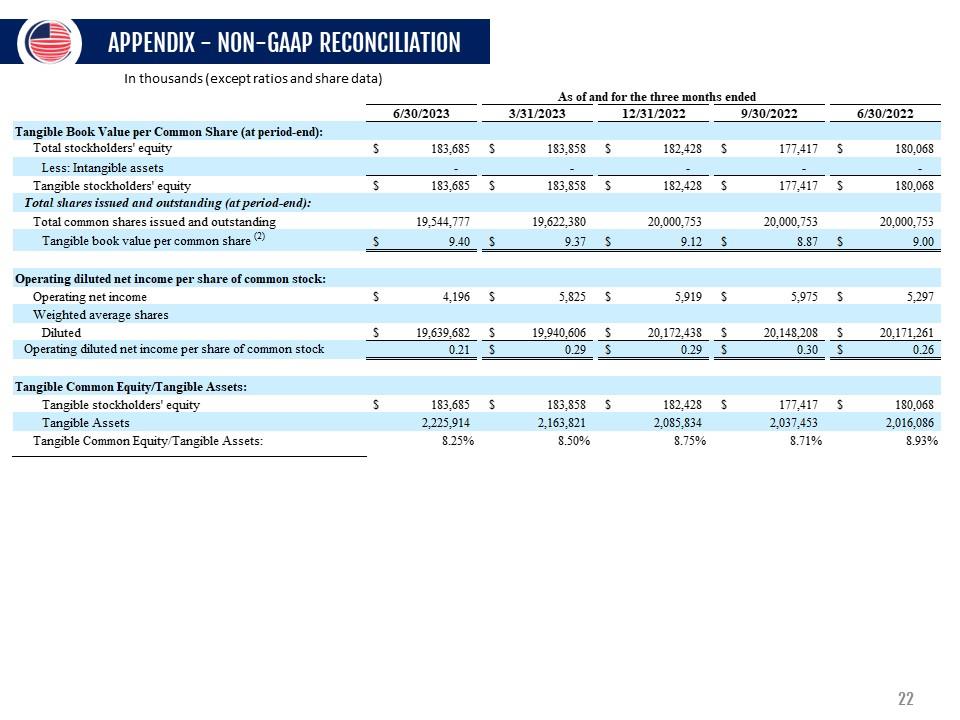
Income: Net income $4:196 Less: Net gain$(losses) on sale
 
of securities Less: Tax effect on sale of securitie$ - Operating
 
net income $4,196 Operating PTPP Income: PTPP income $5:567
 
Less: Net gain$(losses) on sale of securitie$ - Operating PTPP Income
 
$ 5,567 Operating PTPP Return on Average Assets: Operating
 
PTPP income $5,567 Average asset$$2,183,542 Operating PTPP
 
Return on average asset$‘ 1.02% Jl J II íí! O ÍI¿.V $5,809 $4,434
 
$5,558 $5,295 1,881 1,415 1,963 1,708 201 880 910 705 $7,891 $6,729
 
$8,431 $7,708 $7,891 $2,120,218 1.51% $6,729 $2,051,867
 
1.3 0% $8,431 $2,026,791 1.65% $7,708 $1,968,381 1.57% $5,809
 
$4,434 $5,558 $5,295 (21) (1,9 89) (558) (3) 5 504 141 1_
 
$5,825 $5,919 $5,975 $5,297 $7,891 $6,729 $8,431 $7,708 ^211
 
(1Î989) (558) _Q1 $7,912 $8,718 $8,989 $7,711 $7,912 $8,718
 
$8,989 $7,711 $2,120,218 $2,051,867 $2,026,791 $1,968,381 1.51%
 
1.57% 1.69% 1.76% Operating Return on Average Assets: Operating
 
net income $4:196 Average asset$$2,183,542 Operating
 
return on average asset$<1J 0.77% Operating Return on Average
 
Equity: Operating net income $4:196 Average equity $184,238
 
Operating return on average equity (1) 9.13% Operating Revenue:
 
Net interest income $14,173 Non-interest income 1,846 Less: Net
 
gain$(losses) on sale of securitie$ - Operating revenue
 
$16,019 Operating Efficiency Ratio: Total non-interest expense
 
$10,452 Operating revenue
$16,019 Operating efficiency ratio 65.25% (1) Annualized.
exhibit992p22i0
 
$5,825 $2,120,218 1.11% $5,919 $2,051,867 1.14% $5,975 $2,026,791 1.17% $5,297 $1,968,381 1.08% $5,825 $5,919 $5,975 $5,297 $183,371 $177,556 $185,288 $186,597 12.88% 13.23% 12.79% 11.39% $15,997 $16,866 $16,774 $15,642 2,070 (123) 1,789 1,617 (21) (1:989) (558) (3) $18,088 $18,732 $19,121 $17,262 $10,176 $18,088 56.26% $10,014 $18,732 53.46% $10,132 $19,121 52.99% $9,551 $17,262 55.33% (1) Annualized 21 APPENDIX - NON-GAAP RECONCILIATION In thousands (except ratios and share data) 6/30/2023 Tangible Book Value per Common Share (at period-end): Total stockholders 'equity S 183:685 Less: Intangible assets - Tangible stockholders 'equity S 183:685 Total shares issued and outstanding (at period-end): Total common shares issued and outstanding 19:544:777 Tangible book value per common share$ 9.40 Operating diluted net income per share of common stock: Operating net income S 4:196 Weighted average shares Diluted S 19;639;682 Operating diluted net income per share of common stock 0.21 Tangible Common Equity/Tangible Assets: Tangible stockholders 'equity $ 183:685 Tangible Assets 2:225:914 Tangible Common Equity /Tangible Assets: 8.25% As of and for the three months ended 3/31/2023 12/31/2022 9/30/2022 6/30/2022 S 183,858 S 181428 S 177,417 S 180:068 S 183,858 S 181428 S 177,417 S 180,068 19,622,380 20,000,753 20,000,753 20,000,753 S 9.37 $ 9.12 S 8.87 $ 9.00 S 5,825 S 5,919 S 5,975 S 5197 S 19,940,606 S 20,172,438 S 20,148,208 S 20,171161 S 0.29 S 0.29 S 0.30 S 0.26 S 183,858 S 182,428 S 177,417 S 180,068 2,163,821 8.50% 2,085,834 8.75% 2,037,453 8.71% 2,016,086 8.93% 22 CONTACT INFORMATION LOU DE LA AGUILERA Chairman, President & CEO (305) 715-5186 laguilera@uscentury.com ROB ANDERSON EVP, CHIEF FINANCIAL OFFICER (305) 715-5393 rob.anderson@uscentury.com INVESTOR RELATIONS InvestorRelations@uscentury.com 23
exhibit992p23i0