UNITED STATES
SECURITIES AND EXCHANGE COMMISSION
WASHINGTON, D.C. 20549
FORM 6-K
REPORT OF FOREIGN PRIVATE ISSUER
PURSUANT TO RULE 13a-16 OR 15d-16
UNDER THE SECURITIES EXCHANGE ACT OF 1934
For the month of September 2025 (Report No. 2)
Commission File Number: 001-41339
Swvl Holdings Corp
The Offices 4, One Central
Dubai World Trade Centre
Dubai, United Arab Emirates
(Address of principal executive office)
Indicate by check mark whether the registrant files or will file annual reports under cover of Form 20-F or Form 40-F.
Form 20-F ☒ Form 40-F ☐
CONTENTS
Interim Financial Statements
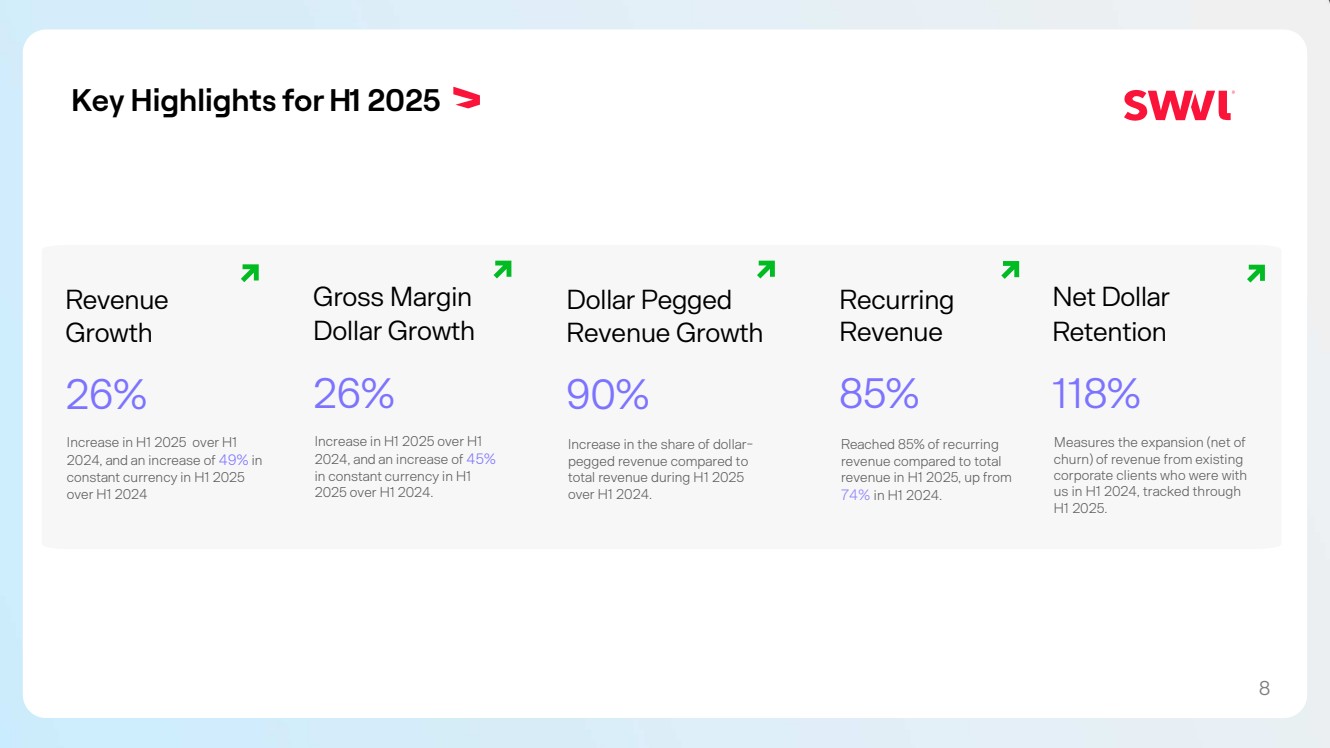
This Report of Foreign Private Issuer on Form 6-K consists of Swvl Holdings Corp (“Swvl”): (i) Unaudited Interim Condensed Consolidated Financial Statements as of and for the six months ended June 30, 2025, which are attached hereto as Exhibit 99.1; (ii) Management’s Discussion and Analysis of Financial Condition and Results of Operation as of and for the six months ended June 30, 2025, which is attached hereto as Exhibit 99.2; (iii) an investor presentation, which is attached hereto as Exhibit 99.3; and (iv) press release titled: “Swvl Announces H1 2025 Results, Delivering 26% Revenue Growth (49% in Constant Currency), 26% Gross Margin Growth, and Net Income of $0.43 Million”, which is attached hereto as Exhibit 99.4.
Exhibits 99.1, 99.2. and the first two paragraphs and the sections titled “Key Highlights” and “Forward Looking Statements” in exhibit 99.4 are incorporated by reference into Swvl’s Registration Statement on Form F-3 (Registration No. 333-279918) and Form S-8 (Registration No. 333-265464) filed with the Securities and Exchange Commission, to be a part thereof from the date on which this Report of Foreign Private Issuer on Form 6-K is submitted, to the extent not superseded by documents or reports subsequently filed or furnished.
EXHIBIT INDEX
Exhibit |
|
Description of Exhibit |
|
|
|
99.1 |
|
Swvl’s Unaudited Interim Condensed Consolidated Financial Statements as of June 30, 2025. |
99.2 |
|
|
99.3 |
|
|
99.4 |
|
|
101 |
|
The following financial information from the Registrant’s Interim Condensed Financial Statements as of June 30, 2025, formatted in XBRL (eXtensible Business Reporting Language): (i) Interim Condensed Statements of Financial Position, (ii) Interim Condensed Statements of Comprehensive Loss, (iii) Interim Condensed Statements of Changes in Shareholders’ Equity; (iv) Interim Condensed Statements of Cash Flows, and (v) Notes to the Unaudited Interim Condensed Financial Statements. |
SIGNATURE
Pursuant to the requirements of the Securities Exchange Act of 1934, the registrant has duly caused this report to be signed on its behalf by the undersigned, thereunto duly authorized.
|
SWVL HOLDINGS CORP |
|
|
|
|
Date: September 8, 2025 |
By: |
/s/ Mostafa Kandil |
|
Name: |
Mostafa Kandil |
|
Title: |
Chief Executive Officer |
Exhibit 99.1
Swvl Holdings Corp and its subsidiaries
Condensed interim consolidated financial statements (unaudited)
For the six-month periods ended 30 June 2025 and 2024
Swvl Holdings Corp and its subsidiaries
Condensed interim consolidated financial statements (unaudited)
For the six-month periods ended 30 June 2025 and 2024
|
|
Page(s) |
|
|
|
Condensed interim consolidated statement of financial position |
|
2 |
|
|
|
Condensed interim consolidated statement of comprehensive profit or loss |
|
3 |
|
|
|
Condensed interim consolidated statement of changes in equity |
|
4 |
|
|
|
|
5 |
|
|
|
|
Notes to the condensed interim consolidated financial statements |
|
6 - 19 |
Swvl Holdings Corp and its subsidiaries
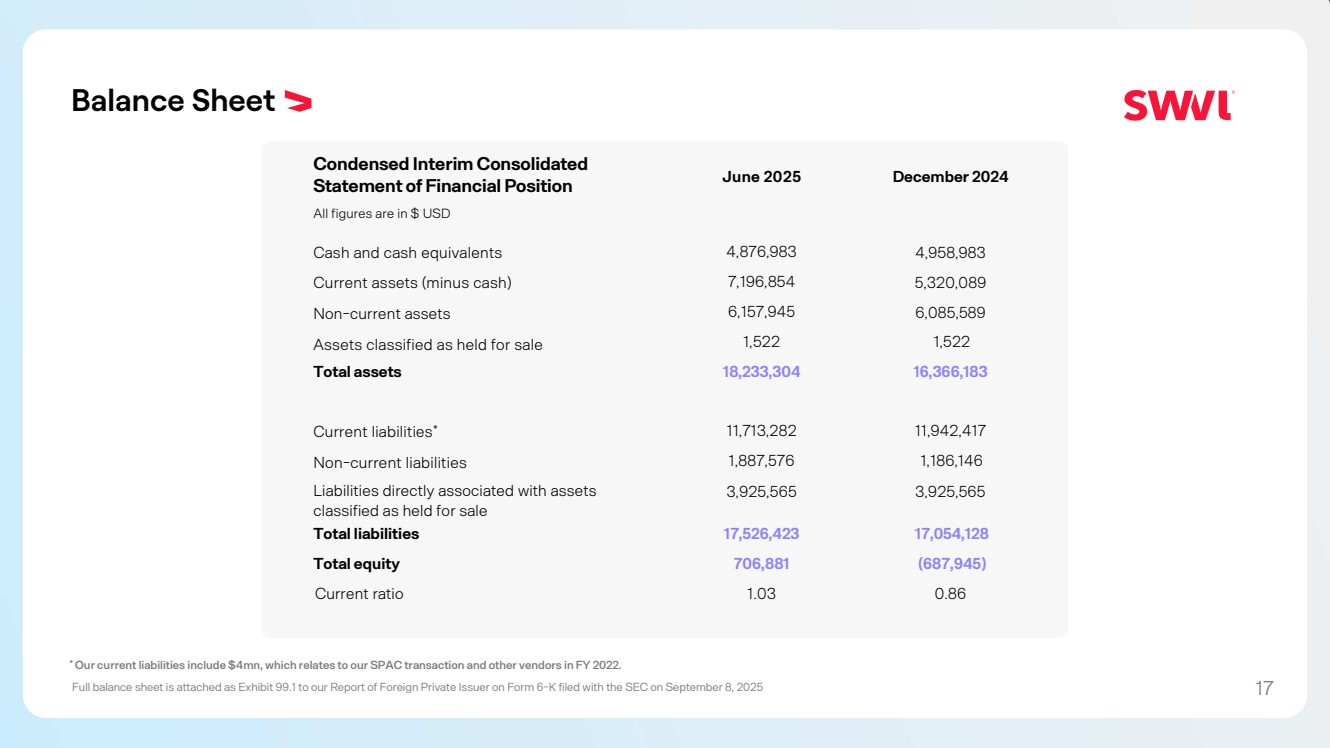
Condensed interim consolidated statement of financial position – As of 30 June 2025
(All amounts are shown in USD unless otherwise stated)
|
|
|
|
(Unaudited) |
|
(Audited) |
|
|
|
|
At 30 June |
|
At 31 December |
|
|
Note |
|
2025 |
|
2024 |
ASSETS |
|
|
|
|
|
|
Non-current assets |
|
|
|
|
|
|
Property and equipment |
|
4 |
|
460,752 |
|
457,802 |
Intangible assets |
|
5 |
|
92,900 |
|
106,262 |
Right-of-use assets |
|
|
|
190,675 |
|
232,612 |
Deferred tax assets |
|
18 |
|
5,413,618 |
|
5,288,913 |
|
|
|
|
6,157,945 |
|
6,085,589 |
|
|
|
|
|
|
|
Current assets |
|
|
|
|
|
|
Prepaid expenses and other current assets |
|
6 |
|
1,323,137 |
|
1,310,807 |
Trade and other receivables |
|
7 |
|
5,873,717 |
|
4,009,282 |
Cash and cash equivalents |
|
8 |
|
4,876,983 |
|
4,958,983 |
|
|
|
|
12,073,837 |
|
10,279,072 |
Assets classified as held for sale |
|
|
|
1,522 |
|
1,522 |
Total assets |
|
|
|
18,233,304 |
|
16,366,183 |
|
|
|
|
|
|
|
EQUITY AND LIABILITIES |
|
|
|
|
|
|
EQUITY |
|
|
|
|
|
|
Share capital |
|
9 |
|
24,912 |
|
24,746 |
Share premium |
|
9 |
|
354,179,327 |
|
353,883,768 |
Employee share scheme reserve |
|
10 |
|
631,629 |
|
564,127 |
Foreign currency translation reserve |
|
|
|
(18,004,387) |
|
(16,603,786) |
Reserve of disposal groups classified as held for sale |
|
|
|
2,372,514 |
|
2,372,514 |
Other reserves |
|
|
|
3,886,000 |
|
1,886,000 |
Accumulated losses |
|
|
|
(339,412,841) |
|
(339,845,041) |
Equity attributable to equity holders of the Parent Company |
|
|
|
3,677,154 |
|
2,282,328 |
|
|
|
|
|
|
|
Non-controlling interests |
|
|
|
(2,970,273) |
|
(2,970,273) |
Total equity/(deficit) |
|
|
|
706,881 |
|
(687,945) |
|
|
|
|
|
|
|
LIABILITIES |
|
|
|
|
|
|
Non-current liabilities |
|
|
|
|
|
|
Provision for employees' end of service benefits |
|
|
|
58,348 |
|
45,957 |
Derivative warrant liabilities |
|
|
|
1,505,540 |
|
669,156 |
Accounts payable, accruals and other payables |
|
11 |
|
— |
|
30,850 |
Lease liabilities |
|
|
|
323,688 |
|
440,183 |
|
|
|
|
1,887,576 |
|
1,186,146 |
|
|
|
|
|
|
|
Current liabilities |
|
|
|
|
|
|
Accounts payable, accruals and other payables |
|
11 |
|
9,511,409 |
|
9,351,406 |
Deferred purchase price |
|
12 |
|
646,678 |
|
1,148,013 |
Current tax liabilities |
|
|
|
1,069,663 |
|
836,117 |
Lease liabilities |
|
|
|
485,532 |
|
606,881 |
|
|
|
|
11,713,282 |
|
11,942,417 |
Liabilities directly associated with assets classified as held for sale |
|
|
|
3,925,565 |
|
3,925,565 |
Total liabilities |
|
|
|
17,526,423 |
|
17,054,128 |
Total equity and liabilities |
|
|
|
18,233,304 |
|
16,366,183 |
op
The accompanying notes are an integral part of these condensed interim consolidated financial statements. |
(2) |
Swvl Holdings Corp and its subsidiaries
Condensed interim consolidated statement of comprehensive profit or loss - For the period ended 30 June 2025
(All amounts are shown in USD unless otherwise stated)
|
|
|
|
(Unaudited) |
|
(Unaudited) |
|
|
Note |
|
2025 |
|
2024 |
Continuing operations |
|
|
|
|
|
|
Revenue |
|
13 |
|
10,189,069 |
|
8,067,008 |
Cost of sales |
|
14 |
|
(8,000,885) |
|
(6,322,748) |
Gross income |
|
|
|
2,188,184 |
|
1,744,260 |
|
|
|
|
|
|
|
General and administrative expenses |
|
15 |
|
(2,898,277) |
|
(5,451,740) |
Selling and marketing costs |
|
|
|
(12,831) |
|
(13,221) |
Other expenses |
|
16 |
|
(127,500) |
|
(625,078) |
Other income |
|
17 |
|
434,165 |
|
273,088 |
Operating loss |
|
|
|
(416,259) |
|
(4,072,691) |
|
|
|
|
|
|
|
Change in fair value of financial liabilities |
|
|
|
836,384 |
|
(1,647,913) |
Finance income |
|
|
|
106,913 |
|
78,623 |
Finance cost |
|
|
|
(94,838) |
|
(50,866) |
Profit/(loss) before tax from continuing operations |
|
|
|
432,200 |
|
(5,692,847) |
|
|
|
|
|
|
|
Income tax benefit |
|
18 |
|
— |
|
— |
Profit/(loss) for the period from continuing operations |
|
|
|
432,200 |
|
(5,692,847) |
|
|
|
|
|
|
|
Discontinued operations |
|
|
|
|
|
|
Profit/(loss) for the period from discontinued operations |
|
|
|
— |
|
— |
Profit/(loss) for the period |
|
|
|
432,200 |
|
(5,692,847) |
|
|
|
|
|
|
|
Attributable to: |
|
|
|
|
|
|
Equity holders of the Parent Company |
|
|
|
432,200 |
|
(5,692,847) |
Non-controlling interests |
|
|
|
— |
|
— |
|
|
|
|
432,200 |
|
(5,692,847) |
|
|
|
|
|
|
|
Profit/(loss) per share attributable to equity holders of the Parent Company |
|
|
|
|
|
|
Basic |
|
19 |
|
0.04 |
|
(0.67) |
Diluted |
|
19 |
|
0.04 |
|
(0.67) |
|
|
|
|
|
|
|
Other comprehensive income |
|
|
|
|
|
|
Items that may be reclassified subsequently to profit or loss: |
|
|
|
|
|
|
Exchange differences on translation of foreign operations, net of tax |
|
|
|
(1,400,601) |
|
(4,713,527) |
Total comprehensive loss for the period |
|
|
|
(968,401) |
|
(10,406,374) |
|
|
|
|
|
|
|
Attributable to: |
|
|
|
|
|
|
Equity holders of the Parent Company |
|
|
|
(968,401) |
|
(10,406,374) |
Non-controlling interests |
|
|
|
— |
|
— |
|
|
|
|
(968,401) |
|
(10,406,374) |
op
The accompanying notes are an integral part of these condensed interim consolidated financial statements. |
(3) |
Swvl Holdings Corp and its subsidiaries
Condensed interim consolidated statement of changes in equity – As of 30 June 2025
(All amounts are shown in USD unless otherwise stated)
|
|
|
|
|
|
|
|
|
|
|
|
|
|
|
|
|
|
Equity |
|
|
|
|
|
|
|
|
|
|
|
|
|
|
Reserve for |
|
Foreign |
|
|
|
|
|
attributable to |
|
|
|
|
|
|
|
|
|
|
|
|
Share-based |
|
disposal |
|
currency |
|
|
|
|
|
equity holders |
|
Non- |
|
|
|
|
|
|
Share |
|
Share |
|
compensation |
|
group held |
|
translation |
|
Other |
|
Accumulated |
|
of the Parent |
|
controlling |
|
Total |
|
|
Note |
|
capital |
|
premium |
|
reserve |
|
for sale |
|
reserve |
|
reserve |
|
losses |
|
Company |
|
interests |
|
equity/(deficit) |
As at 1 January 2024 (Audited) |
|
|
|
16,979 |
|
347,295,152 |
|
507,677 |
|
2,106,737 |
|
(11,466,066) |
|
— |
|
(329,506,304) |
|
8,954,175 |
|
(3,039,317) |
|
5,914,858 |
|
|
|
|
|
|
|
|
|
|
|
|
|
|
|
|
|
|
|
|
|
|
|
Total comprehensive loss for the period |
|
|
|
|
|
|
|
|
|
|
|
|
|
|
|
|
|
|
|
|
|
|
Loss for the period |
|
|
|
— |
|
— |
|
— |
|
— |
|
— |
|
— |
|
(5,692,847) |
|
(5,692,847) |
|
— |
|
(5,692,847) |
Other comprehensive loss for the period |
|
|
|
— |
|
— |
|
— |
|
98,234 |
|
(4,811,761) |
|
— |
|
— |
|
(4,713,527) |
|
— |
|
(4,713,527) |
|
|
|
|
— |
|
— |
|
— |
|
98,234 |
|
(4,811,761) |
|
— |
|
(5,692,847) |
|
(10,406,374) |
|
— |
|
(10,406,374) |
|
|
|
|
|
|
|
|
|
|
|
|
|
|
|
|
|
|
|
|
|
|
|
Issuance of shares |
|
9 |
|
6,006 |
|
2,396,351 |
|
— |
|
— |
|
— |
|
— |
|
— |
|
2,402,357 |
|
— |
|
2,402,357 |
Employee share scheme reserve |
|
10 |
|
— |
|
— |
|
(40,614) |
|
— |
|
— |
|
— |
|
— |
|
(40,614) |
|
— |
|
(40,614) |
As at 30 June 2024 (Unaudited) |
|
|
|
22,985 |
|
349,691,503 |
|
467,063 |
|
2,204,971 |
|
(16,277,827) |
|
— |
|
(335,199,151) |
|
909,544 |
|
(3,039,317) |
|
(2,129,773) |
|
|
|
|
|
|
|
|
|
|
|
|
|
|
|
|
|
|
|
|
|
|
|
As at 1 January 2025 (Audited) |
|
|
|
24,746 |
|
353,883,768 |
|
564,127 |
|
2,372,514 |
|
(16,603,786) |
|
1,886,000 |
|
(339,845,041) |
|
2,282,328 |
|
(2,970,273) |
|
(687,945) |
|
|
|
|
|
|
|
|
|
|
|
|
|
|
|
|
|
|
|
|
|
|
|
Total comprehensive loss for the period |
|
|
|
|
|
|
|
|
|
|
|
|
|
|
|
|
|
|
|
|
|
|
Profit for the period |
|
|
|
— |
|
— |
|
— |
|
— |
|
— |
|
— |
|
432,200 |
|
432,200 |
|
— |
|
432,200 |
Other comprehensive loss for the period |
|
|
|
— |
|
— |
|
— |
|
— |
|
(1,400,601) |
|
— |
|
— |
|
(1,400,601) |
|
— |
|
(1,400,601) |
|
|
|
|
— |
|
— |
|
— |
|
— |
|
(1,400,601) |
|
— |
|
432,200 |
|
(968,401) |
|
— |
|
(968,401) |
|
|
|
|
|
|
|
|
|
|
|
|
|
|
|
|
|
|
|
|
|
|
|
Issuance of shares |
|
9 |
|
166 |
|
295,559 |
|
— |
|
— |
|
— |
|
— |
|
— |
|
295,725 |
|
— |
|
295,725 |
Other reserves |
|
|
|
— |
|
— |
|
— |
|
— |
|
— |
|
2,000,000 |
|
— |
|
2,000,000 |
|
— |
|
2,000,000 |
Employee share scheme reserve |
|
10 |
|
— |
|
— |
|
67,502 |
|
— |
|
— |
|
— |
|
— |
|
67,502 |
|
— |
|
67,502 |
As at 30 June 2025 (Unaudited) |
|
|
|
24,912 |
|
354,179,327 |
|
631,629 |
|
2,372,514 |
|
(18,004,387) |
|
3,886,000 |
|
(339,412,841) |
|
3,677,154 |
|
(2,970,273) |
|
706,881 |
op
The accompanying notes are an integral part of these condensed interim consolidated financial statements. |
(4) |
Swvl Holdings Corp and its subsidiaries
Condensed interim consolidated statement of cash flows - For the period ended 30 June 2025
(All amounts are shown in USD unless otherwise stated)
|
|
For the six-month period ended |
||
|
|
30 June |
||
|
|
(Unaudited) |
|
(Unaudited) |
|
|
2025 |
|
2024 |
Profit/(loss) before tax from continued operations |
|
432,200 |
|
(5,692,847) |
Profit before tax from discontinued operations |
|
— |
|
— |
Profit/(loss) for the period before tax |
|
432,200 |
|
(5,692,847) |
|
|
|
|
|
Adjustments to reconcile profit/(loss) before tax to net cash flows: |
|
|
|
|
Depreciation of property and equipment |
|
— |
|
130,529 |
Depreciation of right-of-use assets |
|
58,297 |
|
92,603 |
Amortization of intangible assets |
|
15,594 |
|
19,916 |
Other non – cash loss/(income) |
|
(90,910) |
|
2,478,195 |
Change in fair value of financial liabilities |
|
836,384 |
|
1,647,913 |
Provision for employees’ end of service benefits |
|
12,391 |
|
— |
|
|
1,263,956 |
|
(1,323,691) |
Changes in working capital: |
|
|
|
|
Trade and other receivables |
|
(1,864,435) |
|
1,180,067 |
Prepaid expenses and other current assets |
|
(12,330) |
|
625,002 |
Due to related party |
|
— |
|
(131,523) |
Accounts payable, accruals and other payables |
|
129,153 |
|
(699,808) |
Current tax liabilities |
|
233,546 |
|
(162,934) |
Net cash flows used in operating activities |
|
(250,110) |
|
(512,887) |
|
|
|
|
|
Cash flows from investing activities |
|
|
|
|
Sublease rentals received |
|
— |
|
366,785 |
Purchase of property and equpiment |
|
(2,950) |
|
— |
Net cash flows (used in)/generated from investing activities |
|
(2,950) |
|
366,785 |
|
|
|
|
|
Cash flows from financing activities |
|
|
|
|
Proceeds from issuance of share capital |
|
— |
|
— |
Proceeds from issuance of other instruments |
|
2,000,000 |
|
— |
Repayment of loan from related party |
|
— |
|
— |
Repayment of external loan |
|
— |
|
— |
Finance lease liabilities paid, net of accretion |
|
(236,844) |
|
(339,540) |
Net cash flows generated from/(used in) financing activities |
|
1,763,156 |
|
(339,540) |
|
|
|
|
|
Net increase/(decrease) in cash and cash equivalents |
|
1,510,096 |
|
(485,642) |
Cash and cash equivalents at the beginning of the period |
|
4,958,983 |
|
2,924,016 |
Effects of exchange rate changes on cash and cash equivalents |
|
(1,592,096) |
|
(1,254,584) |
Cash and cash equivalents at the end of the period |
|
4,876,983 |
|
1,183,790 |
op
The accompanying notes are an integral part of these condensed interim consolidated financial statements. |
(5) |
1 |
Establishment and operations |
Swvl Holdings Corp (the “Parent Company”) (formerly known as “Pivotal Holdings Corp”) is a business company limited by shares incorporated under the laws of the British Virgin Islands and was registered on 23 July 2021. The registered office of the Company is at P.O. Box 173, Kingston Chambers, Road Town, Tortola, the British Virgin Islands.
The condensed interim consolidated financial statements as at and for the six-month period ended 30 June 2025 consist of the Parent Company and its subsidiaries (together referred to as the “Group”). The Group’s principal head office is located in The Offices 4, One Central, Dubai World Trade Centre, Street 1, Dubai, United Arab Emirates.
Swvl Inc. was founded on 17 May 2017. Swvl Holdings Corp was incorporated as a direct wholly-owned subsidiary of Swvl Inc. As a result of various legal entity reorganization transactions undertaken in March 2022, Swvl Holdings Corp became the holding company of the Group, and the then-stockholders of Swvl Inc. became the stockholders of Swvl Holdings Corp. Swvl Inc. is the predecessor of Swvl Holdings Corp for financial reporting purposes.
The Group operates multimodal transportation networks that offer access to transportation options through the Group’s platform and mobile-based application. The Group also licenses its technology to transport operators to manage their service. The Group operates a technology platform that uses a widespread transportation network. The Group uses leading technology, operational excellence and product expertise to operate transportation services on predetermined routes. The Group develops and operates proprietary technology applications supporting a variety of offerings on its platform (“platform(s)” or “Platform(s)”). The Group provides transportation services through contracting with other service providers (or transportation operators). Riders are collectively referred to as “end-user(s)” or “consumer(s)”. The drivers are referred to as “captain(s)”.
1.1 |
Consolidated subsidiaries |
Subsidiaries are all entities over which the Group has control. The Group controls an entity when the Group is exposed, or has right to, variable returns from its involvement with the entity and has the ability to affect those returns through its power over the entity. Subsidiaries are consolidated from the date on which control is transferred to the Group. They are deconsolidated from the date that control ceases.
As of 30 June 2025, the Group still maintained control for all subsidiaries, however, certain subsidiaries were decided to be held for sale or to be discontinued, subsidiaries listed below will be presented with the same alignment.
| i) | Continued operations |
|
|
Country of |
|
Legal ownership % |
|
Principal |
||
Company name |
|
incorporation |
|
30-Jun-25 |
|
31-Dec-24 |
|
business activities |
Swvl Inc. |
|
British Virgin Islands |
|
100 |
% |
100 |
% |
Holding company |
Swvl Group Corp |
|
British Virgin Islands |
|
100 |
% |
100 |
% |
Holding company |
Swvl Holdco Corp |
|
British Virgin Islands |
|
100 |
% |
100 |
% |
Dormant entity |
Pivotal Merger Sub Company I |
|
Cayman Islands |
|
100 |
% |
100 |
% |
Merger entity |
Swvl for Smart Transport Applications and Services LLC |
|
Egypt |
|
99.80 |
% |
99.80 |
% |
Technology platform |
Swvl Saudi for Information Technology |
|
Kingdom of Saudi Arabia |
|
100 |
% |
100 |
% |
Technology platform |
Swvl Saudi Regional Headquarters |
|
Kingdom of Saudi Arabia |
|
100 |
% |
100 |
% |
Technology platform |
Smart Mobility Solutions for Transportation Services (i) |
|
Kingdom of Saudi Arabia |
|
— |
% |
— |
% |
Technology platform |
Swvl for Mobility Solutions FZE (i) |
|
United Arab Emirates |
|
— |
% |
— |
% |
Technology platform |
(6)
1.1 |
Consolidated subsidiaries (continued) |
| ii) | Discontinued operations |
|
|
Country of |
|
Legal ownership % |
|
Principal |
||
Company name |
|
incorporation |
|
30-June-25 |
|
31-Dec-24 |
|
business activities |
Swvl NBO Limited |
|
Kenya |
|
100 |
% |
100 |
% |
Technology platform |
Swvl Technologies Ltd. |
|
Kenya |
|
100 |
% |
100 |
% |
Technology platform |
Smart Way Transportation LLC (ii) |
|
Jordan |
|
— |
% |
— |
% |
Technology platform |
Swvl My For Information Technology SDN BHD |
|
Malaysia |
|
100 |
% |
100 |
% |
Technology platform |
Viapool Inc. |
|
Delaware, USA |
|
51 |
% |
51 |
% |
Technology platform |
Movilidad Digital SAS, a subsidiary of Viapool, Inc. |
|
Argentina |
|
51 |
% |
51 |
% |
Holding company |
Viapool SRL, a subsidiary of Viapool, Inc. |
|
Argentina |
|
51 |
% |
51 |
% |
Technology platform |
Viapool SPA, a subsidiary of Viapool, Inc. |
|
Chile |
|
51 |
% |
51 |
% |
Technology platform |
Swvl Brasil Tecnologia LTDA, a subsidiary of Viapool, Inc. |
|
Brazil |
|
51 |
% |
51 |
% |
Technology platform |
Door2Door GmbH, a subsidiary of Swvl Germany GmbH |
|
Germany |
|
100 |
% |
100 |
% |
Technology platform |
Swvl Germany GmbH (formerly "Blitz B22-203 GmbH") |
|
Germany |
|
100 |
% |
100 |
% |
Holding company |
Swvl Global FZE |
|
United Arab Emirates |
|
— |
% |
— |
% |
Headquarters |
The Group, in certain cases, is required to have a resident as one of the shareholders besides the Parent Company to comply with local laws and regulations. However, in such cases, the Group continues to remain the economic beneficiary of the shareholding held by such resident shareholder and therefore is said to have a “beneficial ownership” of such non-controlling interests. Legal ownership and beneficial ownership are the same except as indicated below.
| (i) | The Parent Company’s subsidiary’s Swvl for Mobility Solutions FZE and Smart Mobility Solutions for Transportation Services were incorporated during the year ended 31 December 2024. The subsidiaries are currently legally owned by a member of the Group’s management and are in the process of a legal ownership transfer to the Group. The subsidiaries have been consolidated based on the beneficial ownership and effective control. |
| (ii) | The Parent Company’s subsidiary Smart Way Transportation LLC was incorporated during the year ended 31 December 2021. The subsidiary is currently legally owned by a member of the Group’s management. During 2022, the Group’s board of directors resolved to discontinue the subsidiary’s operations. As of 30 June 2025, the company is still in liquidation process. The subsidiary has been consolidated based on the beneficial ownership and effective control. |
2 |
Basis of preparation |
i) |
Compliance with International Financial Reporting Standards (“IFRS”) |
These condensed interim consolidated financial statements are for the six-month periods ended 30 June 2025 and 2024 and are presented in United States Dollars (“USD” or “$”), which is the functional currency of the Parent Company. They have been prepared in accordance with IAS 34 ‘Interim Financial Reporting’.
These condensed interim consolidated financial statements do not include all of the information required in annual consolidated financial statements in accordance with IFRS and should be read in conjunction with the consolidated financial statements for the year ended 31 December 2024. However, selected explanatory notes are included to explain events and transactions that are significant to an understanding of the changes in the Group’s financial position and performance since the last annual financial statements.
(7)
ii) |
Historical cost convention |
These condensed interim consolidated financial statements have been prepared under the historical cost convention except for the following:
- |
Certain financial assets, derivative warrant liabilities, derivative liabilities, convertible notes, and earnouts liabilities that are measured at fair value. |
- |
Income and expenses that have been accounted for using the accrual basis. |
2Basis of preparation (continued)
ii)Historical cost convention (continued)
The consolidated financial statements have been presented in US Dollars (“USD”, “$”) which is the reporting currency of the Group.
2.1 |
Going concern |
These condensed interim consolidated financial statements have been prepared on a going concern basis, which assumes that the Group will be able to discharge its liabilities in the ordinary course of business. The Group incurred a profit of $432,200 for the six-month period ended 30 June 2025 (loss of $5,692,847 for the six-month period ended 30 June 2024), had accumulated losses of $339.4 million as at 30 June 2025 ($ 339.8 million as at 31 December 2024), and had negative operating cash flows of $0.25 million for the six-month period ended 30 June 2025 (negative operating cash flows of $ 0.5 million for the six-month period ended 30 June 2024). Notwithstanding these results, Management believes there are no events or conditions that give rise to doubt the ability of the Group to continue as a going concern for a period of twelve months after the preparation of the consolidated financial statements.
2.2 |
Amended standards adopted by the Group |
A number of amended standards became applicable for the current reporting period. The Group did not have to change its accounting policies or make retrospective adjustments as a result of adopting these amended standards.
2.3Accounting policies
The accounting policies used for the condensed interim consolidated financial statements for the six-month period ended 30 June 2025 are consistent with those used in the annual consolidated financial statements for the year ended 31 December 2024.
3Critical accounting judgments and estimates
When preparing the condensed interim consolidated financial statements, management undertakes a number of judgements, estimates and assumptions about recognition and measurement of assets, liabilities, income and expenses. The actual results may differ from the judgements, estimates and assumptions made by management, and will seldom equal the estimated results. The judgements, estimates and assumptions applied in the condensed interim consolidated financial statements for the six-month period ended 30 June 2025 and 2024, including the key sources of estimation uncertainty, were the same as those applied in the Group’s annual consolidated financial statements for the year ended 31 December 2024.
(8)
4Property and equipment
The property and equipment net book value consists of the following:
|
|
(Unaudited) |
|
(Audited) |
|
|
At 30 June |
|
At 31 December |
|
|
2025 |
|
2024 |
|
|
USD |
|
USD |
Leasehold improvements |
|
421,210 |
|
420,601 |
Furniture, fittings and equipment |
|
39,542 |
|
37,201 |
Property and equipment, net |
|
460,752 |
|
457,802 |
5Intangible assets
|
|
(Unaudited) |
|
(Audited) |
|
|
At 30 June |
|
At 31 December |
|
|
2025 |
|
2024 |
|
|
Net book value |
|
Net book value |
|
|
USD |
|
USD |
Licenses |
|
92,900 |
|
106,262 |
|
|
92,900 |
|
106,262 |
In May 2023 the Group obtained a smart transportation operating license in Egypt in collaboration with Land Transport Regulatory Authority (LTRA) which granted the Egyptian entity a five-year operating license commencing on May 16, 2023 and expires on May 15, 2028.
6Prepaid expenses and other current assets
|
|
(Unaudited) |
|
(Audited) |
|
|
At 30 June |
|
At 31 December |
|
|
2025 |
|
2024 |
|
|
USD |
|
USD |
Withholding tax receivables |
|
1,166,732 |
|
983,770 |
Other assets |
|
140,458 |
|
134,826 |
Refundable deposits |
|
— |
|
160,902 |
Prepaid expenses |
|
15,947 |
|
31,309 |
|
|
1,323,137 |
|
1,310,807 |
(9)
7Trade and other receivables
|
|
(Unaudited) |
|
(Audited) |
|
|
At 30 June |
|
At 31 December |
|
|
2025 |
|
2024 |
|
|
USD |
|
USD |
Trade receivables |
|
3,646,592 |
|
2,614,945 |
Accrued income |
|
1,577,598 |
|
1,318,327 |
Customer wallet receivables |
|
1,679,273 |
|
1,585,645 |
Less: provision for expected credit losses |
|
(1,029,746) |
|
(1,514,586) |
|
|
5,873,717 |
|
4,004,331 |
|
|
|
|
|
Other receivables |
|
— |
|
4,951 |
|
|
5,873,717 |
|
4,009,282 |
8Cash and bank balances
|
|
(Unaudited) |
|
(Audited) |
|
|
At 30 June |
|
At 31 December |
|
|
2025 |
|
2024 |
|
|
USD |
|
USD |
Cash at banks |
|
4,876,982 |
|
4,958,983 |
Cash in hand |
|
— |
|
— |
|
|
4,876,982 |
|
4,958,983 |
For the purpose of the cash flow statement, cash and cash equivalents comprise the following:
|
|
(Unaudited) |
|
(Audited) |
|
|
At 30 June |
|
At 31 December |
|
|
2025 |
|
2024 |
|
|
USD |
|
USD |
Cash attributable to continued operations |
|
4,876,982 |
|
4,958,983 |
Cash attributable to discontinued operations |
|
1,522 |
|
1,522 |
|
|
4,878,504 |
|
4,960,505 |
9Share capital
a. Share capital:
In 2023, the Group restructured its authorized shares and issued ordinary shares as detailed below:
| (a) | The number of ordinary shares which the Group is authorized to issue has been decreased to 20,000,000 ordinary shares by the consolidation of every 25 ordinary shares of US$0.0001 par value each currently in issue into 1 ordinary share of US$0.0025 par value each; and |
| (b) | the issued ordinary shares have been combined into a small number of shares, resulting in every 25 issued ordinary share being combined into 1 ordinary share with a par value of US$0.0025 each. |
Following the restructuring, the Group is authorized to issue 20,000,000 ordinary shares and 55,000,000 preference shares. The restructuring was approved on 4 January 2023 and became effective on 25 January 2023.
(10)
9Share capital (Continued)
a. Share capital: (Continued)
The below table sets out the Group’s share structure during the period ended 30 June 2025 and the year ended 31 December 2024:
|
|
At 30 June 2025 |
|
At 31 December 2024 |
||||
|
|
Authorized |
|
Issued |
|
Authorized |
|
Issued |
Class A ordinary shares |
|
20,000,000 |
|
9,964,344 |
|
20,000,000 |
|
9,898,516 |
Preferred shares |
|
55,000,000 |
|
— |
|
55,000,000 |
|
— |
|
|
75,000,000 |
|
9,964,344 |
|
75,000,000 |
|
9,898,516 |
|
|
At 30 June 2025 |
|
At 31 December 2024 |
||||
|
|
Number |
|
Share |
|
Number |
|
Share |
|
|
of shares |
|
capital |
|
of shares |
|
capital |
Issuance of shares in the normal course of business |
|
5,191,300 |
|
12,978 |
|
5,125,472 |
|
12,812 |
Issuance of shares to Swvl Inc. shareholders |
|
3,411,410 |
|
8,529 |
|
3,411,410 |
|
8,529 |
Issuance of shares to SPAC shareholders |
|
557,960 |
|
1,395 |
|
557,960 |
|
1,395 |
Conversion of convertible notes |
|
645,018 |
|
1,613 |
|
645,018 |
|
1,613 |
Issuance of shares to PIPE investors |
|
158,656 |
|
397 |
|
158,656 |
|
397 |
Other shares |
|
— |
|
— |
|
— |
|
0 |
|
|
9,964,344 |
|
24,912 |
|
9,898,516 |
|
24,746 |
b. Share premium:
|
|
At 30 June 2025 |
|
|
Share Premium |
Issuance of shares to shareholders |
|
88,873,188 |
Conversion of convertible notes |
|
145,952,505 |
Issuance of share to PIPE investors |
|
39,663,603 |
Recapitalization costs |
|
121,077,329 |
Other shares issued during the period |
|
— |
|
|
395,566,625 |
Less: |
|
|
Costs attributable to the issuance of shares in connection with the business combination |
|
(8,467,766) |
Fair value of earnout shares |
|
(75,550,455) |
|
|
311,548,404 |
Issuance of shares in the normal course of business |
|
42,630,923 |
|
|
354,179,327 |
|
|
At 31 December 2024 |
|
|
Share Premium |
Issuance of shares to shareholders |
|
88,873,188 |
Conversion of convertible notes |
|
145,952,505 |
Issuance of share to PIPE investors |
|
39,663,603 |
Recapitalization costs |
|
121,077,329 |
|
|
395,566,625 |
Less: |
|
|
Costs attributable to the issuance of shares in connection with the business combination |
|
(8,467,766) |
Fair value of earnout shares |
|
(75,550,455) |
|
|
311,548,404 |
Issuance of shares in the normal course of business |
|
42,335,364 |
|
|
353,883,768 |
(11)
10Employee share scheme reserve
At 30 June 2025, the employee share scheme reserve balance was $631,629 (at 31 December 2024: $564,127).
Total expense arising from share-based payment transactions recognized in the consolidated statement of comprehensive income as part of employee benefit were $67,502 for the six-month period ended 30 June 2025 (reversal of $40,614 for the six-month period ended 30 June 2024).
11Accounts payable, accruals and other payables
|
|
(Unaudited) |
|
(Audited) |
|
|
At 30 June |
|
At 31 December |
|
|
2025 |
|
2024 |
|
|
USD |
|
USD |
Financial items |
|
|
|
|
Accounts payables |
|
6,872,144 |
|
5,709,577 |
Captain payables |
|
91,573 |
|
367,436 |
Salaries payable |
|
277,906 |
|
372,034 |
Accrued expenses |
|
2,123,118 |
|
2,592,446 |
Credit facility |
|
17,226 |
|
158,203 |
LTRA payable |
|
— |
|
78,125 |
Other payables |
|
154,468 |
|
98,745 |
|
|
9,536,435 |
|
9,376,566 |
LTRA payable non-current portion |
|
(30,850) |
|
(30,850) |
|
|
9,505,585 |
|
9,345,716 |
Non-financial items |
|
|
|
|
Advances from individual customers (e-wallets) (i) |
|
5,824 |
|
5,690 |
Total accounts payable, accruals and other payables |
|
9,511,409 |
|
9,351,406 |
| (i) | Advances from individual customers (e-wallets) are used by customers against future bookings. |
12Deferred purchase price
The movement in the deferred purchase price is as follows:
|
|
(Unaudited) |
|
(Audited) |
|
|
At 30 June |
|
At 31 December |
|
|
2025 |
|
2024 |
|
|
USD |
|
USD |
Opening balance |
|
1,148,013 |
|
1,207,682 |
Change in fair value |
|
(205,610) |
|
1,865,274 |
Issuance of shares |
|
(295,725) |
|
(1,924,943) |
Ending balance |
|
646,678 |
|
1,148,013 |
The deferred purchase price consists of outstanding cash payments and share issuances. The change in fair value is a result of revaluing the shares outstanding to reflect share price as per the purchase agreements. Management has not used any complex assumptions in arriving at the fair value of the deferred purchase price.
(12)
12Deferred purchase price (Continued)
The deferred purchase price is detailed as follows:
|
|
(Unaudited) |
|
(Audited) |
|
|
At 30 June |
|
At 31 December |
|
|
2025 |
|
2024 |
|
|
USD |
|
USD |
Shotl Transportation, S.L. |
|
627,158 |
|
627,158 |
Urbvan Mobility Ltd. |
|
— |
|
491,344 |
Door2Door |
|
19,520 |
|
29,511 |
|
|
646,678 |
|
1,148,013 |
|
|
(Unaudited) |
|
(Audited) |
|
|
At 30 June |
|
At 31 December |
Maturity analysis |
|
2025 |
|
2024 |
|
|
USD |
|
USD |
Less than one year (current) |
|
646,678 |
|
1,148,013 |
|
|
646,678 |
|
1,148,013 |
13Revenue
The Group derives its revenue principally from end-users who use the Group’s platform to access routes predetermined by the Group. Revenue for transport services represents the total amount of fees charged to the end user for these services.
Disaggregated revenue information
|
|
(Unaudited) For the six-month |
||
|
|
period ended 30 June |
||
|
|
2025 |
|
2024 |
|
|
USD |
|
USD |
Business to business |
|
8,676,762 |
|
6,001,062 |
Business to customers |
|
1,512,307 |
|
2,065,946 |
|
|
10,189,069 |
|
8,067,008 |
Revenue by geographical location
|
|
(Unaudited) For the six-month |
||
|
|
period ended 30 June |
||
|
|
2025 |
|
2024 |
|
|
USD |
|
USD |
|
|
|
|
|
Egypt |
|
6,752,936 |
|
6,636,048 |
Kingdom of Saudi Arabia |
|
2,576,607 |
|
1,430,960 |
United Arab Emirates |
|
859,526 |
|
— |
|
|
10,189,069 |
|
8,067,008 |
14Cost of sales
|
|
(Unaudited) For the six-month |
||
|
|
period ended 30 June |
||
|
|
2025 |
|
2024 |
|
|
USD |
|
USD |
Captain costs |
|
8,035,494 |
|
6,347,514 |
Captain bonuses |
|
10,113 |
|
22,045 |
Captain deductions |
|
(44,722) |
|
(48,930) |
Tolls and fines |
|
— |
|
2,119 |
|
|
8,000,885 |
|
6,322,748 |
(13)
15General and administrative expenses
|
|
(Unaudited) For the six-month |
||
|
|
period ended 30 June |
||
|
|
2025 |
|
2024 |
|
|
USD |
|
USD |
Staff costs |
|
1,520,733 |
|
3,547,601 |
Professional fees |
|
658,798 |
|
763,538 |
Technology costs |
|
223,539 |
|
285,654 |
Other expenses |
|
185,692 |
|
343,754 |
Depreciation of property and equipment |
|
— |
|
130,529 |
Rent expense |
|
100,855 |
|
110,270 |
Depreciation of right-of-use assets |
|
58,297 |
|
92,603 |
Insurance |
|
50,924 |
|
56,755 |
Office expenses |
|
42,394 |
|
54,160 |
Travel and accommodation |
|
20,504 |
|
26,278 |
Amortization of intangible assets |
|
15,594 |
|
19,916 |
Outsourced employees |
|
13,901 |
|
11,761 |
Entertainment |
|
7,046 |
|
8,921 |
|
|
2,898,277 |
|
5,451,740 |
16 |
Other expenses |
|
|
(Unaudited) For the six-month |
||
|
|
period ended 30 June |
||
|
|
2025 |
|
2024 |
Listing costs |
|
127,500 |
|
625,078 |
|
|
127,500 |
|
625,078 |
(14)
17 |
Other Income |
|
|
(Unaudited) For the six-month |
||
|
|
period ended 30 June |
||
|
|
2025 |
|
2024 |
|
|
USD |
|
USD |
Other income |
|
434,165 |
|
273,088 |
|
|
434,165 |
|
273,088 |
18Taxes
18.1Deferred tax asset
Deferred income taxes reflect the net tax effects of temporary differences between the carrying amounts of assets and liabilities for financial reporting purposes and the amounts used for income tax purposes at the enacted rates. The significant components of the Group’s deferred tax assets as of the six-month period ended 30 June 2025 indicated below were as follows:
|
|
(Unaudited) For |
|
|
|
|
the six-month |
|
(Audited) For the |
|
|
period ended 30 |
|
year ended 31 |
|
|
30 June |
|
31 December |
|
|
USD |
|
USD |
Deferred tax asset movement |
|
|
|
|
|
|
|
|
|
Opening balance |
|
5,288,913 |
|
9,468,808 |
Foreign currency adjustments |
|
124,705 |
|
(3,616,186) |
Expiration |
|
— |
|
(563,709) |
Transfers to assets held for sale |
|
— |
|
— |
Income tax benefit |
|
— |
|
— |
Closing balance |
|
5,413,618 |
|
5,288,913 |
(15)
19Earnings/(loss) per share
Basic earnings/(loss) per share is computed by dividing the net profit/(loss) attributable to ordinary shareholders by the weighted average number of ordinary shares outstanding during the period.
15 million Earnout Shares have been excluded from the calculation of weighted average shares outstanding, as they are contingently issuable subject to achieving certain milestones on the trading price and volume of our Class A ordinary shares on NASDAQ.
During the six-month period ended 30 June 2024, the Group was loss making, therefore, all potentially dilutive instruments have an anti-dilutive impact and have been excluded in the calculation of diluted weighted average number of ordinary shares outstanding. These instruments include certain outstanding equity awards, warrants, share options and convertible loans and could potentially dilute earnings per share in the future.
The following table sets forth the computation of basic and dilutive earnings/(loss) from the continued operations per share attributable to the Group’s ordinary shareholders:
|
|
(Unaudited) |
|
(Unaudited) |
|
|
For the six- |
|
For the six- |
|
|
month period |
|
month period |
|
|
ended 30 |
|
ended 30 |
|
|
June 2025 |
|
June 2024 |
Profit/(loss) from continuing operations for the period attributable to equity holders of the Parent Company |
|
432,200 |
|
(5,692,847) |
Profit from discontinued operations for the period attributable to equity holders of the Parent Company |
|
— |
|
— |
|
|
|
|
|
Weighted average number of ordinary shares outstanding during the period |
|
9,964,344 |
|
8,528,466 |
|
|
|
|
|
Profit/(loss) per share attributable to equity holders of the Parent Company from continuing operations – basic earnings/(loss) per share |
|
0.04 |
|
(0.67) |
Profit/(loss) per share attributable to equity holders of the Parent Company – basic earnings/(loss) per share |
|
0.04 |
|
(0.67) |
|
|
|
|
|
|
|
|
|
|
Weighted average number of ordinary shares outstanding during the period adjusted for the effect of dilution |
|
10,218,200 |
|
8,528,466 |
|
|
|
|
|
Profit/(loss) per share attributable to equity holders of the Parent Company from continuing operations – diluted earnings/(loss) per share |
|
0.04 |
|
(0.67) |
Profit/(loss) per share attributable to equity holders of the Parent Company – diluted earnings/(loss) per share |
|
0.04 |
|
(0.67) |
20Related party transactions and balances
Parties are considered to be related if one party has the ability to control the other party or exercise significant influence over the other party in making financial and operating decisions. Related parties include associates, parent, subsidiaries, and key management personnel or their close family members. The terms and conditions of these transactions have been mutually agreed between the Group and the related parties. To determine significance, the Group considers various qualitative and quantitative factors including whether transactions with related parties are conducted in the ordinary course of business.
Interest in subsidiaries
The details of interests in the subsidiaries with whom the Group had entered into transactions or had agreements or arrangements in place during the period are disclosed in Note 1 of the condensed interim consolidated financial statements.
(16)
20Related party transactions and balances (continued)
Compensation of key management personnel
Key management personnel of the Group comprise the Parent Company’s directors and senior management of the Group.
|
|
(Unaudited) For the six-month |
||
|
|
period ended 30 June |
||
|
|
2025 |
|
2024 |
|
|
USD |
|
USD |
Compensation and short-term employee benefits |
|
231,108 |
|
2,196,693 |
|
|
231,108 |
|
2,196,693 |
On December 26, 2023, the Board of Directors of Swvl approved a grant of 2,196,693 Restricted Stock Units (“RSUs”) to Swvl’s senior management vesting on March 31, 2024, pursuant to their respective employment agreements, and issued in consideration for services provided to the Group.
Balances with related parties
The following balances are outstanding at the end of the reporting periods:
|
|
(Unaudited) |
|
(Audited) |
|
|
At 30 June |
|
At 31 December |
|
|
2025 |
|
2024 |
|
|
USD |
|
USD |
Balances with related parties |
|
— |
|
— |
|
|
— |
|
— |
Transactions with related parties
Details of transactions with related parties during the period, other than those which have been disclosed elsewhere in these condensed interim consolidated financial statements, are as follows:
|
|
(Unaudited) For the six-month |
||
|
|
period ended 30 June |
||
|
|
2025 |
|
2024 |
|
|
USD |
|
USD |
Transactions with related parties |
|
— |
|
— |
(17)
21Financial instruments by category
Financial assets as per statement of financial position
|
|
(Unaudited) |
|
(Audited) |
|
|
At 30 June |
|
At 31 December |
|
|
2025 |
|
2024 |
|
|
USD |
|
USD |
At amortised cost |
|
|
|
|
Trade and other receivables |
|
5,224,190 |
|
4,009,282 |
Cash and cash equivalents |
|
4,876,982 |
|
4,958,983 |
|
|
10,101,172 |
|
8,968,265 |
Financial liabilities as per statement of financial position
|
|
(Unaudited) |
|
(Audited) |
|
|
At 30 June |
|
At 31 December |
|
|
2025 |
|
2024 |
|
|
USD |
|
USD |
Accounts payable, accruals and other payables excluding non-financial items |
|
9,536,435 |
|
9,376,566 |
Deferred purchase price |
|
646,678 |
|
1,148,013 |
Lease liabilities |
|
809,220 |
|
1,047,064 |
Current tax liabilities |
|
1,069,663 |
|
836,117 |
Derivative warrant liabilities |
|
1,505,540 |
|
669,156 |
Due to related parties |
|
— |
|
— |
|
|
13,567,536 |
|
13,076,916 |
(18)
22Fair value of financial instruments
Fair value is the price that would be received to sell an asset or paid to transfer a liability in an orderly transaction between market participants at the measurement date. The fair value measurement is based on the presumption that the transaction to sell the asset or transfer the liability takes place either:
| ● | in the principal market for the asset or liability; or |
| ● | in the absence of a principal market, in the most advantageous market for the asset or liability. |
The principal or the most advantageous market must be accessible to the Group. The fair value of an asset or liability is measured using the assumptions that market participants would use when pricing the asset or liability, assuming that market participants act in their economic best interest.
A fair value measurement of a non-financial asset takes into account a market participant’s ability to generate economic benefits by using the asset in its highest and best use or by selling it to another market participant that would use the asset in its highest and best use.
The Group uses valuation techniques that are appropriate in the circumstances and for which sufficient data are available to measure fair value, maximising the use of relevant observable inputs and minimising the use of unobservable inputs.
In addition, for financial reporting purposes, fair value measurements are categorised into Level 1, 2 or 3 based on the degree to which the inputs to the fair value measurement are observable and the significance of the inputs to the fair value measurement in its entirety, which are described as follows:
Level 1: quoted market price (unadjusted) in an active market for identical assets or liabilities that the entity can access at the measurement date.
Level 2: inputs other than quoted prices included within Level 1 that are observable for the asset or liability; either directly or indirectly.
Level 3: inputs that are unobservable inputs for the asset or liability.
The carrying amounts of the financial assets and financial liabilities approximate their fair values.
(19)
Exhibit 99.2
MANAGEMENT’S DISCUSSION AND ANALYSIS OF
FINANCIAL CONDITION AND RESULTS OF OPERATIONS
The following discussion and analysis of our financial condition and results of operations provides information that we believe to be relevant to an assessment and understanding of our results of operations and financial condition for the periods described. You should read the following discussion and analysis of our financial condition and results of operations together in conjunction with our interim consolidated financial statements and the notes to such financial statements, which are included in this Report of Foreign Private Issuer on Form 6-K (this “Report”). In addition, the information in this Report should also be read in conjunction with the information contained in our Annual Report on Form 20-F for the year ended December 31, 2024 (the “Annual Report”), including the consolidated annual financial statements as of December 31, 2024, and their accompanying notes include therein, filed with the Securities and Exchange Commission (the “SEC”) on April 2, 2025.
We report financial information under International Financial Reporting Standards (“IFRS”), as issued by the International Accounting Standards Board (“IASB”) and related interpretations issued by the IFRS Interpretations Committee. None of the financial statements were prepared in accordance with generally accepted accounting principles in the United States.
Unless otherwise indicated, all references to the terms, “Swvl”, “we”, “us”, “our”, or the “Group” or “Company” refer to the business of Swvl Holdings Corp and its subsidiaries, “H1 2025” refers to the six-month period ending June 30, 2025, “H1 2024” refers to the six-month period ending 30 June 2024, “FY 2024” refers to the fiscal year of Swvl ended December 31, 2024, “FY 2023” refers to the fiscal year of Swvl ended December 31, 2023.
References to “U.S. dollars,” “USD” and “$” are to currency of the United States of America, and references to “EGP” are to the Egyptian Pound.
Forward-Looking Statements
The following discussion contains “forward-looking statements” within the meaning of the Private Securities Litigation Reform Act of 1995 and other securities laws. Forward-looking statements are often characterized by the use of forward-looking terminology such as “may,” “will,” “expect,” “anticipate,” “estimate,” “continue,” “believe,” “should,” “intend,” “project” or other similar words, but are not the only way these statements are identified. These forward-looking statements may include, but are not limited to, statements relating to our objectives, plans and strategy for our business, statements that contain projections of results of operation or of financial condition, risks and uncertainties expected capital needs and expenses, statements relating to the research, development, completion and use of our products, and all statements (other than statements of historical facts) that address activities, events or developments that we intend, expect, project, believe or anticipate will or may occur in the future. Forward-looking statements are not guarantees of future performance and are subject to risks and uncertainties. We have based these forward-looking statements on assumptions and assessments made by our management in light of their experience and their perception of historical trends, current conditions, expected future developments and other factors they believe to be appropriate and are subject to a number of factors and uncertainties that could cause actual results to differ materially from those described in the forward-looking statements.
Please see the sections titled “Risk Factors” and “Cautionary Note Regarding Forward-Looking Statements” for a discussion of the risks, uncertainties and assumptions associated with these statements and for a discussion of important factors that could cause actual results to differ materially from the results described in or implied by the forward-looking statements contained in the following discussion and analysis. Our historical results are not necessarily indicative of the results that may be expected for any period in the future.
These statements are only current predictions and are subject to known and unknown risks, uncertainties, and other factors that may cause our or our industry’s actual results, levels of activity, performance or achievements to be materially different from those anticipated by the forward-looking statements. We discuss many of these risks in our Annual Report. You should not rely upon forward-looking statements as predictions of future events.
Although we believe that the expectations reflected in the forward-looking statements are reasonable, we cannot guarantee future results, performance, or achievements. Except as required by law, we are under no duty to update or revise any of the forward-looking statements, whether as a result of new information, future events or otherwise, after the date of this Report.
Overview
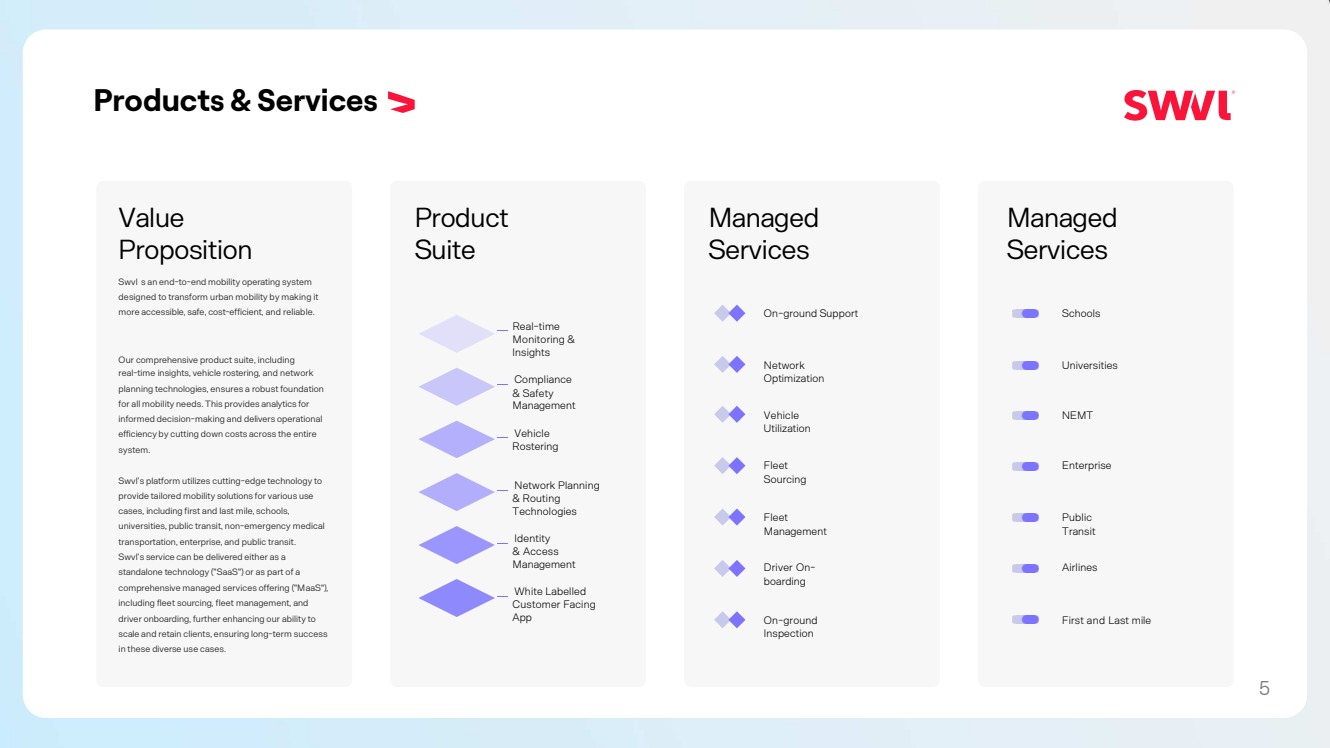
We are a technology-driven disruptive mobility company that aims to provide reliable, safe, cost-effective and environmentally responsible mass transit solutions. Our mission is to identify and solve inefficiencies associated with low-quality or sometimes non-existent public transportation infrastructure in urban areas that are in critical need of such services. Our technology and services provide commuters, travelers and businesses with a valuable alternative to traditional public transportation, taxi companies or other ridesharing companies. Through our Swvl platform, we provide thousands of riders per day with dynamic routing and a self-optimizing network of minibuses and other vehicles, helping people get where they need to go.
Components of Results of Operations
Revenue
Our revenue consists of two components: (i) a business-to-customer (“B2C”) component, representing the gross amount of fares charged to end-users of our platform, not including reductions of end-user discounts and promotions, sales refunds, uncollected cash and Sales waivers (as defined below); and (ii) a business-to-business (“B2B”) component representing contractual smart transportation services for our corporate customer’s employees through the Swvl application, which is referred to as ‘Transport as a service’ (“TaaS”) and ‘Software as a service’ (“SaaS”), which enables corporate customers to manage their own fleets more efficiently. For further details on our revenue recognition, please see the Revenue details in the subsection “Critical Accounting Estimates”.
Cost of Sales
Our cost of sales consists of costs directly related to delivering transportation services, which include payments to captains for operating our routes (net of any deductions, including any amount charged to captains on account of breach of terms of service), bonuses payable to captains, tolls and fines paid by Swvl. Our cost of sales does not include any depreciation or amortization expenses. Our depreciation and amortization expenses are almost exclusively attributable to non-revenue generating activities, including depreciation of our facilities and equipment which support our back-office operations and depreciation of right-of-use assets associated with corporate leases.
General and Administrative Expenses
Our general and administrative expenses primarily consist of personnel-related compensation costs including employee share scheme charges, professional services fees, technology costs, office costs, travel costs, depreciation, insurance, rent, bank fees, foreign exchange losses/gains, utilities, communication and other corporate costs. Our general and administrative expenses are expensed as incurred.
Sales and Marketing Costs
Our sales and marketing expenses primarily consist of growth marketing expenses, offline marketing expenses, personnel compensation expenses and the costs of credits offered to riders for referring new riders. Our sales and marketing costs are expensed as incurred.
Other Income/(expenses)
Our other income consists primarily of recovery of previously written off asset that were not expected to be recovered and rental incomea. Other expenses consist primarily of indirect tax expenses and other expenses not categorized elsewhere.
Finance Income and Finance Costs
Our finance income consists primarily of dividend interest income from bank deposits. Our finance costs consist primarily of lease finance charges and interest expense on financial liabilities.
Changes in Fair Value of Financial Liabilities
Changes in fair value of financial liabilities consist of the change in the fair value of the Group’s earnouts liabilities, certain warrant liabilities and change in fair value of deferred purchase price resulting from the acquisition of certain subsidiaries by the Group.
Income Tax Benefit
Income tax benefit primarily relates to the deferred tax asset created on tax losses incurred by the Company, which can be set off against future taxable income. We have deferred tax asset balances in Egypt as carried forward losses from the early years of operation, planned to be utilized against future taxable income.
Impact of Foreign Currency Translation
As we have operations in countries with different currencies, foreign currencies have an impact on our results of operations. The main impact of foreign currency fluctuations on us is from the change.
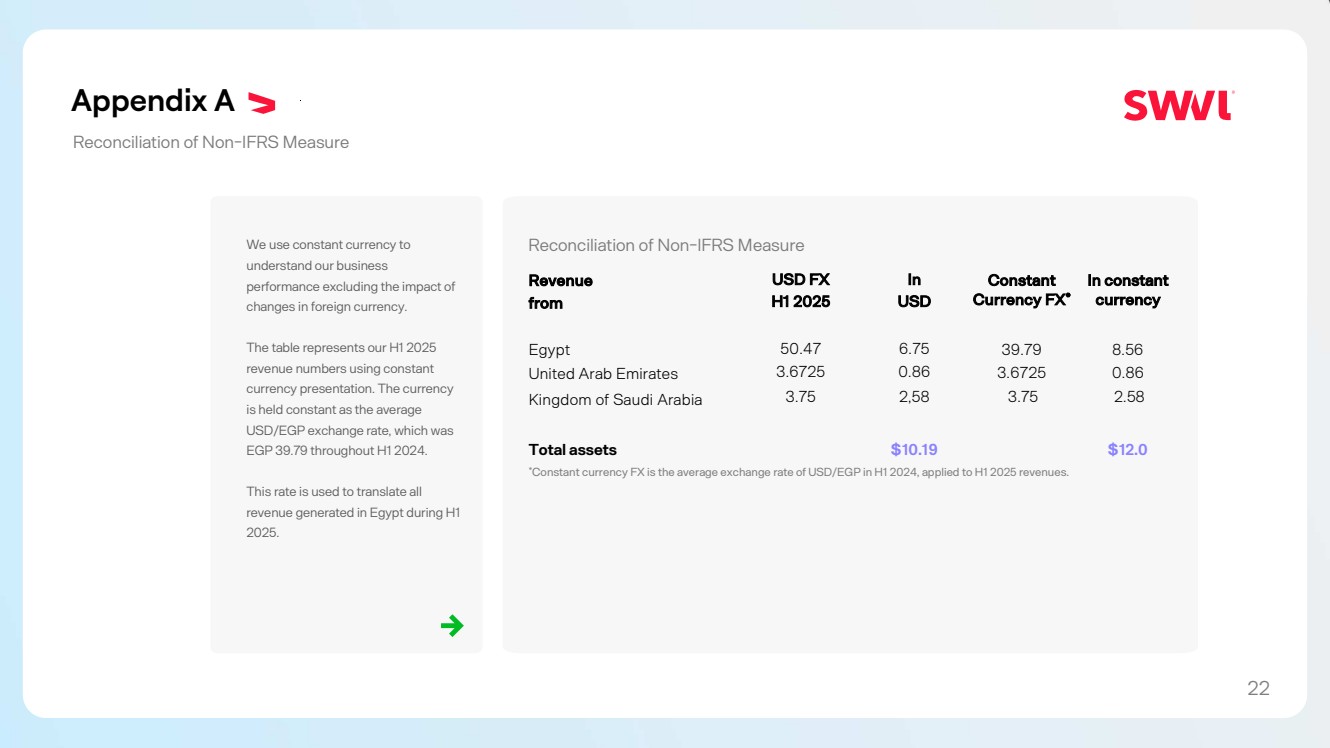
In our results of operations discussion below, we have provided certain comparisons both on an as reported and on a constant currency basis. The constant currency presentation, which is a non-IFRS measure, excludes the impact of fluctuations in foreign currency exchange rates. We believe that providing constant currency information provides valuable supplemental information regarding our results of operations and also provides a framework for assessing how our underlying business performed, excluding the effects of foreign currency rate fluctuations. We calculate constant currency percentages by converting our current period local currency financial results using the prior period exchange rates from the corresponding prior period, and compare these adjusted amounts to its prior period reported results. Amounts may not foot due to rounding.
A. Operating Results
Results of Operations
The following selected consolidated financial data is derived from the unaudited financial statements of the Company for H1 2025 and H1 2024, and should be read in conjunction with the information contained in our Annual Report for the year ended December 31, 2024, including the consolidated annual financial statements as of December 31, 2024, and their accompanying notes include therein, filed with SEC on April 2, 2025.
Our historical results are not necessarily indicative of the results of future operations. For a comparison of FY 2023 to the year ended December 31, 2022, see our Annual Report on Form 20-F for the fiscal year ending December 31, 2023 and the amendment thereto, filed with the SEC on April 30, 2024.
|
|
For the period ended 30 June |
||
($million) |
|
2025 |
|
2024 |
Continued operations |
|
|
|
|
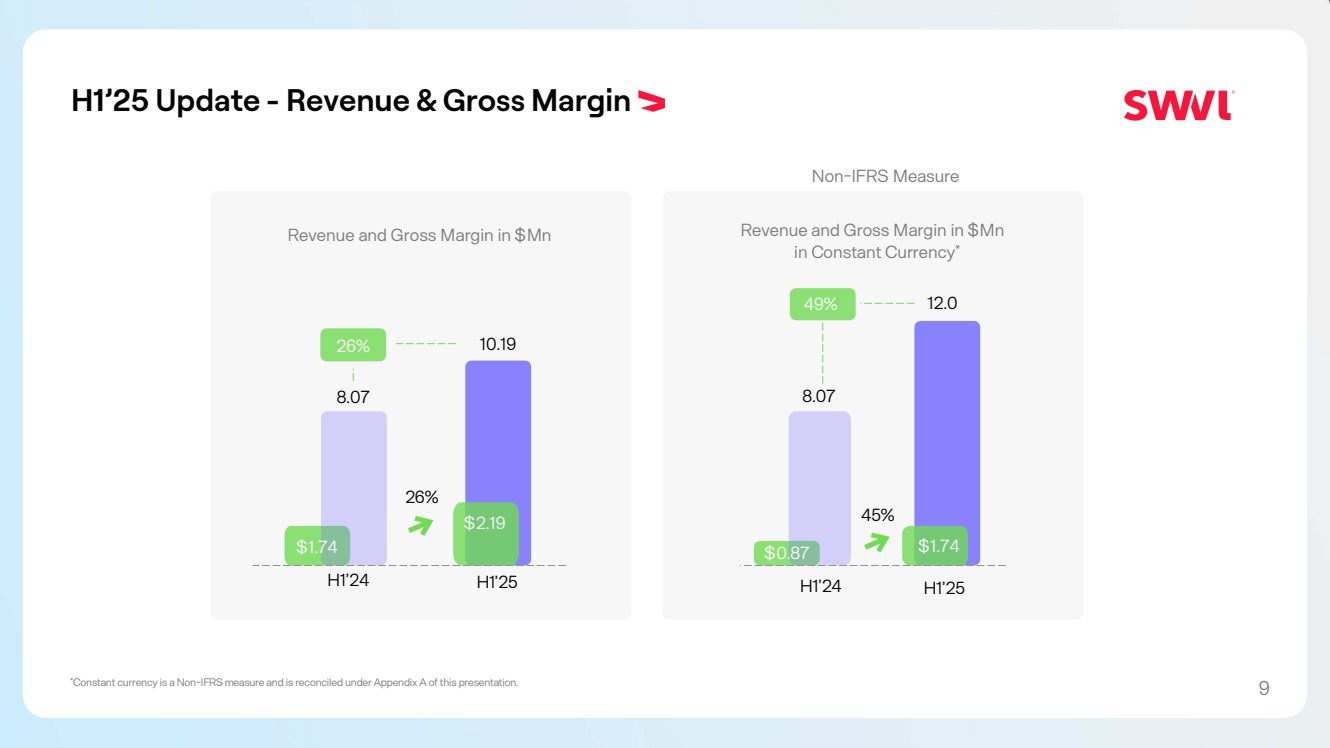
Revenue |
|
10.19 |
|
8.07 |
Cost of sales |
|
(8.00) |
|
(6.32) |
Gross profit |
|
2.19 |
|
1.74 |
General and administrative expenses |
|
(2.90) |
|
(5.45) |
Selling and marketing expenses |
|
(0.01) |
|
(0.01) |
Other expenses |
|
(0.13) |
|
(0.54) |
Other income |
|
0.43 |
|
0.27 |
Operating loss |
|
(0.42) |
|
(4.07) |
Change in fair value of financial liabilities |
|
0.84 |
|
(1.65) |
Finance income |
|
0.11 |
|
0.08 |
Finance cost |
|
(0.09) |
|
(0.05) |
Profit/(loss) for the period before tax from continuing operations |
|
0.43 |
|
(5.69) |
Income tax benefit |
|
— |
|
— |
Profit/(loss) for the period from continuing operations |
|
0.43 |
|
(5.69) |
|
|
|
|
|
Other comprehensive income |
|
|
|
|
Exchange difference on translations of foreign operations |
|
(1.40) |
|
(4.71) |
Total comprehensive loss for the period |
|
(0.97) |
|
(10.41) |
H1 2025 Compared to H1 2024
|
|
For the period ended June 30, |
|
|
|
||||
|
|
|
|
|
|
|
|
H1 2024 - H1 2025 |
|
($ million) |
|
2025 |
|
2024 |
|
% Change |
|
||
Total Revenue |
|
$ |
10.19 |
|
$ |
8.07 |
|
26 |
% |
Disaggregated by |
|
|
|
|
|
|
|
|
|
Business to customer |
|
$ |
1.5 |
|
$ |
2.07 |
|
(27) |
% |
Business to business |
|
$ |
8.69 |
|
$ |
6.0 |
|
45 |
% |
We disaggregate revenue by the type of customer served as follows: Revenue from Swvl Retail and Swvl Travel together is considered as B2C, and revenue from both TaaS and SaaS together is considered as B2B.
Revenues from B2C for H1 2025 were approximately $1.5 million, a decrease of approximately $0.56 million, or 27%, compared to H1 2024. The reason for the decrease was primarily due to the second quarter of FY 2024 having more public holidays, which serve as high volume days, further the devaluation of the EGP compared to the USD has negatively impacted our total revenue generated, as we have operated this business exclusively inside Egypt during both periods presented.
Revenues from B2B for H1 2025 were approximately $8.69 million, an increase of approximately $2.69 million, or 45%, compared to H1 2024. The increase was due to securing new client contracts across Egypt, Saudi Arabia and the United Arab Emirates, as part of our continued strategy that focuses on profitability and sustainable operations.
Further Analysis Using Constant Currency
During H1 2024 and H1 2025, 82.3% and 66.3% of our total revenues were generated in Egypt respectively. We continue to monitor the economic environment for changes impacting our business and have taken multiple measures such as expanding operations in Saudi Arabia, United Arab Emirates. We also plan to expand into other markets including the United States.
Had our business observed a constant currency from H1 2024 to H1 2025, our results of operations would have varied. We measure this variation to understand actual operating performance, without influence from currency exchange fluctuations.
The below table represents our H1 2025 revenue numbers using constant currency presentation. The currency is held constant as the average USD/EGP exchange rate, which was EGP 39.79 throughout H1 2024. This rate is used to translate all revenue generated in Egypt during H1 2025:
|
|
Constant Currency Presentation |
|
|
|
||||
|
|
|
|
|
|
|
|
H1 2024 - H1 2025 |
|
Constant currency, translated at EGP 39.79 per USD ($ million) |
|
H1 2025 |
|
H1 2024 |
|
% Change |
|
||
Total Revenue |
|
$ |
12.0 |
|
$ |
8.07 |
|
48.8 |
% |
Disaggregated by |
|
|
|
|
|
|
|
|
|
Business to customer |
|
$ |
1.92 |
|
$ |
2.07 |
|
(7.16) |
% |
Business to business |
|
$ |
10.08 |
|
$ |
6.0 |
|
68 |
% |
In a constant currency presentation, our total revenue would be stated at $12.0 million, compared to $10.19 million on actual currency presentation, which represents a $1.81 million increase, or 17.8%.
Cost of Sales
|
|
For the period ended June 30 |
|
|
|
||||
|
|
|
|
|
|
|
|
H1 2024 - H1 2025 |
|
($ million) |
|
2025 |
|
2024 |
|
% Change |
|
||
Cost of Sales |
|
$ |
8.00 |
|
$ |
6.32 |
|
27 |
% |
Split into |
|
|
|
|
|
|
|
|
|
Captain costs |
|
$ |
8.03 |
|
$ |
6.35 |
|
26.5 |
% |
Captain bonuses |
|
$ |
0.01 |
|
$ |
0.02 |
|
** |
|
Captain deductions |
|
$ |
(0.04) |
|
$ |
(0.05) |
|
** |
|
*Amount is less than $10,000
** Percentage not meaningful
Cost of sales for H1 2025 was approximately $8.0 million, an increase of approximately $1.68 million, or 27%, compared to H1 2024. This increase is primarily on account of the new captain costs incurred to fulfill the new client contracts secured, and the increase is in-line with the increase in revenue.
General and Administrative Expenses
|
|
For the period ended June 30 |
|
|
|
||||
|
|
|
|
|
|
|
|
FY 2024 - FY 2025 |
|
($ million) |
|
2025 |
|
2024 |
|
% Change |
|
||
General and administrative expenses |
|
$ |
2.90 |
|
$ |
5.45 |
|
(47) |
% |
General and administrative expenses for H1 2025 were approximately $2.9 million, a decrease of approximately $2.55 million, or 47% from H1 2024. This decrease is primarily due to a Restricted Share Unit grant to management where the award cost was recognized in H1 2024 at $2.03 million. The remaining decline is due to reducing our professional fees and technology costs, as well as a reduction in depreciation expense and other expenses.
Sales and Marketing Expenses
|
|
For the period ended June 30 |
|
|
|
||||
|
|
|
|
|
|
|
|
H1 2024 - H1 2025 |
|
($ million) |
|
2025 |
|
2024 |
|
% Change |
|
||
Sales and marketing expenses |
|
$ |
0.01 |
|
$ |
0.01 |
|
* |
|
* Percentage not meaningful
Our sales and marketing expenses for both periods presented in the table above are negligible due to our strategy of continued profitability and sustainable operations. During FY 2022, we spent approximately $17.5 million on sales and marketing, which were mainly used to grow our B2C business, However, as we continue today to carefully curate our B2C portfolio for profitability, we have incurred minimal expenses on performance marketing and growth-related advertisements. We believe that we can continue to expand our B2C and B2B portfolio with minimal investments in sales and marketing, as we employ a wider array of tools and methods to attract new clients.
Other Expenses
|
|
For the period ended June 30 |
|
|
||
|
|
|
|
|
|
H1 2024 - H1 2025 |
($ million) |
|
2025 |
|
2024 |
|
% Change |
Other expenses |
|
0.13 |
|
0.63 |
|
* |
* Percentage not meaningful
Other expenses for H1 2025 were approximately $0.13 million, a decrease of approximately $0.5 million. This decrease is primarily due to the reduction of directors and officers’ insurance costs.
Other Income
|
|
For the period ended June 30 |
|
|
||
|
|
|
|
|
|
H1 2024 - H1 2025 |
($ million) |
|
2025 |
|
2024 |
|
% Change |
Other income |
|
0.43 |
|
0.27 |
|
* |
* Percentage not meaningful
Other income in H1 2025 was approximately $0.43 million, an increase of approximately $0.16 million. The increase is mainly due to rental income generated from subleasing our unused office spaces.
Change in fair value of financial liabilities
|
|
For the period ended June 30 |
|
|
|
||
|
|
|
|
|
|
H1 2024 - H1 2025 |
|
($ million) |
|
2025 |
|
2024 |
|
% Change |
|
Changes in fair value of financial liabilities |
|
0.84 |
|
(1.65) |
|
* |
|
* Percentage not meaningful
Change in fair value of financial liabilities for H1 2025 was approximately a gain of $0.84 million, compared to a loss of $1.65 million in H1 2024. This gain is mainly due to certain warrants which were outstanding and held at a lower fair value as of June 30, 2025, compared to their fair value as of June 30, 2024, as our stock price was $4.22 per share on June 30, 2025, versus $6.36 on June 30, 2024.
Finance Income and Finance Cost
|
|
For the period ended June 30 |
|
|
||||
|
|
|
|
|
|
|
|
H1 2024 - H1 2025 |
($ million) |
|
2025 |
|
2024 |
|
% Change |
||
Finance income |
|
$ |
0.11 |
|
$ |
0.08 |
* |
** |
Finance costs |
|
$ |
(0.09) |
|
$ |
(0.05) |
|
** |
*Amount is less than $10,000 ** Percentage not meaningful
Finance income for H1 2025 was approximately $0.11 million. Finance income is mainly driven by dividend income generated from the Group’s cash sweep account and short-term treasury bills. On average, we maintained higher cash reserves during H1 2025 over H1 2024, hence the increase in our finance income.
Finance costs for H1 2025 were approximately $0.09 million, as compared to $0.05 million for H1 2024. Those costs are mainly interest expenses for financial leases and other financial liability.
B. Liquidity and Capital Resources
Our principal sources of liquidity have been cash and cash equivalents raised from our operating cash flows in Egypt, Kingdom of Saudi Arabia and the United Arab Emirates, which partially supported the day-to-day business and from the issuance of shares.
Our total assets exceeded total liabilities by approximately $0.71 million for H1 2025, compared to H1 2024, where total liabilities exceeded our total assets by approximately $2.13 million. We incurred a profit of approximately $0.43 million for H1 2025, and incurred a loss of approximately $5.69 million for H1 2024.
We have accumulated losses of approximately $339.4 million and $335.2 million as of June 30, 2025 and June 30, 2024, respectively.
To support our business plans, during FY 2023, we obtained additional financing amounting to $12 million by selling our Urbvan subsidiary ($9.5 million net of selling costs) and have issued 253,834 class A ordinary shares (the “Ordinary Shares”) through our equity financing line, amounting to $789,462. During FY 2023, we used these proceeds to continue to support our business and enter into agreements with prior creditors to extinguish our prior liabilities. Our cash and cash equivalents balance was $4.88 million and $4.96 million as of June 30, 2025 and June 30, 2024, respectively.
On November 17, 2024, we entered into a definitive securities purchase agreement (the “Securities Purchase Agreement”) for a private placement financing with certain investors, including certain members of our Board to purchase $4.7 million of our Ordinary Shares. Under the Securities Purchase Agreement, the investors agreed to purchase 981,211 of our Ordinary Shares, or pre-funded warrants in lieu thereof, at a purchase price of $4.79 per share. The investors in the offering also agreed to execute lock up and leak out agreements, pursuant to which they agreed to lock up the securities purchased in the offering for a period of six months, as well as agreed to transfer up to twenty percent of the securities purchased for each ninety-day period thereafter in an amount not more than twenty percent of the trading volume on a proposed date of sale.
On February 10, 2025, the investors exercised their right to purchase additional securities pursuant to the Securities Purchase Agreement and purchased additional 417,537 of our Ordinary Shares at a purchase price of $4.79 per share. Such offering resulted in gross proceeds to the Company of $2.0 million. The investors also agreed to execute lock up and leak out agreements, pursuant to which they agreed to lock up the securities purchase in the offering for a period of six months, as well as agreed to transfer up to twenty percent of the securities purchase for each ninety-day period thereafter in an amount not more than twenty percent of the trading volume on a proposed date of sale..
On November 25, 2024, we obtained a sustainable credit facility with HSBC Bank in the amount of up to $0.6 million (subject to certain milestone conditions) aimed at financing our expansions and pipeline of contracts. This sustainable credit facility enables us to factor invoices with certain customers at our discretion, and we believe this allows us to have better management over the timing of our cash flows. As of June 30, 2025, we had approximately $0.01 million drawn down from this credit facility.
Our cash and cash equivalents consist primarily of cash held with banks or other financial institutions, which is not restricted as to withdrawal and use. Our cash and cash equivalents are primarily denominated in USD as well as in local currencies of the markets in which we operate.
We believe that our current available cash and cash equivalents will be sufficient to meet our working capital requirements and capital expenditures in the ordinary course of business for a period of at least twelve months from the date of this Report. We intend to finance our future working capital requirements and capital expenditures from cash generated from operating activities, funds raised from financing activities.
Our future capital requirements depend on many factors including our growth rate, the continuing market acceptance of our offerings, the timing and extent of spending to support our efforts to develop our platform, the expansion of sales and marketing activities, and the expansion of our business into new geographies and markets. To enhance our liquidity position or increase our cash reserve for future investments or operations through additional financing activities, we may in the future seek equity or debt financing. The issuance and sale of additional equity would result in further dilution to our shareholders. The incurrence of indebtedness would result in increased fixed obligations and could result in operating covenants that would restrict our operations.
We have an effective Form F-3 registration statement (File No. 333-279918), filed under the Securities Act of 1933, as amended, with the SEC using a “shelf” registration process. Under this shelf registration process, we may, from time to time, sell in one or more offerings up to the total amount of $100,000,000 of our Ordinary Shares, par value $0.0025, warrants or units comprising a combination of Ordinary Shares and warrants. As of the date of this Annual Report we have not sold any Ordinary Shares under the registration statement on Form F-3.
Cash Flows
The following table sets forth a summary of our cash flows for the periods indicated.
|
|
For the period ended June 30 |
||
($million) |
|
2025 |
|
2024 |
Cash flow from/(used in): |
|
|
|
|
Operating Activities |
|
(0.25) |
|
(0.52) |
Investing Activities |
|
(0.00) |
|
0.37 |
Financing Activities |
|
1.76 |
|
(0.34) |
Net increase (decrease) in cash and cash equivalents |
|
1.51 |
|
(0.49) |
Operating Activities
During H1 2025, net cash used in operating activities was approximately $0.25 million, primarily consisting of profit before tax of approximately $0.43 million, adjusted for non-cash items of approximately $1.26 million. These adjustments mainly reflected depreciation of right-of-use assets and intangible assets, provision for employees’ end of service benefits, and a change in fair value of financial liabilities, partially offset by other non-cash income. Net impact from changes in working capital decreased operating cash flows by approximately $1.94 million, primarily driven by an increase in trade and other receivables of approximately $1.86 million and an increase in prepaid expenses and other current assets of approximately $0.01 million, partially offset by an increase in accounts payable, accruals and other payables of approximately $0.13 million and an increase in current tax liabilities of approximately $0.23 million.
During H1 2024, net cash used in operating activities was approximately $0.52 million, primarily consisting of approximately $5.69 million net loss, offset by adjustments of non-cash expenses, such as depreciation, amortization, and other non-cash loss for a total of $4.37 million. Net impact from changes in working capital also offset our net loss by approximately $0.81 million, which mainly consisted of an approximately $1.18 increase in trade and other receivables, an approximately $0.63 million increase in prepaid expenses and other current assets, and a reduction of accounts payable, accruals and other payables of approximately $0.7 million
Investing Activities
During H1 2025, we had minimal cash flows used in investing activities.
During H1 2024, we generated approximately $0.37 million net cash flows from investing activities from our sublease rental of our office in the Dubai, United Arab Emirates.
Financing Activities
During H1 2025, we had a $2.0 million inflow from our private placement offering as explained in this Report under Item B. “Liquidity and Capital Resources”, which was offset by a $0.24 million outflow pertaining to paying our finance lease liabilities, net of accretion.
Net cash used in financing activities was $0.34 in H1 2024, and pertains to our finance lease liabilities paid, net of accretion.
Holding Company Structure and Dividends
Swvl Holdings Corp is a holding company without substantive business operations. Swvl Holdings Corp conducts its operations primarily through its subsidiaries in the jurisdictions in which it operates. As a result, our ability to pay dividends depends upon dividends paid by our subsidiaries. If our subsidiaries or any newly formed subsidiaries incur debt on their own behalf in the future, the instruments governing their debt may restrict their ability to pay dividends to us.
In addition, as determined in accordance with local regulations, our subsidiaries in certain jurisdictions may be restricted from paying us dividends offshore or from transferring a portion of their assets to us, either in the form of dividends, loans or advances, unless certain requirements are met, and regulatory approvals are obtained. Even though we currently do not require any such dividends, loans, or advances from our entities for working capital and other funding purposes, we may in the future require additional cash resources from them due to changes in our business conditions, to fund future acquisitions and development, or merely to declare and pay dividends or distributions to our shareholders.
Capital Expenditures
During H1 2025 and H1 2024, we did not incur any capital expenditures other than the purchase of information technology equipment. Our historical capital expenditures are primarily related to additions and purchases of property and equipment, which included the purchase of fixtures and furniture, leasehold improvements and employee laptops. While we are an asset-light business, we expect to moderately increase our capital expenditures to meet the expected growth in scale of our business and as we expand geographically and bolster our existing offerings.
We expect that cash received in connection with the Business Combination and cash from operating activities and financing activities will be used to meet our capital expenditure and marketing spend needs in the foreseeable future.
Indebtedness
The Group does not currently have any long-term loans or convertible debts outstanding.
Off-Balance Sheet Arrangements
As of December 31, 2024, we did not have any off-balance sheet arrangements that have or are reasonably likely to have a current or future effect on our financial condition, revenues or expenses, results of operations, liquidity, capital expenditures or capital resources.
Contractual Obligations and Commitments
The following table summarizes our contractual obligations and commitments as of June 30, 2025.
|
|
Payments Due by Period |
||||||
($million) |
|
<1 year |
|
1-5 years |
|
>5 years |
|
Total |
Convertible Notes |
|
0 |
|
0 |
|
— |
|
0 |
Lease Liabilities Commitments |
|
0.32 |
|
0.49 |
|
— |
|
0.81 |
Deferred and Contingent Consideration |
|
0.65 |
|
— |
|
— |
|
0.65 |
C. Research and Development, Patents and Licenses
We have made, and will continue to make, significant investments in research, development and technology in an effort to improve our platform, to attract and retain drivers and riders, expand the capabilities and scope of our offerings, and enhance our customer experience. We review and target our research and development activities on an ongoing basis based on the needs of our business. For further details regarding our research and development costs, please refer to “Item 4.B. Business Overview” in our Annual Report.
D. Trend Information
For a discussion of the trends that affect our business, financial condition and results of operations, please see other portions entitled “Item 5.A. Operating Results” and “Item 3.D. Risk Factors” in our Annual Report..
E. Critical Accounting Estimates
Our consolidated financial statements are prepared in accordance with IFRS. The preparation of these consolidated financial statements requires us to make estimates and assumptions that affect the reported amounts of assets, liabilities, revenue, expenses and related disclosures. We evaluate our estimates and assumptions on an ongoing basis. Our estimates are based on historical experience and other assumptions that we believe to be reasonable under the circumstances. Our actual results could differ from these estimates under different assumptions or conditions. We believe that the following critical accounting policies reflect the more significant judgments, estimates and assumptions used in the preparation of our consolidated financial statements.
Revenue
We recognize revenue in accordance with IFRS 15, which we adopted as of January 1, 2019. The Company derives its revenue principally from end-users who use the Swvl platform to access routes predetermined by the Company. Revenue for transport represents the gross amount of fares charged to the end-user for these services. The sole performance obligation of the Company is to provide transportation services to the end-users by integrating the use of the Swvl platform and a network of captains and vehicles registered on the platform. The end-users are charged for using transportation services (i.e. fare charges, net of the discounts and incentives) and are given various incentives (as discussed below). The Company recognizes revenue when its performance obligation towards the end-users has been satisfied (i.e. when the ride is completed). It is at that point in time that the end-user becomes liable to transfer the due consideration to the Company.
We evaluate the presentation of revenue on a gross versus net basis based on whether we control the service provided to the end-user and are the principal in the transaction (gross), or whether we arrange for other parties (operators and individual captains) to provide the service to the end-user and is the agent in the transaction (net). The Company considers itself a principal for the transportation services because it controls the services provided to riders.
End-user discounts and promotions
We offer discounts and promotions to end-users to encourage the use of our transportation services. These discounts and promotions are offered in various forms and include:
| ● | Targeted end user discounts and promotions. These discounts and promotions are offered to specific end-users in a market with a goal to acquire, re-engage or increase the end-users’ use of the platform. Because the end-user does not provide the Company with a distinct goods or services against these promotions and discounts, the Company deducts the amount of these promotions and discounts from the transaction price when recognizing revenue. |
| ● | Free credits. We provide end-users booking intercity routes using Swvl’s Travel platform with free credits to encourage bookings of a two-way trip between origin and destination cities. Under Swvl’s free credit program, a credit is transferred to an end-user’s wallet on the Swvl application after the completion of the first trip. that the end-user can then consume while paying for the return trip. Because we provide the discount that is to be used in the future by the end-user, the free credit is recognized as a liability until it is redeemed by the end-user or the validity period of such credit lapses. However, this liability is not recognized when it is immaterial. |
| ● | End-user referrals. End-user referrals are earned when an existing end-user (the “Referring end-User”) refers a new end-user (the “Referred End-User”) to the Swvl platform and the Referred End-User books their first ride on the platform. These referrals are typically paid in the form of a credit given to the Referring End-User. The Referring End-User is deemed to provide growth and marketing services to the Company as it provides a distinct good or service against the end-user referral discounts. As a result of this, the end-user referrals are recognized as sales and marketing costs. |
| ● | Market-wide promotions. Market-wide promotions reduce the end-user fare charged for all or substantially all rides in a specific market in the form of discounts. As a result, we recognize the cost of these promotions as a reduction of revenue when the ride is completed. |
Deferred tax
As we are incorporated in the British Virgin Islands, our profits from operations are not subject to taxation. However, certain subsidiaries of us are based in taxable jurisdictions such as Egypt, where they are liable for tax.
We record deferred tax to provide for temporary differences between the carrying amounts of assets and liabilities for financial reporting purposes and the amounts used for taxation purposes. Deferred tax assets have been recognized by a certain subsidiary of the us on their trading losses where utilization is probable, given that there are probable future taxable profits to offset against these losses. We continuously review the recoverability of the deferred tax asset for any significant changes to these assumptions.
Share-based payments
Our employees (including senior executives) received remuneration in the form of share-based payments starting in May 2017, whereby employees have rendered services as consideration for equity instruments (i.e., equity-settled transactions).
We have issued share-based payment awards, for which the “grant date” was not achieved, due to the absence of a formal approval of the terms and conditions of the grant that reflected the intent of this long-term incentive scheme. The award’s terms, however, included a condition that the employees would be eligible to exercise their vested options only on an exit event occurrence. If an employee leaves the Company before the exit event, the employee could exercise options on a pro-rata basis (based on the length of time that the employee has served since the award was granted). Therefore, the cost of awards is recognized in advance of the grant date, over the period in which services are rendered by the employees, by estimating the fair value of the equity instruments at the end of each reporting period despite the Company’s awards being classified as equity-settled. The grant date was achieved subsequently in July 2021, when the formal terms and conditions were finalized by our Board, which will be communicated and clarified with the employees as part of the exit event. The cost is recognized in employee benefits expense, together with a corresponding increase in equity (other capital reserves). The cumulative expense recognized reflects our best estimate of the number of equity instruments that will ultimately vest.
Service and non-market performance conditions are not taken into account when determining the grant date fair value of awards, but the likelihood of the conditions being met is assessed as part of our best estimate of the number of equity instruments that will ultimately vest. Market performance conditions are reflected within the grant date fair value. Any other conditions attached to an award, but without an associated service requirement, are considered to be non-vesting conditions. Non-vesting conditions are reflected in the fair value of an award. The probability of an exit event occurring is a non-vesting condition and is included in the fair value of the awards, whose charge is amortized over the period in which services are rendered by the employees.
Risk Factors
In addition to the other information set forth in this Management’s Discussion and Analysis of Financial Condition and Results of Operation, you should carefully consider the risk factors discussed and set forth under Item 3.D. “Risk Factors” in our Annual Report, which could materially affect our business, financial condition, or future results.
|
H1 2025 | Update |
|
Disclaimer This presentation may contain “forward-looking statements” which include, but are not limited to, statements regarding future events and other statements that are not historical facts. Forward-looking statements are generally accompanied by words such as “believe,” “may,” “will,” “estimate,” “continue,” “anticipate,” “intend,” “expect,” “should,” “would,” “plan,” “predict,” “potential,” “seem,” “seek,” “future,” “outlook” and similar expressions that predict or indicate future events or trends or that are not statements of historical matters. For example, Swvl Holdings Corp (“Swvl“) is using forward-looking statements when it discusses its technology, solutions and product suite capabilities; the belief that its solutions will enable the operation of a fully optimized transportation network, empowering accessible, efficient and reliable transportation; the expansion of its business in the United States (“US”) and the United Kingdom (“UK”); its long-term sustainability and dollar-pegged growth; the expansion of dollar-pegged revenue to reduce exposure to changes in foreign currencies; the expansion of engineering operations and support teams in some of the cost-effective markets it operates in; the expectation that its new cohort of contracts will continue to grow year-over-year (YoY) while its commercial engine will consistently bring in new cohorts of contracts at an accelerating pace; and the expectation that its strong gross profit growth positions Swvl for continued success in the years ahead and the expected revenue and gross margin in the upcoming fiscal year. These statements are based on the current expectations of Swvl’s management and are not predictions of actual performance. These forward-looking statements must not be relied on by any investor as a guarantee, assurance, prediction, or definitive statement of fact or probability. Actual results and outcomes could differ materially for a variety of reasons, including, among others, general economic, political and business conditions; the ability of Swvl to execute its growth strategy, manage growth profitably and retain its key employees; competition with other companies in the mobility industry; Swvl’s limited operating history and lack of experience as a public company; recent implementation of certain policies and procedures to ensure compliance with applicable laws and regulations, including with respect to anti-bribery, anti-corruption, and cyber protection; the risk that Swvl is not able to execute its portfolio optimization plan; the risk that Swvl is unable to attract and retain consumers and qualified drivers and other high quality personnel; the risk that Swvl is unable to protect and enforce its intellectual property rights; the risk that Swvl is unable to determine rider demand to develop new offerings on its platform; the difficulty of obtaining required registrations, licenses, permits or approvals in jurisdictions in which Swvl currently operates or may in the future operate; the fact that Swvl currently operates in and intends to expand into jurisdictions that are, or have been, characterized by political instability, may have inadequate or limited regulatory and legal frameworks and may have limited, if any, treaties or other arrangements in place to protect foreign investment or involvement; the risk that Swvl’s drivers could be classified as employees, workers or quasi-employees in the jurisdictions they operate; the fact that Swvl has operations in countries known to experience high levels of corruption and is subject to territorial anticorruption laws in these jurisdictions; the ability of Swvl to maintain the listing of its securities on Nasdaq; Swvl’s acquisitions may not be beneficial to Swvl as a result of the cost of integrating geographically disparate operations and the diversion of management’s attention from its existing business, among other things; and other risks that will be detailed from time to time in filings with the U.S. Securities and Exchange Commission. The foregoing list of risk factors is not exhaustive. There may be additional risks that Swvl presently does not know or that Swvl currently believes are immaterial that could also cause actual results to differ from those contained in forward-looking statements. In addition, forward-looking statements provide Swvl’s expectations, plans or forecasts of future events and views as of the date of this communication. Swvl anticipates that subsequent events and developments will cause Swvl’s assessments and projections to change. However, while Swvl may elect to update these forward-looking statements in the future, Swvl specifically disclaims any obligation to do so. These forward-looking statements should not be relied upon as representing Swvl’s assessments as of any date subsequent to the date of this presentation. Accordingly, undue reliance should not be placed upon the forward-looking statements. Forward-looking Statements 2 |
|
Statement Regarding Non-IFRS Measures This presentation includes references to non-IFRS financial measures, which include amounts presented in constant currencies. However, the presentation of these non-IFRS financial measures is not intended to be considered in isolation from, or as an alternative to, financial measures determined in accordance with IFRS. In addition, these non-IFRS financial measures may differ from non-IFRS financial measures with comparable names used by other companies. Swvl uses these non-IFRS financial measures for financial and operational decision-making and as a means to evaluate period-to-period comparisons, and Swvl’s management believes that these non-IFRS financial measures providemeaningful supplemental information regarding its performance by excluding certain items that may not be indicative of recurring core business operating results. There are a number of limitations related to the use of non-IFRS financial measures. In light of these limitations, we provide specific information regarding the IFRS amounts excluded from these non-IFRS financial measures and evaluate these non-IFRS financial measures together with their relevant financial measures in accordance with IFRS. An explanation of the non-IFRS financial measures referenced in this presentation can be found below: For a reconciliation to the most directly comparable IFRS measures please see Appendix A. Key Business Measures In addition to the measures presented in our consolidated financial statements, this presentation includes references to certain key business measures that Swvl’s management uses to help evaluate and identify trends affecting Swvl’s business, formulate business plans and make strategic decisions. The key business measures referenced in this presentation are set forth below. Dollar-Pegged Revenue, Recurring Revenue, Transactional Revenue, Net Dollar Retention which are defined in Appendix B. Forward-looking Statements (continued) 3 |
|
About Swvl Swvl is an end-to-end mobility operating system designed to transform urban transportation by making it more accessible, efficient, and reliable. Our platform leverages real-time data, adaptive networks, and advanced technology to optimize mobility solutions for riders and drivers, ensuring seamless, dynamic operations. By offering tailored mobility solutions for various use cases, such as first and last-mile connectivity, schools, universities, corporations, and factories hubs, Swvl empowers cities to create more inclusive and efficient transit systems. Through flexible access options and a focus on reducingCO2 emissions and operational costs, Swvl enhances shared mobility's overall reliability and sustainability in smarter cities. With products like the Rider& Captain app, Swvl Cloud Platform, and real-time data capabilities we believe that Swvl is the future of smart shared mobility. 4 |
|
Products & Services Product Suite Managed Services Real -time Monitoring & Insights Compliance & Safety Management Vehicle Rostering Network Planning & Routing Technologies Identity & Access Management White Labelled Customer Facing App On -ground Support Network Optimization Vehicle Utilization Fleet Sourcing Fleet Management Driver On - boarding On -ground Inspection Value Proposition Swvl s an end -to -end mobility operating system designed to transform urban mobility by making it more accessible, safe, cost -efficient, and reliable. Our comprehensive product suite, including real -time insights, vehicle rostering, and network planning technologies, ensures a robust foundation for all mobility needs. This provides analytics for informed decision -making and delivers operational efficiency by cutting down costs across the entire system. Swvl’s platform utilizes cutting -edge technology to provide tailored mobility solutions for various use cases, including first and last mile, schools, universities, public transit, non -emergency medical transportation, enterprise, and public transit. Swvl’s service can be delivered either as a standalone technology ("SaaS ") or as part of a comprehensive managed services offering ("MaaS "), including fleet sourcing, fleet management, and driver onboarding, further enhancing our ability to scale and retain clients, ensuring long -term success in these diverse use cases. Managed Services Schools Universities NEMT Enterprise Public Transit Airlines First and Last mile 5 |
|
Strategy Highlight |
|
Strategy Highlight Rapid Margins Increase We have made significant improvements over the past couple of years, and we still believe the business could achieve higher margins, which at a steady state, is 35%- 40%. Increase Recurring Revenue Dollar Pegged Revenue Commercial Organization High Margin Verticals Shareholders Transparency Increase our recurring revenue percentage of total revenue to mitigate any seasonality impact. Increase dollar-pegged revenue as a percentage of total revenue to hedge against currency volatility. Expand our commercial engine to continue to add multiple million dollars of yearly revenue every new month. Scale up more high-margin verticals such as luxury vehicles, captain lending, etc. Strengthen our communications with shareholders by reporting more frequently, sharing market guidance and scaling up our investor relations efforts. 7 |
|
Key Highlights for H1 2025 Revenue Growth 26% Increase in H1 2025 over H1 2024, and an increase of 49% in constant currency in H1 2025 over H1 2024 Gross Margin Dollar Growth 26% Increase in H1 2025 over H1 2024, and an increase of 45% in constant currency in H1 2025 over H1 2024. 8 Recurring Revenue 85% Reached 85% of recurring revenue compared to total revenue in H1 2025, up from 74% in H1 2024. Dollar Pegged Revenue Growth 90% Increase in the share of dollar-pegged revenue compared to total revenue during H1 2025 over H1 2024. Net Dollar Retention 118% Measures the expansion (net of churn) of revenue from existing corporate clients who were with us in H1 2024, tracked through H1 2025. |
|
H1’25 Update - Revenue & Gross Margin Revenue and Gross Margin in $Mn 8.07 26% 10.19 H1’25 $1.74 H1’24 $2.19 26% 8.07 H1’24 $0.87 45% $1.74 H1’25 49% 12.0 Revenue and Gross Margin in $Mn in Constant Currency* *Constant currency is a Non-IFRS measure and is reconciled under Appendix A of this presentation. 9 Non-IFRS Measure |
|
Strong Growth in Dollar-Pegged Revenue 18% 90% 34% H1’24 H1’25 Dollar-Pegged Revenue as a Percentage of Total Revenue Dollar-Pegged Revenue: represents revenue generated in currencies which are pegged to the US Dollar (i.e, currently, all revenues excluding EGP). Dollar-Pegged Revenue Focus Swvl continues to focus on dollar-pegged revenue across the Gulf Cooperation Council (“GCC”), with plans to expand into the UK and U.S. to ensure long-term sustainability and Dollar-Pegged revenue growth. We will continue to expand our Dollar-Pegged revenue to reduce our exposure to fluctuations in foreign currencies. We will also continue to expand our engineering, operations, and support teams in cost-effective markets. 10 |
|
Accelerating Growth in Recurring Revenue Recurring vs. Transactional Revenue Recurring Contract-Based Revenue Focus We have made significant progress in increasing our recurring revenue from 74% in H1 2024 to 85% in H1 2025. This is happening in tandem with increasing our dollar-pegged revenue by expanding our presence in the enterprise and government sectors across the GCC, as well as new planned expansions in the US and UK. Swvl’s recurring revenue comes in the form of enterprise and government contracts that usually range between 1 and 5 years. By prioritizing recurring revenue over transactional revenue, Swvl sets a foundation for predictable and profitable growth while reducing the impact of market volatility. (1) Recurring Revenue: represents our revenue from contract-based operations with our corporate customers (2) Transactional Revenue: represents our revenue from individuals and from non-recurring corporate customer requests. 74% 15% 85% H1’24 H1’25 Recurring Revenue as a % of Total Revenue in H1’24 vs. H1’25 11 |
|
Operating Expenses as a Percentage of Revenue Operating Leverage Our cost structure reflects a business with inherently high operating leverage. A significant portion of our costs is fixed in nature, such as technology, cloud infrastructure, and support functions that enable us to run a global platform. At the same time, our variable cost per transaction is very low, given the asset-light model and the efficiency of our operations. This dynamic means that once our fixed cost base is covered, all incremental revenue flows through at a much higher net profit margin. At a steady state, we believe our business can land at a net profit margin of 20% to 25%. Egypt 17% 15% H1’24 H1’25 KSA* 30% 26% H1’24 H1’25 12 *KSA represents the Kingdom of Saudi Arabia |
|
Improvement in Working Capital Efficiency Net Cash Flows used in Operating Activities in $Mn H1’24 H1’25 (0.51) (0.25) Path to Free Cash Flow Swvl has made significant strides in improving its working capital efficiency over the past two years. In FY22, net cash flows used in operating activities were at a high of $117.6 million. By FY23, we successfully reduced this figure by 92%, bringing it down to $9.10 million, reflecting our effective portfolio optimization program that we embarked on in 2022. In FY24, we continued this positive trend, reducing the net cash flows used in operating activities by 64%, reaching $3.29 million. In H1 2025, we reduced our cash outflow to $0.25 million of cash in operating activities, and we expect to continue this trend in the short term to reach our target of becoming cash flow positive. - 51% 13 |
|
Financial Results H1 2025 |
|
P&L *General and admin expenses breakdown on the following page Condensed Interim Consolidated Statement of Income H1 2025 H1 2024 % Change All figures are in $ USD Revenue 10,189,069 8,067,008 26% Cost of sales (8,000,885) (6,322,748) Gross margin 2,188,184 1,744,260 25% Gross margin % 22% 22% General & administrative expenses* (2,898,277) (5,451,740) Selling and marketing expenses (12,831) (13,221) Charge for provision of expected credit losses (127,500) (625,078) Other income 434,165 273,088 Change in fair value of financial liabilities 836,384 (1,647,913) Finance income 106,913 78,623 Finance cost (94,838) (50,866) Profit/(loss) before tax forthe period 432,200 (5,692,847) 107.5% 15 |
|
Breakdown of General & Administrative Expenses General & Administrative Expenses H1 2025 H1 2024 % Change All figures are in $ USD Staff costs 1,520,733 3,547,601 57% Professional fees 658,798 763,538 14% Technology costs 223,539 285,654 22% Other expenses 185,692 343,754 46% Depreciation of property and equipment - 130,529 100% Office expenses 42,394 54,160 22% Rent expense 100,855 110,270 9% Depreciation of right-of-use assets 58,297 92,603 37% Insurance 50,924 56,755 10% Outsourced employees 13,901 11,761 18% Entertainment 7,046 8,921 21% Travel and accommodation 20,504 26,278 22% Amortization of intangible assets 15,594 19,916 22% Total 2,898,277 5,451,740 47% 16 |
|
Condensed Interim Consolidated Statement of Financial Position June 2025 December 2024 All figures are in $ USD Cash and cash equivalents 4,876,983 4,958,983 Current assets (minus cash) 7,196,854 5,320,089 Non-current assets 6,157,945 6,085,589 Assets classified as held for sale 1,522 1,522 Total assets 18,233,304 16,366,183 Current liabilities* 11,713,282 11,942,417 Non-current liabilities 1,887,576 1,186,146 Liabilities directly associated with assets classified as held for sale 3,925,565 3,925,565 Total liabilities 17,526,423 17,054,128 Total equity 706,881 (687,945) Current ratio 1.03 0.86 Balance Sheet * Our current liabilities include $4mn, which relates to our SPAC transaction and other vendors in FY 2022. Full balance sheet is attached as Exhibit 99.1 to our Report of Foreign Private Issuer on Form 6-K filed with the SEC on September 8, 2025 17 |
|
Market Performance |
|
Kingdom of Saudi Arabia Revenue vs. Gross Margin in $Mn Our business in KSA had an increase in revenue by 80% and margin by 112%. Swvl continues to prioritize high-margin, high-margin contracts, and this focus has yielded outstanding results. In H1 2025, KSA’s gross margin percentage was 30.6%, versus 26% in H1 2024. Revenue Gross Margin % 1.43 2.58 H1’24 H1’25 26.0% 30.6% 18% 80% 19 |
|
Egypt in constant currency in $Mn Note: The 6 Month average FX exchange rate in H1 2024 was USD/EGP 39.79, versus USD/EGP 50.47 in H1 2025 6.64 8.56 H1’24 H1’25 20.7% 29% Non-IFRS Measure Revenue Gross Margin in $Mn 6.64 6.75 H1’24 H1’25 20.7% 18.9% -8% 2% Revenue Gross Margin 18.9% -8% Egypt delivered strong operational growth in H1’25, with revenue increasing 29% in H1’25 over H1’24, and total gross margin increasing by 18% in H1’25 over H1’24, in local currency. 20 |
|
United Arab Emirates Newly Launched Market Our UAE launch achieved strong Revenue vs. Gross Margin Q1 2025 vs Q2 2025 in $Mn traction in H1'25, generating $0.86M in revenue. Revenue grew 79% QoQ from Q1 to Q2, while gross margin expanded 198%, reflecting both accelerating topline growth and strengthening unit economics. The UAE has also increased its gross margin percentage from 9.7% in Q1 2025 to 16.4% in Q2 2025. Revenue Gross Margin 1’25 Q2’25Q 0.31 0.55 79% 66% 9.9% 16.5% 21 |
|
Appendix A Reconciliation of Non-IFRS Measure We use constant currency to Reconciliation of Non-IFRS Measure understand our business performance excluding the impact of changes in foreign currency. The table represents our H1 2025 revenue numbers using constant currency presentation. The currency is held constant as the average USD/EGP exchange rate, which was EGP 39.79 throughout H1 2024. This rate is used to translate all revenue generated in Egypt during H1 2025. Revenue from USD FX H1 2025 In USD Constant Currency FX* In constant currency Egypt 50.47 6.75 39.79 8.56 United Arab Emirates 3.6725 0.86 3.6725 0.86 Kingdom of Saudi Arabia 3.75 2,58 3.75 2.58 Total assets $10.19 $12.0 *Constant currency FX is the average exchange rate of USD/EGP in H1 2024, applied to H1 2025 revenues. 22 |
|
Appendix B Definitions Term Definition Dollar Pegged Revenue Represents revenue generated in currencies which are pegged to the US Dollar (i.e, currently, all revenues excluding EGP). Dollar-Pegged Revenue Growth Represents period over period growth in the percentage of Dollar-Pegged Revenue compared to total revenue. Gross Margin Growth Represents period over period growth in the absolute amount of Gross Margin generated. H1’24 or H1 2024 Refers to the 6 months period ended June 30, 2024. H1’25 or H1 2025 Refers to the 6 months period ended June 30, 2025. Mn Represents amounts presented in millions. Net Dollar Retention Measures the expansion (net of churn) of revenue from existing corporate clients who were with us in one period, tracked through the next period. Q1’25 Refers to the 3 months period ended March 31, 2025. Q2’25 Refers to the 3 months period ended June 30, 2025. Recurring Revenue Represents our revenue from contract-based operations with our corporate customers Revenue Growth Represents the dollar growth of Revenue from period to another. Transactional Revenue Represents our revenue from individuals and from non-recurring corporate and individual customer requests. 23 |
|
Exhibit 99.4
Swvl Announces H1 2025 Results, Delivering 26% Revenue Growth (49% in Constant Currency), 26% Gross Margin Growth, and Net Income of $0.43 Million
Revenue grew 26% year-over-year, and 49% in constant currency in H1 2025 over H1 2024
Achieved Net Income of $0.43 million in H1 2025
The share of dollar-pegged revenue in our portfolio increased from 18% in H1 2024 to 34% in H1 2025, with recurring revenue reaching 85% of total revenue and Net Dollar Retention of 118%
DUBAI, UNITED ARAB EMIRATES, September 8, 2025 (GLOBE NEWSWIRE) — Swvl Holdings Corp (“Swvl” or the “Company”) (Nasdaq: SWVL), a global provider of transformative tech-enabled mass transit solutions, today announced its financial results for the first half of 2025, marking strong and profitable growth across key markets.
The Company reported 26% IFRS revenue growth, from $8.07 million in H1 2024 to $10.19 million in H1 2025, and 49% growth in constant currency from $8.07 million to $12.0 million. Gross margin increased by 26% year-over-year to $2.19 million. Swvl also delivered a net profit of $0.43 million, compared to a loss of $5.7 million in H1 2024.
Key Highlights:
Overall Performance
- |
Revenue Growth: 26% year-over-year growth (49% in constant currency) |
- |
Gross Margin: 26% (with margin percentage steady at 22%) |
- |
Net Profit: $0.43 million (versus loss of $5.7 million in H1 2024) |
- |
Cash Outflows: $0.25 million (versus $0.51 million in H1 2024) |
Revenue Quality
- |
Dollar-Pegged Revenue: 34% of total revenue (versus 18% in H1 2024) |
- |
Recurring Revenue: 85% of total revenue is recurring (versus 74% in H1 2024) |
- |
Net Dollar Retention: 118% |
Market Performance By Region
- |
Kingdom of Saudi Arabia: Revenue +80%, and gross margins up 112% |
- |
Egypt: Revenue +29%, and gross margin +18% in constant currency |
- |
United Arab Emirates: Revenue $0.86 million |
An explanation and reconciliation of non-IFRS to IFRS measures has been provided in this press release below under the heading “Non-IFRS Financial Metrics.”
Mostafa Kandil, Chief Executive Officer of Swvl stated:
“We believe that Swvl’s performance in H1 2025 reflects a successful strategy to align growth with resilience. While we achieved 26% revenue growth (49% in constant currency) and grew our total gross margin by 26%, we are still prioritizing recurring, contract-based revenues and scaled dollar-pegged markets aimed at building quality earnings.
Our growth is anchored in long-term enterprise contracts that compound over multiple years, with net dollar retention well above 100% signaling that existing clients are expanding their spend with Swvl. We believe that this foundation delivers predictable and higher quality earnings and positions Swvl to continue driving scalable results in the future.”
Ahmed Misbah, Chief Financial Officer of Swvl, added:
“Our H1 2025 results demonstrate Swvl’s ability to combine growth with profitability, underpinning our disciplined cost management, we improved working capital efficiency and secured strong revenue and gross margin expansions across all operating markets. Recurring revenue reached 85% of total revenues, while the share of dollar-pegged revenue grew by 90%, which we believe highly strengthens our quality of earnings. With this foundation, we expect Swvl to be well positioned to drive both sustainable profitability and long-term growth.”
About Swvl:
Swvl is a leading provider of technology-driven mobility solutions for enterprises and governments. Its platform leverages real-time data, adaptive networks, and advanced technology to deliver safer, more reliable, and sustainable transportation solutions across emerging and developed markets.
For more information, please visit www.swvl.com.
Forward-Looking Statements:
This press release contains “forward-looking statements” relating to future events. Forward-looking statements generally are accompanied by words such as “believe,” “may,” “will,” “estimate,” “continue,” “anticipate,” “intend,” “expect,” “should,” “would,” “plan,” “predict,” “potential,” “seem,” “seek,” “future,” “outlook” and similar expressions.
These forward-looking statements include, but are not limited to, statements regarding future events and other statements that are not historical facts. For example, Swvl is using forward-looking statements when it discusses its focus on recurring, contract-based revenues and scaled dollar-pegged markets aimed at building quality earnings; its long-term enterprise contracts that compound over multiple years; existing clients expanding their spend with Swvl; its ability to deliver predictable and higher quality earnings; and its ability to drive scalable results in the future and combine growth with profitability.
These statements are based on current expectations of Swvl’s management and are not guarantees or predictions of future or actual performance. These forward-looking statements are provided for illustrative purposes only and are not intended to serve as, and must not be relied on, by any investor as a guarantee, an assurance, a prediction or a definitive statement of fact or probability. Actual results may differ materially due to risks and uncertainties as detailed in Swvl’s filings with the U.S. Securities and Exchange Commission. Actual events and circumstances are difficult or impossible to predict and will differ from assumptions. Many actual events and circumstances are beyond the control of Swvl. These statements are subject to a number of risks and uncertainties regarding Swvl’s business, and actual results may differ materially.
In addition, forward-looking statements provide Swvl’s expectations, plans, or forecasts of future events and views as of the date of this communication. Swvl anticipates that subsequent events and developments could cause Swvl’s assessments and projections to change. However, while Swvl may elect to update these forward-looking statements in the future, Swvl specifically disclaims any obligation to do so.
These forward-looking statements should not be relied upon as representing Swvl’s assessments as of any date subsequent to the date of this communication. Accordingly, undue reliance should not be placed upon any forward-looking statements. Except as otherwise required by law, Swvl undertakes no obligation to publicly release any revisions to these forward-looking statements to reflect events or circumstances after the date hereof or to reflect the occurrence of unanticipated events.
Contact:
Investor Relations: investor.relations@swvl.com
Ahmed Misbah, Swvl’s Chief Financial Officer: ahmed.misbah@swvl.com
Non-IFRS Financial Metrics
This press release includes references to non-IFRS financial measures, which include constant currency presentation. However, the presentation of these non-IFRS financial measures is not intended to be considered in isolation from, or as an alternative to, financial measures determined in accordance with IFRS. In addition, these non-IFRS financial measures may differ from non-IFRS financial measures with comparable names used by other companies.
Swvl uses these non-IFRS financial measures for financial and operational decision-making and as a means to evaluate period-to-period comparisons, and Swvl’s management believes that these non-IFRS financial measures provide meaningful supplemental information regarding its performance by excluding certain items that may not be indicative of recurring core business operating results.
There are a number of limitations related to the use of non-IFRS financial measures. In light of these limitations, we provide specific information regarding the IFRS amounts excluded from these non-IFRS financial measures and evaluate these non-IFRS financial measures together with their relevant financial measures in accordance with IFRS.
Our results of operations varies on account of foreign currency exchange fluctuations in Egypt. We use constant currency to understand actual operating performance, without influence from currency exchange fluctuations.
Below is a reconciliation of our non-IFRS measures to the most directly comparable IFRS measure:
Revenue |
|
USD FX |
|
In |
|
Constant |
|
In constant |
|
||
Egypt |
|
50.47 |
|
|
6.75 |
|
39.79 |
|
|
8.56 |
|
United Arab Emirates |
|
3.6725 |
|
|
0.86 |
|
3.6725 |
|
|
0.86 |
|
Kingdom of Saudi Arabia |
|
3.75 |
|
|
2.58 |
|
3.75 |
|
|
2.58 |
|
Total assets |
|
|
|
$ |
10.19 |
|
|
|
$ |
12.0 |
|
*Constant currency FX is the average exchange rate of USD/EGP in H1 2024, applied to H1 2025 revenues.