FORM 6-K
SECURITIES AND EXCHANGE COMMISSION
WASHINGTON, D.C. 20549
Report of Foreign Private Issuer
Pursuant to Rule 13a - 16 or 15d - 16 of
the Securities Exchange Act of 1934
For the month of: August, 2025 |
Commission File Number: 1-12384 |
SUNCOR ENERGY INC.
(Name of registrant)
150 – 6th Avenue S.W.
P.O. Box 2844
Calgary, Alberta
Canada, T2P 3E3
Indicate by check mark whether the registrant files or will file annual reports under cover of Form 20-F or Form 40-F:
Form 20-F |
|
|
|
Form 40-F |
|
X |
SIGNATURES
Pursuant to the requirements of the Securities Exchange Act of 1934, the registrant has duly caused this report to be signed on its behalf by the undersigned, thereunto duly authorized.
|
|
SUNCOR ENERGY INC. |
|
|
|
|
|
|
|
|
|
|
Date: August 5 , 2025 |
|
By: /s/ Shawn Poirier |
|
|
|
Shawn Poirier Assistant Corporate Secretary |
|
EXHIBIT INDEX
Exhibit |
|
Description of Exhibit |
|
|
|
99.1 |
|
News Release dated August 5, 2025, Suncor Energy reports second quarter 2025 results |
99.2 |
|
Report to Shareholders for the second quarter ended August 5, 2025 |
Exhibit 99.1
|
News Release |
Suncor Energy reports second quarter 2025 results
Unless otherwise noted, all financial figures are unaudited, presented in Canadian dollars (Cdn$), and derived from the company’s condensed consolidated financial statements which are based on Canadian generally accepted accounting principles (GAAP), specifically International Financial Reporting Standards (IFRS) as issued by the International Accounting Standards Board (IASB), and are prepared in accordance with International Accounting Standard (IAS) 34 Interim Financial Reporting. Production volumes are presented on a working-interest basis, before royalties, except for production values from the company's Libya operations, which are presented on an economic basis. Certain financial measures referred to in this news release (adjusted funds from operations, adjusted operating earnings, free funds flow and net debt) are not prescribed by Canadian generally accepted accounting principles (GAAP). See the Non-GAAP Financial Measures section of this news release. References to Oil Sands operations exclude Suncor Energy Inc.’s ownership of Fort Hills and interest in Syncrude.
Calgary, Alberta (August 5, 2025)
Second Quarter Highlights
· |
Generated $2.7 billion in adjusted funds from operations and $1.0 billion in free funds flow. |
· |
Returned $1.45 billion to shareholders, with $750 million in share repurchases and $700 million in dividends. |
· |
Record second quarter upstream production of 808,000 bbls/d and record first half production of 831,000 bbls/d. |
· |
Record second quarter refinery throughput of 442,000 bbls/d and record first half throughput of 462,000 bbls/d. |
· |
Executed major upstream and downstream turnaround activity safely and ahead of schedule. |
· |
Completed the Upgrader 1 coke drum replacement project ahead of schedule in early July. |
· |
Reduced 2025 capital guidance by $400 million, reflecting strong execution performance and capital discipline. |
“What stands out the most about our strong second quarter is the outstanding execution of major upstream and downstream turnaround activities, completed safely and ahead of schedule,” said Rich Kruger, President and Chief Executive Officer. “This performance was a key driver behind Suncor’s record-setting second quarter and first half volumes results and positions us extremely well for a strong second half of the year. The quarter once again demonstrates our unwavering commitment and focus on delivering superior results for our shareholders.”
|
Suncor Energy 150 6 Avenue S.W. Calgary, Alberta T2P 3E3 suncor.com |
Second Quarter Results
Financial Highlights |
|
Q2 |
Q1 |
Q2 |
($ millions, unless otherwise noted) |
|
2025 |
2025 |
2024 |
Net earnings |
|
1 134 |
1 689 |
1 568 |
Per common share(1) (dollars) |
|
0.93 |
1.36 |
1.22 |
Adjusted operating earnings(2) |
|
873 |
1 629 |
1 626 |
Per common share(1)(2) (dollars) |
|
0.71 |
1.31 |
1.27 |
Adjusted funds from operations(2) |
|
2 689 |
3 045 |
3 397 |
Per common share(1)(2) (dollars) |
|
2.20 |
2.46 |
2.65 |
Cash flow provided by operating activities |
|
2 919 |
2 156 |
3 829 |
Per common share(1) (dollars) |
|
2.38 |
1.74 |
2.98 |
Capital and exploration expenditures(3) |
|
1 649 |
1 087 |
1 964 |
Free funds flow(2) |
|
981 |
1 900 |
1 350 |
Dividend per common share(1) (dollars) |
|
0.57 |
0.57 |
0.55 |
Share repurchases per common share(4) (dollars) |
|
0.61 |
0.61 |
0.64 |
Returns to shareholders(5) |
|
1 447 |
1 455 |
1 523 |
Operating, selling and general (OS&G) expenses |
|
3 163 |
3 297 |
3 153 |
Net debt(2) |
|
7 673 |
7 559 |
9 054 |
|
|
|
|
|
|
|
Q2 |
Q1 |
Q2 |
Operating Highlights |
|
2025 |
2025 |
2024 |
Total upstream production (mbbls/d) |
|
808.1 |
853.2 |
770.6 |
Refinery utilization (%) |
|
95 |
104 |
92 |
(1) |
Presented on a basic per share basis. |
(2) |
Non-GAAP financial measures or contains non-GAAP financial measures. See the Non-GAAP Financial Measures section of this news release. |
(3) |
Excludes capitalized interest. |
(4) |
Calculated as the cost of share repurchases, excluding taxes paid on share repurchases, divided by the weighted average number of shares outstanding. |
(5) |
Includes dividends paid on common shares and repurchases of common shares; excludes taxes paid on common share repurchases. |
Financial Results
Adjusted Operating Earnings Reconciliation(1)
|
|
Q2 |
Q1 |
Q2 |
($ millions) |
|
2025 |
2025 |
2024 |
Net earnings |
|
1 134 |
1 689 |
1 568 |
Unrealized foreign exchange (gain) loss on U.S. dollar denominated debt |
|
(461) |
(14) |
103 |
Unrealized loss (gain) on risk management activities |
|
68 |
(60) |
(52) |
Write-down of equity investments |
|
136 |
— |
— |
Income tax (recovery) expense on adjusted operating earnings adjustments |
|
(4) |
14 |
7 |
Adjusted operating earnings(1) |
|
873 |
1 629 |
1 626 |
(1) |
Non-GAAP financial measure. All reconciling items are presented on a before-tax basis and adjusted for income taxes in the income tax expense (recovery) on adjusted operating earnings adjustments line. See the Non-GAAP Financial Measures section of this news release. |
· |
Suncor’s adjusted operating earnings were $873 million ($0.71 per common share) in the second quarter of 2025, compared to $1.626 billion ($1.27 per common share) in the prior year quarter, with the decrease primarily due to lower upstream price realizations, in line with lower benchmark pricing, partially offset by lower royalties and income taxes, and increased sales volumes in both the upstream and downstream. |
· |
Net earnings were $1.134 billion ($0.93 per common share) in the second quarter of 2025, compared to $1.568 billion ($1.22 per common share) in the prior year quarter. In addition to the factors impacting adjusted operating earnings, net earnings for the second quarter of 2025 and the prior year quarter were impacted by the items shown in the table above. |
· |
Adjusted funds from operations were $2.689 billion ($2.20 per common share) in the second quarter of 2025, compared to $3.397 billion ($2.65 per common share) in the prior year quarter, and were primarily influenced by the same factors impacting adjusted operating earnings. |
· |
Cash flow provided by operating activities, which includes changes in non-cash working capital, were $2.919 billion ($2.38 per common share) in the second quarter of 2025, compared to $3.829 billion ($2.98 per common share) in the prior year quarter. |
· |
Operating, selling and general (OS&G) expenses remained consistent at $3.163 billion in the second quarter of 2025, compared to $3.153 billion in the prior year quarter, as higher commodity input costs and increased mining costs were largely offset by decreased share-based compensation expense. |
Operating Results
|
|
Q2 |
Q1 |
Q2 |
(mbbls/d, unless otherwise noted) |
|
2025 |
2025 |
2024 |
Upstream |
|
|
|
|
Total Oil Sands bitumen production |
|
860.8 |
937.3 |
834.4 |
SCO and diesel production |
|
468.0 |
567.3 |
488.3 |
Inter-asset transfers and consumption |
|
(29.8) |
(30.7) |
(26.6) |
Upgraded production – net SCO and diesel |
|
438.2 |
536.6 |
461.7 |
Bitumen production |
|
334.8 |
341.7 |
308.2 |
Inter-asset transfers |
|
(24.6) |
(87.4) |
(53.9) |
Non-upgraded bitumen production |
|
310.2 |
254.3 |
254.3 |
Total Oil Sands production |
|
748.4 |
790.9 |
716.0 |
Exploration and Production |
|
59.7 |
62.3 |
54.6 |
Total upstream production |
|
808.1 |
853.2 |
770.6 |
Upstream sales |
|
812.8 |
828.4 |
773.2 |
|
|
|
|
|
Downstream |
|
|
|
|
Refinery utilization (%) |
|
95 |
104 |
92 |
Refinery crude oil processed |
|
442.3 |
482.7 |
430.5 |
Refined product sales |
|
600.5 |
604.9 |
594.7 |
· |
Total Oil Sands bitumen production increased to a second quarter record of 860,800 bbls/d, compared to 834,400 bbls/d in the prior year quarter, and included record second quarter production at Firebag. |
· |
The company’s net synthetic crude oil (SCO) production was 438,200 bbls/d in the second quarter of 2025, compared to 461,700 bbls/d in the prior year quarter, and was impacted by increased upgrader-related maintenance activities in the current period, including the Upgrader 1 coke drum replacement project and turnaround, which was completed subsequent to the quarter. |
· |
Non-upgraded bitumen production increased to 310,200 bbls/d in the second quarter of 2025, compared to 254,300 bbls/d in the prior year quarter, primarily due to increased bitumen production and lower upgrader availability. |
· |
Exploration and Production (E&P) production increased to 59,700 bbls/d in the second quarter of 2025, compared to 54,600 bbls/d in the prior year quarter and included increased production at Hebron and the addition of production at White Rose, which restarted in the first quarter of 2025. |
· |
Refinery throughput increased to a second quarter record of 442,300 bbls/d with utilization of 95%, compared to 430,500 bbls/d and 92%, respectively, in the prior year quarter. The increase was primarily due to strong operating performance and the efficient execution of planned maintenance activities. |
· |
Refined product sales increased to a second quarter record of 600,500 bbls/d, compared to 594,700 bbls/d in the prior year quarter, with the increase primarily due to higher refinery throughput and execution of the previously announced retail growth plan. |
Corporate and Strategy Updates
· |
Syncrude achieves first ore at Mildred Lake Mine Extension West (MLX-W). Syncrude reached a significant milestone at MLX-W, which is expected to sustain existing bitumen production levels, with first ore extraction completed earlier than expected. |
Corporate Guidance Updates
Suncor has updated its 2025 corporate guidance ranges, previously issued on December 12, 2024, by reducing 2025 full-year estimated capital spend from $6.1-$6.3 billion down to $5.7-$5.9 billion. Estimated ranges for current income taxes, royalties and business environment have also been adjusted to reflect the current business environment as at August 5.
For further details and advisories regarding Suncor’s 2025 corporate guidance, see www.suncor.com/guidance.
Non-GAAP Financial Measures
Certain financial measures in this news release – namely adjusted funds from operations, adjusted operating earnings, free funds flow and net debt, and related per share or per barrel amounts – are not prescribed by GAAP. These non-GAAP financial measures are included because management uses the information to analyze business performance, leverage and liquidity, as applicable, and it may be useful to investors on the same basis. These non-GAAP financial measures do not have any standardized meaning and, therefore, are unlikely to be comparable to similar measures presented by other companies. Therefore, these non-GAAP financial measures should not be considered in isolation or as a substitute for measures of performance prepared in accordance with GAAP. Except as otherwise indicated, these non-GAAP financial measures are calculated and disclosed on a consistent basis from period to period. Specific adjusting items may only be relevant in certain periods.
Adjusted Operating Earnings
Adjusted operating earnings is a non-GAAP financial measure that adjusts net earnings for significant items that are not indicative of operating performance. Management uses adjusted operating earnings to evaluate operating performance because management believes it provides better comparability between periods. Adjusted operating earnings are reconciled to net earnings in the news release above.
Adjusted Funds From (Used In) Operations
Adjusted funds from (used in) operations is a non-GAAP financial measure that adjusts a GAAP measure – cash flow provided by operating activities – for changes in non-cash working capital, which management uses to analyze operating performance and liquidity. Changes to non-cash working capital can be impacted by, among other factors, commodity price volatility, the timing of offshore feedstock purchases and payments for commodity and income taxes, the timing of cash flows related to accounts receivable and accounts payable, and changes in inventory, which management believe reduces comparability between periods.
Three months ended June 30 |
|
Oil Sands |
Exploration and |
Refining and |
Corporate and |
Income Taxes |
Total |
||||||
($ millions) |
|
2025 |
2024 |
2025 |
2024 |
2025 |
2024 |
2025 |
2024 |
2025 |
2024 |
2025 |
2024 |
Earnings (loss) before income taxes |
|
844 |
1 792 |
165 |
196 |
377 |
593 |
48 |
(398) |
— |
— |
1 434 |
2 183 |
Adjustments for: |
|
|
|
|
|
|
|
|
|
|
|
|
|
Depreciation, depletion, amortization and impairment |
|
1 248 |
1 235 |
167 |
184 |
260 |
236 |
34 |
29 |
— |
— |
1 709 |
1 684 |
Accretion |
|
124 |
129 |
16 |
17 |
4 |
3 |
— |
— |
— |
— |
144 |
149 |
Unrealized foreign exchange (gain) loss on U.S. dollar denominated debt |
|
— |
— |
— |
— |
— |
— |
(461) |
103 |
— |
— |
(461) |
103 |
Change in fair value of financial instruments and trading inventory |
|
215 |
(42) |
34 |
15 |
(62) |
41 |
— |
— |
— |
— |
187 |
14 |
Loss on disposal of assets |
|
— |
— |
— |
— |
— |
— |
— |
1 |
— |
— |
— |
1 |
Share-based compensation |
|
7 |
43 |
1 |
3 |
4 |
20 |
(6) |
32 |
— |
— |
6 |
98 |
Settlement of decommissioning and restoration liabilities |
|
(86) |
(85) |
(11) |
(18) |
(15) |
(9) |
— |
— |
— |
— |
(112) |
(112) |
Other |
|
47 |
36 |
— |
1 |
47 |
9 |
100 |
12 |
— |
— |
194 |
58 |
Current income tax expense |
|
— |
— |
— |
— |
— |
— |
— |
— |
(412) |
(781) |
(412) |
(781) |
Adjusted funds from (used in) operations |
|
2 399 |
3 108 |
372 |
398 |
615 |
893 |
(285) |
(221) |
(412) |
(781) |
2 689 |
3 397 |
Change in non-cash working capital |
|
|
|
|
|
|
|
|
|
|
|
230 |
432 |
Cash flow provided by operating activities |
|
|
|
|
|
|
|
|
|
|
|
2 919 |
3 829 |
|
|
|
|
Exploration and |
Refining and |
Corporate and |
|
|
|
|
|||
Six months ended June 30 |
|
Oil Sands |
Production |
Marketing |
Eliminations |
Income Taxes |
Total |
||||||
($ millions) |
|
2025 |
2024 |
2025 |
2024 |
2025 |
2024 |
2025 |
2024 |
2025 |
2024 |
2025 |
2024 |
Earnings (loss) before income taxes |
|
2 519 |
3 163 |
323 |
470 |
1 049 |
1 707 |
(167) |
(937) |
— |
— |
3 724 |
4 403 |
Adjustments for: |
|
|
|
|
|
|
|
|
|
|
|
|
|
Depreciation, depletion, |
|
2 447 |
2 420 |
338 |
354 |
517 |
480 |
70 |
58 |
— |
— |
3 372 |
3 312 |
Accretion |
|
248 |
255 |
32 |
33 |
7 |
6 |
— |
— |
— |
— |
287 |
294 |
Unrealized foreign |
|
— |
— |
— |
— |
— |
— |
(475) |
323 |
— |
— |
(475) |
323 |
Change in fair value of |
|
147 |
(40) |
28 |
18 |
(45) |
66 |
— |
— |
— |
— |
130 |
44 |
Gain on disposal of |
|
— |
— |
— |
— |
— |
— |
— |
(2) |
— |
— |
— |
(2) |
Share-based |
|
(79) |
(128) |
(5) |
6 |
(36) |
(58) |
(177) |
(96) |
— |
— |
(297) |
(276) |
Settlement of |
|
(165) |
(197) |
(14) |
(20) |
(27) |
(18) |
— |
— |
— |
— |
(206) |
(235) |
Other |
|
92 |
78 |
— |
4 |
52 |
16 |
115 |
35 |
— |
— |
259 |
133 |
Current income tax expense |
|
— |
— |
— |
— |
— |
— |
— |
— |
(1 060) |
(1 430) |
(1 060) |
(1 430) |
Adjusted funds from (used in) operations |
|
5 209 |
5 551 |
702 |
865 |
1 517 |
2 199 |
(634) |
(619) |
(1 060) |
(1 430) |
5 734 |
6 566 |
Change in non-cash working capital |
|
|
|
|
|
|
|
|
|
|
|
(659) |
50 |
Cash flow provided by operating activities |
|
|
|
|
|
|
|
|
|
|
|
5 075 |
6 616 |
Free Funds Flow
Free funds flow is a non-GAAP financial measure that is calculated by taking adjusted funds from operations and subtracting capital expenditures, including capitalized interest. Free funds flow reflects cash available for increasing distributions to shareholders and reducing debt. Management uses free funds flow to measure the capacity of the company to increase returns to shareholders and to grow Suncor’s business.
|
|
|
|
Exploration and |
Refining and |
Corporate and |
|
|
|
|
|
|||
Three months ended June 30 |
|
Oil Sands |
Production |
Marketing |
Eliminations |
Income Taxes |
Total |
|||||||
($ millions) |
|
2025 |
2024 |
2025 |
2024 |
2025 |
2024 |
2025 |
2024 |
2025 |
2024 |
2025 |
|
2024 |
Adjusted funds from (used in) operations |
|
2 399 |
3 108 |
372 |
398 |
615 |
893 |
(285) |
(221) |
(412) |
(781) |
2 689 |
|
3 397 |
Capital expenditures including capitalized interest |
|
(1 109) |
(1 437) |
(229) |
(229) |
(362) |
(375) |
(8) |
(6) |
— |
— |
(1 708) |
|
(2 047) |
Free funds flow (deficit) |
|
1 290 |
1 671 |
143 |
169 |
253 |
518 |
(293) |
(227) |
(412) |
(781) |
981 |
|
1 350 |
|
|
|
|
Exploration and |
Refining and |
Corporate and |
|
|
|
|
|
|||
Six months ended June 30 |
|
Oil Sands |
Production |
Marketing |
Eliminations |
Income Taxes |
Total |
|||||||
($ millions) |
|
2025 |
2024 |
2025 |
2024 |
2025 |
2024 |
2025 |
2024 |
2025 |
2024 |
2025 |
|
2024 |
Adjusted funds from (used in) operations |
|
5 209 |
5 551 |
702 |
865 |
1 517 |
2 199 |
(634) |
(619) |
(1 060) |
(1 430) |
5 734 |
|
6 566 |
Capital expenditures including capitalized interest |
|
(1 858) |
(2 432) |
(438) |
(371) |
(542) |
(543) |
(15) |
(12) |
— |
— |
(2 853) |
|
(3 358) |
Free funds flow (deficit) |
|
3 351 |
3 119 |
264 |
494 |
975 |
1 656 |
(649) |
(631) |
(1 060) |
(1 430) |
2 881 |
|
3 208 |
Net Debt and Total Debt
Net debt and total debt are non-GAAP financial measures that management uses to analyze the financial condition of the company. Total debt includes short-term debt, current portion of long-term debt and long-term debt (all of which are GAAP measures). Net debt is equal to total debt less cash and cash equivalents (a GAAP measure).
|
|
June 30 |
December 31 |
($ millions, except as noted) |
|
2025 |
2024 |
Short-term debt |
|
— |
— |
Current portion of long-term debt |
|
1 376 |
997 |
Long-term debt |
|
8 566 |
9 348 |
Total debt |
|
9 942 |
10 345 |
Less: Cash and cash equivalents |
|
2 269 |
3 484 |
Net debt |
|
7 673 |
6 861 |
Shareholders’ equity |
|
44 580 |
44 514 |
Total debt plus shareholders’ equity |
|
54 522 |
54 859 |
Total debt to total debt plus shareholders’ equity (%) |
|
18.2 |
18.9 |
Net debt to net debt plus shareholders’ equity (%) |
|
14.7 |
13.4 |
Legal Advisory – Forward-Looking Information
This news release contains certain forward-looking information and forward-looking statements (collectively referred to herein as “forward-looking statements”) and other information based on Suncor’s current expectations, estimates, projections and assumptions that were made by the company in light of information available at the time the statement was made and consider Suncor’s experience and its perception of historical trends, including expectations and assumptions concerning: the accuracy of reserves estimates; commodity prices and interest and foreign exchange rates; the performance of assets and equipment; uncertainty related to geopolitical conflict; capital efficiencies and cost savings; applicable laws and government policies; future production rates; the sufficiency of budgeted capital expenditures in carrying out planned activities; the availability and cost of labour, services and infrastructure; the satisfaction by third parties of their obligations to Suncor; the development and execution of projects; and the receipt, in a timely manner, of regulatory and third-party approvals. All statements and information that address expectations or projections about the future, and other statements and information about Suncor’s strategy for growth, expected and future expenditures or investment decisions, commodity prices, costs, schedules, production volumes, operating and financial results, future financing and capital activities, and the expected impact of future commitments are forward-looking statements. Some of the forward-looking statements may be identified by words like “expects”, “anticipates”, “will”, “estimates”, “plans”, “scheduled”, “intends”, “believes”, “projects”, “indicates”, “could”, “focus”, “vision”, “goal”, “outlook”, “proposed”, “target”, “objective”, “continue”, “should”, “may”, “future”, “potential”, “opportunity”, “would”, “priority”, “strategy” and similar expressions. Forward-looking statements in this news release include references to: Suncor's strategy, focus, goals and priorities and the expected benefits therefrom, and the anticipated return to normal production at White Rose in in the second quarter. In addition, all other statements and information about Suncor’s strategy for growth, expected and future expenditures or investment decisions, commodity prices, costs, schedules, production volumes, operating and financial results and the expected impact of future commitments are forward-looking statements. Some of the forward-looking statements and information may be identified by words like “expects”, “anticipates”, “will”, “estimates”, “plans”, “scheduled”, “intends”, “believes”, “projects”, “indicates”, “could”, “focus”, “vision”, “goal”, “outlook”, “proposed”, “target”, “objective”, “continue”, “should”, “may” and similar expressions.
Forward-looking statements are based on Suncor’s current expectations, estimates, projections and assumptions that were made by the company in light of its information available at the time the statement was made and consider Suncor’s experience and its perception of historical trends, including expectations and assumptions concerning: the accuracy of reserves estimates; commodity prices and interest and foreign exchange rates; the performance of assets and equipment; capital efficiencies and cost savings; applicable laws and government policies; future production rates; the sufficiency of budgeted capital expenditures in carrying out planned activities; the availability and cost of labour, services and infrastructure; the satisfaction by third parties of their obligations to Suncor; the development and execution of projects; and the receipt, in a timely manner, of regulatory and third-party approvals.
Forward-looking statements and information are not guarantees of future performance and involve a number of risks and uncertainties, some that are similar to other oil and gas companies and some that are unique to Suncor. Suncor’s actual
results may differ materially from those expressed or implied by its forward-looking statements, so readers are cautioned not to place undue reliance on them.
Suncor’s Annual Information Form, Annual Report to Shareholders and Form 40-F, each dated February 26, 2025, Suncor’s Report to Shareholders for the Second Quarter of 2025 dated August 5, 2025, and other documents it files from time to time with securities regulatory authorities describe the risks, uncertainties, material assumptions and other factors that could influence actual results and such factors are incorporated herein by reference. Copies of these documents are available by referring to suncor.com/FinancialReports or on SEDAR+ at sedarplus.ca or EDGAR at sec.gov. Except as required by applicable securities laws, Suncor disclaims any intention or obligation to publicly update or revise any forward-looking statements, whether as a result of new information, future events or otherwise.
To view a full copy of Suncor’s second quarter 2025 Report to Shareholders and the financial statements and notes (unaudited), visit Suncor's profile on sedarplus.ca or sec.gov or visit Suncor’s website at suncor.com/financialreports.
To listen to the conference call discussing Suncor's second quarter results, visit suncor.com/webcasts. The event will be archived for 90 days.
Suncor Energy is Canada's leading integrated energy company. Suncor's operations include oil sands development, production and upgrading; offshore oil production; petroleum refining in Canada and the U.S.; and the company’s Petro-CanadaTM retail and wholesale distribution networks (including Canada’s Electric HighwayTM, a coast-to-coast network of fast-charging EV stations). Suncor is developing petroleum resources while advancing the transition to a lower-emissions future through investments in lower emissions intensity power, renewable feedstock fuels and projects targeting emissions intensity. Suncor also conducts energy trading activities focused primarily on the marketing and trading of crude oil, natural gas, byproducts, refined products and power. Suncor's common shares (symbol: SU) are listed on the Toronto and New York stock exchanges.
For more information about Suncor, visit our web site at suncor.com.
Media inquiries:
833-296-4570
media@suncor.com
Investor inquiries:
invest@suncor.com

All financial figures are unaudited and presented in Canadian dollars unless noted otherwise. Production volumes are presented on a working-interest basis, before royalties, except for production volumes from Suncor Energy Inc.’s (Suncor or the company) Libya operations, which are presented on an economic basis. Certain financial measures in this document are not prescribed by Canadian generally accepted accounting principles (GAAP). For a description of these non-GAAP financial measures, see the Non-GAAP and Other Financial Measures Advisory section of Suncor’s Management Discussion and Analysis (MD&A) dated August 5, 2025. See also the Advisories section of the MD&A. References to Oil Sands operations exclude Suncor’s ownership of Fort Hills and interest in Syncrude.
Second Quarter Highlights
| ● | Generated $2.7 billion in adjusted funds from operations and $1.0 billion in free funds flow. |
| ● | Returned $1.45 billion to shareholders, with $750 million in share repurchases and $700 million in dividends. |
| ● | Record second quarter upstream production of 808,000 bbls/d and record first half production of 831,000 bbls/d. |
| ● | Record second quarter refinery throughput of 442,000 bbls/d and record first half throughput of 462,000 bbls/d. |
| ● | Executed major upstream and downstream turnaround activity safely and ahead of schedule. |
| ● | Completed the Upgrader 1 coke drum replacement project ahead of schedule in early July. |
| ● | Reduced 2025 capital guidance by $400 million, reflecting strong execution performance and capital discipline. |
"What stands out the most about our strong second quarter is the outstanding execution of major upstream and downstream turnaround activities, completed safely and ahead of schedule,” said Rich Kruger, President and Chief Executive Officer. “This performance was a key driver behind Suncor’s record-setting second quarter and first half volumes results and positions us extremely well for a strong second half of the year. The quarter once again demonstrates our unwavering commitment and focus on delivering superior results for our shareholders.”
Second Quarter Results
Financial Highlights |
|
Q2 |
Q1 |
Q2 |
($ millions, unless otherwise noted) |
|
2025 |
2025 |
2024 |
Net earnings |
|
1 134 |
1 689 |
1 568 |
Per common share(1) (dollars) |
|
0.93 |
1.36 |
1.22 |
Adjusted operating earnings(2) |
|
873 |
1 629 |
1 626 |
Per common share(1)(2) (dollars) |
|
0.71 |
1.31 |
1.27 |
Adjusted funds from operations(2) |
|
2 689 |
3 045 |
3 397 |
Per common share(1)(2) (dollars) |
|
2.20 |
2.46 |
2.65 |
Cash flow provided by operating activities |
|
2 919 |
2 156 |
3 829 |
Per common share(1) (dollars) |
|
2.38 |
1.74 |
2.98 |
Capital and exploration expenditures(3) |
|
1 649 |
1 087 |
1 964 |
Free funds flow(2) |
|
981 |
1 900 |
1 350 |
Dividend per common share(1) (dollars) |
|
0.57 |
0.57 |
0.55 |
Share repurchases per common share(4) (dollars) |
|
0.61 |
0.61 |
0.64 |
Returns to shareholders(5) |
|
1 447 |
1 455 |
1 523 |
Operating, selling and general (OS&G) expenses |
|
3 163 |
3 297 |
3 153 |
Net debt(2) |
|
7 673 |
7 559 |
9 054 |
|
|
|
|
|
|
|
Q2 |
Q1 |
Q2 |
Operating Highlights |
|
2025 |
2025 |
2024 |
Total upstream production (mbbls/d) |
|
808.1 |
853.2 |
770.6 |
Refinery utilization (%) |
|
95 |
104 |
92 |
| (1) | Presented on a basic per share basis. |
| (2) | Non-GAAP financial measures or contains non-GAAP financial measures. See the Non-GAAP and Other Financial Measures Advisory section of the MD&A. |
| (3) | Excludes capitalized interest. |
| (4) | Calculated as the cost of share repurchases, excluding taxes paid on share repurchases, divided by the weighted average number of shares outstanding. |
| (5) | Includes dividends paid on common shares and repurchases of common shares; excludes taxes paid on common share repurchases. |
Financial Results
Adjusted Operating Earnings Reconciliation(1)
|
|
Q2 |
Q1 |
Q2 |
($ millions) |
|
2025 |
2025 |
2024 |
Net earnings |
|
1 134 |
1 689 |
1 568 |
Unrealized foreign exchange (gain) loss on U.S. dollar denominated debt |
|
(461) |
(14) |
103 |
Unrealized loss (gain) on risk management activities |
|
68 |
(60) |
(52) |
Write-down of equity investments |
|
136 |
— |
— |
Income tax (recovery) expense on adjusted operating earnings adjustments |
|
(4) |
14 |
7 |
Adjusted operating earnings(1) |
|
873 |
1 629 |
1 626 |
| (1) | Non-GAAP financial measure. All reconciling items are presented on a before-tax basis and adjusted for income taxes in the income tax (recovery) expense on adjusted operating earnings adjustments line. See the Non-GAAP and Other Financial Measures Advisory section of the MD&A. |
| ● | Suncor’s adjusted operating earnings were $873 million ($0.71 per common share) in the second quarter of 2025, compared to $1.626 billion ($1.27 per common share) in the prior year quarter, with the decrease primarily due to lower upstream price realizations, in line with lower benchmark pricing, partially offset by lower royalties and income taxes, and increased sales volumes in both the upstream and downstream. |
| ● | Net earnings were $1.134 billion ($0.93 per common share) in the second quarter of 2025, compared to $1.568 billion ($1.22 per common share) in the prior year quarter. In addition to the factors impacting adjusted operating earnings, net earnings for the second quarter of 2025 and the prior year quarter were impacted by the items shown in the table above. |
| ● | Adjusted funds from operations were $2.689 billion ($2.20 per common share) in the second quarter of 2025, compared to $3.397 billion ($2.65 per common share) in the prior year quarter, and were primarily influenced by the same factors impacting adjusted operating earnings. |
| ● | Cash flow provided by operating activities, which includes changes in non-cash working capital, were $2.919 billion ($2.38 per common share) in the second quarter of 2025, compared to $3.829 billion ($2.98 per common share) in the prior year quarter. |
| ● | Operating, selling and general (OS&G) expenses remained consistent at $3.163 billion in the second quarter of 2025, compared to $3.153 billion in the prior year quarter, as higher commodity input costs and increased mining costs were largely offset by decreased share-based compensation expense. |
|
Operating Results
|
|
Q2 |
Q1 |
Q2 |
(mbbls/d, unless otherwise noted) |
|
2025 |
2025 |
2024 |
Upstream |
|
|
|
|
Total Oil Sands bitumen production |
|
860.8 |
937.3 |
834.4 |
SCO and diesel production |
|
468.0 |
567.3 |
488.3 |
Inter-asset transfers and consumption |
|
(29.8) |
(30.7) |
(26.6) |
Upgraded production – net SCO and diesel |
|
438.2 |
536.6 |
461.7 |
Bitumen production |
|
334.8 |
341.7 |
308.2 |
Inter-asset transfers |
|
(24.6) |
(87.4) |
(53.9) |
Non-upgraded bitumen production |
|
310.2 |
254.3 |
254.3 |
Total Oil Sands production |
|
748.4 |
790.9 |
716.0 |
Exploration and Production |
|
59.7 |
62.3 |
54.6 |
Total upstream production |
|
808.1 |
853.2 |
770.6 |
Upstream sales |
|
812.8 |
828.4 |
773.2 |
|
|
|
|
|
Downstream |
|
|
|
|
Refinery utilization (%) |
|
95 |
104 |
92 |
Refinery crude oil processed |
|
442.3 |
482.7 |
430.5 |
Refined product sales |
|
600.5 |
604.9 |
594.7 |
| ● | Total Oil Sands bitumen production increased to a second quarter record of 860,800 bbls/d, compared to 834,400 bbls/d in the prior year quarter, and included record second quarter production at Firebag. |
| ● | The company’s net synthetic crude oil (SCO) production was 438,200 bbls/d in the second quarter of 2025, compared to 461,700 bbls/d in the prior year quarter, and was impacted by increased upgrader-related maintenance activities in the current period, including the Upgrader 1 coke drum replacement project and turnaround, which was completed subsequent to the quarter. |
| ● | Non-upgraded bitumen production increased to 310,200 bbls/d in the second quarter of 2025, compared to 254,300 bbls/d in the prior year quarter, primarily due to increased bitumen production and lower upgrader availability. |
| ● | Exploration and Production (E&P) production increased to 59,700 bbls/d in the second quarter of 2025, compared to 54,600 bbls/d in the prior year quarter and included increased production at Hebron and the addition of production at White Rose, which restarted in the first quarter of 2025. |
| ● | Refinery throughput increased to a second quarter record of 442,300 bbls/d with utilization of 95%, compared to 430,500 bbls/d and 92%, respectively, in the prior year quarter. The increase was primarily due to strong operating performance and the efficient execution of planned maintenance activities. |
| ● | Refined product sales increased to a second quarter record of 600,500 bbls/d, compared to 594,700 bbls/d in the prior year quarter, with the increase primarily due to higher refinery throughput and execution of the previously announced retail growth plan. |
Corporate and Strategy Updates
| ● | Syncrude achieves first ore at Mildred Lake Mine Extension West (MLX-W). Syncrude reached a significant milestone at MLX-W, which is expected to sustain existing bitumen production levels, with first ore extraction completed earlier than expected. |
Corporate Guidance Updates
Suncor has updated its 2025 corporate guidance ranges, previously issued on December 12, 2024, by reducing 2025 full-year estimated capital spend from $6.1-$6.3 billion down to $5.7-$5.9 billion. Estimated ranges for current income taxes, royalties and business environment have also been adjusted to reflect the current business environment as at August 5.
For further details and advisories regarding Suncor’s 2025 corporate guidance, see www.suncor.com/guidance.
|
Management’s Discussion and Analysis
August 5, 2025
Suncor Energy Inc. (Suncor or the company) is Canada’s leading integrated energy company. Suncor's operations include oil sands development, production and upgrading; offshore oil production; petroleum refining in Canada and the U.S.; and the company’s Petro-CanadaTM retail and wholesale distribution networks (including Canada’s Electric HighwayTM, a coast-to-coast network of fast-charging EV stations). Suncor is developing petroleum resources while advancing the transition to a lower-emissions future through investments in lower emissions intensity power, renewable feedstock fuels and projects targeting emissions intensity. Suncor also conducts energy trading activities focused primarily on the marketing and trading of crude oil, natural gas, byproducts, refined products and power. Suncor’s common shares (symbol: SU) are listed on the Toronto Stock Exchange (TSX) and the New York Stock Exchange (NYSE).
For a description of Suncor’s segments, refer to Suncor’s Management’s Discussion and Analysis (MD&A) for the year ended December 31, 2024, dated February 26, 2025 (the 2024 annual MD&A).
This MD&A, for the three and six months ended June 30, 2025, should be read in conjunction with Suncor’s unaudited interim Consolidated Financial Statements for the three and six months ended June 30, 2025, Suncor’s audited Consolidated Financial Statements for the year ended December 31, 2024, and the 2024 annual MD&A.
Additional information about Suncor filed with Canadian securities regulatory authorities and the United States Securities and Exchange Commission (SEC), including quarterly and annual reports and Suncor’s Annual Information Form dated February 26, 2025 (the 2024 AIF), which is also filed with the SEC under cover of Form 40-F, is available online at www.sedarplus.ca, www.sec.gov and on our website at www.suncor.com. Information contained in or otherwise accessible through our website does not form part of this MD&A and is not incorporated into this MD&A by reference.
References to “we”, “our”, “Suncor”, “Suncor Energy” or “the company” means Suncor Energy Inc., its subsidiaries, partnerships and joint arrangements, unless otherwise specified or the context otherwise requires.
Basis of Presentation
Unless otherwise noted, all financial information is derived from the company’s condensed Consolidated Financial Statements, which are based on Canadian generally accepted accounting principles (GAAP), specifically International Financial Reporting Standards (IFRS) as issued by the International Accounting Standards Board, and are prepared in accordance with International Accounting Standard (IAS) 34 Interim Financial Reporting.
All financial information is reported in Canadian dollars, unless otherwise noted. Production volumes are presented on a working-interest basis, before royalties, except for production volumes from the company’s Libya operations, which are presented on an economic basis.
References to Oil Sands operations exclude Suncor’s ownership of Fort Hills and interest in Syncrude.
Common Abbreviations
For a list of the abbreviations that may be used in this MD&A, please refer to the Common Abbreviations section of this MD&A.
Table of Contents
1. |
5 |
|
|
2. |
6 |
|
|
3. |
10 |
|
|
4. |
20 |
|
|
5. |
21 |
|
|
6. |
22 |
|
|
7. |
25 |
|
|
8. |
27 |
|
|
9. |
28 |
|
|
10. |
37 |
|
|
11. |
38 |
|
| ● | Financial results. Adjusted funds from operations(1) were $2.689 billion ($2.20 per common share), compared to $3.397 billion ($2.65 per common share) in the prior year quarter. Adjusted operating earnings(1) were $873 million ($0.71 per common share), compared to $1.626 billion ($1.27 per common share) in the prior year quarter. |
| ● | Returned value to shareholders. Suncor returned over $1.4 billion of value to shareholders, with $750 million in share repurchases and $697 million in dividends. As at July 31, 2025, since the start of the year, the company has repurchased approximately $1.7 billion of Suncor’s common shares, representing approximately 33.3 million common shares at an average price of $52.60 per common share, or the equivalent of 2.7% of its common shares as at December 31, 2024. |
| ● | Record second quarter upstream and Oil Sands production. Upstream production was a second quarter record of 808,100 bbls/d and included record second quarter Oil Sands production of 748,400 bbls/d during a quarter with significant planned maintenance activities, including the Upgrader 1 coke drum replacement project and turnaround. |
| ● | Record second quarter refining throughput and refined product sales. Refining throughput was 442,300 bbls/d with refinery utilization of 95%, a second quarter record, and included the impacts of planned turnarounds at the Sarnia and Edmonton refineries. Refined product sales were a second quarter record of 600,500 bbls/d. |
| ● | Planned turnarounds completed safely and efficiently. Second quarter planned turnaround activity was executed safely and efficiently across the business, including the Upgrader 1 coke drum replacement project and turnaround, which was completed ahead of schedule subsequent to the second quarter. |
| ● | Syncrude achieves first ore at Mildred Lake Mine Extension West (MLX-W). Syncrude reached a significant milestone at MLX-W, which is expected to sustain existing bitumen production levels, with first ore extraction completed earlier than expected. |
| ● | Capital guidance updated. Suncor has updated its 2025 capital guidance ranges, previously issued on December 12, 2024, by reducing 2025 full-year estimated capital spend from $6.1-$6.3 billion down to $5.7-$5.9 billion. For further details and advisories regarding Suncor’s 2025 corporate guidance, see www.suncor.com/guidance. |
(1) |
Non-GAAP financial measures. See the Non-GAAP and Other Financial Measures Advisory section of this MD&A. |
|
Management’s Discussion and Analysis
2. Consolidated Financial and Operating Information
Financial Highlights
|
|
Three months ended |
Six months ended |
||
($ millions) |
|
2025 |
2024 |
2025 |
2024 |
Earnings (loss) before income taxes |
|
|
|
|
|
Oil Sands |
|
844 |
1 792 |
2 519 |
3 163 |
Exploration and Production |
|
165 |
196 |
323 |
470 |
Refining and Marketing |
|
377 |
593 |
1 049 |
1 707 |
Corporate and Eliminations |
|
48 |
(398) |
(167) |
(937) |
Income tax expense |
|
(300) |
(615) |
(901) |
(1 225) |
Net earnings |
|
1 134 |
1 568 |
2 823 |
3 178 |
Adjusted operating earnings (loss)(1) |
|
|
|
|
|
Oil Sands |
|
926 |
1 745 |
2 546 |
3 110 |
Exploration and Production |
|
165 |
196 |
323 |
470 |
Refining and Marketing |
|
404 |
588 |
1 071 |
1 706 |
Corporate and Eliminations |
|
(318) |
(295) |
(547) |
(614) |
Income tax expense included in adjusted operating earnings |
|
(304) |
(608) |
(891) |
(1 229) |
Total |
|
873 |
1 626 |
2 502 |
3 443 |
Adjusted funds from (used in) operations(1) |
|
|
|
|
|
Oil Sands |
|
2 399 |
3 108 |
5 209 |
5 551 |
Exploration and Production |
|
372 |
398 |
702 |
865 |
Refining and Marketing |
|
615 |
893 |
1 517 |
2 199 |
Corporate and Eliminations |
|
(285) |
(221) |
(634) |
(619) |
Current income tax expense |
|
(412) |
(781) |
(1 060) |
(1 430) |
Total |
|
2 689 |
3 397 |
5 734 |
6 566 |
Change in non-cash working capital |
|
230 |
432 |
(659) |
50 |
Cash flow provided by operating activities |
|
2 919 |
3 829 |
5 075 |
6 616 |
Capital and exploration expenditures(2) |
|
|
|
|
|
Asset sustainment and maintenance |
|
975 |
1 235 |
1 473 |
1 809 |
Economic investment |
|
674 |
729 |
1 263 |
1 392 |
Total |
|
1 649 |
1 964 |
2 736 |
3 201 |
Free funds flow(1) |
|
981 |
1 350 |
2 881 |
3 208 |
| (1) | Non-GAAP financial measures. See the Non-GAAP and Other Financial Measures Advisory section of this MD&A. |
| (2) | Excludes capitalized interest of $59 million and $117 million in the second quarter and first six months of 2025, compared to $83 million and $157 million in the second quarter and first six months of 2024. |
Operating Highlights
|
|
Three months ended |
Six months ended |
||
(mbbls/d, unless otherwise noted) |
|
2025 |
2024 |
2025 |
2024 |
Upstream |
|
|
|
|
|
Production volumes |
|
|
|
|
|
Oil Sands – Upgraded – net SCO and diesel |
|
438.2 |
461.7 |
487.1 |
503.3 |
Oil Sands – Non-upgraded bitumen |
|
310.2 |
254.3 |
282.4 |
247.2 |
Total Oil Sands production volumes |
|
748.4 |
716.0 |
769.5 |
750.5 |
Exploration and Production |
|
59.7 |
54.6 |
61.0 |
52.5 |
Total upstream production |
|
808.1 |
770.6 |
830.5 |
803.0 |
Upstream sales |
|
812.8 |
773.2 |
820.6 |
810.3 |
Downstream |
|
|
|
|
|
Refinery utilization (%) |
|
95 |
92 |
99 |
95 |
Refinery crude oil processed |
|
442.3 |
430.5 |
462.4 |
442.9 |
Refined product sales |
|
600.5 |
594.7 |
602.6 |
587.8 |
Financial Results
Net Earnings and Adjusted Operating Earnings
Adjusted Operating Earnings Reconciliation(1)
|
|
Three months ended |
Six months ended |
||
($ millions) |
|
2025 |
2024 |
2025 |
2024 |
Net earnings |
|
1 134 |
1 568 |
2 823 |
3 178 |
Unrealized foreign exchange (gain) loss on U.S. dollar denominated debt |
|
(461) |
103 |
(475) |
323 |
Unrealized loss (gain) on risk management activities |
|
68 |
(52) |
8 |
(54) |
Write-down of equity investments |
|
136 |
— |
136 |
— |
Income tax (recovery) expense on adjusted operating earnings adjustments |
|
(4) |
7 |
10 |
(4) |
Adjusted operating earnings(1) |
|
873 |
1 626 |
2 502 |
3 443 |
| (1) | Non-GAAP financial measure. All reconciling items are presented on a before-tax basis and adjusted for income taxes in the income tax (recovery) expense on adjusted operating earnings adjustments line. See the Non-GAAP and Other Financial Measures Advisory section of this MD&A. |
Suncor’s consolidated net earnings for the second quarter of 2025 were $1.134 billion, compared to $1.568 billion in the prior year quarter. Net earnings were primarily influenced by the same factors that impacted adjusted operating earnings discussed below.
Other items affecting net earnings over these periods included:
| ● | An unrealized foreign exchange gain on the revaluation of U.S. dollar denominated debt of $461 million recorded in financing expenses in the Corporate and Eliminations segment in the second quarter of 2025, compared to a loss of $103 million in the second quarter of 2024. |
| ● | An unrealized loss on risk management activities of $68 million recorded in other income in the second quarter of 2025, compared to an unrealized gain of $52 million in the second quarter of 2024. |
| ● | During the second quarter of 2025, Suncor recorded a write-down of an equity investment of $95 million in the Corporate and Eliminations segment and $41 million in the Refining and Marketing (R&M) segment. |
| ● | An income tax recovery related to the items noted above of $4 million in the second quarter of 2025, compared to an expense of $7 million in the second quarter of 2024. |
|
Management’s Discussion and Analysis
Bridge Analysis of Adjusted Operating Earnings ($ millions)(1)
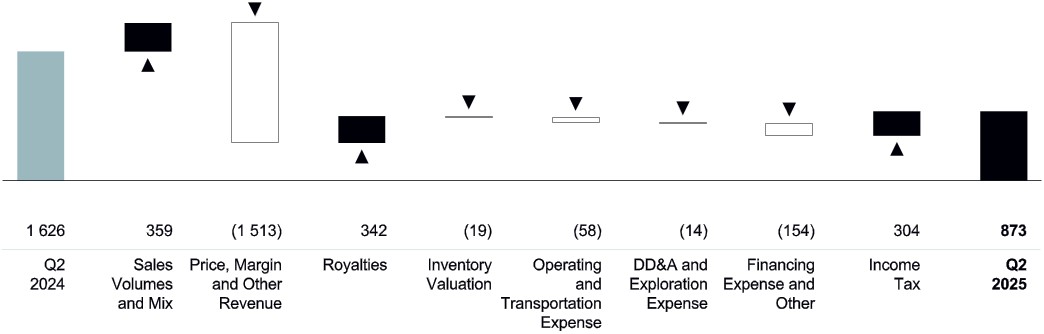
| (1) | For an explanation of this bridge analysis, see the Non-GAAP and Other Financial Measures Advisory section of this MD&A. |
Suncor’s adjusted operating earnings were $873 million ($0.71 per common share) in the second quarter of 2025, compared to $1.626 billion ($1.27 per common share) in the prior year quarter, with the decrease primarily due to lower upstream price realizations, in line with lower benchmark pricing, partially offset by lower royalties and income taxes, and increased sales volumes in both the upstream and downstream.
Adjusted Funds from Operations and Cash Flow Provided by Operating Activities
Adjusted funds from operations were $2.689 billion ($2.20 per common share) in the second quarter of 2025, compared to $3.397 billion ($2.65 per common share) in the prior year quarter, and were primarily influenced by the same factors impacting adjusted operating earnings discussed above.
Cash flow provided by operating activities, which includes changes in non-cash working capital, was $2.919 billion ($2.38 per common share) in the second quarter of 2025, compared to $3.829 billion ($2.98 per common share) in the prior year quarter. In addition to the factors impacting adjusted funds from operations, cash flow provided by operating activities was impacted by a smaller source of cash associated with the company’s working capital balances in the second quarter of 2025 compared to the prior year quarter. Working capital is subject to fluctuations based on commodity prices, the timing of transactions and seasonal factors. The source of cash in the second quarter of 2025 was primarily due to a draw of inventory related to increased sales volumes, partially offset by a decrease in accounts payable and accrued liabilities.
Operating, Selling and General Expenses
|
|
Three months ended |
Six months ended |
||
($ millions) |
|
2025 |
2024 |
2025 |
2024 |
Operations, selling and corporate costs |
|
2 712 |
2 669 |
5 378 |
5 484 |
Commodities |
|
431 |
356 |
917 |
822 |
Share-based compensation(1) |
|
20 |
128 |
165 |
287 |
Total operating, selling and general (OS&G) expenses |
|
3 163 |
3 153 |
6 460 |
6 593 |
| (1) | In the second quarter of 2025, share-based compensation expense of $20 million included $7 million in the Oil Sands segment, $1 million in the E&P segment, $4 million in the R&M segment and $8 million in the Corporate and Eliminations segment. In the second quarter of 2024, share-based compensation expense of $128 million included $45 million in the Oil Sands segment, $4 million in the E&P segment, $19 million in the R&M segment and $60 million in the Corporate and Eliminations segment. |
OS&G expenses remained consistent in the second quarter of 2025, compared to the prior year quarter, as higher commodity input costs and increased mining costs were largely offset by decreased share-based compensation expense. The company’s exposure to commodity costs is partially mitigated by revenue from power sales that are recorded in operating revenues.
Business Environment
Commodity prices, refining crack spreads and foreign exchange rates are important factors that affect the results of Suncor’s operations. For additional details, see the Financial Information section of the 2024 annual MD&A.
|
|
|
Average for the |
Average for the |
||
|
|
|
2025 |
2024 |
2025 |
2024 |
WTI crude oil at Cushing |
|
US$/bbl |
63.70 |
80.55 |
67.55 |
78.75 |
Dated Brent crude |
|
US$/bbl |
67.80 |
84.90 |
71.70 |
84.05 |
Dated Brent/Maya crude oil FOB price differential |
|
US$/bbl |
10.10 |
12.05 |
10.60 |
13.05 |
MSW at Edmonton |
|
Cdn$/bbl |
84.25 |
105.25 |
89.75 |
98.75 |
WCS at Hardisty |
|
US$/bbl |
53.50 |
67.00 |
56.10 |
62.30 |
WCS-WTI heavy/light differential |
|
US$/bbl |
(10.20) |
(13.55) |
(11.45) |
(16.45) |
SYN-WTI premium (differential) |
|
US$/bbl |
1.00 |
2.80 |
(0.65) |
(2.30) |
Condensate at Edmonton |
|
US$/bbl |
63.50 |
77.15 |
66.70 |
75.00 |
Natural gas (Alberta spot) at AECO |
|
Cdn$/GJ |
1.65 |
1.10 |
1.85 |
1.65 |
Alberta Power Pool Price |
|
Cdn$/MWh |
40.50 |
45.15 |
40.15 |
72.25 |
New York Harbor 2-1-1 crack(1) |
|
US$/bbl |
25.90 |
24.75 |
23.50 |
25.90 |
Chicago 2-1-1 crack(1) |
|
US$/bbl |
22.05 |
18.85 |
18.35 |
19.35 |
Portland 2-1-1 crack(1) |
|
US$/bbl |
38.20 |
29.30 |
30.30 |
28.10 |
Gulf Coast 2-1-1 crack(1) |
|
US$/bbl |
23.20 |
22.10 |
22.05 |
25.05 |
U.S. Renewable Volume Obligation |
|
US$/bbl |
6.15 |
3.40 |
5.45 |
3.55 |
Suncor custom 5-2-2-1 index(2) |
|
US$/bbl |
27.85 |
26.70 |
27.30 |
31.35 |
Exchange rate (average) |
|
US$/Cdn$ |
0.72 |
0.73 |
0.71 |
0.74 |
Exchange rate (end of period) |
|
US$/Cdn$ |
0.73 |
0.73 |
0.73 |
0.73 |
| (1) | 2-1-1 crack spreads are indicators of the refining margin generated by converting two barrels of WTI into one barrel of gasoline and one barrel of diesel. The crack spreads presented here generally approximate the regions into which the company sells refined products through retail and wholesale channels. |
| (2) | Suncor has developed an indicative 5-2-2-1 index based on publicly available pricing data to more accurately reflect the company’s realized refining and marketing gross margin. For more details, including how the 5-2-2-1 index is calculated, see Suncor’s 2024 annual MD&A. |
|
Management’s Discussion and Analysis
3. Segment Results and Analysis
Oil Sands
Financial Highlights
|
|
Three months ended |
Six months ended |
||
($ millions) |
|
2025 |
2024 |
2025 |
2024 |
Operating revenues |
|
6 440 |
7 432 |
13 581 |
14 354 |
Less: Royalties |
|
(596) |
(1 001) |
(1 411) |
(1 783) |
Operating revenues, net of royalties |
|
5 844 |
6 431 |
12 170 |
12 571 |
Earnings before income taxes |
|
844 |
1 792 |
2 519 |
3 163 |
Adjusted for: |
|
|
|
|
|
Unrealized loss (gain) on risk management activities |
|
82 |
(47) |
27 |
(53) |
Adjusted operating earnings(1) |
|
926 |
1 745 |
2 546 |
3 110 |
Adjusted funds from operations(1) |
|
2 399 |
3 108 |
5 209 |
5 551 |
Free funds flow(1) |
|
1 290 |
1 671 |
3 351 |
3 119 |
| (1) | Non-GAAP financial measures. See the Non-GAAP and Other Financial Measures Advisory section of this MD&A. |
Oil Sands segment adjusted operating earnings decreased to $926 million in the second quarter of 2025, compared to $1.745 billion in the prior year quarter, primarily due to lower crude oil price realizations as a result of lower benchmark pricing, partially offset by a corresponding decrease in royalties and increased sales volumes.
Production Volumes
|
|
Three months ended |
Six months ended |
||
(mbbls/d) |
|
2025 |
2024 |
2025 |
2024 |
Oil Sands bitumen |
|
|
|
|
|
Upgrader bitumen throughput |
|
550.6 |
580.1 |
616.5 |
636.1 |
Non-upgraded bitumen production |
|
310.2 |
254.3 |
282.4 |
247.2 |
Total Oil Sands bitumen production |
|
860.8 |
834.4 |
898.9 |
883.3 |
Upgraded – net SCO and diesel |
|
|
|
|
|
Oil Sands operations(1) |
|
280.6 |
321.6 |
320.7 |
348.1 |
Syncrude(1) |
|
187.4 |
166.7 |
196.7 |
182.3 |
Inter-asset transfers and consumption(2)(3) |
|
(29.8) |
(26.6) |
(30.3) |
(27.1) |
Upgraded – net SCO and diesel production |
|
438.2 |
461.7 |
487.1 |
503.3 |
Non-upgraded bitumen |
|
|
|
|
|
Oil Sands operations |
|
162.8 |
136.9 |
164.1 |
128.6 |
Fort Hills |
|
162.9 |
166.9 |
169.6 |
172.3 |
Syncrude |
|
9.1 |
4.4 |
4.6 |
2.2 |
Inter-asset transfers(4) |
|
(24.6) |
(53.9) |
(55.9) |
(55.9) |
Non-upgraded bitumen production |
|
310.2 |
254.3 |
282.4 |
247.2 |
Oil Sands production volumes to market |
|
|
|
|
|
Upgraded – net SCO and diesel |
|
438.2 |
461.7 |
487.1 |
503.3 |
Non-upgraded bitumen |
|
310.2 |
254.3 |
282.4 |
247.2 |
Total Oil Sands production volumes |
|
748.4 |
716.0 |
769.5 |
750.5 |
| (1) | Oil Sands Base upgrader yields are approximately 80% of bitumen throughput and Syncrude upgrader yield is approximately 85% of bitumen throughput. Upgrader utilization rates are calculated using total upgraded production, inclusive of internally consumed products and inter-asset transfers. |
| (2) | Both Oil Sands operations and Syncrude produce diesel and other products, which are internally consumed in operations. In the second quarter of 2025, Oil Sands operations produced 15,800 bbls/d of internally consumed products, of which 8,200 bbls/d was consumed at Oil Sands operations, 6,400 bbls/d was consumed at Fort Hills and 1,200 bbls/d was consumed at Syncrude. Syncrude produced 3,700 bbls/d of internally consumed products. |
| (3) | In the second quarter of 2025, upgraded inter-asset transfers consist of 10,300 bbls/d of sour SCO that was transferred from Oil Sands operations to Syncrude. |
| (4) | In the second quarter of 2025, non-upgraded inter-asset transfers consist of 15,500 bbls/d of bitumen that was transferred from Fort Hills to Oil Sands Base and 9,100 bbls/d of bitumen that was transferred from Syncrude to Oil Sands operations. |
Total Oil Sands bitumen production increased to a second quarter record of 860,800 bbls/d, compared to 834,400 bbls/d in the prior year quarter, primarily due to record second quarter production at Firebag and a lower overall maintenance impact in the current period.
The company’s net SCO production was 438,200 bbls/d in the second quarter of 2025, compared to 461,700 bbls/d in the prior year quarter, with upgrader utilization of 91% at Syncrude and 80% at Oil Sands Base, compared to 81% and 92%, respectively, in the prior year quarter. The decrease in SCO production was primarily due to increased upgrader-related maintenance activities in the current period, including the Upgrader 1 coke drum replacement project and turnaround.
Non-upgraded bitumen production increased to 310,200 bbls/d in the second quarter of 2025, compared to 254,300 bbls/d in the prior year quarter, primarily due to increased bitumen production and lower upgrader availability.
|
Management’s Discussion and Analysis
Sales Volumes
|
|
Three months ended |
Six months ended |
||
(mbbls/d) |
|
2025 |
2024 |
2025 |
2024 |
Upgraded – net SCO and diesel |
|
440.2 |
453.8 |
484.1 |
502.0 |
Non-upgraded bitumen |
|
307.6 |
272.6 |
276.4 |
253.3 |
Total |
|
747.8 |
726.4 |
760.5 |
755.3 |
SCO and diesel sales volumes decreased to 440,200 bbls/d in the second quarter of 2025, compared to 453,800 bbls/d in the prior year quarter, primarily due to the decrease in SCO production volumes, partially offset by a draw of inventory in the second quarter of 2025 compared to a build of inventory in the prior year quarter.
Non-upgraded bitumen sales volumes increased to 307,600 bbls/d in the second quarter of 2025, compared to 272,600 bbls/d in the prior year quarter, primarily due to the increase in non-upgraded bitumen production volumes, partially offset by a build of inventory in the second quarter of 2025 compared to a draw of inventory in the prior year quarter.
Price Realizations(1)
Net of transportation costs, but before royalties |
|
Three months ended |
Six months ended |
||
($/bbl) |
|
2025 |
2024 |
2025 |
2024 |
Upgraded – net SCO and diesel |
|
86.43 |
106.49 |
91.74 |
98.03 |
Non-upgraded bitumen |
|
61.24 |
82.46 |
65.60 |
74.37 |
Weighted average |
|
76.06 |
97.48 |
82.24 |
90.09 |
Weighted average crude, relative to WTI |
|
(12.10) |
(12.86) |
(12.93) |
(16.89) |
| (1) | Contains non-GAAP financial measures. See the Non-GAAP and Other Financial Measures Advisory section of this MD&A. |
Oil Sands price realizations decreased in the second quarter of 2025 compared to the prior year quarter, primarily due to weaker crude oil benchmark prices, partially offset by narrower heavy crude oil differentials.
Royalties
Royalties for the Oil Sands segment decreased in the second quarter of 2025 compared to the prior year quarter, primarily due to lower bitumen pricing.
Expenses and Other Factors
Total Oil Sands operating expenses increased in the second quarter of 2025 compared to the prior year quarter, primarily due to increased maintenance activities, higher commodity input costs and increased mining activity at Fort Hills, partially offset by decreased share-based compensation expense.
Depreciation, depletion and amortization (DD&A) expense increased in the second quarter of 2025, compared to the prior year quarter, primarily due to the commissioning of new assets and new leases entered into during the quarter, partially offset by decreased depreciation related to the company’s asset retirement obligation assets.
Transportation costs increased in the second quarter of 2025, compared to the prior year quarter, primarily due to increased sales volumes, which included increased exports to the U.S. Gulf Coast.
Financing expense and other, which includes other income, decreased slightly in the second quarter of 2025 compared to the prior year quarter, primarily due to decreased accretion expense related to asset retirement obligations, partially offset by increased interest related to leases.
Cash Operating Costs
|
|
Three months ended |
Six months ended |
||
($ millions, except as noted) |
|
2025 |
2024 |
2025 |
2024 |
Oil Sands OS&G(1) |
|
2 356 |
2 278 |
4 748 |
4 760 |
Oil Sands operations cash operating costs reconciliation |
|
|
|
|
|
Oil Sands operations OS&G |
|
1 177 |
1 141 |
2 463 |
2 419 |
Non-production costs(3) |
|
17 |
87 |
143 |
124 |
Excess power capacity and other(4) |
|
(68) |
(40) |
(163) |
(145) |
Oil Sands operations cash operating costs(2) |
|
1 126 |
1 188 |
2 443 |
2 398 |
Oil Sands operations production volumes (mbbls/d) |
|
443.4 |
458.5 |
484.8 |
476.7 |
Oil Sands operations cash operating costs(2) ($/bbl) |
|
27.95 |
28.45 |
27.85 |
27.65 |
Fort Hills cash operating costs reconciliation |
|
|
|
|
|
Fort Hills OS&G |
|
633 |
546 |
1 250 |
1 159 |
Non-production costs(3) |
|
(82) |
(76) |
(156) |
(143) |
Excess power capacity(4) |
|
(7) |
(5) |
(12) |
(20) |
Fort Hills cash operating costs(2) |
|
544 |
465 |
1 082 |
996 |
Fort Hills production volumes (mbbls/d) |
|
162.9 |
166.9 |
169.6 |
172.3 |
Fort Hills cash operating costs(2) ($/bbl) |
|
36.75 |
30.60 |
35.25 |
31.75 |
Syncrude cash operating costs reconciliation |
|
|
|
|
|
Syncrude OS&G |
|
650 |
642 |
1 309 |
1 298 |
Non-production costs(3) |
|
4 |
(14) |
18 |
(20) |
Excess power capacity(4) |
|
(2) |
(3) |
(5) |
(11) |
Syncrude cash operating costs(2) |
|
652 |
625 |
1 322 |
1 267 |
Syncrude production volumes (mbbls/d) |
|
196.5 |
171.1 |
201.3 |
184.5 |
Syncrude cash operating costs(2) ($/bbl) |
|
36.50 |
40.15 |
36.30 |
37.75 |
| (1) | Oil Sands inventory changes and internal transfers are presented on an aggregate basis and reflect: i) the impacts of changes in inventory levels and valuations, such that the company is able to present cost information based on production volumes; and ii) adjustments for internal diesel sales between assets. In the second quarter and first six months of 2025, Oil Sands OS&G included ($104) million and ($274) million, respectively, of inventory changes and internal transfers. In the second quarter and first six months of 2024, Oil Sands OS&G included ($51) million and ($116) million, respectively, of inventory changes and internal transfers. |
| (2) | Non-GAAP financial measures. Related per barrel amounts contain non-GAAP financial measures. See the Non-GAAP and Other Financial Measures Advisory section of this MD&A. |
| (3) | Non-production costs include, but are not limited to, share-based compensation adjustments, research costs, project startup costs and adjustments to reflect the cost of internal transfers in the receiving asset at the cost of production versus the cost of purchase. Non-production costs at Fort Hills and Syncrude also include, but are not limited to, an adjustment to reflect internally produced diesel from Oil Sands operations at the cost of production. |
| (4) | Represents excess power revenue from cogeneration units that is recorded in operating revenues. Oil Sands operations excess power capacity and other also includes, but is not limited to, the natural gas expense recorded as part of a non-monetary arrangement involving a third-party processor. |
Oil Sands operations cash operating costs per barrel(1) decreased to $27.95 in the second quarter of 2025, compared to $28.45 in the prior year quarter, primarily due to a lower proportion of Fort Hills bitumen being directed to upgrading at Oil Sands Base due to planned maintenance and increased power sales volumes, partially offset by higher natural gas volumes related to increased consumption at the new co-generation facility, higher natural gas prices and decreased production volumes.
Fort Hills cash operating costs per barrel(1) were $36.75 in the second quarter of 2025, compared to $30.60 in the prior year quarter, with the increase primarily due to increased mining activities, increased commodity costs and decreased production volumes due to a longer planned maintenance program in the current year. The production profile for the current year remains in line with the three year mine plan.
Syncrude cash operating costs per barrel(1) decreased to $36.50 in the second quarter of 2025, compared to $40.15 in the prior year quarter, primarily due to increased production volumes, partially offset by increased maintenance activities.
(1) |
Contains non-GAAP financial measures. See the Non-GAAP and Other Financial Measures Advisory section of this MD&A. |
|
Management’s Discussion and Analysis
Results for the First Six Months of 2025
Oil Sands earnings before income taxes for the first six months of 2025 were $2.519 billion, compared to $3.163 billion in the prior year period. In addition to the factors impacting adjusted operating earnings, earnings before income taxes for the first six months of 2025 included a $27 million unrealized loss on risk management activities, compared to a $53 million unrealized gain in the prior year period.
Oil Sands adjusted operating earnings for the first six months of 2025 were $2.546 billion, compared to $3.110 billion in the prior year period, with the decrease primarily due to lower crude oil price realizations as a result of lower benchmark pricing, partially offset by lower royalties and increased sales volumes.
Oil Sands adjusted funds from operations for the first six months of 2025 were $5.209 billion, compared to $5.551 billion in the prior year period, with the decrease primarily due to the same factors that influenced adjusted operating earnings.
Oil Sands operations cash operating costs per barrel were $27.85 for the first six months of 2025, compared to an average of $27.65 for the first six months of 2024, with the increase primarily due to higher natural gas volumes related to increased consumption at the new co-generation facility and higher natural gas prices, partially offset by increased production volumes and increased power sales volumes.
Fort Hills cash operating costs per barrel were $35.25 for the first six months of 2025, compared to $31.75 in the first six months of 2024, with the increase primarily due to increased mining and maintenance activities, decreased production volumes and increased commodity costs.
Syncrude cash operating costs per barrel decreased to $36.30 for the first six months of 2025, compared to $37.75 in the first six months of 2024, primarily due to increased production volumes, partially offset by increased maintenance activities.
Planned Maintenance Update
The anticipated impact of these maintenance activities has been reflected in the company’s 2025 guidance.
| ● | The Oil Sands Base Upgrader 1 coke drum integrity project and turnaround was completed ahead of schedule subsequent to the quarter, enabling a higher expected proportion of higher value SCO production in the third quarter. |
| ● | The turnaround at Firebag commenced in the second quarter with completion expected in the third quarter. |
| ● | The turnaround at Syncrude is commencing in the third quarter with completion expected in the fourth quarter. |
| ● | Planned maintenance at Oil Sands Base Upgrader 2 which was scheduled to commence in the third quarter has been moved to 2026 as part of an interval extension. This is expected to maintain overall production volumes with a higher proportion of higher value SCO production in the remainder of 2025. |
Exploration and Production
Financial Highlights
|
|
Three months ended |
Six months ended |
||
($ millions) |
|
2025 |
2024 |
2025 |
2024 |
Operating revenues(1) |
|
665 |
673 |
1 394 |
1 438 |
Less: Royalties(1) |
|
(162) |
(124) |
(354) |
(266) |
Operating revenues, net of royalties |
|
503 |
549 |
1 040 |
1 172 |
Earnings before income taxes |
|
165 |
196 |
323 |
470 |
Adjusted operating earnings(2) |
|
165 |
196 |
323 |
470 |
Adjusted funds from operations(2) |
|
372 |
398 |
702 |
865 |
Free funds flow(2) |
|
143 |
169 |
264 |
494 |
| (1) | Production from the company’s Libya operations is presented on an economic basis. Revenue and royalties from the company’s Libya operations are presented on a working-interest basis, which is required for presentation purposes in the company’s Consolidated Financial Statements. See the E&P price realizations table in the Non-GAAP and Other Financial Measures Advisory section of this MD&A. |
| (2) | Non-GAAP financial measures. See the Non-GAAP and Other Financial Measures Advisory section of this MD&A. |
Adjusted operating earnings for the E&P segment in the second quarter of 2025 were $165 million, compared to $196 million in the prior year quarter, with the decrease primarily due to lower price realizations and increased royalties, largely offset by increased sales volumes.
Volumes
|
|
Three months ended |
Six months ended |
||
(mbbls/d) |
|
2025 |
2024 |
2025 |
2024 |
E&P Canada |
|
56.4 |
49.0 |
56.0 |
47.9 |
E&P International |
|
3.3 |
5.6 |
5.0 |
4.6 |
Total production |
|
59.7 |
54.6 |
61.0 |
52.5 |
Total sales volumes |
|
65.0 |
46.8 |
60.1 |
55.0 |
E&P production increased to 59,700 bbls/d in the second quarter of 2025, compared to 54,600 bbls/d in the prior year quarter, primarily due to increased production at Hebron and the addition of production at White Rose, which restarted in the first quarter, partially offset by lower production at Terra Nova.
Total E&P sales volumes increased to 65,000 bbls/d in the second quarter of 2025, compared to 46,800 bbls/d in the prior year quarter, primarily due to the same factors that impacted production volumes, as well as the timing of cargo sales in E&P Canada.
Price Realizations(1)
Net of transportation costs, but before royalties |
|
Three months ended |
Six months ended |
||
($/bbl) |
|
2025 |
2024 |
2025 |
2024 |
E&P Canada |
|
91.60 |
111.39 |
96.96 |
109.50 |
| (1) | Contains non-GAAP financial measures. See the Non-GAAP and Other Financial Measures Advisory section of this MD&A. |
E&P price realizations decreased in the second quarter of 2025 compared to the prior year quarter, in line with the decrease in benchmark prices for Brent crude.
Royalties
E&P royalties, excluding the impact of Libya, increased in the second quarter of 2025 compared to the prior year quarter, primarily due to higher royalty rates and increased sales volumes.
Expenses and Other Factors
Operating and transportation expenses increased in the second quarter of 2025 compared to the prior year quarter, primarily due to increased sales volumes.
|
Management’s Discussion and Analysis
Results for the First Six Months of 2025
Earnings before income taxes for E&P for the first six months of 2025 were $323 million, compared to $470 million in the prior year period.
Adjusted operating earnings for E&P for the first six months of 2025 were $323 million, compared to $470 million in the prior year period, with the decrease primarily due to lower realized crude prices and increased royalties, partially offset by increased sales volumes.
Adjusted funds from operations for the first six months of 2025 were $702 million, compared to $865 million in the prior year period, with the decrease primarily due to the same factors that influenced adjusted operating earnings.
Planned Maintenance Update for Operated Assets
There are no significant planned maintenance events for the E&P segment scheduled for the third quarter of 2025.
Refining and Marketing
Financial Highlights
|
|
Three months ended |
Six months ended |
||
($ millions) |
|
2025 |
2024 |
2025 |
2024 |
Operating revenues |
|
7 310 |
8 057 |
14 938 |
15 670 |
Earnings before income taxes |
|
377 |
593 |
1 049 |
1 707 |
Adjusted for: |
|
|
|
|
|
Unrealized gain on risk management activities |
|
(14) |
(5) |
(19) |
(1) |
Write-down of equity investment(1) |
|
41 |
— |
41 |
— |
Adjusted operating earnings(2) |
|
404 |
588 |
1 071 |
1 706 |
Adjusted funds from operations(2) |
|
615 |
893 |
1 517 |
2 199 |
Free funds flow(2) |
|
253 |
518 |
975 |
1 656 |
| (1) | During the second quarter of 2025, Suncor recorded a write-down of an equity investment of $41 million. |
| (2) | Non-GAAP financial measures. See the Non-GAAP and Other Financial Measures Advisory section of this MD&A. |
R&M adjusted operating earnings in the second quarter of 2025 were $404 million, compared to $588 million in the prior year quarter. The decrease in adjusted operating earnings was primarily due to a first-in, first-out (FIFO) inventory valuation loss in the second quarter of 2025, compared to a gain in the prior year quarter and a one-time emissions compliance charge in the current quarter, partially offset by increased refinery production and sales volumes.
Volumes
|
|
Three months ended |
Six months ended |
||
|
|
2025 |
2024 |
2025 |
2024 |
Crude oil processed (mbbls/d) |
|
|
|
|
|
Eastern North America |
|
231.1 |
169.8 |
234.0 |
193.2 |
Western North America |
|
211.2 |
260.7 |
228.4 |
249.7 |
Total |
|
442.3 |
430.5 |
462.4 |
442.9 |
Refinery utilization(1) (%) |
|
|
|
|
|
Eastern North America |
|
104 |
76 |
105 |
87 |
Western North America |
|
87 |
107 |
94 |
102 |
Average |
|
95 |
92 |
99 |
95 |
Refined product sales (mbbls/d) |
|
|
|
|
|
Gasoline |
|
251.1 |
252.9 |
256.9 |
248.2 |
Distillate |
|
270.1 |
257.0 |
266.4 |
258.5 |
Other |
|
79.3 |
84.8 |
79.3 |
81.1 |
Total |
|
600.5 |
594.7 |
602.6 |
587.8 |
Refinery production(2) (mbbls) |
|
42 282 |
41 669 |
88 080 |
85 743 |
Refining and marketing gross margin – First-in, first-out (FIFO)(3) ($/bbl) |
|
32.45 |
37.65 |
34.65 |
42.30 |
Refining and marketing gross margin – Last-in, first-out (LIFO)(3) ($/bbl) |
|
34.40 |
36.35 |
36.30 |
41.20 |
Refining operating expense(3) ($/bbl) |
|
6.85 |
6.95 |
6.80 |
7.05 |
| (1) | Refinery utilization is the amount of crude oil and natural gas liquids processed by crude distillation units, expressed as a percentage of the nameplate capacity of these units. |
| (2) | Refinery production is the output of the refining process and differs from crude oil processed as a result of volumetric adjustments for non-crude feedstock, volumetric gain associated with the refining process and changes in unfinished product inventories. |
| (3) | Contains non-GAAP financial measures. See the Non-GAAP and Other Financial Measures Advisory section of this MD&A. |
|
Management’s Discussion and Analysis
Refinery throughput increased to a second quarter record of 442,300 bbls/d with utilization of 95%, compared to 430,500 bbls/d and 92%, respectively, in the prior year quarter. The increase was primarily due to strong operating performance and efficient execution of planned maintenance activities.
Refined product sales increased to a second quarter record of 600,500 bbls/d compared to 594,700 bbls/d in the prior year quarter, with the increase primarily due to higher refinery throughput and the execution of the previously announced retail growth plan.
Refining and Marketing Gross Margins(1)
Refining and marketing gross margins were influenced by the following:
| ● | On a LIFO(2) basis, Suncor’s refining and marketing gross margin decreased to $34.40/bbl in the second quarter of 2025, from $36.35/bbl in the prior year quarter, primarily due to narrower heavy crude differentials and a one-time emissions compliance charge in the current quarter, partially offset by higher location differentials associated with the company’s regional markets. Margin capture was 96% compared to Suncor’s 5-2-2-1 index, after adjusting for the one-time settlement of emissions compliance charges. |
| ● | On a FIFO basis, Suncor’s refining and marketing gross margin decreased to $32.45/bbl in the second quarter of 2025, from $37.65/bbl in the prior year quarter, due to the same factors discussed above, in addition to FIFO inventory valuation impacts. In the second quarter of 2025, the FIFO method of inventory valuation resulted in a loss of $82 million, compared to a gain of $53 million in the prior year quarter, for an unfavourable quarter-over-quarter impact of $135 million. |
Expenses and Other Factors
Operating expenses decreased in the second quarter of 2025 compared to the prior year quarter, primarily due to lower share-based compensation expense and maintenance costs, partially offset by higher commodity input costs. Transportation expenses were comparable to the prior year quarter.
Refining operating expense per barrel(1) decreased to $6.85 in the second quarter of 2025, compared to $6.95 in the prior year quarter, primarily due to lower maintenance costs and higher refinery production, partially offset by higher commodity input costs.
Results for the First Six Months of 2025
R&M’s earnings before income taxes were $1.049 billion for the first six months of 2025, compared to $1.707 billion in the prior year period. In addition to the factors impacting adjusted operating earnings, earnings before income taxes for the first six months of 2025 included a $19 million unrealized gain on risk management activities, compared to a $1 million unrealized gain in the prior year period and a $41 million write-down of an equity investment in the current period.
Adjusted operating earnings for R&M in the first six months of 2025 were $1.071 billion, compared to $1.706 billion in the first six months of 2024, with the decrease primarily due to lower benchmark crack spreads, narrower crude differentials and a FIFO inventory valuation loss in the current period, compared to a gain in the prior year period, partially offset by increased refinery production and sales volumes. In the first six months of 2025, the impact of the FIFO method of inventory valuation, relative to an estimated LIFO method, had a negative impact to adjusted operating earnings and adjusted funds from operations of $142 million, compared to a positive impact of $93 million in the first six months of 2024.
R&M’s adjusted funds from operations in the first six months of 2025 were $1.517 billion, compared to $2.199 billion in the prior year period, with the decrease primarily due to the same factors that influenced adjusted operating earnings.
Planned Maintenance
The anticipated impact of these maintenance activities has been reflected in the company’s 2025 guidance.
| ● | Planned maintenance at the Edmonton refinery is commencing in the third quarter, with completion expected in the fourth quarter. |
(1) |
Contains non-GAAP financial measures. See the Non-GAAP and Other Financial Measures Advisory section of this MD&A. |
(2) |
The estimated impact of the LIFO method is a non-GAAP financial measure. The impact of the FIFO method of inventory valuation, relative to an estimated LIFO accounting method, also includes the impact of the realized portion of commodity risk management activities. See the Non-GAAP and Other Financial Measures Advisory section of this MD&A. |
Corporate and Eliminations
Financial Highlights
|
|
Three months ended |
Six months ended |
||
($ millions) |
|
2025 |
2024 |
2025 |
2024 |
Earnings (loss) before income taxes |
|
48 |
(398) |
(167) |
(937) |
Adjusted for: |
|
|
|
|
|
Unrealized foreign exchange (gain) loss on U.S. dollar denominated debt |
|
(461) |
103 |
(475) |
323 |
Write-down of equity investment(1) |
|
95 |
— |
95 |
— |
Adjusted operating loss(2) |
|
(318) |
(295) |
(547) |
(614) |
Corporate |
|
(345) |
(206) |
(646) |
(402) |
Eliminations – Intersegment profit realized (eliminated) |
|
27 |
(89) |
99 |
(212) |
Adjusted funds used in operations(2) |
|
(285) |
(221) |
(634) |
(619) |
Free funds deficit(2) |
|
(293) |
(227) |
(649) |
(631) |
| (1) | During the second quarter of 2025, Suncor recorded a write-down of an equity investment of $95 million. |
| (2) | Non-GAAP financial measures. See the Non-GAAP and Other Financial Measures Advisory section of this MD&A. |
Corporate incurred an adjusted operating loss of $345 million in the second quarter of 2025, compared to a loss of $206 million in the prior year quarter. The increased loss was primarily attributable to an operational foreign exchange loss in the second quarter of 2025 compared to a gain in the prior year quarter, partially offset by a decrease in share-based compensation expense in the second quarter of 2025 compared to the prior year quarter.
Eliminations reflect the deferral or realization of profit or loss on crude oil sales from Oil Sands to Suncor’s refineries. Consolidated profits and losses are only realized when the refined products from internal purchases have been sold to third parties. During the second quarter of 2025, the company realized $27 million of intersegment profit, compared to a deferral of $89 million in the prior year quarter. The realization of intersegment profit in the second quarter of 2025 was primarily driven by a decrease in intersegment inventory volumes.
Corporate and Eliminations adjusted funds used in operations were $285 million for the second quarter of 2025, compared to adjusted funds used in operations of $221 million in the prior year quarter, and were influenced by the same factors impacting adjusted operating loss, excluding the impact of share-based compensation expense.
Results for the First Six Months of 2025
Corporate and Eliminations loss before income taxes was $167 million for the first six months of 2025, compared to $937 million in the prior year period. In addition to the factors impacting adjusted operating loss, the loss before income taxes for the first six months of 2025 included a $475 million unrealized foreign exchange gain on the revaluation of U.S. dollar denominated debt, compared to a $323 million loss in the prior year period and a $95 million write-down of an equity investment in the current period.
The adjusted operating loss for Corporate and Eliminations for the first six months of 2025 was $547 million, compared to $614 million in the prior year period. The decreased loss was primarily attributed to a realization of intersegment profit in the first six months of 2025, compared to a deferral in the prior year period and decreased share-based compensation expense in the first six months of 2025 compared to the prior year period, partially offset by an operational foreign exchange loss in the current period, compared to a gain in the prior year period.
Corporate and Eliminations adjusted funds used in operations for the first six months of 2025 were $634 million, compared to $619 million in the prior year period, and were influenced by the same factors impacting adjusted operating loss, excluding the impact of share-based compensation expense.
|
Management’s Discussion and Analysis
|
|
Three months ended June 30 |
Six months ended |
||
($ millions) |
|
2025 |
2024 |
2025 |
2024 |
Current income tax expense |
|
412 |
781 |
1 060 |
1 430 |
Deferred income tax recovery |
|
(112) |
(166) |
(159) |
(205) |
Income tax expense included in net earnings |
|
300 |
615 |
901 |
1 225 |
Less: Income tax (recovery) expense on adjusted operating earnings adjustments |
|
(4) |
7 |
10 |
(4) |
Income tax expense included in adjusted operating earnings |
|
304 |
608 |
891 |
1 229 |
Effective tax rate |
|
20.9% |
28.2% |
24.2% |
27.8% |
The provision for income taxes in the second quarter of 2025 decreased to $300 million, compared to $615 million in the prior year quarter, primarily due to lower taxable earnings. In the second quarter of 2025, the company's effective tax rate on net earnings decreased compared to the prior year quarter, primarily due to the impact of non-taxable foreign exchange gains on the revaluation of U.S. dollar denominated debt, and other permanent items impacting total tax expense in the second quarter of 2025.
The provision for income taxes in the first six months of 2025 decreased to $901 million, compared to $1.225 billion in the prior year period, primarily due to lower taxable earnings. In the first six months of 2025, the company's effective tax rate on net earnings decreased compared to the prior year period, primarily due to the impact of non-taxable foreign exchange gains on the revaluation of U.S. dollar denominated debt, and other permanent items impacting total tax expense in the current year.
Capital and Exploration Expenditures by Type, Excluding Capitalized Interest
|
|
Three months ended |
|
Six months ended |
||||||||
|
|
|
|
June 30, |
|
June 30, |
|
|
|
June 30, |
|
June 30, |
|
|
Asset Sustainment |
Economic |
|
|
|
|
Asset Sustainment |
Economic |
|
|
|
($ millions) |
|
and Maintenance(1) |
Investment(2) |
Total |
|
Total |
|
and Maintenance(1) |
Investment(2) |
Total |
|
Total |
Oil Sands |
|
|
|
|
|
|
|
|
|
|
|
|
Oil Sands Base |
|
368 |
191 |
559 |
|
684 |
|
499 |
302 |
801 |
|
1 137 |
In Situ |
|
46 |
72 |
118 |
|
127 |
|
84 |
176 |
260 |
|
246 |
Fort Hills |
|
101 |
93 |
194 |
|
203 |
|
152 |
165 |
317 |
|
347 |
Syncrude |
|
144 |
51 |
195 |
|
350 |
|
270 |
127 |
397 |
|
563 |
E&P |
|
— |
213 |
213 |
|
220 |
|
— |
404 |
404 |
|
355 |
R&M |
|
309 |
53 |
362 |
|
374 |
|
454 |
88 |
542 |
|
541 |
Corporate and Eliminations |
|
7 |
1 |
8 |
|
6 |
|
14 |
1 |
15 |
|
12 |
|
|
975 |
674 |
1 649 |
|
1 964 |
|
1 473 |
1 263 |
2 736 |
|
3 201 |
Capitalized interest on debt |
|
|
|
59 |
|
83 |
|
|
|
117 |
|
157 |
Total capital and exploration expenditures |
|
|
|
1 708 |
|
2 047 |
|
|
|
2 853 |
|
3 358 |
| (1) | Asset sustainment and maintenance capital expenditures include capital investments that deliver on existing value by ensuring compliance or maintaining relations with regulators and other stakeholders and maintaining current processing capacity. |
| (2) | Economic investment capital expenditures include capital investments that result in an increase in value by adding reserves or improving processing capacity, utilization, cost or margin, including associated infrastructure. |
During the second quarter of 2025, the company incurred $1.649 billion of capital expenditures, excluding capitalized interest, compared to $1.964 billion in the prior year quarter. Suncor capitalized $59 million of its borrowing costs in the second quarter of 2025 as part of the cost of major development assets and construction projects in progress, compared to $83 million in the prior year quarter.
Economic investment expenditures in the second quarter of 2025 were primarily related to:
| ● | The Upgrader 1 coke drum replacement project, which was completed subsequent to the quarter at Oil Sands Base. |
| ● | The ongoing design and construction of well pads to develop additional reserves that are intended to maintain existing production levels at In Situ. |
| ● | Progressing the second opening at the Fort Hills North Pit mine. |
| ● | The Mildred Lake Mine Extension West project and preparation for autonomous haul system conversion at Syncrude. |
| ● | Progressing the West White Rose Project within the E&P segment. |
| ● | Enhancing R&M sales and marketing business, including continued strategic investment in specific company-owned retail sites. |
Asset sustainment and maintenance expenditures in the second quarter of 2025 were primarily related to:
| ● | Planned turnaround activity in the current quarter, preparation for upcoming planned turnaround activity and mine tailings, mine equipment and other maintenance projects within the Oil Sands segment. |
| ● | Planned turnaround activity in the current quarter, preparation for upcoming planned turnaround activity and sustainment of refinery, retail and logistics assets within the R&M segment. |
|
Management’s Discussion and Analysis
6. Financial Condition and Liquidity
Indicators
|
|
Twelve months ended |
|
|
|
2025 |
2024 |
Return on capital employed (ROCE)(1)(2) (%) |
|
11.1 |
15.6 |
Net debt to adjusted funds from operations(1) (times) |
|
0.6 |
0.6 |
Total debt to total debt plus shareholders’ equity(1) (%) |
|
18.2 |
20.4 |
Net debt to net debt plus shareholders’ equity(1) (%) |
|
14.7 |
16.9 |
| (1) | Non-GAAP financial measures or contains non-GAAP financial measures. See the Non-GAAP and Other Financial Measures Advisory section of this MD&A. |
| (2) | For the twelve months ended June 30, 2025, and the twelve months ended June 30, 2024, there were no impairments or impairment reversals. As a result, ROCE excluding impairments was equal to ROCE. |
Capital Resources
Suncor’s capital resources consist primarily of cash flow provided by operating activities, cash and cash equivalents, and available lines of credit. Suncor’s management believes the company will have the capital resources required to fund its planned 2025 capital spending program of $5.7 billion to $5.9 billion, and to meet working capital requirements, through cash and cash equivalents balances, cash flow provided by operating activities, available committed credit facilities, issuing commercial paper and, if needed, accessing capital markets. The company’s cash flow provided by operating activities depends on several factors, including commodity prices, production, sales volumes, refining and marketing gross margins, operating expenses, taxes, royalties and foreign exchange rates.
The company has invested cash in short-term financial instruments that are presented as cash and cash equivalents. The objectives of the company’s short-term investment portfolio are to ensure the preservation of capital, maintain adequate liquidity to meet Suncor’s cash flow requirements, and deliver competitive returns derived from the quality and diversification of investments within acceptable risk parameters. The maximum weighted average term to maturity of the short-term investment portfolio is not expected to exceed six months, and all investments are with counterparties with investment-grade debt ratings.
Available Sources of Liquidity
For the three months ended June 30, 2025, cash and cash equivalents decreased to $2.269 billion from $2.773 billion as at March 31, 2025. The use of cash in the second quarter of 2025 was primarily due to the company’s shareholder returns, including the repurchase of Suncor’s common shares under its normal course issuer bid (NCIB) and the payment of dividends, and the company’s capital and exploration expenditures exceeding the company’s cash flow provided by operating activities.
For the six months ended June 30, 2025, cash and cash equivalents decreased to $2.269 billion from $3.484 billion as at December 31, 2024. The use of cash in the first six months of 2025 was primarily due to the company’s shareholder returns, including the repurchase of Suncor’s common shares under its NCIB, and the payment of dividends, and the company’s capital and exploration expenditures exceeding the company’s cash flow provided by operating activities.
As at June 30, 2025, the weighted average days to maturity of the company’s short-term investment portfolio was approximately 33 days.
As at June 30, 2025, available credit facilities for liquidity purposes were $5.330 billion, compared to $5.475 billion as at December 31, 2024.
Financing Activities
Management of debt levels and liquidity continues to be a priority for Suncor given the company’s long-term plans and the expected future volatility in the business environment. Suncor believes a phased and flexible approach to existing and future projects will help the company maintain its ability to manage project costs and debt levels.
Total Debt to Total Debt Plus Shareholders’ Equity
Suncor is subject to financial and operating covenants related to its bank debt and public market debt. Failure to meet the terms of one or more of these covenants may constitute an “event of default” as defined in the respective debt agreements, potentially resulting in accelerated repayment of one or more of the debt obligations. The company is in compliance with its financial covenant that requires total debt and lease liabilities to not exceed 65% of its total debt and lease liabilities plus shareholders’ equity. As at June 30, 2025, total debt and lease liabilities to total debt and lease liabilities plus shareholders’ equity was 24.3% (December 31, 2024 – 24.8%). The company also continues to be in compliance with all operating covenants under its debt agreements.
Change in Debt
|
|
Three months ended |
Six months ended |
($ millions) |
|
June 30, 2025 |
June 30, 2025 |
Total debt(1) – beginning of period |
|
10 332 |
10 345 |
Foreign exchange on debt, and other |
|
(390) |
(403) |
Total debt(1) – June 30, 2025 |
|
9 942 |
9 942 |
Less: Cash and cash equivalents – June 30, 2025 |
|
2 269 |
2 269 |
Net debt (1) – June 30, 2025 |
|
7 673 |
7 673 |
| (1) | Non-GAAP financial measures. See the Non-GAAP and Other Financial Measures Advisory section of this MD&A. |
The company’s total debt decreased in the second quarter of 2025, primarily due to favourable foreign exchange rates on U.S. dollar denominated debt compared to March 31, 2025.
The company’s total debt decreased in the first six months of 2025 primarily due to favourable foreign exchange rates on U.S. dollar denominated debt compared to December 31, 2024.
As at June 30, 2025, Suncor’s net debt was $7.673 billion, compared to $6.861 billion as at December 31, 2024. The increase in net debt was primarily due to a decrease in cash and cash equivalents and the factors discussed above.
Common Shares
|
|
June 30, |
(thousands) |
|
2025 |
Common shares |
|
1 217 884 |
Common share options – exercisable |
|
4 887 |
Common share options – non-exercisable |
|
2 237 |
As at July 31, 2025, the total number of common shares outstanding was 1,213,246,632 and the total number of exercisable and non-exercisable common share options outstanding was 7,088,680. Once vested, each outstanding common share option is exercisable for one common share.
|
Management’s Discussion and Analysis
Share Repurchases
|
|
|
|
|
|
Maximum |
|
Maximum |
|
Maximum |
|
|
Commencement |
|
|
|
Shares |
|
Shares |
|
Shares |
(thousands of common shares) |
|
Date |
|
Expiry |
|
for Repurchase |
|
Repurchase (%) |
|
Repurchased |
2023 NCIB |
|
February 17, 2023 |
|
February 16, 2024 |
|
132 900 |
|
10 |
|
47 107 |
2024 NCIB |
|
February 26, 2024 |
|
February 25, 2025 |
|
128 700 |
|
10 |
|
61 066 |
2025 NCIB |
|
March 3, 2025 |
|
March 2, 2026 |
|
123 800 |
|
10 |
|
24 315 |
Between March 3, 2025, and July 31, 2025, Suncor repurchased 24,315,149 common shares on the open market pursuant to its NCIB, representing the equivalent of 2.0% of its outstanding common shares as at February 18, 2025, for $1.2 billion, at a weighted average price of $51.40 per share.
The actual number of common shares that may be repurchased under the NCIB and the timing of any such repurchases will be determined by Suncor. The company believes that, depending on the trading price of its common shares and other relevant factors, repurchasing its own shares represents an attractive investment opportunity and is in the best interests of the company and its shareholders. The company does not expect the decision to allocate cash to repurchase shares will affect its long-term strategy.
|
|
Three months ended |
Six months ended |
||
($ millions, except as noted) |
|
2025 |
2024 |
2025 |
2024 |
Share repurchase activities (thousands of common shares) |
|
14 993 |
15 561 |
28 593 |
21 999 |
Weighted average repurchase price per share (dollars per share) |
|
50.03 |
53.00 |
52.46 |
50.81 |
Share repurchase cost(1) |
|
750 |
825 |
1 500 |
1 118 |
| (1) | The three and six months ended June 30, 2025, excludes nil and $48 million, respectively, of taxes paid on share repurchase costs. |
Contractual Obligations, Commitments, Guarantees and Off-Balance Sheet Arrangements
In the normal course of business, the company is obligated to make future payments, including payment in respect of contractual obligations and non-cancellable commitments. Suncor has included these items in the Financial Condition and Liquidity section of the 2024 annual MD&A, with no material updates to note during the six months ended June 30, 2025. Suncor does not believe it has any guarantees or off-balance sheet arrangements that have, or are reasonably likely to have, a current or future material effect on the company’s financial performance or financial condition, results of operations, liquidity or capital expenditures.
Trends in Suncor’s quarterly revenue, earnings and adjusted funds from operations are driven primarily by production volumes, which can be significantly impacted by major maintenance events, changes in commodity prices and crude differentials, refining crack spreads, foreign exchange rates and other significant events impacting operations, such as operational incidents.
Financial Summary
Three months ended |
|
Jun 30 |
Mar 31 |
Dec 31 |
Sep 30 |
Jun 30 |
Mar 31 |
Dec 31 |
Sep 30 |
($ millions, unless otherwise noted) |
|
2025 |
2025 |
2024 |
2024 |
2024 |
2024 |
2023 |
2023 |
Total production (mbbls/d) |
|
|
|
|
|
|
|
|
|
Oil Sands |
|
748.4 |
790.9 |
817.5 |
776.0 |
716.0 |
785.0 |
757.4 |
646.1 |
Exploration and Production |
|
59.7 |
62.3 |
57.5 |
52.6 |
54.6 |
50.3 |
50.7 |
44.4 |
Total upstream production |
|
808.1 |
853.2 |
875.0 |
828.6 |
770.6 |
835.3 |
808.1 |
690.5 |
Refinery crude oil processed (mbbls/d) |
|
442.3 |
482.7 |
486.2 |
487.6 |
430.5 |
455.3 |
455.9 |
463.2 |
Revenues and other income |
|
|
|
|
|
|
|
|
|
Gross revenues |
|
12 749 |
13 330 |
13 657 |
13 905 |
14 014 |
13 305 |
13 589 |
13 911 |
Royalties |
|
(758) |
(1 007) |
(1 126) |
(1 017) |
(1 125) |
(924) |
(779) |
(1 262) |
Operating revenues, net of royalties |
|
11 991 |
12 323 |
12 531 |
12 888 |
12 889 |
12 381 |
12 810 |
12 649 |
Other (loss) income |
|
(97) |
130 |
(28) |
174 |
151 |
148 |
1 328 |
(13) |
|
|
11 894 |
12 453 |
12 503 |
13 062 |
13 040 |
12 529 |
14 138 |
12 636 |
Net earnings |
|
1 134 |
1 689 |
818 |
2 020 |
1 568 |
1 610 |
2 820 |
1 544 |
Per common share – basic (dollars) |
|
0.93 |
1.36 |
0.65 |
1.59 |
1.22 |
1.25 |
2.18 |
1.19 |
Adjusted operating earnings(1) |
|
873 |
1 629 |
1 566 |
1 875 |
1 626 |
1 817 |
1 635 |
1 980 |
Per common share(1)(2) (dollars) |
|
0.71 |
1.31 |
1.25 |
1.48 |
1.27 |
1.41 |
1.26 |
1.52 |
Adjusted funds from operations(1) |
|
2 689 |
3 045 |
3 493 |
3 787 |
3 397 |
3 169 |
4 034 |
3 634 |
Per common share(1)(2) (dollars) |
|
2.20 |
2.46 |
2.78 |
2.98 |
2.65 |
2.46 |
3.12 |
2.80 |
Cash flow provided by operating activities |
|
2 919 |
2 156 |
5 083 |
4 261 |
3 829 |
2 787 |
4 318 |
4 184 |
Per common share(2) (dollars) |
|
2.38 |
1.74 |
4.05 |
3.36 |
2.98 |
2.16 |
3.34 |
3.22 |
Free funds flow(1) |
|
981 |
1 900 |
1 923 |
2 232 |
1 350 |
1 858 |
2 482 |
2 057 |
Per common share(1)(2) (dollars) |
|
0.80 |
1.53 |
1.53 |
1.76 |
1.05 |
1.44 |
1.92 |
1.58 |
ROCE(1)(3) (%) for the twelve months ended |
|
11.1 |
12.8 |
13.0 |
15.6 |
15.6 |
15.7 |
16.3 |
16.5 |
ROCE excluding impairments and impairment reversals(1)(3) (%) for the twelve months ended |
|
11.1 |
12.8 |
13.0 |
15.6 |
15.6 |
15.7 |
16.3 |
16.5 |
Net debt(1)(4) |
|
7 673 |
7 559 |
6 861 |
7 968 |
9 054 |
9 552 |
9 852 |
9 837 |
Common share information (dollars) |
|
|
|
|
|
|
|
|
|
Dividend per common share(2) |
|
0.57 |
0.57 |
0.57 |
0.55 |
0.55 |
0.55 |
0.55 |
0.52 |
Share price at the end of trading |
|
|
|
|
|
|
|
|
|
Toronto Stock Exchange (Cdn$) |
|
51.01 |
55.72 |
51.31 |
49.92 |
52.15 |
49.99 |
42.45 |
46.71 |
New York Stock Exchange (US$) |
|
37.45 |
38.72 |
35.68 |
36.92 |
38.10 |
36.91 |
32.04 |
34.38 |
| (1) | Such financial measure is a non-GAAP financial measure or contains a non-GAAP financial measure. See the Non-GAAP and Other Financial Measures Advisory section of this MD&A. Adjusted operating earnings, adjusted funds from operations, net debt, free funds flow, ROCE and ROCE excluding impairments are defined in the Non-GAAP and Other Financial Measures Advisory section and reconciled to GAAP measures in the Consolidated Financial Information and the Segment Results and Analysis section in the respective Quarterly Report to Shareholders (Quarterly Report) issued by Suncor in respect of the relevant quarter, which information is incorporated by reference herein and is available on SEDAR+ at www.sedarplus.ca. |
| (2) | Presented on a basic per share basis. |
| (3) | Beginning in the second quarter of 2024, the company revised the definition of ROCE to exclude lease liabilities from the calculation of average capital employed and interest on lease liabilities from net interest expense to better align with how management and industry monitor capital structure. Prior period comparatives have been restated to reflect this change. |
|
Management’s Discussion and Analysis
| (4) | Beginning in the second quarter of 2024, the company revised the definition of net debt to exclude lease liabilities to better align with how management and industry monitor capital structure. Prior period comparatives have been restated to reflect this change. |
Business Environment
|
|
|
Jun 30 |
Mar 31 |
Dec 31 |
Sep 30 |
Jun 30 |
Mar 31 |
Dec 31 |
Sep 30 |
(average for the three months ended) |
|
|
2025 |
2025 |
2024 |
2024 |
2024 |
2024 |
2023 |
2023 |
WTI crude oil at Cushing |
|
US$/bbl |
63.70 |
71.40 |
70.30 |
75.15 |
80.55 |
76.95 |
78.35 |
82.20 |
Dated Brent crude |
|
US$/bbl |
67.80 |
75.70 |
74.70 |
80.25 |
84.90 |
83.25 |
84.05 |
86.70 |
Dated Brent/Maya FOB price differential |
|
US$/bbl |
10.10 |
11.10 |
11.85 |
13.90 |
12.05 |
14.10 |
12.55 |
11.15 |
MSW at Edmonton |
|
Cdn$/bbl |
84.25 |
95.30 |
94.95 |
98.00 |
105.25 |
92.20 |
99.70 |
107.80 |
WCS at Hardisty |
|
US$/bbl |
53.50 |
58.75 |
57.75 |
61.65 |
67.00 |
57.60 |
56.45 |
69.30 |
WCS-WTI heavy/light differential |
|
US$/bbl |
(10.20) |
(12.65) |
(12.55) |
(13.50) |
(13.55) |
(19.35) |
(21.90) |
(12.90) |
SYN-WTI premium (differential) |
|
US$/bbl |
1.00 |
(2.35) |
0.85 |
1.30 |
2.80 |
(7.40) |
0.30 |
2.80 |
Condensate at Edmonton |
|
US$/bbl |
63.50 |
69.90 |
70.65 |
71.30 |
77.15 |
72.80 |
76.25 |
77.90 |
Natural gas (Alberta spot) at AECO |
|
Cdn$/GJ |
1.65 |
2.05 |
1.45 |
0.65 |
1.10 |
2.20 |
2.15 |
2.50 |
Alberta Power Pool Price |
|
Cdn$/MWh |
40.50 |
39.80 |
51.50 |
55.35 |
45.15 |
99.30 |
81.60 |
151.60 |
New York Harbor 2-1-1 crack(1) |
|
US$/bbl |
25.90 |
21.05 |
18.80 |
21.05 |
24.75 |
27.05 |
28.60 |
39.95 |
Chicago 2-1-1 crack(1) |
|
US$/bbl |
22.05 |
14.65 |
13.85 |
19.35 |
18.85 |
19.80 |
17.10 |
27.45 |
Portland 2-1-1 crack(1) |
|
US$/bbl |
38.20 |
22.30 |
20.95 |
20.35 |
29.30 |
26.85 |
29.35 |
55.90 |
Gulf Coast 2-1-1 crack(1) |
|
US$/bbl |
23.20 |
20.85 |
17.00 |
18.90 |
22.10 |
27.95 |
23.00 |
39.10 |
U.S. Renewable Volume Obligation |
|
US$/bbl |
6.15 |
4.75 |
4.05 |
3.90 |
3.40 |
3.70 |
4.75 |
7.45 |
Suncor custom 5-2-2-1 index(2) |
|
US$/bbl |
27.85 |
26.80 |
24.25 |
26.05 |
26.70 |
35.95 |
33.45 |
36.00 |
Exchange rate (average) |
|
US$/Cdn$ |
0.72 |
0.70 |
0.71 |
0.73 |
0.73 |
0.74 |
0.73 |
0.75 |
Exchange rate (end of period) |
|
US$/Cdn$ |
0.73 |
0.69 |
0.69 |
0.74 |
0.73 |
0.74 |
0.76 |
0.74 |
| (1) | 2-1-1 crack spreads are indicators of the refining margin generated by converting two barrels of WTI into one barrel of gasoline and one barrel of diesel. The crack spreads presented here generally approximate the regions into which the company sells refined products through retail and wholesale channels. |
| (2) | Suncor has developed an indicative 5-2-2-1 index based on publicly available pricing data to more accurately reflect the company’s realized refining and marketing gross margin. For more details, including how the custom index is calculated, see Suncor’s 2024 annual MD&A. |
Accounting Policies and New IFRS Standards
Suncor’s significant accounting policies and a summary of recently announced accounting standards are described in the Accounting Policies and Critical Accounting Estimates section of Suncor’s 2024 annual MD&A and in notes 3 and 5 of Suncor’s audited Consolidated Financial Statements for the year ended December 31, 2024.
Critical Accounting Estimates
The preparation of financial statements in accordance with GAAP requires management to make estimates, judgments and assumptions that affect reported assets, liabilities, revenues and expenses, gains and losses, and disclosures of contingencies. These estimates and assumptions are subject to change based on experience and new information. Critical accounting estimates are those that require management to make assumptions about matters that are highly uncertain at the time the estimate is made. Critical accounting estimates are also those estimates that, where a different estimate could have been used or where changes in the estimate that are reasonably likely to occur, would have a material impact on the company’s financial condition, changes in financial condition or financial performance. Critical accounting estimates and judgments are reviewed annually by the Audit Committee of the Board of Directors. A detailed description of Suncor’s critical accounting estimates is provided in note 4 to the audited Consolidated Financial Statements for the year ended December 31, 2024, and in the Accounting Policies and Critical Accounting Estimates section of Suncor’s 2024 annual MD&A.
Financial Instruments
Suncor periodically enters into derivative contracts such as forwards, futures, swaps, options and costless collars to manage exposure to fluctuations in commodity prices and foreign exchange rates, and to optimize the company’s position with respect to interest payments. For more information on Suncor’s financial instruments and the related financial risk factors, see note 27 of the audited Consolidated Financial Statements for the year ended December 31, 2024, note 9 to the unaudited interim Consolidated Financial Statements for the three and six months ended June 30, 2025, and the Financial Condition and Liquidity section of the 2024 annual MD&A.
Control Environment
Based on their evaluation as at June 30, 2025, Suncor’s Chief Executive Officer and Chief Financial Officer concluded that the company’s disclosure controls and procedures (as defined in Rules 13a-15(e) and 15d-15(e) under the United States Securities Exchange Act of 1934, as amended (the Exchange Act)), are effective to ensure that information required to be disclosed by the company in reports that are filed or submitted to Canadian and U.S. securities authorities is recorded, processed, summarized and reported within the time periods specified in Canadian and U.S. securities laws. In addition, as at June 30, 2025, there were no changes in the internal control over financial reporting (as defined in Exchange Act Rules 13a-15(f) and 15d-15(f)) that occurred during the three-month period ended June 30, 2025, that have materially affected, or are reasonably likely to materially affect, the company’s internal control over financial reporting. Management will continue to periodically evaluate the company’s disclosure controls and procedures and internal control over financial reporting and will make any modifications as deemed necessary from time to time.
Based on their inherent limitations, disclosure controls and procedures and internal control over financial reporting may not prevent or detect misstatements, and even those controls determined to be effective can provide only reasonable assurance with respect to financial statement preparation and presentation.
Tariffs
In March 2025, the government of the United States of America announced tariffs on certain goods and products. Several countries (including Canada) responded with an escalation in tariffs and/or retaliatory tariffs. This has resulted in economic uncertainty in the global markets, disruption of supply chains, international competitiveness and fluctuations in commodity pricing. The company is closely monitoring these developments and will continue to assess the impacts of such tariffs and measures as the situation develops.
Corporate Guidance
Suncor has updated its 2025 corporate guidance ranges, previously issued on December 12, 2024, by reducing 2025 full-year estimated capital spend from $6.1-$6.3 billion down to $5.7-$5.9 billion. Estimated ranges for current income taxes, royalties and business environment have also been adjusted to reflect the current business environment as at August 5. For further details and advisories regarding Suncor’s 2025 corporate guidance, see www.suncor.com/guidance.
|
Management’s Discussion and Analysis
9. Non-GAAP And Other Financial Measures Advisory
Certain financial measures in this MD&A – namely adjusted operating earnings (loss), adjusted funds from (used in) operations, measures contained in ROCE and ROCE excluding impairments and impairment reversals, price realizations, free funds flow, Oil Sands operations cash operating costs, Fort Hills cash operating costs, Syncrude cash operating costs, refining and marketing gross margin, refining operating expense, net debt, total debt, LIFO inventory valuation methodology and related per share or per barrel amounts or metrics that contain such measures – are not prescribed by GAAP. These non-GAAP financial measures are included because management uses the information to analyze business performance, leverage and liquidity, as applicable, and it may be useful to investors on the same basis. These non-GAAP financial measures do not have any standardized meaning and, therefore, are unlikely to be comparable to similar measures presented by other companies. Therefore, these non-GAAP financial measures should not be considered in isolation or as a substitute for measures of performance prepared in accordance with GAAP. Except as otherwise indicated, these non-GAAP financial measures are calculated and disclosed on a consistent basis from period to period. Specific adjusting items may only be relevant in certain periods.
Adjusted Operating Earnings (Loss)
Adjusted operating earnings (loss) is a non-GAAP financial measure that adjusts net earnings (loss) for significant items that are not indicative of operating performance. Management uses adjusted operating earnings (loss) to evaluate operating performance because management believes it provides better comparability between periods. Adjusted operating earnings (loss) is reconciled to net earnings (loss) in the Consolidated Financial and Operating Information and Segment Results and Analysis sections of this MD&A.
Bridge Analyses of Adjusted Operating Earnings (Loss)
Within this MD&A, the company presents a chart that illustrates the change in adjusted operating earnings (loss) from the comparative period through key variance factors. These factors are analyzed in the Adjusted Operating Earnings (Loss) narratives following the bridge analysis in this MD&A. This bridge analysis is presented because management uses this presentation to evaluate performance. All reconciling items are presented on a before-tax basis and adjusted for income taxes in the Income Tax bridge factor.
| ● | The factor for Sales Volumes and Mix is calculated based on sales volumes and mix for the Oil Sands and E&P segments and refinery production volumes for the R&M segment. |
| ● | The factor for Price, Margin and Other Revenue includes upstream price realizations before royalties, except for the company’s Libya operations, which is net of royalties, and realized commodity risk management activities. Also included are refining and marketing gross margins, other operating revenue and the net impacts of sales and purchases of third-party crude, including product purchased for use as diluent in the company’s Oil Sands operations and subsequently sold as part of diluted bitumen. |
| ● | The factor for Royalties excludes the impact of the company’s Libya operations, as royalties in Libya are included in Price, Margin and Other Revenue as described above. |
| ● | The factor for Inventory Valuation is comprised of changes in the FIFO inventory valuation and the realized portion of commodity risk management activities reported in the R&M segment, as well as the impact of the deferral or realization of profit or loss on crude oil sales from the Oil Sands segment to Suncor’s refineries reported in the Corporate and Eliminations segment. |
| ● | The factor for Operating and Transportation Expense includes project startup costs, OS&G expense and transportation expense. |
| ● | The factor for Financing Expense and Other includes financing expenses, other income, operational foreign exchange gains and losses and changes in gains and losses on disposal of assets that are not adjusted operating earnings (loss) adjustments. |
| ● | The factor for DD&A and Exploration Expense includes depreciation, depletion and amortization expense, and exploration expense. |
| ● | The factor for Income Tax includes the company’s current and deferred income tax expense on adjusted operating earnings, changes in statutory income tax rates and other income tax adjustments. |
ROCE and ROCE Excluding Impairments and Impairment Reversals
ROCE is a non-GAAP ratio that management uses to analyze operating performance and the efficiency of Suncor’s capital allocation process. ROCE is calculated using the non-GAAP financial measures adjusted net earnings and average capital employed. Adjusted net earnings are calculated by taking net earnings (loss) and adjusting after-tax amounts for unrealized foreign exchange on U.S. dollar denominated debt and net interest expense. Average capital employed is calculated as a twelve-month average of the capital employed balance at the beginning of the twelve-month period and the month-end capital employed balances throughout the remainder of the twelve-month period. Figures for capital employed at the beginning and end of the twelve-month period are presented to show the changes in the components of the calculation over the twelve-month period.
For the twelve months ended June 30 |
|
|
|
|
($ millions, except as noted) |
|
|
2025 |
2024 |
Adjustments to net earnings |
|
|
|
|
Net earnings |
|
|
5 661 |
7 542 |
(Deduct) add after-tax amounts for: |
|
|
|
|
Unrealized foreign exchange (gain) loss on U.S. dollar denominated debt |
|
|
(109) |
344 |
Net interest expense |
|
|
260 |
356 |
Adjusted net earnings(1) |
|
A |
5 812 |
8 242 |
Capital employed – beginning of twelve-month period |
|
|
|
|
Net debt(2) |
|
|
9 054 |
11 170 |
Shareholders’ equity |
|
|
44 501 |
40 819 |
|
|
|
53 555 |
51 989 |
Capital employed – end of twelve-month period |
|
|
|
|
Net debt(2) |
|
|
7 673 |
9 054 |
Shareholders’ equity |
|
|
44 580 |
44 501 |
|
|
|
52 253 |
53 555 |
Average capital employed |
|
B |
52 367 |
52 962 |
ROCE (%)(3) |
|
A/B |
11.1 |
15.6 |
| (1) | Total before-tax impact of adjustments is $263 million for the twelve months ended June 30, 2025, and $848 million for the twelve months ended June 30, 2024. |
| (2) | Net debt is a non-GAAP financial measure. |
| (3) | For the twelve months ended June 30, 2025, and the twelve months ended June 30, 2024, there were no impairments or impairment reversals. As a result, ROCE excluding impairments was equal to ROCE. |
|
Management’s Discussion and Analysis
Adjusted Funds From (Used In) Operations
Adjusted funds from (used in) operations is a non-GAAP financial measure that adjusts a GAAP measure – cash flow provided by operating activities – for changes in non-cash working capital, which management uses to analyze operating performance and liquidity. Changes to non-cash working capital can be impacted by, among other factors, commodity price volatility, the timing of offshore feedstock purchases and payments for commodity and income taxes, the timing of cash flows related to accounts receivable and accounts payable, and changes in inventory, which management believes reduces comparability between periods.
Adjusted funds from (used in) operations for each quarter are separately defined and reconciled to the cash flow provided by the operating activities measure in the Non-GAAP and Other Financial Measures Advisory section of each respective MD&A or Quarterly Report to shareholders, as applicable, for the related quarter, with such information being incorporated by reference herein and available on SEDAR+ at www.sedarplus.ca.
Three months ended June 30 |
|
Oil Sands |
Exploration and Production |
Refining and |
Corporate and Eliminations |
Income Taxes |
Total |
||||||
($ millions) |
|
2025 |
2024 |
2025 |
2024 |
2025 |
2024 |
2025 |
2024 |
2025 |
2024 |
2025 |
2024 |
Earnings (loss) before income taxes |
|
844 |
1 792 |
165 |
196 |
377 |
593 |
48 |
(398) |
— |
— |
1 434 |
2 183 |
Adjustments for: |
|
|
|
|
|
|
|
|
|
|
|
|
|
Depreciation, depletion, amortization and impairment |
|
1 248 |
1 235 |
167 |
184 |
260 |
236 |
34 |
29 |
— |
— |
1 709 |
1 684 |
Accretion |
|
124 |
129 |
16 |
17 |
4 |
3 |
— |
— |
— |
— |
144 |
149 |
Unrealized foreign exchange (gain) loss on U.S. dollar denominated debt |
|
— |
— |
— |
— |
— |
— |
(461) |
103 |
— |
— |
(461) |
103 |
Change in fair value of financial instruments and trading inventory |
|
215 |
(42) |
34 |
15 |
(62) |
41 |
— |
— |
— |
— |
187 |
14 |
Loss on disposal of assets |
|
— |
— |
— |
— |
— |
— |
— |
1 |
— |
— |
— |
1 |
Share-based compensation |
|
7 |
43 |
1 |
3 |
4 |
20 |
(6) |
32 |
— |
— |
6 |
98 |
Settlement of decommissioning and restoration liabilities |
|
(86) |
(85) |
(11) |
(18) |
(15) |
(9) |
— |
— |
— |
— |
(112) |
(112) |
Other |
|
47 |
36 |
— |
1 |
47 |
9 |
100 |
12 |
— |
— |
194 |
58 |
Current income tax expense |
|
— |
— |
— |
— |
— |
— |
— |
— |
(412) |
(781) |
(412) |
(781) |
Adjusted funds from (used in) operations |
|
2 399 |
3 108 |
372 |
398 |
615 |
893 |
(285) |
(221) |
(412) |
(781) |
2 689 |
3 397 |
Change in non-cash working capital |
|
|
|
|
|
|
|
|
|
|
|
230 |
432 |
Cash flow provided by operating activities |
|
|
|
|
|
|
|
|
|
|
|
2 919 |
3 829 |
|
|
|
|
Exploration and |
Refining and |
Corporate and |
|
|
|
|
|||
Six months ended June 30 |
|
Oil Sands |
Production |
Marketing |
Eliminations |
Income Taxes |
Total |
||||||
($ millions) |
|
2025 |
2024 |
2025 |
2024 |
2025 |
2024 |
2025 |
2024 |
2025 |
2024 |
2025 |
2024 |
Earnings (loss) before income taxes |
|
2 519 |
3 163 |
323 |
470 |
1 049 |
1 707 |
(167) |
(937) |
— |
— |
3 724 |
4 403 |
Adjustments for: |
|
|
|
|
|
|
|
|
|
|
|
|
|
Depreciation, depletion, |
|
2 447 |
2 420 |
338 |
354 |
517 |
480 |
70 |
58 |
— |
— |
3 372 |
3 312 |
Accretion |
|
248 |
255 |
32 |
33 |
7 |
6 |
— |
— |
— |
— |
287 |
294 |
Unrealized foreign |
|
— |
— |
— |
— |
— |
— |
(475) |
323 |
— |
— |
(475) |
323 |
Change in fair value of |
|
147 |
(40) |
28 |
18 |
(45) |
66 |
— |
— |
— |
— |
130 |
44 |
Gain on disposal of |
|
— |
— |
— |
— |
— |
— |
— |
(2) |
— |
— |
— |
(2) |
Share-based |
|
(79) |
(128) |
(5) |
6 |
(36) |
(58) |
(177) |
(96) |
— |
— |
(297) |
(276) |
Settlement of |
|
(165) |
(197) |
(14) |
(20) |
(27) |
(18) |
— |
— |
— |
— |
(206) |
(235) |
Other |
|
92 |
78 |
— |
4 |
52 |
16 |
115 |
35 |
— |
— |
259 |
133 |
Current income tax expense |
|
— |
— |
— |
— |
— |
— |
— |
— |
(1 060) |
(1 430) |
(1 060) |
(1 430) |
Adjusted funds from (used in) operations |
|
5 209 |
5 551 |
702 |
865 |
1 517 |
2 199 |
(634) |
(619) |
(1 060) |
(1 430) |
5 734 |
6 566 |
Change in non-cash working capital |
|
|
|
|
|
|
|
|
|
|
|
(659) |
50 |
Cash flow provided by operating activities |
|
|
|
|
|
|
|
|
|
|
|
5 075 |
6 616 |
|
Management’s Discussion and Analysis
Free Funds Flow
Free funds flow is a non-GAAP financial measure that is calculated by taking adjusted funds from operations and subtracting capital expenditures, including capitalized interest. Free funds flow reflects cash available for increasing distributions to shareholders and reducing debt. Management uses free funds flow to measure the capacity of the company to increase returns to shareholders and to grow Suncor’s business.
|
|
|
|
Exploration and |
Refining and |
Corporate and |
|
|
|
|
|
|||
Three months ended June 30 |
|
Oil Sands |
Production |
Marketing |
Eliminations |
Income Taxes |
Total |
|||||||
($ millions) |
|
2025 |
2024 |
2025 |
2024 |
2025 |
2024 |
2025 |
2024 |
2025 |
2024 |
2025 |
|
2024 |
Adjusted funds from (used in) operations |
|
2 399 |
3 108 |
372 |
398 |
615 |
893 |
(285) |
(221) |
(412) |
(781) |
2 689 |
|
3 397 |
Capital expenditures including capitalized interest |
|
(1 109) |
(1 437) |
(229) |
(229) |
(362) |
(375) |
(8) |
(6) |
— |
— |
(1 708) |
|
(2 047) |
Free funds flow (deficit) |
|
1 290 |
1 671 |
143 |
169 |
253 |
518 |
(293) |
(227) |
(412) |
(781) |
981 |
|
1 350 |
|
|
|
|
Exploration and |
Refining and |
Corporate and |
|
|
|
|
|
|||
Six months ended June 30 |
|
Oil Sands |
Production |
Marketing |
Eliminations |
Income Taxes |
Total |
|||||||
($ millions) |
|
2025 |
2024 |
2025 |
2024 |
2025 |
2024 |
2025 |
2024 |
2025 |
2024 |
2025 |
|
2024 |
Adjusted funds from (used in) operations |
|
5 209 |
5 551 |
702 |
865 |
1 517 |
2 199 |
(634) |
(619) |
(1 060) |
(1 430) |
5 734 |
|
6 566 |
Capital expenditures including capitalized interest |
|
(1 858) |
(2 432) |
(438) |
(371) |
(542) |
(543) |
(15) |
(12) |
— |
— |
(2 853) |
|
(3 358) |
Free funds flow (deficit) |
|
3 351 |
3 119 |
264 |
494 |
975 |
1 656 |
(649) |
(631) |
(1 060) |
(1 430) |
2 881 |
|
3 208 |
Oil Sands Operations, Fort Hills and Syncrude Cash Operating Costs
Cash operating costs are calculated by adjusting Oil Sands segment OS&G expenses for non-production costs and excess power capacity. Significant non-production costs include, but are not limited to, share-based compensation adjustments, research costs, project startup costs and adjustments to reflect the cost of internal transfers in the receiving asset at the cost of production versus the cost of purchase. Non-production costs at Fort Hills and Syncrude also include, but are not limited to, an adjustment to reflect internally produced diesel from Oil Sands operations at the cost of production. Excess power capacity represents excess power revenue from cogeneration units that is recorded in operating revenues. Oil Sands operations excess power capacity and other also includes, but is not limited to, the natural gas expense recorded as part of a non-monetary arrangement involving a third-party processor. Oil Sands operations, Fort Hills and Syncrude production volumes are gross of internally consumed diesel and feedstock transfers between assets. Oil Sands operations, Fort Hills and Syncrude cash operating costs are reconciled in the Segment Results and Analysis – Oil Sands – Cash Operating Costs section of this MD&A. Management uses cash operating costs to measure operating performance.
Refining and Marketing Gross Margin and Refining Operating Expense
Refining and marketing gross margins and refining operating expense are non-GAAP financial measures. Refining and marketing gross margin, on a FIFO basis, is calculated by adjusting R&M segment operating revenue, other income and purchases of crude oil and products (all of which are GAAP measures) for intersegment marketing fees recorded in intersegment revenues. Refining and marketing gross margin, on a LIFO basis, is further adjusted for the impacts of FIFO inventory valuation recorded in purchases of crude oil and products and risk management activities recorded in other income (loss). Refinery operating expense is calculated by adjusting R&M segment OS&G expenses for i) non-refining costs pertaining to the company’s supply, marketing and ethanol businesses; and ii) non-refining costs that management believes do not relate to the production of refined products, including, but not limited to, share-based compensation and enterprise shared service allocations. Management uses refining and marketing gross margin and refining operating expense to measure operating performance on a production barrel basis.
|
|
Three months ended |
Six months ended |
||
($ millions, except as noted) |
|
2025 |
2024 |
2025 |
2024 |
Refining and marketing gross margin reconciliation |
|
|
|
|
|
Operating revenues |
|
7 310 |
8 057 |
14 938 |
15 670 |
Purchases of crude oil and products |
|
(5 969) |
(6 519) |
(11 891) |
(12 107) |
|
|
1 341 |
1 538 |
3 047 |
3 563 |
Other income |
|
18 |
43 |
6 |
117 |
Non-refining and marketing margin |
|
14 |
(13) |
1 |
(55) |
Refining and marketing gross margin – FIFO |
|
1 373 |
1 568 |
3 054 |
3 625 |
Refinery production(1) (mbbls) |
|
42 282 |
41 669 |
88 080 |
85 743 |
Refining and marketing gross margin – FIFO ($/bbl) |
|
32.45 |
37.65 |
34.65 |
42.30 |
FIFO and risk management activities adjustment |
|
82 |
(53) |
142 |
(93) |
Refining and marketing gross margin – LIFO |
|
1 455 |
1 515 |
3 196 |
3 532 |
Refining and marketing gross margin – LIFO ($/bbl) |
|
34.40 |
36.35 |
36.30 |
41.20 |
Refining operating expense reconciliation |
|
|
|
|
|
Operating, selling and general expense |
|
578 |
603 |
1 187 |
1 221 |
Non-refining costs |
|
(289) |
(313) |
(590) |
(616) |
Refining operating expense |
|
289 |
290 |
597 |
605 |
Refinery production(1) (mbbls) |
|
42 282 |
41 669 |
88 080 |
85 743 |
Refining operating expense ($/bbl) |
|
6.85 |
6.95 |
6.80 |
7.05 |
| (1) | Refinery production is the output of the refining process and differs from crude oil processed as a result of volumetric adjustments for non-crude feedstock, volumetric gain associated with the refining process and changes in unfinished product inventories. |
|
Management’s Discussion and Analysis
Impact of FIFO Inventory Valuation on Refining and Marketing Net Earnings (Loss)
GAAP requires the use of a FIFO inventory valuation methodology. For Suncor, this results in a disconnect between the sales prices for refined products, which reflect current market conditions, and the amount recorded as the cost of sale for the related refinery feedstock, which reflects market conditions at the time the feedstock was purchased. This lag between purchase and sale can be anywhere from several weeks to several months and is influenced by the time to receive crude after purchase, regional crude inventory levels, the completion of refining processes, transportation time to distribution channels and regional refined product inventory levels.
Suncor prepares and presents an estimate of the impact of using a FIFO inventory valuation methodology compared to a LIFO methodology, because management uses the information to analyze operating performance and compare itself against refining peers that are permitted to use LIFO inventory valuation under U.S. GAAP.
The company’s estimate is not derived from a standardized calculation and, therefore, may not be directly comparable to similar measures presented by other companies, and should not be considered in isolation or as a substitute for measures of performance prepared in accordance with GAAP or U.S. GAAP.
Net Debt and Total Debt
Net debt and total debt are non-GAAP financial measures that management uses to analyze the financial condition of the company. Total debt includes short-term debt, current portion of long-term debt and long-term debt (all of which are GAAP measures). Net debt is equal to total debt less cash and cash equivalents (a GAAP measure).
|
|
June 30 |
December 31 |
($ millions, except as noted) |
|
2025 |
2024 |
Short-term debt |
|
— |
— |
Current portion of long-term debt |
|
1 376 |
997 |
Long-term debt |
|
8 566 |
9 348 |
Total debt |
|
9 942 |
10 345 |
Less: Cash and cash equivalents |
|
2 269 |
3 484 |
Net debt |
|
7 673 |
6 861 |
Shareholders’ equity |
|
44 580 |
44 514 |
Total debt plus shareholders’ equity |
|
54 522 |
54 859 |
Total debt to total debt plus shareholders’ equity (%) |
|
18.2 |
18.9 |
Net debt to net debt plus shareholders’ equity (%) |
|
14.7 |
13.4 |
Price Realizations
Price realizations are a non-GAAP measure used by management to measure profitability. Oil Sands price realizations are presented on a crude product basis and are derived from the Oil Sands segmented statement of net earnings (loss), after adjusting for items not directly attributable to the revenues associated with production. E&P price realizations are presented on an asset location basis and are derived from the E&P segmented statement of net earnings (loss), after adjusting for other E&P assets, such as Libya, for which price realizations are not provided.
Oil Sands Price Realizations
|
|
June 30, 2025 |
|
June 30, 2024 |
||||
|
|
|
Upgraded – |
Oil Sands |
|
|
Upgraded – |
Oil Sands |
Three months ended |
|
Non- |
Net |
Segment |
|
Non- |
Net |
Segment |
|
|
Upgraded |
SCO and |
Average |
|
Upgraded |
SCO and |
Average |
($ millions, except as noted) |
|
Bitumen |
Diesel |
Crude |
|
Bitumen |
Diesel |
Crude |
Operating revenues |
|
2 718 |
3 722 |
6 440 |
|
2 818 |
4 614 |
7 432 |
Other (loss) income |
|
(56) |
(2) |
(58) |
|
60 |
12 |
72 |
Purchases of crude oil and products |
|
(763) |
(50) |
(813) |
|
(651) |
(45) |
(696) |
Gross realization adjustment(1) |
|
3 |
(62) |
(59) |
|
(43) |
(30) |
(73) |
Gross realization |
|
1 902 |
3 608 |
5 510 |
|
2 184 |
4 551 |
6 735 |
Transportation and distribution |
|
(188) |
(147) |
(335) |
|
(139) |
(153) |
(292) |
Price realization |
|
1 714 |
3 461 |
5 175 |
|
2 045 |
4 398 |
6 443 |
Sales volumes (mbbls) |
|
27 989 |
40 055 |
68 044 |
|
24 811 |
41 296 |
66 107 |
Price realization per barrel |
|
61.24 |
86.43 |
76.06 |
|
82.46 |
106.49 |
97.48 |
|
|
|
|
|
|
|
|
|
Six months ended |
|
June 30, 2025 |
|
June 30, 2024 |
||||
|
|
|
Upgraded – |
Oil Sands |
|
|
Upgraded – |
Oil Sands |
|
|
Non- |
Net |
Segment |
|
Non- |
Net |
Segment |
|
|
Upgraded |
SCO and |
Average |
|
Upgraded |
SCO and |
Average |
($ millions, except as noted) |
|
Bitumen |
Diesel |
Crude |
|
Bitumen |
Diesel |
Crude |
Operating revenues |
|
5 003 |
8 578 |
13 581 |
|
4 880 |
9 474 |
14 354 |
Other (loss) income |
|
(15) |
55 |
40 |
|
119 |
8 |
127 |
Purchases of crude oil and products |
|
(1 335) |
(87) |
(1 422) |
|
(1 208) |
(117) |
(1 325) |
Gross realization adjustment(1) |
|
(32) |
(216) |
(248) |
|
(65) |
(124) |
(189) |
Gross realization |
|
3 621 |
8 330 |
11 951 |
|
3 726 |
9 241 |
12 967 |
Transportation and distribution |
|
(339) |
(292) |
(631) |
|
(297) |
(287) |
(584) |
Price realization |
|
3 282 |
8 038 |
11 320 |
|
3 429 |
8 954 |
12 383 |
Sales volumes (mbbls) |
|
50 030 |
87 622 |
137 652 |
|
46 091 |
91 373 |
137 464 |
Price realization per barrel |
|
65.60 |
91.74 |
82.24 |
|
74.37 |
98.03 |
90.09 |
| (1) | Reflects the items not directly attributed to revenues received from the sale of proprietary crude and net non-proprietary activity at its deemed point of sale. |
|
Management’s Discussion and Analysis
E&P Price Realizations
Three months ended |
|
June 30, 2025 |
|
June 30, 2024 |
||||
|
|
E&P |
|
E&P |
|
E&P |
|
E&P |
($ millions, except as noted) |
|
Canada |
Other(1)(2) |
Segment |
|
Canada |
Other(1)(2) |
Segment |
Operating revenues |
|
545 |
120 |
665 |
|
437 |
236 |
673 |
Transportation and distribution |
|
(32) |
(4) |
(36) |
|
(21) |
(3) |
(24) |
Price realization |
|
513 |
116 |
|
|
416 |
233 |
|
Sales volumes (mbbls) |
|
5 619 |
|
|
|
3 748 |
|
|
Price realization per barrel |
|
91.60 |
|
|
|
111.39 |
|
|
|
|
|
|
|
|
|
|
|
Six months ended |
|
June 30, 2025 |
|
June 30, 2024 |
||||
|
|
E&P |
|
E&P |
|
|
|
E&P |
($ millions, except as noted) |
|
Canada |
Other(1)(2) |
Segment |
|
E&P Canada |
Other(1)(2) |
Segment |
Operating revenues |
|
1 015 |
379 |
1 394 |
|
1 046 |
392 |
1 438 |
Transportation and distribution |
|
(51) |
(7) |
(58) |
|
(44) |
(5) |
(49) |
Price realization |
|
964 |
372 |
|
|
1 002 |
387 |
|
Sales volumes (mbbls) |
|
9 963 |
|
|
|
9 180 |
|
|
Price realization per barrel |
|
96.96 |
|
|
|
109.50 |
|
|
| (1) | Reflects other E&P assets, such as Libya, for which price realizations are not provided. |
| (2) | Production from the company’s Libya operations is presented on an economic basis. Revenue and royalties from the company’s Libya operations are presented on a working-interest basis, which is required for presentation purposes in the company’s Consolidated Financial Statements. In the second quarter of 2025, revenue included a gross-up amount of $92 million (2024 – $179 million), with an offsetting amount of $64 million (2024 – $89 million) in royalties in the E&P segment and $28 million (2024 – $90 million) in income tax expense recorded at the consolidated level. In the first six months of 2025, revenue included a gross-up amount of $288 million (2024 – $298 million), with an offsetting amount of $170 million (2024 – $151 million) in royalties in the E&P segment and $118 million (2024 – $147 million) in income tax expense recorded at the consolidated level. |
The following is a list of abbreviations that may be used in this MD&A:
Measurement |
Places and Currencies |
||
bbl |
barrel |
U.S. |
United States |
bbls/d |
barrels per day |
U.K. |
United Kingdom |
mbbls/d |
thousands of barrels per day |
|
|
|
|
$ or Cdn$ |
Canadian dollars |
GJ |
Gigajoule |
US$ |
United States dollars |
|
|
||
MW |
megawatts |
|
|
MWh |
megawatts per hour |
Financial and Business Environment |
|
|
|
Q2 |
Three months ended June 30 |
|
|
DD&A |
Depreciation, depletion and amortization |
|
|
WTI |
West Texas Intermediate |
|
|
WCS |
Western Canadian Select |
SCO |
Synthetic crude oil |
||
|
|
SYN |
Synthetic crude oil benchmark |
|
|
MSW |
Mixed Sweet Blend |
|
Management’s Discussion and Analysis
Forward-Looking Statements
This MD&A contains certain forward-looking statements and other information based on Suncor’s current expectations, estimates, projections and assumptions that were made by the company in light of information available at the time the statement was made and consider Suncor’s experience and its perception of historical trends, including expectations and assumptions concerning: the accuracy of reserves estimates; commodity prices and interest and foreign exchange rates; the performance of assets and equipment; uncertainty related to geopolitical conflict; capital efficiencies and cost savings; applicable laws and government policies; future production rates; the sufficiency of budgeted capital expenditures in carrying out planned activities; the availability and cost of labour, services and infrastructure; the satisfaction by third parties of their obligations to Suncor; the development and execution of projects; and the receipt, in a timely manner, of regulatory and third-party approvals. All statements and information that address expectations or projections about the future, and other statements and information about Suncor’s strategy for growth, expected and future expenditures or investment decisions, commodity prices, costs, schedules, production volumes, operating and financial results, future financing and capital activities, and the expected impact of future commitments are forward-looking statements. Some of the forward-looking statements may be identified by words like “expects”, “anticipates”, “will”, “estimates”, “plans”, “scheduled”, “intends”, “believes”, “projects”, “indicates”, “could”, “focus”, “vision”, “goal”, “outlook”, “proposed”, “target”, “objective”, “continue”, “should”, “may”, “future”, “potential”, “opportunity”, “would”, “priority”, “strategy” and similar expressions. Forward-looking statements in this MD&A include references to:
| ● | Suncor's strategy, focus, goals and priorities and the expected benefits therefrom; |
| ● | expectations regarding planned maintenance events, including the timing and completion of turnarounds at Firebag and Syncrude, and planned maintenance events at the Edmonton refinery and Oil Sands Base Upgrader 2 and that the maintenance deferral at Oil Sands Base Upgrader 2 is expected to increase SCO relative to bitumen production mix for the remainder of 2025; |
| ● | the expectation that completion of the Upgrader 1 turnaround will result in a higher expected proportion of SCO production in the third quarter; |
| ● | Suncor’s expectation that In Situ design and construction of new well pads will maintain existing production levels; |
| ● | statements regarding Suncor’s planned 2025 capital spending program of $5.7 billion to $5.9 billion, including Suncor’s management’s belief that it will have the capital resources to fund it and to meet current and future working capital requirements through cash and cash equivalents balances, cash flow provided by operating activities, available committed credit facilities, issuing commercial paper and, if needed, accessing capital markets; |
| ● | the objectives of Suncor’s short-term investment portfolio and Suncor’s expectation that the maximum weighted average term to maturity of the short-term investment portfolio will not exceed six months, and that all investments will be with counterparties with investment-grade debt ratings; |
| ● | the company’s priority regarding the management of debt levels and liquidity given the company’s long-term plans and future expected volatility in the pricing environment, and Suncor’s belief that a phased and flexible approach to existing and future projects will help the company manage project costs and debt levels; and |
| ● | the company’s expectation that its decision to allocated cash to repurchase shares will not affect its long-term strategy; |
| ● | the company’s belief that it does not have any guarantees or off-balance sheet arrangements that have, or are reasonably likely to have, a current or future material effect on the company’s financial performance or financial condition, results of operations, liquidity or capital expenditures. |
Forward-looking statements are not guarantees of future performance and involve a number of risks and uncertainties, some that are similar to other oil and gas companies and some that are unique to Suncor. Suncor’s actual results may differ materially from those expressed or implied by its forward-looking statements, so readers are cautioned not to place undue reliance on them. The financial and operating performance of the company’s reportable operating segments, specifically Oil Sands, E&P and R&M, may be affected by a number of factors.
Factors that affect Suncor’s Oil Sands segment include, but are not limited to, volatility in the prices for crude oil and other production, and the related impacts of fluctuating light/heavy and sweet/sour crude oil differentials; changes in the demand for refinery feedstock and diesel fuel, including the possibility that refiners that process the company’s proprietary production will be closed, experience equipment failure or other accidents; Suncor’s ability to operate its Oil Sands facilities reliably in order to meet production targets; the output of newly commissioned facilities, the performance of which may be difficult to predict during initial operations; Suncor’s dependence on pipeline capacity and other logistical constraints, which may affect the company’s ability to distribute products to market and which may cause the company to delay or cancel planned growth projects in the event of insufficient takeaway capacity; Suncor’s ability to finance Oil Sands economic investment and asset sustainment and maintenance capital expenditures; the availability of bitumen feedstock for upgrading operations, which can be negatively affected by poor ore grade quality, unplanned mine equipment and extraction plant maintenance, tailings storage, and In Situ reservoir and equipment performance, or the unavailability of third-party bitumen; changes in operating costs, including the cost of labour, natural gas and other energy sources used in oil sands processes; and the company’s ability to complete projects, including planned maintenance events, both on time and on budget, which could be impacted by competition from other projects (including other oil sands projects) for goods and services and demands on infrastructure in Alberta’s Wood Buffalo region and the surrounding area (including housing, roads and schools).
Factors that affect Suncor’s E&P segment include, but are not limited to, volatility in crude oil and natural gas prices; operational risks and uncertainties associated with oil and gas activities, including unexpected formations or pressures, premature declines of reservoirs, fires, blow-outs, equipment failures and other accidents, uncontrollable flows of crude oil, natural gas or well fluids, and pollution and other environmental risks; adverse weather conditions, which could disrupt output from producing assets or impact drilling programs, resulting in increased costs and/or delays in bringing on new production; political, economic and socioeconomic risks associated with Suncor’s foreign operations, including the unpredictability of operating in Libya due to ongoing political unrest; and market demand for mineral rights and producing properties, potentially leading to losses on disposition or increased property acquisition costs.
Factors that affect the R&M segment include, but are not limited to, fluctuations in demand and supply for refined products that impact the company’s margins; market competition, including potential new market entrants; the company’s ability to reliably operate refining and marketing facilities to meet
production or sales targets; and risks and uncertainties affecting construction or planned maintenance schedules, including the availability of labour and other impacts of competing projects drawing on the same resources during the same time period.
Additional risks, uncertainties and other factors that could influence the financial and operating performance of all of Suncor’s operating segments and activities include, but are not limited to, changes in general economic, market and business conditions, such as commodity prices, interest rates, currency exchange rates and potential trade tariffs (including as a result of demand and supply effects resulting from the actions of OPEC+ and/or the impact of armed conflicts in the Middle East, the impact of the Russian invasion of Ukraine and/or the impact of changes to the U.S. government economic policy); fluctuations in supply and demand for Suncor’s products; the successful and timely implementation of capital projects, including growth projects and regulatory projects; risks associated with the development and execution of Suncor’s major projects and the commissioning and integration of new facilities; the possibility that completed maintenance activities may not improve operational performance or the output of related facilities; the risk that projects and initiatives intended to achieve cash flow growth and/or reductions in operating costs may not achieve the expected results in the time anticipated or at all; competitive actions of other companies, including increased competition from other oil and gas companies or from companies that provide alternative sources of energy; labour and material shortages; actions by government authorities, including the imposition or reassessment of, or changes to, taxes, fees, royalties, duties and other government-imposed compliance costs; changes to laws and government policies that could impact the company’s business, including environmental (including climate change), royalty and tax laws and policies; the ability and willingness of parties with whom Suncor has material relationships to perform their obligations to the company; the unavailability of, or outages to, third-party infrastructure that could cause disruptions to production or prevent the company from being able to transport its products; the occurrence of a protracted operational outage, a major safety or environmental incident, or unexpected events such as fires (including forest fires), equipment failures and other similar events affecting Suncor or other parties whose operations or assets directly or indirectly affect Suncor; the potential for security breaches of Suncor’s information technology and infrastructure by malicious persons or entities, and the unavailability or failure of such systems to perform as anticipated as a result of such breaches; security threats and terrorist or activist activities; the risk that competing business objectives may exceed Suncor’s capacity to adopt and implement change; risks and uncertainties associated with obtaining regulatory, third-party and stakeholder approvals outside of Suncor’s control for the company’s operations, projects, initiatives and exploration and development activities and the satisfaction of any conditions to approvals; the potential for disruptions to operations and construction projects as a result of Suncor’s relationships with labour unions that represent employees at the company’s facilities; the company’s ability to find new oil and gas reserves that can be developed economically; the accuracy of Suncor’s reserves, resources and future production estimates; market instability affecting Suncor’s ability to borrow in the capital debt markets at acceptable rates or to issue other securities at acceptable prices; the ability to maintain an optimal debt to cash flow ratio; the success of the company’s marketing and logistics activities using derivatives and other financial instruments; the cost of compliance with current and future environmental laws, including climate change laws; risks relating to increased activism and public opposition to fossil fuels and oil sands; the ability of counterparties to comply with their obligations in a timely manner; risks associated with joint arrangements in which the company has an interest; risks associated with land claims and Indigenous consultation requirements; the risk that the company may be subject to litigation; the impact of technology and risks associated with developing and implementing new technologies; and the accuracy of cost estimates, some of which are provided at the conceptual or other preliminary stage of projects and prior to commencement or conception of the detailed engineering that is needed to reduce the margin of error and increase the level of accuracy. The foregoing important factors are not exhaustive.
Many of these risk factors and other assumptions related to Suncor’s forward-looking statements are discussed in further detail throughout this MD&A, and in the company’s 2024 annual MD&A, the 2024 AIF and Form 40-F on file with Canadian securities commissions at www.sedarplus.ca and the United States Securities and Exchange Commission at www.sec.gov. Readers are also referred to the risk factors and assumptions described in other MD&As that Suncor files from time to time with securities regulatory authorities. Copies of these MD&As are available without charge from the company.
The forward-looking statements contained in this MD&A are made as of the date of this MD&A. Except as required by applicable securities laws, we assume no obligation to update publicly or otherwise revise any forward-looking statements or the foregoing risks and assumptions affecting such forward-looking statements, whether as a result of new information, future events or otherwise.
|
Consolidated Statements of Comprehensive Income
(unaudited)
|
|
Three months ended |
|
Six months ended |
||||
($ millions) |
|
2025 |
|
2024 |
|
2025 |
|
2024 |
Revenues and Other Income |
|
|
|
|
|
|
|
|
Gross revenues (note 3) |
|
12 749 |
|
14 014 |
|
26 079 |
|
27 319 |
Less: royalties |
|
(758) |
|
(1 125) |
|
(1 765) |
|
(2 049) |
Other (loss) income (note 4) |
|
(97) |
|
151 |
|
33 |
|
299 |
|
|
11 894 |
|
13 040 |
|
24 347 |
|
25 569 |
Expenses |
|
|
|
|
|
|
|
|
Purchases of crude oil and products |
|
5 101 |
|
5 162 |
|
9 401 |
|
9 520 |
Operating, selling and general |
|
3 163 |
|
3 153 |
|
6 460 |
|
6 593 |
Transportation and distribution |
|
489 |
|
438 |
|
937 |
|
848 |
Depreciation, depletion, amortization and impairment |
|
1 709 |
|
1 684 |
|
3 372 |
|
3 312 |
Exploration |
|
4 |
|
15 |
|
126 |
|
74 |
Loss (gain) on disposal of assets |
|
— |
|
1 |
|
— |
|
(2) |
Financing (income) expenses (note 6) |
|
(6) |
|
404 |
|
327 |
|
821 |
|
|
10 460 |
|
10 857 |
|
20 623 |
|
21 166 |
Earnings before Income Taxes |
|
1 434 |
|
2 183 |
|
3 724 |
|
4 403 |
|
|
|
|
|
|
|
|
|
Income Tax Expense (Recovery) |
|
|
|
|
|
|
|
|
Current |
|
412 |
|
781 |
|
1 060 |
|
1 430 |
Deferred |
|
(112) |
|
(166) |
|
(159) |
|
(205) |
|
|
300 |
|
615 |
|
901 |
|
1 225 |
Net Earnings |
|
1 134 |
|
1 568 |
|
2 823 |
|
3 178 |
|
|
|
|
|
|
|
|
|
Other Comprehensive Income |
|
|
|
|
|
|
|
|
Items That May be Subsequently Reclassified to Earnings: |
|
|
|
|
|
|
|
|
Foreign currency translation adjustment |
|
(159) |
|
11 |
|
(180) |
|
(5) |
Items That Will Not be Reclassified to Earnings: |
|
|
|
|
|
|
|
|
Actuarial gain on employee retirement benefit plans, net of income taxes (note 11) |
|
209 |
|
91 |
|
244 |
|
490 |
Other Comprehensive Income |
|
50 |
|
102 |
|
64 |
|
485 |
|
|
|
|
|
|
|
|
|
Total Comprehensive Income |
|
1 184 |
|
1 670 |
|
2 887 |
|
3 663 |
|
|
|
|
|
|
|
|
|
Per Common Share (dollars) (note 7) |
|
|
|
|
|
|
|
|
Net earnings – basic and diluted |
|
0.93 |
|
1.22 |
|
2.29 |
|
2.47 |
Cash dividends |
|
0.57 |
|
0.55 |
|
1.14 |
|
1.10 |
See accompanying notes to the condensed interim consolidated financial statements.
Consolidated Balance Sheets
(unaudited)
|
|
June 30 |
|
December 31 |
($ millions) |
|
2025 |
|
2024 |
Assets |
|
|
|
|
Current assets |
|
|
|
|
Cash and cash equivalents |
|
2 269 |
|
3 484 |
Accounts receivable |
|
5 322 |
|
5 245 |
Inventories |
|
5 230 |
|
5 041 |
Income taxes receivable |
|
597 |
|
518 |
Total current assets |
|
13 418 |
|
14 288 |
Property, plant and equipment, net |
|
68 074 |
|
68 512 |
Exploration and evaluation |
|
1 742 |
|
1 742 |
Other assets |
|
1 722 |
|
1 559 |
Goodwill and other intangible assets |
|
3 475 |
|
3 503 |
Deferred income taxes |
|
196 |
|
180 |
Total assets |
|
88 627 |
|
89 784 |
|
|
|
|
|
Liabilities and Shareholders’ Equity |
|
|
|
|
Current liabilities |
|
|
|
|
Current portion of long-term debt |
|
1 376 |
|
997 |
Current portion of long-term lease liabilities |
|
638 |
|
599 |
Accounts payable and accrued liabilities |
|
7 672 |
|
8 161 |
Current portion of provisions |
|
849 |
|
958 |
Income taxes payable |
|
100 |
|
32 |
Total current liabilities |
|
10 635 |
|
10 747 |
Long-term debt |
|
8 566 |
|
9 348 |
Long-term lease liabilities |
|
3 700 |
|
3 745 |
Other long-term liabilities |
|
1 358 |
|
1 502 |
Provisions (note 10) |
|
11 873 |
|
11 931 |
Deferred income taxes |
|
7 915 |
|
7 997 |
Equity |
|
44 580 |
|
44 514 |
Total liabilities and shareholders’ equity |
|
88 627 |
|
89 784 |
See accompanying notes to the condensed interim consolidated financial statements.
Consolidated Statements of Cash Flows
(unaudited)
|
|
Three months ended |
|
Six months ended |
||||
($ millions) |
|
2025 |
|
2024 |
|
2025 |
|
2024 |
Operating Activities |
|
|
|
|
|
|
|
|
Net Earnings |
|
1 134 |
|
1 568 |
|
2 823 |
|
3 178 |
Adjustments for: |
|
|
|
|
|
|
|
|
Depreciation, depletion, amortization and impairment |
|
1 709 |
|
1 684 |
|
3 372 |
|
3 312 |
Deferred income tax recovery |
|
(112) |
|
(166) |
|
(159) |
|
(205) |
Accretion (note 6) |
|
144 |
|
149 |
|
287 |
|
294 |
Unrealized foreign exchange (gain) loss on U.S. dollar denominated debt (note 6) |
|
(461) |
|
103 |
|
(475) |
|
323 |
Change in fair value of financial instruments and trading inventory |
|
187 |
|
14 |
|
130 |
|
44 |
Loss (gain) on disposal of assets |
|
— |
|
1 |
|
— |
|
(2) |
Share-based compensation |
|
6 |
|
98 |
|
(297) |
|
(276) |
Settlement of decommissioning and restoration liabilities |
|
(112) |
|
(112) |
|
(206) |
|
(235) |
Other |
|
194 |
|
58 |
|
259 |
|
133 |
Decrease (increase) in non-cash working capital |
|
230 |
|
432 |
|
(659) |
|
50 |
Cash flow provided by operating activities |
|
2 919 |
|
3 829 |
|
5 075 |
|
6 616 |
Investing Activities |
|
|
|
|
|
|
|
|
Capital and exploration expenditures |
|
(1 708) |
|
(2 047) |
|
(2 853) |
|
(3 358) |
Proceeds from disposal of assets |
|
— |
|
15 |
|
— |
|
23 |
Other investments |
|
(1) |
|
(2) |
|
(7) |
|
(3) |
Decrease (increase) in non-cash working capital |
|
39 |
|
246 |
|
(65) |
|
215 |
Cash flow used in investing activities |
|
(1 670) |
|
(1 788) |
|
(2 925) |
|
(3 123) |
Financing Activities |
|
|
|
|
|
|
|
|
Net decrease in short-term debt |
|
— |
|
(688) |
|
— |
|
(467) |
Lease liability payments |
|
(175) |
|
(107) |
|
(355) |
|
(205) |
Issuance of common shares under share option plans |
|
12 |
|
177 |
|
87 |
|
307 |
Repurchase of common shares(1) (note 8) |
|
(750) |
|
(825) |
|
(1 548) |
|
(1 118) |
Distributions relating to non-controlling interest |
|
(4) |
|
(4) |
|
(8) |
|
(8) |
Dividends paid on common shares |
|
(697) |
|
(698) |
|
(1 402) |
|
(1 400) |
Cash flow used in financing activities |
|
(1 614) |
|
(2 145) |
|
(3 226) |
|
(2 891) |
(Decrease) Increase in Cash and Cash Equivalents |
|
(365) |
|
(104) |
|
(1 076) |
|
602 |
Effect of foreign exchange on cash and cash equivalents |
|
(139) |
|
14 |
|
(139) |
|
43 |
Cash and cash equivalents at beginning of period |
|
2 773 |
|
2 464 |
|
3 484 |
|
1 729 |
Cash and Cash Equivalents at End of Period |
|
2 269 |
|
2 374 |
|
2 269 |
|
2 374 |
Supplementary Cash Flow Information |
|
|
|
|
|
|
|
|
Interest paid |
|
293 |
|
316 |
|
441 |
|
452 |
Income taxes paid |
|
393 |
|
959 |
|
997 |
|
984 |
| (1) | Includes $48 million of taxes paid on 2024 share repurchases for the six months ended June 30, 2025. |
See accompanying notes to the condensed interim consolidated financial statements.
Consolidated Statements of Changes In Equity
(unaudited)
|
|
|
|
|
|
Accumulated |
|
|
|
|
|
Number of |
|
|
|
|
|
|
Other |
|
|
|
|
|
Common |
|
|
Share |
|
Contributed |
|
Comprehensive |
|
Retained |
|
|
|
Shares |
($ millions) |
|
Capital |
|
Surplus |
|
Income |
|
Earnings |
|
Total |
|
(thousands) |
At December 31, 2023 |
|
21 661 |
|
569 |
|
1 048 |
|
20 001 |
|
43 279 |
|
1 290 100 |
Net earnings |
|
— |
|
— |
|
— |
|
3 178 |
|
3 178 |
|
— |
Foreign currency translation adjustment |
|
— |
|
— |
|
(5) |
|
— |
|
(5) |
|
— |
Actuarial gain on employee retirement benefit plans, |
|
— |
|
— |
|
— |
|
490 |
|
490 |
|
— |
Total comprehensive income |
|
— |
|
— |
|
(5) |
|
3 668 |
|
3 663 |
|
— |
Issued under share option plans |
|
351 |
|
(48) |
|
— |
|
— |
|
303 |
|
7 728 |
Repurchase of common shares for cancellation(1) |
|
(372) |
|
— |
|
— |
|
(761) |
|
(1 133) |
|
(21 999) |
Change in liability for share repurchase commitment |
|
(60) |
|
— |
|
— |
|
(158) |
|
(218) |
|
— |
Share-based compensation |
|
— |
|
7 |
|
— |
|
— |
|
7 |
|
— |
Dividends paid on common shares |
|
— |
|
— |
|
— |
|
(1 400) |
|
(1 400) |
|
— |
At June 30, 2024 |
|
21 580 |
|
528 |
|
1 043 |
|
21 350 |
|
44 501 |
|
1 275 829 |
At December 31, 2024 |
|
21 121 |
|
520 |
|
1 201 |
|
21 672 |
|
44 514 |
|
1 244 332 |
Net earnings |
|
— |
|
— |
|
— |
|
2 823 |
|
2 823 |
|
— |
Foreign currency translation adjustment |
|
— |
|
— |
|
(180) |
|
— |
|
(180) |
|
— |
Actuarial gain on employee retirement benefit plans, |
|
— |
|
— |
|
— |
|
244 |
|
244 |
|
— |
Total comprehensive income |
|
— |
|
— |
|
(180) |
|
3 067 |
|
2 887 |
|
— |
Issued under share option plans |
|
101 |
|
(14) |
|
— |
|
— |
|
87 |
|
2 145 |
Repurchase of common shares for cancellation(1) |
|
(488) |
|
— |
|
— |
|
(1 040) |
|
(1 528) |
|
(28 593) |
Change in liability for share repurchase commitment |
|
4 |
|
— |
|
— |
|
11 |
|
15 |
|
— |
Share-based compensation (note 5) |
|
— |
|
7 |
|
— |
|
— |
|
7 |
|
— |
Dividends paid on common shares |
|
— |
|
— |
|
— |
|
(1 402) |
|
(1 402) |
|
— |
At June 30, 2025 |
|
20 738 |
|
513 |
|
1 021 |
|
22 308 |
|
44 580 |
|
1 217 884 |
| (1) | Includes $28 million of taxes on share repurchases for the six months ended June 30, 2025 (June 30, 2024 – $15 million). |
See accompanying notes to the condensed interim consolidated financial statements.
Notes to the Consolidated Financial Statements
(unaudited)
1. Reporting Entity and Description Of The Business
Suncor Energy is Canada’s leading integrated energy company. Suncor’s operations include oil sands development, production and upgrading; offshore oil production; petroleum refining in Canada and the U.S.; and the company’s Petro-Canada™ retail and wholesale distribution networks (including Canada’s Electric Highway™, a coast-to-coast network of fast-charging EV stations). Suncor is developing petroleum resources while advancing the transition to a lower-emissions future through investments in lower emissions intensity power, renewable feedstock fuels and projects targeting emissions intensity. Suncor also conducts energy trading activities focused primarily on the marketing and trading of crude oil, natural gas, byproducts, refined products and power. Suncor’s common shares (symbol: SU) are listed on the TSX and NYSE.
The address of the company’s registered office is 150 – 6th Avenue S.W., Calgary, Alberta, Canada, T2P 3E3.
2. Basis of Preparation
(a) Statement of Compliance
These condensed interim consolidated financial statements are based on International Financial Reporting Standards as issued by the International Accounting Standards Board, and have been prepared in accordance with International Accounting Standard 34 Interim Financial Reporting. They are condensed as they do not include all of the information required for full annual financial statements, and they should be read in conjunction with the audited consolidated financial statements of the company for the year ended December 31, 2024.
(b) Basis of Measurement
The consolidated financial statements are prepared on a historical cost basis except as detailed in the accounting policies disclosed in the company’s audited consolidated financial statements for the year ended December 31, 2024.
(c) Functional Currency and Presentation Currency
These consolidated financial statements are presented in Canadian dollars, which is the company’s functional currency.
(d) Use of Estimates, Assumptions and Judgments
The timely preparation of financial statements requires that management make estimates and assumptions and use judgment. Accordingly, actual results may differ from estimated amounts as future confirming events occur. Significant estimates and judgment used in the preparation of the financial statements are described in the company’s audited consolidated financial statements for the year ended December 31, 2024.
In March 2025, the government of the United States of America announced tariffs on certain goods and products. Several countries (including Canada) responded with an escalation in tariffs and/or retaliatory tariffs. This has resulted in economic uncertainty in the global markets, disruption of supply chains, international competitiveness and fluctuations in commodity pricing. The company is closely monitoring these developments and will continue to assess the impacts of such tariffs and measures as the situation develops.
(e) Income Taxes
The company recognizes the impacts of income tax rate changes in earnings in the period that the applicable rate change is enacted or substantively enacted.
3. Segmented Information
The company’s operating segments are reported based on the nature of their products and services and management responsibility.
Intersegment sales of crude oil are accounted for at market values and are included, for segmented reporting, in revenues of the segment making the transfer and expenses of the segment receiving the transfer. Intersegment amounts are eliminated on consolidation.
|
|
|
|
|
|
Exploration and |
|
Refining and |
|
Corporate and |
|
|
|
|
||||||
Three months ended June 30 |
|
Oil Sands |
|
Production |
|
Marketing |
|
Eliminations |
|
Total |
||||||||||
($ millions) |
|
2025 |
|
2024 |
|
2025 |
|
2024 |
|
2025 |
|
2024 |
|
2025 |
|
2024 |
|
2025 |
|
2024 |
|
|
|
|
|
|
|
|
|
|
|
|
|
|
|
|
|
|
|
|
|
Revenues and Other Income |
|
|
|
|
|
|
|
|
|
|
|
|
|
|
|
|
|
|
|
|
Gross revenues |
|
4 806 |
|
5 319 |
|
665 |
|
673 |
|
7 278 |
|
8 022 |
|
— |
|
— |
|
12 749 |
|
14 014 |
Intersegment revenues |
|
1 634 |
|
2 113 |
|
— |
|
— |
|
32 |
|
35 |
|
(1 666) |
|
(2 148) |
|
— |
|
— |
Less: Royalties |
|
(596) |
|
(1 001) |
|
(162) |
|
(124) |
|
— |
|
— |
|
— |
|
— |
|
(758) |
|
(1 125) |
Operating revenues, net of royalties |
|
5 844 |
|
6 431 |
|
503 |
|
549 |
|
7 310 |
|
8 057 |
|
(1 666) |
|
(2 148) |
|
11 991 |
|
12 889 |
Other (loss) income |
|
(58) |
|
72 |
|
9 |
|
(5) |
|
18 |
|
43 |
|
(66) |
|
41 |
|
(97) |
|
151 |
|
|
5 786 |
|
6 503 |
|
512 |
|
544 |
|
7 328 |
|
8 100 |
|
(1 732) |
|
(2 107) |
|
11 894 |
|
13 040 |
Expenses |
|
|
|
|
|
|
|
|
|
|
|
|
|
|
|
|
|
|
|
|
Purchases of crude oil and products |
|
813 |
|
696 |
|
— |
|
— |
|
5 969 |
|
6 519 |
|
(1 681) |
|
(2 053) |
|
5 101 |
|
5 162 |
Operating, selling and general |
|
2 356 |
|
2 278 |
|
125 |
|
120 |
|
578 |
|
603 |
|
104 |
|
152 |
|
3 163 |
|
3 153 |
Transportation and distribution |
|
335 |
|
292 |
|
36 |
|
24 |
|
127 |
|
132 |
|
(9) |
|
(10) |
|
489 |
|
438 |
Depreciation, depletion, amortization and impairment |
|
1 248 |
|
1 235 |
|
167 |
|
184 |
|
260 |
|
236 |
|
34 |
|
29 |
|
1 709 |
|
1 684 |
Exploration |
|
3 |
|
13 |
|
1 |
|
2 |
|
— |
|
— |
|
— |
|
— |
|
4 |
|
15 |
Loss on disposal of assets |
|
— |
|
— |
|
— |
|
— |
|
— |
|
— |
|
— |
|
1 |
|
— |
|
1 |
Financing expenses (income) |
|
187 |
|
197 |
|
18 |
|
18 |
|
17 |
|
17 |
|
(228) |
|
172 |
|
(6) |
|
404 |
|
|
4 942 |
|
4 711 |
|
347 |
|
348 |
|
6 951 |
|
7 507 |
|
(1 780) |
|
(1 709) |
|
10 460 |
|
10 857 |
Earnings (Loss) before Income Taxes |
|
844 |
|
1 792 |
|
165 |
|
196 |
|
377 |
|
593 |
|
48 |
|
(398) |
|
1 434 |
|
2 183 |
Income Tax Expense (Recovery) |
|
|
|
|
|
|
|
|
|
|
|
|
|
|
|
|
|
|
|
|
Current |
|
— |
|
— |
|
— |
|
— |
|
— |
|
— |
|
— |
|
— |
|
412 |
|
781 |
Deferred |
|
— |
|
— |
|
— |
|
— |
|
— |
|
— |
|
— |
|
— |
|
(112) |
|
(166) |
|
|
— |
|
— |
|
— |
|
— |
|
— |
|
— |
|
— |
|
— |
|
300 |
|
615 |
Net Earnings |
|
— |
|
— |
|
— |
|
— |
|
— |
|
— |
|
— |
|
— |
|
1 134 |
|
1 568 |
Capital and Exploration Expenditures |
|
1 109 |
|
1 437 |
|
229 |
|
229 |
|
362 |
|
375 |
|
8 |
|
6 |
|
1 708 |
|
2 047 |
Notes to the Consolidated Financial Statements
Six months ended June 30 |
|
Oil Sands |
|
Exploration and |
|
Refining and |
|
Corporate and |
|
Total |
||||||||||
($ millions) |
|
2025 |
|
2024 |
|
2025 |
|
2024 |
|
2025 |
|
2024 |
|
2025 |
|
2024 |
|
2025 |
|
2024 |
|
|
|
|
|
|
|
|
|
|
|
|
|
|
|
|
|
|
|
|
|
Revenues and Other Income |
|
|
|
|
|
|
|
|
|
|
|
|
|
|
|
|
|
|
|
|
Gross revenues |
|
9 796 |
|
10 257 |
|
1 394 |
|
1 438 |
|
14 889 |
|
15 625 |
|
— |
|
(1) |
|
26 079 |
|
27 319 |
Intersegment revenues |
|
3 785 |
|
4 097 |
|
— |
|
— |
|
49 |
|
45 |
|
(3 834) |
|
(4 142) |
|
— |
|
— |
Less: Royalties |
|
(1 411) |
|
(1 783) |
|
(354) |
|
(266) |
|
— |
|
— |
|
— |
|
— |
|
(1 765) |
|
(2 049) |
Operating revenues, net of royalties |
|
12 170 |
|
12 571 |
|
1 040 |
|
1 172 |
|
14 938 |
|
15 670 |
|
(3 834) |
|
(4 143) |
|
24 314 |
|
25 270 |
Other income (loss) |
|
40 |
|
127 |
|
14 |
|
1 |
|
6 |
|
117 |
|
(27) |
|
54 |
|
33 |
|
299 |
|
|
12 210 |
|
12 698 |
|
1 054 |
|
1 173 |
|
14 944 |
|
15 787 |
|
(3 861) |
|
(4 089) |
|
24 347 |
|
25 569 |
Expenses |
|
|
|
|
|
|
|
|
|
|
|
|
|
|
|
|
|
|
|
|
Purchases of crude oil and products |
|
1 422 |
|
1 325 |
|
— |
|
— |
|
11 891 |
|
12 107 |
|
(3 912) |
|
(3 912) |
|
9 401 |
|
9 520 |
Operating, selling and general |
|
4 748 |
|
4 760 |
|
245 |
|
261 |
|
1 187 |
|
1 221 |
|
280 |
|
351 |
|
6 460 |
|
6 593 |
Transportation and distribution |
|
631 |
|
584 |
|
58 |
|
49 |
|
266 |
|
235 |
|
(18) |
|
(20) |
|
937 |
|
848 |
Depreciation, depletion, amortization and impairment |
|
2 447 |
|
2 420 |
|
338 |
|
354 |
|
517 |
|
480 |
|
70 |
|
58 |
|
3 372 |
|
3 312 |
Exploration |
|
71 |
|
70 |
|
55 |
|
4 |
|
— |
|
— |
|
— |
|
— |
|
126 |
|
74 |
Gain on disposal of assets |
|
— |
|
— |
|
— |
|
— |
|
— |
|
— |
|
— |
|
(2) |
|
— |
|
(2) |
Financing expenses (income) |
|
372 |
|
376 |
|
35 |
|
35 |
|
34 |
|
37 |
|
(114) |
|
373 |
|
327 |
|
821 |
|
|
9 691 |
|
9 535 |
|
731 |
|
703 |
|
13 895 |
|
14 080 |
|
(3 694) |
|
(3 152) |
|
20 623 |
|
21 166 |
Earnings (Loss) before Income Taxes |
|
2 519 |
|
3 163 |
|
323 |
|
470 |
|
1 049 |
|
1 707 |
|
(167) |
|
(937) |
|
3 724 |
|
4 403 |
Income Tax Expense (Recovery) |
|
|
|
|
|
|
|
|
|
|
|
|
|
|
|
|
|
|
|
|
Current |
|
— |
|
— |
|
— |
|
— |
|
— |
|
— |
|
— |
|
— |
|
1 060 |
|
1 430 |
Deferred |
|
— |
|
— |
|
— |
|
— |
|
— |
|
— |
|
— |
|
— |
|
(159) |
|
(205) |
|
|
— |
|
— |
|
— |
|
— |
|
— |
|
— |
|
— |
|
— |
|
901 |
|
1 225 |
Net Earnings |
|
— |
|
— |
|
— |
|
— |
|
— |
|
— |
|
— |
|
— |
|
2 823 |
|
3 178 |
Capital and Exploration Expenditures |
|
1 858 |
|
2 432 |
|
438 |
|
371 |
|
542 |
|
543 |
|
15 |
|
12 |
|
2 853 |
|
3 358 |
Disaggregation of Revenue from Contracts with Customers and Intersegment Revenue
The company’s revenues are from the following major commodities:
Three months ended June 30 |
|
2025 |
|
2024 |
||||||||
($ millions) |
|
North America |
|
International |
|
Total |
|
North America |
|
International |
|
Total |
Oil Sands |
|
|
|
|
|
|
|
|
|
|
|
|
Synthetic crude oil and diesel |
|
3 722 |
|
— |
|
3 722 |
|
4 614 |
|
— |
|
4 614 |
Bitumen |
|
2 718 |
|
— |
|
2 718 |
|
2 818 |
|
— |
|
2 818 |
|
|
6 440 |
|
— |
|
6 440 |
|
7 432 |
|
— |
|
7 432 |
Exploration and Production |
|
|
|
|
|
|
|
|
|
|
|
|
Crude oil and natural gas liquids |
|
545 |
|
120 |
|
665 |
|
437 |
|
236 |
|
673 |
|
|
545 |
|
120 |
|
665 |
|
437 |
|
236 |
|
673 |
Refining and Marketing |
|
|
|
|
|
|
|
|
|
|
|
|
Gasoline |
|
3 286 |
|
— |
|
3 286 |
|
3 519 |
|
— |
|
3 519 |
Distillate |
|
3 440 |
|
— |
|
3 440 |
|
3 813 |
|
— |
|
3 813 |
Other |
|
584 |
|
— |
|
584 |
|
725 |
|
— |
|
725 |
|
|
7 310 |
|
— |
|
7 310 |
|
8 057 |
|
— |
|
8 057 |
Corporate and Eliminations |
|
|
|
|
|
|
|
|
|
|
|
|
|
|
(1 666) |
|
— |
|
(1 666) |
|
(2 148) |
|
— |
|
(2 148) |
Total Revenue from Contracts with Customers |
|
12 629 |
|
120 |
|
12 749 |
|
13 778 |
|
236 |
|
14 014 |
Six months ended June 30 |
|
2025 |
|
2024 |
||||||||
($ millions) |
|
North America |
|
International |
|
Total |
|
North America |
|
International |
|
Total |
Oil Sands |
|
|
|
|
|
|
|
|
|
|
|
|
Synthetic crude oil and diesel |
|
8 578 |
|
— |
|
8 578 |
|
9 474 |
|
— |
|
9 474 |
Bitumen |
|
5 003 |
|
— |
|
5 003 |
|
4 880 |
|
— |
|
4 880 |
|
|
13 581 |
|
— |
|
13 581 |
|
14 354 |
|
— |
|
14 354 |
Exploration and Production |
|
|
|
|
|
|
|
|
|
|
|
|
Crude oil and natural gas liquids |
|
1 015 |
|
379 |
|
1 394 |
|
1 046 |
|
392 |
|
1 438 |
|
|
1 015 |
|
379 |
|
1 394 |
|
1 046 |
|
392 |
|
1 438 |
Refining and Marketing |
|
|
|
|
|
|
|
|
|
|
|
|
Gasoline |
|
6 534 |
|
— |
|
6 534 |
|
6 509 |
|
— |
|
6 509 |
Distillate |
|
7 187 |
|
— |
|
7 187 |
|
7 774 |
|
— |
|
7 774 |
Other |
|
1 217 |
|
— |
|
1 217 |
|
1 387 |
|
— |
|
1 387 |
|
|
14 938 |
|
— |
|
14 938 |
|
15 670 |
|
— |
|
15 670 |
Corporate and Eliminations |
|
|
|
|
|
|
|
|
|
|
|
|
|
|
(3 834) |
|
— |
|
(3 834) |
|
(4 143) |
|
— |
|
(4 143) |
Total Revenue from Contracts with Customers |
|
25 700 |
|
379 |
|
26 079 |
|
26 927 |
|
392 |
|
27 319 |
Notes to the Consolidated Financial Statements
4. Other (Loss) Income
Other (loss) income consists of the following:
|
|
Three months ended |
|
Six months ended |
||||
($ millions) |
|
2025 |
|
2024 |
|
2025 |
|
2024 |
Energy trading and risk management |
|
(42) |
|
83 |
|
27 |
|
139 |
Investment and interest income (1) |
|
(62) |
|
68 |
|
(6) |
|
107 |
Insurance proceeds and other |
|
7 |
|
— |
|
12 |
|
53 |
|
|
(97) |
|
151 |
|
33 |
|
299 |
| (1) | The three and six months ended June 30, 2025, includes a $95 million write-down of an equity investment, within the Corporate segment and a $41 million write-down of an equity investment, within the Refining and Marketing segment. |
5. Share-Based Compensation
The following table summarizes the share-based compensation expense for all plans recorded within operating, selling and general expense:
|
|
Three months ended |
|
Six months ended |
||||
($ millions) |
|
2025 |
|
2024 |
|
2025 |
|
2024 |
Equity-settled plans |
|
3 |
|
4 |
|
7 |
|
7 |
Cash-settled plans |
|
17 |
|
124 |
|
158 |
|
280 |
|
|
20 |
|
128 |
|
165 |
|
287 |
6. Financing Expenses
|
|
Three months ended |
|
Six months ended |
||||
($ millions) |
|
2025 |
|
2024 |
|
2025 |
|
2024 |
Interest on debt |
|
151 |
|
184 |
|
299 |
|
365 |
Interest on lease liabilities |
|
65 |
|
69 |
|
138 |
|
125 |
Capitalized interest |
|
(59) |
|
(83) |
|
(117) |
|
(157) |
Interest expense |
|
157 |
|
170 |
|
320 |
|
333 |
Interest on partnership liability |
|
11 |
|
12 |
|
23 |
|
24 |
Interest on pension and other post-retirement benefits |
|
— |
|
5 |
|
(1) |
|
11 |
Accretion |
|
144 |
|
149 |
|
287 |
|
294 |
Foreign exchange (gain) loss on U.S. dollar denominated debt and leases |
|
(461) |
|
103 |
|
(475) |
|
323 |
Operational foreign exchange and other |
|
143 |
|
(35) |
|
173 |
|
(164) |
|
|
(6) |
|
404 |
|
327 |
|
821 |
7. Earnings Per Common Share
|
|
Three months ended |
|
Six months ended |
||||
($ millions) |
|
2025 |
|
2024 |
|
2025 |
|
2024 |
Net earnings |
|
1 134 |
|
1 568 |
|
2 823 |
|
3 178 |
|
|
|
|
|
|
|
|
|
(millions of common shares) |
|
|
|
|
|
|
|
|
Weighted average number of common shares |
|
1 225 |
|
1 283 |
|
1 232 |
|
1 286 |
Dilutive securities: |
|
|
|
|
|
|
|
|
Effect of share options |
|
1 |
|
2 |
|
1 |
|
2 |
Weighted average number of diluted common shares |
|
1 226 |
|
1 285 |
|
1 233 |
|
1 288 |
|
|
|
|
|
|
|
|
|
(dollars per common share) |
|
|
|
|
|
|
|
|
Basic and diluted earnings per share |
|
0.93 |
|
1.22 |
|
2.29 |
|
2.47 |
8. Normal Course Issuer Bid
Share Repurchase Programs
|
|
|
|
|
|
Maximum |
|
Maximum |
|
Number of |
|
|
Commencement |
|
|
|
Shares for |
|
Shares for |
|
Shares |
(thousands of common shares) |
|
Date |
|
Expiry |
|
Repurchase |
|
Repurchase (%) |
|
Repurchased |
2023 Normal Course Issuer Bid |
|
February 17, 2023 |
|
February 16, 2024 |
|
132 900 |
|
10 |
|
47 107 |
2024 Normal Course Issuer Bid |
|
February 26, 2024 |
|
February 25, 2025 |
|
128 700 |
|
10 |
|
61 066 |
2025 Normal Course Issuer Bid |
|
March 3, 2025 |
|
March 2, 2026 |
|
123 800 |
|
10 |
|
19 643 |
Notes to the Consolidated Financial Statements
The following table summarizes the share repurchase activities during the period:
|
|
Three months ended |
|
Six months ended |
||||
($ millions, except as noted) |
|
2025 |
|
2024 |
|
2025 |
|
2024 |
Share repurchase activities (thousands of common shares) |
|
|
|
|
|
|
|
|
Shares repurchased |
|
14 993 |
|
15 561 |
|
28 593 |
|
21 999 |
Amounts charged to: |
|
|
|
|
|
|
|
|
Share capital |
|
256 |
|
264 |
|
488 |
|
372 |
Retained earnings |
|
494 |
|
561 |
|
1 012 |
|
746 |
Share repurchase cost before tax |
|
750 |
|
825 |
|
1 500 |
|
1 118 |
Retained earnings - share buyback tax payable |
|
15 |
|
15 |
|
28 |
|
15 |
Share repurchase cost |
|
765 |
|
840 |
|
1 528 |
|
1 133 |
Under an automatic repurchase plan agreement with an independent broker, the company has recorded the following liability for share repurchases that may take place during its internal blackout periods:
|
|
June 30 |
|
December 31 |
($ millions) |
|
2025 |
|
2024 |
Amounts charged to: |
|
|
|
|
Share capital |
|
100 |
|
104 |
Retained earnings |
|
198 |
|
209 |
Liability for share purchase commitment |
|
298 |
|
313 |
9. Financial Instruments
Derivative Financial Instruments
(a) Non-Designated Derivative Financial Instruments
The company uses derivative financial instruments, such as physical and financial contracts, to manage certain exposures to fluctuations in interest rates, commodity prices and foreign currency exchange rates, as part of its overall risk management program, as well as for trading purposes.
The changes in the fair value of non-designated derivatives are as follows:
($ millions) |
|
Total |
Fair value outstanding at December 31, 2024 |
|
82 |
Changes in fair value recognized in earnings during the period |
|
71 |
Contracts realized during the period - (gain) |
|
(205) |
Fair value outstanding at June 30, 2025 |
|
(52) |
(b) Fair Value Hierarchy
To estimate the fair value of derivatives, the company uses quoted market prices when available, or third-party models and valuation methodologies that utilize observable market data. In addition to market information, the company incorporates transaction-specific details that market participants would utilize in a fair value measurement, including the impact of non-performance risk. However, these fair value estimates may not necessarily be indicative of the amounts that could be realized or settled in a current market transaction. The company characterizes inputs used in determining fair value using a hierarchy that prioritizes inputs depending on the degree to which they are observable. The three levels of the fair value hierarchy are as follows:
| ● | Level 1 consists of instruments with a fair value determined by an unadjusted quoted price in an active market for identical assets or liabilities. An active market is characterized by readily and regularly available quoted prices where the prices are representative of actual and regularly occurring market transactions to assure liquidity. |
| ● | Level 2 consists of instruments with a fair value that is determined by quoted prices in an inactive market, prices with observable inputs or prices with insignificant non-observable inputs. The fair value of these positions is determined using observable inputs from exchanges, pricing services, third-party independent broker quotes and published transportation tolls. The observable inputs may be adjusted using certain methods, which include extrapolation over the quoted price term and quotes for comparable assets and liabilities. |
| ● | Level 3 consists of instruments with a fair value that is determined by prices with significant unobservable inputs. As at June 30, 2025, the company does not have any derivative instruments measured at fair value Level 3. |
In forming estimates, the company utilizes the most observable inputs available for valuation purposes. If a fair value measurement reflects inputs of different levels within the hierarchy, the measurement is categorized based upon the lowest level of input that is significant to the fair value measurement.
The following table presents the company’s derivative financial instruments measured at fair value for each hierarchy level as at June 30, 2025:
($ millions) |
|
Level 1 |
|
Level 2 |
|
Level 3 |
|
Total Fair Value |
Accounts receivable |
|
59 |
|
58 |
|
— |
|
117 |
Accounts payable |
|
(119) |
|
(50) |
|
— |
|
(169) |
|
|
(60) |
|
8 |
|
— |
|
(52) |
During the second quarter of 2025, there were no transfers between Level 1 and Level 2 fair value measurements.
Non-Derivative Financial Instruments
At June 30, 2025, the carrying value of fixed-term debt accounted for under amortized cost was $9.9 billion (December 31, 2024 – $10.3 billion) and the fair value was $9.7 billion (December 31, 2024 – $10.1 billion). The estimated fair value of long-term debt is based on pricing sourced from market data.
10. Provisions
Suncor’s decommissioning and restoration provision decreased by $67 million for the six months ended June 30, 2025. The decrease was primarily due to an increase in the credit-adjusted risk-free rate to 4.90% (December 31, 2024 – 4.80%).
11. Pensions and Other Post-Retirement Benefits
For the six months ended June 30, 2025, the actuarial gain on employee retirement benefit plans was $244 million (net of taxes of $77 million), due to an increase in the discount rate to 4.80% (December 31, 2024 – 4.60%) and strong asset performance.
Supplemental Financial and Operating Information
Quarterly Financial Summary
(unaudited)
|
|
Quarter Ended |
|
Six Months Ended |
|
Year Ended |
|||||
|
|
Jun 30 |
Mar 31 |
Dec 31 |
Sep 30 |
Jun 30 |
|
Jun 30 |
Jun 30 |
|
Dec 31 |
($ millions, except per share amounts) |
|
2025 |
2025 |
2024 |
2024 |
2024 |
|
2025 |
2024 |
|
2024 |
Gross revenues |
|
12 749 |
13 330 |
13 657 |
13 905 |
14 014 |
|
26 079 |
27 319 |
|
54 881 |
Less: Royalties |
|
(758) |
(1 007) |
(1 126) |
(1 017) |
(1 125) |
|
(1 765) |
(2 049) |
|
(4 192) |
Operating revenues, net of royalties |
|
11 991 |
12 323 |
12 531 |
12 888 |
12 889 |
|
24 314 |
25 270 |
|
50 689 |
Earnings (loss) before income taxes |
|
|
|
|
|
|
|
|
|
|
|
Oil Sands |
|
844 |
1 675 |
1 625 |
1 819 |
1 792 |
|
2 519 |
3 163 |
|
6 607 |
Exploration and Production |
|
165 |
158 |
125 |
272 |
196 |
|
323 |
470 |
|
867 |
Refining and Marketing |
|
377 |
672 |
410 |
479 |
593 |
|
1 049 |
1 707 |
|
2 596 |
Corporate and Eliminations |
|
48 |
(215) |
(1 070) |
124 |
(398) |
|
(167) |
(937) |
|
(1 883) |
Income tax expense |
|
(300) |
(601) |
(272) |
(674) |
(615) |
|
(901) |
(1 225) |
|
(2 171) |
Net earnings |
|
1 134 |
1 689 |
818 |
2 020 |
1 568 |
|
2 823 |
3 178 |
|
6 016 |
Adjusted operating earnings (loss)(A) |
|
|
|
|
|
|
|
|
|
|
|
Oil Sands |
|
926 |
1 620 |
1 609 |
1 786 |
1 745 |
|
2 546 |
3 110 |
|
6 505 |
Exploration and Production |
|
165 |
158 |
125 |
272 |
196 |
|
323 |
470 |
|
867 |
Refining and Marketing |
|
404 |
667 |
410 |
484 |
588 |
|
1 071 |
1 706 |
|
2 600 |
Corporate and Eliminations |
|
(318) |
(229) |
(200) |
1 |
(295) |
|
(547) |
(614) |
|
(813) |
Income tax expense included in adjusted operating earnings |
|
(304) |
(587) |
(378) |
(668) |
(608) |
|
(891) |
(1 229) |
|
(2 275) |
Total |
|
873 |
1 629 |
1 566 |
1 875 |
1 626 |
|
2 502 |
3 443 |
|
6 884 |
Adjusted funds from (used in) operations(A) |
|
|
|
|
|
|
|
|
|
|
|
Oil Sands |
|
2 399 |
2 810 |
3 126 |
3 165 |
3 108 |
|
5 209 |
5 551 |
|
11 842 |
Exploration and Production |
|
372 |
330 |
274 |
471 |
398 |
|
702 |
865 |
|
1 610 |
Refining and Marketing |
|
615 |
902 |
638 |
701 |
893 |
|
1 517 |
2 199 |
|
3 538 |
Corporate and Eliminations |
|
(285) |
(349) |
(131) |
71 |
(221) |
|
(634) |
(619) |
|
(679) |
Current income tax expense |
|
(412) |
(648) |
(414) |
(621) |
(781) |
|
(1 060) |
(1 430) |
|
(2 465) |
Total |
|
2 689 |
3 045 |
3 493 |
3 787 |
3 397 |
|
5 734 |
6 566 |
|
13 846 |
Change in non-cash working capital |
|
230 |
(889) |
1 590 |
474 |
432 |
|
(659) |
50 |
|
2 114 |
Cash flow provided by operating activities |
|
2 919 |
2 156 |
5 083 |
4 261 |
3 829 |
|
5 075 |
6 616 |
|
15 960 |
Free funds flow (deficit)(A)(B) |
|
|
|
|
|
|
|
|
|
|
|
Oil Sands |
|
1 290 |
2 061 |
2 185 |
2 198 |
1 671 |
|
3 351 |
3 119 |
|
7 502 |
Exploration and Production |
|
143 |
121 |
19 |
190 |
169 |
|
264 |
494 |
|
703 |
Refining and Marketing |
|
253 |
722 |
286 |
406 |
518 |
|
975 |
1 656 |
|
2 348 |
Corporate and Eliminations |
|
(293) |
(356) |
(153) |
59 |
(227) |
|
(649) |
(631) |
|
(725) |
Current income tax expense |
|
(412) |
(648) |
(414) |
(621) |
(781) |
|
(1 060) |
(1 430) |
|
(2 465) |
Total |
|
981 |
1 900 |
1 923 |
2 232 |
1 350 |
|
2 881 |
3 208 |
|
7 363 |
Per common share |
|
|
|
|
|
|
|
|
|
|
|
Net earnings – basic |
|
0.93 |
1.36 |
0.65 |
1.59 |
1.22 |
|
2.29 |
2.47 |
|
4.72 |
Net earnings – diluted |
|
0.93 |
1.36 |
0.65 |
1.59 |
1.22 |
|
2.29 |
2.47 |
|
4.72 |
Adjusted operating earnings(A)(C) |
|
0.71 |
1.31 |
1.25 |
1.48 |
1.27 |
|
2.03 |
2.68 |
|
5.40 |
Cash dividends(C) |
|
0.57 |
0.57 |
0.57 |
0.55 |
0.55 |
|
1.14 |
1.10 |
|
2.22 |
Adjusted funds from operations(A)(C) |
|
2.20 |
2.46 |
2.78 |
2.98 |
2.65 |
|
4.65 |
5.11 |
|
10.87 |
Cash flow provided by operating activities(C) |
|
2.38 |
1.74 |
4.05 |
3.36 |
2.98 |
|
4.12 |
5.14 |
|
12.53 |
Free funds flow(A)(B)(C) |
|
0.80 |
1.53 |
1.53 |
1.76 |
1.05 |
|
2.34 |
2.49 |
|
5.78 |
Returns to shareholders |
|
|
|
|
|
|
|
|
|
|
|
Dividends paid on common shares |
|
697 |
705 |
713 |
690 |
698 |
|
1 402 |
1 400 |
|
2 803 |
Repurchase of common shares |
|
750 |
750 |
1 000 |
790 |
825 |
|
1 500 |
1 118 |
|
2 908 |
Total returns to shareholders |
|
1 447 |
1 455 |
1 713 |
1 480 |
1 523 |
|
2 902 |
2 518 |
|
5 711 |
Capital and exploration expenditures (including capitalized interest) |
|
|
|
|
|
|
|
|
|
|
|
Oil Sands |
|
1 109 |
749 |
941 |
967 |
1 437 |
|
1 858 |
2 432 |
|
4 340 |
Exploration and Production |
|
229 |
209 |
255 |
281 |
229 |
|
438 |
371 |
|
907 |
Refining and Marketing |
|
362 |
180 |
352 |
295 |
375 |
|
542 |
543 |
|
1 190 |
Corporate and Eliminations |
|
8 |
7 |
22 |
12 |
6 |
|
15 |
12 |
|
46 |
Total capital and exploration expenditures |
|
1 708 |
1 145 |
1 570 |
1 555 |
2 047 |
|
2 853 |
3 358 |
|
6 483 |
| (A) | Non-GAAP financial measures or contains non-GAAP financial measures. See the Operating Summary Information – Non-GAAP and Other Financial Measures section of this Quarterly Report. |
| (B) | Beginning in the second quarter of 2024, the company included the presentation of free funds flow by segment and on a basic per share basis. |
| (C) | Presented on a basic per share basis. |
See accompanying footnotes and definitions to the quarterly operating summaries.
Supplemental Financial and Operating Information (continued)
Quarterly Financial Summary
(unaudited)
|
|
For the twelve months ended |
||||
|
|
Jun 30 |
Mar 31 |
Dec 31 |
Sep 30 |
Jun 30 |
|
|
2025 |
2025 |
2024 |
2024 |
2024 |
Return on capital employed (ROCE)(A)(D)(%) |
|
11.1 |
12.8 |
13.0 |
15.6 |
15.6 |
ROCE excluding impairments and impairment reversals(A)(D) (%) |
|
11.1 |
12.8 |
13.0 |
15.6 |
15.6 |
| (A) | Non-GAAP financial measures or contains non-GAAP financial measures. See the Operating Summary Information – Non-GAAP and Other Financial Measures section of this Quarterly Report. |
| (D) | Beginning in the second quarter of 2024, the company revised the definition of ROCE to exclude lease liabilities from the calculation of average capital employed and interest on lease liabilities from net interest expense to better align with how management and industry monitor capital structure. Prior period comparatives have been restated to reflect this change. |
See accompanying footnotes and definitions to the quarterly operating summaries.
Quarterly Operating Summary
(unaudited)
|
|
Quarter Ended |
|
Six Months Ended |
|
Year Ended |
|||||
|
|
Jun 30 |
Mar 31 |
Dec 31 |
Sep 30 |
Jun 30 |
|
Jun 30 |
Jun 30 |
|
Dec 31 |
Oil Sands |
|
2025 |
2025 |
2024 |
2024 |
2024 |
|
2025 |
2024 |
|
2024 |
Production volumes (mbbls/d) |
|
|
|
|
|
|
|
|
|
|
|
Total Oil Sands bitumen production |
|
860.8 |
937.3 |
951.5 |
909.6 |
834.4 |
|
898.9 |
883.3 |
|
907.0 |
Oil Sands production volumes |
|
|
|
|
|
|
|
|
|
|
|
Oil Sands operations – SCO, diesel and other products |
|
280.6 |
361.3 |
357.6 |
329.5 |
321.6 |
|
320.7 |
348.1 |
|
345.8 |
Oil Sands operations – Bitumen |
|
162.8 |
165.3 |
180.9 |
128.5 |
136.9 |
|
164.1 |
128.6 |
|
141.8 |
Syncrude – SCO, diesel and bitumen |
|
196.5 |
206.0 |
214.9 |
213.8 |
171.1 |
|
201.3 |
184.5 |
|
199.5 |
Fort Hills – Bitumen |
|
162.9 |
176.4 |
161.7 |
166.0 |
166.9 |
|
169.6 |
172.3 |
|
168.0 |
Inter-asset transfers and consumption |
|
(54.4) |
(118.1) |
(97.6) |
(61.8) |
(80.5) |
|
(86.2) |
(83.0) |
|
(81.3) |
Total Oil Sands production volumes |
|
748.4 |
790.9 |
817.5 |
776.0 |
716.0 |
|
769.5 |
750.5 |
|
773.8 |
Oil Sands – upgraded – net SCO and diesel |
|
|
|
|
|
|
|
|
|
|
|
Oil Sands operations |
|
280.6 |
361.3 |
357.6 |
329.5 |
321.6 |
|
320.7 |
348.1 |
|
345.8 |
Syncrude |
|
187.4 |
206.0 |
214.9 |
213.7 |
166.7 |
|
196.7 |
182.3 |
|
198.4 |
Inter-asset transfers and consumption |
|
(29.8) |
(30.7) |
(28.9) |
(29.4) |
(26.6) |
|
(30.3) |
(27.1) |
|
(28.1) |
Total Oil Sands – upgraded – net SCO and diesel production |
|
438.2 |
536.6 |
543.6 |
513.8 |
461.7 |
|
487.1 |
503.3 |
|
516.1 |
Oil Sands – non-upgraded bitumen |
|
|
|
|
|
|
|
|
|
|
|
Oil Sands operations |
|
162.8 |
165.3 |
180.9 |
128.5 |
136.9 |
|
164.1 |
128.6 |
|
141.8 |
Fort Hills |
|
162.9 |
176.4 |
161.7 |
166.0 |
166.9 |
|
169.6 |
172.3 |
|
168.0 |
Syncrude |
|
9.1 |
— |
— |
0.1 |
4.4 |
|
4.6 |
2.2 |
|
1.1 |
Inter-asset transfers |
|
(24.6) |
(87.4) |
(68.7) |
(32.4) |
(53.9) |
|
(55.9) |
(55.9) |
|
(53.2) |
Total Oil Sands – non-upgraded bitumen production |
|
310.2 |
254.3 |
273.9 |
262.2 |
254.3 |
|
282.4 |
247.2 |
|
257.7 |
Oil Sands production volumes to market |
|
|
|
|
|
|
|
|
|
|
|
Upgraded – net SCO and diesel |
|
438.2 |
536.6 |
543.6 |
513.8 |
461.7 |
|
487.1 |
503.3 |
|
516.1 |
Non-upgraded bitumen |
|
310.2 |
254.3 |
273.9 |
262.2 |
254.3 |
|
282.4 |
247.2 |
|
257.7 |
Total Oil Sands production volumes |
|
748.4 |
790.9 |
817.5 |
776.0 |
716.0 |
|
769.5 |
750.5 |
|
773.8 |
Oil Sands sales volumes (mbbls/d) |
|
|
|
|
|
|
|
|
|
|
|
Upgraded – net SCO and diesel |
|
440.2 |
528.5 |
538.3 |
510.3 |
453.8 |
|
484.1 |
502.0 |
|
513.2 |
Non-upgraded bitumen |
|
307.6 |
244.9 |
282.3 |
254.2 |
272.6 |
|
276.4 |
253.3 |
|
260.8 |
Total Oil Sands sales volumes |
|
747.8 |
773.4 |
820.6 |
764.5 |
726.4 |
|
760.5 |
755.3 |
|
774.0 |
Oil Sands operations cash operating costs(1)(A) ($ millions) |
|
|
|
|
|
|
|
|
|
|
|
Cash costs |
|
1 024 |
1 194 |
1 235 |
1 045 |
1 123 |
|
2 218 |
2 230 |
|
4 510 |
Natural gas |
|
102 |
123 |
80 |
40 |
65 |
|
225 |
168 |
|
288 |
|
|
1 126 |
1 317 |
1 315 |
1 085 |
1 188 |
|
2 443 |
2 398 |
|
4 798 |
Oil Sands operations cash operating costs(1)(A) ($/bbl)* |
|
|
|
|
|
|
|
|
|
|
|
Cash costs |
|
25.45 |
25.20 |
24.95 |
24.80 |
26.90 |
|
25.30 |
25.70 |
|
25.30 |
Natural gas |
|
2.50 |
2.60 |
1.60 |
0.95 |
1.55 |
|
2.55 |
1.95 |
|
1.60 |
|
|
27.95 |
27.80 |
26.55 |
25.75 |
28.45 |
|
27.85 |
27.65 |
|
26.90 |
Fort Hills cash operating costs(1)(A) ($ millions) |
|
|
|
|
|
|
|
|
|
|
|
Cash costs |
|
528 |
514 |
493 |
501 |
453 |
|
1 042 |
958 |
|
1 952 |
Natural gas |
|
16 |
24 |
17 |
9 |
12 |
|
40 |
38 |
|
64 |
|
|
544 |
538 |
510 |
510 |
465 |
|
1 082 |
996 |
|
2 016 |
Fort Hills cash operating costs(1)(A) ($/bbl)* |
|
|
|
|
|
|
|
|
|
|
|
Cash costs |
|
35.65 |
32.35 |
33.15 |
32.80 |
29.80 |
|
33.95 |
30.50 |
|
31.75 |
Natural gas |
|
1.10 |
1.50 |
1.10 |
0.60 |
0.80 |
|
1.30 |
1.25 |
|
1.05 |
|
|
36.75 |
33.85 |
34.25 |
33.40 |
30.60 |
|
35.25 |
31.75 |
|
32.80 |
Syncrude cash operating costs(1)(A) ($ millions) |
|
|
|
|
|
|
|
|
|
|
|
Cash costs |
|
636 |
654 |
637 |
643 |
615 |
|
1 290 |
1 235 |
|
2 515 |
Natural gas |
|
16 |
16 |
12 |
6 |
10 |
|
32 |
32 |
|
50 |
|
|
652 |
670 |
649 |
649 |
625 |
|
1 322 |
1 267 |
|
2 565 |
Syncrude cash operating costs(1)(A) ($/bbl)* |
|
|
|
|
|
|
|
|
|
|
|
Cash costs |
|
35.60 |
35.25 |
32.20 |
32.70 |
39.50 |
|
35.45 |
36.80 |
|
34.45 |
Natural gas |
|
0.90 |
0.85 |
0.60 |
0.30 |
0.65 |
|
0.85 |
0.95 |
|
0.70 |
|
|
36.50 |
36.10 |
32.80 |
33.00 |
40.15 |
|
36.30 |
37.75 |
|
35.15 |
| (A) | Non-GAAP financial measures or contains non-GAAP financial measures. See the Quarterly Operating Metrics Reconciliation and the Operating Summary Information – Non-GAAP and Other Financial Measures sections of this Quarterly Report. |
See accompanying footnotes and definitions to the quarterly operating summaries.
Quarterly Operating Summary (continued)
(unaudited)
|
|
Quarter Ended |
|
|
Six Months Ended |
|
Year Ended |
||||
|
|
Jun 30 |
Mar 31 |
Dec 31 |
Sep 30 |
Jun 30 |
|
Jun 30 |
Jun 30 |
|
Dec 31 |
Oil Sands Segment Operating Netbacks(A)(B) |
|
2025 |
2025 |
2024 |
2024 |
2024 |
|
2025 |
2024 |
|
2024 |
Non-upgraded bitumen ($/bbl) |
|
|
|
|
|
|
|
|
|
|
|
Average price realized |
|
67.95 |
78.00 |
76.43 |
79.37 |
88.08 |
|
72.38 |
80.80 |
|
79.31 |
Royalties |
|
(8.79) |
(10.20) |
(12.13) |
(10.77) |
(13.29) |
|
(9.41) |
(11.96) |
|
(11.71) |
Transportation and distribution costs |
|
(6.71) |
(6.87) |
(7.19) |
(6.49) |
(5.62) |
|
(6.78) |
(6.43) |
|
(6.66) |
Net operating expenses |
|
(20.69) |
(19.05) |
(19.65) |
(22.93) |
(19.94) |
|
(19.97) |
(21.23) |
|
(21.22) |
Operating netback |
|
31.76 |
41.88 |
37.46 |
39.18 |
49.23 |
|
36.22 |
41.18 |
|
39.72 |
|
|
|
|
|
|
|
|
|
|
|
|
Upgraded – net SCO and diesel ($/bbl) |
|
|
|
|
|
|
|
|
|
|
|
Average price realized |
|
90.10 |
99.27 |
98.58 |
103.52 |
110.20 |
|
95.08 |
101.18 |
|
101.05 |
Royalties |
|
(8.75) |
(12.41) |
(12.58) |
(14.32) |
(16.25) |
|
(10.73) |
(13.47) |
|
(13.45) |
Transportation and distribution costs |
|
(3.67) |
(3.03) |
(3.30) |
(2.95) |
(3.71) |
|
(3.34) |
(3.15) |
|
(3.14) |
Net operating expenses |
|
(39.90) |
(36.83) |
(35.31) |
(33.39) |
(39.28) |
|
(38.23) |
(36.66) |
|
(35.48) |
Operating netback |
|
37.78 |
47.00 |
47.39 |
52.86 |
50.96 |
|
42.78 |
47.90 |
|
48.98 |
|
|
|
|
|
|
|
|
|
|
|
|
Average Oil Sands segment ($/bbl) |
|
|
|
|
|
|
|
|
|
|
|
Average price realized |
|
80.98 |
92.54 |
90.96 |
95.49 |
101.90 |
|
86.83 |
94.34 |
|
93.73 |
Royalties |
|
(8.76) |
(11.71) |
(12.43) |
(13.14) |
(15.14) |
|
(10.25) |
(12.97) |
|
(12.87) |
Transportation and distribution costs |
|
(4.92) |
(4.26) |
(4.64) |
(4.13) |
(4.42) |
|
(4.59) |
(4.25) |
|
(4.32) |
Net operating expenses |
|
(32.00) |
(31.20) |
(29.92) |
(29.91) |
(32.02) |
|
(31.59) |
(31.48) |
|
(30.68) |
Operating netback |
|
35.30 |
45.37 |
43.97 |
48.31 |
50.32 |
|
40.40 |
45.64 |
|
45.86 |
| (A) | Contains non-GAAP financial measures. See the Quarterly Operating Metrics Reconciliation and the Operating Summary Information – Non-GAAP and Other Financial Measures sections of this Quarterly Report. |
| (B) | Netbacks are based on sales volumes. Impact of inventory write-down is excluded until product is sold. |
See accompanying footnotes and definitions to the quarterly operating summaries.
Quarterly Operating Summary (continued)
(unaudited)
|
|
Quarter Ended |
|
Six Months Ended |
|
Year Ended |
|||||
|
|
Jun 30 |
Mar 31 |
Dec 31 |
Sep 30 |
Jun 30 |
|
Jun 30 |
Jun 30 |
|
Dec 31 |
Exploration and Production |
|
2025 |
2025 |
2024 |
2024 |
2024 |
|
2025 |
2024 |
|
2024 |
Production volumes |
|
|
|
|
|
|
|
|
|
|
|
E&P Canada (mbbls/d) |
|
56.4 |
55.6 |
50.3 |
52.6 |
49.0 |
|
56.0 |
47.9 |
|
49.7 |
E&P International (mbbls/d) |
|
3.3 |
6.7 |
7.2 |
— |
5.6 |
|
5.0 |
4.6 |
|
4.1 |
Total production volumes (mbbls/d) |
|
59.7 |
62.3 |
57.5 |
52.6 |
54.6 |
|
61.0 |
52.5 |
|
53.8 |
|
|
|
|
|
|
|
|
|
|
|
|
Total sales volumes (mbbls/d) |
|
65.0 |
55.0 |
44.8 |
70.1 |
46.8 |
|
60.1 |
55.0 |
|
56.2 |
|
|
|
|
|
|
|
|
|
|
|
|
Operating netbacks(A)(B) |
|
|
|
|
|
|
|
|
|
|
|
E&P Canada ($/bbl) |
|
|
|
|
|
|
|
|
|
|
|
Average price realized |
|
97.05 |
108.18 |
104.85 |
111.40 |
117.08 |
|
101.93 |
114.32 |
|
111.61 |
Royalties |
|
(17.50) |
(19.85) |
(19.45) |
(14.63) |
(9.43) |
|
(18.53) |
(12.54) |
|
(14.50) |
Transportation and distribution costs |
|
(5.45) |
(4.36) |
(6.59) |
(2.16) |
(5.69) |
|
(4.97) |
(4.82) |
|
(4.23) |
Operating costs |
|
(17.90) |
(20.24) |
(25.29) |
(17.90) |
(27.23) |
|
(18.92) |
(23.82) |
|
(22.06) |
Operating netback |
|
56.20 |
63.73 |
53.52 |
76.71 |
74.73 |
|
59.51 |
73.14 |
|
70.82 |
| (A) | Contains non-GAAP financial measures. See the Quarterly Operating Metrics Reconciliation and the Operating Summary Information – Non-GAAP and Other Financial Measures sections of this Quarterly Report. |
| (B) | Netbacks are based on sales volumes. |
See accompanying footnotes and definitions to the quarterly operating summaries.
Quarterly Operating Summary (continued)
(unaudited)
|
|
Quarter Ended |
|
Six Months Ended |
|
Year Ended |
|||||
|
|
Jun 30 |
Mar 31 |
Dec 31 |
Sep 30 |
Jun 30 |
|
Jun 30 |
Jun 30 |
|
Dec 31 |
Refining and Marketing |
|
2025 |
2025 |
2024 |
2024 |
2024 |
|
2025 |
2024 |
|
2024 |
Refined product sales (mbbls/d) |
|
600.5 |
604.9 |
613.3 |
612.3 |
594.7 |
|
602.6 |
587.8 |
|
600.4 |
Crude oil processed (mbbls/d) |
|
442.3 |
482.7 |
486.2 |
487.6 |
430.5 |
|
462.4 |
442.9 |
|
465.0 |
Rack forward sales volume (ML) |
|
5 724 |
5 419 |
5 609 |
5 955 |
5 592 |
|
11 143 |
10 700 |
|
22 264 |
Utilization of refining capacity (%) |
|
95 |
104 |
104 |
105 |
92 |
|
99 |
95 |
|
100 |
Refining and marketing gross margin – first-in, first-out (FIFO) ($/bbl)(A) |
|
32.45 |
36.70 |
30.00 |
32.25 |
37.65 |
|
34.65 |
42.30 |
|
36.40 |
Refining and marketing gross margin – last-in, first-out (LIFO) ($/bbl)(A) |
|
34.40 |
38.00 |
30.60 |
35.85 |
36.35 |
|
36.30 |
41.20 |
|
37.00 |
Rack forward gross margin (cpl)(A) |
|
6.15 |
6.45 |
7.35 |
7.30 |
6.25 |
|
6.30 |
5.65 |
|
6.50 |
Refining operating expense ($/bbl)(A) |
|
6.85 |
6.75 |
6.55 |
5.80 |
6.95 |
|
6.80 |
7.05 |
|
6.60 |
Rack forward operating expense (cpl)(A) |
|
2.80 |
3.15 |
3.45 |
3.10 |
3.10 |
|
3.00 |
3.15 |
|
3.25 |
|
|
|
|
|
|
|
|
|
|
|
|
Eastern North America |
|
|
|
|
|
|
|
|
|
|
|
Refined product sales (mbbls/d) |
|
|
|
|
|
|
|
|
|
|
|
Transportation fuels |
|
|
|
|
|
|
|
|
|
|
|
Gasoline |
|
121.3 |
130.4 |
127.2 |
121.6 |
112.9 |
|
125.8 |
112.7 |
|
118.6 |
Distillate |
|
132.2 |
121.4 |
121.3 |
120.4 |
105.0 |
|
126.8 |
111.7 |
|
116.3 |
Total transportation fuel sales |
|
253.5 |
251.8 |
248.5 |
242.0 |
217.9 |
|
252.6 |
224.4 |
|
234.9 |
Petrochemicals |
|
4.4 |
7.3 |
9.5 |
6.3 |
10.3 |
|
5.8 |
12.1 |
|
10.0 |
Asphalt |
|
18.5 |
18.7 |
20.8 |
24.2 |
15.3 |
|
18.6 |
15.5 |
|
19.1 |
Other |
|
13.9 |
18.9 |
27.0 |
19.6 |
23.4 |
|
16.4 |
24.0 |
|
23.6 |
Total refined product sales |
|
290.3 |
296.7 |
305.8 |
292.1 |
266.9 |
|
293.4 |
276.0 |
|
287.6 |
Crude oil supply and refining |
|
|
|
|
|
|
|
|
|
|
|
Processed at refineries (mbbls/d) |
|
231.1 |
236.9 |
232.4 |
235.4 |
169.8 |
|
234.0 |
193.2 |
|
213.6 |
Utilization of refining capacity (%) |
|
104 |
107 |
105 |
106 |
76 |
|
105 |
87 |
|
96 |
|
|
|
|
|
|
|
|
|
|
|
|
Western North America |
|
|
|
|
|
|
|
|
|
|
|
Refined product sales (mbbls/d) |
|
|
|
|
|
|
|
|
|
|
|
Transportation fuels |
|
|
|
|
|
|
|
|
|
|
|
Gasoline |
|
129.8 |
132.4 |
133.1 |
135.0 |
140.0 |
|
131.1 |
135.5 |
|
134.7 |
Distillate |
|
137.9 |
141.2 |
142.2 |
146.3 |
152.0 |
|
139.6 |
146.8 |
|
145.6 |
Total transportation fuel sales |
|
267.7 |
273.6 |
275.3 |
281.3 |
292.0 |
|
270.7 |
282.3 |
|
280.3 |
Asphalt |
|
12.7 |
6.6 |
11.7 |
16.6 |
13.4 |
|
9.7 |
9.4 |
|
11.8 |
Other |
|
29.8 |
28.0 |
20.5 |
22.3 |
22.4 |
|
28.8 |
20.1 |
|
20.7 |
Total refined product sales |
|
310.2 |
308.2 |
307.5 |
320.2 |
327.8 |
|
309.2 |
311.8 |
|
312.8 |
Crude oil supply and refining |
|
|
|
|
|
|
|
|
|
|
|
Processed at refineries (mbbls/d) |
|
211.2 |
245.8 |
253.8 |
252.2 |
260.7 |
|
228.4 |
249.7 |
|
251.4 |
Utilization of refining capacity (%) |
|
87 |
101 |
104 |
103 |
107 |
|
94 |
102 |
|
103 |
| (A) | Contains non-GAAP financial measures. See the Quarterly Operating Metrics Reconciliation and the Operating Summary Information – Non-GAAP and Other Financial Measures sections of this Quarterly Report. |
See accompanying footnotes and definitions to the quarterly operating summaries.
Quarterly Operating Metrics Reconciliation
(unaudited)
Oil Sands Operating Netbacks(A)(B)
($ millions, except per barrel amounts)
|
|
June 30, 2025 |
|
March 31, 2025 |
||||
|
|
Non- |
Upgraded – |
|
|
Non- |
Upgraded – |
|
|
|
Upgraded |
Net SCO and |
Oil Sands |
|
Upgraded |
Net SCO and |
Oil Sands |
Quarter ended |
|
Bitumen |
Diesel |
Segment |
|
Bitumen |
Diesel |
Segment |
Operating revenues |
|
2 718 |
3 722 |
6 440 |
|
2 285 |
4 856 |
7 141 |
Other (loss) income |
|
(56) |
(2) |
(58) |
|
41 |
57 |
98 |
Purchases of crude oil and products |
|
(763) |
(50) |
(813) |
|
(572) |
(37) |
(609) |
Gross realization adjustment(2) |
|
3 |
(62) |
|
|
(35) |
(154) |
|
Gross realizations |
|
1 902 |
3 608 |
|
|
1 719 |
4 722 |
|
Royalties |
|
(246) |
(350) |
(596) |
|
(225) |
(590) |
(815) |
Transportation and distribution |
|
(188) |
(147) |
(335) |
|
(151) |
(145) |
(296) |
Operating, selling and general (OS&G) |
|
(644) |
(1 712) |
(2 356) |
|
(451) |
(1 941) |
(2 392) |
OS&G adjustment(3) |
|
65 |
114 |
|
|
31 |
189 |
|
Net operating expenses |
|
(579) |
(1 598) |
|
|
(420) |
(1 752) |
|
Operating netback |
|
889 |
1 513 |
|
|
923 |
2 235 |
|
Sales volumes (mbbls) |
|
27 989 |
40 055 |
|
|
22 041 |
47 567 |
|
Operating netback per barrel |
|
31.76 |
37.78 |
|
|
41.88 |
47.00 |
|
|
|
December 31, 2024 |
|
September 30, 2024 |
||||
|
|
Non- |
Upgraded – |
|
|
Non- |
Upgraded – |
|
|
|
Upgraded |
Net SCO and |
Oil Sands |
|
Upgraded |
Net SCO and |
Oil Sands |
Quarter ended |
|
Bitumen |
Diesel |
Segment |
|
Bitumen |
Diesel |
Segment |
Operating revenues |
|
2 682 |
4 979 |
7 661 |
|
2 362 |
4 883 |
7 245 |
Other income (loss) |
|
30 |
4 |
34 |
|
(7) |
22 |
15 |
Purchases of crude oil and products |
|
(695) |
(53) |
(748) |
|
(468) |
(18) |
(486) |
Gross realization adjustment(2) |
|
(32) |
(48) |
|
|
(33) |
(27) |
|
Gross realizations |
|
1 985 |
4 882 |
|
|
1 854 |
4 860 |
|
Royalties |
|
(315) |
(624) |
(939) |
|
(251) |
(672) |
(923) |
Transportation and distribution |
|
(187) |
(163) |
(350) |
|
(152) |
(139) |
(291) |
OS&G |
|
(551) |
(1 894) |
(2 445) |
|
(615) |
(1 608) |
(2 223) |
OS&G adjustment(3) |
|
41 |
144 |
|
|
79 |
42 |
|
Net operating expenses |
|
(510) |
(1 750) |
|
|
(536) |
(1 566) |
|
Operating netback |
|
973 |
2 345 |
|
|
915 |
2 483 |
|
Sales volumes (mbbls) |
|
25 973 |
49 519 |
|
|
23 383 |
46 952 |
|
Operating netback per barrel |
|
37.46 |
47.39 |
|
|
39.18 |
52.86 |
|
| (A) | Non-GAAP financial measures. See the Operating Summary Information – Non-GAAP and Other Financial Measures section of this Quarterly Report. |
| (B) | Impact of inventory write-down is excluded until product is sold. |
See accompanying footnotes and definitions to the quarterly operating summaries.
Quarterly Operating Metrics Reconciliation (continued)
(unaudited)
Oil Sands Operating Netbacks(A)(B)
($ millions, except per barrel amounts)
|
|
|
|
June 30, 2024 |
||||
|
|
|
|
|
|
Non- |
Upgraded – |
|
|
|
|
|
|
|
Upgraded |
Net SCO and |
Oil Sands |
Quarter ended |
|
|
|
|
|
Bitumen |
Diesel |
Segment |
Operating revenues |
|
|
|
|
|
2 818 |
4 614 |
7 432 |
Other income |
|
|
|
|
|
60 |
12 |
72 |
Purchases of crude oil and products |
|
|
|
|
|
(651) |
(45) |
(696) |
Gross realization adjustment(2) |
|
|
|
|
|
(43) |
(30) |
|
Gross realizations |
|
|
|
|
|
2 184 |
4 551 |
|
Royalties |
|
|
|
|
|
(330) |
(671) |
(1 001) |
Transportation and distribution |
|
|
|
|
|
(139) |
(153) |
(292) |
OS&G |
|
|
|
|
|
(572) |
(1 706) |
(2 278) |
OS&G adjustment(3) |
|
|
|
|
|
77 |
81 |
|
Net operating expenses |
|
|
|
|
|
(495) |
(1 625) |
|
Operating netback |
|
|
|
|
|
1 220 |
2 102 |
|
Sales volumes (mbbls) |
|
|
|
|
|
24 811 |
41 296 |
|
Operating netback per barrel |
|
|
|
|
|
49.23 |
50.96 |
|
| (A) | Non-GAAP financial measures. See the Operating Summary Information – Non-GAAP and Other Financial Measures section of this Quarterly Report. |
| (B) | Impact of inventory write-down is excluded until product is sold. |
See accompanying footnotes and definitions to the quarterly operating summaries.
Quarterly Operating Metrics Reconciliation (continued)
(unaudited)
Oil Sands Operating Netbacks(A)(B)
($ millions, except per barrel amounts)
|
|
June 30, 2025 |
|
June 30, 2024 |
||||
|
|
Non- |
Upgraded – |
|
|
Non- |
Upgraded – |
|
|
|
Upgraded |
Net SCO and |
Oil Sands |
|
Upgraded |
Net SCO and |
Oil Sands |
Year to date |
|
Bitumen |
Diesel |
Segment |
|
Bitumen |
Diesel |
Segment |
Operating revenues |
|
5 003 |
8 578 |
13 581 |
|
4 880 |
9 474 |
14 354 |
Other (loss) income |
|
(15) |
55 |
40 |
|
119 |
8 |
127 |
Purchases of crude oil and products |
|
(1 335) |
(87) |
(1 422) |
|
(1 208) |
(117) |
(1 325) |
Gross realization adjustment(2) |
|
(32) |
(216) |
|
|
(65) |
(124) |
|
Gross realizations |
|
3 621 |
8 330 |
|
|
3 726 |
9 241 |
|
Royalties |
|
(471) |
(940) |
(1 411) |
|
(552) |
(1 231) |
(1 783) |
Transportation and distribution |
|
(339) |
(292) |
(631) |
|
(297) |
(287) |
(584) |
OS&G |
|
(1 095) |
(3 653) |
(4 748) |
|
(1 154) |
(3 606) |
(4 760) |
OS&G adjustment(3) |
|
96 |
303 |
|
|
175 |
255 |
|
Net operating expenses |
|
(999) |
(3 350) |
|
|
(979) |
(3 351) |
|
Operating netback |
|
1 812 |
3 748 |
|
|
1 898 |
4 372 |
|
Sales volumes (mbbls) |
|
50 030 |
87 622 |
|
|
46 091 |
91 373 |
|
Operating netback per barrel |
|
36.22 |
42.78 |
|
|
41.18 |
47.90 |
|
|
|
|
|
|
|
|
|
|
|
|
|
|
December 31, 2024 |
||||
|
|
|
|
|
|
Non- |
Upgraded – |
|
|
|
|
|
|
|
Upgraded |
Net SCO and |
Oil Sands |
Year ended |
|
|
|
|
|
Bitumen |
Diesel |
Segment |
Operating revenues |
|
|
|
|
|
9 924 |
19 336 |
29 260 |
Other income |
|
|
|
|
|
142 |
34 |
176 |
Purchases of crude oil and products |
|
|
|
|
|
(2 371) |
(188) |
(2 559) |
Gross realization adjustment(2) |
|
|
|
|
|
(130) |
(199) |
|
Gross realizations |
|
|
|
|
|
7 565 |
18 983 |
|
Royalties |
|
|
|
|
|
(1 118) |
(2 527) |
(3 645) |
Transportation and distribution |
|
|
|
|
|
(636) |
(589) |
(1 225) |
OS&G |
|
|
|
|
|
(2 320) |
(7 108) |
(9 428) |
OS&G adjustment(3) |
|
|
|
|
|
295 |
441 |
|
Net operating expenses |
|
|
|
|
|
(2 025) |
(6 667) |
|
Operating netback |
|
|
|
|
|
3 786 |
9 200 |
|
Sales volumes (mbbls) |
|
|
|
|
|
95 447 |
187 844 |
|
Operating netback per barrel |
|
|
|
|
|
39.72 |
48.98 |
|
| (A) | Non-GAAP financial measures. See the Operating Summary Information – Non-GAAP and Other Financial Measures section of this Quarterly Report. |
| (B) | Impact of inventory write-down is excluded until product is sold. |
See accompanying footnotes and definitions to the quarterly operating summaries.
Quarterly Operating Metrics Reconciliation (continued)
(unaudited)
Exploration and Production Operating Netbacks(A)(B)
($ millions, except per barrel amounts)
|
|
June 30, 2025 |
|
March 31, 2025 |
||||
|
|
E&P |
|
E&P |
|
E&P |
|
E&P |
Quarter ended |
|
Canada |
Other(4)(5) |
Segment |
|
Canada |
Other(4)(5) |
Segment |
Operating revenues |
|
545 |
120 |
665 |
|
470 |
259 |
729 |
Royalties |
|
(98) |
(64) |
(162) |
|
(86) |
(106) |
(192) |
Transportation and distribution |
|
(32) |
(4) |
(36) |
|
(19) |
(3) |
(22) |
OS&G |
|
(105) |
(20) |
(125) |
|
(95) |
(25) |
(120) |
Non-production costs(6) |
|
5 |
|
|
|
7 |
|
|
Operating netback |
|
315 |
|
|
|
277 |
|
|
Sales volumes (mbbls) |
|
5 619 |
|
|
|
4 344 |
|
|
Operating netback per barrel |
|
56.20 |
|
|
|
63.73 |
|
|
|
|
December 31, 2024 |
|
September 30, 2024 |
||||
|
|
E&P |
|
E&P |
|
E&P |
|
E&P |
Quarter ended |
|
Canada |
Other(4)(5) |
Segment |
|
Canada |
Other(4)(5) |
Segment |
Operating revenues |
|
363 |
279 |
642 |
|
718 |
— |
718 |
Royalties |
|
(67) |
(120) |
(187) |
|
(94) |
— |
(94) |
Transportation and distribution |
|
(23) |
(3) |
(26) |
|
(14) |
— |
(14) |
OS&G |
|
(96) |
(28) |
(124) |
|
(121) |
(18) |
(139) |
Non-production costs(6) |
|
9 |
|
|
|
6 |
|
|
Operating netback |
|
186 |
|
|
|
495 |
|
|
Sales volumes (mbbls) |
|
3 464 |
|
|
|
6 451 |
|
|
Operating netback per barrel |
|
53.52 |
|
|
|
76.71 |
|
|
|
|
|
|
June 30, 2024 |
||||
|
|
|
|
|
|
E&P |
|
E&P |
Quarter ended |
|
|
|
|
|
Canada |
Other(4)(5) |
Segment |
Operating revenues |
|
|
|
|
|
437 |
236 |
673 |
Royalties |
|
|
|
|
|
(35) |
(89) |
(124) |
Transportation and distribution |
|
|
|
|
|
(21) |
(3) |
(24) |
OS&G |
|
|
|
|
|
(109) |
(11) |
(120) |
Non-production costs(6) |
|
|
|
|
|
7 |
|
|
Operating netback |
|
|
|
|
|
279 |
|
|
Sales volumes (mbbls) |
|
|
|
|
|
3 748 |
|
|
Operating netback per barrel |
|
|
|
|
|
74.73 |
|
|
| (A) | Non-GAAP financial measures. See the Operating Summary Information – Non-GAAP and Other Financial Measures section of this Quarterly Report. |
| (B) | Netbacks are based on sales volumes. |
See accompanying footnotes and definitions to the quarterly operating summaries.
Quarterly Operating Metrics Reconciliation (continued)
(unaudited)
Exploration and Production Operating Netbacks(A)(B)
($ millions, except per barrel amounts)
|
|
June 30, 2025 |
|
June 30, 2024 |
||||
|
|
E&P |
|
E&P |
|
E&P |
|
E&P |
Year to date |
|
Canada |
Other(4)(5) |
Segment |
|
Canada |
Other(4)(5) |
Segment |
Operating revenues |
|
1 015 |
379 |
1 394 |
|
1 046 |
392 |
1 438 |
Royalties |
|
(184) |
(170) |
(354) |
|
(115) |
(151) |
(266) |
Transportation and distribution |
|
(51) |
(7) |
(58) |
|
(44) |
(5) |
(49) |
OS&G |
|
(200) |
(45) |
(245) |
|
(237) |
(24) |
(261) |
Non-production costs(6) |
|
12 |
|
|
|
18 |
|
|
Operating netback |
|
592 |
|
|
|
668 |
|
|
Sales volumes (mbbls) |
|
9 963 |
|
|
|
9 180 |
|
|
Operating netback per barrel |
|
59.51 |
|
|
|
73.14 |
|
|
|
|
|
|
|
|
|
|
|
|
|
|
|
December 31, 2024 |
||||
|
|
|
|
|
|
E&P |
|
E&P |
Year ended |
|
|
|
|
|
Canada |
Other(4)(5) |
Segment |
Operating revenues |
|
|
|
|
|
2 127 |
671 |
2 798 |
Royalties |
|
|
|
|
|
(276) |
(271) |
(547) |
Transportation and distribution |
|
|
|
|
|
(81) |
(8) |
(89) |
OS&G |
|
|
|
|
|
(454) |
(70) |
(524) |
Non-production costs(6) |
|
|
|
|
|
33 |
|
|
Operating netback |
|
|
|
|
|
1 349 |
|
|
Sales volumes (mbbls) |
|
|
|
|
|
19 095 |
|
|
Operating netback per barrel |
|
|
|
|
|
70.82 |
|
|
| (A) | Non-GAAP financial measures. See the Operating Summary Information – Non-GAAP and Other Financial Measures section of this Quarterly Report. |
| (B) | Netbacks are based on sales volumes. |
See accompanying footnotes and definitions to the quarterly operating summaries.
Quarterly Operating Metrics Reconciliation (continued)
(unaudited)
Refining and Marketing
($ millions, except as noted)
|
|
Quarter Ended |
|
Six Months Ended |
|
Year Ended |
|||||
|
|
Jun 30 |
Mar 31 |
Dec 31 |
Sep 30 |
Jun 30 |
|
Jun 30 |
Jun 30 |
|
Dec 31 |
Refining and marketing gross margin reconciliation |
|
2025 |
2025 |
2024 |
2024 |
2024 |
|
2025 |
2024 |
|
2024 |
Operating revenues |
|
7 310 |
7 628 |
7 547 |
8 124 |
8 057 |
|
14 938 |
15 670 |
|
31 341 |
Purchases of crude oil and products |
|
(5 969) |
(5 922) |
(6 123) |
(6 685) |
(6 519) |
|
(11 891) |
(12 107) |
|
(24 915) |
|
|
1 341 |
1 706 |
1 424 |
1 439 |
1 538 |
|
3 047 |
3 563 |
|
6 426 |
Other income (loss) |
|
18 |
(12) |
58 |
80 |
43 |
|
6 |
117 |
|
255 |
Non-refining and marketing margin(7) |
|
14 |
(13) |
(56) |
(1) |
(13) |
|
1 |
(55) |
|
(112) |
Refining and marketing gross margin – FIFO(A) |
|
1 373 |
1 681 |
1 426 |
1 518 |
1 568 |
|
3 054 |
3 625 |
|
6 569 |
Refinery production (mbbls)(8) |
|
42 282 |
45 798 |
47 519 |
47 094 |
41 669 |
|
88 080 |
85 743 |
|
180 356 |
Refining and marketing gross margin – FIFO ($/bbl)(A) |
|
32.45 |
36.70 |
30.00 |
32.25 |
37.65 |
|
34.65 |
42.30 |
|
36.40 |
FIFO loss (gain) and risk management activities adjustment(B) |
|
82 |
60 |
29 |
171 |
(53) |
|
142 |
(93) |
|
107 |
Refining and marketing gross margin – LIFO(A)(B) |
|
1 455 |
1 741 |
1 455 |
1 689 |
1 515 |
|
3 196 |
3 532 |
|
6 676 |
Refining and marketing gross margin – LIFO ($/bbl)(A)(B)(C) |
|
34.40 |
38.00 |
30.60 |
35.85 |
36.35 |
|
36.30 |
41.20 |
|
37.00 |
|
|
|
|
|
|
|
|
|
|
|
|
Rack forward gross margin |
|
|
|
|
|
|
|
|
|
|
|
Refining and marketing gross margin – FIFO(A) |
|
1 373 |
1 681 |
1 426 |
1 518 |
1 568 |
|
3 054 |
3 625 |
|
6 569 |
Refining and supply gross margin |
|
(1 022) |
(1 331) |
(1 014) |
(1 085) |
(1 218) |
|
(2 353) |
(3 020) |
|
(5 119) |
Rack forward gross margin(A)(9) |
|
351 |
350 |
412 |
433 |
350 |
|
701 |
605 |
|
1 450 |
Sales volume (ML) |
|
5 724 |
5 419 |
5 609 |
5 955 |
5 592 |
|
11 143 |
10 700 |
|
22 264 |
Rack forward gross margin (cpl)(A) |
|
6.15 |
6.45 |
7.35 |
7.30 |
6.25 |
|
6.30 |
5.65 |
|
6.50 |
|
|
|
|
|
|
|
|
|
|
|
|
Refining and rack forward operating expense reconciliation |
|
|
|
|
|
|
|
|
|
|
|
Operating, selling and general |
|
578 |
609 |
653 |
592 |
603 |
|
1 187 |
1 221 |
|
2 466 |
Less: Rack forward operating expense(A)(10) |
|
161 |
171 |
195 |
186 |
174 |
|
332 |
339 |
|
720 |
Less: Other operating expenses(11) |
|
128 |
130 |
147 |
133 |
139 |
|
258 |
277 |
|
557 |
Refining operating expense(A) |
|
289 |
308 |
311 |
273 |
290 |
|
597 |
605 |
|
1 189 |
Refinery production (mbbls)(8) |
|
42 282 |
45 798 |
47 519 |
47 094 |
41 669 |
|
88 080 |
85 743 |
|
180 356 |
Refining operating expense ($/bbl)(A) |
|
6.85 |
6.75 |
6.55 |
5.80 |
6.95 |
|
6.80 |
7.05 |
|
6.60 |
Sales volume (ML) |
|
5 724 |
5 419 |
5 609 |
5 955 |
5 592 |
|
11 143 |
10 700 |
|
22 264 |
Rack forward operating expense (cpl)(A) |
|
2.80 |
3.15 |
3.45 |
3.10 |
3.10 |
|
3.00 |
3.15 |
|
3.25 |
| (A) | Non-GAAP financial measures or contains non-GAAP financial measures. See the Operating Summary Information – Non-GAAP and Other Financial Measures section of this Quarterly Report. |
| (B) | Refining and marketing gross margin – LIFO excludes the impact of risk management activities. |
| (C) | The Suncor 5-2-2-1 index is most comparable to the company’s realized refining and marketing margin presented on a LIFO basis. |
See accompanying footnotes and definitions to the quarterly operating summaries.
Quarterly Operating Metrics Reconciliation (continued)
(unaudited)
Refining and Marketing
Suncor custom 5-2-2-1 index(A)(12)
(US$/bbl, except as noted) |
|
|
Quarter Ended |
|
|
Six Months Ended |
|
Year Ended |
||||
|
|
|
Jun 30 |
Mar 31 |
Dec 31 |
Sep 30 |
Jun 30 |
|
Jun 30 |
Jun 30 |
|
Dec 31 |
(average for the three months, six months and twelve months ended) |
|
|
2025 |
2025 |
2024 |
2024 |
2024 |
|
2025 |
2024 |
|
2024 |
WTI crude oil at Cushing |
|
|
63.70 |
71.40 |
70.30 |
75.15 |
80.55 |
|
67.55 |
78.75 |
|
75.70 |
SYN crude oil at Edmonton |
|
|
64.70 |
69.05 |
71.15 |
76.45 |
83.35 |
|
66.90 |
76.45 |
|
75.10 |
WCS at Hardisty |
|
|
53.50 |
58.75 |
57.75 |
61.65 |
67.00 |
|
56.10 |
62.30 |
|
61.00 |
New York Harbor 2-1-1 crack(B) |
|
|
25.90 |
21.05 |
18.80 |
21.05 |
24.75 |
|
23.50 |
25.90 |
|
22.90 |
Chicago 2-1-1 crack(B) |
|
|
22.05 |
14.65 |
13.85 |
19.35 |
18.85 |
|
18.35 |
19.35 |
|
17.95 |
|
|
|
|
|
|
|
|
|
|
|
|
|
Product value |
|
|
|
|
|
|
|
|
|
|
|
|
New York Harbor 2-1-1 crack(C) |
|
40% |
35.85 |
37.00 |
35.65 |
38.50 |
42.10 |
|
36.40 |
41.85 |
|
39.45 |
Chicago 2-1-1 crack(D) |
|
40% |
34.30 |
34.40 |
33.65 |
37.80 |
39.75 |
|
34.35 |
39.25 |
|
37.45 |
WTI |
|
20% |
12.75 |
14.30 |
14.05 |
15.05 |
16.10 |
|
13.50 |
15.75 |
|
15.15 |
Seasonality factor |
|
|
5.00 |
6.50 |
6.50 |
5.00 |
5.00 |
|
5.75 |
5.75 |
|
5.75 |
|
|
|
87.90 |
92.20 |
89.85 |
96.35 |
102.95 |
|
90.00 |
102.60 |
|
97.80 |
|
|
|
|
|
|
|
|
|
|
|
|
|
Crude value |
|
|
|
|
|
|
|
|
|
|
|
|
SYN |
|
40% |
25.90 |
27.60 |
28.45 |
30.60 |
33.35 |
|
26.75 |
30.60 |
|
30.05 |
WCS |
|
40% |
21.40 |
23.50 |
23.10 |
24.65 |
26.80 |
|
22.45 |
24.90 |
|
24.40 |
WTI |
|
20% |
12.75 |
14.30 |
14.05 |
15.05 |
16.10 |
|
13.50 |
15.75 |
|
15.15 |
|
|
|
60.05 |
65.40 |
65.60 |
70.30 |
76.25 |
|
62.70 |
71.25 |
|
69.60 |
Suncor custom 5-2-2-1 index |
|
|
27.85 |
26.80 |
24.25 |
26.05 |
26.70 |
|
27.30 |
31.35 |
|
28.20 |
Suncor custom 5-2-2-1 index (Cdn$/bbl)(A) |
|
|
38.55 |
38.45 |
33.95 |
35.50 |
36.55 |
|
38.50 |
42.60 |
|
38.65 |
| (A) | The Suncor 5-2-2-1 index is most comparable to the company’s realized refining and marketing margin presented on a LIFO basis. |
| (B) | 2-1-1 crack spreads are indicators of the refining margin generated by converting two barrels of WTI into one barrel of gasoline and one barrel of diesel. |
| (C) | Product value of the New York Harbor 2-1-1 crack is calculated by adding the values of the New York Harbor 2-1-1 crack and WTI, multiplying it by 40% and rounding to the nearest nickel. |
| (D) | Product value of the Chicago 2-1-1 crack is calculated by adding the values of the Chicago 2-1-1 crack and WTI, multiplying it by 40% and rounding to the nearest nickel. |
See accompanying footnotes and definitions to the quarterly operating summaries.
Operating Summary Information
Non-GAAP and Other Financial Measures
Certain financial measures in this Supplemental Financial and Operating Information – namely adjusted operating earnings (loss), adjusted funds from (used in) operations, free funds flow, measures contained in return on capital employed (ROCE) and ROCE excluding impairments and impairment reversals, Oil Sands operations cash operating costs, Fort Hills cash operating costs, Syncrude cash operating costs, refining and marketing gross margin, rack forward gross margin, refining operating expense, rack forward operating expense and operating netbacks – are not prescribed by generally accepted accounting principles (GAAP). Suncor uses this information to analyze business performance, leverage and liquidity and includes these financial measures because investors may find such measures useful on the same basis. These non-GAAP financial measures do not have any standardized meaning and, therefore, are unlikely to be comparable to similar measures presented by other companies. The additional information should not be considered in isolation or as a substitute for measures of performance prepared in accordance with GAAP.
Adjusted operating earnings (loss), Oil Sands operations cash operating costs, Fort Hills cash operating costs and Syncrude cash operating costs are defined in the Non-GAAP and Other Financial Measures Advisory section and reconciled to GAAP measures in the Consolidated Financial Information and Segment Results and Analysis sections of each respective Quarterly Report to Shareholders in respect of the relevant quarter (Quarterly Report). Adjusted funds from (used in) operations, free funds flow and measures contained in ROCE and ROCE excluding impairments and impairment reversals are defined and reconciled to GAAP measures in the Non-GAAP and Other Financial Measures Advisory section of each respective Quarterly Report. Refining and marketing gross margin, rack forward gross margin, refining operating expense and rack forward operating expense are defined in the Non-GAAP and Other Financial Measures Advisory section and reconciled to GAAP measures in the Quarterly Operating Metrics Reconciliation section of each respective Quarterly Report. Operating netbacks are defined below and are reconciled to GAAP measures in the Quarterly Operating Metrics Reconciliation section of each respective Quarterly Report. The remainder of the non-GAAP financial measures not otherwise mentioned in this paragraph are defined and reconciled in this Quarterly Report.
Oil Sands Operating Netbacks
Oil Sands operating netbacks are a non-GAAP measure, presented on a crude product and sales barrel basis, and are derived from the Oil Sands segmented statement of net earnings (loss), after adjusting for items not directly attributable to the revenues and costs associated with production and delivery. Management uses Oil Sands operating netbacks to measure crude product profitability on a sales barrel basis.
Exploration and Production (E&P) Operating Netbacks
E&P operating netbacks are a non-GAAP measure, presented on an asset location and sales barrel basis, and are derived from the E&P segmented statement of net earnings (loss), after adjusting for items not directly attributable to the revenues and costs associated with production and delivery. Management uses E&P operating netbacks to measure asset profitability by location on a sales barrel basis.
Definitions
Explanatory Notes
| * | Users are cautioned that the Oil Sands operations, Fort Hills and Syncrude cash operating costs per barrel measures may not be fully comparable to one another or to similar information calculated by other entities due to the differing operations of each entity as well as other entities’ respective accounting policy choices. |
Abbreviations
bbl |
– |
barrel |
bbls/d |
– |
barrels per day |
mbbls |
– |
thousands of barrels |
mbbls/d |
– |
thousands of barrels per day |
cpl |
– |
cents per litre |
ML |
– |
million litres |
WTI |
– |
West Texas Intermediate |
SYN |
– |
Synthetic crude oil benchmark |
WCS |
– |
Western Canadian Select |
Metric Conversion
1 m3 (cubic metre) = approximately 6.29 barrels
|
Suncor Energy Inc. 150 – 6 Avenue S.W., Calgary, Alberta, Canada T2P 3E3 T: 403-296-8000 Suncor.com |