UNITED STATES
SECURITIES AND EXCHANGE COMMISSION
Washington, D.C. 20549
FORM 8-K
CURRENT REPORT
Pursuant to Section 13 or 15(d) of The Securities Exchange Act of 1934
Date of Report (Date of earliest event reported): July 31, 2025 (July 31, 2025)
Matson, Inc.
(Exact Name of Registrant as Specified in its Charter)
_____________________
Hawaii |
|
001-34187 |
|
99-0032630 |
(State or Other Jurisdiction of |
|
(Commission File Number) |
|
(I.R.S. Employer Identification |
1411 Sand Island Parkway |
|
|
Honolulu, Hawaii |
|
96819 |
(Address of principal executive offices) |
|
(zip code) |
Registrant’s telephone number, including area code: (808) 848-1211
(Former Name or former address, if changed since last report)
_____________________
Check the appropriate box below if the Form 8-K filing is intended to simultaneously satisfy the filing obligation of the registrant under any of the following provisions:
☐ |
Written communications pursuant to Rule 425 under the Securities Act (17 CFR 230.425) |
☐ |
Soliciting material pursuant to Rule 14a-12 under the Exchange Act (17 CFR 240.14a-12) |
☐ |
Pre-commencement communications pursuant to Rule 14d-2(b) under the Exchange Act (17 CFR 240.14d-2(b)) |
☐ |
Pre-commencement communications pursuant to Rule 13e-4(c) under the Exchange Act (17 CFR 240.13e-4(c)) |
Securities registered pursuant to Section 12(b) of the Act:
Title of each class |
Trading Symbol(s) |
Name of each exchange on which registered |
Common Stock, without par value |
MATX |
New York Stock Exchange |
Indicate by check mark whether the registrant is an emerging growth company as defined in Rule 405 of the Securities Act of 1933 (§230.405 of this chapter) or Rule 12b-2 of the Securities Exchange Act of 1934 (§240.12b-2 of this chapter).
Emerging growth company ☐
If an emerging growth company, indicate by check mark if the registrant has elected not to use the extended transition period for complying with any new or revised financial accounting standards provided pursuant to Section 13(a) of the Exchange Act. ☐
Item 2.02.Results of Operations and Financial Condition.
On July 31, 2025, Matson, Inc. (the “Company”) issued a press release announcing the Company’s earnings for the quarter ended June 30, 2025. A copy of the press release is attached hereto as Exhibit 99.1. In addition, the Company posted an investor presentation to its website. A copy of the investor presentation is attached hereto as Exhibit 99.2.
The information in this report (including Exhibits 99.1 and 99.2) is being furnished pursuant to Item 2.02 and shall not be deemed to be “filed” for purposes of Section 18 of the Securities Exchange Act of 1934, as amended.
Item 9.01.Financial Statements and Exhibits.
(a) - (c) Not applicable.
(d) Exhibits.
The exhibits listed below are being furnished with this Form 8-K.
99.1 |
|
|
|
99.2 |
|
|
|
104 |
Cover Page Interactive Data File (formatted in Inline XBRL). |
SIGNATURE
Pursuant to the requirements of the Securities Exchange Act of 1934, as amended, the registrant has duly caused this report to be signed on its behalf by the undersigned hereunto duly authorized.
|
MATSON, INC. |
|
|
|
|
|
/s/ Joel M. Wine |
|
Joel M. Wine |
|
Executive Vice President and Chief Financial Officer |
|
|
|
|
Dated: July 31, 2025 |
|
Exhibit 99.1

Investor Relations inquiries: |
News Media inquiries: |
Justin Schoenberg |
Keoni Wagner |
Matson, Inc. |
Matson, Inc. |
510.628.4234 |
510.628.4534 |
jschoenberg@matson.com |
kwagner@matson.com |
FOR IMMEDIATE RELEASE
MATSON, INC. ANNOUNCES SECOND QUARTER 2025 RESULTS
| ● | 2Q25 EPS of $2.92 versus $3.31 in 2Q24 |
| ● | 2Q25 Net Income of $94.7 million versus $113.2 million in 2Q24 |
| ● | 2Q25 Consolidated Operating income of $113.0 million versus $124.6 million in 2Q24 |
| ● | 2Q25 EBITDA of $163.6 million versus $171.5 million in 2Q24 |
| ● | Repurchased approximately 0.9 million shares in 2Q25 |
| ● | Raising full year outlook |
HONOLULU, Hawaii (July 31, 2025) – Matson, Inc. (“Matson” or the “Company”) (NYSE: MATX), a leading U.S. carrier in the Pacific, today reported net income of $94.7 million, or $2.92 per diluted share, for the quarter ended June 30, 2025. Net income for the quarter ended June 30, 2024 was $113.2 million, or $3.31 per diluted share. Consolidated revenue for the second quarter 2025 was $830.5 million compared with $847.4 million for the second quarter 2024.
Matt Cox, Matson’s Chairman and Chief Executive Officer, commented, “Our second quarter financial performance exceeded our expectations amid the challenges of market uncertainty and volatility arising from tariffs and global trade. In Ocean Transportation, our operating income was lower year-over-year primarily due to lower year-over-year volume in our China service. At the onset of tariffs in April, our China service experienced significantly lower year-over-year freight demand, but starting in mid-May our Transpacific services saw a rebound in demand after the U.S. and China agreed to a temporary reduced level of tariffs. During the second quarter, we also moved with our customers as they shifted production throughout Asia in response to the tariffs, which resulted in higher container volume levels outside of China than the levels achieved in the first quarter.”
Mr. Cox added, “In our domestic tradelanes, we saw higher year-over-year volume in Hawaii and Alaska and lower year-over-year volume in Guam. In Logistics, our operating income was lower year-over-year primarily due to a lower contribution from transportation brokerage.”
“Looking ahead, we expect uncertainty regarding tariffs and global trade, regulatory measures, the trajectory of the U.S. economy and other geopolitical factors to continue. Assuming these factors do not materially change from current conditions, for the full year, we expect Ocean Transportation operating income to be higher than the guidance we provided in early May, but moderately lower than the level achieved in the prior year. We also expect Logistics full year operating income to be comparable to the level achieved in the prior year. For the third quarter 2025, we expect Ocean Transportation operating income to be meaningfully lower than the $226.9 million achieved in the third quarter 2024 primarily due to lower year-over-year freight rates and volume in our China service compared to the elevated demand levels achieved in the third quarter last year and our expectation of a muted peak season this year. For Logistics, in the third quarter 2025, we expect operating income to be comparable to the level achieved in the same period last year.”
1
Second Quarter 2025 Discussion and Outlook for 2025
Ocean Transportation: The Company’s container volume in the Hawaii service in the second quarter 2025 was 2.6 percent higher year-over-year. The increase was primarily due to higher general demand. The Hawaii economy remains stable supported by strong construction activity, but faces potential headwinds from slowing tourism, increasing unemployment, and high inflation and interest rates. The Company expects volume in 2025 to be modestly higher than the level achieved in 2024, reflecting modest economic growth in Hawaii and stable market share.
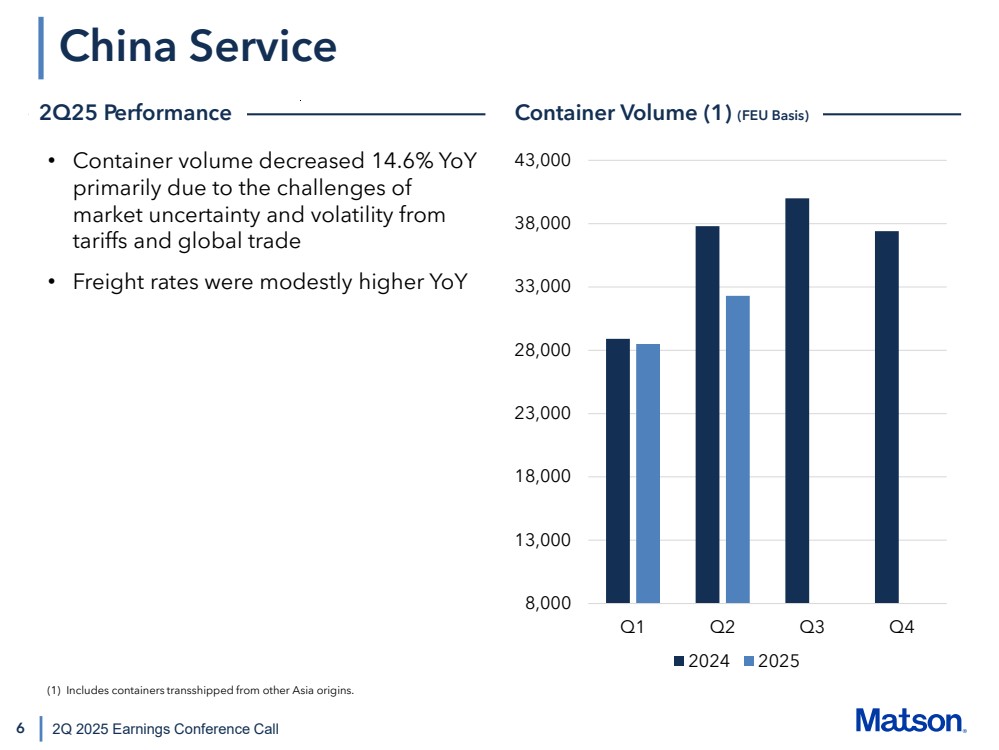
In China, the Company’s container volume in the second quarter 2025 decreased 14.6 percent year-over-year primarily due to the challenges of market uncertainty and volatility from tariffs and global trade. Freight rates in the second quarter 2025 were modestly higher than the levels achieved in the same period last year. At the onset of tariffs in April, the Company experienced significantly lower year-over-year freight demand, but starting in mid-May saw a rebound in demand after the U.S. and China agreed to a temporary reduced level of tariffs. During the second quarter, the Company also moved with its customers as they shifted production throughout Asia in response to the tariffs, which resulted in higher container volume levels outside of China than the levels achieved in the first quarter. For the third quarter 2025, the Company expects lower year-over-year freight rates and volume compared to the elevated demand levels achieved in the third quarter last year and the Company’s expectation of a muted peak season this year. Assuming tariffs and global trade, regulatory measures, the trajectory of the U.S. economy and other geopolitical factors do not materially change from current conditions, the Company expects, for full year 2025, average freight rates and volume to be lower year-over-year.
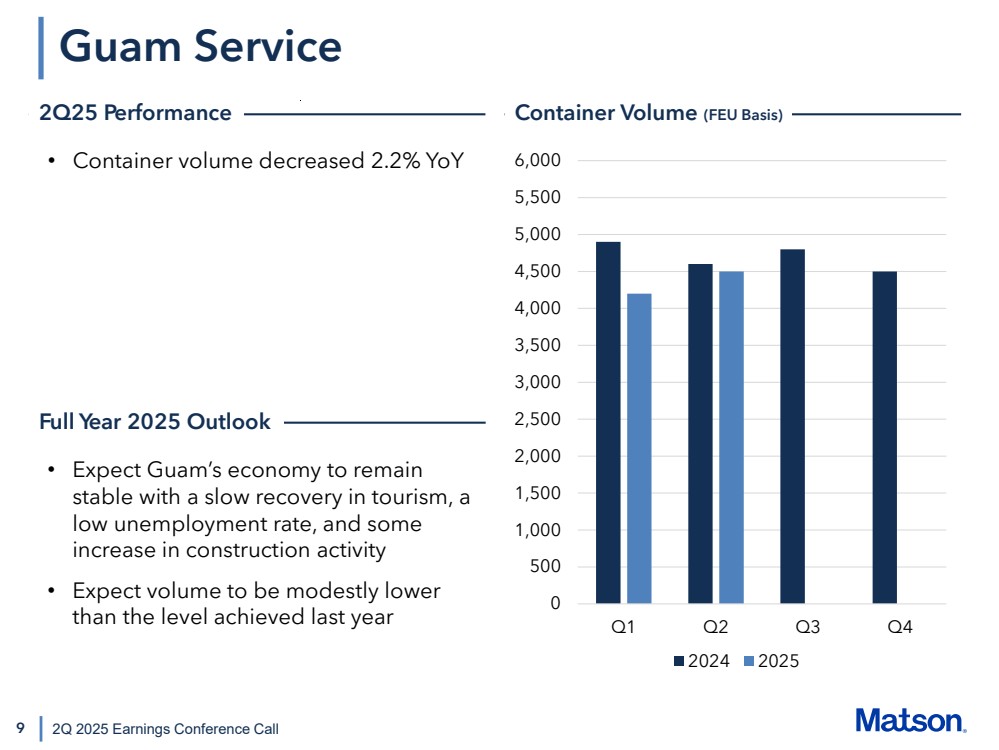
In Guam, the Company’s container volume in the second quarter 2025 decreased 2.2 percent year-over-year. In the near term, the Company expects Guam’s economy to remain stable with a slow recovery in tourism, a low unemployment rate, and some increase in construction activity. For 2025, the Company expects volume to be modestly lower than the level achieved last year.
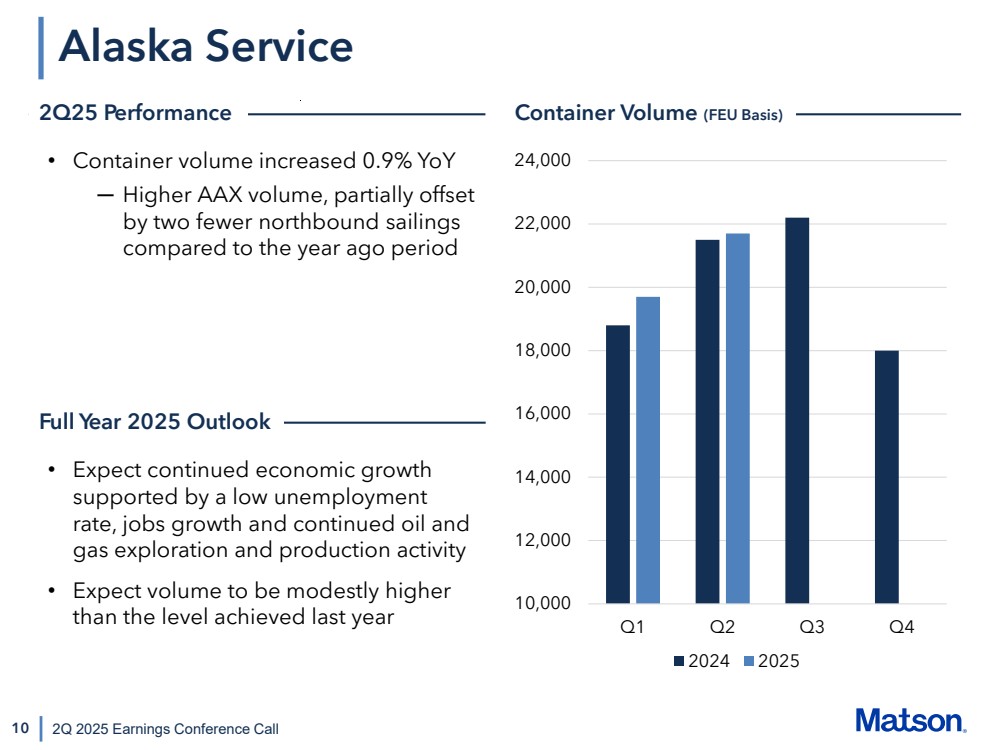
In Alaska, the Company’s container volume for the second quarter 2025 increased 0.9 percent year-over-year. The increase was primarily due to higher AAX volume, partially offset by two fewer northbound sailings compared to the year ago period. In the near term, the Company expects continued economic growth in Alaska supported by a low unemployment rate, jobs growth and continued oil and gas exploration and production activity. For 2025, the Company expects volume to be modestly higher than the level achieved last year.
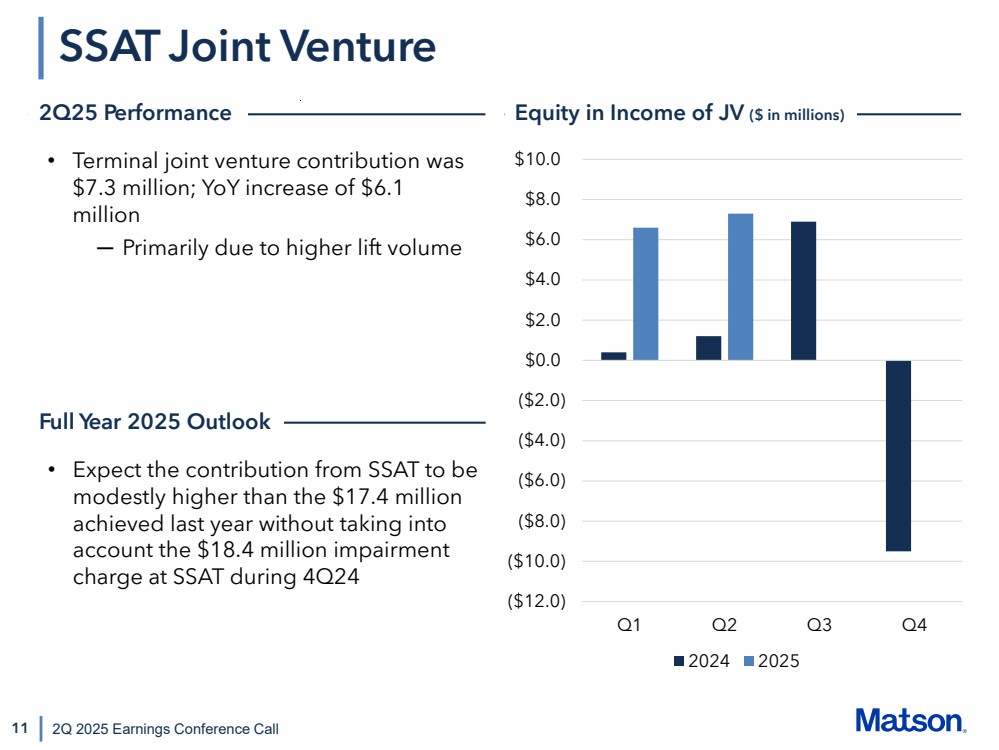
The contribution in the second quarter 2025 from the Company’s SSAT joint venture investment was $7.3 million, or $6.1 million higher than second quarter 2024. The increase was primarily due to higher lift volume. For 2025, the Company expects the contribution from SSAT to be modestly higher than the $17.4 million achieved last year without taking into account the $18.4 million impairment charge at SSAT during the fourth quarter 2024.
In addition to the outlook trends noted above, the Company expects uncertainty regarding tariffs and global trade, regulatory measures, the trajectory of the U.S. economy and other geopolitical factors to continue. Assuming these factors do not materially change from current conditions, the Company expects Ocean Transportation operating income for the full year to be higher than the guidance provided in early May, but moderately lower than the level achieved in the prior year. For the third quarter 2025, the Company expects Ocean Transportation operating income to be meaningfully lower than the level achieved in the same period last year primarily due to lower year-over-year freight rates and volume in the China service compared to the elevated demand levels achieved in the third quarter last year and the Company’s expectation of a muted peak season this year.
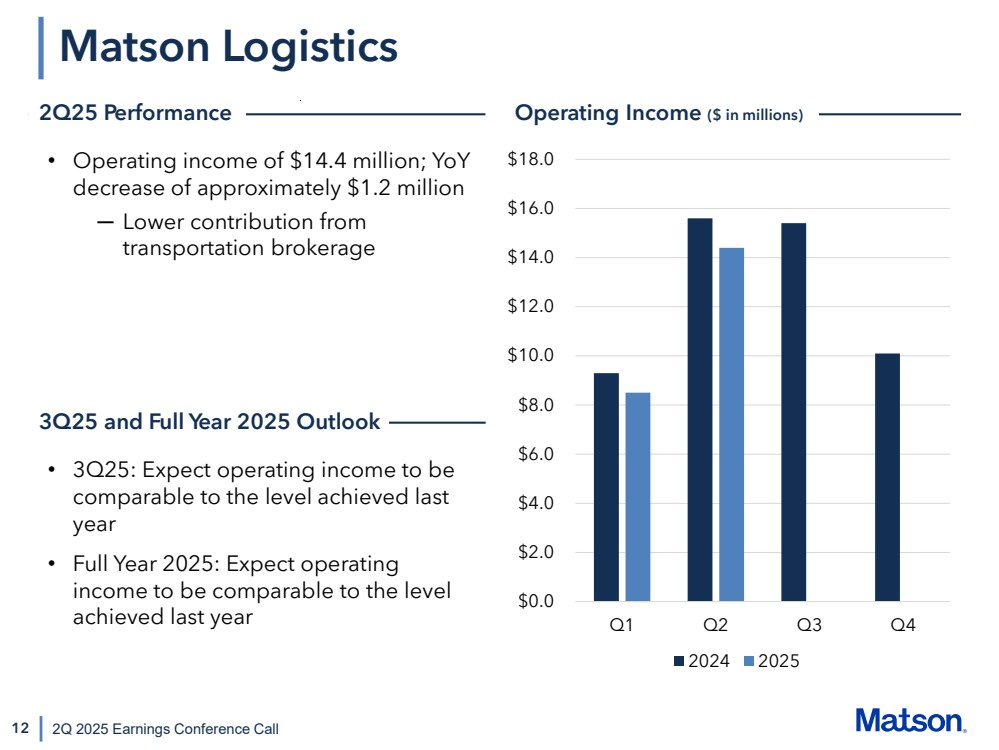
Logistics: In the second quarter 2025, operating income for the Company’s Logistics segment was $14.4 million, or $1.2 million lower compared to the level achieved in the second quarter 2024. The decrease was primarily due to a lower contribution from transportation brokerage. For the third quarter 2025, the Company expects Logistics operating income to be comparable to the $15.4 million achieved in the third quarter 2024. For full year 2025, the Company expects Logistics operating income to be comparable to the level achieved in the prior year.
Consolidated Operating Income: For the third quarter 2025, the Company expects consolidated operating income to be meaningfully lower than the $242.3 million achieved in the third quarter 2024. For full year 2025, the Company expects consolidated operating income to be higher than the guidance provided in early May, but moderately lower than the $551.3 million achieved in 2024.
2
Depreciation and Amortization: For full year 2025, the Company expects depreciation and amortization expense to be approximately $200 million, inclusive of dry-docking amortization of approximately $26 million.
Interest Income: The Company expects interest income for the full year 2025 to be approximately $31 million. In the second quarter 2024, the Company’s interest income of $18.8 million included $10.2 million in interest income earned on the federal tax refund related to the Company’s 2021 federal tax return.
Interest Expense: The Company expects interest expense for the full year 2025 to be approximately $7 million.
Other Income (Expense): The Company expects full year 2025 other income (expense) to be approximately $9 million in income, which is attributable to the amortization of certain components of net periodic benefit costs or gains related to the Company’s pension and post-retirement plans.
Income Taxes: In the second quarter 2025, the Company’s effective tax rate was 22.2 percent. For the full year 2025, the Company expects its effective tax rate to be approximately 22.0 percent.
Capital and Vessel Dry-docking Expenditures: For the second quarter 2025, the Company made capital expenditure payments excluding new vessel construction expenditures of $48.9 million, new vessel construction expenditures (including capitalized interest and owner’s items) of $37.4 million, and dry-docking payments of $13.4 million. For the full year 2025, the Company expects to make other capital expenditure payments, including maintenance capital expenditures, of approximately $100 to $120 million, new vessel construction expenditures (including capitalized interest and owner’s items) of approximately $305 million, and dry-docking payments of approximately $40 million.
Results By Segment
Ocean Transportation — Three months ended June 30, 2025 compared with 2024
|
|
Three Months Ended June 30, |
|
|||||||||
(Dollars in millions) |
|
2025 |
|
2024 |
|
Change |
|
|||||
Ocean Transportation revenue |
|
$ |
675.6 |
|
$ |
689.9 |
|
$ |
(14.3) |
|
(2.1) |
% |
Operating costs and expenses |
|
|
(577.0) |
|
|
(580.9) |
|
|
3.9 |
|
(0.7) |
% |
Operating income |
|
$ |
98.6 |
|
$ |
109.0 |
|
$ |
(10.4) |
|
(9.5) |
% |
Operating income margin |
|
|
14.6 |
% |
|
15.8 |
% |
|
|
|
|
|
|
|
|
|
|
|
|
|
|
|
|
|
|
Volume (Forty-foot equivalent units (FEU)) (1) |
|
|
|
|
|
|
|
|
|
|
|
|
Hawaii containers |
|
|
36,000 |
|
|
35,100 |
|
|
900 |
|
2.6 |
% |
Alaska containers |
|
|
21,700 |
|
|
21,500 |
|
|
200 |
|
0.9 |
% |
China containers (2) |
|
|
32,300 |
|
|
37,800 |
|
|
(5,500) |
|
(14.6) |
% |
Guam containers |
|
|
4,500 |
|
|
4,600 |
|
|
(100) |
|
(2.2) |
% |
Other containers (3) |
|
|
4,400 |
|
|
4,400 |
|
|
— |
|
— |
% |
| (1) | Approximate volume included for the period are based on the voyage departure date, but revenue and operating income are adjusted to reflect the percentage of revenue and operating income earned during the reporting period for voyages in transit at the end of each reporting period. |
| (2) | Includes containers transshipped from other Asia origins. |
| (3) | Includes containers from services in various islands in Micronesia and the South Pacific, and Okinawa, Japan. |
Ocean Transportation revenue decreased $14.3 million, or 2.1 percent, during the three months ended June 30, 2025, compared with the three months ended June 30, 2024. The decrease was primarily due to lower volume in China, partially offset by higher freight rates in China.
3
On a year-over-year FEU basis, Hawaii container volume increased 2.6 percent primarily due to higher general demand; Alaska volume increased 0.9 percent primarily due to higher AAX volume, partially offset by two fewer northbound sailings compared to the year ago period; China volume was 14.6 percent lower primarily due to the challenges of market uncertainty and volatility from tariffs and global trade; Guam volume decreased 2.2 percent; and Other containers volume was flat.
Ocean Transportation operating income decreased $10.4 million, or 9.5 percent, during the three months ended June 30, 2025, compared with the three months ended June 30, 2024. The decrease was primarily due to lower volume in China, partially offset by higher freight rates in China and the timing of fuel-related surcharge collections.
The Company’s SSAT terminal joint venture investment contributed $7.3 million during the three months ended June 30, 2025, compared to a contribution of $1.2 million during the three months ended June 30, 2024. The increase was primarily driven by higher lift volume.
Ocean Transportation — Six months ended June 30, 2025 compared with 2024
|
|
Six Months Ended June 30, |
|
|||||||||
(Dollars in millions) |
|
2025 |
|
2024 |
|
Change |
|
|||||
Ocean Transportation revenue |
|
$ |
1,313.0 |
|
$ |
1,268.9 |
|
$ |
44.1 |
|
3.5 |
% |
Operating costs and expenses |
|
|
(1,140.8) |
|
|
(1,132.3) |
|
|
(8.5) |
|
0.8 |
% |
Operating income |
|
$ |
172.2 |
|
$ |
136.6 |
|
$ |
35.6 |
|
26.1 |
% |
Operating income margin |
|
|
13.1 |
% |
|
10.8 |
% |
|
|
|
|
|
|
|
|
|
|
|
|
|
|
|
|
|
|
Volume (Forty-foot equivalent units (FEU)) (1) |
|
|
|
|
|
|
|
|
|
|
|
|
Hawaii containers |
|
|
71,700 |
|
|
69,700 |
|
|
2,000 |
|
2.9 |
% |
Alaska containers |
|
|
41,400 |
|
|
40,300 |
|
|
1,100 |
|
2.7 |
% |
China containers (2) |
|
|
60,800 |
|
|
66,700 |
|
|
(5,900) |
|
(8.8) |
% |
Guam containers |
|
|
8,700 |
|
|
9,500 |
|
|
(800) |
|
(8.4) |
% |
Other containers (3) |
|
|
7,800 |
|
|
8,000 |
|
|
(200) |
|
(2.5) |
% |
| (1) | Approximate volume included for the period are based on the voyage departure date, but revenue and operating income are adjusted to reflect the percentage of revenue and operating income earned during the reporting period for voyages in transit at the end of each reporting period. |
| (2) | Includes containers transshipped from other Asia origins. |
| (3) | Includes containers from services in various islands in Micronesia and the South Pacific, and Okinawa, Japan. |
Ocean Transportation revenue increased $44.1 million, or 3.5 percent, during the six months ended June 30, 2025, compared with the six months ended June 30, 2024. The increase was primarily due to higher freight rates in China and Hawaii, partially offset by lower volume in China.
On a year-over-year FEU basis, Hawaii container volume increased 2.9 percent primarily due to the dry-docking of a competitor’s vessel in the first half of 2025; Alaska volume increased 2.7 percent due to higher AAX volume and retail-related demand, partially offset by three fewer northbound sailings compared to the year ago period; China volume decreased 8.8 percent due to the challenges of market uncertainty and volatility from tariffs and global trade; Guam volume decreased 8.4 percent primarily due to lower demand from retail and food and beverage segments; and Other containers volume decreased 2.5 percent.
Ocean Transportation operating income increased $35.6 million, or 26.1 percent, during the six months ended June 30, 2025, compared with the six months ended June 30, 2024. The increase was primarily due to higher freight rates in China and the domestic tradelanes, the timing of fuel-related surcharge collections, and a higher contribution from SSAT, primarily offset by lower volume in China and higher operating overhead costs and direct cargo expense.
The Company’s SSAT terminal joint venture investment contributed $13.9 million during the six months ended June 30, 2025, compared to a contribution of $1.6 million during the six months ended June 30, 2024. The increase was primarily driven by higher lift volume.
4
Logistics — Three months ended June 30, 2025 compared with 2024
|
|
Three Months Ended June 30, |
|
|||||||||
(Dollars in millions) |
|
2025 |
|
2024 |
|
Change |
|
|||||
Logistics revenue |
|
$ |
154.9 |
|
$ |
157.5 |
|
$ |
(2.6) |
|
(1.7) |
% |
Operating costs and expenses |
|
|
(140.5) |
|
|
(141.9) |
|
|
1.4 |
|
(1.0) |
% |
Operating income |
|
$ |
14.4 |
|
$ |
15.6 |
|
$ |
(1.2) |
|
(7.7) |
% |
Operating income margin |
|
|
9.3 |
% |
|
9.9 |
% |
|
|
|
|
|
Logistics revenue decreased $2.6 million, or 1.7 percent, during the three months ended June 30, 2025, compared with the three months ended June 30, 2024. The decrease was primarily due to lower revenue in transportation brokerage.
Logistics operating income decreased $1.2 million, or 7.7 percent, during the three months ended June 30, 2025, compared with the three months ended June 30, 2024. The decrease was primarily due to a lower contribution from transportation brokerage.
Logistics — Six months ended June 30, 2025 compared with 2024
|
|
Six Months Ended June 30, |
|
|||||||||
(Dollars in millions) |
|
2025 |
|
2024 |
|
Change |
|
|||||
Logistics revenue |
|
$ |
299.5 |
|
$ |
300.6 |
|
$ |
(1.1) |
|
(0.4) |
% |
Operating costs and expenses |
|
|
(276.6) |
|
|
(275.7) |
|
|
(0.9) |
|
0.3 |
% |
Operating income |
|
$ |
22.9 |
|
$ |
24.9 |
|
$ |
(2.0) |
|
(8.0) |
% |
Operating income margin |
|
|
7.6 |
% |
|
8.3 |
% |
|
|
|
|
|
Logistics revenue decreased $1.1 million, or 0.4 percent, during the six months ended June 30, 2025, compared with the six months ended June 30, 2024. The decrease was primarily due to lower revenue in transportation brokerage.
Logistics operating income decreased $2.0 million, or 8.0 percent, during the six months ended June 30, 2025, compared with the six months ended June 30, 2024. The decrease was primarily due to a lower contribution from transportation brokerage and freight forwarding.
Liquidity, Cash Flows and Capital Allocation
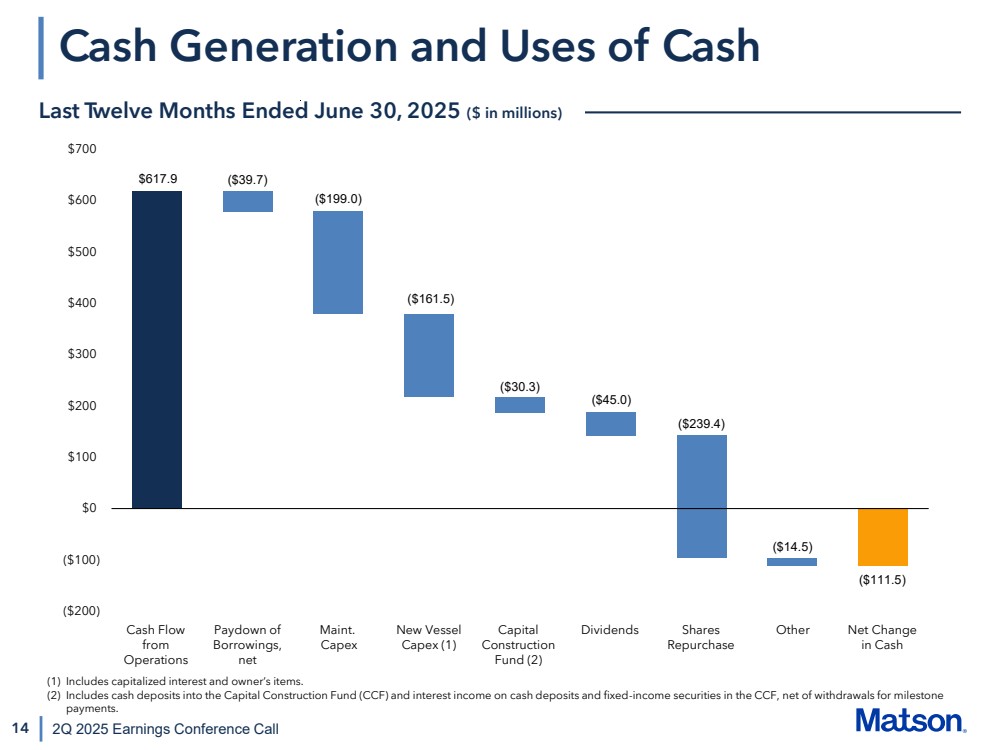
Matson’s Cash and Cash Equivalents decreased by $207.7 million from $266.8 million at December 31, 2024 to $59.1 million at June 30, 2025. As of June 30, 2025, there was $656.7 million of cash and cash equivalents and investments in fixed-rate U.S. Treasuries in the Capital Construction Fund. Matson generated net cash from operating activities of $194.6 million during the six months ended June 30, 2025, compared to $344.5 million during the six months ended June 30, 2024. The year-over-year decline in net cash from operating activities is due primarily to the receipt of a federal tax refund of $118.6 million in second quarter 2024 related to the Company’s 2021 federal tax return, as reflected in prepaid expenses and other assets. Capital expenditures (including capitalized vessel construction expenditures) totaled $175.5 million for the six months ended June 30, 2025, compared with $125.1 million for the six months ended June 30, 2024. Total debt decreased by $19.9 million during the six months to $381.0 million as of June 30, 2025, of which $341.3 million was classified as long-term debt.1 As of June 30, 2025, Matson had available borrowings under its revolving credit facility of $643.9 million.
During the second quarter 2025, Matson repurchased approximately 0.9 million shares for a total cost of $93.7 million.2 As of the end of the second quarter 2025, there were approximately 2.5 million shares remaining in the Company’s share repurchase program. Matson’s Board of Directors also declared a cash dividend of $0.36 per share payable on September 4, 2025 to all shareholders of record as of the close of business on August 7, 2025.
1 Total debt is presented before any reduction for deferred loan fees as required by GAAP.
2 Includes stock repurchased during the quarter but not settled and taxes on share repurchases that will be paid after the quarter end.
5
Teleconference and Webcast
A conference call is scheduled on July 31, 2025 at 4:30 p.m. ET when Matt Cox, Chairman and Chief Executive Officer, and Joel Wine, Executive Vice President and Chief Financial Officer, will discuss Matson’s second quarter results.
Date of Conference Call: |
Thursday, July 31, 2025 |
Scheduled Time: |
4:30 p.m. ET / 1:30 p.m. PT / 10:30 a.m. HT |
The conference call will be broadcast live along with an additional slide presentation on the Company’s website at www.matson.com, under Investors.
Participants may register for the conference call at:
https://register-conf.media-server.com/register/BI00f9cf3afee04f7ead88d73c11e09bd5
Registered participants will receive the conference call dial-in number and a unique PIN code to access the live event. While not required, it is recommended you join 10 minutes prior to the event starting time. A replay of the conference call will be available approximately two hours after the event by accessing the webcast link at www.matson.com, under Investors.
About the Company
Founded in 1882, Matson (NYSE: MATX) is a leading provider of ocean transportation and logistics services. Matson provides a vital lifeline of ocean freight transportation services to the domestic non-contiguous economies of Hawaii, Alaska, and Guam, and to other island economies in Micronesia. Matson also operates premium, expedited services from China to Long Beach, California, which includes transshipment of cargo from other Asia origins, provides service to Okinawa, Japan and various islands in the South Pacific, and operates an international export service from Alaska to Asia. The Company's fleet of owned and chartered vessels includes containerships, combination container and roll-on/roll-off ships and barges. Matson Logistics, established in 1987, extends the geographic reach of Matson’s transportation network throughout North America and Asia. Its integrated, asset-light logistics services include rail intermodal, highway brokerage, warehousing, freight consolidation, supply chain management, and freight forwarding to Alaska. Additional information about the Company is available at www.matson.com.
GAAP to Non-GAAP Reconciliation
This press release, the Form 8-K and the information to be discussed in the conference call include non-GAAP measures. While Matson reports financial results in accordance with U.S. generally accepted accounting principles (“GAAP”), the Company also considers other non-GAAP measures to evaluate performance, make day-to-day operating decisions, help investors understand our ability to incur and service debt and to make capital expenditures, and to understand period-over-period operating results separate and apart from items that may, or could, have a disproportional positive or negative impact on results in any particular period. These non-GAAP measures include, but are not limited to, Earnings Before Interest, Income Taxes, Depreciation and Amortization (“EBITDA”).
Forward-Looking Statements
Statements in this news release that are not historical facts are “forward-looking statements,” within the meaning of the Private Securities Litigation Reform Act of 1995, including without limitation those statements regarding outlook; operating income; depreciation and amortization, including dry-docking amortization; interest income; interest expense; other income (expense); tax rate; capital and vessel dry-docking expenditures; volume and freight rates; geopolitical factors; tariffs and global trade; regulatory measures; trajectory of the U.S. economy; expansion of transshipment capabilities; shifts in customers’ manufacturing locations; a muted peak season; economic growth and drivers in Hawaii, Alaska and Guam; interest rates; tourism levels; unemployment rates; construction activity; jobs growth; inflation; oil and gas exploration and production activity; market share; contribution from SSAT; vessel transit and connection times; refleeting initiatives; timing and amount of cash contributions into the Capital Construction Fund; timing and amount of milestone payments and related costs; and the timing, manner and volume of repurchases of common stock pursuant to the repurchase program.
6
These statements involve a number of risks and uncertainties that could cause actual results to differ materially from those contemplated by the relevant forward-looking statement, including but not limited to risks and uncertainties relating to repeal, invalidation, substantial amendment or waiver of the Jones Act or changes in its application, or the Company were determined not to be a United States citizen under the Jones Act; changes in macroeconomic conditions, geopolitical developments, or governmental policies; our ability to offer a differentiated service in China for which customers are willing to pay a significant premium; new or increased competition; our relationship with customers and vendors and changes in related agreements; fuel prices, our ability to collect fuel-related surcharges and/or the cost or limited availability of required fuels; evolving regulations and stakeholder expectations related to sustainability matters; timely or successful completion of fleet upgrade initiatives; the Company’s vessel construction agreements with Philly Shipyard; the occurrence of weather, natural disasters, maritime accidents, spill events and other physical and operating risks; transitional and other risks arising from climate change; actual or threatened health epidemics, outbreaks of disease, pandemics or other major health crises; significant operating agreements and leases that may not be renewed/replaced on favorable or acceptable terms; any unexpected dry-docking or repair costs; joint venture relationships; conducting business in foreign shipping markets, including the imposition of tariffs or a change in international trade policies; any delays or cost overruns related to the modernization of terminals; war, actual or threatened terrorist attacks, efforts to combat terrorism and other acts of violence; consummating and integrating acquisitions; work stoppages or other labor disruptions caused by our unionized workers and other workers or their unions in related industries; loss of key personnel or failure to adequately manage human capital; the use of our information technology and communication systems and cybersecurity attacks; changes in our credit profile, disruptions of the credit markets, changes in interest rates and our future financial performance; our ability to access the debt capital markets; continuation of the Title XI and CCF programs; costs to comply with and liability related to numerous safety, environmental, and other laws and regulations; and disputes, legal and other proceedings and government inquiries or investigations. These forward-looking statements are not guarantees of future performance. This release should be read in conjunction with our Quarterly Report on Form 10-Q for the quarter ended March 31, 2025 and our other filings with the SEC through the date of this release, which identify important factors that could affect the forward-looking statements in this release. We do not undertake any obligation to update our forward-looking statements.
7
MATSON, INC. AND SUBSIDIARIES
Condensed Consolidated Statements of Income
(Unaudited)
|
|
Three Months Ended |
|
Six Months Ended |
||||||||
|
|
June 30, |
|
June 30, |
||||||||
(In millions, except per share amounts) |
|
2025 |
|
2024 |
|
2025 |
|
2024 |
||||
Operating Revenue: |
|
|
|
|
|
|
|
|
|
|
|
|
Ocean Transportation |
|
$ |
675.6 |
|
$ |
689.9 |
|
$ |
1,313.0 |
|
$ |
1,268.9 |
Logistics |
|
|
154.9 |
|
|
157.5 |
|
|
299.5 |
|
|
300.6 |
Total Operating Revenue |
|
|
830.5 |
|
|
847.4 |
|
|
1,612.5 |
|
|
1,569.5 |
|
|
|
|
|
|
|
|
|
|
|
|
|
Costs and Expenses: |
|
|
|
|
|
|
|
|
|
|
|
|
Operating costs |
|
|
(650.4) |
|
|
(646.9) |
|
|
(1,281.5) |
|
|
(1,259.1) |
Income from SSAT |
|
|
7.3 |
|
|
1.2 |
|
|
13.9 |
|
|
1.6 |
General and administrative |
|
|
(74.4) |
|
|
(77.1) |
|
|
(149.8) |
|
|
(150.5) |
Total Costs and Expenses |
|
|
(717.5) |
|
|
(722.8) |
|
|
(1,417.4) |
|
|
(1,408.0) |
|
|
|
|
|
|
|
|
|
|
|
|
|
Operating Income |
|
|
113.0 |
|
|
124.6 |
|
|
195.1 |
|
|
161.5 |
Interest income |
|
|
8.0 |
|
|
18.8 |
|
|
17.4 |
|
|
27.6 |
Interest expense |
|
|
(1.7) |
|
|
(2.1) |
|
|
(3.4) |
|
|
(4.3) |
Other income (expense), net |
|
|
2.4 |
|
|
1.8 |
|
|
4.8 |
|
|
3.6 |
Income before Taxes |
|
|
121.7 |
|
|
143.1 |
|
|
213.9 |
|
|
188.4 |
Income taxes |
|
|
(27.0) |
|
|
(29.9) |
|
|
(46.9) |
|
|
(39.1) |
Net Income |
|
$ |
94.7 |
|
$ |
113.2 |
|
$ |
167.0 |
|
$ |
149.3 |
|
|
|
|
|
|
|
|
|
|
|
|
|
Basic Earnings Per Share |
|
$ |
2.95 |
|
$ |
3.34 |
|
$ |
5.14 |
|
$ |
4.38 |
Diluted Earnings Per Share |
|
$ |
2.92 |
|
$ |
3.31 |
|
$ |
5.09 |
|
$ |
4.33 |
|
|
|
|
|
|
|
|
|
|
|
|
|
Weighted Average Number of Shares Outstanding: |
|
|
|
|
|
|
|
|
|
|
|
|
Basic |
|
|
32.1 |
|
|
33.9 |
|
|
32.5 |
|
|
34.1 |
Diluted |
|
|
32.4 |
|
|
34.2 |
|
|
32.8 |
|
|
34.5 |
8
MATSON, INC. AND SUBSIDIARIES
Condensed Consolidated Balance Sheets
(Unaudited)
|
|
June 30, |
|
December 31, |
||
(In millions) |
|
2025 |
|
2024 |
||
ASSETS |
|
|
|
|
|
|
Current Assets: |
|
|
|
|
|
|
Cash and cash equivalents |
|
$ |
59.1 |
|
$ |
266.8 |
Other current assets |
|
|
365.4 |
|
|
342.8 |
Total current assets |
|
|
424.5 |
|
|
609.6 |
Long-term Assets: |
|
|
|
|
|
|
Investment in SSAT |
|
|
98.3 |
|
|
84.1 |
Property and equipment, net |
|
|
2,359.7 |
|
|
2,260.9 |
Goodwill |
|
|
327.8 |
|
|
327.8 |
Intangible assets, net |
|
|
152.9 |
|
|
159.4 |
Capital Construction Fund |
|
|
656.7 |
|
|
642.6 |
Other long-term assets |
|
|
462.2 |
|
|
511.0 |
Total long-term assets |
|
|
4,057.6 |
|
|
3,985.8 |
Total assets |
|
$ |
4,482.1 |
|
$ |
4,595.4 |
|
|
|
|
|
|
|
LIABILITIES AND SHAREHOLDERS’ EQUITY |
|
|
|
|
|
|
Current Liabilities: |
|
|
|
|
|
|
Current portion of debt |
|
$ |
39.7 |
|
$ |
39.7 |
Other current liabilities |
|
|
507.2 |
|
|
520.7 |
Total current liabilities |
|
|
546.9 |
|
|
560.4 |
Long-term Liabilities: |
|
|
|
|
|
|
Long-term debt, net of deferred loan fees |
|
|
331.5 |
|
|
350.8 |
Deferred income taxes |
|
|
693.8 |
|
|
693.4 |
Other long-term liabilities |
|
|
291.9 |
|
|
338.8 |
Total long-term liabilities |
|
|
1,317.2 |
|
|
1,383.0 |
|
|
|
|
|
|
|
Total shareholders’ equity |
|
|
2,618.0 |
|
|
2,652.0 |
Total liabilities and shareholders’ equity |
|
$ |
4,482.1 |
|
$ |
4,595.4 |
9
MATSON, INC. AND SUBSIDIARIES
Condensed Consolidated Statements of Cash Flows
(Unaudited)
|
|
Six Months Ended June 30, |
|
||||
(In millions) |
|
2025 |
|
2024 |
|
||
Cash Flows From Operating Activities: |
|
|
|
|
|
|
|
Net income |
|
$ |
167.0 |
|
$ |
149.3 |
|
Reconciling adjustments: |
|
|
|
|
|
|
|
Depreciation and amortization |
|
|
81.8 |
|
|
75.5 |
|
Amortization of operating lease right of use assets |
|
|
66.9 |
|
|
68.1 |
|
Deferred income taxes |
|
|
0.3 |
|
|
7.5 |
|
Share-based compensation expense |
|
|
11.7 |
|
|
12.0 |
|
Income from SSAT |
|
|
(13.9) |
|
|
(1.6) |
|
Distributions from SSAT |
|
|
— |
|
|
14.0 |
|
Other |
|
|
(4.7) |
|
|
(5.6) |
|
Changes in assets and liabilities: |
|
|
|
|
|
|
|
Accounts receivable, net |
|
|
(19.7) |
|
|
(28.9) |
|
Deferred dry-docking payments |
|
|
(23.8) |
|
|
(17.3) |
|
Deferred dry-docking amortization |
|
|
13.6 |
|
|
13.7 |
|
Prepaid expenses and other assets |
|
|
(10.6) |
|
|
114.6 |
|
Accounts payable, accruals and other liabilities |
|
|
(3.0) |
|
|
17.4 |
|
Operating lease assets and liabilities, net |
|
|
(67.8) |
|
|
(69.0) |
|
Other long-term liabilities |
|
|
(3.2) |
|
|
(5.2) |
|
Net cash provided by operating activities |
|
|
194.6 |
|
|
344.5 |
|
|
|
|
|
|
|
|
|
Cash Flows From Investing Activities: |
|
|
|
|
|
|
|
Vessel construction expenditures |
|
|
(104.1) |
|
|
(38.2) |
|
Capital expenditures (excluding vessel construction expenditures) |
|
|
(71.4) |
|
|
(86.9) |
|
Proceeds from disposal of property and equipment, net |
|
|
0.5 |
|
|
3.2 |
|
Cash and interest deposited into the Capital Construction Fund |
|
|
(109.1) |
|
|
(45.0) |
|
Withdrawals from Capital Construction Fund |
|
|
100.7 |
|
|
35.8 |
|
Net cash used in investing activities |
|
|
(183.4) |
|
|
(131.1) |
|
|
|
|
|
|
|
|
|
Cash Flows From Financing Activities: |
|
|
|
|
|
|
|
Repayments of debt |
|
|
(19.9) |
|
|
(19.9) |
|
Dividends paid |
|
|
(22.3) |
|
|
(22.1) |
|
Repurchase of Matson common stock |
|
|
(160.4) |
|
|
(120.1) |
|
Tax withholding related to net share settlements of restricted stock units |
|
|
(16.3) |
|
|
(17.0) |
|
Net cash used in financing activities |
|
|
(218.9) |
|
|
(179.1) |
|
|
|
|
|
|
|
|
|
Net (Decrease) Increase in Cash, Cash Equivalents and Restricted Cash |
|
|
(207.7) |
|
|
34.3 |
|
Cash and Cash Equivalents, and Restricted Cash, Beginning of the Period |
|
|
266.8 |
|
|
136.3 |
|
Cash and Cash Equivalents, and Restricted Cash, End of the Period |
|
$ |
59.1 |
|
$ |
170.6 |
|
|
|
|
|
|
|
|
|
Reconciliation of Cash, Cash Equivalents and Restricted Cash, End of the Period: |
|
|
|
|
|
|
|
Cash and Cash Equivalents |
|
$ |
59.1 |
|
$ |
168.2 |
|
Restricted Cash |
|
|
— |
|
|
2.4 |
|
Total Cash and Cash Equivalents, and Restricted Cash, End of the Period |
|
$ |
59.1 |
|
$ |
170.6 |
|
|
|
|
|
|
|
|
|
Supplemental Cash Flow Information: |
|
|
|
|
|
|
|
Interest paid, net of capitalized interest |
|
$ |
2.7 |
|
$ |
3.5 |
|
Income tax payments (refunds), net |
|
$ |
40.7 |
|
$ |
(114.3) |
|
|
|
|
|
|
|
|
|
Non-cash Information: |
|
|
|
|
|
|
|
Capital expenditures included in accounts payable, accruals and other liabilities |
|
$ |
4.0 |
|
$ |
15.3 |
|
Accrued dividends |
|
$ |
11.4 |
|
$ |
11.4 |
|
10
MATSON, INC. AND SUBSIDIARIES
Net Income to EBITDA Reconciliations
(Unaudited)
|
|
|
Three Months Ended |
|
|
|
|||||||
|
|
|
June 30, |
|
Last Twelve |
||||||||
(In millions) |
|
|
2025 |
|
2024 |
|
Change |
|
Months |
||||
Net Income |
|
|
$ |
94.7 |
|
$ |
113.2 |
|
$ |
(18.5) |
|
$ |
494.1 |
Subtract: |
Interest income |
|
|
(8.0) |
|
|
(18.8) |
|
|
10.8 |
|
|
(38.1) |
Add: |
Interest expense |
|
|
1.7 |
|
|
2.1 |
|
|
(0.4) |
|
|
6.6 |
Add: |
Income taxes |
|
|
27.0 |
|
|
29.9 |
|
|
(2.9) |
|
|
130.8 |
Add: |
Depreciation and amortization |
|
|
41.2 |
|
|
38.2 |
|
|
3.0 |
|
|
159.4 |
Add: |
Dry-dock amortization |
|
|
7.0 |
|
|
6.9 |
|
|
0.1 |
|
|
27.1 |
EBITDA (1) |
|
|
$ |
163.6 |
|
$ |
171.5 |
|
$ |
(7.9) |
|
$ |
779.9 |
|
|
|
Six Months Ended |
|
|
|
|||||||
|
|
|
June 30, |
|
|
|
|||||||
(In millions) |
|
|
2025 |
|
2024 |
|
Change |
|
|
|
|||
Net Income |
|
|
$ |
167.0 |
|
$ |
149.3 |
|
$ |
17.7 |
|
|
|
Subtract: |
Interest income |
|
|
(17.4) |
|
|
(27.6) |
|
|
10.2 |
|
|
|
Add: |
Interest expense |
|
|
3.4 |
|
|
4.3 |
|
|
(0.9) |
|
|
|
Add: |
Income taxes |
|
|
46.9 |
|
|
39.1 |
|
|
7.8 |
|
|
|
Add: |
Depreciation and amortization |
|
|
81.8 |
|
|
75.5 |
|
|
6.3 |
|
|
|
Add: |
Dry-dock amortization |
|
|
13.6 |
|
|
13.7 |
|
|
(0.1) |
|
|
|
EBITDA (1) |
|
|
$ |
295.3 |
|
$ |
254.3 |
|
$ |
41.0 |
|
|
|
| (1) | EBITDA is defined as earnings before interest, income taxes, depreciation and amortization (including deferred dry-docking amortization). EBITDA should not be considered as an alternative to net income (as determined in accordance with GAAP), as an indicator of our operating performance, or to cash flows from operating activities (as determined in accordance with GAAP) as a measure of liquidity. Our calculation of EBITDA may not be comparable to EBITDA as calculated by other companies, nor is this calculation identical to the EBITDA used by our lenders to determine financial covenant compliance. |
11
|
2Q 2025 Earnings Conference Call July 31, 2025 |
|
2 Statements made during this presentation that set forth expectations, predictions, projections or are about future events are based on facts and situations that are known to us as of July 31, 2025. We believe that our expectations and assumptions are reasonable. Actual results may differ materially, due to risks and uncertainties, such as those described on pages 24-35 of our Form 10-Q filed on May 6, 2025 and other subsequent filings by Matson with the SEC. Statements made during this presentation are not guarantees of future performance. We do not undertake any obligation to update our forward-looking statements. 2Q 2025 Earnings Conference Call Forward-Looking Statements |
|
3 • 2Q25 exceeded our expectations amid the challenges of market uncertainty and volatility arising from tariffs and global trade • Ocean Transportation operating income in 2Q25 was lower YoY primarily due to lower YoY volume in our China service ─ In our domestic tradelanes, we saw higher YoY volume in Hawaii and Alaska and lower YoY volume in Guam • In Logistics, our operating income was lower YoY primarily due to a lower contribution from transportation brokerage • Looking ahead, we expect uncertainty regarding tariffs and global trade, regulatory measures, the trajectory of the U.S. economy and other geopolitical factors to continue • Given 2Q25 financial performance and assuming these factors do not materially change from current conditions, we are raising full year outlook 2Q 2025 Earnings Conference Call Opening Remarks |
|
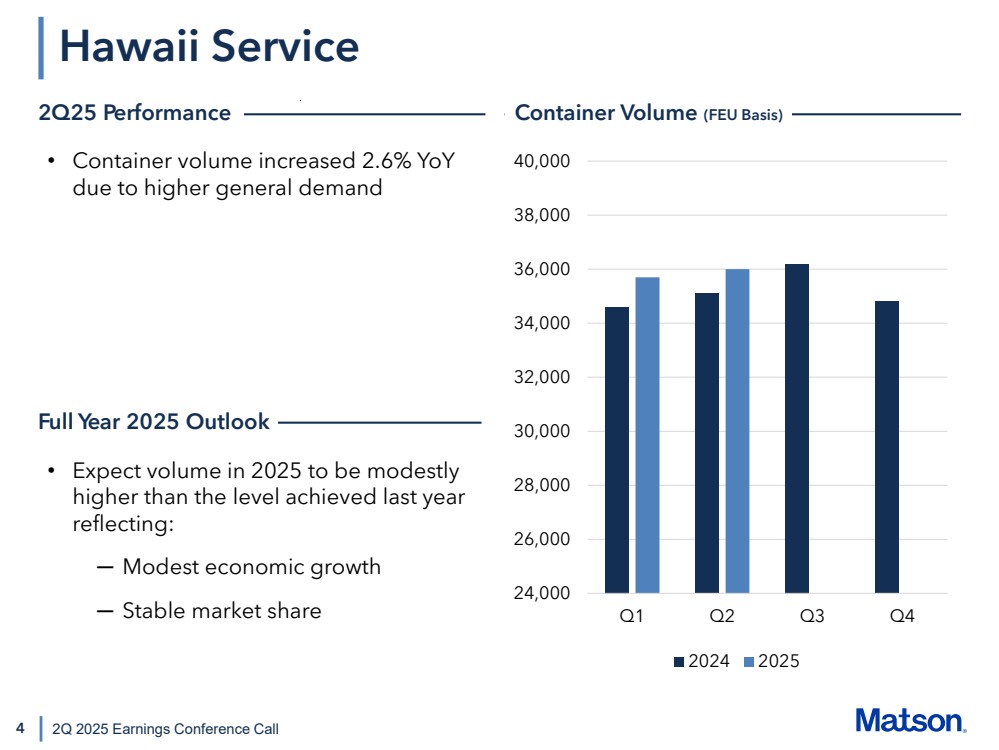
4 24,000 26,000 28,000 30,000 32,000 34,000 36,000 38,000 40,000 Q1 Q2 Q3 Q4 2024 2025 2Q 2025 Earnings Conference Call • Container volume increased 2.6% YoY due to higher general demand • Expect volume in 2025 to be modestly higher than the level achieved last year reflecting: ─ Modest economic growth ─ Stable market share Hawaii Service 2Q25 Performance Container Volume (FEU Basis) Full Year 2025 Outlook |
|
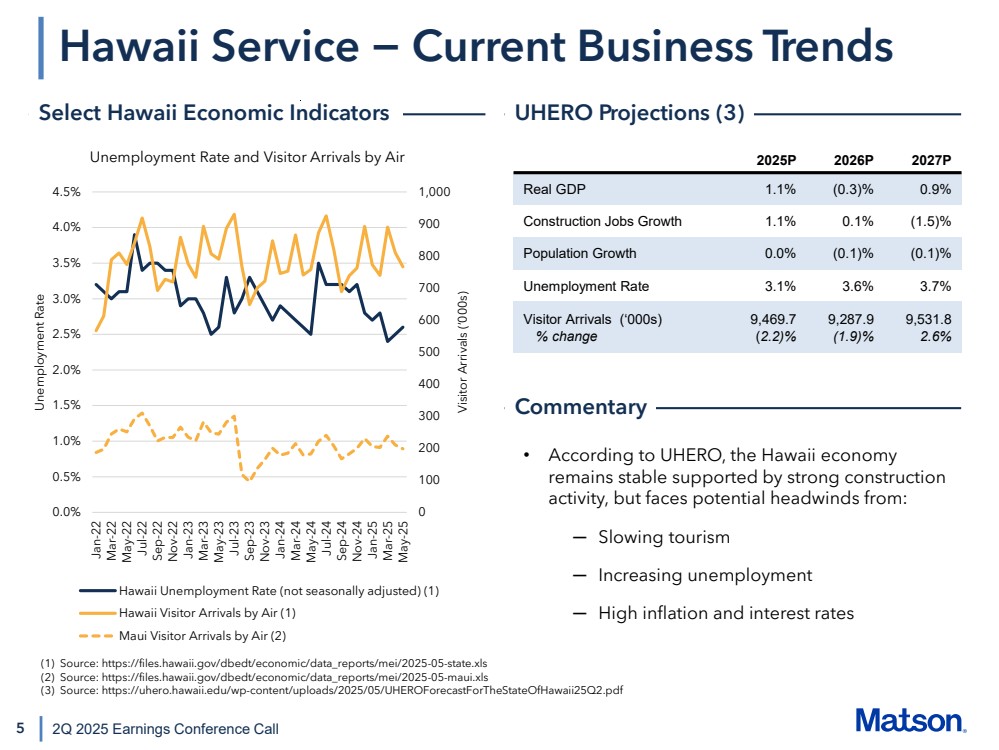
0 100 200 300 400 500 600 700 800 900 1,000 0.0% 0.5% 1.0% 1.5% 2.0% 2.5% 3.0% 3.5% 4.0% 4.5% Jan-22 Mar-22 May-22 Jul-22 Sep-22 Nov-22 Jan-23 Mar-23 May-23 Jul-23 Sep-23 Nov-23 Jan-24 Mar-24 May-24 Jul-24 Sep-24 Nov-24 Jan-25 Mar-25 May-25 Unemployment Rate Visitor Arrivals (‘000s) Unemployment Rate and Visitor Arrivals by Air Hawaii Unemployment Rate (not seasonally adjusted) (1) Hawaii Visitor Arrivals by Air (1) Maui Visitor Arrivals by Air (2) 5 Hawaii Service − Current Business Trends 2Q 2025 Earnings Conference Call • According to UHERO, the Hawaii economy remains stable supported by strong construction activity, but faces potential headwinds from: ─ Slowing tourism ─ Increasing unemployment ─ High inflation and interest rates 2025P 2026P 2027P Real GDP 1.1% (0.3)% 0.9% Construction Jobs Growth 1.1% 0.1% (1.5)% Population Growth 0.0% (0.1)% (0.1)% Unemployment Rate 3.1% 3.6% 3.7% Visitor Arrivals (‘000s) % change 9,469.7 (2.2)% 9,287.9 (1.9)% 9,531.8 2.6% Select Hawaii Economic Indicators UHERO Projections (3) Commentary (1) Source: https://files.hawaii.gov/dbedt/economic/data_reports/mei/2025-05-state.xls (2) Source: https://files.hawaii.gov/dbedt/economic/data_reports/mei/2025-05-maui.xls (3) Source: https://uhero.hawaii.edu/wp-content/uploads/2025/05/UHEROForecastForTheStateOfHawaii25Q2.pdf |
|
6 China Service 2Q 2025 Earnings Conference Call • Container volume decreased 14.6% YoY primarily due to the challenges of market uncertainty and volatility from tariffs and global trade • Freight rates were modestly higher YoY 2Q25 Performance Container Volume (1) (FEU Basis) 8,000 13,000 18,000 23,000 28,000 33,000 38,000 43,000 Q1 Q2 Q3 Q4 2024 2025 (1) Includes containers transshipped from other Asia origins. |
|
7 • At the onset of tariffs in April, we experienced significantly lower year-over-year freight demand as our customers held back less urgent shipments to work through the tariff impacts ─ Many of our customers were negotiating the tariffs with their trading partners on an order-by-order basis ─ At the same time, we saw carriers and alliances begin to reduce capacity in the Transpacific tradelane based on the significant volume downturn • Starting in mid-May, we saw a rebound in demand after the U.S. and China agreed to a temporary reduced level of tariffs, but also in anticipation of country-specific reciprocal tariffs returning in August ─ The build-up of freight that had taken place unwound over several weeks ─ Market freight rates increased quickly to meet the higher demand levels and capacity returned over the subsequent few weeks • Following the London meeting in June between the U.S. and China that upheld the terms from May, we saw a stabilization of volume modestly below the prior year period level amid a number of evolving tradelane supply and demand factors including: ─ Tradelane capacity reductions after the cargo rush in May ─ Customers in Vietnam and other Southeast Asian countries advancing freight ahead of July 9th when the 90-day pause on country-specific reciprocal tariffs expired ─ Some customers pulling forward freight from the traditional peak season in the third quarter to de-risk ahead of the next U.S.-China deadline 2Q 2025 Earnings Conference Call China Service − Current Business Trends |
|
8 • During 2Q25, we moved with our customers as they shifted production throughout Asia in response to the tariffs, which resulted in higher container volume levels outside of China ─ The sequential quarterly increase is primarily due to higher customer demand and the opening of our new expedited Ho Chi Minh service offering as our second best-in-class service out of Vietnam along with Haiphong from two years ago • We remain focused on supporting our customers in the region as they continue to shift their production capabilities, and we will look at opportunities to further expand our transshipment capabilities • Looking ahead, in 3Q25 we expect lower year-over-year freight rates and volume compared to the elevated demand levels achieved in 3Q24 and our expectation of a muted peak season this year ─ In July, we continued to see stabilized volume and rates, notwithstanding lower demand levels and continued pressure in the SCFI; as a result, we significantly outperformed the market relative to the SCFI due to our service differentiation and brand reputation • Assuming tariffs and global trade, regulatory measures, the trajectory of the U.S. economy and other geopolitical factors do not materially change from current conditions, we expect, for full year 2025, average freight rates and volume to be lower year-over-year 2Q 2025 Earnings Conference Call China Service − Current Business Trends (continued) |
|
9 Guam Service 2Q 2025 Earnings Conference Call • Container volume decreased 2.2% YoY • Expect Guam’s economy to remain stable with a slow recovery in tourism, a low unemployment rate, and some increase in construction activity • Expect volume to be modestly lower than the level achieved last year 2Q25 Performance Container Volume (FEU Basis) 0 500 1,000 1,500 2,000 2,500 3,000 3,500 4,000 4,500 5,000 5,500 6,000 Q1 Q2 Q3 Q4 2024 2025 Full Year 2025 Outlook |
|
10 Alaska Service 2Q 2025 Earnings Conference Call • Container volume increased 0.9% YoY ─ Higher AAX volume, partially offset by two fewer northbound sailings compared to the year ago period 10,000 12,000 14,000 16,000 18,000 20,000 22,000 24,000 Q1 Q2 Q3 Q4 2024 2025 • Expect continued economic growth supported by a low unemployment rate, jobs growth and continued oil and gas exploration and production activity • Expect volume to be modestly higher than the level achieved last year 2Q25 Performance Container Volume (FEU Basis) Full Year 2025 Outlook |
|
11 SSAT Joint Venture 2Q 2025 Earnings Conference Call • Terminal joint venture contribution was $7.3 million; YoY increase of $6.1 million ─ Primarily due to higher lift volume ($12.0) ($10.0) ($8.0) ($6.0) ($4.0) ($2.0) $0.0 $2.0 $4.0 $6.0 $8.0 $10.0 Q1 Q2 Q3 Q4 2024 2025 2Q25 Performance Equity in Income of JV ($ in millions) • Expect the contribution from SSAT to be modestly higher than the $17.4 million achieved last year without taking into account the $18.4 million impairment charge at SSAT during 4Q24 Full Year 2025 Outlook |
|
12 Matson Logistics 2Q 2025 Earnings Conference Call • Operating income of $14.4 million; YoY decrease of approximately $1.2 million ─ Lower contribution from transportation brokerage $0.0 $2.0 $4.0 $6.0 $8.0 $10.0 $12.0 $14.0 $16.0 $18.0 Q1 Q2 Q3 Q4 2024 2025 • 3Q25: Expect operating income to be comparable to the level achieved last year • Full Year 2025: Expect operating income to be comparable to the level achieved last year 2Q25 Performance Operating Income ($ in millions) 3Q25 and Full Year 2025 Outlook |
|
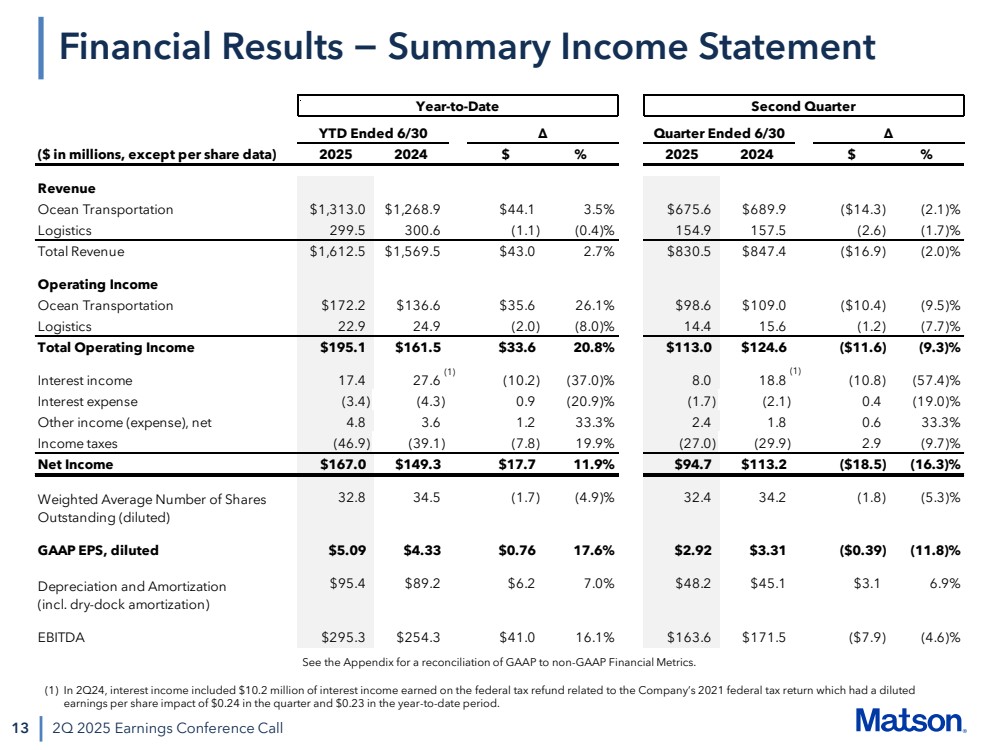
13 2Q 2025 Earnings Conference Call Financial Results − Summary Income Statement (1) In 2Q24, interest income included $10.2 million of interest income earned on the federal tax refund related to the Company’s 2021 federal tax return which had a diluted earnings per share impact of $0.24 in the quarter and $0.23 in the year-to-date period. (1) (1) See the Appendix for a reconciliation of GAAP to non-GAAP Financial Metrics. Year-to-Date Second Quarter YTD Ended 6/30 Δ Quarter Ended 6/30 Δ ($ in millions, except per share data) 2025 2024 $ % 2025 2024 $ % Revenue Ocean Transportation $1,313.0 $1,268.9 $44.1 3.5% $675.6 $689.9 ($14.3) (2.1)% Logistics 299.5 300.6 (1.1) (0.4)% 154.9 157.5 (2.6) (1.7)% Total Revenue $1,612.5 $1,569.5 $43.0 2.7% $830.5 $847.4 ($16.9) (2.0)% Operating Income Ocean Transportation $172.2 $136.6 $35.6 26.1% $98.6 $109.0 ($10.4) (9.5)% Logistics 22.9 24.9 (2.0) (8.0)% 14.4 15.6 (1.2) (7.7)% Total Operating Income $195.1 $161.5 $33.6 20.8% $113.0 $124.6 ($11.6) (9.3)% Interest income 17.4 27.6 (10.2) (37.0)% 8.0 18.8 (10.8) (57.4)% Interest expense (3.4) (4.3) 0.9 (20.9)% (1.7) (2.1) 0.4 (19.0)% Other income (expense), net 4.8 3.6 1.2 33.3% 2.4 1.8 0.6 33.3% Income taxes (46.9) (39.1) (7.8) 19.9% (27.0) (29.9) 2.9 (9.7)% Net Income $167.0 $149.3 $17.7 11.9% $94.7 $113.2 ($18.5) (16.3)% 32.8 34.5 (1.7) (4.9)% 32.4 34.2 (1.8) (5.3)% GAAP EPS, diluted $5.09 $4.33 $0.76 17.6% $2.92 $3.31 ($0.39) (11.8)% $95.4 $89.2 $6.2 7.0% $48.2 $45.1 $3.1 6.9% EBITDA $295.3 $254.3 $41.0 16.1% $163.6 $171.5 ($7.9) (4.6)% Depreciation and Amortization (incl. dry-dock amortization) Weighted Average Number of Shares Outstanding (diluted) |
|
($200) ($100) $0 $100 $200 $300 $400 $500 $600 $700 Cash Flow from Operations Paydown of Borrowings, net Maint. Capex New Vessel Capex (1) Capital Construction Fund (2) Dividends Share Repurchase Other Net change in cash $617.9 ($39.7) ($199.0) ($30.3) ($161.5) ($45.0) ($239.4) ($14.5) ($111.5) 14 Cash Generation and Uses of Cash 2Q 2025 Earnings Conference Call (1) Includes capitalized interest and owner’s items. (2) Includes cash deposits into the Capital Construction Fund (CCF) and interest income on cash deposits and fixed-income securities in the CCF, net of withdrawals for milestone payments. Last Twelve Months Ended June 30, 2025 ($ in millions) Cash Flow from Operations Paydown of Borrowings, net Maint. Capex New Vessel Capex (1) Capital Construction Fund (2) Dividends Shares Repurchase Other Net Change in Cash |
|
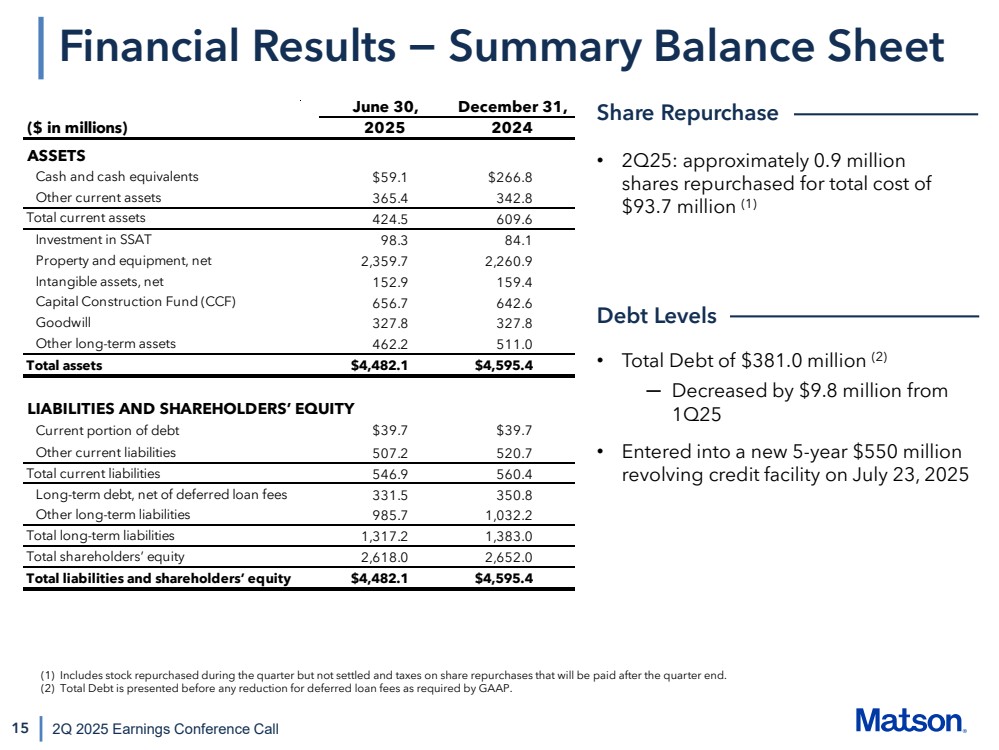
15 Financial Results − Summary Balance Sheet 2Q 2025 Earnings Conference Call • 2Q25: approximately 0.9 million shares repurchased for total cost of $93.7 million (1) • Total Debt of $381.0 million (2) ─ Decreased by $9.8 million from 1Q25 • Entered into a new 5-year $550 million revolving credit facility on July 23, 2025 Share Repurchase Debt Levels (1) Includes stock repurchased during the quarter but not settled and taxes on share repurchases that will be paid after the quarter end. (2) Total Debt is presented before any reduction for deferred loan fees as required by GAAP. ($ in millions) ASSETS Cash and cash equivalents $59.1 $266.8 Other current assets 365.4 342.8 Total current assets 424.5 609.6 Investment in SSAT 98.3 84.1 Property and equipment, net 2,359.7 2,260.9 Intangible assets, net 152.9 159.4 Capital Construction Fund (CCF) 656.7 642.6 Goodwill 327.8 327.8 Other long-term assets 462.2 511.0 Total assets $4,482.1 $4,595.4 LIABILITIES AND SHAREHOLDERS’ EQUITY Current portion of debt $39.7 $39.7 Other current liabilities 507.2 520.7 Total current liabilities 546.9 560.4 Long-term debt, net of deferred loan fees 331.5 350.8 Other long-term liabilities 985.7 1,032.2 Total long-term liabilities 1,317.2 1,383.0 Total shareholders’ equity 2,618.0 2,652.0 Total liabilities and shareholders’ equity $4,482.1 $4,595.4 June 30, December 31, 2025 2024 |
|
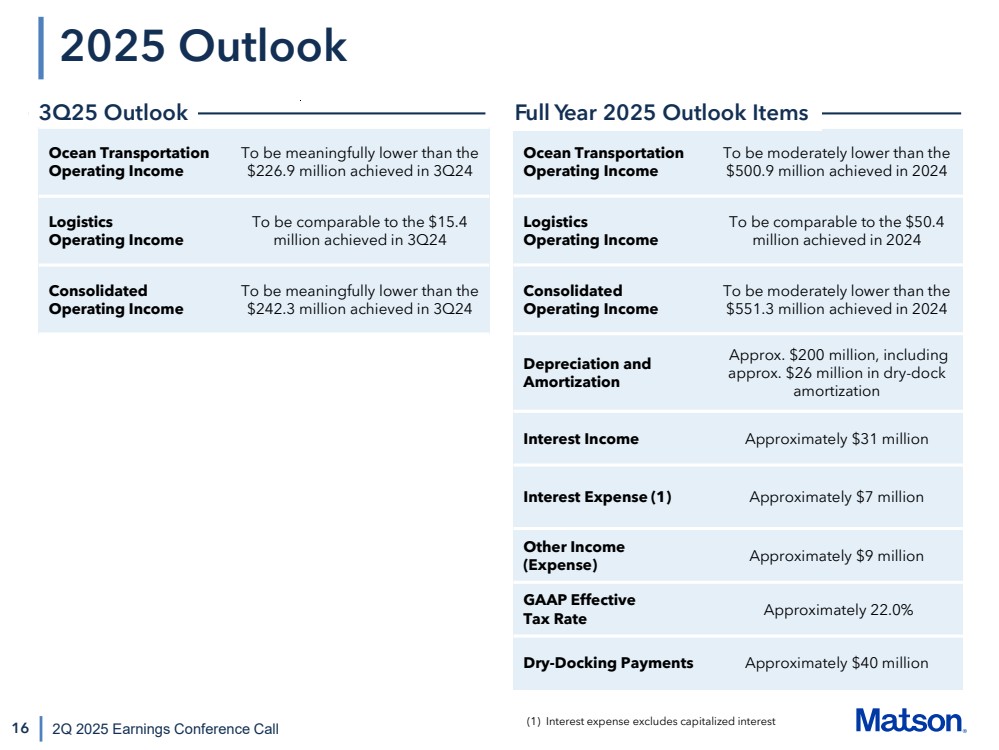
16 2025 Outlook 2Q 2025 Earnings Conference Call Ocean Transportation Operating Income To be moderately lower than the $500.9 million achieved in 2024 Logistics Operating Income To be comparable to the $50.4 million achieved in 2024 Consolidated Operating Income To be moderately lower than the $551.3 million achieved in 2024 Depreciation and Amortization Approx. $200 million, including approx. $26 million in dry-dock amortization Interest Income Approximately $31 million Interest Expense (1) Approximately $7 million Other Income (Expense) Approximately $9 million GAAP Effective Tax Rate Approximately 22.0% Dry-Docking Payments Approximately $40 million 3Q25 Outlook Full Year 2025 Outlook Items Ocean Transportation Operating Income To be meaningfully lower than the $226.9 million achieved in 3Q24 Logistics Operating Income To be comparable to the $15.4 million achieved in 3Q24 Consolidated Operating Income To be meaningfully lower than the $242.3 million achieved in 3Q24 (1) Interest expense excludes capitalized interest |
|
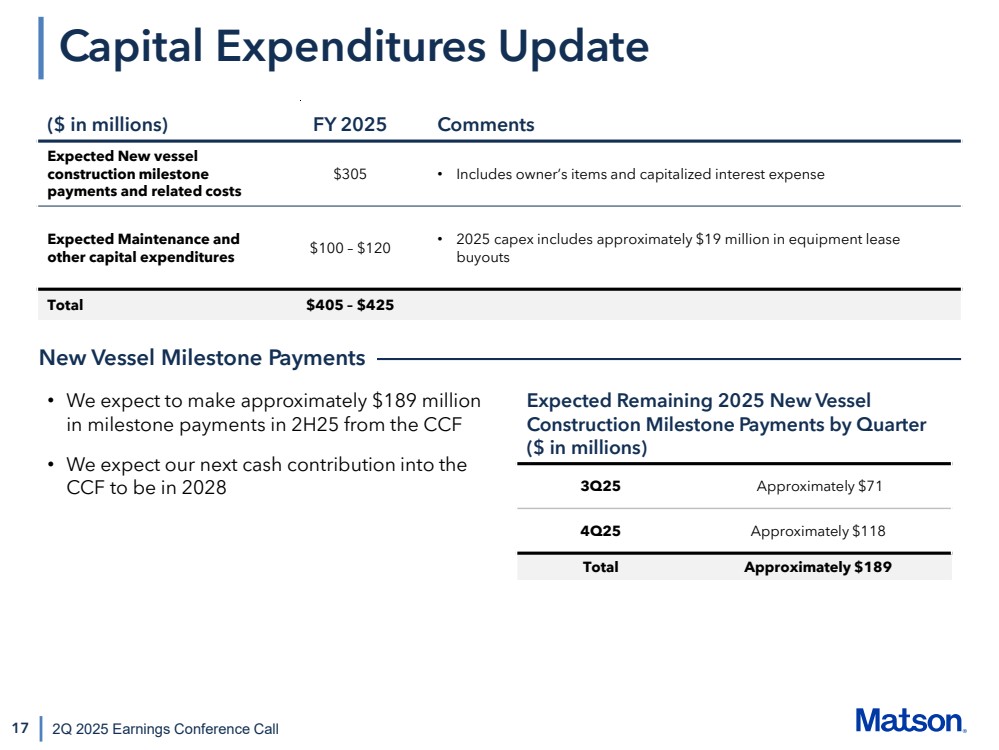
17 2Q 2025 Earnings Conference Call Capital Expenditures Update ($ in millions) FY 2025 Comments Expected New vessel construction milestone payments and related costs $305 • Includes owner’s items and capitalized interest expense Expected Maintenance and other capital expenditures $100 – $120 • 2025 capex includes approximately $19 million in equipment lease buyouts Total $405 – $425 • We expect to make approximately $189 million in milestone payments in 2H25 from the CCF • We expect our next cash contribution into the CCF to be in 2028 New Vessel Milestone Payments Expected Remaining 2025 New Vessel Construction Milestone Payments by Quarter ($ in millions) 3Q25 Approximately $71 4Q25 Approximately $118 Total Approximately $189 |
|
18 Closing Thoughts 2Q 2025 Earnings Conference Call • We are well-positioned in our tradelanes and in logistics as we manage through this period of market uncertainty and volatility ─ It is during uncertain times like these that Matson demonstrates its unique capabilities and service qualities across our organization • With our China service, we are focused on maintaining the two fastest and most reliable Transpacific services • We are also focused on being there for our customers, looking for additional opportunities to support them with world-class services and customer support as they diversify their manufacturing base and grow in an evolving marketplace |
|
Appendix |
|
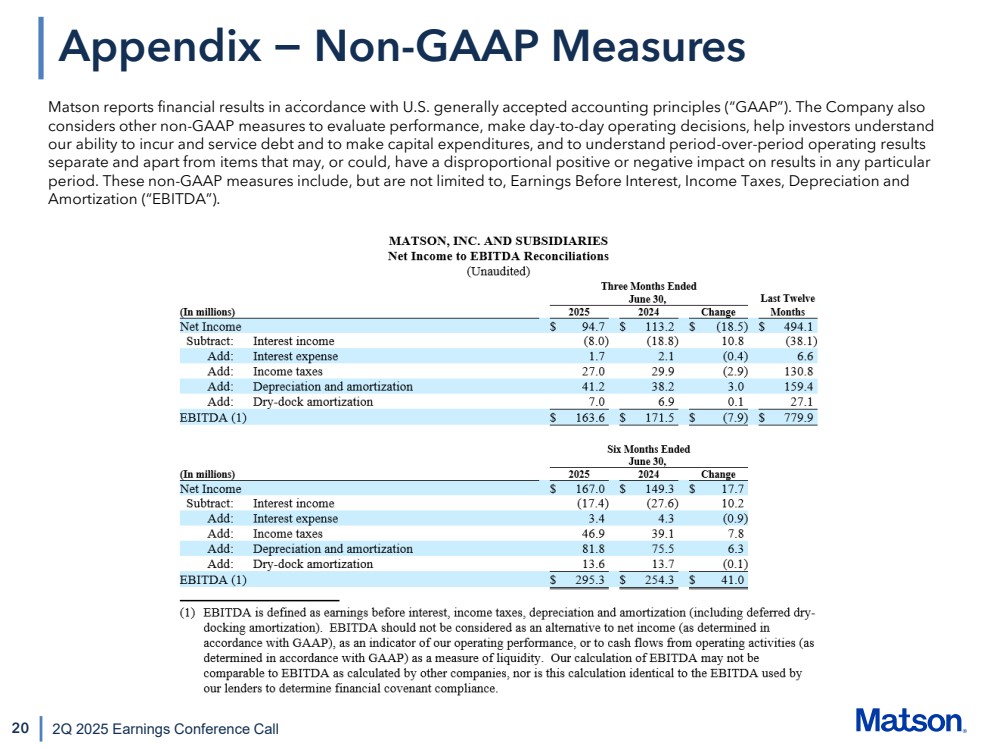
20 2Q 2025 Earnings Conference Call Appendix − Non-GAAP Measures Matson reports financial results in accordance with U.S. generally accepted accounting principles (“GAAP”). The Company also considers other non-GAAP measures to evaluate performance, make day-to-day operating decisions, help investors understand our ability to incur and service debt and to make capital expenditures, and to understand period-over-period operating results separate and apart from items that may, or could, have a disproportional positive or negative impact on results in any particular period. These non-GAAP measures include, but are not limited to, Earnings Before Interest, Income Taxes, Depreciation and Amortization (“EBITDA”). |