UNITED STATES
SECURITIES AND EXCHANGE COMMISSION
Washington, D.C. 20549
FORM 8-K
CURRENT REPORT
Pursuant to Section 13 or 15(d) of
The Securities Exchange Act of 1934
Date of Report (Date of earliest event reported): July 29, 2025
CTO Realty Growth, Inc.
(Exact name of registrant as specified in its charter)
|
|
|
|
|
Maryland (State or other jurisdiction of incorporation) |
001-11350 (Commission File Number) |
59-0483700 (IRS Employer Identification No.) |
|
369 N. New York Avenue, Suite 201 Winter Park, Florida (Address of principal executive offices) |
32789 (Zip Code) |
Registrant’s telephone number, including area code: (407) 904-3324
Not Applicable
(Former name or former address, if changed since last report.)
Check the appropriate box below if the Form 8-K filing is intended to simultaneously satisfy the filing obligation of the registrant under any of the following provisions:
☐ Written communications pursuant to Rule 425 under the Securities Act (17 CFR 230.425)
☐ Soliciting material pursuant to Rule 14a-12 under the Exchange Act (17 CFR 240.14a-12)
☐ Pre-commencement communications pursuant to Rule 14d-2(b) under the Exchange Act (17 CFR 240.14d-2(b))
☐ Pre-commencement communications pursuant to Rule 13e-4(c) under the Exchange Act (17 CFR 240.13e-4(c))
Securities registered pursuant to Section 12(b) of the Act:
|
|
|
|
|
Title of each class: |
|
Trading Symbol |
|
Name of each exchange on which registered: |
Common Stock, $0.01 par value per share |
|
CTO |
|
NYSE |
6.375% Series A Cumulative Redeemable Preferred Stock, $0.01 par value per share |
|
CTO-PA |
|
NYSE |
Indicate by check mark whether the registrant is an emerging growth company as defined in Rule 405 of the Securities Act of 1933 (§230.405 of this chapter) or Rule 12b-2 of the Securities Exchange Act of 1934 (§240.12b-2 of this chapter).
Emerging growth company ☐
If an emerging growth company, indicate by check mark if the registrant has elected not to use the extended transition period for complying with any new or revised financial accounting standards provided pursuant to Section 13(a) of the Exchange Act. ☐
Item 2.02. Results of Operations and Financial Condition
On July 29, 2025, CTO Realty Growth, Inc., a Maryland corporation (the "Company"), issued an earnings press release, an investor presentation, and a supplemental disclosure package relating to the Company’s financial results for the quarter ended June 30, 2025. Copies of the press release, investor presentation, and supplemental disclosure package are attached hereto as Exhibits 99.1, 99.2 and 99.3, respectively, and are incorporated herein by reference.
The information in Item 2.02 of this Current Report, including Exhibits 99.1, 99.2 and 99.3, is being furnished and shall not be deemed “filed” for purposes of Section 18 of the Securities Exchange Act of 1934, as amended (the “Exchange Act”), or otherwise subject to the liabilities of that Section. The information in this Current Report shall not be incorporated by reference into any registration statement or other document pursuant to the Securities Act of 1933, as amended (the “Securities Act”), or the Exchange Act, unless it is specifically incorporated by reference therein.
Item 7.01. Regulation FD Disclosure
On July 29, 2025, the Company issued an earnings press release, an investor presentation, and a supplemental disclosure package relating to the Company’s financial results for the quarter ended June 30, 2025. Copies of the earnings press release, investor presentation, and supplemental disclosure package are attached hereto as Exhibits 99.1, 99.2 and 99.3, respectively, and are incorporated herein by reference.
The furnishing of these materials is not intended to constitute a representation that such furnishing is required by Regulation FD or other securities laws, or that the materials include material investor information that is not otherwise publicly available. In addition, the Company does not assume any obligation to update such information in the future.
The information in Item 7.01 of this Current Report, including Exhibits 99.1, 99.2 and 99.3, is being furnished and shall not be deemed to be “filed” for purposes of Section 18 of the Exchange Act or otherwise subject to the liabilities of that Section. The information in this Current Report shall not be incorporated by reference into any registration statement or other document pursuant to the Securities Act or the Exchange Act, unless it is specifically incorporated by reference therein.
Item 9.01. Financial Statements and Exhibits
(d) Exhibits
104 Cover Page Interactive Data File (embedded within the Inline XBRL document) |
SIGNATURES
Pursuant to the requirements of the Securities Exchange Act of 1934, the registrant has duly caused this report to be signed on its behalf by the undersigned hereunto duly authorized.
Date: July 29, 2025
CTO Realty Growth, Inc.
By: /s/ Philip R. Mays
Senior Vice President, Chief Financial Officer,
and Treasurer (Principal Financial Officer)
Exhibit 99.1

DRAFT DRATDDD
Press Release
|
FOR IMMEDIATE RELEASE |
CTO Realty Growth Reports Second Quarter 2025 Operating Results – Signed 190,000 square feet of comparable leases at 22% growth in cash rent spread – – Reaffirmed 2025 Outlook – |
WINTER PARK, FL – July 29, 2025 – CTO Realty Growth, Inc. (NYSE: CTO) (the “Company” or “CTO”), an owner and operator of retail-based properties located primarily in higher-growth markets, today announced its operating and financial results for the quarter ended June 30, 2025.
Second Quarter 2025 Highlights
“Our portfolio continues to produce strong leasing activity as we leased 190,000 square feet with significant positive spreads, driving our signed-not-open pipeline to $4.6 million, representing 4.6% of in-place cash ABR. We also made significant progress filling our vacant anchor spaces, with six of the ten now leased with ongoing lease negotiations for the remaining spaces,” stated John P. Albright, President and Chief Executive Officer of CTO Realty Growth. “We believe that this leasing activity will provide the Company with earnings tailwinds into 2026.”
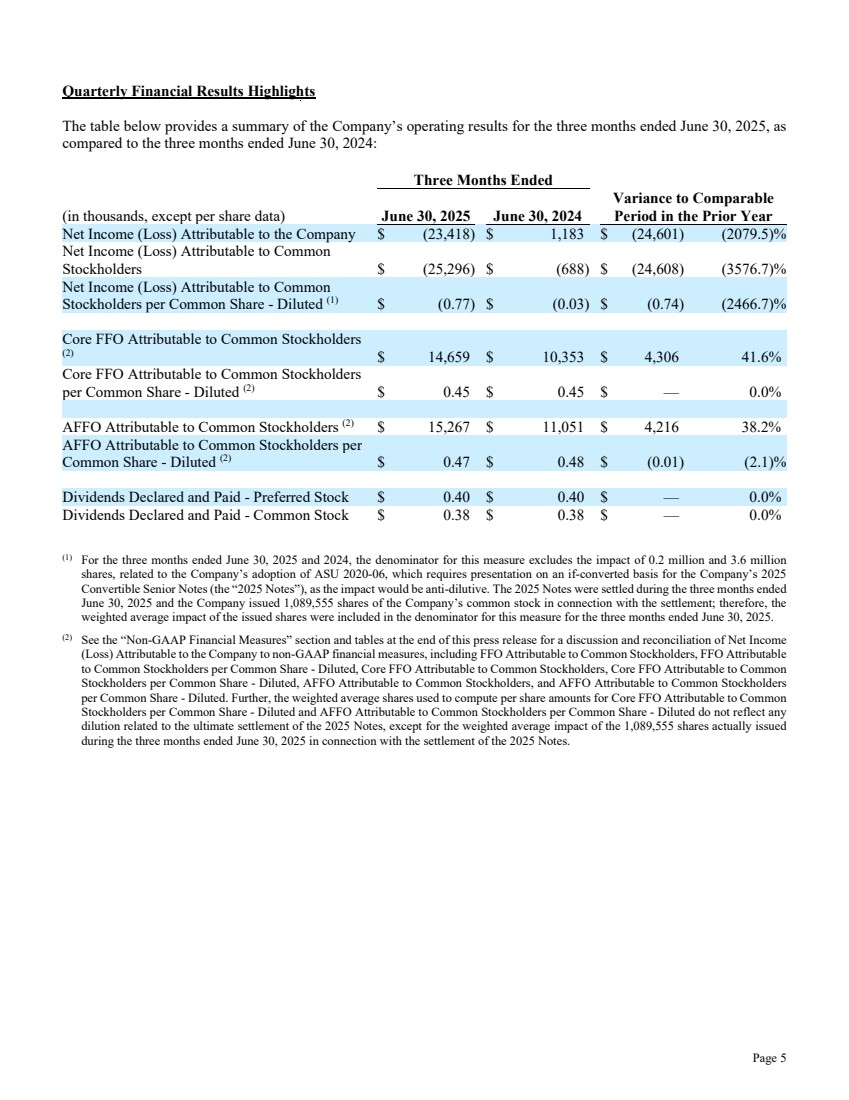
Quarterly Financial Results Highlights
The table below provides a summary of the Company’s operating results for the three months ended June 30, 2025, as compared to the three months ended June 30, 2024:
|
|
Three Months Ended |
|
|
|
|
|||||
(in thousands, except per share data) |
|
June 30, 2025 |
|
June 30, 2024 |
|
Variance to Comparable Period in the Prior Year |
|||||
Net Income (Loss) Attributable to the Company |
|
$ |
(23,418) |
|
$ |
1,183 |
|
$ |
(24,601) |
|
(2079.5)% |
Net Income (Loss) Attributable to Common Stockholders |
|
$ |
(25,296) |
|
$ |
(688) |
|
$ |
(24,608) |
|
(3576.7)% |
Net Income (Loss) Attributable to Common Stockholders per Common Share - Diluted (1) |
|
$ |
(0.77) |
|
$ |
(0.03) |
|
$ |
(0.74) |
|
(2466.7)% |
|
|
|
|
|
|
|
|
|
|
|
|
Core FFO Attributable to Common Stockholders (2) |
|
$ |
14,659 |
|
$ |
10,353 |
|
$ |
4,306 |
|
41.6% |
Core FFO Attributable to Common Stockholders per Common Share - Diluted (2) |
|
$ |
0.45 |
|
$ |
0.45 |
|
$ |
— |
|
0.0% |
|
|
|
|
|
|
|
|
|
|
|
|
AFFO Attributable to Common Stockholders (2) |
|
$ |
15,267 |
|
$ |
11,051 |
|
$ |
4,216 |
|
38.2% |
AFFO Attributable to Common Stockholders per Common Share - Diluted (2) |
|
$ |
0.47 |
|
$ |
0.48 |
|
$ |
(0.01) |
|
(2.1)% |
|
|
|
|
|
|
|
|
|
|
|
|
Dividends Declared and Paid - Preferred Stock |
|
$ |
0.40 |
|
$ |
0.40 |
|
$ |
— |
|
0.0% |
Dividends Declared and Paid - Common Stock |
|
$ |
0.38 |
|
$ |
0.38 |
|
$ |
— |
|
0.0% |
|
|
|
|
|
|
|
|
|
|
|
|
|
(1) |
For the three months ended June 30, 2025 and 2024, the denominator for this measure excludes the impact of 0.2 million and 3.6 million shares, related to the Company’s adoption of ASU 2020-06, which requires presentation on an if-converted basis for the Company’s 2025 Convertible Senior Notes (the “2025 Notes”), as the impact would be anti-dilutive. The 2025 Notes were settled during the three months ended June 30, 2025 and the Company issued 1,089,555 shares of the Company’s common stock in connection with the settlement; therefore, the weighted average impact of the issued shares were included in the denominator for this measure for the three months ended June 30, 2025. |
(2) |
See the “Non-GAAP Financial Measures” section and tables at the end of this press release for a discussion and reconciliation of Net Income (Loss) Attributable to the Company to non-GAAP financial measures, including FFO Attributable to Common Stockholders, FFO Attributable to Common Stockholders per Common Share - Diluted, Core FFO Attributable to Common Stockholders, Core FFO Attributable to Common Stockholders per Common Share - Diluted, AFFO Attributable to Common Stockholders, and AFFO Attributable to Common Stockholders per Common Share - Diluted. Further, the weighted average shares used to compute per share amounts for Core FFO Attributable to Common Stockholders per Common Share - Diluted and AFFO Attributable to Common Stockholders per Common Share - Diluted do not reflect any dilution related to the ultimate settlement of the 2025 Notes, except for the weighted average impact of the 1,089,555 shares actually issued during the three months ended June 30, 2025 in connection with the settlement of the 2025 Notes. |
Page 2
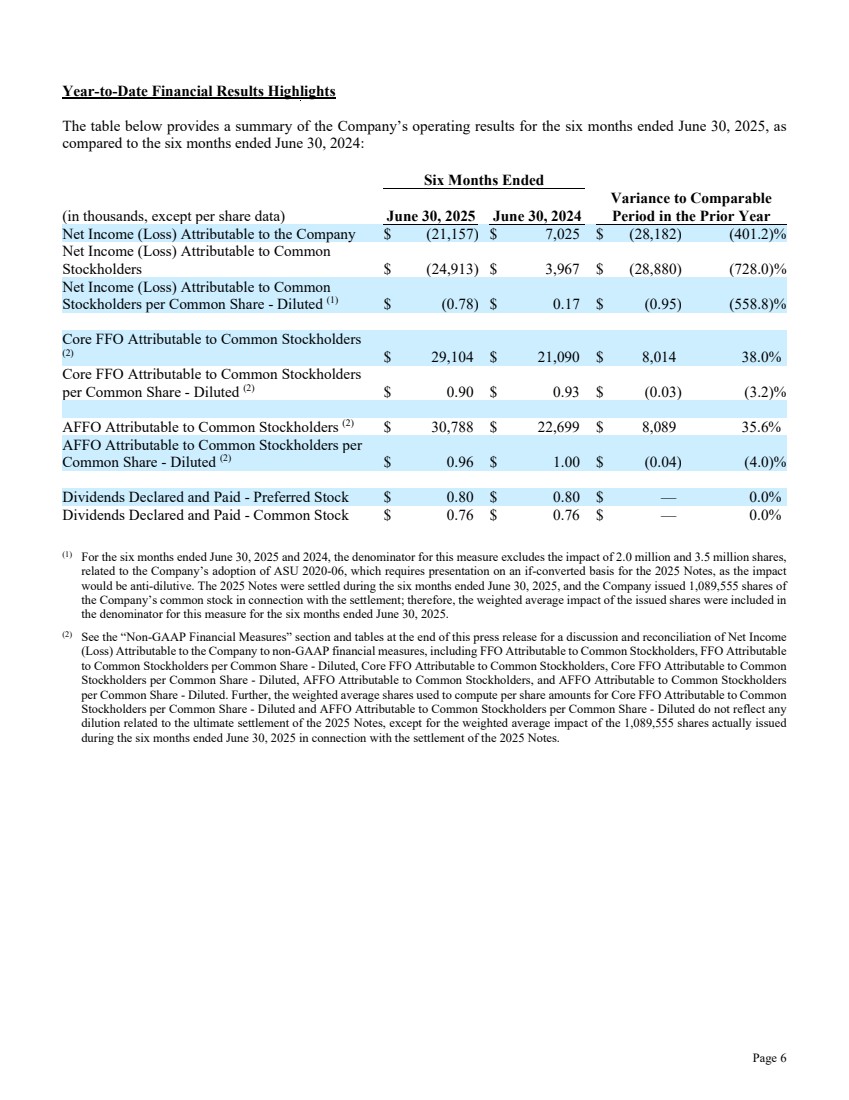
Year-to-Date Financial Results Highlights
The table below provides a summary of the Company’s operating results for the six months ended June 30, 2025, as compared to the six months ended June 30, 2024:
|
|
Six Months Ended |
|
|
|
|
|||||
(in thousands, except per share data) |
|
June 30, 2025 |
|
June 30, 2024 |
|
Variance to Comparable Period in the Prior Year |
|||||
Net Income (Loss) Attributable to the Company |
|
$ |
(21,157) |
|
$ |
7,025 |
|
$ |
(28,182) |
|
(401.2)% |
Net Income (Loss) Attributable to Common Stockholders |
|
$ |
(24,913) |
|
$ |
3,967 |
|
$ |
(28,880) |
|
(728.0)% |
Net Income (Loss) Attributable to Common Stockholders per Common Share - Diluted (1) |
|
$ |
(0.78) |
|
$ |
0.17 |
|
$ |
(0.95) |
|
(558.8)% |
|
|
|
|
|
|
|
|
|
|
|
|
Core FFO Attributable to Common Stockholders (2) |
|
$ |
29,104 |
|
$ |
21,090 |
|
$ |
8,014 |
|
38.0% |
Core FFO Attributable to Common Stockholders per Common Share - Diluted (2) |
|
$ |
0.90 |
|
$ |
0.93 |
|
$ |
(0.03) |
|
(3.2)% |
|
|
|
|
|
|
|
|
|
|
|
|
AFFO Attributable to Common Stockholders (2) |
|
$ |
30,788 |
|
$ |
22,699 |
|
$ |
8,089 |
|
35.6% |
AFFO Attributable to Common Stockholders per Common Share - Diluted (2) |
|
$ |
0.96 |
|
$ |
1.00 |
|
$ |
(0.04) |
|
(4.0)% |
|
|
|
|
|
|
|
|
|
|
|
|
Dividends Declared and Paid - Preferred Stock |
|
$ |
0.80 |
|
$ |
0.80 |
|
$ |
— |
|
0.0% |
Dividends Declared and Paid - Common Stock |
|
$ |
0.76 |
|
$ |
0.76 |
|
$ |
— |
|
0.0% |
(1) |
For the six months ended June 30, 2025 and 2024, the denominator for this measure excludes the impact of 2.0 million and 3.5 million shares, related to the Company’s adoption of ASU 2020-06, which requires presentation on an if-converted basis for the 2025 Notes, as the impact would be anti-dilutive. The 2025 Notes were settled during the six months ended June 30, 2025, and the Company issued 1,089,555 shares of the Company’s common stock in connection with the settlement; therefore, the weighted average impact of the issued shares were included in the denominator for this measure for the six months ended June 30, 2025. |
(2) |
See the “Non-GAAP Financial Measures” section and tables at the end of this press release for a discussion and reconciliation of Net Income (Loss) Attributable to the Company to non-GAAP financial measures, including FFO Attributable to Common Stockholders, FFO Attributable to Common Stockholders per Common Share - Diluted, Core FFO Attributable to Common Stockholders, Core FFO Attributable to Common Stockholders per Common Share - Diluted, AFFO Attributable to Common Stockholders, and AFFO Attributable to Common Stockholders per Common Share - Diluted. Further, the weighted average shares used to compute per share amounts for Core FFO Attributable to Common Stockholders per Common Share - Diluted and AFFO Attributable to Common Stockholders per Common Share - Diluted do not reflect any dilution related to the ultimate settlement of the 2025 Notes, except for the weighted average impact of the 1,089,555 shares actually issued during the six months ended June 30, 2025 in connection with the settlement of the 2025 Notes. |
Page 3
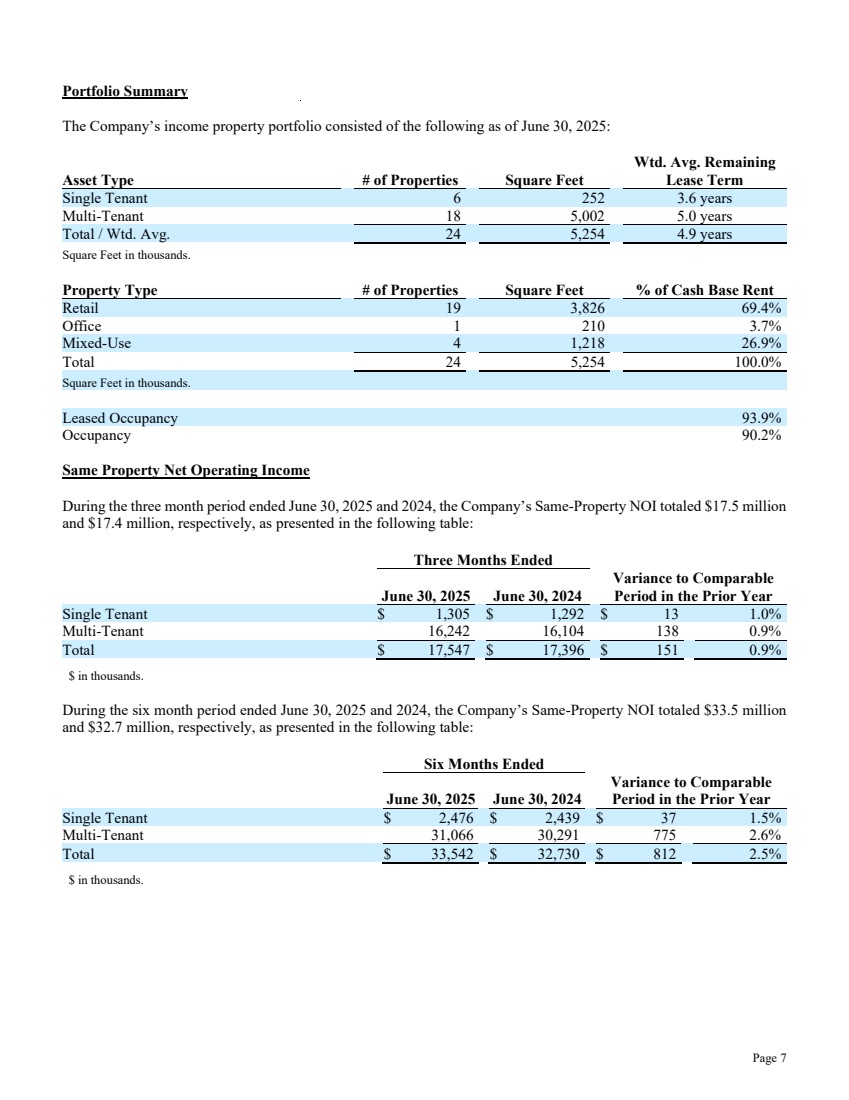
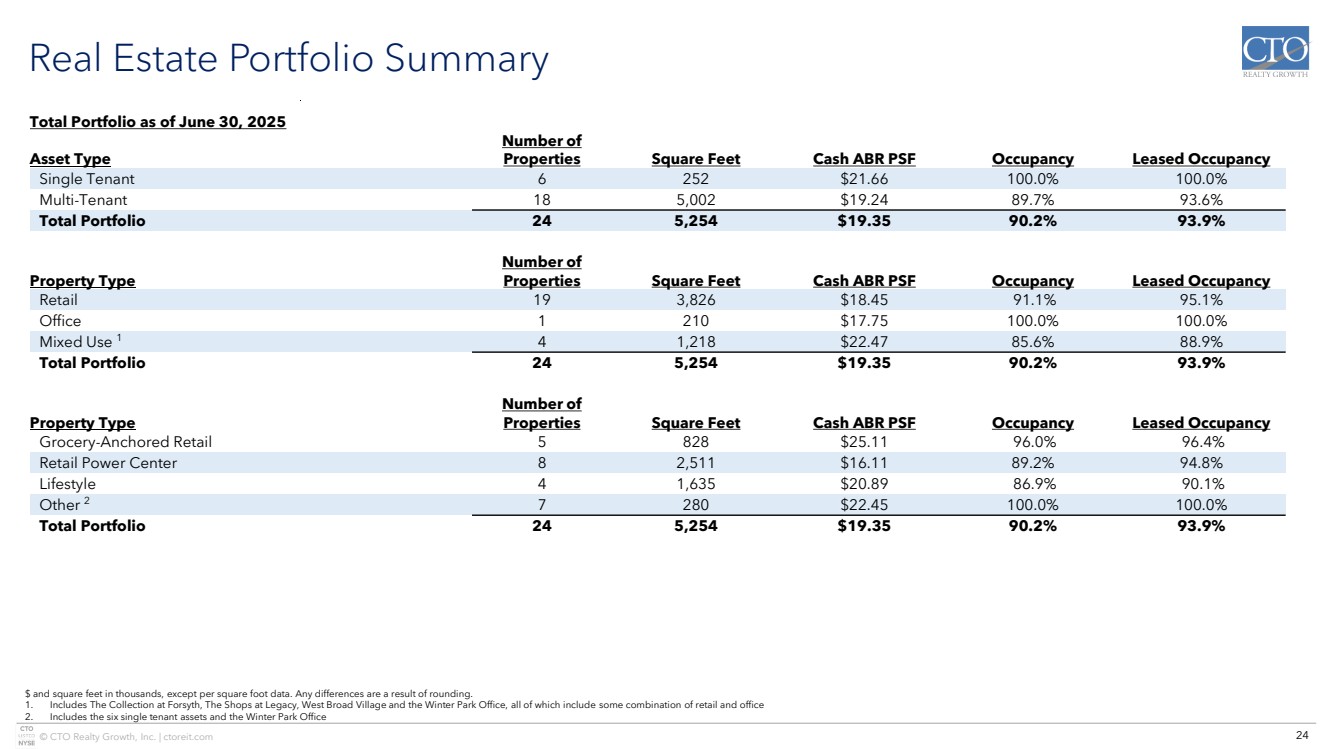
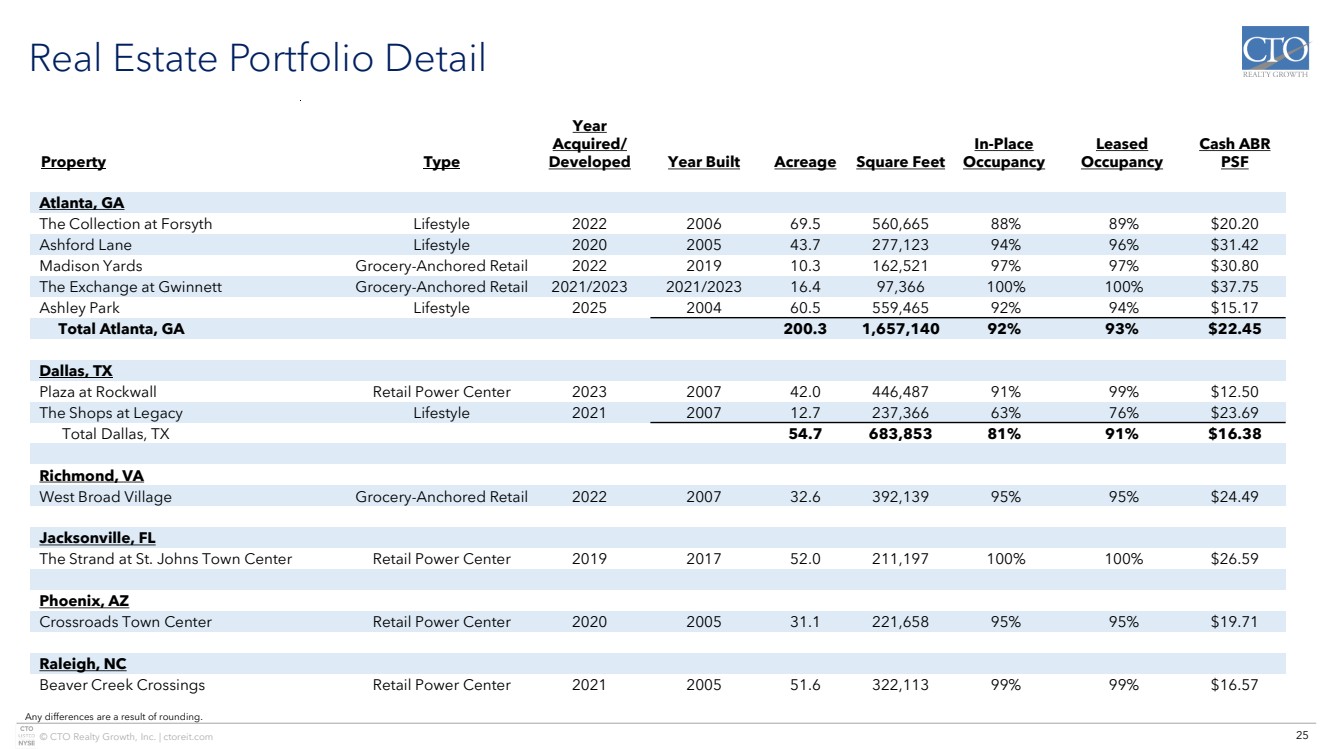
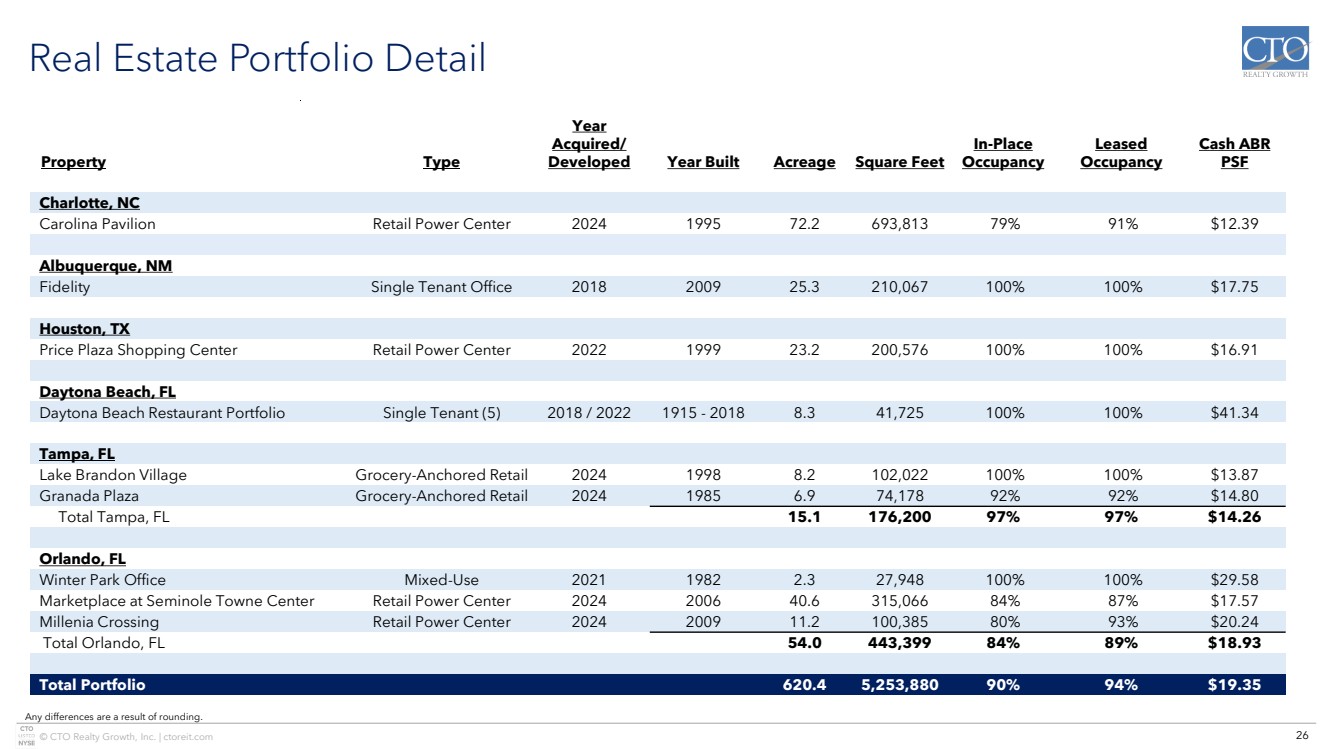
Portfolio Summary
The Company’s income property portfolio consisted of the following as of June 30, 2025:
|
|
|
|
|
|
Wtd. Avg. Remaining |
Asset Type |
|
# of Properties |
|
Square Feet |
|
Lease Term |
Single Tenant |
|
6 |
|
252 |
|
3.6 years |
Multi-Tenant |
|
18 |
|
5,002 |
|
5.0 years |
Total / Wtd. Avg. |
|
24 |
|
5,254 |
|
4.9 years |
Square Feet in thousands. |
|
|
|
|
|
|
Property Type |
|
# of Properties |
|
Square Feet |
|
% of Cash Base Rent |
Retail |
|
19 |
|
3,826 |
|
69.4% |
Office |
|
1 |
|
210 |
|
3.7% |
Mixed-Use |
|
4 |
|
1,218 |
|
26.9% |
Total |
|
24 |
|
5,254 |
|
100.0% |
Square Feet in thousands. |
|
|
|
|
|
|
Leased Occupancy |
|
93.9% |
Occupancy |
|
90.2% |
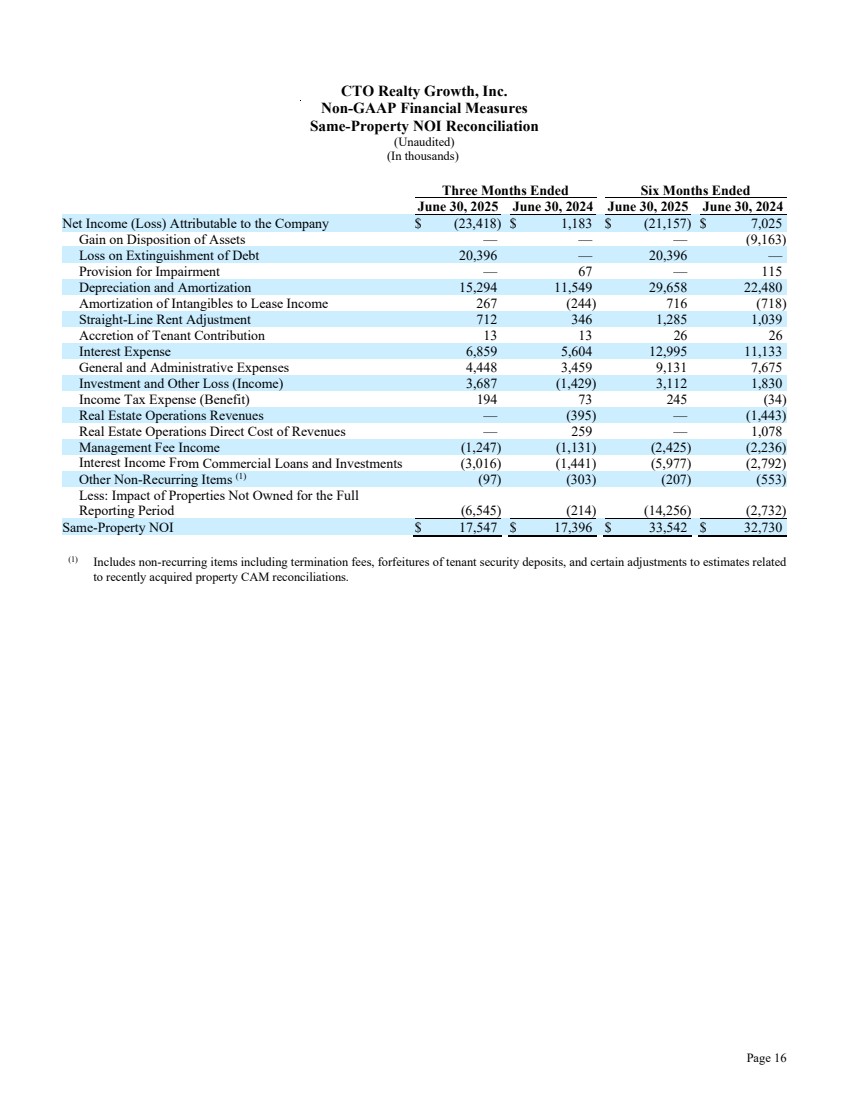
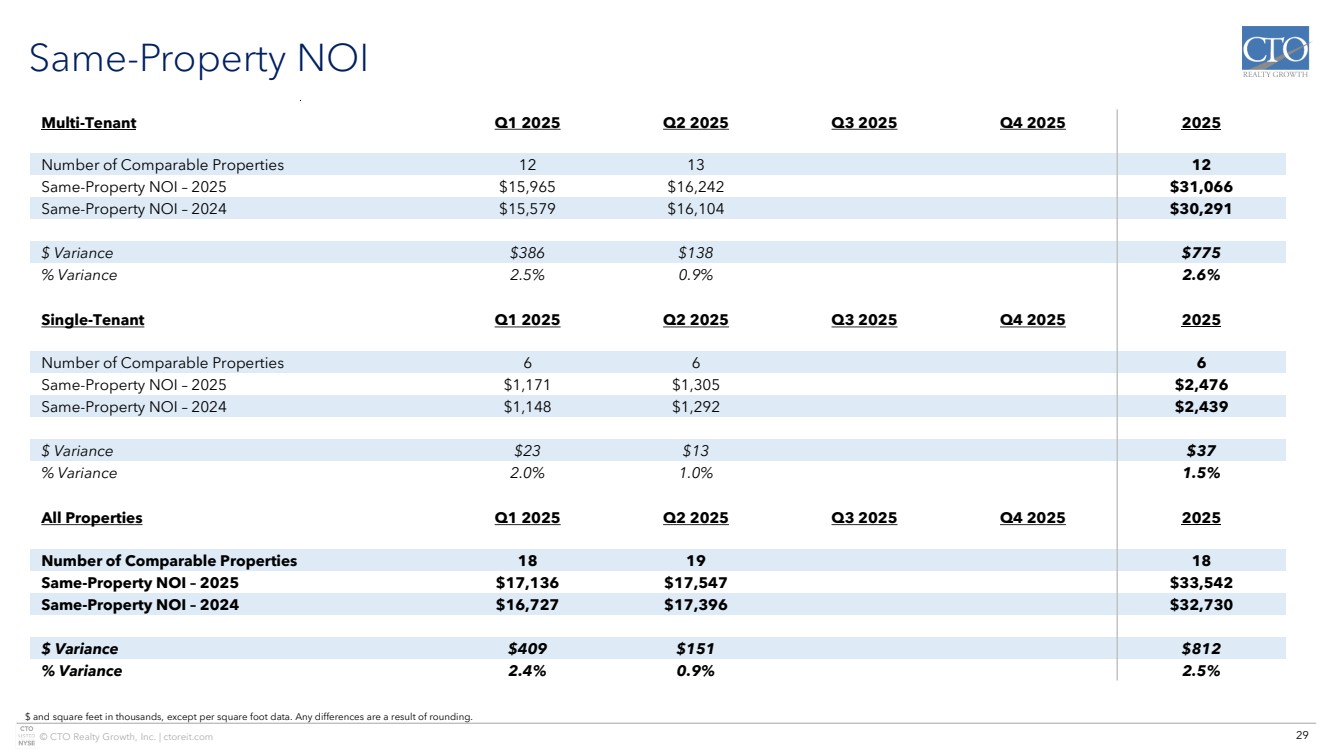
Same Property Net Operating Income
During the three month period ended June 30, 2025 and 2024, the Company’s Same-Property NOI totaled $17.5 million and $17.4 million, respectively, as presented in the following table:
|
|
Three Months Ended |
|
|
|
|
|||||
|
|
June 30, 2025 |
|
June 30, 2024 |
|
Variance to Comparable Period in the Prior Year |
|||||
Single Tenant |
|
$ |
1,305 |
|
$ |
1,292 |
|
$ |
13 |
|
1.0% |
Multi-Tenant |
|
|
16,242 |
|
|
16,104 |
|
|
138 |
|
0.9% |
Total |
|
$ |
17,547 |
|
$ |
17,396 |
|
$ |
151 |
|
0.9% |
$ in thousands.
During the six month period ended June 30, 2025 and 2024, the Company’s Same-Property NOI totaled $33.5 million and $32.7 million, respectively, as presented in the following table:
|
|
Six Months Ended |
|
|
|
|
|||||
|
|
June 30, 2025 |
|
June 30, 2024 |
|
Variance to Comparable Period in the Prior Year |
|||||
Single Tenant |
|
$ |
2,476 |
|
$ |
2,439 |
|
$ |
37 |
|
1.5% |
Multi-Tenant |
|
|
31,066 |
|
|
30,291 |
|
|
775 |
|
2.6% |
Total |
|
$ |
33,542 |
|
$ |
32,730 |
|
$ |
812 |
|
2.5% |
$ in thousands.
Page 4
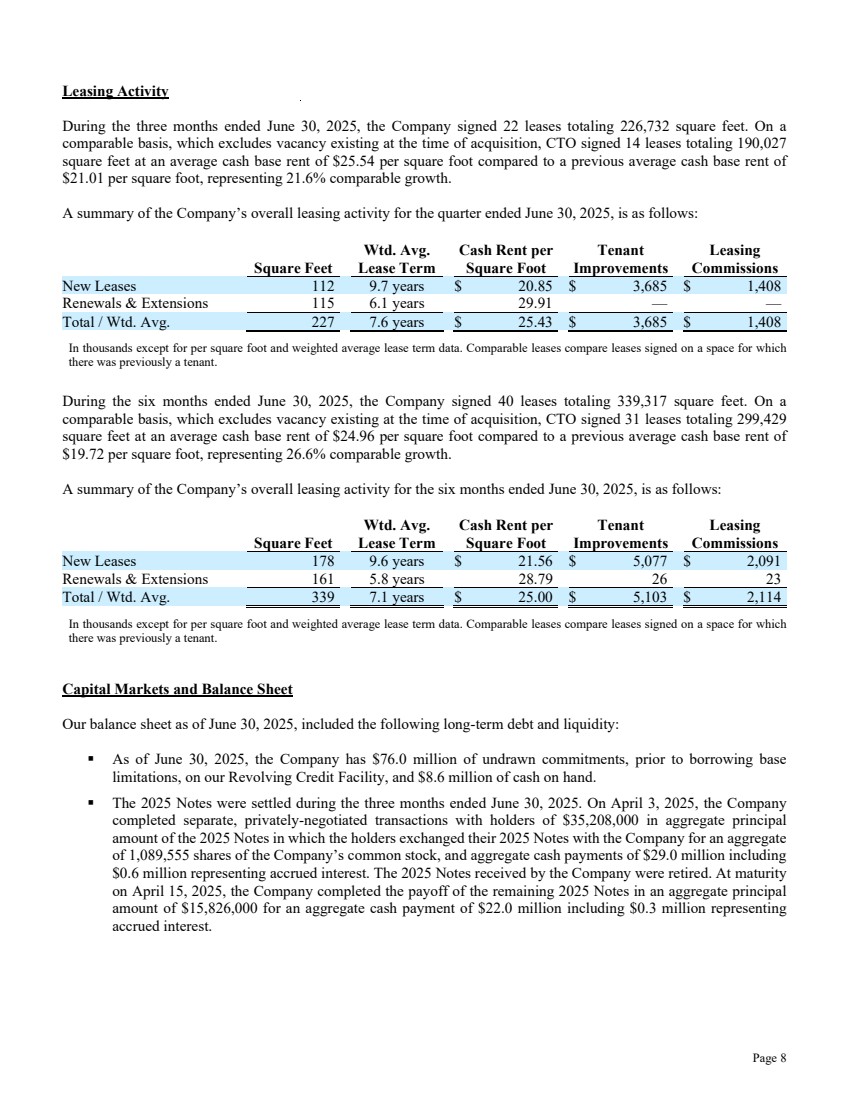
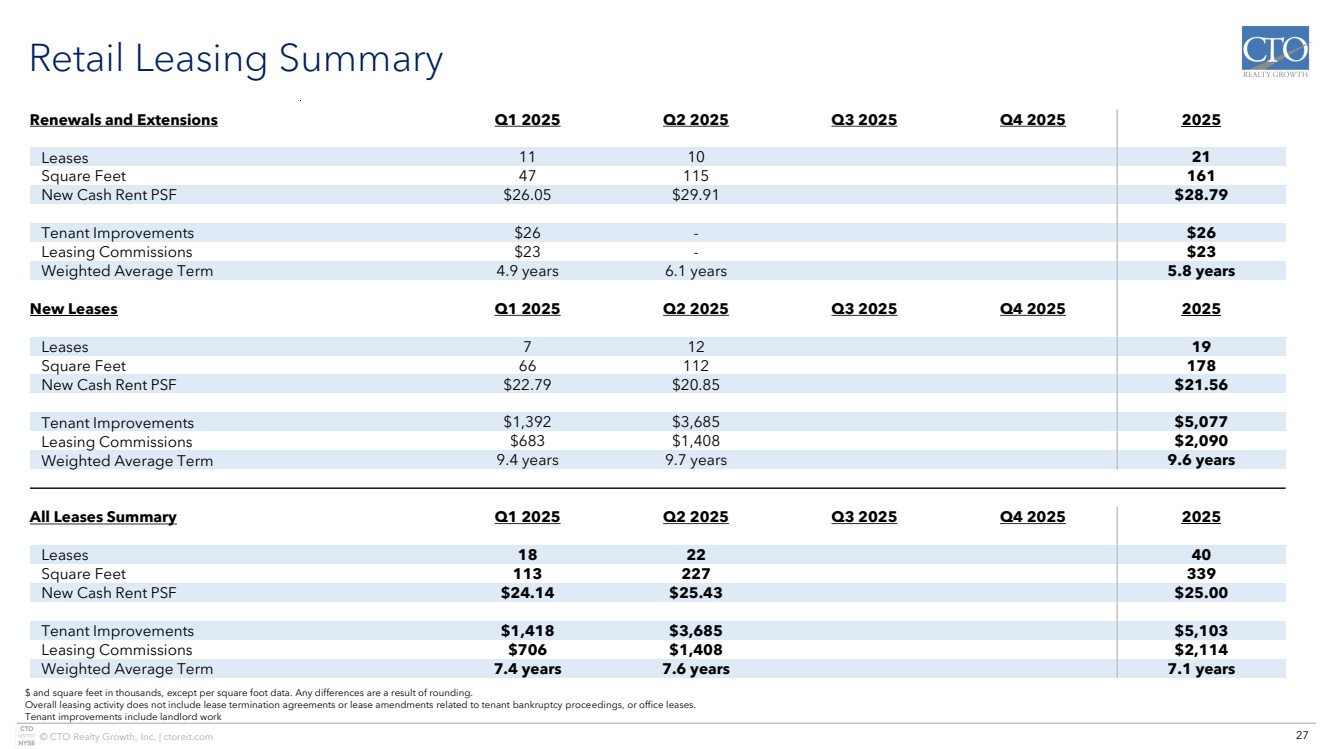
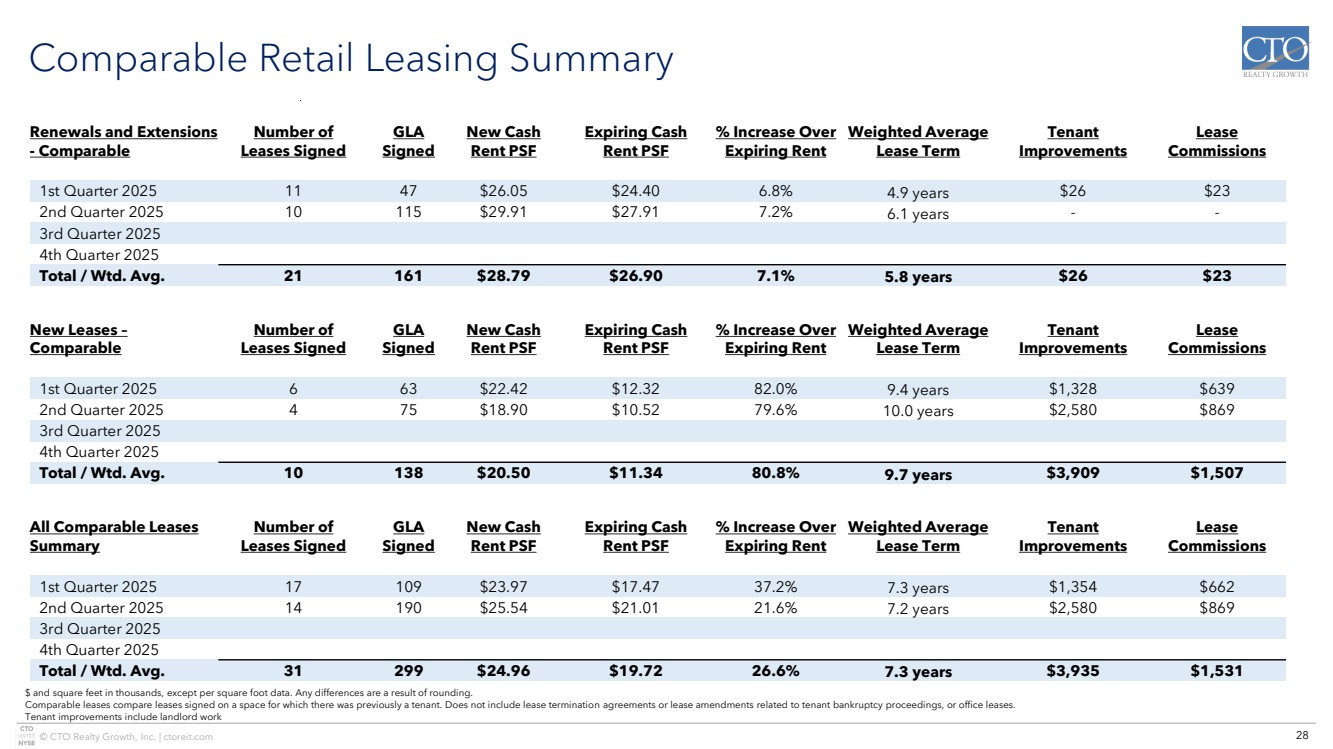
Leasing Activity
During the three months ended June 30, 2025, the Company signed 22 leases totaling 226,732 square feet. On a comparable basis, which excludes vacancy existing at the time of acquisition, CTO signed 14 leases totaling 190,027 square feet at an average cash base rent of $25.54 per square foot compared to a previous average cash base rent of $21.01 per square foot, representing 21.6% comparable growth.
A summary of the Company’s overall leasing activity for the quarter ended June 30, 2025, is as follows:
|
|
|
|
Wtd. Avg. |
|
Cash Rent per |
|
Tenant |
|
Leasing |
|||
|
|
Square Feet |
|
Lease Term |
|
Square Foot |
|
Improvements |
|
Commissions |
|||
New Leases |
|
112 |
|
9.7 years |
|
$ |
20.85 |
|
$ |
3,685 |
|
$ |
1,408 |
Renewals & Extensions |
|
115 |
|
6.1 years |
|
|
29.91 |
|
|
— |
|
|
— |
Total / Wtd. Avg. |
|
227 |
|
7.6 years |
|
$ |
25.43 |
|
$ |
3,685 |
|
$ |
1,408 |
In thousands except for per square foot and weighted average lease term data. Comparable leases compare leases signed on a space for which there was previously a tenant.
During the six months ended June 30, 2025, the Company signed 40 leases totaling 339,317 square feet. On a comparable basis, which excludes vacancy existing at the time of acquisition, CTO signed 31 leases totaling 299,429 square feet at an average cash base rent of $24.96 per square foot compared to a previous average cash base rent of $19.72 per square foot, representing 26.6% comparable growth.
A summary of the Company’s overall leasing activity for the six months ended June 30, 2025, is as follows:
|
|
|
|
Wtd. Avg. |
|
Cash Rent per |
|
Tenant |
|
Leasing |
|||
|
|
Square Feet |
|
Lease Term |
|
Square Foot |
|
Improvements |
|
Commissions |
|||
New Leases |
|
178 |
|
9.6 years |
|
$ |
21.56 |
|
$ |
5,077 |
|
$ |
2,091 |
Renewals & Extensions |
|
161 |
|
5.8 years |
|
|
28.79 |
|
|
26 |
|
|
23 |
Total / Wtd. Avg. |
|
339 |
|
7.1 years |
|
$ |
25.00 |
|
$ |
5,103 |
|
$ |
2,114 |
In thousands except for per square foot and weighted average lease term data. Comparable leases compare leases signed on a space for which there was previously a tenant.
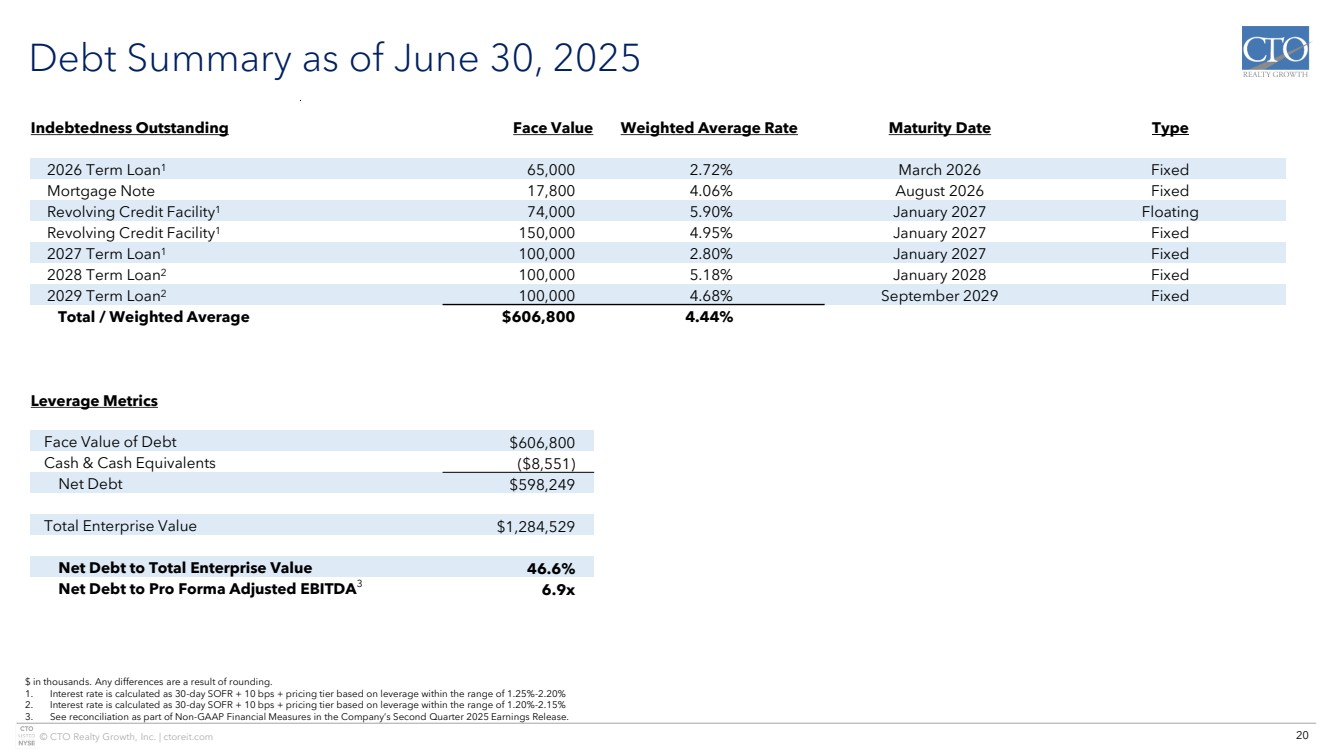
Capital Markets and Balance Sheet
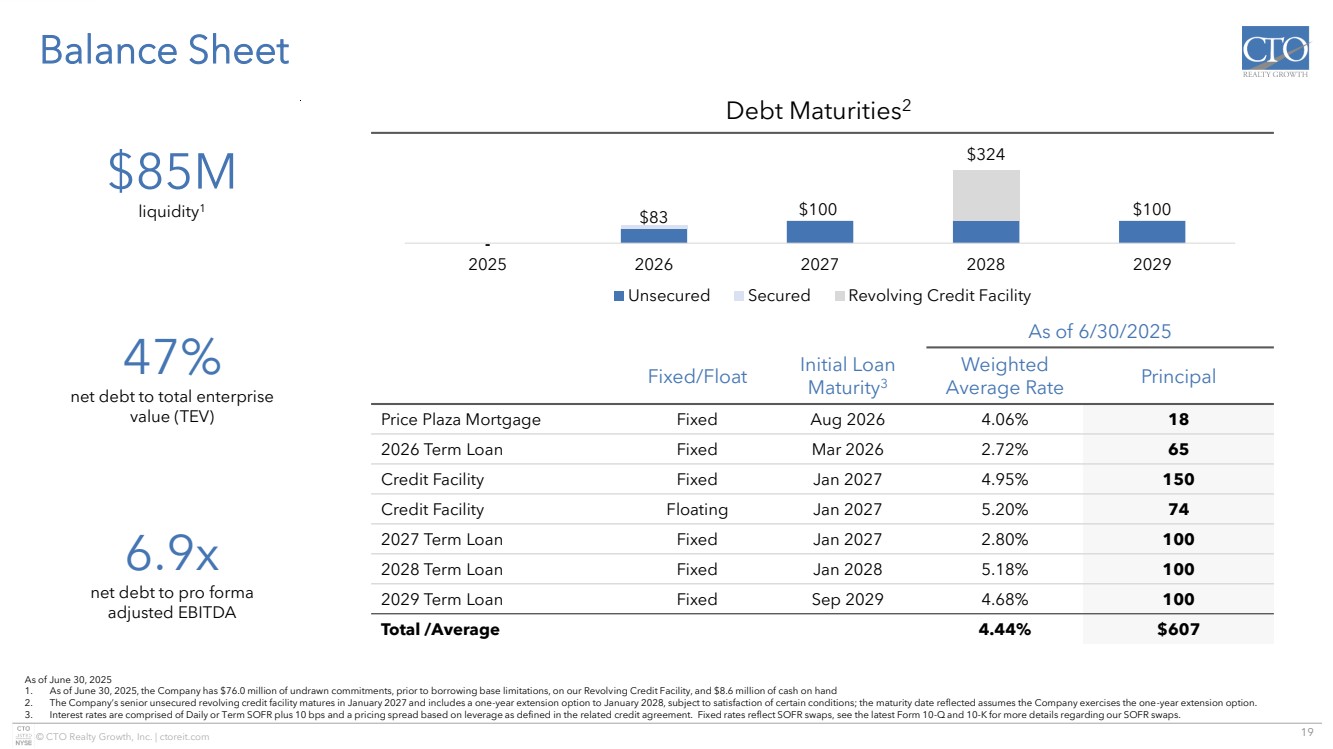
Our balance sheet as of June 30, 2025, included the following long-term debt and liquidity:
| ◾ | As of June 30, 2025, the Company has $76.0 million of undrawn commitments, prior to borrowing base limitations, on our Revolving Credit Facility, and $8.6 million of cash on hand. |
| ◾ | The 2025 Notes were settled during the three months ended June 30, 2025. On April 3, 2025, the Company completed separate, privately-negotiated transactions with holders of $35,208,000 in aggregate principal amount of the 2025 Notes in which the holders exchanged their 2025 Notes with the Company for an aggregate of 1,089,555 shares of the Company’s common stock, and aggregate cash payments of $29.0 million including $0.6 million representing accrued interest. The 2025 Notes received by the Company were retired. At maturity on April 15, 2025, the Company completed the payoff of the remaining 2025 Notes in an aggregate principal amount of $15,826,000 for an aggregate cash payment of $22.0 million including $0.3 million representing accrued interest. |
Page 5
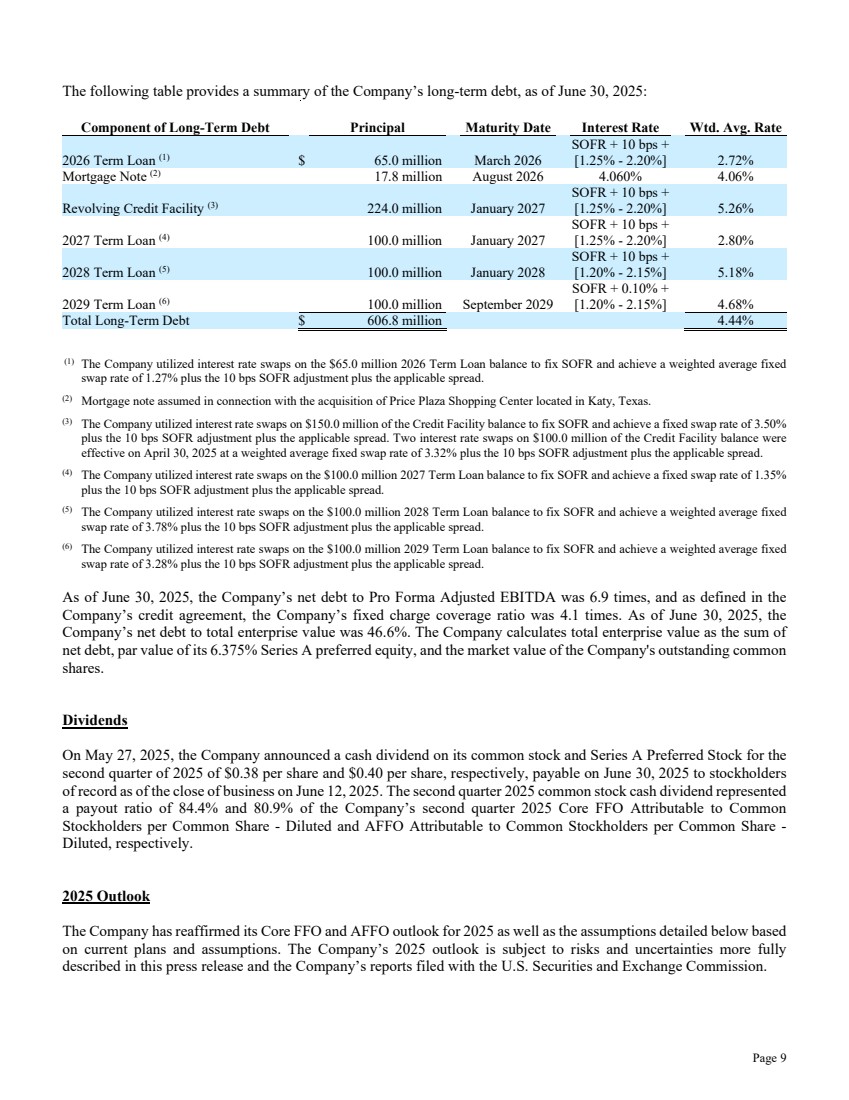
The following table provides a summary of the Company’s long-term debt, as of June 30, 2025:
Component of Long-Term Debt |
|
|
Principal |
|
Maturity Date |
|
Interest Rate |
|
Wtd. Avg. Rate |
2026 Term Loan (1) |
|
$ |
65.0 million |
|
March 2026 |
|
SOFR + 10 bps + |
|
2.72% |
Mortgage Note (2) |
|
|
17.8 million |
|
August 2026 |
|
4.060% |
|
4.06% |
Revolving Credit Facility (3) |
|
|
224.0 million |
|
January 2027 |
|
SOFR + 10 bps + |
|
5.26% |
2027 Term Loan (4) |
|
|
100.0 million |
|
January 2027 |
|
SOFR + 10 bps + |
|
2.80% |
2028 Term Loan (5) |
|
|
100.0 million |
|
January 2028 |
|
SOFR + 10 bps + |
|
5.18% |
2029 Term Loan (6) |
|
|
100.0 million |
|
September 2029 |
|
SOFR + 0.10% + |
|
4.68% |
Total Long-Term Debt |
|
$ |
606.8 million |
|
|
|
|
|
4.44% |
(1) |
The Company utilized interest rate swaps on the $65.0 million 2026 Term Loan balance to fix SOFR and achieve a weighted average fixed swap rate of 1.27% plus the 10 bps SOFR adjustment plus the applicable spread. |
(2) |
Mortgage note assumed in connection with the acquisition of Price Plaza Shopping Center located in Katy, Texas. |
(3) |
The Company utilized interest rate swaps on $150.0 million of the Credit Facility balance to fix SOFR and achieve a fixed swap rate of 3.50% plus the 10 bps SOFR adjustment plus the applicable spread. Two interest rate swaps on $100.0 million of the Credit Facility balance were effective on April 30, 2025 at a weighted average fixed swap rate of 3.32% plus the 10 bps SOFR adjustment plus the applicable spread. |
(4) |
The Company utilized interest rate swaps on the $100.0 million 2027 Term Loan balance to fix SOFR and achieve a fixed swap rate of 1.35% plus the 10 bps SOFR adjustment plus the applicable spread. |
(5) |
The Company utilized interest rate swaps on the $100.0 million 2028 Term Loan balance to fix SOFR and achieve a weighted average fixed swap rate of 3.78% plus the 10 bps SOFR adjustment plus the applicable spread. |
(6) |
The Company utilized interest rate swaps on the $100.0 million 2029 Term Loan balance to fix SOFR and achieve a weighted average fixed swap rate of 3.28% plus the 10 bps SOFR adjustment plus the applicable spread. |
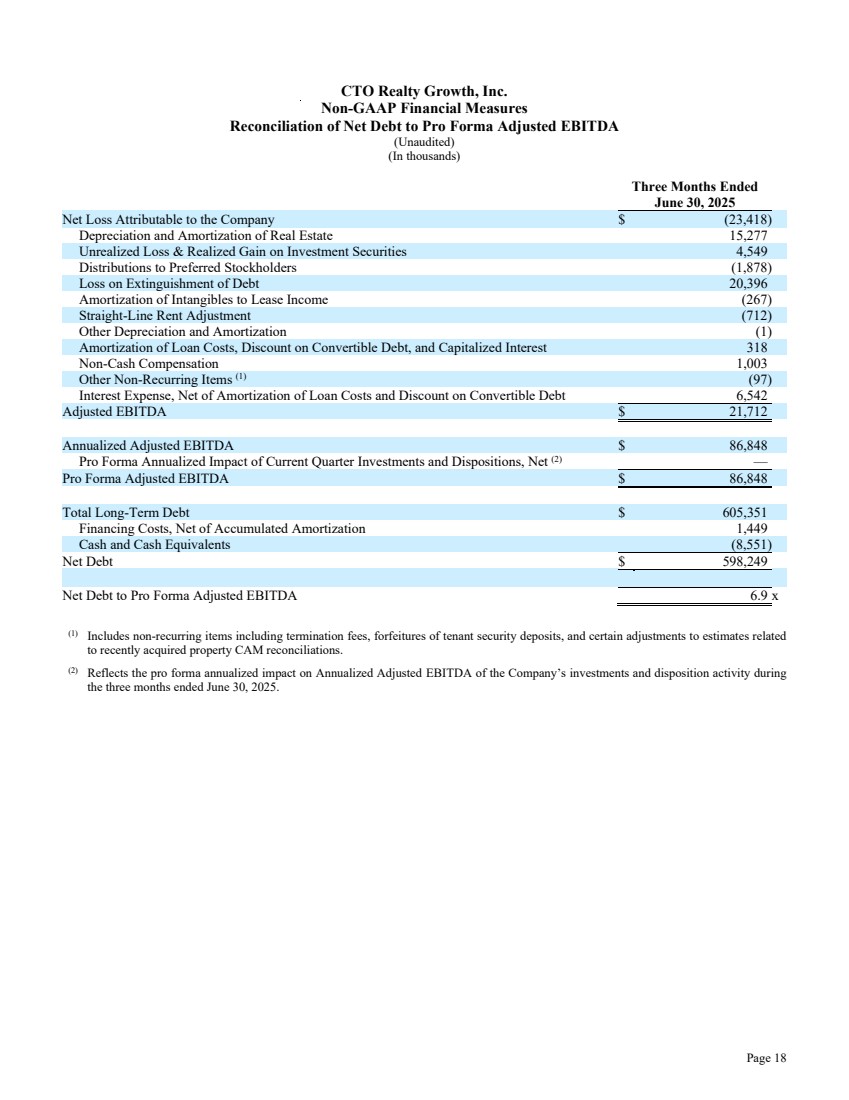
As of June 30, 2025, the Company’s net debt to Pro Forma Adjusted EBITDA was 6.9 times, and as defined in the Company’s credit agreement, the Company’s fixed charge coverage ratio was 4.1 times. As of June 30, 2025, the Company’s net debt to total enterprise value was 46.6%. The Company calculates total enterprise value as the sum of net debt, par value of its 6.375% Series A preferred equity, and the market value of the Company's outstanding common shares.
Dividends
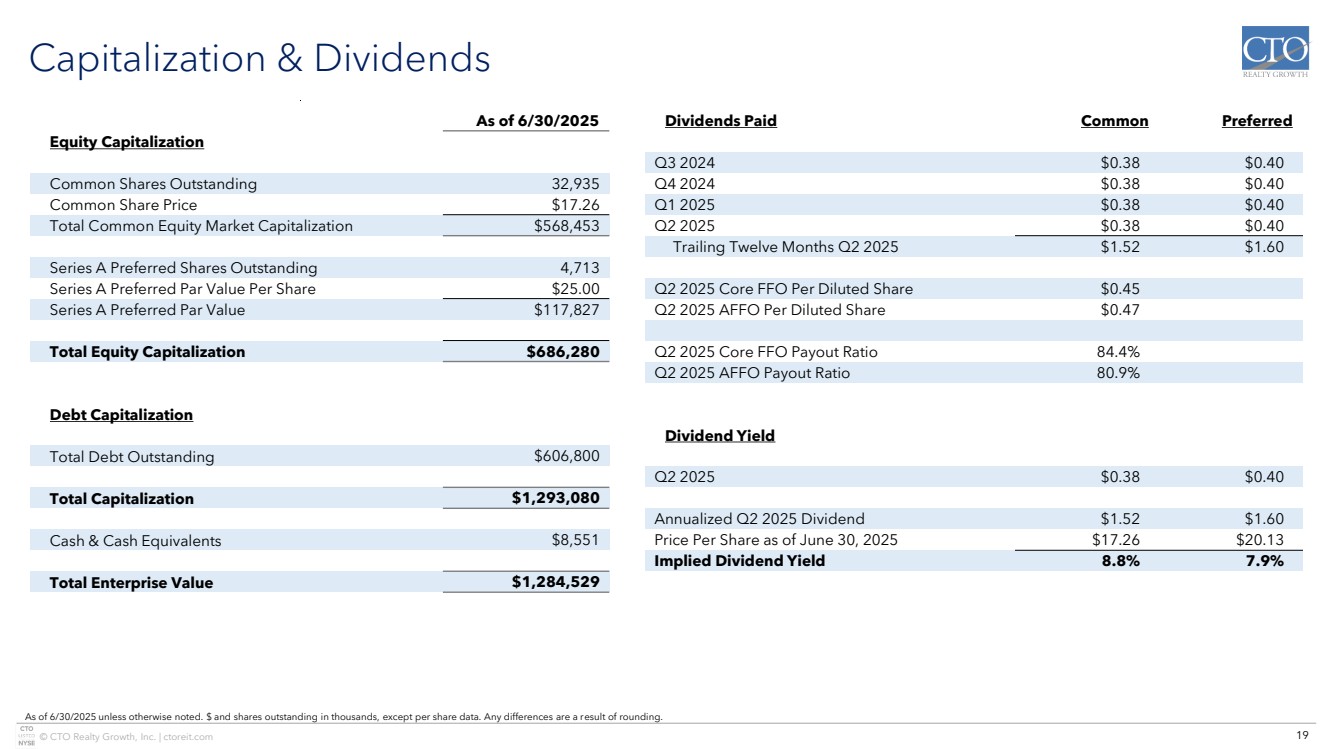
On May 27, 2025, the Company announced a cash dividend on its common stock and Series A Preferred Stock for the second quarter of 2025 of $0.38 per share and $0.40 per share, respectively, payable on June 30, 2025 to stockholders of record as of the close of business on June 12, 2025. The second quarter 2025 common stock cash dividend represented a payout ratio of 84.4% and 80.9% of the Company’s second quarter 2025 Core FFO Attributable to Common Stockholders per Common Share - Diluted and AFFO Attributable to Common Stockholders per Common Share - Diluted, respectively.
2025 Outlook
The Company has reaffirmed its Core FFO and AFFO outlook for 2025 as well as the assumptions detailed below based on current plans and assumptions. The Company’s 2025 outlook is subject to risks and uncertainties more fully described in this press release and the Company’s reports filed with the U.S. Securities and Exchange Commission.
Page 6
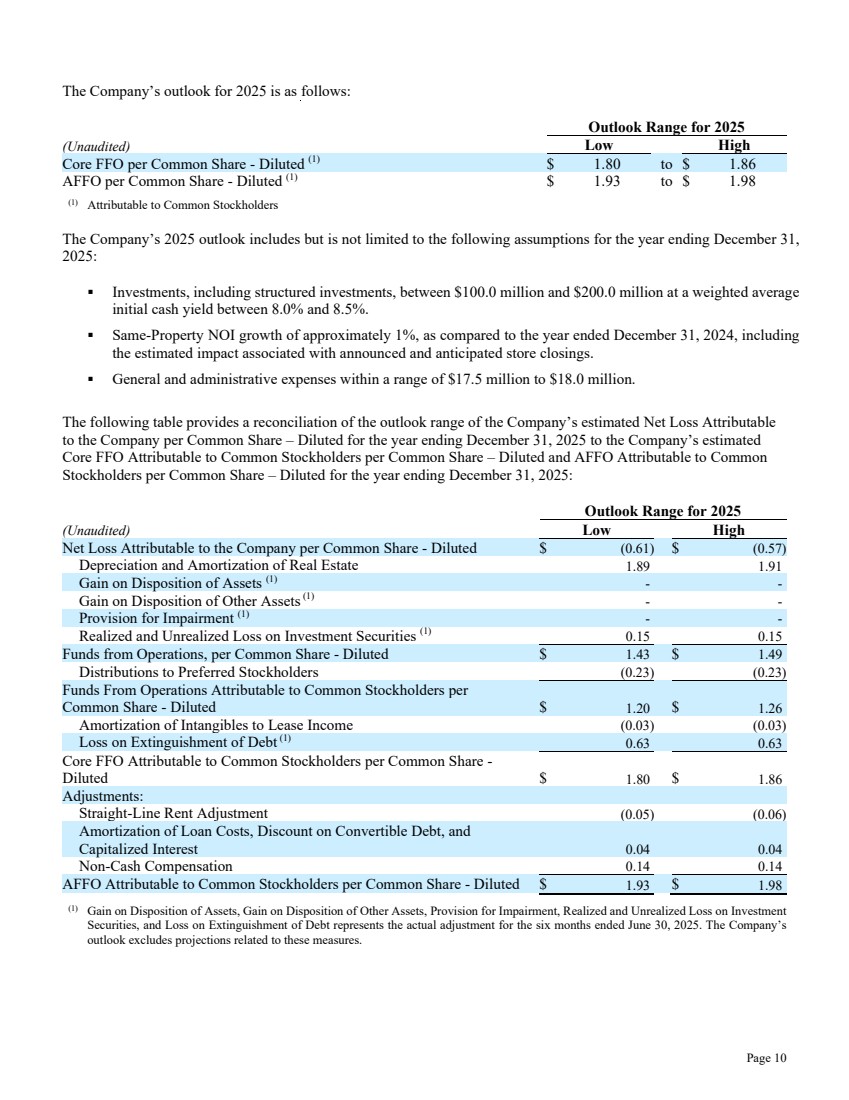
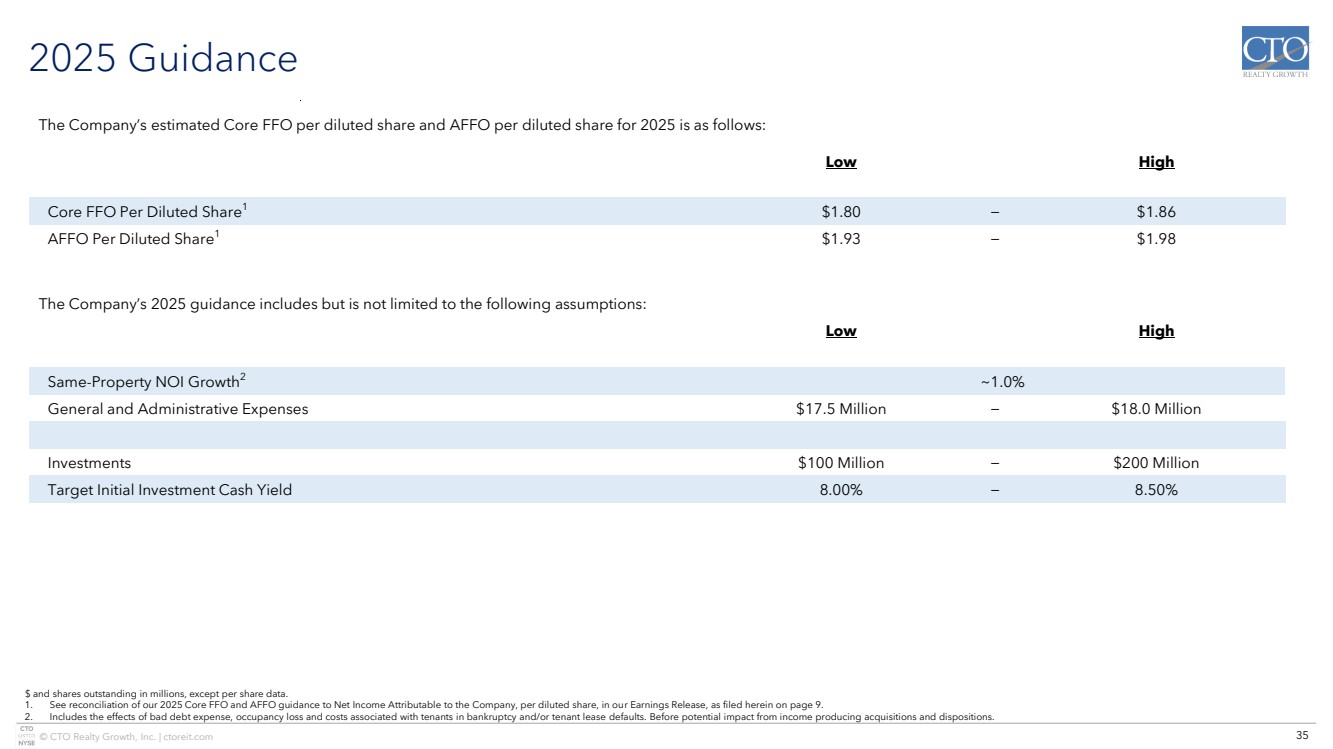
The Company’s outlook for 2025 is as follows:
|
|
Outlook Range for 2025 |
||||
(Unaudited) |
|
Low |
|
High |
||
Core FFO per Common Share - Diluted (1) |
|
$ |
1.80 |
to |
$ |
1.86 |
AFFO per Common Share - Diluted (1) |
|
$ |
1.93 |
to |
$ |
1.98 |
(1) |
Attributable to Common Stockholders |
The Company’s 2025 outlook includes but is not limited to the following assumptions for the year ending December 31, 2025:
| ◾ | Investments, including structured investments, between $100.0 million and $200.0 million at a weighted average initial cash yield between 8.0% and 8.5%. |
| ◾ | Same-Property NOI growth of approximately 1%, as compared to the year ended December 31, 2024, including the estimated impact associated with announced and anticipated store closings. |
| ◾ | General and administrative expenses within a range of $17.5 million to $18.0 million. |
The following table provides a reconciliation of the outlook range of the Company’s estimated Net Loss Attributable to the Company per Common Share – Diluted for the year ending December 31, 2025 to the Company’s estimated Core FFO Attributable to Common Stockholders per Common Share – Diluted and AFFO Attributable to Common Stockholders per Common Share – Diluted for the year ending December 31, 2025:
|
|
Outlook Range for 2025 |
||||
(Unaudited) |
|
Low |
|
High |
||
Net Loss Attributable to the Company per Common Share - Diluted |
|
$ |
(0.61) |
|
$ |
(0.57) |
Depreciation and Amortization of Real Estate |
|
|
1.89 |
|
|
1.91 |
Gain on Disposition of Assets (1) |
|
|
- |
|
|
- |
Gain on Disposition of Other Assets (1) |
|
|
- |
|
|
- |
Provision for Impairment (1) |
|
|
- |
|
|
- |
Realized and Unrealized Loss on Investment Securities (1) |
|
|
0.15 |
|
|
0.15 |
Funds from Operations, per Common Share - Diluted |
|
$ |
1.43 |
|
$ |
1.49 |
Distributions to Preferred Stockholders |
|
|
(0.23) |
|
|
(0.23) |
Funds From Operations Attributable to Common Stockholders per Common Share - Diluted |
|
$ |
1.20 |
|
$ |
1.26 |
Amortization of Intangibles to Lease Income |
|
|
(0.03) |
|
|
(0.03) |
Loss on Extinguishment of Debt (1) |
|
|
0.63 |
|
|
0.63 |
Core FFO Attributable to Common Stockholders per Common Share - Diluted |
|
$ |
1.80 |
|
$ |
1.86 |
Adjustments: |
|
|
|
|
|
|
Straight-Line Rent Adjustment |
|
|
(0.05) |
|
|
(0.06) |
Amortization of Loan Costs, Discount on Convertible Debt, and Capitalized Interest |
|
|
0.04 |
|
|
0.04 |
Non-Cash Compensation |
|
|
0.14 |
|
|
0.14 |
AFFO Attributable to Common Stockholders per Common Share - Diluted |
|
$ |
1.93 |
|
$ |
1.98 |
(1) |
Gain on Disposition of Assets, Gain on Disposition of Other Assets, Provision for Impairment, Realized and Unrealized Loss on Investment Securities, and Loss on Extinguishment of Debt represents the actual adjustment for the six months ended June 30, 2025. The Company’s outlook excludes projections related to these measures. |
Page 7
Earnings Conference Call & Webcast
The Company will host a conference call to present its operating results for the quarter ended June 30, 2025, on Wednesday, July 30, 2025 at 9:00 AM ET.
A live webcast of the call will be available on the Investor Relations page of the Company’s website at www.ctoreit.com or at the link provided in the event details below. To access the call by phone, please go to the registration link provided in the event details below and you will be provided with dial-in details.
Event Details:
Webcast:https://edge.media-server.com/mmc/p/kxmvcnqy
Registration:https://register-conf.media-server.com/register/BIdbee849d58b84ae5b18284ab33284a79
We encourage participants to register and dial into the conference call at least fifteen minutes ahead of the scheduled start time. A replay of the earnings call will be archived and available online through the Investor Relations section of the Company’s website at www.ctoreit.com.
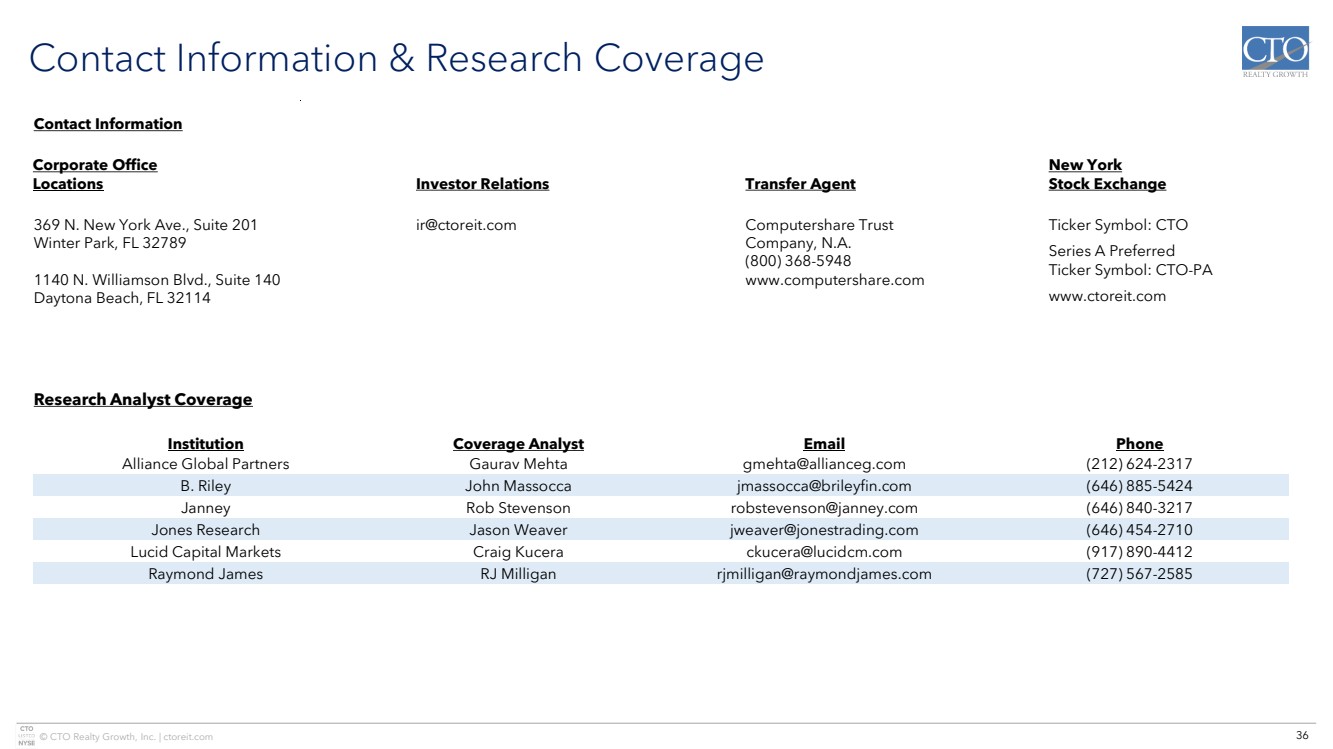
About CTO Realty Growth, Inc.
CTO Realty Growth, Inc. is a publicly traded real estate investment trust that owns and operates a portfolio of high-quality, retail-based properties located primarily in higher growth markets in the United States. CTO also externally manages and owns a meaningful interest in Alpine Income Property Trust, Inc. (NYSE: PINE), a publicly traded net lease REIT.
We encourage you to review our most recent investor presentation and supplemental financial information, which is available on our website at www.ctoreit.com.
Contact:Investor Relations
ir@ctoreit.com
Safe Harbor
Certain statements contained in this press release (other than statements of historical fact) are forward-looking statements within the meaning of Section 27A of the Securities Act of 1933, as amended, and Section 21E of the Securities Exchange Act of 1934, as amended. Forward-looking statements can typically be identified by words such as “believe,” “estimate,” “expect,” “intend,” “anticipate,” “will,” “could,” “may,” “should,” “plan,” “potential,” “predict,” “forecast,” “project,” and similar expressions, as well as variations or negatives of these words.
Although forward-looking statements are made based upon management’s present expectations and beliefs concerning future developments and their potential effect upon the Company, a number of factors could cause the Company’s actual results to differ materially from those set forth in the forward-looking statements. Such factors may include, but are not limited to: the Company’s ability to remain qualified as a REIT; the Company’s exposure to U.S. federal and state income tax law changes, including changes to the REIT requirements; general adverse economic and real estate conditions; macroeconomic and geopolitical factors, including but not limited to inflationary pressures, interest rate volatility, distress in the banking sector, global supply chain disruptions, and ongoing geopolitical war; credit risk associated with the Company investing in structured investments; the ultimate geographic spread, severity and duration of pandemics such as the COVID-19 Pandemic and its variants, actions that may be taken by governmental authorities to contain or address the impact of such pandemics, and the potential negative impacts of such pandemics on the global economy and the Company’s financial condition and results of operations; the inability of major tenants to continue paying their rent or obligations due to bankruptcy, insolvency or a general downturn in their business; the loss or failure, or decline in the business or assets of PINE; the completion of 1031 exchange transactions; the availability of investment properties that meet the Company’s investment goals and criteria; the uncertainties associated with obtaining required governmental permits and satisfying other closing conditions for planned acquisitions and sales; and the uncertainties and risk factors discussed in the Company’s Annual Report on Form 10-K for the fiscal year ended December 31, 2024 and other risks and uncertainties discussed from time to time in the Company’s filings with the U.S. Securities and Exchange Commission.
Page 8
There can be no assurance that future developments will be in accordance with management’s expectations or that the effect of future developments on the Company will be those anticipated by management. Readers are cautioned not to place undue reliance on these forward-looking statements, which speak only as of the date of this press release. The Company undertakes no obligation to update the information contained in this press release to reflect subsequently occurring events or circumstances.
Non-GAAP Financial Measures
Our reported results are presented in accordance with accounting principles generally accepted in the United States of America (“GAAP”). We also disclose Funds From Operations (“FFO”), Core Funds From Operations (“Core FFO”), Adjusted Funds From Operations (“AFFO”), Pro Forma Earnings Before Interest, Taxes, Depreciation and Amortization (“Pro Forma Adjusted EBITDA”), and Same-Property Net Operating Income (“Same-Property NOI”), each of which are non-GAAP financial measures. We believe these non-GAAP financial measures are useful to investors because they are widely accepted industry measures used by analysts and investors to compare the operating performance of REITs.
FFO, Core FFO, AFFO, Pro Forma Adjusted EBITDA, and Same-Property NOI do not represent cash generated from operating activities and are not necessarily indicative of cash available to fund cash requirements; accordingly, they should not be considered alternatives to net income as a performance measure or cash flows from operating activities as reported on our statement of cash flows as a liquidity measure and should be considered in addition to, and not in lieu of, GAAP financial measures.
We compute FFO in accordance with the definition adopted by the Board of Governors of the National Association of Real Estate Investment Trusts, or NAREIT.
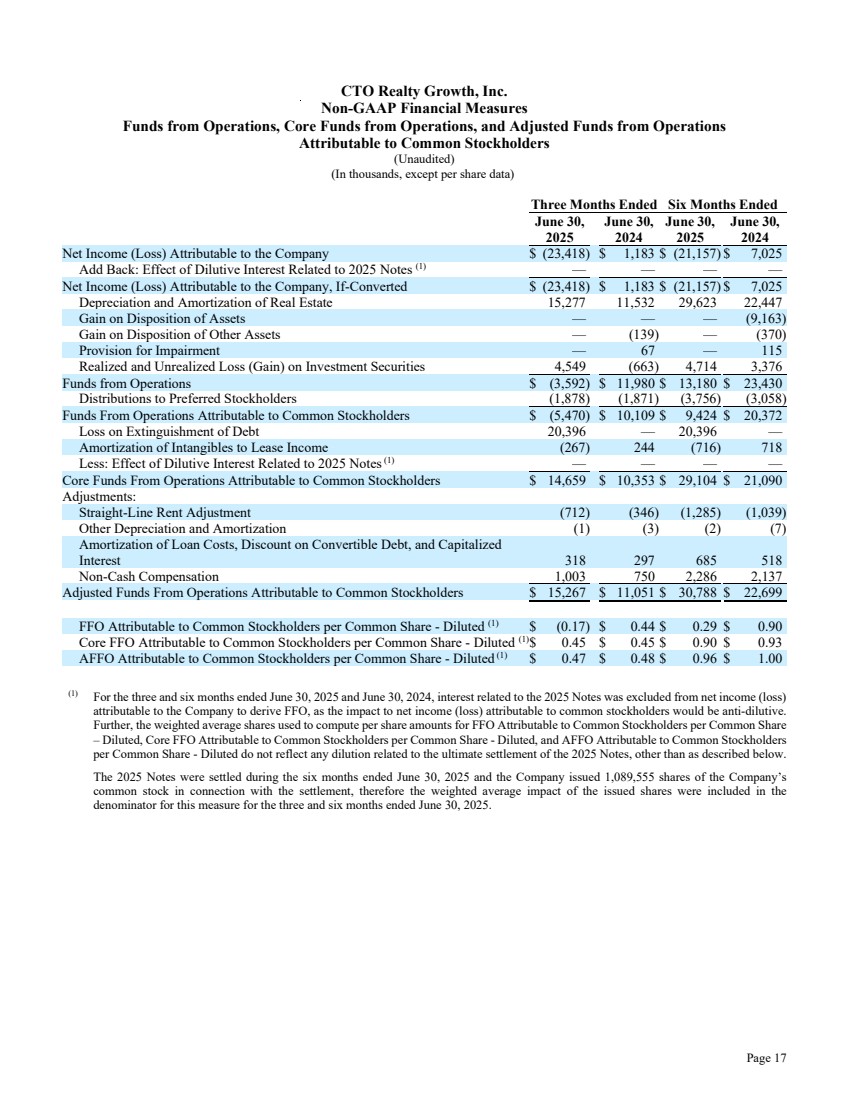
NAREIT defines FFO as GAAP net income or loss adjusted to exclude real estate related depreciation and amortization, as well as extraordinary items (as defined by GAAP) such as net gain or loss from sales of depreciable real estate assets, impairment write-downs associated with depreciable real estate assets and impairments associated with the implementation of current expected credit losses on commercial loans and investments at the time of origination, including the pro rata share of such adjustments of unconsolidated subsidiaries. The Company also excludes the gains or losses from sales of assets incidental to the primary business of the REIT which specifically include the sales of mitigation credits, subsurface sales, investment securities, and land sales, in addition to the mark-to-market of the Company’s investment securities and interest related to the 2025 Notes, if the effect is dilutive. To derive Core FFO, we modify the NAREIT computation of FFO to include other adjustments to GAAP net income related to gains and losses recognized on the extinguishment of debt, amortization of above- and below-market lease related intangibles, and other unforecastable market- or transaction-driven non-cash items, as well as adding back the interest related to the 2025 Notes, if the effect is dilutive. To derive AFFO, we further modify the NAREIT computation of FFO and Core FFO to include other adjustments to GAAP net income related to non-cash revenues and expenses such as straight-line rental revenue, non-cash compensation, and other non-cash amortization. Such items may cause short-term fluctuations in net income but have no impact on operating cash flows or long-term operating performance. We use AFFO as one measure of our performance when we formulate corporate goals.
To derive Pro Forma Adjusted EBITDA, GAAP net income or loss attributable to the Company is adjusted to exclude real estate related depreciation and amortization, as well as extraordinary items (as defined by GAAP) such as net gain or loss from sales of depreciable real estate assets, impairment write-downs associated with depreciable real estate assets, impairments associated with the implementation of current expected credit losses on commercial loans and investments at the time of origination, including the pro rata share of such adjustments of unconsolidated subsidiaries, non-cash revenues and expenses such as straight-line rental revenue, amortization of deferred financing costs, above- and below-market lease related intangibles, non-cash compensation, other non-recurring items such as termination fees, forfeitures of tenant security deposits, and certain adjustments to reconciliation estimates related to reimbursable revenue for recently acquired properties, and other non-cash income or expense.
Page 9
The Company also excludes the gains or losses from sales of assets incidental to the primary business of the REIT which specifically include the sales of mitigation credits, subsurface sales, investment securities, and land sales, in addition to the mark-to-market of the Company’s investment securities. Cash interest expense is also excluded from Pro Forma Adjusted EBITDA, and GAAP net income or loss is adjusted for the annualized impact of acquisitions, dispositions and other similar activities.
To derive Same-Property NOI, GAAP net income or loss attributable to the Company is adjusted to exclude real estate related depreciation and amortization, as well as extraordinary items (as defined by GAAP) such as net gain or loss from sales of depreciable real estate assets, impairment write-downs associated with depreciable real estate assets, impairments associated with the implementation of current expected credit losses on commercial loans and investments at the time of origination, including the pro rata share of such adjustments of unconsolidated subsidiaries, non-cash revenues and expenses such as straight-line rental revenue, amortization of deferred financing costs, above- and below-market lease related intangibles, non-cash compensation, other non-recurring items such as termination fees, forfeitures of tenant security deposits, and certain adjustments to reconciliation estimates related to reimbursable revenue for recently acquired properties, and other non-cash income or expense. Interest expense, general and administrative expenses, investment and other income or loss, income tax benefit or expense, real estate operations revenues and direct cost of revenues, management fee income, and interest income from commercial loans and investments are also excluded from Same-Property NOI. GAAP net income or loss is further adjusted to remove the impact of properties that were not owned for the full current and prior year reporting periods presented. Cash rental income received under the leases pertaining to the Company’s assets that are presented as commercial loans and investments in accordance with GAAP is also used in lieu of the interest income equivalent.
FFO is used by management, investors and analysts to facilitate meaningful comparisons of operating performance between periods and among our peers primarily because it excludes the effect of real estate depreciation and amortization and net gains or losses on sales, which are based on historical costs and implicitly assume that the value of real estate diminishes predictably over time, rather than fluctuating based on existing market conditions. We believe that Core FFO and AFFO are additional useful supplemental measures for investors to consider because they will help them to better assess our operating performance without the distortions created by other non-cash revenues or expenses. We also believe that Pro Forma Adjusted EBITDA is an additional useful supplemental measure for investors to consider as it allows for a better assessment of our operating performance without the distortions created by other non-cash revenues, expenses or certain effects of the Company’s capital structure on our operating performance. We use Same-Property NOI to compare the operating performance of our assets between periods. It is an accepted and important measurement used by management, investors and analysts because it includes all property-level revenues from the Company’s properties, less operating and maintenance expenses, real estate taxes and other property-specific expenses (“Net Operating Income” or “NOI”) of properties that have been owned and stabilized for the entire current and prior year reporting periods. Same-Property NOI attempts to eliminate differences due to the acquisition or disposition of properties during the particular period presented, and therefore provides a more comparable and consistent performance measure for the comparison of the Company’s properties. FFO, Core FFO, AFFO, Pro Forma Adjusted EBITDA, and Same-Property NOI may not be comparable to similarly titled measures employed by other companies.
Page 10
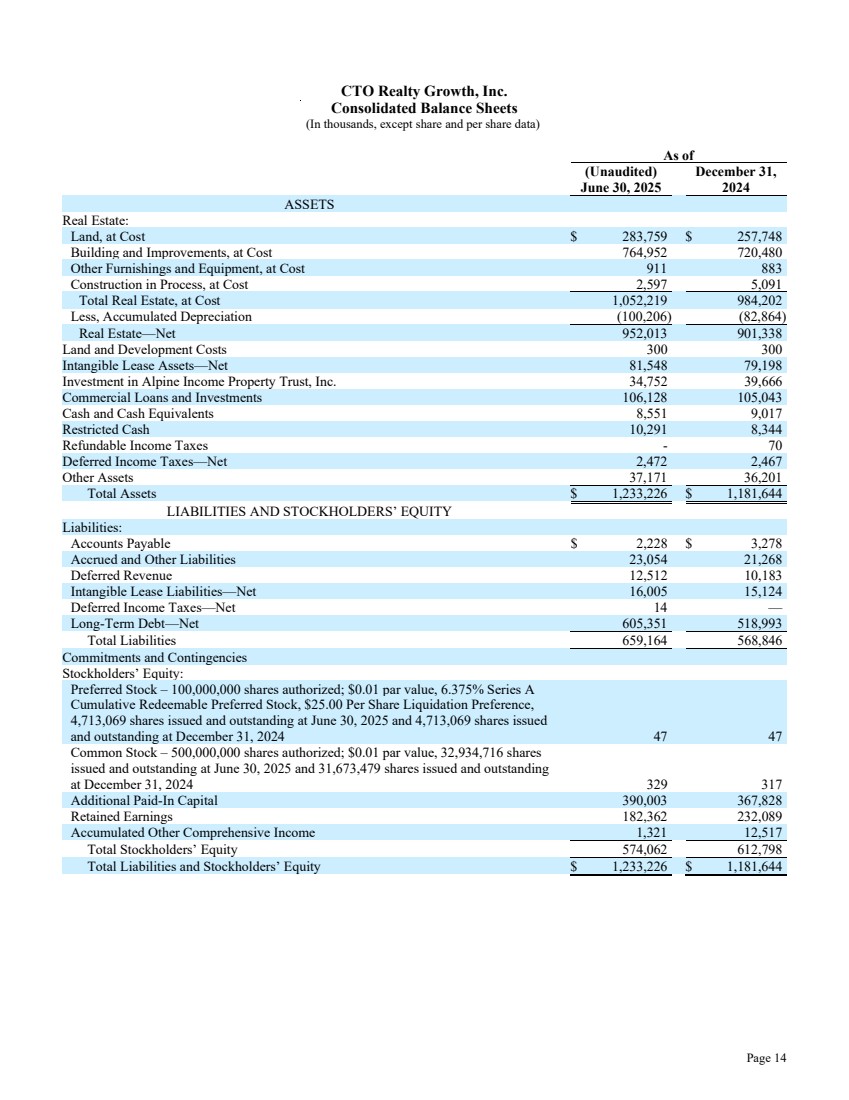
CTO Realty Growth, Inc.
Consolidated Balance Sheets
(In thousands, except share and per share data)
|
|
As of |
||||
|
|
(Unaudited) |
|
December 31, 2024 |
||
ASSETS |
|
|
|
|
|
|
Real Estate: |
|
|
|
|
|
|
Land, at Cost |
|
$ |
283,759 |
|
$ |
257,748 |
Building and Improvements, at Cost |
|
|
764,952 |
|
|
720,480 |
Other Furnishings and Equipment, at Cost |
|
|
911 |
|
|
883 |
Construction in Process, at Cost |
|
|
2,597 |
|
|
5,091 |
Total Real Estate, at Cost |
|
|
1,052,219 |
|
|
984,202 |
Less, Accumulated Depreciation |
|
|
(100,206) |
|
|
(82,864) |
Real Estate—Net |
|
|
952,013 |
|
|
901,338 |
Land and Development Costs |
|
|
300 |
|
|
300 |
Intangible Lease Assets—Net |
|
|
81,548 |
|
|
79,198 |
Investment in Alpine Income Property Trust, Inc. |
|
|
34,752 |
|
|
39,666 |
Commercial Loans and Investments |
|
|
106,128 |
|
|
105,043 |
Cash and Cash Equivalents |
|
|
8,551 |
|
|
9,017 |
Restricted Cash |
|
|
10,291 |
|
|
8,344 |
Refundable Income Taxes |
|
|
- |
|
|
70 |
Deferred Income Taxes—Net |
|
|
2,472 |
|
|
2,467 |
Other Assets |
|
|
37,171 |
|
|
36,201 |
Total Assets |
|
$ |
1,233,226 |
|
$ |
1,181,644 |
LIABILITIES AND STOCKHOLDERS’ EQUITY |
|
|
|
|
|
|
Liabilities: |
|
|
|
|
|
|
Accounts Payable |
|
$ |
2,228 |
|
$ |
3,278 |
Accrued and Other Liabilities |
|
|
23,054 |
|
|
21,268 |
Deferred Revenue |
|
|
12,512 |
|
|
10,183 |
Intangible Lease Liabilities—Net |
|
|
16,005 |
|
|
15,124 |
Deferred Income Taxes—Net |
|
|
14 |
|
|
— |
Long-Term Debt—Net |
|
|
605,351 |
|
|
518,993 |
Total Liabilities |
|
|
659,164 |
|
|
568,846 |
Commitments and Contingencies |
|
|
|
|
|
|
Stockholders’ Equity: |
|
|
|
|
|
|
Preferred Stock – 100,000,000 shares authorized; $0.01 par value, 6.375% Series A Cumulative Redeemable Preferred Stock, $25.00 Per Share Liquidation Preference, 4,713,069 shares issued and outstanding at June 30, 2025 and 4,713,069 shares issued and outstanding at December 31, 2024 |
|
|
47 |
|
|
47 |
Common Stock – 500,000,000 shares authorized; $0.01 par value, 32,934,716 shares issued and outstanding at June 30, 2025 and 31,673,479 shares issued and outstanding at December 31, 2024 |
|
|
329 |
|
|
317 |
Additional Paid-In Capital |
|
|
390,003 |
|
|
367,828 |
Retained Earnings |
|
|
182,362 |
|
|
232,089 |
Accumulated Other Comprehensive Income |
|
|
1,321 |
|
|
12,517 |
Total Stockholders’ Equity |
|
|
574,062 |
|
|
612,798 |
Total Liabilities and Stockholders’ Equity |
|
$ |
1,233,226 |
|
$ |
1,181,644 |
Page 11
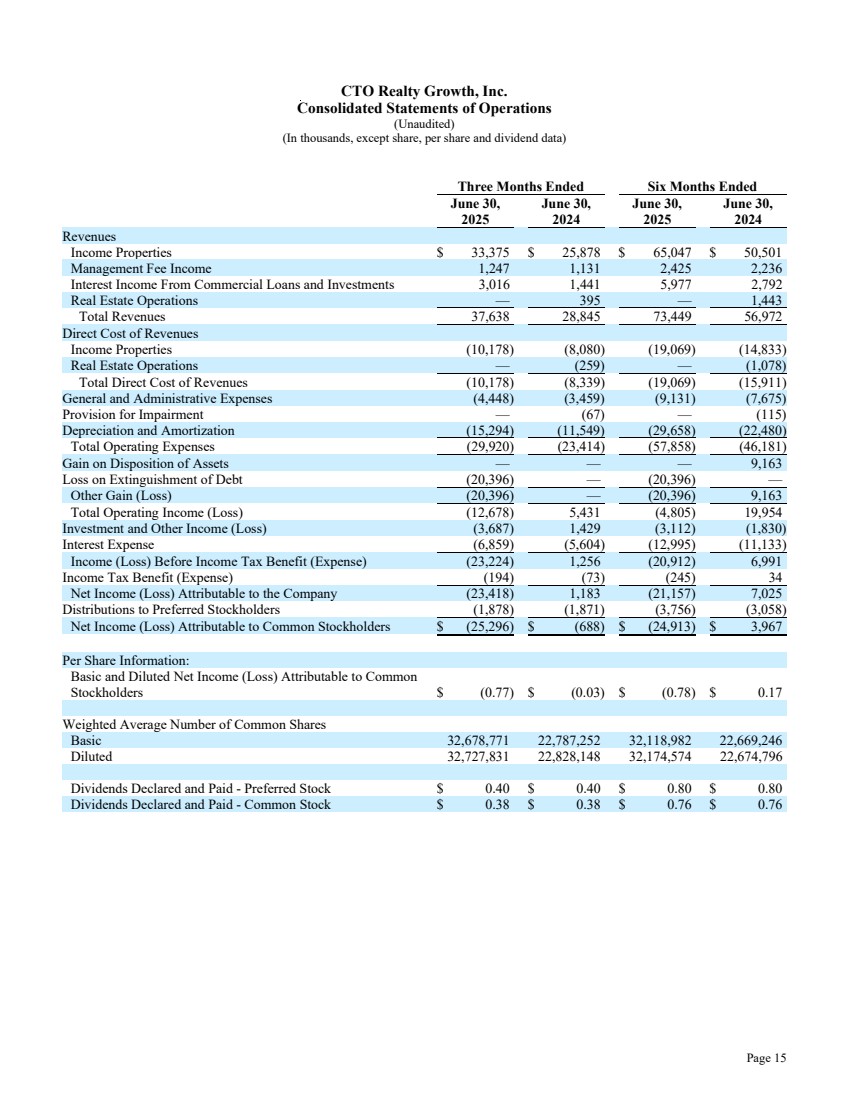
CTO Realty Growth, Inc.
Consolidated Statements of Operations
(Unaudited)
(In thousands, except share, per share and dividend data)
|
|
|
|
|
||||||||
|
|
Three Months Ended |
|
Six Months Ended |
||||||||
|
|
June 30, |
|
June 30, |
|
June 30, |
|
June 30, |
||||
|
|
2025 |
|
2024 |
|
2025 |
|
2024 |
||||
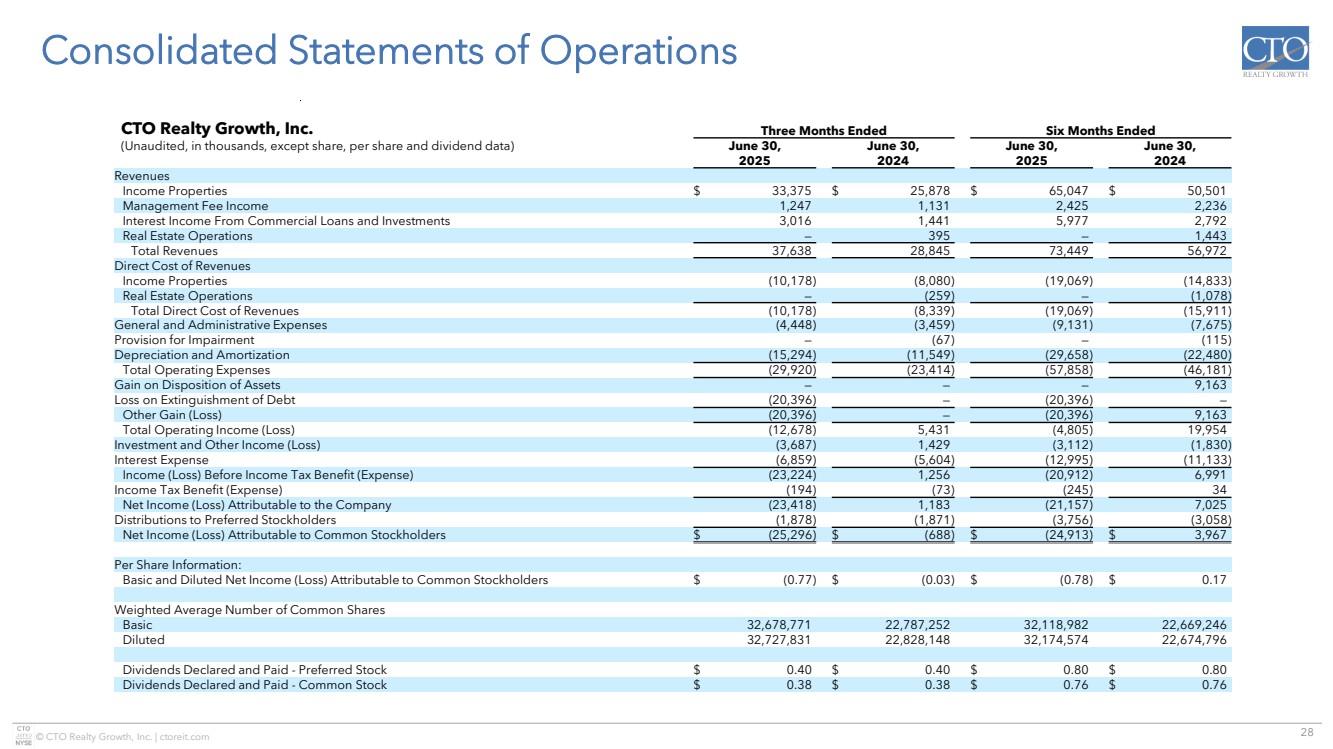
Revenues |
|
|
|
|
|
|
|
|
|
|
|
|
Income Properties |
|
$ |
33,375 |
|
$ |
25,878 |
|
$ |
65,047 |
|
$ |
50,501 |
Management Fee Income |
|
|
1,247 |
|
|
1,131 |
|
|
2,425 |
|
|
2,236 |
Interest Income From Commercial Loans and Investments |
|
|
3,016 |
|
|
1,441 |
|
|
5,977 |
|
|
2,792 |
Real Estate Operations |
|
|
— |
|
|
395 |
|
|
— |
|
|
1,443 |
Total Revenues |
|
|
37,638 |
|
|
28,845 |
|
|
73,449 |
|
|
56,972 |
Direct Cost of Revenues |
|
|
|
|
|
|
|
|
|
|
|
|
Income Properties |
|
|
(10,178) |
|
|
(8,080) |
|
|
(19,069) |
|
|
(14,833) |
Real Estate Operations |
|
|
— |
|
|
(259) |
|
|
— |
|
|
(1,078) |
Total Direct Cost of Revenues |
|
|
(10,178) |
|
|
(8,339) |
|
|
(19,069) |
|
|
(15,911) |
General and Administrative Expenses |
|
|
(4,448) |
|
|
(3,459) |
|
|
(9,131) |
|
|
(7,675) |
Provision for Impairment |
|
|
— |
|
|
(67) |
|
|
— |
|
|
(115) |
Depreciation and Amortization |
|
|
(15,294) |
|
|
(11,549) |
|
|
(29,658) |
|
|
(22,480) |
Total Operating Expenses |
|
|
(29,920) |
|
|
(23,414) |
|
|
(57,858) |
|
|
(46,181) |
Gain on Disposition of Assets |
|
|
— |
|
|
— |
|
|
— |
|
|
9,163 |
Loss on Extinguishment of Debt |
|
|
(20,396) |
|
|
— |
|
|
(20,396) |
|
|
— |
Other Gain (Loss) |
|
|
(20,396) |
|
|
— |
|
|
(20,396) |
|
|
9,163 |
Total Operating Income (Loss) |
|
|
(12,678) |
|
|
5,431 |
|
|
(4,805) |
|
|
19,954 |
Investment and Other Income (Loss) |
|
|
(3,687) |
|
|
1,429 |
|
|
(3,112) |
|
|
(1,830) |
Interest Expense |
|
|
(6,859) |
|
|
(5,604) |
|
|
(12,995) |
|
|
(11,133) |
Income (Loss) Before Income Tax Benefit (Expense) |
|
|
(23,224) |
|
|
1,256 |
|
|
(20,912) |
|
|
6,991 |
Income Tax Benefit (Expense) |
|
|
(194) |
|
|
(73) |
|
|
(245) |
|
|
34 |
Net Income (Loss) Attributable to the Company |
|
|
(23,418) |
|
|
1,183 |
|
|
(21,157) |
|
|
7,025 |
Distributions to Preferred Stockholders |
|
|
(1,878) |
|
|
(1,871) |
|
|
(3,756) |
|
|
(3,058) |
Net Income (Loss) Attributable to Common Stockholders |
|
$ |
(25,296) |
|
$ |
(688) |
|
$ |
(24,913) |
|
$ |
3,967 |
|
|
|
|
|
|
|
|
|
|
|
|
|
Per Share Information: |
|
|
|
|
|
|
|
|
|
|
|
|
Basic and Diluted Net Income (Loss) Attributable to Common Stockholders |
|
$ |
(0.77) |
|
$ |
(0.03) |
|
$ |
(0.78) |
|
$ |
0.17 |
|
|
|
|
|
|
|
|
|
|
|
|
|
Weighted Average Number of Common Shares |
|
|
|
|
|
|
|
|
|
|
|
|
Basic |
|
|
32,678,771 |
|
|
22,787,252 |
|
|
32,118,982 |
|
|
22,669,246 |
Diluted |
|
|
32,727,831 |
|
|
22,828,148 |
|
|
32,174,574 |
|
|
22,674,796 |
|
|
|
|
|
|
|
|
|
|
|
|
|
Dividends Declared and Paid - Preferred Stock |
|
$ |
0.40 |
|
$ |
0.40 |
|
$ |
0.80 |
|
$ |
0.80 |
Dividends Declared and Paid - Common Stock |
|
$ |
0.38 |
|
$ |
0.38 |
|
$ |
0.76 |
|
$ |
0.76 |
Page 12
CTO Realty Growth, Inc.
Non-GAAP Financial Measures
Same-Property NOI Reconciliation
(Unaudited)
(In thousands)
|
|
Three Months Ended |
|
Six Months Ended |
||||||||
|
|
June 30, 2025 |
|
June 30, 2024 |
|
June 30, 2025 |
|
June 30, 2024 |
||||
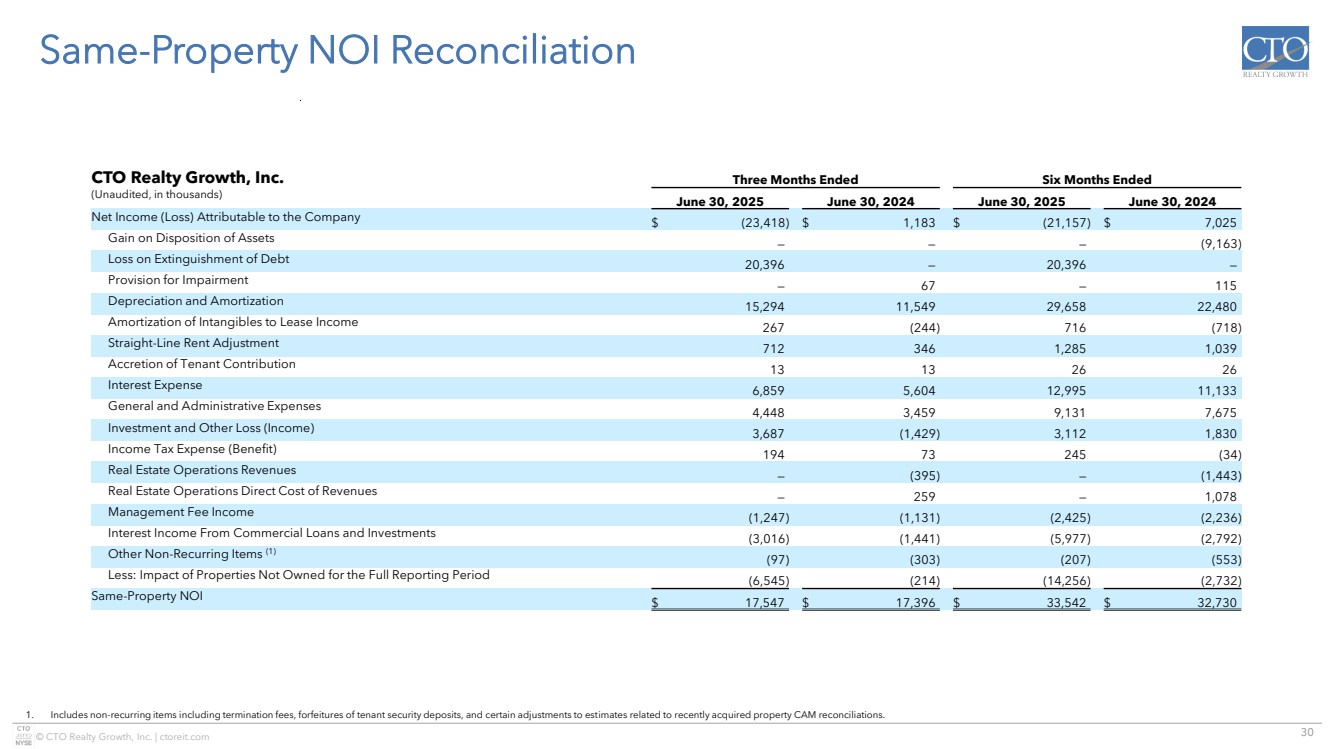
Net Income (Loss) Attributable to the Company |
|
$ |
(23,418) |
|
$ |
1,183 |
|
$ |
(21,157) |
|
$ |
7,025 |
Gain on Disposition of Assets |
|
|
— |
|
|
— |
|
|
— |
|
|
(9,163) |
Loss on Extinguishment of Debt |
|
|
20,396 |
|
|
— |
|
|
20,396 |
|
|
— |
Provision for Impairment |
|
|
— |
|
|
67 |
|
|
— |
|
|
115 |
Depreciation and Amortization |
|
|
15,294 |
|
|
11,549 |
|
|
29,658 |
|
|
22,480 |
Amortization of Intangibles to Lease Income |
|
|
267 |
|
|
(244) |
|
|
716 |
|
|
(718) |
Straight-Line Rent Adjustment |
|
|
712 |
|
|
346 |
|
|
1,285 |
|
|
1,039 |
Accretion of Tenant Contribution |
|
|
13 |
|
|
13 |
|
|
26 |
|
|
26 |
Interest Expense |
|
|
6,859 |
|
|
5,604 |
|
|
12,995 |
|
|
11,133 |
General and Administrative Expenses |
|
|
4,448 |
|
|
3,459 |
|
|
9,131 |
|
|
7,675 |
Investment and Other Loss (Income) |
|
|
3,687 |
|
|
(1,429) |
|
|
3,112 |
|
|
1,830 |
Income Tax Expense (Benefit) |
|
|
194 |
|
|
73 |
|
|
245 |
|
|
(34) |
Real Estate Operations Revenues |
|
|
— |
|
|
(395) |
|
|
— |
|
|
(1,443) |
Real Estate Operations Direct Cost of Revenues |
|
|
— |
|
|
259 |
|
|
— |
|
|
1,078 |
Management Fee Income |
|
|
(1,247) |
|
|
(1,131) |
|
|
(2,425) |
|
|
(2,236) |
Interest Income From Commercial Loans and Investments |
|
|
(3,016) |
|
|
(1,441) |
|
|
(5,977) |
|
|
(2,792) |
Other Non-Recurring Items (1) |
|
|
(97) |
|
|
(303) |
|
|
(207) |
|
|
(553) |
Less: Impact of Properties Not Owned for the Full Reporting Period |
|
|
(6,545) |
|
|
(214) |
|
|
(14,256) |
|
|
(2,732) |
Same-Property NOI |
|
$ |
17,547 |
|
$ |
17,396 |
|
$ |
33,542 |
|
$ |
32,730 |
| (1) | Includes non-recurring items including termination fees, forfeitures of tenant security deposits, and certain adjustments to estimates related to recently acquired property CAM reconciliations. |
Page 13
CTO Realty Growth, Inc.
Non-GAAP Financial Measures
Funds from Operations, Core Funds from Operations, and Adjusted Funds from Operations
Attributable to Common Stockholders
(Unaudited)
(In thousands, except per share data)
|
|
Three Months Ended |
|
Six Months Ended |
||||||||
|
|
June 30, 2025 |
|
June 30, 2024 |
|
June 30, 2025 |
|
June 30, 2024 |
||||
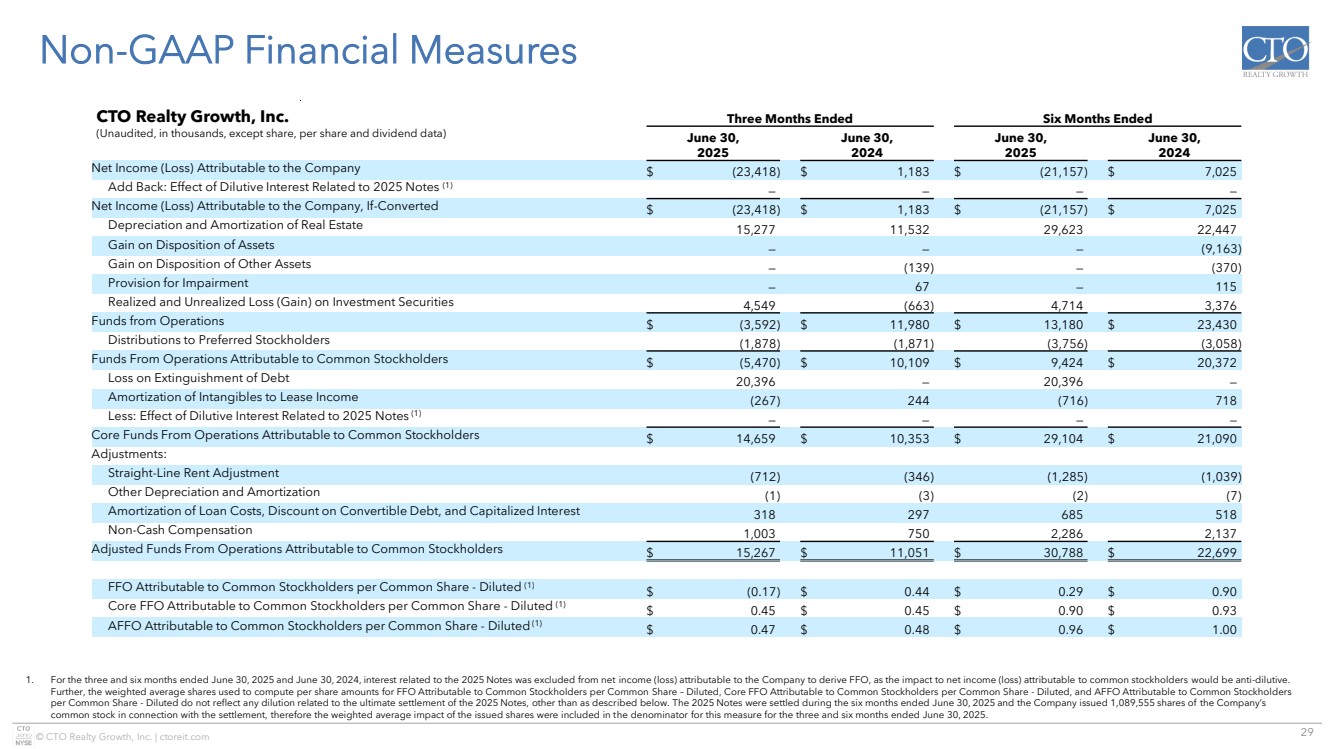
Net Income (Loss) Attributable to the Company |
|
$ |
(23,418) |
|
$ |
1,183 |
|
$ |
(21,157) |
|
$ |
7,025 |
Add Back: Effect of Dilutive Interest Related to 2025 Notes (1) |
|
|
— |
|
|
— |
|
|
— |
|
|
— |
Net Income (Loss) Attributable to the Company, If-Converted |
|
$ |
(23,418) |
|
$ |
1,183 |
|
$ |
(21,157) |
|
$ |
7,025 |
Depreciation and Amortization of Real Estate |
|
|
15,277 |
|
|
11,532 |
|
|
29,623 |
|
|
22,447 |
Gain on Disposition of Assets |
|
|
— |
|
|
— |
|
|
— |
|
|
(9,163) |
Gain on Disposition of Other Assets |
|
|
— |
|
|
(139) |
|
|
— |
|
|
(370) |
Provision for Impairment |
|
|
— |
|
|
67 |
|
|
— |
|
|
115 |
Realized and Unrealized Loss (Gain) on Investment Securities |
|
|
4,549 |
|
|
(663) |
|
|
4,714 |
|
|
3,376 |
Funds from Operations |
|
$ |
(3,592) |
|
$ |
11,980 |
|
$ |
13,180 |
|
$ |
23,430 |
Distributions to Preferred Stockholders |
|
|
(1,878) |
|
|
(1,871) |
|
|
(3,756) |
|
|
(3,058) |
Funds From Operations Attributable to Common Stockholders |
|
$ |
(5,470) |
|
$ |
10,109 |
|
$ |
9,424 |
|
$ |
20,372 |
Loss on Extinguishment of Debt |
|
|
20,396 |
|
|
— |
|
|
20,396 |
|
|
— |
Amortization of Intangibles to Lease Income |
|
|
(267) |
|
|
244 |
|
|
(716) |
|
|
718 |
Less: Effect of Dilutive Interest Related to 2025 Notes (1) |
|
|
— |
|
|
— |
|
|
— |
|
|
— |
Core Funds From Operations Attributable to Common Stockholders |
|
$ |
14,659 |
|
$ |
10,353 |
|
$ |
29,104 |
|
$ |
21,090 |
Adjustments: |
|
|
|
|
|
|
|
|
|
|
|
|
Straight-Line Rent Adjustment |
|
|
(712) |
|
|
(346) |
|
|
(1,285) |
|
|
(1,039) |
Other Depreciation and Amortization |
|
|
(1) |
|
|
(3) |
|
|
(2) |
|
|
(7) |
Amortization of Loan Costs, Discount on Convertible Debt, and Capitalized Interest |
|
|
318 |
|
|
297 |
|
|
685 |
|
|
518 |
Non-Cash Compensation |
|
|
1,003 |
|
|
750 |
|
|
2,286 |
|
|
2,137 |
Adjusted Funds From Operations Attributable to Common Stockholders |
|
$ |
15,267 |
|
$ |
11,051 |
|
$ |
30,788 |
|
$ |
22,699 |
|
|
|
|
|
|
|
|
|
|
|
|
|
FFO Attributable to Common Stockholders per Common Share - Diluted (1) |
|
$ |
(0.17) |
|
$ |
0.44 |
|
$ |
0.29 |
|
$ |
0.90 |
Core FFO Attributable to Common Stockholders per Common Share - Diluted (1) |
|
$ |
0.45 |
|
$ |
0.45 |
|
$ |
0.90 |
|
$ |
0.93 |
AFFO Attributable to Common Stockholders per Common Share - Diluted (1) |
|
$ |
0.47 |
|
$ |
0.48 |
|
$ |
0.96 |
|
$ |
1.00 |
| (1) | For the three and six months ended June 30, 2025 and June 30, 2024, interest related to the 2025 Notes was excluded from net income (loss) attributable to the Company to derive FFO, as the impact to net income (loss) attributable to common stockholders would be anti-dilutive. Further, the weighted average shares used to compute per share amounts for FFO Attributable to Common Stockholders per Common Share – Diluted, Core FFO Attributable to Common Stockholders per Common Share - Diluted, and AFFO Attributable to Common Stockholders per Common Share - Diluted do not reflect any dilution related to the ultimate settlement of the 2025 Notes, other than as described below. |
The 2025 Notes were settled during the six months ended June 30, 2025 and the Company issued 1,089,555 shares of the Company’s common stock in connection with the settlement, therefore the weighted average impact of the issued shares were included in the denominator for this measure for the three and six months ended June 30, 2025.
Page 14
CTO Realty Growth, Inc.
Non-GAAP Financial Measures
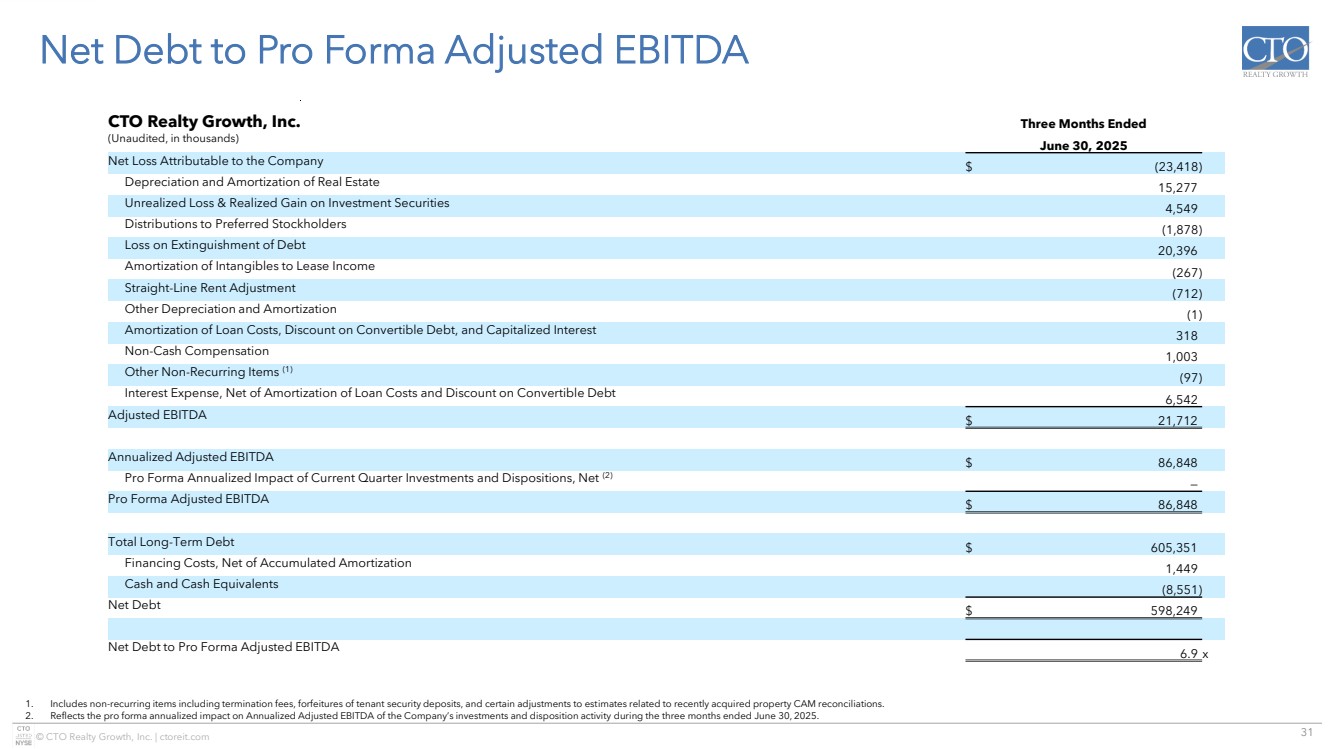
Reconciliation of Net Debt to Pro Forma Adjusted EBITDA
(Unaudited)
(In thousands)
|
|
Three Months Ended |
|
|
|
|
June 30, 2025 |
|
|
Net Loss Attributable to the Company |
|
$ |
(23,418) |
|
Depreciation and Amortization of Real Estate |
|
|
15,277 |
|
Unrealized Loss & Realized Gain on Investment Securities |
|
|
4,549 |
|
Distributions to Preferred Stockholders |
|
|
(1,878) |
|
Loss on Extinguishment of Debt |
|
|
20,396 |
|
Amortization of Intangibles to Lease Income |
|
|
(267) |
|
Straight-Line Rent Adjustment |
|
|
(712) |
|
Other Depreciation and Amortization |
|
|
(1) |
|
Amortization of Loan Costs, Discount on Convertible Debt, and Capitalized Interest |
|
|
318 |
|
Non-Cash Compensation |
|
|
1,003 |
|
Other Non-Recurring Items (1) |
|
|
(97) |
|
Interest Expense, Net of Amortization of Loan Costs and Discount on Convertible Debt |
|
|
6,542 |
|
Adjusted EBITDA |
|
$ |
21,712 |
|
|
|
|
|
|
Annualized Adjusted EBITDA |
|
$ |
86,848 |
|
Pro Forma Annualized Impact of Current Quarter Investments and Dispositions, Net (2) |
|
|
— |
|
Pro Forma Adjusted EBITDA |
|
$ |
86,848 |
|
|
|
|
|
|
Total Long-Term Debt |
|
$ |
605,351 |
|
Financing Costs, Net of Accumulated Amortization |
|
|
1,449 |
|
Cash and Cash Equivalents |
|
|
(8,551) |
|
Net Debt |
|
$ |
598,249 |
|
|
|
|
|
|
Net Debt to Pro Forma Adjusted EBITDA |
|
|
6.9 |
x |
(1) |
Includes non-recurring items including termination fees, forfeitures of tenant security deposits, and certain adjustments to estimates related to recently acquired property CAM reconciliations. |
(2) |
Reflects the pro forma annualized impact on Annualized Adjusted EBITDA of the Company’s investments and disposition activity during the three months ended June 30, 2025. |
Page 15
|
Second Quarter 2025 Investor Presentation The Exchange at Gwinnett | Atlanta, GA |
|
2 © CTO Realty Growth, Inc. | ctoreit.com $50M $51M $69M $97M $111M $134M 2020 2021 2022 2023 2024 Q2 2025 Annualized $496M $690M $919M $946M $1.3B $1.3B 1/1/2020 1/1/2021 1/1/2022 1/1/2023 1/1/2024 1/1/2025 Highlights Income Properties Revenues Enterprise Value As of June 30, 2025. Metrics based on ABR represent cash ABR excluding the impact of straight-line rent. 1. See reconciliation of our 2025 Core FFO and AFFO guidance to Net Income Attributable to the Company, per diluted share, in our Earnings Release on page 7. $0.45 Core FFO Per Share $213 Implied property value per square foot $19.35 Cash ABR PSF ~190,000 Square feet of comparable leasing activity 22% Comparable leasing spread 83% ABR from Georgia, Texas, Florida & North Carolina 93.9% Leased Occupancy $4.6M SNO Pipeline – 4.6% of in-place ABR 0.9% Quarterly same-property NOI growth $1.80 - $1.86 Guidance – Core FFO Per Diluted Share1 Q2 2025 Highlights 6/30/2025 |
|
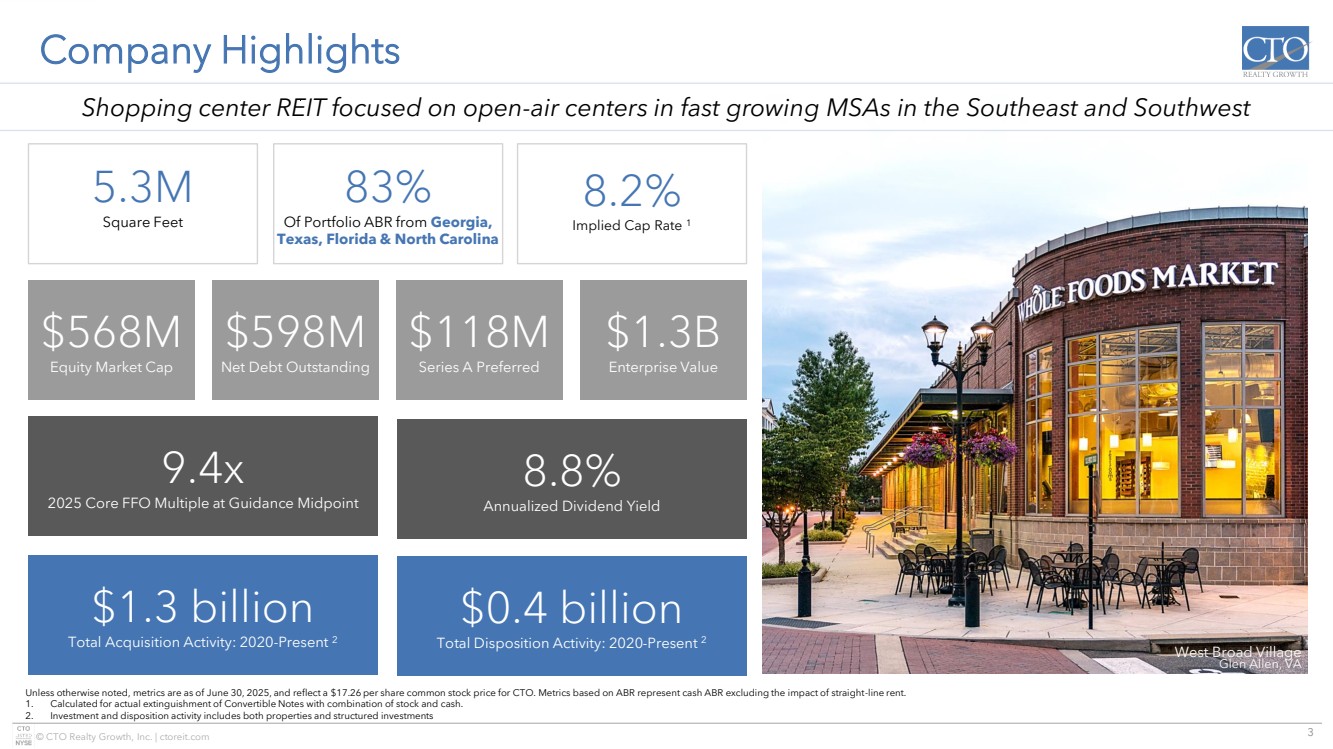
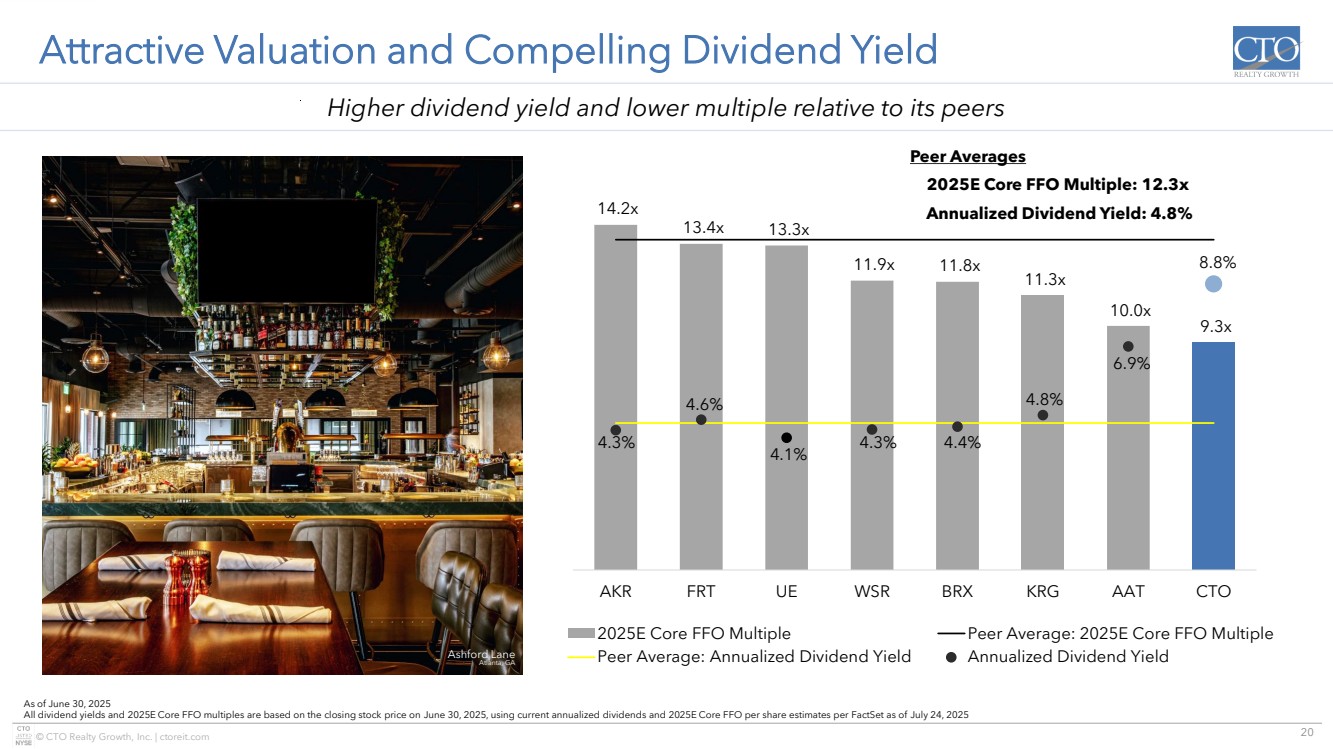
3 © CTO Realty Growth, Inc. | ctoreit.com Company Highlights Unless otherwise noted, metrics are as of June 30, 2025, and reflect a $17.26 per share common stock price for CTO. Metrics based on ABR represent cash ABR excluding the impact of straight-line rent. 1. Calculated for actual extinguishment of Convertible Notes with combination of stock and cash. 2. Investment and disposition activity includes both properties and structured investments West Broad Village Glen Allen, VA 5.3M Square Feet 83% Of Portfolio ABR from Georgia, Texas, Florida & North Carolina 8.2% Implied Cap Rate 1 8.8% Annualized Dividend Yield 9.4x 2025 Core FFO Multiple at Guidance Midpoint $0.4 billion Total Disposition Activity: 2020-Present 2 $1.3 billion Total Acquisition Activity: 2020-Present 2 $598M Net Debt Outstanding $118M Series A Preferred $1.3B Enterprise Value $568M Equity Market Cap Shopping center REIT focused on open-air centers in fast growing MSAs in the Southeast and Southwest |
|
4 © CTO Realty Growth, Inc. | ctoreit.com Portfolio by Asset Type 20% Grocery-Anchored Retail 48% if including shadow-anchored assets 34% Lifestyle 40% Power Center As of June 30, 2025 Percentages based on cash ABR excluding the impact of straight-line rent. Excludes 6% of ABR from other assets comprised of mixed-use asset, single tenant retail & single tenant office Madison Yards | Atlanta, GA The Shops at Legacy | Plano, TX Marketplace at Seminole | Sanford, FL |
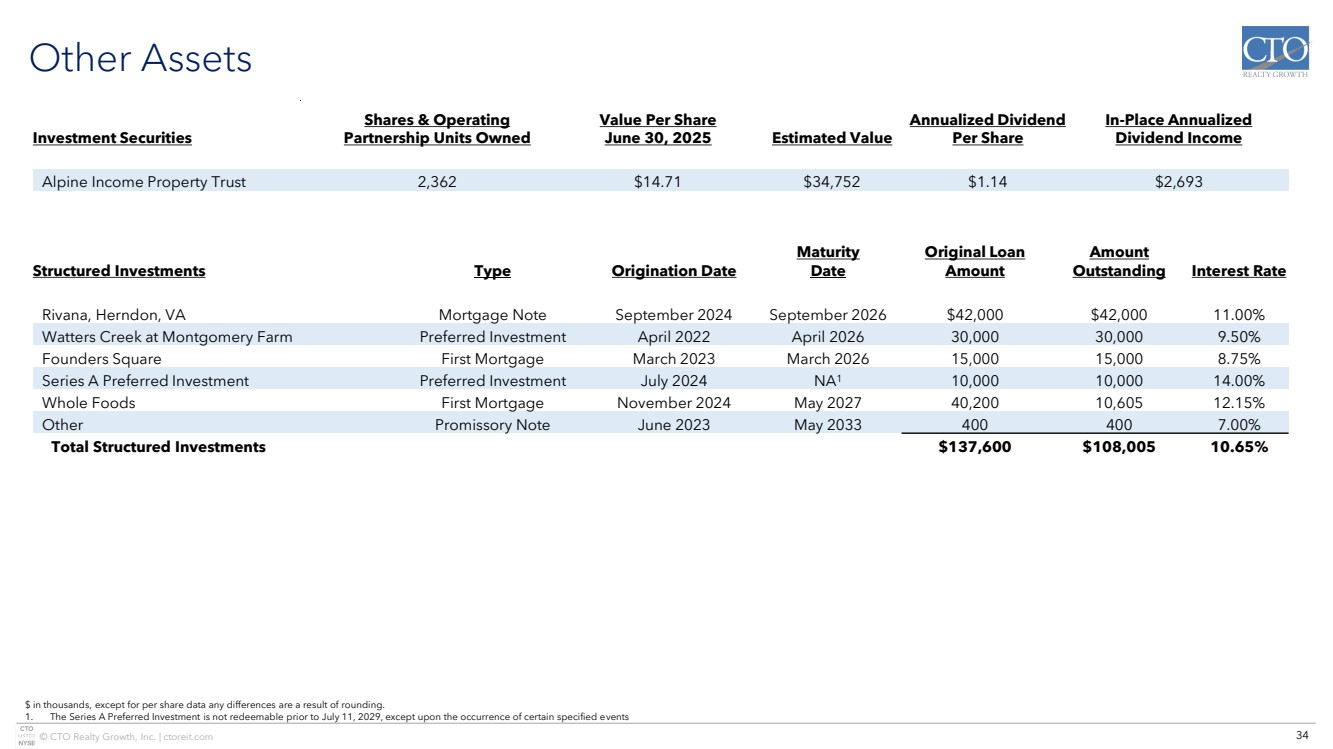
|
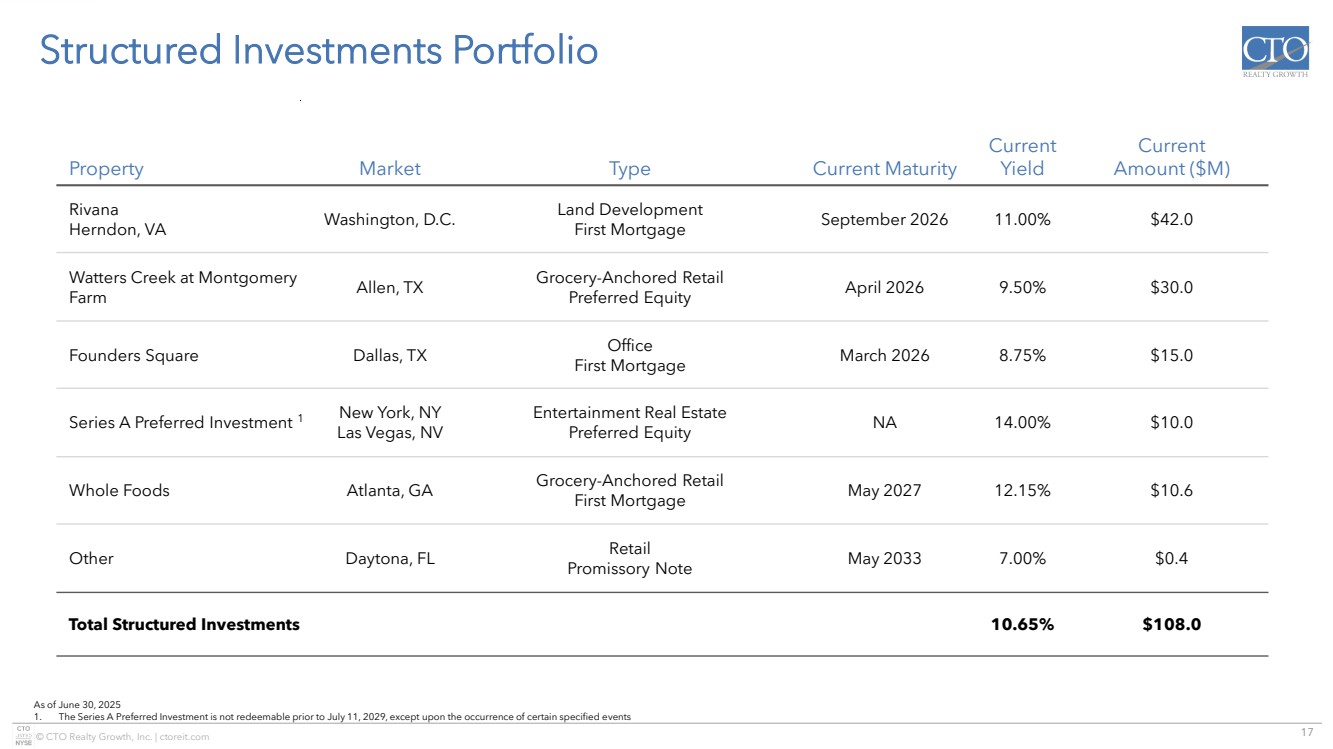
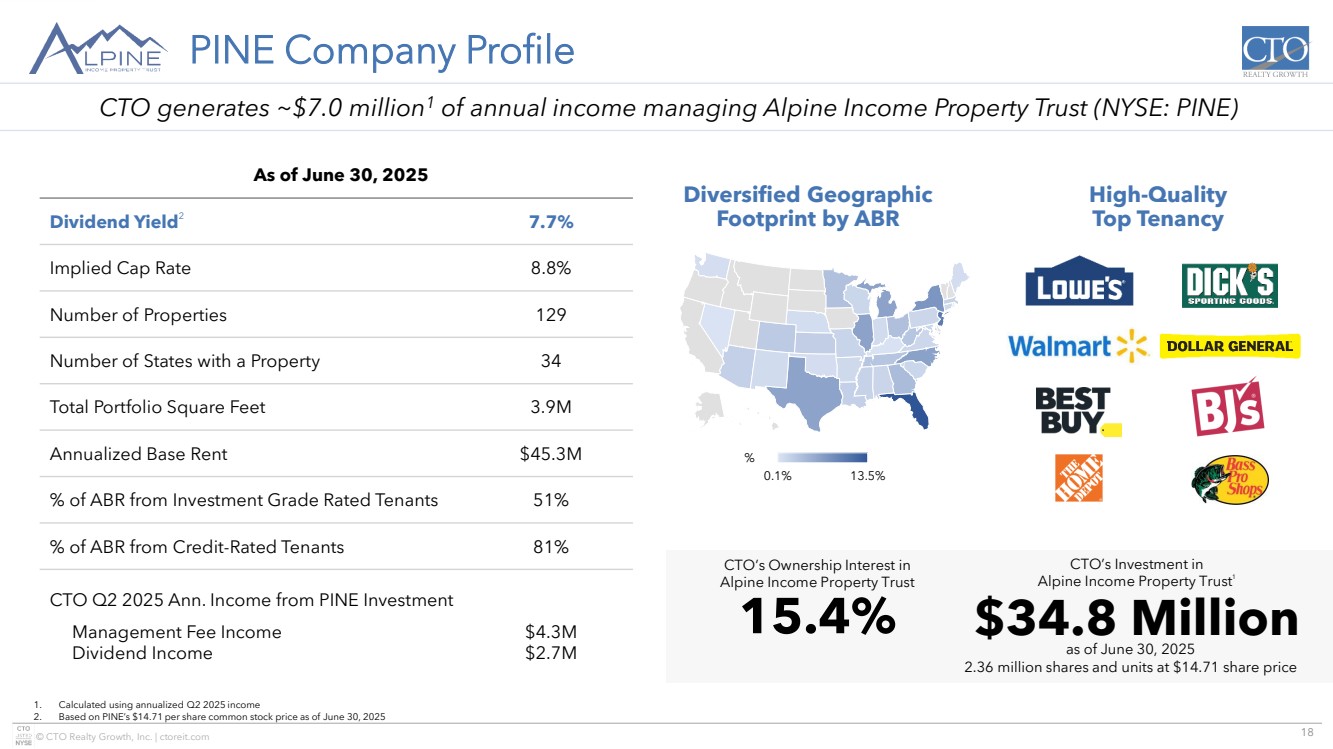
5 © CTO Realty Growth, Inc. | ctoreit.com Investment Strategy As of June 30, 2025 unless otherwise noted. 1. Also includes commercial loans secured by the borrower’s pledge of its ownership interest in an entity that owns real estate 2. Q2 2025 annualized metric comprised of $4.3 million of management fee income and $2.7 million of dividend income through CTO’s $34.8 million investment Ashford Lane | Atlanta, GA The Collection at Forsyth | Cumming, GA ▪ Focused on Southeast & Southwest U.S.: 83% of ABR comes from assets located in Georgia, Florida, Texas, and North Carolina ▪ Below Replacement Cost: Implied property value per square foot is $213, a discount to replacement cost ▪ Below Market Rents: 27% cash spreads on comparable leases year-to-date ▪ High Dividend: highest dividend yield in the shopping center sector ▪ Undervalued: the lowest core FFO multiples in the shopping center sector ▪ Focused on Lease-up and/or Repositioning Upside: Signed not opened pipeline is $4.6 million, or 4.6%, of current in-place cash rent ▪ Alternative Investments Provide High Yields: $108 million of commercial loans and investments at a blended 10.65% yield secured by real estate1 ▪ Alpine Income Property Trust (NYSE: PINE): CTO seeded and externally manages PINE, a pure-place net lease REIT, which generates ~$7.0 million of annual income2 |
|
6 © CTO Realty Growth, Inc. | ctoreit.com Strong Retail Leasing Execution As of June 30, 2025 1. Excludes newly leased units that were acquired as vacant, lease amendments, and office leases. Anchors Small Shops 6 YTD 2025 Square Feet New Leases 178,071 Renewals, Options & Extensions 161,246 Total Square Feet Executed 339,317 % of Portfolio Square Feet as of 6/30/2025 6% Comparable Cash Spread1 New Leases 81% Renewals, Options & Extensions 7% Blended 27% Occupancy at Quarter End Current Occupancy 90.2% Leased Occupancy 93.9% Spread 370 bps Strong tenant demand demonstrated by leasing growth 244k SF 95k SF Recently Executed Leases |
|
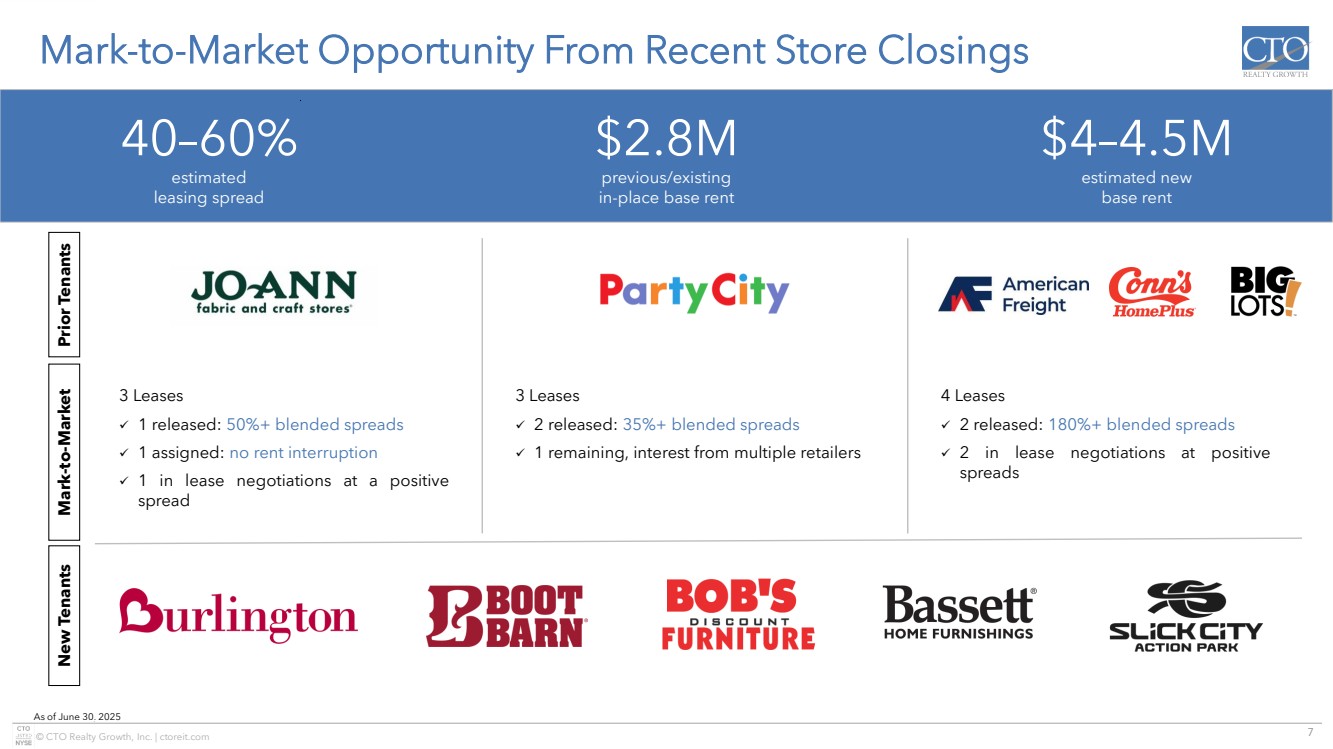
7 © CTO Realty Growth, Inc. | ctoreit.com Mark-to-Market Opportunity From Recent Store Closings As of June 30, 2025 $2.8M previous/existing in-place base rent 40–60% estimated leasing spread $4–4.5M estimated new base rent 3 Leases ✓ 1 released: 50%+ blended spreads ✓ 1 assigned: no rent interruption ✓ 1 in lease negotiations at a positive spread 3 Leases ✓ 2 released: 35%+ blended spreads ✓ 1 remaining, interest from multiple retailers 4 Leases ✓ 2 released: 180%+ blended spreads ✓ 2 in lease negotiations at positive spreads New Tenants Prior Tenants Mark-to-Market |
|
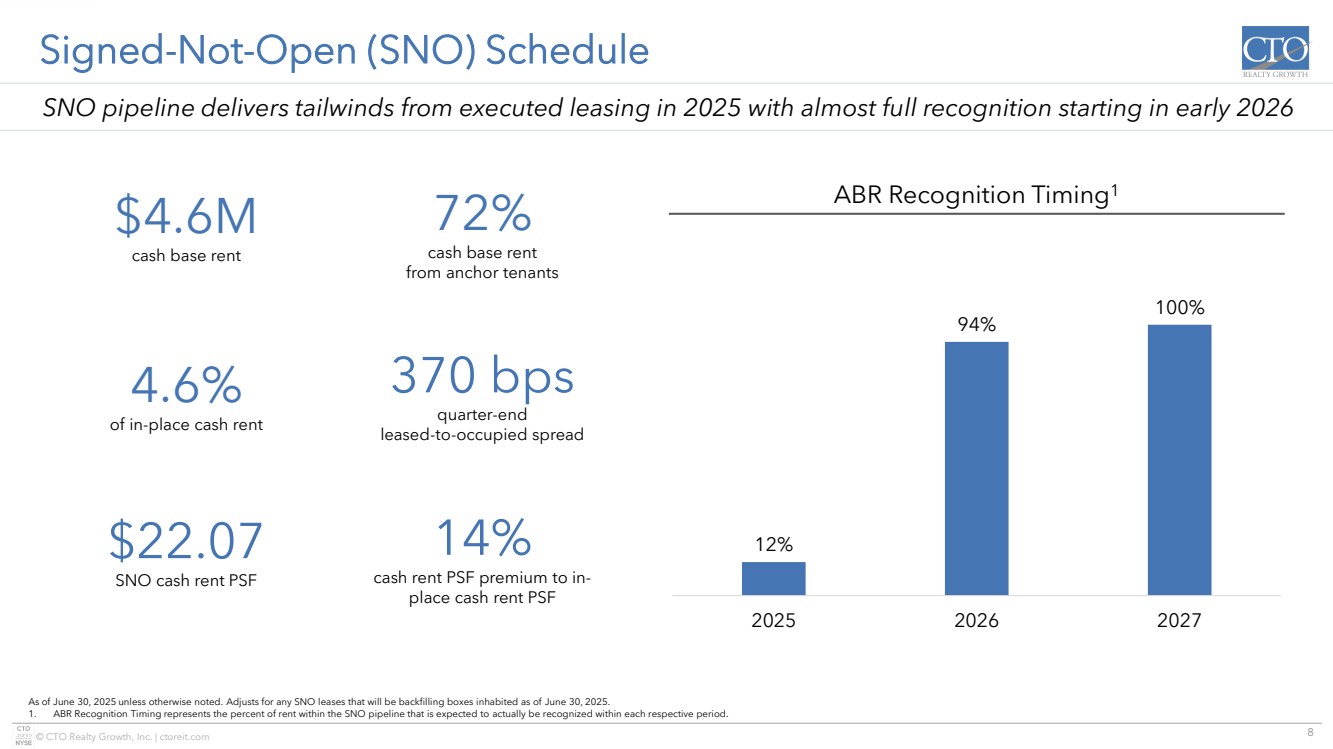
8 © CTO Realty Growth, Inc. | ctoreit.com Signed-Not-Open (SNO) Schedule As of June 30, 2025 unless otherwise noted. Adjusts for any SNO leases that will be backfilling boxes inhabited as of June 30, 2025. 1. ABR Recognition Timing represents the percent of rent within the SNO pipeline that is expected to actually be recognized within each respective period. SNO pipeline delivers tailwinds from executed leasing in 2025 with almost full recognition starting in early 2026 ABR Recognition Timing1 $4.6M cash base rent $22.07 SNO cash rent PSF 14% cash rent PSF premium to in-place cash rent PSF 4.6% of in-place cash rent 72% cash base rent from anchor tenants 370 bps quarter-end leased-to-occupied spread 12% 94% 100% 2025 2026 2027 |
|
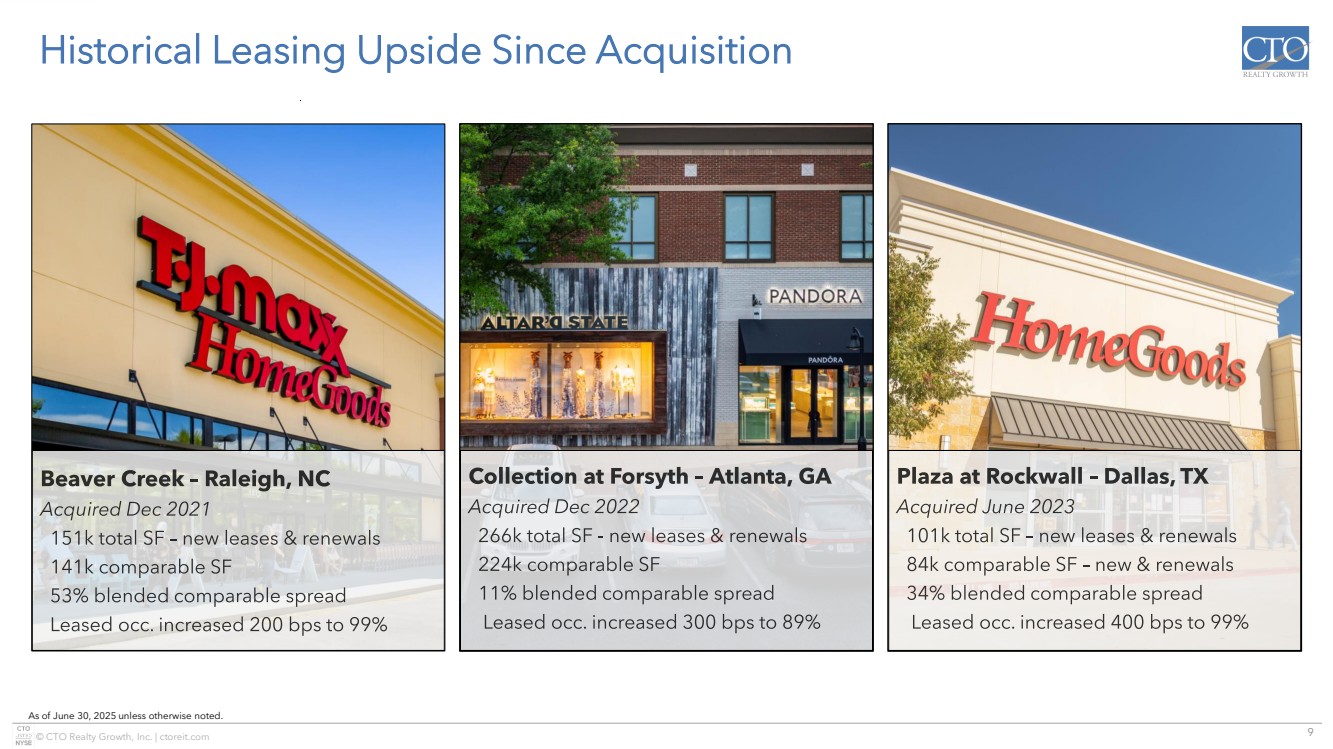
9 © CTO Realty Growth, Inc. | ctoreit.com Historical Leasing Upside Since Acquisition As of June 30, 2025 unless otherwise noted. |
|
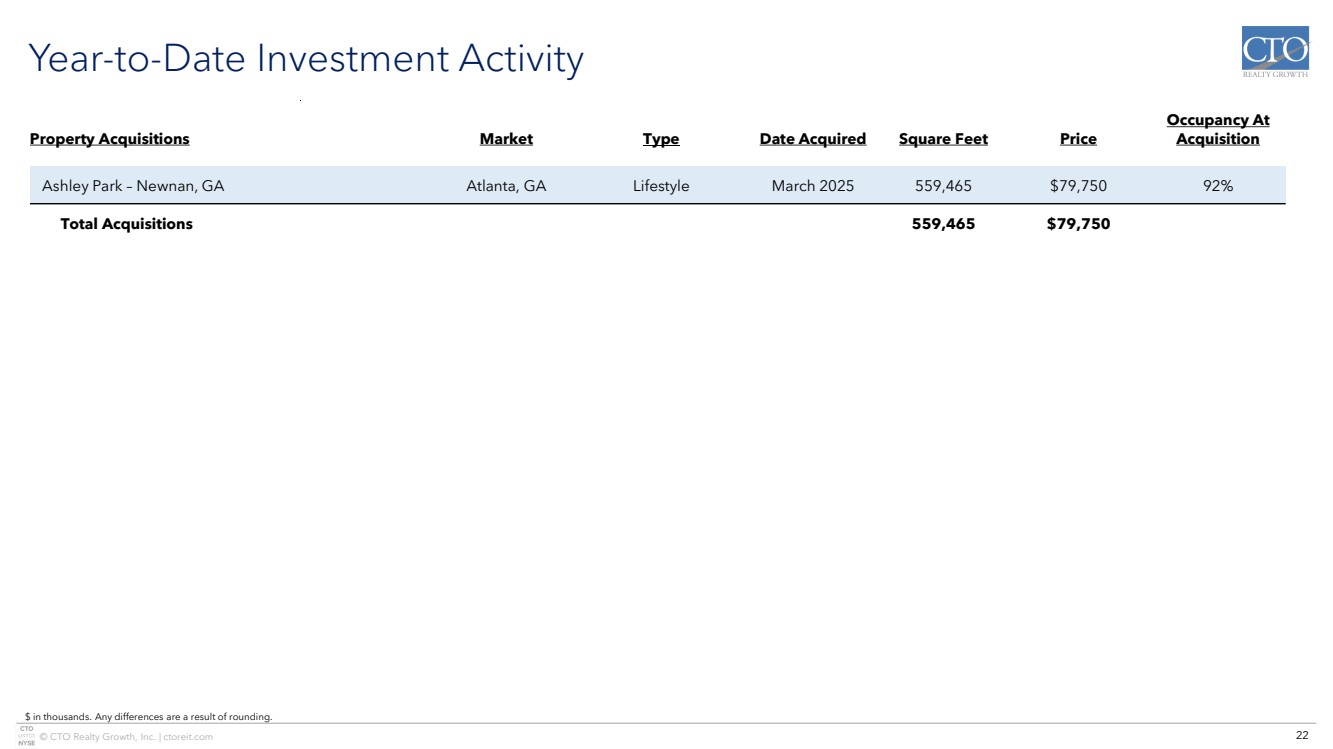
10 © CTO Realty Growth, Inc. | ctoreit.com Ashley Park ▪ Atlanta, GA ▪ 559,000 sf ▪ 61 acres ▪ 94% Q2 leased occupancy ▪ Closed March 2025 Lake Brandon Village ▪ Tampa, FL ▪ 102,000 sf ▪ 8 acres ▪ 100% Q2 leased occupancy ▪ Closed August 2024 Recent Acquisitions with Average Basis of $165 per SF As of June 30, 2025 unless otherwise noted. Carolina Pavilion ▪ Charlotte, NC ▪ 686,000 sf ▪ 72 acres ▪ 91% Q2 leased occupancy ▪ Closed August 2024 l Millenia Crossing ▪ Orlando, FL ▪ 100,000 sf ▪ 11 acres ▪ 93% Q2 leased occupancy ▪ Closed August 2024 Granada Plaza ▪ Tampa, FL ▪ 74,000 sf ▪ 7 acres ▪ 92% Q2 leased occupancy ▪ Closed December 2024 ▪ Orlando, FL ▪ 315,000 sf ▪ 41 acres ▪ 87% Q2 leased occupancy ▪ Closed March 2024 Marketplace at Seminole |
|
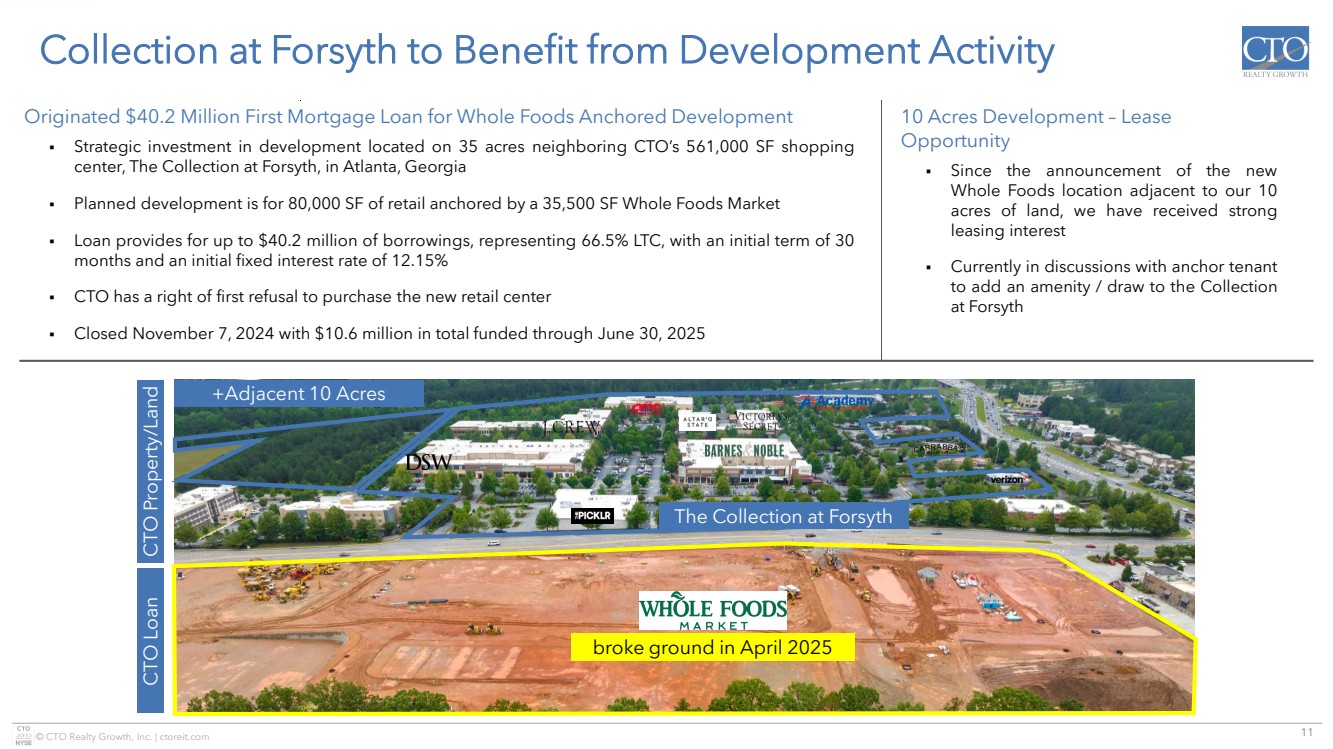
11 © CTO Realty Growth, Inc. | ctoreit.com Collection at Forsyth to Benefit from Development Activity Originated $40.2 Million First Mortgage Loan for Whole Foods Anchored Development ▪ Strategic investment in development located on 35 acres neighboring CTO’s 561,000 SF shopping center, The Collection at Forsyth, in Atlanta, Georgia ▪ Planned development is for 80,000 SF of retail anchored by a 35,500 SF Whole Foods Market ▪ Loan provides for up to $40.2 million of borrowings, representing 66.5% LTC, with an initial term of 30 months and an initial fixed interest rate of 12.15% ▪ CTO has a right of first refusal to purchase the new retail center ▪ Closed November 7, 2024 with $10.6 million in total funded through June 30, 2025 10 Acres Development – Lease Opportunity ▪ Since the announcement of the new Whole Foods location adjacent to our 10 acres of land, we have received strong leasing interest ▪ Currently in discussions with anchor tenant to add an amenity / draw to the Collection at Forsyth broke ground in April 2025 The Collection at Forsyth +Adjacent 10 Acres CTO Property/Land CTO Loan |
|
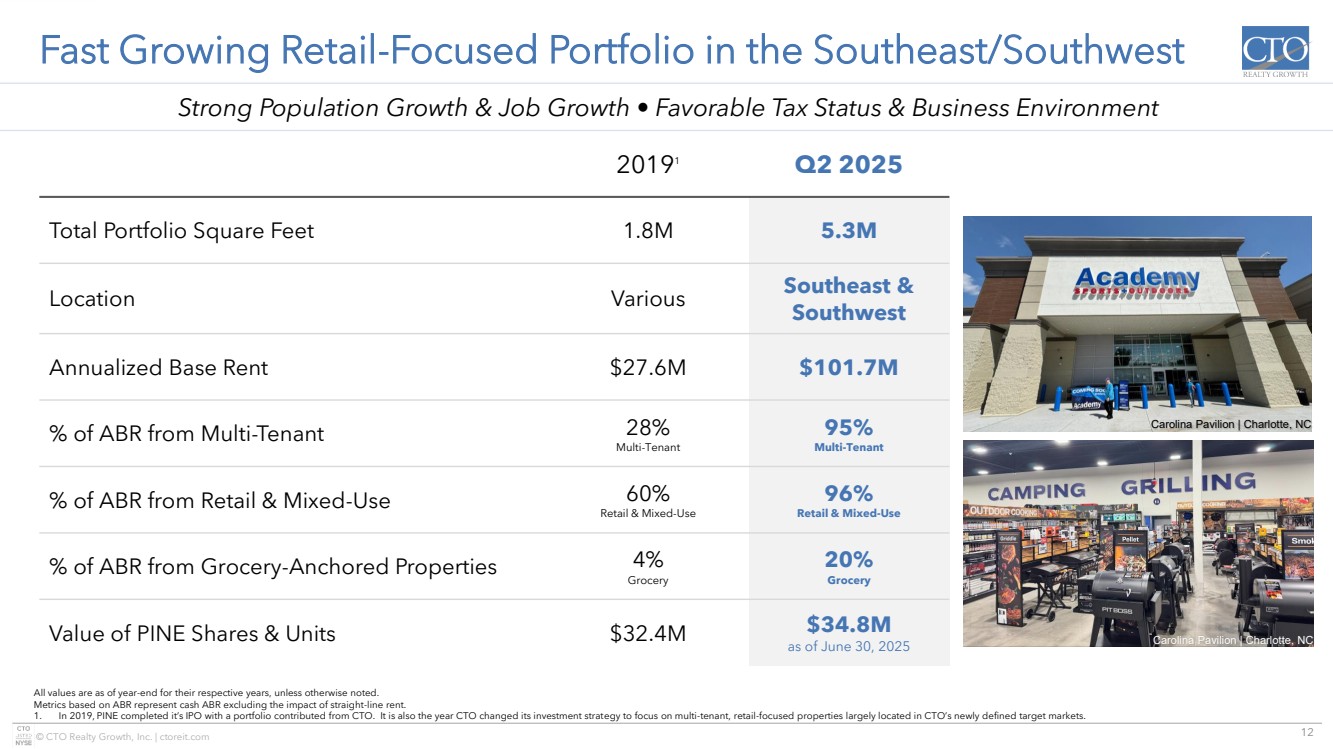
12 © CTO Realty Growth, Inc. | ctoreit.com Fast Growing Retail-Focused Portfolio in the Southeast/Southwest All values are as of year-end for their respective years, unless otherwise noted. Metrics based on ABR represent cash ABR excluding the impact of straight-line rent. 1. In 2019, PINE completed it’s IPO with a portfolio contributed from CTO. It is also the year CTO changed its investment strategy to focus on multi-tenant, retail-focused properties largely located in CTO’s newly defined target markets. 20191 Q2 2025 Total Portfolio Square Feet 1.8M 5.3M Location Various Southeast & Southwest Annualized Base Rent $27.6M $101.7M % of ABR from Multi-Tenant 28% Multi-Tenant 95% Multi-Tenant % of ABR from Retail & Mixed-Use 60% Retail & Mixed-Use 96% Retail & Mixed-Use % of ABR from Grocery-Anchored Properties 4% Grocery 20% Grocery Value of PINE Shares & Units $32.4M $34.8M as of June 30, 2025 Strong Population Growth & Job Growth • Favorable Tax Status & Business Environment Carolina Pavilion | Charlotte, NC Carolina Pavilion | Charlotte, NC |
|
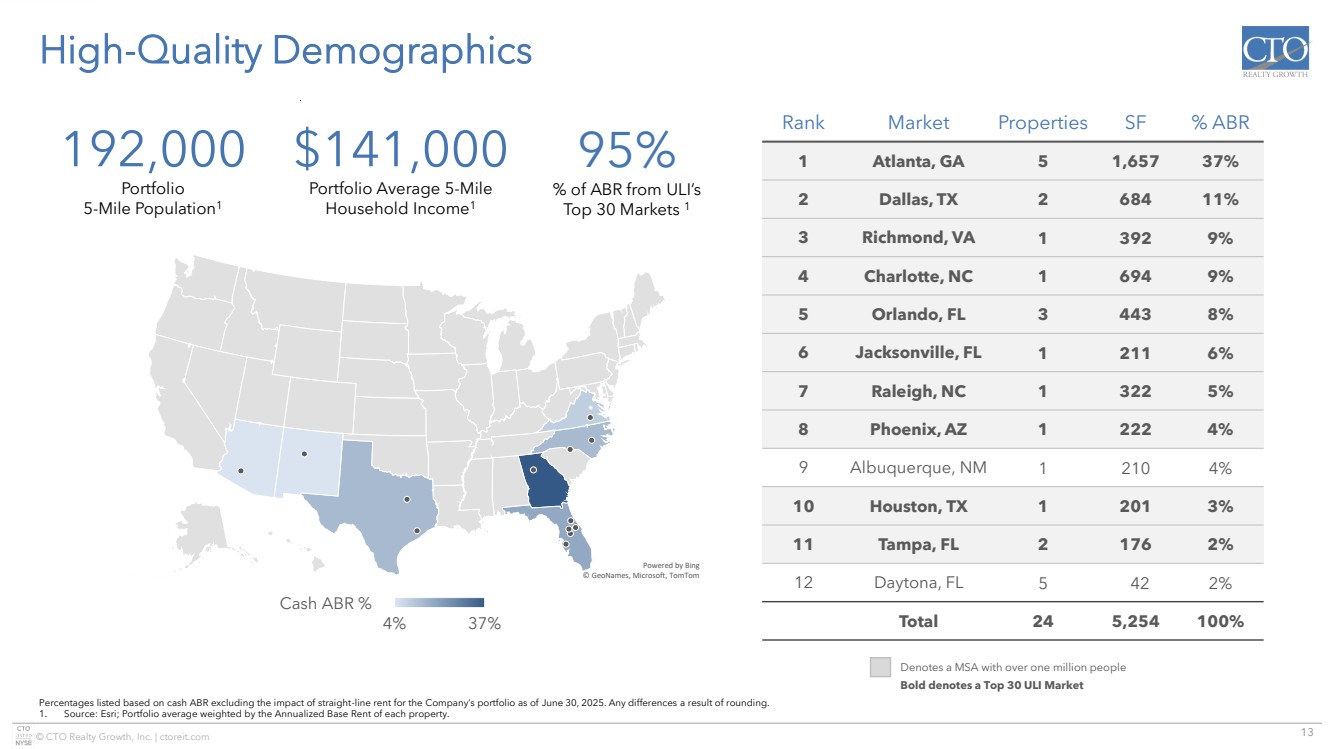
13 © CTO Realty Growth, Inc. | ctoreit.com © GeoNames, Microsoft, TomTom Powered by Bing 4% 37% Cash ABR % 95% % of ABR from ULI’s Top 30 Markets 1 High-Quality Demographics Percentages listed based on cash ABR excluding the impact of straight-line rent for the Company’s portfolio as of June 30, 2025. Any differences a result of rounding. 1. Source: Esri; Portfolio average weighted by the Annualized Base Rent of each property. Rank Market Properties SF % ABR 1 Atlanta, GA 5 1,657 37% 2 Dallas, TX 2 684 11% 3 Richmond, VA 1 392 9% 4 Charlotte, NC 1 694 9% 5 Orlando, FL 3 443 8% 6 Jacksonville, FL 1 211 6% 7 Raleigh, NC 1 322 5% 8 Phoenix, AZ 1 222 4% 9 Albuquerque, NM 1 210 4% 10 Houston, TX 1 201 3% 11 Tampa, FL 2 176 2% 12 Daytona, FL 5 42 2% Total 24 5,254 100% Denotes a MSA with over one million people Bold denotes a Top 30 ULI Market 192,000 Portfolio 5-Mile Population1 $141,000 Portfolio Average 5-Mile Household Income1 |
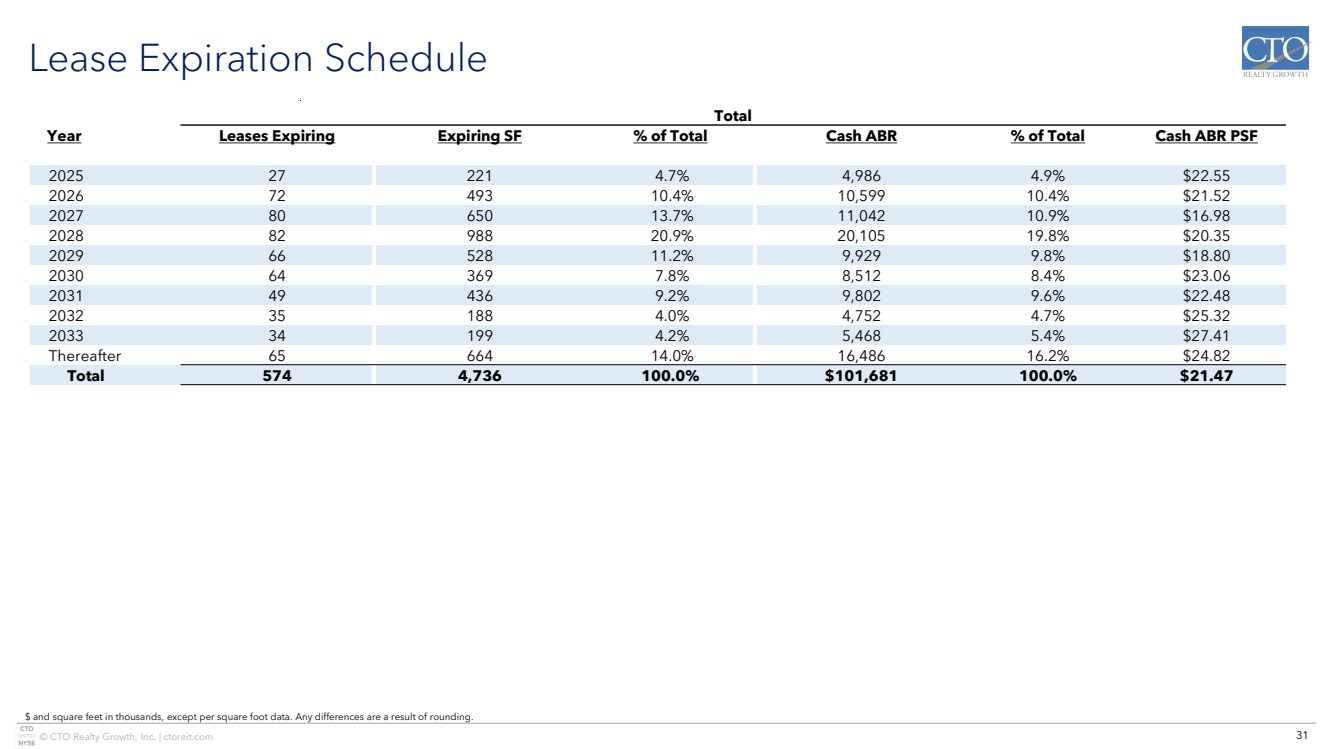
|
14 © CTO Realty Growth, Inc. | ctoreit.com Contractual Rent Bumps & Lease Rollover Schedule As of June 30, 2025. ABR metrics represent cash ABR excluding the impact of straight-line rent. 1. Percent of ABR from tenants or the parents of a tenant. A credit rated, or investment grade rated tenant (rating of BBB-, Baa3 or NAIC-2 or higher) is a tenant or the parent of a tenant with a credit rating from S&P Global Ratings, Moody’s Investors Service, Fitch Ratings or the National Associated of Insurance Commissioners (NAIC). Lease Rollover Schedule - % ABR 5% 10% 11% 20% 10% 8% 10% 5% 5% 6% 10% Non-Annual Contractual Rent Increases Contractual Rent 21% Increases At Extension 32% Annual Contractual Rent Increases 37% of Leases Have Contractual Rent Increases in the Current Lease Term 58% No Contractual Rent Increases 10% 90% of Leases Have Contractual Rent Increases Contractual Rent Bumps - % ABR |
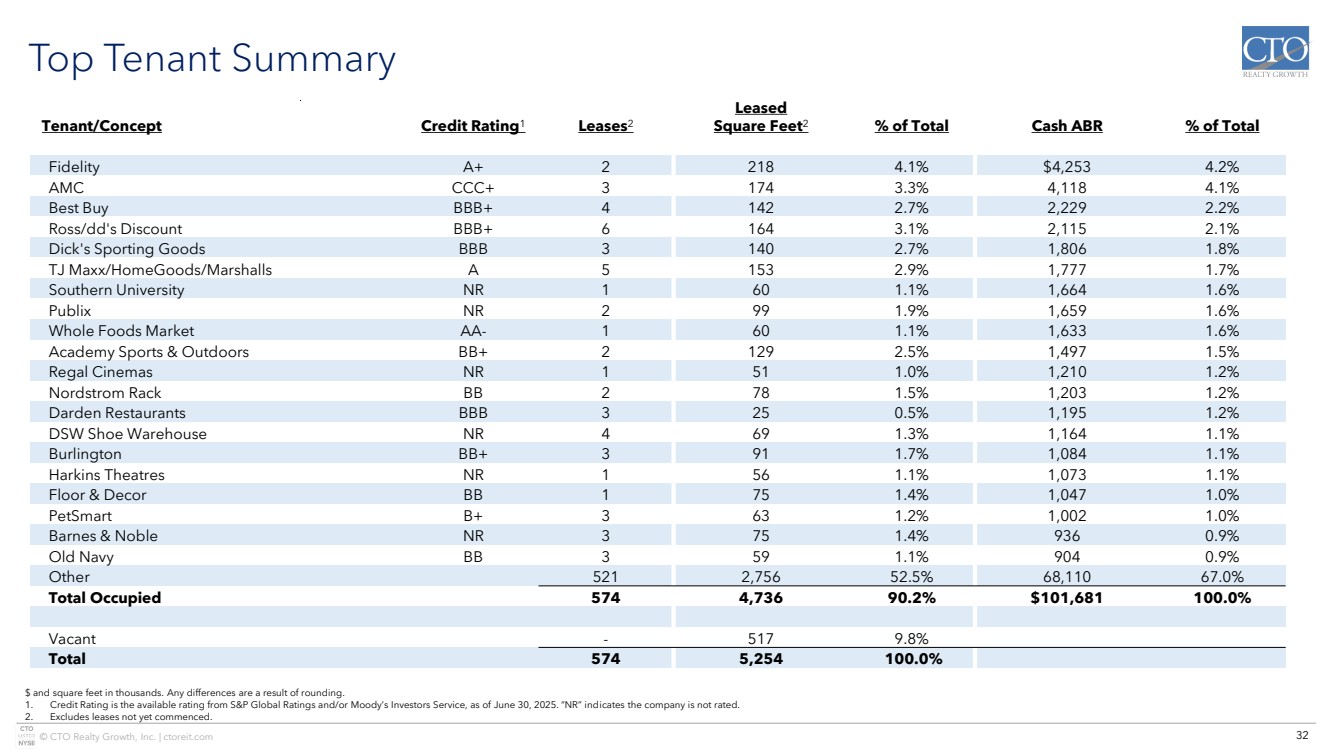
|
15 © CTO Realty Growth, Inc. | ctoreit.com Anchor 48% Small Shop 52% Tenant Overview Rank Tenant Credit Rating1 Leases SF (000s) ABR % 1 Fidelity A+ 2 218 4% 2 AMC CCC+ 3 174 4% 3 Best Buy BBB+ 4 142 2% 4 Ross/dd's Discount BBB+ 6 164 2% 5 Dick's Sporting Goods BBB 3 140 2% 6 TJ Maxx/HomeGoods/Marshalls A 5 153 2% 7 Southern University NR 1 60 2% 8 Publix NR 2 99 2% 9 Whole Foods Market AA- 1 60 2% 10 Academy Sports & Outdoors BB+ 2 129 1% 11 Regal Cinemas NR 1 51 1% 12 Nordstrom Rack BB 2 78 1% 13 Darden Restaurants BBB 3 25 1% 14 DSW Shoe Warehouse NR 4 69 1% 15 Burlington BB+ 3 91 1% 16 Harkins Theatres NR 1 56 1% 17 Floor & Decor BB 1 75 1% 18 PetSmart B+ 3 63 1% 19 Barnes & Noble NR 3 75 1% 20 Old Navy BB 3 59 1% Top 20 53 1,981 33% As of June 30, 2025 ABR metrics represent cash ABR excluding the impact of straight-line rent. 1. A credit rated, or investment grade rated tenant (rating of BBB-, Baa3 or NAIC-2 or higher) is a tenant or the parent of a tenant with a credit rating from S&P Global Ratings, Moody’s Investors Service, Fitch Ratings or the National Association of Insurance Commissioners (NAIC). Anchor & Small Shop Composition % of ABR Tenant Type % of ABR Single Tenant 5% Multi-Tenant 95% Denotes grocery |
|
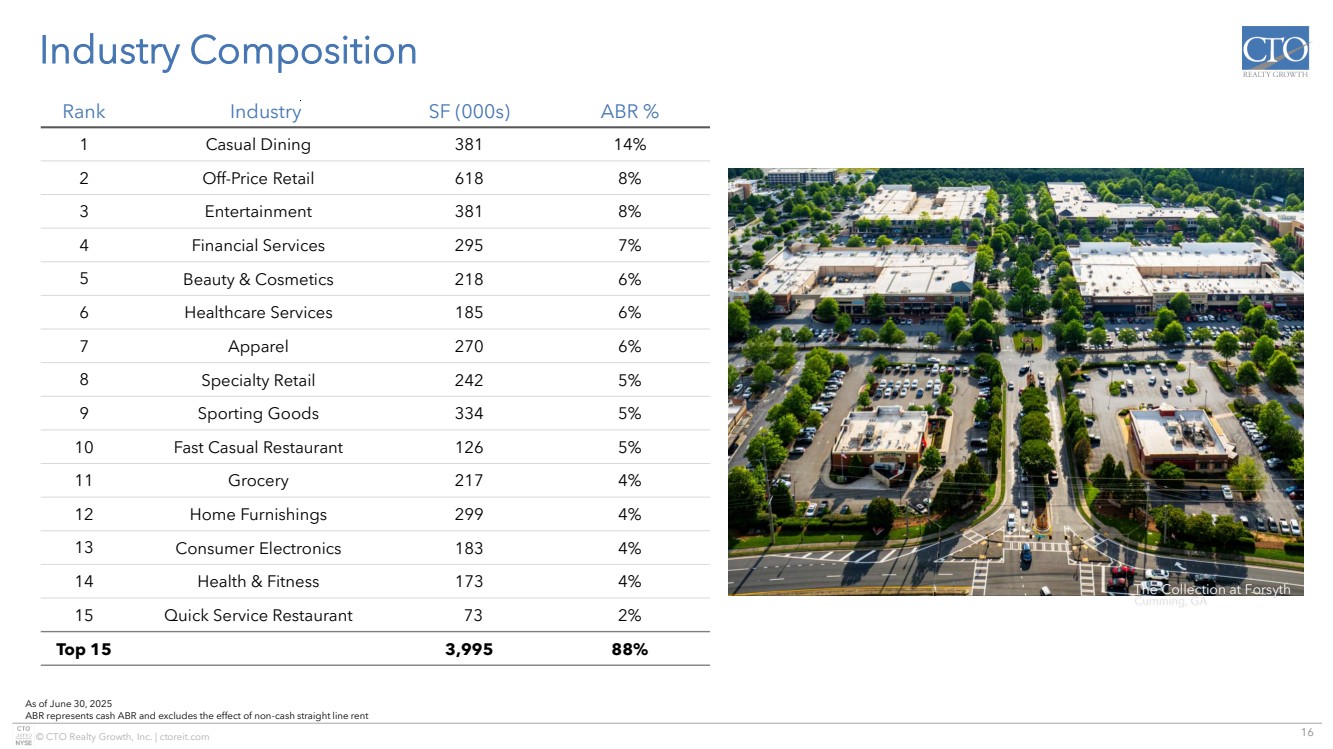
16 © CTO Realty Growth, Inc. | ctoreit.com Rank Industry SF (000s) ABR % 1 Casual Dining 381 14% 2 Off-Price Retail 618 8% 3 Entertainment 381 8% 4 Financial Services 295 7% 5 Beauty & Cosmetics 218 6% 6 Healthcare Services 185 6% 7 Apparel 270 6% 8 Specialty Retail 242 5% 9 Sporting Goods 334 5% 10 Fast Casual Restaurant 126 5% 11 Grocery 217 4% 12 Home Furnishings 299 4% 13 Consumer Electronics 183 4% 14 Health & Fitness 173 4% 15 Quick Service Restaurant 73 2% Top 15 3,995 88% Industry Composition As of June 30, 2025 ABR represents cash ABR and excludes the effect of non-cash straight line rent The Collection at Forsyth Cumming, GA |
|
17 © CTO Realty Growth, Inc. | ctoreit.com Structured Investments Portfolio Property Market Type Current Maturity Current Yield Current Amount ($M) Rivana Herndon, VA Washington, D.C. Land Development First Mortgage September 2026 11.00% $42.0 Watters Creek at Montgomery Farm Allen, TX Grocery-Anchored Retail Preferred Equity April 2026 9.50% $30.0 Founders Square Dallas, TX Office First Mortgage March 2026 8.75% $15.0 Series A Preferred Investment 1 New York, NY Las Vegas, NV Entertainment Real Estate Preferred Equity NA 14.00% $10.0 Whole Foods Atlanta, GA Grocery-Anchored Retail First Mortgage May 2027 12.15% $10.6 Other Daytona, FL Retail Promissory Note May 2033 7.00% $0.4 Total Structured Investments 10.65% $108.0 As of June 30, 2025 1. The Series A Preferred Investment is not redeemable prior to July 11, 2029, except upon the occurrence of certain specified events |
|
18 © CTO Realty Growth, Inc. | ctoreit.com © GeoNames, Microsoft, TomTom Powered by Bing 0.1% 13.5% % PINE Company Profile 1. Calculated using annualized Q2 2025 income 2. Based on PINE’s $14.71 per share common stock price as of June 30, 2025 As of June 30, 2025 Dividend Yield2 7.7% Implied Cap Rate 8.8% Number of Properties 129 Number of States with a Property 34 Total Portfolio Square Feet 3.9M Annualized Base Rent $45.3M % of ABR from Investment Grade Rated Tenants 51% % of ABR from Credit-Rated Tenants 81% CTO Q2 2025 Ann. Income from PINE Investment Management Fee Income Dividend Income $4.3M $2.7M Diversified Geographic Footprint by ABR High-Quality Top Tenancy 15.4% CTO’s Ownership Interest in Alpine Income Property Trust $34.8 Million CTO’s Investment in Alpine Income Property Trust1 as of June 30, 2025 2.36 million shares and units at $14.71 share price CTO generates ~$7.0 million1 of annual income managing Alpine Income Property Trust (NYSE: PINE) |
|
19 © CTO Realty Growth, Inc. | ctoreit.com - $100 $100 $83 $324 2025 2026 2027 2028 2029 Unsecured Secured Revolving Credit Facility Balance Sheet Exchange at Gwinnett Buford, GA As of June 30, 2025 1. As of June 30, 2025, the Company has $76.0 million of undrawn commitments, prior to borrowing base limitations, on our Revolving Credit Facility, and $8.6 million of cash on hand 2. The Company’s senior unsecured revolving credit facility matures in January 2027 and includes a one-year extension option to January 2028, subject to satisfaction of certain conditions; the maturity date reflected assumes the Company exercises the one-year extension option. 3. Interest rates are comprised of Daily or Term SOFR plus 10 bps and a pricing spread based on leverage as defined in the related credit agreement. Fixed rates reflect SOFR swaps, see the latest Form 10-Q and 10-K for more details regarding our SOFR swaps. As of 6/30/2025 Fixed/Float Initial Loan Maturity3 Weighted Average Rate Principal Price Plaza Mortgage Fixed Aug 2026 4.06% 18 2026 Term Loan Fixed Mar 2026 2.72% 65 Credit Facility Fixed Jan 2027 4.95% 150 Credit Facility Floating Jan 2027 5.20% 74 2027 Term Loan Fixed Jan 2027 2.80% 100 2028 Term Loan Fixed Jan 2028 5.18% 100 2029 Term Loan Fixed Sep 2029 4.68% 100 Total /Average 4.44% $607 Debt Maturities2 $85M liquidity1 47% net debt to total enterprise value (TEV) 6.9x net debt to pro forma adjusted EBITDA |
|
20 © CTO Realty Growth, Inc. | ctoreit.com 14.2x 13.4x 13.3x 11.9x 11.8x 11.3x 10.0x 9.3x 4.3% 4.6% 4.1% 4.3% 4.4% 4.8% 6.9% 8.8% – 2.0% 4.0% 6.0% 8.0% 10.0% 12.0% – 2.0x 4.0x 6.0x 8.0x 10.0x 12.0x 14.0x 16.0x AKR FRT UE WSR BRX KRG AAT CTO 2025E Core FFO Multiple Peer Average: 2025E Core FFO Multiple Peer Average: Annualized Dividend Yield Annualized Dividend Yield Attractive Valuation and Compelling Dividend Yield As of June 30, 2025 All dividend yields and 2025E Core FFO multiples are based on the closing stock price on June 30, 2025, using current annualized dividends and 2025E Core FFO per share estimates per FactSet as of July 24, 2025 Higher dividend yield and lower multiple relative to its peers Peer Averages 2025E Core FFO Multiple: 12.3x Annualized Dividend Yield: 4.8% Ashford Lane Atlanta, GA |
|
21 © CTO Realty Growth, Inc. | ctoreit.com 2025 Guidance Exchange at Gwinnett Buford, GA $ and shares outstanding in millions, except per share data. 1. See reconciliation of our 2025 Core FFO and AFFO guidance to Net Income Attributable to the Company, per diluted share, in our Earnings Release on page 7. 2. Includes the effects of bad debt expense, occupancy loss and costs associated with tenants in bankruptcy and/or tenant lease defaults. Before potential impact from income producing acquisitions and dispositions. Low High Core FFO Per Diluted Share1 $1.80 − $1.86 AFFO Per Diluted Share1 $1.93 − $1.98 The Company’s estimated Core FFO per diluted share and AFFO per diluted share for 2025 is as follows: The Company’s 2025 guidance includes but is not limited to the following assumptions: Low High Same-Property NOI Growth2 ~1.0% General and Administrative Expenses $17.5 Million − $18.0 Million Investments $100 Million − $200 Million Target Initial Investment Cash Yield 8.00% − 8.50% |
|
22 © CTO Realty Growth, Inc. | ctoreit.com Experienced Management Team Exchange at Gwinnett Buford, GA Yonder Yoga John P. Albright President & Chief Executive Officer ▪ Former Co-Head and Managing Director of Archon Capital, a Goldman Sachs Company; Executive Director of Merchant Banking – Investment Management at Morgan Stanley; and Managing Director of Crescent Real Estate (NYSE: CEI) Daniel E. Smith Senior Vice President, General Counsel & Corporate Secretary ▪ Former Vice President and Associate General Counsel of Goldman Sachs & Co. and Senior Vice President and General Counsel of Crescent Real Estate (NYSE: CEI) Philip R. Mays Senior Vice President, Chief Financial Officer & Treasurer ▪ Former Chief Financial Officer & Treasurer of Shadowbox Studios; EVP, Chief Financial Officer & Treasurer of Cedar Realty; and Vice President and Chief Accounting Officer of Federal Realty (NYSE: FRT) Steven R. Greathouse Senior Vice President & Chief Investment Officer ▪ Former Director of Finance for N3 Real Estate; Senior Associate of Merchant Banking – Investment Management at Morgan Stanley; and Senior Associate at Crescent Real Estate (NYSE: CEI) Lisa M. Vorakoun Senior Vice President & Chief Accounting Officer ▪ Former Assistant Finance Director of the City of DeLand, Florida and Audit Manager for James Moore & Company, an Accounting and Consulting Firm Matt J. Trau Vice President, Investments ▪ Former Senior Director of Transactions at ShopCore Properties; Senior Associate of Transactions at DDR Corp (currently Site Centers NYSE: SITC) Alexander M. Gordon Vice President, Leasing & Investments ▪ Former Senior Associate, Brokerage & Retail Advisory Services at CBRE (NYSE: CBRE) |
|
23 © CTO Realty Growth, Inc. | ctoreit.com Corporate Responsibility Exchange at Gwinnett Buford, GA Yonder Yoga Fully committed to sustainability, strong corporate governance, and meaningful corporate social responsibility programs. Social Responsibility Inclusive and Supportive Company Culture ▪ Dedicated to an inclusive and supportive office environment filled with diverse backgrounds and perspectives, with a demonstrated commitment to financial, mental and physical wellness Notable Community Outreach ▪ Numerous and diverse community outreach programs, supporting environmental, artistic, civil and social organizations in the community Corporate Governance ▪ Independent Chairman of the Board and 5 of 6 Directors classified as independent ▪ Annual election of all Directors ▪ Annual Board of Director evaluations ▪ Board oversees risk assessment/management, with oversight for specific areas of risk delegated to Board committees ▪ Stock ownership requirements for all Executive Management and Directors ▪ Prohibition against hedging and pledging CTO Realty Growth stock ▪ Robust policies and procedures for approval of related party transactions ▪ All team members adhere to a comprehensive Code of Business Conduct and Ethics policy |
|
24 © CTO Realty Growth, Inc. | ctoreit.com Environmental Responsibility Yonder Yoga Over the past ten years, CTO has planted approximately 170,000 pine trees in Florida and has restored over 700 acres of former industrial timberland. These 170,000 trees absorb more than 1,000 tons of carbon each year. Environmental Responsibility Committed Focus & Targeted Investment ▪ Committed to maintaining an environmentally conscious culture, the utilization of environmentally friendly & renewable products, and the promotion of sustainable business practices. Notable achievements: o Formed a conservation mitigation bank on approximately 2,500 acres of land, resulting in the land being barred from development permanently preserved o Invested in LED lighting, recycling and waste reduction strategies, programmable thermostats, energy management systems in our office and/or at our owned properties o Conveyed over 11,000 acres of land to the State of Florida to significantly enlarge the neighboring Tiger Bay State Forest Tenant Alignment ▪ Alignment with environmentally aware tenants who have strong sustainability programs and initiatives embedded into their corporate culture and business practices |
|
25 © CTO Realty Growth, Inc. | ctoreit.com Forward Looking Statements & Non-GAAP Financial Measures Forward Looking Statements Certain statements contained in this presentation (other than statements of historical fact) are forward-looking statements within the meaning of Section 27A of the Securities Act of 1933, as amended, and Section 21E of the Securities Exchange Act of 1934, as amended. Forward-looking statements can typically be identified by words such as “believe,” “estimate,” “expect,” “intend,” “anticipate,” “will,” “could,” “may,” “should,” “plan,” “potential,” “predict,” “forecast,” “project,” and similar expressions, as well as variations or negatives of these words. Although forward-looking statements are made based upon management’s present expectations and reasonable beliefs concerning future developments and their potential effect upon the Company, a number of factors could cause the Company’s actual results to differ materially from those set forth in the forward-looking statements. Such factors may include, but are not limited to: the Company’s ability to remain qualified as a REIT; the Company’s exposure to U.S. federal and state income tax law changes, including changes to the REIT requirements; general adverse economic and real estate conditions; macroeconomic and geopolitical factors, including but not limited to inflationary pressures, interest rate volatility, distress in the banking sector, global supply chain disruptions, and ongoing geopolitical war; credit risk associated with the Company investing in structured investments; the ultimate geographic spread, severity and duration of pandemics such as the COVID-19 Pandemic and its variants, actions that may be taken by governmental authorities to contain or address the impact of such pandemics, and the potential negative impacts of such pandemics on the global economy and the Company’s financial condition and results of operations; the inability of major tenants to continue paying their rent or obligations due to bankruptcy, insolvency or a general downturn in their business; the loss or failure, or decline in the business or assets of PINE; the completion of 1031 exchange transactions; the availability of investment properties that meet the Company’s investment goals and criteria; the uncertainties associated with obtaining required governmental permits and satisfying other closing conditions for planned acquisitions and sales; and the uncertainties and risk factors discussed in the Company’s Annual Report on Form 10-K for the fiscal year ended December 31, 2024 and other risks and uncertainties discussed from time to time in the Company’s filings with the U.S. Securities and Exchange Commission. There can be no assurance that future developments will be in accordance with management’s expectations or that the effect of future developments on the Company will be those anticipated by management. Readers are cautioned not to place undue reliance on these forward-looking statements, which speak only as of the date of this presentation. The Company undertakes no obligation to update the information contained in this presentation to reflect subsequently occurring events or circumstances. Non-GAAP Financial Measures Our reported results are presented in accordance with accounting principles generally accepted in the United States of America (“GAAP”). We also disclose Funds From Operations (“FFO”), Core Funds From Operations (“Core FFO”), Adjusted Funds From Operations (“AFFO”), Pro Forma Earnings Before Interest, Taxes, Depreciation and Amortization (“Pro Forma Adjusted EBITDA”), and Same-Property Net Operating Income (“Same-Property NOI”), each of which are non-GAAP financial measures. We believe these non-GAAP financial measures are useful to investors because they are widely accepted industry measures used by analysts and investors to compare the operating performance of REITs. FFO, Core FFO, AFFO, Pro Forma Adjusted EBITDA, and Same-Property NOI do not represent cash generated from operating activities and are not necessarily indicative of cash available to fund cash requirements; accordingly, they should not be considered alternatives to net income as a performance measure or cash flows from operating activities as reported on our statement of cash flows as a liquidity measure and should be considered in addition to, and not in lieu of, GAAP financial measures. We compute FFO in accordance with the definition adopted by the Board of Governors of the National Association of Real Estate Investment Trusts, or NAREIT. NAREIT defines FFO as GAAP net income or loss adjusted to exclude real estate related depreciation and amortization, as well as extraordinary items (as defined by GAAP) such as net gain or loss from sales of depreciable real estate assets, impairment write-downs associated with depreciable real estate assets and impairments associated with the implementation of current expected credit losses on commercial loans and investments at the time of origination, including the pro rata share of such adjustments of unconsolidated subsidiaries. The Company also excludes the gains or losses from sales of assets incidental to the primary business of the REIT which specifically include the sales of mitigation credits, subsurface sales, investment securities, and land sales, in addition to the mark-to-market of the Company’s investment securities and interest related to the 2025 Convertible Senior Notes, if the effect is dilutive. |
|
26 © CTO Realty Growth, Inc. | ctoreit.com Non-GAAP Financial Measures Non-GAAP Financial Measures (continued) To derive Core FFO, we modify the NAREIT computation of FFO to include other adjustments to GAAP net income related to gains and losses recognized on the extinguishment of debt, amortization of above- and below-market lease related intangibles, and other unforecastable market- or transaction-driven non-cash items, as well as adding back the interest related to the 2025 Convertible Senior Notes, if the effect is dilutive. To derive AFFO, we further modify the NAREIT computation of FFO and Core FFO to include other adjustments to GAAP net income related to non-cash revenues and expenses such as straight-line rental revenue, non-cash compensation, and other non-cash amortization. Such items may cause short-term fluctuations in net income but have no impact on operating cash flows or long-term operating performance. We use AFFO as one measure of our performance when we formulate corporate goals. To derive Pro Forma Adjusted EBITDA, GAAP net income or loss attributable to the Company is adjusted to exclude real estate related depreciation and amortization, as well as extraordinary items (as defined by GAAP) such as net gain or loss from sales of depreciable real estate assets, impairment write-downs associated with depreciable real estate assets, impairments associated with the implementation of current expected credit losses on commercial loans and investments at the time of origination, including the pro rata share of such adjustments of unconsolidated subsidiaries, non-cash revenues and expenses such as straight-line rental revenue, amortization of deferred financing costs, above- and below-market lease related intangibles, non-cash compensation, other non-recurring items such as termination fees, forfeitures of tenant security deposits, and certain adjustments to reconciliation estimates related to reimbursable revenue for recently acquired properties, and other non-cash income or expense. The Company also excludes the gains or losses from sales of assets incidental to the primary business of the REIT which specifically include the sales of mitigation credits, subsurface sales, investment securities, and land sales, in addition to the mark-to-market of the Company’s investment securities. Cash interest expense is also excluded from Pro Forma Adjusted EBITDA, and GAAP net income or loss is adjusted for the annualized impact of acquisitions, dispositions and other similar activities. To derive Same-Property NOI, GAAP net income or loss attributable to the Company is adjusted to exclude real estate related depreciation and amortization, as well as extraordinary items (as defined by GAAP) such as net gain or loss from sales of depreciable real estate assets, impairment write-downs associated with depreciable real estate assets, impairments associated with the implementation of current expected credit losses on commercial loans and investments at the time of origination, including the pro rata share of such adjustments of unconsolidated subsidiaries, non-cash revenues and expenses such as straight-line rental revenue, amortization of deferred financing costs, above- and below-market lease related intangibles, non-cash compensation, other non-recurring items such as termination fees, forfeitures of tenant security deposits, and certain adjustments to reconciliation estimates related to reimbursable revenue for recently acquired properties, and other non-cash income or expense. Interest expense, general and administrative expenses, investment and other income or loss, income tax benefit or expense, real estate operations revenues and direct cost of revenues, management fee income, and interest income from commercial loans and investments are also excluded from Same-Property NOI. GAAP net income or loss is further adjusted to remove the impact of properties that were not owned for the full current and prior year reporting periods presented. Cash rental income received under the leases pertaining to the Company’s assets that are presented as commercial loans and investments in accordance with GAAP is also used in lieu of the interest income equivalent. FFO is used by management, investors and analysts to facilitate meaningful comparisons of operating performance between periods and among our peers primarily because it excludes the effect of real estate depreciation and amortization and net gains or losses on sales, which are based on historical costs and implicitly assume that the value of real estate diminishes predictably over time, rather than fluctuating based on existing market conditions. We believe that Core FFO and AFFO are additional useful supplemental measures for investors to consider because they will help them to better assess our operating performance without the distortions created by other non-cash revenues or expenses. We also believe that Pro Forma Adjusted EBITDA is an additional useful supplemental measure for investors to consider as it allows for a better assessment of our operating performance without the distortions created by other non-cash revenues, expenses or certain effects of the Company’s capital structure on our operating performance. We use Same-Property NOI to compare the operating performance of our assets between periods. It is an accepted and important measurement used by management, investors and analysts because it includes all property-level revenues from the Company’s properties, less operating and maintenance expenses, real estate taxes and other property-specific expenses (“Net Operating Income” or “NOI”) of properties that have been owned and stabilized for the entire current and prior year reporting periods. Same-Property NOI attempts to eliminate differences due to the acquisition or disposition of properties during the particular period presented, and therefore provides a more comparable and consistent performance measure for the comparison of the Company’s properties. FFO, Core FFO, AFFO, Pro Forma Adjusted EBITDA, and Same-Property NOI may not be comparable to similarly titled measures employed by other companies. |
|
27 © CTO Realty Growth, Inc. | ctoreit.com References References and terms used in this presentation that are in addition to terms defined in the Non-GAAP Financial Measures include: ▪ This presentation was published on July 29, 2025. ▪ All information is as of June 30, 2025, unless otherwise noted. ▪ Any calculation differences are assumed to be a result of rounding. ▪ “2025 Guidance” in this presentation is based on the 2025 Guidance provided in the Company’s Second Quarter 2025 Operating Results press release filed on July 29, 2025. ▪ “Alpine” or “PINE” refers to Alpine Income Property Trust, a publicly traded net lease REIT traded on the New York Stock Exchange under the ticker symbol PINE. ▪ “Annualized Base Rent”, “ABR” or “Rent” and the statistics based on ABR are calculated based on the current portfolio and represent straight-line rent calculated in accordance with GAAP. ▪ “Annualized Cash Base Rent”, “Cash ABR” and the statistics based on Cash ABR are calculated based on the current portfolio and represent the annualized cash base rent calculated in accordance with GAAP due from the tenants at a specific point in time. ▪ “Credit Rated” is a tenant or the parent of a tenant with a credit rating from S&P Global Ratings, Moody’s Investors Service, Fitch Ratings or the National Association of Insurance Commissioners (NAIC) (together, the “Major Rating Agencies”). The Company defines an Investment Grade Rated Tenant as a tenant or the parent of a tenant with a credit rating from S&P Global Ratings, Moody’s Investors Service, Fitch Ratings or the National Association of Insurance Commissioners of Baa3, BBB-, or NAIC-2 or higher. If applicable, in the event of a split rating between S&P Global Ratings and Moody’s Investors Services, the Company utilizes the higher of the two ratings as its reference point as to whether a tenant is defined as an Investment Grade Rated Tenant. ▪ “Dividend” or “Dividends”, subject to the required dividends to maintain the Company’s qualification as a REIT, are set by the Board of Directors and declared on a quarterly basis and there can be no assurances as to the likelihood or number of dividends in the future. ▪ “Investment in Alpine Income Property Trust” or “Alpine Investment” or “PINE Ownership” is calculated based on the 2,362,475 common shares and partnership units CTO owns in PINE and is based on PINE’s closing stock price as of the referenced period on the respective slide. ▪ “Leased Occupancy” refers to space that is currently leased but for which rent payments have not yet commenced. ▪ “MSA” or “Metropolitan Statistical Area” is a region that consists of a city and surrounding communities that are linked by social and economic factors, as established by the U.S. Office of Management and Budget. The names of the MSA have been shortened for ease of reference. ▪ “Net Debt” is calculated as total long-term debt as presented on the face of the balance sheet; plus financing costs, net of accumulated amortization and unamortized convertible debt discount; less cash, restricted cash and cash equivalents. ▪ “Net Operating Income” or “NOI” is revenues from all income properties less operating expense, maintenance expense, real estate taxes and rent expense. ▪ “Total Enterprise Value” is calculated as the Company’s Total Common Shares Outstanding multiplied by the common stock price; plus the par value of the Series A perpetual preferred equity outstanding and Net Debt. |
|
28 © CTO Realty Growth, Inc. | ctoreit.com Consolidated Statements of Operations CTO Realty Growth, Inc. Three Months Ended Six Months Ended (Unaudited, in thousands, except share, per share and dividend data) June 30, June 30, June 30, June 30, 2025 2024 2025 2024 Revenues Income Properties $ 33,375 $ 25,878 $ 65,047 $ 50,501 Management Fee Income 1,247 1,131 2,425 2,236 Interest Income From Commercial Loans and Investments 3,016 1,441 5,977 2,792 Real Estate Operations — 395 — 1,443 Total Revenues 37,638 28,845 73,449 56,972 Direct Cost of Revenues Income Properties (10,178) (8,080) (19,069) (14,833) Real Estate Operations — (259) — (1,078) Total Direct Cost of Revenues (10,178) (8,339) (19,069) (15,911) General and Administrative Expenses (4,448) (3,459) (9,131) (7,675) Provision for Impairment — (67) — (115) Depreciation and Amortization (15,294) (11,549) (29,658) (22,480) Total Operating Expenses (29,920) (23,414) (57,858) (46,181) Gain on Disposition of Assets — — — 9,163 Loss on Extinguishment of Debt (20,396) — (20,396) — Other Gain (Loss) (20,396) — (20,396) 9,163 Total Operating Income (Loss) (12,678) 5,431 (4,805) 19,954 Investment and Other Income (Loss) (3,687) 1,429 (3,112) (1,830) Interest Expense (6,859) (5,604) (12,995) (11,133) Income (Loss) Before Income Tax Benefit (Expense) (23,224) 1,256 (20,912) 6,991 Income Tax Benefit (Expense) (194) (73) (245) 34 Net Income (Loss) Attributable to the Company (23,418) 1,183 (21,157) 7,025 Distributions to Preferred Stockholders (1,878) (1,871) (3,756) (3,058) Net Income (Loss) Attributable to Common Stockholders $ (25,296) $ (688) $ (24,913) $ 3,967 Per Share Information: Basic and Diluted Net Income (Loss) Attributable to Common Stockholders $ (0.77) $ (0.03) $ (0.78) $ 0.17 Weighted Average Number of Common Shares Basic 32,678,771 22,787,252 32,118,982 22,669,246 Diluted 32,727,831 22,828,148 32,174,574 22,674,796 Dividends Declared and Paid - Preferred Stock $ 0.40 $ 0.40 $ 0.80 $ 0.80 Dividends Declared and Paid - Common Stock $ 0.38 $ 0.38 $ 0.76 $ 0.76 |
|
29 © CTO Realty Growth, Inc. | ctoreit.com Non-GAAP Financial Measures 1. For the three and six months ended June 30, 2025 and June 30, 2024, interest related to the 2025 Notes was excluded from net income (loss) attributable to the Company to derive FFO, as the impact to net income (loss) attributable to common stockholders would be anti-dilutive. Further, the weighted average shares used to compute per share amounts for FFO Attributable to Common Stockholders per Common Share – Diluted, Core FFO Attributable to Common Stockholders per Common Share - Diluted, and AFFO Attributable to Common Stockholders per Common Share - Diluted do not reflect any dilution related to the ultimate settlement of the 2025 Notes, other than as described below. The 2025 Notes were settled during the six months ended June 30, 2025 and the Company issued 1,089,555 shares of the Company’s common stock in connection with the settlement, therefore the weighted average impact of the issued shares were included in the denominator for this measure for the three and six months ended June 30, 2025. CTO Realty Growth, Inc. Three Months Ended Six Months Ended (Unaudited, in thousands, except share, per share and dividend data) June 30, 2025 June 30, 2024 June 30, 2025 June 30, 2024 Net Income (Loss) Attributable to the Company $ (23,418) $ 1,183 $ (21,157) $ 7,025 Add Back: Effect of Dilutive Interest Related to 2025 Notes (1) — — — — Net Income (Loss) Attributable to the Company, If-Converted $ (23,418) $ 1,183 $ (21,157) $ 7,025 Depreciation and Amortization of Real Estate 15,277 11,532 29,623 22,447 Gain on Disposition of Assets — — — (9,163) Gain on Disposition of Other Assets — (139) — (370) Provision for Impairment — 67 — 115 Realized and Unrealized Loss (Gain) on Investment Securities 4,549 (663) 4,714 3,376 Funds from Operations $ (3,592) $ 11,980 $ 13,180 $ 23,430 Distributions to Preferred Stockholders (1,878) (1,871) (3,756) (3,058) Funds From Operations Attributable to Common Stockholders $ (5,470) $ 10,109 $ 9,424 $ 20,372 Loss on Extinguishment of Debt 20,396 — 20,396 — Amortization of Intangibles to Lease Income (267) 244 (716) 718 Less: Effect of Dilutive Interest Related to 2025 Notes (1) — — — — Core Funds From Operations Attributable to Common Stockholders $ 14,659 $ 10,353 $ 29,104 $ 21,090 Adjustments: Straight-Line Rent Adjustment (712) (346) (1,285) (1,039) Other Depreciation and Amortization (1) (3) (2) (7) Amortization of Loan Costs, Discount on Convertible Debt, and Capitalized Interest 318 297 685 518 Non-Cash Compensation 1,003 750 2,286 2,137 Adjusted Funds From Operations Attributable to Common Stockholders $ 15,267 $ 11,051 $ 30,788 $ 22,699 FFO Attributable to Common Stockholders per Common Share - Diluted (1) $ (0.17) $ 0.44 $ 0.29 $ 0.90 Core FFO Attributable to Common Stockholders per Common Share - Diluted (1) $ 0.45 $ 0.45 $ 0.90 $ 0.93 AFFO Attributable to Common Stockholders per Common Share - Diluted(1) $ 0.47 $ 0.48 $ 0.96 $ 1.00 |
|
30 © CTO Realty Growth, Inc. | ctoreit.com Same-Property NOI Reconciliation 1. Includes non-recurring items including termination fees, forfeitures of tenant security deposits, and certain adjustments to estimates related to recently acquired property CAM reconciliations. CTO Realty Growth, Inc. Three Months Ended Six Months Ended (Unaudited, in thousands) June 30, 2025 June 30, 2024 June 30, 2025 June 30, 2024 Net Income (Loss) Attributable to the Company $ (23,418) $ 1,183 $ (21,157) $ 7,025 Gain on Disposition of Assets — — — (9,163) Loss on Extinguishment of Debt 20,396 — 20,396 — Provision for Impairment — 67 — 115 Depreciation and Amortization 15,294 11,549 29,658 22,480 Amortization of Intangibles to Lease Income 267 (244) 716 (718) Straight-Line Rent Adjustment 712 346 1,285 1,039 Accretion of Tenant Contribution 13 13 26 26 Interest Expense 6,859 5,604 12,995 11,133 General and Administrative Expenses 4,448 3,459 9,131 7,675 Investment and Other Loss (Income) 3,687 (1,429) 3,112 1,830 Income Tax Expense (Benefit) 194 73 245 (34) Real Estate Operations Revenues — (395) — (1,443) Real Estate Operations Direct Cost of Revenues — 259 — 1,078 Management Fee Income (1,247) (1,131) (2,425) (2,236) Interest Income From Commercial Loans and Investments (3,016) (1,441) (5,977) (2,792) Other Non-Recurring Items (1) (97) (303) (207) (553) Less: Impact of Properties Not Owned for the Full Reporting Period (6,545) (214) (14,256) (2,732) Same-Property NOI $ 17,547 $ 17,396 $ 33,542 $ 32,730 |
|
31 © CTO Realty Growth, Inc. | ctoreit.com Net Debt to Pro Forma Adjusted EBITDA 1. Includes non-recurring items including termination fees, forfeitures of tenant security deposits, and certain adjustments to estimates related to recently acquired property CAM reconciliations. 2. Reflects the pro forma annualized impact on Annualized Adjusted EBITDA of the Company’s investments and disposition activity during the three months ended June 30, 2025. CTO Realty Growth, Inc. Three Months Ended (Unaudited, in thousands) June 30, 2025 Net Loss Attributable to the Company $ (23,418) Depreciation and Amortization of Real Estate 15,277 Unrealized Loss & Realized Gain on Investment Securities 4,549 Distributions to Preferred Stockholders (1,878) Loss on Extinguishment of Debt 20,396 Amortization of Intangibles to Lease Income (267) Straight-Line Rent Adjustment (712) Other Depreciation and Amortization (1) Amortization of Loan Costs, Discount on Convertible Debt, and Capitalized Interest 318 Non-Cash Compensation 1,003 Other Non-Recurring Items (1) (97) Interest Expense, Net of Amortization of Loan Costs and Discount on Convertible Debt 6,542 Adjusted EBITDA $ 21,712 Annualized Adjusted EBITDA $ 86,848 Pro Forma Annualized Impact of Current Quarter Investments and Dispositions, Net (2) — Pro Forma Adjusted EBITDA $ 86,848 Total Long-Term Debt $ 605,351 Financing Costs, Net of Accumulated Amortization 1,449 Cash and Cash Equivalents (8,551) Net Debt $ 598,249 Net Debt to Pro Forma Adjusted EBITDA 6.9 x |
|
Investor Inquiries: ir@ctoreit.com |
|
© CTO Realty Growth, Inc. | ctoreit.com Ashley Park Atlanta, GA Supplemental Reporting Information Q2 2025 |
|
© CTO Realty Growth, Inc. | ctoreit.com 2 Table of Contents Second Quarter 2025 Earnings Release 4 Key Financial Information ▪ Consolidated Balance Sheets 14 ▪ Consolidated Statements of Operations 15 ▪ Non-GAAP Financial Measures 16 Capitalization & Dividends 19 Summary of Debt 20 Debt Maturity Schedule 21 Year -to -Date Investment Activity 22 Real Estate Portfolio Capital Investments 23 Real Estate Portfolio Summary 24 Real Estate Portfolio Detail 25 Leasing Summary 27 |
|
© CTO Realty Growth, Inc. | ctoreit.com 3 Table of Contents Comparable Leasing Summary 28 Same-Property NOI 29 Lease Expiration Schedule 30 Top Tenant Summary 32 Geographic Diversification 33 Other Assets 34 2025 Guidance 35 Contact Information & Research Coverage 36 Safe Harbor, Non-GAAP Financial Measures, and Definitions and Terms 37 |
|
Page 4 DRAFT DRATDDD Press Release FOR IMMEDIATE RELEASE CTO REALTY GROWTH REPORTS SECOND QUARTER 2025 OPERATING RESULTS – Signed 190,000 square feet of comparable leases at 22% growth in cash rent spread – – Reaffirmed 2025 Outlook – WINTER PARK, FL – July 29, 2025 – CTO Realty Growth, Inc. (NYSE: CTO) (the “Company” or “CTO”), an owner and operator of retail-based properties located primarily in higher-growth markets, today announced its operating and financial results for the quarter ended June 30, 2025. Second Quarter 2025 Highlights Net Loss attributable to common stockholders of $(0.77) per diluted share. Core Funds from Operations (“FFO”) attributable to common stockholders, of $0.45 per diluted share. Adjusted Funds from Operations (“AFFO”) attributable to common stockholders of $0.47 per diluted share. Signed 190,027 square feet of comparable leases at a positive cash rent spread of 21.6%. Current signed-not-open pipeline represents $4.6 million, or 4.6%, of annual cash base rent in place at quarter end. Leased occupancy of 93.9%. Fully retired Convertible Senior Notes. Reaffirmed full year Core FFO and AFFO guidance per diluted share attributable to common stockholders. “Our portfolio continues to produce strong leasing activity as we leased 190,000 square feet with significant positive spreads, driving our signed-not-open pipeline to $4.6 million, representing 4.6% of in-place cash ABR. We also made significant progress filling our vacant anchor spaces, with six of the ten now leased with ongoing lease negotiations for the remaining spaces,” stated John P. Albright, President and Chief Executive Officer of CTO Realty Growth. “We believe that this leasing activity will provide the Company with earnings tailwinds into 2026.” |
|
Page 5 Quarterly Financial Results Highlights The table below provides a summary of the Company’s operating results for the three months ended June 30, 2025, as compared to the three months ended June 30, 2024: Three Months Ended (in thousands, except per share data) June 30, 2025 June 30, 2024 Variance to Comparable Period in the Prior Year Net Income (Loss) Attributable to the Company $ (23,418) $ 1,183 $ (24,601) (2079.5)% Net Income (Loss) Attributable to Common Stockholders $ (25,296) $ (688) $ (24,608) (3576.7)% Net Income (Loss) Attributable to Common Stockholders per Common Share - Diluted (1) $ (0.77) $ (0.03) $ (0.74) (2466.7)% Core FFO Attributable to Common Stockholders (2) $ 14,659 $ 10,353 $ 4,306 41.6% Core FFO Attributable to Common Stockholders per Common Share - Diluted (2) $ 0.45 $ 0.45 $ — 0.0% AFFO Attributable to Common Stockholders (2) $ 15,267 $ 11,051 $ 4,216 38.2% AFFO Attributable to Common Stockholders per Common Share - Diluted (2) $ 0.47 $ 0.48 $ (0.01) (2.1)% Dividends Declared and Paid - Preferred Stock $ 0.40 $ 0.40 $ — 0.0% Dividends Declared and Paid - Common Stock $ 0.38 $ 0.38 $ — 0.0% (1) For the three months ended June 30, 2025 and 2024, the denominator for this measure excludes the impact of 0.2 million and 3.6 million shares, related to the Company’s adoption of ASU 2020-06, which requires presentation on an if-converted basis for the Company’s 2025 Convertible Senior Notes (the “2025 Notes”), as the impact would be anti-dilutive. The 2025 Notes were settled during the three months ended June 30, 2025 and the Company issued 1,089,555 shares of the Company’s common stock in connection with the settlement; therefore, the weighted average impact of the issued shares were included in the denominator for this measure for the three months ended June 30, 2025. (2) See the “Non-GAAP Financial Measures” section and tables at the end of this press release for a discussion and reconciliation of Net Income (Loss) Attributable to the Company to non-GAAP financial measures, including FFO Attributable to Common Stockholders, FFO Attributable to Common Stockholders per Common Share - Diluted, Core FFO Attributable to Common Stockholders, Core FFO Attributable to Common Stockholders per Common Share - Diluted, AFFO Attributable to Common Stockholders, and AFFO Attributable to Common Stockholders per Common Share - Diluted. Further, the weighted average shares used to compute per share amounts for Core FFO Attributable to Common Stockholders per Common Share - Diluted and AFFO Attributable to Common Stockholders per Common Share - Diluted do not reflect any dilution related to the ultimate settlement of the 2025 Notes, except for the weighted average impact of the 1,089,555 shares actually issued during the three months ended June 30, 2025 in connection with the settlement of the 2025 Notes. |
|
Page 6 Year-to-Date Financial Results Highlights The table below provides a summary of the Company’s operating results for the six months ended June 30, 2025, as compared to the six months ended June 30, 2024: Six Months Ended (in thousands, except per share data) June 30, 2025 June 30, 2024 Variance to Comparable Period in the Prior Year Net Income (Loss) Attributable to the Company $ (21,157) $ 7,025 $ (28,182) (401.2)% Net Income (Loss) Attributable to Common Stockholders $ (24,913) $ 3,967 $ (28,880) (728.0)% Net Income (Loss) Attributable to Common Stockholders per Common Share - Diluted (1) $ (0.78) $ 0.17 $ (0.95) (558.8)% Core FFO Attributable to Common Stockholders (2) $ 29,104 $ 21,090 $ 8,014 38.0% Core FFO Attributable to Common Stockholders per Common Share - Diluted (2) $ 0.90 $ 0.93 $ (0.03) (3.2)% AFFO Attributable to Common Stockholders (2) $ 30,788 $ 22,699 $ 8,089 35.6% AFFO Attributable to Common Stockholders per Common Share - Diluted (2) $ 0.96 $ 1.00 $ (0.04) (4.0)% Dividends Declared and Paid - Preferred Stock $ 0.80 $ 0.80 $ — 0.0% Dividends Declared and Paid - Common Stock $ 0.76 $ 0.76 $ — 0.0% (1) For the six months ended June 30, 2025 and 2024, the denominator for this measure excludes the impact of 2.0 million and 3.5 million shares, related to the Company’s adoption of ASU 2020-06, which requires presentation on an if-converted basis for the 2025 Notes, as the impact would be anti-dilutive. The 2025 Notes were settled during the six months ended June 30, 2025, and the Company issued 1,089,555 shares of the Company’s common stock in connection with the settlement; therefore, the weighted average impact of the issued shares were included in the denominator for this measure for the six months ended June 30, 2025. (2) See the “Non-GAAP Financial Measures” section and tables at the end of this press release for a discussion and reconciliation of Net Income (Loss) Attributable to the Company to non-GAAP financial measures, including FFO Attributable to Common Stockholders, FFO Attributable to Common Stockholders per Common Share - Diluted, Core FFO Attributable to Common Stockholders, Core FFO Attributable to Common Stockholders per Common Share - Diluted, AFFO Attributable to Common Stockholders, and AFFO Attributable to Common Stockholders per Common Share - Diluted. Further, the weighted average shares used to compute per share amounts for Core FFO Attributable to Common Stockholders per Common Share - Diluted and AFFO Attributable to Common Stockholders per Common Share - Diluted do not reflect any dilution related to the ultimate settlement of the 2025 Notes, except for the weighted average impact of the 1,089,555 shares actually issued during the six months ended June 30, 2025 in connection with the settlement of the 2025 Notes. |
|
Page 7 Portfolio Summary The Company’s income property portfolio consisted of the following as of June 30, 2025: Wtd. Avg. Remaining Asset Type # of Properties Square Feet Lease Term Single Tenant 6 252 3.6 years Multi-Tenant 18 5,002 5.0 years Total / Wtd. Avg. 24 5,254 4.9 years Square Feet in thousands. Property Type # of Properties Square Feet % of Cash Base Rent Retail 19 3,826 69.4% Office 1 210 3.7% Mixed-Use 4 1,218 26.9% Total 24 5,254 100.0% Square Feet in thousands. Leased Occupancy 93.9% Occupancy 90.2% Same Property Net Operating Income During the three month period ended June 30, 2025 and 2024, the Company’s Same-Property NOI totaled $17.5 million and $17.4 million, respectively, as presented in the following table: Three Months Ended June 30, 2025 June 30, 2024 Variance to Comparable Period in the Prior Year Single Tenant $ 1,305 $ 1,292 $ 13 1.0% Multi-Tenant 16,242 16,104 138 0.9% Total $ 17,547 $ 17,396 $ 151 0.9% $ in thousands. During the six month period ended June 30, 2025 and 2024, the Company’s Same-Property NOI totaled $33.5 million and $32.7 million, respectively, as presented in the following table: Six Months Ended June 30, 2025 June 30, 2024 Variance to Comparable Period in the Prior Year Single Tenant $ 2,476 $ 2,439 $ 37 1.5% Multi-Tenant 31,066 30,291 775 2.6% Total $ 33,542 $ 32,730 $ 812 2.5% $ in thousands. |
|
Page 8 Leasing Activity During the three months ended June 30, 2025, the Company signed 22 leases totaling 226,732 square feet. On a comparable basis, which excludes vacancy existing at the time of acquisition, CTO signed 14 leases totaling 190,027 square feet at an average cash base rent of $25.54 per square foot compared to a previous average cash base rent of $21.01 per square foot, representing 21.6% comparable growth. A summary of the Company’s overall leasing activity for the quarter ended June 30, 2025, is as follows: Wtd. Avg. Cash Rent per Tenant Leasing Square Feet Lease Term Square Foot Improvements Commissions New Leases 112 9.7 years $ 20.85 $ 3,685 $ 1,408 Renewals & Extensions 115 6.1 years 29.91 — — Total / Wtd. Avg. 227 7.6 years $ 25.43 $ 3,685 $ 1,408 In thousands except for per square foot and weighted average lease term data. Comparable leases compare leases signed on a space for which there was previously a tenant. During the six months ended June 30, 2025, the Company signed 40 leases totaling 339,317 square feet. On a comparable basis, which excludes vacancy existing at the time of acquisition, CTO signed 31 leases totaling 299,429 square feet at an average cash base rent of $24.96 per square foot compared to a previous average cash base rent of $19.72 per square foot, representing 26.6% comparable growth. A summary of the Company’s overall leasing activity for the six months ended June 30, 2025, is as follows: Wtd. Avg. Cash Rent per Tenant Leasing Square Feet Lease Term Square Foot Improvements Commissions New Leases 178 9.6 years $ 21.56 $ 5,077 $ 2,091 Renewals & Extensions 161 5.8 years 28.79 26 23 Total / Wtd. Avg. 339 7.1 years $ 25.00 $ 5,103 $ 2,114 In thousands except for per square foot and weighted average lease term data. Comparable leases compare leases signed on a space for which there was previously a tenant. Capital Markets and Balance Sheet Our balance sheet as of June 30, 2025, included the following long-term debt and liquidity: As of June 30, 2025, the Company has $76.0 million of undrawn commitments, prior to borrowing base limitations, on our Revolving Credit Facility, and $8.6 million of cash on hand. The 2025 Notes were settled during the three months ended June 30, 2025. On April 3, 2025, the Company completed separate, privately-negotiated transactions with holders of $35,208,000 in aggregate principal amount of the 2025 Notes in which the holders exchanged their 2025 Notes with the Company for an aggregate of 1,089,555 shares of the Company’s common stock, and aggregate cash payments of $29.0 million including $0.6 million representing accrued interest. The 2025 Notes received by the Company were retired. At maturity on April 15, 2025, the Company completed the payoff of the remaining 2025 Notes in an aggregate principal amount of $15,826,000 for an aggregate cash payment of $22.0 million including $0.3 million representing accrued interest. |
|
Page 9 The following table provides a summary of the Company’s long-term debt, as of June 30, 2025: Component of Long-Term Debt Principal Maturity Date Interest Rate Wtd. Avg. Rate 2026 Term Loan (1) $ 65.0 million March 2026 SOFR + 10 bps + [1.25% - 2.20%] 2.72% Mortgage Note (2) 17.8 million August 2026 4.060% 4.06% Revolving Credit Facility (3) 224.0 million January 2027 SOFR + 10 bps + [1.25% - 2.20%] 5.26% 2027 Term Loan (4) 100.0 million January 2027 SOFR + 10 bps + [1.25% - 2.20%] 2.80% 2028 Term Loan (5) 100.0 million January 2028 SOFR + 10 bps + [1.20% - 2.15%] 5.18% 2029 Term Loan (6) 100.0 million September 2029 SOFR + 0.10% + [1.20% - 2.15%] 4.68% Total Long-Term Debt $ 606.8 million 4.44% (1) The Company utilized interest rate swaps on the $65.0 million 2026 Term Loan balance to fix SOFR and achieve a weighted average fixed swap rate of 1.27% plus the 10 bps SOFR adjustment plus the applicable spread. (2) Mortgage note assumed in connection with the acquisition of Price Plaza Shopping Center located in Katy, Texas. (3) The Company utilized interest rate swaps on $150.0 million of the Credit Facility balance to fix SOFR and achieve a fixed swap rate of 3.50% plus the 10 bps SOFR adjustment plus the applicable spread. Two interest rate swaps on $100.0 million of the Credit Facility balance were effective on April 30, 2025 at a weighted average fixed swap rate of 3.32% plus the 10 bps SOFR adjustment plus the applicable spread. (4) The Company utilized interest rate swaps on the $100.0 million 2027 Term Loan balance to fix SOFR and achieve a fixed swap rate of 1.35% plus the 10 bps SOFR adjustment plus the applicable spread. (5) The Company utilized interest rate swaps on the $100.0 million 2028 Term Loan balance to fix SOFR and achieve a weighted average fixed swap rate of 3.78% plus the 10 bps SOFR adjustment plus the applicable spread. (6) The Company utilized interest rate swaps on the $100.0 million 2029 Term Loan balance to fix SOFR and achieve a weighted average fixed swap rate of 3.28% plus the 10 bps SOFR adjustment plus the applicable spread. As of June 30, 2025, the Company’s net debt to Pro Forma Adjusted EBITDA was 6.9 times, and as defined in the Company’s credit agreement, the Company’s fixed charge coverage ratio was 4.1 times. As of June 30, 2025, the Company’s net debt to total enterprise value was 46.6%. The Company calculates total enterprise value as the sum of net debt, par value of its 6.375% Series A preferred equity, and the market value of the Company's outstanding common shares. Dividends On May 27, 2025, the Company announced a cash dividend on its common stock and Series A Preferred Stock for the second quarter of 2025 of $0.38 per share and $0.40 per share, respectively, payable on June 30, 2025 to stockholders of record as of the close of business on June 12, 2025. The second quarter 2025 common stock cash dividend represented a payout ratio of 84.4% and 80.9% of the Company’s second quarter 2025 Core FFO Attributable to Common Stockholders per Common Share - Diluted and AFFO Attributable to Common Stockholders per Common Share - Diluted, respectively. 2025 Outlook The Company has reaffirmed its Core FFO and AFFO outlook for 2025 as well as the assumptions detailed below based on current plans and assumptions. The Company’s 2025 outlook is subject to risks and uncertainties more fully described in this press release and the Company’s reports filed with the U.S. Securities and Exchange Commission. |
|
Page 10 The Company’s outlook for 2025 is as follows: Outlook Range for 2025 (Unaudited) Low High Core FFO per Common Share - Diluted (1) $ 1.80 to $ 1.86 AFFO per Common Share - Diluted (1) $ 1.93 to $ 1.98 (1) Attributable to Common Stockholders The Company’s 2025 outlook includes but is not limited to the following assumptions for the year ending December 31, 2025: Investments, including structured investments, between $100.0 million and $200.0 million at a weighted average initial cash yield between 8.0% and 8.5%. Same-Property NOI growth of approximately 1%, as compared to the year ended December 31, 2024, including the estimated impact associated with announced and anticipated store closings. General and administrative expenses within a range of $17.5 million to $18.0 million. The following table provides a reconciliation of the outlook range of the Company’s estimated Net Loss Attributable to the Company per Common Share – Diluted for the year ending December 31, 2025 to the Company’s estimated Core FFO Attributable to Common Stockholders per Common Share – Diluted and AFFO Attributable to Common Stockholders per Common Share – Diluted for the year ending December 31, 2025: Outlook Range for 2025 (Unaudited) Low High Net Loss Attributable to the Company per Common Share - Diluted $ (0.61) $ (0.57) Depreciation and Amortization of Real Estate 1.89 1.91 Gain on Disposition of Assets (1) - - Gain on Disposition of Other Assets (1) - - Provision for Impairment (1) - - Realized and Unrealized Loss on Investment Securities (1) 0.15 0.15 Funds from Operations, per Common Share - Diluted $ 1.43 $ 1.49 Distributions to Preferred Stockholders (0.23) (0.23) Funds From Operations Attributable to Common Stockholders per Common Share - Diluted $ 1.20 $ 1.26 Amortization of Intangibles to Lease Income (0.03) (0.03) Loss on Extinguishment of Debt (1) 0.63 0.63 Core FFO Attributable to Common Stockholders per Common Share - Diluted $ 1.80 $ 1.86 Adjustments: Straight-Line Rent Adjustment (0.05) (0.06) Amortization of Loan Costs, Discount on Convertible Debt, and Capitalized Interest 0.04 0.04 Non-Cash Compensation 0.14 0.14 AFFO Attributable to Common Stockholders per Common Share - Diluted $ 1.93 $ 1.98 (1) Gain on Disposition of Assets, Gain on Disposition of Other Assets, Provision for Impairment, Realized and Unrealized Loss on Investment Securities, and Loss on Extinguishment of Debt represents the actual adjustment for the six months ended June 30, 2025. The Company’s outlook excludes projections related to these measures. |
|
Page 11 Earnings Conference Call & Webcast The Company will host a conference call to present its operating results for the quarter ended June 30, 2025, on Wednesday, July 30, 2025 at 9:00 AM ET. A live webcast of the call will be available on the Investor Relations page of the Company’s website at www.ctoreit.com or at the link provided in the event details below. To access the call by phone, please go to the registration link provided in the event details below and you will be provided with dial-in details. Event Details: Webcast: https://edge.media-server.com/mmc/p/kxmvcnqy Registration: https://register-conf.media-server.com/register/BIdbee849d58b84ae5b18284ab33284a79 We encourage participants to register and dial into the conference call at least fifteen minutes ahead of the scheduled start time. A replay of the earnings call will be archived and available online through the Investor Relations section of the Company’s website at www.ctoreit.com. About CTO Realty Growth, Inc. CTO Realty Growth, Inc. is a publicly traded real estate investment trust that owns and operates a portfolio of high-quality, retail-based properties located primarily in higher growth markets in the United States. CTO also externally manages and owns a meaningful interest in Alpine Income Property Trust, Inc. (NYSE: PINE), a publicly traded net lease REIT. We encourage you to review our most recent investor presentation and supplemental financial information, which is available on our website at www.ctoreit.com. Contact: Investor Relations ir@ctoreit.com Safe Harbor Certain statements contained in this press release (other than statements of historical fact) are forward-looking statements within the meaning of Section 27A of the Securities Act of 1933, as amended, and Section 21E of the Securities Exchange Act of 1934, as amended. Forward-looking statements can typically be identified by words such as “believe,” “estimate,” “expect,” “intend,” “anticipate,” “will,” “could,” “may,” “should,” “plan,” “potential,” “predict,” “forecast,” “project,” and similar expressions, as well as variations or negatives of these words. Although forward-looking statements are made based upon management’s present expectations and beliefs concerning future developments and their potential effect upon the Company, a number of factors could cause the Company’s actual results to differ materially from those set forth in the forward-looking statements. Such factors may include, but are not limited to: the Company’s ability to remain qualified as a REIT; the Company’s exposure to U.S. federal and state income tax law changes, including changes to the REIT requirements; general adverse economic and real estate conditions; macroeconomic and geopolitical factors, including but not limited to inflationary pressures, interest rate volatility, distress in the banking sector, global supply chain disruptions, and ongoing geopolitical war; credit risk associated with the Company investing in structured investments; the ultimate geographic spread, severity and duration of pandemics such as the COVID-19 Pandemic and its variants, actions that may be taken by governmental authorities to contain or address the impact of such pandemics, and the potential negative impacts of such pandemics on the global economy and the Company’s financial condition and results of operations; the inability of major tenants to continue paying their rent or obligations due to bankruptcy, insolvency or a general downturn in their business; the loss or failure, |
|
Page 12 or decline in the business or assets of PINE; the completion of 1031 exchange transactions; the availability of investment properties that meet the Company’s investment goals and criteria; the uncertainties associated with obtaining required governmental permits and satisfying other closing conditions for planned acquisitions and sales; and the uncertainties and risk factors discussed in the Company’s Annual Report on Form 10-K for the fiscal year ended December 31, 2024 and other risks and uncertainties discussed from time to time in the Company’s filings with the U.S. Securities and Exchange Commission. There can be no assurance that future developments will be in accordance with management’s expectations or that the effect of future developments on the Company will be those anticipated by management. Readers are cautioned not to place undue reliance on these forward-looking statements, which speak only as of the date of this press release. The Company undertakes no obligation to update the information contained in this press release to reflect subsequently occurring events or circumstances. Non-GAAP Financial Measures Our reported results are presented in accordance with accounting principles generally accepted in the United States of America (“GAAP”). We also disclose Funds From Operations (“FFO”), Core Funds From Operations (“Core FFO”), Adjusted Funds From Operations (“AFFO”), Pro Forma Earnings Before Interest, Taxes, Depreciation and Amortization (“Pro Forma Adjusted EBITDA”), and Same-Property Net Operating Income (“Same-Property NOI”), each of which are non-GAAP financial measures. We believe these non-GAAP financial measures are useful to investors because they are widely accepted industry measures used by analysts and investors to compare the operating performance of REITs. FFO, Core FFO, AFFO, Pro Forma Adjusted EBITDA, and Same-Property NOI do not represent cash generated from operating activities and are not necessarily indicative of cash available to fund cash requirements; accordingly, they should not be considered alternatives to net income as a performance measure or cash flows from operating activities as reported on our statement of cash flows as a liquidity measure and should be considered in addition to, and not in lieu of, GAAP financial measures. We compute FFO in accordance with the definition adopted by the Board of Governors of the National Association of Real Estate Investment Trusts, or NAREIT. NAREIT defines FFO as GAAP net income or loss adjusted to exclude real estate related depreciation and amortization, as well as extraordinary items (as defined by GAAP) such as net gain or loss from sales of depreciable real estate assets, impairment write-downs associated with depreciable real estate assets and impairments associated with the implementation of current expected credit losses on commercial loans and investments at the time of origination, including the pro rata share of such adjustments of unconsolidated subsidiaries. The Company also excludes the gains or losses from sales of assets incidental to the primary business of the REIT which specifically include the sales of mitigation credits, subsurface sales, investment securities, and land sales, in addition to the mark-to-market of the Company’s investment securities and interest related to the 2025 Notes, if the effect is dilutive. To derive Core FFO, we modify the NAREIT computation of FFO to include other adjustments to GAAP net income related to gains and losses recognized on the extinguishment of debt, amortization of above- and below-market lease related intangibles, and other unforecastable market- or transaction-driven non-cash items, as well as adding back the interest related to the 2025 Notes, if the effect is dilutive. To derive AFFO, we further modify the NAREIT computation of FFO and Core FFO to include other adjustments to GAAP net income related to non-cash revenues and expenses such as straight-line rental revenue, non-cash compensation, and other non-cash amortization. Such items may cause short-term fluctuations in net income but have no impact on operating cash flows or long-term operating performance. We use AFFO as one measure of our performance when we formulate corporate goals. To derive Pro Forma Adjusted EBITDA, GAAP net income or loss attributable to the Company is adjusted to exclude real estate related depreciation and amortization, as well as extraordinary items (as defined by GAAP) such as net gain or loss from sales of depreciable real estate assets, impairment write-downs associated with depreciable real estate assets, impairments associated with the implementation of current expected credit losses on commercial loans and |
|
Page 13 investments at the time of origination, including the pro rata share of such adjustments of unconsolidated subsidiaries, non-cash revenues and expenses such as straight-line rental revenue, amortization of deferred financing costs, above-and below-market lease related intangibles, non-cash compensation, other non-recurring items such as termination fees, forfeitures of tenant security deposits, and certain adjustments to reconciliation estimates related to reimbursable revenue for recently acquired properties, and other non-cash income or expense. The Company also excludes the gains or losses from sales of assets incidental to the primary business of the REIT which specifically include the sales of mitigation credits, subsurface sales, investment securities, and land sales, in addition to the mark-to-market of the Company’s investment securities. Cash interest expense is also excluded from Pro Forma Adjusted EBITDA, and GAAP net income or loss is adjusted for the annualized impact of acquisitions, dispositions and other similar activities. To derive Same-Property NOI, GAAP net income or loss attributable to the Company is adjusted to exclude real estate related depreciation and amortization, as well as extraordinary items (as defined by GAAP) such as net gain or loss from sales of depreciable real estate assets, impairment write-downs associated with depreciable real estate assets, impairments associated with the implementation of current expected credit losses on commercial loans and investments at the time of origination, including the pro rata share of such adjustments of unconsolidated subsidiaries, non-cash revenues and expenses such as straight-line rental revenue, amortization of deferred financing costs, above- and below-market lease related intangibles, non-cash compensation, other non-recurring items such as termination fees, forfeitures of tenant security deposits, and certain adjustments to reconciliation estimates related to reimbursable revenue for recently acquired properties, and other non-cash income or expense. Interest expense, general and administrative expenses, investment and other income or loss, income tax benefit or expense, real estate operations revenues and direct cost of revenues, management fee income, and interest income from commercial loans and investments are also excluded from Same-Property NOI. GAAP net income or loss is further adjusted to remove the impact of properties that were not owned for the full current and prior year reporting periods presented. Cash rental income received under the leases pertaining to the Company’s assets that are presented as commercial loans and investments in accordance with GAAP is also used in lieu of the interest income equivalent. FFO is used by management, investors and analysts to facilitate meaningful comparisons of operating performance between periods and among our peers primarily because it excludes the effect of real estate depreciation and amortization and net gains or losses on sales, which are based on historical costs and implicitly assume that the value of real estate diminishes predictably over time, rather than fluctuating based on existing market conditions. We believe that Core FFO and AFFO are additional useful supplemental measures for investors to consider because they will help them to better assess our operating performance without the distortions created by other non-cash revenues or expenses. We also believe that Pro Forma Adjusted EBITDA is an additional useful supplemental measure for investors to consider as it allows for a better assessment of our operating performance without the distortions created by other non-cash revenues, expenses or certain effects of the Company’s capital structure on our operating performance. We use Same-Property NOI to compare the operating performance of our assets between periods. It is an accepted and important measurement used by management, investors and analysts because it includes all property-level revenues from the Company’s properties, less operating and maintenance expenses, real estate taxes and other property-specific expenses (“Net Operating Income” or “NOI”) of properties that have been owned and stabilized for the entire current and prior year reporting periods. Same-Property NOI attempts to eliminate differences due to the acquisition or disposition of properties during the particular period presented, and therefore provides a more comparable and consistent performance measure for the comparison of the Company’s properties. FFO, Core FFO, AFFO, Pro Forma Adjusted EBITDA, and Same-Property NOI may not be comparable to similarly titled measures employed by other companies. |
|
Page 14 CTO Realty Growth, Inc. Consolidated Balance Sheets (In thousands, except share and per share data) As of (Unaudited) June 30, 2025 December 31, 2024 ASSETS Real Estate: Land, at Cost $ 283,759 $ 257,748 Building and Improvements, at Cost 764,952 720,480 Other Furnishings and Equipment, at Cost 911 883 Construction in Process, at Cost 2,597 5,091 Total Real Estate, at Cost 1,052,219 984,202 Less, Accumulated Depreciation (100,206) (82,864) Real Estate—Net 952,013 901,338 Land and Development Costs 300 300 Intangible Lease Assets—Net 81,548 79,198 Investment in Alpine Income Property Trust, Inc. 34,752 39,666 Commercial Loans and Investments 106,128 105,043 Cash and Cash Equivalents 8,551 9,017 Restricted Cash 10,291 8,344 Refundable Income Taxes - 70 Deferred Income Taxes—Net 2,472 2,467 Other Assets 37,171 36,201 Total Assets $ 1,233,226 $ 1,181,644 LIABILITIES AND STOCKHOLDERS’ EQUITY Liabilities: Accounts Payable $ 2,228 $ 3,278 Accrued and Other Liabilities 23,054 21,268 Deferred Revenue 12,512 10,183 Intangible Lease Liabilities—Net 16,005 15,124 Deferred Income Taxes—Net 14 — Long-Term Debt—Net 605,351 518,993 Total Liabilities 659,164 568,846 Commitments and Contingencies Stockholders’ Equity: Preferred Stock – 100,000,000 shares authorized; $0.01 par value, 6.375% Series A Cumulative Redeemable Preferred Stock, $25.00 Per Share Liquidation Preference, 4,713,069 shares issued and outstanding at June 30, 2025 and 4,713,069 shares issued and outstanding at December 31, 2024 47 47 Common Stock – 500,000,000 shares authorized; $0.01 par value, 32,934,716 shares issued and outstanding at June 30, 2025 and 31,673,479 shares issued and outstanding at December 31, 2024 329 317 Additional Paid-In Capital 390,003 367,828 Retained Earnings 182,362 232,089 Accumulated Other Comprehensive Income 1,321 12,517 Total Stockholders’ Equity 574,062 612,798 Total Liabilities and Stockholders’ Equity $ 1,233,226 $ 1,181,644 |
|
Page 15 CTO Realty Growth, Inc. Consolidated Statements of Operations (Unaudited) (In thousands, except share, per share and dividend data) Three Months Ended Six Months Ended June 30, June 30, June 30, June 30, 2025 2024 2025 2024 Revenues Income Properties $ 33,375 $ 25,878 $ 65,047 $ 50,501 Management Fee Income 1,247 1,131 2,425 2,236 Interest Income From Commercial Loans and Investments 3,016 1,441 5,977 2,792 Real Estate Operations — 395 — 1,443 Total Revenues 37,638 28,845 73,449 56,972 Direct Cost of Revenues Income Properties (10,178) (8,080) (19,069) (14,833) Real Estate Operations — (259) — (1,078) Total Direct Cost of Revenues (10,178) (8,339) (19,069) (15,911) General and Administrative Expenses (4,448) (3,459) (9,131) (7,675) Provision for Impairment — (67) — (115) Depreciation and Amortization (15,294) (11,549) (29,658) (22,480) Total Operating Expenses (29,920) (23,414) (57,858) (46,181) Gain on Disposition of Assets — — — 9,163 Loss on Extinguishment of Debt (20,396) — (20,396) — Other Gain (Loss) (20,396) — (20,396) 9,163 Total Operating Income (Loss) (12,678) 5,431 (4,805) 19,954 Investment and Other Income (Loss) (3,687) 1,429 (3,112) (1,830) Interest Expense (6,859) (5,604) (12,995) (11,133) Income (Loss) Before Income Tax Benefit (Expense) (23,224) 1,256 (20,912) 6,991 Income Tax Benefit (Expense) (194) (73) (245) 34 Net Income (Loss) Attributable to the Company (23,418) 1,183 (21,157) 7,025 Distributions to Preferred Stockholders (1,878) (1,871) (3,756) (3,058) Net Income (Loss) Attributable to Common Stockholders $ (25,296) $ (688) $ (24,913) $ 3,967 Per Share Information: Basic and Diluted Net Income (Loss) Attributable to Common Stockholders $ (0.77) $ (0.03) $ (0.78) $ 0.17 Weighted Average Number of Common Shares Basic 32,678,771 22,787,252 32,118,982 22,669,246 Diluted 32,727,831 22,828,148 32,174,574 22,674,796 Dividends Declared and Paid - Preferred Stock $ 0.40 $ 0.40 $ 0.80 $ 0.80 Dividends Declared and Paid - Common Stock $ 0.38 $ 0.38 $ 0.76 $ 0.76 |
|
Page 16 CTO Realty Growth, Inc. Non-GAAP Financial Measures Same-Property NOI Reconciliation (Unaudited) (In thousands) Three Months Ended Six Months Ended June 30, 2025 June 30, 2024 June 30, 2025 June 30, 2024 Net Income (Loss) Attributable to the Company $ (23,418) $ 1,183 $ (21,157) $ 7,025 Gain on Disposition of Assets — — — (9,163) Loss on Extinguishment of Debt 20,396 — 20,396 — Provision for Impairment — 67 — 115 Depreciation and Amortization 15,294 11,549 29,658 22,480 Amortization of Intangibles to Lease Income 267 (244) 716 (718) Straight-Line Rent Adjustment 712 346 1,285 1,039 Accretion of Tenant Contribution 13 13 26 26 Interest Expense 6,859 5,604 12,995 11,133 General and Administrative Expenses 4,448 3,459 9,131 7,675 Investment and Other Loss (Income) 3,687 (1,429) 3,112 1,830 Income Tax Expense (Benefit) 194 73 245 (34) Real Estate Operations Revenues — (395) — (1,443) Real Estate Operations Direct Cost of Revenues — 259 — 1,078 Management Fee Income (1,247) (1,131) (2,425) (2,236) Interest Income From Commercial Loans and Investments (3,016) (1,441) (5,977) (2,792) Other Non-Recurring Items (1) (97) (303) (207) (553) Less: Impact of Properties Not Owned for the Full Reporting Period (6,545) (214) (14,256) (2,732) Same-Property NOI $ 17,547 $ 17,396 $ 33,542 $ 32,730 (1) Includes non-recurring items including termination fees, forfeitures of tenant security deposits, and certain adjustments to estimates related to recently acquired property CAM reconciliations. |
|
Page 17 CTO Realty Growth, Inc. Non-GAAP Financial Measures Funds from Operations, Core Funds from Operations, and Adjusted Funds from Operations Attributable to Common Stockholders (Unaudited) (In thousands, except per share data) Three Months Ended Six Months Ended June 30, 2025 June 30, 2024 June 30, 2025 June 30, 2024 Net Income (Loss) Attributable to the Company $ (23,418) $ 1,183 $ (21,157) $ 7,025 Add Back: Effect of Dilutive Interest Related to 2025 Notes (1) — — — — Net Income (Loss) Attributable to the Company, If-Converted $ (23,418) $ 1,183 $ (21,157) $ 7,025 Depreciation and Amortization of Real Estate 15,277 11,532 29,623 22,447 Gain on Disposition of Assets — — — (9,163) Gain on Disposition of Other Assets — (139) — (370) Provision for Impairment — 67 — 115 Realized and Unrealized Loss (Gain) on Investment Securities 4,549 (663) 4,714 3,376 Funds from Operations $ (3,592) $ 11,980 $ 13,180 $ 23,430 Distributions to Preferred Stockholders (1,878) (1,871) (3,756) (3,058) Funds From Operations Attributable to Common Stockholders $ (5,470) $ 10,109 $ 9,424 $ 20,372 Loss on Extinguishment of Debt 20,396 — 20,396 — Amortization of Intangibles to Lease Income (267) 244 (716) 718 Less: Effect of Dilutive Interest Related to 2025 Notes (1) — — — — Core Funds From Operations Attributable to Common Stockholders $ 14,659 $ 10,353 $ 29,104 $ 21,090 Adjustments: Straight-Line Rent Adjustment (712) (346) (1,285) (1,039) Other Depreciation and Amortization (1) (3) (2) (7) Amortization of Loan Costs, Discount on Convertible Debt, and Capitalized Interest 318 297 685 518 Non-Cash Compensation 1,003 750 2,286 2,137 Adjusted Funds From Operations Attributable to Common Stockholders $ 15,267 $ 11,051 $ 30,788 $ 22,699 FFO Attributable to Common Stockholders per Common Share - Diluted (1) $ (0.17) $ 0.44 $ 0.29 $ 0.90 Core FFO Attributable to Common Stockholders per Common Share - Diluted (1) $ 0.45 $ 0.45 $ 0.90 $ 0.93 AFFO Attributable to Common Stockholders per Common Share - Diluted (1) $ 0.47 $ 0.48 $ 0.96 $ 1.00 (1) For the three and six months ended June 30, 2025 and June 30, 2024, interest related to the 2025 Notes was excluded from net income (loss) attributable to the Company to derive FFO, as the impact to net income (loss) attributable to common stockholders would be anti-dilutive. Further, the weighted average shares used to compute per share amounts for FFO Attributable to Common Stockholders per Common Share – Diluted, Core FFO Attributable to Common Stockholders per Common Share - Diluted, and AFFO Attributable to Common Stockholders per Common Share - Diluted do not reflect any dilution related to the ultimate settlement of the 2025 Notes, other than as described below. The 2025 Notes were settled during the six months ended June 30, 2025 and the Company issued 1,089,555 shares of the Company’s common stock in connection with the settlement, therefore the weighted average impact of the issued shares were included in the denominator for this measure for the three and six months ended June 30, 2025. |
|
Page 18 CTO Realty Growth, Inc. Non-GAAP Financial Measures Reconciliation of Net Debt to Pro Forma Adjusted EBITDA (Unaudited) (In thousands) Three Months Ended June 30, 2025 Net Loss Attributable to the Company $ (23,418) Depreciation and Amortization of Real Estate 15,277 Unrealized Loss & Realized Gain on Investment Securities 4,549 Distributions to Preferred Stockholders (1,878) Loss on Extinguishment of Debt 20,396 Amortization of Intangibles to Lease Income (267) Straight-Line Rent Adjustment (712) Other Depreciation and Amortization (1) Amortization of Loan Costs, Discount on Convertible Debt, and Capitalized Interest 318 Non-Cash Compensation 1,003 Other Non-Recurring Items (1) (97) Interest Expense, Net of Amortization of Loan Costs and Discount on Convertible Debt 6,542 Adjusted EBITDA $ 21,712 Annualized Adjusted EBITDA $ 86,848 Pro Forma Annualized Impact of Current Quarter Investments and Dispositions, Net (2) — Pro Forma Adjusted EBITDA $ 86,848 Total Long-Term Debt $ 605,351 Financing Costs, Net of Accumulated Amortization 1,449 Cash and Cash Equivalents (8,551) Net Debt $ 598,249 Net Debt to Pro Forma Adjusted EBITDA 6.9 x (1) Includes non-recurring items including termination fees, forfeitures of tenant security deposits, and certain adjustments to estimates related to recently acquired property CAM reconciliations. (2) Reflects the pro forma annualized impact on Annualized Adjusted EBITDA of the Company’s investments and disposition activity during the three months ended June 30, 2025. |
|
© CTO Realty Growth, Inc. | ctoreit.com Capitalization & Dividends As of 6/30/2025 Equity Capitalization Common Shares Outstanding 32,935 Common Share Price $17.26 Total Common Equity Market Capitalization $568,453 Series A Preferred Shares Outstanding 4,713 Series A Preferred Par Value Per Share $25.00 Series A Preferred Par Value $117,827 Total Equity Capitalization $686,280 Debt Capitalization Total Debt Outstanding $606,800 Total Capitalization $1,293,080 Cash & Cash Equivalents $8,551 Total Enterprise Value $1,284,529 Dividends Paid Common Preferred Q3 2024 $0.38 $0.40 Q4 2024 $0.38 $0.40 Q1 2025 $0.38 $0.40 Q2 2025 $0.38 $0.40 Trailing Twelve Months Q2 2025 $1.52 $1.60 Q2 2025 Core FFO Per Diluted Share $0.45 Q2 2025 AFFO Per Diluted Share $0.47 Q2 2025 Core FFO Payout Ratio 84.4% Q2 2025 AFFO Payout Ratio 80.9% Dividend Yield Q2 2025 $0.38 $0.40 Annualized Q2 2025 Dividend $1.52 $1.60 Price Per Share as of June 30, 2025 $17.26 $20.13 Implied Dividend Yield 8.8% 7.9% As of 6/30/2025 unless otherwise noted. $ and shares outstanding in thousands, except per share data. Any differences are a result of rounding. 19 |
|
© CTO Realty Growth, Inc. | ctoreit.com Debt Summary as of June 30, 2025 $ in thousands. Any differences are a result of rounding. 1. Interest rate is calculated as 30-day SOFR + 10 bps + pricing tier based on leverage within the range of 1.25%-2.20% 2. Interest rate is calculated as 30-day SOFR + 10 bps + pricing tier based on leverage within the range of 1.20%-2.15% 3. See reconciliation as part of Non-GAAP Financial Measures in the Company’s Second Quarter 2025 Earnings Release. Indebtedness Outstanding Face Value Weighted Average Rate Maturity Date Type 2026 Term Loan1 65,000 2.72% March 2026 Fixed Mortgage Note 17,800 4.06% August 2026 Fixed Revolving Credit Facility1 74,000 5.90% January 2027 Floating Revolving Credit Facility1 150,000 4.95% January 2027 Fixed 2027 Term Loan1 100,000 2.80% January 2027 Fixed 2028 Term Loan2 100,000 5.18% January 2028 Fixed 2029 Term Loan2 100,000 4.68% September 2029 Fixed Total / Weighted Average $606,800 4.44% Leverage Metrics Face Value of Debt $606,800 Cash & Cash Equivalents ($8,551) Net Debt $598,249 Total Enterprise Value $1,284,529 Net Debt to Total Enterprise Value 46.6% Net Debt to Pro Forma Adjusted EBITDA3 6.9x 20 |
|
© CTO Realty Growth, Inc. | ctoreit.com Debt Maturity Schedule Year Outstanding % of Debt Maturing Cumulative % of Debt Maturing Weighted Average Rate 2025 - - - - 2026 82,800 14% 14% 3.01% 2027 324,000 53% 67% 4.50% 2028 100,000 16% 84% 5.18% 2029 100,000 16% 100% 4.68% Total $606,800 100% 4.44% $ in thousands. Any differences are a result of rounding. 21 |
|
© CTO Realty Growth, Inc. | ctoreit.com Year-to-Date Investment Activity Property Acquisitions Market Type Date Acquired Square Feet Price Occupancy At Acquisition Ashley Park – Newnan, GA Atlanta, GA Lifestyle March 2025 559,465 $79,750 92% Total Acquisitions 559,465 $79,750 $ in thousands. Any differences are a result of rounding. 22 |
|
© CTO Realty Growth, Inc. | ctoreit.com Real Estate Portfolio Capital Investments Investment in Previously Occupied Space Q1 2025 Q2 2025 Q3 2025 Q4 2025 2025 Capital Expenditures $1 $18 $19 Tenant Improvement Allowances 156 336 492 Leasing Commissions 214 234 448 Total Investment in Previously Occupied Space $371 $588 $959 New Investment in Acquired Vacancy Q1 2025 Q2 2025 Q3 2025 Q4 2025 2025 Capital Expenditures $10 $107 $117 Tenant Improvement Allowances 389 657 1,046 Leasing Commissions 170 499 669 Total New Investment in Acquired Vacancy $569 $1,263 $1,832 Other Capital Investments Q1 2025 Q2 2025 Q3 2025 Q4 2025 2025 Property Improvement Costs $160 $191 $351 Investment in Property Repositioning 88 140 228 Total Other Capital Investments $248 $331 $579 Total Capital Investments Q1 2025 Q2 2025 Q3 2025 Q4 2025 2025 Capital Expenditures and Other Capital Investments $259 $456 $715 Tenant Improvement Allowances 545 993 1,538 Leasing Commissions 384 733 1,117 Total Capital Investments $1,188 $2,182 $3,370 $ in thousands. Any differences are a result of rounding. 23 |
|
© CTO Realty Growth, Inc. | ctoreit.com Real Estate Portfolio Summary Total Portfolio as of June 30, 2025 Asset Type Number of Properties Square Feet Cash ABR PSF Occupancy Leased Occupancy Single Tenant 6 252 $21.66 100.0% 100.0% Multi-Tenant 18 5,002 $19.24 89.7% 93.6% Total Portfolio 24 5,254 $19.35 90.2% 93.9% Property Type Number of Properties Square Feet Cash ABR PSF Occupancy Leased Occupancy Retail 19 3,826 $18.45 91.1% 95.1% Office 1 210 $17.75 100.0% 100.0% Mixed Use 1 4 1,218 $22.47 85.6% 88.9% Total Portfolio 24 5,254 $19.35 90.2% 93.9% Property Type Number of Properties Square Feet Cash ABR PSF Occupancy Leased Occupancy Grocery-Anchored Retail 5 828 $25.11 96.0% 96.4% Retail Power Center 8 2,511 $16.11 89.2% 94.8% Lifestyle 4 1,635 $20.89 86.9% 90.1% Other 2 7 280 $22.45 100.0% 100.0% Total Portfolio 24 5,254 $19.35 90.2% 93.9% $ and square feet in thousands, except per square foot data. Any differences are a result of rounding. 1. Includes The Collection at Forsyth, The Shops at Legacy, West Broad Village and the Winter Park Office, all of which include some combination of retail and office 2. Includes the six single tenant assets and the Winter Park Office 24 |
|
© CTO Realty Growth, Inc. | ctoreit.com Real Estate Portfolio Detail Property Type Year Acquired/ Developed Year Built Acreage Square Feet In-Place Occupancy Leased Occupancy Cash ABR PSF Atlanta, GA The Collection at Forsyth Lifestyle 2022 2006 69.5 560,665 88% 89% $20.20 Ashford Lane Lifestyle 2020 2005 43.7 277,123 94% 96% $31.42 Madison Yards Grocery-Anchored Retail 2022 2019 10.3 162,521 97% 97% $30.80 The Exchange at Gwinnett Grocery-Anchored Retail 2021/2023 2021/2023 16.4 97,366 100% 100% $37.75 Ashley Park Lifestyle 2025 2004 60.5 559,465 92% 94% $15.17 Total Atlanta, GA 200.3 1,657,140 92% 93% $22.45 Dallas, TX Plaza at Rockwall Retail Power Center 2023 2007 42.0 446,487 91% 99% $12.50 The Shops at Legacy Lifestyle 2021 2007 12.7 237,366 63% 76% $23.69 Total Dallas, TX 54.7 683,853 81% 91% $16.38 Richmond, VA West Broad Village Grocery-Anchored Retail 2022 2007 32.6 392,139 95% 95% $24.49 Jacksonville, FL The Strand at St. Johns Town Center Retail Power Center 2019 2017 52.0 211,197 100% 100% $26.59 Phoenix, AZ Crossroads Town Center Retail Power Center 2020 2005 31.1 221,658 95% 95% $19.71 Raleigh, NC Beaver Creek Crossings Retail Power Center 2021 2005 51.6 322,113 99% 99% $16.57 Any differences are a result of rounding. 25 |
|
© CTO Realty Growth, Inc. | ctoreit.com Real Estate Portfolio Detail Property Type Year Acquired/ Developed Year Built Acreage Square Feet In-Place Occupancy Leased Occupancy Cash ABR PSF Charlotte, NC Carolina Pavilion Retail Power Center 2024 1995 72.2 693,813 79% 91% $12.39 Albuquerque, NM Fidelity Single Tenant Office 2018 2009 25.3 210,067 100% 100% $17.75 Houston, TX Price Plaza Shopping Center Retail Power Center 2022 1999 23.2 200,576 100% 100% $16.91 Daytona Beach, FL Daytona Beach Restaurant Portfolio Single Tenant (5) 2018 / 2022 1915 - 2018 8.3 41,725 100% 100% $41.34 Tampa, FL Lake Brandon Village Grocery-Anchored Retail 2024 1998 8.2 102,022 100% 100% $13.87 Granada Plaza Grocery-Anchored Retail 2024 1985 6.9 74,178 92% 92% $14.80 Total Tampa, FL 15.1 176,200 97% 97% $14.26 Orlando, FL Winter Park Office Mixed-Use 2021 1982 2.3 27,948 100% 100% $29.58 Marketplace at Seminole Towne Center Retail Power Center 2024 2006 40.6 315,066 84% 87% $17.57 Millenia Crossing Retail Power Center 2024 2009 11.2 100,385 80% 93% $20.24 Total Orlando, FL 54.0 443,399 84% 89% $18.93 Total Portfolio 620.4 5,253,880 90% 94% $19.35 Any differences are a result of rounding. 26 |
|
© CTO Realty Growth, Inc. | ctoreit.com Retail Leasing Summary Renewals and Extensions Q1 2025 Q2 2025 Q3 2025 Q4 2025 2025 Leases 11 10 21 Square Feet 47 115 161 New Cash Rent PSF $26.05 $29.91 $28.79 Tenant Improvements $26 - $26 Leasing Commissions $23 - $23 Weighted Average Term 4.9 years 6.1 years 5.8 years New Leases Q1 2025 Q2 2025 Q3 2025 Q4 2025 2025 Leases 7 12 19 Square Feet 66 112 178 New Cash Rent PSF $22.79 $20.85 $21.56 Tenant Improvements $1,392 $3,685 $5,077 Leasing Commissions $683 $1,408 $2,090 Weighted Average Term 9.4 years 9.7 years 9.6 years All Leases Summary Q1 2025 Q2 2025 Q3 2025 Q4 2025 2025 Leases 18 22 40 Square Feet 113 227 339 New Cash Rent PSF $24.14 $25.43 $25.00 Tenant Improvements $1,418 $3,685 $5,103 Leasing Commissions $706 $1,408 $2,114 Weighted Average Term 7.4 years 7.6 years 7.1 years $ and square feet in thousands, except per square foot data. Any differences are a result of rounding. Overall leasing activity does not include lease termination agreements or lease amendments related to tenant bankruptcy proceedings, or office leases. Tenant improvements include landlord work 27 |
|
© CTO Realty Growth, Inc. | ctoreit.com Comparable Retail Leasing Summary Renewals and Extensions - Comparable Number of Leases Signed GLA Signed New Cash Rent PSF Expiring Cash Rent PSF % Increase Over Expiring Rent Weighted Average Lease Term Tenant Improvements Lease Commissions 1st Quarter 2025 11 47 $26.05 $24.40 6.8% 4.9 years $26 $23 2nd Quarter 2025 10 115 $29.91 $27.91 7.2% 6.1 years - - 3rd Quarter 2025 4th Quarter 2025 Total / Wtd. Avg. 21 161 $28.79 $26.90 7.1% 5.8 years $26 $23 New Leases – Comparable Number of Leases Signed GLA Signed New Cash Rent PSF Expiring Cash Rent PSF % Increase Over Expiring Rent Weighted Average Lease Term Tenant Improvements Lease Commissions 1st Quarter 2025 6 63 $22.42 $12.32 82.0% 9.4 years $1,328 $639 2nd Quarter 2025 4 75 $18.90 $10.52 79.6% 10.0 years $2,580 $869 3rd Quarter 2025 4th Quarter 2025 Total / Wtd. Avg. 10 138 $20.50 $11.34 80.8% 9.7 years $3,909 $1,507 All Comparable Leases Summary Number of Leases Signed GLA Signed New Cash Rent PSF Expiring Cash Rent PSF % Increase Over Expiring Rent Weighted Average Lease Term Tenant Improvements Lease Commissions 1st Quarter 2025 17 109 $23.97 $17.47 37.2% 7.3 years $1,354 $662 2nd Quarter 2025 14 190 $25.54 $21.01 21.6% 7.2 years $2,580 $869 3rd Quarter 2025 4th Quarter 2025 Total / Wtd. Avg. 31 299 $24.96 $19.72 26.6% 7.3 years $3,935 $1,531 $ and square feet in thousands, except per square foot data. Any differences are a result of rounding. Comparable leases compare leases signed on a space for which there was previously a tenant. Does not include lease termination agreements or lease amendments related to tenant bankruptcy proceedings, or office leases. Tenant improvements include landlord work 28 |
|
© CTO Realty Growth, Inc. | ctoreit.com Same-Property NOI Multi-Tenant Q1 2025 Q2 2025 Q3 2025 Q4 2025 2025 Number of Comparable Properties 12 13 12 Same-Property NOI – 2025 $15,965 $16,242 $31,066 Same-Property NOI – 2024 $15,579 $16,104 $30,291 $ Variance $386 $138 $775 % Variance 2.5% 0.9% 2.6% Single-Tenant Q1 2025 Q2 2025 Q3 2025 Q4 2025 2025 Number of Comparable Properties 6 6 6 Same-Property NOI – 2025 $1,171 $1,305 $2,476 Same-Property NOI – 2024 $1,148 $1,292 $2,439 $ Variance $23 $13 $37 % Variance 2.0% 1.0% 1.5% All Properties Q1 2025 Q2 2025 Q3 2025 Q4 2025 2025 Number of Comparable Properties 18 19 18 Same-Property NOI – 2025 $17,136 $17,547 $33,542 Same-Property NOI – 2024 $16,727 $17,396 $32,730 $ Variance $409 $151 $812 % Variance 2.4% 0.9% 2.5% $ and square feet in thousands, except per square foot data. Any differences are a result of rounding. 29 |
|
© CTO Realty Growth, Inc. | ctoreit.com Lease Expiration Schedule Anchor Tenants 1 Year Leases Expiring Expiring SF % of Total Cash ABR % of Total Cash ABR PSF 2025 2 151 3.2% 2,703 2.7% $17.85 2026 9 267 5.6% 4,399 4.3% $16.46 2027 12 443 9.4% 4,921 4.8% $11.11 2028 19 763 16.1% 12,630 12.4% $16.56 2029 8 338 7.1% 3,753 3.7% $11.10 2030 6 171 3.6% 2,352 2.3% $13.74 2031 11 328 6.9% 6,074 6.0% $18.51 2032 5 91 1.9% 1,423 1.4% $15.72 2033 5 100 2.1% 1,807 1.8% $17.99 Thereafter 16 468 9.9% 8,791 8.6% $18.80 Total 93 3,121 65.9% $48,853 48.0% $15.65 Small Shop Tenants Year Leases Expiring Expiring SF % of Total Cash ABR % of Total Cash ABR PSF 2025 25 70 1.5% 2,283 2.2% $32.77 2026 63 225 4.8% 6,199 6.1% $27.52 2027 68 207 4.4% 6,121 6.0% $29.54 2028 63 225 4.7% 7,475 7.4% $33.23 2029 58 190 4.0% 6,176 6.1% $32.50 2030 58 198 4.2% 6,160 6.1% $31.13 2031 38 108 2.3% 3,728 3.7% $34.58 2032 30 97 2.1% 3,329 3.3% $34.26 2033 29 99 2.1% 3,661 3.6% $36.98 Thereafter 49 197 4.2% 7,696 7.6% $39.12 Total 481 1,616 34.1% $52,827 52.0% $32.70 $ and square feet in thousands, except per square foot data. Any differences are a result of rounding. 1. Anchor Tenant defined as over 10,000 NRA. 30 |
|
© CTO Realty Growth, Inc. | ctoreit.com Lease Expiration Schedule Total Year Leases Expiring Expiring SF % of Total Cash ABR % of Total Cash ABR PSF 2025 27 221 4.7% 4,986 4.9% $22.55 2026 72 493 10.4% 10,599 10.4% $21.52 2027 80 650 13.7% 11,042 10.9% $16.98 2028 82 988 20.9% 20,105 19.8% $20.35 2029 66 528 11.2% 9,929 9.8% $18.80 2030 64 369 7.8% 8,512 8.4% $23.06 2031 49 436 9.2% 9,802 9.6% $22.48 2032 35 188 4.0% 4,752 4.7% $25.32 2033 34 199 4.2% 5,468 5.4% $27.41 Thereafter 65 664 14.0% 16,486 16.2% $24.82 Total 574 4,736 100.0% $101,681 100.0% $21.47 $ and square feet in thousands, except per square foot data. Any differences are a result of rounding. 31 |
|
© CTO Realty Growth, Inc. | ctoreit.com Top Tenant Summary Tenant/Concept Credit Rating1 Leases2 Leased Square Feet2 % of Total Cash ABR % of Total Fidelity A+ 2 218 4.1% $4,253 4.2% AMC CCC+ 3 174 3.3% 4,118 4.1% Best Buy BBB+ 4 142 2.7% 2,229 2.2% Ross/dd's Discount BBB+ 6 164 3.1% 2,115 2.1% Dick's Sporting Goods BBB 3 140 2.7% 1,806 1.8% TJ Maxx/HomeGoods/Marshalls A 5 153 2.9% 1,777 1.7% Southern University NR 1 60 1.1% 1,664 1.6% Publix NR 2 99 1.9% 1,659 1.6% Whole Foods Market AA- 1 60 1.1% 1,633 1.6% Academy Sports & Outdoors BB+ 2 129 2.5% 1,497 1.5% Regal Cinemas NR 1 51 1.0% 1,210 1.2% Nordstrom Rack BB 2 78 1.5% 1,203 1.2% Darden Restaurants BBB 3 25 0.5% 1,195 1.2% DSW Shoe Warehouse NR 4 69 1.3% 1,164 1.1% Burlington BB+ 3 91 1.7% 1,084 1.1% Harkins Theatres NR 1 56 1.1% 1,073 1.1% Floor & Decor BB 1 75 1.4% 1,047 1.0% PetSmart B+ 3 63 1.2% 1,002 1.0% Barnes & Noble NR 3 75 1.4% 936 0.9% Old Navy BB 3 59 1.1% 904 0.9% Other 521 2,756 52.5% 68,110 67.0% Total Occupied 574 4,736 90.2% $101,681 100.0% Vacant - 517 9.8% Total 574 5,254 100.0% $ and square feet in thousands. Any differences are a result of rounding. 1. Credit Rating is the available rating from S&P Global Ratings and/or Moody’s Investors Service, as of June 30, 2025. “NR” indicates the company is not rated. 2. Excludes leases not yet commenced. 32 |
|
© CTO Realty Growth, Inc. | ctoreit.com Geographic Diversification Markets Properties Square Feet % of Total Cash ABR % of Total 5-Mile 2024 Average Household Income 5-Mile 2024 Total Population 2024-2029 Projected Population Annual Growth Atlanta, GA 5 1,657 32% $37,201 37% $153,734 189,792 1.06% Dallas, TX 2 684 13% 11,204 11% 159,802 213,891 1.20% Richmond, VA 1 392 7% 9,602 9% 148,730 176,752 0.26% Charlotte, NC 1 694 13% 8,597 9% 139,148 202,919 0.83% Orlando, FL 3 443 8% 8,395 8% 113,596 176,900 0.81% Jacksonville, FL 1 211 4% 5,617 6% 100,165 203,212 0.58% Raleigh, NC 1 322 6% 5,338 5% 186,523 136,419 1.22% Phoenix, AZ 1 222 4% 4,368 4% 152,857 320,215 0.64% Albuquerque, NM 1 210 4% 3,729 4% 71,658 50,175 6.09% Houston, TX 1 201 4% 3,392 3% 120,888 282,214 0.89% Tampa, FL 2 176 3% 2,513 2% 99,495 231,575 0.45% Daytona Beach, FL 5 42 1% 1,725 2% 69,367 112,530 0.43% Total 24 5,254 100% $101,681 100% $141,230 192,488 1.08% States Properties Square Feet % of Total Cash ABR % of Total 5-Mile 2024 Average Household Income 5-Mile 2024 Total Population 2024-2029 Projected Population Annual Growth Georgia 5 1,657 32% $37,201 37% $153,734 189,792 1.06% Florida 11 873 17% 18,250 18% 103,340 186,443 0.65% Texas 3 884 17% 14,596 14% 150,760 229,767 1.13% North Carolina 2 1,016 19% 13,935 14% 157,297 177,443 0.98% Virginia 1 392 7% 9,602 9% 148,730 176,752 0.26% Arizona 1 222 4% 4,368 4% 152,857 320,215 0.64% New Mexico 1 210 4% 3,729 4% 71,658 50,175 6.09% Total 24 5,254 100% $101,681 100% $141,230 192,488 1.08% $ and square feet in thousands, except for average household income demographic information. Any differences are a result of rounding. Demographic information sourced from Esri. Market, state and portfolio averages weighted by the Annualized Cash Base Rent of each property. 33 |
|
© CTO Realty Growth, Inc. | ctoreit.com Other Assets Investment Securities Shares & Operating Partnership Units Owned Value Per Share June 30, 2025 Estimated Value Annualized Dividend Per Share In-Place Annualized Dividend Income Alpine Income Property Trust 2,362 $14.71 $34,752 $1.14 $2,693 Structured Investments Type Origination Date Maturity Date Original Loan Amount Amount Outstanding Interest Rate Rivana, Herndon, VA Mortgage Note September 2024 September 2026 $42,000 $42,000 11.00% Watters Creek at Montgomery Farm Preferred Investment April 2022 April 2026 30,000 30,000 9.50% Founders Square First Mortgage March 2023 March 2026 15,000 15,000 8.75% Series A Preferred Investment Preferred Investment July 2024 NA1 10,000 10,000 14.00% Whole Foods First Mortgage November 2024 May 2027 40,200 10,605 12.15% Other Promissory Note June 2023 May 2033 400 400 7.00% Total Structured Investments $137,600 $108,005 10.65% $ in thousands, except for per share data any differences are a result of rounding. 1. The Series A Preferred Investment is not redeemable prior to July 11, 2029, except upon the occurrence of certain specified events 34 |
|
© CTO Realty Growth, Inc. | ctoreit.com 2025 Guidance Low High Core FFO Per Diluted Share1 $1.80 − $1.86 AFFO Per Diluted Share1 $1.93 − $1.98 The Company’s estimated Core FFO per diluted share and AFFO per diluted share for 2025 is as follows: The Company’s 2025 guidance includes but is not limited to the following assumptions: Low High Same-Property NOI Growth2 ~1.0% General and Administrative Expenses $17.5 Million − $18.0 Million Investments $100 Million − $200 Million Target Initial Investment Cash Yield 8.00% − 8.50% $ and shares outstanding in millions, except per share data. 1. See reconciliation of our 2025 Core FFO and AFFO guidance to Net Income Attributable to the Company, per diluted share, in our Earnings Release, as filed herein on page 9. 2. Includes the effects of bad debt expense, occupancy loss and costs associated with tenants in bankruptcy and/or tenant lease defaults. Before potential impact from income producing acquisitions and dispositions. 35 |
|
© CTO Realty Growth, Inc. | ctoreit.com Contact Information & Research Coverage Contact Information Corporate Office Locations Investor Relations Transfer Agent New York Stock Exchange 369 N. New York Ave., Suite 201 Winter Park, FL 32789 1140 N. Williamson Blvd., Suite 140 Daytona Beach, FL 32114 ir@ctoreit.com Computershare Trust Company, N.A. (800) 368-5948 www.computershare.com Ticker Symbol: CTO Series A Preferred Ticker Symbol: CTO-PA www.ctoreit.com Research Analyst Coverage Institution Coverage Analyst Email Phone Alliance Global Partners Gaurav Mehta gmehta@allianceg.com (212) 624-2317 B. Riley John Massocca jmassocca@brileyfin.com (646) 885-5424 Janney Rob Stevenson robstevenson@janney.com (646) 840-3217 Jones Research Jason Weaver jweaver@jonestrading.com (646) 454-2710 Lucid Capital Markets Craig Kucera ckucera@lucidcm.com (917) 890-4412 Raymond James RJ Milligan rjmilligan@raymondjames.com (727) 567-2585 36 |
|
© CTO Realty Growth, Inc. | ctoreit.com Safe Harbor Certain statements contained in this presentation (other than statements of historical fact) are forward-looking statements within the meaning of Section 27A of the Securities Act of 1933, as amended, and Section 21E of the Securities Exchange Act of 1934, as amended. Forward-looking statements can typically be identified by words such as “believe,” “estimate,” “expect,” “intend,” “anticipate,” “will,” “could,” “may,” “should,” “plan,” “potential,” “predict,” “forecast,” “project,” and similar expressions, as well as variations or negatives of these words. Although forward-looking statements are made based upon management’s present expectations and beliefs concerning future developments and their potential effect upon the Company, a number of factors could cause the Company’s actual results to differ materially from those set forth in the forward-looking statements. Such factors may include, but are not limited to: the Company’s ability to remain qualified as a REIT; the Company’s exposure to U.S. federal and state income tax law changes, including changes to the REIT requirements; general adverse economic and real estate conditions; macroeconomic and geopolitical factors, including but not limited to inflationary pressures, interest rate volatility, distress in the banking sector, global supply chain disruptions, and ongoing geopolitical war; credit risk associated with the Company investing in structured investments; the ultimate geographic spread, severity and duration of pandemics such as the COVID-19 Pandemic and its variants, actions that may be taken by governmental authorities to contain or address the impact of such pandemics, and the potential negative impacts of such pandemics on the global economy and the Company’s financial condition and results of operations; the inability of major tenants to continue paying their rent or obligations due to bankruptcy, insolvency or a general downturn in their business; the loss or failure, or decline in the business or assets of PINE; the completion of 1031 exchange transactions; the availability of investment properties that meet the Company’s investment goals and criteria; the uncertainties associated with obtaining required governmental permits and satisfying other closing conditions for planned acquisitions and sales; and the uncertainties and risk factors discussed in the Company’s Annual Report on Form 10-K for the fiscal year ended December 31, 2024 and other risks and uncertainties discussed from time to time in the Company’s filings with the U.S. Securities and Exchange Commission. There can be no assurance that future developments will be in accordance with management’s expectations or that the effect of future developments on the Company will be those anticipated by management. Readers are cautioned not to place undue reliance on these forward-looking statements, which speak only as of the date of this presentation. The Company undertakes no obligation to update the information contained in this presentation to reflect subsequently occurring events or circumstances. 37 |
|
© CTO Realty Growth, Inc. | ctoreit.com Non-GAAP Financial Measures Our reported results are presented in accordance with accounting principles generally accepted in the United States of America (“GAAP”). We also disclose Funds From Operations (“FFO”), Core Funds From Operations (“Core FFO”), Adjusted Funds From Operations (“AFFO”), Pro Forma Earnings Before Interest, Taxes, Depreciation and Amortization (“Pro Forma Adjusted EBITDA”), and Same-Property Net Operating Income (“Same-Property NOI”), each of which are non-GAAP financial measures. We believe these non-GAAP financial measures are useful to investors because they are widely accepted industry measures used by analysts and investors to compare the operating performance of REITs. FFO, Core FFO, AFFO, Pro Forma Adjusted EBITDA, and Same-Property NOI do not represent cash generated from operating activities and are not necessarily indicative of cash available to fund cash requirements; accordingly, they should not be considered alternatives to net income as a performance measure or cash flows from operating activities as reported on our statement of cash flows as a liquidity measure and should be considered in addition to, and not in lieu of, GAAP financial measures. We compute FFO in accordance with the definition adopted by the Board of Governors of the National Association of Real Estate Investment Trusts, or NAREIT. NAREIT defines FFO as GAAP net income or loss adjusted to exclude real estate related depreciation and amortization, as well as extraordinary items (as defined by GAAP) such as net gain or loss from sales of depreciable real estate assets, impairment write-downs associated with depreciable real estate assets and impairments associated with the implementation of current expected credit losses on commercial loans and investments at the time of origination, including the pro rata share of such adjustments of unconsolidated subsidiaries. The Company also excludes the gains or losses from sales of assets incidental to the primary business of the REIT which specifically include the sales of mitigation credits, subsurface sales, investment securities, and land sales, in addition to the mark-to-market of the Company’s investment securities and interest related to the 2025 Notes, if the effect is dilutive. To derive Core FFO, we modify the NAREIT computation of FFO to include other adjustments to GAAP net income related to gains and losses recognized on the extinguishment of debt, amortization of above- and below-market lease related intangibles, and other unforecastable market- or transaction-driven non-cash items, as well as adding back the interest related to the 2025 Notes, if the effect is dilutive. To derive AFFO, we further modify the NAREIT computation of FFO and Core FFO to include other adjustments to GAAP net income related to non-cash revenues and expenses such as straight-line rental revenue, non-cash compensation, and other non-cash amortization. Such items may cause short-term fluctuations in net income but have no impact on operating cash flows or long-term operating performance. We use AFFO as one measure of our performance when we formulate corporate goals. To derive Pro Forma Adjusted EBITDA, GAAP net income or loss attributable to the Company is adjusted to exclude real estate related depreciation and amortization, as well as extraordinary items (as defined by GAAP) such as net gain or loss from sales of depreciable real estate assets, impairment write-downs associated with depreciable real estate assets, impairments associated with the implementation of current expected credit losses on commercial loans and investments at the time of origination, including the pro rata share of such adjustments of unconsolidated subsidiaries, non-cash revenues and expenses such as straight-line rental revenue, amortization of deferred financing costs, above- and below-market lease related intangibles, non-cash compensation, other non-recurring items such as termination fees, forfeitures of tenant security deposits, and certain adjustments to reconciliation estimates related to reimbursable revenue for recently acquired properties, and other non-cash income or expense. The Company also excludes the gains or losses from sales of assets incidental to the primary business of the REIT which specifically include the sales of mitigation credits, subsurface sales, investment securities, and land sales, in addition to the mark-to-market of the Company’s investment securities. Cash interest expense is also excluded from Pro Forma Adjusted EBITDA, and GAAP net income or loss is adjusted for the annualized impact of acquisitions, dispositions and other similar activities. 38 |
|
© CTO Realty Growth, Inc. | ctoreit.com Non-GAAP Financial Measures (Continued) To derive Same-Property NOI, GAAP net income or loss attributable to the Company is adjusted to exclude real estate related depreciation and amortization, as well as extraordinary items (as defined by GAAP) such as net gain or loss from sales of depreciable real estate assets, impairment write-downs associated with depreciable real estate assets, impairments associated with the implementation of current expected credit losses on commercial loans and investments at the time of origination, including the pro rata share of such adjustments of unconsolidated subsidiaries, non-cash revenues and expenses such as straight-line rental revenue, amortization of deferred financing costs, above- and below-market lease related intangibles, non-cash compensation, other non-recurring items such as termination fees, forfeitures of tenant security deposits, and certain adjustments to reconciliation estimates related to reimbursable revenue for recently acquired properties, and other non-cash income or expense. Interest expense, general and administrative expenses, investment and other income or loss, income tax benefit or expense, real estate operations revenues and direct cost of revenues, management fee income, and interest income from commercial loans and investments are also excluded from Same-Property NOI. GAAP net income or loss is further adjusted to remove the impact of properties that were not owned for the full current and prior year reporting periods presented. Cash rental income received under the leases pertaining to the Company’s assets that are presented as commercial loans and investments in accordance with GAAP is also used in lieu of the interest income equivalent. FFO is used by management, investors and analysts to facilitate meaningful comparisons of operating performance between periods and among our peers primarily because it excludes the effect of real estate depreciation and amortization and net gains or losses on sales, which are based on historical costs and implicitly assume that the value of real estate diminishes predictably over time, rather than fluctuating based on existing market conditions. We believe that Core FFO and AFFO are additional useful supplemental measures for investors to consider because they will help them to better assess our operating performance without the distortions created by other non-cash revenues or expenses. We also believe that Pro Forma Adjusted EBITDA is an additional useful supplemental measure for investors to consider as it allows for a better assessment of our operating performance without the distortions created by other non-cash revenues, expenses or certain effects of the Company’s capital structure on our operating performance. We use Same-Property NOI to compare the operating performance of our assets between periods. It is an accepted and important measurement used by management, investors and analysts because it includes all property-level revenues from the Company’s properties, less operating and maintenance expenses, real estate taxes and other property-specific expenses (“Net Operating Income” or “NOI”) of properties that have been owned and stabilized for the entire current and prior year reporting periods. Same-Property NOI attempts to eliminate differences due to the acquisition or disposition of properties during the particular period presented, and therefore provides a more comparable and consistent performance measure for the comparison of the Company’s properties. FFO, Core FFO, AFFO, Pro Forma Adjusted EBITDA, and Same-Property NOI may not be comparable to similarly titled measures employed by other companies. 39 |
|
© CTO Realty Growth, Inc. | ctoreit.com Definitions & Terms References and terms used in this presentation that are in addition to terms defined in the Non-GAAP Financial Measures include: ▪ This presentation was published on July 29, 2025. ▪ All information is as of June 30, 2025, unless otherwise noted. ▪ Any calculation differences are assumed to be a result of rounding. ▪ “2025 Guidance” in this presentation is based on the 2025 Guidance provided in the Company’s Second Quarter 2025 Operating Results press release filed on July 29, 2025. ▪ “Alpine” or “PINE” refers to Alpine Income Property Trust, a publicly traded net lease REIT traded on the New York Stock Exchange under the ticker symbol PINE. ▪ “Annualized Base Rent”, “ABR” or “Rent” and the statistics based on ABR are calculated based on our current portfolio and represent straight-line rent calculated in accordance with GAAP. ▪ “Annualized Cash Base Rent”, “Cash ABR” and the statistics based on Cash ABR are calculated based on our current portfolio and represent the annualized cash base rent calculated in accordance with GAAP due from the tenants at a specific point in time. ▪ “Credit Rated” is a tenant or the parent of a tenant with a credit rating from S&P Global Ratings, Moody’s Investors Service, Fitch Ratings or the National Association of Insurance Commissioners (NAIC) (together, the “Major Rating Agencies”). The Company defines an Investment Grade Rated Tenant as a tenant or the parent of a tenant with a credit rating from S&P Global Ratings, Moody’s Investors Service, Fitch Ratings or the National Association of Insurance Commissioners of Baa3, BBB-, or NAIC-2 or higher. If applicable, in the event of a split rating between S&P Global Ratings and Moody’s Investors Services, the Company utilizes the higher of the two ratings as its reference point as to whether a tenant is defined as an Investment Grade Rated Tenant. ▪ “Dividend” or “Dividends”, subject to the required dividends to maintain our qualification as a REIT, are set by the Board of Directors and declared on a quarterly basis and there can be no assurances as to the likelihood or number of dividends in the future. ▪ “Investment in Alpine Income Property Trust” or “Alpine Investment” or “PINE Ownership” is calculated based on the 2,362,475 common shares and partnership units CTO owns in PINE and is based on PINE’s closing stock price as of the referenced period on the respective slide. ▪ “Leased Occupancy” refers to space that is currently leased but for which rent payments have not yet commenced. ▪ “MSA” or “Metropolitan Statistical Area” is a region that consists of a city and surrounding communities that are linked by social and economic factors, as established by the U.S. Office of Management and Budget. The names of the MSA have been shortened for ease of reference. ▪ “Net Debt” is calculated as our total long-term debt as presented on the face of our balance sheet; plus financing costs, net of accumulated amortization and unamortized convertible debt discount; less cash, restricted cash and cash equivalents. ▪ “Net Operating Income” or “NOI” is revenues from all income properties less operating expense, maintenance expense, real estate taxes and rent expense. ▪ “Total Enterprise Value” is calculated as the Company’s Total Common Shares Outstanding multiplied by the common stock price; plus the par value of the Series A perpetual preferred equity outstanding and Net Debt. 40 |