UNITED STATES
SECURITIES AND EXCHANGE COMMISSION
Washington, D.C. 20549
FORM 8-K
CURRENT REPORT
Pursuant to Section 13 or 15(d) of the Securities Exchange Act of 1934
Date of Report (Date of earliest event reported): June 2, 2025
Boot Barn Holdings, Inc.
(Exact name of registrant as specified in its charter)
Delaware |
001-36711 |
90-0776290 |
(State or other jurisdiction |
(Commission |
(I.R.S. Employer |
17100 Laguna Canyon Road, Irvine, California |
92618 |
(Address of principal executive offices) |
(Zip Code) |
(949) 453-4400
(Registrant’s telephone number, including area code)
Not Applicable
(Former name or former address, if changed since last report)
Check the appropriate box below if the Form 8-K filing is intended to simultaneously satisfy the filing obligation of the registrant under any of the following provisions:
☐ |
Written communications pursuant to Rule 425 under the Securities Act (17 CFR 230.425) |
☐ |
Soliciting material pursuant to Rule 14a-12 under the Exchange Act (17 CFR 240.14a-12) |
☐ |
Pre-commencement communications pursuant to Rule 14d-2(b) under the Exchange Act (17 CFR 240.14d-2(b)) |
☐ |
Pre-commencement communications pursuant to Rule 13e-4(c) under the Exchange Act (17 CFR 240.13e-4(c)) |
Indicate by check mark whether the registrant is an emerging growth company as defined in Rule 405 of the Securities Act of 1933 (§230.405 of this chapter) or Rule 12b-2 of the Securities Exchange Act of 1934 (§240.12b-2 of this chapter).
☐ Emerging growth company
☐ If an emerging growth company, indicate by check mark if the registrant has elected not to use the extended transition period for complying with any new or revised financial accounting standards provided pursuant to section 13(a) of the Exchange Act.
Securities registered pursuant to Section 12(b) of the Act:
Title of each class |
Trading Symbol |
Name of each exchange on which registered |
Common Stock, $0.0001 par value |
BOOT |
New York Stock Exchange |
Item 7.01 Regulation FD Disclosure.
Boot Barn Holdings, Inc. (the “Company”) is furnishing this Current Report on Form 8-K in connection with the disclosure of information contained in an investor presentation (the “Presentation”) to be used by the Company at various meetings with institutional investors and analysts. This information may be amended or updated at any time and from time to time through another Current Report on Form 8-K or other means. A copy of the Presentation is furnished herewith as Exhibit 99.1 and is incorporated into this Item 7.01 by reference.
The information furnished in this Item 7.01, including Exhibit 99.1, is being furnished and shall not be deemed to be “filed” for the purposes of Section 18 of the Securities Exchange Act of 1934, as amended (the “Exchange Act”), or otherwise subject to the liabilities of that section, nor shall it be deemed to be incorporated by reference into any other filing under the Securities Act of 1933, as amended, or the Exchange Act, except as expressly set forth by specific reference in such filing.
The Company expressly disclaims any obligation to update or revise any of the information contained in the Presentation.
The Presentation is available on the Company’s investor relations website located at investor.bootbarn.com, although the Company reserves the right to discontinue that availability at any time. The website address included herein is an inactive textual reference only. The information contained on such website is not incorporated into this Current Report on Form 8-K.
Item 9.01 Financial Statements and Exhibits
(d) Exhibits.
Exhibit No. |
|
Description of Exhibit |
Exhibit 99.1 |
|
|
Exhibit 104 |
|
Cover Page Interactive Data File (embedded within Inline XBRL document). |
SIGNATURES
Pursuant to the requirements of the Securities Exchange Act of 1934, the registrant has duly caused this report to be signed on its behalf by the undersigned hereunto duly authorized.
|
BOOT BARN HOLDINGS, INC. |
|
Date: June 2, 2025 |
By: |
/s/ James M. Watkins |
|
|
Name: James M. Watkins |
|
|
Title: Chief Financial Officer and Secretary |
|
0 Offering everyone a piece of the American spirit—one handshake at a time. |
|
1 Important Information Forward-Looking Statements This presentation contains forward-looking statements that are subject to risks and uncertainties. All statements other than statements of historical fact included in this presentation are forward-looking statements. You can identify forward-looking statements by the fact that they do not relate strictly to historical or current facts. These statements may include words such as "anticipate," "estimate," "expect," "project," "plan,“ "intend," "believe," “outlook” and other words of similar meaning in connection with any discussion of the timing or nature of future operating or financial performance or other events, but not all forward-looking statements contain these identifying words. These forward-looking statements are based on assumptions that the Boot Barn Holdings, Inc.’s (the “Company,” “Boot Barn,” “BOOT,” “we,” “us,” and “our”) management has made in light of their industry experience and on their perceptions of historical trends, current conditions, expected future developments and other factors that they believe are appropriate under the circumstances. As you consider this presentation, you should understand that these statements are not guarantees of performance or results. They involve risks, uncertainties (some of which are beyond the Company’s control) and assumptions. These risks, uncertainties and assumptions include, but are not limited to, the following: decreases in consumer spending due to declines in consumer confidence, local economic conditions or changes in consumer preferences; the impact that import tariffs and other trade restrictions imposed by the U.S., China or other countries have had, and may continue to have, on our product costs and changes to U.S. or other countries’ trade policies and tariff and import/export regulations, including, without limitation, uncertainty with respect to the U.S. – China tariff deal; the Company’s ability to effectively execute on its growth strategy; and the Company’s failure to maintain and enhance its strong brand image, to compete effectively, to maintain good relationships with its key suppliers, and to improve and expand its exclusive product offerings. The Company discusses the foregoing risks and other risks in greater detail under the heading “Risk factors” in the periodic reports filed by the Company with the Securities and Exchange Commission. Although the Company believes that these forward-looking statements are based on reasonable assumptions, you should be aware that many factors could affect the Company’s actual financial results and cause them to differ materially from those anticipated in the forward-looking statements. Because of these factors, the Company cautions that you should not place undue reliance on any of these forward-looking statements. New risks and uncertainties arise from time to time, and it is impossible for the Company to predict those events or how they may affect the Company. Further, any forward-looking statement speaks only as of the date on which it is made. Except as required by law, the Company does not intend to update or revise the forward-looking statements in this presentation after the date of this presentation. Industry and Market Information Statements in this presentation concerning our industry and the markets in which we operate, including our general expectations and competitive position, business opportunity and market size, growth and share, are based on information from independent industry organizations and other third-party sources, data from our internal research and management estimates. Management estimates are derived from publicly available information and the information and data referred to above and are based on assumptions and calculations made by us based upon our interpretation of such information and data. The information and data referred to above are imprecise and may prove to be inaccurate because the information cannot always be verified with complete certainty due to the limitations on the availability and reliability of raw data, the voluntary nature of the data gathering process and other limitations and uncertainties. As a result, please be aware that the data and statistical information in this presentation may differ from information provided by our competitors or from information found in current or future studies conducted by market research institutes, consultancy firms or independent sources. Recent Developments Our business and opportunities for growth depend on consumer discretionary spending, and as such, our results are particularly sensitive to economic conditions and consumer confidence. Inflation, changes to U.S. or other countries’ trade policies and tariff and import/export regulations, and other challenges affecting the global economy could impact our operations and will depend on future developments, which are uncertain. These and other effects make it more challenging for us to estimate the future performance of our business, particularly over the near-to-medium term. For further discussion of the uncertainties and business risks affecting the Company, see the sections captioned “Risk factors” in our periodic reports filed with the Securities and Exchange Commission. |
|
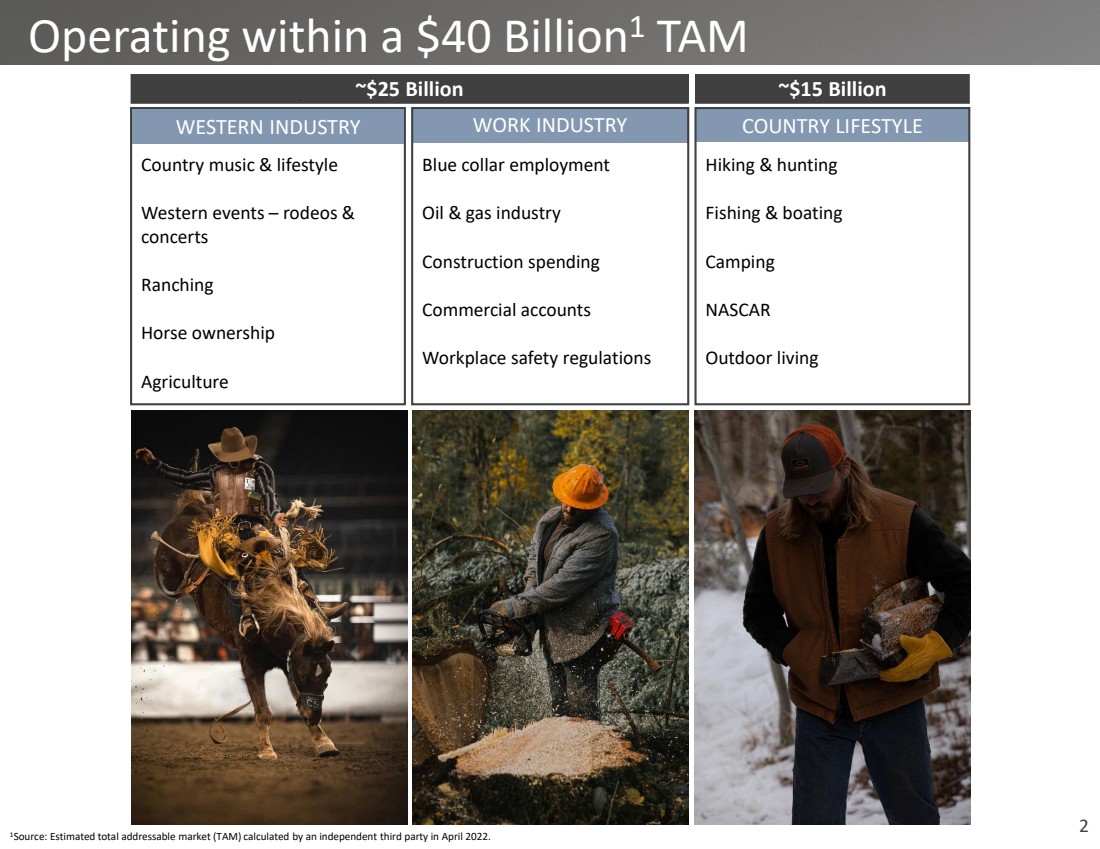
2 Country music & lifestyle Western events – rodeos & concerts Ranching Horse ownership Agriculture Operating within a $40 Billion1 TAM WORK INDUSTRY Blue collar employment Oil & gas industry Construction spending Commercial accounts Workplace safety regulations WESTERN INDUSTRY 1Source: Estimated total addressable market (TAM) calculated by an independent third party in April 2022. COUNTRY LIFESTYLE Hiking & hunting Fishing & boating Camping NASCAR Outdoor living ~$25 Billion ~$15 Billion |
|
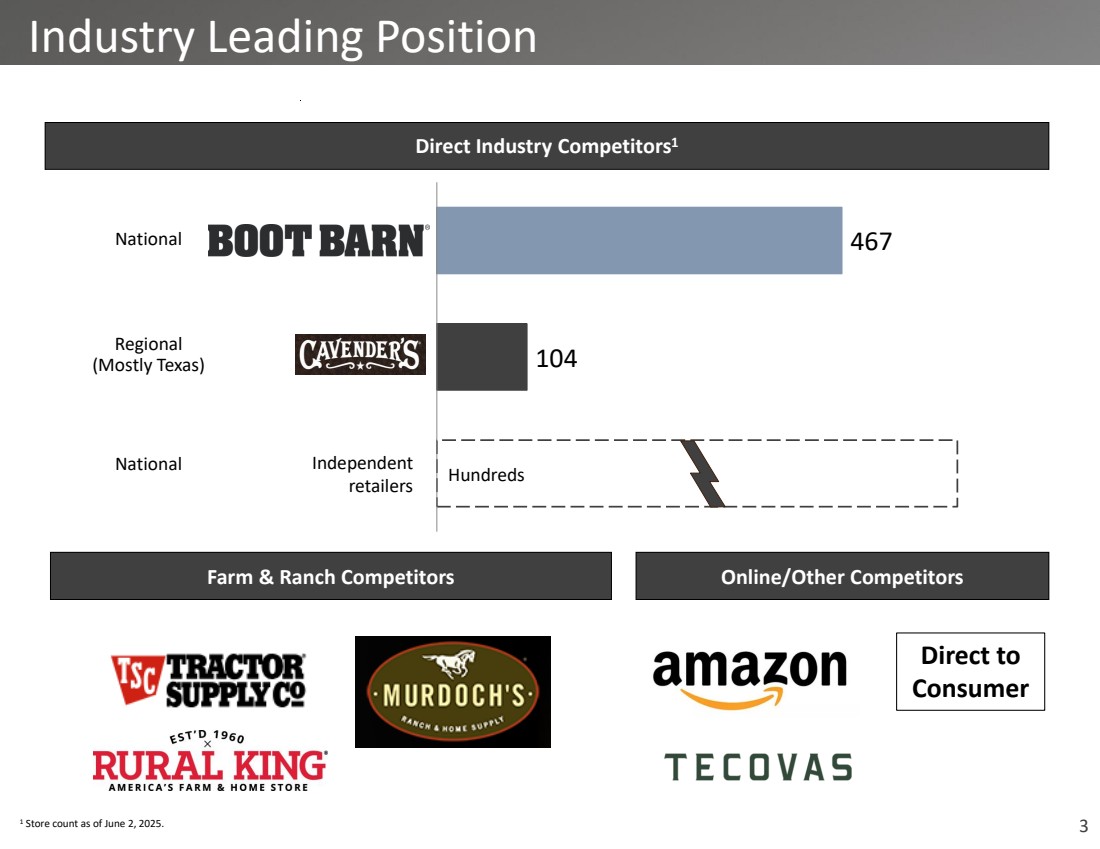
3 1 Store count as of June 2, 2025. 104 National 467 Regional (Mostly Texas) Independent retailers Hundreds National Direct Industry Competitors1 Industry Leading Position Farm & Ranch Competitors Online/Other Competitors Direct to Consumer |
|
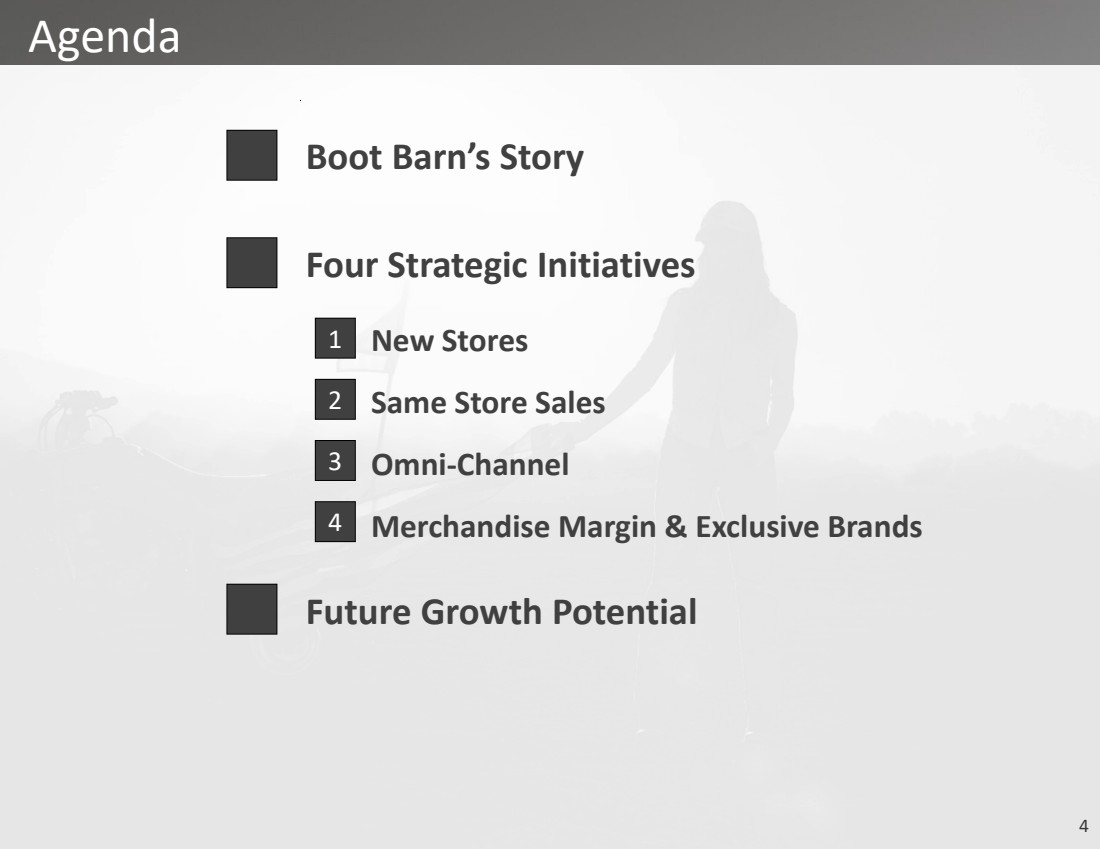
4 Agenda Boot Barn’s Story Four Strategic Initiatives Future Growth Potential 1 2 3 4 New Stores Same Store Sales Omni-Channel Merchandise Margin & Exclusive Brands |
|
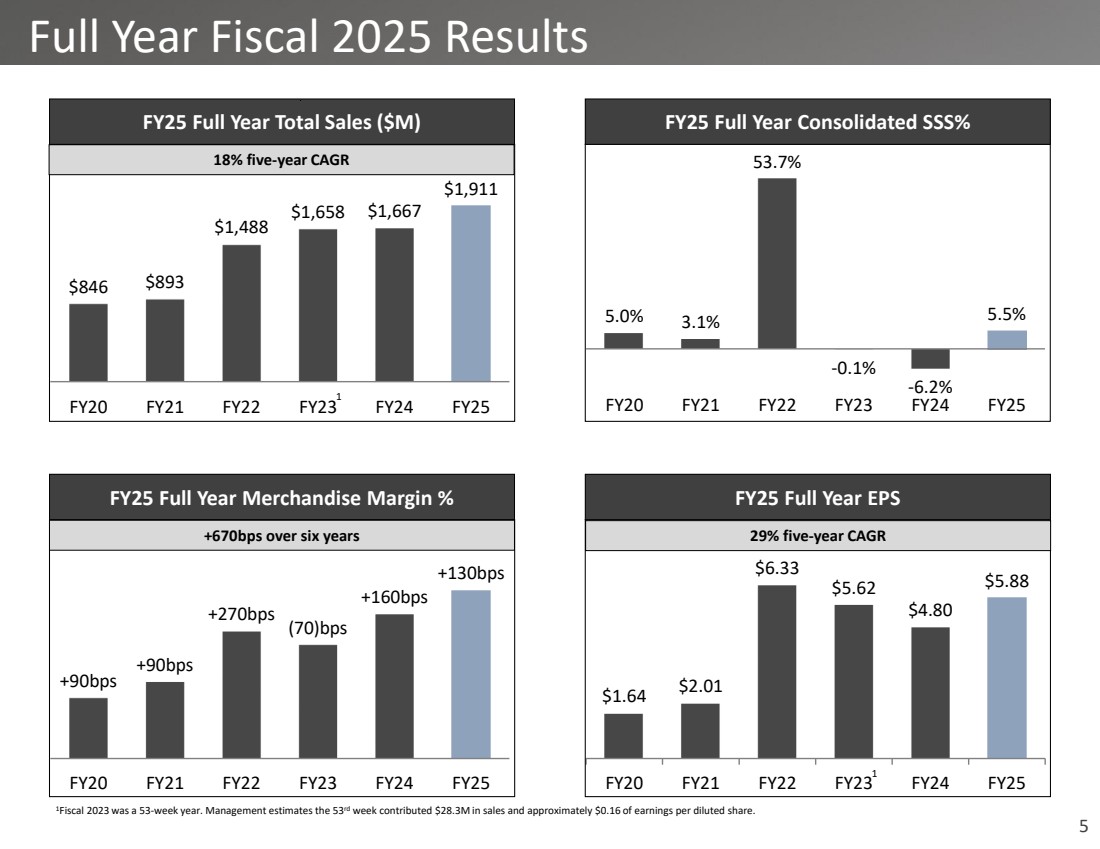
5 Full Year Fiscal 2025 Results 1Fiscal 2023 was a 53-week year. Management estimates the 53rd week contributed $28.3M in sales and approximately $0.16 of earnings per diluted share. $846 $893 $1,488 $1,658 $1,667 $1,911 FY20 FY21 FY22 FY23 FY24 FY25 FY25 Full Year Total Sales ($M) 5.0% 3.1% 53.7% -0.1% -6.2% 5.5% FY20 FY21 FY22 FY23 FY24 FY25 FY25 Full Year Consolidated SSS% +90bps +90bps +270bps (70)bps +160bps +130bps FY20 FY21 FY22 FY23 FY24 FY25 FY25 Full Year Merchandise Margin % $1.64 $2.01 $6.33 $5.62 $4.80 $5.88 FY20 FY21 FY22 FY23 FY24 FY25 FY25 Full Year EPS 18% five-year CAGR +670bps over six years 29% five-year CAGR 1 1 |
|
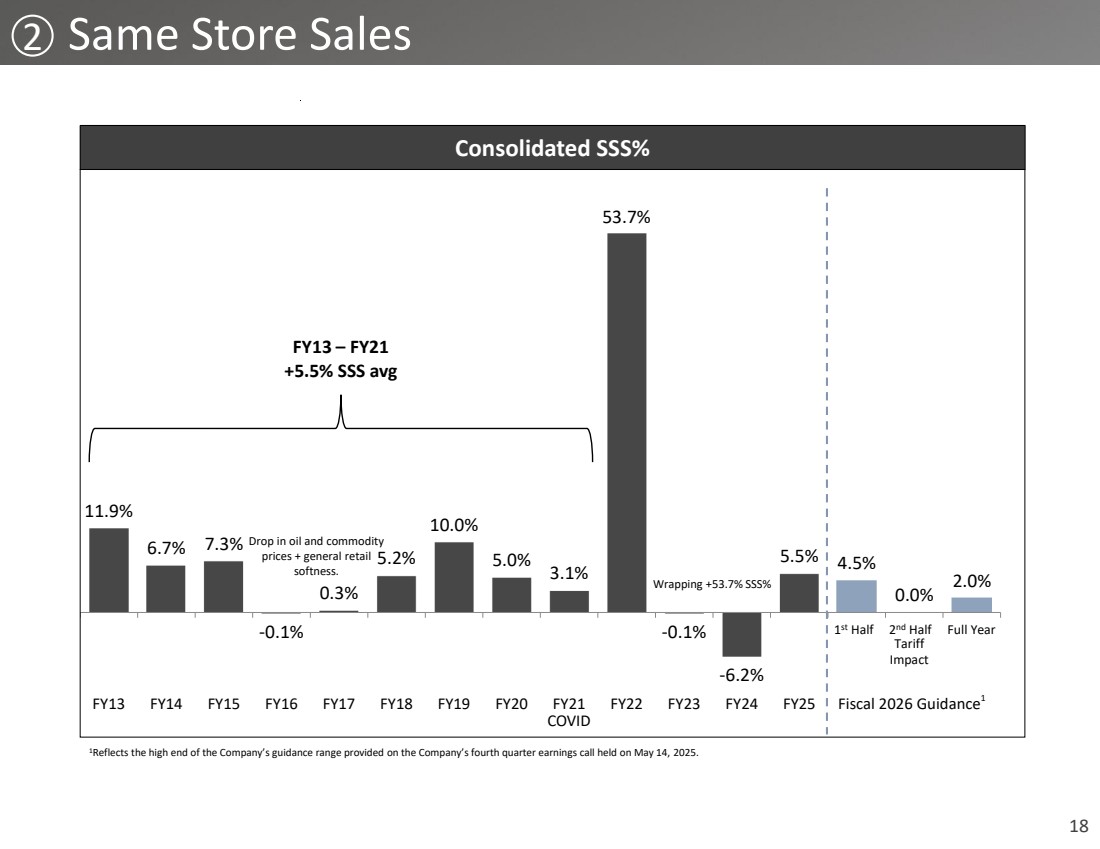
6 11.9% 6.7% 7.3% -0.1% 0.3% 5.2% 10.0% 5.0% 3.1% 53.7% -0.1% -6.2% 5.5% 4.5% 0.0% 2.0% FY13 FY14 FY15 FY16 FY17 FY18 FY19 FY20 FY21 FY22 FY23 FY24 FY25 Full Year Consolidated SSS% 1 1Reflects the high end of the Company’s guidance range provided on the Company’s fourth quarter earnings call held on May 14, 2025. Drop in oil and commodity prices + general retail softness. Wrapping +53.7% SSS% Historical Same Store Sales Growth COVID FY13 – FY21 +5.5% SSS avg 1 st Half 2 nd Half Fiscal 2026 Guidance Tariff Impact |
|
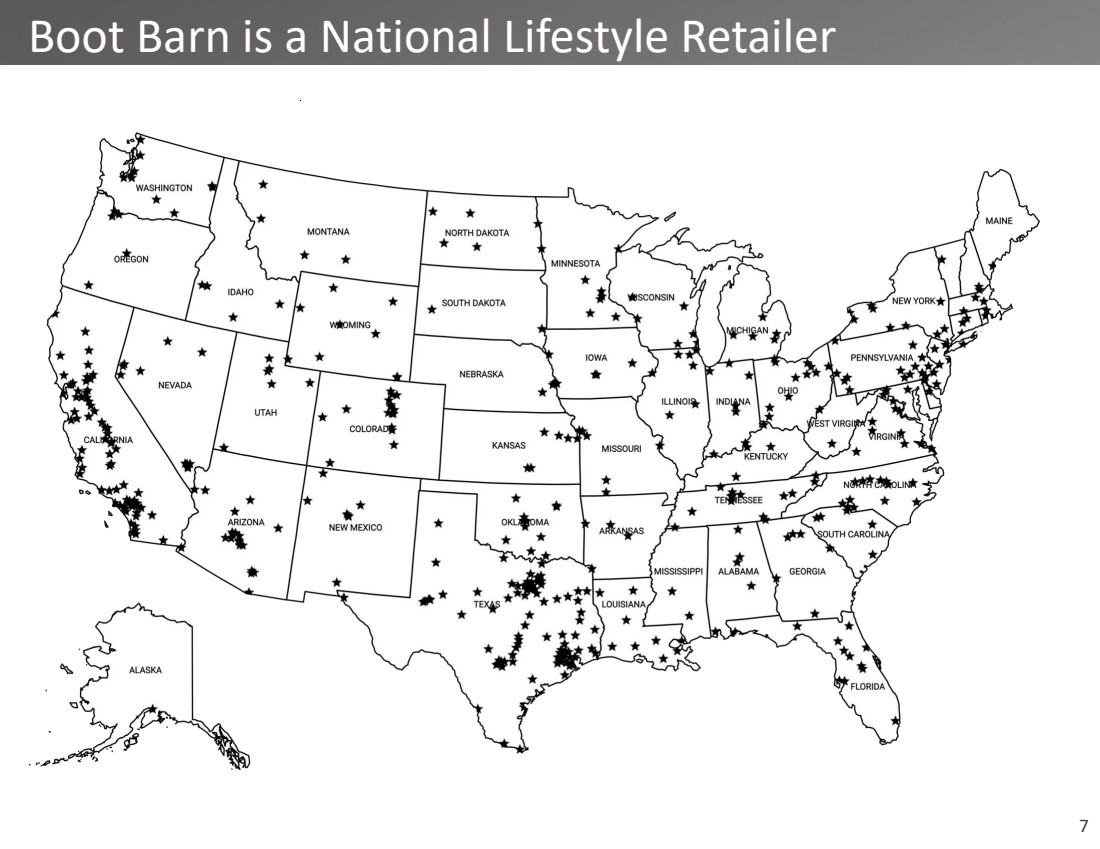
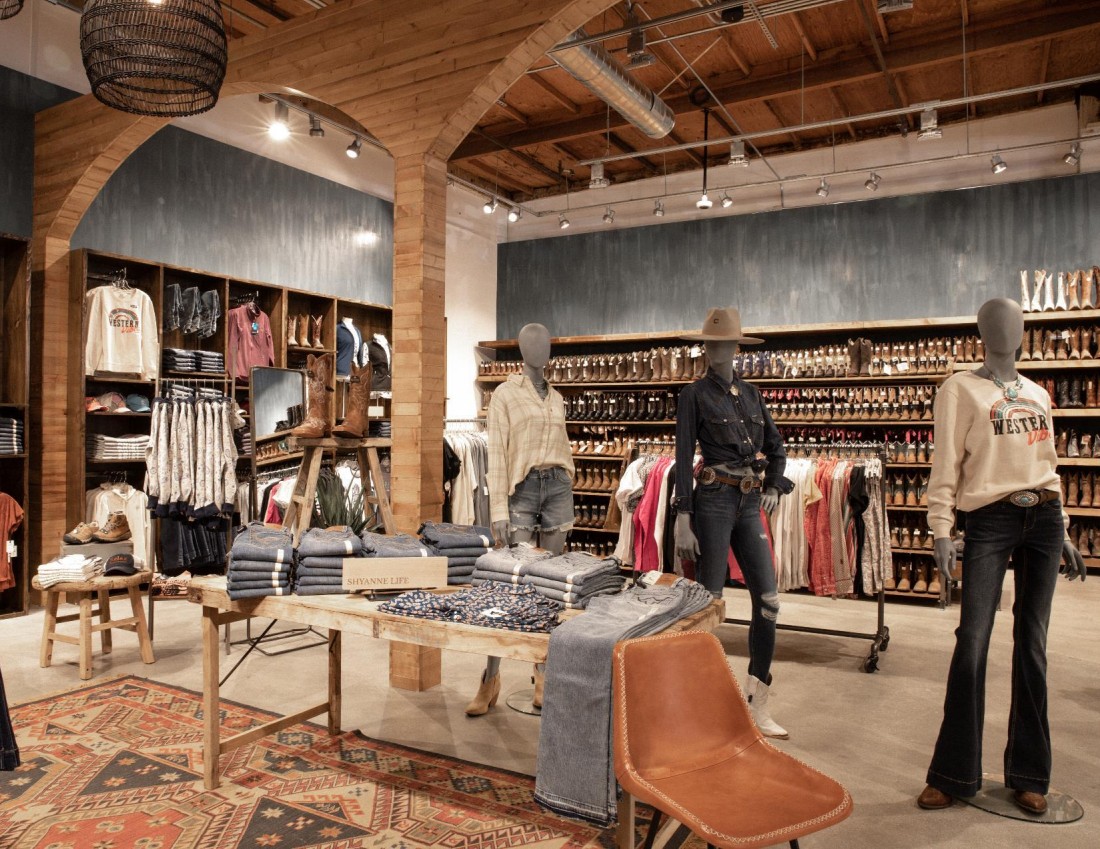
7 Boot Barn is a National Lifestyle Retailer |
|
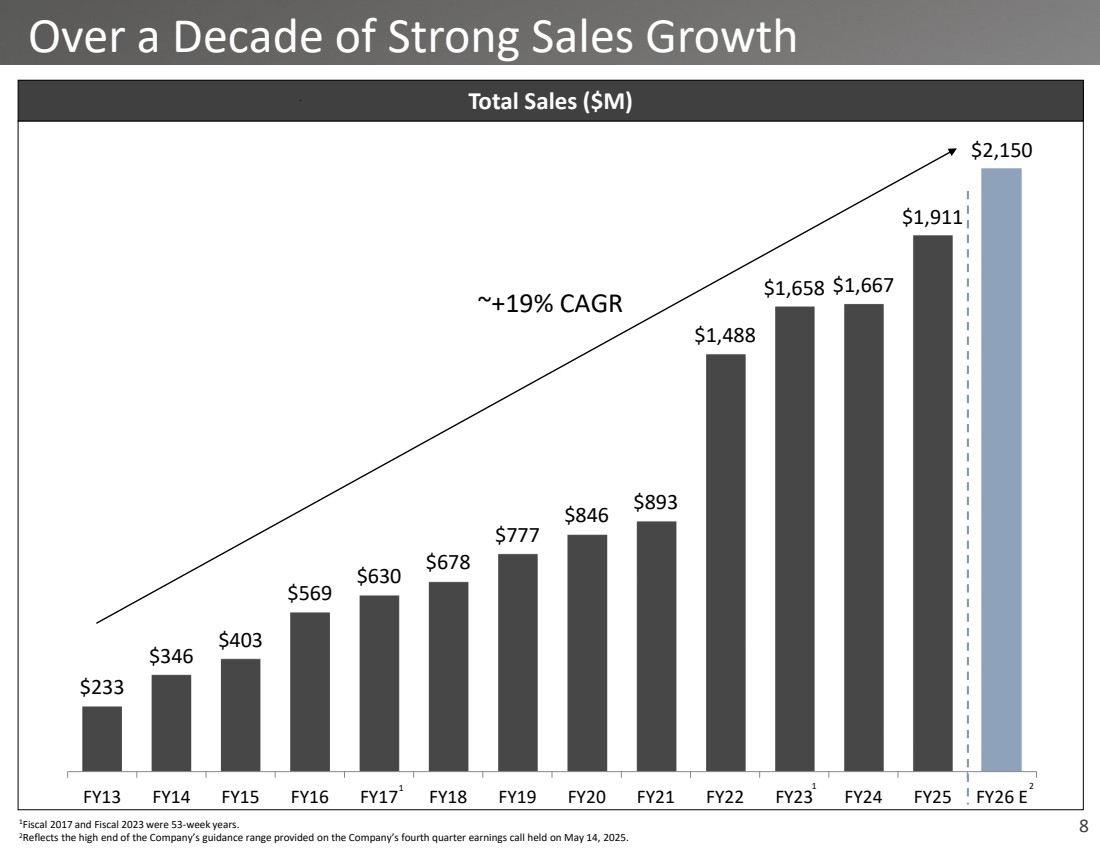
8 $233 $346 $403 $569 $630 $678 $777 $846 $893 $1,488 $1,658 $1,667 $1,911 $2,150 FY13 FY14 FY15 FY16 FY17 FY18 FY19 FY20 FY21 FY22 FY23 FY24 FY25 FY26 E Total Sales ($M) Over a Decade of Strong Sales Growth 1 1 1Fiscal 2017 and Fiscal 2023 were 53-week years. 2Reflects the high end of the Company’s guidance range provided on the Company’s fourth quarter earnings call held on May 14, 2025. ~+19% CAGR 2 |
|
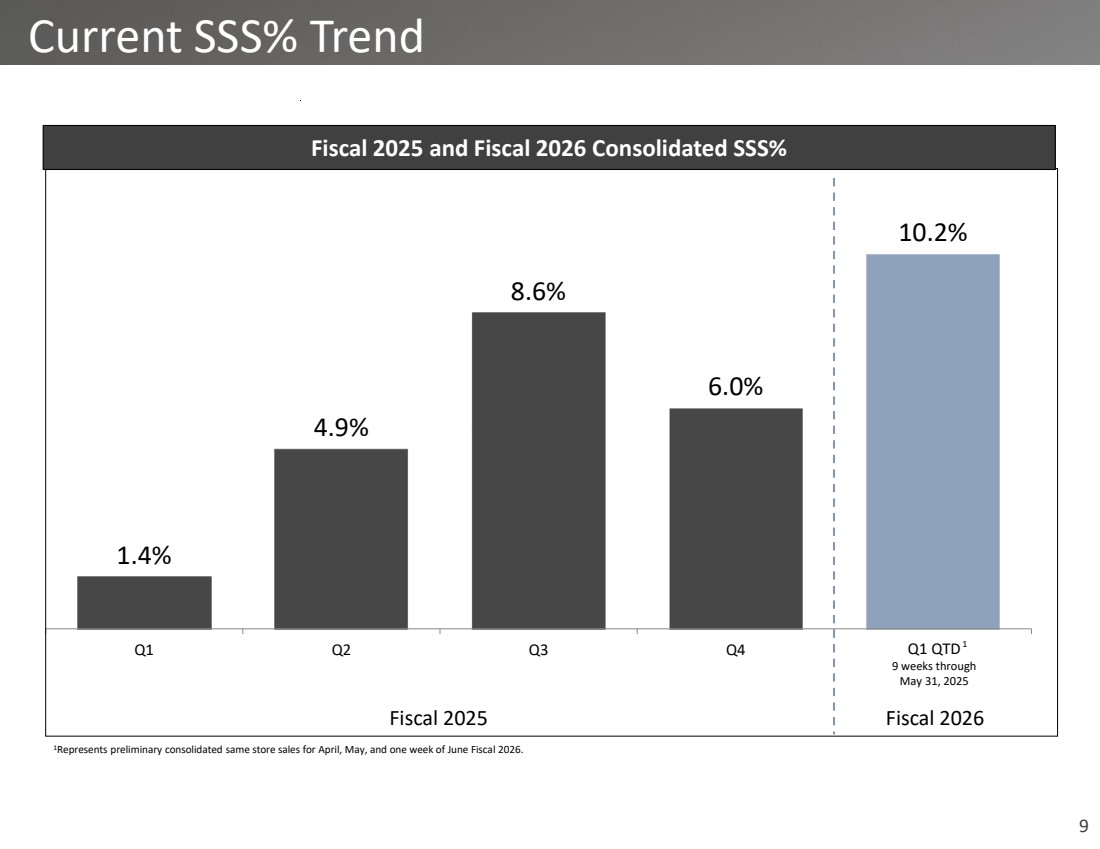
9 1.4% 4.9% 8.6% 6.0% 10.2% Q1 Q2 Q3 Q4 Q1 QTD 9 weeks through May 31, 2025 Current SSS% Trend Fiscal 2025 and Fiscal 2026 Consolidated SSS% Fiscal 2025 Fiscal 2026 1 1Represents preliminary consolidated same store sales for April, May, and one week of June Fiscal 2026. |
|
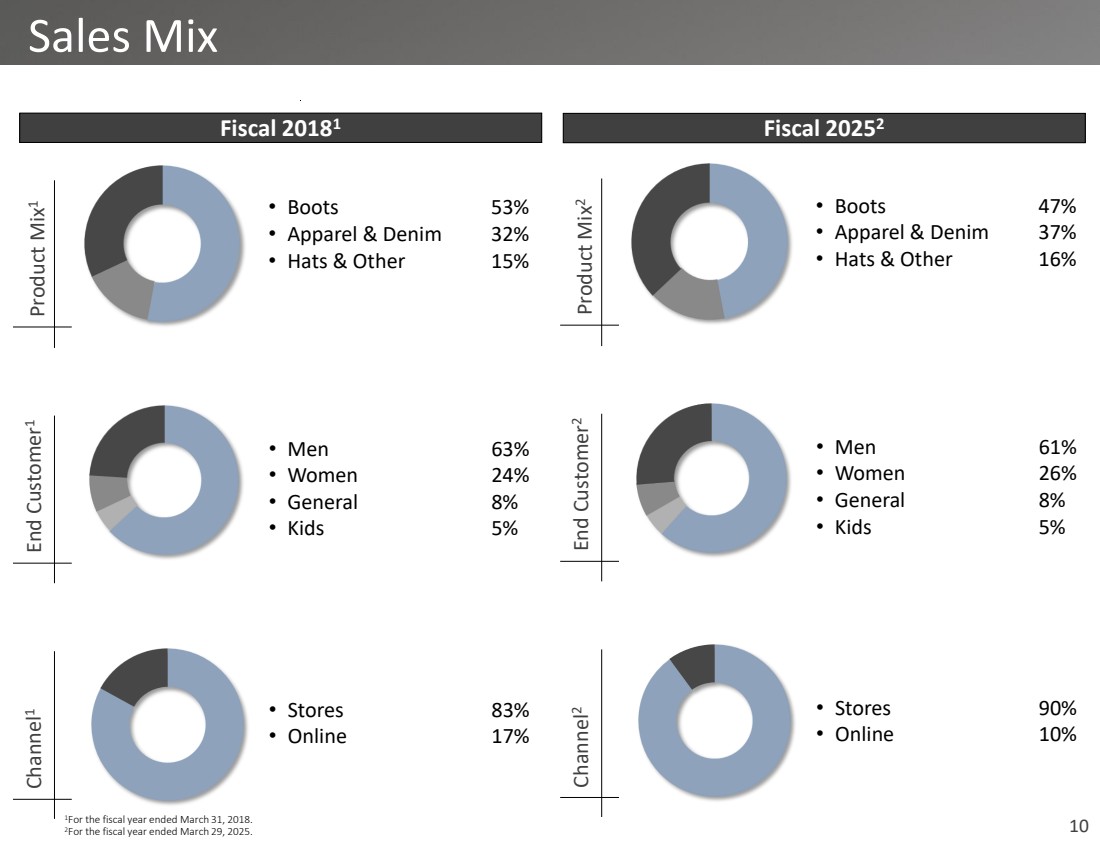
10 Sales Mix Western: ~70% of Sales6 1For the fiscal year ended March 31, 2018. 2For the fiscal year ended March 29, 2025. Product Mix 1 End Customer 1 Channel 1 • Boots 53% • Apparel & Denim 32% • Hats & Other 15% • Men 63% • Women 24% • General 8% • Kids 5% • Stores 83% • Online 17% Product Mix 2 End Customer 2 Channel 2 • Boots 47% • Apparel & Denim 37% • Hats & Other 16% • Men 61% • Women 26% • General 8% • Kids 5% • Stores 90% • Online 10% Fiscal 20181 Fiscal 20252 |
|
11 Strategic Initiatives Update 1 2 3 4 New Stores Same Store Sales Omni-Channel Merchandise Margin & Exclusive Brands |
|
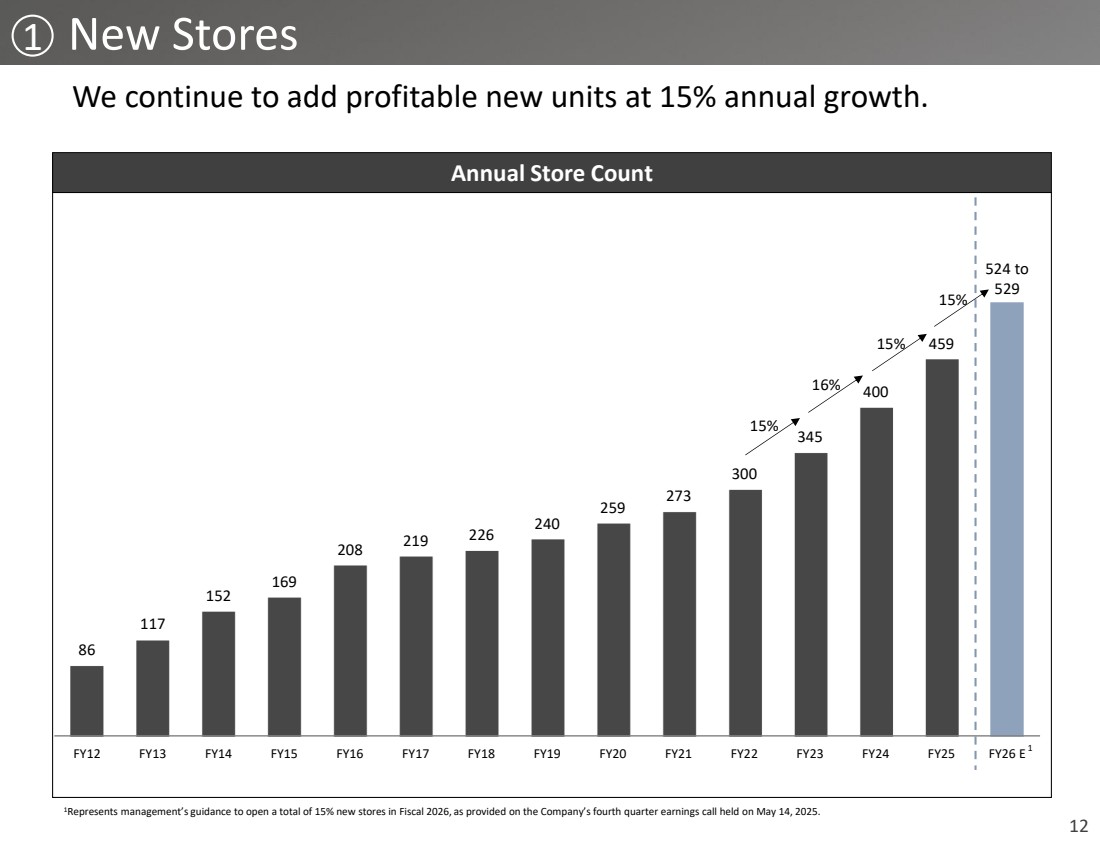
12 New Stores 86 117 152 169 208 219 226 240 259 273 300 345 400 459 524 to 529 FY12 FY13 FY14 FY15 FY16 FY17 FY18 FY19 FY20 FY21 FY22 FY23 FY24 FY25 FY26 E Annual Store Count 1 1Represents management’s guidance to open a total of 15% new stores in Fiscal 2026, as provided on the Company’s fourth quarter earnings call held on May 14, 2025. 1 We continue to add profitable new units at 15% annual growth. 15% 16% 15% 15% |
|
13 |
|
14 |
|
15 |
|
16 |
|
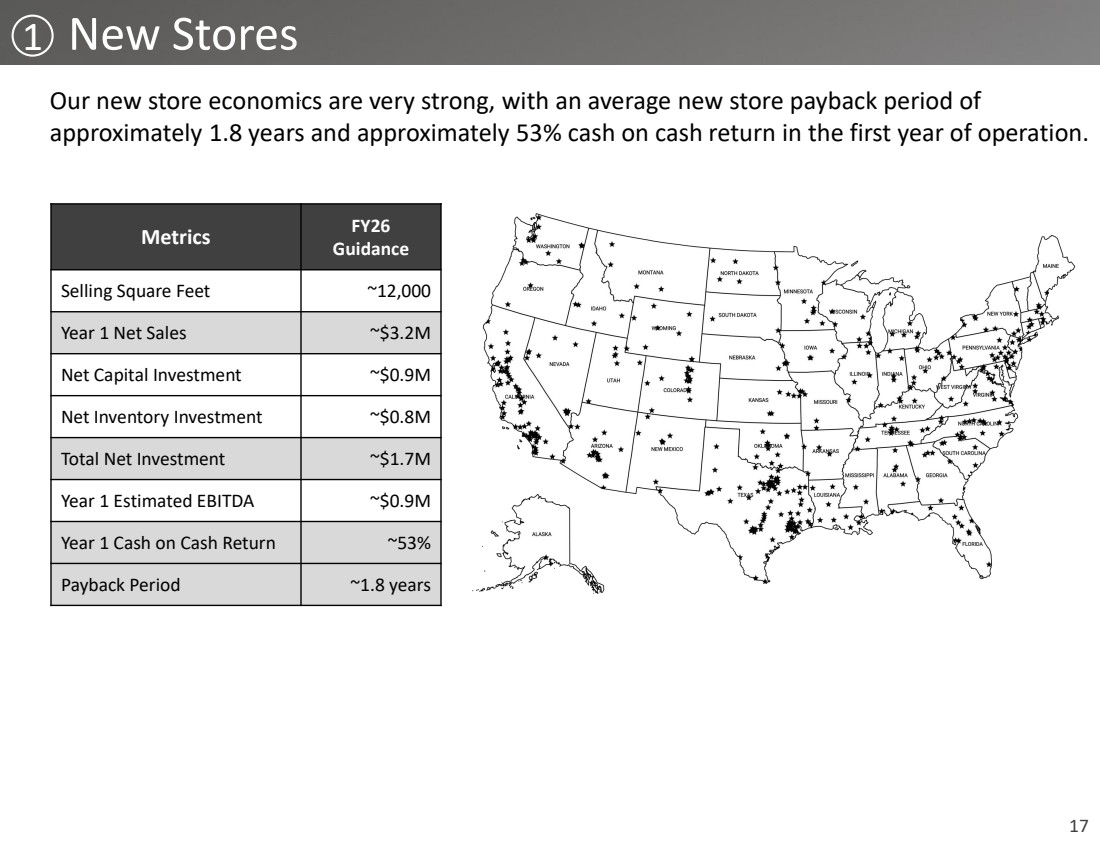
17 1 New Stores Metrics FY26 Guidance Selling Square Feet ~12,000 Year 1 Net Sales ~$3.2M Net Capital Investment ~$0.9M Net Inventory Investment ~$0.8M Total Net Investment ~$1.7M Year 1 Estimated EBITDA ~$0.9M Year 1 Cash on Cash Return ~53% Payback Period ~1.8 years Our new store economics are very strong, with an average new store payback period of approximately 1.8 years and approximately 53% cash on cash return in the first year of operation. |
|
18 11.9% 6.7% 7.3% -0.1% 0.3% 5.2% 10.0% 5.0% 3.1% 53.7% -0.1% -6.2% 5.5% 4.5% 0.0% 2.0% FY13 FY14 FY15 FY16 FY17 FY18 FY19 FY20 FY21 FY22 FY23 FY24 FY25 Full Year Consolidated SSS% 1 1Reflects the high end of the Company’s guidance range provided on the Company’s fourth quarter earnings call held on May 14, 2025. Wrapping +53.7% SSS% COVID FY13 – FY21 +5.5% SSS avg 1 st Half 2 nd Half Fiscal 2026 Guidance Tariff Impact 2 Same Store Sales Drop in oil and commodity prices + general retail softness. |
|
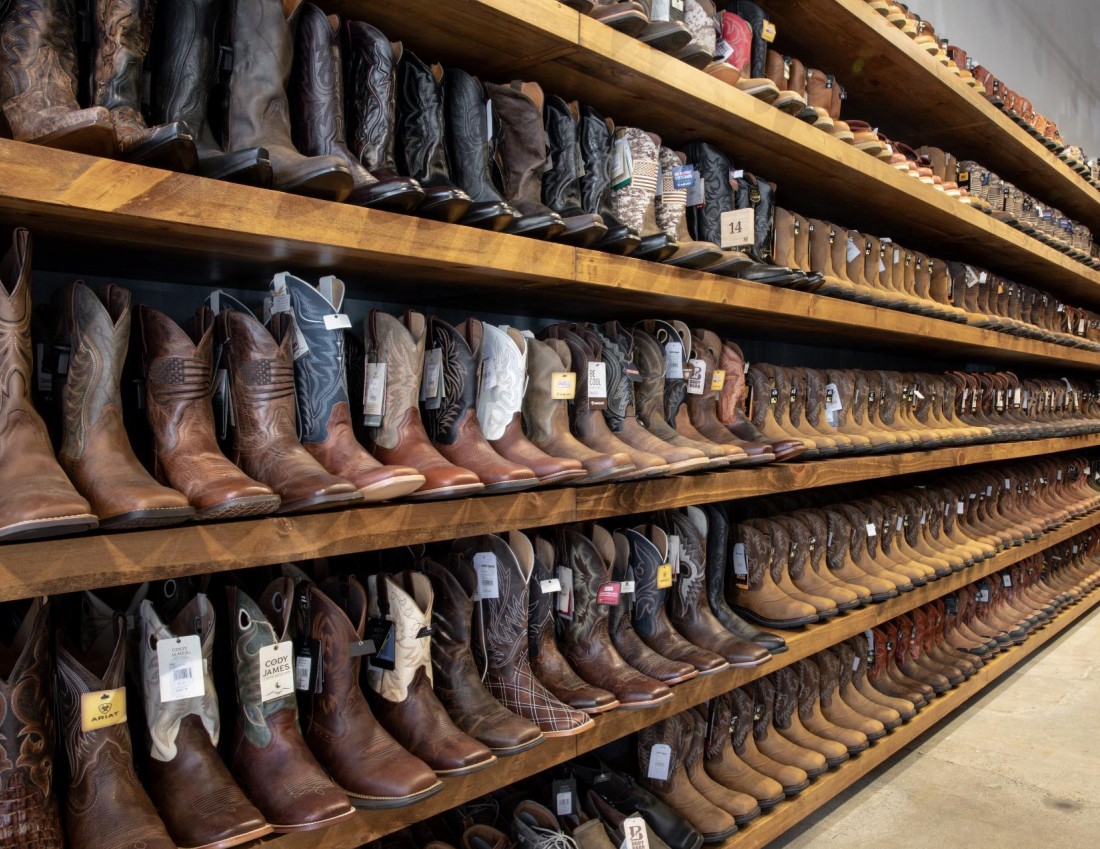
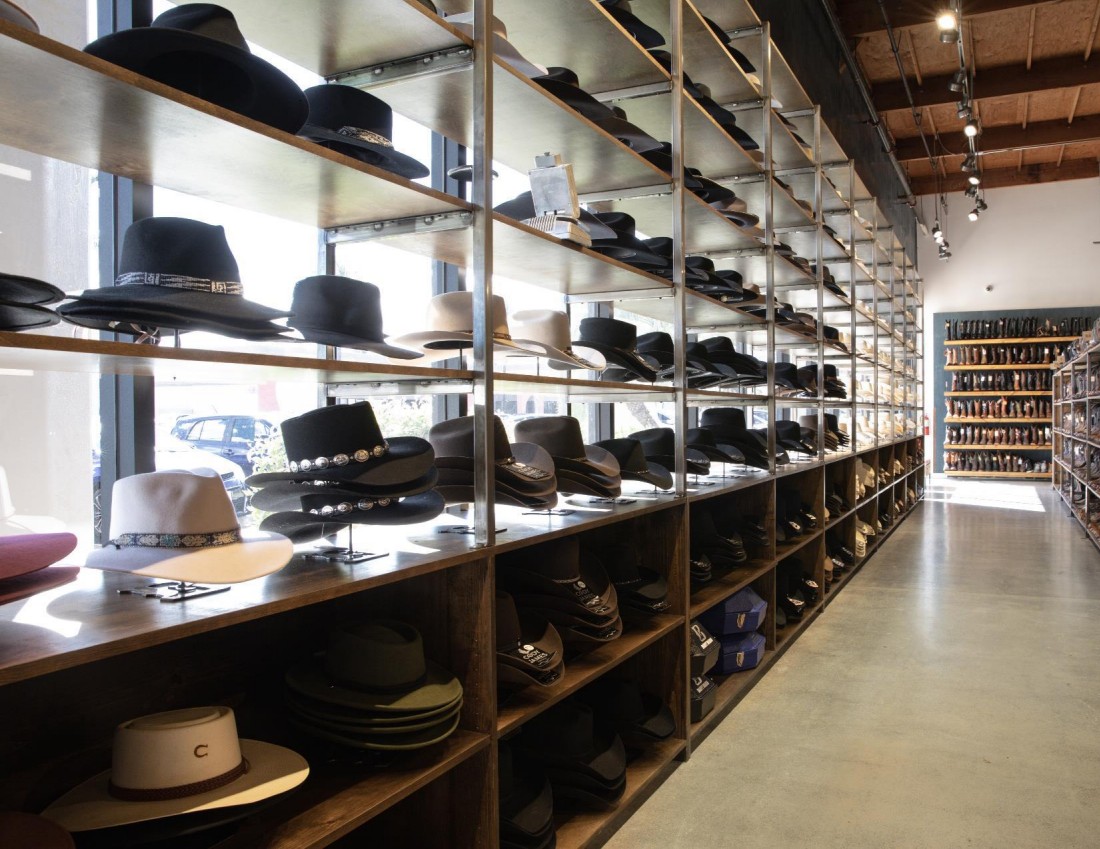
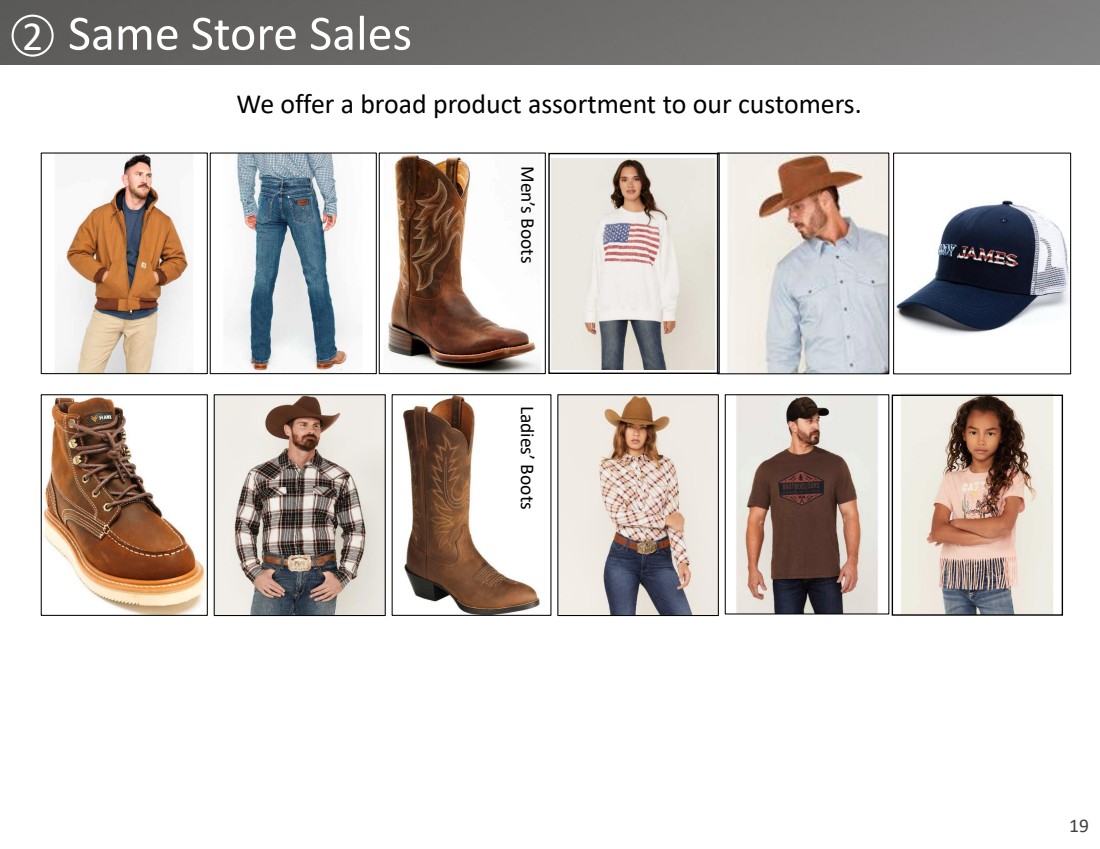
19 Men’s Boots Ladies’ Boots We offer a broad product assortment to our customers. 2 Same Store Sales |
|
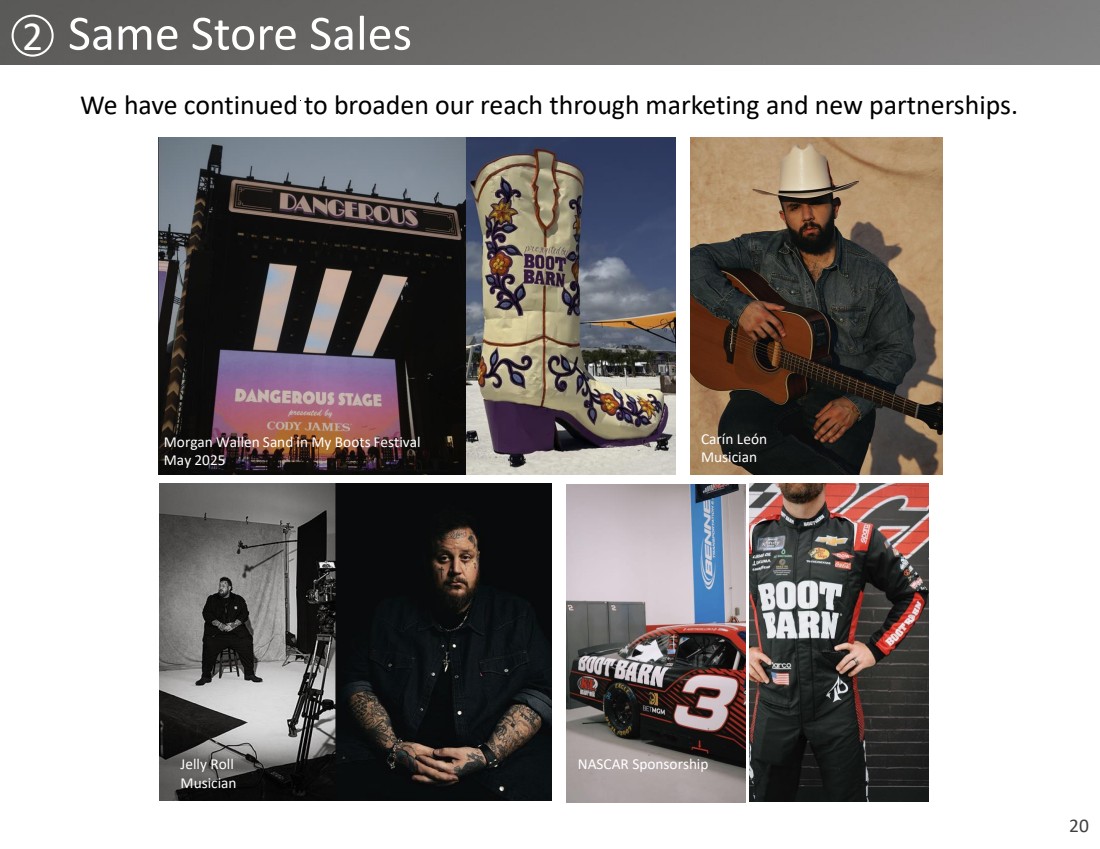
20 National Finals Rodeo (NFR) Boot Barn Booth 2023 Luke Grimes Actor / Musician We have continued to broaden our reach through marketing and new partnerships. Morgan Wallen Sand in My Boots Festival May 2025 Carín León Musician Jelly Roll Musician NASCAR Sponsorship 2 Same Store Sales |
|
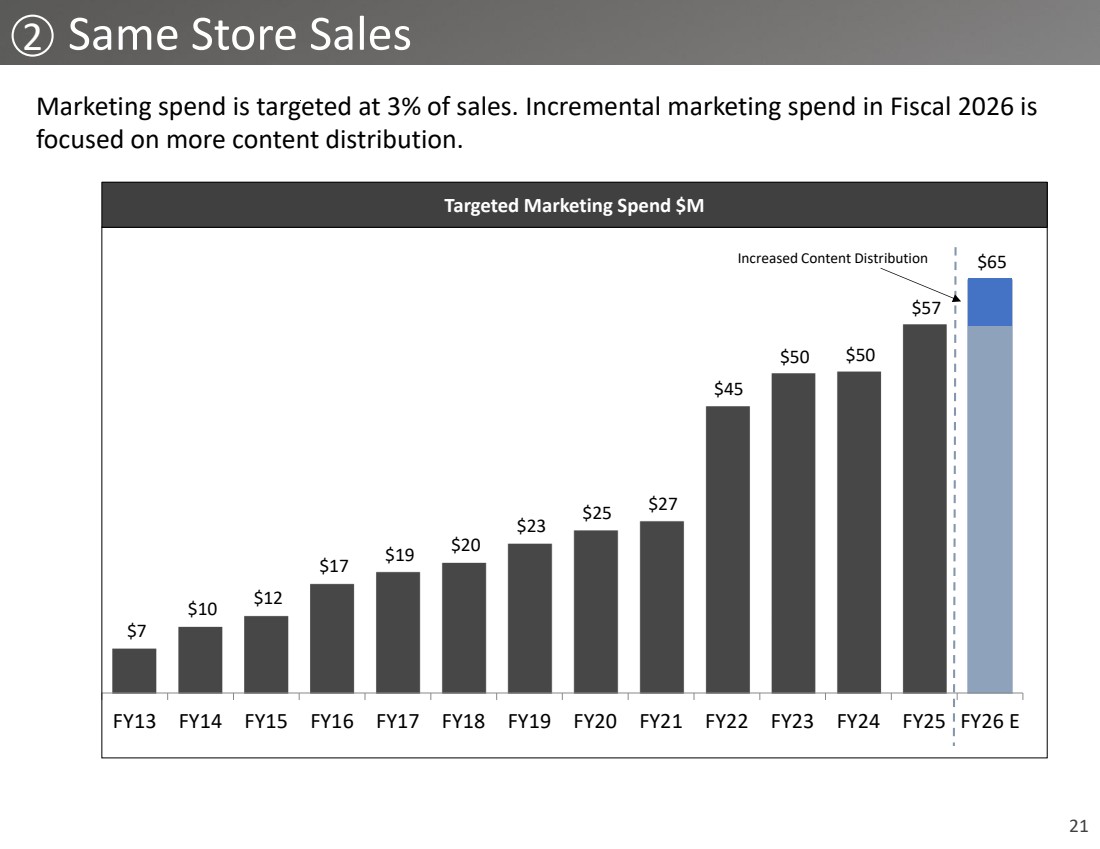
21 Marketing spend is targeted at 3% of sales. Incremental marketing spend in Fiscal 2026 is focused on more content distribution. $7 $10 $12 $17 $19 $20 $23 $25 $27 $45 $50 $50 $57 $65 FY13 FY14 FY15 FY16 FY17 FY18 FY19 FY20 FY21 FY22 FY23 FY24 FY25 FY26 E Targeted Marketing Spend $M Increased Content Distribution 2 Same Store Sales |
|
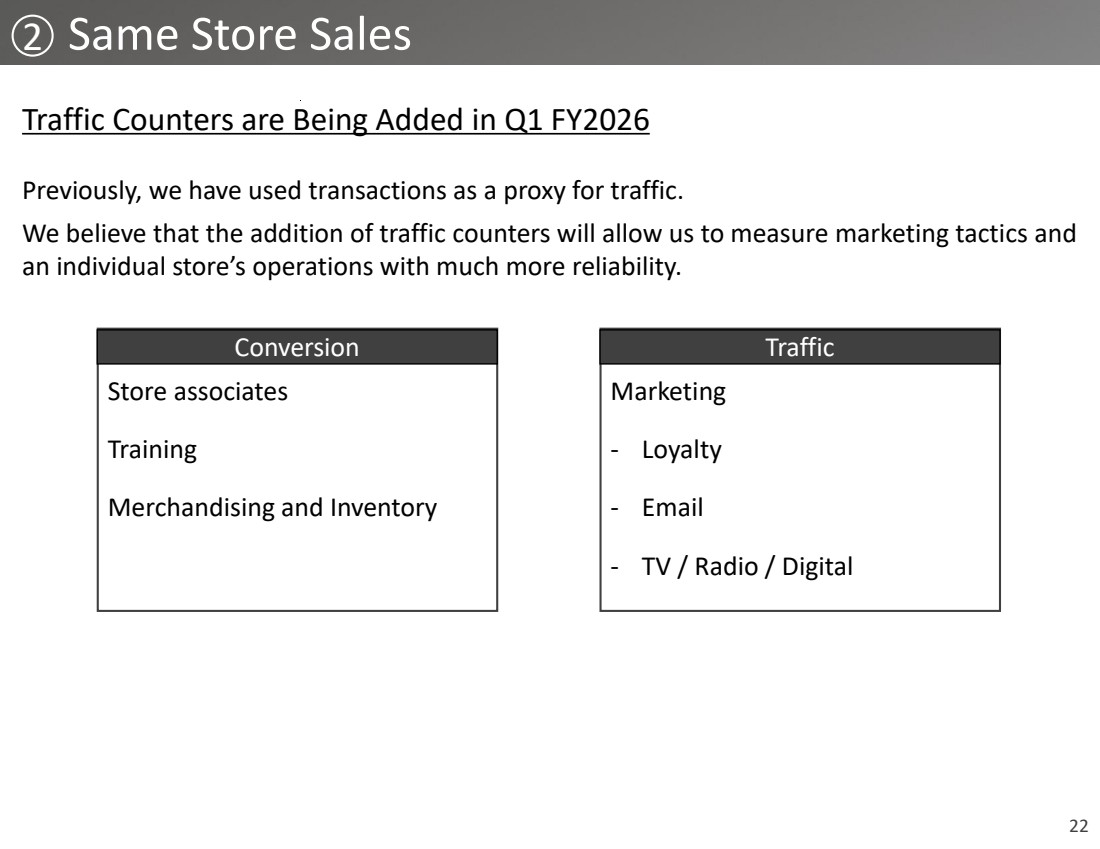
22 Traffic Counters are Being Added in Q1 FY2026 Previously, we have used transactions as a proxy for traffic. We believe that the addition of traffic counters will allow us to measure marketing tactics and an individual store’s operations with much more reliability. 2 Same Store Sales Store associates Training Merchandising and Inventory Conversion Marketing - Loyalty - Email - TV / Radio / Digital Traffic |
|
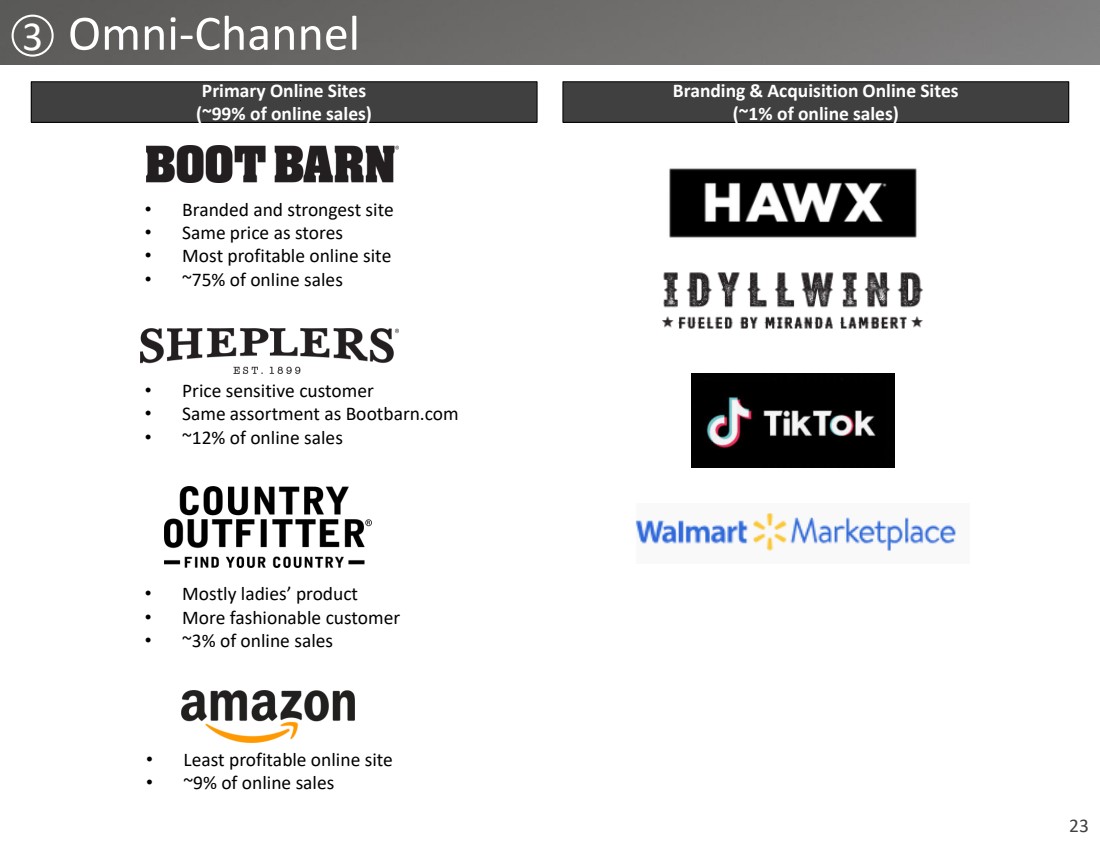
23 • Branded and strongest site • Same price as stores • Most profitable online site • ~75% of online sales • Price sensitive customer • Same assortment as Bootbarn.com • ~12% of online sales • Mostly ladies’ product • More fashionable customer • ~3% of online sales • Least profitable online site • ~9% of online sales Primary Online Sites (~99% of online sales) Branding & Acquisition Online Sites (~1% of online sales) 3 Omni-Channel |
|
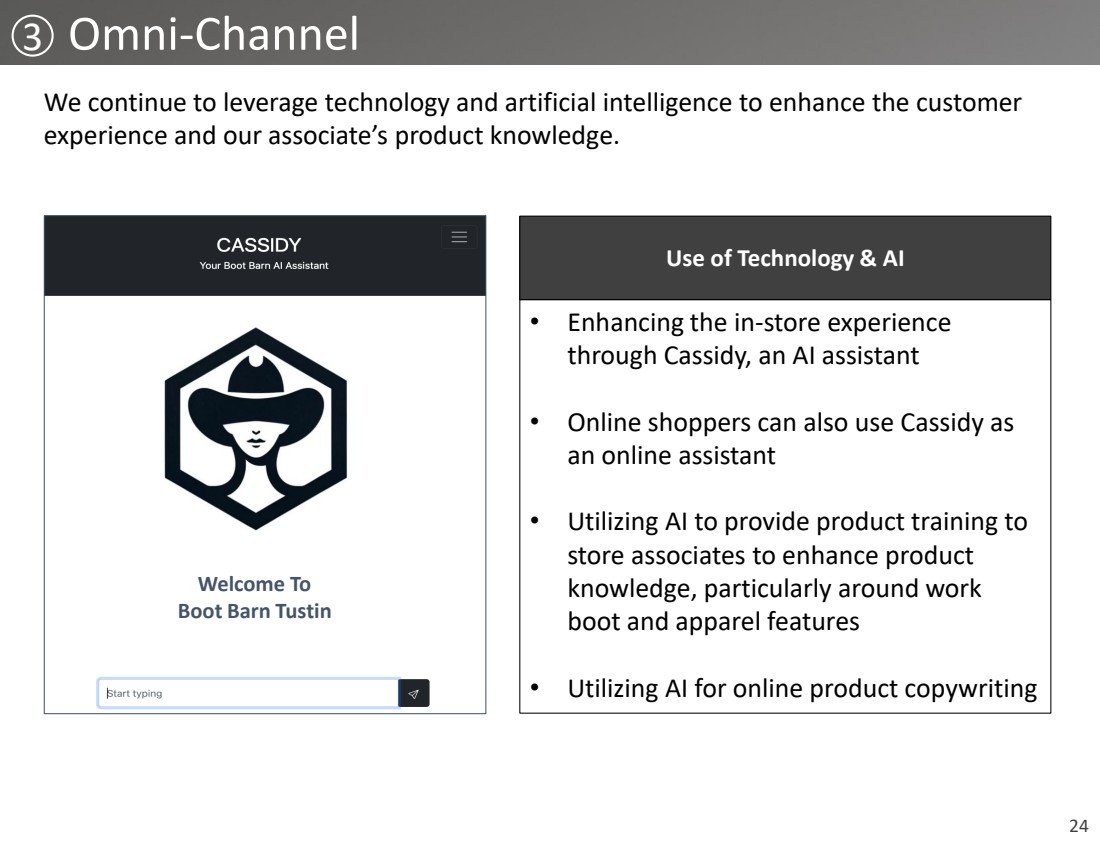
24 Welcome To Boot Barn Tustin We continue to leverage technology and artificial intelligence to enhance the customer experience and our associate’s product knowledge. Use of Technology & AI • Enhancing the in-store experience through Cassidy, an AI assistant • Online shoppers can also use Cassidy as an online assistant • Utilizing AI to provide product training to store associates to enhance product knowledge, particularly around work boot and apparel features • Utilizing AI for online product copywriting 3 Omni-Channel |
|
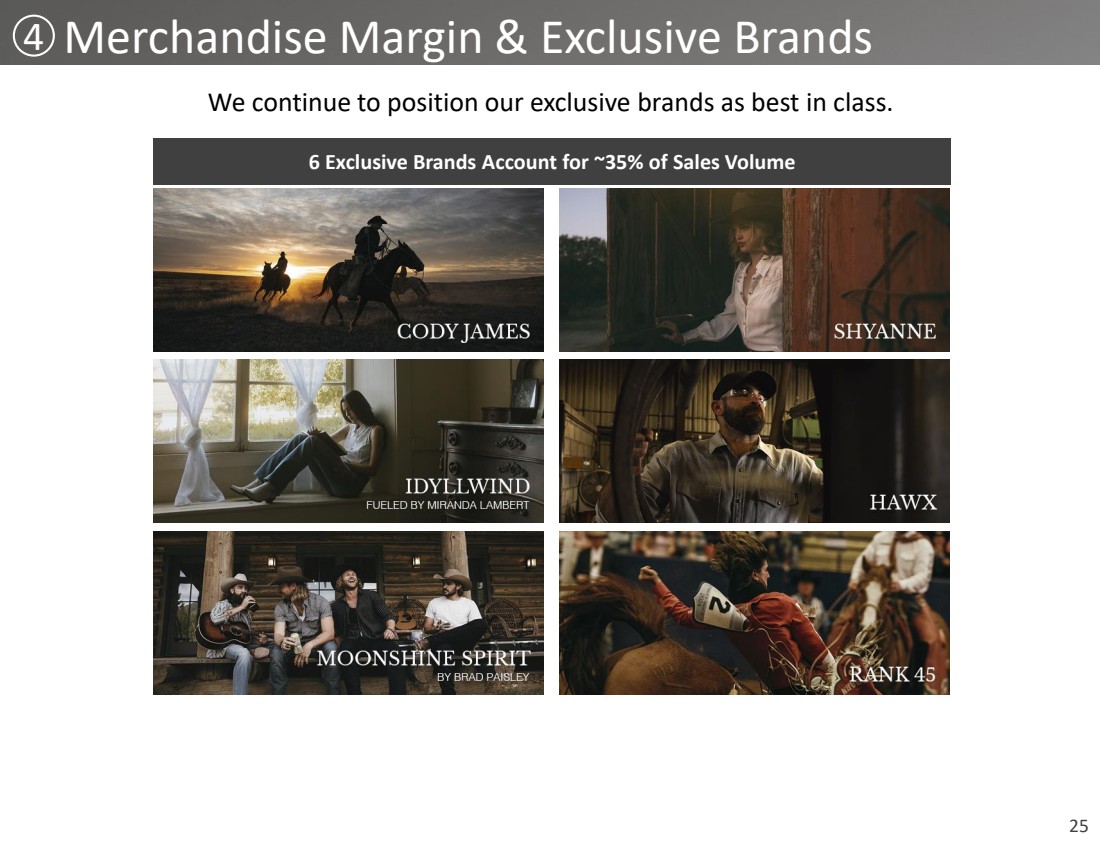
25 4 Merchandise Margin & Exclusive Brands 6 Exclusive Brands Account for ~35% of Sales Volume We continue to position our exclusive brands as best in class. |
|
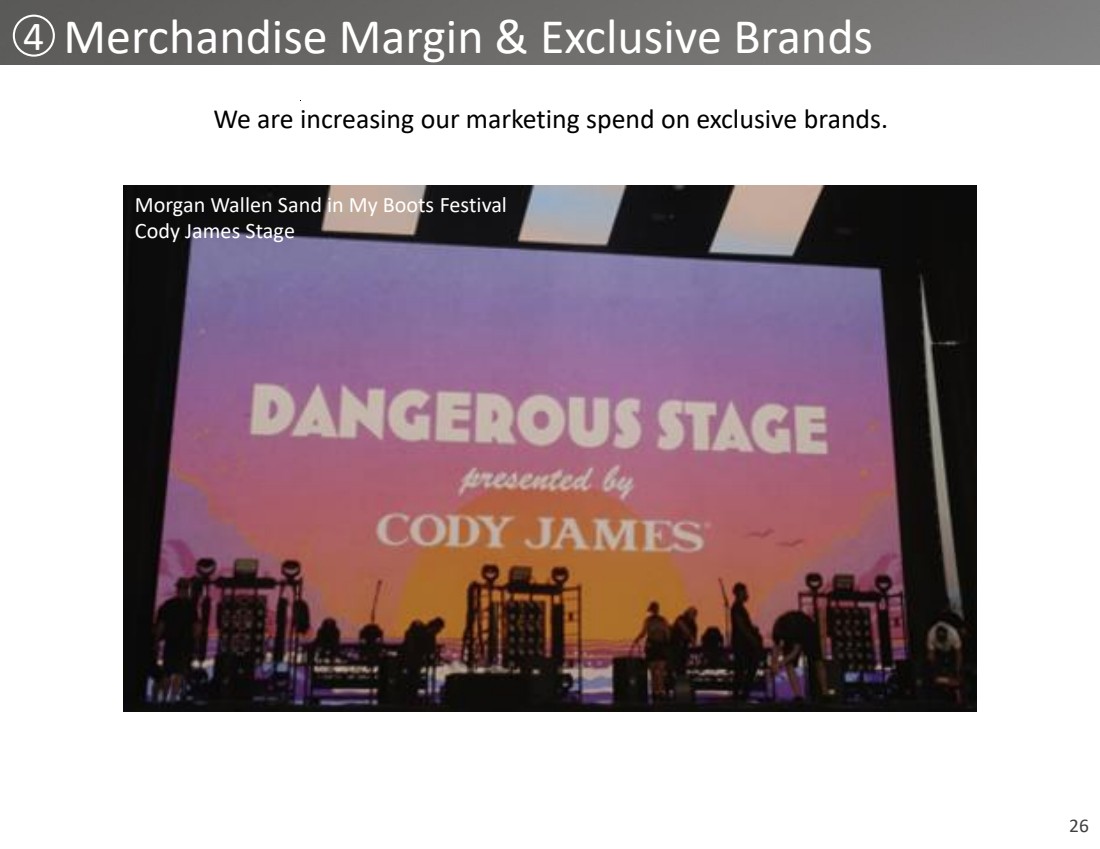
26 4 Merchandise Margin & Exclusive Brands Morgan Wallen Sand in My Boots Festival Cody James Stage We are increasing our marketing spend on exclusive brands. |
|
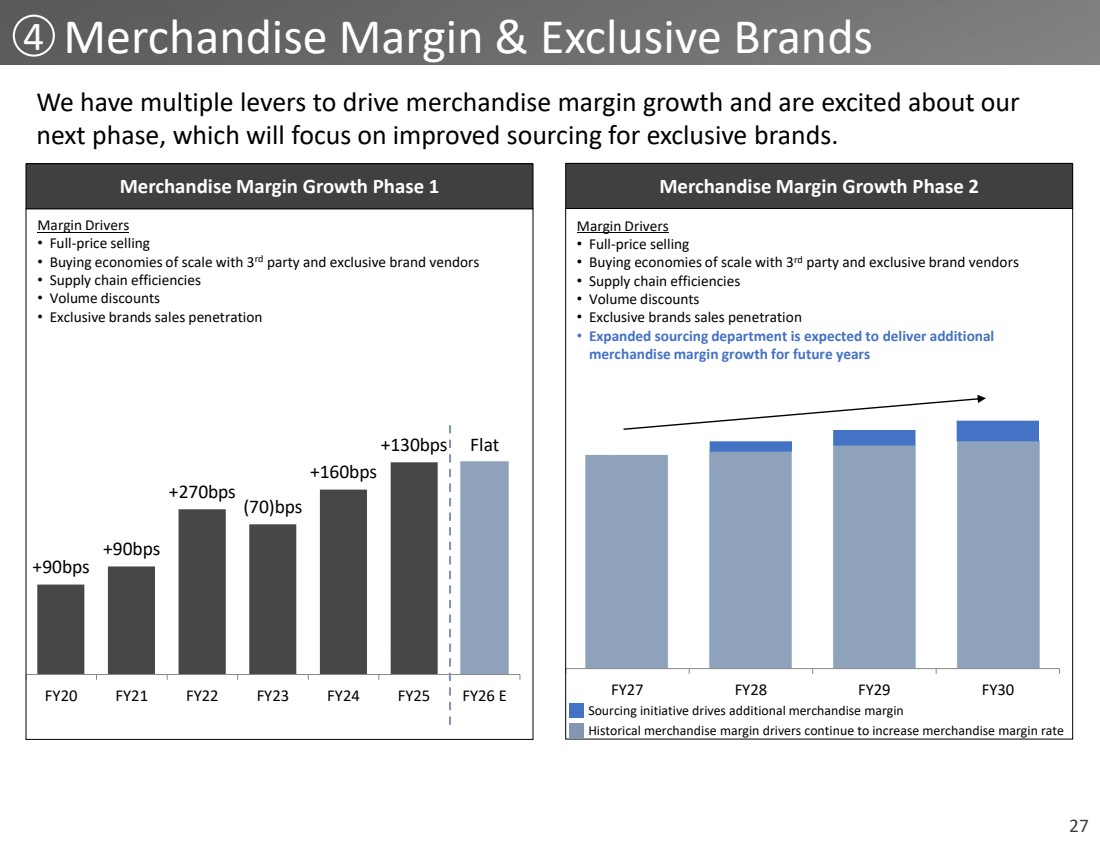
27 4 Merchandise Margin & Exclusive Brands +90bps +90bps +270bps (70)bps +160bps +130bps Flat FY20 FY21 FY22 FY23 FY24 FY25 FY26 E Merchandise Margin Growth Phase 1 FY27 FY28 FY29 FY30 Merchandise Margin Growth Phase 2 We have multiple levers to drive merchandise margin growth and are excited about our next phase, which will focus on improved sourcing for exclusive brands. Margin Drivers • Full-price selling • Buying economies of scale with 3rd party and exclusive brand vendors • Supply chain efficiencies • Volume discounts • Exclusive brands sales penetration Sourcing initiative drives additional merchandise margin Historical merchandise margin drivers continue to increase merchandise margin rate Margin Drivers • Full-price selling • Buying economies of scale with 3rd party and exclusive brand vendors • Supply chain efficiencies • Volume discounts • Exclusive brands sales penetration • Expanded sourcing department is expected to deliver additional merchandise margin growth for future years |
|
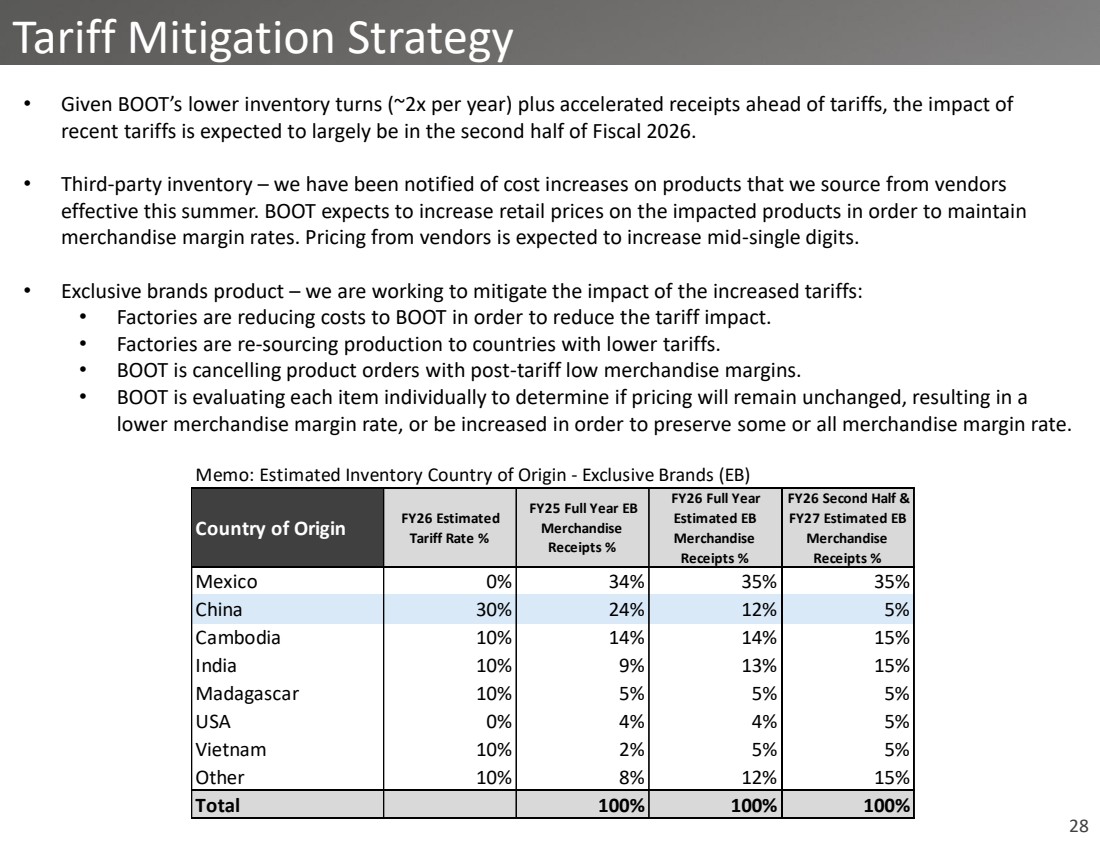
28 Tariff Mitigation Strategy • Given BOOT’s lower inventory turns (~2x per year) plus accelerated receipts ahead of tariffs, the impact of recent tariffs is expected to largely be in the second half of Fiscal 2026. • Third-party inventory – we have been notified of cost increases on products that we source from vendors effective this summer. BOOT expects to increase retail prices on the impacted products in order to maintain merchandise margin rates. Pricing from vendors is expected to increase mid-single digits. • Exclusive brands product – we are working to mitigate the impact of the increased tariffs: • Factories are reducing costs to BOOT in order to reduce the tariff impact. • Factories are re-sourcing production to countries with lower tariffs. • BOOT is cancelling product orders with post-tariff low merchandise margins. • BOOT is evaluating each item individually to determine if pricing will remain unchanged, resulting in a lower merchandise margin rate, or be increased in order to preserve some or all merchandise margin rate. Memo: Estimated Inventory Country of Origin - Exclusive Brands (EB) Country of Origin FY26 Estimated Tariff Rate % FY25 Full Year EB Merchandise Receipts % FY26 Full Year Estimated EB Merchandise Receipts % FY26 Second Half & FY27 Estimated EB Merchandise Receipts % Mexico 0% 34% 35% 35% China 30% 24% 12% 5% Cambodia 10% 14% 14% 15% India 10% 9% 13% 15% Madagascar 10% 5% 5% 5% USA 0% 4% 4% 5% Vietnam 10% 2% 5% 5% Other 10% 8% 12% 15% Total 100% 100% 100% |
|
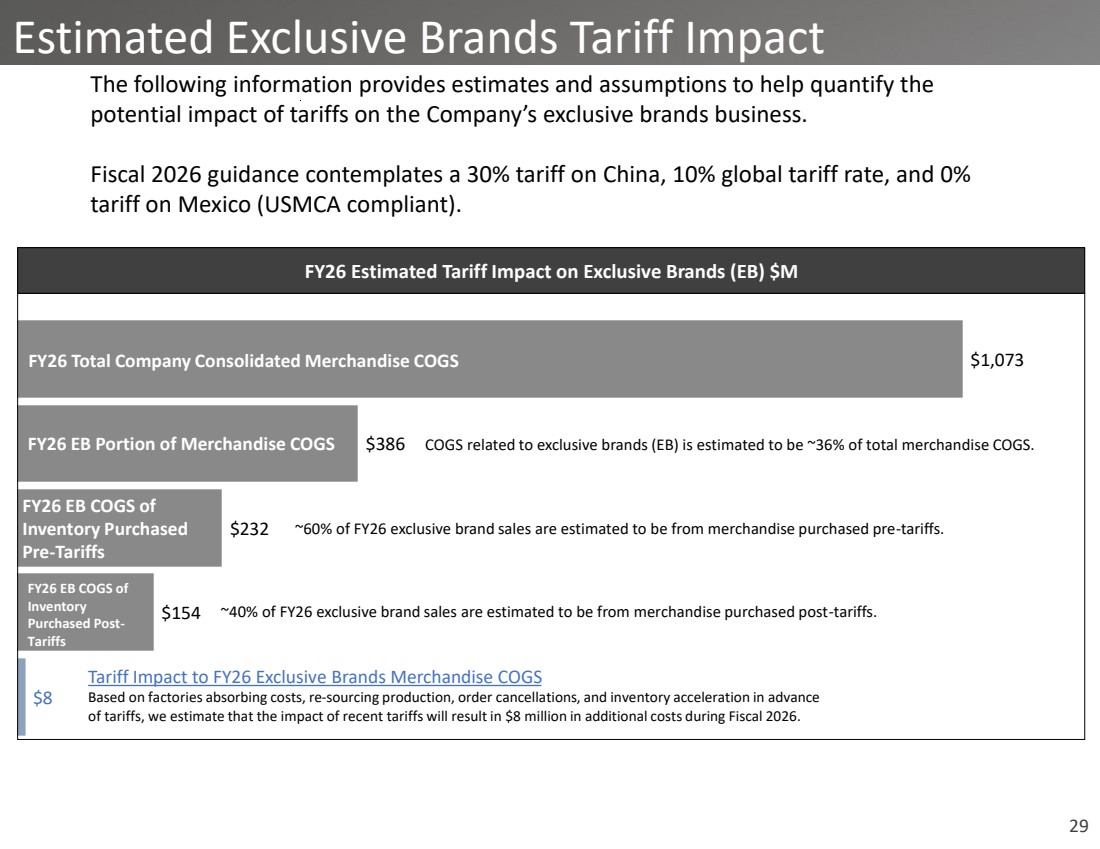
29 Estimated Exclusive Brands Tariff Impact The following information provides estimates and assumptions to help quantify the potential impact of tariffs on the Company’s exclusive brands business. Fiscal 2026 guidance contemplates a 30% tariff on China, 10% global tariff rate, and 0% tariff on Mexico (USMCA compliant). $8 $154 $232 $386 $1,073 FY26 Estimated Tariff Impact on Exclusive Brands (EB) $M FY26 Total Company Consolidated Merchandise COGS FY26 EB Portion of Merchandise COGS FY26 EB COGS of Inventory Purchased Pre-Tariffs FY26 EB COGS of Inventory Purchased Post-Tariffs COGS related to exclusive brands (EB) is estimated to be ~36% of total merchandise COGS. ~60% of FY26 exclusive brand sales are estimated to be from merchandise purchased pre-tariffs. ~40% of FY26 exclusive brand sales are estimated to be from merchandise purchased post-tariffs. Tariff Impact to FY26 Exclusive Brands Merchandise COGS Based on factories absorbing costs, re-sourcing production, order cancellations, and inventory acceleration in advance of tariffs, we estimate that the impact of recent tariffs will result in $8 million in additional costs during Fiscal 2026. |
|
30 Growth Potential |
|
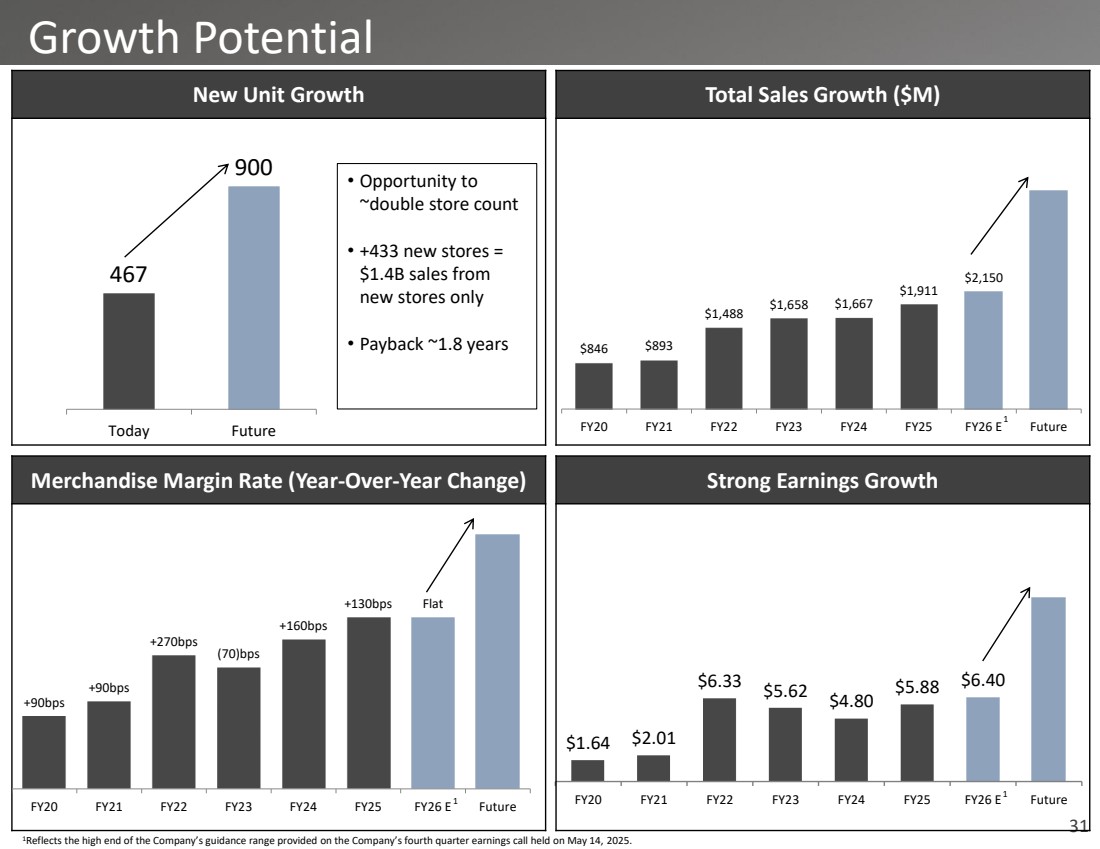
31 $1.64 $2.01 $6.33 $5.62 $4.80 $5.88 $6.40 FY20 FY21 FY22 FY23 FY24 FY25 FY26 E Future Merchandise Margin Rate (Year-Over-Year Change) +90bps +90bps +270bps (70)bps +160bps +130bps Flat FY20 FY21 FY22 FY23 FY24 FY25 FY26 E Future Growth Potential New Unit Growth 467 900 Today Future • Opportunity to ~double store count • +433 new stores = $1.4B sales from new stores only • Payback ~1.8 years Strong Earnings Growth Total Sales Growth ($M) 1 1 $846 $893 $1,488 $1,658 $1,667 $1,911 $2,150 FY20 FY21 FY22 FY23 FY24 FY25 FY26 E Future 1 1Reflects the high end of the Company’s guidance range provided on the Company’s fourth quarter earnings call held on May 14, 2025. |
|
32 investor.bootbarn.com |