UNITED STATES
SECURITIES AND EXCHANGE COMMISSION
Washington, D.C. 20549
FORM 8-K
CURRENT REPORT
PURSUANT TO SECTION 13 OR 15(d) OF THE
SECURITIES EXCHANGE ACT OF 1934
Date of Report (Date of earliest event reported): May 7, 2025
VEECO INSTRUMENTS INC.
(Exact name of registrant as specified in its charter)
Delaware |
0-16244 |
11-2989601 |
Terminal Drive, Plainview, New York 11803
(Address of principal executive offices)
(516) 677-0200
(Registrant’s telephone number, including area code)
Not applicable
(Former name or former address, if changed since last report)
Check the appropriate box below if the Form 8-K filing is intended to simultaneously satisfy the filing obligation of the registrant under any of the following provisions (see General Instruction A.2. below):
☐ Written communications pursuant to Rule 425 under the Securities Act (17 CFR 230.425)
☐ Soliciting material pursuant to Rule 14a-12 under the Exchange Act (17 CFR 240.14a-12)
☐ Pre-commencement communications pursuant to Rule 14d-2(b) under the Exchange Act (17 CFR 240.14d-2(b))
☐ Pre-commencement communications pursuant to Rule 13e-4(c) under the Exchange Act (17 CFR 240.13e-4(c))
Securities registered pursuant to Section 12(b) of the Act:
Title of each class |
Trading Symbol(s) |
Name of each exchange on which registered |
Common Stock, par value $0.01 per share |
VECO |
The NASDAQ Global Select Market |
Indicate by check mark whether the registrant is an emerging growth company as defined in Rule 405 of the Securities Act of 1933 (§230.405 of this chapter) or Rule 12b-2 of the Securities Exchange Act of 1934 (§240.12b-2 of this chapter).
Emerging growth company ☐
If an emerging growth company, indicate by check mark if the registrant has elected not to use the extended transition period for complying with any new or revised financial accounting standards provided pursuant to Section 13(a) of the Exchange Act. ☐
Item 2.02 Results of Operations and Financial Condition.
On May 7, 2025, Veeco Instruments Inc. issued a press release announcing its financial results for the quarter ended March 31, 2025. In connection with the release and the related conference call, Veeco posted a presentation relating to its first quarter 2025 financial results on its website (www.veeco.com). Copies of the press release and presentation are furnished as Exhibit 99.1 and Exhibit 99.2 to this report.
Item 9.01 Financial Statements and Exhibits.
(d) Exhibits.
EXHIBIT INDEX
Exhibit |
|
Description |
|
|
|
99.1 |
|
|
|
|
|
99.2 |
|
|
|
|
|
104 |
|
Cover Page Interactive Data File (formatted as inline XBRL). |
Limitation on Incorporation by Reference
In accordance with general instruction B.2 of Form 8-K, the information in this report, including exhibits, is furnished pursuant to Items 2.02 and 9.01 and shall not be deemed “filed” for purposes of Section 18 of the Securities Exchange Act of 1934, as amended (the “Exchange Act”), or otherwise subject to the liability of that section, nor shall this information or exhibits be deemed to be incorporated by reference into any filing under the Securities Act of 1933, as amended, or the Exchange Act, except as expressly set forth by specific reference in such a filing.
SIGNATURES
Pursuant to the requirements of the Securities Exchange Act of 1934, the registrant has duly caused this report to be signed on its behalf by the undersigned hereunto duly authorized.
May 7, 2025 |
VEECO INSTRUMENTS INC. |
|
|
|
|
|
By: |
/s/ Kirk Mackey |
|
Name: Kirk Mackey |
|
|
Title: Vice President, General Counsel |
|
2
EXHIBIT 99.1

VEECO REPORTS FIRST QUARTER 2025 FINANCIAL RESULTS
First Quarter 2025 Highlights:
| ● | Revenue of $167.3 million, compared with $174.5 million in the same period last year |
| ● | GAAP net income of $11.9 million, or $0.20 per diluted share, compared with $21.9 million, or $0.37 per diluted share in the same period last year |
| ● | Non-GAAP net income of $22.2 million, or $0.37 per diluted share, compared with $26.4 million, or $0.45 per diluted share in the same period last year |
Plainview, N.Y., May 7, 2025 -- Veeco Instruments Inc. (Nasdaq: VECO) today announced financial results for its first quarter ended March 31, 2025. Results are reported in accordance with U.S. generally accepted accounting principles (“GAAP”) and are also reported adjusting for certain items (“Non-GAAP”). A reconciliation between GAAP and Non-GAAP operating results is provided at the end of this press release.
U.S. Dollars in millions, except per share data |
GAAP Results |
|
Q1 '25 |
|
Q1 '24 |
||
Revenue |
|
$ |
167.3 |
|
$ |
174.5 |
Net income |
|
$ |
11.9 |
|
$ |
21.9 |
Diluted earnings per share |
|
$ |
0.20 |
|
$ |
0.37 |
Non-GAAP Results |
|
Q1 '25 |
|
Q1 '24 |
||
Operating income |
|
$ |
24.3 |
|
$ |
29.4 |
Net income |
|
$ |
22.2 |
|
$ |
26.4 |
Diluted earnings per share |
|
$ |
0.37 |
|
$ |
0.45 |
“Veeco delivered solid results during the first quarter, including sequential and year-over-year growth in our Semiconductor business driven by growth in Advanced Packaging,” commented Bill Miller, Ph.D., Veeco’s Chief Executive Officer. “In addition, Veeco shared several exciting announcements, including receipt of Intel’s 2025 EPIC supplier award, new application wins in Laser Annealing, and new application wins in Wet Processing. Each reflect our continued execution and confidence our long-term strategy can generate value for shareholders in the coming years.”
1
Guidance and Outlook
The following guidance is provided for Veeco’s second quarter 2025:
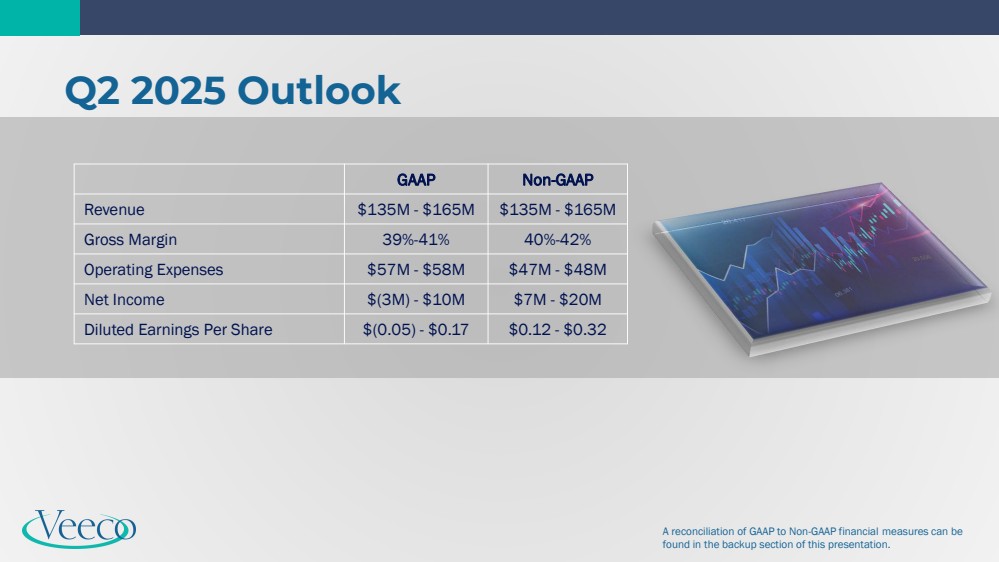
| ● | Revenue is expected in the range of $135 million to $165 million |
| ● | GAAP diluted earnings (loss) per share are expected in the range of ($0.05) to $0.17 |
| ● | Non-GAAP diluted earnings per share are expected in the range of $0.12 to $0.32 |
Conference Call Information
A conference call reviewing these results has been scheduled for today, May 7, 2025 starting at 5:00pm ET. To join the call, dial 1-877-407-8029 (toll-free) or 1-201-689-8029. Participants may also access a live webcast of the call by visiting the investor relations section of Veeco's website at ir.veeco.com. A replay of the webcast will be made available on the Veeco website that evening. We will post an accompanying slide presentation to our website prior to the beginning of the call.
About Veeco
Veeco (NASDAQ: VECO) is an innovative manufacturer of semiconductor process equipment. Our laser annealing, ion beam, metal organic chemical vapor deposition (MOCVD), single wafer etch & clean and lithography technologies play an integral role in the fabrication and packaging of advanced semiconductor devices. With equipment designed to optimize performance, yield and cost of ownership, Veeco holds leading technology positions in the markets we serve. To learn more about Veeco’s systems and service offerings, visit www.veeco.com.
Forward-looking Statements
This press release contains “forward-looking statements”, within the meaning of the safe harbor provisions of the U.S. Private Securities Litigation Reform Act of 1995, as amended, that are based on management’s expectations, estimates, projections and assumptions. Words such as “expects,” “anticipates,” “plans,” “believes,” “scheduled,” “estimates” and variations of these words and similar expressions are intended to identify forward-looking statements. Forward-looking statements include, but are not limited to, those regarding anticipated growth and trends in our businesses and markets, industry outlooks and demand drivers, our investment and growth strategies, our development of new products and technologies, our business outlook for current and future periods, our ongoing transformation initiative and the effects thereof on our operations and financial results; and other statements that are not historical facts. These statements and their underlying assumptions are subject to risks and uncertainties and are not guarantees of future performance. Factors that could cause actual results to differ materially from those expressed or implied by such statements include, without limitation: the level of demand for our products; global economic and industry conditions; global trade issues, including the ongoing trade disputes between the U.S. and China, and changes in trade and export license policies; our dependency on third-party suppliers and outsourcing partners; the timing of customer orders; our ability to develop, deliver and support new products and technologies; our ability to expand our current markets, increase market share and develop new markets; the concentrated nature of our customer base; our ability to obtain and protect intellectual property rights in key technologies; the effects of regional or global health epidemics; our ability to achieve the objectives of operational and strategic initiatives and attract, motivate and retain key employees; the variability of results among products and end-markets, and our ability to accurately forecast future results, market conditions, and customer requirements; the impact of our indebtedness, including our convertible senior notes and our capped call transactions; and other risks and uncertainties described in our SEC filings on Forms 10-K, 10-Q and 8-K, and from time-to-time in our other SEC reports. All forward-looking statements speak only to management’s expectations, estimates, projections and assumptions as of the date of this press release or, in the case of any document referenced herein or incorporated by reference, the date of that document. The Company does not undertake any obligation to update or publicly revise any forward-looking statements to reflect events, circumstances or changes in expectations after the date of this press release.
-financial tables attached-
Veeco Contacts:
Investors:Anthony Pappone (516) 500-8798apappone@veeco.com
Media:Brenden Wright (410) 984-2610bwright@veeco.com
2
Veeco Instruments Inc. and Subsidiaries
Condensed Consolidated Statements of Operations
(in thousands, except per share amounts)
(unaudited)
|
|
Three months ended March 31, |
|
||||
|
|
2025 |
|
2024 |
|
||
Net sales |
|
$ |
167,292 |
|
$ |
174,484 |
|
Cost of sales |
|
|
98,825 |
|
|
99,065 |
|
Gross profit |
|
|
68,467 |
|
|
75,419 |
|
Operating expenses, net: |
|
|
|
|
|
|
|
Research and development |
|
|
28,514 |
|
|
29,642 |
|
Selling, general, and administrative |
|
|
25,028 |
|
|
24,700 |
|
Amortization of intangible assets |
|
|
821 |
|
|
1,891 |
|
Other operating expense (income), net |
|
|
(44) |
|
|
(2,859) |
|
Total operating expenses, net |
|
|
54,319 |
|
|
53,374 |
|
Operating income |
|
|
14,148 |
|
|
22,045 |
|
Interest income (expense), net |
|
|
836 |
|
|
705 |
|
Income (loss) before income taxes |
|
|
14,984 |
|
|
22,750 |
|
Income tax expense (benefit) |
|
|
3,037 |
|
|
896 |
|
Net income |
|
$ |
11,947 |
|
$ |
21,854 |
|
|
|
|
|
|
|
|
|
Income per common share: |
|
|
|
|
|
|
|
Basic |
|
$ |
0.21 |
|
$ |
0.39 |
|
Diluted |
|
$ |
0.20 |
|
$ |
0.37 |
|
|
|
|
|
|
|
|
|
Weighted average number of shares: |
|
|
|
|
|
|
|
Basic |
|
|
57,753 |
|
|
55,968 |
|
Diluted |
|
|
60,234 |
|
|
60,764 |
|
3
Veeco Instruments Inc. and Subsidiaries
Condensed Consolidated Balance Sheets
(in thousands)
|
|
March 31, |
|
December 31, |
||
|
|
2025 |
|
2024 |
||
|
|
(unaudited) |
|
|
|
|
Assets |
|
|
|
|
|
|
Current assets: |
|
|
|
|
|
|
Cash and cash equivalents |
|
$ |
174,898 |
|
$ |
145,595 |
Restricted cash |
|
|
169 |
|
|
224 |
Short-term investments |
|
|
178,395 |
|
|
198,719 |
Accounts receivable, net |
|
|
114,368 |
|
|
96,834 |
Contract assets |
|
|
33,586 |
|
|
37,109 |
Inventories |
|
|
254,051 |
|
|
246,735 |
Prepaid expenses and other current assets |
|
|
39,338 |
|
|
39,316 |
Total current assets |
|
|
794,805 |
|
|
764,532 |
Property, plant and equipment, net |
|
|
113,787 |
|
|
113,789 |
Operating lease right-of-use assets |
|
|
25,991 |
|
|
26,503 |
Intangible assets, net |
|
|
8,010 |
|
|
8,832 |
Goodwill |
|
|
214,964 |
|
|
214,964 |
Deferred income taxes |
|
|
118,567 |
|
|
120,191 |
Other assets |
|
|
2,700 |
|
|
2,766 |
Total assets |
|
$ |
1,278,824 |
|
$ |
1,251,577 |
|
|
|
|
|
|
|
Liabilities and stockholders’ equity |
|
|
|
|
|
|
Current liabilities: |
|
|
|
|
|
|
Accounts payable |
|
$ |
57,845 |
|
$ |
43,519 |
Accrued expenses and other current liabilities |
|
|
62,257 |
|
|
55,195 |
Contract liabilities |
|
|
57,211 |
|
|
64,986 |
Income taxes payable |
|
|
1,546 |
|
|
2,086 |
Current portion of long-term debt |
|
|
— |
|
|
26,496 |
Total current liabilities |
|
|
178,859 |
|
|
192,282 |
Deferred income taxes |
|
|
663 |
|
|
689 |
Long-term debt |
|
|
249,955 |
|
|
249,702 |
Long-term operating lease liabilities |
|
|
33,694 |
|
|
34,318 |
Other liabilities |
|
|
3,795 |
|
|
3,816 |
Total liabilities |
|
|
466,966 |
|
|
480,807 |
|
|
|
|
|
|
|
Total stockholders’ equity |
|
|
811,858 |
|
|
770,770 |
Total liabilities and stockholders’ equity |
|
$ |
1,278,824 |
|
$ |
1,251,577 |
Note on Reconciliation Tables
The below tables include financial measures adjusted for the impact of certain items; these financial measures are therefore not calculated in accordance with U.S. generally accepted accounting principles (“GAAP”). These Non-GAAP financial measures exclude items such as: share-based compensation expense; charges relating to restructuring initiatives; non-cash asset impairments; certain other non-operating gains and losses; and acquisition-related items such as transaction costs, non-cash amortization of acquired intangible assets, and certain integration costs.
These Non-GAAP financial measures may be different from Non-GAAP financial measures used by other companies. Non-GAAP financial measures should not be considered a substitute for, or superior to, measures of financial performance prepared in accordance with GAAP. By excluding these items, Non-GAAP financial measures are intended to facilitate meaningful comparisons to historical operating results, competitors’ operating results, and estimates made by securities analysts. Management is evaluated on key performance metrics including Non-GAAP Operating income (loss), which is used to determine management incentive compensation as well as to forecast future periods. These Non-GAAP financial measures may be useful to investors in allowing for greater transparency of supplemental information used by management in its financial and operational decision-making. In addition, similar Non-GAAP financial measures have historically been reported to investors; the inclusion of comparable numbers provides consistency in financial reporting. Investors are encouraged to review the reconciliation of the Non-GAAP financial measures used in this news release to their most directly comparable GAAP financial measures.
4
Reconciliation of GAAP to Non-GAAP Financial Data (Q1 2025)
(in thousands)
(unaudited)
|
|
|
|
|
Non-GAAP Adjustments |
|
|
|
|
||||
|
|
|
|
|
Share-Based |
|
|
|
|
|
|
|
|
Three months ended March 31, 2025 |
|
GAAP |
|
Compensation |
|
Amortization |
|
Other |
|
Non-GAAP |
|
||
Net sales |
|
$ |
167,292 |
|
|
|
|
|
|
|
$ |
167,292 |
|
Gross profit |
|
|
68,467 |
|
1,343 |
|
|
|
|
|
|
69,810 |
|
Gross margin |
|
|
40.9 |
% |
|
|
|
|
|
|
|
41.7 |
% |
Operating expenses |
|
|
54,319 |
|
(7,865) |
|
(821) |
|
(99) |
|
|
45,534 |
|
Operating income |
|
|
14,148 |
|
9,208 |
|
821 |
|
99 |
^ |
|
24,276 |
|
Net income |
|
|
11,947 |
|
9,208 |
|
821 |
|
231 |
^ |
|
22,207 |
|
^ |
- See table below for additional details. |
Other Non-GAAP Adjustments (Q1 2025)
(in thousands)
(unaudited)
Three months ended March 31, 2025 |
|
|
Other |
$ |
99 |
Subtotal |
|
99 |
Non-cash interest expense |
|
257 |
Non-GAAP tax adjustment * |
|
(125) |
Total Other |
$ |
231 |
* |
- The ‘with or without’ method is utilized to determine the income tax effect of all Non-GAAP adjustments. |
Net Income per Common Share (Q1 2025)
(in thousands, except per share amounts)
(unaudited)
|
|
Three months ended March 31, 2025 |
||||
|
|
GAAP |
|
Non-GAAP |
||
Numerator: |
|
|
|
|
|
|
Net income |
|
$ |
11,947 |
|
$ |
22,207 |
Interest expense associated with 2025 and 2027 Convertible Senior Notes |
|
|
253 |
|
|
273 |
Net income available to common shareholders |
|
$ |
12,200 |
|
$ |
22,480 |
|
|
|
|
|
|
|
Denominator: |
|
|
|
|
|
|
Basic weighted average shares outstanding |
|
|
57,753 |
|
|
57,753 |
Effect of potentially dilutive share-based awards |
|
|
693 |
|
|
693 |
Dilutive effect of 2025 Convertible Senior Notes |
|
|
— |
|
|
174 |
Dilutive effect of 2027 Convertible Senior Notes (1) |
|
|
1,788 |
|
|
1,354 |
Diluted weighted average shares outstanding |
|
|
60,234 |
|
|
59,974 |
|
|
|
|
|
|
|
Net income per common share: |
|
|
|
|
|
|
Basic |
|
$ |
0.21 |
|
$ |
0.38 |
Diluted |
|
$ |
0.20 |
|
$ |
0.37 |
(1) - The non-GAAP incremental dilutive shares includes the impact of the Company’s capped call transaction issued concurrently with our 2027 Notes, and as such, an effective conversion price of $18.46 is used when determining incremental shares to add to the dilutive share count. The GAAP incremental dilutive shares does not include the impact of the Company’s capped call transaction, and as such, an effective conversion price of $13.98 is used when determining incremental shares to add to the dilutive share count.
5
Reconciliation of GAAP to Non-GAAP Financial Data (Q1 2024)
(in thousands)
(unaudited)
|
|
|
|
|
Non-GAAP Adjustments |
|
|
|
|
||||
|
|
|
|
|
Share-based |
|
|
|
|
|
|
|
|
Three months ended March 31, 2024 |
|
|
GAAP |
|
Compensation |
|
Amortization |
|
Other |
|
Non-GAAP |
|
|
Net sales |
|
$ |
174,484 |
|
|
|
|
|
|
|
$ |
174,484 |
|
Gross profit |
|
|
75,419 |
|
1,730 |
|
|
|
|
|
|
77,149 |
|
Gross margin |
|
|
43.2 |
% |
|
|
|
|
|
|
|
44.2 |
% |
Operating expenses |
|
|
53,374 |
|
(6,352) |
|
(1,891) |
|
2,658 |
|
|
47,789 |
|
Operating income |
|
|
22,045 |
|
8,082 |
|
1,891 |
|
(2,658) |
^ |
|
29,360 |
|
Net income |
|
|
21,854 |
|
8,082 |
|
1,891 |
|
(5,384) |
^ |
|
26,443 |
|
|
|
|
|
|
|
|
|
|
|
|
|
|
|
^ |
- See table below for additional details. |
Other Non-GAAP Adjustments (Q1 2024)
(in thousands)
(unaudited)
Three months ended March 31, 2024 |
|
|
Changes in contingent consideration |
$ |
(625) |
Sale of productive assets |
|
(2,033) |
Subtotal |
|
(2,658) |
Non-cash interest expense |
|
296 |
Non-GAAP tax adjustment * |
|
(3,022) |
Total Other |
$ |
(5,384) |
* |
- The ‘with or without’ method is utilized to determine the income tax effect of all Non-GAAP adjustments. |
Net Income per Common Share (Q1 2024)
(in thousands, except per share amounts)
(unaudited)
|
|
Three months ended March 31, 2024 |
||||
|
|
GAAP |
|
Non-GAAP |
||
Numerator: |
|
|
|
|
|
|
Net income |
|
$ |
21,854 |
|
$ |
26,443 |
Interest expense associated with 2025 and 2027 Convertible Senior Notes |
|
|
514 |
|
|
466 |
Net income available to common shareholders |
|
$ |
22,368 |
|
$ |
26,909 |
|
|
|
|
|
|
|
Denominator: |
|
|
|
|
|
|
Basic weighted average shares outstanding |
|
|
55,968 |
|
|
55,968 |
Effect of potentially dilutive share-based awards |
|
|
939 |
|
|
939 |
Dilutive effect of 2025 Convertible Senior Notes |
|
|
1,104 |
|
|
1,104 |
Dilutive effect of 2027 Convertible Senior Notes (1) |
|
|
1,788 |
|
|
1,354 |
Dilutive effect of 2029 Convertible Senior Notes |
|
|
965 |
|
|
965 |
Diluted weighted average shares outstanding |
|
|
60,764 |
|
|
60,330 |
|
|
|
|
|
|
|
Net income per common share: |
|
|
|
|
|
|
Basic |
|
$ |
0.39 |
|
$ |
0.47 |
Diluted |
|
$ |
0.37 |
|
$ |
0.45 |
| (1) | - The non-GAAP incremental dilutive shares includes the impact of the Company’s capped call transaction issued concurrently with our 2027 Notes, and as such, an effective conversion price of $18.46 is used when determining incremental shares to add to the dilutive share count. The GAAP incremental dilutive shares does not include the impact of the Company’s capped call transaction, and as such, an effective conversion price of $13.98 is used when determining incremental shares to add to the dilutive share count. |
6
Reconciliation of GAAP Net Income to Non-GAAP Operating Income (Q1 2025 and 2024)
(in thousands)
(unaudited)
|
|
Three months ended |
|
Three months ended |
||
|
|
March 31, 2025 |
|
March 31, 2024 |
||
GAAP Net income |
|
$ |
11,947 |
|
$ |
21,854 |
Share-based compensation |
|
|
9,208 |
|
|
8,082 |
Amortization |
|
|
821 |
|
|
1,891 |
Sale of productive assets |
|
|
— |
|
|
(2,033) |
Changes in contingent consideration |
|
|
— |
|
|
(625) |
Interest (income) expense, net |
|
|
(836) |
|
|
(705) |
Other |
|
|
99 |
|
|
— |
Income tax expense (benefit) |
|
|
3,037 |
|
|
896 |
Non-GAAP Operating income |
|
$ |
24,276 |
|
$ |
29,360 |
Reconciliation of GAAP to Non-GAAP Financial Data (Q2 2025)
(in millions, except per share amounts)
(unaudited)
|
|
|
|
|
|
|
|
|
|
Non-GAAP Adjustments |
|
|
|
|
|
|
|
|
|
||||
Guidance for the three months ending |
|
|
|
|
|
|
|
|
|
Share-based |
|
|
|
|
|
|
|
|
|
|
|
|
|
June 30, 2025 |
|
GAAP |
|
Compensation |
|
Amortization |
|
Other |
|
Non-GAAP |
|
||||||||||||
Net sales |
|
$ |
135 |
|
- |
|
$ |
165 |
|
|
|
|
|
|
|
$ |
135 |
|
- |
|
$ |
165 |
|
Gross profit |
|
|
54 |
|
- |
|
|
69 |
|
1 |
|
— |
|
— |
|
|
55 |
|
- |
|
|
70 |
|
Gross margin |
|
|
39% |
|
- |
|
|
41% |
|
|
|
|
|
|
|
|
40% |
|
- |
|
|
42% |
|
Operating expenses |
|
|
57 |
|
- |
|
|
58 |
|
(9) |
|
(1) |
|
— |
|
|
47 |
|
- |
|
|
48 |
|
Operating income (loss) |
|
|
(3) |
|
- |
|
|
11 |
|
10 |
|
1 |
|
— |
|
|
8 |
|
- |
|
|
22 |
|
Net income (loss) |
|
$ |
(3) |
|
- |
|
$ |
10 |
|
10 |
|
1 |
|
(1) |
|
$ |
7 |
|
- |
|
$ |
20 |
|
|
|
|
|
|
|
|
|
|
|
|
|
|
|
|
|
|
|
|
|
|
|
|
|
Income (loss) per diluted common share |
|
$ |
(0.05) |
|
- |
|
$ |
0.17 |
|
|
|
|
|
|
|
$ |
0.12 |
|
- |
|
$ |
0.32 |
|
7
Income per Diluted Common Share (Q2 2025)
(in millions, except per share amounts)
(unaudited)
Guidance for the three months ending June 30, 2025 |
|
GAAP |
|
Non-GAAP |
||||||||||||
Numerator: |
|
|
|
|
|
|
|
|
|
|
|
|
|
|
|
|
Net income (loss) available to common shareholders |
|
$ |
(3) |
|
- |
|
$ |
10 |
|
$ |
7 |
|
- |
|
$ |
20 |
|
|
|
|
|
|
|
|
|
|
|
|
|
|
|
|
|
Denominator: |
|
|
|
|
|
|
|
|
|
|
|
|
|
|
|
|
Basic weighted average shares outstanding |
|
|
58 |
|
|
|
|
58 |
|
|
58 |
|
|
|
|
58 |
Effect of potentially dilutive share-based awards |
|
|
— |
|
|
|
|
1 |
|
|
1 |
|
|
|
|
1 |
Dilutive effect of 2027 Convertible Senior Notes (1) |
|
|
— |
|
|
|
|
2 |
|
|
— |
|
|
|
|
1 |
Diluted weighted average shares outstanding |
|
|
58 |
|
|
|
|
61 |
|
|
59 |
|
|
|
|
61 |
|
|
|
|
|
|
|
|
|
|
|
|
|
|
|
|
|
Net income per common share: |
|
|
|
|
|
|
|
|
|
|
|
|
|
|
|
|
Income (loss) per diluted common share |
|
$ |
(0.05) |
|
- |
|
$ |
0.17 |
|
$ |
0.12 |
|
- |
|
$ |
0.32 |
(1) - The non-GAAP incremental dilutive shares includes the impact of the Company’s capped call transaction issued concurrently with our 2027 Notes, and as such, an effective conversion price of $18.46 is used when determining incremental shares to add to the dilutive share count. The GAAP incremental dilutive shares does not include the impact of the Company’s capped call transaction, and as such, an effective conversion price of $13.98 is used when determining incremental shares to add to the dilutive share count.
Reconciliation of GAAP Net Income to Non-GAAP Operating Income (Q2 2025)
(in millions)
(unaudited)
Guidance for the three months ending June 30, 2025 |
|
|
|
|
|
|
|
|
GAAP Net income (loss) |
|
$ |
(3) |
|
- |
|
$ |
10 |
Share-based compensation |
|
|
10 |
|
- |
|
|
10 |
Amortization |
|
|
1 |
|
- |
|
|
1 |
Interest income, net |
|
|
(1) |
|
- |
|
|
(1) |
Income tax expense (benefit) |
|
|
— |
|
- |
|
|
1 |
Non-GAAP Operating income |
|
$ |
8 |
|
- |
|
$ |
22 |
Note: Amounts may not calculate precisely due to rounding.
8
|
Q1 2025 Financial Results Conference Call May 7th, 2025 Veeco Instruments |
|
Safe Harbor This presentation contains “forward-looking statements”, within the meaning of the safe harbor provisions of the U.S. Private Securities Litigation Reform Act of 1995, as amended, that are based on management’s expectations, estimates, projections and assumptions. Words such as “expects,” “anticipates,” “plans,” “believes,” “scheduled,” “estimates” and variations of these words and similar expressions are intended to identify forward-looking statements. Forward-looking statements include, but are not limited to, those regarding anticipated growth and trends in our businesses and markets, industry outlooks and demand drivers, our investment and growth strategies, our development of new products and technologies, our business outlook for current and future periods, our ongoing transformation initiative and the effects thereof on our operations and financial results; and other statements that are not historical facts. These statements and their underlying assumptions are subject to risks and uncertainties and are not guarantees of future performance. Factors that could cause actual results to differ materially from those expressed or implied by such statements include, without limitation: global trade issues, including the effects of foreign and domestic tariffs and the ongoing trade disputes between the U.S. and China, and changes in trade and export license policies; the level of demand for our products; global economic and industry conditions; global conflicts; our dependency on third-party suppliers and outsourcing partners; the timing of customer orders; our ability to develop, deliver and support new products and technologies; our ability to expand our current markets, increase market share and develop new markets; the concentrated nature of our customer base; cybersecurity attacks and our ability to safeguard sensitive information and protect our intellectual property rights in key technologies; the effects of regional or global health epidemics; our ability to achieve the objectives of operational and strategic initiatives and attract, motivate and retain key employees; the variability of results among products and end-markets, and our ability to accurately forecast future results, market conditions, and customer requirements; the impact of our indebtedness, including our convertible senior notes and our capped call transactions; and other risks and uncertainties described in our SEC filings on Forms 10-K, 10-Q and 8-K, and from time-to-time in our other SEC reports. All forward-looking statements speak only to management’s expectations, estimates, projections and assumptions as of the date of this presentation. The Company does not undertake any obligation to update or publicly revise any forward-looking statements to reflect events, circumstances or changes in expectations after the date of this presentation. |
|
Bill Miller, Ph.D. CEO Overview |
|
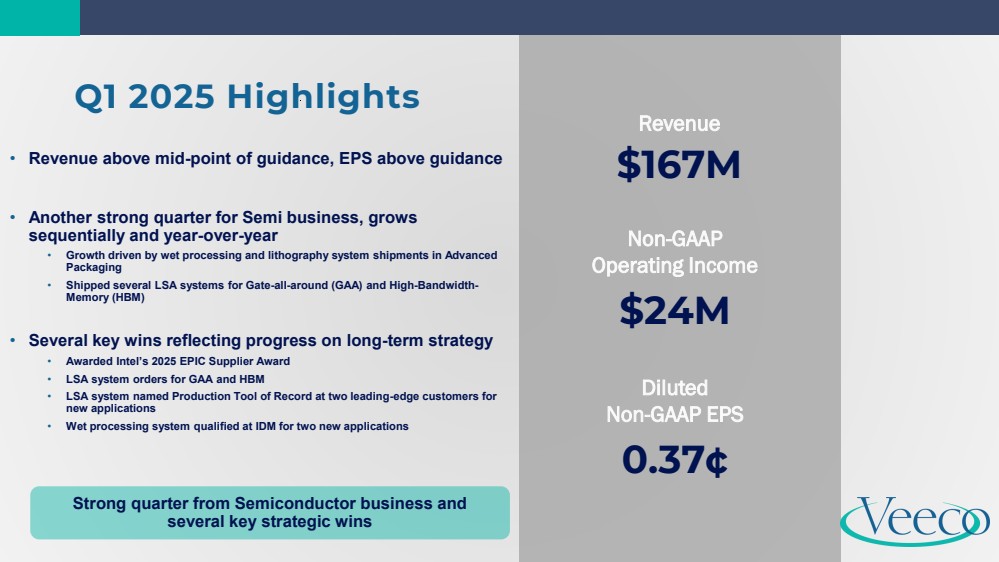
Q1 2025 Highlights • Revenue above mid-point of guidance, EPS above guidance • Another strong quarter for Semi business, grows sequentially and year-over-year • Growth driven by wet processing and lithography system shipments in Advanced Packaging • Shipped several LSA systems for Gate-all-around (GAA) and High-Bandwidth-Memory (HBM) • Several key wins reflecting progress on long-term strategy • Awarded Intel’s 2025 EPIC Supplier Award • LSA system orders for GAA and HBM • LSA system named Production Tool of Record at two leading-edge customers for new applications • Wet processing system qualified at IDM for two new applications Revenue $167M Non-GAAP Operating Income $24M Diluted Non-GAAP EPS 0.37¢ Strong quarter from Semiconductor business and several key strategic wins |
|
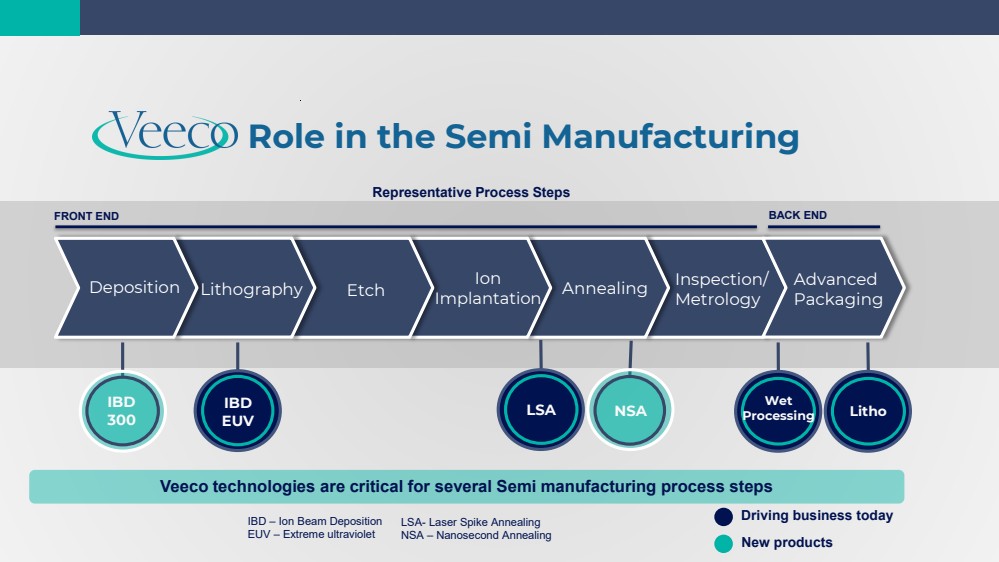
Role in the Semi Manufacturing Deposition Lithography Ion Implantation Etch Annealing Inspection/ Metrology Advanced Packaging IBD 300 IBD EUV LSA NSA Wet Processing Litho New products FRONT END BACK END Driving business today Representative Process Steps Veeco technologies are critical for several Semi manufacturing process steps IBD – Ion Beam Deposition EUV – Extreme ultraviolet LSA- Laser Spike Annealing NSA – Nanosecond Annealing |
|
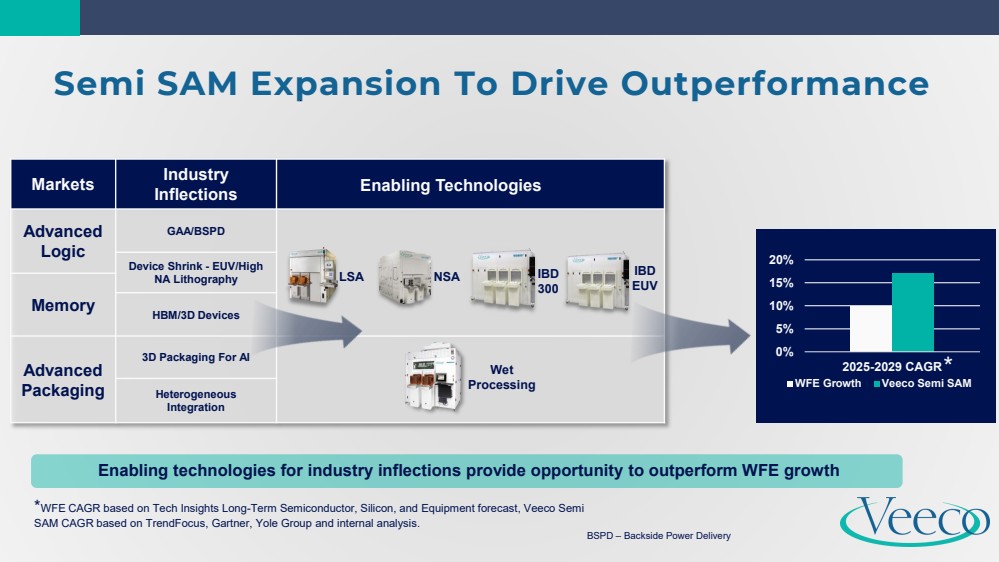
Semi SAM Expansion To Drive Outperformance Markets Industry Inflections Advanced Logic GAA/BSPD Device Shrink - EUV/High NA Lithography Memory HBM/3D Devices Advanced Packaging 3D Packaging For AI Heterogeneous Integration LSA NSA IBD 300 Wet Processing IBD EUV 0% 5% 10% 15% 20% 2025-2029 CAGR WFE Growth Veeco Semi SAM Enabling Technologies Enabling technologies for industry inflections provide opportunity to outperform WFE growth *WFE CAGR based on Tech Insights Long-Term Semiconductor, Silicon, and Equipment forecast, Veeco Semi SAM CAGR based on TrendFocus, Gartner, Yole Group and internal analysis. * BSPD – Backside Power Delivery |
|
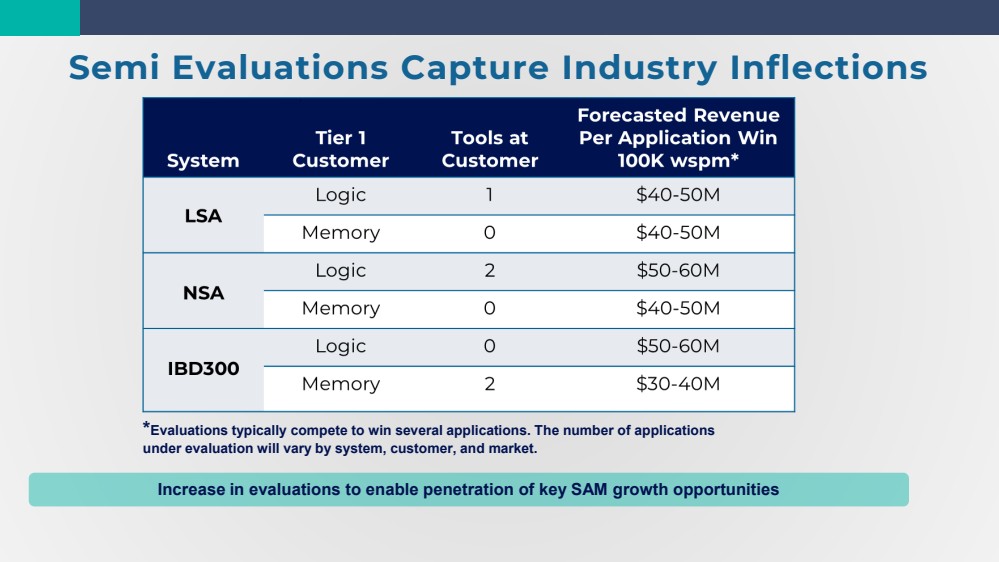
Semi Evaluations Capture Industry Inflections Increase in evaluations to enable penetration of key SAM growth opportunities *Evaluations typically compete to win several applications. The number of applications under evaluation will vary by system, customer, and market. |
|
John Kiernan CFO Financial Overview |
|
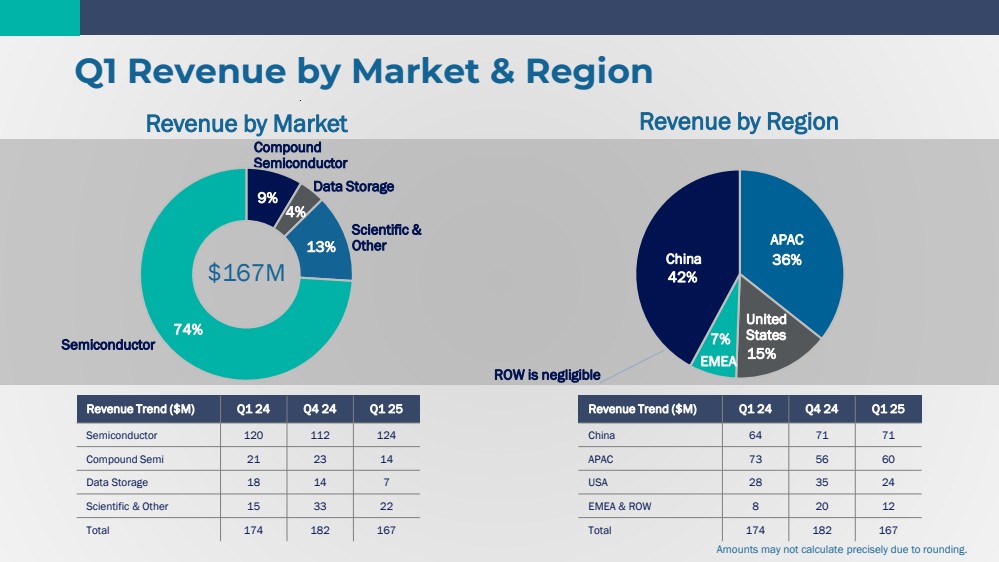
Q1 Revenue by Market & Region Revenue by Market Revenue by Region Scientific & Other Semiconductor Compound Semiconductor Data Storage EMEA APAC China United States $167M Revenue Trend ($M) Q1 24 Q4 24 Q1 25 Semiconductor 120 112 124 Compound Semi 21 23 14 Data Storage 18 14 7 Scientific & Other 15 33 22 Total 174 182 167 Amounts may not calculate precisely due to rounding. ROW is negligible 9% 4% 13% 74% 36% 15% 7% 42% United States China APAC EMEA Revenue Trend ($M) Q1 24 Q4 24 Q1 25 China 64 71 71 APAC 73 56 60 USA 28 35 24 EMEA & ROW 8 20 12 Total 174 182 167 |
|
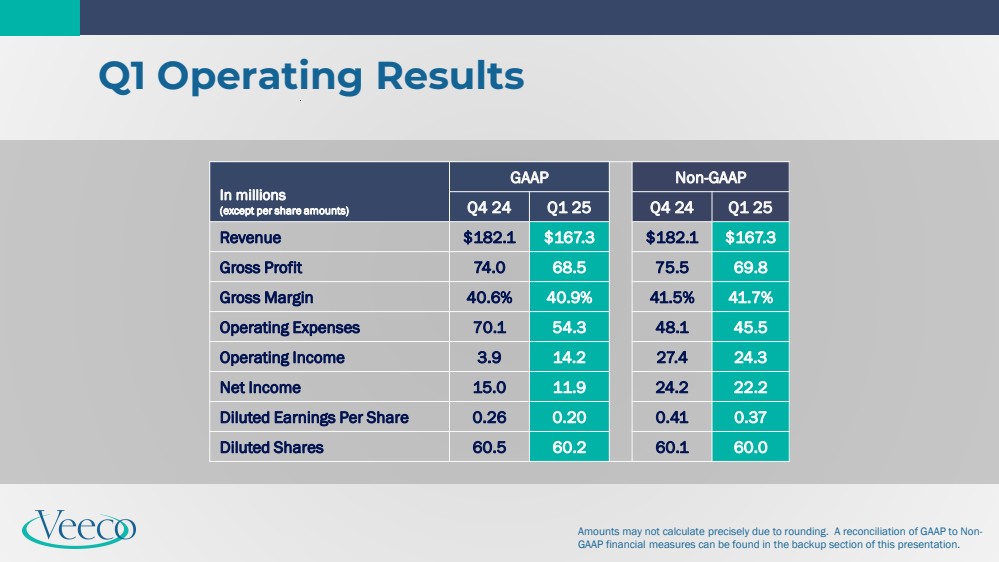
In millions (except per share amounts) GAAP Non-GAAP Q4 24 Q1 25 Q4 24 Q1 25 Revenue $182.1 $167.3 $182.1 $167.3 Gross Profit 74.0 68.5 75.5 69.8 Gross Margin 40.6% 40.9% 41.5% 41.7% Operating Expenses 70.1 54.3 48.1 45.5 Operating Income 3.9 14.2 27.4 24.3 Net Income 15.0 11.9 24.2 22.2 Diluted Earnings Per Share 0.26 0.20 0.41 0.37 Diluted Shares 60.5 60.2 60.1 60.0 Amounts may not calculate precisely due to rounding. A reconciliation of GAAP to Non-GAAP financial measures can be found in the backup section of this presentation. Q1 Operating Results |
|
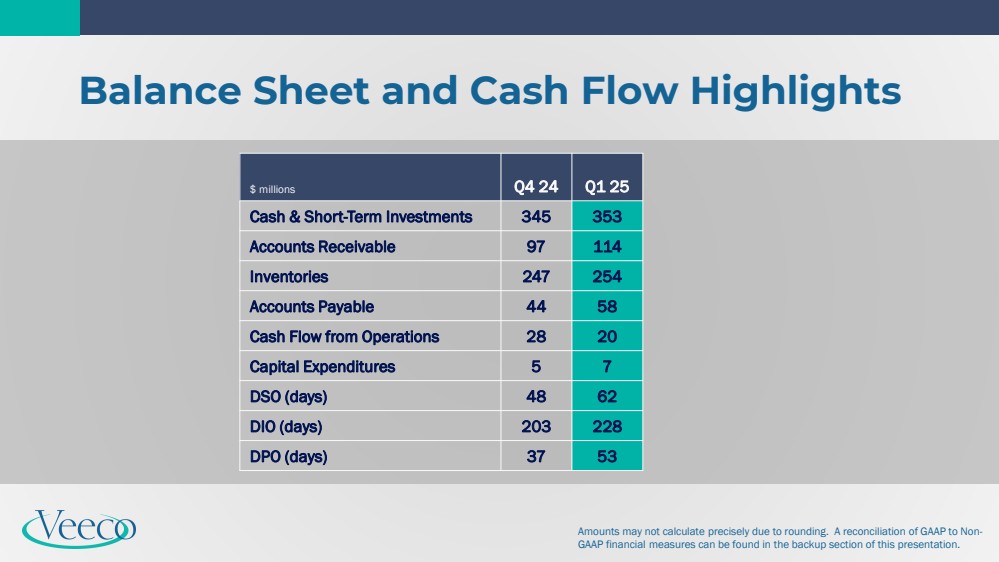
Amounts may not calculate precisely due to rounding. A reconciliation of GAAP to Non-GAAP financial measures can be found in the backup section of this presentation. Balance Sheet and Cash Flow Highlights $ millions Q4 24 Q1 25 Cash & Short-Term Investments 345 353 Accounts Receivable 97 114 Inventories 247 254 Accounts Payable 44 58 Cash Flow from Operations 28 20 Capital Expenditures 5 7 DSO (days) 48 62 DIO (days) 203 228 DPO (days) 37 53 |
|
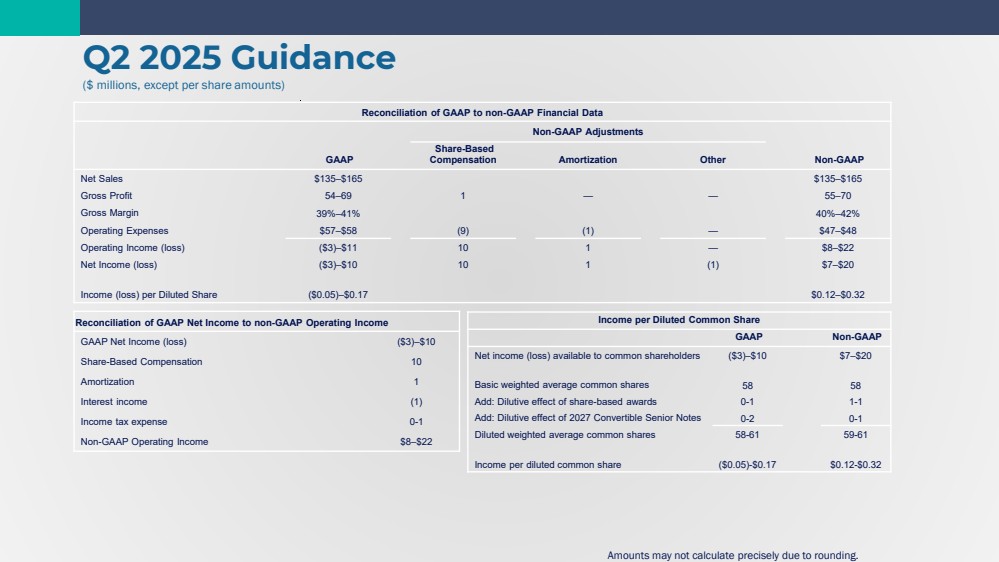
Q2 2025 Outlook A reconciliation of GAAP to Non-GAAP financial measures can be found in the backup section of this presentation. GAAP Non-GAAP Revenue $135M - $165M $135M - $165M Gross Margin 39%-41% 40%-42% Operating Expenses $57M - $58M $47M - $48M Net Income $(3M) - $10M $7M - $20M Diluted Earnings Per Share $(0.05) - $0.17 $0.12 - $0.32 |
|
Q&A |
|
Backup & Financial Tables |
|
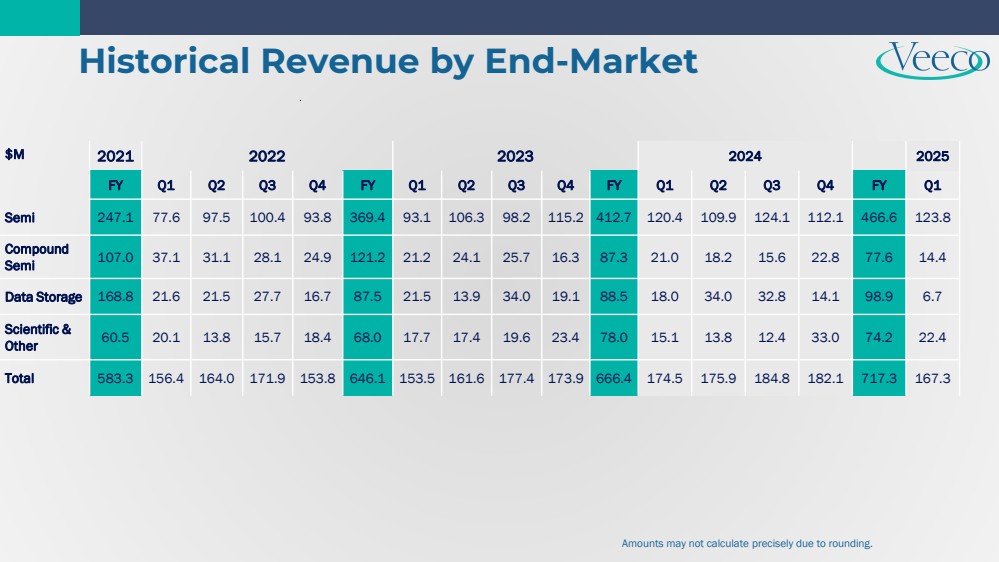
Historical Revenue by End-Market Amounts may not calculate precisely due to rounding. $M 2021 2022 2023 2024 2025 FY Q1 Q2 Q3 Q4 FY Q1 Q2 Q3 Q4 FY Q1 Q2 Q3 Q4 FY Q1 Semi 247.1 77.6 97.5 100.4 93.8 369.4 93.1 106.3 98.2 115.2 412.7 120.4 109.9 124.1 112.1 466.6 123.8 Compound Semi 107.0 37.1 31.1 28.1 24.9 121.2 21.2 24.1 25.7 16.3 87.3 21.0 18.2 15.6 22.8 77.6 14.4 Data Storage 168.8 21.6 21.5 27.7 16.7 87.5 21.5 13.9 34.0 19.1 88.5 18.0 34.0 32.8 14.1 98.9 6.7 Scientific & Other 60.5 20.1 13.8 15.7 18.4 68.0 17.7 17.4 19.6 23.4 78.0 15.1 13.8 12.4 33.0 74.2 22.4 Total 583.3 156.4 164.0 171.9 153.8 646.1 153.5 161.6 177.4 173.9 666.4 174.5 175.9 184.8 182.1 717.3 167.3 |
|
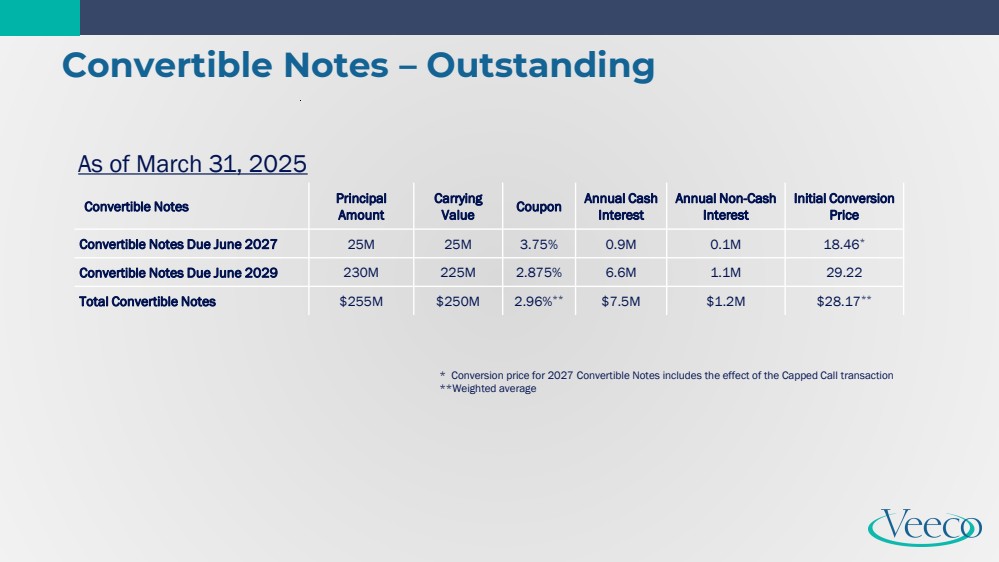
Convertible Notes – Outstanding * Conversion price for 2027 Convertible Notes includes the effect of the Capped Call transaction **Weighted average Convertible Notes Principal Amount Carrying Value Coupon Annual Cash Interest Annual Non-Cash Interest Initial Conversion Price Convertible Notes Due June 2027 25M 25M 3.75% 0.9M 0.1M 18.46* Convertible Notes Due June 2029 230M 225M 2.875% 6.6M 1.1M 29.22 Total Convertible Notes $255M $250M 2.96%** $7.5M $1.2M $28.17** As of March 31, 2025 |
|
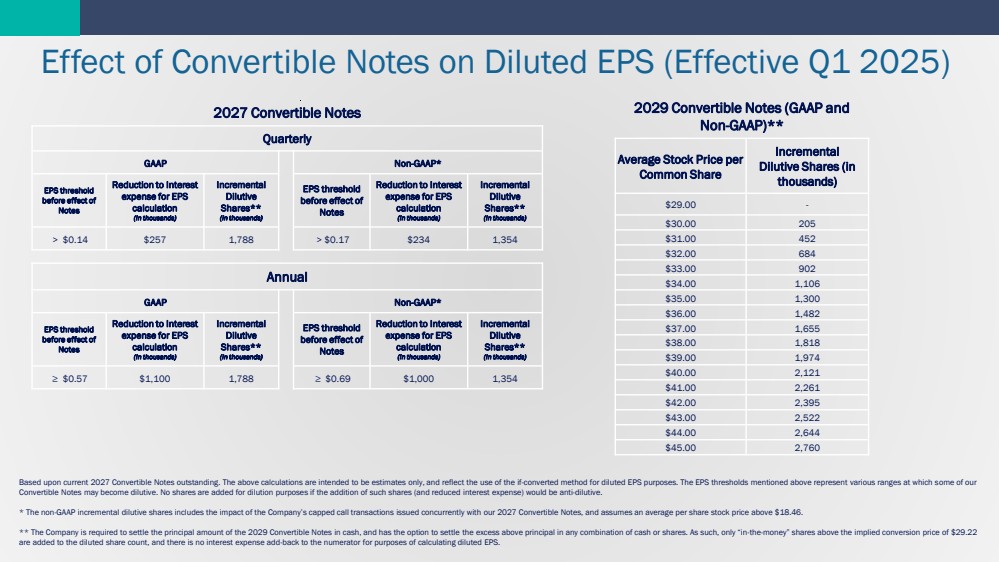
Effect of Convertible Notes on Diluted EPS (Effective Q1 2025) Based upon current 2027 Convertible Notes outstanding. The above calculations are intended to be estimates only, and reflect the use of the if-converted method for diluted EPS purposes. The EPS thresholds mentioned above represent various ranges at which some of our Convertible Notes may become dilutive. No shares are added for dilution purposes if the addition of such shares (and reduced interest expense) would be anti-dilutive. * The non-GAAP incremental dilutive shares includes the impact of the Company’s capped call transactions issued concurrently with our 2027 Convertible Notes, and assumes an average per share stock price above $18.46. ** The Company is required to settle the principal amount of the 2029 Convertible Notes in cash, and has the option to settle the excess above principal in any combination of cash or shares. As such, only “in-the-money” shares above the implied conversion price of $29.22 are added to the diluted share count, and there is no interest expense add-back to the numerator for purposes of calculating diluted EPS. 2027 Convertible Notes Quarterly GAAP Non-GAAP* EPS threshold before effect of Notes Reduction to Interest expense for EPS calculation (in thousands) Incremental Dilutive Shares** (in thousands) EPS threshold before effect of Notes Reduction to Interest expense for EPS calculation (in thousands) Incremental Dilutive Shares** (in thousands) > $0.14 $257 1,788 > $0.17 $234 1,354 Annual GAAP Non-GAAP* EPS threshold before effect of Notes Reduction to Interest expense for EPS calculation (in thousands) Incremental Dilutive Shares** (in thousands) EPS threshold before effect of Notes Reduction to Interest expense for EPS calculation (in thousands) Incremental Dilutive Shares** (in thousands) ≥ $0.57 $1,100 1,788 ≥ $0.69 $1,000 1,354 2029 Convertible Notes (GAAP and Non-GAAP)** Average Stock Price per Common Share Incremental Dilutive Shares (in thousands) $29.00 - $30.00 205 $31.00 452 $32.00 684 $33.00 902 $34.00 1,106 $35.00 1,300 $36.00 1,482 $37.00 1,655 $38.00 1,818 $39.00 1,974 $40.00 2,121 $41.00 2,261 $42.00 2,395 $43.00 2,522 $44.00 2,644 $45.00 2,760 |
|
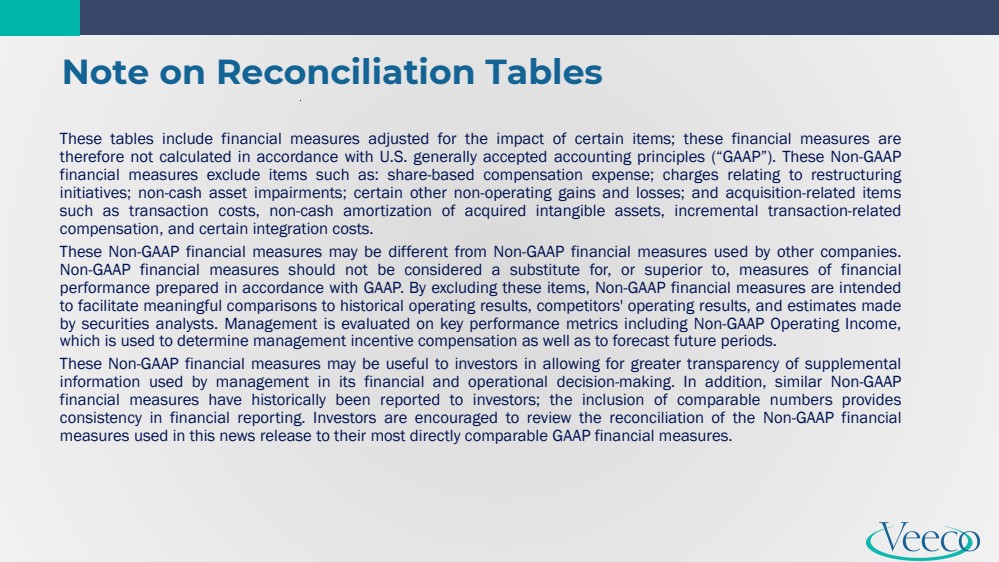
Note on Reconciliation Tables These tables include financial measures adjusted for the impact of certain items; these financial measures are therefore not calculated in accordance with U.S. generally accepted accounting principles (“GAAP”). These Non-GAAP financial measures exclude items such as: share-based compensation expense; charges relating to restructuring initiatives; non-cash asset impairments; certain other non-operating gains and losses; and acquisition-related items such as transaction costs, non-cash amortization of acquired intangible assets, incremental transaction-related compensation, and certain integration costs. These Non-GAAP financial measures may be different from Non-GAAP financial measures used by other companies. Non-GAAP financial measures should not be considered a substitute for, or superior to, measures of financial performance prepared in accordance with GAAP. By excluding these items, Non-GAAP financial measures are intended to facilitate meaningful comparisons to historical operating results, competitors' operating results, and estimates made by securities analysts. Management is evaluated on key performance metrics including Non-GAAP Operating Income, which is used to determine management incentive compensation as well as to forecast future periods. These Non-GAAP financial measures may be useful to investors in allowing for greater transparency of supplemental information used by management in its financial and operational decision-making. In addition, similar Non-GAAP financial measures have historically been reported to investors; the inclusion of comparable numbers provides consistency in financial reporting. Investors are encouraged to review the reconciliation of the Non-GAAP financial measures used in this news release to their most directly comparable GAAP financial measures. |
|
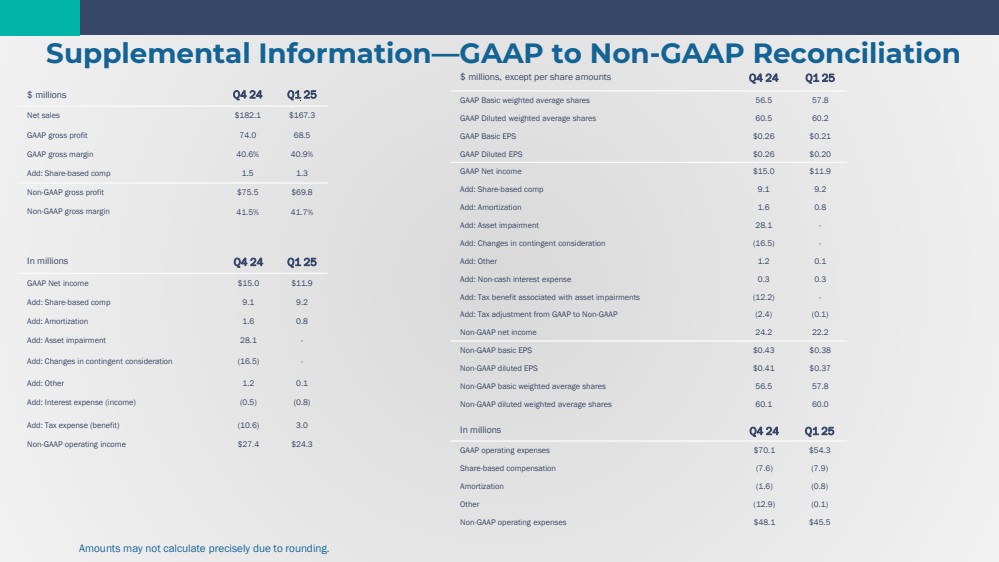
Amounts may not calculate precisely due to rounding. Supplemental Information—GAAP to Non-GAAP Reconciliation $ millions Q4 24 Q1 25 Net sales $182.1 $167.3 GAAP gross profit 74.0 68.5 GAAP gross margin 40.6% 40.9% Add: Share-based comp 1.5 1.3 Non-GAAP gross profit $75.5 $69.8 Non-GAAP gross margin 41.5% 41.7% In millions Q4 24 Q1 25 GAAP Net income $15.0 $11.9 Add: Share-based comp 9.1 9.2 Add: Amortization 1.6 0.8 Add: Asset impairment 28.1 - Add: Changes in contingent consideration (16.5) - Add: Other 1.2 0.1 Add: Interest expense (income) (0.5) (0.8) Add: Tax expense (benefit) (10.6) 3.0 Non-GAAP operating income $27.4 $24.3 $ millions, except per share amounts Q4 24 Q1 25 GAAP Basic weighted average shares 56.5 57.8 GAAP Diluted weighted average shares 60.5 60.2 GAAP Basic EPS $0.26 $0.21 GAAP Diluted EPS $0.26 $0.20 GAAP Net income $15.0 $11.9 Add: Share-based comp 9.1 9.2 Add: Amortization 1.6 0.8 Add: Asset impairment 28.1 - Add: Changes in contingent consideration (16.5) - Add: Other 1.2 0.1 Add: Non-cash interest expense 0.3 0.3 Add: Tax benefit associated with asset impairments (12.2) - Add: Tax adjustment from GAAP to Non-GAAP (2.4) (0.1) Non-GAAP net income 24.2 22.2 Non-GAAP basic EPS $0.43 $0.38 Non-GAAP diluted EPS $0.41 $0.37 Non-GAAP basic weighted average shares 56.5 57.8 Non-GAAP diluted weighted average shares 60.1 60.0 In millions Q4 24 Q1 25 GAAP operating expenses $70.1 $54.3 Share-based compensation (7.6) (7.9) Amortization (1.6) (0.8) Other (12.9) (0.1) Non-GAAP operating expenses $48.1 $45.5 |
|
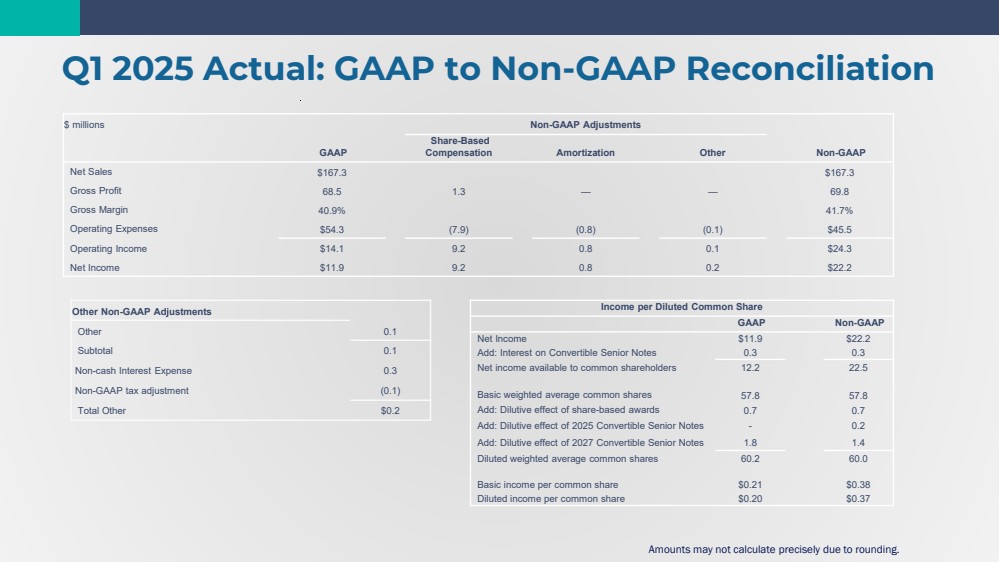
$ millions Non-GAAP Adjustments GAAP Share-Based Compensation Amortization Other Non-GAAP Net Sales $167.3 $167.3 Gross Profit 68.5 1.3 — — 69.8 Gross Margin 40.9% 41.7% Operating Expenses $54.3 (7.9) (0.8) (0.1) $45.5 Operating Income $14.1 9.2 0.8 0.1 $24.3 Net Income $11.9 9.2 0.8 0.2 $22.2 Q1 2025 Actual: GAAP to Non-GAAP Reconciliation Amounts may not calculate precisely due to rounding. Income per Diluted Common Share GAAP Non-GAAP Net Income $11.9 $22.2 Add: Interest on Convertible Senior Notes 0.3 0.3 Net income available to common shareholders 12.2 22.5 Basic weighted average common shares 57.8 57.8 Add: Dilutive effect of share-based awards 0.7 0.7 Add: Dilutive effect of 2025 Convertible Senior Notes - 0.2 Add: Dilutive effect of 2027 Convertible Senior Notes 1.8 1.4 Diluted weighted average common shares 60.2 60.0 Basic income per common share $0.21 $0.38 Diluted income per common share $0.20 $0.37 Other Non-GAAP Adjustments Other 0.1 Subtotal 0.1 Non-cash Interest Expense 0.3 Non-GAAP tax adjustment (0.1) Total Other $0.2 |
|
Reconciliation of GAAP to non-GAAP Financial Data Non-GAAP Adjustments GAAP Share-Based Compensation Amortization Other Non-GAAP Net Sales $135–$165 $135–$165 Gross Profit 54–69 1 — — 55–70 Gross Margin 39%–41% 40%–42% Operating Expenses $57–$58 (9) (1) — $47–$48 Operating Income (loss) ($3)–$11 10 1 — $8–$22 Net Income (loss) ($3)–$10 10 1 (1) $7–$20 Income (loss) per Diluted Share ($0.05)–$0.17 $0.12–$0.32 Q2 2025 Guidance ($ millions, except per share amounts) Amounts may not calculate precisely due to rounding. Income per Diluted Common Share GAAP Non-GAAP Net income (loss) available to common shareholders ($3)–$10 $7–$20 Basic weighted average common shares 58 58 Add: Dilutive effect of share-based awards 0-1 1-1 Add: Dilutive effect of 2027 Convertible Senior Notes 0-2 0-1 Diluted weighted average common shares 58-61 59-61 Income per diluted common share ($0.05)-$0.17 $0.12-$0.32 Reconciliation of GAAP Net Income to non-GAAP Operating Income GAAP Net Income (loss) ($3)–$10 Share-Based Compensation 10 Amortization 1 Interest income (1) Income tax expense 0-1 Non-GAAP Operating Income $8–$22 |