UNITED STATES
SECURITIES AND EXCHANGE COMMISSION
WASHINGTON, D.C. 20549
FORM 20-F
☐ |
REGISTRATION STATEMENT PURSUANT TO SECTION 12(b) OR 12(g) OF THE SECURITIES EXCHANGE ACT OF 1934 |
OR
☒ |
ANNUAL REPORT PURSUANT TO SECTION 13 OR 15(d) OF THE SECURITIES EXCHANGE ACT OF 1934 |
For the fiscal year ended December 31, 2024
OR
☐ |
TRANSITION REPORT PURSUANT TO SECTION 13 OR 15(d) OF THE SECURITIES EXCHANGE ACT OF 1934 |
For the transition period from to
OR
☐ |
SHELL COMPANY REPORT PURSUANT TO SECTION 13 OR 15(d) OF THE SECURITIES EXCHANGE ACT OF 1934 |
Date of event requiring this shell company report,
Commission file number: 001-37723
ENEL CHILE S.A.
(Exact name of Registrant as specified in its charter)
ENEL CHILE S.A.
(Translation of Registrant’s name into English)
CHILE
(Jurisdiction of incorporation or organization)
Roger de Flor 2725, Torre 2, Piso 19, Las Condes, Santiago, Chile
(Address of principal executive offices)
Isabela Klemes, phone: (56-2) 2630-9000, ir.enelchile@enel.com, Roger de Flor 2725, Torre 2, Piso 17, Las Condes, Santiago, Chile
(Name, Telephone, E-mail, and Address of Company Contact Person)
Securities registered or to be registered pursuant to Section 12(b) of the Act:
|
|||
|---|---|---|---|
Title of Each Class |
|
Trading Symbol(s) |
Name of Each Exchange on Which Registered |
American Depositary Shares Representing Common Stock |
|
ENIC |
New York Stock Exchange |
Common Stock, no par value * |
|
* |
New York Stock Exchange |
US$ 1,000,000,000 4.875% Notes due June 12, 2028 |
|
ENIC28 |
New York Stock Exchange |
_____________________
* |
Listed, not for trading, but only in connection with the registration of American Depositary Shares, under the Securities and Exchange Commission’s requirements. |
Securities registered or to be registered pursuant to Section 12(g) of the Act: None
Securities for which there is a reporting obligation pursuant to Section 15(d) of the Act: None
Indicate the number of outstanding shares of each of the issuer’s classes of capital or common stock as of the close of the period covered by the annual report
Shares of Common Stock: 69,166,557,220
Indicate by check mark if the registrant is a well-known seasoned issuer, as defined in Rule 405 of the Securities Act. ☒ Yes ☐ No
If this report is an annual or transition report, indicate by check mark if the registrant is not required to file reports pursuant to Section 13 or 15(d) of the Securities Exchange Act of 1934. ☐ Yes ☒ No
Indicate by check mark whether the registrant (1) has filed all reports required to be filed by Section 13 or 15(d) of the Securities Exchange Act of 1934 during the preceding 12 months (or for such shorter period that the registrant was required to file such reports), and (2) has been subject to such filing requirements for the past 90 days. ☒ Yes ☐ No
Indicate by check mark whether the registrant has submitted electronically every Interactive Data File required to be submitted pursuant to Rule 405 of Regulation S-T during the preceding 12 months (or for such shorter period that the registrant was required to submit such files). ☒ Yes ☐ No
Indicate by check mark whether the registrant is a large accelerated filer, an accelerated filer, a non-accelerated filer, or an emerging growth company. See the definitions of “large accelerated filer,” “accelerated filer,” and “emerging growth company” in Rule 12b-2 of the Exchange Act.
Large Accelerated Filer ☒ |
Accelerated Filer ☐ |
Non-accelerated Filer ☐ Emerging growth company ☐ |
If an emerging growth company that prepares its financial statements in accordance with U.S. GAAP, indicate by check mark if the registrant has elected not to use the extended transition period for complying with any new or revised financial accounting standards † provided pursuant to Section 13(a) of the Exchange Act. ◻
† The term “new or revised financial accounting standard” refers to any update issued by the Financial Accounting Standards Board to its Accounting Standards Codification after April 5, 2012.
Indicate by check mark whether the registrant has filed a report on and attestation to its management’s assessment of the effectiveness of its internal control over financial reporting under Section 404(b) of the Sarbanes-Oxley Act (15 U.S.C. 7262(b)) by the registered public accounting firm that prepared or issued its audit report ☒
If securities are registered pursuant to Section 12(b) of the Act, indicate by check mark whether the financial statements of the registrant included in the filing reflect the correction of an error to previously issued financial statements. ☐
Indicate by check mark whether any of those error corrections are restatements that required a recovery analysis of incentive-based compensation received by any of the registrant’s executive officers during the relevant recovery period pursuant to §240.10D-1(b) ☐
Indicate by check mark which basis of accounting the registrant has used to prepare the financial statements included in this filing:
U.S. GAAP ☐ |
International Financial Reporting Standards as issued by the International Accounting Standards Board ☒ |
Other ☐ |
If “Other” has been checked in response to the previous question, indicate by check mark which financial statement item the registrant has elected to follow.☐ Item 17 ☐ Item 18
If this is an annual report, indicate by check mark whether the registrant is a shell company (as defined in Rule 12b-2 of the Exchange Act). ☐ Yes ☒ No
Enel Chile’s Simplified Organizational Structure(1)
As of December 31, 2024

| (1) | Only principal operating consolidated entities are presented here. |
1
TABLE OF CONTENTS
|
|
Page |
3 |
||
|
|
|
6 |
||
|
|
|
7 |
||
|
|
|
9 |
||
|
|
|
|
|
|
|
|
|
10 |
||
|
|
|
10 |
||
|
|
|
10 |
||
|
|
|
25 |
||
|
|
|
48 |
||
|
|
|
48 |
||
|
|
|
74 |
||
|
|
|
81 |
||
|
|
|
84 |
||
|
|
|
85 |
||
|
|
|
86 |
||
|
|
|
102 |
||
|
|
|
107 |
||
|
|
|
|
|
|
|
|
|
109 |
||
|
|
|
Material Modifications to the Rights of Security Holders and Use of Proceeds |
109 |
|
|
|
|
109 |
||
|
|
|
110 |
||
|
|
|
110 |
||
|
|
|
110 |
||
|
|
|
112 |
||
|
|
|
113 |
||
|
|
|
Purchases of Equity Securities by the Issuer and Affiliated Purchasers |
113 |
|
|
|
|
113 |
||
|
|
|
113 |
||
|
|
|
114 |
||
|
|
|
Disclosure Regarding Foreign Jurisdictions that Prevent Inspections |
114 |
|
|
|
|
114 |
||
|
|
|
115 |
||
|
|
|
|
|
|
|
|
|
118 |
||
|
|
|
118 |
||
|
|
|
118 |
||
2
GLOSSARY | ||||
ADR |
|
American Depositary Receipt(s) |
|
A certificate issued by our depositary that represents ADS, or American Depositary Shares. |
|
|
|
|
|
ADS |
|
American Depositary Share(s) |
|
An equity interest in our company that is issued by Citibank, N.A., as the depositary, in respect of shares of our company held by the depositary. Each ADS represents 50 shares, and ADSs are traded on the New York Stock Exchange. |
AFP |
|
Administradora de Fondos de Pensiones |
|
A legal entity that manages a Chilean pension fund. |
|
|
|||
CEN |
|
Coordinador Eléctrico Nacional |
|
The Chilean system operator. An autonomous entity in charge of coordinating the efficient operation of the SEN, dispatching generation units to satisfy demand, and known as the National Electricity Coordinator. |
|
|
|||
Chilean Stock Exchanges |
|
Chilean Stock Exchanges |
|
The two stock exchanges located in Chile: the Santiago Stock Exchange and the Electronic Stock Exchange. |
|
|
|
|
|
CMF |
|
Comisión para el Mercado Financiero |
|
Chilean Financial Market Commission, the governmental authority that supervises the financial markets. |
|
|
|
|
|
CNE |
|
Comisión Nacional de Energía |
|
Chilean National Energy Commission, a governmental entity with responsibilities under the Chilean regulatory framework. |
|
|
|
|
|
EFI |
|
Enel Finance International N.V. |
|
A Dutch company operating as a financing company for the Enel Group, raising funds through bond issuances, loans, and other facilities, and in turn lending funds to companies in the Enel Group, and a subsidiary of Enel. |
|
|
|
|
|
EGP Chile |
|
Enel Green Power Chile S.A. |
|
A Chilean corporation engaged in non-conventional renewable electricity generation and a subsidiary of Enel Chile. |
|
|
|
|
|
Enel |
|
Enel S.p.A. |
|
An Italian company with multinational operations in the power and gas markets, with a 64.93% ownership of Enel Chile as of December 31, 2024, and our ultimate parent company. |
|
|
|
|
|
3
Enel Américas |
|
Enel Américas S.A. |
|
An affiliated Chilean publicly held limited liability stock corporation headquartered in Chile, with subsidiaries engaged primarily in the generation, transmission, and distribution of electricity in Argentina, Brazil, Colombia, and Peru, controlled by Enel. |
|
|
|
|
|
Enel Chile |
|
Enel Chile S.A. |
|
Our company, a Chilean publicly held limited liability stock corporation, with subsidiaries engaged primarily in the generation and distribution of electricity in Chile. The registrant of this Report. |
|
|
|
|
|
Enel Colina |
|
Enel Colina S.A. |
|
A subsidiary of Enel Distribución Chile engaged in electricity distribution in Chile, formerly known as Empresa Eléctrica de Colina Ltda. |
|
|
|
|
|
Enel Distribución Chile |
|
Enel Distribución Chile S.A. |
|
A Chilean publicly held limited liability stock corporation engaged in electricity distribution and a subsidiary of Enel Chile operating in the Santiago Metropolitan Region. |
|
|
|
|
|
Enel Generación Chile |
|
Enel Generación Chile S.A. |
|
A Chilean publicly held limited liability stock corporation engaged in electricity generation and a subsidiary of Enel Chile. |
|
|
|
|
|
Enel Group |
|
Enel Group |
|
Enel S.p.A. and the companies that it directly and indirectly controls. |
|
|
|
|
|
Enel X Chile |
|
Enel X Chile S.p.A. |
|
A Chilean company by shares and our wholly owned subsidiary, engaged in providing services associated with new technologies, with a strategic focus on digitalization, innovation, and sustainability. |
|
|
|
|
|
IFRS |
|
International Financial Reporting Standards |
|
International Financial Reporting Standards as issued by the International Accounting Standards Board (IASB). |
|
|
|
|
|
LNG |
|
Liquefied Natural Gas |
|
Liquefied natural gas, a fuel for our thermal power plants. |
|
|
|
|
|
NCRE |
|
Non-Conventional Renewable Energy |
|
Energy sources continuously replenished by natural processes, such as biomass, geothermal, mini-hydro, solar, tidal, or wind energy. |
|
|
|
|
|
PMGD |
|
Pequeños Medios de Generación Distribuida |
|
A Chilean regime for distributed generation facilities. |
4
|
|
|
|
|
OSM |
|
Ordinary Shareholders’ Meeting |
|
Ordinary Shareholders’ Meeting |
|
|
|
|
|
Pehuenche |
|
Empresa Eléctrica Pehuenche S.A. |
|
A Chilean publicly held limited liability stock corporation engaged in the electricity generation business and a subsidiary of Enel Generación Chile. |
|
|
|
|
|
SAIDI |
|
System Average Interruption Duration Index |
|
Index of average duration of interruption in the power supply. |
|
|
|
|
|
SAIFI |
|
System Average Interruption Frequency Index |
|
Index of average frequency of interruptions in the power supply. |
|
|
|
|
|
SEN |
|
Sistema Eléctrico Nacional |
|
The National Electricity System is the Chilean national interconnected electricity system. |
|
|
|
|
|
UF |
|
Unidad de Fomento |
|
Chilean inflation-indexed, Chilean peso-denominated monetary unit, equivalent to Ch$38,416.69 as of December 31, 2024. |
|
|
|
|
|
VAD |
|
Valor Agregado de Distribución |
|
Value-added from distribution of electricity. |
5
INTRODUCTION
As used in this Report on Form 20-F (“Report”), first-person personal pronouns such as “we,” “us,” or “our,” as well as “Enel Chile” or the “Company,” refer to Enel Chile S.A. and our consolidated subsidiaries unless the context indicates otherwise. Unless otherwise noted, our interest in our principal subsidiaries and jointly controlled companies and associates is expressed in terms of our economic interest as of December 31, 2024.
We are a Chilean publicly held limited liability stock corporation organized on March 1, 2016, under the laws of the Republic of Chile as a result of a corporate reorganization completed in 2016 by the former Enersis S.A., which separated its Chilean businesses from its non-Chilean businesses.
We are engaged in electricity generation and distribution businesses in Chile through our subsidiaries and affiliates. We own 93.55% of Enel Generación Chile S.A. (“Enel Generación Chile”), a Chilean electricity generation company with operations in Chile, 99.99% of Enel Green Power Chile S.A. (“EGP Chile”), a Chilean renewable electricity generation company, and 99.09% of Enel Distribución Chile S.A. (“Enel Distribución Chile”), a Chilean electricity distribution company that operates in the Santiago Metropolitan Region.
As of December 31, 2024, Enel S.p.A. (“Enel”), an Italian energy company with multinational operations in the power and gas markets, owns 64.93% of us and is our ultimate controlling shareholder.
6
PRESENTATION OF INFORMATION
Financial Information
In this Report, unless otherwise specified, references to “U.S. dollars” or “US$,” are to dollars of the United States of America (“United States”); references to “pesos” or “Ch$” are to Chilean pesos, the currency of Chile; references to “EUR” or “€” are to Euro, the currency of the European Union and references to “UF” are to Unidades de Fomento. The UF is a Chilean inflation-indexed, peso-denominated monetary unit that is adjusted daily to reflect changes in the official Consumer Price Index (“CPI”) of the Chilean National Institute of Statistics (Instituto Nacional de Estadísticas or “INE”). The UF is adjusted in monthly cycles. Each day in the period beginning on the tenth day of the current month through the ninth day of the succeeding month, the nominal peso value of the UF is indexed to reflect a proportionate amount of the change in the Chilean CPI during the prior calendar month. As of December 31, 2024, one UF was equivalent to Ch$38,416.69. The U.S. dollar equivalent of one UF was US$38.55 as of December 31, 2024, using the Observed Exchange Rate reported by the Central Bank of Chile (Banco Central de Chile) as of December 31, 2024, of Ch$996.46 per US$1.00. The U.S. dollar observed exchange rate (dólar observado) (the “Observed Exchange Rate”), which is reported by the Central Bank of Chile and published daily on its web page, is the weighted-average exchange rate of the previous business day’s transactions in the Formal Exchange Market. Unless the context specifies otherwise, all amounts translated from Chilean pesos to U.S. dollars or vice versa, or from UF to Chilean pesos, have been made at the rates applicable as of December 31, 2024. The Federal Reserve Bank of New York does not report a noon buying rate for Chilean pesos. No representation is made that the Chilean peso or U.S. dollar amounts disclosed in this Report could have been or could be converted into U.S. dollars or Chilean pesos, at such rate or any other rate.
Our consolidated financial statements and, unless otherwise indicated, other financial information concerning us included in this Report are presented in Chilean pesos. We have prepared our consolidated financial statements under International Financial Reporting Standards (“IFRS”) Accounting Standards, as issued by the International Accounting Standards Board (“IASB”). All our subsidiaries are integrated, and all their assets, liabilities, income, expenses, and cash flows are included in the consolidated financial statements after making the adjustments and eliminations related to intra-group transactions. Our interest in associated companies over which we exercise significant influence is included in our consolidated financial statements using the equity method. For detailed information regarding consolidated entities, jointly controlled entities, and associated companies, see Note 2.4, Note 2.5, and Note 2.6 of the Notes to our consolidated financial statements.
Technical Terms
References to “TW” are to terawatts (1012 watts or a trillion watts); references to “GW” and “GWh” are to gigawatts (109 watts or a billion watts) and gigawatt-hours, respectively; references to “MW” and “MWh” are to megawatts (106 watts or a million watts) and megawatt-hours, respectively; references to “kW” and “kWh” are to kilowatts (103 watts or a thousand watts) and kilowatt-hours, respectively; references to “kV” are to kilovolts, and references to “MVA” are to megavolt amperes. References to “BTU” and “MBTU” are to British thermal unit and million British thermal units, respectively. A “BTU” is an energy unit equal to approximately 1,055 joules. References to “Hz” are to hertz, and references to “mtpa” are to metric tons per annum. Unless otherwise indicated, statistics provided in this Report concerning the installed capacity of electricity generation facilities are expressed in MW. One TW equals 1,000 GW, one GW equals 1,000 MW, and one MW equals 1,000 kW. The installed capacity we present in this Report corresponds to the net installed capacity, which excludes the MW that each power plant consumes for its operation.
Statistics relating to aggregate annual electricity production are expressed in GWh and based on a year of 8,760 hours, except for a leap year, which is based instead on 8,784 hours. Statistics relating to installed capacity and production of the electricity industry do not include electricity of self-generators.
Energy losses experienced by generation companies during transmission are calculated by subtracting the number of GWh of energy sold from the number of GWh of energy generated (excluding their energy consumption and losses on the part of the power plant) within a given period. Losses are expressed as a percentage of total energy generated.
7
Energy losses during distribution are calculated as the difference between total energy purchased (GWh of electricity demand, including own generation) and the energy sold excluding tolls and energy consumption not billed (also measured in GWh), within a given period. Distribution losses are expressed as a percentage of the total energy purchased. Losses in distribution arise from illegally tapped energy as well as technical losses.
Calculation of Economic Interest
In this Report, references are made to the “economic interest” of Enel Chile in its related companies. We have direct and/or indirect interests in such companies. In circumstances in which we do not directly own an interest in an affiliated company, our economic interest in such ultimate affiliated company is calculated by multiplying the percentage of economic interest in a directly held affiliated company by the percentage of economic interest of any entity in the ownership chain of such affiliated company. For example, if we directly own a 6% equity stake in an affiliated company and 40% is directly held by our 60%-owned subsidiary, our economic interest in such an associate would be 60% times 40% plus 6%, equal to 30%.
Rounding
Some figures included in this Report have been rounded for ease of presentation. Due to rounding, the sums in tables may not equal the sums of the entries.
8
FORWARD-LOOKING STATEMENTS
This Report contains statements that are or may constitute forward-looking statements within the meaning of Section 27A of the Securities Act of 1933, as amended, and Section 21E of the Securities Exchange Act of 1934, as amended (the “Exchange Act”). These statements appear throughout this Report and include statements regarding our intent, belief, or current expectations, including but not limited to any statements concerning:
| ● | our capital investment program; |
| ● | trends affecting our financial condition or results of operations; |
| ● | our dividend policy; |
| ● | the future impact of competition and regulation; |
| ● | political and economic conditions in the countries in which our related companies or we operate or may operate in the future; |
| ● | any statements preceded by, followed by, or that include the words “believes,” “expects,” “predicts,” “anticipates,” “intends,” “estimates,” “should,” “may,” or similar expressions; and |
| ● | other statements contained or incorporated by reference in this Report regarding matters that are not historical facts. |
Because such statements are subject to risks and uncertainties, actual results may differ materially from those expressed or implied by such forward-looking statements. Factors that could cause actual results to differ materially include, but are not limited to:
· |
demographic developments, political events, social unrest, economic fluctuations, worldwide or regional health crises, epidemics and pandemics, and interventionist measures by authorities in Chile; |
· |
geopolitical events, financial or other crises, armed conflicts in other countries, and foreign exchange risks; |
· |
adverse litigation proceedings and labor disputes; |
· |
water supply, droughts, flooding, storms, and other weather-related conditions as a result of climate change effects; |
· |
changes in Chilean electricity, water, and environmental regulations, including climate regulations to limit GHG emissions, and the regulatory framework of the electricity industry; |
· |
our ability to implement proposed capital expenditures, including our ability to arrange financing where required; |
· |
the nature and extent of future competition in our principal markets; |
· |
disruptions in infrastructure and supply chains and fluctuations in market prices of energy and certain commodities; |
· |
interruption or failure of our information technology, control, and communications systems, cyberattacks, cybersecurity breaches, and uncertain risks related to artificial intelligence; and |
· |
the factors discussed below under “Risk Factors.” |
You should not place undue reliance on such statements, which speak only as of the date that they were made. Our independent registered public accounting firm has not examined or compiled the forward-looking statements and, accordingly, does not provide any assurance concerning such statements. You should consider these cautionary statements together with any written or oral forward-looking statements that we may issue in the future. We do not undertake any obligation to release publicly any revisions to forward-looking statements contained in this Report to reflect later events or circumstances or the occurrence of unanticipated events, except as required by law.
For all these forward-looking statements, we claim the protection of the safe harbor for forward-looking statements contained in the Private Securities Litigation Reform Act of 1995.
9
PART I
Item 1. Identity of Directors, Senior Management and Advisers
Not applicable.
Item 2. Offer Statistics and Expected Timetable
Not applicable.
Item 3. Key Information
| A. | [Reserved] |
B. Capitalization and Indebtedness.
Not applicable.
C. Reasons for the Offer and Use of Proceeds.
Not applicable.
D. |
Risk Factors. |
Material Risks Related to Our Business
Our businesses depend heavily on hydrology and are affected by droughts, flooding, storms, ocean currents, and other chronic changes in climatic and weather conditions as a result of climate change.
Climate change is a major global challenge that exposes our businesses to a variety of medium- and long-term risks. Our generation business has been and could be in the future negatively affected by arid hydrological conditions, which have and could negatively affect our ability to dispatch energy from our hydroelectric generation facilities. Our operations and results have been adversely affected when hydrological conditions in Chile have been significantly below average, as has been the case for much of the period since 2007.
Hydrological conditions in Chile have often been subject to two weather phenomena dealing with ocean currents - El Niño and La Niña - that influence rainfall and may result in drought or flooding, depending on the region affected. In the past, El Niño has affected Chile’s hydrological conditions, leading to rainfall deficits, high temperatures, and higher energy prices in some years, and to unusually intensive rains, flooding, and landslides in other years. For example, in 2024, El Niño brought heavy rains during the fall and winter months, resulting in above-average reservoir levels in Chile, which positively affected our hydroelectric generation. However, cumulative hydrological conditions in Chile remained abnormally dry in 2024.
Our subsidiary Enel Generación Chile has entered into certain agreements with the Chilean government and local irrigators regarding water use for hydroelectric generation during low water levels. However, if droughts persist, we have and may in the future face increased pressure from the Chilean government or other third parties to further restrict our water use, which could have a material adverse effect on our business and results of operations.
Our distribution business is also affected by inclement weather conditions. With extreme temperatures, electricity demand can increase significantly within a short period, affecting service and causing service outages that have resulted and may in the future result in the imposition of fines on our distribution business. Furthermore, with increased severity and frequency of extreme climate events, heavy rainfall or snowfall may occur in a short period and be accompanied by windstorms and lightning. These events may damage our power distribution infrastructure, resulting in service outages. Depending on weather conditions, our distribution business results can vary significantly from year to year.
10
On August 1 and 2, 2024, the Santiago Metropolitan Region was severely hit by an extraordinary, devastating, and unpredictable storm with winds of up to 124 kilometers per hour, which felled more than 2,000 trees, 800 public service poles and large tree branches and destroyed significant portions of the above-ground electrical energy distribution network. The resulting damages were comparable only to those that occurred during the 2010 earthquake in Chile. The storm caused widespread electrical power outages throughout Enel Distribución Chile’s concession area. While Enel Distribución Chile deployed all available resources and adopted special measures to restore electricity supply to its customers in the shortest time possible under the particular circumstances, several portions of the concession area were without power for an extended period, in some cases for more than 15 days. As a result, the Chilean government initiated an investigation to determine whether the actions taken by Enel Distribución Chile met the concession requirements, considering thousands of customers experienced service outages for an extended period following the storm. Failure to meet the concession’s requirements could result in the revocation and termination of our public service concessions. As of the date of this Report, Enel Distribución Chile has not been legally notified of any administrative proceeding resulting from the Chilean government’s investigation aimed at declaring the termination of its public service concessions for the distribution of electrical energy.
On January 22, 2025, the Chilean Superintendency of Electricity and Fuels (the “SEF”) fined Enel Distribución Chile Ch$18.8 billion (US$ 19 million) for four failures relating to the extended power outages resulting from the August 2024 storm: failure to properly maintain its infrastructure; delay in restoring service; failure to provide information to the government in a timely manner; and failure to have an adequate system to receive customer complaints and outage reports. Enel Distribución Chile subsequently filed a motion requesting the SEF to reconsider the charges and reduce the fine.
On February 4, 2025, Enel Distribución Chile announced an agreement with the Chilean National Consumer Service (“SERNAC” in its Spanish acronym) to voluntarily compensate more than 800,000 customers whose service was affected by the August 2024 storm. If the Chilean courts approve the agreement, the total compensation will be Ch$17.1 billion (US$17.6 million), with payments expected to begin in June or July 2025.
Our operating expenses also increase during droughts when thermal power plants, which have higher operating costs relative to hydroelectric power plants, are dispatched more frequently to compensate for the electricity generation deficit from reduced hydroelectric generation. In addition, our thermal power plants generate greenhouse gas (“GHG”) emissions. Depending on our commercial obligations, we may need to buy electricity at higher spot prices to comply with our contractual supply obligations. Beyond increasing our operating costs, the cost of these electricity purchases has exceeded and may in the future exceed our contracted electricity sale prices, thus potentially producing losses from those contracts. For example, in 2022, spot prices reached historic highs, resulting in losses from certain contracts. For further information concerning the effect of hydrology on our business and financial results, please refer to “Item 5. Operating and Financial Review and Prospects — A. Operating Results —1. Discussion of Main Factors Affecting Operating Results and Financial Condition of the Company —a. Generation Business.”
Droughts also indirectly affect the operation of our thermal power plants that use natural gas or diesel fuel. Our thermal power plants require water for cooling, and droughts may reduce water availability and increase transportation costs. As a result, we may have to purchase water from agricultural areas that are also experiencing water shortages to operate our thermal power plants. These water purchases have and may continue to increase our operating costs and require us to negotiate further with the local communities. If such negotiations are unsuccessful, we may be unable to obtain the water necessary to operate our thermal power plants.
Recovery from current or future droughts affecting the regions in Chile where most of our hydroelectric power plants are located may take place over an extended period, and there can be no assurance that any recovery will reach pre-drought hydrological conditions, or that any recovery will occur at all. Climate change may increase the likelihood of prolonged droughts and exacerbate the risks described above, which would have a further adverse effect on our business, results of operations, and financial condition.
11
Our non-conventional renewable energy businesses are also subject to physical, operational, and financial risks related to climate change effects.
The electricity generated by our solar and wind generation facilities is highly dependent on climate factors other than hydrology, including suitable solar and wind conditions, which, even under normal operating circumstances, can vary greatly. Climate change may also have long-term effects on wind patterns and the amount of solar energy received at a particular solar facility, reducing or increasing electricity generated by these facilities. Although we base our business decisions on solar and wind studies for each renewable energy facility, actual conditions may not conform to the findings of these studies. The solar and wind conditions may be negatively affected by changes in weather patterns, including the potential impact of climate change.
If our renewable energy production falls below anticipated levels, we may have to dispatch electricity from our backup thermal power plants to compensate for the electricity generation deficit. Our thermal power plants have higher operating costs than our renewable energy facilities and generate GHG emissions. We also have needed and may in the future need to buy electricity in the spot market to fulfill our solar and wind generation facilities’ contractual supply obligations, which may be at prices higher than the contracted electricity sales, thus potentially producing losses from those contracts. These impacts have increased and could in the future increase our costs or result in losses and have a material adverse effect on our business, results of operations, and financial condition.
We depend on distributions from our subsidiaries to meet our payment obligations.
We rely on cash from dividends, loans, interest payments, capital reductions, and other distributions from our subsidiaries to pay our obligations. Such payments and distributions may be subject to legal constraints, such as dividend restrictions, fiduciary obligations, and contractual limitations.
Our subsidiaries’ ability to pay dividends or make loan payments or other distributions to us is limited by their operating results. To the extent that any of our subsidiaries’ cash requirements exceed their available cash, they will not be able to make funds available to us. Insufficient cash flows from our subsidiaries may result in their inability to meet debt obligations and the need to seek waivers to comply with some debt covenants. To a limited extent, these subsidiaries may require guarantees or other emergency measures from us as shareholders. For further details regarding financial support provided to our subsidiaries, please refer to “Item 7. Major Shareholders and Related-Party Transactions — B. Related-Party Transactions.”
The inability to obtain distributions from our subsidiaries could adversely affect our business, results of operations, and financial condition.
Construction and operation of power plants may encounter significant delays, stoppages, cost overruns, and stakeholder opposition that may damage our reputation and impair our goodwill with other stakeholders.
Our power plant projects may be delayed in obtaining regulatory approvals or may face shortages and increases in the price of equipment, materials, or labor. They may be subject to construction delays, strikes, accidents, and human error. Any such event could negatively affect our business, results of operations, and financial condition.
Market conditions may change significantly between the approval and completion of a project, which, in some cases, may decrease its profitability or render it impracticable. Deviations in market conditions, such as estimates of timing and expenditures, may lead to cost overruns and delays in project completion that widely exceed our initial forecasts. In turn, this may have a material adverse effect on our business, results of operations, and financial condition.
We may develop new projects in locations with challenging geographical topography, such as mountain slopes, high altitudes, or other areas with limited access. Additionally, given some projects’ locations, there may be inherent risks to archaeological heritage sites. These factors may also lead to significant delays and cost overruns.
The operation of our thermal power plants may also affect our goodwill with stakeholders due to GHG emissions that could adversely affect the environment and local residents. In addition, communities might have their own interests and different perceptions of the company and may be influenced by other stakeholders or motivations unrelated to the project.
12
Therefore, if we fail to engage with our relevant stakeholders, we may face opposition, which could negatively affect our reputation, impact operations, or lead to litigation threats or actions.
Our reputation is the foundation of our relationship with key stakeholders and other constituencies. Any damage to our reputation may exert considerable pressure on regulators, creditors, and other stakeholders, possibly leading to the abandonment of projects and operations, which could cause our share prices to drop and hinder our ability to attract and retain valuable employees. Any of these outcomes could result in an impairment of our goodwill with stakeholders. If we do not effectively manage these sensitive issues, they could adversely affect our business, results of operations, and financial condition.
Our long-term electricity sales contracts are subject to fluctuations in the market prices of certain commodities, energy, and other factors.
We are exposed to fluctuations in certain commodity market prices that affect our long-term electricity sales contracts. These contracts commit our generation subsidiaries to material obligations as selling parties and contain prices indexed to different commodities, exchange rates, inflation, and the market price of electricity. Unfavorable changes to these indices would reduce the rates we can charge under these contracts, which could adversely affect our business, results of operations, and financial condition.
We are subject to incremental risks in distribution markets that are becoming more liberalized.
In our distribution business, some customers who meet certain requirements are free to choose between regulated and unregulated tariffs. Customers who switch must give 12 months’ notice of the change and remain in the new tariff regime for at least four years. Since 2016, some customers who had freely chosen regulated tariffs have switched to the unregulated tariff regime due to lower prices. These customers are tendering their electricity needs, either directly or in association with other customers, under the unregulated tariff regime because regulated tariffs are currently higher than unregulated tariffs due to the former being based on contracts tendered in the past at higher prices. Additionally, in November 2024 the Ministry of Energy published Exempt Resolution No. 58 lowering the minimum connected capacity requirement for customers to choose unregulated tariffs from 500 kW to 300 kW, which, combined with lower market prices, may reduce the number of customers who choose regulated tariffs. Customers switching to unregulated tariffs may also choose an alternative energy provider other than one of our generation subsidiaries, which could adversely affect our business, results of operations, and financial condition.
If third-party electricity transmission facilities, gas pipeline infrastructure, or fuel supply contracts fail to provide us with adequate service, we may be unable to deliver the electricity we sell to our final customers.
We depend on transmission facilities owned and operated by other companies to deliver the electricity we sell. This dependence exposes us to several risks. If the transmission is disrupted, or its capacity is inadequate, we may be unable to sell and deliver our electricity, particularly electricity generated by our solar and wind plants, which requires more flexibility because they are located far from demand centers. If a region’s power transmission infrastructure is inadequate, our recovery of sales costs and profits may be insufficient. If restrictive transmission price regulations are imposed, transmission companies that we rely on may not have sufficient incentives to invest in expanding their infrastructure, which could unfavorably affect our results of operations and financial condition or affect our ability to deploy our portfolio of projects under development.
The construction of new transmission lines may take longer than in the past, mainly because of higher social and environmental requirements that create uncertainties regarding project completion timing. As a result, renewable energy generation projects are being completed faster than new transmission projects, creating a backlog of electricity that is difficult to transmit through current transmission systems. Also, our thermal power plants connected to natural gas pipelines are subject to stoppages causing significant disruptions. Stoppages could force us to purchase electricity at spot market prices, which could be higher than the contracted fixed sale price to customers. We could also be forced to dispatch our natural gas power plants using LNG that is transported by barge and is more expensive than natural gas that is transported from Argentina through these pipelines, which, in turn, could increase our operating expenses.
13
These scenarios could adversely affect our business, results of operations, and financial condition.
Labor disputes, our inability to reach satisfactory collective bargaining agreements with our unionized employees, or our inability to attract, train, and retain key employees could adversely affect our business, results of operations, financial condition, and reputation.
Our business relies on attracting and retaining many highly specialized employees. A large percentage of our employees are members of unions with whom we have collective bargaining agreements that must be renewed regularly. Our business, results of operations, and financial condition could be unfavorably affected by a failure to reach a collective bargaining agreement with any labor union or by a deal with a labor union that contains terms we view as unfavorable. Chilean law provides legal mechanisms for judicial authorities to impose a collective bargaining agreement if the parties cannot agree. Specific actions such as strikes, walkouts, or work stoppages by these unionized employees could negatively impact our business, results of operations, financial condition, and reputation.
In addition, we may experience shortages of qualified key personnel if we are unable to hire new employees to fill key positions, and there can be no assurances that we will be able to attract, train, or retain key personnel or be able to do so without costs or delays, which could adversely affect our business, results of operations, financial condition, and reputation.
Interruption in or failure of our information technology, control, and communications systems, or cyberattacks to or cybersecurity breaches of these systems could have a material adverse effect on our business, results of operations, and financial condition.
We operate in an industry that requires the continued operation of sophisticated information technology, control, and communications systems (“IT Systems”) and network infrastructure. We use our IT Systems and network infrastructure to create, collect, use, disclose, store, dispose of, and otherwise process sensitive information, including company and customer data and personal information regarding customers, employees and their dependents, contractors, shareholders, and other individuals. IT Systems are also critical to controlling and monitoring our power plants’ operations, maintaining generation and network performance, monitoring smart grids, managing billing processes and customer service platforms, achieving operating efficiencies, and meeting our service targets and standards in our generation and distribution businesses. The operation of our generation system depends on the physical interconnection of our facilities with the electricity network infrastructure and communications among the various parties connected to the network. The reliance on IT Systems to manage information and communication among those parties has increased significantly since the implementation of smart meters and intelligent grids in Chile.
Our generation and distribution facilities, IT Systems, and operations technology systems (“OT Systems”), and other infrastructure, as well as the information processed in our digital assets, could be affected by cybersecurity incidents, including those caused by human error. Cybersecurity incidents have evolved dramatically in recent years and have grown exponentially in terms of frequency and degree of impact. Our industry has begun to see an increase in the volume and sophistication of cybersecurity attacks from international activist organizations, nation-states, and individuals.
Cybersecurity incidents could harm our business by limiting our generation and distribution capabilities, delaying our development and construction of new facilities or capital improvement projects to existing facilities, disrupting our customer operations, or exposing us to various events that could increase our liability exposure. Our generation and distribution business systems are part of an interconnected system. Given the role of electricity as a vital resource in modern society, a widespread or prolonged disruption caused by a cybersecurity incident in the electric transmission grid, network infrastructure, fuel sources, or our third-party service providers’ operations could have broad socio-economic ramifications across households, businesses, and vital institutions, which could unfavorably affect our business.
In addition, our businesses require the collection and storage of personally identifiable information of our customers, employees, and shareholders, who expect that we will adequately protect the privacy of such information. Cybersecurity breaches may expose us to a risk of loss or misuse of confidential and proprietary information. Significant theft, loss, or fraudulent use of information, or other unauthorized disclosure of personal or sensitive data, may lead to high costs to notify and protect the impacted persons.
14
It could cause us to become subject to significant litigation, losses, liability, fines, or penalties, any of which could materially and adversely affect our results of operations and reputation. We may also be required to incur significant costs associated with governmental actions in response to such intrusions or to strengthen our digital assets.
In this context, we believe that proper cybersecurity risk management requires a long-term strategy leveraging a proactive approach and iterative actions performed over time, and that approaching cyber risk with a single initiative may not be an efficient and effective strategy to manage and reduce risks related to cybersecurity. Although the Enel Group has adopted a “Cyber Security Framework” to guide and manage cybersecurity processes and created its own organizational model for implementing the Cyber Security Framework processes, we could still be subject to cyber incidents and other security threats to our IT Systems and OT Systems, which could result in a material decrease in revenues and additional costs associated with penalties, third-party claims, repairs, insurance expenses, litigation, notification and remediation, security, and compliance. For further details regarding our Cyber Security Framework, please refer to “Item 16K. Cybersecurity.”
The use of artificial intelligence (“AI”) technology creates uncertain risks for our business.
The Enel Group, including Enel Chile, evaluates opportunities to implement AI in all areas of our business to improve operational efficiency, optimize energy resource management, and develop new and increasingly sustainable solutions. Due to the rapid development of AI technologies and an uncertain regulatory landscape, successfully identifying and mitigating every associated risk will be crucial. The misuse of AI by our employees or third-party vendors, the use of AI in a cyberattack, or unexpected AI behaviors and decision-making could compromise our IT Systems, operations, and confidential information, which may result in further security risks to our systems and other unpredictable outcomes. Any of these events could adversely affect our business, results of operations, financial condition, and reputation.
We have experienced and may in the future experience increased interest in our environmental, social, and governance (“ESG”) practices and commitments from our stakeholders, investors, and regulatory bodies. Failure to disclose, meet, or address our ESG practices or commitments could negatively impact our reputation, investment in our common stock and ADSs, or our access to capital markets.
Our goal is to reduce carbon emissions from our electric generation facilities to achieve zero direct (Scope 1) emissions by 2040. We continue to monitor the financial and operational feasibility of taking more aggressive action to further reduce GHG emissions. Our strategic plan to replace older, fossil-fueled generation with zero-carbon-emitting renewable generation will contribute to the achievement of our goals related to reducing GHG emissions. However, our ability to achieve such goals depends on many external factors, including the development of relevant energy technologies and the ability to execute our capital plan. These efforts could impact how we operate our electric generating units and lead to increased competition and regulation, all of which could have a material adverse effect on our operations and financial condition.
We cannot guarantee that we will be able to achieve or maintain our announced ESG goals, practices, and commitments. Our failure or perceived failure to achieve our ESG goals, maintain practices aligned with stakeholder expectations for best practices, or comply with new ESG expectations could harm our reputation, adversely impact our ability to attract and retain customers and employees, and expose us to legal and regulatory proceedings and increased scrutiny from a range of stakeholders. Some stakeholders may disagree with our ESG-related goals and commitments, which may adversely impact our business and reputation and the prices of our securities.
Our ability to successfully execute our strategic plan, including the transition of our generation facilities and achievement of our GHG emissions reduction targets, may affect customers’, investors’, legislators’, and regulators’ opinions and actions. If they have or develop a negative opinion of us due to increasing scrutiny of ESG practices or our failure to meet our announced ESG commitments, this could result in increased costs associated with regulatory oversight and could make it more difficult for our businesses to achieve favorable legislative or regulatory outcomes. In addition, increased focus and activism related to ESG and similar matters may hinder our access to capital, as investors may decide to reallocate capital or not commit capital as a result of their assessment of our ESG practices. Any of these consequences could adversely affect our reputation, investment in our securities, or our access to capital markets and negatively impact our results of operations, financial position, and liquidity.
15
We may be unable to enter into suitable acquisitions or successfully integrate businesses that we acquire.
On an ongoing basis, we carry out mergers and review acquisition prospects to expand and improve our operations, which may increase our market coverage or provide synergies with our existing businesses. However, there can be no assurance that we will be able to identify and acquire suitable companies in the future. The acquisition and integration of independent companies that we do not control may be a complicated, costly, and time-consuming process that may strain our resources and relationships with our employees and customers.
These mergers and acquisitions may not ultimately be successful or achieve the expected benefits and may encounter delays or difficulties in connection with the integration of their operations due to several factors, including but not limited to:
| ● | inconsistencies in standards, controls, procedures and policies, business cultures, and compensation structures; |
| ● | difficulties in integrating various business-specific operating procedures and systems, as well as our financial, accounting, information, and other systems; |
| ● | complications in retaining key employees, customers, and suppliers; |
| ● | unexpected transaction costs or failures in the assessed value or a proper projection of the potential benefits and synergies; and |
| ● | diversion of our management’s attention from their other responsibilities. |
Any of these risks encountered in the integration process could have a material adverse effect on our revenues, expenses, results of operations, and financial condition.
Material Risks Related to Regulatory Matters
Governmental regulations may unfavorably affect our businesses, cause delays, impede the development of new projects, or increase the costs of operations and capital expenditures.
Our electricity businesses are subject to extensive regulation, inspections, and audits. The tariffs we charge to our customers are a result of a tariff-setting process defined by regulators, which may negatively affect our profitability. Our business is also exposed to the decision of governmental authorities regarding material rationing policies during droughts or prolonged power outages, or regulatory changes that may unfavorably affect our future operations and profitability.
For example, in the context of the social crisis that began in October 2019, the government enacted Law No. 21,185, which established a transitory mechanism for stabilizing customers’ electricity prices under the regulated price system. The mechanism eliminates the price increase of 9.2% that would have been applied to regulated customers as of July 2019 and defers the price increase for the sale of electricity under contracts between generation and distribution companies that start before 2021. A price stabilization funding program was implemented by the National Energy Commission (“CNE” in its Spanish acronym) and financed by companies in the generation industry, including our subsidiaries Enel Generación Chile and, to a lesser extent, EGP Chile through accounts receivable generated by the differences between the contractual rates and the stabilized rates. The maximum amount of the stabilization fund of US$1.35 billion was reached ahead of schedule in January 2022.
In July 2022, the Chilean Congress passed Law No. 21,472, which complements Law No. 21,185 by creating a new stabilization fund program and establishing a new transitory mechanism for stabilizing customers’ electricity prices under the regulated price system. The purpose of the mechanism is to limit the increase in electricity bills for regulated customers during 2022 and to allow such increases to occur gradually over the following 10 years. The accounts receivable balances must be repaid by no later than December 31, 2032, and have a 100% guarantee of the Chilean government. The maximum amount of the stabilization fund program established by Law No. 21,472 of US$ 1.8 billion was reached in February 2024.
16
In April 2024, Law No. 21,667 was enacted, to prevent generation companies from continuing to accumulate debt due to stabilized prices under the regulated price system. Under this law, tariffs for regulated customers will be gradually adjusted to reflect the real costs of energy, and generation companies will be able to recover the balance of debt accumulated under the price stabilization mechanisms generated by Laws No. 21,185 and No. 21,472. Law No. 21,667 increases the stabilization fund established under Law 21,472 to US$5.5 billion, of which US$3.7 billion will have a 30% guarantee of the Chilean government. The accounts receivable balances must be repaid no later than December 31, 2035.
Due to the tariff increases implemented under Law No. 21,667, the Chilean government has proposed a new electricity subsidy to protect the most vulnerable customers. The lower chamber of the Chilean Congress has approved a bill to finance the subsidy, which includes a transitory surcharge on the “green tax”, already being paid by generation companies, based on measured CO2 emissions of power plants from 2024 to 2026. The bill is currently being debated in the Chilean Senate.
As a result of applying the laws mentioned above as of and for the year ended December 31, 2024, our current and non-current accounts receivables, financial income, and financial costs increased. Please see Note 9 and Note 34 of the Notes to our consolidated financial statements for further information.
Our operating subsidiaries are also subject to environmental regulations that, among other things, require us to perform environmental impact studies on future projects and obtain construction and operating permits from local and national regulators. Governmental authorities may withhold or delay the approval of these permits until the completion of environmental impact studies, sometimes unexpectedly. Environmental regulations for existing and future generation capacity have become stricter and require increased capital investments. Any delay in meeting the required emission standards may constitute a violation of environmental regulations. Failure to certify the original implementation and ongoing emission standard requirements of monitoring systems may result in significant penalties and sanctions or legal claims for damages. We expect that more restrictive emission limits will be established in the future. We are also subject to an annual “green tax” based on our GHG emissions in the previous year. Such taxes may increase in the future and discourage thermal electricity generation.
In May 2023, the Chilean Congress approved a progressive increase in the minimum wage, which as of July 1, 2024, reached the total amount of Ch$500,000 (approximately US$500) per month. As of January 1, 2025, the minimum wage was adjusted based on the consumer price index to Ch$510,636 (approximately US$512) per month.
On January 29, 2025, the Chilean Congress approved reforms to the Chilean pension fund regime that would, among other things, increase the employer contributions to employee pensions from 1.5% to 8.5% of the employee’s monthly wages. While the increases are expected to be implemented gradually over a 9-year period, it could result in increased labor costs for employers. Any increase in our labor costs could have an adverse effect on our business, results of operations, and financial condition.
Proposed changes to the regulatory framework are often submitted to legislators and administrative authorities. Some of these changes, if implemented, could have a material adverse effect on our business, results of operations, and financial condition.
Our business faces risks from the Chilean government’s decarbonization efforts.
In June 2019, the Chilean government announced its plan to phase out coal entirely from its energy mix by 2040 and achieve carbon neutrality by 2050. Our subsidiary Enel Generación Chile signed an agreement with the Chilean Ministry of Energy defining the process for the closures of our coal-fired power plants: Tarapacá (158 MW), Bocamina I (128 MW), and Bocamina II (350 MW). We closed the Tarapacá plant in December 2019, the Bocamina I plant in December 2020, and the Bocamina II plant in September 2022, well ahead of the Bocamina II plant’s scheduled deadline of December 31, 2040. In doing so, we became the first power generation company in the Chilean electricity sector to completely remove coal from its generation operations. However, our efforts to decarbonize our energy matrix by closing coal-fired power plants might be insufficient if our renewable energy projects suffer delays and do not enter into operation on schedule.
17
Even though the Chilean government’s plan to achieve decarbonization may overlap with our sustainability strategy, the governmental targets’ actual implementation may exert considerable pressure on us and our ability to satisfy our contractual obligations with other cleaner energy sources. In turn, this may increase our expenses, decrease our profitability, and limit our ability to satisfy fully customers’ electricity demands.
Our business and profitability could be unfavorably affected if water rights are denied, if water concessions are granted with a limited duration, or if the cost of water rights is increased.
The Chilean Water Authority (“Dirección General de Aguas”) grants us water rights for water supply from rivers and lakes near our generation facilities. Currently, these water rights:
| ● | are for an unlimited duration; |
| ● | are absolute and unconditional property rights; and |
| ● | are not subject to further challenge. Chilean generation companies must pay an annual license fee for unused water rights. New hydroelectric facilities are required to obtain water rights, and the conditions of such water rights may affect the design, timing, or profitability of a project. |
Any revocation of or limitations on our current water rights, additional water rights, the duration of our water concessions, or an increase in the cost of water rights could have a material adverse effect on our hydroelectric development projects and profitability.
We are subject to potential business and financial risks resulting from climate change legislation and regulations to limit GHG emissions.
Climate change legislation and regulations restricting or regulating GHG emissions could increase our operating costs and have a material adverse effect on our business, results of operations, and financial condition. The adoption and implementation of any international treaty, legislation, or regulation imposing new or additional reporting obligations or limiting emissions of GHGs from our operations could require us to incur additional costs to comply with such requirements and possibly require the reduction or limitation of GHG emissions associated with our operations. These higher compliance standards, such as net zero emissions, may require higher levels of investment in new, more efficient technologies. Failure to monitor or delay the adoption of new technologies may jeopardize our ability to adapt to climate change. It may involve additional costs to operate and maintain our equipment and facilities, install emission controls, or pay taxes and fees relating to GHG emissions, which could have a material adverse effect on our business, results of operations, and financial condition.
Material Risks Related to Chile and Other Global Risks
Fluctuations in the Chilean economy, economic interventionist measures by governmental authorities, political and financial events, or other crises in Chile and other countries may affect our results of operations, financial condition, liquidity, and the value of our securities.
All our operations are in Chile. Accordingly, our consolidated revenues may be affected by the performance of the Chilean economy. We are exposed to political volatility and social unrest in Chile due to the challenges arising from changes in economic conditions, regulatory policies, and laws governing foreign trade, manufacturing, development, investments, and taxation. For example, in October 2024, the Chilean government enacted fiscal reforms focused on modernizing tax administration, combating tax crimes and evasion, regularizing tax debts, and strengthening institutions, without increasing individual or corporate taxes. Upcoming general and presidential elections in November 2025, may create heightened uncertainty regarding future monetary, fiscal, tax, social and other policies in Chile.
Future adverse developments in Chile, including political events, financial or other crises, and changes to policies regarding foreign exchange controls, regulations, and taxation may impair our ability to execute our business plan and could adversely affect our growth, results of operations, and financial condition.
18
Economic and market conditions in Chilean financial and capital markets may be affected by international events, which could unfavorably affect the value of our securities and our ability to access the capital markets.
Political events or financial or other crises in any region worldwide can significantly impact Chile and may unfavorably affect our operations and liquidity.
Chile is vulnerable to external shocks that could cause significant economic difficulties and affect growth. If Chile experiences lower than expected economic growth or a recession, it is likely that consumer demand for electricity will decrease and that some of our customers may have difficulties paying their electric bills, possibly increasing our uncollectible accounts. Any of these situations could adversely affect our results of operations and financial condition.
Financial and political events in other parts of the world could also negatively affect our business. Export trade is important to the Chilean economy. The new presidential administration in the United States has made a number of policy changes to trade, foreign relations, governmental regulation, immigration, and other matters that differ significantly from those of the prior administration, which could have material effects on the global political and economic landscape. The current administration is undertaking changes to tariffs on imports of most goods to the United States. These tariffs have led and could lead to further retaliatory actions by other countries, which could impact foreign trade globally. Protectionist developments, or the perception they may occur, may have a material adverse effect on global economic conditions, and may significantly reduce global trade.
We are unable to predict how governmental policy in the United States, China, and other trading partners, or the outbreak of a trade war, may continue to impact global economic conditions. If the scope or amount of the tariffs is further expanded or increased, global economic conditions could be impacted, which may have a material adverse effect on our business, financial condition, and results of operations.
Also, instability in the Middle East or any other major oil-producing region could result in higher fuel prices worldwide, which would increase the operating costs for our thermal generation power plants and unfavorably affect our results of operations and financial condition. An international financial crisis and its disruptive effects on the financial industry could adversely affect our ability to obtain new bank financings under the same historical terms and conditions that we have benefited from to date.
Political events or financial or other crises could also diminish our ability to access capital markets in Chile and international capital markets as sources of liquidity or increase interest rates available to us. Reduced liquidity could negatively affect our capital expenditures, long-term investments and acquisitions, growth prospects, and dividend payout policy.
We may be subject to the effects of armed conflicts in other countries.
Global markets have been and may continue to be subjected to periods of economic uncertainty, volatility, and disruption due to armed conflicts around the world, including the current conflicts in Ukraine and the Middle East, such as in Gaza and between Israel and Iran. In addition to economic sanctions, such as those imposed on Russia and certain Russian citizens and enterprises, armed conflicts could have a negative effect on the global economy and are highly uncertain and difficult to predict. President Trump has recently made several statements signaling a shift from the previous administration approach to U.S. foreign policy regarding Ukraine, NATO and Gaza, which could have material effects on the global political and economic landscape. Although we do not have direct business transactions with suppliers, clients, or lenders from Russia or Ukraine, our business, results of operations, and financial condition may be impacted by (i) limited access to financial markets; (ii) possible interruptions in the global supply chain; (iii) volatility in commodity prices; and (iv) an increase in inflationary pressures in Chile, which could increase the rates charged to our customers.
Our operations and financial results could be adversely impacted by the effects of worldwide or regional health crises, epidemics or pandemics.
A global or regional health crisis, epidemic or pandemic, or a similar outbreak in a region where we or our key partners, customers, or suppliers operate, could disrupt our business.
19
The extent of the disruption would depend on various factors, including but not limited to, the duration and severity of the outbreak, government-imposed restrictions on businesses and individuals, changes in demand for our products and services, supply chain disruptions, and the health and safety of our employees and the communities in which we operate. For instance, the measures instituted by the Chilean government during the Covid-19 pandemic temporarily disrupted our business and operations, decreased the electricity demand, destabilized financial markets, negatively affected the global supply chain, and compromised our ability to generate income.
The potential impact of any future health crisis, epidemic or pandemic, and the measures governments and businesses may take to control such outbreaks, cannot be predicted and are beyond our control, and it is possible that any such future outbreak could adversely affect our business and results of operations.
Foreign exchange risks may unfavorably affect our results and the U.S. dollar value of dividends payable to ADS holders.
Until December 31, 2024, our functional currency was the Chilean peso, which has been subject to devaluations and appreciations against the U.S. dollar. Effective January 1, 2025, our functional currency is the U.S. dollar.
Because all our operations are in Chile, our operating subsidiaries generate revenues in Chilean pesos, and we pay our dividends in Chilean pesos. Although a substantial amount of our consolidated indebtedness and operating cash flows are linked to the U.S. dollar, we are exposed to fluctuations in the Chilean peso against the U.S. dollar because of time lags and other limitations to pegging our tariff rates to the U.S. dollar. For information on the change to our functional currency, see “Item 5. Operating and Financial Review and Prospects — A. Operating Results — 1. Discussion of Main Factors Affecting Operating Results and Financial Condition of the Company,” and Note 41.i of the Notes to our consolidated financial statements. This exposure can substantially decrease the value of the cash we generate in U.S. dollars due to the peso’s devaluation. Future volatility in the currency exchange rate in which we receive revenues or incur expenditures may adversely affect our business, results of operations, and financial condition.
Material Risks Related to Ownership of Our Shares and ADSs
Our controlling shareholder may influence us and may have a strategic view for our development that differs from that of our minority shareholders.
Enel, our controlling shareholder, owns a beneficial interest of 64.93% of our share capital as of the date of this Report. Under Law No. 18,046 (the “Chilean Corporations Law”), Enel has the power to determine the outcome of all material matters that require a simple majority of shareholders’ votes, such as the election of most of the seats on our board, and, subject to contractual and legal restrictions, the adoption of our dividend policy. Enel also exercises significant influence over our business strategy and operations. However, in some cases, its interests may differ from those of our minority shareholders. Certain conflicts of interest affecting Enel in these matters may be resolved in a manner that is different from the interests of our company or our minority shareholders.
The relative illiquidity and volatility of the Chilean securities markets could unfavorably affect the price of our common stock and ADSs.
Chilean securities markets are substantially smaller and have less liquidity than major securities markets in the United States and other developed countries. The low liquidity of the Chilean markets may impair shareholders’ ability to sell shares, or holders of ADSs to sell shares of our common stock withdrawn from the ADS program, on the Chilean Stock Exchanges in the amount and at the desired price and time.
Lawsuits against us brought outside of Chile, or complaints against us based on foreign legal concepts, may be unsuccessful.
All our operations are located outside of the United States. All our directors and officers reside outside of the United States, and substantially all their assets are located outside the United States. If investors were to bring a lawsuit against our directors and officers in the United States, it may be difficult for them to effect service of legal process within the United States upon these persons.
20
It may also be difficult to enforce judgments obtained in the U.S. courts based on civil liability provisions of U.S. federal securities laws against them in U.S. or Chilean courts. There is also doubt about whether an action could be brought successfully in Chile for liability based solely on the civil liability provisions of U.S. federal securities laws.
General Risk Factors
Our electricity business is subject to risks arising from extreme weather events related to climate change, natural disasters, catastrophic accidents, and acts of vandalism or terrorism, which could unfavorably affect our operations, earnings, and cash flow.
Our primary facilities include power plants and distribution assets that are exposed to damage from the increased severity and frequency of extreme weather events related to climate change, catastrophic accidents, natural disasters, and human causes, such as vandalism, protests, riots, and terrorism. A catastrophic event could cause prolonged unavailability of our assets, disruptions in our business, significant decreases in revenues due to lower demand, or significant additional costs not covered by our business interruption insurance and could require us to incur unplanned capital expenditures. There may be lags between a significant accident or catastrophic event and the final reimbursement from our insurance policies, which typically carry a deductible and are subject to per-event policy maximum amounts.
Any natural or human catastrophic disruption to our electricity assets in Chile could significantly affect our business, results of operations, and financial condition.
We are subject to financing risks, such as those associated with funding our new projects and capital expenditures or refinancing existing obligations.
A significant portion of our financial indebtedness is subject to (i) financial covenants, (ii) affirmative and negative covenants, (iii) events of default, (iv) mandatory prepayments for contractual breaches, (v) change of control clauses for material mergers and divestments, (vi) bankruptcy and insolvency proceeding covenants, and (vii) cross-default provisions, which have varying definitions, criteria, materiality thresholds, and applicability concerning subsidiaries that could result in a cross-default event. Our debt may also become immediately due and payable in cases involving bankruptcy or insolvency proceedings of a significant or material subsidiary.
The market conditions prevailing at any time may prevent us from accessing capital markets or satisfying our financial needs to fund new projects. We may also be unable to raise the funds required to finish our projects under development or construction. Likewise, we may be unable to refinance our debt or obtain such refinancing in terms acceptable to us. Without such refinancing, we could be forced to liquidate assets at unfavorable prices to make payments due on our debt. Furthermore, we may be unable to sell our assets at opportune moments or sufficiently high prices to obtain proceeds that would enable us to make such payments.
Our inability to finance new projects or capital expenditures, refinance our existing debt, or comply with our covenants could negatively affect our business, results of operations, and financial condition.
Regulatory authorities may impose fines, penalties, or sanctions on our subsidiaries due to operational failures or any breach of regulations.
Our electricity businesses may be subject to regulatory sanctions for any breach of current regulations, including failures to supply energy. Local regulatory entities supervise our generation subsidiaries. We may be subject to fines, penalties, or sanctions when the regulator determines that the company is responsible for the operational failures that affect the system’s regular energy supply, including coordination issues. Regulations establish a compensation fee to end customers when energy is interrupted more than the standard allowed time due to events or failures affecting transmission facilities. Please see Note 38 of the Notes to our consolidated financial statements for further information on sanctions.
21
We are involved in litigation proceedings.
We are involved in various litigation proceedings, including lawsuits and arbitrations, that could result in unfavorable decisions or financial penalties against us. Given the difficulty of predicting the outcome of legal matters, we have no certainty about the most likely outcome of these proceedings, or the eventual fines or penalties related to each litigation. Although we intend to defend our positions vigorously, our defense of these litigation proceedings may not be successful, and responding to such lawsuits and arbitrations diverts resources and our management’s attention from day-to-day operations.
Our financial condition or results of operations could be unfavorably affected if we are unsuccessful in defending these litigations or other lawsuits and legal proceedings against us. Please see Note 36.3 of the Notes to our consolidated financial statements for further information on our litigation proceedings.
E. Climate Change
General
Climate change is a principal challenge of the 21st century, and we are actively contributing to drive the global energy transition towards zero emissions with actions and strategies aligned with the most ambitious objectives at national and international levels. Our aim is to reduce our vulnerability to the physical impacts of climate change by improving our adaptability while reducing carbon emissions through innovative technologies and processes.
Climate change mitigation and adaptation is part of our strategy and is integrated into our existing processes, which allows us to assess climate-related risks and opportunities, thus helping us become more resilient and flexible, as well as improving our capital allocation. An integrated process allows us to assess the impacts of climate change on our businesses and make appropriate adjustments to other areas of risk, such as operational or financial risks.
Our strategy for managing climate change has been developed in line with the recommendations of the Task Force on Climate-related Financial Disclosures (“TCFD”) of the Financial Stability Board which were incorporated by the International Sustainability Standards Board (ISSB). A Group policy has been adopted to provide guidelines for managing risks and opportunities related to climate change. Additionally, appropriate policies and procedures have been established for specific areas.
Identifying and Managing Risks
Climate change risk management affects various business units and processes across the Company, which implies risks and opportunities related to the management of our assets and delivery of services offered to our customers. Risks related to climate change cut across several risk categories classified and defined by the Company, each requiring appropriate metrics and analysis to measure and mitigate its effects, as well as to seize its opportunities.
Climate change produces phenomena that affect our business in the short-, medium-, or long-term, which we classify as:
| ● | Physical acute phenomena, namely short-lived but intense phenomena, such as flooding, hurricanes etc. with potential impacts on assets (e.g., physical losses and business interruptions). |
| ● | Physical chronic phenomena related to structural changes in the climate, such as the rising trend in temperatures, rising sea levels etc., which may cause persistent changes in the output of generation plants and in electricity consumption profiles in the residential and commercial sectors. |
| ● | Transition phenomena, which describes how energy production and consumption can evolve in a specific geopolitical, macroeconomic, regulatory, and competitive context consistent with the available technological options. |
We conduct impact assessment using a methodology related to the specific phenomena assessed, allowing for quantitative impact evaluation at the operational, economic, or financial level. The methodology used to assess the physical acute phenomena considers an event probability defined by scenarios.
22
To connect scenarios to impacts, two elements are considered: (1) vulnerability (the value lost upon the occurrence of a given catastrophic event for each location and asset) and (2) exposure (the economic value that could be materially impacted).
To assess physical chronic phenomena, climate scenario metrics (e.g., increase in temperature, increase in rain precipitation, etc.) are applied to calculate the change in relevant indicators such as production and demand. Assessing physical impacts requires establishing links between climate variables and the business risks and opportunities. These links enable a quantitative assessment of effects on our business related to a selected climate phenomenon expected in the future.
Similarly, to assess the impact of transition phenomena, internal models weigh the effects of changes in selected variables with the greatest impact on the Company (e.g., price of electricity, power demand, commodity prices, local or global policies, increase in competition, etc.).
The results of the impact assessment are used across all levels and units in the Company and thoroughly integrated into processes and strategic planning. Strategic planning activities consider the consequences of climate change and define events and related risks and opportunities relevant to the Company. These activities also determine how short-, medium-, and long-term scenarios affect our assets and services. Analyzing climate change provides insight and information for direct investments to improve the development and operation and management of the current assets.
Effects of Risks on Business and Strategy
We use scenarios in the planning, capital allocation, strategic positioning, risk assessment and strategic resilience processes. With the use of scenarios, we can model alternatives considering assumptions such as the achievement of the objectives defined in the 2015 Paris Agreement on Climate Change (the “Paris Agreement”). A forecasting approach that provides projections based on past behavior does not allow us to anticipate changes or incorporate assessments of risks or uncertainties. Conversely, the use of scenarios offers us greater flexibility and allows us to prepare for risks and opportunities. As part of the process of defining our scenarios, we have identified and analyzed in depth the medium- and long-term trends, as well as their expected impacts on our industry. This analysis is the basis for defining our actions to anticipate and adapt to changes and developments, as well as take advantage of opportunities in our businesses.
We analyze the different scenarios published by external bodies and organizations in order to compare the results in terms of energy mix, emissions trends, and technological options, and identify the main drivers of the energy transition for each of them. These scenarios are grouped by global and local contexts. We analyze reports, data, and scenarios supported by a constant dialogue with the analysts of the main scenario providers.
Global energy scenarios are typically classified according to the level of climate ambition:
| ● | Business as usual/ Stated policies: energy scenario based on current policies that provides a conservative reference point for the future, representing the evolution of the energy system in the absence of additional climate and energy policies. These scenarios currently fail to achieve the goals of the Paris Agreement. |
| ● | Paris Aligned: energy scenario aligned to the Paris Agreement that includes a goal of limiting the increase in global average temperature to “well below 2°C” compared to pre-industrial levels. To achieve this objective, the scenarios consider new and more ambitious policies for the electrification of end uses and for the development of renewable energies. |
| ● | Paris Ambitious: global energy scenario that maps out a path to net zero emissions by 2050, in line with the most ambitious goal of the Paris Agreement: the stabilization of the increase in global average temperature within 1.5°C, albeit with different probability intervals. |
We collect the key metrics of the energy system, including, for example: primary energy, total and sectoral final energy, electrical capacity by technology, electricity generation by technology, hydrogen production, electric vehicle fleet, etc. The data analysis gives each provider an understanding of the key elements of the Business-as-usual/Stated-policies scenarios and leads to the identification of the drivers for accelerating the energy transition in the Paris-Aligned and Paris-Ambitious scenarios.
23
The main assumptions considered in developing our energy transition scenarios concern the macroeconomic and energy context, local policies and regulatory measures, the evolution, costs and adoption of energy production, and conversion and consumption technologies.
With regard to full achievement of the Paris Agreement objectives (i.e., to stabilize global average temperatures to within +1.5 °C), there are uncertainties that a number of countries could remain on Business-as-usual trajectories and not adopt effective measures to reduce their emissions in a timely manner, thereby slowing the decarbonization process towards net zero emissions by 2050.
Nevertheless, we operate a business model with strategic guidelines that are in line with the maximum ambition of the objectives of the Paris Agreement. To mitigate climate change risks, we have set a goal for 2040 to achieve zero direct emissions (Scope 1), with fully renewable electricity generation. We continue to monitor the financial and operational feasibility of taking actions to further reduce our GHG emissions.
For further information regarding the effects of related risks on our strategy, business model, and outlook, please see “Item 3. Key Information — D. Risk Factors.”
Transition Plan
We are committed to transforming our energy matrix to achieve 100% renewable energy generation with zero direct GHG emissions by 2040. To achieve zero emissions, we are focusing on the following areas:
| ● | Closure of coal-fired power plants: We closed the Tarapacá plant (158 MW) in December 2019, the Bocamina I plant (128 MW) in December 2020, and the Bocamina II plant (350 MW) in September 2022. |
| ● | Focus on renewable energy: We expect to add approximately 600 MW of net installed capacity from renewable energy sources by 2027, increasing to 79% our net installed capacity from renewable sources, including solar, hydroelectric, wind, and battery storage technology. The capital expenditure to develop these renewable energy plants between 2025 and 2027 is expected to be US$1.8 billion. |
| ● | Innovation and new technologies: Coal phase-out and poor hydrology conditions affect spot prices. Thus, diversifying generation technologies and geography promotes a resilient strategy. In 2022 we developed the first project for green hydrogen production, several distributed generation projects, and we are currently adopting several battery energy storage systems (“BESS”) in our existing power plants. We are also exploring wave energy through our MERIC Open Sea Lab pilot project. |
| ● | Electrification: It is essential to our goal of zero emissions that we help consumers achieve and manage their emissions. To that end, our affiliate, Enel X Chile, has implemented e-home services (assistance services, air conditioning, and photovoltaic (PV) panels) and heating replacement to retail customers; PV and demand response solutions to commercial and industrial sector; and public lighting, and public charging points, and e-buses solutions to the Chilean government as e-mobility solutions. |
| ● | Sustainable financing: To promote a sustainable business model, we have entered into sustainability-linked credit agreements financing contracts that link the interest rate to the reduction of our direct GHG emissions (Scope 1) targets. |
In March 2024, the review process of Enel Chile’s GHG emissions related to Scope 1 electricity generation was completed and measured at 128 gCO2eq/kWh, an amount higher than the Scope 1 emissions target announced in 2020 of less than 100 gCO2eq/kWh by the end of 2023. The same Scope 1 emissions target is used in some of the Enel Group’s debt instruments. Failure to reach the emissions target increased the interest rate payable on our SDG-linked financing contracts that include said target by 5 basis points. The outstanding amount of these SDG-linked financing contracts was US$300 million as of December 31, 2024.
24
In March 2025, the review process of Enel Chile’s GHG emissions related to Scope 1 electricity generation was completed and measured at 94 gCO2eq/kWh, an amount higher than the Scope 1 emissions target announced in 2021 of less than 90 gCO2eq/kWh by the end of 2024. As of June 2025, failure to reach the emissions target will increase the interest rate payable on our SDG-linked financing contract that includes said target by 5 basis points. The outstanding amount of this SDG-linked financing contract was US$150 million as of December 31, 2024.
The following table sets forth our direct (Scope 1) GHG emissions for the year ended December 31 for the following periods:
|
|
Year ended December 31, |
||||
Greenhouse Gas (GHG) Emissions |
|
2024 |
|
2023 |
|
2022 |
|
|
in millions of tons of CO2 eq. |
||||
Total direct emissions (Scope 1) |
|
2.38 |
|
3.13 |
|
4.85 |
We operate a business model aligned with the goal of not exceeding a temperature increase of 1.5°C compared to pre-industrial levels. To achieve this and our zero emissions goals, we have closed all our coal-fired power plants as of 2022, and our target is to close all our natural gas plants by 2040. We do not rely on carbon-removal technologies to achieve the target. Furthermore, since 2012, we have made systematic continuous investments in renewable energy that allow us to set our own targets to achieve zero emissions by 2040.
Item 4. Information on the Company
| A. | History and Development of the Company. |
We are a publicly held limited liability stock corporation organized on March 1, 2016, under the laws of the Republic of Chile. Since April 2016, we have been registered in Santiago with the CMF. We are also registered with the SEC under the commission file number 001-37723. Our full legal name is Enel Chile S.A., and we are also known commercially as “Enel Chile.” As of December 31, 2024, Enel beneficially owned 64.93% of our shares. Our shares are listed and traded on the Chilean Stock Exchanges under the trading symbol “ENELCHILE,” and our ADSs are listed and traded on the NYSE under the trading symbol “ENIC.”
Our contact information for the Investor Relations Department in Chile is:
Contact Person: |
Isabela Klemes |
Street Address: |
Roger de Flor 2725, Torre 2, Piso 17 Las Condes, Santiago Chile |
Email: |
ir.enelchile@enel.com |
Telephone: |
(56-2) 2630-9000 |
Website: |
www.enelchile.cl |
The information contained on or linked from our website is not included as part of, or incorporated by reference into, this Report. The SEC maintains a website that contains reports, proxy and information statements, and other information regarding issuers that file electronically with the SEC, such as our company, at www.sec.gov.
The Chilean electric utility sector was reorganized in the 1980s under the Chilean Electricity Law, known as Decree with Force of Law No. 1 of 1982 (“DFL1”). In August 1988, Compañía Chilena Metropolitana de Distribución Eléctrica S.A., our predecessor company, changed its name to Enersis S.A. (“Enersis”) and became the new parent company of Distribuidora Chilectra Metropolitana S.A., later renamed Chilectra S.A. (“Chilectra”). In the 1990s, Enersis diversified into electricity generation through increasing equity stakes in Endesa Chile S.A. (“Endesa Chile”).
Enel Chile was created as part of the corporate reorganization process of Enersis that began in April 2015. At the time, Enersis controlled the generation, transmission, and distribution businesses in Chile and in four other countries in the region (Argentina, Brazil, Colombia, and Peru). In December 2015, Enersis’ shareholders approved the first phase of the reorganization plan, which created Enersis Chile as the only vehicle to control the Enel Group’s generation and distribution assets in Chile.
25
Enersis was renamed Enersis Américas and became the vehicle to control all assets of the businesses in other countries in the region. Endesa Chile and Chilectra went through a similar division process to create Endesa Américas and Chilectra Américas.
In September 2016, during the second phase of the plan, Enersis Américas absorbed Endesa Américas and Chilectra Américas and was renamed Enel Américas through the merger.
In October 2016, Enersis Chile, Endesa Chile, and Chilectra changed their names to Enel Chile, Enel Generación Chile, and Enel Distribución Chile, respectively.
Since the merger, Enel Chile’s electricity generation business has been held through its subsidiary Enel Generación Chile, and until 2021 its distribution and transmission business had been operated through its subsidiary Enel Distribución Chile, which operates a 2,105 km2 concession area granted by the Chilean government, for an unlimited duration, to transmit and distribute electricity throughout 33 municipalities in the Santiago Metropolitan Region, including the areas serviced by Enel Colina. The concession area is regarded as a densely populated area in terms of tariff regulation, making the Company the largest electricity commercialization company in Chile.
In August 2017, a corporate reorganization of Enel Chile was proposed, which would involve the merger of Enel Green Power Latin America S.A. with and into Enel Chile and a public tender offer (“PTO”) for 100% of the shares of Enel Generación Chile. The merger was approved in December 2017.
On April 2, 2018, Enel Green Power Latin America merged with and into Enel Chile, and Enel Chile’s shareholding in Enel Generación Chile increased to 93.55%. This transaction added 1,189 MW of installed capacity in non-conventional renewable energy (NCRE), mainly wind and solar technology.
In September 2018, Enel Chile announced the creation of a new subsidiary named Enel X Chile to develop, implement, and sell products and services related to energy that involve innovation, cutting-edge technology, future trends, and ancillary services, but that are not an electricity distribution concession service or considered ancillary to electricity distribution, either regulated or not.
In accordance with the Distribution Short Law approved in late 2019, establishing a “Sole Business” for electricity distribution companies in Chile, Enel Distribución Chile separated its operations into two separate and independent business lines: electricity distribution and electricity transmission. This new structure allowed Enel Distribución Chile to focus exclusively on the regulated electricity distribution business in its concession area and have the new company that resulted from the division, Enel Transmisión Chile, hold the assets and operation of the transmission business as of January 1, 2021, including the operations of the subsidiary Empresa de Transmisión de Chena S.A. Later, as part of the Company’s plan to simplify its corporate structure, on November 1, 2021, Empresa de Transmisión de Chena S.A. merged with its parent company, with Enel Transmisión Chile as the surviving entity.
On December 9, 2022, Enel Chile completed the sale of its entire 99.09% ownership interest in Enel Transmisión Chile to Sociedad Transmisora Metropolitana S.p.A., (a company controlled by Inversiones Saesa Ltda.). The transaction was carried out through a PTO that took place from November 7, 2022, to December 6, 2022.
On January 1, 2023, EGP Chile completed a spin-off of assets and liabilities associated with the solar plants Carrera Pinto, Pampa Solar Norte, Diego de Almagro, and Domeyko, which were allocated to a new company called Arcadia Generación Solar S.A. (“Arcadia”). All shareholders of EGP Chile received a number of shares of Arcadia equal to the number of shares they held in EGP Chile. As a result, Enel Chile became the owner of 99.99% of Arcadia.
On October 24, 2023, Enel Chile completed the sale of its entire 99.99% ownership interest in Arcadia to Sonnedix Chile Arcadia S.p.A. and Sonnedix Chile Arcadia Generación S.p.A.
26
Capital Investments, Capital Expenditures, and Divestitures
We coordinate our overall financing strategy, including the terms and conditions of loans and intercompany advances entered into by our subsidiaries, to optimize debt and liquidity management. Our capital expenditures are financed by internally generated funds or direct financings. Our goal is to focus on investments that will provide long-term benefits. Although we have considered how these investments will be financed as part of our budget process, we have not committed to any particular financing structure, and investments will depend on the prevailing market conditions when cash flows are needed.
For the 2025-2027 period, we expect to make capital expenditures of Ch$1.8 trillion in our subsidiaries (US$1.8 billion, calculated based on the Observed Exchange Rate as of December 31, 2024), related to managing and optimizing our distribution network, new client connections, increasing battery storage capacity, developing renewable generation plants, maintenance of current projects and assets, and studies required to develop other potential generation and distribution projects. While our planned investments go beyond the 2025-2027 period, we report three years to align with Enel’s three-year industrial plan disclosed in November 2024. Please refer to “Item 4. Information on the Company — D. Property, Plant and Equipment — Project Investments” for further information.
The table below sets forth the cash flows used to purchase property, plant and equipment and intangible assets in 2024, 2023, and 2022:
|
|
Year ended December 31, |
||||
|
|
2024 |
|
2023 |
|
2022 |
|
|
(in millions of Ch$) |
||||
Cash flows used |
|
722,354 |
|
662,424 |
|
937,561 |
Capital Expenditures in 2024, 2023, and 2022
In the last three years, our capital expenditures were principally related to the development of solar projects, PMGD projects, Los Cóndores hydroelectric power plant, wind farms, maintenance of our existing power plants, and projects to facilitate new client connections and optimize our distribution network through digitalization.
During 2024, our investments in the distribution business focused on facilitating new customer connections through low- and medium-voltage networks, reinforcing service quality, increasing the capacity of our substations, and automating our systems through the installation of remote control devices and smart meters for residential customers.
During 2024, our generation business investments focused primarily on (i) solar projects; (ii) hydroelectric projects; and (iii) BESS. Please see “Item 4. Information on the Company — D. Property, Plant and Equipment — Project Investments” for further details on our projects.
We reserve a portion of our capital expenditures for maintenance and the assurance of our facilities’ quality and operational standards. Projects in progress will be financed with resources provided by external financing and internally generated funds.
| B. | Business Overview. |
We are a publicly held limited liability stock corporation engaged in the generation and distribution of electricity in Chile through our subsidiaries and affiliates. As of December 31, 2024, we had 8,869 MW of net installed capacity and approximately 2.2 million distribution customers. Of our total net installed capacity, 78% corresponds to renewable energies and BESS, including 3,665 MW of hydroelectric power plants, 903 MW of wind farms, 2,050 MW of solar plants, 83 MW of geothermal capacity, and 203 MW from BESS. All our thermoelectric net installed capacity corresponds to gas/diesel power plants (1,965 MW). As of and for the year ended December 31, 2024, we had consolidated assets amounting to Ch$12.6 trillion and operating revenues of Ch$4.0 trillion.
27
We also participate in other activities that are not core businesses and represent approximately 1% of our 2024 revenues. We do not report them as a separate segment in this Report or in our consolidated financial statements.
The table below presents our revenues:
|
|
Year ended December 31, |
||||||
Revenues |
|
2024 |
|
2023 |
|
2022 |
|
Change 2024 vs. 2023 |
|
|
(in millions of Ch$) |
|
(in %) |
||||
Generation |
|
2,784,385 |
|
3,276,387 |
|
3,877,759 |
|
(15.0) |
Distribution |
|
1,641,410 |
|
1,511,619 |
|
1,454,722 |
|
8.6 |
Non-electricity business and consolidation adjustments |
|
(438,660) |
|
(407,760) |
|
(376,049) |
|
(7.6) |
Total revenues and other operating income |
|
3,987,135 |
|
4,380,246 |
|
4,956,432 |
|
(9.0) |
For further financial information related to our revenues, see “Item 5. Operating and Financial Review and Prospects — A. Operating Results” and Note 28 of the Notes to our consolidated financial statements.
Electricity Generation Segment
In 2024, our consolidated electricity sales were 35,974 GWh, and our electricity production was 24,639 GWh, representing a 9.5% increase and 2.1% increase, respectively, compared to 2023. Our total net installed capacity in 2024 was 8,869 MW, representing a 4.6% increase compared to 2023, due to BESS projects that reached commercial operation and Los Cóndores hydroelectric power plant that was connected to the grid in 2024.
For additional information on our historical capacity, see “Item 4. Information on the Company — D. Property, Plant and Equipment.”
The following tables summarize the operating data relating to our electricity generation:
ELECTRICITY DATA
|
|
Year ended December 31, |
||||
|
|
2024 |
|
2023 |
|
2022 |
Number of generation facilities(1) |
|
70 |
|
67 |
|
61 |
Net installed capacity (MW)(2) |
|
8,869 |
|
8,478 |
|
8,408 |
Electricity generation (GWh) |
|
24,639 |
|
24,122 |
|
22,215 |
Electricity sales (GWh) |
|
35,974 |
|
32,847 |
|
32,120 |
| (1) | For details on generation facilities, see “Item 4. Information on the Company — D. Property, Plant and Equipment — Property, Plant and, Equipment of Generation Companies.” |
| (2) | Total net installed capacity is the maximum capacity (MW) under specific technical conditions and characteristics and excludes the MW that each facility consumes for its own operation. In most cases, installed capacity is confirmed by satisfaction guarantee tests performed by equipment suppliers. Figures may differ from installed capacity declared to governmental authorities and customers, according to criteria defined by such authorities and relevant contracts. |
28
The following table contains information regarding our consolidated sales of electricity by type of customer for each of the periods indicated:
ELECTRICITY SALES BY CUSTOMER TYPE (GWh)
|
|
|
|
|
|
|
|
|
|
|
|
|
|
|
Year ended December 31, |
||||||||||
|
|
2024 |
|
2023 |
|
2022 |
||||||
|
|
Sales |
|
% of Sales |
|
Sales |
|
% of Sales |
|
Sales |
|
% of Sales |
Regulated customers |
|
13,895 |
|
38.6 |
|
11,848 |
|
36.1 |
|
11,853 |
|
37.0 |
Unregulated customers |
|
19,500 |
|
54.2 |
|
19,024 |
|
57.9 |
|
18,863 |
|
58.7 |
Total contracted sales(1) |
|
33,395 |
|
92.8 |
|
30,872 |
|
94.0 |
|
30,716 |
|
95.6 |
Electricity pool market sales |
|
2,579 |
|
7.2 |
|
1,975 |
|
6.0 |
|
1,404 |
|
4.4 |
Total electricity sales |
|
35,974 |
|
100.0 |
|
32,847 |
|
100.0 |
|
32,120 |
|
100.0 |
| (1) | Includes sales to distribution companies not backed by contracts. |
Dividing sales by customer type in terms of regulated and unregulated customers helps manage and understand the business. We sell electricity to regulated customers, through distribution companies, and to unregulated customers through generation companies. The sales to distribution companies to supply their regulated customers, that is, residential, commercial, or others, are classified as regulated sales and subject to government-regulated electricity tariffs. Generation companies’ sales to unregulated customers are governed by contracts at freely negotiated prices and terms. We sell directly to large commercial and industrial customers and other generators. The sales to generators are classified as unregulated sales and generally governed by contracts with freely negotiated prices and terms. Finally, pool market sales occur either when the National Electricity System (the “SEN” in its Spanish acronym) dispatches generation companies in excess of their contractual obligations and therefore must sell their surplus electricity in the pool market or when the generators’ electricity dispatched is less than their contractual commitments with customers. Therefore, they must purchase the deficit in the pool market. These purchase and sale transactions among electricity generation companies are typically made in the pool market at the spot price and do not require a contractual agreement.
The regulatory framework often requires that electricity distribution companies have contracts to support their commitments to small-volume customers. Chilean regulations also determine which customers can purchase energy directly in the electricity pool market.
Tenders
We routinely participate in energy bids and have been awarded long-term electricity sale contracts that incorporate the expected variable costs considering changes to the most relevant variables. These contracts secure the sale of our current and expected new capacity and allow us to stabilize our income. In 2024, contracts awarded in the November 2017 auction came into effect with an average price of US$32.5 per MWh, which is 31% lower than the average price of the previous tender process.
In November 2017, the outcome of a bidding process for tenders of 2,200 GWh per year to be delivered between 2024 and 2043 was announced. Enel Generación Chile was awarded 54% of the tender, corresponding to 1.2 TWh at an average price of US$34.7 per MWh (US$ as of October 2017) with a mix of wind, solar, and geothermal generation. This price is 6.8% higher than the average awarded price in that tender, which is 100% indexed to the US CPI every six months.
In May 2024, 3,600 GWh, divided into two parts of 1,500 GWh and 2,100 GWh starting in 2027 and 2028, respectively, were tendered to supply electricity to regulated customers for 20 years. Enel Generación Chile was awarded 100% of the energy tendered for an average price of US$56.68 per MWh. The tender includes an incentive for BESS projects lasting more than 4 hours or for generation projects with non-variable renewable energy, a discount corresponding to US$0.15 per MWh will be applied for each GWh of energy generated by such means in the respective Schedule Block A or C (non-solar), with a limit of US$15 per MWh in each block.
29
Energy purchases and transportation costs are the principal variable costs involved in the electricity generation business, in addition to the direct variable cost of generating hydroelectric or thermal electricity, such as fuel costs. Our thermal generation increases during relatively low rainfall periods, typically resulting in higher fuel costs. Under dry conditions, the electricity we have contractually agreed to provide may exceed the electricity we generate, requiring us to purchase electricity in the pool market at spot prices to satisfy our contractual obligations. The cost of these purchases at spot prices may, under certain circumstances, exceed the price at which we sell electricity under contracts and, therefore, may result in a loss. We attempt to minimize the effect of poor hydrological conditions on our operations in any given year by limiting our contractual sales requirements to a quantity that does not exceed our estimated electricity production in a dry year. To determine the estimated production in a dry year, we consider the available statistical information concerning rainfall, mountain snow and ice, and when they are expected to melt, hydrological levels, and critical reservoirs’ capacity.
In addition to limiting contracted sales, we may adopt other strategies, including installing temporary thermal power, negotiating lower consumption levels with unregulated customers, negotiating with other water users, and pass-through cost clauses in contracts with customers. For further details about hydrological conditions and their effects on our business, please refer to “Item 5. Operating and Financial Review and Prospects — A. Operating Results. — 1. Discussion of Main Factors Affecting Operating Results and Financial Condition of the Company — a. Generation and Transmission Business.”
Seasonality
While our core business is subject to weather patterns, only extreme events such as prolonged droughts, rather than seasonal weather variations, may adversely affect our generation capacity and materially affect our operating results and financial condition.
Our generation business is affected by seasonal changes throughout the year. During average hydrological years, snowmelts typically occur during the warmer months of October through March. These snowmelts increase the level of water in our reservoirs. May through August typically have the most precipitation.
When there is more precipitation, hydroelectric generating facilities can accumulate additional water for generation. Our reservoirs’ increased level allows us to generate more electricity with hydroelectric power plants during months when marginal electricity costs are lower.
In general, hydrological conditions such as droughts and insufficient rainfall adversely affect our generation capacity. For example, severe prolonged drought conditions or reduced rainfall levels in Chile caused by the La Niña weather phenomenon reduce water accumulated in reservoirs, thereby curtailing our hydroelectric generation capacity. To mitigate hydrological risk associated with our contractual obligations with our customers, hydroelectric generation may be substituted with thermal sources (natural gas, LNG, or diesel) and energy purchases on the spot market. These actions could result in higher costs.
Operations
We participate in electricity generation through our subsidiaries, EGP Chile, Enel Generación Chile, and Pehuenche. As of December 31, 2024, we had 70 generation power plants in Chile with a total net installed capacity of 8,869 MW, representing 24% of the SEN’s installed capacity in 2024.
Enel Generación Chile owns 14 hydroelectric, six thermal, and two wind-powered power plants, with a total net installed capacity of 4,921 MW. EGP Chile owns 32 solar, nine wind-powered, two hydroelectric, and two geothermal power plants, as well as four BESS, with a total net installed capacity of 3,249 MW. Pehuenche owns three hydroelectric power plants, with a net installed capacity of 699 MW. For information on the net installed generation capacity for each of our subsidiaries, see “Item 4. Information on the Company — D. Property, Plant, and Equipment—Property, Plant, and Equipment of Generating Companies.”
30
The following table sets forth the electricity generation by each of our generation companies:
ELECTRICITY GENERATION BY COMPANY (GWh)
|
|
|
|
|
|
|
|
|
Year ended December 31, |
||||
|
|
2024 |
|
2023 |
|
2022 |
Enel Generación Chile |
|
15,111 |
|
15,391 |
|
15,686 |
EGP Chile(1) |
|
6,325 |
|
6,012 |
|
4,486 |
Pehuenche |
|
3,203 |
|
2,719 |
|
2,043 |
Total |
|
24,639 |
|
24,122 |
|
22,215 |
(1) |
Includes all of EGP Chile’s subsidiaries. |
It is common in the electricity industry to divide the business into hydroelectric, thermoelectric, and other generation types because each has significantly different variable costs. Thermoelectric generation requires fuel purchase, which generally leads to higher variable costs than hydroelectric generation from reservoirs or rivers, which typically has immaterial variable costs. Our total hydroelectric generation (including mini-hydro) accounted for 55.5% of our total generation in 2024, reaching 13,688 GWh, an increase of 12.1% compared to 2023, while our thermal generation accounted for 19.9% of our total generation in 2024, reaching 4,900 GWh, a decrease of 20.9% compared to 2023.
The following table sets forth the electricity generation by type:
ELECTRICITY GENERATION BY TYPE (GWh)
|
|
|
|
|
|
|
|
|
|
|
|
|
|
|
Year ended December 31, |
||||||||||
|
|
2024 |
|
2023 |
|
2022 |
||||||
|
|
Generation |
|
% |
|
Generation |
|
% |
|
Generation |
|
% |
Hydroelectric generation |
|
13,636 |
|
55.3 |
|
12,158 |
|
50.4 |
|
9,731 |
|
43.8 |
Thermal generation |
|
4,900 |
|
19.9 |
|
6,198 |
|
25.7 |
|
8,211 |
|
37.0 |
Wind generation – NCRE |
|
2,161 |
|
8.8 |
|
1,796 |
|
7.4 |
|
1,694 |
|
7.6 |
Mini-hydro generation – NCRE |
|
52 |
|
0.2 |
|
49 |
|
0.2 |
|
37 |
|
0.2 |
Solar generation – NCRE |
|
3,627 |
|
14.7 |
|
3,546 |
|
14.7 |
|
2,160 |
|
9.7 |
Geothermal generation – NCRE |
|
261 |
|
1.1 |
|
374 |
|
1.5 |
|
382 |
|
1.7 |
Total generation |
|
24,639 |
|
100.0 |
|
24,122 |
|
100.0 |
|
22,215 |
|
100.0 |
Water Resource Use Agreements
Water resource use agreements refer to a user’s right to utilize water from a particular source, such as a river, stream, pond, or groundwater. In times of favorable hydrological conditions, water agreements are generally not complicated or contentious. However, with poor hydrological conditions, water agreements protect our right to use water resources for hydroelectric generation. The following agreements allow us to use water more efficiently and avoid additional litigation with the local community and farmers.
We have three current agreements signed with the Chilean Hydraulic Works Directorate (“DOH” in its Spanish acronym). The agreements are related to water consumption from Maule Lagoon and Laja Lake, both located in southcentral Chile in areas where irrigation is more demanding, generally from September to April. Enel Generación Chile signed the agreements regarding the use of water from Maule Lagoon and Laja Lake on September 9, 1947, and October 24, 1958, respectively. On November 16, 2017, Enel Generación Chile signed an agreement to operate and recover water resources from Laja Lake, complementing the 1958 agreement with DOH.
In October 2020, our subsidiary Pehuenche, Colbún S.A., and the Maule Lagoon Vigilance Board-First Section, signed an agreement to optimize the use of water during drought periods. The agreement expires on August 31, 2025, and may be renewed by agreement of the parties.
31
In September 2024, Enel Generación Chile signed an agreement with the Biobío River Basin Vigilance Board to ensure a minimum volume of water in the Ralco reservoir during the 2024/2025 irrigation season, along with making the generation of the Pangue power plant and its reservoir more flexible.
Thermal Generation
Our thermal electricity generation facilities use mostly LNG and, to a lesser extent, diesel. To satisfy our natural gas requirements, we signed a long-term LNG supply contract that establishes maximum quantities and prices. We also have long-term gas transportation agreements with pipeline companies. Our gas-fired efficient power plants can operate using either natural gas or diesel. In particular, San Isidro and Quintero power plants operate using LNG from the Quintero LNG Terminal.
The LNG supply is based on long-term agreements with Mejillones LNG Terminal in northern Chile and Quintero LNG Terminal in central Chile for regasification services, and Shell for supply. Our LNG sale and purchase agreement with Shell is in force through 2030 and is indexed to the Henry Hub/Brent commodity prices. Electrogas S.A. is our current gas transportation provider.
During 2024, Enel Chile, through our subsidiary Enel Generación Chile, used 300 million cubic meters of LNG, which represents a decrease of 41% compared to 2023, mainly due to a greater availability of natural gas from Argentina and lower thermal generation using LNG due to better hydrological conditions.
The availability of natural gas from Argentina allowed us to have an available supply throughout 2024. In 2024, Enel Generación Chile operated utilizing various supply agreements, importing 855 million cubic meters of Argentine natural gas through central Chile, which represented 48% of our total natural gas requirements in Chile (electricity plus supply to customers) and 74% of the total natural gas for generation in central Chile.
During 2024, we continued to actively manage the supply of LNG and natural gas in central Chile by optimizing the supply mix, allowing us to sell LNG at the Quintero LNG Terminal, as well as executing other trading actions. Through the Mejillones LNG Terminal in northern Chile, we supplied the Atacama and Taltal plants and industrial clients with more than 599 million cubic meters of LNG and natural gas.
In 2024, 126 million cubic meters of LNG were delivered by truck, an increase of 11% compared to 2023.
Generation from NCRE Sources
Under Chilean law, electricity generation companies must derive a minimum amount of their electricity sales from NCRE. This minimum amount depends on the date of execution of the sale contract and ranges from zero, for those signed before 2007, to 20% for those signed starting in July 2013. Our Canela wind farms and Ojos de Agua mini-hydroelectric plant, and most of EGP Chile’s power plants (except the Pullinque and Pilamiquén power plants), qualify as NCRE facilities.
Electricity Sales
During 2024, the electricity demand throughout the SEN increased by 2.7% to 80,091 GWh in 2024 from 77,953 GWh in 2023. Our total generation amounted to 24,639 GWh in 2024, which represents 30.8% of the total demand.
The following table sets forth the SEN’s electricity sales:
ELECTRICITY SALES IN THE SEN (GWh)
|
|
|
|
|
|
|
|
|
Year ended December 31, |
||||
|
|
2024 |
|
2023 |
|
2022 |
Total electricity sales (SEN) |
|
80,091 |
|
77,953 |
|
77,044 |
32
Our electricity sales reached 35,974 GWh in 2024, 32,847 GWh in 2023, and 32,120 GWh in 2022, which represented a 44.9%, 42.1%, and 41.7% market share, respectively.
Electricity Generation and Purchases
Energy purchases increased by 29.9% in 2024, compared to 2023.
The following table sets forth our electricity generation and purchases:
ELECTRICITY GENERATION AND PURCHASES (GWh)
|
|
|
|
|
|
|
|
|
|
|
|
|
|
|
Year ended December 31, |
||||||||||
|
|
2024 |
|
2023 |
|
2022 |
||||||
|
|
(GWh) |
|
% |
|
(GWh) |
|
% |
|
(GWh) |
|
% |
Electricity generation |
|
24,639 |
|
68.5 |
|
24,122 |
|
73.4 |
|
22,215 |
|
69.2 |
Electricity purchases |
|
11,335 |
|
31.5 |
|
8,725 |
|
26.6 |
|
9,905 |
|
30.8 |
Total |
|
35,974 |
|
100.0 |
|
32,847 |
|
100.0 |
|
32,120 |
|
100.0 |
Generation Customers
We supply electricity to the major regulated electricity distribution companies, large unregulated industrial firms (primarily in the mining, pulp, and steel sectors), and the pool market. Contracts usually govern commercial relationships with our customers. Supply contracts with distribution companies must be auctioned and are generally standardized with an average term of ten years.
Supply contracts with unregulated customers (large industrial customers) are specific to each customer’s needs, and the conditions are agreed upon by both parties, reflecting competitive market conditions.
For the year ended December 31, 2024, our principal distribution customers were (in alphabetical order): Empresa Eléctrica de Puente Alto, Enel Distribución Chile, Grupo CGE, Grupo Chilquinta, and Grupo SAESA.
Our generation contracts with unregulated customers are generally on a long-term basis and typically range from five to fifteen years. These agreements are usually automatically extended at the end of the applicable term unless terminated by either party upon prior notice. Contracts with unregulated customers may also include specifications regarding power sources and equipment, which may be provided at special rates and provisions for technical assistance to the customer. We have not experienced any supply interruptions under our contracts. If we experience a force majeure event, as defined in the agreement, we can reject purchases and have no obligation to supply electricity to our unregulated customers. Disputes are typically subject to binding arbitration between the parties, with limited exceptions.
For the year ended December 31, 2024, our principal unregulated customers were (in alphabetical order): Anglo American Sur, BHP Billiton, Compañía Minera Doña Inés de Collahuasi SCM, Minera Valle Central, and SCM Minera Lumina Copper Chile.
Electricity generation companies compete mainly on price, technical experience, and reliability. We have lower marginal production costs than companies whose installed capacity is primarily thermal because 41% of our installed capacity connected to the SEN is hydroelectric. Our installed thermal capacity benefits from access to gas from the Quintero LNG Terminal. However, during periods of extended droughts, we may be forced to buy more expensive electricity from thermal generators at spot prices to comply with our contractual obligations.
Electricity Distribution and Networks Segment
Our distribution and networks operations are conducted through Enel Distribución Chile, in which we have a 99.09% economic interest.
33
We distribute electricity in a concession area of 2,105 square kilometers, under an indefinite concession granted by the Chilean government. We distribute electricity in 33 municipalities in the Santiago Metropolitan Region. As of December 31, 2024, we distributed electricity to more than 2.2 million residential, commercial, industrial, and other customers, who are primarily municipalities, representing 39.3%, 14.9%, 4.6%, and 41.2%, respectively, of our total electricity sales of 14,810 GWh, an increase of 3.2% compared to 2023.
The following table sets forth our principal operating data for each of the periods indicated:
|
|
Year ended December 31, |
||||
|
|
2024 |
|
2023 |
|
2022 |
Electricity sales (GWh)(1) |
|
14,810 |
|
14,356 |
|
17,534 |
Residential |
|
5,820 |
|
5,730 |
|
6,309 |
Commercial |
|
2,213 |
|
2,228 |
|
1,986 |
Industrial |
|
675 |
|
410 |
|
144 |
Other customers(2) |
|
6,103 |
|
5,989 |
|
9,095 |
Number of customers (thousands) |
|
2,163 |
|
2,130 |
|
2,080 |
Residential |
|
1,944 |
|
1,913 |
|
1,866 |
Commercial |
|
158 |
|
158 |
|
157 |
Industrial |
|
12 |
|
12 |
|
11 |
Other customers(2) |
|
49 |
|
47 |
|
46 |
Energy purchased (GWh)(1)(2)(3) |
|
15,549 |
|
15,035 |
|
18,243 |
Total energy losses (%)(4) |
|
5.8 |
|
5.3 |
|
5.1 |
SAIDI (minutes)(5) |
|
150 |
|
121 |
|
145 |
SAIFI (times) |
|
1.3 |
|
1.2 |
|
1.3 |
Collection rate(6) |
|
102.0 |
|
98.9 |
|
95.5 |
| (1) | 2022 includes date from Enel Tranmisión Chile until December 9, 2022, when it was sold to Sociedad Transmisora Metropolitana S.p.A. |
| (2) | The data for other customers includes tolls. |
| (3) | In 2024, 2023, and 2022, Enel Distribución Chile acquired 30%, 26%, and 23%, respectively, of its electricity purchases from Enel Generación Chile. |
| (4) | Energy losses are calculated as the percent difference between the energy purchased and energy sold, excluding tolls and energy consumption not billed (GWh) within a given period. Losses in distribution arise from illegally tapped lines and technical losses. |
| (5) | 2024 does not include data related to the extraordinary, devastating, and unpredictable weather event that occurred in August 2024, due to Enel Distribución Chile’s claim pending before the Santiago Court of Appeals regarding the occurrence of a force majeure claim. |
| (6) | The collection rate is seasonally adjusted. It corresponds to the ratio between the amount collected in the last 12 months and the amount of debt invoiced in the same period. It may be greater than 100% due to the collection of unpaid bills from previous periods. |
Tariff Update Process
The tariff decree for the 2020-2024 period was issued in June 2024. The tariffs are retroactively effective from November 4, 2020, and will apply until the tariff decree for the 2024-2028 period is issued and the updated tariffs become effective. The 2024-2028 period tariff update process is ongoing.
Distribution Customers
For the supply to regulated distribution customers, Enel Distribución Chile’s principal suppliers during 2024 were (in alphabetical order): Colbún S.A., Enel Generación Chile, Engie Energía Chile S.A., and GM Holdings.
34
Seasonality
Seasonal changes in energy demand directly influence the distribution business. Although the price at which a distribution company purchases electricity can change seasonally and has an impact on the price at which it is sold to end-users, it does not affect our profitability since the cost of electricity purchased is passed on to end-users through tariffs that are set for multi-year periods. However, in the case of regulated customers, an increase in tariffs due to rate adjustments may not happen immediately, which could affect our profitability in the short term.
ELECTRICITY INDUSTRY STRUCTURE AND REGULATORY FRAMEWORK
| 1. | Overview and Industry Structure |
In the Chilean Electricity Market, there are four categories of local agents: generators, transmitters, distributors, and large customers. The industry’s three business segments—generation, transmission, and distribution—must operate in an interconnected and coordinated manner to supply electricity to final customers at minimum cost and within the standards of quality and security required by the industry’s rules and regulations.
The Chilean electricity sector is physically divided into three main networks: the SEN, which extends from Arica in northern Chile to Chiloé in southern Chile, and two smaller isolated networks (Aysén and Magallanes).
The following chart shows the relationships among the different agents in the Chilean electricity market:
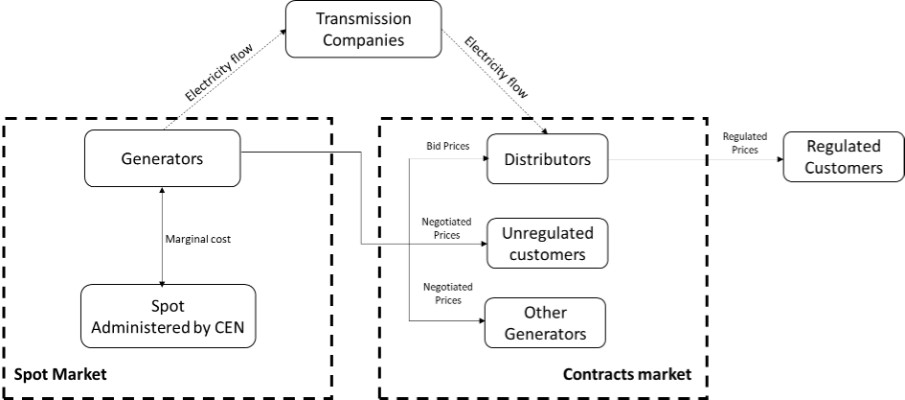
Generation
Generators supply electricity to end customers using lines and substations that belong to transmission and distribution companies. The generation segment operates competitively, and generators may sell their energy to unregulated customers and other generation companies through contracts at freely negotiated prices. They may also sell to distribution companies to supply regulated customers through contracts governed by bids defined by the authorities.
Transmission
Transmission companies own lines and substations with a voltage higher than 23 kV flowing from generators’ production points to the centers of consumption or distribution, charging a regulated toll for the use of their installations. The transmission segment is a natural monopoly subject to special industry regulations, including antitrust legislation. Tariffs are regulated, and access must be open and guaranteed under non-discriminatory conditions.
35
Distribution
Distribution companies supply electricity to end customers using electricity infrastructure lower than 23 kV. The distribution segment is a natural monopoly subject to special industry regulations as well, including antitrust legislation. The electricity network is open access, and distribution tariffs are regulated. Distribution companies must provide electricity to regulated customers within their concession area at regulated prices. According to Law No. 21,194 (the “Distribution Short Law”), distribution companies may not enter into new electricity supply contracts with unregulated customers as of 2021.
Concessions
Hydroelectric generation requires a concession granted by the authorities to operate for an indefinite time; however, other types of technologies for generating electricity do not require concessions. The Chilean Ministry of Energy grants distribution concessions for undefined periods and the right to use public areas for building distribution lines. Distribution companies must supply electricity to all customers who request service within their concession area. A concession may be declared expired if the quality of service does not meet specific minimum standards established by the regulator.
Customers
Customers are classified according to their demand as regulated or unregulated. Regulated customers are those with a connected capacity of up to 5,000 kW. Unregulated customers are those with a connected capacity of more than 5,000 kW. However, customers with a connected capacity between 300 kW and 5,000 kW may choose to be regulated or unregulated, subject to the respective price regime, but must remain in the selected category for at least four years.
Limits on Integration and Concentration
The antitrust legislation established in Decree with the Force of Law (Decreto con Fuerza de Ley) (“DFL”) 211 (modified in 2016 by Law No. 20,945) and the regulations applicable to the electricity industry stated in DFL 4 (“Electricity Law”) and Law No. 20,018 (Ley General de Servicios Eléctricos) have established the criteria to avoid economic concentration and abusive market practices in Chile. Companies can participate in different market segments (generation, distribution, transmission) to the extent that they are appropriately separated, both from an accounting and corporate perspective. Companies must also comply with the conditions provided in Resolution No. 667/2002 and the Distribution Short Law, discussed below.
The transmission sector is subject to the most significant restrictions, mainly because of its open access requirements. The Electricity Law establishes that companies that own the National Transmission System (“STN” in its Spanish acronym) may not engage in activities within the generation or distribution segment. Owners of the STN must be limited liability stock corporations. Individual interests in the STN by companies operating in another electricity or unregulated customer segment cannot exceed, directly or indirectly, 8% of the total investment value of the STN. Furthermore, the aggregate interest of all such agents in the STN cannot exceed 40% of the total investment value.
According to the Electricity Law, there are no restrictions on market concentration for generation and distribution activities. However, Chilean antitrust authorities have imposed specific measures to increase transparency associated with our subsidiaries and us through Resolution No. 667/2002 issued by the Chilean government antitrust agency, the Tribunal de la Libre Competencia.
Resolution No. 667/2002 states that Enel Chile must keep its generation and distribution segments separate and manage them as independent business units; Enel Chile, Enel Generación Chile, and Enel Distribución Chile are registered with the CMF and must remain subject to the regulatory authority of the CMF and comply with the regulations applicable to publicly held limited liability stock corporations, even if any of these companies should lose such designation. The members of the Boards of Directors of these companies must be elected from different and independent groups, and the external auditors of the companies must be different for local statutory purposes.
36
Electricity Markets
Generation companies may sell to distribution companies, unregulated end customers, or other generation companies through contracts. Generation companies satisfy their contractual sales requirements with dispatched electricity, whether produced by them or purchased from other generation companies in the spot market or through contracts. They balance their contractual obligations with their dispatch by trading deficit and surplus electricity at the spot market price set hourly by the CEN, which is based on the lowest production cost of the last kWh dispatched.
Customers subject to the unregulated price regime may negotiate their electricity supply with any supplier; however, they must pay a regulated toll for using the transmission and distribution network. Regulated customers with residential generation units can sell their surpluses to a distribution company under certain conditions (net billing regulation). Since November 2018, Law No. 21,118 has permitted customers with a connected capacity of up to 300 kW to sell their surpluses on an aggregated or individual basis.
Water Rights
Companies in Chile must pay an annual fee for unused water rights. License fees already paid may be recovered through monthly tax credits, commencing on the project’s start-up date associated with the water rights. The maximum license fees that may be recovered are those paid during the eight years before the start-up date.
| 1. | Electricity Sector Laws |
Since its inception, private sector companies have developed the Chilean electricity industry; however, nationalization by the government was conducted between 1970 and 1973. During the 1980s, the Electricity Law reorganized the sector, allowing for the private sector’s renewed participation. Law No. 20,018 and its modifications currently govern the industry under the Electricity Law, the reformed DFL 4, published in 2006 by the Ministry of Economy, and its respective regulations included in Decreto Supremo (D.S.) No. 327/1998.
Non-Conventional Renewable Energy (“NCRE”) has been promoted in Chile since 2008. NCRE refers to electricity from wind, solar, geothermal, biomass, ocean (movement of tides, waves, currents, and the ocean’s thermal gradient), and mini-hydropower plants with a capacity under 20 MW. Law No. 20,698 (2013) established a mandatory 20% share of NCRE source as a percentage of total contracted electricity sales by 2025, except for contracts signed between 2007 and 2013, which had a 10% target by 2024.
| 2. | Principal Regulatory Authorities |
Responsible for Setting Policy
The Ministry of Energy is the leading regulatory authority in the Chilean energy industry. It promulgates and coordinates plans, policies, and standards for the sector’s proper operation and the development of the industry in Chile.
Responsible for Regulation and Supervisory Body
The CNE is the entity in charge of approving the annual transmission expansion plans, managing the indicative plan for the construction of new electricity generation facilities, calculating the rates of generation capacity, and proposing regulated tariffs to the Ministry of Energy for approval. The Superintendence of Electricity and Fuels (“SEF”) inspects and oversees compliance with laws, rules, regulations, and technical norms applicable to the generation, transmission, and distribution of electricity, as well as liquid fuels and gas, and reports to the Ministry of Energy.
System Operator
Then CEN is a centralized dispatch center that coordinates the SEN’s operations with an approach that minimizes costs while monitoring the quality of the generation and transmission companies’ service. The CEN calculates market balances (energy injections and withdrawals), determines the transfers among generation companies, and calculates the hourly marginal cost, the price at which energy transfers are made in the spot market.
37
The CEN schedules the energy production of each generating company considering their marginal costs, the maximum capacity a generator may supply to the system at certain peak hours, statistical information, accounting for maintenance time, and arid conditions for hydroelectric power plants. However, it does not take into account the power plants’ contribution to the security of the entire system.
| 3. | Remuneration and Tariffs |
Remuneration for Generators
To reduce operating costs, the CEN applies an efficiency criterion in which the lowest cost producer available is usually required to satisfy demand at any given time. As a result, at any specific level of demand, the appropriate supply is provided at the lowest possible production cost, also known as the marginal cost, available in the system. This marginal cost on an hourly basis is the price at which generators trade energy in the spot market, using both their injections (sales) and their withdrawals (purchases) to balance their contracted customer sales with their production determined by the CEN.
Transmission Tariffs
The remuneration of existing national and zonal transmission installations is determined by a tariff-setting process conducted every four years regulated by Law No. 20,936. This process determines the annual transmission value that considers efficient operation and maintenance costs, and a yearly valuation of investments based on a discount rate determined by the authorities every four years (minimum 7% after-tax) and the installations’ useful life.
The regulation currently in force states that transmission remuneration is the sum of tariff revenue and the usage charge revenue received for the transmission system, defined as $/kWh by the CNE. Revenues are calculated on a semi-annual basis. The tariff-setting process for the 2020-2023 period was concluded in February 2023 and has been effective retrospectively since January 1, 2020. In connection with the tariff-setting process for the 2024-2027 period, the CNE published the definitive technical report for the classification of transmission installations. The tariff-setting process for the 2024-2027 period is expected to be completed in 2025.
Distribution Tariffs
The Distribution Short Law established new limits on returns on investments for distribution companies. Tariffs charged by distribution companies to regulated end customers are set every four years. Tariffs are determined by the sum of the cost of electricity purchased by the distribution company, a transmission charge, and the value-added from the distribution of electricity (“VAD”), allowing distribution companies to recover their investment and operating costs, including a legally mandated return on investment. The transmission charge reflects the price paid for electricity transmission and transformation. The law also prohibits distribution companies from operating in other sectors or industries as of 2021.
The VAD is based on a so-called “efficient model company” within a typical distribution area (“TDA”). The CNE determines the VAD of each TDA. With the resulting VAD, preliminary tariffs are tested to ensure an industry aggregate rate of return between 6% and 8%. However, the Distribution Short Law establishes that the after-tax rate of return for each distributor must be between three percentage points below and two percentage points above the rate of return calculated by the CNE. The real return on investment for a distribution company depends on its actual performance relative to the standards chosen by the CNE for the efficient model company. The tariff system allows for a higher return to distribution companies that are more efficient than the model company.
Electricity regulation establishes tariff equality mechanisms for electrical services. Law No. 20,928 states that the maximum tariff that distribution companies may charge residential customers must not exceed the average national tariff by more than 10%. The differences arising from applying this mechanism are progressively absorbed by the remaining customers subject to regulated prices, under the mentioned average, except for those residential users whose monthly average consumption of energy in the prior calendar year is less than or equal to 200 kWh.
38
The tariff decree for the 2020-2024 period was issued in June 2024. The tariffs are retroactively effective from November 4, 2020, and will apply until the tariff decree for the 2024-2028 period is issued and the updated tariffs become effective. The 2024-2028 period tariff update process is ongoing.
| 4. | Environmental Regulations |
Chile has numerous laws, regulations, decrees, and municipal ordinances that address environmental considerations. Among them are regulations relating to waste disposal (including the discharge of liquid industrial wastes), the establishment of industries in areas that may affect public health, and the protection of water for human consumption.
On June 13, 2022, Law No. 21,455 (the “Climate Change Framework Law”) was enacted. The law establishes that Chile be carbon neutral and climate resilient by 2050, which could be moved up if circumstances allow for it. To address climate change, the law establishes concrete actions for 17 executive departments as well as powers and obligations at regional and local levels. It also establishes the Long-Term Climate Strategy, a roadmap detailing how Chile will fulfill its commitments through concrete actions over a 30-year period and requires the preparation of sectoral mitigation and adaptation plans with concrete measures and actions to meet these goals.
For more information about regulatory framework and matters, see Note 4 of the Notes to our consolidated financial statements.
| C. | Organizational Structure. |
Principal Subsidiaries and Affiliates
We are part of an electricity group controlled by Enel S.p.A, an Italian company and our controlling shareholder that beneficially owned 64.93% of our shares as of December 31, 2024. Enel is a multinational power company and a leading integrated player in the global power and renewables markets. It is one of the largest European utility companies with operations in 28 countries worldwide and a consolidated installed capacity of approximately 90 GW, including BESS. Enel distributes electricity through a network of 1.9 million kilometers to 68.5 million customers. It is one of the world’s largest network operators and has one of the most extensive customer bases. Enel’s shares are listed on Euronext Milan organized and managed by Borsa Italiana S.p.A.
39
Enel Chile’s Simplified Organizational Structure(1)
As of December 31, 2024
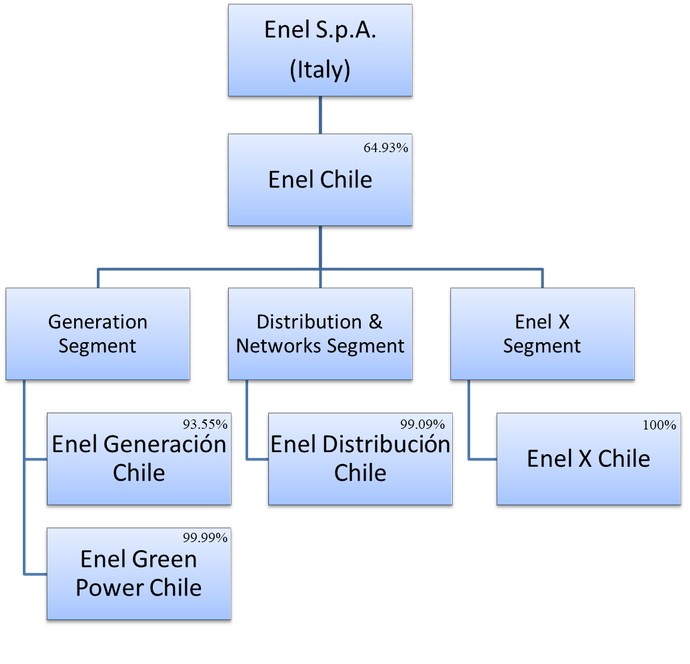
| (1) | Only principal operating consolidated entities are presented here. |
We consolidated the principal subsidiaries listed in the following table as of December 31, 2024. In the case of subsidiaries, economic interest is calculated by multiplying our percentage of economic interest in a directly held subsidiary by the percentage economic interest of any entity in the chain of ownership of such ultimate subsidiary.
|
|
|
|
|
|
|
Principal Subsidiaries |
|
Ownership |
|
Consolidated |
|
Consolidated Revenues and Other Operating Income |
Electricity Generation |
|
|
|
(in billions of Ch$) |
||
Enel Generación Chile |
|
93.55% |
|
4,808 |
|
3,080 |
EGP Chile |
|
99.99% |
|
4,686 |
|
617 |
Electricity Distribution |
|
|
|
|
|
|
Enel Distribución Chile |
|
99.09% |
|
2,803 |
|
1,641 |
Enel X |
|
|
|
|
|
|
Enel X Chile |
|
100.00% |
|
151 |
|
47 |
40
For more information about our consolidated subsidiaries, see Note 2.4 of the Notes to our consolidated financial statements.
| D. | Property, Plant, and Equipment. |
Our property, plant, and equipment is concentrated in electricity generation and distribution assets in Chile.
We conduct our generation business through EGP Chile, Enel Generación Chile, and their subsidiaries, which together own 70 power plants, all located in Chile, of which 32 are solar (2,050 MW of net installed capacity), 19 are hydroelectric (3,665 MW of net installed capacity), 11 are wind-powered (903 MW of net installed capacity), six are thermal (1,965 MW of net installed capacity), and two are geothermal (83 MW of net installed capacity), in addition to four BESS (203 MW of net installed capacity).
The following table identifies the power plants and BESS that we own that are connected to the grid, all located in Chile, at the end of each year, organized by company and technology:
Property, Plant, and Equipment of Generation Companies
|
|
|
|
|
|
Net Installed Capacity |
||||
Company |
|
Power Plant Name |
|
Power Plant Type(1) |
|
2024 |
|
2023 |
|
2022 |
|
|
|
|
|
|
(in MW) |
||||
Enel Generación Chile |
|
Ralco |
|
Reservoir |
|
689 |
|
689 |
|
689 |
|
|
Pangue |
|
Reservoir |
|
466 |
|
466 |
|
466 |
|
|
El Toro |
|
Reservoir |
|
449 |
|
449 |
|
449 |
|
|
Rapel |
|
Reservoir |
|
377 |
|
375 |
|
375 |
|
|
Antuco |
|
Run-of-the-river |
|
320 |
|
320 |
|
320 |
|
|
Los Cóndores |
|
Run-of-the-river |
|
153 |
|
— |
|
— |
|
|
Cipreses |
|
Reservoir |
|
106 |
|
106 |
|
106 |
|
|
Abanico |
|
Run-of-the-river |
|
93 |
|
93 |
|
93 |
|
|
Sauzal |
|
Run-of-the-river |
|
80 |
|
80 |
|
80 |
|
|
Isla |
|
Run-of-the-river |
|
70 |
|
70 |
|
70 |
|
|
Palmucho |
|
Run-of-the-river |
|
34 |
|
34 |
|
34 |
|
|
Los Molles |
|
Run-of-the-river |
|
18 |
|
18 |
|
18 |
|
|
Sauzalito |
|
Run-of-the-river |
|
11 |
|
11 |
|
11 |
|
|
Ojos de Agua |
|
Run-of-the-river |
|
9 |
|
9 |
|
9 |
|
|
Total Hydroelectric |
|
|
|
2,874 |
|
2,720 |
|
2,720 |
|
|
|
|
|
|
|
|
|
|
|
|
|
Atacama |
|
Combined Cycle /Natural |
|
716 |
|
716 |
|
716 |
|
|
San Isidro 2(2) |
|
Combined Cycle /Natural |
|
380 |
|
380 |
|
380 |
|
|
San Isidro 1(2) |
|
Combined Cycle /Natural |
|
372 |
|
372 |
|
372 |
|
|
Quintero |
|
Gas Turbine/Natural |
|
236 |
|
249 |
|
255 |
|
|
Taltal |
|
Gas Turbine/Natural |
|
241 |
|
242 |
|
242 |
|
|
Tarapacá |
|
Gas Turbine/Diesel Oil |
|
20 |
|
20 |
|
20 |
|
|
Huasco(3) |
|
Gas Turbine |
|
— |
|
— |
|
64 |
|
|
Total Thermal |
|
|
|
1,965 |
|
1,979 |
|
2,049 |
|
|
|
|
|
|
|
|
|
|
|
|
|
Canela 2 |
|
Wind |
|
64 |
|
64 |
|
64 |
|
|
Canela 1 |
|
Wind |
|
18 |
|
18 |
|
18 |
|
|
Total Wind |
|
|
|
82 |
|
82 |
|
82 |
|
|
|
|
|
|
|
|
|
|
|
|
|
Total Enel Generación Chile |
|
|
|
4,921 |
|
4,781 |
|
4,851 |
|
|
|
|
|
|
|
|
|
|
|
Pehuenche |
|
Pehuenche |
|
Reservoir |
|
570 |
|
570 |
|
568 |
|
|
Curillinque |
|
Run-of-the-river |
|
89 |
|
89 |
|
89 |
|
|
Loma Alta |
|
Run-of-the-river |
|
40 |
|
40 |
|
40 |
|
|
Total Pehuenche |
|
|
|
699 |
|
699 |
|
697 |
|
|
|
|
|
|
|
|
|
|
|
EGP Chile |
|
La Cabaña (1 & 2) |
|
Battery Storage (BESS) |
|
69 |
|
34 |
|
— |
|
|
Don Humberto |
|
Battery Storage (BESS) |
|
67 |
|
— |
|
— |
|
|
El Manzano |
|
Battery Storage (BESS) |
|
67 |
|
— |
|
— |
41
|
|
Total Battery Storage (BESS) |
|
|
|
203 |
|
34 |
|
— |
|
|
|
|
|
|
|
|
|
|
|
|
|
Cerro Pabellón (1 & 3) |
|
Geothermal |
|
83 |
|
83 |
|
83 |
|
|
Total Geothermal |
|
|
|
83 |
|
83 |
|
83 |
|
|
|
|
|
|
|
|
|
|
|
|
|
Pullinque |
|
Run-of-the-river |
|
51 |
|
51 |
|
51 |
|
|
Pilmaiquén |
|
Reservoir |
|
41 |
|
41 |
|
41 |
|
|
Total Hydroelectric |
|
|
|
92 |
|
92 |
|
92 |
|
|
|
|
|
|
|
|
|
|
|
|
|
Guanchoi |
|
Solar |
|
398 |
|
398 |
|
398 |
|
|
Campos del Sol |
|
Solar |
|
375 |
|
375 |
|
375 |
|
|
Las Salinas |
|
Solar |
|
205 |
|
205 |
|
0 |
|
|
Valle del Sol |
|
Solar |
|
163 |
|
163 |
|
163 |
|
|
Sol de Lila |
|
Solar |
|
161 |
|
161 |
|
161 |
|
|
Finis Terrae |
|
Solar |
|
160 |
|
160 |
|
160 |
|
|
Finis Terrae Ext |
|
Solar |
|
126 |
|
126 |
|
126 |
|
|
El Manzano |
|
Solar |
|
99 |
|
99 |
|
— |
|
|
PMGD(4) |
|
Solar |
|
83 |
|
83 |
|
44 |
|
|
Don Humberto |
|
Solar |
|
81 |
|
0 |
|
— |
|
|
Azabache |
|
Solar |
|
61 |
|
61 |
|
61 |
|
|
Lalackama |
|
Solar |
|
60 |
|
60 |
|
60 |
|
|
Chañares |
|
Solar |
|
40 |
|
40 |
|
40 |
|
|
Lalackama 2 |
|
Solar |
|
18 |
|
18 |
|
18 |
|
|
Finis Terrae 3 |
|
Solar |
|
18 |
|
18 |
|
18 |
|
|
La Silla |
|
Solar |
|
2 |
|
2 |
|
2 |
|
|
Carrera Pinto(5) |
|
Solar |
|
— |
|
— |
|
97 |
|
|
Diego de Almagro(5) |
|
Solar |
|
— |
|
— |
|
36 |
|
|
Domeyko(5) |
|
Solar |
|
— |
|
— |
|
204 |
|
|
Pampa Norte(5) |
|
Solar |
|
— |
|
— |
|
79 |
|
|
Total Solar |
|
|
|
2,050 |
|
1,970 |
|
2,042 |
|
|
|
|
|
|
|
|
|
|
|
|
|
Renaico 2 |
|
Wind |
|
144 |
|
144 |
|
72 |
|
|
Sierra Gorda Este |
|
Wind |
|
112 |
|
112 |
|
112 |
|
|
La Cabaña |
|
Wind |
|
106 |
|
106 |
|
0 |
|
|
Taltal |
|
Wind |
|
106 |
|
106 |
|
106 |
|
|
Talinay Oriente |
|
Wind |
|
90 |
|
90 |
|
90 |
|
|
Valle De Los Vientos |
|
Wind |
|
90 |
|
90 |
|
90 |
|
|
Renaico |
|
Wind |
|
88 |
|
88 |
|
88 |
|
|
Talinay Poniente |
|
Wind |
|
61 |
|
61 |
|
61 |
|
|
Los Buenos Aires |
|
Wind |
|
24 |
|
24 |
|
24 |
|
|
Total Wind |
|
|
|
821 |
|
821 |
|
643 |
|
|
|
|
|
|
|
|
|
|
|
|
|
Total EGP Chile |
|
|
|
3,249 |
|
3,000 |
|
2,861 |
|
|
Total Net Capacity Enel Chile |
|
8,869 |
|
8,478 |
|
8,408 |
||
| (1) | “Reservoir” and “run-of-the-river” refer to hydroelectric plants that use the force of a dam or a river, respectively, to move the turbines that generate electricity. “Gas Turbine” refers to thermal power that uses either diesel or natural gas to produce steam that turns the turbines. “Combined Cycle” refers to a thermal power plant that burns natural gas, diesel oil, or fuel oil to turn the first turbine and then recovers the heat to generate steam to turn a second turbine. |
| (2) | The environmental permit limits the capacity of San Isidro 1 and 2 combined to 740 MW. |
| (3) | The Huasco gas turbine plant was sold in 2023. |
| (4) | Includes 17 PMGD plants. |
| (5) | Included in the sale of Arcadia on October 24, 2023. |
Property, Plant, and Equipment of Distribution Companies
We conduct our distribution business through Enel Distribución Chile and its subsidiary Enel Colina. A substantial portion of our distribution subsidiaries’ cash flow and net income are derived from the sale of electricity distributed through our distribution installations.
42
The table below describes our leading electricity distribution equipment, such as distribution concession, networks, and transformers. They include the consolidated property, plant, and equipment figures of our subsidiary Enel Distribución Chile.
Distribution Network – Concession area and Medium and Low Voltage Lines(1)
|
|
As of December 31, 2024 |
|
As of December 31, 2023 |
|
As of December 31, 2022 |
|||||||||||||
|
|
Concession Area (km2) |
|
MV |
|
LV |
|
Concession Area (km2) |
|
MV |
|
LV |
|
Concession Area (km2) |
|
MV |
|
LV |
|
Enel Distribución Chile |
|
2,105 |
|
5,741 |
|
12,263 |
|
2,105 |
|
5,709 |
|
12,174 |
|
2,105 |
|
5,598 |
|
12,068 |
|
| (1) | Medium voltage lines: 1 kV - 34.5 kV; low voltage lines: 380-110 V. |
Transformers from Medium to Low Voltage for Distribution(1)
|
|
|
|
|
|
|
|
|
|
|
|
|
|
|
As of December 31, 2024 |
|
As of December 31, 2023 |
|
As of December 31, 2022 |
||||||
|
|
Number of |
|
Capacity |
|
Number of |
|
Capacity |
|
Number of |
|
Capacity |
Enel Distribución Chile |
|
22,607 |
|
5,411 |
|
22,628 |
|
5,364 |
|
22,622 |
|
5,250 |
| (1) | These transformers’ voltage is in the range of 34.5 kV (in - medium voltage, “mv”) and 380-110 V (out - low voltage, “lv”). |
Insurance
Our electricity generation and distribution facilities are insured against damage caused by natural disasters such as earthquakes, fires, floods, other acts of God (but not for droughts, which are not considered force majeure risks and are not covered by insurance), and from damage from third-party actions, based on the appraised value of the facilities as determined from time to time by an independent appraiser. Based on geological, hydrological, and engineering studies, we believe that the risk of the previously described events resulting in a material adverse effect on our facilities is remote.
Claims under our subsidiaries’ insurance policies are subject to customary deductibles and other conditions. We also maintain business interruption insurance, providing coverage for the failure of any of our facilities. Insurance policies include liability clauses, which protect our companies from claims made by third parties. The insurance coverage taken for our property is approved by each company’s management, considering the quality of the insurance companies and the coverage needs, conditions, risk evaluations of each facility, and general corporate guidelines. All insurance policies are purchased from reputable international insurers. We continuously engage with insurance companies to negotiate what we believe is the most commercially reasonable insurance coverage.
Project Investments
We continuously analyze potential growth opportunities, together with the profitability of our project portfolio. Industry technology allows for smaller, less environmentally impacting power plants that can be built more quickly, allow greater flexibility to activate or deactivate according to system needs, and are preferred by our stakeholders. We favor renewable energy technology for our new power plant investments and seek opportunities by building new greenfield projects or modernizing existing brownfield assets and improving operational or environmental performance. Each project’s expected start-up is assessed and defined based on the commercial opportunities and our financing capacity to fund these projects. Our project investments are ordinarily submitted for internal approvals in U.S. dollars but occasionally may be approved in another currency, such as euros.
Below we list our most material projects that reached commercial operation, added additional capacity, were under construction, or were under development during the fiscal year ended December 31, 2024. However, any decision related to construction will depend on commercial opportunities foreseen in the upcoming years, including future tenders for supplying the regulated market and the evolution of the regulatory framework (mainly associated with ancillary services).
43
Budgeted amounts include connecting lines that could be owned by third parties and paid as tolls unless otherwise indicated. The financing for all our projects described below comes from internal and external sources.
Distribution and Networks Business Projects
In 2024, our subsidiary Enel Distribución Chile and its subsidiary Enel Colina invested a total of Ch$122.9 billion in projects related to our customers’ natural growth rate, service quality requirements, and safety and information system needs.
The most relevant investments in 2024 included the following:
| ● | Ch$58.9 billion in the medium and low voltage network to facilitate new customer connections, including residential customers, large volume clients, and real estate projects; |
| ● | Ch$17.8 billion for corrective network maintenance and technological adaptation; |
| ● | Ch$12 billion to reinforce quality of service: Ch$7.7 billion to reinforce feeders through maintenance and telecontrol equipment; and Ch$4.3 billion in the smart meter program; |
| ● | Ch$11.4 billion oriented to digitalization projects; |
| ● | Ch$7.0 billion due to the storm on August 1 and 2, 2024 (Ch$5.6 billion dedicated to the emergency plan and Ch$1.4 to network reconstruction); |
| ● | Ch$6.4 billion to increase our distribution capacity for construction and reinforcement of new feeders; |
| ● | Ch$4.3 billion in network relocations due to new highways and requests from municipalities; |
| ● | Ch$2.9 billion in anti-theft measures, such as the shielding and network reinforcement; and |
| ● | Ch$2.3 billion to comply with regulations and higher standards regarding network and substation normalization. |
Generation Business Projects
Projects that Reached Commercial Operation in 2024
EGP Chile
Don Humberto Solar Project and BESS
The Don Humberto solar project is in the Santiago Metropolitan Region and has a net installed capacity of 81 MW, with BESS storage capacity of 67 MW. The land has been secured, and environmental approval has been obtained.
The total investment was approximately US$145 million. Construction began in 2023, and the PV solar power plant and BESS reached commercial operation during the fourth quarter of 2024.
El Manzano Solar Project and BESS
The El Manzano solar project is located 30 km north of Santiago in the Santiago Metropolitan Region. It is a greenfield solar project with a net installed capacity of 99 MW that consists of 162,000 monocrystalline bifacial PV modules and a solar tracking system. The power plant also includes BESS storage capacity of 67 MW. The project site occupies 185 hectares. El Manzano connects to the El Manzano substation through a 6.3 km medium-voltage transmission line.
44
The total investment was approximately US$158 million. Construction on the project began during the first quarter of 2022. The PV solar power plant reached commercial operation during the first quarter of 2024, and the BESS reached commercial operation during the third quarter of 2024.
La Cabaña Wind Project and BESS
The La Cabaña wind project is in the Araucanía Region in southern Chile and has a net installed capacity of 106 MW and includes two BESS, with a total storage capacity of 69 MW. The project connects to the national system through the Renaico wind farm substation.
The total investment was approximately US$223 million. Construction began in 2022. The wind project reached commercial operation during the first quarter of 2024, and BESS I and BESS II reached commercial operation during the third and fourth quarter of 2024, respectively.
Las Salinas Solar Project (f.k.a. Sierra Gorda Solar Project)
The Las Salinas solar project is in Sierra Gorda, near Calama, in the Antofagasta Region in northern Chile. The PV solar power plant has a net installed capacity of 205 MW. The site occupies 347 hectares.
It is a greenfield project inside the existing Sierra Gorda wind farm owned by EGP Chile. The project has two principal areas for PV modules inside the wind farm and an independent space for the medium voltage/high voltage substation. It consists of 461,000 monocrystalline bifacial PV modules with a solar tracking system. The project connects to the Centinela substation located 19 km from the solar plant, in the Centinela substation owned by Red Eléctrica Chile.
The total investment was approximately US$283 million. Construction began in 2021, and the project reached commercial operation during the third quarter of 2024.
PMGD Solar Project (Pataguas)
The Pataguas PMGD project is located near Melipilla in the Metropolitan Region. The plant has a net installed capacity of 10 MW and connects to the Bajo Melipilla substation.
The total investment was approximately US$10 million. Construction began in 2022, and the project reached commercial operation during the second quarter of 2024.
Projects that Reached Additional Capacity in 2024
EGP Chile
PMGD Solar Projects
The seven PMGD projects are in central Chile and have a net installed capacity of 29 MW. The total approved investment is approximately US$28 million, approximately all of which had been incurred as of December 31, 2024. Construction began in 2023, and the projects were connected to the grid during 2023, adding 29 MW of net installed capacity. We expect the projects to reach commercial operation in 2025.
Enel Generación Chile
Los Cóndores Hydroelectric Project
The Los Cóndores project is in the Maule Region, in the San Clemente area in central Chile. It consists of a 153 MW run-of-the-river hydroelectric power plant, with two Pelton vertical water turbine units that will use water from the Maule Lagoon reservoir through a pressure tunnel. The construction of the power plant and the commissioning tests of equipment were successfully completed in December 2024.
45
The power plant connects to the SEN at the Ancoa substation (220 kV) through an 87 km transmission line.
The total approved investment is approximately US$1.2 billion, approximately all of which had been incurred as of December 31, 2024. The project was connected to the grid during the fourth quarter of 2024 and reached commercial operation during the first quarter of 2025.
Rapel Hydroelectric Repowering Project
The Rapel Hydroelectric Repowering project is being carried out within our existing 375 MW Rapel power plant in the O’Higgins Region in central Chile. Rapel is a reservoir hydroelectric power plant with five Francis vertical units that use water from the Rapel River.
The project involves replacing two turbines (Unit 3 and Unit 4) installed in 1968 with an efficiency rate of less than 85%. The turbines will have a new hydraulic design offering improved efficiency (>92%) and increase the net installed capacity by 2 MW (1 MW for each unit).
The total approved investment is approximately US$12 million, of which approximately US$10 million had been incurred as of December 31, 2024. The project reached additional capacity during the third quarter of 2024, and we expect the project to be completed in 2025.
Projects under Construction in 2024
EGP Chile
PMGD Solar Projects
We are currently building six new PMGD solar plants in central Chile, totaling 33 MW of net installed capacity.
The total approved investment for the six projects is approximately US$30 million, of which approximately US$21 million had been incurred as of December 31, 2024. Construction on the six projects began in 2024, and we expect the projects to reach commercial operation in 2025 and 2026.
Enel Generación Chile
Pangue Hydroelectric Repowering Project
The Pangue Hydroelectric Repowering project is being carried out within our existing 466 MW power plant in the Bio-Bio Region in central Chile. Pangue is a reservoir hydroelectric power plant with two Francis vertical units that use water from the Bio-Bio reservoir.
The project involves replacing one turbine (Unit 1) with a modern design that will improve efficiency and reliability and require less maintenance. We expect the new turbine to generate an additional 54 GWh of energy per year.
The total approved investment is approximately US$22 million, of which approximately US$7 million had been incurred as of December 31, 2024. We expect work at the project site to begin during the fourth quarter of 2025 and the project to reach commercial operation in 2026.
San Isidro Power Plant Upgrade
The San Isidro power plant is a combined cycle plant in the Valparaiso Region in central Chile. The power plant has two combined-cycle units (Unit 1 and Unit 2), limited by environmental authorizations to 740 MW of net installed capacity. The project consists of upgrading the existing gas turbine to improve the efficiency of both units and recover 15 MW for each unit, within the approved environmental permit.
46
The total approved investment is approximately US$26 million, of which approximately US$8 million had been incurred as of December 31, 2024. The project began in 2022, and Unit 2 reached additional capacity in 2023. Work on Unit 1 was postponed, and we expect the project to reach additional capacity in 2025.
San Isidro Emissions Reduction
The San Isidro power plant is a combined cycle plant located in the Valparaíso Region, in central Chile, and recently obtained a new environmental permit that allows it to extend its operational useful life until 2040. The project at Unit 2 will allow the power plant to comply with the new emissions limits approved by the environmental permit, which also allows for eliminating the environmental limit on installed capacity. When the project is completed, the power plant will have a gross installed capacity of 780 MW.
The project consists of installing a selective catalytic reduction (“SCR”) DeNOx system in Unit 2, operating with a <25% ammonia solution injected into the flue gases upstream of the SCR blocks. The ammonia solution will be provided by trucks and stored in dedicated tanks inside a new building specially designed for this purpose. The project is expected to lower NOx flue gas emissions to 10 mg/Nm3 (with natural gas firing), complying with the new environmental permit.
The total approved investment is approximately US$30 million, of which approximately US$6 million had been incurred as of December 31, 2024. The project began in 2024, and we expect it to be completed in 2026.
Projects under Development in 2024
We are currently evaluating the development of the following projects, which we classify as “under development.” We will decide whether to proceed with each project depending on the commercial and other opportunities foreseen in upcoming years, as well as future tender prices for supplying the energy requirements of the regulated market and negotiations with existing or new unregulated customers.
EGP Chile
BESS Retrofit
We are developing plans to incorporate BESS storage capacity into existing renewable generation plants, including Azabache, Guanchoi, Las Salinas (f.k.a. Sierra Gorda Solar), Sol de Lila, and Valle del Sol, with an aggregate storage capacity of 457 MW. The BESS will be installed at each plant’s existing project site and connected to the grid using existing infrastructure. Environmental approvals for each BESS are in process.
The total estimated investment is approximately US$500 million, of which approximately US$1 million had been incurred as of December 31, 2024. We expect the projects to reach commercial operation by the end of 2027.
Cerro Los Loros Wind Project and BESS
The Cerro Los Loros wind farm is in Ovalle in the Coquimbo Region. The project has a net installed capacity of 79 MW, including BESS storage capacity of 30 MW, and consists of 11 wind turbines. The project will be built on approximately 1,900 hectares and connect to the grid through the Talinay Oriente substation (220kV). The land has been secured, and environmental approval is in process.
The total estimated investment is approximately US$150 million, of which approximately US$1 million had been incurred as of December 31, 2024. We expect construction to begin during the first quarter of 2026 and the project to reach commercial operation during the end of 2027.
47
Ovejera Sur Wind Project
The Ovejera Sur wind project is in La Unión in the Los Ríos Region. The project has a net installed capacity of 156 MW and consists of 20 wind turbines. The project will be built on approximately 5,500 hectares and will connect to the grid through the new Pichirropulli substation (220 kV). The land has been secured, and environmental approval is in process.
The total estimated investment is approximately US$220 million, of which approximately US$1 million had been incurred as of December 31, 2024. We expect construction to begin in 2025 and the project to reach commercial operation by the end of 2027.
Major Encumbrances
As of December 31, 2024, we did not have any major encumbrances.
Item 4A. Unresolved Staff Comments
None.
Item 5. Operating and Financial Review and Prospects
Introduction
The following selected consolidated financial data should be read in conjunction with our consolidated financial statements included in this Report. The selected consolidated financial data as of December 31, 2024, and 2023, and for the three years ended December 31, 2024, are derived from our audited consolidated financial statements included in this Report. Our consolidated financial statements were prepared in accordance with IFRS Accounting Standards (“IFRS”), as issued by the IASB.
The tables are expressed in millions, except for ratios, operating data, and data for shares and ADS. For the reader’s convenience, all data presented in U.S. dollars in the following summary, as of and for the year ended December 31, 2024, has been converted at the U.S. dollar Observed Exchange Rate for that date of Ch$ 996.46 per US$ 1.00. The Observed Exchange Rate, which is reported and published daily on the Central Bank of Chile’s web page, corresponds to the weighted average exchange rate of the previous business day’s transactions in the Formal Exchange Market.
48
The following tables set forth our selected consolidated financial data and operating data for the years indicated:
|
|
For the year ended December 31, |
||||||
|
|
2024(1) |
|
2024 |
|
2023 |
|
2022(2) |
|
|
(US$ millions) |
|
(Ch$ millions) |
||||
Consolidated Statement of Comprehensive Income Data |
|
|
|
|
|
|
|
|
Revenues and other operating income |
|
4,001 |
|
3,987,135 |
|
4,380,246 |
|
4,956,432 |
Raw materials and consumables used |
|
(2,916) |
|
(2,905,569) |
|
(2,995,585) |
|
(3,399,524) |
Employee benefits expenses and other work capitalized, depreciation, amortization and impairment losses, and other expense, by nature |
|
(711) |
|
(708,507) |
|
(616,900) |
|
(644,551) |
Operating income (loss) |
|
374 |
|
373,059 |
|
767,761 |
|
912,357 |
Financial results(3) |
|
(156) |
|
(155,209) |
|
(88,384) |
|
(118,939) |
Other gains |
|
— |
|
(292) |
|
221,847 |
|
981,981 |
Share of profit (loss) of associates and joint ventures accounted for using the equity method |
|
9 |
|
8,414 |
|
5,702 |
|
3,282 |
Income (loss) before income taxes |
|
227 |
|
225,972 |
|
906,926 |
|
1,778,681 |
Income taxes |
|
(35) |
|
(34,929) |
|
(226,913) |
|
(469,697) |
Net income |
|
192 |
|
191,043 |
|
680,013 |
|
1,308,984 |
Net income attributable to the Parent Company |
|
146 |
|
145,112 |
|
633,456 |
|
1,252,082 |
Net income attributable to non-controlling interests |
|
46 |
|
45,931 |
|
46,557 |
|
56,902 |
Total basic and diluted earnings per average number of shares (Ch$/US$ per share) |
|
0.002 |
|
2.10 |
|
9.16 |
|
18.10 |
Total basic and diluted earnings per average number of ADS (Ch$/US$ per ADS) |
|
0.105 |
|
104.90 |
|
457.92 |
|
905.12 |
Cash dividends per share (Ch$/US$ per share) |
|
0.00460 |
|
4.58 |
|
5.43 |
|
0.37 |
Cash dividends per ADS (Ch$/US$ per ADS) |
|
0.230 |
|
228.96 |
|
271.54 |
|
18.47 |
Weighted average number of shares of common stock (millions) |
|
69,167 |
|
69,167 |
|
69,167 |
|
69,167 |
|
|
As of December 31, |
||||||
|
|
2024(1) |
|
2024 |
|
2023 |
|
2022 |
|
|
(US$ millions) |
|
(Ch$ millions) |
||||
Consolidated Statement of Financial Position Data |
|
|
|
|
|
|
|
|
Total assets |
|
12,765 |
|
12,719,898 |
|
11,833,721 |
|
11,865,580 |
Non-current liabilities |
|
5,168 |
|
5,150,031 |
|
4,278,916 |
|
4,308,149 |
Equity attributable to the parent company |
|
4,976 |
|
4,958,799 |
|
4,446,080 |
|
4,097,201 |
Equity attributable to non-controlling interests |
|
369 |
|
367,581 |
|
314,806 |
|
291,738 |
Total equity |
|
5,345 |
|
5,326,380 |
|
4,760,886 |
|
4,388,939 |
Capital stock(4) |
|
3,896 |
|
3,882,103 |
|
3,882,103 |
|
3,882,103 |
(1) |
Solely for the reader’s convenience, Chilean peso amounts have been converted into U.S. dollars at the exchange rate of Ch$ 996.46 per U.S. dollar, as of December 31, 2024. |
(2) |
For 2024, operating results reflect a significant reduction due to losses from the discontinuation of certain accounting cash flow hedges that were entered into to reduce the exchange rate risk of revenues directly linked to the U.S. dollar from our subsidiary Enel Generación Chile. The discontinuation of these hedges occurred because Enel Generación Chile changed its functional currency to the U.S. dollar effective as of January 1, 2025, thereby eliminating the exchange rate risk (see Note 28 of the Notes to our consolidated financial statements). |
(3) |
On October 24, 2023, we sold our entire 99.99% ownership interest in Arcadia Generación Solar S.A., see Note 5.1 of the Notes to our consolidated financial statements. |
(4) |
On December 9, 2022, we completed the sale of our subsidiary Enel Transmisión Chile, see Note 5.3 of the Notes to our consolidated financial statements. |
(5) |
Financial results represent (+) financial income, (-) financial costs, (+/-) foreign currency exchange differences, and net gains/losses from indexed assets and liabilities. |
(6) |
Capital stock represents issued capital. |
49
Exchange Rates
Fluctuations in the exchange rate between the Chilean peso and the U.S. dollar will affect the U.S. dollar equivalent of the price in Chilean pesos of our shares of common stock on the Chilean Stock Exchanges. These fluctuations in the exchange rate affect the price of our ADS and the conversion of cash dividends relating to the common shares represented by ADS from Chilean pesos to U.S. dollars. Also, to the extent that our significant financial liabilities are denominated in foreign currencies, fluctuations in the foreign currency exchange rate may significantly impact our earnings.
There are two currency markets in Chile, the Formal Exchange Market (Mercado Cambiario Formal) and the Informal Exchange Market (Mercado Cambiario Informal). The Formal Exchange Market consists of banks and other entities authorized by the Central Bank of Chile. The Informal Exchange Market includes entities that are not expressly permitted to operate in the Formal Exchange Market, such as stockbrokers, securities agents, and foreign currency exchange houses, among others. The Central Bank of Chile has the authority to require that certain purchases and sales of foreign currencies be made on the Formal Exchange Market. Free market forces drive both the Formal and Informal Exchange Markets. Current regulations require that the Central Bank of Chile be informed of transactions that must be executed through the Formal Exchange Market.
The U.S. dollar Observed Exchange Rate, which is reported by the Central Bank of Chile and published daily on its web page, is the weighted-average exchange rate of the previous business day’s transactions in the Formal Exchange Market. Nevertheless, the Central Bank of Chile may intervene by buying or selling foreign currency on the Formal Exchange Market to attempt to maintain the Observed Exchange Rate within the desired range. Foreign currency for payments and distributions concerning the ADS are purchased and remitted in the Formal Exchange Market.
Calculation of the appreciation or devaluation of the Chilean peso against the U.S. dollar in any given period is made by determining the percent change between the reciprocals of the Chilean peso equivalent of US$1.00 at the end of the preceding period and the end of the period for which the calculation is being made. For example, to calculate the devaluation of the year-end Chilean peso in 2024, one determines the percentage change between the reciprocal of Ch$877.12, the value of one U.S. dollar as of December 31, 2023, or 0.0011401, and the reciprocal of Ch$996.46, the value of one U.S. dollar as of December 31, 2024, or 0.0010036. In this example, the percentage change between the two dates is 12.0%, representing the 2024 year-end devaluation of the Chilean peso against the 2023 year-end U.S. dollar. A positive percentage change means that the Chilean peso appreciated against the U.S. dollar, while a negative percentage change means that the Chilean peso devaluated against the U.S. dollar.
The following table sets forth the period-end rates for U.S. dollars for the years ended December 31, 2020, through December 31, 2024, based on information published by the Central Bank of Chile.
|
|
Ch$ per US$(1) |
||
Year ended December 31, |
|
Period End |
|
Appreciation (Devaluation) |
|
|
(in Ch$) |
|
(in %) |
2024 |
|
996.46 |
|
(12.0) |
2023 |
|
877.12 |
|
(2.4) |
2022 |
|
855.86 |
|
(1.3) |
2021 |
|
844.69 |
|
(15.8) |
2020 |
|
710.95 |
|
5.3 |
Source: Central Bank of Chile.
| (1) | Calculated based on the variation of the reciprocals of the period-end exchange rates. |
A. Operating Results
General
The following discussion should be read in conjunction with our audited consolidated financial statements and the notes thereto, included in Item 18 in this Report, and the selected financial data included above. Our audited consolidated financial statements as of December 31, 2024, and 2023, and for each year in the three-year period ended December 31, 2024, have been prepared in accordance with IFRS Accounting Standards, as issued by the IASB.
50
1. Discussion of Main Factors Affecting Operating Results and Financial Condition of the Company
Through our subsidiaries, we own and operate electricity generation and distribution companies in Chile. Our revenues, income, and cash flow are derived primarily from the operations of our subsidiaries and associates in Chile.
Factors such as (i) hydrological conditions, (ii) fuel prices, (iii) regulatory developments, (iv) actions adopted by governmental authorities in response to extraordinary events during the pandemic, and (v) changes in economic conditions may materially affect our financial results. Our results from operations and financial condition are affected by variations in the exchange rate between the Chilean peso and the U.S. dollar. We have certain critical accounting policies that affect our consolidated operating results. For the years covered by this Report, the impact of these factors on us is discussed below.
On November 2, 2019, the Chilean Ministry of Energy published Law No. 21,185 (the “Tariff Stabilization Law”), which established a transitional mechanism for stabilizing customers’ electricity prices under the regulated price system. This Law creates a Temporary Regulated Customer Tariff Stabilization Mechanism that states that the price to charge regulated customers for electricity from July 1, 2019, through December 31, 2020, is to be equal to the prices in force during the first half of 2019 (Decree 20T/2018). This stabilized price was named the “Stabilized Regulated Customer Price” (Precio Estabilizado para Clientes Regulados or “PEC” in its Spanish acronym). From January 1, 2021, until the stabilization mechanism is suspended, the prices will be those defined in the tariff-setting processes carried out every six months as established in Article 158 of the Electricity Law, but not to exceed the PEC adjusted for inflation using the Consumer Price Index as of January 1, 2021, as a baseline (adjusted PEC). The billing differences until 2023 were recorded as accounts receivable in favor of electricity generation companies, limited to a maximum of US$1,350 million, which was reached ahead of schedule in January 2022. The balance of these accounts receivable is to be recovered, at the latest, by December 31, 2027.
On September 14, 2020, the CNE published Exempt Resolution No. 340, which modified the technical provisions for implementing the Tariff Stabilization Law. This Resolution clarified that the payment to each supplier must be imputed to the payment of balances chronologically, first paying off the oldest balances and then the newest ones, and not on a weighted basis over the total payment balances pending, as the industry had interpreted before said date.
On August 2, 2022, the Chilean Ministry of Energy published Law No. 21,472, which establishes a Temporary Customer Protection Mechanism (Mecanismo de Protección al Cliente or “MPC” in its Spanish acronym) that stabilizes energy prices in the SEN and medium-sized systems in addition to those established by the Tariff Stabilization Law for regulated customers under the Electricity Law. The purpose of the MPC is to pay for the differences that may arise between the billing of the electricity distribution companies to end customers and the amount payable to electricity generation companies. The resources available for the MPC may not exceed US$1,800 million through a new instrument called a Payment Document in U.S. dollars that is indexed and transferable, with a maximum due date of December 2032 and State guarantee that is issued monthly by the General Treasury of the Republic to energy generating companies. The maximum amount of the stabilization fund program established by Law No. 21,472 of US$1,800 billion was reached in February 2024.
On March 14, 2023, Resolution No. 86 was published, and on August 9, 2023, Exempt Resolution No. 334 was published, establishing, among other matters, certain provisions, procedures, deadlines, and conditions for the proper implementation of the MPC law.
On April 30, 2024, Law No. 21,667 was published, which, among other things, establishes the following:
· |
It allows generation companies not to accumulate more debt, since the tariffs for customers subject to price regulation will gradually take on the real costs of energy and power prices. |
· |
The generation companies will recover the balances generated by Law No. 21,185 and Law No. 21,472, the PEC and MPC stabilization mechanisms, respectively. |
51
· |
The MPC fund limit is increased to US$5,500 million, of which the additional US$3,700 million will have a 30% government guarantee. These balances must be paid no later than by December 31, 2035. |
· |
The most vulnerable customers will be protected through of the creation of an electricity subsidy. |
Furthermore, customers with monthly consumption exceeding 350 kWh will pay the real price of the energy and power as of the date of publication of the average node price decree for the first half of 2024 plus an additional charge (MPC charge) that will allow the accumulated debt from the PEC and MPC stabilization mechanisms to be extinguished. Customers with monthly consumption equal to or less than 350 kWh will pay the real price of energy and power as of the date of publication of the decree for the second half of 2024, and from the publication of the decree for first half of 2025 the MPC charge will be added.
The effects of the Tariff Stabilization Law as of December 31, 2024, and 2023 are described in Note 9a.1 of the Notes to our consolidated financial statements.
On February 13, 2021, the Energy Efficiency Law was published, aimed at developing the First National Energy Efficiency Plan. On September 13, 2022, the Ministry of Energy published Decree No. 28 corresponding to the Regulations on Energy Management of consumers with energy management capacity and of public entities, as referred to by articles 2 and 5 of Law No. 21,305.
On November 21, 2022, Law No. 21,505 was published, which encourages the storage of electric power through remuneration for energy, power sufficiency, and complementary services to energy storage systems, as well as electromobility through a temporary price reduction of the registration certificate for electric vehicles. This law enables new electromobility business models and the option to charge electric vehicle batteries through the provision of services to the grid. In addition, it incorporates projects related to generation and consumption infrastructure for renewable energy projects, plus storage in order to withdraw energy from and inject surpluses into the electric system.
On July 23, 2020, the CNE issued Exempt Resolution No. 266 authorizing the final withdrawal, disconnection, and termination of operations of the Bocamina II generation unit as of May 31, 2022.
On May 3, 2022, the CNE issued Exempt Resolution No. 325, which, based on technical studies and system operation projections, ordered Enel Generación Chile to perform the final withdrawal, disconnection, and termination of operations at the Bocamina II generation unit beginning on September 30, 2022, in accordance with article No. 72-18 of the Electricity Law.
At the end of 2022, we decided to not proceed with certain projects, which resulted in Enel Generación Chile writing off assets for Ch$22,912.1 billion that were mainly associated with thermal and hydroelectric projects, including the Quintero and Vallecito projects. EGP Chile also wrote off Ch$29,887.9 billion associated with a geothermal project, which was being developed in the Antofagasta region. See Notes 16.c). v) and 32 of the Notes to our consolidated financial statements.
On December 9, 2022, we completed the sale of our subsidiary Enel Transmisión Chile to Sociedad Transmisora Metropolitana S.p.A. (a subsidiary of Inversiones Grupo Saesa Ltda.). The sale was made through a public tender offer between November 7 and December 6, 2022. Consequently, all the shares of Enel Transmisión Chile owned by us, representing 99.09% of the share capital, were transferred to the new controlling shareholder. The gain recorded on this sale amounted to Ch$ 981,856.6 billion. See Notes 5.3 and 33 of the Notes to our consolidated financial statements.
On December 19, 2022, Enel Generación Chile amended its gas supply contract with Shell Global LNG Limited (“Shell”), primarily to reduce the volume of gas to be purchased. The contract amendments involved a US$520 million payment by Shell to Enel Generación Chile, which was recorded as other operating income in 2022. The reduction in the volume of gas purchased by Enel Generación Chile aligns with the total projected gas surplus upon fulfilling the Company’s contractual commitments. See Note 28 of the Notes to our consolidated financial statements.
On January 1, 2023, EGP Chile completed a spin-off of assets and liabilities associated with the solar plants Carrera Pinto, Pampa Solar Norte, Diego de Almagro, and Domeyko, which were allocated to a new company called Arcadia Generación Solar S.A (“Arcadia”).
52
All shareholders of EGP Chile received a number of shares of Arcadia equal to the number of shares they held in EGP Chile. As a result, Enel Chile became the owner of 99.99% of Arcadia. On October 24, 2023, Enel Chile completed the sale of all the shares it owned in Arcadia, representing 99.99% of the capital, to Sonnedix Chile Arcadia S.p.A. and Sonnedix Chile Arcadia Generación S.p.A.
The generation segment in Chile has undergone changes during the last three years, mainly due to the following factors affecting Enel Generación Chile:
| (i) | the enactment of Law No. 21,667 in April 2024, which has extended a temporary government subsidy aimed at stabilizing energy prices for regulated customers until 2035. This temporary subsidy was initially going to be applied until December 2027 at the latest, as established by the Tariff Stabilization Law in November 2019. However, the initial period had already been extended until December 2032, as established by Law 21,472 in August 2022. The temporary government measure for stabilizing prices for regulated customers has been extended much longer than was originally planned and could be further extended. The tariff stabilization laws have established a mechanism by which price differences in the regulated market are currently denominated in U.S. dollars and not in Chilean pesos, which are settled regularly as in the past. This has significantly reduced the impact of exchange rate variations that naturally occur in the regulated market; and |
| (ii) | the unregulated market is expected to become the main source of income of the electricity generation segment from 2025 onwards. |
As a result of these changes, the management of Enel Generación Chile has focused on the unregulated market in recent years. Enel Generación Chile expects that the percentage of revenue from contracts with unregulated customers will exceed revenue from contracts with regulated customers from 2025 onwards. This trend is expected to continue for at least the next 10 years.
Therefore, the functional currency of Enel Chile, Enel Generación Chile, and Pehuenche will change from the Chilean peso to the U.S. dollar effective as of January 1, 2025. Consequently, as Enel Chile’s main source of income will be denominated in U.S. dollars, the dividends from its subsidiaries will be denominated in U.S. dollars.
| a. | Generation Segment |
A substantial part of our generation capacity is hydroelectric and depends on the prevailing hydrological conditions in Chile. Our net installed capacity as of December 31, 2024, 2023, and 2022 was 8,869 MW, 8,478 MW, and 8,408 MW, respectively, of which 41.3%, 41.4%, and 41.7% were hydroelectric, respectively. See “Item 4. Information on the Company — D. Property, Plant and Equipment.”
Hydroelectric generation was 13,688 GWh, 12,208 GWh, and 9,768 GWh, in 2024, 2023, and 2022, respectively. Our hydroelectric generation increased in 2024 compared to 2023, mainly related to better hydrological conditions.
Hydrological conditions in Chile can range from very wet, as a result of several years of abundant rainfall with lakes at their peak capacity, to extremely dry, as a consequence of a prolonged drought lasting for several years, the partial or material depletion of water reservoirs, and the significant reduction of snow and ice in the mountains, which in turn leads to materially lower levels of available water as a consequence of lower melts. There is a wide range of possible hydrological conditions between these two extremes, and their final effect on us often depends on accumulated hydrology. For instance, a new year with drought conditions has a smaller impact on us if it follows several abundant rainfall periods instead of exacerbating a prolonged drought. Likewise, an abundant hydrological year has a smaller marginal effect after several wet years instead of after a prolonged drought.
In Chile, the period of the year that typically has the most precipitation is from May through August. The period in which snow and ice in the mountains melt at higher levels is during the warmer months, from October through March, providing water flow to lakes, reservoirs, and rivers, which supply our hydroelectric plants, most of which are located in southern Chile.
53
We generally classify our hydrological conditions as either dry or wet, although there are several other intermediate scenarios. Extreme hydrological conditions materially affect our operating results and financial condition. However, it is difficult to indicate the effects of hydrology on our operating income without concurrently considering other factors. Our operating income can only be explained by looking at a combination of factors.
Hydrological conditions affect electricity market prices, generation costs, spot prices, tariffs, and the mix of hydroelectric, thermal, and NCRE generation. The CEN is constantly defining the mix to minimize the operating costs of the entire system. According to the current regulatory framework, the price at which energy is traded on the spot market (known as the “spot price”) is determined by the system’s marginal cost. The marginal cost is the cost of the most expensive power plant in operation, given an efficiency-based dispatch. The regulations also consider capacity payments to generators, which remunerate each power plant’s installed capacity according to its availability and contribution to the system’s safety. This capacity payment is determined by the regulator every six months. Hydroelectric and NCRE generation are almost always the least expensive generation technologies and typically have a marginal cost close to zero. Water from reservoirs used to generate electricity, on the other hand, is assigned an opportunity cost for the use of water, which may lead to hydroelectric generation using water from reservoirs having a high cost during extended drought conditions. Our thermal generation cost does not depend on hydrological conditions but instead on international commodity prices for LNG and diesel. Solar and wind sources are currently the NCRE technologies most widely used. NCRE facilities can dispatch energy to the system at very low marginal costs, but they depend on the wind blowing or the sun shining.
Spot prices primarily depend on hydrological conditions and commodity prices and, to a lesser extent, on NCRE availability. Under most circumstances, abundant hydrological conditions lower spot prices while dry conditions usually increase spot prices. Spot market prices affect our results because we must purchase electricity in the spot market when our contracted energy sales are more than our generation. We sell electricity in the spot market when we have electricity surpluses.
Hydrological conditions do not have an isolated effect but need to be evaluated along with other factors to understand the impact on our operating results better. Many different factors may affect our operating income, including the level of contracted sales, purchases and sales in the spot market, commodity prices, energy demand and supply, technical and unforeseen problems that can affect the availability of our thermal plants, plant locations in relation to urban demand centers, and transmission system conditions, among others.
To illustrate the effects of hydrology on our operating results, the following table describes certain hydrological conditions, their expected effects on spot prices and generation, and the expected impact on our operating income, assuming that other factors remain unchanged.
54
Hydrological |
Expected effects on spot prices |
|
Expected impact on our operating results |
|
|---|---|---|---|---|
|
|
|||
Dry |
|
Higher spot prices |
|
Positive: if our generation is higher than our contracted energy sales, energy surpluses are sold in the spot market at higher prices. Negative: if our generation is lower than our contracted sales, we have an energy deficit and must purchase energy in the spot market at higher prices. |
|
Reduced hydroelectric generation |
|
Negative: less energy available to sell in the spot market. |
|
|
Increased thermal generation |
|
Positive: increases our energy available for sale and either reduces spot market purchases or increases spot market sales at higher prices. |
|
|
|
|||
Wet |
|
Lower spot prices |
|
Positive: if our generation is lower than our contracted energy sales, the energy deficit is covered by spot market purchases at lower prices. Negative: if our generation is higher than our contracted energy sales, energy surpluses are sold in the spot market at lower prices. |
|
|
|
|
|
|
Increased hydroelectric generation |
|
Positive: more energy available to sell in the spot market at lower prices. |
|
|
|
|
|
|
|
Reduced thermal generation |
|
Negative: less energy available for sale in the spot market. |
If factors other than those described above apply, the expected impact of hydrological conditions on operating results will differ from those shown above. For instance, in a dry year with lower commodity prices, spot prices may decrease, or in a wet year, if demand increases or generation plants are not available for technical or other reasons, the spot price may increase, altering the impact of hydrological conditions discussed in the table above.
| b. | Distribution and Networks Segment |
Our electricity distribution and networks segment is conducted through Enel Distribución Chile in the Santiago Metropolitan Region, providing electricity to approximately 2.2 million customers. Santiago is Chile’s most densely populated area and has the highest concentration of industries, industrial parks, and office facilities.
For the year ended December 31, 2024, electricity sales were 14,810 GWh, representing a 3.2% increase compared to 2023. For the year ended December 31, 2023, electricity sales were 14,356 GWh, representing an 18.1% decrease compared to 2022.
Distribution and networks segment revenues are mainly derived from the resale of electricity purchased from generators. Revenues associated with distribution include the recovery of the cost of electricity purchased and the resulting revenues from the “Value Added from Distribution,” or VAD, plus the physical energy losses permitted by the regulator. Other revenues derived from our distribution and networks segment typically consist of networks revenues, charges for new connections and maintenance, and rental of meters, among others. It also includes revenues from public lighting, infrastructure projects mainly associated with real estate development, and energy efficiency solutions, including air conditioning equipment, LED lights, etc., in all cases, including customers outside of our concession area.
Although these other revenue sources have increased, our core business continues to be the distribution of electricity at regulated prices. Therefore, the electricity regulatory framework has a substantive impact on our distribution business results. In particular, regulators set distribution tariffs considering the cost of electricity purchases paid by distribution companies (which distribution companies pass on to their customers) and the VAD, all of which are intended to reflect the investment and operating costs incurred by distribution and generation companies and to allow them to earn a regulated level of return on their investments and guarantee service quality and reliability.
55
Our earnings are determined to a large degree by government regulation, mainly through the tariff-setting process. Our ability to purchase electricity relies heavily on generation availability and, to a lesser degree, regulation. The cost of electricity purchases is passed on to end-users through tariffs that are set for multi-year periods. Therefore, variations in the price at which a distribution company purchases electricity do not impact our profitability.
In the past, we focused on reducing physical losses, especially those due to illegally tapped energy. Our physical losses have generally been around 5% for the 2022-2024 period, a level close to our concession’s distribution technical loss threshold. Reducing losses below this level requires additional investments to reduce illegal tapping that would not be expected to have an economically attractive return. Currently, we are working instead on improving our efficiency, primarily through new technologies to automate our networks, as well as on increasing our quality of service to enhance the effectiveness of our facilities, profitability of our business, and our capacity to satisfy our growing number of customers and their increasing demands.
The technical bases for the tariff-setting process for the 2020-2024 period were published at the end of the first half of 2020. This is the first tariff-setting process where the CNE determined the tariff by a single study performed by CNE. In the tariff-setting process for 2016-2020, the tariff was calculated using a weighted average between the Reference Company study (one-third) and the CNE study (two-thirds). During the second half of 2020, the consulting company that carried out the study was assigned. On December 23, 2022, the CNE approved the Technical Report on the Calculation of Components of Distribution Value Added for the 2020-2024 period, through Exempt Resolution No. 908. The 2020-2024 process was concluded in 2024 and is retroactively effective from November 4, 2020, and will remain in effect until the tariff decree for the 2024-2028 period is issued and the updated tariffs become effective.
On December 21, 2019, the Chilean Ministry of Energy issued Law No. 21,194 (the “Distribution Short Law”) that reduces distribution companies’ rate of return and improves the electricity distribution tariff setting process. The Distribution Short Law eliminates the prior methodology that involved weighing the results of the VAD study performed by the CNE (two-thirds) and the VAD study performed by distribution companies (one-third) and replaces it by using only the CNE’s VAD study. The discount rate in the calculation of the annual investment cost was also modified. The previous 10% real annual pre-tax discount rate was replaced by a 6% real annual after-tax discount rate to be applied in the following tariff-setting process that began on November 4, 2020. The after-tax economic rate of return of distribution companies may not be more than 2 percentage points higher or 3 percentage points lower than the rate determined by the CNE.
On December 29, 2020, Law No. 21,301 was ratified and extended the Basic Services Law, increasing the prohibition on cutting off services from 90 days to 270 days, as well as the maximum number of monthly installments from 12 to 36. On May 13, 2021, Law No. 21,340 was enacted, which extended the effects of the Basic Services Law until December 31, 2021. Additionally, the number of installments was increased to a maximum of 48 monthly installments from 36 monthly installments.
On February 11, 2022, Law No. 21,423 established a payment schedule for all debts arising from the application of the Basic Services Law, through which each customer may pay their debt in 48 equal monthly installments, with a maximum limit equivalent to 15% of their average billing. The balance of the debt that may not be covered in the 48 installments will be absorbed by the distribution company. On June 23, 2022, the Ministry of Energy published the procedure for the payment of subsidies established in Law No. 21,423, which regulates the proration and payment of water and electricity services generated during COVID-19 and establishes subsidies for vulnerable customers. On September 30, 2022, the SEF issued Circular No. 140129 to modify the instructions provided by SEF Circular No. 119977, regarding the termination of the customer subsidy benefit. Among these amendments is the reincorporation of the customer subsidy benefit once the customer has paid off its debt with the respective concessionaire company.
As a result of the application of these laws as of December 31, 2024, our current accounts receivable decreased, and our non-current accounts receivable, financial income, and financial costs increased. Please see Notes 9 and 34 of the Notes to our consolidated financial statements for further information.
56
c. |
Economic Conditions |
Macroeconomic conditions, such as economic growth or recessions, changes in employment levels, and inflation or deflation, may significantly affect our operating results. Macroeconomic factors, such as the variation of the Chilean peso against the U.S. dollar, may impact our operating results, as well as our assets and liabilities, depending on the amounts denominated in U.S. dollars. For example, a devaluation of the Chilean peso against the U.S. dollar increases the cost of capital expenditure plans and the cost of servicing U.S. dollar debt. For additional information, see “Item 3. Key Information — C. Risk Factors — Foreign exchange risks may unfavorably affect our results and the U.S. dollar value of dividends payable to ADS holders.” and “Item 3. Key Information — C. Risk Factors — Fluctuations in the Chilean economy, economic interventionist measures by governmental authorities, political and financial events, or other crises in Chile and other countries may affect our results of operations, financial condition, liquidity, and the value of our securities.”
The following table sets forth the closing and average Chilean pesos per U.S. dollar exchange rates for the years indicated:
|
|
Local Currency U.S. Dollar Exchange Rates |
||||||||||
|
|
2024 |
|
2023 |
|
2022 |
||||||
|
|
Average |
|
Year End |
|
Average |
|
Year End |
|
Average |
|
Year End |
Chilean pesos per U.S. dollar |
|
943.74 |
|
996.46 |
|
839.91 |
|
877.12 |
|
871.19 |
|
855.86 |
Source: Central Bank of Chile
2. |
Analysis of Results of Operations for the Years Ended December 31, 2024, and 2023 |
Consolidated Revenues and other operating income
The following table sets forth our revenues and other operating income by reportable segment for the years ended December 31, 2024, and 2023:
|
|
Years ended December 31, |
||||||
|
|
2024(1) |
|
2023 |
|
Change |
|
Change |
|
|
(in millions of Ch$) |
|
(in %) |
||||
Generation segment |
|
|
|
|
|
|
|
|
Enel Generación Chile, EGP Chile(1), and subsidiaries |
|
2,784,385 |
|
3,276,387 |
|
(492,002) |
|
(15.0) |
Distribution and networks segment |
|
|
|
|
|
|
|
|
Enel Distribución Chile and subsidiary |
|
1,641,410 |
|
1,511,619 |
|
129,791 |
|
8.6 |
Non-electricity business and consolidation adjustments |
|
(438,660) |
|
(407,760) |
|
(30,900) |
|
(7.6) |
Total revenues and other operating income |
|
3,987,135 |
|
4,380,246 |
|
(393,111) |
|
(9.0) |
| (1) | On January 1, 2023, EGP Chile completed the spin-off of a new company, Arcadia Generación Solar S.A., to its shareholders, resulting in Enel Chile owning 99.99% of Arcadia. On October 24, 2023, Enel Chile sold its entire 99.99% ownership interest in Arcadia. |
Generation Segment: Revenues and other operating income
Revenues and other operating income from our generation segment decreased Ch$492.0 billion, or 15.0%, in 2024 compared to 2023, due to:
| (i) | a Ch$240.0 billion decrease in other sales, mainly due to lower gas sales in 2024; |
57
| (ii) | a Ch$219.1 billion decrease in energy sales, mainly due to: |
| a) | a Ch$620.2 billion losses from the discontinuation of certain accounting cash flow hedges that were entered into to reduce the exchange rate risk of revenues directly linked to the U.S. dollar from our subsidiary Enel Generación Chile. The discontinuation of these hedges ocurred because Enel Generación Chile changed its functional currency to the U.S. dollar effective as of January 1, 2025, thereby eliminating the exchange rate risk; and |
| b) | Ch$39.1 billion in lower commodity hedging revenue. |
These effects were partially offset by:
| c) | a Ch$262.1 billion increase in physical sales (+3,127 GWh), due to higher regulated customer sales (+2,047 GWh), spot market sales (+604 GWh), and unregulated customer sales (+476 GWh); and |
| d) | Ch$177.8 billion in a higher average sales price due to a positive exchange rate effect during the 2024 period. |
| (iii) | a Ch$34.8 billion decrease in other operating revenues, mainly due to: |
| a) | Ch$ 26.9 billion in lower additional revenue related to the improvement of commercial terms of transactions with energy and fuel suppliers in 2023; and |
| b) | Ch$19.7 billion in lower revenue from commodity hedges. |
These effects were partially offset by:
| c) | a Ch$ 8.7 billion increase in revenue from insurance claims. |
Distribution and Networks Segment: Revenues and other operating income
Revenues and other operating income from our distribution and networks segment increased Ch$129.8 billion, or 8.6%, in 2024 compared to 2023, primarily due to:
| (i) | an increase of Ch$134.7 billion in energy sales mainly due to: |
| a) | Ch$103.1 billion in a higher average sales price due to a positive exchange rate effect during the 2024 period; and |
| b) | Ch$50.6 billion increase in physical energy sales (+454GWh), primarily in the commercial and industrial customer segments. |
These effects were partially offset mainly by:
| c) | greater provisions related to collective voluntary process agreements with the National Consumer Service (“SERNAC” in its Spanish acronym) for Ch$17.1 billion, related to the weather events that occurred in May and August 2024. |
This increase was partially offset by:
| (ii) | a Ch$6.4 billion decrease in revenue from other services, due to lower revenue from the construction of customer power connections and public lighting. |
58
Total raw materials and consumables used
The following table sets forth our total raw materials and consumables used for the years ended December 31, 2024, and 2023 by segment.
|
|
Years ended December 31, |
||||||
|
|
2024 |
|
2023 |
|
Change |
|
Change |
|
|
(in millions of Ch$) |
|
(in %) |
||||
Generation segment |
|
|
|
|
|
|
|
|
Enel Generación Chile, EGP Chile(1), and subsidiaries |
|
1,845,817 |
|
2,077,671 |
|
(231,854) |
|
(11.2) |
Distribution and networks segment |
|
|
|
|
|
|
|
|
Enel Distribución Chile and subsidiary |
|
1,467,109 |
|
1,321,193 |
|
145,916 |
|
11.0 |
Non-electricity business and consolidation adjustments |
|
(407,357) |
|
(403,279) |
|
(4,078) |
|
(1.0) |
Total raw materials and consumables used |
|
2,905,569 |
|
2,995,585 |
|
(90,016) |
|
(3.0) |
(1) |
On January 1, 2023, EGP Chile completed the spin-off of a new company, Arcadia Generación Solar S.A., to its shareholders, resulting in Enel Chile owning 99.99% of Arcadia. On October 24, 2023, Enel Chile sold its entire 99.99% ownership interest in Arcadia |
Generation Segment: Raw materials and consumables used
Raw materials and consumables used in our generation segment decreased Ch$231.9 billion, or 11.2%, in 2024 compared to 2023, mainly due to:
| (i) | a Ch$201.6 billion decrease in fuel consumption costs, mainly due to: |
| a) | a Ch$116.0 billion decrease in gas consumption costs due to lower thermal electricity generation and a lower average purchase price; |
| b) | a Ch$74.5 billion decrease in commodity hedging costs due to improved hydrological production during 2024; and |
| c) | a Ch$11.2 billion decrease in fuel-oil consumption costs primarily due to lower thermal electricity generation. |
| (ii) | a Ch$86.4 billion decrease in other variable procurement and services costs, primarily due to: |
| a) | a Ch$67.2 billion decrease in gas commercialization cost of sales; |
| b) | a Ch$26.0 billion decrease in commodity hedging costs; and |
| c) | a Ch$5.1 billion decrease in rental cost associated with the leasing of temporary fixtures. |
These effects were partially offset by:
| d) | Ch$11.4 billion of greater thermal emission tax expense. |
These decreases were partially offset by:
| (iii) | a Ch$28.2 billion increase in transportation costs primarily due Ch$45.1 billion of higher regasification and gas transportation costs, partially offset by a decrease of Ch$16.4 billion due to reduction in tolls; and |
| (iv) | a Ch$28.0 billion increase in energy purchases mainly due to higher physical energy purchases (+2,611 GWh: +2,356 GWh from other power generators and +255 GWh on the spot market). |
59
Distribution and Networks Segment: Raw materials and consumables used
Raw materials and consumables used in our distribution and networks segment increased by Ch$145.9 billion, or 11.0% in 2024 compared to 2023, mainly due to:
| (i) | a Ch$118.0 billion increase in energy purchases mainly due to Ch$84.9 billion in a higher average purchase price when expressed in Chilean pesos and a Ch$33.1 billion increase in physical energy purchases (+514 GWh); and |
| (ii) | a Ch$25.1 billion increase in other procurement and services explained by: |
| a) | a Ch$29.1 billion increase in fines imposed by the SEF, including the Ch$18.8 billion (280,000 UTM) fine related to the extraordinary, devastating, and unpredictable storm on August 1 and 2, 2024. |
This increase was partially offset by:
| b) | Ch$2.6 billion in lower costs related to disconnecting and reconnecting customers’ power supply; and |
| c) | Ch$1.4 billion in lower costs of value-added services. |
Total Employee benefits expenses and other work capitalized, depreciation, amortization and impairment losses, and other expense
Our employee benefits expenses and other work capitalized, depreciation, amortization and impairment losses, and other expense are comprised of salaries and other compensation expenses, depreciation, amortization and impairment losses, and office materials and supplies.
The following table sets forth our employee benefits expenses and other work capitalized, depreciation, amortization and impairment losses and other expense for the years ended December 31, 2024, and 2023, by segment:
|
|
Years ended December 31, |
||||||
|
|
2024 |
|
2023 |
|
Change |
|
Change |
|
|
(in millions of Ch$) |
|
(in %) |
||||
Generation segment |
|
|
|
|
|
|
|
|
Enel Generación Chile, EGP Chile(1), and subsidiaries |
|
486,666 |
|
414,529 |
|
72,137 |
|
17.4 |
Distribution and networks segment |
|
|
|
|
|
|
|
|
Enel Distribución Chile and subsidiary |
|
186,519 |
|
159,093 |
|
27,426 |
|
17.2 |
Non-electricity business and consolidation adjustments |
|
35,322 |
|
43,278 |
|
(7,956) |
|
(18.4) |
Total employee benefits expenses and other work capitalized, depreciation, amortization and impairment losses and other expenses, by nature |
|
708,507 |
|
616,900 |
|
91,607 |
|
14.8 |
(1) |
On January 1, 2023, EGP Chile completed the spin-off of a new company, Arcadia Generación Solar S.A., to its shareholders, resulting in Enel Chile owning 99.99% of Arcadia. On October 24, 2023, Enel Chile sold its entire 99.99% ownership interest in Arcadia. |
Consolidated employee benefits expenses and other work capitalized, depreciation, amortization and impairment losses and other expense increased Ch$91.6 billion, or 14.8%, in 2024 compared to 2023, mainly due to:
| (i) | a Ch$35.5 billion increase in depreciation and amortization expense in the generation segment primarily due to Ch$46.8 billion of higher expenses in EGP Chile primarily related to the commissioning of new solar generation units and the increase in the exchange rate, partially compensated by Ch$16.6 billion in lower expenses resulting from the sale of Arcadia in October 2023; |
60
| (ii) | a Ch$27.2 billion increase in impairment loss of property, plant and equipment primarily mainly explained by Ch$34.2 billion higher expenses in the generation segment due to the impairment of the Las Salinas power plant expansion project recognized at year-end 2024. This was partly offset by Ch$7.0 billion in lower property, plant and equipment impairment loss related to the gas-fired unit of Tarapacá power plant booked in 2023; |
| (iii) | a Ch$ 24.7 billion increase in other expenses mainly explained by; |
| a) | a Ch$12.9 billion increase in maintenance and repair costs related to the weather events during May and August of 2024; |
| b) | a Ch$7.5 billion increase in maintenance and repair services for due to the commissioning of new solar and wind projects; and |
| c) | a Ch$7.0 billion increase in insurance premiums. |
| (iv) | a Ch$7.8 billion increase in accounts receivable impairment losses in the distribution and networks segment due to the lower credit rating of residential customers; |
| (v) | a Ch$3.9 billion increase in depreciation and amortization expense in the distribution and networks segment primarily due to the commissioning of projects that were previously in the development stage; and |
| (vi) | a Ch$2.7 billion increase in depreciation of right-of-use assets related to the lease of the Group’s new corporate building. |
All of the above were partially offset by:
| (vii) | a Ch$10 billion decrease in personnel expenses mainly due to: |
| a) | a Ch$3.7 billion decrease in expenses related to the Group’s digitalization strategy; |
| b) | a Ch$2.1 billion decrease in vacation provisions; and |
| c) | a Ch$1.6 billion increase in capitalization of personnel expenses related to investment projects. |
These effects were partially offset by:
| d) | a Ch$1.4 billion increase in employee collective bargaining agreement bonuses and other employee benefits. |
61
Consolidated Operating Income
The following table sets forth our operating income by reportable segment for the years ended December 31, 2024, and 2023:
|
|
Years ended December 31, |
||||||
|
|
2024 |
|
2023 |
|
Change |
|
Change |
|
|
(in millions of Ch$) |
|
(in %) |
||||
Generation segment |
|
|
|
|
|
|
|
|
Enel Generación Chile, EGP Chile(1), and subsidiaries |
|
451,902 |
|
784,188 |
|
(332,286) |
|
(42.4) |
Distribution and networks segment |
|
|
|
|
|
|
|
|
Enel Distribución Chile and subsidiary |
|
(12,219) |
|
31,333 |
|
(43,552) |
|
n.a. |
Non-electricity business and consolidation adjustments |
|
(66,624) |
|
(47,760) |
|
(18,864) |
|
(39.5) |
Total consolidated operating income |
|
373,059 |
|
767,761 |
|
(394,702) |
|
(51.4) |
Operating margin(2) |
|
9.4% |
|
17.5% |
|
— |
|
— |
(1) |
On January 1, 2023, EGP Chile completed the spin-off of a new company, Arcadia Generación Solar S.A., to its shareholders, resulting in Enel Chile owning 99.99% of Arcadia. On October 24, 2023, Enel Chile sold its entire 99.99% ownership interest in Arcadia. |
(2) |
Operating margin, a measure of efficiency, represents operating income as a percentage of revenues and other operating income. However, caution must be applied in making comparisons among periods, which may have experienced non-recurring gains or losses. |
Our operating income in 2024 decreased compared to 2023 due to the following:
Generation Segment: Operating Income
Revenues totaled Ch$2,784.4 billion for the year ended December 31, 2024, a decrease of Ch$492.0 billion, or 15.0%, compared to 2023, primarily due to (i) the discontinuation of certain accounting cash flow hedges that were entered into to reduce the exchange rate risk of revenues directly linked to the U.S. dollar from our subsidiary Enel Generación Chile. The discontinuation of these hedges occured because Enel Generación Chile changed its functional currency to the U.S. dollar effective as of January 1, 2025, thereby eliminating the exchange rate risk, and (ii) lower gas sales in 2024.
The raw materials and consumables used totaled Ch$1,845.8 billion as of December 31, 2024, a decrease of Ch$ 231.9 billion, or 11.2%, compared to 2023, mainly due to lower gas consumption costs and commodity price hedging costs.
Distribution and Networks Segment: Operating Income
Revenues were Ch$1,641.4 billion for the year ended December 31, 2024, an increase of Ch$129.8 billion, or 8.6%, compared to 2023, mainly due to higher energy sales, partly offset by greater provisions related to collective voluntary process agreements with SERNAC for Ch$17.1 billion related to the weather events that occurred in May and August 2024.
The raw materials and consumables used totaled Ch$1,467.1 billion for the year ended December 31, 2024, an increase of Ch$145.9 billion, or 11.0%, compared to 2023, mainly due to higher energy purchase costs and other procurement and services costs as a result of higher fines imposed by the SEF.
62
Consolidated Financial and Other Results
The following table sets forth our financial and other results for the years ended December 31, 2024 and 2023:
|
|
Years ended December 31, |
||||||
|
|
2024 |
|
2023 |
|
Change |
|
Change |
|
|
(in millions of Ch$) |
|
(in %) |
||||
Financial results |
|
|
|
|
|
|
|
|
Financial income |
|
78,282 |
|
134,254 |
|
(55,972) |
|
(41.7) |
Financial costs |
|
(232,584) |
|
(247,068) |
|
14,484 |
|
5.9 |
Gain from indexed assets and liabilities |
|
20,825 |
|
25,286 |
|
(4,461) |
|
(17.6) |
Foreign currency exchange differences |
|
(21,732) |
|
(856) |
|
(20,876) |
|
n.a. |
Total financial results |
|
(155,209) |
|
(88,384) |
|
(66,825) |
|
(75.6) |
Other results |
|
|
|
|
|
|
|
|
Share of the profit of associates and joint ventures accounted for using the equity method |
|
8,414 |
|
5,702 |
|
2,712 |
|
47.6 |
Other gains |
|
(292) |
|
221,847 |
|
(222,139) |
|
n.a. |
Total other results |
|
8,122 |
|
227,549 |
|
(219,427) |
|
(96.4) |
Total consolidated financial and other results |
|
(147,087) |
|
139,165 |
|
(286,252) |
|
n.a. |
Financial Results
Consolidated financial results decreased by Ch$66.8 billion for the year ended December 31, 2024 as compared to 2023, primarily attributable to:
| (i) | a decrease of Ch$56.0 billion in financial income, mainly due to: |
| a) | Ch$43.5 billion in lower interest income from accounts receivable with distribution companies, related to billings that have been accumulating since July 2022 due to the postponement of the issuance of the corresponding tariff decrees; and |
| b) | Ch$13.7 billion in lower income on short-term fixed income investments. |
| (ii) | a decrease of Ch$14.5 billion in financial expenses, mainly due to: |
| a) | a Ch$25.6 billion decrease in interest expenses mainly related to losses from the sale of accounts receivable in 2023, specifically related to the Company’s financial leasing contracts related to electromobility projects; |
| b) | Ch$10.7 billion in lower interest income, mainly related to the implementation of the Tariff Stabilization Law for Ch$ 7.7 billion; and |
| c) | a Ch$5.0 billion decrease in financial expenses resulting from amendments to the supplier payment schedule. |
These effects were partially offset by:
| d) | Ch$17.3 billion in higher interest expenses on bonds and bank loans; and |
| e) | Ch$9.5 billion in higher financial expenses with related parties resulting from a higher amount of debt owed to Enel Finance International N.V. (“EFI”). |
63
| (iii) | a decrease of Ch$4.5 billion from indexed assets and liabilities, mainly due to: |
| a) | Ch$13.6 billion in lower income from the indexation of recoverable taxes and other non-financial assets; and |
| b) | Ch$7.9 billion in lower income from the indexation of trade accounts receivable. |
These effects were partially offset by:
| c) | a Ch$14.0 billion increase in positive effects caused by IAS 29 “Financial Reporting in Hyperinflationary Economies” on the branch of Enel Generación Chile located in Argentina; and |
| d) | a Ch$2.6 billion increase in income due to trade accounts payable indexation. |
| (iv) | an increase of Ch$20.9 billion in the loss from foreign currency exchange rate differences, mainly due to: |
| a) | Ch$172.0 billion in higher negative exchange rate differences on related party trade accounts payable related to loans obtained from EFI; |
| b) | Ch$157.5 billion in higher negative exchange rate differences on financial debt and derivative instruments; and |
| c) | Ch$152.0 billion in higher negative exchange rate differences on trade accounts payable, including a negative effect of Ch$93.1 billion related to the tariff stabilization mechanisms established by Law No. 21,185, Law No. 21,472 and Law No. 21,667 that dollarized accumulated billings to regulated customers. |
These effects were partially offset by:
| d) | Ch$288.8 billion in higher positive exchange rate differences on trade accounts receivable from related parties, primarily accounts receivable from EGP Chile; |
| e) | Ch$136.9 billion in higher positive exchange rate differences on trade accounts receivable related to the tariff stabilization mechanisms established by the Law No. 21,185, Law No. 21,472 and Law No. 21,667; |
| f) | Ch$23.8 billion in higher positive exchange rate differences on other financial assets; and |
| g) | Ch$12.9 billion in higher positive exchange rate differences on cash and cash equivalents. |
Other Results
Gain on disposal of assets decreased Ch$219.4 billion in 2024, compared to 2023, mainly due to the Ch$215.6 billion gain on the of sale the Company’s 99.99% share ownership in Arcadia on October 24, 2023. The sale price for this transaction was Ch$521.9 billion. This was compared to 2024 in which there were no significant gains.
Consolidated Income Tax Expenses
The effective tax rate was an income tax expense of 15.4% in 2024, compared to 25.0% in 2023.
Consolidated income tax expense totaled Ch$34.9 billion in 2024, a decrease of Ch$192.0 billion compared to 2023, mainly due to:
| (i) | a Ch$128.3 billion decrease in income tax expense due to the Company’s lower profit in 2024; and |
64
| (ii) | a Ch$61.8 billion decrease in income tax expense due to the sale of Arcadia in October 2023. |
These effects were partially offset by:
| (iii) | a Ch$5.0 billion higher income tax expense related to price-level restatement. |
For further details, please refer to Note 19 of the Notes to our consolidated financial statements.
Consolidated Net Income
The following table sets forth our consolidated net income before taxes, income tax expenses, and net income for the years ended December 31, 2024, and 2023:
|
|
Years ended December 31, |
||||||
|
|
2024 |
|
2023 |
|
Change |
|
Change |
|
|
(in millions of Ch$) |
|
(in %) |
||||
Operating income |
|
373,059 |
|
767,761 |
|
(394,702) |
|
(51.4) |
Financial and other results |
|
(147,087) |
|
139,165 |
|
(286,252) |
|
n.a. |
Net income before taxes |
|
225,972 |
|
906,926 |
|
(680,954) |
|
(75.1) |
Income tax (expenses) |
|
(34,929) |
|
(226,913) |
|
191,984 |
|
84.6 |
Consolidated net income |
|
191,043 |
|
680,013 |
|
(488,970) |
|
(71.9) |
Net income attributable to the Parent Company |
|
145,112 |
|
633,456 |
|
(488,344) |
|
(77.1) |
Net income attributable to non-controlling interests |
|
45,931 |
|
46,557 |
|
(626) |
|
(1.3) |
Net income attributable to our Parent Company decreased Ch$488.3 billion in 2024 compared to 2023, mainly due to the effect caused to the discontinuation of certain accounting cash flow hedges that were entered into to reduce the exchange rate risk of revenues directly linked to the U.S. dollar from our subsidiary Enel Generación Chile. The discontinuation of these hedges occurred because Enel Generación Chile changed its functional currency to the U.S. dollar effective as of January 1, 2025, thereby eliminating the exchange rate risk.
3. Analysis of Results of Operations for the Years Ended December 31, 2023, and 2022
The comparative analysis of our results of operations for the years ended December 31, 2023, and 2022, is incorporated herein by reference from Item 5.A. of our Annual Report on Form 20-F for the year ended December 31, 2023, filed with the SEC on April 30, 2024.
B. Liquidity and capital resources.
Our main assets are our consolidated Chilean subsidiaries, EGP Chile, Enel Distribución Chile, and Enel Generación Chile. The following discussion of cash sources and uses reflects the key drivers of our cash flow.
We receive cash inflows from our subsidiaries and related companies. Cash flows from our subsidiaries and associates may not always be available to satisfy our own liquidity needs because there may be a time lag before we have access to those funds through dividends or capital reductions. However, we believe that cash flow generated from our business operations, cash balances, borrowings from commercial banks, short- and long-term intercompany loans, and ample access to the capital markets will be sufficient to satisfy all our present requirements for cash to fund our working capital, expected debt service, dividends, and planned capital expenditures in the foreseeable future, as discussed in further detail below.
65
Set forth below is a summary of our consolidated cash flow information for the years ended December 31, 2024, 2023, and 2022:
|
|
Year ended December 31, |
||||
|
|
2024 |
|
2023 |
|
2022 |
|
|
(in billions of Ch$) |
||||
Net cash flows provided by operating activities |
|
1,531 |
|
705 |
|
745 |
Net cash flows provided by (used in) investing activities |
|
(696) |
|
(86) |
|
456 |
Net cash flows provided by (used in) financing activities |
|
(1,033) |
|
(934) |
|
(629) |
Net increase (decrease) in cash and cash equivalents before the effect of exchange rate changes |
|
(198) |
|
(315) |
|
572 |
Effect of exchange rate changes on cash and cash equivalents |
|
18 |
|
3 |
|
(7) |
Cash and cash equivalents at the beginning of the period |
|
563 |
|
875 |
|
310 |
Cash and cash equivalents at the end of the period |
|
383 |
|
563 |
|
875 |
For the year ended December 31, 2024, net cash flow provided by operating activities were inflows amounting to Ch$1,531.0 billion, representing an increase of 116.9%, or Ch$825.2 billion, compared to the same period in 2023. The increase was in part the result of:
| (i) | Ch$600.2 billion from increased cash collections from the sale of goods and services principally from (i) our generation segment due to higher energy sales of 2,047 GWh mainly in the spot market and to regulated customers; and (ii) our distribution and networks segment due to higher physical energy sales of 454 GWh mainly in the industrial and residential customer segments; |
| (ii) | Ch$128.4 billion from decreased payments to suppliers mainly from our generation segment due to lower thermal electricity generation and a lower average purchase price. This was partially offset by an increase of 2,611 GWh in physical energy purchases; and |
| (iii) | Ch$100.4 billion from decreased income tax payments in 2024, mainly due to: |
| a) | a Ch$235.2 billion increase in Enel Chile’s income tax payments in 2023 due to the gain from the sale of Enel Transmisión Chile in December 2022; and |
| b) | a Ch$47.7 billion decrease in income tax payments due to the Company’s lower profit in 2024. |
These effects are partially offset by:
| c) | a Ch$84.8 billion increase in Enel Generación Chile’s income tax payments; |
| d) | a Ch$61.8 billion increase in Enel Chile’s income tax payments due to the gain from the sale of Arcadia in 2023; and |
| e) | a Ch$32.0 billion increase in 2023 due to Enel Generación’s Chile income tax refund. |
For the year ended December 31, 2023, net cash flow provided by operating activities were inflows amounting to Ch$705 billion, representing a decrease of 5.4%, or Ch$40 billion, compared to the same period in 2022. The decrease was in part the result of:
| (i) | Ch$168.6 billion from increased payments to suppliers mainly from our distribution and networks segment of Ch$230.9 billion due to a higher energy purchase and tolls services, which was partially offset by (i) our generation segment due to lower energy purchase costs for fuel consumption and lower gas costs due to the |
66
| efficiency of the generation mix as a result of improved hydrology conditions of Ch$35.3 billion, and (ii) Ch$33.5 billion due to the disposition of Enel Transmisión Chile in 2022; and |
| (ii) | Ch$235.2 billion in higher income tax payments in 2023, mainly due to a Ch$253.3 billion increase in Enel Chile’s income tax payments due to the gain from the sale of Enel Transmisión Chile in 2022. This was partially offset by Ch$14.4 billion reduction in income tax expense due to the disposition of Enel Transmisión Chile in 2022. |
These operating activity net cash flow decreases were partially offset by:
| (iii) | a Ch$ 376.9 billion increasing cash collections from the sale of goods and services principally from (i) our generation segment of Ch$217.2 billion due to higher energy sales of 726 GWh mainly in the spot market and to regulated customers; and (ii) our distribution and networks segment of Ch$263.8 billion due to higher physical energy sales of 146 GWh mainly due to higher sales to residential customers and tolls. These were partially offset by Ch$92.4 billion due to the disposition of Enel Transmisión Chile in 2022. |
For further information regarding our operating results in 2024, 2023, and 2022, please see “— A. Operating Results — 2. Analysis of Results of Operations for the Years Ended December 31, 2024, and 2023” and “— 3. Analysis of Results of Operations for the Years Ended December 31, 2023, and 2022.”
For the year ended December 31, 2024, net cash flows used in investing activities were outflows amounting to Ch$696.0 billion, representing an increase of 707.2% or Ch$609.9 billion, compared to the same period in 2023, mainly due to:
| (i) | an increase of Ch$684.0 billion in cash flows from the purchase of property, plant and equipment due to additional plants and equipment mainly for the generation segment; and |
| (ii) | an increase of Ch$38.4 billion in cash flows from the purchase of intangibles assets due to an increase in intangible assets under development, primarily in the generation segment, and greater investment in software. |
These investing activities net cash flow outflows were partially offset by:
| (iii) | a Ch$20.8 billion increase in interest received; and |
| (iv) | Ch$4.1 billion in higher cash received from future, forward, options, and swap contracts corresponding to financial derivatives. |
For the year ended December 31, 2023, net cash flows provided by investing activities were outflows amounting to Ch$86 billion, representing a decrease of 119% or Ch$542 billion, compared to the same period in 2022, mainly due to:
| (i) | a decrease of Ch$714.4 billion in cash flows from the sale of subsidiaries or other businesses due to the amounts received for the sales in 2022 of: a) Enel Transmisión Chile for Ch$1,221.2 billion; b) Enel X Way Chile for Ch$11.4 million; and c) Enel X AMPCI Ebus Chile for Ch$2.0 billion. This decrease was partially offset by cash received for the sale of Arcadia in 2023 for Ch$520 billion (See Note 2.4.1.ii. and Note 5.1 of the Notes to our consolidated financial statements); |
67
| (ii) | Ch$172.3 billion in lower proceeds from the repayment of advances and loans granted to third parties compared to 2022 related to Enel Transmisión Chile’s debt owed to Enel Chile that was repaid in December 2022 (See Note 2.4.1.i. and Note 5.3 of the Notes to our consolidated financial statements); and |
| (iii) | Payments for future, forward, options, and swap contracts corresponding to financial derivatives, such as cross-currency swaps or currency forwards, of Ch$27.6 billion, including a) Enel Chile for Ch$17.3 billion; b) EGP Chile for Ch$5.7 billion; and c) Enel Distribución Chile for Ch$5.6 billion. |
These investing activities net cash flow outflows were partially offset by:
| (iv) | Ch$278.9 billion in lower investments in property, plant and equipment made by our subsidiaries in 2023, mainly due to Ch$259.4 billion of lower investments by EGP Chile for developing renewable projects; |
| (v) | Other collections from the sale of shares in joint ventures of Ch$29.7 billion, due to cash inflows received for the payment of Sociedad de Inversiones K Cuatro S.p.A. debt owed to Enel X Chile (See Note 2.6.i. and Note 13.3.b of the Notes to our consolidated financial statements); |
| (vi) | Ch$29.9 billion of lower other cash payments in 2023 compared to other cash payments made in 2022 to acquire shares in joint ventures mainly due to the payment of Enel X Chile’s capital contribution in Sociedad de Inversiones K Cuatro S.p.A. for Ch$ 29.6 billion; and |
| (vii) | Proceeds from the sale of property, plant and equipment of Ch$32.5 billion, mainly due to cash flows received for the purchase of our corporate office building by Territoria Santa Rosa S.p.A. from Enel Generación Chile for Ch$28.7 billion (See Note 5.2 of the Notes to our consolidated financial statements). |
For the year ended December 31, 2024, net cash used in financing activities were Ch$1,033.2 billion compared to Ch$934 billion in 2023.
The aggregate cash payments associated with financing activities in 2024 were primarily due to:
| (i) | Ch$428.2 billion in bond principal payments by Enel Generación Chile; |
| (ii) | Ch$345.1 billion in dividend payments, of which Ch$203.0 billion was paid to Enel, our controlling shareholder, and Ch$142.1 billion to third parties; |
| (iii) | Ch$327.3 billion in loan principal payments by Enel Generación Chile; |
| (iv) | aggregate outflows from financing activities in 2024 of Ch$138.7 billion: inflows primarily from loans received from EFI, a related company, of Ch$1,092.2 billion; and outflows primarily from loan payments by Enel Chile to EFI for Ch$1,230.9 billion; |
| (v) | Ch$205.5 billion of interest payments (Ch$191.8 billion paid by EGP Chile; Ch$65.2 billion paid by Enel Generación Chile; Ch$33.3 billion paid by Enel Distribución Chile; Ch$177.3 billion paid by Enel Chile; and Ch$9.1 billion paid by Enel X Chile); and |
| (vi) | Ch$36.9 billion in leasing liability payments and other cash outflows. |
These financing activities were partially offset by:
| (vii) | aggregate inflows from financing activities from short-term loans in 2024 of Ch$448.3 billion. |
For the year ended December 31, 2023, net cash used in financing activities were Ch$934 billion compared to Ch$628 billion in 2022.
68
The aggregate cash payments associated with financing activities in 2023 were primarily due to:
| (i) | aggregate outflows from financing activities in 2023 for Ch$487.3 billion: inflows primarily from loans received from EFI, a related company, for Ch$767.7 billion; and outflows primarily from loan payments by Enel Chile to EFI for Ch$1,255 billion; |
| (ii) | Ch$401.6 billion in dividend payments, of which Ch$240.8 billion was paid to Enel, our controlling shareholder, and Ch$160.8 billion to third parties; |
| (iii) | Ch$193 billion of interest payments (Ch$89 billion paid by EGP Chile, Ch$64.8 billion paid by Enel Generación Chile, Ch$32.2 billion paid by Enel Distribución Chile, and Ch$7.2 billion paid by Enel Chile); and |
| (iv) | Ch$84.8 billion in loan and bond principal payments by Enel Generación Chile. |
These financing activities were partially offset by:
| (v) | aggregate inflows from financing activities from short-term loans in 2023 of Ch$248.8 billion. |
For a description of liquidity risks resulting from the inability of our subsidiaries to transfer funds, please see “Item 3. Key Information — C. Risk Factors — We depend on distributions from our subsidiaries to meet our payment obligations.” Please see Notes 20 and 23 of the Notes to our consolidated financial statements for further details regarding the features and conditions of financial obligations and financial derivatives. These notes also refer to the material cash requirements of known contractual and other obligations.
Contractual Obligations
The table below sets forth our cash payment of contractual obligations as of December 31, 2024:
|
|
Payments Due by Period |
||||||||
Contractual Obligation |
|
Total |
|
2025 |
|
2026-2027 |
|
2028-2029 |
|
After 2029 |
|
|
In billions of Ch$ |
||||||||
Purchase obligations(1) |
|
20,329 |
|
7,705 |
|
7,692 |
|
3,614 |
|
1,318 |
Yankee bonds |
|
1,312 |
|
0 |
|
205 |
|
996 |
|
111 |
Interest expense |
|
1,300 |
|
183 |
|
312 |
|
171 |
|
634 |
Accounts payable to related parties(2) |
|
1,181 |
|
161 |
|
322 |
|
0 |
|
698 |
Bank debt |
|
926 |
|
0 |
|
248 |
|
116 |
|
562 |
Lease obligations |
|
296 |
|
27 |
|
23 |
|
24 |
|
222 |
Local bonds |
|
209 |
|
43 |
|
86 |
|
80 |
|
0 |
Pension and post-retirement obligations(3) |
|
66 |
|
7 |
|
14 |
|
14 |
|
31 |
Total contractual obligations |
|
25,619 |
|
8,126 |
|
8,902 |
|
5,015 |
|
3,576 |
| (1) | Includes generation and distribution business purchase obligations, comprised mainly of electricity purchases, operating and maintenance contracts, and other services. Of the total contractual obligations of Ch$20,329 billion, 55% corresponds primarily to fuel supply, maintenance of medium- and low-voltage lines, cable and utility poles, and electricity purchased for generation, and 41% corresponds to electricity purchased for distribution. The remaining 4% corresponds to miscellaneous services, such as LNG regasification and fuel transportation. |
| (2) | Represents loans payable to EFI. |
| (3) | Our pension and post-retirement benefit plans are unfunded. Cash flow estimates in the table are based on such obligations, including certain estimated variable factors such as interest. Cash flow estimates in the table relating to our unfunded plans are based on future discounted payments necessary to meet all of our pension and post-retirement obligations. |
69
We coordinate the overall financing strategy of our subsidiaries. However, our subsidiaries independently develop their capital expenditure plans and finance their capital expansion programs through internally generated funds, intercompany financings, or direct financings. In recent years, we have adopted a preference to incur debt at the Enel Chile level and to finance most of the obligations of our subsidiaries through intercompany loans. Among the advantages to this financing strategy is the mitigation of structural subordination risk arising from subsidiary debt, with its favorable consequences for us from the perspective of rating agency credit ratings. Furthermore, as a holding company, we can frequently access liquidity from several sources on better terms and conditions than some of our subsidiaries. However, we have no legal obligations or other commitments to support our subsidiaries financially. For information regarding our commitments for capital expenditures, see “Item 4. Information on the Company — A. History and Development of the Company — Capital Investments, Capital Expenditures and Divestitures.”
Our ADSs have been listed and traded on the NYSE since April 26, 2016. In the future, we may again tap the international equity capital markets (including SEC-registered ADS offerings). We also issued bonds in the United States (“Yankee Bonds”) in 2018 and may issue Yankee Bonds in the future depending on liquidity needs.
The following table lists the Yankee Bonds issued by us and our subsidiaries and the aggregate principal amount that are outstanding as of December 31, 2024:
|
|
|
|
|
Aggregate Principal Amount |
|
Issuer |
Term |
Maturity |
Coupon |
|
Issued |
Outstanding |
|
|
|
|
|
(in millions of US$) |
|
Enel Chile |
10 years |
June 2028 |
4.875% |
|
1,000 |
1,000 |
Enel Generación Chile(1) |
30 years |
February 2027 |
7.875% |
|
230 |
206 |
Enel Generación Chile(2) |
40 years |
February 2037 |
7.325% |
|
220 |
71 |
Enel Generación Chile(1) |
100 years |
February 2097 |
8.125% |
|
200 |
40 |
Total |
|
|
5.575% |
(3) |
1,650 |
1,317 |
| (1) | Enel Generación Chile repurchased some of these bonds in 2001. |
| (2) | Holders of the Enel Generación Chile’s 7.325% Yankee Bonds due 2037 exercised a put option on February 1, 2009, for a total amount of US$149.2 million. The remaining US$70.8 million principal amount of the Yankee Bonds matures in February 2037. |
| (3) | Weighted-average coupon by outstanding amount. |
We also have access to the Chilean domestic capital markets. In March 2018, we registered a 30-year local bond program with the CMF for UF 15 million (Ch$576 billion as of December 31, 2024). As of December 31, 2024, and as of the date of this Report, there have been no issuances of bonds under this program.
Our subsidiary, Enel Generación Chile, has issued debt instruments that have been primarily sold to Chilean pension funds, life insurance companies, and other institutional investors.
The following table lists UF-denominated Chilean bonds issued by Enel Generación Chile that are outstanding on December 31, 2024:
|
|
|
Coupon (inflation |
|
Aggregate Principal Amount |
||
Issuer |
Term |
Maturity |
adjusted rate) |
|
Issued |
Outstanding |
|
|
|
|
|
|
(in millions of UF) |
(in millions of UF) |
(in billions of Ch$) |
Enel Generación Chile Series M |
21 years |
December 2029 |
4.75% |
|
10.00 |
4.55 |
174.6 |
Enel Generación Chile Series H |
25 years |
October 2028 |
6.20% |
|
4.00 |
0.88 |
33.8 |
Total |
|
|
4.99% |
(1) |
14.00 |
5.43 |
208.4 |
| (1) | Weighted-average coupon by outstanding amount. |
For a complete description of local bonds issued by Enel Generación Chile, see “Unsecured liabilities detailed by currency and maturity” in Note 20.2 of the Notes to our consolidated financial statements.
70
We may also participate in the international and local commercial bank markets through syndicated or bilateral senior unsecured loans, including fixed-term and revolving credit facilities. The following table lists our U.S. dollar syndicated and bilateral revolving loans, which are governed by the laws of the State of New York and Chile, and the amounts outstanding as of December 31, 2024.
Borrower |
|
Type |
|
Lender |
|
Maturity(1) |
|
Facility Amount |
|
Amount Drawn |
|
|
|
|
|
|
|
|
(in millions of US$) |
|
(in millions of US$) |
Enel Chile |
|
SDG-linked Bilateral Revolving Loan |
|
EFI |
|
April 2026 |
|
290 |
|
— |
Enel Chile |
|
Bilateral Revolving Loan |
|
Corporación Andina de Fomento (CAF) |
|
December 2027 |
|
200 |
|
— |
Enel Chile |
|
Syndicated Revolving Loan |
|
DNB Bank ASA & Citibank N.A. |
|
March 2027 |
|
150 |
|
— |
Enel Chile |
|
Bilateral Revolving Loan |
|
EFI |
|
March 2027 |
|
50 |
|
— |
Total |
|
|
|
|
|
|
|
690 |
|
— |
| (1) | Refers to the facility’s maturity. |
The disbursement of the revolving loans is not subject to the compliance of conditions precedent regarding the non-occurrence of a “Material Adverse Effect” (or MAE, as defined contractually). This kind of contract with committed credit lines allows us complete flexibility for a drawdown under any circumstances, including situations involving an MAE.
Additionally, we and our subsidiaries have also entered into uncommitted Chilean bank facilities for approximately Ch$108 billion in the aggregate, none of which was drawn as of December 31, 2024. Unlike the committed lines described above, which are not subject to an MAE condition precedent to disbursements, these facilities are subject to a risk of not being disbursed because they are subject to an MAE condition precedent to disbursements. Our liquidity could be limited under such circumstances.
As for our term loans, the detail of each transaction and the outstanding principal amount as of December 31, 2024, is described in the following table:
Borrower |
|
Type |
|
Lender |
|
Issuance Date |
|
Maturity |
|
Outstanding principal |
|
|
|
|
|
|
|
|
|
|
(in millions of US$) |
Enel Chile |
|
Term Loan |
|
EFI |
|
December 2015 |
|
December 2027 |
|
483 |
Enel Chile |
|
Term Loan |
|
EFI |
|
March 2020 |
|
March 2030 |
|
400 |
Enel Chile |
|
SDG-linked Term Loan |
|
EFI |
|
April 2021 |
|
April 2031 |
|
300 |
Enel Chile |
|
SDG-linked Term Loan |
|
Citibank N.A. - London Branch |
|
May 2024 |
|
December 2037 |
|
286 |
Enel Chile |
|
SDG-linked Term Loan |
|
European Investment Bank |
|
December 2022 |
|
December 2037 |
|
244 |
Enel Chile |
|
SDG-linked Term Loan |
|
Scotiabank Chile |
|
December 2021 |
|
December 2026 |
|
150 |
Enel Chile |
|
SDG-linked Term Loan |
|
European Investment Bank |
|
December 2023 |
|
December 2038 |
|
101 |
Enel Chile |
|
SDG-linked Term Loan |
|
European Investment Bank |
|
July 2023 |
|
July 2038 |
|
99 |
Enel Chile |
|
SDG-linked Term Loan |
|
European Investment Bank |
|
October 2022 |
|
October 2037 |
|
50 |
Total |
|
|
|
|
|
|
|
|
|
2,113 |
For a complete description of our credit lines and term loans, see Note 10.1.d) and Note 20.1 of the Notes to our consolidated financial statements.
71
As is customary for certain credit and capital market debt facilities, some of our financial indebtedness is subject to covenants. The main covenants governing the loans granted to us are bankruptcy, insolvency, cross default clauses, limitations on liens, change of control, restrictions on the sale of assets and corporate reorganizations, adverse court judgments, and governmental actions, among others. As of December 31, 2024, Enel Chile, on a stand-alone basis, had debt obligations that included covenants or events of default but were not subject to financial ratios. In addition, two of Enel Generación Chile’s loan agreements include the obligation to comply with certain financial ratios. These agreements include affirmative and negative covenants and restrictions in the event of default, which all require monitoring to ensure their compliance. For more information about financial restrictions please see Note 36.4 of the Notes to our consolidated financial statements.
The payment of dividends and distributions by our subsidiaries and affiliates represents an essential source of funds and liquidity and is potentially subject to legal restrictions, such as legal reserve requirements, capital and retained earnings criteria, and other contractual conditions. We are currently in compliance with the legal restrictions, and therefore, they do not affect the payment of dividends or distributions to us as of the date of this Report. Certain credit facilities and investment agreements of our subsidiaries may restrict dividends or distributions in certain exceptional circumstances. For instance, one of Enel Generación Chile’s UF-denominated Chilean bonds limits intercompany loans that Enel Generación Chile and its subsidiaries can lend to related parties. The threshold for such aggregate restriction of intercompany loans is currently US$500 million. For a description of liquidity risks resulting from our company’s status, see “Item 3. Key Information — D. Risk Factors— We depend on distributions from our subsidiaries to meet our payment obligations.”
Our estimated capital expenditures for 2025 through 2027 are expected to amount to Ch$1.8 trillion related to managing and optimizing our distribution network, new customer connections, increasing battery storage capacity, developing renewable generation plants, maintenance of current projects and assets, and studies required to develop other potential generation and distribution projects.
We do not currently anticipate liquidity shortfalls affecting our ability to satisfy the material obligations described in this Report. We expect to refinance our consolidated indebtedness as it becomes due, fund our purchase obligations with internally generated cash, and fund capital expenditures with a mixture of internally generated cash and external financings.
LIBOR Transition
The U.K. Financial Conduct Authority found that the London Interbank Offered Rate (“LIBOR”) had inconsistencies in its calculations and recommended that it be based on actual transactions. As a result, the authority agreed to stop requiring banks to comply with the submission of interbank rates to calculate LIBOR as of December 31, 2021. On March 5, 2021, LIBOR succession dates were announced (December 31, 2021, for all tenors EUR, CHF, JPY, and GBP LIBOR, and one-week and two-month USD LIBOR; and June 30, 2023, for all other USD LIBOR tenors). The Secured Overnight Financing Rate (“SOFR”) was the successor benchmark rate. All of our floating rate financing arrangements have been transitioned from LIBOR to SOFR.
C. Research and Development, Patents and Licenses, etc.
None.
D. Trend Information.
Generation Segment
Enel Generación Chile foresees that the percentage of revenue from contracts with unregulated customers will exceed revenue from contracts with regulated customers from 2025 onwards. This trend is expected to continue for at least the next 10 years. This forecast is supported by two material facts, firstly: some contracts expired in December 2024. These contracts were with regulated customers at prices that are significantly higher than the current ones. Secondly, new contracts with unregulated customers will commence in 2025, some of which are at advanced stages of negotiation and include prices in U.S. dollars.
72
As a result of these changes, the Company's management is focusing on the unregulated market and is using the U.S. dollar as the Company’s functional currency effective as of January 1, 2025.
In March 2025, we started operations in the Los Cóndores hydroelectric plant powered by two Pelton-type turbines capable of a maximum flow rate of 25 m3/s, which generates around 350 GWh per year. This renewable energy will be injected into the SEN, avoiding 70,721 tons of CO2 emissions per year.
In 2024, contracts awarded in the November 2017 auction came into effect with an average price of the total allocated energy of US$32.5 per MWh, 31% lower than the average price of the previous tender process. The total amount of energy tendered (2,200 GWh) was based on NCRE offers. Enel Generación Chile was awarded 54% of the tender, corresponding to 1,180 GWh per year at an average price of US$34.7 per MWh, with a mix of wind, solar, and geothermal generation.
In May 2024, 3,600 GWh, divided into two parts of 1,500 GWh and 2,100 GWh and starting in 2027 and 2028, respectively, were tendered to supply electricity to regulated customers for 20 years. Enel Generación Chile was awarded 100% of the energy tendered for an average price of US$56.68 per MWh.
Distribution and Networks Segment
In our distribution and networks segment, some customers who meet certain requirements are free to choose between regulated and unregulated tariffs. They must give 12 months’ notice of the change and remain in the new regime for at least 4 years. Additionally, the minimum connected capacity requirement for customers to choose unregulated tariffs is currently 300 kW, which, combined with lower market prices, may reduce the number of customers who choose regulated tariffs. Customers switching to unregulated tariffs may also choose an alternative energy provider other than one of our generation subsidiaries, which could adversely affect our business, results of operations, and financial condition.
During 2024, regulated electricity tariffs rates were normalized for the first time since 2019 due to transitory mechanisms for stabilizing customers’ regulated electricity price. The Ministry of Energy enacted the Average Node Price decrees for the first and second halves of 2024 and the VAD decree for the 2020-2024 period. These decrees increased residential customer billing by more than 50%.
Supply Contracts
In the large-customer segment, new electricity supply contracts were signed with wholesale, mining, and industrial unregulated customers for approximately 550 GWh per year and with terms between 4 and 6 years, allowing the Company to increase and diversify its commercial portfolio under very favorable conditions.
Many smaller customers, who have the option of migrating to the regulated market, continued to choose the unregulated market. Enel Generación Chile signed direct supply contracts with these unregulated customers, totaling 700 GWh per year, with average terms of over four years.
In December 2024, Exempt Resolution No. 58 announced a reduction in the consumption threshold for unregulated customers from 500 kW to 300 kW, who have the option of directly negotiating their energy supply. This allows more customers to access customized rates, more favorable contract terms, and specialized support, thus optimizing energy use and reducing operating costs. This resolution has created new opportunities for a new segment of companies that can now access 100% renewable energy, stable long-term prices, and complement their energy offerings with the implementation of energy efficiency solutions for their facilities. Enel Generación Chile and Enel X Chile began an integrated offering model, allowing clients to combine energy contracts with innovative solutions and personalized consulting services that enable various industries and institutions to optimize their consumption and reduce costs.
73
Hydrology
During 2024, the Company faced a favorable hydrological scenario. The El Niño phenomenon was observed starting in mid-2023 and began to decline during 2024, reaching a neutral state in the second half of the year. In Chile, this phenomenon is associated with increased rainfall, which largely explains the hydrological conditions observed in 2024.
In 2023, hydrological conditions were wet during the winter months, leading to significant snow accumulation and increased snowmelt through the beginning of 2024. Although 2024 saw lower precipitation compared to 2023, water flows at the beginning of the year were higher due to the snowmelt accumulated from the previous year. In 2024, water levels in tributaries were comparable to those of 2023, making 2024 the second-best hydrological year in the last 15 years, surpassed only by 2023.
Fuel Prices
In 2024, average fuel prices decreased compared to 2023. Although Enel Chile's purchase prices are confidential, the general parameters representative of the variation in natural gas’s long-term LNG contracts are Henry Hub, which decreased 17% on average (2.7 to 2.3 USD/MMBTU), and Brent, which decreased 2% (82.6 to 80.8 USD/bbl). This decrease in fuel costs coupled with favorable hydrology and increased generation from renewable power plants, reduced marginal costs in 2024, compared to 2023.
Digitalization Strategy
Enel Chile is carrying out a digital transformation process of its entire value chain, developing new business models and digitalizing processes, integrating systems, and adopting new technologies. These initiatives help accelerate the digitalization of network infrastructure through the innovation and development of a robust and resilient electricity system. We continue to add technology to get closer to our customers, connect with them, and anticipate and solve their needs by providing greater service reliability and quality while strengthening and digitalizing the physical network.
| E. | Critical Accounting Estimates |
For information regarding our critical accounting estimates, see Note 2.3 of the Notes to our consolidated financial statements.
Item 6. Directors, Senior Management, and Employees
A. |
Directors and Senior Management. |
Directors
Our board of directors (the “Board”) consists of seven members elected for a three-year term at the Ordinary Shareholders’ Meeting (“OSM”). Following the end of their term, they may be re-elected or replaced. If a vacancy occurs in the interim, the Board may elect a temporary director to fill the vacancy until the next OSM, at which time the entire Board will be elected for new three-year terms. Our executive officers are elected and hold office at the discretion of the Board.
Mónica Girardi resigned her position as director, effective September 30, 2024. Our current Board was elected at the OSM held on April 28, 2025, for a three-year term that ends in April 2028. The current chairman of the board is Marcelo Castillo Agurto, and the current directors are Gina Ocqueteau Tacchini, María Teresa Vial Álamos, Pablo Cruz Olivos, Rodolfo Avogadro Di Vigliano, Salvatore Bernabei, and Valentina de Cesare.
74
As of March 31, 2025, the members of our Board were as follows:
|
|
|
|
|
|
|
Directors |
|
Position |
|
Age(1) |
|
Current Position |
Marcelo Castillo Agurto |
|
Chairman |
|
59 |
|
2024 |
Isabella Alessio |
|
Director |
|
50 |
|
2021 |
María Teresa Vial Álamos |
|
Director |
|
51 |
|
2024 |
Pablo Cabrera Gaete |
|
Director |
|
77 |
|
2016 |
Pablo Cruz Olivos |
|
Director |
|
57 |
|
2024 |
Salvatore Bernabei |
|
Director |
|
51 |
|
2016 |
| (1) | As of the date of this Report. |
Set forth below are brief biographical descriptions of the members of our Board as of March 31, 2025.
Marcelo Castillo Agurto: Mr. Castillo is currently head of institutional affairs international governance of Enel S.p.A. He has been a lecturer for more than 15 years in energy regulation and management at numerous universities and business schools. Since joining the Enel Group in 1990, he has held various positions throughout Europe, the Americas and Africa, among others. In 2014, he became head of business development of Enel Grids, a position he held until October 2023. He was head of international regulatory and antitrust affairs (2013), director and vice president of regulation for Latin America (2002-2013), and deputy director of business in a joint venture between Endesa S.A. and Morgan Stanley (2002). Previously, he was deputy commercial director, head of analysis, and deputy director of energy management of Endesa Chile. Mr. Castillo holds a degree in civil, industrial and electrical engineering from Pontifícia Universidad Católica de Chile, and an MBA from Universidad de Navarra in Madrid, Spain.
Isabella Alessio: Isabella is head of business to consumer legal affairs of Enel S.p.A. She was previously head of legal affairs for North, Central, and South America for the global infrastructure and networks line of Enel (2014-2017). She joined Enel as head of corporate affairs for Iberia and Latin America at Enel Green Power (2011-2014). Previously, she held positions at Grimaldi e Associati and at Clifford Chance law firms. She holds a law degree from University of Rome “La Sapienza” and has a master’s degree in European law.
María Teresa Vial Álamos: María Teresa is president of the Santiago Chamber of Commerce and a member of the board of directors of E-Cert Chile and Resolución en Línea S.p.A. She is also member of Chapter Zero Chile, a network of directors for climate action. María Teresa holds a law degree and a certificate in negotiation from Pontificia Universidad Católica de Chile. She also holds a master’s degree in business law and a certificate in construction from Universidad de Los Andes.
Pablo Cabrera Gaete: Mr. Cabrera is an advisor to the Asia Pacific Chamber of Commerce and a director of the Hong Kong Latin American Business Association, as well as a member of the Sociedad Chilena de Derecho Internacional. Mr. Cabrera was director of Academia Diplomática Andrés Bello (2010-2014) and served concurrently as ambassador to the Holy See, the Sovereign Military Order of Malta and Albania (2006-2010), the People’s Republic of China (2004-2006), Russia and Ukraine (2000-2004), and the United Kingdom and Ireland (1999-2000). He also headed the Subsecretaría de Marina de Chile (1995-1999). Mr. Cabrera holds a law degree from Pontificia Universidad Católica de Chile and is a certified career diplomat from Academia Diplomática Andrés Bello.
Pablo Cruz Olivos: Mr. Cruz has been and is a director of several private companies and non-profit foundations. He advises and consults for businesses seeking to expand and invest in new markets in Latin America. For more than a decade, he has been actively involved in the operational leasing business as an executive and director at Empresas Relsa and Arval Relsa. Additionally, he gained extensive experience in executive, managerial, commercial, and operational roles in various countries across Latin America and the United States from his service at ExxonMobil. Mr. Cruz holds a degree in civil engineering from Pontificia Universidad Católica de Chile.
75
Salvatore Bernabei: Mr. Bernabei is currently the CEO of Enel Green Power and head of global power generation. He was head of global procurement of Enel S.p.A. (2017-2020), head of renewable energy Latin America of Enel Green Power (2016-2017), and country manager for Chile and the Andean countries (2013-2016). He joined Enel in 1999 and has held several positions in engineering, construction, operation & maintenance, and safety, environment, and quality of life. Mr. Bernabei holds a degree in industrial engineering from Università degli Studi di Roma “Tor Vergata” and an MBA from Politecnico di Milan.
Executive Officers
Set forth below are our executive officers as of March 31, 2025:
Executive Officers |
|
Position |
|
Age(1) |
|
Year Joined Enel |
|
Current Position |
Giuseppe Turchiarelli |
|
Chief Executive Officer |
|
54 |
|
1998 |
|
2024 |
Simone Conticelli |
|
Chief Financial Officer |
|
52 |
|
2006 |
|
2024 |
Gaetano Manzulli |
|
People & Organization Officer |
|
40 |
|
2010 |
|
2025 |
Juan Diaz Valenzuela |
|
Internal Audit Officer |
|
38 |
|
2010 |
|
2022 |
Pedro Urzúa Frei |
|
External Relations & Sustainability Officer |
|
54 |
|
2012 |
|
2024 |
| (1) | As of the date of this Report. |
Set forth below are brief biographical descriptions of our executive officers as of March 31, 2025.
Giuseppe Turchiarelli: Mr. Turchiarelli has held prominent financial positions in Enel since 1998. He served as Interim CEO of Enel Chile from March to April 2024, and CFO of Enel Chile from 2019 to 2024. He was previously CFO for Europe and North Africa (2017-2019), head of planning and control in Italy (2015-2017), CFO for Iberia and Latin America (2013-2015), head of planning and control of the Enel Green Power group (2012-2013), CFO of Enel Latin America BV (2009-2011), and CFO for renewable generation in Italy and Europe (2001-2012). He holds a degree in business administration from Università degli Studi di Cagliari and an executive MBA from LUISS Business School.
Simone Conticelli: Mr. Conticelli joined the Enel Group in 2006, working in the Administration, Finance and Control – AFC area, as head of planning and control for Global Digital Solutions and the “Divisione Mercato Italia”. In 2023, he was appointed CFO of Slovenske Elektrarne. In 2019, he was head of industrial planning and control for the Global Power Generation Chile area, and then CFO of Enel Generación Chile. He has also served in the human resources area as head of organizational development of the Enel Group. He holds a degree in nuclear physics from Università degli Studi di Roma “Tor Vergata” and an MBA from the LUISS Business School.
Gaetano Manzulli: Mr. Manzulli joined the Enel Group in 2010 and has experience working on various projects in Latin America and Italy, including serving as head of people and organization for Colombia and Central America. He holds a master’s degree in electrical engineering from Politecnico di Bari.
Juan Diaz Valenzuela: Mr. Diaz joined Enel in 2010 and has held different positions in Internal Audit in Latin America. Between 2019 and 2022, he worked as audit and compliance manager of Enel Peru and its subsidiaries where he successfully implemented the Anti-Bribery Management System and the Local Crime Prevention Compliance Model. He holds a degree in information and management control engineering from Universidad de Chile, as well as specializations in electricity markets and project management from Universidad del Desarrollo and Universidad de Chile.
Pedro Urzúa Frei: Mr. Urzúa joined the Enel Group in 2012 as manager of institutional affairs for Chile and Andean countries of Enel Green Power, later becoming manager of institutional relations of Enel Chile. He is currently president of the San Ignacio de Huinay Foundation, director of the Chilean Chapter of the World Energy Council (WEC), and director of the Chilean-Argentine Chamber of Commerce. Mr. Urzúa holds a degree in journalism from Universidad de Artes y Ciencias de la Comunicación (UNIACC).
76
B. |
Compensation. |
At the OSM held on April 29, 2024, our shareholders approved our Board’s compensation policy for 2024. Director compensation consists of a monthly fixed compensation of UF 216 per month and an additional fee of UF 79.2 per meeting, up to a maximum of 16 sessions in total, including ordinary and extraordinary meetings, within the respective fiscal year. The chairman of the board is entitled to double the compensation of other directors.
Our Directors Committee members are paid a monthly fixed compensation of UF 72 per month and an additional fee of UF 26.4 per meeting, up to a maximum of 16 sessions in total, including ordinary and extraordinary meetings.
If a director serves on one or more boards of directors of the subsidiaries or associate companies or serves as a director of other companies or corporations where the group holds an interest directly or indirectly, the director can only receive compensation from one of these boards.
Our subsidiaries’ or affiliates’ executive officers will not receive compensation if they serve as directors of any other affiliate. However, the officer may receive compensation to the extent that it is expressly and previously authorized as an advance payment of the variable portion of the wage to be paid by the affiliate with which the officer signed a contract.
In 2024, the total compensation paid to each of our directors, including fees for attending Directors Committee meetings, was as follows:
Director |
|
Fixed |
|
Ordinary and Extraordinary Session |
|
Directors |
|
Ordinary and Extraordinary Session (Directors Committee) |
|
Total |
|
|
(in ThCh$) |
||||||||
Marcelo Castillo Agurto(1) |
|
— |
|
— |
|
— |
|
— |
|
— |
María Teresa Vial Álamos |
|
65,896 |
|
29,924 |
|
21,965 |
|
8,972 |
|
126,757 |
Pablo Cabrera Gaete |
|
97,314 |
|
38,690 |
|
32,438 |
|
11,894 |
|
180,336 |
Pablo Cruz Olivos |
|
65,896 |
|
29,924 |
|
21,965 |
|
8,972 |
|
126,757 |
Herman Chadwick Piñera(2) |
|
63,373 |
|
17,532 |
|
- |
|
- |
|
80,905 |
Fernán Gazmuri Plaza(2) |
|
31,686 |
|
8,766 |
|
10,562 |
|
2,922 |
|
53,936 |
Luis Gonzalo Palacios Vásquez(2) |
|
31,686 |
|
8,766 |
|
10,562 |
|
2,922 |
|
53,936 |
Isabella Alessio(1)(2) |
|
— |
|
— |
|
— |
|
— |
|
— |
Mónica Girardi(1)(3) |
|
— |
|
— |
|
— |
|
— |
|
— |
Salvatore Bernabei(1) |
|
— |
|
— |
|
— |
|
— |
|
— |
Total |
|
355,851 |
|
133,602 |
|
97,492 |
|
35,682 |
|
622,627 |
| (1) | Chairman Castillo and directors Alessio, Bernabei, and Girardi waived their compensation as directors of Enel Chile due to their positions as employees of Enel or other companies affiliated with Enel. |
| (2) | Held position until April 29, 2024. |
| (3) | Held position until September 27, 2024. |
We do not disclose any information about an individual executive officer’s compensation. Executive officers are eligible for variable compensation under a bonus plan. The yearly bonus plan is paid to our executive officers for achieving company-wide objectives and for their contribution to our results and goals. The annual bonus plan provides a range of bonus amounts according to seniority level and consists of a certain multiple of gross monthly salaries. For the year ended December 31, 2024, the aggregate gross compensation, paid and accrued, for all our executive officers, attributable to the fiscal year 2024, was Ch$1.9 billion in fixed compensation, and Ch$781 million in variable compensation and benefits.
We entered into severance indemnity agreements with all our executive officers. We will pay a severance indemnity for voluntary resignation or termination by mutual understanding among the parties. The severance indemnity does not apply if the termination is due to willful misconduct, prohibited negotiations, unjustified absences, or abandonment of duties, among other causes, as defined in Article 160 of the Chilean Labor Code. All our employees are entitled to a severance indemnity if terminated due to our needs, as described in Article 161 of the Chilean Labor Code.
77
We did not pay severance indemnity to our executive officers in 2024. There are no other amounts set aside or accrued to provide for pension, retirement, or similar benefits for our executive officers.
Incentive-Based Compensation Policy
In October 2022, the SEC adopted Rule 10D-1 under the Exchange Act, requiring national securities exchanges and national securities associations, such as NYSE, to require listed companies to adopt a written compensation recovery (clawback) policy providing for the recovery, in the event of a required accounting restatement, of incentive-based compensation received by the chief executive officer and certain other “executive officers” as defined in Rule 10D-1(d) under the Exchange Act. The amendment to NYSE’s listing rules became effective on October 2, 2023, and issuers like Enel Chile listed on NYSE were required to adopt SEC-compliant clawback policies by December 1, 2023.
On September 27, 2023, our Board adopted Enel Chile’s incentive-based compensation policy effective as of October 2, 2023, a copy of which is filed as Exhibit 97 to this Report. The incentive-based compensation policy complies with the requirements of Section 303A.14 of the NYSE listing rules implementing SEC Rule 10D-1.
Under our incentive-based compensation policy, in the event we are required to prepare an accounting restatement due to (i) material noncompliance with any financial reporting requirements under U.S. federal securities laws, including any required accounting restatement to correct an error in a previously issued financial statement that is material to such previously issued financial statement, or (ii) an error not material to a previously issued financial statement, but that would result in a material misstatement if the error were corrected in the current period financial statements or left uncorrected in the current period financial statements, we are entitled to recover or pay, as applicable, a portion or all of any incentive-based compensation provided to certain specified current or former executive officers (including the CEO, the CFO and the principal accounting officer), who, during a three-year period preceding the date on which an accounting restatement is required, received incentive compensation based on the erroneous financial data that exceeds or falls short of or is deficient with respect to, as applicable, the amount of incentive-based compensation the executive officer would have received based on the restatement. The Board (with a majority vote of the independent directors) administers our incentive-based compensation policy and has discretion, in accordance with the applicable laws, rules and regulations, to determine how to seek recovery under the policy and may forego recovery if it determines that recovery would be impracticable.
C. Board Practices.
Members of the Board do not have service contracts with us or with any of our subsidiaries that provide them benefits upon the termination of their service. Our current Board was elected at the OSM held on April 28, 2025, for a three-year term. The current chair of the Directors Committee is Maria Teresa Vial Álamos, and the other members are Gina Ocqueteau Tacchini and Pablo Cruz Olivos. For information about the directors in office as of March 31, 2025, and the year they began their service on the Board, see “Item 6. Directors, Senior Management and Employees — A. Directors and Senior Management” above.
Directors Committee (Audit Committee)
Set forth below are our members of the Directors Committee as of March 31, 2025:
Committee Member |
|
Position in Committee |
María Teresa Vial Álamos |
|
Chair |
Pablo Cabrera Gaete |
|
Member |
Pablo Cruz Olivos |
|
Member |
Our Directors Committee performs the following functions:
| ● | reviews of financial statements and the reports of the external auditors before their submission for shareholders’ approval; |
78
| ● | presents proposals to the board of directors, who then undertake their recommendations to shareholders meetings, for the selection of external auditors and private rating agencies; |
| ● | reviews information related to our transactions with related parties and reports the opinion of the Directors Committee to the board of directors; |
| ● | proposes to the board of directors a general policy on conflicts of interests, as well as reviews the related-party transaction policy; |
| ● | examines the compensation framework and plans for managers, executive officers, and employees; |
| ● | prepares an Annual Management Report, including recommendations to shareholders; |
| ● | provides information to the board of directors about the convenience of recruiting external auditors to provide non-auditing services, when such services are not prohibited by law, depending on whether such services might affect the external auditors’ independence; |
| ● | oversees the work of external auditors; |
| ● | reviews and approves of the annual auditing plan by the external auditors; |
| ● | evaluates the qualifications, independence, and quality of the auditing services; |
| ● | elaborates policies regarding the employment of former members of the external auditing firm; |
| ● | reviews and discusses problems or disagreements between management and external auditors regarding the auditing process; |
| ● | establishes procedures for receiving and dealing with complaints regarding accounting, internal controls, and auditing matters; and |
| ● | carries out other functions mandated to the Committee by the bylaws, our board of directors, or our shareholders. |
D. Employees.
The following table sets forth the total number of our personnel (permanent and temporary employees) in Enel Chile and our subsidiaries as of December 31, 2024, 2023, and 2022:
Company |
|
2024 |
|
2023 |
|
2022 |
Enel Distribución Chile(1) |
|
553 |
|
588 |
|
587 |
Enel Generación Chile |
|
559 |
|
573 |
|
616 |
Enel Chile(2) |
|
436 |
|
474 |
|
498 |
EGP Chile |
|
290 |
|
347 |
|
363 |
Enel X Chile |
|
97 |
|
94 |
|
93 |
Enel X Way Chile |
|
15 |
|
— |
|
— |
Pehuenche |
|
2 |
|
1 |
|
1 |
Total Personnel(3) |
|
1,952 |
|
2,077 |
|
2,158 |
| (1) | Includes Enel Colina S.A. |
| (2) | Beginning in 2023, includes Enel Mobility Chile |
| (3) | The total number of temporary employees was not significant. |
The Chilean Labor Code entitles all employees in Chile who are fired for reasons other than misconduct to a severance indemnity payment. In most cases, contracted employees are entitled to a legal minimum severance indemnity payment of one month’s salary for each year (and every fraction thereof beyond six months) worked, subject to a maximum of 11 months’ salary.
79
Our employment contracts typically provide severance indemnity payments higher than those required by the Chilean Labor Code. In most cases, we respect seniority as the time that the employee first joined us or an affiliate. Therefore, employees hired by one of our Chilean affiliates or predecessor companies maintain their seniority in the company and are treated contractually as if we had hired them. Under such employment contracts, severance indemnity payments for most of our employees consist of one month’s salary for each full year worked (and every fraction thereof beyond six months), subject to a maximum of 25 months. Under our collective bargaining agreements and other employment contracts not covered by such agreements, we are typically obligated to make severance indemnity payments to all covered employees in cases of voluntary resignation or death in specified amounts that increase according to seniority and often exceed the amounts required under Chilean law.
Collective Bargaining
The Company offers employment terms to its employees through contracts and collective bargaining agreements reached through collective negotiation processes between the Company and unions, in line with current legislation. The main topics covered by the current collective agreements are benefits and working conditions linked to productivity bonuses, overtime, and welfare benefits related to health, education, food, vacations, among others.
For Enel Chile and its subsidiaries, collective negotiation is an instrument that is validated by both sides and facilitates collaborative efforts. It enhances the organization’s positive social impact and includes the promotion of best practices such as freedom of association and fair wages. Enel Chile’s employees have the right to associate collectively and can join one of the many unions at the Company and its subsidiaries.
The following table sets forth the collective bargaining agreements with our personnel as of December 31, 2024.
|
|
|
|
|
|
|
|
|
|
|
In Force |
||
Company |
|
Union |
|
From |
|
To |
EGP Chile |
|
Workers, Engineers, and Professional Staff (SIPEF) |
|
December 2024 |
|
December 2027 |
EGP Chile |
|
EGP Workers, Engineers, and Professional Staff |
|
October 2023 |
|
October 2026 |
EGP Chile |
|
Professional/Technical Staff |
|
January 2024 |
|
December 2026 |
Enel Chile |
|
Professional Staff |
|
July 2022 |
|
July 2025 |
Enel Chile |
|
Administrative Staff |
|
January 2023 |
|
December 2025 |
Enel Chile |
|
Professional IT Staff |
|
January 2023 |
|
December 2025 |
Enel Colina |
|
Professional/Technical Staff |
|
November 2022 |
|
October 2025 |
Enel Colina |
|
Professional Staff |
|
January 2024 |
|
December 2026 |
Enel Distribución Chile |
|
Professional Staff |
|
January 2024 |
|
December 2026 |
Enel Distribución Chile |
|
Professional/Technical Staff |
|
January 2024 |
|
December 2026 |
Enel Distribución Chile |
|
Professional/Technical Staff |
|
January 2024 |
|
December 2026 |
Enel Distribución Chile |
|
Professional/Technical Staff |
|
January 2024 |
|
December 2026 |
Enel Distribución Chile |
|
Professional/Technical Staff |
|
January 2024 |
|
December 2026 |
Enel Generación Chile |
|
Professional/Technical Staff |
|
July 2022 |
|
June 2025 |
Enel Generación Chile |
|
Workers, Engineers, and Professional Staff (SIPEF) |
|
July 2023 |
|
June 2026 |
Enel Generación Chile |
|
Workers, Engineers, and Professional Staff (SINTEF) |
|
July 2023 |
|
June 2026 |
Enel Generación Chile |
|
Engineers and Professional Staff (SIEP) |
|
January 2024 |
|
December 2026 |
Enel Generación Chile |
|
Professional/Technical Staff (GAT) |
|
January 2024 |
|
December 2026 |
Enel X Chile |
|
Professional Staff |
|
January 2024 |
|
December 2026 |
Enel X Way |
|
Professional Staff |
|
January 2024 |
|
December 2026 |
80
The following table sets forth the percentage of our personnel who were unionized (permanent and temporary employees) at Enel Chile and our subsidiaries as of December 31, 2024, 2023, and 2022:
Company |
|
2024 |
|
2023 |
|
2022 |
|
|
(in %) |
||||
EGP Chile(1) |
|
84 |
|
79 |
|
76 |
Enel Chile(2)(3) |
|
75 |
|
73 |
|
72 |
Enel Distribución Chile(1) |
|
93 |
|
94 |
|
89 |
Enel Generación Chile(1) |
|
77 |
|
75 |
|
74 |
Enel X Chile |
|
85 |
|
81 |
|
— |
Total |
|
81 |
|
81 |
|
77 |
| (1) | Includes subsidiary(ies). |
| (2) | Beginning in 2023, includes Enel Mobility Chile |
| (3) | Includes Enel X Chile for year 2022. |
E. |
Share Ownership. |
To the best of our knowledge, none of our directors or officers owns more than 0.1% of our shares or holds any stock options. It is not possible to confirm whether any of our directors or officers has a beneficial, rather than direct, interest in our shares. Any share ownership by all our directors and officers amounts to significantly less than 10% of our outstanding shares.
F. Disclosure of a Registrant’s Action to Recover Erroneously Awarded Compensation.
As of the date of this Report, we have not been required to prepare an accounting restatement for the fiscal year ended December 31, 2024, that required recovery of erroneously awarded compensation pursuant to our incentive-based compensation policy.
Item 7. Major Shareholders and Related-Party Transactions
A. |
Major Shareholders. |
We have only one class of capital stock, and Enel, our controlling shareholder, has the same voting rights as our other shareholders. As of December 31, 2024, 5,895 shareholders of record held 69,166,557,220 shares of our outstanding common stock. Enel owned 44,334,165,152 common shares and 11,457,799 ADSs equivalent to 572,889,950 shares, aggregating a 64.93% ownership interest in us. There were five record holders of our ADSs, as of such date.
It is not practicable for us to determine the number of our ADSs, or our common shares, beneficially owned in the United States. The depositary for our ADSs only registers the record holders, including the Depositary Trust Company and its nominees. As a result, we are not able to ascertain the domicile of the ultimate beneficial holders represented by the five ADS record holders in the United States, nor are we able to determine the domicile of any of our foreign shareholders who hold our common stock, either directly or indirectly.
As of December 31, 2024, Chilean private pension funds (“AFPs”) owned 7.3% of our shares in the aggregate. Chilean stockbrokers, mutual funds, insurance companies, foreign equity funds, and other Chilean institutional investors collectively held 22.2% of our shares. ADS holders owned 4.4% of our shares, and 5,753 minority shareholders held the remaining 1.1% of our shares.
81
The following table sets forth information concerning ownership of the common stock as of April 1, 2025, for the only stockholder known by us to own more than 5% of the outstanding shares of common stock:
|
|
Number of Shares |
|
Percentage of Shares |
Enel S.p.A. (Italy) |
|
44,907,055,101 |
|
64.93% |
Enel, an Italian company and our controlling shareholder that beneficially owned 64.93% of our shares as of December 31, 2024, is a multinational power company and a leading integrated player in the global power and renewables markets. It is one of the largest European utility companies with operations in 28 countries worldwide and a consolidated installed capacity of approximately 90 GW, including BESS. Enel distributes electricity through a network of 1.9 million kilometers to 68.5 million customers. It is one of the world’s largest network operators and has one of the most extensive customer bases. Enel’s shares are listed on Euronext Milan organized and managed by Borsa Italiana S.p.A.
B. |
Related-Party Transactions. |
Article 146 of Law No. 18,046 (the “Chilean Corporations Law”) defines related-party transactions as those involving a company and any entity belonging to the corporate group, its parent companies, controlling companies, subsidiaries or related companies, board members, managers, administrators, senior officers or company liquidators, including their spouses, some of their relatives, and all entities controlled by them, in addition to individuals who may appoint at least one member of the company’s board of directors or who hold 10% or more of voting capital, or companies in which a board member, manager, administrator, senior officer or company liquidator has been serving in the same position within the last 18 months.
Article 147 of the Chilean Corporations Law (“Article 147”) requires that related-party transactions contribute to the corporate interest and consider the prices, terms, and conditions prevailing in the market at the time of their approval. Article 147 provides that board members, managers, administrators, senior officers, or company liquidators having a personal interest or acting on negotiations of a related-party transaction must immediately inform the board of directors. Such a transaction shall only be approved if an absolute majority of the directors (excluding interested directors) consider the transaction beneficial for the corporate interest. Chilean law requires an interested director to abstain from voting on such a transaction. If an absolute majority of the directors are obliged to abstain from voting on any particular transaction, it shall only be approved if authorized unanimously by the non-interested directors or during an ESM. Board resolutions approving related-party transactions must be reported to the company’s shareholders at the next shareholders’ meeting.
The law described above, which also applies to our subsidiaries, provides for some exceptions. In some instances, the board’s approval would suffice for related-party transactions, under certain transaction thresholds when the transactions are conducted with another entity in which we hold 95% or more of their capital, or when such transactions are conducted in compliance with the related-party policies defined by the company’s board. In 2024, CMF General Rule 501 came into effect, which provides for the inclusion of minimum information in Habituality Policies and sets specific requirements for transactions to be included in such policies, as well as requires semi-annual reports to the public of all transactions with related parties carried out during the respective period, whether or not under an exception. At its meeting held on July 24, 2024, our Board updated our related-party transaction policy. This policy is available on our website at www.enelchile.cl.
If a transaction is not in compliance with Article 147, this will not affect its validity. Still, the Company or its shareholders may demand compensation for damages from the individual associated with the infringement as provided by law.
82
The following are related-party financial transactions conducted between January 1, 2024, and March 31, 2025:
Lender |
|
Borrower |
|
Issuance Date |
|
Maturity Date |
|
Amount (millions) |
|
Interest Rate |
|
Outstanding Principal(1) |
|
Contract Type |
Enel Chile |
|
EGP Chile |
|
Dec-24 |
|
Dec-29 |
|
US$196 |
|
6.85% |
|
US$196 |
|
Term loan |
Enel Chile |
|
EGP Chile |
|
Dec-24 |
|
Dec-31 |
|
US$96 |
|
6.93% |
|
US$96 |
|
Term loan |
Enel Chile |
|
EGP Chile |
|
Dec-24 |
|
Dec-30 |
|
US$86 |
|
6.88% |
|
US$86 |
|
Term loan |
Enel Chile |
|
Enel Distribución Chile |
|
Feb-25 |
|
Feb-28 |
|
Ch$250,000 |
|
7.73% |
|
Ch$250,000 |
|
CCM-LT(2) |
Enel Chile |
|
Enel Distribución Chile |
|
Mar-25 |
|
Mar-28 |
|
Ch$130,000 |
|
7.22% |
|
Ch$130,000 |
|
CCM-LT(2) |
EFI |
|
Enel Chile |
|
Mar-24 |
|
Mar-27 |
|
US$50 |
|
SOFR + 1,00% |
|
— |
|
Revolving loan |
EFI |
|
Enel Chile |
|
Mar-24 |
|
Mar-26(3) |
|
US$700 |
|
SOFR + 1,45% |
|
— |
|
Revolving loan |
| (1) | Expressed in millions as of March 31, 2025. |
| (2) | Long-term transaction under our centralized cash management mechanism. |
| (3) | Enel Chile closed the loan contract in November 2024. |
Our internal procedure provides that all our subsidiaries’ cash inflows and outflows are managed through a centralized cash management mechanism. It is common practice in Chile to transfer surplus funds from one company to an affiliate that has a cash deficit. These transfers are executed through either short-term or long-term transactions. Under Chilean laws and regulations, such transactions must be conducted on an arms-length basis. All these transactions are subject to the supervision of our Directors Committee. As of April 1, 2025, the peso-denominated short-term transactions were priced at TAB 1m (a Chilean interbank interest rate published daily) plus 1.44% when lending to subsidiaries and TAB 1m minus 0.18% when accepting deposits of cash surpluses from subsidiaries. The US$-denominated short-term transactions were priced at SOFR 1m plus 1.48% when lending to subsidiaries and SOFR 1m plus 0.21% when accepting deposits of cash surpluses from subsidiaries.
The following are related-party transactions under the centralized cash management mechanism conducted between January 1, 2024, and March 31, 2025.
| ● | We granted short-term intercompany loans to our subsidiaries EGP Chile, Enel Colina, Enel Distribución Chile, Enel Generación Chile, Enel Mobility Chile S.pA., Enel X Chile, Geotérmica del Norte, Parque Eólico Talinay Oriente S.A., Pehuenche, and Sociedad Agrícola de Cameros Ltda. As of March 31, 2025, the total outstanding balance of these loans was Ch$118 billion, including interest. |
| ● | Under our cash management contracts, EGP Chile, Enel Colina, Enel Distribución Chile, Enel Generación Chile, Enel Mobility Chile S.pA., Enel X Chile, Geotérmica del Norte, Parque Eólico Talinay Oriente S.A., Pehuenche, and Sociedad Agrícola de Cameros Ltda. all transfer cash surpluses to Enel Chile. As of March 31, 2025, the total outstanding balance of these transfers was Ch$584 billion, including interest. |
All these intercompany cash flows help meet our working capital needs and those of our subsidiaries.
We have various contractual relationships with EGP Chile, Enel Americas, Enel Distribución Chile, Enel Generación Chile, Enel S.p.A., and Enel X Chile to provide intercompany services. We entered into intercompany agreements under which we provide services directly and indirectly to Enel Americas, to Enel Distribución Chile and its subsidiaries, to Enel Generación Chile and its subsidiaries, and to our other subsidiaries. The services to be rendered by us include specific legal, finance, treasury, insurance, capital markets, financial and documentary compliance, accounting, human resources, communications, security, relations with contractors, purchases, IT, tax, corporate affairs, and other corporate support and administrative services. The services rendered vary depending on the company receiving the service. These services are provided and charged at market prices if there is a comparable reference service. If there are no similar services in the market, they will be provided at cost plus a specified percentage. The intercompany services contracts are valid for one-year terms as of July 21, 2021, and subject every year to automatic renewal for one year.
As of the date of this Report, the transactions above have not experienced material changes. As of December 31, 2024, there were other commercial transactions with related parties. Please see Note 10 of the Notes to our consolidated financial statements for more information regarding related-party transactions.
83
C. |
Interests of Experts and Counsel. |
Not applicable.
Item 8. Financial Information.
| A. | Consolidated Statements and Other Financial Information. |
See “Item 18. Financial Statements.”
Legal Proceedings
Our subsidiaries and we are parties to legal proceedings arising in the ordinary course of business. We believe it is unlikely that any loss associated with pending lawsuits will significantly affect the normal development of our business.
Please refer to Note 36.3 of the Notes to our consolidated financial statements for detailed information as of December 31, 2024, on the status of the pending material lawsuits filed against us.
Concerning the legal proceedings reported in the Notes to our consolidated financial statements, we use the criterion of disclosing lawsuits above a minimum threshold of US$10 million of potential impact to us, and, in some cases, qualitative criteria according to the materiality of the plausible effect on the conduct of our business. The lawsuit status includes a general description, the process status, and the estimate of the amount involved in each lawsuit.
Dividend Policy
Our Board presents an annual proposal for approval to the OSM for a final dividend payable each year. The dividend is accrued in the prior year and cannot be less than the legal minimum of 30% of annual net income. Our Board also informs the dividend policy for the current fiscal year. Additionally, our Board generally establishes an interim dividend for the current fiscal year, payable in January of the following year and deducted from the final dividend payable in May of the next year. The Board can freely establish an interim dividend provided there are no accumulated losses.
For dividends accrued in the fiscal year 2024, on November 15, 2024, the Board agreed to distribute an interim dividend of Ch$0.90671 per share of common stock on January 24, 2025, equal to 15% of consolidated net income as of September 30, 2024. At the OSM held on April 28, 2025, our shareholders approved a final dividend, after deducting the interim dividend paid in January 2025, of Ch$0.14229 per share for the year 2024, equivalent to a payout of 50% of annual net income for the fiscal year 2024. At the OSM held on April 28, 2025, our shareholders also approved a dividend of Ch$3.19579 charged to retained earnings from prior fiscal years. Both dividends will be distributed in May 2025.
For dividends relating to the fiscal year 2025, our Board presented at the OSM held on April 28, 2025, the following proposed dividend policy:
| ● | An interim dividend, accrued in the fiscal year 2025 and amounting to 15% of consolidated net income as of September 30, 2025, to be paid in January 2026. |
| ● | A final dividend payout of 50% of annual net income for the fiscal year 2025, to be paid in May 2026, from which the interim dividend to be paid in January 2026 will be deducted. |
This dividend policy is conditional on generating net profits in each period, expectations of future profit levels, and other conditions that may exist at the time of such dividend declaration. The proposed dividend policy is subject to our Board’s right to change the amount and timing of the dividends under prevailing circumstances at the time of the payment.
84
Dividends will continue to be paid in Chilean pesos in 2025 notwithstanding the change in our functional currency to the U.S. dollar.
Dividend payments are potentially subject to legal restrictions, such as the requirement to pay dividends from either net income or retained earnings of the fiscal year. However, these potential legal restrictions do not currently affect our ability or any of our subsidiaries’ ability to pay dividends. Please see “Item 5. Operating and Financial Review and Prospects — B. Liquidity and Capital Resources” for additional information.
Shareholders of each subsidiary and affiliate agree on the final dividend payments. Dividends are paid to shareholders of record as of midnight of the fifth business day before the payment date. Holders of ADSs on the applicable record dates will be entitled to receive dividend payments.
Dividends
For each of the years indicated, the table below sets forth the dividends paid in each year by us in Chilean pesos per common share and U.S. dollars per ADS. For additional information, see Note 27.2 of the Notes to our consolidated financial statements.
|
|
Dividends Distributed(1) |
||
Year |
|
Ch$ per Share |
|
US$ per ADS(2) |
2024 |
|
4.58 |
|
0.23 |
2023 |
|
5.43 |
|
0.31 |
2022 |
|
0.37 |
|
0.02 |
| (1) | This table shows dividends paid in, rather than dividends declared with respect to, the given year. These amounts do not reflect a reduction for Chilean withholding taxes, if applicable. Figures have been rounded. |
| (2) | The U.S. dollar per ADS amount was calculated by applying the exchange rate as of December 31 of each year. One ADS = 50 shares of common stock. |
For a discussion of Chilean withholding taxes and access to the formal currency market in Chile in connection with the payment of dividends and sales of ADS and the underlying common stock, see “Item 10. Additional Information — E. Taxation” and “Item 10. Additional Information — D. Exchange Controls.”
B. |
Significant Changes |
As of January 1, 2025, we changed our functional currency from Chilean pesos to U.S. dollars. In the future, we will present our financial statements in U.S. dollars, although dividends will remain paid in Chilean pesos.
Item 9. The Offer and Listing
A. |
Offer and Listing Details. |
Our shares of common stock are listed and traded on the Chilean Stock Exchanges under the trading symbol “ENELCHILE,” and our ADS are listed and traded on the NYSE under the trading symbol “ENIC.”
B. |
Plan of Distribution. |
Not applicable.
C. |
Markets. |
In Chile, our common stock is traded on the following stock exchanges: the Bolsa de Comercio de Santiago (Santiago Stock Exchange or “SSE”) and the Bolsa Electrónica de Chile (Chilean Electronic Stock Exchange or “ESE”). These stock exchanges operate on business days from 9:30 a.m. to 4:00 p.m., which may differ from New York City time by up to two hours, depending on the season.
85
As of December 31, 2024, the SSE and ESE accounted for 94.9% and 5.1% of our total equity traded in Chile, respectively.
In the United States, our common stock trades on the NYSE, our primary market, in the form of ADSs. Each ADS represents 50 shares of common stock, with the ADS in turn evidenced by American Depositary Receipts (“ADRs”). The ADRs were issued under a Deposit Agreement dated April 26, 2016, between us, Citibank N.A., acting as Depositary (the “Depositary”), and the holders and beneficial owners from time to time of ADRs issued thereunder, which was amended on February 14, 2018 (the “Deposit Agreement”). The Depositary treats only persons in whose names ADRs are registered in the books of the Depositary as owners of ADRs. The NYSE operates on business days from 9:30 a.m. to 4:00 p.m.
Our equity shares are part of the SPCLXIGPA and SPCLXIPSA, leading Chilean stock market indices, as well as the MSCI Universal and ESG focus indices, FTSE4Good Emerging Latin America index, and S&P Dow Jones Sustainability Index, in which we are leaders three categories: Emerging Markets, Pacific Alliance Integrated Markets (“MILA” in its Spanish acronym), and S&P IPSA ESG Tilted index.
The following table contains information regarding the amount of total traded shares of common stock and the corresponding percentage traded per market during 2024:
Market |
|
Number of Common |
|
Percentage of Shares Traded |
Chile(1) |
|
22,022,976,607 |
|
80.3% |
United States (One ADS = 50 shares of common stock)(2) |
|
5,389,951,150 |
|
19.7% |
Total |
|
27,412,927,757 |
|
100.0% |
(1) |
Includes SSE and ESE. |
(2) |
Includes the NYSE and over-the-counter trading. |
D. |
Selling Shareholders. |
Not applicable.
E. |
Dilution. |
Not applicable.
F. |
Expenses of the Issue. |
Not applicable.
Item 10. Additional Information
A. |
Share Capital. |
Not applicable.
B. |
Memorandum and Articles of Association. |
Description of Share Capital
Set forth below is certain information concerning our share capital and a summary of certain significant Chilean law provisions and our bylaws.
86
General
Shareholders’ rights in Chilean companies are governed by the company’s bylaws (estatutos), which have the same purpose as the articles or the certificate of incorporation and the bylaws of a company incorporated in the United States and the Chilean Corporations Law (Law No. 18,046). Under the Chilean Corporations Law, shareholders’ legal actions to enforce their rights as shareholders of the company must be brought in Chile in arbitration proceedings or, at the plaintiff’s option, before Chilean courts. Members of the board of directors, managers, officers, and principal executives of the company, or shareholders that individually own shares with a book value or stock value higher than UF 5,000 (approximately Ch$192 million as of December 31, 2024) do not have the option to bring the procedure to the courts.
The CMF regulates the Chilean securities markets under the Securities Market Law (Law No. 18,045) and the Chilean Corporations Law. These two laws state the disclosure requirements, restrictions on insider trading and price manipulation, and protect minority shareholders. The Securities Market Law sets forth requirements for public offerings, stock exchanges, and brokers and outlines disclosure requirements for companies that issue publicly offered securities. The Chilean Corporations Law and the Securities Market Law, both as amended, state rules regarding takeovers, tender offers, transactions with related parties, qualified majorities, share repurchases, directors committees, independent directors, stock options, and derivative actions.
Public Register
We are a publicly held limited liability stock corporation incorporated under the laws of Chile. We were incorporated by public deed issued on January 8, 2016, by the Santiago Notary Public, Mr. Iván Torrealba A., and registered on January 19, 2016, in the Commercial Register (Registro de Comercio del Conservador de Bienes Raíces y Comercio de Santiago) on pages 4288 No. 2570. Our registry in the Securities Registry of the CMF was approved by the CMF on April 13, 2016. We also registered with the United States Securities and Exchange Commission under the commission file number 001-37723 on March 31, 2016.
Reporting Requirements Regarding Acquisition or Sale of Shares
Under Article 12 of the Securities Market Law and General Norm Regulation No. 269 of the CMF, certain information regarding transactions in shares of a publicly held limited liability stock corporation or in contracts or securities whose price or financial results depend on, or are conditioned in whole or in a significant part on the price of such shares, must be reported to the CMF and the Chilean Stock Exchanges. Since ADSs are deemed to represent the shares of common stock underlying the ADRs, transactions in ADRs will be subject to these reporting requirements and those established in Circular No. 1375 of the CMF. Shareholders of publicly held limited liability stock corporations are required to report to the CMF and the Chilean Stock Exchanges:
| ● | any direct or indirect acquisition or sale of shares made by a holder who owns, directly or indirectly, at least 10% of a publicly held limited liability stock corporation’s subscribed capital; |
| ● | any direct or indirect acquisition or sale of contracts or securities whose price or financial results depend on or are conditioned in whole or in a significant part on the price of shares made by a holder who owns, directly or indirectly, at least 10% of a publicly held limited liability stock corporation’s subscribed capital; |
| ● | any direct or indirect acquisition of shares made by a holder who, due to a purchase of shares of such publicly held stock company, results in the holder acquiring, directly or indirectly, at least 10% of a publicly held limited liability stock corporation’s subscribed capital; |
| ● | any direct or indirect acquisition or sale of shares in any amount, made by a director, receiver, principal executive, general manager, or manager of a publicly held limited liability stock corporation; and |
| ● | any direct or indirect acquisition or sale of contracts or securities whose price or financial results depend on or are conditioned in whole or in significant part on the price of shares made by a director, receiver, principal executive, general manager, or manager of a publicly held limited liability stock corporation. |
87
The majority shareholders of a publicly held limited liability stock corporation must inform the CMF and the Chilean Stock Exchanges if such acquisitions are entered into to acquire control of the company or make a passive financial investment instead.
Under Article 54 of the Securities Market Law and General Rule No. 104 enacted by the CMF, unless the tender offer regulation applies, any person who directly or indirectly intends to take control of a publicly held limited liability stock corporation must disclose this intent to the market at least ten business days in advance of the proposed change of control and, in any event, as soon as the negotiations for the change of control have taken place or reserved information of the publicly held limited liability stock corporation has been provided.
Corporate Objectives and Purposes
Article 4 of our bylaws states that our corporate objectives and purposes are, among other things, to conduct the exploration, development, operation, generation, distribution, transformation, or sale of energy in Chile in any form, directly or through other companies, as well as to provide engineering consulting services related to these objectives and to make loans to related companies, subsidiaries, and affiliates.
Board of Directors
Our Board consists of seven members elected by shareholders at an OSM for a three-year term, at the end of which each member will be re-elected or replaced.
The seven directors elected at the OSM are the seven individual nominees who receive the highest majority of the votes, provided that one of those individuals is an independent director. Shareholders may vote their shares in favor of one nominee or may apportion their shares among any number of nominees.
The effect of these voting provisions is to ensure that a shareholder owning more than 12.5% of our shares can elect a board member. However, depending on the distribution of the rest of the votes at the OSM, a director may in some cases be elected with the votes of less than 12.5% of our shares. This number is derived from the reciprocal of the number of directors plus one. In our case, there are seven directors, and the reciprocal of eight is equal to 12.5%.
The compensation of the directors is established annually at the OSM. See “Item 6. Directors, Senior Management and Employees — B. Compensation.”
Agreements entered into by us with related parties can only be executed when such agreements serve our interest, and their price, terms, and conditions are consistent with prevailing market conditions at the time of their approval and comply with all the requirements and procedures indicated in Article 147 of the Chilean Corporations Law.
Certain Powers of the Board of Directors
As of the date of this Report, every agreement or contract that we enter into with our controlling shareholder, our directors or executives, or their related parties, must be previously approved by two-thirds of the Board and be included in the board meetings, as set forth by the Chilean Corporations Law.
Our bylaws do not contain provisions relating to:
| ● | the directors’ power, in the absence of an independent quorum, to vote on compensation for themselves or any members of their body; |
| ● | borrowing powers exercisable by the directors and how such borrowing powers can be changed; |
| ● | retirement or non-retirement of directors under an age limit requirement; or |
88
| ● | the number of shares, if any, required for directors’ qualification. |
Certain Provisions Regarding Shareholder Rights
As of the date of this Report, our capital comprises only one class of shares, all of which are common shares and have the same rights.
Our bylaws do not contain any provisions relating to:
| ● | redemption provisions; |
| ● | sinking funds; or |
| ● | liability for capital reductions by us. |
Under Chilean law, the rights of our shareholders may only be modified by an amendment to the bylaws that complies with the requirements explained below under “Item 10. Additional Information — B. Memorandum and Articles of Association — Shareholders’ Meetings and Voting Rights.”
Capitalization
Under Chilean law, only the shareholders of a company acting at an ESM have the power to authorize a capital increase. When an investor subscribes shares, these are officially issued and registered under the subscriber’s name. The subscriber is treated as a shareholder for all purposes, except the receipt of dividends and return of capital if the shares have been subscribed but not paid. The subscriber becomes eligible to receive dividends only for the shares that the subscriber has paid for or, if the subscriber has paid for only a portion of such shares, the pro-rata portion of the dividends declared with respect to such shares unless the company’s bylaws provide otherwise. If a subscriber does not fully pay for subscribed shares on or before the payment date, notwithstanding the actions intended by the company to collect payment, the company is entitled to auction on the stock exchange where such shares are traded, for the account and risk of the debtor, the number of shares held by the debtor necessary for the company to pay the outstanding balances and disposal expenses. However, until such shares are sold at auction, the subscriber continues to hold all the shareholder rights, except the right to receive dividends and return of capital. The chief executive officer, or the person replacing the chief executive officer, will reduce in the shareholders’ register the number of shares in the name of the debtor shareholder to the number of shares that remain, deducting the shares sold by the company and settling the debt in the amount necessary to cover the result of such disposal after related expenses.
When there are authorized and issued shares for which full payment has not been made within the period fixed by shareholders at the same ESM at which the subscription was authorized (which may not exceed three years from the date of such meeting, unless a stock option plan is approved, in which case the period to pay for the shares under such program may be up to five years), these shall be reduced in the non-subscribed amount until that date. Concerning the shares subscribed and not paid following the term mentioned above, the board must proceed to collect payment, unless the shareholders’ meeting authorizes the board not to do so (by two-thirds of the voting shares), in which case the capital shall be reduced by force of law to the amount effectively paid. Once collection actions have been exhausted, the board should propose to the shareholders’ meeting the approval by a simple majority of the write-off of the outstanding balance and the reduction of capital to the amount effectively collected.
As of December 31, 2024, the Company’s subscribed and fully paid capital totaled Ch$ 3.9 trillion consisting of 69,166,557,220 shares.
Preemptive Rights and Increases of Share Capital
Except for capital increases needed to carry out a merger, Chilean regulation requires Chilean publicly held limited liability stock corporations to grant shareholders preemptive rights to purchase a sufficient number of shares, or any other securities convertible into shares or that confer future rights over shares, to maintain their existing ownership percentage of such company whenever such company issues new shares, or any other securities convertible into shares or that confer future rights over shares.
89
Under Chilean law, preemptive rights are exercisable or freely transferable by shareholders for 30 days. The options to subscribe for shares in capital increases of the company or of any other securities convertible into shares or that confer future rights over these shares should be offered at least once to the shareholders pro-rata to the shares held registered in their name at midnight on the fifth business day before the date of the start of the preemptive rights period. The preemptive rights offering and the beginning of the 30 days for exercising them shall be communicated through the publication of a prominent notice, at least once, in the newspaper that should be used for notifications of shareholders’ meetings. During such 30 days, and for an additional period of at least 30 days immediately following the initial 30-day period, publicly held limited liability stock corporations are not permitted to offer any unsubscribed shares to third parties under more favorable terms than those provided to their shareholders. At the end of the second 30-day period, a Chilean publicly held limited liability stock corporation is authorized to sell unsubscribed shares to third parties on any terms, provided they are sold on one of the Chilean Stock Exchanges.
Shareholders’ Meetings and Voting Rights
An OSM must be held within the first four months following the end of our fiscal year. Our last OSM was held on April 28, 2025. An ESM may be called by the Board when deemed appropriate. An ESM or OSM, as the case may be, must be called when requested by shareholders representing at least 10% of the issued shares with voting rights, or by the CMF. To convene an OSM or ESM, notice must be given three times in a newspaper located in our corporate domicile, at least ten days in advance of the scheduled meeting. The newspaper designated by our shareholders is El Mercurio de Santiago. The notice must also be mailed to the CMF and the Chilean Stock Exchanges.
The OSM or ESM shall be held on the day stated in the notice and should remain in session until all the matters stated in the notice have been addressed. However, once constituted, upon the proposal of the chairman of the board or shareholders representing at least 10% of the shares with voting rights, the majority of the shareholders present may agree to suspend it and to continue it within the same day and place, with no new constitution of the meeting or qualification of powers being necessary, recorded in one set of minutes. Only those shareholders who were present or represented may attend the recommencement of the meeting with voting rights.
Under Chilean law, a quorum for a shareholders’ meeting is established by the presence, in person or by proxy, of shareholders representing at least a majority of the issued shares with voting rights of a company. If a quorum is not present at the first meeting, a reconvened meeting can occur at which the shareholders present are deemed to constitute a quorum regardless of the percentage of the shares represented. This second meeting must take place within 45 days following the scheduled date for the first meeting. Shareholders’ meetings adopt resolutions by the affirmative vote of a majority of those shares present or represented at the meeting unless a qualified majority is required.
Regardless of the quorum present, a vote of at least a two-thirds majority of the outstanding shares with voting rights is required to adopt any of the following actions:
● |
a transformation of the company into a form other than a publicly held limited liability stock corporation under the Chilean Corporations Law, a merger or split-up of the company; |
● |
an amendment to the term of duration or early dissolution of the company; |
● |
a change in the company’s domicile; |
● |
a decrease in corporate capital; |
● |
an approval of capital contributions in kind and non-monetary assessments; |
● |
a modification of the authority reserved to shareholders or limitations on the board of directors; |
● |
a reduction in the number of members of the board of directors; |
90
● |
the disposition of 50% or more of the assets of the company, whether it includes the disposition of liabilities or not, as well as the approval or the amendment of the business plan that contemplates the disposition of assets in an amount greater than such percentage; |
● |
the disposition of 50% or more of the assets of a subsidiary, as long as such subsidiary represents at least 20% of the assets of the corporation, as well as any disposition of its shares that results in the parent company losing its position as controlling shareholder; |
● |
the form of distributing corporate benefits; |
● |
issue of guarantees for third-party liabilities that exceed 50% of the assets, except when the third party is a subsidiary of the company, in which case approval of the board of directors is deemed sufficient; |
● |
the purchase of the company’s shares; |
● |
other actions established by the bylaws or the laws; |
● |
certain remedies for the nullification of the company’s bylaws; |
● |
inclusion in the bylaws of the right to purchase shares from minority shareholders, when the controlling shareholders reach 95% of the company’s shares through a tender offer for all of the company’s shares, where at least 15% of the shares have been acquired from unrelated shareholders; and |
● |
approval or ratification of acts or contracts with related parties. |
Certain amendments to our bylaws require the affirmative vote of 75% of the outstanding shares with voting rights.
Bylaw amendments for creating a new class of shares, or an amendment to or an elimination of those classes of shares that already exist, must be approved by at least two-thirds of the outstanding shares of the affected series.
Chilean law does not require a publicly held limited liability stock corporation to provide its shareholders the same level and type of information required by the U.S. securities laws regarding proxies’ solicitation. However, shareholders are entitled to examine the financial statements and corporate books of a publicly held limited liability stock corporation and its subsidiaries within 15 calendar days before its scheduled shareholders’ meeting. Under Chilean law, publicly held limited liability stock corporations must also inform, at least ten days in advance of the scheduled meeting and in the manner to be established by the CMF, the fact that an ESM or OSM has been summoned, indicating the date, a reference to the matters to be discussed, and how complete copies of the documents that support the issues submitted for voting can be obtained, which must also be made available to the shareholders on the company’s website. In the case of an OSM, our annual report of activities, which includes audited financial statements, must also be made available to shareholders and published on our website at: www.enelchile.cl.
The Chilean Corporations Law provides that, upon the request by the Directors Committee or by shareholders representing at least 10% of the issued shares with voting rights, a Chilean company’s annual report must include, in addition to the materials provided by the board of directors to shareholders, such shareholders’ comments and proposals concerning the company’s affairs. Under Article 136 of the Chilean Corporations Regulation (Reglamento de Sociedades Anónimas), the shareholder(s) holding or representing at least 10% of the shares issued with voting rights, may:
● |
make comments and proposals relating to the progress of the corporate businesses in the corresponding year, no shareholder can make individually or jointly more than one presentation. These observations should be presented in writing to the company concisely, responsibly, and respectfully. The respective shareholder(s) should state their willingness to be included as an appendix to the annual report. The board shall include in an appendix to the annual report of the year a faithful summary of the pertinent comments and proposals the interested parties had made, provided they are presented during the year or within 30 days after its ending; or |
● |
make comments and proposals on matters that the board submits for the shareholders’ knowledge or voting. The board shall include a faithful summary of those comments and proposals in all information it sends to |
91
shareholders, provided the shareholders’ proposal is received at the offices of the company at least ten days before the date of dispatch of the information by the company.
The shareholders should present their comments and proposals to the company, expressing their willingness to be included in the appendix to the respective annual report or in information sent to shareholders, as the case may be. The observations referred to in Article 136 may be made separately by each shareholder holding at least 10% of the shares issued with voting rights or shareholders who together hold that percentage, who should act as one.
Similarly, the Chilean Corporations Law provides that whenever the board of directors of a publicly held limited liability stock corporation convenes an OSM or ESM and solicits proxies for the meeting, or circulates information supporting its decisions or other similar material, it is obligated to include the pertinent comments and proposals that may have been made by the Directors Committee or by shareholders owning at least 10% of the shares with voting rights who request that such comments and proposals be so included.
Only shareholders registered as such with us as of midnight on the fifth business day before a meeting date, are entitled to attend and vote their shares. A shareholder may appoint another individual, who does not need to be a shareholder, as his proxy to attend the meeting and vote on his behalf. Proxies for such representation shall be given for all the shares held by the owner. The proxy may contain specific instructions to approve, reject, or abstain concerning any of the matters submitted for voting at the meeting and included in the notice. Every shareholder entitled to attend and vote at a shareholders’ meeting shall have one vote for every share subscribed.
There are no limitations imposed by Chilean law or our bylaws on the right of nonresidents or foreigners to hold or vote shares of common stock. However, the registered holder of the shares of common stock represented by ADSs, and evidenced by outstanding ADSs, is the custodian for the Depositary (Citibank, N.A.), currently Banco Santander-Chile, or any successor custodian. Accordingly, holders of ADSs are not entitled to receive notice of shareholders’ meetings or vote the underlying shares of common stock represented by ADSs directly. The Deposit Agreement contains provisions under which the Depositary has agreed to request instructions from registered holders of ADSs regarding the exercise of the voting rights of the shares of common stock represented by the ADSs. Subject to compliance with the requirements of the Deposit Agreement and receipt of such instructions, the Depositary has agreed to endeavor, insofar as practicable and permitted under Chilean law and the provisions of the bylaws, to vote or cause to be voted (or grant a discretionary proxy to the chairman of the board or to a person designated by the chairman of the board to vote) the shares of common stock represented by the ADSs under any such instruction. The Depositary shall not exercise any voting discretion over any shares of common stock underlying ADSs. If the Depositary receives no voting instructions from a holder of ADSs concerning the shares of common stock represented by the ADSs, on or before the date established by the Depositary for such purpose, the shares of common stock represented by the ADSs may, in some situations, be voted in the manner directed by the chairman of the board, or by a person designated by the chairman of the board, subject to the limitations outlined in the Deposit Agreement.
Dividends and Liquidation Rights
According to the Chilean Corporations Law, unless otherwise decided by a unanimous vote of its issued shares eligible to vote, all publicly held limited liability stock corporations must distribute a cash dividend in an amount equal to at least 30% of their consolidated net income, unless and except to the extent we have carried forward losses. The law provides that the Board must agree to the dividend policy and inform such policy to the shareholders at the OSM.
For any dividend above 30% of net income, publicly held limited liability stock corporations may grant their shareholders an option to receive those dividends, in cash, or shares issued by such publicly held limited liability stock corporation, or in shares of publicly held corporations owned by such company. Shareholders who do not expressly elect to receive a dividend other than cash are legally presumed to have decided to accept the dividend in cash.
Dividends declared but not paid within the appropriate period outlined in the Chilean Corporations Law (30 days after declaration for the minimum dividend, and the date set for payment at the time of declaration for additional dividends) are adjusted to reflect the change in the value of the UF, from the date set for payment to the date such dividends are paid. Such dividends also accrue interest at the prevailing rate for UF-denominated deposits during such period. The right to receive a dividend lapses if it is not claimed within five years from the date such dividend is payable.
92
Payments not collected in such a period are transferred to the Chilean volunteer fire department.
In the event of our liquidation, the shareholders would participate in the assets available in proportion to the number of paid-in shares held by them after payment to all creditors.
Approval of Financial Statements
The Board is required to submit our consolidated financial statements to the shareholders annually for their approval. If the shareholders by a vote of a majority of shares present (in person or by proxy) at the shareholders’ meeting reject the financial statements, the Board must submit new financial statements no later than 60 days from the date of such meeting. If the shareholders reject the new financial statements, the entire Board is deemed removed from office, and a new board is elected at the same meeting. Directors who individually approved such financial statements are disqualified for reelection for the following period. Our shareholders have never rejected the financial statements presented by the Board.
Change of Control
The Capital Markets Law establishes a comprehensive regulation related to tender offers. The law defines a tender offer as the offer to purchase shares of companies that publicly offer their shares or convertible securities. This offer is made to shareholders to purchase their shares under conditions that allow the bidder to reach a certain percentage of ownership of the company within a fixed period. These provisions apply to both voluntary and hostile tender offers.
Acquisition of Shares
No provision in our bylaws discriminates against any existing or prospective holder of shares due to such shareholder owning a substantial number of shares. However, no person may directly or indirectly own more than 65% of our stock’s outstanding shares. The preceding restriction does not apply to the depositary as record owner of shares represented by ADRs, but it does apply to each beneficial ADS holder. Additionally, our bylaws currently prohibit any shareholder from exercising voting power concerning more than 65% of the common stock owned by such shareholder or on behalf of others representing more than 65% of the outstanding issued shares with voting rights.
Right of Dissenting Shareholders to Tender Their Shares
The Chilean Corporations Law provides that upon adopting any of the resolutions enumerated below at a shareholders’ meeting, dissenting shareholders acquire the right to withdraw from the company and compel the company to repurchase their shares, subject to the fulfillment of specific terms and conditions. To exercise such withdrawal rights, holders of ADRs must first withdraw the shares represented by their ADRs under the Deposit Agreement’s terms. In case of a bankruptcy proceeding, the withdrawal right from an adopted resolution is suspended until the existing debt has been paid.
“Dissenting” shareholders are defined as those at a shareholders’ meeting who vote against a resolution that results in the withdrawal right or who, if absent from such meeting, state in writing their opposition to the respective resolution within the 30 days following the shareholders’ meeting. Shareholders who are present or represented at the meeting and who abstain from exercising their voting rights shall not be considered dissenting. The right to withdraw should be exercised for all the shares that the dissenting shareholder had registered in their name on the date on which the right is determined to participate in the meeting at which the resolution is adopted that motivates the withdrawal and which remains on the date on which their intention to withdraw is communicated to the company.
The price paid to a dissenting shareholder of a publicly held limited liability stock corporation whose shares are quoted and actively traded on one of the Chilean Stock Exchanges is the weighted average of the sales prices for the shares as reported on the Chilean Stock Exchanges on which the shares are quoted for the 60 trading days between the ninetieth and the thirtieth trading day before the shareholders’ meeting giving rise to the withdrawal right. If the CMF determines that the shares are not actively traded on a stock exchange, the price paid to the dissenting shareholder shall be the book value. Book value for this purpose must be equal to the company’s equity attributable to the parent company, divided by the total number of subscribed shares, whether entirely or partially paid. To make this calculation, the latest consolidated statement of financial position is used, as adjusted to reflect inflation up to the date of the shareholders meeting which gave rise to the withdrawal right.
93
Article 126 of the Chilean Corporations Regulation (Reglamento de Sociedades Anónimas) establishes that in cases where the right to withdraw arises, the company is obliged to inform the shareholders of this situation, the value per share that will be paid to shareholders exercising their right to withdraw, and the term for exercising it. Such information should be given to shareholders at the same meeting at which the resolutions are adopted, giving rise to the right of withdrawal, before its voting. A special communication should be given to the shareholders with rights within two days following the date on which the rights to withdraw arise. In the case of publicly held companies, such information shall be communicated by a prominent notice in a newspaper with a wide national circulation and on its website, plus a written communication addressed to the shareholders with rights at the address they have registered with the company. The notice of the shareholders’ meeting to vote on a matter that could give rise to withdrawal rights should mention this circumstance.
The resolutions that result in a shareholder’s right to withdraw include, among others, the following:
| ● | the transformation of the company into an entity that is not a publicly held limited liability stock corporation governed by the Chilean Corporations Law; |
| ● | the merger of the company with another company; |
| ● | disposition of 50% or more of the assets of the company, whether it includes the disposition of liabilities or not, as well as the approval or the amendment of the business plan that contemplates the disposition of assets in an amount greater than such percentage; |
| ● | the disposition of 50% or more of the assets of a subsidiary, as long as such subsidiary represents at least 20% of the assets of the company, as well as any disposition of its shares that results in the parent company losing its position of controlling shareholder; |
| ● | issue of guarantees for third parties’ liabilities that exceed 50% of the assets (if the third party is a subsidiary of the company, the approval of the board of directors is sufficient and shall not give rise to the right to withdraw); |
| ● | the creation of preferential rights for a class of shares or an amendment to the existing ones. In this case, the right to withdraw only accrues to the dissenting shareholders of the class or classes of shares adversely affected; |
| ● | certain remedies for the nullification of the corporate bylaws; and |
| ● | such other causes as may be established by the law or by the company’s bylaws. |
Investments by AFPs
The Pension Fund System Law permits AFPs to invest their funds in companies subject to Title XII of such law, and these companies are subject to greater restrictions than other companies. The determination of which stocks may be purchased by AFPs is made by the Risk Classification Committee. The Risk Classification Committee establishes investment guidelines and is empowered to approve or disapprove those companies that are eligible for AFP investments. We are and have been subject to Title XII provisions and are approved by the Risk Classification Committee.
Companies subject to Title XII provisions are required to have bylaws that:
| ● | limit the ownership of any shareholder to a specified maximum percentage, currently 65%; |
| ● | require that certain actions be taken only at a meeting of the shareholders; and |
| ● | give the shareholders the right to approve certain investment and financing policies. |
94
Registrations and Transfers
Shares issued by us are registered with an administrative agent, which is DCV Registros S.A. This entity is also responsible for our shareholders’ registry. In the case of jointly owned shares, an attorney-in-fact must be appointed to represent the joint owners in dealing with us.
C. |
Material Contracts. |
None.
D. |
Exchange Controls. |
The Central Bank of Chile is responsible for, among other things, monetary policies and exchange controls in Chile. Currently, applicable foreign exchange regulations are outlined in the Compendium of Foreign Exchange Regulations (the “Compendium”) approved by the Central Bank of Chile.
a) |
Chapter XIV of the Compendium |
The following is a summary of certain provisions of Chapter XIV that apply to all existing shareholders (and ADS holders). This summary does not intend to be complete and is qualified in its entirety by reference to Chapter XIV. Chapter XIV regulates the following types of investments: credits, deposits, investments, and equity contributions. A Chapter XIV investor may repatriate at any time an investment made in us upon selling our shares, and the profits derived from there, with no monetary ceiling, subject to the regulations in effect at the time, must be reported to the Central Bank of Chile.
Except for compliance with tax regulations and some reporting requirements, currently, there are no rules in Chile affecting repatriation rights, except that the remittance of foreign currency must be made through a Formal Exchange Market entity. However, the Central Bank of Chile has the authority to change such rules and impose exchange controls.
b) |
The Compendium and International Bond Issuances |
Chilean issuers may offer bonds internationally, subject to the reporting requirements outlined in Chapter XIV of the Compendium.
E. Taxation.
Chilean Tax Considerations
The following discussion summarizes Chilean material income and withholding tax consequences to Foreign Holders arising from the ownership and disposition of shares and ADSs. The summary that follows does not purport to be a comprehensive description of all of the tax considerations that may be relevant to a decision to purchase, own, or dispose of shares or ADSs, if any, and does not purport to deal with the tax consequences applicable to all categories of investors, some of which may be subject to special rules. Holders of shares and ADSs are advised to consult their own tax advisors concerning the Chilean and other tax consequences of the ownership of shares or ADSs.
The summary that follows is based on Chilean law, in effect on the date hereof, and is subject to any changes in these or other laws occurring after such date, possibly with retroactive effect. Under Chilean law, provisions in statutes such as tax rates applicable to foreign investors, the computation of taxable income for Chilean purposes, and how Chilean taxes are imposed and collected may be amended only by another law. The Chilean tax authorities also enact rulings and regulations of either general or specific application and interpret the Chilean Income Tax Law provisions. Chilean tax may not be assessed retroactively against taxpayers who act in good faith, relying on such rulings, regulations, and interpretations, but Chilean tax authorities may change their rulings, regulations, and interpretations in the future. The discussion that follows is also based, in part, on representations of the Depositary and assumes that each obligation in the Deposit Agreement and any related agreements will be performed under its terms.
95
In 2010, the United States and Chile signed an income tax treaty that was ratified by both countries on December 19, 2023, and came into effect on January 1, 2024.
For the purposes of the treaty, the expression “resident of a contracting country” means any person who, under the laws of that country, is subject to tax therein by reason of his domicile, residence, citizenship, place of management, place of incorporation, or any other criterion of an analogous nature.
As used in this Report, the term “foreign holder” means either:
| ● | in the case of a legal entity holder, an entity that is not organized under Chile’s laws, unless the shares or ADSs are assigned to a branch, agent, representative, or permanent establishment of such entity in Chile. |
Taxation of Cash Dividends and Property Distributions
Cash dividends paid concerning the shares or ADSs held by a Foreign Holder will be subject to Chilean withholding tax, which is withheld and paid by the company. The amount of the Chilean withholding tax is determined by applying a 35% rate to a “grossed-up” distribution amount (such amount equal to the sum of the actual distribution amount and the correlative Chilean corporate income tax (“CIT”), paid by the issuer), and then subtracting as a credit 65% of such Chilean CIT paid by the issuer, if the country of residence of the holder of shares or ADSs does not have a tax treaty with Chile. If there is a tax treaty between both countries (in force or signed before January 1, 2021), the Foreign Holder can apply 100% of the CIT as a credit. For 2024, the Chilean CIT applicable to us is a rate of 27%, and depending on the circumstances mentioned above, the Foreign Holder may apply 100% or 65% of the CIT as a credit.
In February 2020, tax reform contemplating only a partially integrated tax regime was enacted. Under the current Chilean Income Tax Law, publicly held limited liability stock corporations, such as our company, are subject to this regime, consisting of a cash basis shareholder taxation.
Under the cash basis regime (or partially integrated regime), a company pays CIT on its annual income tax result. Foreign and local individual shareholders will only pay in Chile the relevant tax on effective profit distributions. They will be allowed to use the CIT paid by the distributing company as credit, with certain limitations. Only 65% of the CIT is creditable against the 35% shareholder-level tax. However, in those cases where tax treaties between Chile and the jurisdiction of the shareholder’s residence were signed before January 1, 2021 (even if not yet in effect), the CIT is entirely creditable against the 35% withholding tax. The Chile-U.S. tax treaty was ratified by both countries on December 19, 2023, and came into effect on January 1, 2024. In the case of treaties signed before January 1, 2021, but not ratified as of December 31, 2026, the shareholder may apply 100% of the CIT as a credit if a dividend distribution is made before December 31, 2026, on a transitional basis. As of January 1, 2024, the Chile-U.S. tax treaty is in effect, and 100% of the CIT may be applied as a credit against withholding tax of U.S. holders without distinction of the date of payment.
The example below illustrates the effective Chilean withholding tax burden on a cash dividend received by a Foreign Holder, assuming a Chilean withholding tax base rate of 35%, an effective Chilean CIT rate of 27% (the CIT rate for 2024 under cash basis regime) and a distribution of 50% of the net income of the company distributable after payment of the Chilean CIT:
96
Line |
|
Concept and calculation assumptions |
|
Amount Tax |
|
Amount Non-Tax |
1 |
|
Company taxable income (based on Line 1 = 100) |
|
100 |
|
100 |
2 |
|
Chilean corporate income tax: 27% x Line 1 |
|
27 |
|
27 |
3 |
|
Net distributable income: Line 1 - Line 2 |
|
73 |
|
73 |
4 |
|
Dividend distributed (50% of net distributable income): 50% of Line 3 |
|
36.50 |
|
36.50 |
5 |
|
Withholding tax: 35% of (the sum of Line 4 and 50% of Line 2) |
|
17.50 |
|
17.50 |
6 |
|
Credit for 50% of Chilean corporate income tax: 50% of Line 2 |
|
13.50 |
|
13.50 |
7 |
|
CIT partial restitution (Line 6 x 35%)(1) |
|
— |
|
4.73 |
8 |
|
Net withholding tax: Line 5 - Line 6 + Line 7 |
|
4.00 |
|
8.73 |
9 |
|
Net dividend received: Line 4 - Line 8 |
|
32.50 |
|
27.78 |
10 |
|
Effective dividend withholding rate: Line 8 / Line 4 |
|
10.96 |
|
23.90 |
| (1) | Only applicable to non-tax treaty jurisdiction residents. From a practical standpoint, the foregoing means that the CIT is only partially creditable (65%) against the withholding tax (i.e., CIT of 8.73%). |
However, for purposes of the foregoing, the tax authority has not clarified whether the taxpayer’s residence will be the ADS holder’s address or the depositary’s address.
Taxation on Sale or Exchange of ADSs Outside of Chile
Gains obtained by a Foreign Holder from the sale or exchange of ADSs outside Chile are not subject to Chilean taxation.
Taxation on Sale or Exchange of Shares
In February 2022, a tax reform eliminated the tax exemption on capital gains obtained from the sale of shares that meet certain requirements detailed below and established a new tax that applies to sales of shares made as of September 1, 2022. For non-residents, the tax will be withheld by the purchaser, stockbroker, or securities agent acting on behalf of the seller.
The Chilean Income Tax Law provides for a 10% tax on capital gains from the sale of shares of listed companies traded in stock markets. Although there are certain restrictions, in general terms, the law provides that in order to qualify for the 10% tax: (i) the shares must be of a publicly held limited liability stock corporation with a “sufficient stock market liquidity” status in the Chilean Stock Exchanges; (ii) the sale must be conducted in a Chilean Stock Exchange authorized by the CMF, or in a tender offer subject to Chapter XXV of the Chilean Securities Market Law or as the consequence of a contribution to a fund as regulated in Section 109 of the Chilean Income Tax Law; (iii) the shares which are being sold must have been acquired on a Chilean Stock Exchange, or in a tender offer subject to Chapter XXV of the Chilean Securities Market Law, or in an initial public offering (due to the creation of a company or to a capital increase), or due to the exchange of convertible publicly offered securities, or due to the redemption of a fund’s quota as regulated in Section 109 of the Chilean Income Tax Law; and (iv) the shares must have been acquired after April 19, 2001. For purposes of considering the ADSs as convertible publicly offered securities, they should be registered in the Chilean foreign securities registry (unless expressly excluded from such registry by the CMF).
Shares are considered to have a “high presence” in the Chilean Stock Exchanges (i) when they have been traded for a certain number of days at or beyond a volume threshold specified under Chilean law and regulations or (ii) in case the issuer has retained a market maker, under Chilean law and regulations. As of the date of this Report, our shares are considered to have a high presence in the Chilean Stock Exchanges, and we have not retained any market maker. Should our shares cease to have a “high presence” in the Chilean Stock Exchanges, the sale of our shares will be subject to the general tax regime, which will apply at varying levels depending on the time of the sale with respect to the date of loss of sufficient trading volume to qualify as a “high presence” security. If our shares regain a “high presence,” the 10% tax will again be available to holders thereof.
If the shares do not qualify for the 10% tax, capital gains on their sale or exchange of shares (as distinguished from sales or exchanges of ADSs representing such shares of common stock) could be subject to the general tax regime, with a 27% Chilean CIT, the rate applicable during 2024, and a 35% Chilean withholding tax, the former being creditable against the latter.
97
The date of acquisition of the ADSs is the date of purchase of the shares for which the ADSs are exchanged.
Taxation of Share Rights and ADS Rights
For Chilean tax purposes and to the extent we issue any share rights or ADS rights, the receipt of share rights or ADS rights by a Foreign Holder of shares or ADSs under a rights offering is a nontaxable event. Also, there are no Chilean income tax consequences to Foreign Holders upon the exercise or the expiration of the share rights or the ADS rights.
Any gain on the sale, exchange, or transfer of any ADS rights by a Foreign Holder is not subject to taxes in Chile.
Any gain on the sale, exchange, or transfer of the share rights by a Foreign Holder is subject to a 35% Chilean withholding tax.
Other Chilean Taxes
There is no gift, inheritance, or succession tax applicable to Foreign Holders’ ownership, transfer, or disposition of ADSs. However, such taxes will generally apply to the transfer at death or by a gift of the shares by a Foreign Holder. There is no Chilean stamp, issue, registration, or similar taxes or duties payable by holders of shares or ADSs.
Material U.S. Federal Income Tax Considerations
This discussion is based on the U.S. Internal Revenue Code of 1986, as amended (the “Code”), administrative pronouncements, judicial decisions, and final, temporary, and proposed Treasury regulations, all as of the date of this Report. These authorities are subject to change, possibly with retroactive effect. This discussion assumes that the depositary’s activities are clearly and appropriately defined to ensure that the tax treatment of ADSs will be identical to the tax treatment of the underlying shares.
The following are the material U.S. federal income tax consequences to U.S. Holders (as defined herein) of receiving, owning, and disposing of shares or ADSs. However, it does not purport to be a comprehensive description of all of the tax considerations that may be relevant to a particular person’s decision to hold such securities and is based on the assumption stated above under “Chilean Tax Considerations” that there is no applicable income tax treaty in effect between the United States and Chile. The discussion applies only if the beneficial owner holds shares or ADSs as capital assets for U.S. federal income tax purposes. It does not describe all of the tax consequences that may be relevant in light of the beneficial owner’s particular circumstances. For instance, it does not describe all the tax consequences that may be relevant to:
| ● | certain financial institutions; |
| ● | insurance companies; |
| ● | dealers and traders in securities who use a mark-to-market method of tax accounting; |
| ● | persons holding shares or ADSs as part of a “straddle” integrated transaction or similar transaction; |
| ● | persons whose functional currency for U.S. federal income tax purposes is not the U.S. dollar; |
| ● | partnerships or other entities classified as partnerships for U.S. federal income tax purposes or partners in such partnerships; |
| ● | persons liable for the alternative minimum tax; |
| ● | tax-exempt organizations; |
| ● | persons holding shares or ADSs that own or are deemed to own ten percent or more of our stock; or |
| ● | persons holding shares or ADSs connected with a trade or business conducted outside of the United States. |
98
Persons or entities described above, including partnerships holding shares or ADSs and partners in such partnerships, should consult their own tax advisors about the particular U.S. federal income tax consequences of holding and disposing of shares or ADSs.
You will be a “U.S. Holder” for purposes of this discussion if you become a beneficial owner of our shares or ADSs and if you are, for U.S. federal income tax purposes:
| ● | a citizen or an individual resident of the United States; or |
| ● | a corporation, or other entity taxable as a corporation, created or organized in or under the laws of the United States or any political subdivision thereof; or |
| ● | an estate, the income of which is subject to U.S. federal income taxation regardless of its source; or |
| ● | a trust (i) that validly elects to be treated as a U.S. person for U.S. federal income tax purposes or (ii) if (A) a court within the United States can exercise primary supervision over the administration of the trust and (B) one or more U.S. persons have the authority to control all substantial decisions of the trust. |
For U.S. federal income tax purposes, it is generally expected that a U.S. Holder of ADSs will be treated as the beneficial owner of the underlying shares represented by the ADSs. The remainder of this discussion assumes that a U.S. Holder of our ADSs will be treated in this manner for U.S. federal income tax purposes. Accordingly, deposits or withdrawals of shares for ADSs will generally not be subject to U.S. federal income tax.
The U.S. Treasury has expressed concerns that parties to whom ADSs are released before shares are delivered to the depositary (pre-release) or intermediaries in the chain of ownership between beneficial owners and the issuer of the security underlying the ADSs may be taking actions that are inconsistent with the claiming of foreign tax credits for beneficial owners of depositary shares. Such actions would also be inconsistent with claiming the reduced tax rate, described below, applicable to dividends received by certain non-corporate beneficial owners. Accordingly, the analysis of the creditability of Chilean taxes and the availability of the reduced tax rate for dividends received by certain non-corporate holders, each described below, could be affected by actions taken by such parties or intermediaries.
This discussion assumes that we will not be a passive foreign investment company, as described below. The discussion below does not address the effect of any U.S. state, local, estate, or gift tax law or non-U.S. tax law or tax considerations that arise from rules of general application to all taxpayers on a U.S. Holder of the shares or ADSs or of any future administrative guidance interpreting provisions thereof. U.S. Holders should consult their own tax advisors concerning their particular tax consequences of owning or disposing of shares or ADSs, including the applicability and effect of state, local, non-U.S., and other tax laws and the possibility of changes in tax laws, including the effects of any future administrative guidance interpreting provisions thereof.
Taxation of Distributions
The following discussion of cash dividends and other distributions is subject to the discussion below under “—Passive Foreign Investment Company Rules.” Distributions received by a U.S. Holder on shares or ADSs, including the amount of any Chilean taxes withheld, other than certain pro-rata distributions of shares to all shareholders, will constitute foreign-source income to the extent paid out of our current or accumulated earnings and profits (as determined for U.S. federal income tax purposes). Because we do not maintain calculations of our earnings and profits under U.S. federal income tax principles, it is expected that distributions generally will be reported to U.S. Holders as dividends. The amount of dividend income paid in Chilean pesos that a U.S. Holder will be required to include in income will equal the U.S. dollar value of the distributed Chilean peso, calculated by reference to the exchange rate in effect on the date the payment is received, regardless of whether the payment is converted into U.S. dollars on the date of receipt. If the dividend is converted into U.S. dollars on the date of receipt, a U.S. Holder generally will not be required to recognize foreign currency gain or loss regarding the dividend income. A U.S. Holder may have foreign currency gain or loss if the dividend is converted into U.S. dollars after the date of its receipt, which would be ordinary income or loss and would be treated as income from U.S. sources for foreign tax credit purposes. Dividends will be included in a U.S. Holder’s income on the date of the U.S.
99
Holder’s, or in the case of ADSs, the depositary’s, receipt of the dividend. Corporate U.S. Holders will not be entitled to claim the dividends-received deduction with respect to dividends paid by us.
Subject to certain exceptions for short-term and hedged positions, the discussion above regarding concerns expressed by the U.S. Treasury and the discussion below regarding rules intended to be promulgated by the U.S. Treasury, the U.S. dollar amount of dividends received by a non-corporate U.S. Holder in respect of shares or ADSs generally will be subject to taxation at preferential rates if the dividends are “qualified dividends.” Dividends paid on the ADSs generally will be treated as qualified dividends if (i) the ADSs are readily tradable on an established securities market in the United States (ii) we were not, in the year before the year in which the dividend was paid, and is not, in the year in which the dividend is paid, a passive foreign investment company (“PFIC”) and (iii) the holder thereof has satisfied certain holding period requirements. The ADSs are listed on the New York Stock Exchange and generally will qualify as readily tradable on an established securities market in the United States so long as they are so listed. We do not believe that we were a PFIC for U.S. federal income tax purposes with respect to our 2024 taxable year. In addition, based on our current expectations regarding the value and nature of our assets, the sources and nature of our income, and relevant market and shareholder data, we do not anticipate becoming a PFIC for our 2025 taxable year. However, because PFIC status depends upon the composition of a company’s income and assets and the market value of its assets from time to time, and because it is unclear whether certain types of our income constitute passive income for PFIC purposes, there can be no assurance that we will not be considered a PFIC for any current, prior or future taxable year.
Based on existing guidance, it is not entirely clear whether dividends received concerning shares will be treated as qualified dividends because they are not themselves listed on a U.S. exchange. In addition, the U.S. Treasury has announced its intention to promulgate rules under which holders of ADSs and intermediaries through whom such securities are held will be permitted to rely on certifications from issuers to establish that dividends are treated as qualified dividends. Because such procedures have not yet been issued, it is not clear whether we will comply with them. U.S. Holders should consult their own tax advisors to determine whether the favorable rate will apply to dividends they receive and whether it is subject to any special rules limiting its ability to be taxed at this favorable rate.
The amount of a dividend generally will be treated as foreign-source dividend income to a U.S. Holder for foreign tax credit purposes. As discussed in more detail below under “—Foreign Tax Credits,” it is not free from doubt whether Chilean withholding taxes imposed on distributions on shares or ADSs will be treated as income taxes eligible for a foreign tax credit for U.S. federal income tax purposes. If a Chilean withholding tax is treated as an eligible foreign income tax, subject to generally applicable limitations, you may claim a credit against your U.S. federal income tax liability for the eligible Chilean taxes withheld from distributions on shares or ADSs. If the dividends are taxed as qualified dividend income (as discussed above), special rules will apply in determining the amount of the dividend taken into account to calculate the foreign tax credit limitation. The rules relating to foreign tax credits are complex. U.S. Holders are urged to consult their own tax advisors regarding the treatment of Chilean withholding taxes imposed on distributions on shares or ADSs.
Sale or Other Disposition of Shares or ADSs
If a beneficial owner is a U.S. Holder, for U.S. federal income tax purposes, the gain or loss a beneficial owner realizes on the sale or other disposition of shares or ADSs will be a capital gain or loss, and will be a long-term capital gain or loss if the beneficial holder has held the shares or ADSs for more than one year. The amount of a beneficial owner’s gain or loss will equal the difference between the beneficial owner’s tax basis in the shares or ADSs disposed of and the amount realized on the disposition, in each case as determined in U.S. dollars. Such gain or loss will generally be U.S.-source gain or loss for foreign tax credit purposes. In addition, certain limitations exist on the deductibility of capital losses by both corporate and individual taxpayers.
In certain circumstances, Chilean taxes may be imposed upon the sale of shares (but not ADSs). See “— Chilean Tax Considerations — Taxation of Shares and ADSs.” If a Chilean tax is imposed on the sale or disposition of shares, a beneficial owner who is a U.S. Holder may be eligible to claim a credit against its U.S. federal income tax liability for the eligible Chilean taxes withheld under a sale or disposition of shares or ADSs as discussed in “— Foreign Tax Credits” below. U.S. Holders are urged to consult their own tax advisors with respect to the particular consequences to them of owning or disposing of our shares or ADSs.
100
Foreign Tax Credits
Subject to applicable limitations that may vary depending upon a U.S. Holder’s circumstances and subject to the discussion above regarding concerns expressed by the U.S. Treasury, you may be eligible to claim a credit against your U.S. tax liability for Chilean income taxes (or taxes imposed in lieu of an income tax) imposed in connection with distributions on and proceeds from the sale or other disposition of our shares or ADSs. Chilean dividend withholding taxes generally are expected to be income taxes eligible for the foreign tax credit. Pursuant to the Chile-U.S. Tax Treaty, after the effective date of the Chile-U.S. Tax Treaty (which was February 1, 2024, with respect to taxes withheld at source, and January 1, 2024, for all other taxes), the Chilean dividend withholding taxes and Chilean capital gains tax will be eligible for the foreign tax credit; however, you generally may claim a foreign tax credit only after taking into account any available opportunity to reduce the Chilean capital gains tax, such as the reduction for the credit for Chilean corporate income tax that is taken into account when calculating Chilean withholding tax. If a Chilean tax is imposed on the sale or disposition of our shares or ADSs, and a U.S. Holder does not receive significant foreign source income from other sources, such U.S. Holder may not be able to credit such Chilean tax against its U.S. federal income tax liability. If a Chilean tax is not treated as an income tax (or a tax paid in lieu of an income tax) for U.S. federal income tax purposes, a U.S. Holder would be unable to claim a foreign tax credit for any such Chilean tax withheld; however, a U.S. Holder may be able to deduct such tax in computing its U.S. federal income tax liability, subject to applicable limitations. In addition, instead of claiming a credit, a U.S. Holder may, at the U.S. Holder’s election, deduct such Chilean taxes in computing the U.S. Holder’s taxable income, subject to generally applicable limitations under U.S. law. An election to deduct foreign taxes instead of claiming foreign tax credits applies to all taxes paid or accrued in the taxable year to foreign countries and possessions of the U.S. The calculation of foreign tax credits and, in the case of a U.S. Holder that elects to deduct foreign income taxes, the availability of deductions, involves the application of complex rules that depend on such U.S. Holder’s particular circumstances. U.S. Holders are urged to consult their own tax advisors regarding the availability of foreign tax credits in their particular circumstances.
Passive Foreign Investment Company Rules
We do not believe that we were a PFIC for U.S. federal income tax purposes with respect to our 2024 taxable year and do not anticipate being a PFIC for our 2025 taxable year. However, because PFIC status depends upon the composition of a company’s income and assets and the market value of its assets from time to time, and because it is unclear whether certain types of our income constitute passive income for PFIC purposes, there can be no assurance that we will not be considered a PFIC for any current, prior, or future taxable year. If we were to become a PFIC for any taxable year during which a beneficial owner held shares or ADSs, certain adverse consequences could apply to the U.S. Holder, including the imposition of higher amounts of tax than would otherwise apply and additional filing requirements. In addition, if we were treated as a PFIC in a taxable year in which we pay a dividend or in the prior taxable year, the favorable dividend rates discussed above with respect to dividends paid to certain non-corporate U.S. Holders would not apply (see “— Taxation of Distributions” above). U.S. Holders should consult their own tax advisors regarding the consequences to them if we were to become a PFIC and the availability and advisability of making any election that might mitigate the adverse consequences of PFIC status.
Required Disclosure with Respect to Foreign Financial Assets
Certain U.S. Holders are required to report information relating to an interest in our shares or ADSs, subject to certain exceptions (including an exception for our shares or ADSs held in accounts maintained by certain financial institutions), by attaching a completed IRS Form 8938, Statement of Specified Foreign Financial Assets, with their tax return for each year in which they hold an interest in our shares or ADSs. U.S. Holders are urged to consult their own U.S. tax advisors regarding information reporting requirements relating to their ownership of our shares or ADSs.
Information Reporting and Backup Withholding
Payments of dividends and sales proceeds that are made within the United States or through certain U.S.-related financial intermediaries generally are subject to information reporting and backup withholding unless: (i) the U.S. Holder is an exempt recipient or (ii) in the case of backup withholding, the beneficial owner provides a correct taxpayer identification number and certifies that the U.S. Holder is not subject to backup withholding.
101
The amount of any backup withholding from a payment to a beneficial owner will be allowed as a credit against the beneficial owner’s U.S. federal income tax liability and may entitle the U.S. Holder to a refund, provided that the required information is furnished in a timely fashion to the U.S. Internal Revenue Service.
Medicare Contribution Tax
A U.S. Holder that is an individual or estate, or a trust that does not meet certain requirements for an exemption, is subject to a tax of 3.8% on its “net investment income.” Among other items, net investment income generally includes gross income from dividends and net gain attributable to the disposition of certain property, like the shares or ADSs, less certain deductions. A U.S. Holder should consult the holder’s own tax advisor regarding the applicability of the “net investment income” tax regarding such beneficial owner’s particular circumstances. U.S. Holders should consult their own tax advisors with respect to the particular consequences to them of owning or disposing of shares or ADSs.
F.Dividends and Paying Agents.
Not applicable.
G.Statement by Experts.
Not applicable.
H.Documents on Display.
We are subject to the information requirements of the Exchange Act, except that as a foreign private issuer, we are not subject to the SEC proxy rules (other than general anti-fraud rules) or the short-swing profit disclosure rules of the Exchange Act. Under these statutory requirements, we file or furnish reports and other information with the SEC. Reports, information statements, and other information we file with or furnish to the SEC are available electronically on the SEC’s website at www.sec.gov and on our website at www.enelchile.cl. Copies of such material may also be inspected at the offices of the New York Stock Exchange, at 11 Wall Street, New York, New York 10005, on which our ADSs are listed.
I. |
Subsidiary Information. |
For information on our principal subsidiaries, see “Item 4. Information on the Company — C. Organizational Structure — Principal Subsidiaries and Affiliates.”
Item 11. Quantitative and Qualitative Disclosures About Market Risk
We are exposed to risks arising from volatility in commodity prices, interest rates, and foreign exchange rates that affect the generation, distribution, and transmission businesses in Chile.
Commodity Price Risk
In our electricity generation segment, we are exposed to market risks from the price volatility of some commodities, mainly through fuel purchases and sales for the electricity generation process and energy purchase-sale transactions carried out in local markets.
In order to reduce risk under extreme drought conditions, we have designed a commercial policy that aligns sale commitment levels with generation capacity during a dry year by including risk mitigation clauses with unregulated clients in some contracts. In the case of regulated clients subject to long-term tender processes, indexed polynomials are determined to minimize commodity exposure.
102
Considering the operating conditions faced in the electricity generation market in Chile, drought, and the volatility of commodity prices in international markets, we continually evaluate if it is in our best interests to engage in hedging to mitigate the impact of price changes on profits.
As of December 31, 2024, we held the following hedges:
| ● | Brent oil: 45 kBbl for purchases to be settled; |
| ● | Coal: 10.7 kTon for sales to be settled. |
As of December 31, 2023, we held the following hedges:
| ● | Brent oil: 551 kBbl for purchases and 217 kBbl for sales to be settled; |
| ● | Henry Hub natural gas: 1.5 TBtu swap for sales to be settled; 5.9 TBtu future for purchases to be settled; and 3.9 TBtu future for sales to be settled; and |
| ● | Coal: 47 kTon for sales to be settled. |
Depending on the operating conditions that are updated continuously, these hedging measures may be modified or included in other commodities.
Interest Rate and Foreign Currency Risk
As of December 31, 2024, the carrying values according to maturity and the corresponding fair value of our interest-bearing debt are detailed below. The amounts do not include derivatives. The rates in the table below are the result of the weighted average of the effective interest rates of each obligation, including expenses associated with financing and withholding taxes on interest payments related to financing obtained outside the country of domicile of each company.
103
|
|
Expected Maturity Date |
|||||||||||||||
For the year ended December 31, |
|
2025 |
|
2026 |
|
2027 |
|
2028 |
|
2029 |
|
Thereafter |
|
Total |
|
Fair |
|
|
|
(in millions of Ch$)(1) |
|||||||||||||||
Fixed Rate |
|
|
|
|
|
|
|
|
|
|
|
|
|
|
|
|
|
Ch$/UF |
|
— |
|
— |
|
— |
|
— |
|
— |
|
— |
|
— |
|
— |
|
Weighted average interest rate |
|
— |
|
— |
|
— |
|
— |
|
— |
|
— |
|
— |
|
— |
|
US$ |
|
160,748 |
|
179,370 |
|
397,987 |
|
1,030,339 |
|
35,521 |
|
1,187,888 |
|
2,991,854 |
|
2,937,953 |
|
Weighted average interest rate |
|
2.9% |
|
3.2% |
|
5.9% |
|
5.1% |
|
5.4% |
|
4.3% |
|
4.6% |
|
— |
|
Other currencies |
|
1,142 |
|
610 |
|
610 |
|
610 |
|
610 |
|
3,267 |
|
6,848 |
|
6,848 |
|
Weighted average interest rate |
|
4.8% |
|
4.8% |
|
4.8% |
|
4.8% |
|
4.8% |
|
4.8% |
|
4.8% |
|
— |
|
Total fixed rate |
|
161,890 |
|
179,980 |
|
398,597 |
|
1,030,949 |
|
36,131 |
|
1,191,155 |
|
2,998,702 |
|
2,944,801 |
|
Weighted average interest rate |
|
3.0% |
|
3.2% |
|
5.9% |
|
5.1% |
|
5.4% |
|
4.3% |
|
4.6% |
|
n.a. |
|
|
|
|
|
|
|
|
|
|
|
|
|
|
|
|
|
|
|
Variable Rate |
|
|
|
|
|
|
|
|
|
|
|
|
|
|
|
|
|
Ch$/UF |
|
62,016 |
|
55,419 |
|
54,884 |
|
56,314 |
|
46,456 |
|
206,582 |
|
481,669 |
|
499,078 |
|
Weighted average interest rate |
|
4.7% |
|
4.9% |
|
4.9% |
|
5.0% |
|
4.6% |
|
3.4% |
|
4.2% |
|
n.a. |
|
US$ |
|
— |
|
173,218 |
|
23,749 |
|
23,749 |
|
23,749 |
|
189,992 |
|
434,457 |
|
434,457 |
|
Weighted average interest rate |
|
— |
|
6.7% |
|
6.5% |
|
6.5% |
|
6.5% |
|
6.5% |
|
6.6% |
|
— |
|
Total variable rate |
|
62,016 |
|
228,637 |
|
78,633 |
|
80,063 |
|
70,205 |
|
396,574 |
|
916,126 |
|
933,535 |
|
Weighted average interest rate |
|
4.7% |
|
6.3% |
|
5.4% |
|
5.4% |
|
5.2% |
|
4.9% |
|
5.3% |
|
n.a. |
|
|
|
|
|
|
|
|
|
|
|
|
|
|
|
|
|
|
|
Total |
|
223,906 |
|
408,617 |
|
477,230 |
|
1,111,012 |
|
106,336 |
|
1,587,729 |
|
3,914,828 |
|
3,878,336 |
|
| (1) | Calculated based on the Observed Exchange Rate as of December 31, 2024. |
| (2) | Fair value was calculated based on the discounted value of future cash flows expected to be paid (or received), considering current discount rates that reflect the different risks involved. |
As of December 31, 2023, the carrying values according to maturity and the corresponding fair value of our interest-bearing debt are detailed below. The amounts do not include derivatives. The rates in the table below are the result of the weighted average of the effective interest rates of each obligation, including expenses associated with financing and withholding taxes on interest payments related to financing obtained outside the country of domicile of each company.
104
|
|
Expected Maturity Date |
||||||||||||||
For the year ended December 31, |
|
2024 |
|
2025 |
|
2026 |
|
2027 |
|
2028 |
|
Thereafter |
|
Total |
|
Fair |
|
|
(in millions of Ch$)(1) |
||||||||||||||
Fixed Rate |
|
|
|
|
|
|
|
|
|
|
|
|
|
|
|
|
Ch$/UF |
|
0.3 |
|
— |
|
— |
|
— |
|
— |
|
— |
|
0.3 |
|
0.3 |
Weighted average interest rate |
|
1.4% |
|
— |
|
— |
|
— |
|
— |
|
— |
|
1.4% |
|
n.a. |
US$ |
|
492,920 |
|
141,437 |
|
157,766 |
|
350,201 |
|
906,819 |
|
1,071,538 |
|
3,120,680 |
|
3,061,147 |
Weighted average interest rate |
|
4.0% |
|
2.9% |
|
3.2% |
|
5.9% |
|
5.1% |
|
4.3% |
|
4.5% |
|
n.a. |
Other currencies |
|
317 |
|
476 |
|
476 |
|
476 |
|
476 |
|
3,075 |
|
5,294 |
|
5,294 |
Weighted average interest rate |
|
4.8% |
|
4.8% |
|
4.8% |
|
4.8% |
|
4.8% |
|
4.8% |
|
4.8% |
|
n.a. |
Total fixed rate |
|
493,237 |
|
141,913 |
|
158,242 |
|
350,677 |
|
907,295 |
|
1,074,613 |
|
3,125,974 |
|
3,066,441 |
Weighted average interest rate |
|
4.0% |
|
2.9% |
|
3.2% |
|
5.9% |
|
5.1% |
|
4.3% |
|
4.5% |
|
n.a. |
|
|
|
|
|
|
|
|
|
|
|
|
|
|
|
|
|
Variable Rate |
|
|
|
|
|
|
|
|
|
|
|
|
|
|
|
|
Ch$/UF |
|
59,173 |
|
52,856 |
|
52,476 |
|
52,264 |
|
54,030 |
|
225,569 |
|
496,367 |
|
512,600 |
Weighted average interest rate |
|
4.9% |
|
4.9% |
|
4.9% |
|
4.9% |
|
5.0% |
|
4.3% |
|
4.6% |
|
n.a. |
US$ |
|
131,568 |
|
— |
|
131,568 |
|
— |
|
— |
|
— |
|
263,136 |
|
263,136 |
Weighted average interest rate |
|
6.3% |
|
— |
|
6.6% |
|
— |
|
— |
|
— |
|
6.4% |
|
— |
Total variable rate |
|
190,741 |
|
52,856 |
|
184,044 |
|
52,264 |
|
54,030 |
|
225,569 |
|
759,503 |
|
775,736 |
Weighted average interest rate |
|
5.9% |
|
4.9% |
|
6.1% |
|
4.9% |
|
5.0% |
|
4.3% |
|
5.3% |
|
n.a. |
|
|
|
|
|
|
|
|
|
|
|
|
|
|
|
|
|
Total |
|
683,978 |
|
194,769 |
|
342,286 |
|
402,941 |
|
961,325 |
|
1,300,182 |
|
3,885,477 |
|
3,842,177 |
| (1) | Calculated based on the Observed Exchange Rate as of December 31, 2023. |
| (2) | Fair value was calculated based on the discounted value of future cash flows expected to be paid (or received), considering current discount rates that reflect the different risks involved. |
Interest Rate Risk
Our policy aims to minimize the average cost of debt and reduce the volatility of our financial results. Depending on our estimates and the debt structure, we sometimes manage interest rate risk by using interest rate derivatives.
As of December 31, 2024 and 2023, 89% and 88%, respectively, of our total outstanding debt had fixed interest rates, and 11% and 12%, respectively, of our total outstanding debt was subject to variable interest rates. Because of the exposure to variable interest rate risks, we engage in derivative hedging instruments.
As of December 31, 2024, the carrying values for financial reporting purposes and the corresponding fair value of the instruments that hedge the interest rate risk of our interest-bearing debt were as follows:
|
|
Expected Maturity Date |
||||||||||||||
For the year ended December 31, |
|
2025 |
|
2026 |
|
2027 |
|
2028 |
|
2029 |
|
Thereafter |
|
Total |
|
Fair |
|
|
(in millions of Ch$)(1) |
||||||||||||||
Variable to fixed rates |
|
— |
|
— |
|
— |
|
— |
|
— |
|
284,988 |
|
284,988 |
|
(3,045) |
Fixed to variable rates |
|
— |
|
— |
|
— |
|
— |
|
— |
|
— |
|
— |
|
— |
Total |
|
— |
|
— |
|
— |
|
— |
|
— |
|
284,988 |
|
284,988 |
|
(3,045) |
| (1) | Calculated based on the Observed Exchange Rate as of December 31, 2024. |
| (2) | Fair value was calculated based on the discounted value of future cash flows expected to be paid (or received), considering current discount rates that reflect the different risks involved. |
105
As of December 31, 2023, the carrying values for financial reporting purposes and the corresponding fair value of the instruments that hedge the interest rate risk of our interest-bearing debt were as follows:
|
|
Expected Maturity Date |
||||||||||||||
For the year ended December 31, |
|
2024 |
|
2025 |
|
2026 |
|
2027 |
|
2028 |
|
Thereafter |
|
Total |
|
Fair |
|
|
(in millions of Ch$)(1) |
||||||||||||||
Variable to fixed rates |
|
43,856 |
|
— |
|
— |
|
— |
|
— |
|
— |
|
43,856 |
|
1,075 |
Fixed to variable rates |
|
— |
|
— |
|
— |
|
— |
|
— |
|
— |
|
— |
|
— |
Total |
|
43,856 |
|
— |
|
— |
|
— |
|
— |
|
— |
|
43,856 |
|
1,075 |
| (1) | Calculated based on the Observed Exchange Rate as of December 31, 2023. |
| (2) | Fair value was calculated based on the discounted value of future cash flows expected to be paid (or received), considering current discount rates that reflect the different risks involved. |
Foreign Currency Risk
Our policy seeks to maintain a balance between the currencies in which cash flows are indexed and each company’s debt. Most of our subsidiaries have access to funding in the same currency as their revenues, reducing the exchange rate volatility impact. In some cases, we cannot fully benefit from this. Therefore, we try to manage the exposure with financial derivatives such as cross-currency swaps or currency forwards. However, this may not always be available under reasonable terms due to market conditions.
Until December 31, 2024, our functional currency was the Chilean peso, which has been subject to devaluations and appreciations against the U.S. dollar. Effective January 1, 2025, our functional currency is the U.S. dollar. For information on the change to our functional currency, see Note 41.i of the Notes to our consolidated financial statements.
As of December 31, 2024, the carrying values for financial accounting purposes and the corresponding fair value of the instruments that hedge the foreign exchange risk of our interest-bearing debt were as follows:
|
|
Expected Maturity Date |
||||||||||||||
For the year ended December 31, |
|
2025 |
|
2026 |
|
2027 |
|
2028 |
|
2029 |
|
Thereafter |
|
Total |
|
Fair |
|
|
(in millions of Ch$)(1) |
||||||||||||||
UF to US$ |
|
58,308 |
|
— |
|
— |
|
— |
|
177,586 |
|
— |
|
235,894 |
|
(1,215) |
US$ to Ch$/UF |
|
— |
|
— |
|
— |
|
— |
|
— |
|
— |
|
— |
|
— |
Ch$ to US$ |
|
— |
|
— |
|
— |
|
— |
|
— |
|
— |
|
— |
|
— |
Total |
|
58,308 |
|
— |
|
— |
|
— |
|
177,586 |
|
— |
|
235,894 |
|
(1,215) |
| (1) | Calculated based on the Observed Exchange Rate as of December 31, 2024. |
| (2) | Fair value was calculated based on the discounted value of future cash flows expected to be paid (or received), considering current discount rates that reflect the different risks involved. |
106
As of December 31, 2023, the carrying values for financial accounting purposes and the corresponding fair value of the instruments that hedge the foreign exchange risk of our interest-bearing debt were as follows:
|
|
Expected Maturity Date |
||||||||||||||
For the year ended December 31, |
|
2024 |
|
2025 |
|
2026 |
|
2027 |
|
2028 |
|
Thereafter |
|
Total |
|
Fair |
|
|
(in millions of Ch$)(1) |
||||||||||||||
UF to US$ |
|
338,337 |
|
67,227 |
|
— |
|
— |
|
— |
|
— |
|
405,564 |
|
12,131 |
US$ to Ch$/UF |
|
— |
|
— |
|
— |
|
— |
|
— |
|
— |
|
— |
|
— |
Ch$ to US$ |
|
— |
|
— |
|
— |
|
— |
|
— |
|
— |
|
— |
|
— |
Total |
|
338,337 |
|
67,227 |
|
— |
|
— |
|
— |
|
— |
|
405,564 |
|
12,131 |
| (1) | Calculated based on the Observed Exchange Rate as of December 31, 2023. |
| (2) | Fair value was calculated based on the discounted value of future cash flows expected to be paid (or received), considering current discount rates that reflect the different risks involved. |
Please refer to Note 22 of the Notes to our consolidated financial statements for further detail.
Effective January 1, 2025, our functional currency is the U.S. dollar. For further information on the change to our functional currency, see “Item 5. Operating and Financial Review and Prospects — A. Operating Results — 1. Discussion of Main Factors Affecting Operating Results and Financial Condition of the Company — e. Critical Accounting Policies — Change in Functional and Reporting Currency for Financial Reporting” and “Item 3. Key Information — Risk Factors.”
(d) Safe Harbor
The information in this “Item 11. Quantitative and Qualitative Disclosures About Market Risk,” contains information that may constitute forward-looking statements. See “Forward-Looking Statements” in the Introduction of this Report for safe harbor provisions.
Item 12. Description of Securities Other Than Equity Securities
| A. | Debt Securities. |
Not applicable.
| B. | Warrants and Rights. |
Not applicable.
| C. | Other Securities. |
Not applicable.
| D. | American Depositary Shares. |
Depositary Fees and Charges
Our ADS program’s Depositary is Citibank, N.A. The Depositary collects fees for delivery and surrender of ADSs directly from investors depositing shares or surrendering ADSs for withdrawal or from intermediaries acting for them. The Depositary fees payable for cash distributions are deducted from the cash being distributed. For non-cash distributions, the Depositary will invoice the applicable ADS record date holders, and such fees may be deducted from distributions. The Depositary may generally refuse to provide the requested services until its fees for those services are paid. Under the terms of the Deposit Agreement, an ADS holder may have to pay the following service fees to the Depositary:
107
Service Fees |
|
Fees |
(1) Issuance of ADSs upon deposit of shares (excluding issuances as a result of distributions described in paragraph (4) below) |
|
Up to US$5 per 100 ADSs (or fraction thereof) issued |
(2) Delivery of deposited securities against surrender of ADSs |
|
Up to US$5 per 100 ADSs (or fraction thereof) surrendered |
(3) Distribution of cash dividends or other cash distributions (i.e., sale of rights and other entitlements) |
|
Up to US$5 per 100 ADSs (or fraction thereof) held |
(4) Distribution of ADSs pursuant to (i) stock dividends or other free stock distributions, or (ii) exercise of rights to purchase additional ADSs |
|
Up to US$5 per 100 ADSs (or fraction thereof) held |
(5) Distribution of securities other than ADSs or rights to purchase additional ADSs (i.e., a spin-off of shares) |
|
Up to US$5 per 100 ADSs (or fraction thereof) held |
(6) Depositary services |
|
Up to US$5 per 100 ADSs (or fraction thereof) held on the applicable record date(s) established by the Depositary |
Depositary Payments for Fiscal Year 2024
The Depositary has agreed to reimburse certain expenses incurred by us in connection with our ADS program. In 2024, the Depositary reimbursed us for expenses related primarily to investor relations activities for approximately US$400,000 (after the deduction of applicable U.S. taxes).
108
PART II
Item 13. Defaults, Dividend Arrearages and Delinquencies
None.
Item 14. Material Modifications to the Rights of Security Holders and Use of Proceeds
None.
Item 15. Controls and Procedures
(a)Disclosure Controls and Procedures
We carried out an evaluation under the supervision and with the participation of our senior management, including the chief executive officer and chief financial officer, of the effectiveness of the design and operation of our disclosure controls and procedures (as defined in Rules 13a-15(e) and 15d-15(e) under the Exchange Act) as of December 31, 2024.
There are inherent limitations to the effectiveness of any system of disclosure controls and procedures, including the possibility of human error, and the circumvention or overriding of the controls and procedures. Accordingly, our disclosure controls and procedures are designed to provide reasonable assurance of achieving their control objectives.
Based upon our evaluation, the chief executive officer and the chief financial officer concluded that the disclosure controls and procedures are effective in providing reasonable assurance that information required to be disclosed in the reports we file and submit under the Exchange Act is recorded, processed, summarized and reported, within the time periods specified in the applicable rules and forms, and that it is gathered and communicated to our management, including the chief executive officer and chief financial officer, as appropriate, to allow timely decisions regarding required disclosure.
Our disclosure controls and procedures are designed to provide reasonable assurance of achieving their objectives, and our principal executive officer and principal financial officer have concluded that our disclosure controls and procedures are effective at that reasonable assurance level.
(b)Management’s Annual Report on Internal Control Over Financial Reporting
As required by Section 404 of the Sarbanes-Oxley Act of 2002, our management is responsible for establishing and maintaining “adequate internal control over financial reporting” (as defined in Rule13a-15(f) under the Exchange Act). Our internal control over financial reporting is designed to provide reasonable assurance regarding the reliability of financial reporting and the preparation of the financial statements for external purposes in accordance with IFRS, as issued by the IASB.
Because of its inherent limitations, internal control over financial reporting may not necessarily prevent or detect some misstatements. It can only provide reasonable assurance regarding financial statement preparation and presentation. Also, projections of any evaluation of effectiveness for future periods are subject to the risk that controls may become inadequate because of changes in conditions or because the degree of compliance with the policies or procedures may deteriorate over time.
Management assessed the effectiveness of its internal control over financial reporting for the year ended December 31, 2024. The assessment was based on criteria established in “Internal Control – Integrated Framework” issued by the Committee of Sponsoring Organizations of the Treadway Commission (“COSO 2013 Framework”). Based on the assessment, our management has concluded that as of December 31, 2024, our internal control over financial reporting was effective.
109
(c) Attestation Report of the Public Accounting Firm
Our independent registered public accounting firm has audited the effectiveness of our internal control over financial reporting as of December 31, 2024. Their attestation report appears on page F-4 of this Report.
(d)Changes in Internal Control Over Financial Reporting
There were no changes in our internal control over financial reporting identified in connection with the evaluation required by Rules 13a-15(d) or 15d-15(d) under the Exchange Act that occurred during the year ended December 31, 2024, that have materially affected, or are reasonably likely to materially affect, our internal control over financial reporting.
Item 16. Reserved
Item 16A. Audit Committee Financial Expert
The Directors Committee performs the Audit Committee’s functions.
Under Chilean law, we are not required to appoint a financial expert. As of April 28, 2025, our Board has decided that our corporate governance system, including the Directors Committee’s ability to consult internal and external experts, satisfies the function provided by a financial expert on the Directors Committee and, therefore, has decided to not appoint a financial expert, as such term is defined under Item 407 of Regulation S-K.
Item 16B. Code of Ethics
Our standards of ethical conduct are governed using the following corporate rulings or policies approved by our Board: (i) the Manual for the Management of Information of Interest to the Market (the “Manual”); (ii) the Human Rights Policy; (iii) the Politically Exposed Person Policy; (iv) the Code of Ethics; (v) the Zero Tolerance Anti-Corruption Plan (the “ZTAC Plan”); (vi) the Penal Risk Prevention Model; (vii) the Enel Global Compliance Program on Corporate Criminal Liability (the “Enel Global Compliance Program”); (viii) the Internal Control and Risk Management System; (ix) procedures issued in compliance with the requirements of CMF General Norm Regulation No. 385, which was in force and subsequently replaced by CMF General Norm Regulation No. 461 (“NCG 461” in its Spanish acronym); and (x) the Diversity Policy.
The Manual addresses the following issues: applicable standards and blackout periods regarding the information in connection with transactions of our securities, or those of our affiliates, entered into by directors, management, principal executives, employees, and other related parties; the existence of mechanisms for the continuous disclosure of information that is of interest to the market; and procedures that protect confidential information. Please refer to “Item 16J. Insider Trading Policies” for further information.
The Human Rights Policy incorporates and adapts the United Nations’ general principles related to human rights into our corporate policies, and the Politically Exposed Person Policy includes procedures for regulating the commercial and contractual relationships between Politically Exposed People and us. The Code of Ethics is based on general principles such as impartiality, honesty, integrity, and other ethical standards, all of which are expected from our employees. The ZTAC Plan reinforces the Code of Ethics principles, with emphasis on avoiding corruption through bribes, preferential treatment, and other similar matters.
The Penal Risk Prevention Model satisfies the standards imposed by Chilean Law No. 20,393, which imposes criminal responsibility for legal entities for certain crimes, including money laundering, financing of terrorism, and bribery of public officials. The Enel Global Compliance Program is designed to reinforce the group’s commitment to the highest ethical, legal, and professional standards for enhancing and preserving the group’s reputation. It sets several preventive measures for corporate criminal liability.
The Internal Control and Risk Management System is a set of guidelines defined by Enel for the standards, procedures, and systems applied at different levels of our company to identify, analyze, evaluate, manage, and communicate risks.
110
Enel Chile classifies risk monitored in its Risk Catalogue into 6 macro-categories: Financial, Strategic, Governance and Culture, Operational, Compliance, and Digital Technology, as well as 37 sub-categories.
Enel Chile’s Risk Control and Management policy is guided by our principles rooted in Enel’s Internal Control and Risk Management System and contains policies that monitor limits and indicators related to our specific risks, corporate functions, or businesses. Our main risk control and management policies are described as follows:
| ● | The Guarantee Management Policy establishes the guidelines and methodologies to manage guarantees from suppliers and to ensure effective mitigation of counterparty risk related to the profile of the supplier and the guarantor. |
| ● | The Commodities Risk Control Policy manages commodity risk and control activities through the optimization of risks decisions, enabling the minimization of the probability of not achieving strategic results by controlling price, volume, exchange rate, commodity credit and counterparty risks. |
| ● | The Credit and Counterparty Risk Control Policy is designed to minimize the probability that expected results will be affected by a default or reduction in the credit quality of a counterparty. |
| ● | The Financial Risk Control Policy strives to minimize the probability of not achieving commercial and financial strategic results by controlling risks involving financial markets, financial counterparties, liquidity, and operations. |
| ● | The Hedge Policy aims to mitigate the risk of variations in exchange rates by maintaining a balance between flows indexed to US dollars or local currencies, if any, and the levels of assets and liabilities in such currency. |
| ● | The Climate Change Policy establishes a common framework for the Company to guarantee the effectiveness in strategically managing the risks and opportunities associated with climate change while integrating with the Company’s main processes and decision-making. |
The Risk Control and Management Policy also follows the standards and best practices established in the ISO 31000:2018 (G31000), and part of its team is already certified and acts under the guidelines of these international standards. The primary objective is to identify internal and external risks preemptively and to analyze, evaluate, and quantify the probability of their occurrence and impact on the Company. Each area within the Company manages risks using mitigation measures stipulated in action plans. In the risk management phase, necessary actions determined by internal policies and procedures are considered. The strict observance of ISO international standards and governmental regulations may require risk management actions to be documented to guarantee good governance practices and ensure business continuity.
NCG 30, issued by CMF as amended from time to time, establishes the structure and contents for the Company’s annual report, including corporate social responsibility practices, information related to the Board’s functions and composition; relationships between the company, shareholders, and the general public; third-party assessments; and internal control and risk management. This information is available at the public’s disposal on the Company’s website (www.enelchile.cl) and is sent to the stock exchanges.
In 2016, we established the Diversity Policy that defines the key principles required to spread a culture focused on diversity and respect, preventing arbitrary discrimination, and encouraging equal opportunities and inclusion, all fundamental values in developing the Company’s activities. Through this policy, the Company seeks to improve our employees’ work environment and quality of life. The Company is committed to creating an inclusive work environment where employees can develop their potential and maximize their contribution.
In 2018, the Board approved a policy dealing with environmental and biodiversity issues. ESG criteria are integrated into our business model. The Board periodically receives reports from management to identify and assess all risks associated with ESG and climate change issues, including compliance with its policies.
111
A copy of these documents is available on our webpage at www.enelchile.cl, as well as upon request, free of charge, by writing or calling us at:
Enel Chile S.A.
Investor Relations Department
Roger de Flor 2725, Torre 2, Piso 17
Las Condes, Santiago
Chile
Tel: (56-2) 2630-9000
In the fiscal year 2024, our Board updated the Manual and the Penal Risk Prevention Model to reflect the most recent Chilean regulation applicable to the Company. No waivers from any provisions of the Code of Ethics, the ZTAC Plan, or the Manual were expressly or implicitly granted to the chief executive officer, the chief financial officer, or any other senior financial officers in the fiscal year 2024.
Item 16C. Principal Accountant Fees and Services
The following table provides information on the aggregate fees for approved services billed by our independent registered accounting firm KPMG Auditores Consultores Ltda. (“KPMG”) and its respective affiliates by type of service for the periods indicated.
Services Rendered |
|
2024 |
|
2023 |
|
|
(in millions of Ch$) |
||
Audit fees |
|
1,048 |
|
1,114 |
Audit-related fees |
|
52 |
|
63 |
Tax fees |
|
— |
|
— |
All other fees |
|
— |
|
— |
Total |
|
1,100 |
|
1,177 |
All the fees disclosed under audit-related fees and all other fees were pre-approved as required by the Directors Committee pre-approval policies and procedures.
The amounts included in the table above and any related footnotes have been classified in accordance with SEC guidance.
Directors Committee Pre-Approval Policies and Procedures
The Directors Committee, which performs the functions of the Audit Committee, has a pre-approval policy regarding the contracting of our external auditor, or any affiliate of the external auditor, for professional services. The professional services covered by such policy include audit and non-audit services provided to us.
Fees payable in connection with recurring audit services are pre-approved as part of our annual budget. Fees payable in connection with non-recurring audit services, once the chief financial officer has examined them, are submitted to the Directors Committee for its final consideration.
The pre-approval policy established by the Directors Committee for non-audit services and audit-related fees is as follows:
| ● | The business unit that has requested the service and the audit firm expected to perform the service must request that the chief financial officer review the nature of the service to be provided. |
| ● | The chief financial officer then analyzes the request and requires the selected audit firm to issue a certificate signed by the partner responsible for the audit of our consolidated financial statements confirming such an audit firm’s independence. |
| ● | Finally, the proposal is submitted to the Directors Committee for approval or denial. |
112
The Directors Committee has designed, approved, and implemented the necessary procedures to fulfill the SEC requirements regarding the Audit Committee’s pre-approval of certain tax services.
Item 16D. Exemptions from the Listing Standards for Audit Committees
Not applicable.
Item 16E. Purchases of Equity Securities by the Issuer and Affiliated Purchasers
In the fiscal year 2024, there were no purchases of Enel Chile’s equity securities by us or any of our affiliates.
Item 16F. Change in Registrant’s Certifying Accountant
None.
Item 16G. Corporate Governance
The following summarizes the significant differences between our corporate governance practices and those applicable to U.S. domestic issuers under the NYSE’s corporate governance rules.
Independence and Functions of the Directors Committee (Audit Committee)
Chilean law requires that at least two-thirds of the Directors Committee be independent directors. The CMF may, by a general norms’ regulation, set forth the requirements and conditions that must be met by board members to be independent directors. Notwithstanding the above, according to Article 50 bis of the Chilean Corporations Law, a member would not be considered independent if, at any time, within the last 18 months such member (i) had any link, interest or economic, professional, credit or commercial dependency, of a relevant nature and amount with the company, with other companies of the same group, with its controlling shareholder, or with the principal officers of any of them or has been a director, manager, administrator, principal officer or advisor of any of them (being the CMF authorized to set forth the criteria of what will be deemed “relevant nature and amount”); (ii) had a family relationship up to the second degree of consanguinity or affinity with any of the members described in (i) above; (iii) has been a director, manager, administrator or principal officer of a non-profit organization that has received contributions from (i) above; (iv) has been a partner or a shareholder who has controlled, directly or indirectly, 10% or more of the capital stock or has been a director, manager, administrator or principal officer of an entity that has provided consulting or legal services for a relevant consideration or external audit services to the persons listed in (i) above; and (v) has been a partner or a shareholder who has controlled, directly or indirectly, 10% or more of the capital stock or has been a director, manager, administrator, or principal officer of the top competitors, suppliers, or customers. In case there are not enough independent directors on the board to serve on the Directors Committee, Chilean law determines that the independent director nominates the rest of the Directors Committee members among the remaining board members who do not meet the Chilean law independence requirements. Chilean law also requires that all publicly held limited liability stock corporations that have a market capitalization of at least UF 1.5 million (Ch$58 billion as of December 31, 2024) and at least 12.5% of its voting shares are held by shareholders that individually control or own less than 10% of such shares, must have at least one independent director and a Directors Committee.
Under the NYSE corporate governance rules, all members of the Audit Committee must be independent. The Audit Committee of a U.S. company must perform the functions detailed in, and also comply with, the requirements of NYSE Listed Company Manual Rules 303A.06 and 303A.07. As of July 31, 2005, non-U.S. companies have been required to comply with Rule 303A.06, but not with Rule 303A.07. Since our incorporation on March 1, 2016, we have complied with the independence and the functional requirement of Rule 303A.06.
Under our bylaws, all Directors Committee members must satisfy the requirements of independence, as stipulated by the NYSE. The Directors Committee comprises three members of the Board. It complies with Article 50 bis of the Chilean Corporations Law and the criteria and requirements of independence prescribed by the Sarbanes-Oxley Act (“SOX”), the SEC, and the NYSE. As of the date of this Report, the Directors Committee complies with the Audit Committee’s conditions as required by the SOX, the SEC, and the NYSE corporate governance rules.
113
As a result, we have a single Committee, the Directors Committee, which includes the duties performed by an Audit Committee among its functions.
Corporate Governance Guidelines
The NYSE’s corporate governance rules require U.S.-listed companies to adopt and disclose corporate governance guidelines. Chilean law provides for this practice through the procedures related to NCG 461 and the Manual. We have also adopted the Code of Ethics. Our bylaws include provisions that govern the creation, composition, attributions, functions, and compensation of the Directors Committee, including among its functions the duties performed by an Audit Committee. Please see “Item 6. Directors, Senior Management and Employees — C. Board Practices” for more information about the Director Committee’s functions and duties.
Item 16H. Mine Safety Disclosure
Not applicable.
Item 16I. Disclosure Regarding Foreign Jurisdictions that Prevent Inspections
Not applicable.
Item 16J. Insider Trading Policies
In order to guarantee compliance with the guidelines contained in Law No. 18,045 on the Securities Market and General Rule No. 270 of the CMF, our Board approved the Manual in 2016. It was updated in 2023 and includes our insider trading policy and procedure (the “Insider Trading Policy”), which determines the general behavior criteria that our directors, management, principal executives, employees, and other related parties (the “Parties”) must follow in the transactions they carry out, including with respect to our securities. The Insider Trading Policy is reasonably designated to promote compliance with applicable insider trading laws, rules and regulations and NYSE listing standards and contributes to the transparency and protection of investors. A copy of the Manual is filed as Exhibit 11 to this Report. The principles reflected in the Manual are transparency, good faith, prioritization of general interests before personal ones, and care of and diligence in the use of information and the actions carried out in the markets.
The Manual sets forth the internal policies and rules regarding the information that will be made available to investors and implements systems aimed at guaranteeing that such information is communicated to the market in a timely manner. The Manual reflects our belief that timely and efficient information provided either with respect to securities transactions carried out by persons holding positions of directors, managers, administrators, chief executives, or employees, as well as entities controlled directly by them or through third parties, with respect to information of interest or essential information related to the Company’s progress contributes to the formation of a transparent market.
The Manual regulates the following:
| ● | the Parties’ actions involving the transactions and holding of securities issued either by the Company or by other companies belonging to our business group, or of securities whose price or result depends on or is conditioned, in whole or in significant part, to the variation or evolution of the same in accordance with the provisions of CMF General Norm Regulation No. 269. For further information concerning the reporting requirements under this regulation, please refer to “Item 10. Additional Information — B. Memorandum and Articles of Association — Reporting Requirements Regarding Acquisition of Sale of Shares”; |
| ● | the type, form, and content of the information that should be made known to the market in general regarding such transactions and holdings; |
| ● | the dissemination to the general public of material facts, as well as confidential, privileged, or other information of interest; |
114
| ● | the procedures for safeguarding confidential information about the Company and its dissemination mechanisms to prevent such information from being disclosed to persons other than those who, due to their position or activity at the Company must know such information before it is made available to shareholders and the public; and |
| ● | the policies that govern relationships with the media, analysts, or investment banks. |
Item 16K. Cybersecurity
Governance
Since September 2016, Enel has operated a Cyber Security unit committed to guaranteeing governance, direction, and control of cybersecurity topics. The head of the Cyber Security unit, who is also Enel’s chief information security officer (“CISO”), reports directly to the head of Security function and to the head of global information and communication technology (“ICT”), the Enel Group’s chief information officer (“CIO”), as part of Global Service function.
At the Enel Group’s executive management level, the Cyber Security Committee addresses and approves the Group cybersecurity strategy and periodically conducts oversight of strategy implementation (at least annually). The committee is chaired by the Enel Group’s CEO and made up of his/her front-line officers, including the head of the Cyber Security unit.
A separate Cyber Risks Operating Committee meets quarterly to define criteria to set priorities for risk analysis and acceptance according to Enel Group risk posture, in addition to sharing best practices and lessons learned. The committee consists of the head of the Cyber Security unit and cybersecurity risk “referents” (i.e., cybersecurity focal points for business areas and holding function—one focal point for each business area and holding function of the Enel Group). These risk “referents” report to the head of the Cyber Security unit.
Additionally, cybersecurity risks and strategic initiatives are periodically discussed in depth by the Enel Group’s main executive and supervisory boards, such as the Risk Control Committee. Moreover, cyber risk is defined within the Enel Group Risk Catalogue as a risk related to digital technology.
Since June 2016, Mr. Yuri Rassega has been the CISO and head of the Cyber Security unit for the Enel Group. Mr. Rassega oversees all information technology (“IT”), operational technology (“OT”), and Internet of things (“IoT”) processes for Cyber Security Risk Management, Governance, Engineering, Assurance, and Operations areas, including the Enel Group’s Cyber Emergency Readiness Team (“CERT”) and Digital Identity Management. Mr. Rassega joined Enel in 2001 and, after several responsibilities within both the ICT and Audit functions, was appointed CISO in June 2016.
Before joining Enel, Mr. Rassega served in roles with various responsibilities in the ICT industry, including the development of systems in the finance sector, telecommunications, internet service providers (ISPs), enterprise resource planning (ERP), supervisory control and data acquisition (SCADA) systems, automation control systems (ACS), and industrial control systems (ICS) solutions for several clients. His experience has developed through a wide range of roles, from software development and electronic design to consultancy, entrepreneurial roles, and senior management positions. He is a member of expert working groups sponsored by EU authorities and forums, such as the G7 and G20, the World Economic Forum (with 5 publications), and the International Council on Large Electric Systems (CIGRE).
He is a founding partner and chairperson of AssoCISO (National Chief Information Security Officer Association) in Italy. He has participated as a speaker, panel chair, and member of the advisory board at dozens of international conferences in Europe, North America, Middle East, and Asia on cybersecurity, digital transformation, and wireless communications technologies. Mr. Rassega has also designed digital fraud detection tools and methods patented in Europe, the USA, and Latin America.
115
Cybersecurity Risk Management and Strategy
Cybersecurity Framework
In order to mitigate cyber risks, in all digital environments of the Group (IT, OT, IoT), in 2017, Enel adopted the Cyber Security Framework (the “Framework”) to guide and manage cybersecurity processes. It has been integrated into each company throughout the entire organization, including Enel Chile. The Framework is based on sector best practices and international standards (ISO 27001/NIST) and addresses the principles and operational processes that support a global strategy of cyber risk analysis, prevention, and management. This document is structured in eight processes fully applicable to the complexity of the IT, OT, and IoT environment. The Framework defines roles and responsibilities by fully involving business areas, assigning responsibilities to stakeholders in the organization, and establishing a solid basis for the full merger of technologies, core processes, and people. It focuses on and is driven by a “risk-based” approach and a “cybersecurity by design” principle.
The “risk-based” approach places risk assessment as a prerequisite for our strategic decisions. The estimation of cybersecurity risk factors (impacts, threats, vulnerabilities) is critical to assess our level of cyber risk and to identify appropriate treatment actions to mitigate it. The “cybersecurity by design” principle ensures that we consider cybersecurity requirements throughout the entire lifecycle of systems and services.
The Framework provides the overall coverage of the following areas:
· |
Cyber Security Risk Assessment: aims to identify, analyze, and evaluate cybersecurity risks, while taking into consideration our risk posture. |
· |
Cyber Security Strategy: aims to guide cybersecurity strategy, define cybersecurity objectives and priorities, address cybersecurity initiatives, and coordinate investment activities on cybersecurity topics for the Company. It guarantees oversight of international cybersecurity standards and regulations and ensures cybersecurity policy definitions, in accordance with regulatory compliance and Enel Group organizational documents. It also ensures managerial reporting and continuous monitoring of ongoing cybersecurity initiatives. |
· |
Cyber Security Engineering, Design, and Implementation: aims to ensure the adoption of cybersecurity principles from the beginning and during the entire lifecycle of IT/OT/IoT solutions and infrastructures; |
· |
Cyber Security Risk Treatment: aims to define and implement the most appropriate risk treatment actions to face cybersecurity risks. |
· |
Cyber Security Assurance: aims to analyze, verify, and test the effectiveness of the implemented risk response measures, detecting vulnerabilities, and assessing cybersecurity controls, ensuring the monitoring of remediation plans. |
· |
Cyber Emergency Readiness: aims to monitor, track, and report risk exposures and handle cybersecurity incidents that could occur. |
· |
Identity Management and Access Control: aims to manage the full lifecycle of digital identities used within the Company and perform security controls on access privileges to highlight possible risks and security improvements, triggering the necessary remediation processes. |
· |
Cyber Security Awareness and Training: aims to drive and run our Cyber Security Awareness and Training initiatives to focus attention on critical cybersecurity topics, working on behaviors and human factors. |
In accordance with the Framework, we use a Cyber Security Business Impact Analysis and Risk Assessment methodology (“Cyber Risk Management Procedure”), applicable to the entire Enel Group. It aims to identify, prioritize, and estimate cybersecurity risks within the Company, taking into consideration established risk acceptance levels.
116
The first phase of the process aims to identify the risk level associated with a logical or physical asset (Risk Center), while the second phase of the process aims to define the controls necessary to achieve the desired level of risk mitigation.
As part of Cyber Security unit, the Enel Group’s CERT is a global unit that is active 24 hours a day, whose mission is to protect Enel’s employees and assets (instrumental to our business that could be compromised by cyber threats) by promoting a proactive approach based on “incident readiness” rather than “incident response”. The CERT operates with threat intelligence, incident response, and information sharing processes, and exchanges information within a network of accredited international partners.
The Threat Intelligence service helps Enel’s CERT detect and protect privileged information to avoid, mitigate, or manage a potential cyber incident. The Cyber Incident Response process outlines the responsibilities for implementing corrective actions to put in place when an incident occurs. During the execution of response activities, depending on the type and impact of a cyber incident, all internal stakeholders and required actors support Enel’s CERT to respond to an incident in the shortest time possible, relying on procedures, knowledgeable people, technical resources, and connections to external partners. Depending on the incident typology and related classification of risk level, the Cyber Incident Response process can activate all the procedures defined for incidents and critical events management (e.g., Policy for Data Breach management, Policy for IT Service Continuity Management) to facilitate an efficient and quick response, minimizing impacts on people, services, and assets. Induction sessions are periodically held to inform the Enel’s Board about cybersecurity risks and the occurrence of any cybersecurity incidents.
Additionally, Enel’s CERT conducts periodic “cyber exercises” aimed at simulating a cybersecurity incident to increase the ability of response, readiness, incident management, and training of all relevant parties. The exercises involve both technical and business reference structures and, at the end of simulations, a report is provided with details of the results of the cyber exercise. These simulations are performed worldwide, generate awareness, and address any need for technical and/or organizational improvements.
If a cybersecurity incident occurs, it is classified according to the Enel Cyber Impact Matrix considering the improved event correlation capabilities coming from the adoption of new cybersecurity services. Most incidents are classified at level 0/1 and are considered “day-by-day” instances because they do not significantly impact our systems. Enel’s CERT manages incidents classified at this level. Generally, these incidents are automatically or semi-automatically blocked or managed by our systems, thus preventing and/or reducing the potential impact of a cyberattack. Incidents classified at levels 2, 3, or 4 of the Enel Cyber Impact Matrix may impact the Enel Group and are managed by Enel’s CERT in conjunction with the relevant stakeholders depending on incident typology, business area, and geographic boundaries.
For the year ended December 31, 2024, there were no cybersecurity incidents classified at level 4, the maximum impact of the Enel Cyber Impact Matrix.
117
PART III
Item 17. Financial Statements
Not Applicable.
Item 18. Financial Statements
See Financial Statements included at the end of this Report.
Item 19. Exhibits
Exhibit |
|
Description |
|---|---|---|
1.1 |
|
|
2.1 |
|
|
8.1 |
|
|
11 |
|
|
12.1 |
|
Certification of Chief Executive Officer pursuant to Section 302 of the Sarbanes-Oxley Act. |
12.2 |
|
Certification of Chief Financial Officer pursuant to Section 302 of the Sarbanes-Oxley Act. |
13.1 |
|
|
97 |
|
|
101.INS |
|
Inline XBRL Instance Document – The Instance Document does not appear in the Interactive Data File because its XBRL tags are embedded within the Inline XBRL document. |
101.SCH |
|
Inline XBRL Taxonomy Extension Schema Document |
101.CAL |
|
Inline XBRL Taxonomy Extension Calculation Linkbase Document |
101.DEF |
|
Inline XBRL Taxonomy Extension Definition Linkbase Document |
101.LAB |
|
Inline XBRL Taxonomy Extension Label Linkbase Document |
101.PRE |
|
Inline XBRL Taxonomy Extension Presentation Linkbase Document |
104 |
|
Inline Cover Page Interactive File – The Cover Page Interactive Data File does not appear in the Interactive Data File because its XBRL tags are embedded within the Inline XBRL document. |
We will furnish to the Securities and Exchange Commission, upon request, copies of any non-filed instruments that define the rights of holders of long-term debt of Enel Chile.
118
SIGNATURES
The registrant hereby certifies that it meets all of the requirements for filing on Form 20-F and that it has duly caused and authorized the undersigned to sign this annual report on its behalf.
|
ENEL CHILE S.A. |
|
|
||
By: |
/s/ Giuseppe Turchiarelli |
|
|
Name: |
Giuseppe Turchiarelli |
|
Title: |
Chief Executive Officer |
|
|
|
Date: April 29, 2025 |
|
|
119
Enel Chile and subsidiaries
Index to the Audited Consolidated Financial Statements
Reports of Independent Registered Public Accounting Firms:
Report of KPMG Auditores Consultores SpA (PCAOB ID No. 1273) at December 31, 2024, 2023, and 2022 |
F-1 – F-5 |
|||
|
||||
Consolidated Financial Statements: |
|
|||
|
||||
F-6 |
||||
F-8 |
||||
F-10 |
||||
F-12 |
||||
F-13 |
||||
|
|
|||
Ch$Chilean pesos |
US$U.S. dollars |
UF“Unidades de Fomento” – A Chilean inflation-indexed, Chilean peso-denominated monetary unit that is set daily in advance based on the previous month’s inflation rate. |
UTM“Unidad Tributaria Mensual” –Chilean inflation-indexed monthly tax unit used to define fines, among other purposes. |
UTA“Unidad Tributaria Annual” – Chilean inflation-indexed annual tax unit. One UTA equals 12 UTM. |
ThCh$Thousands of Chilean pesos |
ThUS$Thousands of U.S. dollars |
EUREuro |

Report of Independent Registered Public Accounting Firm
To the Stockholders and Board of Directors
Enel Chile S.A.:
Opinion on the Consolidated Financial Statements
We have audited the accompanying consolidated statements of financial position, classified of Enel Chile S.A. and subsidiaries (the Company) as of December 31, 2024 and 2023, the related consolidated statements of comprehensive income, by nature, changes in equity, and cash flows, direct method for each of the years in the three-year period ended December 31, 2024, and the related notes (collectively, the consolidated financial statements). In our opinion, the consolidated financial statements present fairly, in all material respects, the financial position of the Company as of December 31, 2024 and 2023, and the results of its operations and its cash flow for each of the years in the three-year period ended December 31, 2024, in conformity with IFRS Accounting Standards issued by the International Accounting Standards Board (IASB).
We also have audited, in accordance with the standards of the Public Company Accounting Oversight Board (United States) (PCAOB), the Company’s internal control over financial reporting as of December 31, 2024, based on criteria established in Internal Control – Integrated Framework (2013) issued by the Committee of Sponsoring Organizations of the Treadway Commission, and our report dated April 29, 2025, expressed an unqualified opinion on the effectiveness of the Company’s internal control over financial reporting.
Basis for Opinion
These consolidated financial statements are the responsibility of the Company’s management. Our responsibility is to express an opinion on these consolidated financial statements based on our audits. We are a public accounting firm registered with the PCAOB and are required to be independent with respect to the Company in accordance with the U.S. federal securities laws and the applicable rules and regulations of the Securities and Exchange Commission and the PCAOB.
We conducted our audits in accordance with the standards of the PCAOB. Those standards require that we plan and perform the audit to obtain reasonable assurance about whether the consolidated financial statements are free of material misstatement, whether due to error or fraud. Our audits included performing procedures to assess the risks of material misstatement of the consolidated financial statements, whether due to error or fraud, and performing procedures that respond to those risks. Such procedures included examining, on a test basis, evidence regarding the amounts and disclosures in the consolidated financial statements. Our audits also included evaluating the accounting principles used and significant estimates made by management, as well as evaluating the overall presentation of the consolidated financial statements. We believe that our audits provide a reasonable basis for our opinion.
KPMG Auditores Consultores Ltda, a Chilean joint-stock company and a member firm of the KPMG network of independent member firms affiliated with KPMG International Cooperative (“KPMG International”), a Swiss entity. All rights reserved.
F-1
Critical Audit Matter
The critical audit matters communicated below are matters arising from the current period audit of the consolidated financial statements that were communicated or required to be communicated to the audit committee and that: (1) relate to accounts or disclosures that are material to the consolidated financial statements and (2) involved our especially challenging, subjective, or complex judgments. The communication of critical audit matters does not alter in any way our opinion on the consolidated financial statements, taken as a whole, and we are not, by communicating the critical audit matters below, providing separate opinions on the critical audit matters or on the accounts or disclosures to which they relate.
Unbilled Revenue
As discussed in Notes 3q and Appendix 2.2 to the consolidated financial statements, revenue from sales to customers includes estimates of energy provided and not billed as of December 31, 2024, amounting to ThCh$994.692.375 related to the distribution and generation entities in Chile. These estimates are made based on the quantity of energy consumed by customers during the period, at the prices stipulated in the electricity tariffs in accordance with the current regulation or, if applicable, contractual arrangements with customers.
We identified the revenue recognition of energy provided and not invoiced as a critical audit matter due to the auditor judgment required to assess the complexity of the non-standardized determination of energy consumed by customers and the calculation of price formulas established in the contracts and regulations. In addition, auditor judgment was required to assess the adequacy of the nature and extent of the audit evidence obtained.
The following are the primary procedures we performed to address this critical audit matter. We evaluated the design and tested the operating effectiveness of certain internal controls related to the unbilled revenue process for the generation and distribution entities. This included controls related to:
| ● | The price used for estimation of unbilled sales to customers. |
| ● | inputs used to estimate the quantity of energy consumed by customers, such as energy purchased from the Company and the customer´s historical consumption information, including the energy consumption by customers in the previous month. |
| ● | the comparison between the estimate of unbilled revenue at the end of the month versus the actual billed to customers (back-testing) for the distribution and generation entities. |
We compared the amount of unbilled revenue at the end of the year versus the actual amount billed in January 2024 to customers (back-testing) or to external data provided by the local regulator, as applicable. We reassessed a sample of the price used to calculate the unbilled revenue to customers based on current contracts and decrees issued by the local regulator. We extracted a sample from the sales ledger to January 2024, to obtain evidence about the accuracy of the relevant data elements associated to billed amount to customers. We evaluated the reconciliation of the sales ledger to the actual sales report as of year-end. In addition, we evaluated the sufficiency of audit evidence obtained by assessing the results of procedures performed, including the appropriateness of such evidence.
KPMG Auditores Consultores Ltda, a Chilean joint-stock company and a member firm of the KPMG network of independent member firms affiliated with KPMG International Cooperative (“KPMG International”), a Swiss entity. All rights reserved.
F-2
Changes in functional currency
As discussed in Note 41 to the consolidated financial statements, as of January 1, 2025, the Company and its subsidiary, Enel Generación Chile, changed its functional currency from Chilean pesos to United States dollars as a result of changes in events and conditions relevant to their business operations. The main source of income for the Company’s subsidiary will originate in the group of free customer agreements, which gives rises to a substantially lower exposure to exchange rate risk compared to the group of regulated customer agreements, which historically represented the largest source of income. As discussed in Note 28, as a result of the change in functional currency, the accumulated amount in cash flow hedging reserves of ThCh$620,163,696, before taxes and minority interests, was fully recognized as a reduction in revenue from unregulated customers for the year ended December 31, 2024.
We identified the evaluation of the change in functional currency as a critical audit matter. Subjective auditor judgment was required to evaluate the revenue projections in determining the functional currency that most faithfully represents the economic effects of the underlying transactions, events and conditions.
The following are the primary procedures we performed to address this critical audit matter. We evaluated the design and tested the operating effectiveness of certain internal controls related to the financial reporting process. This included controls related to the development of revenue projections and evaluation of the triggering events for the change in functional currency. For a sample of revenue projections, we compared the amounts for consistency with underlying documentation, including contracts with customers. These procedures also included obtaining and evaluating the reasonableness of the Company’s assessment of primary and other indicators and evaluating the sufficiency of the Company’s disclosures in the consolidated financial statements regarding the facts and circumstances that led to a change in functional currency.
/s/ KPMG
KPMG Auditores Consultores Ltda.
We have served as the Company’s auditor since 2020.
Santiago, Chile
April 29, 2025
KPMG Auditores Consultores Ltda, a Chilean joint-stock company and a member firm of the KPMG network of independent member firms affiliated with KPMG International Cooperative (“KPMG International”), a Swiss entity. All rights reserved.
F-3
Report of Independent Registered Public Accounting Firm
To the Stockholders and Board of Directors
Enel Chile S.A.:
Opinion on Internal Control Over Financial Reporting
We have audited Enel Chile S.A. and subsidiaries’ (the Company) internal control over financial reporting as of December 31, 2024, based on criteria established in Internal Control – Integrated Framework (2013) issued by the Committee of Sponsoring Organizations of the Treadway Commission. In our opinion, the Company maintained, in all material respects effective internal control over financial reporting as of December 31, 2024, based on criteria established in Internal Control – Integrated Framework (2013) issued by the Committee of Sponsoring Organizations of the Treadway Commission.
We also have audited, in accordance with the standards of the Public Company Accounting Oversight Board (United States) (PCAOB), the consolidated statements of financial position, classified of the Company as of December 31, 2024 and 2023, the related consolidated statements of comprehensive income, by nature, changes in equity, and cash flows, direct method for each of the years in the three-year period ended December 31, 2024, and the related notes (collectively, the consolidated financial statements), and our report dated April 29, 2025, expressed an unqualified opinion on those consolidated financial statements.
Basis for Opinion
The Company’s management is responsible for maintaining effective internal control over financial reporting and for its assessment of the effectiveness of internal control over financial reporting, included in the accompanying Management’s Report on Internal Control over Financial Reporting. Our responsibility is to express an opinion on the Company’s internal control over financial reporting based on our audit. We are a public accounting firm registered with the PCAOB and are required to be independent with respect to the Company in accordance with the U.S. federal securities laws and the applicable rules and regulations of the Securities and Exchange Commission and the PCAOB.
We conducted our audit in accordance with the standards of the PCAOB. Those standards require that we plan and perform the audit to obtain reasonable assurance about whether effective internal control over financial reporting was maintained in all material respects. Our audit of internal control over financial reporting included obtaining an understanding of internal control over financial reporting, assessing the risk that a material weakness exists, and testing and evaluating the design and operating effectiveness of internal control based on the assessed risk. Our audit also included performing such other procedures as we considered necessary in the circumstances. We believe that our audit provides a reasonable basis for our opinion.
KPMG Auditores Consultores Ltda, a Chilean limited liability partnership and a member firm of the KPMG network of independent member firms affiliated with KPMG International Cooperative (“KPMG International”), a Swiss entity. All rights reserved.
F-4
Definition and Limitations of Internal Control Over Financial Reporting
A company’s internal control over financial reporting is a process designed to provide reasonable assurance regarding the reliability of financial reporting and the preparation of financial statements for external purposes in accordance with generally accepted accounting principles. A company’s internal control over financial reporting includes those policies and procedures that (1) pertain to the maintenance of records that, in reasonable detail, accurately and fairly reflect the transactions and dispositions of the assets of the company; (2) provide reasonable assurance that transactions are recorded as necessary to permit preparation of financial statements in accordance with generally accepted accounting principles, and that receipts and expenditures of the company are being made only in accordance with authorizations of management and directors of the company; and (3) provide reasonable assurance regarding prevention or timely detection of unauthorized acquisition, use, or disposition of the company’s assets that could have a material effect on the financial statements.
Because of its inherent limitations, internal control over financial reporting may not prevent or detect misstatements. Also, projections of any evaluation of effectiveness to future periods are subject to the risk that controls may become inadequate because of changes in conditions, or that the degree of compliance with the policies or procedures may deteriorate.
/s/ KPMG
KPMG Auditores Consultores Ltda.
Santiago, Chile
April 29, 2025
KPMG Auditores Consultores Ltda, a Chilean limited liability partnership and a member firm of the KPMG network of independent member firms affiliated with KPMG International Cooperative (“KPMG International”), a Swiss entity. All rights reserved.
.
F-5
ENEL CHILE S.A. AND SUBSIDIARIES
Consolidated Statements of Financial Position
As of December 31, 2024 and 2023
|
|
Note |
|
12-31-2024 |
|
12-31-2023 |
|
|
|
|
ThCh$ |
|
ThCh$ |
ASSETS |
|
|
|
|
|
|
CURRENT ASSETS |
|
|
|
|
|
|
Cash and cash equivalents |
|
6 |
|
383,399,319 |
|
563,291,290 |
Other current financial assets |
|
7 |
|
19,518,512 |
|
67,736,634 |
Other current non-financial assets |
|
8.a |
|
153,163,381 |
|
100,497,325 |
Trade and other receivables, current |
|
9 |
|
1,489,965,233 |
|
1,449,294,549 |
Current receivables due from related parties |
|
10 |
|
42,783,336 |
|
50,274,125 |
Inventories |
|
11 |
|
65,168,573 |
|
58,761,879 |
Current tax assets |
|
12 |
|
80,220,499 |
|
81,115,457 |
TOTAL CURRENT ASSETS |
|
[Subtotal] |
|
2,234,218,853 |
|
2,370,971,259 |
|
|
|
|
|
|
|
NON-CURRENT ASSETS |
|
|
|
|
|
|
Other non-current financial assets |
|
7 |
|
4,646,303 |
|
11,602,385 |
Other non-current non-financial assets |
|
8.a |
|
148,597,823 |
|
238,393,864 |
Trade and other non-current receivables |
|
9 |
|
1,159,251,669 |
|
903,678,141 |
Investments accounted for using the equity method |
|
13 |
|
32,703,763 |
|
25,353,785 |
Intangible assets other than goodwill |
|
14 |
|
293,348,456 |
|
195,009,500 |
Goodwill |
|
15 |
|
889,242,912 |
|
884,464,658 |
Property, plant and equipment |
|
16 |
|
7,552,861,067 |
|
6,850,184,820 |
Investment property |
|
17 |
|
7,175,892 |
|
7,340,561 |
Right-of-use assets |
|
18 |
|
272,610,975 |
|
269,052,555 |
Deferred tax assets |
|
19.b |
|
125,239,871 |
|
77,669,508 |
TOTAL NON-CURRENT ASSETS |
|
[Subtotal] |
|
10,485,678,731 |
|
9,462,749,777 |
|
|
|
|
|
|
|
TOTAL ASSETS |
|
|
|
12,719,897,584 |
|
11,833,721,036 |
The accompanying notes are an integral part of these consolidated financial statements.
F-6
ENEL CHILE S.A. AND SUBSIDIARIES
Consolidated Statements of Financial Position (continued)
As of December 31, 2024 and 2023
|
|
Note |
|
12-31-2024 |
|
12-31-2023 |
|
|
|
|
ThCh$ |
|
ThCh$ |
LIABILITIES AND EQUITY |
|
|
|
|
|
|
CURRENT LIABILITIES |
|
|
|
|
|
|
Other current financial liabilities |
|
20 |
|
83,705,578 |
|
615,014,915 |
Current lease liabilities |
|
21 |
|
26,886,119 |
|
24,138,193 |
Trade and other payables, current |
|
24 |
|
1,530,434,532 |
|
1,464,491,965 |
Current payables to related parties |
|
10 |
|
298,301,928 |
|
462,578,466 |
Other current provisions |
|
25 |
|
51,351,795 |
|
25,152,710 |
Current tax liabilities |
|
12 |
|
189,070,151 |
|
160,107,212 |
Other current non-financial liabilities |
|
8.b |
|
63,737,298 |
|
42,434,883 |
TOTAL CURRENT LIABILITIES |
|
[Subtotal] |
|
2,243,487,401 |
|
2,793,918,344 |
|
|
|
|
|
|
|
NON-CURRENT LIABILITIES |
|
|
|
|
|
|
Other non-current financial liabilities |
|
20 |
|
2,373,962,103 |
|
1,904,512,941 |
Non-current lease liabilities |
|
21 |
|
267,718,931 |
|
243,924,027 |
Trade and other payables non-current |
|
24 |
|
966,072,117 |
|
595,534,857 |
Non-Current payables to related parties |
|
10 |
|
1,015,904,873 |
|
1,034,791,219 |
Other long-term provisions |
|
25 |
|
215,266,701 |
|
211,600,686 |
Deferred tax liabilities |
|
19.b |
|
207,896,524 |
|
172,512,663 |
Non-current provisions for employee benefits |
|
26 |
|
65,598,156 |
|
62,820,044 |
Other non-current non-financial liabilities |
|
8.b |
|
37,611,263 |
|
53,219,983 |
TOTAL NON-CURRENT LIABILITIES |
|
[Subtotal] |
|
5,150,030,668 |
|
4,278,916,420 |
|
|
|
|
|
|
|
TOTAL LIABILITIES |
|
|
|
7,393,518,069 |
|
7,072,834,764 |
|
|
|
|
|
|
|
EQUITY |
|
|
|
|
|
|
Share and paid-in capital |
|
27.1 |
|
3,882,103,470 |
|
3,882,103,470 |
Retained earnings |
|
|
|
2,871,345,789 |
|
2,917,851,065 |
Other reserves |
|
27.5 |
|
(1,794,650,838) |
|
(2,353,874,617) |
Equity attributable to shareholders of Enel Chile |
|
[Subtotal] |
|
4,958,798,421 |
|
4,446,079,918 |
Non-controlling interests |
|
27.6 |
|
367,581,094 |
|
314,806,354 |
TOTAL EQUITY |
|
|
|
5,326,379,515 |
|
4,760,886,272 |
|
|
|
|
|
|
|
TOTAL LIABILITIES AND EQUITY |
|
|
|
12,719,897,584 |
|
11,833,721,036 |
The accompanying notes are an integral part of these consolidated financial statements.
F-7
ENEL CHILE S.A.
Consolidated Statements of Comprehensive Income, by Nature
For the years ended December 31, 2024, 2023 and 2022
|
|
Note |
|
2024 |
|
2023 |
|
2022 |
|
|
|
|
ThCh$ |
|
ThCh$ |
|
ThCh$ |
STATEMENTS OF PROFIT (LOSS) |
|
|
|
|
|
|
|
|
Revenue |
|
28 |
|
3,904,732,890 |
|
4,262,591,097 |
|
4,379,000,090 |
Other operating income |
|
28 |
|
82,402,403 |
|
117,654,896 |
|
577,431,773 |
Revenues and other operating income |
|
[Subtotal] |
|
3,987,135,293 |
|
4,380,245,993 |
|
4,956,431,863 |
Raw materials and consumables used |
|
29 |
|
(2,905,568,914) |
|
(2,995,585,459) |
|
(3,399,524,067) |
Contribution Margin |
|
[Subtotal] |
|
1,081,566,379 |
|
1,384,660,534 |
|
1,556,907,796 |
|
|
|
|
|
|
|
|
|
Other work performed by the entity and capitalized |
|
16.b.2 |
|
40,732,541 |
|
39,629,466 |
|
44,569,685 |
Employee benefits expense |
|
30 |
|
(163,937,134) |
|
(172,787,800) |
|
(158,239,393) |
Depreciation and amortization expense |
|
31.a |
|
(295,468,978) |
|
(253,399,784) |
|
(238,272,951) |
Impairment (loss) reversal recognized in profit or loss |
|
31.b |
|
(34,203,486) |
|
(7,023,888) |
|
(1,547,699) |
Impairment (loss) impairment gain and reversal of impairment loss determined in accordance with IFRS 9 |
|
31.b |
|
(18,429,856) |
|
(10,773,445) |
|
(22,025,354) |
Other expenses, by nature |
|
32 |
|
(237,200,190) |
|
(212,543,865) |
|
(269,034,847) |
Operating Income |
|
[Subtotal] |
|
373,059,276 |
|
767,761,218 |
|
912,357,237 |
|
|
|
|
|
|
|
|
|
Other gains (losses) |
|
33 |
|
(291,724) |
|
221,846,937 |
|
981,981,296 |
Financial income |
|
34 |
|
78,282,443 |
|
134,253,836 |
|
50,414,585 |
Financial costs |
|
34 |
|
(232,584,262) |
|
(247,067,556) |
|
(193,618,033) |
Share of profit of associates and joint ventures accounted for using the equity method |
|
13 |
|
8,413,675 |
|
5,702,088 |
|
3,281,241 |
Foreign currency exchange differences |
|
34 |
|
(21,732,058) |
|
(856,350) |
|
18,401,453 |
Gains or losses from indexed assets and liabilities |
|
34 |
|
20,824,185 |
|
25,285,703 |
|
5,862,890 |
Profit (loss) before taxes |
|
[Subtotal] |
|
225,971,535 |
|
906,925,876 |
|
1,778,680,669 |
Income tax expense |
|
19.a |
|
(34,928,564) |
|
(226,912,485) |
|
(469,696,880) |
PROFIT (LOSS) |
|
[Subtotal] |
|
191,042,971 |
|
680,013,391 |
|
1,308,983,789 |
|
|
|
|
|
|
|
|
|
Profit (loss) attributable to |
|
|
|
|
|
|
|
|
Profit (loss) attributable to owners of the parent |
|
|
|
145,112,153 |
|
633,455,775 |
|
1,252,082,258 |
Profit (loss) attributable to non-controlling interests |
|
27.6 |
|
45,930,818 |
|
46,557,616 |
|
56,901,531 |
Profit (loss) |
|
|
|
191,042,971 |
|
680,013,391 |
|
1,308,983,789 |
|
|
|
|
|
|
|
|
|
Basic earnings per share |
|
|
|
|
|
|
|
|
Basic earnings (losses) per share |
|
Ch$ / Share |
|
2.10 |
|
9.16 |
|
18.10 |
Weighted average number of outstanding shares |
|
Th |
|
69,166,557 |
|
69,166,557 |
|
69,166,557 |
|
|
|
|
|
|
|
|
|
Diluted earnings per share |
|
|
|
|
|
|
|
|
Diluted earnings (losses) per share |
|
Ch$ / Share |
|
2.10 |
|
9.16 |
|
18.10 |
Weighted average number of outstanding shares |
|
Th |
|
69,166,557 |
|
69,166,557 |
|
69,166,557 |
The accompanying notes are an integral part of these consolidated financial statements.
F-8
ENEL CHILE S.A.
Consolidated Statements of Comprehensive Income, by Nature (continued)
For the years ended December 31, 2024, 2023 and 2022
(In thousands of Chilean pesos – ThCh$)
|
|
Note |
|
2024 |
|
2023 |
|
2022 |
|
|
|
|
ThCh$ |
|
ThCh$ |
|
ThCh$ |
STATEMENTS OF COMPREHENSIVE INCOME |
|
|
|
|
|
|
|
|
Profit (loss) |
|
|
|
191,042,971 |
|
680,013,391 |
|
1,308,983,789 |
Components of other comprehensive income that will not be reclassified subsequently to profit or loss, before taxes |
|
|
|
|
|
|
|
|
Profit (loss) from defined benefit plans |
|
26.2.b |
|
(3,051,575) |
|
(27,122) |
|
(7,304,757) |
Other comprehensive loss that will not be reclassified subsequently to profit or loss |
|
[Subtotal] |
|
(3,051,575) |
|
(27,122) |
|
(7,304,757) |
Components of other comprehensive income that will be reclassified subsequently to profit or loss, before taxes |
|
|
|
|
|
|
|
|
Gains (losses) from foreign currency translation differences |
|
|
|
146,781,406 |
|
54,024,068 |
|
18,994,934 |
Gains (losses) on measuring financial asset at fair value through other comprehensive income |
|
|
|
(43) |
|
(44) |
|
(2) |
Share of other comprehensive income from associates and joint ventures accounted for using the equity method |
|
13.1 |
|
— |
|
13,494 |
|
1,043,185 |
Gains (losses) on cash flow hedges |
|
|
|
(113,147,813) |
|
(270,587,570) |
|
67,832,602 |
Adjustments from reclassification of cash flow hedges, transferred to profit or loss |
|
|
|
720,247,855 |
|
81,979,339 |
|
79,672,895 |
Other comprehensive income that will be reclassified subsequently to profit or loss |
|
[Subtotal] |
|
753,881,405 |
|
(134,570,713) |
|
167,543,614 |
Total components of other comprehensive income (loss) before taxes |
|
[Subtotal] |
|
750,829,830 |
|
(134,597,835) |
|
160,238,857 |
Income tax related to components of other comprehensive income that will not be reclassified subsequently to profit or loss |
|
|
|
|
|
|
|
|
Income tax related to defined benefit plans |
|
|
|
823,925 |
|
7,323 |
|
1,972,561 |
Income tax related to components of other comprehensive income that will not be reclassified subsequently to profit or loss |
|
[Subtotal] |
|
823,925 |
|
7,323 |
|
1,972,561 |
Income tax related to components of other comprehensive income that will be reclassified subsequently to profit or loss |
|
|
|
|
|
|
|
|
Income tax expense (benefit) related to cash flow hedge |
|
|
|
(165,985,007) |
|
50,924,221 |
|
(39,826,484) |
Income tax related to financial assets at fair value through other comprehensive income |
|
|
|
12 |
|
12 |
|
1 |
Income tax expense (benefit) related to components of other comprehensive income that will be reclassified subsequently to profit or loss |
|
[Subtotal] |
|
(165,984,995) |
|
50,924,233 |
|
(39,826,483) |
|
|
|
|
|
|
|
|
|
Total other comprehensive (loss) income |
|
|
|
585,668,760 |
|
(83,666,279) |
|
122,384,935 |
TOTAL COMPREHENSIVE INCOME |
|
|
|
776,711,731 |
|
596,347,112 |
|
1,431,368,724 |
|
|
|
|
|
|
|
|
|
Comprehensive income (loss) attributable to: |
|
|
|
|
|
|
|
|
Owners of Enel Chile |
|
|
|
699,079,375 |
|
551,958,629 |
|
1,363,350,140 |
Non-controlling interests |
|
|
|
77,632,356 |
|
44,388,483 |
|
68,018,584 |
TOTAL COMPREHENSIVE INCOME |
|
|
|
776,711,731 |
|
596,347,112 |
|
1,431,368,724 |
The accompanying notes are an integral part of these consolidated financial statements.
F-9
ENEL CHILE S.A.
Consolidated Statements of Changes in Equity
For the years ended December 31, 2024, 2023 and 2022
|
|
|
|
|
|
Changes in Other Reserves |
|
|
|
|
|
|
|
|
||||||||||
|
|
Share and Paid-in |
|
Translation |
|
Reserve for |
|
Reserve for |
|
Reserve for |
|
Other Comprehensive Income |
|
Other |
|
Total Other |
|
Retained Earnings |
|
Equity |
|
Non-Controlling |
|
Total Equity |
Consolidated Statement of Changes in Equity |
|
ThCh$ |
|
ThCh$ |
|
ThCh$ |
|
ThCh$ |
|
ThCh$ |
|
ThCh$ |
|
ThCh$ |
|
ThCh$ |
|
ThCh$ |
|
ThCh$ |
|
ThCh$ |
|
ThCh$ |
Opening balance as of January 1, 2024 |
|
3,882,103,470 |
|
326,555,507 |
|
(424,534,563) |
|
— |
|
1,772 |
|
(97,977,284) |
|
(2,255,897,333) |
|
(2,353,874,617) |
|
2,917,851,065 |
|
4,446,079,918 |
|
314,806,354 |
|
4,760,886,272 |
Changes in equity |
|
|
|
|
|
|
|
|
|
|
|
|
|
|
|
|
|
|
|
|
|
|
|
|
Comprehensive income |
|
|
|
|
|
|
|
|
|
|
|
|
|
|
|
|
|
|
|
|
|
|
|
|
Profit (loss) |
|
— |
|
— |
|
— |
|
— |
|
— |
|
— |
|
— |
|
— |
|
145,112,153 |
|
145,112,153 |
|
45,930,818 |
|
191,042,971 |
Other comprehensive income (loss) |
|
— |
|
126,931,921 |
|
429,247,809 |
|
(2,212,479) |
|
(29) |
|
553,967,222 |
|
— |
|
553,967,222 |
|
— |
|
553,967,222 |
|
31,701,538 |
|
585,668,760 |
Comprehensive income |
|
— |
|
— |
|
— |
|
— |
|
— |
|
— |
|
— |
|
— |
|
— |
|
699,079,375 |
|
77,632,356 |
|
776,711,731 |
Dividends |
|
— |
|
— |
|
— |
|
— |
|
— |
|
— |
|
— |
|
— |
|
(189,404,950) |
|
(189,404,950) |
|
(30,773,439) |
|
(220,178,389) |
Increase (decrease) from other changes |
|
— |
|
— |
|
— |
|
2,212,479 |
|
— |
|
2,212,479 |
|
3,044,078 |
|
5,256,557 |
|
(2,212,479) |
|
3,044,078 |
|
5,915,823 |
|
8,959,901 |
Total changes in equity |
|
— |
|
126,931,921 |
|
429,247,809 |
|
— |
|
(29) |
|
556,179,701 |
|
3,044,078 |
|
559,223,779 |
|
(46,505,276) |
|
512,718,503 |
|
52,774,740 |
|
565,493,243 |
|
|
|
|
|
|
|
|
|
|
|
|
|
|
|
|
|
|
|
|
|
|
|
|
|
Closing balance as of December 31, 2024 |
|
3,882,103,470 |
|
453,487,428 |
|
4,713,246 |
|
— |
|
1,743 |
|
458,202,417 |
|
(2,252,853,255) |
|
(1,794,650,838) |
|
2,871,345,789 |
|
4,958,798,421 |
|
367,581,094 |
|
5,326,379,515 |
|
|
|
|
|
|
Changes in Other Reserves |
|
|
|
|
|
|
|
|
||||||||||
|
|
Share and Paid-in |
|
Translation |
|
Reserve for |
|
Reserve for |
|
Reserve for |
|
Other Comprehensive Income |
|
Other |
|
Total Other |
|
Retained Earnings |
|
Equity |
|
Non-Controlling |
|
Total Equity |
Consolidated Statements of Changes in Equity |
|
ThCh$ |
|
ThCh$ |
|
ThCh$ |
|
ThCh$ |
|
ThCh$ |
|
ThCh$ |
|
ThCh$ |
|
ThCh$ |
|
ThCh$ |
|
ThCh$ |
|
ThCh$ |
|
ThCh$ |
Opening balance as of January 1, 2023 |
|
3,882,103,470 |
|
296,704,509 |
|
(293,168,877) |
|
— |
|
1,802 |
|
3,537,434 |
|
(2,262,872,826) |
|
(2,259,335,392) |
|
2,474,432,817 |
|
4,097,200,895 |
|
291,738,408 |
|
4,388,939,303 |
Changes in equity |
|
|
|
|
|
|
|
|
|
|
|
— |
|
— |
|
— |
|
— |
|
— |
|
— |
|
— |
Comprehensive income |
|
|
|
|
|
|
|
|
|
|
|
|
|
|
|
|
|
|
|
|
|
|
|
|
Profit (loss) |
|
— |
|
— |
|
— |
|
— |
|
— |
|
— |
|
— |
|
— |
|
633,455,775 |
|
633,455,775 |
|
46,557,616 |
|
680,013,391 |
Other comprehensive income (loss) |
|
— |
|
49,855,870 |
|
(131,365,686) |
|
(794) |
|
(30) |
|
(81,510,640) |
|
13,494 |
|
(81,497,146) |
|
— |
|
(81,497,146) |
|
(2,169,133) |
|
(83,666,279) |
Comprehensive income |
|
— |
|
— |
|
— |
|
— |
|
— |
|
— |
|
— |
|
— |
|
— |
|
551,958,629 |
|
44,388,483 |
|
596,347,112 |
Dividends |
|
— |
|
— |
|
— |
|
— |
|
— |
|
— |
|
— |
|
— |
|
(190,036,734) |
|
(190,036,734) |
|
(21,769,278) |
|
(211,806,012) |
Increase (decrease) from other changes |
|
— |
|
(20,004,872) |
|
— |
|
794 |
|
— |
|
(20,004,078) |
|
6,961,999 |
|
(13,042,079) |
|
(793) |
|
(13,042,872) |
|
448,741 |
|
(12,594,131) |
Total changes in equity |
|
— |
|
29,850,998 |
|
(131,365,686) |
|
— |
|
(30) |
|
(101,514,718) |
|
6,975,493 |
|
(94,539,225) |
|
443,418,248 |
|
348,879,023 |
|
23,067,946 |
|
371,946,969 |
|
|
|
|
|
|
|
|
|
|
|
|
|
|
|
|
|
|
|
|
|
|
|
|
|
Closing balance as of December 31, 2023 |
|
3,882,103,470 |
|
326,555,507 |
|
(424,534,563) |
|
— |
|
1,772 |
|
(97,977,284) |
|
(2,255,897,333) |
|
(2,353,874,617) |
|
2,917,851,065 |
|
4,446,079,918 |
|
314,806,354 |
|
4,760,886,272 |
F-10
|
|
|
|
|
|
Changes in Other Reserves |
|
|
|
|
|
|
|
|
||||||||||
|
|
Share and Paid-in |
|
Translation |
|
Reserve for |
|
Reserve for |
|
Reserve for |
|
Other Comprehensive Income |
|
Other |
|
Total Other |
|
Retained Earnings |
|
Equity |
|
Non-Controlling |
|
Total Equity |
Consolidated Statement of Changes in Equity |
|
ThCh$ |
|
ThCh$ |
|
ThCh$ |
|
ThCh$ |
|
ThCh$ |
|
ThCh$ |
|
ThCh$ |
|
ThCh$ |
|
ThCh$ |
|
ThCh$ |
|
ThCh$ |
|
ThCh$ |
Opening balance as of January 1, 2022 |
|
3,882,103,470 |
|
279,801,463 |
|
(391,523,134) |
|
— |
|
1,804 |
|
(111,719,867) |
|
(2,275,701,545) |
|
(2,387,421,412) |
|
1,603,186,295 |
|
3,097,868,353 |
|
248,624,545 |
|
3,346,492,898 |
Changes in equity |
|
|
|
|
|
|
|
|
|
|
|
— |
|
— |
|
— |
|
— |
|
— |
|
— |
|
— |
Comprehensive income |
|
|
|
|
|
|
|
|
|
|
|
|
|
|
|
|
|
|
|
|
|
|
|
|
Profit (loss) |
|
— |
|
— |
|
— |
|
— |
|
— |
|
— |
|
|
|
— |
|
1,252,082,258 |
|
1,252,082,258 |
|
56,901,531 |
|
1,308,983,789 |
Other comprehensive income (loss) |
|
— |
|
17,081,503 |
|
99,387,492 |
|
(5,211,060) |
|
(2) |
|
111,257,933 |
|
9,949 |
|
111,267,882 |
|
— |
|
111,267,882 |
|
11,117,053 |
|
122,384,935 |
Comprehensive income |
|
— |
|
— |
|
— |
|
— |
|
— |
|
— |
|
— |
|
— |
|
— |
|
1,363,350,140 |
|
68,018,584 |
|
1,431,368,724 |
Dividends |
|
— |
|
— |
|
— |
|
— |
|
— |
|
— |
|
— |
|
— |
|
(375,624,676) |
|
(375,624,676) |
|
(23,365,365) |
|
(398,990,041) |
Increase (decrease) from other changes |
|
— |
|
(178,457) |
|
(1,033,235) |
|
5,211,060 |
|
— |
|
3,999,368 |
|
12,818,770 |
|
16,818,138 |
|
(5,211,060) |
|
11,607,078 |
|
(1,539,356) |
|
10,067,722 |
Total changes in equity |
|
— |
|
16,903,046 |
|
98,354,257 |
|
— |
|
(2) |
|
115,257,301 |
|
12,828,719 |
|
128,086,020 |
|
871,246,522 |
|
999,332,542 |
|
43,113,863 |
|
1,042,446,405 |
|
|
|
|
|
|
|
|
|
|
|
|
|
|
|
|
|
|
|
|
|
|
|
|
|
Closing balance as of December 31, 2022 |
|
3,882,103,470 |
|
296,704,509 |
|
(293,168,877) |
|
— |
|
1,802 |
|
3,537,434 |
|
(2,262,872,826) |
|
(2,259,335,392) |
|
2,474,432,817 |
|
4,097,200,895 |
|
291,738,408 |
|
4,388,939,303 |
(1) See Note 27.1
(2) See Note 27.3
(3) See Note 27.5
(4) See Note 27.6
F-11
ENEL CHILE S.A.
Consolidated Statements of Cash Flows, Direct Method
For the years ended December 31, 2024, 2023 and 2022
|
|
|
|
2024 |
|
2023 |
|
2022 |
Statements of Cash Flows - Direct Method |
|
Note |
|
ThCh$ |
|
ThCh$ |
|
ThCh$ |
|
|
|
|
|
|
|
|
|
Cash flows from (used in) operating activities |
|
|
|
|
|
|
|
|
Types of collection from operating activities |
|
|
|
|
|
|
|
|
Collections from the sale of goods and services |
|
|
|
6,486,575,452 |
|
5,886,342,023 |
|
5,509,393,246 |
Collections from leasing and subsequent sale of such assets |
|
|
|
27,340,625 |
|
44,527,326 |
|
14,082,550 |
Other collections from operating activities |
|
|
|
12,842,555 |
|
1,812,296 |
|
43,898,286 |
|
|
|
|
|
|
|
|
|
Types of payment in cash from operating activities |
|
|
|
|
|
|
|
|
Payments to suppliers for goods and services |
|
|
|
(4,509,721,561) |
|
(4,638,105,198) |
|
(4,469,547,402) |
Payments to and on behalf of employees |
|
|
|
(147,134,962) |
|
(146,490,612) |
|
(147,549,249) |
Payments to manufacture or acquire assets held to lease to others and subsequently held for sale |
|
|
|
(6,326,670) |
|
— |
|
— |
Other payments for operating activities |
|
6.c) |
|
(132,565,162) |
|
(139,212,339) |
|
(134,649,957) |
|
|
|
|
|
|
|
|
|
Cash flows from (used in) operating activities |
|
|
|
|
|
|
|
|
Income taxes paid |
|
|
|
(194,603,727) |
|
(294,998,284) |
|
(59,828,183) |
Other cash outflows, net |
|
|
|
(5,500,674) |
|
(8,212,967) |
|
(11,020,478) |
Net cash flows from operating activities |
|
|
|
1,530,905,876 |
|
705,662,245 |
|
744,778,813 |
|
|
|
|
|
|
|
|
|
|
|
|
|
|
|
|
|
|
Cash flows from (used in) investing activities |
|
|
|
|
|
|
|
|
Cash flows from the loss of control of subsidiaries or other businesses |
|
6.d) |
|
— |
|
520,086,080 |
|
1,234,493,876 |
Cash flows used to obtain control of subsidiaries or other businesses |
|
|
|
— |
|
(63,727) |
|
— |
Other cash payments to acquire equity or debt instruments of other entities |
|
|
|
(2,216,167) |
|
(1,470,000) |
|
(4,664,044) |
Other collections from the sale of shares in joint ventures |
|
13.3.b) |
|
— |
|
29,662,554 |
|
— |
Other cash payments to acquire shares in joint ventures |
|
|
|
— |
|
— |
|
(29,940,350) |
Loans to related companies |
|
|
|
— |
|
— |
|
(43,013) |
Proceeds from the sale of property, plant and equipment |
|
|
|
— |
|
33,979,203 |
|
1,482,597 |
Purchases of property, plant and equipment |
|
|
|
(684,003,978) |
|
(636,792,401) |
|
(915,692,779) |
Acquisition of intangible assets |
|
|
|
(38,350,319) |
|
(25,631,385) |
|
(21,868,532) |
Collections from reimbursement of advances and loans granted to others |
|
6.e) |
|
— |
|
— |
|
172,369,859 |
Payments for future, forward, option and swap contracts |
|
|
|
(4,475,539) |
|
(54,333,349) |
|
(26,695,926) |
Collections from future, forward, option and swap contracts |
|
|
|
8,622,118 |
|
13,710,904 |
|
25,298,133 |
Dividends received |
|
|
|
— |
|
27,540 |
|
484,369 |
Interest received |
|
|
|
20,774,572 |
|
34,586,244 |
|
20,152,225 |
Other cash inflows |
|
|
|
3,549,909 |
|
— |
|
194,964 |
Net cash flows (used in) from investing activities |
|
|
|
(696,099,404) |
|
(86,238,337) |
|
455,571,379 |
|
|
|
|
|
|
|
|
|
Cash flows from (used in) financing activities |
|
|
|
|
|
|
|
|
Proceeds from long-term loans |
|
6.f) |
|
448,296,220 |
|
248,718,361 |
|
263,892,100 |
Proceeds from short-term loans |
|
6.f) |
|
— |
|
273,777 |
|
448,854,514 |
Loans from related companies |
|
6.f) |
|
1,092,247,399 |
|
767,682,700 |
|
602,033,501 |
Payments of loans |
|
6.f) |
|
(755,433,698) |
|
(84,762,889) |
|
(510,046,267) |
Payments on borrowings and lease liabilities |
|
6.f) |
|
(17,889,151) |
|
(18,418,666) |
|
(6,613,399) |
Payments of loans to related entities |
|
6.f) |
|
(1,230,854,131) |
|
(1,255,012,700) |
|
(1,187,697,500) |
Dividends paid |
|
|
|
(345,072,557) |
|
(401,593,903) |
|
(39,609,648) |
Interest paid |
|
6.f) |
|
(205,473,569) |
|
(193,172,908) |
|
(186,961,822) |
Other outflows of cash, net |
|
6.f) |
|
(19,013,832) |
|
2,050,585 |
|
(12,507,838) |
Net cash flows (used in) from financing activities |
|
|
|
(1,033,193,319) |
|
(934,235,643) |
|
(628,656,359) |
|
|
|
|
|
|
|
|
|
Net (decrease) increase in cash and cash equivalents before effect of exchange rate movements |
|
|
|
(198,386,847) |
|
(314,811,735) |
|
571,693,833 |
|
|
|
|
|
|
|
|
|
Effect of exchange rate changes on cash and cash equivalents |
|
|
|
|
|
|
|
|
Effect of exchange rate changes on cash and cash equivalents |
|
|
|
18,494,876 |
|
2,889,326 |
|
(6,455,274) |
Net (decrease) increase in cash and cash equivalents |
|
|
|
(179,891,971) |
|
(311,922,409) |
|
565,238,559 |
Cash and cash equivalents at beginning of year |
|
6 |
|
563,291,290 |
|
875,213,699 |
|
309,975,140 |
Cash and cash equivalents at end of year |
|
6 |
|
383,399,319 |
|
563,291,290 |
|
875,213,699 |
The accompanying notes are an integral part of these consolidated financial statements.
F-12
ENEL CHILE S.A.
NOTES TO THE CONSOLIDATED FINANCIAL STATEMENTS
Contents |
|
Page |
|
F-16 |
|
2. BASIS OF PRESENTATION OF THE CONSOLIDATED FINANCIAL STATEMENTS |
|
F-17 |
|
F-17 |
|
|
F-17 |
|
2.3 Responsibility for the information, judgments and estimates provided |
|
F-21 |
|
F-22 |
|
|
F-24 |
|
|
F-25 |
|
|
F-25 |
|
|
F-27 |
|
2.9 Conversion of financial statements denominated in foreign currency |
|
F-27 |
|
F-29 |
|
|
F-29 |
|
|
F-30 |
|
|
F-31 |
|
|
F-31 |
|
|
F-31 |
|
|
F-31 |
|
|
F-32 |
|
|
F-33 |
|
|
F-33 |
|
|
F-34 |
|
|
F-35 |
|
|
F-35 |
|
|
F-36 |
|
|
F-36 |
|
|
F-38 |
|
|
F-38 |
|
|
F-39 |
|
g.7) Offsetting of financial assets and financial liabilities |
|
F-40 |
|
F-40 |
|
|
F-40 |
|
|
F-41 |
|
|
F-42 |
|
|
F-42 |
|
|
F-43 |
|
|
F-43 |
|
m.1) Provisions for post-employment benefits and similar obligations |
|
F-43 |
|
F-44 |
|
|
F-44 |
|
|
F-44 |
|
|
F-45 |
|
|
F-47 |
|
|
F-47 |
|
|
F-47 |
|
|
F-48 |
|
|
F-49 |
|
|
F-49 |
|
|
F-52 |
|
|
F-54 |
|
|
F-56 |
|
|
F-59 |
|
|
F-62 |
|
|
F-62 |
F-13
|
F-63 |
|
|
F-71 |
|
|
F-71 |
|
|
F-71 |
|
|
F-72 |
|
|
F-73 |
|
|
F-73 |
|
|
F-76 |
|
|
F-79 |
|
|
F-79 |
|
|
F-80 |
|
|
F-80 |
|
|
F-81 |
|
|
F-81 |
|
|
F-82 |
|
|
F-82 |
|
13.2. Additional financial information on investments in associates |
|
F-83 |
|
F-84 |
|
|
F-86 |
|
|
F-88 |
|
|
F-90 |
|
|
F-94 |
|
|
F-95 |
|
|
F-96 |
|
|
F-96 |
|
|
F-97 |
|
|
F-99 |
|
|
F-99 |
|
|
F-101 |
|
|
F-102 |
|
|
F-103 |
|
|
F-103 |
|
|
F-104 |
|
|
F-105 |
|
|
F-107 |
|
|
F-107 |
|
|
F-108 |
|
|
F-108 |
|
|
F-109 |
|
|
F-109 |
|
|
F-110 |
|
|
F-111 |
|
|
F-111 |
|
|
F-112 |
|
|
F-115 |
|
|
F-116 |
|
|
F-117 |
|
|
F-118 |
|
|
F-118 |
|
26.2 Details, movements and presentation in financial statements |
|
F-118 |
|
F-119 |
|
|
F-120 |
|
|
F-120 |
|
|
F-120 |
|
|
F-120 |
|
|
F-120 |
|
27.4 Restrictions on subsidiaries transferring funds to the parent |
|
F-120 |
|
F-121 |
|
|
F-122 |
|
|
F-123 |
F-14
|
F-124 |
|
|
F-124 |
|
|
F-125 |
|
|
F-125 |
|
|
F-126 |
|
|
F-126 |
|
|
F-129 |
|
|
F-129 |
|
|
F-131 |
|
36. GUARANTEES WITH THIRD PARTIES, CONTINGENT ASSETS AND, LIABILITIES, AND OTHER COMMITMENTS |
|
F-133 |
|
F-133 |
|
|
F-133 |
|
|
F-133 |
|
|
F-136 |
|
|
F-139 |
|
|
F-139 |
|
|
F-141 |
|
|
F-144 |
|
|
F-145 |
|
APPENDIX 1 DETAILS OF ASSETS AND LIABILITIES IN FOREIGN CURRENCY |
|
F-148 |
APPENDIX 2 ADDITIONAL INFORMATION CIRCULAR No. 715 OF FEBRUARY 3, 2012 |
|
F-150 |
|
F-152 |
|
APPENDIX 2.2 ESTIMATED SALES AND PURCHASES OF ENERGY, POWER AND TOLL |
|
F-154 |
|
F-155 |
F-15
ENEL CHILE S.A. AND SUBSIDIARIES
NOTES TO THE CONSOLIDATED FINANCIAL STATEMENTS
FOR THE YEAR ENDED DECEMBER 31, 2024
(In thousands of Chilean pesos – ThCh$)
1. |
GENERAL INFORMATION |
Enel Chile S.A., (hereinafter the “Parent Company”, the “Company” or “Enel Chile”) and its subsidiaries comprise the Enel Chile Group (hereinafter the “Group”).
The Company is a publicly traded corporation with registered address and head office located at Roger de Flor 2725, Tower 2, Piso 17, Las Condes, Santiago, Chile. Since April 13, 2016, the Company is registered with the securities register of the Chilean Financial Market Commission (“Comisión para el Mercado Financiero” or “CMF”) and since March 31, 2016 is registered with the Securities and Exchange Commission of the United States of America (hereinafter the “U.S. SEC”). On April 21, 2016, the Company’s shares began trading on the Santiago Stock Exchange and the Electronic Stock Exchange. In addition, the Company’s common stock began trading in the United States in the form of American Depositary Shares on the New York Stock Exchange on a “when-issued” basis from April 21, 2016 to April 26, 2017 and on a “regular-way” basis since April 27, 2016.
Enel Chile is a subsidiary of Enel S.p.A. (hereinafter “Enel”), an entity that has direct and indirect ownership interests of 64.93%.
The Company was initially incorporated by public deed dated January 22, 2016 and came into legal existence on March 1, 2016 under the name of Enersis Chile S.A. The Company changed its name to Enel Chile S.A. effective October 4, 2016, when the Company’s name was changed by means of an amendment of the by-laws. For tax purposes, the Company operates under Chilean Tax identification number 76.536.353-5.
As of December 31, 2024, the Group had 1,952 employees. During the year ended 2024, the Group averaged a total of 2,003 employees (see Note 37).
The Company’s corporate purpose consists of exploring for, developing, operating, generating, distributing, transmitting, transforming, and/or selling energy of any kind or form, whether in Chile or abroad, either directly or through other companies. It is also engaged in telecommunications activities, and it provides engineering consulting services in Chile and abroad. The Company’s corporate purpose also includes investing in, and managing, its investments in subsidiaries and associates which generate, transmit, distribute, or sell electricity, or whose corporate purpose includes any of the following:
| i) | Energy of any kind or form, |
| ii) | Supplying public services, or services whose main component is energy |
| iii) | Telecommunications and information technology services, and |
| iv) | Internet-based intermediation business. |
F-16
2. |
BASIS OF PRESENTATION OF THE CONSOLIDATED FINANCIAL STATEMENTS |
2.1. Accounting principles
The consolidated financial statements of Enel Chile as of December 31, 2024, approved by its Board of Directors at its meeting held on April 28, 2025, have been prepared in accordance with International Financial Reporting Standards (IFRS) Accounting Standards, as issued by the International Accounting Standards Board (IASB).
These consolidated financial statements reflect faithfully the financial position of Enel Chile and its subsidiaries as of December 31, 2024 and 2023 and the results of operations, changes in equity and cash flows for the years ended on December 31, 2024, 2023 and 2022, and the related notes.
These consolidated financial statements have been prepared undergoing concern assumptions on a historical cost basis except when, in accordance with IFRS, those assets and liabilities are measured at a fair value.
Appendix 1 Detail of Assets and Liabilities in Foreign Currency; Appendix 2 Additional Information Circular No. 715 of February 2, 2012; Appendix 2.1 Supplementary Information on Trade Receivables; Appendix 2.2 Estimates of Sales and Purchases of Energy, Power and Toll; and Appendix 3 Detail of Due Dates of Payments to Suppliers form an integral part of these consolidated financial statements.
2.2. New accounting pronouncements
| a) | The following accounting pronouncements have been adopted by the Group effective beginning on January 1, 2024 |
Amendments and Improvements |
|
Mandatory application for annual periods beginning on or after: |
|
|
|
Amendments to IFRS 16: Lease Liability in a Sale and Leaseback |
|
January 1, 2024 |
|
|
|
Amendments to IAS 1: Classification of Liabilities as Current or Non-current and Long-term Debt with Covenants |
|
January 1, 2024 |
|
|
|
Amendments to IAS 7 and IFRS 7: Supplier Financing Arrangements |
|
January 1, 2024 |
Amendments to IFRS 16: "Lease Liability in a Sale and Leaseback”
On September 22, 2022, the IASB issued amendments to IFRS 16 Leases, to clarify how a lessee-seller measures a leaseback operation after the transaction date to meet the requirements of IFRS 15 Revenue from Contracts with Customers, to be recorded as a sale.
These amendments are applicable to annual periods beginning on or after January 1, 2024. The amendments will be applied retrospectively to leaseback transactions performed after the initial application of IFRS 16.
The adoption of these amendments did not have any impact on the Group's consolidated financial statements at the initial application date.
Amendments to IAS 1 “Classification of Liabilities as Current and Non-Current” and “Non-Current Liabilities with Covenants”
On January 23, 2020, the IASB issued limited-scope amendments to IAS 1: Presentation of Financial Statements, to clarify how to classify debt and other liabilities as current or non-current. The amendments provide that a liability is classified as non-current if the entity has, at the end of the reporting period, the substantial right to defer settlement of the liability during at least 12 months. The classification is not affected by the expectations of the entity or by events after the reporting date. The amendments include clarification of the classification requirements for debt that a company could settle by converting it to equity.
F-17
The amendments only affect the presentation of liabilities as current and non-current in the statement of financial position, not the amount and timing of their recognition, or the related disclosures. However, they could lead to companies reclassifying certain current liabilities to non-current and vice versa. This could affect compliance with covenants in the debt agreements of companies.
In addition, on October 31, 2022, the IASB issued new amendments to IAS 1, with the aim of improving the information that companies provide on long-term debt with covenants. The amendments also respond to comments from stakeholders on the classification of debt as current or non-current when applying the requirements issued in 2020.
The amendments are effective for annual periods beginning on or after January 1, 2024.
The adoption of these amendments did not have any impact on the Group's consolidated financial statements at the initial application date.
Amendments to IAS 7 and IFRS 7: “Supplier Finance Arrangements”
On May 25, 2023, the IASB issued amendments to the disclosure requirements of IAS 7 Statement of Cash Flows and IFRS 7 Financial Instruments: Disclosures to enhance the transparency of supplier finance arrangements and their effects on companies’ liabilities, cash flows, and liquidity risk exposure. These agreements are often referred to as supply chain finance, trade payables finance, or reverse factoring arrangements.
The amendments supplement requirements already in the IFRS and require that an entity discloses the terms and conditions of finance arrangements, quantitative information regarding the liabilities involved in the arrangements, the related payment due date ranges, and information about liquidity risk.
These amendments are applicable to annual periods beginning on or after January 1, 2024.
The adoption of these amendments did not have any impact on the Group's consolidated financial statements at the initial application date.
| b) | Accounting pronouncements effective as of January 1, 2025 and thereafter |
As of the date of issuance of these consolidated financial statements, the following accounting pronouncements had been issued by the IASB, but were not mandatory:
Standards, Amendments and Improvements |
|
Mandatory application for annual periods beginning on or after: |
|
|
|
Amendments to IAS 21: Lack of Exchangeability |
|
January 1, 2025 |
|
|
|
Amendments to IFRS 9 and IFRS 7: Classification and Measurement of Financial Instruments |
|
January 1, 2026 |
|
|
|
Annual Improvements to IFRS Accounting Standards (Volume 11): |
|
January 1, 2026 |
|
|
|
- IFRS 1 First-time Adoption of IFRS |
|
|
|
|
|
- IFRS 7 Financial Instruments: Disclosures |
|
|
|
|
|
- IFRS 9 Financial Instruments |
|
|
|
|
|
- IFRS 10 Consolidated Financial Statements |
|
|
|
|
|
- IAS 7 Statement of Cash Flows |
|
|
|
|
|
Amendments to IFRS 9 and IFRS 7: Contracts referring to electricity dependent on nature |
|
January 1, 2026 |
|
|
|
IFRS 18: Financial Statement Presentation and Disclosures |
|
January 1, 2027 |
|
|
|
IFRS 19: Subsidiaries without Public Liability - Disclosures |
|
January 1, 2027 |
F-18
Amendments to IAS 21: “Lack of Exchangeability”
On August 15, 2023, the IASB issued amendments to IAS 21 The Effects of Changes in Foreign Exchange Rates to respond to commentary from stakeholders and concerns regarding diverse practices when accounting for the lack of exchangeability between currencies.
These amendments establish criteria that will allow entities to apply a consistent approach to assess whether or not a currency is exchangeable into another and, when it is not, determining the exchange rate to be used and the disclosures to be provided. The amendment establishes that a currency is exchangeable into another at the measurement date when an entity can exchange that currency into another currency within a timeframe that includes a normal administrative delay and through an exchange market or mechanism in which an exchange transaction would create enforceable rights or obligations.
These amendments are effective for annual periods beginning on or after January 1, 2025 and early adoption is permitted.
Management is assessing the potential impact of the application of these amendments on the Group's consolidated financial statements.
Amendments to IFRS 9 and IFRS 7 “Classification and Measurement of Financial Instruments”
On May 30, 2024, the IASB issued limited scope amendments to the requirements for the classification and measurement of financial instruments in IFRS 9 Financial Instruments and IFRS 7 Financial Instruments: Disclosures. These amendments are a response to the comments of the “Post-implementation review” of the 2022 Accounting Standards and clarify the requirements in areas where the stakeholders have expressed concerns or where new issues have arisen from the issuance of IFRS 9.
These amendments address the following issues:
| - | settlement of financial liabilities through an electronic payment system; and |
| - | classification of financial assets, including those with ESG (Environmental, Social and Governance) features. |
The IASB also changed the disclosure requirements related to investments in equity instruments designated at fair value through other comprehensive income and added disclosure requirements for financial instruments with contingent features that are not directly related to the risks and basic costs of loans.
These amendments are applicable retrospectively for annual periods beginning on or after January 1, 2026 and early adoption is permitted.
Management is assessing the potential impact of the application of these amendments on the Group’s consolidated financial statements.
Annual Improvement to IFRS Accounting Standards (Volume 11)
On July 18, 2024, the IASB issued limited amendments to IFRS Accounting Standards and the accompanying guide as part of its regular Standards maintenance process. Annual improvements are limited to changes that clarify the wording of an IFRS Accounting Standard or correct relatively minor undesired consequences or conflicts between the requirements in IFRS Accounting Standards.
These amendments include clarifications, simplifications, corrections and changes destined to improve the consistency of the following IFRS Accounting Standards:
F-19
| • | IFRS 1 First-time Adoption of International Financial Reporting Standards |
| • | IFRS 7 Financial Instruments: Disclosures |
| • | IFRS 9 Financial Instruments |
| • | IFRS 10 Consolidated Financial Statements |
| • | IAS 7 Statement of Cash flows |
These amendments are effective for annual periods beginning on or after January 1, 2026 and early adoption is permitted.
Management is assessing the potential impact of the application of these improvements on the Group's consolidated financial statements.
Amendments to IFRS 9 and IFRS 7 “Contracts Referencing Nature-dependent Electricity”
On December 18, 2024, the IASB issued amendments to IFRS 9 Financial Instruments and IFRS 7 Financial Instruments: Disclosures. These amendments are intended to help companies better report financial effects of nature-dependent electricity contracts in their financial statements, which are often structured as power purchase agreements.
Nature-dependent electricity contracts help companies secure their electricity supply from sources, such as wind and solar power. The amount of electricity generated under these agreements can vary depending on uncontrollable factors, such as weather conditions. Current accounting requirements may not adequately reflect how these contracts affect a company's performance.
The amendments relate to own-use requirements and hedge accounting requirements, together with related disclosures.
These amendments are effective for annual periods beginning on or after January 1, 2026 and early adoption is permitted.
Management is assessing the potential impact of the application of these amendments in the Group consolidated financial statements.
IFRS 18 “Presentation and Disclosure in Financial Statements”
On April 9, 2024, the IASB issued IFRS 18 Presentation and Disclosure in Financial Statements for the purpose of improving the transparency and comparability of information on the financial performance of companies, allowing better investing decisions. The new standard supersedes IAS 1 Presentation of Financial Statements.
IFRS 18 introduces three sets of new requirements to improve an entity’s reporting of its financial performance and provide investors with a better basis to analyze and compare companies:
| ● | Improves comparability of the statement of profit or loss. The standard introduces three defined categories of revenue and expenses (operating, investing and financing) to improve the structure of the statement of profit or loss and requires the presentation of new defined subtotals, including operating profit. The improved structure and new subtotals will provide investors with a consistent starting point to analyze the performance of companies and facilitate comparison of companies. |
F-20
| ● | Greater transparency in the performance measures defined by management. The standard requires that companies disclose explanations for specific measures related to the statement of profit or loss, referred to as “performance measures defined by management”. The new requirements will improve the transparency of the performance measures defined by management and will make them subject to audit. |
| ● | More useful grouping of information in the financial statements. The standard established improved guidelines on how to organize information and whether to provide it in the primary financial statements or the notes. |
| ● | The new standard is applicable for annual periods beginning on or after January 1, 2027 and early adoption is permitted. |
Management is assessing the potential impact of the adoption of IFRS 18 on the Group’s consolidated financial statements.
IFRS 19 “Subsidiaries without Public Accountability - Disclosures”
On May 9, 2024, the IASB issued IFRS 19 Subsidiaries without Public Accountability: Disclosures, whose objective is to allow eligible subsidiaries to opt for using IFRS Accounting Standards with reduced disclosures. The new standard seeks to reduce the cost of preparation of the financial statements of subsidiaries, while maintaining the usefulness of the information for its users.
Subsidiaries are eligible to apply IFRS 19 if they have no public accountability and their parent applies IFRS Accounting Standards in its consolidated financial statements. A subsidiary has no public accountability if it does not have shares or debt that is traded in a stock exchange and it does not act in a fiduciary capacity for the assets of a broad group of outsiders. Entities that choose to apply IFRS 19 must still apply the recognition, measurement and presentation requirements of other IFRS Accounting Standards.
An entity can elect to apply IFRS 19 for annual periods beginning on or after January 1, 2027 and early adoption is permitted.
Management has determined that IFRS 19 is not applicable to the consolidated financial statements of the Group because Enel Chile does not meet the eligibility criteria.
2.3. Responsibility for the information, judgments and estimates provided
The Company’s Board of Directors is responsible for the information contained in these consolidated financial statements and expressly states that all IFRS principles and standards have been fully implemented.
In preparing the consolidated financial statements, certain judgments and estimates made by the Group’s management have been used to quantify some of the assets, liabilities, revenue, expenses and commitments recognized.
The information included in the consolidated financial statements is selected based on a materiality analysis conducted in accordance with the requirements set out in IAS 1 “Presentation of Financial Statements” and IFRS Practice Statement No. 2 “Making Materiality Judgements” and based on investor expectations.
The most significant areas where material judgment has been required are:
-The identification of Cash Generating Units (CGU) for impairment testing (see Note 3.e).
-The hierarchy of information used to measure assets and liabilities at fair value (see Note 3.h).
-Application of the revenue recognition model in accordance with IFRS 15 (see Note 3.q).
F-21
-Determination of the functional currency of Enel Chile and each of its subsidiaries (see Note 40.i).
Accounting estimates generally refer to:
- |
The valuations performed to determine the existence of impairment losses in non-financial assets and goodwill (see Note 3.e). |
- |
The assumptions used to calculate the actuarial liabilities and obligations with employees, such as discount rates, mortality tables, salary increases, etc. (see Notes 3.m.1 and 26). |
-The useful lives of property, plant and equipment and intangible assets (see Notes 3.a and 3.d).
-The assumptions used to calculate the fair value of financial instruments (see Notes 3.h and 23).
-The energy supplied to customer whose meters have not yet been read.
- |
Certain assumptions inherent in the electricity system affecting transactions with other companies, such as production, customer billings, energy consumption, that allow for estimation of electricity system settlements that occur on the corresponding final settlement dates, but that are pending as of the date of issuance of the consolidated financial statements and could affect the balances of assets, liabilities, income and expenses recognized in the financial statements (see Appendix 2.2). |
- |
The interpretation of new normative related to the regulation of the Electric Sector, whose final economic effects will be determined by the resolutions of the relevant agencies (see Notes 4 and 9). |
-The probability that uncertain or contingent liabilities will be incurred and their related amounts (see Note 3.m).
- |
Future disbursements for closure of facilities and restoration of land, as well as associated discount rates to be used (see Note 3.a). |
- |
The tax results of the different Group subsidiaries that will be reported to the respective tax authorities in the future, and other estimates have been used as a basis for recording the different income tax related balances in these consolidated financial statements (see Note 3.p). |
- |
The fair value of assets acquired, and liabilities assumed, and any pre-existing interest in an entity acquired in a business combination. |
-Determination of expected credit losses on financial assets (see Note 3.g.3).
- |
In the measurement of lease liabilities, determination of the lease term of contracts with renewal options, as well as the rates to be used to discount lease payments (see Note 3.f.1). |
Estimates and judgements by Management have been made based on the best information available at the date of issuance of these consolidated financial statements and are based on past experiences and other factors considered reasonable given the circumstances. Accordingly, actual results may differ from these estimates. Estimates and assumptions are periodically reviewed and the effects of any changes are reflected in results if they only involve that period. If the review involves both the current period and the future period, the change is recognized in the period in which the review is conducted and in the related future periods.
2.4Subsidiaries
Subsidiaries are defined as those entities controlled, directly or indirectly by Enel Chile. Control is exercised if and only if the following conditions are met: Enel Chile has i) power over the subsidiary; ii) exposure, or rights to variable returns from these entities; and iii) the ability to use its power to influence the amount of these returns.
F-22
Enel Chile has power over its subsidiaries when it holds the majority of substantive voting rights, or if this is not the case, when it holds the rights that grant it present capacity to direct their relevant activities, i.e., the activities that significantly affect the subsidiary’s performance.
The Group will reassess whether or not it controls a subsidiary if facts and circumstances indicate that there are changes to one or more of the control elements listed above.
Subsidiaries are consolidated as described in Note 2.7.
The entities in which the Group has the ability to exercise control and consequently are included in consolidation in these consolidated financial statements are detailed below:
|
|
|
|
|
|
|
|
|
|
|
|
|
|
|
|
|
|
|
Taxpayer ID |
|
|
|
|
|
|
|
Ownership % at |
|
Ownership % at |
||||||||
No. |
|
Company |
|
Country |
|
Currency |
|
Direct |
|
Indirect |
|
Total |
|
Direct |
|
Indirect |
|
Total |
96.800.570-7 |
|
Enel Distribución Chile S.A. |
|
Chile |
|
Chilean peso |
|
99.09% |
|
— |
|
99.09% |
|
99.09% |
|
— |
|
99.09% |
96.783.910-8 |
|
Enel Colina S.A. |
|
Chile |
|
Chilean peso |
|
— |
|
100.00% |
|
100.00% |
|
— |
|
100.00% |
|
100.00% |
91.081.000-6 |
|
Enel Generación Chile S.A. |
|
Chile |
|
Chilean peso |
|
93.55% |
|
— |
|
93.55% |
|
93.55% |
|
— |
|
93.55% |
96.504.980-0 |
|
Empresa Eléctrica Pehuenche S.A. |
|
Chile |
|
Chilean peso |
|
— |
|
92.65% |
|
92.65% |
|
— |
|
92.65% |
|
92.65% |
77.047.280-6 |
|
Sociedad Agrícola de Cameros Ltda. |
|
Chile |
|
Chilean peso |
|
57.50% |
|
— |
|
57.50% |
|
57.50% |
|
— |
|
57.50% |
76.924.079-9 |
|
Enel X Chile Spa |
|
Chile |
|
Chilean peso |
|
100.00% |
|
— |
|
100.00% |
|
100.00% |
|
— |
|
100.00% |
76.412.562-2 |
|
Enel Green Power Chile S.A. (i) |
|
Chile |
|
U.S. dollar |
|
99.99% |
|
— |
|
99.99% |
|
99.99% |
|
— |
|
99.99% |
96.971.330-6 |
|
Geotérmica del Norte S.A. |
|
Chile |
|
U.S. dollar |
|
— |
|
84.59% |
|
84.59% |
|
— |
|
84.59% |
|
84.59% |
76.126.507-5 |
|
Parque Talinay Oriente S.A. |
|
Chile |
|
U.S. dollar |
|
— |
|
60.91% |
|
60.91% |
|
— |
|
60.91% |
|
60.91% |
77.696.828-5 |
|
Arcadia Generación Solar S.A. (i) |
|
Chile |
|
U.S. dollar |
|
— |
|
— |
|
— |
|
— |
|
— |
|
— |
77.741.548-4 |
|
Enel Mobility Chile SpA (ii) |
|
Chile |
|
Chilean peso |
|
100.00% |
|
— |
|
100.00% |
|
100.00% |
|
— |
|
100.00% |
77.569.067-4 |
|
Enel X Way Chile S.p.A. (iii) |
|
Chile |
|
Chilean peso |
|
62.46% |
|
— |
|
62.46% |
|
— |
|
— |
|
— |
F-23
2.4.1Changes in the scope of consolidation
2023
| i. | On January 1, 2023, the spin-off of Enel Green Power Chile S.A. was completed, resulting in the incorporation of a new company, Arcadia Generación Solar S.A. In this process, assets and liabilities associated with the solar plants Carrera Pinto, Pampa Solar Norte, Diego de Almagro, and Domeyko were allocated to Arcadia Generación Solar S.A., The shareholders of Enel Green Power Chile S.A. received a number of shares of Arcadia Generación Solar S.A. equal to the number of shares they held in the spun-off company. On October 24, 2023, Enel Chile completed the sale of all the shares it owned in Arcadia Generación Solar S.A., equivalent to 99.99% of the capital, to Sonnedix Chile Arcadia SpA and Sonnedix Chile Arcadia Generación SpA. (See Note 5.1). |
| ii. | On April 24, 2023, subsidiary Enel X Chile SpA completed the spin-off of assets related to the public electric charging infrastructure, which were contributed to a new company named Enel Mobility Chile SpA, which is now a wholly owned subsidiary. |
2024
| iii. | On August 1, 2024, Enel Chile participated in a capital increase in Enel X Way Chile S.p.A., which was fully contributed on August 23, 2024. As a result of this capital increase, Enel Chile’s ownership interest in Enel X Way Chile S.p.A. increased from 49% to 62.46%, thereby gaining control of the company and resulting in this company becoming a subsidiary. |
2.5. Investments in associates
Associates are entities over which Enel Chile, either directly or indirectly, exercises significant influence.
Significant influence is the power to participate in the decisions related to the financial and operating policy of the associate but without having control or joint control over those policies.
In assessing significant influence, the Group takes into account the existence and effect of currently exercisable voting rights or convertible rights at the end of each reporting period, including currently exercisable voting rights held by the Company or other entities. In general, significant influence is presumed to be present in those cases in which the Group has more than 20% of the voting power of the investee.
Associates are accounted for in the consolidated financial statements using the equity method of accounting as described in Note 3.i.
The detail of the companies that qualify as associates is the following:
|
|
|
|
|
|
|
|
|
|
|
|
|
|
|
|
|
|
|
Taxpayer ID |
|
|
|
|
|
|
|
Ownership % at |
|
Ownership % at |
||||||||
No. |
|
Company |
|
Country |
|
Currency |
|
Direct |
|
Indirect |
|
Total |
|
Direct |
|
Indirect |
|
Total |
76.418.940-K |
|
GNL Chile S.A. |
|
Chile |
|
U.S. dollar |
|
— |
|
33.33% |
|
33.33% |
|
— |
|
33.33% |
|
33.33% |
76.364.085-K |
|
Energía Marina S.p.A. |
|
Chile |
|
Chilean peso |
|
— |
|
25.00% |
|
25.00% |
|
— |
|
25.00% |
|
25.00% |
77.569.067-4 |
|
Enel X Way Chile S.p.A.(i) |
|
Chile |
|
Chilean peso |
|
— |
|
— |
|
— |
|
49.00% |
|
— |
|
49.00% |
i. |
On August 1, 2024, Enel Chile participated in a capital increase in Enel X Way Chile S.p.A., which was fully contributed on August 23, 2024, As a result of this capital increase, Enel Chile’s ownership interest in Enel X Way Chile S.p.A. increased from 49% to 62.46%, thereby gaining control of the company and resulting in this company becoming a subsidiary. |
F-24
2.6. Joint arrangements
Joint arrangements are defined as those entities in which the Group exercises control under an agreement with other shareholders and jointly with them, i.e., when decisions on the entities’ relevant activities require the unanimous consent of the parties sharing control.
Depending on the rights and obligations of the participants, joint agreements are classified as:
| - | Joint venture: an agreement whereby the parties exercising joint control have rights to the entity’s net assets. Joint ventures are included in the consolidated financial statements using the equity method of accounting, as described in Note 3.i. |
| - | Joint operation: an agreement whereby the parties exercising joint control have rights to the assets and obligations with respect to the liabilities relating to the arrangement. Joint operations are included in the consolidated financial statements recognizing the proportional interest in the assets and liabilities impacted by such operation. |
In determining the type of joint arrangement in which it is involved, the Group’s Management assesses its rights and obligations arising from the arrangement by considering the structure and legal form of the arrangement, the terms agreed by the parties in the contractual arrangement and, when relevant, other facts and circumstances. If facts and circumstances change, the Group reassesses whether the type of joint arrangement in which it is involved has changed.
The detail of companies classified as joint ventures is as follows:
|
|
|
|
|
|
|
|
|
|
|
|
|
|
|
|
|
|
|
|
|
|
|
|
|
|
|
Ownership % at |
|
Ownership % at |
||||||||
Taxpayer ID No. |
|
Company |
|
Country |
|
Currency |
|
Direct |
|
Indirect |
|
Total |
|
Direct |
|
Indirect |
|
Total |
77.110.358-8 |
|
HIF H2 SpA. |
|
Chile |
|
U.S. dollar |
|
— |
|
50.00% |
|
50.00% |
|
— |
|
50.00% |
|
50.00% |
Currently, Enel Chile is not involved in any joint arrangement that qualifies as a joint operation.
2.7. Basis of consolidation and business combinations
The subsidiaries are consolidated and all their assets, liabilities, revenues, expenses, and cash flows are included in the consolidated financial statements once the adjustments and eliminations of intra-group transactions have been made.
The comprehensive income from subsidiaries is included in the consolidated statement of comprehensive income from the date when the Enel Chile obtains control of the subsidiary until the date on which it loses control of the subsidiary.
The Group records business combinations using the acquisition method when all the activities and assets acquired meet the definition of a business and control is transferred to the Group. To be considered a business, a set of activities and assets acquired must include at least one input and a substantive process applied to it that, together, contribute significantly to the ability to create output. IFRS 3 provides the option of applying a “concentration test” that allows a simplified assessment of whether a set of acquired activities and assets is not a business. The concentration test is met if substantially all of the fair value of the gross assets acquired is concentrated in a single identifiable asset or group of similar identifiable assets.
F-25
The operations of Enel Chile and its subsidiaries have been consolidated under the following basic principles:
| 1. | At the date the Parent Company obtains control, the subsidiary’s assets acquired and its liabilities assumed are recorded at fair value, except for certain assets and liabilities that are recorded using valuation principles established in other IFRS standards. If the fair value of the consideration transferred plus the fair value of any non-controlling interests exceeds the fair value of the net assets acquired, this difference is recorded as goodwill. In the case of a bargain purchase, the resulting gain is recognized in profit or loss after reassessing whether all of the assets acquired and the liabilities assumed have been properly identified and following a review of the procedures used to measure the fair value of these amounts. |
For each business combination, IFRS allow valuation of the non-controlling interests in the acquiree on the date of acquisition: i) at fair value; or ii) for the proportional ownership of the identifiable net assets of the acquiree, with the latter being the methodology that the Group has systematically applied to its business combinations.
If the fair value of all assets acquired and liabilities assumed at the acquisition date has not been completed, the Group reports the provisional values accounted for in the business combination. During the measurement period, which shall not exceed one year from the acquisition date, the provisional values recognized will be adjusted retrospectively as if the accounting for the business combination had been completed at the acquisition date, and also additional assets or liabilities will be recognized to reflect new information obtained about events and circumstances that existed on the acquisition date, but which were unknown to Management at that time. Comparative information for prior periods presented in the financial statements is revised as needed, including making any change in depreciation, amortization or other income effects recognized in completing the initial accounting.
For business combinations achieved in stages, the Parent Company measures at fair value the participation previously held in the equity of the acquiree on the date of acquisition and the resulting gain or loss, if any, is recognized in profit or loss of the period.
2. |
Non-controlling interests in equity and in the comprehensive income of the consolidated subsidiaries are presented, respectively, under the line items “Total Equity: Non-controlling interests” in the consolidated statement of financial position and “Profit (loss) attributable to non-controlling interests” and “Comprehensive income attributable to non-controlling interests” in the consolidated statement of comprehensive income. |
3. |
Balances and transactions between consolidated companies have been fully eliminated on consolidation. |
4. |
Changes in the ownership interests in subsidiaries that do not result in the Group obtaining or losing control are recognized as equity transactions. The carrying amounts of the controlling and non-controlling interests are adjusted to reflect the changes in their relative interests in the subsidiaries. Any difference between the amount by which the non-controlling interests are adjusted and the fair value of the consideration paid or received, is recognized directly in equity attributable to shareholders of the Parent Company. |
5. |
Business combinations under common control are accounted for using the “pooling of interest” method. Under this method, the assets and liabilities involved in the transaction remain reflected at the same carrying amounts at which they were recorded in the ultimate parent company, although subsequent accounting adjustments may be needed to align the accounting policies of the companies involved. The Group does not apply a retrospective item of business combinations under common control. |
Any difference between assets and liabilities contributed to the consolidation and the consideration paid is recorded directly in equity as a charge or credit to “Other reserves”.
F-26
2.8. Functional currency
The functional and presentation currency of the consolidated financial statements of Enel Chile is the Chilean peso (Ch$). The functional currency has been determined, considering the economic environment in which the Company operates.
Any information presented in Ch$ has been rounded to the closest thousand (ThCh$) or million (MCh$), unless indicated otherwise.
2.9. Conversion of financial statements denominated in foreign currency
Conversion of the financial statements of the Group companies that have functional currencies different than Ch$, and do not operate in hyperinflationary economies, is carried out as follows:
| a. | Assets and liabilities, using the exchange rate prevailing at the closing date of the financial statements. |
| b. | Statements of comprehensive income using the average exchange rate for the period (unless this average is not a reasonable approximation of the cumulative effect of the exchange rate existing on the transaction dates, in which case the exchange rate on the date of each transaction is used). |
| c. | Equity is maintained at the historical exchange rate on the date of its acquisition or contribution, and at the average exchange rate as of the date of generation for retained earnings. |
| d. | Foreign currency translation differences generated in the conversion of the financial statements are recorded under “Foreign currency translation gains (losses)” in the consolidated statement of comprehensive income in Other comprehensive income (see Note 27.3). |
The financial statements of subsidiaries the functional currency of which is that of a hyperinflationary economy, are first adjusted for inflation, recording any gain or loss in the net monetary position in profit or loss. Subsequently, all items (assets, liabilities, equity items, expenses and revenue) are converted at the exchange rate prevailing at the closing date of the most recent statement of financial position. Changes in the Company’s net investment in the subsidiary, which operates in a hyperinflationary economy, based on the application of the price-level restatement/translation method, are recorded as follows: (i) the effect of restatement due to inflation is recognized directly in Equity, under the account "Other reserves"; and (ii) the translation effect is recognized in Gains (losses) from foreign currency translation, in the consolidated statements of comprehensive income.
Argentine Hyperinflation
Beginning on July 2018, the Argentine economy has been considered to be hyperinflationary in accordance with the criteria established in IAS 29 “Financial Reporting in Hyperinflationary Economies”. This determination was made on the basis of a number of qualitative and quantitative criteria, especially the presence of accumulated inflation in excess of 100% during the three previous years.
In accordance with IAS 29, the financial statements of the Argentine branch owned by Enel Generación Chile S.A., a subsidiary of Enel Chile, have been restated retrospectively, applying the general price index at historical cost, to reflect changes in the purchasing power of the Argentine peso, as of the closing date of these consolidated financial statements.
F-27
The general price indexes used at the end of the reporting periods are as follows:
|
|
General price index |
|
From January to December 2022 |
|
94.79 |
% |
From January to December 2023 |
|
211.41 |
% |
From January to December 2024 |
|
117.76 |
% |
The effects of the application of this standard on these consolidated financial statements are detailed in Note 34.
Exchange rates
The exchange rates used for the translation of the financial statements of the different subsidiaries with a functional currency other than the Group's functional currency are recorded at the following values (foreign currency against the Chilean peso):
|
As of December 31, |
||||||||
|
2024 |
|
2023 |
|
2022 |
||||
|
Close |
|
Average |
|
Close |
|
Average |
|
Average |
|
ThCh$ |
|
ThCh$ |
|
ThCh$ |
|
ThCh$ |
|
ThCh$ |
United States dollar |
996.46 |
|
943.74 |
|
877.12 |
|
839.91 |
|
871.19 |
Argentine peso |
0.96 |
|
0.96 |
|
1.08 |
|
1.08 |
|
4.81 |
F-28
3. ACCOUNTING POLICIES
The material accounting policies used in preparing the accompanying consolidated financial statements are the following:
| a) | Property, plant and equipment |
Property, plant and equipment are generally measured at acquisition cost, net of accumulated depreciation and any impairment losses experienced. In addition to the price paid to acquire each item, the cost also includes the following concepts where applicable:
| - | Finance costs accrued during the construction period that are directly attributable to the acquisition, construction, or production of qualifying assets, which require a substantial period of time before being ready for use; such as electricity generation or distribution facilities. The Group defines “substantial period” as a period exceeding twelve months. On the other hand, the capitalization of interest is suspended for periods in which the performance of activities for a qualifying asset has been interrupted, if these periods are extended over time. The interest rate used is that corresponding to the specific financing or, if it does not exist, the average financing rate of the company making the investment (see Note 16.b.1). |
| - | Employee expenses directly related to construction in progress (see Note 16.b.2). |
| - | Future disbursements that the Group will have to make to close its facilities are added to the value of the asset at fair value, recognizing the related provision for dismantling or restoration. Changes in the measurement of the provision resulting from changes in the estimated amount or timing of future expenditures required to settle the obligation, or changes in the discount rate, are added to or deducted from the cost of the asset, as appropriate (see Note 25). |
Assets under construction are transferred to operating assets once the testing period has been completed and they are available for use, at which time depreciation begins.
Expansion, modernization or improvement costs that represent an increase in productivity, capacity or efficiency, or a longer useful life are capitalized as an increase in the cost of the related assets.
The replacement or overhaul of entire components that increase the asset’s useful life or economic capacity are recorded as an increase in cost of the related assets, derecognizing the replaced or overhauled components.
Expenditures for periodic maintenance and repair are recognized directly as an expense for the year in which they are incurred.
Property, plant and equipment, net of its residual value, is depreciated by distributing the cost of the different items that comprise it on a straight-line basis over its estimated useful life, which is the period during which the Group expects to use the assets. Useful life estimates and residual values are reviewed on an annual basis and if appropriate adjusted prospectively.
In addition, the Group recognizes right-of-use assets for leases relating to property, plant and equipment in accordance with the criteria established in Note 3.f.1.
F-29
The following are the main categories of property, plant and equipment with their related estimated useful lives:
Classes of property, plant and equipment |
|
Years of estimated useful life |
Buildings |
|
10 – 60 |
Plant and equipment |
|
6 – 65 |
IT equipment |
|
3 – 15 |
Fixtures and fittings |
|
2 – 35 |
Motor vehicles |
|
5 – 10 |
In addition, for further information, the following is a more detailed breakdown of the class of plant and equipment:
Class of plant and equipment |
|
Years of estimated useful life |
Generating plant and equipment |
|
|
Hydroelectric plants |
|
|
Civil engineering works |
|
10 – 65 |
Electromechanical equipment |
|
10 – 45 |
Combined cycle power plants |
|
10 – 25 |
Renewable |
|
10 – 50 |
Wind Power Plants |
|
10 – 60 |
Solar Power Plants |
|
10 – 25 |
Geothermal Power Plants |
|
10 – 40 |
Distribution plant and equipment |
|
|
Low- and medium-voltage network |
|
10 – 50 |
Measuring and remote control equipment |
|
10 – 50 |
Primary substations |
|
6 – 25 |
Natural gas transportation plant and equipment |
|
|
Gas pipelines |
|
20 |
Land is not depreciated since it has an indefinite useful life, unless it relates to a right-of- use asset in which case it is depreciated over the term of the lease.
An item of property, plant and equipment is written off when sold or otherwise disposed of, or when no future economic benefits are expected to be obtained from its use, sale or other disposal.
Gains or losses arising from sales or retirement of items of property, plant and equipment, are recognized as “Other gains (losses)” in the statement of comprehensive income and are determined as the difference between the sale value and net carrying amount of the asset.
| b) | Investment property |
“Investment property” includes land and buildings that are kept for the purpose of obtaining gains from future sales or lease arrangements.
Investment property is measured at acquisition cost, net of accumulated depreciation and any impairment losses experienced. Investment property, excluding land, is depreciated by distributing the cost of the several elements that comprise it on a straight-line basis over the years of useful life.
An investment property is derecognized on disposal, or when no future economic benefits are expected from use or disposal.
Gains or losses arising from the sale or disposal of items of investment property are recognized as “Other gains (losses)” in the statement of comprehensive income and determined as the difference between the sales amount and the net carrying amount of the asset.
The fair value of investment property is disclosed in Note 17.
F-30
| c) | Goodwill |
Goodwill arising from business combinations and reflected in consolidation, represents the excess of the value of the consideration transferred plus the amount of any non-controlling interest over the net identifiable assets acquired and liabilities assumed, measured at fair value at the date of acquisition of the subsidiary. During the measurement period of the business combination, goodwill may be adjusted as a result of changes in the provisional amounts recognized for the assets acquired and liabilities assumed (see Note 2.7.1).
Goodwill arising from acquisition of companies with functional currencies other than the functional currency of the Parent Company is measured in the functional currency of the acquiree and translated to Chilean peso using the exchange rate effective as of the date of the statement of financial position.
After initial recognition, goodwill is not amortized, but rather, at the end of each accounting period, or when there are indications thereof, an impairment test is performed to determine whether any impairment has occurred that reduces its recoverable value to an amount lower than the recorded net cost, and if this is the case, the impairment is recorded in the statement of income for the period (see Note 3.e).
| d) | Intangible assets other than goodwill |
Intangible assets are initially recognized at their acquisition cost or production cost, and are subsequently measured at their cost, net of their accumulated amortization and impairment losses experienced.
Intangible assets are amortized on a straight-line basis over their useful lives starting from the time they are in use, except for those assets with indefinite useful lives, for which amortization is not applicable. As of December 31, 2024 and 2023, intangible assets with indefinite useful lives amounted to ThCh$7,241,069 and ThCh$6,555,491, respectively, mainly related to easements and water rights.
An intangible asset is derecognized when it is sold or otherwise disposed of, or when no future economic benefits are expected from its use, sale or other disposal.
Gains or losses arising from sales of intangible assets are recognized in profit or loss for the period and determined as the difference between the amount of the sale and the carrying amount of the asset.
The criteria for recognizing impairment losses on these assets and, if applicable, recoveries of impairment losses recorded in prior periods are explained in letter e) of this Note below.
d.1) Research and development expenses
The Group recognizes the costs incurred in a project’s development phase as intangible assets in the statement of financial position as long as the project’s technical feasibility and future economic benefits have been demonstrated.
Research costs are recorded as an expense in the consolidated statement of comprehensive income in the period in which they are incurred.
d.2) Other intangible assets
These assets correspond mainly to computer software, water rights and easements. They are initially recognized at acquisition or production cost and are subsequently valued at cost net of the related accumulated amortization and impairment losses, if any.
Computer software is amortized (on average) over four years. Certain easements and water rights have indefinite useful lives and are therefore not amortized.
F-31
| e) | Impairment of non-financial assets |
During the period, and mainly at the end of each reporting period, the Group evaluates whether there is any indication that an asset has been impaired. If any such indication exists, the Group estimates the recoverable amount of that asset to determine the amount of the impairment loss. For identifiable assets that do not generate cash flows independently, the Group estimates the recoverable amount of the Cash Generating Unit (CGU) to which the asset belongs, which is understood to be the smallest identifiable group of assets that generates independent cash inflows.
Notwithstanding the preceding paragraph, for CGUs to which goodwill or intangible assets with indefinite useful lives have been allocated, a recoverability analysis is performed routinely at each year-end.
The criteria used to identify the CGUs are based, in line with Management’s strategic and operating vision, within the specific characteristics of the business, the operating rules and regulations of the market in which the Group operates and corporate organization.
Recoverable amount is the higher of fair value less costs of disposal and value in use, which is defined as the present value of the estimated future cash flows. In order to calculate the recoverable amount of Property, plant, and equipment, as well as of goodwill and intangible assets, at the level of each CGUs the Group uses value in use criteria in practically all cases.
To estimate value in use, the Group prepares future pre-tax cash flow forecasts based on the most recent budgets available. These budgets include Management’s best estimates of a CGU’s revenue and costs using sector forecasts, past experience and future expectations.
In general, these projections cover the next three years, estimating cash flows for subsequent years by applying reasonable growth rates which, in no case, are increasing rates nor exceed the average long-term growth rates for the particular sector. As of December 31, 2024, the rates used to extrapolate the projections were between 2.3% and 3.0% (between 2.3% and 3.3% as of December 31, 2023).
These flows are discounted to calculate their present value at a pre-tax rate that includes the cost of capital of the business and the geographical zone where it is carried out. This calculation considers the current cost of money and the risk premiums used in general among analysts for the business and geographical zone.
Future cash flows are discounted to calculate their present value at a pre-tax rate that covers the cost of capital for the business activity and the geographic area in which it is being carried out. The time value of money and risk premiums generally used among analysts for the business activity and the geographic zone are taken into account to calculate the pre-tax rate.The pre-tax discount rates, expressed in nominal terms, applied as of December 31, 2024 were between 8.6% and 10.9% (between 8.2% and 11.0% as of December 31, 2023).
The Company’s approach to allocate value to each key assumption used to project cash flows, considers:
| - | Demand evolution: the growth estimate has been calculated based on the projected increase in Gross Domestic Product (GDP), in addition to other assumptions used by the Company regarding the evolution of consumption, such as the growth in the number of customers. |
| - | Energy purchase and sale prices: based on specifically developed internal projection models. The price of the planned “pool” is estimated by considering a number of determining factors, such as the different technology’ costs and productions and energy demand, among other items. |
| - | Regulatory measures: an important part of the Company’s business is regulated and subject to extensive standards, which could undergo revisions, either as a result of new laws or the amendment of existing laws, and therefore the projections include adequate application of the current standards, those that are currently being developed, and those expected to be effective during the projected period. |
F-32
| - | Installed capacity: in the estimating of the Group’s installed capacity, the existing facilities are taken into account, as well as the plans for both increasing capacity and capacity closure. The investment plan is constantly updated based on the evolution of the business, quality of service regulations determined by the regulator and changes in the business development strategy adopted by Management. In the generation area, the investments necessary to maintain the installed capacity in adequate operating conditions are taken into account; in the distribution activity, investments for maintenance, improvement and strengthening of the network are considered, as well as the investments necessary to carry out the implementation of the technological improvement plan (e.g., Smart Meters). |
| - | Hydrology and NCRE: the projections are made from historical series of meteorological conditions and projecting an average year, based on these. |
| - | Fuel costs for the estimation of fuel costs take into consideration existing supply contracts and based on these long-term projections of oil, gas or coal prices based on forward markets and available analysts’ estimates. |
| - | Fixed costs: these are projected considering the foreseen level of business activities, both in terms of the evolution of the workforce (considering salary raises in line with the CPI), and in term of other operating and maintenance costs, the level of projected inflation and long-term existing maintenance or other contracts. The efficiencies that the Group is adopting over time are also considered, such as those that arise from the initiatives for the digitalization of internal processes. |
| - | External sources are always considered to verify the assumptions related to the macroeconomic environment such as price evolution, GDP growth, demand, inflation, interest rates and exchange rates, among others. |
Past experience has demonstrated the reliability of the Company's forecasts, which allows it to base key assumptions on historical information. During 2024, the deviations observed with respect to the projections used to perform impairment testing as of December 31, 2023 were not significant and cash flows generated in 2024 remained in a reasonable variance range compared to those expected for that period.
If the recoverable amount of the CGU is less than the net carrying amount of the asset, the related impairment loss is recognized for the difference, and charged to “Impairment loss (impairment reversals) recognized in profit or loss” in the consolidated statement of comprehensive income. The impairment is first allocated to the CGU’s goodwill carrying amount, if any, and then to the other assets comprising it, prorated on the basis of the carrying amount of each one, limited to the fair value less costs of disposal, or value in use, where no negative amount could be obtained.
Impairment losses recognized in prior periods for an asset other than goodwill are reversed, if and only if, there has been a change in the estimates used to determine the asset’s recoverable amount since the last impairment loss was recognized. If this is the case, the carrying amount of the asset is increased to its recoverable amount with a credit to profit or loss, but so that the increased carrying amount does not exceed the carrying amount that would have been determined had no impairment loss been recognized for the asset. For goodwill, impairment losses are not reversed in subsequent periods.
| f) | Leases |
In order to determine whether an arrangement is, or contains, a lease, Enel Chile assesses the economic substance of the agreement, assessing whether the agreement conveys the right to control the use of an identified asset for a period of time in exchange for consideration. Control is considered to exist if the customer has (i) the right to obtain substantially all the economic benefits arising from the use of an identified asset; and (ii) the right to direct the use of the asset.
F-33
f.1) Lessee
When the Group acts as a lessee at the commencement of the lease (i.e., on the date on which the underlying asset is available for use) it records a right-of-use asset and a lease liability in the statement of financial position.
The Group initially recognizes right-of-use assets at cost. The cost of right-of-use assets consists of: i) the amount of the initial measurement of the lease liability; (ii) lease payments made until the commencement date less lease incentives received, (iii) initial direct costs incurred; and (iv) the estimate of decommissioning or restoration costs.
Subsequently, the right-of-use asset is measured at cost, adjusted by any re-measurement of the lease liability, less accumulated depreciation and accumulated impairment losses. A right-of-use asset is depreciated on the same terms as other similar depreciable assets, as long as there is reasonable certainty that the lessee will acquire ownership of the asset at the end of the lease. If no such certainty exists, the leased assets are depreciated over the shorter of the useful lives of the assets and their lease term. The same criteria detailed in Note 3.e are applied to determine whether the right-of-use asset has become impaired.
Lease liabilities are initially measured at the present value of the lease payments, discounted at the Company’s incremental borrowing rate, if the interest rate implicit in the lease cannot be readily determined. The incremental borrowing rate is the interest rate that the company would have to pay to borrow over a similar term, and with similar security, the funds necessary to obtain an asset of similar value to the right-of-use asset in a similar economic environment. The Group determines its incremental borrowing rate using observable data (such as market interest rates) or by making specific estimates when observable rates are not available (e.g., for subsidiaries that do not engage in financing transactions) or when they must be adjusted to reflect the terms and conditions of the lease (e.g., when the leases are not in the subsidiary’s functional currency).
Lease payments included in the measurement of liabilities comprise: (i) fixed payments, less any lease incentive receivable; (ii) variable lease payments that depend on an index or a rate; (iii) residual value guarantees if it is reasonably certain that the Group will exercise that option; (iv) the exercise price of a purchase option, if the Group is it is reasonably certain to exercise that option; and (v) penalties for terminating the lease, if any.
After the commencement date, the lease liability increases to reflect the accrual of interest and is reduced by the lease payments made. In addition, the carrying amount of the liability is remeasured if there is a change in the terms of the lease (changes in the lease term, in the amount of expected payments related to a residual value guarantee, in the evaluation of a purchase option or in an index or rate used to determine lease payments). Interest expense is recognized as finance cost and distributed over the years making up the lease period, so that a constant interest rate is obtained in each year on the outstanding balance of the lease liability.
Short-term leases of one year or less or leases of low value assets are exempt from the application of the recognition criteria described above, with the payments associated with the lease recorded as an expense on a straight-line basis over the term of the lease.
Right-of-use assets and lease liabilities are presented separately from other assets and liabilities, respectively, in the consolidated statement of financial position.
f.2) Lessor
When the Group acts as a lessor, it classifies at the commencement of the agreement whether the lease is an operating or finance lease, based on the substance of the transaction. Leases in which all the risks and rewards incidental to ownership of an underlying asset are substantially transferred are classified as finance leases. All other leases are classified as operating leases.
F-34
For finance leases, at the commencement date, the Company recognizes in its statement of financial position the assets held under finance leases and presents them as an account receivable, for an amount equal to the net investment in the lease, calculated as the sum of the present value of the lease payments and the present value of any accrued residual value, discounted at the interest rate implicit in the lease. Subsequently, finance income is recognized over the term of the lease, based on a model that reflects a constant rate of return on the net financial investment made in the lease.
For operating leases, lease payments are recognized as income on a straight-line basis, over the term of the lease unless another type of systematic basis of distribution is deemed more representative. The initial direct costs incurred in obtaining an operating lease are added to the carrying amount of the underlying asset and are recognized as expense throughout the lease period, applying the same basis as for rental income.
| g) | Financial instruments |
Financial instruments are contracts that give rise to both a financial asset in one entity and a financial liability or equity instrument in another entity.
g.1) Financial assets other than derivatives
The Group classifies its non-derivative financial assets, whether permanent or temporary, excluding investments accounted for using the equity method (see Notes 3.i and 13) and non-current assets and disposal groups held for sale or distribution to owners (see Note 3.k), into three categories:
| (i) | Amortized cost |
This category includes the financial assets that meet the following conditions (i) the business model that supports the financial assets seeks to maintain such financial assets to obtain contractual cash flows, and (ii) the contractual terms of such financial assets give rise on specific dates to cash flows that are solely payments of principal and interest (SPPI criterion).
Financial assets that meet the conditions established in IFRS 9, to be valued at amortized cost in the Group are: cash equivalents, receivables, and loans. Such assets are recorded at amortized cost, which is the initial fair value, less repayments of principal, plus uncollected accrued interest, calculated using the effective interest method.
The effective interest method is a method for calculating the amortized cost of a financial asset or a financial liability (or a group of financial assets or financial liabilities) and allocating the finance income or financial costs throughout the relevant period. The effective interest rate is the discount rate that exactly matches the estimated cash flows to be received or paid over the expected useful life of the financial instrument (or when appropriate in a shorter period of time), with the net carrying amount of the financial asset or financial liability.
| (ii) | Financial Assets Recorded at Fair Value through Other Comprehensive Income |
This category includes the financial assets that meet the following conditions: (i) they are classified in a business model, the purpose of which is to maintain the financial assets both to collect the contractual cash flows and to sell them, and (ii) the contractual conditions meet the SPPI criterion.
These financial assets are recognized in the consolidated statement of financial position at fair value when this can be determined reliably. For the holdings in unlisted companies or companies with low liquidity, it is usually not possible to determine the fair value reliably; therefore, when this occurs, such holdings are valued at their acquisition cost or for a lower amount if there is evidence of their impairment.
F-35
Changes in fair value, net of their tax effect, are recorded in the consolidated statement of comprehensive income: Other comprehensive income, until the disposal of these financial assets, when the accumulated amount in this section is fully allocated to profit or loss for the period except for investments in equity instruments where the accumulated balance in other comprehensive income is never reclassified to profit or loss.
In the event that the fair value is lower than the acquisition cost, if there is objective evidence that the asset has suffered an impairment that cannot be considered as temporary, the difference is recorded directly in the loss for the period.
| (iii) | Financial Assets Recorded at Fair Value through Profit or Loss |
This category includes the trading portfolio of the financial assets that have been allocated as such upon their initial recognition and which are managed and assessed according to the fair value criterion, and the financial assets that do not meet the conditions to be classified in the two categories indicated above.
These are valued in the consolidated statement of financial position at fair value, and variations in their value are recorded directly in income when they occur.
g.2) Cash and cash equivalents
This item within the consolidated statement of financial position includes cash and bank balances, time deposits, and other highly liquid investments (with original maturity of less than or equal to 90 days) that are readily convertible into cash and are subject to insignificant risk of changes in value.
g.3) Impairment of financial assets
Following the requirements of IFRS 9, the Group applies an impairment model based on the determination of expected credit losses, based on the Group’s past history, existing market conditions, as well as forward-looking estimates at the end of each reporting period. This model is applied to financial assets measured at amortized cost or measured at fair value through other comprehensive income, except for investments in equity instruments.
Expected credit loss is the difference between the contractual cash flows that are due in accordance with the contract and all the cash flows that are expected to be received (i.e. all cash shortfalls), discounted at the original effective interest rate. It is determined considering: i) the Probability of Default (PD); ii) Loss Given Default (LGD), and iii) Exposure at Default (EAD).
To determine the expected credit losses the Group applies two separate approaches:
| • | General approach: applied to financial assets other than trade receivables, contractual assets or lease receivables. This approach is based on the evaluation of significant increases in the credit risk of financial assets, from the date of initial recognition. If on the reporting date of the financial statements the credit risk has not increased significantly, the impairment losses are measured related to the expected credit losses in the next 12 months. If, on the contrary, the credit risk has increased significantly, the impairment is measured considering the expected credit losses throughout the lifetime of the asset. |
In general, the measurement of expected credit losses for financial assets other than trade receivables, contractual assets or lease receivables, are performed separately.
F-36
| • | Simplified approach: The Group applies a simplified approach for trade receivables, contract assets and lease receivables so that the impairment provision is always recognized related to the lifetime expected credit losses for the asset. This is the approach that the Group has mostly applied because trade receivables represent the main financial asset of Enel Chile and its subsidiaries. |
For trade accounts receivable, contractual assets and lease receivables, the Group applies two types of evaluations of expected credit losses:
| - | Collective evaluation: based on grouping receivables into specific groups or “clusters”, taking into account each business and the local regulatory context. Receivables are grouped according to the characteristics of customer portfolios in terms of credit risk, maturity information and recovery rates. A specific definition of default is considered for each group. |
To measure the expected credit losses collectively, the Group considers the following assumptions:
| - | PD: average default estimate, calculated for each group of trade receivables, using a statistical model that considers, among other variables, the normalized payment behavior of customers in each cluster, taking into account a minimum of 24-month historical data. |
| - | LGD: calculated based on the recovery rates of a predetermined section, discounted at the effective interest rate; and. |
| - | EAD: accounting exposure at the reporting date, including invoices issued but not due and invoices pending issuance for services rendered, net of potential cash deposits obtained as guarantees. |
| - | Analytical or individual evaluation: if receivables are considered individually significant by Management and there is specific information regarding any significant increase in the credit risk, the Group applies an individual evaluation of receivables. For the individual evaluation, the PD is obtained mainly from an external supplier, when it is possible to do so, and the LGD through an internal model that considers the recovery rate and other contractual and financial characteristics of receivables. The expected credit loss is obtained by multiplying both factors by the EAD, which is defined as the accounting exposure at the reporting date, including the invoices issued but not due and invoices pending issuance for services rendered, net of potential cash deposits obtained as guarantees. |
On the basis of the benchmark market and the regulatory context of the sector as well as the recovery expectations after 90 days for those receivables, the Group mainly applies a predetermined definition of 180 days overdue to determine expected credit losses, since this is considered an effective indicator of a significant increase in credit risk and, accordingly, in the impairment of receivables.
Based on specific evaluations performed by Management, the prospective adjustment can be applied considering qualitative and quantitative information to reflect possible future events and macroeconomic scenarios, which may affect the risk of the portfolio or the financial instrument.
F-37
g.4) Financial liabilities other than derivatives
General financial liabilities are initially recognized, at fair value net of any costs incurred in the transaction. In subsequent periods, these obligations are measured at their amortized cost using the effective interest method (see Note 3.g.1).
Lease liabilities are initially measured at the present value of future lease payments, determined in accordance with the criteria described in Note 3.f.1.
In the particular case that a liability is the hedged item in a fair value hedge, as an exception, such liability is measured at its fair value for the portion of the hedged risk.
In order to calculate the fair value of debt, both when it is recorded in the statement of financial position and for fair value disclosure purposes as shown in Note 23, debt has been divided into fixed interest rate debt (hereinafter “fixed-rate debt”) and floating interest rate debt (hereinafter “floating-rate debt”). Fixed-rate debt is that on which fixed-interest coupons established at the beginning of the transaction are paid explicitly or implicitly over its term. Floating-rate debt is that debt issued at floating interest rate (i.e., each coupon is established at the beginning of each period based on the benchmark interest rate). All debt has been measured by discounting expected future cash flows with a market interest rate curve based on the payment currency.
g.5) Derivative financial instruments and hedge accounting
Derivatives held by the Group are transactions entered into to hedge interest and/or exchange rate risk, intended to eliminate or significantly reduce these risks in the underlying transactions being hedged.
Derivatives are recorded at fair value at the end of each reporting period as follows: if their fair value is positive, they are recorded within “Other financial assets” and if their fair value is negative, they are recorded within “Other financial liabilities”.
Changes in fair value are recorded directly in profit or loss, except when the derivative has been designated for hedge accounting purposes as a hedging instrument and all of the conditions for applying hedge accounting established by IFRS are met, including that the hedge is highly effective. In this case, changes are recognized as follows:
| - | Fair value hedges: The underlying portion for which the risk is being hedged and the hedging instrument are measured at fair value, and any changes in the value of both items are recognized in the statement of comprehensive income offsetting the effects in the same caption of the statement comprehensive income. |
| - | Cash flow hedges: Changes in the fair value of the effective portion of the hedged item and hedge instrument are recognized in other comprehensive income and accumulated in an equity reserve referred to as “Hedging reserve.” The cumulative loss or gain in this caption is transferred to the consolidated statement of comprehensive income to the extent that the hedged item impacts the consolidated statement of comprehensive income offsetting the effect in the same consolidated statement of comprehensive income caption. Gains or losses from the ineffective portion of the hedging relationship are recognized directly in the statement of comprehensive income. |
Hedge accounting is discontinued only when the hedging relationship (or a part of the relationship) fails to meet the required criteria, after making any rebalancing of the hedging relationship, if applicable. If it is not possible to continue the hedging relationship, including when the hedging instrument expires, is sold, settled or exercised, any gain or loss accumulated in equity at that date remains in the equity until the forecast transaction affects the statement of comprehensive income. When a forecast transaction is no longer expected to occur, the gain or loss accumulated in equity is immediately transferred to the statement of income.
F-38
As a general rule, long-term commodity purchases or sales agreements are recognized in the statement of financial position at their fair value at the end of each reporting period, recognizing any differences in value directly in profit or loss, except for, when all of the following conditions are met:
| - | The sole purpose of the agreement is for its own use, which is understood as: for fuel purchase agreements such use is to generate electricity; for electrical energy purchased for sale, its sale is to the end-customers; and for electricity sales its sale is to the end-customers. |
| - | The Group’s future projections evidence the existence of these agreements for own use. |
| - | Past experience with agreements shows that they have been use for the Group’s “own use”, except for certain isolated cases when for exceptional reasons or reasons associated with logistical issues, these have been used for other purposes beyond the Group’s control and expectations. |
| - | The agreement does not establish net settlement of differences and there has been no practice to settle similar differences in similar contracts in the past. |
The long-term commodity purchase or sale agreements maintained by the Group, which are mainly for electricity, fuel, and other supplies, meet the conditions described above. Accordingly, the purpose of fuel purchase agreements is to use them to generate electricity, electricity purchase contracts for use in sales to end-customers, and electricity sale contracts for sale of the Group’s own products.
The Group also evaluates the existence of derivatives embedded in contracts or financial instruments to determine if their characteristics and risk are closely related to the host contract, provided that when taken as a whole they are not being accounted for at fair value. If they are not closely related, they are recorded separately and changes in value are accounted for directly in the statement of comprehensive income.
g.6) Derecognition of financial assets and liabilities
Financial assets are derecognized when:
| - | The contractual rights to receive cash flows from the financial asset expire or have been transferred or, when the Group has assumed a contractual obligation to pay these cash flows to one or more recipients. |
| - | The Group has substantially transferred all the risks and rewards of their ownership, or, if it has neither assigned nor retained substantially all the risks and rewards, when it does not retain control of the financial asset. |
For transactions in which the Group retains substantially all the inherent risks and rewards of their ownership of the financial asset assigned, it recognizes them as a financial liability for the consideration received. Transactions costs are recognized in profit and loss by using the effective interest method (see Note 3.g.1).
Financial liabilities are derecognized when they are extinguished (i.e., when the obligation arising from the liability has been paid or cancelled or has expired). An exchange for a debt instrument with substantially different conditions, or a substantial modification in recognition of the current conditions of an existing financial liability (or a part thereof), is recorded as a cancellation of the original financial liability, and a recognition of a new financial liability.
F-39
g.7) Offsetting of financial assets and financial liabilities
The Group offsets financial assets and liabilities and the net amount is presented in the statement of financial position only when:
| - | there is a legally binding right to offset the amounts recognized; and |
| - | the Group intends to settle them on a net basis, or to realize the asset and settle the liability simultaneously. |
Such rights may only be legally enforceable in the normal course of business, or in the event of default, or in the event of insolvency or bankruptcy, of one or all the counterparties.
g.8) Financial guarantee contracts
The financial guarantee contracts, defined as the guarantees issued by the Group to third parties, are initially measured at their fair value, adjusted for transaction costs that are directly attributable to the issuance of the guarantee.
Subsequent to initial recognition, financial guarantee contracts are recognized at the higher of:
| - | the amount of the liability determined in accordance with the accounting policy described in Note 3.m; and |
| - | the amount of the asset initially recognized less, if applicable, any accumulated amortization recognized in accordance with the revenue recognition policies described in Note 3.q. |
| h) | Fair value measurement |
The fair value of an asset or liability is defined as the price that would be received from the sale of an asset or paid to transfer a liability in an orderly transaction between market participants at the measurement date.
Fair value measurement assumes that the transaction to sell an asset or transfer a liability occurs in the principal market, namely, the market with the greatest volume and level of activity for that asset or liability. In the absence of a principal market, it is assumed that the transaction is carried out in the most advantageous market available to the entity, namely, the market that maximizes the amount that would be received to sell the asset or minimizes the amount that would be paid to transfer the liability.
In estimating fair value, the Group uses valuation techniques that are appropriate for the circumstances and for which there is sufficient data to perform the measurement where it maximizes the use of relevant observable data and minimizes the use of unobservable data.
Given the hierarchy explained below, data used in the valuation techniques, assets and liabilities measured at fair value can be classified at the following levels:
| • | Level 1: Quoted prices (unadjusted) in active markets for identical assets or liabilities. |
| • | Level 2: Inputs other than quoted prices included in Level 1 that are observable for the assets or liabilities, either directly (i.e., as prices) or indirectly (i.e., derived from prices). The methods and assumptions used to determine the fair values at Level 2 by type of financial assets or financial liabilities take into consideration estimated future cash flows discounted at market rates. Future cash flows for financial assets and financial liabilities are discounted with the zero-coupon interest rate curves for each currency. These valuations are performed using external tools, such as Bloomberg. |
| • | Level 3: Inputs for assets or liabilities that are not based on observable market data (unobservable inputs). |
F-40
The Group takes into account the characteristics of the asset or liability when measuring fair value, in particular:
| - | For non-financial assets, fair value measurement takes into account the ability of a market participant to generate economic benefits by using the asset in its highest and best use or by selling it to another market participant that would use the asset at its highest and best use; |
| - | For liabilities and equity instruments, the fair value measurement assumes that the liability would not be settled, and an equity instrument would not be cancelled or otherwise extinguished on the measurement date. The fair value of the liability reflects the effect of non-performance risk, namely, the risk that an entity will not fulfill the obligation, which includes but is not limited to, the Company’s own credit risk; |
| - | For derivatives not traded in active markets, the fair value is determined by using the discounted cash flow method and generally accepted options valuation models, based on current and future market conditions as of the closing date of the financial statements. This methodology also adjusts the value based on the Company’s own credit risk (Debt Valuation Adjustment, or DVA), and the counterparty risk (Credit Valuation Adjustment, or CVA). These CVA and DVA adjustments are measured on the basis of the potential future exposure of the instrument (asset or liability position) and the risk profile of both the counterparties and the Group itself. |
| - | For financial assets and financial liabilities with offsetting positions in market risks or counterparty credit risks, measuring the fair value on a net basis is allowed. However, this must be consistent with the manner in which market participants would price the net risk exposure at the measurement date. |
Financial assets and financial liabilities measured at fair value are shown in Note 23.3.
| i) | Investments accounted for using the equity method |
The Group’s interests in joint ventures and associates are recognized using the equity method of accounting (see Notes 2.5 and 2.6, respectively).
Under the equity method of accounting, an investment in an associate or joint venture is initially recognized at cost. As of the acquisition date, the investment is recognized in the statement of financial position based on the share of equity that the Group’s interest represents in capital, adjusted for, if appropriate, the effect of transactions with the Group plus any goodwill generated in acquiring the company. If the resulting amount is negative, zero is recorded for that investment in the statement of financial position, unless the Group has a present obligation (either legal or constructive) to reinstate the Company’s equity position, in which case the related provision is recognized.
The financial statements of associates or joint ventures are prepared for the same reporting period as the Group. When necessary, adjustments are made to align the accounting policies with those of the Group.
Goodwill from the associate or joint venture is included in the carrying amount of the investment. It is not amortized but is subject to impairment testing as part of the overall investment carrying amount when there are indicators of impairment.
Dividends received from these investments are deducted from the carrying amount of the investment, and any profit or loss obtained from them to which the Group is entitled based on its ownership interest is recognized under “Share of profit (loss) of associates accounted for using the equity method of accounting”.
F-41
| j) | Inventories |
Inventories are measured at their weighted average acquisition cost or the net realizable value, whichever is lower. The net realizable value is the estimated selling price in the ordinary course of business less the applicable costs to sell.
The cost of inventories includes all costs of purchase and all necessary costs incurred in bringing the inventories to their present location and condition net of trade discounts and other rebates.
| k) | Non-current assets (or disposal groups of assets) held for sale or held for distribution to owners and discontinued operations. |
Non-current assets, including property, plant and equipment; intangible assets; investments accounted for using the equity method of accounting and joint ventures and disposal groups (a group of assets for disposal or distribution together with liabilities directly associated with those assets), are classified as:
| - | Held for sale, if their carrying amount will be recovered mainly through a sale transaction rather than through continuing use, or |
| - | Held for distribution to owners, when the entity is committed to distribute the assets (or disposal groups) to the owners. |
For the above classifications, the assets must be available for immediate sale or distribution in their present condition and their sale or distribution must be highly probable. For a transaction to be considered highly probable, management must be committed to the sale or distribution and actions to complete the transaction must have been initiated and should be expected to be completed within one year from the date of classification.
Actions required to complete the sale or distribution plan should indicate that it is unlikely that significant changes to the plan can be made or that the plan will be cancelled. The probability of shareholders’ approval (if required in the jurisdiction) should be considered as part of the assessment of whether the sale or distribution is highly probable.
The assets or disposal groups classified as held-for-sale or held for distribution to owners are measured at the lower of their carrying amount and fair value less costs to sell or costs to distribute, as appropriate.
Depreciation and amortization on these assets cease when they meet the criteria to be classified as non-current assets held for sale or held for distribution to owners.
Assets that are no longer classified as held for sale or held for distribution to owners, or are no longer part of a disposal group, are measured at the lower of their carrying amounts before being classified as held for sale or held for distribution, less any depreciation, amortization or revaluation that would have been recognized had they had not been classified as held for sale or held for distribution to owners and their recoverable amount at the date of reclassification as non-current assets.
Non-current assets held for sale and the components of the disposal groups classified as held for sale or held for distribution to owners are presented in the consolidated statement of financial position as a single line item within assets referred to as “Non-current assets or disposal groups held for sale or for distribution to owners”, and the related liabilities are presented as a single line item within liabilities referred to as “Liabilities included in disposal groups held for sale or for distribution to owners”.
F-42
The Group classifies as discontinued operations those components of the Group that either have been disposed of, or are classified as held for sale and:
| - | represent a separate major line of business or geographical area of operations; |
| - | is part of a single coordinated plan to dispose of a separate major line of business or geographical area of operations; or |
| - | is a subsidiary acquired exclusively with a view to resale it. |
The after-tax results of discontinued operations are presented in a single line of the statement of comprehensive income referred to as “Profit (loss) from discontinued operations”, as well as the gain or loss recognized from the measurement at fair value less costs to sell or from the disposal of the assets or groups for disposal comprising the discontinued operation.
| l) | Treasury shares |
Treasury shares are presented as a deduction to the caption “Total equity” in the consolidated statement of financial position and measured at acquisition cost.
Gains and losses from the disposal of treasury shares are recognized directly in “Total Equity – Retained earnings (losses)”, without affecting profit or loss for the period.
| m) | Provisions |
Provisions are recognized when the Group has a present obligation (legal or constructive) as a result of a past event, it is probable that an outflow of economic benefits will be required to settle the obligation, and a reliable estimate can be made of the amount of the obligation.
The amount recognized as a provision is the best estimate of the consideration required to settle the present obligation at the end of the reporting period, taking into account the risks and uncertainties surrounding the obligation. When a provision is measured using the cash flows estimated to settle the present obligation, its carrying amount is the present value of those cash flows (when the effect of the time value of money is material). The unwinding of the discount is recognized as finance cost. Incremental legal costs expected to be incurred in resolving a legal claim are included in measuring of the provision.
Provisions are reviewed at the end of each reporting period and adjusted to reflect the current best estimate. If it is no longer probable that an outflow of resources embodying economic benefits will be required to settle the obligation, the provision is reversed.
A contingent liability does not result in the recognition of a provision. Legal costs expected to be incurred in defending a legal claim are expensed as incurred. Significant contingent liabilities are disclosed unless the likelihood of an outflow of resources embodying economic benefits is remote.
m.1) Provisions for post-employment benefits and similar obligations
Certain of the Group’s companies have entered into pension and other similar commitments with their employees. Those defined benefit and defined contribution commitments are basically through pension plans, except for those related to certain benefits in lieu of payment, basically commitments to supply electric energy, which, due to their nature have not been outsourced and their coverage is provided through the related internal provision.
F-43
For defined benefit plans, the companies record the related expense for these commitments following the accrual criteria over the service life of the employees through timely actuarial studies performed as of the reporting date calculated applying the projected credit unit method. The cost of past services which correspond to variances in benefits is recognized immediately.
The defined benefit plan obligations in the statement of financial position represent the present value of the accrued obligations, upon deduction of the fair value of the different plans’ assets, if any.
Actuarial gains and losses arising from measurements of both the plan liabilities and the plan asset, are recorded directly as a component of “Other comprehensive income”.
| n) | Translation of balances in foreign currency |
Transactions performed by each entity in a currency other than its functional currency are recognized using the exchange rates prevailing as of the date of the transactions. During the period, differences arising between the prevailing exchange rate at the date of the transaction and the exchange rate as of the date of collection or payment are recognized as “Foreign currency translation differences” in the consolidated statement of comprehensive income.
Likewise, at the end of each reporting period, balances receivable or payable denominated in a currency other than each entity’s functional currency are remeasured using the closing date exchange rate. Any differences are recorded as “Foreign currency translation differences” in the consolidated statement of comprehensive income.
The Group has established a policy to hedge the portion of revenue from its consolidated entities that is directly linked to variations in the U.S. dollar, through obtaining financing in such currency. Exchange differences related to this debt, which is regarded as the hedging instrument in cash flow hedge transactions, are recognized, net of taxes, in “other comprehensive income" and are accumulated in an equity reserve and recorded in profit or loss in the term in which the cash flows hedged will be realized. This term has been estimated as ten years.
| o) | Classification of balances as current and non-current |
In these consolidated statements of financial position, assets and liabilities expected to be recovered or settled within twelve months are presented as current assets or liabilities, except for post-employment and other similar obligations. Those assets and liabilities expected to be recovered or settled in more than twelve months are presented as non-current items. Deferred income tax assets and liabilities are classified as non-current.
Obligations maturing in less than twelve months, but for which the Company has the substantial right to defer settlement for at least 12 months at the end of the reporting period, are classified as non-current liabilities.
| p) | Income taxes |
Income tax expense for the period is determined as the sum of current taxes from each of the Group’s subsidiaries and results from applying the tax rate to the taxable income for the period, after deductions allowed have been made, plus any changes in deferred tax assets and liabilities and tax credits, both for tax losses and deductions. Differences between the carrying amount and tax basis of assets and liabilities generate deferred tax assets and liabilities, which are calculated using the tax rates expected to be applied when the assets and liabilities are realized or settled, based on tax rates that have been enacted or substantively enacted by the end of the reporting period.
F-44
Deferred tax assets are recognized for all deductible temporary differences, tax losses and unused tax credits to the extent that it is probable that sufficient future taxable profits exist to recover the deductible temporary differences and use the tax credits. Such deferred tax asset is not recognized if the deductible temporary difference arises from the initial recognition of an asset or liability that:
| - | did not arise from a business combination; and |
| - | at initial recognition provide it affected neither accounting profit nor taxable profit (loss). |
With respect to deductible temporary differences associated with investments in subsidiaries, associates and joint arrangements, deferred tax assets are recognized only to the extent that it is probable that the temporary differences will reverse in the foreseeable future and taxable profits will be available against which the temporary differences can be utilized.
Deferred tax liabilities are recognized for all temporary differences, except for those derived from the initial recognition of goodwill and those that arose from investments in subsidiaries, associates and joint ventures in which the Group can control their reversal and where it is probable that they will not be reversed in the foreseeable future.
Current tax and changes in deferred tax assets or liabilities are recorded in profit or loss, other comprehensive income or total equity in the statement of financial position, depending on where the gains or losses that triggered these tax entries have been recognized.
Any tax deductions that can be applied to current tax liabilities are credited to earnings within the line item “Income tax expenses”, except when uncertainty exists about their tax realization, in which case they are not recognized until they are effectively realized, or when they relate to specific tax incentives, in which case they are recorded as grants.
At the end of each reporting period, the Group reviews the deferred tax assets and liabilities recognized, and makes, any necessary corrections based on the results of this analysis.
Deferred tax assets and deferred tax liabilities are offset in the consolidated statement of financial position if the Group has a legally enforceable right to set off current tax assets against current tax liabilities, and only when the deferred taxes relate to income taxes levied by the same tax authority.
| q) | Revenue and expense recognition |
Revenue is recognized when (or as) the control over a good or service is transferred to the customer. Revenue is measured based on the consideration to which the Group is expected to be entitled for said transfer of control, excluding the amounts collected on behalf of third parties.
The Group analyzes and takes into consideration all the relevant facts and circumstances for revenue recognition, applying the five-step model established by IFRS 15: 1) Identifying the contract with a customer; 2) Identifying the performance obligations; 3) Determining the transaction price; 4) Allocating the transaction price; and 5) Recognizing revenue.
The following are the criteria for revenue recognition by type of good or service provided by the Group:
| • | Electricity supply (sale and transportation): corresponds to a single performance obligation that transfers to the customer a number of different goods/services that are substantially the same and that have the same transfer pattern. Since the customer receives and simultaneously consumes the benefits provided by the Company, it is considered a performance obligation met over time. In these cases, the Group applies an output method to recognize revenue in the amount to which it is entitled to bill for electricity supplied to date. |
F-45
| - | Generation: revenue is recorded according to the physical deliveries of energy and power, at the prices established in the respective contracts, at the prices established in the electricity market by the current regulations, or at the marginal cost of energy and power, depending on whether they are unregulated customers, regulated customers or energy trading in the spot market are involved, respectively. |
| - | Distribution of electricity: revenue is recognized based on the amount of energy supplied to customers during the period, at prices established in the related contracts or at prices stipulated in the electricity market by applicable regulations, depending on whether they are unregulated or regulated customers, as applicable. |
These revenues include an estimate of the service provided and not invoiced, through the reporting date of the financial statements (see Notes 2.3 and 28 and Appendix 2.2).
| • | Gas sale and transport: revenue is recognized over time based on the actual physical deliveries of gas in the consumption period, at the prices established in the respective contracts. |
| • | Other Services: mainly the provision of supplementary services to the electricity business, construction of works and engineering and consulting services. Customers control committed assets as they are created or improved. Therefore, the Company recognizes this revenue over time based on the progress, measuring progress through output methods (percentage of completion through the present date, milestones reached, etc.), or costs incurred (resources consumed, hours of labor spent, etc.), as appropriate in each case. |
| • | Sale of goods: revenue from the sale of goods is recognized at a certain time, when control of the goods has been transferred to the customer, which generally occurs at the time of the physical delivery. Revenues are measured at the independent sale price of each good, and any type of applicable variable compensation. |
In contracts in which multiple committed goods and services are identified, the recognition criteria will be applied to each of the identifiable performance obligations of the transaction, based on the control transfer pattern of each good or service that is separate and an independent selling price allocated to each of them, or jointly to two or more transactions, when these are linked to contracts with customers that are negotiated with a single business purpose and the goods and services committed represent a single performance obligation and their selling prices are not independent.
The Group determines the existence of significant financing components in its contracts, adjusting the value of the consideration if applicable, to reflect the effects of the time value of money. However, the Group applies the practical expedient provided by IFRS 15, and will not adjust the value of the consideration committed for the purpose of a significant financing component, if it expects, at the beginning of the contract, that the period between the payment and the transfer of goods or service to the customer is one year or less.
The Group excludes from revenue those gross inflows of economic benefits received when it acts as agent or commission agent on behalf of third parties, recording as revenues only the payment or commission to which it expects to be entitled.
Because the Group mainly recognizes revenue for the amount to which it has the right to invoice, it has decided to apply the disclosure practical expedient provided in IFRS 15, through which it is not required to disclose the aggregate amount of the transaction price allocated to the performance obligations not met (or not met partially) at the end of the reporting period.
In addition, the Group evaluates the existence of incremental costs of obtaining a contract with a customer and costs directly related to the fulfillment of a contract with a customer. These costs are recognized as an intangible asset if their recovery is expected to be amortized in a manner consistent with the transfer of the related goods or services. As a practical expedient, the incremental costs of obtaining a contract are recognized as an expense if the amortization period of the asset that would have been recognized is one year or less. Costs that do not qualify for capitalization are recognized as expenses at the time they are incurred, unless they are explicitly attributable to the customer.
F-46
As of December 31, 2024 and 2023, incremental costs of obtaining a contract capitalized by the Group primarily relate to commissions paid to sales agents (see Note 14).
Interest income (expense) are recorded considering the effective interest rate applicable to the principal pending amortization during the related accrual period.
| r) | Earnings per share |
Basic earnings per share are calculated by dividing net income attributable to shareholders of the Parent Company by the weighted average number of ordinary shares of outstanding during the period, excluding the average number of shares of the Company held by other subsidiaries within the Group, if any.
Basic earnings per share for continuing and discontinued operations are calculated by dividing net income from continuing and discontinued operations attributable to shareholders of the Company (the numerator) by the weighted average number of shares of common stock outstanding (the denominator) during the year, excluding the average number of shares of the Company held by other subsidiaries within the Group, if any.
Diluted earnings per share is calculated by dividing profit attributable to shareholders of the Parent by the weighted average number of ordinary shares outstanding during the period plus the weighted average number of ordinary shares of that would be issued on conversion of all the potential dilutive securities into ordinary shares, if any.
| s) | Dividends |
Article No. 79 of Law No. 18,046 (Chilean Corporations Law) establishes that, unless unanimously agreed otherwise by the shareholders of all issued shares, listed corporations must distribute a cash dividend to shareholders on an annual basis, pro rata among the shares owned or the proportion established in the Company’s by-laws if there are preferred shares, of at least 30% of profit for each year, except when accumulated losses from prior years must be absorbed.
As it is practically impossible to achieve a unanimous agreement given Enel Chile’s highly fragmented share ownership, at the end of each reporting period the amount of the minimum statutory dividend obligation to its shareholders is determined, net of interim dividends approved during the period, and then accounted for in “Trade and other payables, current” and “Payables due to related parties, current”, as appropriate, and recognized in equity.
The interim and final dividends are deducted from equity when approved by the relevant authority, which in the first case is normally the Board of Directors and in the second case is the responsibility of the shareholders as agreed at a General Shareholders’ Meeting.
| t) | Share issuance costs |
Share issuance costs, only when they represent incremental expenses directly attributable to the transaction, are recognized directly in equity as a deduction from “Share premiums,” net of any applicable taxes.
If the share premium account has a zero balance or if the costs described exceed the balance, they are recognized in “Other reserves”. Subsequently, these costs must be deducted from paid-in capital, and this deduction must be approved at the closest Extraordinary Shareholders’ Meeting that occurs immediately after the date on which the disbursements were incurred.
Share issuance and placement expenses directly related to a probable future transaction are recorded as prepaid expenses in the statement of financial position. These expenses are recorded in equity upon issuance and placement of the shares, or in profit or loss when the condition changes and the transaction is no longer expected to occur.
F-47
| u) | Statement of cash flows |
The statement of cash flows reflects changes in cash and cash equivalents that took place during the period, determined with the direct method. It uses the following definitions and related meanings:
| - | Cash flows: inflows and outflows of cash or cash equivalents, which are defined as highly liquid investments maturing in less than three months with a low risk of changes in value. |
| - | Operating activities: the principal revenue-producing activities of the Group that cannot be considered investing or financing activities. |
| - | Investing activities: the acquisition and disposal of long-term assets and other investments not included in cash and cash equivalents. |
| - | Financing activities: activities that result in changes in the size and composition of the total equity and borrowings of the Group. |
F-48
4. SECTOR REGULATION AND ELECTRICITY SYSTEM OPERATIONS
| a) | Regulatory Framework |
The Chilean electricity sector is regulated by the General Law of Electricity Services (Ley General de Servicios Eléctricos), contained in Decree Law (DFL) No. 1 of 1982, of the Ministry of Mining, whose restated and coordinated text was established by DFL No. 4 of 2006 of the Ministry of Economy (the “Electricity Law”) its subsequent amendments and its corresponding Regulations, contained in Supreme Decree D.S. No. 327 of 1998.
The main authority on Chilean energy matters is the Ministry of Energy, which is responsible for proposing and conducting public policies on energy, strengthening coordination, and facilitating a comprehensive vision of the sector.
Within the Ministry of Energy, the Chilean National Energy Commission (or “CNE” in its Spanish acronym), is the regulatory body for the Chilean electricity sector and the Superintendency of Electricity and Fuel (“SEF”), is the oversight entity. The Ministry of Energy also includes the Chilean Commission of Nuclear Energy (CChEN) and the Energy Sustainability Agency.
The CNE is the entity in charge of approving the annual transmission expansion plans, responsible for the indicative plan for the construction of new electricity generation facilities, and proposing regulated tariffs to the Ministry of Energy for approval. Meanwhile, the SEF inspects and oversees compliance with the law, rules, regulations, and technical norms applicable to the generation, transmission, and distribution of electricity, as well as liquid fuels and gas.
Additionally, the legislation considers an Expert Panel, composed of expert professionals whose key job is to decide on any discrepancies produced in terms of the matters established in the Electricity Law and in the application of other laws on energy, through binding rulings.
The Electricity Law establishes a National Electric Coordinator, an independent body governed by public law, in charge of the operation and coordination of the Chilean electricity system whose main objectives are to: i) Preserve the security of the service, ii) Guarantee an economic operation of the interconnected installations of the system and iii) Guarantee open access to all transmission systems. Its main activities include coordinating the Electricity Market, authorizing connections, managing complementary services, implementing public information systems, monitoring competition and the payment chain, among others.
From a physical perspective, the Chilean electricity sector is divided into three main networks: the National Electricity System (“SEN” in its Spanish acronym), and two smaller isolated networks: Aysén and Magallanes.
The Chilean electricity industry can be divided into three business segments: generation, transmission and distribution. The electricity facilities associated with these three segments have the obligation to operate in an interconnected and coordinated manner, with the primary objective of providing electricity to the market at minimal cost and within the service quality and safety standards required by the electricity regulations.
Due to their essential nature, the transmission and distribution activities constitute natural monopolies, therefore their segments are regulated as such by the electricity regulations, requiring free access to the grids and definition of regulated rates.
In the electricity market, two products (Energy and Capacity) are traded, and different services are provided. In particular, the National Electric Coordinator is responsible for making balances, determining the corresponding transfers between generators, and calculating the marginal time-specific cost, the price at which energy transfers are valued. The CNE determines the prices of Power.
F-49
Limits to Integration and Concentration
In Chile, there is legislation to defend free competition, which along with the specific regulations applicable to electricity, define the criteria to avoid certain levels of economic concentration and/or abusive market practices.
a.1 Generation Segment
Electricity generation companies must operate under the operation plan designed by the National Electric Coordinator. However, each company can freely decide whether to sell its energy and capacity to regulated or unregulated customers. Any surplus or deficit between sales to customers and production is sold to other generators at the spot market price. A generation company may have the following types of customers:
| • | Unregulated Customers: users with a connected capacity of more than 5,000 kW (mainly industrial and mining companies), or customers with connected capacity between 300 and 5,000 kW that choose to be an unregulated customer but must remain in the selected category for at least four years. These consumers can freely negotiate their electricity supply prices with suppliers. |
| • | Distribution Companies: those that deliver supply to their regulated customers. Distribution companies buy energy from generation companies through a public bid process regulated by the CNE. |
| • | Other Generation Companies: The relationship between generation companies may come about through bilateral contracts or transfers in the short-term or Spot Market. The latter correspond to energy and capacity transactions among generation companies coordinated by the National Electric Coordinator to achieve the cost-effective operation of the system; any surplus (deficit) in production with respect to their commercial commitments are transferred through sales (purchases) to other generators within the system, and energy is valued at marginal cost and capacity at the corresponding regulated price established twice a year by the authority. |
In Chile, the capacity to be paid to each generator depends on a calculation performed centrally by the National Electric Coordinator each year, based on current regulations, to obtain the sufficiency capacity for each plant. This value depends primarily on the availability of the facilities themselves and the technology-specific generation resource.
F-50
a.2 Distribution Segment
The distribution system relates to electric facilities aimed at supplying electricity to end customers, at a maximum voltage of 23 kV.
Distribution companies operate under a public service concessions system and are required to provide service to all customers and supply electricity to all customers subject to regulated rates (customers with connected capacity less than 5,000 kW, with the exception of customers between 300 and 5,000 kW who may opt for the free rate). Note that unregulated customers may negotiate their supply with any supplier, and must pay a regulated toll for using the distribution network.
Regarding the supply for users subject to price regulation, the law establishes that distribution companies must provide an ongoing energy supply, based on open, non-discriminatory and transparent public bids. These bid processes are designed by the CNE and performed at least 5 years ahead of time, with a supply contract agreement of up to 20 years. In the case of unforeseen variations in demand, the authority has the power to carry out a short-term bid. There is also a regulated procedure to remunerate potential supply not under contract.
The fee-setting in this segment is performed every four years based on a cost study to determine the Added Value of Distribution (“VAD” in its Spanish acronym). The VAD is determined according to an efficient model company scheme and the concept of typical area.
To determine the VAD, the CNE classifies companies with similar distribution costs into groups known as “typical areas.” For each typical area, the CNE engages independent consultants to carry out a study to determine the costs associated with an “efficient model company”, considering fixed costs, average energy and capacity losses, standard investment, maintenance, and operating costs related to distribution, including some restrictions faced by real distribution companies. The annual costs of investment are calculated considering the New Replacement Value (NRV) of the facilities adapted to demand, their useful life, and a rate of renewal, calculated every four years by the CNE, will be a yearly after-tax rate of between 6% and 8%.
Subsequently, the after-tax rate of return for each distribution company must be between three percentage points below and two percentage points above the rate calculated by the CNE.
Additionally, and along with the calculation of the VAD, every four years the CNE reviews the related services not consisting of energy supply which the Free Competition Defense Court qualifies as subject to rate regulation.
F-51
| b) | Regulatory matters |
2019 – 2024 Laws
| (i) | Law No. 21,185 – Creates a Transitional Mechanism for Stabilizing Customers´ Electricity Prices under the Regulated Price System |
On November 2, 2019, the Ministry of Energy published Law No. 21,185, which established a transitional mechanism for stabilizing customers’ electricity prices under the regulated price system. Through this Law, between July 1, 2019 and December 31, 2020, the prices to be transferred to regulated customers are the price levels defined for the first half of 2019 (Decree 20T/2018) to be referred to as “Stabilized Price to Regulated Customers” (“PEC” in its Spanish acronym). Between January 1, 2021 and until the end of the stabilization mechanism, prices shall be those defined in the semiannual price-setting processes referred to in article 158 of the Electricity Law, but may not be higher than the adjusted PEC according to the Consumer Price Index beginning on January 1, 2021, based on the same date (adjusted PEC). The billing differences due to the application of this mechanism lead to an account receivable in favor of the generators with a limit of US$1,350 million. The balance must be recovered by December 31, 2027. The technical provisions of this mechanism are established in the CNE’s Exempt Resolution No. 72/2020 and its amendments. It should be noted that the fund limit was reached in January 2022.
| (ii) | Law No. 21,472 - Creates a price stabilization fund and establishes a new temporary electricity price stabilization mechanism for customers subject to price regulation |
On August 2, 2022, the Ministry of Energy published Law No. 21,472, which creates a tariff stabilization fund and establishes a new mechanism for transitory stabilization of electricity prices for customers subject to price regulation. Through this law, a Transitory Customer Protection Mechanism (“CPM”) was established to stabilize energy prices for the National Electric System and medium-sized systems complementary to those established in Law No. 21,185, for customers subject to price regulation. The objective of the CPM is to pay the differences that arise between the billing of distribution companies to end customers for the energy and power component, and the amount payable for the electric supply to generation companies. The resources accounted for in the operation of the CPM shall not exceed US$1.8 billion, and its validity shall extend until the balances originated by the application of this law are extinguished. As of 2023, the CNE will make a semiannually forecast of the total payment of the remaining final balance for a date no later than December 31, 2032. Exempt Resolution No. 86 was published on March 14, 2023 and Exempt Resolution No. 334 (as amended by Exempt Resolution No. 379 of August 8, 2024), was published on August 9, 2023. The Exempt Resolutions established, among other matters, certain provisions, procedures, deadlines and conditions for the proper implementation of the Law No. 21,472.
Because of the application of the price stabilization mechanism established under the Law No. 21,472 and the Exempt Resolutions, the General Treasury, as delegated by the Ministry of Finance and on behalf of the Tariff Stabilization Fund (“FET” in its Spanish acronym), will issue transferable credit titles payable to the order (the “Payment Documents”), which will allow their holder to collect the restitution of certain amounts owed as a result of the application of Law No. 21,472 and such energy price stabilization mechanism, and the interest recognized in the aforementioned Payment Documents, on the dates established.
During February 2024, the limit of US$ 1.8 billion of accounts receivable from regulated customers established by Law No. 21,472 was reached.
| (iii) | Law No. 21,667 - Amends several laws on Tariff Stabilization |
On April 30, 2024, Law No. 21,667 was published, which establishes, among other aspects, four significant items:
| a. | It will allow the generation companies not to accumulate more debt, since the tariffs for customers subject to price regulation will gradually return to the real costs of energy and voltage price. |
F-52
| b. | The generation companies will recover the balances generated by Laws Nos. 21,185 and 21,472; the PEC and CPM stabilization mechanisms, respectively. |
| c. | The FET limit increased to US$5.5 billion, of which the additional amount of US$3.7 billion will have a 30% government guarantee. Such balances must be paid no later than December 31, 2035. |
| d. | The most vulnerable users will be protected through the creation of an electricity subsidy. |
Furthermore, customers recording monthly consumption exceeding 350 kWh will pay the actual price of energy and capacity starting from the publication of the average node price decree for the first half of 2024, plus an additional charge (CPM charge) that will allow the extinguishment of the accumulated debt from the PEC and CPM stabilization mechanisms. Customers recording monthly consumption of 350 kWh or less will pay the actual price of energy and capacity starting from the publication of the decree for the second half of 2024 and from the decree for the first half of 2025, the CPM charge will be added.
| (iv) | Law No. 21,721 - Amends the General Law of Electric Services in terms of Electric Transmission. |
On December 27, 2024, the Ministry of Energy published Law No. 21,721 to, among other things, address problems concerning the lack of transmission in the National Electric System. Law No. 21,721 introduces improvements in the efficient development of transmission and in bidding processes and creates new mechanisms for expansion works that will allocate risks to those who are in the best position to manage them, thus providing greater certainty in the development of transmission works. The four main pillars are:
a. |
An exceptional procedure is established to allow the execution of urgent and necessary expansion works proposed by the CNE without going through the Expansion Plan. |
b. |
Expansion works will be tendered and supervised by the owners of the respective infrastructures. |
c. |
An Investment Value (IV) review mechanism is created for cases of early termination of the contract. The CNE must evaluate and approve any request for revision of the IV. |
d. |
Small Distributed Generation Entities (SDGE) will be enabled to propose and finance zonal transmission system works. Expansion-associated costs of the zonal transmission systems will be allocated to SDGE owners and the corresponding customers that will receive a charge rebate. |
Regulations, Decrees, and Technical Standards Issued
Reduce connected power capacity level to become an unregulated customer: On December 13, 2023, the Ministry of Energy requested a ruling from the Free Competition Tribunal (“TDLC” in its Spanish acronym) regarding the capacity limit to 300KW to qualify a customer as unregulated. Note that the law establishes that the capacity limit to qualify as an unregulated customer may be reduced by the Ministry of Energy, subject to a report by the TDLC. On November 27, 2024, the TDLC issued its Report No.33/2024, where it concludes that “the request made by the Ministry of Energy does not generate substantial risks to competition. Consequently, it is reported favorably”. Finally, the Ministry of Energy published Exempt Resolution No.58 that reduces the limit of installed capacity to opt to be an unregulated customer from 500 to 300 kW, in accordance with the provisions of article 147°, paragraph d) of the General Law of Electric Services.
Amendment to the Technical Standard for Connection and Operation of SDGE in Medium Voltage Installations: On February 8, 2024, the CNE published Exempt Resolution No. 42 in the Official Gazette, approving amendments to the technical standard for connection and operation of SDGE in medium voltage installations. These amendments incorporate provisions aimed at improving the preparation of technical studies, the performance of additional works, making adjustments or customization, among others, to enhance the interaction between market
F-53
agents. On August 6, 2024, Exempt Resolution No. 395 reinstates provisions and makes clarifications in the technical standard for connection and operation of SDGE.
Amendment to the Sufficiency Capacity Regulation: On June 5, 2024, the Ministry of Energy published Supreme Decree No. 70, which introduces amendments to the current Capacity Transfer Regulation.
Amendment to the Technical Standard for Service Quality for Distribution Systems: On May 3, 2024, the CNE, through Exempt Resolution No. 763, approved amendments to the Technical Standard and its Technical Annex on Measurement, Monitoring, and Control Systems.
| c) | Tariff Revisions and Supply Processes |
In the electricity market there is a continuous revision of tariffs and supply processes that affect those volumes that were realized in previous periods on the dates of publication of these revisions. Set forth below is a description of the rules that are currently applicable to the Group.
c.1 Distribution Price-Setting 2020-2024
The final customer rates that have been in force from 2020 were determined based on the following decrees and resolutions:
| i) | Distribution Price Decrees |
Decree No. |
|
Date |
|
Matter |
|
Effective from |
5T/2024 |
|
06-07-2024 |
|
Establishes the rate formulas applicable to electricity supply subject to regulated prices. |
|
11-04-2020 |
Supreme Decree No.4T |
|
09-08-2018 |
|
Sets Distribution Tolls applicable to the transportation service provided by the public electricity distribution concessionaire companies indicated |
|
11-04-2020 |
Exempt Resolution No.369 |
|
07-22-2024 |
|
Publishes a list of energy and power prices of the primary distribution substations of the National Electric System. |
|
01-01-2024 |
| a) | Average Prices in the National Electric System |
Decree No. |
|
Date |
|
Matter |
|
Effective from |
9T/2022 |
|
06-17-2022 |
|
Establishes prices and adjustment factor under Law No. 21,185. |
|
01-01-2022 |
475 |
|
06-28-2022 |
|
Exempt Resolution issued by the CNE that approves the Final Technical Report for the setting of Average Node Prices of the National Electric System and the adjustment factor. |
|
N/A |
836 |
|
11-16-2022 |
|
Establishes prices and adjustment factor under Law No. 21,185. |
|
07-01-2022 |
886 |
|
12-12-2022 |
|
Establishes prices and adjustment factor under Law No. 21,185. |
|
11-01-2022 |
16T/2023 |
|
04-12-2023 |
|
Establishes prices considering the price stabilization mechanism under Law No. 21,472. |
|
07-01-2022 |
7T/2024 |
|
07-05-2024 |
|
Establishes prices considering the price stabilization mechanism under Law No. 21,472, as amended by Law No. 21,667. |
|
01-01-2024 |
10T/2024 |
|
10-05-2024 |
|
Establishes prices considering the price stabilization mechanism under Law No. 21,472, as amended by Law No. 21,667. |
|
07-01-2024 |
15T/2024 |
|
12-30-2024 |
|
Establishes prices considering the price stabilization mechanism under Law No. 21,472, as amended by Law No. 21,667 |
|
01-01-2025 |
F-54
| b) | Short term Node Prices for electricity supply |
Decree No. |
|
Date |
|
Matter |
|
Effective from |
3T/2022 |
|
07-07-2022 |
|
Establishes node prices. Indexation in Exempt Res. No. 690 of 09-01-2022. |
|
04-01-2022 |
11T/2022 |
|
11-09-2022 |
|
Establishes node prices. Indexation in Exempt Res. No. 866 of 12-01-2022, No. 131 of 04-03-2023, and No. 306 of 07-20-2023. |
|
10-01-2022 |
1T/2023 |
|
07-27-2023 |
|
Establishes node prices. Indexation in Exempt Res. No. 349 of 08-04-2023 and No. 619 of 12-15-2023. |
|
04-01-2023 |
3T/2023 |
|
02-13-2024 |
|
Establishes node prices. Indexation in Exempt Res. No. 83 of 03-01-2024. |
|
10-01-2023 |
1T/2024 |
|
08-03-2024 |
|
Establishes node prices. Indexation in Exempt Res. No.05 de 01-07-2025 |
|
04-01-2024 |
| c) | Stabilized Price for small scale means of generation |
Decree No. |
|
Date |
|
Matter |
|
Effective from |
5T/2021 |
|
02-22-2022 |
|
Establishes stabilized prices. |
|
02-22-2022 |
14T/2021 |
|
02-26-2022 |
|
Establishes stabilized prices. |
|
02-26-2022 |
8T/2022 |
|
10-13-2022 |
|
Establishes stabilized prices. |
|
10-13-2022 |
14T/2022 |
|
04-15-2023 |
|
Establishes stabilized prices. |
|
04-15-2023 |
2T/2023 |
|
08-10-2023 |
|
Establishes stabilized prices. |
|
08-10-2023 |
6T/2023 |
|
04-26-2024 |
|
Establishes stabilized prices. |
|
04-26-2024 |
6T/2024 |
|
10-15-2024 |
|
Establishes stabilized prices. |
|
10-15-2024 |
| ii) | Exempt Resolution of the CNE that establishes charges for the use of transmission systems applied to unregulated and regulated final consumers. |
Decree No. |
|
Date |
|
Matter |
|
Effective from |
551 |
|
12-15-2021 |
|
Related to articles 115 and 116 of the General Law on Electric Services |
|
01-10-2022 |
442 |
|
06-20-2022 |
|
Related to articles 115 and 116 of the General Law on Electric Services |
|
07-01-2022 |
898 |
|
12-21-2022 |
|
Related to articles 115 and 116 of the General Law on Electric Services |
|
01-01-2023 |
257 |
|
06-16-2023 |
|
Related to articles 115 and 116 of the General Law on Electric Services |
|
07-01-2023 |
624 |
|
12-21-2023 |
|
Related to articles 115 and 116 of the General Law on Electric Services |
|
01-01-2024 |
315 |
|
06-25-2024 |
|
Related to articles 115 and 116 of the General Law on Electric Services |
|
07-01-2024 |
674 |
|
12-20-2024 |
|
Related to articles 115 and 116 of the General Law on Electric Services |
|
01-01-2025 |
| iii) | Exempt Resolution of the CNE that establishes and communicates the Public Service Charge. |
Decree No. |
|
Date |
|
Matter |
|
Effective from |
841 |
|
11-18-2022 |
|
Establishes the Public Service Charge. |
|
12-01-2022 |
565 |
|
11-20-2023 |
|
Establishes the Public Service Charge. |
|
12-01-2023 |
615 |
|
11-19-2024 |
|
Establishes the Public Service Charge. |
|
12-01-2024 |
c.2 Distribution-Associated Services Price Setting for 2020-2024
This process is currently in progress and rates established by Decree No. 13T/2018 remain.
c.3 Distribution Price-Setting for 2024 – 2028
Currently, this process is under development.
c.4 Supply Bids (Regulated Power Purchase Agreements - Regulated PPAs)
Under the new bidding law, several processes have been developed, the most recent being Supply Tender 2021/01, Supply Tender 2022/01, and Supply Tender 2023/01. The latter included the auction of a total of 3,600 GWh, divided into 2 supply blocks of 1,500 GWh and 2,100 GWh each, intended to cover consumption starting in 2027 and in 2028. The tender included an incentive for storage projects of more than 4 hours or for generation projects with non-variable renewable energies, consisting of a discount of 0.15 US$/MWh for each GWh of energy that can be generated by such means in the related Time Block A or C (non-solar). The process was completed on May 7, 2024, where Enel Generación was awarded 100% of the supply blocks of the tendered energy at an average price of US$56.679 per MWh.
F-55
5. NON-CURRENT ASSETS HELD FOR SALE
The composition and movements of non-current assets or groups of assets held for sale for the years ended December 31, 2024 and 2023, are summarized as follows:
|
|
|
|
|
|
|
|
|
|
|
ASSETS |
|
01-01-2023 |
|
Reclassification to / from current and non-current assets |
|
Dispositions and changes in the scope of consolidation |
|
Other movements |
|
12-31-2024 |
|
|
|
|
|
|
|
|
|
|
|
Current assets |
|
|
|
|
|
|
|
|
|
|
Cash and cash equivalents |
|
— |
|
|
|
(1,795,800) |
|
1,795,800 |
|
— |
Other current non-financial assets |
|
— |
|
|
|
— |
|
— |
|
— |
Trade and other receivables, current |
|
— |
|
|
|
(4,461,402) |
|
4,461,402 |
|
— |
Inventories |
|
— |
|
2,218,478 |
|
(2,182,405) |
|
(36,073) |
|
— |
Current tax assets |
|
— |
|
|
|
— |
|
— |
|
— |
Total current assets |
|
— |
|
2,218,478 |
|
(8,439,607) |
|
6,221,129 |
|
— |
Non-current assets |
|
|
|
|
|
|
|
|
|
|
Other non-financial assets, non-current |
|
|
|
|
|
— |
|
— |
|
— |
Trade and other non-current receivables |
|
— |
|
— |
|
— |
|
— |
|
— |
Intangible assets other than goodwill |
|
— |
|
— |
|
— |
|
— |
|
— |
Goodwill |
|
— |
|
— |
|
— |
|
— |
|
— |
Property, plant, and equipment |
|
28,601,633 |
|
335,702,647 |
|
(396,770,388) |
|
32,466,108 |
|
— |
Right-of-use assets |
|
— |
|
7,192,555 |
|
(8,175,426) |
|
982,871 |
|
— |
Total non-current assets |
|
28,601,633 |
|
342,895,202 |
|
(404,945,814) |
|
33,448,979 |
|
— |
Total assets |
|
28,601,633 |
|
345,113,680 |
|
(413,385,421) |
|
39,670,108 |
|
— |
Liabilities |
|
01-01-2023 |
|
Reclassification to / from current and non-current assets |
|
Dispositions and changes in the scope of consolidation |
|
Other movements |
|
12-31-2024 |
|
|
|
|
|
|
|
|
|
|
|
Current liabilities |
|
|
|
|
|
|
|
|
|
|
Other current financial liabilities |
|
— |
|
— |
|
— |
|
— |
|
— |
Current lease liabilities |
|
— |
|
93,886 |
|
(287,209) |
|
193,323 |
|
|
Trade and other payables, current |
|
— |
|
— |
|
(85,910) |
|
85,910 |
|
— |
Current payables to related parties |
|
— |
|
— |
|
— |
|
— |
|
— |
Other current provisions |
|
— |
|
— |
|
— |
|
— |
|
— |
Current tax liabilities |
|
— |
|
1,932,844 |
|
(2,536,094) |
|
603,250 |
|
— |
Other current non-financial liabilities |
|
— |
|
4,067,708 |
|
(471,289) |
|
(3,596,419) |
|
— |
Total current liabilities |
|
— |
|
6,094,438 |
|
(3,380,502) |
|
(2,713,936) |
|
— |
Non-current liabilities |
|
|
|
|
|
|
|
|
|
|
Other non-current financial liabilities |
|
— |
|
— |
|
— |
|
— |
|
— |
Non-current lease liabilities |
|
|
|
7,431,156 |
|
(8,456,773) |
|
1,025,617 |
|
|
Other long-term provisions |
|
— |
|
2,261,180 |
|
(2,552,770) |
|
291,590 |
|
— |
Deferred tax liabilities |
|
— |
|
40,085,389 |
|
(45,258,176) |
|
5,172,787 |
|
— |
Non-current provisions for employee benefits |
|
— |
|
— |
|
— |
|
— |
|
— |
Total non-current liabilities |
|
— |
|
49,777,725 |
|
(56,267,719) |
|
6,489,994 |
|
— |
Total liabilities |
|
— |
|
55,872,163 |
|
(59,648,221) |
|
3,776,058 |
|
— |
|
|
|
|
|
|
|
|
|
|
|
Net assets and liabilities |
|
28,601,633 |
|
289,241,517 |
|
(353,737,200) |
|
35,894,050 |
|
— |
F-56
5.1.Arcadia Generación Solar S.A. Sale
On July 12, 2023, Enel Chile entered into an agreement with the international renewable energy company Sonnedix for the sale of its subsidiary Arcadia Generación Solar S.A., which owns a portfolio of 416 MW of generation assets through four solar plants named “Diego de Almagro,” “Carrera Pinto,” “Pampa Solar Norte,” and “Domeyko”.
Considering the sale process, the requirements of IFRS 5 "Non-Current Assets Held for Sale and Discontinued Operations" and following the accounting criterion described in Note 3.k), the assets and liabilities of the subsidiary Arcadia Solar Generation S.A. were classified as held-for-sale.
On October 24, 2023, the transfer of 99.99% of the shares held in this company was completed, and it ceased to be a subsidiary of Enel Chile was no longer consolidated as of that date. The sale price was ThCh$521,881,880 (ThUS$ 556,223), resulting in a gain of ThCh$ 215,618,389. (See Note 33).
5.2 Sale of Corporate Building
On November 4, 2022, our subsidiary Enel Generación Chile received a purchase offer for the Santa Rosa Complex, which is located in Santiago and comprises four properties:
-76 Santa Rosa Avenue, where the Company’s headquarters are located.
-65 San Isidro.
-634 Marcoleta.
-638 Marcoleta.
Considering the progress of negotiations, as of the closing date of the year 2022, the Santa Rosa Complex assets were reclassified as held for sale; measuring them at the lower of their carrying value and their fair value, in conformity with the provisions of IFRS 5 "Non-Current Assets Held for Sale and Discontinued Operations" and the accounting criteria described in Note 3.k.
As of December 31, 2022, the carrying value of the Santa Rosa Complex assets amounted to ThCh$28,601,633. This includes the value of certain movable assets belonging to Enel Chile, Enel Generación Chile and Enel Distribución Chile, that were also sold to the offeror. The above implied the recognition of an impairment loss of ThCh$2,286,438 in the consolidated financial statements of Enel Chile S.A. (See Note 31.b).
On February 1, 2023, the sale of the Santa Rosa Complex was completed. With respect to the movable assets held in the corporate building, a gain of ThCh$959,228 was recognized. (See Note 33).
5.3 Enel Transmisión Chile S.A. Sale
On July 28, 2022, the “Stock Purchase Agreement” was signed by Enel Chile, who agreed to sell to Sociedad Transmisora Metropolitana SpA, all of the Enel Transmisión Chile S.A. shares it owned (the “Sale”), representing 99.09% of the capital of such company. Sociedad Transmisora Metropolitana SpA. is company wholly owned by Inversiones Grupo Saesa Limitada.
The execution of the sale and subsequent transfer of shares owned by Enel Chile that were issued by Enel Transmisión Chile S.A. was subject to certain customary conditions precedent applicable to these types of transactions, including the approval by the National Economic Attorney General's Office in accordance with D.L. 211 of 1973. According to Law No. 18,045 on the Securities Market, the sale was carried out by the buyer making a takeover bid for all of the shares of Enel Transmisión Chile S.A.
F-57
The sale price was US$1,345 million for 99.09% of the share capital of Enel Transmisión Chile S.A. owned by Enel Chile, which may vary upon the application of the purchase price adjustments provided in the Stock Purchase Agreement.
Enel Transmisión Chile S.A. operates and owns 683 kilometers of transmission lines, of which 183 kilometers correspond to the Domestic Transmission System, 499 kilometers to the Zone D Transmission System, 0.1 kilometers to the Zone C Transmission System, and 0.2 kilometers to a dedicated transmission line. It also operates 57 of its own substations and owns and operates assets installed in 3 substations owned by third parties.
Given the sale process and the requirements of IFRS 5: “Non-Current Assets Held for Sale and Discontinued Operations”, and following the accounting criterion established in Note 3.k, the assets and liabilities of Enel Transmisión Chile S.A. were classified as held for sale.
On December 9, 2022, the announcement of the successful results of the Takeover Bid for all the shares of Enel Transmisión Chile S.A was published. Consequently, after the related obligations were fulfilled, the change of control of Enel Transmisión Chile S.A was confirmed, and it ceased to be a subsidiary of Enel Chile S.A. and became controlled by Sociedad Transmisora Metropolitana SpA. The gain realized from this sale amounted to ThCh$981,856,639. (See Note 33).
F-58
6. CASH AND CASH EQUIVALENTS
| a) | The detail of cash and cash equivalents as of December 31, 2024 and 2023 is as follows: |
|
|
As of December 31, |
||
|
|
2024 |
|
2023 |
|
|
ThCh$ |
|
ThCh$ |
Cash balances |
|
27,613 |
|
173,228 |
Bank balances |
|
222,788,690 |
|
137,048,228 |
Time deposits |
|
38,228 |
|
319,994,843 |
Other fixed-income instruments |
|
160,544,788 |
|
106,074,991 |
Total |
|
383,399,319 |
|
563,291,290 |
Time deposits have a maturity of three months or less from their date of acquisition and accrue the market interest for this type of short-term investment. Other fixed-income investments are mainly comprised of resale agreements maturing in 90 days or less from the date of investment. There are no restrictions on cash and cash equivalents.
| b) | The detail, by type of currency, of the above balance is as follows: |
|
|
As of December 31, |
||
|
|
2024 |
|
2023 |
Currency |
|
ThCh$ |
|
ThCh$ |
Chilean peso |
|
246,506,945 |
|
449,278,983 |
U.S. dollar |
|
136,705,029 |
|
113,862,934 |
Argentine peso |
|
20 |
|
10,959 |
Euro |
|
149,097 |
|
102,479 |
UF |
|
38,228 |
|
35,935 |
Total |
|
383,399,319 |
|
563,291,290 |
For further detail of the Statement of Cash Flows see below:
| c) | The following table presents the cash flows used in "Other payments for operating activities" included in the Statement of Cash Flows for the years ended December 31, 2024, 2023 and 2022: |
|
|
2024 |
|
2023 |
|
2022 |
Other payments from operating activities |
|
ThCh$ |
|
ThCh$ |
|
ThCh$ |
VAT tax debit |
|
(73,604,984) |
|
(82,831,649) |
|
(74,401,438) |
Insurance premiums |
|
(31,671,075) |
|
(25,880,528) |
|
(26,594,156) |
Tax on emissions |
|
(14,701,389) |
|
(20,707,956) |
|
(24,277,529) |
Other |
|
(12,587,714) |
|
(9,792,206) |
|
(9,376,834) |
Total |
|
(132,565,162) |
|
(139,212,339) |
|
(134,649,957) |
F-59
| d) | The following table presents the details of "Cash flows from the loss of control of subsidiaries or other businesses" in the Statement of Cash Flows as of December 31, 2024, 2023 and 2022. |
|
|
2024 |
|
2023 |
|
2022 |
|
|
ThCh$ |
|
ThCh$ |
|
ThCh$ |
Cash received from the sale of Arcadia Generación Solar S.A |
|
— |
|
521,881,880 |
|
— |
Cash and cash equivalents outflow from Arcadia Generación Solar S.A. leaving the Group |
|
— |
|
(1,795,800) |
|
|
Cash received from the sale of Enel X Way Chile S.p.A. |
|
— |
|
— |
|
11,358,338 |
Cash received for the sale of Enel Transmisión Chile S.A. |
|
— |
|
— |
|
1,228,616,013 |
Cash received for the sale of Enel X AMPCI Ebus Chile S.A.P.A. |
|
— |
|
— |
|
2,001,407 |
Cash and cash equivalents outflow from Enel Transmisión Chile S.A. leaving the Group |
|
— |
|
— |
|
(7,481,882) |
Total |
|
— |
|
520,086,080 |
|
1,234,493,876 |
| e) | For the year 2022, “Proceeds from repayment of advances and loans granted to third parties” correspond to the cash flow received for the payment of debt owed by Enel Transmission Chile to Enel Chile and was made on December 9, 2022, the date the sale of Enel Transmission Chile was completed (See Note 5.3). |
F-60
| f) | Reconciliation of liabilities arising from financing activities for the years ended December 31, 2024, 2023 and 2022: |
|
|
|
|
|
|
|
|
|
|
|
|
|
|
|
|
|
Short-term loans |
|
Long-term loans |
|
Lease liabilities |
|
Assets held to cover liabilities arising from financing activities |
|
Total |
|
|
|
|
ThCh$ |
|
ThCh$ |
|
ThCh$ |
|
ThCh$ |
|
ThCh$ |
|
|
Opening balance as of January 1, 2024 |
|
725,808,865 |
|
2,937,358,794 |
|
268,062,220 |
|
(55,222,256) |
|
3.876.007.623 |
Cash flows from (used in) financing activities |
|
From |
|
— |
|
1,540,543,620 |
|
— |
|
61,608,894 |
|
1,602,152,514 |
|
|
Used |
|
(993,288,036) |
|
(1,073,622,519) |
|
(17,889,152) |
|
— |
|
(2,084,799,707) |
|
|
Interest paid |
|
(202,836,644) |
|
(494,378) |
|
(2,142,547) |
|
— |
|
(205,473,569) |
|
|
Total cash flows from financing activities |
|
(1,196,124,680) |
|
466,426,723 |
|
(20,031,699) |
|
61,608,894 |
|
(688,120,762) |
Movements that do not represent cash flows |
|
Movements in fair value |
|
6,219,019 |
|
(4,752,413) |
|
(23,679) |
|
130,359 |
|
1,573,286 |
|
|
Foreign currency translation differences |
|
71,126,386 |
|
405,464,959 |
|
13,478,505 |
|
(12,460,542) |
|
477,609,308 |
|
|
Financial costs (1) |
|
201,799,753 |
|
7,309,984 |
|
11,315,118 |
|
(2,639,395) |
|
217,785,460 |
|
|
New leases |
|
— |
|
— |
|
41,434,286 |
|
— |
|
41,434,286 |
|
|
Other Movements |
|
426,533,021 |
|
(421,941,071) |
|
(19,629,701) |
|
— |
|
(15,037,751) |
|
|
Closing balance as of December 31, 2024 |
|
235,362,364 |
|
3,389,866,976 |
|
294,605,050 |
|
(8,582,940) |
|
3,911,251,450 |
|
|
|
|
|
|
|
|
|
|
|
|
|
|
|
Detail by category |
|
|
|
|
|
|
|
|
|
|
|
|
Payables due to related parties (see Note 10.1. b) |
|
166,505,078 |
|
1,015,904,873 |
|
— |
|
— |
|
1,182,409,951 |
|
|
Interest-bearing loans (See Note 20.1) |
|
61,229,866 |
|
2,368,746,913 |
|
— |
|
— |
|
2,429,976,779 |
|
|
Cash flow hedges (See Note 23.2.a) |
|
7,627,420 |
|
5,215,190 |
|
— |
|
(8,582,940) |
|
4,259,670 |
|
|
Lease liabilities (See Note 21) |
|
— |
|
— |
|
294,605,050 |
|
— |
|
294,605,050 |
|
|
Closing balance as of December 31, 2024 |
|
235,362,364 |
|
3,389,866,976 |
|
294,605,050 |
|
(8,582,940) |
|
3,911,251,450 |
|
|
|
|
|
|
|
|
|
|
|
|
|
|
|
|
|
Short-term loans |
|
Long-term loans |
|
Lease liabilities |
|
Assets held to hedge liabilities arising from financing activities |
|
Total |
|
|
|
|
ThCh$ |
|
ThCh$ |
|
ThCh$ |
|
ThCh$ |
|
ThCh$ |
|
|
Opening balance as of January 1, 2023 |
|
484,932,624 |
|
3,330,899,969 |
|
235,685,555 |
|
(56,790,534) |
|
3,994,727,614 |
Cash flows from (used in) financing activities |
|
From |
|
335,975,577 |
|
680,699,261 |
|
— |
|
10,988,015 |
|
1,027,662,853 |
|
|
Used |
|
(848,619,797) |
|
(500,093,222) |
|
(18,418,666) |
|
— |
|
(1,367,131,685) |
|
|
Interest paid |
|
(183,857,128) |
|
— |
|
(9,315,780) |
|
— |
|
(193,172,908) |
|
|
Total cash flows from financing activities |
|
(696,501,348) |
|
180,606,039 |
|
(27,734,446) |
|
10,988,015 |
|
(532,641,740) |
Movements that do not represent cash flows |
|
Sales of subsidiaries |
|
|
|
|
|
|
|
|
|
|
|
|
Movements in fair value |
|
38,953,566 |
|
(37,185,597) |
|
— |
|
(10,718,816) |
|
(8,950,847) |
|
|
Foreign currency translation differences |
|
31,017,248 |
|
144,324,870 |
|
10,526,578 |
|
3,329,751 |
|
189,198,447 |
|
|
Financial costs (1) |
|
182,314,687 |
|
4,729,704 |
|
9,688,516 |
|
(2,030,672) |
|
194,702,235 |
|
|
New leases |
|
— |
|
— |
|
47,203,550 |
|
— |
|
47,203,550 |
|
|
Other Movements |
|
685,092,088 |
|
(686,016,191) |
|
(7,307,533) |
|
— |
|
(8,231,636) |
|
|
Closing balance as of December 31, 2023 |
|
725,808,865 |
|
2,937,358,794 |
|
268,062,220 |
|
(55,222,256) |
|
3,876,007,623 |
|
|
|
|
|
|
|
|
|
|
|
|
|
|
|
Detail by category |
|
|
|
|
|
|
|
|
|
|
|
|
Payables due to related parties (see Note 10.1. b) |
|
146,577,056 |
|
1,034,791,219 |
|
|
|
— |
|
1,181,368,275 |
|
|
Interest-bearing loans (See Note 20.1) |
|
542,220,313 |
|
1,897,563,167 |
|
— |
|
— |
|
2,439,783,480 |
|
|
Cash flow hedges (See Note 23.2.a) |
|
37,011,496 |
|
5,004,408 |
|
— |
|
(55,222,256) |
|
(13,206,352) |
|
|
Lease liabilities (See Note 21) |
|
— |
|
— |
|
268,062,220 |
|
|
|
268,062,220 |
|
|
Closing balance as of December 31, 2023 |
|
725,808,865 |
|
2,937,358,794 |
|
268,062,220 |
|
(55,222,256) |
|
3,876,007,623 |
|
|
|
|
|
|
|
|
|
|
|
|
|
|
|
|
|
Short-term loans |
|
Long-term loans |
|
Lease liabilities |
|
Assets held to hedge liabilities arising from financing activities |
|
Total |
|
|
|
|
ThCh$ |
|
ThCh$ |
|
ThCh$ |
|
ThCh$ |
|
ThCh$ |
Cash flows from (used in) financing activities |
|
Opening balance as of January 1, 2022 |
|
881,659,765 |
|
3,241,250,805 |
|
159,662,077 |
|
(36,094,475) |
|
4,246,478,172 |
|
|
From |
|
1,050,888,015 |
|
263,892,100 |
|
— |
|
37,803,988 |
|
1,352,584,103 |
|
|
Used |
|
(1,711,034,741) |
|
(37,020,850) |
|
(6,613,399) |
|
— |
|
(1,754,668,990) |
|
|
Interest paid |
|
(182,171,676) |
|
— |
|
(4,790,146) |
|
— |
|
(186,961,822) |
Movements that do not represent cash flows |
|
Total cash flows from financing activities |
|
(842,318,402) |
|
226,871,250 |
|
(11,403,545) |
|
37,803,988 |
|
(589,046,709) |
|
|
Sales of subsidiaries |
|
— |
|
— |
|
(1,450,648) |
|
— |
|
(1,450,648) |
|
|
Movements in fair value |
|
— |
|
(792,940) |
|
— |
|
(23,814,586) |
|
(24,607,526) |
|
|
Foreign currency translation differences |
|
53,561,223 |
|
58,670,485 |
|
20,751,687 |
|
(34,664,273) |
|
98,319,122 |
|
|
Financial costs (1) |
|
192,928,894 |
|
4,081,277 |
|
6,810,965 |
|
(21,188) |
|
203,799,948 |
|
|
New leases |
|
— |
|
— |
|
61,996,854 |
|
— |
|
61,996,854 |
|
|
Other Movements |
|
199,101,144 |
|
(199,180,908) |
|
(681,835) |
|
— |
|
(761,599) |
|
|
Closing balance as of December 31, 2022 |
|
484,932,624 |
|
3,330,899,969 |
|
235,685,555 |
|
(56,790,534) |
|
3,994,727,614 |
|
|
|
|
|
|
|
|
|
|
|
|
|
|
|
Detail by category |
|
|
|
|
|
|
|
|
|
|
|
|
Payables due to related parties |
|
428,466,443 |
|
1,147,096,713 |
|
— |
|
— |
|
1,575,563,156 |
|
|
Interest-bearing loans |
|
55,977,988 |
|
2,138,411,462 |
|
— |
|
— |
|
2,194,389,450 |
|
|
Cash flow hedges |
|
488,193 |
|
45,391,794 |
|
— |
|
(56,790,534) |
|
(10,910,547) |
|
|
Lease liabilities |
|
— |
|
— |
|
235,685,555 |
|
— |
|
235,685,555 |
|
|
Closing balance as of December 31, 2022 |
|
484,932,624 |
|
3,330,899,969 |
|
235,685,555 |
|
(56,790,534) |
|
3,994,727,614 |
(1) Relates to accrual of interest.
F-61
7. OTHER FINANCIAL ASSETS
The detail of other financial assets as of December 31, 2024 and 2023 is as follows:
|
|
Current |
|
Non-current |
||||
|
|
12-31-2024 |
|
12-31-2023 |
|
12-31-2024 |
|
12-31-2023 |
Other Financial Assets |
|
ThCh$ |
|
ThCh$ |
|
ThCh$ |
|
ThCh$ |
Financial assets at fair value through profit or loss |
|
— |
|
— |
|
2,319,881 |
|
— |
Financial assets at fair value through other comprehensive income |
|
127,854 |
|
127,854 |
|
2,326,422 |
|
2,326,466 |
Financial assets measured at amortized cost |
|
10,807,718 |
|
9,552,991 |
|
— |
|
— |
Hedging derivatives |
|
8,582,940 |
|
58,009,661 |
|
— |
|
9,275,919 |
Non-hedging derivatives |
|
— |
|
46,128 |
|
— |
|
— |
Total |
|
19,518,512 |
|
67,736,634 |
|
4,646,303 |
|
11,602,385 |
8. OTHER NON-FINANCIAL ASSETS AND LIABILITIES
| a) | Other non-financial assets |
The detail of other non-financial assets as of December 31, 2024 and 2023 is as follows:
|
|
Current |
|
Non-current |
||||
Other non-financial assets |
|
12-31-2024 |
|
12-31-2023 |
|
12-31-2024 |
|
12-31-2023 |
|
|
ThCh$ |
|
ThCh$ |
|
ThCh$ |
|
ThCh$ |
Value-added tax fiscal credit and other taxes |
|
77,391,041 |
|
41,702,626 |
|
119,922,021 |
|
209,515,973 |
Prepaid expenses |
|
71,246,247 |
|
55,689,522 |
|
— |
|
— |
Water right credits |
|
— |
|
— |
|
18,220,080 |
|
14,419,852 |
Spare-parts with a consumption schedule of more than 12 months |
|
— |
|
— |
|
7,441,985 |
|
8,399,351 |
Guarantee deposits |
|
— |
|
— |
|
1,773,050 |
|
3,953,515 |
Other |
|
4,526,093 |
|
3,105,177 |
|
1,240,687 |
|
2,105,173 |
Total |
|
153,163,381 |
|
100,497,325 |
|
148,597,823 |
|
238,393,864 |
| b) | Other non-financial liabilities |
The detail of other non-financial liabilities as of December 31, 2024 and 2023 is as follows:
|
|
Current |
|
Non-current |
||||
Other non-financial liabilities |
|
12-31-2024 |
|
12-31-2023 |
|
12-31-2024 |
|
12-31-2023 |
|
|
ThCh$ |
|
ThCh$ |
|
ThCh$ |
|
ThCh$ |
Value-added tax fiscal credit and other taxes |
|
31,913,026 |
|
19,661,207 |
|
— |
|
— |
Deferred revenue from energy sales (1) |
|
17,031,808 |
|
13,531,953 |
|
36,463,050 |
|
52,287,807 |
Deferred revenue from transfer of networks |
|
7,080,104 |
|
1,952,515 |
|
— |
|
— |
Deferred revenue from retail businesses |
|
6,825,691 |
|
4,795,903 |
|
— |
|
— |
Deferred revenue from other services |
|
278,261 |
|
1,474,276 |
|
18,896 |
|
— |
Deferred revenue from connections |
|
251,784 |
|
417,852 |
|
— |
|
— |
Deferred revenue from lighting services |
|
124,969 |
|
481,053 |
|
— |
|
— |
Reimbursable financial contributions |
|
167,700 |
|
120,124 |
|
771,590 |
|
932,176 |
Other |
|
63,955 |
|
— |
|
357,727 |
|
— |
Total |
|
63,737,298 |
|
42,434,883 |
|
37,611,263 |
|
53,219,983 |
| (1) | Prepaid income related to energy sales contracts. |
F-62
9. TRADE AND OTHER RECEIVABLES
| a) | The detail of trade and other receivables as of December 31, 2024 and 2023 is as follows: |
|
|
Current |
|
Non-current |
||||
Trade and Other Receivables, Gross |
|
12-31-2024 |
|
12-31-2023 |
|
12-31-2024 |
|
12-31-2023 |
|
|
ThCh$ |
|
ThCh$ |
|
ThCh$ |
|
ThCh$ |
Trade and other receivables, gross (1) |
|
1,585,696,074 |
|
1,526,741,488 |
|
1,162,097,195 |
|
916,729,235 |
Trade receivables, gross |
|
1,502,576,369 |
|
1,427,709,524 |
|
1,065,146,628 |
|
775,262,173 |
Accounts receivable due from finance leases, gross |
|
18,396,542 |
|
20,755,542 |
|
92,119,034 |
|
137,964,743 |
Other receivables, gross |
|
64,723,163 |
|
78,276,422 |
|
4,831,533 |
|
3,502,319 |
|
|
|
|
|
|
|
|
|
|
|
Current |
|
Non-current |
||||
Trade and Other Receivables, Net |
|
12-31-2024 |
|
12-31-2023 |
|
12-31-2024 |
|
12-31-2023 |
|
|
ThCh$ |
|
ThCh$ |
|
ThCh$ |
|
ThCh$ |
Trade and other receivables, net |
|
1,489,965,233 |
|
1,449,294,549 |
|
1,159,251,669 |
|
903,678,141 |
Trade receivables, net |
|
1,419,662,852 |
|
1,361,832,944 |
|
1,063,420,598 |
|
763,183,696 |
Accounts receivable due from finance leases, gross |
|
18,232,819 |
|
20,615,588 |
|
90,999,538 |
|
136,992,126 |
Other receivables, net |
|
52,069,562 |
|
66,846,017 |
|
4,831,533 |
|
3,502,319 |
| (1) | The detail of other accounts receivable is as follows: |
|
|
Current |
|
Non-current |
||||
Other receivables, net (1) |
|
12-31-2024 |
|
12-31-2023 |
|
12-31-2024 |
|
12-31-2023 |
|
|
ThCh$ |
|
ThCh$ |
|
ThCh$ |
|
ThCh$ |
Receivables from employees |
|
14,909,003 |
|
13,898,223 |
|
3,742,925 |
|
2,131,377 |
Advances to suppliers and creditors |
|
16,531,678 |
|
39,345,695 |
|
517,077 |
|
515,827 |
Insurance receivable |
|
1,992,920 |
|
— |
|
— |
|
— |
Other receivables for deposits in transit and others |
|
14,702,735 |
|
9,662,938 |
|
— |
|
— |
Other |
|
3,933,226 |
|
3,939,161 |
|
571,531 |
|
855,115 |
Total |
|
52,069,562 |
|
66,846,017 |
|
4,831,533 |
|
3,502,319 |
a.1) Increase in trade accounts receivable, gross:
a.1.i) As of December 31, 2024, the main variation was in current trade receivables, which increased ThCh$74,866,845 compared to December 31, 2023. This variation is mainly explained by the following factors: (i) an increase of ThCh$714,522,538 generated in the period as a result of the application of the laws that establish tariff stabilization mechanisms for regulated customers; (ii) a decrease of ThCh$634,286,049, as a result of sales of receivables generated as a consequence of the application of Law No. 21,472 (see section a.2.II of this Note - detail of sales).
a.1.ii) As of December 31, 2024, non-current trade receivables increased by ThCh$289,884,455 compared to the end of 2023. This is mainly explained by (i) ThCh$294,999,809 of increase due to the application of the laws that establish tariff stabilization mechanisms for regulated customers; and (ii) ThCh$8,500,074 due to lower energy sales to regulated customers.
General background:
Law No. 21,185
On November 2, 2019, by the Ministry of Energy, and creates a Transitory Mechanism to Stabilize Electricity Prices for Customers Subject to Rate Regulation. Pursuant to this law, between July 1, 2019 and December 31, 2020, the prices to be transferred to regulated customers are the price levels defined for the first half of 2019 (Decree 20T/2018) and will be referred to as “Stabilized Price to Regulated Customers” (“PEC” in its Spanish acronym).
F-63
Between January 1, 2021 and up to the end of the stabilization mechanism, prices shall be those defined in the semiannual price-setting processes mentioned in article 158 of the Electricity Law, but could not be higher than the adjusted PEC according to the Consumer Price Index beginning on January 1, 2021, based on the same date (adjusted PEC).
The differences to be produced between the billing period while applying the stabilization mechanism and the theoretical billing, considering the price that would have been applied according to the conditions of the respective contracts with the electricity distribution companies, will generate an account receivable in favor of the electricity generation companies, up to a maximum of US$1,350 million until 2023. The limit was reached in January 2022.
All billing differences will be recorded in U.S. dollars and will not accrue financial remuneration until December 31, 2025. The balance must be recovered by December 31, 2027.
The application of this law generates a greater delay in the billing and collection of sales generated by the Company´s electricity generation segment, with the corresponding financial and accounting impact this situation generates. In the case of the Company´s electricity distribution segment, the financial and accounting effects are neutralized (pass-through principle).
The limit of US$1,350 million in receivables from regulated customers established by Law No. 21,185, which created a Transitory Mechanism to Stabilize Prices for that customer segment (see Note 9.a.1.ii) was reached in January 2022.
Law No. 21,472
On August 2, 2022, Law No. 21,472 was published, which created a price stabilization fund and established a new temporary price stabilization mechanism for regulated customers.
F-64
Law No. 21,472 established the CPM aimed at paying differences resulting between the prices of the respective regulated supply contracts and the stabilized price. These differences will be covered by a temporary fund of US$1,800 million through a new instrument known as a Payment Document (described below), issued monthly by the General Treasury to electricity generation companies, denominated in U.S. dollars, adjustable, transferable, with a maximum maturity date of December 2032 and state guarantee. It should be noted that all fund balances generated that are over the US$1,350 million limit under Law No. 21,185, are recognized as part of the CPM established in Law No. 21,472.
The fund will be financed through an additional fee charged to end users segmented by consumption level, where customers with a monthly consumption of less than 350 kWh will be exempt from such fee, as well as micro and small companies with monthly consumption up to 1,000 kWh. The fund will be managed by the General Treasury, with fiscal contribution of US$20 million per year, effective until December 31, 2032, in addition to the US$15 million contributed in 2022.
Exempt Resolutions Nos. 86 and 334 issued in 2023 establish technical provisions for the implementation of Law No. 21,472, among which the General Treasury will issue transferable order credit instruments (the “Payment Documents”), allowing the bearer to collect the reimbursement of certain amounts owed arising from the application of the Law No. 21,472 and the new energy price stabilization mechanism, along with interest recognized in the above-mentioned Payment Documents from the General Treasury, on the dates established therein. This makes it possible to settle receivables associated with the implementation of Law No. 21,472.
During February 2024, the limit of US$ 1,800 million of receivables from regulated customers established by Law No. 21,472 was reached.
Law No.21,667
On April 30, 2024, Law No. 21,667 was published, which introduces the following:
| - | Allows generation companies to avoid accumulating further debt, as the tariffs for customers subject to price regulation will gradually return to the actual costs of energy and power prices. |
| - | Generation companies will recover the balances generated by Laws No. 21,185 and No. 21,472, the PEC and MPC stabilization mechanisms, respectively. |
| - | Increases the CPM fund to US$ 5.5 billion, of which an additional US$ 3.7 billion will have a 30% government guarantee. These balances must be repaid no later than December 31, 2035. |
| - | The most vulnerable users will be protected through the creation of an electricity subsidy. |
On the other hand, customers with monthly consumption of more than 350 kWh-month will pay the real price of energy and power as from the publication of the average node price decree corresponding to the first semester 2024 plus an additional charge (CPM charge) that will allow extinguishing the debt accumulated by the PEC and CPM. At the same time, customers with consumption less than or equal to 350 kWh-month will pay the real price of energy and power as from the publication of the decree corresponding to the second semester 2024 and, as from the decree of the first semester 2025, the CPM charge will be added.
After eliminating transactions between related companies, the accounting effects recorded by the Group are summarized as follows:
| - | Classification as current in trade receivables of ThCh$297,654,047 as of December 31, 2024 (ThCh$434,804,901 as of December 31, 2023). |
F-65
| - | Classification as non-current in trade receivables of ThCh$1,046,288,601 as of December 31, 2024 (ThCh$750,565,211 as of December 31, 2023) and suppliers for energy purchases ThCh$965,522,118 as of December 31, 2024 (ThCh$595,066,548 as of December 31, 2023). See Note 24. |
| - | Higher finance income of ThCh$6,236,847 for the year ended December 31, 2024 (ThCh$6,108,432 and ThCh$7,455,121 for the years ended December 31, 2023 and 2022, respectively). See Note 34. |
| - | Higher finance costs of ThCh$3,427,073 for the year ended December 31, 2024 (ThCh$3,363,744 and ThCh$2,235,708 for the years ended December 31, 2023 and 2022, respectively). See Note 34. |
| - | Net loss from foreign currency translation differences of ThCh$58,202,166 December 31, 2024, (foreign exchange gain of ThCh$15,627,555 and ThCh$4,801,364 for the years ended December 31, 2023 and 2022, respectively), due to the dollarization of receivables pending invoicing. See Note 34. |
The aforementioned trade and non-trade concepts, while included in the model to determine impairment losses (see Note 3.g.3), have no significant impact as of December 31, 2024 and 2023, due to the nature of these items: invoices not yet issued, invoices not yet due, or past due invoices within normal business ranges.
a.2) Assignment of rights and sale of trade receivables
| I. | Distribution Segment |
| • | In December 2020, December 2023 and January 2024, Enel Distribución Chile entered into framework agreements with Inter-American Investment Corporation (IDB Invest), Banco BCI and Banco Santander, respectively, by virtue of which, from time to time and during the term of such agreements, our subsidiary Enel Distribución Chile may assign the collection rights it holds , including a portion of accounts receivable for energy sales made to certain customer segments. The contract with IDB Invest expired in December 2024. As of December 31, 2024, collection rights were assigned for ThCh$696,873,816 (ThCh$508,366,460 as of December 31, 2023 and ThCh$390,202,619 as of December 31, 2022). According to the accounting criteria described in Note 3.g.6, cash inflows have led to the derecognition of receivables and the recognition of finance costs of ThCh$10,237,182 (ThCh$10,653,582 as of December 31, 2023 and ThCh$9,535,442 as of December 31, 2022). |
As indicated above, Enel Distribución Chile can continue to make new transfers of collection rights from time to time. The completion of additional transfers of collection rights will depend on Management’s analysis and ongoing evaluation of the cash needs and market conditions.
F-66
| II. | Generation Segment |
| • | On January 20, 2021, our subsidiaries Enel Generación Chile and Enel Green Power Chile signed a “Joinder”, whereby they became parties to the “Commitment and Engagement Letter” dated December 31, 2020, which is subject to foreign governing law. The “Commitment and Engagement Letter” was entered into by Goldman Sachs & Co. LLC and Goldman Sachs Lending Partners LLC, among others. Subsequently, on January 29, 2021, Enel Generación Chile and Enel Green Power Chile entered into a “Commitment Agreement” (also subject to foreign governing law), with IDB Invest. The purpose of these agreements is to regulate the terms and conditions for the sale and assignment, by Enel Generación Chile and Enel Green Power Chile of balances generated in their favor (the “Balances”) by applying the transitional electricity price stabilization mechanism to customers who are subject to tariff rate regulation, as established by Law No. 21,185. |
Pursuant to the terms and conditions established in the “Sale and Purchase Agreement” (also subject to foreign governing law), entered into and between Enel Generación Chile S.A., Enel Green Power Chile and Chile Electricity PEC SpA., assignments of Balances may be made by Enel Generación Chile and Enel Green Power Chile from time to time, in favor of Chile Electricity PEC SpA, an unrelated entity which was specifically incorporated for this purpose.
In addition, on January 29, 2021, Enel Generación Chile and Enel Green Power Chile entered into an agreement (subject to foreign governing law) with Chile Electricity PEC SpA referred to as the “Sale and Purchase Agreement” for the sale and assignment of Balances. By virtue of this agreement, Enel Generación Chile and Enel Green Power Chile have agreed to sell and assign to Chile Electricity PEC two groups of Balances for a nominal value of approximately US$158.9 million (ThCh$115,867,879) and US$12.2 million (ThCh$8,666,252) for Enel Generación and Enel Green Power Chile, respectively, totaling ThCh$121,652,067. The sale and assignment of these groups of Balances was effected on February 8, 2021, and March 31, 2021, respectively.
In addition, on June 18, 2021, Enel Generación Chile and Enel Green Power Chile entered into amendments to the aforementioned “Commitment Agreements” entered into with the IDB Invest. The main purpose of these amendments is to recognize new groups of Balances that the companies may sell and assign to Chile Electricity PEC SpA, as well as to make adjustments to reflect the incorporation of a third financing provider to Chile Electricity PEC SpA. Likewise, on June 21, 2021, Enel Generación Chile, Enel Green Power Chile, Goldman Sachs & Co. LLC and Goldman Sachs Lending Partners LLC, among others, agreed to modify the aforementioned “Commitment and Engagement Letter”, to reflect the incorporation of certain entities of the Allianz Group as holders of promissory notes issued by Chile Electricity PEC SpA.
On June 21, 2021, Enel Generación Chile, Enel Green Power Chile, and some entities of the Allianz Group signed a “Fee Letter”, detailing the commitments assumed by the Allianz Group entities to provide financing to Chile Electricity PEC SpA, among other matters, including its amendments. On the same date, Enel Generación Chile, Enel Green Power Chile, and Chile Electricity PEC SpA amended the aforementioned “Sale and Purchase Agreements” to regulate the terms and conditions of future sales of Balances that Enel Generación Chile and Enel Green Power Chile may decide to effect.
On August 14, 2023, Enel Generación Chile S.A. and Enel Green Power Chile S.A. entered into an agreement with the IDB Invest as the buyer. Under this agreement, they agreed to sell, assign, and transfer to IDB Invest certain Payment Documents related to Law No. 21,472, for an approximate amount of up to US$606 million for Enel Generación Chile S.A. and US$34.8 million for Enel Green Power Chile S.A.
F-67
Detail of sales and disposals:
- |
On May 12, 2023, Enel Generación Chile and Enel Green Power Chile sold and assigned Balances to Chile Electricity PEC SpA for a nominal value of approximately US$48 million (ThCh $38,226,668) and US$3 million (ThCh $2,377,174), respectively. |
- |
On August 30, 2023, Enel Generación Chile and Enel Green Power Chile sold and assigned Payment Documents to IDB Invest for a nominal value of approximately US$294.8 million (ThCh$246,410,679) and US$17.2 million (ThCh $14,790,498), respectively. |
- |
On October 30, 2023, Enel Generación Chile and Enel Green Power Chile sold and transferred Payment Documents to IDB Invest with a nominal value of approximately US$ 15.9 million (ThCh $ 14,818,102) and US$1.03 million (ThCh $960,540), respectively. |
- |
On December 28, 2023, Enel Generación Chile and Enel Green Power Chile sold and transferred Payment Documents to IDB Invest with a nominal value of approximately US$14.7 million (ThCh$ 13,053,271) and US$0.95 million (ThCh$842,684), respectively. |
- |
On January 17, 2024, Enel Generación Chile and Enel Green Power Chile sold and transferred Payment Documents to IDB Invest with a nominal value of approximately US$14.2 million (ThCh$13,834,462) and US$0.9 million (ThCh$856,130), respectively. |
- |
On May 31, 2024, Enel Generación Chile and Enel Green Power Chile sold and transferred Payment Documents to IDB Invest with a nominal value of approximately US$50.8 million (ThCh$ 46,655,935) and US$3.6 million (ThCh$ 3,291,693), respectively. |
- |
On August 9, 2024, Enel Generación Chile and Enel Green Power Chile sold and transferred Payment Documents to IDB Invest with a nominal value of approximately US$12.7 million (ThCh$ 11,940,907) and US$1.0 million (ThCh$ 895,022), respectively. |
- |
On October 24, 2024, Enel Generación Chile and Enel Green Power Chile sold and transferred Payment Documents to IDB Invest with a nominal value of approximately US$592.5 million (ThCh$561,854,744) and US$21.4 million (ThCh$20,283,808), respectively. |
As a result of the sales and transfers of Balances and Payment Documents described above for the year ended December 31, 2024 , Enel Generación Chile and Enel Green Power Chile did not recognize financial costs for the transfers (ThCh$7,210,573 and ThCh$446,556, respectively, for the year ended December 31, 2023 and ThCh$12,623,444 and ThCh$1,033,564, respectively, for the year ended December 31, 2022).
In addition, during 2024, Enel Generación Chile and Enel Green Power Chile conducted sales of short-term receivables, other than those originating from the application of Laws Nos. 21,185, 21,472 and 21,667, for a nominal value of ThCh$1,499,383,451 and ThCh$51,604,397, respectively, for the year ended December 21, 2024 (ThCh$1,280,073,680 and ThCh$40,417,845, respectively, for the year ended December 31, 2023), recognizing a financial cost of ThCh$9,088,544 and ThCh$467,705, respectively, for the year ended December 31, 2024 (ThCh$11,759,416 and ThCh$402,208, respectively, for the year ended December 31, 2023 and ThCh$8,226,102 and ThCh$208,364, respectively, for the year ended December 31, 2022).
The financial cost implications as previously outlined for the segments of Distribution and Generation for the year ended December 31, 2024 total ThCh$19,793,431 (ThCh$30,472,335 and ThCh$31,626,916 for the years ended December 31, 2023 and 2022, respectively) (see Note 34 (5)).
F-68
a.3) Other
There are no restrictions on the disposal of these types of receivables in a significant amount.
The Group has one customer in the Generation segment whose sales represent 10% or more of its revenue for the years ended, December 31, 2024, 2023 and 2022. This customer corresponds to:
| - | Compañía General de Electricidad S.A. |
For amounts, terms and conditions related to receivables due from related parties, refer to Note 10.1.
| b) | Financial lease receivables |
As of December 31, 2024 and 2023, future collections on financial lease receivables are the following:
|
|
12-31-2024 |
|
12-31-2023 |
||||||||
|
|
Gross |
|
Interest |
|
Present value |
|
Gross |
|
Interest |
|
Present value |
|
|
ThCh$ |
|
ThCh$ |
|
ThCh$ |
|
ThCh$ |
|
ThCh$ |
|
ThCh$ |
Less than one year |
|
21,400,056 |
|
3,003,514 |
|
18,396,542 |
|
25,892,541 |
|
5,136,999 |
|
20,755,542 |
From one to two years |
|
14,919,310 |
|
1,440,666 |
|
13,478,644 |
|
15,166,099 |
|
1,765,693 |
|
13,400,406 |
From two to three years |
|
12,758,599 |
|
1,071,743 |
|
11,686,856 |
|
13,046,179 |
|
1,268,723 |
|
11,777,456 |
From three to four years |
|
10,537,170 |
|
789,057 |
|
9,748,113 |
|
11,136,437 |
|
829,245 |
|
10,307,192 |
From four to five years |
|
8,997,568 |
|
548,372 |
|
8,449,196 |
|
8,983,791 |
|
274,262 |
|
8,709,529 |
More than five years |
|
55,279,539 |
|
6,523,314 |
|
48,756,225 |
|
109,421,299 |
|
15,651,139 |
|
93,770,160 |
Total |
|
123,892,242 |
|
13,376,666 |
|
110,515,576 |
|
183,646,346 |
|
24,926,061 |
|
158,720,285 |
The amounts correspond to the performance of public lighting projects, mainly for municipalities, and the fleet of electric buses for public transportation with their respective charging stations.
As of December 31, 2024, financial income from lease debtors reached ThCh$2,093,680 (ThCh$3,109,982 and ThCh$2,062,710 as of December 31, 2023 and 2022, respectively).
| c) | As of December 31, 2024 and 2023, the analysis of past-due, unpaid trade receivables, but for which no impairment losses have been recorded, is detailed as follows: |
|
|
As of December 31, |
||
|
|
2024 |
|
2023 |
Trade receivables due and unpaid, but for which no impairment losses have been recorded |
|
ThCh$ |
|
ThCh$ |
Less than three months |
|
56,594,763 |
|
93,786,602 |
Between three and six months |
|
34,855,466 |
|
49,053,096 |
Between six and twelve months |
|
12,560,015 |
|
72,489,852 |
More than twelve months |
|
26,130,770 |
|
90,256,399 |
Total |
|
130,141,014 |
|
305,585,949 |
F-69
| d) | The movement of impairment loss of trade receivables, determined according to Note 3.g.3, is detailed as follows: |
|
|
Current and |
|
|
Non-current |
Trade receivables due and unpaid, with impairment losses |
|
ThCh$ |
Balance as of January 1, 2023 |
|
89,205,444 |
Increases (decreases) for the year |
|
10,773,445 |
Amounts written off |
|
(9,460,991) |
Increases (decreases) in foreign currency translation differences |
|
1,801 |
Other |
|
(21,666) |
Balance as of December 31, 2023 |
|
90,498,033 |
Increases (decreases) of the year (1) |
|
18,429,856 |
Amounts written off |
|
(10,379,444) |
Increases (decreases) in foreign currency translation differences |
|
27,922 |
Balance as of December 31, 2024 |
|
98,576,367 |
| (1) | Impairment losses on trade receivables amounted to ThCh$18,429,856 during 2024, representing a 71.07% compared to the previous year (See note 31(b)). This increase is mainly due to the Distribution and Networks Segment, primarily driven by a higher expected credit loss associated with residential customers. |
Write-offs of doubtful accounts
The write-off of doubtful accounts is performed once all collections proceedings have been exhausted, including judicial proceedings, and proof of the debtors’ insolvency has been obtained. In the case of the Company’s Generation Segment, the process normally considers at least one year of proceedings. In the Company’s Distribution and Network Segment, the process takes less than 24 months. Overall, the risk of uncollectability and, therefore, the write-off of the Company’s customers, is limited. (See Notes 3.g.3 and 22.5).
| e) | Additional Information: |
| - | Additional statistical information required by CMF Circular No. 715, dated February 3, 2012 (XBRL taxonomy). See Appendix 2. |
| - | Complementary information on trade receivables, see Appendix 2.1. |
F-70
10. BALANCES AND TRANSACTIONS WITH RELATED PARTIES
Related party transactions are performed at current market conditions.
Transactions between companies comprising the Group have been eliminated in the consolidation process and are not disclosed in this Note.
As of the date of these consolidated financial statements, there are no allowances for doubtful accounts between related entities.
The controlling company of Enel Chile is the Italian company Enel S.p.A.
Enel Chile S.A. provides administrative services to its subsidiaries, through a centralized cash contract used to finance cash deficits or consolidate cash surpluses. These accounts may have a debtor or creditor balance and are prepayable, short-term accounts with a variable interest rate that represents market conditions. To reflect these market conditions, the interest rates are reviewed periodically through an update procedure approved by the Boards of Directors of the respective companies.
10.1 Balances and transactions with related parties
The balances of receivables and payable as of December 31, 2024 and 2023 are as follows:
| a) | Receivables from related parties |
|
|
|
|
|
|
|
|
|
|
|
|
Current |
|
Non-current |
||||
Taxpayer ID No. |
|
Company |
|
Country |
|
Relationship |
|
Currency |
|
Transaction Description |
|
12-31-2024 |
|
12-31-2023 |
|
12-31-2024 |
|
12-31-2023 |
|
|
|
|
|
|
|
|
|
|
|
|
ThCh$ |
|
ThCh$ |
|
ThCh$ |
|
ThCh$ |
Foreign |
|
Empresa Distribuidora Sur S.A. |
|
Argentina |
|
Common Immediate Parent |
|
US$ |
|
Other Services |
|
249,045 |
|
247,437 |
- |
— |
|
— |
Foreign |
|
Empresa Distribuidora Sur S.A. |
|
Argentina |
|
Common Immediate Parent |
|
US$ |
|
IT Services |
|
1,874,494 |
|
1,670,459 |
- |
— |
|
— |
Foreign |
|
Enel Generacion El Chocón S.A. |
|
Argentina |
|
Common Immediate Parent |
|
US$ |
|
Engineering Services |
|
16,754 |
|
14,748 |
- |
— |
|
— |
Foreign |
|
Enel Brasil S.A. |
|
Brazil |
|
Common Immediate Parent |
|
US$ |
|
Engineering Services |
|
17,671 |
|
15,555 |
- |
— |
|
— |
Foreign |
|
Enel Brasil S.A. |
|
Brazil |
|
Common Immediate Parent |
|
US$ |
|
Other Services |
|
2,218,800 |
|
1,859,584 |
- |
— |
|
— |
94.271.000-3 |
|
Enel Américas S.A. |
|
Chile |
|
Common Immediate Parent |
|
CLP |
|
IT Services |
|
905,961 |
|
767,621 |
- |
— |
|
— |
94.271.000-3 |
|
Enel Américas S.A. |
|
Chile |
|
Common Immediate Parent |
|
CLP |
|
Other Services |
|
332,309 |
|
147,491 |
- |
— |
|
— |
94.271.000-3 |
|
Enel Américas S.A. |
|
Chile |
|
Common Immediate Parent |
|
CLP |
|
Administrative Services |
|
2,960,875 |
|
1,133,921 |
- |
— |
|
— |
Foreign |
|
Enel Distribución Sao Paulo S.A. |
|
Brazil |
|
Common Immediate Parent |
|
US$ |
|
Other Services |
|
83,764 |
|
67,307 |
— |
— |
|
— |
77.569.067-4 |
|
Enel X Way Chile SpA |
|
Chile |
|
Associated |
|
CLP |
|
Technical Services |
|
- |
|
710,446 |
- |
— |
|
— |
77.569.067-4 |
|
Enel X Way Chile SpA |
|
Chile |
|
Associated |
|
CLP |
|
Other Services |
|
— |
|
1,389,644 |
— |
— |
|
— |
77.569.067-4 |
|
Enel X Way Chile SpA |
|
Chile |
|
Associated |
|
CLP |
|
Administrative Services |
|
- |
|
521,628 |
- |
— |
|
— |
76.418.940-K |
|
GNL Chile S.A. |
|
Chile |
|
Associated |
|
US$ |
|
Gas Purchase Advance |
|
19,671,039 |
|
3,988,333 |
— |
— |
|
— |
Foreign |
|
Enel Colombia S.A. ESP. |
|
Colombia |
|
Common Immediate Parent |
|
US$ |
|
Engineering Services |
|
2,351,737 |
|
1,447,752 |
- |
— |
|
— |
Foreign |
|
Enel Colombia S.A. ESP. |
|
Colombia |
|
Common Immediate Parent |
|
US$ |
|
Other Services |
|
11,426 |
|
55,113 |
- |
— |
|
— |
Foreign |
|
Endesa España |
|
Spain |
|
Common Immediate Parent |
|
EUR |
|
Other Services |
|
- |
|
12,748 |
— |
|
|
— |
Foreign |
|
Enel North America Inc |
|
United States |
|
Common Immediate Parent |
|
CLP |
|
Other Services |
|
233,615 |
|
224,177 |
- |
— |
|
— |
Foreign |
|
Enel Global Services S.r.l. |
|
Italy |
|
Common Immediate Parent |
|
EUR |
|
Other Services |
|
68,271 |
|
22,741 |
- |
— |
|
— |
Foreign |
|
Enel Global Trading S.p.A. |
|
Italy |
|
Common Immediate Parent |
|
EUR |
|
Other Services |
|
525,325 |
|
492,226 |
- |
— |
|
— |
Foreign |
|
Enel Global Trading S.p.A. |
|
Italy |
|
Common Immediate Parent |
|
EUR |
|
Commodity derivatives |
|
2,120,908 |
|
23,737,063 |
- |
— |
|
— |
Foreign |
|
Enel Green Power Spa |
|
Italy |
|
Common Immediate Parent |
|
EUR |
|
Engineering Services |
|
694,913 |
|
615,499 |
- |
— |
|
— |
Foreign |
|
Enel Green Power Spa |
|
Italy |
|
Common Immediate Parent |
|
EUR |
|
Technical Services |
|
2,055,772 |
|
1,828,895 |
- |
— |
|
— |
Foreign |
|
Enel Green Power Spa |
|
Italy |
|
Common Immediate Parent |
|
EUR |
|
Other Services |
|
946,162 |
|
672,349 |
- |
— |
|
— |
Foreign |
|
Enel Grids S.r.L |
|
Italy |
|
Common Immediate Parent |
|
EUR |
|
Other Services |
|
599,280 |
|
561,521 |
- |
— |
|
— |
Foreign |
|
Enel Innovation Hubs Srl |
|
Italy |
|
Common Immediate Parent |
|
EUR |
|
IT Services |
|
35,461 |
|
111,271 |
- |
— |
|
— |
Foreign |
|
Enel Italia SrL. |
|
Italy |
|
Common Immediate Parent |
|
EUR |
|
Other Services |
|
1,530,307 |
|
1,438,058 |
- |
— |
|
— |
Foreign |
|
Enel Produzione |
|
Italy |
|
Common Immediate Parent |
|
EUR |
|
Other Services |
|
297,171 |
|
278,448 |
- |
— |
|
— |
Foreign |
|
Enel S.p.A. |
|
Italy |
|
Parent |
|
EUR |
|
Other Services |
|
1,166,485 |
|
1,020,093 |
— |
— |
|
— |
Foreign |
|
Enel X S.R.L. |
|
Italy |
|
Common Immediate Parent |
|
EUR |
|
Other Services |
|
58,104 |
|
54,443 |
- |
— |
|
— |
Foreign |
|
Enel Green Power Morocco |
|
Morocco |
|
Common Immediate Parent |
|
EUR |
|
Other Services |
|
698,896 |
|
580,915 |
- |
— |
|
— |
Foreign |
|
Chinango S.A.C. |
|
Peru |
|
Common Immediate Parent |
|
US$ |
|
Engineering Services |
|
— |
|
18,970 |
- |
— |
|
— |
Foreign |
|
Enel Distribución Perú S.A. |
|
Peru |
|
Common Immediate Parent |
|
US$ |
|
IT Services |
|
— |
|
242,125 |
- |
— |
|
— |
Foreign |
|
Enel Generación Perú S.A. |
|
Peru |
|
Common Immediate Parent |
|
US$ |
|
Engineering Services |
|
— |
|
3,298,013 |
- |
— |
|
— |
Foreign |
|
Enel Generación Perú S.A. |
|
Peru |
|
Common Immediate Parent |
|
US$ |
|
Other Services |
|
— |
|
215,021 |
- |
— |
|
— |
Foreign |
|
Enel Generación Piura S.A. |
|
Peru |
|
Common Immediate Parent |
|
US$ |
|
Engineering Services |
|
42,453 |
|
8,199 |
- |
— |
|
— |
Foreign |
|
Enel Generación Piura S.A. |
|
Peru |
|
Common Immediate Parent |
|
US$ |
|
Other Services |
|
650,016 |
|
— |
- |
— |
|
— |
Foreign |
|
EGP Magdalena Solar SA de CV |
|
Mexico |
|
Common Immediate Parent |
|
US$ |
|
Engineering Services |
|
366,322 |
|
— |
- |
— |
|
— |
Foreign |
|
Energetica Monzon S.A.C. |
|
Peru |
|
Common Immediate Parent |
|
US$ |
|
Engineering Services |
|
— |
|
804,311 |
- |
— |
|
— |
|
|
|
|
Total |
|
|
|
|
|
|
|
42,783,336 |
|
50,274,125 |
|
— |
|
— |
F-71
| b) | Payables to related parties |
Taxpayer |
|
|
|
|
|
|
|
|
|
|
|
Current |
|
Non-current |
||||
ID No. |
|
Company |
|
Country |
|
Relationship |
|
Currency |
|
Transaction Description |
|
12-31-2024 |
|
12-31-2023 |
|
12-31-2024 |
|
12-31-2023 |
|
|
|
|
|
|
|
|
|
|
|
|
ThCh$ |
|
ThCh$ |
|
ThCh$ |
|
ThCh$ |
Foreign |
|
Enel Argentina S.A. |
|
Argentina |
|
Common Immediate Parent |
|
US$ |
|
Other Services |
|
2,130 |
|
- |
|
— |
|
— |
Foreign |
|
Enel Trading Argentina S.R.L. |
|
Argentina |
|
Common Immediate Parent |
|
US$ |
|
IT Services |
|
96,815 |
|
85,066 |
|
— |
|
— |
Foreign |
|
Enel Trading Argentina S.R.L. |
|
Argentina |
|
Common Immediate Parent |
|
US$ |
|
Other Services |
|
21,897 |
|
18,532 |
|
— |
|
— |
Foreign |
|
Enel Brasil S.A. |
|
Brazil |
|
Common Immediate Parent |
|
US$ |
|
Other Services |
|
100,750 |
|
99,449 |
|
— |
|
— |
Foreign |
|
Enel X Brasil Gerenciamento de Energia Ltda |
|
Brazil |
|
Common Immediate Parent |
|
US$ |
|
IT Services |
|
12,961 |
|
10,889 |
|
— |
|
— |
94.271.000-3 |
|
Enel Américas S.A. |
|
Chile |
|
Common Immediate Parent |
|
CLP |
|
Other Services |
|
- |
|
725,547 |
|
— |
|
— |
94.271.000-3 |
|
Enel Américas S.A. |
|
Chile |
|
Common Immediate Parent |
|
US$ |
|
Other Services |
|
664,597 |
|
211,676 |
|
— |
|
— |
77.569.067-4 |
|
Enel X Way Chile SpA |
|
Chile |
|
Associated |
|
CLP |
|
Other Services |
|
- |
|
3,504,042 |
|
— |
|
— |
77.569.067-4 |
|
Enel X Way Chile SpA |
|
Chile |
|
Associated |
|
CLP |
|
Administrative Services |
|
- |
|
2,237,282 |
|
— |
|
— |
76.418.940-K |
|
GNL Chile S.A. |
|
Chile |
|
Associated |
|
US$ |
|
Gas Purchase Advance |
|
17,411,427 |
|
13,109,107 |
|
— |
|
— |
Foreign |
|
Enel Distribución Sao Paulo S.A. |
|
Brazil |
|
Common Immediate Parent |
|
US$ |
|
Other Services |
|
830,054 |
|
845,605 |
|
— |
|
— |
Foreign |
|
Enel Colombia S.A. ESP. |
|
Colombia |
|
Common Immediate Parent |
|
US$ |
|
Other Services |
|
204,123 |
|
86,671 |
|
— |
|
— |
Foreign |
|
Endesa España |
|
Spain |
|
Common Immediate Parent |
|
EUR |
|
Other Services |
|
33,171 |
|
31,005 |
|
— |
|
— |
Foreign |
|
Endesa Generación |
|
Spain |
|
Common Immediate Parent |
|
EUR |
|
Coal purchases |
|
591,816 |
|
520,938 |
|
— |
|
— |
Foreign |
|
Endesa Generación |
|
Spain |
|
Common Immediate Parent |
|
EUR |
|
Other Services |
|
191,814 |
|
171,500 |
|
— |
|
— |
Foreign |
|
Enel Green Power España SL |
|
Spain |
|
Common Immediate Parent |
|
EUR |
|
Other Services |
|
1,273,957 |
|
713,663 |
|
— |
|
— |
Foreign |
|
Enel Iberia SRL |
|
Spain |
|
Common Immediate Parent |
|
EUR |
|
IT Services |
|
- |
|
22,016 |
|
— |
|
— |
Foreign |
|
Enel Iberia SRL |
|
Spain |
|
Common Immediate Parent |
|
EUR |
|
Other Services |
|
671,338 |
|
323,962 |
|
— |
|
— |
Foreign |
|
Enel Green Power North America Inc |
|
United States |
|
Common Immediate Parent |
|
US$ |
|
Other Services |
|
113,106 |
|
451,430 |
|
— |
|
— |
Foreign |
|
Enel Green Power North America Inc |
|
United States |
|
Common Immediate Parent |
|
US$ |
|
Technical Services |
|
- |
|
220,579 |
|
— |
|
— |
Foreign |
|
Enel Finance International NV (*) |
|
Netherlands |
|
Common Immediate Parent |
|
US$ |
|
Loan payable |
|
166,505,078 |
|
146,577,056 |
|
1,015,904,873 |
|
1,034,791,219 |
Foreign |
|
Cesi S.p.A. |
|
Italy |
|
Common Immediate Parent |
|
EUR |
|
Engineering Services |
|
12,218 |
|
114,153 |
|
— |
|
— |
Foreign |
|
Enel X Advisory Services S.r.L. |
|
Italy |
|
Common Immediate Parent |
|
EUR |
|
Technical Services |
|
7,287 |
|
- |
|
— |
|
— |
Foreign |
|
Enel Global Services S.r.l. |
|
Italy |
|
Common Immediate Parent |
|
EUR |
|
Technical Services |
|
506,009 |
|
1,973,905 |
|
— |
|
— |
Foreign |
|
Enel Global Services S.r.l. |
|
Italy |
|
Common Immediate Parent |
|
EUR |
|
IT Services |
|
3,065,906 |
|
7,773,093 |
|
— |
|
— |
Foreign |
|
Enel Global Services S.r.l. |
|
Italy |
|
Common Immediate Parent |
|
EUR |
|
Other Services |
|
- |
|
238,209 |
|
— |
|
— |
Foreign |
|
Enel Global Trading S.p.A. |
|
Italy |
|
Common Immediate Parent |
|
EUR |
|
Other Services |
|
- |
|
538,142 |
|
— |
|
— |
Foreign |
|
Enel Global Trading S.p.A. |
|
Italy |
|
Common Immediate Parent |
|
EUR |
|
Engineering Services |
|
28,312 |
|
26,463 |
|
— |
|
|
Foreign |
|
Enel Global Trading S.p.A. |
|
Italy |
|
Common Immediate Parent |
|
EUR |
|
Commodities derivatives |
|
1,353,173 |
|
29,915,452 |
|
— |
|
— |
Foreign |
|
Enel Global Trading S.p.A. |
|
Italy |
|
Common Immediate Parent |
|
EUR |
|
Technical Services |
|
1,461,321 |
|
5,084,420 |
|
— |
|
— |
Foreign |
|
Enel Global Trading S.p.A. |
|
Italy |
|
Common Immediate Parent |
|
EUR |
|
IT Services |
|
311,776 |
|
642,625 |
|
— |
|
— |
Foreign |
|
Enel Green Power Italia |
|
Italy |
|
Common Immediate Parent |
|
EUR |
|
Engineering Services |
|
707,985 |
|
653,225 |
|
— |
|
— |
Foreign |
|
Enel Green Power Spa |
|
Italy |
|
Common Immediate Parent |
|
US$ |
|
Other Services |
|
- |
|
245,139 |
|
— |
|
— |
Foreign |
|
Enel Green Power Spa |
|
Italy |
|
Common Immediate Parent |
|
EUR |
|
Technical Services |
|
9,000,456 |
|
31,310,148 |
|
— |
|
— |
Foreign |
|
Enel Green Power Spa |
|
Italy |
|
Common Immediate Parent |
|
EUR |
|
Engineering Services |
|
14,125,373 |
|
16,707,060 |
|
— |
|
— |
Foreign |
|
Enel Green Power Spa |
|
Italy |
|
Common Immediate Parent |
|
EUR |
|
Other Services |
|
3,743,485 |
|
6,259,507 |
|
— |
|
— |
Foreign |
|
Enel Green Power Spa |
|
Italy |
|
Common Immediate Parent |
|
EUR |
|
IT Services |
|
2,241,694 |
|
7,680,812 |
|
— |
|
— |
Foreign |
|
Enel Grids S.r.L |
|
Italy |
|
Common Immediate Parent |
|
EUR |
|
Other Services |
|
— |
|
325,943 |
|
— |
|
— |
Foreign |
|
Enel Grids S.r.L |
|
Italy |
|
Common Immediate Parent |
|
EUR |
|
IT Services |
|
2,125,763 |
|
16,688,192 |
|
— |
|
— |
Foreign |
|
Enel Grids S.r.L |
|
Italy |
|
Common Immediate Parent |
|
EUR |
|
Technical Services |
|
2,532,327 |
|
8,393,271 |
|
— |
|
— |
Foreign |
|
Enel Italia S.p.A |
|
Italy |
|
Common Immediate Parent |
|
EUR |
|
IT Services |
|
695,578 |
|
714,721 |
|
— |
|
— |
Foreign |
|
Enel Italia S.p.A |
|
Italy |
|
Common Immediate Parent |
|
EUR |
|
Other Services |
|
2,059,352 |
|
1,919,621 |
|
— |
|
— |
Foreign |
|
Enel Produzione |
|
Italy |
|
Common Immediate Parent |
|
EUR |
|
Other Services |
|
- |
|
113,349 |
|
— |
|
— |
Foreign |
|
Enel Produzione |
|
Italy |
|
Common Immediate Parent |
|
EUR |
|
Engineering Services |
|
1,485,162 |
|
1,471,152 |
|
— |
|
— |
Foreign |
|
Enel S.p.A. |
|
Italy |
|
Parent |
|
CLP |
|
Dividends |
|
40,198,093 |
|
123,046,700 |
|
— |
|
— |
Foreign |
|
Enel S.p.A. |
|
Italy |
|
Parent |
|
US$ |
|
Dividends |
|
2,264 |
|
1,988 |
|
— |
|
— |
Foreign |
|
Enel S.p.A. |
|
Italy |
|
Parent |
|
EUR |
|
Technical Services |
|
4,608,916 |
|
6,259,685 |
|
— |
|
— |
Foreign |
|
Enel S.p.A. |
|
Italy |
|
Parent |
|
EUR |
|
IT Services |
|
2,486,018 |
|
2,924,035 |
|
— |
|
— |
Foreign |
|
Enel S.p.A. |
|
Italy |
|
Parent |
|
EUR |
|
Other Services |
|
1,253,659 |
|
3,594,734 |
|
— |
|
— |
Foreign |
|
Enel S.p.A. |
|
Italy |
|
Parent |
|
EUR |
|
Financial Guarantee Services |
|
1,698,197 |
|
1,194,512 |
|
— |
|
— |
Foreign |
|
Enel X S.R.L. |
|
Italy |
|
Common Immediate Parent |
|
EUR |
|
Other Services |
|
- |
|
113,027 |
|
— |
|
— |
Foreign |
|
Enel X S.R.L. |
|
Italy |
|
Common Immediate Parent |
|
EUR |
|
IT Services |
|
259,839 |
|
434,851 |
|
— |
|
— |
Foreign |
|
Enel X S.R.L. |
|
Italy |
|
Common Immediate Parent |
|
EUR |
|
Technical Services |
|
13,582,828 |
|
14,627,961 |
|
— |
|
— |
Foreign |
|
Gridspertise s.r.l. |
|
Italy |
|
Common Immediate Parent |
|
EUR |
|
IT Services |
|
23,903 |
|
1,626,356 |
|
- |
|
- |
|
|
|
|
Total |
|
|
|
|
|
|
|
298,301,928 |
|
462,578,466 |
|
1,015,904,873 |
|
1,034,791,219 |
(*) See Note 10.1. d) and e) below.
F-72
| c) | Significant transactions and effects on profit or loss: |
The significant transactions with related companies that are not consolidated, are as follows:
|
|
|
|
|
|
|
|
|
|
|
|
|
|
|
|
|
|
|
|
|
|
|
|
|
For the years ended December 31, |
||||
Taxpayer ID No. |
|
Company |
|
Country |
|
Relationship |
|
Transaction Description |
|
2024 |
|
2023 |
|
2022 |
|
|
|
|
|
|
|
|
|
|
ThCh$ |
|
ThCh$ |
|
ThCh$ |
Foreign |
|
Endesa Energía S.A. |
|
Spain |
|
Common Immediate Parent |
|
Gas Sales |
|
— |
|
22,404,257 |
|
180,214,107 |
Foreign |
|
Endesa Energía S.A. |
|
Spain |
|
Common Immediate Parent |
|
Fuel Consumption |
|
— |
|
(2,702,995) |
|
— |
94.271.000-3 |
|
Enel Américas S.A. |
|
Chile |
|
Common Immediate Parent |
|
Provision of administration services and others |
|
6,688,879 |
|
8,356,103 |
|
7,859,162 |
76.418.940-K |
|
GNL Chile S.A. |
|
Chile |
|
Associated |
|
Gas consumption |
|
(223,839,011) |
|
(214,830,783) |
|
(443,243,955) |
76.418.940-K |
|
GNL Chile S.A. |
|
Chile |
|
Associated |
|
Gas Sales |
|
— |
|
6,588,337 |
|
— |
Foreign |
|
Enel X S.R.L. |
|
Italy |
|
Common Immediate Parent |
|
Technical Services |
|
(5,806,595) |
|
(4,857,322) |
|
(3,545,918) |
Foreign |
|
Enel Global Services S.r.l. |
|
Italy |
|
Common Immediate Parent |
|
IT Services |
|
(2,438,974) |
|
(2,014,876) |
|
— |
Foreign |
|
Enel Grids S.r.L |
|
Italy |
|
Common Immediate Parent |
|
IT Services |
|
(3,089,468) |
|
(3,274,480) |
|
(1,254,045) |
Foreign |
|
Enel Grids S.r.L |
|
Italy |
|
Common Immediate Parent |
|
Technical Services |
|
(3,035,638) |
|
(3,483,451) |
|
(2,260,739) |
Foreign |
|
Enel S.p.A. |
|
Italy |
|
Parent |
|
Technical Services |
|
(3,652,282) |
|
(3,965,495) |
|
(2,340,510) |
Foreign |
|
Enel S.p.A. |
|
Italy |
|
Parent |
|
Financial expenses |
|
(3,794,499) |
|
(914,228) |
|
— |
Foreign |
|
Enel Global Trading SpA. |
|
Italy |
|
Common Immediate Parent |
|
Commodity derivatives |
|
(18,681,998) |
|
156,461,363 |
|
36,940,008 |
Foreign |
|
Enel Global Trading SpA. |
|
Italy |
|
Common Immediate Parent |
|
Gas Sales |
|
19,224,275 |
|
— |
|
166,792,281 |
Foreign |
|
Enel Global Trading SpA. |
|
Italy |
|
Common Immediate Parent |
|
Technical Services |
|
— |
|
(1,477,536) |
|
(1,492,743) |
Foreign |
|
Enel Finance International NV |
|
Netherlands |
|
Common Immediate Parent |
|
Financial expenses |
|
(63,392,975) |
|
(56,576,882) |
|
(72,578,171) |
Foreign |
|
Enel Green Power SpA |
|
Italy |
|
Common Immediate Parent |
|
Technical Services |
|
(11,924,956) |
|
(12,774,436) |
|
(6,136,692) |
Foreign |
|
Gridspertise S.r.L. |
|
Italy |
|
Common Immediate Parent |
|
Purchase of materials |
|
— |
|
(2,867,907) |
|
— |
The transactions detailed in the preceding table correspond to all transactions that exceed ThCh$2,000,000, by counterparty and nature of the transactions.
| d) | Future undiscounted debt flows |
The estimates of undiscounted cash flows for loans payable as of December 31, 2024 and 2023 are as follows:
|
|
|
|
|
|
|
|
|
|
|
|
|
|
|
|
|
|
|
|
|
|
|
|
|
|
|
|
|
|
|
|
|
|
|
|
|
12-31-2024 |
||||||||||||||||
|
|
|
|
|
|
|
|
|
|
Maturity |
|
|
|
Maturity |
|
|
||||||||||
Taxpayer ID No. |
|
Company |
|
Country |
|
Currency |
|
Nominal Interest |
|
One to three months |
|
Three to twelve months |
|
Total Current |
|
One to two years |
|
Two to three years |
|
Three to four years |
|
Four to five years |
|
More than five years |
|
Total Non-Current |
|
|
|
|
|
|
|
|
|
|
ThCh$ |
|
ThCh$ |
|
ThCh$ |
|
ThCh$ |
|
ThCh$ |
|
ThCh$ |
|
ThCh$ |
|
ThCh$ |
|
ThCh$ |
Foreign |
|
Enel Finance International NV |
|
Netherlands |
|
US$ |
|
2.91% |
|
8,589,101 |
|
185,610,222 |
|
194,199,323 |
|
189,609,714 |
|
185,020,106 |
|
21,122,461 |
|
21,064,749 |
|
709,735,278 |
|
1,126,552,308 |
|
|
|
|
|
|
|
|
Total |
|
8,589,101 |
|
185,610,222 |
|
194,199,323 |
|
189,609,714 |
|
185,020,106 |
|
21,122,461 |
|
21,064,749 |
|
709,735,278 |
|
1,126,552,308 |
|
|
|
|
|
|
|
|
|
|
|
|
|
|
|
|
|
|
|
|
|
|
|
|
|
|
|
|
|
|
|
|
|
|
|
|
|
|
|
|
|
|
|
|
|
|
|
|
|
|
|
|
|
|
|
|
|
|
|
|
|
|
|
|
12-31-2023 |
||||||||||||||||
|
|
|
|
|
|
|
|
|
|
Maturity |
|
|
|
Maturity |
|
|
||||||||||
Taxpayer ID No. |
|
Company |
|
Country |
|
Currency |
|
Nominal Interest |
|
One to three months |
|
Three to twelve months |
|
Total Current |
|
One to two years |
|
Two to three years |
|
Three to four years |
|
Four to five years |
|
More than five years |
|
Total Non-Current |
Foreign |
|
Enel Finance International NV |
|
Netherlands |
|
US$ |
|
2.89% |
|
8,618,400 |
|
166,324,092 |
|
174,942,492 |
|
170,807,846 |
|
166,767,908 |
|
162,727,969 |
|
18,458,990 |
|
642,976,471 |
|
1,161,739,184 |
|
|
|
|
|
|
|
|
Total |
|
8,618,400 |
|
166,324,092 |
|
174,942,492 |
|
170,807,846 |
|
166,767,908 |
|
162,727,969 |
|
18,458,990 |
|
642,976,471 |
|
1,161,739,184 |
| e) | Significant transaction |
| i. | In June 2019, Enel Chile entered into a revolving credit facility with Enel Finance International N.V. in US dollars for a total of US$50 million, initially at a LIBOR 1M, 3M or 6M variable rate plus a margin of 0.90% (transitioned to SOFR in June 2023), with monthly, quarterly or semiannual interest payments, and a maturity date of June 24, 2024. As of December 31, 2024 the revolving credit facility is no longer available, in accordance with the termination date established in the contract. |
F-73
| ii. | On March 11, 2020, Enel Finance International NV granted a loan in US dollars to Enel Chile for up to US$400 million, with a fixed interest rate of 3.30%, with the payment of interest every six months and a maturity date of March 11, 2030. The loan contracted by Enel Chile S.A. is a bullet maturity loan and can be repaid in advance, partially or in full, as established in the agreement. The debt balance as of December 31, 2024 amounts to US$400 million equivalent to ThCh$398,584,000 (US$400 million equivalent to ThCh$350,848,000 as of December 31, 2023). The accrued interest as of December 31, 2024 amounts to ThCh$4,055,592 (ThCh$3,569,878 as of December 31, 2023). |
| iii. | On April 1, 2021, Enel Chile S.A. entered into an SDG-Linked loan of US$300 million from Enel Finance International N.V. This loan has a fixed interest rate of 2.50% (which is subject to compliance with a reduction of greenhouse gas emissions (CO2) until December 2023), with semi-annual interest payments and maturing on April 1, 2031. The loan contracted by Enel Chile S.A. has a bullet maturity and can be repaid in advance, partially or totally, as established in the contract. As of December 31, 2024, the debt balance amounts to US$300 million equivalent to ThCh$298,938,000 (US$300 million equivalent to ThCh$263,136,000 as of December 31, 2023). As of December 31, 2024, the accrued interest amounts to ThCh$1,926,905 (ThCh$1,699,420 as of December 31, 2023). As of October 1, 2024, the rate increased by 0.05% due to the fact that at the end of 2023 the CO2 target planned by the company was not reached. |
| iv. | On April 1, 2021, Enel Chile S.A. entered into an SDG-Linked revolving committed credit facility from Enel Finance International N.V. for US$290 million. This credit facility initially had a variable interest rate of LIBOR 1M, 3M or 6M + 1.00% margin, which is indexed to compliance with a reduction of greenhouse gas emissions to December 2023, with monthly, quarterly or semi-annual interest payments and maturity on April 1, 2026. During the effective period of the credit facility, Enel Chile S.A. will pay an annual availability fee equal to 35% of the margin on the undrawn amount. In June 2023, the Group successfully completed the LIBOR-SOFR transition of 100% of its financial and derivative contracts, in line with market standards. According to this change the current rate would be SOFR + margin (1.00%) + adjustment margin 1M (0.11448%), 3M (0.26161%) and 6M (0.42826%). On April 8, 2024, this line was drawn for an amount of US$190 million at a 1M SOFR rate, maturing on October 28, 2024, the same date on which the facility was repaid. On April 12, 2024, a new draw was made for an amount of US$100 million at SOFR 1M, maturing on October 28, 2024, the same date on which the draw was amortized. Because of to its revolving line characteristic, upon maturity, a decision will be made to renew or repay it, and it cannot be extended beyond the line's maturity date. As of December 31, 2024, the line is 100% available. Starting from April 2024 the rate increased by 0.05% because the CO2 target planned by the company was not achieved by the end of 2023. |
| v. | On June 30, 2021, the debt previously held by Enel Green Power S.A. was transferred to Enel Chile under the following conditions: the debt was refinanced by Enel Finance International N.V. for US$644 million, at a fixed interest rate of 2.82% per annum, with semi-annual interest payments (beginning on June 30, 2024) and maturing on December 31, 2027. The debt has a semi-annual amortization schedule, beginning on June 30, 2024 and voluntary prepayment with a “breakage cost”. On June 30, 2024, the first amortization of this debt was made, according to the contract schedule. The debt balance as of December 31, 2024, amounts to US$483 million, equivalent to ThCh$481,567,745 (US$644 million as of December 31, 2023, equivalent to ThCh$565,191,044). This debt does not have accrued interest as of December 31, 2024, since the payment of interest was made on December 30, 2024. |
F-74
| vi. | On September 30, 2021, Enel Chile S.A. entered into an SDG-Linked revolving committed credit facility from Enel Finance International N.V. for US$200 million. This credit line initially had a variable interest rate of LIBOR 1M, 3M or 6M + 1.15% margin (structured so that the interest rate relates to compliance with a reduction in the ratio of greenhouse effect gas emissions as of December 2023), with monthly, quarterly, or semi-annual interest payments, and maturing on September 30, 2025. During the effective period of the credit facility, Enel Chile S.A. will pay an annual availability fee equal to 30.0% of the margin on the undrawn amount. In June 2023, the Group successfully completed the LIBOR-SOFR transition of 100% of its financial and derivative contracts, in line with market standards. According to this change the current rate would be SOFR + margin (1.15%) + adjustment margin 1M (0.11448%), 3M (0.26161%) and 6M (0.42826%). On April 12, 2024, this line was drawn for an amount of US$200 million at SOFR 1M, being partially repaid for an amount of US$100 million on June 10, 2024, maturing on October 9, 2024, where US$50 million was repaid. The remaining balance of US$50 million was amortized on October 28, 2024. On June 25, 2024, a new drawdown was made for US$100 million at SOFR 1M, maturing on October 28, 2024, the same date on which the drawdown was amortized. As of December 31, 2024, the facility is not available, since it was closed early on December 30, 2024. As of April 22, 2024, the rate increased by 0.05% because the CO2 target planned by the company was not achieved by the end of 2023. |
| vii. | On May 31, 2023, Enel Chile S.A. entered into a committed revolving credit line with Enel Finance International N.V. in US dollars for a total of US$100 million, at a variable interest rate of Term SOFR 1M, 3M, or 6M plus a margin of 1.25%, with monthly, quarterly, or semi-annual interest payment, and draws can be made for periods of 1, 3, or 6 months, renewable until the final maturity on May 31, 2024. During the year 2024, no draws were made from the line. As of December 31, 2024, this line is no longer available, in accordance with the termination date established in the contract. |
| viii. | On March 28, 2024, Enel Chile S.A. entered into a committed revolving credit facility with Enel Finance International N.V. in US dollars for a total of US$700 million, at a variable interest rate of Term SOFR 1M, 3M or 6M plus a margin of 1.45%, with monthly, quarterly or biannual payment of interest, which can be drawn for periods of 1, 3 or 6 months, renewable until final maturity on March 28, 2026. During the period of availability, Enel Chile S.A. shall pay an annual availability fee equivalent to 35% of the margin on the undrawn amount. On April 12, there was a draw on this credit facility for the amount of US$100 million at a rate of SOFR 1M, and it was partially amortized in the amount of US$50 million on May 10, 2024, with the remaining balance of US$50 million amortized on June 10, 2024. On April 30, 2024, there was a new draw in the amount of US$200 million at a rate of SOFR 1M, which was partially amortized in the amount of US$50 million on May 31, 2024, and the remaining balance of US$150 million was renewed until August 23, 2024, where there was a new amortization of US$70 million. The remaining balance of US$80 million was amortized on September 23, 2024. As of December 31, 2024, the line is not available, since it was closed early on November 7, 2024. |
| ix. | On March 28, 2024, Enel Chile S.A. entered into a committed revolving credit facility with Enel Finance International N.V. in US dollars for a total amount of US$50 million, at a variable Term SOFR 1M, 3M or 6M interest rate, plus a 1.00% margin, with monthly, quarterly or biannual interest payment, which can be drawn for periods of 1, 3 or 6 months, renewable until the final maturity on March 28, 2027. During the period of availability, Enel Chile S.A. shall pay an annual availability fee equivalent to 30% of the margin of the undrawn amount. In turn, the contract contemplates an initial upfront fee payment corresponding to 0.5% of the committed amount. On July 5, 2024, this line was drawn in the amount of US$50 million at SOFR 1M, maturing on October 28, 2024, the date on which the facility was repaid. As of December 31, 2024, the facility is 100% available. |
F-75
10.2 Board of directors and key management personnel
Enel Chile is managed by a Board of Directors which consists of seven members. Each director serves for a three-year term after which they can be reelected.
The Board of Directors in office as of December 31, 2024, and comprises the following people:
| • | Mr. Marcelo Castillo Agurto |
| • | Mrs. María Teresa Vial Álamos |
| • | Mr. Pablo Cabrera Gaete |
| • | Mrs. Isabella Alessio |
| • | Mr. Salvatore Bernabei |
| • | Mr. Pablo Cruz Olivos |
At the Ordinary Board Meeting held on April 29, 2024, Mr. Marcelo Castillo Agurto was elected as Chairman of the Board and Mr. Domingo Valdés Prieto as Secretary of the Board. As of November 15, 2024, the Board of Directors appointed Mr. Nicolás Lustig Falcón as the new Secretary of the Board of Directors, effective as of December 17, 2024, replacing Mr. Valdés who had resigned from his position. As of January 31, 2025, Mr. Lustig resigned from the Company and Ms. Josefa Rodríguez Benavente was appointed to replace him as Secretary of the Board of Directors.
The Directors’ Committee was also appointed during the same Board Meeting, which is governed by Law No. 18,046 and the Sarbanes-Oxley Act of 2022. This Committee comprises the Directors Mrs. Maria Teresa Vial Álamos, Mr. Pablo Cabrera Gaete, and Mr. Pablo Cruz Olivos. In accordance with the provisions of Circular No. 1,956 of the Financial Market Commission, we inform that Mr. Pablo Cabrera Gaete and Mr. Pablo Cruz Olivos are independent directors.
On April 29, 2024, the Company's Directors' Committee appointed Ms. Maria Teresa Vial Álamos as Chair of the Directors’ Committee and Mr. Domingo Valdés Prieto as Secretary of the Directors’ Committee. As of December 17, 2024, the Directors' Committee appointed Mr. Nicolás Lustig Falcón as the new Secretary of the Committee. As of January 31, 2025, Mr. Lustig resigned from the Company and Ms. Josefa Rodríguez Benavente was appointed as Secretary of the Directors' Committee.
| a) | Receivables and payable and other transactions |
| - | Receivables and payables |
There are no outstanding balances receivable and payable between the Company and its Directors and Group Management.
| - | Other transactions |
There are no transactions other than remuneration between the Company and its Directors and Group Management.
| b) | Guarantees given by the Company in favor of the directors |
No guarantees have been given to the Directors.
| c) | Compensation for directors |
In accordance with Article 33 of Law No. 18,046 (Chilean Corporations Law), governing stock corporations, the compensation of Directors is established each year at the General Shareholders Meeting of Enel Chile S.A.
F-76
A monthly compensation, one part a fixed monthly fee and another part dependent on the number of meetings attended, shall also be paid to each member of the Board of Directors. This compensation is broken down as follows:
| - | UF 216 as a fixed monthly fee in any event; and |
| - | UF 79.2 as a per diem for each Board meeting attended with a maximum of 16 sessions in total, whether ordinary or extraordinary, within the corresponding exercise. |
According to the provisions of the bylaws, the compensation of the Chairman of the Board will be twice that of a Director.
In the event a Director of Enel Chile S.A. participates in more than one Board of Directors of domestic or foreign subsidiaries and/or affiliates, or acts as director or consultant for other domestic or foreign companies or legal entities in which Enel Chile S.A. has direct or indirect interest, he/she may receive remuneration only in one of said Board of Directors or Management Boards.
The executive officers of Enel Chile S.A. and/or its domestic or foreign subsidiaries or affiliates will not receive remunerations or per diem allowances if acting as directors of any of Enel Chile S.A.’s domestic or foreign subsidiaries, affiliates or investee in any way. However, said remunerations or per diem allowances may be received by the executive officers as long as they are previously and expressly authorized as advances of their variable portion of remuneration by the corresponding companies with which they are associated through an employment contract.
Directors’ Committee:
Each member will be paid monthly compensation, one part a fixed monthly fee and another part dependent on the number of meetings attended.
This compensation is broken down as follows:
| - | UF 72 as a fixed monthly fee in any event, and |
| - | UF 26.4 as a per diem for each Committee meeting attended, all with a maximum of 16 meetings in total, whether ordinary or extraordinary, within the corresponding year. |
F-77
The following tables show details of the compensation paid to the members of the Board of Directors of the Company for the years ended December 31, 2024, 2023 and 2022:
|
|
|
|
|
|
|
|
December 31, 2024 |
||||
Taxpayer ID No. |
|
Name |
|
Position |
|
Period in position |
|
Enel Chile Board |
|
Board of subsidiaries |
|
Directors' Committee |
|
|
|
|
|
|
|
|
ThCh$ |
|
ThCh$ |
|
ThCh$ |
4.975.992-4 |
|
Herman Chadwick Piñera |
|
Chairman |
|
January - April 2024 |
|
80,905 |
|
- |
|
- |
4.461.192-9 |
|
Fernán Gazmuri Plaza |
|
Director |
|
January - April 2024 |
|
40,452 |
|
- |
|
13,484 |
5.545.086-2 |
|
Luis Gonzalo Palacios Vasquez |
|
Director |
|
January - April 2024 |
|
40,452 |
|
- |
|
13,484 |
4.774.797-K |
|
Pablo Cabrera Gaete |
|
Director |
|
January - December 2024 |
|
136,004 |
|
- |
|
44,332 |
12.627.794-6 |
|
Maria Teresa Vial Alamos |
|
Director |
|
April - December 2024 |
|
95,820 |
|
|
|
30,937 |
10.434.628-6 |
|
Pablo Cruz Olivos |
|
Director |
|
April - December 2024 |
|
95,820 |
|
|
|
30,937 |
9.973.492-2 |
|
Marcelo Castillo Agurto (1) |
|
Chairman |
|
April - December 2024 |
|
- |
|
- |
|
- |
Foreign |
|
Monica Girardi (2) |
|
Director |
|
January - September 2024 |
|
- |
|
- |
|
- |
Foreign |
|
Isabella Alessio |
|
Director |
|
January - December 2024 |
|
- |
|
- |
|
- |
Foreign |
|
Salvatore Bernabei |
|
Director |
|
January - December 2024 |
|
- |
|
- |
|
- |
|
|
|
|
|
|
TOTAL |
|
489,453 |
|
- |
|
133,174 |
|
|
|
|
|
|
|
|
December 31, 2023 |
||||
Taxpayer ID No. |
|
Name |
|
Position |
|
Period in position |
|
Enel Chile Board |
|
Board of subsidiaries |
|
Directors' Committee |
|
|
|
|
|
|
|
|
ThCh$ |
|
ThCh$ |
|
ThCh$ |
4.975.992-4 |
|
Herman Chadwick Piñera |
|
Chairman |
|
January - December 2023 |
|
260,904 |
|
- |
|
- |
4.461.192-9 |
|
Fernán Gazmuri Plaza |
|
Director |
|
January - December 2023 |
|
130,452 |
|
- |
|
42,531 |
4.774.797-K |
|
Pablo Cabrera Gaete |
|
Director |
|
January - December 2023 |
|
130,452 |
|
- |
|
42,531 |
5.545.086-2 |
|
Luis Gonzalo Palacios Vasquez |
|
Director |
|
January - December 2023 |
|
130,452 |
|
- |
|
42,531 |
Foreign |
|
Monica Girardi |
|
Director |
|
January - December 2023 |
|
- |
|
- |
|
- |
Foreign |
|
Isabella Alessio |
|
Director |
|
January - December 2023 |
|
- |
|
- |
|
- |
Foreign |
|
Salvatore Bernabei |
|
Director |
|
January - December 2023 |
|
- |
|
- |
|
- |
|
|
|
|
|
|
TOTAL |
|
652,260 |
|
- |
|
127,593 |
|
|
|
|
|
|
|
|
December 31, 2022 |
||||
Taxpayer ID No. |
|
Name |
|
Position |
|
Period in position |
|
Enel Chile Board |
|
Board of subsidiaries |
|
Directors' Committee |
|
|
|
|
|
|
|
|
ThCh$ |
|
ThCh$ |
|
ThCh$ |
4.975.992-4 |
|
Herman Chadwick Piñera |
|
Chairman |
|
January - December 2022 |
|
250,419 |
|
- |
|
- |
4.461.192-9 |
|
Fernán Gazmuri Plaza |
|
Director |
|
January - December 2022 |
|
125,209 |
|
- |
|
41,688 |
4.774.797-K |
|
Pablo Cabrera Gaete |
|
Director |
|
January - December 2022 |
|
125,209 |
|
- |
|
41,688 |
5.545.086-2 |
|
Luis Gonzalo Palacios Vasquez |
|
Director |
|
January - December 2022 |
|
125,209 |
|
- |
|
41,688 |
Foreign |
|
Monica Girardi |
|
Director |
|
January - December 2022 |
|
- |
|
- |
|
- |
Foreign |
|
Isabella Alessio |
|
Director |
|
January - December 2022 |
|
- |
|
- |
|
- |
Foreign |
|
Salvatore Bernabei |
|
Director |
|
January - December 2022 |
|
- |
|
- |
|
- |
|
|
|
|
|
|
TOTAL |
|
626,046 |
|
- |
|
125,064 |
| (1) | Mr. Marcelo Castillo Agurto was elected as Chairman of the Board of Directors of the Company at the Ordinary Board Meeting held on April 29, 2024, a position previously held by Mr. Herman Chadwick Piñera. |
| (2) | On September 27, 2024, Mrs. Mónica Girardi submitted her resignation from the Company's Board of Directors. |
F-78
10.3 Key management personnel
Enel Chile’s key management personnel as of December 31, 2024, is comprised of the following people:
Key Management Personnel | ||||
Taxpayer ID No. |
|
Name |
|
Position |
Foreign |
|
Fabrizio Barderi (1) |
|
Chief Executive Officer |
Foreign |
|
Giuseppe Turchiarelli (1) |
|
Chief Executive Officer |
Foreign |
|
Simone Conticelli (1) |
|
Administration Finance and Control Officer |
Foreign |
|
Giuseppe Turchiarelli (1) |
|
Interim Administration Finance and Control Officer |
13.903.626-3 |
|
Liliana Schnaidt Hagedorn (2) |
|
Human Resources and Organization Manager |
Foreign |
|
Gaetano Manzulli (2) |
|
Human Resources and Organization Manager |
6.973.465-0 |
|
Domingo Valdés Prieto (3) |
|
General Counsel and Secretary to the Board |
8.664.305-7 |
|
Nicolás Lustig Falcón (3) |
|
General Counsel and Secretary to the Board |
16.261.687-0 |
|
Juan Francisco Díaz Valenzuela |
|
Internal Audit Manager |
27.965.892-2 |
|
Montserrat Palomar Quilez (4) |
|
Sustainability and Relationship Manager |
11.625.161-2 |
|
Pedro Urzúa Frei (4) |
|
External Relations & Sustainability Officer |
| (1) | On January 25, 2024, Mr. Fabrizio Barderi submitted his resignation as Chief Executive Officer of the Company and remained in his role until February 29, 2024. Effective March 1, 2024, Mr. Giuseppe Turchiarelli assumed the position of Interim Chief Executive Officer, maintaining this appointment until May 1, 2024, when he took on the role of Chief Executive Officer of the Company on a permanent basis. Mr. Turchiarelli continued to serve as Interim Chief Financial Officer until September 30, 2024. Effective October 1, 2024, Mr. Simone Conticelli assumed the position of Chief Financial Officer. |
| (2) | On December 31, 2024, Ms. Liliana Schnaidt Hagedorn ceased to be Human Resources Officer of the Company, in her place Mr. Gaetano Manzulli was appointed, who assumed his position on January 1, 2025. |
| (3) | On December 16, 2024, Mr. Domingo Valdés Prieto ceased to be General Counsel of the Company, in his replacement Mr. Nicolás Lustig Falcón was appointed, who assumed his position on December 17, 2024. On January 31, 2025, Mr. Lustig resigned from the Company. |
| (4) | On March 31, 2024, Ms. Montserrat Palomar Quilez ceased to be a Sustainability and Relationship Manager of the Company. Effective April 1, 2024, Mr. Pedro Urzúa Frei assumed the position of External Relations & Sustainability Officer. |
10.4 Compensation and incentive plans for key management personnel
Enel Chile has implemented an annual bonus plan for its executives based on meeting company-wide objectives and on the level of their individual contribution in achieving the overall goals of the Group. The plan provides for a range of cash bonus amounts according to seniority level. The bonuses paid to the executives consist of a certain number of monthly gross remunerations.
For expatriate executives, compensation, annual bonus plans, and long-term incentives are subject to recharge agreements, so this cost has been borne by Enel Chile.
Compensation received by key management personnel are as follows:
|
|
December 31, 2024 |
|
December 31, 2023 |
|
December 31, 2022 |
|
|
ThCh$ |
|
ThCh$ |
|
ThCh$ |
Remuneration |
|
1,876,455 |
|
2,455,831 |
|
2,241,508 |
Short-term benefits for employees |
|
371,839 |
|
345,548 |
|
261,306 |
Other long-term benefits |
|
409,206 |
|
394,570 |
|
143,969 |
Total |
|
2,657,500 |
|
3,195,949 |
|
2,646,783 |
| a) | Guarantees established by the Company in favor of key management personnel |
No guarantees have been given to key management personnel.
F-79
10.5 Compensation plans linked to share price
There are no payment plans granted to the Directors or key Management personnel based on the share price of the Enel Chile common stock.
10.6 Restricted stock unit program
In 2022, under an established restricted stock unit (“RSU”) program that was implemented for that year only, certain key personnel of Enel Chile received a one-time issuance of Enel S.p.A. shares for the corresponding RSU award. These shares were not issued on a discretionary basis, but were automatically issued upon vesting of the RSUs on a pre-established date once certain performance-based vesting conditions were met. The cost of the RSU program is subject to an outstanding recharge agreement; accordingly, such cost has been borne by Enel Chile. This agreement establishes that all fixed and variable remuneration of certain expatriate executives (whether in cash or in kind) is paid by the company to which the expatriate executive provides services. The cost of the program amounted to ThCh$27,395, which is included in the item Payroll expenses for 2022.
F-80
11. INVENTORIES
The detail of inventories as of December 31, 2024 and 2023 is as follows:
|
|
As of December 31, |
||
|
|
2024 |
|
2023 |
|
|
ThCh$ |
|
ThCh$ |
Supplies for Production |
|
11,858,656 |
|
13,856,303 |
Gas |
|
1,852,864 |
|
1,852,864 |
Oil |
|
10,005,792 |
|
12,003,439 |
Supplies for projects and spare parts |
|
41,515,714 |
|
37,093,505 |
Electrical materials |
|
11,794,203 |
|
7,812,071 |
Total |
|
65,168,573 |
|
58,761,879 |
There are no Inventories pledged as debt compliance guarantees.
For the years ended December 31, 2024, 2023 and 2022, raw materials and supplies recognized as fuel cost amount to ThCh$334,665,363, ThCh$536,292,557 and ThCh$587,063,837, respectively. See Note 29.
12. CURRENT TAX ASSETS AND LIABILITIES
| a) | The composition of current tax receivables as of December 31, 2024 and 2023 is as follows: |
|
|
As of December 31, |
||
|
|
2024 |
|
2023 |
Tax Receivables |
|
ThCh$ |
|
ThCh$ |
Advance income tax payments |
|
12,401,976 |
|
13,518,958 |
Credit for adsorbed tax profits |
|
67,222,361 |
|
67,222,361 |
Tax credit for training expenses |
|
596,162 |
|
374,138 |
Total |
|
80,220,499 |
|
81,115,457 |
| b) | The detail of current tax payables as of as of December 31, 2024 and 2023 is as follows: |
|
|
As of December 31, |
||
|
|
2024 |
|
2023 |
Current tax liabilities |
|
ThCh$ |
|
ThCh$ |
Income tax |
|
189,070,151 |
|
160,107,212 |
Total |
|
189,070,151 |
|
160,107,212 |
F-81
13. INVESTMENTS ACCOUNTED FOR USING THE EQUITY METHOD
13.1. Investments accounted for using the equity method
The detail of the Group’s investees accounted for using the equity method and the movements for the years ended December 31, 2024 and 2023:
|
|
|
|
|
|
|
|
|
|
|
|
|
|
|
|
Share of |
|
|
|
Foreign |
|
Other |
|
Other |
|
Balance as |
|
|
|
Balance as |
|
|
|
|
|
|
|
|
|
|
|
|
Balance as of |
|
|
|
Profit |
|
Dividends |
|
Currency |
|
Comprehensive |
|
Increase |
|
of |
|
Negative |
|
of |
Taxpayer ID |
|
|
|
|
|
|
|
|
|
Ownership |
|
1-1-2024 |
|
Additions |
|
(Loss) |
|
Declared |
|
Translation |
|
Income |
|
(Decrease) |
|
12-31-2024 |
|
Equity |
|
12-31-2024 |
Number |
|
Associates and Joint Ventures |
|
Relationship |
|
Country |
|
Currency |
|
Percentage |
|
ThCh$ |
|
ThCh$ |
|
ThCh$ |
|
ThCh$ |
|
ThCh$ |
|
ThCh$ |
|
ThCh$ |
|
ThCh$ |
|
Provision |
|
ThCh$ |
76.418.940-K |
|
GNL Chile S.A. |
|
Associate |
|
Chile |
|
U.S. dollar |
|
33.33% |
|
19,668,637 |
|
— |
|
9,176,565 |
|
— |
|
3,224,455 |
|
— |
|
— |
|
32,069,657 |
|
— |
|
32,069,657 |
76.014.570-K |
|
Enel Argentina S.A. |
|
Associate |
|
Argentina |
|
Argentine Peso |
|
0.0793% |
|
283,362 |
|
— |
|
(40,782) |
|
— |
|
(30,912) |
|
— |
|
309,145 |
|
520,813 |
|
— |
|
520,813 |
76.364.085-K |
|
Energías Marina SpA |
|
Associate |
|
Chile |
|
Chilean Peso |
|
25.00% |
|
58,859 |
|
— |
|
54,434 |
|
— |
|
— |
|
— |
|
— |
|
113,293 |
|
— |
|
113,293 |
77.374.847-0 |
|
HIF H2 SpA (1) |
|
Joint venture |
|
Chile |
|
U.S. dollar |
|
50.00% |
|
— |
|
— |
|
(329,838) |
|
— |
|
(19,506) |
|
— |
|
— |
|
(349,344) |
|
349,344 |
|
— |
77.569.067-4 |
|
Enel X Way Chile S.p.A. (2) |
|
Associate |
|
Chile |
|
Chilean Peso |
|
49.00% |
|
5,342,927 |
|
— |
|
(446,704) |
|
— |
|
— |
|
— |
|
(4,896,223) |
|
— |
|
— |
|
— |
|
|
|
|
|
|
|
|
|
|
TOTAL |
|
25,353,785 |
|
— |
|
8,413,675 |
|
— |
|
3,174,037 |
|
— |
|
(4,587,078) |
|
32,354,419 |
|
349,344 |
|
32,703,763 |
|
|
|
|
|
|
|
|
|
|
|
|
|
|
|
|
Share of |
|
|
|
Foreign |
|
Other |
|
Other |
|
Balance as |
|
|
|
Balance as |
|
|
|
|
|
|
|
|
|
|
|
|
Balance as of |
|
|
|
Profit |
|
Dividends |
|
Currency |
|
Comprehensive |
|
Increase |
|
of |
|
Negative |
|
of |
Taxpayer ID |
|
|
|
|
|
|
|
|
|
Ownership |
|
1-1-2023 |
|
Additions |
|
(Loss) |
|
Declared |
|
Translation |
|
Income |
|
(Decrease) |
|
12-31-2023 |
|
Equity |
|
12-31-2023 |
Number |
|
Associates and Joint Ventures |
|
Relationship |
|
Country |
|
Currency |
|
Percentage |
|
ThCh$ |
|
ThCh$ |
|
ThCh$ |
|
ThCh$ |
|
ThCh$ |
|
ThCh$ |
|
ThCh$ |
|
ThCh$ |
|
Provision |
|
ThCh$ |
76.418.940-K |
|
GNL Chile S.A. |
|
Associate |
|
Chile |
|
U.S. dollar |
|
33.33% |
|
12,404,147 |
|
— |
|
6,688,098 |
|
— |
|
576,392 |
|
— |
|
— |
|
19,668,637 |
|
— |
|
19,668,637 |
76.014.570-K |
|
Enel Argentina S.A. |
|
Associate |
|
Argentina |
|
Argentine Peso |
|
0.0793% |
|
388,328 |
|
— |
|
60,300 |
|
(68,676) |
|
(252,284) |
|
— |
|
155,694 |
|
283,362 |
|
— |
|
283,362 |
76.364.085-K |
|
Energías Marina SpA |
|
Associate |
|
Chile |
|
Chilean Peso |
|
25.00% |
|
— |
|
98,222 |
|
61,702 |
|
— |
|
(1,428) |
|
— |
|
(99,637) |
|
58,859 |
|
— |
|
58,859 |
77.374.847-0 |
|
HIF H2 SpA (1) |
|
Joint venture |
|
Chile |
|
U.S. dollar |
|
50.00% |
|
— |
|
— |
|
(7,142) |
|
— |
|
(412) |
|
— |
|
— |
|
(7,554) |
|
7,554 |
|
— |
77.569.067-4 |
|
Enel X Way Chile S.p.A. |
|
Associate |
|
Chile |
|
Chilean Peso |
|
49.00% |
|
4,960,303 |
|
1,470,000 |
|
(1,100,870) |
|
— |
|
— |
|
13,494 |
|
— |
|
5,342,927 |
|
— |
|
5,342,927 |
|
|
|
|
|
|
|
|
|
|
TOTAL |
|
17,752,778 |
|
1,568,222 |
|
5,702,088 |
|
(68,676) |
|
322,268 |
|
13,494 |
|
56,057 |
|
25,346,231 |
|
7,554 |
|
25,353,785 |
F-82
13.2. Additional financial information on investments in associates
Financial information as of December 31, 2024 and 2023 of the main companies in which the Group exercises significant influence is as follows:
|
|
As of December 31, 2024 |
||||||||||||||||
|
|
Direct / Indirect |
|
Current Assets |
|
Non-current Assets |
|
Current Liabilities |
|
Non-current Liabilities |
|
Revenues |
|
Profit (Loss) |
|
Other Comprehensive Income |
|
Comprehensive Income |
Investments with Significant Influence |
|
Ownership % |
|
ThCh$ |
|
ThCh$ |
|
ThCh$ |
|
ThCh$ |
|
ThCh$ |
|
ThCh$ |
|
ThCh$ |
|
ThCh$ |
GNL Chile S.A. |
|
33.33% |
|
174,668,445 |
|
1,851,304,512 |
|
298,739,430 |
|
1,631,024,554 |
|
1,045,888,202 |
|
27,529,696 |
|
9,673,371 |
|
37,203,067 |
|
|
As of December 31, 2023 |
||||||||||||||||
|
|
Direct / Indirect |
|
Current Assets |
|
Non-current |
|
Current Liabilities |
|
Non-current |
|
Revenues |
|
Profit (Loss) |
|
Other |
|
Comprehensive |
Investments with Significant Influence |
|
Ownership % |
|
ThCh$ |
|
ThCh$ |
|
ThCh$ |
|
ThCh$ |
|
ThCh$ |
|
ThCh$ |
|
ThCh$ |
|
ThCh$ |
GNL Chile S.A. |
|
33.33% |
|
144,820,356 |
|
1,776,749,121 |
|
251,678,137 |
|
1,610,885,427 |
|
1,042,145,056 |
|
20,064,295 |
|
1,729,184 |
|
21,793,479 |
Enel X Way Chile S.p.A. |
|
49.00% |
|
14,966,228 |
|
3,393,337 |
|
7,094,389 |
|
361,244 |
|
9,082,236 |
|
(2,246,673) |
|
27,539 |
|
(2,219,134) |
None of the Company’s associates have issued price quotations.
F-83
13.3. Joint ventures
The detail of the Group’s statements of financial position and statements of income of joint ventures as of December 31, 2024 and 2023, are as follows:
| a) | HIF H2 SpA.: |
|
|
HIF H2 SpA |
||
Ownership % |
|
50.0% |
|
50.0% |
|
|
12-31-2024 |
|
12-31-2023 |
|
|
ThCh$ |
|
ThCh$ |
Total current assets |
|
1,989 |
|
2,620 |
Total non-current assets |
|
995 |
|
— |
Total current liabilities |
|
726,998 |
|
27,945 |
Cash and cash equivalents |
|
1,989 |
|
2,620 |
|
|
|
|
|
Other fixed operating expenses |
|
(659,674) |
|
(14,278) |
Profit (Loss) |
|
(659,674) |
|
(14,278) |
Comprehensive income (Loss) |
|
(659,674) |
|
(14,278) |
| b) | Sociedad de Inversiones K Cuatro SpA: |
|
|
Sociedad de Inversiones |
|
|
K Cuatro SpA |
Ownership % |
|
50.0% |
|
|
12-06-2022 |
|
|
ThCh$ |
Total current assets |
|
237,410 |
Total non-current assets |
|
59,474,494 |
Total current liabilities |
|
1,927 |
Total non-current liabilities |
|
886,326 |
Cash and cash equivalents |
|
1,557 |
|
|
|
Other fixed operating expenses |
|
(600,822) |
Finance costs |
|
(129) |
Foreign currency translation gains (losses) |
|
58,279 |
Income per adjustment units |
|
3,497 |
Profit (loss) |
|
(539,175) |
Comprehensive income (Loss) |
|
(539,175) |
On October 28, 2021, Enel X Chile purchased a 10% interest in Sociedad de Inversiones K Cuatro SpA for ThCh$31,632. Before February 28, 2022, this interest was conditioned upon the long-term financial asset, because the Group did not have significant influence over the company. Then, on February 28, 2022, Enel X Chile increased its interest in Sociedad de Inversiones K Cuatro SpA to 50%, through the acquisition of 400 shares for a total of ThCh$259,393, thus meeting the conditions to be classified as a joint venture (see Note 2.6).
Sociedad de Inversiones K Cuatro SpA was awarded the public bid for the complementary bus supply service for the Public Transportation System of the Province of Santiago and the communities of San Bernardo and Puente Alto. Accordingly, it formed a special purpose vehicle known as Suministradora de Buses K Cuatro SpA. (hereinafter, the “Supplier”).
As a result of the aforementioned bid, the Supplier acquired 991 buses for subsequent leasing to Public Transport System operators. The approximate cost of this acquisition amounted to US$364 million plus VAT. The bidding terms established certain minimum capital obligations for the Supplier, and on May 13, 2022, the Supplier made a capital increase of US$63.5 million (ThCh$58,769,207), of which, pro rata to its new shareholding, Enel X Chile contributed US$31.5 million (ThCh$29,384,103) through Sociedad de Inversiones K Cuatro SpA.
F-84
On December 6, 2022, our subsidiary Enel X Chile completed the sale of its entire ownership interests in Sociedad de Inversiones K Cuatro SpA and Suministradora de Buses K Cuatro SpA.
On June 30, 2023, Enel X Chile received a payment of ThCh$14,821,848, representing 50% of the total sales amount. As of December 22, 2023, Enel X Chile received a payment of ThCh$14,840,706 for the remaining 50% of the total sales amount.
There are no significant commitments and contingencies, or restrictions to the availability of funds in associated companies and joint ventures.
F-85
14. INTANGIBLE ASSETS OTHER THAN GOODWILL
The balances of this caption as of December 31, 2024 and 2023, are presented below:
|
|
As of December 31, |
||
|
|
2024 |
|
2023 |
Classes of Intangible Assets, Gross |
|
ThCh$ |
|
ThCh$ |
Intangible Assets, Gross |
|
476,503,121 |
|
356,981,391 |
Development Costs |
|
10,558,392 |
|
— |
Easements and water rights |
|
18,572,355 |
|
13,474,625 |
Concessions |
|
83,104,814 |
|
72,236,123 |
Patents, registered trademarks and other rights |
|
2,163,872 |
|
1,694,467 |
Software licenses |
|
200,219,401 |
|
160,513,233 |
Intangible assets in development |
|
149,465,477 |
|
99,173,455 |
Other Identifiable Intangible Assets |
|
11,045,005 |
|
9,594,568 |
Contract costs |
|
1,373,805 |
|
294,920 |
|
|
As of December 31, |
||
|
|
2024 |
|
2023 |
Classes of Intangible Assets, Amortization and Impairment |
|
ThCh$ |
|
ThCh$ |
Accumulated Amortization and Impairment, Total |
|
(183,154,665) |
|
(161,971,891) |
Development Costs |
|
(904,018) |
|
— |
Easements and water rights |
|
(5,767,381) |
|
(5,149,420) |
Concessions |
|
(22,991,263) |
|
(18,032,743) |
Patents, registered trademarks and other rights |
|
(1,209,557) |
|
(1,033,510) |
Software licenses |
|
(148,889,288) |
|
(134,853,986) |
Other Identifiable Intangible Assets |
|
(2,868,156) |
|
(2,840,144) |
Contract costs |
|
(525,002) |
|
(62,088) |
|
|
As of December 31, |
||
|
|
2024 |
|
2023 |
Classes of Intangible Assets, Net |
|
ThCh$ |
|
ThCh$ |
Intangibles Assets, Net |
|
293,348,456 |
|
195,009,500 |
Development Costs |
|
9,654,374 |
|
— |
Easements and water rights |
|
12,804,974 |
|
8,325,205 |
Concessions |
|
60,113,551 |
|
54,203,380 |
Patents, registered trademarks and other rights |
|
954,315 |
|
660,957 |
Software licenses |
|
51,330,113 |
|
25,659,247 |
Intangible assets in development |
|
149,465,477 |
|
99,173,455 |
Other Identifiable Intangible Assets |
|
8,176,849 |
|
6,754,424 |
Contract costs |
|
848,803 |
|
232,832 |
F-86
As of December 31, 2024 and 2023 the detail and movements of intangible assets other than goodwill were as follows:
|
|
Development Costs |
|
Easements and water rights |
|
Concessions |
|
Patents, Registered Trademarks and Other Rights |
|
Computer |
|
Intangible assets in development |
|
Other Identifiable Intangible Assets |
|
Contract Costs |
|
Intangible Assets, |
Movements in Intangible Assets |
|
|
|
ThCh$ |
|
ThCh$ |
|
ThCh$ |
|
ThCh$ |
|
|
|
ThCh$ |
|
ThCh$ |
|
ThCh$ |
Opening balance as of January 1, 2024 |
|
— |
|
8,325,205 |
|
54,203,380 |
|
660,957 |
|
25,659,247 |
|
99,173,455 |
|
6,754,424 |
|
232,832 |
|
195,009,500 |
Movements in identifiable intangible assets |
|
|
|
|
|
|
|
|
|
|
|
|
|
|
|
|
|
|
Increases other than from business combinations |
|
— |
|
— |
|
95,451 |
|
— |
|
7,757,880 |
|
90,135,979 |
|
— |
|
— |
|
97,989,310 |
Increase (decrease) from foreign currency translation differences |
|
493,000 |
|
788,424 |
|
7,382,449 |
|
— |
|
23,764 |
|
6,009,595 |
|
1,188,164 |
|
— |
|
15,885,396 |
Amortization (1) |
|
(857,854) |
|
— |
|
(2,329,631) |
|
(176,047) |
|
(18,369,647) |
|
— |
|
(16,340) |
|
(462,914) |
|
(22,212,433) |
Increases (decreases) from transfers and other Movements |
|
— |
|
— |
|
— |
|
711,405 |
|
36,263,275 |
|
(38,053,565) |
|
— |
|
1,078,885 |
|
— |
Increases (decreases) from transfers |
|
|
|
— |
|
— |
|
711,405 |
|
36,263,275 |
|
(38,053,565) |
|
— |
|
1,078,885 |
|
— |
Argentina Hyperinflation Effect |
|
— |
|
— |
|
— |
|
— |
|
— |
|
— |
|
6,899 |
|
— |
|
6,899 |
Increase (decrease) |
|
10,019,228 |
|
3,691,345 |
|
761,902 |
|
(242,000) |
|
(4,406) |
|
(7,799,987) |
|
243,702 |
|
— |
|
6,669,784 |
Total Movements in identifiable intangible assets |
|
9,654,374 |
|
4,479,769 |
|
5,910,171 |
|
293,358 |
|
25,670,866 |
|
50,292,022 |
|
1,422,425 |
|
615,971 |
|
98,338,956 |
Closing balance as of December 31, 2024 |
|
9,654,374 |
|
12,804,974 |
|
60,113,551 |
|
954,315 |
|
51,330,113 |
|
149,465,477 |
|
8,176,849 |
|
848,803 |
|
293,348,456 |
|
|
Development Costs |
|
Easements and water rights |
|
Concessions |
|
|
|
Computer |
|
Intangible assets in development |
|
Other Identifiable Intangible Assets |
|
Contract Costs |
|
Intangible Assets, |
Movements in Intangible Assets |
|
|
|
ThCh$ |
|
ThCh$ |
|
ThCh$ |
|
ThCh$ |
|
|
|
ThCh$ |
|
ThCh$ |
|
ThCh$ |
Opening balance as of January 1, 2023 |
|
— |
|
8,186,463 |
|
62,011,030 |
|
890,094 |
|
36,629,420 |
|
77,287,560 |
|
6,436,696 |
|
— |
|
191,441,263 |
Movements in identifiable intangible assets |
|
— |
|
|
|
|
|
|
|
|
|
|
|
|
|
|
|
|
Increases other than from business combinations |
|
— |
|
— |
|
— |
|
— |
|
— |
|
20,085,632 |
|
— |
|
— |
|
20,085,632 |
Increase (decrease) from foreign currency translation differences |
|
— |
|
138,742 |
|
1,174,512 |
|
— |
|
4,729 |
|
475,048 |
|
336,562 |
|
— |
|
2,129,593 |
Amortization (1) |
|
— |
|
— |
|
(2,175,117) |
|
(268,898) |
|
(16,097,225) |
|
— |
|
(23,529) |
|
(62,088) |
|
(18,626,857) |
Increases (decreases) from transfers and other Movements |
|
— |
|
— |
|
— |
|
39,761 |
|
5,121,836 |
|
(5,456,517) |
|
— |
|
294,920 |
|
— |
Increases (decreases) from transfers |
|
— |
|
— |
|
— |
|
39,761 |
|
5,121,836 |
|
(5,456,517) |
|
— |
|
294,920 |
|
— |
Dispositions and removal from service |
|
— |
|
— |
|
(1,437) |
|
— |
|
(2,360) |
|
(160,104) |
|
— |
|
— |
|
(163,901) |
Dispositions |
|
— |
|
— |
|
— |
|
— |
|
— |
|
(145,532) |
|
— |
|
— |
|
(145,532) |
Removal |
|
— |
|
— |
|
(1,437) |
|
— |
|
(2,360) |
|
(14,572) |
|
— |
|
— |
|
(18,369) |
Argentina Hyperinflation Effect |
|
— |
|
— |
|
— |
|
— |
|
— |
|
|
|
6,397 |
|
— |
|
6,397 |
Increase (decrease) |
|
— |
|
— |
|
(6,805,608) |
|
— |
|
2,847 |
|
6,941,836 |
|
(1,702) |
|
— |
|
137,373 |
Total Movements in identifiable intangible assets |
|
— |
|
138,742 |
|
(7,807,650) |
|
(229,137) |
|
(10,970,173) |
|
21,885,895 |
|
317,728 |
|
232,832 |
|
3,568,237 |
Closing balance as of December 31, 2023 |
|
— |
|
8,325,205 |
|
54,203,380 |
|
660,957 |
|
25,659,247 |
|
99,173,455 |
|
6,754,424 |
|
232,832 |
|
195,009,500 |
| (3) | See Note 31.a). |
As of December 31, 2024, the additions to intangible assets under development come mainly from Enel Green Power Chile for ThCh$81,447,827, corresponding to the internal development of Renewable Projects (Greenfield projects).
No impairment losses have been recognized as of December 31, 2024 and 2023. According to the estimates and projections of the Group’s Management, the cash flows projections attributable to intangible assets allow recovering the net value of these assets recorded as of December 31, 2024 (see Note 3 e).
F-87
15. GOODWILL
The following table sets forth goodwill by cash-generating unit or group of cash-generating units and changes as of December 31, 2024 and 2023:
Company |
|
Cash Generating Unit |
|
Opening Balance |
|
Foreign Currency Translation |
|
Closing Balance |
|
Foreign Currency Translation |
|
Closing Balance 12-31-2024 |
|
|
|
|
ThCh$ |
|
ThCh$ |
|
ThCh$ |
|
ThCh$ |
|
ThCh$ |
Enel Colina S.A. |
|
Enel Colina S.A. |
|
2,240,478 |
|
— |
|
2,240,478 |
|
— |
|
2,240,478 |
Enel Distribución Chile S.A. |
|
Enel Distribución Chile |
|
90,462,357 |
|
— |
|
90,462,357 |
|
— |
|
90,462,357 |
Enel Generación Chile S.A. |
|
Generación Chile |
|
756,642,815 |
|
— |
|
756,642,815 |
|
— |
|
756,642,815 |
Enel Green Power Chile S.A. |
|
Enel Green Power Chile |
|
24,845,615 |
|
617,178 |
|
25,462,793 |
|
3,464,440 |
|
28,927,233 |
Geotérmica del Norte |
|
Enel Green Power Chile |
|
93,290 |
|
2,317 |
|
95,607 |
|
13,008 |
|
108,615 |
Parque Eólico Talinay Oriente |
|
Enel Green Power Chile |
|
9,328,874 |
|
231,734 |
|
9,560,608 |
|
1,300,806 |
|
10,861,414 |
Total |
|
|
|
883,613,429 |
|
851,229 |
|
884,464,658 |
|
4,778,254 |
|
889,242,912 |
According to the Group Management’s estimates and projections, the expected future cash flows projections attributable to the cash-generating units or groups of cash-generating units, to which the acquired goodwill has been allocated, allow the recovery of its carrying amount as of December 31, 2024 and 2023 (see Note 3 e).
The origin of the goodwill is detailed below:
| 1. | Enel Colina S.A. |
On December 31, 1996, Enel Distribución Chile S.A acquired 100% of Empresa Eléctrica de Colina Ltda. (currently Enel Colina S.A.) from Inversiones Saint Thomas S.A., a company that is neither directly or indirectly related to Enel Distribución Chile S.A.
| 2. | Enel Distribución Chile S.A. |
On November 2000, Enersis S.A. (currently Enel Américas S.A.) acquired through a public tender offer, an additional ownership interest of 25.4% in Enel Distribución Chile S.A., reaching 99.09% ownership.
| 3. | Enel Generación Chile S.A. |
On May 11, 1999, Enersis S.A. (currently Enel Américas S.A.) acquired an additional 35% ownership interest in Empresa Nacional de Electricidad S.A. (currently Enel Generación Chile S.A.) achieving 60% ownership of the generation company, through a public tender offer in the Santiago Stock Exchange and the purchase of shares in the United States (30% and 5%, respectively).
On October 1, 2019, GasAtacama Chile S.A. merged with Enel Generación Chile S.A., with the latter being the legal surviving company. The resulting goodwill was directly recognized in Enel Generación Chile S.A.:
3.1 GasAtacama Chile S.A. (formerly Inversiones GasAtacama Holding Limitada)
On April 22, 2014, Empresa Nacional de Electricidad S.A. (currently Enel Generación Chile S.A.) acquired 50% ownership interest in GasAtacama Chile S.A. (formerly Inversiones GasAtacama Holding Limitada), previously held by Southern Cross Latin América Private Equity Fund III L.P.
3.2.GasAtacama Chile S.A. (formerly Empresa Eléctrica Pangue S.A.)
On July 12, 2002, Empresa Nacional de Electricidad S.A. (currently Enel Generación Chile S.A.) acquired 2.51% of the shares of Empresa Eléctrica Pangue S.A., upon exercise of the sale option by the minority shareholder International Finance Corporation (IFC).
On May 2, 2012, Empresa Eléctrica Pangue S.A. merged with Compañía Eléctrica San Isidro S.A., with the latter being the legal surviving company.
F-88
3.3. GasAtacama Chile S.A. (formerly Compañía Eléctrica San Isidro S.A.)
On August 11, 2005, Empresa Nacional de Electricidad S.A. (currently Enel Generación Chile S.A.) acquired an ownership interest in Inversiones Lo Venecia Ltda., whose sole asset was a 25% interest in San Isidro S.A.
On September 1, 2013, Compañía Eléctrica San Isidro S.A. merged with Endesa Eco S.A., with the latter being the legal surviving company.
On November 1, 2013, Endesa Eco S.A. merged with Compañía Eléctrica Tarapacá S.A., with the latter being the legal surviving company.
On November 1, 2016, Compañía Eléctrica Tarapacá S.A. merged with GasAtacama Chile S.A., with the latter being the legal surviving company.
| 4. | Enel Green Power Chile S.A. |
On March 26, 2013, Enel Green Power Chile S.A. acquired ownership interest in Parque Eólico Talinay Oriente S.A.
In addition, on August 6, 2001, Enel Green Power Chile S.A. acquired interests on the companies Empresa Eléctrica Panguipulli S.A. and Empresa Eléctrica Puyehue S.A., where subsequently Puyehue merged into Panguipulli and the latter became the legal surviving company. On July 1, 2020, Empresa Eléctrica Panguipulli S.A. was absorbed by Parque Eólico Taltal SpA and the latter became the legal surviving company. On August 1, 2020, Parque Eólico Taltal SpA merged with Almeyda Solar SpA and the latter became the legal surviving company. Finally, on January 1, 2021, Almeyda Solar SpA merged with Enel Green Power Chile S.A. and the latter became the legal surviving company.
F-89
16. PROPERTY, PLANT AND EQUIPMENT
The following table sets forth the property, plant and equipment as of December 31, 2024 and 2023:
|
|
As of December 31, |
||
|
|
2024 |
|
2023 |
Classes of Property, Plant and Equipment, Gross |
|
ThCh$ |
|
ThCh$ |
Property, Plant and Equipment, Gross |
|
12,924,344,525 |
|
11,833,075,817 |
Construction in progress |
|
2,279,619,377 |
|
2,471,906,134 |
Land |
|
75,362,518 |
|
70,029,950 |
Buildings |
|
1,004,446,360 |
|
820,488,268 |
Generation plant and equipment |
|
8,036,764,066 |
|
7,025,101,427 |
Network infrastructure |
|
1,348,527,373 |
|
1,283,066,501 |
Fixtures and fittings |
|
155,623,189 |
|
141,407,876 |
Other property, plant, and equipment |
|
24,001,642 |
|
21,075,661 |
|
|
As of December 31, |
||
|
|
2024 |
|
2023 |
Classes of Accumulated Depreciation and Impairment in Property, Plant and Equipment |
|
ThCh$ |
|
ThCh$ |
Total Accumulated Depreciation and Impairment in Property, Plant and Equipment |
|
(5,371,483,458) |
|
(4,982,890,997) |
Buildings |
|
(223,059,218) |
|
(190,875,178) |
Plant and equipment |
|
(4,484,514,221) |
|
(4,168,517,659) |
Network infrastructure |
|
(544,436,473) |
|
(513,708,508) |
Fixtures and fittings |
|
(95,653,705) |
|
(89,015,209) |
Other property, plant, and equipment |
|
(23,819,841) |
|
(20,774,443) |
|
|
As of December 31, |
||
|
|
2024 |
|
2023 |
Classes of Property, Plant and Equipment, Net |
|
ThCh$ |
|
ThCh$ |
Property, Plant and Equipment, Net |
|
7,552,861,067 |
|
6,850,184,820 |
Construction in progress |
|
2,279,619,377 |
|
2,471,906,134 |
Land |
|
75,362,518 |
|
70,029,950 |
Buildings |
|
781,387,142 |
|
629,613,090 |
Generation plant and equipment |
|
3,552,249,845 |
|
2,856,583,768 |
Network infrastructure |
|
804,090,900 |
|
769,357,993 |
Fixtures and fittings |
|
59,969,484 |
|
52,392,667 |
Other property, plant, and equipment |
|
181,801 |
|
301,218 |
F-90
The composition and movements of the property, plant and equipment accounts during the years ended December 31, 2024 and 2023 are as follows:
|
|
|
|
|
|
|
|
|
|
|
|
|
|
|
|
|
|
|
Construction in progress |
|
Land |
|
Buildings, Net |
|
Generation Plant and Equipment Net |
|
Network infrastructure, Net |
|
Fixtures and Fittings, Net |
|
Other property, plant and equipment, Net |
|
Property, Plant and Equipment, Net |
Movements in 2024 |
|
ThCh$ |
|
ThCh$ |
|
ThCh$ |
|
ThCh$ |
|
ThCh$ |
|
ThCh$ |
|
ThCh$ |
|
ThCh$ |
Balance as of January 1, 2024 |
|
2,471,906,134 |
|
70,029,950 |
|
629,613,090 |
|
2,856,583,768 |
|
769,357,993 |
|
52,392,667 |
|
301,218 |
|
6,850,184,820 |
Increases other than from business combinations |
|
522,711,445 |
|
— |
|
- |
|
11,072,923 |
|
3,332,300 |
|
- |
|
— |
|
537,116,668 |
Increases (decreases) from foreign currency translation differences |
|
104,447,303 |
|
1,055,319 |
|
82,248,823 |
|
269,250,625 |
|
5,781,046 |
|
117,860 |
|
33,587 |
|
462,934,563 |
Depreciation (1) |
|
— |
|
— |
|
(9,763,490) |
|
(202,728,215) |
|
(29,003,426) |
|
(8,240,161) |
|
(153,004) |
|
(249,888,296) |
Impairment losses recognized in income for the year (2) |
|
(34,203,486) |
|
— |
|
— |
|
— |
|
— |
|
— |
|
— |
|
(34,203,486) |
Increases (decreases) from transfers and other movements |
|
(782,091,137) |
|
5,382,253 |
|
80,696,990 |
|
622,315,617 |
|
59,437,164 |
|
14,259,113 |
|
— |
|
— |
Increases (decreases) from transfers from construction in progress |
|
(782,091,137) |
|
5,382,253 |
|
80,696,990 |
|
622,315,617 |
|
59,437,164 |
|
14,259,113 |
|
— |
|
— |
Disposals and removals from service |
|
(729,252) |
|
(10,634) |
|
— |
|
(958,864) |
|
(572,200) |
|
(10,609) |
|
— |
|
(2,281,559) |
Removals |
|
(729,252) |
|
(10,634) |
|
— |
|
(958,864) |
|
(572,200) |
|
(10,609) |
|
— |
|
(2,281,559) |
Other increases (decreases) |
|
(3,425,435) |
|
(1,251,562) |
|
(1,632,305) |
|
(4,697,890) |
|
(4,241,977) |
|
1,196,034 |
|
— |
|
(14,053,135) |
Argentine hyperinflationary economy |
|
1,003,805 |
|
157,192 |
|
224,034 |
|
1,411,881 |
|
— |
|
254,580 |
|
— |
|
3,051,492 |
Total movements |
|
(192,286,757) |
|
5,332,568 |
|
151,774,052 |
|
695,666,077 |
|
34,732,907 |
|
7,576,817 |
|
(119,417) |
|
702,676,247 |
Balance as of December 31, 2024 |
|
2,279,619,377 |
|
75,362,518 |
|
781,387,142 |
|
3,552,249,845 |
|
804,090,900 |
|
59,969,484 |
|
181,801 |
|
7,552,861,067 |
|
|
|
|
|
|
|
|
|
|
|
|
|
|
|
|
|
|
|
Construction in progress |
|
Land |
|
Buildings, Net |
|
Generation Plant and Equipment Net |
|
Network infrastructure, Net |
|
Fixtures and Fittings, Net |
|
Other property, plant and equipment, Net |
|
Property, Plant and Equipment, Net |
Movements in 2023 |
|
ThCh$ |
|
ThCh$ |
|
ThCh$ |
|
ThCh$ |
|
ThCh$ |
|
ThCh$ |
|
ThCh$ |
|
ThCh$ |
Balance as of January 1, 2023 |
|
3,099,937,769 |
|
64,680,270 |
|
441,878,570 |
|
2,211,136,474 |
|
708,440,346 |
|
45,782,339 |
|
498,226 |
|
6,572,353,994 |
Increases other than from business combinations |
|
734,471,374 |
|
92,938 |
|
9,906 |
|
25,281 |
|
2,410,658 |
|
- |
|
— |
|
737,010,157 |
Increases (decreases) from foreign currency translation differences |
|
5,306,989 |
|
106,008 |
|
15,692,204 |
|
40,417,640 |
|
1,266,833 |
|
(467,418) |
|
4,509 |
|
62,326,765 |
Depreciation |
|
— |
|
— |
|
(25,464,456) |
|
(153,690,399) |
|
(35,239,266) |
|
(6,788,472) |
|
(187,984) |
|
(221,370,577) |
Impairment losses recognized in income for the year (3) |
|
— |
|
— |
|
— |
|
(7,023,888) |
|
— |
|
— |
|
— |
|
(7,023,888) |
Increases (decreases) from transfers and other movements |
|
(1,357,056,393) |
|
6,891,887 |
|
351,945,261 |
|
890,133,064 |
|
94,453,986 |
|
13,632,195 |
|
— |
|
— |
Increases (decreases) from transfers from construction in progress |
|
(1,357,056,393) |
|
6,891,887 |
|
351,945,261 |
|
890,133,064 |
|
94,453,986 |
|
13,632,195 |
|
— |
|
— |
Disposals and removals from service |
|
(1,832,639) |
|
(1,280,569) |
|
(43,824) |
|
(1,445,026) |
|
(414,606) |
|
(129,978) |
|
(22,200) |
|
(5,168,842) |
Disposals (4) |
|
(1,369,868) |
|
(66,882) |
|
— |
|
(880,411) |
|
— |
|
— |
|
— |
|
(2,317,161) |
Removals |
|
(462,771) |
|
(1,213,687) |
|
(43,824) |
|
(564,615) |
|
(414,606) |
|
(129,978) |
|
(22,200) |
|
(2,851,681) |
Decreases to be classified as held for sale (5) |
|
(4,869,003) |
|
— |
|
(52,861,456) |
|
(277,983,606) |
|
— |
|
2,751 |
|
8,667 |
|
(335,702,647) |
Other increases (decreases) |
|
(4,665,289) |
|
(571,632) |
|
(101,701,141) |
|
153,850,501 |
|
(1,559,958) |
|
— |
|
— |
|
45,352,481 |
Argentine hyperinflationary economy |
|
613,326 |
|
111,048 |
|
158,026 |
|
1,163,727 |
|
— |
|
361,250 |
|
— |
|
2,407,377 |
Total movements |
|
(628,031,635) |
|
5,349,680 |
|
187,734,520 |
|
645,447,294 |
|
60,917,647 |
|
6,610,328 |
|
(197,008) |
|
277,830,826 |
Balance as of December 31, 2023 |
|
2,471,906,134 |
|
70,029,950 |
|
629,613,090 |
|
2,856,583,768 |
|
769,357,993 |
|
52,392,667 |
|
301,218 |
|
6,850,184,820 |
| (1) | See Note 31.a). |
| (2) | See Note 16 c) item vi). |
| (3) | Relates to a higher impairment loss on property, plant and equipment, mainly explained by the impairment of items of property, plant, and equipment related to the gas-fired unit of the Tarapacá Power Plant. |
| (4) | The main component is the sale of the Huasco Power Plant, by our subsidiary Enel Generación Chile, for ThCh$5,318,040, from which a gain of ThCh$3,808,947 was recognized (See Note 33). |
| (5) | See Note 5. |
Additional information on property, plant and equipment, net
| a) | Main Investments |
The main additions to property, plant and equipment are related to investments in the Company’s networks and operating plants and new projects under construction. These investments totaled ThCh$2,279,619,377 and ThCh$2,471,906,134 as of December 31, 2024 and 2023, respectively.
In the Distribution Segment, the main investments are improvements in networks to optimize their operation, to enhance efficiency and quality of service level. The book value of these works in progress totaled ThCh$177,427,590 and ThCh$169,052,263, as of December 31, 2024 and 2023, respectively.
F-91
In the Generation Segment, investments include works towards the new capacity program. This includes:
| (i) | Progress on the construction of the Los Cóndores Hydroelectric power plant, by Enel Generación Chile, which will use the resources from the Maule Lake and will have an installed capacity of approximately 150 MW. As of December 31, 2024 and 2023, the capitalized carrying amount of these works in progress amounted to ThCh$1,176,484,395 and ThCh$1,064,200,511, respectively. |
| (ii) | Progress on the Rihue, Don Humberto, Hijuelas, Graneros, Don Rodrigo, Valera, Maitencillo, Cabimas and La Pataguas projects, which together represent an installed capacity of approximately 1.35 GW, and are being executed by Enel Green Power Chile. The capitalized carrying amount of these projects amounted to ThCh$360,683,352 and ThCh$585,443,444, as of December 31, 2024 and 2023, respectively. |
During 2024, Operación Finis Terrae II, El Manzano, La Cabaña and Las Salinas, came into operation, accumulating a carrying amount of ThCh$632,046,041 with installed capacity of 0.57 GW.
According to the accounting criteria described in Note 3.a), only those investments made in the generation projects described above qualify as assets eligible to capitalize interest. Together, these projects represent accumulated cash disbursements of ThCh$1,689,108,504 and ThCh$1,820,862,146 as of December 31, 2024 and 2023, respectively.
| b) | Capitalized cost |
b.1) Capitalized financial expenses in work-in-progress
As of December 31, 2024, the capitalized interest expense amounted to ThCh$85,267,021 (ThCh$81,447,057 and ThCh$83,292,276 as of December 31, 2023 and 2022, respectively (see Note 34)). As of December 31, 2024, the average financing rate ranged between 5.49% and 6.64% (5.29% and 6.08% as of December 31, 2023 and 5.93% and 6.17% as of December 31, 2022).
The increased interest capitalization is mainly explained by an improved performance of non-conventional renewable energy projects and by a greater continuity in the performance of the Los Cóndores project, which currently shows significant advancement. With respect to the Los Cóndores project, given the difficulties inherent to a project of this magnitude and the impacts related to COVID-19, which implied some suspensions in the execution of the project during the previous years, an update of the project schedule provided by Enel Generación Chile on July 27, 2020. As of December 31, 2024, the construction of the main elements of the civil works is practically completed and the project is in the testing stage.
b.2) Capitalized personnel expenses in work-in-progress
As of December 31, 2024, 2023 and 2022, the capitalized cost for personnel expenses directly related to constructions in progress amounted to ThCh$40,732,541, ThCh$39,629,466 and ThCh$44,569,685, respectively.
| c) | Other information |
| (i) | As of December 31, 2024 and 2023, the Group maintained commitments for the acquisition of property, plant, and equipment amounting to ThCh$144,764,301 and ThCh$126,041,911, respectively. |
| (ii) | As of December 31, 2024 and 2023, Enel Chile had no property, plant, and equipment pledged as collateral for liabilities. |
F-92
| (iii) | The Group and its consolidated entities have insurance contracts that include all-risk, earthquake and machinery breakdown policies with a limit of €1,000 million (ThCh$1,029,830,750), and this coverage includes damages due to business disruption. |
Additionally, the Group has civil liability insurance to cover third-party claims up to a limit of €400 million (ThCh$411,932,300) in case these claims are due to the rupture of any dams owned by the Company or its subsidiaries, as well as environmental civil liability to cover environmental damage claims up to €20 million (ThCh$20,596,615). The premiums associated with these policies are recorded proportionally to each company in the caption prepaid expense.
| (iv) | Decarbonization plan |
Development during 2019:
On June 4, 2019, the Company’s subsidiaries Enel Generación Chile and GasAtacama Chile entered into an agreement by which both companies, in line with their own sustainability strategy and strategic plan, and the Ministry of Energy, regulated how they would proceed to progressively eliminate the operations of the Tarapacá, Bocamina I and Bocamina II coal-fired generation units (hereinafter, Tarapacá, Bocamina I and Bocamina II).
Development during 2020:
On May 27, 2020, the Board of Directors of Enel Generación Chile approved, subject to the corresponding CNE authorizations, the early withdrawal of Bocamina I and Bocamina II, establishing deadlines for such withdrawals on December 31, 2020, and May 31, 2022, respectively. The corresponding request was communicated to the CNE that same day.
During the year 2021, the Group recorded an additional impairment loss of ThCh$28,773,083. The resulting recoverable value, after accounting for the previous impairment losses, corresponds to the value of the land associated with this power plant and amounts to ThCh$2,014,684.
These situations have effects on deferred taxes, which are disclosed in Note 19.b.
Development during 2022:
On May 3, 2022, the CNE issued Exempt Resolution No. 325, which based on technical studies and system operation projections, ordered Enel Generación Chile S.A. to perform the final removal, disconnection, and termination of operations at the Bocamina II generation unit beginning on September 30, 2022, in accordance with article 72-18 of the General Law of Electricity Services.
| (v) | As part of its decarbonization strategy, community engagement, and considering the current prevailing conditions in the increasingly competitive market with a growing investment in non-conventional renewable energies, the Company subjected its project portfolio to a thorough analysis. As a result of this process, at the end of the 2022 fiscal year, the Group decided to abandon certain projects it had been developing. As a consequence of the above, Enel Generación Chile had to impair assets by ThCh$22,912,146, mainly associated with thermal and hydroelectric projects, notably the Quintero and Vallecito projects. On the other hand, Enel Green Power Chile had to impair ThCh$29,887,851, an amount entirely associated with a geothermal project called El Tatio, which was under development in the Antofagasta region (see Note 32). |
| (vi) | At the end of 2024, Enel Green Power Chile recorded an impairment charge of ThCh$34,203,486 associated with the Las Salinas expansion project. This loss arises from a new assessment of the expected profitability of the project, which determined the decision to suspend it, at least temporarily, until existing conditions change and the project can be considered viable. |
F-93
17. INVESTMENT PROPERTY
As of December 31, 2024 and 2023, the detail and movements of investment property were as follows:
|
|
Investment Properties, Gross |
|
Accumulated Depreciation, Amortization and Impairment |
|
Investment Properties, Net |
Investment Property, Net, Cost Model |
|
ThCh$ |
|
ThCh$ |
|
ThCh$ |
Balance as of January 1, 2023 |
|
7,710,314 |
|
(362,052) |
|
7,348,262 |
Depreciation expense (*) |
|
— |
|
(7,701) |
|
(7,701) |
Balance as of December 31, 2023 |
|
7,710,314 |
|
(369,753) |
|
7,340,561 |
Owner-occupied real property transfers |
|
(362,445) |
|
197,776 |
|
(164,669) |
Balance as of December 31, 2024 |
|
7,347,869 |
|
(171,977) |
|
7,175,892 |
(*) See note 31.a).
During the years ended December 31, 2024 and 2023, no real estate property has been sold.
| - | Fair value measurement and hierarchy |
As of December 31, 2024 and 2023, the fair value of the investment amounted to ThCh$9,149,277 and ThCh$8,903,618, respectively. This value was determined based on independent appraisals.
The inputs used in this valuation are considered Level 3 for the purposes of the fair value hierarchy.
The fair value hierarchy for investment properties is the following:
|
|
Fair value measured as of December 31, 2024 |
||||
|
|
Level 1 |
|
Level 2 |
|
Level 3 |
|
|
ThCh$ |
|
ThCh$ |
|
ThCh$ |
Investment properties |
|
— |
|
— |
|
9,149,277 |
See Note 3.h.
The revenue and expenses derived from investment properties for the years ended December 31, 2024, 2023 and 2022 are as follows:
|
|
2024 |
|
2023 |
|
2022 |
Income and expense from investment properties |
|
ThCh$ |
|
ThCh$ |
|
ThCh$ |
Income derived from rental income from investment properties |
|
114,879 |
|
88,179 |
|
131,531 |
Direct operating expenses from investment properties that generate rental income |
|
(12,125) |
|
(19,837) |
|
(18,551) |
Total |
|
102,754 |
|
68,342 |
|
112,980 |
As of December 31, 2024 and 2023, there are no contracts for repairs, maintenance, acquisition, construction or development that represent future obligations for the Group.
The Group has obtained insurance policies to cover the possible risks to which the different elements of its real estate investments are exposed, as well as potential claims that may arise due to the performance of its activities, with the understanding that these policies sufficiently cover these risks.
F-94
18. RIGHT-OF-USE-ASSETS
Right-of-use assets as of December 31, 2024 and 2023 are detailed as follows:
|
|
Land |
|
Buildings, Net |
|
Other plants and equipment |
|
Right-of-use assets, Net |
Movements in 2024 |
|
ThCh$ |
|
ThCh$ |
|
ThCh$ |
|
ThCh$ |
Opening balance as of January 1, 2024 |
|
227,690,973 |
|
24,539,131 |
|
16,822,451 |
|
269,052,555 |
New assets contracts, by right-of use |
|
40,850,336 |
|
483,328 |
|
100,622 |
|
41,434,286 |
Increases (decreases) from foreign currency translation differences, net |
|
11,949,673 |
|
2,222,138 |
|
147,298 |
|
14,319,109 |
Depreciation (1) |
|
(11,117,090) |
|
(5,304,825) |
|
(6,946,334) |
|
(23,368,249) |
Retirements |
|
(28,751,084) |
|
(75,642) |
|
— |
|
(28,826,726) |
Total movements |
|
12,931,835 |
|
(2,675,001) |
|
(6,698,414) |
|
3,558,420 |
Closing balance as of December 31, 2024 |
|
240,622,808 |
|
21,864,130 |
|
10,124,037 |
|
272,610,975 |
|
|
|
|
|
|
|
|
|
|
|
Land |
|
Buildings, Net |
|
Other plants and equipment |
|
Right-of-use assets, Net |
Movements in 2023 |
|
ThCh$ |
|
ThCh$ |
|
ThCh$ |
|
ThCh$ |
Opening balance as of January 1, 2023 |
|
216,012,927 |
|
- |
|
17,685,505 |
|
233,698,432 |
New assets contracts, by right-of use |
|
16,726,443 |
|
30,477,107 |
|
— |
|
47,203,550 |
Increases (decreases) from foreign currency translation differences, net |
|
9,238,845 |
|
(635,842) |
|
150,451 |
|
8,753,454 |
Depreciation |
|
(7,094,687) |
|
(5,286,457) |
|
(1,013,505) |
|
(13,394,649) |
Retirements |
|
— |
|
(15,677) |
|
— |
|
(15,677) |
Decreases for classification as held for sale (2) |
|
(7,192,555) |
|
— |
|
— |
|
(7,192,555) |
Total movements |
|
11,678,046 |
|
24,539,131 |
|
(863,054) |
|
35,354,123 |
Closing balance as of December 31, 2023 |
|
227,690,973 |
|
24,539,131 |
|
16,822,451 |
|
269,052,555 |
| (1) | See Note 31.a). |
| (2) | See Note 5.1. |
As of December 31, 2024, the main right-of-use assets and lease liabilities derive mainly from land leases for the development of non-conventional renewable energy projects within the Enel Green Power Chile Group, in projects such as Altozano, Alwa, Las Salinas, Campos del Sol, Finis Terrae and La Cabaña, with remaining durations from 21 to 34 years, which accrue interest at an annual rate ranging from 0.7% to 5.49%.
The present value of future payments derived from those contracts is detailed as follows:
|
|
As of December 31, |
||||||||||
|
|
2024 |
|
2023 |
||||||||
|
|
Gross |
|
Interest |
|
Present value |
|
Gross |
|
Interest |
|
Present value |
|
|
ThCh$ |
|
ThCh$ |
|
ThCh$ |
|
ThCh$ |
|
ThCh$ |
|
ThCh$ |
Less than one year |
|
37,568,810 |
|
10,682,691 |
|
26,886,119 |
|
33,002,320 |
|
8,864,127 |
|
24,138,193 |
From one to two years |
|
22,416,134 |
|
11,079,596 |
|
11,336,538 |
|
18,156,807 |
|
8,625,314 |
|
9,531,493 |
From two to three years |
|
21,679,403 |
|
10,207,030 |
|
11,472,373 |
|
17,614,228 |
|
7,964,453 |
|
9,649,775 |
From three to four years |
|
21,526,710 |
|
9,770,031 |
|
11,756,679 |
|
17,420,525 |
|
7,839,832 |
|
9,580,693 |
From four to five years |
|
21,535,925 |
|
9,375,862 |
|
12,160,063 |
|
17,509,738 |
|
7,494,285 |
|
10,015,453 |
More than five years |
|
376,358,660 |
|
155,365,382 |
|
220,993,278 |
|
333,452,345 |
|
128,305,732 |
|
205,146,613 |
Total |
|
501,085,642 |
|
206,480,592 |
|
294,605,050 |
|
437,155,963 |
|
169,093,743 |
|
268,062,220 |
| a) | Short-term and low-value leases |
The consolidated income statement for the years ended December 31, 2024, 2023 and 2022 include expenses of ThCh$6,711,205, ThCh$5,459,314 and ThCh$5,436,911, respectively, of which ThCh$6,488,688 correspond to short-term lease payments in 2024 (ThCh$4,612,939 in 2023 and ThCh$3,614,981 in 2022) and ThCh$222,517 related to leases with variable payment clauses in 2024 (ThCh$846,375 in 2023 and ThCh$1,821,930 in 2022), which are exempt from the application of IFRS 16 (see Note 3.f).
F-95
As of December 31, 2024, 2023 and 2022, the future payments arising from these contracts are as follows:
|
|
|
|
|
|
|
As of December 31, |
|
As of December 31, |
|
|
2024 |
|
2023 |
|
|
ThCh$ |
|
ThCh$ |
Less than one year |
|
932,468 |
|
1,102,423 |
From one to two years |
|
— |
|
— |
From two to three years |
|
— |
|
— |
From three to four years |
|
— |
|
— |
From four to five years |
|
— |
|
— |
More than five years |
|
— |
|
— |
Total |
|
932,468 |
|
1,102,423 |
19. INCOME TAX AND DEFERRED TAXES
| a) | Income taxes |
The following are the components of income tax recorded in the consolidated statements of comprehensive income for the years ended December 31, 2024, 2023 and 2022 are as follows:
|
|
2024 |
|
2023 |
|
2022 |
Current Income Tax and Adjustments to Current Income Tax for Previous Periods |
|
ThCh$ |
|
ThCh$ |
|
ThCh$ |
(Expense) / Current income tax |
|
(231,442,764) |
|
(163,618,437) |
|
(394,133,842) |
Adjustments to current tax from the previous period |
|
(2,810,805) |
|
(5,823,911) |
|
(2,021,133) |
(Expense) / Current tax (expenses) / benefit (related to cash flow hedges) (1) |
|
165,985,007 |
|
(50,924,221) |
|
39,826,484 |
Current tax expense, net |
|
(68,268,562) |
|
(220,366,569) |
|
(356,328,491) |
|
|
|
|
|
|
|
Benefit / (expense) from deferred taxes for origination and reversal of temporary differences |
|
33,339,998 |
|
(6,545,916) |
|
(113,368,389) |
Total deferred tax benefit / (expense) |
|
33,339,998 |
|
(6,545,916) |
|
(113,368,389) |
|
|
|
|
|
|
|
Income tax (expense) /benefit |
|
(34,928,564) |
|
(226,912,485) |
|
(469,696,880) |
1) |
The variation in 2024 is primarily explained by the discontinuation of accounting hedges associated with income directly related to the evolution of the U.S. dollar (see Notes 28.1 and 41.i). |
The following table shows the reconciliation of the tax rate as of December 31, 2024, 2023 and 2022:
|
|
|
|
2024 |
|
|
|
2023 |
|
|
|
2022 |
Reconciliation of Tax Expense |
|
Tax Rate |
|
ThCh$ |
|
Tax Rate |
|
ThCh$ |
|
Tax Rate |
|
ThCh$ |
Accounting profit before tax |
|
|
|
225,971,535 |
|
|
|
906,925,876 |
|
|
|
1,778,680,669 |
Total tax expense using statutory rate |
|
(27.00)% |
|
(61,012,314) |
|
(27.00)% |
|
(244,869,987) |
|
(27.00)% |
|
(480,243,781) |
Tax effect of rates applied in other countries |
|
2.87% |
|
6,494,366 |
|
(0.48)% |
|
(4,360,505) |
|
— |
|
23,800 |
Tax effect of tax-exempt revenue and other positive effects impacting the effective rate |
|
1.99% |
|
4,507,592 |
|
0.39% |
|
3,493,906 |
|
1.28% |
|
22,736,630 |
Tax effect of non-deductible expenses for determining taxable profit (loss) |
|
(5.55)% |
|
(12,540,466) |
|
(1.22)% |
|
(11,104,171) |
|
(3.20)% |
|
(56,916,018) |
Tax effect of adjustments to income taxes in previous periods |
|
(1.24)% |
|
(2,810,805) |
|
(0.64)% |
|
(5,823,911) |
|
(0.11)% |
|
(2,021,133) |
Price level restatement for tax purposes (investments and equity) |
|
13.47% |
|
30,433,063 |
|
3.94% |
|
35,752,183 |
|
2.63% |
|
46,723,622 |
Total adjustments to tax expense using statutory rate |
|
11.54% |
|
26,083,750 |
|
1.98% |
|
17,957,502 |
|
0.59% |
|
10,546,901 |
Income tax expense |
|
(15.46)% |
|
(34,928,564) |
|
(25.02)% |
|
(226,912,485) |
|
(26.41)% |
|
(469,696,880) |
The main temporary differences are described below.
F-96
| b) | Deferred taxes |
The origin of and changes in deferred tax assets and liabilities as of December 31, 2024 and 2023 are as follows:
|
|
12-31-2024 |
|
12-31-2023 |
||||
|
|
Assets |
|
Liabilities |
|
Assets |
|
Liabilities |
Deferred Tax Assets/(Liabilities) |
|
ThCh$ |
|
ThCh$ |
|
ThCh$ |
|
ThCh$ |
Depreciations |
|
35,134,313 |
|
(274,313,481) |
|
32,979,882 |
|
(276,533,506) |
Obligations for post-employment benefits |
|
7,417,814 |
|
(1,163,210) |
|
6,570,506 |
|
(870,485) |
Tax loss |
|
85,530,119 |
|
— |
|
81,812,529 |
|
— |
Provisions |
|
107,782,311 |
|
(1,022,258) |
|
113,150,520 |
|
(658,777) |
Decommissioning provision |
|
54,445,753 |
|
— |
|
58,885,329 |
|
— |
Provision for civil contingencies |
|
5,523,724 |
|
— |
|
397,921 |
|
— |
Provision for doubtful trade accounts |
|
9,018,771 |
|
(1,018,706) |
|
5,633,504 |
|
(658,777) |
Provision of Human Resources accounts |
|
12,661,427 |
|
— |
|
12,407,422 |
|
— |
Provision of services rendered by foreign companies |
|
11,267,720 |
|
— |
|
23,213,077 |
|
— |
Other Provisions |
|
14,864,916 |
|
(3,552) |
|
12,613,267 |
|
— |
Other Deferred Taxes |
|
101,850,316 |
|
(143,872,577) |
|
102,601,837 |
|
(153,895,661) |
Capitalization of expenses for issuance of financial debt |
|
— |
|
(12,230,611) |
|
— |
|
(13,891,584) |
Leasing Net effect |
|
95,751,154 |
|
(100,183,767) |
|
98,434,279 |
|
(112,975,882) |
Gain from bargain purchase for tax purposes |
|
— |
|
(6,538,430) |
|
— |
|
(7,571,505) |
Price-level Adjustment – Argentina |
|
— |
|
(24,531,765) |
|
— |
|
(19,381,132) |
Other deferred taxes |
|
6,099,162 |
|
(388,004) |
|
4,167,558 |
|
(75,558) |
Deferred tax assets/(liabilities) before compensation |
|
337,714,873 |
|
(420,371,526) |
|
337,115,274 |
|
(431,958,429) |
Compensation deferred taxes assets/liabilities |
|
(212,475,002) |
|
212,475,002 |
|
(259,445,766) |
|
259,445,766 |
Deferred tax assets/(liabilities) after compensation |
|
125,239,871 |
|
(207,896,524) |
|
77,669,508 |
|
(172,512,663) |
|
|
|
|
|
|
|
|
|
|
|
|
|
|
|
|
|
|
|
Movements |
|
|
||||||||
Recognized in other in comprehensive income |
|
Net balance at January 1, 2024 |
|
Recognized in profit or loss |
|
Recognized in others in comprehensive income |
|
Incorporation of subsidiaries to the scope of consolidation (1) |
|
Foreign currency exchange difference |
|
Other increases (decreases) |
|
Net balance as of December 31, 2024 |
|
|
ThCh$ |
|
ThCh$ |
|
ThCh$ |
|
ThCh$ |
|
ThCh$ |
|
ThCh$ |
|
ThCh$ |
Depreciation |
|
(243,553,624) |
|
31,354,978 |
|
— |
|
21,860 |
|
(27,002,382) |
|
— |
|
(239,179,168) |
Obligations for post-employment benefits |
|
5,700,021 |
|
(358,772) |
|
823,925 |
|
— |
|
89,430 |
|
— |
|
6,254,604 |
Tax loss |
|
81,812,529 |
|
(5,140,202) |
|
— |
|
1,502,766 |
|
7,355,026 |
|
— |
|
85,530,119 |
Provisions |
|
112,491,743 |
|
(8,184,470) |
|
— |
|
281,900 |
|
2,170,880 |
|
— |
|
106,760,053 |
Decommissioning Provision |
|
58,885,329 |
|
(5,500,309) |
|
— |
|
— |
|
1,060,733 |
|
— |
|
54,445,753 |
Provision for civil contingencies |
|
397,921 |
|
5,125,803 |
|
— |
|
— |
|
— |
|
— |
|
5,523,724 |
Provision for doubtful trade accounts |
|
4,974,727 |
|
3,016,864 |
|
— |
|
— |
|
8,474 |
|
— |
|
8,000,065 |
Provision of Human Resources accounts |
|
12,407,422 |
|
(138,132) |
|
— |
|
299,286 |
|
92,851 |
|
— |
|
12,661,427 |
Provision of services rendered by foreign companies |
|
23,213,077 |
|
(11,969,256) |
|
— |
|
— |
|
23,899 |
|
— |
|
11,267,720 |
Other provisions |
|
12,613,267 |
|
1,280,560 |
|
— |
|
(17,386) |
|
984,923 |
|
— |
|
14,861,364 |
Other deferred taxes |
|
(51,293,824) |
|
15,668,464 |
|
12 |
|
552,489 |
|
(6,363,676) |
|
(585,726) |
|
(42,022,261) |
Capitalization of expenses for issuance of financial debt |
|
(13,891,584) |
|
1,660,973 |
|
— |
|
— |
|
— |
|
— |
|
(12,230,611) |
Leasing Net effect |
|
(14,541,603) |
|
9,563,533 |
|
— |
|
— |
|
545,457 |
|
— |
|
(4,432,613) |
Gain from bargain purchase for tax purposes |
|
(7,571,505) |
|
1,433,149 |
|
— |
|
— |
|
(400,074) |
|
— |
|
(6,538,430) |
Price-level Adjustment – Argentina |
|
(19,381,132) |
|
1,943,451 |
|
— |
|
— |
|
(6,508,358) |
|
(585,726) |
|
(24,531,765) |
Other deferred taxes |
|
4,092,000 |
|
1,067,358 |
|
12 |
|
552,489 |
|
(701) |
|
— |
|
5,711,158 |
Deferred tax assets/(liabilities) |
|
(94,843,155) |
|
33,339,998 |
|
823,937 |
|
2,359,015 |
|
(23,750,722) |
|
(585,726) |
|
(82,656,653) |
(1)On August 1, 2024, Enel Chile subscribed a capital increase in Enel X Way Chile S.p.A., which was fully contributed on August 23, 2024. This capital increase implied that Enel Chile will increase its interest in Enel X Way Chile S.p.A. from 49% to 62.46%, becoming a subsidiary entity (see Note 2.4.1 iii).
|
|
|
|
|
|
|
|
|
|
|
|
|
|
|
|
|
|
|
Movements |
|
|
||||||||
Recognized in other in comprehensive income |
|
Net balance at January 1, 2023 |
|
Recognized in profit or loss |
|
Recognized in others in comprehensive income |
|
Transfers to groups held for sale (i) |
|
Foreign currency exchange difference |
|
Other increases (decreases) |
|
Net balance as of December 31, 2023 |
|
|
ThCh$ |
|
ThCh$ |
|
ThCh$ |
|
ThCh$ |
|
ThCh$ |
|
ThCh$ |
|
ThCh$ |
Depreciation |
|
(292,769,199) |
|
(3,379,536) |
|
— |
|
40,785,680 |
|
11,809,431 |
|
— |
|
(243,553,624) |
Obligations for post-employment benefits |
|
6,331,315 |
|
(927,544) |
|
7,323 |
|
— |
|
288,927 |
|
— |
|
5,700,021 |
Tax loss |
|
86,090,908 |
|
(4,475,412) |
|
— |
|
— |
|
197,033 |
|
— |
|
81,812,529 |
Provisions |
|
104,978,720 |
|
(8,171,796) |
|
— |
|
(610,519) |
|
292,044 |
|
16,003,294 |
|
112,491,743 |
Decommissioning Provision |
|
51,516,840 |
|
7,754,219 |
|
— |
|
(610,519) |
|
224,789 |
|
— |
|
58,885,329 |
Provision for civil contingencies |
|
2,080,890 |
|
(1,682,969) |
|
— |
|
— |
|
— |
|
— |
|
397,921 |
Provision for doubtful trade accounts |
|
4,067,205 |
|
906,882 |
|
— |
|
— |
|
640 |
|
— |
|
4,974,727 |
Provision of Human Resources accounts |
|
11,372,224 |
|
1,018,370 |
|
— |
|
— |
|
16,828 |
|
— |
|
12,407,422 |
Provision of services rendered by foreign companies |
|
— |
|
— |
|
— |
|
— |
|
— |
|
23,213,077 |
|
23,213,077 |
Other provisions |
|
35,941,561 |
|
(16,168,298) |
|
— |
|
— |
|
49,787 |
|
(7,209,783) |
|
12,613,267 |
Other deferred taxes |
|
(37,770,609) |
|
10,889,158 |
|
12 |
|
(89,772) |
|
654,213 |
|
(24,976,826) |
|
(51,293,824) |
Capitalization of expenses for issuance of financial debt |
|
(19,635,737) |
|
5,744,153 |
|
— |
|
— |
|
— |
|
— |
|
(13,891,584) |
Leasing Net effect |
|
— |
|
— |
|
— |
|
— |
|
— |
|
(14,541,603) |
|
(14,541,603) |
Gain from bargain purchase for tax purposes |
|
(8,896,416) |
|
1,393,557 |
|
— |
|
— |
|
(68,646) |
|
— |
|
(7,571,505) |
Price-level Adjustment – Argentina |
|
(11,526,750) |
|
1,119,150 |
|
— |
|
— |
|
— |
|
(8,973,532) |
|
(19,381,132) |
Other deferred taxes |
|
2,288,294 |
|
2,632,298 |
|
12 |
|
(89,772) |
|
722,859 |
|
(1,461,691) |
|
4,092,000 |
Deferred tax assets/(liabilities) |
|
(133,138,865) |
|
(6,065,130) |
|
7,335 |
|
40,085,389 |
|
13,241,648 |
|
(8,973,532) |
|
(94,843,155) |
(i) See Note 5.
F-97
Recovery of deferred tax assets will depend on whether sufficient taxable profits are obtained in the future. The Company’s Management believes that the future profit projections for its subsidiaries will allow these assets to be recovered.
As of December 31, 2024 and 2023, the Group has accounted for all deferred tax assets associated with its tax losses (see Note 3.p).
Regarding temporary differences related to investments in consolidated entities and certain joint ventures, the Group has not recognized deferred tax liabilities associated with undistributed earnings, where the Group's position of control over such consolidated entities makes it possible to manage the timing of the reversal of the temporary differences, and it is probable that the temporary differences will not reverse in the foreseeable future. As of December 31, 2024, the total amount of these taxable temporary differences, for which no deferred tax liabilities have been recognized, amounts to ThCh$1,187,784,722 (ThCh$1,044,776,794 as of December 31, 2023). In addition, deferred tax assets have not been recorded in relation to deductible temporary differences related to investments in consolidated entities and certain joint ventures for which they are not expected to reverse in the foreseeable future or taxable profits are not available for their use. As of December 31, 2024, such deductible temporary differences amount to ThCh$1,171,473,917 (ThCh$1,335,426,974 as of December 31,2023).
Group companies are potentially subject to income tax audits by the tax authorities of each country in which the Group operates. Such tax audits are limited to a number of annual tax periods and once these have expired, audits of these periods can no longer be performed. Tax audits by nature are often complex and can require several years to complete. Tax years potentially subject to examination are 2021 to 2023.
Because of the range of possible interpretations of tax standards, the results of any future inspections carried out by tax authorities for the years subject to audit can give rise to tax liabilities that cannot currently be quantified objectively. Nevertheless, the Company’s Management estimates that the liabilities, if any, that may arise from such audits, would not significantly impact the Group companies’ future results.
For the years ended December 31, 2024, 2023 and 2022, the current and deferred tax effects of the components of other comprehensive income attributable to owners of the Group and non-controlling interests are detailed below:
|
|
2024 |
|
2023 |
|
2022 |
|
|
|
|
||||||||
Deferred Income Tax Effects on the Components of Other Comprehensive Income |
|
Amount Before |
|
Income Tax |
|
Amount After |
|
Amount Before |
|
Income Tax |
|
Amount After |
|
Amount Before |
|
Income Tax |
|
Amount After |
|
|
ThCh$ |
|
ThCh$ |
|
ThCh$ |
|
ThCh$ |
|
ThCh$ |
|
ThCh$ |
|
ThCh$ |
|
ThCh$ |
|
ThCh$ |
Financial assets at fair value with movements in other comprehensive income |
|
(43) |
|
12 |
|
(31) |
|
(44) |
|
12 |
|
(32) |
|
(2) |
|
1 |
|
(1) |
Cash flow hedge |
|
607,100,042 |
|
(165,985,007) |
|
441,115,035 |
|
(188,608,231) |
|
50,924,221 |
|
(137,684,010) |
|
147,505,497 |
|
(39,826,484) |
|
107,679,013 |
Share of other comprehensive income from associates and joint ventures accounted for using the equity method |
|
- |
|
— |
|
— |
|
13,494 |
|
— |
|
13,494 |
|
1,043,185 |
|
— |
|
1,043,185 |
Foreign currency translation differences |
|
146,781,406 |
|
— |
|
146,781,406 |
|
54,024,068 |
|
— |
|
54,024,068 |
|
18,994,934 |
|
— |
|
18,994,934 |
Actuarial gains(losses) on defined-benefit pension plans |
|
(3,051,575) |
|
823,925 |
|
(2,227,650) |
|
(27,122) |
|
7,323 |
|
(19,799) |
|
(7,304,757) |
|
1,972,561 |
|
(5,332,196) |
Income tax related to components of other income and expenses with a charge or credit in equity |
|
750,829,830 |
|
(165,161,070) |
|
585,668,760 |
|
(134,597,835) |
|
50,931,556 |
|
(83,666,279) |
|
160,238,857 |
|
(37,853,922) |
|
122,384,935 |
The following table shows the reconciliation of deferred tax movements between balance sheet and income taxes in other comprehensive income as of December 31, 2024, 2023 and 2022:
|
|
For the years ended December 31, |
||||
|
|
2024 |
|
2023 |
|
2022 |
Deferred taxes of components of other comprehensive income |
|
ThCh$ |
|
ThCh$ |
|
ThCh$ |
Total increases (decreases) for deferred taxes of other comprehensive income from continuing operations |
|
823,937 |
|
7,335 |
|
1,972,562 |
Income tax of movements in cash flow hedge transactions |
|
(165,985,007) |
|
50,924,221 |
|
(39,826,484) |
Total income tax relating to components of other comprehensive income |
|
(165,161,070) |
|
50,931,556 |
|
(37,853,922) |
F-98
20. OTHER FINANCIAL LIABILITIES.
The balance of other financial liabilities as of December 31, 2024 and 2023 is as follows:
|
|
Current |
|
Non-current |
||||
|
|
12-31-2024 |
|
12-31-2023 |
|
12-31-2024 |
|
12-31-2023 |
Other financial liabilities |
|
ThCh$ |
|
ThCh$ |
|
ThCh$ |
|
ThCh$ |
Interest-bearing borrowings |
|
61,229,866 |
|
542,220,313 |
|
2,368,746,913 |
|
1,897,563,167 |
Hedging derivatives (*) |
|
22,461,567 |
|
72,793,962 |
|
5,215,190 |
|
6,949,774 |
Non-hedging derivatives (**) |
|
14,145 |
|
640 |
|
— |
|
— |
Total |
|
83,705,578 |
|
615,014,915 |
|
2,373,962,103 |
|
1,904,512,941 |
(*) See Note 23.2.a.
(**) See Note 23.2.b.
20.1 Interest-bearing borrowings
The details of current and non-current interest-bearing borrowings as of December 31, 2024 and 2023 are as follows:
|
|
Current |
|
Non-current |
||||
|
|
12-31-2024 |
|
12-31-2023 |
|
12-31-2024 |
|
12-31-2023 |
Classes of Interest-bearing borrowings |
|
ThCh$ |
|
ThCh$ |
|
ThCh$ |
|
ThCh$ |
Secured bank loans |
|
4,012,112 |
|
2,709,891 |
|
761,536,580 |
|
433,297,280 |
Unsecured bank loans |
|
691,291 |
|
132,507,740 |
|
149,469,000 |
|
131,568,000 |
Unsecured obligations with the public |
|
56,526,463 |
|
407,002,682 |
|
1,457,741,333 |
|
1,332,697,887 |
Total |
|
61,229,866 |
|
542,220,313 |
|
2,368,746,913 |
|
1,897,563,167 |
Bank borrowings by currency and contractual maturity as of December 31, 2024 and 2023 are as follows:
| - | Summary of bank borrowings by currency and maturity |
|
|
|
|
|
|
|
|
|
|
12-31-2024 |
||||||||||||||||
|
|
|
|
|
|
|
|
|
|
Maturity |
|
|
|
Maturity |
|
|
||||||||||
Country |
|
Currency |
|
Effective |
|
Nominal |
|
Secured / |
|
Less than 90 days |
|
More than 90 days |
|
Total Current |
|
One |
|
Two |
|
Three |
|
Four |
|
More |
|
Total |
|
|
|
|
Rate |
|
Rate |
|
|
|
ThCh$ |
|
ThCh$ |
|
ThCh$ |
|
ThCh$ |
|
ThCh$ |
|
ThCh$ |
|
ThCh$ |
|
ThCh$ |
|
ThCh$ |
Chile |
|
US$ |
|
5.40% |
|
5.02% |
|
Yes |
|
925,082 |
|
3,087,030 |
|
4,012,112 |
|
42,304,447 |
|
55,769,899 |
|
57,335,950 |
|
58,978,660 |
|
547,147,624 |
|
761,536,580 |
Chile |
|
CLP |
|
6.00% |
|
6.00% |
|
No |
|
3 |
|
— |
|
3 |
|
— |
|
— |
|
— |
|
— |
|
— |
|
— |
Chile |
|
US$ |
|
2.24% |
|
2.24% |
|
No |
|
4,014 |
|
687,274 |
|
691,288 |
|
149,469,000 |
|
- |
|
- |
|
— |
|
— |
|
149,469,000 |
|
|
|
|
|
|
|
|
Total |
|
929,099 |
|
3,774,304 |
|
4,703,403 |
|
191,773,447 |
|
55,769,899 |
|
57,335,950 |
|
58,978,660 |
|
547,147,624 |
|
911,005,580 |
|
|
|
|
|
|
|
|
|
|
|
|
|
|
|
|
|
|
|
|
|
|
|
|
|
|
|
|
|
|
|
|
|
|
|
|
|
12-31-2023 |
||||||||||||||||
|
|
|
|
|
|
|
|
|
|
Maturity |
|
|
|
Maturity |
|
|
||||||||||
Country |
|
Currency |
|
Effective |
|
Nominal |
|
Secured / Unsecured |
|
Less than 90 days |
|
More than 90 days |
|
Total Current |
|
One to two years |
|
Two to three |
|
Three to four years |
|
Four to five years |
|
More than Five Years |
|
Total Non-Current |
|
|
|
|
Rate |
|
Rate |
|
|
|
ThCh$ |
|
ThCh$ |
|
ThCh$ |
|
ThCh$ |
|
ThCh$ |
|
ThCh$ |
|
ThCh$ |
|
ThCh$ |
|
ThCh$ |
Chile |
|
US$ |
|
4.89% |
|
4.89% |
|
Yes |
|
— |
|
2,709,891 |
|
2,709,891 |
|
— |
|
21,489,439 |
|
32,548,640 |
|
33,094,962 |
|
346,164,239 |
|
433,297,280 |
Chile |
|
CLP |
|
3.05% |
|
3.05% |
|
No |
|
163 |
|
— |
|
163 |
|
— |
|
— |
|
— |
|
— |
|
— |
|
— |
Chile |
|
US$ |
|
5.13% |
|
5.13% |
|
No |
|
295,283 |
|
132,212,294 |
|
132,507,577 |
|
— |
|
131,568,000 |
|
- |
|
— |
|
— |
|
131,568,000 |
|
|
|
|
|
|
|
|
Total |
|
295,446 |
|
134,922,185 |
|
135,217,631 |
|
- |
|
153,057,439 |
|
32,548,640 |
|
33,094,962 |
|
346,164,239 |
|
564,865,280 |
F-99
Fair value measurement and hierarchy
The fair value of current and non-current bank borrowings as of December 31, 2024 is ThCh$902,938,528 (ThCh$680,249,170 as of December 31, 2023). The borrowings have been categorized as Level 2 fair value measurement based on the entry data used in the valuation techniques (see Note 3.h).
| - | Summary of bank loans by borrower |
|
|
|
|
|
|
|
|
|
|
|
|
|
|
|
|
|
|
|
|
|
|
12-31-2024 |
||||||||||||||||
|
|
|
|
|
|
|
|
|
|
|
|
|
|
|
|
|
|
|
|
|
|
Maturity |
|
|
|
Maturity |
|
|
||||||||||
Taxpayer |
|
Company |
|
Country |
|
Taxpayer |
|
Financial |
|
Country |
|
Currency |
|
Effective |
|
Nominal |
|
Type |
|
Secured (1) |
|
Less |
|
More |
|
Total |
|
One |
|
Two |
|
Three |
|
Four |
|
More |
|
Non-current |
91.081.000-6 |
|
Enel Generación Chile S.A. |
|
Chile |
|
97.036.000-k |
|
Banco Santander (Overdraft facility) |
|
Chile |
|
CLP |
|
6.00% |
|
6.00% |
|
Upon expiration |
|
No |
|
3 |
|
— |
|
3 |
|
— |
|
— |
|
— |
|
— |
|
— |
|
— |
76.536.353-5 |
|
Enel Chile S.A. |
|
Chile |
|
97.018.000-1 |
|
Scotiabank Chile |
|
Chile |
|
US$ |
|
5.91% |
|
5.91% |
|
Upon expiration |
|
No |
|
— |
|
687,274 |
|
687,274 |
|
149,469,000 |
|
— |
|
— |
|
— |
|
— |
|
149,469,000 |
76.536.353-5 |
|
Enel Chile S.A. |
|
Chile |
|
Foreign |
|
European Investment Bank |
|
Luxembourg |
|
US$ |
|
4.89% |
|
4.89% |
|
Annual |
|
Yes |
|
— |
|
3,087,030 |
|
3,087,030 |
|
18,555,484 |
|
32,020,936 |
|
33,586,987 |
|
35,229,697 |
|
372,858,136 |
|
492,251,240 |
76.536.353-5 |
|
Enel Chile S.A. |
|
Chile |
|
Foreign |
|
CitiBank N.A. London Branch |
|
USA |
|
US$ |
|
5.90% |
|
5.15% |
|
Biannual |
|
Yes |
|
925,082 |
|
— |
|
925,082 |
|
23,748,963 |
|
23,748,963 |
|
23,748,963 |
|
23,748,963 |
|
174,289,488 |
|
269,285,340 |
76.536.353-5 |
|
Enel Chile S.A. |
|
Chile |
|
Foreign |
|
DNB Bank ASA (Commitment fee) |
|
Norway |
|
US$ |
|
0.30% |
|
0.30% |
|
Upon expiration |
|
No |
|
1,246 |
|
— |
|
1,246 |
|
— |
|
— |
|
— |
|
— |
|
— |
|
— |
76.536.353-5 |
|
Enel Chile S.A. |
|
Chile |
|
Foreign |
|
CAF_VE (Commitment fee) |
|
Venezuela |
|
US$ |
|
0.50% |
|
0.50% |
|
Upon expiration |
|
No |
|
2,768 |
|
— |
|
2,768 |
|
— |
|
— |
|
— |
|
— |
|
— |
|
— |
|
|
|
|
|
|
|
|
|
|
Total |
|
|
|
|
|
|
|
|
|
|
|
929,099 |
|
3,774,304 |
|
4,703,403 |
|
191,773,447 |
|
55,769,899 |
|
57,335,950 |
|
58,978,660 |
|
547,147,624 |
|
911,005,580 |
|
|
|
|
|
|
|
|
|
|
|
|
|
|
|
|
|
|
|
|
|
|
12-31-2023 |
||||||||||||||||
|
|
|
|
|
|
|
|
|
|
|
|
|
|
|
|
|
|
|
|
|
|
Maturity |
|
|
|
Maturity |
|
|
||||||||||
Taxpayer |
|
Company |
|
Country |
|
Taxpayer |
|
Financial |
|
Country |
|
Currency |
|
Effective |
|
Nominal |
|
Type |
|
Secured (1) |
|
Less |
|
More |
|
Total |
|
One |
|
Two |
|
Three |
|
Four |
|
More |
|
Non-current |
91.081.000-6 |
|
Enel Generación Chile S.A. |
|
Chile |
|
97.036.000-k |
|
Banco Santander (Overdraft facility) |
|
Chile |
|
CLP |
|
6.00% |
|
6.00% |
|
Upon expiration |
|
No |
|
3 |
|
— |
|
3 |
|
— |
|
— |
|
— |
|
— |
|
— |
|
— |
76.536.353-5 |
|
Enel Chile S.A. |
|
Chile |
|
97.036.000-k |
|
Banco Santander |
|
Chile |
|
US$ |
|
5.71% |
|
5.71% |
|
Upon expiration |
|
No |
|
— |
|
43,823,228 |
|
43,823,228 |
|
— |
|
— |
|
— |
|
— |
|
— |
|
— |
76.536.353-5 |
|
Enel Chile S.A. |
|
Chile |
|
97.018.000-1 |
|
Scotiabank Chile |
|
Chile |
|
US$ |
|
6.86% |
|
6.86% |
|
Upon expiration |
|
No |
|
— |
|
677,066 |
|
677,066 |
|
— |
|
131,568,000 |
|
— |
|
— |
|
— |
|
131,568,000 |
76.536.353-5 |
|
Enel Chile S.A. |
|
Chile |
|
Foreign |
|
European Investment Bank |
|
Luxembourg |
|
US$ |
|
4.89% |
|
4.89% |
|
Annual |
|
Yes |
|
— |
|
2,709,891 |
|
2,709,891 |
|
— |
|
21,489,439 |
|
32,548,640 |
|
33,094,962 |
|
346,164,239 |
|
433,297,280 |
76.536.353-5 |
|
Enel Chile S.A. |
|
Chile |
|
Foreign |
|
Banco Bilbao Viscaya Argentaria S.A NY Branch |
|
USA |
|
US$ |
|
6.37% |
|
6.37% |
|
Upon expiration |
|
No |
|
279,550 |
|
65,784,000 |
|
66,063,550 |
|
— |
|
— |
|
— |
|
— |
|
— |
|
— |
76.536.353-5 |
|
Enel Chile S.A. |
|
Chile |
|
Foreign |
|
Mizuho Bank LTD. |
|
USA |
|
US$ |
|
6.37% |
|
6.37% |
|
Upon expiration |
|
No |
|
|
|
21,928,000 |
|
21,928,000 |
|
— |
|
— |
|
— |
|
— |
|
— |
|
— |
76.536.353-5 |
|
Enel Chile S.A. |
|
Chile |
|
97.018.000-1 |
|
Scotiabank (Commitment fee) |
|
Chile |
|
CLP |
|
0.09% |
|
0.09% |
|
Upon expiration |
|
No |
|
160 |
|
— |
|
160 |
|
— |
|
— |
|
— |
|
— |
|
— |
|
— |
76.536.353-5 |
|
Enel Chile S.A. |
|
Chile |
|
Foreign |
|
SMBC (Commitment fee) |
|
USA |
|
US$ |
|
0.32% |
|
0.32% |
|
Upon expiration |
|
No |
|
15,733 |
|
— |
|
15,733 |
|
— |
|
— |
|
— |
|
— |
|
— |
|
— |
|
|
|
|
|
|
|
|
|
|
Total |
|
|
|
|
|
|
|
|
|
|
|
295,446 |
|
134,922,185 |
|
135,217,631 |
|
— |
|
153,057,439 |
|
32,548,640 |
|
33,094,962 |
|
346,164,239 |
|
564,865,280 |
(1)See Note 36.2.
F-100
20.2 Unsecured liabilities
The details of unsecured liabilities by currency and maturity as of December 31, 2024 and 2023, are as follows:
| - | Summary of unsecured liabilities by currency and maturity |
|
|
|
|
|
|
|
|
|
|
|
|
|
|
|
|
|
|
|
|
|
|
|
|
|
|
|
|
|
|
|
|
|
|
|
|
|
12-31-2024 |
||||||||||||||||
|
|
|
|
|
|
|
|
|
|
Maturity |
|
|
|
Maturity |
|
|
||||||||||
|
|
|
|
Effective |
|
Nominal |
|
Secured |
|
Less |
|
More |
|
Total |
|
One |
|
Two |
|
Three |
|
Four |
|
More |
|
Total |
Country |
|
Currency |
|
Rate |
|
Rate |
|
|
|
ThCh$ |
|
ThCh$ |
|
ThCh$ |
|
ThCh$ |
|
ThCh$ |
|
ThCh$ |
|
ThCh$ |
|
ThCh$ |
|
ThCh$ |
Chile |
|
US$ |
|
7.68% |
|
7.05% |
|
No |
|
10,247,579 |
|
2,563,809 |
|
12,811,388 |
|
— |
|
204,914,920 |
|
985,628,435 |
|
— |
|
104,467,766 |
|
1,295,011,121 |
Chile |
|
UF |
|
6.01% |
|
5.48% |
|
No |
|
— |
|
43,715,075 |
|
43,715,075 |
|
42,914,901 |
|
42,914,901 |
|
42,470,675 |
|
34,429,735 |
|
— |
|
162,730,212 |
|
|
|
|
|
|
|
|
Total |
|
10,247,579 |
|
46,278,884 |
|
56,526,463 |
|
42,914,901 |
|
247,829,821 |
|
1,028,099,110 |
|
34,429,735 |
|
104,467,766 |
|
1,457,741,333 |
|
|
|
|
|
|
|
|
|
|
|
|
|
|
|
|
|
|
|
|
|
|
|
|
|
|
|
|
|
|
|
|
|
|
|
|
|
12-31-2023 |
||||||||||||||||
|
|
|
|
|
|
|
|
|
|
Maturity |
|
|
|
Maturity |
|
|
||||||||||
|
|
|
|
Effective |
|
Nominal |
|
Secured |
|
Less |
|
More |
|
Total |
|
One |
|
Two |
|
Three |
|
Four |
|
More |
|
Total |
Country |
|
Currency |
|
Rate |
|
Rate |
|
|
|
ThCh$ |
|
ThCh$ |
|
ThCh$ |
|
ThCh$ |
|
ThCh$ |
|
ThCh$ |
|
ThCh$ |
|
ThCh$ |
|
ThCh$ |
Chile |
|
US$ |
|
7.08% |
|
6.49% |
|
No |
|
9,020,288 |
|
355,950,646 |
|
364,970,934 |
|
— |
|
— |
|
180,244,202 |
|
865,156,308 |
|
91,174,497 |
|
1,136,575,007 |
Chile |
|
UF |
|
6.01% |
|
5.48% |
|
No |
|
— |
|
42,031,748 |
|
42,031,748 |
|
41,097,026 |
|
41,097,026 |
|
41,097,026 |
|
40,071,906 |
|
32,759,896 |
|
196,122,880 |
|
|
|
|
|
|
|
|
Total |
|
9,020,288 |
|
397,982,394 |
|
407,002,682 |
|
41,097,026 |
|
41,097,026 |
|
221,341,228 |
|
905,228,214 |
|
123,934,393 |
|
1,332,697,887 |
F-101
| - | Summary of unsecured liabilities by debtor |
|
|
|
|
|
|
|
|
|
|
|
|
|
|
|
|
|
|
|
|
|
|
|
|
|
|
|
|
|
|
|
|
|
|
|
|
|
|
|
|
|
|
|
|
|
|
|
|
|
|
|
|
|
|
|
|
|
|
|
|
|
12-31-2024 |
||||||||||||||||
|
|
|
|
|
|
|
|
|
|
|
|
|
|
|
|
|
|
|
|
|
|
Maturity |
|
|
|
Maturity |
|
|
||||||||||
Taxpayer |
|
Company |
|
Country |
|
Taxpayer |
|
Financial |
|
Country |
|
Currency |
|
Effective |
|
Nominal |
|
Type |
|
Secured |
|
Less |
|
More |
|
Total |
|
One |
|
Two |
|
Three |
|
Four |
|
More |
|
Total |
91.081.000-6 |
|
Enel Generación Chile S.A. |
|
Chile |
|
Foreign |
|
BNY Mellon - First issuance S-1 |
|
USA |
|
US$ |
|
8.00% |
|
7.87% |
|
Upon expiration |
|
No |
|
6,731,556 |
|
— |
|
6,731,556 |
|
— |
|
204,914,920 |
|
— |
|
— |
|
— |
|
204,914,920 |
91.081.000-6 |
|
Enel Generación Chile S.A. |
|
Chile |
|
Foreign |
|
BNY Mellon - First issuance S-2 |
|
USA |
|
US$ |
|
8.80% |
|
7.33% |
|
Upon expiration |
|
No |
|
2,152,617 |
|
— |
|
2,152,617 |
|
— |
|
— |
|
— |
|
— |
|
69,575,684 |
|
69,575,684 |
91.081.000-6 |
|
Enel Generación Chile S.A. |
|
Chile |
|
Foreign |
|
BNY Mellon - First issuance S-3 |
|
USA |
|
US$ |
|
8.68% |
|
8.13% |
|
Upon expiration |
|
No |
|
1,363,406 |
|
— |
|
1,363,406 |
|
— |
|
— |
|
— |
|
— |
|
34,892,082 |
|
34,892,082 |
91.081.000-6 |
|
Enel Generación Chile S.A. |
|
Chile |
|
97.036.000-K |
|
Banco Santander -317 Series-H (1) |
|
Chile |
|
UF |
|
7.17% |
|
6.20% |
|
Biannual |
|
No |
|
— |
|
8,426,502 |
|
8,426,502 |
|
7,990,672 |
|
7,990,672 |
|
7,546,446 |
|
— |
|
— |
|
23,527,790 |
91.081.000-6 |
|
Enel Generación Chile S.A. |
|
Chile |
|
97.036.000-K |
|
Banco Santander 522 Series-M (1) |
|
Chile |
|
UF |
|
4.85% |
|
4.75% |
|
Biannual |
|
No |
|
— |
|
35,288,573 |
|
35,288,573 |
|
34,924,229 |
|
34,924,229 |
|
34,924,229 |
|
34,429,735 |
|
— |
|
139,202,422 |
76.536.353-5 |
|
Enel Chile S.A. |
|
Chile |
|
Foreign |
|
BNY Mellon - Single |
|
USA |
|
US$ |
|
5.24% |
|
4.88% |
|
Upon expiration |
|
No |
|
— |
|
2,563,809 |
|
2,563,809 |
|
— |
|
— |
|
985,628,435 |
|
— |
|
— |
|
985,628,435 |
|
|
|
|
|
|
|
|
|
|
|
|
|
|
|
|
Total |
|
|
|
|
|
10,247,579 |
|
46,278,884 |
|
56,526,463 |
|
42,914,901 |
|
247,829,821 |
|
1,028,099,110 |
|
34,429,735 |
|
104,467,766 |
|
1,457,741,333 |
|
|
|
|
|
|
|
|
|
|
|
|
|
|
|
|
|
|
|
|
|
|
|
|
|
|
|
|
|
|
|
|
|
|
|
|
|
|
|
|
|
|
|
|
|
|
|
|
|
|
|
|
|
|
|
|
|
|
|
|
|
12-31-2023 |
||||||||||||||||
|
|
|
|
|
|
|
|
|
|
|
|
|
|
|
|
|
|
|
|
|
|
Maturity |
|
|
|
Maturity |
|
|
||||||||||
Taxpayer |
|
Company |
|
Country |
|
Taxpayer |
|
Financial |
|
Country |
|
Currency |
|
Effective |
|
Nominal |
|
Type |
|
Secured |
|
Less |
|
More |
|
Total |
|
One |
|
Two |
|
Three |
|
Four |
|
More |
|
Total |
91.081.000-6 |
|
Enel Generación Chile S.A. |
|
Chile |
|
Foreign |
|
BNY Mellon - First issuance S-1 |
|
USA |
|
US$ |
|
8.00% |
|
7.87% |
|
Upon expiration |
|
No |
|
5,925,358 |
|
— |
|
5,925,358 |
|
— |
|
— |
|
180,244,202 |
|
— |
|
— |
|
180,244,202 |
91.081.000-6 |
|
Enel Generación Chile S.A. |
|
Chile |
|
Foreign |
|
BNY Mellon - First issuance S-2 |
|
USA |
|
US$ |
|
8.80% |
|
7.33% |
|
Upon expiration |
|
No |
|
1,894,811 |
|
— |
|
1,894,811 |
|
— |
|
— |
|
— |
|
— |
|
61,106,625 |
|
61,106,625 |
91.081.000-6 |
|
Enel Generación Chile S.A. |
|
Chile |
|
Foreign |
|
BNY Mellon - First issuance S-3 |
|
USA |
|
US$ |
|
8.68% |
|
8.13% |
|
Upon expiration |
|
No |
|
1,200,119 |
|
— |
|
1,200,119 |
|
— |
|
— |
|
— |
|
— |
|
30,067,872 |
|
30,067,872 |
91.081.000-6 |
|
Enel Generación Chile S.A. |
|
Chile |
|
Foreign |
|
BNY Mellon - Unica 24296 |
|
USA |
|
US$ |
|
4.67% |
|
4.25% |
|
Upon expiration |
|
No |
|
— |
|
353,693,888 |
|
353,693,888 |
|
— |
|
— |
|
— |
|
— |
|
— |
|
— |
91.081.000-6 |
|
Enel Generación Chile S.A. |
|
Chile |
|
97.036.000-K |
|
Banco Santander -317 Series-H (1) |
|
Chile |
|
UF |
|
7.17% |
|
6.20% |
|
Biannual |
|
No |
|
— |
|
8,168,209 |
|
8,168,209 |
|
7,652,187 |
|
7,652,187 |
|
7,652,187 |
|
6,627,067 |
|
— |
|
29,583,628 |
91.081.000-6 |
|
Enel Generación Chile S.A. |
|
Chile |
|
97.036.000-K |
|
Banco Santander 522 Series-M (1) |
|
Chile |
|
UF |
|
4.85% |
|
4.75% |
|
Biannual |
|
No |
|
— |
|
33,863,539 |
|
33,863,539 |
|
33,444,839 |
|
33,444,839 |
|
33,444,839 |
|
33,444,839 |
|
32,759,896 |
|
166,539,252 |
76.536.353-5 |
|
Enel Chile S.A. |
|
Chile |
|
Foreign |
|
BNY Mellon - Single |
|
USA |
|
US$ |
|
5.24% |
|
4.88% |
|
Upon expiration |
|
No |
|
— |
|
2,256,758 |
|
2,256,758 |
|
— |
|
— |
|
— |
|
865,156,308 |
|
— |
|
865,156,308 |
|
|
|
|
|
|
|
|
|
|
|
|
|
|
|
|
Total |
|
|
|
|
|
9,020,288 |
|
397,982,394 |
|
407,002,682 |
|
41,097,026 |
|
41,097,026 |
|
221,341,228 |
|
905,228,214 |
|
123,934,393 |
|
1,332,697,887 |
1) |
Related to liabilities associated with covenants (See Note 36.4. Financial Restrictions item 2. Financial Covenants), which amount to ThCh$162,730,212 as of December 31, 2024 and ThCh$196,122,880 as of December 31, 2023. |
20.3 Secured liabilities
As of December 31, 2024 and 2023, there were no secured liabilities.
Fair value measurement and hierarchy
The fair value of the current and non-current secured and unsecured liabilities as of December 31, 2024 was ThCh$1,586,382,068 (ThCh$1,813,354,006 as of December 31, 2023). These liabilities have been categorized as Level 2 (see Note 3 h). It is important to note that these financial liabilities are measured at amortized cost (see note 3 g.4).
F-102
20.4 Hedged debt
The debt denominated in U.S. dollars held by the Group as of December 31, 2024 was equivalent to ThCh$0 (ThCh$1,134,993,280 as of December 31, 2023) and is related to future cash flow hedges for the Group’s U.S. dollar-linked operating revenues (see Note 3.g.5).
The following table details changes in “Reserve for cash flow hedges” as of December 31, 2024 and 2023 due to exchange differences:
|
|
For the years ended December 31, |
||||
|
|
2024 |
|
2023 |
|
2022 |
|
|
ThCh$ |
|
ThCh$ |
|
ThCh$ |
Balance in hedging reserves (income hedge) at the beginning of the year net |
|
(341,729,245) |
|
(313,681,107) |
|
(281,553,799) |
Foreign currency translation differences recorded in equity, net |
|
(89,918,107) |
|
(77,802,235) |
|
(79,982,722) |
Allocation of foreign currency exchange differences to profit or loss, net |
|
431,647,352 |
|
49,754,097 |
|
47,855,414 |
Balance in hedging reserves (income hedge) at the end of the year net (i) |
|
- |
|
(341,729,245) |
|
(313,681,107) |
(i) |
Considering the anticipated change in functional currency for Enel Generación Chile starting in 2025, these accounting hedges lose their effectiveness and, therefore, due to the change in risk management objectives, were prospectively discontinued. At the end of the 2024 fiscal year, the accumulated amount in the corresponding cash flow hedge reserves, where financial liabilities were defined as hedging instruments, amounted to ThCh $521,524,727, before taxes and minority interests. This amount was fully recognized as lower revenues for 2024 (see Notes 23.2.a, 28.1, and 41.i). |
20.5 Other information
As of December 31, 2024, the Group has unconditional long-term credit lines available of ThCh$687,557,400 (ThCh$473,644,800 as of December 31, 2023).
F-103
20.6 Future undiscounted debt flows.
The following tables are the estimates of undiscounted flows by type of financial debt:
| a) | Summary of secured and unsecured bank borrowings |
|
|
|
|
|
|
|
|
|
|
|
|
|
|
|
|
|
|
|
|
|
|
|
|
|
|
|
|
|
|
|
|
|
|
|
|
|
|
|
|
|
|
|
|
|
|
|
12-31-2024 |
|
12-31-2023 |
||||||||||||||||||||||||||||||||
|
|
|
|
|
|
Current |
|
Non-Current |
|
Current |
|
Non-Current |
||||||||||||||||||||||||||||
|
|
|
|
|
|
Maturity |
|
|
|
Maturity |
|
|
|
Maturity |
|
|
|
Maturity |
|
|
||||||||||||||||||||
Country |
|
Currency |
|
Nominal |
|
Less than 90 days |
|
More than 90 days |
|
Total |
|
One |
|
Two |
|
Three |
|
Four |
|
More |
|
Total |
|
Less than 90 days |
|
More than 90 days |
|
Total |
|
One |
|
Two |
|
Three |
|
Four |
|
More |
|
Total |
|
|
|
|
|
|
ThCh$ |
|
ThCh$ |
|
ThCh$ |
|
ThCh$ |
|
ThCh$ |
|
ThCh$ |
|
ThCh$ |
|
ThCh$ |
|
ThCh$ |
|
ThCh$ |
|
ThCh$ |
|
ThCh$ |
|
ThCh$ |
|
ThCh$ |
|
ThCh$ |
|
ThCh$ |
|
ThCh$ |
|
ThCh$ |
Chile |
|
US$ |
|
3.63% |
|
12,442,991 |
|
38,020,251 |
|
50,463,242 |
|
241,207,402 |
|
94,561,862 |
|
93,247,890 |
|
91,726,554 |
|
703,736,625 |
|
1,224,480,333 |
|
4,328,459 |
|
148,032,780 |
|
152,361,239 |
|
32,578,347 |
|
179,751,687 |
|
50,591,710 |
|
50,497,511 |
|
465,392,457 |
|
778,811,712 |
Chile |
|
CLP |
|
6.00% |
|
3 |
|
— |
|
3 |
|
— |
|
— |
|
— |
|
— |
|
— |
|
— |
|
3 |
|
— |
|
3 |
|
— |
|
— |
|
— |
|
— |
|
— |
|
— |
Total |
|
12,442,994 |
|
38,020,251 |
|
50,463,245 |
|
241,207,402 |
|
94,561,862 |
|
93,247,890 |
|
91,726,554 |
|
703,736,625 |
|
1,224,480,333 |
|
4,328,462 |
|
148,032,780 |
|
152,361,242 |
|
32,578,347 |
|
179,751,687 |
|
50,591,710 |
|
50,497,511 |
|
465,392,457 |
|
778,811,712 |
||||
| b) | Summary of guaranteed and unsecured bonds |
|
|
|
|
|
|
12-31-2024 |
|
12-31-2023 |
||||||||||||||||||||||||||||||||
|
|
|
|
|
|
|
|
|
|
|
|
Non-Current |
|
Current |
|
Non-Current |
||||||||||||||||||||||||
|
|
|
|
|
|
Maturity |
|
|
|
Maturity |
|
|
|
Maturity |
|
|
|
Maturity |
|
|
||||||||||||||||||||
Country |
|
Currency |
|
Nominal |
|
Less than 90 days |
|
More than 90 days |
|
Total |
|
One |
|
Two |
|
Three |
|
Four |
|
More |
|
Total |
|
Less than 90 days |
|
More than 90 days |
|
Total |
|
One |
|
Two |
|
Three |
|
Four |
|
More |
|
Total |
|
|
|
|
|
|
ThCh$ |
|
ThCh$ |
|
ThCh$ |
|
ThCh$ |
|
ThCh$ |
|
ThCh$ |
|
ThCh$ |
|
ThCh$ |
|
ThCh$ |
|
ThCh$ |
|
ThCh$ |
|
ThCh$ |
|
ThCh$ |
|
ThCh$ |
|
ThCh$ |
|
ThCh$ |
|
ThCh$ |
|
ThCh$ |
Chile |
|
US$ |
|
7.05% |
|
20,985,526 |
|
53,202,362 |
|
74,187,888 |
|
74,187,887 |
|
264,396,015 |
|
1,027,168,814 |
|
8,555,657 |
|
370,682,608 |
|
1,744,990,981 |
|
20,050,165 |
|
400,670,073 |
|
420,720,238 |
|
65,302,852 |
|
65,302,852 |
|
232,730,900 |
|
904,151,004 |
|
333,819,188 |
|
1,601,306,796 |
Chile |
|
UF |
|
5.48% |
|
2,597,632 |
|
50,217,648 |
|
52,815,280 |
|
50,631,034 |
|
48,446,788 |
|
48,081,992 |
|
36,145,400 |
|
- |
|
183,305,214 |
|
3,036,733 |
|
49,666,384 |
|
52,703,117 |
|
50,578,025 |
|
48,486,304 |
|
46,394,583 |
|
46,045,239 |
|
34,614,282 |
|
226,118,433 |
Total |
|
23,583,158 |
|
103,420,010 |
|
127,003,168 |
|
124,818,921 |
|
312,842,803 |
|
1,075,250,806 |
|
44,701,057 |
|
370,682,608 |
|
1,928,296,195 |
|
23,086,898 |
|
450,336,457 |
|
473,423,355 |
|
115,880,877 |
|
113,789,156 |
|
279,125,483 |
|
950,196,243 |
|
368,433,470 |
|
1,827,425,229 |
||||
F-104
21. LEASE LIABILITIES
As of December 31, 2024 and 2023, the balance of lease liabilities is as follows:
|
|
Current |
|
Non-Current |
||||
Lease liability |
|
12-31-2024 |
|
12-31-2023 |
|
12-31-2024 |
|
12-31-2023 |
Lease liability |
|
26,886,119 |
|
24,138,193 |
|
267,718,931 |
|
243,924,027 |
Total |
|
26,886,119 |
|
24,138,193 |
|
267,718,931 |
|
243,924,027 |
21.1. Individualization of Lease Liabilities
|
|
|
|
|
|
|
|
|
|
|
|
|
|
|
|
|
|
|
|
|
|
|
|
|
|
|
|
|
|
|
|
|
|
|
|
|
|
|
|
|
|
|
|
|
|
|
|
|
|
|
|
|
|
12-31-2024 |
|
||||||||||||||||
|
|
|
|
|
|
|
|
|
|
|
|
|
|
|
|
|
|
Maturiry |
|
|
|
Maturity |
|
|
|
||||||||||
Taxpayer ID |
|
Company |
|
Country |
|
Taxpayer ID |
|
Company |
|
Country |
|
Currency |
|
Effective |
|
Maturity |
|
Less than |
|
More |
|
Total |
|
One to |
|
Two to |
|
Three to |
|
Four to |
|
More |
|
Total Non- |
|
91.081.000-6 |
|
Enel Generación Chile S.A. |
|
Chile |
|
10.579.624-2 |
|
Marcelo Alberto Amar Basulto |
|
Chile |
|
UF |
|
2.06% |
|
Monthly |
|
6,561 |
|
16,880 |
|
23,441 |
|
26,992 |
|
27,547 |
|
28,113 |
|
28,691 |
|
152,007 |
|
263,350 |
|
91.081.000-6 |
|
Enel Generación Chile S.A. |
|
Chile |
|
91.004.000-6 |
|
Productos Fernandez S.A. |
|
Chile |
|
UF |
|
2.09% |
|
Monthly |
|
12,344 |
|
37,655 |
|
49,999 |
|
50,800 |
|
51,862 |
|
52,948 |
|
54,055 |
|
380,899 |
|
590,564 |
|
91.081.000-6 |
|
Enel Generación Chile S.A. |
|
Chile |
|
61.216.000-7 |
|
Empresa de Ferrocarriles del Estado |
|
Chile |
|
UF |
|
0.10% |
|
Biannual |
|
5,751 |
|
5,772 |
|
11,523 |
|
11,511 |
|
— |
|
— |
|
— |
|
— |
|
11,511 |
|
91.081.000-6 |
|
Enel Generación Chile S.A. |
|
Chile |
|
78.086.990-9 |
|
Inversiones San Isidro |
|
Chile |
|
UF |
|
2.86% |
|
Monthly |
|
1,676 |
|
5,136 |
|
6,812 |
|
1,132 |
|
— |
|
— |
|
— |
|
— |
|
1,132 |
|
91.081.000-6 |
|
Enel Generación Chile S.A. |
|
Chile |
|
77.088.295-8 |
|
Consultoria y transpor. |
|
Chile |
|
UF |
|
4.15% |
|
Monthly |
|
6,957 |
|
21,858 |
|
28,815 |
|
29,463 |
|
30,711 |
|
32,011 |
|
13,637 |
|
— |
|
105,822 |
|
91.081.000-6 |
|
Enel Generación Chile S.A. |
|
Chile |
|
81.591.800-2 |
|
Cuerpo de bomberos Quillota |
|
Chile |
|
UF |
|
2.86% |
|
Monthly |
|
1,341 |
|
4,109 |
|
5,450 |
|
906 |
|
— |
|
— |
|
— |
|
— |
|
906 |
|
96.800.570-7 |
|
Enel Distribución Chile S.A. |
|
Chile |
|
70.015.730-K |
|
Mutual de Seguros de Chile |
|
Chile |
|
UF |
|
1.91% |
|
Monthly |
|
22,828 |
|
60,424 |
|
83,252 |
|
96,813 |
|
— |
|
— |
|
— |
|
— |
|
96,813 |
|
96.800.570-7 |
|
Enel Distribución Chile S.A. |
|
Chile |
|
76.596.523-3 |
|
Capital Investi |
|
Chile |
|
UF |
|
1.91% |
|
Monthly |
|
18,703 |
|
55,272 |
|
73,975 |
|
85,303 |
|
— |
|
— |
|
— |
|
— |
|
85,303 |
|
96.800.570-7 |
|
Enel Distribución Chile S.A. |
|
Chile |
|
61.219.000-3 |
|
Empresa de Transporte de Pasajeros Metro S.A. |
|
Chile |
|
US$ |
|
5.99% |
|
Annual |
|
— |
|
263,260 |
|
263,260 |
|
103,394 |
|
104,910 |
|
111,190 |
|
117,845 |
|
501,306 |
|
938,645 |
|
96.800.570-7 |
|
Enel Distribución Chile S.A. |
|
Chile |
|
99.530.420-1 |
|
Inmobiliaria Nialem S.A. |
|
Chile |
|
UF |
|
0.40% |
|
Monthly |
|
57,590 |
|
— |
|
57,590 |
|
18,868 |
|
— |
|
— |
|
— |
|
— |
|
18,868 |
|
96.800.570-7 |
|
Enel Distribución Chile S.A. |
|
Chile |
|
76.013.489-9 |
|
Inversiones Don Issa Ltda. |
|
Chile |
|
UF |
|
1.87% |
|
Monthly |
|
4,030 |
|
16,367 |
|
20,397 |
|
55,988 |
|
— |
|
— |
|
— |
|
— |
|
55,988 |
|
96.800.570-7 |
|
Enel Distribución Chile S.A. |
|
Chile |
|
76.164.095-K |
|
Inmobiliaria Mixto Renta Spa |
|
Chile |
|
UF |
|
7.10% |
|
Monthly |
|
28,476 |
|
85,791 |
|
114,267 |
|
17,885 |
|
— |
|
— |
|
— |
|
— |
|
17,885 |
|
96.800.570-7 |
|
Enel Distribución Chile S.A. |
|
Chile |
|
78.844.390-0 |
|
Poliplast |
|
Chile |
|
UF |
|
5.36% |
|
Monthly |
|
11,076 |
|
33,563 |
|
44,639 |
|
— |
|
— |
|
— |
|
— |
|
— |
|
— |
|
96.800.570-7 |
|
Enel Distribución Chile S.A. |
|
Chile |
|
96.643.660-3 |
|
Inmobiliaria El Roble S.A. |
|
Chile |
|
UF |
|
0.79% |
|
Monthly |
|
18,829 |
|
56,461 |
|
75,290 |
|
11,937 |
|
— |
|
— |
|
— |
|
— |
|
11,937 |
|
96.800.570-7 |
|
Enel Distribución Chile S.A. |
|
Chile |
|
76.378.333-2 |
|
Inmobiliaria Fernandez |
|
Chile |
|
UF |
|
7.13% |
|
Monthly |
|
25,617 |
|
68,673 |
|
94,290 |
|
76,043 |
|
— |
|
— |
|
— |
|
— |
|
76,043 |
|
96.800.570-7 |
|
Enel Distribución Chile S.A. |
|
Chile |
|
76.409.056-k |
|
ALD Automovile Ltda. |
|
Chile |
|
UF |
|
5.29% |
|
Monthly |
|
8,912 |
|
26,837 |
|
35,749 |
|
33,839 |
|
— |
|
— |
|
— |
|
— |
|
33,839 |
|
76.412.562-2 |
|
Enel Green Power Chile S.A. |
|
Chile |
|
61.402.000-8 |
|
Ministerio de Bienes Nacionales |
|
Chile |
|
EUR |
|
5.01% |
|
Annual |
|
— |
|
735,385 |
|
735,385 |
|
261,937 |
|
275,083 |
|
288,889 |
|
303,387 |
|
1,389,127 |
|
2,518,423 |
|
76.412.562-2 |
|
Enel Green Power Chile S.A. |
|
Chile |
|
61.402.000-8 |
|
Ministerio de Bienes Nacionales |
|
Chile |
|
UF |
|
3.13% |
|
Annual |
|
3,710,703 |
|
13,364,038 |
|
17,074,741 |
|
4,494,016 |
|
4,638,067 |
|
5,084,923 |
|
5,230,952 |
|
183,366,273 |
|
202,814,231 |
|
76.412.562-2 |
|
Enel Green Power Chile S.A. |
|
Chile |
|
76.364.150-3 |
|
Inversiones Interover Sur S.A. |
|
Chile |
|
UF |
|
3.83% |
|
Annual |
|
81,643 |
|
106,613 |
|
188,256 |
|
59,511 |
|
61,677 |
|
63,921 |
|
66,247 |
|
1,188,092 |
|
1,439,448 |
|
76.412.562-2 |
|
Enel Green Power Chile S.A. |
|
Chile |
|
76.400.311-K |
|
Fundo Los Buenos Aires SpA |
|
Chile |
|
UF |
|
2.54% |
|
Annual |
|
284,771 |
|
— |
|
284,771 |
|
103,379 |
|
106,006 |
|
108,699 |
|
111,460 |
|
1,133,906 |
|
1,563,450 |
|
76.412.562-2 |
|
Enel Green Power Chile S.A. |
|
Chile |
|
5.704.494-2 |
|
Pablo Rioseco and Others |
|
Chile |
|
UF |
|
4.94% |
|
Annual |
|
31,812 |
|
— |
|
31,812 |
|
5,064 |
|
5,315 |
|
5,577 |
|
5,853 |
|
88,092 |
|
109,901 |
|
76.412.562-2 |
|
Enel Green Power Chile S.A. |
|
Chile |
|
10.249.202-1 |
|
Juan Rioseco and Others |
|
Chile |
|
UF |
|
3.91% |
|
Annual |
|
43,399 |
|
— |
|
43,399 |
|
11,154 |
|
11,706 |
|
12,285 |
|
12,892 |
|
152,727 |
|
200,764 |
|
76.412.562-2 |
|
Enel Green Power Chile S.A. |
|
Chile |
|
5.704.494-2 |
|
Pablo Rioseco and Others |
|
Chile |
|
UF |
|
4.94% |
|
Annual |
|
10,022 |
|
— |
|
10,022 |
|
2,532 |
|
2,657 |
|
2,789 |
|
2,927 |
|
44,232 |
|
55,137 |
|
76.412.562-2 |
|
Enel Green Power Chile S.A. |
|
Chile |
|
77.378.630-5 |
|
Agricola Santa Amalia |
|
Chile |
|
UF |
|
4.40% |
|
Annual |
|
129,565 |
|
— |
|
129,565 |
|
22,309 |
|
23,412 |
|
24,570 |
|
25,785 |
|
245,784 |
|
341,860 |
|
76.412.562-2 |
|
Enel Green Power Chile S.A. |
|
Chile |
|
77.378.630-5 |
|
Agricola Santa Amalia |
|
Chile |
|
UF |
|
4.94% |
|
Annual |
|
81,068 |
|
— |
|
81,068 |
|
22,309 |
|
23,412 |
|
24,570 |
|
25,785 |
|
302,092 |
|
398,168 |
|
76.412.562-2 |
|
Enel Green Power Chile S.A. |
|
Chile |
|
77.894.990-3 |
|
Orafti Chile S.A. |
|
Chile |
|
UF |
|
4.94% |
|
Annual |
|
16,853 |
|
— |
|
16,853 |
|
10,629 |
|
11,154 |
|
11,706 |
|
12,285 |
|
153,613 |
|
199,387 |
|
76.412.562-2 |
|
Enel Green Power Chile S.A. |
|
Chile |
|
78.201.750-0 |
|
Sociedad Agricola Parant |
|
Chile |
|
UF |
|
4.94% |
|
Annual |
|
26,915 |
|
— |
|
26,915 |
|
3,678 |
|
3,860 |
|
4,050 |
|
4,251 |
|
70,523 |
|
86,362 |
|
76.412.562-2 |
|
Enel Green Power Chile S.A. |
|
Chile |
|
4.595.479-K |
|
Sucesión Aguilera Parada |
|
Chile |
|
UF |
|
4.47% |
|
Annual |
|
243,013 |
|
— |
|
243,013 |
|
63,775 |
|
66,928 |
|
70,237 |
|
73,710 |
|
967,179 |
|
1,241,829 |
|
76.412.562-2 |
|
Enel Green Power Chile S.A. |
|
Chile |
|
10.966.957-8 |
|
Macarena Rioseco |
|
Chile |
|
UF |
|
3.91% |
|
Annual |
|
32,026 |
|
— |
|
32,026 |
|
5,315 |
|
5,577 |
|
5,853 |
|
6,142 |
|
80,156 |
|
103,043 |
|
76.412.562-2 |
|
Enel Green Power Chile S.A. |
|
Chile |
|
76.170.091-K |
|
Multicenter SpA |
|
Chile |
|
UF |
|
5.95% |
|
Annual |
|
— |
|
550,881 |
|
550,881 |
|
210,717 |
|
628,078 |
|
— |
|
— |
|
— |
|
838,795 |
|
76.412.562-2 |
|
Enel Green Power Chile S.A. |
|
Chile |
|
77.423.282-6 |
|
Sociedad Agrícola La Cruz |
|
Chile |
|
UF |
|
4.29% |
|
Annual |
|
2,284 |
|
— |
|
2,284 |
|
— |
|
— |
|
— |
|
— |
|
— |
|
— |
|
76.412.562-2 |
|
Enel Green Power Chile S.A. |
|
Chile |
|
76.064.627-K |
|
Forestal Danco |
|
Chile |
|
UF |
|
5.92% |
|
Annual |
|
— |
|
58,928 |
|
58,928 |
|
304,104 |
|
94,694 |
|
100,299 |
|
106,234 |
|
5,748,397 |
|
6,353,728 |
|
76.412.562-2 |
|
Enel Green Power Chile S.A. |
|
Chile |
|
7.872.865-5 |
|
Paulina Camus Bories |
|
Chile |
|
UF |
|
3.35% |
|
Annual |
|
— |
|
8,415 |
|
8,415 |
|
53,500 |
|
56,045 |
|
59,119 |
|
62,358 |
|
227,610 |
|
458,632 |
|
76.412.562-2 |
|
Enel Green Power Chile S.A. |
|
Chile |
|
96.629.120-6 |
|
Agricola Esmeralda |
|
Chile |
|
UF |
|
5.30% |
|
Annual |
|
576,148 |
|
— |
|
576,148 |
|
55,600 |
|
57,500 |
|
58,952 |
|
62,440 |
|
6,870,823 |
|
7,105,315 |
|
76.412.562-2 |
|
Enel Green Power Chile S.A. |
|
Chile |
|
76.238.102-8 |
|
Crucero Este Uno SpA |
|
Chile |
|
UF |
|
2.96% |
|
Annual |
|
— |
|
27,781 |
|
27,781 |
|
41,572 |
|
42,233 |
|
42,904 |
|
43,586 |
|
721,343 |
|
891,638 |
|
76.412.562-2 |
|
Enel Green Power Chile S.A. |
|
Chile |
|
84.810.200-8 |
|
Huertos Carmen Sociedad Agrícola Limitada |
|
Chile |
|
US$ |
|
3.61% |
|
Annual |
|
27,164 |
|
— |
|
27,164 |
|
44,866 |
|
— |
|
— |
|
— |
|
— |
|
44,866 |
|
76.412.562-2 |
|
Enel Green Power Chile S.A. |
|
Chile |
|
99.576.780-5 |
|
Inversiones E Inmobiliaria Itraque S.A. |
|
Chile |
|
UF |
|
3.70% |
|
Annual |
|
9,303 |
|
— |
|
9,303 |
|
4,009 |
|
4,157 |
|
4,309 |
|
4,470 |
|
277,229 |
|
294,174 |
|
76.412.562-2 |
|
Enel Green Power Chile S.A. |
|
Chile |
|
79.771.340-6 |
|
Agricola El Tapial Ltda. |
|
Chile |
|
UF |
|
3.70% |
|
Annual |
|
— |
|
27,797 |
|
27,797 |
|
14,231 |
|
14,756 |
|
15,303 |
|
15,869 |
|
631,645 |
|
691,804 |
|
76.412.562-2 |
|
Enel Green Power Chile S.A. |
|
Chile |
|
5.121.031-K |
|
Sergio Jose Retamal Iglesias |
|
Chile |
|
UF |
|
5.72% |
|
Annual |
|
197,333 |
|
— |
|
197,333 |
|
42,608 |
|
45,043 |
|
47,615 |
|
50,338 |
|
3,012,908 |
|
3,198,512 |
|
76.412.562-2 |
|
Enel Green Power Chile S.A. |
|
Chile |
|
6.372.943-4 |
|
Francisco Javier Ovalle Irarrazabal |
|
Chile |
|
UF |
|
3.70% |
|
Annual |
|
— |
|
87,231 |
|
87,231 |
|
20,488 |
|
21,242 |
|
22,029 |
|
22,844 |
|
923,562 |
|
1,010,165 |
|
76.412.562-2 |
|
Enel Green Power Chile S.A. |
|
Chile |
|
77.412.950-2 |
|
Inverko S.A. |
|
Chile |
|
UF |
|
5.70% |
|
Annual |
|
45,907 |
|
— |
|
45,907 |
|
30,266 |
|
30,675 |
|
31,089 |
|
31,508 |
|
747,391 |
|
870,929 |
|
76.412.562-2 |
|
Enel Green Power Chile S.A. |
|
Chile |
|
79.745.330-7 |
|
Soc. Aagricola Ancona Ltda. |
|
Chile |
|
US$ |
|
0.07% |
|
Annual |
|
— |
|
7,896 |
|
7,896 |
|
127,416 |
|
127,500 |
|
260,360 |
|
260,531 |
|
7,371,528 |
|
8,147,335 |
|
76.412.562-2 |
|
Enel Green Power Chile S.A. |
|
Chile |
|
84.810.200-2 |
|
Huertos Carmen Soc. Agricola Lt. |
|
Chile |
|
US$ |
|
0.07% |
|
Annual |
|
1,987 |
|
— |
|
1,987 |
|
28,974 |
|
17,328 |
|
— |
|
— |
|
— |
|
46,302 |
|
76.412.562-2 |
|
Enel Green Power Chile S.A. |
|
Chile |
|
76.769.393-1 |
|
Rentas Coquimbo SpA |
|
Chile |
|
UF |
|
7.74% |
|
Annual |
|
28,373 |
|
— |
|
28,373 |
|
— |
|
— |
|
— |
|
— |
|
— |
|
— |
|
76.126.507-5 |
|
Parque Eólico Talinay Oriente S.A. |
|
Chile |
|
76.248.317-3 |
|
Agricola Alto Talinay |
|
Chile |
|
EUR |
|
4.61% |
|
Annual |
|
987,211 |
|
— |
|
987,211 |
|
309,933 |
|
324,221 |
|
339,167 |
|
354,803 |
|
2,174,977 |
|
3,503,101 |
|
76.536.353-5 |
|
Enel Chile S.A. |
|
Chile |
|
76.203.473-5 |
|
Territoria Apoquindo S:A |
|
Chile |
|
UF |
|
4.17% |
|
Monthly |
|
1,111,140 |
|
3,141,857 |
|
4,252,997 |
|
4,344,762 |
|
4,559,017 |
|
4,843,202 |
|
5,049,178 |
|
2,069,857 |
|
20,866,016 |
|
76.536.353-5 |
|
Enel Chile S.A. |
|
Chile |
|
96.839.400-2 |
|
Inversiones San Jorge |
|
Chile |
|
UF |
|
4.34% |
|
Monthly |
|
58,231 |
|
43,677 |
|
101,908 |
|
17,010 |
|
|
|
|
|
|
|
|
|
17,010 |
|
|
|
|
|
|
|
Total |
|
|
|
|
|
|
|
|
|
|
|
7,967,562 |
|
18,918,557 |
|
26,886,119 |
|
11,336,538 |
|
11,472,373 |
|
11,756,679 |
|
12,160,063 |
|
220,993,278 |
|
267,718,931 |
|
F-105
|
|
|
|
|
|
|
|
|
|
|
|
|
|
|
|
|
|
12-31-2023 |
|
||||||||||||||||
|
|
|
|
|
|
|
|
|
|
|
|
|
|
|
|
|
|
Maturiry |
|
|
|
Maturity |
|
|
|
||||||||||
Taxpayer ID |
|
Company |
|
Country |
|
Taxpayer ID |
|
Company |
|
Country |
|
Currency |
|
Effective |
|
Maturity |
|
Less than |
|
More |
|
Total |
|
One to |
|
Two to |
|
Three to |
|
Four to |
|
More |
|
Total Non- |
|
91.081.000-6 |
|
Enel Generación Chile S.A. |
|
Chile |
|
10.579.624-2 |
|
Marcelo Alberto Amar Basulto |
|
Chile |
|
UF |
|
2.06% |
|
Monthly |
|
3,273 |
|
18,659 |
|
21,932 |
|
25,328 |
|
25,849 |
|
26,380 |
|
26,921 |
|
168,892 |
|
273,370 |
|
91.081.000-6 |
|
Enel Generación Chile S.A. |
|
Chile |
|
91.004.000-6 |
|
Productos Fernandez S.A. |
|
Chile |
|
UF |
|
2.09% |
|
Monthly |
|
13,029 |
|
35,097 |
|
48,126 |
|
47,652 |
|
48,648 |
|
49,665 |
|
50,705 |
|
345,211 |
|
541,881 |
|
91.081.000-6 |
|
Enel Generación Chile S.A. |
|
Chile |
|
78.392.580-K |
|
Agricola el Bagual Ltda. |
|
Chile |
|
UF |
|
1.91% |
|
Annual |
|
12 |
|
— |
|
12 |
|
— |
|
— |
|
— |
|
— |
|
— |
|
— |
|
91.081.000-6 |
|
Enel Generación Chile S.A. |
|
Chile |
|
99.527.200-8 |
|
Rentaequipos Tramaca S.A. |
|
Chile |
|
UF |
|
0.83% |
|
Monthly |
|
144,477 |
|
— |
|
144,477 |
|
— |
|
— |
|
— |
|
— |
|
— |
|
— |
|
91.081.000-6 |
|
Enel Generación Chile S.A. |
|
Chile |
|
96.565.580-8 |
|
Compañía de Leasing Tattersall S A. |
|
Chile |
|
UF |
|
0.83% |
|
Monthly |
|
11,524 |
|
— |
|
11,524 |
|
— |
|
— |
|
— |
|
— |
|
— |
|
— |
|
91.081.000-6 |
|
Enel Generación Chile S.A. |
|
Chile |
|
61.216.000-7 |
|
Empresa de Ferrocarriles del Estado |
|
Chile |
|
UF |
|
0.10% |
|
Biannual |
|
5,503 |
|
5,505 |
|
11,008 |
|
11,017 |
|
11,027 |
|
— |
|
— |
|
— |
|
22,044 |
|
96.800.570-7 |
|
Enel Distribución Chile S.A. |
|
Chile |
|
70.015.730-K |
|
Mutual de Seguros de Chile |
|
Chile |
|
UF |
|
1.91% |
|
Monthly |
|
15,030 |
|
63,461 |
|
78,491 |
|
86,028 |
|
85,784 |
|
— |
|
— |
|
— |
|
171,812 |
|
96.800.570-7 |
|
Enel Distribución Chile S.A. |
|
Chile |
|
76.596.523-3 |
|
Capital Investi |
|
Chile |
|
UF |
|
1.91% |
|
Monthly |
|
18,343 |
|
51,879 |
|
70,222 |
|
70,327 |
|
64,227 |
|
— |
|
— |
|
— |
|
134,554 |
|
96.800.570-7 |
|
Enel Distribución Chile S.A. |
|
Chile |
|
76.253.641-2 |
|
Bcycle Latam S.P.A |
|
Chile |
|
CLP |
|
6.24% |
|
Annual |
|
99,719 |
|
— |
|
99,719 |
|
18,825 |
|
— |
|
— |
|
— |
|
— |
|
18,825 |
|
96.800.570-7 |
|
Enel Distribución Chile S.A. |
|
Chile |
|
61.219.000-3 |
|
Empresa de Transporte de Pasajeros Metro S.A. |
|
Chile |
|
US$ |
|
5.99% |
|
Annual |
|
— |
|
327,729 |
|
327,729 |
|
82,209 |
|
87,130 |
|
92,345 |
|
97,873 |
|
755,674 |
|
1,115,231 |
|
96.800.570-7 |
|
Enel Distribución Chile S.A. |
|
Chile |
|
96.565.580-8 |
|
Compañia de Leasing Tattersall S. A. |
|
Chile |
|
UF |
|
1.41% |
|
Monthly |
|
13,244 |
|
— |
|
13,244 |
|
— |
|
— |
|
— |
|
— |
|
— |
|
— |
|
96.800.570-7 |
|
Enel Distribución Chile S.A. |
|
Chile |
|
99.530.420-1 |
|
Inmobiliaria Nialem S.A. |
|
Chile |
|
UF |
|
0.40% |
|
Monthly |
|
19,352 |
|
165,114 |
|
184,466 |
|
91,981 |
|
— |
|
— |
|
— |
|
— |
|
91,981 |
|
96.800.570-7 |
|
Enel Distribución Chile S.A. |
|
Chile |
|
76.013.489-9 |
|
Inversiones Don Issa Ltda. |
|
Chile |
|
UF |
|
1.87% |
|
Monthly |
|
174,242 |
|
69,597 |
|
243,839 |
|
61,405 |
|
— |
|
— |
|
— |
|
— |
|
61,405 |
|
96.800.570-7 |
|
Enel Distribución Chile S.A. |
|
Chile |
|
76.203.089-6 |
|
Rentas Inmobiliarias Amanecer S.A. |
|
Chile |
|
UF |
|
2.84% |
|
Monthly |
|
6,800 |
|
49,032 |
|
55,832 |
|
26,488 |
|
— |
|
— |
|
— |
|
— |
|
26,488 |
|
96.800.570-7 |
|
Enel Distribución Chile S.A. |
|
Chile |
|
76.164.095-K |
|
Inmobiliaria Mixto Renta Spa |
|
Chile |
|
UF |
|
3.78% |
|
Monthly |
|
11,369 |
|
— |
|
11,369 |
|
21,071 |
|
— |
|
— |
|
— |
|
— |
|
21,071 |
|
96.800.570-7 |
|
Enel Distribución Chile S.A. |
|
Chile |
|
78.844.390-0 |
|
Poliplast |
|
Chile |
|
UF |
|
5.36% |
|
Monthly |
|
10,425 |
|
30,288 |
|
40,713 |
|
42,322 |
|
10,760 |
|
— |
|
— |
|
— |
|
53,082 |
|
96.800.570-7 |
|
Enel Distribución Chile S.A. |
|
Chile |
|
96.643.660-3 |
|
Inmobiliaria El Roble S.A. |
|
Chile |
|
UF |
|
0.79% |
|
Monthly |
|
23,740 |
|
53,594 |
|
77,334 |
|
71,957 |
|
72,483 |
|
— |
|
— |
|
— |
|
144,440 |
|
96.800.570-7 |
|
Enel Distribución Chile S.A. |
|
Chile |
|
76.378.333-2 |
|
Inmobiliaria Fernandez |
|
Chile |
|
UF |
|
7.13% |
|
Monthly |
|
23,272 |
|
69,660 |
|
92,932 |
|
98,215 |
|
— |
|
— |
|
— |
|
— |
|
98,215 |
|
76.412.562-2 |
|
Enel Green Power Chile S.A. |
|
Chile |
|
61.402.000-8 |
|
Ministerio de Bienes Nacionales |
|
Chile |
|
UF |
|
3.03% |
|
Annual |
|
2,851,919 |
|
12,471,821 |
|
15,323,740 |
|
3,349,055 |
|
4,050,273 |
|
3,975,272 |
|
4,110,447 |
|
174,285,601 |
|
189,770,648 |
|
76.412.562-2 |
|
Enel Green Power Chile S.A. |
|
Chile |
|
61.402.000-8 |
|
Ministerio de Bienes Nacionales |
|
Chile |
|
EUR |
|
5.02% |
|
Annual |
|
— |
|
660,708 |
|
660,708 |
|
233,135 |
|
244,835 |
|
257,123 |
|
270,028 |
|
1,551,305 |
|
2,556,426 |
|
76.412.562-2 |
|
Enel Green Power Chile S.A. |
|
Chile |
|
76.400.311-K |
|
Fundo Los Buenos Aires SpA |
|
Chile |
|
UF |
|
2.54% |
|
Annual |
|
266,289 |
|
— |
|
266,289 |
|
96,311 |
|
98,759 |
|
101,268 |
|
103,841 |
|
1,332,777 |
|
1,732,956 |
|
76.412.562-2 |
|
Enel Green Power Chile S.A. |
|
Chile |
|
3.750.131-K |
|
Federico Rioseco Garcia |
|
Chile |
|
UF |
|
4.94% |
|
Annual |
|
58,607 |
|
— |
|
58,607 |
|
9,448 |
|
9,915 |
|
10,405 |
|
10,919 |
|
188,973 |
|
229,660 |
|
76.412.562-2 |
|
Enel Green Power Chile S.A. |
|
Chile |
|
3.750.132-8 |
|
Juan Rioseco Garcia |
|
Chile |
|
UF |
|
4.94% |
|
Annual |
|
49,370 |
|
— |
|
49,370 |
|
12,459 |
|
13,075 |
|
13,721 |
|
14,400 |
|
228,913 |
|
282,568 |
|
76.412.562-2 |
|
Enel Green Power Chile S.A. |
|
Chile |
|
4.595.479-K |
|
Adriana Castro Parra |
|
Chile |
|
UF |
|
4.94% |
|
Annual |
|
119,141 |
|
— |
|
119,141 |
|
20,309 |
|
21,313 |
|
22,367 |
|
23,473 |
|
343,140 |
|
430,602 |
|
76.412.562-2 |
|
Enel Green Power Chile S.A. |
|
Chile |
|
77.378.630-5 |
|
Agricola Santa Amalia |
|
Chile |
|
UF |
|
4.94% |
|
Annual |
|
75,277 |
|
— |
|
75,277 |
|
20,308 |
|
21,312 |
|
22,366 |
|
23,472 |
|
346,026 |
|
433,484 |
|
76.412.562-2 |
|
Enel Green Power Chile S.A. |
|
Chile |
|
77.894.990-3 |
|
Orafti Chile S.A. |
|
Chile |
|
UF |
|
4.94% |
|
Annual |
|
20,905 |
|
— |
|
20,905 |
|
9,676 |
|
10,154 |
|
10,656 |
|
11,183 |
|
175,078 |
|
216,747 |
|
76.412.562-2 |
|
Enel Green Power Chile S.A. |
|
Chile |
|
78.201.750-0 |
|
Sociedad Agricola Parant |
|
Chile |
|
UF |
|
4.94% |
|
Annual |
|
249,846 |
|
— |
|
249,846 |
|
61,402 |
|
64,438 |
|
67,624 |
|
70,967 |
|
1,177,873 |
|
1,442,304 |
|
76.412.562-2 |
|
Enel Green Power Chile S.A. |
|
Chile |
|
76.259.106-5 |
|
Inmobiliaria Terra Australis Tres S.A. |
|
Chile |
|
UF |
|
6.39% |
|
Biannual |
|
26,228 |
|
146,619 |
|
172,847 |
|
54,856 |
|
56,851 |
|
58,920 |
|
61,064 |
|
1,233,202 |
|
1,464,893 |
|
76.412.562-2 |
|
Enel Green Power Chile S.A. |
|
Chile |
|
79.938.160-5 |
|
Soc. Serv. Com. Multiservice F.L. |
|
Chile |
|
UF |
|
2.94% |
|
Annual |
|
— |
|
83,382 |
|
83,382 |
|
307,686 |
|
— |
|
— |
|
— |
|
794,551 |
|
1,102,237 |
|
76.412.562-2 |
|
Enel Green Power Chile S.A. |
|
Chile |
|
76.064.627-K |
|
Fortestal Danco |
|
Chile |
|
UF |
|
2.42% |
|
Annual |
|
— |
|
150,907 |
|
150,907 |
|
40,501 |
|
41,480 |
|
42,482 |
|
43,509 |
|
2,034,449 |
|
2,202,421 |
|
76.412.562-2 |
|
Enel Green Power Chile S.A. |
|
Chile |
|
96.629.120-6 |
|
Agricola Esmeralda |
|
Chile |
|
UF |
|
5.24% |
|
Annual |
|
— |
|
102,540 |
|
102,540 |
|
56,310 |
|
56,315 |
|
56,317 |
|
56,317 |
|
7,089,408 |
|
7,314,667 |
|
76.412.562-2 |
|
Enel Green Power Chile S.A. |
|
Chile |
|
84.810.200-8 |
|
Huertos Carmen Sociedad Agrícola Limitada |
|
Chile |
|
US$ |
|
3.56% |
|
Annual |
|
29,461 |
|
— |
|
29,461 |
|
— |
|
— |
|
— |
|
— |
|
— |
|
— |
|
76.412.562-2 |
|
Enel Green Power Chile S.A. |
|
Chile |
|
99.576.780-5 |
|
Inversiones E Inmobiliaria Itraque S.A. |
|
Chile |
|
UF |
|
3.70% |
|
Annual |
|
48,985 |
|
— |
|
48,985 |
|
3,694 |
|
3,830 |
|
3,971 |
|
4,116 |
|
131,496 |
|
147,107 |
|
76.412.562-2 |
|
Enel Green Power Chile S.A. |
|
Chile |
|
77.412.950-2 |
|
Inverko S A |
|
Chile |
|
UF |
|
5.70% |
|
Annual |
|
8,115 |
|
14,833 |
|
22,948 |
|
25,536 |
|
27,030 |
|
23,442 |
|
— |
|
— |
|
76,008 |
|
76.412.562-2 |
|
Enel Green Power Chile S.A. |
|
Chile |
|
79.771.340-6 |
|
Agricola El Tapial Ltda. |
|
Chile |
|
UF |
|
3.70% |
|
Annual |
|
— |
|
29,436 |
|
29,436 |
|
13,108 |
|
13,595 |
|
14,096 |
|
14,619 |
|
613,471 |
|
668,889 |
|
76.412.562-2 |
|
Enel Green Power Chile S.A. |
|
Chile |
|
6.372.943-4 |
|
Francisco Javier Ovalle Irarrazabal |
|
Chile |
|
UF |
|
3.70% |
|
Annual |
|
37,539 |
|
— |
|
37,539 |
|
19,572 |
|
19,572 |
|
20,293 |
|
21,045 |
|
896,011 |
|
976,493 |
|
76.412.562-2 |
|
Enel Green Power Chile S.A. |
|
Chile |
|
5.121.031-K |
|
Sergio Jose Retamal Iglesias |
|
Chile |
|
UF |
|
5.71% |
|
Annual |
|
141,635 |
|
— |
|
141,635 |
|
38,502 |
|
40,704 |
|
43,030 |
|
45,487 |
|
2,860,340 |
|
3,028,063 |
|
76.126.507-5 |
|
Parque Eólico Talinay Oriente S.A. |
|
Chile |
|
76.248.317-3 |
|
Agricola Alto Talinay |
|
Chile |
|
EUR |
|
4.61% |
|
Annual |
|
871,180 |
|
— |
|
871,180 |
|
276,931 |
|
289,698 |
|
303,053 |
|
317,023 |
|
1,787,483 |
|
2,974,188 |
|
76.536.353-5 |
|
Enel Chile S.A. |
|
Chile |
|
76.203.473-5 |
|
Territoria Apoquindo S:A |
|
Chile |
|
UF |
|
4.17% |
|
Monthly |
|
1,037,198 |
|
2,889,588 |
|
3,926,786 |
|
3,990,986 |
|
4,160,718 |
|
4,365,897 |
|
4,638,044 |
|
6,806,739 |
|
23,962,384 |
|
76.536.353-5 |
|
Enel Chile S.A. |
|
Chile |
|
96.839.400-2 |
|
Inversiones San Jorge |
|
Chile |
|
UF |
|
4.34% |
|
Monthly |
|
38,257 |
|
125,438 |
|
163,695 |
|
136,883 |
|
— |
|
— |
|
— |
|
— |
|
136,883 |
|
|
|
|
|
|
|
Total |
|
|
|
|
|
|
|
|
|
|
|
6,523,306 |
|
17,614,887 |
|
24,138,193 |
|
9,531,493 |
|
9,649,775 |
|
9,580,693 |
|
10,015,453 |
|
205,146,613 |
|
243,924,027 |
|
21.2. Undiscounted debt cash flows.
The following tables are the estimates of undiscounted cash flows:
|
|
|
|
|
|
12-31-2024 |
|
12-31-2023 |
||||||||||||||||||||||||||||||||
|
|
|
|
|
|
Maturity |
|
|
|
Maturity |
|
|
|
Maturity |
|
|
|
Maturity |
|
|
||||||||||||||||||||
Country |
|
Currency |
|
Nominal Interest Rate |
|
Less than 90 days |
|
More than 90 days |
|
Total Current |
|
One to two years |
|
Two to three years |
|
Three to four years |
|
Four to five years |
|
More than five years |
|
Total Non-Current |
|
Less than 90 days |
|
More than 90 days |
|
Total Current |
|
One to two years |
|
Two to three years |
|
Three to four years |
|
Four to five years |
|
More than five years |
|
Total Non-Current |
|
|
|
|
|
|
ThCh$ |
|
ThCh$ |
|
ThCh$ |
|
ThCh$ |
|
ThCh$ |
|
ThCh$ |
|
ThCh$ |
|
ThCh$ |
|
ThCh$ |
|
ThCh$ |
|
ThCh$ |
|
ThCh$ |
|
ThCh$ |
|
ThCh$ |
|
ThCh$ |
|
ThCh$ |
|
ThCh$ |
|
ThCh$ |
Chile |
|
US$ |
|
2.43% |
|
50,217 |
|
270,032 |
|
320,249 |
|
310,123 |
|
337,921 |
|
332,436 |
|
326,716 |
|
6,904,393 |
|
8,211,589 |
|
277,786 |
|
605,501 |
|
883,287 |
|
217,694 |
|
204,865 |
|
196,689 |
|
188,670 |
|
959,457 |
|
1,767,375 |
Chile |
|
EUR |
|
4.81% |
|
793,228 |
|
649,595 |
|
1,442,823 |
|
869,408 |
|
840,028 |
|
811,240 |
|
781,265 |
|
3,688,853 |
|
6,990,794 |
|
285,363 |
|
— |
|
285,363 |
|
367,773 |
|
355,867 |
|
343,961 |
|
332,284 |
|
1,741,828 |
|
3,141,713 |
Chile |
|
UF |
|
3.98% |
|
7,770,994 |
|
20,639,984 |
|
28,410,978 |
|
21,224,722 |
|
20,201,594 |
|
19,351,366 |
|
18,870,159 |
|
429,493,985 |
|
509,141,826 |
|
6,633,708 |
|
22,483,077 |
|
29,116,785 |
|
21,976,524 |
|
21,110,001 |
|
20,418,361 |
|
19,967,906 |
|
443,451,766 |
|
526,924,558 |
Chile |
|
CLP |
|
6.24% |
|
- |
|
- |
|
- |
|
- |
|
- |
|
— |
|
— |
|
— |
|
- |
|
99,719 |
|
- |
|
99,719 |
|
18,825 |
|
- |
|
— |
|
— |
|
— |
|
18,825 |
Total |
|
8,614,439 |
|
21,559,611 |
|
30,174,050 |
|
22,404,253 |
|
21,379,543 |
|
20,495,042 |
|
19,978,140 |
|
440,087,231 |
|
524,344,209 |
|
7,296,576 |
|
23,088,578 |
|
30,385,154 |
|
22,580,816 |
|
21,670,733 |
|
20,959,011 |
|
20,488,860 |
|
446,153,051 |
|
531,852,471 |
||||
F-106
22. RISK MANAGEMENT POLICY
The Group companies follow the guidelines of the Risk Management Control System (“SCGR” in its Spanish acronym) defined at the Holding level (Enel S.p.A.), which establishes rules for managing risks through the respective standards, procedures, systems, etc., applicable to the different levels of the Group companies, in the business risk identification, analysis, evaluation, treatment, and communication processes the business addresses on a continuous basis. These guidelines are approved by the Enel S.p.A. Board of Directors, which includes a Risk and Controls Committee responsible for supporting the Enel Chile Board’s evaluation and decisions regarding internal control and risk management system, as well as those related to the approval of periodic financial statements.
To comply with the guidelines, each company has its own specific Control Management and Risk Management policy, which is reviewed and approved each year by the Enel Chile Board of Directors, observing and applying all local requirements in terms of the risk culture.
The Company seeks protection against all risks that could affect the achievement of the business objectives. The Enel Group has a risk taxonomy for the entire Group which considers 6 risk macro-categories: financial; strategic; governance and culture; digital technology; compliance; and operational; and 37 risk sub-categories to identify, analyze, assess, evaluate, treat, monitor and communicate their risks.
The Enel Group risk management system considers three lines of action (defense) to obtain effective and efficient risk management and controls. Each of these three “lines” plays a different role within the organization’s broader governance structure (Business and Internal Control areas acting as the first line, Risk Control as the second line, and Internal Audit as the third line of defense). Each line of defense has the obligation to report to and keep senior management and the Directors up-to-date on risk management. In this sense, the first and second lines of defense report to the senior management, and the second and third lines report to the Directors.
Within each of the Group’s companies, the risk management is decentralized. Each manager responsible for the operating process in which the risk arises is also responsible for treating the risk and adopting risk control and mitigating measures.
22.1 Interest rate risk
Changes in interest rates affect the fair value of assets and liabilities bearing fixed interest rates, as well as the expected future cash flows of assets and liabilities subject to floating interest rates.
The objective of managing interest rate risk exposure is to achieve a balance in the debt structure to minimize the cost of debt with reduced volatility in profit or loss.
The Group’s financial debt structure per fixed and/or hedged interest rate on gross, net of hedging derivative instruments engaged, is as follows:
|
|
For the years ended December 31, |
||
|
|
2024 |
|
2023 |
|
|
% |
|
% |
Fixed interest rate |
|
89% |
|
88% |
This ratio only considers debt transactions between third parties and Enel Finance International N.V., if any.
Depending on the Group’s estimates and the objectives of the debt structure, hedging transactions are performed by entering into derivative contracts to mitigate these risks.
Risk control through specific processes and indicators allows companies to limit possible adverse financial impacts and, at the same time, optimize the debt structure with an adequate degree of flexibility.
The US dollar LIBOR (London Interbank Offered Rate) was discontinued on June 30, 2023 and was replaced by the SOFR (Secured Overnight Financing Rate) reference rate. In June 2023, the Group successfully completed the transition from LIBOR to SOFR for 100% of its financial and derivative contracts, in line with market standards.
F-107
22.2 Exchange rate risk
Exchange rate risks involve basically the following transactions:
| - | Debt taken on by the Group’s companies that is denominated in a currency other than the currency in which its cash flows are indexed. |
| - | Payments to be made in a currency other than the one to which its cash flows are indexed, for example, for the acquisition of materials associated with projects and payments of corporate insurance policies, among others. |
| - | Income in Group companies directly linked to changes in currencies other than the currency of its cash flows. |
In order to minimize foreign currency risk, the Group’s foreign currency risk management policy is based on cash flows and includes maintaining a balance between U.S. dollar flows and the levels of assets and liabilities denominated in such currency. The objective is to minimize the exposure to variability in cash flows that are attributable to foreign exchange risk.
The hedging instruments currently being used to comply with the policy are currency swaps and forward exchange contracts.
During 2024, the respective Boards of Directors of Enel Chile, Enel Generación Chile, and Empresa Eléctrica Pehuenche agreed to change the functional currency of these companies from Chilean pesos to US dollars, as of January 1, 2025, since the U.S. dollar will become the currency that will significantly influence the economic environment in which each of them operates (see Note 41.i).
22.3 Commodities risk
The Group has a risk exposure to price fluctuations in certain commodities, basically due to:
| - | Purchases of fuel used to generate electricity. |
| - | Energy purchase/sale transactions that take place in local markets. |
To reduce the risk in situations of extreme drought, the Group has designed a commercial policy that defines the levels of sales commitments in line with the capacity of its generating power plants in a dry year. It also includes risk mitigation terms in certain contracts with unregulated customers and with regulated customers subject to long-term tender processes, establishing indexation polynomials that allow for reducing commodities exposure risk.
Considering the operating conditions faced by the power generation market, with drought and highly volatile commodity prices on international markets, the Company is constantly evaluating the use of hedging to minimize the impacts that these price fluctuations have on its results.
As of December 31, 2024, there are active Brent hedges to be settled totaling 45 kBbl associated with purchases. Regarding gas, no active hedges to be settled were recorded at the end of 2024, either in Henry Hub Swap or in Henry Hub Future. In relation to coal hedges, as of December 31, 2024, there were settlement obligations totaling 10.7 kTon corresponding to sales contracts. As of December 31, 2023, we maintained active Brent hedges to be settled totaling 551 kBbl associated with purchases and 217 kBbl in sales contracts. Regarding gas, at the end of 2023, we had active hedges in two types of commodities: a) Henry Hub Swap with 1.5 TBtu to be settled by sales, and b) Henry Hub Future, with 5.9 TBtu and 3.9 TBtu to be settled for purchases and sales, respectively. For coal hedges, as of December 31, 2023, settlement obligations totaling 47 kTon were recorded related to sales contracts.
Depending on the Group’s permanently updated operating conditions, these hedges may be modified, or include other commodities.
As a result of the mitigation strategies implemented, the Group was able to minimize the effects of the volatility of commodity prices on the profit or loss for the year ended 2024.
F-108
22.4 Liquidity risk
The Group maintains a liquidity risk management policy that consists of entering into long-term committed banking facilities and temporary financial investments for amounts that cover the projected needs over a period of time that is determined based on the situation and expectations for debt and capital markets.
The projected needs mentioned above include maturities of financial debt net of financial derivatives. For further details regarding the features and conditions of financial obligations and financial derivatives see Notes 20, 21 and 23.
As of December 31, 2024, the Group has liquidity of ThCh$383,399,319 in cash and cash equivalents and ThCh$687,557,400 in unconditionally available long-term credit lines. As of December 31, 2023, the Group had a liquidity of ThCh$563,291,290 in cash and cash equivalents and ThCh$473,644,800 in unconditionally available long-term credit lines.
22.5 Credit risk
The Group closely monitors its credit risk.
Trade receivables:
Regarding the credit risk of our electricity generation line of business, related to trade receivables, this risk is historically very limited because the customer collection period is short, accordingly, no significant individual amounts are accumulated before the service is shut-off due to late payment, according to contract conditions. For this reason, credit risk is continuously monitored, measuring the maximum amounts exposed to payment risk which is very limited.
In relation to the credit risk corresponding to the receivables stemming from distribution commercial activity, this risk is historically very limited given that the short - term billing to customers does not individually accumulate very significant amounts before the supply suspension for non-payment can occur, in accordance with the related regulation. Additionally, tracking and control measures exist for all the Company’s segments: Corporate, Public Administration, and Residential, with exclusive commercial executives assigned for dealing with Corporate and Public Administration customers, with the aim of mitigating any activity that results in risk of payment default by the customer.
Financial assets
Cash surpluses are invested in the highest-rated local and foreign financial thresholds established for each entity.
Banks that have received investment grade ratings from the three major international rating agencies (Moody’s, S&P, and Fitch) are selected for making investments.
Investments may be supported through Chilean treasury bonds and/or commercial paper issued by the highest rated banks; the latter are preferable as they offer higher returns (always in line with current investment policies).
F-109
22.6 Risk measurement
Exchange Rate Risk
In order to monitor this risk and limit the income statement volatility, the Group prepares a prospective measurement based on a monthly Monte Carlo simulation on exchange fluctuations of the General Ledger accounts mismatch over a 3-month period at 95% confidence level.
Based on the Company's estimated exposure and taking into account current hedges, the estimated impact of exchange rate fluctuations as of the next quarter would reach US$ 47.9 million.
Given that as of January 1, 2025 Enel Chile and its subsidiaries Enel Generación Chile and Empresa Eléctrica Pehuenche will adopt the US dollar as their functional currency, measurement of the exchange rate risk described above has been determined taking this into consideration.
Interest Rate Risk
Exposure associated with interest rates variance is measured as the financial expense sensitivity. The sensitivity analysis performed on the monthly interest expense shows that a 25-basis point variance in the benchmark interest rate, SOFR, would have the following effects:
| - | An increase of 25 basis points would increase the monthly interest expense by ThUS$31.25. |
| - | A decrease of 25 basis points would reduce the monthly interest expense by ThUS$31.25. |
Because of the Company's effective control over its exposure to variable rates, this risk is considered limited. To further reduce this exposure, the Company continuously monitors market scenarios and seeks a balance between fixed and variable rate financing.
F-110
23. FINANCIAL INSTRUMENTS
22.1 Financial instruments classified by type and category
| a) | The details of financial assets, classified by type and category, as of December 31, 2024 and 2023 are as follows: |
|
|
12-31-2024 |
||||||
|
|
Financial assets at fair value through profit or loss |
|
Financial assets measured at amortized cost |
|
Financial assets at fair value through other comprehensive income |
|
Financial derivatives for hedging |
|
|
ThCh$ |
|
ThCh$ |
|
ThCh$ |
|
ThCh$ |
Equity instruments |
|
— |
|
— |
|
127,854 |
|
— |
Trade and other receivables |
|
— |
|
1,530,797,366 |
|
— |
|
— |
Derivative instruments |
|
1,196 |
|
— |
|
1,950,008 |
|
8,582,940 |
Other financial assets |
|
— |
|
10,807,718 |
|
— |
|
— |
Total Current |
|
1,196 |
|
1,541,605,084 |
|
2,077,862 |
|
8,582,940 |
|
|
|
|
|
|
|
|
|
Equity instruments |
|
— |
|
— |
|
2,326,422 |
|
— |
Trade and other receivables |
|
— |
|
1,159,251,669 |
|
— |
|
— |
Derivative instruments |
|
— |
|
— |
|
— |
|
— |
Other financial assets |
|
2,319,881 |
|
— |
|
— |
|
— |
Total Non-current |
|
2,319,881 |
|
1,159,251,669 |
|
2,326,422 |
|
— |
|
|
|
|
|
|
|
|
|
Total |
|
2,321,077 |
|
2,700,856,753 |
|
4,404,284 |
|
8,582,940 |
|
|
|
|
|
|
|
|
|
|
|
12-31-2023 |
||||||
|
|
Financial assets at fair value through profit or loss |
|
Financial assets measured at amortized cost |
|
Financial assets at fair value through other comprehensive income |
|
Financial derivatives for hedging |
|
|
ThCh$ |
|
ThCh$ |
|
ThCh$ |
|
ThCh$ |
Equity instruments |
|
— |
|
— |
|
127,854 |
|
— |
Trade and other receivables |
|
— |
|
1,496,875,382 |
|
— |
|
— |
Derivative instruments |
|
46,128 |
|
— |
|
2,693,292 |
|
58,009,661 |
Other financial assets |
|
— |
|
9,552,991 |
|
— |
|
— |
Total Current |
|
46,128 |
|
1,506,428,373 |
|
2,821,146 |
|
58,009,661 |
|
|
|
|
|
|
|
|
|
Equity instruments |
|
— |
|
— |
|
2,326,466 |
|
— |
Trade and other receivables |
|
— |
|
903,678,141 |
|
— |
|
— |
Derivative instruments |
|
— |
|
— |
|
— |
|
9,275,919 |
Total Non-current |
|
— |
|
903,678,141 |
|
2,326,466 |
|
9,275,919 |
|
|
|
|
|
|
|
|
|
Total |
|
46,128 |
|
2,410,106,514 |
|
5,147,612 |
|
67,285,580 |
F-111
| b) | The details of financial liabilities, classified by type and category, as of December 31, 2024 and 2023 are as follows: |
|
|
12-31-2024 |
||||||
|
|
Financial liabilities at fair value through profit or loss |
|
Financial liabilities measured at amortized cost |
|
Financial liabilities at fair value through other comprehensive income |
|
Financial derivatives for hedging |
|
|
|
|
ThCh$ |
|
ThCh$ |
|
ThCh$ |
Interest-bearing loans |
|
— |
|
61,229,866 |
|
— |
|
— |
Trade and other payables |
|
— |
|
1,828,004,718 |
|
— |
|
— |
Derivative instruments |
|
16,616 |
|
— |
|
729,271 |
|
22,461,567 |
Other financial liabilities |
|
— |
|
26,886,119 |
|
— |
|
— |
Total Current |
|
16,616 |
|
1,916,120,703 |
|
729,271 |
|
22,461,567 |
|
|
|
|
|
|
|
|
|
Interest-bearing loans |
|
— |
|
2,368,746,913 |
|
— |
|
— |
Trade and other payables |
|
— |
|
1,981,976,990 |
|
— |
|
— |
Derivative instruments |
|
— |
|
— |
|
— |
|
5,215,190 |
Other financial liabilities |
|
— |
|
267,718,931 |
|
— |
|
— |
Total Non-current |
|
— |
|
4,618,442,834 |
|
— |
|
5,215,190 |
|
|
|
|
|
|
|
|
|
Total |
|
16,616 |
|
6,534,563,537 |
|
729,271 |
|
27,676,757 |
|
|
|
|
|
|
|
|
|
|
|
12-31-2023 |
||||||
|
|
Financial liabilities at fair value through profit or loss |
|
Financial liabilities measured at amortized cost |
|
Financial liabilities at fair value through other comprehensive income |
|
Financial derivatives for hedging |
|
|
ThCh$ |
|
ThCh$ |
|
ThCh$ |
|
ThCh$ |
Interest-bearing loans |
|
— |
|
542,220,313 |
|
— |
|
— |
Trade and other payables |
|
— |
|
1,911,613,832 |
|
— |
|
— |
Derivative instruments |
|
640 |
|
— |
|
15,456,599 |
|
72,793,962 |
Other financial liabilities |
|
— |
|
24,138,193 |
|
— |
|
— |
Total Current |
|
640 |
|
2,477,972,338 |
|
15,456,599 |
|
72,793,962 |
|
|
|
|
|
|
|
|
|
Interest-bearing loans |
|
— |
|
1,897,563,167 |
|
— |
|
— |
Trade and other payables |
|
— |
|
1,630,326,076 |
|
— |
|
— |
Derivative instruments |
|
— |
|
— |
|
— |
|
6,949,774 |
Other financial liabilities |
|
— |
|
243,924,027 |
|
— |
|
— |
Total Non-current |
|
— |
|
3,771,813,270 |
|
— |
|
6,949,774 |
|
|
|
|
|
|
|
|
|
Total |
|
640 |
|
6,249,785,608 |
|
15,456,599 |
|
79,743,736 |
The carrying value of trade receivables and payables approximates their fair value.
23.2 Derivative instruments
The risk management policy of the Group uses primarily interest rate and foreign exchange rate derivatives to hedge its exposure to interest rate and foreign currency risks.
The Company classifies its hedges as follows:
| - | Cash flow hedges: Those that hedge the cash flows of the underlying hedged item. |
| - | Fair value hedges: Those that hedge the fair value of the underlying hedged item. |
| - | Non-hedge derivatives: Financial derivatives that do not meet the requirements established by IFRS to be designated as hedging instruments are recognized at fair value through profit or loss (financial assets held for trading). |
F-112
| a) | Assets and liabilities for hedge derivative instruments |
As of December 31, 2024 and 2023, financial derivative qualifying as hedging instruments resulted in recognition of the following assets and liabilities in the statement of financial position:
|
|
12-31-2024 |
|
12-31-2023 |
||||||||||||
|
|
Assets |
|
Liabilities |
|
Assets |
|
Liabilities |
||||||||
|
|
Current |
|
Non-current |
|
Current |
|
Non-current |
|
Current |
|
Non-current |
|
Current |
|
Non-current |
|
|
ThCh$ |
|
ThCh$ |
|
ThCh$ |
|
ThCh$ |
|
ThCh$ |
|
ThCh$ |
|
ThCh$ |
|
ThCh$ |
Interest rate hedge: |
|
74,283 |
|
— |
|
— |
|
3,118,600 |
|
1,075,171 |
|
— |
|
— |
|
— |
Cash flow hedge |
|
74,283 |
|
— |
|
— |
|
3,118,600 |
|
1,075,171 |
|
— |
|
— |
|
— |
Exchange rate hedge: |
|
8,508,657 |
|
— |
|
22,461,567 |
|
2,096,590 |
|
56,934,490 |
|
9,275,919 |
|
72,793,962 |
|
6,949,774 |
Cash flow hedge (i) |
|
8,508,657 |
|
— |
|
22,461,567 |
|
2,096,590 |
|
56,934,490 |
|
9,275,919 |
|
72,793,962 |
|
6,949,774 |
TOTAL |
|
8,582,940 |
|
— |
|
22,461,567 |
|
5,215,190 |
|
58,009,661 |
|
9,275,919 |
|
72,793,962 |
|
6,949,774 |
Additionally, the details of the associated instruments and underlying assets are presented in a complementary manner:
|
|
|
|
|
|
|
|
|
|
|
|
|
|
|
|
|
|
|
12-31-2024 |
|
12-31-2023 |
||||||||||||
|
|
Assets |
|
Liabilities |
|
Assets |
|
Liabilities |
||||||||
Description of Instruments covered |
|
Current |
|
Non-current |
|
Current |
|
Non-current |
|
Current |
|
Non-current |
|
Current |
|
Non-current |
|
|
ThCh$ |
|
ThCh$ |
|
ThCh$ |
|
ThCh$ |
|
ThCh$ |
|
ThCh$ |
|
ThCh$ |
|
ThCh$ |
Finance debt |
|
8,582,940 |
|
- |
|
7,627,420 |
|
5,215,190 |
|
46,969,512 |
|
8,252,744 |
|
37,011,496 |
|
5,004,408 |
Investments in property, plant & equipment |
|
- |
|
- |
|
278,000 |
|
- |
|
715,556 |
|
229,145 |
|
597,382 |
|
- |
Operating income (i) |
|
- |
|
- |
|
14,556,147 |
|
- |
|
9,228,335 |
|
794,030 |
|
34,222,093 |
|
1,945,366 |
Other |
|
- |
|
- |
|
- |
|
- |
|
1,096,258 |
|
- |
|
962,991 |
|
- |
TOTAL |
|
8,582,940 |
|
- |
|
22,461,567 |
|
5,215,190 |
|
58,009,661 |
|
9,275,919 |
|
72,793,962 |
|
6,949,774 |
(i) Considering the anticipated change in functional currency for Enel Generación Chile, the accounting hedges associated with a portion of the revenues of this subsidiary, which are directly linked to the evaluation of the US dollar, lose their effectiveness. Therefore, due to the change in risk management objectives, they were prospectively discontinued. At the end of the 2024 fiscal year, the accumulated amount in the cash flow hedge reserves, where financial derivatives were defined as the hedging instrument, amounted to ThCh$98,638,969, before taxes and minority interests. This amount was fully recognized as lower revenues for 2024 (see Notes 20.3, 28.1, and 41.i).
| - | General information Related to Hedging Derivative Instruments |
Hedging derivative instruments and their corresponding hedged instruments are shown in the following table:
|
|
|
|
|
|
|
|
|
|
|
|
|
|
|
|
|
|
|
Fair value of |
|
Fair value of |
Type of |
|
Description |
|
Description |
|
Type |
|
hedged item |
|
hedged item |
hedge |
|
of hedged |
|
of hedged |
|
of |
|
12-31-2024 |
|
12-31-2023 |
instrument |
|
risk |
|
item |
|
risk hedged |
|
ThCh$ |
|
ThCh$ |
SWAP |
|
Exchange rate |
|
Unsecured obligations (bonds) |
|
Cash flow |
|
(1,215,353) |
|
12,131,181 |
SWAP |
|
Interest rate |
|
Loans with related parties |
|
Cash flow |
|
(3,044,317) |
|
1,075,171 |
FORWARD |
|
Exchange rate |
|
Operating income |
|
Cash flow |
|
(14,556,147) |
|
(26,145,093) |
FORWARD |
|
Exchange rate |
|
Investments in property, plant & equipment |
|
Cash flow |
|
(278,000) |
|
347,318 |
FORWARD |
|
Interest rate |
|
Other |
|
Cash flow |
|
— |
|
133,267 |
As of December 31, 2024 and 2023, the Group has not recognized significant gains or losses for ineffective cash flow hedges.
At the reporting date, the Group did not establish fair value hedging relationships.
F-113
| b) | Financial derivative instruments assets and liabilities at fair value through profit or loss |
As of December 31, 2024 and 2023, liabilities were recognized in the statement of financial position as a result of financial derivative transactions that are recorded at fair value through profit or loss. The amounts are detailed as follows:
|
|
|
|
|
|
|
|
|
|
|
|
|
|
|
|
|
|
|
12-31-2024 |
|
12-31-2023 |
||||||||||||
|
|
Current |
|
Current |
|
Non-Current |
|
Non-Current |
|
Current |
|
Current |
|
Non-Current |
|
Non-Current |
|
|
ThCh$ |
|
ThCh$ |
|
ThCh$ |
|
ThCh$ |
|
ThCh$ |
|
ThCh$ |
|
ThCh$ |
|
ThCh$ |
Non-hedging derivative instrument |
|
— |
|
14,145 |
|
— |
|
— |
|
46,128 |
|
640 |
|
— |
|
— |
Total |
|
— |
|
14,145 |
|
— |
|
— |
|
46,128 |
|
640 |
|
— |
|
— |
These derivative instruments correspond to forward contracts entered into by the Group, the purpose of which is to hedge the exchange rate risk related to future obligations arising from civil works contracts linked to the construction of the Los Cóndores Plant. Although these hedges have an economic substance, they do not qualify for hedge accounting because they do not strictly comply with the hedge accounting requirements established in IFRS 9 Financial Instruments.
| c) | Other information on derivatives: |
The following table sets forth the fair value of hedging and non-hedging derivatives entered into by the Group as well as the remaining contractual maturities as of December 31, 2024 and 2023:
|
|
|
|
|
|
|
|
|
|
|
|
|
|
|
|
|
|
|
12-31-2024 |
||||||||||||||
|
|
|
|
Notional Amount |
||||||||||||
|
|
Fair value |
|
Less than 1 year |
|
1-2 years |
|
2-3 years |
|
3-4 years |
|
4-5 years |
|
More than 5 years |
|
Total |
Financial derivatives |
|
ThCh$ |
|
ThCh$ |
|
ThCh$ |
|
ThCh$ |
|
ThCh$ |
|
ThCh$ |
|
|
|
ThCh$ |
Interest rate hedge: |
|
(3,044,317) |
|
— |
|
— |
|
— |
|
— |
|
— |
|
284,987,560 |
|
284,987,560 |
Cash flow hedge |
|
(3,044,317) |
|
— |
|
— |
|
— |
|
— |
|
— |
|
284,987,560 |
|
284,987,560 |
Exchange rate hedge: |
|
(16,049,500) |
|
227,318,765 |
|
— |
|
— |
|
— |
|
177,585,979 |
|
— |
|
404,904,743 |
Cash flow hedge |
|
(16,049,500) |
|
227,318,765 |
|
— |
|
— |
|
— |
|
177,585,979 |
|
— |
|
404,904,743 |
Derivatives not designated for hedge accounting |
|
(14,145) |
|
2,227,579 |
|
— |
|
— |
|
— |
|
— |
|
— |
|
2,227,579 |
TOTAL |
|
(19,107,962) |
|
229,546,344 |
|
— |
|
— |
|
— |
|
177,585,979 |
|
284,987,560 |
|
692,119,882 |
|
|
|
|
|
|
|
|
|
|
|
|
|
|
|
|
|
|
|
12-31-2023 |
||||||||||||||
|
|
|
|
Notional Amount |
||||||||||||
|
|
Fair value |
|
Less than 1 year |
|
1-2 years |
|
2-3 years |
|
3-4 years |
|
4-5 years |
|
More than 5 years |
|
Total |
Financial derivatives |
|
ThCh$ |
|
ThCh$ |
|
ThCh$ |
|
ThCh$ |
|
ThCh$ |
|
ThCh$ |
|
|
|
ThCh$ |
Interest rate hedge: |
|
1,075,171 |
|
43,856,000 |
|
— |
|
— |
|
— |
|
— |
|
— |
|
43,856,000 |
Cash flow hedge |
|
1,075,171 |
|
43,856,000 |
|
— |
|
— |
|
— |
|
— |
|
— |
|
43,856,000 |
Exchange rate hedge: |
|
(13,533,327) |
|
1,490,311,984 |
|
188,944,903 |
|
— |
|
— |
|
— |
|
— |
|
1,679,256,887 |
Cash flow hedge |
|
(13,533,327) |
|
1,490,311,984 |
|
188,944,903 |
|
— |
|
— |
|
— |
|
— |
|
1,679,256,887 |
Derivatives not designated for hedge accounting |
|
45,488 |
|
3,707,241 |
|
— |
|
— |
|
— |
|
— |
|
— |
|
3,707,241 |
TOTAL |
|
(12,412,668) |
|
1,537,875,225 |
|
188,944,903 |
|
— |
|
— |
|
— |
|
— |
|
1,726,820,128 |
The notional amount of the contracts entered into does not represent the risk assumed by the Group, as this amount only relates to the basis on which the derivative settlement calculations are made.
F-114
23.3 Fair value hierarchy
Financial instruments recognized at fair value in the consolidated statement of financial position are classified based on the hierarchies described in Note 3.h.
The following table presents financial assets and liabilities measured at fair value as of December 31, 2024 and 2023:
|
|
|
|
Fair Value Measured at End of Reporting Period Using: |
||||
|
|
12-31-2024 |
|
Level 1 |
|
Level 2 |
|
Level 3 |
Financial Instruments Measured at Fair Value |
|
ThCh$ |
|
ThCh$ |
|
ThCh$ |
|
ThCh$ |
Financial Assets: |
|
|
|
|
|
|
|
|
Financial derivatives designated as cash flow hedges |
|
8,582,940 |
|
— |
|
8,582,940 |
|
— |
Derivatives of commodities designated as non-hedging of cash flow at fair value through profit or loss |
|
1,196 |
|
— |
|
1,196 |
|
— |
Derivatives of commodities designated as cash flow hedges at fair value through other comprehensive income |
|
1,950,008 |
|
— |
|
1,950,008 |
|
— |
Equity instruments at fair value through other comprehensive income |
|
2,454,276 |
|
2,326,422 |
|
127,854 |
|
— |
Total |
|
12,988,420 |
|
2,326,422 |
|
10,661,998 |
|
— |
Financial Liabilities: |
|
|
|
|
|
|
|
|
Financial derivatives designated as cash flow hedges |
|
27,676,757 |
|
— |
|
27,676,757 |
|
— |
Financial derivatives not designated for hedge accounting |
|
14,145 |
|
— |
|
14,145 |
|
— |
Derivatives of commodities designated as non-hedging of cash flow at fair value through profit or loss |
|
2,471 |
|
— |
|
2,471 |
|
— |
Derivatives of commodities designated as cash flow hedges at fair value through other comprehensive income |
|
729,271 |
|
— |
|
729,271 |
|
— |
Total |
|
28,422,644 |
|
— |
|
28,422,644 |
|
— |
|
|
|
|
|
|
|
|
|
|
|
|
|
Fair Value Measured at End of Reporting Period Using: |
||||
|
|
12-31-2023 |
|
Level 1 |
|
Level 2 |
|
Level 3 |
Financial Instruments Measured at Fair Value |
|
ThCh$ |
|
ThCh$ |
|
ThCh$ |
|
ThCh$ |
Financial Assets: |
|
|
|
|
|
|
|
|
Financial derivatives designated as cash flow hedges |
|
67,285,580 |
|
— |
|
67,285,580 |
|
— |
Financial derivatives not designated for hedge accounting |
|
46,128 |
|
— |
|
46,128 |
|
— |
Derivatives of commodities designated as cash flow hedges at fair value through other comprehensive income |
|
2,693,291 |
|
— |
|
2,693,291 |
|
— |
Equity instruments at fair value through other comprehensive income |
|
2,454,320 |
|
2,326,466 |
|
127,854 |
|
— |
Total |
|
72,479,319 |
|
2,326,466 |
|
70,152,853 |
|
— |
Financial Liabilities: |
|
|
|
|
|
|
|
|
Financial derivatives designated as cash flow hedges |
|
79,743,736 |
|
— |
|
79,743,736 |
|
— |
Financial derivatives not designated for hedge accounting |
|
640 |
|
— |
|
640 |
|
— |
Derivatives of commodities designated as cash flow hedges at fair value through other comprehensive income |
|
15,456,599 |
|
— |
|
15,456,599 |
|
— |
Total |
|
95,200,975 |
|
— |
|
95,200,975 |
|
— |
F-115
24. TRADE AND OTHER PAYABLES
As of December 31, 2024 and 2023 the details of trade and other payables, current, are as follows:
|
|
Current |
|
Non-current |
||||
|
|
12-31-2024 |
|
12-31-2023 |
|
12-31-2024 |
|
12-31-2023 |
Trade payables |
|
ThCh$ |
|
ThCh$ |
|
ThCh$ |
|
ThCh$ |
Energy suppliers (1) |
|
595,215,006 |
|
296,463,374 |
|
965,522,118 |
|
595,066,548 |
Fuel and gas suppliers |
|
189,221,414 |
|
255,565,802 |
|
— |
|
— |
Payables for goods and services |
|
483,630,510 |
|
360,701,265 |
|
— |
|
290,572 |
Payables for assets acquisition |
|
177,602,375 |
|
411,906,974 |
|
187,990 |
|
165,073 |
Subtotal Trade Payables |
|
1,445,669,305 |
|
1,324,637,415 |
|
965,710,108 |
|
595,522,193 |
Other Payables |
|
|
|
|
|
|
|
|
Dividends payable to third parties |
|
35,680,069 |
|
80,661,541 |
|
— |
|
— |
Payables to employees |
|
42,498,778 |
|
46,238,848 |
|
— |
|
— |
Other payables |
|
6,586,380 |
|
12,954,161 |
|
362,009 |
|
12,664 |
Subtotal other current payables |
|
84,765,227 |
|
139,854,550 |
|
362,009 |
|
12,664 |
Total |
|
1,530,434,532 |
|
1,464,491,965 |
|
966,072,117 |
|
595,534,857 |
(1)The non-current portion shows delays in payments for energy purchases of ThCh$965,522,118 as of December 31, 2024 and ThCh$595,066,548 as of December 31, 2023, generated by the temporary electric power pricing stabilization mechanism for customers subject to price regulation, as established in Laws No. 21,185, No. 21,472 and No. 21,667 (see Note 9.a.1.ii).
The description of the liquidity risk management policy is detailed in Note 22.4.
The details of trade payables, both current and past due as of December 31, 2024 and 2023, are presented in Appendix 3.
F-116
25. PROVISIONS
| a) | The details of provisions as of December 31, 2024 and 2023 are as follows: |
|
|
Current |
|
Non-current |
||||
|
|
12-31-2024 |
|
12-31-2023 |
|
12-31-2024 |
|
12-31-2023 |
Provisions |
|
ThCh$ |
|
ThCh$ |
|
ThCh$ |
|
ThCh$ |
Provision for legal proceedings (1) |
|
1,819,244 |
|
1,146,184 |
|
39,307,984 |
|
10,471,912 |
Decommissioning or restoration (2) |
|
27,982,094 |
|
19,604,923 |
|
175,122,600 |
|
199,692,340 |
Other provisions (3) |
|
21,550,457 |
|
4,401,603 |
|
836,117 |
|
1,436,434 |
Total |
|
51,351,795 |
|
25,152,710 |
|
215,266,701 |
|
211,600,686 |
| (1) | The main contingencies are disclosed in Note 36.3. |
| (2) | See Note 3.a. |
| (3) | The increase in 2024 primarily refers to the recognition of provisions in Enel Distribución Chile and Enel Colina related to agreements with SERNAC for the extraordinary compensation mechanism for customers affected by the prolonged supply outages that occurred during the extraordinary climatic events that occurred during the months of May and August 2024. |
The expected timing and amount of any cash outflows related to the above provisions is uncertain and depends on the resolution of specific matters related to each one. For example, specifically for litigation, this depends on the final resolution of the corresponding legal claim. Management believes that provisions recognized in the financial statements cover the related risks appropriately.
| b) | Movements in provisions as of December 31, 2024 and 2023 are as follows: |
|
|
Legal |
|
Decommissioning or |
|
Environmental Issues and Other Provisions |
|
Total |
Movements in Provisions |
|
ThCh$ |
|
ThCh$ |
|
ThCh$ |
|
ThCh$ |
Balance as of January 1, 2024 |
|
11,618,096 |
|
219,297,263 |
|
5,838,037 |
|
236,753,396 |
Increase (decrease) in existing provisions (1) |
|
38,117,388 |
|
(8,087,974) |
|
17,535,106 |
|
47,564,520 |
Provisions used (2) |
|
(1,174,206) |
|
(23,097,865) |
|
— |
|
(24,272,071) |
Reversal of unused provision |
|
(7,954,964) |
|
— |
|
(867,340) |
|
(8,822,304) |
Increase from adjustment to time value of money (3) |
|
— |
|
10,877,229 |
|
— |
|
10,877,229 |
Foreign currency translation differences |
|
520,914 |
|
4,116,041 |
|
(119,229) |
|
4,517,726 |
Total movements in provisions |
|
29,509,132 |
|
(16,192,569) |
|
16,548,537 |
|
29,865,100 |
Balance as of December 31, 2024 |
|
41,127,228 |
|
203,104,694 |
|
22,386,574 |
|
266,618,496 |
|
|
|
|
|
|
|
|
|
|
|
Legal |
|
Decommissioning or |
|
Environmental Issues and Other Provisions |
|
Total |
Movements in Provisions |
|
ThCh$ |
|
ThCh$ |
|
ThCh$ |
|
ThCh$ |
Balance as of January 1, 2023 |
|
17,104,559 |
|
192,011,837 |
|
3,255,853 |
|
212,372,249 |
Increase (decrease) in existing provisions (4) |
|
998,509 |
|
35,791,283 |
|
3,789,060 |
|
40,578,852 |
Provisions used (3) |
|
(5,369,356) |
|
(19,730,606) |
|
(63,265) |
|
(25,163,227) |
Reversal of unused provision |
|
(1,110,322) |
|
— |
|
(1,298,849) |
|
(2,409,171) |
Increase from adjustment to time value of money (3) |
|
— |
|
12,737,015 |
|
— |
|
12,737,015 |
Foreign currency translation differences |
|
(5,294) |
|
748,914 |
|
155,238 |
|
898,858 |
Decreases due to classification as held for sale (5) |
|
— |
|
(2,261,180) |
|
— |
|
(2,261,180) |
Total movements in provisions |
|
(5,486,463) |
|
27,285,426 |
|
2,582,184 |
|
24,381,147 |
Balance as of December 31, 2023 |
|
11,618,096 |
|
219,297,263 |
|
5,838,037 |
|
236,753,396 |
| (1) | The increase in legal claims during the year 2024 is mainly explained by expenses recorded in the Distribution Segment, which include, among others, fines issued by the SEF (see Note 41.iii) during the period. Regarding decommissioning or restoration provisions, the decrease in 2024 is primarily explained by the increase in interest rates observed during the period. Finally, the increase in other provisions is primarily due to the recognition of provisions related to the extraordinary compensation mechanism for customers affected by the prolonged supply outages that occurred during the extraordinary and unforeseen events of August 1 and 2, 2024, which our subsidiaries Enel Distribución Chile and Enel Colina agreed upon with SERNAC (see Note 41.vi). |
| (2) | Corresponds to the use of the provision in the dismantling processes of the Bocamina and Tarapacá power plants. |
| (3) | Corresponding to financial update, see Note 34. |
| (4) | The increase in the provision for dismantling or restoration during the year ended December 31, 2023 is primarily explained by an increase related to the Los Cóndores Power Plant of ThCh$19,053,494. The construction phase of the main elements of the civil works is practically finished, and the effect on the valuation of all obligations that originated from the drop in interest rates during the year. This was offset |
F-117
| by expenditure made during 2023, which reduce the balance of the provision and related to the dismantling processes of the Bocamina complex and the Tarapacá Power Plant. |
| (5) | See Note 5. |
26. POST-EMPLOYMENT BENEFIT OBLIGATIONS.
26.1 General information
Enel Chile S.A. and certain subsidiaries grant various post-employment benefits to either all or certain active or retired employees. These benefits are calculated and recognized in the financial statements according to the criteria described in Note 3.m.1, and include primarily the following:
Defined benefit plans:
| • | Employee severance indemnities: The beneficiary receives a certain number of contractual salary payments on the date of the employees’ retirement. This benefit becomes enforceable once the employee has provided services for a minimum period that, depending on the company, ranges from 5 to 15 years. |
| • | Complementary pension: The beneficiary is entitled to receive a monthly amount that supplements the pension obtained from the social security system. |
| • | Electricity supply: The beneficiary receives a monthly bonus, which covers a part of the billing for their home consumption. |
| • | Healthcare benefits: The beneficiary receives additional coverage that supplements the coverage provided by the social security regime. |
26.2 Details, changes and presentation in financial statements
| a) | The post-employment obligations associated with defined benefits plans as of December 31, 2024 and 2023 are as follows: |
|
|
12-31-2024 |
|
12-31-2023 |
|
|
ThCh$ |
|
ThCh$ |
Employee severance indemnities |
|
44,239,203 |
|
43,374,602 |
Complementary Pension |
|
15,680,273 |
|
14,208,449 |
Health Plans |
|
2,597,708 |
|
2,383,550 |
Energy Supply Plans |
|
3,080,972 |
|
2,853,443 |
Total post-employment obligations, net |
|
65,598,156 |
|
62,820,044 |
| b) | The following amounts were recognized in the consolidated statement of comprehensive income as of December 31, 2024, 2023 and 2022 are as follows: |
|
|
For the years ended December 31, |
||||
|
|
2024 |
|
2023 |
|
2022 |
|
|
ThCh$ |
|
ThCh$ |
|
ThCh$ |
Cost of current defined benefit plan service |
|
(1,650,001) |
|
(1,454,028) |
|
(1,362,838) |
Defined benefit plan interest cost (1) |
|
(3,478,747) |
|
(3,179,469) |
|
(3,072,155) |
Past service cost |
|
— |
|
— |
|
(31,456) |
Expenses recognized in Profit or Loss |
|
(5,128,748) |
|
(4,633,497) |
|
(4,466,449) |
Gains (losses) from remeasurement of defined benefit plans |
|
(3,051,575) |
|
(27,122) |
|
(7,304,757) |
Total expense recognized in the Statement of Comprehensive Income |
|
(8,180,323) |
|
(4,660,619) |
|
(11,771,206) |
(1) See Note 34.
F-118
| c) | The balance and movements in post-employment defined benefit obligations as of as of December 31, 2024 and 2023 are as follows: |
|
|
ThCh$ |
Balance as of January 1, 2023 |
|
62,699,415 |
Current service cost |
|
1,454,028 |
Interest cost |
|
3,179,469 |
Actuarial (gains) losses from changes in financial assumptions |
|
279,660 |
Actuarial (gains) losses from changes in experience adjustments |
|
(252,538) |
Foreign currency translation differences |
|
38,189 |
Contributions paid |
|
(5,115,909) |
Transfer of employees |
|
537,730 |
Balance as of December 31, 2023 |
|
62,820,044 |
Current service cost |
|
1,650,001 |
Interest cost |
|
3,478,747 |
Actuarial (gains) losses from changes in financial assumptions |
|
1,198,340 |
Actuarial (gains) losses from changes in experience adjustments |
|
1,853,235 |
Foreign currency translation differences |
|
(221,095) |
Contributions paid |
|
(5,489,643) |
Transfer of employees |
|
308,527 |
Balance as of December 31, 2024 |
|
65,598,156 |
26.3 Other disclosures
| • | Actuarial assumptions: |
As of December 31, 2024 and 2023, the following assumptions were used in the actuarial calculation of defined benefit plans:
|
|
12-31-2024 |
|
12-31-2023 |
Discount rates used |
|
5.10% |
|
5.31% |
Expected rate of salary increases |
|
3.80% |
|
3.80% |
Turnover rate |
|
8.74% |
|
6.80% |
Mortality tables |
|
CB-H-2020 and RV-M-2020 |
|
CB-H-2014 and RV-M-2014 |
| • | Sensitivity: |
As of December 31, 2024, the sensitivity of the actuarial liability value for post-employment benefits to variations of 100 basis points in the discount rate implies a decrease of ThCh$5,240,189 (ThCh$3,764,660 as of December 31, 2023) in the event of an increase in the rate and an increase of ThCh$6,012,598 (ThCh$3,992,164 as of December 31, 2023) in the event of a decrease in the rate.
| • | Defined contribution: |
According to the available estimate, the disbursements to cover the defined benefit plans for 2024 would amount to ThCh$6,799,514.
F-119
| • | Length of commitments: |
Enel Chile´s obligations have a weighted average length of 12.18 years and the outflows of benefits for the next 10 years is expected to be as follows:
Years |
|
ThCh$ |
1 |
|
6,799,514 |
2 |
|
6,817,977 |
3 |
|
6,940,791 |
4 |
|
7,007,504 |
5 |
|
6,843,752 |
6 to 10 |
|
31,739,715 |
27. EQUITY
27.1.Equity attributable to the owners of Enel Chile
27.1.1. Subscribed and paid capital and number of shares
The issued capital Enel Chile as of December 31, 2024 and 2023, is ThCh$3,882,103,470 divided into 69,166,557,220 authorized, subscribed, and paid shares. All shares issued by the Company are subscribed and paid. Enel Chile’s common stock is traded on the Santiago Stock Exchange (Bolsa de Comercio de Santiago de Chile), the Chilean Electronic Stock Exchange (Bolsa Electrónica de Chile), and the New York Stock Exchange (NYSE).
27.2 Dividends
Dividend No. |
|
Type of |
|
Agreement |
|
Payment Date |
|
Total Amount |
|
CLP per |
|
Charged to Fiscal |
11 |
|
Provisional |
|
11-26-2022 |
|
01-28-2022 |
|
7,260,512 |
|
0.10497 |
|
2021 |
12 |
|
Definitive |
|
04-27-2022 |
|
05-27-2022 |
|
18,285,678 |
|
0.26437 |
|
2021 |
13 |
|
Provisional |
|
11-25-2023 |
|
01-27-2023 |
|
22,416,356 |
|
0.32409 |
|
2022 |
14 |
|
Definitive |
|
04-26-2023 |
|
05-26-2023 |
|
353,208,322 |
|
5.10663 |
|
2022 |
15 |
|
Provisional |
|
11-23-2024 |
|
01-26-2024 |
|
41,348,740 |
|
0.59781 |
|
2023 |
16 |
|
Definitive |
|
04-29-2024 |
|
05-29-2024 |
|
275,379,148 |
|
3.98139 |
|
2023 |
17 |
|
Provisional |
|
11-15-2025 |
|
01-24-2025 |
|
62,713,795 |
|
0.90671 |
|
2024 |
| (1) |
27.3 Foreing currency translation reserves
The details by company of the translation differences attributable to owners of the Group of the consolidated statement of financial position as of December 31, 2024, 2023 and 2022 are as follows:
|
|
For the years ended December 31, |
||||
|
|
12-31-2024 |
|
12-31-2023 |
|
12-31-2022 |
|
|
ThCh$ |
|
ThCh$ |
|
ThCh$ |
Enel Generación Chile S.A. |
|
2,741,712 |
|
4,515,843 |
|
(4,083,680) |
GNL Chile S.A. |
|
5,014,862 |
|
1,998,444 |
|
1,459,238 |
Grupo Enel Green Power Chile |
|
445,730,854 |
|
320,041,220 |
|
299,328,951 |
TOTAL |
|
453,487,428 |
|
326,555,507 |
|
296,704,509 |
27.4 Restrictions on subsidiaries transferring funds to the parent
Our subsidiary Enel Generación Chile must comply with certain financial ratios or covenants, which require a minimum level of equity or contain other characteristics that restrict the transfer of assets to the Parent Company. As of December 31, 2024 and 2023, the Company’s interest in the net restricted assets of Enel Generación Chile was ThCh$712,519,037.
F-120
27.5 Other reserves
Other reserves for the year ended December 31, 2024, 2023 and 2022 are as follows:
|
|
01-01-2024 |
|
2024 Changes |
|
12-31-2024 |
Detail of other reserves |
|
ThCh$ |
|
ThCh$ |
|
ThCh$ |
Foreign currency translation differences |
|
326,555,507 |
|
126,931,921 |
|
453,487,428 |
Cash flow hedges |
|
(424,534,563) |
|
429,247,809 |
|
4,713,246 |
Financial assets at fair value through other comprehensive income |
|
1,772 |
|
(29) |
|
1,743 |
Other miscellaneous reserves |
|
(2,255,897,333) |
|
3,044,078 |
|
(2,252,853,255) |
TOTAL |
|
(2,353,874,617) |
|
559,223,779 |
|
(1,794,650,838) |
|
|
|
|
|
|
|
|
|
01-01-2023 |
|
2023 Changes |
|
12-31-2023 |
Detail of other reserves |
|
ThCh$ |
|
ThCh$ |
|
ThCh$ |
Foreign currency translation differences |
|
296,704,509 |
|
29,850,998 |
|
326,555,507 |
Cash flow hedges |
|
(293,168,877) |
|
(131,365,686) |
|
(424,534,563) |
Financial assets at fair value through other comprehensive income |
|
1,802 |
|
(30) |
|
1,772 |
Other miscellaneous reserves |
|
(2,262,872,826) |
|
6,975,493 |
|
(2,255,897,333) |
TOTAL |
|
(2,259,335,392) |
|
(94,539,225) |
|
(2,353,874,617) |
|
|
|
|
|
|
|
|
|
01-01-2022 |
|
2022 Changes |
|
12-31-2022 |
Detail of other reserves |
|
ThCh$ |
|
ThCh$ |
|
ThCh$ |
Foreign currency translation differences |
|
279,801,463 |
|
16,903,046 |
|
296,704,509 |
Cash flow hedges |
|
(391,523,134) |
|
98,354,257 |
|
(293,168,877) |
Financial assets at fair value through other comprehensive income |
|
1,804 |
|
(2) |
|
1,802 |
Other miscellaneous reserves |
|
(2,275,701,545) |
|
12,828,719 |
|
(2,262,872,826) |
TOTAL |
|
(2,387,421,412) |
|
128,086,020 |
|
(2,259,335,392) |
| a) | Foreign currency translation differences reserves: These reserves arise primarily from exchange differences relating to the translation of financial statements of the Company’s consolidated entities with functional currencies other than the Chilean peso (see Note 2.9). |
| b) | Cash flow hedge reserves: These reserves represent the cumulative effective portion of gains and losses on cash flow hedges (see Note 3.g.5 and 3.h). |
| c) | Other miscellaneous reserves: |
The main items and their effects are the following:
|
|
|
|
|
|
|
|
|
For the years ended |
||||
|
|
2024 |
|
2023 |
|
2022 |
Other Miscellaneous Reserves |
|
ThCh$ |
|
ThCh$ |
|
ThCh$ |
Company restructuring reserve ("Division") (i) |
|
(534,057,733) |
|
(534,057,733) |
|
(534,057,733) |
Reserve for transition to IFRS (ii) |
|
(457,221,836) |
|
(457,221,836) |
|
(457,221,836) |
Reserve for subsidiaries transactions (iii) |
|
12,502,494 |
|
12,502,494 |
|
12,502,494 |
Reserves for Tender Offer of Enel Generation “Reorganization of Renewable Assets” (iv) |
|
(910,437,224) |
|
(910,437,224) |
|
(910,437,224) |
Reserves “Reorganization of Renewable Assets” (v) |
|
(407,354,462) |
|
(407,354,462) |
|
(407,354,462) |
Argentine hyperinflation (vi) |
|
29,263,511 |
|
25,649,268 |
|
18,688,009 |
Other miscellaneous reserves (vii) |
|
14,451,995 |
|
15,022,160 |
|
15,007,926 |
TOTAL |
|
(2,252,853,255) |
|
(2,255,897,333) |
|
(2,262,872,826) |
| i) | Corporate restructuring reserve (Division): This represents the effect generated by the corporate reorganization of Enersis S.A. (currently Enel Américas), concluded in 2016, whereby the company divided its businesses between Chile and the rest of South America. The new company was called Enersis Chile (now Enel Chile), and was assigned the equity corresponding to the related businesses in Chile. |
| ii) | Reserves for transition to IFRS: In compliance with the provisions of Circular No. 456 by the CMF, the price-level restatement of accumulated paid-in capital has been incorporated in this category from the date of the Company’s transition to IFRS (i.e., January 1, 2004, through December 31, 2008). |
| iii) | Reserves for business combinations: These represent the effect generated by the purchases of interest under common control. |
F-121
| iv) | “Reorganization of Renewable Assets” Enel Generación Chile Takeover Reserve: This represents the difference between the carrying amount of non-controlling interest acquired as part of the tender offer aimed at acquiring all shares issued by the subsidiary Enel Generación Chile completed on March 16, 2018. |
| v) | “Reorganization of Renewable Assets” Reserve: This corresponds to the reserve constituted by the merger between Enel Green Power Latin América S.A. and Enel Chile on April 2, 2018. It represents the recognition of the difference produced by the capital increase in Enel Chile (corresponding to the market value of interest in Enel Green Power Chile and subsidiaries) and the carrying amount of Enel Green Power Latin América S.A. equity that was incorporated under share capital in the equity distributable to the owners of Enel Chile, as a result of the merger. |
| vi) | Hyperinflation in Argentina: This corresponds to the calculated effect of the application of IAS 29 “Financial Reporting in Hyperinflationary Economies” on the branch held by the Enel Generación Chile Group in Argentina (see Note 2.9). |
| vii) | Other miscellaneous reserves: This reserve is derived from transactions performed in the current and prior periods. |
27.6 Non-controlling Interests
As of December 31, 2024, 2023 and 2022, the detail of non-controlling interests is as follows:
|
|
|
|
Non-controlling Interests |
||||||||
|
|
|
|
Equity |
|
Profit (Loss) |
||||||
|
|
12-31-2024 |
|
12-31-2024 |
|
12-31-2023 |
|
2024 |
|
2023 |
|
2022 |
Companies |
|
% |
|
ThCh$ |
|
ThCh$ |
|
ThCh$ |
|
ThCh$ |
|
ThCh$ |
Enel Distribución Chile S.A. |
|
0.91% |
|
6,099,465 |
|
6,355,777 |
|
(231,720) |
|
127,316 |
|
201,180 |
Enel Transmisión Chile S.A. (1) |
|
0.91% |
|
— |
|
— |
|
— |
|
— |
|
441,203 |
Enel Generación Chile S.A. |
|
6.45% |
|
175,823,007 |
|
151,219,559 |
|
31,677,705 |
|
32,630,554 |
|
38,554,346 |
Empresa Eléctrica Pehuenche S.A. |
|
7.35% |
|
12,168,820 |
|
11,753,423 |
|
11,896,358 |
|
10,855,794 |
|
13,741,749 |
Sociedad AgrÍcola de Cameros Ltda. |
|
42.50% |
|
2,174,914 |
|
2,137,425 |
|
(32,653) |
|
(147,686) |
|
194,687 |
Geotermica del Norte S.A. |
|
15.41% |
|
77,091,214 |
|
66,439,207 |
|
1,550,180 |
|
461,920 |
|
(1,408,970) |
Parque Eólico Talinay Oriente S.A. |
|
39.09% |
|
89,370,921 |
|
76,728,440 |
|
2,096,724 |
|
2,606,244 |
|
5,155,807 |
Enel X Way Chile S.p.A. |
|
37.54% |
|
4,609,176 |
|
— |
|
(1,046,577) |
|
— |
|
|
Others |
|
|
|
243,577 |
|
172,523 |
|
20,801 |
|
23,474 |
|
21,529 |
TOTAL |
|
|
|
367,581,094 |
|
314,806,354 |
|
45,930,818 |
|
46,557,616 |
|
56,901,531 |
(1) See Note 2.4.1.i.
F-122
28. REVENUE AND OTHER OPERATING INCOME
The details of revenue from ordinary activities and other income for the years ended December 31, 2024, 2023 and 2022 are as follows:
|
|
For the years ended December 31, |
||||
|
|
2024 |
|
2023 |
|
2022 |
Revenues |
|
ThCh$ |
|
ThCh$ |
|
ThCh$ |
Energy sales |
|
3,579,733,604 |
|
3,690,958,879 |
|
3,555,216,142 |
|
|
|
|
|
|
|
Generation |
|
2,009,018,518 |
|
2,252,662,000 |
|
2,233,369,420 |
Regulated customers |
|
1,094,724,787 |
|
835,562,424 |
|
822,190,715 |
Unregulated customers (1) |
|
770,365,040 |
|
1,299,269,842 |
|
1,209,931,004 |
Spot market sales |
|
143,928,691 |
|
117,829,734 |
|
201,247,701 |
Distribution |
|
1,570,715,086 |
|
1,438,296,879 |
|
1,321,846,722 |
Residential |
|
841,865,489 |
|
742,496,383 |
|
732,865,039 |
Business |
|
452,894,125 |
|
435,449,860 |
|
362,207,598 |
Industrial |
|
121,963,135 |
|
120,007,325 |
|
109,083,560 |
Other consumers (2) |
|
153,992,337 |
|
140,343,311 |
|
117,690,525 |
|
|
|
|
|
|
|
Other sales |
|
270,581,235 |
|
510,542,878 |
|
716,907,816 |
Gas sales |
|
223,751,539 |
|
463,898,120 |
|
671,732,249 |
Sales of goods and services |
|
46,829,696 |
|
46,644,758 |
|
45,175,567 |
|
|
|
|
|
|
|
Revenue from other services |
|
54,418,051 |
|
61,089,340 |
|
106,876,132 |
Tolls and transmission |
|
2,728,752 |
|
897,969 |
|
52,534,938 |
Metering equipment leases |
|
3,616,652 |
|
3,494,551 |
|
3,062,728 |
Services and Business Advisories provided (Public lighting, connections and electrical advisories) |
|
34,152,201 |
|
40,495,038 |
|
35,353,775 |
Other services |
|
13,920,446 |
|
16,201,782 |
|
15,924,691 |
|
|
|
|
|
|
|
Total Revenues |
|
3,904,732,890 |
|
4,262,591,097 |
|
4,379,000,090 |
|
|
|
|
|
|
|
|
|
For the years ended December 31, |
||||
|
|
2024 |
|
2023 |
|
2022 |
Other Income |
|
ThCh$ |
|
ThCh$ |
|
ThCh$ |
Income by agreement with Shell (3) |
|
— |
|
5,613,300 |
|
460,714,800 |
Revenue from modification of contracts with suppliers (4) |
|
11,385,480 |
|
32,713,420 |
|
— |
Regasification service |
|
36,309,863 |
|
31,789,548 |
|
29,739,775 |
Income from sanctions to users |
|
3,089,109 |
|
4,548,654 |
|
3,801,165 |
Commodity derivative income |
|
3,271,860 |
|
22,968,987 |
|
66,506,258 |
Compensation from delayed suppliers |
|
948,062 |
|
625,908 |
|
3,304,994 |
Income from insurance claims |
|
14,770,520 |
|
6,074,155 |
|
8,233,249 |
Other |
|
12,627,509 |
|
13,320,924 |
|
5,131,532 |
Total other income |
|
82,402,403 |
|
117,654,896 |
|
577,431,773 |
| (1) | Revenues for 2024 show a significant decrease compared to previous years, mainly due to the discontinuation of certain accounting hedges, which implied the recognition of a significant non-recurring effect in the current year. The situation is summarized as follows: |
During the last quarter of 2024, Enel Generación Chile completed an update of the analysis on the determination of its functional currency, concluding that it should be changed from Chilean pesos to U.S. dollars, effective January 1, 2025 (see Note 41.i).
Up to then, the Company had maintained certain transactions defined as cash flow hedges, which hedged the exchange rate risk of a portion of Enel Generación Chile's revenues directly linked to the evolution of the U.S. dollar, which were managed by obtaining financing in the latter currency and through derivative contracts (see Notes 3.g5, 3n, 20.3, 22.2 and 23.2).
Considering the change of functional currency contemplated for Enel Generación Chile, the accounting hedges described above lose their effectiveness and, therefore, due to the change in the risk management objective, they were discontinued prospectively. At year-end 2024, the amount accumulated in cash flow hedge reserves, related to income directly linked to the evolution of the US dollar, amounted to ThCh$ 620,163,696, before taxes and minority interests. This amount was fully recognized as a lower revenue for the year 2024.
| (2) | For the year ended December 31, 2024, includes revenues from the sale of energy to (i) municipalities of ThCh$55,957,265 (ThCh$49,987,374 and ThCh$38,916,267 at December 31, 2023 and 2022, respectively); (ii) government entities of ThCh$42,249,686 (ThCh$38,764,296 and ThCh$32,527,895 at December 31, |
F-123
| 2023 and 2022, respectively); (iii) agricultural companies of ThCh$7,888,246 (ThCh$7,329,544 and ThCh$7,203,781 at December 31, 2023 and 2022, respectively); (iv) public and telecommunications services of ThCh$4,225,879 (ThCh$3,803,246 and ThCh$3,148,872 as of December 31, 2023 and 2022, respectively); (v) educational institutions of ThCh$1,767,169 (ThCh$1,653,215 and ThCh$2,309,902 as of December 31, 2023 and 2022, respectively); (vi) health services of ThCh$12,323,769 (ThCh$12,676,699 and ThCh$10,397,470 as of December 31, 2023 and 2022, respectively); and (vii) others of ThCh$29,580,323 (ThCh$26,128,937 and ThCh$23,186,338 as of December 31, 2023 and 2022, respectively). |
| (3) | On December 19, 2022, an agreement was signed between our subsidiary Enel Generacion Chile and Shell Global Energy Limited, Singapore Branch, for the modification of the LNG Sale and Purchase Agreement, consisting mainly of accepting the reduction of volumes committed by the supplier during the remaining term of the contract, maintaining the same level of costs and mitigating the volatility of the price formula. The price of the agreement, which amounted to US$ 520 million, was fully paid by Shell Global Energy Limited on December 29, 2022. |
| (4) | Additional income generated by the renegotiation of commercial terms considered in contracts with energy suppliers. |
29. RAW MATERIALS AND CONSUMABLES USED
The details of the item raw materials and consumables used for the years ended December 31, 2024, 2023 and 2022 are as follows:
|
|
For the years ended December 31, |
||||
|
|
2024 |
|
2023 |
|
2022 |
Raw materials and consumables used |
|
ThCh$ |
|
ThCh$ |
|
ThCh$ |
Energy purchases |
|
(1,915,342,460) |
|
(1,785,282,844) |
|
(1,885,218,041) |
Fuel consumption |
|
(334,665,363) |
|
(536,292,557) |
|
(587,063,837) |
Gas |
|
(329,031,898) |
|
(519,490,872) |
|
(441,848,645) |
Oil (*) |
|
(5,633,465) |
|
(16,801,685) |
|
(45,657,067) |
Coal (*) |
|
— |
|
— |
|
(99,558,125) |
Energy transmission cost |
|
(356,220,770) |
|
(321,591,798) |
|
(295,519,943) |
Gas sales costs |
|
(176,143,032) |
|
(243,391,369) |
|
(519,475,247) |
Other variable supplies and services |
|
(123,197,289) |
|
(109,026,891) |
|
(112,246,999) |
Total raw materials and consumables used |
|
(2,905,568,914) |
|
(2,995,585,459) |
|
(3,399,524,067) |
(*) In 2022, it includes an impairment loss of ThCh$50,136,749 related to the discontinuation of the Bocamina II power plant. For the same reason, it also includes an impairment loss associated with diesel oil of ThCh$1,076,839. For further information, see Note 16.c.iv.
30. EMPLOYEE BENEFITS EXPENSE
The details of employee expenses for the years ended December 31, 2024, 2023 and 2022 are as follows:
|
|
For the years ended December 31, |
||||
|
|
2024 |
|
2023 |
|
2022 |
Employee Benefits Expense |
|
ThCh$ |
|
ThCh$ |
|
ThCh$ |
Wages and salaries |
|
(144,874,878) |
|
(146,824,150) |
|
(141,118,974) |
Post-employment benefit obligations expense |
|
(1,650,001) |
|
(1,454,028) |
|
(1,394,294) |
Social security and other contributions |
|
(14,472,300) |
|
(15,071,705) |
|
(14,545,508) |
Other employee expenses (*) |
|
(2,939,955) |
|
(9,437,917) |
|
(1,180,617) |
Total Employee Benefits Expenses |
|
(163,937,134) |
|
(172,787,800) |
|
(158,239,393) |
(*) In 2023, this item includes an amount of ThCh$3,700,000 for restructuring expenses and provisions.
F-124
31. DEPRECIATION, AMORTIZATION AND IMPAIRMENT LOSS OF PROPERTY, PLANT AND EQUIPMENT AND FINANCIAL ASSETS UNDER IFRS 9
| a) | The details of depreciation and amortization expense for the years ended December 31, 2024, 2023 and 2022 are as follows: |
|
|
For the years ended December 31, |
||||
|
|
2024 |
|
2023 |
|
2022 |
|
|
ThCh$ |
|
ThCh$ |
|
ThCh$ |
Depreciation |
|
(273,256,545) |
|
(234,772,927) |
|
(215,986,710) |
Amortization |
|
(22,212,433) |
|
(18,626,857) |
|
(22,286,241) |
Total |
|
(295,468,978) |
|
(253,399,784) |
|
(238,272,951) |
| b) | The details of the items related to impairment for the years ended December 31, 2024, 2023 and 2022 are as follows: |
|
|
For the years ended December 31, |
||||||||||||||||||||||
|
|
Generation |
|
Distribution and Transmission |
|
Other |
|
Total |
||||||||||||||||
|
|
2024 |
|
2023 |
|
2022 |
|
2024 |
|
2023 |
|
2022 |
|
2024 |
|
2023 |
|
2022 |
|
2024 |
|
2023 |
|
2022 |
Information on Impairment Losses by Reportable Segment |
|
ThCh$ |
|
ThCh$ |
|
ThCh$ |
|
ThCh$ |
|
ThCh$ |
|
ThCh$ |
|
ThCh$ |
|
ThCh$ |
|
ThCh$ |
|
ThCh$ |
|
ThCh$ |
|
ThCh$ |
Non-current assets held for sale (1) |
|
— |
|
— |
|
(2,286,438) |
|
— |
|
— |
|
— |
|
— |
|
— |
|
— |
|
— |
|
— |
|
(2,286,438) |
Property, plant and equipment (2) |
|
(34,203,486) |
|
(7,023,888) |
|
— |
|
— |
|
— |
|
— |
|
— |
|
— |
|
— |
|
(34,203,486) |
|
(7,023,888) |
|
— |
Investment property |
|
— |
|
— |
|
— |
|
— |
|
— |
|
— |
|
— |
|
— |
|
738,739 |
|
— |
|
— |
|
738,739 |
Total Reversal of impairment losses (impairment losses) recognized in profit or loss |
|
(34,203,486) |
|
(7,023,888) |
|
(2,286,438) |
|
— |
|
— |
|
— |
|
— |
|
— |
|
738,739 |
|
(34,203,486) |
|
(7,023,888) |
|
(1,547,699) |
Impairment gain and reversals from impairment losses (impairment losses) in accordance with IFRS 9 (3) |
|
(594,370) |
|
90,538 |
|
(1,992,280) |
|
(17,842,904) |
|
(10,068,805) |
|
(20,030,616) |
|
7,418 |
|
(795,178) |
|
(2,458) |
|
(18,429,856) |
|
(10,773,445) |
|
(22,025,354) |
(1)See Note 5.2.
(2)See Note 16.
(3)See Note 9.d).
32. OTHER EXPENSE, BY NATURE
Other miscellaneous operating expense for the years ended December 31, 2024, 2023 and 2022 are as follows:
|
|
For the years ended December 31, |
||||
|
|
2024 |
|
2023 |
|
2022 |
Other Expenses by nature |
|
ThCh$ |
|
ThCh$ |
|
ThCh$ |
Professional, outsourced and other services |
|
(86,880,145) |
|
(89,383,102) |
|
(83,023,012) |
Write-off of property, plant and equipment (1) |
|
— |
|
— |
|
(52,799,997) |
Repairs and maintenance |
|
(61,737,907) |
|
(50,960,014) |
|
(50,001,947) |
Insurance premiums |
|
(29,665,139) |
|
(22,189,722) |
|
(24,551,805) |
Environmental expenses |
|
(10,165,552) |
|
(4,385,912) |
|
(10,091,657) |
Administrative expenses |
|
(11,392,046) |
|
(9,205,282) |
|
(9,895,827) |
Taxes and charges |
|
(5,881,450) |
|
(5,450,817) |
|
(6,773,397) |
Leases and rental costs |
|
(6,711,205) |
|
(5,459,314) |
|
(5,436,911) |
Marketing, public relations and advertising |
|
(2,775,046) |
|
(3,018,208) |
|
(2,991,329) |
Travel expenses |
|
(2,311,332) |
|
(2,887,832) |
|
(3,197,752) |
Indemnities and fines |
|
(725,335) |
|
(113,298) |
|
(354,539) |
Other supplies and services |
|
(18,955,033) |
|
(19,490,364) |
|
(19,916,674) |
Total |
|
(237,200,190) |
|
(212,543,865) |
|
(269,034,847) |
(1)See explanation in Note 16 c) clause v).
F-125
33. OTHER GAINS (LOSSES)
The details of other gains (losses) for the years ended December 31, 2024, 2023 and 2022 are as follows:
|
|
For the years ended December 31, |
||||
|
|
2024 |
|
2023 |
|
2022 |
Other Gains (Losses) |
|
ThCh$ |
|
ThCh$ |
|
ThCh$ |
Gain on sale of Enel Transmisión Chile S.A. (1) |
|
— |
|
— |
|
981,856,639 |
Gain on sale of investment in Arcadia Generación Solar S.A. (2) |
|
(525,517) |
|
215,618,389 |
|
— |
Profit on sale of corporate building (3) |
|
— |
|
959,228 |
|
— |
Sale of Huasco Power Station (4) |
|
— |
|
3,808,947 |
|
— |
Proceeds (losses) from sales of other property, plant and equipment |
|
— |
|
(372,916) |
|
810,776 |
Gain on sale of Transmisora Eléctrica de Quillota Ltda. (5) |
|
— |
|
1,833,289 |
|
— |
Loss on sale of Enel X AMPCI Ebus Chile SpA |
|
— |
|
— |
|
(788,848) |
Loss on sale of Sociedad de Inversiones K Cuatro SpA (6) |
|
— |
|
— |
|
(20,938) |
Gain (loss) on sale of other investments |
|
233,793 |
|
— |
|
123,667 |
Total |
|
(291,724) |
|
221,846,937 |
|
981,981,296 |
(1)See Note 5.3.
(2)See Note 5.1.
(3)See Note 5.2.
(4)See Note 16.
(5) |
Additional gain related to the sale of Transmisora Eléctrica de Quillota Ltda, carried out in December 2021, as a result of the closing of the price adjustment process established in the purchase-sale contract. |
(6)See Note 13.3.b).
34. FINANCIAL RESULTS
Finance income and costs for the years ended December 31, 2024, 2023 and 2022 are as follows:
|
|
For the years ended December 31, |
||||
|
|
2024 |
|
2023 |
|
2022 |
Finance Income |
|
ThCh$ |
|
ThCh$ |
|
ThCh$ |
Income from deposits and other financial instruments |
|
20,915,241 |
|
34,603,188 |
|
19,898,958 |
Interests charged to customers in energy accounts and billing |
|
22,242,367 |
|
22,872,508 |
|
16,001,236 |
Finance income per Law No.21,185 (1) |
|
6,236,847 |
|
6,108,432 |
|
7,455,121 |
Finance income from contracts with electrical distribution companies (2) |
|
19,201,409 |
|
62,702,987 |
|
— |
Financial update of decommissioning provisions Bocamina I, II and Tarapacá |
|
— |
|
— |
|
1,197,149 |
Finance income by Law No.21,340 and No.21,249 (6) |
|
— |
|
— |
|
3,833,564 |
Other finance income |
|
9,686,579 |
|
7,966,721 |
|
2,028,557 |
Total |
|
78,282,443 |
|
134,253,836 |
|
50,414,585 |
F-126
|
|
For the years ended December 31, |
||||
|
|
2024 |
|
2023 |
|
2022 |
Finance Costs |
|
ThCh$ |
|
ThCh$ |
|
ThCh$ |
Bank loans |
|
(50,672,605) |
|
(31,817,545) |
|
(11,590,144) |
Bonds payable to the public not guaranteed |
|
(87,599,725) |
|
(89,158,452) |
|
(92,414,063) |
Lease obligations |
|
(11,315,118) |
|
(9,688,516) |
|
(6,822,606) |
Valuation of financial derivatives for cash flow hedging |
|
2,639,395 |
|
2,036,248 |
|
(3,034,351) |
Financial cost by Law No.21,185 (1) |
|
(3,427,073) |
|
(3,363,744) |
|
(2,235,708) |
Financial update of provisions (3) |
|
(10,877,229) |
|
(12,737,015) |
|
(11,338,594) |
Post-employment benefit obligations (4) |
|
(3,478,747) |
|
(3,179,469) |
|
(3,072,155) |
Debt formalization expenses and other associated expenses |
|
(7,309,984) |
|
(4,729,704) |
|
(4,822,933) |
Capitalized borrowing costs |
|
85,267,021 |
|
81,447,057 |
|
83,292,276 |
Financial cost related companies |
|
(67,187,474) |
|
(57,701,258) |
|
(72,780,613) |
Assignment of rights and sale of accounts receivable to customers (5) |
|
(19,793,431) |
|
(30,472,335) |
|
(31,626,916) |
Financial costs by law No.21,340 and No.21,249 (6) |
|
— |
|
— |
|
(1,046,173) |
Trade agreements with customers |
|
(27,008,116) |
|
(29,585,996) |
|
(11,412,536) |
Interest taxes remitted abroad |
|
(6,365,620) |
|
(7,918,905) |
|
(10,380,979) |
Sales agreements with customers |
|
— |
|
(4,445,170) |
|
(5,090,971) |
Other financial costs (7) |
|
(25,455,556) |
|
(45,752,752) |
|
(9,241,567) |
Total |
|
(232,584,262) |
|
(247,067,556) |
|
(193,618,033) |
Gains or loss from indexed assets and liabilities, net (*) |
|
20,824,185 |
|
25,285,703 |
|
5,862,890 |
Foreign currency exchange differences (**) |
|
(21,732,058) |
|
(856,350) |
|
18,401,453 |
Total Finance Costs |
|
(233,492,135) |
|
(222,638,203) |
|
(169,353,690) |
Total Financial Results |
|
(155,209,692) |
|
(88,384,367) |
|
(118,939,105) |
| (1) | Relates to finance income and costs generated by the temporary electric power pricing stabilization mechanism for customers subject to price regulation, as established in Law No. 21,185 (see Note 9). |
| (2) | Relates to interest generated by receivables from Electric Distribution Companies, which are pending billing and have been accumulating from July 2022, due to the postponement in the issuance of the related tariff decrees. |
| (3) | See Note 25. |
| (4) | See Note 26.2, b). |
| (5) | See Note 9.a.2. |
| (6) | Costs resulting from financial discounting of accounts receivable related to the Basic Services Law (see Note 4.b). |
| (7) | During 2024, finance cost includes the amount of ThCh$9,915,488 (ThCh$35,545,640 as of December 31, 2023), related to losses on sales of financial receivables, specifically assets arising from finance lease contracts held by the Company, related to electric mobility projects. Proceeds from the sale of these financial assets amounted to ThCh$6,735,475 (ThCh$ 18,409,620 as of December 31, 2023). |
F-127
The origins of the effects on results for the application of adjustment units and foreign exchange gains (losses) are as follows:
|
|
For the years ended December 31, |
||||
|
|
2024 |
|
2023 |
|
2022 |
Gains (losses) from Indexed Assets and Liabilities (*) |
|
ThCh$ |
|
ThCh$ |
|
ThCh$ |
Other financial assets |
|
— |
|
— |
|
41,683 |
Other non-financial assets |
|
1,926,658 |
|
644,567 |
|
12,478,960 |
Trade and other receivables (1) |
|
16,027,332 |
|
24,019,915 |
|
3,086,549 |
Current tax assets and liabilities |
|
1,167,884 |
|
16,003,529 |
|
4,405,500 |
Other financial liabilities (Financial Debt and Derivative Instruments) |
|
577,115 |
|
(49,998) |
|
41,681 |
Trade and other payables |
|
1,352,591 |
|
(1,281,898) |
|
(275,114) |
Other provisions |
|
(617,065) |
|
(409,422) |
|
(772,689) |
Other non-financial liabilities |
|
73,423 |
|
(81) |
|
— |
Subtotal result after adjustment |
|
20,507,938 |
|
38,926,612 |
|
19,006,570 |
Inventories |
|
483,135 |
|
124,039 |
|
57,829 |
Intangible assets other than goodwill |
|
6,899 |
|
6,397 |
|
(130,899) |
Property, plant and equipment |
|
3,051,491 |
|
2,407,376 |
|
2,453,485 |
Deferred tax liability |
|
(585,726) |
|
(8,973,532) |
|
(9,635,742) |
Equity |
|
(3,863,513) |
|
(7,441,370) |
|
(5,842,818) |
Other Provisions of Services |
|
24,138 |
|
123 |
|
(1,900) |
Personal expenses |
|
381,973 |
|
132,101 |
|
286,371 |
Other fixed operating expenses |
|
1,186,430 |
|
97,126 |
|
324,911 |
Financial income |
|
(517,446) |
|
(7,032) |
|
(726,557) |
Financial expenses |
|
148,866 |
|
13,863 |
|
71,640 |
Subtotal Hyperinflation result (2) |
|
316,247 |
|
(13,640,909) |
|
(13,143,680) |
Gains from indexed assets and liabilities net |
|
20,824,185 |
|
25,285,703 |
|
5,862,890 |
|
|
|
|
|
|
|
|
|
For the years ended December 31, |
||||
|
|
2024 |
|
2023 |
|
2022 |
Foreign currency exchange differences (**) |
|
ThCh$ |
|
ThCh$ |
|
ThCh$ |
Cash and cash equivalents |
|
3,978,488 |
|
(8,872,872) |
|
(8,613,242) |
Other financial assets |
|
6,797,130 |
|
(16,979,855) |
|
13,779,941 |
Other non-financial assets |
|
(2,048,984) |
|
(1,610,766) |
|
(4,278,891) |
Trade and other receivables (3) and (4) |
|
188,909,303 |
|
51,987,670 |
|
(12,070,666) |
Current tax assets and liabilities |
|
(88,940) |
|
970,564 |
|
475,285 |
Other financial liabilities (Financial Debt and Derivative Instruments) |
|
(209,007,288) |
|
(51,548,616) |
|
28,913,122 |
Trade and other payables (3) and (4) |
|
(147,328,618) |
|
4,694,067 |
|
(25,910,351) |
Accounts payable to related entities |
|
137,734,339 |
|
20,900,256 |
|
34,745,005 |
Other non-financial liabilities |
|
(677,488) |
|
(396,798) |
|
(8,638,750) |
Total Foreign currency Exchange differences |
|
(21,732,058) |
|
(856,350) |
|
18,401,453 |
| (1) | Mainly includes adjustments generated by receivables from Electric Distribution Companies amounting to ThCh$14,500,519 as of December 31, 2024 (ThCh$18,408,579 as of December 31, 2023), which are pending billing due to the postponement of the issuance of the related tariff decrees. |
| (2) | Corresponds to the financial effect derived from the application of IAS 29 “Financial Reporting in Hyperinflationary Economies” on the branch held by the Enel Generación Chile Group in Argentina (see Note 2.9). |
| (3) | Includes the exchange rate effect from the dollarization of trade receivables and payables, non-current amounting to ThCh$47,204,873 and ThCh$(25,949,443), respectively, as of December 31, 2024, (ThCh$5,206,396 and ThCh$(4,541,705), respectively, as of December 31, 2023 and ThCh$14,855,933 and ThCh$(2,940,425), respectively, as of December 31, 2022), generated by the temporary mechanism for stabilizing electricity prices for customers subject to rate regulation, as established in Law No. 21,185 (see Note 4.b).(i) and Note 9). |
| (4) | Contains the exchange rate effect from the dollarization of trade receivables and payables, current and non-current amounting to ThCh$105,020,395 and ThCh$(68,073,659), respectively, as of December 31, 2024, (ThCh$11,279,382 and ThCh$3,683,482, respectively, as of December 31, 2023 and ThCh$(10,220,465) and ThCh$3,106,322, respectively, as of December 31, 2022), generated by the temporary mechanism for stabilizing electricity prices for customers subject to rate regulation, as established in Laws No. 21,472 and No. 21,667 (see Note 4.b).(i) and Note 9). |
F-128
35. INFORMATION BY SEGMENT
35.1. Basis of segmentation
The Group’s activities operate under a matrix management structure with dual and cross management responsibilities (based on business and geographical areas of responsibility), and its subsidiaries are engaged in either the generation or the distribution business.
The Group adopted a “bottom-up” approach to determine its reportable segments. The generation and networks and the distribution reportable segments were defined based on IFRS 8.9 and on the criteria described in IFRS 8.12.
Generation Segment: The electricity generation segment is composed of a group of electricity companies that own electricity generating plants, whose energy is transmitted and distributed to end consumers. The generation business in Chile is conducted by the Company’s subsidiaries Enel Generación Chile S.A. and Empresa Eléctrica Pehuenche S.A., and the Company’s Group is engaged in the development and exploitation of non-conventional renewable energies through our subsidiary Enel Green Power Chile S.A.
Distribution and Networks Segments: The electricity distribution and network segments are comprised of the companies Enel Distribución Chile S.A. and its subsidiary Enel Colina S.A., which operate under an energy distribution concession regime, with service obligations and regulated rates to supply the electricity through their distribution networks to regulated customers.
It should be noted that on December 9, 2022, the Group disposed of its interest in Enel Transmisión Chile, a company belonging to the Distribution and Networks segment until that date. Following the accounting criteria described in Note 3.k), the sale of this company did not qualify as a discontinued operation. Therefore, its results up to the sale date are part of the consolidated results of Enel Chile and are included in the results of the Distribution and Networks segment detailed below.
Each of the operating segments generates separate financial information, which is aggregated into one combined set of information for the Generation Business, and another set of combined information for the Distribution and Networks Business at the reportable segment level. In addition, in order to assist the decision-making process, the Planning & Control Department at Parent Company level prepares internal reports containing combined information at the reportable segment level about the main key performance indicators (KPIs), such as: EBITDA1, Total Capex2, Profit for the Year, Total Energy Generation3, Distribution and Networks4, among others. The presentation of information under this business approach has been made taking into consideration that the KPIs are similar in each of the following aspects:
| a) | The nature of the activities: generation on one hand, and distribution and networks on the other; |
| b) | The nature of the production processes: The Generation Business deals with the generation of electricity and its transmission to dispatch centers, while the Distribution and Networks Business does not generate electricity, but distributes electricity to end customers; |
| c) | The methods used to distribute its products or provide the services: generators normally sell energy through energy bids, whereas distributors and transmitters deliver energy in their concession area or area where their facilities operate; and |
1 Corresponds to Profit (loss) before taxes excluding Depreciation and amortization expense, Impairment recognized in profit or loss, Impairment determined in accordance with IFRS 9, Financial result, Share of profit (loss) of associates and joint ventures accounted for using the equity method and Other gains (losses). This is represented by Gross Operating Income.
2 Corresponds to acquisition of Property, plant and equipment and Intangible assets other than goodwill.
3 Corresponds to electrical energy generated in power plant units, by technology, eliminating self-consumption in a given period.
4 Corresponds to the amount of electricity distributed, free of any losses, in a given period.
F-129
| d) | The nature of the regulatory framework for public electricity services: the regulatory framework distinguishes between Generation companies, which can freely decide whether to sell their energy and capacity to regulated or unregulated customers; and Distribution and Networks companies, which, as natural monopolies, are subject to regulated tariffs and are required free access to their networks. |
The Company’s highest decision-making authority reviews on a monthly basis these internal reports and uses the KPI information to make decisions on the allocation of resources and the assessment of the performance of the operating segments for each reportable segment.
The information disclosed in the following tables is based on the financial information of the companies forming each segment. The accounting policies used to determine the segment information are the same as those used in the preparation of the Group’s consolidated financial statements.
F-130
35.2 Financial information by business line
|
|
Generation |
|
Distribution and Networks |
|
Holdings and eliminations |
|
Total |
||||||||
|
|
12-31-2024 |
|
12-31-2023 |
|
12-31-2024 |
|
12-31-2023 |
|
12-31-2024 |
|
12-31-2023 |
|
12-31-2024 |
|
12-31-2023 |
Line of Business |
|
ThCh$ |
|
ThCh$ |
|
ThCh$ |
|
ThCh$ |
|
ThCh$ |
|
ThCh$ |
|
ThCh$ |
|
ThCh$ |
ASSETS |
|
|
|
|
|
|
|
|
|
|
|
|
|
|
|
|
CURRENT ASSETS |
|
2,104,242,746 |
|
1,918,545,247 |
|
669,750,788 |
|
536,336,504 |
|
(539,774,681) |
|
(83,910,492) |
|
2,234,218,853 |
|
2,370,971,259 |
Cash and cash equivalents |
|
266,287,007 |
|
212,823,126 |
|
2,697,596 |
|
2,940,695 |
|
114,414,716 |
|
347,527,469 |
|
383,399,319 |
|
563,291,290 |
Other current financial assets |
|
18,950,949 |
|
65,072,295 |
|
24,290 |
|
1,120,178 |
|
543,273 |
|
1,544,161 |
|
19,518,512 |
|
67,736,634 |
Other current non-financial assets |
|
109,757,756 |
|
63,169,465 |
|
5,133,403 |
|
4,807,040 |
|
38,272,222 |
|
32,520,820 |
|
153,163,381 |
|
100,497,325 |
Trade and other receivables, current |
|
802,321,259 |
|
912,771,091 |
|
653,308,293 |
|
494,896,062 |
|
34,335,681 |
|
41,627,396 |
|
1,489,965,233 |
|
1,449,294,549 |
Current receivables due from related parties |
|
841,728,683 |
|
602,190,049 |
|
3,382,883 |
|
24,952,429 |
|
(802,328,230) |
|
(576,868,353) |
|
42,783,336 |
|
50,274,125 |
Inventories |
|
53,363,088 |
|
50,938,318 |
|
4,866,498 |
|
5,724,742 |
|
6,938,987 |
|
2,098,819 |
|
65,168,573 |
|
58,761,879 |
Current tax assets |
|
11,834,004 |
|
11,580,903 |
|
337,825 |
|
1,895,358 |
|
68,048,670 |
|
67,639,196 |
|
80,220,499 |
|
81,115,457 |
|
|
|
|
|
|
|
|
|
|
|
|
|
|
|
|
|
NON-CURRENT ASSETS |
|
7,341,260,924 |
|
6,773,894,183 |
|
2,213,624,570 |
|
1,849,188,188 |
|
930,793,237 |
|
839,667,406 |
|
10,485,678,731 |
|
9,462,749,777 |
Other non-current financial assets |
|
2,326,422 |
|
11,602,385 |
|
— |
|
— |
|
2,319,881 |
|
— |
|
4,646,303 |
|
11,602,385 |
Other non-current non-financial assets |
|
146,175,121 |
|
233,071,238 |
|
1,773,050 |
|
3,953,515 |
|
649,652 |
|
1,369,111 |
|
148,597,823 |
|
238,393,864 |
Trade and other non-current receivables |
|
8,379,685 |
|
4,475,497 |
|
1,091,505,544 |
|
802,625,706 |
|
59,366,440 |
|
96,576,938 |
|
1,159,251,669 |
|
903,678,141 |
Non-current receivables due from related parties |
|
78,148,329 |
|
153,975,416 |
|
— |
|
— |
|
(78,148,329) |
|
(153,975,416) |
|
— |
|
— |
Investments accounted for using the equity method |
|
32,703,763 |
|
20,010,858 |
|
— |
|
— |
|
— |
|
5,342,927 |
|
32,703,763 |
|
25,353,785 |
Intangible assets other than goodwill |
|
206,938,335 |
|
109,392,412 |
|
74,586,328 |
|
77,195,083 |
|
11,823,793 |
|
8,422,005 |
|
293,348,456 |
|
195,009,500 |
Goodwill |
|
35,809,083 |
|
34,627,899 |
|
2,240,478 |
|
2,240,478 |
|
851,193,351 |
|
847,596,281 |
|
889,242,912 |
|
884,464,658 |
Property, plant and equipment |
|
6,543,014,783 |
|
5,922,784,386 |
|
995,156,139 |
|
925,450,961 |
|
14,690,145 |
|
1,949,473 |
|
7,552,861,067 |
|
6,850,184,820 |
Investment property |
|
— |
|
— |
|
— |
|
— |
|
7,175,892 |
|
7,340,561 |
|
7,175,892 |
|
7,340,561 |
Right-of-use-assets |
|
248,401,576 |
|
251,295,312 |
|
1,891,693 |
|
2,447,477 |
|
22,317,706 |
|
15,309,766 |
|
272,610,975 |
|
269,052,555 |
Deferred tax assets |
|
39,363,827 |
|
32,658,780 |
|
46,471,338 |
|
35,274,968 |
|
39,404,706 |
|
9,735,760 |
|
125,239,871 |
|
77,669,508 |
|
|
|
|
|
|
|
|
|
|
|
|
|
|
|
|
|
TOTAL ASSETS |
|
9,445,503,670 |
|
8,692,439,430 |
|
2,883,375,358 |
|
2,385,524,692 |
|
391,018,556 |
|
755,756,914 |
|
12,719,897,584 |
|
11,833,721,036 |
|
|
Generation |
|
Distribution and Networks |
|
Holdings and eliminations |
|
Total |
||||||||
|
|
12-31-2024 |
|
12-31-2023 |
|
12-31-2024 |
|
12-31-2023 |
|
12-31-2024 |
|
12-31-2023 |
|
12-31-2024 |
|
12-31-2023 |
Line of Business |
|
ThCh$ |
|
ThCh$ |
|
ThCh$ |
|
ThCh$ |
|
ThCh$ |
|
ThCh$ |
|
ThCh$ |
|
ThCh$ |
LIABILITIES AND EQUITY |
|
|
|
|
|
|
|
|
|
|
|
|
|
|
|
|
CURRENT LIABILITIES |
|
1,716,804,666 |
|
2,065,637,016 |
|
775,649,811 |
|
576,000,954 |
|
(248,967,076) |
|
152,280,374 |
|
2,243,487,401 |
|
2,793,918,344 |
Other current financial liabilities |
|
76,438,369 |
|
476,577,537 |
|
— |
|
962,993 |
|
7,267,209 |
|
137,474,385 |
|
83,705,578 |
|
615,014,915 |
Current lease liabilities |
|
21,668,505 |
|
18,751,822 |
|
862,709 |
|
1,295,890 |
|
4,354,905 |
|
4,090,481 |
|
26,886,119 |
|
24,138,193 |
Trade and other payables, current |
|
963,288,430 |
|
1,002,109,641 |
|
495,310,241 |
|
295,724,035 |
|
71,835,861 |
|
166,658,289 |
|
1,530,434,532 |
|
1,464,491,965 |
Current Payable to related parties |
|
468,873,905 |
|
460,472,605 |
|
242,621,695 |
|
265,096,026 |
|
(413,193,672) |
|
(262,990,165) |
|
298,301,928 |
|
462,578,466 |
Other current provisions |
|
30,281,880 |
|
22,069,709 |
|
17,059,475 |
|
180,851 |
|
4,010,440 |
|
2,902,150 |
|
51,351,795 |
|
25,152,710 |
Current tax liabilities |
|
121,847,790 |
|
62,449,826 |
|
— |
|
— |
|
67,222,361 |
|
97,657,386 |
|
189,070,151 |
|
160,107,212 |
Other current non-financial liabilities |
|
34,405,787 |
|
23,205,876 |
|
19,795,691 |
|
12,741,159 |
|
9,535,820 |
|
6,487,848 |
|
63,737,298 |
|
42,434,883 |
NON-CURRENT LIABILITIES |
|
3,766,133,706 |
|
3,247,604,951 |
|
1,436,878,152 |
|
1,110,485,915 |
|
(52,981,190) |
|
(79,174,446) |
|
5,150,030,668 |
|
4,278,916,420 |
Other non-current financial liabilities |
|
474,209,488 |
|
474,491,353 |
|
— |
|
— |
|
1,899,752,615 |
|
1,430,021,588 |
|
2,373,962,103 |
|
1,904,512,941 |
Non-current lease liabilities |
|
245,500,584 |
|
217,887,656 |
|
1,335,321 |
|
1,937,104 |
|
20,883,026 |
|
24,099,267 |
|
267,718,931 |
|
243,924,027 |
Trade and other payables, non-current |
|
549,999 |
|
177,737 |
|
965,522,118 |
|
595,066,548 |
|
— |
|
290,572 |
|
966,072,117 |
|
595,534,857 |
Non-Current payables to related parties |
|
2,596,422,512 |
|
2,098,869,424 |
|
407,150,575 |
|
482,987,295 |
|
(1,987,668,214) |
|
(1,547,065,500) |
|
1,015,904,873 |
|
1,034,791,219 |
Other long-term provisions |
|
178,783,087 |
|
205,028,658 |
|
36,483,614 |
|
6,572,028 |
|
— |
|
— |
|
215,266,701 |
|
211,600,686 |
Deferred tax liabilities |
|
213,791,517 |
|
178,226,692 |
|
— |
|
— |
|
(5,894,993) |
|
(5,714,029) |
|
207,896,524 |
|
172,512,663 |
Non-current provisions for employee benefits |
|
20,413,470 |
|
20,635,624 |
|
25,614,934 |
|
22,990,764 |
|
19,569,752 |
|
19,193,656 |
|
65,598,156 |
|
62,820,044 |
Other non-current non-financial liabilities |
|
36,463,049 |
|
52,287,807 |
|
771,590 |
|
932,176 |
|
376,624 |
|
— |
|
37,611,263 |
|
53,219,983 |
|
|
|
|
|
|
|
|
|
|
|
|
|
|
|
|
|
EQUITY |
|
3,962,565,298 |
|
3,379,197,463 |
|
670,847,395 |
|
699,037,823 |
|
692,966,822 |
|
682,650,986 |
|
5,326,379,515 |
|
4,760,886,272 |
Equity attributable to owners of the parent |
|
3,962,565,298 |
|
3,379,197,463 |
|
670,847,395 |
|
699,037,823 |
|
692,966,822 |
|
682,650,986 |
|
4,958,798,421 |
|
4,446,079,918 |
Share and paid-in capital |
|
1,148,758,198 |
|
1,076,103,676 |
|
177,568,664 |
|
177,568,664 |
|
2,555,776,608 |
|
2,628,431,130 |
|
3,882,103,470 |
|
3,882,103,470 |
Retained earnings |
|
2,500,583,736 |
|
2,202,473,358 |
|
760,828,097 |
|
788,921,243 |
|
(390,066,044) |
|
(73,543,536) |
|
2,871,345,789 |
|
2,917,851,065 |
Share premiums |
|
85,511,492 |
|
85,511,492 |
|
273,307 |
|
273,307 |
|
(85,784,799) |
|
(85,784,799) |
|
— |
|
— |
Other reserves |
|
227,711,872 |
|
15,108,937 |
|
(267,822,673) |
|
(267,725,391) |
|
(1,386,958,943) |
|
(1,786,451,809) |
|
(1,794,650,838) |
|
(2,353,874,617) |
Non-controlling interests |
|
- |
|
— |
|
— |
|
— |
|
— |
|
— |
|
367,581,094 |
|
314,806,354 |
|
|
|
|
|
|
|
|
|
|
|
|
|
|
|
|
|
Total Liabilities and Equity |
|
9,445,503,670 |
|
8,692,439,430 |
|
2,883,375,358 |
|
2,385,524,692 |
|
391,018,556 |
|
755,756,914 |
|
12,719,897,584 |
|
11,833,721,036 |
The Holdings and eliminations column corresponds to transactions between companies in different lines of business and country, primarily purchases and sales of energy and services.
F-131
|
|
Generation |
|
Distribution and Networks |
|
Holdings and eliminations |
|
Total |
||||||||||||||||
|
|
2024 |
|
2023 |
|
2022 |
|
2024 |
|
2023 |
|
2022 |
|
2024 |
|
2023 |
|
2022 |
|
2024 |
|
2023 |
|
2022 |
Line of Business |
|
ThCh$ |
|
ThCh$ |
|
ThCh$ |
|
ThCh$ |
|
ThCh$ |
|
ThCh$ |
|
ThCh$ |
|
ThCh$ |
|
ThCh$ |
|
ThCh$ |
|
ThCh$ |
|
ThCh$ |
STATEMENTS OF COMPREHENSIVE INCOME (LOSS) |
|
|
|
|
|
|
|
|
|
|
|
|
|
|
|
|
|
|
|
|
|
|
|
|
REVENUES AND OTHER OPERATING INCOME |
|
2,784,385,141 |
|
3,276,386,938 |
|
3,877,758,513 |
|
1,641,409,755 |
|
1,511,618,986 |
|
1,454,721,924 |
|
(438,659,603) |
|
(407,759,931) |
|
(376,048,574) |
|
3,987,135,293 |
|
4,380,245,993 |
|
4,956,431,863 |
Revenues |
|
2,706,809,183 |
|
3,164,037,940 |
|
3,302,181,412 |
|
1,635,173,833 |
|
1,504,847,651 |
|
1,449,144,572 |
|
(437,250,126) |
|
(406,294,494) |
|
(372,325,894) |
|
3,904,732,890 |
|
4,262,591,097 |
|
4,379,000,090 |
Energy sales |
|
2,476,814,605 |
|
2,695,962,741 |
|
2,625,836,969 |
|
1,590,441,019 |
|
1,455,710,472 |
|
1,334,971,825 |
|
(487,522,020) |
|
(460,714,334) |
|
(405,592,652) |
|
3,579,733,604 |
|
3,690,958,879 |
|
3,555,216,142 |
Other sales |
|
224,001,691 |
|
463,955,105 |
|
672,104,106 |
|
7,436,464 |
|
5,416,211 |
|
6,719,051 |
|
39,143,080 |
|
41,171,562 |
|
38,084,659 |
|
270,581,235 |
|
510,542,878 |
|
716,907,816 |
Other services rendered |
|
5,992,887 |
|
4,120,094 |
|
4,240,337 |
|
37,296,350 |
|
43,720,968 |
|
107,453,696 |
|
11,128,814 |
|
13,248,278 |
|
(4,817,901) |
|
54,418,051 |
|
61,089,340 |
|
106,876,132 |
Other operating income |
|
77,575,958 |
|
112,348,998 |
|
575,577,101 |
|
6,235,922 |
|
6,771,335 |
|
5,577,352 |
|
(1,409,477) |
|
(1,465,437) |
|
(3,722,680) |
|
82,402,403 |
|
117,654,896 |
|
577,431,773 |
|
|
|
|
|
|
|
|
|
|
|
|
|
|
|
|
|
|
|
|
|
|
|
|
|
RAW MATERIALS AND CONSUMABLES USED |
|
(1,845,817,132) |
|
(2,077,670,582) |
|
(2,573,293,127) |
|
(1,467,109,226) |
|
(1,321,193,173) |
|
(1,194,700,166) |
|
407,357,444 |
|
403,278,296 |
|
368,469,226 |
|
(2,905,568,914) |
|
(2,995,585,459) |
|
(3,399,524,067) |
Energy purchases |
|
(976,134,775) |
|
(948,153,270) |
|
(1,102,539,973) |
|
(1,353,035,134) |
|
(1,235,044,187) |
|
(1,139,342,609) |
|
413,827,449 |
|
397,914,613 |
|
356,664,541 |
|
(1,915,342,460) |
|
(1,785,282,844) |
|
(1,885,218,041) |
Fuel consumption |
|
(334,665,363) |
|
(536,292,557) |
|
(587,063,837) |
|
— |
|
— |
|
— |
|
— |
|
— |
|
— |
|
(334,665,363) |
|
(536,292,557) |
|
(587,063,837) |
Transportation expenses |
|
(318,675,365) |
|
(290,452,424) |
|
(305,760,332) |
|
(54,916,726) |
|
(52,134,074) |
|
(17,909,689) |
|
17,371,321 |
|
20,994,700 |
|
28,150,078 |
|
(356,220,770) |
|
(321,591,798) |
|
(295,519,943) |
Other miscellaneous supplies and services |
|
(216,341,629) |
|
(302,772,331) |
|
(577,928,985) |
|
(59,157,366) |
|
(34,014,912) |
|
(37,447,868) |
|
(23,841,326) |
|
(15,631,017) |
|
(16,345,393) |
|
(299,340,321) |
|
(352,418,260) |
|
(631,722,246) |
|
|
|
|
|
|
|
|
|
|
|
|
|
|
|
|
|
|
|
|
|
|
|
|
|
CONTRIBUTION MARGIN |
|
938,568,009 |
|
1,198,716,356 |
|
1,304,465,386 |
|
174,300,529 |
|
190,425,813 |
|
260,021,758 |
|
(31,302,159) |
|
(4,481,635) |
|
(7,579,348) |
|
1,081,566,379 |
|
1,384,660,534 |
|
1,556,907,796 |
|
|
|
|
|
|
|
|
|
|
|
|
|
|
|
|
|
|
|
|
|
|
|
|
|
Other work performed by the entity and capitalized |
|
22,404,218 |
|
25,505,720 |
|
23,738,963 |
|
12,853,893 |
|
11,265,189 |
|
16,574,703 |
|
5,474,430 |
|
2,858,557 |
|
4,256,019 |
|
40,732,541 |
|
39,629,466 |
|
44,569,685 |
Employee benefits expense |
|
(75,311,306) |
|
(86,389,203) |
|
(72,744,313) |
|
(42,240,347) |
|
(37,799,634) |
|
(39,078,134) |
|
(46,385,481) |
|
(48,598,963) |
|
(46,416,946) |
|
(163,937,134) |
|
(172,787,800) |
|
(158,239,393) |
Other expenses, by nature |
|
(162,972,834) |
|
(146,245,510) |
|
(195,666,710) |
|
(84,444,936) |
|
(71,513,304) |
|
(77,662,552) |
|
10,217,580 |
|
5,214,949 |
|
4,294,415 |
|
(237,200,190) |
|
(212,543,865) |
|
(269,034,847) |
|
|
|
|
|
|
|
|
|
|
|
|
|
|
|
|
|
|
|
|
|
|
|
|
|
GROSS OPERATING INCOME |
|
722,688,087 |
|
991,587,363 |
|
1,059,793,326 |
|
60,469,139 |
|
92,378,064 |
|
159,855,775 |
|
(61,995,630) |
|
(45,007,092) |
|
(45,445,860) |
|
721,161,596 |
|
1,038,958,335 |
|
1,174,203,241 |
|
|
|
|
|
|
|
|
|
|
|
|
|
|
|
|
|
|
|
|
|
|
|
|
|
Depreciation and amortization expense |
|
(235,988,508) |
|
(200,466,363) |
|
(183,459,507) |
|
(54,844,885) |
|
(50,976,045) |
|
(56,293,022) |
|
(4,635,585) |
|
(1,957,376) |
|
1,479,578 |
|
(295,468,978) |
|
(253,399,784) |
|
(238,272,951) |
Impairment losses (reversal of impairment losses) recognized in profit or loss |
|
(34,203,486) |
|
(7,023,888) |
|
(2,286,438) |
|
— |
|
— |
|
— |
|
— |
|
— |
|
738,739 |
|
(34,203,486) |
|
(7,023,888) |
|
(1,547,699) |
Impairment gains and reversals of impairment losses (Impairment losses) determined in accordance with IFRS 9. |
|
(594,370) |
|
90,538 |
|
(1,992,280) |
|
(17,842,904) |
|
(10,068,805) |
|
(20,030,616) |
|
7,418 |
|
(795,178) |
|
(2,458) |
|
(18,429,856) |
|
(10,773,445) |
|
(22,025,354) |
|
|
|
|
|
|
|
|
|
|
|
|
|
|
|
|
|
|
|
|
|
|
|
|
|
OPERATING INCOME |
|
451,901,723 |
|
784,187,650 |
|
872,055,101 |
|
(12,218,650) |
|
31,333,214 |
|
83,532,137 |
|
(66,623,797) |
|
(47,759,646) |
|
(43,230,001) |
|
373,059,276 |
|
767,761,218 |
|
912,357,237 |
|
|
|
|
|
|
|
|
|
|
|
|
|
|
|
|
|
|
|
|
|
|
|
|
|
FINANCIAL RESULT |
|
(123,513,540) |
|
(23,516,358) |
|
(85,132,092) |
|
(23,360,369) |
|
(22,406,029) |
|
(20,577,980) |
|
(8,335,783) |
|
(42,461,980) |
|
(13,229,033) |
|
(155,209,692) |
|
(88,384,367) |
|
(118,939,105) |
Financial income |
|
47,858,387 |
|
89,621,150 |
|
13,008,285 |
|
33,153,908 |
|
35,168,522 |
|
29,585,814 |
|
(2,729,852) |
|
9,464,164 |
|
7,820,486 |
|
78,282,443 |
|
134,253,836 |
|
50,414,585 |
Cash and cash equivalents |
|
3,002,395 |
|
651,382 |
|
18,295 |
|
84,365 |
|
2,946,011 |
|
4,038,512 |
|
17,828,481 |
|
31,005,795 |
|
15,842,151 |
|
20,915,241 |
|
34,603,188 |
|
19,898,958 |
Other financial income |
|
44,855,992 |
|
88,969,768 |
|
12,989,990 |
|
33,069,543 |
|
32,222,511 |
|
25,547,302 |
|
(20,558,333) |
|
(21,541,631) |
|
(8,021,665) |
|
57,367,202 |
|
99,650,648 |
|
30,515,627 |
Financial costs |
|
(161,085,122) |
|
(147,833,749) |
|
(115,872,168) |
|
(54,864,611) |
|
(55,938,128) |
|
(50,482,680) |
|
(16,634,529) |
|
(43,295,679) |
|
(27,263,185) |
|
(232,584,262) |
|
(247,067,556) |
|
(193,618,033) |
Bank loans |
|
(248) |
|
(13,677) |
|
(347,388) |
|
(100) |
|
(12,988) |
|
(184) |
|
(50,672,257) |
|
(31,790,880) |
|
(11,242,572) |
|
(50,672,605) |
|
(31,817,545) |
|
(11,590,144) |
Secured and unsecured obligations |
|
(40,980,417) |
|
(48,465,752) |
|
(50,378,424) |
|
— |
|
— |
|
— |
|
(46,619,308) |
|
(40,692,700) |
|
(42,035,639) |
|
(87,599,725) |
|
(89,158,452) |
|
(92,414,063) |
Other |
|
(120,104,457) |
|
(99,354,320) |
|
(65,146,356) |
|
(54,864,511) |
|
(55,925,140) |
|
(50,482,496) |
|
80,657,036 |
|
29,187,901 |
|
26,015,026 |
|
(94,311,932) |
|
(126,091,559) |
|
(89,613,826) |
Income from indexation units |
|
16,992,481 |
|
19,385,143 |
|
609,680 |
|
753,498 |
|
5,199,031 |
|
4,023,279 |
|
3,078,206 |
|
701,529 |
|
1,229,931 |
|
20,824,185 |
|
25,285,703 |
|
5,862,890 |
Foreign exchange profits (losses) |
|
(27,279,286) |
|
15,311,098 |
|
17,122,111 |
|
(2,403,164) |
|
(6,835,454) |
|
(3,704,393) |
|
7,950,392 |
|
(9,331,994) |
|
4,983,735 |
|
(21,732,058) |
|
(856,350) |
|
18,401,453 |
|
|
|
|
|
|
|
|
|
|
|
|
|
|
|
|
|
|
|
|
|
|
|
|
|
Share of profit (loss) of associates and joint ventures accounted for using the equity method |
|
8,860,379 |
|
6,802,958 |
|
4,014,081 |
|
— |
|
— |
|
— |
|
(446,704) |
|
(1,100,870) |
|
(732,840) |
|
8,413,675 |
|
5,702,088 |
|
3,281,241 |
Other gains (losses) |
|
233,792 |
|
8,285,111 |
|
935,428 |
|
— |
|
(910,726) |
|
— |
|
(525,516) |
|
214,472,552 |
|
981,045,868 |
|
(291,724) |
|
221,846,937 |
|
981,981,296 |
Gain (loss) from other investments |
|
233,792 |
|
1,833,289 |
|
124,652 |
|
— |
|
— |
|
— |
|
(525,516) |
|
215,618,389 |
|
981,045,868 |
|
(291,724) |
|
217,451,678 |
|
981,170,520 |
Gain (loss) from the sale of assets |
|
— |
|
6,451,822 |
|
810,776 |
|
— |
|
(910,726) |
|
— |
|
— |
|
(1,145,837) |
|
— |
|
— |
|
4,395,259 |
|
810,776 |
|
|
|
|
|
|
|
|
|
|
|
|
|
|
|
|
|
|
|
|
|
|
|
|
|
Profit (loss) before taxes |
|
337,482,354 |
|
775,759,361 |
|
791,872,518 |
|
(35,579,019) |
|
8,016,459 |
|
62,954,157 |
|
(75,931,800) |
|
123,150,056 |
|
923,853,994 |
|
225,971,535 |
|
906,925,876 |
|
1,778,680,669 |
|
|
|
|
|
|
|
|
|
|
|
|
|
|
|
|
|
|
|
|
|
|
|
|
|
Income tax |
|
(58,822,194) |
|
(191,408,432) |
|
(151,330,979) |
|
10,093,354 |
|
5,986,351 |
|
7,698,062 |
|
13,800,276 |
|
(41,490,404) |
|
(326,063,963) |
|
(34,928,564) |
|
(226,912,485) |
|
(469,696,880) |
|
|
— |
|
|
|
|
|
— |
|
|
|
|
|
— |
|
|
|
|
|
— |
|
|
|
|
PROFIT (LOSS) |
|
278,660,160 |
|
584,350,929 |
|
640,541,539 |
|
(25,485,665) |
|
14,002,810 |
|
70,652,219 |
|
(62,131,524) |
|
81,659,652 |
|
597,790,031 |
|
191,042,971 |
|
680,013,391 |
|
1,308,983,789 |
|
|
|
|
|
|
|
|
|
|
|
|
|
|
|
|
|
|
|
|
|
|
|
|
|
Profit (loss) attributable to |
|
278,660,160 |
|
584,350,929 |
|
640,541,539 |
|
(25,485,665) |
|
14,002,810 |
|
70,652,219 |
|
(62,131,524) |
|
81,659,652 |
|
597,790,031 |
|
191,042,971 |
|
680,013,391 |
|
1,308,983,789 |
Profit (loss) attributable to owners of the parent |
|
— |
|
— |
|
|
|
— |
|
— |
|
— |
|
— |
|
— |
|
— |
|
145,112,153 |
|
633,455,775 |
|
1,252,082,258 |
Profit (loss) attributable to non-controlling interests |
|
— |
|
— |
|
|
|
— |
|
— |
|
— |
|
— |
|
— |
|
— |
|
45,930,818 |
|
46,557,616 |
|
56,901,531 |
|
|
|
|
|
|
|
|
|
|
|
|
|
|
|
|
|
|
|
|
|
|
|
|
|
|
|
Generation |
|
Distribution and Networks |
|
Holdings and eliminations |
|
Total |
||||||||||||||||
|
|
12-31-2024 |
|
12-31-2023 |
|
12-31-2022 |
|
12-31-2024 |
|
12-31-2023 |
|
12-31-2022 |
|
12-31-2024 |
|
12-31-2023 |
|
12-31-2022 |
|
12-31-2024 |
|
12-31-2023 |
|
12-31-2022 |
|
|
ThCh$ |
|
ThCh$ |
|
ThCh$ |
|
ThCh$ |
|
ThCh$ |
|
ThCh$ |
|
ThCh$ |
|
ThCh$ |
|
ThCh$ |
|
ThCh$ |
|
ThCh$ |
|
ThCh$ |
STATEMENT OF CASH FLOWS |
|
|
|
|
|
|
|
|
|
|
|
|
|
|
|
|
|
|
|
|
|
|
|
|
Net cash flows from (used in) operating activities |
|
1,536,637,041 |
|
940,980,864 |
|
689,196,260 |
|
58,550,733 |
|
96,049,904 |
|
91,074,469 |
|
(64,281,898) |
|
(331,368,523) |
|
(35,491,916) |
|
1,530,905,876 |
|
705,662,245 |
|
744,778,813 |
Net cash flows from (used in) investing activities |
|
(825,484,908) |
|
(589,841,542) |
|
(990,157,962) |
|
(68,767,691) |
|
(99,120,863) |
|
(98,077,760) |
|
198,153,195 |
|
602,724,068 |
|
1,543,807,101 |
|
(696,099,404) |
|
(86,238,337) |
|
455,571,379 |
Net cash flows from (used in) financing activities |
|
(665,526,190) |
|
(155,850,946) |
|
315,350,620 |
|
10,434,579 |
|
8,624,953 |
|
9,965,731 |
|
(378,101,708) |
|
(787,009,650) |
|
(953,972,710) |
|
(1,033,193,319) |
|
(934,235,643) |
|
(628,656,359) |
The Holdings and eliminations column corresponds to transactions between companies in different lines of business and country, primarily purchases and sales of energy and services.
F-132
36. GUARANTEES WITH THIRD PARTIES, CONTINGENT ASSETS AND, LIABILITIES, AND OTHER COMMITMENTS
36.1 Direct guarantees
As of December 31, 2024, Enel Chile has future energy purchase commitments amounting to ThCh$20,329,101,105 (ThCh$15,383,584,129 as of December 31, 2023).
36.2 Indirect guarantees
|
|
|
|
|
|
Debtor |
|
Guarantee |
|
Outstanding balance as of |
||||||||
Contract |
|
Maturity |
|
Creditor of Guarantee |
|
Company |
|
Relationship |
|
Guarantor |
|
Type of Guarantee |
|
Currency |
|
12-31-2024 |
|
12-31-2023 |
Enel Energy Efficiency & Renewables FL (LATAM) C & D |
|
December 2038 |
|
European Investment Bank |
|
Enel Chile |
|
Parent |
|
Enel SpA (*) |
|
Guarantor |
|
US$ |
|
99,079,122 |
|
87,211,501 |
Up to USD 286M Facility Agreement |
|
December 2037 |
|
Citibank N.A. - London Branch |
|
Enel Chile |
|
Parent |
|
Enel SpA |
|
Guarantor |
|
US$ |
|
285,912,642 |
|
- |
Total |
|
|
|
|
|
|
|
|
|
|
|
|
|
|
|
384,991,764 |
|
87,211,501 |
(*) Corresponds to a guarantee for 20% of the debt. The credit includes another guarantee with SACE (Italian Export Credit Agency) for the remaining 80%.
36.3 Litigation and Arbitration
| 1.1. | In October 2020, Inversiones Tricahue S.A. filed a tort claim against Enel Chile, claiming its alleged liability for the economic losses suffered as a result of the corporate restructuring. The main claim by Inversiones Tricahue is for the amount of ThCh$72,558,025, and the claim by its subsidiary is for the amount of ThCh$12,431,395. The case is pending judgment. On July 20, 2024, a judgment was handed down dismissing the lawsuit in its entirety, whereupon Inversiones Tricahue filed the respective appeals, which are pending. |
| 2.1. | On March 21, 2022, Inversiones Tricahue filed a lawsuit against Enel Generación before the arbitrator Rafael Gómez Balmaceda, alleging a breach of a settlement agreement dated August 22, 2012, requesting that the breach be declared by the court and requesting that Enel Generación be ordered to pay the fine or penalty clause established in the settlement agreement. On July 18, 2024, a judgment was handed down dismissing the lawsuit. Inversiones Tricahue filed the corresponding appeals, which are pending. |
| 2.2. | On August 20, 2019, a lawsuit was filed against Enel Generación for alleged liability for damages suffered by the plaintiffs as a result of the operations of the Bocamina I and II power plants. The amount claimed is ThCh$38,160,000. The case is in the evidentiary stage. |
| 3.1. | On February 27, 2021, the National Consumer and User Protection Agency, CONADECUS, filed a class action lawsuit against Enel Distribución for violation of the collective and diffuse interest of consumers due to non-compliance with Law No. 19,496, the amount of which is undetermined. The case is in the evidentiary stage. |
| 3.2. | On October 21, 2021, the National Consumer Service, SERNAC, filed a lawsuit against Enel Distribución and Empresa Eléctrica Colina for the power outages that occurred between January 29 and February 2, 2021. A guilty verdict was handed down, against which Enel Distribución filed the corresponding appeals, which are pending resolution. |
| 3.3. | On March 11, 2022, the National Consumer Service, SERNAC, filed a lawsuit against Enel Distribución for alleged violations related to the contracting of insurance, the amount of which is undetermined. The case is awaiting judgment. |
F-133
| 3.4. | On May 22, 2024, the National Consumers and Users Protection Agency, CONADECUS, is suing for the blackouts that occurred on May 20, 2024, for an undetermined amount. The case is currently in the discussion stage. |
4.1.On October 19, 2023, Global Energy Services Siemsa S.A. Chile Limitada, filed a counterclaim against Enel Green Power Chile S.A. alleging that it had breached the contract for the construction of the photovoltaic plant project called “Finis Terrae Extension”. The plaintiff requests that the contract be terminated with compensation for damages in its favor, the amount of the counterclaim is ThCh$14,884,256. In turn, Enel Green Power S.A. filed a counterclaim for breach of contract and compensation for damages. The case is in the final evidentiary stage, with closing procedures pending.
4.2.On December 15, 2022, Enel Green Power Chile S.A. filed a lawsuit against Aldesa Chile SpA. for breach of contract and compensation for damages in the construction of the photovoltaic plant project called “Sierra Gorda Solar”. At the same time, Aldesa Chile SpA. also filed a lawsuit against Enel Green Power S.A. for breach of the same contract, seeking damages in its favor for ThCh$19,448,233. The case is pending evidentiary proceedings, awaiting a summons for judgment.
F-134
In relation to the litigation matters described above, the Group has set up provisions in the sum of ThCh$932,432 as of December 31, 2024 (see Note 25). There are other litigation matters that have associated provisions but are not described in this note since they individually represent immaterial amounts. Management believes that the provisions recorded for such cases adequately cover the litigation risks, and therefore does not expect additional liabilities other than those already recorded.
Given the characteristics of the risks covered by these provisions, it is not possible to determine a reasonable schedule of payment dates, if any.
Other litigation of relevance is reported below:
In 2017, legal proceedings were commenced by certain operators of the Northern Chile Grid (SING), including AES Gener SA, Eléctrica Angamos SA and Engie Energía Chile SA, against Gas Atacama Chile (currently Enel Generación Chile). On October 17, 2023, a first instance judgment was issued in which the plaintiffs' claims were partially upheld. Enel Generación Chile filed the corresponding procedural appeals before the Court of Appeals of Santiago, which are pending resolution. A very minor risk of adverse judgment is estimated.
In December 2016, a tort action was brought by Compañía Minera Arbiodo Limitada and Ingenieros y Asesores Limitada against Parque Eólico Taltal S.A. (currently, Enel Green Power Chile S.A.), the National Geology and Mining Service and the Chilean Treasury, for the alleged liability in the potential economic losses caused by the failure to carry out a mining project of interest to the plaintiffs. In December 2023, the claim was accepted, and the National Geology and Mining Service and Enel Green Power Chile were ordered to pay to the plaintiffs, jointly and severally, the amount of ThCh$346,067,011 as consequential damages. This matter is currently being considered before the Court of Appeals of Santiago, regarding the procedural appeals filed by the defendants. A very minor risk of adverse judgment is estimated.
F-135
36.4. Financial restrictions
Several debt contracts of the Company, and of some of its subsidiaries include the obligation to comply with certain financial ratios, which is common in contracts of this nature. There are also affirmative and negative covenants that require monitoring of these commitments. In addition, there are restrictions in the sections of events of default that must be fulfilled to avoid acceleration of the debt.
| 1. | Cross Default |
Some of the financial debt contracts contain cross default clauses.
Financial restrictions |
|
Enel Chile |
|
Enel Chile |
|
Enel Chile |
|
Enel Chile |
|
Instrument type with restriction |
|
Cred. with Fin. Inst. |
|
Cred. with Fin. Inst. |
|
Uncommitted line of credit |
|
Yankee bonds |
|
Restriction to be fulfilled by Informant or Subsidiary |
|
Any financial debt that Enel Chile maintains, for any amount past due, and that the principal of the debt that gives rise to the cross default exceeds US$150 million in an individual debt. |
|
Any financial debt that Enel Chile maintains, for any amount past due, and that the principal of the debt that gives rise to the cross default exceeds US$150 million in an individual debt. |
|
Any financial debt held by Enel Generación Chile, for any amount past due. |
|
Any financial debt that Enel Chile maintains, for any amount past due, and that the principal of the debt that gives rise to the cross default exceeds US$150 million in an individual debt. |
|
Creditor |
|
DNB Bank ASA (Administrative Agent) |
|
Corporación Andina de Fomento, Citibank, European Investment Bank and Scotiabank Chile |
|
BCI |
|
Bank of New York Mellon (Bondholder Representative) |
|
Registration Number |
|
- |
|
- |
|
- |
|
ISIN: US29278DAA37 |
|
Name of financial indicator or ratio |
|
Cross default |
|
Cross default |
|
Cross default |
|
Cross default |
|
Measurement frequency |
|
Quarterly |
|
Quarterly |
|
Quarterly |
|
Quarterly |
|
Calculation mechanism or definition of the indicator or ratio |
|
Debt past due higher than US$150 million of principal individually. |
|
Debt past due higher than US$150 million of principal individually. |
|
Delinquent debt. |
|
Debt past due higher than US$150 million of principal individually. |
|
Restriction that must be fulfilled (Range, Value and Unit of measure) |
|
Not having individual debts past due higher than US$150 million. |
|
Not having individual debts past due higher than US$150 million. |
|
Not have individual debts past due. |
|
Not having individual debts past due higher than US$150 million. |
|
Indicator or ratio determined by the company |
|
There are no outstanding debts for an individual amount higher than US$150 million. |
|
There are no outstanding debts for an individual amount higher than US$150 million. |
|
There are no delinquent debts. |
|
There are no outstanding debts for an individual amount higher than US$150 million. |
|
Compliance YES/NO |
|
Yes |
|
Yes |
|
Yes |
|
Yes |
|
Accounts used in the calculation of the indicator or ratio |
|
- |
|
- |
|
- |
|
- |
|
F-136
Financial restrictions |
|
Enel Generación Chile |
|
Enel Generación Chile |
|
Enel Generación Chile |
|
Enel Distribución Chile |
|
Instrument type with restriction |
|
Yankee bonds |
|
Series H and M Bonds |
|
Uncommitted line of credit |
|
Uncommitted line of credit |
|
Restriction to be fulfilled by Informant or Subsidiary |
|
Any financial debt held by Enel Generación Chile or its Chilean subsidiaries, for any amount in default, and that the principal amount of the debt giving rise to the cross default exceeds US$30 million in an individual debt. |
|
Any financial debt held by Enel Generación Chile, for any amount in default, and that the principal amount of the debt giving rise to the cross default exceeds US$50 million in an individual debt. |
|
Any financial debt held by Enel Generación Chile, for any amount in arrears. |
|
Any financial debt held by Enel Distribución Chile, for any amount in arrears. |
|
Creditor |
|
Bank of New York Mellon (Bondholder Representative) |
|
Banco Santander Chile (Bondholders' Representative) |
|
Banco Santander Chile and Scotiabank Chile |
|
Banco Santander Chile and Scotiabank Chile |
|
Registration Number |
|
ISIN: US29244TAC53; US29244TAB7; US29244TAA9 |
|
CMF Securities Registry Registration No. 317 for Series H and No. 522 for Series M |
|
- |
|
- |
|
Name of financial indicator or ratio |
|
Cross default |
|
Cross default |
|
Cross default |
|
Cross default |
|
Measurement frequency |
|
Quarterly |
|
Quarterly |
|
Quarterly |
|
Quarterly |
|
Calculation mechanism or definition of the indicator or ratio |
|
Debt in arrears greater than US$30 million principal amount on an individual basis. |
|
Debt in arrears greater than US$50 million principal amount on an individual basis. |
|
Delinquent debt. |
|
Delinquent debt. |
|
Restriction that must be fulfilled (Range, Value and Unit of measure) |
|
Not to have individual debts in arrears in excess of US$30 million. |
|
Not to have individual debts in arrears in excess of US$50 million. |
|
Not have individual debts past due. |
|
Not have individual debts past due. |
|
Indicator or ratio determined by the company |
|
There are no delinquent debts in excess of US$30 million on an individual basis. |
|
There are no delinquent debts in excess of US$50 million on an individual basis. |
|
There are no delinquent debts. |
|
There are no delinquent debts. |
|
Compliance YES/NO |
|
Yes |
|
Yes |
|
Yes |
|
Yes |
|
Accounts used in the calculation of the indicator or ratio |
|
- |
|
- |
|
- |
|
- |
|
F-137
| 2. | Financial covenants |
Financial covenants are contractual commitments with respect to minimum or maximum financial ratios that the Company is obliged to meet at certain periods of time (quarterly, annually, etc.) and in some cases only when certain conditions are met. Most of the financial covenants of the Company limit leverage and track the ability to generate cash flow that will service the companies’ indebtedness. Certain companies are also required to periodically certify these covenants. The types of covenants and their respective limits vary according to the type of debt and contract.
Financial restrictions |
|
Enel Generación Chile |
|
Enel Generación Chile |
|
Enel Generación Chile |
|
Enel Generación Chile |
Instrument type with restriction |
|
Series H and M Bonds |
|
Series H and M Bonds |
|
Series H and M Bonds |
|
Series H Bonds |
Restriction to be fulfilled by Informant or Subsidiary |
|
A ratio between Financial Obligations and Total Capitalization must be maintained of less than or equal to 0.64. |
|
Maintain Minimum Equity of Ch$761,661 million, a limit that is updated at the end of each fiscal year, as established in the contract. |
|
Maintain a Financial Expense Coverage ratio of greater than or equal to 1.85. |
|
Maintain a Net Active Position with Related Companies not exceeding the equivalent amount in Chilean pesos, legal tender, of US$500 million, according to the exchange rate observed on the date of its calculation. |
Creditor |
|
Banco Santander Chile (Bondholders' Representative) |
|
Banco Santander Chile (Bondholders' Representative) |
|
Banco Santander Chile (Bondholders' Representative) |
|
Banco Santander Chile (Bondholders' Representative) |
Registration Number |
|
Registration with the CMF Securities Registry No. 317 for Series H and No. 522 for Series M |
|
Registration with the CMF Securities Registry No. 317 for Series H and No. 522 for Series M |
|
Registration with the CMF Securities Registry No. 317 for Series H and No. 522 for Series M |
|
Registration with the Securities Registry with CMF No. 317 |
Name of financial indicator or ratio |
|
Consolidated Indebtedness Level |
|
Equity Attributable to the Parent |
|
Financial Expenses Coverage rate |
|
Net Active Position with Related Companies |
Measurement frequency |
|
Quarterly |
|
Quarterly |
|
Quarterly |
|
Quarterly |
Calculation mechanism or definition of the indicator or ratio |
|
Financial Obligations corresponding to the sum between Loans that accrue interest, current, Loans that accrue interest, non-current, Other financial liabilities, current, Other financial liabilities, non-current and Other obligations guaranteed by the Issuer or its subsidiaries, while Total Capitalization is the sum between Financial Obligations and Total Equity. |
|
The Equity corresponds to the Equity attributable to the owners of the parent company, which is contrasted with the level of Minimum Equity that will be readjusted by a percentage, provided it is positive of the annual variation of the Consumer Price Index multiplied by the difference between 1 minus the ratio of Non-Monetary Assets in Chile recorded in pesos and the Equity Attributable to the Parent Company. If the annual variation of the Consumer Price Index is negative or if the ratio between Non-Monetary Assets in Chile recorded in pesos and Equity Attributable to the Parent Company is greater than one, there will be no readjustment in that year. |
|
Financial expense coverage is the quotient between: i) Gross operating profit, plus Financial income and dividends received from associated companies, and ii) Financial expenses; both items refer to the period of four consecutive quarters ending at the end of the quarter being reported. |
|
The Net Active Position with Related Companies is the difference between: i) the sum of Receivables due from Related Parties of Current and Non-Current Assets and ii) the sum of Payables due to Related Parties, Current and Non-Current Liabilities. The amounts corresponding to those that jointly comply with the following must be excluded from the foregoing: i) operations lasting less than 180 days, and ii) operations arising from the ordinary course of business of Enel Generación Chile or its subsidiaries. |
Restriction that must be fulfilled (Range, Value and Unit of measure) |
|
A ratio between Financial Obligations and Total Capitalization must be maintained of less than or equal to 0.64. |
|
Maintain a Minimum Equity of Ch$761,661 million, a limit that is updated at the end of each fiscal year, as established in the contract. |
|
Maintain a Financial Expense Coverage Coefficient of greater than or equal to 1.85. |
|
Maintain a Net Active Position with Related Companies not exceeding the equivalent amount in pesos, legal tender, of US$500 million, according to the exchange rate observed on the date of its calculation. |
Indicator or ratio determined by the company |
|
0.16 |
|
$2,725,132 million |
|
19.37 |
|
US$206.67 million |
Compliance YES/NO |
|
Yes |
|
Yes |
|
Yes |
|
Yes |
Accounts used in the calculation of the indicator or ratio |
|
Financial Obligations and Total Capitalization |
|
Equity attributable to the owners of the parent company. |
|
Gross Operating Income and Financial Expenses |
|
Current and Non-Current Accounts Receivable and Payable to Related Entities. |
Finally, in most contracts, the acceleration of the debt due to non-compliance with covenants does not occur automatically. Certain conditions must be met, such as the expiration of remediation periods, among others.
As of December 31, 2024, both Enel Chile and its subsidiaries were in compliance with their financial obligations summarized herein, they also comply with other financial obligations whose non-compliance could result in the acceleration of the maturity of its financial commitments. Additionally, Management is not aware of any facts or circumstances indicating that the Company may have difficulties in meeting these covenants during or after the reporting period.
F-138
37. HEADCOUNT
Enel Chile’s personnel as of December 31, 2024 and 2023 is as follows:
Country |
|
12-31-2024 |
|
12-31-2023 |
Chile |
|
1,932 |
|
2,056 |
Argentina (1) |
|
20 |
|
21 |
Total |
|
1,952 |
|
2,077 |
Average |
|
2,003 |
|
2,134 |
| (1) | This item corresponds to the branch of Enel Generación Chile located in the province of Jujuy, Argentina. |
38. SANCTIONS
The following Group companies have received sanctions from administrative authorities:
| 1. | Enel Distribución Chile S.A. |
| 1.1. | By means of Exempt Resolution No. 10,921 dated February 21, 2022, the SEF imposed on Enel Distribución a fine equivalent to 39,261 UTM (ThCh$2,642,030), for not complying with the provisions of Article 4-1 of the Technical Standard of Service Quality for Distribution Systems, in relation to Articles 145 and 222, letter h), of the Regulations of the General Law of Electric Services and, in turn, in relation to Articles 72-14 and 130 of the General Law of Electric Services, based on the information provided by the company in the process titled "Interruptions 2018". Enel Distribución filed an appeal for reconsideration against this resolution, which is pending resolution. |
| 1.2. | By means of Exempt Resolution No. 25,189 dated May 13, 2024, the SEF imposed a fine on Enel Distribución equivalent to 60,000 UTM (ThCh$4,037,640), on the grounds that there were violations of Art. 8 ter of the General Law on Electrical Services, relating to the performance of activities that violate the exclusive distribution obligation. Enel Distribución filed an appeal for reconsideration against this resolution, which is pending resolution. |
| 1.3. | By means of Exempt Resolution No. 27,691 dated September 15, 2024, the SEF imposed a fine on Enel Distribución equivalent to 39,600 UTM (ThCh$2,664,842), deeming that during the period from January to December 2022 Enel Distribución exceeded the maximum SAIDI limit established in current regulations in the Metropolitan Region, specifically, the districts of Colina, Conchalí, Estación Central, Huechuraba, Lampa, Lo Espejo, Lo Prado and Maipú. Enel Distribución filed an appeal against this decision, which is pending resolution. |
| 1.4. | By means of Exempt Resolution No. 26,948 dated February 28, 2024, the SEF imposed a fine on Enel Distribución equivalent to 40,000 UTM (ThCh$2,691,760), deeming that its obligations were breached due to line interruptions. Enel Distribución filed an appeal against this decision, which is pending resolution. |
| 1.5. | By means of Official Letter No. 246,328 and Exempt Resolutions Nos. 36,621, 36,622, 36,623 and 36,624 received in September 2024 and January 2025, respectively, the SEF imposed fines on Enel Distribución for a total amount of 280,000 UTM (ThCh$18,842,320), in relation to potential breaches related to the effects that occurred in the context of the climatic event that took place on August 1 and 2, 2024 in various districts of the Metropolitan Region. In response to this notification, Enel Distribución filed its defense, which is pending resolution, and the corresponding appeals for reconsideration will also be filed (see Note 41.v). |
In relation to the sanctions described above, the Group has established provisions for ThCh$28,844,481 as of December 31, 2024 (see Note 25). There are other sanctions that also have associated provisions but are not described in this Note since they individually represent immaterial amounts.
F-139
The Management of the Company believes that the provisions recorded are adequate to cover the risks resulting from sanctions, and therefore do not expect additional liabilities other than those already specified.
F-140
39. ENVIRONMENT
Environmental expenses for the years ended December 31, 2024, 2023 and 2022 are as follows:
|
|
|
|
|
|
|
|
|
|
|
|
12-31-2024 |
|
|
|
|
|
|
|
12-31-2023 |
Disbursing Company |
|
Project Name |
|
Environmental Description |
|
Project status [Completed, in progress] |
|
Disbursement amount |
|
Capitalized amount |
|
Expense amount |
|
Future disbursement amount |
|
Estimated date of future disbursement |
|
Total disbursements |
|
Amount of prior period disbursement |
Pehuenche S.A. |
|
|
|
Waste Management |
|
In progress |
|
42,693 |
|
— |
|
42,693 |
|
— |
|
— |
|
42,693 |
|
68,947 |
|
|
Pehuenche power plant |
|
Environmental Sanitation |
|
In progress |
|
6,652 |
|
— |
|
6,652 |
|
— |
|
— |
|
6,652 |
|
1,707 |
|
|
|
|
Environmental materials |
|
In progress |
|
5,690 |
|
— |
|
5,690 |
|
— |
|
— |
|
5,690 |
|
18,170 |
Enel Distribución Chile S.A. |
|
Vegetation control in MT/BT |
|
Pruning of trees near the media network and low voltage. |
|
In progress |
|
3,550,212 |
|
— |
|
3,550,212 |
|
8,622,291 |
|
12/31/2025 |
|
12,172,503 |
|
1,532,887 |
|
|
SEF STANDARDIZATION PROJECT (CAPEX) |
|
Underground Networks Interaction Project between Enel and Metrogas |
|
In progress |
|
612,337 |
|
— |
|
612,337 |
|
— |
|
— |
|
612,337 |
|
639,601 |
|
|
Improvements environmental impact |
|
Urban tree planting project (2T) |
|
In progress |
|
— |
|
— |
|
— |
|
10,000,000 |
|
12/31/2025 |
|
10,000,000 |
|
— |
|
|
|
|
Waste recovery initiative (4T) |
|
In progress |
|
— |
|
— |
|
— |
|
2,000,000 |
|
12/31/2025 |
|
2,000,000 |
|
— |
|
|
|
|
Asbestos Storage Project (2T) |
|
In progress |
|
— |
|
— |
|
— |
|
7,000,000 |
|
12/31/2025 |
|
7,000,000 |
|
— |
|
|
|
|
MA Space in the CEO (2T) |
|
In progress |
|
— |
|
— |
|
— |
|
12,000,000 |
|
12/31/2025 |
|
12,000,000 |
|
— |
Enel Generación Chile S.A. |
|
Environmental expenses, and certifications, Coal Power Plants (CP) |
|
The main expenses incurred are: Investments, improvements and work performed to obtain certificates in Diesel tanks,. Operation and maintenance, monitoring air quality and meteorological stations, Environmental audit monitoring network once a year, Annual CEMS Validation, Biomass Protocol Service, Environmental Materials (magazine, books), Isokinetic Measurements, SGI Works (NC objective, inspections, audits and supervision) ISO 14001, OHSAS certification, CEMS operation and maintenance service. |
|
In progress |
|
9,564,824 |
|
7,168,324 |
|
2,396,500 |
|
1,487,715 |
|
— |
|
11,052,539 |
|
1,798,851 |
|
|
Environmental expenses, adaptations and certifications, Thermal Power Plants (TP) |
|
Studies, monitoring, laboratory analysis, removal and final disposal of solid waste in thermoelectric plants (TP) |
|
In progress |
|
1,521,191 |
|
424,705 |
|
1,096,486 |
|
894,654 |
|
— |
|
2,415,845 |
|
1,790,310 |
|
|
Environmental expenses, Hydroelectric Power Plants (HP) |
|
Studies, monitoring, laboratory analysis, removal and final disposal of solid waste in hydroelectric plants (HP) |
|
In progress |
|
378,046 |
|
— |
|
378,046 |
|
— |
|
— |
|
378,046 |
|
502,557 |
Enel Green Power Chile S.A. |
|
Waste management |
|
Contracts for the removal of hazardous and non-hazardous waste |
|
In progress |
|
436,358 |
|
— |
|
436,358 |
|
— |
|
— |
|
436,358 |
|
91,480 |
|
|
Environmental sanitation |
|
Contracts for vector control, deratization, disinfection |
|
In progress |
|
49,880 |
|
— |
|
49,880 |
|
— |
|
— |
|
49,880 |
|
22,180 |
|
|
Campaigns and Studies |
|
Contracts for Environmental Monitoring ( Flora and Fauna- Archeology, others) |
|
In progress |
|
595,261 |
|
— |
|
595,261 |
|
— |
|
— |
|
595,261 |
|
— |
|
|
Environmental materials |
|
Buy environmental materials (containers, spill kit, others) |
|
In progress |
|
38,663 |
|
— |
|
38,663 |
|
— |
|
— |
|
38,663 |
|
19,073 |
|
|
Outsourced services |
|
Other services (contracts with third parties) |
|
In progress |
|
32,667 |
|
— |
|
32,667 |
|
— |
|
— |
|
32,667 |
|
83,111 |
|
|
Household waste removal |
|
Household / domestic waste removal contract (payment of municipal retreat) |
|
In progress |
|
22,132 |
|
— |
|
22,132 |
|
— |
|
— |
|
22,132 |
|
6,177 |
|
|
Environmental Travel |
|
Tickets - accommodation and travel allowance for site visits to facilities |
|
In progress |
|
124,926 |
|
— |
|
124,926 |
|
— |
|
— |
|
124,926 |
|
— |
|
|
Legal requirements contract |
|
Environmental and sectorial permit management contract. |
|
In progress |
|
193,742 |
|
— |
|
193,742 |
|
— |
|
— |
|
193,742 |
|
27,037 |
|
|
Rent/vehicle expenses |
|
Vehicle rental for environmental trips (field visits / Plants) |
|
In progress |
|
8,526 |
|
— |
|
8,526 |
|
— |
|
— |
|
8,526 |
|
41,615 |
|
|
Bird collision monitoring contract |
|
Bird Collision Monitoring Contract |
|
In progress |
|
10,760 |
|
— |
|
10,760 |
|
— |
|
— |
|
10,760 |
|
388,175 |
Geotérmica del Norte S.A. |
|
Waste management |
|
Contracts for removal of hazardous and non-hazardous waste |
|
In progress |
|
63,192 |
|
— |
|
63,192 |
|
— |
|
— |
|
63,192 |
|
13,607 |
|
|
Environmental sanitation |
|
Contracts for vector control, deratization, disinfection. |
|
In progress |
|
4,380 |
|
— |
|
4,380 |
|
— |
|
— |
|
4,380 |
|
8,630 |
|
|
Campaigns and Studies |
|
Contracts for Environmental Monitoring (Birds Collision - Flora and Fauna - Archeology, others) |
|
In progress |
|
366,260 |
|
— |
|
366,260 |
|
— |
|
— |
|
366,260 |
|
275,403 |
|
|
Permitting framework agreement |
|
Management contract for environmental and sectoral permits |
|
In progress |
|
18,821 |
|
— |
|
18,821 |
|
— |
|
— |
|
18,821 |
|
30,286 |
Parque Eólico Talinay Oriente S.A. |
|
Environmental sanitation |
|
Contracts for vector control, deratization, disinfection. |
|
In progress |
|
11,763 |
|
— |
|
11,763 |
|
— |
|
— |
|
11,763 |
|
1,251 |
|
|
Campaigns and Studies |
|
Contracts for Environmental Monitoring (Birds Collision - Flora and Fauna - Archeology, others) |
|
In progress |
|
30,882 |
|
— |
|
30,882 |
|
— |
|
— |
|
30,882 |
|
5,559 |
|
|
Environmental materials |
|
Buy environmental materials (containers, spill kit, others) |
|
In progress |
|
27,118 |
|
— |
|
27,118 |
|
— |
|
— |
|
27,118 |
|
614 |
|
|
Household waste removal |
|
Household / domestic waste removal contract (payment of municipal retreat) |
|
In progress |
|
19,664 |
|
— |
|
19,664 |
|
— |
|
— |
|
19,664 |
|
— |
|
|
|
|
Household / domestic waste removal contract |
|
In progress |
|
21,942 |
|
— |
|
21,942 |
|
— |
|
— |
|
21,942 |
|
11,713 |
|
|
|
|
Total |
|
|
|
17,758,581 |
|
7,593,029 |
|
10,165,552 |
|
42,004,660 |
|
|
|
59,763,241 |
|
7,378,941 |
F-141
|
|
|
|
|
|
|
|
|
|
|
|
|
|
|
|
|
|
|
|
|
|
|
|
|
|
|
12-31-2023 |
||||||||||
Disbursing Company |
|
Project Name |
|
Environmental Description |
|
Project status [Completed, in progress] |
|
Disbursement amount |
|
Capitalized amount |
|
Expense amount |
|
Future disbursement amount |
|
Estimated date of future disbursement |
|
Total disbursements |
Pehuenche S.A. |
|
Pehuenche power plant |
|
Waste Management |
|
In progress |
|
34,473 |
|
— |
|
34,473 |
|
34,473 |
|
12-31-2024 |
|
68,946 |
|
|
|
|
Environmental Sanitation |
|
In progress |
|
854 |
|
— |
|
854 |
|
854 |
|
12/31/2024 |
|
1,708 |
|
|
|
|
Materials Environment |
|
In progress |
|
9,085 |
|
— |
|
9,085 |
|
9,085 |
|
12/31/2024 |
|
18,170 |
Enel Distribución Chile S.A. |
|
Vegetation control in MT/BT |
|
Pruning of trees near the media network and low voltage. |
|
In progress |
|
1,532,887 |
|
— |
|
1,532,887 |
|
— |
|
— |
|
1,532,887 |
|
|
Improvements in the MT network |
|
Replacement underground transformers by Technical Standard (PCB) |
|
Completed |
|
230,606 |
|
230,606 |
|
— |
|
— |
|
— |
|
230,606 |
|
|
SEF STANDARDIZATION PROJECT (CAPEX) |
|
Underground Networks Interaction Project between Enel and Metrogas |
|
In progress |
|
639,601 |
|
639,601 |
|
— |
|
— |
|
— |
|
639,601 |
Enel Generación Chile S.A. |
|
Environmental expenses, and certifications, Coal Power Plants (CP) |
|
The main expenses incurred are: Investments, improvements and work performed to obtain certificates in Diesel tanks,. Operation and maintenance, monitoring air quality and meteorological stations, Environmental audit monitoring network once a year, Annual CEMS Validation, Biomass Protocol Service, Environmental Materials (magazine, books), Isokinetic Measurements, SGI Works (NC objective, inspections, audits and supervision) ISO 14001, OHSAS certification, CEMS operation and maintenance service. |
|
In progress |
|
587,545 |
|
105,196 |
|
482,349 |
|
1,211,306 |
|
12/31/2024 |
|
1,798,851 |
|
|
Environmental expenses, adaptations and certifications, Thermal Power Plants (TP) |
|
Studies, monitoring, laboratory analysis, removal and final disposal of solid waste in thermoelectric plants (TP) |
|
In progress |
|
1,174,689 |
|
436,295 |
|
738,394 |
|
615,621 |
|
12/31/2024 |
|
1,790,310 |
|
|
Environmental expenses, Hydroelectric Power Plants (HP) |
|
Studies, monitoring, laboratory analysis, removal and final disposal of solid waste in hydroelectric plants (HP) |
|
In progress |
|
143,262 |
|
— |
|
143,262 |
|
359,295 |
|
12/31/2024 |
|
502,557 |
Enel Green Power Chile S.A. |
|
Waste management |
|
Contracts for the removal of hazardous and non-hazardous waste |
|
In progress |
|
91,480 |
|
— |
|
91,480 |
|
— |
|
— |
|
91,480 |
|
|
Environmental sanitation |
|
Contracts for vector control, deratization, disinfection. |
|
In progress |
|
22,180 |
|
— |
|
22,180 |
|
— |
|
— |
|
22,180 |
|
|
Water analysis |
|
Monitoring and analysis of drinking water and sewage |
|
In progress |
|
58,235 |
|
— |
|
58,235 |
|
— |
|
— |
|
58,235 |
|
|
Environmental materials |
|
Buy environmental materials (containers, spill kit, others) |
|
In progress |
|
19,073 |
|
— |
|
19,073 |
|
— |
|
— |
|
19,073 |
|
|
Sewage treatment plant |
|
Contract for removal and cleaning of pits and sewage |
|
In progress |
|
22,707 |
|
— |
|
22,707 |
|
— |
|
— |
|
22,707 |
|
|
Outsourced services |
|
Other services (contracts with third parties) |
|
In progress |
|
83,111 |
|
— |
|
83,111 |
|
— |
|
— |
|
83,111 |
|
|
Permitting framework agreement |
|
Management contract for environmental and sectoral permits |
|
In progress |
|
108,170 |
|
— |
|
108,170 |
|
— |
|
— |
|
108,170 |
|
|
Domestic waste removal |
|
Household / domestic waste removal contract (payment of municipal retreat) |
|
In progress |
|
6,177 |
|
— |
|
6,177 |
|
— |
|
— |
|
6,177 |
|
|
Legal requirement contract |
|
Environmental and sectorial permit management contract. |
|
In progress |
|
27,037 |
|
— |
|
27,037 |
|
— |
|
— |
|
27,037 |
|
|
Rent/vehicle expenses |
|
Vehicle rental for environmental trips (field visits / Plants) |
|
In progress |
|
41,615 |
|
— |
|
41,615 |
|
— |
|
— |
|
41,615 |
|
|
Bird collision monitoring contract |
|
Bird collision monitoring contract |
|
In progress |
|
388,175 |
|
— |
|
388,175 |
|
— |
|
— |
|
388,175 |
|
|
Wildlife monitoring |
|
Contracts for Environmental Monitoring (Wildlife) |
|
In progress |
|
100,470 |
|
— |
|
100,470 |
|
— |
|
— |
|
100,470 |
|
|
Archaeological monitoring |
|
Monitoring of archaeological sites |
|
In progress |
|
36,972 |
|
— |
|
36,972 |
|
— |
|
— |
|
36,972 |
|
|
Noise monitoring |
|
Noise monitoring |
|
In progress |
|
30,545 |
|
— |
|
30,545 |
|
— |
|
— |
|
30,545 |
Geotérmica del Norte S.A. |
|
Waste management |
|
Contracts for removal of hazardous and non-hazardous waste |
|
In progress |
|
13,607 |
|
— |
|
13,607 |
|
— |
|
— |
|
13,607 |
|
|
Environmental sanitation |
|
Contracts for vector control, deratization, disinfection. |
|
In progress |
|
8,630 |
|
— |
|
8,630 |
|
— |
|
— |
|
8,630 |
|
|
Water analysis |
|
Monitoring and analysis of potable water and wastewater |
|
In progress |
|
15,675 |
|
— |
|
15,676 |
|
— |
|
— |
|
15,675 |
|
|
Environmental materials |
|
Purchase of environmental materials (containers, anti-leak kits, others) |
|
In progress |
|
275,403 |
|
— |
|
275,403 |
|
— |
|
— |
|
275,403 |
|
|
Sewage treatment plant |
|
Contract for removal and cleaning of pits and sewage |
|
In progress |
|
613 |
|
— |
|
613 |
|
— |
|
— |
|
613 |
|
|
Permitting framework agreement |
|
Management contract for environmental and sectoral permits |
|
In progress |
|
1,140 |
|
— |
|
1,140 |
|
— |
|
— |
|
1,140 |
|
|
Outsourced services |
|
Other services (contracts with third parties) |
|
In progress |
|
30,286 |
|
30,286 |
|
30,286 |
|
— |
|
— |
|
30,286 |
Parque Eólico Talinay Oriente S.A. |
|
Water analysis |
|
Monitoring and analysis of potable water and wastewater |
|
In progress |
|
15,903 |
|
— |
|
15,903 |
|
— |
|
— |
|
15,903 |
|
|
Campaigns and studies |
|
Contracts for Environmental Monitoring (Birds - Flora and Fauna - Archaeology, etc.) |
|
In progress |
|
1,251 |
|
— |
|
1,251 |
|
— |
|
— |
|
1,251 |
|
|
Water analysis |
|
Monitoring and analysis of potable water and wastewater |
|
In progress |
|
5,478 |
|
— |
|
5,478 |
|
— |
|
— |
|
5,478 |
|
|
Campaigns and studies |
|
Contracts for Environmental Monitoring (Birds - Flora and Fauna - Archaeology, etc.) |
|
In progress |
|
5,559 |
|
— |
|
5,559 |
|
— |
|
— |
|
5,559 |
|
|
Environmental materials |
|
Purchase of environmental materials (containers, anti-leak kits, others) |
|
In progress |
|
614 |
|
— |
|
614 |
|
— |
|
— |
|
614 |
|
|
Sewage treatment plant |
|
Contract for removal and cleaning of pits and sewage |
|
In progress |
|
585 |
|
— |
|
585 |
|
— |
|
— |
|
585 |
|
|
Domestic waste removal |
|
Household / domestic waste removal contract |
|
In progress |
|
11,713 |
|
— |
|
11,713 |
|
— |
|
— |
|
11,713 |
|
|
Bird Collision Monitoring Contract |
|
Bird Collision Monitoring Contract |
|
In progress |
|
22,203 |
|
— |
|
22,203 |
|
— |
|
— |
|
22,203 |
|
|
|
|
Total |
|
|
|
5,797,609 |
|
1,441,984 |
|
4,385,912 |
|
2,230,634 |
|
|
|
8,028,243 |
F-142
|
|
|
|
|
|
|
|
|
|
|
|
|
|
|
|
|
|
|
|
|
|
|
|
|
|
|
12-31-2022 |
||||||||||
Disbursing Company |
|
Project Name |
|
Environmental Description |
|
Project status [Completed, in progress] |
|
Disbursement amount |
|
Capitalized amount |
|
Expense amount |
|
Future disbursement amount |
|
Estimated date of future disbursement |
|
Total disbursements |
Pehuenche S.A. |
|
Pehuenche power plant |
|
Waste Management |
|
In progress |
|
29,164 |
|
— |
|
29,164 |
|
5,405 |
|
12-31-2023 |
|
34,569 |
|
|
|
|
Environmental Sanitation |
|
In progress |
|
3,105 |
|
— |
|
3,105 |
|
19,298 |
|
12-31-2023 |
|
22,403 |
|
|
|
|
Materials Environment |
|
In progress |
|
25,144 |
|
— |
|
25,144 |
|
24,720 |
|
12-31-2023 |
|
49,864 |
Enel Distribución Chile S.A. |
|
Vegetation Control In At Networks (OPEX) |
|
This activity contemplates the maintenance of the band of easement of high voltage lines between 34.5 and 500kv. |
|
In progress |
|
525,809 |
|
— |
|
525,809 |
|
— |
|
— |
|
525,809 |
|
|
Vegetation control in MT/BT |
|
Pruning of trees near the media network and low voltage. |
|
In progress |
|
2,383,970 |
|
— |
|
2,383,970 |
|
— |
|
— |
|
2,383,970 |
|
|
Improvements in the MT network |
|
Replacement underground transformers by Technical Standard (PCB) |
|
In progress |
|
139,820 |
|
— |
|
139,820 |
|
— |
|
— |
|
139,820 |
|
|
SEF standardization project (CAPEX) |
|
Underground Networks Interaction Project between Enel and Metrogas |
|
In progress |
|
2,932,689 |
|
— |
|
2,932,689 |
|
— |
|
— |
|
2,932,689 |
Enel Generación Chile S.A. |
|
Environmental expenses, and certifications, Coal Power Plants (CP) |
|
The main expenses incurred are: Investments, improvements and work performed to obtain certificates in Diesel tanks,. Operation and maintenance, monitoring air quality and meteorological stations, Environmental audit monitoring network once a year, Annual CEMS Validation, Biomass Protocol Service, Environmental Materials (magazine, books), Isokinetic Measurements, SGI Works (NC objective, inspections, audits and supervision) ISO 14001, OHSAS certification, CEMS operation and maintenance service. |
|
In progress |
|
1,611,874 |
|
689,327 |
|
922,547 |
|
632,635 |
|
12-31-2023 |
|
2,244,509 |
|
|
Environmental expenses, adaptations and certifications, Thermal Power Plants (TP) |
|
Studies, monitoring, laboratory analysis, removal and final disposal of solid waste in thermoelectric plants (TP) |
|
In progress |
|
1,231,175 |
|
182,861 |
|
1,048,314 |
|
2,120,483 |
|
12-31-2023 |
|
3,351,658 |
|
|
Environmental expenses, Hydroelectric Power Plants (HP) |
|
Studies, monitoring, laboratory analysis, removal and final disposal of solid waste in hydroelectric plants (HP) |
|
In progress |
|
426,453 |
|
— |
|
426,453 |
|
718,751 |
|
12-31-2023 |
|
1,145,204 |
Enel Green Power Chile S.A. |
|
Waste management |
|
Contracts for the removal of hazardous and non-hazardous waste |
|
In progress |
|
75,422 |
|
— |
|
75,422 |
|
193,828 |
|
12-31-2023 |
|
269,250 |
|
|
Environmental sanitation |
|
Contracts for vector control, deratization, disinfection |
|
In progress |
|
22,316 |
|
— |
|
22,316 |
|
195,796 |
|
12-31-2023 |
|
218,112 |
|
|
Water analysis |
|
Monitoring and analysis of drinking water and sewage |
|
In progress |
|
61,552 |
|
— |
|
61,552 |
|
91,153 |
|
12-31-2023 |
|
152,705 |
|
|
Rent/vehicle expenses |
|
Vehicle rental for environmental trips (field visits / Plants) |
|
In progress |
|
75,481 |
|
— |
|
75,481 |
|
114,211 |
|
12-31-2023 |
|
189,692 |
|
|
Campaigns and studies |
|
Contracts for Environmental Monitoring (Collision of Birds- Flora and Fauna- Archeology, others) |
|
In progress |
|
13,234 |
|
— |
|
13,234 |
|
109,770 |
|
12-31-2023 |
|
123,004 |
|
|
Environmental materials |
|
Buy environmental materials (containers, spill kit, others) |
|
In progress |
|
14,203 |
|
— |
|
14,203 |
|
46,944 |
|
12-31-2023 |
|
61,147 |
|
|
Sewage treatment plant |
|
Contract for removal and cleaning of pits and sewage |
|
In progress |
|
65,043 |
|
— |
|
65,043 |
|
110,887 |
|
12-31-2023 |
|
175,930 |
|
|
Outsourced services |
|
Other services (contracts with third parties) |
|
In progress |
|
10,932 |
|
— |
|
10,932 |
|
227,590 |
|
12-31-2023 |
|
238,522 |
|
|
Permitting framework agreement |
|
Management contract for environmental and sectoral permits |
|
In progress |
|
43,576 |
|
— |
|
43,576 |
|
181,299 |
|
12-31-2023 |
|
224,875 |
|
|
Domestic waste removal |
|
Household / domestic waste removal contract |
|
In progress |
|
78,617 |
|
— |
|
78,617 |
|
69,700 |
|
12-31-2023 |
|
148,317 |
|
|
Environment travel |
|
Tickets - accommodation and travel allowance for site visits to facilities |
|
In progress |
|
49,605 |
|
— |
|
49,605 |
|
99,316 |
|
12-31-2023 |
|
148,921 |
|
|
Legal requirement contract |
|
Environmental and sectorial permit management contract. |
|
In progress |
|
217,870 |
|
— |
|
217,870 |
|
617,101 |
|
12-31-2023 |
|
834,971 |
|
|
Bird collision monitoring contract |
|
Bird Collision Monitoring Contract |
|
In progress |
|
71,680 |
|
— |
|
71,680 |
|
63,000 |
|
12-31-2023 |
|
134,680 |
|
|
Waste management |
|
Contracts for the removal of hazardous and non-hazardous waste |
|
In progress |
|
26,667 |
|
— |
|
26,667 |
|
36,764 |
|
12-31-2023 |
|
63,431 |
|
|
Environmental sanitation |
|
Contracts for vector control, deratization, disinfection. |
|
In progress |
|
2,293 |
|
— |
|
2,293 |
|
37,750 |
|
12-31-2023 |
|
40,043 |
Geotérmica del Norte S.A. |
|
Water analysis |
|
Monitoring and analysis of drinking water and sewage |
|
In progress |
|
5,589 |
|
— |
|
5,589 |
|
5,378 |
|
12-31-2023 |
|
10,967 |
|
|
Campaigns and studies |
|
Contracts for Environmental Monitoring (Collision of Birds- Flora and Fauna- Archeology, others) |
|
In progress |
|
277,126 |
|
— |
|
277,126 |
|
406,915 |
|
12-31-2023 |
|
684,041 |
|
|
Environmental materials |
|
Buy environmental materials (containers, spill kit, others) |
|
In progress |
|
4,209 |
|
— |
|
4,209 |
|
5,227 |
|
12-31-2023 |
|
9,436 |
|
|
Sewage treatment plant |
|
Contract for removal and cleaning of pits and sewage |
|
In progress |
|
— |
|
— |
|
— |
|
3,659 |
|
12-31-2023 |
|
3,659 |
|
|
Permitting framework agreement |
|
Management contract for environmental and sectoral permits |
|
In progress |
|
31,411 |
|
— |
|
31,411 |
|
— |
|
12-31-2023 |
|
31,411 |
|
|
Domestic waste removal |
|
Household / domestic waste removal contract (payment of municipal retreat) |
|
In progress |
|
8,150 |
|
— |
|
8,150 |
|
10,950 |
|
12-31-2023 |
|
19,100 |
|
|
Vegetation control in AT networks |
|
This activity contemplates the maintenance of the band of easement of high voltage lines between 34.5 and 500kv. |
|
In progress |
|
102,015 |
|
— |
|
102,015 |
|
142,081 |
|
11-30-2022 |
|
244,096 |
|
|
|
|
It consists of cutting branches until reaching the safety conditions that the foliage must be left with respect to the drivers. |
|
In progress |
|
223,178 |
|
— |
|
223,178 |
|
— |
|
— |
|
223,178 |
Enel Transmisión Chile S.A. |
|
Environmental management in SSEE |
|
The service consists of the maintenance of green areas with replacement of species and grass in Enel substation enclosures |
|
In progress |
|
59,999 |
|
— |
|
59,999 |
|
81,570 |
|
11-30-2022 |
|
141,569 |
|
|
Environmental management |
|
Environmental management of reforestation in the Parque Metropolitano. |
|
In progress |
|
7,715 |
|
— |
|
7,715 |
|
2,580 |
|
11-30-2022 |
|
10,295 |
|
|
|
|
Nests and Others |
|
In progress |
|
1,590 |
|
— |
|
1,590 |
|
6,010 |
|
11-30-2022 |
|
7,600 |
|
|
Silica gel replacement in power transformers |
|
Considers the replacement of silica gel (hygroscopic salt) to one (1) power transformer. |
|
Completed |
|
113 |
|
— |
|
113 |
|
— |
|
— |
|
113 |
Parque Eolico Talinay Oriente S.A. |
|
Waste management |
|
Contracts for the removal of hazardous and non-hazardous waste |
|
In progress |
|
6,496 |
|
— |
|
6,496 |
|
7,841 |
|
12-31-2023 |
|
14,337 |
|
|
Environmental sanitation |
|
Contracts for vector control, deratization, disinfection. |
|
In progress |
|
1,789 |
|
— |
|
1,789 |
|
15,642 |
|
12-31-2023 |
|
17,431 |
|
|
Water analysis |
|
Monitoring and analysis of drinking water and sewage |
|
In progress |
|
4,916 |
|
— |
|
4,916 |
|
4,640 |
|
12-31-2023 |
|
9,556 |
|
|
Campaigns and studies |
|
Contracts for Environmental Monitoring (Collision of Birds- Flora and Fauna- Archeology, others) |
|
In progress |
|
39,093 |
|
— |
|
39,093 |
|
— |
|
- |
|
39,093 |
|
|
Environmental materials |
|
Buy environmental materials (containers, spill kit, others) |
|
In progress |
|
1,949 |
|
— |
|
1,949 |
|
5,227 |
|
12-31-2023 |
|
7,176 |
|
|
Sewage treatment plant |
|
Contract for removal and cleaning of pits and sewage |
|
In progress |
|
— |
|
— |
|
— |
|
1,830 |
|
12-31-2023 |
|
1,830 |
|
|
Permitting framework agreement |
|
Management contract for environmental and sectoral permits |
|
In progress |
|
453 |
|
— |
|
453 |
|
— |
|
— |
|
453 |
|
|
Domestic waste removal |
|
Household / domestic waste removal contract |
|
In progress |
|
8,884 |
|
— |
|
8,884 |
|
25,027 |
|
12-31-2023 |
|
33,911 |
|
|
Bird collision monitoring contract |
|
Bird collision monitoring contract |
|
In progress |
|
41,476 |
|
— |
|
41,476 |
|
— |
|
— |
|
41,476 |
|
|
|
|
Total |
|
|
|
10,963,845 |
|
872,188 |
|
10,091,657 |
|
6,440,978 |
|
|
|
17,404,823 |
F-143
40. FINANCIAL INFORMATION ON SUBSIDIARIES, SUMMARIZED
As of December 31, 2024, 2023 and 2022, summarized financial information of the Company’s principal consolidated subsidiaries prepared under IFRS is as follows.
|
|
|
|
|
|
|
|
|
|
|
|
|
|
|
|
|
|
|
|
|
|
|
|
|
|
|
|
|
|
|
|
|
|
|
|
|
|
|
|
|
|
12-31-2024 |
|
||||||||||||||||||||||||||||||||||||
|
|
Financial |
|
Current |
|
Non-Current |
|
Total Assets |
|
Current |
|
Non-Current |
|
Equity |
|
Total Equity and |
|
Revenues |
|
Raw Materials and |
|
Contribution |
|
Gross |
|
Operating |
|
Financial |
|
Income |
|
Income tax |
|
Profit (Loss) |
|
Other Comprehensive Income |
|
Total Comprehensive Income |
|
|
|
Statements |
|
ThCh$ |
|
ThCh$ |
|
ThCh$ |
|
ThCh$ |
|
ThCh$ |
|
ThCh$ |
|
ThCh$ |
|
ThCh$ |
|
ThCh$ |
|
ThCh$ |
|
ThCh$ |
|
ThCh$ |
|
ThCh$ |
|
ThCh$ |
|
ThCh$ |
|
ThCh$ |
|
ThCh$ |
|
ThCh$ |
|
Grupo Enel Distribución Chile |
|
Consolidated |
|
669,750,787 |
|
2,213,624,569 |
|
2,883,375,356 |
|
775,649,811 |
|
1,436,878,152 |
|
670,847,393 |
|
2,883,375,356 |
|
1,641,409,755 |
|
(1,467,109,226) |
|
174,300,529 |
|
60,469,139 |
|
(12,218,650) |
|
(23,360,369) |
|
(35,579,019) |
|
10,093,354 |
|
(25,485,665) |
|
(2,704,765) |
|
(28,190,430) |
|
Enel Generación Chile |
|
Separate |
|
1,757,858,299 |
|
2,927,683,402 |
|
4,685,541,701 |
|
1,094,624,777 |
|
853,934,154 |
|
2,736,982,770 |
|
4,685,541,701 |
|
2,961,926,314 |
|
(2,339,691,479) |
|
622,234,834 |
|
498,934,150 |
|
441,872,262 |
|
(27,920,001) |
|
558,864,064 |
|
(82,252,530) |
|
476,611,534 |
|
182,007,551 |
|
658,619,085 |
|
Enel Distribución Chile |
|
Separate |
|
659,256,202 |
|
2,200,865,345 |
|
2,860,121,547 |
|
764,742,650 |
|
1,436,842,637 |
|
658,536,260 |
|
2,860,121,547 |
|
1,636,765,123 |
|
(1,462,595,679) |
|
174,169,443 |
|
60,673,321 |
|
(11,000,088) |
|
(23,676,847) |
|
(34,676,935) |
|
9,678,533 |
|
(24,998,402) |
|
(2,700,019) |
|
(27,698,421) |
|
Empresa Eléctrica Pehuenche S.A. |
|
Separate |
|
92,706,260 |
|
158,625,979 |
|
251,332,239 |
|
51,508,159 |
|
34,309,142 |
|
165,514,938 |
|
251,332,239 |
|
249,124,751 |
|
(16,366,495) |
|
232,758,255 |
|
224,506,165 |
|
217,595,776 |
|
3,797,253 |
|
221,393,029 |
|
(59,584,001) |
|
161,809,028 |
|
— |
|
161,809,028 |
|
Enel X Chile SPA |
|
Separate |
|
71,021,967 |
|
79,563,449 |
|
150,585,416 |
|
73,394,163 |
|
87,611,986 |
|
(10,420,733) |
|
150,585,416 |
|
47,372,440 |
|
(25,938,804) |
|
21,433,636 |
|
2,978,191 |
|
2,051,031 |
|
(14,272,853) |
|
(12,221,822) |
|
3,517,272 |
|
(8,704,550) |
|
17,759 |
|
(8,686,791) |
|
Enel X Way Chile S.p.A. |
|
Separate |
|
16,935,442 |
|
2,544,040 |
|
19,479,482 |
|
6,784,325 |
|
417,771 |
|
12,277,386 |
|
19,479,482 |
|
3,073,703 |
|
(2,645,090) |
|
428,613 |
|
(1,309,643) |
|
(1,508,397) |
|
147,744 |
|
(1,360,653) |
|
(1,427,097) |
|
(2,787,750) |
|
(27,715) |
|
(2,815,465) |
|
Enel Mobility Chile SPA |
|
Separate |
|
2,362,663 |
|
8,185,400 |
|
10,548,063 |
|
11,599,376 |
|
— |
|
(1,051,313) |
|
10,548,063 |
|
690,515 |
|
(545,687) |
|
144,828 |
|
(1,042,732) |
|
(1,427,396) |
|
(561,638) |
|
(1,989,033) |
|
(93,549) |
|
(2,082,582) |
|
— |
|
(2,082,582) |
|
Geotérmica del Norte S.A. |
|
Separate |
|
52,681,092 |
|
485,600,836 |
|
538,281,928 |
|
38,660,048 |
|
6,749,581 |
|
492,872,299 |
|
538,281,928 |
|
53,157,963 |
|
(15,351,291) |
|
37,806,672 |
|
32,362,187 |
|
5,470,154 |
|
7,131,725 |
|
12,601,879 |
|
(2,294,234) |
|
10,307,645 |
|
59,315,301 |
|
69,622,946 |
|
Parque Eólico Talinay Oriente S.A. |
|
Separate |
|
167,635,258 |
|
85,504,106 |
|
253,139,364 |
|
10,572,831 |
|
24,774,608 |
|
217,791,925 |
|
253,139,364 |
|
13,273,053 |
|
(1,317,734) |
|
11,955,320 |
|
8,070,944 |
|
445,862 |
|
6,817,527 |
|
7,263,389 |
|
(1,898,972) |
|
5,364,417 |
|
26,149,984 |
|
31,514,401 |
|
Enel Green Power Chile S.A |
|
Separate |
|
164,466,777 |
|
4,241,781,610 |
|
4,406,248,387 |
|
570,623,171 |
|
2,839,560,300 |
|
996,064,916 |
|
4,406,248,387 |
|
614,080,766 |
|
(173,871,990) |
|
440,208,775 |
|
353,307,960 |
|
181,693,468 |
|
(113,340,043) |
|
68,353,425 |
|
(19,489,923) |
|
48,863,502 |
|
117,954,715 |
|
166,818,217 |
|
Grupo Enel Green Power Chile |
|
Consolidated |
|
355,104,853 |
|
4,330,554,984 |
|
4,685,659,837 |
|
590,177,775 |
|
2,877,283,498 |
|
1,218,198,564 |
|
4,685,659,837 |
|
616,697,946 |
|
(130,057,863) |
|
486,640,083 |
|
393,741,092 |
|
186,793,960 |
|
(99,390,792) |
|
87,127,765 |
|
(23,462,937) |
|
63,664,828 |
|
140,616,668 |
|
204,281,496 |
|
Grupo Enel Generación Chile |
|
Consolidated |
|
1,805,201,223 |
|
3,002,358,288 |
|
4,807,559,511 |
|
1,182,232,737 |
|
888,026,719 |
|
2,737,300,055 |
|
4,807,559,511 |
|
3,079,772,877 |
|
(2,227,757,665) |
|
852,015,212 |
|
723,307,269 |
|
659,468,037 |
|
(24,122,748) |
|
644,714,864 |
|
(141,836,531) |
|
502,878,333 |
|
185,510,243 |
|
688,388,576 |
|
|
|
12-31-2023 |
||||||||||||||||||||||||||||||||||||
|
|
Financial |
|
Current |
|
Non-Current |
|
Total Assets |
|
Current |
|
Non-Current |
|
Equity |
|
Total Equity and |
|
Revenues |
|
Raw Materials and |
|
Contribution |
|
Gross |
|
Operating |
|
Financial |
|
Income |
|
Income tax |
|
Profit (Loss) |
|
Other Comprehensive Income |
|
Total Comprehensive Income |
|
|
Statements |
|
ThCh$ |
|
ThCh$ |
|
ThCh$ |
|
ThCh$ |
|
ThCh$ |
|
ThCh$ |
|
ThCh$ |
|
ThCh$ |
|
ThCh$ |
|
ThCh$ |
|
ThCh$ |
|
ThCh$ |
|
ThCh$ |
|
ThCh$ |
|
ThCh$ |
|
ThCh$ |
|
ThCh$ |
|
ThCh$ |
Grupo Enel Distribución Chile |
|
Consolidated |
|
536,336,504 |
|
1,849,188,188 |
|
2,385,524,692 |
|
576,000,953 |
|
1,110,485,916 |
|
699,037,823 |
|
2,385,524,692 |
|
1,511,618,986 |
|
(1,321,193,173) |
|
190,425,813 |
|
92,378,064 |
|
31,333,214 |
|
(22,406,029) |
|
8,016,459 |
|
5,986,351 |
|
14,002,810 |
|
4,256,843 |
|
18,259,653 |
Enel Generación Chile |
|
Separate |
|
1,639,751,390 |
|
2,891,976,787 |
|
4,531,728,177 |
|
1,253,245,045 |
|
874,687,249 |
|
2,403,795,883 |
|
4,531,728,177 |
|
3,093,713,774 |
|
(2,492,460,074) |
|
601,253,700 |
|
479,828,601 |
|
421,257,037 |
|
43,699,104 |
|
623,784,931 |
|
(111,039,121) |
|
512,745,810 |
|
(89,523,631) |
|
423,222,179 |
Enel Distribución Chile |
|
Separate |
|
527,062,985 |
|
1,838,003,681 |
|
2,365,066,666 |
|
565,443,694 |
|
1,110,458,785 |
|
689,164,187 |
|
2,365,066,666 |
|
1,507,064,996 |
|
(1,319,758,411) |
|
187,306,585 |
|
90,583,023 |
|
28,536,267 |
|
(21,595,248) |
|
6,030,293 |
|
6,318,917 |
|
12,349,210 |
|
4,255,736 |
|
16,604,946 |
Empresa Eléctrica Pehuenche S.A. |
|
Separate |
|
91,177,341 |
|
155,350,662 |
|
246,528,003 |
|
50,383,350 |
|
36,279,770 |
|
159,864,883 |
|
246,528,003 |
|
217,717,148 |
|
(7,818,815) |
|
209,898,332 |
|
201,464,786 |
|
194,705,044 |
|
6,861,192 |
|
201,566,236 |
|
(53,910,507) |
|
147,655,728 |
|
— |
|
147,655,728 |
Arcadia Generación Solar S.A. (1) |
|
Separate |
|
— |
|
— |
|
— |
|
— |
|
— |
|
— |
|
— |
|
43,093,497 |
|
(908,539) |
|
42,184,958 |
|
30,522,549 |
|
13,883,421 |
|
570,731 |
|
14,454,153 |
|
(5,973,184) |
|
8,480,969 |
|
8,442,564 |
|
16,923,533 |
Enel X Chile SPA |
|
Separate |
|
83,136,706 |
|
109,373,485 |
|
192,510,191 |
|
106,830,357 |
|
87,413,776 |
|
(1,733,942) |
|
192,510,191 |
|
46,467,999 |
|
(18,085,114) |
|
28,382,885 |
|
13,553,843 |
|
12,349,930 |
|
(42,751,424) |
|
(30,401,494) |
|
8,468,810 |
|
(21,932,684) |
|
(30,735) |
|
(21,963,419) |
Geotérmica del Norte S.A. |
|
Separate |
|
20,720,312 |
|
449,885,526 |
|
470,605,838 |
|
37,049,192 |
|
10,307,294 |
|
423,249,352 |
|
470,605,838 |
|
45,865,852 |
|
(11,566,230) |
|
34,299,622 |
|
26,786,584 |
|
4,392,257 |
|
(940,485) |
|
3,451,771 |
|
(1,209,441) |
|
2,242,330 |
|
10,372,466 |
|
12,614,796 |
Parque Eólico Talinay Oriente S.A. |
|
Separate |
|
138,191,942 |
|
79,433,206 |
|
217,625,148 |
|
7,836,118 |
|
23,511,505 |
|
186,277,525 |
|
217,625,148 |
|
14,016,228 |
|
(1,221,066) |
|
12,795,162 |
|
9,457,579 |
|
2,703,605 |
|
6,961,749 |
|
9,665,354 |
|
(2,997,342) |
|
6,668,012 |
|
4,646,496 |
|
11,314,508 |
Enel Green Power Chile S.A |
|
Separate |
|
129,441,688 |
|
3,700,078,682 |
|
3,829,520,370 |
|
704,179,322 |
|
2,296,094,345 |
|
829,246,703 |
|
3,829,520,370 |
|
533,135,755 |
|
(208,840,806) |
|
324,294,949 |
|
243,660,309 |
|
147,896,440 |
|
(81,930,070) |
|
65,966,371 |
|
(16,113,795) |
|
49,852,576 |
|
21,410,915 |
|
71,263,491 |
Grupo Enel Green Power Chile |
|
Consolidated |
|
265,831,009 |
|
3,806,579,686 |
|
4,072,410,695 |
|
726,541,701 |
|
2,335,254,987 |
|
1,010,614,007 |
|
4,072,410,695 |
|
536,160,033 |
|
(169,604,794) |
|
366,555,239 |
|
279,904,471 |
|
154,342,148 |
|
(74,647,386) |
|
79,749,325 |
|
(20,485,619) |
|
59,263,706 |
|
25,380,251 |
|
84,643,957 |
Grupo Enel Generación Chile |
|
Consolidated |
|
1,683,683,256 |
|
2,950,604,840 |
|
4,634,288,096 |
|
1,368,122,040 |
|
910,617,397 |
|
2,355,548,659 |
|
4,634,288,096 |
|
3,198,265,169 |
|
(2,390,034,659) |
|
808,230,510 |
|
681,160,341 |
|
615,962,079 |
|
50,560,296 |
|
681,555,884 |
|
(164,949,629) |
|
516,606,255 |
|
(89,055,604) |
|
427,550,651 |
|
|
|
|
|
|
|
|
|
|
|
|
|
|
|
|
|
|
|
|
|
|
|
|
|
|
|
|
|
|
|
|
|
|
|
|
|
|
|
|
|
12-31-2022 |
||||||||||||||||||||||||||||||||||||
|
|
Financial |
|
Current |
|
Non-Current |
|
Total Assets |
|
Current |
|
Non-Current |
|
Equity |
|
Total Equity and |
|
Revenues |
|
Raw Materials and |
|
Contribution |
|
Gross |
|
Operating |
|
Financial |
|
Income |
|
Income tax |
|
Profit (Loss) |
|
Other Comprehensive Income |
|
Total Comprehensive Income |
|
|
Statements |
|
ThCh$ |
|
ThCh$ |
|
ThCh$ |
|
ThCh$ |
|
ThCh$ |
|
ThCh$ |
|
ThCh$ |
|
ThCh$ |
|
ThCh$ |
|
ThCh$ |
|
ThCh$ |
|
ThCh$ |
|
ThCh$ |
|
ThCh$ |
|
ThCh$ |
|
ThCh$ |
|
ThCh$ |
|
ThCh$ |
Grupo Enel Distribución Chile |
|
Consolidated |
|
517,448,832 |
|
1,503,735,962 |
|
2,021,184,794 |
|
707,079,953 |
|
629,125,828 |
|
684,979,013 |
|
2,021,184,794 |
|
1,390,067,039 |
|
(1,219,057,344) |
|
171,009,695 |
|
80,618,603 |
|
13,031,895 |
|
(11,117,156) |
|
1,914,739 |
|
20,211,987 |
|
22,126,726 |
|
(6,670,042) |
|
15,456,684 |
Enel Generación Chile |
|
Separate |
|
1,616,083,142 |
|
2,654,629,663 |
|
4,270,712,805 |
|
899,409,125 |
|
1,202,746,824 |
|
2,168,556,856 |
|
4,270,712,805 |
|
3,666,453,365 |
|
(2,927,568,119) |
|
738,885,246 |
|
593,454,679 |
|
525,197,060 |
|
(36,631,364) |
|
635,647,512 |
|
(71,927,760) |
|
563,719,752 |
|
147,458,665 |
|
711,178,417 |
Enel Distribución Chile |
|
Separate |
|
509,513,449 |
|
1,493,545,567 |
|
2,003,059,016 |
|
695,744,040 |
|
629,055,841 |
|
678,259,135 |
|
2,003,059,016 |
|
1,386,278,469 |
|
(1,217,064,139) |
|
169,214,330 |
|
79,680,726 |
|
14,077,959 |
|
(11,098,303) |
|
2,979,657 |
|
19,475,413 |
|
22,455,070 |
|
(6,665,575) |
|
15,789,495 |
Empresa Eléctrica Pehuenche S.A. |
|
Separate |
|
153,652,579 |
|
156,567,496 |
|
310,220,075 |
|
97,367,848 |
|
38,214,373 |
|
174,637,854 |
|
310,220,075 |
|
272,441,946 |
|
(8,068,518) |
|
264,373,428 |
|
256,448,537 |
|
248,835,473 |
|
5,859,222 |
|
254,694,695 |
|
(67,785,473) |
|
186,909,222 |
|
— |
|
186,909,222 |
Enel Transmision Chile S.A. (2) |
|
Separate |
|
— |
|
— |
|
— |
|
— |
|
— |
|
— |
|
— |
|
96,056,284 |
|
(2,416,696) |
|
93,639,588 |
|
79,237,171 |
|
70,500,241 |
|
(9,460,824) |
|
61,039,418 |
|
(12,513,925) |
|
48,525,493 |
|
55,652 |
|
48,581,145 |
Enel X Chile SPA |
|
Separate |
|
120,842,754 |
|
129,627,868 |
|
250,470,622 |
|
227,063,403 |
|
1,615,388 |
|
21,791,831 |
|
250,470,622 |
|
44,555,174 |
|
(19,227,050) |
|
25,328,124 |
|
10,911,375 |
|
10,785,706 |
|
(9,297,839) |
|
918,355 |
|
930,710 |
|
1,849,065 |
|
(72,940) |
|
1,776,125 |
Geotérmica del Norte S.A. |
|
Separate |
|
25,635,151 |
|
449,371,985 |
|
475,007,136 |
|
54,576,871 |
|
9,795,709 |
|
410,634,556 |
|
475,007,136 |
|
42,338,738 |
|
(2,085,161) |
|
40,253,577 |
|
2,484,607 |
|
(16,314,492) |
|
(1,906,202) |
|
(18,220,694) |
|
5,882,266 |
|
(12,338,428) |
|
436,250 |
|
(11,902,178) |
Parque Eólico Talinay Oriente S.A. |
|
Separate |
|
127,752,924 |
|
84,532,822 |
|
212,285,746 |
|
12,169,016 |
|
25,153,714 |
|
174,963,016 |
|
212,285,746 |
|
27,384,124 |
|
(1,255,906) |
|
26,128,218 |
|
22,691,033 |
|
15,654,610 |
|
2,650,649 |
|
18,305,259 |
|
(5,114,251) |
|
13,191,008 |
|
(228,602) |
|
12,962,406 |
Enel Green Power Chile S.A |
|
Separate |
|
155,208,869 |
|
3,614,007,070 |
|
3,769,215,939 |
|
734,804,810 |
|
1,950,173,417 |
|
1,084,237,712 |
|
3,769,215,939 |
|
497,274,888 |
|
(247,339,410) |
|
249,935,478 |
|
182,795,798 |
|
97,069,706 |
|
(59,481,555) |
|
37,588,151 |
|
(11,322,450) |
|
26,265,701 |
|
(2,216,269) |
|
24,049,432 |
Grupo Enel Green Power Chile |
|
Consolidated |
|
291,452,465 |
|
3,734,811,118 |
|
4,026,263,583 |
|
784,406,218 |
|
1,990,260,594 |
|
1,251,596,771 |
|
4,026,263,583 |
|
510,321,233 |
|
(198,979,315) |
|
311,341,918 |
|
210,023,156 |
|
98,022,568 |
|
(54,359,950) |
|
40,852,508 |
|
(11,617,745) |
|
29,234,763 |
|
7,747,281 |
|
36,982,044 |
Grupo Enel Generación Chile |
|
Consolidated |
|
1,700,122,637 |
|
2,707,181,983 |
|
4,407,304,620 |
|
1,082,602,388 |
|
1,240,478,531 |
|
2,084,223,701 |
|
4,407,304,620 |
|
3,818,906,698 |
|
(2,818,054,885) |
|
1,000,851,813 |
|
849,770,172 |
|
774,032,534 |
|
(30,772,142) |
|
751,020,012 |
|
(139,713,234) |
|
611,306,778 |
|
147,333,179 |
|
758,639,957 |
| (1) | See Note 2.4.1.i. |
| (2) | See Note 5.3. |
F-144
41. SUBSEQUENT EVENTS
Enel Chile S.A.
| i. | Effective as of January 1, 2025, Enel Chile changed its functional currency from Chilean pesos to US dollars, since that currency will significantly influence the economic environment in which the Company operates. |
Enel Chile’s change of functional currency will be accounted for prospectively from inception by translating all items in the financial statements into the new functional currency, using the then-current exchange rate as of the effective date of the change.
The functional currency change is substantially motivated by the fact that the subsidiary Enel Generación Chile will change its functional currency from Chilean pesos to US dollars on the same date. The main reason for this change is that as of 2025 the main source of revenue of this subsidiary is expected to originate from the group of unregulated customer agreements that, considering the billing and collection cycles, give rise to a substantially lower exposure to exchange rate fluctuations compared with the group of regulated customers, which require considerably more time to complete the collection process. The group of regulated customer agreements represented the Company's main source of revenue in 2024.
Thus, in consideration to the relevance of the Generation Segment for the Group, the main source of revenue of Enel Chile (i.e. dividends from its subsidiaries, will be determined on a consistent basis in US dollars).
Effective as of January 1, 2025, Enel Chile will also change the presentation currency of its consolidated financial statements to US dollars. The change in the presentation currency of the Company's consolidated financial statements will be accounted for as a change in accounting policy and applied retrospectively as if the new presentation currency had always been the presentation currency. Consequently, the comparative figures for the years prior to January 1, 2025 will be restated to be presented in US dollars, using average exchange rates for revenues and expenses and the closing exchange rate at the balance sheet date for assets and liabilities. Issued capital, retained earnings, and other reserves in equity will be translated using historical exchange rates. The resulting exchange differences will be recognized in equity.
| ii. | On January 23, 2025, Enel Chile held an ordinary board meeting, where the modification of the Centralized Cash Agreement (“CCA”), entered into by Enel Chile and its subsidiaries, was approved. The proposal consisted in harmonizing all new intercompany transactions under a single procedure via the CCA. This agreement allows for performing two categories of transactions, namely: i) short-term CCAs (for short-term deficit or surplus), and ii) long-term CCAs (for 1-year or 3-year deficit or surplus), thus standardizing the instruments for all transactions. Under this scheme, daily movements of the CCA will be automatically recorded in the short-term CCA and the subsidiary will be able to request Enel Chile to reallocate a portion of, or the entire amount to, a long-term CCA, contingent on the financial position of the subsidiary. |
| iii. | On February 29, 2025, Enel Chile made a draw in the amount of US$50 million from the committed revolving line of credit provided by Corporación Andina de Fomento (“CAF”, in its Spanish acronym), arranged in December 2024. This operation was at SOFR 1 month variable interest rate, maturing on February 28, 2025. Given that this is a revolving line, its renewal or payment is defined at maturity and cannot be extended beyond the line of credit maturity date. |
| iv. | At the OSM held on April 28, 2025, our new Board of Directors was elected for a term of three years starting from the date of the meeting. At the Board of Directors meeting held on April 28, 2025, the directors agreed to appoint María Teresa Vial Álamos, Gina Ocqueteau Tacchini and Pablo Cruz Olivos as members of the Directors’ Committee. Additionally, María Teresa Vial Álamos was appointed Chair of the Directors’ Committee. |
The members of our new Board of Directors are as follows:
F-145
Enel Distribución Chile S.A.
| v. | On January 22, 2025, Enel Distribución received Exempt Resolutions Nos. 36,621, 36,622, 36,623 and 36,624 from SEF, fining the Company for the total amount of 280,000 UTM (ThCh$18,842,320), in connection with possible non-compliance associated with damages caused by the weather event on August 1 and 2, 2024 (see Note 38.1.5). |
| vi. | On February 4, 2025, Enel Distribución and its subsidiary Enel Colina, in the context of a Voluntary Collective Procedure (VCP), reached an agreement with the National Consumer Service (SERNAC, for its acronym in Spanish) that establishes an extraordinary compensation mechanism for the benefit of those residential customers affected by the prolonged power outages that occurred during the extraordinary events of August 1 and 2, 2024. The agreement with SERNAC provides for a voluntary and extraordinary, one-time, total, and final payment of ThCh$17,059,475 that would benefit nearly 800,000 customers. The amount referred to above is divided into (i) compensation for interruptions; (ii) compensation for claims; and (iii) compensation for loss of food, medicines or other similar refrigerated or frozen products. In addition, it establishes a special procedure to compensate customers for damage to property, provided that certain requirements of the agreement are met (see Note 25 b.1). |
Enel Generación Chile S.A.
| vii. | On February 25, 2025 the Board of Directors of Enel Generación Chile S.A. agreed to propose the following to the next Ordinary Shareholders' Meeting of the Company: |
| A. | the distribution of a final dividend amounting to Ch$343,687,382,602 and representing 70% of net profits for the year, in line with the Dividend Policy for the year 2024. The final dividend will be reduced by the amount of the interim dividend paid in January 2025; therefore, the effective amount to be distributed to the shareholders in May 2025, if approved by the Ordinary Shareholders' Meeting, would be Ch$277,855,927,535, which represents a dividend of Ch$33.877620309750800 per share. |
| B. | the distribution of a contingent dividend of Ch$115,385,547,898 to offset the effects of the accounting loss recorded as a result of the Company's functional currency change, which represents a dividend of Ch$14.068398020512300 per share to be paid along with the final dividend. |
The next Ordinary Shareholders' Meeting of the Company will be held on April 25, 2025, and the other businesses to be submitted to the consideration of the shareholders will be duly informed on the Company's website and by means of other communications required by the applicable regulations.
In addition, the Board of Directors agreed to call an Extraordinary Shareholders' Meeting of the Company held on April 25, 2025, immediately after the aforementioned Ordinary Shareholders' Meeting. Notice of the Extraordinary Shareholders' Meeting will be duly informed on the Company's website and by means of other communications required by the applicable regulations.
| viii. | On April 3, 2025, our subsidiary Enel Generación Chile sold and assigned to IDB Invest the second and final group of Payment Documents in accordance with the price stabilization mechanism established under Law No. 21,472, as amended by Law No. 21,667. With this transaction, the program has been officially concluded. The total amount of these balances was ThCh$229,607,723 (US$242.6 million, including interest of US$7.5 |
F-146
| million) in favor of Enel Generación Chile. See Note 9 for further information on Law No. 21,472, as amended by Law No. 21,667. |
Empresa Eléctrica Pehuenche S.A.
| ix. | On February 24, 2025, the Board of Directors of Empresa Eléctrica Pehuenche, in accordance with the current approved Dividend Policy, agreed to propose to the Ordinary Shareholders' Meeting held on April 24, 2025, payment of year 2024 final dividend balance for the amount of Ch$98.153826825 per share. This proposal would result in the distribution of 100% of net profits for the year ended December 31, 2024, thus fully complying with the Dividend Policy reported by the Board of Directors to the Ordinary Shareholders' Meeting held on April 25, 2024. |
Enel Green Power Chile S.A.
| x. | On April 3, 2025, our subsidiary Enel Green Power Chile sold and assigned to IDB Invest the second and final group of Payment Documents in accordance with the price stabilization mechanism established under Law No. 21,472, as amended by Law No. 21,667. With this transaction, the program has been officially concluded. The total amount of these balances was ThCh$17,756,971 (US$18.8 million, including interest of US$0.6 million) in favor of Enel Green Power Chile. See Note 9 for further information onLaw No. 21,472, as amended by Law No. 21,667. |
Between January 1, 2025 and the date of issue of these consolidated financial statements, Management is not aware of any other financial events or of any other kind that could significantly affect the financial position and income presented herein.
F-147
APPENDIX 1 DETAIL OF ASSETS AND LIABILITIES IN FOREIGN CURRENCY
This appendix is an integral part of the consolidated financial statements of Enel Chile.
The detail of assets and liabilities denominated in foreign currency is as follows:
|
|
|
|
|
|
|
|
|
|
|
|
|
|
|
12-31-2024 |
||||||||||
ASSETS |
|
U.F. |
|
Chilean Peso |
|
U.S. dollar |
|
Euro |
|
Argentine Peso |
|
Total |
|
|
ThCh$ |
|
ThCh$ |
|
ThCh$ |
|
ThCh$ |
|
ThCh$ |
|
ThCh$ |
CURRENT ASSETS |
|
|
|
|
|
|
|
|
|
|
|
|
Cash and cash equivalents |
|
38,228 |
|
246,506,945 |
|
136,705,029 |
|
149,097 |
|
20 |
|
383,399,319 |
Other current financial assets |
|
— |
|
9,284,462 |
|
10,234,050 |
|
— |
|
— |
|
19,518,512 |
Other current non-financial assets |
|
- |
|
127,832,837 |
|
23,830,167 |
|
569,776 |
|
930,601 |
|
153,163,381 |
Trade and other receivables, current |
|
5,442,270 |
|
950,816,232 |
|
533,706,028 |
|
703 |
|
— |
|
1,489,965,233 |
Current receivables due from related parties |
|
— |
|
4,432,760 |
|
27,553,521 |
|
10,797,055 |
|
— |
|
42,783,336 |
Inventories |
|
- |
|
38,211,002 |
|
26,116,643 |
|
227,037 |
|
613,891 |
|
65,168,573 |
Current tax assets |
|
- |
|
69,092,991 |
|
10,119,318 |
|
- |
|
1,008,190 |
|
80,220,499 |
TOTAL CURRENT ASSETS |
|
5,480,498 |
|
1,446,177,229 |
|
768,264,756 |
|
11,743,668 |
|
2,552,702 |
|
2,234,218,853 |
|
|
|
|
|
|
|
|
|
|
|
|
|
NON-CURRENT ASSETS |
|
|
|
|
|
|
|
|
|
|
|
|
Other non-current financial assets |
|
- |
|
4,646,303 |
|
- |
|
— |
|
— |
|
4,646,303 |
Other non-current non-financial assets |
|
76,832 |
|
142,667,189 |
|
5,853,802 |
|
— |
|
— |
|
148,597,823 |
Trade and other non-current receivables |
|
28,010,923 |
|
63,052,195 |
|
1,068,188,551 |
|
— |
|
- |
|
1,159,251,669 |
Investments accounted for using the equity method |
|
— |
|
32,590,470 |
|
113,293 |
|
— |
|
- |
|
32,703,763 |
Intangible assets other than goodwill |
|
— |
|
113,442,016 |
|
179,728,647 |
|
— |
|
177,793 |
|
293,348,456 |
Goodwill |
|
— |
|
849,345,650 |
|
39,897,262 |
|
— |
|
— |
|
889,242,912 |
Property, plant and equipment |
|
— |
|
3,704,836,526 |
|
3,833,351,366 |
|
— |
|
14,673,175 |
|
7,552,861,067 |
Investment property |
|
— |
|
7,175,892 |
|
— |
|
— |
|
— |
|
7,175,892 |
Right-of-use asset |
|
220,361,086 |
|
31,802,677 |
|
12,661,541 |
|
7,785,671 |
|
— |
|
272,610,975 |
Deferred tax assets |
|
— |
|
119,258,343 |
|
5,981,528 |
|
— |
|
— |
|
125,239,871 |
TOTAL NON CURRENT ASSETS |
|
248,448,841 |
|
5,068,817,261 |
|
5,145,775,990 |
|
7,785,671 |
|
14,850,968 |
|
10,485,678,731 |
|
|
|
|
|
|
|
|
|
|
|
|
|
TOTAL ASSETS |
|
253,929,339 |
|
6,514,994,490 |
|
5,914,040,746 |
|
19,529,339 |
|
17,403,670 |
|
12,719,897,584 |
|
|
12-31-2023 |
||||||||||
ASSETS |
|
U.F. |
|
Chilean Peso |
|
U.S. dollar |
|
Euro |
|
Argentine Peso |
|
Total |
|
|
ThCh$ |
|
ThCh$ |
|
ThCh$ |
|
ThCh$ |
|
ThCh$ |
|
ThCh$ |
CURRENT ASSETS |
|
|
|
|
|
|
|
|
|
|
|
|
Cash and cash equivalents |
|
35,935 |
|
449,278,983 |
|
113,862,934 |
|
102,479 |
|
10,959 |
|
563,291,290 |
Other current financial assets |
|
— |
|
57,180,139 |
|
10,537,499 |
|
18,996 |
|
— |
|
67,736,634 |
Other current non-financial assets |
|
3,055,257 |
|
69,227,975 |
|
27,260,077 |
|
593,326 |
|
360,690 |
|
100,497,325 |
Trade and other receivables, current |
|
5,357,143 |
|
1,244,013,158 |
|
199,870,569 |
|
53,679 |
|
— |
|
1,449,294,549 |
Current receivables due from related parties |
|
— |
|
5,340,093 |
|
32,373,527 |
|
12,560,505 |
|
— |
|
50,274,125 |
Inventories |
|
627,574 |
|
12,759,347 |
|
40,218,695 |
|
5,009,744 |
|
146,519 |
|
58,761,879 |
Current tax assets |
|
- |
|
73,779,644 |
|
7,333,950 |
|
- |
|
1,863 |
|
81,115,457 |
TOTAL CURRENT ASSETS |
|
9,075,909 |
|
1,911,579,339 |
|
431,457,251 |
|
18,338,729 |
|
520,031 |
|
2,370,971,259 |
|
|
|
|
|
|
|
|
|
|
|
|
|
NON-CURRENT ASSETS |
|
|
|
|
|
|
|
|
|
|
|
|
Other non-current financial assets |
|
1,838,328 |
|
9,764,057 |
|
- |
|
— |
|
— |
|
11,602,385 |
Other non-current non-financial assets |
|
79,460 |
|
238,284,871 |
|
29,533 |
|
— |
|
— |
|
238,393,864 |
Trade and other non-current receivables |
|
30,745,450 |
|
353,276,892 |
|
519,655,799 |
|
— |
|
- |
|
903,678,141 |
Investments accounted for using the equity method |
|
— |
|
25,294,926 |
|
58,859 |
|
— |
|
- |
|
25,353,785 |
Intangible assets other than goodwill |
|
— |
|
112,207,320 |
|
82,682,099 |
|
— |
|
120,081 |
|
195,009,500 |
Goodwill |
|
— |
|
849,345,650 |
|
35,119,008 |
|
— |
|
— |
|
884,464,658 |
Property, plant and equipment |
|
— |
|
3,437,454,240 |
|
3,400,624,560 |
|
— |
|
12,106,020 |
|
6,850,184,820 |
Investment property |
|
— |
|
7,340,561 |
|
— |
|
— |
|
— |
|
7,340,561 |
Right-of-use asset |
|
217,535,040 |
|
32,890,521 |
|
11,875,392 |
|
6,751,602 |
|
— |
|
269,052,555 |
Deferred tax assets |
|
— |
|
54,989,051 |
|
22,680,457 |
|
— |
|
— |
|
77,669,508 |
TOTAL NON CURRENT ASSETS |
|
250,198,278 |
|
5,120,848,089 |
|
4,072,725,707 |
|
6,751,602 |
|
12,226,101 |
|
9,462,749,777 |
|
|
|
|
|
|
|
|
|
|
|
|
|
TOTAL ASSETS |
|
259,274,187 |
|
7,032,427,428 |
|
4,504,182,958 |
|
25,090,331 |
|
12,746,132 |
|
11,833,721,036 |
F-148
|
|
|
|
|
|
|
|
|
|
|
|
|
|
|
|
|
12-31-2024 |
|
|
|
|
||||||||
LIABILITIES |
|
U.F. |
|
Chilean Peso |
|
U.S. dollar |
|
Euro |
|
Argentine Peso |
|
Brazilian Real |
|
Total |
|
|
ThCh$ |
|
ThCh$ |
|
ThCh$ |
|
ThCh$ |
|
ThCh$ |
|
ThCh$ |
|
ThCh$ |
CURRENT LIABILITIES | ||||||||||||||
Other current financial liabilities |
|
43,715,075 |
|
- |
|
39,990,503 |
|
— |
|
— |
|
— |
|
83,705,578 |
Current lease liability |
|
24,863,216 |
|
- |
|
300,307 |
|
1,722,596 |
|
|
|
— |
|
26,886,119 |
Trade and other current payables |
|
80,896,661 |
|
960,717,553 |
|
470,864,547 |
|
17,746,306 |
|
209,465 |
|
- |
|
1,530,434,532 |
Current payable to related parties |
|
— |
|
40,198,093 |
|
185,965,202 |
|
72,138,633 |
|
— |
|
— |
|
298,301,928 |
Other current provisions |
|
— |
|
50,871,254 |
|
480,541 |
|
— |
|
— |
|
— |
|
51,351,795 |
Current tax liabilities |
|
— |
|
184,793,922 |
|
4,276,229 |
|
— |
|
— |
|
— |
|
189,070,151 |
Other current non-financial liabilities |
|
— |
|
54,304,600 |
|
9,432,698 |
|
- |
|
— |
|
— |
|
63,737,298 |
TOTAL CURRENT LIABILITIES |
|
149,474,952 |
|
1,290,885,422 |
|
711,310,027 |
|
91,607,535 |
|
209,465 |
|
- |
|
2,243,487,401 |
|
|
|
|
|
|
|
|
|
|
|
|
|
|
|
NON-CURRENT LIABILITIES |
|
|
|
|
|
|
|
|
|
|
|
|
|
|
Other non-current financial liabilities |
|
- |
|
— |
|
2,373,962,103 |
|
— |
|
— |
|
— |
|
2,373,962,103 |
Non-current lease liability |
|
252,520,259 |
|
- |
|
9,177,148 |
|
6,021,524 |
|
— |
|
— |
|
267,718,931 |
Trade and other non-current receivables |
|
— |
|
2 |
|
966,072,115 |
|
— |
|
— |
|
— |
|
966,072,117 |
Non-Current accounts payable to related parties |
|
— |
|
— |
|
1,015,904,873 |
|
— |
|
— |
|
— |
|
1,015,904,873 |
Other long-term provisions |
|
— |
|
180,158,117 |
|
35,108,584 |
|
— |
|
— |
|
— |
|
215,266,701 |
Deferred tax liabilities |
|
— |
|
182,363,771 |
|
25,532,753 |
|
— |
|
— |
|
— |
|
207,896,524 |
Non-current provisions for employee benefits |
|
— |
|
65,598,156 |
|
- |
|
— |
|
— |
|
— |
|
65,598,156 |
Other non-current non-financial liabilities |
|
— |
|
37,611,263 |
|
— |
|
— |
|
— |
|
— |
|
37,611,263 |
TOTAL NON-CURRENT LIABILITIES |
|
252,520,259 |
|
465,731,309 |
|
4,425,757,576 |
|
6,021,524 |
|
— |
|
— |
|
5,150,030,668 |
|
|
|
|
|
|
|
|
|
|
|
|
|
|
|
TOTAL LIABILITIES |
|
401,995,211 |
|
1,756,616,731 |
|
5,137,067,603 |
|
97,629,059 |
|
209,465 |
|
- |
|
7,393,518,069 |
|
|
|
|
|
|
|
|
|
|
|
|
|
|
|
|
|
12-31-2023 |
|
|
|
|
||||||||
LIABILITIES |
|
U.F. |
|
Chilean Peso |
|
U.S. dollar |
|
Euro |
|
Argentine Peso |
|
Brazilian Real |
|
Total |
|
|
ThCh$ |
|
ThCh$ |
|
ThCh$ |
|
ThCh$ |
|
ThCh$ |
|
ThCh$ |
|
ThCh$ |
CURRENT LIABILITIES | ||||||||||||||
Other current financial liabilities |
|
42,031,748 |
|
164 |
|
572,983,003 |
|
— |
|
— |
|
— |
|
615,014,915 |
Current lease liability |
|
22,149,396 |
|
99,718 |
|
357,191 |
|
1,531,888 |
|
— |
|
— |
|
24,138,193 |
Trade and other current payables |
|
9,300,520 |
|
1,105,027,430 |
|
339,850,625 |
|
10,075,306 |
|
238,084 |
|
- |
|
1,464,491,965 |
Current payables to related parties |
|
— |
|
6,712,011 |
|
161,400,415 |
|
294,455,151 |
|
— |
|
10,889 |
|
462,578,466 |
Other current provisions |
|
— |
|
25,105,457 |
|
15,663 |
|
— |
|
31,590 |
|
— |
|
25,152,710 |
Current tax liabilities |
|
— |
|
155,757,190 |
|
4,350,022 |
|
— |
|
— |
|
— |
|
160,107,212 |
Other current non-financial liabilities |
|
— |
|
33,056,546 |
|
7,903,913 |
|
1,466,297 |
|
8,127 |
|
— |
|
42,434,883 |
TOTAL CURRENT LIABILITIES |
|
73,481,664 |
|
1,325,758,516 |
|
1,086,860,832 |
|
307,528,642 |
|
277,801 |
|
10,889 |
|
2,793,918,344 |
|
|
|
|
|
|
|
|
|
|
|
|
|
|
|
NON-CURRENT LIABILITIES |
|
|
|
|
|
|
|
|
|
|
|
|
|
|
Other non-current financial liabilities |
|
196,122,880 |
|
— |
|
1,708,390,061 |
|
— |
|
— |
|
— |
|
1,904,512,941 |
Non-current lease liability |
|
236,309,986 |
|
968,197 |
|
1,115,232 |
|
5,530,612 |
|
— |
|
— |
|
243,924,027 |
Trade and other non-current receivables |
|
— |
|
292,062,875 |
|
303,471,982 |
|
— |
|
— |
|
— |
|
595,534,857 |
Non-Current payables to related parties |
|
— |
|
— |
|
1,034,791,219 |
|
— |
|
— |
|
— |
|
1,034,791,219 |
Other long-term provisions |
|
— |
|
176,624,539 |
|
34,976,147 |
|
— |
|
— |
|
— |
|
211,600,686 |
Deferred tax liabilities |
|
— |
|
31,195,552 |
|
141,317,111 |
|
— |
|
— |
|
— |
|
172,512,663 |
Non-current provisions for employee benefits |
|
— |
|
61,930,822 |
|
889,222 |
|
— |
|
— |
|
— |
|
62,820,044 |
Other non-current non-financial liabilities |
|
— |
|
53,219,983 |
|
— |
|
— |
|
— |
|
— |
|
53,219,983 |
TOTAL NON-CURRENT LIABILITIES |
|
432,432,866 |
|
616,001,968 |
|
3,224,950,974 |
|
5,530,612 |
|
— |
|
— |
|
4,278,916,420 |
|
|
|
|
|
|
|
|
|
|
|
|
|
|
|
TOTAL LIABILITIES |
|
505,914,530 |
|
1,941,760,484 |
|
4,311,811,806 |
|
313,059,254 |
|
277,801 |
|
10,889 |
|
7,072,834,764 |
F-149
APPENDIX 2 ADDITIONAL INFORMATION CIRCULAR No. 715 OF FEBRUARY 3, 2012
This appendix forms an integral part of these consolidated financial statements.
| a) | Portfolio stratification |
-Trade and other receivables by maturity:
|
|
|
|
|
|
|
|
|
|
|
|
|
|
|
|
|
|
|
|
|
|
|
|
|
|
|
As of December 31, 2024 |
||||||||||||||||||||||
|
|
Current |
|
1 - 30 days |
|
31 - 60 days |
|
61 - 90 days |
|
91 - 120 days |
|
121 - 150 days |
|
151 - 180 days |
|
181 - 210 days |
|
211 - 250 days |
|
More than |
|
Total |
|
Total Non- |
Trade and Other Receivables |
|
ThCh$ |
|
ThCh$ |
|
ThCh$ |
|
ThCh$ |
|
ThCh$ |
|
ThCh$ |
|
ThCh$ |
|
ThCh$ |
|
ThCh$ |
|
ThCh$ |
|
ThCh$ |
|
ThCh$ |
Trade receivables, gross |
|
1,299,913,086 |
|
28,315,349 |
|
17,140,561 |
|
15,086,512 |
|
12,572,821 |
|
12,650,247 |
|
15,441,857 |
|
7,821,092 |
|
4,784,424 |
|
88,850,420 |
|
1,502,576,369 |
|
1,065,146,628 |
Allowance for impairment |
|
(10,391,250) |
|
(409,335) |
|
(1,717,116) |
|
(1,821,207) |
|
(1,718,607) |
|
(1,874,292) |
|
(2,216,559) |
|
(2,868,512) |
|
(2,491,763) |
|
(57,404,876) |
|
(82,913,517) |
|
(1,726,030) |
Lease receivables, gross |
|
18,396,542 |
|
|
|
|
|
|
|
|
|
|
|
|
|
|
|
|
|
|
|
18,396,542 |
|
92,119,034 |
Allowance for impairment |
|
(163,723) |
|
|
|
|
|
|
|
|
|
|
|
|
|
|
|
|
|
|
|
(163,723) |
|
(1,119,496) |
Other receivables, gross |
|
52,069,563 |
|
— |
|
— |
|
— |
|
— |
|
— |
|
— |
|
— |
|
— |
|
12,653,601 |
|
64,723,164 |
|
4,831,533 |
Allowance for impairment |
|
— |
|
— |
|
— |
|
— |
|
— |
|
— |
|
— |
|
— |
|
— |
|
(12,653,601) |
|
(12,653,601) |
|
— |
Total |
|
1,359,824,218 |
|
27,906,014 |
|
15,423,445 |
|
13,265,305 |
|
10,854,214 |
|
10,775,955 |
|
13,225,298 |
|
4,952,580 |
|
2,292,661 |
|
31,445,544 |
|
1,489,965,234 |
|
1,159,251,669 |
|
|
|
|
|
|
|
|
|
|
|
|
|
|
|
|
|
|
|
|
|
|
|
|
|
|
|
As of December 31, 2023 |
||||||||||||||||||||||
|
|
Current |
|
1 - 30 days |
|
31 - 60 days |
|
61 - 90 days |
|
91 - 120 days |
|
121 - 150 days |
|
151 - 180 days |
|
181 - 210 days |
|
211 - 250 days |
|
More than |
|
Total |
|
Total Non- |
Trade and Other Receivables |
|
ThCh$ |
|
ThCh$ |
|
ThCh$ |
|
ThCh$ |
|
ThCh$ |
|
ThCh$ |
|
ThCh$ |
|
ThCh$ |
|
ThCh$ |
|
ThCh$ |
|
ThCh$ |
|
ThCh$ |
Trade receivables, gross |
|
1,074,822,684 |
|
31,474,982 |
|
48,358,190 |
|
17,972,222 |
|
16,543,822 |
|
11,522,260 |
|
27,808,169 |
|
11,142,122 |
|
28,572,932 |
|
159,492,141 |
|
1,427,709,524 |
|
775,262,173 |
Allowance for impairment |
|
(18,575,689) |
|
(454,616) |
|
(1,848,768) |
|
(1,715,408) |
|
(1,844,114) |
|
(2,143,323) |
|
(2,833,718) |
|
(3,353,938) |
|
(3,555,933) |
|
(29,551,108) |
|
(65,876,615) |
|
(12,078,477) |
Lease receivables, gross |
|
20,755,542 |
|
— |
|
— |
|
— |
|
— |
|
— |
|
— |
|
— |
|
— |
|
— |
|
20,755,542 |
|
137,964,743 |
Allowance for impairment |
|
(139,954) |
|
— |
|
— |
|
— |
|
— |
|
— |
|
— |
|
— |
|
— |
|
— |
|
(139,954) |
|
(972,617) |
Other receivables, gross |
|
66,801,742 |
|
— |
|
— |
|
— |
|
— |
|
— |
|
— |
|
— |
|
— |
|
11,474,680 |
|
78,276,422 |
|
3,502,319 |
Allowance for impairment |
|
— |
|
— |
|
— |
|
— |
|
— |
|
— |
|
— |
|
— |
|
— |
|
(11,430,370) |
|
(11,430,370) |
|
— |
Total |
|
1,143,664,325 |
|
31,020,366 |
|
46,509,422 |
|
16,256,814 |
|
14,699,708 |
|
9,378,937 |
|
24,974,451 |
|
7,788,184 |
|
25,016,999 |
|
129,985,343 |
|
1,449,294,549 |
|
903,678,141 |
|
|
|
|
|
|
|
|
|
|
|
|
|
|
|
|
|
|
|
|
|
|
|
|
|
-By type of portfolio:
|
|
December 31, 2024 |
|
December 31, 2023 |
|
||||||||||||||||||||
|
|
Portfolio with no renegotiated terms |
|
Portfolio with renegotiated terms |
|
Total Gross Portfolio |
|
Portfolio with no renegotiated terms |
|
Portfolio with renegotiated terms |
|
Total Gross Portfolio |
|
||||||||||||
|
|
|
|
Gross |
|
|
|
Gross |
|
|
|
Gross |
|
|
|
Gross |
|
|
|
Gross |
|
|
|
Gross |
|
|
|
Number of |
|
Amount |
|
Number of |
|
Amount |
|
Number of |
|
Amount |
|
Number of |
|
Amount |
|
Number of |
|
Amount |
|
Number of |
|
Amount |
|
|
|
customers |
|
ThCh$ |
|
customers |
|
ThCh$ |
|
customers |
|
ThCh$ |
|
customers |
|
ThCh$ |
|
customers |
|
ThCh$ |
|
customers |
|
ThCh$ |
|
Up-to-date |
|
1,429,625 |
|
1,268,012,570 |
|
157,411 |
|
1,097,047,144 |
|
1,587,036 |
|
2,365,059,714 |
|
1,616,667 |
|
1,020,578,796 |
|
38,745 |
|
829,506,061 |
|
1,655,412 |
|
1,850,084,857 |
|
1 to 30 days |
|
35,866 |
|
27,343,307 |
|
4,343 |
|
972,042 |
|
40,209 |
|
28,315,349 |
|
35,707 |
|
30,148,065 |
|
1,025 |
|
1,326,917 |
|
36,732 |
|
31,474,982 |
|
31 to 60 days |
|
5,149 |
|
16,670,638 |
|
143 |
|
469,923 |
|
5,292 |
|
17,140,561 |
|
61,951 |
|
47,632,946 |
|
1,425 |
|
725,244 |
|
63,376 |
|
48,358,190 |
|
61 to 90 days |
|
3,335 |
|
14,708,566 |
|
206 |
|
377,946 |
|
3,541 |
|
15,086,512 |
|
71,704 |
|
17,533,472 |
|
1,729 |
|
438,750 |
|
73,433 |
|
17,972,222 |
|
91 to 120 days |
|
25,431 |
|
12,292,204 |
|
4,834 |
|
280,617 |
|
30,265 |
|
12,572,821 |
|
60,511 |
|
16,206,301 |
|
1,502 |
|
337,521 |
|
62,013 |
|
16,543,822 |
|
121 to 150 days |
|
36,734 |
|
12,442,431 |
|
7,463 |
|
207,816 |
|
44,197 |
|
12,650,247 |
|
54,035 |
|
11,244,718 |
|
1,246 |
|
277,542 |
|
55,281 |
|
11,522,260 |
|
151 to 180 days |
|
2,316 |
|
15,233,383 |
|
7 |
|
208,474 |
|
2,323 |
|
15,441,857 |
|
18,904 |
|
27,552,420 |
|
856 |
|
255,749 |
|
19,760 |
|
27,808,169 |
|
181 to 210 days |
|
32,394 |
|
7,624,305 |
|
6,326 |
|
196,787 |
|
38,720 |
|
7,821,092 |
|
18,982 |
|
10,939,853 |
|
953 |
|
202,269 |
|
19,935 |
|
11,142,122 |
|
211 to 250 days |
|
51,265 |
|
4,571,898 |
|
6,062 |
|
212,526 |
|
57,327 |
|
4,784,424 |
|
16,785 |
|
28,291,389 |
|
917 |
|
281,543 |
|
17,702 |
|
28,572,932 |
|
More than 251 days |
|
1,236,484 |
|
85,172,799 |
|
123,928 |
|
3,677,621 |
|
1,360,412 |
|
88,850,420 |
|
1,022,959 |
|
157,014,702 |
|
152,571 |
|
2,477,439 |
|
1,175,530 |
|
159,492,141 |
|
Total |
|
2,858,599 |
|
1,464,072,101 |
|
310,723 |
|
1,103,650,896 |
|
3,169,322 |
|
2,567,722,997 |
|
2,978,205 |
|
1,367,142,662 |
|
200,969 |
|
835,829,035 |
|
3,179,174 |
|
2,202,971,697 |
|
F-150
| b) | Portfolio in default and in legal collection process |
|
|
As of December 31, |
||||||
|
|
2024 |
|
2023 |
||||
|
|
Number of |
|
Amount |
|
Number of |
|
Amount |
Portfolio in Default and in Legal Collection Process |
|
clients |
|
ThCh$ |
|
clients |
|
ThCh$ |
Notes receivable in default |
|
— |
|
— |
|
— |
|
— |
Notes receivable in legal collection process (*) |
|
1,536 |
|
7,081,752 |
|
1,702 |
|
7,853,447 |
Total |
|
1,536 |
|
7,081,752 |
|
1,702 |
|
7,853,447 |
(*)Legal collections are included in the portfolio past due.
| c) | Allowances and write-offs |
|
|
As of December 31, |
||
|
|
12-31-2024 |
|
12-31-2023 |
|
|
ThCh$ |
|
ThCh$ |
Allowances and Write-offs |
|
|
|
|
Allowance for portfolio with no renegotiated terms |
|
13,582,321 |
|
7,606,450 |
Allowance for portfolio with renegotiated terms |
|
4,500,824 |
|
3,732,378 |
Recoveries for the period |
|
(984) |
|
— |
Total |
|
18,082,161 |
|
11,338,828 |
| d) | Number and value of transactions |
|
|
12-31-2024 |
|
12-31-2023 |
||||
|
|
Total detail by type of transaction |
|
Total detail by |
|
Total detail by type of transaction |
|
Total detail by |
Number and Amount of Transactions |
|
Last Quarter |
|
Year-to-date |
|
Last Quarter |
|
Year-to-date |
Allowance for impairment and recoveries: |
|
|
|
|
|
|
|
|
Number of Transactions |
|
18,686 |
|
720,560 |
|
130,641 |
|
444,155 |
Amount of transactions |
|
3,176,823 |
|
18,082,161 |
|
5,395,100 |
|
11,338,828 |
F-151
APPENDIX 2.1 SUPPLEMENTARY INFORMATION ON TRADE RECEIVABLES:
This appendix forms an integral part of these consolidated financial statements.
| a) | Portfolio stratification |
| - | Trade receivables detailed by aging: |
|
|
|
|
|
|
|
|
|
|
|
|
|
|
|
|
|
|
|
|
|
|
|
|
|
|
|
|
|
12-31-2024 |
||||||||||||||||||||||||
Trade receivables |
|
Up-to-date |
|
1-30 days past due |
|
31-60 days past due |
|
61 - 90 days |
|
91 - 120 days |
|
121 - 150 days |
|
151 - 180 days |
|
181 - 210 days |
|
211 - 250 days |
|
More than 251 |
|
More than 365 |
|
Total |
|
Total Non- |
|
|
ThCh$ |
|
ThCh$ |
|
ThCh$ |
|
ThCh$ |
|
ThCh$ |
|
ThCh$ |
|
ThCh$ |
|
ThCh$ |
|
ThCh$ |
|
ThCh$ |
|
ThCh$ |
|
ThCh$ |
|
ThCh$ |
Trade receivables, Generation and Transmission |
|
737,978,886 |
|
3,254,163 |
|
5,837,793 |
|
7,872,271 |
|
7,067,483 |
|
7,760,256 |
|
10,247,704 |
|
3,862,387 |
|
1,595,126 |
|
705,857 |
|
5,249,888 |
|
791,431,814 |
|
6,000,627 |
- Large customers |
|
737,978,886 |
|
3,254,163 |
|
5,837,793 |
|
7,872,271 |
|
7,067,483 |
|
7,760,256 |
|
10,247,704 |
|
3,862,387 |
|
1,595,126 |
|
705,857 |
|
5,249,888 |
|
791,431,814 |
|
6,000,627 |
- Institutional customers |
|
— |
|
— |
|
— |
|
— |
|
— |
|
— |
|
— |
|
— |
|
— |
|
— |
|
— |
|
— |
|
— |
- Other |
|
— |
|
— |
|
— |
|
— |
|
— |
|
— |
|
— |
|
— |
|
— |
|
— |
|
— |
|
— |
|
— |
Allowance for impairment |
|
(4,115,886) |
|
(31,931) |
|
(30,065) |
|
(33,105) |
|
(29,576) |
|
(32,378) |
|
(42,701) |
|
(16,088) |
|
(6,641) |
|
(2,336) |
|
(24,612) |
|
(4,365,319) |
|
(6,808) |
|
|
|
|
|
|
|
|
|
|
|
|
|
|
|
|
|
|
|
|
|
|
|
|
|
|
|
Unbilled services |
|
47,895,620 |
|
— |
|
— |
|
— |
|
— |
|
— |
|
— |
|
— |
|
— |
|
— |
|
— |
|
47,895,620 |
|
— |
Billed services |
|
690,083,266 |
|
3,254,163 |
|
5,837,793 |
|
7,872,271 |
|
7,067,483 |
|
7,760,256 |
|
10,247,704 |
|
3,862,387 |
|
1,595,126 |
|
705,857 |
|
5,249,888 |
|
743,536,194 |
|
6,000,627 |
|
|
|
|
|
|
|
|
|
|
|
|
|
|
|
|
|
|
|
|
|
|
|
|
|
|
|
Trade receivables, Distribution |
|
561,934,200 |
|
25,061,186 |
|
11,302,768 |
|
7,214,241 |
|
5,505,338 |
|
4,889,991 |
|
5,194,153 |
|
3,958,705 |
|
3,189,298 |
|
12,784,995 |
|
70,109,680 |
|
711,144,555 |
|
1,059,146,001 |
- Mass-market customers |
|
518,746,883 |
|
19,027,198 |
|
8,355,567 |
|
6,184,080 |
|
4,793,604 |
|
4,574,364 |
|
4,918,101 |
|
3,672,886 |
|
2,893,724 |
|
9,192,186 |
|
55,309,483 |
|
637,668,076 |
|
1,058,749,474 |
- Large customers |
|
29,772,961 |
|
3,491,346 |
|
1,400,729 |
|
431,151 |
|
389,604 |
|
47,304 |
|
75,422 |
|
92,193 |
|
88,961 |
|
3,324,501 |
|
4,846,539 |
|
43,960,711 |
|
201,730 |
- Institutional customers |
|
13,414,356 |
|
2,542,642 |
|
1,546,472 |
|
599,010 |
|
322,130 |
|
268,323 |
|
200,630 |
|
193,626 |
|
206,613 |
|
268,308 |
|
9,953,658 |
|
29,515,768 |
|
194,797 |
Allowance for impairment |
|
(6,275,364) |
|
(377,404) |
|
(1,687,051) |
|
(1,788,102) |
|
(1,689,031) |
|
(1,841,914) |
|
(2,173,858) |
|
(2,852,424) |
|
(2,485,122) |
|
(8,173,741) |
|
(49,204,187) |
|
(78,548,198) |
|
(1,719,222) |
|
|
|
|
|
|
|
|
|
|
|
|
|
|
|
|
|
|
|
|
|
|
|
|
|
|
|
Unbilled services |
|
488,507,474 |
|
— |
|
— |
|
— |
|
— |
|
— |
|
— |
|
— |
|
— |
|
— |
|
— |
|
488,507,474 |
|
960,193,812 |
Billed services |
|
73,426,726 |
|
25,061,186 |
|
11,302,768 |
|
7,214,241 |
|
5,505,338 |
|
4,889,991 |
|
5,194,153 |
|
3,958,705 |
|
3,189,298 |
|
12,784,995 |
|
70,109,680 |
|
222,637,081 |
|
18,308,503 |
Total trade receivables, gross |
|
1,299,913,086 |
|
28,315,349 |
|
17,140,561 |
|
15,086,512 |
|
12,572,821 |
|
12,650,247 |
|
15,441,857 |
|
7,821,092 |
|
4,784,424 |
|
13,490,852 |
|
75,359,568 |
|
1,502,576,369 |
|
1,065,146,628 |
Total Allowance for impairment |
|
(10,391,250) |
|
(409,335) |
|
(1,717,116) |
|
(1,821,207) |
|
(1,718,607) |
|
(1,874,292) |
|
(2,216,559) |
|
(2,868,512) |
|
(2,491,763) |
|
(8,176,077) |
|
(49,228,799) |
|
(82,913,517) |
|
(1,726,030) |
Total trade receivables, net |
|
1,289,521,836 |
|
27,906,014 |
|
15,423,445 |
|
13,265,305 |
|
10,854,214 |
|
10,775,955 |
|
13,225,298 |
|
4,952,580 |
|
2,292,661 |
|
5,314,775 |
|
26,130,769 |
|
1,419,662,852 |
|
1,063,420,598 |
|
|
12-31-2023 |
|||||||||||||||||||||||||
Trade receivables |
|
Up-to-date |
|
1-30 days past due |
|
31-60 days past due |
|
61 - 90 days |
|
91 - 120 days |
|
121 - 150 days |
|
151 - 180 days |
|
181 - 210 days |
|
211 - 250 days |
|
More than 251 |
|
More than 365 |
|
Total |
|
Total Non- |
|
|
|
ThCh$ |
|
ThCh$ |
|
ThCh$ |
|
ThCh$ |
|
ThCh$ |
|
ThCh$ |
|
ThCh$ |
|
ThCh$ |
|
ThCh$ |
|
ThCh$ |
|
ThCh$ |
|
ThCh$ |
|
ThCh$ |
|
Trade receivables, Generation and Transmission |
|
685,684,933 |
|
12,061,685 |
|
35,583,465 |
|
9,511,845 |
|
10,257,758 |
|
4,950,129 |
|
21,602,876 |
|
5,729,653 |
|
23,719,622 |
|
35,690,038 |
|
16,151,472 |
|
860,943,476 |
|
2,234,948 |
|
- Large customers |
|
685,468,573 |
|
12,061,685 |
|
35,583,465 |
|
9,511,845 |
|
10,257,758 |
|
4,950,129 |
|
21,602,876 |
|
5,729,653 |
|
23,719,622 |
|
35,690,038 |
|
15,748,987 |
|
860,324,631 |
|
2,234,948 |
|
- Institutional customers |
|
— |
|
— |
|
— |
|
— |
|
— |
|
— |
|
— |
|
— |
|
— |
|
— |
|
— |
|
— |
|
— |
|
- Other |
|
216,360 |
|
— |
|
— |
|
— |
|
— |
|
— |
|
— |
|
— |
|
— |
|
— |
|
402,485 |
|
618,845 |
|
— |
|
Allowance for impairment |
|
(1,213,072) |
|
(86,661) |
|
(759,055) |
|
(199,997) |
|
(218,187) |
|
(104,314) |
|
(460,833) |
|
(122,220) |
|
(503,753) |
|
(755,173) |
|
(720,399) |
|
(5,143,664) |
|
(5,257) |
|
|
|
|
|
|
|
|
|
|
|
|
|
|
|
|
|
|
|
|
|
|
|
|
|
|
|
|
|
Unbilled services |
|
557,351,449 |
|
— |
|
— |
|
— |
|
— |
|
— |
|
— |
|
— |
|
— |
|
— |
|
— |
|
557,351,449 |
|
2,234,948 |
|
Billed services |
|
128,333,484 |
|
12,061,685 |
|
35,583,465 |
|
9,511,845 |
|
10,257,758 |
|
4,950,129 |
|
21,602,876 |
|
5,729,653 |
|
23,719,622 |
|
35,690,038 |
|
16,151,472 |
|
303,592,027 |
|
— |
|
|
|
|
|
|
|
|
|
|
|
|
|
|
|
|
|
|
|
|
|
|
|
|
|
|
|
|
|
Trade receivables, Distribution |
|
389,137,751 |
|
19,413,297 |
|
12,774,725 |
|
8,460,377 |
|
6,286,064 |
|
6,572,131 |
|
6,205,293 |
|
5,412,469 |
|
4,853,310 |
|
12,262,562 |
|
95,388,069 |
|
566,766,048 |
|
773,027,225 |
|
- Mass-market customers |
|
354,259,121 |
|
13,606,413 |
|
8,670,840 |
|
6,786,030 |
|
5,328,004 |
|
5,290,332 |
|
5,429,950 |
|
4,254,816 |
|
4,083,091 |
|
10,122,853 |
|
75,072,837 |
|
492,904,287 |
|
767,893,506 |
|
- Large customers |
|
20,856,819 |
|
3,430,853 |
|
1,777,236 |
|
583,180 |
|
465,211 |
|
320,367 |
|
63,668 |
|
143,118 |
|
78,772 |
|
479,814 |
|
7,900,893 |
|
36,099,931 |
|
3,515,123 |
|
- Institutional customers |
|
14,021,811 |
|
2,376,031 |
|
2,326,649 |
|
1,091,167 |
|
492,849 |
|
961,432 |
|
711,675 |
|
1,014,535 |
|
691,447 |
|
1,659,895 |
|
12,414,339 |
|
37,761,830 |
|
1,618,596 |
|
Allowance for impairment |
|
(17,362,617) |
|
(367,955) |
|
(1,089,713) |
|
(1,515,411) |
|
(1,625,927) |
|
(2,039,009) |
|
(2,372,885) |
|
(3,231,718) |
|
(3,052,180) |
|
(7,512,758) |
|
(20,562,743) |
|
(60,732,916) |
|
(12,073,220) |
|
|
|
|
|
|
|
|
|
|
|
|
|
|
|
|
|
|
|
|
|
|
|
|
|
|
|
|
|
Unbilled services |
|
331,194,439 |
|
— |
|
— |
|
— |
|
— |
|
— |
|
— |
|
— |
|
— |
|
— |
|
— |
|
331,194,439 |
|
744,470,323 |
|
Billed services |
|
57,943,312 |
|
19,413,297 |
|
12,774,725 |
|
8,460,377 |
|
6,286,064 |
|
6,572,131 |
|
6,205,293 |
|
5,412,469 |
|
4,853,310 |
|
12,262,562 |
|
95,388,069 |
|
235,571,609 |
|
28,556,902 |
|
Total trade receivables, gross |
|
1,074,822,684 |
|
31,474,982 |
|
48,358,190 |
|
17,972,222 |
|
16,543,822 |
|
11,522,260 |
|
27,808,169 |
|
11,142,122 |
|
28,572,932 |
|
47,952,600 |
|
111,539,541 |
|
1,427,709,524 |
|
775,262,173 |
|
Total Allowance for impairment |
|
(18,575,689) |
|
(454,616) |
|
(1,848,768) |
|
(1,715,408) |
|
(1,844,114) |
|
(2,143,323) |
|
(2,833,718) |
|
(3,353,938) |
|
(3,555,933) |
|
(8,267,931) |
|
(21,283,142) |
|
(65,876,580) |
|
(12,078,477) |
|
Total trade receivables, net |
|
1,056,246,995 |
|
31,020,366 |
|
46,509,422 |
|
16,256,814 |
|
14,699,708 |
|
9,378,937 |
|
24,974,451 |
|
7,788,184 |
|
25,016,999 |
|
39,684,669 |
|
90,256,399 |
|
1,361,832,944 |
|
763,183,696 |
|
Because not all of our commercial databases in our Group’s different consolidated entities distinguish whether the final electricity service consumer is an individual or legal entity, the main management segmentation used by all consolidated entities to monitor and follow up on trade receivables is the following:
-
Mass-market Customers
|
|
|
|
-
Large Customers
-
Institutional Customers
|
|
|
F-152
| - | By type of portfolio: |
|
|
|
|
|
|
|
|
|
|
|
|
|
|
|
|
|
|
|
|
|
|
|
|
|
|
|
12-31-2024 |
||||||||||||||||||||||
Type of Portfolio |
|
Current balances Portfolio |
|
1 - 30 days |
|
31 - 60 days |
|
61 - 90 days |
|
91 - 120 days |
|
121 - 150 days |
|
151 - 180 days |
|
181 - 210 days |
|
211 - 250 days |
|
More than 251 |
|
Total currrent |
|
Total non-current |
|
|
ThCh$ |
|
ThCh$ |
|
ThCh$ |
|
ThCh$ |
|
ThCh$ |
|
ThCh$ |
|
ThCh$ |
|
ThCh$ |
|
ThCh$ |
|
ThCh$ |
|
ThCh$ |
|
ThCh$ |
GENERATION AND TRANSMISSION |
|
|
|
|
|
|
|
|
|
|
|
|
|
|
|
|
|
|
|
|
|
|
|
|
Portfolio with no renegotiated terms |
|
737,978,886 |
|
3,254,163 |
|
5,837,793 |
|
7,872,271 |
|
7,067,483 |
|
7,760,256 |
|
10,247,704 |
|
3,862,387 |
|
1,595,126 |
|
5,955,745 |
|
791,431,814 |
|
6,000,627 |
- Large customers |
|
737,978,886 |
|
3,254,163 |
|
5,837,793 |
|
7,872,271 |
|
7,067,483 |
|
7,760,256 |
|
10,247,704 |
|
3,862,387 |
|
1,595,126 |
|
5,955,745 |
|
791,431,814 |
|
6,000,627 |
- Institutional customers |
|
— |
|
— |
|
— |
|
— |
|
— |
|
— |
|
— |
|
— |
|
— |
|
— |
|
— |
|
— |
- Other |
|
— |
|
— |
|
— |
|
— |
|
— |
|
— |
|
— |
|
— |
|
— |
|
— |
|
— |
|
— |
Portfolio with renegotiated terms |
|
— |
|
— |
|
— |
|
— |
|
— |
|
— |
|
— |
|
— |
|
— |
|
— |
|
— |
|
— |
- Large customers |
|
— |
|
— |
|
— |
|
— |
|
— |
|
— |
|
— |
|
— |
|
— |
|
— |
|
— |
|
— |
- Institutional customers |
|
— |
|
— |
|
— |
|
— |
|
— |
|
— |
|
— |
|
— |
|
— |
|
— |
|
— |
|
— |
- Other |
|
— |
|
— |
|
— |
|
— |
|
— |
|
— |
|
— |
|
— |
|
— |
|
— |
|
— |
|
— |
DISTRIBUTION |
|
|
|
|
|
|
|
|
|
|
|
|
|
|
|
|
|
|
|
|
|
|
|
|
Portfolio with no renegotiated terms |
|
523,204,075 |
|
24,089,144 |
|
10,832,845 |
|
6,836,295 |
|
5,224,721 |
|
4,682,175 |
|
4,985,679 |
|
3,761,918 |
|
2,976,772 |
|
79,217,054 |
|
665,810,678 |
|
828,982 |
- Mass-market customers |
|
482,002,754 |
|
18,093,224 |
|
7,899,463 |
|
5,838,664 |
|
4,535,788 |
|
4,379,360 |
|
4,709,825 |
|
3,476,303 |
|
2,681,507 |
|
61,163,903 |
|
594,780,791 |
|
828,982 |
- Large customers |
|
29,196,093 |
|
3,460,131 |
|
1,387,559 |
|
421,228 |
|
389,604 |
|
42,702 |
|
75,422 |
|
92,193 |
|
88,961 |
|
8,168,784 |
|
43,322,677 |
|
|
- Institutional customers |
|
12,005,228 |
|
2,535,789 |
|
1,545,823 |
|
576,403 |
|
299,329 |
|
260,113 |
|
200,432 |
|
193,422 |
|
206,304 |
|
9,884,367 |
|
27,707,210 |
|
— |
Portfolio with renegotiated terms |
|
38,730,125 |
|
972,042 |
|
469,923 |
|
377,946 |
|
280,617 |
|
207,816 |
|
208,474 |
|
196,787 |
|
212,526 |
|
3,677,621 |
|
45,333,877 |
|
1,058,317,019 |
- Mass-market customers |
|
36,744,129 |
|
933,975 |
|
456,105 |
|
345,416 |
|
257,816 |
|
195,004 |
|
208,276 |
|
196,583 |
|
212,217 |
|
3,337,766 |
|
42,887,287 |
|
1,057,920,492 |
- Large customers |
|
576,868 |
|
31,214 |
|
13,169 |
|
9,923 |
|
— |
|
4,602 |
|
— |
|
— |
|
— |
|
2,256 |
|
638,032 |
|
201,730 |
- Institutional customers |
|
1,409,128 |
|
6,853 |
|
649 |
|
22,607 |
|
22,801 |
|
8,210 |
|
198 |
|
204 |
|
309 |
|
337,599 |
|
1,808,558 |
|
194,797 |
Total gross portfolio |
|
1,299,913,086 |
|
28,315,349 |
|
17,140,561 |
|
15,086,512 |
|
12,572,821 |
|
12,650,247 |
|
15,441,857 |
|
7,821,092 |
|
4,784,424 |
|
88,850,420 |
|
1,502,576,369 |
|
1,065,146,628 |
|
|
|
|
|
|
|
|
|
|
|
|
|
|
|
|
|
|
|
|
|
|
|
|
|
|
|
12-31-2023 |
||||||||||||||||||||||
Type of Portfolio |
|
Current balances Portfolio |
|
1 - 30 days past due |
|
31 - 60 days past due |
|
61 - 90 days past due |
|
91 - 120 days past due |
|
121 - 150 days past due |
|
151 - 180 days past due |
|
181 - 210 days past due |
|
211 - 250 days past due |
|
More than 251 days past due |
|
Total currrent |
|
Total non-current |
|
|
ThCh$ |
|
ThCh$ |
|
ThCh$ |
|
ThCh$ |
|
ThCh$ |
|
ThCh$ |
|
ThCh$ |
|
ThCh$ |
|
ThCh$ |
|
ThCh$ |
|
ThCh$ |
|
ThCh$ |
GENERATION AND TRANSMISSION |
|
|
|
|
|
|
|
|
|
|
|
|
|
|
|
|
|
|
|
|
|
|
|
|
Portfolio with no renegotiated terms |
|
685,684,933 |
|
12,061,685 |
|
35,583,465 |
|
9,511,845 |
|
10,257,758 |
|
4,950,129 |
|
21,602,876 |
|
5,729,653 |
|
23,719,622 |
|
51,841,516 |
|
860,943,482 |
|
2,234,948 |
- Large customers |
|
685,468,573 |
|
12,061,685 |
|
35,583,465 |
|
9,511,845 |
|
10,257,758 |
|
4,950,129 |
|
21,602,876 |
|
5,729,653 |
|
23,719,622 |
|
51,439,031 |
|
860,324,637 |
|
2,234,948 |
- Institutional customers |
|
— |
|
— |
|
— |
|
— |
|
— |
|
— |
|
— |
|
— |
|
— |
|
— |
|
— |
|
— |
- Other |
|
216,360 |
|
— |
|
— |
|
— |
|
— |
|
— |
|
— |
|
— |
|
— |
|
402,485 |
|
618,845 |
|
— |
Portfolio with renegotiated terms |
|
— |
|
— |
|
— |
|
— |
|
— |
|
— |
|
— |
|
— |
|
— |
|
— |
|
— |
|
— |
- Large customers |
|
— |
|
— |
|
— |
|
— |
|
— |
|
— |
|
— |
|
— |
|
— |
|
— |
|
— |
|
— |
- Institutional customers |
|
— |
|
— |
|
— |
|
— |
|
— |
|
— |
|
— |
|
— |
|
— |
|
— |
|
— |
|
— |
- Other |
|
— |
|
— |
|
— |
|
— |
|
— |
|
— |
|
— |
|
— |
|
— |
|
— |
|
— |
|
— |
DISTRIBUTION |
|
|
|
|
|
|
|
|
|
|
|
|
|
|
|
|
|
|
|
|
|
|
|
|
Portfolio with no renegotiated terms |
|
331,680,208 |
|
18,086,380 |
|
12,049,481 |
|
8,021,627 |
|
5,948,543 |
|
6,294,589 |
|
5,949,544 |
|
5,210,200 |
|
4,571,767 |
|
105,173,186 |
|
502,985,525 |
|
978,707 |
- Mass-market customers |
|
301,435,164 |
|
12,716,511 |
|
8,095,751 |
|
6,348,925 |
|
4,994,573 |
|
5,016,199 |
|
5,176,184 |
|
4,052,768 |
|
3,802,001 |
|
83,053,046 |
|
434,691,122 |
|
847,575 |
- Large customers |
|
19,546,310 |
|
3,418,154 |
|
1,766,205 |
|
582,003 |
|
461,826 |
|
317,234 |
|
61,937 |
|
143,118 |
|
78,772 |
|
8,380,707 |
|
34,756,266 |
|
131,132 |
- Institutional customers |
|
10,698,734 |
|
1,951,715 |
|
2,187,525 |
|
1,090,699 |
|
492,144 |
|
961,156 |
|
711,423 |
|
1,014,314 |
|
690,994 |
|
13,739,433 |
|
33,538,137 |
|
— |
Portfolio with renegotiated terms |
|
57,457,543 |
|
1,326,917 |
|
725,244 |
|
438,750 |
|
337,521 |
|
277,542 |
|
255,749 |
|
202,269 |
|
281,543 |
|
2,477,439 |
|
63,780,517 |
|
772,048,518 |
- Mass-market customers |
|
52,823,957 |
|
889,902 |
|
575,090 |
|
437,104 |
|
333,432 |
|
274,132 |
|
253,765 |
|
202,048 |
|
281,090 |
|
2,142,639 |
|
58,213,159 |
|
767,045,931 |
- Large customers |
|
1,310,509 |
|
12,699 |
|
11,031 |
|
1,177 |
|
3,384 |
|
3,134 |
|
1,732 |
|
— |
|
— |
|
— |
|
1,343,666 |
|
3,383,991 |
- Institutional customers |
|
3,323,077 |
|
424,316 |
|
139,123 |
|
469 |
|
705 |
|
276 |
|
252 |
|
221 |
|
453 |
|
334,800 |
|
4,223,692 |
|
1,618,596 |
Total gross portfolio |
|
1,074,822,684 |
|
31,474,982 |
|
48,358,190 |
|
17,972,222 |
|
16,543,822 |
|
11,522,260 |
|
27,808,169 |
|
11,142,122 |
|
28,572,932 |
|
159,492,141 |
|
1,427,709,524 |
|
775,262,173 |
F-153
APPENDIX 2.2 ESTIMATES OF SALES AND PURCHASES OF ENERGY, POWER AND TOLL
This appendix forms an integral part of these consolidated financial statements.
|
|
12-31-2024 |
|
12-31-2023 |
||||
|
|
Energy and |
|
|
|
Energy and |
|
|
|
|
Capacity |
|
Tolls |
|
Capacity |
|
Tolls |
|
|
ThCh$ |
|
ThCh$ |
|
ThCh$ |
|
ThCh$ |
STATEMENT OF FINANCIAL POSITION |
|
|
|
|
|
|
|
|
Trade and other receivables, current |
|
1,292,952,828 |
|
107,471,571 |
|
1,079,071,545 |
|
57,680,280 |
Trade and other receivables, non-current |
|
852,426,063 |
|
— |
|
970,575,153 |
|
— |
Total Estimated Assets |
|
2,145,378,891 |
|
107,471,571 |
|
2,049,646,698 |
|
57,680,280 |
Trade and other payables, current |
|
208,906,622 |
|
29,167,180 |
|
99,375,819 |
|
22,172,523 |
Trade and other payables, non-current |
|
792,620,246 |
|
— |
|
571,821,560 |
|
— |
Total Estimated Liabilities |
|
1,001,526,868 |
|
29,167,180 |
|
671,197,379 |
|
22,172,523 |
|
|
12-31-2024 |
|
12-31-2023 |
||||
|
|
Energy and |
|
|
|
Energy and |
|
|
|
|
Capacity |
|
Tolls |
|
Capacity |
|
Tolls |
|
|
ThCh$ |
|
ThCh$ |
|
ThCh$ |
|
ThCh$ |
STATEMENT OF INCOME |
|
|
|
|
|
|
|
|
Energy sales |
|
994,692,375 |
|
107,471,571 |
|
1,052,873,402 |
|
57,684,300 |
Energy purchases |
|
309,187,730 |
|
29,167,180 |
|
163,111,943 |
|
22,333,297 |
F-154
APPENDIX 3 DETAIL OF DUE DATES OF PAYMENTS TO SUPPLIERS
This appendix forms an integral part of these consolidated financial statements.
|
|
12-31-2024 |
|
12-31-2023 |
||||||||||||
|
|
Goods |
|
Services |
|
Other |
|
Total |
|
Goods |
|
Services |
|
Other |
|
Total |
|
|
ThCh$ |
|
ThCh$ |
|
ThCh$ |
|
ThCh$ |
|
ThCh$ |
|
ThCh$ |
|
ThCh$ |
|
ThCh$ |
Suppliers with Payments Up-to-Date |
|
|
|
|
|
|
|
|
|
|
|
|
|
|
|
|
Up to 30 days |
|
206,687,069 |
|
767,414,035 |
|
350,525,935 |
|
1,324,627,039 |
|
109,995,114 |
|
735,006,985 |
|
223,423,829 |
|
1,068,425,928 |
Between 31 and 60 days |
|
6,103,587 |
|
23,935 |
|
1,953,792 |
|
8,081,314 |
|
8,941,687 |
|
7,096,098 |
|
27,431,127 |
|
43,468,912 |
Between 61 and 90 days |
|
42,473,999 |
|
12,779,122 |
|
57,707,831 |
|
112,960,952 |
|
17,435,120 |
|
16,709,409 |
|
178,535,976 |
|
212,680,505 |
Between 91 and 120 days |
|
— |
|
— |
|
— |
|
— |
|
— |
|
— |
|
— |
|
— |
Between 121 and 365 days |
|
— |
|
— |
|
— |
|
— |
|
— |
|
62,070 |
|
— |
|
62,070 |
More than 365 days |
|
— |
|
— |
|
965,710,108 |
|
965,710,108 |
|
— |
|
290,572 |
|
595,231,621 |
|
595,522,193 |
Total |
|
255,264,655 |
|
780,217,092 |
|
1,375,897,666 |
|
2,411,379,413 |
|
136,371,921 |
|
759,165,134 |
|
1,024,622,553 |
|
1,920,159,608 |
|
|
12-31-2024 |
|
12-31-2023 |
||||||||||||
|
|
Goods |
|
Services |
|
Other |
|
Total |
|
Goods |
|
Services |
|
Other |
|
Total |
|
|
ThCh$ |
|
ThCh$ |
|
ThCh$ |
|
ThCh$ |
|
ThCh$ |
|
ThCh$ |
|
ThCh$ |
|
ThCh$ |
Suppliers Details |
|
|
|
|
|
|
|
|
|
|
|
|
|
|
|
|
Suppliers for energy purchase |
|
— |
|
258,274,884 |
|
1,302,462,240 |
|
1,560,737,124 |
|
— |
|
196,388,412 |
|
695,141,510 |
|
891,529,922 |
Suppliers for the purchase of fuels and gas |
|
— |
|
189,221,414 |
|
— |
|
189,221,414 |
|
— |
|
255,565,802 |
|
— |
|
255,565,802 |
Payables for goods and services |
|
150,909,716 |
|
332,720,794 |
|
— |
|
483,630,510 |
|
53,780,917 |
|
307,210,920 |
|
— |
|
360,991,837 |
Payables for the purchase of assets |
|
104,354,939 |
|
— |
|
73,435,426 |
|
177,790,365 |
|
82,591,004 |
|
— |
|
329,481,043 |
|
412,072,047 |
Total |
|
255,264,655 |
|
780,217,092 |
|
1,375,897,666 |
|
2,411,379,413 |
|
136,371,921 |
|
759,165,134 |
|
1,024,622,553 |
|
1,920,159,608 |
F-155
Exhibit 1.1
BYLAWS OF ENEL CHILE S. A.
(Effective as of July 3, 2024)
CHAPTER ONE
Name, Domicile, Duration and Purpose
Article 1: An open, joint-stock company to be called “Enel Chile S.A.” (“the Company”), is organized and shall be governed by these bylaws and, where these bylaws are silent, by legal and regulatory norms that apply to this type of company.
Article 1 bis: Notwithstanding the preceding Article, the Company is subject to the provisions of Decree Law No. 3,500 and its amendments.
Article 2: The Company’s address shall be in the city of Santiago and agencies or branches may be opened in other parts of the country or abroad.
Article 3: The life of the Company is indefinite.
Article 4: The Company’s purpose shall be to invest in subsidiaries or related companies whose business is the exploration, development, operation, generation, distribution, transmission, transformation, and/or sale of energy in Chile, in any of its forms or nature, as well as activities related to research, development, operation, commercialization, purchase, sale, importation, and maintenance of any type of goods related to information technology and telecommunications, such as software, hardware, licenses, software development, and, in general, any type of goods related to the aforementioned activities; and consultancy services in any of the aforementioned matters.
An additional purpose shall be to invest and manage its investments in subsidiaries and related companies such as generators, transmission companies, distributors, or electricity traders or business whose business activity corresponds to any of the following: (i) energy in any of its forms or nature, (ii) providing public services or services whose main input is energy, (iii) telecommunications and information technology services, and (iv) business intermediation via the Internet.
In order to comply with its mission, the Company will carry out the following objectives:
a) Promote, organize, establish, modify, dissolve, or liquidate companies of any nature, whose corporate purpose is related to those previously mentioned.
b) Propose investment, financing, and commercial policies to its subsidiaries, as well as the accounting systems and criteria to which they must adhere.
c) Oversee the management of its subsidiaries and related companies.
d) Lend the financial resources necessary for its subsidiaries and related companies to develop their business and, furthermore, provide to its subsidiaries, related companies, and third parties management services; consulting, financial, commercial, audit, technical, and legal services; and, in general, services of any nature that may be necessary convenient to improve their performance.
Apart from its main purpose and always acting within the limits established by the Investment and Financing Policy approved at the Shareholders’ Meeting, the Company may invest in:
One: The acquisition, development, construction, rental, management, intermediation, trading, and disposal of all kinds of movable and immovable assets, either directly or through subsidiaries or related companies.
Two: All kinds of financial assets, including stocks, bonds and debentures, trade bills, and, in general, all kinds of transferable securities and contributions to companies, either directly or through subsidiaries or related companies.
CHAPTER TWO
Capital and Shares
Article 5: The capital of the Company amounts to three billion eight hundred eighty-two thousand one hundred three million four hundred seventy thousand one hundred eighty-four pesos (Ch$ 3,882,103,470,184), divided into sixty-nine billion, one hundred sixty-six million, five hundred fifty-seven thousand, two hundred twenty (69,166,557,220) common and nominative shares, all of the same series and with no par value, which are entered and paid in the manner described in the First Transitory Article of these bylaws.
Article 5 bis: No person shall directly or through other related persons hold more than 65% of the capital with voting rights of the Company or a higher percentage than the law may allow for holding a concentration factor of 0.6. The minority shareholders must hold at least 10% of the capital with voting rights, and at least 15% of the capital with voting rights must be held by more than one hundred unrelated shareholders, each of whom shall hold a minimum equivalent to one hundred Unidades de Fomento in shares, according to the value at which they appear in the latest balance sheet. Minority shareholders and related persons shall be understood as defined in current legislation.
Article 6: Shares shall be registered, and their subscription shall be recorded in writing in the manner determined under current legislation and regulations. Their transfers and transmission shall be in accordance with those regulations. Payment for subscribed shares may be in cash or other tangible or intangible assets.
Article 7: The Company shall not recognize fractions of shares. Should one or more shares belong jointly to various parties, the co-owners shall all be obliged to provide a power of attorney to act before the Company.
Article 8: Unpaid balances of subscribed shares shall be adjusted in the same proportion as changes in the value of the Unidad de Fomento.
Article 9: Shareholders are only responsible for the payment of their shares and are not obliged to return to the Company the amounts of any benefits they might have received as a benefit. In the case of the transfer of subscribed and unpaid shares, the transferor shall be liable severally with the transferee for its payment, and notice must be recorded on the certificate of the share payment conditions.
Article 10: Private agreements between shareholders relating to shares disposal shall be registered with the Company and made available to other shareholders and interested third parties, and reference shall be made to them in the Shareholders Register. If this procedure is not followed, such agreements shall be not opposable to third parties.
2
Such agreements shall not affect the obligation of the Company to register without further formality the transfers that are presented, in accordance with the law.
Article 11: The Shareholders Register, the details to be stated on share certificates, and the procedure in the case of lost or mislaid certificates shall comply with pertinent legal rules and regulations.
CHAPTER THREE
Administration
Article 12: The Company shall be administered by a Board of Directors composed of seven re-eligible members who may or may not be shareholders of the Company.
Article 13: Members of the Board of Directors shall be elected by the Ordinary Shareholders Meeting. The Board of Directors shall remain for a period of three years, at the end of which it shall be completely renewed or re-elected.
Article 14: Board of Directors meetings shall be constituted with the absolute majority of the Directors, and decisions shall be taken by the absolute majority of the Directors present with voting rights. In the case of a tied vote, the person presiding the meeting shall decide.
Article 14 bis: All acts or contracts entered into by the Company with its majority shareholders, its Directors or Executives, or with parties related to these shall be previously approved by two thirds of the Board of Directors and appear in the corresponding minutes, notwithstanding the provisions of Chapter XVI of Law No. 18,046.
Article 15: The Board of Directors shall meet at least once every month, and whenever the Company’s business so requires. There shall be ordinary and extraordinary meetings. The former shall be held on dates and times pre-established by the Board of Directors itself; the latter when especially convened by the Chairman himself or at the request of one or more Directors, in which case prior qualification by the President with respect to the need to hold such meeting is required, except where the meeting is requested by the absolute majority of all Board members, in which case such meeting may be held without any prior qualification. Extraordinary Meetings may only deal with those matters specifically included in the meeting notification. In the first session following the appointment of the Directors at an Ordinary Shareholders Meeting, the Board of Directors shall elect a Chairman from amongst its members.
Article 16: The Directors shall be remunerated. The Ordinary Shareholders’ Meeting will set the amount of remuneration annually. The Chairman shall be entitled to receive twice the amount paid to each Director.
Article 17: The Board of Directors represent the Company judicially and extra-judicially, and to comply with its objects, which shall not be necessary to demonstrate to third parties, it has all the powers of administration and disposal that the Law or the bylaws do not reserve for the shareholders’ meeting, without the necessity to give it any special powers, even for those acts or contracts for which the law demands such. This does not impede actions appropriate to the Chief Executive Officer. The Board of Directors may delegate part of its powers to the Chief Executive Officer, Managers, Assistant Managers, Lawyers and senior executives of the Company, to one Director or to a Committee of Directors, and to other persons for specially defined objectives.
3
Article 17 bis: In carrying out the powers set out in the preceding Article, the Board of Directors shall act always within the limitations set by the investment and financing policy approved at the Ordinary Shareholders’ Meeting in accordance with the terms of Article 119 of Decree Law No. 3,500 of 1980, and its amendments.
Article 18: The Company shall have a Chief Executive Officer who shall be appointed by the Board of Directors and shall be granted all the powers of a commercial agent and those expressly agreed by the Board of Directors. The position of Chief Executive Officer is incompatible with that of Chairman, Director, Auditor, or Accountant of the Company.
CHAPTER FOUR
Shareholders’ Meetings
Article 19: Shareholders shall meet in Ordinary and Extraordinary Meetings. The former shall be held once each year within four months following the balance sheet date to decide on matters of mutual interest without necessarily being mentioned in the respective meeting notification. The latter may be held at any time as required by the business to decide on any matter that the Law or these bylaws reserves for consideration by a shareholders’ meeting and provided these matters are stated in the respective meeting notification. Notifications of Ordinary and Extraordinary Meetings shall not be necessary when the whole number of validly issued shares is represented at the respective meeting. When an Extraordinary Meeting must resolve on matters appropriate to an Ordinary Shareholders’ Meeting, its procedures and resolutions shall be subject, where appropriate, to the quorums applicable to the latter class of meetings.
Article 20: The following are matters for an Ordinary Meeting: 1) Examination of the situation of the Company and of the reports of accounting inspectors and external auditors and the approval or rejection of the annual report, balance sheet, financial statements, and presentations prepared by the managers or liquidators of the Company; 2) The distribution of profits for each year and, especially, the dividend distribution; 3) The election or renewal of the members of the Board of Directors, of liquidators and of management inspectors; and 4) Generally, any matter of general interest that is not reserved for an Extraordinary Meeting. Ordinary Meetings shall annually appoint an external auditing firm governed by Title XXVIII of Law Number 18,045, in order to (a) selectively examine the amounts, supports and background information that comprise the accounting and financial statements; (b) evaluate the accounting principles used and their application consistent with relevant standards, as well as significant estimates made by management, and; (c) issue their conclusions regarding the overall presentation of the accounting and financial statements, indicating with a reasonable degree of assurance, whether they are free of material misstatement and comply with relevant standards in a fair, consistent and reliable manner.
Article 20 bis: In addition to the terms of the preceding Article, the Ordinary Meeting shall be responsible for approving the investment and financing policy proposed by the management in the terms contemplated in Article 119 of Decree Law No. 3,500 of 1980 and its amendments. It shall also be the responsibility of the Ordinary Meeting to appoint annually the inspectors of accounts and their respective alternates, with the powers established in Article 51 of Law No. 18,046.
Article 21: The following are matters for an Extraordinary Meeting: 1) The dissolution of the Company; 2) Transformation, merger, or division of the Company and amendments to its bylaws; 3) Bond and convertible debenture issuances; 4) The disposal of 50% or more of assets, with or without its liabilities, to be determined on the basis of the balance sheet for the previous financial year; and likewise, any business plan definition or amendment that involves the sale of assets above the aforementioned percentage.
4
Likewise the sale or transfer of ownership of 50% or more of the assets of a subsidiary, provided that this represents at least 20% of the assets of the Company, and any disposal of its shares that implies that the parent company ceases to be its controller; 5) The granting of real or personal guarantees to secure third party obligations, unless granted to subsidiaries, in which case, the approval of the Board of Directors will be sufficient and; 6) Other matters which, by law, or by these bylaws, should be known by, and subject to the Shareholders’ Meetings. The matter referred to in items one, two, three and four may only be agreed upon in Meetings held before a Notary, who must certify that the Minutes of the Meeting is the true expression of what occurred and was agreed upon in the Meeting.
Article 21 bis: Notwithstanding the terms of the preceding Article, the following shall also be matters of an Extraordinary Meeting: a) The disposal of assets or rights of the Company that are declared essential for its business in the investment and financing policy, as well as the granting of guarantees over them; and b) The modification in advance of the investment and financing policy approved by the Ordinary Meeting.
Article 22: Meetings shall be convened by the Board of Directors of the Company and notifications shall be effected by means of conspicuous advice that shall be published in time and form and within the timeframes established by law. It shall also disclose the fact that a shareholders’ meeting will be held in the manner, at such times at within the timeframes provided by law or by the Financial Market Commission, which should mention the matters for consideration at the meeting, as well as an explanation of the way full copies of the documents justifying the various options submitted to a vote can be obtained, if any, which should be made available to shareholders on the web site of the Company. The omission of this obligation shall not affect the validity of the notification, but the Directors, Liquidators, and Managers of the Company at fault shall be responsible for any damage suffered by shareholders, irrespective of the administrative sanctions that the Financial Market Commission may apply. However, those meetings attended by the whole of the issued shares with voting rights may be self-convened and held validly even when the required formalities for notifications have not been complied with. All shareholder meetings must be informed to the Financial Market Commission in the manner, at such times and within such timeframes as determined by law or by the Financial Market Commission. For the holding of a Shareholders' Meeting, the Company may establish systems that allow remote participation and voting, provided that such systems duly safeguard the rights of the shareholders and the regularity of the voting process.
Article 23: Meetings are constituted with an absolute majority of shares with voting rights on the first notification, and with those present or represented, whatever their number, on the second notification, and resolutions shall be adopted by the absolute majority of the shares present or represented with voting rights. Notices of the second notification may only be published once the meeting subject to the first notification fails to convene, and in any case the new meeting should be convened within 45 days following the date fixed for the meeting not held. Meetings shall be presided by the Chairman of the Board of Directors or the person taking his place, and the Secretary of the Board of Directors of the Company, or the Chief Executive Officer in his absence, shall act as Secretary of the meeting.
Article 24: Resolutions of Extraordinary Shareholders’ Meetings that relate to modifications of the bylaws shall require the vote of two thirds of the shares with voting rights.
Article 24 bis: As long as the Company remains subject to the terms contained in Chapter Twelve and other relevant parts of Decree Law No. 3,500, of 1980, as amended, any modification to the regulations set out in Articles 1 bis, 5 bis, 14 bis, 17 bis, 20 bis, 21 bis, 27 bis and this Article shall require the consenting vote of 75% of the issued shares with voting rights, in accordance with Article 121 of the said Decree Law No.
5
3,500.
Article 25: Only those shareholders registered in the Shareholders Register by midnight of the fifth business day prior to the date for which the respective Meeting is convened may participate in meetings and exercise their rights to speak and vote. Shareholders without voting rights, as well as the Directors and Managers who are not shareholders, may participate in General Meetings with a right to speak.
Article 26: Shareholders may be represented at meetings by another person even if such person is not a shareholder, notwithstanding that established in Article 45 bis of Decree Law No. 3,500. Proxies for such representations shall be given in writing for all the shares held by the owner on the date stated in the preceding Article.
Article 27: Shareholders shall have a right to one vote for each share they own or represent and may accumulate or distribute them as they wish in any election.
Article 27 bis: Notwithstanding the contents of the preceding Article, no shareholder may exercise for his own account or on behalf of other shareholders, the right to vote for a percentage of subscribed shares with voting rights of the Company in excess of the maximum concentration permitted in the bylaws and must deduct any excess over this limit for this purpose. For calculating this percentage, the shares held by the shareholder shall be added to those of parties related to the former. Neither may any person represent shareholders who in aggregate hold more than the maximum concentration level permitted in the bylaws.
CHAPTER FIVE
The Directors’ Committee and Audit Committee
Article 28: While the Company meets the equity and concentration requirements established in Article 50 bis, or that succeeding or replacing it, of Law No. 18,046, it shall be obliged to appoint an independent director and a Directors’ Committee. This Committee shall be governed in its formation, membership, functioning, and powers by the provisions of the Chilean Corporations Law and instructions on this subject issued by the Financial Market Commission.
Article 29: Notwithstanding the provisions of the preceding Article and while the Company is an issuer of securities duly registered with the New York Stock Exchange (NYSE) or any other American national stock exchange, the formation, membership, functioning, and powers of the Directors’ Committee shall also be governed, where not to be contrary to Chilean law, by the obligatory provision for the so-called “Audit Committee” in the Sarbanes Oxley Act (SOX) of the United States of America, the instructions issued by the Securities and Exchange Commission (SEC), and the New York Stock Exchange (NYSE), or the organism or entity that definitively corresponds in accordance with the legislation of the United States of America. In case of an irreconcilable or irremediable conflict, disagreement, or incompatibility between the provisions of Chilean and American legislation for the Directors’ Committee and the Audit Committee, respectively, Chilean law shall prevail over foreign law, although the Board of Directors may call an Extraordinary Shareholders’ Meeting to amend the bylaws should this be necessary, and shall have the widest powers, acting within its powers, to solve such conflict, disagreement, or incompatibility should this be possible, by the creation of new committees and/or sub-committees, as also the delegation of part of its powers in accordance with Article 40 of the Chilean Corporations Law. The shareholders, directors, and Board of Directors of the Company should ensure at all times that the agreements and policies adopted by it are compatible and harmonious with the provisions of both legislations.
6
Article 30: The Directors’ Committee shall be composed of three members, the majority of whom shall be independent according to the criteria and requirements established for this purpose in Article 50 bis of Law No. 18,046, both at the time of their appointment and during the whole period in which they perform as members of the Committee. Notwithstanding the above and complementing the provisions of Article 29 above, while the corporation is an issuer of securities duly registered on the NYSE or any other American national stock exchange, and in order to give strict compliance with the legal and regulatory requirements that the registration involves, all the members of the Directors’ Committee should also meet the criteria and requirements of independence prescribed for this purpose by the SOX, the SEC, and the NYSE. Thus, no director who has been elected or appointed as a member of the Directors’ Committee may, therefore, have any link, interest, or dependence with the corporation, whether economic, professional, credit, or commercial, whatever the amount or nature, nor receive, directly or indirectly, any income, remuneration, or compensation from the corporation or any of its subsidiaries that is not by concept nor has as the sole and exclusive source the duties performed as a member of the Board of Directors, as a member of the Directors’ Committee, or as a member of any other committee or sub-committee of directors of the Company.
Article 31: The loss of independence that, according to the laws governing the Company and these bylaws, affects a member of the Committee shall generate the following incapacity of the respective director to perform his or her duties as a director and member of the Directors’ Committee and therefore he or she should cease automatically in that position, notwithstanding his or her responsibility to the shareholders.
Article 32: The directors appointed as members of the Directors’ Committee shall remain as such for the period they were appointed as director and may only resign from this position when they resign as director or having acquired an incapacity to perform the duties, in which case the provisions of the preceding Article shall apply. No director elected or appointed as a member of the Directors’ Committee may be excused from this election or appointment.
Article 33: The meetings of the Directors’ Committee shall be validly constituted with the absolute majority of its members and its resolutions shall be adopted by the absolute majority of the members present. The Directors’ Committee should elect a Chairman from among its members who shall have the casting vote in the event of a tied vote.
Article 34: The Committee shall have the powers and duties that have been expressly contemplated both in the laws and their regulations, as well as the rules issued for the purpose by the competent administrative authority, especially those stated in Article 50 bis of Law No. 18,046, and any other matter, mandate, power, or duty commended to it by a shareholders or Board meeting.
Article 35: The deliberations, agreements, and organization of the Directors’ Committee shall be governed, in everything applicable, by the regulations relating to the Board meetings of the Company.
CHAPTER SIX
Balance Sheet, Funds and Earnings
Article 36: As of December 31 of each year, a financial statement with the operations of the Company shall be prepared, and the Board of Directors shall present this to the Ordinary Shareholders’ Meeting together with a report analyzing the situation of the Company and the statement of income and the related report provided by the inspectors of accounts and external auditors. All these documents must reflect clearly the equity position of the Company at the close of the respective year and the profits obtained or losses suffered during the year.
7
Article 37: On a date no later than the first notification convening the Ordinary Shareholders’ Meeting, the Board of Directors must make available to each shareholder registered in the respective register a copy of the duly audited Financial Statements and Annual Report of the Company, including the reports of the external auditors and inspectors of accounts, and their respective notes. The duly audited balance sheet, statement of income, and other information that the law or the Financial Market Commission requires shall be published on the web site of the Company within the timeframes and with the advance notice established by applicable statutes or regulations. Moreover, the aforementioned documents shall be filed with the Financial Market Commission and in time and form as the latter shall determine. The annual report, balance sheet, inventories, minutes of Board and Shareholders’ Meetings, books, and reports of inspectors must be available to shareholders in the offices of the Company for 15 days prior to the date informed for the meeting. Should the balance sheet and statement of income be altered by the Meeting, the amendments, where corresponding, shall be made available to shareholders within 15 days following the date of the Meeting.
Article 38: Unless otherwise approved at the respective Meeting with the unanimous vote of the issued shares, a cash dividend shall be distributed annually to shareholders, pro-rata to their shares, for at least 30% of the net income for each year. In any event, the Board of Directors may, under the personal responsibility of the Directors present at the respective approval, distribute interim dividends during the year as a charge against the profits of that year, provided that there are no accumulated losses. The portion of profits earnings not allocated by the Meeting to dividends may be capitalized at any time, subject to amending the bylaws through the issue of free shares or by increasing the nominal value of the shares, or be retained to meet possible dividend payments in following years.
CHAPTER SEVEN
Dissolution and Liquidation
Article 39: The dissolution of the Company shall occur in the cases foreseen in the Law. Dissolution in advance shall only be agreed at an Extraordinary Shareholders’ Meeting with the consenting vote of two thirds of the issued shares with voting rights.
Article 40: Once the Company is dissolved, the liquidation shall be performed by a Liquidation Committee formed by three people, shareholders or not, chosen by the Shareholders’ Meeting, and who shall have the powers, duties, and obligations established in the law or regulations. If the Company is dissolved as a result of all the shares being held by one person through an uninterrupted period of at least ten days, liquidation shall be unnecessary.
Article 41: The liquidators shall convene an Ordinary Shareholders’ Meeting in the month of April each year to report on the state of the liquidation. Should the liquidation not be completed within two years, a new election of liquidators shall be made, the same persons being re-eligible. The position of liquidators is remunerated and the Ordinary Shareholders’ Meeting shall set the remuneration. The position of liquidator is revocable by an Ordinary or Extraordinary Shareholders’ Meeting. Liquidators shall be suspended from their positions by overriding legal incapacity or by their declaration of bankruptcy.
8
CHAPTER EIGHT
General Provisions
Article 42: The differences that may arise between the shareholders as such, or between them and the Company or its officers, either during its existence or its dissolution, will be solved by an arbitrator named by common accord between both parties who will exercise the role as arbitrator in such a proceeding and must decide according to Law. In the absence of such an agreement, the arbitrator shall be designated by Common Courts at the request of either party, in which case such nomination must be from attorneys who teach or who have taught for at least three consecutive years as Professors of Economic or Commercial Law in the Department of Law at the Universidad de Chile, Universidad Católica de Chile or Universidad Católica de Valparaíso. Notwithstanding the above, in the event of a conflict, the plaintiff may withdraw his recognition of the authority of the arbitrator and submit to the jurisdiction of the Common Justice a right that cannot be exercised by the directors, managers, administrators, and senior executives of the Company, nor by those shareholders that individually hold, directly and indirectly, shares whose book or market value exceeds 5,000 Unidades de Fomento, according to the value of this unit on the date of presentation of the demand.
Article 43: In all matters that are not expressly addressed within these bylaws, the provisions of Law No. 18,046, its amendments and regulations applicable to open joint-stock companies and those contained within Decree 3,500 article 111 shall apply.
Article 44: The Company will be subject to Resolution No. 667 of the Antitrust Resolutive Commission, dated as of October 30, 2002, on the understanding that the restrictions it contemplates will not apply to the Company in respect of Enel Américas S.A.
TRANSITORY ARTICLES
First Transitory Article: The Company’s capital amounts to three billion eight hundred eighty-two thousand one hundred three million four hundred seventy thousand one hundred eighty-four pesos (Ch$ 3,882,103,470,184) divided into sixty-nine billion, one hundred sixty-six million, five hundred fifty-seven thousand, two hundred twenty (69,166,557,220) common and nominative shares, all of the same series and with no par value, which has been paid for as follows: (a) the amount of two billion two hundred and twenty-nine thousand one hundred and eight million nine hundred and seventy-four thousand five hundred and thirty-eight pesos (Ch$ 2,229,108,974,538) divided into forty-nine billion, ninety-two million, seven hundred seventy-two thousand sixty-two (49,092,772,762) shares, fully subscribed and dully paid for; (b) the amount of six hundred and fifty-three billion six hundred and fifty-five million two hundred and twenty-five thousand five hundred and eighty pesos (Ch$ 653,655,225,580) divided into seven billion nine hundred and seventy-one million four hundred and sixty thousand one hundred and ninety-four (7,971,460,194) shares, which were issued in connection with the capital increase approved at the extraordinary shareholders’ meeting of the Company on December 20, 2017, which were fully subscribed and paid for in cash on or before December 31, 2018; (c) the amount of one billion seventy-one thousand seven hundred and twenty-seven million two hundred and seventy-eight thousand six hundred and sixty-eight pesos (Ch$ 1,071,727,278,668) divided into thirteen billion, sixty-nine million, eight hundred forty-four thousand, eight hundred sixty-two (13,069,844,862) shares, which corresponds to the capital increase approved at the extraordinary shareholders’ meeting of the Company on December 20, 2017, in which the merger of Enel Green Power Latin América S.A.
9
with and into the Company was agreed and approved, subject to fulfillment of the conditions precedents agreed upon in said meeting, which include, among others, that Enel Chile publish, in accordance with article 212 of the Securities Market Law, a notice of the results of the 2018 Tender Offer (OPA) for minority shares of Enel Generación Chile S.A. (the “OPA Enel Generación”), declaring the OPA Enel Generación successful in accordance with its own terms and conditions (The aforementioned merger had its effects on April 2, 2018. As a result of the merger, the Company, as the absorbing entity, absorbed Enel Green Power Latin América S.A. and succeed to all of its rights and obligations. The shares issued in connection with the capital increase for the merger were subscribed and paid for with the equity of the absorbed company. Such shares were issued and delivered to the shareholders of Enel Green Power Latin América S.A. in proportion to interest in said company through the exchange of its shares in said entity for shares of the Company based on an exchange ratio of 15.8 shares of the Company for each share of Enel Green Power Latin América S.A. held.); and (d) less the amount of seventy-one billion nine hundred and forty-four million eight hundred and thirty-one thousand six hundred and sixty-seven pesos (-Ch$ 71,944,831,667) equivalent to nine hundred and sixty-seven million five hundred and twenty thousand five hundred and ninety-eight (967,520,598) common and nominative shares, all of the same series and with no par value, which corresponds to the number of shares that the dissenting shareholders exercised their right to withdrawal from the Company, upon payment by the Company of the value of its shares in connection with the merger of Enel Green Power Latin America S.A. with and into the Company, approved at the extraordinary shareholders’ meeting of the Company on December 20, 2017, which were cancelled by operation of law because they were not sold within a year of their acquisition.
10
Exhibit 8.1
List of Subsidiaries as of December 31, 2024
All subsidiaries listed below are incorporated in Chile.
|
|
Ownership Share |
||||
Subsidiary |
|
Direct |
|
Indirect |
|
Total |
|
|
(in %) |
||||
Empresa Eléctrica Pehuenche S.A. |
|
- |
|
92.65% |
|
92.65% |
Enel Colina S.A. |
|
- |
|
100.00% |
|
100.00% |
Enel Distribución Chile S.A. |
|
99.09% |
|
- |
|
99.09% |
Enel Generación Chile S.A. |
|
93.55% |
|
- |
|
93.55% |
Enel Green Power Chile S.A. |
|
99.99% |
|
- |
|
99.99% |
Enel Mobility Chile S.p.A. |
|
100.00% |
|
- |
|
100.00% |
Enel X Chile S.p.A. |
|
100.00% |
|
- |
|
100.00% |
Enel X Way Chile S.p.A. |
|
62.46% |
|
- |
|
62.46% |
Geotérmica del Norte S.A. |
|
- |
|
84.59% |
|
84.59% |
Parque Talinay Oriente S.A. |
|
- |
|
60.91% |
|
60.91% |
Sociedad Agrícola de Cameros Ltda. |
|
57.50% |
|
- |
|
57.50% |
Exhibit 11
Manual for the Management of Information
of
Interest to the Market
Enel Chile S.A. Updated as of May 2023
1
Table of Contents
Title III Purpose of the Manual5
Title IV Scope of Application of the Manual6
Title V Corporate Body Responsible for Establishing the Manual7
Title VI Body Responsible for Compliance with the Manual8
Title VII Prohibition or Blocked Periods8
SECTION II GENERAL RULES OF CONDUCT IN RELATION TO SECURITIES 11
Title II Obligation to Inform11
Title III Information on Conflicts of Interest11
Title IV Operations of Special Importance __12
Title V Related Persons __13
SECTION III ESSENTIAL, RESERVED AND INSIDER INFORMATION 14
Title I Rules on essential, reserved and insider information _____14
Title I Insider, Reserved or Essential Information Protection Mechanisms 17
SECTION V INFORMATION OF INTEREST 18
Title I Concept of Information of Interest __18
Title II Relationship with the Media __18
Title III Relationship with Financial Analysts, Rating Agencies, Bondholders and Investors _19
SECTION VI NON-COMPLIANCE AND RESOLUTION OF CONFLICTS 20
In order to guarantee compliance with the guidelines contained in Law No. 18,045 on the Securities Market and General Rule No. 270 of the Financial Market Commission (CMF), Enel Chile S.A.’s Board of Directors ("Enel Chile" or the "Company") in a session held of February 26, 2016 approved this "Manual for the Management of Information of Interest to the Market" in a session held on May 26, 2010, and in a session held on May 24, 2023 the Board approved its first update, hereinafter the "Manual".
The principles that inspire this Manual are transparency, good faith, prioritization of general interests before personal ones and care of and diligence in the use of information and the actions carried out in the markets.
Pursuant to the provisions laid down by the CMF, the Company's Board of Directors has approved this Manual in view of the fact that issuers of publicly offered securities must establish internal policies and rules regarding the information that will be made available to investors and must implement systems aimed at guaranteeing that such information is communicated to the market in a timely manner. It has thus been established that timely and efficient information provided either with respect to securities transactions carried out by persons holding positions of directors, managers, administrators, chief executives or employees, as well as entities controlled directly by them or through third parties, with respect to information of interest or essential information related to the Company’s progress contributes to the formation of a transparent market, which increases investor confidence and provides more equitable treatment when dealing with publicly offered securities.
This Manual has been published on the www.enel.cl page, Investors section, and copies are available to the public at the Company’s offices located in Av. Santa Rosa No. 76, Santiago. In addition, an electronic copy has been made available to the CMF through its official channels.
The provisions of this Manual are based on the consideration that the persons this Manual is addressed to will act on the basis of the principles of transparency, good faith, prioritization of general interests over their personal interests, care of and diligence in the use of information and in the performance in the securities markets and the following requirements:
3
| 3. | Provide supervisory entities with due cooperation. |
Compliance with the obligations of this Manual does not release Interested Parties from legal obligations or direct submission of information to the CMF or other competent national or foreign regulatory bodies, as appropriate. In no case will the Company have the obligation to inform said organizations on behalf or subsidy of the Interested Parties. This Manual does not constitute nor is it intended to constitute a form of advice or guidance on the matters dealt with in it.
7. Likewise, this Manual must be considered in harmony with the provisions of the Company's current Code of Ethics (available at: https://www.enel.cl/en/investors/investor-enel-chile/corporate- governance/compliance-program-documents.html)andwiththe Investment Policy in matters of disclosure and symmetry of information, (availableat:https://www.enel.cl/en/investors/investor-enel- chile/corporate-governance/engagement-policy.html).
Title III Purpose of the Manual
The purpose of this Manual is to establish the general standards of conduct to be followed by the addressees, defined in the Title IV of this manual, in their transactions so that they can contribute to greater transparency and the protection of investors.
Furthermore, the purpose of this Manual is to establish the regulation of information to which the following will be subjected:
4
a) The actions of directors, managers, administrators, chief executives, executives and other persons in managerial positions or are part of the Company as professionals or administratives employees regarding transactions and the ownership of securities issued either by the Company or by other companies that are part of its business group, or securities whose price or result depends on or is conditional, completely or in a significant part, to the variation or evolution of said securities pursuant to the provisions of General Standard No. 269.
(b) The type, form and content of the information to be made known to the general market regarding such transactions and ownerships.
Title IV Scope of Application of the Manual
| (a) | Interested Parties |
The provisions of this Manual are mandatory and shall apply to:
| - | The members of the Board of Directors. |
5
The Foundations and Corporations whose Boards of Directors or Councils include representatives of companies or foundations or corporations of the Enel Group.
Similarly, the obligations of the Manual may be required of external advisors who provide services to the Company, both sporadically and permanently.
For all purposes of this Manual, the above shall be referred to as
“Stakeholders".
| (b) | Securities |
For all purposes of this Manual, whenever a reference is made to the term "Securities", such reference shall be construed as referring to the following:
| b.1. | Company Securities |
The scope of this Manual shall include all transactions involving shares, convertible or non-convertible bonds, pledges, promissory notes, subordinated debt, other financial instruments the underlying entity of which is principally the Company or any of its subsidiaries and/or affiliates and, in general, securities that have been issued by the Company or any of its subsidiaries and/or affiliates and that are listed on the Stock Exchange, or on another organized market, as well as covenant or commitment operations related to the instruments or securities indicated above.
| b.2. | Securities of other companies |
This Manual shall also apply to those operations related to securities issued by other companies, when the interested parties have obtained reserved or Insider Information due to their relationship with the Company or any of its subsidiaries and/or affiliates.
For the purposes of this Manual, the expression Securities refers to both the instruments indicated in the first and second paragraphs of this letter b).
Title V Corporate Body responsible for Establishing the Manual
The Company’s Board of Directors will be the Corporate Body responsible for agreeing on the provisions of the Manual, as well as its modifications and updates, as proposed by the Company's relevant management, pursuant to the provisions of this Manual.
6
Title VI The Body Responsible for Compliance with the Manual
All of the following Company’s areas and its members shall be responsible for complying and enforcing the provisions of this Manual. However, the following management departments will monitor compliance and will be responsible for reporting periodically to the General Manager about it: Administration, Finance and Control Manager, Legal Counsel, Communications Manager, Investor Relations Manager.
At the same time, said managers must:
Title VII Prohibition or Blocked Periods
The prohibition of carrying out transactions in the blocked periods indicated below does not in any way exempt the Stakeholders from complying with the rules on insider trading contained in Law No. 18,045 on the Securities Market.
Notwithstanding the obligations that must be observed in the aforementioned blocked periods, Stakeholders must maintain, excluding the exceptions contemplated in this Manual, the confidentiality of any information related to securities or other businesses of the Company or its subsidiaries or affiliates or other companies that has not been disclosed to the market and that, by its nature, may affect the price of the issued securities.
7
Stakeholders are expressly forbidden to, either directly or indirectly, carry out transactions or operations with Securities in the following periods:
The prohibition indicated in literal (i) above will also be required of the spouses, cohabitants and relatives up to the second degree of consanguinity and affinity of the Interested Parties, in accordance with the current CMF regulations. The Interested Parties will be responsible for enforcing the aforementioned prohibition to their aforementioned relatives.
Notwithstanding the foregoing, blocked periods will not apply in the following cases:
8
9
SECTION II GENERAL RULES OF CONDUCT IN RELATION TO SECURITIES
When carrying out their activities, the persons subject to this Manual must act impartially, without putting their own interests before the interests of the Company and subject to the duty of confidentiality as required.
The Interested Parties must inform to the Reserved Electronic Registry of Operations and Securities of any transaction related to the securities of the Company, its subsidiaries and / or affiliates, or those of other related companies.
The communication to the Reserved Electronic Registry of Operations and Securities must take place no later than one business day after the Interested Party has complied with the obligation to inform the CMF and each of the stock exchanges of the country in which the Company’s securities are registered for listing as indicated in Article 12 of Law No. 18,045. Similarly, the persons who, due to any circumstances, are included for the first time in the scope of this Manual, must notify the Reserved Electronic Registry of Operations and Securities , no later than the next business day on which they inform the stock exchanges in which the Company is registered pursuant to Article 17 of Law No. 18,045, of the position, whether direct or indirect of any of the Company’s securities and those of the entities of the business group the Company is part of and, in general, of all the Securities included in the scope of this Manual.
Finally, and pursuant to Article 18 of Law No. 18,045, directors and main executives must inform to the Reserved Electronic Registry of Operations and Securities, each month and in a reserved manner of their position in the securities issued by the Company's most relevant suppliers, customers, and competitors, including those securities they hold through entities controlled directly or through third parties. All this pursuant to the reserved register that will be determined for each calendar year for this purpose by the Company's Board of Directors.
Title III Information on Conflicts of Interest in the Exercise of Activities object of the Manual
The Interested Parties must inform to the Reserved Electronic Registry of Operations and Securities of the Company of any potential conflicts of interest that may arise due to the ownership of Securities either personally or through related persons or in relation to any other circumstance that might interfere with the activities that are the subject matter of this Manual.
10
Notwithstanding the above and additionally, in the case of directors, managers, administrators or main executives who have an interest in or participate in negotiations leading to carrying out an operation with related parties of the Company, they must immediately inform the Board of Directors or the Manager General, in accordance with the provisions of the Corporations Law.
Should there be any doubts about the existence of a conflict of interest, the Interested Parties must consult the Legal Counsel in writing and shall receive a written reply within 5 business days as of the receipt of all the background information necessary to answer the query, whether they must be provided by the querying party or by other Company Managements. The Legal Department may request background and information from the Administration, Finance and Control Management and the Communications and Institutional Relations Management or others, in order to better resolve the query received, as well as derive the matter the General Manager when, due to its importance or complexity, it is deemed necessary.
The Reserved Electronic Registry of Operations and Securities shall keep a record of the enquiries made and their respective responses, the content of which shall be confidential, and may only be revealed to the Company's Board of Directors, the General Manager or whoever they specifically indicate, in the course of a specific action.
Compliance with the obligations of this Title does not release compliance with other information obligations that the Interested Parties may have by virtue of other organizational or procedural documents of the Company or the Group in general, or the Law that is applicable to them.
Title IV Operations of Special Importance
During the study or negotiation stages of any type of legal, commercial, or financial operation (hereinafter Operation) that may significantly affect the price of the Securities, the management departments described in section I title VI of this Manual, under coordination of the project manager, must:
Enter, for each Transaction, the pertinent section of the Reserved Electronic Register of Operations and Securities (hereinafter, the "Section"), which will include the names of the persons participating in the transaction, whose delivery must be coordinated by the Chief of the respective Project, who will provide the respective access code to the Section.
11
The persons participating in an Operation, whether internal or external to the Company, must sign a "Confidentiality Commitment", whose text will be provided by the Legal Counsel and must refrain from carrying out any transaction related to the Securities , as long as the Operation is not disclosed to the market in general or until its failure is definitive and firm, which will be formally communicated through the Reserved Electronic Registry of Operations and Securities.
The management departments indicated in section I title VI of this Manual shall adopt the necessary measures for the corresponding Management to communicate the contents of the Manual to its members and to the aforementioned external persons.
The rules contained in Sections I and II shall also apply to entities controlled directly by the Stakeholders or, through other persons, to those acting on their behalf, to their related persons, when applicable.
For the purposes of this Manual, related persons shall be those defined as such by the provisions set forth by the Securities Market Law and the Financial Market Commission.
Excluded from the concept of related persons, for the purposes of the blocked period, are those securities market companies supervised by the Financial Market Commission and whose line of business is the brokerage or sale of securities on a regular basis, such as stock brokers, mutual funds, investment funds, etc. , as long as they carry out operations on behalf of third parties.
12
SECTION III ESSENTIAL, RESERVED AND INSIDER INFORMATION
Title I Rules on Essential, Reserved and Insider Information
1.Essential Information.
Essential Information is understood to be the type of information that a judicious person would consider important for his/her investment decisions (Article 9, Securities Market Law)), "Essential Information ".
The entities registered in the Securities Registry must disclose truthfully, sufficiently and in a timely manner, any fact or information regarding themselves, their businesses and the securities they offer, as soon as such situations occur or the information is known to them.
Information will be defined as essential by the absolute majority of the Board of Directors’ members or by the General Manager, when relevant, pursuant to the provisions of Circular No. 210 of the Financial Market Commission.
2. Reserved Essential Information.
Reserved Information refers to certain facts or information related to negotiations that are still ongoing and which, when revealed, may harm the corporate interest, as indicated in Article 10 of Law No. 18,045 on the Securities Market, entitled "Reserved Information".
Certain facts or information that may be so defined pursuant to the aforementioned legal definition may be considered reserved with the approval of three quarters of the Directors in office.
The decisions and agreements referred to in the preceding paragraph must be communicated to the Financial Market Commission the day after they are adopted, by any means authorized for that purpose by the CMF.
The Directors who intentionally or culpably define or vote in favor of declaring certain fact or a piece of information as reserved, as referred to in the preceding paragraph, shall respond in the correct manner and shall receive sanctions established in the Securities Market Law as relevant.
| 3. | Insider information. |
Insider Information means any information related to one or more issuers of securities, their businesses, or to one or more securities issued by them, which is not disclosed to the market and whose knowledge, by its nature, may affect the price of the issued securities, as well as the reserved information referred to in number 2 above, entitled "Insider Information".
13
Insider information shall also be understood as information related to acquisition or disposal operations to be carried out by an institutional investor in the securities market.
Significant Events, after having been established as such, will be brought to the attention of the Financial Market Commission by the Company’s General Manager and the executives authorized by the Board of Directors for this purpose, within the deadlines and pursuant to the legal provisions and agreements of the Board of Directors established for that purpose.
Pursuant to Circular No. 210 of the Financial Market Commission, the Board of Directors decided to authorize the Company’s General Manager, to act on his/her own and decide, exclusively in the situations indicated below, if a certain event is of essential nature and thus report it to the CMF and other relevant entities. in the manner established in General Standard No. 210, or the rule that may modify or replace it. Similarly, the Board of Directors resolved that if the General Manager is absent or unable to exercise the authorization granted to him/her by the Board of Directors, a situation that need not be proven to third parties, the powers conferred on him/her on this matter may be exercised by the Administration, Planning and Control Manager, or the Legal Counsel and the Secretary of the Board of Directors.
Said qualification will be carried out in accordance with the criteria and regulations issued by the CMF and with the power structure of the Company.
Interested Parties must not reveal any information whose content is considered essential to analysts, shareholders, bondholders, investors or the press without it being previously disclosed to the shareholders and the public the same information and with the same accuracy and detail.
Pursuant to the provisions of Article 46 of Law No. 18,046, Essential Information must be communicated to the CMF and the market, in general, prior to its dissemination by any other means. The communication addressed to the CMF must be carried out under the terms, deadlines and conditions indicated in General Standard No. 30, or the one that replaces it.
14
| 5. | Standards of Operation for Reserved Essential Information. |
Interested Parties who have Essential Information that has been defined as reserved must safeguard its contents, notwithstanding their duty of communicating and collaborating with the competent judicial and administrative authorities. In particular, they will take measures to prevent such information from being unethically or abusively used, they must report to the competent public authorities cases where such use has occurred and must take the necessary measures to prevent any consequences thereof. Reserved information must be brought to the attention of the Financial Market Commission under the terms and conditions established in Section II, number 2.2 letter B) of the NCG No. 30.
| 6. | Rules of action in cases of Insider Information. |
Interested Parties, as well as any person who, by reason of his/her position, position, activity or relationship with the Company, has Insider Information must keep it confidential and may not use it for his/her own benefit or the benefit of others, and must strictly refrain from carrying out, on his/her own account or on behalf of others, directly or indirectly, any of the following behaviors:
| a) | Carry out any type of transaction onthe securities market on which the information relates to. |
| b) | Communicate such information to third parties, except in the normal exercise of their work, profession, or position. |
| c) | Recommend to a third party to acquireor dispose of such securities based on such information. |
Any doubts as to whether a piece of information is considered insider, reserved or essential information should be raised with the Company's Legal Counsel. In the meantime, the Stakeholders must refrain from carrying out any action as indicated above.
If or when the recipients of this Manual become aware of a breach of the obligations established herein, they must immediately notify any of the management departments described in section I title VI of the Manual so that they can take the actions deemed necessary to correct the situation.
15
Title I Mechanisms for the Protection of Insider, Reserved or Essential Information
The knowledge of Insider, Reserved or Essential Information will be restricted and strictly limited to persons, either internal or external to the organization, whose participation is required (hereinafter the "Participants") and, consequently, any access to such information will be denied to persons other than those indicated above.
A digital record called "Reserved Electronic Register of Operations and Securities" will be kept, which will consist of various watertight sections and with differentiated access in response to the functionalities it develops: i) operations section; ii) section on securities acquired, held and disposed of; and iii) section on conflicts of interest. The operations section will contain the names of the Unitholders, the reason for which they appear in the registry and the date on which each one of them has learned Privileged or reserved Information regarding a relevant operation of the Company, its subsidiaries or associates ( hereinafter Operation), as well as a statement of the operation that has the nature of essential, reserved or privileged.
The Reserved Electronic Register of Operations and Securities will be updated by the corresponding Managements, according to the section in question and its custody will be delivered to the Information Technology Management, which must ensure that its access is limited to the corresponding persons. In the case of the operations section, it must be modified or updated by the corresponding Management when any of the following circumstances occurs:
| (b) | When it is necessary to add a new person. |
Respective management must expressly warn the Participants, as indicated in Section VI of this Manual, from which is part or to which it works, about the nature of the information related to an Operation, their duty of confidentiality and the prohibition of its use, as well as of the potential sanctions arising from non-compliance.
For this purpose, the Participants of an Operation must sign a "Letter of Commitment" or a "Non-Disclosure Agreement" where they declare their knowledge regarding the nature of the information and the consequences of its disclosure. A copy of this commitment letter dully signed will be scanned and incorporated by the corresponding Management in which or for which the person works for in the Confidential Electronic Register of Operations and Securities.
16
17
SECTION V INFORMATION OF INTEREST
Title I Concept of Information of Interest
Information of Interest is any information which, although not factual or essential, is useful for an adequate financial analysis and its securities or the offer thereof, "Information of Interest".
The General Manager shall be responsible for defining information as information of interest. With this purpose, the Company’s General Manager may request an opinion from the managers of the different units or departments about legal, financial, or economic background that could be useful to define any piece of information as Information of Interest.
The Company is not required to publicly disclose any information that must be delivered to a third party in order to comply with a legal, administrative, or contractual regulation, provided that the recipient is subject to the corresponding legal or contractual obligation to maintain confidentiality of such information.
The Legal Management, as instructed by the General Manager, will be responsible for communicating any Information of Interest to the Financial Market Commission and the market in general.
Title II Relationship with the Media
Any communication with the press and other media will be the exclusive responsibility of the Company’s Chairman of the Board of Directors, the General Manager, and the Communications Manager.
The Company’s Communications Management, through its "Media" area, will be the official representative and spokesperson for the media and, through said area, shall channel all the information that must be or is decided to be made known to the general public, with the exception of the communication and disclosure of essential or reserved information or of information of interest, which is subject to specific procedures established in this Manual in section III above.
The Stakeholders and Participants must refrain from communicating to the media, either on their own initiative or at their request, any information or news about the Company, whether or not it is defined as Essential Information, Reserved, Insider or of Interest.
The Company, unless required by the Financial Market Commission or other competent public authority, is not required to respond, comment, specify or clarify any information involving or related to the Company, which has been published, disseminated, or transmitted by the media and which does not emanate from the Company’s official spokespersons indicated in this Manual.
18
Morover, the Company shall only comment, specify or clarify information of a verifiable nature and that does not affect third parties or customers.
Title III Relationship with Financial Analysts, Rating Agencies, Bondholders, and Investors
The Investor Relations Management shall be exclusive responsible for general meetings or conferences with financial analysts, rating agencies, bondholders, and investors, as well as any communication with foreign stock exchanges. Furthermore, such meetings must be prepared and scheduled in such a way so that people external to the Company who participate in such meetings, do not receive Essential, Reserved, Insider or of Interest Information that has not been previously or simultaneously disseminated to the market.
Information of interest to the market must be conveyed to the market in such a way so that everyone has access to information of substantially similar content in quantity, quality, and form, so that the Company must send to its shareholders, bondholders and investors, in general, the content of the presentations made to investment banks, financial analysts and risk rating agencies, from the moment this information becomes known.
19
SECTION VI NON-COMPLIANCE AND RESOLUTION OF CONFLICTS
In case of a violation of the rules established in this Manual by the Stakeholders and / or the Participants, the management departments indicated in section I title VI of this Manual, together with the Internal Audit Management , must gather the contextual information related to the case and must propose to the correspondent area the actions to take according to the merits of the gathered information.
The foregoing is valid in addition to the fines for the benefit of the Company contemplated in the third paragraph of Article 16 of Law No. 18,045, and notwithstanding the administrative and criminal sanctioning powers corresponding to the CMF and the Courts of Justice for the infringement of the provisions established by the Securities Market Law.
20
SECTION VII COMMUNICATION AND VALIDITY
The rules contained in this Manual must be communicated via the Intranet to the addressees defined as Stakeholders or who are subject to the scope of application of the Manual by the Company’s General Management.
With regard to addressees external to the Company, the rules of this Manual must be communicated under the terms indicated by the management set out in section I title V I of this Manual, as provided in General Standard No. 270 of the CMF in Section I, Title VII of this Manual.
In order to publicize the content of the Manual and resolve the queries that may arise in relation to this Manual, the Company’s competent Managements shall give explanatory talks on the matter.
Title II Validity of the Manual
This Manual will be published on the Company's website on May 25, 2023 and will enter into force once thirty legal business days have elapsed from said publication.
The following is the change history of this Manual:
Version |
Date |
Description changes |
1 |
29/02/2016 |
IncorporationoftheManualforthe Management of Information of Interest to the Market. |
2 |
24/05/2023 |
First modification and update according to applicable legal and regulatory regulations. |
|
|
|
21
Exhibit 12.1
302 CERTIFICATION
I, Giuseppe Turchiarelli, certify that:
| 1. | I have reviewed this annual report on Form 20-F of Enel Chile S.A.; |
| 2. | Based on my knowledge, this report does not contain any untrue statement of a material fact or omit to state a material fact necessary to make the statements made, in light of the circumstances under which such statements were made, not misleading with respect to the period covered by this report; |
| 3. | Based on my knowledge, the financial statements, and other financial information included in this report, fairly present in all material respects the financial condition, results of operations and cash flows of the company as of, and for, the periods presented in this report; |
| 4. | The company’s other certifying officer and I are responsible for establishing and maintaining disclosure controls and procedures (as defined in Exchange Act Rules 13a-15(e) and 15d-15(e)) and internal control over financial reporting (as defined in Exchange Act Rules 13a-15(f) and 15d-15(f)) for the company and have: |
| (a) | Designed such disclosure controls and procedures, or caused such disclosure controls and procedures to be designed under our supervision, to ensure that material information relating to the company, including its consolidated subsidiaries, is made known to us by others within those entities, particularly during the period in which this report is being prepared; |
| (b) | Designed such internal control over financial reporting, or caused such internal control over financial reporting to be designed under our supervision, to provide reasonable assurance regarding the reliability of financial reporting and the preparation of financial statements for external purposes in accordance with generally accepted accounting principles; |
| (c) | Evaluated the effectiveness of the company’s disclosure controls and procedures and presented in this report our conclusions about the effectiveness of the disclosure controls and procedures, as of the end of the period covered by this report based on such evaluation; and |
| (d) | Disclosed in this report any change in the company’s internal control over financial reporting that occurred during the period covered by the annual report that has materially affected, or is reasonably likely to materially affect, the company’s internal control over financial reporting; and |
| 5. | The company’s other certifying officer and I have disclosed, based on our most recent evaluation of internal control over financial reporting, to the company’s auditors and the audit committee of the company’s board of directors (or persons performing the equivalent functions): |
| (a) | All significant deficiencies and material weaknesses in the design or operation of internal control over financial reporting which are reasonably likely to adversely affect the company’s ability to record, process, summarize and report financial information; and |
| (b) | Any fraud, whether or not material, that involves management or other employees who have a significant role in the company’s internal control over financial reporting. |
Date: April 29, 2025
/s/ Giuseppe Turchiarelli |
|
Giuseppe Turchiarelli |
|
Chief Executive Officer |
Exhibit 12.2
302 CERTIFICATION
I, Simone Conticelli, certify that:
| 1. | I have reviewed this annual report on Form 20-F of Enel Chile S.A.; |
| 2. | Based on my knowledge, this report does not contain any untrue statement of a material fact or omit to state a material fact necessary to make the statements made, in light of the circumstances under which such statements were made, not misleading with respect to the period covered by this report; |
| 3. | Based on my knowledge, the financial statements, and other financial information included in this report, fairly present in all material respects the financial condition, results of operations and cash flows of the company as of, and for, the periods presented in this report; |
| 4. | The company’s other certifying officer and I are responsible for establishing and maintaining disclosure controls and procedures (as defined in Exchange Act Rules 13a-15(e) and 15d-15(e)) and internal control over financial reporting (as defined in Exchange Act Rules 13a-15(f) and 15d-15(f)) for the company and have: |
| (a) | Designed such disclosure controls and procedures, or caused such disclosure controls and procedures to be designed under our supervision, to ensure that material information relating to the company, including its consolidated subsidiaries, is made known to us by others within those entities, particularly during the period in which this report is being prepared; |
| (b) | Designed such internal control over financial reporting, or caused such internal control over financial reporting to be designed under our supervision, to provide reasonable assurance regarding the reliability of financial reporting and the preparation of financial statements for external purposes in accordance with generally accepted accounting principles; |
| (c) | Evaluated the effectiveness of the company’s disclosure controls and procedures and presented in this report our conclusions about the effectiveness of the disclosure controls and procedures, as of the end of the period covered by this report based on such evaluation; and |
| (d) | Disclosed in this report any change in the company’s internal control over financial reporting that occurred during the period covered by the annual report that has materially affected, or is reasonably likely to materially affect, the company’s internal control over financial reporting; and |
| 5. | The company’s other certifying officer and I have disclosed, based on our most recent evaluation of internal control over financial reporting, to the company’s auditors and the audit committee of the company’s board of directors (or persons performing the equivalent functions): |
| (a) | All significant deficiencies and material weaknesses in the design or operation of internal control over financial reporting which are reasonably likely to adversely affect the company’s ability to record, process, summarize and report financial information; and |
| (b) | Any fraud, whether or not material, that involves management or other employees who have a significant role in the company’s internal control over financial reporting. |
Date: April 29, 2025
|
/s/ Simone Conticelli |
|
Simone Conticelli |
|
Chief Financial Officer |
Exhibit 13.1
906 CERTIFICATION
The certification set forth below is being submitted in connection with the Annual Report on Form 20-F for the year ended December 31, 2024, for the purpose of complying with Rule 13a-14(b) or Rule 15d-14(b) of the Securities Exchange Act of 1934 (the “Exchange Act”) and Section 1350 of Chapter 63 of Title 18 of the United States Code.
Giuseppe Turchiarelli, the Chief Executive Officer, and Simone Conticelli, the Chief Financial Officer, of Enel Chile S.A., each certifies that, to the best of his knowledge:
| 1. | the report fully complies with the requirements of Section 13(a) or 15(d) of the Exchange Act; and |
| 2. | the information contained in the report fairly presents, in all material respects, the financial condition and results of operations of Enel Chile S.A. |
Date: April 29, 2025
|
/s/ Giuseppe Turchiarelli |
|
Name: Giuseppe Turchiarelli |
|
Chief Executive Officer |
|
|
|
/s/ Simone Conticelli |
|
Name: Simone Conticelli |
|
Chief Financial Officer |
|
|