UNITED STATES
SECURITIES AND EXCHANGE COMMISSION
WASHINGTON, D.C. 20549
FORM 8-K
CURRENT REPORT
Pursuant to Section 13 or 15(d) of the Securities Exchange Act of 1934
Date of Report (Date of earliest event reported): April 24, 2025

SOUTHSTATE CORPORATION
(Exact name of registrant as specified in its charter)
|
South Carolina (State or Other Jurisdiction of Incorporation) |
001-12669 (Commission File Number) |
57-0799315 (IRS Employer Identification No.) |
|
1101 First Street South, Suite 202 Winter Haven, FL (Address of principal executive offices) |
|
33880 (Zip Code) |
(863) 293-4710
(Registrant’s telephone number, including area code)
Not Applicable
(Former name or former address, if changed since last report)
Check the appropriate box below if the Form 8-K filing is intended to simultaneously satisfy the filing obligation of the registrant under any of the following provisions (see General Instruction A.2. below):
☐ Written communications pursuant to Rule 425 under the Securities Act (17 CFR 230.425)
☐ Soliciting material pursuant to Rule 14a-12 under the Exchange Act (17 CFR 240.14a-12)
☐ Pre-commencement communications pursuant to Rule 14d-2(b) under the Exchange Act (17 CFR 240.14d-2(b))
☐ Pre-commencement communications pursuant to Rule 13e-4(c) under the Exchange Act (17 CFR 240.13e-4(c))
Securities registered pursuant to Section 12(b) of the Act:
Title of each class |
Trading Symbol(s) |
Name of each exchange on which registered |
Common stock, par value $2.50 per share |
SSB |
The New York Stock Exchange |
Indicate by check mark whether the registrant is an emerging growth company as defined in Rule 405 of the Securities Act of 1933 (§230.405 of this chapter) or Rule 12b-2 of the Securities Exchange Act of 1934 (§240.12b-2 of this chapter).
Emerging growth company ☐
If an emerging growth company, indicate by check mark if the registrant has elected not to use the extended transition period for complying with any new or revised financial accounting standards provided pursuant to Section 13(a) of the Exchange Act. ☐
Item 2.02 |
|
|
Results of Operations and Financial Condition. |
On April 24, 2025, SouthState Corporation (“SouthState” or the “Company”) issued a press release announcing its financial results for the three-month period ended March 31, 2025, along with certain other financial information. Copies of the Company’s press release and presentation are attached as Exhibit 99.1 and 99.2, respectively, to this report and incorporated herein by reference.
SouthState will host a conference call on April 25, 2025 at 9 a.m. (ET) to discuss the Company’s first quarter 2025 results. Investors may call in (toll free) by dialing (888) 350-3899 within the U.S. and (646) 960-0343 for all other locations (passcode 4200408; host: Will Matthews, CFO). The numbers for international participants are listed at https://events.q4irportal.com/custom/access/2324/. Participants may also pre-register for the conference by navigating to https://events.q4inc.com/attendee/812320624. Access detail will be provided via email upon completion of registration.
Item 7.01 |
|
Regulation FD Disclosure. |
||||
On April 24, 2025, the Company also made available the presentation (“Presentation”) prepared for use with the press release during the earnings conference call on April 25, 2025. Attached hereto and incorporated herein as Exhibit 99.2 is the text of that presentation.
The information contained in this Item 7.01 of this Current Report, including the information set forth in the Presentation filed as Exhibit 99.2 to, and incorporated in, this Current Report, is being "furnished" and shall not be deemed to be “filed” for purposes of Section 18 of the Exchange Act, or otherwise subject to the liability of that section, and shall not be incorporated by reference into any registration statement or other document filed under the Securities Act or the Exchange Act, except as shall be expressly set forth by specific reference in such filing.
Item 8.01 |
|
Other Events. |
Second Quarter 2025 Shareholder Dividend
The Board of Directors of the Company declared a quarterly cash dividend on its common stock of $0.54 per share, payable on May 16, 2025 to shareholders of record as of May 9, 2025.
Item 9.01 |
|
Financial Statements and Exhibits. |
||
|
|
|
|
|
|
|
(d) |
|
Exhibits: |
|
|
|
|
|
|
|
Exhibit No. |
|
Description |
|
|
|
|
|
|
|
|
||
|
|
|
|
|
|
|
|
||
|
|
|
|
|
|
|
104 |
|
Cover Page Interactive Data File (embedded within the Inline XBRL document) |
2
Cautionary Statement Regarding Forward Looking Statements
Statements included in this communication, which are not historical in nature are intended to be, and are hereby identified as, forward-looking statements for purposes of the safe harbor provided by Section 27A of the Securities Act of 1933 and Section 21E of the Securities Exchange Act of 1934. Forward-looking statements are based on, among other things, management’s beliefs, assumptions, current expectations, estimates and projections about the financial services industry, the economy and SouthState. Words and phrases such as “may,” “approximately,” “continue,” “should,” “expects,” “projects,” “anticipates,” “is likely,” “look ahead,” “look forward,” “believes,” “will,” “intends,” “estimates,” “strategy,” “plan,” “could,” “potential,” “possible” and variations of such words and similar expressions are intended to identify such forward-looking statements.
SouthState cautions readers that forward looking statements are subject to certain risks, uncertainties and assumptions that are difficult to predict with regard to, among other things, timing, extent, likelihood and degree of occurrence, which could cause actual results to differ materially from anticipated results. Such risks, uncertainties and assumptions, include, among others, the following: (1) economic volatility risk, including as a result of monetary, fiscal, and trade law policies, such as tariffs, and inflation, potentially resulting in higher rates, deterioration in the credit markets, greater than expected noninterest expenses, excessive loan losses, or on the other hand lower rates, which also may have other negative consequences, which risks could be exacerbated by potential negative economic developments resulting from federal spending cuts and/or one or more federal budget-related impasses or actions; (2) risks related to the ability of the Company to pursue its strategic plans which depend upon certain growth goals in our lines of business; (3) risks related to the merger and integration of SouthState and Independent including, among others, (i) the risk that the cost savings and any revenue synergies from the merger may not be fully realized or may take longer than anticipated to be realized, (ii) the risk that the integration of Independent’s operations into SouthState’s operations will be materially delayed or will be more costly or difficult than expected or that the parties are otherwise unable to successfully integrate Independent’s businesses into SouthState’s businesses, (iii) the amount of the costs, fees, expenses and charges related to the merger, and (iv) reputational risk and the reaction of each company's customers, suppliers, employees or other business partners to the merger; (4) risks relating to the ability to retain our culture and attract and retain qualified people as we grow and are located in new markets, and being able to offer competitive salaries and benefits, including flexibility of working remotely or in the office; (5) deposit attrition, client loss or revenue loss following completed mergers or acquisitions that may be greater than anticipated; (6) credit risks associated with an obligor’s failure to meet the terms of any contract with the Bank or otherwise fail to perform as agreed under the terms of any loan-related document; (7) interest rate risk primarily resulting from our inability to effectively manage the risk, and their impact on the Bank’s earnings, including from the correspondent and mortgage divisions, housing demand, the market value of the Bank’s loan and securities portfolios, and the market value of SouthState’s equity; (8) a decrease in our net interest income due to the interest rate environment; (9) liquidity risk affecting the Bank’s ability to meet its obligations when they come due; (10) unexpected outflows of uninsured deposits may require us to sell investment securities at a loss; (11) potential deterioration in real estate values; (12) the loss of value of our investment portfolio could negatively impact market perceptions of us and could lead to deposit withdrawals; (13) price risk focusing on changes in market factors that may affect the value of traded instruments in “mark-to-market” portfolios; (14) transaction risk arising from problems with service or product delivery; (15) the impact of increasing digitization of the banking industry and movement of customers to on-line platforms, and the possible impact on the Bank’s results of operations, customer base, expenses, suppliers and operations; (16) controls and procedures risk, including the potential failure or circumvention of our controls and procedures or failure to comply with regulations related to controls and procedures; (17) volatility in the financial services industry (including failures or rumors of failures of other depository institutions), along with actions taken by governmental agencies to address such turmoil, could affect the ability of depository institutions, including us, to attract and retain depositors and to borrow or raise capital; (18) the impact of competition with other financial institutions, including deposit and loan pricing pressures and the resulting impact, including as a result of compression to net interest margin; (19) compliance risk involving risk to earnings or capital resulting from violations of or nonconformance with laws, rules, regulations, prescribed practices, or ethical standards, and contractual obligations regarding data privacy and cybersecurity; (20) regulatory change risk resulting from new laws, rules, regulations, accounting principles, proscribed practices or ethical standards, including, without limitation, the possibility that regulatory agencies may require higher levels of capital above the current regulatory-mandated minimums and including the impact of special FDIC assessments, the Consumer Financial Protection Bureau regulations or other guidance, and the possibility of changes in accounting standards, policies, principles and practices; (21) risks related to the legal, regulatory, and supervisory environment, including changes in financial services legislation, regulation, policies, or government officials or other personnel; (22) strategic risk resulting from adverse business decisions or improper implementation of business decisions; (23) reputation risk that adversely affects earnings or capital arising from negative public opinion including the effects of social media on market perceptions of us and banks generally; (24) cybersecurity risk related to the dependence of SouthState on internal computer systems and the technology of outside service providers, as well as the potential impacts of internal or external security breaches, which may subject the Company to potential business disruptions or financial losses resulting from deliberate attacks or unintentional events; (25) reputational and operational risks associated with environment, social and governance (ESG) matters, including the impact of changes in federal and state laws, regulations and guidance relating to climate change; (26) excessive loan losses; (27) reputational risk and possible higher than estimated reduced revenue from previously announced or proposed regulatory changes in the Bank’s consumer programs and products; (28) operational, technological, cultural, regulatory, legal, credit and other risks associated with the exploration, consummation and integration of potential future acquisitions, whether involving stock or cash consideration; (29) catastrophic events such as hurricanes, tornados, earthquakes, floods or other natural or human disasters, including public health crises and infectious disease outbreaks, as well as any government actions in response to such events, and the related disruption to local, regional and global economic activity and financial markets, and the impact that any of the foregoing may have on SouthState and its customers and other constituencies; (30) geopolitical risk from terrorist activities and armed conflicts that may result in economic and supply disruptions, and loss of market and consumer confidence; (31) the risks of fluctuations in market prices for SouthState common stock that may or may not reflect economic condition or performance of SouthState; (32) the payment of dividends on SouthState common stock, which is subject to legal and regulatory limitations as well as the discretion of the board of directors of SouthState, SouthState’s performance and other factors; (33) ownership dilution risk associated with potential acquisitions in which SouthState’s stock may be issued as consideration for an acquired company; and (34) other factors that may affect future results of SouthState, as disclosed in SouthState’s Annual Report on Form 10-K, Quarterly Reports on Form 10-Q, and Current Reports on Form 8-K, filed by SouthState with the U.S. Securities and Exchange Commission (“SEC”) and available on the SEC’s website at http://www.sec.gov, any of which could cause actual results to differ materially from future results expressed, implied or otherwise anticipated by such forward-looking statements.
3
All forward-looking statements speak only as of the date they are made and are based on information available at that time. SouthState does not undertake any obligation to update or otherwise revise any forward-looking statements, whether as a result of new information, future events, or otherwise, except as required by federal securities laws. As forward-looking statements involve significant risks and uncertainties, caution should be exercised against placing undue reliance on such statements.
4
SIGNATURES
Pursuant to the requirements of the Securities Exchange Act of 1934, the registrant has duly caused this report to be signed on its behalf by the undersigned hereunto duly authorized.
SOUTHSTATE CORPORATION |
||
|
(Registrant) |
|
|
|
|
|
By: |
/s/ William E. Matthews, V |
Dated: April 24, 2025
5
Exhibit 99.1

|
SouthState Corporation Reports First Quarter 2025 Results Declares Quarterly Cash Dividend |
FOR IMMEDIATE RELEASE |
Media Contact |
|
Jackie Smith, 803.231.3486 |
WINTER HAVEN, FL – April 24, 2025 – SouthState Corporation (“SouthState” or the “Company”) (NYSE: SSB) today released its unaudited results of operations and other financial information for the three-month period ended March 31, 2025.
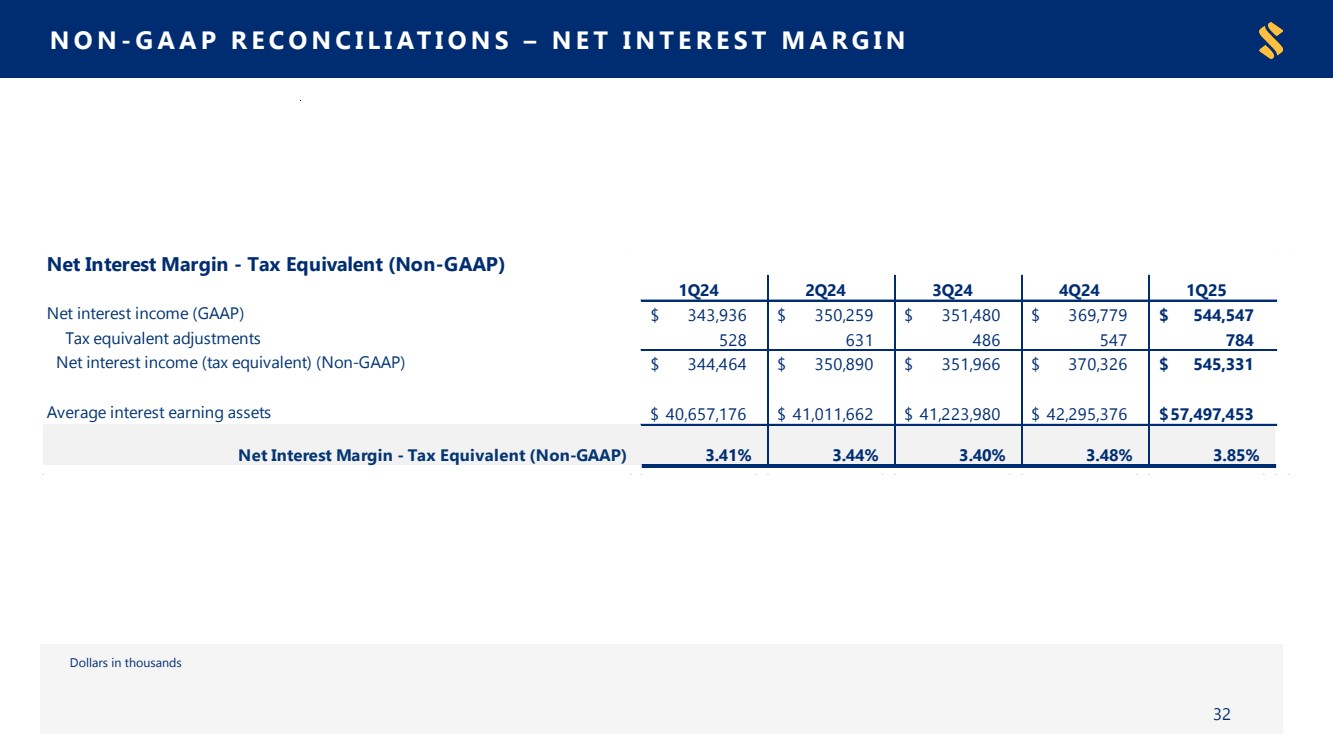
“The first quarter was a strategic reset that took SouthState’s earnings profile from good to great", commented John C. Corbett, SouthState’s Chief Executive Officer. "We closed the IBTX acquisition in January and then closed the sale leaseback transaction and securities restructure in March. The securities restructuring and better than expected deposit pricing pushed our net interest margin to 3.85%. SouthState is now positioned with industry-leading profitability and strong liquidity, capital and asset quality for the uncertainties that lie ahead."
Highlights of the first quarter of 2025 include:
Returns
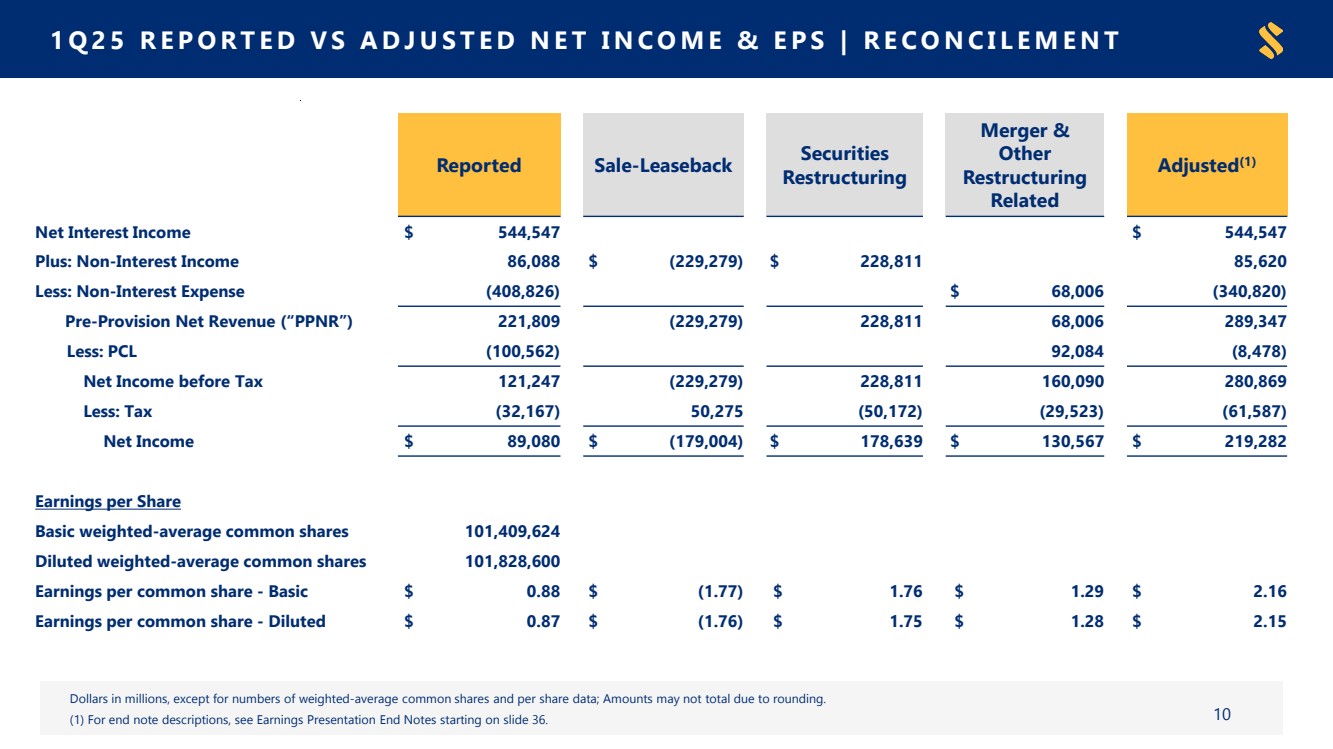
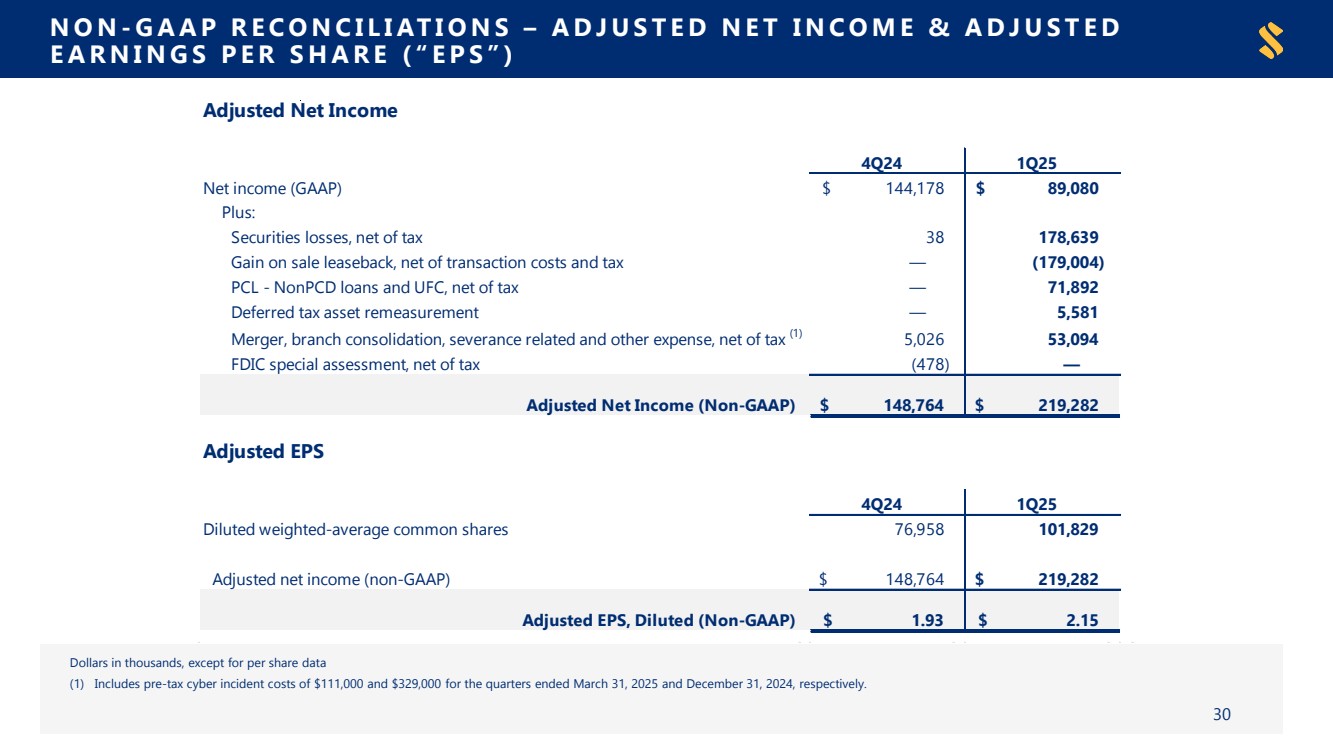
| ● | Reported Diluted Earnings per Share (“EPS”) of $0.87; Adjusted Diluted EPS (Non-GAAP) of $2.15 |
| ● | Net Income of $89.1 million; Adjusted Net Income (Non-GAAP) of $219.3 million |
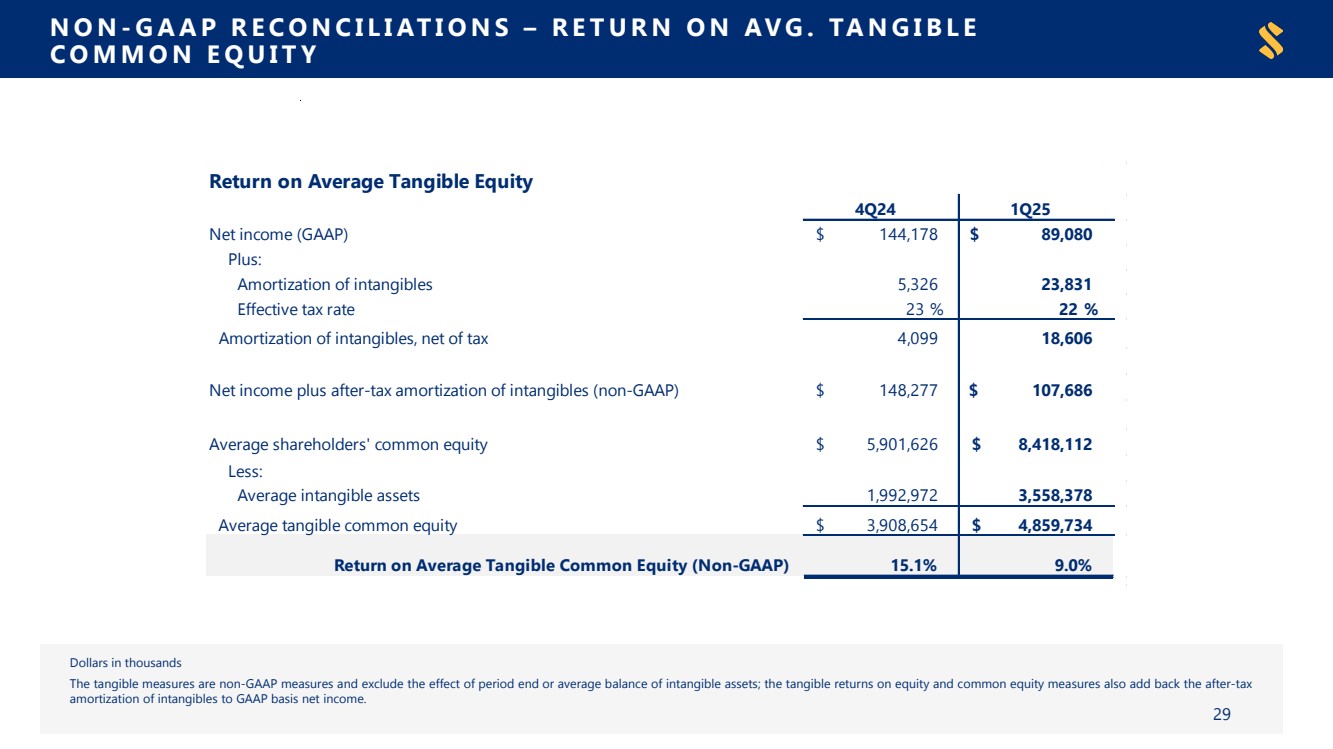
| ● | Return on Average Common Equity of 4.3%; Return on Average Tangible Common Equity (Non-GAAP) of 9.0% and Adjusted Return on Average Tangible Common Equity (Non-GAAP) of 19.9%* |
| ● | Return on Average Assets (“ROAA”) of 0.56% and Adjusted ROAA (Non-GAAP) of 1.38%* |
| ● | Book Value per Share of $84.99; Tangible Book Value (“TBV”) per Share (Non-GAAP) of $50.07 |
Performance
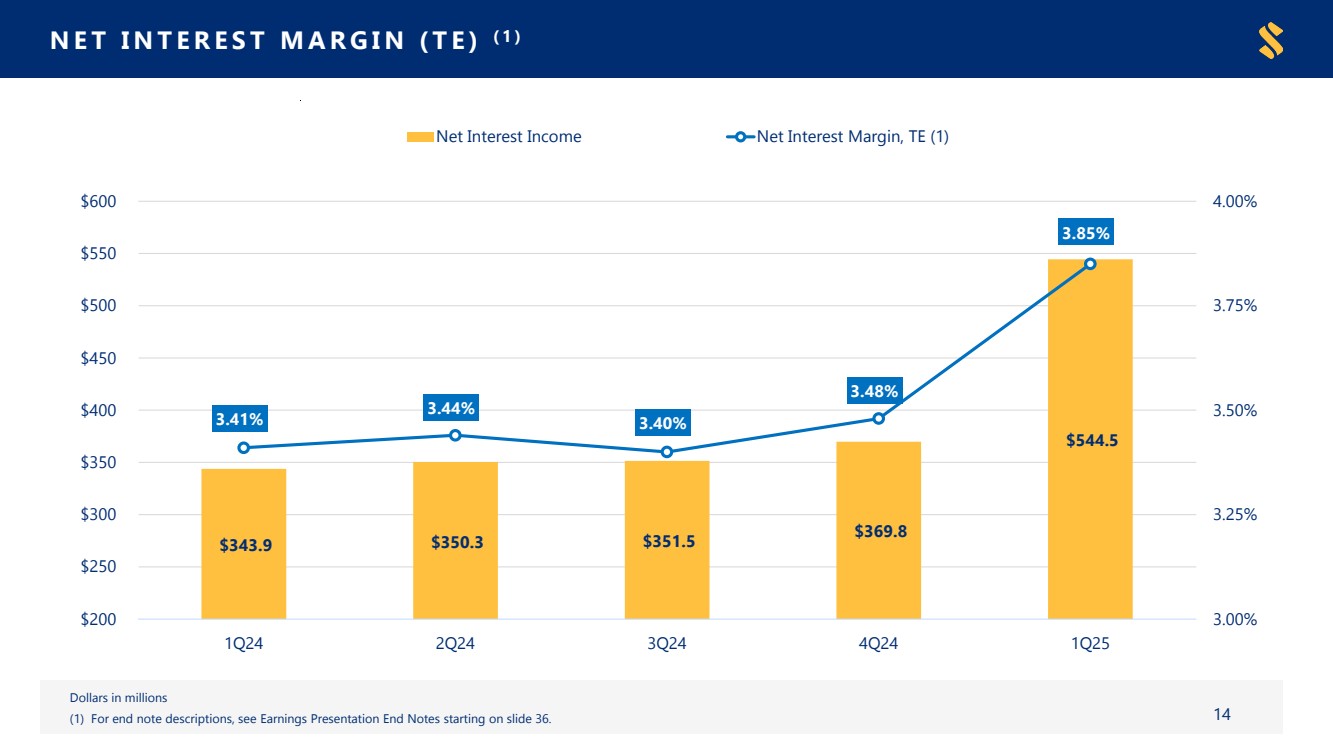
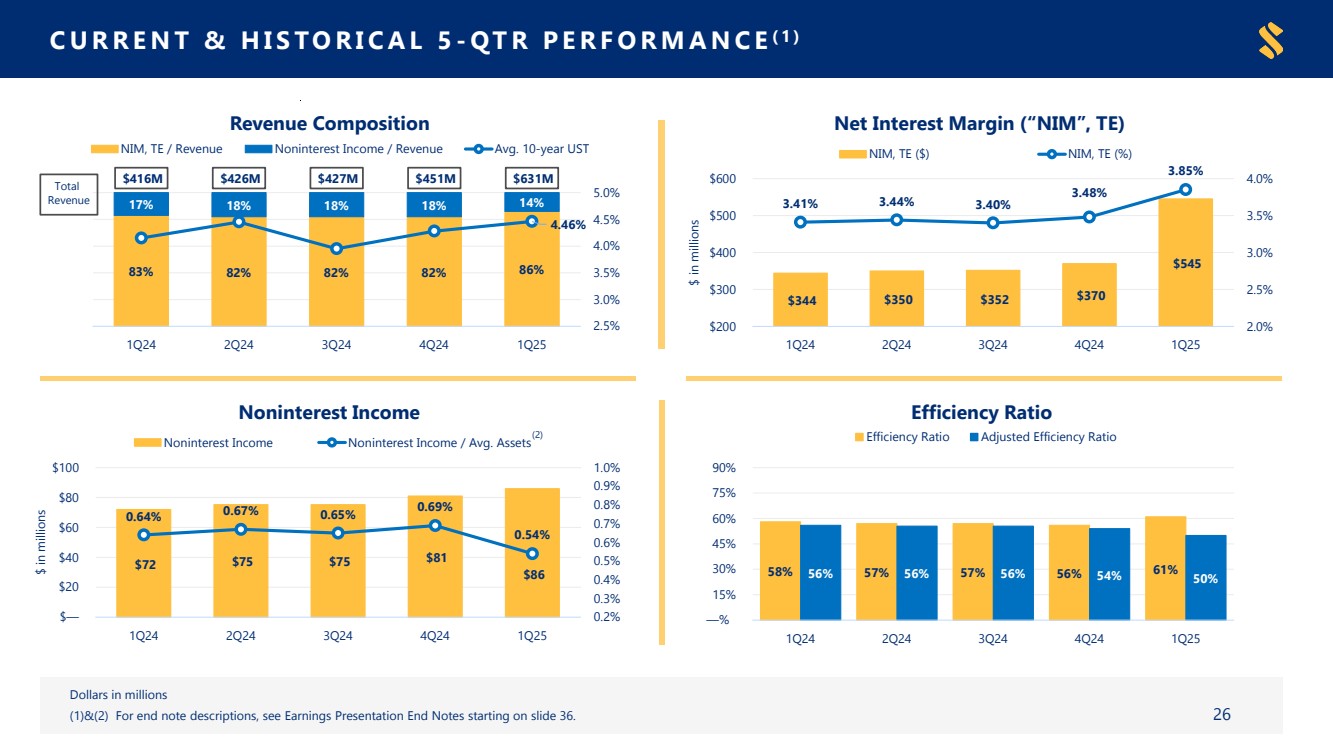
| ● | Net Interest Income of $545 million |
| ● | Net Interest Margin (“NIM”), non-tax equivalent of 3.84%, and tax equivalent (Non-GAAP) of 3.85% |
| ● | $39.4 million of acquisition date charge-offs on PCD loans acquired from Independent Bank Group, Inc. (“Independent”) to bring these loans in accordance with SouthState policies and practices; excluding these day one charge-offs on acquired PCD loans, net charge-offs totaled $4.4 million, or 0.04%* |
| ● | $100.6 million of Provision for Credit Losses (“PCL”), including $92.1 million of initial provision for credit losses related to acquired non-PCD loans and unfunded commitments; total Allowance for Credit Losses (“ACL”) plus reserve for unfunded commitments of 1.47% of loans |
| ● | Noninterest Income of $86 million; Noninterest Income represented 0.54%, of average assets for the first quarter of 2025* |
| ● | Efficiency Ratio of 61% and Adjusted Efficiency Ratio (Non-GAAP) of 50% |
Balance Sheet
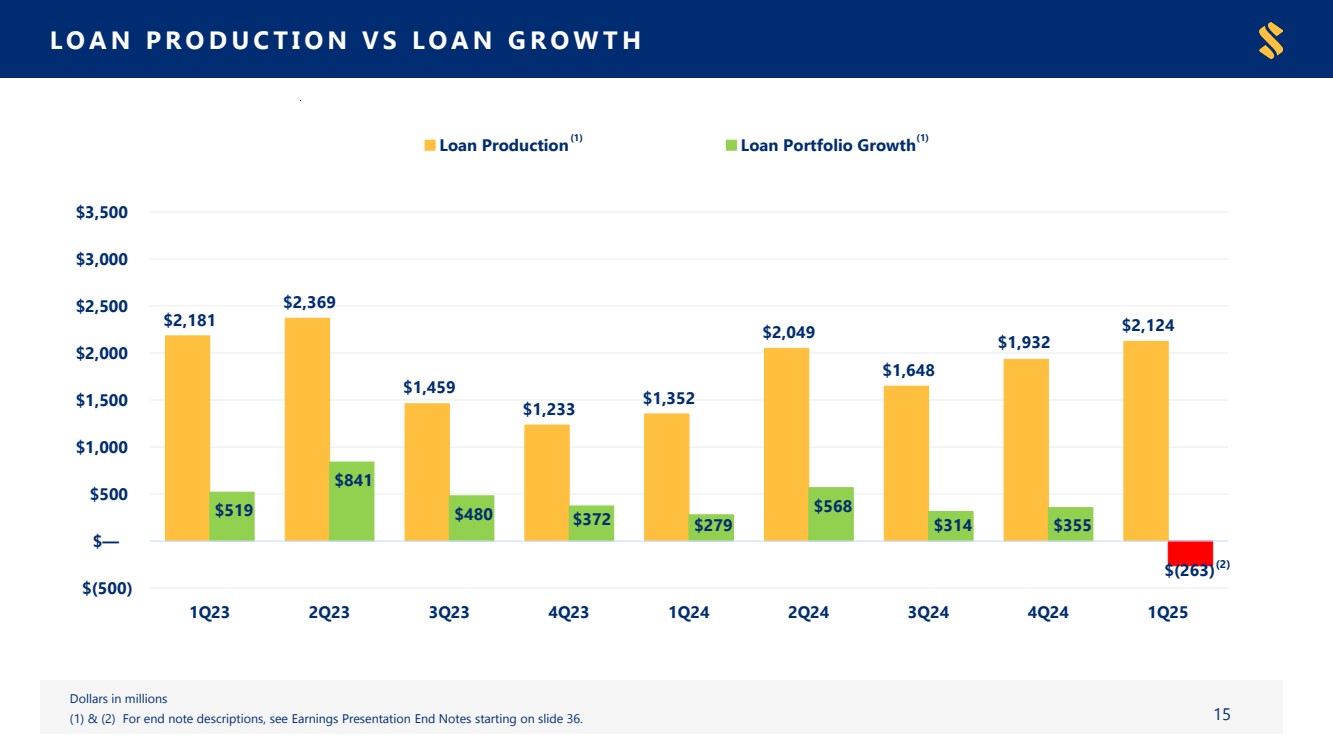
| ● | Loans decreased by $263 million, or 2%*, and deposits increased by $68 million, or 1%*, excluding the effects of the acquisition date balances acquired from Independent(9); ending loan to deposit ratio of 88% |
| ● | Total loan yield of 6.25% and total deposit cost of 1.89% |
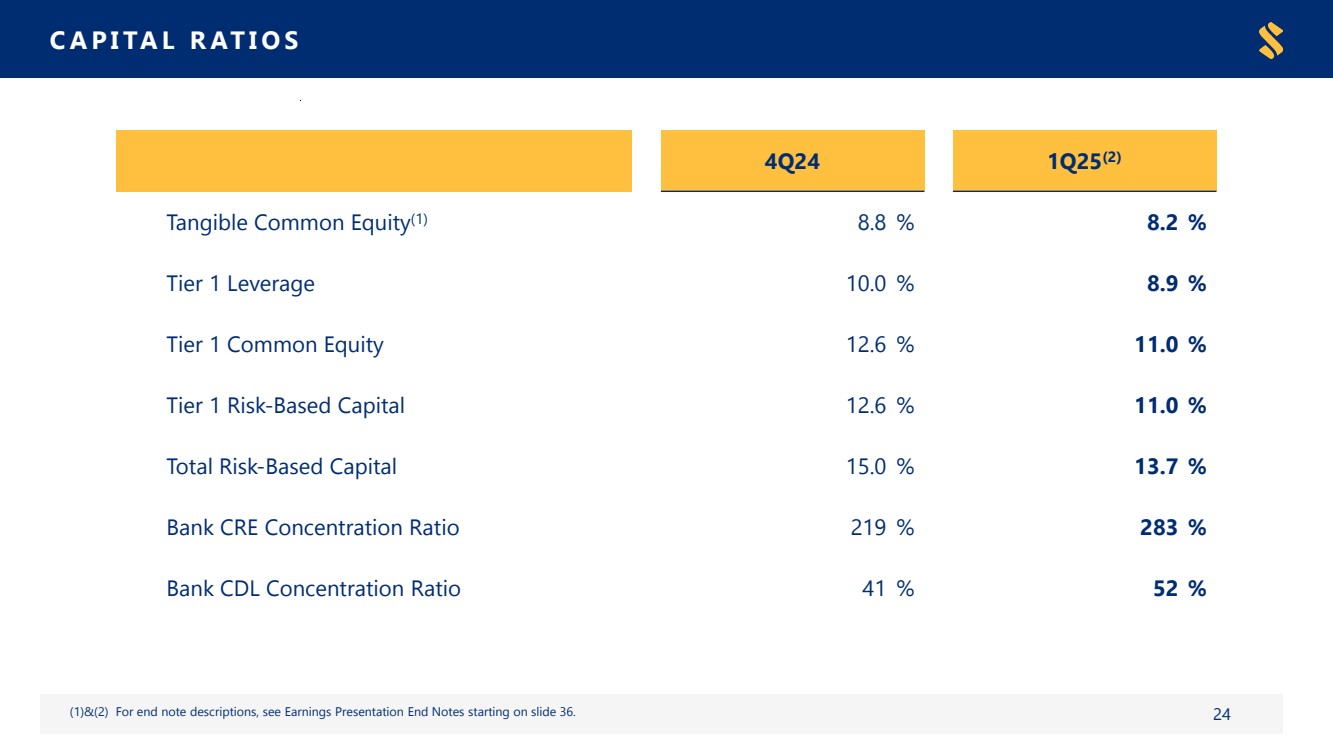
| ● | Strong capital position with Tangible Common Equity, Total Risk-Based Capital, Tier 1 Leverage, and Tier 1 Common Equity ratios of 8.2%, 13.7%, 8.9%, and 11.0%, respectively† |
Significant Transactions
● |
Closed previously announced acquisition of Independent on January 1, 2025 |
| ● | Executed sale leaseback transaction during 1Q 2025, resulting in a gain of $229 million, net of transaction costs |
| ● | Completed securities portfolio restructuring during 1Q 2025 with a total net loss of $229 million |
Subsequent Events
| ● | The Board of Directors of the Company declared a quarterly cash dividend on its common stock of $0.54 per share, payable on May 16, 2025 to shareholders of record as of May 9, 2025 |
∗ Annualized percentages
† Preliminary
Financial Performance
|
|
Three Months Ended |
|
|||||||||||||
(Dollars in thousands, except per share data) |
|
Mar. 31, |
|
Dec. 31, |
|
Sep. 30, |
|
Jun. 30, |
|
Mar. 31, |
|
|||||
INCOME STATEMENT |
|
2025 |
|
2024 |
|
2024 |
|
2024 |
|
2024 |
|
|||||
Interest Income |
|
|
|
|
|
|
|
|
|
|
|
|
|
|
|
|
Loans, including fees (1) |
|
$ |
724,640 |
|
$ |
489,709 |
|
$ |
494,082 |
|
$ |
478,360 |
|
$ |
463,688 |
|
Investment securities, trading securities, federal funds sold and securities |
|
|
|
|
|
|
|
|
|
|
|
|
|
|
|
|
purchased under agreements to resell |
|
|
83,926 |
|
|
59,096 |
|
|
50,096 |
|
|
52,764 |
|
|
53,567 |
|
Total interest income |
|
|
808,566 |
|
|
548,805 |
|
|
544,178 |
|
|
531,124 |
|
|
517,255 |
|
Interest Expense |
|
|
|
|
|
|
|
|
|
|
|
|
|
|
|
|
Deposits |
|
|
245,957 |
|
|
168,263 |
|
|
177,919 |
|
|
165,481 |
|
|
160,162 |
|
Federal funds purchased, securities sold under agreements |
|
|
|
|
|
|
|
|
|
|
|
|
|
|
|
|
to repurchase, and other borrowings |
|
|
18,062 |
|
|
10,763 |
|
|
14,779 |
|
|
15,384 |
|
|
13,157 |
|
Total interest expense |
|
|
264,019 |
|
|
179,026 |
|
|
192,698 |
|
|
180,865 |
|
|
173,319 |
|
Net Interest Income |
|
|
544,547 |
|
|
369,779 |
|
|
351,480 |
|
|
350,259 |
|
|
343,936 |
|
Provision (recovery) for credit losses |
|
|
100,562 |
|
|
6,371 |
|
|
(6,971) |
|
|
3,889 |
|
|
12,686 |
|
Net Interest Income after Provision (Recovery) for Credit Losses |
|
|
443,985 |
|
|
363,408 |
|
|
358,451 |
|
|
346,370 |
|
|
331,250 |
|
Noninterest Income |
|
|
|
|
|
|
|
|
|
|
|
|
|
|
|
|
Operating income |
|
|
85,620 |
|
|
80,595 |
|
|
74,934 |
|
|
75,225 |
|
|
71,558 |
|
Securities losses, net |
|
|
(228,811) |
|
|
(50) |
|
|
— |
|
|
— |
|
|
— |
|
Gain on sale leaseback, net of transaction costs |
|
|
229,279 |
|
|
— |
|
|
— |
|
|
— |
|
|
— |
|
Total noninterest income |
|
|
86,088 |
|
|
80,545 |
|
|
74,934 |
|
|
75,225 |
|
|
71,558 |
|
Noninterest Expense |
|
|
|
|
|
|
|
|
|
|
|
|
|
|
|
|
Operating expense |
|
|
340,820 |
|
|
250,699 |
|
|
243,543 |
|
|
242,343 |
|
|
240,923 |
|
Merger, branch consolidation, severance related and other restructuring expense (8) |
|
|
68,006 |
|
|
6,531 |
|
|
3,304 |
|
|
5,785 |
|
|
4,513 |
|
FDIC special assessment |
|
|
— |
|
|
(621) |
|
|
— |
|
|
619 |
|
|
3,854 |
|
Total noninterest expense |
|
|
408,826 |
|
|
256,609 |
|
|
246,847 |
|
|
248,747 |
|
|
249,290 |
|
Income before Income Tax Provision |
|
|
121,247 |
|
|
187,344 |
|
|
186,538 |
|
|
172,848 |
|
|
153,518 |
|
Income tax provision |
|
|
32,167 |
|
|
43,166 |
|
|
43,359 |
|
|
40,478 |
|
|
38,462 |
|
Net Income |
|
$ |
89,080 |
|
$ |
144,178 |
|
$ |
143,179 |
|
$ |
132,370 |
|
$ |
115,056 |
|
|
|
|
|
|
|
|
|
|
|
|
|
|
|
|
|
|
Adjusted Net Income (non-GAAP) (2) |
|
|
|
|
|
|
|
|
|
|
|
|
|
|
|
|
Net Income (GAAP) |
|
$ |
89,080 |
|
$ |
144,178 |
|
$ |
143,179 |
|
$ |
132,370 |
|
$ |
115,056 |
|
Securities losses, net of tax |
|
|
178,639 |
|
|
38 |
|
|
— |
|
|
— |
|
|
— |
|
Gain on sale leaseback, net of transaction costs and tax |
|
|
(179,004) |
|
|
— |
|
|
— |
|
|
— |
|
|
— |
|
Initial provision for credit losses – Non-PCD loans and UFC from Independent, net of tax |
|
|
71,892 |
|
|
— |
|
|
— |
|
|
— |
|
|
— |
|
Merger, branch consolidation, severance related and other restructuring expense, net of tax (8) |
|
|
53,094 |
|
|
5,026 |
|
|
2,536 |
|
|
4,430 |
|
|
3,382 |
|
Deferred tax asset remeasurement |
|
|
5,581 |
|
|
— |
|
|
— |
|
|
— |
|
|
— |
|
FDIC special assessment, net of tax |
|
|
— |
|
|
(478) |
|
|
— |
|
|
474 |
|
|
2,888 |
|
Adjusted Net Income (non-GAAP) |
|
$ |
219,282 |
|
$ |
148,764 |
|
$ |
145,715 |
|
$ |
137,274 |
|
$ |
121,326 |
|
|
|
|
|
|
|
|
|
|
|
|
|
|
|
|
|
|
Basic earnings per common share |
|
$ |
0.88 |
|
$ |
1.89 |
|
$ |
1.88 |
|
$ |
1.74 |
|
$ |
1.51 |
|
Diluted earnings per common share |
|
$ |
0.87 |
|
$ |
1.87 |
|
$ |
1.86 |
|
$ |
1.73 |
|
$ |
1.50 |
|
Adjusted net income per common share - Basic (non-GAAP) (2) |
|
$ |
2.16 |
|
$ |
1.95 |
|
$ |
1.91 |
|
$ |
1.80 |
|
$ |
1.59 |
|
Adjusted net income per common share - Diluted (non-GAAP) (2) |
|
$ |
2.15 |
|
$ |
1.93 |
|
$ |
1.90 |
|
$ |
1.79 |
|
$ |
1.58 |
|
Dividends per common share |
|
$ |
0.54 |
|
$ |
0.54 |
|
$ |
0.54 |
|
$ |
0.52 |
|
$ |
0.52 |
|
Basic weighted-average common shares outstanding |
|
|
101,409,624 |
|
|
76,360,935 |
|
|
76,299,069 |
|
|
76,251,401 |
|
|
76,301,411 |
|
Diluted weighted-average common shares outstanding |
|
|
101,828,600 |
|
|
76,957,882 |
|
|
76,805,436 |
|
|
76,607,281 |
|
|
76,660,081 |
|
Effective tax rate |
|
|
26.53% |
|
|
23.04% |
|
|
23.24% |
|
|
23.42% |
|
|
25.05% |
|
Adjusted effective tax rate |
|
|
21.93% |
|
|
20.92% |
|
|
20.06% |
|
|
22.42% |
|
|
21.83% |
|
2
Performance and Capital Ratios
|
|
Three Months Ended |
|
|
|||||||||||||
|
|
Mar. 31, |
|
Dec. 31, |
|
Sep. 30, |
|
Jun. 30, |
|
Mar. 31, |
|
|
|||||
|
|
2025 |
|
2024 |
|
2024 |
|
2024 |
|
2024 |
|
|
|||||
PERFORMANCE RATIOS |
|
|
|
|
|
|
|
|
|
|
|
|
|
|
|
|
|
Return on average assets (annualized) |
|
|
0.56 |
% |
|
1.23 |
% |
|
1.25 |
% |
|
1.17 |
% |
|
1.03 |
% |
|
Adjusted return on average assets (annualized) (non-GAAP) (2) |
|
|
1.38 |
% |
|
1.27 |
% |
|
1.27 |
% |
|
1.22 |
% |
|
1.08 |
% |
|
Return on average common equity (annualized) |
|
|
4.29 |
% |
|
9.72 |
% |
|
9.91 |
% |
|
9.58 |
% |
|
8.36 |
% |
|
Adjusted return on average common equity (annualized) (non-GAAP) (2) |
|
|
10.56 |
% |
|
10.03 |
% |
|
10.08 |
% |
|
9.94 |
% |
|
8.81 |
% |
|
Return on average tangible common equity (annualized) (non-GAAP) (3) |
|
|
8.99 |
% |
|
15.09 |
% |
|
15.63 |
% |
|
15.49 |
% |
|
13.63 |
% |
|
Adjusted return on average tangible common equity (annualized) (non-GAAP) (2) (3) |
|
|
19.85 |
% |
|
15.56 |
% |
|
15.89 |
% |
|
16.05 |
% |
|
14.35 |
% |
|
Efficiency ratio (tax equivalent) |
|
|
60.97 |
% |
|
55.73 |
% |
|
56.58 |
% |
|
57.03 |
% |
|
58.48 |
% |
|
Adjusted efficiency ratio (non-GAAP) (4) |
|
|
50.24 |
% |
|
54.42 |
% |
|
55.80 |
% |
|
55.52 |
% |
|
56.47 |
% |
|
Dividend payout ratio (5) |
|
|
61.45 |
% |
|
28.58 |
% |
|
28.76 |
% |
|
29.93 |
% |
|
34.42 |
% |
|
Book value per common share |
|
$ |
84.99 |
|
$ |
77.18 |
|
$ |
77.42 |
|
$ |
74.16 |
|
$ |
72.82 |
|
|
Tangible book value per common share (non-GAAP) (3) |
|
$ |
50.07 |
|
$ |
51.11 |
|
$ |
51.26 |
|
$ |
47.90 |
|
$ |
46.48 |
|
|
|
|
|
|
|
|
|
|
|
|
|
|
|
|
|
|
|
|
CAPITAL RATIOS |
|
|
|
|
|
|
|
|
|
|
|
|
|
|
|
|
|
Equity-to-assets |
|
|
13.2 |
% |
|
12.7 |
% |
|
12.8 |
% |
|
12.4 |
% |
|
12.3 |
% |
|
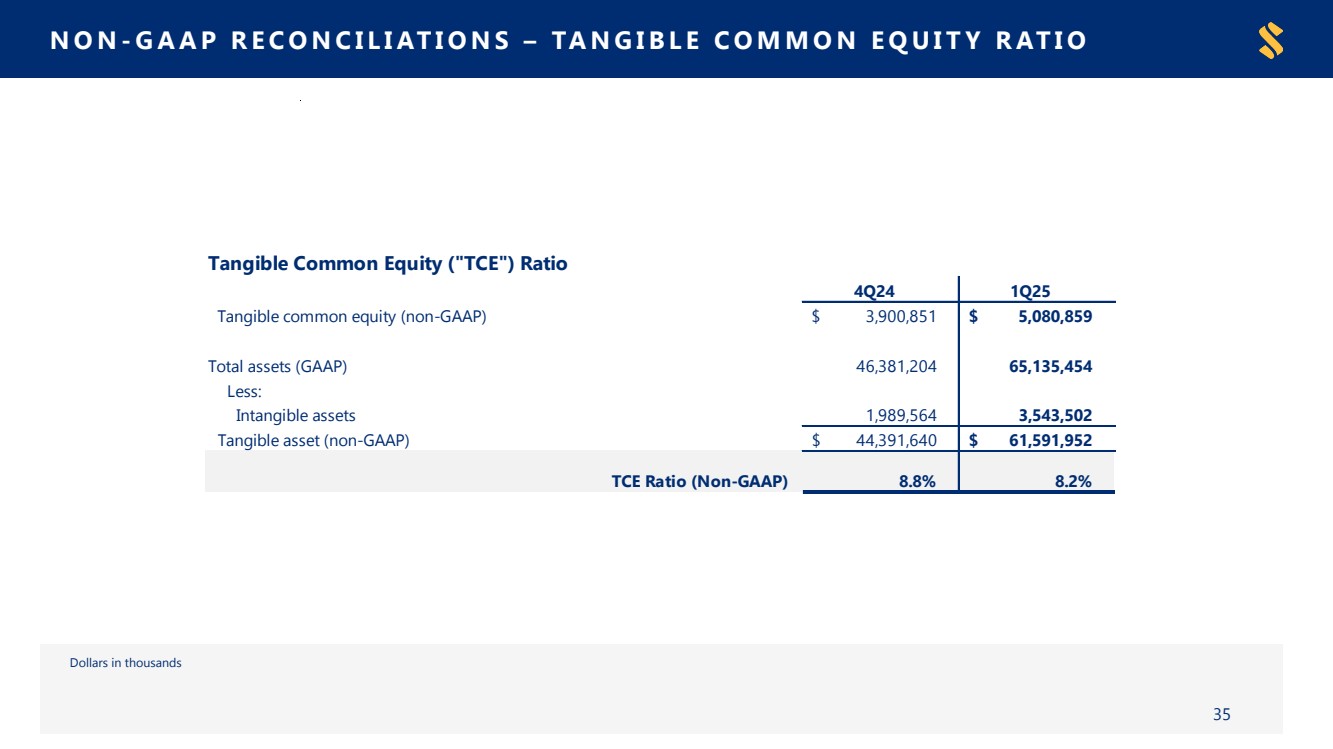
Tangible equity-to-tangible assets (non-GAAP) (3) |
|
|
8.2 |
% |
|
8.8 |
% |
|
8.9 |
% |
|
8.4 |
% |
|
8.2 |
% |
|
Tier 1 leverage (6) |
|
|
8.9 |
% |
|
10.0 |
% |
|
10.0 |
% |
|
9.7 |
% |
|
9.6 |
% |
|
Tier 1 common equity (6) |
|
|
11.0 |
% |
|
12.6 |
% |
|
12.4 |
% |
|
12.1 |
% |
|
11.9 |
% |
|
Tier 1 risk-based capital (6) |
|
|
11.0 |
% |
|
12.6 |
% |
|
12.4 |
% |
|
12.1 |
% |
|
11.9 |
% |
|
Total risk-based capital (6) |
|
|
13.7 |
% |
|
15.0 |
% |
|
14.7 |
% |
|
14.4 |
% |
|
14.4 |
% |
|
3
Balance Sheet
|
|
Ending Balance |
|
|||||||||||||
(Dollars in thousands, except per share and share data) |
|
Mar. 31, |
|
Dec. 31, |
|
Sep. 30, |
|
Jun. 30, |
|
Mar. 31, |
|
|||||
BALANCE SHEET |
|
2025 |
|
2024 |
|
2024 |
|
2024 |
|
2024 |
|
|||||
Assets |
|
|
|
|
|
|
|
|
|
|
|
|
|
|
|
|
Cash and due from banks |
|
$ |
688,153 |
|
$ |
525,506 |
|
$ |
563,887 |
|
$ |
507,425 |
|
$ |
478,271 |
|
Federal funds sold and interest-earning deposits with banks |
|
|
2,611,537 |
|
|
866,561 |
|
|
648,792 |
|
|
609,741 |
|
|
731,186 |
|
Cash and cash equivalents |
|
|
3,299,690 |
|
|
1,392,067 |
|
|
1,212,679 |
|
|
1,117,166 |
|
|
1,209,457 |
|
|
|
|
|
|
|
|
|
|
|
|
|
|
|
|
|
|
Trading securities, at fair value |
|
|
107,401 |
|
|
102,932 |
|
|
87,103 |
|
|
92,161 |
|
|
66,188 |
|
Investment securities: |
|
|
|
|
|
|
|
|
|
|
|
|
|
|
|
|
Securities held to maturity |
|
|
2,195,980 |
|
|
2,254,670 |
|
|
2,301,307 |
|
|
2,348,528 |
|
|
2,446,589 |
|
Securities available for sale, at fair value |
|
|
5,853,369 |
|
|
4,320,593 |
|
|
4,564,363 |
|
|
4,498,264 |
|
|
4,598,400 |
|
Other investments |
|
|
345,695 |
|
|
223,613 |
|
|
211,458 |
|
|
201,516 |
|
|
187,285 |
|
Total investment securities |
|
|
8,395,044 |
|
|
6,798,876 |
|
|
7,077,128 |
|
|
7,048,308 |
|
|
7,232,274 |
|
Loans held for sale |
|
|
357,918 |
|
|
279,426 |
|
|
287,043 |
|
|
100,007 |
|
|
56,553 |
|
Loans: |
|
|
|
|
|
|
|
|
|
|
|
|
|
|
|
|
Purchased credit deteriorated |
|
|
3,634,490 |
|
|
862,155 |
|
|
913,342 |
|
|
957,255 |
|
|
1,031,283 |
|
Purchased non-credit deteriorated |
|
|
13,084,853 |
|
|
3,635,782 |
|
|
3,959,028 |
|
|
4,253,323 |
|
|
4,534,583 |
|
Non-acquired |
|
|
30,047,389 |
|
|
29,404,990 |
|
|
28,675,822 |
|
|
28,023,986 |
|
|
27,101,444 |
|
Less allowance for credit losses |
|
|
(623,690) |
|
|
(465,280) |
|
|
(467,981) |
|
|
(472,298) |
|
|
(469,654) |
|
Loans, net |
|
|
46,143,042 |
|
|
33,437,647 |
|
|
33,080,211 |
|
|
32,762,266 |
|
|
32,197,656 |
|
Premises and equipment, net |
|
|
946,334 |
|
|
502,559 |
|
|
507,452 |
|
|
517,382 |
|
|
512,635 |
|
Bank owned life insurance |
|
|
1,273,472 |
|
|
1,013,209 |
|
|
1,007,275 |
|
|
1,001,998 |
|
|
997,562 |
|
Mortgage servicing rights |
|
|
87,742 |
|
|
89,795 |
|
|
83,512 |
|
|
88,904 |
|
|
87,970 |
|
Core deposit and other intangibles |
|
|
455,443 |
|
|
66,458 |
|
|
71,835 |
|
|
77,389 |
|
|
83,193 |
|
Goodwill |
|
|
3,088,059 |
|
|
1,923,106 |
|
|
1,923,106 |
|
|
1,923,106 |
|
|
1,923,106 |
|
Other assets |
|
|
981,309 |
|
|
775,129 |
|
|
745,303 |
|
|
765,283 |
|
|
778,244 |
|
Total assets |
|
$ |
65,135,454 |
|
$ |
46,381,204 |
|
$ |
46,082,647 |
|
$ |
45,493,970 |
|
$ |
45,144,838 |
|
|
|
|
|
|
|
|
|
|
|
|
|
|
|
|
|
|
Liabilities and Shareholders' Equity |
|
|
|
|
|
|
|
|
|
|
|
|
|
|
|
|
Deposits: |
|
|
|
|
|
|
|
|
|
|
|
|
|
|
|
|
Noninterest-bearing |
|
$ |
13,757,255 |
|
$ |
10,192,117 |
|
$ |
10,376,531 |
|
$ |
10,374,464 |
|
$ |
10,546,410 |
|
Interest-bearing |
|
|
39,580,360 |
|
|
27,868,749 |
|
|
27,261,664 |
|
|
26,723,938 |
|
|
26,632,024 |
|
Total deposits |
|
|
53,337,615 |
|
|
38,060,866 |
|
|
37,638,195 |
|
|
37,098,402 |
|
|
37,178,434 |
|
Federal funds purchased and securities |
|
|
|
|
|
|
|
|
|
|
|
|
|
|
|
|
sold under agreements to repurchase |
|
|
679,337 |
|
|
514,912 |
|
|
538,322 |
|
|
542,403 |
|
|
554,691 |
|
Other borrowings |
|
|
752,798 |
|
|
391,534 |
|
|
691,626 |
|
|
691,719 |
|
|
391,812 |
|
Reserve for unfunded commitments |
|
|
62,253 |
|
|
45,327 |
|
|
41,515 |
|
|
50,248 |
|
|
53,229 |
|
Other liabilities |
|
|
1,679,090 |
|
|
1,478,150 |
|
|
1,268,409 |
|
|
1,460,795 |
|
|
1,419,663 |
|
Total liabilities |
|
|
56,511,093 |
|
|
40,490,789 |
|
|
40,178,067 |
|
|
39,843,567 |
|
|
39,597,829 |
|
|
|
|
|
|
|
|
|
|
|
|
|
|
|
|
|
|
Shareholders' equity: |
|
|
|
|
|
|
|
|
|
|
|
|
|
|
|
|
Common stock - $2.50 par value; authorized 160,000,000 shares |
|
|
253,698 |
|
|
190,805 |
|
|
190,674 |
|
|
190,489 |
|
|
190,443 |
|
Surplus |
|
|
6,667,277 |
|
|
4,259,722 |
|
|
4,249,672 |
|
|
4,238,192 |
|
|
4,230,345 |
|
Retained earnings |
|
|
2,080,053 |
|
|
2,046,809 |
|
|
1,943,874 |
|
|
1,841,933 |
|
|
1,749,215 |
|
Accumulated other comprehensive loss |
|
|
(376,667) |
|
|
(606,921) |
|
|
(479,640) |
|
|
(620,211) |
|
|
(622,994) |
|
Total shareholders' equity |
|
|
8,624,361 |
|
|
5,890,415 |
|
|
5,904,580 |
|
|
5,650,403 |
|
|
5,547,009 |
|
Total liabilities and shareholders' equity |
|
$ |
65,135,454 |
|
$ |
46,381,204 |
|
$ |
46,082,647 |
|
$ |
45,493,970 |
|
$ |
45,144,838 |
|
|
|
|
|
|
|
|
|
|
|
|
|
|
|
|
|
|
Common shares issued and outstanding |
|
|
101,479,065 |
|
|
76,322,206 |
|
|
76,269,577 |
|
|
76,195,723 |
|
|
76,177,163 |
|
4
Net Interest Income and Margin
|
|
Three Months Ended |
|
||||||||||||||||||||||
|
|
Mar. 31, 2025 |
|
Dec. 31, 2024 |
|
Mar. 31, 2024 |
|
||||||||||||||||||
(Dollars in thousands) |
|
Average |
|
Income/ |
|
Yield/ |
|
Average |
|
Income/ |
|
Yield/ |
|
Average |
|
Income/ |
|
Yield/ |
|
||||||
YIELD ANALYSIS |
|
Balance |
|
Expense |
|
Rate |
|
Balance |
|
Expense |
|
Rate |
|
Balance |
|
Expense |
|
Rate |
|
||||||
Interest-Earning Assets: |
|
|
|
|
|
|
|
|
|
|
|
|
|
|
|
|
|
|
|
|
|
|
|
|
|
Federal funds sold and interest-earning deposits with banks |
|
$ |
2,199,800 |
|
$ |
22,540 |
|
4.16% |
|
$ |
1,308,313 |
|
$ |
14,162 |
|
4.31% |
|
$ |
668,349 |
|
$ |
8,254 |
|
4.97% |
|
Investment securities |
|
|
8,325,775 |
|
|
61,386 |
|
2.99% |
|
|
7,144,438 |
|
|
44,934 |
|
2.50% |
|
|
7,465,735 |
|
|
45,313 |
|
2.44% |
|
Loans held for sale |
|
|
174,833 |
|
|
3,678 |
|
8.53% |
|
|
179,803 |
|
|
2,304 |
|
5.10% |
|
|
42,872 |
|
|
681 |
|
6.39% |
|
Total loans held for investment |
|
|
46,797,045 |
|
|
720,962 |
|
6.25% |
|
|
33,662,822 |
|
|
487,405 |
|
5.76% |
|
|
32,480,220 |
|
|
463,007 |
|
5.73% |
|
Total interest-earning assets |
|
|
57,497,453 |
|
|
808,566 |
|
5.70% |
|
|
42,295,376 |
|
|
548,805 |
|
5.16% |
|
|
40,657,176 |
|
|
517,255 |
|
5.12% |
|
Noninterest-earning assets |
|
|
6,785,973 |
|
|
|
|
|
|
|
4,214,390 |
|
|
|
|
|
|
|
4,353,987 |
|
|
|
|
|
|
Total Assets |
|
$ |
64,283,426 |
|
|
|
|
|
|
$ |
46,509,766 |
|
|
|
|
|
|
$ |
45,011,163 |
|
|
|
|
|
|
|
|
|
|
|
|
|
|
|
|
|
|
|
|
|
|
|
|
|
|
|
|
|
|
|
|
Interest-Bearing Liabilities ("IBL"): |
|
|
|
|
|
|
|
|
|
|
|
|
|
|
|
|
|
|
|
|
|
|
|
|
|
Transaction and money market accounts |
|
$ |
29,249,014 |
|
$ |
176,949 |
|
2.45% |
|
$ |
20,823,079 |
|
$ |
121,239 |
|
2.32% |
|
$ |
19,544,019 |
|
$ |
117,292 |
|
2.41% |
|
Savings deposits |
|
|
2,904,961 |
|
|
1,944 |
|
0.27% |
|
|
2,427,760 |
|
|
1,741 |
|
0.29% |
|
|
2,589,251 |
|
|
1,818 |
|
0.28% |
|
Certificates and other time deposits |
|
|
7,165,188 |
|
|
67,064 |
|
3.80% |
|
|
4,517,047 |
|
|
45,283 |
|
3.99% |
|
|
4,282,749 |
|
|
41,052 |
|
3.86% |
|
Federal funds purchased |
|
|
323,400 |
|
|
3,479 |
|
4.36% |
|
|
292,626 |
|
|
3,479 |
|
4.73% |
|
|
256,506 |
|
|
3,369 |
|
5.28% |
|
Repurchase agreements |
|
|
298,305 |
|
|
1,430 |
|
1.94% |
|
|
261,373 |
|
|
1,382 |
|
2.10% |
|
|
280,674 |
|
|
1,358 |
|
1.95% |
|
Other borrowings |
|
|
812,136 |
|
|
13,153 |
|
6.57% |
|
|
394,853 |
|
|
5,902 |
|
5.95% |
|
|
563,848 |
|
|
8,430 |
|
6.01% |
|
Total interest-bearing liabilities |
|
|
40,753,004 |
|
|
264,019 |
|
2.63% |
|
|
28,716,738 |
|
|
179,026 |
|
2.48% |
|
|
27,517,047 |
|
|
173,319 |
|
2.53% |
|
Noninterest-bearing deposits |
|
|
13,493,329 |
|
|
|
|
|
|
|
10,561,382 |
|
|
|
|
|
|
|
10,530,597 |
|
|
|
|
|
|
Other noninterest-bearing liabilities |
|
|
1,618,981 |
|
|
|
|
|
|
|
1,330,020 |
|
|
|
|
|
|
|
1,426,968 |
|
|
|
|
|
|
Shareholders' equity |
|
|
8,418,112 |
|
|
|
|
|
|
|
5,901,626 |
|
|
|
|
|
|
|
5,536,551 |
|
|
|
|
|
|
Total Non-IBL and shareholders' equity |
|
|
23,530,422 |
|
|
|
|
|
|
|
17,793,028 |
|
|
|
|
|
|
|
17,494,116 |
|
|
|
|
|
|
Total Liabilities and Shareholders' Equity |
|
$ |
64,283,426 |
|
|
|
|
|
|
$ |
46,509,766 |
|
|
|
|
|
|
$ |
45,011,163 |
|
|
|
|
|
|
Net Interest Income and Margin (Non-Tax Equivalent) |
|
|
|
|
$ |
544,547 |
|
3.84% |
|
|
|
|
$ |
369,779 |
|
3.48% |
|
|
|
|
$ |
343,936 |
|
3.40% |
|
Net Interest Margin (Tax Equivalent) (non-GAAP) |
|
|
|
|
|
|
|
3.85% |
|
|
|
|
|
|
|
3.48% |
|
|
|
|
|
|
|
3.41% |
|
Total Deposit Cost (without Debt and Other Borrowings) |
|
|
|
|
|
|
|
1.89% |
|
|
|
|
|
|
|
1.75% |
|
|
|
|
|
|
|
1.74% |
|
Overall Cost of Funds (including Demand Deposits) |
|
|
|
|
|
|
|
1.97% |
|
|
|
|
|
|
|
1.81% |
|
|
|
|
|
|
|
1.83% |
|
|
|
|
|
|
|
|
|
|
|
|
|
|
|
|
|
|
|
|
|
|
|
|
|
|
|
Total Accretion on Acquired Loans (1) |
|
|
|
|
$ |
61,798 |
|
|
|
|
|
|
$ |
2,887 |
|
|
|
|
|
|
$ |
4,287 |
|
|
|
Tax Equivalent ("TE") Adjustment |
|
|
|
|
$ |
784 |
|
|
|
|
|
|
$ |
547 |
|
|
|
|
|
|
$ |
528 |
|
|
|
| ● | The remaining loan discount on acquired loans to be accreted into loan interest income totals $457.1 million as of March 31, 2025. |
5
Noninterest Income and Expense
|
|
Three Months Ended |
|
|||||||||||||
|
|
Mar. 31, |
|
Dec. 31, |
|
Sep. 30, |
|
Jun. 30, |
|
Mar. 31, |
|
|||||
(Dollars in thousands) |
|
2025 |
|
2024 |
|
2024 |
|
2024 |
|
2024 |
|
|||||
Noninterest Income: |
|
|
|
|
|
|
|
|
|
|
|
|
|
|
|
|
Fees on deposit accounts |
|
$ |
35,933 |
|
$ |
35,121 |
|
$ |
33,986 |
|
$ |
33,842 |
|
$ |
33,145 |
|
Mortgage banking income |
|
|
7,737 |
|
|
4,777 |
|
|
3,189 |
|
|
5,912 |
|
|
6,169 |
|
Trust and investment services income |
|
|
14,932 |
|
|
12,414 |
|
|
11,578 |
|
|
11,091 |
|
|
10,391 |
|
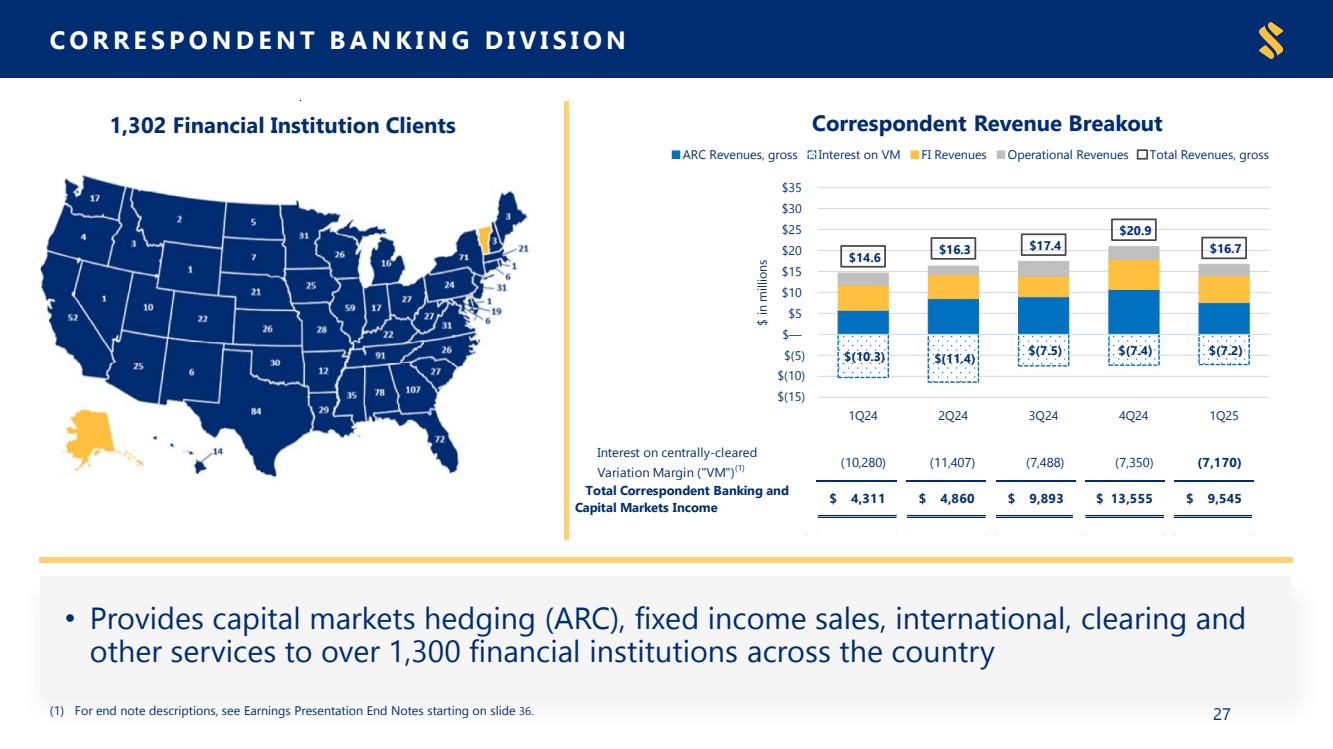
Correspondent banking and capital markets income |
|
|
16,715 |
|
|
20,905 |
|
|
17,381 |
|
|
16,267 |
|
|
14,591 |
|
Expense on centrally-cleared variation margin |
|
|
(7,170) |
|
|
(7,350) |
|
|
(7,488) |
|
|
(11,407) |
|
|
(10,280) |
|
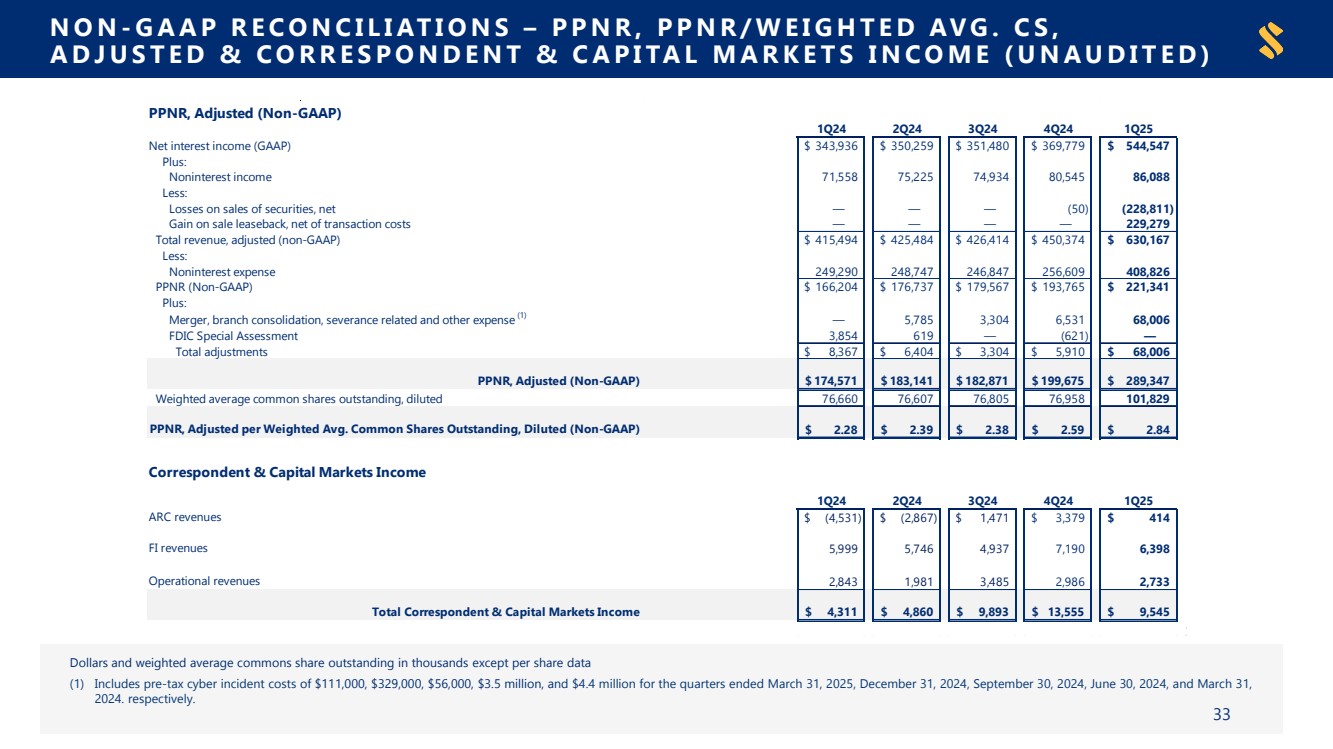
Total correspondent banking and capital markets income |
|
|
9,545 |
|
|
13,555 |
|
|
9,893 |
|
|
4,860 |
|
|
4,311 |
|
Bank owned life insurance income |
|
|
10,199 |
|
|
7,944 |
|
|
8,276 |
|
|
7,372 |
|
|
6,892 |
|
Other |
|
|
7,275 |
|
|
6,784 |
|
|
8,012 |
|
|
12,148 |
|
|
10,650 |
|
Securities losses, net |
|
|
(228,811) |
|
|
(50) |
|
|
— |
|
|
— |
|
|
— |
|
Gain on sale leaseback, net of transaction costs |
|
|
229,279 |
|
|
— |
|
|
— |
|
|
— |
|
|
— |
|
Total Noninterest Income |
|
$ |
86,088 |
|
$ |
80,545 |
|
$ |
74,934 |
|
$ |
75,225 |
|
$ |
71,558 |
|
|
|
|
|
|
|
|
|
|
|
|
|
|
|
|
|
|
Noninterest Expense: |
|
|
|
|
|
|
|
|
|
|
|
|
|
|
|
|
Salaries and employee benefits |
|
$ |
195,811 |
|
$ |
154,116 |
|
$ |
150,865 |
|
$ |
151,435 |
|
$ |
150,453 |
|
Occupancy expense |
|
|
35,493 |
|
|
22,831 |
|
|
22,242 |
|
|
22,453 |
|
|
22,577 |
|
Information services expense |
|
|
31,362 |
|
|
23,416 |
|
|
23,280 |
|
|
23,144 |
|
|
22,353 |
|
OREO and loan related expense |
|
|
1,784 |
|
|
1,416 |
|
|
1,358 |
|
|
1,307 |
|
|
606 |
|
Business development and staff related |
|
|
6,510 |
|
|
6,777 |
|
|
5,542 |
|
|
5,942 |
|
|
5,521 |
|
Amortization of intangibles |
|
|
23,831 |
|
|
5,326 |
|
|
5,327 |
|
|
5,744 |
|
|
5,998 |
|
Professional fees |
|
|
4,709 |
|
|
5,366 |
|
|
4,017 |
|
|
3,906 |
|
|
3,115 |
|
Supplies and printing expense |
|
|
3,128 |
|
|
2,729 |
|
|
2,762 |
|
|
2,526 |
|
|
2,540 |
|
FDIC assessment and other regulatory charges |
|
|
11,258 |
|
|
7,365 |
|
|
7,482 |
|
|
7,771 |
|
|
8,534 |
|
Advertising and marketing |
|
|
2,290 |
|
|
2,269 |
|
|
2,296 |
|
|
2,594 |
|
|
1,984 |
|
Other operating expenses |
|
|
24,644 |
|
|
19,088 |
|
|
18,372 |
|
|
15,521 |
|
|
17,242 |
|
Merger, branch consolidation, severance related and other restructuring expense (8) |
|
|
68,006 |
|
|
6,531 |
|
|
3,304 |
|
|
5,785 |
|
|
4,513 |
|
FDIC special assessment |
|
|
— |
|
|
(621) |
|
|
— |
|
|
619 |
|
|
3,854 |
|
Total Noninterest Expense |
|
$ |
408,826 |
|
$ |
256,609 |
|
$ |
246,847 |
|
$ |
248,747 |
|
$ |
249,290 |
|
6
Loans and Deposits
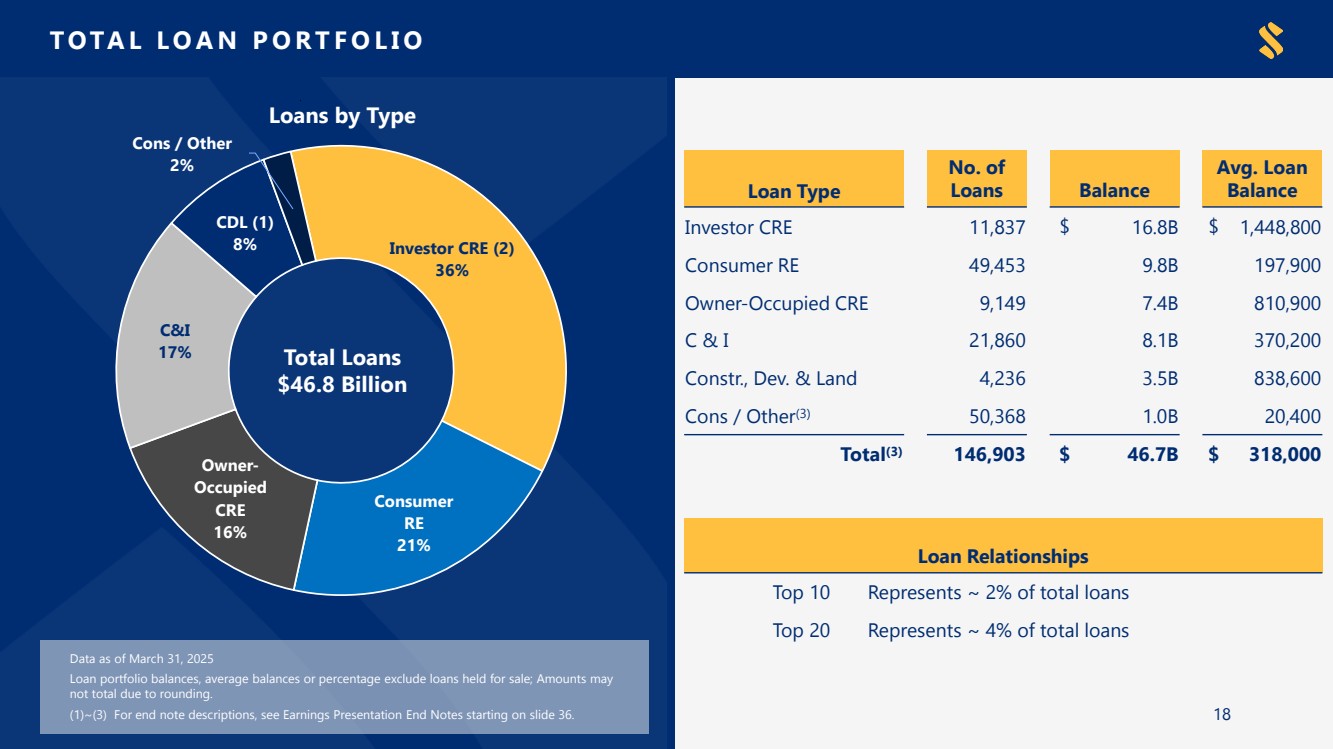
The following table presents a summary of the loan portfolio by type:
|
|
Ending Balance |
|
|||||||||||||
(Dollars in thousands) |
|
Mar. 31, |
|
Dec. 31, |
|
Sep. 30, |
|
Jun. 30, |
|
Mar. 31, |
|
|||||
LOAN PORTFOLIO (7) |
|
2025 |
|
2024 |
|
2024 |
|
2024 |
|
2024 |
|
|||||
Construction and land development * † |
|
$ |
3,497,909 |
|
$ |
2,184,327 |
|
$ |
2,458,151 |
|
$ |
2,592,307 |
|
$ |
2,437,343 |
|
Investor commercial real estate* |
|
|
16,822,119 |
|
|
9,991,482 |
|
|
9,856,709 |
|
|
9,731,773 |
|
|
9,752,529 |
|
Commercial owner occupied real estate |
|
|
7,417,116 |
|
|
5,716,376 |
|
|
5,544,716 |
|
|
5,522,978 |
|
|
5,511,855 |
|
Commercial and industrial |
|
|
8,106,484 |
|
|
6,222,876 |
|
|
5,931,187 |
|
|
5,769,838 |
|
|
5,544,131 |
|
Consumer real estate * |
|
|
9,838,952 |
|
|
8,714,969 |
|
|
8,649,714 |
|
|
8,440,724 |
|
|
8,223,066 |
|
Consumer/other |
|
|
1,084,152 |
|
|
1,072,897 |
|
|
1,107,715 |
|
|
1,176,944 |
|
|
1,198,386 |
|
Total Loans |
|
$ |
46,766,732 |
|
$ |
33,902,927 |
|
$ |
33,548,192 |
|
$ |
33,234,564 |
|
$ |
32,667,310 |
|
* |
Single family home construction-to-permanent loans originated by the Company’s mortgage banking division are included in construction and land development category until completion. Investor commercial real estate loans include commercial non-owner occupied real estate and other income producing property. Consumer real estate includes consumer owner occupied real estate and home equity loans. |
† |
Includes single family home construction-to-permanent loans of $343.5 million, $386.2 million, $429.8 million, $544.2 million, and $623.9 million for the quarters ended March 31, 2025, December 31, 2024, September 30, 2024, June 30, 2024, and March 31, 2024, respectively. |
|
|
Ending Balance |
|
|||||||||||||
(Dollars in thousands) |
|
Mar. 31, |
|
Dec. 31, |
|
Sep. 30, |
|
Jun. 30, |
|
Mar. 31, |
|
|||||
DEPOSITS |
|
2025 |
|
2024 |
|
2024 |
|
2024 |
|
2024 |
|
|||||
Noninterest-bearing checking |
|
$ |
13,757,255 |
|
$ |
10,192,116 |
|
$ |
10,376,531 |
|
$ |
10,374,464 |
|
$ |
10,546,410 |
|
Interest-bearing checking |
|
|
12,034,973 |
|
|
8,232,322 |
|
|
7,550,392 |
|
|
7,547,406 |
|
|
7,898,835 |
|
Savings |
|
|
2,939,407 |
|
|
2,414,172 |
|
|
2,442,584 |
|
|
2,475,130 |
|
|
2,557,203 |
|
Money market |
|
|
17,447,738 |
|
|
13,056,534 |
|
|
12,614,046 |
|
|
12,122,336 |
|
|
11,895,385 |
|
Time deposits |
|
|
7,158,242 |
|
|
4,165,722 |
|
|
4,654,642 |
|
|
4,579,066 |
|
|
4,280,601 |
|
Total Deposits |
|
$ |
53,337,615 |
|
$ |
38,060,866 |
|
$ |
37,638,195 |
|
$ |
37,098,402 |
|
$ |
37,178,434 |
|
|
|
|
|
|
|
|
|
|
|
|
|
|
|
|
|
|
Core Deposits (excludes Time Deposits) |
|
$ |
46,179,373 |
|
$ |
33,895,144 |
|
$ |
32,983,553 |
|
$ |
32,519,336 |
|
$ |
32,897,833 |
|
7
Asset Quality
|
|
Ending Balance |
|
|||||||||||||
|
|
Mar. 31, |
|
Dec. 31, |
|
Sep. 30, |
|
Jun. 30, |
|
Mar. 31, |
|
|||||
(Dollars in thousands) |
|
2025 |
|
2024 |
|
2024 |
|
2024 |
|
2024 |
|
|||||
NONPERFORMING ASSETS: |
|
|
|
|
|
|
|
|
|
|
|
|
|
|
|
|
Non-acquired |
|
|
|
|
|
|
|
|
|
|
|
|
|
|
|
|
Non-acquired nonaccrual loans and restructured loans on nonaccrual |
|
$ |
151,673 |
|
$ |
141,982 |
|
$ |
111,240 |
|
$ |
110,774 |
|
$ |
106,189 |
|
Accruing loans past due 90 days or more |
|
|
3,273 |
|
|
3,293 |
|
|
6,890 |
|
|
5,843 |
|
|
2,497 |
|
Non-acquired OREO and other nonperforming assets |
|
|
2,290 |
|
|
1,182 |
|
|
1,217 |
|
|
2,876 |
|
|
1,589 |
|
Total non-acquired nonperforming assets |
|
|
157,236 |
|
|
146,457 |
|
|
119,347 |
|
|
119,493 |
|
|
110,275 |
|
Acquired |
|
|
|
|
|
|
|
|
|
|
|
|
|
|
|
|
Acquired nonaccrual loans and restructured loans on nonaccrual |
|
|
116,691 |
|
|
65,314 |
|
|
70,731 |
|
|
78,287 |
|
|
63,451 |
|
Accruing loans past due 90 days or more |
|
|
537 |
|
|
— |
|
|
389 |
|
|
916 |
|
|
135 |
|
Acquired OREO and other nonperforming assets |
|
|
5,976 |
|
|
1,583 |
|
|
493 |
|
|
598 |
|
|
655 |
|
Total acquired nonperforming assets |
|
|
123,204 |
|
|
66,897 |
|
|
71,613 |
|
|
79,801 |
|
|
64,241 |
|
Total nonperforming assets |
|
$ |
280,440 |
|
$ |
213,354 |
|
$ |
190,960 |
|
$ |
199,294 |
|
$ |
174,516 |
|
|
|
Three Months Ended |
|
|||||||||||||
|
|
Mar. 31, |
|
Dec. 31, |
|
Sep. 30, |
|
Jun. 30, |
|
Mar. 31, |
|
|||||
|
|
2025 |
|
2024 |
|
2024 |
|
2024 |
|
2024 |
|
|||||
ASSET QUALITY RATIOS (7): |
|
|
|
|
|
|
|
|
|
|
|
|
|
|
|
|
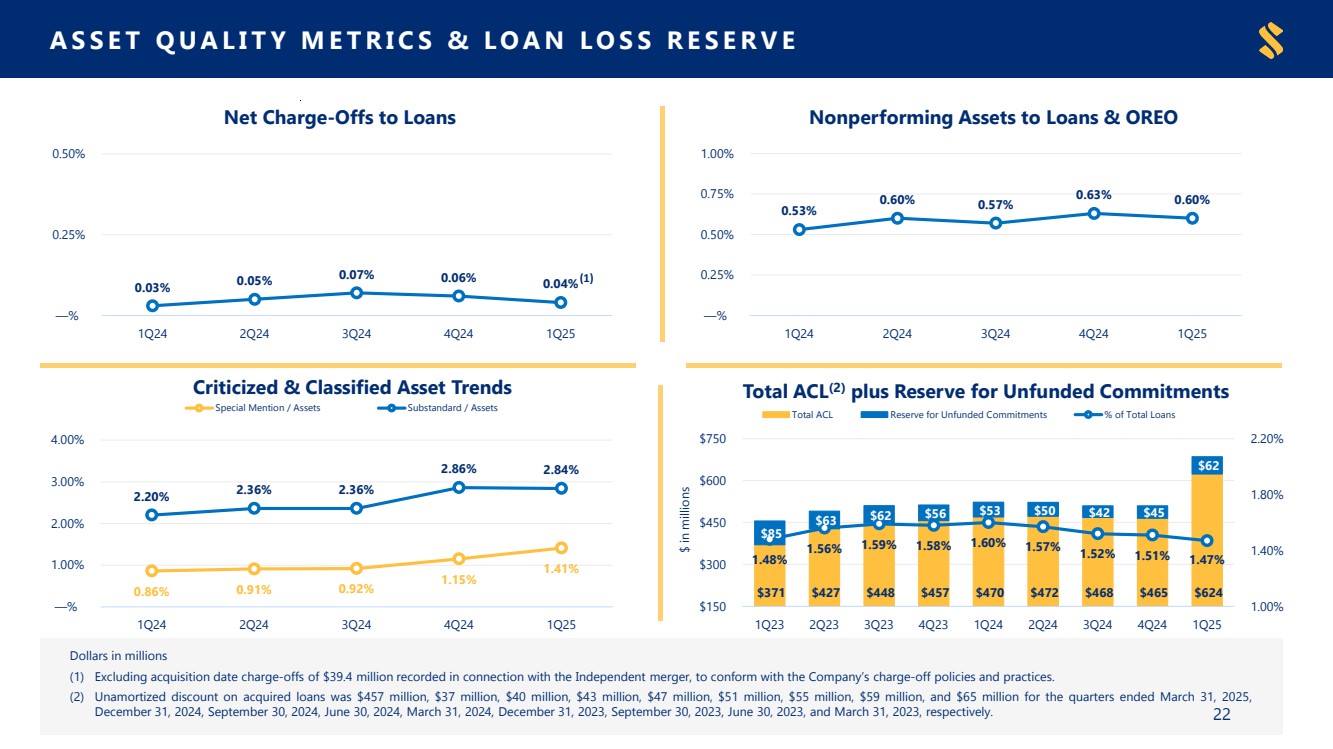
Allowance for credit losses as a percentage of loans |
|
|
1.33% |
|
|
1.37% |
|
|
1.39% |
|
|
1.42% |
|
|
1.44% |
|
Allowance for credit losses, including reserve for unfunded commitments, |
|
|
|
|
|
|
|
|
|
|
|
|
|
|
|
|
as a percentage of loans |
|
|
1.47% |
|
|
1.51% |
|
|
1.52% |
|
|
1.57% |
|
|
1.60% |
|
Allowance for credit losses as a percentage of nonperforming loans |
|
|
229.15% |
|
|
220.94% |
|
|
247.28% |
|
|
241.19% |
|
|
272.62% |
|
Net charge-offs as a percentage of average loans (annualized) |
|
|
0.38% |
|
|
0.06% |
|
|
0.07% |
|
|
0.05% |
|
|
0.03% |
|
Net charge-offs, excluding acquisition date charge-offs, as a percentage |
|
|
|
|
|
|
|
|
|
|
|
|
|
|
|
|
of average loans (annualized) * |
|
|
0.04% |
|
|
0.06% |
|
|
0.07% |
|
|
0.05% |
|
|
0.03% |
|
Total nonperforming assets as a percentage of total assets |
|
|
0.43% |
|
|
0.46% |
|
|
0.41% |
|
|
0.44% |
|
|
0.39% |
|
Nonperforming loans as a percentage of period end loans |
|
|
0.58% |
|
|
0.62% |
|
|
0.56% |
|
|
0.59% |
|
|
0.53% |
|
* Excluding acquisition date charge-offs recorded in connection with the Independent merger.
Current Expected Credit Losses (“CECL”)
Below is a table showing the roll forward of the ACL and UFC for the first quarter of 2025:
|
|
Allowance for Credit Losses ("ACL") and Unfunded Commitments ("UFC") |
|
||||||||||
(Dollars in thousands) |
|
Non-PCD ACL |
|
PCD ACL |
|
Total ACL |
|
UFC |
|
||||
Ending balance 12/31/2024 |
|
$ |
444,959 |
|
$ |
20,321 |
|
$ |
465,280 |
|
$ |
45,327 |
|
ACL - PCD loans from Independent |
|
|
— |
|
|
118,643 |
|
|
118,643 |
|
|
— |
|
Initial provision for credit losses - Independent |
|
|
79,971 |
|
|
— |
|
|
79,971 |
|
|
12,112 |
|
Acquisition date charge-offs on acquired PCD loans - Independent * |
|
|
— |
|
|
(39,429) |
|
|
(39,429) |
|
|
— |
|
Charge offs |
|
|
(6,139) |
|
|
— |
|
|
(6,139) |
|
|
— |
|
Acquired charge offs |
|
|
(885) |
|
|
(398) |
|
|
(1,283) |
|
|
— |
|
Recoveries |
|
|
1,345 |
|
|
— |
|
|
1,345 |
|
|
— |
|
Acquired recoveries |
|
|
291 |
|
|
1,346 |
|
|
1,637 |
|
|
— |
|
Provision for credit losses |
|
|
7,073 |
|
|
(3,408) |
|
|
3,665 |
|
|
4,814 |
|
Ending balance 3/31/2025 |
|
$ |
526,615 |
|
$ |
97,075 |
|
$ |
623,690 |
|
$ |
62,253 |
|
|
|
|
|
|
|
|
|
|
|
|
|
|
|
Period end loans |
|
$ |
43,132,242 |
|
$ |
3,634,490 |
|
$ |
46,766,732 |
|
|
N/A |
|
Allowance for Credit Losses to Loans |
|
|
1.22% |
|
|
2.67% |
|
|
1.33% |
|
|
N/A |
|
Unfunded commitments (off balance sheet) † |
|
|
|
|
|
|
|
|
|
|
$ |
10,654,446 |
|
Reserve to unfunded commitments (off balance sheet) |
|
|
|
|
|
|
|
|
|
|
|
0.58% |
|
* Acquisition date charge-offs recorded in connection with the Independent merger, to conform with the Company’s charge-off policies and practices.
† Unfunded commitments exclude unconditionally cancelable commitments and letters of credit.
8
Conference Call
The Company will host a conference call to discuss its first quarter results at 9:00 a.m. Eastern Time on April 25, 2025. Callers wishing to participate may call toll-free by dialing (888) 350-3899 within the US and (646) 960-0343 for all other locations. The numbers for international participants are listed at https://events.q4irportal.com/custom/access/2324/. The conference ID number is 4200408. Alternatively, individuals may listen to the live webcast of the presentation by visiting SouthStateBank.com. An audio replay of the live webcast is expected to be available by the evening of April 25, 2025 on the Investor Relations section of SouthStateBank.com.
SouthState is a financial services company headquartered in Winter Haven, Florida. SouthState Bank, N.A. (the “Bank”), the Company’s nationally chartered bank subsidiary, provides consumer, commercial, mortgage and wealth management solutions to more than one million customers throughout Florida, Alabama, Georgia, the Carolinas, Virginia, Texas and Colorado. The Bank also serves clients coast to coast through its correspondent banking division. Additional information is available at SouthStateBank.com.
###
Non-GAAP Measures
Statements included in this press release include non-GAAP measures and should be read along with the accompanying tables that provide a reconciliation of non-GAAP measures to GAAP measures. Although other companies may use calculation methods that differ from those used by SouthState for non-GAAP measures, management believes that these non-GAAP measures provide additional useful information, which allows readers to evaluate the ongoing performance of the Company. Non-GAAP measures should not be considered as an alternative to any measure of performance or financial condition as promulgated under GAAP, and investors should consider the Company's performance and financial condition as reported under GAAP and all other relevant information when assessing the performance or financial condition of the Company. Non-GAAP measures have limitations as analytical tools, and investors should not consider them in isolation or as a substitute for analysis of the Company's results or financial condition as reported under GAAP.
(Dollars in thousands) |
|
Three Months Ended |
|
|||||||||||||||||
PRE-PROVISION NET REVENUE ("PPNR") (NON-GAAP) |
|
Mar. 31, 2025 |
|
|
Dec. 31, 2024 |
|
|
Sep. 30, 2024 |
|
|
Jun. 30, 2024 |
|
|
Mar. 31, 2024 |
|
|||||
Net income (GAAP) |
|
$ |
89,080 |
|
|
$ |
144,178 |
|
|
$ |
143,179 |
|
|
$ |
132,370 |
|
|
$ |
115,056 |
|
Provision (recovery) for credit losses |
|
|
100,562 |
|
|
|
6,371 |
|
|
|
(6,971) |
|
|
|
3,889 |
|
|
|
12,686 |
|
Income tax provision |
|
|
26,586 |
|
|
|
43,166 |
|
|
|
43,359 |
|
|
|
40,478 |
|
|
|
38,462 |
|
Income tax provision - deferred tax asset remeasurement |
|
|
5,581 |
|
|
|
— |
|
|
|
— |
|
|
|
— |
|
|
|
— |
|
Securities losses, net |
|
|
228,811 |
|
|
|
50 |
|
|
|
— |
|
|
|
— |
|
|
|
— |
|
Gain on sale leaseback, net of transaction costs |
|
|
(229,279) |
|
|
|
— |
|
|
|
— |
|
|
|
— |
|
|
|
— |
|
Merger, branch consolidation, severance related and other restructuring expense (8) |
|
|
68,006 |
|
|
|
6,531 |
|
|
|
3,304 |
|
|
|
5,785 |
|
|
|
4,513 |
|
FDIC special assessment |
|
|
— |
|
|
|
(621) |
|
|
|
— |
|
|
|
619 |
|
|
|
3,854 |
|
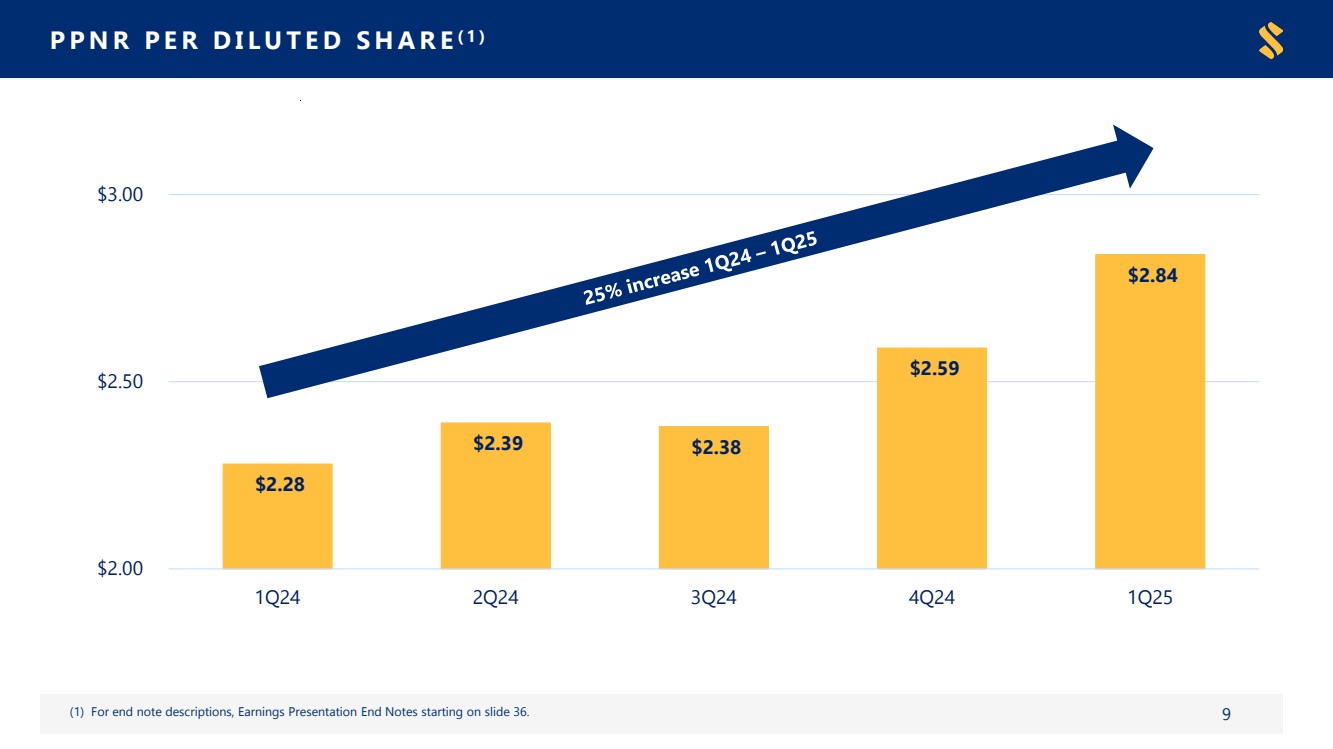
Pre-provision net revenue (PPNR) (Non-GAAP) |
|
$ |
289,347 |
|
|
$ |
199,675 |
|
|
$ |
182,871 |
|
|
$ |
183,141 |
|
|
$ |
174,571 |
|
(Dollars in thousands) |
|
Three Months Ended |
|
|||||||||||||||||
NET INTEREST MARGIN ("NIM"), TE (NON-GAAP) |
|
Mar. 31, 2025 |
|
|
Dec. 31, 2024 |
|
|
Sep. 30, 2024 |
|
|
Jun. 30, 2024 |
|
|
Mar. 31, 2024 |
|
|||||
Net interest income (GAAP) |
|
$ |
544,547 |
|
|
$ |
369,779 |
|
|
$ |
351,480 |
|
|
$ |
350,259 |
|
|
$ |
343,936 |
|
Total average interest-earning assets |
|
|
57,497,453 |
|
|
|
42,295,376 |
|
|
|
41,223,980 |
|
|
|
41,011,662 |
|
|
|
40,657,176 |
|
NIM, non-tax equivalent |
|
|
3.84 |
% |
|
|
3.48 |
% |
|
|
3.39 |
% |
|
|
3.43 |
% |
|
|
3.40 |
% |
|
|
|
|
|
|
|
|
|
|
|
|
|
|
|
|
|
|
|
|
|
Tax equivalent adjustment (included in NIM, TE) |
|
|
784 |
|
|
|
547 |
|
|
|
486 |
|
|
|
631 |
|
|
|
528 |
|
Net interest income, tax equivalent (Non-GAAP) |
|
$ |
545,331 |
|
|
$ |
370,326 |
|
|
$ |
351,966 |
|
|
$ |
350,890 |
|
|
$ |
344,464 |
|
NIM, TE (Non-GAAP) |
|
|
3.85 |
% |
|
|
3.48 |
% |
|
|
3.40 |
% |
|
|
3.44 |
% |
|
|
3.41 |
% |
9
|
|
Three Months Ended |
|
|||||||||||||||||
(Dollars in thousands, except per share data) |
|
Mar. 31, |
|
|
Dec. 31, |
|
|
Sep. 30, |
|
|
Jun. 30, |
|
|
Mar. 31, |
|
|||||
RECONCILIATION OF GAAP TO NON-GAAP |
|
2025 |
|
|
2024 |
|
|
2024 |
|
|
2024 |
|
|
2024 |
|
|||||
Adjusted Net Income (non-GAAP) (2) |
|
|
|
|
|
|
|
|
|
|
|
|
|
|
|
|
|
|
|
|
Net income (GAAP) |
|
$ |
89,080 |
|
|
$ |
144,178 |
|
|
$ |
143,179 |
|
|
$ |
132,370 |
|
|
$ |
115,056 |
|
Securities losses, net of tax |
|
|
178,639 |
|
|
|
38 |
|
|
|
— |
|
|
|
— |
|
|
|
— |
|
Gain on sale leaseback, net of transaction costs and tax |
|
|
(179,004) |
|
|
|
— |
|
|
|
— |
|
|
|
— |
|
|
|
— |
|
PCL - Non-PCD loans and UFC, net of tax |
|
|
71,892 |
|
|
|
— |
|
|
|
— |
|
|
|
— |
|
|
|
— |
|
Merger, branch consolidation, severance related and other restructuring expense, net of tax (8) |
|
|
53,094 |
|
|
|
5,026 |
|
|
|
2,536 |
|
|
|
4,430 |
|
|
|
3,382 |
|
Deferred tax asset remeasurement |
|
|
5,581 |
|
|
|
— |
|
|
|
— |
|
|
|
— |
|
|
|
— |
|
FDIC special assessment, net of tax |
|
|
— |
|
|
|
(478) |
|
|
|
— |
|
|
|
474 |
|
|
|
2,888 |
|
Adjusted net income (non-GAAP) |
|
$ |
219,282 |
|
|
$ |
148,764 |
|
|
$ |
145,715 |
|
|
$ |
137,274 |
|
|
$ |
121,326 |
|
|
|
|
|
|
|
|
|
|
|
|
|
|
|
|
|
|
|
|
|
|
Adjusted Net Income per Common Share - Basic (non-GAAP) (2) |
|
|
|
|
|
|
|
|
|
|
|
|
|
|
|
|
|
|
|
|
Earnings per common share - Basic (GAAP) |
|
$ |
0.88 |
|
|
$ |
1.89 |
|
|
$ |
1.88 |
|
|
$ |
1.74 |
|
|
$ |
1.51 |
|
Effect to adjust for securities losses, net of tax |
|
|
1.76 |
|
|
|
0.00 |
|
|
|
— |
|
|
|
— |
|
|
|
— |
|
Effect to adjust for gain on sale leaseback, net of transaction costs and tax |
|
|
(1.77) |
|
|
|
— |
|
|
|
— |
|
|
|
— |
|
|
|
— |
|
Effect to adjust for PCL - Non-PCD loans and UFC, net of tax |
|
|
0.71 |
|
|
|
— |
|
|
|
— |
|
|
|
— |
|
|
|
— |
|
Effect to adjust for merger, branch consolidation, severance related and other restructuring expense, net of tax (8) |
|
|
0.52 |
|
|
|
0.07 |
|
|
|
0.03 |
|
|
|
0.05 |
|
|
|
0.04 |
|
Effect to adjust for deferred tax asset remeasurement |
|
|
0.06 |
|
|
|
— |
|
|
|
— |
|
|
|
— |
|
|
|
— |
|
Effect to adjust for FDIC special assessment, net of tax |
|
|
— |
|
|
|
(0.01) |
|
|
|
— |
|
|
|
0.01 |
|
|
|
0.04 |
|
Adjusted net income per common share - Basic (non-GAAP) |
|
$ |
2.16 |
|
|
$ |
1.95 |
|
|
$ |
1.91 |
|
|
$ |
1.80 |
|
|
$ |
1.59 |
|
|
|
|
|
|
|
|
|
|
|
|
|
|
|
|
|
|
|
|
|
|
Adjusted Net Income per Common Share - Diluted (non-GAAP) (2) |
|
|
|
|
|
|
|
|
|
|
|
|
|
|
|
|
|
|
|
|
Earnings per common share - Diluted (GAAP) |
|
$ |
0.87 |
|
|
$ |
1.87 |
|
|
$ |
1.86 |
|
|
$ |
1.73 |
|
|
$ |
1.50 |
|
Effect to adjust for securities losses, net of tax |
|
|
1.76 |
|
|
|
0.00 |
|
|
|
— |
|
|
|
— |
|
|
|
— |
|
Effect to adjust for gain on sale leaseback, net of transaction costs and tax |
|
|
(1.76) |
|
|
|
— |
|
|
|
— |
|
|
|
— |
|
|
|
— |
|
Effect to adjust for PCL - Non-PCD loans and UFC, net of tax |
|
|
0.71 |
|
|
|
— |
|
|
|
— |
|
|
|
— |
|
|
|
— |
|
Effect to adjust for merger, branch consolidation, severance related and other restructuring expense, net of tax (8) |
|
|
0.52 |
|
|
|
0.07 |
|
|
|
0.04 |
|
|
|
0.05 |
|
|
|
0.04 |
|
Effect to adjust for deferred tax remeasurement |
|
|
0.05 |
|
|
|
— |
|
|
|
— |
|
|
|
— |
|
|
|
— |
|
Effect to adjust for FDIC special assessment, net of tax |
|
|
— |
|
|
|
(0.01) |
|
|
|
— |
|
|
|
0.01 |
|
|
|
0.04 |
|
Adjusted net income per common share - Diluted (non-GAAP) |
|
$ |
2.15 |
|
|
$ |
1.93 |
|
|
$ |
1.90 |
|
|
$ |
1.79 |
|
|
$ |
1.58 |
|
|
|
|
|
|
|
|
|
|
|
|
|
|
|
|
|
|
|
|
|
|
Adjusted Return on Average Assets (non-GAAP) (2) |
|
|
|
|
|
|
|
|
|
|
|
|
|
|
|
|
|
|
|
|
Return on average assets (GAAP) |
|
|
0.56 |
% |
|
|
1.23 |
% |
|
|
1.25 |
% |
|
|
1.17 |
% |
|
|
1.03 |
% |
Effect to adjust for securities losses, net of tax |
|
|
1.13 |
% |
|
|
0.00 |
% |
|
|
— |
% |
|
|
— |
% |
|
|
— |
% |
Effect to adjust for gain on sale leaseback, net of transaction costs and tax |
|
|
(1.13) |
% |
|
|
— |
% |
|
|
— |
% |
|
|
— |
% |
|
|
— |
% |
Effect to adjust for PCL - Non-PCD loans and UFC, net of tax |
|
|
0.45 |
% |
|
|
— |
% |
|
|
— |
% |
|
|
— |
% |
|
|
— |
% |
Effect to adjust for merger, branch consolidation, severance related and other restructuring expense, net of tax (8) |
|
|
0.33 |
% |
|
|
0.04 |
% |
|
|
0.02 |
% |
|
|
0.05 |
% |
|
|
0.02 |
% |
Effect to adjust for deferred tax remeasurement |
|
|
0.04 |
% |
|
|
— |
% |
|
|
— |
% |
|
|
— |
% |
|
|
— |
% |
Effect to adjust for FDIC special assessment, net of tax |
|
|
— |
% |
|
|
(0.00) |
% |
|
|
— |
% |
|
|
0.00 |
% |
|
|
0.03 |
% |
Adjusted return on average assets (non-GAAP) |
|
|
1.38 |
% |
|
|
1.27 |
% |
|
|
1.27 |
% |
|
|
1.22 |
% |
|
|
1.08 |
% |
|
|
|
|
|
|
|
|
|
|
|
|
|
|
|
|
|
|
|
|
|
Adjusted Return on Average Common Equity (non-GAAP) (2) |
|
|
|
|
|
|
|
|
|
|
|
|
|
|
|
|
|
|
|
|
Return on average common equity (GAAP) |
|
|
4.29 |
% |
|
|
9.72 |
% |
|
|
9.91 |
% |
|
|
9.58 |
% |
|
|
8.36 |
% |
Effect to adjust for securities losses, net of tax |
|
|
8.61 |
% |
|
|
0.00 |
% |
|
|
— |
% |
|
|
— |
% |
|
|
— |
% |
Effect to adjust for gain on sale leaseback, net of transaction costs and tax |
|
|
(8.63) |
% |
|
|
— |
% |
|
|
— |
% |
|
|
— |
% |
|
|
— |
% |
Effect to adjust for PCL - Non-PCD loans and UFC, net of tax |
|
|
3.46 |
% |
|
|
— |
% |
|
|
— |
% |
|
|
— |
% |
|
|
— |
% |
Effect to adjust for merger, branch consolidation, severance related and other restructuring expense, net of tax (8) |
|
|
2.56 |
% |
|
|
0.34 |
% |
|
|
0.17 |
% |
|
|
0.33 |
% |
|
|
0.24 |
% |
Effect to adjust for deferred tax remeasurement |
|
|
0.27 |
% |
|
|
— |
% |
|
|
— |
% |
|
|
— |
% |
|
|
— |
% |
Effect to adjust for FDIC special assessment, net of tax |
|
|
— |
% |
|
|
(0.03) |
% |
|
|
— |
% |
|
|
0.03 |
% |
|
|
0.21 |
% |
Adjusted return on average common equity (non-GAAP) |
|
|
10.56 |
% |
|
|
10.03 |
% |
|
|
10.08 |
% |
|
|
9.94 |
% |
|
|
8.81 |
% |
|
|
|
|
|
|
|
|
|
|
|
|
|
|
|
|
|
|
|
|
|
Return on Average Common Tangible Equity (non-GAAP) (3) |
|
|
|
|
|
|
|
|
|
|
|
|
|
|
|
|
|
|
|
|
Return on average common equity (GAAP) |
|
|
4.29 |
% |
|
|
9.72 |
% |
|
|
9.91 |
% |
|
|
9.58 |
% |
|
|
8.36 |
% |
Effect to adjust for intangible assets |
|
|
4.70 |
% |
|
|
5.37 |
% |
|
|
5.72 |
% |
|
|
5.91 |
% |
|
|
5.27 |
% |
Return on average tangible equity (non-GAAP) |
|
|
8.99 |
% |
|
|
15.09 |
% |
|
|
15.63 |
% |
|
|
15.49 |
% |
|
|
13.63 |
% |
|
|
|
|
|
|
|
|
|
|
|
|
|
|
|
|
|
|
|
|
|
Adjusted Return on Average Common Tangible Equity (non-GAAP) (2) (3) |
|
|
|
|
|
|
|
|
|
|
|
|
|
|
|
|
|
|
|
|
Return on average common equity (GAAP) |
|
|
4.29 |
% |
|
|
9.72 |
% |
|
|
9.91 |
% |
|
|
9.58 |
% |
|
|
8.36 |
% |
Effect to adjust for securities losses, net of tax |
|
|
8.61 |
% |
|
|
0.00 |
% |
|
|
— |
% |
|
|
— |
% |
|
|
— |
% |
Effect to adjust for gain on sale leaseback, net of transaction costs and tax |
|
|
(8.63) |
% |
|
|
— |
% |
|
|
— |
% |
|
|
— |
% |
|
|
— |
% |
Effect to adjust for PCL - Non-PCD loans and UFC, net of tax |
|
|
3.46 |
% |
|
|
— |
% |
|
|
— |
% |
|
|
— |
% |
|
|
— |
% |
Effect to adjust for merger, branch consolidation, severance related and other restructuring expense, net of tax (8) |
|
|
2.56 |
% |
|
|
0.34 |
% |
|
|
0.18 |
% |
|
|
0.32 |
% |
|
|
0.25 |
% |
Effect to adjust for deferred tax remeasurement |
|
|
0.27 |
% |
|
|
— |
% |
|
|
— |
% |
|
|
— |
% |
|
|
— |
% |
Effect to adjust for FDIC special assessment, net of tax |
|
|
— |
% |
|
|
(0.03) |
% |
|
|
— |
% |
|
|
0.03 |
% |
|
|
0.21 |
% |
Effect to adjust for intangible assets, net of tax |
|
|
9.29 |
% |
|
|
5.53 |
% |
|
|
5.80 |
% |
|
|
6.12 |
% |
|
|
5.53 |
% |
Adjusted return on average common tangible equity (non-GAAP) |
|
|
19.85 |
% |
|
|
15.56 |
% |
|
|
15.89 |
% |
|
|
16.05 |
% |
|
|
14.35 |
% |
10
|
|
|
|
|
|
|
|
|
|
|
|
|
|
|
|
|
|
|
|
|
|
|
Three Months Ended |
|
|||||||||||||||||
|
|
Mar. 31, |
|
|
Dec. 31, |
|
|
Sep. 30, |
|
|
Jun. 30, |
|
|
Mar. 31, |
|
|||||
RECONCILIATION OF GAAP TO NON-GAAP |
|
2025 |
|
|
2024 |
|
|
2024 |
|
|
2024 |
|
|
2024 |
|
|||||
Adjusted Efficiency Ratio (non-GAAP) (4) |
|
|
|
|
|
|
|
|
|
|
|
|
|
|
|
|
|
|
|
|
Efficiency ratio |
|
|
60.97 |
% |
|
|
55.73 |
% |
|
|
56.58 |
% |
|
|
57.03 |
% |
|
|
58.48 |
% |
Effect to adjust for securities losses |
|
|
(13.35) |
% |
|
|
— |
% |
|
|
— |
% |
|
|
— |
% |
|
|
— |
% |
Effect to adjust for gain on sale leaseback, net of transaction costs |
|
|
13.39 |
% |
|
|
— |
% |
|
|
— |
% |
|
|
— |
% |
|
|
— |
% |
Effect to adjust for merger, branch consolidation, severance related and other restructuring expense (8) |
|
|
(10.77) |
% |
|
|
(1.45) |
% |
|
|
(0.78) |
% |
|
|
(1.36) |
% |
|
|
(1.08) |
% |
Effect to adjust for FDIC special assessment |
|
|
— |
% |
|
|
0.14 |
% |
|
|
— |
% |
|
|
(0.15) |
% |
|
|
(0.93) |
% |
Adjusted efficiency ratio |
|
|
50.24 |
% |
|
|
54.42 |
% |
|
|
55.80 |
% |
|
|
55.52 |
% |
|
|
56.47 |
% |
|
|
|
|
|
|
|
|
|
|
|
|
|
|
|
|
|
|
|
|
|
Tangible Book Value Per Common Share (non-GAAP) (3) |
|
|
|
|
|
|
|
|
|
|
|
|
|
|
|
|
|
|
|
|
Book value per common share (GAAP) |
|
$ |
84.99 |
|
|
$ |
77.18 |
|
|
$ |
77.42 |
|
|
$ |
74.16 |
|
|
$ |
72.82 |
|
Effect to adjust for intangible assets |
|
|
(34.92) |
|
|
|
(26.07) |
|
|
|
(26.16) |
|
|
|
(26.26) |
|
|
|
(26.34) |
|
Tangible book value per common share (non-GAAP) |
|
$ |
50.07 |
|
|
$ |
51.11 |
|
|
$ |
51.26 |
|
|
$ |
47.90 |
|
|
$ |
46.48 |
|
|
|
|
|
|
|
|
|
|
|
|
|
|
|
|
|
|
|
|
|
|
Tangible Equity-to-Tangible Assets (non-GAAP) (3) |
|
|
|
|
|
|
|
|
|
|
|
|
|
|
|
|
|
|
|
|
Equity-to-assets (GAAP) |
|
|
13.24 |
% |
|
|
12.70 |
% |
|
|
12.81 |
% |
|
|
12.42 |
% |
|
|
12.29 |
% |
Effect to adjust for intangible assets |
|
|
(4.99) |
% |
|
|
(3.91) |
% |
|
|
(3.94) |
% |
|
|
(4.03) |
% |
|
|
(4.08) |
% |
Tangible equity-to-tangible assets (non-GAAP) |
|
|
8.25 |
% |
|
|
8.79 |
% |
|
|
8.87 |
% |
|
|
8.39 |
% |
|
|
8.21 |
% |
Certain prior period information has been reclassified to conform to the current period presentation, and these reclassifications have no impact on net income or equity as previously reported.
Footnotes to tables:
| (1) | Includes loan accretion (interest) income related to the discount on acquired loans of $61.8 million, $2.9 million, $2.9 million, $4.4 million, and $4.3 million during the quarters ended March 31, 2025, December 31, 2024, September 30, 2024, June 30, 2024, and March 31, 2024, respectively. |
| (2) | Adjusted earnings, adjusted return on average assets, adjusted EPS, and adjusted return on average equity are non-GAAP measures and exclude the gains or losses on sales of securities, gain on sale leaseback, net of transaction costs, PCL on non-PCD loans and unfunded commitments, deferred tax asset remeasurement, merger, branch consolidation, severance related and other restructuring expense, and FDIC special assessments. Management believes that non-GAAP adjusted measures provide additional useful information that allows readers to evaluate the ongoing performance of the Company. Non-GAAP measures should not be considered as an alternative to any measure of performance or financial condition as promulgated under GAAP, and investors should consider the Company's performance and financial condition as reported under GAAP and all other relevant information when assessing the performance or financial condition of the Company. Non-GAAP measures have limitations as analytical tools, and investors should not consider them in isolation or as a substitute for analysis of the Company's results or financial condition as reported under GAAP. Adjusted earnings and the related adjusted return measures (non-GAAP) exclude the following from net income (GAAP) on an after-tax basis: (a) pre-tax merger, branch consolidation, severance related and other restructuring expense of $68.0 million, $6.5 million, $3.3 million, $5.8 million, and $4.5 million for the quarters ended March 31, 2025, December 31, 2024, September 30, 2024, June 30, 2024, and March 31, 2024, respectively; (b) pre-tax net securities losses of $(228,811) and $(50,000) for the quarters ended March 31, 2025 and December 31, 2024; (c) pre-tax (c) pre-tax gain on sale leaseback, net of transaction costs of $229,279 for the quarter ended March 31, 2025; (d) pre-tax FDIC special assessment of $(621,000), $619,000, and $3.9 million for the quarters ended December 31, 2024, June 30, 2024, and March 31, 2024, respectively; and (e) deferred tax asset remeasurement of $5.6 million for the quarter ended March 31, 2025. |
| (3) | The tangible measures are non-GAAP measures and exclude the effect of period end or average balance of intangible assets. The tangible returns on equity and common equity measures also add back the after-tax amortization of intangibles to GAAP basis net income. Management believes that these non-GAAP tangible measures provide additional useful information, particularly since these measures are widely used by industry analysts for companies with prior merger and acquisition activities. Non-GAAP measures should not be considered as an alternative to any measure of performance or financial condition as promulgated under GAAP, and investors should consider the Company's performance and financial condition as reported under GAAP and all other relevant information when assessing the performance or financial condition of the Company. Non-GAAP measures have limitations as analytical tools, and investors should not consider them in isolation or as a substitute for analysis of the Company's results or financial condition as reported under GAAP. The sections titled "Reconciliation of GAAP to Non-GAAP" provide tables that reconcile GAAP measures to non-GAAP. |
| (4) | Adjusted efficiency ratio is calculated by taking the noninterest expense excluding transaction costs on sale leaseback, merger, branch consolidation, severance related and other restructuring expenses and amortization of intangible assets, divided by net interest income and noninterest income excluding gains (losses) on sales of securities, net and gain on sale leaseback, net of transaction costs. The pre-tax amortization expenses of intangible assets were $23.8 million, $5.3 million, $5.3 million, $5.7 million, and $6.0 million for the quarters ended March 31, 2025, December 31, 2024, September 30, 2024, June 30, 2024, and March 31, 2024, respectively. |
| (5) | The dividend payout ratio is calculated by dividing total dividends paid during the period by the total net income for the same period. |
| (6) | March 31, 2025 ratios are estimated and may be subject to change pending the final filing of the FR Y-9C; all other periods are presented as filed. |
| (7) | Loan data excludes loans held for sale. |
| (8) | Includes pre-tax cyber incident costs of $111,000, $329,000, $56,000, $3.5 million and $4.4 million for the quarters ended March 31, 2025, December 31, 2024, September 30, 2024, June 30, 2024, and March 31, 2024, respectively. |
| (9) | SouthState acquired $13.1 billion of loans and $15.2 billion of deposits from the Independent acquisition. The total preliminary mark on the newly acquired loans was approximately $482 million, which included a rate mark of approximately $386 million and a credit mark on non-PCD loans of approximately $96 million. The preliminary premium for acquired fixed maturity time deposits was approximately $1.7 million. The Company also added $412.1 million in core deposit intangibles related to the Independent acquisition. |
11
Cautionary Statement Regarding Forward Looking Statements
Statements included in this communication, which are not historical in nature are intended to be, and are hereby identified as, forward-looking statements for purposes of the safe harbor provided by Section 27A of the Securities Act of 1933 and Section 21E of the Securities Exchange Act of 1934. Forward-looking statements are based on, among other things, management’s beliefs, assumptions, current expectations, estimates and projections about the financial services industry, the economy and SouthState. Words and phrases such as “may,” “approximately,” “continue,” “should,” “expects,” “projects,” “anticipates,” “is likely,” “look ahead,” “look forward,” “believes,” “will,” “intends,” “estimates,” “strategy,” “plan,” “could,” “potential,” “possible” and variations of such words and similar expressions are intended to identify such forward-looking statements.
SouthState cautions readers that forward looking statements are subject to certain risks, uncertainties and assumptions that are difficult to predict with regard to, among other things, timing, extent, likelihood and degree of occurrence, which could cause actual results to differ materially from anticipated results. Such risks, uncertainties and assumptions, include, among others, the following: (1) economic volatility risk, including as a result of monetary, fiscal, and trade law policies, such as tariffs, and inflation, potentially resulting in higher rates, deterioration in the credit markets, greater than expected noninterest expenses, excessive loan losses, or on the other hand lower rates, which also may have other negative consequences, which risks could be exacerbated by potential negative economic developments resulting from federal spending cuts and/or one or more federal budget-related impasses or actions; (2) risks related to the ability of the Company to pursue its strategic plans which depend upon certain growth goals in our lines of business; (3) risks related to the merger and integration of SouthState and Independent including, among others, (i) the risk that the cost savings and any revenue synergies from the merger may not be fully realized or may take longer than anticipated to be realized, (ii) the risk that the integration of Independent’s operations into SouthState’s operations will be materially delayed or will be more costly or difficult than expected or that the parties are otherwise unable to successfully integrate Independent’s businesses into SouthState’s businesses, (iii) the amount of the costs, fees, expenses and charges related to the merger, and (iv) reputational risk and the reaction of each company's customers, suppliers, employees or other business partners to the merger; (4) risks relating to the ability to retain our culture and attract and retain qualified people as we grow and are located in new markets, and being able to offer competitive salaries and benefits, including flexibility of working remotely or in the office; (5) deposit attrition, client loss or revenue loss following completed mergers or acquisitions that may be greater than anticipated; (6) credit risks associated with an obligor’s failure to meet the terms of any contract with the Bank or otherwise fail to perform as agreed under the terms of any loan-related document; (7) interest rate risk primarily resulting from our inability to effectively manage the risk, and their impact on the Bank’s earnings, including from the correspondent and mortgage divisions, housing demand, the market value of the Bank’s loan and securities portfolios, and the market value of SouthState’s equity; (8) a decrease in our net interest income due to the interest rate environment; (9) liquidity risk affecting the Bank’s ability to meet its obligations when they come due; (10) unexpected outflows of uninsured deposits may require us to sell investment securities at a loss; (11) potential deterioration in real estate values; (12) the loss of value of our investment portfolio could negatively impact market perceptions of us and could lead to deposit withdrawals; (13) price risk focusing on changes in market factors that may affect the value of traded instruments in “mark-to-market” portfolios; (14) transaction risk arising from problems with service or product delivery; (15) the impact of increasing digitization of the banking industry and movement of customers to on-line platforms, and the possible impact on the Bank’s results of operations, customer base, expenses, suppliers and operations; (16) controls and procedures risk, including the potential failure or circumvention of our controls and procedures or failure to comply with regulations related to controls and procedures; (17) volatility in the financial services industry (including failures or rumors of failures of other depository institutions), along with actions taken by governmental agencies to address such turmoil, could affect the ability of depository institutions, including us, to attract and retain depositors and to borrow or raise capital; (18) the impact of competition with other financial institutions, including deposit and loan pricing pressures and the resulting impact, including as a result of compression to net interest margin; (19) compliance risk involving risk to earnings or capital resulting from violations of or nonconformance with laws, rules, regulations, prescribed practices, or ethical standards, and contractual obligations regarding data privacy and cybersecurity; (20) regulatory change risk resulting from new laws, rules, regulations, accounting principles, proscribed practices or ethical standards, including, without limitation, the possibility that regulatory agencies may require higher levels of capital above the current regulatory-mandated minimums and including the impact of special FDIC assessments, the Consumer Financial Protection Bureau regulations or other guidance, and the possibility of changes in accounting standards, policies, principles and practices; (21) risks related to the legal, regulatory, and supervisory environment, including changes in financial services legislation, regulation, policies, or government officials or other personnel; (22) strategic risk resulting from adverse business decisions or improper implementation of business decisions; (23) reputation risk that adversely affects earnings or capital arising from negative public opinion including the effects of social media on market perceptions of us and banks generally; (24) cybersecurity risk related to the dependence of SouthState on internal computer systems and the technology of outside service providers, as well as the potential impacts of internal or external security breaches, which may subject the Company to potential business disruptions or financial losses resulting from deliberate attacks or unintentional events; (25) reputational and operational risks associated with environment, social and governance (ESG) matters, including the impact of changes in federal and state laws, regulations and guidance relating to climate change; (26) excessive loan losses; (27) reputational risk and possible higher than estimated reduced revenue from previously announced or proposed regulatory changes in the Bank’s consumer programs and products; (28) operational, technological, cultural, regulatory, legal, credit and other risks associated with the exploration, consummation and integration of potential future acquisitions, whether involving stock or cash consideration; (29) catastrophic events such as hurricanes, tornados, earthquakes, floods or other natural or human disasters, including public health crises and infectious disease outbreaks, as well as any government actions in response to such events, and the related disruption to local, regional and global economic activity and financial markets, and the impact that any of the foregoing may have on SouthState and its customers and other constituencies; (30) geopolitical risk from terrorist activities and armed conflicts that may result in economic and supply disruptions, and loss of market and consumer confidence; (31) the risks of fluctuations in market prices for SouthState common stock that may or may not reflect economic condition or performance of SouthState; (32) the payment of dividends on SouthState common stock, which is subject to legal and regulatory limitations as well as the discretion of the board of directors of SouthState, SouthState’s performance and other factors; (33) ownership dilution risk associated with potential acquisitions in which SouthState’s stock may be issued as consideration for an acquired company; and (34) other factors that may affect future results of SouthState, as disclosed in SouthState’s Annual Report on Form 10-K, Quarterly Reports on Form 10-Q, and Current Reports on Form 8-K, filed by SouthState with the U.S. Securities and Exchange Commission (“SEC”) and available on the SEC’s website at http://www.sec.gov, any of which could cause actual results to differ materially from future results expressed, implied or otherwise anticipated by such forward-looking statements.
All forward-looking statements speak only as of the date they are made and are based on information available at that time. SouthState does not undertake any obligation to update or otherwise revise any forward-looking statements, whether as a result of new information, future events, or otherwise, except as required by federal securities laws. As forward-looking statements involve significant risks and uncertainties, caution should be exercised against placing undue reliance on such statements.
12
|
Earnings Call 1Q 2025 April 25, 2025 |
|
Statements included in this communication, which are not historical in nature are intended to be, and are hereby identified as, forward-looking statements for purposes of the safe harbor provided by Section 27A of the Securities Act of 1933 and Section 21E of the Securities Exchange Act of 1934. Forward-looking statements are based on, among other things, management’s beliefs, assumptions, current expectations, estimates and projections about the financial services industry, the economy and SouthState. Words and phrases such as “may,” “approximately,” “continue,” “should,” “expects,” “projects,” “anticipates,” “is likely,” “look ahead,” “look forward,” “believes,” “will,” “intends,” “estimates,” “strategy,” “plan,” “could,” “potential,” “possible” and variations of such words and similar expressions are intended to identify such forward-looking statements. SouthState Corporation (“SouthState” or the “Company”) cautions readers that forward looking statements are subject to certain risks, uncertainties and assumptions that are difficult to predict with regard to, among other things, timing, extent, likelihood and degree of occurrence, which could cause actual results to differ materially from anticipated results. Such risks, uncertainties and assumptions, include, among others, the following: (1) economic volatility risk, including as a result of monetary, fiscal, and trade law policies, such as tariffs, and inflation, potentially resulting in higher rates, deterioration in the credit markets, greater than expected noninterest expenses, excessive loan losses, or on the other hand lower rates, which also may have other negative consequences, which risks could be exacerbated by potential negative economic developments resulting from federal spending cuts and/or one or more federal budget-related impasses or actions; (2) risks related to the ability of the Company to pursue its strategic plans which depend upon certain growth goals in our lines of business; (3) risks related to the merger and integration of SouthState and Independent Bank Group, Inc. (“Independent” or “IBTX”) including, among others, (i) the risk that the cost savings and any revenue synergies from the merger may not be fully realized or may take longer than anticipated to be realized, (ii) the risk that the integration of Independent’s operations into SouthState’s operations will be materially delayed or will be more costly or difficult than expected or that the parties are otherwise unable to successfully integrate Independent’s businesses into SouthState’s businesses, (iii) the amount of the costs, fees, expenses and charges related to the merger, and (iv) reputational risk and the reaction of each company's customers, suppliers, employees or other business partners to the merger; (4) risks relating to the ability to retain our culture and attract and retain qualified people as we grow and are located in new markets, and being able to offer competitive salaries and benefits, including flexibility of working remotely or in the office; (5) deposit attrition, client loss or revenue loss following completed mergers or acquisitions that may be greater than anticipated; (6) credit risks associated with an obligor’s failure to meet the terms of any contract with SouthState Bank, N.A. (the “Bank”) or otherwise fail to perform as agreed under the terms of any loan-related document; (7) interest rate risk primarily resulting from our inability to effectively manage the risk, and their impact on the Bank’s earnings, including from the correspondent and mortgage divisions, housing demand, the market value of the Bank’s loan and securities portfolios, and the market value of SouthState’s equity; (8) a decrease in our net interest income due to the interest rate environment; (9) liquidity risk affecting the Bank’s ability to meet its obligations when they come due; (10) unexpected outflows of uninsured deposits may require us to sell investment securities at a loss; (11) potential deterioration in real estate values; (12) the loss of value of our investment portfolio could negatively impact market perceptions of us and could lead to deposit withdrawals; (13) price risk focusing on changes in market factors that may affect the value of traded instruments in “mark-to-market” portfolios; (14) transaction risk arising from problems with service or product delivery; (15) the impact of increasing digitization of the banking industry and movement of customers to on-line platforms, and the possible impact on the Bank’s results of operations, customer base, expenses, suppliers and operations; (16) controls and procedures risk, including the potential failure or circumvention of our controls and procedures or failure to comply with regulations related to controls and procedures; (17) volatility in the financial services industry (including failures or rumors of failures of other depository institutions), along with actions taken by governmental agencies to address such turmoil, could affect the ability of depository institutions, including us, to attract and retain depositors and to borrow or raise capital; (18) the impact of competition with other financial institutions, including deposit and loan pricing pressures and the resulting impact, including as a result of compression to net interest margin; (19) compliance risk involving risk to earnings or capital resulting from violations of or nonconformance with laws, rules, regulations, prescribed practices, or ethical standards, and contractual obligations regarding data privacy and cybersecurity; (20) regulatory change risk resulting from new laws, rules, regulations, accounting principles, proscribed practices or ethical standards, including, without limitation, the possibility that regulatory agencies may require higher levels of capital above the current regulatory-mandated minimums and including the impact of special FDIC assessments, the Consumer Financial Protection Bureau regulations or other guidance, and the possibility of changes in accounting standards, policies, principles and practices; (21) risks related to the legal, regulatory, and supervisory environment, including changes in financial services legislation, regulation, policies, or government officials or other personnel; (22) strategic risk resulting from adverse business decisions or improper implementation of business decisions; (23) reputation risk that adversely affects earnings or capital arising from negative public opinion including the effects of social media on market perceptions of us and banks generally; (24) cybersecurity risk related to the dependence of SouthState on internal computer systems and the technology of outside service providers, as well as the potential impacts of internal or external security breaches, which may subject the Company to potential business disruptions or financial losses resulting from deliberate attacks or unintentional events; (25) reputational and operational risks associated with environment, social and governance (ESG) matters, including the impact of changes in federal and state laws, regulations and guidance relating to climate change; (26) excessive loan losses; (27) reputational risk and possible higher than estimated reduced revenue from previously announced or proposed regulatory changes in the Bank’s consumer programs and products; (28) operational, technological, cultural, regulatory, legal, credit and other risks associated with the exploration, consummation and integration of potential future acquisitions, whether involving stock or cash consideration; (29) catastrophic events such as hurricanes, tornados, earthquakes, floods or other natural or human disasters, including public health crises and infectious disease outbreaks, as well as any government actions in response to such events, and the related disruption to local, regional and global economic activity and financial markets, and the impact that any of the foregoing may have on SouthState and its customers and other constituencies; (30) geopolitical risk from terrorist activities and armed conflicts that may result in economic and supply disruptions, and loss of market and consumer confidence; (31) the risks of fluctuations in market prices for SouthState common stock that may or may not reflect economic condition or performance of SouthState; (32) the payment of dividends on SouthState common stock, which is subject to legal and regulatory limitations as well as the discretion of the board of directors of SouthState, SouthState’s performance and other factors; (33) ownership dilution risk associated with potential acquisitions in which SouthState’s stock may be issued as consideration for an acquired company; and (34) other factors that may affect future results of SouthState, as disclosed in SouthState’s Annual Report on Form 10-K, Quarterly Reports on Form 10-Q, and Current Reports on Form 8-K, filed by SouthState with the U.S. Securities and Exchange Commission (“SEC”) and available on the SEC’s website at http://www.sec.gov, any of which could cause actual results to differ materially from future results expressed, implied or otherwise anticipated by such forward-looking statements. All forward-looking statements speak only as of the date they are made and are based on information available at that time. SouthState does not undertake any obligation to update or otherwise revise any forward-looking statements, whether as a result of new information, future events, or otherwise, except as required by federal securities laws. As forward-looking statements involve significant risks and uncertainties, caution should be exercised against placing undue reliance on such statements. CAUTIONARY NOTE REGARDING FORWARD LOOKING STATEMENTS |
|
Ranked #14 by S&P Global Greenwich Excellence & Best Brand Awards for Small Business Banking from Coalition Greenwich $65 B Assets $48 B Loans Enhanced Scale Through IBTX Partnership 343 Branch Locations 12 of 15 Fastest Growing U.S. MSAs(2) #5 Largest Regional Bank in the South(3) Dominant Southern Franchise $55 B Deposits $7.4 B Market Cap 17 SOUTHSTATE CORPORATION OVERVIEW (1) Enhanced Scale Through IBTX Partnership $65B Assets $47B Loans $53B Deposits $9B Market Cap 342 Branch Locations 12 of 15 Fastest Growing U.S. MSAs(3) #5 Largest Regional Bank in the South(4) (1) ~ (4) For end note descriptions, see Earnings Presentation End Notes starting on slide 36. PROJECTED POPULATION GROWTH(2) Fastest-growing 20% of MSAs highlighted in blue 3 |
|
SOUTHSTATE’S COMPETITIVE ADVANTAGE 4 GEOGRAPHY • Regulatory sweet spot: $60 – $80 Billion • True alternative to the largest banks – for bankers and for clients • Large enough to invest in technology and capital markets • Local market leadership with income statement control and responsibility • Creating alignment and accountability across all areas of the bank • “Shoot where the ducks are flying” • Fastest growing markets in America SCALE BUSINESS MODEL |
|
Local Market Leadership Our business model supports the unique character of the communities we serve and encourages decision making by the banker that is closest to the customer. Long-Term Horizon We think and act like owners and measure success over entire economic cycles. We prioritize soundness before short-term profitability and growth. Remarkable Experiences We will make our customers’ lives better by anticipating their needs and responding with a sense of urgency. Each of us has the freedom, authority and responsibility to do the right thing for our customers. Meaningful and Lasting Relationships We communicate with candor and transparency. The relationship is more valuable than the transaction. Greater Purpose We enable our team members to pursue their ultimate purpose in life—their personal faith, their family, their service to community. The WHAT The HOW Guiding Principles Core Values The WHY To invest in the entrepreneurial spirit, pursue excellence and inspire a greater purpose. 5 |
|
POSITIONED FOR THE FUTURE IN THE BEST GROWTH MARKETS IN AMERICA 6 The combined GDP of SouthState’s 8 state branch footprint would represent the world’s third largest economy. For end note descriptions, see Earnings Presentation End Notes starting on slide 36. $2.0B $2.1B $1.0B $0.6B $3.2B $2.1B $10.8B $12.3B $7.6B $6.9B $11.2B $6.6B Loans Deposits $3.7B $3.8B $9.1B $9.5B $3.6 $3.9 $4.1 $4.7 $8.3 $18.3 $29.2 UK India Japan Germany SSB Footprint China US GDP ($ in trillions) $329 $357 $563 $781 $857 $899 $1,739 $2,758 AL SC CO VA NC GA FL TX GDP by State ($ in billions) |
|
2.4% 2.7% 3.5% 3.5% 4.1% 4.8% 5.6% 6.0% 6.0% U.S. VA AL CO GA NC TX SC FL Projected Population Growth (2025-2030) Sources: U.S. Census Bureau (Net Domestic Migration) and S&P Global (Projected Population Growth) PANDEMIC ACCELERATES POPULATION MIGRATION TO THE SOUTH 7 |
|
Quarterly Results |
|
PPNR PER DILUTED SHARE (1) (1) For end note descriptions, Earnings Presentation End Notes starting on slide 36. 9 $2.28 $2.39 $2.38 $2.59 $2.84 $2.00 $2.50 $3.00 1Q24 2Q24 3Q24 4Q24 1Q25 |
|
1Q25 REPORTED VS ADJUSTED NET INCOME & EPS | RECONCILEMENT Dollars in millions, except for numbers of weighted-average common shares and per share data; Amounts may not total due to rounding. (1) For end note descriptions, see Earnings Presentation End Notes starting on slide 36. 10 Reported Sale-Leaseback Securities Restructuring Merger & Other Restructuring Related Adjusted(1) Net Interest Income $ 544,547 $ 544,547 Plus: Non-Interest Income 86,088 $ (229,279) $ 228,811 85,620 Less: Non-Interest Expense (408,826) $ 68,006 (340,820) Pre-Provision Net Revenue (“PPNR”) 221,809 (229,279) 228,811 68,006 289,347 Less: PCL (100,562) 92,084 (8,478) Net Income before Tax 121,247 (229,279) 228,811 160,090 280,869 Less: Tax (32,167) 50,275 (50,172) (29,523) (61,587) Net Income $ 89,080 $ (179,004) $ 178,639 $ 130,567 $ 219,282 Earnings per Share Basic weighted-average common shares 101,409,624 Diluted weighted-average common shares 101,828,600 Earnings per common share - Basic $ 0.88 $ (1.77) $ 1.76 $ 1.29 $ 2.16 Earnings per common share - Diluted $ 0.87 $ (1.76) $ 1.75 $ 1.28 $ 2.15 |
|
KEY RATIOS FROM IBTX MODELING PROJECTIONS VS. 1Q25 ACTUAL (1) Projected CRE ratio at Independent announcement does not include purchase accounting adjustments. 11 $50.07 $46.07 1Q25 Actual 1Q25 Projection at Merger Announcement TBV/Share 8.2% 7.5% 1Q25 Actual 1Q25 Projection at Merger Announcement TCE Ratio 11.0% 10.4% 1Q25 Actual 1Q25 Projection at Merger Announcement CET1 Ratio 283.0% 285.0% 1Q25 Actual 1Q25 Projection at Merger Announcement (1) CRE Ratio |
|
HIGHLIGHTS | LINKED QUARTER Dollars in millions, except per share data (1) For end note descriptions, see Earnings Presentation End Notes starting on slide 36. 12 4Q24 1Q25 GAAP Net Income $ 144.2 $ 89.1 EPS (Diluted) $ 1.87 $ 0.87 Return on Average Assets 1.23 % 0.56 % Non-GAAP(1) Return on Average Tangible Common Equity 15.1 % 9.0 % Non-GAAP, Adjusted(1) Net Income $ 148.8 $ 219.3 EPS (Diluted) $ 1.93 $ 2.15 Return on Average Assets 1.27 % 1.38 % Return on Average Tangible Common Equity 15.6 % 19.9 % |
|
QUARTERLY HIGHLIGHTS | 1Q 2025 (1) & (2) For end note descriptions, see Earnings Presentation End Notes starting on slide 36. 13 • Completed the acquisition of Independent Bank Group, Inc. (“Independent”) on January 1, 2025 • Executed sale leaseback transaction during 1Q25, resulting in a net gain of $229 million • Restructured $1.8 billion of securities during 1Q25, resulting in a $229 million loss • Reported Diluted Earnings per Share (“EPS”) of $0.87; adjusted Diluted EPS (non-GAAP)(1) of $2.15 • Pre-Provision Net Revenue (“PPNR”)(non-GAAP)(2) of $289.3 million • Year-over-year PPNR/share growth (non-GAAP)(2) of 25% • Loans decreased by $263 million, or 2% annualized, and deposits increased by $68 million, or 1% annualized, excluding the effects of the acquisition date balances acquired from Independent(3) |
|
$343.9 $350.3 $351.5 $369.8 $544.5 3.41% 3.44% 3.40% 3.48% 3.85% 3.00% 3.25% 3.50% 3.75% 4.00% $200 $250 $300 $350 $400 $450 $500 $550 $600 1Q24 2Q24 3Q24 4Q24 1Q25 Net Interest Income Net Interest Margin, TE (1) NET INTEREST MARGIN (TE) (1) Dollars in millions (1) For end note descriptions, see Earnings Presentation End Notes starting on slide 36. 14 |
|
LOAN PRODUCTION VS LOAN GROWTH $2,181 $2,369 $1,459 $1,233 $1,352 $2,049 $1,648 $1,932 $2,124 $519 $841 $480 $372 $279 $568 $314 $355 $(263) $(500) $— $500 $1,000 $1,500 $2,000 $2,500 $3,000 $3,500 1Q23 2Q23 3Q23 4Q23 1Q24 2Q24 3Q24 4Q24 1Q25 Loan Production Loan Portfolio Growth Dollars in millions (1) & (2) For end note descriptions, see Earnings Presentation End Notes starting on slide 36. 15 (1) (2) (1) |
|
Balance Sheet |
|
1Q24 2Q24 3Q24 4Q24 1Q25 DDA / Total Deposits 28% 28% 28% 27% 26% LOAN AND DEPOSIT TRENDS $32.7 $33.2 $33.5 $33.9 $46.8 $- $0.2B $0.4B $0.6B $0.8B $1.0B $1.2B $— $6 $12 $18 $24 $30 $36 $42 $48 $54 $60 1Q24 2Q24 3Q24 4Q24 1Q25 Loans (1) Dollars in billions Amounts may not total due to rounding. (1) For end note descriptions, see Earnings Presentation End Notes starting on slide 36. 17 $10.5 $10.4 $10.4 $10.2 $13.8 $7.9 $7.5 $7.6 $8.2 $12.0 $14.5 $14.6 $15.1 $15.5 $20.4 $4.3 $4.6 $4.7 $4.2 $7.2 $37.2B $37.1B $37.6B $38.1B $53.3B $— $6 $12 $18 $24 $30 $36 $42 $48 $54 $60 Deposits Noninterest-bearing Checking ("DDA") Interest-bearing Checking MMA & Savings Time Deposits |
|
Investor CRE (2) 36% Consumer RE 21% Owner-Occupied CRE 16% C&I 17% CDL (1) 8% Cons / Other 2% TOTAL LOAN PORTFOLIO 18 Data as of March 31, 2025 Loan portfolio balances, average balances or percentage exclude loans held for sale; Amounts may not total due to rounding. (1)~(3) For end note descriptions, see Earnings Presentation End Notes starting on slide 36. Loan Type No. of Loans Balance Avg. Loan Balance Investor CRE 11,837 $ 16.8B $ 1,448,800 Consumer RE 49,453 9.8B 197,900 Owner-Occupied CRE 9,149 7.4B 810,900 C & I 21,860 8.1B 370,200 Constr., Dev. & Land 4,236 3.5B 838,600 Cons / Other(3) 50,368 1.0B 20,400 Total(3) 146,903 $ 46.7B $ 318,000 Loan Relationships Top 10 Represents ~ 2% of total loans Top 20 Represents ~ 4% of total loans Loans by Type Total Loans $46.8 Billion |
|
6.11% 6.25% 6.90% Peer Loan Yield Median SSB Loan Yield SSB New Loan Production Yield 1Q25 LOAN YIELD COMPARISON 19 • Following purchase accounting marks to bring IBTX loans to market rates, current portfolio yield is near peer median • 1Q25 new loan production yield exceeds current portfolio yield • Accretion from early payoffs represents 0.06% of 1Q25 loan yield (1) 1Q25 MRQs available as of April 24, 2025; Peers as disclosed in the most recent SSB proxy statement. (1) 19 |
|
PREMIUM CORE † DEPOSIT FRANCHISE Noninterest-bearing Checking $13.8B Interest-bearing Checking $12.0B Savings $2.9B Money Market $17.4B Time Deposits $7.2B 20 Data as of March 31, 2025 Dollars in billions except for average checking balances; Amounts may not total due to rounding. † & (1) For end note descriptions, see Earnings Presentation End Notes starting on slide 36. Total Deposits $53.3 Billion Deposits by Type 1.89% 2.16% 1.00% 1.25% 1.50% 1.75% 2.00% 2.25% 2.50% SSB Peer Average Total Cost of Deposits 1Q25 (1) |
|
Credit |
|
0.53% 0.60% 0.57% 0.63% 0.60% —% 0.25% 0.50% 0.75% 1.00% 1Q24 2Q24 3Q24 4Q24 1Q25 Nonperforming Assets to Loans & OREO 0.86% 0.91% 0.92% 1.15% 1.41% 2.20% 2.36% 2.36% 2.86% 2.84% —% 1.00% 2.00% 3.00% 4.00% 1Q24 2Q24 3Q24 4Q24 1Q25 Criticized & Classified Asset Trends Special Mention / Assets Substandard / Assets ASSET QUALITY METRICS & LOAN LOSS RESERVE Dollars in millions (1) Excluding acquisition date charge-offs of $39.4 million recorded in connection with the Independent merger, to conform with the Company’s charge-off policies and practices. (2) Unamortized discount on acquired loans was $457 million, $37 million, $40 million, $43 million, $47 million, $51 million, $55 million, $59 million, and $65 million for the quarters ended March 31, 2025, December 31, 2024, September 30, 2024, June 30, 2024, March 31, 2024, December 31, 2023, September 30, 2023, June 30, 2023, and March 31, 2023, respectively. 22 0.03% 0.05% 0.07% 0.06% 0.04% —% 0.25% 0.50% 1Q24 2Q24 3Q24 4Q24 1Q25 Net Charge-Offs to Loans $371 $427 $448 $457 $470 $472 $468 $465 $624 $85 $63 $62 $56 $53 $50 $42 $45 $62 1.48% 1.56% 1.59% 1.58% 1.60% 1.57% 1.52% 1.51% 1.47% 1.00% 1.40% 1.80% 2.20% $150 $300 $450 $600 $750 1Q23 2Q23 3Q23 4Q23 1Q24 2Q24 3Q24 4Q24 1Q25 $ in millions Total ACL(2) plus Reserve for Unfunded Commitments Total ACL Reserve for Unfunded Commitments % of Total Loans (1) |
|
Capital |
|
CAPITAL RATIOS 4Q24 1Q25(2) Tangible Common Equity(1) 8.8 % 8.2 % Tier 1 Leverage 10.0 % 8.9 % Tier 1 Common Equity 12.6 % 11.0 % Tier 1 Risk-Based Capital 12.6 % 11.0 % Total Risk-Based Capital 15.0 % 13.7 % Bank CRE Concentration Ratio 219 % 283 % Bank CDL Concentration Ratio 41 % 52 % (1)&(2) For end note descriptions, see Earnings Presentation End Notes starting on slide 36. 24 |
|
Appendix |
|
CURRENT & HISTORICAL 5 - QTR PERFORMANCE (1) 83% 82% 82% 82% 86% 17% 18% 18% 18% 14% $416M $426M $427M $451M $631M 4.46% 2.5% 3.0% 3.5% 4.0% 4.5% 5.0% 0% 20% 40% 60% 80% 100% 1Q24 2Q24 3Q24 4Q24 1Q25 Revenue Composition NIM, TE / Revenue Noninterest Income / Revenue Avg. 10-year UST Total Revenue Dollars in millions (1)&(2) For end note descriptions, see Earnings Presentation End Notes starting on slide 36. $72 $75 $75 $81 $86 0.64% 0.67% 0.65% 0.69% 0.54% 0.2% 0.3% 0.4% 0.5% 0.6% 0.7% 0.8% 0.9% 1.0% $— $20 $40 $60 $80 $100 1Q24 2Q24 3Q24 4Q24 1Q25 $ in millions Noninterest Income Noninterest Income Noninterest Income / Avg. Assets $344 $350 $352 $370 $545 3.41% 3.44% 3.40% 3.48% 3.85% 2.0% 2.5% 3.0% 3.5% 4.0% $200 $300 $400 $500 $600 1Q24 2Q24 3Q24 4Q24 1Q25 $ in millions Net Interest Margin (“NIM”, TE) NIM, TE ($) NIM, TE (%) 58% 56% 57% 56% 57% 56% 56% 61% 54% 50% —% 15% 30% 45% 60% 75% 90% 1Q24 2Q24 3Q24 4Q24 1Q25 Efficiency Ratio Efficiency Ratio Adjusted Efficiency Ratio 26 (2) |
|
$(10.3) $(11.4) $(7.5) $(7.4) $(7.2) $14.6 $16.3 $17.4 $20.9 $16.7 ($10.0) ($5.0) $0.0 $5.0 $10.0 $15.0 $20.0 $25.0 $30.0 $35.0 $(15) $(10) $(5) $— $5 $10 $15 $20 $25 $30 $35 1Q24 2Q24 3Q24 4Q24 1Q25 $ in millions Correspondent Revenue Breakout ARC Revenues, gross Interest on VM FI Revenues Operational Revenues Total Revenues, gross • Provides capital markets hedging (ARC), fixed income sales, international, clearing and other services to over 1,300 financial institutions across the country CORRESPONDENT BANKING DIVISION 27 1,302 Financial Institution Clients (1) For end note descriptions, see Earnings Presentation End Notes starting on slide 36. Interest on centrally-cleared Variation Margin ("VM")(1) (10,280) (11,407) (7,488) (7,350) (7,170) Total Correspondent Banking and Capital Markets Income $ 4,311 $ 4,860 $ 9,893 $ 13,555 $ 9,545 |
|
Dollars in billions, unless otherwise noted; data as of March 31, 2025 Amounts may not total due to rounding. † , (1)~(4) For end note descriptions, see Earnings Presentation End Notes starting on slide 36. 2.44% 2.48% 2.42% 2.50% 2.99% 1.00% 1.40% 1.80% 2.20% 2.60% 3.00% 3.40% 1Q24 2Q24 3Q24 4Q24 1Q25 Investment Securities Yield(2) HIGH QUALITY INVESTMENT PORTFOLIO 79% 9% 11% 0.3% Investment Portfolio† Composition Agency MBS(1) Treasury, Agency & SBA Municipal Corporates Type AFS HTM Balance Duration (yrs)(3,4) Balance Duration (yrs)(4) Agency MBS(1) $4.4B 3.8 $2.0B 5.9 Municipal 0.9B 8.5 — — Treasury, Agency & SBA 0.6B 1.4 0.2B 5.4 Corporates 0.03B 1.6 — — Total $5.9B 4.4 $2.2B 5.8 28 Total Investment Portfolio† $8.0 Billion Securities Sold • $1.8 billion • 2.23% book yield • $229 million realized loss Securities Purchased • $1.6 billion • 5.11% book yield Impact Improved Yield Shortened Duration Enhanced Liquidity Reduced Risk Weight Securities Repositioning in 1Q25 |
|
NON - GAAP RECONCILIATIONS – RETURN ON AVG. TANGIBLE COMMON EQUITY Dollars in thousands The tangible measures are non-GAAP measures and exclude the effect of period end or average balance of intangible assets; the tangible returns on equity and common equity measures also add back the after-tax amortization of intangibles to GAAP basis net income. 29 Return on Average Tangible Equity 4Q24 1Q25 Net income (GAAP) $ 144,178 $ 89,080 Plus: Amortization of intangibles 5,326 23,831 Effective tax rate 23 % 22 % Amortization of intangibles, net of tax 4,099 18,606 Net income plus after-tax amortization of intangibles (non-GAAP) $ 148,277 $ 107,686 Average shareholders' common equity $ 5,901,626 $ 8,418,112 Less: Average intangible assets 1,992,972 3,558,378 Average tangible common equity $ 3,908,654 $ 4,859,734 Return on Average Tangible Common Equity (Non-GAAP) 15.1% 9.0% |
|
NON - GAAP RECONCILIATIONS – ADJUSTED NET INCOME & ADJUSTED EARNINGS PER SHARE (“EPS”) Dollars in thousands, except for per share data (1) Includes pre-tax cyber incident costs of $111,000 and $329,000 for the quarters ended March 31, 2025 and December 31, 2024, respectively. 30 Adjusted Net Income 4Q24 1Q25 Net income (GAAP) $ 144,178 $ 89,080 Plus: Securities losses, net of tax 38 178,639 Gain on sale leaseback, net of transaction costs and tax — (179,004) PCL - NonPCD loans and UFC, net of tax — 71,892 Deferred tax asset remeasurement — 5,581 Merger, branch consolidation, severance related and other expense, net of tax (1) 5,026 53,094 FDIC special assessment, net of tax (478) — Adjusted Net Income (Non-GAAP) $ 148,764 $ 219,282 Adjusted EPS 4Q24 1Q25 Diluted weighted-average common shares 76,958 101,829 Adjusted net income (non-GAAP) $ 148,764 $ 219,282 Adjusted EPS, Diluted (Non-GAAP) $ 1.93 $ 2.15 |
|
NON - GAAP RECONCILIATIONS – ADJUSTED RETURN ON AVG. ASSETS & AVG. TANGIBLE COMMON EQUITY Dollars in thousands The tangible measures are non-GAAP measures and exclude the effect of period end or average balance of intangible assets; the tangible returns on equity and common equity measures also add back the after-tax amortization of intangibles to GAAP basis net income. 31 Dollars in thousands, except for per share data Adjusted Return on Average Assets 4Q24 1Q25 Adjusted net income (non-GAAP) $ 148,764 $ 219,282 Total average assets 46,509,766 64,283,426 Adjusted Return on Average Assets (Non-GAAP) 1.27% 1.38% Adjusted Return on Average Tangible Common Equity 4Q24 1Q25 Adjusted net income (non-GAAP) $ 148,764 $ 219,282 Plus: Amortization of intangibles, net of tax 4,099 18,606 Adjusted net income plus after-tax amortization of intangibles (non-GAAP) $ 152,863 $ 237,888 Average tangible common equity $ 3,908,654 $ 4,859,734 Adjusted Return on Average Tangible Common Equity (Non-GAAP) 15.56% 19.85% |
|
NON - GAAP RECONCILIATIONS – NET INTEREST MARGIN Dollars in thousands 32 Dollars in thousands, except for per share data Net Interest Margin - Tax Equivalent (Non-GAAP) 1Q24 2Q24 3Q24 4Q24 1Q25 Net interest income (GAAP) $ 343,936 $ 350,259 $ 351,480 $ 369,779 $ 544,547 Tax equivalent adjustments 528 631 486 547 784 Net interest income (tax equivalent) (Non-GAAP) $ 344,464 $ 350,890 $ 351,966 $ 370,326 $ 545,331 Average interest earning assets $ 40,657,176 $ 41,011,662 $ 41,223,980 $ 42,295,376 $57,497,453 Net Interest Margin - Tax Equivalent (Non-GAAP) 3.41% 3.44% 3.40% 3.48% 3.85% |
|
NON - GAAP RECONCILIATIONS – PPNR, PPNR/WEIGHTED AVG. CS, ADJUSTED & CORRESPONDENT & CAPITAL MARKETS INCOME (UNAUDITED) Dollars and weighted average commons share outstanding in thousands except per share data (1) Includes pre-tax cyber incident costs of $111,000, $329,000, $56,000, $3.5 million, and $4.4 million for the quarters ended March 31, 2025, December 31, 2024, September 30, 2024, June 30, 2024, and March 31, 2024. respectively. 33 1Q24 2Q24 3Q24 4Q24 1Q25 Net interest income (GAAP) $ 343,936 $ 350,259 $ 351,480 $ 369,779 $ 544,547 Plus: Noninterest income 71,558 75,225 74,934 80,545 86,088 Less: Losses on sales of securities, net — — — (50) (228,811) Gain on sale leaseback, net of transaction costs — — — — 229,279 Total revenue, adjusted (non-GAAP) $ 415,494 $ 425,484 $ 426,414 $ 450,374 $ 630,167 Less: Noninterest expense 249,290 248,747 246,847 256,609 408,826 PPNR (Non-GAAP) $ 166,204 $ 176,737 $ 179,567 $ 193,765 $ 221,341 Plus: Merger, branch consolidation, severance related and other expense (1) — 5,785 3,304 6,531 68,006 FDIC Special Assessment 3,854 619 — (621) — Total adjustments $ 8,367 $ 6,404 $ 3,304 $ 5,910 $ 68,006 PPNR, Adjusted (Non-GAAP) $ 174,571 $ 183,141 $ 182,871 $ 199,675 $ 289,347 Weighted average common shares outstanding, diluted 76,660 76,607 76,805 76,958 101,829 PPNR, Adjusted per Weighted Avg. Common Shares Outstanding, Diluted (Non-GAAP) $ 2.28 $ 2.39 $ 2.38 $ 2.59 $ 2.84 Correspondent & Capital Markets Income 1Q24 2Q24 3Q24 4Q24 1Q25 ARC revenues $ (4,531) $ (2,867) $ 1,471 $ 3,379 $ 414 FI revenues 5,999 5,746 4,937 7,190 6,398 Operational revenues 2,843 1,981 3,485 2,986 2,733 Total Correspondent & Capital Markets Income $ 4,311 $ 4,860 $ 9,893 $ 13,555 $ 9,545 PPNR, Adjusted (Non-GAAP) |
|
NON - GAAP RECONCILIATIONS – CURRENT & HISTORICAL: EFFICIENCY RATIOS (UNAUDITED) Dollars in thousands (1) Includes pre-tax cyber incident costs of $111,000, $329,000, $56,000, $3.5 million, and $4.4 million for the quarters ended March 31, 2025, December 31, 2024, September 30, 2024, June 30, 2024, and March 31, 2024. respectively. 34 1Q24 2Q24 3Q24 4Q24 1Q25 Noninterest expense (GAAP) $ 249,290 $ 248,747 $ 246,847 $ 256,609 $ 408,826 Less: Amortization of intangible assets 5,998 5,744 5,327 5,326 23,831 Adjusted noninterest expense (non-GAAP) $ 243,292 $ 243,003 $ 241,520 $ 251,283 $ 384,995 Net interest income (GAAP) $ 343,936 $ 350,259 $ 351,480 $ 369,779 $ 544,547 Tax Equivalent ("TE") adjustments 528 631 486 547 784 Net interest income, TE (non-GAAP) $ 344,464 $ 350,890 $ 351,966 $ 370,326 $ 545,331 Noninterest income (GAAP) $ 71,558 $ 75,225 $ 74,934 $ 80,545 $ 86,088 Efficiency Ratio (Non-GAAP) 58% 57% 57% 56% 61% Noninterest income (GAAP) $ 71,558 $ 75,225 $ 74,934 $ 80,545 $ 86,088 Less: Losses on sales of securities, net — — — (50) (228,811) Gain on sale leaseback, net of transaction costs — — — — 229,279 Adjusted noninterest income (non-GAAP) $ 71,558 $ 75,225 $ 74,934 $ 80,595 $ 85,620 Noninterest expense (GAAP) $ 249,290 $ 248,747 $ 246,847 $ 256,609 $ 408,826 Less: Merger, branch consolidation, severance related and other expense (1) 4,513 5,785 3,304 6,531 68,006 FDIC special assessment 3,854 619 — (621) — Amortization of intangible assets 5,998 5,744 5,327 5,326 23,831 Total adjustments $ 14,365 $ 12,148 $ 8,631 $ 11,236 $ 91,837 Adjusted noninterest expense (non-GAAP) $ 234,925 $ 236,599 $ 238,216 $ 245,373 $ 316,989 Adjusted Efficiency Ratio (Non-GAAP) 56% 56% 56% 54% 50% Efficiency Ratio (Non-GAAP) & Adjusted Efficiency Ratio (Non-GAAP) |
|
NON - GAAP RECONCILIATIONS – TANGIBLE COMMON EQUITY RATIO Dollars in thousands 35 Tangible Common Equity ("TCE") Ratio 4Q24 1Q25 Tangible common equity (non-GAAP) $ 3,900,851 $ 5,080,859 Total assets (GAAP) 46,381,204 65,135,454 Less: Intangible assets 1,989,564 3,543,502 Tangible asset (non-GAAP) $ 44,391,640 $ 61,591,952 TCE Ratio (Non-GAAP) 8.8% 8.2% |
|
EARNINGS PRESENTATION END NOTES 36 Slide 3 End Notes (1) Financial metrics as of March 31, 2025; market cap as of April 22, 2025 (2) Projected population growth shown as the percent growth 2025 – projected 2030 (3) Includes MSAs with greater than 1 million in total population in 2025 (4) Excludes Bank of America, Capital One Financial, and Truist Financial Slide 6 End Notes • Loans and deposits as of March 31, 2025; excludes $2.6B of loans and $5.0B of deposits from national lines of business and brokered deposits. • Country GDP as of 2024; State GDP as of 4Q24 • Sources: International Monetary Fund, US Bureau of Economic Analysis Slide 9 End Notes (1) Adjusted PPNR per weighted average diluted shares; this is a Non-GAAP financial measure that excludes the impact of merger, branch consolidation and severance related expense and gain on sale of securities - See reconciliation of GAAP to Non-GAAP measures in Appendix. Slide 10 End Notes (1) The adjusted figures presented are Non-GAAP financial measures that exclude the impact of losses on sales of securities, gain on sale leaseback, net of transaction costs, PCL on non-PCD loans and unfunded commitments, and merger, branch consolidation, severance related and other restructuring expenses - See reconciliation of GAAP to Non-GAAP measures in Appendix. Slide 12 End Notes (1) The tangible measures are non-GAAP measures and exclude the effect of period end or average balance of intangible assets. The tangible returns on equity and common equity measures also add back the after-tax amortization of intangibles to GAAP basis net income; other adjusted figures presented are also Non-GAAP financial measures that exclude the impact of losses on sales of securities, gain on sale leaseback net of transaction costs, PCL on non-PCD loans and unfunded commitments, deferred tax asset remeasurement, FDIC special assessment, and merger, branch consolidation, severance related and other restructuring expenses - See reconciliation of GAAP to Non-GAAP measures in Appendix. Slide 13 End Notes (1) Adjusted diluted EPS excludes the impact of losses on sales of securities, gain on sale leaseback net of transaction costs, PCL on non-PCD loans and unfunded commitments, deferred tax asset remeasurement, and merger, branch consolidation, severance related and other restructuring expenses - See reconciliation of GAAP to Non-GAAP measures in Appendix. (2) Adjusted PPNR and adjusted PPNR per weighted average diluted share are non-GAAP financial measures that exclude the impact of losses on sales of securities, gain on sale leaseback, net of transaction costs, and merger, branch consolidation, severance related and other restructuring expenses - See reconciliation of GAAP to Non-GAAP measures in Appendix. (3) SouthState acquired $13.1 billion of loans and $15.2 billion of deposits from the Independent acquisition. The total preliminary mark on the newly acquired loans was approximately $482 million, which included a rate mark of approximately $386 million and a credit mark on non-PCD loans of approximately $96 million. The preliminary premium for acquired fixed maturity time deposits was approximately $1.7 million. Slide 14 End Notes (1) Tax equivalent NIM is a Non-GAAP financial measure - See reconciliation of GAAP to Non-GAAP measures in Appendix. |
|
EARNINGS PRESENTATION END NOTES 37 Slide 15 End Notes (1) Excludes loans held for sale; loan production indicates committed balance total; loan portfolio growth indicates quarter-over-quarter loan ending balance growth, excluding loans held for sale. (2) Excludes the effects of the acquisition date loan balance of $13.1 billion acquired from Independent. Slide 17 End Notes (1) Excludes loans held for sale. Slide 18 End Notes (1) CDL includes residential construction, commercial construction, and all land development loans. (2) Investor CRE includes nonowner-occupied CRE and other income producing property. (3) Excludes SELF loans acquired from ACBI. Slide 20 End Notes † Core deposits defined as non-time deposits (1) Source: S&P Global Market Intelligence; 1Q25 MRQs available as of April 22, 2025; Peers as disclosed in the most recent SSB proxy statement. Slide 24 End Notes (1) The tangible measures are non-GAAP measures and exclude the effect of period end intangible assets - See reconciliation of GAAP to Non-GAAP measures in Appendix. (2) Preliminary Slide 26 End Notes (1) Total revenue and noninterest income are adjusted by gains or losses on sales of securities and gains on sale leaseback. The total revenue also includes tax equivalent adjustments; Tax equivalent NIM, efficiency ratio and adjusted efficiency ratio are Non-GAAP financial measures; Adjusted Efficiency Ratio excludes losses on sales of securities, gain on sale leaseback net of transaction costs, merger, branch consolidation, FDIC special assessment, severance related and other restructuring expenses, and amortization of intangible assets , as applicable – See Current & Historical Efficiency Ratios and Net Interest Margin reconciliation in Appendix. (2) Annualized Slide 27 End Notes (1) Interest on centrally-cleared variation margin (expense or income) is included in ARC revenue within Correspondent Banking and Capital Markets Income. Slide 28 End Notes † Investment portfolio excludes non-marketable equity. (1) MBS issued by U.S. government agencies or sponsored enterprises (commercial and residential collateral) (2) Investment securities yield include non-marketable equity and trading securities. (3) Excludes principal receivable balance as of March 31, 2025. (4) Based on current book value |
|