UNITED STATES
SECURITIES AND EXCHANGE COMMISSION
Washington, D.C. 20549
FORM 10-K
(Mark One)
☒ |
ANNUAL REPORT PURSUANT TO SECTION 13 OR 15(d) OF THE SECURITIES EXCHANGE ACT OF 1934 |
For the fiscal year ended December 31, 2024
OR
☐ |
TRANSITION REPORT PURSUANT TO SECTION 13 OR 15(d) OF THE SECURITIES EXCHANGE ACT OF 1934 |
For the transition period from to
Commission file number 1-1361
TOOTSIE ROLL INDUSTRIES, INC.
(Exact name of Registrant as specified in its charter)
Virginia |
|
22-1318955 |
(State or other jurisdiction of |
|
(IRS Employer Identification No.) |
incorporation or organization) |
|
|
7401 South Cicero Avenue, Chicago, Illinois 60629
(Address of principal executive offices) (Zip Code)
Registrant’s Telephone Number: (773) 838-3400
Securities registered pursuant to Section 12(b) of the Act:
Title of each class |
Trading Symbol |
Name of each exchange |
Common Stock — Par Value $0.694 Per Share |
TR |
New York Stock Exchange |
Securities registered pursuant to Section 12(g) of the Act: Class B Common Stock — Par Value $0.694 Per Share
Indicate by check mark if the registrant is a well-known seasoned issuer, as defined in Rule 405 of the Securities Act. Yes ☒ No ☐
Indicate by check mark if the registrant is not required to file reports pursuant to Section 13 or Section 15(d) of the Act. Yes ☐ No ☒
Indicate by check mark whether the registrant: (1) has filed all reports required to be filed by Section 13 or 15(d) of the Securities Exchange Act of 1934 during the preceding 12 months (or for such shorter period that the registrant was required to file such reports), and (2) has been subject to such filing requirements for the past 90 days. Yes ☒ No ☐
Indicate by check mark whether the registrant has submitted electronically every Interactive Data File required to be submitted pursuant to Rule 405 of Regulation S-T (§ 232.405 of this chapter) during the preceding 12 months (or for such shorter period that the registrant was required to submit such files). Yes ☒ No ☐
Indicate by check mark whether the registrant is a large accelerated filer, an accelerated filer, a non-accelerated filer, a smaller reporting company or an emerging growth company. See the definitions of “large accelerated filer,” “accelerated filer,” “smaller reporting company” and “emerging growth company” in Rule 12b-2 of the Exchange Act.
|
|
||||
Large accelerated filer ☒ |
Accelerated filer ☐ |
Non-accelerated filer ☐ |
Smaller reporting company ☐ |
Emerging growth company ☐ |
If an emerging growth company, indicate by check mark if the registrant has elected not to use the extended transition period for complying with any new or revised financial accounting standards provided pursuant to Section 13(a) of the Exchange Act. ☐
Indicate by check mark whether the registrant has filed a report on and attestation to its management’s assessment of the effectiveness of its internal control over financial reporting under Section 404(b) of the Sarbanes-Oxley Act (15 U.S.C. 7262(b)) by the registered public accounting firm that prepared or issued its audit report. ☒
If securities are registered pursuant to Section 12(b) of the Act, indicate by check mark whether the financial statements of the registrant included in the filing reflect the correction of an error to previously issued financial statements. ☐
Indicate by check mark whether any of those error corrections are restatements that required a recovery analysis of incentive-based compensation received by any of the registrant’s executive officers during the relevant recovery period pursuant to §240.10D-1(b). ☐
Indicate by check mark whether the registrant is a shell company (as defined in Rule 12b-2 of the Exchange Act). Yes ☐ No ☒
As of June 30, 2024 the aggregate market value of the Common Stock (based upon the closing price of the stock on the New York Stock Exchange on such date) held by non-affiliates was approximately $509,344,000. Class B Common Stock is not traded on any exchange, is restricted as to transfer or other disposition, but is convertible into Common Stock on a share-for-share basis. Upon such conversion, the resulting shares of Common Stock are freely transferable and publicly traded. Assuming all 30,309,118 shares of outstanding Class B Common Stock were converted into Common Stock, the aggregate market value of Common Stock held by non-affiliates on June 30, 2024 (based upon the closing price of the stock on the New York Stock Exchange on such date) would have been approximately $651,460,000. Determination of stock ownership by non-affiliates was made solely for the purpose of this requirement, and the Registrant is not bound by these determinations for any other purpose.
As of February 9, 2025, there were outstanding 40,011,930 shares of Common Stock par value $0.694 per share, and 29,431,638 shares of Class B Common Stock par value $0.694 per share.
DOCUMENTS INCORPORATED BY REFERENCE
Portions of the Company’s Definitive Proxy Statement for the Company’s Annual Meeting of Shareholders (the “Proxy Statement”) scheduled to be held on May 5, 2025 are incorporated by reference in Part III of this report.
TABLE OF CONTENTS
|
|
|
|
3 |
|||
|
|
|
|
5 |
|||
|
|
|
|
9 |
|||
|
|
|
|
9 |
|||
|
|
|
|
11 |
|||
|
|
|
|
11 |
|||
|
|
|
|
11 |
|||
|
|
|
|
12 |
|||
|
|
|
|
13 |
|||
|
|
|
|
Management’s Discussion and Analysis of Financial Condition and Results of Operations |
13 |
||
|
|
|
|
24 |
|||
|
|
|
|
24 |
|||
|
|
|
|
Changes in and Disagreements with Accountants on Accounting and Financial Disclosure |
47 |
||
|
|
|
|
47 |
|||
|
|
|
|
48 |
|||
|
|
|
|
Disclosure Regarding Foreign Jurisdictions that Prevent Inspections |
48 |
||
|
|
|
|
49 |
|||
|
|
|
|
49 |
|||
|
|
|
|
Security Ownership of Certain Beneficial Owners and Management and Related Stockholder Matters |
50 |
||
|
|
|
|
Certain Relationships and Related Transactions, and Director Independence |
50 |
||
|
|
|
|
50 |
|||
|
|
|
|
50 |
|||
|
|
|
|
51 |
|||
2
Forward-Looking Information
From time to time, in the Company’s statements and written reports, including this report, the Company discusses its expectations regarding future performance by making certain “forward-looking statements” within the meaning of the Private Securities Litigation Reform Act of 1995. Forward-looking statements can be identified by the use of words such as “anticipate,” “believe,” “expect,” “intend,” “estimate,” “project,” and other words of similar meaning in connection with a discussion of future operating or financial performance and are subject to certain factors, risks, trends and uncertainties that could cause actual results and achievements to differ materially from those expressed in the forward-looking statements. These forward-looking statements are based on currently available competitive, financial and economic data, and management’s views and assumptions regarding future events. Such forward-looking statements are inherently uncertain, and actual results may differ materially from those expressed or implied herein. Consequently, the Company wishes to caution readers not to place undue reliance on any forward-looking statements. Factors, among others, which could cause the Company’s future results to differ materially from the forward-looking statements, expectations and assumptions expressed or implied herein include economic conditions, political developments, currency exchange rates, interest and inflation rates, accounting standards, taxes, and laws and regulations affecting the Company in markets where it competes and those factors described in Item 1A “Risk Factors” and elsewhere in this Form 10-K and in other Company filings with the Securities and Exchange Commission. The Company does not undertake to update any of these forward-looking statements.
PART I
ITEM 1. Business.
Tootsie Roll Industries, Inc. and its consolidated subsidiaries (the “Company”) have been engaged in the manufacture and sale of confectionery products for over 100 years. This is the only industry segment in which the Company operates and is its only line of business. The majority of the Company’s products are sold under the registered trademarks TOOTSIE ROLL, TOOTSIE FRUIT ROLLS, FROOTIES, TOOTSIE POPS, TOOTSIE MINI POPS, CHILD’S PLAY, CARAMEL APPLE POPS, CHARMS, BLOW-POP, CHARMS MINI POPS, CELLA’S, DOTS, JUNIOR MINTS, CHARLESTON CHEW, SUGAR DADDY, SUGAR BABIES, ANDES, FLUFFY STUFF, DUBBLE BUBBLE, RAZZLES, CRY BABY, NIK-L-NIP, and TUTSI POP (Mexico).
The Company’s products are marketed in a variety of packages designed to be suitable for display and sale in different types of retail outlets. They are sold through food and grocery brokers or directly by the Company to customers throughout the United States, Canada and Mexico. These customers include wholesale distributors of candy, food and groceries, supermarkets, variety stores, dollar stores, chain grocers, drug chains, discount chains, cooperative grocery associations, mass merchandisers, warehouse and membership club stores, vending machine operators, e-commerce merchants, the U.S. military and fund-raising charitable organizations.
The Company’s principal markets are in the United States, Canada and Mexico. The majority of production from the Company’s Canadian plants is sold in the United States. The majority of production from the Company’s Mexican plant is sold in Mexico.
The domestic confectionery business is highly competitive. The Company competes primarily with other manufacturers of confectionery products sold to the above mentioned customers. Although accurate statistics are not available, the Company believes it is among the ten largest domestic manufacturers in this industry. In the markets in which the Company competes, the main forms of competition comprise brand recognition, as well as competition for retail shelf space and a fair price for the Company’s products at various retail price points.
The Company’s backlog of orders as of December 31, 2024 was approximately $10 million and is generally consistent with the prior year.
The Company has historically hedged certain of its future sugar needs with derivatives at such times that it believes that the forward markets are favorable. The Company’s decision to hedge its major ingredient requirements is dependent on the Company’s evaluation of forward commodity markets and their comparison to vendor quotations, if available, and/or historical costs.
3
The Company has generally entered into commodity futures contracts before the commencement of the next calendar year to better manage product pricing changes or product weight decline (indirect price change) adjustments to its product sales portfolio and ingredient costs. The Company will generally purchase forward derivative contracts (i.e., “long” position) in selected future months that correspond to the Company’s estimated procurement and usage needs of the respective commodity in the respective forward periods.
Based on increases in its input costs, the Company plans to increase its sales prices to recover higher input costs, primarily ingredients, packaging materials, labor and benefits, manufacturing maintenance, supplies and services, and freight and delivery. The Company may also change the size and weight of certain of its products in response to significant changes in ingredient and other input costs.
The Company does not hold any material patents, licenses, franchises or concessions. The Company’s major trademarks are registered in the United States, Canada, Mexico and in many other countries. Continued trademark protection is of material importance to the Company’s business as a whole.
Although the Company does research and develops new products and product line extensions for existing brands, it also improves the quality of existing products, improves and modernizes production processes, and develops and implements new technologies. The Company does not expend material amounts of money on research or development activities.
The manufacture and sale of consumer food products is highly regulated. In the United States, the Company’s activities are subject to regulation by various government agencies, including the Food and Drug Administration, the Department of Agriculture, the Federal Trade Commission, the Department of Commerce and the Environmental Protection Agency, as well as various state and local agencies. Similar agencies also regulate the businesses outside of the United States. The Company maintains quality assurance, food safety and other programs to help ensure that all products the Company manufactures and distributes are safe, of high quality, and comply with all applicable laws and regulations.
The Company’s compliance with federal, state and local regulations which have been enacted to regulate the protection of the environment, has not had a material effect on the capital expenditures, earnings or competitive position of the Company nor does the Company anticipate any such material effects from presently enacted or adopted regulations.
The Company employs approximately 2,300 full-time persons at all locations. Our business has seasonality which results in bringing on some additional employees to meet seasonal production demands principally in advance of the Halloween selling season. The Company experiences a relatively consistent sales level throughout the year except for an increase in the third quarter which reflects pre-Halloween and back-to-school sales. In anticipation of this seasonal sales period, the Company generally begins building inventories, and its seasonal workforce, in the second and third quarter of each year. Although Halloween is the most significant season in sales and related production, other seasons, including Christmas, Valentines, and Easter also have some impact on workforce levels. The Company’s union labor agreement at its Chicago plant was negotiated and executed in 2023 and expires in September 2027. The Company concluded negotiations with its labor union at its Canadian plant in first quarter 2024 and is now operating under a contract with the labor union in Canada that expires in January 2029.
We believe our employees are among our most important resources and are critical to our continued success. We focus significant attention on attracting and retaining talented and experienced individuals to manage and support our operations. We pay our employees competitively and offer a broad range of company-paid benefits, which we believe are competitive with others in our industry. Our management teams and all of our employees are expected to exhibit and promote honest, ethical and respectful conduct in the workplace. All of our employees must adhere to a Code of Conduct that sets standards for appropriate behavior. A copy of our Code of Conduct can be found on our website, www.tootsie.com.
Our net product sales from Wal-Mart Stores, Inc. (“Wal-Mart”) aggregated approximately 23.2%, 22.2%, and 23.0% of net product sales during the years ended December 31, 2024, 2023 and 2022, respectively. Our net sales from Dollar Tree, Inc. (“Dollar Tree”, which includes net sales from Family Dollar which is owned by Dollar Tree)
4
aggregated approximately 12.6%, 14.2%, and 12.4% of net product sales during the years ended December 31, 2024, 2023 and 2022, respectively. Some of the aforementioned sales to Wal-Mart and Dollar Tree were sold to McLane Company (“McLane”), a large national grocery wholesaler, which services and delivers certain of the Company’s products to Wal-Mart, Dollar Tree and other retailers in the U.S.A. Net product sales revenues from McLane, which includes these Wal-Mart and Dollar Tree sales as well as sales and deliveries to other Company customers, were 20.7% in 2024 and 20.1% in 2023 and 20.4% in 2022. At December 31, 2024 and 2023, the Company’s three largest customers discussed above accounted for approximately 41.9% and 39.6% of total accounts receivable, respectively. Although no customer, other than McLane, Wal-Mart and Dollar Tree, accounted for more than 10% of net product sales, the loss of one or more significant customers could have a material adverse effect on the Company’s business.
For a summary of sales and long-lived assets of the Company by geographic area see Note 8 of the Notes to Consolidated Financial Statements which is incorporated herein by reference.
Information regarding the Company’s Form 10-K, Form 10-Q, current reports on Form 8-K, and any amendments to these reports, will be made available, free of charge, upon written request to Tootsie Roll Industries, Inc., 7401 South Cicero Avenue, Chicago, Illinois 60629, Attention: Barry Bowen, Treasurer and Assistant Secretary. The Company does not make all such reports available on its website at www.tootsie.com because it believes that they are readily available from the Securities Exchange Commission at www.sec.gov, and because the Company provides them free of charge upon request. The information on our website is not incorporated into this Annual Report on Form 10-K. Interested parties, including shareholders, may communicate to the Board of Directors or any individual director in writing, by regular mail, addressed to the Board of Directors or an individual director, in care of Tootsie Roll Industries, Inc., 7401 South Cicero Avenue, Chicago, Illinois 60629, Attention: Ellen R. Gordon, Chairman and Chief Executive Officer. If an interested party wishes to communicate directly with the Company’s non-employee directors, it should be noted on the cover of the communication.
ITEM 1A. Risk Factors.
Significant factors that could impact the Company’s financial condition or results of operations include, without limitation, the following:
Risk factors which we believe affect all competitors in our industry
| ● | Risk of changes in the price and availability of ingredients and raw materials - The principal ingredients used by the Company are subject to price volatility. Although the Company engages in commodity hedging transactions and annual supply agreements as well as leveraging the high volume of its annual purchases, the Company may experience price increases in certain ingredients, packaging materials, operating supplies, services, and wages and benefits, including the effects of higher inflation, that it may not be able to offset, which could have an adverse impact on the Company’s results of operations and financial condition. In addition, although the Company has historically been able to procure sufficient supplies of its ingredients, packaging materials, and other supplies, supply chain disruptions and market conditions could change such that adequate materials might not be available or only become available at substantially higher costs. Adverse weather patterns, including the effects of climate change or supply interruptions, could also significantly affect the cost and availability of ingredients and other needed materials to manufacture products for sale. |
| ● | Risk of changes in product performance and competition - The Company competes with other well-established manufacturers of confectionery products. A failure of new or existing products to be favorably received, a failure to retain preferred shelf space at retailers or a failure to sufficiently counter aggressive promotional and price competition could have an adverse impact on the Company’s results of operations and financial condition. |
| ● | Risk of discounting and other competitive actions - Discounting and pricing pressure by the Company’s retail customers and other competitive actions could make it more difficult for the Company to maintain its |
5
| operating margins. Actions taken by major customers and competitors may make shelf space less available for the confectionery product category or some of the Company’s products. |
| ● | Risk of pricing actions - Inherent risks in the marketplace, including uncertainties about trade and consumer acceptance of pricing actions, including related trade discounts or product weight changes (indirect price increases), could make it more difficult for the Company to maintain its sales and operating margins. Higher costs for ingredients and materials, and other input costs may be difficult to pass onto customers and consumers of Company products through price increases, and therefore may adversely affect the Company’s profit margins. |
| ● | Risk related to seasonality of sales - The Company’s sales are highest during the Halloween season, although Christmas, Easter and Valentine’s Day are also key seasons for the Company. Circumstances surrounding Halloween could significantly affect the Company’s sales, such as, widespread adverse weather or other widespread events that affect consumer behavior, related media coverage at that time of year, or general changes in consumer interest in Halloween. |
| ● | Risk of changes in consumer preferences and tastes - Failure to adequately anticipate and react to changing demographics, consumer trends, consumer health concerns and product preferences, including product ingredients and packaging materials, could have an adverse impact on the Company’s results of operations and financial condition. |
| ● | Risk of economic conditions on consumer purchases - The Company’s sales are impacted by consumer spending levels and impulse purchases which are affected by general macroeconomic conditions, consumer confidence, employment levels, disposable income, inflation, availability of consumer credit and interest rates on that credit, consumer debt levels, energy costs and other factors. Volatility in food and energy costs, rising unemployment and/or underemployment, declines in personal spending, recessionary economic conditions or other adverse market conditions, could adversely impact the Company’s revenues, profitability and financial condition. |
| ● | Risks related to environmental matters - The Company’s operations are not particularly impactful on the environment, but increased government environmental regulation or legislation could adversely impact the Company’s profitability. |
| ● | Risk of new governmental laws and regulations - Governmental laws and regulations, including those that affect food advertising and marketing to children, use of certain ingredients in products, new labeling requirements, income and other taxes, tariffs on U.S. imports and retaliatory tariffs in response, including the effects of changes to international trade agreements, new taxes targeted toward confectionery products and the environment, both in and outside the U.S.A., are subject to change over time, which could adversely impact the Company’s results of operations and ability to compete in domestic or foreign marketplaces. |
| ● | Risk of labor stoppages - To the extent the Company experiences any significant labor stoppages and disputes, labor organizing efforts, strikes or possible labor shortages, could negatively affect overall operations including production or shipments of finished product to customers. |
| ● | Risk of the cost of energy increasing and overall inflation - Higher energy costs as well as overall inflation would likely result in higher plant overhead, distribution, freight and delivery, and other operating costs. The Company may not be able to offset these cost increases or pass such cost increases onto customers in the form of price increases, which could have an adverse impact on the Company’s results of operations and financial condition. In addition, higher energy costs also adversely affect the cost of many resins which are used as a foundation material for many of our packaging materials. |
| ● | Risk of a product recall - Issues related to the quality and safety of the Company’s products could result in a voluntary or involuntary large-scale product recall. Costs associated with a product recall and related litigation or fines, and marketing costs relating to the re-launch of such products or brands, could negatively |
6
| affect operating results. In addition, negative publicity associated with this type of event, including a product recall relating to product contamination or product tampering, whether valid or not, could negatively impact future demand for the specific products subject to the recall as well as present reputational risk that could negatively impact the Company and demand more broadly for its brands. |
| ● | Risk of operational interruptions relating to computer software or hardware failures, including cyber-attacks - The Company is reliant on computer systems to operate its business and supply chain. Software failure or corruption, including cyber-based attacks or network security breaches, or catastrophic hardware or software failures or other disasters could disrupt communications, supply chain planning and activities relating to sales demand forecasts, materials procurement, production and inventory planning, customer orders, shipments, and collections, and financial and accounting, all of which could negatively impact sales and profits. |
| ● | Risk of releasing sensitive information - Although the Company does not believe that it maintains a large amount of sensitive data, a system breach, whether inadvertent or perpetrated by hackers, could result in identity theft, ransomware and/or a disruption in operations which could expose the Company to financial costs and adversely affect profitability. |
| ● | Disruption to the Company’s supply chain could impair the Company’s ability to produce or deliver its finished products, resulting in a negative impact on operating results - Disruptions to the manufacturing operations or supply chain, some of which are discussed above, could result from, but are not limited to, unpredictable events such as natural disasters, pandemics, weather, fire or explosion, earthquakes, terrorism or other acts of violence. Adverse tariffs could effectively limit the quantities we may want to acquire or affect the cost of our supplies. Ingredients or packaging materials may not be available if circumstances occur under which our suppliers are unable to obtain certain raw materials or make timely deliveries. Our suppliers may experience logistical delays involving materials sourced from foreign locations, operational and/or financial instabilities may impact availability, or availability may be indirectly impacted as a result of availability of certain ingredients or packaging materials to our suppliers. Labor strikes or other labor activities, labor shortages to meet demand for Company products, including the staffing of seasonal labor needs might also disrupt our supply chain. Although precautions are taken to mitigate the impact of possible disruptions, if the Company is unable to effectively mitigate the likelihood or potential impact of such disruptive events, the Company’s results of operations and financial condition could be negatively impacted. |
| ● | Risks associated with climate change and other environmental impacts and regulations, and increased focus and evolving views of our customers and consumers of our products could negatively affect our business and operations - Climate-related changes such as natural disasters, including weather patterns, with the potential for increased frequency and severity of significant weather events, natural hazards, rising mean temperature and sea levels, and long-term changes in precipitation patterns could increase variability in, or otherwise impact costs. Climate change or weather-related disruptions to agricultural crop yields and our supply chain can impact the availability and cost of materials needed for manufacturing and could increase commodity prices and our operating costs. Increased focus on climate change has led to legislative and regulatory efforts to combat both potential causes and adverse impacts of climate change, including regulation of greenhouse gas (GHG) emissions. New or increasing laws and regulations related to GHG emissions and other climate change related concerns may adversely affect us, our suppliers and our customers, and may require additional capital investments. Our global supply chain faces similar challenges as our products rely on agricultural ingredients some of which are sourced from a global supply chain. Climate change poses a significant and increasing risk to global food production systems and to the safety and resilience of the communities where we source certain of our ingredients. Additionally, any non-compliance with legislative and regulatory requirements could negatively impact our reputation and ability to do business. Customers, consumers, and government regulators have increasingly focused on the environmental or sustainability practices of companies. New legislation or an enforcement action in this area could harm our reputation and financial results. |
7
Risk factors which we believe are principally specific to our Company (although some may apply to varying degrees to competitors in our industry)
| ● | Risks relating to participation in the multi-employer pension plan for certain Company union employees - As outlined in the Note 7 of the Company’s Notes to Consolidated Financial Statements and discussed in Management’s Discussion and Analysis of Financial Condition and Results of Operations, the Company participates in a multi-employer union pension plan (Plan) which is currently in “critical and declining status”, as defined by applicable law. A designation of “critical and declining status” implies that the Plan is expected to become insolvent within the next 20 years. Should the Company withdraw from the Plan, it would be subject to a significant withdrawal liability which is discussed in Note 7 of the Company’s Notes to Consolidated Financial Statements and Management’s Discussion and Analysis of Financial Condition and Results of Operations. The Company is currently unable to determine the ultimate outcome of this matter and therefore, is unable to determine the effects on its consolidated financial statements, but the ultimate outcome could be material to its consolidated results of operations in one or more future periods. |
| ● | Risk of impairment of goodwill or indefinite-lived intangible assets - In accordance with authoritative guidance, goodwill and indefinite-lived intangible assets are not amortized but are subject to an impairment evaluation annually or more frequently upon the occurrence of a triggering event. Other long-lived assets are likewise tested for impairment upon the occurrence of a triggering event. Such evaluations are based on assumptions and variables including sales demands and growth, profit margins and discount rates. Adverse changes in any of these variables could affect the carrying value of these intangible assets and the Company’s reported profitability. |
| ● | Risk of production interruptions - The majority of the Company’s products are manufactured in a single production facility on specialized equipment. In the event of a disaster, such as a fire or earthquake, at a specific plant location, or other disruption, including labor stoppages or shortages, it would be difficult to transfer production to other facilities or a new location in a timely manner, which could result in loss of market share for the affected products. In addition, from time to time, the Company upgrades or replaces this specialized equipment. In many cases these are integrated and complex installations. A failure or delay in implementing such an installation could impact the availability of one or more of the Company’s products which would have an adverse impact on sales and profits. |
| ● | Risk related to investments in marketable securities - The Company invests its surplus cash in a diversified portfolio of highly rated marketable securities, principally corporate bonds, with maturities generally of three to five years. Such investments could become impaired in the event of certain adverse economic and/or geopolitical events which, if severe, would adversely affect the Company’s financial condition. |
| ● | Risk of further losses in Spain - The Company is exploring a variety of programs to increase sales and profitability of its Spanish subsidiary, which is experiencing losses. Nonetheless, if the Company’s efforts are not successful, additional losses and impairments may be reported in the future. See also Management’s Discussion and Analysis of Financial Condition and Results of Operations. |
| ● | Risk of dependence on large customers - The Company’s largest customers, McLane, Wal-Mart and Dollar Tree, accounted for approximately 37% of net product sales in 2024, and other large national chains are also material to the Company’s sales. The loss of any of these customers, or one or more other large customers, or a material decrease in purchases by one or more large customers, could result in decreased sales and adversely impact the Company’s results of operations and financial condition. |
| ● | Risk related to acquisitions - From time to time, the Company has purchased other confectionery companies or brands. These acquisitions generally come at a high multiple of earnings and are justified based on various assumptions related to sales growth, and operating margins. Were the Company to make another acquisition and be unable to achieve the assumed sales and operating margins, it could have an adverse impact on future sales and profits. In addition, it could become necessary to record an impairment which would have a further adverse impact on reported profits. |
8
| ● | Risk of “slack fill” or other product label litigation - The Company, as well as other confectionery and food companies, have experienced a number of plaintiff claims that certain products are sold in boxes that are not completely full, and therefore such “slack filled” products are misleading, and even deceptive, to the consumer. The Company has also experienced some litigation claims regarding product and ingredients labeling, and specific state laws that have effectively banned certain ingredients which have not been prohibited by the U.S. Food and Drug Administration. Although the Company believes that these claims and other product labeling claims are without merit and has generally been successful in litigation and court decrees, the Company could be exposed to significant legal fees to defend its position, and in the event that it is not successful, could be subject to fines and costs of settlement, including class action settlements. |
| ● | Risk related to international operations - To the extent there are political leadership or legislative changes, social and/or political unrest, civil war, pandemics such as the Covid-19, terrorism, significant economic or social instability, or the imposition of retaliatory tariffs in the countries in which the Company operates, the results of the Company’s business in such countries could be adversely impacted. Currency exchange rate fluctuations between the U.S. dollar and foreign currencies could also have an adverse impact on the Company’s results of operations and financial condition. The Company’s principal markets are the U.S.A., Canada, and Mexico. |
| ● | Risk of tariffs – The Company has manufacturing operations outside the US and imports a significant amount of product specifically from Canada. The imposition of tariffs on goods and services imported from Canada to the US may have a material impact on our input costs. Moreover, in combination with adverse consumer sentiment regarding price increases, the Company may not be able to pass these cost increases to customers in the form of higher price; as a result, the imposition of tariffs may have an adverse impact on our profitability. |
| ● | Risk of union labor stoppages, slowdowns or strikes - Significant labor stoppages, strikes or possible labor shortages could negatively affect overall operations including production or shipments of finished product to customers which could have material effects on the Company’s sales and profits. |
| ● | The Company is a controlled company due to the common stock holdings of the Gordon family - The Gordon family’s share ownership represents a majority of the combined voting power of all classes of the Company’s common stock as of December 31, 2024. As a result, the Gordon family has the power to elect the Company’s directors and approve actions requiring the approval of the shareholders of the Company. |
The factors identified above are believed to be significant factors, but not necessarily all of the significant factors, that could impact the Company’s business. Unpredictable or unknown factors could also have material effects on the Company.
Additional significant factors that may affect the Company’s operations, performance and business results include the risks and uncertainties listed from time to time in filings with the Securities and Exchange Commission and the risk factors or uncertainties listed herein or listed in any document incorporated by reference herein.
ITEM 1B. Unresolved Staff Comments.
None.
ITEM 1C. Cybersecurity.
Information technology is important to our business operations, and we are committed to protecting the privacy, security and integrity of our data, as well as our employee and customer data. The Company has a cybersecurity program in place for assessing, identifying and managing cybersecurity risks that is designed to protect its systems and data from unauthorized access, use or other security impact. Our cybersecurity risk program is designed to identify, assess, prioritize and mitigate risks across the organization; and to ensure that cyber risks are not viewed in isolation, but are assessed, prioritized and managed in alignment with the Company’s other operational, financial and strategic risk mitigation strategies.
9
We continuously monitor and update our information technology networks and infrastructure in an effort to prevent, detect, address and mitigate risks associated with unauthorized access, misuse, computer viruses and other events that could have a security impact. We invest in industry standard security technology to protect the Company’s data and business processes against risk of cybersecurity incidents. Our data security program includes identity, trust, vulnerability and threat management business processes, as well as adoption of standard data protection policies. We maintain and periodically test backup systems and disaster recovery. We also have processes in place that are designed to prevent disruptions resulting from our implementation of new software, including software updates, and new systems.
The Company has a comprehensive incident response plan to address cybersecurity incidents. The Company’s incident response plan includes procedures for identifying, containing and responding to cybersecurity incidents and is subject to periodic review and assessment. The Company also engages external parties, including consultants and a computer security firm to facilitate its cybersecurity oversight and assist in our response in the event of a cyber-attack or breach. Further, the Company has procured cyber-insurance that would provide coverage and consulting services in the event of a significant security breach. To date, the Company believes that its cybersecurity program has been effective in protecting the confidentiality and integrity of its information and systems; however, the Company cannot guarantee that its cybersecurity program will be successful in preventing all cybersecurity incidents. In addition, the Company’s cyber insurance may not be sufficient in type or amount to cover claims related to security breaches and cyber-attacks.
The Company has not experienced any material cybersecurity incidents or a series of related unauthorized occurrences for the year ended December 31, 2024, and the Company is not currently aware of any cyber security attacks or breaches that are reasonably likely to materially affect the Company’s business, business strategy, operating results or financial condition. However, as discussed under Item 1A “Risk Factors,” specifically the risks titled “Risk of operational interruptions relating to computer software or hardware failures, including cyber-attacks,” a cybersecurity incident could negatively impact sales and profits. The sophistication of cyber, ransomware and other security threats continues to increase, and the preventative actions we take to reduce the risk of these incidents and protect our systems and information may be insufficient. Accordingly, no matter how well controls are designed and implemented, we will not be able to anticipate all cybersecurity attacks, ransomware and other security breaches and we may not be able to implement effective preventive measures against such security breaches in a timely manner.
The Company’s cybersecurity risk program is supervised by members of our executive team. The program is led and managed by the Director of Information Technology, whose experience includes over ten years in information security leadership roles, with the assistance of third-party experts, including consultants and a computer security firm. The Audit Committee and the Board of Directors receive periodic reports on the Company’s actions to respond to the cyber security incidents and the overall cyber risk environment. In accordance with our Security Incident Response Plan (“SIRP”), the Audit Committee is to be promptly informed by management of cybersecurity incidents with the potential to have a material impact on the Company, its financial results, or its information systems.
To ensure our employees are educated on potential cybersecurity threats or actions, we train our executive officers and management in the event of a potential cyber threat or cybersecurity incident. Our Company-wide information security training program includes security awareness training, including regular phishing simulations, cyber wellness training and other targeted training and simulations. These programs provide employees the opportunity to gain an understanding and awareness of the various forms of cybersecurity incidents, including how to identify and report any suspicious activity or threat.
10
ITEM 2. Properties.
The Company owns its principal manufacturing, warehousing and distribution, and office facilities. The Company’s largest operating facility in Chicago, Illinois also serves as the Corporate headquarters. The Company also owns domestic manufacturing, warehousing and distribution facilities in Tennessee (Covington), Massachusetts (Cambridge), and Wisconsin (Delavan) and international manufacturing facilities in Mexico (Mexico City), Spain (Barcelona) and two in Canada (Concord, Ontario). In addition, the Company leases warehouse facilities near its Chicago, Covington, and Mexico City facilities as well as a smaller manufacturing facility at a second location in Chicago. The lease for this smaller manufacturing facility is renewable by the Company every five years through June 2041.
The Company owns substantially all of the production machinery and equipment located in its plants, warehouses and distribution centers. The Company also holds four commercial real estate properties for investment which were acquired with the proceeds from a sale of surplus real estate in 2005 as well as two warehouse facilities (in Concord, Ontario, Canada, and Hazelton, Pennsylvania) that are currently leased to third parties.
ITEM 3. Legal Proceedings.
In the ordinary course of business, the Company is, from time to time, subject to a variety of active or threatened legal proceedings and claims. While it is not possible to predict the outcome of such matters with certainty, in the Company’s opinion, both individually and in the aggregate, they are not expected to have a material effect on the Company’s financial condition, results of operations or cash flows.
ITEM 4. Mine Safety Disclosures.
None.
11
PART II
ITEM 5. Market for Registrant’s Common Equity, Related Stockholder Matters and Issuer Purchases of Equity Securities.
The Company’s common stock is traded on the New York Stock Exchange under the trading symbol, “TR”. The Company’s Class B common stock is subject to restrictions on transferability. The Class B common stock is convertible at the option of the holder into shares of common stock on a share-for-share basis. As of February 9, 2025 there were approximately 2,200 and 800 registered holders of record of common and Class B common stock, respectively. In addition, the Company estimates that as of February 9, 2025 there were 87,000 and 130 beneficial holders of common and Class B common stock, respectively.
The following table sets forth information about the shares of its common stock the Company purchased on the open market during the fiscal quarter ended December 31, 2024:
Issuer Purchases of Equity Securities
|
|
|
|
|
|
|
Total Number of |
|
Maximum Number (or |
|
|
|
Total |
|
Average |
|
Shares Purchased |
|
Approximate Dollar Value) |
|
|
|
|
Number |
|
Price |
|
as Part of Publicly |
|
of Shares that May Yet |
|
|
|
|
of Shares |
|
Paid per |
|
Announced Plans |
|
be Purchased Under the |
|
|
Period |
|
Purchased |
|
Share |
|
or Programs |
|
Plans or Programs |
|
|
|
|
|
|
|
|
|
|
|
|
|
Oct 1 to Oct 31 |
|
217,418 |
|
$ |
30.02 |
|
Not Applicable |
|
Not Applicable |
|
Nov 1 to Nov 30 |
|
70,952 |
|
|
30.09 |
|
Not Applicable |
|
Not Applicable |
|
Dec 1 to Dec 31 |
|
82,867 |
|
|
32.10 |
|
Not Applicable |
|
Not Applicable |
|
Total |
|
371,237 |
|
$ |
30.50 |
|
|
|
|
|
All of the above share purchases were made in the open market. The Company does not have a formal dividend policy, but has historically issued quarterly dividends and in 2024 issued quarterly dividends of $0.09 per share. The Company has also historically distributed an annual 3% stock dividend. While the Company plans to continue to issue quarterly cash dividends and the annual stock dividend there can be no assurance that it will continue to do so in the future.
12
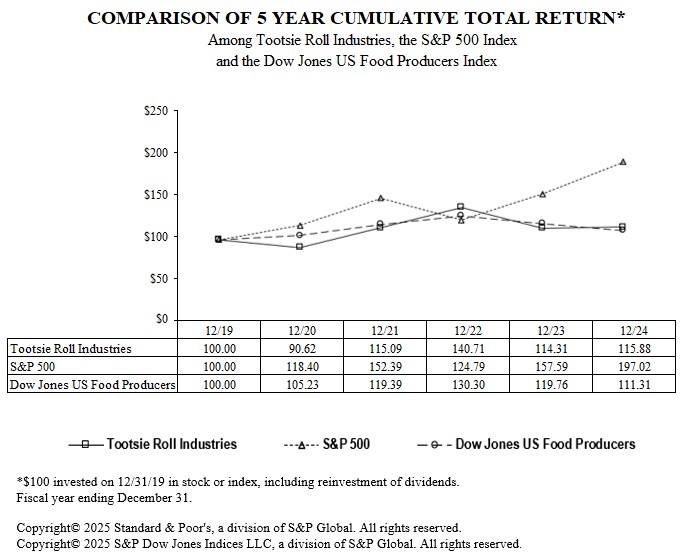
Performance Graph
The following performance graph compares the cumulative total shareholder return on the Company’s common stock for a five-year period (December 31, 2019 to December 31, 2024) with the cumulative total return of Standard & Poor’s 500 Stock Index (“S&P 500”) and the Dow Jones Industry Food Index (“Peer Group,” which includes the Company), assuming (i) $100 invested on December 31 of the first year of the chart in each of the Company’s common stock, S&P 500 and the Dow Jones Industry Food Index and (ii) the reinvestment of cash and stock dividends.
ITEM 6. [RESERVED]
ITEM 7. Management’s Discussion and Analysis of Financial Condition and Results of Operations.
(Thousands of dollars except per share, percentage and ratio figures)
The following discussion should be read in conjunction with the other sections of this report, including the consolidated financial statements and related notes contained in Item 8 of this Form 10-K. This section of this Form 10-K generally discusses the twelve months ended December 31, 2024 as compared to the same period of 2023. Discussions comparing the results of the twelve months ended December 31, 2023 as compared to same period of 2022 can be found in “Management’s Discussion and Analysis of Financial Condition and Results of Operations” in Part II, Item 7 of the Form 10-K for the year ended December 31, 2023.
13
FINANCIAL REVIEW
This financial review discusses the Company’s financial condition, results of operations, liquidity and capital resources, significant accounting policies and estimates, new accounting pronouncements, market risks and other matters. It should be read in conjunction with the Consolidated Financial Statements and related Notes that follow this discussion.
FINANCIAL CONDITION
The Company’s overall financial position remains strong given that aggregate cash, cash equivalents and investments is $526,968 at December 31, 2024, including $105,067 in trading securities discussed below. Cash flows from 2024 operating activities totaled $138,889 compared to $94,611 in 2023, and are discussed in the section entitled Liquidity and Capital Resources. During 2024, the Company paid cash dividends of $25,515, purchased and retired $13,534 of its outstanding shares, and made capital expenditures of $17,997, all of which was financed from internal sources.
The Company’s net working capital was $246,319 at December 31, 2024 compared to $245,763 at December 31, 2023. As of December 31, 2024, the Company’s total cash, cash equivalents and investments, including all long-term investments, was $526,968 compared to $427,028 at December 31, 2023, an increase of $99,940. See Liquidity And Capital Resources section below for discussion. The aforementioned includes $105,067 and $87,800 of investments in trading securities as of December 31, 2024 and 2023, respectively. The Company invests in trading securities to provide an economic hedge for its deferred compensation liabilities, as further discussed herein and in Note 7 of the Company’s Notes to Consolidated Financial Statements.
Shareholders’ equity increased from $823,422 at December 31, 2023 to $870,743 as of December 31, 2024, which principally reflects 2024 net earnings of $86,827, less cash dividends of $25,515 and share repurchases of $13,534.
The Company has a relatively straight-forward financial structure and has historically maintained a conservative financial position. The Company has no special financing arrangements or “off-balance sheet” special purpose entities. Cash flows from operations plus maturities of short-term investments are expected to be adequate to meet the Company’s overall financing needs, including capital expenditures, in 2025. Periodically, the Company considers possible acquisitions, and if the Company were to pursue and complete such an acquisition, that could result in bank borrowings or other financing.
RESULTS OF OPERATIONS
2024 vs. 2023
The consolidated net product sales for the twelve months of 2024 were $715,530 compared to the twelve months 2023 of $763,252, a decrease of $47,722 or 6.3%. Fourth quarter 2024 net product sales were $191,356 compared to $195,368 in fourth quarter 2023, a decrease of $4,012, or 2.1%. The sales decline in fourth quarter and twelve months 2024 was driven primarily by lower sales volumes. The Company faced a more challenging market in 2024 as customers and consumers became more resistant to higher prices for our products. which were implemented to help restore our margins.
Product cost of goods sold were $468,056 in 2024 compared to $510,737 in 2023, a decrease of $42,681 or 8.4%. Product cost of goods sold includes $803 and $814 in certain deferred compensation expenses in 2024 and 2023, respectively. These deferred compensation expenses principally result from changes in the market value of investments and investment income from trading securities relating to compensation deferred in previous years and are not reflective of current operating results. Adjusting for the aforementioned, product cost of goods sold decreased from $509,923 in 2023 to $467,253 in 2024, a decrease of $42,670 or 8.4%. As a percent of net product sales, these adjusted costs decreased from 66.8% in 2023 to 65.3% in 2024, a 1.5 favorable percentage point change. Certain cost and expense reductions, as well as higher price realizations helped benefit 2024 cost of goods sold and gross profit margins.
We have experienced significant increases in input costs, primarily ingredients, packaging materials, labor, and manufacturing maintenance and supply costs from 2021 through 2024. Fourth quarter and twelve months 2024 gross profit margins benefited from improvements in plant manufacturing operating efficiencies.
14
However, lower sales volumes adversely affected our results in fourth quarter and twelve months 2024 because a significant portion of our plant overhead costs, and certain other costs and operating expenses, do not decrease with lower sales. The Company uses the Last-In-First-Out (LIFO) method of accounting for inventory and costs of goods sold which results in lower current income taxes during such periods of increasing costs and higher inflation, but this method does charge the most current costs to cost of goods sold and usually accelerates the realization of these higher costs. During fourth quarter 2024, the Company reduced inventories which resulted in a LIFO liquidation. The liquidated inventory was carried at lower costs prevailing in prior years as compared with current costs in 2024, and therefore benefited fourth quarter and twelve months 2024 operating earnings and pre-tax earnings.
In response to increases in input costs in recent years, many companies in the consumer products industry have increased selling prices. We have implemented price increases as well during this period with the objective of improving sales price realization in order to recover our margin declines. Although we made progress in restoring our margins in 2024, cocoa and chocolate costs have moved significantly higher in the markets this year, and we expect to experience even higher cocoa and chocolate costs in 2025 as many of our older supply contracts expire and new contracts at higher costs become effective. Although the Company continues to monitor its input costs, we are mindful of the effects and limits when passing on the above-discussed higher input costs to our customers as well as the final consumers of our products.
Selling, marketing and administrative expenses were $152,675 in 2024 compared to $155,012 in 2023, a decrease of $2,337 or 1.5%. Selling, marketing and administrative expenses include $15,521 and $14,675 in certain deferred compensation expenses in 2024 and 2023, respectively. These deferred compensation expenses principally result from changes in the market value of investments and investment income from trading securities relating to compensation deferred in previous years and are not reflective of current operating results. Adjusting for the aforementioned, selling, marketing and administrative expenses decreased from $140,337 in 2023 to $137,154 in 2024, a decrease of $3,183 or 2.3%. As a percent of net product sales, these adjusted expenses increased from 18.4% of net product sales in 2023 to 19.2% of net product sales in 2024, a 0.8 unfavorable percentage point change. The increase in these expenses, as a percentage of net product sales was attributable to lower sales volume in 2024 compared to 2023, primarily due to the impact of employee compensation, that is largely fixed in nature.
As outlined in Note 1 to the consolidated financial statements, the Company records revenue from net product sales based on accounting guidance. Adjustments for estimated customer cash discounts upon payment, discounts for price adjustments, product returns, allowances, and certain advertising and promotional costs, including consumer coupons, are variable considerations and are recorded as a reduction of net product sales revenue in the same period the related net product sales are recorded. These estimates are calculated using historical averages adjusted for any expected changes due to current business conditions and experience. The Company identified changes in business conditions that changed Management’s estimated current and future liabilities resulting in a $5,665 reduction in accrued liabilities and an increase in net product sales in twelve months 2024.
Selling, marketing and administrative expenses include freight, delivery and warehousing expenses. These expenses decreased from $65,465 in 2023 to $57,581 in 2024, a decrease of $7,884 or 12.0%. As a percent of net product sales, these adjusted expenses decreased from 8.6% in 2023 to 8.0% in 2024, a 0.6 favorable percentage point change, which generally reflects the benefits of lower freight surcharges and a more favorable freight market.
The Company has foreign operating businesses in Mexico, Canada and Spain, and exports products to many foreign markets. The Company’s Spanish subsidiary (97% owned by the Company) incurred an operating loss of $611 in 2024 compared to its $828 loss in 2023. Company management expects the competitive and business challenges in Spain to continue. Management believes that operating losses at its Spanish subsidiary are expected to continue beyond 2025 and that these future losses, as well as some capital expenditures, will likely require additional cash financing.
The Company believes that the carrying values of its goodwill and trademarks have indefinite lives as they are expected to generate cash flows indefinitely. In accordance with current accounting guidance, these indefinite-lived intangible assets are assessed at least annually for impairment as of December 31 or whenever events or circumstances indicate that the carrying values may not be recoverable from future cash flows. No impairments were recorded in 2024, 2023 or 2022. Current accounting guidance provides entities an option of performing a qualitative assessment (a "step-zero" test) before performing a quantitative analysis.
15
If the entity determines, on the basis of certain qualitative factors, that it is more-likely-than-not that the intangibles (goodwill and certain trademarks) are not impaired, the entity would not need to proceed to the two step impairment testing process (quantitative analysis) as prescribed in the guidance. During fourth quarter 2024 (and fourth quarters 2023 and 2022), the Company performed a “step zero” test of its goodwill and certain trademarks, and concluded that there was no impairment based on this guidance. For the fair value assessment of certain trademarks where the “step-zero” analysis was not considered appropriate, impairment testing was performed in fourth quarter 2024 (and fourth quarters 2023 and 2022) using discounted cash flows and estimated royalty rates and concluded that the trademarks were not impaired. For these trademarks, holding all other assumptions constant, as of December 31, 2024, a 100 basis point increase in the discount rate would reduce the fair value of these trademarks by approximately 12% and a 100 basis point decrease in the royalty rate would increase the fair value of these trademarks by approximately 16%. Individually, a 100 basis point increase in the discount rate or a 100 basis point decrease in the royalty rate would not result in a potential impairment as of December 31, 2024.
Earnings from operations were $100,505 in 2024 compared to $101,828 in 2023, a decrease of $1,323. Earnings from operations include $16,324 and $15,489 in certain deferred compensation expense in 2024 and 2023, respectively, which are discussed above. Adjusting for these deferred compensation expenses, adjusted earnings from operations decreased from $117,317 in 2023 to $116,829 in 2024, a decrease of $488 or 0.4%. The above discussed decrease in net product sales was the principal driver of lower adjusted operating earnings in 2024 compared to 2023.
Management believes the comparisons presented in the preceding paragraphs, after adjusting for changes in deferred compensation, are more reflective of the underlying operations of the Company.
Other income, net was $26,366 in 2024 compared to $18,066 in 2023, an increase of $8,300. Other income, net principally reflects $16,324 and $15,489 of aggregate net gains and investment income on trading securities in 2024 and 2023, respectively. These trading securities provide an economic hedge of the Company’s deferred compensation liabilities; and the related net gains and investment income were offset by a like amount of expense in aggregate product cost of goods sold and selling, marketing, and administrative expenses in the respective years as discussed above. Other income, net includes investment income from available for sale securities of $9,598 and $5,211 in 2024 and 2023, respectively, which reflects both higher interest rates and related investment returns on the Company’s available for sale marketable securities, as well as an increase in the average balances in 2024 on such securities. Other income, net also includes foreign exchange gains (losses) of $511 and $(2,803) in 2024 and 2023, respectively.
On December 3, 2024, the Board of Directors (the “Board”) of the Company revoked its prior action dated December 28, 2018 that permitted management to take appropriate action to preserve the full income tax deductibility of certain amounts under its nonqualified deferred compensation plans in light of changes to Section 162(m) of Internal Revenue Code made by the Tax Cuts and Jobs Act of 2017 (“TCJA”). The Board revoked its authorization after determining that it was no longer feasible, after considering the purpose of these plans, to secure tax deductions on all accrued deferred compensation by further deferring payment amounts, in large part, due to interpretations of TCJA later adopted by the IRS and the subsequent growth of plan account balances due to sustained equity market appreciation. Given this Board action and the resulting expectation that certain additional amounts of deferred compensation will not be tax deductible in future years, the Company concluded that it will be required under generally accepted accounting principles in the United States of America to write off the related deferred tax assets. The adjustment to the deferred tax assets resulted in a non-cash tax charge of $11,010 in fourth quarter 2024. The Company does not anticipate that this write off will result in future cash expenditures other than the Company’s inability to deduct certain deferred compensation payments against future taxable income.
The Company’s effective income tax rates were 48.8% and 21.8% in fourth quarter 2024 and 2023, respectively, and 31.6% and 23.4% in twelve months 2024 and 2023, respectively. Excluding the effects of the write-off of deferred tax assets as discussed above, the Company’s effective income tax rates were 23.8% and 21.8% in fourth quarter 2024 and 2023, respectively, and 22.9% and 23.4% in twelve months 2024 and 2023, respectively. A reconciliation of the differences between the U.S. statutory rate and these effective tax rates is provided in Note 4 of the Company’s Notes to Consolidated Financial Statements.
16
The Company has provided a full valuation allowance on its Spanish subsidiaries’ tax loss carry-forward benefits of $4,681 and $4,836 as of December 31, 2024 and 2023, respectively, because the Company has concluded that it is not more-likely-than-not that these losses will be utilized before their expiration dates. The Spanish subsidiary has a history of net operating losses and it is not known when and if they will generate taxable income in the future.
U.S. tax reform (the TCJA) changed the United States approach to the taxation of foreign earnings to a territorial system by providing a one hundred percent dividends received deduction for certain qualified dividends received from foreign subsidiaries. These provisions of U.S. tax reform significantly impact the accounting for the undistributed earnings of foreign subsidiaries. After carefully considering these facts, the Company determined that it asserts the permanent reinvestment of all of its foreign subsidiaries’ earnings as of December 31, 2024.
Net earnings attributable to Tootsie Roll Industries, Inc. were $86,827 in twelve months 2024 compared to $91,912 in 2023, and net earnings per share were $1.22 and $1.28 in 2024 and 2023, respectively, a decrease of $0.06 per share or 4.7%. Fourth quarter 2024 and 2023 net earnings attributable to Tootsie Roll Industries, Inc. were $22,509 and $29,403, respectively, and net earnings per share were $0.32 and $0.41, respectively, a decrease of $0.09 per share or 22.0%. Adjusting for the above-discussed write-off of deferred tax assets relating to deferred compensation, net earnings in fourth quarter 2024 would have been $33,519 compared to $29,403 in fourth quarter 2023, an increase of $4,116 or 14%, and net earnings in twelve months 2024 would have been $97,837 compared to $91,912 in 2023, an increase of $5,925 or 6%. Earnings per share in both fourth quarter and twelve months 2024 benefited by the reduction in average shares outstanding resulting from purchases of the Company’s common stock in the open market by the Company. Average shares outstanding decreased from 71,903 in 2023 to 71,320 in 2024 which reflects share repurchases of $13,534 during 2024.
Beginning in 2012, the Company received periodic notices from the Bakery and Confectionery Union and Industry International Pension Fund (Plan), a multi-employer defined benefit pension plan for certain Company union employees, that the Plan’s actuary certified the Plan to be in “critical status”, as defined by the Pension Protection Act (PPA) and the Pension Benefit Guaranty Corporation (PBGC); and that a plan of rehabilitation was adopted by the trustees of the Plan in 2012. The Plan’s status was changed to “critical and declining status”, as defined by the PPA and PBGC, for the plan year beginning January 1, 2015, and this status has continued. In 2016, the Company received new notices that the Plan’s trustees adopted an updated Rehabilitation Plan effective January 1, 2016, and all annual notices through 2024 have continued to classify the Plan in the “critical and declining status” category.
Based on these updated notices, the Plan’s funded percentage (plan investment assets as a percentage of plan liabilities), as defined, were 47.0%, 49.3%, and 48.5% as of January 1, 2023, 2022, and 2021, respectively (these valuation dates are as of the beginning of each Plan year). These funded percentages are based on actuarial values, as defined, and do not reflect the actual market value of Plan investments as of these dates. If the market value of investments had been used as of January 1, 2023, the funded percentage would be 43.6% (not 47.0%). As of the January 1, 2023 valuation date (most recent valuation available), only 14% of Plan participants were current active employees, 55% were retired or separated from service and receiving benefits, and 31% were retired or separated from service and entitled to future benefits. The number of current active employee Plan participants as of January 1, 2023 fell 1% from the previous year and 6% over the past two years. When compared to the Plan valuation date of January 1, 2011 (just prior to the Plan being certified to be in “critical status”), current active employee participants have declined 55%, whereas participants who were retired or separated from service and receiving benefits increased 3% and participants who were retired or separated from service and entitled to future benefits increased 6%.
The Company has been advised that its withdrawal liability would have been $97,500, $102,200 and $96,000 if it had withdrawn from the Plan during 2024, 2023 and 2022 respectively (most recent information provided by the Plan). The most recent decrease in the withdrawal liability as advised by the Plan was primarily driven by an increase in the PBGC interest rates used to value a portion of the present value of vested benefits (the Plan uses a blended interest rate assumption). As discussed below, the Plan was granted $3.4 billion in Special Financial Assistance in July 2024. The withdrawal liability, since it is calculated as of the end of 2023 as if the Company were to have withdrawn in 2024, does not include any of the $3.4 billion of assets received. After receiving the Special Financial Assistance, the Plan will be required to use PBGC interest rates to value all, instead of a portion, of the present value of vested benefits to provide an estimate of the Company’s withdrawal liability. In addition, for withdrawal liability purposes, PBGC regulations require the Special Financial Assistance to be phased-in over a period of time instead of fully recognized immediately.
17
Based on the Company’s most recent actuarial estimates using the information provided by the Plan with respect to its 2024 withdrawal liability (based on most recent information provided to the Company) and certain provisions in ERISA and laws relating to withdrawal liability payments, management believes that the Company’s liability had the Company withdrawn in 2024 would likely be limited to twenty annual payments of $2,664 which have a present value in the range of $31,262 to $37,654 depending on the interest rate used to discount these payments. While the Company’s actuarial consultant did not believe that the Plan will suffer a future mass withdrawal (as defined) of participating employers, in the event of a mass withdrawal, the Company’s annual withdrawal payments would theoretically be payable in perpetuity. Based on the same actuarial estimates, had a mass withdrawal occurred in 2024, the present value of such perpetuities is in the range of $43,650 to $69,266 and would apply in the unlikely event that substantially all employers withdraw from the Plan. The aforementioned is based on a range of valuations and interest rates which the Company’s actuary has advised is provided under the statute. Should the Company actually withdraw from the Plan at a future date, a withdrawal liability, which could be higher than the above discussed amounts, could be payable to the Plan.
In fourth quarter 2020, the Plan Trustees advised the Company that the surcharges would no longer increase annually and therefore be “frozen” at the rates and amounts in effect as of December 31, 2020 provided that the local bargaining union and the Company executed a formal consent agreement by March 31, 2021. The Trustees advised that they have concluded that continuing increases in surcharges would likely have a long-term adverse effect on the solvency of the Plan. The Trustees concluded that further increases would result in increasing financial hardships and withdrawals of participating employers, and that this change will not have a material effect on the Plan’s insolvency date. In first quarter 2021, the local bargaining union and the Company executed this agreement which resulted in the “freezing” of such surcharges as of December 31, 2020.
The Company’s pension expense for this Plan for twelve months 2024 and 2023 was $3,332 and $3,516, respectively. The aforementioned expense includes surcharges of $1,174 and $1,239 for twelve months 2024 and 2023, respectively, as required under the amended plan of rehabilitation. The decrease in the twelve months 2024 expense compared to twelve months 2023 reflects the effects of lower sales volumes in twelve months 2024, and corresponding reductions in lower production and labor hours worked.
In June 2024, the PBGC announced that it had approved the Plan’s application for Special Financial Assistance under the American Rescue Plan Act of 2021. Company management understands that this legislation would provide financial assistance from the PBGC to shore up financially distressed multi-employer plans to ensure that they can remain solvent and continue to pay benefits to retirees through 2051 without any reduction in retiree benefits. The Plan advised the Company that it was granted approximately $3.4 billion in Special Financial Assistance funds and received those funds in July 2024. The Company’s actuary believes that it still remains unclear if the Plan can remain solvent through the targeted date of 2051 although as a requirement of the American Rescue Plan Act of 2021, the Plan must remain in “critical status” through 2051 regardless of solvency. The regulations under the aforementioned PBGC financial assistance could result in a higher withdrawal liability even with PBGC financial assistance since those regulations require use of settlement interest rates to value all, instead of a portion, of the present value of vested benefits in determining the Company’s withdrawal liability. In addition, for withdrawal liability purposes, PBGC regulations require the Special Financial Assistance to be phased-in over a period of time instead of fully recognized immediately. While it is uncertain how the requirements imposed by the Special Financial Assistance will impact the Company’s withdrawal liability in the future, the Company’s actuary believes any withdrawal will continue to be limited to the twenty annual payments previously discussed and that those payments will not be affected by Special Financial Assistance regulation.
During second quarter 2023, the Company and the union associated with the Plan concluded negotiations and entered into a new labor contract which expires in September 2027. Under terms of the union contract the Company is obligated to continue its participation in the Plan during the contract period. The Company is unable to determine the ultimate outcome of the above discussed multi-employer union pension matter and therefore is unable to determine the effects on its consolidated financial statements, but the ultimate outcome could have a material adverse effect on the Company’s consolidated results of operations or cash flows in one or more future periods. See also Note 7 of the Company’s Notes to Consolidated Financial Statements on Form 10-K for the year ended December 31, 2024.
18
The Company is focused on the longer term and therefore is continuing to make investments in plant manufacturing operations to meet new consumer and customer product demands, achieve product quality improvements, expand capacity in certain product lines, and increase operational efficiencies in order to provide genuine value to consumers.
LIQUIDITY AND CAPITAL RESOURCES
Cash flows from operating activities were $138,889, $94,611 and $72,051 in 2024, 2023 and 2022, respectively. The $44,278 increase in cash flows from operating activities from 2023 to 2024 primarily reflects a lower investment in net working capital. Inventories decreased by $17,296 or 18.2% in 2024 to better meet demand on a timely basis. The $22,560 increase in cash flows from operating activities from 2022 to 2023 primarily reflects increases net earnings during 2023, lower inventories, and changes in deferred income taxes including the write-off of deferred tax assets relating to deferred compensation as discussed above.
The Company manages and controls a VEBA trust, to fund the estimated future costs of certain union employee health, welfare and other benefits. Contributions of $20,000 and $5,000 were made to this trust in 2023 and 2022, respectively; no contribution was made to the trust during 2024. The Company uses these funds to pay the actual cost of such benefits over each union contract period. At December 31, 2024 and 2023, the VEBA trust held $13,926 and $19,126 respectively, of aggregate cash and cash equivalents, which the Company expects to use to pay certain union employee benefits through part or all of 2027. This asset value is included in prepaid expenses and long-term other assets in the Company’s Consolidated Statement of Financial Position and is categorized as Level 1 within the fair value hierarchy.
Cash flows from investing activities reflect capital expenditures of $17,997, $26,796, and $23,356 in 2024, 2023 and 2022, respectively. The Company is currently pursuing a plant expansion, including additional and replacement of certain processing and packaging lines, to better meet its higher level of forecasted demand for certain products on a timelier and more cost effective basis. The Company expects that this will take place over the next seven years, however, most of the actual expenditures are expected to occur in 2025 and 2026. Company management believes that the total cost of this expansion, including new machinery, equipment and food processing infrastructure, and warehousing will approximate $100,000. All capital expenditures have been and are expected to be funded from the Company’s cash flow from operations and internal sources including available for sale securities.
Other than the bank loans and the related restricted cash of the Company’s Spanish subsidiary which are discussed in Note 1 of the Company’s Notes to Consolidated Financial Statements, the Company had no bank borrowings or repayments in 2022, 2023, or 2024, and had no outstanding bank borrowings as of December 31, 2023 or 2022. Nonetheless, the Company would consider bank borrowing or other financing in the event that a business acquisition is completed.
Financing activities include Company common stock purchases and retirements of $13,534, $33,114, and $31,910 in 2024, 2023 and 2022, respectively. Cash dividends of $25,515, $25,076, and $24,629 were paid in 2024, 2023 and 2022, respectively.
CRITICAL ACCOUNTING POLICIES AND ESTIMATES
Preparation of the Company’s financial statements involves judgments and estimates due to uncertainties affecting the application of accounting policies, and the likelihood that different amounts would be reported under different conditions or using different assumptions. The Company bases its estimates on historical experience and other assumptions, as discussed herein, that it believes are reasonable. If actual amounts are ultimately different from previous estimates, the revisions are included in the Company’s results of operations for the period in which the actual amounts become known. The Company’s significant accounting policies are discussed in Note 1 of the Company’s Notes to Consolidated Financial Statements.
Following is a summary and discussion of the more significant accounting policies and estimates which management believes to have a significant impact on the Company’s operating results, financial position, cash flows and footnote disclosure.
19
Revenue recognition
As further discussed in Note 1 of the Company’s Notes to Consolidated Financial Statements, the Company follows the revenue recognition guidance in ASC 606. ASC 606 requires adjustments for estimated customer cash discounts upon payment, discounts for price adjustments, product returns, allowances, and certain advertising and promotional costs, including consumer coupons, which are variable consideration and are recorded as a reduction of product sales revenue in the same period the related product sales are recorded. Such estimates are calculated using historical averages adjusted for any expected changes due to current business conditions and experience. Revenue for net product sales is recognized at a point in time when products are delivered to or picked up by the customer, as designated by customers’ purchase orders, as discussed in Note 1 of the Company’s Notes to Consolidated Financial Statements.
Provisions for bad debts are recorded as selling, marketing and administrative expenses. Write-offs of bad debts did not exceed 0.2% of net product sales in each of 2024, 2023 and 2022, and accordingly, have not been significant to the Company’s financial position or results of operations.
Intangible assets
The Company’s intangible assets consist primarily of goodwill and acquired trademarks. In accordance with accounting guidance, goodwill and other indefinite-lived assets, trademarks, are not amortized, but are instead subjected to annual testing for impairment unless certain triggering events or circumstances are noted. The Company performs its annual impairment review and assessment as of December 31. All trademarks have been assessed by management to have indefinite lives because they are expected to generate cash flows indefinitely. The Company reviews and assesses certain trademarks (non-amortizable intangible assets) for impairment by comparing the fair value of each trademark with its carrying value. Current accounting guidance provides entities an option of performing a qualitative assessment (a "step-zero" test) before performing a quantitative analysis. If the entity determines, on the basis of certain qualitative factors, that it is more-likely-than-not that the intangibles (goodwill and certain trademarks) are not impaired, the entity would not need to proceed to the two step impairment testing process (quantitative analysis) as prescribed in the guidance. During fourth quarter 2024, the Company performed a “step zero” test of its goodwill and certain trademarks, and concluded that there was no impairment based on this guidance.
The Company determines the fair value of certain trademarks using discounted cash flows and estimates of royalty rates. If the carrying value exceeds fair value, such trademarks are considered impaired and are reduced to fair value. The Company utilizes third-party professional valuation firms to assist in the determination of valuation of certain trademarks. Impairments have not generally been material to the Company’s historical operating results. Cash flow projections require the Company to make assumptions and estimates regarding the Company’s future plans, including sales projections and profit margins, market based discount rates, competitive factors, and economic conditions; and the Company’s actual results and conditions may differ over time. A change in the assumptions relating to the impairment analysis including but not limited to a reduction in projected cash flows, the use of a different discount rate to discount future cash flows or a different royalty rate applied to such trademarks, could cause impairment in the future.
Customer incentive programs, advertising and marketing
Advertising and marketing costs are recorded in the period to which such costs relate. The Company does not defer the recognition of any amounts on its consolidated balance sheet with respect to such costs. The expected cost of future payments to customers for incentives and other trade promotional programs is recorded at the time sale as a reduction of Net product sales. The liabilities associated with these programs are reviewed quarterly and adjusted if the expected utilization rate differs from management’s original estimates. Although the Company recorded a $5,665 favorable change in this estimate in 2024, as discussed above, such adjustments have not historically been material to the Company’s operating results.
20
Valuation of long-lived assets
Long-lived assets, primarily property, plant and equipment, are reviewed for impairment as events or changes in business circumstances occur indicating that the carrying value of the asset may not be recoverable. The estimated cash flows produced by assets or asset groups, are compared to the asset carrying value to determine whether impairment exists. Such estimates involve considerable management judgment and are based upon assumptions about expected future operating performance. As a result, actual cash flows could differ from management’s estimates due to changes in business conditions, operating performance, and economic and competitive conditions. Such impairments have not historically been material to the Company’s operating results.
Income taxes
Deferred income taxes are recognized for future tax effects of temporary differences between financial and income tax reporting using tax rates in effect for the years in which the differences are expected to reverse. The Company records valuation allowances, or may actually adjust or write-off deferred tax assets, in situations where the realization of deferred tax assets, including those relating to net operating tax losses, is not more-likely-than-not; and the Company adjusts and releases such valuation allowances when realization becomes more-likely-than-not as defined by accounting guidance. The Company periodically reviews assumptions and estimates of the Company’s probable tax obligations and effects on its liability for uncertain tax positions, using informed judgment which may include the use of third-party consultants, advisors and legal counsel, as well as historical experience.
Valuation of investments
Investments are classified as either available for sale or trading. Investments classified as available for sale primarily comprise high quality corporate bonds which are generally not sold prior to maturity, which is typically three to five years. The Company uses a “ladder” approach to its maturities so that approximately 20% to 35% of the portfolio matures each year with the objective of achieving higher yields with minimum interest rate risk. The Company also invests in variable rate demand notes (generally long term bonds where interest rates are reset weekly, and provide a weekly “put” which allows the holder to also sell each week with no loss in principal). Available for sale investments are reviewed for impairment at each reporting period by comparing the carrying value or amortized cost to the fair market value. In the event that the Company determines that a security’s fair value is permanently impaired, the Company will record the amount of the impairment attributable to credit factors in earnings as credit loss expense or, as applicable, a reversal of that expense, with the amount attributable to non-credit factors in other comprehensive income, net of applicable taxes. The Company’s investment policy, which guides investment decisions, is focused on high quality investments which mitigates the risk of impairment. Investments classified as trading securities primarily comprise mutual funds which are used as an economic hedge against our deferred compensation liabilities. Trading securities are carried at fair value with gains or losses included in other income, net. The Company does not invest in Level 3 securities, as defined, but may utilize third-party professional valuation firms as necessary to assist in the determination of the value of investments that utilize Level 3 inputs (as defined by guidance) should any of its investments be downgraded to Level 3.
Other matters
In the opinion of management, other than contracts for foreign currency forwards and raw materials, including currency and commodity hedges and outstanding purchase orders for packaging, ingredients, supplies, operational services, and capital expenditures, all entered into in the ordinary course of business, the Company does not have any significant contractual obligations or future commitments.
RECENT ACCOUNTING PRONOUNCEMENTS
See Note 1 of the Company’s Notes to Consolidated Financial Statements.
MARKET RISKS
The Company is exposed to market risks related to commodity prices, interest rates, investments in marketable securities, equity price and foreign exchange.
21
The Company’s ability to forecast the direction and scope of changes to its major input costs is impacted by significant potential volatility in crude oil and energy, sugar, corn, edible oils, cocoa and cocoa powder, and dairy products markets. The prices of these commodities are influenced by changes in global demand, changes in weather and crop yields, including the effects of climate change, changes in import tariffs and governments’ farm policies, including mandates for ethanol and bio-fuels, environmental matters, fluctuations in the U.S. dollar relative to dollar-denominated commodities in world markets, and in some cases, geo-political and military conflict risks. The Company believes that its competitors face the same or similar challenges.
In order to address the impact of changes in input and other costs, the Company periodically reviews each item in its product portfolio to ascertain if price realization adjustments or other actions should be taken. These reviews include an evaluation of the risk factors relating to market place acceptance of such changes and their potential effect on future sales volumes. In addition, the estimated cost of packaging modifications associated with weight changes, if applicable, is evaluated. The Company also maintains ongoing cost reduction and productivity improvement programs under which cost savings initiatives are encouraged and progress monitored, and continuously reviews automation and productivity opportunities requiring capital investments. The Company is not able to accurately predict the outcome of these cost savings initiatives and their effects on its future results.
Commodity future and foreign currency forward contracts
Commodity price risks relate to ingredients, primarily sugar, cocoa and cocoa powder, chocolate, corn syrup, dextrose, edible oils, milk, whey and gum base ingredients. The Company believes its competitors face similar risks, and the industry has historically adjusted prices, and/or product weights, to compensate for adverse fluctuations in commodity costs. The Company, as well as competitors in the confectionery industry, has historically taken actions, including higher price realization to mitigate rising input costs for ingredients, packaging, labor and fringe benefits, energy, freight and delivery, and plant manufacturing maintenance, supplies and services. Although management seeks to substantially recover cost increases over the long-term, there is risk that higher price realization cannot be fully passed on to customers and, to the extent they are passed on, they could adversely affect customer and consumer acceptance and resulting sales volume.
The Company utilizes commodity futures contracts, as well as annual supply agreements, to hedge and plan for anticipated purchases of certain ingredients, including sugar, in order to mitigate commodity cost fluctuation. The Company also may purchase forward foreign exchange contracts to hedge its costs of manufacturing certain products in Canada for sale and distribution in the United States (U.S.A.), and periodically does so for purchases of equipment or raw materials from foreign suppliers. Such commodity futures and currency forward contracts are cash flow hedges and are effective as hedges as defined by accounting guidance. The unrealized gains and losses on such contracts are deferred as a component of accumulated other comprehensive loss (or gain) and are recognized as a component of product cost of goods sold when the related inventory is sold.
The potential change in fair value of commodity and foreign currency derivative instruments held by the Company at December 31, 2024, assuming a 10% change in the underlying contract price, was $4,709. The analysis only includes commodity and foreign currency derivative instruments and, therefore, does not consider the offsetting effect of changes in the price of the underlying commodity or foreign currency. This amount is not significant compared with the net earnings and shareholders’ equity of the Company.
Interest rates
Interest rate risks primarily relate to the Company’s investments in available for sale marketable securities with maturity dates of generally three to five years.
The majority of the Company’s investments which are classified as available for sale have generally not been sold prior to their maturity, which is typically three to five years. Approximately 20% to 35% of this investment portfolio matures each year. This “ladder” approach to investing limits the Company’s exposure to interest rate fluctuations. The Company also invests in variable rate demand notes which have interest rates that are reset weekly and can be “put back” and sold each week through a remarketing agent, generally a large financial broker, which also substantially eliminates the Company’s exposure to interest rate fluctuations on the principal invested.
22
The accompanying chart summarizes the maturities of the Company’s investments in debt securities at December 31, 2024.
Less than 1 year |
|
$ |
55,789 |
1 – 2 years |
|
|
46,980 |
2 – 5 years |
|
|
180,291 |
Total |
|
$ |
283,060 |
The Company’s outstanding debt at December 31, 2024 and 2023 was $7,500 in an industrial development bond in which interest rates reset each week based on the current market rate. Therefore, the Company does not believe that it has significant interest rate risk with respect to its interest bearing debt.
Investment in marketable securities
As stated above, the Company’s investments classified as available for sale primarily include marketable securities which mature in three to five years and variable rate demand notes (VRDNs). The VRDNs have weekly “puts” which are collateralized by bank letters of credit or other assets, and interest rates are reset weekly. Except for VRDNs, the Company’s marketable securities are generally not sold prior to maturity and such maturities generally approximate three to five years. The Company utilizes professional money managers and maintains investment policy guidelines which emphasize high quality and liquidity in order to minimize the potential loss exposures that could result in the event of higher interest rates, a default or other adverse event. The Company continues to monitor these investments and markets, as well as its investment policies, however, the financial markets could experience unanticipated or unprecedented events and future outcomes may be less predictable than in the past.
Equity price
Equity price risk relates to the Company’s investments in mutual funds which are principally used to fund and hedge the Company’s deferred compensation liabilities. These investments in mutual funds are classified as trading securities. Any change in the fair value of these trading securities is completely offset by a corresponding change in the respective hedged deferred compensation liability, and therefore, the Company does not believe that it has significant equity price risk with respect to these investments.
Foreign currency
Foreign currency risk principally relates to the Company’s foreign operations in Canada, Mexico and Spain, as well as periodic purchase commitments of machinery and equipment from foreign sources, generally the European Union where the Euro is the currency.
Certain of the Company’s Canadian manufacturing costs, including local payroll and plant operations, and a portion of its packaging and ingredients are sourced in Canadian dollars. The Company may purchase Canadian forward contracts to receive Canadian dollars at a specified date in the future and uses its Canadian dollar collections on Canadian sales as a partial hedge of its overall Canadian manufacturing obligations sourced in Canadian dollars. The Company also periodically purchases and holds Canadian dollars to facilitate the risk management of these currency changes.
From time to time, the Company may use foreign exchange forward contracts and derivative instruments to mitigate its exposure to foreign exchange risks, as well as those related to firm commitments to purchase equipment from foreign vendors. See Note 10 of the Company’s Notes to Consolidated Financial Statements for outstanding foreign exchange forward contracts as of December 31, 2024.
23
ITEM 7A. Quantitative and Qualitative Disclosures About Market Risk.
The information required by this item is included under the caption “Market Risk” in Item 7 above.
See also Note 1 of the Notes to Consolidated Financial Statements.
ITEM 8. Financial Statements and Supplementary Data.
Management’s Report on Internal Control Over Financial Reporting
The management of Tootsie Roll Industries, Inc. is responsible for establishing and maintaining adequate internal control over financial reporting, as such term is defined in the Securities Exchange Act of 1934 (SEC) Rule 13a-15(f). Company management conducted an evaluation of the effectiveness of the Company’s internal control over financial reporting as of December 31, 2024 as required by SEC Rule 13a-15(c). In making this assessment, the Company used the criteria established in Internal Control—Integrated Framework (2013) issued by the Committee of Sponsoring Organizations of the Treadway Commission (the COSO criteria). Based on the Company’s evaluation under the COSO criteria, Company management concluded that its internal control over financial reporting was effective as of December 31, 2024.
The effectiveness of the Company’s internal control over financial reporting as of December 31, 2024 has been audited by Grant Thornton LLP (PCAOB ID: 248), an independent registered public accounting firm, as stated in their report which is included herein.
24
REPORT OF INDEPENDENT REGISTERED PUBLIC ACCOUNTING FIRM
Board of Directors and Shareholders
Tootsie Roll Industries, Inc.
Opinions on the financial statements and internal control over financial reporting
We have audited the accompanying consolidated financial positions of Tootsie Roll Industries, Inc. (a Virginia corporation) and subsidiaries (the “Company”) as of December 31, 2024 and 2023, and the related consolidated statements of earnings and retained earnings, comprehensive earnings, and cash flows for each of the three years in the period ended December 31, 2024, and the related notes and financial statement schedules included under Item 15(a) (collectively referred to as the “financial statements”). We also have audited the Company’s internal control over financial reporting as of December 31, 2024, based on criteria established in the 2013 Internal Control—Integrated Framework issued by the Committee of Sponsoring Organizations of the Treadway Commission (“COSO”).
In our opinion, the financial statements referred to above present fairly, in all material respects, the financial position of the Company as of December 31, 2024 and 2023, and the results of its operations and its cash flows for each of the three years in the period ended December 31, 2024 in conformity with accounting principles generally accepted in the United States of America. Also in our opinion, the Company maintained, in all material respects, effective internal control over financial reporting as of December 31, 2024, based on criteria established in the 2013 Internal Control—Integrated Framework issued by COSO.
Basis for opinions
The Company’s management is responsible for these consolidated financial statements, for maintaining effective internal control over financial reporting, and for its assessment of the effectiveness of internal control over financial reporting, included in the accompanying Management’s Report on Internal Control over Financial Reporting. Our responsibility is to express an opinion on the Company’s consolidated financial statements and an opinion on the Company’s internal control over financial reporting based on our audits. We are a public accounting firm registered with the Public Company Accounting Oversight Board (United States) (“PCAOB”) and are required to be independent with respect to the Company in accordance with the U.S. federal securities laws and the applicable rules and regulations of the Securities and Exchange Commission and the PCAOB.
We conducted our audits in accordance with the standards of the PCAOB. Those standards require that we plan and perform the audits to obtain reasonable assurance about whether the financial statements are free of material misstatement, whether due to error or fraud, and whether effective internal control over financial reporting was maintained in all material respects.
Our audits of the financial statements included performing procedures to assess the risks of material misstatement of the financial statements, whether due to error or fraud, and performing procedures that respond to those risks. Such procedures included examining, on a test basis, evidence regarding the amounts and disclosures in the financial statements. Our audits also included evaluating the accounting principles used and significant estimates made by management, as well as evaluating the overall presentation of the financial statements. Our audit of internal control over financial reporting included obtaining an understanding of internal control over financial reporting, assessing the risk that a material weakness exists, and testing and evaluating the design and operating effectiveness of internal control based on the assessed risk. Our audits also included performing such other procedures as we considered necessary in the circumstances. We believe that our audits provide a reasonable basis for our opinions.
Definition and limitations of internal control over financial reporting
A company’s internal control over financial reporting is a process designed to provide reasonable assurance regarding the reliability of financial reporting and the preparation of financial statements for external purposes in accordance with generally accepted accounting principles. A company’s internal control over financial reporting includes those policies and procedures that (1) pertain to the maintenance of records that, in reasonable detail, accurately and fairly reflect the transactions and dispositions of the assets of the company; (2) provide reasonable assurance that transactions are recorded as necessary to permit preparation of financial statements in accordance with generally accepted accounting principles, and that receipts and expenditures of the company are being made only in accordance with authorizations of management and directors of the company; and (3) provide reasonable assurance regarding prevention or timely detection of unauthorized acquisition, use, or disposition of the company’s assets that could have a material effect on the financial statements.
25
Because of its inherent limitations, internal control over financial reporting may not prevent or detect misstatements. Also, projections of any evaluation of effectiveness to future periods are subject to the risk that controls may become inadequate because of changes in conditions, or that the degree of compliance with the policies or procedures may deteriorate.
Critical audit matter
The critical audit matter communicated below is a matter arising from the current period audit of the financial statements that was communicated or required to be communicated to the audit committee and that: (1) relates to accounts or disclosures that are material to the financial statements and (2) involved our especially challenging, subjective, or complex judgments. The communication of critical audit matters does not alter in any way our opinion on the financial statements, taken as a whole, and we are not, by communicating the critical audit matter below, providing a separate opinion on the critical audit matter or on the accounts or disclosures to which it relates.
Valuation of Accrued Liabilities for Trade Promotions
As described further in Note 1 and 2 to the consolidated financial statements, the Company promotes products through, but not limited to, discounts, rebates, and volume-based incentives. The Company recognizes the estimated costs of these advertising and promotion activities as a component of variable consideration when determining the transaction price. The unsettled portion of the Company’s obligation for advertising and promotion activities is included in accrued liabilities in the consolidated statements of financial position. We identified valuation of accrued liabilities for advertising and promotions as a critical audit matter.
The principal considerations for our determination that the valuation of accrued liabilities is a critical audit matter are that auditing management’s calculation of the unsettled portion of the Company’s obligation for advertising and promotions was highly subjective and required significant judgement because of the nature of the required estimates and assumptions. In particular, the estimates require an analysis of the program offered, expectations regarding customer and consumer participation, payment trends, and experiences with similar programs. The estimated costs of these programs are sensitive to changes in trends with regard to customer and consumer participation.
Our audit procedures related to the valuation of accrued liabilities included the following, among others. We obtained an understanding, evaluated the design, and tested the operating effectiveness of the controls related to the Company’s calculation of the accrued liabilities for advertising and promotion activities. For example, we tested controls over management’s review of the completeness of the promotional activities as well as the significant assumptions, including future redemption amounts, and data inputs utilized in the calculation.
To test the unsettled portion of the Company’s obligation for advertising and promotion activities, we performed audit procedures that included, among others, (1) the evaluation of the estimation methodology used by management, (2) whether all material advertising and promotion activities were properly included in management’s estimate, (3) the significant assumptions discussed above, and (4) the underlying data used in the analysis. Specially, when evaluating the significant assumptions, we assessed historical and current trends in promotions offered and customer redemption practices. We also performed sensitivity analyses of significant assumptions to evaluate the changes in the estimate that would result from changes in the assumptions.
/s/ GRANT THORNTON LLP
We have served as the Company’s auditor since 2018.
Chicago, Illinois
February 28, 2025
26
CONSOLIDATED STATEMENTS OF
Earnings and Retained Earnings
TOOTSIE ROLL INDUSTRIES, INC. AND SUBSIDIARIES |
(in thousands except per share data) |
|
|
For the year ended December 31, |
|
|||||||
|
|
2024 |
|
2023 |
|
2022 |
|
|||
Net product sales |
|
$ |
715,530 |
|
$ |
763,252 |
|
$ |
681,440 |
|
Rental and royalty revenue |
|
|
7,687 |
|
|
6,113 |
|
|
5,530 |
|
Total revenue |
|
|
723,217 |
|
|
769,365 |
|
|
686,970 |
|
Product cost of goods sold |
|
|
468,056 |
|
|
510,737 |
|
|
452,552 |
|
Rental and royalty cost |
|
|
1,981 |
|
|
1,788 |
|
|
1,687 |
|
Total costs |
|
|
470,037 |
|
|
512,525 |
|
|
454,239 |
|
Product gross margin |
|
|
247,474 |
|
|
252,515 |
|
|
228,888 |
|
Rental and royalty gross margin |
|
|
5,706 |
|
|
4,325 |
|
|
3,843 |
|
Total gross margin |
|
|
253,180 |
|
|
256,840 |
|
|
232,731 |
|
Selling, marketing and administrative expenses |
|
|
152,675 |
|
|
155,012 |
|
|
121,976 |
|
Earnings from operations |
|
|
100,505 |
|
|
101,828 |
|
|
110,755 |
|
Other income (expense), net |
|
|
26,366 |
|
|
18,066 |
|
|
(12,614) |
|
Earnings before income taxes |
|
|
126,871 |
|
|
119,894 |
|
|
98,141 |
|
Provision for income taxes |
|
|
40,063 |
|
|
28,008 |
|
|
22,249 |
|
Net earnings |
|
|
86,808 |
|
|
91,886 |
|
|
75,892 |
|
Less: net earnings (loss) attributable to noncontrolling interests |
|
|
(19) |
|
|
(26) |
|
|
(45) |
|
Net earnings attributable to Tootsie Roll Industries, Inc. |
|
$ |
86,827 |
|
$ |
91,912 |
|
$ |
75,937 |
|
|
|
|
|
|
|
|
|
|
|
|
Net earnings attributable to Tootsie Roll Industries, Inc. per share |
|
$ |
1.22 |
|
$ |
1.28 |
|
$ |
1.04 |
|
Average number of shares outstanding |
|
|
71,320 |
|
|
71,903 |
|
|
72,944 |
|
|
|
|
|
|
|
|
|
|
|
|
Retained earnings at beginning of period |
|
$ |
62,949 |
|
$ |
48,276 |
|
$ |
39,545 |
|
Net earnings attributable to Tootsie Roll Industries, Inc. |
|
|
86,827 |
|
|
91,912 |
|
|
75,937 |
|
Cash dividends |
|
|
(25,478) |
|
|
(24,922) |
|
|
(24,571) |
|
Stock dividends |
|
|
(66,396) |
|
|
(52,317) |
|
|
(42,635) |
|
Retained earnings at end of period |
|
$ |
57,902 |
|
$ |
62,949 |
|
$ |
48,276 |
|
(The accompanying notes are an integral part of these statements.)
27
CONSOLIDATED STATEMENTS OF
Comprehensive Earnings
TOOTSIE ROLL INDUSTRIES, INC. AND SUBSIDIARIES |
(in thousands) |
|
|
For the year ended December 31, |
|
|||||||
|
|
2024 |
|
2023 |
|
2022 |
|
|||
Net earnings |
|
$ |
86,808 |
|
$ |
91,886 |
|
$ |
75,892 |
|
|
|
|
|
|
|
|
|
|
|
|
Other comprehensive income (loss), before tax: |
|
|
|
|
|
|
|
|
|
|
Foreign currency translation adjustments |
|
|
(3,737) |
|
|
2,745 |
|
|
1,087 |
|
|
|
|
|
|
|
|
|
|
|
|
Pension and postretirement reclassification adjustments: |
|
|
|
|
|
|
|
|
|
|
Unrealized gains (losses) for the period on postretirement and pension benefits |
|
|
1,408 |
|
|
(241) |
|
|
3,338 |
|
Less: reclassification adjustment for (gains) losses to net earnings |
|
|
(639) |
|
|
(758) |
|
|
(826) |
|
Unrealized gains (losses) on postretirement and pension benefits |
|
|
769 |
|
|
(999) |
|
|
2,512 |
|
|
|
|
|
|
|
|
|
|
|
|
Investments: |
|
|
|
|
|
|
|
|
|
|
Unrealized gains (losses) for the period on investments |
|
|
4,685 |
|
|
8,510 |
|
|
(9,909) |
|
Less: reclassification adjustment for (gains) losses to net earnings |
|
|
(11) |
|
|
(1) |
|
|
(16) |
|
Unrealized gains (losses) on investments |
|
|
4,674 |
|
|
8,509 |
|
|
(9,925) |
|
|
|
|
|
|
|
|
|
|
|
|
Derivatives: |
|
|
|
|
|
|
|
|
|
|
Unrealized gains (losses) for the period on derivatives |
|
|
(2,685) |
|
|
(2,748) |
|
|
(251) |
|
Less: reclassification adjustment for (gains) losses to net earnings |
|
|
1,925 |
|
|
795 |
|
|
(570) |
|
Unrealized gains (losses) on derivatives |
|
|
(760) |
|
|
(1,953) |
|
|
(821) |
|
|
|
|
|
|
|
|
|
|
|
|
Total other comprehensive income (loss), before tax |
|
|
946 |
|
|
8,302 |
|
|
(7,147) |
|
Income tax benefit (expense) related to items of other comprehensive income |
|
|
(1,151) |
|
|
(1,346) |
|
|
1,991 |
|
Total comprehensive earnings |
|
|
86,603 |
|
|
98,842 |
|
|
70,736 |
|
Comprehensive earnings (loss) attributable to noncontrolling interests |
|
|
(19) |
|
|
(26) |
|
|
(45) |
|
Total comprehensive earnings attributable to Tootsie Roll Industries, Inc. |
|
$ |
86,622 |
|
$ |
98,868 |
|
$ |
70,781 |
|
(The accompanying notes are an integral part of these statements.)
28
CONSOLIDATED STATEMENTS OF |
|
Financial Position |
|
TOOTSIE ROLL INDUSTRIES, INC. AND SUBSIDIARIES |
(in thousands) |
Assets
|
|
December 31, |
|
||||
|
|
2024 |
|
2023 |
|
||
CURRENT ASSETS: |
|
|
|
|
|
|
|
Cash and cash equivalents |
|
$ |
138,841 |
|
$ |
75,915 |
|
Restricted cash |
|
|
352 |
|
|
375 |
|
Investments |
|
|
55,789 |
|
|
95,507 |
|
Accounts receivable trade, less allowances of $2,184 and $2,245 |
|
|
43,811 |
|
|
55,568 |
|
Other receivables |
|
|
6,832 |
|
|
9,165 |
|
Inventories: |
|
|
|
|
|
|
|
Finished goods and work-in-process |
|
|
43,603 |
|
|
51,240 |
|
Raw materials and supplies |
|
|
34,022 |
|
|
43,681 |
|
Prepaid expenses |
|
|
10,355 |
|
|
9,200 |
|
Total current assets |
|
|
333,605 |
|
|
340,651 |
|
PROPERTY, PLANT AND EQUIPMENT, at cost: |
|
|
|
|
|
|
|
Land |
|
|
21,710 |
|
|
21,862 |
|
Buildings |
|
|
148,778 |
|
|
144,949 |
|
Machinery and equipment |
|
|
499,210 |
|
|
485,265 |
|
Construction in progress |
|
|
6,820 |
|
|
11,277 |
|
Operating lease right-of-use assets |
|
|
6,043 |
|
|
7,145 |
|
|
|
|
682,561 |
|
|
670,498 |
|
Less — accumulated depreciation |
|
|
462,758 |
|
|
447,520 |
|
Net property, plant and equipment |
|
|
219,803 |
|
|
222,978 |
|
OTHER ASSETS: |
|
|
|
|
|
|
|
Goodwill |
|
|
73,237 |
|
|
73,237 |
|
Trademarks |
|
|
175,024 |
|
|
175,024 |
|
Investments |
|
|
332,338 |
|
|
255,606 |
|
Prepaid expenses and other assets |
|
|
11,633 |
|
|
15,189 |
|
Deferred income taxes |
|
|
1,541 |
|
|
1,706 |
|
Total other assets |
|
|
593,773 |
|
|
520,762 |
|
Total assets |
|
$ |
1,147,181 |
|
$ |
1,084,391 |
|
(The accompanying notes are an integral part of these statements.)
29
(in thousands except per share data)
Liabilities and Shareholders’ Equity
|
|
December 31, |
|
||||
|
|
2024 |
|
2023 |
|
||
CURRENT LIABILITIES: |
|
|
|
|
|
|
|
Accounts payable |
|
$ |
13,397 |
|
$ |
15,816 |
|
Bank loans |
|
|
924 |
|
|
1,088 |
|
Dividends payable |
|
|
6,403 |
|
|
6,250 |
|
Accrued liabilities |
|
|
63,607 |
|
|
61,690 |
|
Postretirement health care benefits |
|
|
595 |
|
|
665 |
|
Operating lease liabilities |
|
|
1,374 |
|
|
1,289 |
|
Income taxes payable |
|
|
636 |
|
|
8,090 |
|
Deferred compensation |
|
|
350 |
|
|
— |
|
Total current liabilities |
|
|
87,286 |
|
|
94,888 |
|
NONCURRENT LIABILITIES: |
|
|
|
|
|
|
|
Deferred income taxes |
|
|
54,537 |
|
|
45,477 |
|
Postretirement health care benefits |
|
|
8,701 |
|
|
9,653 |
|
Industrial development bond |
|
|
7,500 |
|
|
7,500 |
|
Liability for uncertain tax positions |
|
|
2,564 |
|
|
2,777 |
|
Operating lease liabilities |
|
|
4,992 |
|
|
6,018 |
|
Deferred compensation and other liabilities |
|
|
111,192 |
|
|
94,971 |
|
Total noncurrent liabilities |
|
|
189,486 |
|
|
166,396 |
|
TOOTSIE ROLL INDUSTRIES, INC. SHAREHOLDERS’ EQUITY: |
|
|
|
|
|
|
|
Common stock, $0.694 par value — 120,000 shares authorized — 40,789 and 39,999, respectively, issued |
|
|
28,325 |
|
|
27,777 |
|
Class B common stock, $0.694 par value — 40,000 shares authorized — 30,286 and 29,445, respectively, issued |
|
|
21,032 |
|
|
20,448 |
|
Capital in excess of par value |
|
|
788,894 |
|
|
737,453 |
|
Retained earnings |
|
|
57,902 |
|
|
62,949 |
|
Accumulated other comprehensive loss |
|
|
(23,418) |
|
|
(23,213) |
|
Treasury stock (at cost) — 105 shares and 102 shares, respectively |
|
|
(1,992) |
|
|
(1,992) |
|
Total Tootsie Roll Industries, Inc. shareholders’ equity |
|
|
870,743 |
|
|
823,422 |
|
Noncontrolling interests |
|
|
(334) |
|
|
(315) |
|
Total equity |
|
|
870,409 |
|
|
823,107 |
|
Total liabilities and shareholders' equity |
|
$ |
1,147,181 |
|
$ |
1,084,391 |
|
(The accompanying notes are an integral part of these statements.)
30
CONSOLIDATED STATEMENTS OF |
|
||||||||||
Cash Flows |
|
||||||||||
TOOTSIE ROLL INDUSTRIES, INC. AND SUBSIDIARIES |
(in thousands) |
||||||||||
|
|
For the year ended December 31, |
|
|||||||
|
|
2024 |
|
2023 |
|
2022 |
|
|||
CASH FLOWS FROM OPERATING ACTIVITIES: |
|
|
|
|
|
|
|
|
|
|
Net earnings |
|
$ |
86,808 |
|
$ |
91,886 |
|
$ |
75,892 |
|
Adjustments to reconcile net earnings to net cash provided by operating activities: |
|
|
|
|
|
|
|
|
|
|
Depreciation |
|
|
18,176 |
|
|
18,243 |
|
|
17,668 |
|
Deferred income taxes |
|
|
7,758 |
|
|
(913) |
|
|
1,535 |
|
Amortization of marketable security premiums |
|
|
1,829 |
|
|
3,946 |
|
|
5,531 |
|
Changes in operating assets and liabilities: |
|
|
|
|
|
|
|
|
|
|
Accounts receivable |
|
|
10,226 |
|
|
4,891 |
|
|
(3,073) |
|
Other receivables |
|
|
1,444 |
|
|
(4,574) |
|
|
(1,020) |
|
Inventories |
|
|
15,790 |
|
|
(9,601) |
|
|
(28,415) |
|
Prepaid expenses and other assets |
|
|
2,559 |
|
|
(15,856) |
|
|
49 |
|
Accounts payable and accrued liabilities |
|
|
635 |
|
|
(3,570) |
|
|
10,329 |
|
Income taxes payable |
|
|
(7,664) |
|
|
9,583 |
|
|
(4,565) |
|
Postretirement health care benefits |
|
|
(253) |
|
|
(649) |
|
|
(804) |
|
Deferred compensation and other liabilities |
|
|
1,581 |
|
|
1,225 |
|
|
(1,076) |
|
Net cash provided by operating activities |
|
|
138,889 |
|
|
94,611 |
|
|
72,051 |
|
CASH FLOWS FROM INVESTING ACTIVITIES: |
|
|
|
|
|
|
|
|
|
|
Capital expenditures |
|
|
(17,997) |
|
|
(26,796) |
|
|
(23,356) |
|
Purchases of trading securities |
|
|
(2,257) |
|
|
(1,875) |
|
|
(1,543) |
|
Sales of trading securities |
|
|
1,314 |
|
|
774 |
|
|
2,806 |
|
Purchase of available for sale securities |
|
|
(108,728) |
|
|
(92,431) |
|
|
(96,114) |
|
Sale and maturity of available for sale securities |
|
|
91,826 |
|
|
106,128 |
|
|
49,618 |
|
Net cash used in investing activities |
|
|
(35,842) |
|
|
(14,200) |
|
|
(68,589) |
|
CASH FLOWS FROM FINANCING ACTIVITIES: |
|
|
|
|
|
|
|
|
|
|
Shares purchased and retired |
|
|
(13,534) |
|
|
(33,114) |
|
|
(31,910) |
|
Dividends paid in cash |
|
|
(25,515) |
|
|
(25,076) |
|
|
(24,629) |
|
Proceeds from bank loans |
|
|
3,828 |
|
|
3,499 |
|
|
3,989 |
|
Repayment of bank loans |
|
|
(3,928) |
|
|
(3,489) |
|
|
(3,850) |
|
Net cash used in financing activities |
|
|
(39,149) |
|
|
(58,180) |
|
|
(56,400) |
|
Effect of exchange rate changes on cash |
|
|
(995) |
|
|
424 |
|
|
347 |
|
Increase (decrease) in cash and cash equivalents |
|
|
62,903 |
|
|
22,655 |
|
|
(52,591) |
|
Cash, cash equivalents and restricted cash at beginning of year |
|
|
76,290 |
|
|
53,635 |
|
|
106,226 |
|
Cash, cash equivalents and restricted cash at end of year |
|
$ |
139,193 |
|
$ |
76,290 |
|
$ |
53,635 |
|
|
|
|
|
|
|
|
|
|
|
|
Supplemental cash flow information: |
|
|
|
|
|
|
|
|
|
|
Income taxes paid |
|
$ |
38,165 |
|
$ |
19,583 |
|
$ |
23,884 |
|
Interest paid |
|
$ |
268 |
|
$ |
258 |
|
$ |
78 |
|
Stock dividend issued |
|
$ |
66,243 |
|
$ |
86,433 |
|
$ |
70,242 |
|
(The accompanying notes are an integral part of these statements.)
31
Notes to Consolidated Financial Statements ($ in thousands except per share data)
TOOTSIE ROLL INDUSTRIES, INC. AND SUBSIDIARIES
NOTE 1—SIGNIFICANT ACCOUNTING POLICIES:
Basis of consolidation:
The consolidated financial statements include the accounts of Tootsie Roll Industries, Inc. and its wholly-owned and majority-owned subsidiaries (the “Company”), which are primarily engaged in the manufacture and sales of candy products. Non-controlling interests relating to majority-owned subsidiaries are reflected in the consolidated financial statements and all significant intercompany transactions have been eliminated.
The preparation of financial statements in conformity with generally accepted accounting principles in the United States of America requires management to make estimates and assumptions that affect the reported amounts of assets and liabilities and disclosure of contingent assets and liabilities at the date of the financial statements and the reported amounts of revenues and expenses during the reporting period. Actual results could differ from those estimates.
Revenue recognition:
The Company’s revenues, primarily net product sales, principally result from the sale of goods and reflect the consideration to which the Company expects to be entitled based on customer purchase orders. The Company records revenue based on a five-step model in accordance with Accounting Standards Codification ("ASC") Topic 606. Adjustments for estimated customer cash discounts upon payment, discounts for price adjustments, product returns, allowances, and certain advertising and promotional costs, including consumer coupons, are variable consideration and are recorded as a reduction of product sales revenue in the same period the related product sales are recorded. Such estimates are calculated using historical averages adjusted for any expected change due to current business conditions and experience. The Company identified changes in business conditions that changed Management’s estimated current and future liabilities and resulted in reducing Accrued liabilities. The change increased Net product sales by $5,665 in 2024. A net product sale is recorded when the Company delivers the product to the customer, or in certain instances, the customer picks up the goods at the Company’s distribution centers, and thereby obtains control of such product. Amounts billed and due from our customers are classified as accounts receivables trade on the balance sheet and require payment on a short-term basis. Accounts receivable, less allowances, was $43,811, $55,568, and $58,556 as of December 31, 2024, 2023, and 2022, respectively. Accounts receivables are unsecured. Advertising cost of $3,040, $2,708, and $2,475 in 2024, 2023, and 2022, respectively, are included in selling, marketing, and administrative expenses. Shipping and handling costs of $57,581, $65,465, and $67,342 in 2024, 2023 and 2022, respectively, are included in selling, marketing and administrative expenses. Royalty income (less than 0.1% of our consolidated net sales) is also recognized from sales-based licensing arrangements, pursuant to which revenue is recognized as the third-party licensee sales occur. Rental income (less than 1% of our consolidated net sales) is not considered revenue from contracts from customers.
Leases:
The Company identifies leases by evaluating its contracts to determine if the contract conveys the right to use an identified asset for a stated period of time in exchange for consideration. The Company considers whether it can control the underlying asset and have the right to obtain substantially all of the economic benefits or outputs from the asset. Leases with terms greater than 12 months are classified as either operating or finance leases at the commencement date. For these leases, we record the present value of the minimum lease payments over the lease term as a lease liability with an offsetting right-of-use asset that is then presented net of any deferred rent or lease incentives. The discount rate used to calculate the present value of the minimum lease payments is our incremental borrowing rate, as the rate implicit in the lease is generally not known or determinable. The lease term includes any noncancelable period for which the Company has the right to use the asset as well as any future periods to which the Company has the right and intent to extend the lease under the terms of the lease agreement. Currently, all capitalized leases are classified as operating leases and the Company records rental expense on a straight-line basis over the term of the lease.
32
Cash and cash equivalents:
The Company considers short-term debt securities with an original maturity of three months or less to be cash equivalents. Substantially all cash and cash equivalents are held at a major U.S. money center bank or its foreign branches (Bank of America), or its investment broker affiliate (Merrill Lynch). The cash in the Company’s U.S. banks (primarily Bank of America) is not fully insured by the Federal Deposit Insurance Corporation due to the statutory limit of $250. The Company had approximately $5,312 and $4,244 of cash held and controlled by foreign subsidiaries, principally foreign branches of a U.S. bank (Bank of America), at December 31, 2024 and 2023, respectively. The Company's cash in its foreign bank accounts is also not fully insured.
Investments:
Investments consist of various marketable securities principally corporate bonds, with maturities of generally from three to five years, and variable rate demand notes with interest rates that are generally reset weekly and the security can be “put” back and sold weekly. The Company classifies debt and equity securities as either available for sale or trading. Available for sale debt securities are not actively traded by the Company and are carried at fair value. The Company follows current fair value measurement guidance and unrealized gains and losses on these securities are excluded from earnings and are reported as a separate component of shareholders’ equity, net of applicable taxes, until realized or impaired. Trading securities related to deferred compensation arrangements are carried at fair value with gains or losses included in other income, net. The Company invests in trading securities to economically hedge changes in its deferred compensation liabilities.
The Company regularly reviews its investments to determine whether fair value is less than carrying value and, when necessary, makes qualitative assessments considering impairment indicators to evaluate whether investments are impaired. If impaired, the cost basis of the security is written down to fair value. Further information regarding the fair value of the Company’s investments is included in Note 9 of the Company’s Notes to Consolidated Financial Statements.
Derivative instruments and hedging activities:
From time to time, the Company enters into commodity futures and foreign currency forward contracts. Commodity futures are intended and are effective as hedges of market price risks associated with the anticipated purchase of certain raw materials (primarily sugar). Foreign currency forward contracts are intended and are effective as hedges of the Company’s exposure to the variability of cash flows, primarily related to the foreign exchange rate changes of products manufactured in Canada and sold in the United States, and periodic equipment purchases from foreign suppliers denominated in a foreign currency. The Company does not engage in trading or other speculative use of derivative instruments. Further information regarding derivative instruments and hedging activities is included in Note 10 of the Company’s Notes to Consolidated Financial Statements.
Inventories:
Inventories are stated at lower of cost or net realizable value. The cost of substantially all of the Company’s inventories ($69,692 and $85,644 at December 31, 2024 and 2023, respectively) has been determined by the last-in, first-out (LIFO) method. The excess of current cost over LIFO cost of inventories approximates $42,481 and $44,954 at December 31, 2024 and 2023, respectively. The cost of certain foreign inventories ($7,933 and $9,277 at December 31, 2024 and 2023 respectively) has been determined by the first-in, first-out (FIFO) method. Rebates, discounts and other cash consideration received from vendors related to inventory purchases is reflected as a reduction in the cost of the related inventory item, and is, therefore, reflected in cost of sales when the related inventory item is sold.
Property, plant and equipment:
Depreciation is computed for financial reporting purposes by use of the straight-line method based on useful lives of 20 to 50 years for buildings and 5 to 20 years for machinery and equipment. Depreciation expense was $18,176, $18,243 and $17,668 in 2024, 2023 and 2022, respectively.
33
Carrying value of long-lived assets:
The Company reviews long-lived assets to determine if there are events or circumstances indicating that the amount of the asset reflected in the Company’s balance sheet may not be recoverable. When such indicators are present, the Company compares the carrying value of the long-lived asset, or asset group, to the future undiscounted cash flows of the underlying assets to determine if impairment exists. If applicable, an impairment charge would be recorded to write down the carrying value to its fair value. The determination of fair value involves the use of estimates of future cash flows that involve considerable management judgment and are based upon assumptions about expected future operating performance. The actual cash flows could differ from management’s estimates due to changes in business conditions, operating performance, and economic conditions. No impairment charges of long-lived assets were recorded by the Company during 2024, 2023 or 2022.
Goodwill and indefinite-lived intangible assets:
In accordance with authoritative guidance, goodwill and intangible assets with indefinite lives are not amortized, but rather reviewed and tested for impairment at least annually unless certain interim triggering events or circumstances require more frequent testing. All trademarks have been assessed by management to have indefinite lives because they are expected to generate cash flows indefinitely. Management believes that all assumptions used for the impairment review and testing are consistent with those utilized by market participants performing similar valuations. No impairments of intangibles, including trademarks and goodwill, were recorded in 2024, 2023 or 2022.
Current accounting guidance provides entities an option of performing a qualitative assessment (a "step-zero" test) before performing a quantitative analysis. If the entity determines, on the basis of certain qualitative factors, that it is more-likely-than-not that the intangibles (goodwill and certain trademarks) are not impaired, the entity would not need to proceed to the two step impairment testing process (quantitative analysis) as prescribed in the guidance. During fourth quarter 2024 and 2023, the Company performed a “step zero” test of its goodwill and certain trademarks, and concluded that there was no impairment based on this guidance. For the fair value assessment of certain trademarks where the “step-zero” analysis was not considered appropriate, impairment testing was performed in fourth quarter 2024 and 2023 using discounted cash flows and estimated royalty rates and concluded that the trademarks were not impaired. For these trademarks, holding all other assumption constant, as of December 31, 2024, a 100 basis point increase in the discount rate would reduce the fair value of these trademarks by approximately 12% and a 100 basis point decrease in the royalty rate would increase the fair value of these trademarks by approximately 16%. Individually, a 100 basis point increase in the discount rate or a 100 basis point decrease in the royalty rate would not result in a potential impairment as of December 31, 2024.
Income taxes:
Deferred income taxes are recorded and recognized for future tax effects of temporary differences between financial and income tax reporting. The Company records valuation allowances in situations where the realization of deferred tax assets is not more-likely-than-not. The Company periodically reviews assumptions and estimates of the Company’s probable tax obligations and effects on its liability for uncertain tax positions, using informed judgment which may include the use of third-party consultants, advisors and legal counsel, as well as historical experience.
Further information regarding income tax matters are included in Note 4 of the Company’s Notes to Consolidated Financial Statements.
Foreign currency translation:
The U.S. dollar is used as the functional currency where a substantial portion of the subsidiary’s business is indexed to the U.S. dollar or where its manufactured products are principally sold in the U.S. All other foreign subsidiaries use the local currency as their functional currency. Where the U.S. dollar is used as the functional currency, foreign currency remeasurements are recorded as a charge or credit to other income, net in the statement of earnings. Where the foreign local currency is used as the functional currency, translation adjustments are recorded as a separate component of accumulated other comprehensive income (loss).
34
Restricted cash:
Restricted cash comprises certain cash deposits of the Company’s majority-owned Spanish subsidiary with international banks that are pledged as collateral for letters of credit and bank borrowings.
VEBA trust:
The Company maintains a VEBA trust managed and controlled by the Company, to fund the estimated future costs of certain employee health, welfare and other benefits. The Company contributed $20,000 and $5,000 to the VEBA trust in 2023 and 2022, respectively. No contribution was made to the trust in 2024. The Company will continue using the VEBA trust funds to pay the actual cost of such benefits through most or possibly all of 2027. At December 31, 2024 and 2023, the VEBA trust held $13,926 and $19,126, respectively, of aggregate cash and cash equivalents. This asset value is included in prepaid expenses and long-term other assets in the Company’s Consolidated Statement of Financial Position. These assets primarily comprise cash and corporate bonds and are categorized as Level 1 and Level 2 within the fair value hierarchy.
Bank loans:
Bank loans consist of short term (less than 120 days) borrowings by the Company’s Spanish subsidiary that are held by international banks. The weighted-average interest rate as of December 31, 2024 and 2023 was 5.7% and 6.9%, respectively.
Comprehensive earnings:
Comprehensive earnings include net earnings, foreign currency translation adjustments and unrealized gains/losses on commodity and/or foreign currency hedging contracts, available for sale securities and certain postretirement benefit obligations.
Earnings per share:
A dual presentation of basic and diluted earnings per share is not required due to the lack of potentially dilutive securities under the Company’s simple capital structure. Therefore, all earnings per share amounts represent basic earnings per share.
The Class B common stock has essentially the same rights as common stock, except that each share of Class B common stock has ten votes per share (compared to one vote per share of common stock), is not traded on any exchange, is restricted as to transfer and is convertible on a share-for-share basis, at any time and at no cost to the holders, into shares of common stock which are traded on the New York Stock Exchange.
Use of estimates:
The preparation of consolidated financial statements, in conformity with accounting principles generally accepted in the U.S., requires management to make estimates and assumptions that affect the amounts reported. Estimates are used when accounting for sales discounts, allowances and incentives, product liabilities, assets recorded at fair value, income taxes, depreciation, amortization, employee benefits, contingencies and intangible asset and liability valuations. Actual results may or may not differ from those estimates.
Recent accounting pronouncements:
In November 2023, the Financial Accounting Standards Board ("FASB") issued ASU No. 2023-07, Segment Reporting (Topic 280): "Improvements to Reportable Segment Disclosures". The amendments in this update affect reportable segment disclosure requirements and apply whether an entity presents one or more reportable segments in accordance with Topic 280. The amendments in this update are effective for annual periods beginning after December 15, 2023 and interim periods beginning after December 15, 2024.
35
The Company has adopted this update and revised the disclosures in Note 8 Segment and Geographic Information accordingly.
In December 2023, the FASB issued ASU No. 2023-09, "Improvements to Income Tax Disclosures". The amendments in this update affect income tax disclosures primarily related to the rate reconciliation and income taxes paid information. The amendments in this update are effective for annual periods beginning after December 15, 2024. The Company is currently evaluating the potential effects of this amendment on its Consolidated Financial Statements and believes the adoption will not significantly impact the presentation of our financial condition, results of operations and disclosures.
In November 2024, the FASB issued ASU No. 2024-03, Income Statement-Reporting Comprehensive Income-Expense Disaggregation Disclosures (Subtopic 220-40). The amendments in this update require disclosure, in the notes to the financial statements, of specific expense categories present within expense captions presented on the face of the income statement within continuing operations of public business entities. The amendments in this update are effective for annual periods beginning after December 15, 2026 and interim periods beginning after December 15, 2027. The Company is currently evaluating the potential effects of this amendment on its Consolidated Financial Statements and believes the adoption will not significantly impact the presentation of our financial condition, results of operations and disclosures.
NOTE 2—ACCRUED LIABILITIES:
Accrued liabilities are comprised of the following:
|
|
|
|
|
|
|
|
|
|
December 31, |
|
||||
|
|
2024 |
|
2023 |
|
||
Compensation |
|
$ |
18,705 |
|
$ |
14,048 |
|
Other employee benefits |
|
|
7,271 |
|
|
6,928 |
|
Taxes, other than income |
|
|
4,815 |
|
|
4,526 |
|
Advertising and promotions |
|
|
20,582 |
|
|
26,015 |
|
Other |
|
|
12,234 |
|
|
10,173 |
|
|
|
$ |
63,607 |
|
$ |
61,690 |
|
NOTE 3—INDUSTRIAL DEVELOPMENT BOND:
An industrial development bond is due in 2027. The average floating interest rate, which is reset weekly, was 3.5% and 3.5% in 2024 and 2023, respectively. See Note 9 of the Company’s Notes to Consolidated Financial Statements for fair value disclosures.
NOTE 4—INCOME TAXES:
The domestic and foreign components of pretax income are as follows:
|
|
|
|
|
|
|
|
|
|
|
|
|
2024 |
|
2023 |
|
2022 |
|
|||
Domestic |
|
$ |
110,569 |
|
$ |
105,018 |
|
$ |
84,286 |
|
Foreign |
|
|
16,302 |
|
|
14,876 |
|
|
13,855 |
|
|
|
$ |
126,871 |
|
$ |
119,894 |
|
$ |
98,141 |
|
36
The provision for income taxes is comprised of the following:
|
|
2024 |
|
2023 |
|
2022 |
|
|||
Current: |
|
|
|
|
|
|
|
|
|
|
Federal |
|
$ |
24,804 |
|
$ |
21,710 |
|
$ |
13,070 |
|
Foreign |
|
|
2,676 |
|
|
3,775 |
|
|
4,110 |
|
State |
|
|
3,531 |
|
|
3,738 |
|
|
2,605 |
|
|
|
|
31,011 |
|
|
29,223 |
|
|
19,785 |
|
Deferred: |
|
|
|
|
|
|
|
|
|
|
Federal |
|
|
6,981 |
|
|
(1,209) |
|
|
2,364 |
|
Foreign |
|
|
1,041 |
|
|
658 |
|
|
81 |
|
State |
|
|
1,030 |
|
|
(664) |
|
|
19 |
|
|
|
|
9,052 |
|
|
(1,215) |
|
|
2,464 |
|
|
|
$ |
40,063 |
|
$ |
28,008 |
|
$ |
22,249 |
|
Deferred taxes reflect temporary differences between the tax basis and financial statement carrying value of assets and liabilities. The significant temporary differences that comprised the deferred tax assets and liabilities are as follows:
|
|
December 31, |
|
||||
|
|
2024 |
|
2023 |
|
||
Deferred tax assets: |
|
|
|
|
|
|
|
Accrued customer promotions |
|
$ |
218 |
|
$ |
1,223 |
|
Deferred compensation |
|
|
14,886 |
|
|
21,617 |
|
Postretirement benefits |
|
|
2,326 |
|
|
2,572 |
|
Other accrued expenses |
|
|
993 |
|
|
4,214 |
|
Foreign subsidiary tax loss carry forward |
|
|
4,681 |
|
|
5,012 |
|
Outside basis difference in foreign subsidiary |
|
|
361 |
|
|
361 |
|
Capitalized research and development costs |
|
|
9,965 |
|
|
6,594 |
|
Deductible state tax depreciation |
|
|
1,286 |
|
|
1,386 |
|
Tax credit carry forward |
|
|
2,565 |
|
|
2,368 |
|
|
|
|
37,281 |
|
|
45,347 |
|
Valuation allowances |
|
|
(6,180) |
|
|
(6,361) |
|
Total deferred tax assets |
|
$ |
31,101 |
|
$ |
38,986 |
|
Deferred tax liabilities: |
|
|
|
|
|
|
|
Depreciation |
|
$ |
26,851 |
|
$ |
27,604 |
|
Deductible goodwill and trademarks |
|
|
37,902 |
|
|
38,512 |
|
Accrued export company commissions |
|
|
5,012 |
|
|
4,735 |
|
Employee benefit plans |
|
|
2,894 |
|
|
4,000 |
|
Inventory reserves |
|
|
1,465 |
|
|
(688) |
|
Prepaid insurance |
|
|
1,122 |
|
|
721 |
|
Unrealized capital gains |
|
|
3,598 |
|
|
2,633 |
|
Other Prepaid |
|
|
13 |
|
|
— |
|
Deferred gain on sale of real estate |
|
|
5,240 |
|
|
5,240 |
|
Total deferred tax liabilities |
|
$ |
84,097 |
|
$ |
82,757 |
|
Net deferred tax liability |
|
$ |
52,996 |
|
$ |
43,771 |
|
The valuation allowances as of December 31, 2024 and 2023 were primarily related to foreign jurisdictions’ net operating loss carryforwards and state credits that we do not expect to realize.
The amounts of the Company’s foreign subsidiary valuation allowances for net operating loss carryforwards were $4,681 and $5,012 at December 31, 2024 and 2023, respectively.
The Company has benefits related to state tax credit carryforwards valuation allowances were $1,499 and $1,349 at December 31, 2024 and 2023, respectively.
37
The effective income tax rate differs from the statutory rate as follows:
|
|
2024 |
|
2023 |
|
2022 |
|
U.S. statutory rate |
|
21.0 |
% |
21.0 |
% |
21.0 |
% |
State income taxes, net |
|
2.6 |
|
3.7 |
|
2.3 |
|
Foreign income tax rates |
|
0.1 |
|
0.3 |
|
1.0 |
|
Income tax credits and adjustments |
|
(0.4) |
|
(0.6) |
|
(0.8) |
|
Adjustment of deferred tax balances related to Deferred Compensation |
|
8.7 |
|
— |
|
— |
|
Other adjustment of deferred tax balances |
|
0.1 |
|
(0.2) |
|
(0.7) |
|
Reserve for uncertain tax benefits |
|
(0.1) |
|
(0.2) |
|
0.3 |
|
Other, net |
|
(0.6) |
|
(0.6) |
|
(0.4) |
|
Effective income tax rate |
|
31.6 |
% |
23.4 |
% |
22.7 |
% |
In 2024 the Board revoked its authorization that permitted management to take appropriate action to preserve the full income tax deductibility of certain amounts under its nonqualified deferred compensation plans after determining that it was no longer feasible in light of changes to Section 162(m) of the Internal Revenue Code made by the Tax Cuts and Jobs Act of 2017. Given this Board action and the resulting expectation that certain additional amounts of deferred compensation will not be tax deductible in future years, the Company concluded that it will be required under generally accepted accounting principles in the United States of America to write off the related deferred tax assets. The adjustment to the deferred tax assets resulted in a non-cash tax charge of $11,010 in 2024. The remaining balance of $14,886 represents deferred compensation amounts that are expected to be tax deductible in the future.
As a result of the 2017 Tax Cuts and Jobs Act, the Company asserts it is permanently reinvested in its foreign subsidiaries earnings outside of United States.
At December 31, 2024 and 2023, the Company had unrecognized tax benefits of $2,114 and $2,313, respectively. Included in this balance is $1,671 and $1,736, respectively, of unrecognized tax benefits that, if recognized, would favorably affect the annual effective income tax rate. 2024 includes a change for temporary items that also results in offsetting adjustment to deferred tax. As of December 31, 2024 and 2023, $450 and $463, respectively, of interest and penalties were included in the liability for uncertain tax positions.
A reconciliation of the beginning and ending balances of the total amounts of unrecognized tax benefits is as follows:
|
|
2024 |
|
2023 |
|
2022 |
|
|||
Unrecognized tax benefits at January 1 |
|
$ |
2,313 |
|
$ |
3,392 |
|
$ |
3,133 |
|
Increases in tax positions for the current year |
|
|
285 |
|
|
510 |
|
|
393 |
|
Reductions in tax positions for lapse of statute of limitations |
|
|
(484) |
|
|
(1,589) |
|
|
(134) |
|
Unrecognized tax benefits at December 31 |
|
$ |
2,114 |
|
$ |
2,313 |
|
$ |
3,392 |
|
The Company recognizes interest and penalties related to unrecognized tax benefits in the provision for income taxes on the Consolidated Statements of Earnings and Retained Earnings.
The Company is subject to taxation in the U.S. and various state and foreign jurisdictions, primarily Canada and Mexico. The Company generally remains subject to examination by U.S. federal, state and foreign tax authorities for the years 2021 through 2023. With few exceptions, the Company is no longer subject to examinations by tax authorities for the years 2020 and prior.
38
NOTE 5—SHARE CAPITAL AND CAPITAL IN EXCESS OF PAR VALUE:
|
|
|
|
|
|
|
|
|
|
|
|
|
|
|
|
|
Capital in |
|
|
|
|
|
|
|
|
|
Class B |
|
|
|
|
|
|
Excess |
|
||||
|
|
Common Stock |
|
Common Stock |
|
Treasury Stock |
|
of Par |
|
||||||||||
|
|
Shares |
|
Amount |
|
Shares |
|
Amount |
|
Shares |
|
Amount |
|
Value |
|
||||
|
|
(000’s) |
|
|
|
|
(000’s) |
|
|
|
|
(000’s) |
|
|
|
|
|
|
|
Balance at December 31, 2021 |
|
39,344 |
|
|
27,322 |
|
27,793 |
|
|
19,300 |
|
96 |
|
|
(1,992) |
|
|
709,880 |
|
Issuance of 3% stock dividend |
|
1,176 |
|
|
817 |
|
833 |
|
|
579 |
|
3 |
|
|
— |
|
|
41,068 |
|
Conversion of Class B common shares to common shares |
|
19 |
|
|
13 |
|
(19) |
|
|
(13) |
|
— |
|
|
— |
|
|
— |
|
Purchase and retirement of common shares |
|
(818) |
|
|
(568) |
|
— |
|
|
— |
|
— |
|
|
— |
|
|
(31,342) |
|
Balance at December 31, 2022 |
|
39,721 |
|
|
27,584 |
|
28,607 |
|
|
19,866 |
|
99 |
|
|
(1,992) |
|
|
719,606 |
|
Issuance of 3% stock dividend |
|
1,185 |
|
|
823 |
|
858 |
|
|
596 |
|
3 |
|
|
— |
|
|
50,649 |
|
Conversion of Class B common shares to common shares |
|
20 |
|
|
14 |
|
(20) |
|
|
(14) |
|
— |
|
|
— |
|
|
— |
|
Purchase and retirement of common shares |
|
(927) |
|
|
(644) |
|
— |
|
|
— |
|
— |
|
|
— |
|
|
(32,802) |
|
Balance at December 31, 2023 |
|
39,999 |
|
|
27,777 |
|
29,445 |
|
|
20,448 |
|
102 |
|
|
(1,992) |
|
|
737,453 |
|
Issuance of 3% stock dividend |
|
1,196 |
|
|
830 |
|
883 |
|
|
613 |
|
3 |
|
|
— |
|
|
64,800 |
|
Conversion of Class B common shares to common shares |
|
42 |
|
|
29 |
|
(42) |
|
|
(29) |
|
— |
|
|
— |
|
|
— |
|
Purchase and retirement of common shares |
|
(448) |
|
|
(311) |
|
— |
|
|
— |
|
— |
|
|
— |
|
|
(13,359) |
|
Balance at December 31, 2024 |
|
40,789 |
|
$ |
28,325 |
|
30,286 |
|
$ |
21,032 |
|
105 |
|
$ |
(1,992) |
|
$ |
788,894 |
|
Average shares outstanding and all per share amounts included in the financial statements and notes thereto have been adjusted retroactively to reflect annual three percent stock dividends.
While the Company does not have a formal or publicly announced Company common stock purchase program, the Company’s board of directors periodically authorizes a dollar amount for such share purchases.
Based upon this policy, shares were purchased and retired as follows:
|
|
Total Number of Shares |
|
|
|
|
Year |
|
Purchased (000’s) |
|
Average Price Paid Per Share |
|
|
2024 |
|
448 |
|
$ |
30.16 |
|
2023 |
|
928 |
|
$ |
35.66 |
|
2022 |
|
818 |
|
$ |
38.98 |
|
NOTE 6—OTHER INCOME, NET:
Other income, net is comprised of the following:
|
|
2024 |
|
2023 |
|
2022 |
|
|||
Interest and dividend income relating to available for sale investments |
|
$ |
9,598 |
|
$ |
5,211 |
|
$ |
2,641 |
|
Gains (losses) on trading securities relating to deferred compensation plans |
|
|
16,324 |
|
|
15,489 |
|
|
(17,263) |
|
Interest expense |
|
|
(509) |
|
|
(337) |
|
|
(104) |
|
Foreign exchange gains (losses) |
|
|
511 |
|
|
(2,803) |
|
|
1,307 |
|
Capital gains (losses) |
|
|
176 |
|
|
(172) |
|
|
121 |
|
Miscellaneous, net |
|
|
266 |
|
|
678 |
|
|
684 |
|
|
|
$ |
26,366 |
|
$ |
18,066 |
|
$ |
(12,614) |
|
39
NOTE 7—EMPLOYEE BENEFIT PLANS:
Pension plans:
The Company sponsors a defined contribution pension plan covering certain non-union employees with over one year of credited service. The Company’s policy is to fund pension costs accrued based on compensation levels. Total expense for this plan for 2024, 2023 and 2022 approximated $2,954, $2,812 and $2,682, respectively. The Company also maintains certain defined contribution 401K profit sharing and retirement plans. Company contributions in 2024, 2023 and 2022 to these plans were $3,336, $3,568 and $3,265 respectively.
The Company also contributes to a multi-employer defined benefit pension plan for certain of its union employees under a collective bargaining agreement which is as follows:
Plan name: Bakery and Confectionery Union and Industry International Pension Fund (Plan)
Employer Identification Number and plan number: 52-6118572, plan number 001
Funded Status as of the most recent year available: 47.0% funded as of January 1, 2023
The Company’s contributions to such plan: $3,360, $3,530 and $3,508 in 2024, 2023 and 2022, respectively
Plan status: Critical and declining for the plan year beginning January 1, 2024 (most recent date information is available)
Beginning in 2012, the Company has received periodic notices from the Plan, a multi-employer defined benefit pension plan for certain Company union employees, that the Plan’s actuary certified the Plan to be in “critical status”, as defined by the Pension Protection Act (PPA) and the Pension Benefit Guaranty Corporation (PBGC); and that a plan of rehabilitation was adopted by the trustees of the Plan in 2012. Beginning in 2015, the Plan was reclassified to “critical and declining status”, as defined by the PPA and PBGC, for the plan year beginning January 1, 2015. A designation of “critical and declining status” implies that the Plan is expected to become insolvent in the next 20 years. In 2016, the Company received new notices that the Plan’s trustees adopted an updated Rehabilitation Plan effective January 1, 2016, and all annual notices through 2024 have continued to classify the Plan in the “critical and declining status” category.
The Company has been advised that its withdrawal liability would have been $97,500, $102,200 and $96,000 if it had withdrawn from the Plan during 2024, 2023 and 2022 respectively. Should the Company actually withdraw from the Plan at a future date, a withdrawal liability, which could be different than the above discussed amounts, could be payable to the Plan.
The amended rehabilitation plan, which continues, requires that employer contributions include 5% compounded annual surcharge increases each year for an unspecified period of time beginning January 2013 (in addition to the 5% interim surcharge initiated in 2012) as well as certain plan benefit reductions. In fourth quarter 2020, the Plan Trustees advised the Company that the surcharges would no longer increase and therefore be “frozen” at the rates and amounts in effect as of December 31, 2020 provided that the local bargaining union and the Company executed a formal consenting agreement by March 31, 2021. During first quarter 2021, the local bargaining union and the Company executed this agreement which resulted in the “freezing” of such surcharges as of December 31, 2020. The Company’s pension expense for this Plan for 2024, 2023 and 2022 was $3,332, $3,516 and $3,510, respectively. The aforementioned expense includes surcharges of $1,174, $1,239 and $1,237 in 2024, 2023 and 2022, respectively, as required under the plan of rehabilitation, as amended.
In June 2024, the PBGC announced that it has approved the Plan’s application for Special Financial Assistance under the American Rescue Plan Act of 2021. The Plan was granted approximately $3.4 billion in Special Financial Assistance funds and received those funds in July 2024. The Company’s actuary believes that it still remains unclear if the Plan can remain solvent through the targeted date of 2051 although as a requirement of the American Rescue Plan Act of 2021, the Plan must remain in “critical status” through 2051 regardless of solvency.
40
The regulations under the aforementioned PBGC financial assistance could result in a higher withdrawal liability even with PBGC financial assistance since those regulations require use of settlement interest rates to value all, instead of a portion, of the present value of vested benefits in determining the Company’s withdrawal liability. In addition, for withdrawal liability purposes, PBGC regulations require the Special Financial Assistance to be phased-in over a period of time instead of fully recognized immediately. The most recent withdrawal liability estimate from the Plan, since it is calculated as of the end of 2023 as if the Company were to have withdrawn in 2024, does not include any of the $3.4 billion of assets received. The Company is currently unable to determine the ultimate outcome of the above discussed multi-employer union pension matters and therefore is unable to determine the effects on its consolidated financial statements, but the ultimate outcome could have a material adverse effect on the Company’s consolidated results of operations or cash flows in one or more future periods
Deferred compensation:
The Company sponsors three deferred compensation plans for selected executives and other employees: (i) the Excess Benefit Plan, which restores retirement benefits lost due to Internal Revenue Service limitations on contributions to tax-qualified plans, (ii) the Supplemental Plan, which allows eligible employees to defer the receipt of eligible compensation until designated future dates and (iii) the Career Achievement Plan, which provides a deferred annual incentive award to selected executives. Participants in these plans earn a return on amounts due them based on several investment options, which mirror returns on underlying investments (primarily mutual funds). The Company economically hedges its obligations under the plans by investing in the actual underlying investments. These investments are classified as trading securities and are carried at fair value. At December 31, 2024 and 2023, these investments totaled $105,067 and $87,800, respectively. All gains and losses and related investment income from these investments, which are recorded in other income, net, are equally offset by corresponding increases and decreases in the Company’s deferred compensation liabilities. See also Note 4 - Income Taxes, regarding action taken by the Board of Directors in 2024 whereby certain deferred compensation will not be tax deductible in future years.
Postretirement health care benefit plans:
The Company maintains a post-retirement health benefits plan for a group of “grandfathered” corporate employees. The plan, as amended in 2013, generally limited future annual cost increases in health benefits to 3%, restricted this benefit to current employees and retirees with long-term service with the Company, and eliminated all post-retirement benefits for future employees effective April 1, 2014. Post-retirement benefits liabilities (as amended) were $9,296 and $10,317 at December 31, 2024 and 2023, respectively. Accumulated other comprehensive loss (pre-tax) at December 31, 2024 includes $3,878 of a net actuarial gain.
The changes in the accumulated postretirement benefit obligation at December 31, 2024 and 2023 consist of the following:
|
|
December 31, |
|
||||
|
|
2024 |
|
2023 |
|
||
Benefit obligation, beginning of year |
|
$ |
10,317 |
|
$ |
9,961 |
|
Service cost |
|
|
144 |
|
|
142 |
|
Interest cost |
|
|
474 |
|
|
477 |
|
Actuarial (gain)/loss |
|
|
(1,100) |
|
|
276 |
|
Benefits paid |
|
|
(539) |
|
|
(539) |
|
Benefit obligation, end of year |
|
$ |
9,296 |
|
$ |
10,317 |
|
The actuarial (gain) in 2024 is attributable to an increase in the discount rate. The actuarial loss in 2023 is attributable to a decrease in the discount rate.
41
Net periodic postretirement benefit cost (income) included the following components:
|
|
2024 |
|
2023 |
|
2022 |
|
|||
Service cost—benefits attributed to service during the period |
|
$ |
144 |
|
$ |
142 |
|
$ |
241 |
|
Interest cost on the accumulated postretirement benefit obligation |
|
|
474 |
|
|
477 |
|
|
336 |
|
Net amortization |
|
|
(639) |
|
|
(758) |
|
|
(826) |
|
Net periodic postretirement benefit cost (income) |
|
$ |
(21) |
|
$ |
(139) |
|
$ |
(249) |
|
The Company estimates future benefit payments will be $595, $621, $648, $667 and $690 in each year beginning in 2025 through 2029, respectively, and a total of $3,698 in 2030 through 2034.
NOTE 8—SEGMENT AND GEOGRAPHIC INFORMATION:
The Company uses the management approach to determine segments by evaluating the nature of the Company’s operating activities, the relative significance of operating segments to consolidated results, how management organizes the business, and by evaluating what the Company’s chief operating decision maker “(CODM)” regularly reviews in deciding how to allocate resources and in assessing operating performance. The Company operates and manages an integrated business involved in the manufacture and sale of confectionery products with the overall objective of increasing the volume of sales and profitability of operations. The Company uses similar processes to sell products to similar classes of customers across the entire business. Certain shipping and handling activities supporting operations are integrated to maximize efficiency and productivity and are regularly reviewed separately by our CODM as a result. Those shipping and handling costs are included in selling, marketing and administrative expenses and disclosed separately in Note 1 – Significant Accounting Policies. The Company has determined that it currently has one reportable segment. The Company’s Chief Executive Officer, the Company’s CODM, focuses on consolidated results, specifically consolidated net income (loss), in assessing operating performance and allocating resources.
Its principal manufacturing operations are located in the United States and Canada, and its principal market is the United States. The Company also manufactures confectionary products in Mexico, primarily for sale in Mexico, and exports products to Canada and other countries worldwide.
The following geographic data includes net product sales summarized on the basis of the customer location and long-lived assets based on their physical location:
|
|
|
|
|
|
|
|
|
|
|
|
|
2024 |
|
2023 |
|
2022 |
|
|||
Net product sales: |
|
|
|
|
|
|
|
|
|
|
United States |
|
$ |
653,656 |
|
$ |
693,232 |
|
$ |
622,817 |
|
Canada, Mexico and Other |
|
|
61,874 |
|
|
70,020 |
|
|
58,623 |
|
|
|
$ |
715,530 |
|
$ |
763,252 |
|
$ |
681,440 |
|
Long-lived assets: |
|
|
|
|
|
|
|
|
|
|
United States |
|
$ |
186,064 |
|
$ |
188,979 |
|
$ |
182,393 |
|
Canada |
|
|
28,138 |
|
|
27,981 |
|
|
25,715 |
|
Mexico and Other |
|
|
5,601 |
|
|
6,018 |
|
|
3,935 |
|
|
|
$ |
219,803 |
|
$ |
222,978 |
|
$ |
212,043 |
|
Sales revenues from Wal-Mart Stores, Inc. aggregated approximately 23.2%, 22.2%, and 23.0% of net product sales during the year ended December 31, 2024, 2023 and 2022, respectively. Sales revenues from Dollar Tree, Inc. (which includes Family Dollar which was acquired by Dollar Tree) aggregated approximately 12.6%, 14.2%, and 12.4% of net product sales during the year ended December 31, 2024, 2023 and 2022, respectively. Some of the aforementioned sales to Wal-Mart and Dollar Tree are sold to McLane Company, a large national grocery wholesaler, which services and delivers certain of the Company’s products to Wal-Mart, Dollar Tree and other retailers in the U.S.A. Net product sales revenues from McLane, which includes these Wal-Mart and Dollar Tree sales as well as sales and deliveries to other Company customers, were 20.7% in 2024 and 20.1% in 2023 and 20.4% in 2022. At December 31, 2024 and 2023, the Company’s three largest customers discussed above accounted for approximately 41.9% and 39.6% of total accounts receivable, respectively.
42
NOTE 9—FAIR VALUE MEASUREMENTS:
Current accounting guidance defines fair value as the price that would be received in the sale of an asset or paid to transfer a liability in an orderly transaction between market participants at the measurement date. Guidance requires disclosure of the extent to which fair value is used to measure financial assets and liabilities, the inputs utilized in calculating valuation measurements, and the effect of the measurement of significant unobservable inputs on earnings, or changes in net assets, as of the measurement date. Guidance establishes a three-level valuation hierarchy based upon the transparency of inputs utilized in the measurement and valuation of financial assets or liabilities as of the measurement date. Level 1 inputs include quoted prices for identical instruments and are the most observable. Level 2 inputs include quoted prices for similar assets and observable inputs such as interest rates, foreign currency exchange rates, commodity rates and yield curves. Level 3 inputs are not observable in the market and include management’s own judgments about the assumptions market participants would use in pricing the asset or liability. The use of observable and unobservable inputs is reflected in the hierarchy assessment disclosed in the table below.
As of December 31, 2024 and 2023, the Company held certain financial assets that are required to be measured at fair value on a recurring basis. These include derivative hedging instruments related to the foreign currency forward contracts and purchase of certain raw materials, investments in trading securities and available for sale securities. The Company’s available for sale securities principally consist of corporate bonds and variable rate demand notes. The Company’s trading securities principally consist of mutual fund.
The fair value of the Company’s industrial development bond at December 31, 2024 and 2023 was valued using Level 2 inputs which approximates the carrying value of $7,500 for both periods. Interest rates on the bond resets weekly based on current market conditions.
The following tables present information about the Company’s financial assets and liabilities measured at fair value as of December 31, 2024 and 2023, and indicate the fair value hierarchy and the valuation techniques utilized by the Company to determine such fair value:
|
|
Estimated Fair Value December 31, 2024 |
|
||||||||||
|
|
Total |
|
Input Levels Used |
|
||||||||
|
|
Fair Value |
|
Level 1 |
|
Level 2 |
|
Level 3 |
|
||||
Cash and equivalents |
|
$ |
138,841 |
|
$ |
138,841 |
|
$ |
— |
|
$ |
— |
|
Available for sale securities |
|
|
283,060 |
|
|
4,102 |
|
|
278,958 |
|
|
— |
|
Foreign currency derivatives |
|
|
(818) |
|
|
— |
|
|
(818) |
|
|
— |
|
Commodity derivatives |
|
|
(2,166) |
|
|
(2,166) |
|
|
— |
|
|
— |
|
Trading securities |
|
|
105,067 |
|
|
86,925 |
|
|
18,142 |
|
|
— |
|
Total assets measured at fair value |
|
$ |
523,984 |
|
$ |
227,702 |
|
$ |
296,282 |
|
$ |
— |
|
|
|
Estimated Fair Value December 31, 2023 |
|
||||||||||
|
|
Total |
|
Input Levels Used |
|
||||||||
|
|
Fair Value |
|
Level 1 |
|
Level 2 |
|
Level 3 |
|
||||
Cash and equivalents |
|
$ |
75,915 |
|
$ |
75,915 |
|
$ |
— |
|
$ |
— |
|
Available for sale securities |
|
|
263,313 |
|
|
4,084 |
|
|
259,229 |
|
|
— |
|
Foreign currency derivatives |
|
|
302 |
|
|
— |
|
|
302 |
|
|
— |
|
Commodity derivatives |
|
|
(2,526) |
|
|
(2,526) |
|
|
— |
|
|
— |
|
Trading securities |
|
|
87,800 |
|
|
70,681 |
|
|
17,119 |
|
|
— |
|
Total assets measured at fair value |
|
$ |
424,804 |
|
$ |
148,154 |
|
$ |
276,650 |
|
$ |
— |
|
Available for sale securities which utilize Level 2 inputs consist primarily of corporate bonds and variable rate demand notes, which are valued based on quoted market prices or alternative pricing sources with reasonable levels of price transparency.
43
A summary of the aggregate fair value, gross unrealized gains, gross unrealized losses and amortized cost basis of the Company’s investment portfolio by major security type is as follows:
|
|
December 31, 2024 |
|
|||||||||||
|
|
Amortized |
|
Fair |
|
Unrealized |
|
|
||||||
Available for Sale: |
|
Cost |
|
Value |
|
Gains |
|
Losses |
|
|
||||
Variable rate demand notes |
|
|
5,485 |
|
|
5,485 |
|
|
— |
|
|
— |
|
|
Corporate bonds |
|
|
271,978 |
|
|
273,473 |
|
|
1,495 |
|
|
— |
|
|
Government securities |
|
|
4,036 |
|
|
4,102 |
|
|
66 |
|
|
— |
|
|
|
|
$ |
281,499 |
|
$ |
283,060 |
|
$ |
1,561 |
|
$ |
— |
|
|
|
|
December 31, 2023 |
|
|||||||||||
|
|
Amortized |
|
Fair |
|
Unrealized |
|
|
||||||
Available for Sale: |
|
Cost |
|
Value |
|
Gains |
|
Losses |
|
|
||||
Variable rate demand notes |
|
|
4,590 |
|
|
4,590 |
|
|
— |
|
|
— |
|
|
Corporate bonds |
|
|
257,766 |
|
|
254,640 |
|
|
— |
|
|
(3,126) |
|
|
Government securities |
|
|
4,070 |
|
|
4,083 |
|
|
13 |
|
|
— |
|
|
|
|
$ |
266,426 |
|
$ |
263,313 |
|
$ |
13 |
|
$ |
(3,126) |
|
|
NOTE 10—DERIVATIVE INSTRUMENTS AND HEDGING ACTIVITIES:
From time to time, the Company uses derivative instruments, including foreign currency forward contracts and commodity futures contracts to manage its exposures to foreign exchange and commodity prices. Commodity futures contracts are intended and effective as hedges of market price risks associated with the anticipated purchase of certain raw materials (primarily sugar). Foreign currency forward contracts are intended and effective as hedges of the Company’s exposure to the variability of cash flows, primarily related to the foreign exchange rate changes of products manufactured in Canada and sold in the United States, and periodic equipment purchases from foreign suppliers denominated in a foreign currency. The Company does not engage in trading or other speculative use of derivative instruments.
The Company recognizes all derivative instruments as either assets or liabilities at fair value in the Consolidated Statements of Financial Position. Derivative assets are recorded in other receivables and derivative liabilities are recorded in accrued liabilities. The Company uses either hedge accounting or mark-to-market accounting for its derivative instruments. Derivatives that qualify for hedge accounting are designated as cash flow hedges by formally documenting the hedge relationships, including identification of the hedging instruments, the hedged items and other critical terms, as well as the Company’s risk management objectives and strategies for undertaking the hedge transaction. As of December 31, 2024 and 2023, all derivative instruments are accounted for using hedge accounting.
Changes in the fair value of the Company’s cash flow hedges are recorded in accumulated other comprehensive loss, net of tax, and are reclassified to earnings in the periods in which earnings are affected by the hedged item. Substantially all amounts reported in accumulated other comprehensive loss for commodity derivatives are expected to be reclassified to cost of goods sold. Approximately $1,737, $396 and $33 of this accumulated comprehensive loss is expected to be charged to earnings in 2025, 2026 and 2027. Approximately $597 and $221 in accumulated other comprehensive loss for foreign currency derivatives is expected to be reclassified to other income, net in 2025 and 2026.
44
The following table summarizes the Company’s outstanding derivative contracts and their effects on its Consolidated Statements of Financial Position at December 31, 2024 and 2023:
|
|
December 31, 2024 |
|
|||||||
|
|
Notional |
|
|
|
|
|
|
|
|
|
|
Amounts |
|
Assets |
|
Liabilities |
|
|||
Derivatives designated as hedging instruments: |
|
|
|
|
|
|
|
|
|
|
Foreign currency derivatives |
|
$ |
26,129 |
|
$ |
— |
|
$ |
(818) |
|
Commodity derivatives |
|
|
20,959 |
|
|
39 |
|
|
(2,205) |
|
Total derivatives |
|
|
|
|
$ |
39 |
|
$ |
(3,023) |
|
|
|
December 31, 2023 |
|
|||||||
|
|
Notional |
|
|
|
|
|
|
|
|
|
|
Amounts |
|
Assets |
|
Liabilities |
|
|||
Derivatives designated as hedging instruments: |
|
|
|
|
|
|
|
|
|
|
Foreign currency derivatives |
|
$ |
16,337 |
|
$ |
302 |
|
$ |
— |
|
Commodity derivatives |
|
|
28,247 |
|
|
16 |
|
|
(2,542) |
|
Total derivatives |
|
|
|
|
$ |
318 |
|
$ |
(2,542) |
|
The effects of derivative instruments on the Company’s Consolidated Statement of Earnings, Comprehensive Earnings and Retained Earnings for year ended December 31, 2024 and 2023 are as follows:
|
|
For Year Ended December 31, 2024 |
|
|||||||
|
|
|
|
|
|
|
|
Gain (Loss) |
|
|
|
|
|
|
|
Gain (Loss) |
|
on Amount Excluded |
|
||
|
|
Gain (Loss) |
|
Reclassified from |
|
from Effectiveness |
|
|||
|
|
Recognized |
|
Accumulated OCI |
|
Testing Recognized |
|
|||
|
|
in OCI |
|
into Earnings |
|
in Earnings |
|
|||
Foreign currency derivatives |
|
$ |
(1,348) |
|
$ |
(228) |
|
$ |
— |
|
Commodity derivatives |
|
|
(1,337) |
|
|
(1,697) |
|
|
— |
|
Total |
|
$ |
(2,685) |
|
$ |
(1,925) |
|
$ |
— |
|
|
|
For Year Ended December 31, 2023 |
|
|||||||
|
|
|
|
|
|
|
|
Gain (Loss) |
|
|
|
|
|
|
|
Gain (Loss) |
|
on Amount Excluded |
|
||
|
|
Gain (Loss) |
|
Reclassified from |
|
from Effectiveness |
|
|||
|
|
Recognized |
|
Accumulated OCI |
|
Testing Recognized |
|
|||
|
|
in OCI |
|
into Earnings |
|
in Earnings |
|
|||
Foreign currency derivatives |
|
$ |
374 |
|
$ |
(210) |
|
$ |
— |
|
Commodity derivatives |
|
|
(3,122) |
|
|
(585) |
|
|
— |
|
Total |
|
$ |
(2,748) |
|
$ |
(795) |
|
$ |
— |
|
45
NOTE 11—ACCUMULATED OTHER COMPREHENSIVE LOSS:
The following table sets forth information with respect to accumulated other comprehensive earnings (loss):
|
|
|
|
|
|
|
|
|
|
|
|
|
|
|
|
|
Accumulated |
|
|
|
Foreign |
|
|
|
Foreign |
|
|
|
Postretirement |
|
Other |
||||||
|
|
Currency |
|
|
|
Currency |
|
Commodity |
|
and Pension |
|
Comprehensive |
||||||
|
|
Translation |
|
Investments |
|
Derivatives |
|
Derivatives |
|
Benefits |
|
Earnings (Loss) |
||||||
Balance at December 31, 2022 |
|
$ |
(23,795) |
|
$ |
(8,809) |
|
$ |
(215) |
|
$ |
8 |
|
$ |
2,642 |
|
$ |
(30,169) |
Other comprehensive earnings (loss) before reclassifications |
|
|
2,745 |
|
|
6,450 |
|
|
284 |
|
|
(2,366) |
|
|
(184) |
|
|
6,929 |
Reclassifications from accumulated other comprehensive loss |
|
|
— |
|
|
— |
|
|
159 |
|
|
443 |
|
|
(575) |
|
|
27 |
Other comprehensive earnings (loss) net of tax |
|
|
2,745 |
|
|
6,450 |
|
|
443 |
|
|
(1,923) |
|
|
(759) |
|
|
6,956 |
Balance at December 31, 2023 |
|
$ |
(21,050) |
|
$ |
(2,359) |
|
$ |
228 |
|
$ |
(1,915) |
|
$ |
1,883 |
|
$ |
(23,213) |
Other comprehensive earnings (loss) before reclassifications |
|
|
(3,737) |
|
|
3,551 |
|
|
(1,022) |
|
|
(1,013) |
|
|
1,049 |
|
|
(1,172) |
Reclassifications from accumulated other comprehensive loss |
|
|
— |
|
|
(8) |
|
|
173 |
|
|
1,286 |
|
|
(484) |
|
|
967 |
Other comprehensive earnings (loss) net of tax |
|
|
(3,737) |
|
|
3,543 |
|
|
(849) |
|
|
273 |
|
|
565 |
|
|
(205) |
Balance at December 31, 2024 |
|
$ |
(24,787) |
|
$ |
1,184 |
|
$ |
(621) |
|
$ |
(1,642) |
|
$ |
2,448 |
|
$ |
(23,418) |
The amounts reclassified from accumulated other comprehensive income (loss) consisted of the following:
Details about Accumulated Other |
|
Year to Date Ended |
|
|
|
||||
Comprehensive Income Components |
|
December 31, 2024 |
|
December 31, 2023 |
|
Location of (Gain) Loss Recognized in Earnings |
|
||
Investments |
|
$ |
(11) |
|
$ |
(1) |
|
Other income, net |
|
Foreign currency derivatives |
|
|
228 |
|
|
210 |
|
Other income, net |
|
Commodity derivatives |
|
|
1,697 |
|
|
585 |
|
Product cost of goods sold |
|
Postretirement and pension benefits |
|
|
(639) |
|
|
(758) |
|
Other income, net |
|
Total before tax |
|
|
1,275 |
|
|
36 |
|
|
|
Tax expense (benefit) |
|
|
(308) |
|
|
(9) |
|
|
|
Net of tax |
|
$ |
967 |
|
$ |
27 |
|
|
|
NOTE 12—GOODWILL AND INTANGIBLE ASSETS:
All of the Company’s intangible indefinite-lived assets are trademarks.
The changes in the carrying amount of trademarks for 2024 and 2023 were as follows:
|
|
2024 |
|
2023 |
|
||
Original cost |
|
$ |
193,767 |
|
$ |
193,767 |
|
Accumulated impairment losses as of January 1 |
|
|
(18,743) |
|
|
(18,743) |
|
Balance at January 1 |
|
$ |
175,024 |
|
$ |
175,024 |
|
Current year impairment losses |
|
|
— |
|
|
— |
|
Balance at December 31 |
|
$ |
175,024 |
|
$ |
175,024 |
|
Accumulated impairment losses as of December 31 |
|
$ |
(18,743) |
|
$ |
(18,743) |
|
The fair value of indefinite-lived intangible assets was primarily assessed using the present value of estimated future cash flows and relief-from-royalty method.
46
The Company has no accumulated impairment losses of goodwill.
NOTE 13—LEASES:
The Company leases certain buildings, land and equipment that are classified as operating leases. These leases have remaining lease terms of up to approximately 17 years. Operating lease cost totaled $1,435 and $1,328 for twelve months 2024 and 2023, respectively. Cash paid for operating lease liabilities totaled $1,274 and $1,193 for the twelve months 2024 and 2023, respectively. As of December 31, 2024 and 2023, operating lease right-of-use assets were $6,043 and $7,145, respectively, and operating lease liabilities were $6,366 and $7,306, respectively. The weighted-average remaining lease term related to these operating leases was 11.0 years and 10.2 years as of December 31, 2024 and 2023, respectively. The weighted-average discount rate related to the Company’s operating leases was 3.6% and 3.7% as of December 31, 2024 and 2023, respectively. Maturities of operating lease liabilities at December 31, 2024 are as follows: $1,186 in 2025, $774 in 2026, $709 in 2027, $315 in 2028 and $3,382 thereafter.
The Company, as lessor, rents certain commercial real estate to third party lessees. The December 31, 2024 and 2023 cost related to these leased properties was $52,885 and $51,370, respectively, and the accumulated depreciation related to these leased properties was $19,054 and $17,962, respectively. Terms of certain such leases, including renewal options, may be extended for up to approximately fifty-seven years, many of which provide for periodic adjustment of rent payments based on changes in consumer or other price indices. The Company recognizes lease income on a straight-line basis over the lease term. Lease income in the twelve months of 2024 and 2023 was $7,076 and $5,385, respectively, and is classified in cash flows from operating activities.
ITEM 9. Changes in and Disagreements with Accountants on Accounting and Financial Disclosure.
None.
ITEM 9A. Controls and Procedures.
Disclosure Controls and Procedures
The Company’s Chief Executive Officer and Chief Financial Officer have concluded, based on their evaluation as of the end of the period covered by this report, that the Company’s disclosure controls and procedures (as defined in Rule 13a-15(e) of the Securities Exchange Act of 1934, as amended (the “Exchange Act”) ) are effective to ensure that information required to be disclosed in the reports that the Company files or submits under the Exchange Act is (i) recorded, processed, summarized and reported within the time periods specified in the Securities and Exchange Commission’s rules and forms, and (ii) is accumulated and communicated to the Company’s management, including its Chief Executive Officer and Chief Financial Officer, as appropriate to allow timely decisions regarding required disclosure.
Internal Control over Financial Reporting
| (a) | See “Management’s Report on Internal Control Over Financial Reporting,” included in Item 8 “Financial Statements and Supplementary Data,” which is incorporated herein by reference. |
| (b) | See “Report of Independent Registered Public Accounting Firm” included in Item 8 “Financial Statements and Supplementary Data” for the attestation report of the Company’s independent registered public accounting firm, which is incorporated herein by reference. |
| (c) | There were no changes in the Company’s internal control over financial reporting during the quarter ended December 31, 2024 that have materially affected, or are reasonably likely to materially affect, the Company’s internal control over financial reporting. |
47
48
PART III
ITEM 10. Directors, Executive Officers and Corporate Governance.
See the information with respect to the Directors of the Company which is set forth in the section entitled “Election of Directors” of the Proxy Statement, which is incorporated herein by reference. See the information in the section entitled “Section 16(a) Beneficial Ownership Reporting Compliance” of the Company’s Proxy Statement, which section is incorporated herein by reference.
The following table sets forth the information with respect to the executive officers of the Company:
Name |
|
Position (1) |
|
Age |
|
|
|
|
|
Ellen R. Gordon* |
|
Chairman of the Board and Chief Executive Officer |
|
93 |
|
|
|
|
|
G. Howard Ember Jr. |
|
Vice President/Finance |
|
72 |
|
|
|
|
|
Stephen P. Green |
|
Vice President/Manufacturing |
|
66 |
|
|
|
|
|
Kenneth D. Naylor |
|
Vice President/Marketing and Sales |
|
65 |
|
|
|
|
|
Barry P. Bowen |
|
Treasurer |
|
69 |
|
|
|
|
|
Henry G. Mills |
|
Vice President/Chief Operating Officer |
|
36 |
* A member of the Board of Directors of the Company.
| (1) | All of the above named officers have served in the positions set forth in the table as their principal occupations for more than the past five years except for Mr. Naylor and Mr. Mills who were appointed to their current positions on January 1, 2020 and January 1, 2025, respectively. Previously, Mr. Naylor and Mr. Mills held positions of Vice President, U.S.A. Sales and Vice President, Business Development, respectively, during the past five-year period. |
Code of Ethics
The Company has a Code of Business Conduct and Ethics, which applies to all of the Company’s directors and employees, and which meets the Securities Exchange Commission criteria for a “code of ethics.” The Code of Business Conduct and Ethics is available on the Company’s website, located at www.tootsie.com, and the information in such is available in print to any shareholder who requests a copy.
Insider Trading
Information regarding the Company’s Insider Trading Policy required by Item 408(b) of SEC Regulation S-K will be located in the Proxy Statement in the sections entitled “Ownership of Common Stock and Class B Common Stock by Management”, which information is incorporated herein by reference.
ITEM 11. Executive Compensation.
See the information set forth in the sections entitled “Executive Compensation” and “Director Compensation” of the Company’s Proxy Statement, which are incorporated herein by reference.
49
ITEM 12. Security Ownership of Certain Beneficial Owners and Management and Related Stockholder Matters.
For information with respect to the beneficial ownership of the Company’s common stock and Class B common stock by the beneficial owners of more than 5% of said shares and by the management of the Company, see the sections entitled “Ownership of Common Stock and Class B Common Stock by Certain Beneficial Owners” and “Ownership of Common Stock and Class B Common Stock by Management” of the Proxy Statement. These sections of the Proxy Statement are incorporated herein by reference. The Company does not have any compensation plans under which equity securities of the Company are authorized for issuance.
ITEM 13. Certain Relationships and Related Transactions, and Director Independence.
See the section entitled “Related Person Transactions” of the Proxy Statement, which is incorporated herein by reference.
The Company’s board of directors has determined that its non-management directors, Mr. Chodos and Ms. Wardynski and Ms. Lewis-Brent, are independent under the New York Stock Exchange listing standards because they have no direct or indirect relationship with the Company other than through their service on the Board of Directors.
ITEM 14. Principal Accountant Fees and Services.
See the section entitled “Independent Auditor Fees and Services” of the Proxy Statement, which is incorporated herein by reference.
ITEM 15. Exhibits, Financial Statement Schedules.
|
|
(a) Financial Statements. |
|
|
|
(1) The following financial statements are included in Item 8: |
|
|
|
Report of Independent Registered Public Accounting Firm |
|
|
|
Consolidated Statements of Earnings and Retained Earnings for each of the three years ended December 31, 2024, 2023 and 2022 |
|
|
|
Consolidated Statements of Comprehensive Earnings for each of the three years ended December 31, 2024, 2023 and 2022 |
|
|
|
Consolidated Statements of Financial Position at December 31, 2024 and 2023 |
|
|
|
Consolidated Statements of Cash Flows for each of the three years ended in the period December 31, 2024, 2023 and 2022 |
|
|
|
Notes to Consolidated Financial Statements |
|
|
|
|
|
|
|
(2) Financial Statement Schedules. |
|
|
|
The financial statement schedule included in this Form 10-K is Schedule II - Valuation and Qualifying Accounts and Reserves for the Year Ended December 31, 2024, 2023 and 2022 (see Schedule II immediately following ITEM 16 of this Form 10-K). |
|
|
|
|
|
|
|
(3) Exhibits required by Item 601 of Regulation S-K: |
|
|
|
See Index to Exhibits which appears following Financial Schedule II. |
|
50
SCHEDULE II – VALUATION AND QUALIFYING ACCOUNTS (in thousands)
DECEMBER 31, 2024, 2023 and 2022
|
|
|
|
|
Additions |
|
|
|
|
|
|
|
|
|
|
|
|
|
(reductions) |
|
|
|
|
|
|
|
|
|
|
Balance at |
|
charged |
|
|
|
|
Balance at |
|
|||
|
|
beginning |
|
(credited) to |
|
|
|
|
End of |
|
|||
Description |
|
of year |
|
expense |
|
Deductions(1) |
|
Year |
|
||||
|
|
|
|
|
|
|
|
|
|
|
|
|
|
2024: |
|
|
|
|
|
|
|
|
|
|
|
|
|
Reserve for bad debts |
|
$ |
1,519 |
|
$ |
1,034 |
|
$ |
1,000 |
|
$ |
1,553 |
|
Reserve for cash discounts |
|
|
726 |
|
|
12,681 |
|
|
12,776 |
|
|
631 |
|
Deferred tax asset valuation |
|
|
6,361 |
|
|
(181) |
|
|
— |
|
|
6,180 |
|
|
|
$ |
8,606 |
|
$ |
13,534 |
|
$ |
13,776 |
|
$ |
8,364 |
|
|
|
|
|
|
|
|
|
|
|
|
|
|
|
2023: |
|
|
|
|
|
|
|
|
|
|
|
|
|
Reserve for bad debts |
|
$ |
1,414 |
|
$ |
160 |
|
$ |
55 |
|
$ |
1,519 |
|
Reserve for cash discounts |
|
|
921 |
|
|
13,305 |
|
|
13,500 |
|
|
726 |
|
Deferred tax asset valuation |
|
|
5,703 |
|
|
658 |
|
|
— |
|
|
6,361 |
|
|
|
$ |
8,038 |
|
$ |
14,123 |
|
$ |
13,555 |
|
$ |
8,606 |
|
|
|
|
|
|
|
|
|
|
|
|
|
|
|
2022: |
|
|
|
|
|
|
|
|
|
|
|
|
|
Reserve for bad debts |
|
$ |
1,392 |
|
$ |
34 |
|
$ |
12 |
|
$ |
1,414 |
|
Reserve for cash discounts |
|
|
889 |
|
|
12,153 |
|
|
12,121 |
|
|
921 |
|
Deferred tax asset valuation |
|
|
5,555 |
|
|
148 |
|
|
— |
|
|
5,703 |
|
|
|
$ |
7,836 |
|
$ |
12,335 |
|
$ |
12,133 |
|
$ |
8,038 |
|
| (1) | Deductions against reserve for bad debts consist of accounts receivable written off net of recoveries and exchange rate movements. Deductions against reserve for cash discounts consist of allowances to customers. |
52
INDEX TO EXHIBITS
|
|
|
|
|
3.1 |
|
|||
|
|
|
||
3.2 |
|
|||
|
|
|
||
3.3 |
|
|||
|
|
|
||
4.1 |
|
Specimen Class B Common Stock Certificate. Incorporated by reference to Exhibit 1.1 of the Company’s Registration Statement on Form 8-A dated February 29, 1988. |
||
|
|
|
||
4.2 |
|
|||
|
|
|
||
10.1* |
|
Excess Benefit Plan. Incorporated by reference to Exhibit 10.8.1 of the Company’s Annual Report on Form 10-K for the year ended December 31, 1990. |
||
|
|
|
||
10.2* |
|
|||
|
|
|
||
10.3* |
|
|||
|
|
|
||
10.4* |
|
|||
|
|
|
||
10.5* |
|
|||
|
|
|
||
10.6* |
|
|||
|
|
|
||
10.7* |
|
|||
|
|
|
||
10.8* |
|
|||
|
|
|
||
10.9* |
|
|||
|
|
|
||
10.10* |
|
|||
|
|
|
||
53
10.11* |
|
|||
|
|
|
||
10.12* |
|
|||
|
|
|
||
10.13* |
|
|||
|
|
|
||
10.14* |
|
|
||
10.15* |
|
|
||
21 |
|
|||
|
|
|
||
31.1 |
|
|||
|
|
|
||
31.2 |
|
|||
|
|
|
||
32 |
|
|||
|
|
|
||
97* |
|
|||
|
|
|
||
101.INS |
|
XBRL Instance Document - The instance document does not appear in the Interactive Data File because its XBRL tags are embedded within the Inline XBRL document. |
||
|
|
|
||
101.SCH |
|
XBRL Taxonomy Extension Schema Document. |
||
|
|
|
||
101.CAL |
|
XBRL Taxonomy Extension Calculation Linkbase Document. |
||
|
|
|
||
101.LAB |
|
XBRL Taxonomy Extension Label Linkbase Document. |
||
|
|
|
||
101.PRE |
|
XBRL Taxonomy Extension Presentation Linkbase Document. |
||
|
|
|
||
101.DEF |
|
XBRL Taxonomy Extension Definition Linkbase Document. |
||
|
|
|
||
104 |
|
Cover Page Interactive Data File - The cover page interactive data file does not appear in the Interactive Data File because its XBRL tags are embedded within the Inline XBRL document. |
||
*Management compensation plan or arrangement.
54
SIGNATURES
Pursuant to the requirements of Section 13 or 15 (d) of the Securities Exchange Act of 1934, Tootsie Roll Industries, Inc., has duly caused this report to be signed on its behalf by the undersigned, thereunto duly authorized.
|
|
|
|
TOOTSIE ROLL INDUSTRIES, INC. |
|
|
|
|
|
|
|
|
By: |
/s/ Ellen R. Gordon |
|
|
Ellen R. Gordon, Chairman of the Board of Directors and Chief Executive Officer |
|
|
|
|
Date: |
February 28, 2025 |
Pursuant to the requirements of the Securities Exchange Act of 1934, this report has been signed below by the following persons on behalf of the registrant and in the capacities and on the dates indicated.
/s/ Ellen R. Gordon |
|
Chairman of the Board of Directors and Chief Executive Officer |
|
February 28, 2025 |
Ellen R. Gordon |
|
(principal executive officer) |
|
|
|
|
|
|
|
/s/ Paula M. Wardynski |
|
Director |
|
February 28, 2025 |
Paula M. Wardynski |
|
|
|
|
|
|
|
|
|
/s/ Lana Jane Lewis-Brent |
|
Director |
|
February 28, 2025 |
Lana Jane Lewis-Brent |
|
|
|
|
|
|
|
|
|
/s/ Virginia L. Gordon |
|
Director |
|
February 28, 2025 |
Virginia L. Gordon |
|
|
|
|
|
|
|
|
|
/s/ G. Howard Ember, Jr. |
|
Vice President, Finance |
|
February 28, 2025 |
G. Howard Ember, Jr. |
|
(principal financial officer and principal accounting officer) |
|
|
55
EXHIBIT 21
LIST OF SUBSIDIARIES OF THE COMPANY
NAME |
|
JURISDICTION OF INCORPORATION |
|
|
|
Andes Candies LLC |
|
Illinois |
Andes Manufacturing LLC |
|
Illinois |
Andes Services LLC |
|
Illinois |
C. G. P., Inc. |
|
Delaware |
Cambridge Brands, Inc. |
|
Delaware |
Cambridge Brands Manufacturing, Inc. |
|
Delaware |
Cambridge Brands Services, Inc. |
|
Delaware |
Cambridge Brands Sales LLC |
|
Illinois |
Cella’s Confections, Inc. |
|
Virginia |
CGCLP, Inc. |
|
Delaware |
Charms LLC |
|
Illinois |
Concord Wax, Inc. |
|
Delaware |
Concord (GP) Inc. |
|
Ontario |
Concord Canada Holdings ULC |
|
Nova Scotia |
Concord Confections Holdings USA, Inc. |
|
Delaware |
Concord Partners LP |
|
Ontario |
Fleer Española,S.L. |
|
Spain |
Henry Eisen Advertising Agency, Inc. |
|
New Jersey |
Impel Movie Line, Inc. |
|
Delaware |
JT Company, Inc. |
|
Delaware |
Rizzle Inversiones 2014, S.L. |
|
Spain |
Tootsie Roll Industries LLC |
|
Delaware |
Tootsie Roll of Canada ULC |
|
Alberta |
The Tootsie Roll Company, Inc. |
|
Illinois |
Tootsie Roll Management, Inc. |
|
Illinois |
Tootsie Roll Mfg, LLC |
|
Delaware |
Tootsie Rolls - Latin America, Inc. |
|
Delaware |
Tootsie Roll Worldwide, Ltd. |
|
Illinois |
The Sweets Mix Company, Inc. |
|
Illinois |
TRI de Latinoamerica S.A. de C.V. |
|
Mexico |
TRI Captive Insurance Company, Inc. |
|
Nevada |
TRI Finance, Inc. |
|
Delaware |
TRI International, Inc. |
|
Illinois |
TRI-Mass, Inc. |
|
Massachusetts |
TRI Sales Co. |
|
Delaware |
TRI Sales Services, LLC |
|
Illinois |
Tutsi S. A. de C. V. |
|
Mexico |
World Trade & Marketing Ltd. |
|
British West Indies |
Exhibit 31.1
CERTIFICATIONS
I, Ellen R. Gordon, Chairman and Chief Executive Officer of Tootsie Roll Industries, Inc., certify that:
| 1. | I have reviewed this annual report on Form 10-K of Tootsie Roll Industries, Inc.; |
| 2. | Based on my knowledge, this report does not contain any untrue statement of a material fact or omit to state a material fact necessary to make the statements made, in light of the circumstances under which such statements were made, not misleading with respect to the period covered by this report; |
| 3. | Based on my knowledge, the financial statements, and other financial information included in this report, fairly present in all material respects the financial condition, results of operations and cash flows of the registrant as of, and for, the periods presented in this report; |
| 4. | The registrant’s other certifying officer(s) and I are responsible for establishing and maintaining disclosure controls and procedures (as defined in Exchange Act Rules 13a-15(e) and 15d-15(e)) and internal control over financial reporting (as defined in Exchange Act Rules 13a-15(f) and 15d-15(f)) for the registrant and have: |
| (a) | Designed such disclosure controls and procedures, or caused such disclosure controls and procedures to be designed under our supervision, to ensure that material information relating to the registrant, including its consolidated subsidiaries, is made known to us by others within those entities, particularly during the period in which this report is being prepared; |
| (b) | Designed such internal control over financial reporting, or caused such internal control over financial reporting to be designed under our supervision, to provide reasonable assurance regarding the reliability of financial reporting and the preparation of financial statements for external purposes in accordance with generally accepted accounting principles; |
| (c) | Evaluated the effectiveness of the registrant’s disclosure controls and procedures and presented in this report our conclusions about the effectiveness of the disclosure controls and procedures, as of the end of the period covered by this report based on such evaluation; and |
| (d) | Disclosed in this report any change in the registrant’s internal control over financial reporting that occurred during the registrant’s most recent fiscal quarter (the registrant’s fourth fiscal quarter in the case of an annual report) that has materially affected, or is reasonably likely to materially affect, the registrant’s internal control over financial reporting; and |
| 5. | The registrant’s other certifying officer(s) and I have disclosed, based on our most recent evaluation of internal control over financial reporting, to the registrant’s auditors and the audit committee of the registrant’s board of directors (or persons performing the equivalent functions): |
| (a) | All significant deficiencies and material weaknesses in the design or operation of internal control over financial reporting which are reasonably likely to adversely affect the registrant’s ability to record, process, summarize and report financial information; and |
| (b) | Any fraud, whether or not material, that involves management or other employees who have a significant role in the registrant’s internal control over financial reporting. |
Date: February 28, 2025 |
|
|
|
|
|
|
By: |
/s/ Ellen R. Gordon |
|
|
Ellen R. Gordon |
|
|
|
|
|
Chairman and Chief Executive Officer |
Exhibit 31.2
CERTIFICATIONS
I, G. Howard Ember, Jr., Vice President/Finance and Chief Financial Officer of Tootsie Roll Industries, Inc., certify that:
| 1. | I have reviewed this annual report on Form 10-K of Tootsie Roll Industries, Inc.; |
| 2. | Based on my knowledge, this report does not contain any untrue statement of a material fact or omit to state a material fact necessary to make the statements made, in light of the circumstances under which such statements were made, not misleading with respect to the period covered by this report; |
| 3. | Based on my knowledge, the financial statements, and other financial information included in this report, fairly present in all material respects the financial condition, results of operations and cash flows of the registrant as of, and for, the periods presented in this report; |
| 4. | The registrant’s other certifying officer(s) and I are responsible for establishing and maintaining disclosure controls and procedures (as defined in Exchange Act Rules 13a-15(e) and 15d-15(e)) and internal control over financial reporting (as defined in Exchange Act Rules 13a-15(f) and 15d-15(f)) for the registrant and have: |
| (a) | Designed such disclosure controls and procedures, or caused such disclosure controls and procedures to be designed under our supervision, to ensure that material information relating to the registrant, including its consolidated subsidiaries, is made known to us by others within those entities, particularly during the period in which this report is being prepared; |
| (b) | Designed such internal control over financial reporting, or caused such internal control over financial reporting to be designed under our supervision, to provide reasonable assurance regarding the reliability of financial reporting and the preparation of financial statements for external purposes in accordance with generally accepted accounting principles; |
| (c) | Evaluated the effectiveness of the registrant’s disclosure controls and procedures and presented in this report our conclusions about the effectiveness of the disclosure controls and procedures, as of the end of the period covered by this report based on such evaluation; and |
| (d) | Disclosed in this report any change in the registrant’s internal control over financial reporting that occurred during the registrant’s most recent fiscal quarter (the registrant’s fourth fiscal quarter in the case of an annual report) that has materially affected, or is reasonably likely to materially affect, the registrant’s internal control over financial reporting; and |
| 5. | The registrant’s other certifying officer(s) and I have disclosed, based on our most recent evaluation of internal control over financial reporting, to the registrant’s auditors and the audit committee of the registrant’s board of directors (or persons performing the equivalent functions): |
| (a) | All significant deficiencies and material weaknesses in the design or operation of internal control over financial reporting which are reasonably likely to adversely affect the registrant’s ability to record, process, summarize and report financial information; and |
| (b) | Any fraud, whether or not material, that involves management or other employees who have a significant role in the registrant’s internal control over financial reporting. |
Date: February 28, 2025 |
|
|
|
|
|
|
By: |
/s/ G. Howard Ember, Jr. |
|
|
G. Howard Ember, Jr. |
|
|
Vice President/Finance and Chief Financial Officer |
Exhibit 32
Certificate Pursuant to 18 U.S.C. Section 1350, as Adopted
Pursuant to Section 906 of the Sarbanes-Oxley Act of 2002
Each of the undersigned officers of Tootsie Roll Industries, Inc. certifies that (i) the Annual Report on Form 10-K of Tootsie Roll Industries, Inc. for the year ended December 31, 2024 (the Form 10-K) fully complies with the requirements of Section 13(a) or 15(d) of the Securities Exchange Act of 1934, as amended and (ii) the information contained in the Form 10-K fairly presents, in all material respects, the financial condition and results of operations of Tootsie Roll Industries, Inc.
Dated: |
February 28, 2025 |
|
/s/ Ellen R. Gordon |
|
|
|
Ellen R. Gordon |
|
|
|
Chairman and Chief Executive Officer |
|
|
|
|
|
|
|
|
Dated: |
February 28, 2025 |
|
/s/ G. Howard Ember, Jr. |
|
|
|
G. Howard Ember, Jr. |
|
|
|
Vice President/Finance and Chief Financial Officer |