-
UNITED STATES
SECURITIES AND EXCHANGE COMMISSION
WASHINGTON, D.C. 20549
FORM 10-K
☒ |
ANNUAL REPORT PURSUANT TO SECTION 13 OR 15(d) OF THE SECURITIES EXCHANGE ACT OF 1934 FOR THE FISCAL YEAR ENDED DECEMBER 31, 2024 |
|
|
☐ |
TRANSITION REPORT PURSUANT TO SECTION 13 OR 15(d) OF THE SECURITIES EXCHANGE ACT OF 1934 |
Commission File Number 0-21719
Steel Dynamics, Inc.
(Exact name of registrant as specified in its charter)
Indiana |
|
35-1929476 |
(State or other jurisdiction of incorporation or organization) |
|
(IRS Employer Identification No.) |
|
|
|
7575 West Jefferson Blvd, Fort Wayne, IN |
|
46804 |
(Address of principal executive offices) |
|
(Zip Code) |
Registrant’s telephone number, including area code: (260) 969-3500
Securities registered pursuant to Section 12(b) of the Act:
Title of each class |
Trading Symbol |
Name of each exchange on which registered |
Common Stock voting, $0.0025 par value |
STLD |
NASDAQ Global Select Market |
Securities registered pursuant to Section 12(g) of the Act: None
Indicate by check mark if the registrant is a well-known seasoned issuer, as defined in Rule 405 of the Securities Act. Yes ⌧ No ◻
Indicate by check mark if the registrant is not required to file reports pursuant to Section 13 or Section 15(d) of the Act. Yes ◻ No ⌧
Indicate by check mark whether the registrant (1) has filed all reports required to be filed by Section 13 or 15(d) of the Securities Exchange Act of 1934 during the preceding 12 months (or for such shorter period that the registrant was required to file such reports), and (2) has been subject to such filing requirements for the past 90 days. Yes ⌧ No ◻
Indicate by check mark whether the registrant has submitted electronically every Interactive Data File required to be submitted pursuant to Rule 405 of Regulation S-T (§ 232.405 of this chapter) during the preceding 12 months (or for such shorter period that the registrant was required to submit such files). Yes ⌧ No ◻
Indicate by check mark whether the registrant is a large accelerated filer, an accelerated filer, a non-accelerated filer, a smaller reporting company, or an emerging growth company. See the definitions of “large accelerated filer,” “accelerated filer,” “smaller reporting company,” and “emerging growth company” in Rule 12b-2 of the Exchange Act.
Large accelerated filer ⌧ |
Accelerated filer ◻ |
||
Non-accelerated filer ◻ |
Smaller reporting company ☐ |
Emerging growth company ☐ |
|
If an emerging growth company, indicate by check mark if the registrant has elected not to use the extended transition period for complying with any new or revised financial accounting standards provided pursuant to Section 13(a) of the Exchange Act. ◻
Indicate by check mark whether the registrant has filed a report on and attestation to its management’s assessment of the effectiveness of its internal control over financial reporting under Section 404(b) of the Sarbanes-Oxley Act (15 U.S.C. 7262(b)) by the registered public accounting firm that prepared or issued its audit report. ☒
If securities are registered pursuant to Section 12(b) of the Act, indicate by check mark whether the financial statements of the registrant included in the filing reflect the correction of an error to previously issued financial statements. ☐
Indicate by check mark whether any of those error corrections are restatements that required a recovery analysis of incentive-based compensation received by any of the registrant’s executive officers during the relevant recovery period pursuant to §240.10D-1(b). ◻
Indicate by check mark whether the registrant is a shell company (as defined in Rule 12b-2 of the Act). Yes ☐ No ⌧
The aggregate market value of the voting stock held by non-affiliates of the registrant computed by reference to the price at which the common equity was last sold as of June 30, 2024, was approximately $14.8 billion. Registrant has no non-voting shares. For purposes of this calculation, shares of common stock held by directors, officers and 5% stockholders known to the registrant have been deemed to be owned by affiliates, but this should not be construed as an admission that any such person possesses the power, direct or indirect, to direct or cause the direction of the management or policies of the registrant or that such person is controlled by or under common control with the registrant.
As of February 24, 2025, Registrant had outstanding 150,163,986 shares of common stock.
DOCUMENTS INCORPORATED BY REFERENCE
Portions of registrant’s definitive proxy statement for the 2025 Annual Meeting of Shareholders are incorporated by reference into Part III, Items 10 through 14, of this report.
STEEL DYNAMICS, INC.
Table of Contents
|
|
Page |
|
|
|
|
|
|
3 |
||
22 |
||
30 |
||
31 |
||
33 |
||
34 |
||
34 |
||
|
|
|
|
|
|
|
|
|
35 |
||
37 |
||
Management’s Discussion and Analysis of Financial Condition and Results of Operations |
38 |
|
50 |
||
51 |
||
Changes in and Disagreements with Accountants on Accounting and Financial Disclosure |
82 |
|
82 |
||
82 |
||
Disclosure Regarding Foreign Jurisdictions that Prevent Inspections |
82 |
|
|
|
|
|
|
|
|
|
|
83 |
||
83 |
||
Security Ownership of Certain Beneficial Owners and Management and Related Stockholder Matters |
83 |
|
Certain Relationships and Related Transactions, and Director Independence |
84 |
|
84 |
||
|
|
|
|
|
|
|
|
|
85 |
||
85 |
||
|
|
|
86 |
||
|
|
|
89 |
PART I
Special Note Regarding Forward-Looking Statements
Throughout this report, or in other reports or registration statements filed from time to time with the Securities and Exchange Commission under the Securities Exchange Act of 1934, or under the Securities Act of 1933, as well as in documents we incorporate by reference herein or here-from, or in press releases or oral statements made by our officers or Regulation FD authorized representatives, we may make statements that express our opinions, expectations, or projections regarding future events or future results, in contrast with statements that reflect present or historical facts. These predictive statements, which we generally precede or accompany by such typical conditional words as “anticipate,” “intend,” “believe,” “estimate,” “plan,” “seek,” “project” or “expect,” or by the words “may,” “will,” or “should,” are intended to operate as “forward-looking statements” of the kind permitted by the Private Securities Litigation Reform Act of 1995, incorporated in Section 27A of the Securities Act of 1933 and Section 21E of the Securities Exchange Act of 1934. Such forward-looking statements involve both known and unknown risks, uncertainties and other factors that may cause our actual results, performance or achievements to be materially different from any future results, performance or achievements expressed or implied by such forward-looking statements. That legislation protects such predictive and cautionary statements by creating a “safe harbor” from liability in the event that a particular prediction does not turn out as anticipated.
While we always intend to express our best judgment when we make statements about what we believe will occur in the future, and although we base these statements on assumptions that we believe to be reasonable when made, these forward-looking statements are not a guarantee of performance, and you should not place undue reliance on such statements. Forward-looking statements are subject to many uncertainties and other variable circumstances, many of which are outside of our control, that could cause our actual results and experience to differ materially from those we thought would occur.
The following listing represents some, but not necessarily all, of the factors that may cause actual results to differ from those we may have anticipated or predicted:
Global and National Risks
| ● | domestic and global economic factors including periods of slower than anticipated economic growth and the risk of a recession; |
| ● | global steelmaking overcapacity and imports of steel into the United States, together with increased scrap prices; |
| ● | pandemics, epidemics, widespread illness or other health issues; |
Industry Risks
| ● | the cyclical nature of the steel industry and some of the industries we serve; |
| ● | volatility and major fluctuations in prices and availability of scrap metal, scrap substitutes and supplies, and our potential inability to pass higher costs on to our customers; |
| ● | cost and availability of electricity, natural gas, oil and other energy resources are subject to volatile market conditions; |
| ● | increased environmental, greenhouse gas emissions and sustainability considerations from our customers and investors or related regulations; |
| ● | compliance with and changes in environmental and remediation requirements; |
1
Operational and Commercial Risks
| ● | significant price and other forms of competition from other steel and aluminum producers, scrap processors and alternative materials; |
| ● | availability of an adequate source of supply of scrap for our metals recycling operations; |
| ● | cybersecurity threats and risks to the security of our sensitive data and information technology; |
| ● | the implementation of our growth strategy; |
| ● | our ability to retain, develop and attract key personnel; |
| ● | litigation and legal compliance; |
| ● | unexpected equipment downtime or shutdowns; |
| ● | governmental agencies may refuse to grant or renew some of our licenses and permits required to operate our businesses; |
| ● | our senior unsecured credit facility contains, and any future financing agreements may contain, restrictive covenants that may limit our flexibility; and |
| ● | the impact of impairment charges. |
We also refer you to and urge you to carefully read the section entitled Risk Factors at Item 1A of this report to better understand some of the principal risks and uncertainties inherent in our businesses or in owning our securities, as well as the section entitled Management’s Discussion and Analysis of Financial Condition and Results of Operations at Item 7. You should also review the notes to consolidated financial statements under headings in Note 1. Use of Estimates and in Note 8. Commitments and Contingencies.
Any forward-looking statements which we make in this report, or in any of the documents that are incorporated by reference herein or here-from, speak only as of the date of such statement, and we undertake no ongoing obligation to update such statements. Comparisons of results between current and any prior periods are not intended to express any future trends or indications of future performance, unless expressed as such, and should only be viewed as historical data.
2
ITEM 1. BUSINESS
Steel Dynamics, Inc. is one of the largest domestic steel producers and metal recyclers in the United States, based on estimated steelmaking and steel coating capacity of approximately 16 million tons and actual metals recycling volumes as of December 31, 2024, with one of the most diversified product and end market portfolios in the domestic steel industry, combined with meaningful downstream steel fabrication operations. The company is currently investing in its aluminum operations to further diversify its end markets with plans to supply aluminum flat rolled products with high recycled content to the countercyclical sustainable beverage can industry, in addition to the automotive and industrial sectors. Primary sources of revenue are currently from the manufacture and sale of steel products, the processing and sale of recycled ferrous and nonferrous metals, and the fabrication and sale of steel joists and deck products.
We refer to our founding principles as our six core strategic pillars. They bring us together with a common focus, and they provide the foundation upon which we operate and grow. Our unique entrepreneurial culture and business model benefit us operationally, financially, and through the responsible use of our resources in diverse economic environments. Innovation in all forms is essential to our success, and our teams focus on how to do things “smarter” within our current operations, as well as how we continue to grow. This means creating solutions for our teammates, customers, suppliers, and other stakeholders. It also includes finding ways to “do business” with fewer resources and less environmental impact. Our six strategic pillars and the team’s execution of them each day has driven our success and sustainability.
| ● | Health & Safety – Safety is our primary focus and core value. Nothing surpasses the importance of creating and maintaining a safe work environment. Our goal is zero injuries—no accidents. |
| ● | Entrepreneurial Culture – Fosters a team of energetic, positive, driven, innovative and diverse individuals by utilizing open communication and meaningful performance-based compensation aligned to our strategic focus. |
| ● | Customer Commitment – We focus on being a preferred partner of our customers by providing quality products and unique supply chain solutions to meet their current and future needs. |
| ● | Strategic Sustainable Growth – We focus on strategic growth with intentional margin expansion and consistency through-the-cycle. |
| ● | Innovation – Through individual creativity and ingenuity, our teams drive innovation to improve safety, quality, productivity, and resource sustainability. We strive to provide unique, superior products, customer supply chain solutions, and next-generation technologies and processes. |
| ● | Financial Strength – Through our adaptable value-added product diversification, vertically connected businesses model, coupled with our highly variable operating cost structure and performance-based incentive compensation, along with our continued operating innovations and efficiency, we achieve higher utilization and lower costs, which provide strong cash flow generation through both strong and weak market cycles. |
Differentiated Model - Uniquely Steel Dynamics
Competitively advantaged differentiation in everything we do is core to our long-term value creation strategy. We distinguish ourselves in every aspect of our business through an overarching spirit of excellence.
3
Unique Entrepreneurial Culture
Our entrepreneurial culture is the foundation of our success and is driven by our extensive, performance-based incentive compensation philosophy for those on the plant floor to our senior leadership team. Over 60% of a production team member’s total potential compensation is “at risk” to both quality production and cost-effectiveness metrics. Over 85% of our senior leadership team’s total potential compensation is “at risk” to companywide financial performance metrics that encourage long-term value creation, including return on equity, growth, cash generation, and return on invested capital measures. We believe diversity within our teams enhances broad-based thinking, innovation, and value creation. Our common goal of consistently achieving excellence in all we do is reflected in the esprit de corps that permeates our team.
Diversified, Value-Added Product Offerings and Supply-Chain Solutions
We have one of the most diversified, high-margin product offerings within the domestic steel industry. We have a track record of profitable growth, driving diversification in both end markets and value-added product offerings to sustain higher volume and profitability through varying market environments. Over 70% of our steel and steel fabrication sales are considered value-added. Throughout our history and today, we seek to provide unique supply-chain alternatives for our customers to increase efficiency, reduce time and costs, and promote decarbonization opportunities. Growing with our customers in this manner has proven to be invaluable in creating long-lasting relationships and product development.
The majority of our steelmaking operations are in locations near sustainable sources of scrap metals and near our customer base, allowing us to realize freight savings for inbound scrap as well as for outbound steel products destined for our customers. This also allows us to provide consistent on-time delivery to our customer base with relatively short lead times, further solidifying our customer relationships.
This diversified portfolio of products enables us to access a broad range of markets, serve a large customer base, and helps mitigate our market exposure to any one product or sector, resulting in increased through-cycle steel mill utilization. In addition, our value-added product offerings help to balance our exposure to commodity grade products supplied by other manufacturers. We will continue to seek additional opportunities, such as entering the recycled aluminum flat rolled products market, and collaborating with our customers to anticipate their future needs by further expanding our range of products and offerings. In 2024, we began operations on our four new value-added flat roll steel coating lines comprised of an additional paint line and galvanizing line located onsite at our Southwest-Sinton Flat Roll Division and a paint line and galvanizing line at our Heartland Flat Roll Division. As with all our growth initiatives, we seek to competitively differentiate ourselves through service, product capability and quality, and supply-chain solutions.
Vertically Connected Businesses and Pull-Through Volume Advantage
Our vertically connected businesses contribute to our higher through-cycle steel production and overall profitability. Our internal manufacturing businesses are a significant competitive advantage supporting higher and more stable through-cycle earnings and cash flow generation. Our steel fabrication operations and downstream processing locations use a significant amount of steel in their operations. During weaker steel demand environments, we can source their steel needs internally, and during strong steel demand environments, we have the option to also purchase their steel needs externally. Ultimately, we optimize our companywide profitability and minimize earnings volatility. In 2024, our own steel consuming businesses purchased 1.7 million tons of steel from our steel mills, representing 14% of our total 2024 steel shipments.
A strategic and synergistic relationship also exists between our electric arc furnace (EAF) steel mills and metals recycling operations. Our metals recycling platform is the largest supplier of recycled ferrous scrap to our steel operations and is expected to be the largest supplier of recycled aluminum scrap to our aluminum operations. This allows us to reduce companywide working capital, as lower scrap inventory volume is required at our steel mills. We are also able to source higher-quality scrap for our steel mills, increasing availability, optimizing costs, and improving quality.
4
Technologically Advanced, Low-Cost, Highly Efficient Operations
We operate some of the most technologically advanced and environmentally responsible steel mills in the world. Our steel mills generate a fraction of the greenhouse gas (GHG) emissions per ton of steel produced as compared to traditional blast furnace steel production and the average global steel industry. Our value-added product diversification, circular manufacturing model, and performance-based incentive compensation programs support our efficient, environmentally responsible, and competitively advantaged footprint. Coupled with our low, highly variable cost structure and our continued operating innovation and efficiency, we are one of the most profitable and lowest-cost domestic steel producers.
Transformational Growth / New Recycled Aluminum Flat Rolled Strategic Investments
We are nearing the completion of our lower-carbon-emitting, recycled aluminum flat rolled products mill. Our investment includes a 650,000-metric ton recycled aluminum flat rolled products mill in Columbus, Mississippi, and two supporting satellite recycled aluminum slab centers. We are bringing our culture and related operating efficiencies to the flat rolled aluminum industry. This investment will allow us to broaden our ability to serve our existing customers as well as new customers by adding high-quality, lower-carbon flat rolled aluminum to our product portfolio. A significant number of our existing carbon flat rolled steel customers also consume, or process aluminum flat rolled products for automotive, appliance, construction, and other applications. We are developing our property to allow customers to locate on-site, with one customer already committed to co-locating and others expected to co-locate at the rolling mill site in Columbus, enhancing cost efficiencies and reducing emissions across the supply chain. The product mix from the flat rolled products mill is expected to be approximately 45% sustainable beverage packaging, 35% automotive, and 20% common alloy and industrial use. The state-of-the-art recycled aluminum flat rolled products mill will utilize a significant amount of aluminum scrap, and as such is also a complementary extension of the company’s metals recycling platform. The product offering will be supported by various value-added finishing lines, including two CASH (continuous annealing solutions heat treating) lines, a coating line, and downstream processing and packaging lines. We plan to begin shipments mid-year 2025. Our unique performance-based operating culture, coupled with our experience in successfully constructing and operating cost-effective, highly profitable flat roll steel mills and coating lines, positions us exceptionally well to execute this significant strategic investment.
Sustainability
Our commitment to all aspects of sustainability is embedded in our founding principles – valuing our people, our partners, our communities, and our environment. These strategic principles drive long-term value creation for all of us. We are committed to operating our business in an environmentally responsible manner and have been since our founding. Our steel mills exclusively use EAF technology, which uses recycled ferrous scrap as the primary raw material, producing lower-carbon emission quality steel products for our customers and driving returns for our shareholders. Our sustainability and decarbonization strategy is an ongoing journey, and we plan to use our entrepreneurial, innovative spirit to continue to be a leader in the industry.
We intentionally developed a circular manufacturing model. Our metals recycling platform collects and processes scrap, which is then sold to end users for reuse, including our EAF steel mills and our aluminum operations. Our products are then sold to consumers that both further process and manufacture end products. We sell a meaningful amount of steel to our own manufacturing businesses that in turn sell finished products to consumers. Scrap, from the industrial manufacturing process, and from when these products ultimately reach the end of their lives, can be collected and used again in our steel and aluminum operations, creating our circular manufacturing model.
While we believe we operate some of the most efficient steel operations in the world, we recognize the need for continuous improvement. In 2023, we began construction of a biocarbon production facility located in Columbus, Mississippi. The facility will use high-temperature pyrolysis to convert sustainably sourced biomass to high-purity biocarbon. We will use this biocarbon as a renewable replacement for anthracite in our steelmaking operations, which could result in as much as a 35% reduction in our steel mills’ Scope 1 GHG absolute emissions. The facility is projected to begin operations in the first half of 2025. This investment represents a significant step toward the decarbonization of our steel mills.
5
Experienced Leadership Team / Fosters an Entrepreneurial Culture
Our senior leadership team is highly experienced and has a proven track record in the steel, metals recycling, and steel fabrication industries, as well as in the construction and start-up of new operations, such as our recycled aluminum flat rolled products mill. Our leadership objectives are closely aligned with our shareholders through meaningful stock ownership positions and performance-based incentive compensation programs that are correlated to the company’s profitability and operational performance in relationship to our steel manufacturing peers. We emphasize decentralized operational decision making and responsibility, while continuing to maintain appropriate corporate governance and risk oversight. We reward teamwork, innovation, and operating efficiency, and focus on maintaining the effectiveness of our performance-driven incentive bonus plans that are designed to maximize overall productivity and align the interests of our leadership and teams with our shareholders.
Name |
|
Age |
|
Position |
Mark D. Millett |
|
65 |
|
Co-founder, Chairman, and Chief Executive Officer |
Theresa E. Wagler |
|
54 |
|
Executive Vice President, Chief Financial Officer, and Corporate Secretary |
Barry T. Schneider |
|
56 |
|
President and Chief Operating Officer |
Miguel Alvarez |
|
57 |
|
Senior Vice President, Metals Recycling |
James S. Anderson |
|
64 |
|
Senior Vice President, Long Products Steel Group |
Chris A. Graham |
|
60 |
|
Senior Vice President, Flat Roll Steel Group |
Richard A. Poinsatte |
|
58 |
|
Senior Vice President and Treasurer |
Glenn A. Pushis |
|
59 |
|
Senior Vice President, Special Projects |
Chad Bickford |
|
45 |
|
Vice President, Steel Fabrication |
Mark D. Millett co-founded the Company in 1993. Mr. Millett has been our Board Chair since May 2021 and has been our Chief Executive Officer since January 2012. Prior to that, he has held various positions within the Company, including President and Chief Operating Officer, Executive Vice President of Metals Recycling and Ferrous Resources, and Executive Vice President of Flat Roll Operations. Mr. Millett was responsible for the design, construction, and start-up operation of all of our steel mills, including our Butler, Indiana flat roll, melting, and casting operations. Mr. Millett earned his bachelor’s degree in metallurgy from the University of Surrey, England. Mr. Millett is a Past Chairman of the Steel Manufacturers Association (SMA). In 2019, Mr. Millett was named the recipient of the James F. Collins Achievement in Advocacy Award by the SMA. In 2014 and 2022, Mr. Millet was named Steelmaker of the Year by the Association for Iron & Steel Technology. In 2024, Mr. Millett received the Willy Korf / Ken Iverson Steel Vision Award for his significant contributions to the steel industry while promoting goodwill and integrity.
Theresa E. Wagler has been our Executive Vice President, Chief Financial Officer, and Corporate Secretary since May 2007. Ms. Wagler joined the Steel Dynamics corporate finance team in 1998, and has held various finance and accounting positions, including Chief Accounting Officer and Vice President and Corporate Controller. She is responsible for and oversees accounting and taxation, treasury, risk management, legal, information technology and cybersecurity, human resources, decarbonization strategy, and strategic business development functions, as well as, financial planning and analysis, investor relations, and corporate communications. Ms. Wagler also has various operational responsibilities directly overseeing several joint ventures. Prior to joining Steel Dynamics, Ms. Wagler was a certified public accountant with Ernst & Young LLP. She graduated cum laude from Taylor University with a bachelor’s degree in accounting and systems analysis. In addition, Ms. Wagler serves as a Director, Chair of the Audit Committee, and a member of the environmental sustainability and community committee of CF Industries Holdings, Inc., a public company, and also serves as a trustee for Trine University and a Director for the Metals Service Center Institute.
Barry T. Schneider has been our President and Chief Operating Officer since March 2023. Mr. Schneider is responsible for the company’s steel platform, steel fabrication platform, and metals recycling platform. Before that, Mr. Schneider served as our Senior Vice President, Flat Roll Steel Group, between March 2016 and February 2023, responsible for the company’s entire flat roll steel operations, including the company’s three flat roll steel mills and numerous flat rolled processing, coating, and distribution operations. Before that, Mr. Schneider served in various operational and leadership roles within the company’s steel operations, including our Engineered Bar Products Division and Butler Flat Roll Division.
6
He was also a part of the team that constructed the company’s first steel mill in Butler, Indiana in 1994. Mr. Schneider earned a bachelor's degree in mechanical engineering and a master of science in engineering management from Rose-Hulman Institute of Technology. He also received an executive certificate in Technology, Operations, and Value Chain Management from the MIT Sloan School of Management. In addition, Mr. Schneider served as a Past President for the Association for Iron & Steel Technology.
Miguel Alvarez has been our Senior Vice President, Metals Recycling since March 2022. Mr. Alvarez is responsible for OmniSource’s ferrous and nonferrous metals recycling operations, including marketing, trading and logistics activities. Prior to that, Mr. Alvarez served as Senior Vice President, Southwest United States and Mexico and was responsible for the comprehensive business development and partnerships in the regions, encompassing both steel and recycled metals. Prior to joining Steel Dynamics, Mr. Alvarez served in leadership positions at BlueScope; this included leading BlueScope’s North American metal buildings business with manufacturing facilities in the United States and Mexico, and being responsible for BlueScope’s only North American electric arc furnace flat roll steel mill as President of North Star BlueScope Steel. Mr. Alvarez earned a bachelor’s degree in industrial engineering and an MBA from Tecnológico de Monterrey, México.
James S. Anderson has been our Senior Vice President, Long Products Steel Group since May 2024. Mr. Anderson is responsible for the company’s four long product steel mills, along with a downstream finishing operation and the company’s copper rod manufacturing facility. Prior to that, Mr. Anderson served as our Senior Vice President, Steel Fabrication and was responsible for the company’s steel fabrication operations, comprised of seven steel joist and deck manufacturing facilities located throughout the U.S. and Mexico. Before that, Mr. Anderson held numerous operational and leadership roles including Vice President, Steel Fabrication, Chief Operating Officer of New Millennium Building Systems, and general manager of The Techs three flat roll steel galvanizing lines. Mr. Anderson earned a bachelor's degree in metallurgical engineering from Grove City College and an MBA from the University of Pittsburgh.
Christopher A. Graham has been our Senior Vice President, Flat Roll Steel Group since October 2023. Mr. Graham is responsible for the company’s entire flat roll steel operations, including three flat roll steel mills and numerous flat roll steel processing, coating, and distribution operations. Before that, Mr. Graham served as our Senior Vice President, Long Products Steel Group. In this role, Mr. Graham was responsible for the company’s four long product steel mills, along with a downstream finishing operation and the company’s copper rod manufacturing facility. Prior to that, Mr. Graham served as Senior Vice President, Downstream Manufacturing and President of New Millennium Building Systems, responsible for the company’s steel fabrication and downstream manufacturing operations, and other operational and leadership roles. Mr. Graham was also a part of the team that constructed the company’s first steel mill in Butler, Indiana in 1994. Mr. Graham earned a bachelor's degree in business management from Western Governors University and an MBA from the University of Saint Francis. In addition, Mr. Graham completed the Harvard Advanced Management Program in 2017.
Richard A. Poinsatte has been our Senior Vice President and Treasurer since October 2023. Mr. Poinsatte is responsible for the areas of treasury, legal, business development, and risk. Mr. Poinsatte joined Steel Dynamics in 2000, as the Chief Financial Officer of one of the company’s joint venture businesses, which is now part of the steel fabrication platform. During his time with Steel Dynamics, he has held positions of increasing responsibility, including the operating position of General Manager of the company’s Florida steel fabrication plant. Since 2008, he has served as Vice President and Treasurer and has been responsible for the company’s treasury, risk, and legal applications. Mr. Poinsatte earned a bachelor of business administration with a concentration in accounting from the University of Notre Dame, and he is a certified public accountant. In addition, Mr. Poinsatte serves as the Chairman of the Board of Trustees for the University of Saint Francis.
Glenn A. Pushis has been our Senior Vice President, Special Projects, since February 2019. Mr. Pushis is responsible for the successful design and construction of the company’s new 650,000-metric ton state-of-the-art lower-carbon, recycled aluminum flat rolled products mill in Columbus, Mississippi with two satellite recycled aluminum slab centers in the Southwestern United States and San Luis Potosi, Mexico. From 2019 until 2022, Mr. Pushis was responsible for the successful design and construction of the Company’s new Southwest-Sinton Flat Roll Division, developed to serve the Southwestern United States and Mexico. He has extensive experience in this capacity and has been instrumental in numerous construction projects for Steel Dynamics since its founding.
7
Prior to that, Mr. Pushis served as Senior Vice President, Long Products Steel Group, responsible for the company’s four long product steel mills. Mr. Pushis has been with Steel Dynamics since 1994, holding various operational and leadership roles, including roles within the Engineered Bar Products Division and the Butler Flat Roll Division. He was also a part of the team that constructed the company’s first steel mill in Butler, Indiana, in 1994. Mr. Pushis earned a bachelor’s degree in mechanical engineering from Purdue University and his MBA from Indiana University. In addition, Mr. Pushis served as a Past President of the Association for Iron & Steel Technology Foundation.
Chad Bickford was appointed Vice President, Steel Fabrication in May 2024. Mr. Bickford is responsible for the company’s steel fabrication operations, New Millennium Building Systems, comprised of seven steel joist and deck manufacturing facilities located throughout the United States and Mexico. Prior to that, Mr. Bickford served as General Manager for the company’s Butler Flat Roll Division. Mr. Bickford has been with Steel Dynamics since 2003, holding various operational and leadership roles with increasing responsibility in both steel and steel fabrication operations, including General Manager for the company’s Engineered Bar Products Division and General Manager of the Virginia steel fabrication facility. Mr. Bickford earned a bachelor’s degree in civil engineering from Ohio University.
Human Capital / Valuing People
We value the dedicated people whose passion, innovation, and spirit of excellence have helped successfully grow our company and serve our customers. We have a culture of trust, fostered through individual empowerment and accountability that drives decision-making throughout our business. We empower our teams with performance goals, align their interests with the company’s long-term strategy, provide them with the right tools and resources, and watch them succeed. Our performance-based incentive compensation programs align with the interests of our strategic long-term growth, our customers, communities, and shareholders. We know our teams will do what is right and that trust comes from effective communication and transparency. The Steel Dynamics team consisted of approximately 13,000 full-time team members at December 31, 2024.
Health and Safety
Valuing people includes providing a healthy and safe work environment, and creating a culture of safety that extends beyond the workplace, into our homes and communities. Safety is, and always will be, our primary focus and core value. We intend for each individual to arrive at the workplace safely and return home safely each day. This is achievable when we all work together. It requires commitment from leadership and team members at every level to take ownership and responsibility for their safety and the safety of others. Under no circumstance does the desire to maximize production or earnings override the value of individual safety.
Safety is our first core strategic pillar — it is the foundation of our decision making. Safety is always at the forefront and is discussed regularly across the company, whether led by a team member from the plant floor, a supervisor, or a manager. Leadership is engaged and continuously evaluates where we can improve. We believe having every individual engaged in safety will lead to zero injuries. We are committed to achieving world-class safety performance throughout our operations. This commitment is foundational and integral to our culture.
8
Our total recordable injury rate compared to industry benchmarks and lost time injury rates for 2024 are as follows:

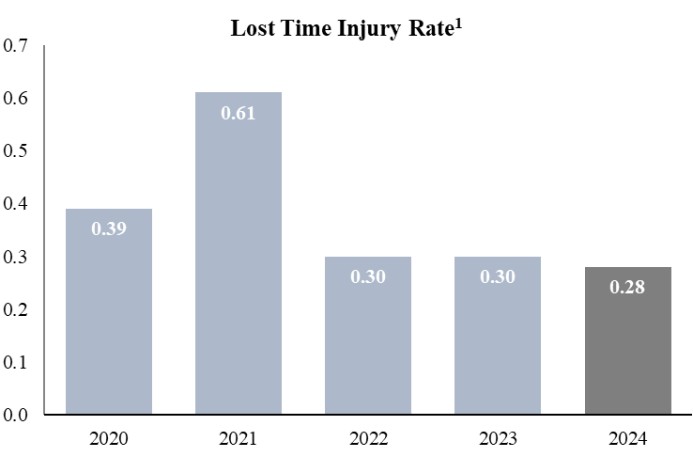
1 Total Recordable Injury Rate is defined as OSHA recordable incidents x 200,000 / hours worked. Lost Time Injury Rate is defined as OSHA days away from work cases x 200,000 / hours worked.
2 Source: 2023 U.S. DOL Bureau of Labor Statistics released in 2024
Compensation Structure
We believe in empowering our teams and rewarding them for their achievements through a four-tiered, performance-based compensation framework. The various components of our compensation programs promote a balance of high-return growth, effective capital investment, low-cost operations, and risk mitigation. By rewarding our teams based on their performance as an individual, as a team, as a company, and based on shareholder interests, we believe we have the ultimate alignment with our external constituents.
9
This is achieved through the following methods:
| ● | Individual performance awards consist of an individual’s base compensation, which is determined by their individual superior performance, responsibilities, and skill level. |
| ● | Team performance awards, such as quality production, return on assets, and conversion bonuses, are based on departmental results, focusing on productivity, cost control, and efficient use of assets. |
| ● | Companywide performance awards unite everyone through our profit-sharing program, which is based on consolidated pretax profitability, and our 401(k) match, which is based on consolidated return on assets. |
| ● | Alignment with our shareholders and the pursuit of long-term value creation is fostered through the issuance of restricted stock units. Each full-time, non-union, United States-based team member receives annual equity awards. These awards generally have a two-year vesting period, supporting retention and companywide strategy alignment. |
Our team-based culture and competitive pay structure support continued high retention. In 2024, our companywide team retention was approximately 79%, with U.S.-based teams retention of 89%. Our compensation framework helps ensure that we remain strong with best-in-class performance and retain top talent even in economic downturns. We all share in the company’s successes, as well as the challenges.
Talent Development and Educational Opportunities
Our people represent the foundation of our six strategic pillars. Their continued education and talent development are paramount to our success. Our educational assistance and development programs encourage personal growth so individuals can remain current in their areas of responsibility, as well as develop new skills for advancement. Senior leadership plays a key role in our development programs, linking our culture to critical, proven leadership concepts. As we continue to grow, building talent, retaining team members with relevant industry and technical experience, and creating opportunities within our teams are some of our most important tasks and are critical to our long-term success.
Workplace Philosophy
Our people are the foundation of our success and are our most important resource. Our culture safeguards all people and requires each person to be treated fairly and with dignity. We have equal employment opportunity, and all job-related considerations are based on merit and ability. We do not tolerate harassment or disrespect of any kind. We respect human rights, which includes providing safe work environments for our people, providing fair compensation based on job responsibilities and performance, and ensuring all team members meet minimum age requirements and eligible working status to qualify for employment. Our leadership receives recurring training on these critical topics.
We recognize the value of having a business that reflects a variety of backgrounds and experiences. We work together as a unified team and respect each other as individuals. Our team-based compensation structure reinforces this philosophy. We strive to create a welcoming and open environment, ensuring the best ideas are heard and valued regardless of the position or the individual. We believe these ideals will continue to drive our success. Our team member population is representative of our industry and the communities where we live and work.
Segments
In the fourth quarter 2024, results from an entity previously reported within the metals recycling operations were moved to the aluminum operations segment, consistent with how the company’s chief operating decision maker currently manages the business. Segment information provided within this Form 10-K has been recast for all prior periods presented, consistent with the current reportable segment presentation. Refer to Notes 1 and 12 in the notes to consolidated financial statements in Part II, Item 8 of this Form 10-K for additional segment information.
10
Steel Operations Segment |
Steel operations consist of our EAF steel mills, producing steel from ferrous scrap and scrap substitutes, utilizing continuous casting and automated rolling mills, and numerous steel coating, processing lines and warehouse operations. Our steel operations sell directly to end-users, steel processors, steel fabricators, and service centers. These products are used in numerous industry sectors, including the construction, automotive, manufacturing, transportation, heavy and agriculture equipment, energy, and pipe and tube (including OCTG) markets. Our steel operations accounted for 69%, 67%, and 65% of our consolidated net sales during 2024, 2023, and 2022, respectively. We are predominantly a domestic steel company. Export sales represented 6%, 8%, and 5% of our steel segment net sales during 2024, 2023, and 2022, respectively.
Our steel operations consist primarily of steelmaking and numerous coating operations. In 2024, we had approximately 9.4 million tons of flat roll steel annual production capacity. We have an additional 2.0 million tons of flat roll steel processing capacity through The Techs and our Heartland Flat Roll Division, as well as distribution of metallic coated and pre-painted products through United Steel Supply (USS). We have annual flat roll galvanizing capability of 5.5 million tons and painting capability of 2.0 million tons. We also have approximately 4.6 million tons of long product steel capacity at our long products divisions.
Capacities represent maximum estimated manufacturing capabilities based on steel mill configuration and related team member support. These capacities do not represent expected volumes in a given year. In addition, estimates of steel mill capacity are highly dependent on the specific product mix manufactured. Each of our steel mills can and do roll many different types and sizes of products; therefore, our capacity estimates assume a typical product mix.
11
The following chart summarizes our steel operations primary products and the estimated percentage of tons sold by end market:
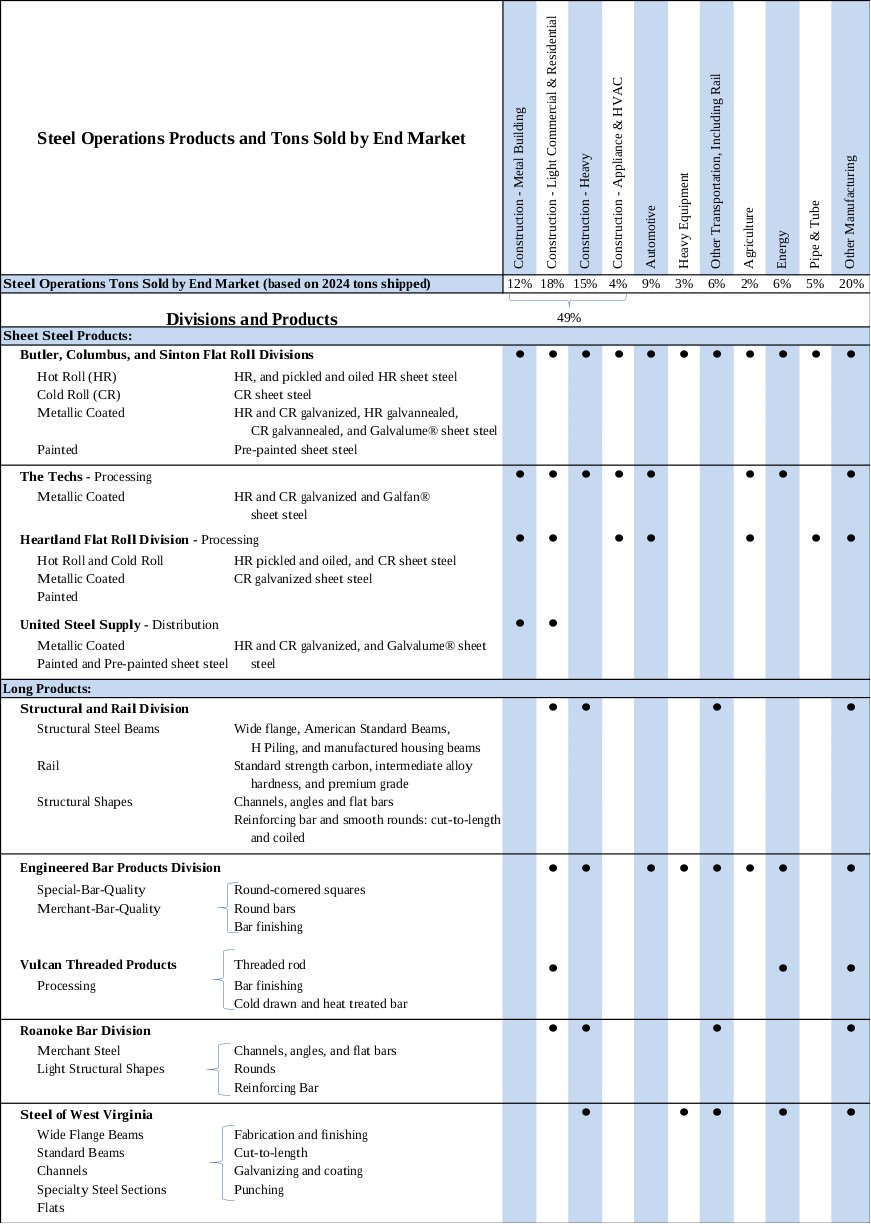
12
SHEET STEEL PRODUCTS
Our sheet steel products, consisting of hot rolled, cold rolled and coated steel products are currently produced by our Butler, Columbus, and Sinton Flat Roll Divisions, and our numerous downstream coating lines, including The Techs, Heartland Flat Roll Division, and USS (Steel Processing divisions). Our sheet steel operations represented 72%, 68%, and 77% of steel operations net sales in 2024, 2023, and 2022, respectively. We produced 9.5 million tons of sheet steel at these facilities in 2024, 9.2 million tons in 2023, and 8.3 million tons in 2022.
We shipped the following sheet steel products volumes at the following facilities (net tons):
|
|
|
|
|
|
|
|
|
|
|
2024 |
|
2023 |
|
2022 |
|
|
|
Butler, Columbus, and Sinton |
7,702,731 |
|
7,459,023 |
|
6,772,162 |
|
|
|
Flat Roll divisions |
|
|
|
|
|
|
|
|
Steel Processing divisions |
1,779,429 |
|
1,731,911 |
|
1,673,967 |
|
|
|
|
|
|
|
|
|
|
|
The following chart summarizes the types of sheet steel products sold by sales dollars, during the respective years, with cold rolled and coated products representing value-added products:

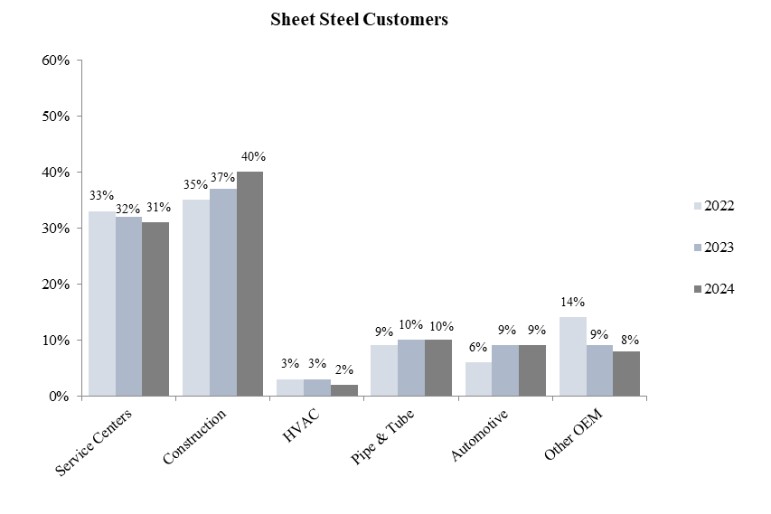
Customers. Steel processors and service centers typically act as intermediaries between primary sheet steel producers and the many end-user manufacturers that require further processing of hot roll coils. The additional processing performed by the intermediate steel processors and service centers include pickling, galvanizing, cutting to length, slitting to size, leveling, blanking, shape correcting, edge rolling, shearing, and stamping. We believe that our intermediate steel processor and service center customers will remain an integral part of our customer base. The Columbus and Sinton Flat Roll Divisions allow us to capitalize on the industrial markets in the Southern United States and Mexico, as well as further expand our customer base in painted, line pipe, and other pipe products. Galvanized flat rolled products produced by our Butler, Columbus, and Sinton Flat Roll Divisions are similar and are sold to a similar customer base. The Techs and Heartland Flat Roll Division specialize in the galvanizing of specific types of flat roll steels in primarily non-automotive applications, servicing a variety of customers in the heating, ventilation and air conditioning (HVAC), construction, agriculture, and consumer goods markets. USS adds a complementary distribution channel for metallic coated and pre-painted flat roll steel coils to the roll-former market, serving the roofing and siding industry. This connects us to an industry sector with customers that have not historically purchased steel directly from a steel producer. Our sheet steel operations also provide a substantial portion (64% in 2024) of the sheet steel utilized in our steel fabrication operations.
13
The following chart summarizes the types of end customers who purchased our sheet steel products, by sales dollars, during the respective years:
LONG PRODUCTS
Our long steel products consist of a wide array of differentiating products produced by our four mills and Vulcan Threaded Products, Inc. (Vulcan), a downstream finishing operation.
Structural and Rail Division produces a variety of parallel flange beams and channel sections, as well as large unequal leg angles, and reinforcing steel bar including custom cut-to-length, smooth bar, and coiled. We also produce standard strength carbon, intermediate alloy hardness, and premium grade rails in 40 to 320 feet length for the railroad industry. Our state-of-the art heat treating system allows us to produce high quality premium rail, which has been certified by all Class I railroads. In addition, our rail-welding facility has the ability to weld (Continuous Welded Rail) in lengths up to 1,650 feet, which offers substantial savings to the railroads both in terms of initial capital cost and through reduced maintenance. We also utilize our Structural and Rail Division’s excess capacity to supply our Engineered Bar Products Division with pull-through volume of billets to utilize its excess rolling capacity.
Engineered Bar Products Division produces a broad range of engineered special-bar-quality (SBQ), merchant-bar-quality (MBQ), and other engineered round steel bars. We also have a bar finishing facility, which provides various downstream finishing operations for SBQ steel bars, including turning, polishing, straightening, chamfering, precision saw-cutting, and heat-treating capabilities. Vulcan produces threaded rod products, and cold drawn and heat-treated bar, creating strategic pull-through demand of our Engineered Bar Products Division’s special-bar-quality products.
Roanoke Bar Division produces merchant products, including channels, angles, flats, merchant rounds, and reinforcing steel bars. Excess steel billet production is sold to mills without sufficient melting capacities, including our Steel of West Virginia facility. Our steel fabrication operations also purchase angles from our Roanoke Bar Division.
Steel of West Virginia produces a wide array of specialty shapes and light structural steel and frequently performs fabrication and finishing operations on those products, such as cutting to length, additional straightening, hole punching, shot blasting, plasma cutting, welding, galvanizing, and coating. Through this array of products and additional finishing, we create custom finished products that are generally placed directly into our customers’ assembly operations.
14
We shipped the following long products volumes at each of these facilities (net tons):
|
|
|
|
|
|
|
|
|
|
|
2024 |
|
2023 |
|
2022 |
|
|
|
Structural and Rail Division |
1,625,913 |
|
1,851,349 |
|
1,865,405 |
|
|
|
Rail shipments (included above) |
254,203 |
|
319,241 |
|
299,795 |
|
|
|
Engineered Bar Products Division |
714,509 |
|
836,179 |
|
894,374 |
|
|
|
Roanoke Bar Division |
516,258 |
|
564,776 |
|
589,449 |
|
|
|
Steel of West Virginia |
321,647 |
|
378,515 |
|
363,832 |
|
|
Customers. The principal customers for our structural steel products are steel service centers, steel fabricators and various manufacturers. Service centers provide key distribution channels for the mills and value-add services to the end-user. The steel rail marketplace in the United States, Canada, and Mexico is specialized and defined, with seven Class I railroads and a large distribution network.
SBQ products are principally consumed by cold finishers, forgers, intermediate processors, OEM manufacturers, steel service centers, and distributors, as well as pull-through volume to Vulcan. Our MBQ products are sold primarily to steel service centers, as well as reinforcing steel bar distributors, joist producers (such as our New Millennium Building Systems), and OEMs. Some of the excess steel billet production at the Roanoke Bar Division is sold to mills without sufficient melting capacities, including our Steel of West Virginia facility. Our steel fabrication operations also purchase angles from Roanoke Bar Division. Steel of West Virginia’s customers are primarily OEMs producing solar panel structures, truck trailers, industrial lift trucks, merchant products, guardrail posts, manufactured housing, mining, and off-highway construction equipment. Steel of West Virginia’s flexible manufacturing capabilities enable us to meet demand for a variety of custom-ordered and designed products. Many of these products are produced in small quantities for low volume end-uses resulting in a wide variety of customers, the largest of which are in the truck trailer and industrial lift truck industries.
Steel Operations Segment Competition
The markets in which we conduct business are highly competitive with an abundance of competition in the carbon steel industry from North American and foreign integrated and mini-mill steelmaking and processing operations. We compete in numerous industry sections, most significantly tied to the construction, automotive, and other manufacturing sectors. In many applications within these industry sections, steel competes with other materials, such as aluminum, cement, composites, plastics, carbon fiber, glass, and wood. Some of our products are commodities, subject to their own cyclical fluctuations in supply and demand. However, we are focused on providing a broad range of diversified value-added products that de-emphasize commodity steel. The primary competitive influences on products we sell are price, quality, and value-added services.
15
Metals Recycling Operations Segment |
Metals Recycling operations include both ferrous and nonferrous scrap metal processing, transportation, marketing, brokerage, and scrap management services, strategically located in close proximity to our steel mills and other end-user scrap consumers, throughout the United States and Mexico. Our metals recycling operations accounted for 11% of our consolidated net sales during 2024 and 2023 and 9% during 2022. Export sales represented 17%, 19%, and 14% of metals recycling segment net sales during 2024, 2023, and 2022, respectively.
We shipped the following from our metals recycling operations:
|
|
|
|
|
|
|
|
|
|
|
2024 |
|
2023 |
|
2022 |
|
|
|
Ferrous metal total (gross tons) |
5,850,544 |
|
5,792,484 |
|
5,314,318 |
|
|
|
Shipments to our steel mills |
3,656,034 |
|
3,593,328 |
|
3,488,206 |
|
|
|
Percent of total to our steel mills |
62% |
|
62% |
|
66% |
|
|
|
|
|
|
|
|
|
|
|
|
Nonferrous metals (thousands of pounds) |
965,491 |
|
970,445 |
|
923,319 |
|
|
We sell various grades of processed ferrous scrap primarily to steel mills and foundries. Ferrous scrap metal is the primary raw material for EAFs, including our steel mills. In addition, we sell various grades of nonferrous metals including copper, brass, aluminum, and stainless steel, to smelters, refineries, alloy manufacturers, specialty mills and other consumers, including our aluminum operations.
We purchase processed and unprocessed ferrous and nonferrous scrap metals in a variety of forms for our metals recycling facilities.
Ferrous scrap comes from two primary sources:
| ● | Manufacturing industrial facilities, metal fabrication plants, and machine shops, which generate ferrous scrap referred to as prompt or industrial scrap, and |
| ● | Scrap dealers, retail individuals, auto wreckers, demolition firms and others who provide steel and iron scrap, referred to as obsolete scrap. Obsolete scrap includes scrap recycled from end-of-life items, such as automobiles, appliances, and machinery. |
Nonferrous scrap comes from three primary sources:
| ● | Manufacturers and other nonferrous scrap sources, which generate or sell scrap aluminum, copper, stainless steel, and other nonferrous metals, |
| ● | Producers of items such as electric wire, telecommunication service providers, aerospace, defense, and recycling companies that generate nonferrous scrap consisting primarily of copper wire, aluminum beverage cans, and various other metals and alloys, and |
| ● | Retail transactions conducted with the general public who sell material directly to our facilities, collected from a variety of sources. |
We do not purchase a significant amount of scrap metal from a single source or from a limited number of major sources. Market demand and the composition, quality, size, weight, and location of the materials are the primary factors that determine prices.
Products. Our metals recycling operations primarily involve the purchase, processing, and resale of ferrous and nonferrous scrap metals into reusable forms and grades. We process an array of ferrous products through a variety of methods, including sorting, shredding, shearing, cutting, bailing, and breaking. Our major ferrous products include heavy melting steel, busheling, bundled scrap, shredded scrap, and other scrap metal products, such as steel turnings and cast iron.
16
These products vary in properties or attributes related to cleanness, size of individual pieces, and residual alloys. The necessary characteristics of the ferrous products are determined by the specific needs and requirements of the consumer and affect the individual product’s relative value. We process numerous grades of nonferrous products, including aluminum, brass, copper, stainless steel, and other nonferrous metals. Additionally, we provide transportation logistics (truck, rail, and river barge), marketing, brokerage, and scrap management services, providing competitive price and cost advantages to our suppliers and customers. We design, install, and manage customized scrap management programs for industrial manufacturing companies.
Customers. We sell various grades of processed ferrous scrap to end-users, such as EAF steel mills, integrated steelmakers, foundries, secondary smelters, and metal brokers, who aggregate materials for other large users. Ferrous scrap metal is the primary raw material for EAFs, including our steel mills. Most of our ferrous scrap customers purchase processed scrap through negotiated spot sales contracts which establish a quantity purchase for the month. The price we charge for ferrous scrap depends upon market demand, composition, size, weight, and transportation costs, as well as the quality and grade of the scrap. We sell various grades of processed nonferrous scrap to end-users such as aluminum sheet and ingot manufacturers, brass and bronze ingot makers, copper refineries, mills, including our new recycled aluminum flat rolled products mill, smelters, specialty steelmakers, alloy manufacturers, wire and cable producers, and utilities. The price we charge for nonferrous scrap also depends upon market demand and pricing, transportation costs, as well as the quality and grade of the scrap.
Competition. Scrap is a global commodity influenced by conditions in a number of industrialized and emerging markets throughout Asia, Europe, and North America. The markets for scrap metals are highly competitive, both in the purchase of raw or unprocessed scrap, and the sale of processed scrap. With regard to the purchase of unprocessed scrap, we compete with numerous independent recyclers, as well as smaller scrap companies engaged only in collecting obsolete scrap. In many cases, we also purchase unprocessed scrap metal from smaller scrap dealers and other processors. Successful procurement of materials is determined primarily by the price offered by the purchaser for the raw scrap and the proximity of our processing facility to the source of the raw scrap. Both ferrous and nonferrous scrap sell as a commodity in both domestic and international markets, which are affected, sometimes significantly, by relative economic conditions, currency fluctuations, and the availability and cost of transportation. Competition for sales of processed scrap is based primarily on the price, quality, and location of the scrap metals, as well as the level of service provided in terms of reliability and timing of delivery.
We also face potential competition for sales of processed scrap from other producers of steel products, such as EAFs and integrated steel mills, some of which, like us, are also vertically connected in the scrap metals recycling business. In addition, other steel mills may compete with us in attempting to secure scrap supply through direct purchasing from our scrap suppliers. Scrap metal processors also face competition from substitutes for prepared ferrous scrap, such as pig iron, pelletized iron, hot briquetted iron (HBI), direct reduced iron (DRI), and other forms of processed iron.
The industry is highly fragmented with many small, regional, national, and global companies, which have multiple locations in areas in which our metals recycling operations operate. No single scrap metals recycler has a significant market share in the domestic market.
17
Steel Fabrication Operations Segment |
Our steel fabrication operations include seven New Millennium Building Systems plants that primarily serve the non-residential construction industry throughout the United States. We have a national operating footprint that allows us to serve the entire domestic non-residential construction market including large retail chains and e-commerce distribution channels.
Steel fabrication operations accounted for 10%, 15%, and 19% of our consolidated net sales during 2024, 2023, and 2022, respectively. We sold 607,000, 663,000, and 856,000 tons of joist and deck products during 2024, 2023, and 2022, respectively.
Products. Our steel fabrication operations produce steel non-residential building components, including steel joists, girders, and steel deck. Our joist products include bowstring, arched, scissor, double-pitched, and single-pitched joists. Our deck products include a full range of steel decking: roof, form, cellular, composite floor, specialty architectural, floor systems, and bridge deck.
Customers and Markets. Our primary steel fabrication operations customers are non-residential steel fabricators, metal building companies, general construction contractors, developers, owners, brokers, and governmental entities. Our customers are located throughout the United States, including national accounts. Our steel fabrication operations maintain approximately one-third of the total domestic steel joist and deck market for bookings, of approximately 1.7 million tons, 1.8 million tons, and 2.1 million tons during 2024, 2023, and 2022, respectively.
Competition. We compete with other North American joist and steel deck producers primarily on the basis of price, quality, customer service, and proximity to the customer. Our national footprint allows us to service the entire domestic non-residential construction market, as well as national accounts such as large retail chains, including their distribution warehouse facilities, and certain specialty deck customers.
18
Other Information |
Sources, Availability, and Cost of Steel and Other Operations’ Raw Materials
Scrap Metals. The principal raw material of our EAF steel operations is recycled ferrous scrap derived from, among other sources, "home scrap,” generated internally at our steel mills themselves; industrial scrap, generated as a by-product of manufacturing; obsolete scrap, recycled from end-of-life automobiles, appliances, and machinery; and demolition scrap, recycled from obsolete structures, containers, and machines.
Recycled ferrous scrap typically comprises more than 80% of the metallic melt mix in EAF steelmaking, in contrast to integrated mill steelmaking, where the proportion of scrap has traditionally been approximately 25% to 35%. Depending upon the scrap substitute material that may be available from time to time, and the relative cost of such material, the percentage of scrap used in our steelmaking operations could be increased or reduced in our metallic melt mix.
Many variables can impact ferrous scrap prices, all of which reflect the pushes and pulls of the supply-demand equation. These factors include the level of domestic steel production (high quality, low-residual scrap is a by-product of manufacturing activity), the level of exports of scrap from the United States, and the amount of obsolete scrap recycled. In addition, historical domestic ferrous scrap prices typically have a strong correlation and spread to global pig iron pricing. Generally, as domestic steel production increases, so does scrap demand and resulting scrap prices. The reverse is also normally, but not always, true with scrap prices following steel prices downward when supply exceeds demand. When scrap prices greatly accelerate, this can challenge one of the principal elements of an EAF based steel mill’s traditional lower cost structure—the cost of its metallic raw material.
Iron Units. In addition to scrap, pig iron, DRI, HBI, and internally sourced liquid pig iron are used in our EAF steel mill production. During 2024 and 2023 we consumed 13.0 million tons and during 2022 we consumed 12.0 million tons of metallic materials in our steelmaking furnaces, of which iron units other than scrap represented approximately 15% of the tons in 2024 and 2023, and 13% of the tons in 2022.
Energy Resources
Electricity. Electricity is a significant input required in our EAF steel operations, representing approximately 4% of steel production costs of goods sold in 2024, 2023, and 2022. We have entered into fixed price electricity contracts for the Butler Flat Roll Division, Columbus Flat Roll Division, Roanoke Bar Division and Steel of West Virginia, while our Engineered Bar Products Division has a combination of fixed pricing and market pricing for the various components of the electrical services (demand charge, energy charge, riders, etc.). Our Sinton Flat Roll Division purchases electricity at current market prices. Our Structural and Rail Division purchases electricity at current market prices and through fixed price forward contracts.
Research and Development
Our research and development activities have consisted of efforts to expand, develop, and improve our products and operating processes, such as our Sinton Flat Roll Division, and our efforts to develop and improve renewable product alternatives, such as our construction of a biocarbon production facility. Most of these research and development efforts have been conducted in-house by our team members.
19
Environmental Matters
Our operations are subject to substantial and evolving environmental, health and safety laws and regulations concerning, among other things, emissions to the air, discharges to surface and ground water and to sewer systems, and the generation, handling, storage, transportation, treatment and disposal of solid and hazardous wastes and secondary materials. Our operations are dependent upon permits regulating discharges into the environment or the use and handling of by-products in order to operate our facilities. We dedicate considerable resources aimed at achieving compliance with applicable laws concerning the environment. While we do not currently believe that our future compliance efforts with such provisions will have a material adverse effect on our results of operations, cash flows, or financial condition, this is subject to change in the ever-evolving regulatory environment in which we operate.
Since the interpretation and enforcement of environmental laws and regulations that may be enacted from time to time can be subject to changing social or political norms, our environmental capital expenditures and costs for environmental compliance may increase in the future. In addition, due to the possibility of unanticipated regulatory or other developments, the amount and timing of future environmental expenditures may vary substantially from those currently anticipated. The cost of current and future environmental compliance may also place our operations at a competitive disadvantage with respect to foreign producers, which may not be required to undertake equivalent costs in their operations.
Pursuant to the Resource Conservation and Recovery Act (RCRA), which governs the handling, recycling and disposal of solid and hazardous wastes and hazardous secondary materials, the United States Environmental Protection Agency (United States EPA) and authorized state or local environmental agencies may conduct inspections to identify alleged violations or areas where there may have been releases of solid or hazardous constituents into the environment and require the facilities to pay penalties and/or take corrective action to address any such releases. RCRA also allows citizens in certain situations to bring claims against regulated facilities for potential damages and cleanup. Many states have statutes and regulatory authorities similar to RCRA that can also apply. Many of our facilities generate wastes and secondary materials subject to these requirements. Some of these materials, for example EAF dust, may be categorized as hazardous waste, requiring special handling for disposal or for the recovery of metallics. While we cannot predict the future actions of the regulators or other interested parties, the potential exists for required corrective action, the costs of which could be substantial.
Under the Comprehensive Environmental Response Compensation and Liability Act, known as CERCLA or Superfund, the United States EPA, state agencies and, in some instances, private parties have the authority to assert joint and several liability for the remediation of contaminated properties upon generators of hazardous substances, current and former site owners and operators, transporters, and other potentially responsible parties, regardless of fault or the legality of the original disposal activity. Many states have statutes and regulatory authorities similar to CERCLA that can also apply. We have a number of material handling agreements with various contractors to properly dispose of or recycle our EAF dust and other by-products of our operations. However, we cannot assure that, even if there has been no fault by us, we may not still be cited as a hazardous substances generator by reason of an environmental cleanup at one of our facilities or a site to which our by-products were transported.
The Clean Water Act and similar state and local laws apply to aspects of our operations and impose regulatory restrictions related to the discharge of wastewater, storm water, and dredged or fill material. The United States EPA, state agencies and, in certain instances, local governments and private parties have the ability to bring claims alleging violations and seeking penalties and injunctive relief. These legal provisions can also require new or expanded water treatment investments to be made and can limit or even prohibit certain current or planned activities at our operations.
The Clean Air Act and analogous state and local laws require many of our facilities to obtain and maintain air permits in order to operate. Air permits can impose new or expanded obligations to limit or prevent current or future emissions and to add costly pollution control equipment. Claims for alleged violations can be brought by the United States EPA, state agencies, and in certain instances local governments and private parties, and can result in penalties and injunctive relief.
20
In addition, there are a number of other environmental, health and safety laws and regulations that apply to our facilities and may affect our operations. By way of example and not of limitation, certain portions of the federal Toxic Substances Control Act, Oil Pollution Act, Safe Drinking Water Act, and Emergency Planning and Community Right-to-Know Act, as well as state and local laws and regulations implemented by the regulatory agencies, apply to aspects of our facilities’ operations. Our operations in Mexico are similarly subject to environmental requirements applicable to those operations. In some instances, we may also be subject to other foreign governments’ regulations and international treaties and laws. Many of these laws allow both the governments and citizens in certain situations to bring claims against regulated facilities for alleged environmental violations. Finally, our operations could in certain situations be subject to toxic tort claims brought by third parties alleging causes of action such as nuisance, negligence, trespass, infliction of emotional distress, or other claims alleging personal injury, property damage, or other harms.
Available Information
Our internet website address is www.steeldynamics.com. We make available on our internet website, under "Investors,” free of charge, as soon as reasonably practicable after such materials are electronically filed with, or furnished to, the Securities and Exchange Commission, our Annual Report on Form 10-K, Quarterly Reports on Form 10-Q, Current Reports on Form 8-K, and amendments to those reports, as well as press releases, ownership reports pursuant to Section 16(a) of the Securities Act of 1933, our Code of Ethics for Principal Executive Officers and Senior Financial Officers, our Code of Business Conduct and Ethics, and any amendments thereto or waivers thereof, as well as our Audit, Compensation, and Corporate Governance and Nominating Committee Charters. The contents of our or any other website are not incorporated into this report. These reports are also available publicly on the Securities and Exchange Commission website, www.sec.gov.
21
ITEM 1A. RISK FACTORS
Many factors may have an effect on our business, results of operations, financial condition and cash flows. We are subject to various risks resulting from changing economic, environmental, regulatory, political, industry, business and financial conditions. The factors described below are some of the risks that could materially negatively impact us.
Global and National Risks Related to our Business
Our industry, as well as the industries of many of our customers and suppliers upon whom we are dependent, is affected by domestic and global economic factors including periods of slower than anticipated economic growth and the risk of a recession.
Our financial results are substantially dependent not only upon overall economic conditions in the United States and globally, including North America, Europe and in Asia, but also as they may affect one or more of the industries upon which we depend for the sale of our products. Global or domestic actions or conditions, including political actions, proposed or actual trade policies or restrictions, including tariffs or quotas, proposed or actual changes in tax laws, including the sunset of certain tax laws, proposed or actual regulation, including those related to the environment, interest rates, terrorism, acts of war or hostility, natural disasters, or pandemics, epidemics, widespread illness or other health issues, could result in changing economic conditions in the United States and globally, disruptions to or slowdowns in our business, our supply chain, or our global or domestic industry, or those of our customers or suppliers upon whom we are dependent. Additionally, periods of slower than anticipated economic growth could reduce customer confidence and adversely affect demand for our products and further adversely affect our business, results of operations, financial condition and cash flows. Metals industries have historically been vulnerable to significant declines in consumption and product pricing during periods of economic downturn or continued uncertainty.
Our business is also dependent upon certain industries, such as construction, automotive, manufacturing, transportation, heavy and agriculture equipment, energy and pipe and tube (including OCTG) markets, and these industries are also cyclical in nature and may experience supply chain disruptions. Therefore, these industries may experience their own fluctuations in demand for our products based on such things as economic conditions, interest rates, supply chain disruptions, raw material and energy costs, consumer demand, the rate of inflation and infrastructure funding decisions by governments. Many of these factors are beyond our control. As a result of volatility in our industry or in the industries we serve, we may have difficulty increasing or maintaining our level of sales or profitability. A downturn in our industry or the industries we serve may adversely affect our business, results of operations, financial condition and cash flows.
A prospective decline in consumer and business confidence and spending, which is often coupled with reductions in the availability of credit or increased cost of credit and interest rates, as well as volatility in the capital and credit markets, may adversely affect the business and economic environment in which we operate and the profitability of our business. We are also exposed to risks associated with the creditworthiness of our customers and suppliers, which during times of high interest rates can be intensified. If the availability of credit to fund or support the continuation and expansion of our customers’ business operations is curtailed or if the cost of that credit is high, the resulting inability of our customers or of their customers to either access credit or absorb the cost of that credit may adversely affect our business by reducing our sales or by increasing our exposure to losses from uncollectible customer accounts. A disruption of the credit markets could also result in financial instability of some of our customers and suppliers. The consequences of such adverse effects could include the interruption of production at the facilities of our customers, the reduction, delay or cancellation of customer orders, delays or interruptions of the supply of raw materials we purchase, and bankruptcy of customers, suppliers or other creditors. Any of these events may adversely affect our business, results of operations, financial condition and cash flows.
22
Global steelmaking overcapacity and imports of steel into the United States may adversely affect United States steel prices, which, together with increased scrap prices, may adversely affect our business, results of operations, financial condition and cash flows.
Global steelmaking capacity currently exceeds global consumption of steel products, which adversely affects United States and global steel prices. Such excess capacity sometimes results in steel manufacturers in certain countries exporting steel and steel products, at prices that are lower than prevailing domestic prices, and sometimes at or below their cost of production. Excessive imports of steel and steel products, into the United States, may exert downward pressure on United States steel and steel products prices, which adversely affects our business, results of operations, financial condition and cash flows. Fluctuations in the value of the dollar can also affect imports, as a strong United States dollar makes imported products less expensive, potentially resulting in more imports of steel and steel products into the United States by our foreign competitors. Furthermore, the introduction of additional domestic steel capacity could increase this global overcapacity. This, in turn, has led to and may further lead to increased domestic demand for ferrous scrap resulting in increased scrap prices. Our results of operations, financial condition and cash flows are driven primarily from the metal spread achieved from the price we sell steel and steel products compared to the price of our metallic raw materials, including scrap. During prolonged periods of steel and steel products overcapacity, leading to lower selling prices, combined with high demand for scrap and raw materials, leading to higher buying prices, our metal spreads could be compressed, which may adversely affect our business, results of operations, financial condition and cash flows.
United States steel producers compete with many foreign producers, including those in China, Vietnam and other Asian and European countries. Competition from foreign producers is typically strong and is periodically exacerbated by weakening of the economies of certain foreign steelmaking countries, at times leading to imports of steel involving dumping and subsidy abuses by foreign steel producers. Some foreign steel producers are owned, controlled or subsidized by foreign governments. As a result, decisions by these producers with respect to their production, sales and pricing are sometimes influenced to a greater degree by political and economic policy considerations than by prevailing market conditions, realities of the marketplace or consideration of profit or loss. Additionally, at times when iron ore prices are low, disruption of the scrap price correlation to iron ore may occur, which may lead to reduced global costs to produce steel, further depressing steel import prices. A higher volume of steel imports into the United States tends to occur at depressed prices when foreign steelmaking countries experience periods of economic difficulty, decreased demand for steel products or excess capacity. The global steelmaking overcapacity is exacerbated by Chinese steel production capacity that far exceeds that country’s demand and has made China a major global exporter of steel, resulting in weakened global steel pricing than otherwise would be expected. While measures to curb unfair trade such as tariffs, duties or quotas, along with trade agreements with other countries, have decreased the volume of steel and steel products imports, domestic steel and steel products prices can be negatively impacted by excessive imports of steel and steel products. Should current or new tariffs, duties or quotas expire or be relaxed, repealed or circumvented by importers of steel and steel products, or should trade agreements be renegotiated, downward pressure may be exerted on United States steel and steel products prices, which may adversely affect our business, results of operations, financial condition and cash flows.
Pandemics, epidemics, widespread illness or other health issues may adversely affect our business, results of operations, financial condition, cash flows, liquidity, and stock price.
Pandemics, epidemics, widespread illness or other health issues may adversely affect our business, results of operations, financial condition, cash flows, liquidity and stock price. Government actions globally, including United States federal and state governmental actions, related to pandemics, epidemics, widespread illness or other health issues have historically impacted demand for our products, our supply chain, our employees, the economy generally, inflation and interest rates, and any similar future actions may result in similar or additional impacts.
23
Industry Risks Related to our Business
Our level of production and our sales and earnings are subject to significant fluctuations as a result of the cyclical nature of the steel industry and some of the industries we serve.
The steel manufacturing business is cyclical in nature, and the selling price of the steel we make may fluctuate significantly due to many factors beyond our control. Furthermore, a number of our products are commodities, subject to their own cyclical fluctuations in supply and demand in both metal consuming and metal generating industries, including the construction and manufacturing industries. The timing, magnitude and duration of these cycles and the resulting price fluctuations are difficult to predict. The sale of our manufactured steel products is directly affected by demand for our products in other cyclical industries, such as construction, automotive, manufacturing, transportation, heavy and agriculture equipment, energy and pipe and tube (including OCTG) markets. Economic difficulties, stagnant or slow global economies, supply and demand imbalances, supply chain disruptions, periods of heightened inflation or high interest rates, and currency fluctuations in the United States or globally may decrease the demand for our products or increase the amount of imports of steel into the United States, which may decrease our sales, margins and profitability.
Volatility and major fluctuations in prices and availability of scrap metal, scrap substitutes and supplies, and our potential inability to pass higher costs on to our customers, may constrain operating levels and reduce profit margins.
Steel producers require large amounts of raw materials, including ferrous scrap metal and scrap substitute products such as pig iron and pelletized iron, and other supplies such as zinc, graphite electrodes and ferroalloys. The principal raw material of our EAF steel operations is recycled ferrous scrap derived from, among other sources, “home scrap,” generated internally at steel mills themselves; industrial scrap, generated as a by-product of manufacturing; obsolete scrap, recycled from end-of-life automobiles, appliances and machinery; and demolition scrap, recycled from obsolete structures, containers and machines. The prices for scrap are subject to market forces largely beyond our control, including demand by United States and foreign steel producers, freight costs and speculation. The scrap metal recycling industry has historically been, and is expected to remain, highly cyclical and the prices for scrap have varied significantly in the past, may vary significantly in the future and do not necessarily fluctuate in tandem with the price of steel. Moreover, some of our integrated steel producer competitors are not as dependent as we are on ferrous scrap as a part of their raw material melt mix, which, during periods of high scrap costs relative to the cost of blast furnace iron used by the integrated producers, give them a raw material cost advantage over EAF mills. However, given environmental considerations of investors, customers and regulators, additional EAF mills may be constructed, or companies currently operating blast furnace mills may invest in EAF mills, leading to increased demand in ferrous scrap possibly resulting in higher scrap prices. While our vertical integration into the metals recycling business and our liquid pig-iron operations are expected to enable us to continue being a cost-effective supplier to our own steelmaking operations, for some of our metallics requirements, we still rely on other metallics and raw material suppliers, as well as upon general industry supply conditions for the balance of our needs.
The availability and prices of raw materials and supplies, particularly those with positive environmental attributes, may also be negatively affected by new, existing or changing laws, regulations, sanctions or embargoes, including those that may impose output limitations or higher costs associated with climate change or GHG allocation by suppliers, interruptions in production, accidents or natural disasters, changes in exchange rates, global price fluctuations, the availability and cost of transportation, and competing uses, all of which may be heighted during times of war or hostilities. As a major producer of galvanized steel products, we purchase and consume a large amount of zinc, which if purchased at high prices, may adversely affect our profit margins. Any inability to secure a consistent, cost-effective and timely supply of our raw materials and supplies may adversely affect our business, financial condition, results of operations and cash flows.
Additionally, our inability to pass on all or a substantial part of any cost increases, whether due to positive environmental attributes, inflation, supply and demand imbalances, or otherwise, or to provide for our customers’ needs because of the potential unavailability of raw materials, supplies or required environmental attributes, may result in production slowdowns or curtailments or may otherwise adversely affect our business, financial condition, results of operations and cash flows.
24
The cost and availability of electricity, natural gas, oil and other energy resources are subject to volatile market conditions.
We consume large amounts of energy to melt scrap, reheat semi-finished products for rolling into finished products and perform other steps necessary to our production process. We rely on third parties for the supply of energy resources we require in our production activities. The prices for and availability of electricity, natural gas, oil and other energy resources, including renewable or other clean energy sources, are subject to regulation and volatile market conditions, often affected by weather conditions as well as political, environmental and economic factors beyond our control. As large consumers of electricity and natural gas, we must have dependable delivery in order to operate. Accordingly, we are at risk in the event of an energy disruption, including power outages, power unavailability or inability to obtain power at a reasonable price or with sufficient desired environmental attributes. Prolonged blackouts, curtailments or disruptions caused by natural disasters or by political or environmental considerations would substantially disrupt our production. Since a significant portion of our finished products are delivered by truck, unforeseen fluctuations in the price of fuel would also adversely affect our costs or the costs of many of our customers.
Increased environmental, GHG emissions and sustainability considerations from our customers and investors or related regulations could affect demand for our products and add significant costs.
Customers, investors and regulators have increased their focus on the environment, GHG emissions and sustainability. We are committed to the environment and sustainability. We are taking further action to reduce our environmental footprint through our 2025, 2030, and 2050 goals for GHG emission reduction and increased renewable energy usage. We believe that achievement of these goals will comport with expectations of our customers and investors, but certain customers and investors may have differing requirements. To achieve these goals, our operational costs may increase and we have had and will continue to have additional capital expenditures, some of which we may not be able to pass along to our customers. Any failure to timely meet these goals, or other requirements of customers or investors, may have an adverse effect on our business, results of operations and stock price.
Additionally, governmental agencies, regulators, investors or other groups have introduced, and may request or require, environmental monitoring, disclosures or regulations in response to the potential impacts of climate change. International treaties or agreements may also result in increasing regulation of GHG emissions, including carbon emissions limitations or trading mechanisms. Any such regulation or disclosure requirement could impose significant costs on our operations and on the operations of our customers and suppliers, including increased energy, capital equipment, emissions controls, environmental monitoring and reporting and other costs in order to comply with current or future laws, regulations or demands concerning the environment, climate change, GHG emissions and sustainability. Any adopted regulations could negatively impact our ability, and that of our customers and suppliers, to compete with companies situated in areas not subject to or not complying with such regulations, or could affect our environmental disclosures for any allowances, offsets or credits. We may see an increase in costs relating to our assets that emit GHGs as a result of these initiatives, which may impact our operations directly or through our customers and suppliers.
Compliance with and changes in environmental and remediation requirements may result in substantially increased capital requirements and operating costs.
Existing laws or regulations, as currently interpreted or as may be interpreted in the future, as well as future laws or regulations, may adversely affect our results of operations and financial condition.
We are subject to numerous local, state, federal and international statutory and regulatory environmental requirements relating to, among other things:
●the generation, storage, treatment, handling and disposal of solid and hazardous wastes and secondary materials;
● |
the discharge of materials into the air, including periodic changes to the National Ambient Air Quality Standards and to emission standards; |
●the management, treatment and discharge of wastewater and storm water; ●the use and treatment of groundwater;
25
●the remediation of soil and groundwater contamination;
●climate change legislation or regulation;
●the need for and the ability to timely obtain air, water or other environmental permits;
●the timely reporting of certain chemical usage, content, storage and releases;
●the remediation and reclamation of land used in our operations;
●natural resource protections; and
●the protection of our employees’ health and safety.
Compliance with environmental laws and regulations, which affect our EAF steelmaking, metals recycling, liquid pig-iron, and copper and aluminum production operations, is a significant factor in our business. We are required to obtain and comply with environmental permits and licenses, and failure to obtain or renew or the violation of any permit or license may result in substantial fines and penalties, capital expenditures, operational changes, suspension of operations or the closure of a subject facility. Similarly, delays, increased costs or the imposition of onerous conditions to the securing or renewal of permits may adversely affect these operations.
Uncertainty regarding adequate pollution control levels, testing and sampling procedures, and new pollution control technology are factors that may increase our future compliance expenditures. We are unable to predict the ultimate cost of future compliance with environmental requirements or their effect on our operations. Although we strive to be in substantial compliance with all applicable laws and regulations, legal requirements frequently change and are subject to interpretation such that regulatory agencies may bring enforcement actions for alleged noncompliance. Private parties might also bring claims against us under citizen suit provisions and/or for property damage or personal injury allegedly resulting from our operations. New laws, regulations and changing interpretations by regulatory authorities, together with uncertainty regarding the application of existing requirements, are among the factors that may increase our future expenditures to comply with environmental requirements. The cost of complying with existing laws or regulations as currently interpreted or reinterpreted in the future, or with future laws or regulations, may adversely affect our results of operations and financial condition.
Our operations produce significant amounts of by-products, some of which are handled as solid or hazardous waste or as hazardous secondary materials. For example, our steel mills generate EAF dust, which the United States Environmental Protection Agency (United States EPA) and other regulatory authorities classify as hazardous waste and regulate accordingly unless recycled in an exempt manner.
In addition, the feed materials for the shredders operated by our metals recycling operations include automobile bodies. A portion of the feed materials consist of currently unrecyclable material known as shredder residue. If laws or regulations or the interpretation of the laws or regulations change with regard to EAF dust or shredder residue or other by-products created by our operations, we may incur significant additional expenditures.
Federal and state environmental laws enable federal and state agencies and certain private parties to recover from owners, operators, generators and transporters the cost of investigation and cleanup of sites at which wastes or hazardous substances were disposed and/or migrated. In connection with these laws, we may be required to clean up contamination discovered at our sites including contamination that may have been caused by former owners or operators of the sites, to conduct additional cleanup at sites that have already had some cleanup performed, to address emerging and newly-regulated contaminants such as per- and polyfluoroalkyl substances (PFAS) and 1,4-dioxane, or to perform cleanup with regard to sites formerly used in connection with our operations.
In addition, we may be required to pay for, or to pay a portion of, the costs of cleanup at sites to which we sent materials for disposal or recycling, notwithstanding that the original disposal or recycling activity may have complied with all regulatory requirements then in effect. Under certain laws, a party can be held jointly and severally liable for all of the cleanup costs associated with a disposal site. In practice, a liable party often splits the costs of cleanup with other potentially responsible parties.
26
We have received notices from the United States EPA, state agencies and third parties that we have been identified as potentially responsible for the costs of investigating and cleaning up a number of disposal sites. In most cases, many other parties are also named as potentially responsible parties and also contribute to payment of those costs.
Because cleanup liability can in some cases be imposed retroactively on activities that occurred many years ago, and because federal and state agencies are still discovering sites that pose a threat to public health or the environment, we can provide no assurance that we will not become liable for significant costs associated with investigation and remediation of cleanup sites.
Operational and Commercial Risks Related to our Business
We may face significant price and other forms of competition from other steel and aluminum producers, scrap processors and alternative materials, which may adversely affect our business, financial condition, results of operations and cash flows.
The global markets in which steel companies and scrap processors conduct business are highly competitive and became even more so due to consolidations in the steel and scrap industries. Additionally, in many applications, steel competes with other materials, such as aluminum, cement, composites, plastics, carbon fiber, glass and wood. Increased use of alternative materials for any reason, including as a response to regulations or customer demands, could decrease demand for steel or force other steel producers into new products or markets that compete more directly with us, and combined with increased competition could cause us to lose market share, increase expenditures or reduce pricing, any one of which may adversely affect our business, financial condition, results of operations and cash flows.
Additionally, our recycled aluminum flat rolled products mill with an anticipated annual production capacity of 650,000 metric tons of finished products located in Columbus, Mississippi is expected to produce commercially viable products by mid-year 2025. Although we anticipate being able to effectively compete in the aluminum industry, along with the other risks described herein, including delays or difficulties with our start-up, we may face unexpected and enhanced competition, which may adversely affect the expected contributions of our aluminum operations and our resulting business, financial condition, results of operations and cash flows.
Availability of an adequate source of supply of scrap is required for our metals recycling operations.
We procure our scrap inventory from numerous sources. These suppliers generally are not bound by long-term contracts and generally have no obligation to sell recyclable metal to us. In periods of low industry scrap prices, scrap suppliers may elect to hold recyclable metal to wait for higher prices or intentionally slow their metal collection activities. If a substantial number of scrap suppliers cease selling recyclable metal to us, we may be unable to recycle metal at desired levels which may adversely affect our results of operations and financial condition. In addition, a slowdown of industrial production in the United States reduces the supply of industrial grades of metal to the metals recycling industry, resulting in our having less recyclable metal available to process and sell. Further, additional EAF steel mill construction or blast furnace mills investing in EAF mills could increase the demand for scrap, potentially resulting in higher scrap prices or periods of decreased scrap supply. Any inability to secure scrap for our EAF steel mills could adversely affect our business, results of operations, financial condition and cash flows.
We are subject to cybersecurity threats and may face risks to the security of our sensitive data and information technology which may adversely affect our business, results of operations, financial condition and cash flows.
Increased cybersecurity and information technology security requirements, vulnerabilities and threats and a rise in sophisticated and targeted cybercrime, all of which may be heightened during times of war or hostilities, pose a risk to the security and functionality of our systems and information networks, and to the confidentiality, availability and integrity of sensitive data, including intellectual property, proprietary information, financial information, customer and supplier information, and personally identifiable information. Additionally, cybersecurity vulnerabilities or attacks could result in an interruption of the functionality of our automated and electronically controlled manufacturing operating systems, which, if compromised, could cease, threaten, delay or slow down our ability to melt, roll or otherwise process steel or any of our other products for the duration of such interruption.
27
Our customers and suppliers may also store certain of our sensitive information on their information technology systems, which if breached or attacked, could likewise expose our sensitive information. Similarly, information system vendors and software suppliers may experience a cybersecurity or information technology breach that exposes our systems or sensitive data. Any of these cybersecurity and information technology breaches or disruptions may result in reputational harm and may adversely affect our business, results of operations, financial condition and cash flows.
Although we believe we have adopted procedures, training programs, and controls to adequately protect our sensitive data, networks and information and operating technology and systems, there can be no assurance that a system or network failure, or cybersecurity breach or attack, will be prevented, whether due to attacks by cyber criminals or due to employee, contractor or other error or malfeasance. This could lead to system interruption, production delays or downtimes and operational disruptions, and the disclosure, modification or destruction of sensitive data, which may adversely affect our reputation, customer and supplier relationships, financial results and results of operations, and could result in litigation or regulatory investigations, actions, fines or penalties, as well as increased cybersecurity monitoring and protection costs, including the cost or availability of insurance. Additionally, as cybersecurity threats continue to evolve and become more sophisticated, we may need to invest additional time, resources and finances to protect the security of our sensitive data, systems and information networks. We maintain an information security risk insurance policy to mitigate the impact of cybersecurity threats.
We may face risks associated with the implementation of our growth strategy.
Our growth strategy subjects us to various risks. As part of our growth strategy, we may expand existing facilities, enter into new business lines, territories, products or process initiatives, acquire or build additional plants, acquire other businesses and assets, enter into joint ventures, or form strategic alliances that we believe will complement our existing business. These expansions and transactions, including our recycled aluminum flat rolled products mill with an anticipated annual production capacity of 650,000 metric tons of finished products located in Columbus, Mississippi, may involve some or all of the following risks:
● the risk of entering business lines or product, domestic, or foreign markets, in which we have little experience, including the aluminum industry;
● the risk of a newly constructed facility being completed over budget or not on time, including due to equipment delays or labor shortages, or having delays or difficulties with its start-up;
● the risk of not being able to adequately obtain sufficient labor to efficiently build or staff a new facility, while maintaining our culture;
● the risk of expected markets, products, customers and demand for products produced by a new facility being lower than expected;
● the risk of new product development, technology development or customer acquisition and penetration being more costly or difficult than expected;
● the difficulty of competing for acquisitions and other growth opportunities with companies having materially greater financial resources than us;
● the inability to realize anticipated synergies or other expected benefits;
● the difficulty of integrating new or acquired operations and personnel into our existing operations, while maintaining our culture;
● the potential disruption of ongoing operations;
● the diversion of financial resources or management attention to new operations or acquired businesses; ● the loss of key employees, customers or suppliers of acquired businesses;
28
● the potential exposure to unknown liabilities;
● the inability of management to maintain uniform standards, controls, procedures and policies;
● the difficulty of managing the growth of a larger company;
● the risk of becoming involved in labor, commercial, or regulatory disputes or litigation related to new operations or acquired businesses;
● the risk of becoming more highly leveraged;
● the risk of contractual or operational liability to other venture participants or to third parties as a result of our participation;
● the inability to work efficiently with joint venture or strategic alliance partners; and
● the difficulties of terminating joint ventures or strategic alliances.
Delays in achieving full operational capacity at our Sinton Flat Roll Division has and may continue to, and any delays in our recycled aluminum flat rolled products mill may, adversely affect our prospects, business, financial condition, results of operations and cash flows.
These expansions or transactions might be required for us to remain competitive, but we may not be able to complete any such expansions or transactions on favorable terms or obtain financing, if necessary. Future expansions and transactions may not improve our competitive position and business prospects as anticipated, and if they do not, our business, financial condition, results of operations and cash flows may be adversely affected.
We may face risks associated with our ability to retain, develop and attract key personnel.
Our people are the foundation of our success and are our most important resource. Their continued education and talent development are paramount to our success. As we continue to grow, our success depends in part on our ability to retain, develop and attract team members with relevant industry and technical experience, while maintaining our culture. A loss of senior managers or other key personnel, without adequate replacement, which could be exacerbated by a shortage of skilled workers and our more senior workforce, could adversely affect our business and results of operations.
We are subject to litigation and legal compliance risks which may adversely affect our financial condition, results of operations and liquidity.
We are involved from time to time in various litigation matters, including administrative proceedings, regulatory proceedings, governmental investigations, environmental matters, and commercial and construction contract disputes, none of which are currently expected to have a material impact on our financial conditions, results of operations or liquidity. For additional information regarding legal proceedings please refer to Item 3. Legal Proceedings.
In addition to risks associated with our environmental and other regulatory compliance, our international operations are subject to complex foreign and United States laws and regulations, including the Foreign Corrupt Practices Act and other anti-bribery laws, regulations related to import-export controls, the Office of Foreign Assets Control, and other laws and regulations, each of which may increase our cost of doing business and expose us to increased risk.
Unexpected equipment downtime or shutdowns may adversely affect our business, financial condition, results of operations and cash flows.
29
Interruptions in our production capabilities may adversely affect our production costs, products available for sale and earnings during the affected period. In addition to equipment failures, our facilities are subject to the risk of catastrophic loss due to unanticipated events such as fires, explosions or violent weather conditions. Our manufacturing processes are dependent upon critical pieces of steelmaking equipment, such as our EAFs, continuous casters and rolling equipment, some of which are controlled by our information technology systems, as well as electrical equipment, such as transformers. This equipment may, on occasion, be out of service as a result of unanticipated failures or other events, including equipment failure, power surges, cybersecurity breaches or attacks or system failures. Further, we have experienced and may continue to experience inefficiencies at our Sinton Flat Roll Division, including those related to major equipment failures. We have experienced and in the future may experience plant shutdowns or periods of reduced production as a result of equipment failures or other events. Supply chain disruptions and labor shortages have and may continue to exacerbate the effects of equipment failures. These disruptions may adversely affect our business, financial condition, results of operations and cash flows.
Governmental agencies may refuse to grant or renew some of our licenses and permits required to operate our businesses.
Some of our operations must receive licenses and air, water and other permits and approvals from federal, state and local governments to conduct certain of our operations or to build, expand or acquire new facilities. Governmental agencies, non-governmental organizations, and members of the public sometimes resist the establishment of certain types of facilities in their communities. There can be no assurance that future approvals, licenses and permits will be granted or that we will be able to maintain and renew the approvals, licenses and permits we currently hold. Failure to do so may adversely affect our business, financial condition, results of operations and cash flows.
Our senior unsecured credit facility contains, and any future financing agreements may contain, restrictive covenants that may limit our flexibility.
Restrictions and covenants in our existing debt agreements, including our senior unsecured credit facility, and any future financing agreements, may impair our ability to finance future operations or capital needs or to engage in other business activities. A breach of any of the restrictions or covenants could cause a default under our senior unsecured credit facility, our senior notes, or our other debt. A significant portion of our indebtedness may then become immediately due and payable.
Under our senior unsecured credit facility, we are required to maintain certain financial covenants. Our ability to meet such covenants or other restrictions can be affected by events beyond our control. If a default were to occur, the lenders could elect to declare all amounts then outstanding to be immediately due and payable and terminate all commitments to extend further credit.
Impairment charges may adversely affect our results of operations.
Occasionally, assumptions that we have made regarding products or businesses we have acquired or sought to develop, about the sustainability of markets we sought to exploit, or about industry conditions that underlie our decision making when we elected to capitalize a venture turn out differently than anticipated. In such instances, the fair value of such assets may fall below their carrying value recorded on our balance sheet.
Accordingly, we periodically test goodwill, and other assets such as long-lived tangible assets and intangible assets, right of use assets and equity method investments when indicators of impairment are present, to determine whether their estimated fair value is in fact less than their value recorded on our balance sheet. If we determine that the fair value of any of these assets, from whatever cause, is less than the value recorded on our balance sheet, we are required to incur non-cash asset impairment charges that adversely affect our results of operations. There can be no assurances that market dynamics or other factors may not result in future impairment charges.
ITEM 1B. UNRESOLVED STAFF COMMENTS
None.
30
ITEM 1C. CYBERSECURITY
We manage risks from cybersecurity threats through our overall companywide risk management process, which is overseen by our Board of Directors and specific Board Committees. Management has created a global information security program, which encompasses a dedicated global information security team and policies, procedures, and processes for assessing, identifying, and managing risks from cybersecurity threats. Our policies, procedures, and processes follow recognized frameworks established by the National Institute of Standards and Technology (“NIST”), as well as other relevant standards. Our program is designed to maintain the confidentiality, integrity, security, and availability of the data that is created, collected, stored, and used to operate our business.
Risk Management and Strategy
We recognize the importance of assessing, identifying, and managing material risks associated with cybersecurity threats, utilizing, from time to time, tabletop exercises, business unit assessments, threat modeling, impact analyses, internal audits, external audits, third party vulnerability scans, third party penetration tests, and engagement of third parties to conduct analysis of our information security programs, including an overall assessment utilizing the NIST standards. These risks include, among other things: operational risks, intellectual property theft, fraud, extortion, harm to team members or customers, and violations of data privacy or security laws.
Our Director of Information Security is responsible for leading the Information Security Team which has established a cybersecurity risk management program of policies and processes for assessing, identifying, and managing risk from cybersecurity threats. We have integrated these processes into our overall risk management systems and processes, and routinely assess risks from cybersecurity threats, including any potential unauthorized access to or activity conducted through our information systems that may result in material adverse effects on the confidentiality, integrity, or availability of our information systems or any information residing therein. This program includes established reasonable safeguards to minimize the identified risks; processes to reasonably address any identified gaps in existing safeguards; updates to existing safeguards as necessary; and monitoring the effectiveness of those safeguards.
Our safeguards include continuous network monitoring, complex passwords, team member training that reinforces our policies, standards, and practices, incident response capability reviews and exercises, and cybersecurity insurance and disaster recovery plans for the protection of our assets. The information security training and awareness program engages personnel through training modules on how to identify potential cybersecurity risks and protect the Company’s resources and information. This training is mandatory for all team members monthly, and is supplemented by companywide testing initiatives, including periodic phishing tests.
Our cybersecurity risk management program also assesses third party providers, such as vendors, suppliers, and other business partners. Cybersecurity risks are evaluated when determining the selection and oversight of applicable third party providers and potential risks when handling or processing our employee, business, or customer data.
Further, we have designated a member of our senior leadership team, our Chief Financial Officer, to oversee the management of the safeguards, cybersecurity risk assessment, and mitigation process. From time to time, the Company’s program is reviewed and validated by internal and external experts.
In general, our incident response process follows the NIST framework and focuses on four phases: (i) preparation; (ii) detection and analysis; (iii) containment, eradication, and recovery; and (iv) post-incident remediation. As cybersecurity incidents occur, including at third party providers, the Director of Information Security leads the Information Security Team through a standardized incident response process that focuses on responding to and containing the threat, minimizing any business impact, and evaluating its severity level. The severity level assessment determines how widespread the incident is and to what degree it could impact our overall business and manufacturing environment. In the event an incident is determined by the Information Security Team to be a high severity level, our cross functional team, with expertise in various disciplines, will assess the incident to determine if it has had a material affect or is reasonably likely of having a material effect on the Company’s business strategy, results of operations, or financial condition.
31
We do not believe that risks from cybersecurity threats, including as a result of any previous cybersecurity incidents, have materially affected or are reasonably likely to materially affect our overall business strategy, results of operations, or financial condition over the long term. In the last three years, the Company has not been aware of any material cybersecurity incidents occurring and we have not incurred material expenses from cybersecurity incidents (including penalties and settlements, of which there were none). For additional discussion of whether and how risks from cybersecurity threats could materially affect or are reasonably likely to materially affect the Company, see Item 1A. Risk Factors – “We are subject to cybersecurity threats and may face risks to the security of our sensitive data and information technology which may adversely affect our business, results of operations, financial condition and cash flows.”
Governance
One of the key functions of our Board of Directors is informed oversight of our risk management process, including risks from cybersecurity threats. Our Board of Directors is responsible for monitoring and assessing strategic risk exposure, and our senior leadership team is responsible for the day-to-day management of the material risks we face. Our Board of Directors administers its cybersecurity risk oversight function directly as a whole, as well as directly through the Audit Committee. Management and members of the Information Security Group (“ISG”) regularly present to the Board of Directors regarding information security and an in-depth review of our processes for assessing, identifying, and managing material risks from cybersecurity threats. On a quarterly basis, the Audit Committee is informed by management concerning the status of existing and new cybersecurity risks, status of how management is addressing and mitigating those risks, cybersecurity and data privacy incidents (if any), and status of key information security initiatives. Additionally, on a biennial basis, we engage third parties to assess our information security program using the NIST framework, as well as perform penetration testing.
We have allocated substantial cross functional internal resources with expertise in information security, information technology, operations, risk management, human resources, finance, and legal to form a governance counsel known as the ISG. The ISG is an internal working group that collaborates with the Director of Information Security to ensure our cybersecurity program is adequately responsive to the evolving threat landscape. Our Director of Information Security has over twenty years of cybersecurity experience, has completed a Masters in Homeland Security, with an emphasis on cybersecurity, and holds several cybersecurity certifications.
32
ITEM 2. PROPERTIES
The following table describes our significant properties as of December 31, 2024. These properties are owned by us and not subject to any significant encumbrances, or are leased by us. We believe these properties are suitable and adequate for our current operations and are appropriately utilized. For additional information regarding our significant facilities please refer to Item 1. Business.
|
|
|
|
|
|
Site |
|
Site |
|
|
|
|
|
|
Acreage |
|
Acreage |
Operations |
|
Location |
|
Description |
|
Owned |
|
Leased |
Steel Operations Segment * |
|
|
|
|
|
|
|
|
Butler Flat Roll Division: |
|
|
|
|
|
|
|
|
Butler Operations |
|
Butler, IN |
|
Flat Roll Steel Mill and Coating Facility |
|
993 |
|
— |
Jeffersonville Operations |
|
Jeffersonville, IN |
|
Flat Roll Steel Coating Facility |
|
27 |
|
10 |
Iron Dynamics |
|
Butler, IN |
|
Liquid Ironmaking Facility |
|
25 |
|
— |
Columbus Flat Roll Division |
|
Columbus, MS |
|
Flat Roll Steel Mill and Coating Facility |
|
1,387 |
|
— |
Sinton Flat Roll Division |
|
Sinton, TX |
|
Flat Roll Steel Mill and Coating Facility |
|
2,842 |
|
— |
The Techs |
|
Pittsburgh, PA |
|
Flat Roll Steel Coating Facilities |
|
16 |
|
2 |
Heartland Flat Roll Division |
|
Terre Haute, IN |
|
Flat Roll Steel Cold-Rolling and Coating Facility |
|
246 |
|
— |
United Steel Supply |
|
IN, ID, MS, OR, and TX |
|
Distributor of Painted Galvalume® Flat Roll Steel |
|
58 |
|
1 |
Structural and Rail Division |
|
Columbia City, IN |
|
Structural and Rail Steel Mill |
|
1,003 |
|
— |
Engineered Bar Products Division |
|
Pittsboro, IN |
|
Engineered Bar Steel Mill and Finishing Facility |
|
312 |
|
— |
Vulcan Threaded Products |
|
Pelham, AL |
|
Bar Steel Processing Facility |
|
31 |
|
— |
Roanoke Bar Division |
|
Roanoke, VA |
|
Merchant Bar Steel Mill |
|
313 |
|
— |
Steel of West Virginia |
|
WV, KY, and TN |
|
Specialty Shapes Steel Mill and Finishing |
|
139 |
|
6 |
|
|
|
|
and Coating Facilities |
|
|
|
|
SDI Biocarbon Solutions |
|
Columbus, MS |
|
Biocarbon Production Facility |
|
133 |
|
— |
SDI Mexico |
|
Monterrey, Mexico |
|
Flat Roll Steel Distribution Warehouse |
|
— |
|
5 |
|
|
|
|
|
|
|
|
|
Metals Recycling Operations Segment |
|
|
|
|
|
|
|
|
OmniSource: |
|
|
|
|
|
|
|
|
Alabama |
|
Birmingham, AL |
|
Ferrous Scrap Processing |
|
59 |
|
— |
Indiana |
|
Multiple Cities |
|
Ferrous and Nonferrous Scrap Processing |
|
359 |
|
26 |
Michigan |
|
Multiple Cities |
|
Ferrous and Nonferrous Scrap Processing |
|
124 |
|
— |
Mississippi |
|
Multiple Cities |
|
Ferrous and Nonferrous Scrap Processing |
|
43 |
|
13 |
North Carolina |
|
Multiple Cities |
|
Ferrous and Nonferrous Scrap Processing |
|
303 |
|
— |
Ohio |
|
Multiple Cities |
|
Ferrous and Nonferrous Scrap Processing |
|
239 |
|
21 |
Oklahoma |
|
Sand Springs, OK |
|
Ferrous Scrap Processing |
|
— |
|
10 |
Tennessee |
|
Multiple Cities |
|
Ferrous and Nonferrous Scrap Processing |
|
65 |
|
— |
Texas |
|
Multiple Cities |
|
Ferrous and Nonferrous Scrap Processing |
|
130 |
|
12 |
Virginia |
|
Multiple Cities |
|
Ferrous and Nonferrous Scrap Processing |
|
121 |
|
— |
Mexico |
|
Multiple Cities |
|
Ferrous and Nonferrous Scrap Processing |
|
17 |
|
62 |
|
|
|
|
|
|
|
|
|
Steel Fabrication Operations Segment |
|
|
|
|
|
|
|
|
New Millennium Building Systems: |
|
|
|
|
|
|
|
|
Joist and Deck Operations |
|
Butler, IN |
|
Steel Joist and Deck Fabrication Facility |
|
156 |
|
— |
Joist Operations |
|
Fallon, NV |
|
Steel Joist Fabrication Facility |
|
68 |
|
— |
Joist and Deck Operations |
|
Hope, AR |
|
Steel Joist and Deck Fabrication Facility |
|
245 |
|
7 |
Joist Operations |
|
Juarez, MX |
|
Steel Joist Fabrication Facility |
|
17 |
|
— |
Joist and Deck Operations |
|
Lake City, FL |
|
Steel Joist and Deck Fabrication Facility |
|
81 |
|
— |
Deck Operations |
|
Memphis, TN |
|
Deck Fabrication Facility |
|
19 |
|
— |
Joist and Deck Operations |
|
Salem, VA |
|
Steel Joist and Deck Fabrication Facility |
|
113 |
|
— |
|
|
|
|
|
|
|
|
|
Aluminum Operations Segment | ||||||||
Aluminum Dynamics, LLC |
|
Columbus, MS |
|
Recycled Aluminum Flat Rolled Products Mill |
|
2,112 |
|
— |
Aluminum Dynamics of Mexico |
|
San Luis Potosi, Mexico |
|
Recycled Aluminum Slab Facility |
|
692 |
|
— |
Superior Aluminum Alloys |
|
New Haven, IN |
|
Aluminum Operations |
|
96 |
|
— |
The company’s corporate headquarters is in Fort Wayne, Indiana on 20 owned acres. Our copper rod and wire facility, a controlled subsidiary, is in New Haven, Indiana on 35 owned and 4 leased acres.
*Our 2024 steel mill production utilization was 81% of our estimated annual steelmaking capability.
33
ITEM 3. LEGAL PROCEEDINGS
We are involved in various litigation matters, including administrative proceedings, regulatory proceedings, governmental investigations, environmental matters, and commercial and construction contract disputes, none of which are currently expected to have a material impact on our financial condition, results of operations, or liquidity.
We may also be involved from time to time in various governmental investigations, regulatory proceedings or judicial actions seeking penalties, injunctive relief, and/or remediation under federal, state and local environmental laws and regulations. The United States EPA has conducted such investigations and proceedings involving us, in some instances along with state environmental regulators, under various environmental laws, including RCRA, CERCLA, the Clean Water Act and the Clean Air Act. Some of these matters have resulted in fines or penalties, exclusive of interest and costs, which did not exceed $1 million in aggregate, as of December 31, 2024.
ITEM 4. MINE SAFETY DISCLOSURES
None.
34
PART II
ITEM 5. MARKET FOR REGISTRANT’S COMMON EQUITY, RELATED STOCKHOLDER MATTERS AND ISSUER PURCHASES OF EQUITY SECURITIES
The information required by Item 5 with respect to securities authorized for issuance under equity compensation plans is set forth in Part III, Item 12 of this Form 10-K. Our common stock trades on The NASDAQ Global Select Stock Market under the symbol STLD.
As of February 24, 2025, we had 150,163,986 shares of common stock outstanding and held beneficially by approximately 30,000 stockholders based on our security position listing. Because many of the shares were held by depositories, brokers and other nominees, the number of registered holders (approximately 1,220) is not representative of the number of beneficial holders.
Issuer Purchases of Equity Securities
We purchased the following equity securities registered by us pursuant to Section 12 of the Exchange Act during the three months ended December 31, 2024.
|
|
|
|
|
|
|
|
|
|
|
|
Period |
|
Total Number of Shares Purchased |
|
Average Price Paid per Share |
|
Total Number of Shares Purchased as Part of Publicly Announced Program(1) |
|
Maximum Dollar Value of Shares That May Yet be Purchased Under the Program (in thousands) (1) |
|||
|
|
|
|
|
|
|
|
|
|
|
|
Quarter ended December 31, 2024 |
|
|
|
|
|
|
|
|
|
||
|
|
|
|
|
|
|
|
|
|
|
|
October 1-31 |
|
664,066 |
|
$ |
132.25 |
|
|
664,066 |
|
$ |
399,476 |
November 1-30 |
|
790,538 |
|
|
144.37 |
|
|
790,538 |
|
|
286,494 |
December 1-31 |
|
728,796 |
|
|
128.87 |
|
|
728,796 |
|
|
193,510 |
|
|
2,183,400 |
|
|
|
|
|
2,183,400 |
|
|
|
| (1) | In November 2023, our board of directors authorized a share repurchase program of up to $1.5 billion of our common stock. In February 2025, our board of directors authorized an additional share repurchase program of up to $1.5 billion of our common stock. |
35
Total Return Graph
The graph below compares Steel Dynamics, Inc.’s cumulative 5-year total shareholder return on common stock with the cumulative total returns of the S&P 500 index and the S&P 500 Steel index. The graph tracks the performance of a $100 investment in our common stock and in each index (with the reinvestment of all dividends) from December 31, 2019 to December 31, 2024.

36
ITEM 7. MANAGEMENT’S DISCUSSION AND ANALYSIS OF FINANCIAL CONDITION AND RESULTS OF OPERATIONS
Forward-Looking Statements
This report contains some predictive statements about future events, including statements related to conditions in domestic or global economies, conditions in steel, aluminum, and recycled metals market places, Steel Dynamics' revenues, costs of purchased materials, future profitability and earnings, and the operation of new, existing or planned facilities. These statements, which we generally precede or accompany by such typical conditional words as "anticipate", "intend", "believe", "estimate", "plan", "seek", "project", or "expect", or by the words "may", "will", or "should", are intended to be made as "forward-looking", subject to many risks and uncertainties, within the safe harbor protections of the Private Securities Litigation Reform Act of 1995. These statements speak only as of this date and are based upon information and assumptions, which we consider reasonable as of this date, concerning our businesses and the environments in which they operate. Such predictive statements are not guarantees of future performance, and we undertake no duty to update or revise any such statements. Some factors that could cause such forward-looking statements to turn out differently than anticipated include: (1) domestic and global economic factors; (2) global steelmaking overcapacity and imports of steel, together with increased scrap prices; (3) pandemics, epidemics, widespread illness or other health issues; (4) the cyclical nature of the steel industry and the industries we serve; (5) volatility and major fluctuations in prices and availability of scrap metal, scrap substitutes and supplies, and our potential inability to pass higher costs on to our customers; (6) cost and availability of electricity, natural gas, oil, and other energy resources are subject to volatile market conditions; (7) increased environmental, greenhouse gas emissions and sustainability considerations from our customers and investors or related regulations; (8) compliance with and changes in environmental and remediation requirements; (9) significant price and other forms of competition from other steel and aluminum producers, scrap processors and alternative materials; (10) availability of an adequate source of supply of scrap for our metals recycling operations; (11) cybersecurity threats and risks to the security of our sensitive data and information technology; (12) the implementation of our growth strategy; (13) our ability to retain, develop and attract key personnel; (14) litigation and legal compliance; (15) unexpected equipment downtime or shutdowns; (16) governmental agencies may refuse to grant or renew some of our licenses and permits; (17) our senior unsecured credit facility contains, and any future financing agreements may contain, restrictive covenants that may limit our flexibility; and (18) the impacts of impairment charges.
More specifically, we refer you to our more detailed explanation of these and other factors and risks that may cause such predictive statements to turn out differently, as set forth in the sections titled Special Note Regarding Forward-Looking Statements at the beginning of Part I of this Report and Item 1A. Risk Factors, as well as in other subsequent reports we file with the Securities and Exchange Commission. These reports are available publicly on the Securities and Exchange Commission website, www.sec.gov, and on our website, www.steeldynamics.com under “Investors – SEC Filings.”
Operating Statement Classifications
Net Sales. Net sales from our operations are a factor of volumes shipped, product mix, and related pricing. We charge premium prices for certain grades of steel, product dimensions, certain smaller volumes, and for value-added processing or coating of our steel products. Except for the steel fabrication operations, we recognize revenues from sales and the allowance for estimated returns and claims from these sales at the point in time control of the product transfers to the customer, upon shipment or delivery. Our steel fabrication operations recognize revenues over time based on completed fabricated tons to date as a percentage of total tons required for each contract.
Costs of Goods Sold. Our costs of goods sold represent all direct and indirect costs associated with the manufacture of our products. The principal elements of these costs are scrap and scrap substitutes (which represent the most significant single component of our consolidated costs of goods sold), steel substrate, direct and indirect labor and related benefits, alloys, zinc, transportation and freight, repairs and maintenance, utilities such as electricity and natural gas, and depreciation.
38
Selling, General and Administrative Expenses. Selling, general and administrative expenses consist of all costs associated with our sales, finance and accounting, and administrative departments, including, among other items, labor and related benefits, and professional services.
Companywide profit sharing and amortization of intangible assets are each separately presented in the statements of income.
Interest Expense, net of Capitalized Interest. Interest expense consists of interest associated with our senior credit facilities and other debt, net of interest costs that are required to be capitalized during the construction period of certain capital investment projects.
Other (Income) Expense, net. Other income consists of interest income earned on our temporary cash deposits, short-term and other investments, and any other non-operating income activity, including income from investments in unconsolidated affiliates accounted for under the equity method. Other expense consists of any non-operating costs, such as certain acquisition and financing expenses.
2024 Overview
During 2024 we achieved steel shipments of 12.7 million tons, our second highest annual volume behind 2023’s 12.8 million tons. Underlying domestic steel demand was stable during 2024, but imports of certain steel products, most notably coated flat rolled steels, caused pricing pressure for flat rolled steel products. While facing a challenging pricing environment throughout much of the year, our metals recycling teams maintained consistent volumes during 2024 compared to 2023. A solid non-residential construction market during 2024 benefited our steel fabrication operations, as the segment achieved historically strong volumes and average selling prices, compared to pre-Covid levels. Consolidated net sales were $17.5 billion during 2024, with cash flow from operations of $1.8 billion. Metal spread compression in our steel and, particularly, steel fabrication segments resulted in significantly lower operating income in 2024 compared to 2023.
Consolidated operating income for 2024 decreased $1.2 billion, or 38%, to $1.9 billion, compared to $3.2 billion in 2023. Net income attributable to Steel Dynamics, Inc. for 2024 decreased $913.7 million, or 37%, to $1.5 billion, compared to 2023. Diluted earnings per share attributable to Steel Dynamics, Inc. was $9.84 for 2024, compared to $14.64 for 2023.
Refer to Item 7. Management’s Discussion and Analysis of Financial Condition and Results of Operations in Part II of our Annual Report on Form 10-K for the year ended December 31, 2023, for additional information regarding results of operations for the year ended December 31, 2023, as compared to the year ended December 31, 2022, and segment operating results for 2023 as compared to 2022. Our 2024 change in reportable segments did not change the discussion previously provided. Refer to the Aluminum Operations segment discussion for additional information.
39
Segment Operating Results (dollars in thousands)
|
|
|
|
|
|
|
|
|
|
|
|
Years Ended December 31, |
|
||||||
|
|
2024 |
|
% Change |
|
2023 |
|
||
|
|
|
|
|
|
|
|
|
|
|
Net sales |
|
|
|
|
|
|
|
|
|
Steel Operations |
$ |
12,527,066 |
|
(4)% |
|
$ |
13,067,622 |
|
|
Metals Recycling Operations |
|
4,136,913 |
|
(1)% |
|
|
4,158,588 |
|
|
Steel Fabrication Operations |
|
1,771,795 |
|
(37)% |
|
|
2,806,777 |
|
|
Aluminum Operations |
|
318,689 |
|
11% |
|
|
285,907 |
|
|
Other |
|
1,451,723 |
|
24% |
|
|
1,171,901 |
|
|
|
|
20,206,186 |
|
|
|
|
21,490,795 |
|
|
Intra-company |
|
(2,665,796) |
|
|
|
|
(2,695,479) |
|
|
|
$ |
17,540,390 |
|
(7)% |
|
$ |
18,795,316 |
|
|
|
|
|
|
|
|
|
|
|
|
Operating income (loss) |
|
|
|
|
|
|
|
|
|
Steel Operations |
$ |
1,582,374 |
|
(16)% |
|
$ |
1,881,600 |
|
|
Metals Recycling Operations |
|
76,807 |
|
61% |
|
|
47,735 |
|
|
Steel Fabrication Operations |
|
666,984 |
|
(58)% |
|
|
1,593,261 |
|
|
Aluminum Operations |
|
(72,331) |
|
(522)% |
|
|
17,146 |
|
|
Other |
|
(317,408) |
|
20% |
|
|
(394,577) |
|
|
|
|
1,936,426 |
|
|
|
|
3,145,165 |
|
|
Intra-company |
|
6,611 |
|
|
|
|
6,016 |
|
|
|
$ |
1,943,037 |
|
(38)% |
|
$ |
3,151,181 |
|
40
Steel Operations Segment |
Steel operations include our EAF steel mills, including Butler Flat Roll Division, Columbus Flat Roll Division, Southwest-Sinton Flat Roll Division, Structural and Rail Division, Engineered Bar Products Division, Roanoke Bar Division, Steel of West Virginia, steel coating and processing operations at The Techs, Heartland Flat Roll Division, United Steel Supply, Vulcan Threaded Products, Inc., warehouse operations in Mexico, and SDI Biocarbon Solutions, LLC, a joint venture to construct and operate a biocarbon production facility. Steel operations accounted for 69% and 67% of our consolidated net sales during 2024 and 2023, respectively. See Item 1. Business for further information on Steel Operations segment operations.
Steel Operations Shipments (tons):
|
|
|
|
|
|
|
|
|
|
Years Ended December 31, |
|
||||
|
|
2024 |
|
% Change |
|
2023 |
|
|
Total shipments |
12,660,487 |
|
(1)% |
|
12,821,753 |
|
|
Intra-segment shipments |
(1,306,364) |
|
|
|
(1,449,832) |
|
|
Steel Operations Segment shipments |
11,354,123 |
|
- |
|
11,371,921 |
|
|
|
|
|
|
|
|
|
|
External shipments |
10,929,453 |
|
- |
|
10,976,707 |
|
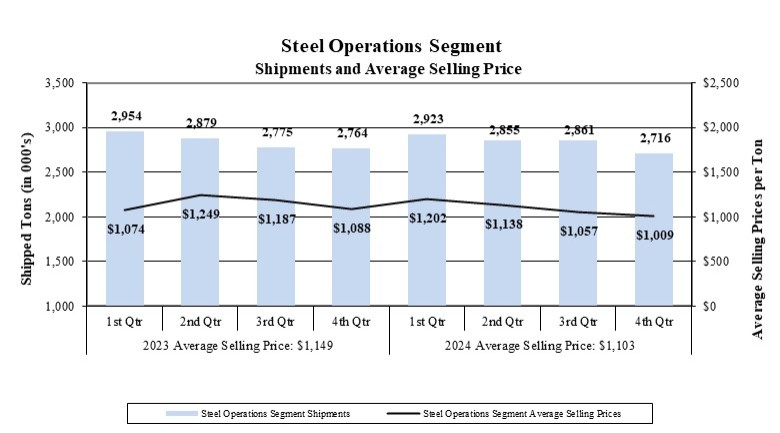
Segment Results 2024 vs. 2023
During 2024, our steel operations achieved annual shipments of 12.7 million tons (11.4 million excluding intra-segment), slightly less than 2023 total record shipments. Customer order activity and steel demand were stable during 2024, with the construction, automotive, industrial, and energy sectors leading demand. In spite of strong market demand, average selling prices were lower during 2024 compared to 2023, as total steel segment average selling prices decreased 4%, or $46 per ton, compared to 2023. Net sales for the steel operations segment were 4% lower in 2024 when compared to 2023, due to lower average steel selling prices on consistent volumes.
41
Metallic raw materials used in our electric arc furnaces represent our single most significant steel manufacturing cost, generally comprising approximately 55% to 65% of our steel mill operations’ manufacturing costs. Our metallic raw material cost consumed in our steel mills decreased $28 per net ton, or 7%, in 2024 compared to 2023, consistent with overall decreased domestic scrap pricing noted below in the metals recycling operations segment discussion.
As a result of average selling prices decreasing more than scrap costs, specifically for long products, metal spread (which we define as the difference between average steel mill selling prices and the cost of ferrous scrap consumed in our steel mills) decreased 3% in 2024 compared to 2023. Due to metal spread compression, operating income for the steel operations decreased 16% to $1.6 billion in 2024 compared to 2023.
Metals Recycling Operations Segment |
Metals recycling operations include our OmniSource ferrous and nonferrous processing, transportation, marketing, brokerage, and scrap management services primarily throughout the United States and Mexico. Our steel mills utilize a large portion of the ferrous scrap sold by our metals recycling operations as raw material in our steelmaking operations, and the remainder is sold to other consumers, such as other steel manufacturers and foundries. In 2024 and 2023, 62% of metals recycling operations ferrous scrap was sold to our own steel mills, while our steel mill utilization remained consistent at 81% and 82% in 2024 and 2023, respectively. Metals recycling operations accounted for 11% of our consolidated net sales during 2024 and 2023.
Metals Recycling Operations Shipments:
|
|
|
|
|
|
|
|
|
|
|
|
Years Ended December 31, |
|
||||
|
|
|
2024 |
|
% Change |
|
2023 |
|
|
Ferrous metal (gross tons) |
|
|
|
|
|
|
|
|
Total |
|
5,850,544 |
|
1% |
|
5,792,484 |
|
|
Inter-company |
|
(3,656,034) |
|
|
|
(3,593,328) |
|
|
External shipments |
|
2,194,510 |
|
- |
|
2,199,156 |
|
|
|
|
|
|
|
|
|
|
|
Nonferrous metal (thousands of pounds) |
|
|
|
|
|
|
|
|
Total |
|
965,491 |
|
(1)% |
|
970,445 |
|
|
Inter-company |
|
(171,915) |
|
|
|
(207,866) |
|
|
External shipments |
|
793,576 |
|
4% |
|
762,579 |
|
Segment Results 2024 vs. 2023
During 2024, our metals recycling operations continued to benefit from solid domestic steel industry demand, resulting in consistent ferrous and nonferrous scrap shipments compared to 2023. Net sales for our metals recycling operations in 2024 were comparable to 2023 based on consistent shipments. Due to a challenging pricing environment throughout much of 2024, ferrous average selling prices decreased 7% while nonferrous average selling prices increased 10% during 2024 compared to 2023.
Ferrous metal spread (which we define as the difference between average selling prices and the cost of purchased scrap) was flat and nonferrous metal spread increased 13% during 2024 compared to 2023. As a result of the overall increased metals spreads, metals recycling operations operating income increased 61% to $76.8 million in 2024 compared to 2023.
42
Steel Fabrication Operations Segment |
Steel fabrication operations include the company’s New Millennium Building Systems’ joist and deck plants located throughout the United States, and in Northern Mexico. Revenues from these plants are generated from the fabrication of girders, steel joists and steel deck used within the non-residential construction industry. Steel fabrication operations accounted for 10% and 15% of our consolidated net sales during 2024 and 2023, respectively.
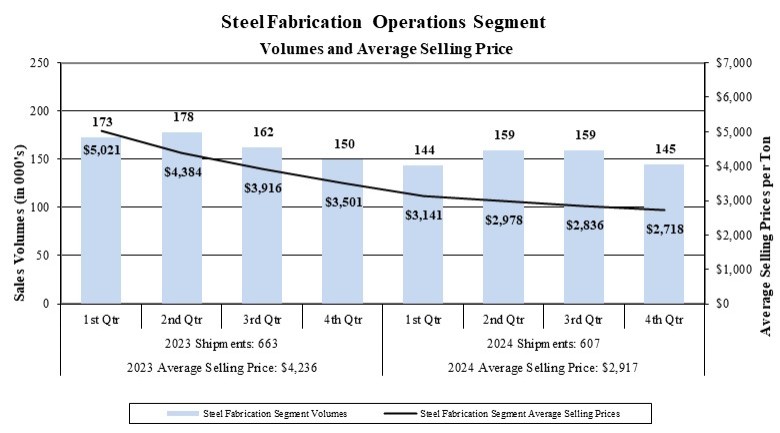
Segment Results 2024 vs. 2023
Net sales for the steel fabrication operations decreased 37% during 2024 compared to 2023, as average selling prices decreased 31% and volumes decreased 8% compared to 2023. Our steel fabrication operations benefited from a solid non-residential construction market, as evidenced by historically solid order backlog that extends deep into the first half of 2025 at attractive pricing levels. The continued onshoring of manufacturing, coupled with the robust U.S. infrastructure and Inflation Reduction Act programs, supports consistent strong demand for steel joist and deck products.
The purchase of various steel products is the largest single cost of production for our steel fabrication operations, historically representing approximately two-thirds of the total cost of manufacturing. The average cost of steel consumed decreased 5% in 2024, as compared to 2023. Due to decreased selling prices per ton more than offsetting decreased steel input costs per ton, metal spread (which we define as the difference between average selling prices and the cost of purchased steel) contracted 41% in 2024 compared to 2023. Metal spread compression coupled with decreased volume resulted in operating income decreasing 58% to $667.0 million in 2024, compared to $1.6 billion in 2023.
43
Aluminum Operations Segment |
Aluminum operations include the recycled aluminum flat rolled products mill nearing completion of construction in Columbus, Mississippi, two satellite recycled aluminum slab centers in the southwest United States (US) and Central Mexico, and an entity with aluminum operations, formerly included in the results of our metals recycling operations segment. The aluminum flat rolled products mill and the Mexico and US recycled aluminum slab centers are expected to begin operations in mid to late 2025. Net sales relate to an entity with aluminum operations, previously reported as part of our metals recycling operations. The results of this segment largely consist of construction and start-up costs recorded in selling, general, and administrative expenses, which continued to increase during 2024, consistent with increased headcount and start-up costs.
Other Operations |
Consolidated Results 2024 vs. 2023
Selling, General and Administrative Expenses. Selling, general and administrative expenses of $664.1 million during 2024 increased 13% from $588.6 million during 2023 primarily due to an increase in payroll and benefits expense related to the growth of the aluminum operations segment during 2024. Selling, general and administrative expenses represented 3.8% and 3.1% of net sales during 2024 and 2023, respectively.
Profit sharing expense during 2024 of $164.9 million decreased 39% from $272.0 million during 2023, consistent with decreased pretax earnings. This decrease in profit sharing expense was the primary driver of decreased operating loss for other operations of 20% in 2024 compared to 2023. Profit sharing expense for eligible employees is 8% of consolidated pretax income excluding noncontrolling interests and other items. Refer to Note 10. Retirement Plans to the consolidated financial statements elsewhere in this report for further information.
Interest Expense, net of Capitalized Interest. During 2024, interest expense of $56.3 million decreased 26% from $76.5 million during 2023. The lower interest expense in 2024 compared to 2023 is due to higher capitalized interest in 2024 ($66.8 million, compared to $33.0 million in 2023) related to our ongoing expansion projects, most notably within Aluminum Operations.
Other (Income) Expense, net. Net other income was $96.2 million in 2024, compared to $144.2 million in 2023, due primarily to the impact of foreign currency exchange rate losses of $18.7 million in 2024 compared to gains of $10.5 million in 2023, as well as a $21.8 million reduction in interest income on investments in 2024 compared to 2023 due to a decrease in the balance of invested cash during 2024.
Income Tax Expense. During 2024, income tax expense of $432.9 million, at an effective income tax rate of 21.8%, decreased 42% compared to the $751.6 million, at an effective income tax rate of 23.3%, during 2023, consistent with decreased pretax earnings. Our effective tax rate decrease was due primarily to certain discrete tax adjustments during the third quarter and fourth quarters of 2024. Refer to Note 4. Income Taxes to the consolidated financial statements elsewhere in this report for additional information.
Included in the balance of unrecognized tax benefits at December 31, 2024, are potential benefits of $26.4 million that, if recognized, would affect the effective tax rate. We recognize interest and penalties related to our tax contingencies on a net-of-tax basis in income tax expense. During the year ended December 31, 2024, we recognized expense from the increase of interest expense and penalties of $710,000, net of tax. In addition to the unrecognized tax benefits noted above, we had $4.2 million accrued for the payment of interest and penalties at December 31, 2024.
We file income tax returns in the United States federal jurisdiction as well as income tax returns in various state jurisdictions. The tax years 2021 through 2023 remain open to examination by the Internal Revenue Service and various state and local jurisdictions. At this time, we do not believe there will be any significant examination adjustments that would result in a material change to our financial position, results of operations or cash flows. It is reasonably possible that the amount of unrecognized tax benefits could change in the next twelve months in an amount ranging from zero to $12.0 million, as a result of the expiration of the statute of limitations and other federal and state income tax audits.
44
Liquidity and Capital Resources
Capital Resources and Long-term Debt. Our business is capital intensive and requires substantial expenditures for, among other things, the purchase and maintenance of equipment used in our operations, and to remain in compliance with environmental laws. Our short-term and long-term liquidity needs arise primarily from working capital requirements, capital expenditures, including expansion projects, principal and interest payments related to our outstanding indebtedness, dividends to our shareholders, potential stock repurchases and acquisitions or investments. We have met and intend to continue to meet these liquidity requirements primarily with available cash and cash provided by operations, long-term borrowings, and we also have availability under our unsecured Revolver. Our liquidity at December 31, 2024, is as follows (in thousands):
|
|
|
|
|
|
|
|
|
|
|
|
|
Cash and equivalents |
|
$ |
589,464 |
|
|
|
|
|
|
Short-term and other investments |
|
|
388,563 |
|
|
|
|
|
|
Unsecured revolver availability |
|
|
1,190,741 |
|
|
|
|
|
|
Total liquidity |
|
$ |
2,168,768 |
|
|
|
Our total outstanding debt of $3.2 billion increased $160.0 million compared to December 31, 2023, due to our issuance of $600.0 million of senior unsecured notes in July 2024 as described in Note 3, the proceeds of which were used for general corporate purposes, including the repayment of our 2.800% senior notes due December 2024, working capital, capital expenditures, advances for or investments in subsidiaries, acquisitions, redemption and repayment of other outstanding indebtedness, and purchases of the company’s common stock. Our total long-term debt to capitalization ratio (representing our long-term debt, including current maturities, divided by the sum of our long-term debt, redeemable noncontrolling interests, and our total stockholders’ equity) was 26.5% and 25.8% at December 31, 2024 and 2023, respectively.
Our unsecured credit agreement has a senior unsecured revolving credit facility (Facility), which provides a $1.2 billion Revolver and matures in July 2028. Subject to certain conditions, we have the ability to increase the Facility size by $500.0 million. The unsecured Revolver is available to fund working capital, capital expenditures, and other general corporate purposes. The Facility contains financial covenants and other covenants pertaining to our ability to incur indebtedness and permit liens on certain assets. Our ability to borrow funds within the terms of the unsecured Revolver is dependent upon our continued compliance with the financial and other covenants. At December 31, 2024, we had $1.2 billion of availability on the Revolver, $9.3 million of outstanding letters of credit and other obligations which reduce availability, and there were no borrowings outstanding.
The financial covenants under our Facility state that we must maintain an interest coverage ratio of not less than 2.50:1.00. Our interest coverage ratio is calculated by dividing our last-twelve-months (LTM) consolidated Adjusted EBITDA as defined in the Facility (earnings before interest, taxes, depreciation, amortization, and certain other non-cash transactions as defined in the Facility) by our LTM gross interest expense, less amortization of financing fees. In addition, a debt to capitalization ratio of not more than 0.60:1.00 must be maintained. At December 31, 2024, our interest coverage ratio and debt to capitalization ratio were 21.68:1.00 and 0.27:1.00, respectively. We were, therefore, in compliance with these covenants at December 31, 2024, and we anticipate we will continue to be in compliance during the next twelve months.
Working Capital (representing excess of current assets over current liabilities). We generated cash flow from operations of $1.8 billion in 2024 compared to $3.5 billion in 2023. Working capital decreased $1.2 billion, or 26%, during 2024 to $3.3 billion at December 31, 2024, due primarily to a $1.4 billion decrease in cash and equivalents and short-term investments in support of our capital investments within our aluminum and steel operations.
45
Capital Investments. During 2024, we invested $1.9 billion in property, plant and equipment, primarily within our aluminum operations and steel operations segments, compared with $1.7 billion invested during 2023. We are currently executing our plan to invest $2.7 billion in a new state-of-the-art lower-carbon recycled aluminum flat rolled products mill with two new supporting satellite recycled aluminum slab centers, which are being funded by available cash and cash flow from operations. Related expenditures began in the third quarter of 2022 and are expected to continue through 2025. Our liquidity of $2.2 billion and anticipated future operating cash flow generation is sufficient to provide for our planned 2025 capital requirements.
Cash Dividends. As a reflection of continued confidence in our current and future cash flow generation capability and financial position, we increased our quarterly cash dividend by 8% to $0.46 per share in the first quarter of 2024 (from $0.425 per share for each quarter in 2023), resulting in declared cash dividends of $284.1 million during 2024, compared to $280.5 million in 2023. We paid cash dividends of $282.6 million and $271.3 million during 2024 and 2023, respectively. Our board of directors, along with executive management, approves the payment of dividends on a quarterly basis. The determination to pay cash dividends in the future is at the discretion of our board of directors, after taking into account various factors, including our financial condition, results of operations, outstanding indebtedness, current and anticipated cash needs and growth plans.
Other. Our board of directors has authorized share repurchase programs during prior years, the most recent of which occurred in November 2023 for a program of up to $1.5 billion of the company’s common stock. In February 2025, our board of directors authorized an additional share repurchase program of up to $1.5 billion of our common stock. Under the share repurchase programs, purchases take place as and when we determine in open market or private transactions made based upon the market price of our common stock, the nature of other investment opportunities or growth projects, our cash flows from operations, and general economic conditions. The share repurchase programs do not require us to acquire any specific number of shares, and may be modified, suspended, extended, or terminated by us at any time. The share repurchase programs do not have an expiration date. There were $1.2 billion and $1.5 billion of share repurchases during 2024 and 2023, respectively. As of December 31, 2024, we had $193.5 million remaining available to purchase under the November 2023 share repurchase program. See Part II, Item 5. Market for Registrant’s Common Equity, Related Stockholder Matters and Issuer Purchases of Equity Securities for additional information.
Our ability to meet our debt service obligations and reduce our total debt will depend upon our future performance which, in turn, will depend upon general economic, financial, and business conditions, along with competition, legislation and regulatory factors that are largely beyond our control. In addition, we cannot assure that our operating results, cash flows, access to credit markets and capital resources will be sufficient for repayment of our indebtedness in the future. We believe that based upon current levels of operations and anticipated growth, cash flows from operations, together with other available sources of funds, including borrowings under our Facility, if necessary, will be adequate for the next twelve months for making required payments of principal and interest on our indebtedness, funding working capital requirements, and funding anticipated capital expenditures.
Contractual Obligations and Other Long-Term Liabilities
We have the following minimum commitments under contractual obligations, including purchase obligations, as defined by the Securities and Exchange Commission. A “purchase obligation” is defined as an agreement to purchase goods or services that is enforceable and legally binding and that specifies all significant terms, including fixed or minimum quantities to be purchased; fixed, minimum or variable price provisions; and the approximate timing of the transaction.
Long-term debt and estimated interest. Refer to Note 3. Long-Term Debt to the consolidated financial statements elsewhere in this report for our long-term debt maturities. Estimated interest payments on our senior unsecured notes were determined based on their outstanding balances through maturity at their contractual interest rates, as detailed in Note 3. Estimated interest payments also include a 0.175% commitment fee on our available Revolver, and an average interest rate of 6.23% on our other debt of $28.8 million. Our estimated interest payments are $116.4 million, $109.4 million, $89.0 million, $83.4 million, and $82.2 million, for the years 2025 through 2029, respectively, and $442.4 million thereafter.
46
Purchase obligations. We have commitments for the purchase of commodities such as electricity, water, natural gas and its transportation services, fuel, air products, zinc, and electrodes. Refer to Note 8. Commitments and Contingencies to the consolidated financial statements elsewhere in this report for this information.
Construction commitments. We have firm contracts with various vendors for the completion of certain construction projects at our various divisions at December 31, 2024. Refer to Note 8. Commitments and Contingencies to the consolidated financial statements elsewhere in this report for this information.
Lease commitments. We have entered into operating leases relating principally to transportation and other equipment, and some real estate. Refer to Note 11. Leases to the consolidated financial statements elsewhere in this report for this information.
Unrecognized tax benefits. We expect to make cash outlays in the future related to our unrecognized tax benefits; however, due to the uncertainty of the timing, we are unable to make reasonably reliable estimates regarding the period of cash settlement with the respective taxing authorities. Refer to Note 4. Income Taxes to the consolidated financial statements elsewhere in this report for this information.
Other Matters
Environmental and Other Contingencies
We have incurred, and in the future will continue to incur, capital expenditures and operating expenses for matters relating to environmental control, remediation, monitoring, and compliance. During 2024, we incurred costs related to the monitoring and compliance of environmental matters in the amount of approximately $60.2 million and capital expenditures related to environmental compliance of approximately $4.3 million. Of the costs incurred during 2024 for monitoring and compliance, approximately 74% were related to the normal transportation of certain types of by-products produced in our steelmaking processes and other facilities in accordance with legal requirements. We incurred combined environmental remediation costs of approximately $4.9 million at all of our facilities during 2024. We have an accrual of $3.8 million recorded for environmental remediation related to our metals recycling operations, $2.6 million related to our idled Minnesota ironmaking operations, and $712,000 related to our steel operations. We believe, apart from our dependence on environmental construction and operating permits for our existing and any future manufacturing facilities, that compliance with current environmental laws and regulations is not likely to have a materially adverse effect on our financial condition, results of operations, or liquidity. However, environmental laws and regulations evolve and change, and we may become subject to more stringent environmental laws and regulations in the future, such as the impact of various governmental legislatures and agencies introducing regulatory changes in response to the potential of climate change.
Critical Accounting Estimates
Management’s Discussion and Analysis of Our Financial Condition and Results of Operations is based upon our consolidated financial statements, which have been prepared in accordance with accounting principles generally accepted in the United States. We review the accounting estimates we use in reporting our financial results on a regular basis. The preparation of these financial statements requires us to make estimates and judgments that affect the reported amounts of assets, liabilities, revenues and expenses and related disclosure of contingent liabilities. We evaluate the appropriateness of these estimations and judgments on an ongoing basis. We base our estimates on historical experience and on various other assumptions that are believed to be reasonable under the circumstances, the results of which form the basis for making judgments about the carrying value of assets and liabilities that are not readily apparent from other sources. Results may differ from these estimates due to actual outcomes being different from those on which we based our assumptions. We believe the following critical accounting estimates affect our more significant judgments and estimates used in the preparation of our consolidated financial statements.
47
Impairments of Long-Lived Tangible and Definite-Lived Intangible Assets. We review long-lived assets for impairment whenever events or changes in circumstances indicate the carrying amount of such assets may not be fully recoverable. Impairment losses are recorded on long-lived assets used in operations when indicators of impairment are present and the undiscounted cash flows estimated to be generated by those assets are less than the assets’ carrying amounts. The impairment loss is measured by comparing the fair value of the asset to its carrying amount. We consider various factors and determine whether an impairment test is necessary, including by way of examples, a significant and prolonged deterioration in operating results and/or projected cash flows, significant changes in the extent or manner in which an asset is used, technological advances with respect to assets which would potentially render them obsolete, our strategy and capital planning, and the economic environment in markets to be served. When determining future cash flows, and, if necessary, fair value, we must make judgments as to the expected utilization of assets and estimated future cash flows related to those assets. We consider historical and anticipated future results, general economic and market conditions, the impact of planned business and operational strategies, and all other available information at the time the estimates are made. Those estimates and judgments may or may not ultimately prove accurate. There were no indicators of impairment or impairment charges recorded during 2024, 2023, or 2022.
Goodwill.
Our goodwill, relating to various business combinations, consisted of the following at December 31, 2024 and 2023 (in thousands):
|
|
|
|
|
|
|
|
Steel Operations Segment |
|
$ |
272,133 |
|
|
|
Aluminum Operations Segment |
|
|
14,000 |
|
|
|
Metals Recycling Operations Segment |
|
|
189,413 |
|
|
|
Steel Fabrication Operations Segment |
|
|
1,925 |
|
|
|
|
|
$ |
477,471 |
|
|
At least once annually (as of October 1), or when indicators of impairment exist, we perform a goodwill impairment analysis. Goodwill is allocated to various reporting units, which are generally one level below the company’s operating segments. If the fair value exceeds the carrying value of the reporting unit, there is no impairment. If the carrying amount exceeds the fair value, we recognize an impairment loss in the amount by which the carrying value of the net assets assigned to the reporting unit exceeds the fair value of the reporting unit, with the impairment loss not to exceed the amount of goodwill allocated to the reporting unit. We have the option to consider qualitative factors to assess if it is more likely than not that the fair value of a reporting unit exceeds its carrying value. If we elect to bypass the qualitative assessment or if indications of a potential impairment exist, we perform a quantitative test.
When conducting a qualitative assessment, we consider the impact of several factors on the company overall and each reporting unit individually including the timing and results of prior quantitative tests performed, changes in the carrying amount of the reporting unit, macroeconomic conditions (including changes in interest and discount rates), industry and market conditions, recent and projected financial performance, the company’s competitive position and other factors. Significant judgment is involved in evaluating the totality of all factors to determine whether it is more likely than not that the fair value of the reporting unit exceeds its carrying value.
When conducting a quantitative test, the fair value of the reporting unit is determined by using an estimate of future cash flows utilizing a risk-adjusted discount rate to calculate the net present value of future cash flows (income approach), and for some years by using a market approach based upon an analysis of valuation metrics of comparable peer companies, using Level 3 fair value inputs as provided for under ASC 820. Key assumptions used to determine the estimated fair value of each reporting unit under the discounted cash flows method (income approach) include: (a) expected cash flows for the five-year period following the testing date (including market share, sales volumes and prices, costs to produce and estimated capital needs); (b) an estimated terminal value using a terminal year growth rate determined based on the growth prospects of the reporting unit; and (c) a risk-adjusted discount rate based on management’s best estimate of market participants’ after-tax weighted average cost of capital and market risk premiums. Key assumptions used to determine the estimated fair value of each reporting unit under the market approach include the expected revenues and cash flows in the next year. We consider historical and anticipated future results, general economic and market conditions, the impact of planned business and operational strategies and all available information at the time the fair values of reporting units are estimated.
48
Those estimates and judgments may or may not ultimately prove accurate.
Goodwill acquired in past transactions is naturally more susceptible to impairment, primarily due to the fact that they are recorded at fair value based on operating plans and economic conditions at the time of acquisition. Consequently, if operating results and/or economic conditions deteriorate after an acquisition, it could result in the impairment of the acquired asset. A deterioration of economic conditions may not only negatively impact the estimated operating cash flows used in our cash flow models but may also negatively impact other assumptions used in our analyses, including, but not limited to, the estimated cost of capital and/or discount rates. Additionally, we are required to ensure that assumptions used to determine fair value in our analyses are consistent with the assumptions a hypothetical marketplace participant would use. As a result, the cost of capital and/or discount rates used in our analyses may increase or decrease based on market conditions and trends, regardless of whether our actual cost of capital has changed. Therefore, we may recognize an impairment in spite of realizing actual cash flows that are approximately equal to or greater than our previously forecasted amounts. Accordingly, our qualitative assessments consider changes in interest rates and our quantitative tests include discount rate scenario analysis to evaluate the impact on estimated reporting unit fair values.
Our fourth quarter 2024, 2023, and 2022 annual goodwill impairment analyses did not result in any impairment charges. During 2024, we performed a qualitative assessment and performed quantitative tests in 2023 and 2022. Management does not believe that it is reasonably likely that our reporting units will fail the goodwill impairment test in the near term, given the results of our most recent qualitative assessment and the determined fair value of the reporting units with goodwill from our most recent quantitative test exceeded their carrying value by more than an insignificant amount. Changes in judgments and estimates underlying our analysis of goodwill for possible impairment, including expected future operating cash flows and discount rate, could decrease the estimated fair value of our reporting units in the future and could result in an impairment of goodwill.
Income Taxes. We are required to estimate our income taxes as a part of the process of preparing our consolidated financial statements. This requires us to estimate our actual current tax exposure together with assessing temporary differences resulting from differing treatments of items for tax and accounting purposes. These differences result in deferred tax assets and liabilities, which are included within our consolidated balance sheet. We must then assess the likelihood that our deferred tax assets will be recovered from future taxable income and, to the extent we believe that recovery is not likely, we must establish a valuation allowance. We also establish reserves to reduce some or all of the tax benefit of any of our tax positions at the time we determine that the positions become uncertain. We adjust these reserves, including any impact on the related interest and penalties, in light of changing facts and circumstances, such as the progress of a tax audit. A number of years may elapse before a particular matter for which we have established a reserve is audited by a taxing authority and finally resolved. The number of years with open tax audits varies depending on the tax jurisdiction. A tax benefit that has been previously reserved because of a failure to meet the "more likely than not" recognition threshold would be recognized in our income tax expense in the first interim period when the uncertainty disappears. Settlement of any particular issue would usually require the use of cash.
49
ITEM 7A. QUANTITATIVE AND QUALITATIVE DISCLOSURES ABOUT MARKET RISK
Market Risk
In the normal course of business, we are exposed to interest rate changes. Our objectives in managing fluctuations in interest rates are to limit the impact of these rate changes on earnings and cash flows and to lower overall borrowing costs.
The following table represents the principal cash repayments and related weighted-average interest rates by maturity date for our long-term debt, as of December 31, 2024 (in thousands):
|
|
|
|
|
|
|
|
|
|
|
|
|
|
|
|
|
|
Interest Rate Risk |
|
||||||||||
|
|
|
Fixed Rate |
|
Variable Rate |
|
||||||||
|
|
|
|
|
Average |
|
|
|
Average |
|
||||
|
|
|
Principal |
|
Rate |
|
Principal |
|
Rate |
|
||||
|
Expected maturity date: |
|
|
|
|
|
|
|
|
|
|
|
|
|
|
2025 |
|
$ |
401,071 |
|
|
2.4% |
|
$ |
26,371 |
|
|
6.4% |
|
|
2026 |
|
|
400,896 |
|
|
5.0 |
|
|
- |
|
|
|
|
|
2027 |
|
|
350,465 |
|
|
1.7 |
|
|
- |
|
|
|
|
|
2028 |
|
|
- |
|
|
- |
|
|
- |
|
|
|
|
|
2029 |
|
|
- |
|
|
- |
|
|
- |
|
|
|
|
|
Thereafter |
|
|
2,100,000 |
|
|
3.9 |
|
|
- |
|
|
|
|
|
Total debt outstanding |
|
$ |
3,252,432 |
|
|
3.6% |
|
$ |
26,371 |
|
|
6.4% |
|
|
Fair value |
|
$ |
2,987,850 |
|
|
|
|
$ |
26,371 |
|
|
|
|
Commodity Risk
In the normal course of business, we are exposed to the market risk and price fluctuations related to the sale of our products and to the purchase of raw materials used in our operations, such as metallic raw materials, electricity, water, natural gas and its transportation services, fuel, air products, zinc, and electrodes. Our risk strategy associated with product sales has generally been to obtain competitive prices for our products and to allow operating results to reflect market price movements dictated by supply and demand.
Our risk strategy associated with the purchase of raw materials utilized within our operations has generally been to make some commitments with suppliers relating to future expected requirements for some commodities such as electricity, water, natural gas and its transportation services, fuel, air products, zinc, and electrodes. Refer to Note 8. Commitments and Contingencies to the consolidated financial statements elsewhere in this report for additional information.
In our metals recycling, aluminum, and steel operations, we have certain fixed price contracts with various customers and suppliers for future delivery of nonferrous and ferrous metals. Our risk strategy has been to enter into base metal financial contracts with the goal to protect the profit margin, within certain parameters, that was contemplated when we entered into the transaction with the customer or vendor. At December 31, 2024, we had a cumulative unrealized gain associated with these financial contracts of $13.1 million, substantially all of which have settlement dates in 2025. We believe the customer contracts associated with the financial contracts will be fully consummated.
50
ITEM 8. CONSOLIDATED FINANCIAL STATEMENTS AND SUPPLEMENTARY DATA
INDEX TO CONSOLIDATED FINANCIAL STATEMENTS
|
|
Page |
|
|
|
Management’s Report on Internal Control Over Financial Reporting |
|
52 |
|
|
|
Reports of Independent Registered Public Accounting Firm (PCAOB ID 42) |
|
53 |
|
|
|
Consolidated Balance Sheets as of December 31, 2024 and 2023 |
|
56 |
|
|
|
Consolidated Statements of Income for each of the three years in the period ended December 31, 2024 |
|
57 |
|
|
|
|
58 |
|
|
|
|
Consolidated Statements of Equity for each of the three years in the period ended December 31, 2024 |
|
59 |
|
|
|
|
60 |
|
|
|
|
|
61 |
51
MANAGEMENT’S REPORT ON INTERNAL CONTROL OVER FINANCIAL REPORTING
The management of Steel Dynamics, Inc. is responsible for the preparation and integrity of the company’s consolidated financial statements and for establishing and maintaining adequate internal control over financial reporting, as such term is defined in Rule 13a – 15(f) of the Exchange Act, for the company (including its consolidated subsidiaries). We maintain accounting and internal control systems which are intended to provide reasonable assurance that assets are safeguarded against loss from unauthorized use or disposition, transactions are executed in accordance with management’s authorization, and accounting records are reliable for preparing financial statements in accordance with accounting principles generally accepted in the United States. We are dedicated to ensuring that we maintain the high standards of financial accounting and reporting that we have established. Our culture demands integrity and an unyielding commitment to strong internal control practices and policies.
Internal control over financial reporting includes those policies and procedures that (1) pertain to the maintenance of records that, in reasonable detail, accurately and fairly reflect the transactions and dispositions of our assets; (2) provide reasonable assurance that transactions are recorded as necessary to permit preparation of the financial statements in accordance with generally accepted accounting principles; and provide reasonable assurance that our receipts and expenditures are being made only in accordance with authorizations of our management and directors; and (3) provide reasonable assurance regarding prevention or timely detection of unauthorized acquisition, use or disposition of our assets that could have a material effect on our financial statements.
Because of its inherent limitations, internal control over financial reporting may not always prevent or detect misstatements. Also, projections of any evaluation of effectiveness to future periods are subject to the risk that controls may become inadequate because of changes in conditions, or that the degree of compliance with policies and procedures may deteriorate.
Under the supervision and with the participation of our management, including our principal executive officer and our principal financial officer, we conducted an evaluation of the effectiveness of our internal control over financial reporting. The framework on which such evaluation was based upon is contained in the report entitled “Internal Control—Integrated Framework” issued by the Committee of Sponsoring Organizations of the Treadway Commission (2013 Framework) (the “COSO criteria”). Based on that evaluation, management concluded that our internal control over financial reporting was effective as of December 31, 2024, the end of the period covered by this report.
/s/ Mark D. Millett |
|
/s/ Theresa E. Wagler |
Chief Executive Officer |
|
Executive Vice President and Chief Financial Officer |
(Principal Executive Officer) |
|
(Principal Financial Officer) |
52
REPORT OF INDEPENDENT REGISTERED PUBLIC ACCOUNTING FIRM
To the Stockholders and the Board of Directors of Steel Dynamics, Inc.
Opinion on Internal Control Over Financial Reporting
We have audited Steel Dynamics, Inc.’s internal control over financial reporting as of December 31, 2024, based on criteria established in Internal Control—Integrated Framework issued by the Committee of Sponsoring Organizations of the Treadway Commission (2013 framework) (the COSO criteria). In our opinion, Steel Dynamics, Inc. (the Company) maintained, in all material respects, effective internal control over financial reporting as of December 31, 2024, based on the COSO criteria.
We also have audited, in accordance with the standards of the Public Company Accounting Oversight Board (United States) (PCAOB), the consolidated balance sheets of the Company as of December 31, 2024 and 2023, the related consolidated statements of income, comprehensive income, equity, and cash flows for each of the three years in the period ended December 31, 2024, and the related notes and our report dated February 28, 2025 expressed an unqualified opinion thereon.
Basis for Opinion
The Company’s management is responsible for maintaining effective internal control over financial reporting and for its assessment of the effectiveness of internal control over financial reporting included in the accompanying Management’s Report on Internal Control Over Financial Reporting. Our responsibility is to express an opinion on the Company’s internal control over financial reporting based on our audit. We are a public accounting firm registered with the PCAOB and are required to be independent with respect to the Company in accordance with the U.S. federal securities laws and the applicable rules and regulations of the Securities and Exchange Commission and the PCAOB.
We conducted our audit in accordance with the standards of the PCAOB. Those standards require that we plan and perform the audit to obtain reasonable assurance about whether effective internal control over financial reporting was maintained in all material respects.
Our audit included obtaining an understanding of internal control over financial reporting, assessing the risk that a material weakness exists, testing and evaluating the design and operating effectiveness of internal control based on the assessed risk, and performing such other procedures as we considered necessary in the circumstances. We believe that our audit provides a reasonable basis for our opinion.
Definition and Limitations of Internal Control Over Financial Reporting
A company’s internal control over financial reporting is a process designed to provide reasonable assurance regarding the reliability of financial reporting and the preparation of financial statements for external purposes in accordance with generally accepted accounting principles. A company’s internal control over financial reporting includes those policies and procedures that (1) pertain to the maintenance of records that, in reasonable detail, accurately and fairly reflect the transactions and dispositions of the assets of the company; (2) provide reasonable assurance that transactions are recorded as necessary to permit preparation of financial statements in accordance with generally accepted accounting principles, and that receipts and expenditures of the company are being made only in accordance with authorizations of management and directors of the company; and (3) provide reasonable assurance regarding prevention or timely detection of unauthorized acquisition, use, or disposition of the company’s assets that could have a material effect on the financial statements.
Because of its inherent limitations, internal control over financial reporting may not prevent or detect misstatements. Also, projections of any evaluation of effectiveness to future periods are subject to the risk that controls may become inadequate because of changes in conditions, or that the degree of compliance with the policies or procedures may deteriorate.
/s/ Ernst & Young LLP
Indianapolis, Indiana
February 28, 2025
53
REPORT OF INDEPENDENT REGISTERED PUBLIC ACCOUNTING FIRM
To the Stockholders and the Board of Directors of Steel Dynamics, Inc.
Opinion on the Financial Statements
We have audited the accompanying consolidated balance sheets of Steel Dynamics, Inc. (the Company) as of December 31, 2024 and 2023, the related consolidated statements of income, comprehensive income, equity and cash flows for each of the three years in the period ended December 31, 2024, and the related notes (collectively referred to as the “consolidated financial statements”). In our opinion, the consolidated financial statements present fairly, in all material respects, the financial position of the Company at December 31, 2024 and 2023, and the results of its operations and its cash flows for each of the three years in the period ended December 31, 2024, in conformity with U.S. generally accepted accounting principles.
We also have audited, in accordance with the standards of the Public Company Accounting Oversight Board (United States) (PCAOB), the Company’s internal control over financial reporting as of December 31, 2024, based on criteria established in Internal Control-Integrated Framework issued by the Committee of Sponsoring Organizations of the Treadway Commission (2013 framework), and our report dated February 28, 2025 expressed an unqualified opinion thereon.
Basis for Opinion
These financial statements are the responsibility of the Company's management. Our responsibility is to express an opinion on the Company’s financial statements based on our audits. We are a public accounting firm registered with the PCAOB and are required to be independent with respect to the Company in accordance with the U.S. federal securities laws and the applicable rules and regulations of the Securities and Exchange Commission and the PCAOB.
We conducted our audits in accordance with the standards of the PCAOB. Those standards require that we plan and perform the audit to obtain reasonable assurance about whether the financial statements are free of material misstatement, whether due to error or fraud. Our audits included performing procedures to assess the risks of material misstatement of the financial statements, whether due to error or fraud, and performing procedures that respond to those risks. Such procedures included examining, on a test basis, evidence regarding the amounts and disclosures in the financial statements. Our audits also included evaluating the accounting principles used and significant estimates made by management, as well as evaluating the overall presentation of the financial statements. We believe that our audits provide a reasonable basis for our opinion.
Critical Audit Matter
The critical audit matter communicated below is a matter arising from the current period audit of the financial statements that was communicated or required to be communicated to the audit committee and that: (1) relates to accounts or disclosures that are material to the financial statements and (2) involved our especially challenging, subjective or complex judgments. The communication of the critical audit matter does not alter in any way our opinion on the consolidated financial statements, taken as a whole, and we are not, by communicating the critical audit matter below, providing a separate opinion on the critical audit matter or on the account or disclosure to which it relates.
54
|
Valuation of Goodwill |
|
Description of |
At December 31, 2024, the Company’s goodwill was approximately $477 million. As discussed in Note 1 of the consolidated financial statements, the Company performs an impairment test for goodwill at least annually or when indicators of impairment exist. The Company performed a qualitative assessment as of October 1, 2024, to assess if it is more likely than not that the fair value of a reporting unit exceeds its carrying amount. |
|
Auditing management’s annual goodwill impairment test was complex and judgmental as management considers the impact of several factors on the Company overall and each reporting unit individually including assessing the qualitative factors to be considered in the qualitative goodwill impairment assessment, changes in the carrying amount of the reporting unit, macroeconomic conditions (including changes in interest and discount rates), industry and market conditions, recent and projected financial performance, the Company’s competitive position and other factors. Significant judgment is involved in evaluating the totality of all factors to determine whether it is more likely than not that the fair value of the reporting unit exceeds its carrying value. |
||
How We |
We obtained an understanding, evaluated the design and tested the operating effectiveness of controls over the Company’s goodwill impairment testing process, including controls over management’s review of the qualitative factors described above. |
|
To test management’s conclusion that it is more likely than not that the fair values of the Company’s reporting units exceed their carrying amounts, we performed audit procedures that included, among others, assessing the reasonableness of the qualitative factors considered within the analyses, testing the evaluation of the qualitative factors and the underlying data used by the Company in its analyses. We evaluated management’s assessment of the qualitative factors for each reporting unit by comparing to current industry and economic trends, current and historical results and key business drivers for each reporting unit, comparing the Company’s share price trends to historical amounts, and other relevant factors, including considering consistency with evidence obtained in other parts of the audit and evaluating whether any contrary evidence exists. |
||
/s/ Ernst & Young LLP
We have served as the Company’s auditor since 1999.
Indianapolis, Indiana
February 28, 2025
55
STEEL DYNAMICS, INC.
CONSOLIDATED BALANCE SHEETS
(in thousands, except share data)
|
December 31, |
|||||
Assets |
2024 |
|
|
2023 |
||
Current assets |
|
|
|
|
|
|
Cash and equivalents |
$ |
589,464 |
|
|
$ |
1,400,887 |
Short-term investments |
|
147,811 |
|
|
|
721,210 |
Accounts receivable, net of allowances for credit losses of $7,728 and $8,480 |
|
|
|
|
|
|
as of December 31, 2024 and 2023, respectively |
|
1,362,969 |
|
|
|
1,535,062 |
Accounts receivable-related parties |
|
54,230 |
|
|
|
73,245 |
Inventories |
|
3,113,733 |
|
|
|
2,894,632 |
Other current assets |
|
163,131 |
|
|
|
162,790 |
Total current assets |
|
5,431,338 |
|
|
|
6,787,826 |
|
|
|
|
|
|
|
Property, plant and equipment, net |
|
8,117,988 |
|
|
|
6,734,218 |
Intangible assets, net |
|
227,234 |
|
|
|
257,759 |
Goodwill |
|
477,471 |
|
|
|
477,471 |
Other assets |
|
681,202 |
|
|
|
651,146 |
Total assets |
$ |
14,935,233 |
|
|
$ |
14,908,420 |
Liabilities and Equity |
|
|
|
|
|
|
Current liabilities |
|
|
|
|
|
|
Accounts payable |
$ |
972,645 |
|
|
$ |
1,078,645 |
Accounts payable-related parties |
|
7,267 |
|
|
|
9,685 |
Income taxes payable |
|
3,783 |
|
|
|
5,524 |
Accrued payroll and benefits |
|
373,216 |
|
|
|
469,143 |
Accrued expenses |
|
366,682 |
|
|
|
309,312 |
Current maturities of long-term debt |
|
426,990 |
|
|
|
459,987 |
Total current liabilities |
|
2,150,583 |
|
|
|
2,332,296 |
|
|
|
|
|
|
|
Long-term debt |
|
2,804,017 |
|
|
|
2,611,069 |
Deferred income taxes |
|
902,186 |
|
|
|
944,768 |
Other liabilities |
|
133,201 |
|
|
|
180,760 |
Total liabilities |
|
5,989,987 |
|
|
|
6,068,893 |
|
|
|
|
|
|
|
Commitments and contingencies |
|
|
|
|
|
|
|
|
|
|
|
|
|
Redeemable noncontrolling interests |
|
171,212 |
|
|
|
171,212 |
|
|
|
|
|
|
|
Equity |
|
|
|
|
|
|
Common stock voting, $.0025 par value; 900,000,000 shares authorized; |
|
|
|
|
|
|
268,377,165 and 268,112,991 shares issued; and 151,117,153 and 160,018,100 |
|
|
|
|
|
|
shares outstanding, as of December 31, 2024 and 2023, respectively |
|
652 |
|
|
|
651 |
Treasury stock, at cost; 117,260,012 and 108,094,891 shares, |
|
|
|
|
|
|
as of December 31, 2024 and 2023, respectively |
|
(7,094,266) |
|
|
|
(5,897,606) |
Additional paid-in capital |
|
1,229,819 |
|
|
|
1,217,610 |
Retained earnings |
|
14,798,082 |
|
|
|
13,545,590 |
Accumulated other comprehensive income |
|
- |
|
|
|
421 |
Total Steel Dynamics, Inc. equity |
|
8,934,287 |
|
|
|
8,866,666 |
Noncontrolling interests |
|
(160,253) |
|
|
|
(198,351) |
Total equity |
|
8,774,034 |
|
|
|
8,668,315 |
Total liabilities and equity |
$ |
14,935,233 |
|
|
$ |
14,908,420 |
See notes to consolidated financial statements.
56
STEEL DYNAMICS, INC.
CONSOLIDATED STATEMENTS OF INCOME
(in thousands, except per share data)
|
|
|
|
|
|
|
|
|
|
Years Ended December 31, |
|||||||
|
2024 |
|
2023 |
|
2022 |
|||
|
|
|
|
|
|
|
|
|
Net sales |
|
|
|
|
|
|
|
|
Unrelated parties |
$ |
16,819,648 |
|
$ |
18,115,312 |
|
$ |
21,469,251 |
Related parties |
|
720,742 |
|
|
680,004 |
|
|
791,523 |
Total net sales |
|
17,540,390 |
|
|
18,795,316 |
|
|
22,260,774 |
|
|
|
|
|
|
|
|
|
Costs of goods sold |
|
14,737,804 |
|
|
14,749,433 |
|
|
16,142,943 |
Gross profit |
|
2,802,586 |
|
|
4,045,883 |
|
|
6,117,831 |
|
|
|
|
|
|
|
|
|
Selling, general and administrative expenses |
|
664,119 |
|
|
588,621 |
|
|
545,621 |
Profit sharing |
|
164,904 |
|
|
272,033 |
|
|
452,551 |
Amortization of intangible assets |
|
30,526 |
|
|
34,048 |
|
|
27,837 |
Operating income |
|
1,943,037 |
|
|
3,151,181 |
|
|
5,091,822 |
|
|
|
|
|
|
|
|
|
Interest expense, net of capitalized interest |
|
56,347 |
|
|
76,484 |
|
|
91,538 |
Other (income) expense, net |
|
(96,191) |
|
|
(144,246) |
|
|
(20,785) |
Income before income taxes |
|
1,982,881 |
|
|
3,218,943 |
|
|
5,021,069 |
|
|
|
|
|
|
|
|
|
Income tax expense |
|
432,925 |
|
|
751,611 |
|
|
1,141,577 |
Net income |
|
1,549,956 |
|
|
2,467,332 |
|
|
3,879,492 |
|
|
|
|
|
|
|
|
|
Net income attributable to noncontrolling interests |
|
(12,822) |
|
|
(16,450) |
|
|
(16,818) |
Net income attributable to Steel Dynamics, Inc. |
$ |
1,537,134 |
|
$ |
2,450,882 |
|
$ |
3,862,674 |
|
|
|
|
|
|
|
|
|
|
|
|
|
|
|
|
|
|
|
|
|
|
|
|
|
|
|
Basic earnings per share attributable to Steel Dynamics, |
|
|
|
|
|
|
|
|
Inc. stockholders |
$ |
9.89 |
|
$ |
14.72 |
|
$ |
21.06 |
|
|
|
|
|
|
|
|
|
Weighted average common shares outstanding |
|
155,420 |
|
|
166,552 |
|
|
183,393 |
|
|
|
|
|
|
|
|
|
Diluted earnings per share attributable to Steel Dynamics, Inc. |
|
|
|
|
|
|
|
|
stockholders, including the effect of assumed conversions |
|
|
|
|
|
|
|
|
when dilutive |
$ |
9.84 |
|
$ |
14.64 |
|
$ |
20.92 |
|
|
|
|
|
|
|
|
|
Weighted average common shares and share equivalents outstanding |
|
156,136 |
|
|
167,431 |
|
|
184,622 |
|
|
|
|
|
|
|
|
|
Dividends declared per share |
$ |
1.84 |
|
$ |
1.70 |
|
$ |
1.36 |
See notes to consolidated financial statements.
57
STEEL DYNAMICS, INC.
CONSOLIDATED STATEMENTS OF COMPREHENSIVE INCOME
(in thousands)
|
|
|
|
|
|
|
|
|
|
Years Ended December 31, |
|||||||
|
2024 |
|
2023 |
|
2022 |
|||
|
|
|
|
|
|
|
|
|
Net income |
$ |
1,549,956 |
|
$ |
2,467,332 |
|
$ |
3,879,492 |
Other comprehensive income (loss) - net unrealized gain (loss) on cash flow |
|
|
|
|
|
|
|
|
hedging derivatives, net of income tax benefits of $135, $149, and |
|
|
|
|
|
|
|
|
income tax expense of $937 for 2024, 2023 and 2022, respectively |
|
(421) |
|
|
(468) |
|
|
2,980 |
Comprehensive income |
|
1,549,535 |
|
|
2,466,864 |
|
|
3,882,472 |
|
|
|
|
|
|
|
|
|
Comprehensive income attributable to noncontrolling interests |
|
(12,822) |
|
|
(16,450) |
|
|
(16,818) |
Comprehensive income attributable to Steel Dynamics, Inc. |
$ |
1,536,713 |
|
$ |
2,450,414 |
|
$ |
3,865,654 |
See notes to consolidated financial statements.
58
STEEL DYNAMICS, INC.
CONSOLIDATED STATEMENTS OF EQUITY
(in thousands)
|
|
|
|
|
|
|
|
|
|
|
|
|
|
|
|
|
|
|
|
|
|
|
|
|
|
|
|
|
|
|
|
|
|
|
|
|
|
|
|
|
|
|
|
|
|
|
|
|
|||||||||||
|
|
|
|
|
|
|
|
|
|
|
|
|
|
|
|
|
|
|
Accumulated |
|
|
|
|
|
|
|
|
|
|
|
|
|
|
|
|
|
|
|
|
|
|
|
Additional |
|
|
|
Other |
|
|
|
|
|
Redeemable |
||||||
|
Shares |
|
Common |
|
Treasury |
|
Paid-In |
|
Retained |
|
Comprehensive |
|
Noncontrolling |
|
Total |
|
Noncontrolling |
||||||||||||
|
Common |
|
Treasury |
|
Stock |
|
Stock |
|
Capital |
|
Earnings |
|
Income (Loss) |
|
Interests |
|
Equity |
|
Interests |
||||||||||
Balances at January 1, 2022 |
|
194,998 |
|
|
72,227 |
|
|
649 |
|
|
(2,674,267) |
|
|
1,218,933 |
|
|
7,761,417 |
|
|
(2,091) |
|
|
(195,884) |
|
|
6,108,757 |
|
|
211,414 |
Dividends declared |
|
- |
|
|
- |
|
|
- |
|
|
- |
|
|
- |
|
|
(245,287) |
|
|
- |
|
|
- |
|
|
(245,287) |
|
|
- |
Noncontrolling investors, net |
|
- |
|
|
- |
|
|
- |
|
|
- |
|
|
630 |
|
|
(2,495) |
|
|
- |
|
|
(36,989) |
|
|
(38,854) |
|
|
(29,911) |
Share repurchases |
|
(22,996) |
|
|
22,996 |
|
|
- |
|
|
(1,800,905) |
|
|
- |
|
|
- |
|
|
- |
|
|
- |
|
|
(1,800,905) |
|
|
- |
Equity-based compensation |
|
934 |
|
|
(397) |
|
|
1 |
|
|
15,659 |
|
|
(6,997) |
|
|
(544) |
|
|
- |
|
|
- |
|
|
8,119 |
|
|
- |
Net income |
|
- |
|
|
- |
|
|
- |
|
|
- |
|
|
- |
|
|
3,862,674 |
|
|
- |
|
|
16,818 |
|
|
3,879,492 |
|
|
- |
Other comprehensive loss, net of tax |
|
- |
|
|
- |
|
|
- |
|
|
- |
|
|
- |
|
|
- |
|
|
2,980 |
|
|
- |
|
|
2,980 |
|
|
- |
Balances at December 31, 2022 |
|
172,936 |
|
|
94,826 |
|
$ |
650 |
|
$ |
(4,459,513) |
|
$ |
1,212,566 |
|
$ |
11,375,765 |
|
$ |
889 |
|
$ |
(216,055) |
|
$ |
7,914,302 |
|
$ |
181,503 |
Dividends declared |
|
- |
|
|
- |
|
|
- |
|
|
- |
|
|
- |
|
|
(280,501) |
|
|
- |
|
|
- |
|
|
(280,501) |
|
|
- |
Noncontrolling investors, net |
|
- |
|
|
- |
|
|
- |
|
|
- |
|
|
- |
|
|
- |
|
|
- |
|
|
1,254 |
|
|
1,254 |
|
|
(10,291) |
Share repurchases |
|
(13,394) |
|
|
13,394 |
|
|
- |
|
|
(1,452,203) |
|
|
- |
|
|
- |
|
|
- |
|
|
- |
|
|
(1,452,203) |
|
|
- |
Equity-based compensation |
|
476 |
|
|
(125) |
|
|
1 |
|
|
14,110 |
|
|
5,044 |
|
|
(556) |
|
|
- |
|
|
- |
|
|
18,599 |
|
|
- |
Net income |
|
- |
|
|
- |
|
|
- |
|
|
- |
|
|
- |
|
|
2,450,882 |
|
|
- |
|
|
16,450 |
|
|
2,467,332 |
|
|
- |
Other comprehensive income, net of tax |
|
- |
|
|
- |
|
|
- |
|
|
- |
|
|
- |
|
|
- |
|
|
(468) |
|
|
- |
|
|
(468) |
|
|
- |
Balances at December 31, 2023 |
|
160,018 |
|
|
108,095 |
|
$ |
651 |
|
$ |
(5,897,606) |
|
$ |
1,217,610 |
|
$ |
13,545,590 |
|
$ |
421 |
|
$ |
(198,351) |
|
$ |
8,668,315 |
|
$ |
171,212 |
Dividends declared |
|
- |
|
|
- |
|
|
- |
|
|
- |
|
|
- |
|
|
(284,122) |
|
|
- |
|
|
- |
|
|
(284,122) |
|
|
- |
Noncontrolling investors, net |
|
- |
|
|
- |
|
|
- |
|
|
- |
|
|
1,350 |
|
|
- |
|
|
- |
|
|
25,276 |
|
|
26,626 |
|
|
- |
Share repurchases |
|
(9,432) |
|
|
9,432 |
|
|
- |
|
|
(1,212,164) |
|
|
- |
|
|
- |
|
|
- |
|
|
- |
|
|
(1,212,164) |
|
|
- |
Equity-based compensation |
|
531 |
|
|
(267) |
|
|
1 |
|
|
15,504 |
|
|
10,859 |
|
|
(520) |
|
|
- |
|
|
- |
|
|
25,844 |
|
|
- |
Net income |
|
- |
|
|
- |
|
|
- |
|
|
- |
|
|
- |
|
|
1,537,134 |
|
|
- |
|
|
12,822 |
|
|
1,549,956 |
|
|
- |
Other comprehensive loss, net of tax |
|
- |
|
|
- |
|
|
- |
|
|
- |
|
|
- |
|
|
- |
|
|
(421) |
|
|
- |
|
|
(421) |
|
|
- |
Balances at December 31, 2024 |
|
151,117 |
|
|
117,260 |
|
$ |
652 |
|
$ |
(7,094,266) |
|
$ |
1,229,819 |
|
$ |
14,798,082 |
|
$ |
- |
|
$ |
(160,253) |
|
$ |
8,774,034 |
|
$ |
171,212 |
See notes to consolidated financial statements.
59
STEEL DYNAMICS, INC.
CONSOLIDATED STATEMENTS OF CASH FLOWS
(in thousands)
|
Years Ended December 31, |
|||||||
|
2024 |
|
2023 |
|
2022 |
|||
|
|
|
|
|
|
|
|
|
Operating activities: |
|
|
|
|
|
|
|
|
Net income |
$ |
1,549,956 |
|
$ |
2,467,332 |
|
$ |
3,879,492 |
|
|
|
|
|
|
|
|
|
Adjustments to reconcile net income to net cash provided by |
|
|
|
|
|
|
|
|
operating activities: |
|
|
|
|
|
|
|
|
Depreciation and amortization |
|
478,907 |
|
|
437,804 |
|
|
384,202 |
Equity-based compensation |
|
66,589 |
|
|
61,744 |
|
|
59,240 |
Deferred income taxes |
|
(42,583) |
|
|
55,665 |
|
|
37,186 |
Other adjustments |
|
(5,507) |
|
|
(19,716) |
|
|
(1,795) |
Changes in certain assets and liabilities: |
|
|
|
|
|
|
|
|
Accounts receivable |
|
191,108 |
|
|
446,765 |
|
|
(110,560) |
Inventories |
|
(221,036) |
|
|
232,282 |
|
|
413,262 |
Other assets |
|
(13,718) |
|
|
(23,777) |
|
|
(6,884) |
Accounts payable |
|
(67,361) |
|
|
(30,148) |
|
|
(289,042) |
Income taxes receivable/payable |
|
10,183 |
|
|
56,756 |
|
|
31,623 |
Accrued expenses |
|
(102,035) |
|
|
(164,779) |
|
|
63,679 |
Net cash provided by operating activities |
|
1,844,503 |
|
|
3,519,928 |
|
|
4,460,403 |
|
|
|
|
|
|
|
|
|
Investing activities: |
|
|
|
|
|
|
|
|
Purchases of property, plant and equipment |
|
(1,868,006) |
|
|
(1,657,905) |
|
|
(908,902) |
Purchases of short-term investments |
|
(739,340) |
|
|
(1,145,493) |
|
|
(927,584) |
Proceeds from maturities of short-term investments |
|
1,312,294 |
|
|
1,054,742 |
|
|
297,950 |
Business combinations, net of cash acquired |
|
- |
|
|
- |
|
|
(134,090) |
Investments in unconsolidated affiliates |
|
- |
|
|
- |
|
|
(222,480) |
Other investing activities |
|
(8,308) |
|
|
(221,593) |
|
|
15,837 |
Net cash used in investing activities |
|
(1,303,360) |
|
|
(1,970,249) |
|
|
(1,879,269) |
|
|
|
|
|
|
|
|
|
Financing activities: |
|
|
|
|
|
|
|
|
Issuance of current and long-term debt |
|
2,482,919 |
|
|
1,365,664 |
|
|
1,465,257 |
Repayment of current and long-term debt |
|
(2,324,058) |
|
|
(1,367,553) |
|
|
(1,507,475) |
Dividends paid |
|
(282,616) |
|
|
(271,317) |
|
|
(237,163) |
Purchases of treasury stock |
|
(1,212,164) |
|
|
(1,452,203) |
|
|
(1,800,905) |
Other financing activities |
|
(16,678) |
|
|
(51,725) |
|
|
(116,298) |
Net cash used in financing activities |
|
(1,352,597) |
|
|
(1,777,134) |
|
|
(2,196,584) |
|
|
|
|
|
|
|
|
|
Increase (decrease) in cash and equivalents, and restricted cash |
|
(811,454) |
|
|
(227,455) |
|
|
384,550 |
Cash and equivalents, and restricted cash at beginning of period |
|
1,406,464 |
|
|
1,633,919 |
|
|
1,249,369 |
|
|
|
|
|
|
|
|
|
Cash and equivalents, and restricted cash at end of period |
$ |
595,010 |
|
$ |
1,406,464 |
|
$ |
1,633,919 |
|
|
|
|
|
|
|
|
|
Supplemental disclosure information: |
|
|
|
|
|
|
|
|
Cash paid for interest |
$ |
100,978 |
|
$ |
103,165 |
|
$ |
100,994 |
Cash paid for income taxes, net |
$ |
463,763 |
|
$ |
642,667 |
|
$ |
1,063,844 |
See notes to consolidated financial statements.
60
Note 1. Description of the Business and Summary of Significant Accounting Policies
Description of the Business
Steel Dynamics, Inc. (SDI), together with its subsidiaries (the company), is one of the largest and most diversified domestic steel producers and metals recycler, combined with a meaningful steel fabrication manufacturing platform. The company has four reporting segments: steel operations, metals recycling operations, steel fabrication operations, and aluminum operations. Effective the fourth quarter 2024, results from an entity previously reported within the metals recycling operations segment were moved to the aluminum operations segment, consistent with a change in how the company’s chief operating decision maker manages the business. Segment information provided within this Form 10-K, including that within Note 12. Segment Information, has been recast for all prior periods consistent with the current reportable segment presentation. Approximately 5% of the company’s workforce in four locations is represented by collective bargaining agreements, and agreements affecting 0.5% of the company’s employees at one location expires during 2025.
Steel Operations Segment
Steel operations include the company’s electric arc furnace (EAF) steel mills, including Butler Flat Roll Division, Columbus Flat Roll Division, Southwest-Sinton Flat Roll Division, Structural and Rail Division, Engineered Bar Products Division, Roanoke Bar Division, and Steel of West Virginia, steel coating and processing operations at The Techs, Heartland Flat Roll Division, United Steel Supply (USS) – 90% equity interest as of April 1, 2023, Vulcan Threaded Products, warehouse operations in Mexico, and SDI Biocarbon Solutions, a joint venture to construct and operate a biocarbon production facility, of which SDI has a 75% equity interest.
Metals Recycling Operations Segment
Metals recycling operations include the company’s OmniSource ferrous and nonferrous processing, transportation, marketing, brokerage, and scrap management services primarily throughout the United States and in Central and Northern Mexico.
Steel Fabrication Operations Segment
Steel fabrication operations include the company’s New Millennium Building Systems joist and deck plants located throughout the United States, and in Northern Mexico. Revenues from these plants are generated from the fabrication of girders, steel joists and steel deck used within the non-residential construction industry.
Aluminum Operations Segment
Aluminum operations include the recycled aluminum flat rolled products mill nearing completion of construction in Columbus, Mississippi, two satellite recycled aluminum slab centers in the southwest United States and Central Mexico, and an entity with aluminum operations, formerly included in the results of the metals recycling operations segment. The flat rolled products mill is a joint venture with Unity Aluminum, Inc. of which SDI has a 94.4% equity interest. The aluminum flat rolled products mill and the Mexico and US recycled aluminum slab centers are expected to begin operations in mid to late 2025.
Other
Other operations consist of subsidiary operations that are below the quantitative thresholds required for reportable segments and primarily consist of joint ventures and the company’s idled Minnesota ironmaking operations. Also included in “Other” are certain unallocated corporate accounts, such as the company’s senior unsecured credit facility, senior notes, certain other investments, and certain profit sharing expenses.
61
Note 1. Description of the Business and Summary of Significant Accounting Policies (Continued)
Summary of Significant Accounting Policies
Principles of Consolidation
The consolidated financial statements include the accounts of SDI, together with its wholly- and majority-owned or controlled subsidiaries, after elimination of intercompany accounts and transactions. Noncontrolling and redeemable noncontrolling interests represent the noncontrolling owners' proportionate share in the equity, income, or losses of the company’s majority-owned or controlled consolidated subsidiaries. Redeemable noncontrolling interests related to USS (owned 90% by SDI) are $60.0 million at December 31, 2024 and 2023. Redeemable noncontrolling interests related to Mesabi Nugget (owned 86% by SDI) are $111.2 million at December 31, 2024 and 2023.
Use of Estimates
These consolidated financial statements are prepared in conformity with accounting principles generally accepted in the United States, and accordingly, include amounts that require management to make estimates and assumptions that affect the amounts reported in the consolidated financial statements and in the notes thereto. Significant items subject to such estimates and assumptions include the carrying value of property, plant and equipment, intangible assets, and goodwill; allowances for credit losses for trade receivables, inventories and deferred income tax assets; unrecognized tax benefits; potential environmental liabilities; and litigation claims and settlements. Actual results may differ from these estimates and assumptions.
Revenue from Contracts with Customers
In the steel, metals recycling, and aluminum operations segments, revenue is recognized at the point in time the performance obligation is satisfied, and control of the product is transferred to the customer upon shipment or delivery, at the amount of consideration the company expects to receive, including any variable consideration. The variable consideration included in the company’s steel operations segment contracts, which is not constrained, includes estimated product returns and customer claims based on historical experience, and may include volume rebates which are recorded on an expected value basis. Revenue recognized is limited to the amount the company expects to receive. The company does not exercise significant judgments in determining the timing of satisfaction of performance obligations or the transaction price. Shipment of products to customers is considered a fulfillment activity with amounts billed to customers included in sales and costs associated with such activities included in cost of goods sold.
The company’s steel fabrication operations segment recognizes revenue over time at the amount of consideration the company expects to receive. Revenue is measured on an output method representing completed fabricated tons to date as a percentage of total tons required for each contract. Revenue from fabrication of tons remaining on partially fabricated customer contracts as of a reporting date, and future revenue from yet to be fabricated customer contracts, has not been disclosed under the practical expedient in Accounting Standards Codification (ASC) 606, Revenue from Contracts with Customers (ASC 606), paragraph ASC 606-10-50-14 related to customer contracts with expected duration of one year or less. The company does not exercise significant judgments in determining the timing of satisfaction of performance obligations or the transaction price. Shipment of products to customers, which occurs after control over the product has transferred to the customer and revenue is recognized, is considered a fulfillment activity with amounts billed to customers included in sales and costs associated with such activities included in cost of goods sold.
Payments from customers are generally due within 30 days of invoicing, which generally occurs upon shipment of the products. Shipment for the steel fabrication operations segment generally occurs within 30 days of satisfaction of the performance obligation and revenue recognition. The company does not have financing components. Payments from customers have historically been within these terms, however, payments for non-U.S. sales may extend longer.
62
Note 1. Description of the Business and Summary of Significant Accounting Policies (Continued)
Refer to Note 12. Segment Information for disaggregated revenue by segment to external, external non-United States, and other segment customers.
Credit Losses
The company is exposed to credit risk in the event of nonpayment of accounts receivable by customers. The company mitigates its exposure to credit risk, which it generally extends on an unsecured basis, by performing ongoing credit evaluations and taking further action if necessary, such as requiring letters of credit or other security interests to support the customer receivable. The allowance for credit losses for accounts receivable is based on the company’s reasonable estimate of known credit risks and historical experience, adjusted for current and anticipated economic and other pertinent factors affecting the company’s customers, that may differ from historical experience. Customer accounts receivable are written off when all collection efforts have been exhausted and the amounts are deemed uncollectible.
At December 31, 2024 and 2023, the company reported $1,417.2 million and $1,608.3 million, respectively, of accounts receivable, net of allowances for credit losses of $7.7 million and $8.5 million, respectively. Changes in the allowance were not significant for the years ended December 31, 2024, 2023, or 2022.
Cash and Equivalents, and Restricted Cash
Cash and equivalents include all highly liquid investments with a maturity of three months or less at the date of acquisition. Restricted cash is primarily funds held in escrow as required by various insurance and government organizations. The balance of cash, cash equivalents and restricted cash in the consolidated statements of cash flows includes restricted cash of $5.5 million at December 31, 2024, $5.6 million at December 31, 2023, and $5.5 million at December 31, 2022, and 2021, which is recorded in Other Assets (noncurrent) in the company’s consolidated balance sheets.
Short-Term Investments
Short-term investments include investments with maturity dates of longer than three months but less than one year when purchased. The company’s short-term investments are classified as trading securities. The short-term investments held as of December 31, 2024 consisted of commercial paper ($19.7 million), US Treasuries ($113.1 million), and certificates of deposit ($15.0 million). Short-term investments held as of December 31, 2023 consisted of commercial paper ($146.2 million), US Treasuries ($564.9 million), and certificates of deposit ($10.1 million). Interest income from invested cash and short-term investments was $90.1 million, $111.9 million, and $29.3 million for the years ended December 31, 2024, 2023, and 2022, respectively, and is recorded in other (income) expense, net as earned.
Inventories
Inventories are stated at lower of cost or net realizable value. Cost is determined using a weighted average cost method for raw materials (including scrap and purchased steel substrate) and supplies, and on a first-in, first-out basis for other inventory. Inventory consisted of the following at December 31 (in thousands):
|
|
2024 |
|
2023 |
|
||
|
Raw materials |
$ |
1,323,920 |
|
$ |
1,226,272 |
|
|
Supplies |
|
805,035 |
|
|
711,653 |
|
|
Work in progress |
|
269,031 |
|
|
296,932 |
|
|
Finished goods |
|
715,747 |
|
|
659,775 |
|
|
Total inventories |
$ |
3,113,733 |
|
$ |
2,894,632 |
|
63
Note 1. Description of the Business and Summary of Significant Accounting Policies (Continued)
Property, Plant and Equipment
Property, plant and equipment are stated at cost which includes capitalized interest on construction in progress amounts, and is reduced by proceeds received from certain state and local government grants and other capital cost reimbursements, except for assets acquired in acquisitions which are valued at fair value at the purchase date. The company assigns each fixed asset a useful life ranging from 3 to 15 years for plant, machinery and equipment, and 5 to 40 years for buildings and improvements. Repairs and maintenance are expensed as incurred. Depreciation is provided utilizing the straight-line depreciation methodology, or the units-of-production depreciation methodology for certain production-related steel operations segment assets, based on units produced, subject to minimum and maximum levels. Depreciation expense was $441.2 million, $397.0 million, and $349.4 million for the years ended December 31, 2024, 2023, and 2022, respectively.
The company’s property, plant and equipment consisted of the following at December 31 (in thousands):
|
|
|
2024 |
|
2023 |
|
||
|
Land and improvements |
|
$ |
801,210 |
|
$ |
693,166 |
|
|
Buildings and improvements |
|
|
1,487,742 |
|
|
1,255,274 |
|
|
Plant, machinery and equipment |
|
|
7,666,513 |
|
|
6,887,985 |
|
|
Construction in progress |
|
|
2,767,013 |
|
|
2,096,489 |
|
|
|
|
|
12,722,478 |
|
|
10,932,914 |
|
|
Less accumulated depreciation |
|
|
4,604,490 |
|
|
4,198,696 |
|
|
Property, plant and equipment, net |
|
$ |
8,117,988 |
|
$ |
6,734,218 |
|
Intangible Assets
The company’s intangible assets consisted of the following at December 31 (in thousands):
|
|
|
|
|
|
|
|
|
|
Weighted |
|
|
|
|
|
|
|
|
|
|
|
Average |
|
|
|
|
|
|
|
|
|
Useful |
|
Amortization |
|
|
|
2024 |
|
2023 |
|
Life |
|
Period |
|
||
|
Customer, vendor and scrap generator relationships |
$ |
444,812 |
|
$ |
444,812 |
|
8 to 25 years |
|
22 years |
|
|
Trade names |
|
147,950 |
|
|
147,950 |
|
15 to 25 years |
|
19 years |
|
|
Other |
|
- |
|
|
600 |
|
|
|
|
|
|
|
|
592,762 |
|
|
593,362 |
|
|
|
22 years |
|
|
Less accumulated amortization |
|
365,528 |
|
|
335,603 |
|
|
|
|
|
|
|
$ |
227,234 |
|
$ |
257,759 |
|
|
|
|
|
The company utilizes an accelerated amortization methodology for customer, vendor and scrap generator relationships in order to follow the pattern in which the economic benefits of the amounts are anticipated to be consumed. Trade names are amortized using a straight-line methodology. Amortization of intangible assets was $30.5 million, $34.0 million, and $27.8 million for the years ended December 31, 2024, 2023, and 2022, respectively.
64
Note 1. Description of the Business and Summary of Significant Accounting Policies (Continued)
Estimated amortization expense related to amortizable intangibles for the years ending December 31 is as follows (in thousands):
|
|
|
|
|
|
|
2025 |
|
$ |
27,464 |
|
|
2026 |
|
|
25,562 |
|
|
2027 |
|
|
23,163 |
|
|
2028 |
|
|
21,953 |
|
|
2029 |
|
|
19,583 |
|
|
Thereafter |
|
|
109,509 |
|
|
Total |
|
$ |
227,234 |
|
Impairment of Long-Lived Tangible and Definite-Lived Intangible Assets
The company reviews long-lived assets for impairment whenever events or changes in circumstances indicate the carrying amount of such assets may not be fully recoverable. Impairment losses are recorded on long-lived assets used in operations when indicators of impairment are present and the undiscounted cash flows estimated to be generated by those assets are less than the assets’ carrying amounts. The impairment loss is measured by comparing the fair value of the assets to its carrying amount. The company considers various factors and determines whether an impairment test is necessary, including by way of examples, a significant and prolonged deterioration in operating results and/or projected cash flows, significant changes in the extent or manner in which an asset is used, technological advances with respect to assets which would potentially render them obsolete, the company’s strategy and capital planning, and the economic environment in markets to be served.
Goodwill
The company’s goodwill consisted of the following at December 31, 2024 and 2023 (in thousands):
|
|
|
|
|
|
|
|
Steel Operations Segment |
|
$ |
272,133 |
|
|
|
Aluminum Operations Segment |
|
|
14,000 |
|
|
|
Metals Recycling Operations Segment |
|
|
189,413 |
|
|
|
Steel Fabrication Operations Segment |
|
|
1,925 |
|
|
|
|
|
$ |
477,471 |
|
|
In the fourth quarter 2024, results from an entity previously included in the metals recycling operations segment were moved to the aluminum operations segment, which also resulted in $14 million of goodwill being reassigned to the aluminum operations segment based on a relative fair value allocation approach. Segment information for 2023 has been recast consistent with the current reportable segment presentation. Cumulative OmniSource goodwill impairment charges were $346.8 million at December 31, 2024 and 2023.
Impairment of Goodwill
At least once annually (as of October 1), or when indicators of impairment exist, the company performs a goodwill impairment analysis. Goodwill is allocated to various reporting units, which are generally one level below the company’s operating segments. If the fair value exceeds the carrying value of the reporting unit, there is no impairment. If the carrying amount exceeds the fair value, the company recognizes an impairment loss in the amount by which the carrying value of the net assets assigned to the reporting unit exceeds the fair value of the reporting unit, with the impairment loss not to exceed the amount of goodwill allocated to the reporting unit. The company has the option to consider qualitative factors to assess if it is more likely than not that the fair value of a reporting unit exceeds its carrying value. If elected to bypass the qualitative assessment or if indications of a potential impairment exist, the company performs a quantitative test.
65
Note 1. Description of the Business and Summary of Significant Accounting Policies (Continued)
When conducting a qualitative assessment, the company considers the impact of several factors on the company overall and each reporting unit individually including the timing and results of prior quantitative tests performed, changes in the carrying amount of the reporting unit, macroeconomic conditions (including changes in interest and discount rates), industry and market conditions, recent and projected financial performance, the company’s competitive position and other factors. When conducting a quantitative test, the fair value of the reporting unit is determined by using an estimate of future cash flows utilizing a risk-adjusted discount rate to calculate the net present value of future cash flows (income approach), and for some years by using a market approach based upon an analysis of valuation metrics of comparable peer companies, using Level 3 fair value inputs as provided for under ASC 820, Fair Value Measurement.
No impairment was identified during the company’s 2024, 2023 or 2022 annual goodwill impairment analysis. During 2024, the company performed a qualitative assessment and performed quantitative tests in 2023 and 2022.
Equity-Based Compensation
The company has several stock-based employee compensation plans which are more fully described in Note 6. Equity-Based Incentive Plans. Compensation expense for restricted stock units, deferred stock units, restricted stock, stock appreciation awards, and performance awards is recorded over the vesting periods using the fair value as determined by the closing fair market value of the company’s common stock on the grant date, and with respect to performance awards, an estimate of probability of award achievement during the performance period. The company recognizes forfeitures as they occur. Compensation expense for these stock-based employee compensation plans was $65.6 million, $60.1 million, and $69.2 million for the years ended December 31, 2024, 2023, and 2022, respectively.
Income Taxes
The company accounts for income taxes and the related accounts under the liability method. Deferred tax liabilities and assets are determined based on the difference between the financial statement and tax bases of assets and liabilities using enacted rates expected to be in effect during the year in which the basis differences reverse.
Earnings Per Share
Basic earnings per share is based on the weighted average shares of common stock outstanding during the period. Diluted earnings per share assumes the weighted average dilutive effect of common share equivalents outstanding during the period applied to the company’s basic earnings per share. Common share equivalents represent potentially dilutive restricted stock units, deferred stock units, restricted stock, and performance awards, and are excluded from the computation in periods in which they have an anti-dilutive effect. There were 269,000 anti-dilutive common stock equivalents as of and for the year ended December 31, 2024. There were no anti-dilutive common stock equivalents as of and for the years ended December 31, 2023, and 2022.
66
Note 1. Description of the Business and Summary of Significant Accounting Policies (Continued)
The following table presents a reconciliation of the numerators and the denominators of the company’s basic and diluted earnings per share computations for the years ended December 31 (in thousands, except per share data):
|
|
2024 |
|
|
2023 |
||||||||||||||
|
|
Net Income |
|
Shares |
|
Per Share |
|
|
Net Income |
|
Shares |
|
Per Share |
||||||
|
|
(Numerator) |
|
(Denominator) |
|
Amount |
|
|
(Numerator) |
|
(Denominator) |
|
Amount |
||||||
Basic earnings per share |
|
$ |
1,537,134 |
|
|
155,420 |
|
$ |
9.89 |
|
|
$ |
2,450,882 |
|
|
166,552 |
|
$ |
14.72 |
Dilutive common share equivalents |
|
|
- |
|
|
716 |
|
|
|
|
|
|
- |
|
|
879 |
|
|
|
Diluted earnings per share |
|
$ |
1,537,134 |
|
|
156,136 |
|
$ |
9.84 |
|
|
$ |
2,450,882 |
|
|
167,431 |
|
$ |
14.64 |
|
2022 |
|
|||||||
|
Net Income |
|
Shares |
|
Per Share |
|
|||
|
(Numerator) |
|
(Denominator) |
|
Amount |
|
|||
Basic earnings per share |
$ |
3,862,674 |
|
|
183,393 |
|
$ |
21.06 |
|
Dilutive common share equivalents |
|
- |
|
|
1,229 |
|
|
|
|
Diluted earnings per share |
$ |
3,862,674 |
|
|
184,622 |
|
$ |
20.92 |
|
Concentration of Credit Risk
Financial instruments that potentially subject the company to significant concentrations of credit risk principally consist of temporary cash investments and accounts receivable. When advantageous, the company places its temporary cash with high credit quality financial institutions and companies and limits the amount of credit exposure from any one entity. The company is exposed to credit risk in the event of nonpayment by customers. The company mitigates its exposure to credit risk, which it generally extends initially on an unsecured basis, by performing ongoing credit evaluations and taking further action if necessary, such as requiring letters of credit or other security interests to support the customer receivable.
Derivative Financial Instruments
The company routinely enters into forward exchange traded futures to manage price risk associated with nonferrous metal inventory, as well as purchases and sales of nonferrous (primarily aluminum and copper) and ferrous metals, to reduce exposure to commodity related price fluctuations. The company does not enter into these derivative financial instruments for speculative purposes. The company recognizes all derivatives as either assets or liabilities in the consolidated balance sheets and measures those instruments at fair value. Derivatives that are not designated as hedges must be adjusted to fair value through earnings. Changes in the fair value of derivatives that are designated as hedges, depending on the nature of the hedge, are recognized as either an offset against the change in fair value of the hedged balance sheet item in the case of fair value hedges or as other comprehensive income in the case of cash flow hedges, until the hedged item is recognized in earnings. The ineffective portion of a derivative’s change in fair value is immediately recognized in earnings for fair value hedges. The company offsets fair value amounts recognized for derivative instruments executed with the same counterparty under master netting agreements.
In the normal course of business, the company has derivative financial instruments in the form of forward contracts in various metallic commodities and those related to managing fluctuations in foreign exchange rates. At the time of acquiring these financial instruments, the company designates and assigns these instruments as hedges of specific assets, liabilities or anticipated transactions. When hedged assets or liabilities are sold or extinguished, or the anticipated transaction being hedged is no longer expected to occur, the company recognizes the gain or loss on the designated hedged financial instrument in earnings.
67
Note 1. Description of the Business and Summary of Significant Accounting Policies (Continued)
The fair value of the Company’s derivative instruments, along with required margin deposit amounts with the same counterparty under master netting arrangements, totaled $26.0 million and $24.0 million at December 31, 2024 and 2023, respectively, and are reflected in other current assets in the consolidated balance sheets. Total gains and losses related to derivatives in fair value hedging relationships, as well as those not designated as hedging instruments, are recognized in costs of goods sold and were insignificant for the years ended December 31, 2024, 2023, and 2022. Derivatives accounted for as cash flow hedges, for which gains and losses are recognized in other comprehensive income, along with net amounts reclassified from accumulated other comprehensive income, were insignificant for the years ended December 31, 2024, 2023, and 2022.
Recently Adopted Accounting Pronouncements
In November 2023, the Financial Accounting Standards Board (FASB) issued Accounting Standards Update (ASU) 2023-07, Segment Reporting (Topic 280): Improvements to Reportable Segment Disclosures, which is intended to improve reportable segment disclosure requirements, primarily through enhanced disclosures about significant segment expenses. The company adopted ASU 2023-07 during the year ended December 31, 2024. See Note 12. Segment Information.
Recently Issued Not Yet Adopted Accounting Pronouncements
In December 2023, the FASB issued ASU 2023-09, Income Taxes (Topic 740): Improvements to Income Tax Disclosures, which modifies the rules on income tax disclosures to require entities to disclose specific categories in the rate reconciliation, the income or loss from continuing operations before income tax expense or benefit (separated between domestic and foreign) and income tax expense or benefit from continuing operations (separated by federal, state and foreign). ASU 2023-09 also requires entities to disclose their income tax payments to international, federal, state, and local jurisdictions, among other changes. The guidance is effective for annual periods beginning after December 15, 2024. Early adoption is permitted for annual financial statements that have not yet been issued or made available for issuance. ASU 2023-09 is to be applied on a prospective basis, but retrospective application is permitted. The company is currently evaluating the impact of adopting ASU 2023-09.
In November 2024, the FASB issued ASU 2024-03, Income Statement Reporting Comprehensive Income-Expense Disaggregation Disclosures (Subtopic 220-40): Disaggregation of Income Statement Expenses, requiring public entitles to disclose additional information about specific expense categories in the notes to the financial statements on an interim and annual basis. ASU 2024-03 is effective for fiscal years beginning after December 15, 2026, and for interim periods beginning after December 15, 2027, with early adoption permitted. The Company is currently evaluating the impact of adopting ASU 2024-03.
Note 2. Business Combinations and Investments in Unconsolidated Affiliates
Business Combinations
ROCA
The company acquired 100% of ROCA ACERO, S.A. de C.V. (ROCA) on October 1, 2022. The acquisition of ROCA is part of the company’s North American raw material procurement strategy. ROCA is headquartered in Monterrey, Mexico, and operates ferrous and nonferrous scrap facilities strategically positioned near high-volume industrial scrap sources located throughout Central and Northern Mexico. The transaction was funded with available cash. Post-acquisition operating results are reflected in the company’s financial statements in the metals recycling operations segment.
68
Note 2. Business Combinations and Investments in Unconsolidated Affiliates (Continued)
Aluminum Dynamics
The company obtained a 94.4% equity interest in a joint venture concurrently formed with Unity Aluminum, Inc. on July 29, 2022, for the construction and operation of a new state-of-the-art lower-carbon recycled aluminum flat rolled products mill. The transaction was funded with available cash. Operating results from and after July 29, 2022, are reflected in the company’s consolidated financial statements in the aluminum operations segment.
United Steel Supply
The company purchased a 75% equity interest in United Steel Supply, LLC on March 1, 2019. On April 1, 2022, the company purchased an additional 12.5% equity interest in USS. On April 1, 2023, a noncontrolling member of USS exercised its option to require SDI to purchase its 2.5% equity interest, increasing SDI’s ownership to 90%. The remaining noncontrolling members have the option to require SDI to purchase the remaining 10% equity interest of USS on or after February 28, 2025. The USS noncontrolling interest is therefore reflected in redeemable noncontrolling interest in the consolidated balance sheets.
Investments in Unconsolidated Affiliates
The company purchased a 45% minority equity interest in New Process Steel, L.P. (NPS) on January 31, 2022. NPS is a metals solutions and distribution supply-chain management company headquartered in Houston, Texas, with a focus toward growing its value-added manufacturing applications. On February 28, 2022, the company also purchased a minority equity interest in Aymium, a producer of renewable biocarbon products. As the company does not have power to control these entities, the company accounts for these investments using the equity method of accounting, which are recorded in Other Assets (noncurrent) in the company’s consolidated balance sheets with related activity recorded in Other (Income) Expense, net. Profits or losses from transactions with NPS are eliminated until realized by the majority equity interest owner.
Note 3. Long-Term Debt
The company’s borrowings consisted of the following at December 31 (in thousands):
|
|
|
2024 |
|
2023 |
|
|
||
|
|
2.800% senior notes due 2024 |
$ |
- |
|
$ |
400,000 |
|
|
|
|
2.400% senior notes due 2025 |
|
400,000 |
|
|
400,000 |
|
|
|
|
5.000% senior notes due 2026 |
|
400,000 |
|
|
400,000 |
|
|
|
|
1.650% senior notes due 2027 |
|
350,000 |
|
|
350,000 |
|
|
|
|
3.450% senior notes due 2030 |
|
600,000 |
|
|
600,000 |
|
|
|
|
3.250% senior notes due 2031 |
|
500,000 |
|
|
500,000 |
|
|
|
|
5.375% senior notes due 2034 |
|
600,000 |
|
|
- |
|
|
|
|
3.250% senior notes due 2050 |
|
400,000 |
|
|
400,000 |
|
|
|
|
Other obligations |
|
28,803 |
|
|
61,836 |
|
|
|
|
Total debt |
|
3,278,803 |
|
|
3,111,836 |
|
|
|
|
Less debt issuance costs and original issue discounts |
|
47,796 |
|
|
40,780 |
|
|
|
|
Total amounts outstanding |
|
3,231,007 |
|
|
3,071,056 |
|
|
|
|
Less current maturities |
|
426,990 |
|
|
459,987 |
|
|
|
|
Long-term debt |
$ |
2,804,017 |
|
$ |
2,611,069 |
|
|
Financing Activity
In July 2024, the company issued $600.0 million of 5.375% notes due 2034. Proceeds from these notes were used for general corporate purposes, including the repayment of the company’s 2.800% senior notes due December 2024, working capital, capital expenditures, advances for or investments in the company’s subsidiaries, acquisitions, redemption and repayment of other outstanding indebtedness, and purchases of the company’s common stock.
69
Note 3. Long-Term Debt (Continued)
Senior Credit Facility, due 2028
On July 19, 2023, the company entered into an unsecured credit agreement comprised of a senior unsecured credit facility (Facility), which provides a $1.2 billion unsecured Revolver, maturing July 2028. Subject to certain conditions, the company has the opportunity to increase the Facility size by $500.0 million. The unsecured Facility is available to fund working capital, capital expenditures, and other general corporate purposes. The Facility contains financial covenants and other covenants pertaining to the company’s ability to incur indebtedness and permit liens on certain assets. The company’s ability to borrow funds within the terms of the unsecured Facility is dependent upon its continued compliance with financial and other covenants. At December 31, 2024, the company had $1.2 billion of availability on the Facility, $9.3 million of outstanding letters of credit and other obligations which reduce availability, and there were no borrowings outstanding.
The Facility pricing grid is adjusted quarterly and is based on either the company’s leverage of net debt (as defined in the Facility) to last-twelve-months (LTM) consolidated Adjusted EBITDA as defined in the Facility (earnings before interest, taxes, depreciation, amortization, and certain other non-cash items as allowed in the Facility), or the company’s credit ratings. The minimum pricing is adjusted Secured Overnight Financing Rate (SOFR) plus 1.000% and the maximum pricing is adjusted SOFR plus 1.75%. In addition, the company is subject to an unused commitment fee of between 0.11% and 0.275% (based on either the leverage of net debt to LTM consolidated adjusted EBITDA, or the company’s credit ratings) which is applied to the unused portion of the Facility.
The financial covenants under the Facility state that the company must maintain an interest coverage ratio of not less than 2.50:1.00. The company’s interest coverage ratio is calculated by dividing its LTM consolidated Adjusted EBITDA by its LTM gross interest expense, less amortization of financing fees. In addition, a debt to capitalization ratio of not more than 0.60:1.00 must be maintained. At December 31, 2024, the company’s interest coverage ratio and debt to capitalization ratio were 21.68:1.00 and 0.27:1.00, respectively. The company was, therefore, in compliance with these covenants at December 31, 2024, and anticipates remaining in compliance during the next twelve months.
Senior Unsecured Notes
The company has seven different tranches of senior unsecured notes (Notes) outstanding. These Notes are in equal right of payment with all existing and future senior unsecured indebtedness and are senior in right of payment to all subordinated indebtedness. These Notes contain provisions that allow the company to redeem the Notes on or after the dates and at redemption prices (expressed as a percentage of principal amount) listed below.
The company’s $400.0 million of 2.400% senior notes due 2025 mature on June 15, 2025, with interest payable semi-annually. Early redemption is permitted any time prior to May 15, 2025, at the greater of par or a make-whole price of the remaining payments to be made discounted at the applicable U.S. Treasury rate plus 0.35%; and as of May 15, 2025, at 100.000%.
The company’s $400.0 million of 5.000% senior notes due 2026 mature on December 15, 2026, with interest payable semi-annually. Early redemption was permitted as of December 15, 2024, at 100.000%.
The company’s $350.0 million of 1.650% senior notes due 2027 mature on October 15, 2027, with interest payable semi-annually. Early redemption is permitted any time prior to August 15, 2027, at the greater of par or a make-whole price of the remaining payments to be made discounted at the applicable U.S. Treasury rate plus 0.20%; and as of August 15, 2027, at 100.000%.
The company’s $600.0 million of 3.450% senior notes due 2030 mature on April 15, 2030, with interest payable semi-annually. Early redemption is permitted any time prior to January 15, 2030, at the greater of par or a make-whole price of the remaining payments to be made discounted at the applicable U.S. Treasury rate plus 0.25%; and as of January 15, 2030, at 100.000%.
70
Note 3. Long-Term Debt (Continued)
The company’s $500.0 million of 3.250% senior notes due 2031 mature on January 15, 2031, with interest payable semi-annually. Early redemption is permitted any time prior to October 15, 2030, at the greater of par or a make-whole price of the remaining payments to be made discounted at the applicable U.S. Treasury rate plus 0.40%; and as of October 15, 2030, at 100.000%.
The company’s $600.0 million of 5.375% senior notes due 2034 mature on August 15, 2034, with interest payable semi-annually. Early redemption is permitted any time prior to May 15, 2034, at the greater of par or a make-whole price of the remaining payments to be made discounted at the applicable U.S. Treasury rate plus 0.20%; and as of May 15, 2034, at 100.000%.
The company’s $400.0 million of 3.250% senior notes due 2050 mature on October 15, 2050, with interest payable semi-annually. Early redemption is permitted any time prior to April 15, 2050, at the greater of par or a make-whole price of the remaining payments to be made discounted at the applicable U.S. Treasury rate plus 0.30%; and as of April 15, 2050, at 100.000%.
Other Obligations
Secured Loans. One of the company’s controlled subsidiaries has entered into financing agreements for certain equipment which bear a weighted average interest rate of 4.34%, with monthly principal and interest payments required through 2027. The outstanding principal balance of these agreements was $2.4 million and $2.0 million at December 31, 2024, and 2023, respectively. The controlled subsidiary also has a secured credit agreement, which matures in March 2026, and provides a revolving variable rate credit facility of up to $30.0 million, subject to a borrowing base determined from eligible accounts receivable and inventory. Interest, which was 5.81% at December 31, 2024, is payable monthly. There were no amounts due under the credit facility at December 31, 2024 or 2023.
One of the company’s controlled subsidiaries has a secured credit agreement, which matures in June 2028, and provides a revolving variable rate credit facility of up to $125.0 million, subject to a borrowing base determined from eligible accounts receivable and inventory. Interest, which was 6.40% at December 31, 2024, is payable monthly. Amounts due under the credit facility were $26.4 million and $59.8 million at December 31, 2024, and 2023, respectively.
Outstanding Debt Maturities
Maturities of outstanding debt as of December 31, 2024, are as follows (in thousands):
|
2025 |
|
$ |
427,442 |
|
|
2026 |
|
|
400,896 |
|
|
2027 |
|
|
350,465 |
|
|
2028 |
|
|
- |
|
|
2029 |
|
|
- |
|
|
Thereafter |
|
|
2,100,000 |
|
|
|
|
$ |
3,278,803 |
|
The company capitalizes interest on all qualifying construction in progress assets. For the years ended December 31, 2024, 2023, and 2022, total interest costs incurred were $123.1 million, $109.5 million, and $107.4 million, respectively, of which $66.8 million, $33.0 million, and $15.8 million, respectively, were capitalized.
71
Note 4. Income Taxes
Components of earnings before income taxes and noncontrolling interests for the years ended December 31 are as follows (in thousands):
|
|
2024 |
|
2023 |
|
2022 |
|
|||
|
United States income |
$ |
1,992,814 |
|
$ |
3,198,048 |
|
$ |
4,996,762 |
|
|
Foreign income (loss) |
|
(9,933) |
|
|
20,895 |
|
|
24,307 |
|
|
Total income before income taxes |
$ |
1,982,881 |
|
$ |
3,218,943 |
|
$ |
5,021,069 |
|
The company files a consolidated federal income tax return. The provision for income tax expense for the years ended December 31 is as follows (in thousands):
|
|
|
|
|
|
|
|
|
|
|
|
|
2024 |
|
2023 |
|
2022 |
|
|||
|
Current income tax expense |
|
|
|
|
|
|
|
|
|
|
Federal |
$ |
409,586 |
|
$ |
600,499 |
|
$ |
946,016 |
|
|
State |
|
57,942 |
|
|
91,965 |
|
|
152,758 |
|
|
Foreign |
|
7,980 |
|
|
3,482 |
|
|
8,605 |
|
|
Total current |
|
475,508 |
|
|
695,946 |
|
|
1,107,379 |
|
|
Deferred income tax expense (benefit) |
|
|
|
|
|
|
|
|
|
|
Federal |
|
(26,311) |
|
|
38,172 |
|
|
22,168 |
|
|
State |
|
(12,476) |
|
|
15,355 |
|
|
13,333 |
|
|
Foreign |
|
(3,796) |
|
|
2,138 |
|
|
(1,303) |
|
|
Total deferred |
|
(42,583) |
|
|
55,665 |
|
|
34,198 |
|
|
Total income tax expense |
$ |
432,925 |
|
$ |
751,611 |
|
$ |
1,141,577 |
|
A reconciliation of the statutory rates to the actual effective tax rates for the years ended December 31 are as follows:
|
|
2024 |
|
2023 |
|
2022 |
|
||||||
|
Statutory federal tax rate |
|
21.0 |
% |
|
|
21.0 |
% |
|
|
21.0 |
% |
|
|
State income taxes, net of federal benefit |
|
1.8 |
|
|
|
2.6 |
|
|
|
2.6 |
|
|
|
Federal research & development credits |
|
(0.9) |
|
|
|
(0.2) |
|
|
|
(0.6) |
|
|
|
Other permanent differences |
|
(0.1) |
|
|
|
(0.1) |
|
|
|
(0.3) |
|
|
|
Effective tax rate |
|
21.8 |
% |
|
|
23.3 |
% |
|
|
22.7 |
% |
|
72
Note 4. Income Taxes (Continued)
Significant components of the company’s deferred tax assets and liabilities at December 31 are as follows (in thousands):
|
|
2024 |
|
2023 |
|
||
|
Deferred tax assets |
|
|
|
|
|
|
|
Accrued expenses and allowances |
$ |
41,031 |
|
$ |
41,894 |
|
|
Inventories |
|
6,892 |
|
|
10,685 |
|
|
Net operating loss carryforwards |
|
24,381 |
|
|
7,663 |
|
|
Amortizable assets |
|
39,657 |
|
|
5,798 |
|
|
Other |
|
5,916 |
|
|
9,149 |
|
|
|
|
117,877 |
|
|
75,189 |
|
|
Less: valuation allowance |
|
(1,150) |
|
|
(816) |
|
|
Total net deferred tax assets |
|
116,727 |
|
|
74,373 |
|
|
|
|
|
|
|
|
|
|
Deferred tax liabilities |
|
|
|
|
|
|
|
Property, plant and equipment |
|
(1,014,515) |
|
|
(1,013,045) |
|
|
Other |
|
(4,398) |
|
|
(6,096) |
|
|
Total deferred tax liabilities |
|
(1,018,913) |
|
|
(1,019,141) |
|
|
Net deferred tax liability |
$ |
(902,186) |
|
$ |
(944,768) |
|
Certain wholly-owned and controlled subsidiaries of the company file separate federal and state income tax returns. One of the controlled subsidiaries generated federal net operating loss carryforwards in the years 2018 and prior, which were fully utilized as of December 31, 2024, but continues to have state net operating loss carryforwards which expire in the years 2034 through 2039. Annually, the company evaluates the realizability of the net deferred tax assets for this controlled subsidiary. In completing this evaluation, the company considers all available positive and negative evidence in order to determine whether, based on the weight of the evidence, a valuation allowance for its deferred tax assets is necessary. Such evidence includes current operating results, historical results, future reversals of existing taxable temporary differences and expectations for future taxable income (exclusive of the reversal of temporary differences and carryforwards), as well as the implementation of feasible and prudent tax planning strategies. Based on the evidence, the company maintained a valuation allowance of $1,150,000 and $816,000 as of December 31, 2024, and 2023, respectively, with respect to certain state tax credits of the controlled subsidiary.
A reconciliation of the beginning and ending amount of unrecognized tax benefits is as follows (in thousands):
|
|
|
|
|
|
|
|
|
|
|
|
|
2024 |
|
2023 |
|
2022 |
|
|||
|
Balance at January 1 |
$ |
31,258 |
|
$ |
28,646 |
|
$ |
20,466 |
|
|
Increases related to current year tax positions |
|
5,115 |
|
|
1,500 |
|
|
9,600 |
|
|
Increases related to prior year tax positions |
|
263 |
|
|
1,798 |
|
|
364 |
|
|
Decreases related to prior year tax positions |
|
(6,949) |
|
|
(686) |
|
|
(1,784) |
|
|
Balance at December 31 |
$ |
29,687 |
|
$ |
31,258 |
|
$ |
28,646 |
|
Included in the balance of unrecognized tax benefits at December 31, 2024 and 2023 are potential benefits of $26.4 million and $27.8 million, respectively, that, if recognized, would affect the effective tax rate. The company recognizes interest and penalties related to its tax contingencies on a net-of-tax basis in income tax expense. During the years ended December 31, 2024, 2023, and 2022, the company recognized expense from the increase of interest expense and penalties of $710,000, $1,560,000, and $480,000, respectively, net of tax. In addition to the unrecognized tax benefits in the table above, the company had $4.2 million and $3.2 million accrued for the payment of interest and penalties at December 31, 2024 and 2023, respectively.
73
Note 4. Income Taxes (Continued)
It is reasonably possible that the amount of unrecognized tax benefits could change in the next twelve months in an amount ranging from zero to $12.0 million, as a result of the expiration of the statute of limitations and other federal and state income tax audits. The company files income tax returns in the U.S. federal jurisdiction as well as income tax returns in various state jurisdictions. The tax years 2021 through 2023 remain open to examination by the Internal Revenue Service and various state and local jurisdictions.
Note 5. Shareholders’ Equity
Cash Dividends
The company declared cash dividends of $284.1 million, or $1.84 per common share, during 2024; $280.5 million, or $1.70 per common share, during 2023; and $245.3 million, or $1.36 per common share, during 2022. The company paid cash dividends of $282.6 million, $271.3 million, and $237.2 million during 2024, 2023, and 2022, respectively.
Treasury Stock
In July 2021, the board of directors authorized a share repurchase program of up to $1.0 billion of the company’s common stock. This program was exhausted in April 2022. In February 2022, the board of directors authorized an additional share repurchase program of up to $1.25 billion of the company’s common stock. This program was exhausted in November 2022. In November 2022, the board of directors authorized an additional share repurchase program of up to $1.5 billion of the company’s common stock. This program was exhausted in November 2023. In November 2023, the board of directors authorized an additional share repurchase program of up to $1.5 billion of the company’s common stock. Subsequent to December 31, 2024, in February 2025, the board of directors authorized an additional share repurchase program of up to $1.5 billion of the company’s common stock. Under the share repurchase programs, purchases take place as and when we determine in open market or private transactions made based upon the market price of our common stock, the nature of other investment opportunities or growth projects, our cash flows from operations, and general economic conditions. The share repurchase programs do not require us to acquire any specific number of shares, and may be modified, suspended, extended, or terminated by us at any time. The share repurchase programs do not have an expiration date. The company repurchased 9.4 million shares for $1.2 billion during 2024, 13.4 million shares for $1.5 billion during 2023, and 23.0 million shares for $1.8 billion during 2022 under the share repurchase programs. At December 31, 2024, the company had remaining authorization to repurchase $193.5 million of additional shares under the November 2023 share repurchase program.
Note 6. Equity-Based Incentive Plans
2023 Equity Incentive Plan
In May 2023, the company’s shareholders approved the 2023 Equity Incentive Plan (2023 Plan), which supersedes the prior Amended and Restated 2015 Equity Incentive Plan. The 2023 Plan is designed to attract, motivate, and retain qualified persons that are able to make important contributions to the company’s success. To accomplish these objectives, the 2023 Plan provides for awards of equity-based incentives through granting of restricted stock units (RSUs), deferred stock units (DSUs), stock appreciation rights (SARs), performance awards, such as the long-term incentive compensation program (LTIP), restricted stock awards (of which none have been granted), stock options (of which none have been granted), and unrestricted stock awards (of which none have been granted). Under the 2023 Plan, 9.0 million shares of common stock were reserved for grant through December 31, 2033. The 2023 Plan uses a fungible share concept under which any awards that are not a full-value award, such as stock options and stock-settled SARs, will be counted against the share reserve as one share for each share of common stock, and awards that are full-value awards, such as RSUs, DSUs, restricted and unrestricted stock awards, and performance awards, will be counted against the share reserve as 2.09 shares for each share of common stock. The SARs the company has granted to date can only be settled in cash, and thus, do not count against the share reserve. At December 31, 2024, there were 6.2 million shares still available for issuance.
74
Note 6. Equity-Based Incentive Plans (Continued)
Substantially all of the company’s full-time, non-union, U.S. team members receive RSUs, which are granted annually in November at no cost to employees and vest 100% over the shorter of two years from grant date or upon the recipient reaching retirement eligible age (59½ years). During 2024, 2023, and 2022, certain senior leadership of the company received RSUs in February which vest over a period of 2 to 4 years. The stock is issued to employees upon vesting. The company satisfies RSUs with newly issued shares, and satisfies restricted and unrestricted stock awards, DSUs, and performance awards with treasury shares. In addition to the RSUs and LTIP awards granted during the three-year period ended December 31, 2024, presented below, the company awarded 13,000, 18,000 and 20,000 DSUs in 2024, 2023 and 2022, respectively. The 1,300 SARs awards outstanding at December 31, 2024, for which no shares of common stock can be issued because the awards must be cash-settled upon exercise, have a weighted-average exercise price of $42.83.
Restricted Stock Units
A summary of the company’s RSU activity and outstanding RSUs as of December 31, 2024, are presented below (dollars in thousands except grant date fair value):
|
|
|
Weighted |
|
Aggregate |
|
|
|
||
|
Number |
|
Average Grant |
|
Intrinsic |
|
Unrecognized |
|||
|
of RSUs |
|
Date Fair Value |
|
Value |
|
Compensation |
|||
Outstanding RSUs as of January 1, 2022 |
1,348,258 |
|
$ |
43.82 |
|
$ |
83,686 |
|
$ |
39,657 |
Granted |
481,926 |
|
|
98.29 |
|
|
|
|
|
|
Vested |
(786,622) |
|
|
37.38 |
|
|
|
|
|
|
Forfeited |
(70,011) |
|
|
46.82 |
|
|
|
|
|
|
As of December 31, 2022 |
973,551 |
|
$ |
71.80 |
|
$ |
94,765 |
|
$ |
44,394 |
Granted |
433,810 |
|
|
108.95 |
|
|
|
|
|
|
Vested |
(517,041) |
|
|
64.03 |
|
|
|
|
|
|
Forfeited |
(40,829) |
|
|
78.70 |
|
|
|
|
|
|
As of December 31, 2023 |
849,491 |
|
$ |
99.13 |
|
$ |
101,480 |
|
$ |
43,073 |
Granted |
374,370 |
|
|
137.14 |
|
|
|
|
|
|
Vested |
(394,675) |
|
|
94.28 |
|
|
|
|
|
|
Forfeited |
(39,874) |
|
|
104.21 |
|
|
|
|
|
|
As of December 31, 2024 (nonvested) |
789,312 |
|
$ |
115.47 |
|
$ |
90,037 |
|
$ |
54,964 |
The weighted average remaining life before vesting of the outstanding RSUs as of December 31, 2024, is 1.6 years. The fair value of RSUs vesting during 2024, 2023, and 2022 was $56.2 million, $58.3 million, and $79.1 million, respectively, and was net-share settled such that the company withheld shares with value equivalent to the employees’ minimum statutory obligation for the applicable income and other employment taxes and remitted the cash to the appropriate taxing authorities. The total shares withheld in 2024, 2023, and 2022 were approximately 287,000, 342,000, and 249,000 shares, respectively, and were based on the value of the RSUs on their vesting dates as determined by the company’s closing stock price.
Long-Term Incentive Compensation Program (LTIP)
The company maintains an LTIP performance-based program directed toward key senior leadership of the company, as determined at the discretion of the Compensation Committee of the Board of Directors. Awards are in shares of the company’s common stock using the stock price on the first day of the performance period to convert each key senior executive’s predetermined multiple of annual base salary. The performance period is generally three years; however, transition awards can be issued with a shorter performance period. Performance is measured in terms of equal portions of four growth and profitability measures, as compared to the same measures, similarly treated, of a pre-established group of steel sector competitors. Awards earned can range from zero to 100% of the shares awarded, and award shares vest immediately once earned on the basis of performance.
75
Note 6. Equity-Based Incentive Plans (Continued)
The Compensation Committee granted the following three-year performance period awards and transition awards, which have been earned and have or will be issued as follows:
|
|
Maximum |
|
|
|
|
|
|
|
|
Shares That |
|
Award |
|
|
|
|
|
|
Could Be Issued |
|
Earned |
|
Award Issued/Issuable |
||
|
|
|
|
|
|
|
|
|
|
2021 LTIP Award: |
|
|
|
|
|
|
|
|
Three-year performance period award |
360,189 |
|
324,173 |
|
324,173 |
|
March 2024 |
|
|
|
|
|
|
|
|
|
|
2022 LTIP Award: |
|
|
|
|
|
|
|
|
Three-year performance period award |
249,759 |
|
249,759 |
|
249,759 |
|
March 2025 |
|
|
|
|
|
|
|
|
|
|
2023 LTIP Award: |
|
|
|
|
|
|
|
|
Three-year performance period award |
193,946 |
|
* |
|
* |
|
|
|
Two-year performance period transition award |
5,517 |
|
4,690 |
|
4,690 |
|
March 2025 |
|
One-year performance period transition award |
3,678 |
|
2,759 |
|
2,759 |
|
March 2024 |
|
|
|
|
|
|
|
|
|
|
2024 LTIP Award: |
|
|
|
|
|
|
|
|
Three-year performance period award |
172,425 |
|
* |
|
* |
|
|
* |
Not yet earned as performance period not complete. |
2018 Executive Incentive Compensation Plan (2018 Executive Plan)
The 2018 Executive Plan provides for eligibility of certain senior leadership of the company to receive cash and stock bonuses based on predetermined formulas. The company’s shareholders approved the 2018 Executive Plan in May 2018 and 2.0 million shares of company stock were reserved for grant through February 28, 2028. At times a portion of the bonus may be distributed in shares of the company’s stock, of which one-third of the shares vest immediately and the remaining shares vest in equal annual installments over an additional two-year service-based vesting period requirement. At December 31, 2024, 2023, and 2022, 1.3 million, 1.3 million, and 1.4 million shares, respectively, under the 2018 Executive Plan remained available for grant. Pursuant to the 2018 Executive Plan, 17,000, 29,000, and 26,000 shares were awarded with a market value of $2.2 million, $3.5 million, and $3.2 million for the 2024, 2023, and 2022 award years, respectively.
Note 7. Fair Value Measurements
Accounting standards provide a comprehensive framework for measuring fair value, sets forth a definition of fair value and establishes a hierarchy prioritizing the inputs to valuation techniques, giving the highest priority to quoted prices in active markets for identical assets and liabilities and the lowest priority to unobservable value inputs. Levels within the hierarchy are defined as follows:
| ● | Level 1—Unadjusted quoted prices for identical assets and liabilities in active markets; |
| ● | Level 2—Quoted prices for similar assets and liabilities in active markets (other than those included in Level 1) which are observable for the asset or liability, either directly or indirectly; and |
| ● | Level 3—Valuations derived from valuation techniques in which one or more significant inputs or significant value drivers are unobservable. |
76
Note 7. Fair Value Measurements (Continued)
The following table sets forth financial assets and liabilities measured at fair value on a recurring basis in the consolidated balance sheet and the respective levels to which the fair value measurements are classified within the fair value hierarchy as of December 31 (in thousands):
|
|
|
|
|
|
|
|
|
|
|
|
|
|
|
|
|
|
|
|
Quoted Prices |
|
Significant |
|
|
|
|
|
||
|
|
|
|
|
in Active |
|
Other |
|
Significant |
|
|
|||
|
|
|
|
|
Markets for |
|
Observable |
|
Unobservable |
|
|
|||
|
|
|
|
|
Identical Assets |
|
Inputs |
|
Inputs |
|
|
|||
|
|
Total |
|
(Level 1) |
|
(Level 2) |
|
(Level 3) |
|
|
||||
|
December 31, 2024 |
|
|
|
|
|
|
|
|
|
|
|
|
|
|
Short-term investments |
$ |
147,811 |
|
$ |
- |
|
$ |
147,811 |
|
$ |
- |
|
|
|
Commodity futures – financial assets |
|
19,323 |
|
|
- |
|
|
19,323 |
|
|
- |
|
|
|
Commodity futures – financial liabilities |
|
6,272 |
|
|
- |
|
|
6,272 |
|
|
- |
|
|
|
|
|
|
|
|
|
|
|
|
|
|
|
|
|
|
December 31, 2023 |
|
|
|
|
|
|
|
|
|
|
|
|
|
|
Short-term investments |
$ |
721,210 |
|
$ |
- |
|
$ |
721,210 |
|
$ |
- |
|
|
|
Commodity futures – financial assets |
|
2,483 |
|
|
- |
|
|
2,483 |
|
|
- |
|
|
|
Commodity futures – financial liabilities |
|
9,305 |
|
|
- |
|
|
9,305 |
|
|
- |
|
|
The carrying amounts of financial instruments including cash equivalents approximate fair value (Level 1). The fair values of short-term investments commodity futures contracts are estimated by the use of quoted market prices, estimates obtained from brokers, and other appropriate valuation techniques based on references available (Level 2). The fair value of long-term debt, including current maturities, as determined by quoted market prices (Level 2), was approximately $3.0 billion and $2.8 billion at December 31, 2024 and 2023, respectively (with a corresponding carrying amount in the consolidated balance sheet of $3.2 billion and $3.1 billion at December 31, 2024 and 2023, respectively).
Note 8. Commitments and Contingencies
The company has entered into certain commitments with suppliers which are of a customary nature. Commitments have been entered into relating to future expected requirements for commodities such as electricity, water, natural gas and its transportation services, fuel, air products, zinc, and electrodes. Certain commitments contain provisions which require that the company “take or pay” for specified quantities at fixed prices without regard to actual usage for periods of generally up to 5 years for physical commodity requirements and commodity transportation requirements, with some extending beyond, and for up to 15 years for air products and 27 years for water products. The company utilized such “take or pay” requirements during the past three years under these contracts. The company believes that production requirements will be such that consumption of the products or services purchased under these commitments will occur in the normal production process.
The company’s commitments for these agreements with “take or pay” or other similar commitment provisions for the years ending December 31 are as follows (in thousands):
|
2025 |
|
$ |
358,976 |
|
|
2026 |
|
|
57,430 |
|
|
2027 |
|
|
37,483 |
|
|
2028 |
|
|
24,360 |
|
|
2029 |
|
|
18,698 |
|
|
Thereafter |
|
|
164,532 |
|
|
|
|
$ |
661,479 |
|
77
Note 8. Commitments and Contingencies (Continued)
At December 31, 2024, the company has outstanding commitments of $578.8 million related to ongoing construction of property, plant, and equipment, most significantly the recycled aluminum flat rolled products mill and recycled aluminum slab facilities, as well as other steel operations expansion projects in 2025. The company’s commitments for operating leases are discussed in Note 11. Leases.
The company is involved in various litigation matters, including administrative and regulatory proceedings, that arise in the ordinary course of business, none of which are expected to have a material impact on the company’s financial condition, results of operations, or liquidity.
Note 9. Transactions with Affiliated Companies
The company purchases and sells recycled and scrap metal, steel, and purchases transportation services with other smaller affiliated companies, including equity method investments. These transactions for the years ended December 31, are as follows (in thousands):
|
|
2024 |
|
2023 |
|
2022 |
|
|||
|
Sales |
$ |
720,742 |
|
$ |
680,004 |
|
$ |
791,523 |
|
|
Accounts receivable |
|
54,230 |
|
|
73,245 |
|
|
79,769 |
|
|
Purchases |
|
188,906 |
|
|
167,798 |
|
|
127,860 |
|
|
Accounts payable |
|
7,267 |
|
|
9,685 |
|
|
9,934 |
|
Note 10. Retirement Plans
The company sponsors several 401(k) retirement savings and profit sharing plans (Plans) for eligible employees, which are considered “qualified plans” for federal income tax purposes. The company’s total expense for the Plans was $209.0 million, $312.4 million, and $466.9 million for the years ended December 31, 2024, 2023, and 2022, respectively. Profit sharing expense for eligible employees is 8% of consolidated pretax income excluding noncontrolling interests and other items. The resulting profit sharing expense under the Plan was $165.2 million, $264.6 million, and $421.6 million for the years ended December 31, 2024, 2023, and 2022, respectively; of which up to $132.2 million, $211.6 million, and $337.2 million, respectively, was directed by the company’s board of directors to be contributed to the Plans (subject to total Plan contribution limitations), with the remaining amounts each year paid directly in cash to the Plans’ participants.
Note 11. Leases
The company has operating leases relating principally to transportation and other equipment, and some real estate. The company determines if an arrangement contains a lease at inception, which generally occurs when the arrangement identifies a specific asset that the company has the right to direct the use of and obtain substantially all of the economic benefit from use of the identified asset. Certain of the lease agreements contain rent escalation clauses (including fixed and index-based escalations), and options to extend or terminate the lease. For purposes of calculating operating lease obligations, the company’s lease terms include options to extend the lease when it is reasonably certain that the company will exercise such option. The company uses its incremental borrowing rate at lease commencement to determine the present value of lease payments. The incremental borrowing rate is the rate of interest the company could borrow on a collateralized basis over a similar term with similar payments. Operating lease expense is recognized on a straight-line basis over the lease term.
78
Note 11. Leases (Continued)
Operating lease right-of-use assets and lease obligations included in the consolidated balance sheets at
December 31, are as follows (in thousands):
|
|
|
2024 |
|
|
2023 |
|
Right-of-use assets under operating leases: |
|
|
|
|
|
|
Other assets - noncurrent |
$ |
113,500 |
|
$ |
127,499 |
|
Lease obligations under operating leases: |
|
|
|
|
|
|
Accrued liabilities |
$ |
19,915 |
|
$ |
21,003 |
|
Other liabilities - noncurrent |
|
94,417 |
|
|
107,147 |
|
|
$ |
114,332 |
|
$ |
128,150 |
The weighted average remaining lease term for our operating leases is nine years as of December 31, 2024 and 2023. The weighted-average discount rate is 4.46% and 4.31% as of December 31, 2024 and 2023, respectively. Future operating lease liabilities as of December 31, 2024, for the next five years and thereafter are as follows (in thousands):
|
|
2025 |
$ |
24,207 |
|
|
|
|
2026 |
|
19,315 |
|
|
|
|
2027 |
|
16,411 |
|
|
|
|
2028 |
|
13,673 |
|
|
|
|
2029 |
|
10,885 |
|
|
|
|
Thereafter |
|
54,126 |
|
|
|
|
Total undiscounted cash flows |
|
138,617 |
|
|
|
|
Less imputed interest |
|
(24,285) |
|
|
|
|
Lease obligations under operating leases |
$ |
114,332 |
|
|
|
|
|
|
|
|
|
Operating lease expense included in the consolidated statements of income was $27.4 million, $27.9 million, and $23.7 million for the years ended December 31, 2024, 2023, and 2022, respectively. Cash paid related to operating lease obligations was $23.2 million, $22.8 million, and $20.1 million for the years ended December 31, 2024, 2023, and 2022, respectively. Variable lease costs were not material for the years ended December 31, 2024, 2023, and 2022. Short-term lease expense included in the consolidated statements of income was $51.3 million, $40.4 million, and $35.8 million for the years ended December 31, 2024, 2023, and 2022, respectively. Right-of-use assets obtained in exchange for new operating lease liabilities for the years ended December 31, 2024, 2023, and 2022 were $12.8 million, $38.8 million, and $30.9 million with addition of $16.8 million related to ROCA, respectively.
79
Note 12. Segment Information
The company’s chief operating decision maker (CODM), who is the Chief Executive Officer, analyzes the results of the business through the following reportable segments: steel operations, metals recycling operations, steel fabrication operations, and aluminum operations. In the fourth quarter 2024, results from an entity previously reported within the metals recycling operations segment were moved to the aluminum operations segment, consistent with a change in how the CODM manages the business. Segment information provided within this Form 10-K has been recast for all prior periods presented consistent with the current reportable segment presentation. The segment operations are more fully described in Note 1. Description of the Business and Summary of Significant Accounting Policies to the consolidated financial statements.
The CODM assesses segment performance and allocates resources primarily based on operating income. The CODM uses operating income to allocate operating and capital resources and assesses performance of each segment by comparing actual operating income results to historical and previously forecasted financial information. The accounting policies of the reportable segments are consistent with those described in Note 1 to the consolidated financial statements. Intra-segment sales and any related profits are eliminated in consolidation.
The company’s segment results, with prior periods recast consistent with our current reportable segments presentation, including disaggregated revenue by segment to external, external non-United States, and other segment customers, are as follows (in thousands):
|
|
|
|
|
Metals |
|
Steel |
|
|
|
|
|
|
|
|
|
|
|
|||
For the year ended |
|
Steel |
|
Recycling |
|
Fabrication |
|
Aluminum |
|
|
|
|
|
|
|
|
|
||||
December 31, 2024 |
|
Operations |
|
Operations |
|
Operations |
|
Operations |
|
Other (a) |
|
Eliminations |
|
Consolidated |
|||||||
|
|
|
|
|
|
|
|
|
|
|
|
|
|
|
|
|
|
|
|
|
|
Net sales - disaggregated revenue |
|
|
|
|
|
|
|
|
|
|
|
|
|
|
|
|
|
|
|
|
|
External |
|
$ |
11,311,552 |
|
$ |
1,311,124 |
|
$ |
1,761,771 |
|
$ |
256,051 |
|
$ |
1,435,062 |
|
$ |
- |
|
$ |
16,075,560 |
External Non-United States |
|
|
749,932 |
|
|
694,010 |
|
|
1,731 |
|
|
2,496 |
|
|
16,661 |
|
|
- |
|
|
1,464,830 |
Other segments |
|
|
465,582 |
|
|
2,131,779 |
|
|
8,293 |
|
|
60,142 |
|
|
- |
|
|
(2,665,796) |
|
|
- |
Net sales |
|
|
12,527,066 |
|
|
4,136,913 |
|
|
1,771,795 |
|
|
318,689 |
|
|
1,451,723 |
|
|
(2,665,796) |
|
|
17,540,390 |
Less: |
|
|
|
|
|
|
|
|
|
|
|
|
|
|
|
|
|
|
|
|
|
Cost of goods sold |
|
|
10,736,557 |
|
|
3,946,457 |
|
|
1,006,211 |
|
|
298,572 |
|
|
1,420,978 |
|
|
(2,670,971) |
|
|
14,737,804 |
Other segment items (b) |
|
|
208,135 |
|
|
113,649 |
|
|
98,600 |
|
|
92,448 |
|
|
348,153 |
|
|
(1,436) |
|
|
859,549 |
Operating income (loss) |
|
|
1,582,374 |
|
|
76,807 |
|
|
666,984 |
|
|
(72,331) |
|
|
(317,408) |
|
|
6,611 |
|
|
1,943,037 |
Interest expense, net of capitalized interest |
|
|
|
|
|
|
|
|
|
|
|
|
|
|
|
|
|
56,347 |
|||
Other (income) expense, net |
|
|
|
|
|
|
|
|
|
|
|
|
|
|
|
|
|
|
|
|
(96,191) |
Income before income taxes |
|
|
|
|
|
|
|
|
|
|
|
|
|
|
|
|
|
|
|
$ |
1,982,881 |
|
|
|
|
|
|
|
|
|
|
|
|
|
|
|
|
|
|
|
|
|
|
Depreciation and amortization |
|
$ |
351,558 |
|
$ |
56,148 |
|
$ |
11,071 |
|
$ |
6,786 |
|
$ |
53,344 |
|
$ |
- |
|
$ |
478,907 |
Capital expenditures |
|
|
461,524 |
|
|
83,020 |
|
|
29,374 |
|
|
1,309,027 |
|
|
55,183 |
|
|
(70,122) |
|
|
1,868,006 |
Total Assets |
|
|
8,776,445 |
|
|
1,301,234 |
|
|
665,867 |
|
|
2,802,647 |
|
|
3,319,917 |
(c) |
|
(1,930,877) |
|
|
14,935,233 |
|
|
|
|
|
|
|
|
|
|
|
|
|
|
|
|
|
|
|
|
|
|
80
Note 12. Segment Information (Continued)
|
|
|
|
|
Metals |
|
Steel |
|
|
|
|
|
|
|
|
|
|
|
|||
For the year ended |
|
Steel |
|
Recycling |
|
Fabrication |
|
Aluminum |
|
|
|
|
|
|
|
|
|
||||
December 31, 2023 |
|
Operations |
|
Operations |
|
Operations |
|
Operations |
|
Other (a) |
|
Eliminations |
|
Consolidated |
|||||||
|
|
|
|
|
|
|
|
|
|
|
|
|
|
|
|
|
|
|
|
|
|
Net sales - disaggregated revenue |
|
|
|
|
|
|
|
|
|
|
|
|
|
|
|
|
|
|
|
|
|
External |
|
$ |
11,603,139 |
|
$ |
1,162,246 |
|
$ |
2,798,262 |
|
$ |
239,095 |
|
$ |
1,164,942 |
|
$ |
- |
|
$ |
16,967,684 |
External Non-United States |
|
|
1,037,412 |
|
|
774,211 |
|
|
672 |
|
|
9,105 |
|
|
6,232 |
|
|
- |
|
|
1,827,632 |
Other segments |
|
|
427,071 |
|
|
2,222,131 |
|
|
7,843 |
|
|
37,707 |
|
|
727 |
|
|
(2,695,479) |
|
|
- |
Net sales |
|
|
13,067,622 |
|
|
4,158,588 |
|
|
2,806,777 |
|
|
285,907 |
|
|
1,171,901 |
|
|
(2,695,479) |
|
|
18,795,316 |
Less: |
|
|
|
|
|
|
|
|
|
|
|
|
|
|
|
|
|
|
|
|
|
Cost of goods sold |
|
|
10,977,249 |
|
|
3,971,743 |
|
|
1,115,515 |
|
|
237,759 |
|
|
1,147,441 |
|
|
(2,700,274) |
|
|
14,749,433 |
Other segment items (b) |
|
|
208,773 |
|
|
139,110 |
|
|
98,001 |
|
|
31,002 |
|
|
419,037 |
|
|
(1,221) |
|
|
894,702 |
Operating income (loss) |
|
|
1,881,600 |
|
|
47,735 |
|
|
1,593,261 |
|
|
17,146 |
|
|
(394,577) |
|
|
6,016 |
|
|
3,151,181 |
Interest expense, net of capitalized interest |
|
|
|
|
|
|
|
|
|
|
|
|
|
|
|
|
|
76,484 |
|||
Other (income) expense, net |
|
|
|
|
|
|
|
|
|
|
|
|
|
|
|
|
|
|
|
|
(144,246) |
Income before income taxes |
|
|
|
|
|
|
|
|
|
|
|
|
|
|
|
|
|
|
|
$ |
3,218,943 |
|
|
|
|
|
|
|
|
|
|
|
|
|
|
|
|
|
|
|
|
|
|
Depreciation and amortization |
|
$ |
331,225 |
|
$ |
65,803 |
|
$ |
9,787 |
|
$ |
4,917 |
|
$ |
26,072 |
|
$ |
- |
|
$ |
437,804 |
Capital expenditures |
|
|
453,955 |
|
|
185,903 |
|
|
22,044 |
|
|
967,739 |
|
|
28,264 |
|
|
- |
|
|
1,657,905 |
Total Assets |
|
|
8,650,450 |
|
|
1,340,445 |
|
|
790,399 |
|
|
1,444,335 |
|
|
3,248,822 |
(c) |
|
(566,031) |
|
|
14,908,420 |
|
|
|
|
|
|
|
|
|
|
|
|
|
|
|
|
|
|
|
|
|
|
|
|
|
|
|
Metals |
|
Steel |
|
|
|
|
|
|
|
|
|
|
|
|||
For the year ended |
|
Steel |
|
Recycling |
|
Fabrication |
|
Aluminum |
|
|
|
|
|
|
|
|
|
||||
December 31, 2022 |
|
Operations |
|
Operations |
|
Operations |
|
Operations |
|
Other (a) |
|
Eliminations |
|
Consolidated |
|||||||
|
|
|
|
|
|
|
|
|
|
|
|
|
|
|
|
|
|
|
|
|
|
Net sales - disaggregated revenue |
|
|
|
|
|
|
|
|
|
|
|
|
|
|
|
|
|
|
|
|
|
External |
|
$ |
13,783,666 |
|
$ |
1,293,258 |
|
$ |
4,245,803 |
|
$ |
252,121 |
|
$ |
1,276,923 |
|
$ |
- |
|
$ |
20,851,771 |
External Non-United States |
|
|
779,683 |
|
|
602,555 |
|
|
183 |
|
|
16,806 |
|
|
9,776 |
|
|
- |
|
|
1,409,003 |
Other segments |
|
|
537,647 |
|
|
2,304,414 |
|
|
11,221 |
|
|
23,158 |
|
|
1,281 |
|
|
(2,877,721) |
|
|
- |
Net sales |
|
|
15,100,996 |
|
|
4,200,227 |
|
|
4,257,207 |
|
|
292,085 |
|
|
1,287,980 |
|
|
(2,877,721) |
|
|
22,260,774 |
Less: |
|
|
|
|
|
|
|
|
|
|
|
|
|
|
|
|
|
|
|
|
|
Cost of goods sold |
|
|
11,787,382 |
|
|
3,986,236 |
|
|
1,737,366 |
|
|
266,950 |
|
|
1,295,721 |
|
|
(2,930,712) |
|
|
16,142,943 |
Other segment items (b) |
|
|
220,925 |
|
|
114,619 |
|
|
95,186 |
|
|
10,365 |
|
|
586,304 |
|
|
(1,390) |
|
|
1,026,009 |
Operating income (loss) |
|
|
3,092,689 |
|
|
99,372 |
|
|
2,424,655 |
|
|
14,770 |
|
|
(594,045) |
|
|
54,381 |
|
|
5,091,822 |
Interest expense, net of capitalized interest |
|
|
|
|
|
|
|
|
|
|
|
|
|
|
|
|
|
91,538 |
|||
Other (income) expense, net |
|
|
|
|
|
|
|
|
|
|
|
|
|
|
|
|
|
|
|
|
(20,785) |
Income before income taxes |
|
|
|
|
|
|
|
|
|
|
|
|
|
|
|
|
|
|
|
$ |
5,021,069 |
|
|
|
|
|
|
|
|
|
|
|
|
|
|
|
|
|
|
|
|
|
|
Depreciation and amortization |
|
$ |
295,468 |
|
$ |
48,851 |
|
$ |
9,727 |
|
$ |
5,127 |
|
$ |
25,029 |
|
$ |
- |
|
$ |
384,202 |
Capital expenditures |
|
|
613,678 |
|
|
63,967 |
|
|
17,519 |
|
|
189,805 |
|
|
23,933 |
|
|
- |
|
|
908,902 |
|
|
|
|
|
|
|
|
|
|
|
|
|
|
|
|
|
|
|
|
|
|
(a) Amounts included in Other are from subsidiary operations that are below the quantitative thresholds required for reportable segments and primarily consist of joint ventures and the idled Minnesota ironmaking operations. Also included are certain unallocated corporate accounts, such as the company's senior unsecured credit facility, senior notes, certain other investments, amortization of intangible assets and certain profit sharing expenses.
(b) Other segment items for each reportable operating segment include selling, general, and administrative expenses including payroll & benefit expenses and professional service expenses. Other segment items within Other include selling, general, and administrative expenses such as payroll & benefit expenses, companywide equity-based compensation expenses, and professional service expenses, as well as company-wide profit sharing expense and amortization of intangible assets.
(c) Asset amounts included in Other consist of assets held by subsidiary operations that are below the quantitative thresholds required for reportable segments and the company's corporate assets. Corporate assets primarily consist of cash, short-term and other investments, and intra-company debt.
81
ITEM 9. CHANGES IN AND DISAGREEMENTS WITH ACCOUNTANTS ON ACCOUNTING AND FINANCIAL DISCLOSURE
None.
ITEM 9A. CONTROLS AND PROCEDURES
(a) Evaluation of Disclosure Controls and Procedures.
As required, we carried out an evaluation, under the supervision and with the participation of our principal executive officer and principal financial officer, of the effectiveness of our disclosure controls and procedures, as defined in Rules 13a-15(e) and 15d-15(e) under the Securities Exchange Act of 1934, as amended (the Exchange Act). Based on this evaluation, our principal executive officer and principal financial officer concluded that, as of December 31, 2024, the end of the period covered by this annual report, our disclosure controls and procedures were designed to provide and were effective to provide reasonable assurance that the information required to be disclosed by us in the reports we file or submit under the Exchange Act is recorded, processed, summarized and reported within the time periods specified in the applicable rules and forms, and that it is accumulated and communicated to our management, including our principal executive and principal financial officer, as appropriate to allow timely decisions regarding required disclosure.
Management’s report on our internal control over financial reporting (as defined in Rules 13a-15(f) and 15d-15(f) under the Exchange Act) and the independent registered public accounting firm’s related audit report are included in Item 8. Consolidated Financial Statements and Supplementary Data of this Form 10-K and are incorporated herein by reference.
(b) Changes in Internal Control Over Financial Reporting
No changes in our internal control over financial reporting (as defined in Rules 13a-15(f) and 15d-15(f) under the Exchange Act) occurred during the fiscal quarter ended December 31, 2024, that has materially affected, or is reasonably likely to materially affect, our internal control over financial reporting.
Our Management’s Report on Internal Control Over Financial Reporting, as of December 31, 2024, can be found on page 52 of this Form 10-K, and the related Report of Independent Registered Public Accounting Firm, Ernst & Young LLP, can be found on page 53 of this Form 10-K, each of which is incorporated by reference into this Item 9A.
ITEM 9B. OTHER INFORMATION
During the three-month period ended December 31, 2024, none of the Company’s directors or executive officers adopted, modified or terminated a “Rule 10b5-1 trading arrangement” or a “non-Rule 10b5-1 trading arrangement” as such terms are defined under Item 408 of Regulation S-K.
ITEM 9C. DISCLOSURE REGARDING FOREIGN JURISDICTIONS THAT PREVENT INSPECTIONS
Not applicable.
82
PART III
ITEM 10. DIRECTORS, EXECUTIVE OFFICERS, AND CORPORATE GOVERANCE
The information required to be furnished pursuant to Item 10 with respect to directors, executive officers, code of ethics, insider trading policies, and audit committee financial experts is incorporated herein by reference from the section entitled “Governance of the Company” and “Proposal No. 1 – Election of Directors” in our Proxy Statement for the 2025 Annual Meeting of Shareholders, which we will file with the Securities and Exchange Commission no later than 120 days after the end of our fiscal year.
ITEM 11. EXECUTIVE COMPENSATION
The information required to be furnished pursuant to Item 11 with respect to executive compensation is incorporated herein by reference from the section entitled “Executive Compensation and Related Information” in our Proxy Statement for the 2025 Annual Meeting of Shareholders, which we will file with the Securities and Exchange Commission no later than 120 days after the end of our fiscal year.
ITEM 12. SECURITY OWNERSHIP OF CERTAIN BENEFICIAL OWNERS AND MANAGEMENT AND RELATED STOCKHOLDER MATTERS
The information relating to security ownership of certain beneficial owners and management required by Item 12 is incorporated herein by reference from the section entitled “Security Ownership of Directors and Executive Officers” and “Security Ownership of Certain Beneficial Owners” in our Proxy Statement for the 2025 Annual Meeting of Shareholders, which we will file with the Securities and Exchange Commission no later than 120 days after the end of our fiscal year. The Equity Compensation Plan Information required by Item 12 is set forth in the table below.
Equity Compensation Plan Information
Our shareholders approved the Steel Dynamics, Inc. 2018 Executive Incentive Compensation Plan at our annual meeting of shareholders held May 17, 2018 (2018 Plan). Our shareholders approved the Steel Dynamics, Inc. 2023 Equity Incentive Plan at our annual meeting of shareholders held May 11, 2023 (2023 Plan). Our shareholders approved the Steel Dynamics, Inc. 2024 Employee Stock Purchase Plan at our annual meeting of shareholders held May 9, 2024 (2024 Plan). The following table summarizes information about our equity compensation plans at December 31, 2024, all of which have been approved by shareholders. We do not have any equity compensation plans that have not been approved by shareholders.
|
|
|
|
|
|
|
|
|
(a) |
|
(b) |
|
(c) |
|
|
|
|
|
|
Number of securities |
|
|
|
|
|
|
remaining available for |
|
|
Number of securities to be |
|
|
|
future issuance under equity |
|
|
issued upon exercise of |
|
Weighted-average |
|
compensation |
|
|
outstanding options, |
|
exercise price of outstanding |
|
plans (excluding securities |
Plan Category |
|
warrants and rights |
|
options, warrants and rights(1) |
|
reflected in column (a)) |
Equity compensation plans approved by security holders: |
|
|
|
|
|
|
2018 Plan |
|
45,511 |
|
— |
|
1,316,899 |
2023 Plan(1) |
|
1,030,403 |
|
— |
|
6,190,152 |
2024 Plan(2) |
|
— |
|
— |
|
— |
Equity compensation plans not approved by security holders |
|
N/A |
|
N/A |
|
N/A |
Total |
|
1,075,914 |
|
— |
|
7,507,051 |
| (1) | Includes 789,312 RSUs and 241,091 DSUs issuable upon expiration of the vesting or deferral periods, which have no exercise price. |
| (2) | Shares are purchased on the open market and no shares are reserved. |
83
ITEM 13. CERTAIN RELATIONSHIPS AND RELATED TRANSACTIONS, AND DIRECTOR INDEPENDENCE
The information required to be furnished pursuant to Item 13 with respect to certain relationships and related transactions is incorporated herein by reference from the sections entitled “Governance of the Company – Statement of Policy for the Review, Approval or Ratification of Transactions with Related Persons,” and “Governance of the Company – Director Independence” in our Proxy Statement for the 2025 Annual Meeting of Shareholders, which we will file with the Securities and Exchange Commission no later than 120 days after the end of our fiscal year; and from Note 9. Transactions with Affiliated Companies to our consolidated financial statements as of December 31, 2024 and 2023, and each of the three years in the periods ended December 31, 2024, 2023, and 2022, included in Item 8. Consolidated Financial Statements and Supplementary Data of this Form 10-K Annual Report for the fiscal year ended December 31, 2024.
ITEM 14. PRINCIPAL ACCOUNTANT FEES AND SERVICES
The information required to be furnished pursuant to Item 14 with respect to principal accountant fees and services is incorporated herein by reference from the sections entitled “Proposal No. 2 – Ratification of the Appointment of Independent Registered Public Accounting Firm as Auditors – Audit and Non-Audit Fees” and “Proposal No. 2 – Ratification of the Appointment of Independent Registered Public Accounting Firm as Auditors – Policy on Audit Committee Pre-Approval of Audit and Permissible Non-Audit Services of Independent Registered Public Accounting Firm” in our Proxy Statement for the 2025 Annual Meeting of Shareholders, which we will file with the Securities and Exchange Commission no later than 120 days after the end of our fiscal year.
84
PART IV
ITEM 15. EXHIBITS AND FINANCIAL STATEMENT SCHEDULES
(a) The following documents are filed as a part of this report:
1. Financial Statements: See the Audited Consolidated Financial Statements of Steel Dynamics, Inc. included as part of Item 8. Consolidated Financial Statements and Supplementary Data and described in the Index on page 51 of this Report.
2. Financial Statement Schedules: All schedules for which provision is made in the applicable regulations of the Securities and Exchange Commission are not required under the related instructions or are inapplicable and therefore have been omitted.
(b) Exhibits:
Reference is made to the Exhibit Index preceding the signature pages hereto, which Exhibit Index is hereby incorporated into this item.
ITEM 16. FORM 10-K SUMMARY
None.
85
86
4.38 |
|
|
|
4.39 |
|
|
|
4.40 |
|
|
|
4.41 |
|
|
|
4.42 |
|
|
|
4.43 |
|
|
|
Material Contracts | |
|
|
10.20† |
|
|
|
10.61† |
|
|
|
10.62 |
|
|
|
10.63† |
|
|
|
10.64† |
|
|
|
Other | |
|
|
19.1* |
Policy Regarding Insider Trading and Certain Prohibited Transactions. |
|
|
21.1* |
|
|
|
23.1* |
|
|
|
24.1 |
Powers of attorney (see signature pages on pages 89 and 90 of this Report). |
|
|
87
97.1 |
|
Executive Officer Certifications | |
|
|
31.1* |
|
|
|
31.2* |
|
|
|
32.1* |
|
|
|
32.2* |
|
|
|
XBRL Documents | |
|
|
101.INS* |
XBRL Instance Document – the instance document does not appear in the Interactive Data File because its XBRL tags are embedded within the Inline XBRL document. |
|
|
101.SCH* |
Inline XBRL Taxonomy Extension Schema Document |
|
|
101.CAL* |
Inline XBRL Taxonomy Extension Calculation Linkbase Document |
|
|
101.DEF* |
Inline XBRL Taxonomy Extension Definition Linkbase Document |
|
|
101.LAB* |
Inline XBRL Taxonomy Extension Label Linkbase Document |
|
|
101.PRE* |
Inline XBRL Taxonomy Presentation Linkbase Document |
|
|
104* |
Cover page Interactive Data File (formatted as Inline XBRL and contained in Exhibit 101) |
* Filed concurrently herewith
† Indicates a management contract or compensatory plan or arrangement.
88
SIGNATURES
Pursuant to the requirements of Section 13 or 15(d) of Securities Exchange Act of 1934, Steel Dynamics, Inc. has duly caused this report to be signed on its behalf by the undersigned, thereunto duly authorized.
February 28, 2025 |
|
|
|
|
|
|
STEEL DYNAMICS, INC. |
|
|
|
|
|
|
|
|
By: |
/s/ MARK D. MILLETT |
|
|
Mark D. Millett |
|
|
Chief Executive Officer |
|
|
(Principal Executive Officer) |
POWER OF ATTORNEY
Each person whose signature appears below constitutes and appoints Mark D. Millett and Theresa E. Wagler, either of whom may act without the joinder of the other, as his or her true and lawful attorneys-in-fact and agents with full power of substitution and resubstitution, for him or her, and in his or her name, place and stead, in any and all capacities to sign any and all amendments, and supplements to this 2024 Annual Report on Form 10-K, filed pursuant to Section 13 or 15(d) of the Securities Exchange Act of 1934, as amended, and to file the same, with all exhibits thereto, and all other documents in connection therewith, with the Securities and Exchange Commission, granting unto said attorneys-in-fact and agents full power and authority to do and performs each and every act and thing requisite and necessary to be done, as full to all intents and purposes as he or she might or could do in person, hereby ratifying and confirming all that said attorneys-in-fact and agents or their substitute or substitutes may lawfully do or cause to be done by virtue thereof. Pursuant to the requirements of the Securities Exchange Act of 1934, this 2024 Annual Report on Form 10-K has been signed below by the following persons on behalf of Steel Dynamics, Inc. and in the capacities and on the dates indicated.
Signatures |
Title |
Date |
|
|
|
/s/ MARK D. MILLETT |
Chairman and Chief Executive Officer |
February 28, 2025 |
Mark D. Millett |
(Principal Executive Officer) |
|
|
|
|
/s/ THERESA E. WAGLER |
Executive Vice President and Chief Financial Officer |
February 28, 2025 |
Theresa E. Wagler |
(Principal Financial Officer and |
|
|
Principal Accounting Officer) |
|
|
|
|
/s/ SHEREE L. BARGABOS |
Director |
February 28, 2025 |
Sheree L. Bargabos |
|
|
|
|
|
/s/ KENNETH W. CORNEW |
Director |
February 28, 2025 |
Kenneth W. Cornew |
|
|
|
|
|
/s/ TRACI M. DOLAN |
Director |
February 28, 2025 |
Traci M. Dolan |
|
|
|
|
|
/s/ JENNIFER L HAMANN |
Director |
February 28, 2025 |
Jennifer L. Hamann |
|
|
|
|
|
/s/ BRADLEY S. SEAMAN |
Director |
February 28, 2025 |
Bradley S. Seaman |
|
|
|
|
|
/s/ GABRIEL L. SHAHEEN |
Director |
February 28, 2025 |
Gabriel L. Shaheen |
|
|
89
|
|
|
/s/ LUIS M. SIERRA |
Director |
February 28, 2025 |
Luis M. Sierra |
|
|
|
|
|
/s/ RICHARD P. TEETS, JR. |
Director |
February 28, 2025 |
Richard P. Teets, Jr. |
|
|
90
Exhibit 19.1
STEEL DYNAMICS, INC.
POLICY REGARDING INSIDER TRADING
AND
CERTAIN PROHIBITED TRANSACTIONS
I
THE NEED FOR A POLICY
Insider Trading
Federal and state securities laws make it illegal for anyone, regardless of status or position, to buy or sell a company’s securities when in possession of “material, nonpublic information” relating to the company. This conduct is known as “insider trading.” Passing such material nonpublic information on to someone else who may buy or sell securities—which is known as “tipping”—is also illegal. These prohibitions apply equally to stock, options, debt securities or any other securities. The law also imposes upon issuers, executive officers and directors the special responsibility of ensuring compliance with these laws, and a failure to take appropriate steps to prevent illegal insider trading can result in civil and criminal penalties.
Certain Transactions in Company Stock
In addition, good governance practices demand that both executive officers and board member stock ownership interests be aligned with stockholder interests, and that anything that decouples that alignment is problematic. Short-term or speculative transactions in company stock, engaging in hedging or other monetizing transactions, acquiring or maintaining company stock on margin, and pledging of significant amounts of company stock are all examples of transactions that should either be prohibited or tightly circumscribed.
II
GENERAL RULES
A. |
Insider Trading |
It is the policy of Steel Dynamics, Inc. that no officer, director or any other employee who becomes aware of material nonpublic information relating to the Company may, directly or through family members or other persons or entities,
· |
Buy or sell securities of the Company (other than pursuant to a pre-approved trading plan that complies with SEC Rule 10b5-1, referred to in Section V), or engage in any other action to take personal advantage of that information, or |
· |
Pass that information on to others outside the Company, including family and friends, whether or not for personal economic benefit. |
It is also the policy of Steel Dynamics, Inc. that no officer, director or any other employee of the Company who, in the course of working for the Company, learns of material nonpublic information about a company with which SDI does business, including customers, suppliers or parties involved in a potential transaction, may trade in that company’s securities, until the information becomes public or is no longer material.
For purposes of the following Section II.B through Section II.D, as well as for purposes of the specific prohibitions described in Section IV, the term “executive” or “executive officer” shall mean any corporate officer of Steel Dynamics, Inc. of the rank of vice president and above.
B. |
Short-term or Speculative Transactions |
Any hedging or other monetizing transactions that enable any executive officer or director to continue to own the Company’s securities without maintaining the full risks and rewards of ownership constitutes a poor governance practice and is prohibited.
C. |
Margin Accounts |
Acquiring company stock on margin or holding it in a margin account involves borrowing money to do so, and, therefore, by its very nature, involves speculating on the continued valuation of those securities. In the event of a decline in market value, this could result in a loss of more money than was invested, and, in the event of a margin call, could result in a forced sale of those securities by the broker, without the account holder’s consent.
Moreover, because such a sale may occur at a time when the account holder is aware of material non-public information, or when that person is otherwise not permitted to trade in the Company’s securities, Steel Dynamics’ executive officers and directors are prohibited from acquiring Company stock on margin or holding Company stock in a margin account.
D. |
Pledging Company Stock |
Pledging Company stock, however acquired, can be a problematic practice if unlimited and uncontrolled. Nevertheless, for purposes of responsible personal asset allocation planning and diversification, or for other sound reasons, and if subjected to certain volume, purpose and financial limitations, as set forth in Section IV.C, some pledging of Company stock may be appropriate and can be prudently managed and allowed.
III
KEY INSIDER TRADING DEFINITIONS
Information is “material” if there is a substantial likelihood that a reasonable investor would consider it important in deciding whether to buy, hold or sell a security. Common examples of information that may be material include:
· |
Earnings information (or significant components thereof) |
· |
Projections of future earnings or other earnings guidance |
· |
A pending or proposed merger, acquisition or sale |
· |
News about a major contract award or cancellation |
· |
Changes in senior management or other major personnel changes |
· |
Offerings of additional securities |
· |
Financial liquidity problems |
· |
Changes in pricing or discount policies |
· |
Significant problems with production or delivery |
· |
Significant legal exposure due to actual, pending or threatened litigation or governmental proceedings |
· |
Gain or loss of a significant customer or supplier |
· |
Changes in the Company’s auditors or a notification from its auditors that the Company may no longer rely on the auditors’ audit report |
Both positive and negative information can be material.
Material information is “nonpublic” if it is not generally known or available to the public through broad disclosure to the marketplace. We consider information to be available to the public only when
· |
It has been released to the public through appropriate channels, such as by means of a press release or a widely disseminated statement from a senior officer, and |
· |
Enough time has elapsed to permit the investment market to absorb and evaluate the information. |
2
As a general rule, information should be considered to be nonpublic until two business days after it has been publicly disclosed through a broad public market announcement.
This Insider Trading Policy also applies to family members who reside with the executive or director, anyone else who lives in the same household, and any family members who do not live in the same household but whose transactions in Company securities are directed by the executive or director or are subject to his or her influence or control.
The Company’s Insider Trading Policy does not apply to the exercise of an employee or director stock option, or to the settlement of a deferred stock unit (DSU) or restricted stock unit (RSU), or to the exercise of a tax withholding right pursuant to which the executive or director elects to have the Company withhold shares subject to an option to satisfy a tax withholding requirement. The policy does apply, however, to any sale of stock as part of a broker-assisted cashless exercise of an option, or any other market sale, either for purposes of generating the cash needed to pay the exercise price of an option or for any other purpose.
IV
SPECIFIC PROHIBITIONS
A. |
No Trading During “Blackout” Periods |
It is the policy of the Company that no trading in Company securities by any executive officer or director should take place during any applicable “blackout” periods. There are two types of blackout periods:
(1)Regular quarterly blackout periods, which shall be deemed to begin 10 days prior to the end of each calendar quarter and extend until the second business day following public release of the Company’s quarterly earnings.
(2)Special event-specific (irregular) blackout periods related to such things as impending mergers, securities offerings, or other material events. This type of blackout period will commence when circumstances require it, and as and when imposed by directive from the Board, the Chief Executive Officer or the Chief Financial Officer, and will end either by further order or when the special event is no longer a consideration, or on the second business day following public disclosure of the occurrence or non-occurrence special event.
B. |
No Short-Term or Speculative Transactions |
Steel Dynamics, Inc. considers it improper for any executive officer or director to engage in short-term or speculative transactions in the Company’s securities. Therefore, the Company’s policy is that executive officers and directors are prohibited from engaging in any of the following transactions:
(1) |
Short-term trading (transactions involving purchases and sales or sales and purchases, whether backward-looking or forward-looking, within any six month period). Short-term trading of Company stock may be distracting to the executive officer or director and may focus that person’s attention on short-term market swings, instead of long-term business objectives. Moreover, such transactions, in the case of executive officers or directors who are also “Section 16 reporting persons,” may also result in the institution of “short-swing profits” recoupment against the trader, measured by the amount of any realized gain. |
(2) |
Short sales. These are sales of Company stock that is borrowed from brokers or dealers, or on exchanges, where the executive or director does not actually own the stock. Such sales not only signify an expectation on the part of the short-seller that the securities will decline in value, but they are flatly prohibited to officers and directors, anyway, by Section 16(c) of the Securities Exchange Act of 1934. |
(3) |
Publicly traded options. A transaction in options (including puts, calls or other derivative securities) is, in effect, a bet on the short-term movement of the Company’s stock and may focus the officer’s or director’s attention on short-term performance at the expense of long-term objectives. Such transactions misalign the executive’s or director’s interests from those of the Company’s other stockholders. |
(4) |
Hedging and Other Monetizing Transactions. Such transactions, accomplished through the use of financial instruments such as exchange funds, prepaid variable forward sale contracts, equity swaps, zero-cost or other types of collars and various other similar derivative instruments, allow a person to lock in much of the value of his or her stock holdings, often in exchange for all or part of the potential for upside appreciation in the stock. Such |
3
transactions allow the officer or director to continue to own the covered securities, but without the full risks and rewards of ownership. When that occurs, the officer or director may no longer have the same objectives as the Company’s other stockholders. Moreover, certain of these and other short- term or speculative transactions in the Company’s stock by Company executive officers or directors create the potential for heightened legal risk and/or the appearance of improper conduct.
(5) |
Margin Transactions. Stock acquired or held in a brokerage margin account as collateral for a margin loan involves acquiring Company stock with borrowed money, involves speculation on the value of those securities, and, in the event of a decline in value, may result in the sale of the company stock without the owner’s consent to meet a margin call. Because this kind of forced sale may occur during a blackout period, or at a time when the executive officer or director is aware of material non-public information or is otherwise prohibited from trading in the Company’s stock, such transactions are inherently dangerous for both the Company and the trader. Accordingly, executive officers and directors are not permitted to purchase or hold Company stock on margin. |
C. |
Pledging of Company Stock |
(1) |
General Rule. Steel Dynamics believes that pledging any amount of Company stock, however acquired, by an executive officer or director, however acquired, is not a preferred use of an executive officer’s or director’s equity, in that, if unlimited and uncontrollable, it could be problematic for many of the same reasons as those applicable where stock is held in a brokerage margin account. For this reason, pledging of such shares is discouraged generally, subject, however, to the limited exception described in Section II.C(2). |
(2) |
Limited Exception to General Rule. The Company recognizes that under certain circumstances, a limited right to pledge a portion of an executive officer’s or director’s stock may be appropriate. |
In contrast to hedging transactions, where the person’s risks of continued ownership are decoupled and protected from a drop in stock price, in a pledge, the risk of continued ownership remains with the executive officer or director. Moreover, under certain circumstances, an inordinate concentration of a person’s wealth in a single asset may not be a good thing, and allowing a pledge of a portion of a person’s stock ownership position could facilitate sound asset diversification and even forestall the need to dispose of company stock in order to accomplish such or similar objectives.
Therefore, the Company believes that a limited ability to pledge Company stock in connection with a general loan, as an exception to the General Rule, ought to be permissible, if done in accordance with the procedures set forth in the following subsections.
(a) |
The Audit Committee shall have jurisdiction to hear requests for and to grant exceptions to permit some pledging, on a case-by-case basis, in connection with this Policy. |
(b) |
Any person wishing to initiate a request for an exception under this Policy must do so, together with all related documents and financial information necessary to demonstrate entitlement to an exception hereunder, no later than fifteen (15) days prior to the intended pledge transaction date. |
(c) |
The pledge must not involve a significant number of the person’s shares at the time of the pledge transaction. For purposes of this provision, “significant” shall mean a number of shares in excess of twenty-five percent (25%) of his or her stock ownership, exclusive of the person’s minimum stock ownership requirements. |
(d) |
The total number of pledged shares of the executive officer (“Named Executive Officer” and other executive officers of the rank of Vice President and above, as well as the director group as a whole (all together, the “Group”)), at the time of the particular pledge transaction, must not involve a significant number of shares in relation to the Company’s total number of issued and outstanding shares. For purposes of this provision, “significant” shall mean, for the Group, a number of shares in excess of one percent (1% of the Company’s issued and outstanding shares immediately following the pledge. |
(e) |
The pledgor must be able to reasonably demonstrate that he or she has the financial capability to repay the loan without resort to the pledged shares, and the pledgor must provide all requested information to the Audit Committee, demonstrating compliance with this Policy. |
4
(f) |
The terms of the pledge may not mitigate in any respect the risks of continued stock ownership of the pledged shares. |
(g) |
The pledgor must first meet stock ownership guidelines before pledging any shares, and, subsequently must continue to meet all required stock ownership guidelines with unpledged shares. |
(h) |
The Audit Committee may from time to time require additional conditions or requirements, as it may from time to time deem reasonable and appropriate under the circumstances. |
(i) |
The Audit Committee may adopt such rules and procedures as it may consider necessary in administering this Policy, including the kind of “Pre-Clearance” Process for permitting individual trades described in Section VI of this Policy. |
V
ESTABLISHMENT OF RULE 10b5-1 TRADING PLANS
Officers, directors or other employees, whose ability to sell Company shares may be prohibited by reason of the existence of material nonpublic information at the desired time of sale, are permitted to enter into a plan, permitted by the terms of SEC Rule 10b5-1(c) and available through most national or regional brokerage firms, under which pre-planned sales or purchases of Company shares may be made within the safe-harbor protections of that Rule. Such plans must first be pre-cleared through the Audit Committee before they may be undertaken.
In general, SEC Rule 10b5-1(c) provides a defense from insider trading liability if trades occur pursuant to a pre-arranged plan that meets the conditions of the Rule. Under this Rule, if a person enters into a binding contract, a standing instruction or a written plan that specifies the amount, price and date on which securities are to be either purchased or sold, and these arrangements are established at a time when the person does not possess material nonpublic information and is otherwise not within a blackout period, then the person may be able to claim a defense to insider trading liability if the actual sales or purchases under the plan occur at a time when the person may be deemed to have come into possession of material nonpublic information or is otherwise prohibited by a blackout from engaging in such a trade.
This Rule is complex and should only be considered and entered into only with professional advice, in order to fully understand the advantages, limitations and conditions of such a plan.
VI
PRE-CLEARANCE
It is the Company’s policy that the Company’s Named Executive Officers, other executive officers of the rank of Vice President and above, the Company’s directors, and any other employee who may or may be deemed have or to have had access to material nonpublic information, should not initiate any transaction to purchase or sell any Company securities, unless that person first pre-clears that transaction by reporting the intended transaction, together with all Required Information, no later than ten (10) days in advance, to the Chair of the Audit Committee, who, for purposes of this Policy, has been designated as Steel Dynamics’ Pre-Clearance Officer, and receives a written approval for that transaction. “Required Information” shall include a description of the proposed purchase, sale or transfer, the number of shares, consideration to be paid or received, the expected transaction and completion dates, and the names of the parties involved. In handling such requests, the decision of the Pre-Clearance Officer on all such requests shall be final.
It shall be the responsibility of each person covered by this Policy, following Pre-Clearance approval, to cause all of the foregoing and any other pertinent information regarding each trade or transaction to be reported to and received by the Pre-Clearance Officer on the same day as the trade or transaction, but in no event later than the morning of the day following the trade or transaction. It is the responsibility of the person making the trade, however, to ensure that all necessary notices, if any, are timely provided by the trader’s broker to the SEC, including any required Form 144s, and that SEC Form 4 is timely filed, if applicable, following the trade.
The Company is not responsible for any market price effect of any delays or the timing of any decision in connection with the pre-clearance process.
5
VII
REGULATORY COMPLIANCE
The Board of Directors or the Audit Committee, shall from time to time adopt and disseminate such additional rules, if any, as may be necessary or appropriate to ensure timely compliance with the Sarbanes-Oxley Act of 2002, with any Dodd-Frank Act requirements, and with applicable SEC, Nasdaq and other filing, reporting or governance rules or regulations.
6
EXHIBIT 21.1
STEEL DYNAMICS, INC.
LIST OF OUR SUBSIDIARIES
Name |
|
State of |
|
Percent of Capital |
|
Names Under which Business is |
|
|
|
|
|
|
|
Aluminum Dynamics, LLC |
|
Indiana |
|
94.4% |
|
|
Mesabi Nugget Delaware, LLC |
|
Delaware |
|
86% |
|
|
New Millennium Building Systems, LLC |
|
Indiana |
|
100% |
|
|
OmniSource, LLC |
|
Indiana |
|
100% |
|
OmniSource |
Roanoke Electric Steel Corporation |
|
Indiana |
|
100% |
|
Steel Dynamics Roanoke Bar Division |
SDI Biocarbon Solutions, LLC |
|
Delaware |
|
75% |
|
|
Steel Dynamics Columbus, LLC |
|
Indiana |
|
100% |
|
|
Steel Dynamics Enterprises, Inc. |
|
Indiana |
|
100% |
|
|
Steel Dynamics Heartland, LLC |
|
Indiana |
|
100% |
|
|
Steel Dynamics Sales North America, Inc. |
|
Indiana |
|
100% |
|
|
Steel Dynamics Southwest, LLC |
|
Indiana |
|
100% |
|
|
Steel of West Virginia, Inc. |
|
Indiana |
|
100% |
|
|
STLD Holdings, Inc. |
|
Indiana |
|
100% |
|
|
The Techs Industries, Inc. |
|
Indiana |
|
100% |
|
The Techs The Techs a Division of Steel Dynamics, Inc. |
United Steel Supply, LLC |
|
Texas |
|
90% |
|
|
Vulcan Threaded Products, Inc. |
|
Indiana |
|
100% |
|
Vulcan Steel Products CLP Systems |
EXHIBIT 23.1
CONSENT OF INDEPENDENT REGISTERED PUBLIC ACCOUNTING FIRM
We consent to the incorporation by reference in the following Registration Statements:
| (1) | Registration Statements (Form S-3 Nos. 333-235343 and 333-268703) of Steel Dynamics, Inc., |
| (2) | Registration Statement (Form S-4 No. 333-217162) of Steel Dynamics, Inc., |
| (3) | Registration Statement (Form S-8 No. 333-55888) pertaining to the Amended and Restated Officer and Manager Cash and Stock Bonus Plan of Steel Dynamics, Inc., |
| (4) | Registration Statement (Form S-8 No. 333-133493) pertaining to the Plan Relating to Assumed Stock Options: Roanoke Electric Steel Corporation Acquisition of Steel Dynamics, Inc., and |
| (5) | Registration Statement (Form S-8 No. 333-147271) pertaining to the 2006 Equity Incentive Plan, the Steel Dynamics, Inc. Amended and Restated 1996 Incentive Stock Option Plan, and the Steel Dynamics, Inc. Non-Employee Directors Stock Option Plan of Steel Dynamics, Inc.; |
of our reports dated February 28, 2025, with respect to the consolidated financial statements of Steel Dynamics, Inc. and the effectiveness of internal control over financial reporting of Steel Dynamics, Inc. included in this Annual Report (Form 10-K) of Steel Dynamics, Inc. for the year ended December 31, 2024.
/s/ Ernst & Young LLP
Indianapolis, Indiana
February 28, 2025
EXHIBIT 31.1
CERTIFICATION PURSUANT TO SECTION 302 OF THE
SARBANES-OXLEY ACT OF 2002
I, Mark D. Millett, certify that:
1. I have reviewed this annual report on Form 10-K of Steel Dynamics, Inc. for 2024;
2. Based on my knowledge, this report does not contain any untrue statement of a material fact or omit to state a material fact necessary to make the statements made, in light of the circumstances under which such statements were made, not misleading with respect to the period covered by this report;
3. Based on my knowledge, the financial statements, and other financial information included in this report, fairly present in all material respects the financial condition, results of operations and cash flows of the registrant as of, and for, the periods presented in this report;
4. The registrant’s other certifying officer and I are responsible for establishing and maintaining disclosure controls and procedures (as defined in Exchange Act Rules 13a-15(e) and 15d-15(e)) and internal control over financial reporting (as defined in Exchange Act Rules 13a-15(f) and 15d-15(f)) for the registrant and have:
(a) Designed such disclosure controls and procedures, or caused such disclosure controls and procedures to be designed under our supervision, to ensure that material information relating to the registrant, including its consolidated subsidiaries, is made known to us by others within those entities, particularly during the period in which this report is being prepared;
(b) Designed such internal control over financial reporting, or caused such internal control over financial reporting to be designed under our supervision, to provide reasonable assurance regarding the reliability of financial reporting and the preparation of financial statements for external purposes in accordance with generally accepted accounting principles;
(c) Evaluated the effectiveness of the registrant’s disclosure controls and procedures and presented in this report our conclusions about the effectiveness of the disclosure controls and procedures, as of the end of the period covered by this report based on such evaluation; and
(d) Disclosed in this report any change in the registrant’s internal control over financial reporting that occurred during the registrant’s most recent fiscal quarter (the registrant’s fourth fiscal quarter in the case of an annual report) that has materially affected, or is reasonably likely to materially affect, the registrant’s internal control over financial reporting; and
5. The registrant’s other certifying officer and I have disclosed, based on our most recent evaluation of internal control over financial reporting, to the registrant’s auditors and the audit committee of the registrant’s board of directors (or persons performing the equivalent functions):
(a) All significant deficiencies and material weaknesses in the design or operation of internal control over financial reporting which are reasonably likely to adversely affect the registrant’s ability to record, process, summarize and report financial information; and
(b) Any fraud, whether or not material, that involves management or other employees who have a significant role in the registrant’s internal control over financial reporting.
Date: February 28, 2025
|
/s/ MARK D. MILLETT |
|
Mark D. Millett |
|
Chairman and Chief Executive Officer |
|
(Principal Executive Officer) |
EXHIBIT 31.2
CERTIFICATION PURSUANT TO SECTION 302 OF THE
SARBANES-OXLEY ACT OF 2002
I, Theresa E. Wagler, certify that:
1. I have reviewed this annual report on Form 10-K of Steel Dynamics, Inc. for 2024;
2. Based on my knowledge, this report does not contain any untrue statement of a material fact or omit to state a material fact necessary to make the statements made, in light of the circumstances under which such statements were made, not misleading with respect to the period covered by this report;
3. Based on my knowledge, the financial statements, and other financial information included in this report, fairly present in all material respects the financial condition, results of operations and cash flows of the registrant as of, and for, the periods presented in this report;
4. The registrant’s other certifying officer and I are responsible for establishing and maintaining disclosure controls and procedures (as defined in Exchange Act Rules 13a-15(e) and 15d-15(e)) and internal control over financial reporting (as defined in Exchange Act Rules 13a-15(f) and 15d-15(f)) for the registrant and have:
(a) Designed such disclosure controls and procedures, or caused such disclosure controls and procedures to be designed under our supervision, to ensure that material information relating to the registrant, including its consolidated subsidiaries, is made known to us by others within those entities, particularly during the period in which this report is being prepared;
(b) Designed such internal control over financial reporting, or caused such internal control over financial reporting to be designed under our supervision, to provide reasonable assurance regarding the reliability of financial reporting and the preparation of financial statements for external purposes in accordance with generally accepted accounting principles;
(c) Evaluated the effectiveness of the registrant’s disclosure controls and procedures and presented in this report our conclusions about the effectiveness of the disclosure controls and procedures, as of the end of the period covered by this report based on such evaluation; and
(d) Disclosed in this report any change in the registrant’s internal control over financial reporting that occurred during the registrant’s most recent fiscal quarter (the registrant’s fourth fiscal quarter in the case of an annual report) that has materially affected, or is reasonably likely to materially affect, the registrant’s internal control over financial reporting; and
5. The registrant’s other certifying officer and I have disclosed, based on our most recent evaluation of internal control over financial reporting, to the registrant’s auditors and the audit committee of the registrant’s board of directors (or persons performing the equivalent functions):
(a) All significant deficiencies and material weaknesses in the design or operation of internal control over financial reporting which are reasonably likely to adversely affect the registrant’s ability to record, process, summarize and report financial information; and
(b) Any fraud, whether or not material, that involves management or other employees who have a significant role in the registrant’s internal control over financial reporting.
Date: February 28, 2025
|
/s/ THERESA E. WAGLER |
|
Theresa E. Wagler |
|
Executive Vice President and Chief Financial Officer |
|
(Principal Financial Officer and Principal Accounting Officer) |
EXHIBIT 32.1
Chief Executive Officer Certification
Pursuant to 18 U.S.C. Section 1350, as Adopted Pursuant to
Section 906 of the Sarbanes-Oxley Act of 2002
In connection with the Annual Report of Steel Dynamics, Inc. (the “Company”) on Form 10-K for the year ended December 31, 2024, as filed with the Securities and Exchange Commission on the date hereof (the “Report”), the undersigned, Mark D. Millett, Chief Executive Officer of the Company, certifies, pursuant to 18 U.S.C. Section 1350, as adopted pursuant to Section 906 of the Sarbanes-Oxley Act of 2002, that:
1. |
The Report fully complies with the requirements of section 13(a) or 15(d) of the Securities Exchange Act of 1934; and |
2. |
The information contained in the Report fairly presents, in all material respects, the financial condition and results of operations of the Company. |
|
/s/ MARK D. MILLETT |
|
Mark D. Millett |
|
Chairman and Chief Executive Officer |
|
(Principal Executive Officer) |
February 28, 2025
A signed original of this written statement required by Section 906 has been provided to Steel Dynamics, Inc. and will be retained by Steel Dynamics, Inc. and furnished to the Securities and Exchange Commission or its staff upon request.
EXHIBIT 32.2
Chief Financial Officer Certification
Pursuant to 18 U.S.C. Section 1350, as Adopted Pursuant to
Section 906 of the Sarbanes-Oxley Act of 2002
In connection with the Annual Report of Steel Dynamics, Inc. (the “Company”) on Form 10-K for the year ended December 31, 2024, as filed with the Securities and Exchange Commission on the date hereof (the “Report”), the undersigned, Theresa E. Wagler, Executive Vice President and Chief Financial Officer of the Company, certifies, pursuant to 18 U.S.C. Section 1350, as adopted pursuant to Section 906 of the Sarbanes-Oxley Act of 2002, that:
1. |
The Report fully complies with the requirements of section 13(a) or 15(d) of the Securities Exchange Act of 1934; and |
2. |
The information contained in the Report fairly presents, in all material respects, the financial condition and results of operations of the Company. |
|
/s/ THERESA E. WAGLER |
|
Theresa E. Wagler |
|
Executive Vice President and Chief Financial Officer |
|
(Principal Financial Officer and Principal Accounting Officer) |
February 28, 2025
A signed original of this written statement required by Section 906 has been provided to Steel Dynamics, Inc. and will be retained by Steel Dynamics, Inc. and furnished to the Securities and Exchange Commission or its staff upon request.