UNITED STATES
SECURITIES AND EXCHANGE COMMISSION
Washington, D.C. 20549
Form 10-K
(Mark One)
☒ |
ANNUAL REPORT PURSUANT TO SECTION 13 OR 15(d) OF THE SECURITIES EXCHANGE ACT OF 1934 |
For the fiscal year ended December 31, 2024
☐ |
TRANSITION REPORT PURSUANT TO SECTION 13 OR 15(d) OF THE SECURITIES EXCHANGE ACT OF 1934 |
For the transition period from to .
Commission file number: 1-10466
The St. Joe Company
(Exact name of registrant as specified in its charter)
Florida |
|
59-0432511 |
|
(State or other jurisdiction of incorporation or organization) |
|
(I.R.S. Employer Identification No.) |
| ||
|
130 Richard Jackson Boulevard, Suite 200 Panama City Beach, Florida |
|
32407 |
(Address of principal executive offices) |
|
(Zip Code) |
(850) 231-6400
(Registrant’s telephone number, including area code)
Securities Registered Pursuant to Section 12(b) of the Act:
Title of Each Class |
|
Trading Symbol(s) |
|
Name of Exchange on Which Registered |
Common Stock, no par value |
|
JOE |
|
New York Stock Exchange |
Securities Registered Pursuant to Section 12(g) of the Act: NONE | ||||
Indicate by check mark whether the registrant is a well-known seasoned issuer, as defined in Rule 405 of the Securities Act. YES ☑ NO ☐
Indicate by check mark if the registrant is not required to file reports pursuant to Section 13 or Section 15(d) of the Act. YES ☐ NO ☑
Indicate by check mark whether the registrant (1) has filed all reports required to be filed by Section 13 or 15(d) of the Securities Exchange Act of 1934 during the preceding 12 months (or for such shorter period that the registrant was required to file such reports), and (2) has been subject to such filing requirements for the past 90 days. YES ☑ NO ☐
Indicate by check mark whether the registrant has submitted electronically every Interactive Data File required to be submitted pursuant to Rule 405 of Regulation S-T (§ 232.405 of this chapter) during the preceding 12 months (or for such shorter period that the registrant was required to submit such files). YES þ NO ☐
Indicate by check mark whether the registrant is a large accelerated filer, an accelerated filer, a non-accelerated filer, a smaller reporting company, or an emerging growth company. See the definitions of “large accelerated filer,” “accelerated filer”, “smaller reporting company” and “emerging growth company” in Rule 12b-2 of the Exchange Act.
Large accelerated filer |
☑ |
Accelerated filer |
☐ |
Non-accelerated filer |
☐ |
Smaller reporting company |
☐ |
|
|
Emerging Growth Company |
☐ |
If an emerging growth company, indicate by check mark if the registrant has elected not to use the extended transition period for complying with any new or revised financial accounting standards provided pursuant to Section 13(a) of the Exchange Act. ☐
Indicate by check mark whether the registrant has filed a report on and attestation to its management’s assessment of the effectiveness of its internal control over financial reporting under Section 404(b) of the Sarbanes-Oxley Act (15 U.S.C. 7262(b)) by the registered public accounting firm that prepared or issued its audit report. ☑
If securities are registered pursuant to Section 12(b) of the Act, indicate by check mark whether the financial statements of the registrant included in the filing reflect the correction of an error to previously issued financial statements. ☐
Indicate by check mark whether any of those error corrections are restatements that required a recovery analysis of incentive-based compensation received by any of the registrant’s executive officers during the relevant recovery period pursuant to §240.10D-1(b). ☐
Indicate by check mark whether the registrant is a shell company (as defined in Rule 12b-2 of the Exchange Act). YES ☐ NO ☑
The aggregate market value of the registrant’s Common Stock held by non-affiliates based on the closing price on June 30, 2024, was approximately $2.0 billion.
As of February 24, 2025, there were 58,326,521 shares of common stock, no par value, issued of which 58,326,521 were outstanding.
Documents Incorporated By Reference
Portions of the Registrant’s definitive proxy statement for its 2025 Annual Meeting of Shareholders, which proxy statement will be filed no later than 120 days after the close of the Registrant’s fiscal year ended December 31, 2024, are hereby incorporated by reference in Part III of this Annual Report on Form 10-K.
THE ST. JOE COMPANY
INDEX
2
PART I
Item 1. Business
As used throughout this Annual Report on Form 10-K, the terms “St. Joe,” the “Company,” “we,” “our,” or “us” include The St. Joe Company, its consolidated subsidiaries and consolidated joint ventures unless the context indicates otherwise.
Description
St. Joe was incorporated in the State of Florida in 1936. We are a diversified real estate development, asset management and operating company. As of December 31, 2024, we owned 167,000 acres of land in Northwest Florida, compared to 168,000 acres and 169,000 acres as of December 31, 2023 and 2022, respectively. A portion of our land is within The Bay-Walton Sector Plan (“Sector Plan”), that entitles, or gives legal rights, for us to originally develop over 170,000 residential dwelling units, over 22 million square feet of retail, commercial and industrial space and over 3,000 hotel rooms on lands within Florida’s Bay and Walton counties. We also have additional entitlements, or legal rights, to develop acreage outside of the Sector Plan. Approximately 87% of our real estate is located in Florida’s Bay, Gulf, and Walton counties. Approximately 90% of our real estate land holdings are located within fifteen miles of the Gulf of Mexico. For additional information regarding our properties, see Item 2. Properties included in this Form 10-K.
Our operations span residential, hospitality, and commercial segments, offering a comprehensive range of real estate activities and lifestyle amenities. In our residential segment, we develop and sell homesites across multiple communities, primarily to homebuilders and on a limited basis to retail customers. Through an unconsolidated joint venture (“JV”) homes are being constructed and sold in the Latitude Margaritaville Watersound community, an approximately 3,500-home active adult residential development. Our hospitality operations include the exclusive Watersound Club, which offers members access to golf courses, a beach club and other recreational amenities. We own, or jointly own, and operate a portfolio of hotels across multiple brands, from luxury boutique properties to branded hotels. Our hospitality segment also includes food and beverage operations, retail outlets, vacation rentals, marinas and other entertainment assets. In our commercial segment we own, or jointly own, develop and lease property for a variety of uses, including multi-family, senior living, self-storage, mixed-use, medical, office, retail, industrial and various other uses. The commercial segment also sells developed and undeveloped land and manages our timber holdings, which includes growing and selling pulpwood, sawtimber and other products. We have investments in unconsolidated JVs that own and operate two hotels, a fuel station and convenience store, a multi-family management business and a golf cart sales and service facility. We continue to expand our portfolio while maintaining our focus on Northwest Florida’s sustained growth and development.
Strategy
St. Joe believes its long-term, owner-oriented capital and management allows us to optimize the value of Northwest Florida real estate by developing residential, hospitality, and commercial projects that meet growing market demand. Our core strategies are to expand our portfolio of income producing commercial properties, develop long-term, scalable residential communities and grow our hospitality offerings. This strategy is designed to provide opportunities to build recurring revenues and enterprise value for the foreseeable future. We may partner with or explore the sale of discrete assets when we and/or others can better deploy resources.
Capital is invested to achieve risk-adjusted rates of return and support future business initiatives that create value. New projects are planned for stand-alone profitably and to benefit other enterprise activities. Investments, which include investments in JVs, are funded with cash proceeds from completed projects, existing cash, owned-land, partner capital and financing arrangements. Actual investments may vary from planned capital investments for various reasons. We do not anticipate immediate benefits from investments. We may choose to operate rather than lease assets, lease rather than sell assets, or sell improved rather than unimproved land that may delay revenue and profits. We continue to maintain low fixed expenses, low corporate debt and high liquidity for sustainability in all environments.
3
We distribute cash in excess of expected operating needs to shareholders through cash dividends and common stock repurchases, as approved by the Board of Directors (the “Board”). In 2024, we paid quarterly cash dividends of $0.12 per share on our common stock in the first and second quarters and $0.14 per share on our common stock in the third and fourth quarters. This represents an increase from 2023, when we paid quarterly cash dividends of $0.10 per share on our common stock in the first and second quarters and $0.12 per share on our common stock in the third and fourth quarters. In 2022, we paid quarterly cash dividends of $0.10 per share throughout the year. In addition, our Board has approved a stock repurchase program (the “Stock Repurchase Program”), pursuant to which we may repurchase our common stock in open market purchases from time to time, in privately negotiated transactions or otherwise, pursuant to Rule 10b-18 under the Securities Exchange Act of 1934, as amended (the “Exchange Act”). During the years ended December 31, 2024 and 2022, we repurchased 70,985 and 576,963 shares of our common stock for an aggregate purchase price of $3.4 million and $20.0 million, respectively, excluding the excise tax on stock repurchases in excess of issuances as a result of the Inflation Reduction Act of 2022 (the “IRA”). During the year ended December 31, 2023, we did not repurchase shares of our common stock. As of December 31, 2024, we had a total authority of $76.7 million available under the program. In February 2025, the Board increased the total authorization under the Stock Repurchase Program to $100.0 million. See Item 5. Market for the Registrant’s Common Equity, Related Stockholder Matters and Issuer Purchases of Equity Securities and Note 15. Stockholders’ Equity included in Item 15 of this Form 10-K.
Reportable Segments
St. Joe operations are reported in three segments: (1) residential, (2) hospitality and (3) commercial. For financial information about our reportable segments, see Item 7. Management’s Discussion and Analysis of Financial Condition and Results of Operations, as well as Note 19. Segment Information included in Item 15 of this Form 10-K.
Investments in Joint Ventures
As part of our core business strategy, we have created a meaningful portion of our business through JVs. We enter into these arrangements for the purposes of developing real estate and other business activities, which we believe allows us to complement our growth strategy, leverage industry expertise and diversify our business.
These entities produce meaningful revenue. However, in the case of our unconsolidated JVs, the revenue generated by these entities is not included in our revenue. Instead, investments in JVs in which we are not the primary beneficiary, or a voting interest entity where we do not have a majority voting interest or control, but have significant influence are unconsolidated and accounted for by the equity method. Equity method investments are recorded initially at cost and adjusted subsequently to recognize the investor’s share of earnings, losses and changes in capital of the investee which are included in investment in unconsolidated joint ventures in the accompanying consolidated balance sheets and equity in income from unconsolidated joint ventures in the accompanying consolidated statements of income. See Note 4. Joint Ventures included in Item 15 of this Form 10-K for additional information.
Additionally, we have determined that as of December 31, 2024 and 2023, our unconsolidated JV, LMWS, LLC (the “Latitude Margaritaville Watersound JV”), has met the conditions of a significant subsidiary under Rule 1-02(w) of Regulation S-X. The Latitude Margaritaville Watersound JV did not meet the significant subsidiary test under Rule 1-02(w) of Regulation S-X as of December 31, 2022. The separate financial statements of the Latitude Margaritaville Watersound JV, as required pursuant to Rule 3-09 of Regulation S-X, are filed as Exhibit 99.1 in Item 15 of this Form 10-K.
Seasonality and Market Variability
St. Joe’s operations may be affected by seasonal fluctuations. The revenues and earnings from our business segments may vary significantly from period to period. Homebuilders tend to buy multiple homesites in sporadic transactions. In addition, homesite prices vary significantly by community, which further impacts period over period results. Therefore, there may be reporting periods in which we have no, or significantly less, revenue from residential or commercial real estate sales. We may also choose to operate rather than lease assets, lease rather than sell assets, or sell improved rather than unimproved land that may delay revenue and profits.
4
Hospitality revenues are typically higher in the second and third quarters, and vary depending on the timing of holidays and school breaks. Commercial real estate sales tend to be non-recurring. Projects depend on uncertain demand. Extraordinary events such as hurricanes or public health emergencies may dramatically change demand and pricing for products and services.
Competition
St. Joe competes with local, regional and national real estate related companies, some of which may have greater financial, marketing, sales and other resources than us. Competition may adversely affect our ability to attract tenants to lease our commercial, multi-family and senior living properties or to attract purchasers of our residential and commercial real estate. In addition to the strong competition we face in our residential and commercial segments, highly competitive companies participate in the hospitality business. Our ability to remain competitive and to attract new and repeat guests, customers and club members depends on our success in distinguishing the quality and value of our products and services from those offered by others. We compete based on location, price and amenities. The principal methods of competition are price and quality. Labor markets in the industries in which we operate are also competitive. We must attract, train and retain a large number of qualified employees while controlling related labor costs. We face significant competition for these employees from the industries in which we operate as well as from other industries. There can be no assurance we will be able to compete successfully against competitors or that competitive pressures will not have a material adverse effect on our business, results of operations, cash flows and financial condition.
Regulations
St. Joe operations are subject to federal, state and local government laws and regulations that affect every aspect of our business, including environmental and land use laws relating to, among other things, water, air, solid waste, hazardous substances, zoning, construction permits or entitlements, building codes and the requirements of the Federal Occupational Safety and Health Act and comparable state statutes relating to the health and safety of our employees. Although we believe that we are in material compliance with these requirements, there can be no assurance that we will not incur significant costs, civil and criminal penalties, and liabilities, including those relating to claims for damages to property or natural resources, resulting from our operations. We maintain environmental and safety compliance programs for our facilities and forestry land to monitor compliance with these laws and regulations. Enactment of new laws or regulations, or changes in existing laws or regulations or the interpretation and enforcement of these laws or regulations, might require significant expenditures.
Human Capital Management
At The St. Joe Company, we believe our employees are our greatest asset. We strive to attract, retain and develop the highest quality talent. As of February 24, 2025, we employed 863 full-time employees and 194 part-time and seasonal employees.
Recruitment and Retention
Success depends upon our ability to attract and retain skilled employees. As such, we are committed to recruiting top talent and offer competitive benefits, wages and a rewarding work environment.
We have a demonstrated history of investing in our workforce by offering competitive salaries and wages, which we continuously evaluate based on the business environment and labor market. We have consistently made enhancements in wages in order to attract talent to support our growth strategy and enhance the customer experience. At times, we rely on the J-1 and H-2B visa programs to bring workers to the United States (“U.S.”) to fill seasonal staffing needs of our hospitality operations and ensure that we have the appropriate workforce in place. These programs allow students participating in internship programs to expand their cultural experience outside of their home country through employment opportunities within the hospitality environment.
In addition to competitive wages, we offer our employees and eligible family members a comprehensive and valuable benefits program. Our suite of benefits offered to all full-time employees include group health plans, which include medical, dental, vision, life and disability benefits with Company sharing of premiums for certain coverages.
5
We also offer a 401(k) retirement savings plan with Company match, paid vacation and holidays, jury pay, bereavement leave, an employee referral bonus program, tuition reimbursement program and discounted gym memberships. From time to time, we provide team members with health care screenings and vaccinations on our properties. Our employees also enjoy discounts at our Company-owned properties and amenities, as well as other exclusive discounts and special offers which may include access to preferred seating and tickets to top attractions, theme parks, shows, sporting events, movie tickets, hotels and more.
As well as being a tool for improving our human capital management strategies, we evaluate employee engagement and satisfaction annually. We focus on our employees’ opinions and collect data through various means, including surveys and focus groups. Our executive team reviews feedback from our employees and, based on the response, action plans are developed to focus on areas of opportunity throughout the course of the year. We are pleased to report that our most recent annual engagement results were favorable overall and have shown that our employees are proud to work for the Company.
We were recently certified as a Great Place to Work®, a national program that recognizes employers who create an outstanding employee experience. Notably, 84% of survey respondents expressed favorable feedback regarding the Company and highlighted favorable ratings in key areas such as equity, collaboration and integrity - values that continue to guide our culture. The results of focus groups and The Great Place to Work certification reflects our collective efforts to create an exceptional workplace whereby we continuously improve our human capital strategies and find ways to foster engagement and growth for our team members.
Diversity and Inclusion
We strive to foster a diverse and inclusive environment where each of our team members are valued and respected while working to build a workplace, community and Company that reflects our core values.
As of February 24, 2025, approximately 32% of our workforce identify as racially diverse and approximately 47% of our workforce, including 50% of our executive management team, is comprised of female employees.
Health and Safety
The health and safety of our team members is a top priority. We are committed to providing a safe and injury-free workplace. We continually invest in programs designed to improve physical, mental and social well-being, and provide access to a variety of innovative, flexible and convenient health and wellness programs.
Community Engagement
We are actively engaged in and committed to supporting the communities we serve. Our community engagement efforts seek to bring our core values to life and make a difference in the places where we live and work. We maintain strong connections to these communities, creating positive impact through outreach, recruitment, advocacy, philanthropy, pro bono service, and volunteerism. In addition, our developments positively impact the communities in which they are located, including by creating jobs in the Northwest Florida region and improving the overall quality of life in the area.
Sustainability
We are committed to the development of sustainable and efficient operations and business practices that enhance and protect our people, our communities and our planet. Our goal is to generate shareholder value while aligning our business practices to support the interests of our stakeholders and the communities we serve, including the sustainable development of Northwest Florida. Our process of defining sustainability priorities focuses on the simultaneous improvement of the environmental, social and financial position of the Company, and our strong leadership and governance practices that strive to integrate sustainability into our business strategy and corporate culture.
6
The acreage we own is located in Northwest Florida and the majority is managed in our forestry operations under our commercial segment. Many of Northwest Florida’s state parks, state forests and wildlife refuges were created in part with St. Joe land.
The guiding principles of our sustainable forest management practices include complying with laws and regulations, developing a long-term sustainable timber harvest plan, and understanding the economic and social impacts on the surrounding region. We take a holistic approach to managing our resources – timber, land, water, soil and wildlife – with the goal of sustainability. We are leading by example and protecting the best of Florida by working closely with environmental agencies, community leaders and leading environmental and conservation organizations. Our sustainable forest management practices take many forms, including eradication of invasive plant species, restoring wetlands, thinning forests, replanting trees and conducting prescribed burns. We carry out prescribed burns annually, which helps restore natural ecosystems, improves wildlife habitats and reduces wildfire hazards. Additionally, we are engaged in the operation of mitigation banks, which pursuant to mitigation plans approved by the applicable state and federal authorities, produce mitigation credits in Bay County, Florida and Walton County, Florida for the purpose of enabling developers to mitigate environmental impacts.
Additional information regarding our sustainability efforts is available in the Stewardship section of our website at https://www.joe.com/stewardship. The content of the Stewardship section of our website is not incorporated by reference into this Annual Report on Form 10-K (“Form 10-K”) or in any other report or document filed with the U.S. Securities and Exchange Commission (“SEC”), unless expressly noted.
Information
St. Joe’s most recent Annual Report on Form 10-K, Quarterly Reports on Form 10-Q (“Form 10-Q”), Current Reports on Form 8-K (“Form 8-K”), and amendments to those reports may be viewed or downloaded electronically, free of charge, from our website at www.joe.com as soon as reasonably practicable after we electronically file such material with, or furnish it to, the SEC. In addition, you may review any materials we file with the SEC on the SEC’s website at www.sec.gov. Our recent press releases are also available to be viewed or downloaded electronically from the Investor Relations section of our website at www.joe.com. St. Joe will provide electronic copies of our SEC filings free of charge upon request. Any information posted on or linked from our website is not incorporated by reference into this Form 10-K.
Item 1A. Risk Factors
Forward-Looking Statements
This annual report contains “forward-looking statements” within the meaning of Section 27A of the Securities Act of 1933 and Section 21E of the Exchange Act. These statements include, among other things, information about possible or assumed future results of the business and our financial condition, liquidity, results of operations, plans, strategies, prospects and objectives. Such forward-looking statements can generally be identified by our use of forward-looking terminology such as “may,” “will,” “expect,” “intend,” “anticipate,” “estimate,” “believe,” “continue” or other similar expressions concerning matters that are not historical facts. The Company cautions that its forward-looking statements involve risks and uncertainties, and while we believe that our expectations for the future are reasonable in view of currently available information, you are cautioned not to place undue reliance on our forward-looking statements. All business decisions involve assessing known risks. However, some risks may be unknown with changing socio-economic, market conditions and interest rates. Estimates are used to assess, among other things, capital allocation decisions. Actual results or events may differ materially from estimates and those indicated in our forward-looking statements as a result of various important factors. Such factors include, but are not limited to, those discussed below.
Forward-looking statements are only as of the date they are made, and the Company undertakes no duty to update its forward-looking statements except as required by law. You are advised, however, to review any further disclosures we make on related subjects in our subsequent Form 10-Q, Form 8-K and other reports filed with the SEC.
7
You should carefully consider the risks described below, together with all of the other information in this Form 10-K. The risks described below are not the only risks facing us. Moreover, we operate in a very competitive and rapidly changing environment. New risk factors emerge from time to time and it is not possible for us to predict all such risk factors, nor can we assess the impact of all such risk factors on our business or the extent to which any factor, or combination of factors, may affect our business. Additional risks and uncertainties not currently known to us, or that we currently deem to be immaterial, may also materially and adversely affect our business. If any of these risks actually occur, our business, financial condition, results of operations, cash flows, strategies and prospects may be materially adversely affected and could cause our actual results to differ materially from the results contemplated by the forward-looking statements in this report and in the other public statements we make.
STRATEGIC AND COMPETITIVE RISKS
We may not be able to successfully implement our business strategy. Our business strategy consists of developing our residential real estate and expanding the scope of our hospitality assets and services, our commercial portfolio of income producing properties and our other ventures to build recurring revenues and enhance enterprise value, while always maintaining sufficient enterprise liquidity. Our strategy also includes operating a portion of our business through JVs. Management may fail in assessing risks related to our strategy, profitably maintaining and growing operations and allocating capital. We may also face risks from unidentified issues not discovered in due diligence of operations and investments. Management may fail in estimating and most efficiently allocating cash in excess of operational and strategic investment needs, including to shareholders by dividends and the repurchase of common stock.
Management may also fail to accurately forecast financial results, and, as a result, actual results may vary greatly from management estimates. As of December 31, 2024, we had approximately $1,040.4 million of real estate investments, $66.5 million of investment in unconsolidated joint ventures and $59.1 million of property and equipment, net recorded on our books at depreciated cost basis subject to impairment testing. If market conditions were to deteriorate, our estimate of undiscounted future cash flows may fall below their carrying value and we may be required to take impairments, which would have an adverse effect on our results of operations and financial condition. Existing and planned operations utilize estimates of revenue, costs, profits, growth, and real estate market values.
We face significant competition across our business units. We compete with local, regional and national real estate leasing and development companies and homebuilders, some of which may have greater financial, marketing, sales and other resources than we do. Hospitality operations are subject to significant competition from other hospitality providers and lodging alternatives. Our ability to remain competitive and to attract new and repeat guests, customers and club members depends on our success in distinguishing the quality and value of our products and services from those offered by others. Competition from real estate leasing and development companies and homebuilders may adversely affect our ability to attract tenants and lease our commercial, multi-family and senior living properties, attract purchasers and sell residential homesites and commercial real estate and attract and retain experienced real estate sales, leasing and development personnel. Labor markets in the industries in which we operate are also competitive, which have led to increased labor costs in recent years. We must attract, train and retain a large number of qualified employees while controlling related labor costs. In addition, we face competition for tenants from other retail shopping centers and commercial facilities, as well as for our multi-family and senior living communities. There can be no assurance we will be able to compete successfully against current or future competitors or that competitive pressures will not have a material adverse effect on our business, results of operations, cash flows and financial condition.
A decline in general economic conditions, particularly in our primary market locations, could lead to reduced consumer demand for our products and services. Demand for our products and services is sensitive to changes in economic conditions over which we have no control, including the level of employment, consumer confidence, consumer income, consumer discretionary spending, consumer preferences, inflation, the availability of financing, changes in fiscal monetary policy and interest rate levels. In addition, the real estate market is subject to downturns, and our business is especially sensitive to economic conditions in Northwest Florida, where our developments and assets are located, and, more broadly, the Southeast region of the U.S., which in the past has produced a high percentage of customers for our products. If market conditions experience volatility or worsen, tenant and other customers’ demand may materially decline. For example, over the past several years, we have faced macroeconomic headwinds caused by, among other things, inflation, elevated interest rates, higher insurance costs, supply chain disruptions, financial institution disruptions and geopolitical conflicts, which impacted buyer sentiment. While demand across our segments remained strong despite these challenges, our business was impacted from the aforementioned macroeconomic factors, which have extended homesite and home deliveries in certain residential communities and increased operating costs.
8
Although these delays generally have not resulted in increased cancellation rates, and therefore only impacted the timing of revenue recognition of our homesites, if conditions worsen or demand declines, we could experience cancellations that could adversely impact our business.
Additionally, we and the real estate industry in general may be adversely affected during periods of high inflation, primarily because of higher construction and operating costs.
Our leasing projects are subject to a variety of risks that could impact returns. Our business strategy includes the development and leasing of multi-family and senior living properties, management of commercial properties and commercial assets for sale. These commercial developments may not be as successful as estimated due to leasing related risks, including the risk that we may not be able to lease new properties, obtain lease rates that are consistent with our projections or achieve targeted occupancy levels within expected timeframes as well as the risks generally associated with real estate development. Senior living properties in particular face challenges such as longer lease-up periods, specialized staffing requirements, and the need to establish and maintain a strong reputation in the local market. Additionally, development of leasing projects involves the risk associated with the significant time lag between commencement and completion of the project. This time lag subjects us to greater risks relating to, among other things:
| ● | fluctuations in the general economy; |
| ● | our ability to obtain construction or permanent financing on favorable commercial terms, if at all; |
| ● | our ability to achieve projected rental rates; |
| ● | the pace that we will be able to lease to new tenants; |
| ● | higher than estimated construction costs (including labor and material costs); and |
| ● | delays in the completion of projects because of, among other factors, inclement weather, labor disruptions, construction delays or delays in receiving zoning or other regulatory approvals, or man-made or natural disasters. |
Failure to lease new properties or obtain lease rates that are consistent with our projections or significant time lags between commencement and completion of a commercial project may lead to lower than anticipated returns, which could adversely impact our ability to successfully execute our business strategy.
We face risks stemming from our strategic partnerships. We currently maintain, and in the future may seek additional strategic partnerships, including the formation of JVs, to develop real estate or to pursue other business activities, capitalize on the potential of our residential, hospitality and commercial opportunities and maximize the value of our assets. Certain of these JVs may be material to our business. For example, for the years ended December 31, 2024 and 2023, our equity in income from the unconsolidated Latitude Margaritaville Watersound JV accounted for over 20% of our pre-tax income. This concentration in a single JV means that any adverse changes affecting this project, whether from market conditions, issues with our joint venture partner, or project-specific challenges, could have a disproportionate impact on our overall financial performance, even if our other operations perform as expected.
Our partners may take actions contrary to our instructions or requests, or contrary to our policies or objectives. We may not have exclusive control over the development, financing, management and other aspects of the partnership, which may prevent us from taking actions that are in our best interest but opposed by our partner. Our partners may experience financial difficulties, become bankrupt or fail to fund their share of capital contributions, which may delay construction or development of property or increase our financial commitment to the partnership. Our partners may take actions that subject us to liabilities in excess of, or other than, those contemplated. We may disagree with our partners about decisions affecting the partnership, which may result in litigation or arbitration that increases our expenses, distracts our officers and directors and disrupts the day-to-day operations of the property or business, which may delay important decisions until the dispute is resolved. Actions by our partners may subject the JV to liabilities or have other adverse consequences, including if the market reputation of a partner deteriorates. If a JV agreement is terminated or dissolved, we may not continue to own or operate the interests or investments of the JV or may need to purchase such interests or investments at a premium to the market price to continue ownership.
9
In addition, we may not have sufficient resources, experience and/or skills to manage our existing JVs or locate additional desirable partners.
Our real estate investments are generally illiquid. Real estate and timber holdings are relatively illiquid. It may be difficult for us to sell such assets if the need or desire arises, which may limit our ability to make rapid adjustments to the size and content of our property assets. Illiquid assets typically experience greater price volatility, as a ready market does not exist and therefore can be more difficult to value. In addition, validating third-party pricing for illiquid assets may be more subjective than more liquid assets. As a result, if we are required to liquidate all or a portion of our real estate or timber assets quickly, we may realize significantly less than the value at which we have previously recorded our assets. This impact may also be exacerbated in periods of general economic instability and capital markets volatility.
We may invest in new business endeavors or product lines, which are inherently risky and could disrupt our ongoing business and present risks not originally contemplated. In recent years, we have invested, and in the future may invest, in new business endeavors and product lines. New endeavors may involve new risks and uncertainties and may amplify existing risks, including additional competition, distraction of management from current operations, greater-than-expected liabilities and expenses, economic, political, legal and regulatory challenges associated with operating in new businesses or product lines, inadequate return on capital and potential impairment of tangible and intangible assets. New ventures are inherently risky and may not be successful. In addition, we may face difficulty integrating new businesses or product lines, assimilating new facilities and personnel and harmonizing diverse businesses and methods of operation. If any of our business endeavors are unsuccessful and we fail to realize the expected benefits of any new investment or product line or are unable to successfully integrate new businesses or product lines, our business, results of operations, cash flows and financial condition could be adversely affected.
We face risks associated with short-term U.S. Treasury Bills. We hold significant cash balances that are invested in a variety of short-term U.S. Treasury Bills that are intended to preserve principal value and maintain a high degree of liquidity. We have exposure to credit risk associated with our short-term U.S. Treasury Bills and these instruments are subject to price fluctuations as a result of changes in the financial market’s assessment of issuer credit quality, increases in delinquency and default rates, changes in prevailing interest rates and other economic factors.
Additionally, we have historically been exposed, and in the future may again be exposed, to credit risk associated with investments – debt securities (“Securities”), which are also subject to such fluctuations. A downgrade of the U.S. government’s credit rating may also decrease the value of any future investments in Securities. The market value of such potential future investments will be subject to change from period-to-period, especially in light of the political landscape, financial institution disruptions and geopolitical conflicts which have caused market volatility. Our Securities have historically included, and in the future may again include, investments in U.S. Treasury Bills classified as investments – debt securities. Credit-related impairment losses can negatively affect earnings. Investments in securities and funds are not insured against loss of principal. Under certain circumstances we may be required to redeem all or part of any future investment, which may result in a loss.
Our investments are supervised and directed by Fairholme Capital Management, L.L.C. (“FCM”), an investment advisor registered with the SEC, pursuant to the terms of an Investment Management Agreement, as amended, (the “Investment Management Agreement”). See Note 5. Investments included in Item 15 of this Form 10-K for additional information.
RISKS RELATED TO THE OPERATION OF OUR BUSINESS SEGMENTS
We are exposed to risks associated with commercial and residential real estate development and construction. Real estate development and construction, including homebuilding activities, entail risks that may adversely impact our results of operations, cash flows and financial condition, including:
| ● | general market conditions; |
| ● | construction delays or cost overruns, which may increase project development costs; |
| ● | labor costs and shortages of skilled labor, particularly as a result of the recent low unemployment rate in the U.S. and Florida especially; |
10
| ● | supply chain disruptions and material shortages; |
| ● | current or potentially new and rapidly evolving tariffs or quotas; |
| ● | claims for construction defects after property has been developed, including claims by purchasers and property owners’ associations, and claims for construction defects arising from third-party contractors; |
| ● | the discovery of hazardous or toxic substances, or other environmental, culturally-sensitive, or related issues; |
| ● | weather-related and geological interference, including hurricanes, landslides, earthquakes, floods, drought, wildfires and other events, which may result in delays or increased costs; |
| ● | an inability to obtain required governmental permits and authorizations; |
| ● | an inability to secure tenants necessary to support commercial, multi-family or senior living projects; |
| ● | compliance with building codes and other local regulations; |
| ● | unavailability of raw materials when needed, which may result in project delays, stoppages or interruptions, which may make the project less profitable; |
| ● | insufficient infrastructure capacity or availability (e.g., water, sewer and roads) to serve the needs of our projects; |
| ● | instability in the financial industry may reduce the availability of financing; and |
| ● | delay or inability to acquire property, rights of way or easements, which may result in delays or increased costs. |
The construction and building industry, similar to many other industries, have experienced, and may continue to experience worldwide supply chain disruptions and cost increases due to a multitude of factors, including inflation, elevated interest rates, higher insurance costs, tariffs, labor shortages and geopolitical conflicts. Materials, parts and labor costs have increased in recent years, sometimes significantly and over a short period of time. In addition, material time delays or increases in construction costs resulting from the aforementioned factors may impact our ability to realize anticipated returns on such projects, impact the timing of revenue recognition, lead to cancellations and otherwise materially adversely affect our business, results of operations, cash flows and financial condition. Nonetheless, should we experience increased cancellations as a result of such macroeconomic factors, our business could be adversely impacted.
Further, with regard to our residential segment, revenues from homesite sales can fluctuate period-to-period due to variations in the mix of sales from different communities, as well as other variations in product mix. Given these fluctuations in product mix, revenues from our residential segment may significantly vary from period to period.
In addition, real estate approvals may be subject to third-party responses. It is not uncommon for delays to occur, which affect the timing of transaction closings and may also impact the terms and conditions of the transaction. Delays related to regulatory approvals may be due to the applicable governmental entity not being open due to the government being shut down or staffed insufficiently due to the government’s budgetary issues. These timing issues may cause our operating results, particularly relating to the impact of our land sales, to vary significantly from quarter-to-quarter and year-to-year.
Mortgage financing issues, including lack of supply of mortgage loans, tightened lending requirements and increases in interest rates, may reduce demand for our products. Purchasers of our real estate products may obtain mortgage loans to finance a substantial portion of the purchase price or may need to obtain mortgage loans to finance the construction costs of homes to be built on homesites purchased from us. Homebuilder customers depend on retail purchasers who rely on mortgage financing. Elevated interest rates have increased the cost of owning a home in recent years and any future increases would further affect purchasing power, which may lower demand for residential real estate. In addition to residential real estate, increased interest rates and restrictions in the availability of credit may also negatively impact sales or development of our commercial properties or other land we offer for sale. While over the past couple years, elevated interest rates have negatively impacted buyers’ ability to obtain financing and the housing market generally, to date we have not experienced material declines in customer demand for our homesites. However, in the event financing challenges reduce demand from homebuilders to purchase homesites, then our sales, results of operations, cash flows and financial condition may be negatively affected.
11
Our residential segment is highly dependent on homebuilders and is subject to the risk of homebuilder concentration. We are highly dependent on homebuilders to be the primary customers for our homesites and to provide construction services in our residential developments. As of December 31, 2024, we had 20 different homebuilders within our residential communities. The homebuilder customers that have already committed to purchase homesites from us may decide to reduce, delay or cancel their existing commitments to purchase homesites in our developments. From time to time, we have financed, and in the future may finance, real estate sales with mortgage note receivables. If these homebuilders fail to pay their debts to us or delay paying us, it would reduce our anticipated cash flows. Homebuilders also may not view our developments as desirable locations for homebuilding operations, or they may choose to purchase land from other sellers. We also rely on a concentrated number of homebuilders for a significant portion of our residential homesite sales. Any of these events may have an adverse effect on our business, results of operations, cash flows and financial condition.
Our hospitality segment is subject to various risks inherent to the hospitality industry. The following factors, among others, are common to the hospitality industry, and may reduce the revenues generated by our hotel properties, food and beverage operations, golf courses, beach clubs, marinas and other entertainment assets:
| ● | reduced travel (including from airline disruptions, business reduction or elimination of typical travel in efforts to be conservative in uncertain financial times or adverse economic conditions), which we may be susceptible to given that the travel tourism on which our hospitality segment relies can entail a relatively high cost of participation and is based on discretionary consumer spending; |
| ● | increased labor costs and shortages of skilled labor; |
| ● | inclement weather conditions; |
| ● | changes in desirability of geographic regions in which our properties are located; |
| ● | significant competition from other hospitality providers and lodging or entertainment alternatives; |
| ● | our relationships with and the performance of third-party managers; |
| ● | increases in operating costs, including increases in the cost of property insurance, utilities and real estate and personal property taxes, due to inflation and other factors that may not be offset by increased prices; and |
| ● | natural or man-made disasters. |
Any of these factors may increase our costs or limit or reduce the prices we are able to charge for our hospitality products or services, or otherwise affect our ability to maintain existing properties, develop new properties or add amenities to our existing properties.
Our insurance coverage on our properties may be inadequate or our insurance costs may increase. We maintain insurance on our properties, including property, liability, fire, flood and extended coverage. However, we do not insure our timber assets. Additionally, our insurance for hurricanes has limitations per named storm and is subject to deductibles. We use our discretion when determining amounts, coverage limits and deductibles for insurance. These terms are determined based on retaining an acceptable level of risk at a reasonable cost. This may result in insurance coverage that, in the event of a substantial loss, would not be sufficient to pay the full current market value or current replacement cost of our lost investment. Inflation, changes in building codes and ordinances, environmental considerations and other factors also may make it unfeasible to use insurance proceeds to replace a facility after it has been damaged or destroyed. Under such circumstances, we may not receive insurance proceeds or the insurance proceeds we receive may not fully cover business interruptions or losses and our earnings, liquidity, or capital resources may be adversely affected.
Homeowner property insurance companies doing business in Florida have reacted to previous hurricanes by increasing premiums, requiring higher deductibles, reducing limits, restricting coverage, imposing exclusions, refusing to insure certain property owners, and in some instances, ceasing insurance operations in the state. It is uncertain what effect these actions may have on future property insurance availability and rates in the state. The high costs of property insurance premiums in Florida may deter potential customers from purchasing a homesite in one of our developments or make Northwest Florida less attractive to new employers that can create high quality jobs needed to increase growth in the region, either of which may have a material adverse effect on our business, results of operations, cash flows and financial condition.
12
Florida’s state-owned property insurance company, Citizens Property Insurance Corp., underwrites homeowner property insurance. If there were to be a catastrophic hurricane or series of hurricanes to hit Florida, the exposure of the state government to property insurance claims may place extreme stress on state finances.
Our insurance policies are generally renewed on an annual basis and, depending on factors such as market conditions, the premiums, terms, policy limits and/or deductibles can vary substantially. We can give no assurance that we will be able to maintain adequate insurance in the future at rates or on other terms we consider commercially reasonable. To offset negative insurance market trends, we may decide to self-insure additional risks. In the even that we decide to self-insure, if we experience a greater number of self-insured losses than we anticipate, our financial performance could be adversely affected. If we lose our ability to, or decide not to, self-insure these risks, our insurance cost could materially increase and we may find it difficult to obtain adequate levels of insurance coverage.
Our commercial segment is subject to risks associated with the financial condition of our commercial tenants. If one or more of our tenants, particularly an anchor tenant, declares bankruptcy, defaults or voluntarily vacates from the leased premises, we may be unable to collect rent payments from such tenant, re-lease such space or to re-lease it on comparable or more favorable terms. Additionally, the loss or failure to renew of an anchor tenant may make it more difficult to lease the remainder of the affected properties, which may have a material adverse effect on our business, results of operations, cash flows and financial condition.
Alternatively, increases in consumer spending through e-commerce channels may significantly affect our tenants’ ability to generate sales in their stores, which could affect their ability to make payments to us. These economic and market conditions, combined with rising or sustained high levels of inflation and lack of labor availability, may also place a number of our key customers under financial stress, which may adversely affect our occupancy rates and our profitability, which, in turn, may have a material adverse effect on our business, results of operations, cash flows and financial condition.
Our commercial segment is exposed to operational risks with respect to our senior living communities. We are exposed to various federal, state, local, and industry-regulated licensure, certification and inspection laws, regulations, and standards; state regulations regarding senior living resident agreements, which typically require a written resident agreement with each resident; the availability and increases in cost of general and professional liability insurance coverage; state regulation and rights of residents related to entrance fees; and the availability and increases in the cost of labor.
Our financial results may vary significantly period over period. The revenues and earnings from our business segments may vary significantly from period to period. Homebuilders tend to buy multiple homesites in sporadic transactions. In addition, homesite prices vary significantly by community, which further impacts period over period results. Therefore, there may be reporting periods in which we have no, or significantly less, revenue from residential or commercial real estate sales. We may also choose to operate rather than lease assets, lease rather than sell assets, or sell improved rather than unimproved land that may delay revenue and profits.
Hospitality operations are affected by seasonal fluctuations. Hospitality revenues are typically higher in the second and third quarters, and vary depending on the timing of holidays and school breaks. Commercial real estate sales tend to be non-recurring. Projects depend on uncertain demand. Extraordinary events such as hurricanes or public health emergencies may dramatically change demand and pricing for products and services.
We are subject to various geographic risks.
| ● | Growth of Northwest Florida. We are focused on developing real estate and expanding operations in Northwest Florida. Our success will be dependent on continued strong migration and population expansion in Northwest Florida. The future economic growth of Northwest Florida will largely depend on the ability and willingness of state and local governments, in combination with the private sector, to plan and complete significant infrastructure improvements in the region, such as new or existing transportation hubs, roads, rail, pipeline, medical facilities and schools and to attract families and companies offering high-quality and high salary jobs. Our future revenues will also depend on individuals seeking retirement or |
13
| vacation homes in Northwest Florida. Florida’s population growth may be negatively affected in the future by a variety of factors, including adverse economic conditions, changes in state income tax or federal immigration laws, the occurrence of natural or man-made disasters or the high cost of real estate, insurance and property taxes. If Northwest Florida experiences an extended period of slow growth, or even net out-migration, our business, results of operations, cash flows and financial condition will likely be materially adversely affected. |
| ● | Hurricanes. Florida is particularly susceptible to the occurrence of hurricanes. Depending on where any particular hurricane makes landfall, our developments in Northwest Florida may experience catastrophic damage. Such damage may materially delay sales or lessen demand for our residential or commercial real estate and lessen demand for our hospitality and leasing operations. If our corporate headquarters facility is damaged or destroyed, we may have difficulty performing certain corporate and operational functions. We maintain property and business interruption insurance, subject to certain deductibles. |
| ● | Climate Conditions. The occurrence of other natural disasters and climate conditions in Northwest Florida, such as tornadoes, floods, fires, unusually heavy or prolonged rain, droughts, extreme heat or cold, or other adverse weather events may have a material adverse effect on our ability to develop and sell properties or realize income from our projects. To the extent that such natural disasters and climate conditions occur, our projects could be damaged or destroyed, which may result in losses exceeding our insurance coverage. Natural disasters and climate conditions can also lead to increased competition for subcontracts, which can delay construction activities even after an event has concluded. In addition, our timber assets are subject to damage by fire, insect infestation, disease, prolonged drought, flooding, hurricane and natural disasters, which may adversely affect our timber inventory and forestry business. Furthermore, sea level rise due to climate change may have a material adverse effect on our coastal properties. The occurrence of natural disasters and the threat of adverse climate changes (or perceived threat from climate change) may also have a long-term negative effect on the attractiveness of Northwest Florida and on our ability to obtain flood or other hazard insurance coverage. Man-made disasters or disruptions, such as oil spills, acts of terrorism, power outages and communications failures may simultaneously disrupt our operations. |
We are dependent on third-party service providers for certain services. We rely on various third parties to conduct the day-to-day operations of certain residential, hospitality, multi-family, senior living and other commercial properties. Failure of such third parties to adequately perform their contracted services may negatively impact our ability to retain customers. As a result, any such failure may negatively impact our results of operations, cash flows and financial condition.
Public health emergencies could adversely affect our business. An epidemic, pandemic or similar serious public health issue, and the measures undertaken by governmental authorities to address it, could significantly disrupt or prevent us from operating our business in the ordinary course for an extended period, and thereby, and/or along with any associated economic and/or social instability or distress, have a material adverse impact on our results of operations, cash flows and financial condition.
In addition to impacting general economic conditions, a public health emergency may exacerbate factors that impact our operations, including supply chain disruptions, labor shortages and rising commodity and product costs, which may continue after the public health emergency has subsided. Any continued impact could also amplify the other risks and uncertainties. The ultimate extent to which a public health emergency could impact our business is highly uncertain and cannot be predicted with any degree of confidence.
RISKS RELATED TO OUR EXISTING OWNERSHIP STRUCTURE
Our largest shareholder controls approximately 35.3% of our common stock, which may limit our minority shareholders’ ability to influence corporate matters. As of December 31, 2024, based on public filings, clients of FCM beneficially owned approximately 35.3% of our common stock. FCM and its client, The Fairholme Fund, a series of investments originating from Fairholme Funds, Inc., may be deemed affiliates of ours. Fairholme Holdings, LLC (“Fairholme”), which wholly owns FCM, is in a position to influence the vote of most matters submitted to our shareholders, including any merger, consolidation or sale of all or substantially all of our assets, the nomination of individuals to our Board and any potential change in our control. These factors may discourage, delay or prevent a takeover attempt that shareholders might consider in their best interests or that might result in shareholders receiving a premium for their common stock.
14
Additionally, our articles of incorporation and certain provisions of Florida law contain anti-takeover provisions that may make it more difficult to effect a change in our control.
Future sales of our common stock by Fairholme, or the perception in the public markets that these sales may occur, may depress our stock price.
LEGAL, REGULATORY, AND LITIGATION RISK
We are subject to various existing government regulations.
| ● | Development and Land Use Requirements. Approval to develop real property entails an extensive entitlements process involving multiple and overlapping regulatory jurisdictions and often requiring discretionary action by local government. This process is often political, uncertain and may require significant exactions in order to secure approvals. Real estate projects in Florida must generally comply with the provisions of the Community Planning Act and local land development regulations. Compliance with the State of Florida planning requirements and local land development regulations is usually lengthy and costly and can be expected to materially affect our real estate development activities. The Community Planning Act requires local governments to adopt comprehensive plans guiding and controlling future real property development in their respective jurisdictions and to evaluate, assess and keep those plans current. Included in all comprehensive plans is a future land use map, which sets forth allowable land use development rights. Some of our land has an “agricultural” or “silviculture” future land use designation and we may be required to seek an amendment to the future land use map to develop real estate projects. Approval of these comprehensive plan map amendments is highly discretionary. |
All development orders and permits must be consistent with the comprehensive plan. Each plan must address such topics as future land use and capital improvements and make adequate provision for a multitude of public services including transportation, schools, solid waste disposal, sewerage, potable water supply, drainage, affordable housing, open space, parks and others. The local governments’ comprehensive plans must also establish “levels of service” with respect to certain specified public facilities, including roads, schools and services to residents. In many areas, infrastructure funding has not kept pace with growth, causing facilities to operate below established levels of service. Local governments are prohibited from issuing development orders or permits if the development will reduce the level of service for public facilities below the level of service established in the local government’s comprehensive plan, unless the developer either sufficiently improves the services up front to meet the required level of service or provides financial assurances that the additional services will be provided as the project progresses. In addition, local governments that fail to keep their plans current may be prohibited by law from amending their plans to allow for new development.
If any one or more of these factors were to occur, we may be unable to develop our real estate projects successfully or within the expected timeframes. Changes in the Community Planning Act or the interpretation thereof, new enforcement of these laws or the enactment of new laws regarding the development of real property may lead to a decline in our ability to develop and market our communities successfully and to generate positive cash flow from these operations in a timely manner, which may have a materially adverse effect on our ability to service our demand and negatively impact our business, results of operations, cash flows or financial condition.
Our properties are subject to federal, state and local environmental regulations and restrictions that may impose significant limitations on our development ability. In most cases, approval to develop requires multiple permits, which involve a long, uncertain and costly regulatory process. Our land holdings contain jurisdictional wetlands, some of which may be unsuitable for development or prohibited from development by applicable law. Development approval most often requires mitigation for impacts to wetlands that require land to be conserved at a disproportionate ratio versus the actual wetlands impacted and approved for development. Some of our property is undeveloped land located in areas where development may have to avoid, minimize or mitigate for impacts to the natural habitats of various protected wildlife or plant species. Additionally, some of our property is in coastal areas that usually have a more restrictive permitting burden or must address issues such as coastal high hazard, hurricane evacuation, floodplains and dune protection.
15
| ● | Environmental Regulation. Current or past operations are subject to extensive and evolving federal, state and local environmental laws and other regulations. The provisions and enforcement of these environmental laws and regulations may become more stringent in the future, including as a result of attention from environmental advocacy groups. Violations of these laws and regulations can result in, among other things, civil penalties, remediation expenses, natural resource damages, personal injury damages, potential injunctions, cease and desist orders and criminal penalties. In addition, some of these environmental laws impose strict liability, which means that we may be held liable for any environmental damage on our property regardless of fault. |
Past and present real property, particularly properties used in connection with our previous transportation and papermill operations, were involved in the storage, use or disposal of hazardous substances that may have contaminated and may in the future contaminate the environment. We may bear liability for this contamination and for the costs of cleaning up a site at which we have disposed of, or to which we have transported, hazardous substances. The presence of hazardous substances on a property may also adversely affect our ability to sell or develop the property or to borrow funds using the property as collateral.
We may be subject to risks from changes in certain governmental policies.
| ● | Mortgage Rates. The availability of mortgage financing is significantly influenced by governmental entities such as the Federal Housing Administration, Veteran’s Administration and Government National Mortgage Association and government-sponsored enterprises known as Fannie Mae and Freddie Mac. Mortgage rates may also be adversely impacted by elevated interest rates. If borrowing standards are tightened and/or the federal government were to reduce or eliminate these mortgage loan programs (including due to any failure of lawmakers to agree on a budget or appropriation legislation to fund relevant programs or operations) or if mortgage rates continue to increase generally, it would likely make it more difficult for potential purchasers of our products, including our homebuilder customers to obtain acceptable financing, which may have a negative effect on demand in our communities. |
| ● | Climate Regulation. Potential impacts of climate change have begun to influence governmental authorities, consumer behavior patterns and the general business environment of the U.S., including, but not limited to, energy-efficiency measures, water use measures and land-use practices. The implementation of these policies may require us to invest additional capital in our properties or it may restrict the availability of land we are able to develop. These changes, or changes in other environmental laws or their interpretation thereof, new enforcement of laws, the identification of new facts or the failure of other parties to perform remediation at our current or former facilities may lead to new or greater liabilities that may materially adversely affect our business, results of operations, cash flows or financial condition. |
| ● | Accounting Standards. Uncertainties posed by various initiatives of accounting standard-setting by the Financial Accounting Standards Board (“FASB”) and the SEC, which create and interpret applicable accounting standards for U.S. companies, may change the financial accounting and reporting standards or their interpretation and application of these standards that govern the preparation of our financial statements. These changes and others may have a material impact on how we record and report our financial condition and results of operations. In some cases, we may be required to apply a new or revised standard retroactively, resulting in potentially material restatements of prior period financial statements. |
Changes to U.S. tax laws may materially affect us.
| ● | Income Tax. Tax laws are dynamic and subject to change as new laws are passed and new interpretations of the law are issued or applied. In many cases, the application of existing, newly enacted or amended tax laws may be uncertain and subject to differing interpretations. Changes in the tax laws, or in the interpretation or enforcement of existing tax laws, could increase our state and federal tax rates and subject our business to audits, inquiries and legal challenges from taxing authorities. As a result of changes in tax laws, we may incur additional costs, including taxes and penalties for historical periods, which may have a material and adverse effect on our business, results of operations, cash flows or financial condition. |
16
| ● | QOZ Program. The Qualified Opportunity Zone program (the “QOZ Program”), in the U.S. provides preferential tax treatment to taxpayers who invest eligible capital gains into qualified opportunity funds (“QOFs”). QOFs are self-certifying entities that invest their capital in economically distressed communities that have been designated as qualified opportunity zones (“QOZs”) by the Internal Revenue Service (“IRS”) and Treasury. We have positioned ourselves to take advantage of the tax benefits offered by the QOZ Program. While the IRS has issued final regulations which address some of the uncertainties under the QOZ Program, because the QOZ Program is relatively new, a number of open questions remain. To the extent the IRS issues additional interpretive guidance that renders ineligible certain categories of projects that are currently expected to qualify, we may be unable to fully realize the benefits of the QOZ Program as anticipated, which may impact our investments. |
We may be subject to periodic litigation and other regulatory proceedings. We may be involved in lawsuits and regulatory actions relating to business agreements, operations, assets, liabilities, or our position as a public company. An adverse outcome in any of these matters may adversely affect our financial condition, our results of operations or impose additional restrictions or limitations on us. In addition, regardless of the outcome of any litigation or regulatory proceedings, these proceedings may result in substantial costs and may require that we devote substantial resources to defend our Company.
Land use approval processes have become increasingly complex. Moreover, the statutes, regulations and ordinances governing the approval processes provide third parties the opportunity to challenge the proposed plans and approvals. As a result, the prospect of third-party challenges to planned real estate developments provides additional uncertainties in real estate development planning and entitlements. Third-party challenges in the form of litigation may result in denial of the right to develop, or would, by their nature, adversely affect the length of time and the cost required to obtain the necessary approvals. In addition, adverse decisions arising from any litigation would increase the costs and length of time to obtain ultimate approval of a project and may adversely affect the design, scope, plans and profitability of a project.
We run the risk of inadvertently being deemed to be an investment company that is required to register under the Investment Company Act of 1940 (the “Investment Company Act”). We are not registered as an “investment company” under the Investment Company Act and we intend to invest our assets in a manner such that we are not required to register as an investment company. This plan will require monitoring our portfolio so that on an unconsolidated basis we will not have more than 40% of total assets (excluding U.S. government securities and cash items) in investment securities or that we will meet and maintain another exemption from registration. As a result, we may be unable to make some potentially profitable investments, unable to sell assets we would otherwise want to sell or forced to sell investments in investment securities before we would otherwise want to do so.
We have not requested approval or guidance from the SEC with respect to our Investment Company Act determinations, including, in particular: our treatment of any subsidiary as majority-owned; the compliance of any subsidiary with any exemption under the Investment Company Act, including any subsidiary’s determinations with respect to the consistency of its assets or operations with the requirements thereof or whether our interests in one or more subsidiaries constitute investment securities for purposes of the 40% test. If the SEC were to disagree with our treatment of one or more subsidiaries as being majority-owned, exempted from the Investment Company Act, with our determination that one or more of our other holdings do not constitute investment securities for purposes of the 40% test, or with our determinations as to the nature of the business in which we engage or the manner in which we hold ourselves out, we and/or one or more of our subsidiaries would need to adjust our operating strategies or assets in order for us to continue to pass the 40% test (as described above) or register as an investment company, either of which may have a material adverse effect on us. Moreover, we may be required to adjust our operating strategy and holdings, or to effect sales of our assets in a manner that, or at a time or price at which, we would not otherwise choose, if there are changes in the laws or rules governing our Investment Company Act status or that of our subsidiaries, or if the SEC or its staff provides more specific or different guidance regarding the application of relevant provisions of, and rules under, the Investment Company Act.
If the SEC or a court of competent jurisdiction were to find that we were required, but failed, to register as an investment company in violation of the Investment Company Act, we would have to cease business activities, we would breach representations and warranties and/or be in default as to certain of our contracts and obligations, civil or criminal actions may be brought against us, certain of our contracts would be unenforceable unless a court were to require enforcement and a court may appoint a receiver to take control of us and liquidate our business, any or all of which would have a material adverse effect on our business.
17
GENERAL RISKS
Risks associated with our human capital. Our ability to successfully implement our business strategy depends on our ability to attract and retain skilled employees. The labor markets in the industries in which we operate are competitive. We must attract, train and retain a large number of qualified employees while controlling related labor costs. Tighter labor markets may make it even more difficult for us to hire and retain qualified employees and control labor costs. Our ability to attract qualified employees and control labor costs is subject to numerous external factors, including prevailing wage rates, employee preferences, employment law and regulation, labor relations and immigration policy. While we are committed to recruiting top talent by offering, among other things, competitive wages, a significant increase in competition or labor costs increasing from any of the aforementioned factors may have a material adverse impact on our business, results of operations, cash flows and financial condition.
Furthermore, our hospitality operations are highly dependent on a large seasonal workforce. We have historically relied on the J-1 and H-2B visa programs to bring workers to the U.S. to fill seasonal staffing needs and ensure that we have the appropriate workforce in place. If we are unable to obtain sufficient numbers of seasonal workers, through the J-1 and H-2B programs or otherwise, we may not be able to recruit and hire adequate personnel, and material increases in the cost of securing our workforce may be possible in the future. Increased seasonal wages or an inadequate workforce may have a material adverse effect on our business, results of operations, cash flows and financial condition.
Risks associated with cybersecurity. We are reliant on computers and digital technology, including certain technology systems from third-party vendors which we use to operate our business which are not under our control. We collect digital information on all aspects of operations. Hospitality related businesses, in particular, require the collection and retention of identifiable information of our customers, as such information is entered into, processed, summarized, and reported by the various information systems we use. All of these activities give rise to material cyber risks and potential costs and consequences that cannot be estimated or predicted and which may not be fully insured by our cyber risk insurance policy. For example, the SEC recently adopted rules requiring the disclosure of cybersecurity incidents that we determine to be “material,” to be made within four business days of such determination, which can be complex, requiring a number of assumptions based on several factors. It is possible that the SEC may not agree with our determinations, which could result in fines, civil litigation or damage to our reputation.
The integrity and protection of our customer, employee and other company data, is critical to us. We make efforts to maintain the security and integrity of these networks and related systems. We have implemented various measures to manage the risk of a security breach or disruption. There can be no assurance that our security efforts and measures will be effective or that attempted security breaches or disruptions, whether through cyber-attacks or cyber intrusions over the Internet, malware, computer viruses, attachments to emails, persons inside our organization or persons with access to systems, energy blackouts, natural disasters, terrorism, war, and other significant disruptions of our networks and related systems, or disruptions would not be successful or damaging. Further, the risk of a security breach or disruption, particularly through cyber-attacks or cyber-intrusion, including by computer hackers, foreign governments or state-sponsored actors, and cyber terrorists, has generally increased as the number, intensity and sophistication of attempted attacks and intrusions from around the world have increased. In particular, there has been a spike in cybersecurity attacks as businesses have increased reliance on virtual environments and communications systems, which have been subject to increasing third-party vulnerabilities and security risks. Additionally, to the extent artificial intelligence capabilities improve and are increasingly adopted, they may be used to identify vulnerabilities and craft increasingly sophisticated cybersecurity attacks. Attachments crafted with artificial intelligence tools could directly attack information systems with greater speed and/or efficiency than a human threat actor or create more effective phishing emails. Vulnerabilities may also be introduced from the use of artificial intelligence by us, our customers, suppliers and other business partners and third-party providers. Use of artificial intelligence by our employees, whether authorized or unauthorized, increases the risk that our intellectual property and other proprietary information will be unintentionally disclosed.
Even the most well protected information, networks, systems and facilities remain potentially vulnerable because the techniques used in such attempted security breaches evolve and generally are not recognized until launched against a target, and in some cases are designed not to be detected and, in fact, may not be detected.
18
Accordingly, we and our service providers may be unable to anticipate these techniques or to implement adequate security barriers or other preventative measures, and thus it is impossible for us and our service providers to entirely mitigate this risk. Our failure to maintain the security of the data, including via the penetration of our network security and the misappropriation of confidential and personal information, may result in business disruption, increase in costs, damage to our reputation, material legal claims, fines, penalties, regulatory proceedings and other severe financial and business implications.
We are subject to risks related to corporate social responsibility and reputation. Our reputation and brands are important to our business. Our reputation and brands affect our ability to attract and retain consumers, financing, and secure development opportunities. There are numerous ways our reputation or brands could be damaged. These include, among others, product safety or quality issues, negative media coverage or scrutiny from political figures or interest groups. Customers are also using social media to provide feedback and information about our Company and products and services in a manner that can be quickly and broadly disseminated. To the extent a customer has a negative experience with, or view of, our Company and shares it over social media, it may adversely impact our brand and reputation.
In addition, companies across many industries are facing scrutiny from lawmakers, regulators, investors, customers, employees and other stakeholders related to their environmental, social, and governance (“ESG”) practices, including those related to the environment, climate, diversity and inclusion, human rights and governance transparency. Various jurisdictions are developing climate-related laws or regulations that could cause us to incur additional direct costs for compliance, as well as indirect costs resulting from our customers, suppliers, or additional compliance costs that are passed on to us. For example, the SEC has issued final rules that would require expanded disclosures related to climate change. Although these rules are currently stayed pending judicial review, if implemented as proposed, these rules would significantly increase our climate-related disclosure obligations. Additionally, investor advocacy groups, including ESG-focused investor advocacy groups, certain institutional investors, investment funds and other influential investors are also focused on ESG practices. Legal and regulatory requirements, as well as stakeholder expectations, on ESG practices and disclosures are subject to change, can be unpredictable, and may be difficult and expensive for us to comply with. Further, there is an increasing number of anti-ESG initiatives in the U.S. that may conflict with other regulatory requirements or various stakeholders’ expectations. If we fail, or are perceived to be failing, to meet evolving legal and regulatory requirements or the expectations of our stakeholders, we may be subject to enforcement actions, required to pay fines, investors may sell their stock, we may suffer from reputational damage and our business or financial condition could be adversely affected.
The design and effectiveness of our disclosure controls and procedures and internal control over financial reporting may not prevent all errors, misstatements, or misrepresentations. While management will continue to review the effectiveness of our disclosure controls and procedures and internal control over financial reporting, there can be no guarantee that our internal control over financial reporting will be effective in accomplishing all control objectives at all times. Deficiencies, including any material weakness, in our internal control over financial reporting, which may occur in the future, may result in misstatements of our results of operations, restatements of our financial statements, a decline in our stock price, or otherwise materially adversely affect our business, reputation, results of operations, financial condition, or liquidity.
Our financing arrangements contain restrictions and limitations. Our financing arrangements contain customary representations and warranties, as well as customary affirmative and negative covenants that restrict some of our activities. See Note 10. Debt, Net included in Item 15 of this Form 10-K for additional information. Our ability to comply with the covenants and restrictions contained in our financing arrangements may be affected by economic, financial and industry conditions beyond our control, including credit or capital market disruptions. The breach of any of these covenants or restrictions could result in a default that would permit the applicable lenders to declare all amounts outstanding thereunder to be due and payable, together with accrued and unpaid interest. In any such case, we may be unable to repay the amounts due under such financing arrangements, which could have a material adverse effect on our results of operations, cash flows and financial condition.
We may provide a guarantee of the debt in connection with our JVs. In certain instances, these guarantees provide for the full payment and performance of the borrower. See Note 10. Debt, Net and Note 20. Commitments and Contingencies included in Item 15 of this Form 10-K for additional information.
19
If we were to become obligated to perform on any of these guarantees, our results of operations, cash flows and financial condition may be adversely affected.
We utilize derivative financial instruments to reduce our exposure to market risks from changes in interest rates. We may enter into interest rate swap instruments to limit our exposure to changes in variable interest rates. While our hedging strategy is designed to minimize the impact of increases in interest rates applicable to some of our variable rate debt, there can be no guarantee that our hedging strategy will be effective, and we may experience credit-related losses in some circumstances. See Note 6. Financial Instruments and Fair Value Measurements and Note 10. Debt, Net included in Item 15 of this Form 10-K for additional information. In addition, we typically refinance our outstanding debt prior to or in connection with its maturity. If we are unable to refinance our debt on favorable terms, our interest expense may increase. A refinancing of our debt could also require us to comply with more onerous covenants and further restrict our business operations. Any of these circumstances could adversely impact our financial position and results of operations.
We cannot assure you that we will not make changes to our existing capital allocation plan, including whether we will continue to pay dividends at the current rate or at all. In 2024, we paid cash dividends of $0.12 per share on our common stock in the first and second quarters and $0.14 per share on our common stock in the third and fourth quarters, and we currently expect to continue to pay quarterly dividends. The declaration and payment of any future dividends will be at the discretion of our Board after taking into account various factors, including without limitation, our financial condition, earnings, capital requirements of our business, and potential growth opportunities, the terms of any credit agreements or indentures to which we may be party at the time, legal requirements, industry practice, market conditions and other factors that our Board deems relevant. Our decisions regarding the allocation of capital among dividends, stock repurchases, development projects, and other uses may not satisfy market expectations or produce the long-term returns we anticipate. Changes in our capital allocation strategy, could adversely affect our stock price and our relationships with investors. Accordingly, there can be no assurance that our dividends or stock repurchases will continue at the same levels, or at all.
We may continue to experience significant volatility in the market price of our common stock. Numerous factors may have a significant effect on the price of our common stock, including low trading volumes and concentrated ownership; announcements of fluctuations in our operating results; other announcements concerning our Company or business, including acquisitions or litigation announcements; changes in market conditions in Northwest Florida, the real estate or real estate development industry or hospitality operations in general; economic and/or political factors unrelated to our performance, such as the impact of the recent elections in the U.S.; comments by public figures or other third parties (including blogs, articles, message boards and social and other media); changes in recommendations or earnings estimates by securities analysts; novel and unforeseen trading strategies adopted by retail investors or other market participants and less volume and reduced shares outstanding due to execution of the Stock Repurchase Program that would reduce our “public float”. The market price of our common stock on the New York Stock Exchange (“NYSE”) has been volatile, which may be unrelated or disproportionate to operating performance. Continued volatility in the market price of our common stock may cause shareholders to lose some or all of their investment in our common stock. Institutional investors might not be interested in owning our common stock.
Item 1B. Unresolved Staff Comments
None.
Item 1C. Cybersecurity
We maintain a data security plan designed to provide a documented and formalized information security policy to detect, identify, classify and mitigate cybersecurity and other data security threats. This cybersecurity program is based in-part on, and its effectiveness is measured using, the Payment Card Industry Data Security Standard (“PCI DSS”), the National Institution of Standard and Technology (“NIST”), and the System and Organization Control (“SOC”), all of which are integrated into our overall enterprise risk management program. This integration ensures that cybersecurity considerations are an integral part of our decision-making processes.
20
In furtherance of detecting, identifying, classifying and mitigating cybersecurity and other data security threats including such threats associated with our use of any third-party vendors. We also:
| ● | assess baseline configuration standards to meet the intent and effectiveness for overall safety and security (both logically and physically) of critical system components; |
| ● | track asset inventory for relevant system components; |
| ● | maintain network connection arrangement documents; |
| ● | limit access rights to system components to authorized personnel, with end-users being granted access in accordance with stated access rights; |
| ● | deploy anti-virus solutions on applicable system components, which are enabled for automatic updates and configured for conducting periodic scans as necessary; |
| ● | provision and harden critical system resources; |
| ● | use internal and external vulnerability scanning procedures, along with network layer and anti-hacking tests; |
| ● | facilitate requests for validation of baseline configurations for purposes of regulatory compliance assessments and audits; |
| ● | provide cybersecurity training for employees; and |
| ● | perform Quarterly User Access Reviews (“UAR”). |
Conducting our businesses involves the collection, storage, use, disclosure, processing, transfer, and other handling of a wide variety of information, including personally identifiable information, for various purposes in our businesses. Like other comparable-sized companies that process a wide variety of information, our information technology systems, networks and infrastructure and technology have been, and may in the future be, vulnerable to cybersecurity attacks and other data security threats. As of the date of this Form 10-K, we do not believe any risks from cybersecurity threats have materially affected or are reasonably likely to materially affect us, including our results of operations or financial condition. However, cybersecurity attacks are constantly evolving, may be difficult to detect quickly, and often are not recognized until after they have been launched against a target. Despite our security measures, there can be no assurance that we, or the third-party vendors with which we interact, will not experience a cybersecurity incident in the future that will materially affect us. For more information about these and other cybersecurity risks faced by us, see Part 1. Item 1A. Risk Factors.
Our Board has ultimate oversight for risks relating to our data security plan. In addition, the Board has delegated primary responsibility to the Audit Committee for assessing and managing data privacy and cybersecurity risks, reviewing data security and cybersecurity policies and processes with respect to data privacy and cybersecurity risk assessment and management, reviewing steps management has taken to monitor and control such risks, and regular inquires with our management team, internal auditors and independent auditors in connection therewith. The Audit Committee is also responsible for overseeing our investigation of, and response to, any cybersecurity attacks or threats.
We also have a dedicated team of employees overseeing our data security plan and initiatives, led by our Vice President of Information Systems (who has over thirty years’ experience working in cyber and information security related roles with mid-size as well as large companies), that works directly in consultation with internal and external advisors in connection with these efforts. We engage such external advisors to assist with the evaluation of our technology, security, critical risk areas and related controls to improve our ability to identify and detect, protect against, and recover from, cybersecurity incidents and other evolving threats and to appropriately benchmark against industry practices.
We have developed a procedure by which the Board and management are informed about and monitor the prevention, detection, mitigation and remediation of cybersecurity incidents. Our Incident Response Team, comprised of representatives of different departments within the Company, including the Vice President of Information Systems, works to identify cybersecurity-related incidents, and reports such incidents, along with any pertinent recommendations to update cybersecurity policies and procedures, to our management team.
21
Committee, on a quarterly basis and more frequently as needed on such matters. The Audit Committee and management also provide an annual report to the Board on pertinent cybersecurity matters.
Item 2. Properties
Our management team reports to the Audit St. Joe owns 167,000 acres in Northwest Florida. A portion of our land is within the Sector Plan, that entitles, or gives legal rights, for us to originally develop over 170,000 residential dwelling units, over 22 million square feet of retail, commercial and industrial space and over 3,000 hotel rooms on lands within Florida’s Bay and Walton counties. We also have additional entitlements, or legal rights, to develop acreage outside of the Sector Plan. Approximately 87% of our real estate is located in Florida’s Bay, Gulf, and Walton counties. Approximately 90% of our real estate land holdings are located within fifteen miles of the Gulf of Mexico. Undeveloped land is managed as forestry land until designated for development. We anticipate a wide range of residential, commercial and hospitality uses on these land holdings. We have operating assets and projects under development in our residential, hospitality, and commercial segments. For more information on our real estate assets and related encumbrances, see “Item 1. Business” and “Schedule III (Consolidated) - Real Estate and Accumulated Depreciation” included in Item 15 of this Form 10-K for further information. In addition to the properties we own, we have investments in unconsolidated JVs that own properties such as the Latitude Margaritaville Watersound JV that includes the Latitude Margaritaville Watersound community.
In our residential segment, we develop communities into homesites for sale to homebuilders and on a limited basis to retail customers. As of December 31, 2024, we had completed homesites and homesites under development, engineering or in conceptual planning in twenty-one separate communities. These include the Watersound Origins, Watersound Origins West, Watersound Camp Creek, Breakfast Point East, Titus Park, Bayside at Ward Creek, Breakwater at Ward Creek, Salt Grass at Ward Creek, College Station, Park Place, Salt Creek at Mexico Beach, WindMark Beach, SouthWood, and other Northwest Florida communities.
In our hospitality segment, we own the Watersound Beach Club; Camp Creek golf course and amenities; Shark’s Tooth golf course and tennis center; Origins golf course; and The Third golf course, which opened in November 2024, as well as other club amenities that are situated in or near our residential communities. We own the WaterColor Inn, The Pearl Hotel, Camp Creek Inn, Hilton Garden Inn Panama City Airport, Homewood Suites by Hilton Panama City Beach, Home2 Suites by Hilton Santa Rosa Beach, and the Watersound Inn, along with nearby retail and commercial space. With our JV partners, we own The Lodge 30A and Embassy Suites by Hilton Panama City Beach Resort. We own additional properties in Panama City Beach, Florida that we operate as rental property. We own two marinas. We also own Hotel Indigo Panama City Marina and Harrison’s Kitchen & Bar, both on leased land in downtown Panama City.
In our commercial segment, we own, or jointly own, the properties used in our operations and have properties under construction that will be used in our operations, which include multi-family, senior living, self-storage, retail, office, industrial and commercial property. These commercial properties are located in Beckrich Office Park, where we are headquartered, North Bay Landing, WindMark Beach, VentureCrossings, Watersound Town Center, Watersound West Bay Center, Florida State University (“FSU”)/Tallahassee Memorial Hospital (“TMH”) Medical Campus and other Northwest Florida locations. In addition, with our JV partners we own Pier Park North, Pier Park Crossings, Pier Park Crossings Phase II, Watersound Origins Crossings, Mexico Beach Crossings and Watercrest Senior Living.
Item 3. Legal Proceedings
For information regarding legal proceedings, see Note 20. Commitments and Contingencies included in Item 15 of this Form 10-K for additional information.
Item 4. Mine Safety Disclosures
Not applicable.
22
PART II
Item 5. Market for the Registrant’s Common Equity, Related Stockholder Matters and Issuer Purchases of Equity Securities
As of February 24, 2025, we had approximately 668 registered holders of record of our common stock. Our common stock is listed on the NYSE under the symbol “JOE.”
In 2024, we paid quarterly cash dividends of $0.12 per share on our common stock in the first and second quarters, and $0.14 per share on our common stock in the third and fourth quarters ($0.52 per share in the aggregate). In 2023, we paid quarterly cash dividends of $0.10 per share on our common stock in the first and second quarters, and $0.12 per share on our common stock in the third and fourth quarters ($0.44 per share in the aggregate). During 2022, we paid quarterly cash dividends of $0.10 per share on our common stock throughout the year ($0.40 per share in the aggregate). While we expect to continue to pay quarterly dividends, the declaration and payment of any future dividends will be at the discretion of our Board after taking into account various factors, including without limitation, our financial condition, earnings, capital requirements of our business, the terms of any credit agreements or indentures to which we may be a party to at the time, legal requirements, industry practice, and other factors that our Board deems relevant. Past payments of dividends should not be construed as a guarantee of payment or declaration of future dividends in the same amount or at all. See Part I. Item 1A. Risk Factors – General Risks – We cannot assure you that we will not make changes to our existing capital allocation plan, including whether we will continue to pay dividends at the current rate or at all.
The following performance graph compares our cumulative shareholder returns for the period from December 31, 2019 through December 31, 2024, assuming $100 was invested on December 31, 2019, in our common stock, in the S&P SmallCap 600 Index, and a custom real estate peer group (the “Custom Real Estate Peer Group”). The Custom Real Estate Peer Group is composed of Alexander & Baldwin Inc. (ALEX), CTO Realty Growth, Inc. (CTO), Five Point Holdings, LLC (FPH), Howard Hughes Holdings, Inc. (HHH), Maui Land & Pineapple Company, Inc. (MLP), Stratus Properties Inc. (STRS) and Tejon Ranch Co. (TRC). Total returns shown assume that dividends are reinvested. Total return for the Custom Real Estate Peer Group uses an equal weighting for each of the stocks within the peer group. The stock price performance shown below is not necessarily indicative of future price performance.
23
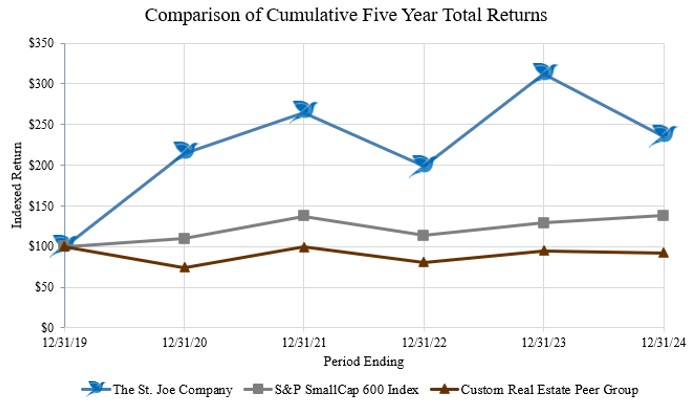
|
|
12/31/2019 |
|
12/31/2020 |
|
12/31/2021 |
|
12/31/2022 |
|
12/31/2023 |
|
12/31/2024 |
||||||
The St. Joe Company |
|
$ |
100 |
|
$ |
214.58 |
|
$ |
264.93 |
|
$ |
198.53 |
|
$ |
311.92 |
|
$ |
235.06 |
S&P SmallCap 600 Index |
|
$ |
100 |
|
$ |
109.57 |
|
$ |
137.26 |
|
$ |
113.35 |
|
$ |
129.09 |
|
$ |
137.90 |
Custom Real Estate Peer Group |
|
$ |
100 |
|
$ |
74.18 |
|
$ |
99.63 |
|
$ |
80.98 |
|
$ |
94.87 |
|
$ |
92.58 |
Stock Repurchase Program
Our Board has approved the Stock Repurchase Program pursuant to which we are authorized to repurchase shares of our common stock. The program has no expiration date. As of December 31, 2024, we had a total authority of $76.7 million available for purchase of shares of our common stock outstanding. In February 2025, the Board increased the total authorization under the Stock Repurchase Program to $100.0 million. We may repurchase our common stock in open market purchases from time to time, in privately negotiated transactions or otherwise, pursuant to Rule 10b-18 under the Exchange Act. The timing and amount of any additional stock to be repurchased will depend upon a variety of factors. Repurchases may be commenced or suspended at any time or from time to time without prior notice. The program will continue until otherwise modified or terminated by our Board at any time in its sole discretion.
The following table provides information on our repurchase of common stock during the three months ended December 31, 2024:
|
|
|
|
|
|
|
Total Number of Shares |
|
Maximum Dollar Value of |
|
|
|
|
|
|
|
|
|
Purchased as Part of |
|
Stock that May Yet Be |
|
|
|
|
Total Number of |
|
Average Price |
|
Publicly Announced |
|
Purchased Under the |
|
||
Period |
|
Shares Purchased |
|
Paid per Share (a) |
|
Plans or Programs |
|
Plans or Programs |
|
||
|
|
|
|
|
|
|
|
|
In Millions |
|
|
October 1-31, 2024 |
|
— |
|
$ |
— |
|
— |
|
$ |
— |
|
November 1-30, 2024 |
|
— |
|
|
— |
|
— |
|
|
— |
|
December 1-31, 2024 |
|
70,985 |
|
|
47.38 |
|
70,985 |
|
|
76.7 |
|
Total |
|
70,985 |
|
$ |
— |
|
70,985 |
|
$ |
76.7 |
(b) |
24
| (a) | Excludes excise tax and commissions paid to brokers. As part of the IRA, a 1% excise tax was imposed on stock repurchases in excess of issuances effective January 1, 2023. |
| (b) | Excludes the increased total authorization under the Stock Repurchase Program to $100.0 million, approved by the Board in February 2025. |
Item 6. Reserved
Item 7. Management’s Discussion and Analysis of Financial Condition and Results of Operations
The following discussion and analysis of our financial condition and results of operations should be read in conjunction with the accompanying audited consolidated financial statements and the related notes included in this Form 10-K. The statements in this discussion regarding industry outlook, our expectations regarding our future performance, liquidity and capital resources and other non-historical statements are forward-looking statements. These forward-looking statements are subject to risks and uncertainties, including the risks and uncertainties described in “Risk Factors” in this Form 10-K. Our actual results may differ materially from those contained in or implied by any forward-looking statements. We assume no obligation to revise or publicly release any revision to any forward-looking statements contained in this Form 10-K, unless required by law.
Business Overview
St. Joe is a diversified real estate development, asset management and operating company with all of its real estate assets and operations in Northwest Florida. We intend to use existing assets for residential, hospitality and commercial ventures. We have significant residential and commercial land-use entitlements. We actively seek higher and better uses for our real estate assets through a range of development activities. As part of our core business strategy, we have created a meaningful portion of our business through JVs. We enter into these arrangements for the purposes of developing real estate and other business activities, which we believe allows us to complement our growth strategy, leverage industry expertise and diversify our business. We may also partner with or explore the sale of discrete assets when we and/or others can better deploy resources. We seek to enhance the value of our owned real estate assets by developing residential, commercial and hospitality projects to meet market demand. Approximately 87% of our real estate is located in Florida’s Bay, Gulf, and Walton counties. Approximately 90% of our real estate land holdings are located within fifteen miles of the Gulf of Mexico.
We believe our present capital structure, liquidity and land provide us with years of opportunities to increase recurring revenue and long-term value for our shareholders. We intend to continue to focus on our core business activity of real estate development, asset management and operations by expanding our portfolio of income producing commercial properties, developing long-term, scalable residential communities and growing our hospitality offerings. We continue to develop a broad range of asset types that we believe will provide acceptable rates of return, grow recurring revenues and support future business. Capital commitments will be funded with cash proceeds from completed projects, existing cash, owned-land, partner capital and financing arrangements. We do not anticipate immediate benefits from investments. Timing of projects may be subject to delays caused by factors beyond our control. We may also choose to operate rather than lease assets, lease rather than sell assets, or sell improved rather than unimproved land that may delay revenue and profits.
Our real estate investment strategy focuses on projects that meet long-term risk-adjusted return criteria. Our practice is to only incur such expenditures when our analysis indicates that a project will generate a return equal to or greater than the threshold return over its life.
Highlights for the year ended December 31, 2024 compared to the year ended December 31, 2023 include:
| ● | Total revenue for 2024 increased by 3.5% over 2023 to $402.7 million. |
| ● | Our hospitality revenue reached a single year record of $199.2 million, eclipsing the prior record achieved in 2023 of $152.4 million by 30.7%. |
25
| ● | Our leasing revenue reached a single year revenue record of $60.3 million, eclipsing the prior record achieved in 2023 of $50.8 million by 18.7%. |
| ● | Our operating income for 2024 increased by 5.4% to $95.6 million, as compared to $90.7 million for 2023. |
| ● | During 2024, we invested $129.4 million in capital expenditures, paid $30.3 million in cash dividends, repurchased $3.4 million of our common stock and repaid a net amount of $17.1 million of debt while increasing the cash and cash equivalents balance as of December 31, 2024, to $88.8 million from $86.1 million at the beginning of the year. |
Market Conditions
Throughout 2024, we continued to generate positive financial results. While macroeconomic factors such as inflation, elevated interest rates, higher insurance costs, supply chain disruptions, labor shortages, financial institution disruptions and geopolitical conflicts, among other things, continued to produce economic headwinds and impacted buyer sentiment, demand across our segments remains strong. We believe this is primarily due to the continued growth of Northwest Florida as a result of increased migration, which we attribute to the region’s high quality of life, natural beauty and outstanding amenities.
Despite the strong demand across our segments, we also continue to feel the impact from the aforementioned macroeconomic factors. In addition, inflation, higher insurance costs and elevated interest rates, have increased operating costs and loan rates, as compared to recent years. While elevated interest rates have negatively impacted buyers’ ability to obtain financing and the housing market generally, the impact has been offset by the net migration into our markets, limited housing supply relative to demand and the number of cash buyers. Market conditions have also not caused an increase in cancellation rates as homebuilders have continued to perform on their contractual obligations with us.
Given our diverse portfolio of residential holdings, the mix of sales and pricing from different communities may impact revenue and margins period over period, as discussed in more detail below. Further discussion of the potential impacts on our business from the current macroeconomic environment are included in Part I. Item 1A. Risk Factors.
Reportable Segments
We conduct primarily all of our business in the following three reportable segments: 1) residential, 2) hospitality and 3) commercial.
The following table sets forth the relative contribution of these reportable segments to our consolidated operating revenue:
|
|
|
Year Ended December 31, |
|
||||
|
|
|
2024 |
|
2023 |
|
2022 |
|
Segment Operating Revenue |
|
|
|
|
|
|
|
|
Residential |
|
|
29.1 |
% |
40.0 |
% |
36.8 |
% |
Hospitality |
|
|
50.3 |
% |
39.7 |
% |
38.6 |
% |
Commercial |
|
|
19.5 |
% |
19.1 |
% |
23.5 |
% |
Other |
|
|
1.1 |
% |
1.2 |
% |
1.1 |
% |
Consolidated operating revenue |
|
|
100.0 |
% |
100.0 |
% |
100.0 |
% |
For more information regarding our reportable segments, see Note 19. Segment Information included in Item 15 of this Form 10-K for additional information.
Residential Segment
Our residential segment typically plans and develops residential communities of various sizes across a wide range of price points and sells homesites to homebuilders or retail consumers. Our residential segment also evaluates opportunities to enter into JV agreements for specific communities such as Latitude Margaritaville Watersound.
26
The residential segment generates revenue from sales of homesites and other residential land and certain homesite residuals from homebuilder sales that provide us a percentage of the sale price of the completed home if the home price exceeds a negotiated threshold. Revenue is recognized at the point in time when a sale is closed and title and control has been transferred to the buyer. The residential segment also generates revenue from the sale of tap and impact fee credits, marketing fees and other fees on certain transactions. Certain homesite residuals and other revenue related to homebuilder homesite sales are recognized in revenue at the point in time of the closing of the sale. The residential segment incurs cost from direct costs (e.g., development and construction costs), selling costs and other indirect costs.
Our residential segment includes the Watersound Origins, Watersound Origins West, Watersound Camp Creek, Breakfast Point East, Titus Park, Bayside at Ward Creek, Breakwater at Ward Creek, Salt Grass at Ward Creek, College Station, Park Place, Salt Creek at Mexico Beach, and WindMark Beach communities, which are large scale, multi-phase communities with current development activity, sales activity or future phases. Homesites in these communities are developed based on market demand and sold primarily to homebuilders and on a limited basis to retail customers.
The East Lake Creek, East Lake Powell, Lake Powell, Teachee, West Bay Creek and West Laird communities have phases of homesites in preliminary planning or permitting. Homesites in these communities will be developed based on market demand.
The SummerCamp Beach community has homesites available for sale and along with the RiverCamps and SouthWood communities, have additional lands for future development.
The Latitude Margaritaville Watersound community is a planned 55+ active adult residential community in Bay County, Florida. The community is located near the Intracoastal Waterway with convenient access to the Northwest Florida Beaches International Airport. The community is being developed through our unconsolidated Latitude Margaritaville Watersound JV with our partner Minto Communities USA, a homebuilder and community developer, and is estimated to include approximately 3,500 residential homes, which will be developed in smaller increments of discrete neighborhoods. As of December 31, 2024, the unconsolidated Latitude Margaritaville Watersound JV has completed 1,663 home sale transactions of the total estimated 3,500 homes planned in the community and had 367 homes under contract, which are expected to result in a sales value of approximately $226.9 million at closing of the homes. See Note 4. Joint Ventures included in Item 15 of this Form 10-K for additional information.
27
The residential homesite pipeline by community/project are as follows:
|
|
|
|
Residential Homesite Pipeline (a) |
||||||
|
|
|
|
Platted or |
|
|
|
Additional |
|
|
|
|
|
|
Under |
|
Engineering |
|
Entitlements with |
|
|
Community/Project |
|
Location |
|
Development |
|
or Permitting |
|
Concept Plan |
|
Total |
Breakfast Point East (b) |
|
Bay County, FL |
|
171 |
|
85 |
|
105 |
|
361 |
College Station |
|
Bay County, FL |
|
40 |
|
55 |
|
209 |
|
304 |
East Lake Creek (b) |
|
Bay County, FL |
|
— |
|
— |
|
200 |
|
200 |
East Lake Powell (c) |
|
Bay County, FL |
|
— |
|
— |
|
360 |
|
360 |
Lake Powell (d) |
|
Bay County, FL |
|
— |
|
327 |
|
1,025 |
|
1,352 |
Latitude Margaritaville Watersound (d) (e) |
|
Bay County, FL |
|
996 |
|
841 |
|
— |
|
1,837 |
Salt Creek at Mexico Beach (b) |
|
Bay County, FL |
|
60 |
|
131 |
|
154 |
|
345 |
Salt Creek at Mexico Beach Townhomes (b) |
|
Bay County, FL |
|
— |
|
42 |
|
— |
|
42 |
Park Place |
|
Bay County, FL |
|
— |
|
196 |
|
— |
|
196 |
RiverCamps (c) |
|
Bay County, FL |
|
— |
|
— |
|
149 |
|
149 |
SouthWood (f) |
|
Leon County, FL |
|
— |
|
— |
|
920 |
|
920 |
SummerCamp Beach (b) |
|
Franklin County, FL |
|
17 |
|
— |
|
260 |
|
277 |
Teachee (d) |
|
Bay County, FL |
|
— |
|
— |
|
1,750 |
|
1,750 |
Titus Park |
|
Bay County, FL |
|
168 |
|
— |
|
564 |
|
732 |
Bayside at Ward Creek (d) |
|
Bay County, FL |
|
44 |
|
330 |
|
— |
|
374 |
Breakwater at Ward Creek (d) |
|
Bay County, FL |
|
161 |
|
97 |
|
— |
|
258 |
Salt Grass at Ward Creek (d) |
|
Bay County, FL |
|
217 |
|
305 |
|
— |
|
522 |
Watersound Camp Creek (f) |
|
Walton County, FL |
|
53 |
|
— |
|
— |
|
53 |
Watersound Origins (f) |
|
Walton County, FL |
|
153 |
|
— |
|
— |
|
153 |
Watersound Origins West (d) |
|
Walton County, FL |
|
50 |
|
493 |
|
2,759 |
|
3,302 |
West Bay Creek (d) |
|
Bay County, FL |
|
— |
|
— |
|
5,250 |
|
5,250 |
West Laird (d) |
|
Bay County, FL |
|
— |
|
1,068 |
|
1,117 |
|
2,185 |
WindMark Beach (f) |
|
Gulf County, FL |
|
189 |
|
306 |
|
329 |
|
824 |
Total Homesites |
|
|
|
2,319 |
|
4,276 |
|
15,151 |
|
21,746 |
| (a) | The number of homesites are preliminary and are subject to change. Includes homesites platted or currently in concept planning, engineering, permitting or development. We have significant additional entitlements for future residential homesites on our land holdings. |
| (b) | Planned Unit Development (“PUD”). |
| (c) | Development Agreement (“DA”). |
| (d) | Detailed Specific Area Plan (“DSAP”). |
| (e) | The unconsolidated Latitude Margaritaville Watersound JV builds and sells homes in this community. |
| (f) | Development of Regional Impact (“DRI”). |
In addition to the communities listed above, we have a number of other residential project concepts in various stages of planning and evaluation.
As of December 31, 2024, we had twenty different homebuilders within our residential communities. As of December 31, 2024, we had 1,074 residential homesites under contract, which are expected to result in revenue of approximately $102.0 million, plus residuals, at closing of the homesites over the next several years. By comparison, as of December 31, 2023, we had 1,486 residential homesites under contract, which were expected to result in revenue of approximately $132.5 million, plus residuals. The change in homesites under contract is due to homesite transactions during 2024 and the amount of remaining homesites in current phases of the residential communities. Homesite prices vary significantly by community and often sell in concentrated transactions that may impact period over period results. As of December 31, 2024, in addition to the 1,074 homesites under contract in other residential communities, our unconsolidated Latitude Margaritaville Watersound JV had 367 homes under contract, which together with the 1,074 homesites are expected to result in a sales value of approximately $328.9 million at closing of the homesites and homes.
Hospitality Segment
Our hospitality segment features a private membership club (the “Watersound Club”), hotel operations, food and beverage operations, golf courses, beach clubs, retail outlets, gulf-front vacation rentals, management services, marinas and other entertainment assets.
28
The hospitality segment generates revenue from membership sales, golf courses, lodging at our hotels, short-term vacation rentals, management of The Pearl Hotel (prior to acquisition in December 2022), food and beverage operations, merchandise sales, marina operations (including boat slip rentals, boat storage fees and fuel sales), flight services, other resort and entertainment activities and beach clubs, which includes food and beverage operations of the WaterColor Beach Club. Hospitality revenue is generally recognized at the point in time services are provided and represent a single performance obligation with a fixed transaction price. Hospitality revenue recognized over time includes non-refundable club membership initiation fees, club membership dues, management fees and other membership fees. The hospitality segment incurs costs from the services and goods provided, personnel costs, maintenance of the facilities and holding costs of the assets. From time to time, we may explore the sale of certain hospitality properties, the development of new hospitality properties, as well as new entertainment and management opportunities. Some of our JV assets and other assets incur interest and financing expenses related to the loans as described in Note 10. Debt, Net included in Item 15 of this Form 10-K.
Watersound Club provides club members access to our member facilities, which include the Watersound Beach Club, Camp Creek golf course and amenities, Shark’s Tooth golf course and tennis center and The Third golf course, which opened in November 2024. In addition, in June 2024, we opened The Sporting Preserve, a 12-stand sporting clays course. Watersound Club offers different types of club memberships, each with different access rights and associated fee structures. Watersound Club is focused on creating an outstanding membership experience combined with the luxurious aspects of a destination resort. Watersound Beach Club located on Scenic Highway 30A with over one mile of Gulf of Mexico frontage, has two resort-style pools, two restaurants, three bars, kid’s room and a recreation area. Camp Creek includes an 18-hole golf course, a full club house, health and wellness center, three restaurants, a tennis and pickle ball center, a resort-style pool complex with separate adult pool, a golf teaching academy, pro shop and multi-sport fields. Shark’s Tooth includes an 18-hole golf course, tennis center, a full club house, a pro shop, as well as two food and beverage outlets. The Third includes an 18-hole golf course. Guests of some of our hotels also have access to certain Watersound Club amenities.
Watersound Origins amenities include a resort-style pool, fitness center, pickle ball courts and tennis courts located in the community. Access to these amenities is reserved to Watersound Origins and Watersound Origins West members consisting of the communities’ residents. In addition, an executive golf course located in the community is available to residents and for public play.
We own and operate the award-winning WaterColor Inn (which includes the Fish Out of Water restaurant) and The Pearl Hotel (which includes the Havana Beach Bar & Grill restaurant); the Camp Creek Inn, the Hilton Garden Inn Panama City Airport, the Homewood Suites by Hilton Panama City Beach, the Hotel Indigo Panama City Marina, the Home2 Suites by Hilton Santa Rosa Beach, the Watersound Inn and two gulf-front vacation rental houses. With our JV partners, we own and operate The Lodge 30A and the Embassy Suites by Hilton Panama City Beach Resort. We also operate the WaterColor Beach Club, which includes food and beverage operations and other hospitality related activities, such as beach chair rentals.
Our hotel portfolio by property is as follows:
Hotel |
|
Location |
|
Rooms (a) |
Camp Creek Inn (b) |
|
Walton County, FL |
|
75 |
WaterColor Inn (c) |
|
Walton County, FL |
|
67 |
The Pearl Hotel (d) |
|
Walton County, FL |
|
55 |
Watersound Inn |
|
Walton County, FL |
|
11 |
The Lodge 30A (e) (f) |
|
Walton County, FL |
|
85 |
Home2 Suites by Hilton Santa Rosa Beach (b) |
|
Walton County, FL |
|
107 |
Embassy Suites by Hilton Panama City Beach Resort (f) (g) |
|
Bay County, FL |
|
255 |
Hilton Garden Inn Panama City Airport |
|
Bay County, FL |
|
143 |
Homewood Suites by Hilton Panama City Beach (h) |
|
Bay County, FL |
|
131 |
Hotel Indigo Panama City Marina (b) |
|
Bay County, FL |
|
124 |
TownePlace Suites by Marriott Panama City Beach Pier Park (i) |
|
Bay County, FL |
|
124 |
Residence Inn Panama City Beach Pier Park (j) |
|
Bay County, FL |
|
121 |
Total rooms |
|
|
|
1,298 |
29
| (a) | Includes hotels currently in operation. We have significant additional entitlements for future hotel projects on our land holdings. |
| (b) | The hotel opened in June 2023. |
| (c) | Seven additional suites were completed in June 2022. |
| (d) | We acquired the hotel in December 2022. The hotel was previously owned by a third party, but operated by our hospitality segment. |
| (e) | The hotel opened in February 2023. |
| (f) | Property is related to a consolidated JV. See Note 4. Joint Ventures included in Item 15 of this Form 10-K for additional information. |
| (g) | The hotel opened in April 2023. |
| (h) | The hotel opened in March 2022. |
| (i) | The hotel is operated by our JV partner. Pier Park TPS, LLC, (the “Pier Park TPS JV”) is unconsolidated and is accounted for under the equity method of accounting, which is included within our commercial segment. See Note 4. Joint Ventures included in Item 15 of this Form 10-K for additional information. |
| (j) | The hotel, which opened in April 2024, is operated by our JV partner. Pier Park RI, LLC, (the “Pier Park RI JV”) is unconsolidated and is accounted for under the equity method of accounting, which is included within our commercial segment. See Note 4. Joint Ventures included in Item 15 of this Form 10-K for additional information. |
We own and operate two marinas, the Point South Marina Bay Point in Bay County, Florida and Point South Marina Port St. Joe in Gulf County, Florida. We are planning new marinas along the Intracoastal Waterway. The Point South Marina Bay Point reopened in the third quarter of 2022 and the Point South Marina Port St. Joe reopened in the fourth quarter of 2022 after completion of reconstruction due to damage from Hurricane Michael.
We also own and operate retail stores, two standalone restaurants and other entertainment assets.
In addition to the properties listed above, we have a number of hospitality projects in various stages of planning.
Commercial Segment
Our commercial segment includes leasing of commercial property, multi-family, senior living, self-storage and other assets. The commercial segment also oversees the planning, development, entitlement, management and sale of our commercial and forestry land holdings for a variety of uses, including a broad range of retail, office, hotel, senior living, multi-family, self-storage and industrial properties. We provide development opportunities for national, regional and local retailers and other strategic partners in Northwest Florida. We own and manage retail shopping centers and develop commercial parcels. We are currently developing the Watersound Town Center in Walton County, Florida and Watersound West Bay Center in Bay County, Florida. These lifestyle centers are complementary to the Watersound Origins and Latitude Margaritaville Watersound residential communities. In conjunction with FSU and TMH, we are in the process of developing an 87-acre medical campus in Panama City Beach, Florida, the first building of which opened in July 2024. We have large land holdings near the Pier Park retail center, adjacent to the Northwest Florida Beaches International Airport, near or within business districts in the region and along major roadways. We lease land for various other uses. The commercial segment manages our timber holdings in Northwest Florida which includes growing and selling pulpwood, sawtimber and other products.
The commercial segment generates leasing revenue and incurs leasing expenses primarily from maintenance and management of our properties, personnel costs and asset holding costs. Our commercial segment generates revenue from the sale of developed and undeveloped land, timber holdings or land with limited development and/or entitlements and the sale of commercial operating properties. Real estate sales in our commercial segment incur costs of revenue directly associated with the land, development, construction, timber and selling costs. Our commercial segment generates timber revenue primarily from open market sales of timber on site without the associated delivery costs. Some of our JV assets and other assets incur interest and financing expenses related to loans as described in Note 10. Debt, Net included in Item 15 of this Form 10-K.
30
Total units and percentage leased for multi-family and senior living communities by location are as follows:
|
|
|
|
|
|
|
|
|
|
|
|
|
|
|
|
|
|
|
|
|
|
|
|
|
|
|
|
|
|
|
|
December 31, 2024 |
|
|
December 31, 2023 |
|
|
December 31, 2022 |
|
||||||||||||
|
|
|
|
|
|
|
|
|
|
Percentage |
|
|
|
|
|
|
Percentage |
|
|
|
|
|
|
Percentage |
|
|
|
|
|
|
|
|
|
|
|
Leased |
|
|
|
|
|
|
Leased |
|
|
|
|
|
|
Leased |
|
|
|
|
|
Units |
|
Units |
|
Units |
|
of Units |
|
|
Units |
|
Units |
|
of Units |
|
|
Units |
|
Units |
|
of Units |
|
|
|
Location |
|
Planned (a) |
|
Completed |
|
Leased |
|
Completed |
|
|
Completed |
|
Leased |
|
Completed |
|
|
Completed |
|
Leased |
|
Completed |
|
Multi-family |
|
|
|
|
|
|
|
|
|
|
|
|
|
|
|
|
|
|
|
|
|
|
|
||
Pier Park Crossings (b) |
|
Bay County, FL |
|
240 |
|
240 |
|
216 |
|
90 |
% |
|
240 |
|
226 |
|
94 |
% |
|
240 |
|
228 |
|
95 |
% |
Pier Park Crossings Phase II (b) |
|
Bay County, FL |
|
120 |
|
120 |
|
111 |
|
93 |
% |
|
120 |
|
118 |
|
98 |
% |
|
120 |
|
115 |
|
96 |
% |
Watersound Origins Crossings (b) |
|
Walton County, FL |
|
217 |
|
217 |
|
202 |
|
93 |
% |
|
217 |
|
193 |
|
89 |
% |
|
217 |
|
199 |
|
92 |
% |
North Bay Landing (c) |
|
Bay County, FL |
|
240 |
|
240 |
|
220 |
|
92 |
% |
|
240 |
|
222 |
|
93 |
% |
|
120 |
|
94 |
|
78 |
% |
Mexico Beach Crossings (b) (d) |
|
Bay County, FL |
|
216 |
|
216 |
|
151 |
|
70 |
% |
|
216 |
|
76 |
|
35 |
% |
|
— |
|
— |
|
N/A |
% |
Origins Crossings Townhomes (e) |
|
Walton County, FL |
|
64 |
|
64 |
|
44 |
|
69 |
% |
|
64 |
|
46 |
|
72 |
% |
|
48 |
|
33 |
|
69 |
% |
WindMark Beach (f) |
|
Gulf County, FL |
|
31 |
|
31 |
|
17 |
|
55 |
% |
|
31 |
|
12 |
|
39 |
% |
|
12 |
|
10 |
|
83 |
% |
Total multi-family units (g) |
|
1,128 |
|
1,128 |
|
961 |
|
85 |
% |
|
1,128 |
|
893 |
|
79 |
% |
|
757 |
|
679 |
|
90% |
% |
||
|
|
|
|
|
|
|
|
|
|
|
|
|
|
|
|
|
|
|
|
|
|
|
|
|
|
Senior living communities |
|
|
|
|
|
|
|
|
|
|
|
|
|
|
|
|
|
|
|
|
|
|
|
||
Watercrest (b) |
|
Walton County, FL |
|
107 |
|
107 |
|
103 |
|
96 |
% |
|
107 |
|
106 |
|
99 |
% |
|
107 |
|
88 |
|
82 |
% |
Watersound Fountains (h) |
|
Walton County, FL |
|
148 |
|
148 |
|
39 |
|
26 |
% |
|
— |
|
— |
|
N/A |
% |
|
— |
|
— |
|
N/A |
% |
Total senior living units |
|
255 |
|
255 |
|
142 |
|
56 |
% |
|
107 |
|
106 |
|
99 |
% |
|
107 |
|
88 |
|
82 |
% |
||
Total units |
|
1,383 |
|
1,383 |
|
1,103 |
|
80 |
% |
|
1,235 |
|
999 |
|
81 |
% |
|
864 |
|
767 |
|
89 |
% |
||
| (a) | We have additional multi-family communities in various stages of planning. |
| (b) | Property is related to a consolidated JV. See Note 4. Joint Ventures included in Item 15 of this Form 10-K for additional information. |
| (c) | Construction was completed in the second quarter of 2023. |
| (d) | Construction was completed in the fourth quarter of 2023. |
| (e) | Construction was completed in the first quarter of 2023. In January 2025, the townhomes were platted as individual units, which created the ability to sell them individually. |
| (f) | Renovation of 19 units for long-term rental use was completed in the second half of 2023. As of December 31, 2022, we were in the process of converting 19 units for long-term rental use, which were not available for lease due to renovation. |
| (g) | All multi-family communities are managed by our unconsolidated JV, Watersound Management, LLC (the “Watersound Management JV”). The Watersound Management JV is unconsolidated and is accounted for under the equity method of accounting. See Note 4. Joint Ventures included in Item 15 of this Form 10-K for additional information. |
| (h) | The community opened in March 2024. The senior living community is operated by our JV partner. WOSL, LLC, (the “Watersound Fountains Independent Living JV”) is unconsolidated and is accounted for under the equity method of accounting. See Note 4. Joint Ventures included in Item 15 of this Form 10-K for additional information. |
Our leasing portfolio consists of approximately 1,182,000 square feet of leasable space for mixed-use, retail, industrial, office, self-storage and medical uses. Through separate unconsolidated JVs, other commercial properties that are operated by our JV partners include a 124-room TownePlace Suites by Marriott (Pier Park TPS JV), a 121-room Residence Inn (Pier Park RI JV), a Busy Bee branded fuel station and convenience store, which includes a Starbucks, (SJBB, LLC, the “Busy Bee JV”) and a golf cart sales and service facility (SJECC, LLC, the “Electric Cart Watersound JV”), all located in Bay County, Florida.
31
The total net rentable square feet and percentage leased of leasing properties are as follows:
|
|
|
|
December 31, 2024 |
|
|
December 31, 2023 |
|
|
December 31, 2022 |
|
||||||
|
|
|
|
Net |
|
|
|
|
Net |
|
|
|
|
Net |
|
|
|
|
|
|
|
Rentable |
|
|
|
|
Rentable |
|
|
|
|
Rentable |
|
|
|
|
|
|
|
Square |
|
Percentage |
|
|
Square |
|
Percentage |
|
|
Square |
|
Percentage |
|
|
|
Location |
|
Feet* |
|
Leased |
|
|
Feet* |
|
Leased |
|
|
Feet* |
|
Leased |
|
Pier Park North (a) |
|
Bay County, FL |
|
320,310 |
|
100 |
% |
|
320,310 |
|
100 |
% |
|
320,310 |
|
97 |
% |
VentureCrossings |
|
Bay County, FL |
|
303,605 |
|
100 |
% |
|
303,605 |
|
98 |
% |
|
303,605 |
|
96 |
% |
Watersound Town Center (b) (c) |
|
Walton County, FL |
|
155,962 |
|
86 |
% |
|
137,921 |
|
83 |
% |
|
89,662 |
|
99 |
% |
FSU/TMH Medical Campus (d) |
|
Bay County, FL |
|
78,670 |
|
100 |
% |
|
— |
|
N/A |
% |
|
— |
|
N/A |
% |
Beckrich Office Park (c) (e) (f) |
|
Bay County, FL |
|
78,322 |
|
90 |
% |
|
78,322 |
|
93 |
% |
|
78,294 |
|
99 |
% |
Watersound Self-Storage |
|
Walton County, FL |
|
67,694 |
|
90 |
% |
|
67,694 |
|
92 |
% |
|
67,694 |
|
87 |
% |
WindMark Beach Town Center (c) (g) |
|
Gulf County, FL |
|
44,748 |
|
71 |
% |
|
44,748 |
|
71 |
% |
|
44,748 |
|
71 |
% |
WaterColor Town Center (c) (h) |
|
Walton County, FL |
|
22,199 |
|
75 |
% |
|
22,199 |
|
100 |
% |
|
22,199 |
|
100 |
% |
Cedar Grove Commerce Park |
|
Bay County, FL |
|
19,389 |
|
100 |
% |
|
19,389 |
|
100 |
% |
|
19,389 |
|
100 |
% |
Port St. Joe Commercial |
|
Gulf County, FL |
|
16,964 |
|
100 |
% |
|
16,964 |
|
100 |
% |
|
16,964 |
|
100 |
% |
Beach Commerce Park (c) |
|
Bay County, FL |
|
14,800 |
|
100 |
% |
|
14,800 |
|
100 |
% |
|
14,800 |
|
100 |
% |
South Walton Commerce Park (i) |
|
Walton County, FL |
|
11,570 |
|
100 |
% |
|
11,570 |
|
100 |
% |
|
11,570 |
|
100 |
% |
Watersound Gatehouse (c) |
|
Walton County, FL |
|
10,271 |
|
87 |
% |
|
10,271 |
|
100 |
% |
|
10,271 |
|
100 |
% |
Other (j) |
|
Bay, Gulf and Walton Counties, FL |
|
37,590 |
|
100 |
% |
|
34,224 |
|
100 |
% |
|
34,224 |
|
100 |
% |
|
|
|
|
1,182,094 |
|
95 |
% |
|
1,082,017 |
|
95 |
% |
|
1,033,730 |
|
95 |
% |
| * | Net Rentable Square Feet is designated as the current square feet available for lease as specified in the applicable lease agreements plus management’s estimate of space available for lease based on construction drawings. |
| (a) | Property is related to a consolidated JV. See Note 4. Joint Ventures included in Item 15 of this Form 10-K for additional information. |
| (b) | An additional building was completed in the second quarter of 2024 and construction of additional leasing space was completed in 2023. Includes net rentable square feet of 6,752 within our residential segment. Included in net rentable square feet as of December 31, 2024 and 2023, is 2,137 square feet leased to a consolidated JV. Included in net rentable square feet as of December 31, 2024 and 2023, is 1,200 square feet leased to an unconsolidated JV. |
| (c) | In addition to net rentable square feet, there is also space that we occupy or that serves as common area. |
| (d) | A medical office building was completed in the third quarter of 2024. |
| (e) | We occupy approximately 24,000 square feet as our headquarters, which is excluded from net rentable square feet as of each December 31, 2024, 2023 and 2022. |
| (f) | Included in net rentable square feet as of December 31, 2024, 2023 and 2022, is 1,500 square feet leased to a consolidated JV. |
| (g) | Included in net rentable square feet as of December 31, 2024, 2023 and 2022, is 13,808 square feet of unfinished space. |
| (h) | As of December 31, 2024, a portion of the vacant space is being held as a future office for our new boutique real estate brokerage business. |
| (i) | Included in net rentable square feet as of December 31, 2022, is 1,364 square feet leased to a consolidated JV. |
| (j) | Includes various other properties, each with less than 10,000 net rentable square feet. |
Our commercial development is currently concentrated in the commercial projects detailed in the table below. In addition to these properties, we have other commercial buildings and sites in various stages of planning and development.
|
|
|
|
December 31, 2024 |
|||||||||
|
|
Location |
|
Completed Net Rentable Square Feet |
|
Percentage Leased |
|
|
Square Feet Under Construction |
|
Additional Planned Square Feet |
|
Total Square Feet* |
Watersound Town Center |
|
Walton County, FL |
|
155,962 |
|
86 |
% |
|
— |
|
244,038 |
|
400,000 |
Watersound West Bay Center |
|
Bay County, FL |
|
3,366 |
|
100 |
% |
|
— |
|
496,634 |
|
500,000 |
FSU/TMH Medical Campus |
|
Bay County, FL |
|
78,670 |
|
100 |
% |
|
— |
|
241,330 |
|
320,000 |
|
|
|
|
237,998 |
|
91 |
% |
|
— |
|
982,002 |
|
1,220,000 |
| * | Total square feet are based on current estimates and are subject to change. |
32
Results of Operations
Consolidated Results
The following table sets forth a comparison of the results of our operations:
|
|
|
|
|
|
|
|
|
|
|
|
Year Ended December 31, |
|||||||
|
|
2024 |
|
2023 |
|
2022 |
|||
|
|
In millions |
|||||||
Revenue: |
|
|
|
|
|
|
|
|
|
Real estate revenue |
|
$ |
143.2 |
|
$ |
186.0 |
|
$ |
115.9 |
Hospitality revenue |
|
|
199.2 |
|
|
152.4 |
|
|
97.2 |
Leasing revenue |
|
|
60.3 |
|
|
50.8 |
|
|
39.2 |
Total revenue |
|
|
402.7 |
|
|
389.2 |
|
|
252.3 |
Expenses: |
|
|
|
|
|
|
|
|
|
Cost of real estate revenue |
|
|
70.3 |
|
|
88.0 |
|
|
50.8 |
Cost of hospitality revenue |
|
|
136.4 |
|
|
122.2 |
|
|
77.5 |
Cost of leasing revenue |
|
|
28.8 |
|
|
25.8 |
|
|
17.6 |
Corporate and other operating expenses |
|
|
25.2 |
|
|
23.8 |
|
|
22.1 |
Depreciation, depletion and amortization |
|
|
46.4 |
|
|
38.7 |
|
|
22.9 |
Total expenses |
|
|
307.1 |
|
|
298.5 |
|
|
190.9 |
Operating income |
|
|
95.6 |
|
|
90.7 |
|
|
61.4 |
Other income (expense): |
|
|
|
|
|
|
|
|
|
Investment income, net |
|
|
13.5 |
|
|
13.3 |
|
|
9.9 |
Interest expense |
|
|
(33.6) |
|
|
(30.6) |
|
|
(18.4) |
Gain on contributions to unconsolidated joint ventures |
|
|
— |
|
|
0.7 |
|
|
2.7 |
Equity in income from unconsolidated joint ventures |
|
|
23.6 |
|
|
22.7 |
|
|
26.0 |
Other (expense) income, net |
|
|
(0.7) |
|
|
3.2 |
|
|
13.0 |
Total other income, net |
|
|
2.8 |
|
|
9.3 |
|
|
33.2 |
Income before income taxes |
|
|
98.4 |
|
|
100.0 |
|
|
94.6 |
Income tax expense |
|
|
(26.0) |
|
|
(26.0) |
|
|
(24.4) |
Net income |
|
$ |
72.4 |
|
$ |
74.0 |
|
$ |
70.2 |
Results of operations in this Form 10-K generally discusses 2024 and 2023 items and comparisons. For a detailed discussion of results of operations and comparisons for 2023 and 2022, see Item 7. Management’s Discussion and Analysis of Financial Condition and Results of Operations, included in our Form 10‑K for the year ended December 31, 2023 filed with the SEC on February 21, 2024.
33
Real Estate Revenue and Gross Profit
The following table sets forth a comparison of our total consolidated real estate revenue and gross profit:
|
|
|
|
|
|
|
|
|
|
|
|
|
|
|
|
|
|
|
|
|
2024 |
|
% (a) |
|
2023 |
|
% (a) |
|
2022 |
|
% (a) |
|
|||
|
|
|
Dollars in millions |
|
|||||||||||||
Revenue: |
|
|
|
|
|
|
|
|
|
|
|
|
|
|
|
|
|
Residential real estate revenue |
|
|
$ |
116.8 |
|
81.6 |
% |
$ |
155.7 |
|
83.7 |
% |
$ |
92.8 |
|
80.1 |
% |
Commercial and forestry real estate revenue |
|
|
|
18.0 |
|
12.6 |
% |
|
21.3 |
|
11.5 |
% |
|
13.7 |
|
11.8 |
% |
Timber revenue |
|
|
|
4.2 |
|
2.9 |
% |
|
4.9 |
|
2.6 |
% |
|
6.7 |
|
5.8 |
% |
Other revenue |
|
|
|
4.2 |
|
2.9 |
% |
|
4.1 |
|
2.2 |
% |
|
2.7 |
|
2.3 |
% |
Real estate revenue |
|
|
$ |
143.2 |
|
100.0 |
% |
$ |
186.0 |
|
100.0 |
% |
$ |
115.9 |
|
100.0 |
% |
|
|
|
|
|
|
|
|
|
|
|
|
|
|
|
|
|
|
Gross profit: |
|
|
|
|
|
|
|
|
|
|
|
|
|
|
|
|
|
Residential real estate |
|
|
$ |
54.8 |
|
46.9 |
% |
$ |
77.8 |
|
50.0 |
% |
$ |
48.7 |
|
52.5 |
% |
Commercial and forestry real estate |
|
|
|
13.1 |
|
72.8 |
% |
|
14.7 |
|
69.0 |
% |
|
9.7 |
|
70.8 |
% |
Timber |
|
|
|
3.4 |
|
81.0 |
% |
|
4.1 |
|
83.7 |
% |
|
5.9 |
|
88.1 |
% |
Other |
|
|
|
1.6 |
|
38.1 |
% |
|
1.4 |
|
34.1 |
% |
|
0.8 |
|
29.6 |
% |
Gross profit |
|
|
$ |
72.9 |
|
50.9 |
% |
$ |
98.0 |
|
52.7 |
% |
$ |
65.1 |
|
56.2 |
% |
| (a) | Calculated percentage of total real estate revenue and the respective gross margin percentage. |
Residential Real Estate Revenue and Gross Profit. During 2024, residential real estate revenue decreased $38.9 million, or 25.0%, to $116.8 million, as compared to $155.7 million in 2023. During 2024, residential real estate gross profit decreased $23.0 million, to $54.8 million (or gross margin of 46.9%), as compared to $77.8 million, (or gross margin of 50.0%) in 2023. During 2024, we sold 912 homesites, compared to 1,063 homesites and unimproved residential land sales of $0.6 million during 2023. During 2024 and 2023 the average base revenue, excluding homesite residuals, per homesite sold was approximately $108,000 and $107,000, respectively. The current period homesite sales also include the sale of 82 entitled but undeveloped homesites sold within the SouthWood community, compared to 100 in the prior period. The revenue, gross profit and margin for each period was impacted by the volume of sales within each of the communities, the difference in pricing among the communities and the difference in the cost of the homesite development. The number of homesites sold varied in each period due to the timing of homebuilder contractual closing obligations in our residential communities.
Commercial and Forestry Real Estate Revenue and Gross Profit. During 2024, we had eleven commercial and forestry real estate sales totaling approximately 634 acres for $18.0 million, resulting in a gross profit of $13.1 million (or gross margin of 72.8%). During 2023, we had twenty-eight commercial and forestry real estate sales totaling approximately 474 acres for $21.0 million and land improvement services of $0.3 million, together resulting in a gross profit of $14.7 million (or gross margin of 69.0%).
Revenue from commercial and forestry real estate can vary significantly from period-to-period depending on the proximity to developed areas and mix of real estate sold in each period, with varying compositions of retail, office, industrial, timber and other commercial uses. Our gross margin can vary significantly from period-to-period depending on the characteristics of the property sold. Sales of forestry land typically have a lower cost basis than residential and commercial real estate sales. In addition, our cost basis in residential and commercial real estate can vary depending on the amount of development or other costs incurred on the property.
Timber Revenue and Gross Profit. Timber revenue decreased $0.7 million, or 14.3%, to $4.2 million during 2024, as compared to $4.9 million in 2023. The decrease was primarily due to a decrease in prices and tons of wood products sold in the current period. There were 256,000 tons of wood products sold at an average price per ton of $14.56 during 2024, as compared to 259,000 tons of wood products sold at an average price per ton of $16.56, during 2023. Timber gross margin was 81.0% during 2024, compared to 83.7% during 2023.
34
The decrease was primarily due to the lower prices and less tons of wood products sold in the current period.
Other Revenue. Other revenue primarily consists of title insurance business revenue and mitigation bank credit sales.
Hospitality Revenue and Gross Profit
|
|
Year Ended December 31, |
|
|||||||
|
|
2024 |
|
2023 |
|
2022 |
|
|||
|
|
Dollars in millions |
||||||||
Hospitality revenue |
|
$ |
199.2 |
|
$ |
152.4 |
|
$ |
97.2 |
|
Gross profit |
|
$ |
62.8 |
|
$ |
30.2 |
|
$ |
19.7 |
|
Gross margin |
|
|
31.5 |
% |
|
19.8 |
% |
|
20.3 |
% |
Hospitality revenue increased $46.8 million, or 30.7% to $199.2 million during 2024, as compared to $152.4 million in 2023. The increase in hospitality revenue was primarily related to the growth in membership dues and membership ancillary spend, new Camp Creek amenities which opened in April 2023, as well as an increase in lodging revenue. The increase in lodging revenue was related to Embassy Suites by Hilton Panama City Beach Resort, which opened in April 2023; The Lodge 30A, which opened in February 2023; and Home2 Suites by Hilton Santa Rosa Beach, Hotel Indigo Panama City Marina and Camp Creek Inn, which all opened in June 2023. As of December 31, 2024, Watersound Club had 3,476 members, compared with 3,317 members as of December 31, 2023, a net increase of 159 members. As of both December 31, 2024 and 2023, we had 1,053 operational hotel rooms (excluding 245 and 124 hotel rooms related to unconsolidated JVs, respectively). Hospitality had a gross margin of 31.5% during 2024, compared to 19.8% during 2023. The increase in gross margin was primarily due to new assets being operational throughout the current period.
Leasing Revenue and Gross Profit
|
|
Year Ended December 31, |
|
|||||||
|
|
2024 |
|
2023 |
|
2022 |
|
|||
|
|
Dollars in millions |
||||||||
Leasing revenue |
|
$ |
60.3 |
|
$ |
50.8 |
|
$ |
39.2 |
|
Gross profit |
|
$ |
31.5 |
|
$ |
25.0 |
|
$ |
21.6 |
|
Gross margin |
|
|
52.2 |
% |
|
49.2 |
% |
|
55.1 |
% |
Leasing revenue increased $9.5 million, or 18.7%, to $60.3 million during 2024, as compared to $50.8 million in 2023. The increase was primarily due to new multi-family, commercial property and marina leases, as well as other new leases. Leasing gross margin increased to 52.2% during 2024, as compared to 49.2% during 2023, primarily due to new leases, as well as lower operating costs in the current period.
Corporate and Other Operating Expenses
|
|
Year Ended December 31, |
|||||||
|
|
2024 |
|
2023 |
|
2022 |
|||
|
|
In millions |
|||||||
Employee costs |
|
$ |
12.7 |
|
$ |
10.4 |
|
$ |
9.6 |
Property taxes and insurance |
|
|
5.5 |
|
|
6.4 |
|
|
5.5 |
Professional fees |
|
|
3.6 |
|
|
4.0 |
|
|
3.7 |
Marketing and owner association costs |
|
|
1.0 |
|
|
1.0 |
|
|
1.1 |
Occupancy, repairs and maintenance |
|
|
0.6 |
|
|
0.4 |
|
|
0.7 |
Other miscellaneous |
|
|
1.8 |
|
|
1.6 |
|
|
1.5 |
Total corporate and other operating expenses |
|
$ |
25.2 |
|
$ |
23.8 |
|
$ |
22.1 |
Corporate and other operating expenses increased $1.4 million to $25.2 million during 2024, as compared to $23.8 million in 2023. The increase was primarily due to employee costs related to bonuses and restricted stock awards, partially offset by a decrease in property taxes due to timing of residential homesite completions.
35
See Note 15. Stockholders’ Equity and Note 16. Stock Based Compensation included in Item 15 of this Form 10-K for additional information related to the issuance of common stock for employee compensation.
Depreciation, Depletion and Amortization
Depreciation, depletion and amortization expense increased $7.7 million during 2024, as compared to 2023, primarily due to new hospitality and commercial assets placed in service. Depreciation is a non-cash, generally accepted accounting principles (“GAAP”) expense which is amortized over an asset’s useful life, while maintenance and repair expenses are period costs and expensed as incurred. See Note 2. Significant Accounting Policies included in Item 15 of this Form 10-K for additional information.
Investment Income, Net
Investment income, net primarily includes (i) interest and dividends earned and accretion of the net discount (ii) interest income earned on the time deposit held by a special purpose entity and (iii) interest earned on notes receivable and other receivables as detailed in the table below:
|
|
Year Ended December 31, |
|||||||
|
|
2024 |
|
2023 |
|
2022 |
|||
|
|
In millions |
|||||||
Interest, dividend and accretion income |
|
$ |
3.3 |
|
$ |
2.9 |
|
$ |
0.8 |
Interest income from investments in special purpose entities |
|
|
8.0 |
|
|
8.0 |
|
|
8.0 |
Interest earned on notes receivable and other interest |
|
|
2.2 |
|
|
2.4 |
|
|
1.1 |
Total investment income, net |
|
$ |
13.5 |
|
$ |
13.3 |
|
$ |
9.9 |
Investment income, net during the years ended December 31, 2024 and 2023 were comparable.
Interest Expense
Interest expense primarily includes interest incurred on project financing, the Senior Notes issued by Northwest Florida Timber Finance, LLC (“Senior Notes”), Community Development District (“CDD”) debt and finance leases, as well as amortization of debt discount and premium and debt issuance costs as detailed in the table below:
|
|
Year Ended December 31, |
|||||||
|
|
2024 |
|
2023 |
|
2022 |
|||
|
|
In millions |
|||||||
Interest incurred for project financing and other interest expense |
|
$ |
24.7 |
|
$ |
21.8 |
|
$ |
9.6 |
Interest expense and amortization of discount and issuance costs for Senior Notes issued by special purpose entity |
|
|
8.9 |
|
|
8.8 |
|
|
8.8 |
Total interest expense |
|
$ |
33.6 |
|
$ |
30.6 |
|
$ |
18.4 |
Interest expense increased $3.0 million, or 9.8%, to $33.6 million in 2024, as compared to $30.6 million in 2023, primarily due to completion of projects where interest expense is no longer capitalized and the increase in project financing throughout 2023. See Note 10. Debt, Net and Note 18. Other Income, Net included in Item 15 of this Form 10-K for additional information regarding project financing.
Gain on Contributions to Unconsolidated Joint Ventures
Gain on contributions to unconsolidated joint ventures includes gain on land, impact fees and additional infrastructure improvements contributed to our unconsolidated JVs as detailed in the table below. See Note 4. Joint Ventures included in Item 15 of this Form 10-K for additional information.
36
|
|
Year Ended December 31, |
|||||||
|
|
2024 |
|
2023 |
|
2022 |
|||
|
|
In millions |
|||||||
Latitude Margaritaville Watersound JV (a) |
|
$ |
— |
|
$ |
0.7 |
|
$ |
0.9 |
Pier Park RI JV (b) |
|
|
— |
|
|
— |
|
|
1.4 |
Electric Cart Watersound JV (c) |
|
|
— |
|
|
— |
|
|
0.4 |
Gain on Contributions to Unconsolidated Joint Ventures |
|
$ |
— |
|
$ |
0.7 |
|
$ |
2.7 |
| (a) | Includes a gain on additional infrastructure improvements contributed in each of 2023 and 2022. |
| (b) | Includes a gain on land and impact fees contributed. |
| (c) | Includes a gain of on land contributed. |
Equity in Income from Unconsolidated Joint Ventures
Equity in income (loss) from unconsolidated joint ventures includes our proportionate share of earnings or losses of unconsolidated JVs accounted for by the equity method as detailed in the table below. See Note 4. Joint Ventures included in Item 15 of this Form 10-K for additional information.
|
Year Ended December 31, |
|||||||
|
2024 |
|
2023 |
|
2022 |
|||
|
In millions |
|||||||
Latitude Margaritaville Watersound JV (a) |
$ |
29.3 |
|
$ |
23.6 |
|
$ |
3.9 |
Sea Sound JV (b) |
|
— |
|
|
— |
|
|
21.7 |
Watersound Fountains Independent Living JV (c) |
|
(4.4) |
|
|
(0.7) |
|
|
(0.2) |
Pier Park TPS JV |
|
(0.5) |
|
|
(0.4) |
|
|
— |
Pier Park RI JV (d) |
|
(0.9) |
|
|
— |
|
|
— |
Busy Bee JV (e) |
|
0.1 |
|
|
— |
|
|
0.5 |
Electric Cart Watersound JV (f) |
|
(0.1) |
|
|
0.1 |
|
|
— |
Watersound Management JV |
|
0.1 |
|
|
0.1 |
|
|
0.1 |
Total equity in income from unconsolidated joint ventures |
$ |
23.6 |
|
$ |
22.7 |
|
$ |
26.0 |
| (a) | During 2024, 2023 and 2022, the Latitude Margaritaville Watersound JV completed 659, 641 and 316 home sale transactions, respectively. |
| (b) | In 2022, FDSJ Eventide, LLC (the “Sea Sound JV”) sold its assets to an unrelated third party for $92.5 million, resulting in a total gain on sale of $36.1 million. The year ended December 31, 2022, includes our proportionate share of the gain on sale of $21.7 million. As a result of the sale, the Sea Sound JV no longer has activity from operations. |
| (c) | The community opened in March 2024 and is currently under lease-up. Activity in the current period includes pre-opening, lease-up, depreciation and interest expenses for the project. |
| (d) | The hotel opened in April 2024. |
| (e) | Includes changes in the fair value of derivatives related to interest rate swaps entered into by the Busy Bee JV. |
| (f) | The permanent sales and service facility located in the Watersound West Bay Center opened in October 2023. An additional sales showroom located in the Watersound Town Center opened in June 2024. |
Other (Expense) Income, Net
Other (expense) income, net primarily includes income from our retained interest investments, gain on insurance recoveries and other income and expense items as detailed in the table below:
37
|
|
Year Ended December 31, |
|||||||
|
|
2024 |
|
2023 |
|
2022 |
|||
|
|
In millions |
|||||||
Accretion income from retained interest investments |
|
$ |
— |
|
$ |
2.6 |
|
$ |
1.7 |
Gain on insurance recoveries |
|
|
— |
|
|
— |
|
|
9.8 |
Miscellaneous (expense) income, net |
|
|
(0.7) |
|
|
0.6 |
|
|
1.5 |
Other (expense) income, net |
|
$ |
(0.7) |
|
$ |
3.2 |
|
$ |
13.0 |
Other (expense) income, net decreased $3.9 million to other expense, net of $0.7 million during 2024, as compared to other income, net of $3.2 million in 2023. Accretion income from retained interest investments includes accretion of investment income over the life of the retained interest using the effective yield method, prior to optional prepayment, in full, of the installment notes in August 2023.
Miscellaneous (expense) income, net during 2024, includes a $0.6 million net loss on disposal of assets. Miscellaneous (expense) income, net during 2023, includes $1.1 million of income received from the Florida Division of Emergency Management’s Florida Timber Recovery Block Grant Program (“TRBG”) for recovery of lost income related to timber crop that was destroyed as a result of Hurricane Michael in 2018. Miscellaneous (expense) income, net during 2023 also includes a $0.4 million gain on retained interest investment. Miscellaneous (expense) income, net during 2023 includes $0.6 million of expense for cleanup of damaged timber as a result of Hurricane Michael. See Note 18. Other Income, Net included in Item 15 of this Form 10-K for additional information.
Income Tax Expense
Income tax expense was $26.0 million in each of 2024 and 2023. Our effective tax rate was 26.4% in 2024, as compared to 25.1% in 2023.
Our effective rate for 2024 and 2023, differed from the federal statutory rate of 21.0% primarily due to state income taxes and other permanent differences. See Note 13. Income Taxes included in Item 15 of this Form 10-K for additional information.
38
Segment Results
Residential
The table below sets forth the consolidated results of operations of our residential segment:
|
|
Year Ended December 31, |
|||||||
|
|
2024 |
|
2023 |
|
2022 |
|||
|
|
In millions |
|||||||
Revenue: |
|
|
|
|
|
|
|
|
|
Real estate revenue |
|
|
|
|
|
|
|
|
|
Residential real estate revenue |
|
$ |
107.2 |
|
$ |
145.6 |
|
$ |
85.1 |
Other revenue |
|
|
9.6 |
|
|
10.1 |
|
|
7.7 |
Total real estate revenue |
|
|
116.8 |
|
|
155.7 |
|
|
92.8 |
Leasing revenue |
|
|
0.2 |
|
|
0.1 |
|
|
0.1 |
Total revenue |
|
|
117.0 |
|
|
155.8 |
|
|
92.9 |
Expenses: |
|
|
|
|
|
|
|
|
|
Cost of real estate and other revenue |
|
|
62.0 |
|
|
77.9 |
|
|
44.1 |
Cost of leasing revenue |
|
|
0.1 |
|
|
— |
|
|
— |
Other operating expenses |
|
|
4.7 |
|
|
4.5 |
|
|
3.9 |
Depreciation, depletion and amortization |
|
|
0.2 |
|
|
0.2 |
|
|
0.2 |
Total expenses |
|
|
67.0 |
|
|
82.6 |
|
|
48.2 |
Operating income |
|
|
50.0 |
|
|
73.2 |
|
|
44.7 |
Other income (expense): |
|
|
|
|
|
|
|
|
|
Investment income, net |
|
|
1.6 |
|
|
1.7 |
|
|
1.1 |
Interest expense |
|
|
(0.4) |
|
|
(0.4) |
|
|
(0.5) |
Gain on contributions to unconsolidated joint ventures |
|
|
— |
|
|
0.7 |
|
|
0.9 |
Equity in income from unconsolidated joint ventures |
|
|
29.3 |
|
|
23.6 |
|
|
3.9 |
Other income (expense), net |
|
|
0.2 |
|
|
0.2 |
|
|
(0.5) |
Total other income, net |
|
|
30.7 |
|
|
25.8 |
|
|
4.9 |
Income before income taxes |
|
$ |
80.7 |
|
$ |
99.0 |
|
$ |
49.6 |
The following tables set forth our consolidated residential real estate revenue and cost of revenue activity:
|
|
Year Ended December 31, 2024 |
|
|||||||||||
|
|
Units |
|
|
|
|
Cost of |
|
Gross |
|
Gross |
|
||
|
|
Sold |
|
Revenue |
|
Revenue |
|
Profit |
|
Margin |
|
|||
|
|
Dollars in millions |
||||||||||||
Consolidated |
|
|
|
|
|
|
|
|
|
|
|
|
|
|
Homesites (a) |
|
912 |
|
$ |
107.2 |
|
$ |
56.8 |
|
$ |
50.4 |
|
47.0 |
% |
Total consolidated |
|
912 |
|
$ |
107.2 |
|
$ |
56.8 |
|
$ |
50.4 |
|
47.0 |
% |
|
|
|
|
|
|
|
|
|
|
|
|
|
|
|
Unconsolidated |
|
|
|
|
|
|
|
|
|
|
|
|
|
|
Homes (b) |
|
659 |
|
|
|
|
|
|
|
|
|
|
|
|
Total consolidated and unconsolidated |
|
1,571 |
|
|
|
|
|
|
|
|
|
|
|
|
| (a) | Includes 82 entitled but undeveloped homesites sold within the SouthWood community. |
| (b) | Includes homes sold by the Latitude Margaritaville Watersound JV, which is unconsolidated and is accounted for under the equity method of accounting. See Note 4. Joint Ventures included in Item 15 of this Form 10-K for additional information. |
39
|
|
Year Ended December 31, 2023 |
|
|||||||||||
|
|
Units |
|
|
|
|
Cost of |
|
Gross |
|
Gross |
|
||
|
|
Sold |
|
Revenue |
|
Revenue |
|
Profit |
|
Margin |
|
|||
|
|
Dollars in millions |
|
|||||||||||
Consolidated |
|
|
|
|
|
|
|
|
|
|
|
|
|
|
Homesites (a) |
|
1,063 |
|
$ |
145.0 |
|
$ |
73.5 |
|
$ |
71.5 |
|
49.3 |
% |
Land sale |
|
N/A |
|
|
0.6 |
|
|
0.1 |
|
|
0.5 |
|
83.3 |
% |
Total consolidated |
|
1,063 |
|
$ |
145.6 |
|
$ |
73.6 |
|
$ |
72.0 |
|
49.5 |
% |
|
|
|
|
|
|
|
|
|
|
|
|
|
|
|
Unconsolidated |
|
|
|
|
|
|
|
|
|
|
|
|
|
|
Homes (b) |
|
641 |
|
|
|
|
|
|
|
|
|
|
|
|
Total consolidated and unconsolidated |
|
1,704 |
|
|
|
|
|
|
|
|
|
|
|
|
| (a) | Includes 100 entitled but undeveloped homesites sold within the SouthWood community. |
| (b) | Includes homes sold by the Latitude Margaritaville Watersound JV, which is unconsolidated and is accounted for under the equity method of accounting. See Note 4. Joint Ventures included in Item 15 of this Form 10-K for additional information. |
|
|
Year Ended December 31, 2022 |
|
|||||||||||
|
|
Units |
|
|
|
|
Cost of |
|
Gross |
|
Gross |
|
||
|
|
Sold |
|
Revenue |
|
Revenue |
|
Profit |
|
Margin |
|
|||
|
|
Dollars in millions |
|
|||||||||||
Consolidated |
|
|
|
|
|
|
|
|
|
|
|
|
|
|
Homesites (a) |
|
752 |
|
$ |
84.0 |
|
$ |
41.0 |
|
$ |
43.0 |
|
51.2 |
% |
Land sale |
|
N/A |
|
|
1.1 |
|
|
— |
|
|
1.1 |
|
100.0 |
% |
Total consolidated |
|
752 |
|
$ |
85.1 |
|
$ |
41.0 |
|
$ |
44.1 |
|
51.8 |
% |
Unconsolidated |
|
|
|
|
|
|
|
|
|
|
|
|
|
|
Homes (b) |
|
316 |
|
|
|
|
|
|
|
|
|
|
|
|
Total consolidated and unconsolidated |
|
1,068 |
|
|
|
|
|
|
|
|
|
|
|
|
| (a) | Includes 42 entitled but undeveloped homesites sold within the SouthWood community. |
| (b) | Includes homes sold by the Latitude Margaritaville Watersound JV, which is unconsolidated and is accounted for under the equity method of accounting. See Note 4. Joint Ventures included in Item 15 of this Form 10-K for additional information. |
Year Ended December 31, 2024 Compared to the Year Ended December 31, 2023
The following discussion sets forth details of the consolidated results of operations of our residential segment.
Homesites. Revenue from homesite sales decreased $37.8 million, or 26.1%, during 2024, as compared to 2023, primarily due to the mix and number of homesites sold per community and the timing of homebuilder contractual closing obligations in our residential communities. During 2024 and 2023, the average base revenue, excluding homesite residuals, per homesite sold was approximately $108,000 and $107,000, respectively. The current period homesite sales also include the sale of 82 entitled but undeveloped homesites sold within the SouthWood community, compared to 100 in the prior period. Revenue includes estimated homesite residuals of $3.6 million and $24.0 million, during 2024 and 2023, respectively. The decrease in estimated homesite residuals was due to the mix and number of homesites sold in specific communities during the current period. Gross margin decreased to 47.0% during 2024, as compared to 49.3% during 2023, primarily due to the cost, mix and number of homesites sold from different communities during each period. Gross margin may vary each period depending on the location of homesite sales.
Land sales. During 2024, we did not have any unimproved residential land sales. During 2023, we had unimproved residential land sales for $0.6 million, resulting in a gross margin of approximately 83.3%.
40
Other revenue includes tap and impact fee credits sold, marketing fees and other fees. Other revenue includes estimated fees related to homebuilder homesite sales of $2.5 million and $5.0 million during 2024 and 2023, respectively. The decrease in estimated fees related to homebuilder homesite sales was due to the mix and number of homesites sold in specific communities during each period.
Leasing revenue includes long-term leases of residential assets.
Other operating expenses include salaries and benefits, property taxes, marketing, professional fees, project administration, owner association and CDD assessments and other administrative expenses.
Investment income, net primarily consists of interest earned on our notes receivable and unimproved land contribution to our unconsolidated Latitude Margaritaville Watersound JV as home sales are transacted in the community. See Note 4. Joint Ventures included in Item 15 of this Form 10-K for additional information. Interest expense primarily consists of interest incurred on our portion of the total outstanding CDD debt. See Note 10. Debt, Net included in Item 15 of this Form 10-K for additional information.
Gain on contributions to unconsolidated joint ventures during 2024 and 2023, includes a gain of less than $0.1 million and $0.7 million, respectively, on additional infrastructure improvements contributed to our unconsolidated Latitude Margaritaville Watersound JV. See Note 4. Joint Ventures included in Item 15 of this Form 10-K for additional information.
Equity in income from unconsolidated joint ventures includes our proportionate share of earnings or losses of an unconsolidated JV accounted for by the equity method. Equity in income from unconsolidated joint ventures increased $5.7 million during 2024, compared to 2023. The increase was due to a higher average margin per home sold and the increased volume of home sale transactions during the current period related to our unconsolidated Latitude Margaritaville Watersound JV. The Latitude Margaritaville Watersound JV completed 659 home sale transactions during 2024, compared to 641 home sale transactions during 2023. See Note 4. Joint Ventures included in Item 15 of this Form 10-K for additional information.
Hospitality
The table below sets forth the consolidated results of operations of our hospitality segment:
|
|
Year Ended December 31, |
|||||||
|
|
2024 |
|
2023 |
|
2022 |
|||
|
|
In millions |
|||||||
Revenue: |
|
|
|
|
|
|
|
|
|
Hospitality revenue |
|
$ |
199.2 |
|
$ |
152.4 |
|
$ |
96.7 |
Leasing revenue |
|
|
3.5 |
|
|
2.1 |
|
|
0.5 |
Total revenue |
|
|
202.7 |
|
|
154.5 |
|
|
97.2 |
Expenses: |
|
|
|
|
|
|
|
|
|
Cost of hospitality revenue |
|
|
136.4 |
|
|
122.2 |
|
|
76.9 |
Cost of leasing revenue |
|
|
2.5 |
|
|
2.6 |
|
|
0.9 |
Other operating expenses |
|
|
1.5 |
|
|
1.8 |
|
|
1.2 |
Depreciation, depletion and amortization |
|
|
27.0 |
|
|
22.1 |
|
|
9.4 |
Total expenses |
|
|
167.4 |
|
|
148.7 |
|
|
88.4 |
Operating income |
|
|
35.3 |
|
|
5.8 |
|
|
8.8 |
Other (expense) income: |
|
|
|
|
|
|
|
|
|
Investment income, net |
|
|
0.2 |
|
|
0.3 |
|
|
— |
Interest expense |
|
|
(11.8) |
|
|
(9.6) |
|
|
(1.7) |
Other (expense) income, net |
|
|
(0.3) |
|
|
(0.1) |
|
|
1.8 |
Total other (expense) income, net |
|
|
(11.9) |
|
|
(9.4) |
|
|
0.1 |
Income (loss) before income taxes |
|
$ |
23.4 |
|
$ |
(3.6) |
|
$ |
8.9 |
41
The following table sets forth details of our hospitality segment consolidated revenue and gross profit:
|
|
|
|
|
|
|
|
|
|
|
|
|
|
|
|
|
|
|
|
|
|
|
|
|
|
|
|
|
|
Year Ended December 31, 2024 |
|
|
Year Ended December 31, 2023 |
|
|
Year Ended December 31, 2022 |
|
||||||||||||||||||
|
|
|
|
|
Gross |
|
Gross |
|
|
|
|
|
Gross |
|
Gross |
|
|
|
|
|
Gross |
|
Gross |
|
|||
|
|
Revenue |
|
Profit |
|
Margin |
|
|
Revenue |
|
Profit |
|
Margin |
|
|
Revenue |
|
Profit |
|
Margin |
|
||||||
|
|
Dollars in millions |
|
||||||||||||||||||||||||
Clubs (a) |
|
$ |
80.8 |
|
$ |
36.0 |
|
44.6 |
% |
|
$ |
54.0 |
|
$ |
15.5 |
|
28.7 |
% |
|
$ |
40.7 |
|
$ |
12.4 |
|
30.5 |
% |
Hotels |
|
|
105.7 |
|
|
24.8 |
|
23.5 |
% |
|
|
86.4 |
|
|
12.4 |
|
14.4 |
% |
|
|
46.0 |
|
|
7.3 |
|
15.9 |
% |
Other |
|
|
12.7 |
|
|
2.0 |
|
15.7 |
% |
|
|
12.0 |
|
|
2.3 |
|
19.2 |
% |
|
|
10.0 |
|
|
0.1 |
|
1.0 |
% |
Total |
|
$ |
199.2 |
|
$ |
62.8 |
|
31.5 |
% |
|
$ |
152.4 |
|
$ |
30.2 |
|
19.8 |
% |
|
$ |
96.7 |
|
$ |
19.8 |
|
20.5 |
% |
| (a) | Includes the Camp Creek Inn due to its proximity and guest access to Watersound Club amenities. The hotel opened in June 2023. |
Year Ended December 31, 2024 Compared to Year Ended December 31, 2023
Revenue from our clubs increased $26.8 million, or 49.6%, during 2024, as compared to 2023. The increase in revenue in the current period was due to growth in membership dues and membership ancillary spend, as well as the new Camp Creek amenities which opened in April 2023 and Camp Creek Inn which opened in June 2023. As of December 31, 2024, Watersound Club had 3,476 members, compared with 3,317 members as of December 31, 2023, a net increase of 159 members. Our clubs gross margin was 44.6% during 2024, compared to 28.7% during 2023. The increase in gross margin was primarily due to new assets being operational throughout the current period.
Revenue from our hotel operations increased $19.3 million, or 22.3%, during 2024, as compared to 2023. The increase was primarily due to an increase in lodging revenue from Embassy Suites by Hilton Panama City Beach Resort, which opened in April 2023; The Lodge 30A, which opened in February 2023; Home2 Suites by Hilton Santa Rosa Beach and Hotel Indigo Panama City Marina, which both opened in June 2023. Our hotels had a gross margin of 23.5% during 2024, as compared to 14.4% during 2023. The increase in gross margin was primarily due to new assets being operational throughout the current period.
As of both December 31, 2024 and 2023, we had 1,053 operational hotel rooms (excluding 245 and 124 hotel rooms related to unconsolidated JVs, respectively).
Revenue from other hospitality operations increased $0.7 million, or 5.8%, during 2024, as compared to 2023. The increase was primarily due to increased occupancy and special events at our Point South Marina Bay Point and Point South Marina Port St. Joe. Our other hospitality operations had a gross margin of 15.7% during 2024, compared to 19.2% during 2023. The decrease in gross margin was due to increased operational costs during the current period.
Leasing revenue includes marina boat slip and dry storage rentals, as well as leases of other hospitality assets. Leasing revenue increased $1.4 million, or 66.7%, during 2024, as compared to 2023, primarily due to increased occupancy at our marinas and other hospitality assets.
Other operating expenses include salaries and benefits, professional fees and other administrative expenses.
The increase of $4.9 million in depreciation, depletion and amortization expense during 2024, as compared to 2023, was primarily due to new properties placed in service.
Interest expense primarily includes interest incurred from our hospitality project financing. The increase of $2.2 million in interest expense during 2024, as compared to 2023, was primarily due to completion of projects where interest expense is no longer capitalized and the increase in project financing throughout 2023. See Note 10. Debt, Net included in Item 15 of this Form 10-K for additional information.
Other (expense) income, net for 2024, primarily includes net loss on disposal of assets.
42
Commercial
The table below sets forth the consolidated results of operations of our commercial segment:
|
|
Year Ended December 31, |
|||||||
|
|
2024 |
|
2023 |
|
2022 |
|||
|
|
In millions |
|||||||
Revenue: |
|
|
|
|
|
|
|
|
|
Leasing revenue |
|
|
|
|
|
|
|
|
|
Commercial leasing revenue |
|
$ |
25.3 |
|
$ |
21.5 |
|
$ |
19.6 |
Multi-family leasing revenue |
|
|
23.3 |
|
|
19.4 |
|
|
14.2 |
Senior living leasing revenue |
|
|
7.8 |
|
|
7.3 |
|
|
4.7 |
Total leasing revenue |
|
|
56.4 |
|
|
48.2 |
|
|
38.5 |
Real estate revenue |
|
|
|
|
|
|
|
|
|
Commercial and forestry real estate revenue |
|
|
18.0 |
|
|
21.3 |
|
|
13.7 |
Timber revenue |
|
|
4.2 |
|
|
4.9 |
|
|
6.7 |
Total real estate revenue |
|
|
22.2 |
|
|
26.2 |
|
|
20.4 |
Hospitality revenue |
|
|
— |
|
|
— |
|
|
0.5 |
Total revenue |
|
|
78.6 |
|
|
74.4 |
|
|
59.4 |
Expenses: |
|
|
|
|
|
|
|
|
|
Cost of leasing revenue |
|
|
25.9 |
|
|
22.9 |
|
|
16.4 |
Cost of real estate revenue |
|
|
5.7 |
|
|
7.4 |
|
|
4.8 |
Cost of hospitality revenue |
|
|
— |
|
|
— |
|
|
0.6 |
Other operating expenses |
|
|
3.8 |
|
|
4.3 |
|
|
4.2 |
Depreciation, depletion and amortization |
|
|
18.8 |
|
|
16.1 |
|
|
13.0 |
Total expenses |
|
|
54.2 |
|
|
50.7 |
|
|
39.0 |
Operating income |
|
|
24.4 |
|
|
23.7 |
|
|
20.4 |
Other (expense) income: |
|
|
|
|
|
|
|
|
|
Interest expense |
|
|
(12.5) |
|
|
(11.7) |
|
|
(7.3) |
Gain on contributions to unconsolidated joint ventures |
|
|
— |
|
|
— |
|
|
1.8 |
Equity in (loss) income from unconsolidated joint ventures |
|
|
(5.7) |
|
|
(0.9) |
|
|
22.1 |
Other (expense) income, net |
|
|
(0.6) |
|
|
0.1 |
|
|
(0.7) |
Total other (expense) income, net |
|
|
(18.8) |
|
|
(12.5) |
|
|
15.9 |
Income before income taxes |
|
$ |
5.6 |
|
$ |
11.2 |
|
$ |
36.3 |
The following table sets forth details of our commercial segment consolidated revenue and gross profit (deficit):
|
|
|
|
|
|
|
|
|
|
|
|
|
|
|
|
|
|
|
|
|
|
|
|
|
|
|
|
|
|
Year Ended December 31, 2024 |
|
|
Year Ended December 31, 2023 |
|
|
Year Ended December 31, 2022 |
|
||||||||||||||||||
|
|
|
|
|
Gross |
|
Gross |
|
|
|
|
|
Gross |
|
Gross |
|
|
|
|
|
Profit |
|
Gross |
|
|||
|
|
Revenue |
|
Profit |
|
Margin |
|
|
Revenue |
|
Profit |
|
Margin |
|
|
Revenue |
|
(Deficit) |
|
Margin |
|
||||||
|
|
Dollars in millions |
|
||||||||||||||||||||||||
Leasing |
|
|
|
|
|
|
|
|
|
|
|
|
|
|
|
|
|
|
|
|
|
|
|
|
|
|
|
Commercial leasing |
|
$ |
25.3 |
|
$ |
16.7 |
|
66.0 |
% |
|
$ |
21.5 |
|
$ |
13.2 |
|
61.4 |
% |
|
$ |
19.6 |
|
$ |
12.7 |
|
64.8 |
% |
Multi-family leasing |
|
|
23.3 |
|
|
11.5 |
|
49.4 |
% |
|
|
19.4 |
|
|
10.3 |
|
53.1 |
% |
|
|
14.2 |
|
|
8.8 |
|
62.0 |
% |
Senior living leasing |
|
|
7.8 |
|
|
2.3 |
|
29.5 |
% |
|
|
7.3 |
|
|
1.8 |
|
24.7 |
% |
|
|
4.7 |
|
|
0.6 |
|
12.8 |
% |
Total leasing |
|
|
56.4 |
|
|
30.5 |
|
54.1 |
% |
|
|
48.2 |
|
|
25.3 |
|
52.5 |
% |
|
|
38.5 |
|
|
22.1 |
|
57.4 |
% |
Real estate |
|
|
|
|
|
|
|
|
|
|
|
|
|
|
|
|
|
|
|
|
|
|
|
|
|
|
|
Commercial and forestry real estate |
|
|
18.0 |
|
|
13.1 |
|
72.8 |
% |
|
|
21.3 |
|
|
14.7 |
|
69.0 |
% |
|
|
13.7 |
|
|
9.7 |
|
70.8 |
% |
Timber |
|
|
4.2 |
|
|
3.4 |
|
81.0 |
% |
|
|
4.9 |
|
|
4.1 |
|
83.7 |
% |
|
|
6.7 |
|
|
5.9 |
|
88.1 |
% |
Total real estate |
|
|
22.2 |
|
|
16.5 |
|
74.3 |
% |
|
|
26.2 |
|
|
18.8 |
|
71.8 |
% |
|
|
20.4 |
|
|
15.6 |
|
76.5 |
% |
Hospitality |
|
|
— |
|
|
— |
|
N/A |
% |
|
|
— |
|
|
— |
|
N/A |
% |
|
|
0.5 |
|
|
(0.1) |
|
(20.0) |
% |
Total |
|
$ |
78.6 |
|
$ |
47.0 |
|
59.8 |
% |
|
$ |
74.4 |
|
$ |
44.1 |
|
59.3 |
% |
|
$ |
59.4 |
|
$ |
37.6 |
|
63.3 |
% |
43
Year Ended December 31, 2024 Compared to Year Ended December 31, 2023
The following discussion sets forth details of the consolidated results of operations of our commercial segment.
Total leasing revenue increased $8.2 million, or 17.0% during 2024, as compared to 2023. The increase was primarily due to new multi-family and commercial property leases, as well as other new leases. Total leasing gross margin during 2024 increased to 54.1%, as compared to 52.5% during 2023. The increase in leasing gross margin was primarily due to new leases, as well as lower operating costs in the current period. As of December 31, 2024, we had net rentable square feet of approximately 1,182,000, of which approximately 1,126,000 square feet were under lease. As of December 31, 2023, we had net rentable square feet of approximately 1,082,000, of which approximately 1,029,000 square feet were under lease. As of December 31, 2024, our consolidated entities had 1,235 multi-family and senior living units completed, of which 1,064 were leased (excludes 148 senior living units related to the unconsolidated Watersound Fountains Independent Living JV), compared to 1,235 multi-family and senior living units completed, of which 999 were leased as of December 31, 2023.
Commercial and forestry real estate revenue related to sales for the three years ended December 31, 2024 includes the following:
|
|
Number of |
|
|
|
Average Price |
|
|
|
|
Gross Profit |
||
Period |
|
Sales |
|
Acres Sold |
|
Per Acre |
|
Revenue |
|
on Sales |
|||
|
|
|
|
|
|
In millions (except for average price per acre) |
|||||||
2024 |
|
11 |
|
634 |
|
$ |
28,391 |
|
$ |
18.0 |
|
$ |
13.1 |
2023 |
|
28 |
|
474 |
|
$ |
44,304 |
|
$ |
21.0 |
|
$ |
14.5 |
2022 |
|
29 |
|
283 |
|
$ |
44,876 |
|
$ |
12.7 |
|
$ |
9.3 |
We believe the diversity of our commercial segment complements the growth of our residential and hospitality segments. Commercial and forestry real estate revenue can vary depending on the proximity to developed areas and the mix and characteristics of commercial and forestry real estate sold in each period, with varying compositions of retail, office, industrial, timber and other commercial uses. During 2024, we had eleven commercial and forestry real estate sales of approximately 634 acres for $18.0 million, resulting in a gross margin of approximately 72.8%. During 2023, we had twenty-eight commercial and forestry real estate sales of approximately 474 acres for $21.0 million and land improvement services of $0.3 million, together resulting in a gross margin of approximately 69.0%.
Timber revenue decreased by $0.7 million, or 14.3%, to $4.2 million during 2024, as compared to $4.9 million in 2023. The decrease was primarily due to a decrease in prices and tons of wood products sold in the current period. There were 256,000 tons of wood products sold during 2024, as compared to 259,000 tons of wood products sold during 2023. The average price of wood product sold decreased to $14.56 per ton during 2024, as compared to $16.56 per ton during 2023. Timber gross margin was 81.0% during 2024, as compared to 83.7% during 2023. The decrease was primarily due to the lower prices and less tons of wood products sold in the current period.
Other operating expenses include salaries and benefits, property taxes, CDD assessments, professional fees, marketing, project administration and other administrative expenses.
The increase of $2.7 million in depreciation, depletion and amortization expense during 2024, as compared to 2023, was primarily due to new properties placed in service.
Interest expense primarily includes interest incurred from our commercial project financing and CDD debt. The increase of $0.8 million in interest expense during 2024, as compared to 2023, was primarily due to completion of projects where interest expense is no longer capitalized and the increase in project financing throughout 2023. See Note 10. Debt, Net included in Item 15 of this Form 10-K for additional information.
Equity in (loss) income from unconsolidated joint ventures includes our proportionate share of earnings or losses of unconsolidated JVs accounted for by the equity method. Equity in loss from unconsolidated joint ventures was $5.7 million during 2024, as compared to $0.9 million in 2023. Equity in loss from unconsolidated joint ventures during 2024 primarily includes pre-opening, lease-up, depreciation and interest expenses related to the Watersound Fountains Independent Living JV, which opened in March 2024 and is currently under lease-up.
44
In 2022, the Sea Sound JV sold its assets to an unrelated third party for $92.5 million, resulting in a total gain on sale of $36.1 million. Equity in (loss) income during 2022 included $21.7 million related to our proportionate share of the gain on sale. See Note 4. Joint Ventures included in Item 15 of this Form 10-K for additional information.
Other (expense) income, net during 2023, includes $1.1 million of income received from the Florida Division of Emergency Management’s TRBG program for recovery of lost income related to timber crop that was destroyed as a result of Hurricane Michael. Other (expense) income, net during 2023, includes $0.6 million of expense for cleanup of damaged timber as a result of Hurricane Michael.
Liquidity and Capital Resources
As of December 31, 2024, we had cash and cash equivalents of $88.8 million, compared to cash and cash equivalents of $86.1 million as of December 31, 2023. Although we do not currently hold any Securities, we did hold Securities as of December 31, 2022. See Note 5. Investments included in Item 15 of this Form 10-K for additional information regarding our previous investments.
We believe that our current cash position, financing arrangements and cash generated from operations will provide us with sufficient liquidity to satisfy our anticipated working capital needs, expected capital expenditures, principal and interest payments on our long-term debt, authorized stock repurchases and authorized dividends for the next twelve months. See Part I. Item 1A. Risk Factors.
During 2024, we invested a total of $129.4 million in capital expenditures, which includes $68.1 million for our residential segment, $28.0 million for our hospitality segment, $30.6 million for our commercial segment and $2.7 million for corporate expenditures. The $129.4 million in capital expenditures included $121.8 million for new operating assets or for residential development and $7.6 million for sustaining capital on existing operating properties. We anticipate that future capital commitments will be funded through cash generated from operations, cash and cash equivalents on hand and new financing arrangements. As of December 31, 2024, we had a total of $37.7 million primarily in construction and development related contractual obligations. Capital expenditures and contractual obligations exclude amounts related to unconsolidated JVs. See Note 4. Joint Ventures included in Item 15 of this Form 10-K for additional information.
As of December 31, 2024 and 2023, we had various loans outstanding totaling $442.7 million and $459.2 million, respectively, with maturities from March 2025 through March 2064. As of December 31, 2024, the weighted average effective interest rate of total outstanding debt was 4.9%, of which 67.5% of the debt outstanding includes fixed or swapped interest rates, and the average remaining life of debt outstanding was 16.7 years. As of December 31, 2024, the weighted average rate on our variable rate loans, excluding the swapped portion, was 6.5%. See Note 10. Debt, Net included in Item 15 of this Form 10-K for additional information.
Our indebtedness consists of various loans on real and leasehold property. These loans are typically secured by various interests in the property such as assignment of rents, leases, deposits, permits, plans, specifications, fees, agreements, approvals, contracts, licenses, construction contracts, development contracts, service contracts, franchise agreements, the borrower’s assets, improvements, and security interests in the rents, personal property, management agreements, construction agreements, improvements, accounts, profits, leases and fixtures (collectively, “Security Interests”). The specific Security Interests vary from loan to loan.
In 2015, the Pier Park North JV (the “Pier Park North JV”) entered into a $48.2 million loan (the “PPN JV Loan”). As of December 31, 2024 and 2023, $40.4 million and $41.5 million, respectively, was outstanding on the PPN JV Loan. The loan accrues interest at a rate of 4.1% per annum and matures in November 2025. In connection with the loan, we entered into a limited guarantee in favor of the lender, based on our percentage ownership of the JV. In addition, the guarantee can become full recourse in the case of any fraud or intentional misrepresentation by the Pier Park North JV; any voluntary transfer or encumbrance of the property in violation of the due-on-sale clause in the security instrument; upon commencement of voluntary bankruptcy or insolvency proceedings and upon breach of covenants in the security instrument.
45
See Note 10. Debt, Net included in Item 15 of this Form 10-K for additional information. We have begun the process to refinance the PPN JV Loan.
In 2018, Pier Park Crossings LLC (the “Pier Park Crossings JV”) entered into a $36.6 million loan, insured by the U.S. Department of Housing and Urban Development (“HUD”) (the “PPC JV Loan”). As of December 31, 2024 and 2023, $34.2 million and $34.7 million, respectively, was outstanding on the PPC JV Loan. The loan bears interest at a rate of 3.1% and matures in June 2060. The loan includes a prepayment premium due to the lender of 2% - 8% for any additional principal that is prepaid through August 2031. The loan is secured by the real property and certain other Security Interests. See Note 10. Debt, Net included in Item 15 of this Form 10-K for additional information.
In 2019, SJWCSL, LLC (the “Watercrest JV”) entered into a $22.5 million loan (the “Watercrest JV Loan”). As of December 31, 2024 and 2023, $19.6 million and $20.1 million, respectively, was outstanding on the Watercrest JV Loan. The loan bears interest at a rate of the Secured Overnight Financing Rate (“SOFR”) plus 2.2% and matures in June 2047. The loan is secured by the real property and certain other Security Interests. In connection with the loan, we executed a guarantee in favor of the lender to guarantee the payment and performance of the borrower under the Watercrest JV Loan. We are the sole guarantor and receive a quarterly fee related to the guarantee from our JV partner based on the JV partner’s ownership percentage. See Note 10. Debt, Net included in Item 15 of this Form 10-K for additional information.
In 2019, a wholly-owned subsidiary of ours entered into a $5.5 million loan, which is guaranteed by us (the “Beckrich Building III Loan”). As of both December 31, 2024 and 2023, $5.0 million was outstanding on the Beckrich Building III Loan. The loan bears interest at a rate of SOFR plus 1.8% and matures in August 2029. The loan is secured by the real property and certain other Security Interests. See Note 10. Debt, Net included in Item 15 of this Form 10-K for additional information.
In 2019, Pier Park Crossings Phase II LLC (the “Pier Park Crossings Phase II JV”) entered into a $22.9 million loan, insured by HUD, as amended (the “PPC II JV Loan”). As of December 31, 2024 and 2023, $21.8 million and $22.2 million, respectively, was outstanding on the PPC II JV Loan. The loan bears interest at a rate of 2.7% and matures in May 2057. The loan includes a prepayment premium due to the lender of 1% - 8% for any principal that is prepaid through May 2032. The loan is secured by the real property and certain other Security Interests. See Note 10. Debt, Net included in Item 15 of this Form 10-K for additional information.
In 2020, a wholly-owned subsidiary of ours entered into a $15.3 million loan, which is guaranteed by us (the “Airport Hotel Loan”). As of December 31, 2024 and 2023, $11.7 million and $13.0 million, respectively, was outstanding on the Airport Hotel Loan. The loan bears interest at SOFR plus 2.1%, with a floor of 3.0%, and matures in March 2025. The loan is secured by the real property and certain other Security Interests. See Note 10. Debt, Net included in Item 15 of this Form 10-K for additional information. We are in the process of extending the maturity date of the current loan to February 2030.
In 2020, Pier Park Resort Hotel, LLC (the “Pier Park Resort Hotel JV”) entered into a loan with an initial amount of $52.5 million up to a maximum of $60.0 million through additional earn-out requests (the “Pier Park Resort Hotel JV Loan”). As of December 31, 2024 and 2023, $50.9 million and $51.9 million, respectively, was outstanding on the Pier Park Resort Hotel JV Loan. The loan matures in April 2027 and bears interest at a rate of SOFR plus 2.1%. The loan is secured by the real property and certain other Security Interests. In connection with the loan, as guarantors, we and our JV partner entered into a guarantee based on each partner’s ownership interest in favor of the lender, to guarantee the payment and performance of the borrower. As guarantor, our liability under the loan will be released upon reaching and maintaining certain debt service coverage for twelve months. In addition, the guarantee can become full recourse in the case of the failure of the guarantor to abide by or perform any of the covenants or warranties to be performed on the part of such guarantor. The Pier Park Resort Hotel JV entered into an interest rate swap to hedge cash flows tied to changes in the underlying floating interest rate tied to SOFR. The interest rate swap matures in April 2027 and fixed the variable rate on the notional amount of related debt, initially at $42.0 million, amortizing to $38.7 million at swap maturity, to a rate of 3.2%. See Note 6. Financial Instruments and Fair Value Measurements and Note 10. Debt, Net included in Item 15 of this Form 10-K for additional information.
46
In 2020, a wholly-owned subsidiary of ours entered into a $16.8 million loan, which is guaranteed by us (the “Breakfast Point Hotel Loan”). As of December 31, 2024 and 2023, $15.5 million and $15.9 million, respectively, was outstanding on the Breakfast Point Hotel Loan. The loan matures in November 2042 and bears interest at a rate of 6.0% through November 2027 and the 1-year constant maturity Treasury rate plus 3.3% from December 2027 through November 2042, with a minimum rate of 6.0% throughout the term of the loan. The loan includes a prepayment premium due to the lender of 1% of the outstanding principal balance for any additional principal that is prepaid through November 2027. The loan is secured by the real property and certain other Security Interests. See Note 10. Debt, Net included in Item 15 of this Form 10-K for additional information.
In 2020, a wholly-owned subsidiary of ours entered into a $5.8 million loan, which is guaranteed by us (the “Self-Storage Facility Loan”). As of December 31, 2024 and 2023, $3.4 million and $4.7 million, respectively, was outstanding on the Self-Storage Facility Loan. The loan matures in November 2025 and bears interest at a rate of SOFR plus 2.5%, with a floor of 2.9%. The loan is secured by the real property and certain other Security Interests. Our liability as guarantor under the loan shall not exceed $2.9 million, plus any additional fees, with the project maintaining a certain debt service coverage. See Note 10. Debt, Net included in Item 15 of this Form 10-K for additional information.
In 2021, 30A Greenway Hotel, LLC (“The Lodge 30A JV”) entered into a $15.0 million loan (the “Lodge 30A JV Loan”). As of December 31, 2024 and 2023, $14.1 million and $14.7 million, respectively, was outstanding on the Lodge 30A JV Loan. The loan bears interest at a rate of 3.8% and matures in January 2028. The loan is secured by the real property and certain other Security Interests. In connection with the loan, we, wholly-owned subsidiaries of ours and our JV partner entered into a joint and several payment and performance guarantee in favor of the lender. Upon reaching a certain debt service coverage ratio for a minimum of twenty-four months, our liability as guarantor will be reduced to 75% of the outstanding principal amount for a twelve-month period. The debt service coverage ratio will be tested annually thereafter and will be reduced to 50% in year four and 25% in year five. We receive a monthly fee related to the guarantee from our JV partner based on the JV partner’s ownership percentage. See Note 10. Debt, Net included in Item 15 of this Form 10-K for additional information.
In 2021, a wholly-owned subsidiary of ours entered into a $26.8 million loan, which is guaranteed by us (the “North Bay Landing Loan”). In August 2024, a wholly-owned subsidiary of ours entered into a modification of the loan that amended the principal amount of the loan to $22.9 million, adjusted the interest rate to SOFR plus 2.5%, with a floor of 3.2%, extended the maturity date by eighteen months and provides for monthly principal and interest payments with a final balloon payment at maturity in March 2026. As of December 31, 2024 and 2023, $22.7 million and $26.8 million, respectively, was outstanding on the North Bay Landing Loan. Upon reaching a certain debt service coverage ratio, the loan will bear interest at a rate of SOFR plus 2.3%, with a floor of 3.0%. The loan is secured by the real property and certain other Security Interests. As guarantor, our liability under the loan is 50% of the outstanding principal amount and will be reduced to 25% of the outstanding principal amount upon reaching and maintaining a certain debt service coverage ratio. In addition, the guarantee can become full recourse in the case of any fraud or intentional misrepresentation or failure to abide by other certain obligations on the part of such guarantor. See Note 10. Debt, Net included in Item 15 of this Form 10-K for additional information. In January 2025, we signed a commitment letter to secure HUD insured refinancing of the North Bay Landing Loan.
In 2021, a wholly-owned subsidiary of ours entered into a $28.0 million loan, which is guaranteed by us (the “Watersound Camp Creek Loan”). As of December 31, 2024 and 2023, $27.4 million and $28.0 million, respectively, was outstanding on the Watersound Camp Creek Loan. The loan matures in December 2047 and bears interest at a rate of SOFR plus 2.1%, with a floor of 2.6%. The loan is secured by the real property and certain other Security Interests. As guarantor, our liability under the loan will be reduced to 50% of the outstanding principal amount upon the project reaching and maintaining a trailing six months of operations with a certain debt service coverage ratio and reduced to 25% of the outstanding principal amount upon reaching and maintaining a trailing twelve months of operations with a certain debt service coverage ratio. In addition, the guarantee can become full recourse in the case of the failure of the guarantor to abide by or perform any of the covenants, warranties or other certain obligations to be performed on the part of such guarantor. See Note 10. Debt, Net included in Item 15 of this Form 10-K for additional information.
In 2021, a wholly-owned subsidiary of ours entered into a $12.0 million loan, which is guaranteed by us (the “Watersound Town Center Grocery Loan”). As of December 31, 2024 and 2023, $8.1 million and $10.5 million, respectively, was outstanding on the Watersound Town Center Grocery Loan.
47
The loan bears interest at SOFR plus 2.1%, with a floor of 2.3%, and matures in August 2031. The loan is secured by the real property and certain other Security Interests. As guarantor, our liability under the loan is 50% of the outstanding principal amount and will be reduced to 25% of the outstanding principal amount upon reaching a certain debt service coverage ratio. See Note 10. Debt, Net included in Item 15 of this Form 10-K for additional information.
In 2021, a wholly-owned subsidiary of ours entered into a $21.2 million loan, which is guaranteed by us (the “Hotel Indigo Loan”). As of December 31, 2024 and 2023, $19.9 million and $20.7 million, respectively, was outstanding on the Hotel Indigo Loan. The loan bears interest a rate of SOFR plus 2.5%, with a floor of 2.5%. The loan matures in October 2028 and includes an option for an extension of the maturity date by sixty months, subject to certain conditions. The loan is secured by the leasehold property and certain other Security Interests. See Note 10. Debt, Net included in Item 15 of this Form 10-K for additional information.
In January 2022, Mexico Beach Crossings, LLC (the “Mexico Beach Crossings JV”) entered into a $43.5 million loan, insured by HUD (the “Mexico Beach Crossings JV Loan”). As of December 31, 2024 and 2023, $43.1 million and $42.4 million, respectively, was outstanding on the Mexico Beach Crossings JV Loan. The loan bears interest at a rate of 3.0% and matures in March 2064. The loan includes a prepayment premium due to the lender of 1% - 10% for any principal that is prepaid through March 2034. The loan is secured by the real property and certain other Security Interests. See Note 10. Debt, Net included in Item 15 of this Form 10-K for additional information.
In July 2022, a wholly-owned subsidiary of ours entered into a $13.7 million loan, which is guaranteed by us (the “Topsail Hotel Loan”). As of both December 31, 2024 and 2023, $12.3 million was outstanding on the Topsail Hotel Loan. The loan bears interest at a rate of SOFR plus 2.1%, with a floor of 3.0% and matures in July 2027. The loan is secured by the real property and certain other Security Interests. See Note 10. Debt, Net included in Item 15 of this Form 10-K for additional information.
In December 2022, a wholly-owned subsidiary of ours entered into a $37.0 million loan, which is guaranteed by us (“The Pearl Hotel Loan”). As of December 31, 2024 and 2023, $34.0 million and $35.5 million, respectively, was outstanding on The Pearl Hotel Loan. The loan bears interest at a rate of 6.3% and matures in December 2032. The loan includes a prepayment fee due to the lender of 1% - 3% of the outstanding principal balance if the loan is refinanced with another financial institution through December 2027. The loan is secured by the real property and certain other Security Interests. See Note 10. Debt, Net included in Item 15 of this Form 10-K for additional information.
In 2023, Origins Crossings, LLC (the “Watersound Origins Crossings JV”) refinanced into a $52.9 million loan, insured by HUD (the “Watersound Origins Crossings JV Loan”). As of December 31, 2024 and 2023, $52.0 million and $52.5 million, respectively, was outstanding on the Watersound Origins Crossings JV Loan. The loan bears interest at a rate of 5.0% and matures in April 2058. The loan includes a prepayment premium due to the lender of 1% - 9% for any principal that is prepaid through April 2033. The refinanced loan is secured by the real property and certain other Security Interests. During 2023, we incurred $0.9 million of additional loan cost due to the refinance. As a result of the refinance, 2023 includes a $0.1 million loss on early extinguishment of debt related to unamortized debt issuance costs, included within other income, net on the consolidated statements of income. See Note 10. Debt, Net included in Item 15 of this Form 10-K for additional information.
CDD bonds financed the construction of infrastructure improvements in some of our communities. The principal and interest payments on the bonds are paid by assessments on the properties benefited by the improvements financed by the bonds. We have recorded a liability for CDD debt that is associated with platted property, which is the point at which it becomes fixed and determinable. Additionally, we have recorded a liability for the balance of the CDD debt that is associated with unplatted property if it is probable and reasonably estimable that we will ultimately be responsible for repayment. We have recorded CDD related debt of $3.2 million as of December 31, 2024. Total outstanding CDD debt related to our land holdings was $9.6 million as of December 31, 2024, which is comprised of $7.8 million at the SouthWood community, $1.7 million at the existing Pier Park retail center and less than $0.1 million at the Wild Heron residential community. We pay interest on this total outstanding CDD debt.
48
As of December 31, 2024, our unconsolidated Latitude Margaritaville Watersound JV, Watersound Fountains Independent Living JV, Pier Park TPS JV, Pier Park RI JV, Busy Bee JV and Electric Cart Watersound JV had various loans outstanding, some of which we have entered into guarantees. See Note 4. Joint Ventures and Note 20. Commitments and Contingencies included in Item 15 of this Form 10-K for additional information.
In 2020, we, as lender, entered into a $10.0 million secured revolving promissory note with the unconsolidated Latitude Margaritaville Watersound JV, as borrower (the “Latitude JV Note”). As of both December 31, 2024 and 2023, there was no principal balance outstanding on the Latitude JV Note. The note was provided by us to finance the development of the pod-level, non-spine infrastructure. Future advances, if any, will be repaid by the JV as each home is sold by the JV, with the aggregate unpaid principal and all accrued and unpaid interest due at maturity in June 2025. The note is secured by a mortgage and security interest in and on the real property and improvements located on the real property of the JV. See Note 4. Joint Ventures and Note 20. Commitments and Contingencies included in Item 15 of this Form 10-K for additional information.
During the year ended December 31, 2024, we repurchased 70,985 shares of our common stock outstanding at an average purchase price of $47.38, per share, for an aggregate purchase price of $3.4 million, excluding the excise tax on stock repurchases in excess of issuances as a result of the IRA. During the year ended December 31, 2023, we did not repurchase shares of our common stock outstanding. See Item 5. Market for the Registrant’s Common Equity, Related Stockholder Matters and Issuer Purchases of Equity Securities and Note 15. Stockholders’ Equity included in Item 15 of this Form 10-K for additional information regarding the Stock Repurchase Program and treasury stock retirement during 2024.
As part of a certain sale of forestry land in 2014, we generated significant tax gains. The installment note’s structure allowed us to defer the resulting federal and state tax liability of $45.6 million until 2029, the maturity date for the installment note. We have a deferred tax liability related to the gain in connection with the sale. At the maturity date of the installment note in 2029, the $200.0 million time deposit included in investments held by special purpose entities will be used to pay the $180.0 million of principal for the Senior Notes held by special purpose entity and the remaining $20.0 million will become available to us, which can be used to pay a portion of the tax liability. See Note 6. Financial Instruments and Fair Value Measurements and Note 13. Income Taxes included in Item 15 of this Form 10-K for additional information.
As of December 31, 2024 and 2023, we were required to provide surety bonds that guarantee completion and maintenance of certain infrastructure in certain development projects and mitigation banks, as well as other financial guarantees of $53.1 million and $40.0 million, respectively, as well as standby letters of credit in the amount of $0.7 million and $0.2 million, respectively, which may potentially result in a liability to us if certain obligations are not met.
In conducting our operations, we routinely hold customers’ assets in escrow pending completion of real estate transactions, and are responsible for the proper disposition of these balances for our customers. These amounts are maintained in segregated bank accounts and have not been included in the accompanying consolidated balance sheets, consistent with GAAP and industry practice. The cash deposit accounts and offsetting liability balances for escrow deposits in connection with our title insurance agencies for real estate transactions were $6.4 million and $10.0 million as of December 31, 2024 and 2023, respectively. These escrow funds are not available for regular operations.
49
Summary of Cash Flows
A summary of our cash flows from operating, investing and financing activities are as follows:
|
|
|
Year Ended December 31, |
|||||||
|
|
|
2024 |
|
2023 |
|
2022 |
|||
|
|
|
In millions |
|||||||
Net cash provided by operating activities |
|
|
$ |
108.0 |
|
$ |
103.8 |
|
$ |
48.2 |
Net cash used in investing activities |
|
|
|
(50.4) |
|
|
(99.1) |
|
|
(189.8) |
Net cash (used in) provided by financing activities |
|
|
|
(52.1) |
|
|
40.8 |
|
|
112.5 |
Net increase (decrease) in cash, cash equivalents and restricted cash |
|
|
|
5.5 |
|
|
45.5 |
|
|
(29.1) |
Cash, cash equivalents and restricted cash at beginning of the year |
|
|
|
90.8 |
|
|
45.3 |
|
|
74.4 |
Cash, cash equivalents and restricted cash at end of the year |
|
|
$ |
96.3 |
|
$ |
90.8 |
|
$ |
45.3 |
Cash Flows from Operating Activities
Net cash flows provided by operating activities includes net income, adjustments for non-cash items, distribution of earnings from unconsolidated joint ventures, changes in operating assets and liabilities and expenditures related to assets ultimately planned to be sold, including developed and undeveloped land. Adjustments for non-cash items primarily include depreciation, depletion and amortization, equity in income from unconsolidated joint ventures, deferred income tax and cost of real estate sold. Net cash provided by operations was $108.0 million in 2024, as compared to $103.8 million in 2023. During 2024 net income was $72.4 million, compared to $74.1 million in 2023. The increase in net cash provided by operating activities was primarily due to the changes in depreciation, depletion and amortization, distribution of earnings from unconsolidated joint ventures, deferred income tax and other assets, partially offset by the changes in cost of real estate sold, deferred revenue and accounts payable and other liabilities during the year.
Cash Flows from Investing Activities
Net cash flows used in investing activities primarily includes capital expenditures for operating property and property and equipment used in our operations, purchases of investments and capital contributions to unconsolidated joint ventures, partially offset by maturities of investments, capital distributions from unconsolidated joint ventures and maturities of assets held by special purpose entities. During 2024, net cash used in investing activities was $50.4 million, which included capital expenditures for operating property and property and equipment of $49.9 million and capital contributions to unconsolidated joint ventures of $1.7 million, partially offset by proceeds from insurance claims of $0.2 million, capital distributions from unconsolidated joint ventures of $0.2 million and maturities of assets held by special purpose entities of $0.8 million. During 2023, net cash used in investing activities was $99.1 million, which included capital expenditures for operating property and property and equipment of $139.9 million, purchases of investments of U.S. Treasury Bills of $37.4 million and capital contributions to unconsolidated joint ventures of $2.3 million, partially offset by maturities of investments of $79.0 million, capital distributions from unconsolidated joint ventures of $0.7 million and maturities of assets held by special purpose entities of $0.8 million.
Cash Flows from Financing Activities
Net cash used in financing activities was $52.1 million for 2024, compared to net cash provided by financing activities of $40.8 million in 2023. Net cash used in financing activities during 2024 included capital distributions to non-controlling interest of $1.0 million, repurchase of common stock of $3.4 million, dividends paid of $30.3 million, principal payments for debt of $18.2 million, principal payments for finance leases of $0.2 million and debt issuance costs of $0.1 million, partially offset by borrowings on debt of $1.1 million. Net cash provided by financing activities during 2023 included capital contributions from non-controlling interest of $1.4 million and borrowings on debt of $121.8 million, partially offset by capital distributions to non-controlling interest of $2.2 million, dividends paid of $25.7 million, principal payments for debt of $53.5 million, principal payments for finance leases of $0.1 million and debt issuance costs of $0.9 million.
50
Critical Accounting Estimates
The discussion and analysis of our financial condition and results of operations are based upon our consolidated financial statements, which have been prepared in accordance with GAAP. The preparation of these financial statements requires us to make estimates and judgments that affect the reported amounts of assets, liabilities, revenue and expenses and related disclosures of contingent assets and liabilities. We base these estimates on historical experience, available current market information and on various other assumptions that management believes are reasonable under the circumstances. Additionally, we evaluate the results of these estimates on an on-going basis. Management’s estimates form the basis for making judgments about the carrying values of assets and liabilities that are not readily apparent from other sources. Actual results may differ from these estimates under different assumptions or conditions and our accounting estimates are subject to change.
Investment in Real Estate, Net and Cost of Real Estate Revenue. Costs associated with a specific real estate project are capitalized during the development period. These development costs include land and common development costs (such as structures, roads, utilities and amenities). We capitalize costs directly associated with development and construction of identified real estate projects. Indirect costs that clearly relate to a specific project under development, such as project administration, interest (up to total interest expense) and real estate taxes, may also be capitalized.
A portion of real estate development costs and estimates for costs to complete are allocated to each unit based on the relative sales value of each unit as compared to the estimated sales value of the total project. These estimates are reevaluated at least annually, and more frequently if warranted by market conditions, changes in the project’s scope or other factors, with any adjustments being allocated prospectively to the remaining property or units.
The capitalization period relating to direct and indirect project costs is the period in which activities necessary to ready a property for its intended use are in progress. The period begins when such activities commence, typically when we begin the site work or construction on land already owned, and ends when the asset is substantially complete and ready for its intended use. In the event that the activities to ready the asset for its intended use are suspended, the capitalization period will cease until such activities are resumed. If we determine not to complete a project, any previously capitalized costs that are not recoverable are expensed in the period in which the determination is made and recovery is not deemed probable.
Our investments in real estate are carried at cost, net of depreciation and timber depletion, unless circumstances indicate that the carrying value of the assets may not be recoverable. If we determine that an impairment exists due to the inability to recover an asset’s carrying value, an impairment charge is recorded to the extent that the carrying value exceeds estimated fair value. If such assets were held for sale, the provision for loss would be recorded to the extent that the carrying value exceeds estimated fair value less costs to sell.
Long-Lived Assets. Long-lived assets include our investments in land holdings, operating and development properties, property and equipment and investment in unconsolidated JV’s. We evaluate our investment in unconsolidated JVs for impairment during each reporting period. A series of operating losses of an investee or other factors may indicate that a decrease in the value of our investment in the unconsolidated JV has occurred. The amount of impairment recognized is the excess of the investment’s carrying value over its estimated fair value.
Our investments in land holdings, operating and development properties and property and equipment are carried at cost, net of depreciation and timber depletion. We review our long-lived assets for impairment quarterly to determine whether events or changes in circumstances indicate that the carrying amount of an asset may not be recoverable. As part of our review for impairment of long-lived assets, we review the long-lived asset’s carrying value, current period actual financial results as compared to prior period and forecasted results contained in our business plan and any other events or changes in circumstances to identify whether an indicator of potential impairment may exist. Some of the events or changes in circumstances that are considered as indicators of potential impairment include:
| ● | a prolonged decrease in the value to below cost or demand for the properties; |
| ● | a change in the expected use or development plans for the properties; |
51
| ● | a material change in strategy that would affect the value of our properties; |
| ● | continuing operating or cash flow losses for an operating property; |
| ● | an accumulation of costs in excess of the projected costs for development or operating property; and |
| ● | any other adverse change that may affect the value of the property. |
We use varying methods to determine if an impairment exists, such as (i) considering indicators of potential impairment, (ii) analyzing expected future cash flows and comparing the expected future undiscounted cash flows of the property to its carrying value or (iii) determining market resale values.
The accounting estimate related to real estate impairment evaluation is susceptible to change due to the use of assumptions about future sales proceeds and future expenditures. For projects under development or construction, an estimate of future cash flows on an undiscounted basis is performed using estimated future expenditures necessary to maintain the existing project and using management’s best estimates about future sales prices and planned holding periods. Based on our investment return criteria for evaluating our projects under development or undeveloped land, management’s assumptions used in the projection of undiscounted cash flows include:
| ● | the projected pace of sales of homesites based on estimated market conditions and our development plans; |
| ● | estimated pricing and projected price appreciation over time; |
| ● | the amount and trajectory of price appreciation over the estimated selling period; |
| ● | the length of the estimated development and selling periods, which can differ depending on the size of the development and the number of phases to be developed; |
| ● | the amount of remaining development costs, including the extent of infrastructure or amenities included in such development costs; |
| ● | holding costs to be incurred over the selling period; |
| ● | for bulk land sales of undeveloped and developed parcels, future pricing is based upon estimated developed homesite pricing less estimated development costs and estimated developer profit; |
| ● | for commercial, multi-family, self-storage and senior living development property, future pricing is based on sales of comparable property in similar markets; and |
| ● | whether liquidity is available to fund continued development. |
For operating properties, an estimate of undiscounted cash flows requires management to make similar assumptions about the use and eventual disposition of such properties. Some of the significant assumptions that are used to develop the undiscounted cash flows include:
| ● | for investments in hotels, other rental units and vacation rental homes, use of average occupancy and room rates, revenue from food and beverage and other amenity operations, operating expenses and capital expenditures, and eventual disposition of such properties as hotels, private residence vacation units or condominiums, based on current prices for similar units appreciated to the expected sale date; |
| ● | for investments in commercial, multi-family, self-storage, senior living or retail property, use of future occupancy and rental rates, operating expenses and capital expenditures and the amount of proceeds to be realized upon eventual disposition of such property at a terminal capitalization rate; and |
| ● | for investments in club, marina and retail assets, use of revenue from membership dues, future golf rounds and greens fees, boat slip rentals and boat storage fees, merchandise and other hospitality operations, operating expenses and capital expenditures, and the amount of proceeds to be realized upon eventual disposition of such properties at a multiple of terminal year cash flows. |
Homesites substantially completed and ready for sale are measured at the lower of carrying value or fair value less costs to sell. Management identifies homesites as being substantially completed and ready for sale when the properties are being actively marketed with intent to sell such properties in the near term and under current market conditions.
52
Other homesites, which management does not intend to sell in the near term under current market conditions, are evaluated for impairment based on management’s best estimate of the long-term use and eventual disposition of such property.
Other properties that management does not intend to sell in the near term under current market conditions and has the ability to hold are evaluated for impairment based on management’s best estimate of the long-term use and eventual disposition of the property. Typically, assets are carried based on historical cost basis, which in some cases may exceed fair value if sold in the near term. The results of impairment analysis for development and operating properties are particularly dependent on the estimated holding and selling period for each asset group.
If a property is considered impaired, the impairment charge is determined by the amount the property’s carrying value exceeds its fair value. We use varying methods to determine fair value, such as (i) analyzing expected future cash flows, (ii) determining resale values in a given market, (iii) applying a capitalization rate to net operating income using prevailing rates in a given market or (iv) applying a multiplier to revenue using prevailing rates in a given market. The fair value of a property may be derived either from discounting projected cash flows at an appropriate discount rate, through appraisals of the underlying property, or a combination thereof.
We classify the assets and liabilities of a long-lived asset as held-for-sale when management approves and commits to a formal plan of sale and it is probable that a sale will be completed. The carrying value of the assets held-for-sale is then recorded at the lower of their carrying value or fair value less costs to sell.
Income Taxes. In preparing our consolidated financial statements, significant management judgment is required to estimate our income taxes. Our estimates are based on our interpretation of federal and state tax laws. We estimate our actual current tax due and assess temporary differences resulting from differing treatment of items for tax and accounting purposes. The temporary differences result in deferred tax assets and liabilities, which are included in our consolidated balance sheets. Adjustments may be required by a change in assessment of our deferred tax assets and liabilities, changes due to audit adjustments by federal and state tax authorities and changes in tax laws. To the extent adjustments are required in any given period, we will include the adjustments in the deferred tax assets and liabilities in our consolidated financial statements. We record a valuation allowance against our deferred tax assets as needed based upon our analysis of the timing and reversal of future taxable amounts and our historical and future expectations of taxable income.
In general, a valuation allowance is recorded, if based on all the available positive and negative evidence, it is more likely than not that some portion or all of the deferred tax assets will not be realized. Realization of our deferred tax assets is dependent upon us generating sufficient taxable income in future years in the appropriate tax jurisdictions to obtain a benefit from the reversal of deductible temporary differences and from loss carryforwards.
As of December 31, 2024 and 2023, we had $9.1 million and $11.0 million, respectively, of federal net operating loss carryforwards (“NOLs”). The federal NOLs are specific to our QOF entity and do not expire. As of December 31, 2024 and 2023, we had state net NOLs of $4.0 million and $12.9 million, respectively. The majority of these state NOLs are available to offset future taxable income through 2044 and will begin expiring in 2040. As of December 31, 2023, we had a valuation allowance of $0.3 million against approximately $7.2 million of certain state NOLs. During 2024, we utilized these NOLs and released the valuation allowance. As of December 31, 2024 and 2023, we had income tax payable of $1.8 million and $9.2 million, respectively, included within accounts payable and other liabilities on the consolidated balance sheets. See Note 13. Income Taxes included in Item 15 of this Form 10-K for additional information.
Recently Adopted Accounting Pronouncements
Business Combinations – Joint Venture Formations
In August 2023, the FASB issued ASU 2023-05, Business Combinations – Joint Venture Formations (Subtopic 805-60): Recognition and Initial Measurement (“ASU 2023-05”) that requires a JV to apply a new basis of accounting upon formation by recognizing and initially measuring its assets and liabilities at fair value. We adopted this guidance as of December 31, 2024, and will apply the guidance prospectively for all JVs with a formation date on or after January 1, 2025.
53
The adoption of this guidance had no impact on our financial condition, results of operations, cash flows and related disclosures.
Segment Reporting
In November 2023, the FASB issued ASU 2023-07, Segment Reporting (“Topic 280”) – Improvements to Reportable Segment Disclosures (“ASU 2023-07”) that requires an entity disclose, on an annual and interim basis, significant segment expenses that are regularly provided to the chief operating decision maker (“CODM”) and included within each reported measure of segment profit or loss. This guidance also requires that an entity disclose an amount and description of other segment items, provide all annual disclosures currently required by Topic 280 in interim periods and disclose the title and position of the CODM and how the CODM uses the reported measure of segment profit or loss in assessing segment performance and deciding how to allocate resources. We adopted the guidance as of December 31, 2024, and applied the guidance retrospectively to all prior periods presented. The adoption of the guidance impacted segment related disclosures, see Note 19. Segment Information included in Item 15 of this Form 10-K for additional information. The adoption of this guidance did not have an impact on our financial condition, results of operations and cash flows.
Income Taxes
In December 2023, the FASB issued ASU 2023-09, Income Taxes (Topic 740) – Improvements to Income Tax Disclosures (“ASU 2023-09”) that increases transparency about income tax information by requiring consistent categories and greater disaggregation of information in the rate reconciliation and income taxes paid, disaggregated by jurisdiction. We adopted the guidance as of December 31, 2024, and applied the guidance retrospectively to all prior periods presented. The adoption of the guidance primarily impacted income tax related disclosures, see Note 13. Income Taxes included in Item 15 of this Form 10-K for additional information. The adoption of this guidance did not have an impact on our financial condition, results of operations and cash flows.
Recently Issued Accounting Pronouncements
Income Statement – Reporting Comprehensive Income – Expense Disaggregation Disclosures
In November 2024, the FASB issued ASU 2024-03, Income Statement - Reporting Comprehensive Income - Expense Disaggregation Disclosures (Subtopic 220-40): Disaggregation of Income Statement Expenses (“ASU 2024-03”) that requires additional disclosure in the notes to the financial statements information about specific costs and expense categories, including purchases of inventory, employee compensation, depreciation, intangible asset amortization and selling expenses, as well as qualitative descriptions for certain other expenses. This guidance will be effective for annual reporting periods beginning after December 15, 2026, and for interim reporting periods beginning after December 15, 2027, with early adoption permitted. The guidance should be applied either prospectively for periods after the effective date or retrospectively to all prior periods presented. We are currently evaluating the impact that the adoption of this guidance will have on our financial condition, results of operations, cash flows and related disclosures.
Item 7A. Quantitative and Qualitative Disclosures about Market Risk
We are exposed to market risks primarily from interest rate fluctuations. We have investments in short-term U.S. Treasury Bills classified as cash equivalents that have fixed interest rates for which changes in interest rates generally affect the fair value of the investment, but not the earnings or cash flows. A hypothetical 100 basis point increase in interest rates would result in a decrease of less than $0.1 million in the market value of these investments as of December 31, 2024. Any realized gain or loss resulting from such interest rate changes would only occur if we sold the investments prior to maturity or if a decline in their value is determined to be related to credit loss.
We have historically been exposed, and in the future may again be exposed, to credit risk associated with Securities and these instruments are subject to price fluctuations as a result of changes in the financial market’s assessment of issuer credit quality, increases in delinquency and default rates, changes in prevailing interest rates and other economic factors.
54
A downgrade of the U.S. government’s credit rating may also decrease the value of Securities.
Some of our cash and cash equivalents are invested in money market instruments. Changes in interest rates related to these investments would not significantly impact our results of operations.
We are subject to interest rate risk on our variable-rate debt and utilize derivative financial instruments to reduce our exposure to market risks from changes in interest rates on certain loans. We have entered into interest rate swap agreements designated as cash flow hedges to manage the interest rate risk associated with some of our variable rate debt, with changes in the fair value recorded to accumulated other comprehensive income. As of December 31, 2024, we had variable-rate debt outstanding totaling $184.6 million, of which $40.7 million was swapped to a fixed interest rate. As of December 31, 2024, the weighted average interest rate on our variable rate loans, excluding the swapped portion, based on SOFR was 6.5%. Based on the outstanding balance of these loans as of December 31, 2024, a hypothetical 100 basis point increase in the applicable rate would result in an increase to our annual interest expense of $1.4 million. See Note 6. Financial Instruments and Fair Value Measurements and Note 10. Debt, Net included in Item 15 of this Form 10-K for additional information.
Item 8. Financial Statements and Supplementary Data
The Financial Statements, related notes and the Report of Independent Registered Public Accounting Firm are included in Part IV, Item 15 of this Form 10-K and incorporated by reference.
Item 9. Changes in and Disagreements with Accountants on Accounting and Financial Disclosure
None.
Item 9A. Controls and Procedures
| (a) | Evaluation of Disclosure Controls and Procedures. Our Chief Executive Officer and Chief Financial Officer have evaluated the effectiveness of our disclosure controls and procedures (as such term is defined in Rules 13a-15(e) and 15d-15(e) under the Exchange Act) as of the end of the period covered by this report. Based on this evaluation, our Chief Executive Officer and Chief Financial Officer have concluded that, as of the end of the period covered by this report, our disclosure controls and procedures were effective. |
| (b) | Changes in Internal Control Over Financial Reporting. During the quarter ended December 31, 2024, there were no changes in our internal control over financial reporting that have materially affected, or are reasonably likely to materially affect, our internal control over financial reporting. |
| (c) | Management’s Annual Report on Internal Control Over Financial Reporting. |
Management is responsible for establishing and maintaining adequate internal control over financial reporting as defined in Rules 13a-15(f) and 15d-15(f) under the Exchange Act. Our internal control over financial reporting is designed to provide reasonable assurance regarding the reliability of financial reporting and the preparation of financial statements for external purposes in accordance with GAAP. Our internal control over financial reporting includes those policies and procedures that:
55
Management assessed the effectiveness of our internal control over financial reporting as of December 31, 2024. In making this assessment, management used the criteria described in Internal Control - Integrated Framework (2013) issued by the Committee of Sponsoring Organizations of the Treadway Commission.
Based on our assessment and those criteria, management concluded that our internal control over financial reporting was effective as of December 31, 2024. Management reviewed the results of their assessment with our Audit Committee. The effectiveness of our internal control over financial reporting as of December 31, 2024 has been audited by Grant Thornton LLP, an independent registered public accounting firm, as stated in their attestation report as follows.
| (d) | Report of Independent Registered Public Accounting Firm. |
Board of Directors and Stockholders
The St. Joe Company
Opinion on internal control over financial reporting
We have audited the internal control over financial reporting of The St. Joe Company (a Florida corporation) and subsidiaries (the “Company”) as of December 31, 2024, based on criteria established in the 2013 Internal Control—Integrated Framework issued by the Committee of Sponsoring Organizations of the Treadway Commission (“COSO”). In our opinion, the Company maintained, in all material respects, effective internal control over financial reporting as of December 31, 2024, based on criteria established in the 2013 Internal Control—Integrated Framework issued by COSO.
We also have audited, in accordance with the standards of the Public Company Accounting Oversight Board (United States) (“PCAOB”), the consolidated financial statements of the Company as of and for the year ended December 31, 2024, and our report dated February 26, 2025, expressed an unqualified opinion on those financial statements.
Basis for opinion
The Company’s management is responsible for maintaining effective internal control over financial reporting and for its assessment of the effectiveness of internal control over financial reporting, included in the accompanying Management’s Annual Report on Internal Control Over Financial Reporting. Our responsibility is to express an opinion on the Company’s internal control over financial reporting based on our audit. We are a public accounting firm registered with the PCAOB and are required to be independent with respect to the Company in accordance with the U.S. federal securities laws and the applicable rules and regulations of the Securities and Exchange Commission and the PCAOB.
We conducted our audit in accordance with the standards of the PCAOB. Those standards require that we plan and perform the audit to obtain reasonable assurance about whether effective internal control over financial reporting was maintained in all material respects. Our audit included obtaining an understanding of internal control over financial reporting, assessing the risk that a material weakness exists, testing and evaluating the design and operating effectiveness of internal control based on the assessed risk, and performing such other procedures as we considered necessary in the circumstances. We believe that our audit provides a reasonable basis for our opinion.
Definition and limitations of internal control over financial reporting
A company’s internal control over financial reporting is a process designed to provide reasonable assurance regarding the reliability of financial reporting and the preparation of financial statements for external purposes in accordance with generally accepted accounting principles. A company’s internal control over financial reporting includes those policies and procedures that (1) pertain to the maintenance of records that, in reasonable detail, accurately and fairly reflect the transactions and dispositions of the assets of the company; (2) provide reasonable assurance that transactions are recorded as necessary to permit preparation of financial statements in accordance with generally accepted accounting principles, and that receipts and expenditures of the company are being made only in accordance with authorizations of management and directors of the company; and (3) provide reasonable assurance regarding prevention or timely detection of unauthorized acquisition, use, or disposition of the company’s assets that could have a material effect on the financial statements.
56
Because of its inherent limitations, internal control over financial reporting may not prevent or detect misstatements. Also, projections of any evaluation of effectiveness to future periods are subject to the risk that controls may become inadequate because of changes in conditions, or that the degree of compliance with the policies or procedures may deteriorate.
/s/ Grant Thornton LLP
Jacksonville, Florida
February 26, 2025
Item 9B. Other Information
During the fourth quarter of 2024, none of our directors or executive officers adopted, modified or terminated any contract, instruction or written plan for the purchase or sale of Company securities that was intended to satisfy the affirmative defense conditions of Rule 10b5-1(c) or any “non-Rule 10b5-1 trading arrangement”.
Item 9C. Disclosure Regarding Foreign Jurisdictions that Prevent Inspections
Not applicable.
57
PART III
Item 10. Directors, Executive Officers and Corporate Governance
We have adopted a Code of Business Conduct and Ethics that applies to our directors and executive officers. The Code of Business Conduct and Ethics is located on our internet web site at www.joe.com under “Investor Relations-Corporate Governance.” We intend to provide disclosure of any amendments or waivers of our Code of Business Conduct and Ethics for our executive officers or directors on our website within four business days following the date of the amendment or waiver.
The items required by Part III, Item 10 are incorporated herein by reference from the Registrant’s Proxy Statement for our 2025 Annual Meeting of Shareholders to be filed on or before April 30, 2025.
Item 11. Executive Compensation
The items required by Part III, Item 11 are incorporated herein by reference from the Registrant’s Proxy Statement for our 2025 Annual Meeting of Shareholders to be filed on or before April 30, 2025.
Item 12. Security Ownership of Certain Beneficial Owners and Management and Related Stockholder Matters
The items required by Part III, Item 12 are incorporated herein by reference from the Registrant’s Proxy Statement for our 2025 Annual Meeting of Shareholders to be filed on or before April 30, 2025.
Item 13. Certain Relationships and Related Transactions and Director Independence
The items required by Part III, Item 13 are incorporated herein by reference from the Registrant’s Proxy Statement for our 2025 Annual Meeting of Shareholders to be filed on or before April 30, 2025.
Item 14. Principal Accounting Fees and Services
The items required by Part III, Item 14 are incorporated herein by reference from the Registrant’s Proxy Statement for our 2025 Annual Meeting of Shareholders to be filed on or before April 30, 2025.
58
PART IV
Item 15. Exhibits, Financial Statement Schedules
| (a) | (1) Financial Statements |
The financial statements listed in the accompanying Index to Financial Statements and Financial Statement Schedules and Report of Independent Registered Public Accounting Firm are filed as part of this Form 10-K.
(2) Financial Statement Schedules
The financial statement schedules listed in the accompanying Index to Financial Statements and Financial Statement Schedules are filed as part of this Form 10-K.
The financial statements of the Company’s unconsolidated JV, LMWS, LLC, required by Rule 3-09 of Regulation S-X are provided as Exhibit 99.1 to this report.
| (3) | Exhibits |
The exhibits listed on the accompanying Index to Exhibits are filed or incorporated by reference as part of this Form 10-K.
Index to Exhibits
Exhibit |
|
Description |
|---|---|---|
|
|
|
3.1 |
|
|
|
|
|
3.2 |
|
|
|
|
|
4.1 |
|
|
|
|
|
4.2 |
|
|
|
|
|
4.3 |
|
|
|
|
|
10.1† |
|
|
|
|
|
10.3† |
|
|
|
|
|
10.4† |
|
|
|
|
|
10.5 |
|
|
|
|
|
59
Exhibit |
|
Description |
|---|---|---|
10.6† |
|
|
|
|
|
10.7 |
|
|
|
|
|
10.8 |
|
|
|
|
|
10.9† |
|
|
|
|
|
10.10 |
|
|
|
|
|
10.11 |
|
|
|
|
|
19.1** |
|
|
|
|
|
21.1** |
|
|
|
|
|
23.1** |
|
Consent of Grant Thornton LLP, independent registered public accounting firm for the registrant. |
|
|
|
23.2** |
|
Consent of independent auditors regarding opinion in Exhibit 99.1. |
|
|
|
31.1** |
|
|
|
|
|
31.2** |
|
|
|
|
|
32.1* |
|
|
|
|
|
32.2* |
|
|
|
|
|
97 |
|
|
|
|
|
99.1** |
|
|
|
|
|
101** |
|
The following information from the registrant’s Annual Report on Form 10-K for the year ended December 31, 2024, formatted in Inline XBRL (eXtensible Business Reporting Language): (i) the Consolidated Balance Sheets, (ii) the Consolidated Statements of Income, (iii) the Consolidated Statements of Comprehensive Income, (iv) the Consolidated Statements of Equity, (v) the Consolidated Statements of Cash Flows and (vi) Notes to the Consolidated Financial Statements. |
104 |
|
Cover Page Interactive Data File (formatted as Inline XBRL and contained in Exhibit 101) |
* Furnished herewith.
** Filed herewith.
† Management contract or compensatory plan or arrangement.
60
SIGNATURES
Pursuant to the requirements of the Securities Exchange Act of 1934, the registrant has duly caused this report to be signed on its behalf by the undersigned thereunto duly authorized.
|
|
THE ST. JOE COMPANY |
|
|
|
Date: |
February 26, 2025 |
/s/ Jorge L. Gonzalez |
|
|
Jorge L. Gonzalez |
|
|
President, Chief Executive Officer and Chairman of the Board |
|
|
(Duly Authorized Officer) |
Pursuant to the requirements of the Securities Exchange Act of 1934, this report has been signed below by the following persons on behalf of the registrant and in the capacities and on the dates indicated.
|
|
Title |
|
Date |
|
|
|
|
|
/s/ Jorge L. Gonzalez |
|
President, Chief Executive Officer and Chairman of the Board |
|
February 26, 2025 |
Jorge L. Gonzalez |
|
(Principal Executive Officer) |
|
|
|
|
|
|
|
/s/ Marek Bakun |
|
Executive Vice President and Chief Financial Officer |
|
February 26, 2025 |
Marek Bakun |
|
(Principal Financial Officer and Principal Accounting Officer) |
|
|
|
|
|
|
|
/s/ Howard S. Frank |
|
Lead Independent Director |
|
February 26, 2025 |
Howard S. Frank |
|
|
|
|
|
|
|
|
|
/s/ Cesar L. Alvarez |
|
Director |
|
February 26, 2025 |
Cesar L. Alvarez |
|
|
|
|
|
|
|
|
|
/s/ Thomas P. Murphy, Jr. |
|
Director |
|
February 26, 2025 |
Thomas P. Murphy, Jr. |
|
|
|
|
|
|
|
|
|
/s/ Rhea Goff |
|
Senior Vice President, Chief Administrative Officer and Director |
|
February 26, 2025 |
Rhea Goff |
|
|
|
|
|
|
|
|
|
61
INDEX TO FINANCIAL STATEMENTS AND FINANCIAL STATEMENT SCHEDULES
|
Page No. |
Report of Independent Registered Public Accounting Firm – Grant Thornton LLP (PCAOB ID 248) |
F 2 |
F 3 |
|
F 5 |
|
F 6 |
|
F 7 |
|
F 8 |
|
F 10 |
|
Schedule III (Consolidated) — Real Estate and Accumulated Depreciation |
F 56 |
F 58 |
F 1
REPORT OF INDEPENDENT REGISTERED PUBLIC ACCOUNTING FIRM
Board of Directors and Stockholders
The St. Joe Company
Opinion on the financial statements
We have audited the accompanying consolidated balance sheets of The St. Joe Company (a Florida corporation) and subsidiaries (the “Company”) as of December 31, 2024 and 2023, the related consolidated statements of income, comprehensive income, equity, and cash flows for each of the three years in the period ended December 31, 2024, and the related notes and financial statement schedules included under Item 15(a) (collectively referred to as the “consolidated financial statements”). In our opinion, the consolidated financial statements present fairly, in all material respects, the financial position of the Company as of December 31, 2024 and 2023, and the results of its operations and its cash flows for each of the three years in the period ended December 31, 2024, in conformity with accounting principles generally accepted in the United States of America.
We also have audited, in accordance with the standards of the Public Company Accounting Oversight Board (United States) (“PCAOB”), the Company’s internal control over financial reporting as of December 31, 2024, based on criteria established in the 2013 Internal Control—Integrated Framework issued by the Committee of Sponsoring Organizations of the Treadway Commission (“COSO”), and our report dated February 26, 2025, expressed an unqualified opinion.
Basis for opinion
These consolidated financial statements are the responsibility of the Company’s management. Our responsibility is to express an opinion on the Company’s consolidated financial statements based on our audits. We are a public accounting firm registered with the PCAOB and are required to be independent with respect to the Company in accordance with the U.S. federal securities laws and the applicable rules and regulations of the Securities and Exchange Commission and the PCAOB.
We conducted our audits in accordance with the standards of the PCAOB. Those standards require that we plan and perform the audit to obtain reasonable assurance about whether the financial statements are free of material misstatement, whether due to error or fraud. Our audits included performing procedures to assess the risks of material misstatement of the financial statements, whether due to error or fraud, and performing procedures that respond to those risks. Such procedures included examining, on a test basis, evidence regarding the amounts and disclosures in the financial statements. Our audits also included evaluating the accounting principles used and significant estimates made by management, as well as evaluating the overall presentation of the financial statements. We believe that our audits provide a reasonable basis for our opinion.
Critical audit matters
Critical audit matters are matters arising from the current period audit of the financial statements that were communicated or required to be communicated to the audit committee and that: (1) relate to accounts or disclosures that are material to the financial statements and (2) involved our especially challenging, subjective, or complex judgments. We determined that there are no critical audit matters.
/s/ Grant Thornton LLP
We have served as the Company’s auditor since 2018.
Jacksonville, Florida
February 26, 2025
F 2
THE ST. JOE COMPANY
CONSOLIDATED BALANCE SHEETS
(Dollars in thousands)
|
|
December 31, |
|
December 31, |
||
|
|
2024 |
|
2023 |
||
ASSETS |
|
|
|
|
|
|
Investment in real estate, net |
|
$ |
1,040,428 |
|
$ |
1,018,618 |
Investment in unconsolidated joint ventures |
|
|
66,454 |
|
|
66,356 |
Cash and cash equivalents |
|
|
88,756 |
|
|
86,068 |
Other assets |
|
|
80,318 |
|
|
82,243 |
Property and equipment, net |
|
|
59,107 |
|
|
66,049 |
Investments held by special purpose entities |
|
|
203,511 |
|
|
204,196 |
Total assets |
|
$ |
1,538,574 |
|
$ |
1,523,530 |
LIABILITIES AND EQUITY |
|
|
|
|
|
|
Liabilities: |
|
|
|
|
|
|
Debt, net |
|
$ |
437,754 |
|
$ |
453,640 |
Accounts payable and other liabilities |
|
|
53,969 |
|
|
58,573 |
Deferred revenue |
|
|
59,274 |
|
|
62,836 |
Deferred tax liabilities, net |
|
|
72,358 |
|
|
71,829 |
Senior Notes held by special purpose entity |
|
|
178,484 |
|
|
178,162 |
Total liabilities |
|
|
801,839 |
|
|
825,040 |
|
|
|
|
|
|
|
Commitments and contingencies (Note 20) |
|
|
|
|
|
|
|
|
|
|
|
|
|
Equity: |
|
|
|
|
|
|
Common stock, no par value; 180,000,000 shares authorized; 58,326,521 and 58,372,040 issued and outstanding at December 31, 2024 and December 31, 2023, respectively |
|
|
268,668 |
|
|
270,848 |
Retained earnings |
|
|
454,193 |
|
|
410,371 |
Accumulated other comprehensive income |
|
|
1,419 |
|
|
1,843 |
Total stockholders’ equity |
|
|
724,280 |
|
|
683,062 |
Non-controlling interest |
|
|
12,455 |
|
|
15,428 |
Total equity |
|
|
736,735 |
|
|
698,490 |
Total liabilities and equity |
|
$ |
1,538,574 |
|
$ |
1,523,530 |
See notes to the consolidated financial statements.
F 3
THE ST. JOE COMPANY
CONSOLIDATED BALANCE SHEETS
(Dollars in thousands)
The following presents the portion of the consolidated balances attributable to the Company’s consolidated JVs, which as of December 31, 2024 and 2023, include the Pier Park North JV, Pier Park Crossings JV, Watersound Origins Crossings JV, Watercrest JV, Watersound Closings & Escrow, LLC (the “Watersound Closings JV”), Pier Park Crossings Phase II JV, Mexico Beach Crossings JV, Pier Park Resort Hotel JV, The Lodge 30A JV, Panama City Timber Finance Company, LLC and Northwest Florida Timber Finance, LLC. See Note 2. Significant Accounting Policies. Basis of Presentation and Principles of Consolidation and Note 4. Joint Ventures for additional information. The following assets may only be used to settle obligations of the consolidated JVs and the following liabilities are only obligations of the consolidated JVs and do not have recourse to the general credit of the Company, except for covenants and guarantees discussed in Note 10. Debt, Net.
|
|
|
|
|
|
|
|
|
December 31, |
|
December 31, |
||
|
|
2024 |
|
2023 |
||
ASSETS |
|
|
|
|
|
|
Investment in real estate, net |
|
$ |
256,275 |
|
$ |
264,837 |
Cash and cash equivalents |
|
|
4,458 |
|
|
4,851 |
Other assets |
|
|
14,288 |
|
|
15,596 |
Property and equipment, net |
|
|
17,487 |
|
|
22,241 |
Investments held by special purpose entities |
|
|
203,511 |
|
|
204,196 |
Total assets |
|
$ |
496,019 |
|
$ |
511,721 |
LIABILITIES |
|
|
|
|
|
|
Debt, net |
|
$ |
272,102 |
|
$ |
275,757 |
Accounts payable and other liabilities |
|
|
7,401 |
|
|
8,384 |
Deferred revenue |
|
|
279 |
|
|
307 |
Senior Notes held by special purpose entity |
|
|
178,484 |
|
|
178,162 |
Total liabilities |
|
$ |
458,266 |
|
$ |
462,610 |
See notes to the consolidated financial statements.
F 4
THE ST. JOE COMPANY
CONSOLIDATED STATEMENTS OF INCOME
(Dollars in thousands except per share amounts)
|
|
|
|
|
|
|
|
|
|
|
|
Year Ended December 31, |
|||||||
|
|
2024 |
|
2023 |
|
2022 |
|||
Revenue: |
|
|
|
|
|
|
|
|
|
Real estate revenue |
|
$ |
143,179 |
|
$ |
186,008 |
|
$ |
115,865 |
Hospitality revenue |
|
|
199,242 |
|
|
152,441 |
|
|
97,260 |
Leasing revenue |
|
|
60,316 |
|
|
50,836 |
|
|
39,196 |
Total revenue |
|
|
402,737 |
|
|
389,285 |
|
|
252,321 |
Expenses: |
|
|
|
|
|
|
|
|
|
Cost of real estate revenue |
|
|
70,323 |
|
|
87,966 |
|
|
50,791 |
Cost of hospitality revenue |
|
|
136,386 |
|
|
122,185 |
|
|
77,518 |
Cost of leasing revenue |
|
|
28,807 |
|
|
25,828 |
|
|
17,589 |
Corporate and other operating expenses |
|
|
25,250 |
|
|
23,797 |
|
|
22,068 |
Depreciation, depletion and amortization |
|
|
46,385 |
|
|
38,776 |
|
|
22,888 |
Total expenses |
|
|
307,151 |
|
|
298,552 |
|
|
190,854 |
Operating income |
|
|
95,586 |
|
|
90,733 |
|
|
61,467 |
Other income (expense): |
|
|
|
|
|
|
|
|
|
Investment income, net |
|
|
13,504 |
|
|
13,282 |
|
|
9,862 |
Interest expense |
|
|
(33,584) |
|
|
(30,618) |
|
|
(18,383) |
Gain on contributions to unconsolidated joint ventures |
|
|
10 |
|
|
718 |
|
|
2,738 |
Equity in income from unconsolidated joint ventures |
|
|
23,578 |
|
|
22,701 |
|
|
25,986 |
Other (expense) income, net |
|
|
(746) |
|
|
3,245 |
|
|
12,947 |
Total other income, net |
|
|
2,762 |
|
|
9,328 |
|
|
33,150 |
Income before income taxes |
|
|
98,348 |
|
|
100,061 |
|
|
94,617 |
Income tax expense |
|
|
(25,952) |
|
|
(26,009) |
|
|
(24,389) |
Net income |
|
|
72,396 |
|
|
74,052 |
|
|
70,228 |
Net loss attributable to non-controlling interest |
|
|
1,793 |
|
|
3,660 |
|
|
699 |
Net income attributable to the Company |
|
$ |
74,189 |
|
$ |
77,712 |
|
$ |
70,927 |
|
|
|
|
|
|
|
|
|
|
NET INCOME PER SHARE ATTRIBUTABLE TO THE COMPANY |
|
|
|
|
|
|
|
|
|
Basic |
|
$ |
1.27 |
|
$ |
1.33 |
|
$ |
1.21 |
Diluted |
|
$ |
1.27 |
|
$ |
1.33 |
|
$ |
1.21 |
|
|
|
|
|
|
|
|
|
|
WEIGHTED AVERAGE SHARES OUTSTANDING |
|
|
|
|
|
|
|
|
|
Basic |
|
|
58,326,286 |
|
|
58,312,878 |
|
|
58,720,050 |
Diluted |
|
|
58,346,726 |
|
|
58,324,254 |
|
|
58,721,338 |
See notes to the consolidated financial statements.
F 5
THE ST. JOE COMPANY
CONSOLIDATED STATEMENTS OF COMPREHENSIVE INCOME
(Dollars in thousands)
|
|
|
|
|
|
|
|
|
|
|
|
|
|
Year Ended December 31, |
|||||||
|
|
|
2024 |
|
2023 |
|
2022 |
|||
Net income: |
|
|
$ |
72,396 |
|
$ |
74,052 |
|
$ |
70,228 |
Other comprehensive income (loss): |
|
|
|
|
|
|
|
|
|
|
Net unrealized gain (loss) on available-for-sale investments |
|
|
|
— |
|
|
244 |
|
|
(235) |
Interest rate swaps |
|
|
|
995 |
|
|
250 |
|
|
4,633 |
Interest rate swap - unconsolidated joint venture |
|
|
|
95 |
|
|
80 |
|
|
621 |
Reclassification of net realized (gain) loss included in earnings |
|
|
|
(1,866) |
|
|
(1,767) |
|
|
140 |
Total before income taxes |
|
|
|
(776) |
|
|
(1,193) |
|
|
5,159 |
Income tax benefit (expense) |
|
|
|
144 |
|
|
199 |
|
|
(957) |
Total other comprehensive (loss) income, net of tax |
|
|
|
(632) |
|
|
(994) |
|
|
4,202 |
Total comprehensive income, net of tax |
|
|
|
71,764 |
|
|
73,058 |
|
|
74,430 |
Total comprehensive loss (income) attributable to non-controlling interest |
|
|
|
2,001 |
|
|
4,067 |
|
|
(684) |
Total comprehensive income attributable to the Company |
|
|
$ |
73,765 |
|
$ |
77,125 |
|
$ |
73,746 |
See notes to the consolidated financial statements.
F 6
THE ST. JOE COMPANY
CONSOLIDATED STATEMENTS OF EQUITY
(Dollars in thousands)
|
|
|
|
|
|
|
|
|
|
|
|
|
|
|
|
|
|
|
|
|
|
|
Common Stock |
|
|
|
|
|
Accumulated Other |
|
|
|
|
|
|
|
|
|
|||
|
|
Outstanding |
|
|
|
|
|
Retained |
|
|
Comprehensive |
|
|
Treasury |
|
|
Non-controlling |
|
|
|
|
|
Shares |
|
|
Amount |
|
|
Earnings |
|
|
(Loss) Income |
|
|
Stock |
|
|
Interest |
|
|
Total |
Balance at December 31, 2021 |
|
58,882,549 |
|
$ |
296,873 |
|
$ |
310,925 |
|
$ |
(389) |
|
$ |
— |
|
$ |
18,691 |
|
$ |
626,100 |
Additional ownership interest acquired in Pier Park North JV |
|
— |
|
|
(7,237) |
|
|
— |
|
|
— |
|
|
— |
|
|
(458) |
|
|
(7,695) |
Capital contributions from non-controlling interest |
|
— |
|
|
— |
|
|
— |
|
|
— |
|
|
— |
|
|
3,823 |
|
|
3,823 |
Capital distributions to non-controlling interest |
|
— |
|
|
— |
|
|
— |
|
|
— |
|
|
— |
|
|
(2,433) |
|
|
(2,433) |
Issuance of restricted stock |
|
29,955 |
|
|
— |
|
|
— |
|
|
— |
|
|
— |
|
|
— |
|
|
— |
Stock based compensation expense |
|
— |
|
|
364 |
|
|
— |
|
|
— |
|
|
— |
|
|
— |
|
|
364 |
Repurchase of common stock |
|
(576,963) |
|
|
— |
|
|
— |
|
|
— |
|
|
(19,972) |
|
|
— |
|
|
(19,972) |
Retirement of treasury stock |
|
— |
|
|
(19,972) |
|
|
— |
|
|
— |
|
|
19,972 |
|
|
— |
|
|
— |
Dividends ($0.40 per share) |
|
— |
|
|
— |
|
|
(23,508) |
|
|
— |
|
|
— |
|
|
— |
|
|
(23,508) |
Other comprehensive income, net of tax |
|
— |
|
|
— |
|
|
— |
|
|
2,819 |
|
|
— |
|
|
1,383 |
|
|
4,202 |
Net income (loss) |
|
— |
|
|
— |
|
|
70,927 |
|
|
— |
|
|
— |
|
|
(699) |
|
|
70,228 |
Balance at December 31, 2022 |
|
58,335,541 |
|
$ |
270,028 |
|
$ |
358,344 |
|
$ |
2,430 |
|
$ |
— |
|
$ |
20,307 |
|
$ |
651,109 |
Capital contributions from non-controlling interest |
|
— |
|
|
— |
|
|
— |
|
|
— |
|
|
— |
|
|
1,430 |
|
|
1,430 |
Capital distributions to non-controlling interest |
|
— |
|
|
— |
|
|
— |
|
|
— |
|
|
— |
|
|
(2,242) |
|
|
(2,242) |
Issuance of restricted stock |
|
36,499 |
|
|
— |
|
|
— |
|
|
— |
|
|
— |
|
|
— |
|
|
— |
Stock based compensation expense |
|
— |
|
|
820 |
|
|
— |
|
|
— |
|
|
— |
|
|
— |
|
|
820 |
Dividends ($0.44 per share) |
|
— |
|
|
— |
|
|
(25,685) |
|
|
— |
|
|
— |
|
|
— |
|
|
(25,685) |
Other comprehensive loss, net of tax |
|
— |
|
|
— |
|
|
— |
|
|
(587) |
|
|
— |
|
|
(407) |
|
|
(994) |
Net income (loss) |
|
— |
|
|
— |
|
|
77,712 |
|
|
— |
|
|
— |
|
|
(3,660) |
|
|
74,052 |
Balance at December 31, 2023 |
|
58,372,040 |
|
$ |
270,848 |
|
$ |
410,371 |
|
$ |
1,843 |
|
$ |
— |
|
$ |
15,428 |
|
$ |
698,490 |
Capital distributions to non-controlling interest |
|
— |
|
|
— |
|
|
— |
|
|
— |
|
|
— |
|
|
(972) |
|
|
(972) |
Issuance of restricted stock, net of forfeitures |
|
25,466 |
|
|
— |
|
|
— |
|
|
— |
|
|
— |
|
|
— |
|
|
— |
Stock based compensation expense |
|
— |
|
|
1,209 |
|
|
— |
|
|
— |
|
|
— |
|
|
— |
|
|
1,209 |
Repurchase of common stock, including excise tax |
|
(70,985) |
|
|
— |
|
|
— |
|
|
— |
|
|
(3,389) |
|
|
— |
|
|
(3,389) |
Retirement of treasury stock |
|
— |
|
|
(3,389) |
|
|
— |
|
|
— |
|
|
3,389 |
|
|
— |
|
|
— |
Dividends ($0.52 per share) |
|
— |
|
|
— |
|
|
(30,367) |
|
|
— |
|
|
— |
|
|
— |
|
|
(30,367) |
Other comprehensive loss, net of tax |
|
— |
|
|
— |
|
|
— |
|
|
(424) |
|
|
— |
|
|
(208) |
|
|
(632) |
Net income (loss) |
|
— |
|
|
— |
|
|
74,189 |
|
|
— |
|
|
— |
|
|
(1,793) |
|
|
72,396 |
Balance at December 31, 2024 |
|
58,326,521 |
|
$ |
268,668 |
|
$ |
454,193 |
|
$ |
1,419 |
|
$ |
— |
|
$ |
12,455 |
|
$ |
736,735 |
See notes to consolidated financial statements.
F 7
THE ST. JOE COMPANY
CONSOLIDATED STATEMENTS OF CASH FLOWS
(Dollars in thousands)
|
|
|
|
|
|
|
|
|
|
|
|
|
|
Year Ended December 31, |
|||||||
|
|
|
2024 |
|
2023 |
|
2022 |
|||
Cash flows from operating activities: |
|
|
|
|
|
|
|
|
|
|
Net income |
|
|
$ |
72,396 |
|
$ |
74,052 |
|
$ |
70,228 |
Adjustments to reconcile net income to net cash provided by operating activities: |
|
|
|
|
|
|
|
|
|
|
Depreciation, depletion and amortization |
|
|
|
46,385 |
|
|
38,776 |
|
|
22,888 |
Stock based compensation |
|
|
|
1,209 |
|
|
820 |
|
|
364 |
Unrealized loss on investments, net |
|
|
|
— |
|
|
— |
|
|
26 |
Equity in income from unconsolidated joint ventures |
|
|
|
(23,578) |
|
|
(22,701) |
|
|
(25,986) |
Distribution of earnings from unconsolidated joint ventures |
|
|
|
26,790 |
|
|
11,464 |
|
|
23,228 |
Deferred income tax |
|
|
|
(803) |
|
|
(10,677) |
|
|
4,490 |
Cost of real estate sold |
|
|
|
65,151 |
|
|
82,610 |
|
|
46,384 |
Expenditures for and acquisition of real estate to be sold |
|
|
|
(79,435) |
|
|
(77,796) |
|
|
(97,535) |
Accretion income and other |
|
|
|
(1,765) |
|
|
(5,193) |
|
|
(2,281) |
Amortization of debt issuance costs |
|
|
|
982 |
|
|
1,004 |
|
|
1,007 |
Loss on disposal of property and equipment |
|
|
|
615 |
|
|
16 |
|
|
181 |
Gain on contributions to unconsolidated joint ventures |
|
|
|
(10) |
|
|
(718) |
|
|
(2,738) |
Gain on insurance for damage to property and equipment, net |
|
|
|
(178) |
|
|
— |
|
|
(9,835) |
Loss on extinguishment of debt |
|
|
|
— |
|
|
133 |
|
|
130 |
Changes in operating assets and liabilities: |
|
|
|
|
|
|
|
|
|
|
Other assets |
|
|
|
9,669 |
|
|
(9,178) |
|
|
15,317 |
Deferred revenue |
|
|
|
(2,899) |
|
|
11,149 |
|
|
2,684 |
Accounts payable and other liabilities |
|
|
|
(6,536) |
|
|
10,088 |
|
|
(331) |
Net cash provided by operating activities |
|
|
|
107,993 |
|
|
103,849 |
|
|
48,221 |
Cash flows from investing activities: |
|
|
|
|
|
|
|
|
|
|
Expenditures for operating property |
|
|
|
(42,188) |
|
|
(133,783) |
|
|
(251,809) |
Expenditures for property and equipment |
|
|
|
(7,746) |
|
|
(6,182) |
|
|
(7,348) |
Proceeds from the disposition of assets |
|
|
|
88 |
|
|
71 |
|
|
49 |
Proceeds from insurance claims |
|
|
|
178 |
|
|
— |
|
|
9,835 |
Purchases of investments - debt securities |
|
|
|
— |
|
|
(37,407) |
|
|
(97,133) |
Maturities of investments - debt securities |
|
|
|
— |
|
|
79,000 |
|
|
92,000 |
Sales of investments - debt securities |
|
|
|
— |
|
|
— |
|
|
53,901 |
Sales of investments - equity securities |
|
|
|
— |
|
|
— |
|
|
424 |
Capital contributions to unconsolidated joint ventures |
|
|
|
(1,734) |
|
|
(2,305) |
|
|
(2,505) |
Capital distributions from unconsolidated joint ventures |
|
|
|
225 |
|
|
676 |
|
|
12,025 |
Maturities of assets held by special purpose entities |
|
|
|
798 |
|
|
787 |
|
|
785 |
Net cash used in investing activities |
|
|
|
(50,379) |
|
|
(99,143) |
|
|
(189,776) |
Cash flows from financing activities: |
|
|
|
|
|
|
|
|
|
|
Capital contributions from non-controlling interest |
|
|
|
— |
|
|
1,430 |
|
|
3,823 |
Capital distributions to non-controlling interest |
|
|
|
(972) |
|
|
(2,242) |
|
|
(2,433) |
Additional ownership interest acquired in Pier Park North JV |
|
|
|
— |
|
|
— |
|
|
(7,695) |
Repurchase of common stock |
|
|
|
(3,364) |
|
|
— |
|
|
(19,972) |
Dividends paid |
|
|
|
(30,347) |
|
|
(25,664) |
|
|
(23,497) |
Borrowings on debt |
|
|
|
1,096 |
|
|
121,839 |
|
|
184,476 |
Principal payments for debt |
|
|
|
(18,170) |
|
|
(53,491) |
|
|
(20,228) |
Principal payments for finance leases |
|
|
|
(163) |
|
|
(153) |
|
|
(121) |
Debt issuance costs |
|
|
|
(148) |
|
|
(958) |
|
|
(1,895) |
Net cash (used in) provided by financing activities |
|
|
|
(52,068) |
|
|
40,761 |
|
|
112,458 |
Net increase (decrease) in cash, cash equivalents and restricted cash |
|
|
|
5,546 |
|
|
45,467 |
|
|
(29,097) |
Cash, cash equivalents and restricted cash at beginning of the year |
|
|
|
90,770 |
|
|
45,303 |
|
|
74,400 |
Cash, cash equivalents and restricted cash at end of the year |
|
|
$ |
96,316 |
|
$ |
90,770 |
|
$ |
45,303 |
See notes to consolidated financial statements.
F 8
THE ST. JOE COMPANY
SUPPLEMENTAL DISCLOSURES OF CASH FLOW INFORMATION
(Dollars in thousands)
The following table provides a reconciliation of cash, cash equivalents and restricted cash reported within the consolidated balance sheets that sum to the total of the amounts shown in the consolidated statements of cash flows.
|
|
|
|
|
|
|
|
|
|
|
|
|
|
|
|
Year Ended December 31, |
|||||||
|
|
|
|
2024 |
|
2023 |
|
2022 |
|||
Cash and cash equivalents |
|
|
|
$ |
88,756 |
|
$ |
86,068 |
|
$ |
37,747 |
Restricted cash included in other assets |
|
|
|
|
7,560 |
|
|
4,702 |
|
|
7,556 |
Total cash, cash equivalents and restricted cash shown in the accompanying consolidated statements of cash flows |
|
|
|
$ |
96,316 |
|
$ |
90,770 |
|
$ |
45,303 |
Restricted cash includes amounts reserved as a requirement of financing and development for certain of the Company’s projects, advance draws on construction loans or long-term mitigation bank management.
|
|
|
|
|
|
|
|
|
|
|
|
|
|
Year Ended December 31, |
|||||||
|
|
|
2024 |
|
2023 |
|
2022 |
|||
Cash paid during the period for: |
|
|
|
|
|
|
|
|
|
|
Interest, net of amounts capitalized |
|
|
$ |
32,690 |
|
$ |
29,602 |
|
$ |
17,152 |
Federal income taxes, net |
|
|
$ |
29,244 |
|
$ |
26,400 |
|
$ |
16,361 |
State income taxes, net |
|
|
$ |
4,900 |
|
$ |
4,518 |
|
$ |
750 |
|
|
|
|
|
|
|
|
|
|
|
Non-cash investing and financing activities: |
|
|
|
|
|
|
|
|
|
|
Non-cash contributions to unconsolidated joint ventures |
|
|
$ |
— |
|
$ |
(1,844) |
|
$ |
(4,044) |
Increase (decrease) in Community Development District debt, net |
|
|
$ |
569 |
|
$ |
(539) |
|
$ |
(311) |
Transfers of expenditures for operating property to property and equipment |
|
|
$ |
4,333 |
|
$ |
35,812 |
|
$ |
9,594 |
(Decrease) increase in expenditures for operating properties and property and equipment financed through accounts payable |
|
|
$ |
(6,984) |
|
$ |
(30,325) |
|
$ |
13,205 |
Unrealized gain (loss) on cash flow hedges |
|
|
$ |
1,090 |
|
$ |
(215) |
|
$ |
5,243 |
See notes to consolidated financial statements.
F 9
THE ST. JOE COMPANY
NOTES TO CONSOLIDATED FINANCIAL STATEMENTS
(Dollars in thousands, unless otherwise stated)
1. Nature of Operations
The St. Joe Company, together with its consolidated subsidiaries, is a diversified Florida real estate development, asset management and operating company with all of its real estate assets and operations in Northwest Florida. Approximately 87% of the Company’s real estate is located in Florida’s Bay, Gulf, and Walton counties. Approximately 90% of the Company’s real estate land holdings are located within fifteen miles of the Gulf of Mexico.
The Company conducts primarily all of its business in the following three reportable segments: 1) residential, 2) hospitality and 3) commercial. See Note 19. Segment Information for additional information.
References to the number of homes related to the unconsolidated Latitude Margaritaville Watersound JV and any amounts derived from these values in the notes to the consolidated financial statements are unaudited.
2. Significant Accounting Policies
Basis of Presentation and Principles of Consolidation
The consolidated financial statements include the accounts of the Company and all of its majority-owned and controlled subsidiaries, voting interest entities where the Company has a majority voting interest or control and variable interest entities where the Company deems itself the primary beneficiary. Investments in JVs in which the Company is not the primary beneficiary, or a voting interest entity where the Company does not have a majority voting interest or control, but has significant influence are unconsolidated and accounted for by the equity method. All significant intercompany transactions and balances have been eliminated in consolidation. Certain prior year amounts in the accompanying consolidated financial statements have been reclassified to conform to the current year presentation. The reclassifications had no effect on the Company’s previously reported total assets and liabilities, equity or net income.
A variable interest entity (“VIE”) is an entity in which a controlling financial interest may be achieved through arrangements that do not involve voting interests. A VIE is required to be consolidated by its primary beneficiary, which is the entity that possesses the power to direct the activities of the VIE that most significantly impact the VIE’s economic performance and has the obligation to absorb losses or the right to receive benefits from the VIE that are significant to the VIE. The Company consolidates VIEs when it is the primary beneficiary of the VIE. The Company continues to evaluate whether it is the primary beneficiary as needed when assessing reconsideration events. See Note 4. Joint Ventures for additional information.
Use of Estimates
The preparation of financial statements in conformity with GAAP requires management to make estimates and assumptions that affect the reported amounts of assets, liabilities and disclosure of contingent assets and liabilities at the date of the financial statements and the reported amounts of revenue and expenses during the reporting period. On an ongoing basis, the Company evaluates its estimates and assumptions including investment in real estate, real estate impairment assessments, other investments, accruals, deferred income taxes, allowance for credit losses and revenue recognition. Actual results could differ from those estimates.
Investment in Real Estate, Net
The Company capitalizes costs directly associated with development and construction of identified real estate projects. These costs include land and common development costs (such as structures, roads, utilities and amenities). The Company may also capitalize indirect costs that relate to specific projects under development or construction. These indirect costs include construction and development administration, legal fees, project administration, interest (up to total interest expense) and real estate taxes.
F 10
A portion of real estate development costs and estimates for costs to complete are allocated to each unit based on the relative sales value of each unit as compared to the estimated sales value of the total project. These estimates are reevaluated at least annually, and more frequently if warranted by market conditions, changes in the project’s scope or other factors, with any adjustments being allocated prospectively to the remaining property or units.
The capitalization period relating to direct and indirect project costs is the period in which activities necessary to ready a property for its intended use are in progress. The period begins when such activities commence, typically when the Company begins site work or construction on land already owned, and ends when the asset is substantially complete and ready for its intended use. In the event that the activities to ready the asset for its intended use are suspended, the capitalization period will cease until such activities are resumed. If the Company determines a project will not be completed, any previously capitalized costs that are not recoverable are expensed in the period in which the determination is made and recovery is not deemed probable.
Investment in real estate, net is carried at cost, net of depreciation and timber depletion, unless circumstances indicate that the carrying value of the assets may not be recoverable. If the Company determines that an impairment exists due to the inability to recover an asset’s carrying value, an impairment charge is recorded to the extent that the carrying value exceeds estimated fair value. If such assets were held for sale, the provision for loss would be recorded to the extent that the carrying value exceeds estimated fair value less costs to sell.
Depreciation for operating property is computed on the straight-line method over the estimated useful life of the assets, as follows:
|
|
|
|
|
Estimated Useful |
|
|
Life (in years) |
Land |
|
N/A |
Land improvements |
|
15 - 20 |
Buildings |
|
20 - 40 |
Building improvements |
|
5 - 25 |
Timber |
|
N/A |
Building improvements are amortized on a straight-line basis over the shorter of the minimum lease term or the estimated useful life of the assets.
Long-Lived Assets
Long-lived assets include the Company’s investments in land holdings, operating and development properties and property and equipment, which are carried at cost, net of depreciation and timber depletion. The Company reviews its long-lived assets for impairment quarterly to determine whether events or changes in circumstances indicate that the carrying value of an asset may not be recoverable. As part of the Company’s review for impairment of its long-lived assets, the Company reviews the long-lived asset’s carrying value, current period actual financial results as compared to prior period and forecasted results contained in the Company’s business plan and any other events or changes in circumstances to identify whether an indicator of potential impairment may exist. Some of the events or changes in circumstances that are considered by the Company as indicators of potential impairment include:
| ● | a prolonged decrease in the value to below cost or demand for the Company’s properties; |
| ● | a change in the expected use or development plans for the Company’s properties; |
| ● | a material change in strategy that would affect the value of the Company’s properties; |
| ● | continuing operating or cash flow loss for an operating property; |
| ● | an accumulation of costs in excess of the projected costs for development or operating property; and |
| ● | any other adverse change that may affect the value of the property. |
F 11
The Company uses varying methods to determine if an impairment exists, such as (i) considering indicators of potential impairment, (ii) analyzing expected future cash flows and comparing the expected future undiscounted cash flows of the property to its carrying value or (iii) determining market resale values.
For projects under development or construction, an estimate of undiscounted future cash flows is performed using estimated future expenditures necessary to develop and maintain the existing project and using management’s best estimates about future sales prices and holding periods. The projection of undiscounted cash flows requires that management develop various assumptions including:
| ● | the projected pace of sales of homesites based on estimated market conditions and the Company’s development plans; |
| ● | estimated pricing and projected price appreciation over time; |
| ● | the amount and trajectory of price appreciation over the estimated selling period; |
| ● | the length of the estimated development and selling periods, which can differ depending on the size of the development and the number of phases to be developed; |
| ● | the amount of remaining development costs, including the extent of infrastructure or amenities included in such development costs; |
| ● | holding costs to be incurred over the selling period; |
| ● | for bulk land sales of undeveloped and developed parcels, future pricing is based upon estimated developed homesite pricing less estimated development costs and estimated developer profit; |
| ● | for commercial, multi-family, self-storage and senior living development property, future pricing is based on sales of comparable property in similar markets; and |
| ● | whether liquidity is available to fund continued development. |
For operating properties, an estimate of undiscounted cash flows also requires management to make assumptions about the use and disposition of such properties. These assumptions include:
| ● | for investments in hotels, other rental units and vacation rental homes, use of average occupancy and room rates, revenue from food and beverage and other amenity operations, operating expenses and capital expenditures, and eventual disposition of such properties as hotels, private residence vacation units or condominiums, based on current prices for similar units appreciated to the expected sale date; |
| ● | for investments in commercial, multi-family, self-storage, senior living or retail property, use of future occupancy and rental rates, operating expenses and capital expenditures and the amount of proceeds to be realized upon eventual disposition of such property at a terminal capitalization rate; and, |
| ● | for investments in club, marina and retail assets, use of revenue from membership dues, future golf rounds and greens fees, boat slip rentals and boat storage fees, merchandise and other hospitality operations, operating expenses and capital expenditures, and the amount of proceeds to be realized upon eventual disposition of such properties at a multiple of terminal year cash flows. |
Homesites substantially completed and ready for sale are measured at the lower of carrying value or fair value less costs to sell. Management identifies homesites as being substantially completed and ready for sale when the properties are being actively marketed with intent to sell such properties in the near term and under current market conditions. Other homesites, which management does not intend to sell in the near term under current market conditions, are evaluated for impairment based on management’s best estimate of the long-term use and eventual disposition of such property.
Other properties that management does not intend to sell in the near term under current market conditions and has the ability to hold are evaluated for impairment based on management’s best estimate of the long-term use and eventual disposition of the property.
F 12
The results of impairment analyses for development and operating properties are particularly dependent on the estimated holding and selling period for each asset group.
If a property is considered impaired, the impairment charge is determined by the amount the property’s carrying value exceeds its fair value. The Company uses varying methods to determine fair value, such as (i) analyzing expected future cash flows, (ii) determining resale values in a given market (iii) applying a capitalization rate to net operating income using prevailing rates in a given market or (iv) applying a multiplier to revenue using prevailing rates in a given market. The fair value of a property may be derived either from discounting projected cash flows at an appropriate discount rate, through appraisals of the underlying property, or a combination thereof.
The Company classifies the assets and liabilities of a long-lived asset as held-for-sale when management approves and commits to a formal plan of sale and it is probable that a sale will be completed. The carrying value of the assets held-for-sale are then recorded at the lower of their carrying value or fair value less estimated costs to sell.
Timber Inventory
The Company estimates its standing timber inventory on an annual basis utilizing a process referred to as a “timber cruise.” Specifically, the Company conducts field measurements of the number of trees, tree height and tree diameter on a sample area equal to approximately 20% of the Company’s timber holdings each year. Inventory data is used to calculate volumes and products along with growth projections to maintain accurate data. Industry practices are used for modeling, including growth projections, volume and product classifications. A depletion rate is established annually by dividing merchantable inventory cost by standing merchantable inventory volume.
Investment in Unconsolidated Joint Ventures
The Company has entered into JVs in which the Company is not the primary beneficiary or does not have a majority voting interest or control. The Company’s investment in these JVs is accounted for by the equity method. The Company evaluates its investment in unconsolidated JVs for impairment during each reporting period. A series of operating losses of an investee or other factors may indicate that a decrease in the value of the Company’s investment in the unconsolidated JV has occurred. The amount of impairment recognized is the excess of the investment’s carrying value over its estimated fair value.
Distributions from equity method investments are classified in the statements of cash flows using the cumulative earnings approach. Under the cumulative earnings approach, cumulative distributions received that do not exceed cumulative equity in earnings are classified as cash inflows from operating activities and cumulative distributions received in excess of cumulative equity in earnings are classified as cash inflows from investing activities. Some of the Company’s unconsolidated JVs have entered into financing agreements, where the Company or its JV partners have provided guarantees. See Note 4. Joint Ventures and Note 20. Commitments and Contingencies for additional information.
Cash and Cash Equivalents
Cash and cash equivalents can include cash on hand, bank demand accounts, money market instruments and U.S. Treasury Bills having original maturities at acquisition date, of ninety days or less.
Investments
Investments – debt securities consist of available-for-sale securities recorded at fair value, which is established through external pricing services that use quoted market prices and pricing data from recently executed market transactions. Unrealized gains and losses on investments, net of tax, are recorded in other comprehensive (loss) income. Realized gains and losses on investments are determined using the specific identification method. The amortized cost of debt securities are adjusted for amortization of premiums and accretion of discounts to maturity computed under the effective interest method. Such amortization and accretion are included in investment income, net.
F 13
For available-for-sale securities where fair value is less than cost, credit related impairment, if any, will be recognized through an allowance for credit losses and adjusted each period for changes in credit risk. If the Company intends to sell the security, or more likely than not will be required to sell the security before recovery of its amortized cost basis, any allowance for credit losses will be written off and the amortized cost basis will be written down to the security's fair value at the reporting date with any incremental impairment reported in earnings.
Investments - equity securities with a readily determinable fair value are recorded at fair value, which is established through external pricing services that use quoted market prices and pricing data from recently executed market transactions. Unrealized holding gains and losses are recognized in investment income, net in the consolidated statements of income.
As of both December 31, 2024 and 2023, the Company did not have investments classified as available-for-sale securities.
Fair Value Measurements
Fair value is an exit price, representing the amount that would be received by selling an asset or paying to transfer a liability in an orderly transaction between market participants. As such, fair value is a market-based measurement that should be determined based on assumptions that market participants would use in pricing an asset or a liability. A three-tier fair value hierarchy is established as a basis for considering such assumptions and for inputs used in the valuation methodologies in measuring fair value:
Level 1. Quoted prices in active markets for identical assets or liabilities;
Level 2. Inputs, other than the quoted prices in active markets, that are observable either directly or indirectly; and
Level 3. Unobservable inputs in which there is little or no market data, such as internally-developed valuation models, which require the reporting entity to develop its own assumptions.
Comprehensive Income
The Company’s comprehensive income includes unrealized gains and losses on available-for-sale securities. Comprehensive income also includes changes in the fair value of effective cash flow hedges, which are subsequently reclassified into earnings in the period during which the hedged transaction affects earnings.
Derivatives and Hedging
The Company has entered into interest rate swap agreements designated as cash flow hedges to manage the interest rate risk associated with variable rate debt. For cash flow hedges that are effective, the gain or loss on the derivative is reported in other comprehensive (loss) income and is reclassified into earnings in the same period during which the hedged transaction affects earnings. Cash flows from derivatives are classified in the consolidated statements of cash flows in the same category as the item being hedged. The Company accounts for the changes in fair value of derivatives that do not qualify for hedge accounting treatment directly in earnings.
Receivables
The Company’s receivables primarily include homesite sales receivable, a revolving promissory note with an unconsolidated JV, leasing receivables, membership fees, hospitality receivables and other receivables. At each reporting period, receivables in the scope of Financial Instruments—Credit Losses (Topic 326) are pooled by type and judgements are made based on historical losses and expected credit losses based on economic trends to determine the allowance for credit losses primarily using the aging method. Actual losses could differ from those estimates. Write-offs are recorded when the Company concludes that all or a portion of the receivable is no longer collectible. The Company does not measure an allowance for credit losses for accrued interest receivables and will write off uncollectible balances in a timely manner, which is within 90 days from when it is determined uncollectible.
F 14
Inventory
Inventory primarily consists of retail products, operating supplies and beverages which are reported at the lower of cost or net realizable value. Cost is determined using weighted-average cost basis or specific identification.
Property and Equipment, net
Property and equipment is stated at cost, net of accumulated depreciation. Major improvements are capitalized while maintenance and repairs are expensed in the period the cost is incurred. Depreciation is computed using the straight-line method over the estimated useful life of various assets, as follows:
|
|
|
|
|
Estimated Useful |
|
|
Life (in years) |
Railroad and equipment |
|
15 - 30 |
Furniture and fixtures |
|
5 - 10 |
Machinery and equipment |
|
3 - 10 |
Office equipment |
|
5 - 10 |
Autos, trucks and aircraft |
|
5 - 10 |
Leases - The Company as Lessee
Finance lease right-of-use assets are included within property and equipment, net and operating lease right-of-use assets are included within other assets on the consolidated balance sheets, which represent the Company’s right to use an underlying asset during a lease term for leases in excess of one year. Corresponding finance lease liabilities and operating lease liabilities are included within accounts payable and other liabilities on the consolidated balance sheets and are related to the Company’s obligation to make lease payments for leases in excess of one year. Right-of-use assets and liabilities are recognized at lease commencement date based on the present value of future minimum lease payments over the lease term. The Company uses its incremental borrowing rate to determine the present value of the lease payments since the rate implicit in each lease is not readily determinable. The Company does not separate lease components from non-lease components, which are presented as a single component when allocating contract consideration. The Company recognizes short-term (twelve months or less) lease payments in profit or loss on a straight-line basis over the term of the lease and variable lease payments in the period in which the obligation for those payments is incurred.
Deferred Revenue
Deferred revenue consists of amounts received related to incomplete performance obligations. Deferred revenue primarily includes club initiation fees, which are recognized as revenue over the estimated average duration of membership, which is evaluated periodically. Deferred revenue also includes land sales that are recognized as revenue once the Company has transferred control to the customer and all revenue recognition criteria are met.
Advertising Costs
Advertising costs are expensed as services are incurred. Advertising costs of $3.9 million, $3.8 million and $2.4 million for the years ended December 31, 2024, 2023 and 2022, respectively, are included within cost of revenue and corporate and other operating expenses in the consolidated statements of income.
Income Taxes
The Company’s provision for income taxes includes the current tax owed on the current period earnings, as well as deferred income taxes, which reflects the future tax consequences attributable to differences between the financial statement carrying amounts of existing assets and liabilities and their respective income tax bases. Deferred tax assets and liabilities are measured using enacted tax rates expected to apply to taxable income in the years in which those temporary differences are expected to be recovered or settled. Changes in existing tax laws and rates, their related interpretations, as well as the uncertainty generated by the prospect of tax legislation in the future may affect the amounts of deferred tax liabilities or the realizability of deferred tax assets.
F 15
For tax positions taken or expected to take in the tax returns, the Company applies a more likely than not assessment (i.e., there is a greater than 50 percent chance) about whether the tax position will be sustained upon examination by the appropriate tax authority with full knowledge of all relevant information. Amounts recorded for uncertain tax positions are periodically assessed, including the evaluation of new facts and circumstances, to ensure sustainability of the position. The Company records interest related to unrecognized tax benefits, if any, in interest expense and penalties in other (expense) income, net in the consolidated statements of income. The Company applies the aggregate portfolio method to account for income tax effects in accumulated other comprehensive income with respect to available-for-sale debt securities.
Concentration of Risks and Uncertainties
All of the Company’s real estate assets are concentrated in Northwest Florida. Uncertain economic conditions could have an adverse impact on the Company’s operations and asset values.
Throughout 2024, the Company continued to generate positive financial results. While macroeconomic factors such as inflation, elevated interest rates, higher insurance costs, supply chain disruptions, labor shortages, financial institution disruptions and geopolitical conflicts, among other things, continued to produce economic headwinds and impacted buyer sentiment, demand across the Company’s segments remains strong. The Company believes this is primarily due to the continued growth of Northwest Florida as a result of increased migration, which the Company attributes to the region’s high quality of life, natural beauty and outstanding amenities.
Despite the strong demand across the Company’s segments, the Company also continues to feel the impact from the aforementioned macroeconomic factors. In addition, inflation, higher insurance costs and elevated interest rates, have increased operating costs and loan rates, as compared to recent years. While elevated interest rates have negatively impacted buyers’ ability to obtain financing and the housing market generally, the impact has been offset by the net migration into the Company’s markets, limited housing supply relative to demand and the number of cash buyers. Market conditions have not caused an increase in cancellation rates as homebuilders have continued to perform on their contractual obligations with the Company.
Given the Company’s diverse portfolio of residential holdings, the mix of sales and pricing from different communities may impact revenue and margins period over period. Further discussion of the potential impacts on the Company’s business from the current macroeconomic environment are included in Part I. Item 1A. Risk Factors.
Financial instruments that potentially subject the Company to a concentration of credit risk consist of cash, cash equivalents, other receivables and investments held by special purpose entity or entities (“SPE”). The Company deposits and invests cash with local, regional and national financial institutions and as of December 31, 2024 these balances exceed the amount of FDIC insurance provided on such deposits by $21.2 million. In addition, as of December 31, 2024, the Company had $59.0 million invested in short-term U.S. Treasury Bills and $2.4 million invested in U.S. Treasury Money Market Funds classified as cash and cash equivalents. As of both December 31, 2024 and 2023, one homebuilder customer represented approximately 16.0% and 17.0%, respectively, of the Company’s receivables, which consists of accounts receivable, net and homesites sales receivable included in other assets on the consolidated balance sheets.
Earnings Per Share
Basic earnings per share is calculated by dividing net income attributable to the Company by the basic weighted average number of common shares outstanding for the period. Diluted earnings per share is calculated by dividing net income attributable to the Company by the weighted average number of shares of common stock outstanding for the period, including potential dilutive common shares. The treasury stock method is used to determine the effect on diluted earnings. For the years ended December 31, 2024, 2023 and 2022, the Company had 65,688, 57,923 and 29,955 respectively, unvested shares of restricted stock. For the years ended December 31, 2024, 2023 and 2022, 45,248, 46,547 and 27,577 respectively, potentially dilutive restricted stock units were excluded from the calculation of diluted income per share, since the effect would have been anti-dilutive based on the application of the treasury stock method.
F 16
See Note 15. Stockholders’ Equity for additional information related to the issuance of common stock for employee compensation.
The computation of basic and diluted earnings per share are as follows:
|
|
|
Year Ended December 31, |
|||||||
|
|
|
2024 |
|
2023 |
|
2022 |
|||
|
|
|
(Dollars in thousands except per share amounts) |
|||||||
Income |
|
|
|
|
|
|
|
|
|
|
Net income attributable to the Company |
|
|
$ |
74,189 |
|
$ |
77,712 |
|
$ |
70,927 |
|
|
|
|
|
|
|
|
|
|
|
Shares |
|
|
|
|
|
|
|
|
|
|
Weighted average shares outstanding - basic |
|
|
|
58,326,286 |
|
|
58,312,878 |
|
|
58,720,050 |
Incremental shares from restricted stock |
|
|
|
20,440 |
|
|
11,376 |
|
|
1,288 |
Weighted average shares outstanding - diluted |
|
|
|
58,346,726 |
|
|
58,324,254 |
|
|
58,721,338 |
|
|
|
|
|
|
|
|
|
|
|
Net income per share attributable to the Company |
|
|
|
|
|
|
|
|
|
|
Basic income per share |
|
|
$ |
1.27 |
|
$ |
1.33 |
|
$ |
1.21 |
Diluted income per share |
|
|
$ |
1.27 |
|
$ |
1.33 |
|
$ |
1.21 |
Revenue and Revenue Recognition
Revenue consists primarily of real estate sales, hospitality operations and leasing operations. Taxes collected from customers and remitted to governmental authorities (e.g., sales tax) are excluded from revenue, cost of revenue and expenses.
In accordance with Accounting Standards Codification (“ASC”) Topic 606, Revenue from Contracts with Customers (“Topic 606”), revenue is recognized to depict the transfer of promised goods or services to customers in an amount that reflects the consideration to which the entity expects to be entitled in exchange for those goods or services by applying the following steps; (i) identifying the contract(s) with a customer, (ii) identifying the performance obligations in the contract, (iii) determining the transaction price, (iv) allocating the transaction price to the performance obligations in the contract and (v) recognizing revenue when (or as) the Company satisfies a performance obligation. Lease related revenue is excluded from Topic 606 and is accounted for under Topic 842, Leases (“Topic 842”). The following summary details the Company’s revenue and the related timing of revenue recognition.
Real Estate Revenue
Revenue from real estate sales, including homesites, commercial properties, operating properties, parcels of entitled or undeveloped land and forestry land, is recognized at the point in time when a sale is closed and title and control has been transferred to the buyer.
Residential real estate revenue includes (i) the sale of developed homesites; (ii) the sale of parcels of entitled or undeveloped land or homesites; (iii) a homesite residual on homebuilder sales that provides the Company a percentage of the sale price of the completed home if the home price exceeds a negotiated threshold; (iv) the sale of tap and impact fee credits; (v) marketing fees; and (vi) other fees on certain transactions.
Estimated homesite residuals and certain estimated fees are recognized as revenue at the time of sale to homebuilders, subject to constraints. Any change in material circumstances from the estimated amounts will be updated at each reporting period. The variable consideration for homesite residuals and certain estimated fees are based on historical experience and are recognized as revenue when it can be reasonably estimated and only to the extent it is probable that a significant reversal in the estimated amount of cumulative revenue will not occur when uncertainties are resolved. For the years ended December 31, 2024, 2023 and 2022, real estate revenue includes $3.6 million, $24.0 million and $5.8 million, respectively, of estimated homesite residuals and $2.5 million, $5.0 million and $1.9 million, respectively, of estimated fees related to homebuilder homesite sales.
F 17
Timber revenue from the sale of the Company’s forestry products is primarily from open market sales of timber on site without the associated delivery costs and is derived from either pay-as-cut sales contracts or timber bid sales.
Under a pay-as-cut sales contract, the risk of loss and title to the specified timber transfers to the buyer when cut by the buyer, and the buyer or some other third party is responsible for all logging and hauling costs, if any. Revenue is recognized at the point in time when risk of loss and title to the specified timber are transferred.
Timber bid sales are agreements in which the buyer agrees to purchase and harvest specified timber (i.e., mature pulpwood and/or sawlogs) on a tract of land over the term of the contract. Unlike a pay-as-cut sales contract, risk of loss and title to the trees transfer to the buyer when the contract is signed and revenue is recognized at that point in time accordingly. The buyer pays the full purchase price when the contract is signed and the Company does not have any additional performance obligations.
Other real estate revenue includes title insurance business revenue which is recognized at the point in time services are provided and represents a single performance obligation with a fixed transaction price. Other real estate revenue also includes the sale of mitigation bank credits, which is recognized at a point in time.
Hospitality Revenue
The Company’s hospitality segment features the Watersound Club, hotel operations, food and beverage operations, golf courses, beach clubs, retail outlets, gulf-front vacation rentals, management services, marinas and other entertainment assets. The Company’s hospitality operations generate revenue from membership sales, golf courses, lodging at the Company’s hotels, short-term vacation rentals, management of The Pearl Hotel (prior to acquisition in December 2022), food and beverage operations, merchandise sales, marina operations (including boat slip rentals, boat storage fees and fuel sales), flight services, other resort and entertainment activities and beach clubs, which includes food and beverage operations of the WaterColor Beach Club.
Hospitality revenue is generally recognized at the point in time services are provided and represent a single performance obligation with a fixed transaction price. Lodging at the Company’s hotels, short-term vacation rentals owned by the Company and food and beverage operations of the WaterColor Beach Club generate revenue from service and/or daily rental fees, recognized at the point in time services are provided. Daily play at the golf courses, food and beverage operations, merchandise sales, marina storage and fuel sales, flight services, other resort and entertainment activities, and other service fees are recognized at the point of sale. Hospitality revenue recognized over time includes non-refundable club membership initiation fees, club membership dues, management fees and other membership fees. Non-refundable initiation fees are deferred and recognized ratably over time, which is the estimated membership period. Club membership revenue consists of monthly dues, which are recognized monthly over time as access is provided for the period. Revenue generated from the Company’s management services is recognized over time as time elapses and the Company’s performance obligations are met.
Leasing Revenue
Leasing revenue consists of rental revenue from multi-family, senior living, self-storage, retail, office and commercial property; forestry land and other assets; as well as boat slip rentals and boat storage fees at the marinas, which is recognized as earned, using the straight-line method over the life of each lease. Certain leases provide for tenant occupancy during periods for which no rent is due or where minimum rent payments change during the lease term. Accordingly, a receivable or liability is recorded representing the difference between the straight-line rent and the rent that is contractually due from the tenant. The Company does not separate non-lease components from lease components and, instead, accounts for each separate lease component and the non-lease components associated with that lease as a single component if the non-lease components otherwise would be accounted for under Topic 606. Non-lease components primarily include common area maintenance and senior living services provided related to the Watercrest JV.
F 18
Leasing revenue includes properties located in the Company’s Watersound Town Center, VentureCrossings, FSU/TMH Medical Campus, Beckrich Office Park, North Bay Landing apartment community, consolidated Pier Park North JV, Pier Park Crossings JV, Pier Park Crossings Phase II JV, Watersound Origins Crossings JV, Mexico Beach Crossings JV and Watercrest JV, as well as the Company’s industrial parks and other properties. See Note 7. Leases for additional information related to leases.
The following represents revenue disaggregated by segment, good or service and timing:
|
|
Year Ended December 31, 2024 |
|||||||||||||
|
|
Residential |
|
Hospitality |
|
Commercial |
|
Other |
|
Total |
|||||
Revenue by Major Good/Service: |
|
|
|
|
|
|
|
|
|
|
|
|
|
|
|
Real estate revenue |
|
$ |
116,815 |
|
$ |
— |
|
$ |
22,176 |
|
$ |
4,188 |
|
$ |
143,179 |
Hospitality revenue |
|
|
— |
|
|
199,242 |
|
|
— |
|
|
— |
|
|
199,242 |
Leasing revenue |
|
|
192 |
|
|
3,459 |
|
|
56,399 |
|
|
266 |
|
|
60,316 |
Total revenue |
|
$ |
117,007 |
|
$ |
202,701 |
|
$ |
78,575 |
|
$ |
4,454 |
|
$ |
402,737 |
|
|
|
|
|
|
|
|
|
|
|
|
|
|
|
|
Timing of Revenue Recognition: |
|
|
|
|
|
|
|
|
|
|
|
|
|
|
|
Recognized at a point in time |
|
$ |
116,815 |
|
$ |
147,513 |
|
$ |
22,176 |
|
$ |
4,188 |
|
$ |
290,692 |
Recognized over time |
|
|
— |
|
|
51,729 |
|
|
— |
|
|
— |
|
|
51,729 |
Over lease term |
|
|
192 |
|
|
3,459 |
|
|
56,399 |
|
|
266 |
|
|
60,316 |
Total revenue |
|
$ |
117,007 |
|
$ |
202,701 |
|
$ |
78,575 |
|
$ |
4,454 |
|
$ |
402,737 |
|
|
Year Ended December 31, 2023 |
|||||||||||||
|
|
Residential |
|
Hospitality |
|
Commercial |
|
Other |
|
Total |
|||||
Revenue by Major Good/Service: |
|
|
|
|
|
|
|
|
|
|
|
|
|
|
|
Real estate revenue |
|
$ |
155,702 |
|
$ |
— |
|
$ |
26,180 |
|
$ |
4,126 |
|
$ |
186,008 |
Hospitality revenue |
|
|
— |
|
|
152,437 |
|
|
4 |
|
|
— |
|
|
152,441 |
Leasing revenue |
|
|
118 |
|
|
2,137 |
|
|
48,253 |
|
|
328 |
|
|
50,836 |
Total revenue |
|
$ |
155,820 |
|
$ |
154,574 |
|
$ |
74,437 |
|
$ |
4,454 |
|
$ |
389,285 |
|
|
|
|
|
|
|
|
|
|
|
|
|
|
|
|
Timing of Revenue Recognition: |
|
|
|
|
|
|
|
|
|
|
|
|
|
|
|
Recognized at a point in time |
|
$ |
155,702 |
|
$ |
117,982 |
|
$ |
26,184 |
|
$ |
4,126 |
|
$ |
303,994 |
Recognized over time |
|
|
— |
|
|
34,455 |
|
|
— |
|
|
— |
|
|
34,455 |
Over lease term |
|
|
118 |
|
|
2,137 |
|
|
48,253 |
|
|
328 |
|
|
50,836 |
Total revenue |
|
$ |
155,820 |
|
$ |
154,574 |
|
$ |
74,437 |
|
$ |
4,454 |
|
$ |
389,285 |
|
|
Year Ended December 31, 2022 |
|||||||||||||
|
|
Residential |
|
Hospitality |
|
Commercial |
|
Other |
|
Total |
|||||
Revenue by Major Good/Service: |
|
|
|
|
|
|
|
|
|
|
|
|
|
|
|
Real estate revenue |
|
$ |
92,804 |
|
$ |
— |
|
$ |
20,384 |
|
$ |
2,677 |
|
$ |
115,865 |
Hospitality revenue |
|
|
— |
|
|
96,731 |
|
|
529 |
|
|
— |
|
|
97,260 |
Leasing revenue |
|
|
82 |
|
|
505 |
|
|
38,466 |
|
|
143 |
|
|
39,196 |
Total revenue |
|
$ |
92,886 |
|
$ |
97,236 |
|
$ |
59,379 |
|
$ |
2,820 |
|
$ |
252,321 |
|
|
|
|
|
|
|
|
|
|
|
|
|
|
|
|
Timing of Revenue Recognition: |
|
|
|
|
|
|
|
|
|
|
|
|
|
|
|
Recognized at a point in time |
|
$ |
92,804 |
|
$ |
68,653 |
|
$ |
20,913 |
|
$ |
2,677 |
|
$ |
185,047 |
Recognized over time |
|
|
— |
|
|
28,078 |
|
|
— |
|
|
— |
|
|
28,078 |
Over lease term |
|
|
82 |
|
|
505 |
|
|
38,466 |
|
|
143 |
|
|
39,196 |
Total revenue |
|
$ |
92,886 |
|
$ |
97,236 |
|
$ |
59,379 |
|
$ |
2,820 |
|
$ |
252,321 |
F 19
Recently Adopted Accounting Pronouncements
Business Combinations – Joint Venture Formations
In August 2023, the FASB issued ASU 2023-05, that requires a JV to apply a new basis of accounting upon formation by recognizing and initially measuring its assets and liabilities at fair value. The Company adopted this guidance as of December 31, 2024, and will apply the guidance prospectively for all JVs with a formation date on or after January 1, 2025. The adoption of this guidance had no impact on the Company’s financial condition, results of operations, cash flows and related disclosures.
Segment Reporting
In November 2023, the FASB issued ASU 2023-07, that requires an entity disclose, on an annual and interim basis, significant segment expenses that are regularly provided to the CODM and included within each reported measure of segment profit or loss. This guidance also requires that an entity disclose an amount and description of other segment items, provide all annual disclosures currently required by Topic 280 in interim periods and disclose the title and position of the CODM and how the CODM uses the reported measure of segment profit or loss in assessing segment performance and deciding how to allocate resources. The Company adopted the guidance as of December 31, 2024, and applied the guidance retrospectively to all prior periods presented. The adoption of the guidance impacted segment related disclosures, see Note 19. Segment Information for additional information. The adoption of this guidance did not have an impact on the Company’s financial condition, results of operations and cash flows.
Income Taxes
In December 2023, the FASB issued ASU 2023-09, that increases transparency about income tax information by requiring consistent categories and greater disaggregation of information in the rate reconciliation and income taxes paid, disaggregated by jurisdiction. The Company adopted the guidance as of December 31, 2024, and applied the guidance retrospectively to all prior periods presented. The adoption of the guidance primarily impacted income tax related disclosures, see Note 13. Income Taxes for additional information. The adoption of this guidance did not have an impact on the Company’s financial condition, results of operations and cash flows.
Recently Issued Accounting Pronouncements
Income Statement – Reporting Comprehensive Income – Expense Disaggregation Disclosures
In November 2024, the FASB issued ASU 2024-03, that requires additional disclosure in the notes to the financial statements information about specific costs and expense categories, including purchases of inventory, employee compensation, depreciation, intangible asset amortization and selling expenses, as well as qualitative descriptions for certain other expenses. This guidance will be effective for annual reporting periods beginning after December 15, 2026, and for interim reporting periods beginning after December 15, 2027, with early adoption permitted. The guidance should be applied either prospectively for periods after the effective date or retrospectively to all prior periods presented. The Company is currently evaluating the impact that the adoption of this guidance will have on its financial condition, results of operations, cash flows and related disclosures.
F 20
3. Investment in Real Estate, Net
Investment in real estate, net, excluding unconsolidated JVs, by property type and segment includes the following:
|
|
December 31, |
|
December 31, |
||
|
|
2024 |
|
2023 |
||
Development property: |
|
|
|
|
|
|
Residential |
|
$ |
149,499 |
|
$ |
141,145 |
Hospitality |
|
|
13,342 |
|
|
23,633 |
Commercial |
|
|
78,453 |
|
|
99,719 |
Other |
|
|
4,234 |
|
|
2,924 |
Total development property |
|
|
245,528 |
|
|
267,421 |
|
|
|
|
|
|
|
Operating property: |
|
|
|
|
|
|
Residential |
|
|
10,254 |
|
|
10,905 |
Hospitality |
|
|
443,291 |
|
|
419,095 |
Commercial |
|
|
483,643 |
|
|
439,671 |
Total operating property |
|
|
937,188 |
|
|
869,671 |
Less: Accumulated depreciation |
|
|
142,288 |
|
|
118,474 |
Total operating property, net |
|
|
794,900 |
|
|
751,197 |
Investment in real estate, net |
|
$ |
1,040,428 |
|
$ |
1,018,618 |
Investment in real estate, net is carried at cost, net of depreciation and timber depletion, unless circumstances indicate that the carrying value of the assets may not be recoverable.
Development property consists of land the Company is developing or intends to develop for sale, lease or future operations and includes direct costs associated with the land, as well as development, construction and indirect costs. Residential development property includes existing and planned residential homesites and related infrastructure. Hospitality development property consists of land, as well as development costs related to improvements to existing properties and design costs for other hospitality assets. Commercial development property primarily consists of land and construction and development costs for planned commercial, multi-family and industrial uses. Development property in the hospitality and commercial segments will be reclassified as operating property as it is placed into service.
Operating property includes the following components:
|
|
|
|
|
|
|
|
|
|
December 31, |
|
|
December 31, |
|
|
|
2024 |
|
|
2023 |
Land and land improvements |
|
$ |
237,492 |
|
$ |
206,089 |
Buildings and building improvements |
|
|
683,440 |
|
|
648,655 |
Timber |
|
|
16,256 |
|
|
14,927 |
|
|
|
937,188 |
|
|
869,671 |
Less: Accumulated depreciation |
|
|
142,288 |
|
|
118,474 |
Total operating property, net |
|
$ |
794,900 |
|
$ |
751,197 |
Operating property includes property that the Company uses for operations and activities. Residential operating property consists primarily of residential utility assets and certain rental properties. Hospitality operating property primarily consists of existing hotels, resorts, clubs, vacation rental homes, marinas and other operations. Commercial operating property includes property used for retail, office, self-storage, light industrial, multi-family, senior living, commercial rental and timber purposes. Operating property may be sold in the future as part of the Company’s principal real estate business. As of December 31, 2024 and 2023, operating property, net related to operating leases was $395.2 million and $367.3 million, respectively.
Depreciation, depletion and amortization expense related to real estate investments was $27.4 million, $23.0 million and $14.3 million in 2024, 2023 and 2022, respectively.
F 21
4. Joint Ventures
The Company enters into JVs, from time to time, for the purpose of developing real estate and other business activities in which the Company may or may not have a controlling financial interest. GAAP requires consolidation of voting interest entities where the Company has a majority voting interest or control and VIEs in which an enterprise has a controlling financial interest and is the primary beneficiary. A controlling financial interest will have both of the following characteristics: (i) the power to direct the VIE activities that most significantly impact economic performance and (ii) the obligation to absorb losses or the right to receive benefits from the VIE that could potentially be significant to the VIE. The Company examines specific criteria and uses judgment when determining whether the Company is the primary beneficiary and must consolidate a VIE. The Company continues to evaluate whether it is the primary beneficiary as needed when assessing reconsideration events. Investments in JVs in which the Company is not the primary beneficiary, or a voting interest entity where the Company does not have a majority voting interest or control, but has significant influence are unconsolidated and accounted for by the equity method.
The timing of cash flows for additional required capital contributions related to the Company’s JVs varies by agreement. Some of the Company’s consolidated and unconsolidated JVs have entered into financing agreements where the Company or its JV partners have provided guarantees. See Note 10. Debt, Net and Note 20. Commitments and Contingencies for additional information. The Company provides mitigation bank credits, impact and other fees, property for lease and services to certain unconsolidated JVs and incurs expense for leasing management services from the Watersound Management JV, see Note 21. Related Party Transactions for additional information.
Consolidated Joint Ventures
Mexico Beach Crossings JV
The Mexico Beach Crossings JV was formed in 2022, when the Company entered into a JV agreement to develop, manage and lease a 216-unit apartment community in Mexico Beach, Florida. Construction of the community was completed in the fourth quarter of 2023. The community is located on land that was contributed to the JV by the Company. As of December 31, 2024 and 2023, the Company owned a 75.0% interest in the consolidated JV. The Company’s unconsolidated Watersound Management JV is responsible for the day-to-day activities of the community. The Company approves all major decisions, including project development, annual budgets and financing. The Company determined Mexico Beach Crossings JV is a voting interest entity as of December 31, 2024 and 2023.
The Lodge 30A JV
The Lodge 30A JV was formed in 2020, when the Company entered into a JV agreement to develop and operate a boutique hotel on Scenic County Highway 30A in Seagrove Beach, Florida. The 85-room hotel opened in the first quarter of 2023. As of December 31, 2024 and 2023, the Company owned a 52.8% interest in the consolidated JV. A wholly-owned subsidiary of the Company manages the day-to-day operations of the hotel. The Company approves all major decisions, including project development, annual budgets and financing. The Company determined The Lodge 30A JV is a VIE and that the Company is the VIE’s primary beneficiary as of December 31, 2024 and 2023.
Pier Park Resort Hotel JV
The Pier Park Resort Hotel JV was formed in 2020, when the Company entered into a JV agreement to develop and operate an Embassy Suites by Hilton hotel in the Pier Park area of Panama City Beach, Florida. The 255-room hotel opened in the second quarter of 2023. As of December 31, 2024 and 2023, the Company owned a 70.0% interest in the consolidated JV. A wholly-owned subsidiary of the Company manages the day-to-day operations of the hotel. The Company has significant involvement in the project design and development, annual budgets and financing. The Company determined Pier Park Resort Hotel JV is a VIE and that the Company is the VIE’s primary beneficiary as of December 31, 2024 and 2023.
F 22
Pier Park Crossings Phase II JV
The Pier Park Crossings Phase II JV was formed in 2019, when the Company entered into a JV agreement to develop, manage and lease a 120-unit apartment community in the Pier Park area of Panama City Beach, Florida. As of December 31, 2024 and 2023, the Company owned a 75.0% interest in the consolidated JV. The Company’s unconsolidated Watersound Management JV is responsible for the day-to-day activities of the community. The Company approves all major decisions, including project development, annual budgets and financing. The Company determined Pier Park Crossings Phase II JV is a VIE and that the Company is the VIE’s primary beneficiary as of December 31, 2024 and 2023.
Watersound Closings JV
Watersound Closings JV was formed in 2019, when the Company entered into a JV agreement to own, operate and manage a real estate title insurance agency business. As of December 31, 2024 and 2023, the Company owned a 58.0% interest in the consolidated JV. A wholly-owned subsidiary of the Company is the managing member of Watersound Closings JV and is responsible for the day-to-day activities of the business. As the manager of the JV, as well as the majority member, the Company has the power to direct all of the activities of the JV that most significantly impact economic performance. The Company determined Watersound Closings JV is a VIE and that the Company is the VIE’s primary beneficiary as of December 31, 2024 and 2023. In February 2025, the Watersound Closings JV’s business operations were transitioned to Watersound Title Agency, LLC, a wholly-owned subsidiary of the Company.
Watercrest JV
The Watercrest JV was formed in 2019, when the Company entered into a JV agreement to develop and operate a 107-unit senior living community in Santa Rosa Beach, Florida. As of December 31, 2024 and 2023, the Company owned an 87.0% interest in the consolidated JV. A wholly-owned subsidiary of the Company’s JV partner is responsible for the day-to-day activities of the community. However, the Company approves all major decisions, including project development, annual budgets and financing. The Company determined Watercrest JV is a VIE and that the Company is the VIE’s primary beneficiary as of December 31, 2024 and 2023.
Watersound Origins Crossings JV
The Watersound Origins Crossings JV was formed in 2019, when the Company entered into a JV agreement to develop, manage and lease a 217-unit apartment community near the entrance to the Watersound Origins residential community. As of December 31, 2024 and 2023, the Company owned a 75.0% interest in the consolidated JV. The Company’s unconsolidated Watersound Management JV is responsible for the day-to-day activities of the community. The Company approves all major decisions, including project development, annual budgets and financing. The Company determined Watersound Origins Crossings JV is a VIE and that the Company is the VIE’s primary beneficiary as of December 31, 2024 and 2023.
Pier Park Crossings JV
The Pier Park Crossing JV was formed in 2017, when the Company entered into a JV agreement to develop, manage and lease a 240-unit apartment community in the Pier Park area of Panama City Beach, Florida. As of December 31, 2024 and 2023, the Company owned a 75.0% interest in the consolidated JV. The Company’s unconsolidated Watersound Management JV is responsible for the day-to-day activities of the community. The Company approves all major decisions, including project development, annual budgets and financing. The Company determined Pier Park Crossings JV is a VIE and that the Company is the VIE’s primary beneficiary as of December 31, 2024 and 2023.
Pier Park North JV
During 2012, the Company entered into a JV agreement with a partner to develop a retail center at Pier Park North. As of December 31, 2024 and 2023, the Company owned a 90.0% interest in the consolidated JV. A wholly-owned subsidiary of the Company’s JV s partner is responsible for the day-to-day activities of the retail center.
F 23
The Company approves all major decisions, including project development, annual budgets and financing. The Company determined the Pier Park North JV is a VIE and that the Company is the VIE’s primary beneficiary as of December 31, 2024 and 2023.
Unconsolidated Joint Ventures
Investment in unconsolidated joint ventures includes the Company’s investment accounted for using the equity method. The following table presents detail of the Company’s investment in unconsolidated joint ventures and total outstanding debt of unconsolidated JVs:
|
|
December 31, |
|
December 31, |
||
|
|
2024 |
|
2023 |
||
Investment in unconsolidated joint ventures |
|
|
|
|
|
|
Latitude Margaritaville Watersound JV |
|
$ |
53,399 |
|
$ |
49,036 |
Watersound Fountains Independent Living JV |
|
|
3,857 |
|
|
6,533 |
Pier Park TPS JV (a) |
|
|
— |
|
|
707 |
Pier Park RI JV |
|
|
5,211 |
|
|
6,156 |
Busy Bee JV |
|
|
2,642 |
|
|
2,535 |
Electric Cart Watersound JV |
|
|
781 |
|
|
815 |
Watersound Management JV |
|
|
564 |
|
|
574 |
Total investment in unconsolidated joint ventures |
|
$ |
66,454 |
|
$ |
66,356 |
|
|
|
|
|
|
|
Outstanding debt principal of unconsolidated JVs |
|
|
|
|
|
|
Latitude Margaritaville Watersound JV (b) (c) |
|
$ |
41,246 |
|
$ |
37,445 |
Watersound Fountains Independent Living JV (c) |
|
|
41,683 |
|
|
38,062 |
Pier Park TPS JV (c) |
|
|
13,161 |
|
|
13,503 |
Pier Park RI JV |
|
|
24,948 |
|
|
16,021 |
Busy Bee JV |
|
|
5,365 |
|
|
5,693 |
Electric Cart Watersound JV (c) |
|
|
4,838 |
|
|
4,732 |
Total outstanding debt principal of unconsolidated JVs |
|
$ |
131,241 |
|
$ |
115,456 |
| (a) | During 2024, the Company’s investment in unconsolidated joint ventures decreased below zero due to cash distributions and depreciation and amortization expense. As of December 31, 2024, the Company’s investment in unconsolidated joint venture is included within accounts payable and other liabilities on the consolidated balance sheets. |
| (b) | See Note 20. Commitments and Contingencies for additional information on the $10.0 million secured revolving promissory note the Company entered into with the unconsolidated Latitude Margaritaville Watersound JV. |
| (c) | See Note 20. Commitments and Contingencies for additional information related to outstanding debt. |
The Company had approximately $20.3 million in cumulative undistributed earnings from its unconsolidated JVs included within investment in unconsolidated joint ventures as of December 31, 2024. During 2024 and 2023, the Company received distributions from unconsolidated JVs totaling $27.0 million and $12.1 million, respectively. The Company’s maximum exposure to loss due to involvement with the unconsolidated JVs as of December 31, 2024, was $115.0 million, which includes the carrying amounts of the investments, guarantees, promissory note receivable, other receivables and derivative instruments.
F 24
The following table presents detail of the Company’s equity in income (loss) from unconsolidated JVs:
|
|
|
Year Ended December 31, |
|||||||
|
|
|
2024 |
|
2023 |
|
2022 |
|||
Equity in income (loss) from unconsolidated joint ventures |
|
|
|
|
|
|
|
|
|
|
Latitude Margaritaville Watersound JV (a) |
|
|
$ |
29,270 |
|
$ |
23,627 |
|
$ |
3,859 |
Sea Sound JV (b) |
|
|
|
— |
|
|
(35) |
|
|
21,705 |
Watersound Fountains Independent Living JV (c) |
|
|
|
(4,410) |
|
|
(725) |
|
|
(250) |
Pier Park TPS JV |
|
|
|
(545) |
|
|
(362) |
|
|
33 |
Pier Park RI JV (d) |
|
|
|
(946) |
|
|
— |
|
|
— |
Busy Bee JV (e) |
|
|
|
107 |
|
|
(36) |
|
|
538 |
Electric Cart Watersound JV (f) |
|
|
|
(34) |
|
|
112 |
|
|
18 |
Watersound Management JV |
|
|
|
136 |
|
|
120 |
|
|
83 |
Total equity in income from unconsolidated joint ventures |
|
|
$ |
23,578 |
|
$ |
22,701 |
|
$ |
25,986 |
| (a) | During 2024, 2023 and 2022, the Latitude Margaritaville Watersound JV completed 659, 641 and 316 home sale transactions, respectively. |
| (b) | In 2022, the Sea Sound JV sold its assets to a third party for $92.5 million, resulting in a total gain on sale of $36.1 million. The year ended December 31, 2022 includes the Company’s proportionate share of the gain on sale of $21.7 million. As a result of the sale, the Sea Sound JV no longer has activity from operations. |
| (c) | The community opened in March 2024 and is currently under lease-up. Activity in the current period includes pre-opening, lease-up, depreciation and interest expenses for the project. |
| (d) | The hotel opened in April 2024. |
| (e) | Includes changes in the fair value of derivatives related to interest rate swaps entered into by the Busy Bee JV. |
| (f) | The permanent sales and service facility located in the Watersound West Bay Center opened in October 2023. An additional sales showroom located in the Watersound Town Center opened in June 2024. |
Summarized balance sheets for the Company’s unconsolidated JVs are as follows:
|
|
|
|
|
|
|
|
|
|
|
|
|
|
|
|
|
|
|
|
|
|
|
|
|
|
|
|
|
|
December 31, 2024 |
|||||||||||||||||||||||||
|
|
Latitude Margaritaville Watersound JV |
|
Sea Sound JV (b) |
|
Watersound Fountains Independent Living JV |
|
Pier Park TPS JV |
|
Pier Park RI JV |
|
Busy Bee JV |
|
Electric Cart Watersound JV |
|
Watersound Management JV |
|
Total |
|||||||||
ASSETS |
|
|
|
|
|
|
|
|
|
|
|
|
|
|
|
|
|
|
|
|
|
|
|
|
|
|
|
Investment in real estate, net |
|
$ |
157,336 |
(a) |
$ |
— |
|
$ |
50,822 |
|
$ |
12,231 |
|
$ |
34,576 |
|
$ |
8,144 |
|
$ |
5,154 |
|
$ |
— |
|
$ |
268,263 |
Cash and cash equivalents |
|
|
27,706 |
|
|
— |
|
|
405 |
|
|
279 |
|
|
529 |
|
|
915 |
|
|
656 |
|
|
104 |
|
|
30,594 |
Other assets |
|
|
2,092 |
|
|
— |
|
|
382 |
|
|
428 |
|
|
235 |
|
|
1,921 |
|
|
824 |
|
|
33 |
|
|
5,915 |
Total assets |
|
$ |
187,134 |
|
$ |
— |
|
$ |
51,609 |
|
$ |
12,938 |
|
$ |
35,340 |
|
$ |
10,980 |
|
$ |
6,634 |
|
$ |
137 |
|
$ |
304,772 |
|
|
|
|
|
|
|
|
|
|
|
|
|
|
|
|
|
|
|
|
|
|
|
|
|
|
|
|
LIABILITIES AND EQUITY |
|
|
|
|
|
|
|
|
|
|
|
|
|
|
|
|
|
|
|
|
|
|
|
|
|
|
|
Debt, net |
|
$ |
41,054 |
|
$ |
— |
|
$ |
41,482 |
|
$ |
13,102 |
|
$ |
24,608 |
|
$ |
5,365 |
|
$ |
4,775 |
|
$ |
— |
|
$ |
130,386 |
Accounts payable and other liabilities |
|
|
59,832 |
|
|
— |
|
|
2,794 |
|
|
128 |
|
|
310 |
|
|
382 |
|
|
328 |
|
|
— |
|
|
63,774 |
Equity (deficit) |
|
|
86,248 |
|
|
— |
|
|
7,333 |
|
|
(292) |
|
|
10,422 |
|
|
5,233 |
|
|
1,531 |
|
|
137 |
|
|
110,612 |
Total liabilities and equity |
|
$ |
187,134 |
|
$ |
— |
|
$ |
51,609 |
|
$ |
12,938 |
|
$ |
35,340 |
|
$ |
10,980 |
|
$ |
6,634 |
|
$ |
137 |
|
$ |
304,772 |
F 25
| (a) | Investment in real estate, net includes the land contributed to the Latitude Margaritaville Watersound JV at the Company’s historical cost basis and additional completed infrastructure improvements. |
| (b) | In 2022, the Sea Sound JV sold its assets to a third party and no longer has activity from operations. |
|
|
December 31, 2023 |
|||||||||||||||||||||||||
|
|
Latitude Margaritaville Watersound JV |
|
Sea Sound JV (b) |
|
Watersound Fountains Independent Living JV |
|
Pier Park TPS JV |
|
Pier Park RI JV |
|
Busy Bee JV |
|
Electric Cart Watersound JV |
|
Watersound Management JV |
|
Total |
|||||||||
ASSETS |
|
|
|
|
|
|
|
|
|
|
|
|
|
|
|
|
|
|
|
|
|
|
|
|
|
|
|
Investment in real estate, net |
|
$ |
149,253 |
(a) |
$ |
— |
|
$ |
52,301 |
|
$ |
13,666 |
|
$ |
32,053 |
|
$ |
8,605 |
|
$ |
5,384 |
|
$ |
— |
|
$ |
261,262 |
Cash and cash equivalents |
|
|
28,235 |
|
|
— |
|
|
215 |
|
|
719 |
|
|
44 |
|
|
613 |
|
|
902 |
|
|
158 |
|
|
30,886 |
Other assets |
|
|
2,883 |
|
|
— |
|
|
67 |
|
|
617 |
|
|
25 |
|
|
1,965 |
|
|
396 |
|
|
— |
|
|
5,953 |
Total assets |
|
$ |
180,371 |
|
$ |
— |
|
$ |
52,583 |
|
$ |
15,002 |
|
$ |
32,122 |
|
$ |
11,183 |
|
$ |
6,682 |
|
$ |
158 |
|
$ |
298,101 |
|
|
|
|
|
|
|
|
|
|
|
|
|
|
|
|
|
|
|
|
|
|
|
|
|
|
|
|
LIABILITIES AND EQUITY |
|
|
|
|
|
|
|
|
|
|
|
|
|
|
|
|
|
|
|
|
|
|
|
|
|
|
|
Debt, net |
|
$ |
37,155 |
|
$ |
— |
|
$ |
37,493 |
|
$ |
13,408 |
|
$ |
15,681 |
|
$ |
5,673 |
|
$ |
4,661 |
|
$ |
— |
|
$ |
114,071 |
Accounts payable and other liabilities |
|
|
72,872 |
|
|
— |
|
|
2,947 |
|
|
181 |
|
|
4,128 |
|
|
439 |
|
|
423 |
|
|
— |
|
|
80,990 |
Equity |
|
|
70,344 |
|
|
— |
|
|
12,143 |
|
|
1,413 |
|
|
12,313 |
|
|
5,071 |
|
|
1,598 |
|
|
158 |
|
|
103,040 |
Total liabilities and equity |
|
$ |
180,371 |
|
$ |
— |
|
$ |
52,583 |
|
$ |
15,002 |
|
$ |
32,122 |
|
$ |
11,183 |
|
$ |
6,682 |
|
$ |
158 |
|
$ |
298,101 |
| (a) | Investment in real estate, net includes the land contributed to the Latitude Margaritaville Watersound JV at the Company’s historical cost basis and additional completed infrastructure improvements. |
| (b) | In 2022, the Sea Sound JV sold its assets to a third party and no longer has activity from operations. |
Summarized statements of operations for unconsolidated JVs are as follows:
|
|
|
|
|
|
|
|
|
|
|
|
|
|
|
|
|
|
|
|
|
|
|
|
|
|
|
|
|
|
Year Ended December 31, 2024 |
|||||||||||||||||||||||||
|
|
Latitude Margaritaville Watersound JV (a) |
|
Sea Sound JV (b) |
|
Watersound Fountains Independent Living JV (c) |
|
Pier Park TPS JV |
|
Pier Park RI JV (d) |
|
Busy Bee JV |
|
Electric Cart Watersound JV (f) |
|
Watersound Management JV |
|
|
Total |
||||||||
Total revenue |
|
$ |
347,583 |
|
$ |
— |
|
$ |
1,621 |
|
$ |
3,982 |
|
$ |
3,249 |
|
$ |
14,900 |
|
$ |
4,391 |
|
$ |
2,443 |
|
$ |
378,169 |
Expenses: |
|
|
|
|
|
|
|
|
|
|
|
|
|
|
|
|
|
|
|
|
|
|
|
|
|
|
|
Cost of revenue |
|
|
269,282 |
|
|
— |
|
|
4,497 |
|
|
2,907 |
|
|
2,268 |
|
|
14,105 |
|
|
3,887 |
|
|
2,171 |
|
|
299,117 |
Other operating expenses |
|
|
19,384 |
|
|
— |
|
|
— |
|
|
— |
|
|
— |
|
|
— |
|
|
— |
|
|
— |
|
|
19,384 |
Depreciation and amortization |
|
|
529 |
|
|
— |
|
|
2,505 |
|
|
1,439 |
|
|
1,600 |
|
|
522 |
|
|
248 |
|
|
— |
|
|
6,843 |
Total expenses |
|
|
289,195 |
|
|
— |
|
|
7,002 |
|
|
4,346 |
|
|
3,868 |
|
|
14,627 |
|
|
4,135 |
|
|
2,171 |
|
|
325,344 |
Operating income (loss) |
|
|
58,388 |
|
|
— |
|
|
(5,381) |
|
|
(364) |
|
|
(619) |
|
|
273 |
|
|
256 |
|
|
272 |
|
|
52,825 |
Other (expense) income: |
|
|
|
|
|
|
|
|
|
|
|
|
|
|
|
|
|
|
|
|
|
|
|
|
|
|
|
Interest expense |
|
|
— |
|
|
— |
|
|
(2,888) |
|
|
(745) |
|
|
(1,272) |
|
|
(164) |
|
|
(324) |
|
|
— |
|
|
(5,393) |
Other income, net |
|
|
153 |
|
|
— |
|
|
58 |
|
|
18 |
|
|
— |
|
|
67 |
(e) |
|
— |
|
|
— |
|
|
296 |
Total other income (expense), net |
|
|
153 |
|
|
— |
|
|
(2,830) |
|
|
(727) |
|
|
(1,272) |
|
|
(97) |
|
|
(324) |
|
|
— |
|
|
(5,097) |
Net income (loss) |
|
$ |
58,541 |
|
$ |
— |
|
$ |
(8,211) |
|
$ |
(1,091) |
|
$ |
(1,891) |
|
$ |
176 |
|
$ |
(68) |
|
$ |
272 |
|
$ |
47,728 |
| (a) | The Latitude Margaritaville Watersound JV completed 659 home sale transactions during 2024. |
| (b) | In 2022, the Sea Sound JV sold its assets to a third party and no longer has activity from operations. |
| (c) | The community opened in March 2024 and is currently under lease-up. Activity includes pre-opening and lease-up expenses for the project. |
F 26
| (d) | The hotel opened in April 2024. |
| (e) | Includes changes in the fair value of derivatives related to interest rate swaps entered into by the Busy Bee JV. |
| (f) | The permanent sales and service facility located in the Watersound West Bay Center opened in October 2023. An additional sales showroom located in the Watersound Town Center opened in June 2024. |
|
|
|
|
|
|
|
|
|
|
|
|
|
|
|
|
|
|
|
|
|
|
|
|
|
|
|
|
|
|
Year Ended December 31, 2023 |
|||||||||||||||||||||||||
|
|
Latitude Margaritaville Watersound JV (a) |
|
Sea Sound JV (b) |
|
Watersound Fountains Independent Living JV (c) |
|
Pier Park TPS JV |
|
Pier Park RI JV (d) |
|
Busy Bee JV |
|
Electric Cart Watersound JV (f) |
|
Watersound Management JV |
|
Total |
|||||||||
Total revenue |
|
$ |
323,881 |
|
$ |
— |
|
$ |
— |
|
$ |
4,716 |
|
$ |
— |
|
$ |
17,170 |
|
$ |
3,235 |
|
$ |
1,956 |
|
$ |
350,958 |
Expenses: |
|
|
|
|
|
|
|
|
|
|
|
|
|
|
|
|
|
|
|
|
|
|
|
|
|
|
|
Cost of revenue |
|
|
259,199 |
|
|
— |
|
|
— |
|
|
3,118 |
|
|
— |
|
|
16,449 |
|
|
2,796 |
|
|
1,717 |
|
|
283,279 |
Other operating expenses |
|
|
17,079 |
|
|
62 |
|
|
1,330 |
|
|
— |
|
|
— |
|
|
— |
|
|
104 |
|
|
— |
|
|
18,575 |
Depreciation and amortization |
|
|
613 |
|
|
— |
|
|
14 |
|
|
1,443 |
|
|
— |
|
|
499 |
|
|
33 |
|
|
— |
|
|
2,602 |
Total expenses |
|
|
276,891 |
|
|
62 |
|
|
1,344 |
|
|
4,561 |
|
|
— |
|
|
16,948 |
|
|
2,933 |
|
|
1,717 |
|
|
304,456 |
Operating income (loss) |
|
|
46,990 |
|
|
(62) |
|
|
(1,344) |
|
|
155 |
|
|
— |
|
|
222 |
|
|
302 |
|
|
239 |
|
|
46,502 |
Other (expense) income: |
|
|
|
|
|
|
|
|
|
|
|
|
|
|
|
|
|
|
|
|
|
|
|
|
|
|
|
Interest expense |
|
|
— |
|
|
— |
|
|
(4) |
|
|
(906) |
|
|
— |
|
|
(176) |
|
|
(82) |
|
|
— |
|
|
(1,168) |
Other income (expense), net |
|
|
264 |
|
|
— |
|
|
— |
|
|
28 |
|
|
— |
|
|
(115) |
(e) |
|
— |
|
|
— |
|
|
177 |
Total other income (expense), net |
|
|
264 |
|
|
— |
|
|
(4) |
|
|
(878) |
|
|
— |
|
|
(291) |
|
|
(82) |
|
|
— |
|
|
(991) |
Net income (loss) |
|
$ |
47,254 |
|
$ |
(62) |
|
$ |
(1,348) |
|
$ |
(723) |
|
$ |
— |
|
$ |
(69) |
|
$ |
220 |
|
$ |
239 |
|
$ |
45,511 |
| (a) | The Latitude Margaritaville Watersound JV completed 641 home sale transactions during 2023. |
| (b) | In 2022, the Sea Sound JV sold its assets to a third party and no longer has activity from operations. |
| (c) | The community was under construction during 2023 and opened in March 2024. |
| (d) | The project was under construction with no income or loss for the year ended December 31, 2023. |
| (e) | Includes changes in the fair value of derivatives related to interest rate swaps entered into by the Busy Bee JV. |
| (f) | The permanent sales and service facility located in the Watersound West Bay Center opened in October 2023. |
|
|
|
|
|
|
|
|
|
|
|
|
|
|
|
|
|
|
|
|
|
|
|
|
|
|
|
|
|
|
Year Ended December 31, 2022 |
|||||||||||||||||||||||||
|
|
Latitude Margaritaville Watersound JV (a) |
|
Sea Sound JV |
|
Watersound Fountains Independent Living JV (c) |
|
Pier Park TPS JV |
|
Pier Park RI JV (d) |
|
Busy Bee JV |
|
Electric Cart Watersound JV |
|
Watersound Management JV |
|
Total |
|||||||||
|
|
|
|
|
|
|
|
|
|
|
|
|
|
|
|
|
|
|
|
|
|
|
|
|
|
|
|
Total revenue |
|
$ |
139,297 |
|
$ |
5,182 |
|
$ |
— |
|
$ |
5,460 |
|
$ |
— |
|
$ |
17,747 |
|
$ |
579 |
|
$ |
1,196 |
|
$ |
169,461 |
Expenses: |
|
|
|
|
|
|
|
|
|
|
|
|
|
|
|
|
|
|
|
|
|
|
|
|
|
|
|
Cost of revenue |
|
|
118,468 |
|
|
1,883 |
|
|
— |
|
|
3,199 |
|
|
— |
|
|
16,954 |
|
|
519 |
|
|
1,030 |
|
|
142,053 |
Other operating expenses |
|
|
12,903 |
|
|
32 |
|
|
465 |
|
|
— |
|
|
— |
|
|
— |
|
|
20 |
|
|
— |
|
|
13,420 |
Depreciation and amortization |
|
|
543 |
|
|
1,671 |
|
|
— |
|
|
1,449 |
|
|
— |
|
|
459 |
|
|
2 |
|
|
— |
|
|
4,124 |
Total expenses |
|
|
131,914 |
|
|
3,586 |
|
|
465 |
|
|
4,648 |
|
|
— |
|
|
17,413 |
|
|
541 |
|
|
1,030 |
|
|
159,597 |
Operating income (loss) |
|
|
7,383 |
|
|
1,596 |
|
|
(465) |
|
|
812 |
|
|
— |
|
|
334 |
|
|
38 |
|
|
166 |
|
|
9,864 |
Other (expense) income: |
|
|
|
|
|
|
|
|
|
|
|
|
|
|
|
|
|
|
|
|
|
|
|
|
|
|
|
Interest expense |
|
|
— |
|
|
(1,560) |
|
|
— |
|
|
(752) |
|
|
— |
|
|
(190) |
|
|
(3) |
|
|
— |
|
|
(2,505) |
Other income, net |
|
|
47 |
|
|
36,138 |
(b) |
|
— |
|
|
17 |
|
|
— |
|
|
957 |
(e) |
|
— |
|
|
— |
|
|
37,159 |
Total other income (expense), net |
|
|
47 |
|
|
34,578 |
|
|
— |
|
|
(735) |
|
|
— |
|
|
767 |
|
|
(3) |
|
|
— |
|
|
34,654 |
Net income (loss) |
|
$ |
7,430 |
|
$ |
36,174 |
|
$ |
(465) |
|
$ |
77 |
|
$ |
— |
|
$ |
1,101 |
|
$ |
35 |
|
$ |
166 |
|
$ |
44,518 |
| (a) | The Latitude Margaritaville Watersound JV completed 316 home sale transactions during 2022. |
F 27
| (b) | In 2022, the Sea Sound JV sold its assets to an unrelated third party for $92.5 million, resulting in a total gain on sale of $36.1 million. As a result of the sale, the Sea Sound JV no longer has activity from operations. |
| (c) | The community was under construction during 2022. |
| (d) | The project was under construction with no income or loss for the year ended December 31, 2022. |
| (e) | Includes changes in the fair value of derivatives related to interest rate swaps entered into by the Busy Bee JV. |
Latitude Margaritaville Watersound JV
LMWS, LLC was formed in 2019, when the Company entered into a JV agreement to develop a 55+ active adult residential community in Bay County, Florida. As of December 31, 2024, the Latitude Margaritaville Watersound JV had 367 homes under contract and has completed 1,663 home sale transactions of the total estimated 3,500 homes planned in the community. As of December 31, 2024 and 2023, the Company’s investment in the unconsolidated Latitude Margaritaville Watersound JV was $53.4 million and $49.0 million, respectively, which includes the net present value of the land contribution, cash contributions, additional completed infrastructure improvements and equity in income, less distributions. During 2024 and 2023, the Company received $26.6 million and $11.4 million, respectively, of cash distributions from the JV. As of December 31, 2024, the Company completed $8.4 million of the $9.2 million total agreed upon infrastructure improvements. As of December 31, 2024 and 2023, the Company owned a 50.0% interest in the JV. The Company’s unimproved land contribution and agreed upon infrastructure improvements are being distributed at an average of $10,000 per home, as each home is sold by the JV.
The Company’s Latitude Margaritaville Watersound JV has met the conditions of a significant subsidiary under Rule 1-02(w) of Regulation S-X for the year ended December 31, 2024 and 2023, but not the year ended December 31, 2022. Therefore, separate financial statements of the Latitude Margaritaville Watersound JV, as required pursuant to Rule 3-09 of Regulation S-X, are filed as Exhibit 99.1 of this Form 10-K. The basis difference of $13.8 million and $18.3 million as of December 31, 2024 and 2023, respectively, is due to the Company maintaining the land and additional completed infrastructure improvements contributed to the JV at its historical cost basis, while the JV recorded these contributions at market value. The basis difference is being reduced as each home is sold by the JV.
Per the JV agreement, the Company, as lender, has provided interest-bearing financing in the form of a $10.0 million secured revolving promissory note to the Latitude Margaritaville Watersound JV, as borrower, to finance the development of the pod-level, non-spine infrastructure. As of both December 31, 2024 and 2023, there was no balance outstanding on the Latitude JV Note. Future advances, if any, will be repaid by the JV as each home is sold. The day-to-day activities of the JV are being managed through a board of managers, with each JV partner having equal voting rights. The Company has determined that Latitude Margaritaville Watersound JV is a VIE, but that the Company is not the primary beneficiary since it does not have the power to direct the activities that most significantly impact the economic performance of the JV. The Company’s investment in the Latitude Margaritaville Watersound JV is accounted for using the equity method. See Note 20. Commitments and Contingencies for additional information related to the revolving promissory note and guaranty by the Company.
Sea Sound JV
In 2022, the Sea Sound JV sold its assets to a third party for $92.5 million, resulting in a total gain on sale of $36.1 million. The Company’s proportionate share of the gain on sale of $21.7 million is included within equity in income from unconsolidated joint ventures on the consolidated statements of income for the year ended December 31, 2022. During 2022, the Company also received a cash distribution of $31.6 million from the JV. As a result of the sale, the Sea Sound JV no longer has activity from operations.
Watersound Fountains Independent Living JV
WOSL, LLC was formed in 2021. The Company entered into a JV agreement to develop, construct and manage a 148-unit independent senior living community located near the Watersound Origins residential community. The community opened in March 2024. As of December 31, 2024 and 2023, the Company owned a 53.8% interest in the JV. The Company’s partners are responsible for the day-to-day activities of the JV. The Company has determined that Watersound Fountains Independent Living JV is a VIE, but that the Company is not the primary beneficiary since it does not have the power to direct the activities that most significantly impact the economic performance of the JV. The Company’s investment in Watersound Fountains Independent Living JV is accounted for using the equity method. See Note 20. Commitments and Contingencies for additional information related to debt guaranteed by the Company.
F 28
Pier Park TPS JV
Pier Park TPS, LLC was formed in 2018. The Company entered into a JV agreement to develop and operate a 124-room hotel in Panama City Beach, Florida. As of December 31, 2024 and 2023, the Company owned a 50.0% interest in the JV. During 2024 and 2023, the Company received $0.2 million and $0.3 million, respectively, of cash distributions from the JV. The Company’s partner is responsible for the day-to-day activities of the JV. The Company has determined that Pier Park TPS JV is a VIE, but that the Company is not the primary beneficiary since it does not have the power to direct the activities that most significantly impact the economic performance of the JV. The Company’s investment in Pier Park TPS JV is accounted for using the equity method. See Note 20. Commitments and Contingencies for additional information related to debt guaranteed by the Company.
Pier Park RI JV
Pier Park RI, LLC was formed in 2022. The Company entered into a JV agreement to develop and operate a 121-room hotel in Panama City Beach, Florida. The hotel opened in April 2024. The hotel is located on land that was contributed to the JV by the Company in 2022, with a fair value of $1.8 million. In addition, as of December 31, 2024, the Company contributed cash and impact fees of $4.4 million, and the JV partner contributed cash of $6.2 million. As of December 31, 2024 and 2023, the Company owned a 50.0% interest in the JV. The Company’s partner is responsible for the day-to-day activities of the JV. The Company has determined that Pier Park RI JV is a VIE, but that the Company is not the primary beneficiary since it does not have the power to direct the activities that most significantly impact the economic performance of the JV. The Company’s investment in Pier Park RI JV is accounted for using the equity method. In 2022, the JV entered into a $25.0 million loan (the “Pier Park RI JV Loan”). The Pier Park RI JV Loan bears interest at SOFR plus 2.5% and matures in August 2025. The Pier Park RI JV Loan includes an option for a fixed rate conversion and two options to extend the maturity date by twenty-four months each, upon satisfaction of certain terms and conditions. The loan is secured by real property and certain other security interests. The Company’s JV partner is the sole guarantor and receives a fee related to the guarantee from the Company based on the Company’s ownership percentage. As of December 31, 2024 and 2023, $24.9 million and $16.0 million, respectively, was outstanding on the Pier Park RI JV Loan.
Busy Bee JV
SJBB, LLC was formed in 2019, when the Company entered into a JV agreement to construct, own and manage a Busy Bee branded fuel station and convenience store, which includes a Starbucks, in Panama City Beach, Florida. As of December 31, 2024 and 2023, the Company owned a 50.0% interest in the JV. The Company’s partner is responsible for the day-to-day activities of the JV. The Company has determined that Busy Bee JV is a VIE, but that the Company is not the primary beneficiary since it does not have the power to direct the activities that most significantly impact the economic performance of the JV. The Company’s investment in the Busy Bee JV is accounted for using the equity method. In 2019, the JV entered into a $5.4 million construction loan (the “Busy Bee JV Construction Loan”) and a $1.2 million equipment loan (the “Busy Bee JV Equipment Loan”). The Busy Bee JV Construction Loan and the Busy Bee JV Equipment Loan bear interest at SOFR plus 1.6%. The Busy Bee JV Construction Loan provides for monthly principal and interest payments with a final balloon payment at maturity in November 2035. The Busy Bee JV Equipment Loan provides for monthly principal and interest payments through maturity in November 2027. The loans are secured by real and personal property and certain other security interests. The Company’s JV partner is the sole guarantor and receives a fee related to the guarantee from the Company based on the Company’s ownership percentage. The Busy Bee JV entered into an interest rate swap to hedge cash flows tied to changes in the underlying floating interest rate tied to SOFR for the Busy Bee JV Construction Loan and the Busy Bee JV Equipment Loan. The Busy Bee JV Construction Loan interest rate swap matures in November 2035 and fixed the variable rate debt, initially at $5.4 million amortizing to $2.8 million at swap maturity, to a rate of 2.7%. The Busy Bee JV Equipment Loan interest rate swap matures in November 2027 and fixed the variable rate debt, initially at $1.2 million to maturity, to a rate of 2.1%. As of December 31, 2024 and 2023, $4.8 million and $5.0 million, respectively, was outstanding on the Busy Bee JV Construction Loan.
F 29
As of December 31, 2024 and 2023, $0.5 million and $0.7 million, respectively, was outstanding on the Busy Bee JV Equipment Loan.
Electric Cart Watersound JV
SJECC, LLC was formed in 2022, when the Company entered into a JV agreement to develop, construct, lease, manage and operate a golf cart and low speed vehicle “LSV” business at the new Watersound West Bay Center adjacent to the Latitude Margaritaville Watersound residential community in Bay County, Florida and at the Watersound Town Center near the Watersound Origins residential community. The JV operated out of a temporary facility while its permanent Watersound West Bay Center location was being constructed. The Watersound West Bay Center Facility opened in October 2023 and provides sales and service. An additional sales showroom opened in June 2024 at the Watersound Town Center on property leased to the JV by the Company. As of December 31, 2024 and 2023, the Company owned a 51% interest in the JV. The Company’s JV partner manages the day-to-day operations of the business. The Company has determined that Electric Cart Watersound JV is a VIE, but that the Company is not the primary beneficiary since it does not have the power to direct the activities that most significantly impact the economic performance of the JV. The Company’s investment in Electric Cart Watersound JV is accounted for using the equity method. As of both December 31, 2024 and 2023, the Electric Cart Watersound JV had $2.4 million of floorplan line of credit facilities to finance its golf cart and LSV inventory, which are secured by the JV. Borrowings under the line of credit facility bear interest at various rates based on the number of days outstanding after an interest free period ranging from two to six months. As of December 31, 2024 and 2023, the JV had an outstanding principal balance of $0.5 million and $0.4 million, respectively, on these line of credit facilities. See Note 20. Commitments and Contingencies for additional information related to debt guaranteed by the Company.
Watersound Management JV
Watersound Management, LLC was formed in 2021, when the Company entered into a JV agreement to lease, manage and operate multi-family housing developments for which the JV is the exclusive renting and management agent. All activity of Watersound Management JV is related to multi-family housing developments owned by the Company or by consolidated JVs of the Company. As of December 31, 2024 and 2023, the Company owned a 50.0% interest in the JV. During both 2024 and 2023, the Company received $0.1 million of cash distributions from the JV. The day-to-day activities of the JV are being managed through a board of managers, with each JV partner having equal voting rights. The Company has determined that Watersound Management JV is a voting interest entity, but that the Company does not have a majority voting interest. The Company’s investment in Watersound Management JV is accounted for using the equity method. See Note 21. Related Party Transactions for additional information.
5. Investments
Available-For-Sale Investments
As of both December 31, 2024 and 2023, the Company did not have investments classified as available-for-sale securities. During 2024 and 2023, the Company did not have any realized gains or losses from the sale of available-for-sale securities. During 2024 and 2023, there were no proceeds from the sale of available-for-sale securities. During 2024, there were no maturities or purchases of available-for-sale securities. During 2023, maturities of available-for-sale securities were $79.0 million and purchases of available-for-sale securities were $37.4 million.
Investment Management Agreement
FCM has provided investment advisory services to the Company since April 2013. FCM does not receive any compensation for services as the Company’s investment advisor. As of December 31, 2024, based on public filings, clients of FCM beneficially owned approximately 35.3% of the Company’s common stock. FCM and its client, The Fairholme Fund, a series of investments originating from the Fairholme Funds, Inc., may be deemed affiliates of the Company.
F 30
Pursuant to the terms of the Investment Management Agreement, with the Company, FCM agreed to supervise and direct the Company’s investment accounts in accordance with the investment guidelines and restrictions approved by the Company. The investment guidelines are set forth in the Investment Management Agreement and require that any new securities for purchase must be issues of the U.S. Treasury or U.S. Treasury Money Market Funds.
6. Financial Instruments and Fair Value Measurements
Fair Value Measurements
The financial instruments measured at fair value on a recurring basis are as follows:
|
|
December 31, 2024 |
||||||||||
|
|
|
|
|
|
|
|
|
|
|
Total Fair |
|
|
|
Level 1 |
|
Level 2 |
|
Level 3 |
|
Value |
||||
Cash equivalents: |
|
|
|
|
|
|
|
|
|
|
|
|
Money market funds |
|
$ |
2,408 |
|
$ |
— |
|
$ |
— |
|
$ |
2,408 |
U.S. Treasury Bills |
|
|
58,971 |
|
|
— |
|
|
— |
|
|
58,971 |
|
|
$ |
61,379 |
|
$ |
— |
|
$ |
— |
|
$ |
61,379 |
|
|
December 31, 2023 |
||||||||||
|
|
|
|
|
|
|
|
|
|
|
Total Fair |
|
|
|
Level 1 |
|
Level 2 |
|
Level 3 |
|
Value |
||||
Cash equivalents: |
|
|
|
|
|
|
|
|
|
|
|
|
Money market funds |
|
$ |
1,383 |
|
$ |
— |
|
$ |
— |
|
$ |
1,383 |
U.S. Treasury Bills |
|
|
59,802 |
|
|
— |
|
|
— |
|
|
59,802 |
|
|
$ |
61,185 |
|
$ |
— |
|
$ |
— |
|
$ |
61,185 |
Money market funds and U.S. Treasury Bills are measured based on quoted market prices in an active market and categorized within Level 1 of the fair value hierarchy. Money market funds and short-term U.S. Treasury Bills with a maturity date of 90 days or less from the date of purchase are classified as cash equivalents in the Company’s consolidated balance sheets.
Assets and liabilities measured at fair value on a recurring basis related to interest rate swap agreements designated as cash flow hedges are as follows:
|
|
|
|
|
|
Fixed |
|
Notional |
|
|
|
|
|
|
|
Fair |
|
Location in |
|
|
|
Effective |
|
Maturity |
|
Interest |
|
Amount as of |
|
Derivative Asset Fair Value |
|
Value |
|
Consolidated |
|||||
Description |
|
Date |
|
Date |
|
Rate |
|
December 31, 2024 |
|
December 31, 2024 |
|
December 31, 2023 |
|
Level |
|
Balance Sheets |
|||
|
|
|
|
|
|
|
|
|
In Millions |
|
In Thousands |
|
|
|
|
||||
Pier Park Resort Hotel JV Loan (a) |
|
December 2022 |
|
April 2027 |
|
3.2% |
|
$ |
40.7 |
|
$ |
2,560 |
|
$ |
3,254 |
|
2 |
|
Other assets |
Pier Park TPS JV Loan (b) |
|
January 2021 |
|
January 2026 |
|
5.2% |
|
$ |
13.2 |
|
$ |
108 |
|
$ |
191 |
|
2 |
|
Accounts payable and other liabilities |
| (a) | See Note 10. Debt, Net for additional information. |
| (b) | Interest rate swap was entered into by the Pier Park TPS JV, which is unconsolidated and accounted for using the equity method. The derivative asset has been recorded at the Company’s proportionate share of its estimated fair value. The Company’s proportionate share of the gain or loss on the derivative instrument is reported as a component of other comprehensive (loss) income and reclassified into equity in income from unconsolidated joint ventures in the period during which the hedged transaction affects earnings. See Note 4. Joint Ventures and Note 20. Commitments and Contingencies for additional information. |
F 31
The following is a summary of the effect of derivative instruments on the Company’s consolidated statements of income and consolidated statements of comprehensive income:
|
|
|
Year Ended December 31, |
|||||||
|
|
|
2024 |
|
2023 |
|
2022 |
|||
Amount of net gain recognized in other comprehensive income |
|
|
$ |
1,090 |
|
$ |
330 |
|
$ |
5,254 |
Amount of net (gain) loss reclassified into interest expense |
|
|
$ |
(1,689) |
|
$ |
(1,605) |
|
$ |
52 |
Amount of net (gain) loss reclassified into equity in income from unconsolidated joint ventures |
|
|
$ |
(177) |
|
$ |
(162) |
|
$ |
88 |
As of December 31, 2024, based on current value, the Company expects to reclassify $1.4 million of derivative instruments from accumulated other comprehensive income to earnings during the next twelve months. See Note 14. Accumulated Other Comprehensive Income for additional information.
Investment in Unconsolidated Joint Ventures
The fair value of the Company’s investment in unconsolidated joint ventures is determined primarily using a discounted cash flow model to value the underlying net assets or cash flows of the respective JV. The fair value of investment in unconsolidated joint ventures required to be assessed for impairment is determined using Level 3 inputs in the fair value hierarchy. No impairment for unconsolidated JVs was recorded during 2024, 2023 or 2022. See Note 4. Joint Ventures for additional information.
Long-lived Assets
The Company reviews its long-lived assets for impairment whenever events or changes in circumstances indicate that the carrying amount of an asset may not be recoverable. The fair value of long-lived assets required to be assessed for impairment is determined using Level 3 inputs in the fair value hierarchy. During 2024, 2023 and 2022 the Company did not record any impairment charges related to long-lived assets.
Fair Value of Financial Instruments
The carrying value of the Company’s cash and cash equivalents, restricted cash, receivables, other assets, accounts payable and other liabilities approximate fair value due to the short-term nature of these instruments.
The Company uses the following methods and assumptions in estimating fair value for financial instruments:
| ● | The fair value of the investments held by SPE - time deposit is based on the present value of future cash flows at the current market rate. |
| ● | The fair value of the investments held by SPE - U.S. Treasury Bills are measured based on quoted market prices in an active market. |
| ● | The fair value of debt is based on discounted future expected cash flows based on current market rates for financial instruments with similar risks, terms and maturities. |
| ● | The fair value of the Senior Notes held by SPE is based on the present value of future cash flows at the current market rate. |
F 32
The carrying amount and estimated fair value, measured on a nonrecurring basis, of the Company’s financial instruments were as follows:
|
|
December 31, 2024 |
|
December 31, 2023 |
||||||||||||
|
|
Carrying |
|
Estimated |
|
|
|
Carrying |
|
Estimated |
|
|
||||
|
|
value |
|
Fair value |
|
Level |
|
value |
|
Fair value |
|
Level |
||||
Investments held by SPEs: |
|
|
|
|
|
|
|
|
|
|
|
|
|
|
|
|
Time deposit |
|
$ |
200,000 |
|
$ |
200,000 |
|
3 |
|
$ |
200,000 |
|
$ |
200,000 |
|
3 |
U.S. Treasury Bills |
|
$ |
3,143 |
|
$ |
3,078 |
|
1 |
|
$ |
3,824 |
|
$ |
3,750 |
|
1 |
|
|
|
|
|
|
|
|
|
|
|
|
|
|
|
|
|
Senior Notes held by SPE |
|
$ |
178,484 |
|
$ |
178,473 |
|
3 |
|
$ |
178,162 |
|
$ |
181,286 |
|
3 |
|
|
|
|
|
|
|
|
|
|
|
|
|
|
|
|
|
Debt |
|
|
|
|
|
|
|
|
|
|
|
|
|
|
|
|
Fixed-rate debt |
|
$ |
258,135 |
|
$ |
206,775 |
|
2 |
|
$ |
262,484 |
|
$ |
215,522 |
|
2 |
Variable-rate debt |
|
|
184,581 |
|
|
184,581 |
|
2 |
|
|
196,737 |
|
|
196,737 |
|
2 |
Total debt |
|
$ |
442,716 |
|
$ |
391,356 |
|
|
|
$ |
459,221 |
|
$ |
412,259 |
|
|
Investments and Senior Notes Held by Special Purpose Entities
In connection with a real estate sale in 2014, the Company received consideration including a $200.0 million fifteen-year installment note (the “Timber Note”) issued by Panama City Timber Finance Company, LLC. The Company contributed the Timber Note and assigned its rights as a beneficiary under a letter of credit to Northwest Florida Timber Finance, LLC. Northwest Florida Timber Finance, LLC monetized the Timber Note by issuing $180.0 million aggregate principal amount of its 4.8% Senior Secured Notes due in 2029 at an issue price of 98.5% of face value to third-party investors. The investments held by Panama City Timber Finance Company, LLC as of December 31, 2024, consist of a $200.0 million time deposit that, subsequent to April 2, 2014, pays interest at 4.0% and matures in March 2029, U.S. Treasuries of $3.1 million and cash of $0.4 million. The Senior Notes held by Northwest Florida Timber Finance, LLC as of December 31, 2024, consist of $178.5 million, net of the $1.5 million discount and debt issuance costs. Panama City Timber Finance Company, LLC and Northwest Florida Timber Finance, LLC are VIEs, which the Company consolidates as the primary beneficiary of each entity.
7. Leases
The Company as Lessor
Leasing revenue consists of rental revenue from multi-family, senior living, self-storage, retail, office and commercial property, marinas, cell towers and other assets, which is recognized as earned, using the straight-line method over the life of each lease. Variable lease payments primarily include property taxes, insurance, utilities and common area maintenance or payments based on a percent of sales over specified levels and senior living services. The Company’s leases have remaining lease terms up to the year 2072, some of which include options to terminate or extend.
The components of leasing revenue are as follows:
|
|
Year Ended December 31, |
|||||||
|
|
2024 |
|
2023 |
|
2022 |
|||
Leasing revenue |
|
|
|
|
|
|
|
|
|
Lease payments |
|
$ |
51,381 |
|
$ |
43,756 |
|
$ |
33,600 |
Variable lease payments |
|
|
8,935 |
|
|
7,080 |
|
|
5,596 |
Total leasing revenue |
|
$ |
60,316 |
|
$ |
50,836 |
|
$ |
39,196 |
F 33
Minimum future base rental revenue on non-cancelable leases subsequent to December 31, 2024, for the years ending December 31 are:
2025 |
|
$ |
30,877 |
2026 |
|
|
17,420 |
2027 |
|
|
15,413 |
2028 |
|
|
12,145 |
2029 |
|
|
9,193 |
Thereafter |
|
|
39,508 |
|
|
$ |
124,556 |
The Company as Lessee
As of December 31, 2024, the Company leased certain office and other equipment under finance leases and had operating leases for property and equipment used in corporate, hospitality and commercial operations with remaining lease terms up to the year 2081. Operating leases also include property for hospitality employee housing. Certain leases include options to purchase, terminate or renew for one or more years, which are included in the lease term used to establish right-of-use assets and lease liabilities when it is reasonably certain that the option will be exercised.
The components of lease expense are as follows:
|
|
|
|
|
|
|
|
|
|
|
Year Ended December 31, |
|
|||||||
|
2024 |
|
2023 |
|
2022 |
|
|||
Lease cost |
|
|
|
|
|
|
|
|
|
Finance lease cost: |
|
|
|
|
|
|
|
|
|
Amortization of right-of-use assets |
$ |
160 |
|
$ |
149 |
|
$ |
122 |
|
Interest on lease liability |
|
24 |
|
|
15 |
|
|
15 |
|
Operating lease cost |
|
1,855 |
|
|
439 |
|
|
378 |
|
Variable and short-term lease cost |
|
1,909 |
|
|
1,940 |
|
|
1,793 |
|
Total lease cost |
$ |
3,948 |
|
$ |
2,543 |
|
$ |
2,308 |
|
|
|
|
|
|
|
|
|
|
|
Other information |
|
|
|
|
|
|
|
|
|
Weighted-average remaining lease term - finance lease (in years) |
|
2.5 |
|
|
2.8 |
|
|
3.3 |
|
Weighted-average remaining lease term - operating leases (in years) |
|
1.9 |
|
|
1.5 |
|
|
2.9 |
|
Weighted-average discount rate - finance lease |
|
5.4 |
% |
|
5.3 |
% |
|
5.2 |
% |
Weighted-average discount rate - operating leases |
|
5.0 |
% |
|
4.9 |
% |
|
4.8 |
% |
The aggregate payments of finance and operating lease liabilities subsequent to December 31, 2024, for the years ending December 31 are:
|
|
Finance Leases |
|
Operating Leases |
||
2025 |
|
$ |
154 |
|
$ |
2,174 |
2026 |
|
|
117 |
|
|
2,084 |
2027 |
|
|
95 |
|
|
56 |
2028 |
|
|
72 |
|
|
55 |
2029 |
|
|
11 |
|
|
55 |
Thereafter |
|
|
— |
|
|
276 |
Total |
|
|
449 |
|
|
4,700 |
Less imputed interest |
|
|
(43) |
|
|
(334) |
Total lease liabilities |
|
$ |
406 |
|
$ |
4,366 |
F 34
8. Other Assets
Other assets consist of the following:
|
|
December 31, |
|
December 31, |
||
|
|
2024 |
|
2023 |
||
Accounts receivable, net |
|
$ |
14,590 |
|
$ |
20,322 |
Homesite sales receivable |
|
|
25,788 |
|
|
29,862 |
Inventory |
|
|
4,036 |
|
|
4,250 |
Prepaid expenses |
|
|
12,556 |
|
|
12,086 |
Straight-line rent |
|
|
2,996 |
|
|
2,755 |
Operating lease right-of-use assets |
|
|
4,417 |
|
|
858 |
Restricted cash |
|
|
7,560 |
|
|
4,702 |
Other assets |
|
|
5,437 |
|
|
4,470 |
Accrued interest receivable for Senior Notes held by SPE |
|
|
2,938 |
|
|
2,938 |
Total other assets |
|
$ |
80,318 |
|
$ |
82,243 |
Accounts Receivable, Net
Accounts receivable, net primarily includes leasing receivables, membership fees, hospitality receivables and other receivables. As of December 31, 2024, 2023 and 2022 accounts receivable, net had opening balances of $20.3 million, $9.0 million and $13.8 million, respectively. As of December 31, 2024 and 2023, accounts receivable includes $7.5 million and $12.1 million, respectively, of club membership initiation fee installments receivable. As of December 31, 2024 and 2023, accounts receivable were presented net of allowance for credit losses and net of allowance for lease related receivables of $0.3 million and $0.2 million, respectively. During 2024 and 2023, allowance for credit losses and allowance for leases related to accounts receivable, net increased $0.1 million and decreased $0.1 million, respectively.
Homesite Sales Receivable
Homesite sales receivable from contracts with customers include estimated homesite residuals and certain estimated fees that are recognized as revenue at the time of sale to homebuilders, subject to constraints. Any change in circumstances from the estimated amounts will be updated at each reporting period. The receivable will be collected as the homebuilders build the homes and sell to retail consumers, which can occur over multiple years. See Note 2. Summary of Significant Accounting Policies for additional information.
The following table presents the changes in homesite sales receivable:
|
|
December 31, |
|
December 31, |
|
December 31, |
|||
|
|
2024 |
|
2023 |
|
2022 |
|||
Balance at beginning of year |
|
$ |
29,862 |
|
$ |
10,086 |
|
$ |
7,651 |
Increases due to revenue recognized for homesites sold |
|
|
6,132 |
|
|
29,005 |
|
|
7,660 |
Decreases due to amounts received |
|
|
(10,206) |
|
|
(9,229) |
|
|
(5,225) |
Balance at end of year |
|
$ |
25,788 |
|
$ |
29,862 |
|
$ |
10,086 |
Prepaid Expenses
Prepaid expenses as of December 31, 2024 and 2023, include commercial leasing related prepaid expenses of $4.7 million, during each period and prepaid insurance of $4.7 million and $4.4 million, respectively, as well as other prepaid items.
F 35
Restricted Cash
Restricted cash as of December 31, 2024 and 2023, includes cash and escrow deposits primarily related to requirements for financing and development for certain of the Company’s projects, advance draws on construction loans or long-term mitigation bank management.
Other Assets
Other assets as of December 31, 2024 and 2023, include $2.6 million and $3.3 million, respectively, for the fair value of derivative assets. See Note 6. Financial Instruments and Fair Value Measurements for additional information.
9. Property and Equipment, Net
Property and equipment, net consists of the following:
|
|
|
|
|
|
|
|
|
December 31, |
|
December 31, |
||
|
|
2024 |
|
2023 |
||
Railroad and equipment |
|
$ |
33,627 |
|
$ |
33,627 |
Furniture and fixtures |
|
|
51,087 |
|
|
50,311 |
Machinery and equipment |
|
|
53,833 |
|
|
46,783 |
Office equipment |
|
|
7,905 |
|
|
7,692 |
Autos, trucks and aircraft |
|
|
7,344 |
|
|
7,108 |
|
|
|
153,796 |
|
|
145,521 |
Less: Accumulated depreciation |
|
|
95,339 |
|
|
80,423 |
|
|
|
58,457 |
|
|
65,098 |
Construction in progress |
|
|
650 |
|
|
951 |
Total property and equipment, net |
|
$ |
59,107 |
|
$ |
66,049 |
Depreciation expense on property and equipment was $19.0 million, $15.7 million and $8.5 million in 2024, 2023 and 2022, respectively.
F 36
10. Debt, Net
Debt consists of the following:
|
|
|
|
|
|
Effective Rate |
|
|
|
|
|||
|
|
|
|
|
|
December 31, |
|
December 31, |
|
December 31, |
|||
|
|
Maturity Date |
|
Interest Rate Terms |
|
2024 |
|
2024 |
|
2023 |
|||
Watersound Origins Crossings JV Loan (insured by HUD) |
|
April 2058 |
|
Fixed |
|
5.0 |
% |
|
$ |
51,953 |
|
$ |
52,546 |
Pier Park Resort Hotel JV Loan |
|
April 2027 |
|
SOFR plus 2.1% (a) |
|
3.9 |
% |
|
|
50,882 |
|
|
51,888 |
Mexico Beach Crossings JV Loan (insured by HUD) |
|
March 2064 |
|
Fixed |
|
3.0 |
% |
|
|
43,069 |
|
|
42,405 |
PPN JV Loan |
|
November 2025 |
|
Fixed |
|
4.1 |
% |
|
|
40,370 |
|
|
41,485 |
PPC JV Loan (insured by HUD) |
|
June 2060 |
|
Fixed |
|
3.1 |
% |
|
|
34,153 |
|
|
34,675 |
Pearl Hotel Loan |
|
December 2032 |
|
Fixed |
|
6.3 |
% |
|
|
34,040 |
|
|
35,520 |
Watersound Camp Creek Loan |
|
December 2047 |
|
SOFR plus 2.1%, floor 2.6% |
|
6.4 |
% |
|
|
27,377 |
|
|
27,999 |
North Bay Landing Loan (b) |
|
March 2026 |
|
SOFR plus 2.5%, floor 3.2% |
|
6.8 |
% |
|
|
22,746 |
|
|
26,750 |
PPC II JV Loan (insured by HUD) |
|
May 2057 |
|
Fixed |
|
2.7 |
% |
|
|
21,796 |
|
|
22,215 |
Hotel Indigo Loan |
|
October 2028 |
|
SOFR plus 2.5%, floor 2.5% |
|
6.8 |
% |
|
|
19,857 |
|
|
20,690 |
Watercrest JV Loan |
|
June 2047 |
|
SOFR plus 2.2% |
|
6.5 |
% |
|
|
19,555 |
|
|
20,074 |
Breakfast Point Hotel Loan |
|
November 2042 |
|
Fixed (c) |
|
6.0 |
% |
|
|
15,473 |
|
|
15,937 |
Lodge 30A JV Loan |
|
January 2028 |
|
Fixed |
|
3.8 |
% |
|
|
14,130 |
|
|
14,655 |
Topsail Hotel Loan |
|
July 2027 |
|
SOFR plus 2.1%, floor 3.0% |
|
6.4 |
% |
|
|
12,307 |
|
|
12,307 |
Airport Hotel Loan |
|
March 2025 (d) |
|
SOFR plus 2.1%, floor 3.0% |
|
6.4 |
% |
|
|
11,717 |
|
|
13,010 |
Watersound Town Center Grocery Loan |
|
August 2031 |
|
SOFR plus 2.1%, floor 2.3% |
|
6.4 |
% |
|
|
8,086 |
|
|
10,531 |
Beckrich Building III Loan |
|
August 2029 |
|
SOFR plus 1.8% |
|
6.1 |
% |
|
|
5,014 |
|
|
5,014 |
Self-Storage Facility Loan |
|
November 2025 |
|
SOFR plus 2.5%, floor 2.9% |
|
6.8 |
% |
|
|
3,360 |
|
|
4,666 |
Community Development District debt |
|
May 2025-May 2039 |
|
Fixed |
|
3.6 to 6.0 |
% |
|
|
3,151 |
|
|
3,046 |
Beach Homes Loan |
|
May 2029 |
|
SOFR plus 1.7% |
|
6.0 |
% |
|
|
1,385 |
|
|
1,416 |
Pier Park Outparcel Loan |
|
March 2027 |
|
SOFR plus 1.8% |
|
6.1 |
% |
|
|
1,252 |
|
|
1,275 |
WaterColor Crossings Loan |
|
February 2029 |
|
SOFR plus 1.8% |
|
6.1 |
% |
|
|
1,043 |
|
|
1,117 |
Total principal outstanding |
|
|
|
|
|
|
|
|
|
442,716 |
|
|
459,221 |
Unamortized discount and debt issuance costs |
|
|
|
|
|
|
|
(4,962) |
|
|
(5,581) |
||
Total debt, net |
|
|
|
|
|
|
|
|
$ |
437,754 |
|
$ |
453,640 |
| (a) | The Pier Park Resort Hotel JV entered into an interest rate swap that matures in April 2027 and fixed the variable rate on the notional amount of related debt, initially at $42.0 million, amortizing to $38.7 million at swap maturity, to a rate of 3.2%. See Note 6. Financial Instruments and Fair Value Measurements for additional information. |
| (b) | In August 2024, the North Bay Landing Loan maturity date was extended from September 2024 and the interest rate was adjusted from SOFR plus 2.6%, with a floor of 3.3%. Upon reaching a certain debt service coverage ratio, the North Bay Landing Loan will bear interest at a rate of SOFR plus 2.3%, with a floor of 3.0%. |
| (c) | The Breakfast Point Hotel Loan interest rate is fixed through November 2027 and in December 2027 the rate will adjust to the 1-year constant maturity Treasury rate plus 3.3% from December 2027 through November 2042, with a minimum rate of 6.0% throughout the term of the loan. |
| (d) | The Company is in the process of extending the maturity date of the current loan to February 2030. |
The Company’s indebtedness consists of various loans on real and leasehold property. These loans are typically secured by various interests in the property such as assignment of rents, leases, deposits, permits, plans, specifications, fees, agreements, approvals, contracts, licenses, construction contracts, development contracts, service contracts, franchise agreements, the borrower’s assets, improvements, and security interests in the rents, personal property, management agreements, construction agreements, improvements, accounts, profits, leases and fixtures. The specific Security Interests vary from loan to loan.
F 37
As of December 31, 2024, the weighted average effective interest rate of outstanding debt was 4.9%, of which 67.5% of the debt outstanding includes fixed or swapped interest rates, and the average remaining life of debt outstanding was 16.7 years.
In 2023, the Watersound Origins Crossings JV refinanced into a $52.9 million loan, insured by HUD, for a multi-family community located near the entrance to the Watersound Origins residential community. The loan provides for monthly payments of principal and interest through maturity in April 2058. The loan includes a prepayment premium due to the lender of 1% - 9% for any principal that is prepaid through April 2033. The loan is secured by the real property and certain other Security Interests.
In 2020, the Pier Park Resort Hotel JV entered into a loan with an initial amount of $52.5 million up to a maximum of $60.0 million through additional earn-out requests. The Pier Park Resort Hotel JV Loan was entered into to finance the construction of a hotel in the Pier Park area of Panama City Beach, Florida. The loan provides for monthly principal and interest payments with a final balloon payment at maturity in April 2027. The loan is secured by the real property and certain other Security Interests. In connection with the loan, as guarantors, the Company and the Company’s JV partner entered into a guarantee based on each partner’s ownership interest in favor of the lender, to guarantee the payment and performance of the borrower. As guarantor, the Company’s liability under the Pier Park Resort Hotel JV Loan will be released upon reaching and maintaining certain debt service coverage for twelve months. In addition, the guarantee can become full recourse in the case of the failure of the guarantor to abide by or perform any of the covenants or warranties to be performed on the part of such guarantor. The Pier Park Resort Hotel JV entered into an interest rate swap to hedge cash flows tied to changes in the underlying floating interest rate tied to SOFR. The interest rate swap matures in April 2027 and fixed the variable rate on the notional amount of related debt, initially at $42.0 million, amortizing to $38.7 million at swap maturity, to a rate of 3.2%. See Note 6. Financial Instruments and Fair Value Measurements for additional information.
In 2022, the Mexico Beach Crossings JV entered into a $43.5 million loan, insured by HUD, to finance the construction of a multi-family community in Mexico Beach, Florida. The Mexico Beach Crossings JV Loan provides for monthly principal and interest payments through maturity in March 2064. The loan includes a prepayment premium due to the lender of 1% - 10% for any principal that is prepaid through March 2034. The loan is secured by the real property and certain other Security Interests.
In 2015, the Pier Park North JV entered into a $48.2 million loan, secured by a first lien on, and Security Interest in, a majority of the Pier Park North JV’s property. The PPN JV Loan provides for principal and interest payments with a final balloon payment at maturity in November 2025. In connection with the loan, the Company entered into a limited guarantee in favor of the lender, based on its percentage ownership of the JV. In addition, the guarantee can become full recourse in the case of any fraud or intentional misrepresentation by the Pier Park North JV; any voluntary transfer or encumbrance of the property in violation of the due-on-sale clause in the security instrument; upon commencement of voluntary bankruptcy or insolvency proceedings and upon breach of covenants in the security instrument. The Company has begun the process to refinance the PPN JV Loan.
In 2018, the Pier Park Crossings JV entered into a $36.6 million loan, insured by HUD, to finance the construction of a multi-family community in Panama City Beach, Florida. The PPC JV Loan provides for monthly principal and interest payments through maturity in June 2060. The loan includes a prepayment premium due to the lender of 2% - 8% for any additional principal that is prepaid through August 2031. The loan is secured by the real property and certain other Security Interests.
In 2022, a wholly-owned subsidiary of the Company entered into a $37.0 million loan, which is guaranteed by the Company, to finance the acquisition of a hotel located on Scenic Highway 30A. The Pearl Hotel Loan provides for monthly principal and interest payments with a final balloon payment at maturity in December 2032. The loan includes a prepayment fee due to the lender of 1% - 3% of the outstanding principal balance if the loan is refinanced with another financial institution through December 2027. The loan is secured by the real property and certain other Security Interests.
F 38
In 2021, a wholly-owned subsidiary of the Company entered into a $28.0 million loan, which is guaranteed by the Company, to finance the construction of an inn and amenity center near the Watersound Camp Creek residential community. The Watersound Camp Creek Loan provides for monthly principal and interest payments through maturity in December 2047. The loan is secured by the real property and certain other Security Interests. As guarantor, the Company’s liability under the loan will be reduced to 50% of the outstanding principal amount upon the project reaching and maintaining a trailing six months of operations with a certain debt service coverage ratio and reduced to 25% of the outstanding principal amount upon reaching and maintaining a trailing twelve months of operations with a certain debt service coverage ratio. In addition, the guarantee can become full recourse in the case of the failure of the guarantor to abide by or perform any of the covenants, warranties or other certain obligations to be performed on the part of such guarantor.
In 2021, a wholly-owned subsidiary of the Company entered into a $26.8 million loan, which is guaranteed by the Company, to finance the construction of a multi-family community in Panama City, Florida. In August 2024, a wholly-owned subsidiary of the Company entered into a modification of the loan that amended the principal amount of the loan to $22.9 million, adjusted the interest rate to SOFR plus 2.5%, with a floor of 3.2%, extended the maturity date by eighteen months and provides for monthly principal and interest payments with a final balloon payment at maturity in March 2026. The loan is secured by the real property and certain other Security Interests. As guarantor, the Company’s liability under the loan is 50% of the principal amount and will be reduced to 25% of the outstanding principal amount upon reaching and maintaining a certain debt service coverage ratio. In addition, the guarantee can become full recourse in the case of any fraud or intentional misrepresentation or failure to abide by other certain obligations on the part of such guarantor. During 2024, the Company incurred less than $0.1 million of additional loan costs due to the loan modification. In January 2025, the Company signed a commitment letter to secure HUD insured refinancing of the North Bay Landing Loan.
In 2019, the Pier Park Crossings Phase II JV entered into a $22.9 million loan, insured by HUD, as amended, to finance the construction of a multi-family community in Panama City Beach, Florida. The PPC II JV Loan provides for monthly payments of principal and interest through maturity in May 2057. The loan includes a prepayment premium due to the lender of 1% - 8% for any additional principal that is prepaid through May 2032. The loan is secured by the real property and certain other Security Interests.
In 2021, a wholly-owned subsidiary of the Company entered into a $21.2 million loan, which is guaranteed by the Company, to finance the construction of a hotel in Panama City, Florida. The Hotel Indigo Loan provides for monthly principal and interest payments with a final balloon payment at maturity in October 2028. The loan includes an option for an extension of the maturity date by sixty months, subject to certain conditions, which would provide for continued principal and interest payments with a final balloon payment at the extended maturity date. The loan is secured by the leasehold property and certain other Security Interests.
In 2019, the Watercrest JV entered into a $22.5 million loan to finance the construction of a senior living facility in Santa Rosa Beach, Florida. The Watercrest JV Loan provides for monthly principal and interest payments through maturity in June 2047. The loan is secured by the real property and certain other Security Interests. In connection with the loan, the Company executed a guarantee in favor of the lender to guarantee the payment and performance of the borrower under the Watercrest JV Loan. The Company is the sole guarantor and receives a quarterly fee related to the guarantee from its JV partner based on the JV partner’s ownership percentage.
In 2020, a wholly-owned subsidiary of the Company entered into a $16.8 million loan, which is guaranteed by the Company, to finance the construction of a hotel in the Breakfast Point area of Panama City Beach, Florida. The Breakfast Point Hotel Loan provides for monthly principal and interest payments through maturity in November 2042. The loan includes a prepayment premium due to the lender of 1% of the outstanding principal balance for any additional principal that is prepaid through November 2027. The loan is secured by the real property and certain other Security Interests.
In 2021, The Lodge 30A JV entered into a $15.0 million loan to finance the construction of a boutique hotel in Seagrove Beach, Florida. The Lodge 30A JV Loan provides for monthly principal and interest payments with a final balloon payment at maturity in January 2028. The loan is secured by the real property and certain other Security Interests.
F 39
In connection with the loan, the Company, wholly-owned subsidiaries of the Company and the Company’s JV partner entered into a joint and several payment and performance guarantee in favor of the lender. Upon reaching a certain debt service coverage ratio for a minimum of twenty-four months, the Company’s liability as guarantor will be reduced to 75% of the outstanding principal amount for a twelve-month period. The debt service coverage ratio will be tested annually thereafter and the Company’s liability will be reduced to 50% in year four and 25% in year five. The Company receives a monthly fee related to the guarantee from its JV partner based on the JV partner’s ownership percentage.
In 2022, a wholly-owned subsidiary of the Company entered into a $13.7 million loan, which is guaranteed by the Company, to finance the construction of a hotel in Santa Rosa Beach, Florida. The Topsail Hotel Loan provides for interest only payments for the first thirty-six months and principal and interest payments thereafter with a final balloon payment at maturity in July 2027. The loan is secured by the real property and certain other Security Interests.
In 2020, a wholly-owned subsidiary of the Company entered into a $15.3 million loan, which is guaranteed by the Company, to finance construction of a hotel in Panama City, Florida. The Airport Hotel Loan provides for monthly principal and interest payments with a final balloon payment at maturity in March 2025. The loan is secured by the real property and certain other Security Interests. The Company is in the process of extending the maturity date of the current loan to February 2030.
In 2021, a wholly-owned subsidiary of the Company entered into a $12.0 million loan, which is guaranteed by the Company, to finance the construction of a building in the Watersound Town Center near the Watersound Origins residential community. The Watersound Town Center Grocery Loan provides for monthly principal and interest payments with a final balloon payment at maturity in August 2031. The loan is secured by the real property and certain other Security Interests. As guarantor, the Company’s liability under the loan is 50% of the outstanding principal amount and will be reduced to 25% of the outstanding principal amount upon reaching a certain debt service coverage ratio.
In 2019, a wholly-owned subsidiary of the Company entered into a $5.5 million loan, which is guaranteed by the Company, to finance the construction of an office building in Panama City Beach, Florida. The Beckrich Building III Loan provides for monthly principal and interest payments with a final balloon payment at maturity in August 2029. The loan is secured by the real property and certain other Security Interests.
In 2020, a wholly-owned subsidiary of the Company entered into a $5.8 million loan, which is guaranteed by the Company, to finance the construction of a self-storage facility in Santa Rosa Beach, Florida. The Self-Storage Facility Loan provides for monthly principal and interest payments with a final balloon payment at maturity in November 2025. The loan is secured by the real property and certain other Security Interests. The Company’s liability as guarantor under the loan shall not exceed $2.9 million, plus any additional fees, with the project maintaining a certain debt service coverage.
CDD bonds financed the construction of infrastructure improvements at some of the Company’s projects. The principal and interest payments on the bonds are paid by assessments on the properties benefited by the improvements financed by the bonds. CDD debt is secured by certain real estate or other collateral. The Company has recorded a liability for CDD debt that is associated with platted property, which is the point at which it becomes fixed and determinable. Additionally, the Company has recorded a liability for the portion of the CDD debt that is associated with unplatted property if it is probable and reasonably estimable that the Company will ultimately be responsible for repayment. The Company’s total CDD debt assigned to property it owns was $9.6 million and $10.7 million as of December 31, 2024 and 2023, respectively. The Company pays interest on this total outstanding CDD debt.
In 2018, a wholly-owned subsidiary of the Company entered into a $1.7 million loan, which is guaranteed by the Company, to finance the construction of two beach homes located in Panama City Beach, Florida (the “Beach Homes Loan”). The loan provides for monthly principal and interest payments with a final balloon payment at maturity in May 2029. The loan is secured by the real property and certain other Security Interests.
In 2017, a wholly-owned subsidiary of the Company entered into a $1.6 million loan to finance the construction of a commercial leasing property located in Panama City Beach, Florida (the “Pier Park Outparcel Loan”). The loan provides for monthly principal and interest payments with a final balloon payment at maturity in March 2027.
F 40
The loan is secured by the real property and certain other Security Interests.
In 2018, a wholly-owned subsidiary of the Company entered into a $1.9 million loan, which is guaranteed by the Company, to finance the construction of a commercial leasing property located in Santa Rosa Beach, Florida (the “WaterColor Crossings Loan”). The loan provides for monthly principal and interest payments with a final balloon payment at maturity in February 2029. The loan is secured by the real property and certain other Security Interests.
The Company’s financing agreements are subject to various customary debt covenants and as both of December 31, 2024 and 2023, the Company was in compliance with the financial debt covenants.
As of December 31, 2024, property, receivables and inventory that were pledged as collateral related to the Company’s debt agreements, had an approximate carrying amount of $553.6 million. These assets are included within investment in real estate, net and property and equipment, net and other assets on the consolidated balance sheets.
The aggregate maturities of debt subsequent to December 31, 2024 are:
2025 |
|
$ |
64,405 |
2026 |
|
|
31,436 |
2027 |
|
|
69,553 |
2028 |
|
|
36,156 |
2029 |
|
|
13,221 |
Thereafter |
|
|
227,945 |
|
|
$ |
442,716 |
11. Accounts Payable and Other Liabilities
Accounts payable and other liabilities consist of the following:
|
|
December 31, |
|
December 31, |
||
|
|
2024 |
|
2023 |
||
Accounts payable |
|
$ |
22,847 |
|
$ |
24,340 |
Income tax payable |
|
|
1,849 |
|
|
9,239 |
Finance lease liabilities |
|
|
406 |
|
|
298 |
Operating lease liabilities |
|
|
4,366 |
|
|
793 |
Accrued compensation |
|
|
7,635 |
|
|
6,037 |
Other accrued liabilities |
|
|
4,982 |
|
|
4,100 |
Club membership deposits |
|
|
3,155 |
|
|
3,314 |
Advance deposits |
|
|
5,879 |
|
|
7,602 |
Accrued interest expense for Senior Notes held by SPE |
|
|
2,850 |
|
|
2,850 |
Total accounts payable and other liabilities |
|
$ |
53,969 |
|
$ |
58,573 |
Accounts payable as of December 31, 2024 and 2023, primarily includes payables and retainage related to the Company’s development and construction projects.
Advance deposits consist of deposits received on hotel rooms and related hospitality activities. Advance deposits are recorded as accounts payable and other liabilities in the consolidated balance sheets without regard to whether they are refundable and are recognized as income at the time the service is provided for the related deposit.
12. Deferred Revenue
As of December 31, 2024 and 2023, deferred revenue includes club initiation fees of $45.9 million and $48.7 million, respectively, and other deferred revenue of $13.4 million and $14.1 million, respectively.
F 41
Club initiation fees are recognized as revenue over the estimated average duration of membership, which is evaluated periodically. The following table presents the changes in club initiation fees related to contracts with customers:
|
|
December 31, |
|
December 31, |
|
December 31, |
|||
|
|
2024 |
|
2023 |
|
2022 |
|||
Balance at beginning of year |
|
$ |
48,742 |
|
$ |
25,088 |
|
$ |
22,850 |
New club memberships |
|
|
11,551 |
|
|
33,200 |
|
|
9,170 |
Revenue from amounts included in contract liability opening balance |
|
|
(12,791) |
|
|
(6,989) |
|
|
(6,040) |
Revenue from current period new memberships |
|
|
(1,617) |
|
|
(2,557) |
|
|
(892) |
Balance at end of year |
|
$ |
45,885 |
|
$ |
48,742 |
|
$ |
25,088 |
Remaining performance obligations represent contracted revenue that has not been recognized related to club initiation fees. As of December 31, 2024, remaining performance obligations were $45.9 million, of which the Company expects to recognize as revenue $11.8 million in 2025, $20.9 million in 2026 through 2027, $12.6 million in 2028 through 2029 and $0.6 million thereafter.
Other deferred revenue as of both December 31, 2024 and 2023, includes $10.9 million related to a 2006 agreement pursuant to which the Company agreed to sell land to the Florida Department of Transportation. Revenue is recognized when title to a specific parcel is legally transferred.
13. Income Taxes
Income tax expense (benefit) consist of the following:
|
|
Year Ended December 31, |
|||||||
|
|
2024 |
|
2023 |
|
2022 |
|||
Current: |
|
|
|
|
|
|
|
|
|
Federal |
|
$ |
21,515 |
|
$ |
32,103 |
|
$ |
19,067 |
State |
|
|
5,239 |
|
|
4,584 |
|
|
832 |
Total |
|
|
26,754 |
|
|
36,687 |
|
|
19,899 |
Deferred: |
|
|
|
|
|
|
|
|
|
Federal |
|
|
(847) |
|
|
(11,413) |
|
|
661 |
State |
|
|
45 |
|
|
735 |
|
|
3,829 |
Total |
|
|
(802) |
|
|
(10,678) |
|
|
4,490 |
Income tax expense |
|
$ |
25,952 |
|
$ |
26,009 |
|
$ |
24,389 |
Total income tax expense (benefit) was allocated in the consolidated financial statements as follows:
|
|
Year Ended December 31, |
|||||||
|
|
2024 |
|
2023 |
|
2022 |
|||
Income tax expense |
|
$ |
25,952 |
|
$ |
26,009 |
|
$ |
24,389 |
Income tax recorded in accumulated other comprehensive income |
|
|
|
|
|
|
|
|
|
Income tax (benefit) expense |
|
|
(144) |
|
|
(199) |
|
|
957 |
Total income tax expense |
|
$ |
25,808 |
|
$ |
25,810 |
|
$ |
25,346 |
F 42
Income tax expense (benefit) attributable to income from operations differed from the amount computed by applying the statutory federal income tax rate of 21% as of December 31, 2024, 2023 and 2022 to pre-tax income as a result of the following:
|
|
Year Ended December 31, |
|
|||||||||||||||
|
|
2024 |
|
|
2023 |
|
|
2022 |
|
|||||||||
U.S. federal statutory tax rate |
|
$ |
20,653 |
|
21.0 |
% |
|
$ |
21,781 |
|
21.0 |
% |
|
$ |
20,016 |
|
21.0 |
% |
State and local income taxes, net of federal income tax effect (a) |
|
|
4,497 |
|
4.6 |
% |
|
|
4,223 |
|
4.1 |
% |
|
|
4,495 |
|
4.7 |
% |
Energy related tax credits |
|
|
— |
|
— |
% |
|
|
(450) |
|
(0.4) |
% |
|
|
(150) |
|
(0.2) |
% |
Changes in valuation allowance |
|
|
(312) |
|
(0.3) |
% |
|
|
22 |
|
— |
% |
|
|
(21) |
|
— |
% |
Nontaxable or nondeductible items |
|
|
580 |
|
0.6 |
% |
|
|
230 |
|
0.2 |
% |
|
|
49 |
|
0.1 |
% |
Other items |
|
|
534 |
|
0.5 |
% |
|
|
203 |
|
0.2 |
% |
|
|
— |
|
— |
% |
Total income tax expense |
|
$ |
25,952 |
|
26.4 |
% |
|
$ |
26,009 |
|
25.1 |
% |
|
$ |
24,389 |
|
25.6 |
% |
| (a) | State taxes in Florida make up the majority of the tax effect in this category. |
The tax effects of temporary differences that give rise to significant portions of deferred tax assets and deferred tax liabilities are presented below:
|
|
December 31, |
|
December 31, |
||
|
|
2024 |
|
2023 |
||
Deferred tax assets: |
|
|
|
|
|
|
Net operating loss carryforwards |
|
$ |
2,094 |
|
$ |
2,862 |
Impairment losses |
|
|
22,388 |
|
|
23,867 |
Deferred revenue |
|
|
13,003 |
|
|
12,594 |
Capitalized costs |
|
|
4,014 |
|
|
3,272 |
Reserves and accruals |
|
|
1,431 |
|
|
1,432 |
Other |
|
|
2,033 |
|
|
921 |
Total gross deferred tax assets |
|
|
44,963 |
|
|
44,948 |
Valuation allowance |
|
|
— |
|
|
(312) |
Total net deferred tax assets |
|
|
44,963 |
|
|
44,636 |
Deferred tax liabilities: |
|
|
|
|
|
|
Investment in real estate and property and equipment basis differences |
|
|
31,104 |
|
|
31,165 |
Deferred gain on land sales and involuntary conversions |
|
|
35,875 |
|
|
36,988 |
Installment sales |
|
|
45,597 |
|
|
45,597 |
Other |
|
|
3,270 |
|
|
2,715 |
Total gross deferred tax liabilities |
|
|
115,846 |
|
|
116,465 |
Net deferred tax liabilities (a) |
|
$ |
(70,883) |
|
$ |
(71,829) |
| (a) | As of December 31, 2024, net deferred tax liabilities consist of $72.4 million included within deferred tax liabilities, net on the consolidated balance sheets and $1.5 million deferred tax asset, net related to the Company’s QOF entity included within other assets on the consolidated balance sheets. |
As of December 31, 2024 and 2023, the Company had $9.1 million and $11.0 million, respectively, of federal NOLs. The federal NOLs are specific to the Company’s QOF entity and do not expire. As of December 31, 2024 and 2023, the Company had state NOLs of $4.0 million and $12.9 million, respectively. The majority of these state NOLs are available to offset future taxable income through 2044 and will begin expiring in 2040. As of December 31, 2023, the Company’s valuation allowance was $0.3 million against approximately $7.2 million of certain state NOLs. During 2024, the Company utilized these NOLs and released this valuation allowance. As of December 31, 2024 and 2023, the Company had income tax payable of $1.8 million and $9.2 million, respectively, included within accounts payable and other liabilities on the consolidated balance sheets.
F 43
Income tax payments, net of refunds, by jurisdiction are presented below:
|
|
Year Ended December 31, |
|||||||
|
|
2024 |
|
2023 |
|
2022 |
|||
U.S. Federal |
|
$ |
29,244 |
|
$ |
26,400 |
|
$ |
16,361 |
State of Florida |
|
|
4,900 |
|
|
4,600 |
|
|
— |
State of Georgia |
|
|
— |
|
|
(82) |
|
|
750 |
Total income tax payments, net |
|
$ |
34,144 |
|
$ |
30,918 |
|
$ |
17,111 |
In general, a valuation allowance is recorded if, based on all available positive and negative evidence, it is more likely than not that some portion or all of the deferred tax assets will not be realized. Realization of the Company’s deferred tax assets is dependent upon the Company generating sufficient taxable income in future years in the appropriate tax jurisdictions to obtain a benefit from the reversal of deductible temporary differences and from loss carryforwards.
Significant judgment is required in evaluating the Company’s uncertain tax positions and determining its provision for income taxes. The Company regularly assesses the likelihood of adverse outcomes resulting from potential examinations to determine the adequacy of its provision for income taxes and applies a “more-likely-than-not” in determining the financial statement recognition and measurement of a tax position taken or expected to be taken in the tax returns. The Company has not identified any material unrecognized tax benefits as of December 31, 2024 or 2023. There were no penalties required to be accrued as of December 31, 2024 and 2023. The Company records interest related to unrecognized tax benefits, if any, in interest expense and penalties in other income, net.
The Company is currently open to examination by taxing authorities for the tax years 2021 through 2023.
14. Accumulated Other Comprehensive Income
Following is a summary of the changes in the balances of accumulated other comprehensive (loss) income, which is presented net of tax:
|
|
Unrealized |
|
Unrealized |
|
|
|||
|
|
(Loss) Gain on |
|
Gain (Loss) on |
|
|
|
||
|
|
Available-for- |
|
Cash Flow |
|
|
|
||
|
|
Sale Securities |
|
Hedges |
|
Total |
|||
Accumulated other comprehensive (loss) income as of December 31, 2022 |
|
$ |
(182) |
|
$ |
2,612 |
|
$ |
2,430 |
Other comprehensive income before reclassifications |
|
|
182 |
|
|
266 |
|
|
448 |
Amounts reclassified from accumulated other comprehensive (loss) income |
|
|
— |
|
|
(1,442) |
|
|
(1,442) |
Other comprehensive income (loss) |
|
|
182 |
|
|
(1,176) |
|
|
(994) |
Less: Other comprehensive loss attributable to non-controlling interest |
|
|
— |
|
|
407 |
|
|
407 |
Accumulated other comprehensive income as of December 31, 2023 |
|
$ |
— |
|
$ |
1,843 |
|
$ |
1,843 |
Other comprehensive income before reclassifications |
|
|
— |
|
|
889 |
|
|
889 |
Amounts reclassified from accumulated other comprehensive income |
|
|
— |
|
|
(1,521) |
|
|
(1,521) |
Other comprehensive loss |
|
|
— |
|
|
(632) |
|
|
(632) |
Less: Other comprehensive loss attributable to non-controlling interest |
|
|
— |
|
|
208 |
|
|
208 |
Accumulated other comprehensive income as of December 31, 2024 |
|
$ |
— |
|
$ |
1,419 |
|
$ |
1,419 |
F 44
Following is a summary of the tax effects allocated to other comprehensive (loss) income:
|
|
Year Ended December 31, 2024 |
|||||||
|
|
Before- |
|
Tax (Expense) |
|
Net-of- |
|||
|
|
Tax Amount |
|
Benefit |
|
Tax Amount |
|||
Interest rate swaps |
|
$ |
995 |
|
$ |
(177) |
|
$ |
818 |
Interest rate swap - unconsolidated joint venture |
|
|
95 |
|
|
(24) |
|
|
71 |
Reclassification adjustment for net (gain) loss included in earnings |
|
|
(1,866) |
|
|
345 |
|
|
(1,521) |
Net unrealized (loss) gain |
|
|
(776) |
|
|
144 |
|
|
(632) |
Other comprehensive (loss) income |
|
$ |
(776) |
|
$ |
144 |
|
$ |
(632) |
|
|
Year Ended December 31, 2023 |
|||||||
|
|
Before- |
|
Tax (Expense) |
|
Net-of- |
|||
|
|
Tax Amount |
|
Benefit |
|
Tax Amount |
|||
Unrealized gain (loss) on available-for-sale investments |
|
$ |
244 |
|
$ |
(62) |
|
$ |
182 |
Interest rate swaps |
|
|
250 |
|
|
(44) |
|
|
206 |
Interest rate swap - unconsolidated joint venture |
|
|
80 |
|
|
(20) |
|
|
60 |
Reclassification adjustment for net (gain) loss included in earnings |
|
|
(1,767) |
|
|
325 |
|
|
(1,442) |
Net unrealized (loss) gain |
|
|
(1,193) |
|
|
199 |
|
|
(994) |
Other comprehensive (loss) income |
|
$ |
(1,193) |
|
$ |
199 |
|
$ |
(994) |
15. Stockholders’ Equity
Dividends
During 2024, 2023 and 2022, the Company paid dividends of $0.52, $0.44 and $0.40, respectively, per share on the Company’s common stock for a total of $30.4 million, $25.7 million and $23.5 million, respectively.
Stock Repurchase Program
The Company’s Board approved the Stock Repurchase Program pursuant to which the Company is authorized to repurchase shares of its common stock. The program has no expiration date.
During the year ended December 31, 2024, the Company repurchased 70,985 shares of its common stock outstanding at an average purchase price of $47.38, per share, for an aggregate purchase price of $3.4 million, excluding the excise tax on stock repurchases in excess of issuances as a result of the IRA. During the year ended December 31, 2023, the Company did not repurchase shares of its common stock outstanding. As of December 31, 2024, the Company had a total authority of $76.7 million available for purchase of shares of its common stock. In February 2025, the Board increased the total authorization under the Stock Repurchase Program to $100.0 million. The Company may repurchase its common stock in open market purchases from time to time, in privately negotiated transactions or otherwise, pursuant to Rule 10b-18 under the Exchange Act. The timing and amount of any additional stock to be repurchased will depend upon a variety of factors. Repurchases may be commenced or suspended at any time or from time to time without prior notice. The Stock Repurchase Program will continue until otherwise modified or terminated by the Company’s Board at any time in its sole discretion. In December 2024, the Company retired 70,985 shares of treasury stock at a value of $3.4 million.
Issuance of Common Stock for Employee Compensation
In February 2024, the Company granted 26,744 restricted stock awards to certain employees pursuant to the Company’s 2015 Performance and Equity Incentive Plan (the “2015 Plan”). The restricted stock vest in equal annual installments on the first, second and third annual anniversary of the grant date, subject to the recipient’s continued employment through and on the applicable vesting date. During 2024, 2,592 of the unvested restricted shares were forfeited due to the recipient’s resignation. In addition, in February 2024, the Company granted 5,418 restricted stock awards to an employee pursuant to the 2015 Plan.
F 45
The restricted stock vest in January 2030, subject to the recipient’s continued employment through and on the applicable vesting date. The weighted average grant date fair value of the restricted stock was $54.16 per share.
In March 2023, the Company granted 12,796 restricted stock awards to certain employees pursuant to the 2015 Plan. The restricted stock vest in equal annual installments on the first, second and third annual anniversary of the grant date, subject to the recipient’s continued employment through and on the applicable vesting date. During 2024, 3,187 of the restricted shares vested on the first annual anniversary. During 2024, 3,237 of the unvested restricted shares were forfeited due to the recipient’s resignation. The weighted average grant date fair value of the restricted stock was $39.42 per share.
In February 2023, the Company granted 17,943 restricted stock awards to certain employees pursuant to the 2015 Plan. The restricted stock vest in equal annual installments on the first, second and third annual anniversary of the grant date, subject to the recipient’s continued employment through and on the applicable vesting date. During 2024, 5,982 of the restricted shares vested on the first annual anniversary. In addition, in February 2023, the Company granted 5,760 restricted stock awards to an employee pursuant to the 2015 Plan. The restricted stock vest in January 2030, subject to the recipient’s continued employment through and on the applicable vesting date. The weighted average grant date fair value of the restricted stock was $44.30 per share.
In April 2022, the Company granted 4,361 restricted stock awards to an employee pursuant to the 2015 Plan. The restricted stock vest in January 2030, subject to the recipient’s continued employment through and on the applicable vesting date. The weighted average grant date fair value of the restricted stock was $55.73 per share.
In February 2022, the Company granted 25,594 restricted stock awards to certain employees pursuant to the 2015 Plan. The restricted stock vest in equal annual installments on the first, second and third annual anniversary of the grant date, subject to the recipient’s continued employment through and on the applicable vesting date. During 2024 and 2023, 8,532 and 8,531, respectively, of the restricted shares vested on the annual anniversaries. During 2024, 867 of the unvested restricted shares were forfeited due to the recipient’s resignation. The weighted average grant date fair value of the restricted stock was $46.73 per share.
Following is a summary of non-vested restricted stock activity:
|
|
Year Ended December 31, 2024 |
|
Year Ended December 31, 2023 |
||||||
|
|
|
|
|
Weighted Average |
|
|
|
|
Weighted Average |
|
|
|
|
|
Grant Date |
|
|
|
|
Grant Date |
|
|
Number of |
|
|
Fair Value |
|
Number of |
|
|
Fair Value |
Non-Vested Restricted Stock |
|
Shares |
|
|
Per Share |
|
Shares |
|
|
Per Share |
Balance at beginning of period |
|
57,923 |
|
$ |
44.80 |
|
29,955 |
|
$ |
48.04 |
Granted |
|
32,162 |
|
$ |
54.16 |
|
36,499 |
|
$ |
42.59 |
Vested |
|
(17,701) |
|
$ |
44.59 |
|
(8,531) |
|
$ |
46.73 |
Forfeited |
|
(6,696) |
|
$ |
46.07 |
|
— |
|
$ |
— |
Balance at end of period |
|
65,688 |
|
$ |
49.31 |
|
57,923 |
|
$ |
44.80 |
During 2024, 2023 and 2022, the Company recorded expense of $1.2 million, $0.8 million and $0.4 million, respectively, related to restricted stock awards for employee compensation.
16. Stock Based Compensation
The Company’s 2015 Plan offers a stock incentive plan whereby awards can be granted to certain employees and non-employee directors of the Company in various forms including restricted shares of Company common stock and options to purchase Company common stock. Awards are discretionary and determined by the Compensation and Human Capital Committee of the Board. Stock based compensation cost is measured at the grant date based on the fair value of the award and is typically recognized as expense on a straight-line basis over the requisite service period, which is the vesting period. Forfeitures are accounted for as they occur. As of December 31, 2024, 1,371,623 shares were available for awards under the 2015 Plan.
F 46
Total stock-based compensation recorded in corporate and other operating expenses on the consolidated statements of income is as follows:
|
|
Year Ended December 31, |
|||||||
|
|
2024 |
|
2023 |
|
2022 |
|||
Stock compensation expense before tax benefit |
|
$ |
1,209 |
|
$ |
820 |
|
$ |
364 |
Income tax benefit (a) |
|
|
(215) |
|
|
(206) |
|
|
(93) |
|
|
$ |
994 |
|
$ |
614 |
|
$ |
271 |
| (a) | A portion of the income tax benefit includes permanent tax differences. |
As of December 31, 2024 and 2023, there were 65,688 and 57,923, respectively, unvested restricted stock units outstanding. As of December 31, 2024 and 2023, unrecognized compensation cost, related to non-vested restricted stock were $2.0 million and $1.8 million, respectively. As of December 31, 2024, unrecognized compensation costs will be recognized over a weighted average period of 2.7 years.
In 2024, the Company granted 32,162 shares of restricted stock awards to some of the Company’s employees pursuant to the 2015 Plan, of which none vested during 2024. The weighted average grant date fair value of restricted stock units during 2024 was $54.16 per share. During 2024, 2,592 of the unvested restricted shares were forfeited with a fair value of $0.1 million.
In 2023, the Company granted 36,499 shares of restricted stock awards to some of the Company’s employees pursuant to the 2015 Plan, of which 9,169 vested during 2024. The weighted average grant date fair value of restricted stock units during 2023 was $42.59 per share. The total fair value of restricted stock units that vested during 2024 was $0.4 million. During 2024, 3,237 of the unvested restricted shares were forfeited with a fair value of $0.1 million.
In 2022, the Company granted 29,955 shares of restricted stock awards to some of the Company’s employees pursuant to the 2015 Plan, of which 8,532 and 8,531 vested during 2024 and 2023, respectively. The weighted average grant date fair value of restricted stock units during 2022 was $48.04 per share. The total fair value of restricted stock units that vested during 2024 and 2023 was $0.4 million during each period. During 2024, 867 of the unvested restricted shares were forfeited with a fair value of less than $0.1 million.
17. Employee Benefit Plan
The Company maintains a 401(k) retirement plan covering substantially all officers and employees of the Company, which permits participants to defer up to the maximum allowable amount determined by the IRS of their eligible compensation.
The plan provides for employer matching contributions of 100% up to the first 3% of eligible compensation. For contributions in excess of 3%, the plan provides for employer matching contributions of 50% up to the next 2%, but not more than 5%, of eligible compensation. The Company’s matching contributions expensed under the plan were $0.9 million, $0.8 million and $0.7 million in 2024, 2023 and 2022, respectively.
F 47
18. Other Income, Net
Other income (expense) consists of the following:
|
|
|
|
|
|
|
|
|
|
|
|
Year Ended December 31, |
|||||||
|
|
2024 |
|
2023 |
|
2022 |
|||
Investment income, net |
|
|
|
|
|
|
|
|
|
Interest, dividend and accretion income |
|
$ |
3,299 |
|
$ |
2,856 |
|
$ |
793 |
Unrealized loss on investments, net |
|
|
— |
|
|
— |
|
|
(26) |
Interest income from investments in SPEs |
|
|
8,012 |
|
|
8,012 |
|
|
8,012 |
Interest earned on notes receivable and other interest |
|
|
2,193 |
|
|
2,414 |
|
|
1,083 |
Total investment income, net |
|
|
13,504 |
|
|
13,282 |
|
|
9,862 |
Interest expense |
|
|
|
|
|
|
|
|
|
Interest incurred for project financing and other interest expense |
|
|
(24,713) |
|
|
(21,762) |
|
|
(9,542) |
Interest expense and amortization of discount and issuance costs for Senior Notes issued by SPE |
|
|
(8,871) |
|
|
(8,856) |
|
|
(8,841) |
Total interest expense |
|
|
(33,584) |
|
|
(30,618) |
|
|
(18,383) |
Gain on contributions to unconsolidated joint ventures |
|
|
10 |
|
|
718 |
|
|
2,738 |
Equity in income from unconsolidated joint ventures |
|
|
23,578 |
|
|
22,701 |
|
|
25,986 |
Other income (expense), net |
|
|
|
|
|
|
|
|
|
Accretion income from retained interest investments |
|
|
— |
|
|
2,594 |
|
|
1,671 |
Gain on insurance recoveries |
|
|
— |
|
|
— |
|
|
9,835 |
Loss from hurricane damage |
|
|
— |
|
|
— |
|
|
(51) |
Miscellaneous (expense) income, net |
|
|
(746) |
|
|
651 |
|
|
1,492 |
Other (expense) income, net |
|
|
(746) |
|
|
3,245 |
|
|
12,947 |
Total other income, net |
|
$ |
2,762 |
|
$ |
9,328 |
|
$ |
33,150 |
Investment Income, Net
Interest, dividend and accretion income includes interest income accrued or received on the Company’s cash, cash equivalents and investments and amortization of the premium or accretion of discount related to the Company’s available-for-sale securities, which is amortized based on an effective interest rate method over the term of the available-for-sale securities. Unrealized loss on investments, net includes unrealized gains or losses on investments – equity securities.
Interest income from investments in SPEs primarily includes interest earned on the investments held by Panama City Timber Finance Company, LLC, which is used to pay the interest expense for Senior Notes held by Northwest Florida Timber Finance, LLC. See Note 6. Financial Instruments and Fair Value Measurements for additional information.
Interest earned on the Company’s notes receivable and other interest includes interest earned on notes receivable and on the Company’s unimproved land contribution to the unconsolidated Latitude Margaritaville Watersound JV as home sales are transacted in the community. See Note 4. Joint Ventures for additional information.
Interest Expense
Interest expense includes interest incurred related to the Company’s project financing, Senior Notes issued by Northwest Florida Timber Finance, LLC, CDD debt and finance leases. Interest expense also includes amortization of debt discount and premium and debt issuance costs. Discount and issuance costs for the Senior Notes issued by Northwest Florida Timber Finance, LLC, are amortized based on the effective interest method at an effective rate of 4.9%. See Note 6. Financial Instruments and Fair Value Measurements for additional information.
F 48
During 2024, the Company did not capitalize interest related to projects under development or construction. During 2023 and 2022 the Company capitalized $2.7 million and $3.0 million, respectively, in interest related to projects under development or construction. These amounts are included within investment in real estate, net on the Company’s consolidated balance sheets.
Gain on Contributions to Unconsolidated Joint Ventures
Gain on contributions to unconsolidated joint ventures during 2024, 2023 and 2022, include a gain of less than $0.1 million, $0.7 million and $0.9 million, respectively, on additional infrastructure improvements contributed to the Company’s unconsolidated Latitude Margaritaville Watersound JV. Gain on contributions to unconsolidated joint ventures during 2022, also include a gain of $1.4 million on land and impact fees contributed to the Company’s unconsolidated Pier Park RI JV and a gain of $0.4 million on land contributed to the Company’s unconsolidated Electric Cart Watersound JV. See Note 4. Joint Ventures for additional information.
Equity in Income from Unconsolidated Joint Ventures
Equity in income from unconsolidated joint ventures includes the Company’s proportionate share of earnings or losses of unconsolidated JVs accounted for by the equity method. Equity in income from unconsolidated joint ventures includes income related to the Latitude Margaritaville Watersound JV of $29.3 million, $23.6 million and $3.9 million during 2024, 2023 and 2022, respectively. Equity in income from unconsolidated joint ventures also includes loss related to the Watersound Fountains Independent Living JV of $4.4 million, $0.7 million and $0.3 million during 2024, 2023 and 2022, respectively. The community opened in March 2024 and is currently under lease-up. Activity in the current period includes pre-opening, lease-up, depreciation and interest expenses for the project. In 2022, the Sea Sound JV sold its assets to an unrelated third party for $92.5 million, resulting in a total gain on sale of $36.1 million. Equity in income from unconsolidated joint ventures includes $21.7 million during 2022 related to the Company’s proportionate share of the gain on sale. See Note 4. Joint Ventures for additional information.
Other (Expense) Income, Net
Other (expense) income, net primarily includes income from the Company’s retained interest investments, gain on insurance recoveries, loss from hurricane damage and other income and expense items. The Company had a beneficial interest in a bankruptcy-remote qualified special purpose entity used in the installment sale monetization of certain sales of forestry real estate in 2008. Prior to optional prepayment, in full, of the installment notes in August 2023, the Company recorded the accretion of investment income from its retained interest investment over the life of the retained interest using the effective yield method. During 2022, the Company had a gain on insurance recovery of $9.7 million and incurred loss from hurricane damage of less than $0.1 million, related to Hurricane Michael. In 2022, the Company closed out the insurance claim related to Hurricane Michael.
Miscellaneous (expense) income, net during the year ended December 31, 2024, includes $0.6 million net loss on disposal of assets. Miscellaneous (expense) income, net during the year ended December 31, 2023, includes $1.1 million the Company received from the Florida Division of Emergency Management’s TRBG program for recovery of lost income related to timber crop that was destroyed as a result of Hurricane Michael in 2018. Miscellaneous (expense) income, net during 2023 and 2022, includes income of $0.4 million and $1.0 million, respectively, related to a gain on retained interest investment. Miscellaneous (expense) income, net during 2023, also includes $0.6 million of expense for cleanup of damaged timber as a result of Hurricane Michael. Miscellaneous (expense) income, net also includes $2.6 million in 2022 received from the Pier Park CDD for repayment of subordinated notes, which have been fully repaid. Miscellaneous (expense) income, net during 2022, also includes expenses of $1.1 million for design costs no longer pursued and $0.6 million for a homeowner’s association special assessment.
19. Segment Information
The Company conducts primarily all of its business in the following three reportable segments: 1) residential, 2) hospitality and 3) commercial. The Company’s reportable segments are strategic business units that offer different
F 49
products and services. They are each managed separately and decisions about allocations of resources are determined by management based on these strategic business units.
The Company’s residential segment typically plans and develops residential communities of various sizes across a wide range of price points and sells homesites to homebuilders or retail consumers. The Company’s hospitality segment features a private membership club, hotel operations, food and beverage operations, golf courses, beach clubs, retail outlets, gulf-front vacation rentals, management services, marinas and other entertainment assets. The Company’s commercial segment includes leasing of commercial property, multi-family, senior living, self-storage and other assets. The commercial segment oversees the planning, development, entitlement, management and sale of the Company’s commercial and forestry land holdings for a variety of uses, including a broad range of retail, office, hotel, senior living, multi-family, self-storage and industrial properties. The commercial segment also manages the Company’s timber holdings, which includes growing and selling pulpwood, sawtimber and other products. All real estate assets and operations are in Northwest Florida.
The accounting policies of the segments are the same as those described herein. Total revenue represents sales to unaffiliated customers, as reported in the Company’s consolidated statements of income. All significant intercompany transactions have been eliminated in consolidation. The Company uses total segment revenue, gross profit and income before income taxes and non-controlling interest and other qualitative measures for purposes of making decisions about allocating resources to each segment and assessing each segment’s performance, which the Company believes represents current performance measures.
The Company’s President, Chief Executive Officer and Chairman of the Board is the CODM. For the residential, hospitality and commercial segments, the CODM uses segment revenue, gross profit and income before income taxes and non-controlling interest to allocate resources (including employees, property, and financial or capital resources) for each segment predominantly in the annual budget and forecasting process. The CODM considers budget-to-actual variances on a monthly basis for the profit measures when making decisions about allocating capital and personnel to the segments. The CODM also uses segment revenue and gross profit for evaluating product pricing and segment income before income taxes and non-controlling interest to assess the performance for each segment by comparing the results and return on assets of each segment with one another and in the compensation of certain employees.
The Company does not allocate income taxes or unusual items to segments. In addition, not all segments have significant noncash items other than depreciation and amortization in reported profit or loss.
The captions entitled “Other” consists of mitigation credit, title and insurance business revenue and cost of revenue; corporate operating expenses; corporate depreciation and amortization and corporate other income and expense items.
Information by business segment is as follows:
|
|
|
|
|
|
|
|
|
|
|
|
Year Ended December 31, |
|||||||
|
|
2024 |
|
2023 |
|
2022 |
|||
Operating revenue: |
|
|
|
|
|
|
|
|
|
Residential |
|
$ |
117,007 |
|
$ |
155,820 |
|
$ |
92,886 |
Hospitality |
|
|
202,701 |
|
|
154,574 |
|
|
97,236 |
Commercial |
|
|
78,575 |
|
|
74,437 |
|
|
59,379 |
Other |
|
|
4,454 |
|
|
4,454 |
|
|
2,820 |
Consolidated operating revenue |
|
$ |
402,737 |
|
$ |
389,285 |
|
$ |
252,321 |
|
|
|
|
|
|
|
|
|
|
Cost of revenue: |
|
|
|
|
|
|
|
|
|
Cost of residential revenue |
|
$ |
62,028 |
|
$ |
77,946 |
|
$ |
44,115 |
Cost of hospitality revenue |
|
|
138,834 |
|
|
124,813 |
|
|
77,862 |
Cost of commercial revenue |
|
|
31,595 |
|
|
30,300 |
|
|
21,786 |
Cost of other revenue |
|
|
3,059 |
|
|
2,920 |
|
|
2,135 |
Consolidated cost of revenue |
|
$ |
235,516 |
|
$ |
235,979 |
|
$ |
145,898 |
F 50
|
|
|
|
|
|
|
|
|
|
|
|
Year Ended December 31, |
|||||||
|
|
2024 |
|
2023 |
|
2022 |
|||
Gross profit: |
|
|
|
|
|
|
|
|
|
Residential |
|
$ |
54,979 |
|
$ |
77,874 |
|
$ |
48,771 |
Hospitality |
|
|
63,867 |
|
|
29,761 |
|
|
19,374 |
Commercial |
|
|
46,980 |
|
|
44,137 |
|
|
37,593 |
Other |
|
|
1,395 |
|
|
1,534 |
|
|
685 |
Consolidated gross profit |
|
$ |
167,221 |
|
$ |
153,306 |
|
$ |
106,423 |
|
|
|
|
|
|
|
|
|
|
Corporate and other operating expenses: |
|
|
|
|
|
|
|
|
|
Residential |
|
$ |
4,712 |
|
$ |
4,501 |
|
$ |
3,901 |
Hospitality |
|
|
1,535 |
|
|
1,820 |
|
|
1,179 |
Commercial |
|
|
3,807 |
|
|
4,321 |
|
|
4,239 |
Other |
|
|
15,196 |
|
|
13,155 |
|
|
12,749 |
Consolidated corporate and other operating expenses |
|
$ |
25,250 |
|
$ |
23,797 |
|
$ |
22,068 |
|
|
|
|
|
|
|
|
|
|
Depreciation, depletion and amortization: |
|
|
|
|
|
|
|
|
|
Residential |
|
$ |
244 |
|
$ |
211 |
|
$ |
156 |
Hospitality |
|
|
27,021 |
|
|
22,101 |
|
|
9,366 |
Commercial |
|
|
18,736 |
|
|
16,056 |
|
|
12,968 |
Other |
|
|
384 |
|
|
408 |
|
|
398 |
Consolidated depreciation, depletion and amortization |
|
$ |
46,385 |
|
$ |
38,776 |
|
$ |
22,888 |
|
|
|
|
|
|
|
|
|
|
Investment income, net: |
|
|
|
|
|
|
|
|
|
Residential |
|
$ |
1,616 |
|
$ |
1,691 |
|
$ |
1,046 |
Hospitality |
|
|
144 |
|
|
265 |
|
|
— |
Commercial |
|
|
54 |
|
|
49 |
|
|
33 |
Other (a) |
|
|
11,690 |
|
|
11,277 |
|
|
8,783 |
Consolidated investment income, net |
|
$ |
13,504 |
|
$ |
13,282 |
|
$ |
9,862 |
|
|
|
|
|
|
|
|
|
|
Interest expense: |
|
|
|
|
|
|
|
|
|
Residential |
|
$ |
392 |
|
$ |
421 |
|
$ |
484 |
Hospitality |
|
|
11,776 |
|
|
9,657 |
|
|
1,709 |
Commercial |
|
|
12,538 |
|
|
11,680 |
|
|
7,343 |
Other (b) |
|
|
8,878 |
|
|
8,860 |
|
|
8,847 |
Consolidated interest expense |
|
$ |
33,584 |
|
$ |
30,618 |
|
$ |
18,383 |
|
|
|
|
|
|
|
|
|
|
Gain on contributions to unconsolidated joint ventures: |
|
|
|
|
|
|
|
|
|
Residential |
|
$ |
10 |
|
$ |
718 |
|
$ |
939 |
Commercial (c) |
|
|
— |
|
|
— |
|
|
1,799 |
Consolidated gain on contributions to unconsolidated joint ventures |
|
$ |
10 |
|
$ |
718 |
|
$ |
2,738 |
|
|
|
|
|
|
|
|
|
|
Equity in income (loss) from unconsolidated joint ventures: |
|
|
|
|
|
|
|
|
|
Residential (d) |
|
$ |
29,271 |
|
$ |
23,627 |
|
$ |
3,859 |
Commercial (e) (f) |
|
|
(5,693) |
|
|
(926) |
|
|
22,127 |
Consolidated equity in income from unconsolidated joint ventures |
|
$ |
23,578 |
|
$ |
22,701 |
|
$ |
25,986 |
F 51
|
|
|
|
|
|
|
|
|
|
|
|
Year Ended December 31, |
|||||||
|
|
2024 |
|
2023 |
|
2022 |
|||
Other income (expense), net: |
|
|
|
|
|
|
|
|
|
Residential |
|
$ |
167 |
|
$ |
202 |
|
$ |
(508) |
Hospitality |
|
|
(286) |
|
|
(82) |
|
|
1,807 |
Commercial (g) |
|
|
(664) |
|
|
30 |
|
|
(687) |
Other (h) |
|
|
37 |
|
|
3,095 |
|
|
12,335 |
Other (expense) income, net |
|
$ |
(746) |
|
$ |
3,245 |
|
$ |
12,947 |
|
|
|
|
|
|
|
|
|
|
Income (loss) before income taxes: |
|
|
|
|
|
|
|
|
|
Residential (d) |
|
$ |
80,696 |
|
$ |
98,978 |
|
$ |
49,566 |
Hospitality |
|
|
23,393 |
|
|
(3,635) |
|
|
8,929 |
Commercial (c) (e) (f) (g) |
|
|
5,596 |
|
|
11,233 |
|
|
36,316 |
Other (a) (b) (h) |
|
|
(11,337) |
|
|
(6,515) |
|
|
(194) |
Consolidated income before income taxes |
|
$ |
98,348 |
|
$ |
100,061 |
|
$ |
94,617 |
|
|
|
|
|
|
|
|
|
|
|
|
|
|
|
|
|
|
|
|
|
|
Year Ended December 31, |
|||||||
|
|
2024 |
|
2023 |
|
2022 |
|||
Capital expenditures: |
|
|
|
|
|
|
|
|
|
Residential |
|
$ |
68,098 |
|
$ |
74,362 |
|
$ |
92,203 |
Hospitality (i) |
|
|
27,964 |
|
|
72,275 |
|
|
171,056 |
Commercial |
|
|
30,561 |
|
|
70,077 |
|
|
92,992 |
Other |
|
|
2,746 |
|
|
1,047 |
|
|
441 |
Total capital expenditures |
|
$ |
129,369 |
|
$ |
217,761 |
|
$ |
356,692 |
|
|
December 31, |
|
December 31, |
||
|
|
2024 |
|
2023 |
||
Investment in unconsolidated joint ventures: |
|
|
|
|
|
|
Residential |
|
$ |
53,399 |
|
$ |
49,036 |
Commercial |
|
|
13,055 |
|
|
17,320 |
Total investment in unconsolidated joint ventures |
|
$ |
66,454 |
|
$ |
66,356 |
|
|
|
|
|
|
|
Total assets: |
|
|
|
|
|
|
Residential |
|
$ |
241,435 |
|
$ |
233,957 |
Hospitality |
|
|
460,604 |
|
|
465,828 |
Commercial |
|
|
515,955 |
|
|
511,978 |
Other |
|
|
320,580 |
|
|
311,767 |
Total assets |
|
$ |
1,538,574 |
|
$ |
1,523,530 |
| (a) | Includes interest income from investments in SPEs of $8.0 million in each of 2024, 2023 and 2022. |
| (b) | Includes interest expense from Senior Notes issued by SPE of $8.9 million in 2024 and 2023 and $8.8 million in 2022. |
| (c) | Includes gains in 2022 of $1.4 million on land and impact fees contributed to the unconsolidated Pier Park RI JV and $0.4 million on land contributed to the unconsolidated Electric Cart Watersound JV. See Note 4. Joint Ventures and Note 18. Other Income, Net for additional information. |
| (d) | Includes $29.3 million, $23.6 million and $3.9 million of equity in income from unconsolidated joint ventures during 2024, 2023 and 2022, respectively, related to the Latitude Margaritaville Watersound JV. See Note 4. Joint Ventures and Note 18. Other Income, Net for additional information. |
| (e) | Includes $4.4 million, $0.7 million and $0.3 million of equity in loss from unconsolidated joint ventures related to the Watersound Fountains Independent Living JV during 2024, 2023 and 2022, respectively. The community opened in March 2024 and is currently under lease-up. See Note 4. Joint Ventures and Note 18. Other Income, Net for additional information. |
| (f) | Includes a gain of $21.7 million in 2022 related to the sale of the Sea Sound JV assets. See Note 4. Joint Ventures and Note 18. Other Income, Net for additional information. |
| (g) | Includes income of $1.1 million in 2023 received from the Florida Division of Emergency Management’s TRBG program. See Note 18. Other Income, Net for additional information. |
F 52
| (h) | Includes gain on insurance recovery of $9.7 million in 2022 related to Hurricane Michael. See Note 18. Other Income, Net for additional information. |
| (i) | Includes $52.0 million related to the acquisition of The Pearl Hotel in 2022. |
20. Commitments and Contingencies
The Company establishes an accrued liability when it is both probable that a material loss has been incurred and the amount of the loss can be reasonably estimated. The Company will evaluate the range of reasonably estimated losses and record an accrued liability based on what it believes to be the minimum amount in the range, unless it believes an amount within the range is a better estimate than any other amount. In such cases, there may be an exposure to loss in excess of the amounts accrued. The Company evaluates quarterly whether further developments could affect the amount of the accrued liability previously established or would make a loss contingency both probable and reasonably estimable.
The Company also provides disclosure when it believes it is reasonably possible that a material loss will be incurred or when it believes it is reasonably possible that the amount of a loss will exceed the recorded liability. The Company reviews loss contingencies at least quarterly to determine whether the likelihood of loss has changed and to assess whether a reasonable estimate of the loss or range of loss can be made. This estimated range of possible losses is based upon currently available information and is subject to significant judgment and a variety of assumptions, as well as known and unknown uncertainties. The matters underlying the estimated range will change from time to time, and actual results may vary significantly from the current estimate.
The Company is subject to a variety of litigation, claims, other disputes and governmental proceedings that arise from time to time in the ordinary course of its business, including litigation related to its prior development activities. The Company cannot make assurances that it will be successful in defending these matters. Based on current knowledge, the Company does not believe that loss contingencies arising from pending litigation, claims, other disputes and governmental proceedings, including those described herein, will have a material adverse effect on the consolidated financial position or liquidity of the Company. However, in light of the inherent uncertainties involved in these matters, an adverse outcome in one or more of these matters could be material to the Company’s results of operations or cash flows for any particular reporting period.
The Company is subject to costs arising out of environmental laws and regulations, which include obligations to remove or limit the effects on the environment of the disposal or release of certain wastes or substances at various sites, including sites which have been previously sold. It is the Company’s policy to accrue and charge against earnings environmental cleanup costs when it is probable that a liability has been incurred and a range of loss can be reasonably estimated. As assessments and cleanups proceed, these accruals are reviewed and adjusted, if necessary, as additional information becomes available. The Company is in the process of assessing certain properties in regard to the effects, if any, on the environment from the disposal or release of wastes or substances. Management is unable to quantify future rehabilitation costs above present accruals at this time or provide a reasonably estimated range of loss.
Other litigation, claims and disputes, including environmental matters, are pending against the Company. Accrued aggregate liabilities related to the matters described above and other litigation matters were $0.3 million and $0.4 million as of December 31, 2024 and 2023, respectively. Significant judgment is required in both the determination of probability and whether the amount of an exposure is reasonably estimable. Due to uncertainties related to these matters, accruals are based only on the information available at that time. As additional information becomes available, management reassesses potential liabilities related to pending claims and litigation and may revise its previous estimates, which could materially affect the Company’s results of operations for any particular reporting period.
The Company has retained certain self-insurance risks with respect to losses for third-party liability and property damage, including its timber assets.
In 2020, the Company, as lender, entered into a $10.0 million secured revolving promissory note with the unconsolidated Latitude Margaritaville Watersound JV, as borrower. As of both December 31, 2024 and 2023, there was no balance outstanding on the Latitude JV Note. The Latitude JV Note was provided by the Company to finance the development of the pod-level, non-spine infrastructure. Future advances, if any, will be repaid by the JV as each home is sold by the JV, with the aggregate unpaid principal and all accrued and unpaid interest due at maturity in June 2025.
F 53
The note is secured by a mortgage and security interest in and on the real property and improvements located on the real property of the JV. See Note 4. Joint Ventures for additional information.
As of December 31, 2024 and 2023, the Company was required to provide surety bonds that guarantee completion and maintenance of certain infrastructure in certain development projects and mitigation banks, as well as other financial guarantees of $53.1 million and $40.0 million, respectively, as well as standby letters of credit in the amount of $0.7 million and $0.2 million, respectively, which may potentially result in liability to the Company if certain obligations of the Company are not met.
As of December 31, 2024, the Company had a total of $37.7 million in construction and development related contractual obligations.
In 2019, the Company’s unconsolidated Pier Park TPS JV, entered into a $14.4 million loan (the “Pier Park TPS JV Loan”). The loan bears interest at SOFR plus 2.6% and provides for monthly principal and interest payments with a final balloon payment at maturity in January 2026. The loan is secured by the real and personal property and certain other Security Interests. In connection with the loan, the Company, a wholly-owned subsidiary of the Company and the Company’s JV partner entered into a joint and several payment and performance guarantee in favor of the lender. The guarantee contains customary provisions providing for full recourse upon the occurrence of certain events. The Pier Park TPS JV entered into an interest rate swap to hedge cash flows tied to changes in the underlying floating interest rate tied to SOFR. The interest rate swap matures in January 2026 and fixed the variable rate on the related debt, initially at $14.4 million, to a rate of 5.2%. As of December 31, 2024 and 2023, $13.2 million and $13.5 million, respectively, was outstanding on the Pier Park TPS JV Loan. See Note 4. Joint Ventures and Note 6. Financial Instruments and Fair Value Measurements for additional information.
In 2020, the Company’s unconsolidated Latitude Margaritaville Watersound JV, entered into a $45.0 million loan, as amended (the “Latitude Margaritaville Watersound JV Loan”). The loan bears interest at SOFR plus 2.5%, with a floor of 3.0%. The loan provides for monthly interest payments with a final balloon payment at maturity in December 2025, with an option to extend the maturity date by one year, subject to bank approval. The loan is secured by the real and personal property and certain other Security Interests. In connection with the loan, the Company and the Company’s JV partner entered into an unconditional guaranty of completion of certain homes and related improvements in favor of the lender. As of December 31, 2024 and 2023, $41.2 million and $37.4 million, respectively, was outstanding on the Latitude Margaritaville Watersound JV Loan. See Note 4. Joint Ventures for additional information.
In 2021, the Company’s unconsolidated Watersound Fountains Independent Living JV, entered into a $41.9 million loan (the “Watersound Fountains JV Loan”). The loan bears interest at SOFR plus 2.1%, with a floor of 2.6%. The loan provides for interest only payments for the first forty-eight months and principal and interest payments thereafter with a final balloon payment at maturity in April 2026. The loan includes an option for an extension of the maturity date by twelve months, subject to certain conditions, which would provide for continued monthly principal and interest payments with a final balloon payment at the extended maturity date. The loan is secured by the real property and certain other Security Interests. In connection with the loan, the Company executed a guarantee in favor of the lender to guarantee the payment and performance of the borrower under the Watersound Fountains JV Loan. During the first quarter of 2024, the Company’s liability as guarantor under the loan was reduced to 50% of the outstanding principal amount upon issuance of the certificate of occupancy and other required permits and will be further reduced to 25% and a further 0% of the outstanding principal balance upon reaching and maintaining certain debt service coverage. The guarantee contains customary provisions providing for full recourse upon the occurrence of certain events. The Company, as the guarantor, receives a quarterly fee related to the guarantee from its JV partners based on the JV partners’ ownership percentage. As of December 31, 2024 and 2023, $41.7 million and $38.1 million, respectively, was outstanding on the Watersound Fountains JV Loan. See Note 4. Joint Ventures for additional information.
In 2022, the Company’s unconsolidated Electric Cart Watersound JV, entered into a $5.4 million loan (the “Electric Cart Watersound JV Loan”). The loan bears interest at SOFR plus 1.8%, with a floor of 2.1%. The loan provides for monthly principal and interest payments with a final balloon payment at maturity in September 2032. The loan is secured by the real property and certain other Security Interests. In connection with the loan, the Company, a wholly-owned subsidiary of the Company and the Electric Cart Watersound JV entered into a joint and several payment and performance guarantee in favor of the lender.
F 54
After the initial forty-eight months of the loan, the Company’s liability as guarantor under the loan will be reduced to 50% of the outstanding principal balance upon reaching a certain debt service coverage and other conditions. The Company is the sole guarantor and receives a quarterly fee related to the guarantee from its JV partner based on the JV partner’s ownership percentage. As of both December 31, 2024 and 2023, $4.4 million was outstanding on the Electric Cart Watersound JV Loan. See Note 4. Joint Ventures for additional information.
The Company has assessed the need to record a liability for the guarantees related to the Company’s unconsolidated JVs and did not record an obligation as of both December 31, 2024 and 2023. As of both December 31, 2024 and 2023, allowance for credit losses related to the contingent aspect of these guarantees, based on historical experience and economic trends, was $0.1 million and is included within accounts payable and other liabilities on the consolidated balance sheets.
As part of a certain sale of forestry land in 2014, the Company generated significant tax gains. The installment note’s structure allowed the Company to defer the resulting federal and state tax liability of $45.6 million until 2029, the maturity date for the installment note. The Company has a deferred tax liability related to the gain in connection with the sale. At the maturity date of the installment note in 2029, the $200.0 million time deposit included in investments held by special purpose entities will be used to pay the $180.0 million of principal for the Senior Notes held by special purpose entity and the remaining $20.0 million will become available to the Company, which can be used to pay a portion of the tax liability. See Note 6. Financial Instruments and Fair Value Measurements and Note 13. Income Taxes for additional information.
21. Related Party Transactions
The Company provides mitigation bank credits, impact and other fees, property for lease and services to certain unconsolidated JVs. During the years ended December 31, 2024, 2023 and 2022, the Company recognized $2.7 million, $1.2 million and $1.6 million, respectively, related to revenues from these transactions. As of December 31, 2024, receivables with unconsolidated JVs were less than $0.1 million. There were no receivables with unconsolidated JVs as of December 31, 2023.
The Watersound Management JV provides leasing management services for the Company’s multi-family communities. The Company incurred expense related to these transactions of $2.4 million, $2.0 million and $1.2 million during the years ended December 31, 2024, 2023 and 2022, respectively.
The Company incurred land development and planning costs reimbursements to the Latitude Margaritaville Watersound JV of $3.8 million, $3.7 million and $1.9 million during the years ended December 31, 2024, 2023 and 2022, respectively, which were primarily included in investment in real estate, net on the consolidated balance sheets. As of December 31, 2024 and 2023, $0.5 million and $0.3 million, respectively, were payable to the Latitude Margaritaville Watersound JV. See Note 4. Joint Ventures for additional information.
22. Subsequent Events
On February 26, 2025, the Company’s Board of Directors declared a cash dividend of $0.14 per share on the Company’s common stock, payable on March 27, 2025, to shareholders of record as of the close of business on March 10, 2025.
F 55
THE ST. JOE COMPANY
SCHEDULE III (CONSOLIDATED) - REAL ESTATE AND ACCUMULATED DEPRECIATION
DECEMBER 31, 2024
(Dollars in thousands, unless otherwise stated)
|
|
|
|
|
|
|
|
|
|
|
|
|
|
|
|
|
|
|
|
|
|
|
|
|
|
|
|
|
|
|
|
Initial Cost to Company (b) |
|
|
|
|
Gross Amount as of December 31, 2024 |
|
|
|
|
|
|||||||||||
|
|
|
|
|
|
|
|
|
|
|
Costs Capitalized |
|
|
|
|
|
|
|
|
|
|
|
|
|
|
|
|
|
|
|
|
|
|
|
|
|
|
Subsequent to |
|
|
|
|
|
|
|
|
|
|
Accumulated |
|
Date of |
||
|
|
|
|
|
Land & |
|
Buildings & |
|
Acquisition or |
|
Land & Land |
|
Buildings and |
|
|
|
|
Depreciation and |
|
Construction or |
||||||
Description (a) |
|
Encumbrances |
|
Improvements |
|
Improvements |
|
Construction (c) |
|
Improvements |
|
Improvements |
|
Total* |
|
Amortization (d) |
|
Acquisition |
||||||||
Residential developments |
|
|
|
|
|
|
|
|
|
|
|
|
|
|
|
|
|
|
|
|
|
|
|
|
|
|
Bay County, FL |
|
$ |
15 |
|
$ |
2,626 |
|
$ |
— |
|
$ |
80,623 |
|
$ |
83,249 |
|
$ |
— |
|
$ |
83,249 |
|
$ |
— |
|
through 2024 |
Gulf County, FL |
|
|
— |
|
|
4,000 |
|
|
— |
|
|
25,681 |
|
|
29,681 |
|
|
— |
|
|
29,681 |
|
|
— |
|
through 2024 |
Walton County, FL |
|
|
— |
|
|
— |
|
|
— |
|
|
32,234 |
|
|
32,234 |
|
|
— |
|
|
32,234 |
|
|
— |
|
through 2024 |
Franklin and Leon Counties, FL |
|
|
1,365 |
|
|
8,873 |
|
|
— |
|
|
(4,803) |
|
|
4,070 |
|
|
— |
|
|
4,070 |
|
|
— |
|
through 2022 |
Residential operating property |
|
|
— |
|
|
6,247 |
|
|
9,549 |
|
|
(5,277) |
|
|
6,527 |
|
|
3,992 |
|
|
10,519 |
|
|
2,172 |
|
2004 - 2007, 2011 - 2012, 2018, 2023 |
Hospitality |
|
|
|
|
|
|
|
|
|
|
|
|
|
|
|
|
|
|
|
|
|
|
|
|
|
|
WaterColor Hospitality |
|
|
— |
|
|
1,137 |
|
|
17,984 |
|
|
12,586 |
|
|
2,639 |
|
|
29,068 |
|
|
31,707 |
|
|
12,461 |
|
2002, 2013, 2022, 2024 |
The Pearl Hotel |
|
|
34,040 |
|
|
10,518 |
|
|
38,742 |
|
|
— |
|
|
10,518 |
|
|
38,742 |
|
|
49,260 |
|
|
2,182 |
|
2022 |
Embassy Suites by Hilton Panama City Beach Resort (e) |
|
|
50,882 |
|
|
5,500 |
|
|
57,962 |
|
|
— |
|
|
5,500 |
|
|
57,962 |
|
|
63,462 |
|
|
3,144 |
|
2023 |
The Lodge 30A (e) |
|
|
14,130 |
|
|
3,303 |
|
|
12,339 |
|
|
— |
|
|
3,303 |
|
|
12,339 |
|
|
15,642 |
|
|
760 |
|
2023 |
Hotel Indigo/Harrison's Kitchen & Bar (f) |
|
|
19,857 |
|
|
2,426 |
|
|
30,758 |
|
|
92 |
|
|
2,518 |
|
|
30,758 |
|
|
33,276 |
|
|
1,592 |
|
2022-2023 |
Hilton Garden Inn Panama City Airport |
|
|
11,717 |
|
|
1,693 |
|
|
17,101 |
|
|
— |
|
|
1,693 |
|
|
17,101 |
|
|
18,794 |
|
|
1,878 |
|
2021 |
Homewood Suites by Hilton Panama City Beach |
|
|
15,473 |
|
|
1,953 |
|
|
20,193 |
|
|
22 |
|
|
1,975 |
|
|
20,193 |
|
|
22,168 |
|
|
1,780 |
|
2022 |
Home2 Suites by Hilton Santa Rosa Beach |
|
|
12,307 |
|
|
2,304 |
|
|
14,959 |
|
|
— |
|
|
2,304 |
|
|
14,959 |
|
|
17,263 |
|
|
772 |
|
2023 |
Watersound Club - Camp Creek Inn, amenity and golf course |
|
|
27,377 |
|
|
34,475 |
|
|
46,892 |
|
|
319 |
|
|
34,794 |
|
|
46,892 |
|
|
81,686 |
|
|
11,512 |
|
2001, 2023 |
Watersound Club other |
|
|
— |
|
|
41,274 |
|
|
20,325 |
|
|
3,306 |
|
|
45,445 |
|
|
19,460 |
|
|
64,905 |
|
|
18,053 |
|
2006, 2007, 2018, 2019, 2024 |
Marinas |
|
|
— |
|
|
24,828 |
|
|
11,098 |
|
|
202 |
|
|
25,979 |
|
|
10,149 |
|
|
36,128 |
|
|
3,746 |
|
2022 |
Other |
|
|
3,156 |
|
|
11,597 |
|
|
13,208 |
|
|
(2,463) |
|
|
9,817 |
|
|
12,525 |
|
|
22,342 |
|
|
4,384 |
|
2008, 2010, 2016, 2019 - 2020 |
Commercial |
|
|
|
|
|
|
|
|
|
|
|
|
|
|
|
|
|
|
|
|
|
|
|
|
|
|
Leasing properties: |
|
|
|
|
|
|
|
|
|
|
|
|
|
|
|
|
|
|
|
|
|
|
|
|
|
|
Pier Park North (e) |
|
|
40,370 |
|
|
13,175 |
|
|
35,243 |
|
|
4,072 |
|
|
13,320 |
|
|
39,170 |
|
|
52,490 |
|
|
18,045 |
|
2014 - 2017 |
VentureCrossings |
|
|
— |
|
|
7,199 |
|
|
29,824 |
|
|
(1,791) |
|
|
5,717 |
|
|
29,515 |
|
|
35,232 |
|
|
10,117 |
|
2012, 2017, 2019 |
FSU/TMH Medical Campus |
|
|
— |
|
|
8,428 |
|
|
21,317 |
|
|
4 |
|
|
8,432 |
|
|
21,317 |
|
|
29,749 |
|
|
565 |
|
2024 |
Watersound Origins Crossings (e) |
|
|
51,953 |
|
|
6,853 |
|
|
33,912 |
|
|
12 |
|
|
6,859 |
|
|
33,918 |
|
|
40,777 |
|
|
4,366 |
|
2020 - 2021 |
Pier Park Crossings (e) |
|
|
34,153 |
|
|
8,456 |
|
|
28,663 |
|
|
— |
|
|
8,456 |
|
|
28,663 |
|
|
37,119 |
|
|
5,930 |
|
2019 - 2020 |
Pier Park Crossings Phase II (e) |
|
|
21,796 |
|
|
3,567 |
|
|
15,587 |
|
|
— |
|
|
3,567 |
|
|
15,587 |
|
|
19,154 |
|
|
2,285 |
|
2020 |
Mexico Beach Crossings (e) |
|
|
43,069 |
|
|
10,951 |
|
|
33,864 |
|
|
— |
|
|
10,951 |
|
|
33,864 |
|
|
44,815 |
|
|
1,834 |
|
2023 |
North Bay Landing |
|
|
22,746 |
|
|
3,502 |
|
|
34,383 |
|
|
38 |
|
|
3,540 |
|
|
34,383 |
|
|
37,923 |
|
|
2,240 |
|
2022-2023 |
Origins Crossings Townhomes |
|
|
— |
|
|
2,944 |
|
|
18,352 |
|
|
— |
|
|
2,944 |
|
|
18,352 |
|
|
21,296 |
|
|
1,628 |
|
2022-2023 |
Watercrest (e) |
|
|
19,555 |
|
|
3,083 |
|
|
18,475 |
|
|
11 |
|
|
3,094 |
|
|
18,475 |
|
|
21,569 |
|
|
2,389 |
|
2020 |
F 56
|
|
|
|
|
Initial Cost to Company (b) |
|
|
|
|
Gross Amount as of December 31, 2024 |
|
|
|
|
|
|||||||||||
|
|
|
|
|
|
|
|
|
|
|
Costs Capitalized |
|
|
|
|
|
|
|
|
|
|
|
|
|
|
|
|
|
|
|
|
|
|
|
|
|
|
Subsequent to |
|
|
|
|
|
|
|
|
|
|
Accumulated |
|
Date of |
||
|
|
|
|
|
Land & |
|
Buildings & |
|
Acquisition or |
|
Land & Land |
|
Buildings and |
|
|
|
|
Depreciation and |
|
Construction or |
||||||
Description (a) |
|
Encumbrances |
|
Improvements |
|
Improvements |
|
Construction (c) |
|
Improvements |
|
Improvements |
|
Total* |
|
Amortization (d) |
|
Acquisition |
||||||||
Self-Storage |
|
|
3,360 |
|
|
1,003 |
|
|
6,188 |
|
|
— |
|
|
1,311 |
|
|
5,880 |
|
|
7,191 |
|
|
628 |
|
2021 |
Beckrich Office Park |
|
|
5,014 |
|
|
2,200 |
|
|
13,298 |
|
|
340 |
|
|
2,223 |
|
|
13,615 |
|
|
15,838 |
|
|
2,401 |
|
2017, 2020 |
Watersound Town Center |
|
|
8,086 |
|
|
13,906 |
|
|
51,590 |
|
|
17 |
|
|
13,916 |
|
|
51,597 |
|
|
65,513 |
|
|
3,913 |
|
2020 - 2024 |
Watersound West Bay, WindMark Beach, WaterColor and WaterSound Gatehouse Town centers |
|
|
— |
|
|
7,853 |
|
|
13,901 |
|
|
2,761 |
|
|
8,050 |
|
|
16,465 |
|
|
24,515 |
|
|
12,769 |
|
2001 - 2007, 2016, 2024 |
Other leasing |
|
|
2,295 |
|
|
5,457 |
|
|
16,795 |
|
|
450 |
|
|
5,878 |
|
|
16,824 |
|
|
22,702 |
|
|
6,425 |
|
through 2023 |
Commercial developments |
|
|
— |
|
|
31,028 |
|
|
— |
|
|
29,476 |
|
|
60,504 |
|
|
— |
|
|
60,504 |
|
|
35 |
|
through 2024 |
Forestry and other unimproved land |
|
|
— |
|
|
6,542 |
|
|
1,774 |
|
|
17,393 |
|
|
23,935 |
|
|
1,774 |
|
|
25,709 |
|
|
2,282 |
|
N/A |
Mitigation banks and other |
|
|
— |
|
|
— |
|
|
— |
|
|
4,234 |
|
|
4,234 |
|
|
— |
|
|
4,234 |
|
|
— |
|
through 2024 |
Total |
|
$ |
442,716 |
|
$ |
298,901 |
|
$ |
684,276 |
|
$ |
199,539 |
|
$ |
489,177 |
|
$ |
693,539 |
|
$ |
1,182,716 |
|
$ |
142,288 |
|
|
| * | Excludes unconsolidated JVs. |
| (a) | All real estate properties are located in Northwest Florida. |
| (b) | Includes initial costs to the Company to place the assets in service. |
| (c) | Includes cumulative impairments. |
| (d) | Depreciation is computed based on the following estimated useful lives. See Note 2. Significant Accounting Policies for additional information. |
| (i) | Land improvements 15 – 20 years |
| (ii) | Buildings 20 – 40 years |
| (iii) | Building improvements 5 – 25 years |
| (iv) | Leasehold improvements 2 – 25 years (shorter of the minimum lease term or the estimated useful life) |
| (e) | Property is related to a consolidated JV. See Note 4. Joint Ventures for additional information. |
| (f) | Properties are located on leased land. |
Notes:
| (A) | The aggregate cost of real estate owned as of December 31, 2024 for federal income tax purposes is approximately $976.6 million. |
| (B) | Reconciliation of real estate owned (in thousands of dollars): |
|
|
December 31, 2024 |
|
December 31, 2023 |
|
December 31, 2022 |
|||
Balance at beginning of the year |
|
$ |
1,137,092 |
|
$ |
1,092,229 |
|
$ |
777,279 |
Amounts capitalized |
|
|
118,762 |
|
|
165,474 |
|
|
379,183 |
Impairments |
|
|
— |
|
|
— |
|
|
— |
Cost of real estate sold |
|
|
(65,151) |
|
|
(82,610) |
|
|
(48,646) |
Amounts retired or adjusted (a) |
|
|
(7,987) |
|
|
(38,001) |
|
|
(15,587) |
Balance at the end of the year |
|
$ |
1,182,716 |
|
$ |
1,137,092 |
|
$ |
1,092,229 |
| (a) | Includes transfers of operating property to property and equipment, net. |
| (C) | Reconciliation of accumulated depreciation (in thousands of dollars): |
|
|
December 31, 2024 |
|
December 31, 2023 |
|
December 31, 2022 |
|||
Balance at beginning of the year |
|
$ |
118,474 |
|
$ |
95,968 |
|
$ |
87,168 |
Depreciation expense |
|
|
27,092 |
|
|
22,734 |
|
|
13,886 |
Amounts retired or adjusted |
|
|
(3,278) |
|
|
(228) |
|
|
(5,086) |
Balance at the end of the year |
|
$ |
142,288 |
|
$ |
118,474 |
|
$ |
95,968 |
F 57
THE ST. JOE COMPANY
SCHEDULE IV (CONSOLIDATED) - MORTGAGE LOANS ON REAL ESTATE
DECEMBER 31, 2024
(Dollars in thousands)
|
|
|
|
|
|
|
|
|
|
|
|
|
|
|
|
|
Principal Amount |
|
|
|
|
|
|
|
|
|
|
|
|
|
|
|
|
|
|
|
of Loans Subject |
|
|
|
|
|
|
|
|
Periodic |
|
|
|
|
Face |
|
Carrying |
|
to Delinquent |
|
|||
|
|
Interest |
|
|
|
Payment |
|
Prior |
|
Amount of |
|
Amount of |
|
Principal |
|
||||
Description of Note Receivable (a) |
|
Rate |
|
Final Maturity Date |
|
Terms |
|
Liens |
|
Mortgages |
|
Mortgages |
|
or Interest |
|
||||
Secured revolving promissory note with unconsolidated Latitude Margaritaville Watersound JV, homesite development |
|
5.0% |
|
June 2025 |
|
P&I(b) |
|
$ |
— |
|
$ |
— |
|
$ |
— |
|
$ |
— |
|
Total (c) |
|
|
|
|
|
|
|
$ |
— |
|
$ |
— |
|
$ |
— |
|
$ |
— |
|
| (a) | All seller financed properties are located in Northwest Florida. |
| (b) | Principal and interest due at closing of each residential home to a third party. On the maturity date, all outstanding principal, all accrued interest and any other customary charges shall be due and payable in full. See Note 4. Joint Ventures and Note 20. Commitments and Contingencies for additional information related to the revolving promissory note. |
| (c) | The aggregate cost for federal income tax purposes approximates the amount of unpaid principal. |
The summarized changes in the carrying amount of mortgage loans are as follows:
|
|
December 31, |
|
December 31, |
|
December 31, |
|||
|
|
2024 |
|
2023 |
|
2022 |
|||
Balance at beginning of the year |
|
$ |
— |
|
$ |
1,315 |
|
$ |
11,942 |
Additions during the year - new mortgage loans |
|
|
— |
|
|
— |
|
|
— |
Deductions during the year: |
|
|
|
|
|
|
|
|
|
Collections of principal |
|
|
— |
|
|
1,315 |
|
|
10,699 |
Foreclosures |
|
|
— |
|
|
— |
|
|
— |
Other |
|
|
— |
|
|
— |
|
|
(72) |
Balance at the end of the year |
|
$ |
— |
|
$ |
— |
|
$ |
1,315 |
F 58
Exhibit 19.1

THE ST. JOE COMPANY
INSIDER TRADING POLICY
Purpose
Preventing insider trading is necessary to comply with securities laws and to preserve the reputation and integrity of The St. Joe Company and its subsidiaries (collectively, the “Company”) as well as that of all persons affiliated with the Company. “Insider trading” occurs when any person purchases or sells a security while in possession of material inside information relating to the security. The Company’s Board of Directors (the “Board”) has adopted this Insider Trading Policy (this “Policy”) to promote compliance with federal, state and foreign securities laws that prohibit certain persons who are aware of material nonpublic information about a company from: (i) trading in securities of that company or (ii) providing material nonpublic information to other persons who may trade on the basis of that information. Insider trading is a crime and the penalties are severe. In addition, persons violating this Policy may be subject to immediate dismissal from the Company.
This Policy applies to all employees of the Company, including all officers, all members of the Board and any other persons that the Board determines should be subject to this Policy, such as contractors or consultants who have access to material nonpublic information (“Insider”). In addition, this Policy also applies to your family members who reside with you (including a spouse, a child, a child away at college, stepchildren, grandchildren, parents, stepparents, grandparents, siblings and in-laws), anyone else who lives in your household, and any family members who do not live in your household but who rely principally on you for financial support (collectively referred to as “Family Members”). Finally, this Policy applies to any entities that you influence or control, including any corporations, partnerships or trusts (collectively referred to as “Controlled Entities”), and transactions by these Controlled Entities should be treated for the purposes of this Policy and applicable securities laws as if they were for your own account. Collectively, this Policy refers to Insiders, their respective Family Members and their respective Controlled Entities, as “Covered Persons.”
This Policy is designed to promote compliance with insider trading laws, rules and regulations, as well as listing standards applicable to the Company. In addition, it is the Company’s policy not to engage in transactions involving the Company’s securities in violation of applicable laws.
1
Statement of Policies Prohibiting Insider Trading
Prohibited Activities
It is the policy of the Company that no director, officer or other employee of the Company (or any other Covered Person subject to this Policy) who is aware of material nonpublic information relating to the Company may directly or indirectly through family members or other persons or entities:
| 1. | Engage in transactions in Company securities, except as otherwise specified in this Policy under the headings “Transactions Under Company Plans,” “Transactions Not Involving a Purchase or Sale” and “Rule 10b5-1 Plans;” |
| 2. | Recommend the purchase, sale or bona fide gift of any Company securities; |
| 3. | Disclose material nonpublic information to persons within the Company whose jobs do not require them to have that information, or to persons outside of the Company, including, but not limited to, family, friends, business associates, investors and expert consulting firms, other than with the prior written consent of the Company; or |
| 4. | Assist anyone engaged in the above activities. |
In addition, it is the policy of the Company that no director, officer or other employee of the Company (or any other Covered Person designated as subject to this Policy) who, in the course of working for the Company, learns of material nonpublic information about a company with which the Company does or proposes to do business, including a buyer or seller of property or a venture partner customer or supplier of the Company, may trade in that company’s securities until the information becomes public or is no longer material.
There are no exceptions to this Policy, except as specifically noted herein. Transactions that may be necessary or justifiable for independent reasons (such as the need to raise money for an emergency expenditure), or small transactions, are not excepted from this Policy. The securities laws do not recognize any mitigating circumstances, and, in any event, even the appearance of an improper transaction must be avoided to preserve the Company’s reputation for adhering to the highest standards of conduct.
Unauthorized Disclosure of Material, Nonpublic Information Prohibited
No employee, officer or director may disclose material, nonpublic information about the Company or any company with which the Company deals to anyone outside the Company, unless authorized to do so. This prohibition on the unauthorized disclosure of material nonpublic information shall:
• |
apply to all employees, officers and directors of the Company and its subsidiaries, and also to Family Members; |
2
• |
apply equally to any statements that are made on the Internet and through social media outlets; |
• |
apply to discussions made with other Company employees; therefore, employees should seriously consider the consequences of disclosing nonpublic information to co-workers; |
• |
apply to all Company employees, officers or directors authorized to communicate information regarding the Company with securities market professionals, shareholders or members of the media; and |
• |
apply to all Company employees, officers or directors authorized to disclose material and non-public information with parties outside of the Company. |
Employees, officers and directors involved in transactions or other negotiations that require disclosure of material, nonpublic information with parties outside the Company should generally have those to whom such information is being disclosed sign a non-disclosure agreement in a form approved by the Compliance Officer. The non-disclosure agreement will require that the recipient of information not disclose the information to others and require the recipient not to trade in Company securities while in possession of such information. You should confer with the Compliance Officer whenever a non-disclosure agreement may be needed.
Explanation of Insider Trading
As noted above, “insider trading” refers to the purchase, sale or making of a bona fide gift of a security while in possession of “material” “nonpublic” information relating to the security. “Securities” include not only stocks, bonds, notes and debentures, but also options, warrants and similar instruments. “Purchase” and “sale” are defined broadly under the federal securities law. “Purchase” includes not only the actual purchase of a security, but any contract or instruction to purchase or otherwise acquire a security. “Sale” includes not only the actual sale of a security, but any contract or instruction to sell or otherwise dispose of a security. These definitions extend to a broad range of transactions including conventional cash-for-stock transactions, conversions, a sale of a security upon a cashless exercise of an option and acquisitions and exercises of warrants or puts, calls or other options related to a security. However, there are certain limited exemptions in the securities laws to this broad prohibition, for which Elizabeth J. (“Lisa”) Walters, our Compliance Officer, can provide additional details. It is generally understood that insider trading includes the following:
• |
Trading by insiders while in possession of material non-public information; |
• |
Trading by persons other than insiders while in possession of material non-public information where the information either was given in breach of an insider’s fiduciary duty to keep it confidential or was misappropriated; or |
• |
Communicating or tipping material non-public information to others, including recommending the purchase, sale or bona fide gift of a security while in possession of such information. |
3
Information. Information is considered “material” if a reasonable investor would consider that information important in making a decision to buy, hold or sell securities. Any information that could be expected to affect the Company’s stock price, whether it is positive or negative, should be considered material. There is no bright-line standard for assessing materiality; rather, materiality is based on an assessment of all of the facts and circumstances, and is often evaluated by enforcement authorities with the benefit of hindsight. While it is not possible to define all categories of material information, some examples of information that may, under the particular circumstances, be regarded as material are set forth on Attachment A of this Policy.
When Information is Considered Public. Information that has not been disclosed to the public is generally considered to be nonpublic information. In order to establish that the information has been disclosed to the public, it may be necessary to demonstrate that the information has been widely disseminated to the public for a sufficient period of time. Information generally would be considered widely disseminated if it has been disclosed by the Company through a press release, through a webcast or telephone conference call that was accessible to the member of the public through the Dow Jones “broad tape,” newswire services, publication in a widely-available newspaper, magazine or news website, or public disclosure documents filed with the SEC that are available on the SEC’s website. By contrast, information would likely not be considered widely disseminated if it is available only to the Company’s employees or directors, or if it is only available to a select group of analysts, brokers and institutional investors under a confidentiality agreement.
Once information is widely disseminated, it is still necessary to afford the investing public sufficient time to absorb the information. As a general rule, information should not be considered fully absorbed by the marketplace until one full business day after the day on which the information is released. If, for example, the Company were to make an announcement before open of the Market on a Monday, you should not trade in Company securities until Tuesday. However, if the Company were to make an announcement after close of the Market on a Monday, you should not trade in Company securities until Wednesday. Depending on the particular circumstances, the Company may determine that a longer or shorter period should apply to the release of specific material nonpublic information.
Excluded Transactions
Except as specifically noted below under the headings “Transactions Under Company Plans,” and “Transactions Not Involving a Purchase or Sale,” there are no exceptions to this Policy.
Transactions Under Company Plans
Stock Option Exercises. This Policy does not apply to the exercise of an employee stock option acquired pursuant to the Company’s plans or to the exercise of a tax withholding right pursuant to which you elect to have the Company withhold shares issuable upon exercise of the option to satisfy tax withholding requirements. This Policy does apply, however, to any sale of stock as part of a broker-assisted cashless exercise of an option, or any other market sale of the stock, including a sale for the purpose of generating the cash needed to pay the exercise price of an option or the tax withholding requirements.
4
Restricted Stock Awards. This Policy does not apply to the vesting of restricted stock or the exercise of a tax withholding right pursuant to which you elect to have the Company withhold shares of stock to satisfy tax withholding requirements. This Policy does apply, however, to any market sale of restricted stock, including a sale for the purpose of generating the cash needed to pay the exercise price of an option or the tax withholding requirements.
401(k) Plan. This Policy does not apply to purchases of Company securities in the Company’s 401(k) plan resulting from your periodic contribution of money to the plan pursuant to your payroll deduction election. This Policy does apply, however, to certain elections you may make under the 401(k) plan, including: (a) an election to increase or decrease the percentage of your periodic contributions that will be allocated to the Company stock fund; (b) an election to make an intraplan transfer of an existing account balance into or out of the Company stock fund; (c) an election to borrow money against your 401(k) plan account if the loan will result in a liquidation of some or all of your Company stock fund balance; and (d) an election to pre-pay a plan loan if the prepayment will result in allocation of loan proceeds to the Company stock fund.
Other Similar Transactions. Any other purchase of Company securities directly from the Company or sales of Company securities directly to the Company are not subject to this Policy.
Transactions in Mutual Funds
Transactions in mutual funds that are invested in Company securities are not transactions subject to this Policy.
Gifts Subject to Same Restrictions as All Other Securities Trades.
No Insider or Covered Person may give or make any other transfer of Company securities without consideration (e.g., a gift) during the period when such Insider or Covered Person is prohibiting from trading in such securities under this Policy.
Pre-Clearance Procedures and Trading Restrictions for Officers, Directors and Designated Employees
In order to assist our officers, directors or other employees who the Compliance Officer has determined may regularly have access to material nonpublic information (“Designated Employees”) in maintaining compliance with their securities law obligations and to avoid the appearance of any impropriety, the Company has adopted a pre-clearance procedure for transactions by such persons and established certain periods during which such individuals will be therefore restricted from trading absent a finding to the contrary by the Audit Committee of the Board.
Pre-Clearance Procedures.
Prior to conducting any transactions in Company securities (other than transactions that are Excluded Transactions or transactions pursuant to a Rule 10b5-1 Plan), an officer, director or Designated Employee must request, and obtain, in each case in writing, pre-clearance of such transaction from the Compliance Officer.
5
In the case of the Compliance Officer, pre-clearance of such transaction must be requested and obtained, in each case in writing, from the Principal Executive Officer or the Principal Financial Officer of the Company.
This pre-clearance procedure has been established:
• |
to provide assistance in preventing inadvertent violations of applicable securities laws; |
• |
to avoid the appearance of impropriety in connection with the purchase, sale or bona fide gift of the Company securities; and |
• |
to insure timely compliance by all Company Insiders with the strict time requirements for the filings of Form 4 reports. |
A request for pre-clearance should be submitted to the Compliance Officer at least one business day in advance of the proposed transaction. The Compliance Officer is under no obligation to approve a transaction submitted for pre-clearance, and may determine not to permit the transaction. If a person seeks pre-clearance and permission to engage in the transaction is denied, then he or she should refrain from initiating any transaction in Company securities, and should not inform any other person of the restriction.
When a request for pre-clearance is made, the requestor should carefully consider and disclose to the Compliance Officer:
• |
whether he or she may be aware of any material nonpublic information about the Company; |
• |
whether he or she has effected any non-exempt “opposite-way” transaction within the past six months; and |
• |
whether he or she must comply with SEC Rule 144 and file a Form 144 at the time of any sale. |
Pre-cleared trades must be effected within the period set forth in the pre-clearance approval (typically, before the end of the fifth business day after the pre-clearance is granted). Transactions not effected within the time limit are subject to pre-clearance again.
Quarterly Trading Restriction Periods
In order to ensure that our officers, directors or Designated Employees do not unintentionally engage in transactions during a time when they may have, or may have access to, material nonpublic information, the Company has established a “Blackout Period” beginning fourteen days prior to the end of each fiscal quarter and ending one full business day following the date of the public release of the Company’s earnings results for that quarter. Due to the possibility that officers, directors or Designated Employees may have, or may have access to, material nonpublic information during a Blackout Period, such persons may not conduct any transactions involving the Company’s Securities during a Blackout Period.
6
Under certain very limited circumstances, a person subject to this restriction may be permitted to trade during a Blackout Period, but only if the Audit Committee of the Board concludes that the person does not in fact possess material nonpublic information. Persons wishing to trade during a Blackout Period must contact the Compliance Officer to request Audit Committee approval at least five business days in advance of any proposed transaction involving Company securities.
Safest Time for Transactions. All employees, whether or not subject to the trading windows or pre-clearance procedures described in this Policy, are reminded that the safest time for transactions in Company securities will generally be just after the trading window opens after the release by the Company of financial information relating to a completed quarter. The appearance of improper trading may increase as the Company approaches the end of the next fiscal quarter.
Event-Specific Trading Restriction Periods.
From time to time, an event may occur that is material to the Company and is known by only a few directors, officers and/or employees. So long as the event remains material and nonpublic, the persons designated by the Compliance Officer may not conduct any transactions involving the Company securities. In addition, in a particular fiscal quarter, material information about the Company’s financial results may be known to the Company prior to the scheduled Blackout Period, so that, in the judgment of the Compliance Officer, designated persons should refrain from trading in Company securities even sooner than the typical Blackout Period described above. In that situation, the Compliance Officer may without disclosing the reason for the restriction notify these persons that they should not conduct any transactions involving the Company securities. The existence of an event-specific trading restriction period or extension of a Blackout Period will not be announced to the Company as a whole, and should not be communicated to any other person. Even if the Compliance Officer has not designated you as a person who should not trade due to an event-specific restriction, you should not trade while aware of material nonpublic information. Exceptions will not be granted during an event-specific trading restriction period.
Exceptions. The quarterly trading restrictions and event-specific trading restrictions do not apply to those Excluded Transactions described above nor to transactions pursuant to an approved Rule 10b5-1 Plan.
Rule 10b5-1 Plans
Rule 10b5-1 under the Exchange Act provides an affirmative defense from insider trading liability under Rule 10b-5. In order to be eligible to rely on this defense, a person subject to this Policy must enter into a Rule 10b5-1 plan for transactions in Company securities that meets certain conditions specified in the Rule (a “Rule 10b5-1 Plan”).The initiation of, and any modification to (including termination), any such Rule 10b5-1 Plan will be deemed to be a transaction in the Company’s securities, and such initiation or modification (including termination) is subject to all limitations and prohibitions relating to transactions in the Company’s securities. Each such Rule 10b5-1 Plan, and any modification (including termination) thereof, must be submitted to and pre-approved by the Compliance Officer, who may impose such conditions on the implementation and operation of the Rule 10b5-1 Plan as the Compliance Officer deems necessary or advisable.
7
However, compliance of the Rule 10b5-1 Plan to the terms of Rule 10b5-1 and the execution of transactions pursuant to the Rule 10b5-1 Plan are the sole responsibility of the person initiating the Rule 10b5-1 Plan, not the Company or the Compliance Officer. Any Rule 10b5-1 Plan must be submitted for approval three business days prior to the entry into the Rule 10b5-1 Plan.
Rule 10b5-1 Plans do not exempt individuals from complying with Section 16 short-swing profit rules or liability.
Rule 10b5-1 presents an opportunity for insiders to establish arrangements to sell (or purchase) Company stock without the restrictions of Blackout Periods, even when there is undisclosed material information. A Rule 10b5-1 Plan may also help reduce negative publicity that may result when key executives sell the Company’s stock. Rule 10b5-1 only provides an “affirmative defense” in the event there is an insider trading lawsuit. It does not prevent someone from bringing a lawsuit.
A director, officer or employee may enter into a Rule 10b5-1 Plan only when he or she is not in possession of material, non-public information, and only during a period outside of the Blackout Period. Although transactions effected under a Rule 10b5-1 Plan will not require further pre-clearance at the time of the trade, any transaction (including the quantity and price) made pursuant to a Rule 10b5-1 Plan of a Section 16 reporting person must be reported to the Company promptly on the day of each trade to permit the Company’s filing coordinator to assist in the preparation and filing of a required Form 4. Such reporting may be oral or in writing (including by e-mail) and should include the identity of the reporting person, the type of transaction, the date of the transaction, the number of shares involved and the purchase or sale price. However, the ultimate responsibility, and liability, for timely filing remains with the Section 16 reporting person.
The Company reserves the right from time to time to suspend, discontinue or otherwise prohibit any transaction in the Company’s securities, even pursuant to a previously approved Rule 10b5-1 Plan, if the Compliance Officer, in its discretion, determines that such suspension, discontinuation or other prohibition is in the best interests of the Company. Any Rule 10b5-1 Plan submitted for approval hereunder should explicitly acknowledge the Company’s right to prohibit transactions in the Company’s securities. Failure to discontinue purchases and sales as directed shall constitute a violation of the terms of this Policy and result in a loss of the exemption set forth herein.
Officers, directors and employees may adopt Rule 10b5-1 Plans with brokers that outline a pre-set plan for trading of the Company’s stock, including the exercise of options. Trades pursuant to a Rule 10b5-1 Plan generally may occur at any time. Rule 10b5-1 Plans must be reviewed, approved and counter-signed by the Company, and must comply in all respects with the requirements of Rule 10b5-1, which include the following:
| ● | a cooling-off period for insiders of the later of (1) 90 days following adoption of the Rule 10b5-1 Plan; or (2) two business days following the disclosure in certain periodic reports of the Company’s financial results for the fiscal quarter in which the plan was adopted (but not to exceed 120 days following adoption of the Rule 10b5-1 Plan) before any trading can commence under the Rule 10b5-1 Plan; |
8
| ● | a cooling-off period of 30 days for other persons; |
| ● | a condition for insiders to include a representation in their Rule 10b5-1 Plan certifying, at the time of the adoption, that: (1) they are not aware of material nonpublic information about the Company or its securities; and (2) they are adopting the Rule 10b5-1 Plan in good faith and not as part of a plan or scheme to evade the prohibitions of Rule 10b-5; |
| ● | a limitation on using multiple overlapping Rule 10b5-1 Plans (except as otherwise permitted by Rule 10b5-1); |
| ● | a limitation on the ability of anyone other than issuers to rely on the affirmative defense for a single trade plan to one such Rule 10b5-1 Plan during any consecutive 12-month period; and |
| ● | a condition that all persons entering into a Rule 10b5-1 Plan must act in good faith with respect to that plan. |
Please review the following description of how a Rule 10b5-1 Plan works.
Pursuant to Rule 10b5-1, an individual’s purchase or sale of securities will not be “on the basis of” material, non-public information if:
| ● | First, before becoming aware of the information, the individual enters into a binding contract to purchase or sell the securities, provides instructions to another person to sell the securities or adopts a written plan for trading the securities (i.e., the Rule 10b5-1 Plan). |
| ● | Second, the Rule 10b5-1 Plan must either: |
| ● | specify the amount of securities to be purchased or sold, the price at which the securities are to be purchased or sold and the date on which the securities are to be purchased or sold; |
| ● | include a written formula or computer program for determining the amount, price and date of the transactions; or |
| ● | prohibit the individual from exercising any subsequent influence over the purchase or sale of the Company’s stock under the Rule 10b5-1 Plan in question. |
| ● | Third, the purchase or sale must occur pursuant to the Rule 10b5-1 Plan and the individual must not enter into a corresponding hedging transaction or alter or deviate from the Rule 10b5-1 Plan. |
| ● | Fourth, the Rule 10b5-1 Plan must satisfy the requirements set forth above. |
Revocation of Rule 10b5-1 Plans should occur only in unusual circumstances. Effectiveness of any revocation or amendment of a Rule 10b5-1 Plan will be subject to the prior review and approval of the Compliance Officer. Revocation is effected upon written notice to the broker. Once a Rule 10b5-1 Plan has been revoked, the participant must wait until the applicable cooling-off period has expired as described above before trading outside of a Rule 10b5-1 Plan or establishing a new Rule 10b5-1 Plan. You should note that revocation of a Rule 10b5-1 Plan can result in the loss of an affirmative defense for past or future transactions under a Rule 10b5-1 Plan.
9
You should consult with your own legal counsel before deciding to revoke a Rule 10b5-1 Plan. In any event, you should not assume that compliance with the aforementioned cooling-off period will protect you from possible adverse legal consequences of a Rule 10b5-1 Plan revocation.
A person acting in good faith may amend a prior Rule 10b5-1 Plan so long as such amendments are made outside of a quarterly trading black-out period and at a time when the Rule 10b5-1 Plan participant does not possess material, non-public information. Plan amendments must not take effect for at least 30 days after the plan amendments are made.
Under certain circumstances, a Rule 10b5-1 Plan must be revoked. This may include circumstances such as the announcement of a merger or the occurrence of an event that would cause the transaction either to violate the law or to have an adverse effect on the Company. The Compliance Officer or administrator of the Company’s stock plans is authorized to notify the broker in such circumstances, thereby insulating the insider in the event of revocation.
Special and Prohibited Transactions
The Company has determined that there is a heightened legal risk and/or the appearance of improper or inappropriate conduct if its employees, officers and directors, and other Covered Persons engage in certain types of transactions. It therefore is the Company’s policy that all the persons covered by this Policy should be subject to heightened restrictions or considerations with respect to each of the following types of transactions:
Short Sales. Section 16(c) of the Securities Exchange Act of 1934, as amended (the “Exchange Act”), prohibits insiders absolutely from making short sales of Company securities, i.e., sales of shares which the insider does not own at the time of sale, or sales of stock against which the insider does not deliver the shares within 20 days after the sale, either directly or indirectly. Under certain circumstances, the purchase or sale of put or call options, or the writing of such options, can result in a violation of Section 16(c). Insiders violating Section 16(c) face criminal liability. Furthermore, short sales of Company securities may evidence an expectation on the part of the seller that the securities will decline in value, and therefore have the potential to signal to the market that the seller lacks confidence in the Company’s prospects. By operation of this Policy, the Company hereby prohibits any officer, director or employee, or other Covered Person, from making a short sale of Company securities which would be prohibited by Section 16(c) if such person were an insider. Sales “against the box” are also prohibited. A sale “against the box” is a sale of securities which are owned but are not delivered after the sale. A sale “against the box” has the same effect as a short sale. The Compliance Officer should be consulted if you have any questions regarding this prohibition on reporting obligations, short-swing profits or short sales.
Options and Derivative Securities. Derivative securities are securities contracts or arrangements whose value varies in relation to the price of Company securities. For example, derivative securities would include exchange-traded put or call options, as well as individually arranged derivative transactions, such as prepaid forwards. Many forms of derivatives are speculative in nature (meaning that their value fluctuated based on short-term changes in the price of Company shares), and the purchase or sale of such derivatives by Company employees could motivate them to take actions that are in conflict with the long-term interest of other shareholders and could also cause the appearance of misuse of inside information.
10
Accordingly, our employees, officers and directors are prohibited from purchasing or selling derivative securities, or entering into derivatives contracts relating to Company shares. The prohibition on transactions in derivatives does not apply to stock options and other interests issued under Company employee benefit plans. If you have any question as to whether a particular type of arrangement or derivative transaction is permitted under this Policy, you should contact the Compliance Officer.
Hedging Transactions. Certain forms of hedging or monetization transactions, such as zerocost collars and forward-sale contracts, allow a person to lock in much of the value of his or her stock holdings, often in exchange for at least a part of the potential for upside appreciation in the stock. These transactions allow a person to continue to own the covered securities, but without the full risks and rewards of ownership. In that situation, the person may no longer have the same objectives as the Company’s other stockholders. Therefore, directors, officers, employees and consultants are prohibited from engaging in any such transactions with respect to Company shares.
Margin Account and Pledged Securities. Securities held in a margin account may be sold by a broker without the customer’s consent if the customer fails to meet a margin call. Similarly, securities pledged as collateral for a loan may be sold in foreclosure if the borrower defaults on the loan. Because a margin sale or foreclosure sale may occur at a time when the pledgor is aware of material nonpublic information or otherwise is not permitted to trade in Company securities, insiders should take special precautions when placing Company securities in a margin account or when pledging Company securities as collateral for a loan. In order for the Company to comply with its securities disclosure requirements and to ensure that margin accounts are structured in a manner to minimize inside trading concerns, any employee, officer or director who wishes to place Company securities in a margin account or pledge Company securities as collateral for a loan must provide the Compliance Officer written notice of his or her intent to margin or pledge Company securities, accompanied by a copy of the proposed documentation, at least two business days prior to the margin or pledge.
Short-Term Trading. Employees, officers and directors are to avoid engaging in speculative transactions that are designed to result in profit based on short-term fluctuations in the price of the Company’s securities. Purchases of the Company’s securities should be made with the expectation of owning those securities for an extended period of time - at a minimum, for six months. Executive officers and directors of the Company are subject to Section 16 of the Exchange Act, which requires such persons to disgorge to the Company any profits made on open market or certain other purchases or sales of Company securities that are made within six months of an opposite way transaction. Section 16 can be extremely complicated, so any person who is subject to Section 16 should ensure that the all prior transactions are reported to the Compliance Officer in connection with the Pre-Clearance Approval Procedures set forth above.
11
Post-Termination Transactions
This Policy continues to apply to transactions in Company securities even after termination of service to the Company. If an employee, officer or director is in possession of material nonpublic information when his or her service terminates, that individual and his or her family members may not trade in Company securities until that information has become public or is no longer material. The pre-clearance procedures for officers, directors and Designated Employees, however, will cease to apply to transactions in Company securities upon the expiration of any Blackout Period or other event-specific trading restriction period that is applicable to an officer, director or Designated Employee at the time of his or her termination of service.
Consequences of Violations
The purchase, sale or bona fide gift of securities while aware of material nonpublic information, or the disclosure of material nonpublic information to others who then trade in the Company’s Securities, is prohibited by the federal and state laws. Insider trading violations are pursued vigorously by the SEC, U.S. Attorneys and state enforcement authorities and are also prohibited under as the laws of foreign jurisdictions. Penalties for violating the law include imprisonment, disgorgement of profits, civil fines of up to three times the profit gained or loss avoided, and criminal fines of up to $5,000,000 for individuals and $25,000,000 for entities. While the regulatory authorities concentrate their efforts on the individuals who trade, or who tip inside information to others who trade, the federal securities laws also impose potential liability on companies and other “controlling persons” if they fail to take reasonable steps to prevent insider trading by company personnel. Accordingly, all Company employees must comply with this policy and applicable securities laws and to ensure that those employees who they supervise also comply.
In addition, an individual’s failure to comply with this Policy may subject the individual to Company-imposed sanctions, including dismissal for cause, whether or not the individual actually benefitted from a prohibited transaction or the individual’s failure to comply results in a violation of law. Needless to say, a violation of law, or even an SEC investigation that does not result in prosecution, can tarnish a person’s reputation and irreparably damage a career.
Company Assistance
Any person who has a question about this Policy or its application to any proposed transaction may obtain additional guidance from the Compliance Officer, who can be reached by telephone at (850) 231-6575 or by e-mail at lisa.walters@joe.com.
Individual Responsibility
Persons subject to this Policy have ethical and legal obligations to maintain the confidentiality of information about the Company and to not engage in transactions in Company securities while in possession of material nonpublic information. Each individual is responsible for making sure that he or she complies with this Policy, and that any family member, household member or entity whose transactions are subject to this Policy, as discussed above, also comply with this Policy.
12
In all cases, the responsibility for determining whether an individual is in possession of material nonpublic information rests with that individual, and any action on the part of the Company, the Compliance Officer or any other employee or director pursuant to this Policy (or otherwise) does not in any way constitute legal advice or insulate an individual from liability under applicable securities laws. You could be subject to severe legal penalties and disciplinary action by the Company for any conduct prohibited by this Policy or applicable securities laws, as described above in more detail under the heading “Consequences of Violations.”
Certification
All persons subject to this Policy must certify their understanding of, and intent to comply with, this Policy, by annually executing and returning to the Compliance Officer the Certification of Compliance form attached hereto as Attachment B.
[Approved by the Board on 11-12-24]
13
ATTACHMENT A
TYPES OF MATERIAL INFORMATION
The following is a list of certain types of information that may, under the particular circumstances, be considered material. This list is not all-inclusive and is only intended as a guide. Please keep in mind that both positive and negative information may be material.
| ● | Fundamental Corporate Changes—What is the Company doing? |
| ◾ | Information about current, proposed or contemplated transactions, such as acquisitions, tender offers, mergers, spin-offs, joint ventures, restructurings or changes in assets; |
| ◾ | changes in directors, senior management or auditors; |
| ◾ | plans to go into a new line of business; |
| ◾ | the number of homes, land or other properties sold; |
| ◾ | the number of tenant leases signed; |
| ◾ | awards of construction or site development business; |
| ◾ | information about major contracts; |
| ◾ | labor negotiations; or |
| ◾ | plans to engage in a new marketing strategy. |
| ● | Financial Reporting—How is the Company doing? |
| ◾ | earnings, profits and losses; |
| ◾ | unpublished financial reports or projections; |
| ◾ | adjustments of reported earnings; |
| ◾ | purchases, sales and revaluations of company assets; |
| ◾ | gain or loss of a significant customer; |
| ◾ | environmental compliance and its related costs; |
| ◾ | solvency problems that may arise from litigation, final judgments, loan defaults, and losses of major contracts; |
| ◾ | institution of, or developments in, major litigation, investigations, or regulatory actions or proceedings; |
| ◾ | the interruption of any aspect of a company’s business as a result of an accident, fire, natural disaster, or breakdown of labor negotiations or any major shutdown; |
| ◾ | a significant disruption in the Company’s operations or a loss, potential loss, breach or unauthorized access to the Company’s property, assets or systems, including its facilities and information technology infrastructure; |
| ◾ | changes in dividend policies or the declaration of a stock split; or |
| ◾ | contemplated issuance, redemption, or repurchase of securities. |
| ● | Management Integrity—How is the Company being managed? |
| ◾ | knowledge that management has engaged in self-dealing; |
| ◾ | knowledge that the Company has been engaged in illegal activity; |
| ◾ | knowledge that the Company is under investigation; or |
| ◾ | knowledge that a governmental body has begun or is about to begin an action against the Company. |
ATTACHMENT B
CERTIFICATION OF COMPLIANCE
I certify that:
1. |
I have read and understand The St. Joe Company’s Insider Trading Policy (the “Policy”). I understand that the Compliance Officer is available to answer any questions I have regarding the Policy. |
2.Since [], 20 , or such shorter period of time that I have been an employee of The St. Joe Company, I have complied with the Policy.
3. |
I will continue to comply with the Policy for as long as I am subject to the Policy. |
Signature:
Print name:
Date:
Exhibit 21.1
THE ST. JOE COMPANY
LIST OF SUBSIDIARIES
(Includes 100% directly owned entities, indirectly owned entities and joint venture entities of which we may be a majority, equal or minority partner)
COMPANY NAME |
|
STATE OF |
30A Greenway Hotel, LLC |
|
FL |
Bay Parkway Multi-Family, LLC |
|
FL |
Bay Parkway Multi-Family II, LLC |
|
FL |
Bay Point Marina, LLC |
|
FL |
Breakfast Point, LLC |
|
FL |
Breakfast Point Commercial, LLC |
|
FL |
Camp Creek Golf Club, LLC |
|
FL |
Camp Creek Residential Development, LLC |
|
FL |
Commercial Real Estate Acquisitions, LLC |
|
FL |
Commercial Real Estate Development, LLC |
|
FL |
Commercial Real Estate Holdings, LLC |
|
FL |
Crooked Creek Utility Company |
|
FL |
JOE PCOZ, LLC |
|
FL |
JOE QOZ Fund, Inc. |
|
FL |
JOE RI, LLC |
|
FL |
LMWS, LLC |
|
DE |
MB Multi-Family, LLC |
|
FL |
Mexico Beach Crossings, LLC |
|
FL |
N850J, LLC |
|
FL |
NatureWalk Office, LLC |
|
FL |
Northwest Florida Timber Finance, LLC |
|
DE |
OC Multi-Family, LLC |
|
FL |
Origins Crossings, LLC |
|
FL |
Origins Senior Living, LLC |
|
FL |
Panama City Beach Venture II, LLC |
|
FL |
Panama City Beach Venture III, LLC |
|
FL |
Paradise Pointe, L.L.C. |
|
FL |
Park Point Land, LLC |
|
FL |
PCIQOZ, LLC |
|
FL |
Peach Creek Aggregate Storage and Transport, LLC |
|
FL |
Pier Park Crossings, LLC |
|
FL |
Pier Park Crossings Phase II LLC |
|
FL |
Pier Park Resort Hotel, LLC |
|
DE |
Pier Park RI, LLC |
|
DE |
Pier Park TPS, LLC |
|
DE |
Port St. Joe Marina, LLC |
|
FL |
PPCC Development, LLC |
|
FL |
PSJ Commercial, LLC |
|
FL |
Resort Real Estate Holdings, LLC |
|
FL |
RiverCamps Development, LLC |
|
FL |
Salt Creek Development, LLC |
|
FL |
Scratch Biscuit Company, LLC |
|
FL |
SJ30AH, LLC |
|
FL |
SJ CARTS, LLC |
|
FL |
SJ COLLEGE STATION, LLC |
|
FL |
SJ Education Leasing Services, LLC |
|
FL |
SJ PARK PLACE, LLC |
|
FL |
SJAH, LLC |
|
FL |
SJAP, LLC |
|
FL |
SJBB, LLC |
|
FL |
SJBB Investor, LLC |
|
FL |
SJBPWA, LLC |
|
FL |
SJECC, LLC |
|
FL |
SJIMTPS Investor, LLC |
|
FL |
SJK Investor, LLC |
|
FL |
SJLMWS, LLC |
|
FL |
SJMC, LLC |
|
FL |
SJOSL, LLC |
|
FL |
SJPPN, LLC |
|
FL |
SJPR, LLC |
|
FL |
SJRBH, LLC |
|
FL |
SJSA, LLC |
|
FL |
SJSCH, LLC |
|
FL |
SJSP, LLC |
|
FL |
SJSS, LLC |
|
FL |
SJTC, LLC |
|
FL |
SJTSH, LLC |
|
FL |
SJWC, LLC |
|
FL |
SJWCSL, LLC |
|
FL |
SJWM, LLC |
|
FL |
South Walton Commerce Park, LLC |
|
FL |
Southeastern Land Ventures, LLC |
|
DE |
SouthWood Tallahassee, LLC |
|
FL |
STGC of PCB, LLC |
|
FL |
St. James Island Utility Company |
|
FL |
St. Joe Club & Resorts Vacation Rentals, LLC |
|
FL |
St. Joe Corporate Services, LLC |
|
FL |
St. Joe Development, LLC |
|
FL |
St. Joe Resort Operations, LLC |
|
FL |
St. Joe-Southwood Properties, Inc. |
|
FL |
St. Joe Timberland Company of Delaware, L.L.C. |
|
DE |
St. Joe VentureCrossings Leasing, LLC |
|
FL |
SummerCamp Beach, LLC |
|
FL |
The WaterSound Company, LLC |
|
FL |
Titus Road Station, LLC |
|
FL |
Topsail Commercial Development, LLC |
|
FL |
VentureCrossings, LLC |
|
FL |
Ward Creek, LLC |
|
FL |
WaterColor Development, LLC |
|
FL |
WaterColor Inn, LLC |
|
FL |
Watercrest Santa Rosa Beach RE, LLC |
|
FL |
Watercrest Santa Rosa Beach SL, LLC |
|
FL |
Watersound Aggregate Storage & Transport, LLC |
|
FL |
Watersound Beach and West Beach, LLC |
|
FL |
WaterSound Beach Club, LLC |
|
FL |
Watersound Closings & Escrow, LLC |
|
FL |
Watersound Club, LLC |
|
FL |
Watersound Community Sales, Inc. |
|
FL |
Watersound Insurance Company, LLC |
|
FL |
Watersound Management, LLC |
|
FL |
Watersound Parkway, LLC |
|
FL |
Watersound Title Agency, LLC |
|
FL |
Watersound Town Center, LLC |
|
FL |
WaterSound Trail, LLC |
|
FL |
West Bay Center, LLC |
|
FL |
Wild Heron PCB, LLC |
|
FL |
WindMark Beach, LLC |
|
FL |
Windmark JV, LLC |
|
FL |
WMOZ, LLC |
|
FL |
WOSL, LLC |
|
FL |
WOTH, LLC |
|
FL |
WSECC Operations, LLC |
|
FL |
WSECC Property, LLC |
|
FL |
WSER, LLC |
|
FL |
|
|
|
Exhibit 23.1
Consent of Independent Registered Public Accounting Firm
We have issued our reports dated February 26, 2025, with respect to the consolidated financial statements and internal control over financial reporting included in the Annual Report of The St. Joe Company on Form 10-K for the year ended December 31, 2024. We consent to the incorporation by reference of said reports in the Registration Statements of The St. Joe Company on Form S-3 (File No. 333-209264) and on Form S-8 (File No. 333-211183).
/s/ Grant Thornton LLP
Jacksonville, Florida
February 26, 2025
Exhibit 23.2
Consent of Independent Auditors
We hereby consent to the incorporation by reference in the Registration Statements on Form S‑3 (File No. 333-209264) and Form S‑8 (File No. 333-211183) of The St. Joe Company of our report dated January 24, 2025 relating to the financial statements of LMWS, LLC, appearing in the Annual Report on Form 10-K of The St. Joe Company for the year ended December 31, 2024.
/s/ Gerson, Preston, Klein, Lips, Eisenberg, Gelber, P.A.
Miami, Florida
February 11, 2025
Exhibit 31.1
CERTIFICATION
I, Jorge L. Gonzalez, certify that:
| 1. | I have reviewed this annual report on Form 10-K for the year ended December 31, 2024 of The St. Joe Company; |
| 2. | Based on my knowledge, this report does not contain any untrue statement of a material fact or omit to state a material fact necessary to make the statements made, in light of the circumstances under which such statements were made, not misleading with respect to the period covered by this report; |
| 3. | Based on my knowledge, the financial statements, and other financial information included in this report, fairly present in all material respects the financial condition, results of operations and cash flows of the registrant as of, and for, the periods presented in this report; |
| 4. | The registrant’s other certifying officer and I are responsible for establishing and maintaining disclosure controls and procedures (as defined in Exchange Act Rules 13a-15(e) and 15d-15(e)) and internal control over financial reporting (as defined in Exchange Act Rules 13a-15(f) and 15d-15(f)) for the registrant and have: |
| (a) | Designed such disclosure controls and procedures, or caused such disclosure controls and procedures to be designed under our supervision, to ensure that material information relating to the registrant, including its consolidated subsidiaries, is made known to us by others within those entities, particularly during the period in which this report is being prepared; |
| (b) | Designed such internal control over financial reporting, or caused such internal control over financial reporting to be designed under our supervision, to provide reasonable assurance regarding the reliability of financial reporting and the preparation of financial statements for external purposes in accordance with generally accepted accounting principles; |
| (c) | Evaluated the effectiveness of the registrant’s disclosure controls and procedures and presented in this report our conclusions about the effectiveness of the disclosure controls and procedures, as of the end of the period covered by this report based on such evaluation; and |
| (d) | Disclosed in this report any change in the registrant’s internal control over financial reporting that occurred during the registrant’s most recent fiscal quarter (the registrant’s fourth fiscal quarter in the case of an annual report) that has materially affected, or is reasonably likely to materially affect, the registrant’s internal control over financial reporting; and |
| 5. | The registrant’s other certifying officer and I have disclosed, based on our most recent evaluation of internal control over financial reporting, to the registrant’s auditors and the audit committee of the registrant’s board of directors (or persons performing the equivalent functions): |
| (a) | All significant deficiencies and material weaknesses in the design or operation of internal control over financial reporting which are reasonably likely to adversely affect the registrant’s ability to record, process, summarize and report financial information; and |
| (b) | Any fraud, whether or not material, that involves management or other employees who have a significant role in the registrant’s internal control over financial reporting. |
Date: February 26, 2025
|
/s/ Jorge L. Gonzalez |
|
Jorge L. Gonzalez |
|
President, Chief Executive Officer and Chairman of the Board |
Exhibit 31.2
CERTIFICATION
I, Marek Bakun, certify that:
1. I have reviewed this annual report on Form 10-K for the year ended December 31, 2024 of The St. Joe Company;
2. Based on my knowledge, this report does not contain any untrue statement of a material fact or omit to state a material fact necessary to make the statements made, in light of the circumstances under which such statements were made, not misleading with respect to the period covered by this report;
3. Based on my knowledge, the financial statements, and other financial information included in this report, fairly present in all material respects the financial condition, results of operations and cash flows of the registrant as of, and for, the periods presented in this report;
4. The registrant’s other certifying officer and I are responsible for establishing and maintaining disclosure controls and procedures (as defined in Exchange Act Rules 13a-15(e) and 15d-15(e)) and internal control over financial reporting (as defined in Exchange Act Rules 13a-15(f) and 15d-15(f)) for the registrant and have:
(a) Designed such disclosure controls and procedures, or caused such disclosure controls and procedures to be designed under our supervision, to ensure that material information relating to the registrant, including its consolidated subsidiaries, is made known to us by others within those entities, particularly during the period in which this report is being prepared;
(b) Designed such internal control over financial reporting, or caused such internal control over financial reporting to be designed under our supervision, to provide reasonable assurance regarding the reliability of financial reporting and the preparation of financial statements for external purposes in accordance with generally accepted accounting principles;
(c) Evaluated the effectiveness of the registrant’s disclosure controls and procedures and presented in this report our conclusions about the effectiveness of the disclosure controls and procedures, as of the end of the period covered by this report based on such evaluation; and
(d) Disclosed in this report any change in the registrant’s internal control over financial reporting that occurred during the registrant’s most recent fiscal quarter (the registrant’s fourth fiscal quarter in the case of an annual report) that has materially affected, or is reasonably likely to materially affect, the registrant’s internal control over financial reporting; and
5. The registrant’s other certifying officer and I have disclosed, based on our most recent evaluation of internal control over financial reporting, to the registrant’s auditors and the audit committee of the registrant’s board of directors (or persons performing the equivalent functions):
(a) All significant deficiencies and material weaknesses in the design or operation of internal control over financial reporting which are reasonably likely to adversely affect the registrant’s ability to record, process, summarize and report financial information; and
(b) Any fraud, whether or not material, that involves management or other employees who have a significant role in the registrant’s internal control over financial reporting.
Date: February 26, 2025
|
/s/ Marek Bakun |
|
Marek Bakun |
|
Executive Vice President, Chief Financial Officer and Principal Accounting Officer |
Exhibit 32.1
CERTIFICATION
Pursuant to 18 USC §1350, the undersigned officer of The St. Joe Company (the “Company”) hereby certifies that the Company’s Annual Report on Form 10-K for the year ended December 31, 2024 (the “Report”) fully complies with the requirements of Section 13(a) or 15(d) of the Securities Exchange Act of 1934, as amended, and that the information contained in the Report fairly presents, in all material respects, the financial condition and results of operations of the Company.
|
/s/ Jorge L. Gonzalez |
|
Jorge L. Gonzalez |
|
President, Chief Executive Officer and Chairman of the Board |
Dated: February 26, 2025
Exhibit 32.2
CERTIFICATION
Pursuant to 18 USC §1350, the undersigned officer of The St. Joe Company (the “Company”) hereby certifies that the Company’s Annual Report on Form 10-K for the year ended December 31, 2024 (the “Report”) fully complies with the requirements of Section 13(a) or 15(d) of the Securities Exchange Act of 1934, as amended, and that the information contained in the Report fairly presents, in all material respects, the financial condition and results of operations of the Company.
|
/s/ Marek Bakun |
|
Marek Bakun |
|
Executive Vice President, Chief Financial Officer and Principal Accounting Officer |
|
|
Dated: February 26, 2025 |
|
Exhibit 99.1
FINANCIAL STATEMENTS
LMWS, LLC
(A DELAWARE LIMITED LIABILITY COMPANY)
FOR THE YEARS ENDED DECEMBER 31, 2024, 2023 AND 2022
Contents
|
|
PAGE |
|
|
|
Independent Auditor’s Report |
|
|
|
|
|
Financial Statements: |
|
|
Balance Sheets |
|
1 |
Statements of Income |
|
2 |
Statements of Members Equity |
|
3 |
Statements of Cash Flows |
|
4 |
|
|
|
Notes to Financial Statements |
|
5-10 |

C E R T I F I E D P U B L I C A C C O U N T A N T S |
www.GPKLEG.com |
|
MIAMI 4770 Biscayne Blvd., Suite 400 Miami, FL 33137 T. (305) 868-3600 F. (305) 864-6740 |
DENVER Galleria at Cherry Creek 720 S. Colorado Blvd., Suite 530-S Glendale, CO 80246 T. (303) 600-0305 F. (303) 200-7295 |
BOCA RATON 1951 NW 19 Street, Suite 200 Boca Raton, FL 33431 T. (561) 392-9059 F. (561) 372-7957 |
Independent Auditor’s Report
To the Members
LMWS, LLC
Opinion
We have audited the accompanying financial statements of LMWS, LLC (the “Company”) (a Delaware Limited Liability Company), which comprise the balance sheets as of December 31, 2024 and 2023, and the related statements of income, members’ equity, and cash flows for each of the three years in the period ended December 31, 2024, and the related notes to the financial statements.
In our opinion, the financial statements referred to above present fairly, in all material respects, the financial position of LMWS, LLC as of December 31, 2024 and 2023, and the results of its operations and its cash flows for each of the three years in the period ended December 31, 2024, in accordance with accounting principles generally accepted in the United States of America.
Basis for Opinion
We conducted our audits in accordance with auditing standards generally accepted in the United States of America. Our responsibilities under those standards are further described in the Auditor’s Responsibilities for the Audit of the Financial Statements section of our report. We are required to be independent of LMWS, LLC and to meet our other ethical responsibilities in accordance with the relevant ethical requirements relating to our audits. We believe that the audit evidence we have obtained is sufficient and appropriate to provide a basis for our audit opinion.
Responsibilities of Management for the Financial Statements
Management is responsible for the preparation and fair presentation of the financial statements in accordance with accounting principles generally accepted in the United States of America, and for the design, implementation, and maintenance of internal control relevant to the preparation and fair presentation of financial statements that are free from material misstatement, whether due to fraud or error.
In preparing the financial statements, management is required to evaluate whether there are conditions or events, considered in the aggregate, that raise substantial doubt about LMWS, LLC’s ability to continue as a going concern within one year after the date that the financial statements are available to be issued.
Auditor’s Responsibilities for the Audits of the Financial Statements
Our objectives are to obtain reasonable assurance about whether the financial statements as a whole are free from material misstatement, whether due to fraud or error, and to issue an auditor’s report that includes our opinion. Reasonable assurance is a high level of assurance but is not absolute assurance and therefore is not a guarantee that an audit conducted in accordance with generally accepted auditing standards will always detect a material misstatement when it exists. The risk of not detecting a material misstatement resulting from fraud is higher than for one resulting from error, as fraud may involve collusion, forgery, intentional omissions, misrepresentations, or the override of internal control.
LMWS, LLC
Cont'd.
Misstatements are considered material if there is a substantial likelihood that, individually or in the aggregate, they would influence the judgment made by a reasonable user based on the financial statements.
In performing an audit in accordance with generally accepted auditing standards, we:
| ● | Exercise professional judgment and maintain professional skepticism throughout the audits. |
| ● | Identify and assess the risks of material misstatement of the financial statements, whether due to fraud or error, and design and perform audit procedures responsive to those risks. Such procedures include examining, on a test basis, evidence regarding the amounts and disclosures in the financial statements. |
| ● | Obtain an understanding of internal control relevant to the audits in order to design audit procedures that are appropriate in the circumstances, but not for the purpose of expressing an opinion on the effectiveness of LMWS, LLC’s internal control. Accordingly, no such opinion is expressed. |
| ● | Evaluate the appropriateness of accounting policies used and the reasonableness of significant accounting estimates made by management, as well as evaluate the overall presentation of the financial statements. |
| ● | Conclude whether, in our judgment, there are conditions or events, considered in the aggregate, that raise substantial doubt about LMWS, LLC’s ability to continue as a going concern for a reasonable period of time. |
We are required to communicate with those charged with governance regarding, among other matters, the planned scope and timing of the audits, significant audit findings, and certain internal control related matters that we identified during the audits.

Miami, Florida
January 24, 2025
LMWS, LLC
Balance Sheets
At December 31, 2024 and 2023
(In thousands)
2024 |
2023 |
|||||
ASSETS | ||||||
Real estate inventory |
$ |
165,803 |
$ |
162,558 |
||
Cash and cash equivalents |
|
27,269 |
|
26,230 |
||
Restricted cash |
|
437 |
|
2,005 |
||
Accounts receivable, prepaid expenses and other assets |
2,092 |
2,883 |
||||
Property and other equipment, net |
|
5,296 |
|
4,965 |
||
Total assets |
$ |
200,897 |
$ |
198,641 |
||
LIABILITIES AND MEMBERS' EQUITY | ||||||
Liabilities |
||||||
Mortgage notes payable, net of unamortized financing costs |
$ |
41,054 |
$ |
37,155 |
||
Accounts payable and accrued expenses |
|
18,315 |
|
18,177 |
||
Customer deposits |
|
41,517 |
|
54,695 |
||
Total liabilities |
100,886 |
110,027 |
||||
Members' equity |
|
100,011 |
|
88,614 |
||
Total liabilities and members' equity |
$ |
200,897 |
$ |
198,641 |
||
LMWS, LLC
Statements of Income
For the Years Ended December 31, 2024, 2023 and 2022
(In thousands)
2024 |
2023 |
|
2022 |
||||||
Revenues |
|||||||||
Sales of homes |
$ |
347,583 |
$ |
323,881 |
$ |
139,297 |
|||
Costs |
|||||||||
Cost of homes sold |
|
269,282 |
|
259,199 |
|
118,468 |
|||
Operating income |
|
78,301 |
|
64,682 |
|
20,829 |
|||
Expenses |
|||||||||
Selling, general and administrative |
19,384 |
17,079 |
12,903 |
||||||
Depreciation and amortization |
|
529 |
|
613 |
|
543 |
|||
Total expenses |
|
19,913 |
|
17,692 |
|
13,446 |
|||
Operating income before other income |
58,388 |
46,990 |
7,383 |
||||||
Other income |
|
153 |
|
264 |
|
47 |
|||
Net income |
$ |
58,541 |
$ |
47,254 |
$ |
7,430 |
|||
LMWS, LLC
Statements of Members' Equity
For the Years Ended December 31, 2024, 2023 and 2022
(In thousands)
Capital |
Total |
||||||||
Contributions |
Accumulated |
Members' |
|||||||
(Distributions) |
Equity (Deficit) |
|
Equity |
||||||
Balance, January 1, 2022 |
$ |
57,979 |
$ |
(4,623) |
$ |
53,356 |
|||
Members' distributions |
(3,052) |
— |
(3,052) |
||||||
Net income |
|
— |
|
7,430 |
|
7,430 |
|||
Balance, December 31, 2022 |
|
54,927 |
2,807 |
|
57,734 |
||||
Members' distributions |
(16,374) |
— |
(16,374) |
||||||
Net income |
|
— |
|
47,254 |
|
47,254 |
|||
Balance, December 31, 2023 |
38,553 |
50,061 |
88,614 |
||||||
Members' distributions |
(19,569) |
(27,575) |
(47,144) |
||||||
Net income |
|
— |
|
58,541 |
|
58,541 |
|||
Balance, December 31, 2024 |
$ |
18,984 |
$ |
81,027 |
$ |
100,011 |
|||
LMWS, LLC
Statements of Cash Flows
For the Years Ended December 31, 2024, 2023 and 2022
(In thousands)
2024 |
2023 |
|
2022 |
||||||
Operating activities |
$ |
58,541 |
$ |
47,254 |
$ |
7,430 |
|||
Net income |
|||||||||
Adjustments to reconcile net income to net cash |
|||||||||
provided by (used in) operating activities: |
|||||||||
Depreciation and amortization |
529 |
613 |
543 |
||||||
Donation of property and equipment |
— |
456 |
— |
||||||
Changes in operating assets and liabilities: |
|||||||||
Real estate inventory |
(3,245) |
(17,341) |
(68,087) |
||||||
Accounts receivable, prepaid expenses and other assets |
791 |
385 |
(1,859) |
||||||
Accounts payable and accrued expenses |
|
138 |
2,098 |
10,276 |
|||||
Customer deposits |
|
(13,178) |
|
(6,855) |
|
30,934 |
|||
Net cash provided by (used in) operating activities |
|
43,576 |
|
26,610 |
|
(20,763) |
|||
Investing activities |
|||||||||
Proceeds from sale of property and equipment |
— |
35 |
— |
||||||
Additions to property and equipment |
|
(650) |
|
— |
|
(593) |
|||
Net cash (used in) provided by investing activities |
|
(650) |
|
35 |
|
(593) |
|||
Financing activities |
|||||||||
Principal payments on mortgage notes payable |
— |
— |
(7,147) |
||||||
Proceeds from revolving credit facility |
179,106 |
178,153 |
104,776 |
||||||
Payments on revolving credit facility |
(175,304) |
(170,709) |
(74,775) |
||||||
Members' distributions |
(47,144) |
(16,374) |
(3,052) |
||||||
Payment of financing costs |
|
(113) |
|
(113) |
|
(354) |
|||
Net cash (used in) provided by financing activities |
|
(43,455) |
|
(9,043) |
|
19,448 |
|||
Net (decrease) increase in cash |
(529) |
17,602 |
(1,908) |
||||||
Cash, cash equivalents and restricted cash, beginning of year |
|
28,235 |
|
10,633 |
|
12,541 |
|||
Cash, cash equivalents and restricted cash, end of year |
$ |
27,706 |
$ |
28,235 |
$ |
10,633 |
|||
Supplemental disclosures of cash flow information: |
|||||||||
The following table provides a reconciliation of cash, cash equivalents and restricted cash reporting within | |||||||||
the balance sheet that sum to the total of the amounts shown in the statement of cash flows: | |||||||||
Cash and cash equivalents |
$ |
27,269 |
$ |
26,230 |
$ |
8,295 |
|||
Restricted cash |
|
437 |
|
2,005 |
|
2,338 |
|||
Total cash, cash equivalents and restricted cash above |
$ |
27,706 |
$ |
28,235 |
$ |
10,633 |
|||
Cash paid for interest |
$ |
1,747 |
$ |
2,023 |
$ |
722 |
|||
Interest incurred |
$ |
1,812 |
$ |
2,067 |
$ |
809 |
|||
Interest capitalized to real estate inventory |
|
(1,812) |
|
(2,067) |
|
(809) |
|||
Interest incurred, net of amounts capitalized |
$ |
— |
$ |
— |
$ |
— |
|||
LMWS, LLC
Notes to Financial Statements
LMWS, LLC (the “Company”), a Delaware Limited Liability Company, was formed effective June 20, 2019. The Company has two members, each with a 50% voting interest. The Company is primarily in the business of acquiring, developing, constructing and selling of homes in the Latitude Margaritaville Watersound community located in Bay County, Florida. The community consists of approximately 3,500 planned residential units, of which 1,663 home sale transactions have been completed as of December 31, 2024.
This summary of significant accounting policies for the Company is presented to assist in understanding the Company’s financial statements. The financial statements and notes are representations of the Company’s management who is responsible for their integrity and objectivity. These accounting policies conform to accounting principles generally accepted in the United States of America and have been consistently applied in the preparation of the financial statements.
Use of Estimates. The preparation of financial statements in conformity with U.S. generally accepted accounting principles requires management to make estimates and assumptions that affect the reported amounts of assets and liabilities and disclosure of contingent assets and liabilities at the date of the financial statements and the reported amounts to revenues and expenses during the reporting period. Actual results could differ from those estimates. Changes in the facts or circumstances underlying these estimates could result in material changes and actual results could materially differ from these estimates.
Revenue Recognition. Revenues and cost of revenues from sales of single-family homes is recorded at the time each home sale is closed and title and possession has been transferred to the buyer in accordance with Accounting Standards Codification (ASC) Topic 606, Revenue from Contracts with Customers (Topic 606). The Company’s performance obligation, to deliver the agreed-upon home, is generally satisfied at the home closing date. Land, land development, and related costs, both incurred and estimated to be incurred in the future for home sales, are recorded to cost of revenues based upon the total number of homes to be constructed in each community under a square footage method. Any changes resulting from a change in the estimated number of homes to be constructed or in the estimated costs subsequent to the commencement of delivery of homes are allocated to the remaining undelivered homes in the community. Home construction and related costs are charged to cost of revenues under the specific identification method. The estimated common area development and related costs of master planned communities are allocated to individual communities within a master planned community under a square footage method.
Real Estate Inventory. All direct and indirect costs relating to the Company’s real estate inventory are capitalized in accordance with the applicable guidance and include costs related to planning and development of land or construction. Planning costs include legal and professional fees, market feasibility studies, engineering and architectural design, impact, and permitting fees. Construction costs include all subcontractor, direct material and labor costs, and indirect costs related to overhead and supervision fees. Interest and real estate taxes are capitalized to real estate inventory during the active development period. Indirect costs that do not clearly relate to development or construction, including selling, general, and administrative expenses, are charged to expense as incurred.
Cash and Cash Equivalents. The Company considers certificates of deposit with initial maturities of three months or less to be cash equivalents for purposes of balance sheet classification and the statement of cash flows.
Restricted Cash. Restricted cash consists primarily of deposits received from customers in conjunction with the anticipated closing of single-family homes and is held in escrow accounts.
Property and Other Equipment. Property and other equipment are stated at cost. Depreciation is provided by using the straight-line method over the estimated useful lives, which range from three to seven years. The costs of maintenance and repairs are expensed as incurred.
5
LMWS, LLC
Notes to Financial Statements
Customer Deposits. Customer deposits represent cash deposits received related to sales contracts with homebuyers and are recorded as liabilities until the homes are closed.
Financing Costs. Financing costs are incurred in connection with obtaining financing from third-party lenders and are presented in the balance sheet as a direct deduction from the carrying value of the associated debt liability. Financing costs are amortized over the estimated useful life of the related debt using a method that approximates the level-yield method. Amortization of deferred financing costs during the construction period is capitalized as property costs to real estate inventory.
Advertising. Advertising costs are expensed as incurred and amounted to $1,303, $1,106 and $1,083 (in thousands) during the years ending December 31, 2024, 2023 and 2022, respectively.
Income Taxes. No provision has been made for income taxes in the accompanying financial statements since the Company is not directly subject to income taxes and the results of operations are included in the tax returns of the members. Accounting principles generally accepted in the United States require management to evaluate tax positions taken by the Company and recognize a tax liability (or asset) if the Company has taken an uncertain tax position that more likely than not would not be sustained upon examination by the Internal Revenue Service. Management has analyzed the tax positions taken by the Company and has concluded that as of December 31, 2024, there are no uncertain positions taken or expected to be taken that would require recognition of a liability (or asset) or disclosure in the financial statements. The Company is subject to routine audits by taxing jurisdictions; however, there are currently no audits for any tax periods in progress.
Business Risk. A deterioration in national, regional, and local economic conditions could adversely impact the Company’s operations and may have a material impact on the Company’s business. The Company’s revenues, financial condition, and results of operations could decline due to this deterioration of national, regional and local economies.
Impairment of Long-lived Assets. In accordance with the applicable guidance, long-lived assets are reviewed for impairment whenever events or changes in circumstances indicate that the carrying amount of an asset may not be recoverable. If circumstances require an asset to be tested for possible impairment, the Company first compares the undiscounted cash flows expected to be generated by that asset to its carrying value. If the carrying value of the asset is not recoverable on an undiscounted cash flow basis, an impairment is recognized to the extent that the carrying value exceeds its fair value. Fair value is determined through various valuation techniques including discounted cash flow models, quoted market values, and third party independent appraisals, as considered necessary. At December 31, 2024 and 2023, no impairment losses were recorded.
Concentration of Risks and Uncertainties. All of the Company’s real estate assets are located in Bay County, Florida. Uncertain economic conditions could have an adverse impact on the Company’s operations and asset values. The Company is subject to risks from macroeconomic factors such as inflation, rising interest rates and insurance costs, supply chain disruptions, financial institution disruptions and geopolitical conflicts, among other things, which have created economic headwinds and impacted buyer sentiment.
Subsequent Events. The Company has evaluated subsequent events through January 24, 2025, the date these financial statements were available to be issued.
The Company maintains its cash balances at various financial institutions. The balances are insured by the Federal Deposit Insurance Corporation. As of December 31, 2024 and 2023, the Company had a balance in excess of the insured limit.
6
LMWS, LLC
Notes to Financial Statements
The following methods and assumptions were used to estimate the fair value of the Company’s financial instruments at December 31, 2024 and 2023:
| • | The carrying value of cash and cash equivalents, restricted cash, accounts receivable, prepaid expenses and other assets, accounts payable and accrued expenses and customer deposits approximate fair value due to the short maturity of these instruments. |
| • | The carrying value of mortgage notes payable approximates the fair value as such debt resets to the market interest rate periodically. |
The fair value estimates are made at a specific point in time, based on relevant market information and information about the financial instruments. These estimates are subjective in nature and involve uncertainties and matters of significant judgment and, therefore, cannot be determined with precision. Changes in assumptions could significantly affect the estimates.
The Company applies the provisions of the applicable guidance, for fair value measurements of financial assets and financial liabilities and for fair value measurements of nonfinancial items that are recognized or disclosed at fair value in the statements of financial position on a recurring basis. The applicable guidance defines fair value as the price that would be received to sell an asset or paid to transfer a liability in an orderly transaction between market participants at the measurement date. The applicable guidance also establishes a framework for measuring fair value and expands disclosures about fair value measurements.
The applicable guidance establishes a fair value hierarchy that prioritizes the inputs to valuation techniques used to measure fair value. The hierarchy gives the highest priority to unadjusted quoted prices in active markets for identical assets or liabilities (level 1 measurements) and the lowest priority to measurements involving significant unobservable inputs (level 3 measurements).
The three levels of the fair value hierarchy under the applicable guidance are described below:
Level 1 |
Inputs to the valuation methodology are unadjusted quoted prices for identical assets or liabilities in active markets that the Company has the ability to access at the measurement date. |
Level 2Inputs to the valuation methodology include:
| a) | Quoted prices for similar assets or liabilities in active markets; |
| b) | Quoted prices for identical or similar assets or liabilities in inactive markets; |
| c) | Inputs other than quoted prices that are observable for the asset or liability; |
| d) | Inputs that are derived principally from or corroborated by observable market data by correlation or other means. |
If the asset or liability has a specified (contractual) term, the level 2 input must be observable for substantially the full term of the asset or liability.
Level 3 |
Inputs to the valuation methodology are unobservable and significant to the fair value measurement. |
The level in the fair value hierarchy within which a fair value measurement in its entirety falls is based on the lowest level of input that is significant to the fair value measurement in its entirety.
The Company does not have any financial assets and financial liabilities that are measured at fair value on a recurring basis as of December 31, 2024 and 2023. The financial statements as of December 31, 2024 and 2023 do not include any significant nonrecurring fair value measurements relating to assets or liabilities for which the Company had adopted the provisions of the applicable guidance.
7
LMWS, LLC
Notes to Financial Statements
The Company values its real estate inventory at fair value on a nonrecurring basis if it is determined that an impairment has occurred. Such fair value measurements use significant other observable inputs and significant unobservable inputs and are classified as Level 2 or Level 3 as determined appropriate. No impairments have been recorded on this property.
Real estate inventory is comprised of the following at December 31, 2024 and 2023, respectively:
(in thousands) |
2024 |
2023 |
||||
Land and development |
$ |
19,304 |
$ |
25,552 |
||
Construction in progress |
|
146,499 |
|
137,006 |
||
Real estate inventory |
$ |
165,803 |
$ |
162,558 |
||
Accounts receivable, prepaid expenses and other assets is comprised of the following at December 31, 2024 and 2023, respectively:
(in thousands) |
2024 |
2023 |
||||
Accounts receivable |
$ |
485 |
$ |
253 |
||
Prepaid commissions |
|
1,015 |
|
1,865 |
||
Other assets |
|
592 |
|
765 |
||
Total accounts receivable, prepaid expenses and other assets |
$ |
2,092 |
$ |
2,883 |
||
On June 25, 2020, the Company entered into a secured revolving promissory note with one of its members in the amount of $10 million. The loan has a maturity date of June 25, 2025 and bears interest at a rate of 5%. At December 31, 2024 there was $- drawn on the note. The note is secured by a mortgage and security interest in and on the real property and improvements located on the real property.
On December 16, 2022, the Company entered into a Master Note (Line of Credit) which includes two separate notes totaling $45 million. Both notes have a maturity date of December 16, 2025 and bear interest at a variable rate which was 6.787% at December 31, 2024. At December 31, 2024 there was $41,246 drawn on the note. The loan is secured by the real and personal property and certain other security interests. In connection with the loan, the Company’s members entered into an unconditional guaranty of completion of certain homes and related improvements in favor of the lender.
Through the years ended December 31, 2024 and 2023, interest on these loans was $1,812 and $2,067, respectively, of which $1,812 and $2,067 was capitalized to real estate inventory, respectively.
As of December 31, 2024 and 2023, there was $192 and $290, respectively, of unamortized deferred financing costs.
8
LMWS, LLC
Notes to Financial Statements
Accounts payable and accrued expenses is comprised of the following at December 31, 2024 and 2023, respectively:
(in thousands) |
2024 |
2023 |
||||
Trade and accrued trade payable |
$ |
9,027 |
$ |
8,904 |
||
Retention payable |
|
2,517 |
|
4,841 |
||
Accrued reserve to complete |
3,323 |
2,025 |
||||
Accrued warranties |
2,764 |
1,738 |
||||
Other accrued expenses |
|
684 |
|
669 |
||
Total accounts payable and accrued expenses |
$ |
18,315 |
$ |
18,177 |
||
One of the Company’s members provides services for the day-to-day operations of the Company, which are reimbursed to the member. During the years ended December 31, 2024, 2023 and 2022, the Company incurred selling, general and administrative expenses of $20,913, $12,905 and $8,406, respectively, related to costs from transactions with the member. There were $10 and $19 of payables due related to service arrangements with the member as of December 31, 2024 and 2023.
In addition, land development and planning costs incurred were reimbursed from a member which totaled $3,800 and $3,713 during the years ended December 31, 2024 and 2023, respectively. The entire amount received were used to offset real estate inventory costs during those respective years. There was $485 and $253 due from this member for this arrangement as of December 31, 2024 and 2023, respectively.
The Company purchased mitigation bank credits and impact fees and leased property from a member which totaled $2,735, $935 and $701 during the years ended December 31, 2024, 2023 and 2022, respectively. These amounts were included within real estate inventory costs during the respective years. Payables related to these items were $48 and $- as of December 31, 2024 and 2023, respectively.
10.Commitments and Contingencies
Surety bonds are issued primarily to governmental authorities to guarantee fulfillment of Company obligations with respect to the installation of road, water, sewer and drainage improvements on land as well as to secure the use of buyer deposits. These bonds do not have stated expiration dates; rather, the Company is released from the bonds as the contractual performance is completed. At December 31, 2024 and 2023, the Company had outstanding surety bonds totaling (in thousands) $74,081 and $69,704, respectively. Management does not expect that any material losses or obligations will result from the issuance of the surety bonds because they expect to meet their obligations under their agreements with such parties in the ordinary course of business.
The Company accrues for expected warranty costs at the time each home is closed and title and possession are transferred to the buyer. Warranty costs are accrued based upon historical data and trends with respect to similar product types and geographical areas. Management continuously evaluates the accrual to determine whether the amount remains contingent. Adjustments to the accrual related to homes delivered in prior years are recorded in the period in which a change in estimate occurs, as a component of cost of sales in the statements of income.
9
LMWS, LLC
Notes to Financial Statements
10.Commitments and Contingencies (Cont’d.)
The following table is a reconciliation of the changes in the Company’s aggregate warranty liability (in thousands):
Balance, December 31, 2022 |
$ |
650 |
|
Accruals for warranties issued during the year |
|
3,429 |
|
Warranty costs incurred during the year |
|
(2,341) |
|
Balance, December 31, 2023 |
1,738 |
||
Accruals for warranties issued during the year |
|
4,821 |
|
Warranty costs incurred during the year |
|
(3,795) |
|
Balance, December 31, 2024 |
$ |
2,764 |
10