UNITED STATES
SECURITIES AND EXCHANGE COMMISSION
Washington, D.C. 20549
Form 8-K
CURRENT REPORT
Pursuant to Section 13 or 15(d) of the Securities Exchange Act of 1934
Date of Report (Date of earliest event reported): February 24, 2025

HELIX ENERGY SOLUTIONS GROUP, INC.
(Exact name of registrant as specified in its charter)
Minnesota |
001-32936 |
95-3409686 |
(State or other jurisdiction |
(Commission |
(IRS Employer |
3505 West Sam Houston Parkway North |
|
|
Suite 400 |
|
|
Houston, Texas |
|
77043 |
(Address of principal executive offices) |
|
(Zip Code) |
Registrant’s telephone number, including area code: 281-618-0400
NOT APPLICABLE
(Former name or former address, if changed since last report)
Check the appropriate box below if the Form 8-K filing is intended to simultaneously satisfy the filing obligation of the registrant under any of the following provisions:
☐ Written communications pursuant to Rule 425 under the Securities Act (17 CFR 230.425)
☐ Soliciting material pursuant to Rule 14a-12 under the Exchange Act (17 CFR 240.14a-12)
☐ Pre-commencement communications pursuant to Rule 14d-2(b) under the Exchange Act (17 CFR 240.14d-2(b))
☐ Pre-commencement communications pursuant to Rule 13e-4(c) under the Exchange Act (17 CFR 240.13e-4(c))
Securities registered pursuant to Section 12(b) of the Act:
Title of each class |
|
Trading Symbol(s) |
|
Name of each exchange on which registered |
Common Stock, no par value |
|
HLX |
|
New York Stock Exchange |
Indicate by check mark whether the registrant is an emerging growth company as defined in Rule 405 of the Securities Act of 1933 (§230.405 of this chapter) or Rule 12b-2 of the Securities Exchange Act of 1934 (§240.12b-2 of this chapter).
Emerging growth company ☐
If an emerging growth company, indicate by check mark if the registrant has elected not to use the extended transition period for complying with any new or revised financial accounting standards provided pursuant to Section 13(a) of the Exchange Act. ☐
Item 2.02. Results of Operations and Financial Condition.
On February 24, 2025, Helix Energy Solutions Group, Inc. (“Helix”) issued a press release reporting its financial results for the fourth quarter and full year 2024. The press release is furnished herewith as Exhibit 99.1 and incorporated herein by reference.
Item 7.01. Regulation FD Disclosure.
On February 24, 2025, Helix issued a press release reporting its financial results for the fourth quarter and full year 2024. In addition, on February 25, 2025, Helix is making a presentation (with slides) to analysts and investors regarding its financial and operating results. Furnished herewith as Exhibits 99.1 and 99.2, respectively, and incorporated herein by reference, are the press release and the slides for the Fourth Quarter 2024 Conference Call Presentation issued by Helix. The presentation materials are also available on the Investor Relations section of Helix’s website, www.helixesg.com.
The information furnished pursuant to Items 2.02 and 7.01, including Exhibits 99.1 and 99.2, shall not be deemed to be “filed” for the purposes of Section 18 of the Securities Exchange Act of 1934, as amended, and will not be incorporated by reference into any filing under the Securities Act of 1933, as amended, unless specifically identified therein as being incorporated therein by reference.
Item 9.01. Financial Statements and Exhibits.
(d) Exhibits.
SIGNATURES
Pursuant to the requirements of the Securities Exchange Act of 1934, the Registrant has duly caused this report to be signed on its behalf by the undersigned hereunto duly authorized.
Date: February 24, 2025 |
|
|
|
|
|
HELIX ENERGY SOLUTIONS GROUP, INC. |
|
|
|
|
|
|
By: |
/s/ Erik Staffeldt |
|
|
|
|
Erik Staffeldt |
|
|
|
Executive Vice President and |
EXHIBIT 99.1
|
|
|
|
|
|
|
|
|
Helix Energy Solutions Group, Inc. |
● |
3505 W. Sam Houston Parkway N., Suite 400 |
● |
Houston, TX 77043 |
● |
281-618-0400 |
● |
fax: 281-618-0505 |
|
|
|
|
|
|
|
|
|
For Immediate Release |
|
|
|
|
|
|
25-004 |
|
|
|
|
|
|
|
|
|
|
Date: February 24, 2025 |
Contact: |
Erik Staffeldt |
|
|
|
|
||
|
|
|
Executive Vice President & CFO |
|
|
|||
|
|
|
|
|
|
|
|
|
Helix Reports Fourth Quarter and Full Year 2024 Results
HOUSTON, TX – Helix Energy Solutions Group, Inc. (“Helix”) (NYSE: HLX) reported net income of $20.1 million, or $0.13 per diluted share, for the fourth quarter 2024 compared to net income of $29.5 million, or $0.19 per diluted share, for the third quarter 2024 and a net loss of $28.3 million, or $(0.19) per diluted share, for the fourth quarter 2023. Net loss in the fourth quarter 2023 includes a net pre-tax loss of approximately $37.3 million related to the repurchase of $159.8 million principal amount of our former Convertible Senior Notes due 2026 (“2026 Notes”). Helix reported adjusted EBITDA1 of $71.6 million for the fourth quarter 2024 compared to $87.6 million for the third quarter 2024 and $70.6 million for the fourth quarter 2023.
For the full year 2024, Helix reported net income of $55.6 million, or $0.36 per diluted share, compared to a net loss of $10.8 million, or $(0.07) per diluted share, for the full year 2023. Net income in 2024 included a pre-tax loss of $20.9 million related to the retirement of the 2026 Notes, and the net loss in 2023 included pre-tax losses of $37.3 million related to the repurchase of $159.8 million principal amount of the 2026 Notes and $42.2 million related to the increase in the fair value of the contingent consideration related to the Alliance acquisition. Adjusted EBITDA for the full year 2024 was $303.1 million compared to $273.4 million for the full year 2023. The table below summarizes our results of operations:
Summary of Results
($ in thousands, except per share amounts, unaudited)
|
|
Three Months Ended |
|
Year Ended |
|
|||||||||||
|
|
12/31/2024 |
|
12/31/2023 |
|
9/30/2024 |
|
12/31/2024 |
|
12/31/2023 |
|
|||||
Revenues |
|
$ |
355,133 |
|
$ |
335,157 |
|
$ |
342,419 |
|
$ |
1,358,560 |
|
$ |
1,289,728 |
|
Gross Profit |
|
$ |
58,859 |
|
$ |
49,278 |
|
$ |
65,665 |
|
$ |
219,564 |
|
$ |
200,356 |
|
|
|
|
17 |
% |
|
15 |
% |
|
19 |
% |
|
16 |
% |
|
16 |
% |
Net Income (loss) |
|
$ |
20,121 |
|
$ |
(28,333) |
|
$ |
29,514 |
|
$ |
55,637 |
|
$ |
(10,838) |
|
Basic Earnings (Loss) Per Share |
|
$ |
0.13 |
|
$ |
(0.19) |
|
$ |
0.19 |
|
$ |
0.37 |
|
$ |
(0.07) |
|
Diluted Earnings (Loss) Per Share |
|
$ |
0.13 |
|
$ |
(0.19) |
|
$ |
0.19 |
|
$ |
0.36 |
|
$ |
(0.07) |
|
Adjusted EBITDA1 |
|
$ |
71,641 |
|
$ |
70,632 |
|
$ |
87,621 |
|
$ |
303,147 |
|
$ |
273,403 |
|
Cash and Cash Equivalents |
|
$ |
368,030 |
|
$ |
332,191 |
|
$ |
324,120 |
|
$ |
368,030 |
|
$ |
332,191 |
|
Net Debt1 |
|
$ |
(52,873) |
|
$ |
29,531 |
|
$ |
(9,447) |
|
$ |
(52,873) |
|
$ |
29,531 |
|
Cash Flows from Operating Activities |
|
$ |
77,977 |
|
$ |
94,737 |
|
$ |
55,731 |
|
$ |
186,028 |
|
$ |
152,457 |
|
Free Cash Flow1 |
|
$ |
65,454 |
|
$ |
91,878 |
|
$ |
52,645 |
|
$ |
163,188 |
|
$ |
133,798 |
|
Owen Kratz, President and Chief Executive Officer of Helix, stated, “Our full-year results for 2024 reflect our third consecutive year of revenue and EBITDA growth, with our highest EBITDA since 2014, despite a pull-back in our Shallow Water Abandonment segment. Our Free Cash Flow is the highest in two decades and would have been even higher absent the $58 million earnout payment included in our operating cash flows. Our Well Intervention and Robotics businesses continue to generate strong results, with high levels of utilization and improving rates. We completed the restructuring of our balance sheet with the retirement of our remaining convertible notes during the year, and we ended the year in a strong financial position, with significant cash levels and negative net debt. Based on the strength of this market and the value we bring to our customers, we signed new awards that provide over half of our well intervention fleet with contracted work for multiple years as we enter 2025 with strong contract coverage with expected significant improvements over 2024. We continue to execute on our capital allocation framework, and we’ve now repurchased over $40 million in our shares and expect to increase repurchases in 2025.”
|
1 Adjusted EBITDA, Net Debt and Free Cash Flow are non-GAAP measures; see reconciliations below |
Segment Information, Operational and Financial Highlights
($ in thousands, unaudited)
|
|
Three Months Ended |
|
Year Ended |
|||||||||||
|
|
12/31/2024 |
|
12/31/2023 |
|
9/30/2024 |
|
12/31/2024 |
|
12/31/2023 |
|||||
Revenues: |
|
|
|
|
|
|
|
|
|
|
|
|
|
|
|
Well Intervention |
|
$ |
226,188 |
|
$ |
203,866 |
|
$ |
174,613 |
|
$ |
829,862 |
|
$ |
707,718 |
Robotics |
|
|
81,594 |
|
|
62,957 |
|
|
84,526 |
|
|
297,678 |
|
|
257,875 |
Shallow Water Abandonment |
|
|
37,690 |
|
|
61,995 |
|
|
71,595 |
|
|
186,979 |
|
|
274,954 |
Production Facilities |
|
|
18,462 |
|
|
19,383 |
|
|
20,695 |
|
|
88,709 |
|
|
87,885 |
Intercompany Eliminations |
|
|
(8,801) |
|
|
(13,044) |
|
|
(9,010) |
|
|
(44,668) |
|
|
(38,704) |
Total |
|
$ |
355,133 |
|
$ |
335,157 |
|
$ |
342,419 |
|
$ |
1,358,560 |
|
$ |
1,289,728 |
|
|
|
|
|
|
|
|
|
|
|
|
|
|
|
|
Income (Loss) from Operations: |
|
|
|
|
|
|
|
|
|
|
|
|
|
|
|
Well Intervention |
|
$ |
29,118 |
|
$ |
21,041 |
|
$ |
16,109 |
|
$ |
93,205 |
|
$ |
32,398 |
Robotics |
|
|
19,335 |
|
|
9,224 |
|
|
24,158 |
|
|
77,343 |
|
|
52,450 |
Shallow Water Abandonment |
|
|
(5,422) |
|
|
12,032 |
|
|
8,808 |
|
|
(9,323) |
|
|
66,240 |
Production Facilities |
|
|
5,498 |
|
|
(985) |
|
|
8,288 |
|
|
21,340 |
|
|
20,832 |
Change in Fair Value of Contingent Consideration |
|
|
— |
|
|
(10,927) |
|
|
— |
|
|
— |
|
|
(42,246) |
Corporate / Other / Eliminations |
|
|
(17,651) |
|
|
(15,005) |
|
|
(12,723) |
|
|
(55,130) |
|
|
(66,164) |
Total |
|
$ |
30,878 |
|
$ |
15,380 |
|
$ |
44,640 |
|
$ |
127,435 |
|
$ |
63,510 |
Fourth Quarter Results
Segment Results
Well Intervention
Well Intervention revenues increased $51.6 million, or 30%, during the fourth quarter 2024 compared to the prior quarter primarily due to a fewer number of transit and mobilization days and higher day rates compared to the prior quarter. During the fourth quarter 2024, the Q4000 incurred 58 fewer days of mobilization and transit compared to the prior quarter, a period during which mobilization revenues and costs were deferred and not recognized. The Q4000 completed its mobilization for its Nigeria campaign and commenced operations at higher rates in early October 2024, and the Q7000 generated higher rates during the fourth quarter 2024 compared to the prior quarter prior to commencing its transit to Brazil early November 2024. Revenues also increased quarter over quarter due to a contract cancellation for work scheduled in 2025 of approximately $14 million in our North Sea operations, as well as higher rates and utilization on the Siem Helix 1, which commenced its contract extension with Trident in Brazil at higher rates during the fourth quarter 2024. Revenue increases were offset in part by low seasonal utilization on our North Sea vessels, which were nearly fully utilized during the prior quarter, and lower utilization on the Siem Helix 2, which commenced its vessel acceptance period at the end of December on its new contract with Petrobras. Overall Well Intervention vessel utilization was 79% during the fourth quarter 2024 compared to 97% during the prior quarter. Well Intervention operating income increased $13.0 million during the fourth quarter 2024 compared to the prior quarter. The increase was due primarily to the contract cancellation fee in addition to improvements in operating income on the Q4000 and the Siem Helix 1 being mostly offset by idle vessel-related costs in the North Sea.
Well Intervention revenues increased $22.3 million, or 11%, during the fourth quarter 2024 compared to the fourth quarter 2023. The increase was due to the contract cancellation fee in addition to higher rates on the Q4000, Q7000 and Siem Helix 1, offset in part primarily by lower revenues on the Q5000 during the fourth quarter 2024. The Q4000 and the Q7000 generated higher rates during the fourth quarter 2024 compared to the same quarter in 2023. Additionally during the fourth quarter 2024, the Siem Helix 1 commenced its contract extension with Trident in Brazil at higher rates. Fourth quarter 2024 utilization was lower on our North Sea vessels, which were fully utilized during the fourth quarter 2023, and with the Siem Helix 2 commencing its vessel acceptance period at the end of December. Revenues on the Q5000 were also lower due to the vessel working at lower legacy rates during the fourth quarter 2024. There were a similar number of mobilization and transit days during both the fourth quarters 2024 and 2023. Overall Well Intervention vessel utilization decreased to 79% during the fourth quarter 2024 compared to 95% during the fourth quarter 2023. Well Intervention operating income increased $8.1 million during the fourth quarter 2024 compared to the fourth quarter 2023, primarily due to the contract cancellation fee and higher margins on the Q7000 Australia operations, offset in part by idle vessel costs in the North Sea and lower margins on the Q5000.
Robotics
Robotics revenues decreased $2.9 million, or 3%, during the fourth quarter 2024 compared to the prior quarter. The decrease in revenues was due to lower overall vessel, trenching and ROV utilization, offset in part by an increase in integrated vessel trenching days compared to the prior quarter. Chartered vessel activity decreased to 508 days, or 98%, during the fourth quarter 2024 compared to 532 days, or 96%, during the prior quarter. ROV and trencher utilization decreased to 64% during the fourth quarter 2024 compared to 77% during the prior quarter. Integrated vessel trenching increased to 269 days during the fourth quarter 2024 compared to 249 days during the prior quarter. The i-Plough had 26 days of utilization on a third-party vessel and the IROV boulder grab had 65 days of utilization during the fourth quarter 2024, whereas the i-Plough and the IROV boulder grab each had 92 days of utilization during the prior quarter. Robotics operating income decreased $4.8 million during the fourth quarter 2024 compared to the prior quarter primarily due to lower revenue and project demobilization costs incurred related to two vessels during the fourth quarter.
Robotics revenues increased $18.6 million, or 30%, during the fourth quarter 2024 compared to the fourth quarter 2023. The increase in revenues was primarily due to higher rates on our vessels and ROVs and higher vessel activities, offset by lower ROV utilization during the fourth quarter 2024. Chartered vessel activity increased to 508 days, or 98%, during the fourth quarter 2024 compared to 463 days, or 97%, during the fourth quarter 2023. Integrated vessel trenching remained relatively flat with 269 days during the fourth quarter 2024 compared to 271 days during the fourth quarter 2023, and the fourth quarter 2024 included 26 days of utilization on the i-Plough trencher on a third-party vessel and 65 days of utilization on the IROV boulder grab, whereas the i-Plough and IROV were idle during the fourth quarter 2023. Overall ROV and trencher utilization decreased to 64% during the fourth quarter 2024 compared to 68% during the fourth quarter 2023. Robotics operating income increased $10.1 million during the fourth quarter 2024 primarily due to higher revenues compared to the fourth quarter 2023.
Shallow Water Abandonment
Shallow Water Abandonment revenues decreased $33.9 million, or 47%, during the fourth quarter 2024 compared to the prior quarter. The decrease in revenues was due to the seasonal decrease in vessel and system utilization during the fourth quarter 2024. Vessel utilization (excluding heavy lift) decreased to 65% during the fourth quarter 2024 compared to 76% during the prior quarter. Plug and Abandonment (“P&A”) and Coiled Tubing (“CT”) systems activity declined to 416 days, or 17% utilization, during the fourth quarter 2024 compared to 607 days, or 25% utilization, during the prior quarter. The Epic Hedron heavy lift barge had 41% utilization during the fourth quarter 2024 compared to 88% during the prior quarter. Shallow Water Abandonment operating income decreased $14.2 million during the fourth quarter 2024 compared to the prior quarter primarily due to lower revenues during the fourth quarter 2024.
Shallow Water Abandonment revenues decreased $24.3 million, or 39%, during the fourth quarter 2024 compared to the fourth quarter 2023 due to lower vessel and system utilization during the fourth quarter 2024. Vessel utilization (excluding heavy lift) was 65% during the fourth quarter 2024 compared to 71% during the fourth quarter 2023. P&A and CT systems utilization declined to 416 days, or 17%, during the fourth quarter 2024 compared to 1,386 days of utilization, or 58%, during the fourth quarter 2023. The Epic Hedron heavy lift barge had 41% utilization during the fourth quarter 2024 compared to 76% utilization during the fourth quarter 2023. Shallow Water Abandonment operating income decreased $17.5 million during the fourth quarter 2024 compared to the fourth quarter 2023 primarily due to lower revenues.
Production Facilities
Production Facilities revenues decreased $2.2 million, or 11%, during the fourth quarter 2024 compared to the prior quarter primarily due to lower oil and gas production and prices during the fourth quarter. Oil and gas production declined quarter over quarter due to no production from the Thunder Hawk wells, which had one month of production in the prior quarter before being shut in, and an unplanned shut-in of the Droshky wells during October 2024, which had a full quarter of production during the prior quarter. Production Facilities operating income decreased $2.8 million during the fourth quarter 2024 compared to the prior quarter primarily due to lower revenues during the fourth quarter 2024.
Production Facilities revenues decreased $0.9 million, or 5%, during the fourth quarter 2024 compared to the fourth quarter 2023 primarily due to lower oil and gas production and prices during the fourth quarter 2024. Oil and gas production declined during the fourth quarter 2024 due to an unplanned shut-in of the Droshky wells during October 2024. The Thunder Hawk wells were shut-in during both the fourth quarters 2024 and 2023. Production Facilities operating income increased $6.5 million during the fourth quarter 2024 compared to the fourth quarter 2023 primarily due to the incurrence of well workover costs related to the Thunder Hawk wells at the end of the fourth quarter 2023.
Selling, General and Administrative and Other
Selling, General and Administrative
Selling, general and administrative expenses were $27.6 million, or 7.8% of revenue, during the fourth quarter 2024 compared to $21.1 million, or 6.2% of revenue, during the prior quarter and $23.0 million, or 6.9% of revenue, during the fourth quarter 2023. The increase in expenses during the fourth quarter 2024 was primarily due to higher compensation costs compared to the prior quarter and prior year.
Other Income and Expenses
Other expense, net was $1.3 million during the fourth quarter 2024 compared to $0.0 million during the prior quarter and other income, net of $7.0 million during the fourth quarter 2023. Other expense, net in the fourth quarter 2024 primarily included foreign currency losses related to the approximate 6% depreciation of the British pound. Other income, net during the fourth quarter 2023 primarily includes foreign currency gains related to the approximate 4% appreciation in the British pound, offset in part by losses on conversions of our Nigerian naira into dollars.
Change in Fair Value of Contingent Consideration
Change in fair value of contingent consideration of $10.9 million during the fourth quarter 2023 was related to our acquisition of Alliance and reflected an increase in the fair value during the fourth quarter 2023 of the estimated earnout, which was paid in April 2024.
Cash Flows
Operating cash flows were $78.0 million during the fourth quarter 2024 compared to $55.7 million during the prior quarter and $94.7 million during the fourth quarter 2023. Fourth quarter 2024 operating cash flows increased compared to the prior quarter primarily due to working capital inflows during the fourth quarter 2024 compared to outflows during the prior quarter and lower regulatory certification costs on our vessels and systems, offset in part by lower earnings during the fourth quarter 2024. Fourth quarter 2024 operating cash flows decreased compared to the fourth quarter 2023 primarily due to higher regulatory certification costs on our vessels and systems, and lower working capital inflows during the fourth quarter 2024. Regulatory certifications for our vessels and systems, which are included in operating cash flows, were $6.1 million during the fourth quarter 2024 compared to $8.9 million during the prior quarter and $3.3 million during the fourth quarter 2023.
Capital expenditures, which are included in investing cash flows, totaled $12.5 million during the fourth quarter 2024 compared to $3.2 million during the prior quarter and $3.4 million during the fourth quarter 2023.Free Cash Flow was $65.5 million during the fourth quarter 2024 compared to $52.6 million during the prior quarter and $91.9 million during the fourth quarter 2023. The increase in Free Cash Flow in the fourth quarter 2024 compared to the prior quarter was due primarily to higher operating cash flows, offset in part by higher capital expenditures, during the fourth quarter 2024. The decrease in Free Cash Flow in the fourth quarter 2024 compared to the fourth quarter 2023 was due to lower operating cash flow and higher capital expenditures during the fourth quarter 2024. (Free Cash Flow is a non-GAAP measure. See reconciliation below.)
Full Year Results
Segment Results
Well Intervention
Well Intervention revenues increased $122.1 million, or 17%, in 2024 compared to 2023 due primarily to overall higher rates and utilization in 2024. U.S. Gulf Coast utilization improved in 2024 following a higher number of regulatory docking days during 2023 on the Q4000 and Q5000 vessels. Revenues on the Q7000 also increased during 2024 as the vessel incurred fewer transit and mobilization days in 2024 compared to 2023, and the vessel generated higher integrated project revenues on its Australia campaign during 2024 compared to the rates generated in New Zealand in 2023. During transit and mobilization periods, mobilization revenues and costs are deferred and not recognized. Revenues in Brazil improved primarily due to the transition of the Siem Helix 1 to its improved contracted rates with Trident during the fourth quarter 2024. North Sea revenues increased with year-over-year improvements in rates on both vessels and the recognition of a contract cancellation fee, offset in part by the return to lower winter seasonal utilization and the regulatory docking of the Well Enhancer during 2024, whereas both vessels had high utilization in 2023. Overall Well Intervention vessel utilization increased to 90% during 2024 compared to 88% in 2023. Well Intervention operating income increased $60.8 million during 2024 compared 2023 primarily due to higher revenues in 2024.
Robotics
Robotics revenues increased $39.8 million, or 15%, in 2024 compared to 2023. The increase was due to higher vessel, trenching and ROV utilization and higher rates in 2024. Chartered vessel days increased to 1,901 days, which included 371 spot vessel days, in 2024 compared to 1,699 days, which included 310 spot vessel days, in 2023. Vessel trenching days increased to 835 days in 2024 compared to 807 days in 2023. Overall ROV and trencher utilization increased to 69% in 2024 compared to 62% in 2023. Robotics operating income increased $24.9 million in 2024 compared to 2023. The increase in operating income was primarily due to higher revenues during 2023.
Shallow Water Abandonment
Shallow Water Abandonment revenues decreased $88.0 million, or 32%, in 2024 compared to 2023. The decrease in revenues was due primarily to lower utilization on our systems and vessels in 2024 compared to 2023. P&A and CT systems achieved 2,281 days of utilization, or 24%, during 2024 compared to 5,748 days, or 70%, during 2023. Vessel utilization (excluding heavy lift) declined to 61% in 2024 compared to 75% during 2023. Utilization on the Epic Hedron heavy lift barge was 44% in 2024 compared to 68% during 2023. Shallow Water Abandonment generated an operating loss of $9.3 million during 2024 compared to operating income of $66.2 million in 2023, primarily due to lower revenue in 2024.
Production Facilities
Production Facilities revenues increased $0.8 million, or 1%, during 2024 compared to 2023. The increase was primarily due to higher oil and gas production volumes in 2024, offset in part by lower rates on the Helix Fast Response System, which were reduced with the Q4000 project in Nigeria during the second half 2024. Production Facilities operating income increased $0.5 million during 2024 primarily due to higher revenues compared to 2023.
Selling, General and Administrative and Other
Selling, General and Administrative
Selling, general and administrative expenses were $91.7 million, or 6.7% of revenue, in 2024 compared to $94.4 million, or 7.3% of revenue, in 2023. The decrease in expense was primarily due to a net decrease in compensation related costs offset partially by an increase in other facilities and professional fees in 2024.
Net Interest Expense
Net interest expense increased to $22.6 million in 2024 compared to $17.3 million in 2023. The increase was due to a full year of interest on our $300 million Senior Notes due 2029 issued during the fourth quarter 2023, offset in part by higher interest income on our invested cash during 2024.
Change in Fair Value of Contingent Consideration
Change in fair value of contingent consideration related to our acquisition of Alliance was $42.2 million during 2023 and reflects an increase in the fair value of the earnout that was based on Alliance earnings through 2023, which was paid in cash in April 2024.
Losses Related to Convertible Senior Notes
Losses related to convertible senior notes was $20.9 million in 2024 and $37.3 million in 2023 and are related to the redemption of the remaining $40.2 million principal amount of the 2026 Notes in 2024 and the repurchase of $159.8 million principal amount of the 2026 Notes during 2023.
Other Income and Expenses
Other expense, net was $3.9 million in 2024 compared to $3.6 million in 2023. Other expense, net in 2024 was primarily due to a charge of $2.4 million related to an increase in the value of incentive credits issued to the seller of P&A equipment acquired in 2023 and foreign currency losses due to the weakening of the British pound and Brazilian real in 2024, whereas other expense, net in 2023 primarily included foreign currency gains due to the strengthening in the British pound, offset in part by losses associated with the devaluation of our Nigerian naira holdings during 2023.
Cash Flows
Helix generated operating cash flows of $186.0 million in 2024 compared to $152.5 million in 2023. Operating cash flows in 2024 included $58.3 million cash paid for the earnout related to the Alliance acquisition. Absent this payment, operating cash flows would have increased $91.9 million compared to 2023 primarily due to higher earnings, improved working capital inflows, and lower regulatory certification costs on our vessels and systems in 2024. Regulatory certification costs, which are considered part of Helix’s capital spending program but are classified in operating cash flows, were $35.4 million in 2024 compared to $62.5 million in 2023.
Capital expenditures increased to $23.3 million in 2024 compared to $19.6 million in 2023.
Free Cash Flow increased to $163.2 million in 2024 compared to $133.8 million in 2023. The increase was due to higher operating cash flows, offset in part by higher capital expenditures in 2024 compared to 2023. (Free Cash Flow is a non-GAAP measure. See reconciliation below.)
Share Repurchases
Share repurchases in 2024 totaled 2.9 million shares for approximately $29.6 million compared to share repurchases in 2023 of 1.6 million shares for approximately $12.0 million.
Financial Condition and Liquidity
Cash and cash equivalents were $368.0 million on December 31, 2024. Available capacity under our ABL facility on December 31, 2024 was $66.6 million, and total liquidity was $429.6 million, and excludes cash pledged toward our ABL facility. Consolidated long-term debt was $315.2 million on December 31, 2024, resulting in negative Net Debt of $52.9 million. (Net Debt is a non-GAAP measure. See reconciliation below.)
* * * * *
Conference Call Information
Further details are provided in the presentation for Helix’s quarterly teleconference to review its fourth quarter and full year 2024 results (see the Investor Relations page of Helix’s website, www.helixesg.com). The teleconference is scheduled for Tuesday, February 25, 2025, at 9:00 a.m. Central Time. Investors and other interested parties wishing to participate in the teleconference should dial 1-800-715-9871 within the United States and 1-646-307-1963 outside the United States. The passcode is “Staffeldt.” A live webcast of the teleconference will be available in a listen-only mode on the Investor Relations section of Helix’s website. A replay of the webcast will be available on Helix’s website beginning approximately three hours after the completion of the event.
About Helix
Helix Energy Solutions Group, Inc., headquartered in Houston, Texas, is an international offshore energy services company that provides specialty services to the offshore energy industry, with a focus on well intervention, robotics and decommissioning operations. Our services are key in supporting a global energy transition by maximizing production of existing oil and gas reserves, decommissioning end-of-life oil and gas fields and supporting renewable energy developments. For more information about Helix, please visit our website at www.helixesg.com.
Non-GAAP Financial Measures
Management evaluates operating performance and financial condition using certain non-GAAP measures, primarily EBITDA, Adjusted EBITDA, Free Cash Flow and Net Debt. We define EBITDA as earnings before income taxes, net interest expense, net other income or expense, and depreciation and amortization expense. Non-cash impairment losses on goodwill and other long-lived assets are also added back if applicable. To arrive at our measure of Adjusted EBITDA, we exclude gains or losses on disposition of assets, acquisition and integration costs, gains or losses related to convertible senior notes, the change in fair value of contingent consideration, and the general provision (release) for current expected credit losses, if any. We define Free Cash Flow as cash flows from operating activities less capital expenditures, net of proceeds from asset sales and insurance recoveries (related to property and equipment), if any. Net Debt is calculated as long-term debt including current maturities of long-term debt less cash and cash equivalents and restricted cash.
We use EBITDA, Adjusted EBITDA, Free Cash Flow and Net Debt to monitor and facilitate internal evaluation of the performance of our business operations, to facilitate external comparison of our business results to those of others in our industry, to analyze and evaluate financial and strategic planning decisions regarding future investments and acquisitions, to plan and evaluate operating budgets, and in certain cases, to report our results to the holders of our debt as required by our debt covenants. We believe that our measures of EBITDA, Adjusted EBITDA, Free Cash Flow and Net Debt provide useful information to the public regarding our operating performance and ability to service debt and fund capital expenditures and may help our investors understand and compare our results to other companies that have different financing, capital and tax structures. Other companies may calculate their measures of EBITDA, Adjusted EBITDA, Free Cash Flow and Net Debt differently from the way we do, which may limit their usefulness as comparative measures. EBITDA, Adjusted EBITDA, Free Cash Flow and Net Debt should not be considered in isolation or as a substitute for, but instead are supplemental to, income from operations, net income, cash flows from operating activities, or other income or cash flow data prepared in accordance with GAAP. Users of this financial information should consider the types of events and transactions that are excluded from these measures. See reconciliation of the non-GAAP financial information presented in this press release to the most directly comparable financial information presented in accordance with GAAP. We have not provided reconciliations of forward-looking non-GAAP financial measures to comparable GAAP measures due to the challenges and impracticability with estimating some of the items without unreasonable effort, which amounts could be significant.
Forward-Looking Statements
This press release contains forward-looking statements that involve risks, uncertainties and assumptions that could cause our results to differ materially from those expressed or implied by such forward-looking statements. All statements, other than statements of historical fact, are “forward-looking statements” within the meaning of the Private Securities Litigation Reform Act of 1995, including, without limitation, any statements regarding: our plans, strategies and objectives for future operations; any projections of financial items including projections as to guidance and other outlook information; future operations expenditures; our ability to enter into, renew and/or perform commercial contracts; the spot market; our current work continuing; visibility and future utilization; our protocols and plans; future economic or political conditions; energy transition or energy security; our spending and cost management efforts and our ability to manage changes; oil price volatility and its effects and results; our ability to identify, effect and integrate mergers, acquisitions, joint ventures or other transactions, including the integration of the Alliance acquisition and any subsequently identified legacy issues with respect thereto; developments; any financing transactions or arrangements or our ability to enter into such transactions or arrangements; our sustainability initiatives; our share repurchase program or execution; any statements of expectation or belief; and any statements of assumptions underlying any of the foregoing. Forward-looking statements are subject to a number of known and unknown risks, uncertainties and other factors that could cause results to differ materially from those in the forward-looking statements, including but not limited to market conditions and the demand for our services; volatility of oil and natural gas prices; complexities of global political and economic developments; results from mergers, acquisitions, joint ventures or similar transactions; results from acquired properties; our ability to secure and realize backlog; the performance of contracts by customers, suppliers and other counterparties; actions by governmental and regulatory authorities; operating hazards and delays, which include delays in delivery, chartering or customer acceptance of assets or terms of their acceptance; the effectiveness of our sustainability initiatives and disclosures; human capital management issues; geologic risks; and other risks described from time to time in our filings with the Securities and Exchange Commission (“SEC”), including our most recently filed Annual Report on Form 10-K, which are available free of charge on the SEC’s website at www.sec.gov. We assume no obligation and do not intend to update these forward-looking statements, which speak only as of their respective dates, except as required by law.
HELIX ENERGY SOLUTIONS GROUP, INC.
|
|
|
Three Months Ended Dec. 31, |
|
Year Ended Dec. 31, |
||||||||
(in thousands, except per share data) |
|
|
2024 |
|
2023 |
|
2024 |
|
2023 |
||||
|
|
|
(unaudited) |
|
(unaudited) |
|
|
|
|||||
|
|
|
|
|
|
|
|
|
|
|
|
|
|
Net revenues |
|
|
$ |
355,133 |
|
$ |
335,157 |
|
$ |
1,358,560 |
|
$ |
1,289,728 |
Cost of sales |
|
|
|
296,274 |
|
|
285,879 |
|
|
1,138,996 |
|
|
1,089,372 |
Gross profit |
|
|
|
58,859 |
|
|
49,278 |
|
|
219,564 |
|
|
200,356 |
Gain (loss) on disposition of assets, net |
|
|
(429) |
|
|
— |
|
|
(479) |
|
|
367 |
|
Acquisition and integration costs |
|
|
— |
|
|
— |
|
|
— |
|
|
(540) |
|
Change in fair value of contingent consideration |
|
|
— |
|
|
(10,927) |
|
|
— |
|
|
(42,246) |
|
Selling, general and administrative expenses |
|
|
(27,552) |
|
|
(22,971) |
|
|
(91,650) |
|
|
(94,427) |
|
Income from operations |
|
|
30,878 |
|
|
15,380 |
|
|
127,435 |
|
|
63,510 |
|
Net interest expense |
|
|
|
(5,572) |
|
|
(4,771) |
|
|
(22,629) |
|
|
(17,338) |
Losses related to convertible senior notes |
|
|
— |
|
|
(37,277) |
|
|
(20,922) |
|
|
(37,277) |
|
Other income (expense), net |
|
|
(1,275) |
|
|
6,963 |
|
|
(3,922) |
|
|
(3,590) |
|
Royalty income and other |
|
|
(30) |
|
|
93 |
|
|
2,102 |
|
|
2,209 |
|
Income (loss) before income taxes |
|
|
24,001 |
|
|
(19,612) |
|
|
82,064 |
|
|
7,514 |
|
Income tax provision |
|
|
3,880 |
|
|
8,721 |
|
|
26,427 |
|
|
18,352 |
|
Net income (loss) |
|
|
$ |
20,121 |
|
$ |
(28,333) |
|
$ |
55,637 |
|
$ |
(10,838) |
|
|
|
|
|
|
|
|
|
|
|
|
|
|
Earnings (loss) per share of common stock: |
|
|
|
|
|
|
|
|
|
|
|
|
|
Basic |
|
|
$ |
0.13 |
|
$ |
(0.19) |
|
$ |
0.37 |
|
$ |
(0.07) |
Diluted |
|
|
$ |
0.13 |
|
$ |
(0.19) |
|
$ |
0.36 |
|
$ |
(0.07) |
|
|
|
|
|
|
|
|
|
|
|
|
|
|
Weighted average common shares outstanding: |
|
|
|
|
|
|
|
|
|
|
|
|
|
Basic |
|
|
|
151,446 |
|
|
150,580 |
|
|
151,989 |
|
|
150,917 |
Diluted |
|
|
|
154,246 |
|
|
150,580 |
|
|
154,699 |
|
|
150,917 |
|
|
|
Dec. 31, 2024 |
|
Dec. 31, 2023 |
||
(in thousands) |
|
|
(unaudited) |
|
|
|
|
|
|
|
|
|
|
|
|
ASSETS |
|
|
|
|
|
|
|
|
|
|
|
|
|
|
|
Current Assets: |
|
|
|
|
|
|
|
Cash and cash equivalents |
|
|
$ |
368,030 |
|
$ |
332,191 |
Accounts receivable, net |
|
|
|
258,630 |
|
|
280,427 |
Other current assets |
|
|
|
83,022 |
|
|
85,223 |
Total Current Assets |
|
|
|
709,682 |
|
|
697,841 |
|
|
|
|
|
|
|
|
Property and equipment, net |
|
|
|
1,437,853 |
|
|
1,572,849 |
Operating lease right-of-use assets |
|
|
|
329,649 |
|
|
169,233 |
Deferred recertification and dry dock costs, net |
|
|
71,718 |
|
|
71,290 |
|
Other assets, net |
|
|
|
48,178 |
|
|
44,823 |
Total Assets |
|
|
$ |
2,597,080 |
|
$ |
2,556,036 |
|
|
|
|
|
|
|
|
LIABILITIES AND SHAREHOLDERS' EQUITY |
|
|
|
|
|
|
|
|
|
|
|
|
|
|
|
Current Liabilities: |
|
|
|
|
|
|
|
Accounts payable |
|
|
$ |
144,793 |
|
$ |
134,552 |
Accrued liabilities |
|
|
|
90,455 |
|
|
203,112 |
Current maturities of long-term debt |
|
|
|
9,186 |
|
|
48,292 |
Current operating lease liabilities |
|
|
|
59,982 |
|
|
62,662 |
Total Current Liabilities |
|
|
|
304,416 |
|
|
448,618 |
|
|
|
|
|
|
|
|
Long-term debt |
|
|
|
305,971 |
|
|
313,430 |
Operating lease liabilities |
|
|
|
285,984 |
|
|
116,185 |
Deferred tax liabilities |
|
|
|
113,973 |
|
|
110,555 |
Other non-current liabilities |
|
|
|
66,971 |
|
|
66,248 |
Shareholders' equity |
|
|
|
1,519,765 |
|
|
1,501,000 |
Total Liabilities and Equity |
|
|
$ |
2,597,080 |
|
$ |
2,556,036 |
HELIX ENERGY SOLUTIONS GROUP, INC.
|
|
|
Year Ended |
||||
(in thousands) |
|
|
12/31/2024 |
|
12/31/2023 |
||
|
|
|
(unaudited) |
|
|
|
|
Cash flows from operating activities: |
|
|
|
|
|
|
|
Net income (loss) |
|
|
$ |
55,637 |
|
$ |
(10,838) |
Adjustments to reconcile net income (loss) to net cash provided by operating activities: |
|
|
|
|
|
|
|
Depreciation and amortization |
|
|
|
173,292 |
|
|
164,116 |
Deferred recertification and dry dock costs |
|
|
(35,387) |
|
|
(62,522) |
|
Payment of earnout consideration |
|
|
|
(58,300) |
|
|
— |
Change in fair value of contingent consideration |
|
|
— |
|
|
42,246 |
|
Losses related to convertible senior notes |
|
|
20,922 |
|
|
37,277 |
|
Working capital and other |
|
|
|
29,864 |
|
|
(17,822) |
Net cash provided by operating activities |
|
|
186,028 |
|
|
152,457 |
|
|
|
|
|
|
|
|
|
Cash flows from investing activities: |
|
|
|
|
|
|
|
Capital expenditures |
|
|
|
(23,303) |
|
|
(19,588) |
Proceeds from sale of assets |
|
|
|
100 |
|
|
365 |
Proceeds from insurance recoveries |
|
|
|
363 |
|
|
564 |
Net cash used in investing activities |
|
|
(22,840) |
|
|
(18,659) |
|
|
|
|
|
|
|
|
|
Cash flows from financing activities: |
|
|
|
|
|
|
|
Proceeds from long-term debt |
|
|
|
— |
|
|
298,578 |
Repayments of long-term debt |
|
|
|
(69,469) |
|
|
(269,480) |
Repurchases of common stock |
|
|
|
(29,620) |
|
|
(11,988) |
Payment of earnout consideration |
|
|
|
(26,700) |
|
|
— |
Other financing activities |
|
|
|
479 |
|
|
7,999 |
Net cash provided by (used in) financing activities |
|
|
(125,310) |
|
|
25,109 |
|
|
|
|
|
|
|
|
|
Effect of exchange rate changes on cash and cash equivalents |
|
|
(2,039) |
|
|
(15,827) |
|
Net increase (decrease) in cash and cash equivalents |
|
|
35,839 |
|
|
143,080 |
|
Cash and cash equivalents: |
|
|
|
|
|
|
|
Balance, beginning of year |
|
|
|
332,191 |
|
|
189,111 |
Balance, end of year |
|
|
$ |
368,030 |
|
$ |
332,191 |
Helix Energy Solutions Group, Inc.
Reconciliation of Non-GAAP Measures
|
|
|
|
Three Months Ended |
|
Year Ended |
|||||||||||
(in thousands, unaudited) |
|
|
|
12/31/2024 |
|
12/31/2023 |
|
9/30/2024 |
|
12/31/2024 |
|
12/31/2023 |
|||||
|
|
|
|
|
|
|
|
|
|
|
|
|
|
|
|
|
|
Reconciliation from Net Income (loss) to Adjusted EBITDA: |
|
|
|
|
|
|
|
|
|
|
|
|
|
|
|
||
Net income (loss) |
|
|
|
$ |
20,121 |
|
$ |
(28,333) |
|
$ |
29,514 |
|
$ |
55,637 |
|
$ |
(10,838) |
Adjustments: |
|
|
|
|
|
|
|
|
|
|
|
|
|
|
|
|
|
Income tax provision |
|
|
|
|
3,880 |
|
|
8,721 |
|
|
9,520 |
|
|
26,427 |
|
|
18,352 |
Net interest expense |
|
|
|
|
5,572 |
|
|
4,771 |
|
|
5,689 |
|
|
22,629 |
|
|
17,338 |
Other (income) expense, net |
|
|
|
|
1,275 |
|
|
(6,963) |
|
|
49 |
|
|
3,922 |
|
|
3,590 |
Depreciation and amortization |
|
|
|
|
40,564 |
|
|
44,103 |
|
|
42,904 |
|
|
173,292 |
|
|
164,116 |
EBITDA |
|
|
|
|
71,412 |
|
|
22,299 |
|
|
87,676 |
|
|
281,907 |
|
|
192,558 |
Adjustments: |
|
|
|
|
|
|
|
|
|
|
|
|
|
|
|
|
|
(Gain) loss on disposition of assets, net |
|
|
429 |
|
|
— |
|
|
(100) |
|
|
479 |
|
|
(367) |
||
Acquisition and integration costs |
|
|
|
— |
|
|
— |
|
|
— |
|
|
— |
|
|
540 |
|
Change in fair value of contingent consideration |
|
|
— |
|
|
10,927 |
|
|
— |
|
|
— |
|
|
42,246 |
||
General provision (release) for current expected credit losses |
|
|
(200) |
|
|
129 |
|
|
45 |
|
|
(161) |
|
|
1,149 |
||
Losses related to convertible senior notes |
|
|
— |
|
|
37,277 |
|
|
— |
|
|
20,922 |
|
|
37,277 |
||
Adjusted EBITDA |
|
|
|
$ |
71,641 |
|
$ |
70,632 |
|
$ |
87,621 |
|
$ |
303,147 |
|
$ |
273,403 |
|
|
|
|
|
|
|
|
|
|
|
|
|
|
|
|
|
|
Free Cash Flow: |
|
|
|
|
|
|
|
|
|
|
|
|
|
|
|
|
|
Cash flows from operating activities |
|
|
$ |
77,977 |
|
$ |
94,737 |
|
$ |
55,731 |
|
$ |
186,028 |
|
$ |
152,457 |
|
Less: Capital expenditures, net of proceeds from asset sales and insurance recoveries |
|
|
(12,523) |
|
|
(2,859) |
|
|
(3,086) |
|
|
(22,840) |
|
|
(18,659) |
||
Free Cash Flow |
|
|
|
$ |
65,454 |
|
$ |
91,878 |
|
$ |
52,645 |
|
$ |
163,188 |
|
$ |
133,798 |
|
|
|
|
|
|
|
|
|
|
|
|
|
|
|
|
|
|
Net Debt: |
|
|
|
|
|
|
|
|
|
|
|
|
|
|
|
|
|
Long-term debt including current maturities |
|
|
$ |
315,157 |
|
$ |
361,722 |
|
$ |
314,673 |
|
$ |
315,157 |
|
$ |
361,722 |
|
Less: Cash and cash equivalents |
|
|
(368,030) |
|
|
(332,191) |
|
|
(324,120) |
|
|
(368,030) |
|
|
(332,191) |
||
Net Debt |
|
|
|
$ |
(52,873) |
|
$ |
29,531 |
|
$ |
(9,447) |
|
$ |
(52,873) |
|
$ |
29,531 |
|
February 25, 2025 Fourth Quarter 2024 Conference Call |
|
2 2 This presentation contains forward-looking statements that involve risks, uncertainties and assumptions that could cause our results to differ materially from those expressed or implied by such forward-looking statements. All statements, other than statements of historical fact, are "forward-looking statements" within the meaning of the Private Securities Litigation Reform Act of 1995, including, without limitation, any statements regarding: our plans, strategies and objectives for future operations; any projections of financial items including projections as to guidance and other outlook information; future operations expenditures; our ability to enter into, renew and/or perform commercial contracts; the spot market; our current work continuing; visibility and future utilization; our protocols and plans; future economic or political conditions; energy transition or energy security; our spending and cost management efforts and our ability to manage changes; oil price volatility and its effects and results; our ability to identify, effect and integrate mergers, acquisitions, joint ventures or other transactions, including the integration of the Alliance acquisition and any subsequently identified legacy issues with respect thereto; developments; any financing transactions or arrangements or our ability to enter into such transactions or arrangements; our sustainability initiatives; our share repurchase program or execution; any statements of expectation or belief; and any statements of assumptions underlying any of the foregoing. Forward-looking statements are subject to a number of known and unknown risks, uncertainties and other factors that could cause results to differ materially from those in the forward-looking statements, including but not limited to market conditions and the demand for our services; volatility of oil and natural gas prices; complexities of global political and economic developments; results from mergers, acquisitions, joint ventures or similar transactions; results from acquired properties; our ability to secure and realize backlog; the performance of contracts by customers, suppliers and other counterparties; actions by governmental and regulatory authorities; operating hazards and delays, which include delays in delivery, chartering or customer acceptance of assets or terms of their acceptance; the effectiveness of our sustainability initiatives and disclosures; human capital management issues; geologic risks; and other risks described from time to time in our filings with the Securities and Exchange Commission ("SEC"), including our most recently filed Annual Report on Form 10-K, which are available free of charge on the SEC's website at www.sec.gov. We assume no obligation and do not intend to update these forward-looking statements, which speak only as of their respective dates, except as required by law. INTRODUCTION Forward-Looking Statements |
|
3 3 • Executive Summary (pg. 4) • Operational Highlights (pg. 8) • Key Financial Metrics (pg. 13) • 2025 Outlook (pg. 15) • Non-GAAP Reconciliations (pg. 20) • Questions and Answers PRESENTATION OUTLINE Agenda |
|
4 Executive Summary |
|
5 5 EXECUTIVE SUMMARY Summary of Results ($ in millions, except per share amounts, unaudited) Three Months Ended 12/31/24 12/31/23 9/30/24 12/31/24 12/31/23 Revenues 355 $ 335 $ 342 $ 1,359 $ 1,290 $ Gross profit 59 $ 49 $ 66 $ 220 $ 200 $ 17% 15% 19% 16% 16% Net income (loss) 20 $ (28) $ 30 $ 56 $ (11) $ Basic earnings (loss) per share 0.13 $ (0.19) $ 0.19 $ 0.37 $ (0.07) $ Diluted earnings (loss) per share $ (0.19) 0.13 $ 0.19 $ 0.36 $ (0.07) $ Adjusted EBITDA1 Business segments 89 $ 85 $ 100 $ 356 $ 335 $ Corporate, eliminations and other (18) (15) (12) (53) (62) Adjusted EBITDA1 $ 71 72 $ 88 $ 303 $ 273 $ Cash and cash equivalents 368 $ 332 $ 324 $ 368 $ 332 $ Net Debt1 $ 30 (53) $ (9) $ (53) $ 30 $ Cash flows from operating activities2 $ 95 78 $ 56 $ 186 $ 152 $ Free Cash Flow1,2 $ 92 65 $ 53 $ 163 $ 134 $ Year Ended 1 Adjusted EBITDA, Net Debt and Free Cash Flow are non-GAAP financial measures; see non-GAAP reconciliations below 2 Cash flows from operating activities and Free Cash Flow for the year ended 12/31/24 include $58 million of the $85 million Alliance earnout paid in cash in April 2024 Amounts may not add due to rounding |
|
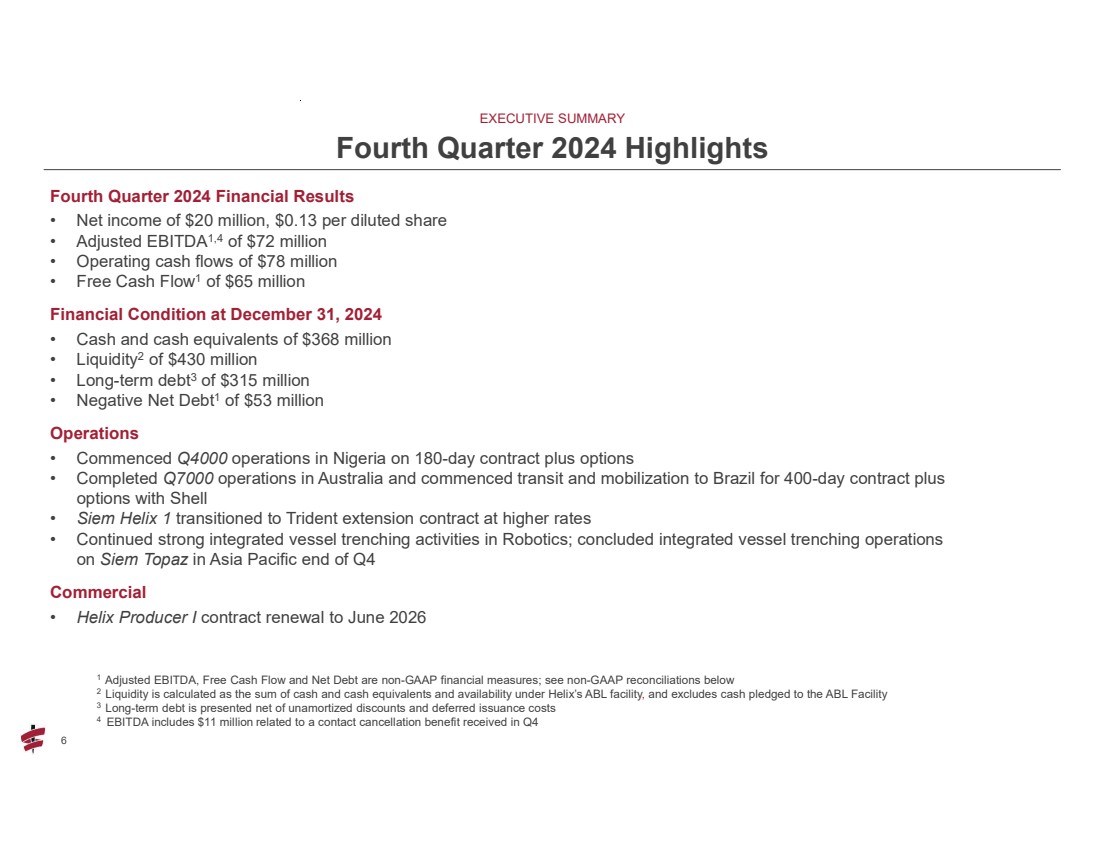
6 6 Fourth Quarter 2024 Financial Results • Net income of $20 million, $0.13 per diluted share • Adjusted EBITDA1,4 of $72 million • Operating cash flows of $78 million • Free Cash Flow1 of $65 million Financial Condition at December 31, 2024 • Cash and cash equivalents of $368 million • Liquidity2 of $430 million • Long-term debt3 of $315 million • Negative Net Debt1 of $53 million Operations • Commenced Q4000 operations in Nigeria on 180-day contract plus options • Completed Q7000 operations in Australia and commenced transit and mobilization to Brazil for 400-day contract plus options with Shell • Siem Helix 1 transitioned to Trident extension contract at higher rates • Continued strong integrated vessel trenching activities in Robotics; concluded integrated vessel trenching operations on Siem Topaz in Asia Pacific end of Q4 Commercial • Helix Producer I contract renewal to June 2026 EXECUTIVE SUMMARY Fourth Quarter 2024 Highlights 1 Adjusted EBITDA, Free Cash Flow and Net Debt are non-GAAP financial measures; see non-GAAP reconciliations below 2 Liquidity is calculated as the sum of cash and cash equivalents and availability under Helix’s ABL facility, and excludes cash pledged to the ABL Facility 3 Long-term debt is presented net of unamortized discounts and deferred issuance costs 4 EBITDA includes $11 million related to a contact cancellation benefit received in Q4 |
|
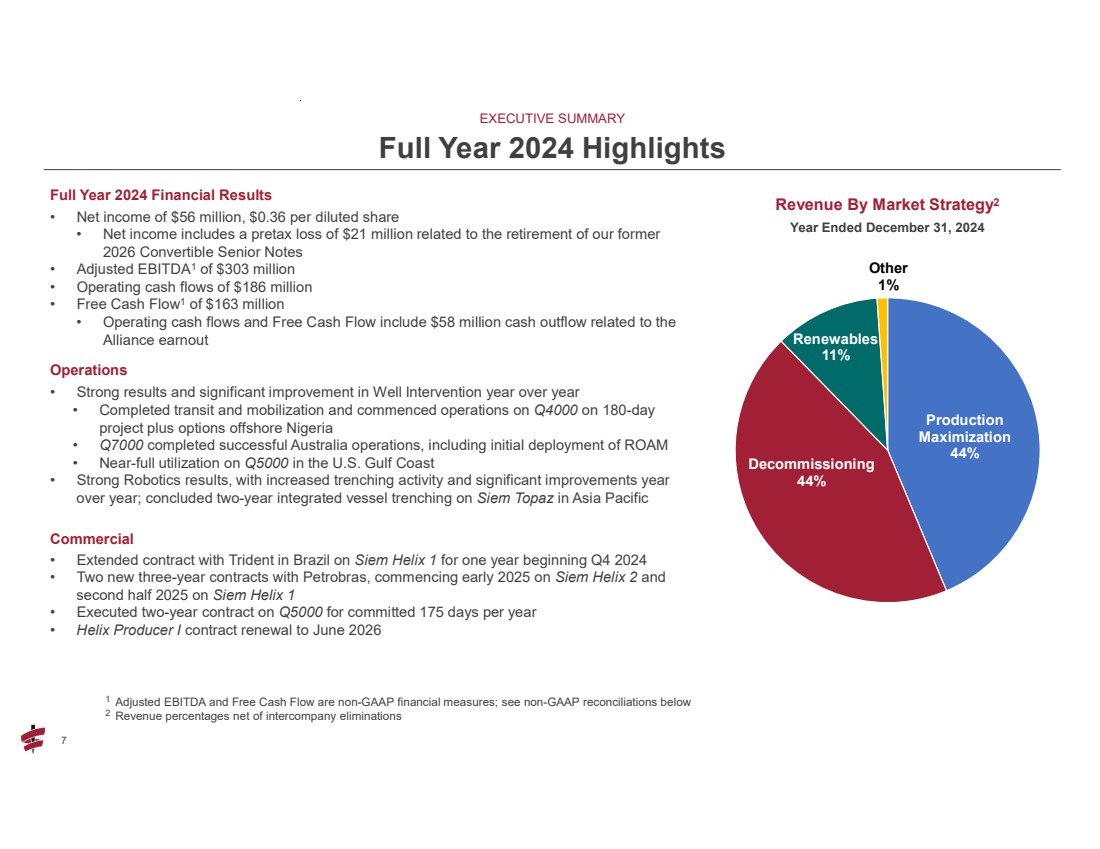
7 7 Full Year 2024 Financial Results • Net income of $56 million, $0.36 per diluted share • Net income includes a pretax loss of $21 million related to the retirement of our former 2026 Convertible Senior Notes • Adjusted EBITDA1 of $303 million • Operating cash flows of $186 million • Free Cash Flow1 of $163 million • Operating cash flows and Free Cash Flow include $58 million cash outflow related to the Alliance earnout Operations • Strong results and significant improvement in Well Intervention year over year • Completed transit and mobilization and commenced operations on Q4000 on 180-day project plus options offshore Nigeria • Q7000 completed successful Australia operations, including initial deployment of ROAM • Near-full utilization on Q5000 in the U.S. Gulf Coast • Strong Robotics results, with increased trenching activity and significant improvements year over year; concluded two-year integrated vessel trenching on Siem Topaz in Asia Pacific Commercial • Extended contract with Trident in Brazil on Siem Helix 1 for one year beginning Q4 2024 • Two new three-year contracts with Petrobras, commencing early 2025 on Siem Helix 2 and second half 2025 on Siem Helix 1 • Executed two-year contract on Q5000 for committed 175 days per year • Helix Producer I contract renewal to June 2026 EXECUTIVE SUMMARY Full Year 2024 Highlights 1 Adjusted EBITDA and Free Cash Flow are non-GAAP financial measures; see non-GAAP reconciliations below 2 Revenue percentages net of intercompany eliminations Production Maximization 44% Decommissioning 44% Renewables 11% Other 1% Revenue By Market Strategy2 Year Ended December 31, 2024 |
|
8 Operational Highlights |
|
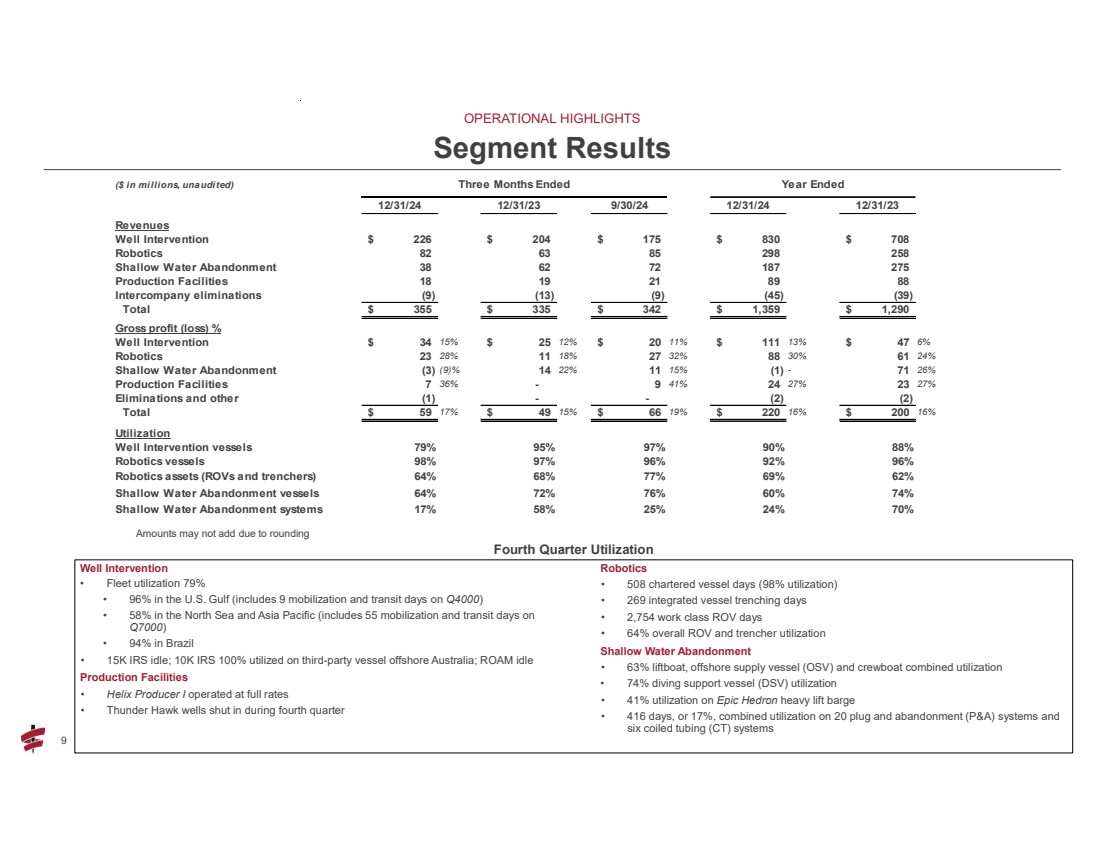
9 9 OPERATIONAL HIGHLIGHTS Segment Results ($ in millions, unaudited) Three Months Ended Year Ended 12/31/24 12/31/23 9/30/24 12/31/24 12/31/23 Revenues Well Intervention 226 $ 204 $ 175 $ 830 $ 708 $ Robotics 82 63 85 298 258 Shallow Water Abandonment 38 62 72 187 275 Production Facilities 18 19 21 89 88 Intercompany eliminations (9) (13) (9) (45) (39) Total 355 $ 335 $ 342 $ 1,359 $ 1,290 $ Gross profit (loss) % Well Intervention 34 $ 15% $ 25 12% $ 20 11% $ 111 13% $ 47 6% Robotics 23 28% 11 18% 27 32% 88 30% 61 24% Shallow Water Abandonment (3) (9)% 14 22% 11 15% (1) - 71 26% Production Facilities 7 36% 9 - 41% 24 27% 23 27% Eliminations and other (1) - - (2) (2) Total 59 $ 17% $ 49 15% $ 66 19% $ 220 16% $ 200 16% Utilization Well Intervention vessels 79% 95% 97% 90% 88% Robotics vessels 98% 97% 96% 92% 96% Robotics assets (ROVs and trenchers) 64% 68% 77% 69% 62% Shallow Water Abandonment vessels 64% 72% 76% 60% 74% Shallow Water Abandonment systems 17% 58% 25% 24% 70% Amounts may not add due to rounding Well Intervention • Fleet utilization 79% • 96% in the U.S. Gulf (includes 9 mobilization and transit days on Q4000) • 58% in the North Sea and Asia Pacific (includes 55 mobilization and transit days on Q7000) • 94% in Brazil • 15K IRS idle; 10K IRS 100% utilized on third-party vessel offshore Australia; ROAM idle Production Facilities • Helix Producer I operated at full rates • Thunder Hawk wells shut in during fourth quarter Robotics • 508 chartered vessel days (98% utilization) • 269 integrated vessel trenching days • 2,754 work class ROV days • 64% overall ROV and trencher utilization Shallow Water Abandonment • 63% liftboat, offshore supply vessel (OSV) and crewboat combined utilization • 74% diving support vessel (DSV) utilization • 41% utilization on Epic Hedron heavy lift barge • 416 days, or 17%, combined utilization on 20 plug and abandonment (P&A) systems and six coiled tubing (CT) systems Fourth Quarter Utilization |
|
10 10 OPERATIONAL HIGHLIGHTS Well Intervention Utilization • Q4000 (US Gulf Coast, West Africa) – 94% utilized in Q4; completed mobilization and transit and commenced work for customer offshore Nigeria; performed production enhancement operations on four wells; utilization includes 9 days of paid mobilization and transit with related fees and costs deferred and recognized over contract term beginning mid-October 2024 • Q5000 (US Gulf Coast) – 98% utilized in Q4; completed heavy lift scope prior to commencing production enhancement and decommissioning scopes on four wells for one customer • Well Enhancer (North Sea) – 27% utilized in Q4; worked for two customers performing decommissioning operations; vessel idle for remainder of quarter • Seawell (North Sea) – 50% utilized in Q4; completed production enhancement work scope for two customers; vessel utilization excludes 12 days working for Helix Robotics performing survey work as a cost reduction measure (vessel days are included in Helix Robotics utilization); net cancellation benefit of $11 million in Q4 related to 2025 commitment • Q7000 (Australia) – 99% utilized in Q4; completed four-well production enhancement campaign off northwest Australia; vessel subsequently commenced mobilization and transit to Brazil; vessel utilization includes 55 days of paid mobilization and transit with related fees and costs deferred and recognized over contract term expected to begin Q1 2025 • Siem Helix 1 (Brazil) – 100% utilized in Q4; completed decommissioning scopes on five wells for Trident Energy; vessel transitioned to contract extension with Trident at improved rates at end of quarter • Siem Helix 2 (Brazil) – 88% utilized in Q4; completed temporary abandonment scope on one well and production enhancement scopes on two wells for Petrobras in the quarter; existing contract with Petrobras ended late December 2024, and vessel subsequently underwent an approximate six-day unpaid acceptance period before commencing new Petrobras contract • 15K IRS – idle during Q4 • 10K IRS – one system 100% utilized for project in Australia • ROAM – idle during Q4 1 U.S. Gulf Coast utilization includes Q4000 utilization offshore West Africa during Q4 2024 on a six-month contract 2 North Sea utilization includes Seawell utilization in the western Mediterranean between Q4 2023 and Q2 2024 3 Q7000 utilization includes utilization in West Africa through Q4 2022, New Zealand in 2023 and Australia in 2024 |
|
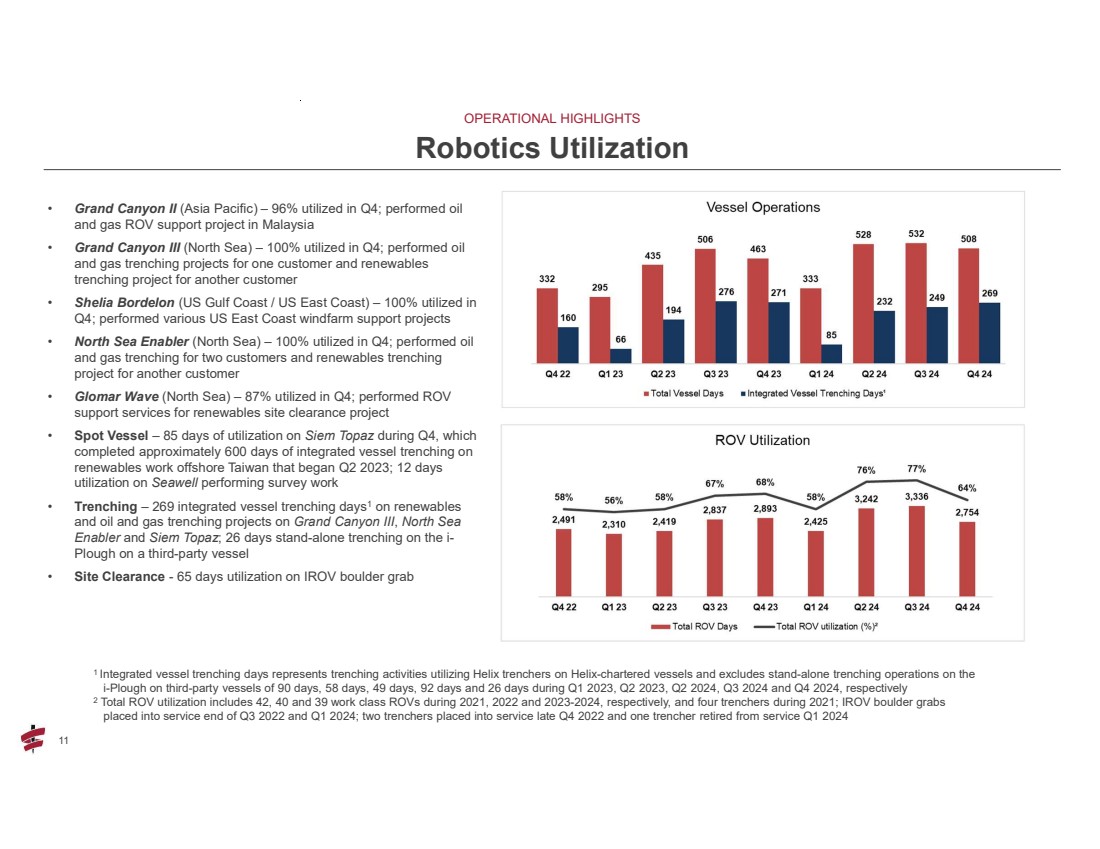
11 11 OPERATIONAL HIGHLIGHTS Robotics Utilization 1 Integrated vessel trenching days represents trenching activities utilizing Helix trenchers on Helix-chartered vessels and excludes stand-alone trenching operations on the i-Plough on third-party vessels of 90 days, 58 days, 49 days, 92 days and 26 days during Q1 2023, Q2 2023, Q2 2024, Q3 2024 and Q4 2024, respectively 2 Total ROV utilization includes 42, 40 and 39 work class ROVs during 2021, 2022 and 2023-2024, respectively, and four trenchers during 2021; IROV boulder grabs placed into service end of Q3 2022 and Q1 2024; two trenchers placed into service late Q4 2022 and one trencher retired from service Q1 2024 • Grand Canyon II (Asia Pacific) – 96% utilized in Q4; performed oil and gas ROV support project in Malaysia • Grand Canyon III (North Sea) – 100% utilized in Q4; performed oil and gas trenching projects for one customer and renewables trenching project for another customer • Shelia Bordelon (US Gulf Coast / US East Coast) – 100% utilized in Q4; performed various US East Coast windfarm support projects • North Sea Enabler (North Sea) – 100% utilized in Q4; performed oil and gas trenching for two customers and renewables trenching project for another customer • Glomar Wave (North Sea) – 87% utilized in Q4; performed ROV support services for renewables site clearance project • Spot Vessel – 85 days of utilization on Siem Topaz during Q4, which completed approximately 600 days of integrated vessel trenching on renewables work offshore Taiwan that began Q2 2023; 12 days utilization on Seawell performing survey work • Trenching – 269 integrated vessel trenching days1 on renewables and oil and gas trenching projects on Grand Canyon III, North Sea Enabler and Siem Topaz; 26 days stand-alone trenching on the i-Plough on a third-party vessel • Site Clearance - 65 days utilization on IROV boulder grab |
|
12 12 OPERATIONAL HIGHLIGHTS Shallow Water Abandonment Utilization 1 Systems utilization includes six CT systems; 15 P&A systems from Q4 2022 to August 2023 and 20 P&A systems beginning September 2023 2 Liftboat utilization includes ten liftboats during Q4 2022 and nine liftboats beginning Q1 2023 Q4 activity levels reflect the expected seasonal slowdown in utilization; overall activity levels reflective of weak 2024 U.S. Gulf Coast shelf market Offshore • Liftboats – nine liftboats with combined utilization of 58% in Q4 • OSVs – six OSVs and one crew boat with combined utilization of 71% in Q4 Energy Services • P&A Systems – 289 days utilization, or 16%, on 20 P&A systems in Q4 • CT Systems – 127 days utilization, or 23%, on six CT systems in Q4 Diving & Heavy Lift • Epic Hedron – 41% utilized in Q4 • DSVs – three DSVs with combined utilization of 74% in Q4 |
|
13 Key Financial Metrics |
|
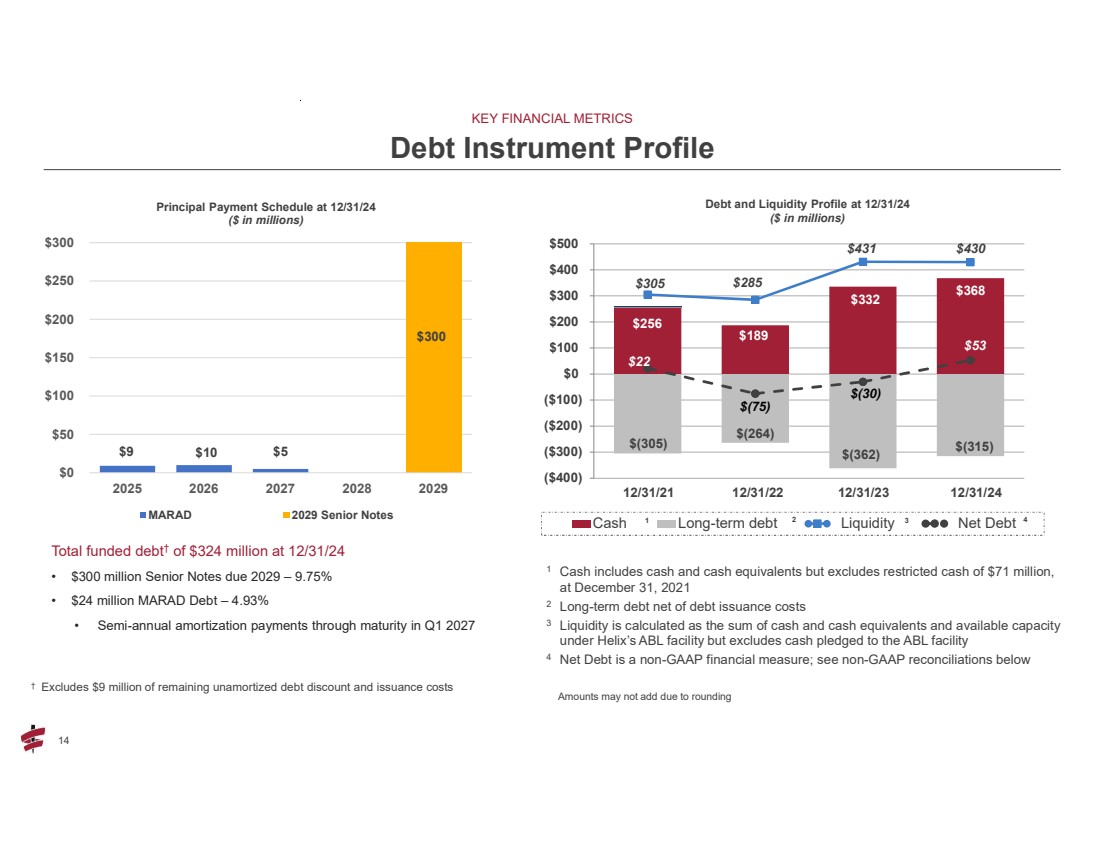
14 14 Total funded debt† of $324 million at 12/31/24 • $300 million Senior Notes due 2029 – 9.75% • $24 million MARAD Debt – 4.93% • Semi-annual amortization payments through maturity in Q1 2027 KEY FINANCIAL METRICS Debt Instrument Profile † Excludes $9 million of remaining unamortized debt discount and issuance costs $9 $10 $5 $300 $0 $50 $100 $150 $200 $250 $300 2025 2026 2027 2028 2029 Principal Payment Schedule at 12/31/24 ($ in millions) MARAD 2029 Senior Notes $256 $189 $332 $368 $(305) $(264) $(362) $(315) $305 $285 $431 $430 $22 $(75) $(30) $53 ($400) ($300) ($200) ($100) $0 $100 $200 $300 $400 $500 Cash Long-term debt Liquidity Net Debt 12/31/21 12/31/22 12/31/23 12/31/24 Debt and Liquidity Profile at 12/31/24 ($ in millions) 1 Cash includes cash and cash equivalents but excludes restricted cash of $71 million, at December 31, 2021 2 Long-term debt net of debt issuance costs 3 Liquidity is calculated as the sum of cash and cash equivalents and available capacity under Helix’s ABL facility but excludes cash pledged to the ABL facility 4 Net Debt is a non-GAAP financial measure; see non-GAAP reconciliations below 1 2 3 4 Amounts may not add due to rounding |
|
15 2025 Outlook |
|
16 16 2025 OUTLOOK Forecast ($ in millions) 2025 2024 Outlook Actual Revenues $ 1,360 - 1,500 1,359 $ Adjusted EBITDA1 320 - 380 303 Free Cash Flow1,2 175 - 225 163 Capital Additions3 70 - 90 59 Revenue Split: Well Intervention $ 850 - 890 830 $ Robotics 290 - 340 298 Shallow Water Abandonment 190 - 230 187 Production Facilities 70 - 80 89 Eliminations (40) (45) Total Revenue $ 1,360 - 1,500 1,359 $ 1 Adjusted EBITDA and Free Cash Flow are non-GAAP financial measures; see non-GAAP reconciliations below 2 Free Cash Flow in 2024 included $58 million related to the Alliance acquisition earnout 3 Capital Additions include regulatory certification costs for our vessels and systems as well as other capital expenditures Our 2025 outlook will be affected, among other things, by the timing and extent of the winter weather seasonal impact to our utilization and the following expected key drivers: Well Intervention • Q4000 – length of Nigeria campaign and utilization on return to the U.S. Gulf Coast • Q5000 – operating efficiency North Sea; seasonal utilization on Well Enhancer and Seawell • Brazil – Siem Helix 1 transition from Trident to new Petrobras contract; Siem Helix 2 operating efficiency • Q7000 – transition to Brazil Shell contract and operating efficiency Robotics • Seasonal utilization in the North Sea and Asia Pacific on chartered vessels Shallow Water Abandonment • Strength of contracting for oil and gas properties in bankruptcies reverting to former owners; seasonal utilization of shallow water operations on the U.S. Gulf Coast shelf Production Facilities • Thunder Hawk duration of well shut-ins; timing of remediation efforts Key Financial Metrics Key Forecast Drivers |
|
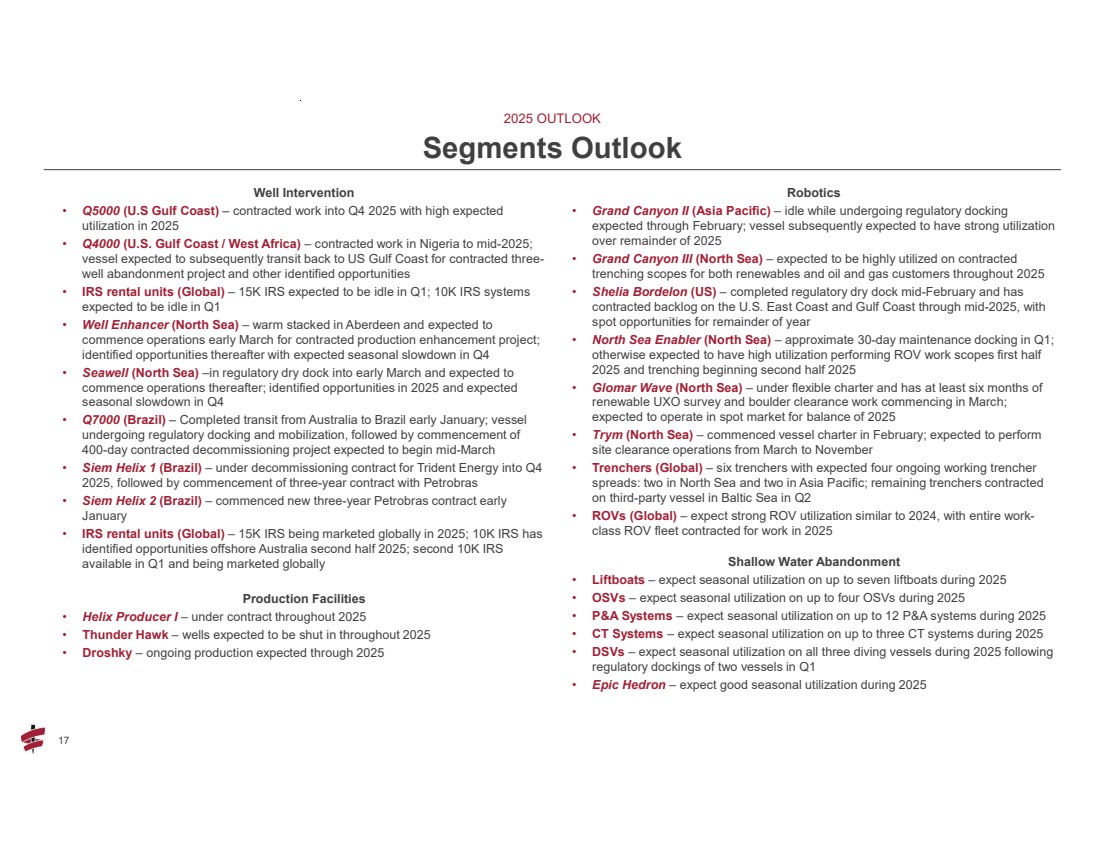
17 17 Well Intervention • Q5000 (U.S Gulf Coast) – contracted work into Q4 2025 with high expected utilization in 2025 • Q4000 (U.S. Gulf Coast / West Africa) – contracted work in Nigeria to mid-2025; vessel expected to subsequently transit back to US Gulf Coast for contracted three-well abandonment project and other identified opportunities • IRS rental units (Global) – 15K IRS expected to be idle in Q1; 10K IRS systems expected to be idle in Q1 • Well Enhancer (North Sea) – warm stacked in Aberdeen and expected to commence operations early March for contracted production enhancement project; identified opportunities thereafter with expected seasonal slowdown in Q4 • Seawell (North Sea) –in regulatory dry dock into early March and expected to commence operations thereafter; identified opportunities in 2025 and expected seasonal slowdown in Q4 • Q7000 (Brazil) – Completed transit from Australia to Brazil early January; vessel undergoing regulatory docking and mobilization, followed by commencement of 400-day contracted decommissioning project expected to begin mid-March • Siem Helix 1 (Brazil) – under decommissioning contract for Trident Energy into Q4 2025, followed by commencement of three-year contract with Petrobras • Siem Helix 2 (Brazil) – commenced new three-year Petrobras contract early January • IRS rental units (Global) – 15K IRS being marketed globally in 2025; 10K IRS has identified opportunities offshore Australia second half 2025; second 10K IRS available in Q1 and being marketed globally Production Facilities • Helix Producer I – under contract throughout 2025 • Thunder Hawk – wells expected to be shut in throughout 2025 • Droshky – ongoing production expected through 2025 Robotics • Grand Canyon II (Asia Pacific) – idle while undergoing regulatory docking expected through February; vessel subsequently expected to have strong utilization over remainder of 2025 • Grand Canyon III (North Sea) – expected to be highly utilized on contracted trenching scopes for both renewables and oil and gas customers throughout 2025 • Shelia Bordelon (US) – completed regulatory dry dock mid-February and has contracted backlog on the U.S. East Coast and Gulf Coast through mid-2025, with spot opportunities for remainder of year • North Sea Enabler (North Sea) – approximate 30-day maintenance docking in Q1; otherwise expected to have high utilization performing ROV work scopes first half 2025 and trenching beginning second half 2025 • Glomar Wave (North Sea) – under flexible charter and has at least six months of renewable UXO survey and boulder clearance work commencing in March; expected to operate in spot market for balance of 2025 • Trym (North Sea) – commenced vessel charter in February; expected to perform site clearance operations from March to November • Trenchers (Global) – six trenchers with expected four ongoing working trencher spreads: two in North Sea and two in Asia Pacific; remaining trenchers contracted on third-party vessel in Baltic Sea in Q2 • ROVs (Global) – expect strong ROV utilization similar to 2024, with entire work-class ROV fleet contracted for work in 2025 Shallow Water Abandonment • Liftboats – expect seasonal utilization on up to seven liftboats during 2025 • OSVs – expect seasonal utilization on up to four OSVs during 2025 • P&A Systems – expect seasonal utilization on up to 12 P&A systems during 2025 • CT Systems – expect seasonal utilization on up to three CT systems during 2025 • DSVs – expect seasonal utilization on all three diving vessels during 2025 following regulatory dockings of two vessels in Q1 • Epic Hedron – expect good seasonal utilization during 2025 2025 OUTLOOK Segments Outlook |
|
18 18 2025 Capital additions are forecasted at approximately $70 – $90 million: • Approximately $45 – $55 million for regulatory recertifications of our vessels and systems, reported in operating cash flows • Approximately $25 – $35 million for capital expenditures, reported in investing cash flows Free Cash Flow1 • Free Cash Flow outlook includes approximately $70 – $90 million of capital spending, $30 million of cash interest, and cash taxes expected between $40 – $50 million • Working capital expected to be impacted by seasonality and the timing of payments related to extended mobilizations Balance Sheet • Entering 2025 with significant levels of cash and strong Free Cash Flow outlook; expected increase in cash position subject to level of share repurchases and/or opportunistic capital spending • Our funded debt is expected to decrease by $9 million due to scheduled MARAD principal repayments in 2025; no significant debt maturities until 2029 • Targeting a minimum 25% of Free Cash Flow for share repurchases, or approximately $50 million 2025 OUTLOOK Capital Additions, Cash Flow & Balance Sheet 1 Free Cash Flow is a non-GAAP financial measure; see non-GAAP reconciliation below |
|
19 Capital Allocation Strategic Capital • Build cash surplus to deploy opportunistically Return to Shareholders • $200M share repurchase plan • $42M of repurchases to date under plan Maintenance Capital • Regulatory certification of vessels and systems Balance Sheet • Simplified capital structure • Maintain sufficient liquidity, low net debt $430M Liquidity at 12/31/24 ($53M) Net Debt1 at 12/31/24 Targeting minimum 25% FCF $70-90M Forecasted in 2025 Opportunistic KEY FINANCIAL METRICS 1 Net Debt is a non-GAAP financial measure; see non-GAAP reconciliation below |
|
20 Non-GAAP Reconciliations |
|
21 21 NON-GAAP RECONCILIATIONS Non-GAAP Reconciliations ($ in thousands, unaudited) 12/31/24 12/31/23 9/30/24 12/31/24 12/31/23 Reconciliation from Net Income (Loss) to Adjusted EBITDA: Net income income (loss) 20,121 $ (28,333) $ 29,514 $ 55,637 $ (10,838) $ Adjustments: Income tax provision 3,880 8,721 9,520 26,427 18,352 Net interest expense 5,572 4,771 5,689 22,629 17,338 Other expense (income), net 1,275 (6,963) 49 3,922 3,590 Depreciation and amortization 40,564 44,103 42,904 173,292 164,116 EBITDA 71,412 22,299 87,676 281,907 192,558 Adjustments: (Gain) loss on disposition of assets 429 - (100) 479 (367) Acquisition and integtation costs - - - - 540 Change in fair value of contingent consideration - 10,927 - - 42,246 Losses related to convertible senior notes - 37,277 - 20,922 37,277 General provision (release) for current expected credit losses (200) 129 45 (161) 1,149 Adjusted EBITDA 71,641 $ 70,632 $ 87,621 $ 303,147 $ 273,403 $ Free Cash Flow: Cash flows from operating activities 77,977 $ 94,737 $ 55,731 $ 186,028 $ 152,457 $ Less: Capital expenditures, net of proceeds from asset sales and insurance recoveries (12,523) (2,859) (3,086) (22,840) (18,659) Free Cash Flow 65,454 $ 91,878 $ 52,645 $ 163,188 $ 133,798 $ Net Debt: Long-term debt including current maturities of long-term debt 315,157 $ 361,722 $ 314,673 $ 315,157 $ 361,722 $ Less: Cash and cash equivalents (368,030) (332,191) (324,120) (368,030) (332,191) Net Debt (52,873) $ 29,531 $ (9,447) $ (52,873) $ 29,531 $ Three Months Ended Year Ended |
|
22 22 NON-GAAP RECONCILIATIONS Non-GAAP Definitions Non-GAAP Financial Measures We define EBITDA as earnings before income taxes, net interest expense, net other income or expense, and depreciation and amortization expense. Non-cash impairment losses on goodwill and other long-lived assets are also added back if applicable. To arrive at our measure of Adjusted EBITDA, we exclude gains or losses on disposition of assets, acquisition and integration costs, gains or losses related to convertible senior notes, the change in fair value of contingent consideration and the general provision (release) for current expected credit losses, if any. We define Free Cash Flow as cash flows from operating activities less capital expenditures, net of proceeds from asset sales and insurance recoveries (related to property and equipment), if any. Net debt is calculated as long-term debt including current maturities of long-term debt less cash and cash equivalents and restricted cash. We use EBITDA, Adjusted EBITDA, Free Cash Flow and Net Debt to monitor and facilitate internal evaluation of the performance of our business operations, to facilitate external comparison of our business results to those of others in our industry, to analyze and evaluate financial and strategic planning decisions regarding future investments and acquisitions, to plan and evaluate operating budgets, and in certain cases, to report our results to the holders of our debt as required by our debt covenants. We believe that our measures of EBITDA, Adjusted EBITDA, Free Cash Flow and Net Debt provide useful information to the public regarding our operating performance and ability to service debt and fund capital expenditures and may help our investors understand and compare our results to other companies that have different financing, capital and tax structures. Other companies may calculate their measures of EBITDA, Adjusted EBITDA, Free Cash Flow and Net Debt differently from the way we do, which may limit their usefulness as comparative measures. EBITDA, Adjusted EBITDA, Free Cash Flow and Net Debt should not be considered in isolation or as a substitute for, but instead are supplemental to, income from operations, net income, cash flows from operating activities, or other income or cash flow data prepared in accordance with GAAP. Users of this financial information should consider the types of events and transactions that are excluded from these measures. See reconciliation of the non-GAAP financial information presented in this press release to the most directly comparable financial information presented in accordance with GAAP. We have not provided reconciliations of forward-looking non-GAAP financial measures to comparable GAAP measures due to the challenges and impracticability with estimating some of the items without unreasonable effort, which amounts could be significant. |
|
At Helix, our purpose is to enable energy transition through: Maximizing Existing Reserves Enhancing remaining production from existing oil and gas wells Lowering Decommissioning Costs Restoring the seabed in an environmentally safe manner Offshore Renewables & Wind Farms Transitioning our energy economy to a sustainable model |