UNITED STATES
SECURITIES AND EXCHANGE COMMISSION
WASHINGTON, DC 20549
FORM 8-K
CURRENT REPORT
Pursuant to Section 13 or 15(d) of the Securities Exchange Act of 1934
Date of earliest event reported: January 21, 2025
SMARTFINANCIAL, INC.
(Exact name of registrant as specified in its charter)
Tennessee |
|
001-37661 |
|
62-1173944 |
(State or other jurisdiction of incorporation) |
|
(Commission File Number) |
|
(IRS Employer Identification No.) |
5401 Kingston Pike, Suite 600 |
|
|
Knoxville, Tennessee |
|
37919 |
(Address of Principal Executive Offices) |
|
(Zip Code) |
(865) 437-5700 |
(Registrant’s telephone number, including area code) |
(Former name or former address, if changed since last report) |
Check the appropriate box below if the Form 8-K filing is intended to simultaneously satisfy the filing obligation of the registrant under any of the following provisions:
☐ Written communications pursuant to Rule 425 under the Securities Act (17 CFR 230.425)
☐ Soliciting material pursuant to Rule 14a-12 under the Exchange Act (17 CFR 240.14a-12)
☐ Pre-commencement communications pursuant to Rule 14d-2(b) under the Exchange Act (17 CFR 240.14d-2(b))
☐ Pre-commencement communications pursuant to Rule 13e-4(c) under the Exchange Act (17 CFR 240.13e-4(c))
Securities registered pursuant to Section 12(b) of the Act:
Title of each class |
|
|
Trading |
|
|
Name of Exchange on which Registered |
Common Stock, par value $1.00 per share |
|
SMBK |
|
New York Stock Exchange |
Indicate by check mark whether the registrant is an emerging growth company as defined in Rule 405 of the Securities Act of 1933 (§ 230.405 of this chapter) or Rule 12b-2 of the Securities Exchange Act of 1934 (§ 240.12b-2 of this chapter).
Emerging growth company ☐
If an emerging growth company, indicate by check mark if the registrant has elected not to use the extended transition period for complying with any new or revised financial accounting standards provided pursuant to Section 13(a) of the On January 21, 2025, SmartFinancial, Inc. (“SmartFinancial”) issued a press release (the “Press Release”) reporting earnings results for its fourth quarter ending December 31, 2024. A copy of the Press Release is attached hereto as Exhibit 99.1.
Exchange Act. ☐
Item 2.02 |
|
Results of Operations and Financial Condition. |
In accordance with General Instructions B.2 of Form 8K, the information in Item 2.02 of this report (including Exhibit 99.1) shall not be deemed to be “filed” for purposes of Section 18 of the Securities Exchange Act of 1934, as amended (the “Exchange Act”), or otherwise subject to the liabilities of that section, and shall not be incorporated by reference into any registration statement or other document filed under the Securities Act of 1933, as amended, or the Exchange Act, except as shall be expressly set forth by specific reference in such filing.
Item 7.01 |
|
Regulation FD Disclosure. |
SmartFinancial is filing an investor slide presentation that it intends to review in conjunction with its earnings release conference call on January 22, 2025. The slides are attached hereto as Exhibit 99.2.
In accordance with General Instructions B.2 of Form 8K, the information in Item 7.01 of this report (including Exhibit 99.2) shall not be deemed to be “filed” for purposes of Section 18 of the Exchange Act, or otherwise subject to the liabilities of that section, and shall not be incorporated by reference into any registration statement or other document filed under the Securities Act of 1933, as amended, or the Exchange Act, except as shall be expressly set forth by specific reference in such filing.
Item 9.01 |
|
Financial Statements and Exhibits |
|
|
|
Exhibit No. |
|
Description |
99.1 |
|
Press release announcing fourth quarter 2024 financial results dated January 21, 2025 |
99.2 |
|
|
104 |
|
Cover Page Interactive Data File (embedded within the Inline XBRL document) |
SIGNATURES
Pursuant to the requirements of the Securities Exchange Act of 1934, the registrant has duly caused this report to be signed on its behalf by the undersigned hereunto duly authorized.
|
SMARTFINANCIAL, INC. |
|
|
Date: January 21, 2025 |
|
|
/s/ William Y. Carroll, Jr. |
|
William Y. Carroll, Jr. |
|
President & Chief Executive Officer |
Exhibit 99.1

4Q 2024
SmartFinancial Announces Results for the Fourth Quarter 2024
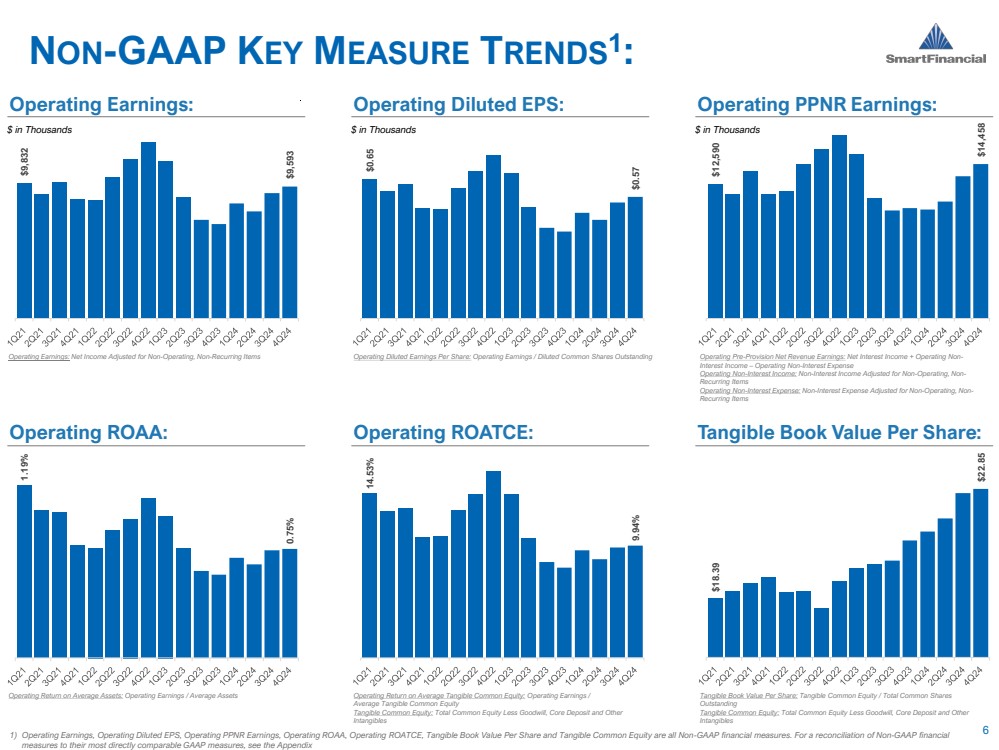
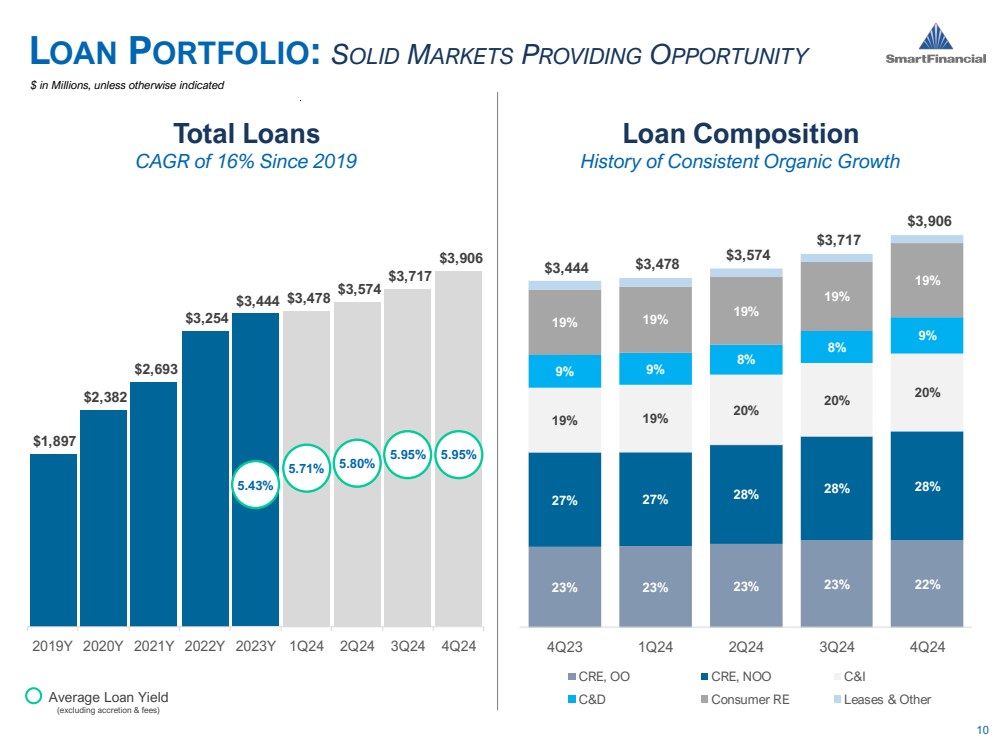
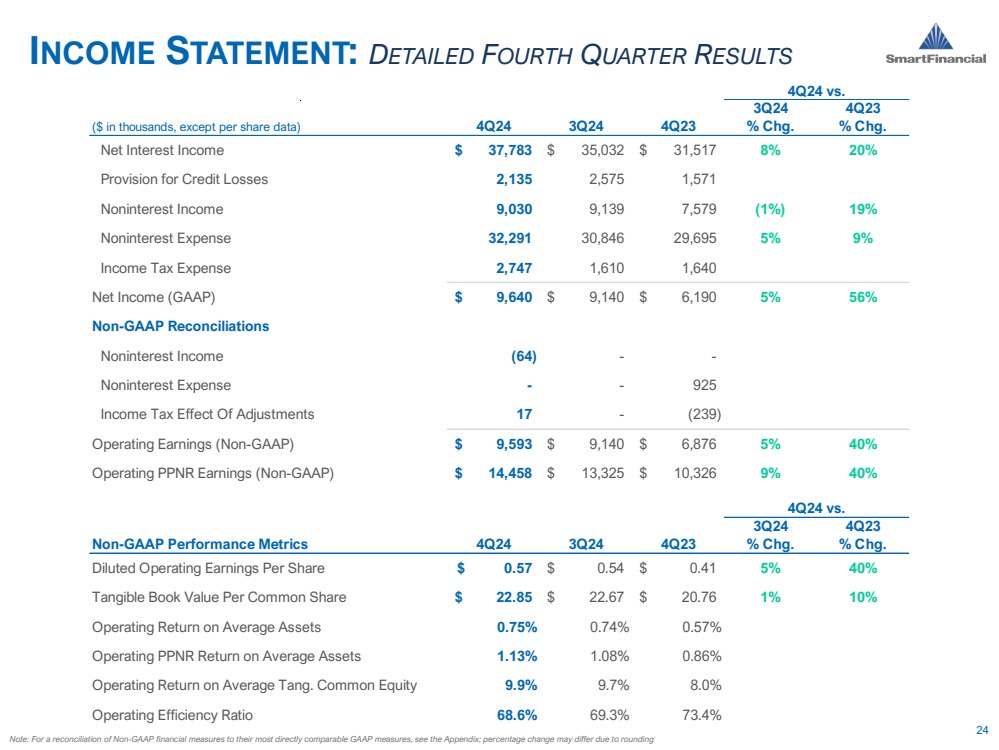
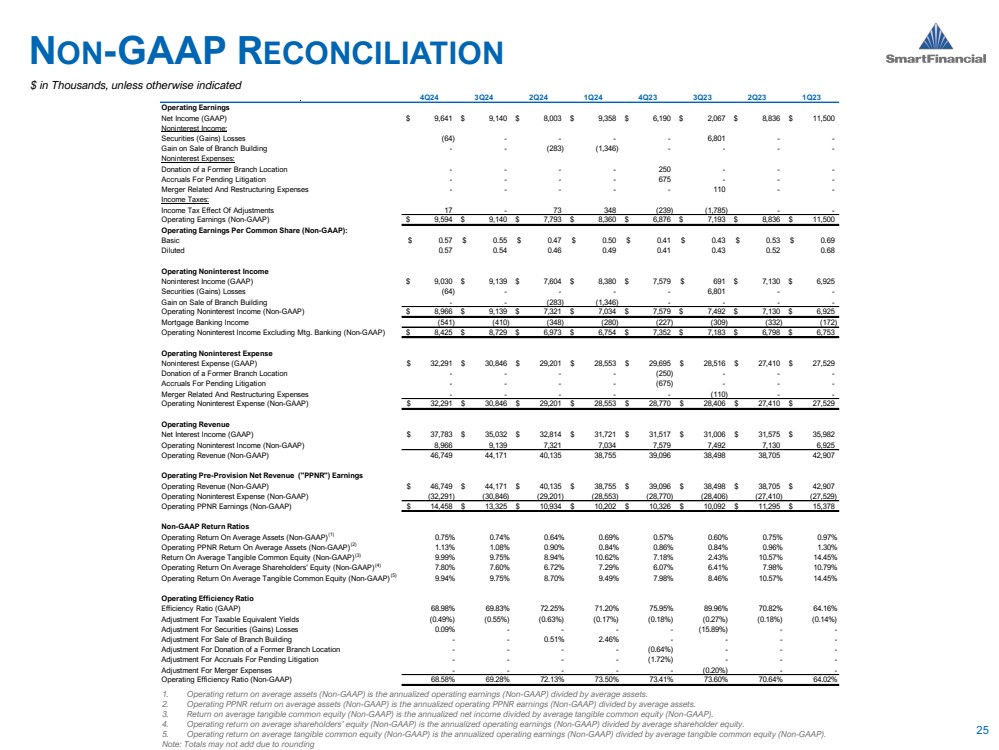
KNOXVILLE, TN – January 21, 2025 - SmartFinancial, Inc. ("SmartFinancial" or the "Company"; NYSE: SMBK), today announced net income of $9.6 million, or $0.57 per diluted common share, for the fourth quarter of 2024, compared to net income of $6.2 million, or $0.37 per diluted common share, for the fourth quarter of 2023, and compared to prior quarter net income of $9.1 million, or $0.54 per diluted common share. Operating earnings1, which excludes non-recurring income, net of tax adjustments, totaled $9.6 million, or $0.57 per diluted common share, in the fourth quarter of 2024, compared to $6.9 million, or $0.41 per diluted common share, in the fourth quarter of 2023, and compared to $9.1 million, or $0.54 per diluted common share, in the third quarter of 2024.
Highlights for the Fourth Quarter of 2024
| ● | Operating earnings1 of $9.6 million, or $0.57 per diluted common share |
| ● | Net organic loan and lease growth of $189 million with 20% annualized quarter-over-quarter increase |
| ● | Quarter-over-quarter net tax equivalent interest margin expansion of 13 basis points to 3.24% |
| ● | Credit quality remains solid with nonperforming assets to total assets of 0.19% |
Billy Carroll, President & CEO, stated: "As we closed 2023, I noted the strong positioning of our Company and expressed my optimism for the year ahead. Now, reflecting on 2024, it’s clear that this optimism was justified. Highlighted by 13% year-over-year loan and lease growth, a fourth quarter net interest margin of 3.24%, 38 basis points higher than the fourth quarter of 2023, continued profitability improvement and numerous operational achievements, 2024 was a notable year. As we look ahead to 2025, we remain committed and confident in our ability to further enhance profitability and drive value for our shareholders.”
SmartFinancial's Chairman, Miller Welborn, concluded: "2024 was a great year of growth and profitability expansion following an extremely challenging 2023. The Board is pleased with the Company’s 10% annual tangible book value growth and steady return metric enhancement. Equally important is SmartBank’s ongoing commitment to its culture and associates. Our associates continue to make SmartBank a great place to work, which is foundational to our present and future success through 2025 and beyond. Thank you!”
Net Interest Income and Net Interest Margin
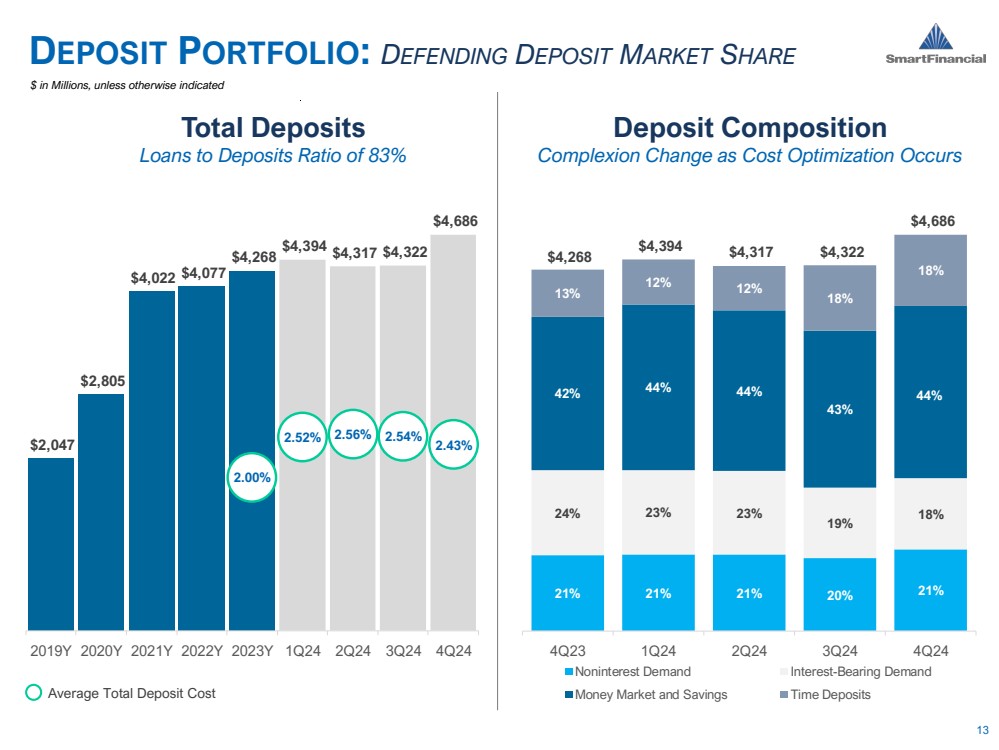
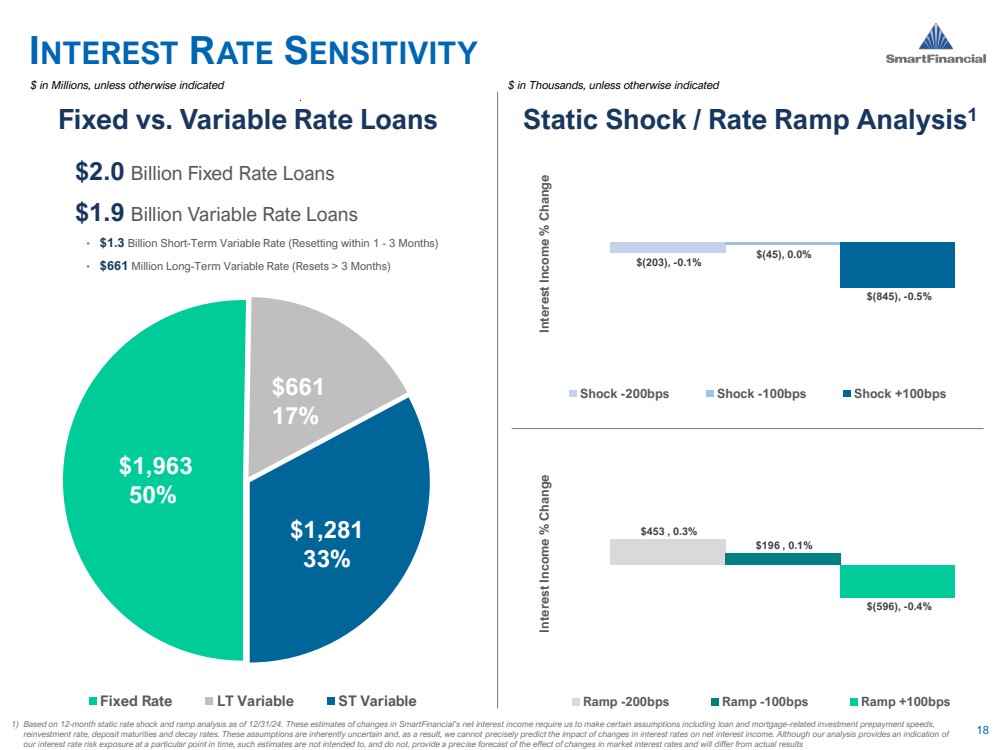
Net interest income was $37.8 million for the fourth quarter of 2024, compared to $35.0 million for the prior quarter. Average earning assets totaled $4.7 billion, an increase of $151.0 million from the prior quarter. The balances of average earnings assets changed quarter-over-quarter, primarily from an increase in average loans and leases of $195.5 million, offset by a decrease in average interest-earning cash of $33.5 million and securities of $11.1 million. Average interest-bearing liabilities increased by $162.3 million from the prior quarter, primarily attributable to an increase in average deposits of $207.9 million, offset by a decrease in borrowings of $44.4 million.
The tax equivalent net interest margin was 3.24% for the fourth quarter of 2024, compared to 3.11% for the prior quarter. The tax equivalent net interest margin was positively impacted primarily by the decreased cost of interest-bearing deposits, quarter-over-quarter. The yield on loans and leases, excluding loan fees, on a fully tax equivalent basis (“FTE”) held constant at 5.95% quarter-over-quarter.
The cost of total deposits for the fourth quarter of 2024 was 2.43%, compared to 2.54% in the prior quarter. The cost of interest-bearing liabilities was 3.08% for the fourth quarter, compared to 3.29% in the prior quarter. The cost of average interest-bearing deposits was 3.02% for the fourth quarter of 2024, compared to 3.20% for the prior quarter, a decrease of 18 basis points.
The following table presents selected interest rates and yields for the periods indicated:
1 Non-GAAP measure. See “Non-GAAP Financial Measures” for more information and see the Non-GAAP Reconciliations.

|
|
Three Months Ended |
|
|
|
||
|
|
Dec |
|
Sep |
|
Increase |
|
Selected Interest Rates and Yields |
|
2024 |
|
2024 |
|
(Decrease) |
|
Yield on loans and leases, excluding loan fees, FTE |
|
5.95 |
% |
5.95 |
% |
- |
% |
Yield on loans and leases, FTE |
|
6.04 |
% |
6.02 |
% |
0.02 |
% |
Yield on earning assets, FTE |
|
5.64 |
% |
5.65 |
% |
(0.01) |
% |
Cost of interest-bearing deposits |
|
3.02 |
% |
3.20 |
% |
(0.18) |
% |
Cost of total deposits |
|
2.43 |
% |
2.54 |
% |
(0.11) |
% |
Cost of interest-bearing liabilities |
|
3.08 |
% |
3.29 |
% |
(0.21) |
% |
Net interest margin, FTE |
|
3.24 |
% |
3.11 |
% |
0.13 |
% |
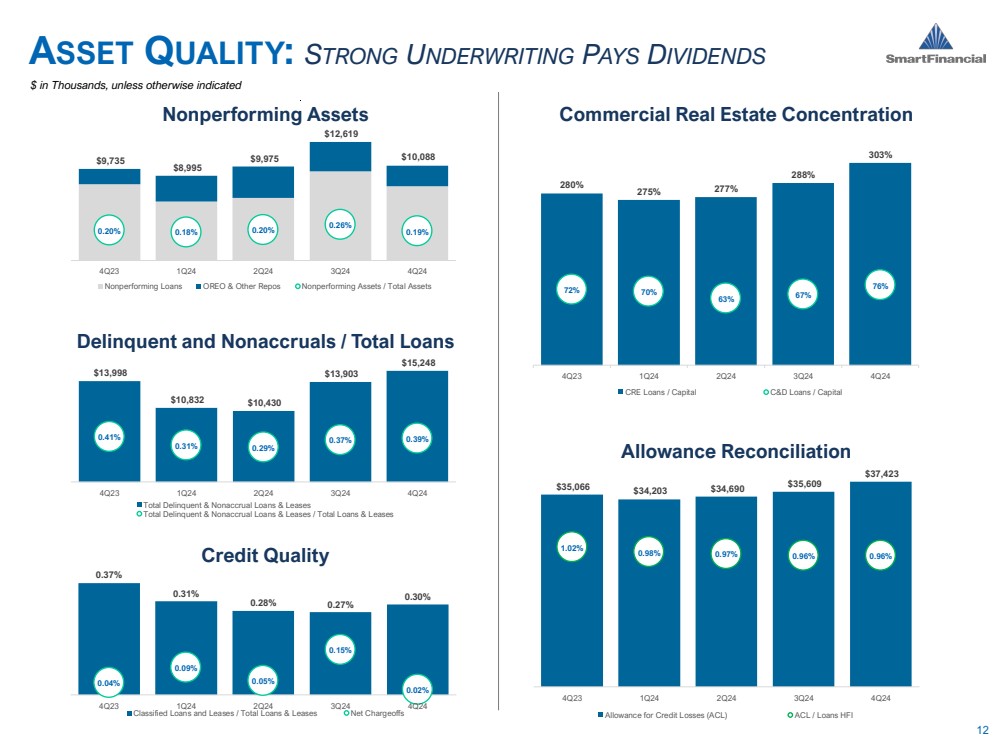
Provision for Credit Losses on Loans and Leases and Credit Quality
At December 31, 2024, the allowance for credit losses was $37.4 million. The allowance for credit losses to total loans and leases was 0.96% as of December 31, 2024, and September 30, 2024.
The following table presents detailed information related to the provision for credit losses for the periods indicated (dollars in thousands):
|
|
|
Three Months Ended |
|
|
|
|
||||
|
|
|
|
Dec |
|
|
Sep |
|
|
Increase |
|
|
Provision for Credit Losses on Loans and Leases Rollforward |
|
|
2024 |
|
|
2024 |
|
|
(Decrease) |
|
|
Beginning balance |
|
$ |
35,609 |
|
$ |
34,690 |
|
$ |
919 |
|
|
Charge-offs |
|
|
(214) |
|
|
(1,426) |
|
|
1,212 |
|
|
Recoveries |
|
|
53 |
|
|
72 |
|
|
(19) |
|
|
Net (charge-offs) recoveries |
|
|
(161) |
|
|
(1,354) |
|
|
1,193 |
|
|
Provision for credit losses (1) |
|
|
1,975 |
|
|
2,273 |
|
|
(298) |
|
|
Ending balance |
|
$ |
37,423 |
|
$ |
35,609 |
|
$ |
1,814 |
|
|
|
|
|
|
|
|
|
|
|
|
|
|
Allowance for credit losses to total loans and leases, gross |
|
|
0.96 |
% |
|
0.96 |
% |
|
- |
% |
| (1) | The current quarter-ended and prior quarter-ended excludes unfunded commitments provision of $160 thousand and $302 thousand, respectively. At December 31, 2024, the unfunded commitment liability totaled $2.5 million. |
Nonperforming loans and leases as a percentage of total loans and leases was 0.20% as of December 31, 2024, a decrease of 6 basis points from the 0.26% reported in the third quarter of 2024. Total nonperforming assets (which include nonaccrual loans and leases, loans and leases past due 90 days or more and still accruing, other real estate owned and other repossessed assets) as a percentage of total assets was 0.19% as of December 31, 2024, and 0.26% as of September 30, 2024.
The following table presents detailed information related to credit quality for the periods indicated (dollars in thousands):
|
|
|
Three Months Ended |
|
|
|
|
||||
|
|
|
|
Dec |
|
|
Sep |
|
|
Increase |
|
|
Credit Quality |
|
|
2024 |
|
|
2024 |
|
|
(Decrease) |
|
|
Nonaccrual loans and leases |
|
$ |
7,710 |
|
$ |
9,319 |
|
$ |
(1,609) |
|
|
Loans and leases past due 90 days or more and still accruing |
|
|
162 |
|
|
172 |
|
|
(10) |
|
|
Total nonperforming loans and leases |
|
|
7,872 |
|
|
9,491 |
|
|
(1,619) |
|
|
Other real estate owned |
|
|
179 |
|
|
179 |
|
|
- |
|
|
Other repossessed assets |
|
|
2,037 |
|
|
2,949 |
|
|
(912) |
|
|
Total nonperforming assets |
|
$ |
10,088 |
|
$ |
12,619 |
|
$ |
(2,531) |
|
|
|
|
|
|
|
|
|
|
|
|
|
|
Nonperforming loans and leases to total loans and leases, gross |
|
|
0.20 |
% |
|
0.26 |
% |
|
(0.06) |
% |
|
Nonperforming assets to total assets |
|
|
0.19 |
% |
|
0.26 |
% |
|
(0.07) |
% |
Noninterest Income
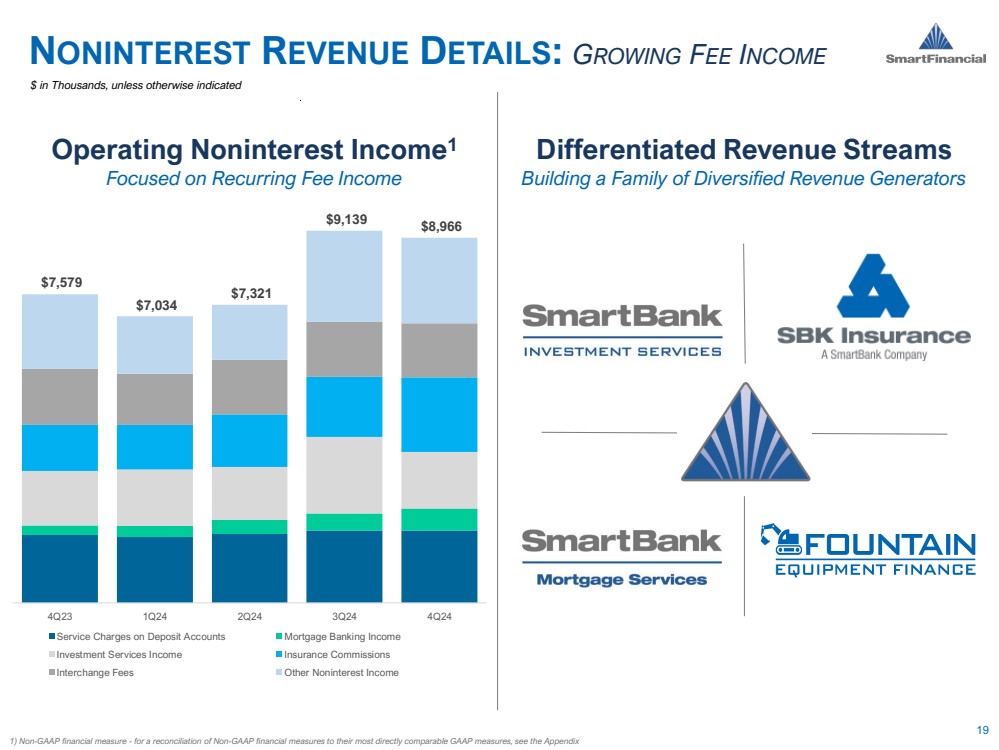
Noninterest income decreased $109 thousand for the fourth quarter of 2024, compared to $9.1 million for the prior quarter. The current quarter decrease was primarily associated with a $499 thousand decrease in investment services from a lower volume of investment activity and offset by a $355 thousand increase in insurance commissions from new policies.
2
The following table presents detailed information related to noninterest income for the periods indicated (dollars in thousands):
|
|
Three Months Ended |
|
|
|
||||
|
|
|
Dec |
|
|
Sep |
|
|
Increase |
Noninterest Income |
|
|
2024 |
|
|
2024 |
|
|
(Decrease) |
Service charges on deposit accounts |
|
$ |
1,778 |
|
$ |
1,780 |
|
$ |
(2) |
Mortgage banking income |
|
|
541 |
|
|
410 |
|
|
131 |
Investment services |
|
|
1,382 |
|
|
1,881 |
|
|
(499) |
Insurance commissions |
|
|
1,832 |
|
|
1,477 |
|
|
355 |
Interchange and debit card transaction fees |
|
|
1,332 |
|
|
1,349 |
|
|
(17) |
Other |
|
|
2,101 |
|
|
2,242 |
|
|
(141) |
Total noninterest income |
|
$ |
9,030 |
|
$ |
9,139 |
|
$ |
(109) |
Noninterest Expense
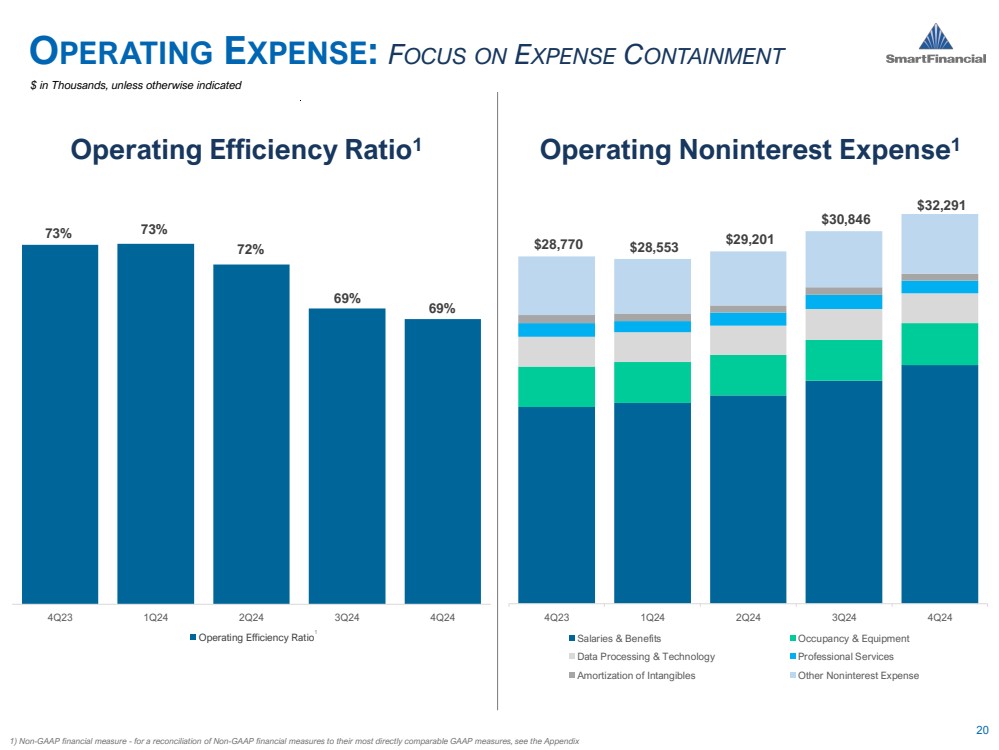
Noninterest expense increased $1.4 million to $32.3 million for the fourth quarter of 2024 compared to $30.8 million for the prior quarter. The current quarter increase was primarily related to an increase in salaries and employee benefits related to incentive accruals for production performance and an increase in other real estate and loan related expenses due to write downs on repossessed assets at the Company’s equipment leasing subsidiary, offset by a decrease in other related to lower operational cost and lower franchise taxes related to the newly established Real Estate Investment Trust (“REIT”).
The following table presents detailed information related to noninterest expense for the periods indicated (dollars in thousands):
|
|
Three Months Ended |
|
|
|
||||
|
|
|
Dec |
|
|
Sep |
|
|
Increase |
Noninterest Expense |
|
|
2024 |
|
|
2024 |
|
|
(Decrease) |
Salaries and employee benefits |
|
$ |
19,752 |
|
$ |
18,448 |
|
$ |
1,304 |
Occupancy and equipment |
|
|
3,473 |
|
|
3,423 |
|
|
50 |
FDIC insurance |
|
|
825 |
|
|
825 |
|
|
- |
Other real estate and loan related expenses |
|
|
1,241 |
|
|
460 |
|
|
781 |
Advertising and marketing |
|
|
397 |
|
|
327 |
|
|
70 |
Data processing and technology |
|
|
2,495 |
|
|
2,519 |
|
|
(24) |
Professional services |
|
|
1,017 |
|
|
1,201 |
|
|
(184) |
Amortization of intangibles |
|
|
601 |
|
|
604 |
|
|
(3) |
Other |
|
|
2,490 |
|
|
3,039 |
|
|
(549) |
Total noninterest expense |
|
$ |
32,291 |
|
$ |
30,846 |
|
$ |
1,445 |
Income Tax Expense
Income tax expense was $2.7 million for the fourth quarter of 2024, an increase of $1.1 million, compared to $1.6 million for the prior quarter. The increase was due to an increase in pre-tax income compared to the prior quarter and final state income tax adjustments during the quarter related to the Bank’s REIT. The REIT will create a more tax-effective structure that will result in a lower effective tax rate during future periods by lowering the Bank’s state income tax expense.
Balance Sheet Trends
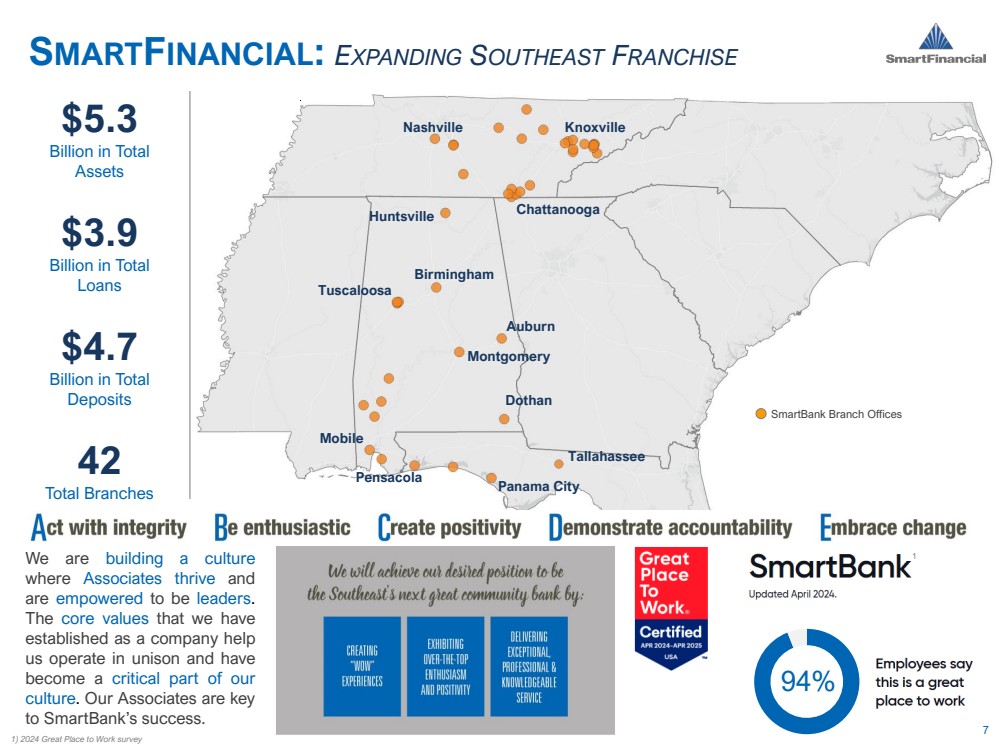
Total assets at December 31, 2024 were $5.28 billion compared to $4.83 billion at December 31, 2023. The $446.5 million increase is primarily attributable to increases in loans and leases of $461.9 million, cash and cash equivalents of $35.3 million and bank owned life insurance of $32.5 million, offset by a decrease in securities of $80.7 million.
Total liabilities were $4.78 billion at December 31, 2024, compared to $4.37 billion at December 31, 2023, an increase of $414.9 million. Total deposits increased $418.6 million, which was driven primarily by increases in money market deposits of $227.1 million, the issuance of brokered deposits of $189.8 million, other time deposits of $104.4 million and noninterest demand deposits of $67.5 million, offset by a decline in interest-bearing demand deposits of $170.2 million. Other liabilities increased $3.7 million, which was offset by a decrease in borrowings of $4.9 million and subordinated debt of $2.4 million.
3
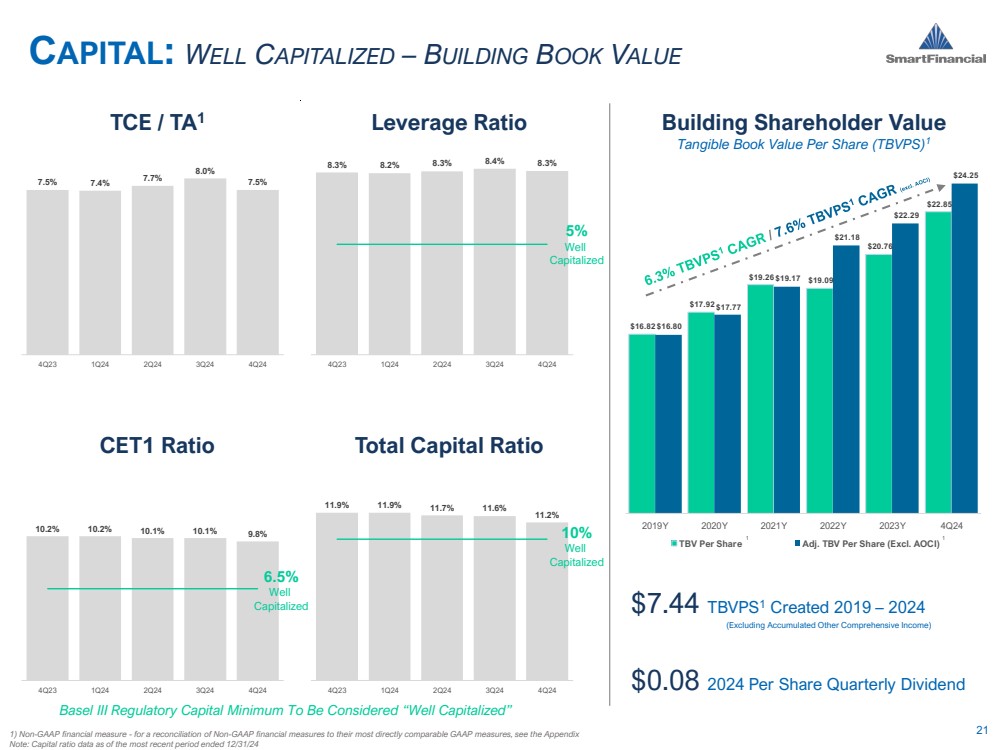
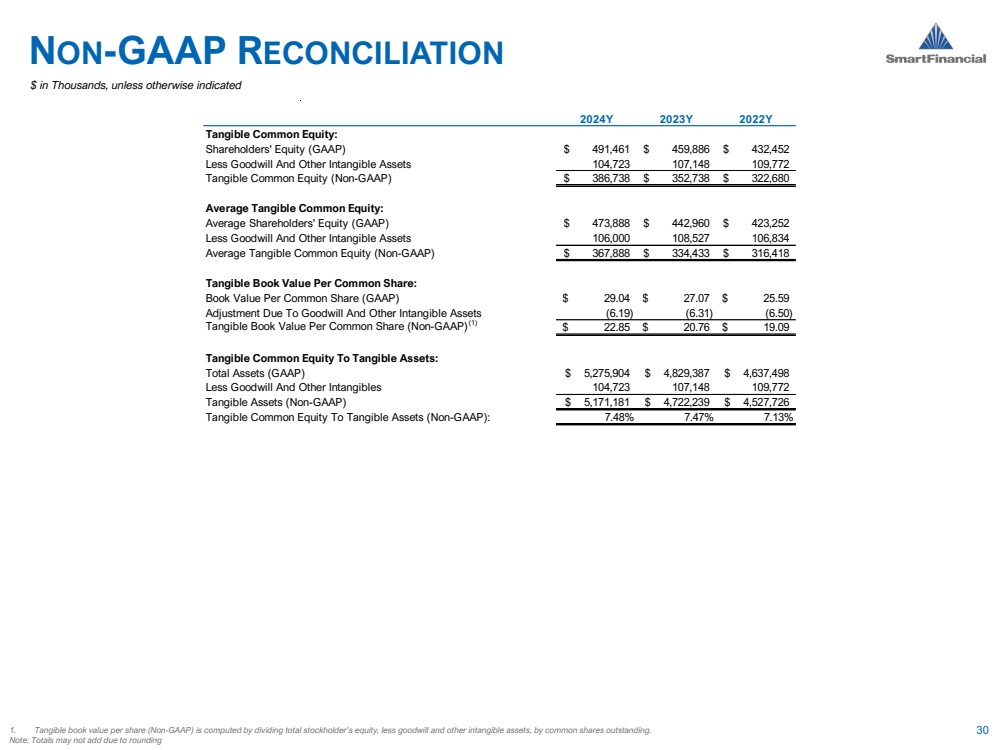
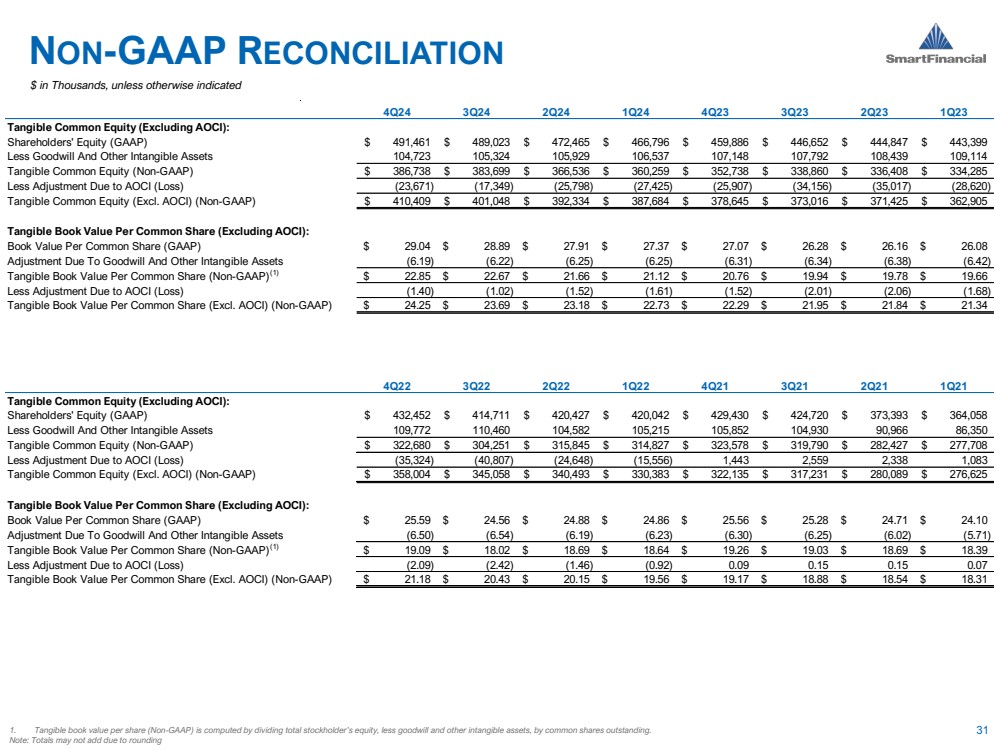
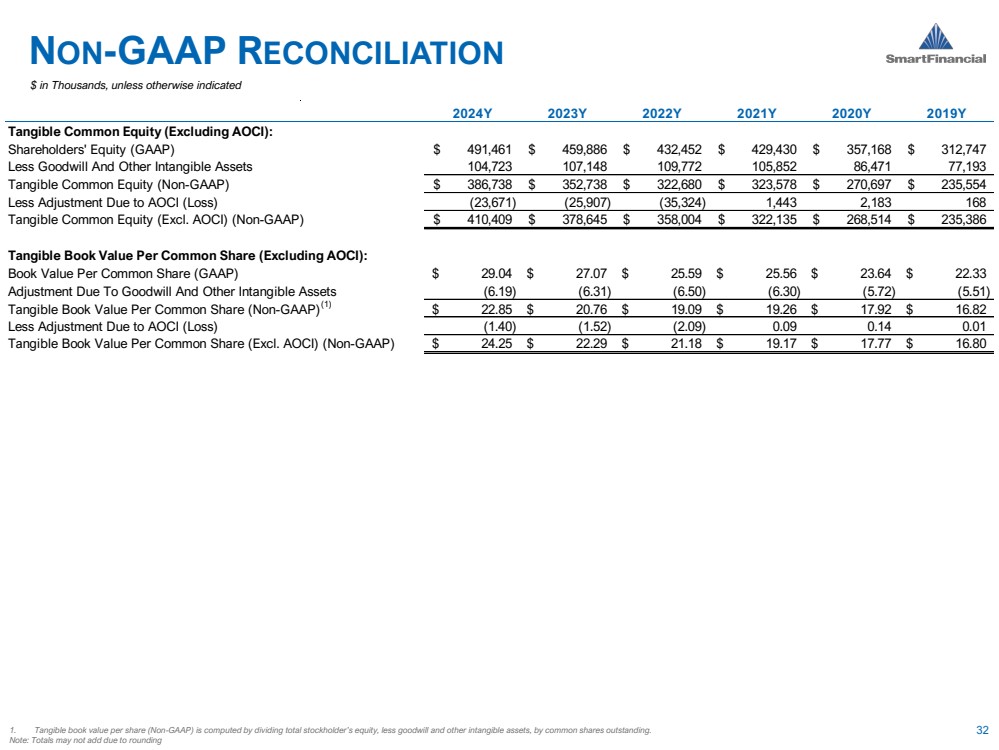
Shareholders' equity at December 31, 2024, totaled $491.5 million, an increase of $31.6 million, from December 31, 2023. The increase in shareholders' equity was primarily driven by net income of $36.1 million for the twelve months ended December 31, 2024, and a positive change of $2.2 million in accumulated other comprehensive income, offset by dividends paid of $5.4 million. Tangible book value per share1 was $22.85 at December 31, 2024, compared to $20.76 at December 31, 2023. Tangible common equity1 as a percentage of tangible assets1 was 7.48% at December 31, 2024, compared with 7.47% at December 31, 2023.
The following table presents selected balance sheet information for the periods indicated (dollars in thousands):
|
|
Dec |
|
Dec |
|
Increase |
|
|||
Selected Balance Sheet Information |
|
2024 |
|
2023 |
|
(Decrease) |
|
|||
Total assets |
|
$ |
5,275,904 |
|
$ |
4,829,387 |
|
$ |
446,517 |
|
Total liabilities |
|
|
4,784,443 |
|
|
4,369,501 |
|
|
414,942 |
|
Total equity |
|
|
491,461 |
|
|
459,886 |
|
|
31,575 |
|
Securities |
|
|
608,987 |
|
|
689,646 |
|
|
(80,659) |
|
Loans and leases |
|
|
3,906,340 |
|
|
3,444,462 |
|
|
461,878 |
|
Deposits |
|
|
4,686,483 |
|
|
4,267,854 |
|
|
418,629 |
|
Borrowings |
|
|
8,135 |
|
|
13,078 |
|
|
(4,943) |
|
Board of Directors Declares Dividend
On January 16, 2025, the board of directors of SmartFinancial declared a quarterly cash dividend of $0.08 per share of SmartFinancial common stock payable on February 18, 2025, to shareholders of record as of the close of business on January 31, 2025.
Conference Call Information
SmartFinancial issued this earnings release for the fourth quarter of 2024 on Tuesday, January 21, 2025, and will host a conference call on Wednesday, January 22, 2025, at 10:00 a.m. ET. To access this interactive teleconference, dial (833) 470-1428 or (404) 975-4839 and entering the access code, 994691. A replay of the conference call will be available through March 23, 2025, by dialing (866) 813-9403 or (929) 458-6194 and entering the access code, 147026. Conference call materials will be published on the Company’s webpage located at http://www.smartfinancialinc.com/CorporateProfile, at 9:00 a.m. ET prior to the conference call.
About SmartFinancial, Inc.
SmartFinancial, Inc., based in Knoxville, Tennessee, is the bank holding company for SmartBank. SmartBank is a full-service commercial bank founded in 2007, with branches across Tennessee, Alabama, and Florida. Recruiting the best people, delivering exceptional client service, strategic branching, and a disciplined approach to lending have contributed to SmartBank’s success. More information about SmartFinancial can be found on its website: www.smartfinancialinc.com.
Source |
|
SmartFinancial, Inc. |
|
|
|
Investor Contacts |
|
|
|
Billy Carroll |
Nathan Strall |
President & Chief Executive Officer |
Vice President and Director of Strategy & Corporate Development |
Email: billy.carroll@smartbank.com |
Email: nathan.strall@smartbank.com |
Phone: (865) 868-0613 |
Phone: (865) 868-2604 |
|
|
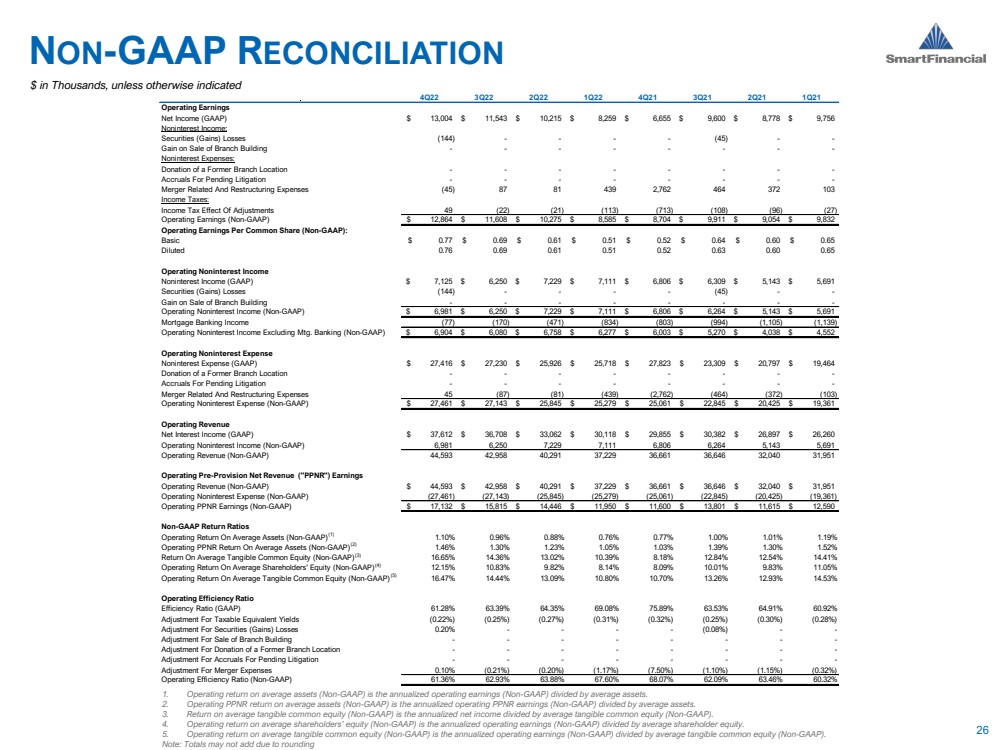
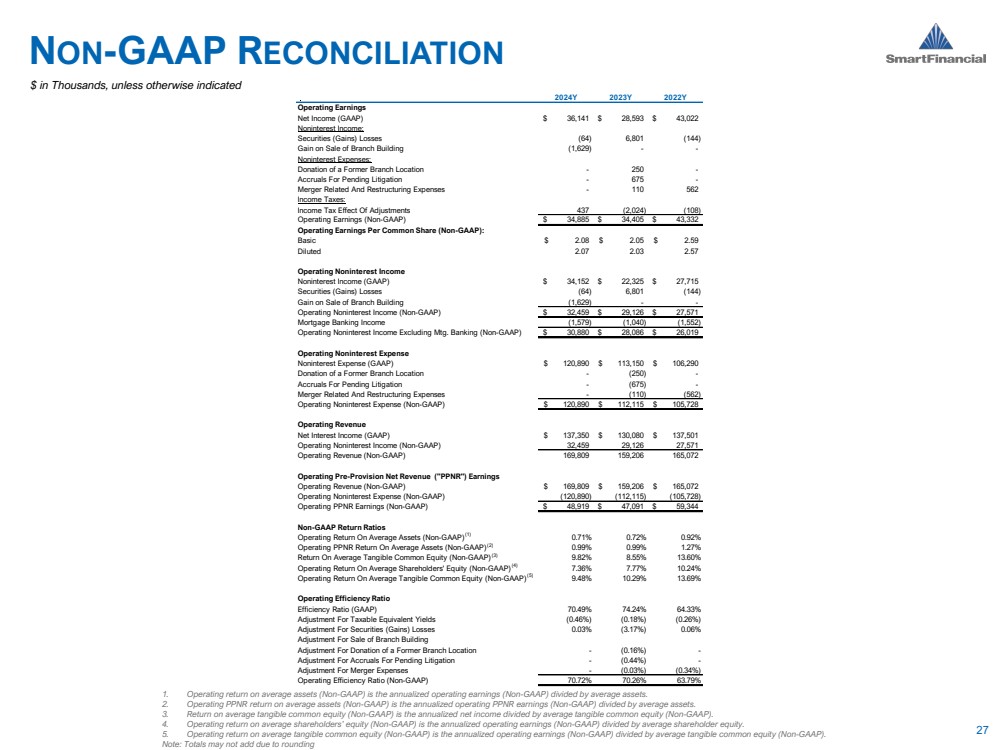
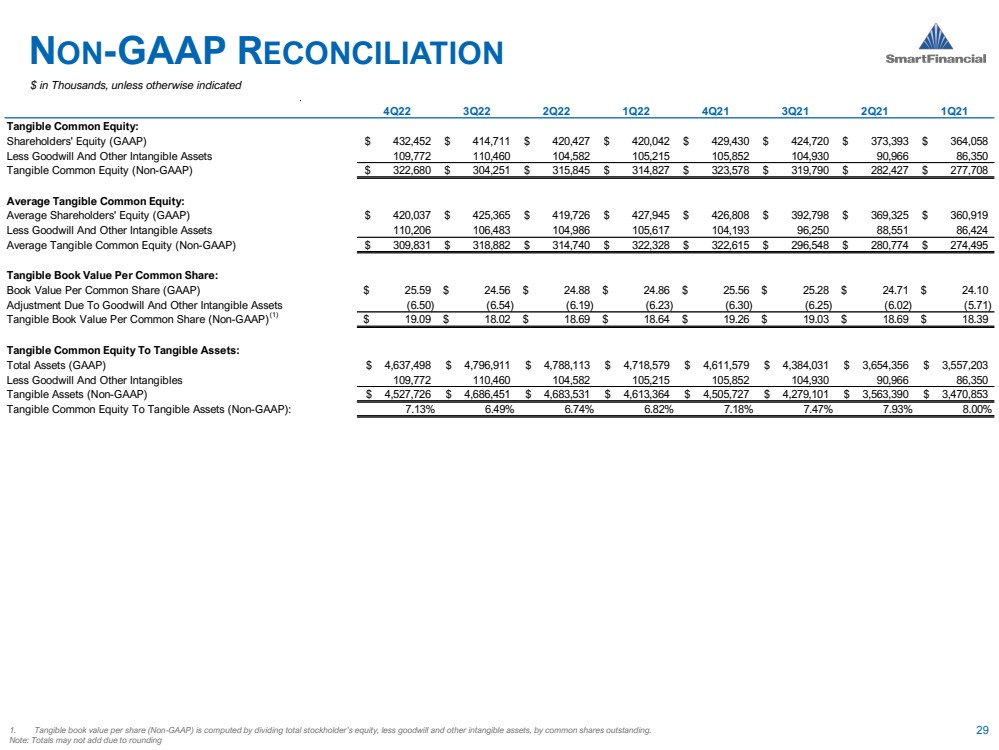
1 Non-GAAP measure. See “Non-GAAP Financial Measures” for more information and see the Non-GAAP Reconciliation
4
Non-GAAP Financial Measures
Statements included in this earnings release include measures not recognized under U.S. generally accepted accounting principles (“GAAP”) and therefore are considered Non-GAAP financial measures (“Non-GAAP”) and should be read along with the accompanying tables, which provide a reconciliation of Non-GAAP financial measures to GAAP financial measures. SmartFinancial management uses several Non-GAAP financial measures and ratios derived therefrom in its analysis of the Company's performance, including:
| (i) | Operating earnings |
| (ii) | Operating noninterest income |
| (iii) | Operating noninterest expense |
| (iv) | Operating pre-provision net revenue (“PPNR”) earnings |
| (v) | Tangible common equity |
| (vi) | Average tangible common equity |
| (vii) | Tangible book value per common share |
| (viii) | Tangible assets |
| (ix) | Operating efficiency ratio |
Operating earnings, operating noninterest income, operating noninterest expense and operating PPNR earnings exclude non-operating related income and expense items from net income, noninterest income and noninterest expense, respectively. Tangible common equity and average tangible common equity exclude goodwill and other intangible assets from shareholders' equity and average shareholders' equity, respectively. Tangible book value per common share is tangible common equity divided by common shares outstanding. Tangible assets excludes goodwill and other intangibles from total assets. Operating efficiency ratio is the quotient of operating noninterest expense divided by the sum of net interest income adjusted for taxable equivalent yields plus operating noninterest income. A detailed reconciliation of these items and the ratios derived therefrom is available in the Non-GAAP reconciliations.
Management believes that Non-GAAP financial measures provide additional useful information that allows investors to evaluate the ongoing performance of the company and provide meaningful comparisons to its peers. Management also believes these Non-GAAP financial measures enhance investors' ability to compare period-to-period financial results and allow investors and company management to view our operating results excluding the impact of items that are not reflective of the underlying operating performance.
Non-GAAP financial measures should not be considered as an alternative to any measure of performance or financial condition as promulgated under GAAP, and investors should consider SmartFinancial's performance and financial condition as reported under GAAP and all other relevant information when assessing the performance or financial condition of the company. Non-GAAP financial measures have limitations as analytical tools, and investors should not consider them in isolation or as a substitute for analysis of the results or financial condition as reported under GAAP.
5
Forward-Looking Statements
This news release may contain statements that are based on management’s current estimates or expectations of future events or future results, and that may be deemed to constitute forward-looking statements as defined under the Private Securities Litigation Reform Act of 1995. These statements are not historical in nature and can generally be identified by such words as “expect,” “anticipate,” “intend,” “plan,” “believe,” “seek,” “may,” “estimate,” and similar expressions. All forward-looking statements are subject to risks, uncertainties, and other factors that may cause the actual results of SmartFinancial to differ materially from future results expressed or implied by such forward-looking statements. Such risks, uncertainties, and other factors include, among others,
| (1) | risks associated with our growth strategy, including a failure to implement our growth plans or an inability to manage our growth effectively; |
| (2) | claims and litigation arising from our business activities and from the companies we acquire, which may relate to contractual issues, environmental laws, fiduciary responsibility, and other matters; |
| (3) | general risks related to our merger and acquisition activity, including risks associated with our pursuit of future acquisitions; |
| (4) | changes in management’s plans for the future; |
| (5) | prevailing, or changes in, economic or political conditions (including those resulting from the new administration and Congress), particularly in our market areas, including the effects of declines in the real estate market, high unemployment rates, inflationary pressures, elevated interest rates and slowdowns in economic growth, as well as the financial stress on borrowers as a result of the foregoing; |
| (6) | our ability to anticipate interest rate changes and manage interest rate risk (including the impact of higher interest rates on macroeconomic conditions, competition, and the cost of doing business and the impact of interest rate fluctuations on our financial projections, models and guidance); |
| (7) | increased technology and cybersecurity risks, including generative artificial intelligence risks; |
| (8) | credit risk associated with our lending activities; |
| (9) | changes in loan demand, real estate values, or competition; |
| (10) | developments in our mortgage banking business, including loan modifications, general demand, and the effects of judicial or regulatory requirements or guidance; |
| (11) | changes in accounting principles, policies, or guidelines; |
| (12) | changes in applicable laws, rules, or regulations; |
| (13) | adverse results from current or future litigation, regulatory examinations or other legal and/or regulatory actions; |
| (14) | potential impacts of any adverse developments in the banking industry, including the impacts on customer confidence, deposit outflows, liquidity and the regulatory response thereto; |
| (15) | significant turbulence or a disruption in the capital or financial markets and the effect of a fall in stock market prices on our investment securities; |
| (16) | the effects of war or other conflicts including the impacts related to or resulting from Russia’s military action in Ukraine or the conflict in Israel and surrounding areas; and |
| (17) | other general competitive, economic, political, and market factors, including those affecting our business, operations, pricing, products, or services. |
These and other factors that could cause results to differ materially from those described in the forward-looking statements can be found in SmartFinancial’s most recent annual report on Form 10-K, quarterly reports on Form 10-Q, and current reports on Form 8-K, in each case filed with or furnished to the Securities and Exchange Commission (the “SEC”) and available on the SEC’s website (www.sec.gov). Undue reliance should not be placed on forward-looking statements. SmartFinancial disclaims any obligation to update or revise any forward-looking statements contained in this release, which speak only as of the date hereof, whether as a result of new information, future events, or otherwise.
6
SmartFinancial, Inc. and Subsidiary
Condensed Consolidated Financial Information - (unaudited)
(dollars in thousands)
|
Ending Balances |
|||||||||||||
|
Dec |
|
Sep |
|
Jun |
|
Mar |
|
Dec |
|||||
|
2024 |
|
2024 |
|
2024 |
|
2024 |
|
2023 |
|||||
Assets: |
|
|
|
|
|
|
|
|
|
|
|
|
|
|
Cash and cash equivalents |
$ |
387,570 |
|
$ |
192,914 |
|
$ |
342,835 |
|
$ |
477,941 |
|
$ |
352,271 |
Securities available-for-sale, at fair value |
|
482,328 |
|
|
501,336 |
|
|
500,821 |
|
|
474,347 |
|
|
408,410 |
Securities held-to-maturity, at amortized cost |
|
126,659 |
|
|
127,779 |
|
|
128,996 |
|
|
180,169 |
|
|
281,236 |
Other investments |
|
14,740 |
|
|
20,352 |
|
|
13,780 |
|
|
13,718 |
|
|
13,662 |
Loans held for sale |
|
5,996 |
|
|
5,804 |
|
|
3,103 |
|
|
4,861 |
|
|
4,418 |
Loans and leases |
|
3,906,340 |
|
|
3,717,478 |
|
|
3,574,158 |
|
|
3,477,555 |
|
|
3,444,462 |
Less: Allowance for credit losses |
|
(37,423) |
|
|
(35,609) |
|
|
(34,690) |
|
|
(34,203) |
|
|
(35,066) |
Loans and leases, net |
|
3,868,917 |
|
|
3,681,869 |
|
|
3,539,468 |
|
|
3,443,352 |
|
|
3,409,396 |
Premises and equipment, net |
|
91,093 |
|
|
91,055 |
|
|
91,315 |
|
|
92,694 |
|
|
92,963 |
Other real estate owned |
|
179 |
|
|
179 |
|
|
688 |
|
|
696 |
|
|
517 |
Goodwill and other intangibles, net |
|
104,723 |
|
|
105,324 |
|
|
105,929 |
|
|
106,537 |
|
|
107,148 |
Bank owned life insurance |
|
115,917 |
|
|
105,025 |
|
|
84,483 |
|
|
83,957 |
|
|
83,434 |
Other assets |
|
77,782 |
|
|
77,297 |
|
|
79,591 |
|
|
76,418 |
|
|
75,932 |
Total assets |
$ |
5,275,904 |
|
$ |
4,908,934 |
|
$ |
4,891,009 |
|
$ |
4,954,690 |
|
$ |
4,829,387 |
Liabilities: |
|
|
|
|
|
|
|
|
|
|
|
|
|
|
Deposits: |
|
|
|
|
|
|
|
|
|
|
|
|
|
|
Noninterest-bearing demand |
$ |
965,552 |
|
$ |
863,949 |
|
$ |
903,300 |
|
$ |
907,254 |
|
$ |
898,044 |
Interest-bearing demand |
|
836,731 |
|
|
834,207 |
|
|
988,057 |
|
|
996,298 |
|
|
1,006,915 |
Money market and savings |
|
2,039,560 |
|
|
1,854,777 |
|
|
1,901,281 |
|
|
1,952,410 |
|
|
1,812,427 |
Time deposits |
|
844,640 |
|
|
769,558 |
|
|
524,018 |
|
|
538,159 |
|
|
550,468 |
Total deposits |
|
4,686,483 |
|
|
4,322,491 |
|
|
4,316,656 |
|
|
4,394,121 |
|
|
4,267,854 |
Borrowings |
|
8,135 |
|
|
8,997 |
|
|
12,732 |
|
|
9,849 |
|
|
13,078 |
Subordinated debt |
|
39,684 |
|
|
39,663 |
|
|
42,142 |
|
|
42,120 |
|
|
42,099 |
Other liabilities |
|
50,141 |
|
|
48,760 |
|
|
47,014 |
|
|
41,804 |
|
|
46,470 |
Total liabilities |
|
4,784,443 |
|
|
4,419,911 |
|
|
4,418,544 |
|
|
4,487,894 |
|
|
4,369,501 |
Shareholders' Equity: |
|
|
|
|
|
|
|
|
|
|
|
|
|
|
Common stock |
|
16,926 |
|
|
16,926 |
|
|
16,926 |
|
|
17,057 |
|
|
16,989 |
Additional paid-in capital |
|
294,269 |
|
|
293,909 |
|
|
293,586 |
|
|
296,061 |
|
|
295,699 |
Retained earnings |
|
203,824 |
|
|
195,537 |
|
|
187,751 |
|
|
181,103 |
|
|
173,105 |
Accumulated other comprehensive loss |
|
(23,671) |
|
|
(17,349) |
|
|
(25,798) |
|
|
(27,425) |
|
|
(25,907) |
Total shareholders' equity attributable to SmartFinancial Inc. and Subsidiary |
|
491,348 |
|
|
489,023 |
|
|
472,465 |
|
|
466,796 |
|
|
459,886 |
Non-controlling interest - preferred stock of subsidiary |
|
113 |
|
|
— |
|
|
— |
|
|
— |
|
|
— |
Total shareholders' equity |
|
491,461 |
|
|
489,023 |
|
|
472,465 |
|
|
466,796 |
|
|
459,886 |
Total liabilities & shareholders' equity |
$ |
5,275,904 |
|
$ |
4,908,934 |
|
$ |
4,891,009 |
|
$ |
4,954,690 |
|
$ |
4,829,387 |
7
SmartFinancial, Inc. and Subsidiary
Condensed Consolidated Financial Information - (unaudited)
(dollars in thousands except share and per share data)
|
Three Months Ended |
|
Year Ended |
|||||||||||||||||
|
Dec |
|
Sep |
|
Jun |
|
Mar |
|
Dec |
|
Dec |
|
Dec |
|||||||
|
2024 |
|
2024 |
|
2024 |
|
2024 |
|
2023 |
|
2024 |
|
2023 |
|||||||
Interest income: |
|
|
|
|
|
|
|
|
|
|
|
|
|
|
|
|
|
|
|
|
Loans and leases, including fees |
$ |
57,951 |
|
$ |
54,738 |
|
$ |
50,853 |
|
$ |
50,020 |
|
$ |
48,767 |
|
$ |
213,562 |
|
$ |
186,479 |
Investment securities: |
|
|
|
|
|
|
|
|
|
|
|
|
|
|
|
|
|
|
|
|
Taxable |
|
5,050 |
|
|
5,233 |
|
|
5,320 |
|
|
4,548 |
|
|
4,344 |
|
|
20,151 |
|
|
16,665 |
Tax-exempt |
|
351 |
|
|
350 |
|
|
353 |
|
|
352 |
|
|
352 |
|
|
1,406 |
|
|
1,418 |
Federal funds sold and other earning assets |
|
2,744 |
|
|
3,635 |
|
|
4,759 |
|
|
4,863 |
|
|
4,032 |
|
|
16,000 |
|
|
13,481 |
Total interest income |
|
66,096 |
|
|
63,956 |
|
|
61,285 |
|
|
59,783 |
|
|
57,495 |
|
|
251,119 |
|
|
218,043 |
Interest expense: |
|
|
|
|
|
|
|
|
|
|
|
|
|
|
|
|
|
|
|
|
Deposits |
|
27,437 |
|
|
27,350 |
|
|
27,439 |
|
|
27,035 |
|
|
24,926 |
|
|
109,260 |
|
|
84,260 |
Borrowings |
|
89 |
|
|
709 |
|
|
148 |
|
|
128 |
|
|
162 |
|
|
1,075 |
|
|
936 |
Subordinated debt |
|
787 |
|
|
865 |
|
|
884 |
|
|
899 |
|
|
890 |
|
|
3,434 |
|
|
2,767 |
Total interest expense |
|
28,313 |
|
|
28,924 |
|
|
28,471 |
|
|
28,062 |
|
|
25,978 |
|
|
113,769 |
|
|
87,963 |
Net interest income |
|
37,783 |
|
|
35,032 |
|
|
32,814 |
|
|
31,721 |
|
|
31,517 |
|
|
137,350 |
|
|
130,080 |
Provision for credit losses |
|
2,135 |
|
|
2,575 |
|
|
883 |
|
|
(440) |
|
|
1,571 |
|
|
5,153 |
|
|
3,029 |
Net interest income after provision for credit losses |
|
35,648 |
|
|
32,457 |
|
|
31,931 |
|
|
32,161 |
|
|
29,946 |
|
|
132,197 |
|
|
127,051 |
Noninterest income: |
|
|
|
|
|
|
|
|
|
|
|
|
|
|
|
|
|
|
|
|
Service charges on deposit accounts |
|
1,778 |
|
|
1,780 |
|
|
1,692 |
|
|
1,612 |
|
|
1,673 |
|
|
6,862 |
|
|
6,511 |
Gain (loss) on sale of securities, net |
|
64 |
|
|
— |
|
|
— |
|
|
— |
|
|
— |
|
|
64 |
|
|
(6,801) |
Mortgage banking |
|
541 |
|
|
410 |
|
|
348 |
|
|
280 |
|
|
227 |
|
|
1,579 |
|
|
1,040 |
Investment services |
|
1,382 |
|
|
1,881 |
|
|
1,302 |
|
|
1,380 |
|
|
1,339 |
|
|
5,945 |
|
|
5,105 |
Insurance commissions |
|
1,832 |
|
|
1,477 |
|
|
1,284 |
|
|
1,103 |
|
|
1,133 |
|
|
5,696 |
|
|
4,684 |
Interchange and debit card transaction fees |
|
1,332 |
|
|
1,349 |
|
|
1,343 |
|
|
1,253 |
|
|
1,370 |
|
|
5,277 |
|
|
5,457 |
Other |
|
2,101 |
|
|
2,242 |
|
|
1,635 |
|
|
2,752 |
|
|
1,837 |
|
|
8,729 |
|
|
6,329 |
Total noninterest income |
|
9,030 |
|
|
9,139 |
|
|
7,604 |
|
|
8,380 |
|
|
7,579 |
|
|
34,152 |
|
|
22,325 |
Noninterest expense: |
|
|
|
|
|
|
|
|
|
|
|
|
|
|
|
|
|
|
|
|
Salaries and employee benefits |
|
19,752 |
|
|
18,448 |
|
|
17,261 |
|
|
16,639 |
|
|
16,275 |
|
|
72,100 |
|
|
65,749 |
Occupancy and equipment |
|
3,473 |
|
|
3,423 |
|
|
3,324 |
|
|
3,396 |
|
|
3,378 |
|
|
13,617 |
|
|
13,451 |
FDIC insurance |
|
825 |
|
|
825 |
|
|
825 |
|
|
915 |
|
|
915 |
|
|
3,390 |
|
|
3,156 |
Other real estate and loan related expense |
|
1,241 |
|
|
460 |
|
|
538 |
|
|
584 |
|
|
781 |
|
|
2,823 |
|
|
2,397 |
Advertising and marketing |
|
397 |
|
|
327 |
|
|
295 |
|
|
302 |
|
|
336 |
|
|
1,321 |
|
|
1,342 |
Data processing and technology |
|
2,495 |
|
|
2,519 |
|
|
2,452 |
|
|
2,465 |
|
|
2,458 |
|
|
9,930 |
|
|
9,235 |
Professional services |
|
1,017 |
|
|
1,201 |
|
|
1,064 |
|
|
924 |
|
|
1,136 |
|
|
4,207 |
|
|
3,443 |
Amortization of intangibles |
|
601 |
|
|
604 |
|
|
608 |
|
|
612 |
|
|
643 |
|
|
2,425 |
|
|
2,624 |
Merger related and restructuring expenses |
|
— |
|
|
— |
|
|
— |
|
|
— |
|
|
— |
|
|
— |
|
|
110 |
Other |
|
2,490 |
|
|
3,039 |
|
|
2,834 |
|
|
2,716 |
|
|
3,773 |
|
|
11,077 |
|
|
11,643 |
Total noninterest expense |
|
32,291 |
|
|
30,846 |
|
|
29,201 |
|
|
28,553 |
|
|
29,695 |
|
|
120,890 |
|
|
113,150 |
Income before income taxes |
|
12,387 |
|
|
10,750 |
|
|
10,334 |
|
|
11,988 |
|
|
7,830 |
|
|
45,459 |
|
|
36,226 |
Income tax expense |
|
2,747 |
|
|
1,610 |
|
|
2,331 |
|
|
2,630 |
|
|
1,640 |
|
|
9,318 |
|
|
7,633 |
Net income |
$ |
9,640 |
|
$ |
9,140 |
|
$ |
8,003 |
|
$ |
9,358 |
|
$ |
6,190 |
|
$ |
36,141 |
|
$ |
28,593 |
Earnings per common share: |
|
|
|
|
|
|
|
|
|
|
|
|
|
|
|
|
|
|
|
|
Basic |
$ |
0.58 |
|
$ |
0.55 |
|
$ |
0.48 |
|
$ |
0.56 |
|
$ |
0.37 |
|
$ |
2.16 |
|
$ |
1.70 |
Diluted |
$ |
0.57 |
|
$ |
0.54 |
|
$ |
0.48 |
|
$ |
0.55 |
|
$ |
0.37 |
|
$ |
2.14 |
|
$ |
1.69 |
Weighted average common shares outstanding: |
|
|
|
|
|
|
|
|
|
|
|
|
|
|
|
|
|
|
|
|
Basic |
|
16,729,509 |
|
|
16,726,658 |
|
|
16,770,819 |
|
|
16,849,735 |
|
|
16,814,647 |
|
|
16,768,956 |
|
|
16,805,068 |
Diluted |
|
16,863,780 |
|
|
16,839,998 |
|
|
16,850,250 |
|
|
16,925,408 |
|
|
16,918,234 |
|
|
16,875,456 |
|
|
16,911,185 |
8
SmartFinancial, Inc. and Subsidiary
Condensed Consolidated Financial Information - (unaudited)
(dollars in thousands)
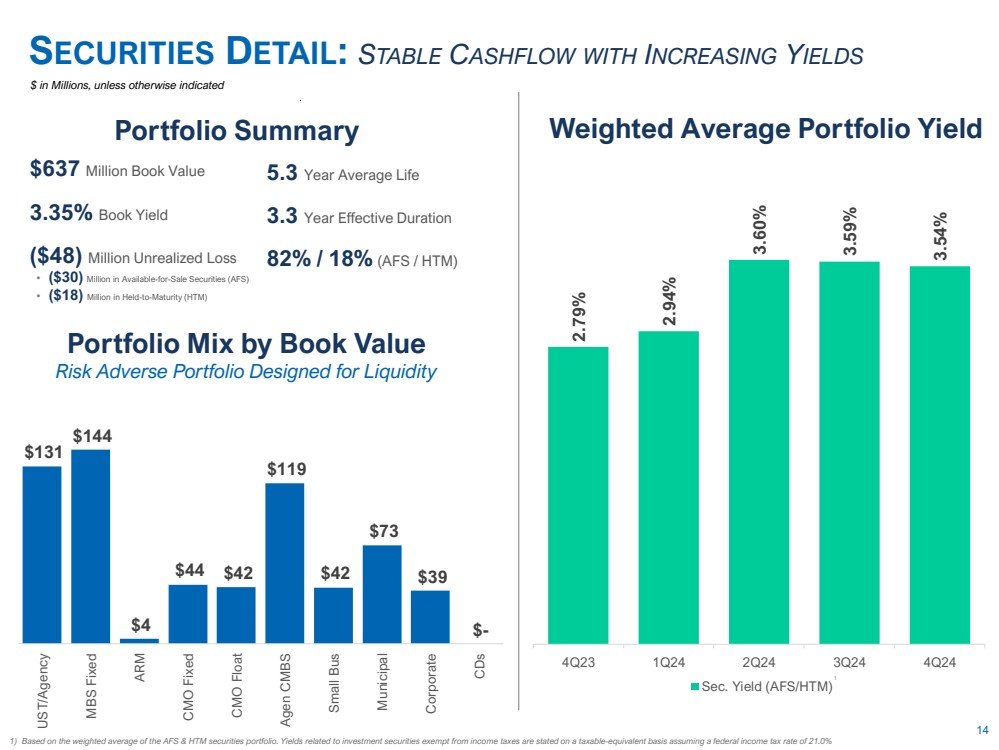
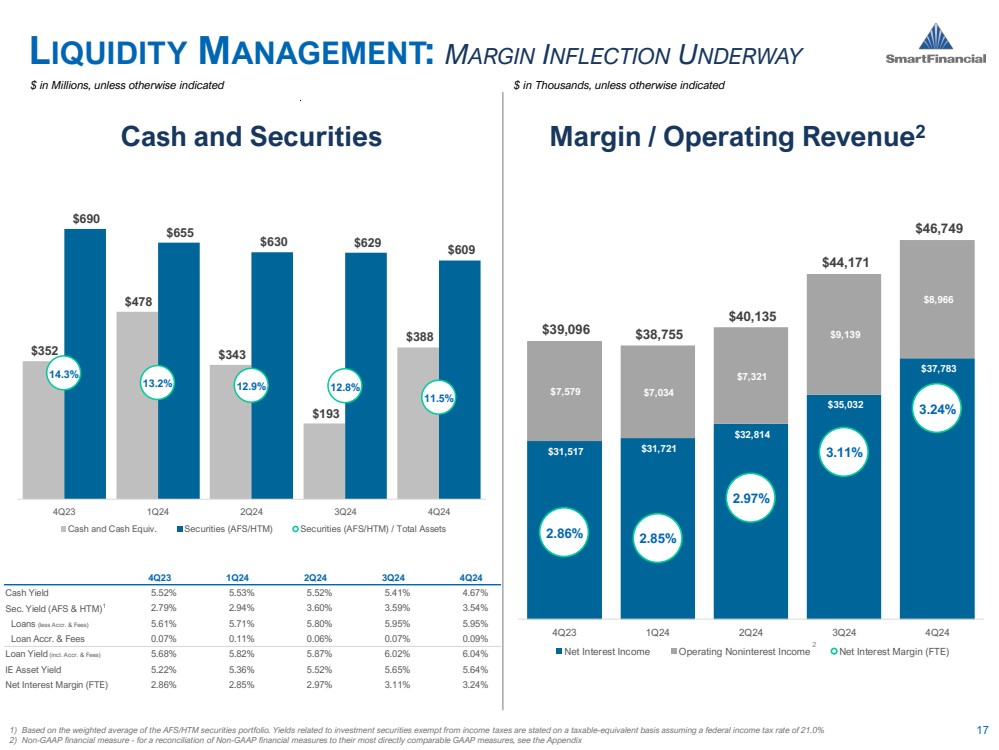
YIELD ANALYSIS
|
|
Three Months Ended |
|
||||||||||||||||||||||
|
|
December 31, 2024 |
|
September 30, 2024 |
|
December 31, 2023 |
|
||||||||||||||||||
|
|
Average |
|
|
|
|
Yield/ |
|
Average |
|
|
|
|
Yield/ |
|
Average |
|
|
|
|
Yield/ |
|
|||
|
|
Balance |
|
Interest |
|
Cost |
|
Balance |
|
Interest |
|
Cost |
|
Balance |
|
Interest |
|
Cost |
|
||||||
Assets: |
|
|
|
|
|
|
|
|
|
|
|
|
|
|
|
|
|
|
|
|
|
|
|
|
|
Loans and leases, including fees1 |
|
$ |
3,830,301 |
|
$ |
58,188 |
|
6.04 |
% |
$ |
3,634,808 |
|
$ |
54,993 |
|
6.02 |
% |
$ |
3,408,430 |
|
$ |
48,767 |
|
5.68 |
% |
Taxable securities |
|
|
554,152 |
|
|
5,050 |
|
3.63 |
% |
|
564,978 |
|
|
5,233 |
|
3.68 |
% |
|
618,511 |
|
|
4,344 |
|
2.79 |
% |
Tax-exempt securities2 |
|
|
63,309 |
|
|
444 |
|
2.79 |
% |
|
63,561 |
|
|
443 |
|
2.77 |
% |
|
63,767 |
|
|
445 |
|
2.77 |
% |
Federal funds sold and other earning assets |
|
|
233,793 |
|
|
2,745 |
|
4.67 |
% |
|
267,252 |
|
|
3,634 |
|
5.41 |
% |
|
289,896 |
|
|
4,032 |
|
5.52 |
% |
Total interest-earning assets |
|
|
4,681,555 |
|
|
66,427 |
|
5.64 |
% |
|
4,530,599 |
|
|
64,303 |
|
5.65 |
% |
|
4,380,604 |
|
|
57,588 |
|
5.22 |
% |
Noninterest-earning assets |
|
|
407,695 |
|
|
|
|
|
|
|
381,306 |
|
|
|
|
|
|
|
386,202 |
|
|
|
|
|
|
Total assets |
|
$ |
5,089,250 |
|
|
|
|
|
|
$ |
4,911,905 |
|
|
|
|
|
|
$ |
4,766,806 |
|
|
|
|
|
|
|
|
|
|
|
|
|
|
|
|
|
|
|
|
|
|
|
|
|
|
|
|
|
|
|
|
Liabilities and Shareholders’ Equity: |
|
|
|
|
|
|
|
|
|
|
|
|
|
|
|
|
|
|
|
|
|
|
|
|
|
Interest-bearing demand deposits |
|
$ |
826,750 |
|
|
3,775 |
|
1.82 |
% |
$ |
925,307 |
|
|
5,289 |
|
2.27 |
% |
$ |
974,637 |
|
|
5,631 |
|
2.29 |
% |
Money market and savings deposits |
|
|
1,923,265 |
|
|
14,830 |
|
3.07 |
% |
|
1,917,301 |
|
|
16,608 |
|
3.45 |
% |
|
1,764,826 |
|
|
14,556 |
|
3.27 |
% |
Time deposits |
|
|
861,211 |
|
|
8,832 |
|
4.08 |
% |
|
560,699 |
|
|
5,453 |
|
3.87 |
% |
|
556,996 |
|
|
4,739 |
|
3.38 |
% |
Total interest-bearing deposits |
|
|
3,611,226 |
|
|
27,437 |
|
3.02 |
% |
|
3,403,307 |
|
|
27,350 |
|
3.20 |
% |
|
3,296,459 |
|
|
24,926 |
|
3.00 |
% |
Borrowings |
|
|
9,145 |
|
|
89 |
|
3.87 |
% |
|
53,592 |
|
|
709 |
|
5.26 |
% |
|
13,420 |
|
|
162 |
|
4.79 |
% |
Subordinated debt |
|
|
39,672 |
|
|
787 |
|
7.89 |
% |
|
40,846 |
|
|
865 |
|
8.42 |
% |
|
42,087 |
|
|
890 |
|
8.39 |
% |
Total interest-bearing liabilities |
|
|
3,660,043 |
|
|
28,313 |
|
3.08 |
% |
|
3,497,745 |
|
|
28,924 |
|
3.29 |
% |
|
3,351,966 |
|
|
25,978 |
|
3.07 |
% |
Noninterest-bearing deposits |
|
|
889,151 |
|
|
|
|
|
|
|
884,938 |
|
|
|
|
|
|
|
915,259 |
|
|
|
|
|
|
Other liabilities |
|
|
50,884 |
|
|
|
|
|
|
|
50,580 |
|
|
|
|
|
|
|
50,055 |
|
|
|
|
|
|
Total liabilities |
|
|
4,600,078 |
|
|
|
|
|
|
|
4,433,263 |
|
|
|
|
|
|
|
4,317,280 |
|
|
|
|
|
|
Shareholders' equity |
|
|
489,172 |
|
|
|
|
|
|
|
478,642 |
|
|
|
|
|
|
|
449,526 |
|
|
|
|
|
|
Total liabilities and shareholders' equity |
|
$ |
5,089,250 |
|
|
|
|
|
|
$ |
4,911,905 |
|
|
|
|
|
|
$ |
4,766,806 |
|
|
|
|
|
|
|
|
|
|
|
|
|
|
|
|
|
|
|
|
|
|
|
|
|
|
|
|
|
|
|
|
Net interest income, taxable equivalent |
|
|
|
|
$ |
38,114 |
|
|
|
|
|
|
$ |
35,379 |
|
|
|
|
|
|
$ |
31,610 |
|
|
|
Interest rate spread |
|
|
|
|
|
|
|
2.57 |
% |
|
|
|
|
|
|
2.36 |
% |
|
|
|
|
|
|
2.14 |
% |
Tax equivalent net interest margin |
|
|
|
|
|
|
|
3.24 |
% |
|
|
|
|
|
|
3.11 |
% |
|
|
|
|
|
|
2.86 |
% |
|
|
|
|
|
|
|
|
|
|
|
|
|
|
|
|
|
|
|
|
|
|
|
|
|
|
Percentage of average interest-earning assets to average interest-bearing liabilities |
|
|
|
|
|
|
|
127.91 |
% |
|
|
|
|
|
|
129.53 |
% |
|
|
|
|
|
|
130.69 |
% |
Percentage of average equity to average assets |
|
|
|
|
|
|
|
9.61 |
% |
|
|
|
|
|
|
9.74 |
% |
|
|
|
|
|
|
9.43 |
% |
1 Yields computed on tax-exempt loans on a tax equivalent basis include $237 thousand, $255 thousand, and $0 thousand of taxable equivalent income for the quarters ended December 31, 2024, September 30, 2024, and December 31, 2023, respectively.
2 Yields computed on tax-exempt instruments on a tax equivalent basis include $93 thousand, $93 thousand, and $94 thousand of taxable equivalent income for the quarters ended December 31, 2024, September 30, 2024, and December 31, 2023, respectively.
9
SmartFinancial, Inc. and Subsidiary
Condensed Consolidated Financial Information - (unaudited)
(dollars in thousands)
YIELD ANALYSIS
|
|
Year Ended |
||||||||||||||||
|
|
December 31, 2024 |
|
December 31, 2023 |
|
|||||||||||||
|
|
Average |
|
|
|
|
Yield/ |
|
Average |
|
|
|
|
Yield/ |
|
|||
|
|
Balance |
|
Interest |
|
Cost |
|
Balance |
|
Interest |
|
Cost |
|
|||||
Assets: |
|
|
|
|
|
|
|
|
|
|
|
|
|
|
|
|
|
|
Loans and leases, including fees1 |
|
$ |
3,607,558 |
|
$ |
214,310 |
|
|
5.94 |
% |
$ |
3,334,523 |
|
$ |
186,479 |
|
5.59 |
% |
Taxable securities |
|
|
580,001 |
|
|
20,151 |
|
|
3.47 |
% |
|
713,637 |
|
|
16,665 |
|
2.34 |
% |
Tax-exempt securities2 |
|
|
63,679 |
|
|
1,780 |
|
|
2.80 |
% |
|
64,816 |
|
|
1,795 |
|
2.77 |
% |
Federal funds sold and other earning assets |
|
|
300,081 |
|
|
16,000 |
|
|
5.33 |
% |
|
272,864 |
|
|
13,481 |
|
4.94 |
% |
Total interest-earning assets |
|
|
4,551,319 |
|
|
252,241 |
|
|
5.54 |
% |
|
4,385,840 |
|
|
218,420 |
|
4.98 |
% |
Noninterest-earning assets |
|
|
388,267 |
|
|
|
|
|
|
|
|
370,436 |
|
|
|
|
|
|
Total assets |
|
$ |
4,939,586 |
|
|
|
|
|
|
|
$ |
4,756,276 |
|
|
|
|
|
|
|
|
|
|
|
|
|
|
|
|
|
|
|
|
|
|
|
|
|
Liabilities and Shareholders’ Equity: |
|
|
|
|
|
|
|
|
|
|
|
|
|
|
|
|
|
|
Interest-bearing demand deposits |
|
$ |
932,598 |
|
|
21,074 |
|
|
2.26 |
% |
$ |
959,639 |
|
|
20,214 |
|
2.11 |
% |
Money market and savings deposits |
|
|
1,913,673 |
|
|
64,116 |
|
|
3.35 |
% |
|
1,768,869 |
|
|
50,468 |
|
2.85 |
% |
Time deposits |
|
|
623,652 |
|
|
24,070 |
|
|
3.86 |
% |
|
520,799 |
|
|
13,578 |
|
2.61 |
% |
Total interest-bearing deposits |
|
|
3,469,923 |
|
|
109,260 |
|
|
3.15 |
% |
|
3,249,307 |
|
|
84,260 |
|
2.59 |
% |
Borrowings |
|
|
21,719 |
|
|
1,075 |
|
|
4.95 |
% |
|
17,824 |
|
|
936 |
|
5.25 |
% |
Subordinated debt |
|
|
41,184 |
|
|
3,434 |
|
|
8.34 |
% |
|
42,055 |
|
|
2,767 |
|
6.58 |
% |
Total interest-bearing liabilities |
|
|
3,532,826 |
|
|
113,769 |
|
|
3.22 |
% |
|
3,309,186 |
|
|
87,963 |
|
2.66 |
% |
Noninterest-bearing deposits |
|
|
883,923 |
|
|
|
|
|
|
|
|
958,078 |
|
|
|
|
|
|
Other liabilities |
|
|
48,949 |
|
|
|
|
|
|
|
|
46,052 |
|
|
|
|
|
|
Total liabilities |
|
|
4,465,698 |
|
|
|
|
|
|
|
|
4,313,316 |
|
|
|
|
|
|
Shareholders' equity |
|
|
473,888 |
|
|
|
|
|
|
|
|
442,960 |
|
|
|
|
|
|
Total liabilities and shareholders' equity |
|
$ |
4,939,586 |
|
|
|
|
|
|
|
$ |
4,756,276 |
|
|
|
|
|
|
|
|
|
|
|
|
|
|
|
|
|
|
|
|
|
|
|
|
|
Net interest income, taxable equivalent |
|
|
|
|
$ |
138,472 |
|
|
|
|
|
|
|
$ |
130,457 |
|
|
|
Interest rate spread |
|
|
|
|
|
|
|
|
2.32 |
% |
|
|
|
|
|
|
2.32 |
% |
Tax equivalent net interest margin |
|
|
|
|
|
|
|
|
3.04 |
% |
|
|
|
|
|
|
2.97 |
% |
|
|
|
|
|
|
|
|
|
|
|
|
|
|
|
|
|
|
|
Percentage of average interest-earning assets to average interest-bearing liabilities |
|
|
|
|
|
|
|
|
128.83 |
% |
|
|
|
|
|
|
132.54 |
% |
Percentage of average equity to average assets |
|
|
|
|
|
|
|
|
9.59 |
% |
|
|
|
|
|
|
9.31 |
% |
1Yields computed on tax-exempt loans on a tax equivalent basis included $749 thousand and $0 thousand of taxable equivalent income for the year ended December 31, 2024, and 2023, respectively.
2Yields computed on tax-exempt instruments on a tax equivalent basis included $374 thousand and $377 thousand of taxable equivalent income for the year ended December 31, 2024, and 2023, respectively.
10
SmartFinancial, Inc. and Subsidiary
Condensed Consolidated Financial Information - (unaudited)
(dollars in thousands)
|
|
As of and for The Three Months Ended |
|
|||||||||||||
|
|
Dec |
|
Sep |
|
Jun |
|
Mar |
|
Dec |
|
|||||
|
|
2024 |
|
2024 |
|
2024 |
|
2024 |
|
2023 |
|
|||||
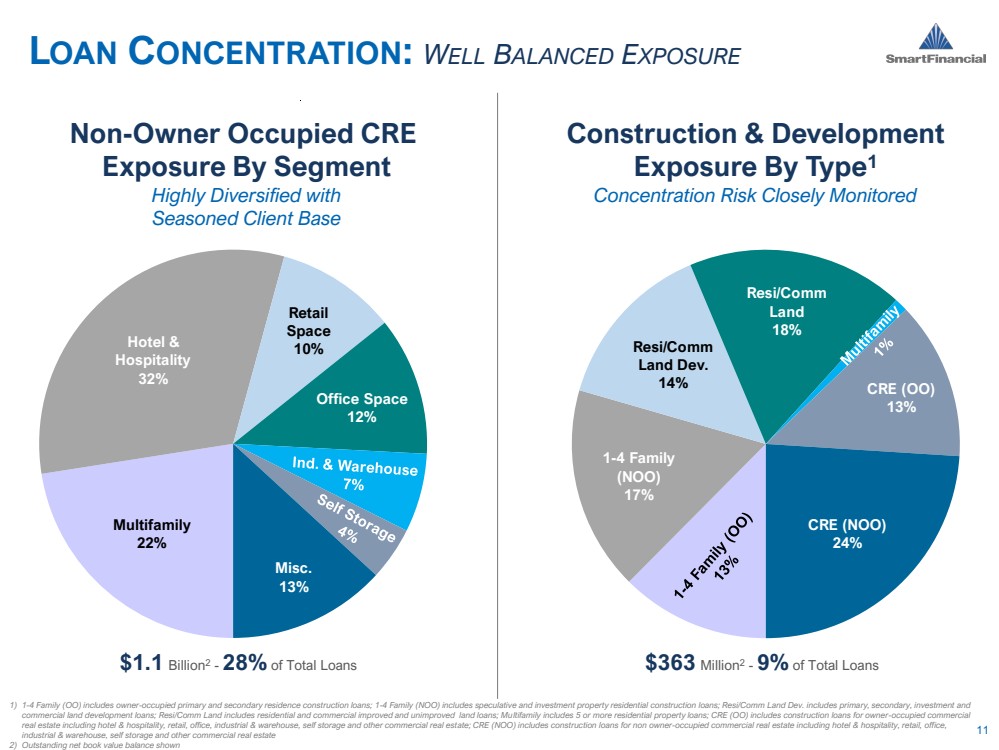
Composition of Loans and Leases: |
|
|
|
|
|
|
|
|
|
|
|
|
|
|
|
|
Commercial real estate: |
|
|
|
|
|
|
|
|
|
|
|
|
|
|
|
|
Owner occupied |
|
$ |
867,678 |
|
$ |
868,077 |
|
$ |
829,085 |
|
$ |
804,557 |
|
$ |
798,416 |
|
Non-owner occupied |
|
|
1,080,404 |
|
|
1,031,708 |
|
|
986,278 |
|
|
938,648 |
|
|
940,789 |
|
Commercial real estate, total |
|
|
1,948,082 |
|
|
1,899,785 |
|
|
1,815,363 |
|
|
1,743,205 |
|
|
1,739,205 |
|
Commercial & industrial |
|
|
775,620 |
|
|
731,600 |
|
|
701,460 |
|
|
667,903 |
|
|
645,918 |
|
Construction & land development |
|
|
361,735 |
|
|
315,006 |
|
|
294,575 |
|
|
321,860 |
|
|
327,185 |
|
Consumer real estate |
|
|
741,836 |
|
|
690,504 |
|
|
678,331 |
|
|
659,209 |
|
|
649,867 |
|
Leases |
|
|
64,878 |
|
|
67,052 |
|
|
70,299 |
|
|
71,909 |
|
|
68,752 |
|
Consumer and other |
|
|
14,189 |
|
|
13,531 |
|
|
14,130 |
|
|
13,469 |
|
|
13,535 |
|
Total loans and leases |
|
$ |
3,906,340 |
|
$ |
3,717,478 |
|
$ |
3,574,158 |
|
$ |
3,477,555 |
|
$ |
3,444,462 |
|
|
|
|
|
|
|
|
|
|
|
|
|
|
|
|
|
|
Asset Quality and Additional Loan Data: |
|
|
|
|
|
|
|
|
|
|
|
|
|
|
|
|
Nonperforming loans and leases |
|
$ |
7,872 |
|
$ |
9,491 |
|
$ |
6,642 |
|
$ |
6,266 |
|
$ |
8,101 |
|
Other real estate owned |
|
|
179 |
|
|
179 |
|
|
688 |
|
|
696 |
|
|
517 |
|
Other repossessed assets |
|
|
2,037 |
|
|
2,949 |
|
|
2,645 |
|
|
2,033 |
|
|
1,117 |
|
Total nonperforming assets |
|
$ |
10,088 |
|
$ |
12,619 |
|
$ |
9,975 |
|
$ |
8,995 |
|
$ |
9,735 |
|
Modified loans and leases1 not included in nonperforming loans and leases |
|
$ |
3,989 |
|
$ |
4,053 |
|
$ |
4,241 |
|
$ |
4,413 |
|
$ |
4,245 |
|
Net charge-offs to average loans and leases (annualized) |
|
|
0.02 |
% |
|
0.15 |
% |
|
0.05 |
% |
|
0.09 |
% |
|
0.04 |
% |
Allowance for credit losses to loans and leases |
|
|
0.96 |
% |
|
0.96 |
% |
|
0.97 |
% |
|
0.98 |
% |
|
1.02 |
% |
Nonperforming loans and leases to total loans and leases, gross |
|
|
0.20 |
% |
|
0.26 |
% |
|
0.19 |
% |
|
0.18 |
% |
|
0.24 |
% |
Nonperforming assets to total assets |
|
|
0.19 |
% |
|
0.26 |
% |
|
0.20 |
% |
|
0.18 |
% |
|
0.20 |
% |
|
|
|
|
|
|
|
|
|
|
|
|
|
|
|
|
|
Capital Ratios: |
|
|
|
|
|
|
|
|
|
|
|
|
|
|
|
|
Equity to Assets |
|
|
9.32 |
% |
|
9.96 |
% |
|
9.66 |
% |
|
9.42 |
% |
|
9.52 |
% |
Tangible common equity to tangible assets (Non-GAAP)2 |
|
|
7.48 |
% |
|
7.99 |
% |
|
7.66 |
% |
|
7.43 |
% |
|
7.47 |
% |
|
|
|
|
|
|
|
|
|
|
|
|
|
|
|
|
|
SmartFinancial, Inc.3 |
|
|
|
|
|
|
|
|
|
|
|
|
|
|
|
|
Tier 1 leverage |
|
|
8.33 |
% |
|
8.44 |
% |
|
8.32 |
% |
|
8.23 |
% |
|
8.27 |
% |
Common equity Tier 1 |
|
|
9.83 |
% |
|
10.06 |
% |
|
10.06 |
% |
|
10.20 |
% |
|
10.14 |
% |
Tier 1 capital |
|
|
9.83 |
% |
|
10.06 |
% |
|
10.06 |
% |
|
10.20 |
% |
|
10.14 |
% |
Total capital |
|
|
11.17 |
% |
|
11.62 |
% |
|
11.68 |
% |
|
11.85 |
% |
|
11.78 |
% |
|
|
|
|
|
|
|
|
|
|
|
|
|
|
|
|
|
SmartBank |
|
|
Estimated4 |
|
|
|
|
|
|
|
|
|
|
|
|
|
Tier 1 leverage |
|
|
8.98 |
% |
|
9.17 |
% |
|
9.11 |
% |
|
9.07 |
% |
|
9.18 |
% |
Common equity Tier 1 |
|
|
10.58 |
% |
|
10.92 |
% |
|
11.02 |
% |
|
11.23 |
% |
|
11.26 |
% |
Tier 1 capital |
|
|
10.58 |
% |
|
10.92 |
% |
|
11.02 |
% |
|
11.23 |
% |
|
11.26 |
% |
Total capital |
|
|
11.36 |
% |
|
11.69 |
% |
|
11.79 |
% |
|
12.00 |
% |
|
12.02 |
% |
1Borrowers that have experienced financial difficulty.
2Total common equity less intangibles divided by total assets less intangibles. See reconciliation of Non-GAAP measures.
3All periods presented are estimated.
4 Current period capital ratios are estimated as of the date of this earnings release.
11
SmartFinancial, Inc. and Subsidiary
Condensed Consolidated Financial Information - (unaudited)
(dollars in thousands except share and per share data)
|
As of and for The |
|
|
As of and for The |
|
|||||||||||||||||
|
Three Months Ended |
|
|
Year Ended |
|
|||||||||||||||||
|
Dec |
|
Sep |
|
Jun |
|
Mar |
|
Dec |
|
|
Dec |
|
Dec |
|
|||||||
|
2024 |
|
2024 |
|
2024 |
|
2024 |
|
2023 |
|
|
2024 |
|
2023 |
|
|||||||
Selected Performance Ratios (Annualized): |
|
|
|
|
|
|
|
|
|
|
|
|
|
|
|
|
|
|
|
|
|
|
Return on average assets |
|
0.75 |
% |
|
0.74 |
% |
|
0.66 |
% |
|
0.77 |
% |
|
0.52 |
% |
|
|
0.73 |
% |
|
0.60 |
% |
Return on average shareholders' equity |
|
7.84 |
% |
|
7.60 |
% |
|
6.90 |
% |
|
8.16 |
% |
|
5.46 |
% |
|
|
7.63 |
% |
|
6.45 |
% |
Return on average tangible common equity¹ |
|
9.99 |
% |
|
9.75 |
% |
|
8.94 |
% |
|
10.63 |
% |
|
7.18 |
% |
|
|
9.82 |
% |
|
8.55 |
% |
Noninterest income / average assets |
|
0.71 |
% |
|
0.74 |
% |
|
0.63 |
% |
|
0.69 |
% |
|
0.63 |
% |
|
|
0.69 |
% |
|
0.47 |
% |
Noninterest expense / average assets |
|
2.52 |
% |
|
2.50 |
% |
|
2.41 |
% |
|
2.35 |
% |
|
2.47 |
% |
|
|
2.45 |
% |
|
2.38 |
% |
Efficiency ratio |
|
68.98 |
% |
|
69.83 |
% |
|
72.25 |
% |
|
71.20 |
% |
|
75.95 |
% |
|
|
70.49 |
% |
|
74.24 |
% |
|
|
|
|
|
|
|
|
|
|
|
|
|
|
|
|
|
|
|
|
|
|
|
Operating Selected Performance Ratios (Annualized): |
|
|
|
|
|
|
|
|
|
|
|
|
|
|
|
|
|
|
|
|
|
|
Operating return on average assets1 |
|
0.75 |
% |
|
0.74 |
% |
|
0.64 |
% |
|
0.69 |
% |
|
0.57 |
% |
|
|
0.71 |
% |
|
0.72 |
% |
Operating PPNR return on average assets1 |
|
1.13 |
% |
|
1.08 |
% |
|
0.90 |
% |
|
0.84 |
% |
|
0.86 |
% |
|
|
0.99 |
% |
|
0.99 |
% |
Operating return on average shareholders' equity1 |
|
7.80 |
% |
|
7.60 |
% |
|
6.72 |
% |
|
7.29 |
% |
|
6.07 |
% |
|
|
7.36 |
% |
|
7.77 |
% |
Operating return on average tangible common equity1 |
|
9.94 |
% |
|
9.75 |
% |
|
8.70 |
% |
|
9.49 |
% |
|
7.98 |
% |
|
|
9.48 |
% |
|
10.29 |
% |
Operating efficiency ratio1 |
|
68.58 |
% |
|
69.28 |
% |
|
72.13 |
% |
|
73.50 |
% |
|
73.41 |
% |
|
|
70.72 |
% |
|
70.26 |
% |
Operating noninterest income / average assets1 |
|
0.70 |
% |
|
0.74 |
% |
|
0.60 |
% |
|
0.58 |
% |
|
0.63 |
% |
|
|
0.66 |
% |
|
0.61 |
% |
Operating noninterest expense / average assets1 |
|
2.52 |
% |
|
2.50 |
% |
|
2.41 |
% |
|
2.35 |
% |
|
2.39 |
% |
|
|
2.45 |
% |
|
2.36 |
% |
|
|
|
|
|
|
|
|
|
|
|
|
|
|
|
|
|
|
|
|
|
|
|
Selected Interest Rates and Yields: |
|
|
|
|
|
|
|
|
|
|
|
|
|
|
|
|
|
|
|
|
|
|
Yield on loans and leases, excluding loan fees, FTE |
|
5.95 |
% |
|
5.95 |
% |
|
5.80 |
% |
|
5.71 |
% |
|
5.61 |
% |
|
|
5.86 |
% |
|
5.43 |
% |
Yield on loans and leases, FTE |
|
6.04 |
% |
|
6.02 |
% |
|
5.87 |
% |
|
5.82 |
% |
|
5.68 |
% |
|
|
5.94 |
% |
|
5.59 |
% |
Yield on earning assets, FTE |
|
5.64 |
% |
|
5.65 |
% |
|
5.52 |
% |
|
5.36 |
% |
|
5.22 |
% |
|
|
5.54 |
% |
|
4.98 |
% |
Cost of interest-bearing deposits |
|
3.02 |
% |
|
3.20 |
% |
|
3.23 |
% |
|
3.16 |
% |
|
3.00 |
% |
|
|
3.15 |
% |
|
2.59 |
% |
Cost of total deposits |
|
2.43 |
% |
|
2.54 |
% |
|
2.56 |
% |
|
2.52 |
% |
|
2.35 |
% |
|
|
2.51 |
% |
|
2.00 |
% |
Cost of interest-bearing liabilities |
|
3.08 |
% |
|
3.29 |
% |
|
3.29 |
% |
|
3.23 |
% |
|
3.07 |
% |
|
|
3.22 |
% |
|
2.66 |
% |
Net interest margin, FTE |
|
3.24 |
% |
|
3.11 |
% |
|
2.97 |
% |
|
2.85 |
% |
|
2.86 |
% |
|
|
3.04 |
% |
|
2.97 |
% |
|
|
|
|
|
|
|
|
|
|
|
|
|
|
|
|
|
|
|
|
|
|
|
Per Common Share: |
|
|
|
|
|
|
|
|
|
|
|
|
|
|
|
|
|
|
|
|
|
|
Net income, basic |
$ |
0.58 |
|
$ |
0.55 |
|
$ |
0.48 |
|
$ |
0.56 |
|
$ |
0.37 |
|
|
$ |
2.16 |
|
$ |
1.70 |
|
Net income, diluted |
|
0.57 |
|
|
0.54 |
|
|
0.48 |
|
|
0.55 |
|
|
0.37 |
|
|
|
2.14 |
|
|
1.69 |
|
Operating earnings, basic¹ |
|
0.57 |
|
|
0.55 |
|
|
0.47 |
|
|
0.50 |
|
|
0.41 |
|
|
|
2.08 |
|
|
2.05 |
|
Operating earnings, diluted¹ |
|
0.57 |
|
|
0.54 |
|
|
0.46 |
|
|
0.49 |
|
|
0.41 |
|
|
|
2.07 |
|
|
2.03 |
|
Book value |
|
29.04 |
|
|
28.89 |
|
|
27.91 |
|
|
27.37 |
|
|
27.07 |
|
|
|
29.04 |
|
|
27.07 |
|
Tangible book value¹ |
|
22.85 |
|
|
22.67 |
|
|
21.66 |
|
|
21.12 |
|
|
20.76 |
|
|
|
22.85 |
|
|
20.76 |
|
Common shares outstanding |
|
16,925,672 |
|
|
16,926,374 |
|
|
16,925,902 |
|
|
17,056,704 |
|
|
16,988,879 |
|
|
|
16,925,672 |
|
|
16,988,879 |
|
¹Non-GAAP measure. See reconciliation of Non-GAAP measures.
12
SmartFinancial, Inc. and Subsidiary
Condensed Consolidated Financial Information - (unaudited)
(dollars in thousands)
NON-GAAP RECONCILIATIONS
|
Three Months Ended |
|
|
Year Ended |
|
|||||||||||||||||
|
Dec |
|
Sep |
|
Jun |
|
Mar |
|
Dec |
|
|
Dec |
|
Dec |
|
|||||||
|
2024 |
|
2024 |
|
2024 |
|
2024 |
|
2023 |
|
|
2024 |
|
2023 |
|
|||||||
Operating Earnings: |
|
|
|
|
|
|
|
|
|
|
|
|
|
|
|
|
|
|
|
|
|
|
Net income (GAAP) |
$ |
9,641 |
|
$ |
9,140 |
|
$ |
8,003 |
|
$ |
9,358 |
|
$ |
6,190 |
|
|
$ |
36,141 |
|
$ |
28,593 |
|
Noninterest income: |
|
|
|
|
|
|
|
|
|
|
|
|
|
|
|
|
|
|
|
|
|
|
Securities (gains) losses, net |
|
(64) |
|
|
— |
|
|
— |
|
|
— |
|
|
— |
|
|
|
(64) |
|
|
6,801 |
|
Gain on sale of former branch building |
|
— |
|
|
— |
|
|
(283) |
|
|
(1,346) |
|
|
— |
|
|
|
(1,629) |
|
|
— |
|
Noninterest expenses: |
|
|
|
|
|
|
|
|
|
|
|
|
|
|
|
|
|
|
|
|
|
|
Donation of a former branch location |
|
— |
|
|
— |
|
|
— |
|
|
— |
|
|
250 |
|
|
|
— |
|
|
250 |
|
Accruals for pending litigation |
|
— |
|
|
— |
|
|
— |
|
|
— |
|
|
675 |
|
|
|
— |
|
|
675 |
|
Merger related and restructuring expenses |
|
— |
|
|
— |
|
|
— |
|
|
— |
|
|
— |
|
|
|
— |
|
|
110 |
|
Income taxes: |
|
|
|
|
|
|
|
|
|
|
|
|
|
|
|
|
|
|
|
|
|
|
Income tax effect of adjustments |
|
17 |
|
|
— |
|
|
73 |
|
|
348 |
|
|
(239) |
|
|
|
437 |
|
|
(2,024) |
|
Operating earnings (Non-GAAP) |
$ |
9,594 |
|
$ |
9,140 |
|
$ |
7,793 |
|
$ |
8,360 |
|
$ |
6,876 |
|
|
$ |
34,885 |
|
$ |
34,405 |
|
Operating earnings per common share (Non-GAAP): |
|
|
|
|
|
|
|
|
|
|
|
|
|
|
|
|
|
|
|
|
|
|
Basic |
$ |
0.57 |
|
$ |
0.55 |
|
$ |
0.47 |
|
$ |
0.50 |
|
$ |
0.41 |
|
|
$ |
2.08 |
|
$ |
2.05 |
|
Diluted |
|
0.57 |
|
|
0.54 |
|
|
0.46 |
|
|
0.49 |
|
|
0.41 |
|
|
|
2.07 |
|
|
2.03 |
|
|
|
|
|
|
|
|
|
|
|
|
|
|
|
|
|
|
|
|
|
|
|
|
Operating Noninterest Income: |
|
|
|
|
|
|
|
|
|
|
|
|
|
|
|
|
|
|
|
|
|
|
Noninterest income (GAAP) |
$ |
9,030 |
|
$ |
9,139 |
|
$ |
7,604 |
|
$ |
8,380 |
|
$ |
7,579 |
|
|
$ |
34,152 |
|
$ |
22,325 |
|
Securities (gains) losses, net |
|
(64) |
|
|
— |
|
|
— |
|
|
— |
|
|
— |
|
|
|
(64) |
|
|
6,801 |
|
Gain on sale of former branch building |
|
— |
|
|
— |
|
|
(283) |
|
|
(1,346) |
|
|
— |
|
|
|
(1,629) |
|
|
— |
|
Operating noninterest income (Non-GAAP) |
$ |
8,966 |
|
$ |
9,139 |
|
$ |
7,321 |
|
$ |
7,034 |
|
$ |
7,579 |
|
|
$ |
32,459 |
|
$ |
29,126 |
|
Operating noninterest income (Non-GAAP)/average assets1 |
|
0.70 |
% |
|
0.74 |
% |
|
0.60 |
% |
|
0.58 |
% |
|
0.63 |
% |
|
|
0.66 |
% |
|
0.61 |
% |
|
|
|
|
|
|
|
|
|
|
|
|
|
|
|
|
|
|
|
|
|
|
|
Operating Noninterest Expense: |
|
|
|
|
|
|
|
|
|
|
|
|
|
|
|
|
|
|
|
|
|
|
Noninterest expense (GAAP) |
$ |
32,291 |
|
$ |
30,846 |
|
$ |
29,201 |
|
$ |
28,553 |
|
$ |
29,695 |
|
|
$ |
120,890 |
|
$ |
113,150 |
|
Donation of a former branch location |
|
— |
|
|
— |
|
|
— |
|
|
— |
|
|
(250) |
|
|
|
— |
|
|
(250) |
|
Accruals for pending litigation |
|
— |
|
|
— |
|
|
— |
|
|
— |
|
|
(675) |
|
|
|
— |
|
|
(675) |
|
Merger related and restructuring expenses |
|
— |
|
|
— |
|
|
— |
|
|
— |
|
|
— |
|
|
|
— |
|
|
(110) |
|
Operating noninterest expense (Non-GAAP) |
$ |
32,291 |
|
$ |
30,846 |
|
$ |
29,201 |
|
$ |
28,553 |
|
$ |
28,770 |
|
|
$ |
120,890 |
|
$ |
112,115 |
|
Operating noninterest expense (Non-GAAP)/average assets2 |
|
2.52 |
% |
|
2.50 |
% |
|
2.41 |
% |
|
2.35 |
% |
|
2.39 |
% |
|
|
2.45 |
% |
|
2.36 |
% |
|
|
|
|
|
|
|
|
|
|
|
|
|
|
|
|
|
|
|
|
|
|
|
Operating Pre-provision Net revenue ("PPNR") Earnings: |
|
|
|
|
|
|
|
|
|
|
|
|
|
|
|
|
|
|
|
|
|
|
Net interest income (GAAP) |
$ |
37,783 |
|
$ |
35,032 |
|
$ |
32,814 |
|
$ |
31,721 |
|
$ |
31,517 |
|
|
$ |
137,350 |
|
$ |
130,080 |
|
Operating noninterest income (Non-GAAP) |
|
8,966 |
|
|
9,139 |
|
|
7,321 |
|
|
7,034 |
|
|
7,579 |
|
|
|
32,459 |
|
|
29,126 |
|
Operating noninterest expense (Non-GAAP) |
|
(32,291) |
|
|
(30,846) |
|
|
(29,201) |
|
|
(28,553) |
|
|
(28,770) |
|
|
|
(120,890) |
|
|
(112,115) |
|
Operating PPNR earnings (Non-GAAP) |
$ |
14,458 |
|
$ |
13,325 |
|
$ |
10,934 |
|
$ |
10,202 |
|
$ |
10,326 |
|
|
$ |
48,919 |
|
$ |
47,091 |
|
|
|
|
|
|
|
|
|
|
|
|
|
|
|
|
|
|
|
|
|
|
|
|
Non-GAAP Return Ratios: |
|
|
|
|
|
|
|
|
|
|
|
|
|
|
|
|
|
|
|
|
|
|
Operating return on average assets (Non-GAAP)3 |
|
0.75 |
% |
|
0.74 |
% |
|
0.64 |
% |
|
0.69 |
% |
|
0.57 |
% |
|
|
0.71 |
% |
|
0.72 |
% |
Operating PPNR return on average assets (Non-GAAP)4 |
|
1.13 |
% |
|
1.08 |
% |
|
0.90 |
% |
|
0.84 |
% |
|
0.86 |
% |
|
|
0.99 |
% |
|
0.99 |
% |
Return on average tangible common equity (Non-GAAP)5 |
|
9.99 |
% |
|
9.75 |
% |
|
8.93 |
% |
|
10.63 |
% |
|
7.18 |
% |
|
|
9.82 |
% |
|
8.55 |
% |
Operating return on average shareholders' equity (Non-GAAP)6 |
|
7.80 |
% |
|
7.60 |
% |
|
6.72 |
% |
|
7.29 |
% |
|
6.07 |
% |
|
|
7.36 |
% |
|
7.77 |
% |
Operating return on average tangible common equity (Non-GAAP)7 |
|
9.94 |
% |
|
9.75 |
% |
|
8.70 |
% |
|
9.49 |
% |
|
7.98 |
% |
|
|
9.48 |
% |
|
10.29 |
% |
|
|
|
|
|
|
|
|
|
|
|
|
|
|
|
|
|
|
|
|
|
|
|
Operating Efficiency Ratio: |
|
|
|
|
|
|
|
|
|
|
|
|
|
|
|
|
|
|
|
|
|
|
Efficiency ratio (GAAP) |
|
68.98 |
% |
|
69.83 |
% |
|
72.25 |
% |
|
71.20 |
% |
|
75.95 |
% |
|
|
70.49 |
% |
|
74.24 |
% |
Adjustment for taxable equivalent yields |
|
(0.49) |
% |
|
(0.55) |
% |
|
(0.63) |
% |
|
(0.17) |
% |
|
(0.18) |
% |
|
|
(0.46) |
% |
|
(0.18) |
% |
Adjustment for securities gains (losses) |
|
0.09 |
% |
|
— |
% |
|
— |
% |
|
— |
% |
|
— |
% |
|
|
0.03 |
% |
|
(3.17) |
% |
Adjustment for sale of branch location |
|
— |
% |
|
— |
% |
|
0.51 |
% |
|
2.46 |
% |
|
— |
% |
|
|
0.66 |
% |
|
— |
% |
Adjustment for donation of a former branch location |
|
— |
% |
|
— |
% |
|
— |
% |
|
— |
% |
|
(0.64) |
% |
|
|
— |
% |
|
(0.16) |
% |
Adjustment for accruals for pending litigation |
|
— |
% |
|
— |
% |
|
— |
% |
|
— |
% |
|
(1.72) |
% |
|
|
— |
% |
|
(0.44) |
% |
Adjustment for merger related income and costs |
|
— |
% |
|
— |
% |
|
— |
% |
|
— |
% |
|
— |
% |
|
|
— |
% |
|
(0.03) |
% |
Operating efficiency ratio (Non-GAAP) |
|
68.58 |
% |
|
69.28 |
% |
|
72.13 |
% |
|
73.50 |
% |
|
73.41 |
% |
|
|
70.72 |
% |
|
70.26 |
% |
1Operating noninterest income (Non-GAAP) is annualized and divided by average assets.
2Operating noninterest expense (Non-GAAP) is annualized and divided by average assets.
3Operating return on average assets (Non-GAAP) is the annualized operating earnings (Non-GAAP) divided by average assets.
4Operating PPNR return on average assets (Non-GAAP) is the annualized operating PPNR earnings (Non-GAAP) divided by average assets.
5Return on average tangible common equity (Non-GAAP) is the annualized net income divided by average tangible common equity (Non-GAAP).
6Operating return on average shareholders’ equity (Non-GAAP) is the annualized operating earnings (Non-GAAP) divided by average equity.
7Operating return on average tangible common equity (Non-GAAP) is the annualized operating earnings (Non-GAAP) divided by average tangible common equity (Non-GAAP).
13
SmartFinancial, Inc. and Subsidiary
Condensed Consolidated Financial Information - (unaudited)
(dollars in thousands)
NON-GAAP RECONCILIATIONS
|
|
Three Months Ended |
|
|||||||||||||
|
|
Dec |
|
Sep |
|
Jun |
|
Mar |
|
Dec |
|
|||||
|
|
2024 |
|
2024 |
|
2024 |
|
2024 |
|
2023 |
|
|||||
Tangible Common Equity: |
|
|
|
|
|
|
|
|
|
|
|
|
|
|
|
|
Shareholders' equity (GAAP) |
|
$ |
491,461 |
|
$ |
489,023 |
|
$ |
472,465 |
|
$ |
466,796 |
|
$ |
459,886 |
|
Less goodwill and other intangible assets |
|
|
104,723 |
|
|
105,324 |
|
|
105,929 |
|
|
106,537 |
|
|
107,148 |
|
Tangible common equity (Non-GAAP) |
|
$ |
386,738 |
|
$ |
383,699 |
|
$ |
366,536 |
|
$ |
360,259 |
|
$ |
352,738 |
|
|
|
|
|
|
|
|
|
|
|
|
|
|
|
|
|
|
Average Tangible Common Equity: |
|
|
|
|
|
|
|
|
|
|
|
|
|
|
|
|
Average shareholders' equity (GAAP) |
|
$ |
489,172 |
|
$ |
478,642 |
|
$ |
466,371 |
|
$ |
461,148 |
|
$ |
449,526 |
|
Less average goodwill and other intangible assets |
|
|
105,093 |
|
|
105,701 |
|
|
106,301 |
|
|
106,920 |
|
|
107,551 |
|
Average tangible common equity (Non-GAAP) |
|
$ |
384,079 |
|
$ |
372,941 |
|
$ |
360,070 |
|
$ |
354,228 |
|
$ |
341,975 |
|
|
|
|
|
|
|
|
|
|
|
|
|
|
|
|
|
|
Tangible Book Value per Common Share: |
|
|
|
|
|
|
|
|
|
|
|
|
|
|
|
|
Book value per common share (GAAP) |
|
$ |
29.04 |
|
$ |
28.89 |
|
$ |
27.91 |
|
$ |
27.37 |
|
$ |
27.07 |
|
Adjustment due to goodwill and other intangible assets |
|
|
(6.19) |
|
|
(6.22) |
|
|
(6.25) |
|
|
(6.25) |
|
|
(6.31) |
|
Tangible book value per common share (Non-GAAP)1 |
|
$ |
22.85 |
|
$ |
22.67 |
|
$ |
21.66 |
|
$ |
21.12 |
|
$ |
20.76 |
|
|
|
|
|
|
|
|
|
|
|
|
|
|
|
|
|
|
Tangible Common Equity to Tangible Assets: |
|
|
|
|
|
|
|
|
|
|
|
|
|
|
|
|
Total Assets (GAAP) |
|
$ |
5,275,904 |
|
$ |
4,908,934 |
|
$ |
4,891,009 |
|
$ |
4,954,690 |
|
$ |
4,829,387 |
|
Less goodwill and other intangibles |
|
|
104,723 |
|
|
105,324 |
|
|
105,929 |
|
|
106,537 |
|
|
107,148 |
|
Tangible Assets (Non-GAAP) |
|
$ |
5,171,181 |
|
$ |
4,803,610 |
|
$ |
4,785,080 |
|
$ |
4,848,153 |
|
$ |
4,722,239 |
|
Tangible common equity to tangible assets (Non-GAAP) |
|
|
7.48% |
|
|
7.99% |
|
|
7.66% |
|
|
7.43% |
|
|
7.47% |
|
1Tangible book value per share (Non-GAAP) is computed by dividing total shareholders’ equity, less goodwill and other intangible assets, by common shares outstanding.
14
|
1 INVESTOR CALL 4Q 2024 January 22, 2025, 10:00am ET Webcast: www.smartbank.com (Investor Relations) Audio Only: 1 -833 -470 -1428 Access Code: 994691 Miller Welborn Chairman of the Board Billy Carroll President & CEO Ron Gorczynski CFO |
|
Forward-Looking Statements This presentation may contain statements that are based on management’s current estimates or expectations of future events or future results, and that may be deemed to constitute forward-looking statements as defined under the Private Securities Litigation Reform Act of 1995. These statements on SmartFinancial Inc.’s (“SmartFinancial”) business and financial results and conditions, are not historical in nature and can generally be identified by such words as “expect,” “anticipate,” “intend,” “plan,” “believe,” “seek,” “may,” “estimate,” and similar expressions. All forward-looking statements are subject to risks, uncertainties, and other factors that may cause the actual results of SmartFinancial to differ materially from future results expressed or implied by such forward-looking statements. Such risks, uncertainties, and other factors include, among others, (1) risks associated with our growth strategy, including a failure to implement our growth plans or an inability to manage our growth effectively; (2) claims and litigation arising from our business activities and from the companies we acquire, which may relate to contractual issues, environmental laws, fiduciary responsibility, and other matters; (3) general risks related to our merger and acquisition activity, including risks associated with our pursuit of future acquisitions; (4) changes in management’s plans for the future; (5) prevailing, or changes in, economic or political conditions (including those resulting from the new U.S. administration and Congress), particularly in our market areas, including the effects of declines in the real estate market, high unemployment rates, inflationary pressures, elevated interest rates and slowdowns in economic growth, as well as the financial stress on borrowers as a result of the foregoing; (6) our ability to anticipate interest rate changes and manage interest rate risk (including the impact of higher interest rates on macroeconomic conditions, competition, and the cost of doing business and the impact of interest rate fluctuations on our financial projections, models and guidance); (7) increased technology and cybersecurity risks, including generative artificial intelligence risks; (8) credit risk associated with our lending activities; (9) changes in loan demand, real estate values, or competition; (10) developments in our mortgage banking business, including loan modifications, general demand, and the effects of judicial or regulatory requirements or guidance; (11) changes in accounting principles, policies, or guidelines; (12) changes in applicable laws, rules, or regulations; (13) adverse results from current or future litigation, regulatory examinations or other legal and/or regulatory actions; (14) potential impacts of any adverse developments in the banking industry, including the impacts on customer confidence, deposit outflows, liquidity and the regulatory response thereto; (15) significant turbulence or a disruption in the capital or financial markets and the effect of a fall in stock market prices on our investment securities; (16) the effects of war or other conflicts including the impacts related to or resulting from Russia’s military action in Ukraine or the conflict in Israel and surrounding areas; and (17) other general competitive, economic, political, and market factors, including those affecting our business, operations, pricing, products, or services. These and other factors that could cause results to differ materially from those described in the forward-looking statements can be found in SmartFinancial’s most recent annual report on Form 10-K, quarterly reports on Form 10-Q, and current reports on Form 8-K, in each case filed with or furnished to the Securities and Exchange Commission (the “SEC”) and available on the SEC’s website (www.sec.gov). Undue reliance should not be placed on forward-looking statements. SmartFinancial disclaims any obligation to update or revise any forward-looking statements contained in this presentation, which speak only as of the date hereof, whether as a result of new information, future events, or otherwise. DISCLOSURES 2 Non-GAAP Financial Measures Statements included in this presentation include measures not recognized under U.S. generally accepted accounting principles (“GAAP”) and therefore are considered Non-GAAP financial measures (“Non-GAAP”) and should be read along with the accompanying tables, which provide a reconciliation of Non-GAAP financial measures to GAAP financial measures. SmartFinancial management uses several Non-GAAP financial measures and ratios derived therefrom in its analysis of the Company's performance, including: (i) Operating earnings (ii) Operating revenue (iii) Operating pre-provision net revenue (“PPNR”) earnings (iv) Operating noninterest income (v) Operating noninterest expense (vi) Operating efficiency ratio (vii) Tangible common equity (viii) Tangible common equity (excluding Accumulated Other Comprehensive income (“AOCI”)) (ix) Average tangible common equity (x) Tangible book value per common share (xi) Tangible book value per common share (excluding AOCI) (xii) Tangible assets Operating earnings, operating revenue, operating PPNR earnings, operating noninterest income and operating noninterest expense exclude non-operating related income and expense items from net income, noninterest income and noninterest expense, respectively. Operating efficiency ratio is the quotient of operating noninterest expense divided by the sum of net interest income adjusted for taxable equivalent yields plus operating noninterest income. Tangible common equity and average tangible common equity excludes goodwill and other intangible assets from shareholders' equity and average shareholders' equity, respectively. Tangible common equity (excluding AOCI) excludes goodwill and other intangible assets from shareholders’ equity and accumulated other comprehensive income. Tangible book value per common share is tangible common equity divided by common shares outstanding. Tangible book value per common share (excluding AOCI) is tangible common equity (excluding AOCI) divided by common shares outstanding. Tangible assets excludes goodwill and other intangibles from total assets. A detailed reconciliation of these items and the ratios derived therefrom is available in the Non-GAAP reconciliations. Management believes that Non-GAAP financial measures provide additional useful information that allows investors to evaluate the ongoing performance of the company and provide meaningful comparisons to its peers. Management also believes these Non-GAAP financial measures enhance investors' ability to compare period-to-period financial results and allow investors and company management to view our operating results excluding the impact of items that are not reflective of the underlying operating performance. Non-GAAP financial measures should not be considered as an alternative to any measure of performance or financial condition as promulgated under GAAP, and investors should consider SmartFinancial's performance and financial condition as reported under GAAP and all other relevant information when assessing the performance or financial condition of the company. Non-GAAP financial measures have limitations as analytical tools, and investors should not consider them in isolation or as a substitute for analysis of the results or financial condition as reported under GAAP. Unless otherwise indicated, all financial data contained in this presentation is as of 12/31/24 |
|
'22 -'24 2022Y 2023Y 2024Y CAGR3 Total Loans and Leases (Excl. HFS & PPP) $ 3,253.6 $ 3,444.5 $ 3,906.3 10% Annual Net Balance Loan Growth 560.2 190.8 461.9 Total Deposits 4,077.1 4,267.9 4,686.5 7% Loan / Deposit Ratio 80% 81% 83% Operating Revenue1 165.1 159.2 169.8 1% Operating PPNR Earnings1 59.3 47.1 48.9 (9%) Operating Noninterest Income1 27.6 29.1 32.5 9% Operating Noninterest Income (Excl. Mtg. Bking)1 26.0 28.1 30.9 9% Operating Return on Average Assets1 0.92% 0.72% 0.71% Operating Return on Average Tang. Common Equity1 13.7% 10.3% 9.5% Operating Efficiency Ratio1 63.8% 70.3% 70.7% Diluted Operating Earnings Per Share1 $ 2.57 $ 2.03 $ 2.07 (10%) Tangible Book Value Per Share (Excl. AOCI)1,2 $ 21.18 $ 22.29 $ 24.25 7% 3 SMARTBANK 2024: A YEAR IN REVIEW $ in Millions, except per share data Robust Loan and Deposit Growth / Funding Leveraged through Strategic Deployment YoY PPNR Enhancement Resulting from Growth Stable NII Advancement with Strategy Execution Another Year of Tangible Book Value Growth 2H 2024 Profitability Recovery – Positive Outlook Ahead Balance Sheet / Non-GAAP Revenue Highlights: Non-GAAP Performance Highlights: 1) Non-GAAP financial measure - for a reconciliation of Non-GAAP financial measures to their most directly comparable GAAP measures, see the Appendix 2) AOCI: Accumulated Other Comprehensive Income 3) CAGR: Compound Annualized Growth Rate 4) 2024 Great Place to Work survey 94% of our associates said SmartBank is a great place to work, 37 points higher than the average U.S. company. We are thrilled to become Great Place To Work-Certified . Associate experience is a top priority as success starts with our team members! Corporate Highlights: 4 94% |
|
$0.37 $0.54 $0.57 $0.41 $0.54 $0.57 4Q23 3Q24 4Q24 GAAP EPS Diluted Operating EPS $27.07 $28.89 $29.04 $20.76 $22.67 $22.85 4Q23 3Q24 4Q24 BV Per Share TBV Per Share 0.52% 0.74% 0.75% 0.57% 0.74% 0.75% 4Q23 3Q24 4Q24 GAAP ROAA Operating ROAA 7.2% 9.7% 10.0% 8.0% 9.7% 9.9% 4Q23 3Q24 4Q24 ROATCE Operating ROATCE AOCI Impact 4 Unless otherwise indicated, financial data as of or for the three months ended 12/31/24 1) Non-GAAP financial measure - for a reconciliation of Non-GAAP financial measures to their most directly comparable GAAP measures, see the Appendix 2) QoQ: Quarter-over-Quarter 3) “Loans” for purposes of this presentation includes all SmartFinancial loans and leases 4) AOCI: Accumulated Other Comprehensive Income QUARTERLY HIGHLIGHTS: FOURTH QUARTER 2024 9.3% QoQ2 Annualized Tang. Book Value Per Share Growth (Excluding AOCI)1,4 $0.57 Diluted Operating EPS1 0.75% Operating Return on Average Assets1 9.9% Operating Return Average Tang. Common Equity1 69% Operating Efficiency Ratio1 34% QoQ Annualized Deposit Growth 20% QoQ Annualized Organic Loan3 Growth 83% Loan / Deposit Ratio3 0.19% Non-Performing Assets / Assets $5.3 Billion in Total Assets Diluted Earnings Per Share Book Value Per Share Return on Average Assets Return on Average Tangible Common Equity 1 1 1 1 1,4 $24.25 $22.85 $23.69 $22.67 $20.76 $22.29 |
|
$9,756 $9,640 $- $2, 000 $4, 000 $6, 000 $8, 000 $10, 000 $12, 000 $14, 000 $16, 000 $0.65 $0.57 $- $0 $0 $0 $0 $1 $1 $1 $1 $1 $31,951 $46,813 $( 3, 000) $7, 000 $17, 000 $27, 000 $37, 000 $47, 000 $57, 000 $2,487 $3,906 $- $500 $1, 000 $1, 500 $2, 000 $2, 500 $3, 000 $3, 500 $4, 000 $4, 500 $3,048 $4,686 $( 500) $500 $1, 500 $2, 500 $3, 500 $4, 500 $5, 500 0.29% 0.19% $- $0 $0 $0 $0 $0 5 GAAP KEY MEASURE TRENDS: $ in Thousands Net Income: Diluted Earnings Per Share: Total Revenue: Loans HFI: Deposits: NPAs / Assets: $ in Thousands $ in Millions $ in Millions Diluted Earnings Per Share: Net Income / Diluted Common Shares Outstanding Total Revenue: Net Interest Income + Total Non-Interest Income Loans HFI: Total Loans Held for Investment NPAs / Assets: Total Nonperforming Assets / Total Assets |
|
$9,832 $9,593 $- $2, 000 $4, 000 $6, 000 $8, 000 $10, 000 $12, 000 $14, 000 $0.65 $0.57 $- $0 $0 $0 $0 $1 $1 $1 $1 $1 $12,590 $14,458 $- $2, 000 $4, 000 $6, 000 $8, 000 $10, 000 $12, 000 $14, 000 $16, 000 $18, 000 1.19% 0.75% $- $0 $0 $0 $0 $0 $0 $0 14.53% 9.94% $- $0 $0 $0 $0 $0 $0 $0 $0 $0 $18.39 $22.85 $16 $17 $18 $19 $20 $21 $22 $23 $24 6 NON-GAAP KEY MEASURE TRENDS1 : 1) Operating Earnings, Operating Diluted EPS, Operating PPNR Earnings, Operating ROAA, Operating ROATCE, Tangible Book Value Per Share and Tangible Common Equity are all Non-GAAP financial measures. For a reconciliation of Non-GAAP financial measures to their most directly comparable GAAP measures, see the Appendix $ in Thousands Operating Earnings: Operating Diluted EPS: Operating PPNR Earnings: Operating ROAA: Operating ROATCE: Tangible Book Value Per Share: $ in Thousands Operating Diluted Earnings Per Share: Operating Earnings / Diluted Common Shares Outstanding Operating Pre-Provision Net Revenue Earnings: Net Interest Income + Operating Non-Interest Income – Operating Non-Interest Expense Operating Non-Interest Income: Non-Interest Income Adjusted for Non-Operating, Non-Recurring Items Operating Non-Interest Expense: Non-Interest Expense Adjusted for Non-Operating, Non-Recurring Items Operating Return on Average Assets: Operating Earnings / Average Assets Tangible Book Value Per Share: Tangible Common Equity / Total Common Shares Outstanding Tangible Common Equity: Total Common Equity Less Goodwill, Core Deposit and Other Intangibles Operating Earnings: Net Income Adjusted for Non-Operating, Non-Recurring Items Operating Return on Average Tangible Common Equity: Operating Earnings / Average Tangible Common Equity Tangible Common Equity: Total Common Equity Less Goodwill, Core Deposit and Other Intangibles $ in Thousands |
|
7 SMARTFINANCIAL: EXPANDING SOUTHEAST FRANCHISE $5.3 Billion in Total Assets $3.9 Billion in Total Loans We are building a culture where Associates thrive and are empowered to be leaders. The core values that we have established as a company help us operate in unison and have become a critical part of our culture. Our Associates are key to SmartBank’s success. $4.7 Billion in Total Deposits 42 Total Branches Nashville Knoxville Huntsville Tuscaloosa Mobile Pensacola Birmingham Auburn Tallahassee Dothan Montgomery SmartBank Branch Offices Chattanooga 1) 2024 Great Place to Work survey Panama City 1 94% |
|
$1.0 $1.1 $1.7 $2.3 $2.4 $3.3 $4.6 $4.6 $4.8 $5.3 $( 1) $1 $2 $3 $4 $5 $6 $7 2015 2016 2017 2018 2019 2020 2021 2022 2023 2024 8 SMARTBANK JOURNEY: LOOKING AHEAD Validation: Scaling: Leveraging: • Focused on validating platform and substantiating market need • Completed Cornerstone merger-of-equals • Completed functional initial public offering • Began expanding commercial banking product offering • Quickly recognized the need for scale to spread operating cost over larger asset base • Focused on building scale through asset growth with emphasis on fee revenue drivers • Completed four bank acquisitions • Acquired Fountain Equipment Finance • Started dealer floor plan lending unit • Expanded into seven new de novo markets • Broadened Treasury Management and commercial banking product package • Implemented several multi-year IT infrastructure projects • Consolidated inconsistent legacy products, services and operational procedures • Focus on leveraging existing investments to efficiently deploy capital and enhance EPS and ROATCE • Strategic hiring supported by existing infrastructure • Further investment in commercial banking business • Heightened focus on commercial sales process • Targeted business relationship generation and client profitability profiles • Operational and product enhancement in key areas (Treasury Management, digital capabilities, etc.) • M&A focus shifted to strategics and/or “needle moving” opportunities $ in Billions, unless otherwise indicated Strategic Focus: Leverage Existing Infrastructure Investments to Drive Profitability and Optimize Efficiency |
|
$( 500, 000) $- $500, 000 $1, 000, 000 $1, 500, 000 $2, 000, 000 MARKET AREA: BUILDING DENSITY IN ATTRACTIVE SOUTHEAST MARKETS 9 ► Producers: 44 ► Loans: 61% ► Deposits: 63% ► ’21-’24 Growth: 10% Tennessee Source: S&P Market Intelligence; U.S. Census; https://www.cnbc.com/americas-top-states-for-business/ 1) Producers includes relationship managers, market leaders and regional presidents responsible for meeting business production goals 2) Market loan and deposit percentages shown as a percentage of the total loans and deposits of SmartBank as of 12/31/24, respectively 3) 12/31/21 – 12/31/24 Compound Annualized Growth Rate based on market loan growth over the time period Profile by Market Area: Abundant Organic Opportunity US Population Migration: Strong Migration into Great Markets 1,2,3 ► Producers: 27 ► Loans: 24% ► Deposits: 28% ► ’21-’24 Growth: 27% Alabama ► Producers: 11 ► Loans: 15% ► Deposits: 8% ► ’21-’24 Growth: 11% Coastal July 1, 2022 to July 1, 2023 AMERICA’S TOP STATES FOR BUSINESS 2024 N. CAROLINA: #2 GEORGIA: #4 FLORIDA: #5 TENNESSEE: #8 S. CAROLINA: #19 ALABAMA: #20 Knoxville Nashville Huntsville Pensacola Birmingham Tallahassee Montgomery Chattanooga Mobile 1.1% 1,423,260 0.2% 137,299 0.2% 126,255 -43,330 1.1% Auburn Dothan Tuscaloosa Panama City |
|
23% 23% 23% 23% 22% 27% 27% 28% 28% 28% 19% 19% 20% 20% 20% 9% 9% 8% 8% 9% 19% 19% 19% 19% 19% $3,444 $3,478 $3,574 $3,717 $3,906 4Q23 1Q24 2Q24 3Q24 4Q24 CRE, OO CRE, NOO C&I C&D Consumer RE Leases & Other $1,897 $2,382 $2,693 $3,254 $3,444 $3,478 $3,574 $3,717 $3,906 5.43% 5.71% 5.80% 5.95% 5.95% 3. 00% 4. 00% 5. 00% 6. 00% 7. 00% 8. 00% 9. 00% 10. 00% $- $500 $1, 000 $1, 500 $2, 000 $2, 500 $3, 000 $3, 500 $4, 000 $4, 500 2019Y 2020Y 2021Y 2022Y 2023Y 1Q24 2Q24 3Q24 4Q24 10 LOAN PORTFOLIO: SOLID MARKETS PROVIDING OPPORTUNITY Total Loans CAGR of 16% Since 2019 $ in Millions, unless otherwise indicated Average Loan Yield (excluding accretion & fees) Loan Composition History of Consistent Organic Growth |
|
1-4 Family (NOO) 17% Resi/Comm Land Dev. 14% Resi/Comm Land 18% CRE (OO) 13% CRE (NOO) 24% Multifamily 22% Hotel & Hospitality 32% Retail Space 10% Office Space 12% Misc. 13% 11 LOAN CONCENTRATION: WELL BALANCED EXPOSURE Non-Owner Occupied CRE Exposure By Segment Highly Diversified with Seasoned Client Base Construction & Development Exposure By Type1 Concentration Risk Closely Monitored 1) 1-4 Family (OO) includes owner-occupied primary and secondary residence construction loans; 1-4 Family (NOO) includes speculative and investment property residential construction loans; Resi/Comm Land Dev. includes primary, secondary, investment and commercial land development loans; Resi/Comm Land includes residential and commercial improved and unimproved land loans; Multifamily includes 5 or more residential property loans; CRE (OO) includes construction loans for owner-occupied commercial real estate including hotel & hospitality, retail, office, industrial & warehouse, self storage and other commercial real estate; CRE (NOO) includes construction loans for non owner-occupied commercial real estate including hotel & hospitality, retail, office, industrial & warehouse, self storage and other commercial real estate 2) Outstanding net book value balance shown $1.1 Billion2 - 28% of Total Loans $363 Million2 - 9% of Total Loans |
|
$9,735 $8,995 $9,975 $12,619 $10,088 0.20% 0.18% 0.20% 0.26% 0.19% - 0.10% 0.10% 0.30% 0.50% 0.70% 0.90% 1.10% 1.30% 1.50% $- $2, 000 $4, 000 $6, 000 $8, 000 $10, 000 $12, 000 $14, 000 $16, 000 4Q23 1Q24 2Q24 3Q24 4Q24 Nonperforming Loans OREO & Other Repos Nonperforming Assets / Total Assets 280% 275% 277% 288% 303% 72% 70% 63% 67% 76% 0% 50% 100% 150% 200% 250% 150% 170% 190% 210% 230% 250% 270% 290% 310% 330% 350% 4Q23 1Q24 2Q24 3Q24 4Q24 CRE Loans / Capital C&D Loans / Capital $13,998 $10,832 $10,430 $13,903 $15,248 0.41% 0.31% 0.29% 0.37% 0.39% - 0.10% 0.10% 0.30% 0.50% 0.70% 0.90% 1.10% 1.30% 1.50% 1.70% $2, 000 $4, 000 $6, 000 $8, 000 $10, 000 $12, 000 $14, 000 $16, 000 $18, 000 $20, 000 4Q23 1Q24 2Q24 3Q24 4Q24 Total Delinquent & Nonaccrual Loans & Leases Total Delinquent & Nonaccrual Loans & Leases / Total Loans & Leases 0.37% 0.31% 0.28% 0.27% 0.30% 0.04% 0.09% 0.05% 0.15% 0.02% - 0.10% 0.00% 0.10% 0.20% 0.30% 0.40% 0.50% 4Q23 1Q24 2Q24 3Q24 4Q24 Classified Loans and Leases / Total Loans & Leases Net Chargeoffs $35,066 $34,203 $34,690 $35,609 $37,423 1.02% 0.98% 0.97% 0.96% 0.96% 0.00% 0.50% 1.00% 1.50% 2.00% $- $2, 000 $4, 000 $6, 000 $8, 000 $10, 000 $12, 000 $14, 000 $16, 000 $18, 000 $20, 000 $22, 000 $24, 000 $26, 000 $28, 000 $30, 000 $32, 000 $34, 000 $36, 000 $38, 000 $40, 000 $42, 000 $44, 000 $46, 000 $48, 000 $50, 000 4Q23 1Q24 2Q24 3Q24 4Q24 Allowance for Credit Losses (ACL) ACL / Loans HFI 12 Credit Quality Delinquent and Nonaccruals / Total Loans Nonperforming Assets Commercial Real Estate Concentration ASSET QUALITY: STRONG UNDERWRITING PAYS DIVIDENDS $ in Thousands, unless otherwise indicated Allowance Reconciliation |
|
21% 21% 21% 20% 21% 24% 23% 23% 19% 18% 42% 44% 44% 43% 44% 13% 12% 12% 18% 18% $4,268 $4,394 $4,317 $4,322 $4,686 4Q23 1Q24 2Q24 3Q24 4Q24 Noninterest Demand Interest-Bearing Demand Money Market and Savings Time Deposits $2,047 $2,805 $4,022 $4,077 $4,268 $4,394 $4,317 $4,322 $4,686 2.00% 2.52% 2.56% 2.54% 2.43% 0. 00% 1. 00% 2. 00% 3. 00% 4. 00% 5. 00% $- $500 $1, 000 $1, 500 $2, 000 $2, 500 $3, 000 $3, 500 $4, 000 $4, 500 $5, 000 2019Y 2020Y 2021Y 2022Y 2023Y 1Q24 2Q24 3Q24 4Q24 $3,906 13 DEPOSIT PORTFOLIO: DEFENDING DEPOSIT MARKET SHARE Total Deposits Loans to Deposits Ratio of 83% $ in Millions, unless otherwise indicated Average Total Deposit Cost Deposit Composition Complexion Change as Cost Optimization Occurs |
|
$131 $144 $4 $44 $42 $119 $42 $73 $39 $- $- $50 $100 $150 $200 $250 $300 UST/Agency MBS Fixed ARM CMO Fixed CMO Float Agen CMBS Small Bus Municipal Corporate CDs 2.79% 2.94% 3.60% 3.59% 3.54% 0.00% 1.00% 2.00% 3.00% 4.00% 5.00% 6.00% 4Q23 1Q24 2Q24 3Q24 4Q24 Sec. Yield (AFS/HTM) 14 SECURITIES DETAIL: STABLE CASHFLOW WITH INCREASING YIELDS $ in Millions, unless otherwise indicated Portfolio Summary Weighted Average Portfolio Yield Portfolio Mix by Book Value Risk Adverse Portfolio Designed for Liquidity $637 Million Book Value 3.35% Book Yield ($48) Million Unrealized Loss • ($30) Million in Available-for-Sale Securities (AFS) • ($18) Million in Held-to-Maturity (HTM) 5.3 Year Average Life 3.3 Year Effective Duration 82% / 18% (AFS / HTM) 1 1) Based on the weighted average of the AFS & HTM securities portfolio. Yields related to investment securities exempt from income taxes are stated on a taxable-equivalent basis assuming a federal income tax rate of 21.0% |
|
15 REPRICING SCHEDULE: YIELD ENHANCEMENT ON THE HORIZON $158 Million in Fixed Rate Loans Yielding 4.72% Maturing by 2025 Year End $88 Million in Adjustable-Rate Loans Yielding 6.50% Maturing or Repricing by 2025 Year End $53 Million in Investment Portfolio Principal Cash Flow Yielding 3.75% Returning by 2025 Year End 2028 & ($ in millions) 1Q25 2Q25 3Q25 4Q25 2026 2027 Beyond Loan Repricing Schedule: Fixed Rate Loans $ 37 $ 32 $ 23 $ 66 $ 313 $ 383 $ 1,107 Weighted Average Yield 5.21% 4.95% 4.84% 4.30% 5.00% 5.17% 5.26% Adjustable Rate Loans $ 12 $ 27 $ 25 $ 24 $ 128 $ 111 $ 334 Weighted Average Yield 7.22% 6.83% 6.14% 6.14% 4.40% 4.55% 6.07% Investment Cashflow Schedule: Principal Cashflow $ 13 $ 14 $ 13 $ 12 $ 58 $ 85 $ 425 Yield Roll-Off 3.84% 3.74% 3.71% 3.72% 3.14% 2.41% 3.57% Quarterly FYE |
|
105% 97% Peer Average SMBK 89% 83% Peer Average SMBK 16 LIQUIDITY OVERVIEW: PRUDENTLY MANAGING LIQUIDITY 1) Peer average based on most recently reported period results for each peer; peers include major exchange traded banks in the Southeast with assets between $2.0 billion and $8.0 billion 2) FRB discount window borrowing capacity shown as of December 31, 2024 Source: S&P Global Loan + Securities / Deposit Ratio (Most Recent Quarter Period End) Loan / Deposit Ratio (Most Recent Quarter Period End) Other Liquidity Sources Access to a Variety of Funding Robust Liquidity on Hand $1.4 Billion in Untapped Liquidity Sources $545 Million in On-Balance Sheet Liquidity 1.2x Liquidity to Uninsured Deposit Ratio 1 1 $ in Millions, unless otherwise indicated 2 Total Amount Net Available Used Availability Current On-Balance Sheet: Cash & Cash Equiv. $388 $0 $388 Unpledged Securities 158 0 158 Available Sources of Liquidity: Fed Funds 96 0 96 FHLB 519 212 307 FRB 428 0 428 HC LoC 35 4 31 Total Liquidity $1,623 $216 $1,407 |
|
$31,517 $31,721 $32,814 $35,032 $37,783 $7,579 $7,034 $7,321 $9,139 $8,966 $39,096 $38,755 $40,135 $44,171 $46,749 2.86% 2.85% 2.97% 3.11% 3.24% $18, 000 $23, 000 $28, 000 $33, 000 $38, 000 $43, 000 $48, 000 2.60% 2.80% 3.00% 3.20% 3.40% 3.60% 3.80% 4Q23 1Q24 2Q24 3Q24 4Q24 Net Interest Income Operating Noninterest Income Net Interest Margin (FTE) $352 $478 $343 $193 $388 $690 $655 $630 $629 $609 14.3% 13.2% 12.9% 12.8% 11.5% 0.0% 5.0% 10.0% 15.0% 20.0% 25.0% 30.0% 35.0% 40.0% $- $100 $200 $300 $400 $500 $600 $700 $800 $900 4Q23 1Q24 2Q24 3Q24 4Q24 Cash and Cash Equiv. Securities (AFS/HTM) Securities (AFS/HTM) / Total Assets 17 LIQUIDITY MANAGEMENT: MARGIN INFLECTION UNDERWAY Cash and Securities Margin / Operating Revenue2 1) Based on the weighted average of the AFS/HTM securities portfolio. Yields related to investment securities exempt from income taxes are stated on a taxable-equivalent basis assuming a federal income tax rate of 21.0% 2) Non-GAAP financial measure - for a reconciliation of Non-GAAP financial measures to their most directly comparable GAAP measures, see the Appendix 2 $ in Millions, unless otherwise indicated $ in Thousands, unless otherwise indicated 4Q23 1Q24 2Q24 3Q24 4Q24 Cash Yield 5.52% 5.53% 5.52% 5.41% 4.67% Sec. Yield (AFS & HTM)1 2.79% 2.94% 3.60% 3.59% 3.54% Loans (less Accr. & Fees) 5.61% 5.71% 5.80% 5.95% 5.95% Loan Accr. & Fees 0.07% 0.11% 0.06% 0.07% 0.09% Loan Yield (incl. Accr. & Fees) 5.68% 5.82% 5.87% 6.02% 6.04% IE Asset Yield 5.22% 5.36% 5.52% 5.65% 5.64% Net Interest Margin (FTE) 2.86% 2.85% 2.97% 3.11% 3.24% |
|
$(203), -0.1% $(45), 0.0% $(845), -0.5% Interest Income % Change Shock -200bps Shock -100bps Shock +100bps $453 , 0.3% $196 , 0.1% $(596), -0.4% Interest Income % Change Ramp -200bps Ramp -100bps Ramp +100bps $1,963 50% $661 17% $1,281 33% Fixed Rate LT Variable ST Variable 18 INTEREST RATE SENSITIVITY Fixed vs. Variable Rate Loans Static Shock / Rate Ramp Analysis1 1) Based on 12-month static rate shock and ramp analysis as of 12/31/24. These estimates of changes in SmartFinancial’s net interest income require us to make certain assumptions including loan and mortgage-related investment prepayment speeds, reinvestment rate, deposit maturities and decay rates. These assumptions are inherently uncertain and, as a result, we cannot precisely predict the impact of changes in interest rates on net interest income. Although our analysis provides an indication of our interest rate risk exposure at a particular point in time, such estimates are not intended to, and do not, provide a precise forecast of the effect of changes in market interest rates and will differ from actual results $2.0 Billion Fixed Rate Loans $1.9 Billion Variable Rate Loans • $1.3 Billion Short-Term Variable Rate (Resetting within 1 - 3 Months) • $661 Million Long-Term Variable Rate (Resets > 3 Months) $ in Millions, unless otherwise indicated $ in Thousands, unless otherwise indicated |
|
$7,579 $7,034 $7,321 $9,139 $8,966 4Q23 1Q24 2Q24 3Q24 4Q24 Service Charges on Deposit Accounts Mortgage Banking Income Investment Services Income Insurance Commissions Interchange Fees Other Noninterest Income 19 NONINTEREST REVENUE DETAILS: GROWING FEE INCOME Operating Noninterest Income1 Focused on Recurring Fee Income 1) Non-GAAP financial measure - for a reconciliation of Non-GAAP financial measures to their most directly comparable GAAP measures, see the Appendix Differentiated Revenue Streams Building a Family of Diversified Revenue Generators $ in Thousands, unless otherwise indicated |
|
73% 73% 72% 69% 69% 4Q23 1Q24 2Q24 3Q24 4Q24 Operating Efficiency Ratio $28,770 $28,553 $29,201 $30,846 $32,291 4Q23 1Q24 2Q24 3Q24 4Q24 Salaries & Benefits Occupancy & Equipment Data Processing & Technology Professional Services Amortization of Intangibles Other Noninterest Expense 20 1) Non-GAAP financial measure - for a reconciliation of Non-GAAP financial measures to their most directly comparable GAAP measures, see the Appendix OPERATING EXPENSE: FOCUS ON EXPENSE CONTAINMENT Operating Efficiency Ratio1 Operating Noninterest Expense1 1 $ in Thousands, unless otherwise indicated |
|
7.5% 7.4% 7.7% 8.0% 7.5% 4Q23 1Q24 2Q24 3Q24 4Q24 10.2% 10.2% 10.1% 10.1% 9.8% 4Q23 1Q24 2Q24 3Q24 4Q24 8.3% 8.2% 8.3% 8.4% 8.3% 4Q23 1Q24 2Q24 3Q24 4Q24 11.9% 11.9% 11.7% 11.6% 11.2% 4Q23 1Q24 2Q24 3Q24 4Q24 $16.82 $17.92 $19.26 $19.09 $20.76 $22.85 $16.80 $17.77 $19.17 $21.18 $22.29 $24.25 $8. 00 $10. 00 $12. 00 $14. 00 $16. 00 $18. 00 $20. 00 $22. 00 $24. 00 2019Y 2020Y 2021Y 2022Y 2023Y 4Q24 TBV Per Share Adj. TBV Per Share (Excl. AOCI) CAPITAL: WELL CAPITALIZED – BUILDING BOOK VALUE 1) Non-GAAP financial measure - for a reconciliation of Non-GAAP financial measures to their most directly comparable GAAP measures, see the Appendix 21 Note: Capital ratio data as of the most recent period ended 12/31/24 TCE / TA1 CET1 Ratio Total Capital Ratio Leverage Ratio Basel III Regulatory Capital Minimum To Be Considered “Well Capitalized” Building Shareholder Value Tangible Book Value Per Share (TBVPS)1 $7.44 TBVPS1 Created 2019 – 2024 (Excluding Accumulated Other Comprehensive Income) $0.08 2024 Per Share Quarterly Dividend 5% Well Capitalized 10% Well Capitalized 6.5% Well Capitalized 1 1 |
|
WHY SMARTBANK: INVESTMENT HIGHLIGHTS 22 Franchise Scarcity Value – Building Southeast Density Engaged Management Team Stable Markets Experiencing Population Expansion Valuable Deposit Base Growing Business Lines with Revenue Diversification Solid Credit Quality and Underwriting History of Defending Book Value and Delivering Shareholder Value $ |
|
APPENDIX 23 |
|
3Q24 4Q23 ($ in thousands, except per share data) 4Q24 3Q24 4Q23 % Chg. % Chg. Net Interest Income $ 37,783 $ 35,032 $ 31,517 8% 20% Provision for Credit Losses 2,135 2,575 1,571 Noninterest Income 9,030 9,139 7,579 (1%) 19% Noninterest Expense 32,291 30,846 29,695 5% 9% Income Tax Expense 2,747 1,610 1,640 Net Income (GAAP) $ 9,640 $ 9,140 $ 6,190 5% 56% Non-GAAP Reconciliations Noninterest Income (64) - - Noninterest Expense - - 925 Income Tax Effect Of Adjustments 17 - (239) Operating Earnings (Non-GAAP) $ 9,593 $ 9,140 $ 6,876 5% 40% Operating PPNR Earnings (Non-GAAP) $ 14,458 $ 13,325 $ 10,326 9% 40% 3Q24 4Q23 Non-GAAP Performance Metrics 4Q24 3Q24 4Q23 % Chg. % Chg. Diluted Operating Earnings Per Share $ 0.57 $ 0.54 $ 0.41 5% 40% Tangible Book Value Per Common Share $ 22.85 $ 22.67 $ 20.76 1% 10% Operating Return on Average Assets 0.75% 0.74% 0.57% Operating PPNR Return on Average Assets 1.13% 1.08% 0.86% Operating Return on Average Tang. Common Equity 9.9% 9.7% 8.0% Operating Efficiency Ratio 68.6% 69.3% 73.4% 4Q24 vs. 4Q24 vs. 24 Note: For a reconciliation of Non-GAAP financial measures to their most directly comparable GAAP measures, see the Appendix; percentage change may differ due to rounding INCOME STATEMENT: DETAILED FOURTH QUARTER RESULTS |
|
NON-GAAP RECONCILIATION 25 1. Operating return on average assets (Non-GAAP) is the annualized operating earnings (Non-GAAP) divided by average assets. 2. Operating PPNR return on average assets (Non-GAAP) is the annualized operating PPNR earnings (Non-GAAP) divided by average assets. 3. Return on average tangible common equity (Non-GAAP) is the annualized net income divided by average tangible common equity (Non-GAAP). 4. Operating return on average shareholders’ equity (Non-GAAP) is the annualized operating earnings (Non-GAAP) divided by average shareholder equity. 5. Operating return on average tangible common equity (Non-GAAP) is the annualized operating earnings (Non-GAAP) divided by average tangible common equity (Non-GAAP). Note: Totals may not add due to rounding $ in Thousands, unless otherwise indicated 4Q24 3Q24 2Q24 1Q24 4Q23 3Q23 2Q23 1Q23 Operating Earnings Net Income (GAAP) $ 9,641 $ 9,140 $ 8,003 $ 9,358 $ 6,190 $ 2,067 $ 8,836 $ 11,500 Noninterest Income: Securities (Gains) Losses (64) - - - - 6,801 - - Gain on Sale of Branch Building - - (283) (1,346) - - - - Noninterest Expenses: Donation of a Former Branch Location - - - - 250 - - - Accruals For Pending Litigation - - - - 675 - - - Merger Related And Restructuring Expenses - - - - - 110 - - Income Taxes: Income Tax Effect Of Adjustments 17 - 73 348 (239) (1,785) - - Operating Earnings (Non-GAAP) $ 9,594 $ 9,140 $ 7,793 $ 8,360 $ 6,876 $ 7,193 $ 8,836 $ 11,500 Operating Earnings Per Common Share (Non-GAAP): Basic $ 0.57 $ 0.55 $ 0.47 $ 0.50 $ 0.41 $ 0.43 $ 0.53 $ 0.69 Diluted 0.57 0.54 0.46 0.49 0.41 0.43 0.52 0.68 Operating Noninterest Income Noninterest Income (GAAP) $ 9,030 $ 9,139 $ 7,604 $ 8,380 $ 7,579 $ 691 $ 7,130 $ 6,925 Securities (Gains) Losses (64) - - - - 6,801 - - Gain on Sale of Branch Building - - (283) (1,346) - - - - Operating Noninterest Income (Non-GAAP) $ 8,966 $ 9,139 $ 7,321 $ 7,034 $ 7,579 $ 7,492 $ 7,130 $ 6,925 Mortgage Banking Income (541) (410) (348) (280) (227) (309) (332) (172) Operating Noninterest Income Excluding Mtg. Banking (Non-GAAP) $ 8,425 $ 8,729 $ 6,973 $ 6,754 $ 7,352 $ 7,183 $ 6,798 $ 6,753 Operating Noninterest Expense Noninterest Expense (GAAP) $ 32,291 $ 30,846 $ 29,201 $ 28,553 $ 29,695 $ 28,516 $ 27,410 $ 27,529 Donation of a Former Branch Location - - - - (250) - - - Accruals For Pending Litigation - - - - (675) - - - Merger Related And Restructuring Expenses - - - - - (110) - - Operating Noninterest Expense (Non-GAAP) $ 32,291 $ 30,846 $ 29,201 $ 28,553 $ 28,770 $ 28,406 $ 27,410 $ 27,529 Operating Revenue Net Interest Income (GAAP) $ 37,783 $ 35,032 $ 32,814 $ 31,721 $ 31,517 $ 31,006 $ 31,575 $ 35,982 Operating Noninterest Income (Non-GAAP) 8,966 9,139 7,321 7,034 7,579 7,492 7,130 6,925 Operating Revenue (Non-GAAP) 46,749 44,171 40,135 38,755 39,096 38,498 38,705 42,907 Operating Pre-Provision Net Revenue ("PPNR") Earnings Operating Revenue (Non-GAAP) $ 46,749 $ 44,171 $ 40,135 $ 38,755 $ 39,096 $ 38,498 $ 38,705 $ 42,907 Operating Noninterest Expense (Non-GAAP) (32,291) (30,846) (29,201) (28,553) (28,770) (28,406) (27,410) (27,529) Operating PPNR Earnings (Non-GAAP) $ 14,458 $ 13,325 $ 10,934 $ 10,202 $ 10,326 $ 10,092 $ 11,295 $ 15,378 Non-GAAP Return Ratios Operating Return On Average Assets (Non-GAAP)(1) 0.75% 0.74% 0.64% 0.69% 0.57% 0.60% 0.75% 0.97% Operating PPNR Return On Average Assets (Non-GAAP)(2) 1.13% 1.08% 0.90% 0.84% 0.86% 0.84% 0.96% 1.30% Return On Average Tangible Common Equity (Non-GAAP)(3) 9.99% 9.75% 8.94% 10.62% 7.18% 2.43% 10.57% 14.45% Operating Return On Average Shareholders' Equity (Non-GAAP)(4) 7.80% 7.60% 6.72% 7.29% 6.07% 6.41% 7.98% 10.79% Operating Return On Average Tangible Common Equity (Non-GAAP)(5) 9.94% 9.75% 8.70% 9.49% 7.98% 8.46% 10.57% 14.45% Operating Efficiency Ratio Efficiency Ratio (GAAP) 68.98% 69.83% 72.25% 71.20% 75.95% 89.96% 70.82% 64.16% Adjustment For Taxable Equivalent Yields (0.49%) (0.55%) (0.63%) (0.17%) (0.18%) (0.27%) (0.18%) (0.14%) Adjustment For Securities (Gains) Losses 0.09% - - - - (15.89%) - - Adjustment For Sale of Branch Building - - 0.51% 2.46% - - - - Adjustment For Donation of a Former Branch Location - - - - (0.64%) - - - Adjustment For Accruals For Pending Litigation - - - - (1.72%) - - - Adjustment For Merger Expenses - - - - - (0.20%) - - Operating Efficiency Ratio (Non-GAAP) 68.58% 69.28% 72.13% 73.50% 73.41% 73.60% 70.64% 64.02% |
|
NON-GAAP RECONCILIATION 26 1. Operating return on average assets (Non-GAAP) is the annualized operating earnings (Non-GAAP) divided by average assets. 2. Operating PPNR return on average assets (Non-GAAP) is the annualized operating PPNR earnings (Non-GAAP) divided by average assets. 3. Return on average tangible common equity (Non-GAAP) is the annualized net income divided by average tangible common equity (Non-GAAP). 4. Operating return on average shareholders’ equity (Non-GAAP) is the annualized operating earnings (Non-GAAP) divided by average shareholder equity. 5. Operating return on average tangible common equity (Non-GAAP) is the annualized operating earnings (Non-GAAP) divided by average tangible common equity (Non-GAAP). Note: Totals may not add due to rounding $ in Thousands, unless otherwise indicated 4Q22 3Q22 2Q22 1Q22 4Q21 3Q21 2Q21 1Q21 Operating Earnings Net Income (GAAP) $ 13,004 $ 11,543 $ 10,215 $ 8,259 $ 6,655 $ 9,600 $ 8,778 $ 9,756 Noninterest Income: Securities (Gains) Losses (144) - - - - (45) - - Gain on Sale of Branch Building - - - - - - - - Noninterest Expenses: Donation of a Former Branch Location - - - - - - - - Accruals For Pending Litigation - - - - - - - - Merger Related And Restructuring Expenses (45) 87 81 439 2,762 464 372 103 Income Taxes: Income Tax Effect Of Adjustments 49 (22) (21) (113) (713) (108) (96) (27) Operating Earnings (Non-GAAP) $ 12,864 $ 11,608 $ 10,275 $ 8,585 $ 8,704 $ 9,911 $ 9,054 $ 9,832 Operating Earnings Per Common Share (Non-GAAP): Basic $ 0.77 $ 0.69 $ 0.61 $ 0.51 $ 0.52 $ 0.64 $ 0.60 $ 0.65 Diluted 0.76 0.69 0.61 0.51 0.52 0.63 0.60 0.65 Operating Noninterest Income Noninterest Income (GAAP) $ 7,125 $ 6,250 $ 7,229 $ 7,111 $ 6,806 $ 6,309 $ 5,143 $ 5,691 Securities (Gains) Losses (144) - - - - (45) - - Gain on Sale of Branch Building - - - - - - - - Operating Noninterest Income (Non-GAAP) $ 6,981 $ 6,250 $ 7,229 $ 7,111 $ 6,806 $ 6,264 $ 5,143 $ 5,691 Mortgage Banking Income (77) (170) (471) (834) (803) (994) (1,105) (1,139) Operating Noninterest Income Excluding Mtg. Banking (Non-GAAP) $ 6,904 $ 6,080 $ 6,758 $ 6,277 $ 6,003 $ 5,270 $ 4,038 $ 4,552 Operating Noninterest Expense Noninterest Expense (GAAP) $ 27,416 $ 27,230 $ 25,926 $ 25,718 $ 27,823 $ 23,309 $ 20,797 $ 19,464 Donation of a Former Branch Location - - - - - - - - Accruals For Pending Litigation - - - - - - - - Merger Related And Restructuring Expenses 45 (87) (81) (439) (2,762) (464) (372) (103) Operating Noninterest Expense (Non-GAAP) $ 27,461 $ 27,143 $ 25,845 $ 25,279 $ 25,061 $ 22,845 $ 20,425 $ 19,361 Operating Revenue Net Interest Income (GAAP) $ 37,612 $ 36,708 $ 33,062 $ 30,118 $ 29,855 $ 30,382 $ 26,897 $ 26,260 Operating Noninterest Income (Non-GAAP) 6,981 6,250 7,229 7,111 6,806 6,264 5,143 5,691 Operating Revenue (Non-GAAP) 44,593 42,958 40,291 37,229 36,661 36,646 32,040 31,951 Operating Pre-Provision Net Revenue ("PPNR") Earnings Operating Revenue (Non-GAAP) $ 44,593 $ 42,958 $ 40,291 $ 37,229 $ 36,661 $ 36,646 $ 32,040 $ 31,951 Operating Noninterest Expense (Non-GAAP) (27,461) (27,143) (25,845) (25,279) (25,061) (22,845) (20,425) (19,361) Operating PPNR Earnings (Non-GAAP) $ 17,132 $ 15,815 $ 14,446 $ 11,950 $ 11,600 $ 13,801 $ 11,615 $ 12,590 Non-GAAP Return Ratios Operating Return On Average Assets (Non-GAAP)(1) 1.10% 0.96% 0.88% 0.76% 0.77% 1.00% 1.01% 1.19% Operating PPNR Return On Average Assets (Non-GAAP)(2) 1.46% 1.30% 1.23% 1.05% 1.03% 1.39% 1.30% 1.52% Return On Average Tangible Common Equity (Non-GAAP)(3) 16.65% 14.36% 13.02% 10.39% 8.18% 12.84% 12.54% 14.41% Operating Return On Average Shareholders' Equity (Non-GAAP)(4) 12.15% 10.83% 9.82% 8.14% 8.09% 10.01% 9.83% 11.05% Operating Return On Average Tangible Common Equity (Non-GAAP)(5) 16.47% 14.44% 13.09% 10.80% 10.70% 13.26% 12.93% 14.53% Operating Efficiency Ratio Efficiency Ratio (GAAP) 61.28% 63.39% 64.35% 69.08% 75.89% 63.53% 64.91% 60.92% Adjustment For Taxable Equivalent Yields (0.22%) (0.25%) (0.27%) (0.31%) (0.32%) (0.25%) (0.30%) (0.28%) Adjustment For Securities (Gains) Losses 0.20% - - - - (0.08%) - - Adjustment For Sale of Branch Building - - - - - - - - Adjustment For Donation of a Former Branch Location - - - - - - - - Adjustment For Accruals For Pending Litigation - - - - - - - - Adjustment For Merger Expenses 0.10% (0.21%) (0.20%) (1.17%) (7.50%) (1.10%) (1.15%) (0.32%) Operating Efficiency Ratio (Non-GAAP) 61.36% 62.93% 63.88% 67.60% 68.07% 62.09% 63.46% 60.32% |
|
NON-GAAP RECONCILIATION 27 1. Operating return on average assets (Non-GAAP) is the annualized operating earnings (Non-GAAP) divided by average assets. 2. Operating PPNR return on average assets (Non-GAAP) is the annualized operating PPNR earnings (Non-GAAP) divided by average assets. 3. Return on average tangible common equity (Non-GAAP) is the annualized net income divided by average tangible common equity (Non-GAAP). 4. Operating return on average shareholders’ equity (Non-GAAP) is the annualized operating earnings (Non-GAAP) divided by average shareholder equity. 5. Operating return on average tangible common equity (Non-GAAP) is the annualized operating earnings (Non-GAAP) divided by average tangible common equity (Non-GAAP). Note: Totals may not add due to rounding $ in Thousands, unless otherwise indicated 2024Y 2023Y 2022Y Operating Earnings Net Income (GAAP) $ 36,141 $ 28,593 $ 43,022 Noninterest Income: Securities (Gains) Losses (64) 6,801 (144) Gain on Sale of Branch Building (1,629) - - Noninterest Expenses: Donation of a Former Branch Location - 250 - Accruals For Pending Litigation - 675 - Merger Related And Restructuring Expenses - 110 562 Income Taxes: Income Tax Effect Of Adjustments 437 (2,024) (108) Operating Earnings (Non-GAAP) $ 34,885 $ 34,405 $ 43,332 Operating Earnings Per Common Share (Non-GAAP): Basic $ 2.08 $ 2.05 $ 2.59 Diluted 2.07 2.03 2.57 Operating Noninterest Income Noninterest Income (GAAP) $ 34,152 $ 22,325 $ 27,715 Securities (Gains) Losses (64) 6,801 (144) Gain on Sale of Branch Building (1,629) - - Operating Noninterest Income (Non-GAAP) $ 32,459 $ 29,126 $ 27,571 Mortgage Banking Income (1,579) (1,040) (1,552) Operating Noninterest Income Excluding Mtg. Banking (Non-GAAP) $ 30,880 $ 28,086 $ 26,019 Operating Noninterest Expense Noninterest Expense (GAAP) $ 120,890 $ 113,150 $ 106,290 Donation of a Former Branch Location - (250) - Accruals For Pending Litigation - (675) - Merger Related And Restructuring Expenses - (110) (562) Operating Noninterest Expense (Non-GAAP) $ 120,890 $ 112,115 $ 105,728 Operating Revenue Net Interest Income (GAAP) $ 137,350 $ 130,080 $ 137,501 Operating Noninterest Income (Non-GAAP) 32,459 29,126 27,571 Operating Revenue (Non-GAAP) 169,809 159,206 165,072 Operating Pre-Provision Net Revenue ("PPNR") Earnings Operating Revenue (Non-GAAP) $ 169,809 $ 159,206 $ 165,072 Operating Noninterest Expense (Non-GAAP) (120,890) (112,115) (105,728) Operating PPNR Earnings (Non-GAAP) $ 48,919 $ 47,091 $ 59,344 Non-GAAP Return Ratios Operating Return On Average Assets (Non-GAAP)(1) 0.71% 0.72% 0.92% Operating PPNR Return On Average Assets (Non-GAAP)(2) 0.99% 0.99% 1.27% Return On Average Tangible Common Equity (Non-GAAP)(3) 9.82% 8.55% 13.60% Operating Return On Average Shareholders' Equity (Non-GAAP)(4) 7.36% 7.77% 10.24% Operating Return On Average Tangible Common Equity (Non-GAAP)(5) 9.48% 10.29% 13.69% Operating Efficiency Ratio Efficiency Ratio (GAAP) 70.49% 74.24% 64.33% Adjustment For Taxable Equivalent Yields (0.46%) (0.18%) (0.26%) Adjustment For Securities (Gains) Losses 0.03% (3.17%) 0.06% Adjustment For Sale of Branch Building Adjustment For Donation of a Former Branch Location - (0.16%) - Adjustment For Accruals For Pending Litigation - (0.44%) - Adjustment For Merger Expenses - (0.03%) (0.34%) Operating Efficiency Ratio (Non-GAAP) 70.72% 70.26% 63.79% |
|
NON-GAAP RECONCILIATION 1. Tangible book value per share (Non-GAAP) is computed by dividing total stockholder’s equity, less goodwill and other intangible assets, by common shares outstanding. 28 Note: Totals may not add due to rounding $ in Thousands, unless otherwise indicated 4Q24 3Q24 2Q24 1Q24 4Q23 3Q23 2Q23 1Q23 Tangible Common Equity: Shareholders' Equity (GAAP) $ 491,461 $ 489,023 $ 472,465 $ 466,796 $ 459,886 $ 446,652 $ 444,847 $ 443,399 Less Goodwill And Other Intangible Assets 104,723 105,324 105,929 106,537 107,148 107,792 108,439 109,114 Tangible Common Equity (Non-GAAP) $ 386,738 $ 383,699 $ 366,536 $ 360,259 $ 352,738 $ 338,860 $ 336,408 $ 334,285 Average Tangible Common Equity: Average Shareholders' Equity (GAAP) $ 489,172 $ 478,642 $ 466,371 $ 461,148 $ 449,526 $ 445,432 $ 444,283 $ 432,382 Less Goodwill And Other Intangible Assets 105,093 105,701 106,301 106,920 107,551 108,194 108,851 109,537 Average Tangible Common Equity (Non-GAAP) $ 384,079 $ 372,941 $ 360,070 $ 354,228 $ 341,975 $ 337,238 $ 335,432 $ 322,845 Tangible Book Value Per Common Share: Book Value Per Common Share (GAAP) $ 29.04 $ 28.89 $ 27.91 $ 27.37 $ 27.07 $ 26.28 $ 26.16 $ 26.08 Adjustment Due To Goodwill And Other Intangible Assets (6.19) (6.22) (6.25) (6.25) (6.31) (6.34) (6.38) (6.42) Tangible Book Value Per Common Share (Non-GAAP)(1) $ 22.85 $ 22.67 $ 21.66 $ 21.12 $ 20.76 $ 19.94 $ 19.78 $ 19.66 Tangible Common Equity To Tangible Assets: Total Assets (GAAP) $ 5,275,904 $ 4,908,934 $ 4,891,009 $ 4,954,690 $ 4,829,387 $ 4,797,171 $ 4,745,800 $ 4,769,805 Less Goodwill And Other Intangibles 104,723 105,324 105,929 106,537 107,148 107,792 108,439 109,114 Tangible Assets (Non-GAAP) $ 5,171,181 $ 4,803,610 $ 4,785,080 $ 4,848,153 $ 4,722,239 $ 4,689,379 $ 4,637,361 $ 4,660,691 Tangible Common Equity To Tangible Assets (Non-GAAP): 7.48% 7.99% 7.66% 7.43% 7.47% 7.23% 7.25% 7.17% |
|
NON-GAAP RECONCILIATION 1. Tangible book value per share (Non-GAAP) is computed by dividing total stockholder’s equity, less goodwill and other intangible assets, by common shares outstanding. 29 Note: Totals may not add due to rounding $ in Thousands, unless otherwise indicated 4Q22 3Q22 2Q22 1Q22 4Q21 3Q21 2Q21 1Q21 Tangible Common Equity: Shareholders' Equity (GAAP) $ 432,452 $ 414,711 $ 420,427 $ 420,042 $ 429,430 $ 424,720 $ 373,393 $ 364,058 Less Goodwill And Other Intangible Assets 109,772 110,460 104,582 105,215 105,852 104,930 90,966 86,350 Tangible Common Equity (Non-GAAP) $ 322,680 $ 304,251 $ 315,845 $ 314,827 $ 323,578 $ 319,790 $ 282,427 $ 277,708 Average Tangible Common Equity: Average Shareholders' Equity (GAAP) $ 420,037 $ 425,365 $ 419,726 $ 427,945 $ 426,808 $ 392,798 $ 369,325 $ 360,919 Less Goodwill And Other Intangible Assets 110,206 106,483 104,986 105,617 104,193 96,250 88,551 86,424 Average Tangible Common Equity (Non-GAAP) $ 309,831 $ 318,882 $ 314,740 $ 322,328 $ 322,615 $ 296,548 $ 280,774 $ 274,495 Tangible Book Value Per Common Share: Book Value Per Common Share (GAAP) $ 25.59 $ 24.56 $ 24.88 $ 24.86 $ 25.56 $ 25.28 $ 24.71 $ 24.10 Adjustment Due To Goodwill And Other Intangible Assets (6.50) (6.54) (6.19) (6.23) (6.30) (6.25) (6.02) (5.71) Tangible Book Value Per Common Share (Non-GAAP)(1) $ 19.09 $ 18.02 $ 18.69 $ 18.64 $ 19.26 $ 19.03 $ 18.69 $ 18.39 Tangible Common Equity To Tangible Assets: Total Assets (GAAP) $ 4,637,498 $ 4,796,911 $ 4,788,113 $ 4,718,579 $ 4,611,579 $ 4,384,031 $ 3,654,356 $ 3,557,203 Less Goodwill And Other Intangibles 109,772 110,460 104,582 105,215 105,852 104,930 90,966 86,350 Tangible Assets (Non-GAAP) $ 4,527,726 $ 4,686,451 $ 4,683,531 $ 4,613,364 $ 4,505,727 $ 4,279,101 $ 3,563,390 $ 3,470,853 Tangible Common Equity To Tangible Assets (Non-GAAP): 7.13% 6.49% 6.74% 6.82% 7.18% 7.47% 7.93% 8.00% |
|
NON-GAAP RECONCILIATION 1. Tangible book value per share (Non-GAAP) is computed by dividing total stockholder’s equity, less goodwill and other intangible assets, by common shares outstanding. 30 Note: Totals may not add due to rounding $ in Thousands, unless otherwise indicated 2024Y 2023Y 2022Y Tangible Common Equity: Shareholders' Equity (GAAP) $ 491,461 $ 459,886 $ 432,452 Less Goodwill And Other Intangible Assets 104,723 107,148 109,772 Tangible Common Equity (Non-GAAP) $ 386,738 $ 352,738 $ 322,680 Average Tangible Common Equity: Average Shareholders' Equity (GAAP) $ 473,888 $ 442,960 $ 423,252 Less Goodwill And Other Intangible Assets 106,000 108,527 106,834 Average Tangible Common Equity (Non-GAAP) $ 367,888 $ 334,433 $ 316,418 Tangible Book Value Per Common Share: Book Value Per Common Share (GAAP) $ 29.04 $ 27.07 $ 25.59 Adjustment Due To Goodwill And Other Intangible Assets (6.19) (6.31) (6.50) Tangible Book Value Per Common Share (Non-GAAP)(1) $ 22.85 $ 20.76 $ 19.09 Tangible Common Equity To Tangible Assets: Total Assets (GAAP) $ 5,275,904 $ 4,829,387 $ 4,637,498 Less Goodwill And Other Intangibles 104,723 107,148 109,772 Tangible Assets (Non-GAAP) $ 5,171,181 $ 4,722,239 $ 4,527,726 Tangible Common Equity To Tangible Assets (Non-GAAP): 7.48% 7.47% 7.13% |
|
NON-GAAP RECONCILIATION 1. Tangible book value per share (Non-GAAP) is computed by dividing total stockholder’s equity, less goodwill and other intangible assets, by common shares outstanding. 31 Note: Totals may not add due to rounding $ in Thousands, unless otherwise indicated 4Q22 3Q22 2Q22 1Q22 4Q21 3Q21 2Q21 1Q21 Tangible Common Equity (Excluding AOCI): Shareholders' Equity (GAAP) $ 432,452 $ 414,711 $ 420,427 $ 420,042 $ 429,430 $ 424,720 $ 373,393 $ 364,058 Less Goodwill And Other Intangible Assets 109,772 110,460 104,582 105,215 105,852 104,930 90,966 86,350 Tangible Common Equity (Non-GAAP) $ 322,680 $ 304,251 $ 315,845 $ 314,827 $ 323,578 $ 319,790 $ 282,427 $ 277,708 Less Adjustment Due to AOCI (Loss) (35,324) (40,807) (24,648) (15,556) 1,443 2,559 2,338 1,083 Tangible Common Equity (Excl. AOCI) (Non-GAAP) $ 358,004 $ 345,058 $ 340,493 $ 330,383 $ 322,135 $ 317,231 $ 280,089 $ 276,625 Tangible Book Value Per Common Share (Excluding AOCI): Book Value Per Common Share (GAAP) $ 25.59 $ 24.56 $ 24.88 $ 24.86 $ 25.56 $ 25.28 $ 24.71 $ 24.10 Adjustment Due To Goodwill And Other Intangible Assets (6.50) (6.54) (6.19) (6.23) (6.30) (6.25) (6.02) (5.71) Tangible Book Value Per Common Share (Non-GAAP)(1) $ 19.09 $ 18.02 $ 18.69 $ 18.64 $ 19.26 $ 19.03 $ 18.69 $ 18.39 Less Adjustment Due to AOCI (Loss) (2.09) (2.42) (1.46) (0.92) 0.09 0.15 0.15 0.07 Tangible Book Value Per Common Share (Excl. AOCI) (Non-GAAP) $ 21.18 $ 20.43 $ 20.15 $ 19.56 $ 19.17 $ 18.88 $ 18.54 $ 18.31 4Q24 3Q24 2Q24 1Q24 4Q23 3Q23 2Q23 1Q23 Tangible Common Equity (Excluding AOCI): Shareholders' Equity (GAAP) $ 491,461 $ 489,023 $ 472,465 $ 466,796 $ 459,886 $ 446,652 $ 444,847 $ 443,399 Less Goodwill And Other Intangible Assets 104,723 105,324 105,929 106,537 107,148 107,792 108,439 109,114 Tangible Common Equity (Non-GAAP) $ 386,738 $ 383,699 $ 366,536 $ 360,259 $ 352,738 $ 338,860 $ 336,408 $ 334,285 Less Adjustment Due to AOCI (Loss) (23,671) (17,349) (25,798) (27,425) (25,907) (34,156) (35,017) (28,620) Tangible Common Equity (Excl. AOCI) (Non-GAAP) $ 410,409 $ 401,048 $ 392,334 $ 387,684 $ 378,645 $ 373,016 $ 371,425 $ 362,905 Tangible Book Value Per Common Share (Excluding AOCI): Book Value Per Common Share (GAAP) $ 29.04 $ 28.89 $ 27.91 $ 27.37 $ 27.07 $ 26.28 $ 26.16 $ 26.08 Adjustment Due To Goodwill And Other Intangible Assets (6.19) (6.22) (6.25) (6.25) (6.31) (6.34) (6.38) (6.42) Tangible Book Value Per Common Share (Non-GAAP)(1) $ 22.85 $ 22.67 $ 21.66 $ 21.12 $ 20.76 $ 19.94 $ 19.78 $ 19.66 Less Adjustment Due to AOCI (Loss) (1.40) (1.02) (1.52) (1.61) (1.52) (2.01) (2.06) (1.68) Tangible Book Value Per Common Share (Excl. AOCI) (Non-GAAP) $ 24.25 $ 23.69 $ 23.18 $ 22.73 $ 22.29 $ 21.95 $ 21.84 $ 21.34 |
|
NON-GAAP RECONCILIATION 1. Tangible book value per share (Non-GAAP) is computed by dividing total stockholder’s equity, less goodwill and other intangible assets, by common shares outstanding. 32 Note: Totals may not add due to rounding $ in Thousands, unless otherwise indicated 2024Y 2023Y 2022Y 2021Y 2020Y 2019Y Tangible Common Equity (Excluding AOCI): Shareholders' Equity (GAAP) $ 491,461 $ 459,886 $ 432,452 $ 429,430 $ 357,168 $ 312,747 Less Goodwill And Other Intangible Assets 104,723 107,148 109,772 105,852 86,471 77,193 Tangible Common Equity (Non-GAAP) $ 386,738 $ 352,738 $ 322,680 $ 323,578 $ 270,697 $ 235,554 Less Adjustment Due to AOCI (Loss) (23,671) (25,907) (35,324) 1,443 2,183 168 Tangible Common Equity (Excl. AOCI) (Non-GAAP) $ 410,409 $ 378,645 $ 358,004 $ 322,135 $ 268,514 $ 235,386 Tangible Book Value Per Common Share (Excluding AOCI): Book Value Per Common Share (GAAP) $ 29.04 $ 27.07 $ 25.59 $ 25.56 $ 23.64 $ 22.33 Adjustment Due To Goodwill And Other Intangible Assets (6.19) (6.31) (6.50) (6.30) (5.72) (5.51) Tangible Book Value Per Common Share (Non-GAAP)(1) $ 22.85 $ 20.76 $ 19.09 $ 19.26 $ 17.92 $ 16.82 Less Adjustment Due to AOCI (Loss) (1.40) (1.52) (2.09) 0.09 0.14 0.01 Tangible Book Value Per Common Share (Excl. AOCI) (Non-GAAP) $ 24.25 $ 22.29 $ 21.18 $ 19.17 $ 17.77 $ 16.80 |
|
CONTACT 33 Billy Carroll President & CEO 865.868.0613 Billy.Carroll@smartbank.com Miller Welborn Chairman 423.385.3067 Miller.Welborn@smartbank.com 5401 Kingston Pike, Suite 600 Knoxville, TN 37919 Ron Gorczynski Chief Financial Officer 865.437.5724 Ron.Gorczynski@smartbank.com |